UNITED STATES
SECURITIES AND EXCHANGE COMMISSION
Washington, D.C. 20549
FORM N-CSR
Certified Shareholder Report of
Registered Management Investment Companies
Investment Company Act File Number: 811-23122
American Funds Emerging Markets Bond Fund
(Exact Name of Registrant as Specified in Charter)
6455 Irvine Center Drive
Irvine, California 92618
(Address of Principal Executive Offices)
Registrant's telephone number, including area code: (949) 975-5000
Date of fiscal year end: December 31
Date of reporting period: December 31, 2023
Becky L. Park
American Funds Emerging Markets Bond Fund
6455 Irvine Center Drive
Irvine, California 92618
(Name and Address of Agent for Service)
ITEM 1 – Reports to Stockholders
American Funds Emerging
Markets Bond Fund® Annual report
for the year ended
December 31, 2023 |  |

Find compelling
opportunities in
emerging markets
bonds with a
flexible approach
The Securities and Exchange Commission has adopted new regulations that will change the content and design of annual and semi-annual shareholder reports beginning in July 2024. Certain types of information, including investment portfolio and financial statements, will not be included in the shareholder reports but will be available online, delivered free of charge upon request, and filed on a semi-annual basis on Form N-CSR.
If you would like to receive shareholder reports and other communications from the fund electronically, you may update your mailing preferences with your financial intermediary or enroll in e-delivery at capitalgroup.com (for accounts held directly with the fund).
American Funds Emerging Markets Bond Fund seeks to provide a high level of total return over the long term, of which current income is a large component.
This fund is one of more than 40 offered by Capital Group, home of American Funds, one of the nation’s largest mutual fund families. For over 90 years, Capital Group has invested with a long-term focus based on thorough research and attention to risk.
Fund results shown in this report, unless otherwise indicated, are for Class F-2 shares. Class A share results are shown at net asset value unless otherwise indicated. If a sales charge (maximum 3.75%) had been deducted, the results would have been lower. Results are for past periods and are not predictive of results for future periods. Current and future results may be lower or higher than those shown. Prices and returns will vary, so investors may lose money. Investing for short periods makes losses more likely. For current information and month-end results, refer to capitalgroup.com.
Refer to page 3 for Class F-2 and Class A share results with relevant sales charges deducted. For other share class results, refer to capitalgroup. com and americanfundsretirement.com.
Investment results assume all distributions are reinvested and reflect applicable fees and expenses. The investment adviser is currently reimbursing a portion of other expenses. The reimbursement will be in effect through at least March 1, 2024. The adviser may elect at its discretion to extend, modify or terminate the reimbursement at that time. The investment results shown reflect the reimbursement, without which the results would have been lower. Refer to the fund’s most recent prospectus for details.
The fund’s net 30-day yield as of December 31, 2023, calculated in accordance with the U.S. Securities and Exchange Commission (SEC) formula, was 6.80% for Class F-2 shares and 6.16% for Class A shares. The fund’s gross 30-day yield as of that date was 6.66% for Class F-2 shares and 6.08% for Class A shares. The Class A share results reflect the 3.75% maximum sales charge.
The return of principal for bond funds and for funds with significant underlying bond holdings is not guaranteed. Fund shares are subject to the same interest rate, inflation and credit risks associated with the underlying bond holdings. The use of derivatives involves a variety of risks, which may be different from, or greater than, the risks associated with investing in traditional cash securities, such as stocks and bonds. Lower rated bonds are subject to greater fluctuations in value and risk of loss of income and principal than higher rated bonds. Investing outside the United States involves additional risks, such as currency fluctuations, periods of illiquidity and price volatility, as more fully described in the prospectus. These risks may be heightened in connection with investments in developing countries. Refer to the fund prospectus and the Risk Factors section of this report for more information on these and other risks associated with investing in the fund.
Investments are not FDIC-insured, nor are they deposits of or guaranteed by a bank or any other entity, so they may lose value.
Contents
Fellow investors:
Emerging markets bonds rose sharply in 2023 as inflation fell in key Latin American markets and remained well-contained across much of Asia. In our view, central banks in Brazil, Mexico, Colombia and Indonesia (among others) acted effectively to mitigate the post-COVID-19 inflation that affected both developed and emerging markets to varying degrees. Against this backdrop, F-2 shares of American Funds Emerging Markets Bond Fund returned 13.75% in U.S. dollar terms for the 12-month period ended December 31, 2023.
In comparison, the J.P. Morgan Emerging Markets Bond Index (EMBI) Global Diversified* gained 11.09% over the same period. This index measures broad returns across U.S. dollar-denominated emerging markets bonds. The local currency index, the J.P. Morgan Government Bond Index-Emerging Markets (GBI-EM) Global Diversified*, produced a gain of 12.70% in U.S. dollar terms for the 12-month period ended December 31, 2023.
Meanwhile, the J.P. Morgan Index Blend–50% JPM EMBI Global Diversified & 50% JPM GBI-EM Global Diversified*, a 50%/50% blend of the local currency index and the dollar bond market index, returned 11.92% in U.S. dollar terms. This index is more reflective of the fund’s strategy.
The fund paid dividends at each month-end during the period for a total of about $0.55 per share for Class F-2 shares. Fund investors who reinvested their dividends earned an income return of 7.51%, while those who elected to take their dividends in cash received an income return of 7.26%.
Market overview
Emerging markets bonds entered 2023 following a very difficult 2022, in which the J.P. Morgan Index Blend returned –14.75%. While 2023 was certainly volatile, emerging markets bonds ultimately produced strong returns, most notably in Latin America. As financial conditions
Results at a glance
For periods ended December 31, 2023, with all distributions reinvested
| | | | | | | Average annual total returns |
| | | Cumulative
total returns | | | | | | Lifetime (since
Class A inception |
| | | 6 months | | 1 year | | 3 years | | 5 years | | on 4/22/2016) |
| | | | | | | | | | | | | | | | | | | | | |
| American Funds Emerging Markets Bond Fund (Class F-2 shares) | | | 6.01 | % | | | 13.75 | % | | | –1.25 | % | | | 3.45 | % | | | 3.54 | % |
| American Funds Emerging Markets Bond Fund (Class A shares) | | | 5.84 | | | | 13.39 | | | | –1.53 | | | | 3.16 | | | | 3.30 | |
| J.P Morgan Emerging Markets Bond Index (EMBI) Global Diversified* | | | 6.73 | | | | 11.09 | | | | –3.56 | | | | 1.67 | | | | 2.23 | |
| J.P. Morgan Government Bond Index-Emerging Markets (GBI-EM) Global Diversified* | | | 4.55 | | | | 12.70 | | | | –3.16 | | | | 1.14 | | | | 1.52 | |
| Lipper Emerging Markets Hard Currency Debt Funds Average† | | | 6.69 | | | | 11.00 | | | | –2.80 | | | | 1.93 | | | | 2.40 | |
Past results are not predictive of results in future periods.
| * | The J.P. Morgan Emerging Market Bond Index (EMBI) Global Diversified is a uniquely weighted emerging market debt benchmark that tracks total returns for U.S. dollar-denominated bonds issued by emerging market sovereign and quasi-sovereign entities. The J.P. Morgan Government Bond Index-Emerging Markets Global Diversified covers the universe of regularly traded, liquid fixed-rate, domestic currency emerging market government bonds to which international investors can gain exposure. The J.P. Morgan Index Blend-50% JPM EMBI Global Diversified & 50% JPM GBI-EM Global Diversified tracks the universe of regularly traded, liquid fixed-rate local and external sovereign debt issued by emerging markets. 50% of the index covers USD-denominated emerging markets sovereign bonds and the remaining 50% has exposure to local government bonds issued by emerging markets countries except India and China, which have capital controls. The indexes are unmanaged, and their results include reinvested dividends and/or distributions but do not reflect the effect of account fees, expenses or U.S. federal income taxes. Investors cannot invest directly in an index. This report, and any product, index or fund referred to herein, is not sponsored, endorsed or promoted in any way by J.P. Morgan or any of its affiliates who provide no warranties whatsoever, express or implied, and shall have no liability to any prospective investor, in connection with this report. J.P. Morgan disclaimer: https://www.jpmm.com/research/disclosures. |
| † | Lipper averages reflect the current composition of all eligible mutual funds (all share classes) within a given category. Source: Refinitiv Lipper. Lipper categories are dynamic, and averages may have few funds, especially over longer periods. To see the number of funds included in the Lipper category for each fund’s lifetime, refer to the Quarterly Statistical Update, available on our website. |
| American Funds Emerging Markets Bond Fund | 1 |
eased, many distressed credits also posted strong returns in U.S. dollars and euros as investors gained confidence.
Broadly speaking, these returns came as emerging markets central banks took effective action to manage their interest rate cycles following the volatility and economic disruptions caused by the COVID-19 pandemic. As the pandemic receded in late 2022 and early 2023, many emerging markets central banks were well ahead of their developed market counterparts in managing the pandemic’s inflationary effects. As a result, key central banks in Latin America and Asia either kept interest rates on hold or began easing cycles by the third quarter of 2023, which generally aided local currency emerging markets bond returns.
This came as the U.S. Federal Reserve (the Fed) continued its rate-hiking campaign during the year, eventually increasing the federal funds target rate to a multiyear high of 5.25%–5.50%. While broad-based U.S. inflation remained elevated on a historical basis, core inflation fell significantly toward the end of 2023.
Within this environment, the U.S. Dollar Index (DXY)† fell 2.7% over the course of the year, while currencies such as the Colombian peso (+25.2%), the Mexican nuevo peso (+15.1%) and the Brazilian real (+8.7%) rose in U.S. dollar terms. In contrast, currencies such as the Argentine peso (–78.1%) and the Turkish lira (–36.6%) fell sharply in U.S. dollar terms as investors avoided these markets due to their economic and political challenges.
While emerging markets bonds generally rose during the year, individual markets experienced significant duress. In China, for example, economic conditions were challenging as the country’s long-anticipated post-COVID-19 reopening failed to produce the kind of sustained growth for which many investors had hoped. Meanwhile, Russia’s ongoing invasion of Ukraine continued to damage both economies dramatically as the war appeared to fall into a relative stalemate. Still, gains in other emerging bond markets more than offset these macro difficulties during the year as investors remained constructive on the asset class.
Inside the portfolio
As emerging markets bonds rose during the year, the fund’s returns exceeded the J.P. Morgan Index Blend by 1.83 percentage points in U.S. dollar terms, due in part to the portfolio’s currency, yield curve and duration positioning. (The yield curve is defined as the slope of the yield differential between short- and long-term interest rates, while duration in this context is defined as a fund’s sensitivity to changes in interest rates.) Security selection was also a meaningful contributor to relative results. The fund’s greater-than-benchmark positions in Colombia, Argentina, Brazil and Tunisia added to relative returns, while a small off-benchmark holding in Russia and the fund’s less-than-benchmark exposure to Poland both detracted.
In Colombia, political gridlock benefited returns as the lack of a clear mandate for President Gustavo Petro gave the country’s central bank an opportunity to focus squarely on implementing effective monetary policy. Meanwhile, the Brazilian central bank followed a similar course.
Hard currency bonds, and especially corporate credits, aided relative returns as they rose sharply during some of the more volatile months of the year. However, the fund’s underweight position in the U.S. dollar market and the higher yielding part of that universe in the last two months of the year detracted from overall returns. Still, the fund’s local currency positions more than compensated for this underweight exposure.
The fund benefited from its overweight exposures to the Colombian peso, Mexican peso and Brazilian real as compared to the J.P. Morgan Index Blend. The fund’s underweight position in the Czech koruna and its greater-than-benchmark exposure to the Polish zloty both detracted from returns.
Looking ahead
While the global inflation and interest rate environments appear more ambiguous in 2024 than in 2023, we believe that most developed and emerging markets are at or near a peak in both inflation and rates. In fact, broad-based inflation appears to be declining in many markets, including the U.S. Although the strong returns that emerging markets bonds produced in 2023 were on the back of a weak 2022, we believe that 2024 can provide positive returns as well.
In our view, the duration, foreign exchange and starting yield components of emerging bond markets remain very attractive. At this stage of the economic cycle, most local currencies appear reasonably valued versus the U.S. dollar. In addition, we believe emerging markets bonds will likely benefit if global interest rates fall significantly in 2024, given that in that scenario, issuers would be refinancing at lower rates than in the recent past.
Nevertheless, some uncertainty remains within the global economic outlook. While the Fed appears to be leaning toward cutting rates in 2024, that posture may change if U.S. inflation is more persistent than expected. In China, although some degree of economic stimulus seems likely this year, we remain concerned about the country’s political environment and the resilience of Chinese consumers. Taking these factors into account, volatility appears likely to persist during the year. Even in light of this uncertainty, however, we continue to believe that emerging markets bond valuations appear attractive and that economic growth in most emerging markets is likely to be reasonably strong in 2024.
During the year, former fund president Robert Neithart retired from Capital Group. I am honored to assume the role of president of the fund in Robert’s stead. We thank you for making American Funds Emerging Markets Bond Fund part of your portfolio and look forward to reporting to you again in six months.
Sincerely,

Kirstie Spence
President
February 9, 2024
For current information about the fund, visit capitalgroup.com.
Past results are not predictive of results in future periods.
| † | The ICE U.S. Dollar Index is a geometrically averaged calculation that measures the value of the U.S. dollar relative to a basket of foreign currencies: the euro, the yen, the British pound, the Canadian dollar, the Swedish krona and the Swiss franc. The U.S. Dollar Index, together with all rights, title and interest in and related to the U.S. Dollar Index, including all content included therein and all related intellectual property and property rights, is the exclusive property of ICE Data Indices, LLC. |
| 2 | American Funds Emerging Markets Bond Fund |
The value of a $10,000 investment
How a hypothetical $10,000 investment has fared for the period April 22, 2016, to December 31, 2023, with all distributions reinvested.
Fund results shown are for Class F-2 and Class A shares. Class A shares reflect deduction of the maximum sales charge of 3.75% on the $10,000 investment.1 Thus, the net amount invested was $9,625.
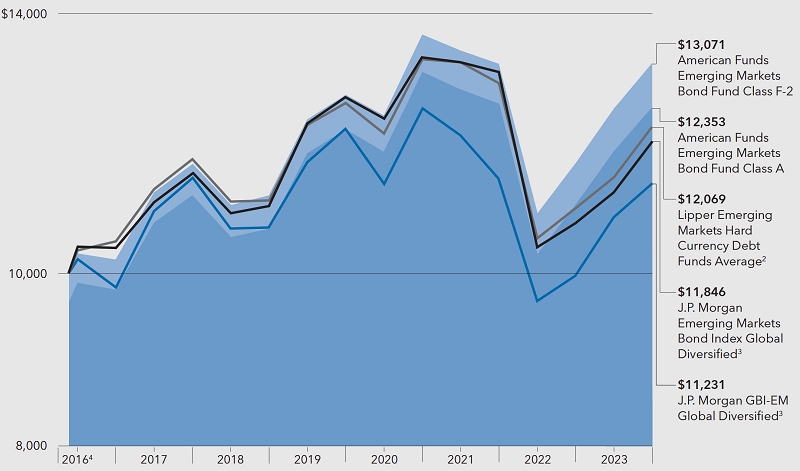
Past results are not predictive of results for future periods. The results shown are before taxes on fund distributions and sale of fund shares.
| 1 | As outlined in the prospectus, the sales charge is reduced for accounts (and aggregated investments) of $100,000 or more and is eliminated for purchases of $500,000 or more. There is no sales charge on dividends or capital gain distributions that are reinvested in additional shares. |
| 2 | Results of the Lipper Emerging Markets Hard Currency Debt Funds Average do not reflect any sales charges. Lipper averages reflect the current composition of all eligible mutual funds (all share classes) within a given category. Source: Refinitiv Lipper. Lipper categories are dynamic and averages may have few funds, especially over longer periods. For the number of funds included in the Lipper category for each fund’s lifetime, refer to the Quarterly Statistical Update, available on our website. |
| 3 | This report, and any product, index or fund referred to herein, is not sponsored, endorsed or promoted in any way by J.P. Morgan or any of its affiliates who provide no warranties whatsoever, express or implied, and shall have no liability to any prospective investor, in connection with this report. J.P. Morgan disclaimer: https://www.jpmm.com/research/disclosures. |
| 4 | For the period April 22, 2016, commencement of fund operations, through December 31, 2016. |
Total returns based on a $1,000 investment (for the period ended December 31, 2023)
| | | 1 year | | 5 years | | Lifetime (since
Class A inception
on 4/22/16) |
| | | | | | | |
| Class F-2 shares | | | 13.75 | % | | | 3.45 | % | | | 3.54 | % |
| Class A shares* | | | 9.08 | | | | 2.38 | | | | 2.78 | |
| * | Assumes payment of the maximum 3.75% sales charge. |
The total annual fund operating expense ratios are 0.66% for Class F-2 shares and 0.97% for Class A shares as of the prospectus dated March 1, 2024 (unaudited).
Investment results assume all distributions are reinvested and reflect applicable fees and expenses. When applicable, investment results reflect fee waivers and/or expense reimbursements, without which they would have been lower. Refer to capitalgroup.com for more information.
| American Funds Emerging Markets Bond Fund | 3 |
Investment portfolio December 31, 2023
| Investment mix by security type | Percent of net assets |

| Portfolio quality summary* | | Percent of
net assets |
| U.S. Treasury and agency† | | | 4.62 | % |
| AA/Aa | | | 7.99 | |
| A/A | | | 14.10 | |
| BBB/Baa | | | 30.51 | |
| Below investment grade | | | 35.23 | |
| Short-term securities & other assets less liabilities | | | 7.55 | |
| * | Bond ratings, which typically range from AAA/Aaa (highest) to D (lowest), are assigned by credit rating agencies such as Standard & Poor’s, Moody’s and/or Fitch as an indication of an issuer’s creditworthiness. In assigning a credit rating to a security, the fund looks specifically to the ratings assigned to the issuer of the security by Standard & Poor’s, Moody’s and/or Fitch. If agency ratings differ, the security will be considered to have received the highest of those ratings, consistent with the fund’s investment policies. The ratings are not covered by the Report of Independent Registered Public Accounting Firm. |
| † | These securities are guaranteed by the full faith and credit of the U.S. government. |
| | |
| Bonds, notes & other debt instruments 91.67% | | Principal amount
(000) | | | Value
(000) | |
| Bonds & notes of governments & government agencies outside the U.S. 69.17% | | | | | | | | |
| Abu Dhabi (Emirate of) 2.50% 9/30/20291 | | USD | 1,150 | | | $ | 1,054 | |
| Abu Dhabi (Emirate of) 3.125% 9/30/2049 | | | 2,700 | | | | 1,990 | |
| Albania (Republic of) 5.90% 6/9/2028 | | EUR | 4,140 | | | | 4,682 | |
| Angola (Republic of) 9.50% 11/12/2025 | | USD | 1,280 | | | | 1,260 | |
| Angola (Republic of) 8.00% 11/26/20291 | | | 4,100 | | | | 3,653 | |
| Angola (Republic of) 8.00% 11/26/2029 | | | 2,110 | | | | 1,880 | |
| Angola (Republic of) 8.75% 4/14/2032 | | | 3,000 | | | | 2,647 | |
| Angola (Republic of) 8.75% 4/14/20321 | | | 500 | | | | 441 | |
| Angola (Republic of) 9.125% 11/26/2049 | | | 3,480 | | | | 2,849 | |
| Argentine Republic 0.50% 7/9/2029 | | EUR | 65 | | | | 26 | |
| Argentine Republic 1.00% 7/9/2029 | | USD | 1,290 | | | | 519 | |
| Argentine Republic 0.75% 7/9/2030 (1.75% on 7/9/2027)2 | | | 19,050 | | | | 7,687 | |
| Argentine Republic 3.625% 7/9/2035 (4.125% on 7/9/2024)2 | | | 11,460 | | | | 3,960 | |
| Argentine Republic 0% 12/15/2035 | | | 600 | | | | 21 | |
| Argentine Republic 3.00% 1/9/2038 (3.75% on 7/9/2024)2 | | EUR | 978 | | | | 385 | |
| Azerbaijan (Republic of) 3.50% 9/1/2032 | | USD | 910 | | | | 792 | |
| Brazil (Federative Republic of) 6.00% 8/15/20243 | | BRL | 11,063 | | | | 2,271 | |
| Brazil (Federative Republic of) 10.00% 1/1/2025 | | | 10,600 | | | | 2,184 | |
| Brazil (Federative Republic of) 0% 7/1/2025 | | | 7,123 | | | | 1,277 | |
| Brazil (Federative Republic of) 0% 1/1/2026 | | | 61,600 | | | | 10,543 | |
| Brazil (Federative Republic of) 6.00% 8/15/20263 | | | 12,882 | | | | 2,704 | |
| Brazil (Federative Republic of) 10.00% 1/1/2027 | | | 23,420 | | | | 4,841 | |
| Brazil (Federative Republic of) 10.00% 1/1/2029 | | | 101,081 | | | | 20,768 | |
| Brazil (Federative Republic of) 10.00% 1/1/2031 | | | 52,986 | | | | 10,780 | |
| Brazil (Federative Republic of) 10.00% 1/1/2033 | | | 12,525 | | | | 2,542 | |
| Brazil (Federative Republic of) 6.00% 8/15/20503 | | | 58,322 | | | | 12,926 | |
| Bulgaria (Republic of) 4.375% 5/13/2031 | | EUR | 1,390 | | | | 1,615 | |
| Bulgaria (Republic of) 4.50% 1/27/2033 | | | 1,310 | | | | 1,522 | |
| Chile (Republic of) 5.00% 10/1/2028 | | CLP | 595,000 | | | | 664 | |
| Chile (Republic of) 4.70% 9/1/2030 | | | 1,740,000 | | | | 1,904 | |
| Chile (Republic of) 6.00% 4/1/2033 | | | 340,000 | | | | 406 | |
| | |
| 4 | American Funds Emerging Markets Bond Fund |
| Bonds, notes & other debt instruments (continued) | | Principal amount
(000) | | | Value
(000) | |
| Bonds & notes of governments & government agencies outside the U.S. (continued) | | | | | | | | |
| Chile (Republic of) 5.30% 11/1/2037 | | CLP | 2,980,000 | | | $ | 3,407 | |
| Chile (Republic of) 3.10% 5/7/2041 | | USD | 2,150 | | | | 1,642 | |
| Chile (Republic of) 4.34% 3/7/2042 | | | 1,810 | | | | 1,623 | |
| Chile (Republic of) 4.00% 1/31/2052 | | | 200 | | | | 165 | |
| China (People’s Republic of), Series INBK, 2.26% 2/24/2025 | | CNY | 8,650 | | | | 1,221 | |
| China (People’s Republic of), Series INBK, 2.48% 4/15/2027 | | | 3,930 | | | | 556 | |
| China (People’s Republic of), Series INBK, 2.85% 6/4/2027 | | | 1,480 | | | | 212 | |
| China (People’s Republic of), Series INBK, 2.40% 7/15/2028 | | | 4,100 | | | | 579 | |
| China (People’s Republic of), Series INBK, 2.80% 3/24/2029 | | | 25,260 | | | | 3,621 | |
| China (People’s Republic of), Series INBK, 2.68% 5/21/2030 | | | 16,050 | | | | 2,281 | |
| China (People’s Republic of), Series INBK, 2.69% 8/15/2032 | | | 9,450 | | | | 1,343 | |
| China (People’s Republic of), Series 1910, 3.86% 7/22/2049 | | | 15,670 | | | | 2,589 | |
| China (People’s Republic of), Series INBK, 3.39% 3/16/2050 | | | 23,270 | | | | 3,575 | |
| China (People’s Republic of), Series INBK, 3.32% 4/15/2052 | | | 2,070 | | | | 315 | |
| China (People’s Republic of), Series INBK, 3.12% 10/25/2052 | | | 54,400 | | | | 8,001 | |
| China (People’s Republic of), Series INBK, 3.19% 4/15/2053 | | | 5,500 | | | | 829 | |
| China Development Bank Corp., Series 2009, 3.39% 7/10/2027 | | | 6,590 | | | | 958 | |
| China Development Bank Corp., Series 1905, 3.48% 1/8/2029 | | | 8,350 | | | | 1,228 | |
| Colombia (Republic of) 4.50% 3/15/2029 | | USD | 241 | | | | 226 | |
| Colombia (Republic of) 3.00% 1/30/2030 | | | 278 | | | | 235 | |
| Colombia (Republic of) 7.00% 3/26/2031 | | COP | 5,102,400 | | | | 1,137 | |
| Colombia (Republic of) 3.125% 4/15/2031 | | USD | 1,311 | | | | 1,071 | |
| Colombia (Republic of) 3.25% 4/22/2032 | | | 1,053 | | | | 839 | |
| Colombia (Republic of) 8.00% 4/20/2033 | | | 2,560 | | | | 2,797 | |
| Colombia (Republic of) 7.50% 2/2/2034 | | | 1,720 | | | | 1,820 | |
| Colombia (Republic of) 8.00% 11/14/2035 | | | 1,250 | | | | 1,370 | |
| Colombia (Republic of) 7.375% 9/18/2037 | | | 610 | | | | 635 | |
| Colombia (Republic of) 5.625% 2/26/2044 | | | 261 | | | | 220 | |
| Colombia (Republic of) 5.00% 6/15/2045 | | | 785 | | | | 612 | |
| Colombia (Republic of) 5.20% 5/15/2049 | | | 200 | | | | 157 | |
| Colombia (Republic of) 4.125% 5/15/2051 | | | 4,850 | | | | 3,239 | |
| Colombia (Republic of), Series B, 5.75% 11/3/2027 | | COP | 17,804,900 | | | | 4,073 | |
| Colombia (Republic of), Series B, 7.00% 3/26/2031 | | | 48,378,900 | | | | 10,777 | |
| Colombia (Republic of), Series B, 7.25% 10/18/2034 | | | 6,248,200 | | | | 1,328 | |
| Colombia (Republic of), Series UVR, 3.75% 2/25/20373 | | | 20,000 | | | | 1,770 | |
| Colombia (Republic of), Series B, 9.25% 5/28/2042 | | | 29,273,000 | | | | 6,859 | |
| Colombia (Republic of), Series B, 7.25% 10/26/2050 | | | 3,615,200 | | | | 680 | |
| Cote d’Ivoire (Republic of) 5.25% 3/22/2030 | | EUR | 1,380 | | | | 1,371 | |
| Cote d’Ivoire (Republic of) 5.875% 10/17/2031 | | | 1,745 | | | | 1,732 | |
| Cote d’Ivoire (Republic of) 4.875% 1/30/2032 | | | 970 | | | | 905 | |
| Cote d’Ivoire (Republic of) 6.875% 10/17/2040 | | | 4,000 | | | | 3,707 | |
| Czech Republic 5.70% 5/25/2024 | | CZK | 23,170 | | | | 1,040 | |
| Czech Republic 1.25% 2/14/2025 | | | 61,810 | | | | 2,662 | |
| Czech Republic 2.40% 9/17/2025 | | | 13,000 | | | | 562 | |
| Czech Republic 1.00% 6/26/2026 | | | 9,070 | | | | 376 | |
| Czech Republic 2.50% 8/25/2028 | | | 19,360 | | | | 822 | |
| Czech Republic 0.95% 5/15/2030 | | | 10,520 | | | | 398 | |
| Czech Republic 1.20% 3/13/2031 | | | 30,160 | | | | 1,138 | |
| Czech Republic 4.90% 4/14/2034 | | | 159,600 | | | | 7,838 | |
| Czech Republic 1.95% 7/30/2037 | | | 258,940 | | | | 9,336 | |
| Czech Republic 1.50% 4/24/2040 | | | 53,320 | | | | 1,717 | |
| Development Bank of Kazakhstan JSC 10.75% 2/12/2025 | | KZT | 85,750 | | | | 179 | |
| Development Bank of Kazakhstan JSC 10.95% 5/6/2026 | | | 1,313,500 | | | | 2,595 | |
| Development Bank of Kazakhstan JSC 10.95% 5/6/2026 | | | 218,500 | | | | 432 | |
| Dominican Republic 5.95% 1/25/20271 | | USD | 2,300 | | | | 2,313 | |
| Dominican Republic 5.95% 1/25/2027 | | | 1,700 | | | | 1,710 | |
| Dominican Republic 5.50% 2/22/20291 | | | 1,420 | | | | 1,392 | |
| Dominican Republic 5.50% 2/22/2029 | | | 500 | | | | 490 | |
| Dominican Republic 4.50% 1/30/20301 | | | 4,988 | | | | 4,608 | |
| Dominican Republic 7.05% 2/3/20311 | | | 665 | | | | 700 | |
| Dominican Republic 13.625% 2/3/2033 | | DOP | 49,250 | | | | 1,034 | |
| Dominican Republic 13.625% 2/3/2033 | | | 24,200 | | | | 508 | |
| Dominican Republic 6.00% 2/22/20331 | | USD | 805 | | | | 796 | |
| Dominican Republic 11.25% 9/15/2035 | | DOP | 121,300 | | | | 2,259 | |
| Dominican Republic 11.25% 9/15/2035 | | | 38,450 | | | | 716 | |
| Dominican Republic 5.30% 1/21/2041 | | USD | 1,000 | | | | 867 | |
| Dominican Republic 5.30% 1/21/20411 | | | 887 | | | | 769 | |
| | |
| American Funds Emerging Markets Bond Fund | 5 |
| Bonds, notes & other debt instruments (continued) | | Principal amount
(000) | | | Value
(000) | |
| Bonds & notes of governments & government agencies outside the U.S. (continued) | | | | | | | | |
| Dominican Republic 5.875% 1/30/2060 | | USD | 6,365 | | | $ | 5,522 | |
| Dominican Republic 5.875% 1/30/20601 | | | 2,170 | | | | 1,882 | |
| Egypt (Arab Republic of) 6.588% 2/21/20281 | | | 2,528 | | | | 1,946 | |
| Egypt (Arab Republic of) 6.588% 2/21/2028 | | | 1,445 | | | | 1,112 | |
| Egypt (Arab Republic of) 5.625% 4/16/2030 | | EUR | 1,000 | | | | 708 | |
| Egypt (Arab Republic of) 7.053% 1/15/2032 | | USD | 404 | | | | 278 | |
| Egypt (Arab Republic of) 7.625% 5/29/2032 | | | 1,000 | | | | 697 | |
| Egypt (Arab Republic of) 7.625% 5/29/20321 | | | 575 | | | | 401 | |
| Egypt (Arab Republic of) 8.875% 5/29/2050 | | | 660 | | | | 422 | |
| Egypt (Arab Republic of) 8.75% 9/30/2051 | | | 880 | | | | 559 | |
| Egypt (Arab Republic of) 8.15% 11/20/20591 | | | 1,300 | | | | 802 | |
| Ethiopia (Federal Democratic Republic of) 6.625% 12/11/20244 | | | 3,575 | | | | 2,430 | |
| European Bank for Reconstruction & Development 5.15% 2/16/2024 | | INR | 66,300 | | | | 796 | |
| European Bank for Reconstruction & Development 6.30% 10/26/2027 | | | 75,500 | | | | 896 | |
| Export-Import Bank of India 3.25% 1/15/2030 | | USD | 250 | | | | 229 | |
| Export-Import Bank of India 5.50% 1/18/2033 | | | 1,000 | | | | 1,036 | |
| Export-Import Bank of Korea 4.25% 9/15/2027 | | | 805 | | | | 798 | |
| Gabonese Republic 6.95% 6/16/2025 | | | 1,048 | | | | 1,002 | |
| Gabonese Republic 6.625% 2/6/20311 | | | 400 | | | | 335 | |
| Gabonese Republic 7.00% 11/24/20311 | | | 1,820 | | | | 1,522 | |
| Gabonese Republic 7.00% 11/24/2031 | | | 1,710 | | | | 1,430 | |
| Gaci First Investment Co. 5.00% 10/13/2027 | | | 500 | | | | 505 | |
| Georgia (Republic of) 2.75% 4/22/20261 | | | 1,975 | | | | 1,856 | |
| Ghana (Republic of) 7.75% 4/7/20291,4 | | | 1,900 | | | | 835 | |
| Ghana (Republic of) 7.625% 5/16/20294 | | | 490 | | | | 215 | |
| Honduras (Republic of) 6.25% 1/19/2027 | | | 6,610 | | | | 6,362 | |
| Honduras (Republic of) 6.25% 1/19/20271 | | | 263 | | | | 253 | |
| Honduras (Republic of) 5.625% 6/24/2030 | | | 3,806 | | | | 3,402 | |
| Honduras (Republic of) 5.625% 6/24/20301 | | | 2,285 | | | | 2,042 | |
| Hungary (Republic of) 5.00% 2/22/2027 | | EUR | 1,625 | | | | 1,875 | |
| Hungary (Republic of) 6.125% 5/22/20281 | | USD | 3,130 | | | | 3,259 | |
| Hungary (Republic of) 2.00% 5/23/2029 | | HUF | 170,250 | | | | 410 | |
| Hungary (Republic of) 2.125% 9/22/2031 | | USD | 810 | | | | 655 | |
| Hungary (Republic of) 6.25% 9/22/20321 | | | 1,000 | | | | 1,069 | |
| Hungary (Republic of) 5.375% 9/12/2033 | | EUR | 2,000 | | | | 2,365 | |
| Hungary (Republic of), Series B, 3.00% 6/26/2024 | | HUF | 478,930 | | | | 1,356 | |
| Hungary (Republic of), Series B, 5.50% 6/24/2025 | | | 788,900 | | | | 2,249 | |
| Hungary (Republic of), Series A, 6.75% 10/22/2028 | | | 854,520 | | | | 2,560 | |
| Hungary (Republic of), Series A, 3.25% 10/22/2031 | | | 675,650 | | | | 1,659 | |
| Hungary (Republic of), Series 32-A, 4.75% 11/24/2032 | | | 738,200 | | | | 1,967 | |
| Hungary (Republic of), Series 41-A, 3.00% 4/25/2041 | | | 1,200,000 | | | | 2,344 | |
| India (Republic of) 6.54% 1/17/2032 | | INR | 405,000 | | | | 4,680 | |
| Indonesia (Republic of) 4.65% 9/20/2032 | | USD | 2,040 | | | | 2,043 | |
| Indonesia (Republic of) 6.625% 2/15/2034 | | IDR | 2,995,000 | | | | 195 | |
| Indonesia (Republic of) 6.625% 2/17/2037 | | USD | 300 | | | | 352 | |
| Indonesia (Republic of) 5.25% 1/17/2042 | | | 600 | | | | 627 | |
| Indonesia (Republic of), Series 77, 8.125% 5/15/2024 | | IDR | 6,918,000 | | | | 452 | |
| Indonesia (Republic of), Series 59, 7.00% 5/15/2027 | | | 31,785,000 | | | | 2,100 | |
| Indonesia (Republic of), Series 64, 6.125% 5/15/2028 | | | 69,965,000 | | | | 4,489 | |
| Indonesia (Republic of), Series 95, 6.375% 8/15/2028 | | | 29,230,000 | | | | 1,895 | |
| Indonesia (Republic of), Series 71, 9.00% 3/15/2029 | | | 15,635,000 | | | | 1,124 | |
| Indonesia (Republic of), Series 78, 8.25% 5/15/2029 | | | 35,718,000 | | | | 2,502 | |
| Indonesia (Republic of), Series 82, 7.00% 9/15/2030 | | | 100,205,000 | | | | 6,653 | |
| Indonesia (Republic of), Series 87, 6.50% 2/15/2031 | | | 107,654,000 | | | | 6,964 | |
| Indonesia (Republic of), Series 73, 8.75% 5/15/2031 | | | 28,473,000 | | | | 2,070 | |
| Indonesia (Republic of), Series 91, 6.375% 4/15/2032 | | | 154,160,000 | | | | 9,911 | |
| Indonesia (Republic of), Series 58, 8.25% 6/15/2032 | | | 40,712,000 | | | | 2,907 | |
| Indonesia (Republic of), Series 74, 7.50% 8/15/2032 | | | 50,000,000 | | | | 3,441 | |
| Indonesia (Republic of), Series 96, 7.00% 2/15/2033 | | | 97,834,000 | | | | 6,589 | |
| Indonesia (Republic of), Series 65, 6.625% 5/15/2033 | | | 19,400,000 | | | | 1,265 | |
| Indonesia (Republic of), Series 68, 8.375% 3/15/2034 | | | 45,362,000 | | | | 3,295 | |
| Indonesia (Republic of), Series 80, 7.50% 6/15/2035 | | | 33,080,000 | | | | 2,291 | |
| Indonesia (Republic of), Series 72, 8.25% 5/15/2036 | | | 33,753,000 | | | | 2,472 | |
| Indonesia (Republic of), Series 92, 7.125% 6/15/2042 | | | 19,170,000 | | | | 1,292 | |
| Indonesia Asahan Aluminium (Persero) PT 4.75% 5/15/2025 | | USD | 1,600 | | | | 1,581 | |
| Indonesia Asahan Aluminium (Persero) PT 6.53% 11/15/2028 | | | 264 | | | | 277 | |
| Indonesia Asahan Aluminium (Persero) PT 5.80% 5/15/2050 | | | 300 | | | | 292 | |
| | |
| 6 | American Funds Emerging Markets Bond Fund |
| Bonds, notes & other debt instruments (continued) | | Principal amount
(000) | | | Value
(000) | |
| Bonds & notes of governments & government agencies outside the U.S. (continued) | | | | | | | | |
| International Bank for Reconstruction and Development 6.85% 4/24/2028 | | INR | 316,500 | | | $ | 3,815 | |
| International Finance Corp. 6.30% 11/25/2024 | | | 159,470 | | | | 1,905 | |
| Israel (State of) 2.875% 3/16/2026 | | USD | 373 | | | | 356 | |
| Israel (State of) 2.25% 9/28/2028 | | ILS | 1,750 | | | | 456 | |
| Israel (State of) 2.75% 7/3/2030 | | USD | 4,319 | | | | 3,825 | |
| Israel (State of) 6.50% 11/6/2031 | | | 4,201 | | | | 4,533 | |
| Israel (State of) 1.30% 4/30/2032 | | ILS | 13,390 | | | | 3,013 | |
| Israel (State of) 4.50% 1/17/2033 | | USD | 2,655 | | | | 2,528 | |
| Jordan (Hashemite Kingdom of) 7.50% 1/13/2029 | | | 1,555 | | | | 1,579 | |
| Jordan (Hashemite Kingdom of) 5.85% 7/7/2030 | | | 1,555 | | | | 1,450 | |
| Jordan (Hashemite Kingdom of) 7.375% 10/10/2047 | | | 1,036 | | | | 924 | |
| Kazakhstan (Republic of) 6.50% 7/21/2045 | | | 800 | | | | 917 | |
| Kenya (Republic of) 6.875% 6/24/2024 | | | 775 | | | | 755 | |
| Kenya (Republic of) 7.25% 2/28/20281 | | | 1,725 | | | | 1,582 | |
| Magyar Export-Import Bank 6.00% 5/16/2029 | | EUR | 6,204 | | | | 7,286 | |
| Malaysia (Federation of), Series 0319, 3.478% 6/14/2024 | | MYR | 2,599 | | | | 566 | |
| Malaysia (Federation of), Series 0115, 3.955% 9/15/2025 | | | 5 | | | | 1 | |
| Malaysia (Federation of), Series 0120, 3.422% 9/30/2027 | | | 3,852 | | | | 832 | |
| Malaysia (Federation of), Series 0417, 3.899% 11/16/2027 | | | 1,300 | | | | 286 | |
| Malaysia (Federation of), Series 0513, 3.733% 6/15/2028 | | | 1,870 | | | | 408 | |
| Malaysia (Federation of), Series 0218, 4.369% 10/31/2028 | | | 5,197 | | | | 1,165 | |
| Malaysia (Federation of), Series 0219, 3.885% 8/15/2029 | | | 12,810 | | | | 2,811 | |
| Malaysia (Federation of), Series 0220, 2.632% 4/15/2031 | | | 3,367 | | | | 677 | |
| Malaysia (Federation of), Series 0122, 3.582% 7/15/2032 | | | 2,100 | | | | 449 | |
| Malaysia (Federation of), Series 0419, 3.828% 7/5/2034 | | | 44,230 | | | | 9,567 | |
| Malaysia (Federation of), Series 0415, 4.254% 5/31/2035 | | | 19,350 | | | | 4,320 | |
| Malaysia (Federation of), Series 0615, 4.786% 10/31/2035 | | | 5,925 | | | | 1,392 | |
| Malaysia (Federation of), Series 0317, 4.762% 4/7/2037 | | | 562 | | | | 132 | |
| Malaysia (Federation of), Series 0418, 4.893% 6/8/2038 | | | 44,666 | | | | 10,676 | |
| Malaysia (Federation of), Series 0519, 3.757% 5/22/2040 | | | 2,500 | | | | 521 | |
| Malaysia (Federation of), Series 0221, 4.417% 9/30/2041 | | | 699 | | | | 158 | |
| Malaysia (Federation of), Series 0519, 4.638% 11/15/2049 | | | 2,448 | | | | 559 | |
| Malaysia (Federation of), Series 0120, 4.065% 6/15/2050 | | | 2,594 | | | | 555 | |
| Malaysia (Federation of), Series 022, 5.357% 5/15/2052 | | | 2,352 | | | | 598 | |
| MFB Magyar Fejlesztesi Bank Zartkoruen Mukodo Reszvenytarsasag 6.50% 6/29/2028 | | USD | 2,200 | | | | 2,269 | |
| Mic Capital Management (Rsc) Seven, Ltd. 5.084% 5/22/20531 | | | 200 | | | | 197 | |
| Mongolia (State of) 3.50% 7/7/2027 | | | 200 | | | | 179 | |
| Mongolia (State of) 8.65% 1/19/20281 | | | 1,492 | | | | 1,566 | |
| Mongolia (State of) 8.65% 1/19/2028 | | | 550 | | | | 577 | |
| Morocco (Kingdom of) 1.375% 3/30/2026 | | EUR | 433 | | | | 452 | |
| Morocco (Kingdom of) 5.95% 3/8/20281 | | USD | 1,225 | | | | 1,259 | |
| Mozambique (Republic of) 9.00% 9/15/2031 | | | 4,590 | | | | 3,921 | |
| Namibia (Republic of) 5.25% 10/29/2025 | | | 2,000 | | | | 1,981 | |
| Nigeria (Republic of) 8.375% 3/24/2029 | | | 250 | | | | 241 | |
| Nigeria (Republic of) 7.875% 2/16/2032 | | | 3,030 | | | | 2,732 | |
| Nigeria (Republic of) 8.25% 9/28/2051 | | | 4,585 | | | | 3,776 | |
| Oman (Sultanate of) 5.625% 1/17/2028 | | | 1,000 | | | | 1,021 | |
| Oman (Sultanate of) 4.875% 6/15/20301 | | | 800 | | | | 792 | |
| Oman (Sultanate of) 6.25% 1/25/20311 | | | 2,771 | | | | 2,920 | |
| Oman (Sultanate of) 6.75% 1/17/2048 | | | 3,437 | | | | 3,605 | |
| Oman (Sultanate of) 7.00% 1/25/2051 | | | 279 | | | | 302 | |
| Panama (Republic of) 7.125% 1/29/2026 | | | 710 | | | | 729 | |
| Panama (Republic of) 3.16% 1/23/2030 | | | 830 | | | | 709 | |
| Panama (Republic of) 6.375% 7/25/20331 | | | 5,310 | | | | 4,989 | |
| Panama (Republic of) 6.40% 2/14/2035 | | | 2,560 | | | | 2,505 | |
| Panama (Republic of) 6.875% 1/31/2036 | | | 2,240 | | | | 2,241 | |
| Panama (Republic of) 4.50% 5/15/2047 | | | 1,350 | | | | 962 | |
| Panama (Republic of) 4.50% 4/16/2050 | | | 700 | | | | 487 | |
| Panama (Republic of) 4.30% 4/29/2053 | | | 820 | | | | 551 | |
| Panama (Republic of) 6.853% 3/28/2054 | | | 1,200 | | | | 1,126 | |
| Panama (Republic of) 4.50% 4/1/2056 | | | 673 | | | | 454 | |
| Panama (Republic of) 3.87% 7/23/2060 | | | 1,696 | | | | 1,020 | |
| Panama (Republic of) 4.50% 1/19/2063 | | | 2,704 | | | | 1,776 | |
| Paraguay (Republic of) 5.00% 4/15/2026 | | | 154 | | | | 153 | |
| Paraguay (Republic of) 4.95% 4/28/2031 | | | 430 | | | | 421 | |
| Paraguay (Republic of) 5.60% 3/13/20481 | | | 2,432 | | | | 2,224 | |
| Peru (Republic of) 4.125% 8/25/2027 | | | 1,056 | | | | 1,035 | |
| | |
| American Funds Emerging Markets Bond Fund | 7 |
| Bonds, notes & other debt instruments (continued) | | Principal amount
(000) | | | Value
(000) | |
| Bonds & notes of governments & government agencies outside the U.S. (continued) | | | | | | | | |
| Peru (Republic of) 6.95% 8/12/2031 | | PEN | 3,045 | | | $ | 854 | |
| Peru (Republic of) 6.15% 8/12/2032 | | | 6,752 | | | | 1,783 | |
| Peru (Republic of) 3.00% 1/15/2034 | | USD | 840 | | | | 712 | |
| Peru (Republic of) 5.40% 8/12/2034 | | PEN | 14,786 | | | | 3,615 | |
| Peru (Republic of) 5.40% 8/12/2034 | | | 3,039 | | | | 743 | |
| Peru (Republic of) 3.55% 3/10/2051 | | USD | 1,100 | | | | 837 | |
| Peru (Republic of) 2.78% 12/1/2060 | | | 1,615 | | | | 1,011 | |
| PETRONAS Capital, Ltd. 3.50% 4/21/20301 | | | 1,000 | | | | 940 | |
| PETRONAS Capital, Ltd. 3.50% 4/21/2030 | | | 300 | | | | 282 | |
| PETRONAS Capital, Ltd. 4.50% 3/18/2045 | | | 200 | | | | 184 | |
| PETRONAS Capital, Ltd. 3.404% 4/28/2061 | | | 250 | | | | 180 | |
| Philippines (Republic of) 2.95% 5/5/2045 | | | 1,487 | | | | 1,120 | |
| Philippines (Republic of) 5.95% 10/13/2047 | | | 600 | | | | 671 | |
| Poland (Republic of) 7.50% 7/25/2028 | | PLN | 2,825 | | | | 791 | |
| Poland (Republic of) 4.875% 10/4/2033 | | USD | 2,545 | | | | 2,586 | |
| Poland (Republic of) 6.00% 10/25/2033 | | PLN | 7,830 | | | | 2,112 | |
| Poland (Republic of), Series 0726, 2.50% 7/25/2026 | | | 17,700 | | | | 4,238 | |
| Poland (Republic of), Series 5Y, 3.75% 5/25/2027 | | | 36,370 | | | | 8,909 | |
| Poland (Republic of), Series 0727, 2.50% 7/25/2027 | | | 1,754 | | | | 412 | |
| Poland (Republic of), Series 1029, 2.75% 10/25/2029 | | | 1,781 | | | | 404 | |
| Poland (Republic of), Series 1030, 1.25% 10/25/2030 | | | 1,413 | | | | 284 | |
| Poland (Republic of), Series 0432, 1.75% 4/25/2032 | | | 9,044 | | | | 1,789 | |
| Qatar (State of) 4.00% 3/14/2029 | | USD | 2,330 | | | | 2,315 | |
| Qatar (State of) 3.75% 4/16/20301 | | | 1,000 | | | | 978 | |
| Qatar (State of) 4.40% 4/16/20501 | | | 2,300 | | | | 2,125 | |
| Republika Srpska 4.75% 4/27/2026 | | EUR | 959 | | | | 1,014 | |
| Romania 3.65% 7/28/2025 | | RON | 11,410 | | | | 2,454 | |
| Romania 2.50% 10/25/2027 | | | 900 | | | | 175 | |
| Romania 1.75% 7/13/2030 | | EUR | 3,000 | | | | 2,684 | |
| Romania 2.124% 7/16/2031 | | | 1,000 | | | | 883 | |
| Romania 2.00% 4/14/2033 | | | 830 | | | | 688 | |
| Romania 4.75% 10/11/2034 | | RON | 4,515 | | | | 885 | |
| Romania 7.625% 1/17/20531 | | USD | 200 | | | | 225 | |
| Russian Federation 7.00% 1/25/20234,5 | | RUB | 49,732 | | | | — | 6 |
| Saudi Arabia (Kingdom of) 4.75% 1/18/20281 | | USD | 2,600 | | | | 2,630 | |
| Saudi Arabia (Kingdom of) 4.875% 7/18/20331 | | | 3,178 | | | | 3,250 | |
| Saudi Arabia (Kingdom of) 4.625% 10/4/2047 | | | 2,000 | | | | 1,800 | |
| Saudi Arabia (Kingdom of) 5.00% 1/18/20531 | | | 3,005 | | | | 2,837 | |
| Saudi Arabia (Kingdom of) 3.45% 2/2/2061 | | | 1,300 | | | | 917 | |
| Senegal (Republic of) 4.75% 3/13/2028 | | EUR | 2,960 | | | | 3,026 | |
| Senegal (Republic of) 4.75% 3/13/2028 | | | 1,140 | | | | 1,165 | |
| Senegal (Republic of) 5.375% 6/8/2037 | | | 1,000 | | | | 819 | |
| Senegal (Republic of) 6.75% 3/13/2048 | | USD | 4,425 | | | | 3,492 | |
| Serbia (Republic of) 6.50% 9/26/20331 | | | 5,617 | | | | 5,778 | |
| Serbia (Republic of) 6.50% 9/26/2033 | | | 300 | | | | 309 | |
| Sharjah (Emirate of) 6.50% 11/23/20321 | | | 2,405 | | | | 2,530 | |
| South Africa (Republic of), Series R-186, 10.50% 12/21/2026 | | ZAR | 10,900 | | | | 624 | |
| South Africa (Republic of), Series R-2030, 8.00% 1/31/2030 | | | 253,395 | | | | 12,769 | |
| South Africa (Republic of), Series R-213, 7.00% 2/28/2031 | | | 149,800 | | | | 6,859 | |
| South Africa (Republic of), Series R-2032, 8.25% 3/31/2032 | | | 49,044 | | | | 2,348 | |
| South Africa (Republic of), Series R-2035, 8.875% 2/28/2035 | | | 379,453 | | | | 17,539 | |
| South Africa (Republic of), Series R-2037, 8.50% 1/31/2037 | | | 57,630 | | | | 2,469 | |
| South Africa (Republic of), Series R-2040, 9.00% 1/31/2040 | | | 9,872 | | | | 423 | |
| South Africa (Republic of), Series R-214, 6.50% 2/28/2041 | | | 380,265 | | | | 12,583 | |
| South Africa (Republic of), Series R-2048, 8.75% 2/28/2048 | | | 124,512 | | | | 5,021 | |
| South Korea (Republic of), Series 2709, 3.125% 9/10/2027 | | KRW | 4,650,800 | | | | 3,606 | |
| South Korea (Republic of), Series 3212, 4.25% 12/10/2032 | | | 7,363,100 | | | | 6,180 | |
| South Korea (Republic of), Series 4209, 3.25% 9/10/2042 | | | 940,000 | | | | 743 | |
| Sri Lanka (Democratic Socialist Republic of) 5.75% 4/18/20234 | | USD | 1,282 | | | | 659 | |
| Sri Lanka (Democratic Socialist Republic of) 6.20% 5/11/20271,4 | | | 880 | | | | 447 | |
| Sri Lanka (Democratic Socialist Republic of) 6.75% 4/18/20284 | | | 250 | | | | 126 | |
| Sri Lanka (Democratic Socialist Republic of) 7.55% 3/28/2030 | | | 750 | | | | 379 | |
| Thailand (Kingdom of) 3.85% 12/12/2025 | | THB | 124,390 | | | | 3,719 | |
| Thailand (Kingdom of) 2.25% 3/17/2027 | | | 297,850 | | | | 8,621 | |
| Thailand (Kingdom of) 1.00% 6/17/2027 | | | 126,651 | | | | 3,511 | |
| Thailand (Kingdom of) 2.875% 12/17/2028 | | | 64,850 | | | | 1,922 | |
| Thailand (Kingdom of) 2.00% 12/17/2031 | | | 63,400 | | | | 1,761 | |
| | |
| 8 | American Funds Emerging Markets Bond Fund |
| Bonds, notes & other debt instruments (continued) | | Principal amount
(000) | | | Value
(000) | |
| Bonds & notes of governments & government agencies outside the U.S. (continued) | | | | | | | | |
| Thailand (Kingdom of) 1.60% 6/17/2035 | | THB | 6,127 | | | $ | 159 | |
| Thailand (Kingdom of) 3.39% 6/17/2037 | | | 148,774 | | | | 4,581 | |
| Thailand (Kingdom of) 3.30% 6/17/2038 | | | 45,019 | | | | 1,366 | |
| Thailand (Kingdom of) 2.00% 6/17/2042 | | | 54,600 | | | | 1,355 | |
| Thailand (Kingdom of) 2.875% 6/17/2046 | | | 13,000 | | | | 347 | |
| Tunisia (Republic of) 5.625% 2/17/2024 | | EUR | 10,768 | | | | 11,502 | |
| Tunisia (Republic of) 5.75% 1/30/2025 | | USD | 465 | | | | 383 | |
| Tunisia (Republic of) 6.375% 7/15/2026 | | EUR | 1,300 | | | | 1,005 | |
| Tunisia (Republic of) 6.375% 7/15/2026 | | | 550 | | | | 425 | |
| Turkey (Republic of) 6.375% 10/14/2025 | | USD | 1,035 | | | | 1,041 | |
| Turkey (Republic of) 4.25% 4/14/2026 | | | 1,270 | | | | 1,220 | |
| Turkey (Republic of) 4.875% 10/9/2026 | | | 2,000 | | | | 1,934 | |
| Turkey (Republic of) 9.875% 1/15/2028 | | | 1,000 | | | | 1,112 | |
| Turkey (Republic of) 17.30% 7/19/2028 | | TRY | 75,000 | | | | 2,061 | |
| Turkey (Republic of) 17.80% 7/13/2033 | | | 73,372 | | | | 1,954 | |
| Turkey (Republic of) 6.50% 9/20/2033 | | USD | 900 | | | | 863 | |
| Turkey (Republic of) 6.00% 1/14/2041 | | | 400 | | | | 341 | |
| Ukraine 9.99% 5/22/2024 | | UAH | 24,136 | | | | 502 | |
| Ukraine 7.75% 9/1/20244 | | USD | 1,600 | | | | 499 | |
| Ukraine 15.50% 10/2/2024 | | UAH | 15,026 | | | | 323 | |
| Ukraine 12.70% 10/30/2024 | | | 6,612 | | | | 137 | |
| Ukraine 19.50% 1/15/2025 | | | 35,574 | | | | 777 | |
| Ukraine 8.994% 2/1/20264 | | USD | 5,523 | | | | 1,658 | |
| Ukraine 7.75% 9/1/20274 | | | 1,200 | | | | 332 | |
| Ukraine 6.75% 6/20/20284 | | EUR | 2,072 | | | | 565 | |
| Ukraine 6.876% 5/21/20311,4 | | USD | 1,800 | | | | 420 | |
| Ukraine 4.375% 1/27/20324 | | EUR | 700 | | | | 162 | |
| Ukraine 7.253% 3/15/20354 | | USD | 2,012 | | | | 489 | |
| Ukraine 7.253% 3/15/20351,4 | | | 1,700 | | | | 413 | |
| United Mexican States 0% 10/3/2024 | | MXN | 4,200 | | | | 228 | |
| United Mexican States 4.50% 12/4/20253 | | | 69,289 | | | | 3,966 | |
| United Mexican States 8.30% 8/15/2031 | | USD | 1,800 | | | | 2,195 | |
| United Mexican States 4.875% 5/19/2033 | | | 875 | | | | 845 | |
| United Mexican States 4.50% 1/31/2050 | | | 417 | | | | 342 | |
| United Mexican States 6.338% 5/4/2053 | | | 1,792 | | | | 1,829 | |
| United Mexican States 3.771% 5/24/2061 | | | 720 | | | | 490 | |
| United Mexican States 3.75% 4/19/2071 | | | 880 | | | | 590 | |
| United Mexican States, Series M, 7.50% 6/3/2027 | | MXN | 5,355 | | | | 299 | |
| United Mexican States, Series M20, 8.50% 5/31/2029 | | | 127,810 | | | | 7,370 | |
| United Mexican States, Series M, 7.75% 5/29/2031 | | | 166,467 | | | | 9,149 | |
| United Mexican States, Series M, 7.50% 5/26/2033 | | | 56,200 | | | | 3,000 | |
| United Mexican States, Series M, 7.75% 11/23/2034 | | | 5,660 | | | | 305 | |
| United Mexican States, Series M30, 8.50% 11/18/2038 | | | 132,000 | | | | 7,421 | |
| United Mexican States, Series M, 7.75% 11/13/2042 | | | 16,950 | | | | 879 | |
| United Mexican States, Series M, 8.00% 11/7/2047 | | | 16,363 | | | | 862 | |
| United Mexican States, Series M, 8.00% 7/31/2053 | | | 342,940 | | | | 17,938 | |
| Uruguay (Oriental Republic of) 4.375% 12/15/20283 | | UYU | 53 | | | | 1 | |
| Venezuela (Bolivarian Republic of) 7.00% 12/1/20184 | | USD | 155 | | | | 22 | |
| Venezuela (Bolivarian Republic of) 7.75% 10/13/20194 | | | 3,170 | | | | 451 | |
| Venezuela (Bolivarian Republic of) 6.00% 12/9/20204 | | | 2,293 | | | | 321 | |
| Venezuela (Bolivarian Republic of) 9.00% 5/7/20234 | | | 2,257 | | | | 357 | |
| Venezuela (Bolivarian Republic of) 8.25% 10/13/20244 | | | 1,076 | | | | 169 | |
| Venezuela (Bolivarian Republic of) 9.25% 5/7/20284 | | | 562 | | | | 98 | |
| Venezuela (Bolivarian Republic of) 7.00% 3/31/20384 | | | 377 | | | | 58 | |
| | | | | | | | 760,180 | |
| | | | | | | | | |
| Corporate bonds, notes & loans 17.88% | | | | | | | | |
| Energy 4.81% | | | | | | | | |
| Abu Dhabi Crude Oil Pipeline, LLC 4.60% 11/2/2047 | | | 4,950 | | | | 4,558 | |
| AI Candelaria (Spain), SLU 5.75% 6/15/20331 | | | 2,250 | | | | 1,747 | |
| AI Candelaria (Spain), SLU 5.75% 6/15/2033 | | | 250 | | | | 194 | |
| Borr IHC, Ltd. 10.375% 11/15/20301 | | | 2,300 | | | | 2,381 | |
| Cosan Luxembourg SA 7.50% 6/27/20301 | | | 1,200 | | | | 1,254 | |
| Ecopetrol SA 8.625% 1/19/2029 | | | 200 | | | | 213 | |
| Ecopetrol SA 8.875% 1/13/2033 | | | 1,730 | | | | 1,882 | |
| Ecopetrol SA 5.875% 5/28/2045 | | | 457 | | | | 362 | |
| FORESEA Holding SA 7.50% 6/15/2030 | | | 639 | | | | 592 | |
| | |
| American Funds Emerging Markets Bond Fund | 9 |
| Bonds, notes & other debt instruments (continued) | | Principal amount
(000) | | | Value
(000) | |
| Corporate bonds, notes & loans (continued) | | | | | | | | |
| Energy (continued) | | | | | | | | |
| Galaxy Pipeline Assets Bidco, Ltd. 2.94% 9/30/2040 | | USD | 980 | | | $ | 809 | |
| Galaxy Pipeline Assets Bidco, Ltd. 3.25% 9/30/2040 | | | 1,050 | | | | 826 | |
| GeoPark, Ltd. 5.50% 1/17/2027 | | | 500 | | | | 443 | |
| Guara Norte SARL 5.198% 6/15/20341 | | | 2,406 | | | | 2,194 | |
| Kosmos Energy, Ltd. 7.125% 4/4/20267 | | | 1,684 | | | | 1,603 | |
| Kosmos Energy, Ltd. 7.50% 3/1/20287 | | | 800 | | | | 729 | |
| Modec Finance BV 7.84% 7/15/20265,7 | | | 200 | | | | 201 | |
| MV24 Capital BV 6.748% 6/1/20341 | | | 1,388 | | | | 1,300 | |
| MV24 Capital BV 6.748% 6/1/2034 | | | 887 | | | | 831 | |
| Oleoducto Central SA 4.00% 7/14/20271 | | | 2,495 | | | | 2,321 | |
| Petroleos Mexicanos 7.19% 9/12/2024 | | MXN | 46,570 | | | | 2,623 | |
| Petroleos Mexicanos 7.19% 9/12/2024 | | | 26,639 | | | | 1,500 | |
| Petroleos Mexicanos 6.875% 10/16/2025 | | USD | 730 | | | | 719 | |
| Petroleos Mexicanos 6.875% 8/4/2026 | | | 2,489 | | | | 2,419 | |
| Petroleos Mexicanos 7.47% 11/12/2026 | | MXN | 71,690 | | | | 3,698 | |
| Petroleos Mexicanos 6.70% 2/16/2032 | | USD | 2,141 | | | | 1,779 | |
| Petroleos Mexicanos 6.625% 6/15/2035 | | | 2,182 | | | | 1,676 | |
| Petroleos Mexicanos 7.69% 1/23/2050 | | | 4,250 | | | | 3,028 | |
| Petroleos Mexicanos 6.95% 1/28/2060 | | | 4,265 | | | | 2,814 | |
| Petrorio Luxembourg SARL 6.125% 6/9/20261 | | | 500 | | | | 491 | |
| PTTEP Treasury Center Co., Ltd. 2.587% 6/10/20271 | | | 278 | | | | 258 | |
| PTTEP Treasury Center Co., Ltd. 2.587% 6/10/2027 | | | 200 | | | | 186 | |
| PTTEP Treasury Center Co., Ltd. 2.993% 1/15/2030 | | | 228 | | | | 206 | |
| Qatar Energy 3.125% 7/12/2041 | | | 3,314 | | | | 2,554 | |
| Qatar Energy 3.125% 7/12/20411 | | | 2,995 | | | | 2,309 | |
| Qatar Energy 3.30% 7/12/20511 | | | 2,710 | | | | 1,985 | |
| Tullow Oil PLC 10.25% 5/15/2026 | | | 200 | | | | 179 | |
| | | | | | | | 52,864 | |
| | | | | | | | | |
| Financials 3.52% | | | | | | | | |
| AIA Group, Ltd. 0.88% 9/9/2033 (5-year EUR Mid-Swap + 1.10% on 9/9/2028)2 | | EUR | 2,000 | | | | 1,886 | |
| Banco de Credito del Peru SA 3.25% 9/30/2031 (5-year UST Yield Curve Rate T Note Constant Maturity + 2.45% on 9/30/2026)1,2 | | USD | 2,955 | | | | 2,705 | |
| Banco do Brasil SA 4.625% 1/15/2025 | | | 400 | | | | 395 | |
| Banco do Brasil SA 3.25% 9/30/2026 | | | 850 | | | | 808 | |
| Bangkok Bank Public Co., Ltd. 4.45% 9/19/20281 | | | 900 | | | | 883 | |
| Bangkok Bank Public Co., Ltd. 3.733% 9/25/2034 (5-year UST Yield Curve Rate T Note Constant Maturity + 1.90% on 9/25/2029)2 | | | 2,956 | | | | 2,630 | |
| Bank of East Asia, Ltd. 4.875% 4/22/2032 (5-year UST Yield Curve Rate T Note Constant Maturity + 2.30% on 4/22/2027)2 | | | 1,250 | | | | 1,132 | |
| Bank of East Asia, Ltd. 5.825% junior subordinated perpetual bonds (5-year UST Yield Curve Rate T Note Constant Maturity + 5.527% on 10/21/2025)2 | | | 500 | | | | 437 | |
| BBVA Bancomer SA 5.875% 9/13/2034 (5-year UST Yield Curve Rate T Note Constant Maturity + 4.308% on 9/13/2029)2 | | | 2,200 | | | | 2,079 | |
| BBVA Bancomer SA 8.45% 6/29/2038 (5-year UST Yield Curve Rate T Note Constant Maturity + 4.661% on 6/29/2033)1,2 | | | 1,000 | | | | 1,067 | |
| China Ping An Insurance Overseas (Holdings), Ltd. 2.85% 8/12/2031 | | | 272 | | | | 221 | |
| HDFC Bank, Ltd. 8.10% 3/22/2025 | | INR | 60,000 | | | | 718 | |
| HSBC Holdings PLC 7.39% 11/03/2028 (USD-SOFR + 7.39% on 11/3/2027)2 | | USD | 1,000 | | | | 1,072 | |
| HSBC Holdings PLC 2.206% 8/17/2029 (USD-SOFR + 1.285% on 8/17/2028)2 | | | 1,000 | | | | 874 | |
| HSBC Holdings PLC 8.113% 11/3/2033 (USD-SOFR + 4.25% on 11/3/2032)2 | | | 1,900 | | | | 2,197 | |
| HSBC Holdings PLC 7.399% 11/13/2034 (USD-SOFR + 3.02% on 11/13/2033)2 | | | 500 | | | | 549 | |
| Huarong Finance 2017 Co., Ltd. 4.75% 4/27/2027 | | | 300 | | | | 282 | |
| Itau Unibanco Holding SA 4.50% 11/21/2029 (5-year UST Yield Curve Rate T Note Constant Maturity + 2.822% on 11/21/2024)2 | | | 800 | | | | 786 | |
| Kasikornbank PCL (Hong Kong Branch) 3.343% 10/2/2031 (5-year UST Yield Curve Rate T Note Constant Maturity + 1.70% on 10/2/2026)2 | | | 5,400 | | | | 4,970 | |
| Korea Exchange Bank 3.25% 3/30/20271 | | | 870 | | | | 832 | |
| NongHyup Bank 4.875% 7/3/20281 | | | 3,560 | | | | 3,583 | |
| Power Finance Corp., Ltd. 3.90% 9/16/2029 | | | 500 | | | | 467 | |
| PT Bank Negara Indonesia (Persero) Tbk 4.30% junior subordinated perpetual bonds (5-year UST Yield Curve Rate T Note Constant Maturity + 3.466% on 3/24/2027)2 | | | 3,400 | | | | 3,021 | |
| Shinhan Financial Group Co., Ltd. 5.00% 7/24/20281 | | | 1,600 | | | | 1,600 | |
| Standard Chartered PLC 6.296% 7/6/2034 (1-year UST Yield Curve Rate T Note Constant Maturity + 2.58% on 7/6/2033)1,2 | | | 471 | | | | 495 | |
| Vigorous Champion International, Ltd. 4.25% 5/28/2029 | | | 950 | | | | 875 | |
| Xiaomi Best Time International, Ltd. 2.875% 7/14/2031 | | | 1,000 | | | | 833 | |
| | |
| 10 | American Funds Emerging Markets Bond Fund |
| Bonds, notes & other debt instruments (continued) | | Principal amount
(000) | | | Value
(000) | |
| Corporate bonds, notes & loans (continued) | | | | | | | | |
| Financials (continued) | | | | | | | | |
| Xiaomi Best Time International, Ltd. 2.875% 7/14/20311 | | USD | 415 | | | $ | 345 | |
| Xiaomi Best Time International, Ltd. 4.10% 7/14/20511 | | | 1,120 | | | | 797 | |
| Xiaomi Best Time International, Ltd. 4.10% 7/14/2051 | | | 200 | | | | 142 | |
| | | | | | | | 38,681 | |
| | | | | | | | | |
| Materials 2.64% | | | | | | | | |
| Alpek, SAB de CV 3.25% 2/25/20311 | | | 1,285 | | | | 1,102 | |
| Aris Mining Corp. 6.875% 8/9/20261 | | | 1,760 | | | | 1,530 | |
| Braskem Idesa SAPI 7.45% 11/15/20291 | | | 381 | | | | 240 | |
| Braskem Idesa SAPI 7.45% 11/15/2029 | | | 200 | | | | 126 | |
| Braskem Idesa SAPI 6.99% 2/20/20321 | | | 4,230 | | | | 2,480 | |
| Braskem Idesa SAPI 6.99% 2/20/2032 | | | 1,770 | | | | 1,038 | |
| Braskem Netherlands Finance BV 4.50% 1/10/2028 | | | 1,564 | | | | 1,281 | |
| Braskem Netherlands Finance BV 4.50% 1/31/2030 | | | 236 | | | | 184 | |
| Braskem Netherlands Finance BV 8.50% 1/12/20311 | | | 1,005 | | | | 936 | |
| Braskem Netherlands Finance BV 8.50% 1/12/2031 | | | 300 | | | | 279 | |
| Braskem Netherlands Finance BV 7.25% 2/13/20331 | | | 1,250 | | | | 1,054 | |
| Braskem Netherlands Finance BV 7.25% 2/13/2033 | | | 410 | | | | 346 | |
| CAP SA 3.90% 4/27/2031 | | | 200 | | | | 156 | |
| CEMEX, SAB de CV 9.125% senior subordinated perpetual bonds (5-year UST Yield Curve Rate T Note Constant Maturity + 4.907% on 6/14/2028)1,2 | | | 600 | | | | 640 | |
| CSN Inova Ventures 6.75% 1/28/2028 | | | 300 | | | | 293 | |
| CSN Resources SA 8.875% 12/5/20301 | | | 1,100 | | | | 1,147 | |
| CSN Resources SA 5.875% 4/8/20321 | | | 1,610 | | | | 1,402 | |
| Endeavour Mining PLC 5.00% 10/14/2026 | | | 200 | | | | 185 | |
| First Quantum Minerals, Ltd. 8.625% 6/1/20311 | | | 3,750 | | | | 3,183 | |
| Fresnillo PLC 4.25% 10/2/20501 | | | 2,160 | | | | 1,653 | |
| GC Treasury Center Co., Ltd. 2.98% 3/18/20311 | | | 375 | | | | 317 | |
| GC Treasury Center Co., Ltd. 4.40% 3/30/20321 | | | 300 | | | | 274 | |
| Gold Fields Orogen Holding (BVI), Ltd. 6.125% 5/15/2029 | | | 200 | | | | 206 | |
| POSCO 5.75% 1/17/20281 | | | 200 | | | | 205 | |
| Sasol Financing USA, LLC 5.875% 3/27/2024 | | | 400 | | | | 398 | |
| Sasol Financing USA, LLC 4.375% 9/18/2026 | | | 2,410 | | | | 2,247 | |
| Sasol Financing USA, LLC 8.75% 5/3/20291 | | | 2,500 | | | | 2,553 | |
| Sasol Financing USA, LLC 8.75% 5/3/20297 | | | 1,585 | | | | 1,619 | |
| Sasol Financing USA, LLC 5.50% 3/18/2031 | | | 2,250 | | | | 1,898 | |
| | | | | | | | 28,972 | |
| | | | | | | | | |
| Utilities 2.58% | | | | | | | | |
| Aegea Finance SARL 9.00% 1/20/20311 | | | 645 | | | | 686 | |
| AES Panama Generation Holdings SRL 4.375% 5/31/20301 | | | 3,236 | | | | 2,723 | |
| AES Panama Generation Holdings SRL 4.375% 5/31/2030 | | | 196 | | | | 165 | |
| Alfa Desarrollo SpA 4.55% 9/27/20511 | | | 1,113 | | | | 870 | |
| Azure Power Energy, Ltd. 3.575% 8/19/20261 | | | 173 | | | | 153 | |
| Chile Electricity Lux MPC SARL 6.01% 1/20/20331 | | | 2,605 | | | | 2,674 | |
| Empresas Publicas de Medellin ESP 8.375% 11/8/2027 | | COP | 10,000,000 | | | | 2,243 | |
| Empresas Publicas de Medellin ESP 8.375% 11/8/2027 | | | 3,744,000 | | | | 840 | |
| Empresas Publicas de Medellin ESP 4.25% 7/18/20291 | | USD | 1,602 | | | | 1,367 | |
| Empresas Publicas de Medellin ESP 4.375% 2/15/20311 | | | 960 | | | | 786 | |
| Enel Américas SA 4.00% 10/25/2026 | | | 215 | | | | 209 | |
| Enel Chile SA 4.875% 6/12/2028 | | | 1,701 | | | | 1,682 | |
| Enfragen Energia Sur SA 5.375% 12/30/2030 | | | 3,609 | | | | 2,823 | |
| ENN Clean Energy International Investment, Ltd. 3.375% 5/12/20261 | | | 510 | | | | 479 | |
| Eskom Holdings SOC, Ltd. 8.45% 8/10/2028 | | | 740 | | | | 752 | |
| Instituto Costarricense de Electricidad 6.75% 10/7/2031 | | | 570 | | | | 576 | |
| Investment Energy Resources, Ltd. 6.25% 4/26/20291 | | | 1,375 | | | | 1,300 | |
| Korea Electric Power Corp. 5.375% 7/31/20261 | | | 2,010 | | | | 2,033 | |
| Korea Electric Power Corp. 4.00% 6/14/2027 | | | 300 | | | | 294 | |
| Korea Electric Power Corp. 4.00% 6/14/20271 | | | 200 | | | | 196 | |
| Light Servicos de Eletricidade SA 4.375% 6/18/20261,4 | | | 1,500 | | | | 700 | |
| Light Servicos de Eletricidade SA 4.375% 6/18/20264 | | | 700 | | | | 327 | |
| Minejesa Capital BV 4.625% 8/10/2030 | | | 1,100 | | | | 1,046 | |
| MVM Energetika Zartkoruen Mukodo Reszvenytarsasag 7.50% 6/9/2028 | | | 2,895 | | | | 3,029 | |
| ReNew Power Pvt., Ltd. 5.875% 3/5/20271 | | | 200 | | | | 191 | |
| ReNew Power Pvt., Ltd. 5.875% 3/5/2027 | | | 200 | | | | 191 | |
| | | | | | | | 28,335 | |
| | |
| American Funds Emerging Markets Bond Fund | 11 |
| Bonds, notes & other debt instruments (continued) | | Principal amount
(000) | | | Value
(000) | |
| Corporate bonds, notes & loans (continued) | | | | | | | | |
| Consumer staples 1.14% | | | | | | | | |
| Indofood CBP Sukses Makmur Tbk PT 3.398% 6/9/2031 | | USD | 559 | | | $ | 484 | |
| Indofood CBP Sukses Makmur Tbk PT 3.541% 4/27/2032 | | | 400 | | | | 347 | |
| Indofood CBP Sukses Makmur Tbk PT 4.745% 6/9/2051 | | | 765 | | | | 622 | |
| InRetail Consumer 3.25% 3/22/20281 | | | 2,730 | | | | 2,452 | |
| MARB BondCo PLC 3.95% 1/29/20311 | | | 1,500 | | | | 1,220 | |
| MARB BondCo PLC 3.95% 1/29/2031 | | | 700 | | | | 569 | |
| Minerva Luxembourg SA 4.375% 3/18/20311 | | | 400 | | | | 330 | |
| Minerva Luxembourg SA 8.875% 9/13/20331 | | | 5,168 | | | | 5,473 | |
| Natura Cosmeticos SA 4.125% 5/3/20281 | | | 820 | | | | 742 | |
| NBM US Holdings, Inc. 7.00% 5/14/20267 | | | 250 | | | | 253 | |
| | | | | | | | 12,492 | |
| | | | | | | | | |
| Industrials 0.83% | | | | | | | | |
| Bidvest Group (UK) PLC 3.625% 9/23/2026 | | | 200 | | | | 186 | |
| BOC Aviation, Ltd. 3.00% 9/11/2029 | | | 600 | | | | 540 | |
| BOC Aviation, Ltd. 2.625% 9/17/2030 | | | 200 | | | | 173 | |
| Embraer Netherlands Finance BV 7.00% 7/28/20301 | | | 400 | | | | 420 | |
| Hidrovias International Finance SARL 4.95% 2/8/20311 | | | 2,610 | | | | 2,066 | |
| Lima Metro Line 2 Finance, Ltd. 5.875% 7/5/20341 | | | 489 | | | | 484 | |
| Lima Metro Line 2 Finance, Ltd. 4.35% 4/5/20361 | | | 875 | | | | 803 | |
| Mexico City Airport Trust 4.25% 10/31/2026 | | | 900 | | | | 869 | |
| Mexico City Airport Trust 5.50% 7/31/2047 | | | 1,000 | | | | 864 | |
| MISC Capital Two (Labuan), Ltd. 3.75% 4/6/20271 | | | 1,260 | | | | 1,214 | |
| OCP SA 3.75% 6/23/2031 | | | 200 | | | | 173 | |
| Simpar Europe SA 5.20% 1/26/2031 | | | 200 | | | | 174 | |
| Summit Digitel Infrastructure Pvt, Ltd. 2.875% 8/12/2031 | | | 1,100 | | | | 903 | |
| Summit Digitel Infrastructure Pvt, Ltd. 2.875% 8/12/20311 | | | 300 | | | | 246 | |
| | | | | | | | 9,115 | |
| | | | | | | | | |
| Consumer discretionary 0.77% | | | | | | | | |
| Alibaba Group Holding, Ltd. 4.50% 11/28/2034 | | | 300 | | | | 282 | |
| Arcos Dorados BV 6.125% 5/27/20291 | | | 890 | | | | 889 | |
| Meituan 3.05% 10/28/20301 | | | 250 | | | | 211 | |
| Melco Resorts Finance, Ltd. 4.875% 6/6/20251 | | | 850 | | | | 825 | |
| Melco Resorts Finance, Ltd. 4.875% 6/6/2025 | | | 400 | | | | 389 | |
| Melco Resorts Finance, Ltd. 5.375% 12/4/20291 | | | 1,250 | | | | 1,106 | |
| MercadoLibre, Inc. 3.125% 1/14/2031 | | | 1,142 | | | | 979 | |
| MGM China Holdings, Ltd. 5.375% 5/15/2024 | | | 300 | | | | 299 | |
| Prosus NV 3.68% 1/21/2030 | | | 1,120 | | | | 981 | |
| Sands China, Ltd. 2.55% 3/8/2027 | | | 300 | | | | 273 | |
| Sands China, Ltd. 3.50% 8/8/2031 | | | 532 | | | | 446 | |
| Studio City Finance, Ltd. 6.50% 1/15/2028 | | | 400 | | | | 372 | |
| Studio City Finance, Ltd. 5.00% 1/15/2029 | | | 820 | | | | 690 | |
| Studio City Finance, Ltd. 5.00% 1/15/20291 | | | 800 | | | | 673 | |
| | | | | | | | 8,415 | |
| | | | | | | | | |
| Communication services 0.74% | | | | | | | | |
| América Móvil, SAB de CV, 9.50% 1/27/2031 | | MXN | 80,060 | | | | 4,588 | |
| Axiata SPV5 (Labuan), Ltd. 3.064% 8/19/2050 | | USD | 1,053 | | | | 729 | |
| PLDT, Inc. 2.50% 1/23/2031 | | | 200 | | | | 167 | |
| Tencent Holdings, Ltd. 2.39% 6/3/2030 | | | 500 | | | | 426 | |
| Tencent Holdings, Ltd. 3.68% 4/22/2041 | | | 400 | | | | 315 | |
| Tencent Holdings, Ltd. 3.24% 6/3/20501 | | | 900 | | | | 601 | |
| Tencent Holdings, Ltd. 3.24% 6/3/2050 | | | 400 | | | | 267 | |
| Tencent Holdings, Ltd. 3.84% 4/22/2051 | | | 1,400 | | | | 1,047 | |
| | | | | | | | 8,140 | |
| | | | | | | | | |
| Municipals 0.35% | | | | | | | | |
| Aeropuerto Internacional de Tocumen, SA 4.00% 8/11/20411 | | | 700 | | | | 527 | |
| Aeropuerto Internacional de Tocumen, SA 5.125% 8/11/20611 | | | 1,140 | | | | 870 | |
| Rutas 2 & 7 Finance, Ltd. 0% 9/30/20361 | | | 2,444 | | | | 1,627 | |
| Rutas 2 & 7 Finance, Ltd. 0% 9/30/2036 | | | 1,300 | | | | 865 | |
| | | | | | | | 3,889 | |
| | |
| 12 | American Funds Emerging Markets Bond Fund |
| Bonds, notes & other debt instruments (continued) | | Principal amount
(000) | | | Value
(000) | |
| Corporate bonds, notes & loans (continued) | | | | | | | | |
| Health care 0.22% | | | | | | | | |
| Rede D’Or Finance SARL 4.95% 1/17/2028 | | USD | 205 | | | $ | 195 | |
| Rede D’Or Finance SARL 4.50% 1/22/2030 | | | 2,500 | | | | 2,267 | |
| | | | | | | | 2,462 | |
| | | | | | | | | |
| Real estate 0.15% | | | | | | | | |
| Corp. Inmobiliaria Vesta, SAB de CV 3.625% 5/13/20311 | | | 725 | | | | 623 | |
| FibraSOMA 4.375% 7/22/20311 | | | 1,430 | | | | 1,085 | |
| | | | | | | | 1,708 | |
| | | | | | | | | |
| Information technology 0.13% | | | | | | | | |
| SK hynix, Inc. 6.375% 1/17/20281 | | | 200 | | | | 207 | |
| SK hynix, Inc. 2.375% 1/19/20311 | | | 400 | | | | 325 | |
| SK hynix, Inc. 6.50% 1/17/2033 | | | 650 | | | | 687 | |
| TSMC Global, Ltd. 2.25% 4/23/20311 | | | 200 | | | | 170 | |
| | | | | | | | 1,389 | |
| | | | | | | | | |
| Total corporate bonds, notes & loans | | | | | | | 196,462 | |
| | | | | | | | | |
| U.S. Treasury bonds & notes 4.37% | | | | | | | | |
| U.S. Treasury 4.37% | | | | | | | | |
| U.S. Treasury 4.50% 11/15/20258 | | | 19,200 | | | | 19,271 | |
| U.S. Treasury 3.625% 5/31/2028 | | | 3,358 | | | | 3,324 | |
| U.S. Treasury 4.125% 7/31/2028 | | | 10,000 | | | | 10,104 | |
| U.S. Treasury 4.625% 9/30/2028 | | | 13,100 | | | | 13,526 | |
| U.S. Treasury 3.375% 5/15/20338 | | | 1,920 | | | | 1,844 | |
| | | | | | | | | |
| Total U.S. Treasury bonds & notes | | | | | | | 48,069 | |
| | | | | | | | | |
| Federal agency bonds & notes 0.25% | | | | | | | | |
| Korea Development Bank 4.25% 9/8/2032 | | | 2,070 | | | | 2,016 | |
| Korea National Oil Corp. 4.875% 4/3/20281 | | | 400 | | | | 402 | |
| Korea National Oil Corp. 2.625% 4/18/2032 | | | 200 | | | | 169 | |
| Sinopec Group Overseas Development (2018), Ltd. 2.30% 1/8/20311 | | | 250 | | | | 219 | |
| | | | | | | | 2,806 | |
| | | | | | | | | |
| Total bonds, notes & other debt instruments (cost: $1,007,793,000) | | | | | | | 1,007,517 | |
| | | | | | | | | |
| Convertible bonds & notes 0.64% | | | | | | | | |
| Energy 0.64% | | | | | | | | |
| Abu Dhabi National Oil Co., convertible notes, 0.70% 6/4/2024 | | | 7,200 | | | | 7,037 | |
| | | | | | | | | |
| Total convertible bonds & notes (cost: $7,029,000) | | | | | | | 7,037 | |
| | | | | | | | | |
| | | | Shares | | | | | |
| Common stocks 0.14% | | | | | | | | |
| Energy 0.14% | | | | | | | | |
| FORESEA Holding SA, Class C, nonvoting shares9 | | | 55,880 | | | | 1,369 | |
| FORESEA Holding SA, Class B9 | | | 6,208 | | | | 152 | |
| | | | | | | | | |
| Total common stocks (cost: $1,540,000) | | | | | | | 1,521 | |
| | | | | | | | | |
| Short-term securities 5.69% | | | | | | | | |
| Money market investments 5.63% | | | | | | | | |
| Capital Group Central Cash Fund 5.44%10,11 | | | 618,713 | | | | 61,865 | |
| | |
| American Funds Emerging Markets Bond Fund | 13 |
| Short-term securities (continued) | | Weighted
average yield
at acquisition | | Principal amount
(000) | | Value
(000) | |
| Bills & notes of governments & government agencies outside the U.S. 0.06% | | | |
| Sri Lanka (Democratic Socialist Republic of) 5/10/2024 | | 17.983% | | LKR | 218,000 | | $ | 642 | |
| | | | | | | | | | |
| Total short-term securities (cost: $62,527,000) | | | | | | | | 62,507 | |
| Total investment securities 98.14% (cost: $1,078,889,000) | | | | | 1,078,582 | |
| Other assets less liabilities 1.86% | | | | | | | | 20,440 | |
| | | | | | | | | | |
| Net assets 100.00% | | | | | | | $ | 1,099,022 | |
Futures contracts
| Contracts | | Type | | Number of
contracts | | Expiration
date | | Notional
amount
(000) | | | Value and
unrealized
appreciation
(depreciation)
at 12/31/2023
(000) | |
| 2 Year U.S. Treasury Note Futures | | Long | | 632 | | 4/3/2024 | | | USD | 130,138 | | | | $ | 1,284 | |
| 5 Year Euro-Bobl Futures | | Short | | 13 | | 3/11/2024 | | | (1,712 | ) | | | | (23 | ) |
| 5 Year U.S. Treasury Note Futures | | Long | | 33 | | 4/3/2024 | | | 3,590 | | | | | 82 | |
| 10 Year Euro-Bund Futures | | Short | | 14 | | 3/11/2024 | | | (2,121 | ) | | | | (62 | ) |
| 10 Year U.S. Treasury Note Futures | | Long | | 4 | | 3/28/2024 | | | 452 | | | | | 1 | |
| 10 Year Ultra U.S. Treasury Note Futures | | Short | | 97 | | 3/28/2024 | | | (11,448 | ) | | | | (513 | ) |
| 20 Year U.S. Treasury Bond Futures | | Long | | 8 | | 3/28/2024 | | | 999 | | | | | 76 | |
| 30 Year Ultra U.S. Treasury Bond Futures | | Long | | 37 | | 3/28/2024 | | | 4,943 | | | | | 458 | |
| | | | | | | | | | | | | | $ | 1,303 | |
Forward currency contracts
| Contract amount | | | | | | Unrealized
appreciation
(depreciation) | |
Currency purchased
(000) | | Currency sold
(000) | | Counterparty | | Settlement
date | | at 12/31/2023
(000) | |
| EUR | | 840 | | USD | | 912 | | Morgan Stanley | | 1/8/2024 | | | $ | 16 | |
| CZK | | 72,840 | | USD | | 3,245 | | JPMorgan Chase | | 1/8/2024 | | | | 11 | |
| PLN | | 1,150 | | USD | | 287 | | UBS AG | | 1/8/2024 | | | | 5 | |
| USD | | 386 | | CZK | | 8,637 | | Bank of New York Mellon | | 1/8/2024 | | | | — | 6 |
| USD | | 143 | | ZAR | | 2,700 | | UBS AG | | 1/8/2024 | | | | (4 | ) |
| USD | | 22,678 | | EUR | | 20,898 | | Morgan Stanley | | 1/8/2024 | | | | (402 | ) |
| ZAR | | 10,923 | | USD | | 577 | | UBS AG | | 1/9/2024 | | | | 19 | |
| HUF | | 265,180 | | USD | | 751 | | UBS AG | | 1/9/2024 | | | | 13 | |
| PLN | | 757 | | USD | | 188 | | JPMorgan Chase | | 1/9/2024 | | | | 4 | |
| USD | | 1,642 | | CNH | | 11,755 | | BNP Paribas | | 1/9/2024 | | | | (9 | ) |
| USD | | 1,501 | | EUR | | 1,390 | | Citibank | | 1/9/2024 | | | | (34 | ) |
| USD | | 2,578 | | ZAR | | 48,789 | | UBS AG | | 1/9/2024 | | | | (86 | ) |
| THB | | 13,253 | | USD | | 376 | | Citibank | | 1/11/2024 | | | | 10 | |
| THB | | 13,557 | | USD | | 392 | | Citibank | | 1/11/2024 | | | | 3 | |
| USD | | 387 | | CZK | | 8,735 | | Goldman Sachs | | 1/11/2024 | | | | (4 | ) |
| USD | | 24,720 | | EUR | | 22,890 | | Morgan Stanley | | 1/11/2024 | | | | (563 | ) |
| USD | | 17,246 | | KRW | | 22,167,205 | | Citibank | | 1/12/2024 | | | | 135 | |
| KRW | | 9,000,000 | | USD | | 6,939 | | Standard Chartered Bank | | 1/12/2024 | | | | 8 | |
| BRL | | 1,909 | | USD | | 386 | | JPMorgan Chase | | 1/12/2024 | | | | 6 | |
| BRL | | 1,919 | | USD | | 391 | | JPMorgan Chase | | 1/12/2024 | | | | 4 | |
| INR | | 194,000 | | USD | | 2,326 | | Citibank | | 1/12/2024 | | | | 3 | |
| PEN | | 113 | | USD | | 30 | | JPMorgan Chase | | 1/12/2024 | | | | — | 6 |
| BRL | | 1,595 | | USD | | 328 | | JPMorgan Chase | | 1/12/2024 | | | | — | 6 |
| USD | | 162 | | BRL | | 796 | | Citibank | | 1/12/2024 | | | | (2 | ) |
| USD | | 1,079 | | IDR | | 16,660,952 | | Citibank | | 1/12/2024 | | | | (3 | ) |
| USD | | 386 | | BRL | | 1,895 | | Standard Chartered Bank | | 1/12/2024 | | | | (4 | ) |
| USD | | 555 | | BRL | | 2,728 | | Citibank | | 1/12/2024 | | | | (6 | ) |
| USD | | 541 | | PLN | | 2,181 | | Goldman Sachs | | 1/12/2024 | | | | (14 | ) |
| USD | | 604 | | ZAR | | 11,403 | | Citibank | | 1/12/2024 | | | | (19 | ) |
| 14 | American Funds Emerging Markets Bond Fund |
Forward currency contracts (continued)
| Contract amount | | | | | | Unrealized
appreciation | |
Currency
purchased
(000) | | Currency sold
(000) | | Counterparty | | Settlement
date | | (depreciation)
at 12/31/2023
(000) | |
| CLP | | 1,540,825 | | USD | | 1,768 | | Morgan Stanley | | 1/12/2024 | | | $ | (20 | ) |
| USD | | 2,766 | | PEN | | 10,335 | | JPMorgan Chase | | 1/12/2024 | | | | (26 | ) |
| USD | | 2,020 | | EUR | | 1,877 | | Goldman Sachs | | 1/12/2024 | | | | (53 | ) |
| PLN | | 2,320 | | USD | | 586 | | Bank of New York Mellon | | 1/16/2024 | | | | 4 | |
| HUF | | 150,473 | | USD | | 431 | | Goldman Sachs | | 1/16/2024 | | | | 1 | |
| HUF | | 1,603,400 | | USD | | 4,514 | | JPMorgan Chase | | 1/18/2024 | | | | 94 | |
| HUF | | 1,097,000 | | USD | | 3,075 | | BNP Paribas | | 1/18/2024 | | | | 78 | |
| PLN | | 6,225 | | USD | | 1,547 | | Goldman Sachs | | 1/18/2024 | | | | 35 | |
| PLN | | 5,759 | | USD | | 1,428 | | JPMorgan Chase | | 1/18/2024 | | | | 35 | |
| CZK | | 46,500 | | USD | | 2,056 | | Barclays Bank PLC | | 1/18/2024 | | | | 22 | |
| HUF | | 255,050 | | EUR | | 664 | | Goldman Sachs | | 1/18/2024 | | | | — | 6 |
| USD | | 103 | | CZK | | 2,330 | | Standard Chartered Bank | | 1/18/2024 | | | | (1 | ) |
| USD | | 734 | | CZK | | 16,601 | | Barclays Bank PLC | | 1/18/2024 | | | | (8 | ) |
| USD | | 386 | | PLN | | 1,557 | | Goldman Sachs | | 1/18/2024 | | | | (10 | ) |
| CZK | | 57,008 | | USD | | 2,571 | | UBS AG | | 1/18/2024 | | | | (24 | ) |
| THB | | 146,300 | | USD | | 4,100 | | Citibank | | 1/19/2024 | | | | 160 | |
| THB | | 115,000 | | USD | | 3,223 | | Citibank | | 1/19/2024 | | | | 127 | |
| THB | | 111,000 | | USD | | 3,111 | | Citibank | | 1/19/2024 | | | | 123 | |
| THB | | 25,120 | | USD | | 704 | | Citibank | | 1/19/2024 | | | | 28 | |
| MYR | | 6,340 | | USD | | 1,361 | | HSBC Bank | | 1/19/2024 | | | | 24 | |
| CNH | | 6,520 | | USD | | 908 | | HSBC Bank | | 1/19/2024 | | | | 8 | |
| THB | | 13,520 | | USD | | 389 | | Citibank | | 1/19/2024 | | | | 5 | |
| TRY | | 61,000 | | USD | | 2,041 | | Goldman Sachs | | 1/19/2024 | | | | (11 | ) |
| USD | | 9,612 | | MYR | | 44,774 | | HSBC Bank | | 1/19/2024 | | | | (166 | ) |
| PLN | | 35,486 | | USD | | 8,968 | | Citibank | | 1/22/2024 | | | | 47 | |
| PLN | | 4,070 | | USD | | 1,029 | | HSBC Bank | | 1/22/2024 | | | | 5 | |
| CLP | | 330,680 | | USD | | 378 | | JPMorgan Chase | | 1/22/2024 | | | | (3 | ) |
| USD | | 494 | | EUR | | 450 | | Standard Chartered Bank | | 1/22/2024 | | | | (3 | ) |
| USD | | 502 | | ZAR | | 9,355 | | Goldman Sachs | | 1/22/2024 | | | | (9 | ) |
| THB | | 52,060 | | USD | | 1,490 | | UBS AG | | 1/23/2024 | | | | 27 | |
| HUF | | 112,153 | | USD | | 318 | | BNP Paribas | | 1/23/2024 | | | | 4 | |
| USD | | 1,853 | | CNH | | 13,200 | | Morgan Stanley | | 1/23/2024 | | | | (3 | ) |
| BRL | | 5,000 | | USD | | 1,019 | | Morgan Stanley | | 2/9/2024 | | | | 7 | |
| USD | | 900 | | BRL | | 5,000 | | BNP Paribas | | 2/9/2024 | | | | (125 | ) |
| USD | | 1,134 | | ILS | | 4,303 | | JPMorgan Chase | | 2/16/2024 | | | | (56 | ) |
| USD | | 3,565 | | BRL | | 17,500 | | Morgan Stanley | | 2/20/2024 | | | | (20 | ) |
| TRY | | 58,000 | | USD | | 1,853 | | Barclays Bank PLC | | 3/5/2024 | | | | (5 | ) |
| TRY | | 50,000 | | USD | | 1,605 | | BNP Paribas | | 3/5/2024 | | | | (12 | ) |
| TRY | | 84,000 | | USD | | 2,677 | | Barclays Bank PLC | | 3/7/2024 | | | | (6 | ) |
| USD | | 1,560 | | ILS | | 6,260 | | Morgan Stanley | | 4/24/2024 | | | | (176 | ) |
| CZK | | 50,190 | | USD | | 2,220 | | Barclays Bank PLC | | 6/10/2024 | | | | 18 | |
| TRY | | 6,652 | | USD | | 196 | | BNP Paribas | | 6/10/2024 | | | | (3 | ) |
| TRY | | 13,483 | | USD | | 398 | | Morgan Stanley | | 6/10/2024 | | | | (7 | ) |
| BRL | | 10,000 | | USD | | 1,874 | | Morgan Stanley | | 10/2/2024 | | | | 124 | |
| USD | | 3,791 | | BRL | | 20,000 | | JPMorgan Chase | | 10/2/2024 | | | | (204 | ) |
| USD | | 432 | | ILS | | 1,675 | | BNP Paribas | | 10/18/2024 | | | | (36 | ) |
| | | | | | | | | | | | | | $ | (924 | ) |
| American Funds Emerging Markets Bond Fund | 15 |
Swap contracts
Interest rate swaps
Centrally cleared interest rate swaps
| Receive | | Pay | | | | Notional | | Value at | | Upfront
premium
paid | | | Unrealized
appreciation
(depreciation) | |
| Rate | | Payment
frequency | | Rate | | Payment
frequency | | Expiration
date | | amount
(000) | | 12/31/2023
(000) | | (received)
(000) | | | at 12/31/2023
(000) | |
| 6-month PLN-WIBOR | | Semi-annual | | 5.178% | | Annual | | 12/1/2025 | | | PLN12,000 | | | $ | (10 | ) | | $ | — | | | | $ | (10 | ) |
| 6.44% | | 28-day | | 28-day MXN-TIIE | | 28-day | | 7/24/2026 | | | MXN20,650 | | | | (80 | ) | | | — | | | | | (80 | ) |
| 7.28% | | 28-day | | 28-day MXN-TIIE | | 28-day | | 9/30/2026 | | | 13,000 | | | | (36 | ) | | | — | | | | | (36 | ) |
| 7.24% | | 28-day | | 28-day MXN-TIIE | | 28-day | | 10/2/2026 | | | 13,000 | | | | (37 | ) | | | — | | | | | (37 | ) |
| 8.705% | | 28-day | | 28-day MXN-TIIE | | 28-day | | 6/4/2027 | | | 19,700 | | | | (7 | ) | | | — | | | | | (7 | ) |
| 6-month PLN-WIBOR | | Semi-annual | | 4.745% | | Annual | | 10/10/2028 | | | PLN5,200 | | | | (19 | ) | | | — | | | | | (19 | ) |
| 8.875% | | 28-day | | 28-day MXN-TIIE | | 28-day | | 11/14/2028 | | | MXN115,000 | | | | 82 | | | | — | | | | | 82 | |
| 8.84% | | 28-day | | 28-day MXN-TIIE | | 28-day | | 11/22/2028 | | | 25,800 | | | | 17 | | | | — | | | | | 17 | |
| | | | | | | | | | | | | | | $ | (90 | ) | | $ | — | | | | $ | (90 | ) |
Bilateral interest rate swaps
| Receive | | Pay | | | | | | Notional | | Value at | | Upfront
premium
paid | | | Unrealized
appreciation
(depreciation) | |
| Rate | | Payment
frequency | | Rate | | Payment frequency | | Counterparty | | Expiration
date | | amount
(000) | | 12/31/2023
(000) | | (received)
(000) | | | at 12/31/2023
(000) | |
| 10.655% | | At maturity | | BZDIOVER | | At maturity | | Goldman Sachs | | 1/4/2027 | | BRL10,441 | | | $ | 57 | | | $ | — | | | | $ | 57 | |
Investments in affiliates11
| | | Value at
1/1/2023
(000) | | | Additions
(000) | | | Reductions
(000) | | | Net
realized
gain (loss)
(000) | | | Net
unrealized
appreciation
(depreciation)
(000) | | | Value at
12/31/2023
(000) | | | Dividend
or interest
income
(000) | |
| Short-term securities 5.63% | | | | | | | | | | | | | | | | | | | | | | | | | | | | |
| Money market investments 5.63% | | | | | | | | | | | | | | | | | | | | | | | | | | | | |
| Capital Group Central Cash Fund 5.44%10 | | $ | 48,614 | | | $ | 353,673 | | | $ | 340,418 | | | $ | 2 | | | $ | (6 | ) | | $ | 61,865 | | | $ | 3,009 | |
Restricted securities7
| | | Acquisition
date(s) | | Cost
(000) | | | Value
(000) | | | Percent
of net
assets | |
| Kosmos Energy, Ltd. 7.125% 4/4/2026 | | 7/20/2023-8/15/2023 | | $ | 1,585 | | | $ | 1,603 | | | | .14 | % |
| Kosmos Energy, Ltd. 7.50% 3/1/2028 | | 7/20/2023-12/15/2023 | | | 718 | | | | 729 | | | | .07 | |
| Sasol Financing USA, LLC 8.75% 5/3/2029 | | 7/5/2023-7/18/2023 | | | 1,571 | | | | 1,619 | | | | .15 | |
| NBM US Holdings, Inc. 7.00% 5/14/2026 | | 8/4/2021 | | | 253 | | | | 253 | | | | .02 | |
| Modec Finance BV 7.84% 7/15/20265 | | 7/28/2023 | | | 200 | | | | 201 | | | | .02 | |
| Total | | | | $ | 4,327 | | | $ | 4,405 | | | | .40 | % |
| 16 | American Funds Emerging Markets Bond Fund |
| 1 | Acquired in a transaction exempt from registration under Rule 144A or, for commercial paper, Section 4(a)(2) of the Securities Act of 1933. May be resold in the U.S. in transactions exempt from registration, normally to qualified institutional buyers. The total value of all such securities was $157,261,000, which represented 14.31% of the net assets of the fund. |
| 2 | Step bond; coupon rate may change at a later date. |
| 3 | Index-linked bond whose principal amount moves with a government price index. |
| 4 | Scheduled interest and/or principal payment was not received. |
| 5 | Value determined using significant unobservable inputs. |
| 6 | Amount less than one thousand. |
| 7 | Restricted security, other than Rule 144A securities or commercial paper issued pursuant to Section 4(a)(2) of the Securities Act of 1933. The total value of all such restricted securities was $4,405,000, which represented .40% of the net assets of the fund. |
| 8 | All or a portion of this security was pledged as collateral. The total value of pledged collateral was $2,954,000, which represented .27% of the net assets of the fund. |
| 9 | Security did not produce income during the last 12 months. |
| 10 | Rate represents the seven-day yield at 12/31/2023. |
| 11 | Part of the same “group of investment companies” as the fund as defined under the Investment Company Act of 1940, as amended. |
Key to abbreviation(s)
BRL = Brazilian reais
BZDIOVER = Overnight Brazilian Interbank Deposit Rate
CLP = Chilean pesos
CNH = Chinese yuan renminbi
CNY = Chinese yuan
COP = Colombian pesos
CZK = Czech korunas
DOP = Dominican pesos
EUR = Euros
HUF = Hungarian forints
IDR = Indonesian rupiah
ILS = Israeli shekels
INR = Indian rupees
KRW = South Korean won
KZT = Kazakhstani tenge
LKR = Sri Lankan rupees
MXN = Mexican pesos
MYR = Malaysian ringgits
PEN = Peruvian nuevos soles
PLN = Polish zloty
RON = Romanian leu
RUB = Russian rubles
SOFR = Secured Overnight Financing Rate
THB = Thai baht
TIIE = Equilibrium Interbank Interest Rate
TRY = Turkish lira
UAH = Ukrainian hryvnia
USD = U.S. dollars
UYU = Uruguayan pesos
WIBOR = Warsaw Interbank Offer Rate
ZAR = South African rand
Refer to the notes to financial statements.
| American Funds Emerging Markets Bond Fund | 17 |
Financial statements
| Statement of assets and liabilities | |
| at December 31, 2023 | (dollars in thousands) |
| Assets: | | | | | | |
| Investment securities, at value: | | | | | | | | |
| Unaffiliated issuers (cost: $1,017,018) | | $ | 1,016,717 | | | | | |
| Affiliated issuers (cost: $61,871) | | | 61,865 | | | $ | 1,078,582 | |
| Cash | | | | | | | 255 | |
| Cash denominated in currencies other than U.S. dollars (cost: $921) | | | | | | | 765 | |
| Unrealized appreciation on open forward currency contracts | | | | | | | 1,213 | |
| Bilateral swaps, at value | | | | | | | 57 | |
| Receivables for: | | | | | | | | |
| Sales of investments | | | 535 | | | | | |
| Sales of fund’s shares | | | 1,900 | | | | | |
| Dividends and interest | | | 20,942 | | | | | |
| Variation margin on futures contracts | | | 120 | | | | | |
| Variation margin on centrally cleared swap contracts | | | 24 | | | | | |
| Other | | | 302 | | | | 23,823 | |
| | | | | | | | 1,104,695 | |
| Liabilities: | | | | | | | | |
| Unrealized depreciation on open forward currency contracts | | | | | | | 2,137 | |
| Payables for: | | | | | | | | |
| Purchases of investments | | | 335 | | | | | |
| Repurchases of fund’s shares | | | 2,148 | | | | | |
| Dividends on fund’s shares | | | 191 | | | | | |
| Investment advisory services | | | 417 | | | | | |
| Services provided by related parties | | | 152 | | | | | |
| Trustees’ deferred compensation | | | 11 | | | | | |
| Variation margin on futures contracts | | | 21 | | | | | |
| Variation margin on centrally cleared swap contracts | | | 20 | | | | | |
| Non-U.S. taxes | | | 204 | | | | | |
| Other | | | 37 | | | | 3,536 | |
| Net assets at December 31, 2023 | | | | | | $ | 1,099,022 | |
| | | | | | | | | |
| Net assets consist of: | | | | | | | | |
| Capital paid in on shares of beneficial interest | | | | | | $ | 1,339,002 | |
| Total distributable earnings (accumulated loss) | | | | | | | (239,980 | ) |
| Net assets at December 31, 2023 | | | | | | $ | 1,099,022 | |
Refer to the notes to financial statements.
| 18 | American Funds Emerging Markets Bond Fund |
Financial statements (continued)
| Statement of assets and liabilities | |
| at December 31, 2023 (continued) | (dollars and shares in thousands, except per-share amounts) |
Shares of beneficial interest issued and outstanding (no stated par value) —
unlimited shares authorized (136,709 total shares outstanding)
| | | Net assets | | | Shares
outstanding | | | Net asset value
per share | |
| Class A | | $ | 306,709 | | | | 38,152 | | | $ | 8.04 | |
| Class C | | | 17,261 | | | | 2,147 | | | | 8.04 | |
| Class T | | | 8 | | | | 1 | | | | 8.04 | |
| Class F-1 | | | 16,513 | | | | 2,054 | | | | 8.04 | |
| Class F-2 | | | 239,761 | | | | 29,824 | | | | 8.04 | |
| Class F-3 | | | 379,547 | | | | 47,213 | | | | 8.04 | |
| Class 529-A | | | 8,907 | | | | 1,108 | | | | 8.04 | |
| Class 529-C | | | 459 | | | | 57 | | | | 8.04 | |
| Class 529-E | | | 576 | | | | 72 | | | | 8.04 | |
| Class 529-T | | | 12 | | | | 1 | | | | 8.04 | |
| Class 529-F-1 | | | 10 | | | | 1 | | | | 8.04 | |
| Class 529-F-2 | | | 7,022 | | | | 874 | | | | 8.04 | |
| Class 529-F-3 | | | 11 | | | | 1 | | | | 8.04 | |
| Class R-1 | | | 194 | | | | 24 | | | | 8.04 | |
| Class R-2 | | | 1,663 | | | | 207 | | | | 8.04 | |
| Class R-2E | | | 129 | | | | 16 | | | | 8.04 | |
| Class R-3 | | | 2,035 | | | | 253 | | | | 8.04 | |
| Class R-4 | | | 859 | | | | 107 | | | | 8.04 | |
| Class R-5E | | | 977 | | | | 122 | | | | 8.04 | |
| Class R-5 | | | 898 | | | | 112 | | | | 8.04 | |
| Class R-6 | | | 115,471 | | | | 14,363 | | | | 8.04 | |
Refer to the notes to financial statements.
| American Funds Emerging Markets Bond Fund | 19 |
Financial statements (continued)
| Statement of operations | |
| for the year ended December 31, 2023 | (dollars in thousands) |
| Investment income: | | | | | | |
| Income: | | | | | | | | |
| Interest from unaffiliated issuers (net of non-U.S. taxes of $223) | | $ | 69,048 | | | | | |
| Dividends from affiliated issuers | | | 3,009 | | | $ | 72,057 | |
| Fees and expenses*: | | | | | | | | |
| Investment advisory services | | | 4,392 | | | | | |
| Distribution services | | | 1,027 | | | | | |
| Transfer agent services | | | 722 | | | | | |
| Administrative services | | | 288 | | | | | |
| 529 plan services | | | 9 | | | | | |
| Reports to shareholders | | | 56 | | | | | |
| Registration statement and prospectus | | | 292 | | | | | |
| Trustees’ compensation | | | 5 | | | | | |
| Auditing and legal | | | 25 | | | | | |
| Custodian | | | 175 | | | | | |
| Other | | | 25 | | | | | |
| Total fees and expenses before reimbursement | | | 7,016 | | | | | |
| Less reimbursement of fees and expenses: | | | | | | | | |
| Miscellaneous fee reimbursement | | | 2 | | | | | |
| Total fees and expenses after reimbursement | | | | | | | 7,014 | |
| Net investment income | | | | | | | 65,043 | |
| | | | | | | | | |
| Net realized gain (loss) and unrealized appreciation (depreciation): | | | | | | | | |
| Net realized gain (loss) on: | | | | | | | | |
| Investments (net of non-U.S. taxes of $39): | | | | | | | | |
| Unaffiliated issuers | | | (74,791 | ) | | | | |
| Affiliated issuers | | | 2 | | | | | |
| Futures contracts | | | (1,442 | ) | | | | |
| Forward currency contracts | | | 1,467 | | | | | |
| Swap contracts | | | (1,066 | ) | | | | |
| Currency transactions | | | 1,081 | | | | (74,749 | ) |
| Net unrealized appreciation (depreciation) on: | | | | | | | | |
| Investments (net of non-U.S. taxes of $17): | | | | | | | | |
| Unaffiliated issuers | | | 132,363 | | | | | |
| Affiliated issuers | | | (6 | ) | | | | |
| Futures contracts | | | 1,139 | | | | | |
| Forward currency contracts | | | 61 | | | | | |
| Swap contracts | | | 1,378 | | | | | |
| Currency translations | | | (370 | ) | | | 134,565 | |
| Net realized gain (loss) and unrealized appreciation (depreciation) | | | | | | | 59,816 | |
| | | | | | | | | |
| Net increase (decrease) in net assets resulting from operations | | | | | | $ | 124,859 | |
| * | Additional information related to class-specific fees and expenses is included in the notes to financial statements. |
Refer to the notes to financial statements.
| 20 | American Funds Emerging Markets Bond Fund |
Financial statements (continued)
| Statements of changes in net assets | |
| (dollars in thousands) |
| | | Year ended December 31, | |
| | | 2023 | | | 2022 | |
| Operations: | | | | | | | | |
| Net investment income | | $ | 65,043 | | | $ | 68,660 | |
| Net realized gain (loss) | | | (74,749 | ) | | | (175,420 | ) |
| Net unrealized appreciation (depreciation) | | | 134,565 | | | | (90,707 | ) |
| Net increase (decrease) in net assets resulting from operations | | | 124,859 | | | | (197,467 | ) |
| | | | | | | | | |
| Distributions paid or accrued and return of capital paid to shareholders: | | | | | | | | |
| Distributions | | | (49,011 | ) | | | (63,536 | ) |
| Return of capital | | | (18,869 | ) | | | (12,328 | ) |
| Total distributions paid or accrued and return of capital paid to shareholders | | | (67,880 | ) | | | (75,864 | ) |
| | | | | | | | | |
| Net capital share transactions | | | 169,954 | | | | (325,113 | ) |
| | | | | | | | | |
| Total increase (decrease) in net assets | | | 226,933 | | | | (598,444 | ) |
| | | | | | | | | |
| Net assets: | | | | | | | | |
| Beginning of year | | | 872,089 | | | | 1,470,533 | |
| End of year | | $ | 1,099,022 | | | $ | 872,089 | |
Refer to the notes to financial statements.
| American Funds Emerging Markets Bond Fund | 21 |
Notes to financial statements
1. Organization
American Funds Emerging Markets Bond Fund (the “fund”) is registered under the Investment Company Act of 1940, as amended (the “1940 Act”), as an open-end, nondiversified management investment company. The fund seeks to provide a high level of total return over the long term, of which current income is a large component.
The fund has 21 share classes consisting of six retail share classes (Classes A, C, T, F-1, F-2 and F-3), seven 529 college savings plan share classes (Classes 529-A, 529-C, 529-E, 529-T, 529-F-1, 529-F-2 and 529-F-3) and eight retirement plan share classes (Classes R-1, R-2, R-2E, R-3, R-4, R-5E, R-5 and R-6). The 529 college savings plan share classes can be used to save for college education. The retirement plan share classes are generally offered only through eligible employer-sponsored retirement plans. The fund’s share classes are described further in the following table:
| Share class | | Initial sales charge | | Contingent deferred sales
charge upon redemption | | Conversion feature |
| Class A | | Up to 3.75% | | None (except 0.75% for certain redemptions within 18 months of purchase without an initial sales charge) | | None |
| Class 529-A | | Up to 3.50% | | None (except 1.00% for certain redemptions within 18 months of purchase without an initial sales charge) | | None |
| Classes C and 529-C | | None | | 1.00% for redemptions within one year of purchase | | Class C converts to Class A after eight years and Class 529-C converts to Class 529-A after five years |
| Class 529-E | | None | | None | | None |
| Classes T and 529-T* | | Up to 2.50% | | None | | None |
| Classes F-1, F-2, F-3, 529-F-1, 529-F-2 and 529-F-3 | | None | | None | | None |
| Classes R-1, R-2, R-2E, R-3, R-4, R-5E, R-5 and R-6 | | None | | None | | None |
| * | Class T and 529-T shares are not available for purchase. |
Holders of all share classes have equal pro rata rights to the assets, dividends and liquidation proceeds of the fund. Each share class has identical voting rights, except for the exclusive right to vote on matters affecting only its class. Share classes have different fees and expenses (“class-specific fees and expenses”), primarily due to different arrangements for distribution, transfer agent and administrative services. Differences in class-specific fees and expenses will result in differences in net investment income and, therefore, the payment of different per-share dividends by each share class.
2. Significant accounting policies
The fund is an investment company that applies the accounting and reporting guidance issued in Topic 946 by the U.S. Financial Accounting Standards Board. The fund’s financial statements have been prepared to comply with U.S. generally accepted accounting principles (“U.S. GAAP”). These principles require the fund’s investment adviser to make estimates and assumptions that affect reported amounts and disclosures. Actual results could differ from those estimates. Subsequent events, if any, have been evaluated through the date of issuance in the preparation of the financial statements. The fund follows the significant accounting policies described in this section, as well as the valuation policies described in the next section on valuation.
Security transactions and related investment income — Security transactions are recorded by the fund as of the date the trades are executed with brokers. Realized gains and losses from security transactions are determined based on the specific identified cost of the securities. In the event a security is purchased with a delayed payment date, the fund will segregate liquid assets sufficient to meet its payment obligations. Dividend income is recognized on the ex-dividend date and interest income is recognized on an accrual basis. Market discounts, premiums and original issue discounts on fixed-income securities are amortized daily over the expected life of the security.
Class allocations — Income, fees and expenses (other than class-specific fees and expenses) are allocated daily among the various share classes based on the relative value of their settled shares. Realized gains and losses and unrealized appreciation and depreciation are allocated daily among the various share classes based on their relative net assets. Class-specific fees and expenses, such as distribution, transfer agent and administrative services, are charged directly to the respective share class.
| 22 | American Funds Emerging Markets Bond Fund |
Distributions paid or accrued to shareholders — Income dividends are declared daily after the determination of the fund’s net investment income and are paid to shareholders monthly. Capital gain distributions are recorded on the ex-dividend date. The fund may deem a portion of the income dividends and/or capital gain distributions as a return of capital for tax purposes.
Currency translation — Assets and liabilities, including investment securities, denominated in currencies other than U.S. dollars are translated into U.S. dollars at the exchange rates supplied by one or more pricing vendors on the valuation date. Purchases and sales of investment securities and income and expenses are translated into U.S. dollars at the exchange rates on the dates of such transactions. The effects of changes in exchange rates on investment securities are included with the net realized gain or loss and net unrealized appreciation or depreciation on investments in the fund’s statement of operations. The realized gain or loss and unrealized appreciation or depreciation resulting from all other transactions denominated in currencies other than U.S. dollars are disclosed separately.
3. Valuation
Capital Research and Management Company (“CRMC”), the fund’s investment adviser, values the fund’s investments at fair value as defined by U.S. GAAP. The net asset value per share is calculated once daily as of the close of regular trading on the New York Stock Exchange, normally 4 p.m. New York time, each day the New York Stock Exchange is open.
Methods and inputs — The fund’s investment adviser uses the following methods and inputs to establish the fair value of the fund’s assets and liabilities. Use of particular methods and inputs may vary over time based on availability and relevance as market and economic conditions evolve.
Fixed-income securities, including short-term securities, are generally valued at evaluated prices obtained from third-party pricing vendors. Vendors value such securities based on one or more of the inputs described in the following table. The table provides examples of inputs that are commonly relevant for valuing particular classes of fixed-income securities in which the fund is authorized to invest. However, these classifications are not exclusive, and any of the inputs may be used to value any other class of fixed-income security.
| Fixed-income class | | Examples of standard inputs |
| All | | Benchmark yields, transactions, bids, offers, quotations from dealers and trading systems, new issues, spreads and other relationships observed in the markets among comparable securities; and proprietary pricing models such as yield measures calculated using factors such as cash flows, financial or collateral performance and other reference data (collectively referred to as “standard inputs”) |
| Corporate bonds, notes & loans; convertible securities | | Standard inputs and underlying equity of the issuer |
| Bonds & notes of governments & government agencies | | Standard inputs and interest rate volatilities |
| Mortgage-backed; asset-backed obligations | | Standard inputs and cash flows, prepayment information, default rates, delinquency and loss assumptions, collateral characteristics, credit enhancements and specific deal information |
The Capital Group Central Cash Fund (“CCF”), a fund within the Capital Group Central Fund Series (“Central Funds”), is valued based upon a floating net asset value, which fluctuates with changes in the value of CCF’s portfolio securities. The underlying securities are valued based on the policies and procedures in CCF’s statement of additional information. Exchange-traded futures are generally valued at the official settlement price of the exchange or market on which such instruments are traded, as of the close of business on the day the futures are being valued. Forward currency contracts are valued based on the spot and forward exchange rates obtained from a third-party pricing vendor. Swaps are generally valued using evaluated prices obtained from third-party pricing vendors who calculate these values based on market inputs that may include the yields of the indices referenced in the instrument and the relevant curve, dealer quotes, default probabilities and recovery rates, and terms of the contract.
| American Funds Emerging Markets Bond Fund | 23 |
Securities and other assets for which representative market quotations are not readily available or are considered unreliable by the fund’s investment adviser are fair valued as determined in good faith under fair valuation guidelines adopted by the fund’s investment adviser and approved by the board of trustees as further described. The investment adviser follows fair valuation guidelines, consistent with U.S. Securities and Exchange Commission rules and guidance, to consider relevant principles and factors when making fair value determinations. The investment adviser considers relevant indications of value that are reasonably and timely available to it in determining the fair value to be assigned to a particular security, such as the type and cost of the security, restrictions on resale of the security, relevant financial or business developments of the issuer, actively traded similar or related securities, dealer or broker quotes, conversion or exchange rights on the security, related corporate actions, significant events occurring after the close of trading in the security, and changes in overall market conditions. In addition, the closing prices of equity securities that trade in markets outside U.S. time zones may be adjusted to reflect significant events that occur after the close of local trading but before the net asset value of each share class of the fund is determined. Fair valuations of investments that are not actively trading involve judgment and may differ materially from valuations that would have been used had greater market activity occurred.
Processes and structure — The fund’s board of trustees has designated the fund’s investment adviser to make fair value determinations, subject to board oversight. The investment adviser has established a Joint Fair Valuation Committee (the “Committee”) to administer, implement and oversee the fair valuation process and to make fair value decisions. The Committee regularly reviews its own fair value decisions, as well as decisions made under its standing instructions to the investment adviser’s valuation team. The Committee reviews changes in fair value measurements from period to period, pricing vendor information and market data, and may, as deemed appropriate, update the fair valuation guidelines to better reflect the results of back testing and address new or evolving issues. Pricing decisions, processes and controls over security valuation are also subject to additional internal reviews facilitated by the investment adviser’s global risk management group. The Committee reports changes to the fair valuation guidelines to the board of trustees. The fund’s board and audit committee also regularly review reports that describe fair value determinations and methods.
Classifications — The fund’s investment adviser classifies the fund’s assets and liabilities into three levels based on the inputs used to value the assets or liabilities. Level 1 values are based on quoted prices in active markets for identical securities. Level 2 values are based on significant observable market inputs, such as quoted prices for similar securities and quoted prices in inactive markets. Certain securities trading outside the U.S. may transfer between Level 1 and Level 2 due to valuation adjustments resulting from significant market movements following the close of local trading. Level 3 values are based on significant unobservable inputs that reflect the investment adviser’s determination of assumptions that market participants might reasonably use in valuing the securities. The valuation levels are not necessarily an indication of the risk or liquidity associated with the underlying investment. For example, U.S. government securities are reflected as Level 2 because the inputs used to determine fair value may not always be quoted prices in an active market. The following tables present the fund’s valuation levels as of December 31, 2023 (dollars in thousands):
| | | Investment securities | |
| | | Level 1 | | | Level 2 | | | Level 3 | | | Total | |
| Assets: | | | | | | | | | | | | | | | | |
| Bonds, notes & other debt instruments: | | | | | | | | | | | | | | | | |
| Bonds & notes of governments & government agencies outside the U.S. | | $ | — | | | $ | 760,180 | | | | — | * | | $ | 760,180 | |
| Corporate bonds, notes & loans | | | — | | | | 196,261 | | | | 201 | | | | 196,462 | |
| U.S. Treasury bonds & notes | | | — | | | | 48,069 | | | | — | | | | 48,069 | |
| Federal agency bonds & notes | | | — | | | | 2,806 | | | | — | | | | 2,806 | |
| Convertible bonds & notes | | | — | | | | 7,037 | | | | — | | | | 7,037 | |
| Common stocks | | | — | | | | 1,521 | | | | — | | | | 1,521 | |
| Short-term securities | | | 61,865 | | | | 642 | | | | — | | | | 62,507 | |
| Total | | $ | 61,865 | | | $ | 1,016,516 | | | $ | 201 | | | $ | 1,078,582 | |
Refer to the end of the table for footnotes.
| 24 | American Funds Emerging Markets Bond Fund |
| | | Other investments† | |
| | | Level 1 | | | Level 2 | | | Level 3 | | | Total | |
| Assets: | | | | | | | | | | | | | | | | |
| Unrealized appreciation on futures contracts | | $ | 1,901 | | | $ | — | | | $ | — | | | $ | 1,901 | |
| Unrealized appreciation on open forward currency contracts | | | — | | | | 1,213 | | | | — | | | | 1,213 | |
| Unrealized appreciation on centrally cleared interest rate swaps | | | — | | | | 99 | | | | — | | | | 99 | |
| Unrealized appreciation on bilateral interest rate swaps | | | — | | | | 57 | | | | — | | | | 57 | |
| Liabilities: | | | | | | | | | | | | | | | | |
| Unrealized depreciation on futures contracts | | | (598 | ) | | | — | | | | — | | | | (598 | ) |
| Unrealized depreciation on open forward currency contracts | | | — | | | | (2,137 | ) | | | — | | | | (2,137 | ) |
| Unrealized depreciation on centrally cleared interest rate swaps | | | — | | | | (189 | ) | | | — | | | | (189 | ) |
| Total | | $ | 1,303 | | | $ | (957 | ) | | $ | — | | | $ | 346 | |
| | |
| * | Amount less than one thousand. |
| † | Futures contracts, forward currency contracts and interest rate swaps are not included in the fund’s investment portfolio. |
4. Risk factors
Investing in the fund may involve certain risks including, but not limited to, those described below.
Market conditions — The prices of, and the income generated by, the securities held by the fund may decline — sometimes rapidly or unpredictably — due to various factors, including events or conditions affecting the general economy or particular industries or companies; overall market changes; local, regional or global political, social or economic instability; governmental, governmental agency or central bank responses to economic conditions; changes in inflation rates; and currency exchange rate, interest rate and commodity price fluctuations.
Economies and financial markets throughout the world are highly interconnected. Economic, financial or political events, trading and tariff arrangements, wars, terrorism, cybersecurity events, natural disasters, public health emergencies (such as the spread of infectious disease), bank failures and other circumstances in one country or region, including actions taken by governmental or quasi-governmental authorities in response to any of the foregoing, could have impacts on global economies or markets. As a result, whether or not the fund invests in securities of issuers located in or with significant exposure to the countries affected, the value and liquidity of the fund’s investments may be negatively affected by developments in other countries and regions.
Issuer risks — The prices of, and the income generated by, securities held by the fund may decline in response to various factors directly related to the issuers of such securities, including reduced demand for an issuer’s goods or services, poor management performance, major litigation, investigations or other controversies related to the issuer, changes in the issuer’s financial condition or credit rating, changes in government regulations affecting the issuer or its competitive environment and strategic initiatives such as mergers, acquisitions or dispositions and the market response to any such initiatives. An individual security may also be affected by factors relating to the industry or sector of the issuer or the securities markets as a whole, and conversely an industry or sector or the securities markets may be affected by a change in financial condition or other event affecting a single issuer.
Investing in debt instruments — The prices of, and the income generated by, bonds and other debt securities held by the fund may be affected by factors such as the interest rates, maturities and credit quality of these securities.
Rising interest rates will generally cause the prices of bonds and other debt securities to fall. Also, when interest rates rise, issuers of debt securities that may be prepaid at any time, such as mortgage-or other asset-backed securities, are less likely to refinance existing debt securities, causing the average life of such securities to extend. A general change in interest rates may cause investors to sell debt securities on a large scale, which could also adversely affect the price and liquidity of debt securities and could also result in increased redemptions from the fund. Falling interest rates may cause an issuer to redeem, call or refinance a debt security before its stated maturity, which may result in the fund having to reinvest the proceeds in lower yielding securities. Longer maturity debt securities generally have greater sensitivity to changes in interest rates and may be subject to greater price fluctuations than shorter maturity debt securities.
| American Funds Emerging Markets Bond Fund | 25 |
Bonds and other debt securities are also subject to credit risk, which is the possibility that the credit strength of an issuer or guarantor will weaken or be perceived to be weaker, and/or an issuer of a debt security will fail to make timely payments of principal or interest and the security will go into default. Changes in actual or perceived creditworthiness may occur quickly. A downgrade or default affecting any of the fund’s securities could cause the value of the fund’s shares to decrease. Lower quality debt securities generally have higher rates of interest and may be subject to greater price fluctuations than higher quality debt securities. Credit risk is gauged, in part, by the credit ratings of the debt securities in which the fund invests. However, ratings are only the opinions of the rating agencies issuing them and are not guarantees as to credit quality or an evaluation of market risk. The fund’s investment adviser relies on its own credit analysts to research issuers and issues in assessing credit and default risks.
Investing in lower rated debt instruments — Lower rated bonds and other lower rated debt securities generally have higher rates of interest and involve greater risk of default or price declines due to changes in the issuer’s creditworthiness than those of higher quality debt securities. The market prices of these securities may fluctuate more than the prices of higher quality debt securities and may decline significantly in periods of general economic difficulty. These risks may be increased with respect to investments in junk bonds.
Investing in derivatives — The use of derivatives involves a variety of risks, which may be different from, or greater than, the risks associated with investing in traditional securities, such as stocks and bonds. Changes in the value of a derivative may not correlate perfectly with, and may be more sensitive to market events than, the underlying asset, rate or index, and a derivative instrument may cause the fund to lose significantly more than its initial investment. Derivatives may be difficult to value, difficult for the fund to buy or sell at an opportune time or price and difficult, or even impossible, to terminate or otherwise offset. The fund’s use of derivatives may result in losses to the fund, and investing in derivatives may reduce the fund’s returns and increase the fund’s price volatility. The fund’s counterparty to a derivative transaction (including, if applicable, the fund’s clearing broker, the derivatives exchange or the clearinghouse) may be unable or unwilling to honor its financial obligations in respect of the transaction. In certain cases, the fund may be hindered or delayed in exercising remedies against or closing out derivative instruments with a counterparty, which may result in additional losses. Derivatives are also subject to operational risk (such as documentation issues, settlement issues and systems failures) and legal risk (such as insufficient documentation, insufficient capacity or authority of a counterparty, and issues with the legality or enforceability of a contract).
Liquidity risk — Certain fund holdings may be or may become difficult or impossible to sell, particularly during times of market turmoil. Liquidity may be impacted by the lack of an active market for a holding, legal or contractual restrictions on resale, or the reduced number and capacity of market participants to make a market in such holding. Market prices for less liquid or illiquid holdings may be volatile or difficult to determine, and reduced liquidity may have an adverse impact on the market price of such holdings. Additionally, the sale of less liquid or illiquid holdings may involve substantial delays (including delays in settlement) and additional costs and the fund may be unable to sell such holdings when necessary to meet its liquidity needs or to try to limit losses, or may be forced to sell at a loss.
Investing outside the U.S. — Securities of issuers domiciled outside the U.S., or with significant operations or revenues outside the U.S., and securities tied economically to countries outside the U.S., may lose value because of adverse political, social, economic or market developments (including social instability, regional conflicts, terrorism and war) in the countries or regions in which the issuers are domiciled, operate or generate revenue or to which the securities are tied economically. These securities may also lose value due to changes in foreign currency exchange rates against the U.S. dollar and/or currencies of other countries. Issuers of these securities may be more susceptible to actions of foreign governments, such as nationalization, currency blockage or the imposition of price controls, sanctions, or punitive taxes, each of which could adversely impact the value of these securities. Securities markets in certain countries may be more volatile and/or less liquid than those in the U.S. Investments outside the U.S. may also be subject to different regulatory, legal, accounting, auditing, financial reporting and recordkeeping requirements, and may be more difficult to value, than those in the U.S. In addition, the value of investments outside the U.S. may be reduced by foreign taxes, including foreign withholding taxes on interest and dividends. Further, there may be increased risks of delayed settlement of securities purchased or sold by the fund, which could impact the liquidity of the fund’s portfolio. The risks of investing outside the U.S. may be heightened in connection with investments in emerging markets.
| 26 | American Funds Emerging Markets Bond Fund |
Investing in emerging markets — Investing in emerging markets may involve risks in addition to and greater than those generally associated with investing in the securities markets of developed countries. For instance, emerging market countries tend to have less developed political, economic and legal systems than those in developed countries. Accordingly, the governments of these countries may be less stable and more likely to intervene in the market economy, for example, by imposing capital controls, nationalizing a company or industry, placing restrictions on foreign ownership and on withdrawing sale proceeds of securities from the country, and/or imposing punitive taxes that could adversely affect the prices of securities. Information regarding issuers in emerging markets may be limited, incomplete or inaccurate, and such issuers may not be subject to regulatory, accounting, auditing, and financial reporting and recordkeeping standards comparable to those to which issuers in more developed markets are subject. The fund’s rights with respect to its investments in emerging markets, if any, will generally be governed by local law, which may make it difficult or impossible for the fund to pursue legal remedies or to obtain and enforce judgments in local courts. In addition, the economies of these countries may be dependent on relatively few industries, may have limited access to capital and may be more susceptible to changes in local and global trade conditions and downturns in the world economy. Securities markets in these countries can also be relatively small and have substantially lower trading volumes. As a result, securities issued in these countries may be more volatile and less liquid, more vulnerable to market manipulation, and more difficult to value, than securities issued in countries with more developed economies and/or markets. Less certainty with respect to security valuations may lead to additional challenges and risks in calculating the fund’s net asset value. Additionally, emerging markets are more likely to experience problems with the clearing and settling of trades and the holding of securities by banks, agents and depositories that are less established than those in developed countries.
Currency — The prices of, and the income generated by, many debt securities held by the fund may also be affected by changes in relative currency values. If the U.S. dollar appreciates against foreign currencies, the value in U.S. dollars of the fund’s securities denominated in such currencies would generally fall and vice versa.
Nondiversification risk — As a nondiversified fund, the fund has the ability to invest a larger percentage of its assets in the securities of a smaller number of issuers than a diversified fund. To the extent that the fund invests a larger percentage of its assets in securities of one or more issuers, poor performance by these securities could have a greater adverse impact on the fund’s investment results.
Management — The investment adviser to the fund actively manages the fund’s investments. Consequently, the fund is subject to the risk that the methods and analyses, including models, tools and data, employed by the investment adviser in this process may be flawed or incorrect and may not produce the desired results. This could cause the fund to lose value or its investment results to lag relevant benchmarks or other funds with similar objectives.
5. Certain investment techniques
Index-linked bonds — The fund has invested in index-linked bonds, which are fixed-income securities whose principal value is periodically adjusted to a government price index. Over the life of an index-linked bond, interest is paid on the adjusted principal value. Increases or decreases in the principal value of index-linked bonds are recorded as interest income in the fund’s statement of operations.
Futures contracts — The fund has entered into futures contracts, which provide for the future sale by one party and purchase by another party of a specified amount of a specific financial instrument for a specified price, date, time and place designated at the time the contract is made. Futures contracts are used to strategically manage the fund’s interest rate sensitivity by increasing or decreasing the duration of the fund or a portion of the fund’s portfolio.
Upon entering into futures contracts, and to maintain the fund’s open positions in futures contracts, the fund is required to deposit with a futures broker, known as a futures commission merchant (“FCM”), in a segregated account in the name of the FCM an amount of cash, U.S. government securities or other liquid securities, known as initial margin. The margin required for a particular futures contract is set by the exchange on which the contract is traded to serve as collateral, and may be significantly modified from time to time by the exchange during the term of the contract.
On a daily basis, the fund pays or receives variation margin based on the increase or decrease in the value of the futures contracts and records variation margin on futures contracts in the statement of assets and liabilities. Futures contracts may involve a risk of loss in excess of the variation margin shown on the fund’s statement of assets and liabilities. The fund records realized gains or losses at the time the futures contract is closed or expires. Net realized gains or losses and net unrealized appreciation or depreciation from futures contracts are recorded in the fund’s statement of operations. The average month-end notional amount of futures contracts while held was $177,130,000.
Forward currency contracts — The fund has entered into forward currency contracts, which represent agreements to exchange currencies on specific future dates at predetermined rates. The fund’s investment adviser uses forward currency contracts to manage the fund’s
| American Funds Emerging Markets Bond Fund | 27 |
exposure to changes in exchange rates. Upon entering into these contracts, risks may arise from the potential inability of counterparties to meet the terms of their contracts and from possible movements in exchange rates.
On a daily basis, the fund’s investment adviser values forward currency contracts and records unrealized appreciation or depreciation for open forward currency contracts in the fund’s statement of assets and liabilities. Realized gains or losses are recorded at the time the forward currency contract is closed or offset by another contract with the same broker for the same settlement date and currency.
Closed forward currency contracts that have not reached their settlement date are included in the respective receivables or payables for closed forward currency contracts in the fund’s statement of assets and liabilities. Net realized gains or losses from closed forward currency contracts and net unrealized appreciation or depreciation from open forward currency contracts are recorded in the fund’s statement of operations. The average month-end notional amount of open forward currency contracts while held was $225,403,000.
Swap contracts — The fund has entered into swap agreements, which are two-party contracts entered into primarily by institutional investors for a specified time period. In a typical swap transaction, two parties agree to exchange the returns earned or realized from one or more underlying assets or rates of return. Swap agreements can be traded on a swap execution facility (SEF) and cleared through a central clearinghouse (cleared), traded over-the-counter (OTC) and cleared, or traded bilaterally and not cleared. Because clearing interposes a central clearinghouse as the ultimate counterparty to each participant’s swap, and margin is required to be exchanged under the rules of the clearinghouse, central clearing is intended to decrease (but not eliminate) counterparty risk relative to uncleared bilateral swaps. To the extent the fund enters into bilaterally negotiated swap transactions, the fund will enter into swap agreements only with counterparties that meet certain credit standards and subject to agreed collateralized procedures. The term of a swap can be days, months or years and certain swaps may be less liquid than others.
Upon entering into a centrally cleared swap contract, the fund is required to deposit cash, U.S. government securities or other liquid securities, which is known as initial margin. Generally, the initial margin required for a particular swap is set and held as collateral by the clearinghouse on which the contract is cleared. The amount of initial margin required may be significantly modified from time to time by the clearinghouse during the term of the contract.
On a daily basis, interest accruals related to the exchange of future payments are recorded as a receivable and payable in the fund’s statement of assets and liabilities for centrally cleared swaps and as unrealized appreciation or depreciation in the fund’s statement of assets and liabilities for bilateral swaps. For centrally cleared swaps, the fund also pays or receives a variation margin based on the increase or decrease in the value of the swaps, including accrued interest as applicable, and records variation margin in the statement of assets and liabilities. The fund records realized gains and losses on both the net accrued interest and any gain or loss recognized at the time the swap is closed or expires. Net realized gains or losses, as well as any net unrealized appreciation or depreciation, from swaps are recorded in the fund’s statement of operations.
Swap agreements can take different forms. The fund has entered into the following types of swap agreements:
Interest rate swaps — The fund has entered into interest rate swaps, which seek to manage the interest rate sensitivity of the fund by increasing or decreasing the duration of the fund or a portion of the fund’s portfolio. An interest rate swap is an agreement between two parties to exchange or swap payments based on changes in an interest rate or rates. Typically, one interest rate is fixed and the other is variable based on a designated short-term interest rate such as the Secured Overnight Financing Rate (SOFR), prime rate or other benchmark, or on an inflation index such as the U.S. Consumer Price Index (which is a measure that examines the weighted average of prices of a basket of consumer goods and services and measures changes in the purchasing power of the U.S. dollar and the rate of inflation). In other types of interest rate swaps, known as basis swaps, the parties agree to swap variable interest rates based on different designated short-term interest rates. Interest rate swaps generally do not involve the delivery of securities or other principal amounts. Rather, cash payments are exchanged by the parties based on the application of the designated interest rates to a notional amount, which is the predetermined dollar principal of the trade upon which payment obligations are computed. Accordingly, the fund’s current obligation or right under the swap agreement is generally equal to the net amount to be paid or received under the swap agreement based on the relative value of the position held by each party. The average month-end notional amount of interest rate swaps while held was $26,384,000.
Credit default swap indices — The fund has entered into centrally cleared credit default swap indices, including CDX and iTraxx indices (collectively referred to as “CDSI”), in order to assume exposure to a diversified portfolio of credits or to hedge against existing credit risks. A CDSI is based on a portfolio of credit default swaps with similar characteristics, such as credit default swaps on high-yield bonds. In a typical CDSI transaction, one party (the protection buyer) is obligated to pay the other party (the protection seller) a stream of periodic payments over the term of the contract. If a credit event, such as a default or restructuring, occurs with respect to any of the underlying reference obligations, the protection seller must pay the protection buyer the loss on those credits.
| 28 | American Funds Emerging Markets Bond Fund |
The fund may enter into a CDSI transaction as either protection buyer or protection seller. If the fund is a protection buyer, it would pay the counterparty a periodic stream of payments over the term of the contract and would not recover any of those payments if no credit events were to occur with respect to any of the underlying reference obligations. However, if a credit event did occur, the fund, as a protection buyer, would have the right to deliver the referenced debt obligations or a specified amount of cash, depending on the terms of the applicable agreement, and to receive the par value of such debt obligations from the counterparty protection seller. As a protection seller, the fund would receive fixed payments throughout the term of the contract if no credit events were to occur with respect to any of the underlying reference obligations. If a credit event were to occur, however, the value of any deliverable obligation received by the fund, coupled with the periodic payments previously received by the fund, may be less than the full notional value that the fund, as a protection seller, pays to the counterparty protection buyer, effectively resulting in a loss of value to the fund. Furthermore, as a protection seller, the fund would effectively add leverage to its portfolio because it would have investment exposure to the notional amount of the swap transaction. As of December 31, 2023, the fund did not have any credit default swaps. The average month-end notional amount of credit default swaps while held was $7,000,000.
The following tables identify the location and fair value amounts on the fund’s statement of assets and liabilities and the effect on the fund’s statement of operations resulting from the fund’s use of futures contracts, forward currency contracts, interest rate swaps and credit default swaps as of, or for the year ended, December 31, 2023 (dollars in thousands):
| | | | | Assets | | | Liabilities | |
| Contracts | | Risk type | | Location on statement of
assets and liabilities | | Value | | | Location on statement of
assets and liabilities | | Value | |
| Futures | | Interest | | Unrealized appreciation* | | $ | 1,901 | | | Unrealized depreciation* | | $ | 598 | |
| Forward currency | | Currency | | Unrealized appreciation on open forward currency contracts | | | 1,213 | | | Unrealized depreciation on open forward currency contracts | | | 2,137 | |
| Swap (centrally cleared) | | Interest | | Unrealized appreciation* | | | 99 | | | Unrealized depreciation* | | | 189 | |
| Swap (bilateral) | | Interest | | Bilateral swaps, at value | | | 57 | | | Bilateral swaps, at value | | | — | |
| | | | | | | $ | 3,270 | | | | | $ | 2,924 | |
| | | | | | | | | | | | | | | |
| | | | | Net realized gain (loss) | | | Net unrealized appreciation (depreciation) | |
| Contracts | | Risk type | | Location on statement of operations | | | Value | | | Location on statement of operations | | | Value | |
| Futures | | Interest | | Net realized loss on futures contracts | | $ | (1,442 | ) | | Net unrealized appreciation on futures contracts | | $ | 1,139 | |
| Forward currency | | Currency | | Net realized gain on forward currency contracts | | | 1,467 | | | Net unrealized appreciation on forward currency contracts | | | 61 | |
| Swap | | Interest | | Net realized loss on swap contracts | | | (902 | ) | | Net unrealized appreciation on swap contracts | | | 1,378 | |
| Swap | | Credit | | Net realized loss on swap contracts | | | (164 | ) | | Net unrealized appreciation on swap contracts | | | — | |
| | | | | | | $ | (1,041 | ) | | | | $ | 2,578 | |
| | |
| * | Includes cumulative appreciation/depreciation on futures contracts and centrally cleared interest rate swaps as reported in the applicable tables following the fund’s investment portfolio. Only current day’s variation margin is reported within the fund’s statement of assets and liabilities. |
Collateral — The fund receives or pledges highly liquid assets, such as cash or U.S. government securities, as collateral due to its use of futures contracts, forward currency contracts, interest rate swaps and credit default swaps. For futures contracts, centrally cleared interest rate swaps and centrally cleared credit default swaps, the fund pledges collateral for initial and variation margin by contract. For forward currency contracts and bilateral interest rate swaps, the fund either receives or pledges collateral based on the net gain or loss on unsettled contracts by counterparty. The purpose of the collateral is to cover potential losses that could occur in the event that either party cannot meet its contractual obligation. Non-cash collateral pledged by the fund, if any, is disclosed in the fund’s investment portfolio, and cash collateral pledged by the fund, if any, is held in a segregated account with the fund’s custodian, which is reflected as pledged cash collateral in the fund’s statement of assets and liabilities.
| American Funds Emerging Markets Bond Fund | 29 |
Rights of offset — The fund has entered into enforceable master netting agreements with certain counterparties for forward currency contracts and bilateral interest rate swaps, where on any date amounts payable by each party to the other (in the same currency with respect to the same transaction) may be closed or offset by each party’s payment obligation. If an early termination date occurs under these agreements following an event of default or termination event, all obligations of each party to its counterparty are settled net through a single payment in a single currency (“close-out netting”). For financial reporting purposes, the fund does not offset financial assets and financial liabilities that are subject to these master netting arrangements in the statement of assets and liabilities.
The following table presents the fund’s forward currency contracts and bilateral interest rate swaps by counterparty that are subject to master netting agreements but that are not offset in the fund’s statement of assets and liabilities. The net amount column shows the impact of offsetting on the fund’s statement of assets and liabilities as of December 31, 2023, if close-out netting was exercised (dollars in thousands):
| | | Gross amounts
recognized in the | | | Gross amounts not offset in the
statement of assets and liabilities and
subject to a master netting agreement | | | | |
| Counterparty | | statement of assets
and liabilities | | | Available
to offset | | | Non-cash
collateral* | | | Cash
collateral* | | | Net
amount | |
| Assets: | | | | | | | | | | | | | | | | | | | | |
| Bank of New York Mellon | | $ | 4 | | | $ | — | | | $ | — | | | $ | — | | | $ | 4 | |
| Barclays Bank PLC | | | 40 | | | | (19 | ) | | | — | | | | — | | | | 21 | |
| BNP Paribas | | | 82 | | | | (82 | ) | | | — | | | | — | | | | — | |
| Citibank | | | 641 | | | | (64 | ) | | | — | | | | (577 | ) | | | — | |
| Goldman Sachs | | | 93 | | | | (93 | ) | | | — | | | | — | | | | — | |
| HSBC Bank | | | 37 | | | | (37 | ) | | | — | | | | — | | | | — | |
| JPMorgan Chase | | | 154 | | | | (154 | ) | | | — | | | | — | | | | — | |
| Morgan Stanley | | | 147 | | | | (147 | ) | | | — | | | | — | | | | — | |
| Standard Chartered Bank | | | 8 | | | | (8 | ) | | | — | | | | — | | | | — | |
| UBS AG | | | 64 | | | | (64 | ) | | | — | | | | — | | | | — | |
| Total | | $ | 1,270 | | | $ | (668 | ) | | $ | — | | | $ | (577 | ) | | $ | 25 | |
| Liabilities: | | | | | | | | | | | | | | | | | | | | |
| Barclays Bank PLC | | $ | 19 | | | $ | (19 | ) | | $ | — | | | $ | — | | | $ | — | |
| BNP Paribas | | | 185 | | | | (82 | ) | | | — | | | | — | | | | 103 | |
| Citibank | | | 64 | | | | (64 | ) | | | — | | | | — | | | | — | |
| Goldman Sachs | | | 101 | | | | (93 | ) | | | — | | | | — | | | | 8 | |
| HSBC Bank | | | 166 | | | | (37 | ) | | | — | | | | — | | | | 129 | |
| JPMorgan Chase | | | 289 | | | | (154 | ) | | | — | | | | — | | | | 135 | |
| Morgan Stanley | | | 1,191 | | | | (147 | ) | | | (1,044 | ) | | | — | | | | — | |
| Standard Chartered Bank | | | 8 | | | | (8 | ) | | | — | | | | — | | | | — | |
| UBS AG | | | 114 | | | | (64 | ) | | | — | | | | — | | | | 50 | |
| Total | | $ | 2,137 | | | $ | (668 | ) | | $ | (1,044 | ) | | $ | — | | | $ | 425 | |
| | |
| * | Collateral is shown on a settlement basis. |
| | |
| 30 | American Funds Emerging Markets Bond Fund |
6. Taxation and distributions
Federal income taxation — The fund complies with the requirements under Subchapter M of the Internal Revenue Code applicable to regulated investment companies and intends to distribute substantially all of its net taxable income and net capital gains each year. The fund is not subject to income taxes to the extent such distributions are made. Therefore, no federal income tax provision is required.
As of and during the year ended December 31, 2023, the fund did not have a liability for any unrecognized tax benefits. The fund recognizes interest and penalties, if any, related to unrecognized tax benefits as income tax expense in the statement of operations. During the year, the fund did not incur any significant interest or penalties.
The fund’s tax returns are generally not subject to examination by federal, state and, if applicable, non-U.S. tax authorities after the expiration of each jurisdiction’s statute of limitations, which is typically three years after the date of filing but can be extended in certain jurisdictions.
Non-U.S. taxation — Dividend and interest income are recorded net of non-U.S. taxes paid. The fund may file withholding tax reclaims in certain jurisdictions to recover a portion of amounts previously withheld. These reclaims are recorded when the amount is known and there are no significant uncertainties on collectability. Gains realized by the fund on the sale of securities in certain countries, if any, may be subject to non-U.S. taxes. The fund generally records an estimated deferred tax liability based on unrealized gains to provide for potential non-U.S. taxes payable upon the sale of these securities.
Distributions — Distributions determined on a tax basis may differ from net investment income and net realized gains for financial reporting purposes. These differences are due primarily to different treatment for items such as currency gains and losses; short-term capital gains and losses; capital losses related to sales of certain securities within 30 days of purchase; deferred expenses; cost of investments sold; net capital losses; non-U.S. taxes on capital gains; amortization of premiums and discounts and income on certain investments. The fiscal year in which amounts are distributed may differ from the year in which the net investment income and net realized gains are recorded by the fund for financial reporting purposes.
During the year ended December 31, 2023, the fund reclassified $393,000 from total accumulated loss to capital paid in on shares of beneficial interest to align financial reporting with tax reporting.
As of December 31, 2023, the tax basis components of distributable earnings, unrealized appreciation (depreciation) and cost of investments were as follows (dollars in thousands):
| Undistributed ordinary income | | $ | 191 | |
| Distributions in excess of ordinary income | | | 18,869 | |
| Late year ordinary loss deferral1 | | | (6,250 | ) |
| Capital loss carryforward2 | | | (224,983 | ) |
| Gross unrealized appreciation on investments | | | 49,797 | |
| Gross unrealized depreciation on investments | | | (50,787 | ) |
| Net unrealized appreciation (depreciation) on investments | | | (990 | ) |
| Cost of investments | | | 1,079,918 | |
| | |
| 1 | This deferral is considered incurred in the subsequent year. |
| 2 | The capital loss carryforward will be used to offset any capital gains realized by the fund in future years. The fund will not make distributions from capital gains while a capital loss carryforward remains. |
| | |
| American Funds Emerging Markets Bond Fund | 31 |
For the year ended December 31, 2023, the fund’s distributions exceeded total taxable income resulting in a return of capital for tax purposes. Distributions paid or accrued were characterized for tax purposes as follows (dollars in thousands):
| | | Year ended December 31, 2023 | | | Year ended December 31, 2022 | |
| Share class | | | Ordinary
income | | | | Return of
capital | | | | Total
paid or
accrued | | | | Ordinary
income | | | | Return of
capital | | | | Total
paid or
accrued | |
| Class A | | $ | 14,077 | | | $ | 5,420 | | | $ | 19,497 | | | $ | 17,670 | | | $ | 3,428 | | | $ | 21,098 | |
| Class C | | | 733 | | | | 282 | | | | 1,015 | | | | 952 | | | | 185 | | | | 1,137 | |
| Class T | | | — | 3 | | | — | 3 | | | — | 3 | | | — | 3 | | | — | 3 | | | — | 3 |
| Class F-1 | | | 679 | | | | 262 | | | | 941 | | | | 554 | | | | 107 | | | | 661 | |
| Class F-2 | | | 10,453 | | | | 4,024 | | | | 14,477 | | | | 19,761 | | | | 3,834 | | | | 23,595 | |
| Class F-3 | | | 16,019 | | | | 6,168 | | | | 22,187 | | | | 14,264 | | | | 2,768 | | | | 17,032 | |
| Class 529-A | | | 405 | | | | 156 | | | | 561 | | | | 488 | | | | 95 | | | | 583 | |
| Class 529-C | | | 21 | | | | 8 | | | | 29 | | | | 33 | | | | 6 | | | | 39 | |
| Class 529-E | | | 27 | | | | 10 | | | | 37 | | | | 32 | | | | 6 | | | | 38 | |
| Class 529-T | | | 1 | | | | — | 3 | | | 1 | | | | 1 | | | | — | 3 | | | 1 | |
| Class 529-F-1 | | | 1 | | | | — | 3 | | | 1 | | | | 1 | | | | — | 3 | | | 1 | |
| Class 529-F-2 | | | 327 | | | | 126 | | | | 453 | | | | 366 | | | | 71 | | | | 437 | |
| Class 529-F-3 | | | 1 | | | | — | 3 | | | 1 | | | | 1 | | | | — | 3 | | | 1 | |
| Class R-1 | | | 8 | | | | 3 | | | | 11 | | | | 8 | | | | 2 | | | | 10 | |
| Class R-2 | | | 70 | | | | 27 | | | | 97 | | | | 84 | | | | 16 | | | | 100 | |
| Class R-2E | | | 5 | | | | 2 | | | | 7 | | | | 6 | | | | 1 | | | | 7 | |
| Class R-3 | | | 85 | | | | 33 | | | | 118 | | | | 91 | | | | 18 | | | | 109 | |
| Class R-4 | | | 37 | | | | 14 | | | | 51 | | | | 55 | | | | 11 | | | | 66 | |
| Class R-5E | | | 44 | | | | 17 | | | | 61 | | | | 39 | | | | 8 | | | | 47 | |
| Class R-5 | | | 44 | | | | 17 | | | | 61 | | | | 55 | | | | 11 | | | | 66 | |
| Class R-6 | | | 5,974 | | | | 2,300 | | | | 8,274 | | | | 9,075 | | | | 1,761 | | | | 10,836 | |
| Total | | $ | 49,011 | | | $ | 18,869 | | | $ | 67,880 | | | $ | 63,536 | | | $ | 12,328 | | | $ | 75,864 | |
| | |
| 3 | Amount less than one thousand. |
7. Fees and transactions with related parties
CRMC, the fund’s investment adviser, is the parent company of American Funds Distributors®, Inc. (“AFD”), the principal underwriter of the fund’s shares, and American Funds Service Company® (“AFS”), the fund’s transfer agent. CRMC, AFD and AFS are considered related parties to the fund.
Investment advisory services — The fund has an investment advisory and service agreement with CRMC that provides for monthly fees accrued daily. These fees are based on a series of decreasing annual rates beginning with 0.457% on the first $15 billion of daily net assets and decreasing to 0.428% on such assets in excess of $15 billion. For the year ended December 31, 2023, the investment advisory services fees were $4,392,000, which were equivalent to an annualized rate of 0.457% of average daily net assets.
| 32 | American Funds Emerging Markets Bond Fund |
Class-specific fees and expenses — Expenses that are specific to individual share classes are accrued directly to the respective share class. The principal class-specific fees and expenses are further described below:
Distribution services — The fund has plans of distribution for all share classes, except Class F-2, F-3, 529-F-2, 529-F-3, R-5E, R-5 and R-6 shares. Under the plans, the board of trustees approves certain categories of expenses that are used to finance activities primarily intended to sell fund shares and service existing accounts. The plans provide for payments, based on an annualized percentage of average daily net assets, ranging from 0.30% to 1.00% as noted in this section. In some cases, the board of trustees has limited the amounts that may be paid to less than the maximum allowed by the plans. All share classes with a plan may use up to 0.25% of average daily net assets to pay service fees, or to compensate AFD for paying service fees, to firms that have entered into agreements with AFD to provide certain shareholder services. The remaining amounts available to be paid under each plan are paid to dealers to compensate them for their sales activities.
| Share class | | Currently approved limits | | Plan limits |
| Class A | | | 0.30 | % | | | 0.30 | % |
| Class 529-A | | | 0.30 | | | | 0.50 | |
| Classes C, 529-C and R-1 | | | 1.00 | | | | 1.00 | |
| Class R-2 | | | 0.75 | | | | 1.00 | |
| Class R-2E | | | 0.60 | | | | 0.85 | |
| Classes 529-E and R-3 | | | 0.50 | | | | 0.75 | |
| Classes T, F-1, 529-T, 529-F-1 and R-4 | | | 0.25 | | | | 0.50 | |
For Class A and 529-A shares, distribution-related expenses include the reimbursement of dealer and wholesaler commissions paid by AFD for certain shares sold without a sales charge. These share classes reimburse AFD for amounts billed within the prior 15 months but only to the extent that the overall annual expense limits are not exceeded. As of December 31, 2023, there were no unreimbursed expenses subject to reimbursement for Class A or 529-A shares.
Transfer agent services — The fund has a shareholder services agreement with AFS under which the fund compensates AFS for providing transfer agent services to each of the fund’s share classes. These services include recordkeeping, shareholder communications and transaction processing. In addition, the fund reimburses AFS for amounts paid to third parties for performing transfer agent services on behalf of fund shareholders.
Administrative services — The fund has an administrative services agreement with CRMC under which the fund compensates CRMC for providing administrative services to all share classes. Administrative services are provided by CRMC and its affiliates to help assist third parties providing non-distribution services to fund shareholders. These services include providing in-depth information on the fund and market developments that impact fund investments. Administrative services also include, but are not limited to, coordinating, monitoring and overseeing third parties that provide services to fund shareholders. The agreement provides the fund the ability to charge an administrative services fee at the annual rate of 0.05% of the average daily net assets attributable to each share class of the fund. Currently the fund pays CRMC an administrative services fee at the annual rate of 0.03% of the average daily net assets attributable to each share class of the fund for CRMC’s provision of administrative services.
529 plan services — Each 529 share class is subject to service fees to compensate the Virginia College Savings Plan (“Virginia529”) for its oversight and administration of the CollegeAmerica 529 college savings plan. The fees are based on the combined net assets invested in Class 529 and ABLE shares of the American Funds. Class ABLE shares are offered on other American Funds by Virginia529 through ABLEAmerica®, a tax-advantaged savings program for individuals with disabilities. Virginia529 is not considered a related party to the fund.
| American Funds Emerging Markets Bond Fund | 33 |
The quarterly fees are based on a series of decreasing annual rates beginning with 0.09% on the first $20 billion of the combined net assets invested in the American Funds and decreasing to 0.03% on such assets in excess of $75 billion. The fees for any given calendar quarter are accrued and calculated on the basis of the average net assets of Class 529 and ABLE shares of the American Funds for the last month of the prior calendar quarter. For the year ended December 31, 2023, the 529 plan services fees were $9,000, which were equivalent to 0.059% of the average daily net assets of each 529 share class.
For the year ended December 31, 2023, class-specific expenses under the agreements were as follows (dollars in thousands):
| Share class | | Distribution
services | | | Transfer agent
services | | | Administrative
services | | | 529 plan
services | |
| Class A | | | $776 | | | | $429 | | | | $86 | | | | Not applicable | |
| Class C | | | 166 | | | | 25 | | | | 5 | | | | Not applicable | |
| Class T | | | — | | | | — | * | | | — | * | | | Not applicable | |
| Class F-1 | | | 34 | | | | 19 | | | | 4 | | | | Not applicable | |
| Class F-2 | | | Not applicable | | | | 214 | | | | 61 | | | | Not applicable | |
| Class F-3 | | | Not applicable | | | | 7 | | | | 92 | | | | Not applicable | |
| Class 529-A | | | 18 | | | | 11 | | | | 2 | | | | $5 | |
| Class 529-C | | | 5 | | | | 1 | | | | — | * | | | — | * |
| Class 529-E | | | 3 | | | | — | * | | | — | * | | | — | * |
| Class 529-T | | | — | | | | — | * | | | — | * | | | — | * |
| Class 529-F-1 | | | — | | | | — | * | | | — | * | | | — | * |
| Class 529-F-2 | | | Not applicable | | | | 4 | | | | 2 | | | | 4 | |
| Class 529-F-3 | | | Not applicable | | | | — | * | | | — | * | | | — | * |
| Class R-1 | | | 1 | | | | — | * | | | — | * | | | Not applicable | |
| Class R-2 | | | 12 | | | | 4 | | | | 1 | | | | Not applicable | |
| Class R-2E | | | 1 | | | | — | * | | | — | * | | | Not applicable | |
| Class R-3 | | | 9 | | | | 3 | | | | 1 | | | | Not applicable | |
| Class R-4 | | | 2 | | | | 1 | | | | — | * | | | Not applicable | |
| Class R-5E | | | Not applicable | | | | 1 | | | | — | * | | | Not applicable | |
| Class R-5 | | | Not applicable | | | | — | * | | | — | * | | | Not applicable | |
| Class R-6 | | | Not applicable | | | | 3 | | | | 34 | | | | Not applicable | |
| Total class-specific expenses | | | $1,027 | | | | $722 | | | | $288 | | | | $9 | |
| | |
| * | Amount less than one thousand. |
Miscellaneous fee reimbursement — CRMC has agreed to reimburse a portion of miscellaneous fees and expenses of the fund. For the year ended December 31, 2023, total fees and expenses reimbursed by CRMC were $2,000, which CRMC does not intend to recoup. This reimbursement may be adjusted or discontinued, subject to any restrictions in the fund’s prospectus. Fees and expenses in the statement of operations are presented gross of any reimbursement from CRMC.
Trustees’ deferred compensation — Trustees who are unaffiliated with CRMC may elect to defer the cash payment of part or all of their compensation. These deferred amounts, which remain as liabilities of the fund, are treated as if invested in shares of the fund or other American Funds. These amounts represent general, unsecured liabilities of the fund and vary according to the total returns of the selected funds. Trustees’ compensation of $5,000 in the fund’s statement of operations reflects $4,000 in current fees (either paid in cash or deferred) and a net increase of $1,000 in the value of the deferred amounts.
Affiliated officers and trustees — Officers and certain trustees of the fund are or may be considered to be affiliated with CRMC, AFD and AFS. No affiliated officers or trustees received any compensation directly from the fund.
Investment in CCF — The fund holds shares of CCF, an institutional prime money market fund managed by CRMC. CCF invests in high-quality, short-term money market instruments. CCF is used as the primary investment vehicle for the fund’s short-term instruments. CCF shares are only available for purchase by CRMC, its affiliates, and other funds managed by CRMC or its affiliates, and are not available to the public. CRMC does not receive an investment advisory services fee from CCF.
Security transactions with related funds — The fund may purchase investment securities from, or sell investment securities to, other funds managed by CRMC (or funds managed by certain affiliates of CRMC) under procedures adopted by the fund’s board of trustees. The funds involved in such transactions are considered related by virtue of having a common investment adviser (or affiliated investment advisers), common trustees and/or common officers. When such transactions occur, each transaction is executed at the current market price of the security and no brokerage commissions or fees are paid in accordance with Rule 17a-7 of the 1940 Act. During the year ended December 31, 2023, the fund did not engage in any such purchase or sale transactions with any related funds.
| 34 | American Funds Emerging Markets Bond Fund |
Interfund lending — Pursuant to an exemptive order issued by the SEC, the fund, along with other CRMC-managed funds (or funds managed by certain affiliates of CRMC), may participate in an interfund lending program. The program provides an alternate credit facility that permits the funds to lend or borrow cash for temporary purposes directly to or from one another, subject to the conditions of the exemptive order. The fund did not lend or borrow cash through the interfund lending program at any time during the year ended December 31, 2023.
8. Committed line of credit
The fund participates with other funds managed by CRMC (or funds managed by certain affiliates of CRMC) in a $1.5 billion credit facility (the “line of credit”) to be utilized for temporary purposes to support shareholder redemptions. The fund has agreed to pay commitment fees on its pro-rata portion of the line of credit, which are reflected in other expenses in the fund’s statement of operations. The fund did not borrow on this line of credit at any time during the year ended December 31, 2023.
9. Indemnifications
The fund’s organizational documents provide board members and officers with indemnification against certain liabilities or expenses in connection with the performance of their duties to the fund. In the normal course of business, the fund may also enter into contracts that provide general indemnifications. The fund’s maximum exposure under these arrangements is unknown since it is dependent on future claims that may be made against the fund. The risk of material loss from such claims is considered remote. Insurance policies are also available to the fund’s board members and officers.
10. Capital share transactions
Capital share transactions in the fund were as follows (dollars and shares in thousands):
| | | Sales* | | | Reinvestments of
distributions | | | Repurchases* | | | Net increase
(decrease) | |
| Share class | | Amount | | | Shares | | | Amount | | | Shares | | | Amount | | | Shares | | | Amount | | | Shares | |
| | | | | | | | | | | | | | | | | | | | | | | |
| Year ended December 31, 2023 | | | | | | | | | | | | | | | | | | | | | | |
| | | | | | | | | | | | | | | | | | | | | | | |
| Class A | | $ | 56,110 | | | | 7,247 | | | $ | 18,136 | | | | 2,352 | | | $ | (54,057 | ) | | | (7,041 | ) | | $ | 20,189 | | | | 2,558 | |
| Class C | | | 3,266 | | | | 422 | | | | 1,003 | | | | 130 | | | | (4,370 | ) | | | (568 | ) | | | (101 | ) | | | (16 | ) |
| Class T | | | — | | | | — | | | | — | | | | — | | | | — | | | | — | | | | — | | | | — | |
| Class F-1 | | | 31,555 | | | | 4,037 | | | | 930 | | | | 120 | | | | (28,308 | ) | | | (3,647 | ) | | | 4,177 | | | | 510 | |
| Class F-2 | | | 110,369 | | | | 14,288 | | | | 14,400 | | | | 1,866 | | | | (65,717 | ) | | | (8,557 | ) | | | 59,052 | | | | 7,597 | |
| Class F-3 | | | 151,653 | | | | 19,720 | | | | 21,368 | | | | 2,770 | | | | (61,180 | ) | | | (7,985 | ) | | | 111,841 | | | | 14,505 | |
| Class 529-A | | | 2,009 | | | | 259 | | | | 558 | | | | 72 | | | | (1,823 | ) | | | (236 | ) | | | 744 | | | | 95 | |
| Class 529-C | | | 193 | | | | 25 | | | | 29 | | | | 4 | | | | (329 | ) | | | (43 | ) | | | (107 | ) | | | (14 | ) |
| Class 529-E | | | 111 | | | | 15 | | | | 37 | | | | 5 | | | | (113 | ) | | | (15 | ) | | | 35 | | | | 5 | |
| Class 529-T | | | — | | | | — | | | | 1 | | | | — | † | | | — | | | | — | | | | 1 | | | | — | † |
| Class 529-F-1 | | | — | | | | — | | | | 1 | | | | — | † | | | — | | | | — | | | | 1 | | | | — | † |
| Class 529-F-2 | | | 1,495 | | | | 193 | | | | 451 | | | | 59 | | | | (1,245 | ) | | | (160 | ) | | | 701 | | | | 92 | |
| Class 529-F-3 | | | — | | | | — | | | | 1 | | | | — | † | | | — | | | | — | | | | 1 | | | | — | † |
| Class R-1 | | | 20 | | | | 3 | | | | 10 | | | | 1 | | | | (17 | ) | | | (2 | ) | | | 13 | | | | 2 | |
| Class R-2 | | | 513 | | | | 67 | | | | 96 | | | | 12 | | | | (586 | ) | | | (75 | ) | | | 23 | | | | 4 | |
| Class R-2E | | | 13 | | | | 1 | | | | 6 | | | | 1 | | | | (9 | ) | | | (1 | ) | | | 10 | | | | 1 | |
| Class R-3 | | | 518 | | | | 67 | | | | 117 | | | | 15 | | | | (326 | ) | | | (43 | ) | | | 309 | | | | 39 | |
| Class R-4 | | | 159 | | | | 21 | | | | 51 | | | | 7 | | | | (151 | ) | | | (20 | ) | | | 59 | | | | 8 | |
| Class R-5E | | | 359 | | | | 47 | | | | 59 | | | | 8 | | | | (184 | ) | | | (24 | ) | | | 234 | | | | 31 | |
| Class R-5 | | | 99 | | | | 13 | | | | 60 | | | | 8 | | | | (140 | ) | | | (18 | ) | | | 19 | | | | 3 | |
| Class R-6 | | | 5,938 | | | | 770 | | | | 8,274 | | | | 1,073 | | | | (41,459 | ) | | | (5,472 | ) | | | (27,247 | ) | | | (3,629 | ) |
| Total net increase (decrease) | | $ | 364,380 | | | | 47,195 | | | $ | 65,588 | | | | 8,503 | | | $ | (260,014 | ) | | | (33,907 | ) | | $ | 169,954 | | | | 21,791 | |
Refer to the end of the table for footnotes.
| American Funds Emerging Markets Bond Fund | 35 |
| | | Sales* | | | Reinvestments of
distributions | | | Repurchases* | | | Net increase
(decrease) | |
| Share class | | Amount | | | Shares | | | Amount | | | Shares | | | Amount | | | Shares | | | Amount | | | Shares | |
| | | | | | | | | | | | | | | | | | | | | | | |
| Year ended December 31, 2022 | | | | | | | | | | | | | | | | | | | | | | |
| | | | | | | | | | | | | | | | | | | | | | | |
| Class A | | $ | 38,860 | | | | 4,913 | | | $ | 19,775 | | | | 2,557 | | | $ | (94,751 | ) | | | (12,160 | ) | | $ | (36,116 | ) | | | (4,690 | ) |
| Class C | | | 1,876 | | | | 238 | | | | 1,120 | | | | 145 | | | | (6,000 | ) | | | (757 | ) | | | (3,004 | ) | | | (374 | ) |
| Class T | | | — | | | | — | | | | — | | | | — | | | | — | | | | — | | | | — | | | | — | |
| Class F-1 | | | 6,864 | | | | 903 | | | | 657 | | | | 85 | | | | (5,678 | ) | | | (732 | ) | | | 1,843 | | | | 256 | |
| Class F-2 | | | 117,465 | | | | 14,577 | | | | 23,501 | | | | 2,962 | | | | (461,927 | ) | | | (60,297 | ) | | | (320,961 | ) | | | (42,758 | ) |
| Class F-3 | | | 178,967 | | | | 22,817 | | | | 16,180 | | | | 2,100 | | | | (137,841 | ) | | | (17,685 | ) | | | 57,306 | | | | 7,232 | |
| Class 529-A | | | 1,610 | | | | 202 | | | | 578 | | | | 75 | | | | (2,625 | ) | | | (335 | ) | | | (437 | ) | | | (58 | ) |
| Class 529-C | | | 75 | | | | 9 | | | | 39 | | | | 5 | | | | (230 | ) | | | (29 | ) | | | (116 | ) | | | (15 | ) |
| Class 529-E | | | 1 | | | | — | † | | | 38 | | | | 5 | | | | (93 | ) | | | (12 | ) | | | (54 | ) | | | (7 | ) |
| Class 529-T | | | — | | | | — | | | | 1 | | | | — | † | | | — | | | | — | | | | 1 | | | | — | † |
| Class 529-F-1 | | | — | | | | — | | | | 1 | | | | — | † | | | — | | | | — | | | | 1 | | | | — | † |
| Class 529-F-2 | | | 2,364 | | | | 290 | | | | 433 | | | | 56 | | | | (1,691 | ) | | | (221 | ) | | | 1,106 | | | | 125 | |
| Class 529-F-3 | | | — | | | | — | | | | 1 | | | | — | † | | | — | | | | — | | | | 1 | | | | — | † |
| Class R-1 | | | 52 | | | | 7 | | | | 9 | | | | 1 | | | | (6 | ) | | | (1 | ) | | | 55 | | | | 7 | |
| Class R-2 | | | 410 | | | | 52 | | | | 99 | | | | 13 | | | | (488 | ) | | | (61 | ) | | | 21 | | | | 4 | |
| Class R-2E | | | 17 | | | | 2 | | | | 6 | | | | 1 | | | | — | † | | | — | † | | | 23 | | | | 3 | |
| Class R-3 | | | 530 | | | | 69 | | | | 108 | | | | 14 | | | | (680 | ) | | | (85 | ) | | | (42 | ) | | | (2 | ) |
| Class R-4 | | | 91 | | | | 11 | | | | 65 | | | | 8 | | | | (537 | ) | | | (68 | ) | | | (381 | ) | | | (49 | ) |
| Class R-5E | | | 336 | | | | 42 | | | | 45 | | | | 6 | | | | (158 | ) | | | (20 | ) | | | 223 | | | | 28 | |
| Class R-5 | | | 51 | | | | 7 | | | | 64 | | | | 8 | | | | (228 | ) | | | (28 | ) | | | (113 | ) | | | (13 | ) |
| Class R-6 | | | 10,583 | | | | 1,449 | | | | 10,834 | | | | 1,398 | | | | (45,886 | ) | | | (5,730 | ) | | | (24,469 | ) | | | (2,883 | ) |
| Total net increase (decrease) | | $ | 360,152 | | | | 45,588 | | | $ | 73,554 | | | | 9,439 | | | $ | (758,819 | ) | | | (98,221 | ) | | $ | (325,113 | ) | | | (43,194 | ) |
| | |
| * | Includes exchanges between share classes of the fund. |
| † | Amount less than one thousand. |
11. Investment transactions
The fund engaged in purchases and sales of investment securities, excluding short-term securities and U.S. government obligations, if any, of $584,161,000 and $470,409,000, respectively, during the year ended December 31, 2023.
| 36 | American Funds Emerging Markets Bond Fund |
Financial highlights
| | | | | | Income (loss) from
investment operations1 | | | Dividends, distributions and return of capital | | | | | | | | | | | | | | | | | | | |
| Year ended | | Net asset
value,
beginning
of year | | | Net
investment
income | | | Net gains
(losses) on
securities
(both
realized and
unrealized) | | | Total from
investment
operations | | | Dividends
(from net
investment
income) | | | Distributions
(from capital
gains) | | | Return of
capital | | | Total
dividends,
distributions
and return
of capital | | | Net assets
value, end
of year | | | Total return2,3 | | | Net assets,
end of year
(in millions) | | | Ratio of
expenses to
average net
assets before
waivers/
reimburse-
ments4 | | | Ratio of
expenses to
average net
assets after
waivers/
reimburse-
ments3,4 | | | Ratio of
net income
to average
net assets3 | |
| Class A: | | | | | | | | | | | | | | | | | | | | | | | | | | | | | | | | | | | | | | | | | | | | | | | | | | | | | | | | |
| 12/31/2023 | | $ | 7.59 | | | $ | .50 | | | $ | .48 | | | $ | .98 | | | $ | (.38 | ) | | $ | — | | | $ | (.15 | ) | | $ | (.53 | ) | | $ | 8.04 | | | | 13.39 | % | | $ | 307 | | | | .97 | % | | | .97 | % | | | 6.54 | % |
| 12/31/2022 | | | 9.30 | | | | .50 | | | | (1.65 | ) | | | (1.15 | ) | | | (.47 | ) | | | — | | | | (.09 | ) | | | (.56 | ) | | | 7.59 | | | | (12.30 | ) | | | 270 | | | | .99 | | | | .98 | | | | 6.36 | |
| 12/31/2021 | | | 10.15 | | | | .45 | | | | (.85 | ) | | | (.40 | ) | | | (.38 | ) | | | — | | | | (.07 | ) | | | (.45 | ) | | | 9.30 | | | | (3.98 | ) | | | 375 | | | | 1.06 | | | | 1.06 | | | | 4.70 | |
| 12/31/2020 | | | 9.94 | | | | .50 | | | | .21 | | | | .71 | | | | (.16 | ) | | | — | | | | (.34 | ) | | | (.50 | ) | | | 10.15 | | | | 7.62 | | | | 372 | | | | 1.09 | | | | 1.06 | | | | 5.24 | |
| 12/31/2019 | | | 9.35 | | | | .63 | | | | .62 | | | | 1.25 | | | | (.36 | ) | | | (.03 | ) | | | (.27 | ) | | | (.66 | ) | | | 9.94 | | | | 13.69 | | | | 387 | | | | 1.03 | | | | 1.00 | | | | 6.44 | |
| Class C: | | | | | | | | | | | | | | | | | | | | | | | | | | | | | | | | | | | | | | | | | | | | | | | | | | | | | | | | |
| 12/31/2023 | | | 7.59 | | | | .44 | | | | .48 | | | | .92 | | | | (.34 | ) | | | — | | | | (.13 | ) | | | (.47 | ) | | | 8.04 | | | | 12.57 | | | | 17 | | | | 1.70 | | | | 1.70 | | | | 5.81 | |
| 12/31/2022 | | | 9.30 | | | | .44 | | | | (1.65 | ) | | | (1.21 | ) | | | (.42 | ) | | | — | | | | (.08 | ) | | | (.50 | ) | | | 7.59 | | | | (12.96 | ) | | | 16 | | | | 1.74 | | | | 1.73 | | | | 5.60 | |
| 12/31/2021 | | | 10.15 | | | | .38 | | | | (.85 | ) | | | (.47 | ) | | | (.32 | ) | | | — | | | | (.06 | ) | | | (.38 | ) | | | 9.30 | | | | (4.66 | ) | | | 24 | | | | 1.76 | | | | 1.76 | | | | 3.99 | |
| 12/31/2020 | | | 9.94 | | | | .43 | | | | .21 | | | | .64 | | | | (.14 | ) | | | — | | | | (.29 | ) | | | (.43 | ) | | | 10.15 | | | | 6.87 | | | | 28 | | | | 1.79 | | | | 1.77 | | | | 4.54 | |
| 12/31/2019 | | | 9.35 | | | | .56 | | | | .62 | | | | 1.18 | | | | (.32 | ) | | | (.03 | ) | | | (.24 | ) | | | (.59 | ) | | | 9.94 | | | | 12.82 | | | | 28 | | | | 1.79 | | | | 1.77 | | | | 5.67 | |
| Class T: | | | | | | | | | | | | | | | | | | | | | | | | | | | | | | | | | | | | | | | | | | | | | | | | | | | | | | | | |
| 12/31/2023 | | | 7.59 | | | | .52 | | | | .48 | | | | 1.00 | | | | (.40 | ) | | | — | | | | (.15 | ) | | | (.55 | ) | | | 8.04 | | | | 13.76 | 5 | | | — | 6 | | | .67 | 5 | | | .67 | 5 | | | 6.86 | 5 |
| 12/31/2022 | | | 9.30 | | | | .51 | | | | (1.65 | ) | | | (1.14 | ) | | | (.48 | ) | | | — | | | | (.09 | ) | | | (.57 | ) | | | 7.59 | | | | (12.09) | 5 | | | — | 6 | | | .74 | 5 | | | .73 | 5 | | | 6.61 | 5 |
| 12/31/2021 | | | 10.15 | | | | .48 | | | | (.85 | ) | | | (.37 | ) | | | (.40 | ) | | | — | | | | (.08 | ) | | | (.48 | ) | | | 9.30 | | | | (3.70) | 5 | | | — | 6 | | | .75 | 5 | | | .75 | 5 | | | 4.98 | 5 |
| 12/31/2020 | | | 9.94 | | | | .53 | | | | .21 | | | | .74 | | | | (.17 | ) | | | — | | | | (.36 | ) | | | (.53 | ) | | | 10.15 | | | | 7.95 | 5 | | | — | 6 | | | .79 | 5 | | | .77 | 5 | | | 5.57 | 5 |
| 12/31/2019 | | | 9.35 | | | | .65 | | | | .62 | | | | 1.27 | | | | (.37 | ) | | | (.03 | ) | | | (.28 | ) | | | (.68 | ) | | | 9.94 | | | | 13.96 | 5 | | | — | 6 | | | .80 | 5 | | | .78 | 5 | | | 6.67 | 5 |
| Class F-1: | | | | | | | | | | | | | | | | | | | | | | | | | | | | | | | | | | | | | | | | | | | | | | | | | | | | | | | | |
| 12/31/2023 | | | 7.59 | | | | .50 | | | | .48 | | | | .98 | | | | (.38 | ) | | | — | | | | (.15 | ) | | | (.53 | ) | | | 8.04 | | | | 13.43 | | | | 17 | | | | .94 | | | | .94 | | | | 6.55 | |
| 12/31/2022 | | | 9.30 | | | | .50 | | | | (1.65 | ) | | | (1.15 | ) | | | (.47 | ) | | | — | | | | (.09 | ) | | | (.56 | ) | | | 7.59 | | | | (12.30 | ) | | | 12 | | | | .99 | | | | .98 | | | | 6.36 | |
| 12/31/2021 | | | 10.15 | | | | .45 | | | | (.85 | ) | | | (.40 | ) | | | (.38 | ) | | | — | | | | (.07 | ) | | | (.45 | ) | | | 9.30 | | | | (3.95 | ) | | | 12 | | | | 1.03 | | | | 1.03 | | | | 4.72 | |
| 12/31/2020 | | | 9.94 | | | | .50 | | | | .21 | | | | .71 | | | | (.16 | ) | | | — | | | | (.34 | ) | | | (.50 | ) | | | 10.15 | | | | 7.65 | | | | 14 | | | | 1.06 | | | | 1.04 | | | | 5.29 | |
| 12/31/2019 | | | 9.35 | | | | .63 | | | | .62 | | | | 1.25 | | | | (.36 | ) | | | (.03 | ) | | | (.27 | ) | | | (.66 | ) | | | 9.94 | | | | 13.64 | | | | 13 | | | | 1.07 | | | | 1.04 | | | | 6.41 | |
| Class F-2: | | | | | | | | | | | | | | | | | | | | | | | | | | | | | | | | | | | | | | | | | | | | | | | | | | | | | | | | |
| 12/31/2023 | | | 7.59 | | | | .52 | | | | .48 | | | | 1.00 | | | | (.40 | ) | | | — | | | | (.15 | ) | | | (.55 | ) | | | 8.04 | | | | 13.75 | | | | 240 | | | | .65 | | | | .65 | | | | 6.84 | |
| 12/31/2022 | | | 9.30 | | | | .51 | | | | (1.65 | ) | | | (1.14 | ) | | | (.48 | ) | | | — | | | | (.09 | ) | | | (.57 | ) | | | 7.59 | | | | (12.10 | ) | | | 169 | | | | .75 | | | | .74 | | | | 6.50 | |
| 12/31/2021 | | | 10.15 | | | | .48 | | | | (.85 | ) | | | (.37 | ) | | | (.40 | ) | | | — | | | | (.08 | ) | | | (.48 | ) | | | 9.30 | | | | (3.69 | ) | | | 604 | | | | .75 | | | | .75 | | | | 5.01 | |
| 12/31/2020 | | | 9.94 | | | | .53 | | | | .21 | | | | .74 | | | | (.17 | ) | | | — | | | | (.36 | ) | | | (.53 | ) | | | 10.15 | | | | 7.95 | | | | 513 | | | | .77 | | | | .74 | | | | 5.35 | |
| 12/31/2019 | | | 9.35 | | | | .65 | | | | .62 | | | | 1.27 | | | | (.37 | ) | | | (.03 | ) | | | (.28 | ) | | | (.68 | ) | | | 9.94 | | | | 13.94 | | | | 214 | | | | .80 | | | | .78 | | | | 6.67 | |
| Class F-3: | | | | | | | | | | | | | | | | | | | | | | | | | | | | | | | | | | | | | | | | | | | | | | | | | | | | | | | | |
| 12/31/2023 | | | 7.59 | | | | .53 | | | | .48 | | | | 1.01 | | | | (.40 | ) | | | — | | | | (.16 | ) | | | (.56 | ) | | | 8.04 | | | | 13.86 | | | | 380 | | | | .55 | | | | .55 | | | | 6.94 | |
| 12/31/2022 | | | 9.30 | | | | .53 | | | | (1.65 | ) | | | (1.12 | ) | | | (.49 | ) | | | — | | | | (.10 | ) | | | (.59 | ) | | | 7.59 | | | | (11.95 | ) | | | 248 | | | | .59 | | | | .58 | | | | 6.78 | |
| 12/31/2021 | | | 10.15 | | | | .49 | | | | (.85 | ) | | | (.36 | ) | | | (.41 | ) | | | — | | | | (.08 | ) | | | (.49 | ) | | | 9.30 | | | | (3.58 | ) | | | 237 | | | | .65 | | | | .65 | | | | 5.13 | |
| 12/31/2020 | | | 9.94 | | | | .53 | | | | .21 | | | | .74 | | | | (.17 | ) | | | — | | | | (.36 | ) | | | (.53 | ) | | | 10.15 | | | | 8.06 | | | | 152 | | | | .71 | | | | .66 | | | | 5.61 | |
| 12/31/2019 | | | 9.35 | | | | .66 | | | | .62 | | | | 1.28 | | | | (.38 | ) | | | (.03 | ) | | | (.28 | ) | | | (.69 | ) | | | 9.94 | | | | 14.05 | | | | 112 | | | | .74 | | | | .67 | | | | 6.76 | |
| Class 529-A: | | | | | | | | | | | | | | | | | | | | | | | | | | | | | | | | | | | | | | | | | | | | | | | | | | | | | | | | |
| 12/31/2023 | | | 7.59 | | | | .50 | | | | .48 | | | | .98 | | | | (.38 | ) | | | — | | | | (.15 | ) | | | (.53 | ) | | | 8.04 | | | | 13.39 | | | | 9 | | | | .97 | | | | .97 | | | | 6.53 | |
| 12/31/2022 | | | 9.30 | | | | .50 | | | | (1.65 | ) | | | (1.15 | ) | | | (.47 | ) | | | — | | | | (.09 | ) | | | (.56 | ) | | | 7.59 | | | | (12.32 | ) | | | 8 | | | | 1.01 | | | | 1.00 | | | | 6.35 | |
| 12/31/2021 | | | 10.15 | | | | .45 | | | | (.85 | ) | | | (.40 | ) | | | (.38 | ) | | | — | | | | (.07 | ) | | | (.45 | ) | | | 9.30 | | | | (3.97 | ) | | | 10 | | | | 1.05 | | | | 1.05 | | | | 4.71 | |
| 12/31/2020 | | | 9.94 | | | | .50 | | | | .21 | | | | .71 | | | | (.16 | ) | | | — | | | | (.34 | ) | | | (.50 | ) | | | 10.15 | | | | 7.65 | | | | 9 | | | | 1.06 | | | | 1.04 | | | | 5.26 | |
| 12/31/2019 | | | 9.35 | | | | .63 | | | | .62 | | | | 1.25 | | | | (.36 | ) | | | (.03 | ) | | | (.27 | ) | | | (.66 | ) | | | 9.94 | | | | 13.63 | | | | 8 | | | | 1.08 | | | | 1.05 | | | | 6.39 | |
Refer to the end of the table for footnotes.
| American Funds Emerging Markets Bond Fund | 37 |
Financial highlights (continued)
| | | | | | Income (loss) from
investment operations1 | | | Dividends, distributions and return of capital | | | | | | | | | | | | | | | | | | | |
| Year ended | | Net asset
value,
beginning
of year | | | Net
investment
income | | | Net gains
(losses) on
securities
(both
realized and
unrealized) | | | Total from
investment
operations | | | Dividends
(from net
investment
income) | | | Distributions
(from capital
gains) | | | Return of
capital | | | Total
dividends,
distributions
and return
of capital | | | Net assets
value, end
of year | | | Total return2,3 | | | Net assets,
end of year
(in millions) | | | Ratio of
expenses to
average net
assets before
waivers/
reimburse-
ments4 | | | Ratio of
expenses to
average net
assets after
waivers/
reimburse-
ments3,4 | | | Ratio of
net income
to average
net assets3 | |
| Class 529-C: | | | | | | | | | | | | | | | | | | | | | | | | | | | | | | | | | | | | | | | | | | | | | | | | | | | | | | | | |
| 12/31/2023 | | $ | 7.59 | | | $ | .44 | | | $ | .48 | | | $ | .92 | | | $ | (.34 | ) | | $ | — | | | $ | (.13 | ) | | $ | (.47 | ) | | $ | 8.04 | | | | 12.51 | % | | $ | — | 6 | | | 1.75 | % | | | 1.75 | % | | | 5.76 | % |
| 12/31/2022 | | | 9.30 | | | | .43 | | | | (1.65 | ) | | | (1.22 | ) | | | (.41 | ) | | | — | | | | (.08 | ) | | | (.49 | ) | | | 7.59 | | | | (13.00 | ) | | | 1 | | | | 1.79 | | | | 1.78 | | | | 5.56 | |
| 12/31/2021 | | | 10.15 | | | | .38 | | | | (.85 | ) | | | (.47 | ) | | | (.32 | ) | | | — | | | | (.06 | ) | | | (.38 | ) | | | 9.30 | | | | (4.70 | ) | | | 1 | | | | 1.80 | | | | 1.80 | | | | 3.94 | |
| 12/31/2020 | | | 9.94 | | | | .42 | | | | .22 | | | | .64 | | | | (.14 | ) | | | — | | | | (.29 | ) | | | (.43 | ) | | | 10.15 | | | | 6.82 | | | | 1 | | | | 1.84 | | | | 1.81 | | | | 4.57 | |
| 12/31/2019 | | | 9.35 | | | | .55 | | | | .62 | | | | 1.17 | | | | (.31 | ) | | | (.03 | ) | | | (.24 | ) | | | (.58 | ) | | | 9.94 | | | | 12.79 | | | | 1 | | | | 1.82 | | | | 1.80 | | | | 5.65 | |
| Class 529-E: | | | | | | | | | | | | | | | | | | | | | | | | | | | | | | | | | | | | | | | | | | | | | | | | | | | | | | | | |
| 12/31/2023 | | | 7.59 | | | | .48 | | | | .48 | | | | .96 | | | | (.37 | ) | | | — | | | | (.14 | ) | | | (.51 | ) | | | 8.04 | | | | 13.16 | | | | 1 | | | | 1.18 | | | | 1.18 | | | | 6.33 | |
| 12/31/2022 | | | 9.30 | | | | .48 | | | | (1.65 | ) | | | (1.17 | ) | | | (.45 | ) | | | — | | | | (.09 | ) | | | (.54 | ) | | | 7.59 | | | | (12.50 | ) | | | — | 6 | | | 1.21 | | | | 1.20 | | | | 6.14 | |
| 12/31/2021 | | | 10.15 | | | | .43 | | | | (.85 | ) | | | (.42 | ) | | | (.36 | ) | | | — | | | | (.07 | ) | | | (.43 | ) | | | 9.30 | | | | (4.17 | ) | | | 1 | | | | 1.25 | | | | 1.25 | | | | 4.50 | |
| 12/31/2020 | | | 9.94 | | | | .48 | | | | .20 | | | | .68 | | | | (.15 | ) | | | — | | | | (.32 | ) | | | (.47 | ) | | | 10.15 | | | | 7.41 | | | | 1 | | | | 1.29 | | | | 1.27 | | | | 5.09 | |
| 12/31/2019 | | | 9.35 | | | | .60 | | | | .62 | | | | 1.22 | | | | (.34 | ) | | | (.03 | ) | | | (.26 | ) | | | (.63 | ) | | | 9.94 | | | | 13.40 | | | | 1 | | | | 1.28 | | | | 1.26 | | | | 6.18 | |
| Class 529-T: | | | | | | | | | | | | | | | | | | | | | | | | | | | | | | | | | | | | | | | | | | | | | | | | | | | | | | | | |
| 12/31/2023 | | | 7.59 | | | | .51 | | | | .48 | | | | .99 | | | | (.39 | ) | | | — | | | | (.15 | ) | | | (.54 | ) | | | 8.04 | | | | 13.61 | 5 | | | — | 6 | | | .75 | 5 | | | .75 | 5 | | | 6.73 | 5 |
| 12/31/2022 | | | 9.30 | | | | .51 | | | | (1.65 | ) | | | (1.14 | ) | | | (.48 | ) | | | — | | | | (.09 | ) | | | (.57 | ) | | | 7.59 | | | | (12.16 | )5 | | | — | 6 | | | .79 | 5 | | | .78 | 5 | | | 6.55 | 5 |
| 12/31/2021 | | | 10.15 | | | | .47 | | | | (.85 | ) | | | (.38 | ) | | | (.40 | ) | | | — | | | | (.07 | ) | | | (.47 | ) | | | 9.30 | | | | (3.75 | )5 | | | — | 6 | | | .81 | 5 | | | .81 | 5 | | | 4.92 | 5 |
| 12/31/2020 | | | 9.94 | | | | .52 | | | | .21 | | | | .73 | | | | (.17 | ) | | | — | | | | (.35 | ) | | | (.52 | ) | | | 10.15 | | | | 7.89 | 5 | | | — | 6 | | | .84 | 5 | | | .81 | 5 | | | 5.49 | 5 |
| 12/31/2019 | | | 9.35 | | | | .65 | | | | .62 | | | | 1.27 | | | | (.37 | ) | | | (.03 | ) | | | (.28 | ) | | | (.68 | ) | | | 9.94 | | | | 13.87 | 5 | | | — | 6 | | | .85 | 5 | | | .83 | 5 | | | 6.61 | 5 |
| Class 529-F-1: | | | | | | | | | | | | | | | | | | | | | | | | | | | | | | | | | | | | | | | | | | | | | | | | | | | | | | | | |
| 12/31/2023 | | | 7.59 | | | | .51 | | | | .48 | | | | .99 | | | | (.39 | ) | | | — | | | | (.15 | ) | | | (.54 | ) | | | 8.04 | | | | 13.61 | 5 | | | — | 6 | | | .76 | 5 | | | .76 | 5 | | | 6.72 | 5 |
| 12/31/2022 | | | 9.30 | | | | .51 | | | | (1.65 | ) | | | (1.14 | ) | | | (.48 | ) | | | — | | | | (.09 | ) | | | (.57 | ) | | | 7.59 | | | | (12.14 | )5 | | | — | 6 | | | .79 | 5 | | | .78 | 5 | | | 6.55 | 5 |
| 12/31/2021 | | | 10.15 | | | | .47 | | | | (.85 | ) | | | (.38 | ) | | | (.40 | ) | | | — | | | | (.07 | ) | | | (.47 | ) | | | 9.30 | | | | (3.78 | )5 | | | — | 6 | | | .84 | 5 | | | .84 | 5 | | | 4.89 | 5 |
| 12/31/2020 | | | 9.94 | | | | .52 | | | | .21 | | | | .73 | | | | (.17 | ) | | | — | | | | (.35 | ) | | | (.52 | ) | | | 10.15 | | | | 7.89 | 5 | | | — | 6 | | | .84 | 5 | | | .84 | 5 | | | 5.61 | 5 |
| 12/31/2019 | | | 9.35 | | | | .65 | | | | .62 | | | | 1.27 | | | | (.37 | ) | | | (.03 | ) | | | (.28 | ) | | | (.68 | ) | | | 9.94 | | | | 13.88 | | | | 4 | | | | .84 | | | | .82 | | | | 6.60 | |
| Class 529-F-2: | | | | | | | | | | | | | | | | | | | | | | | | | | | | | | | | | | | | | | | | | | | | | | | | | | | | | | | | |
| 12/31/2023 | | | 7.59 | | | | .52 | | | | .48 | | | | 1.00 | | | | (.40 | ) | | | — | | | | (.15 | ) | | | (.55 | ) | | | 8.04 | | | | 13.74 | | | | 7 | | | | .66 | | | | .66 | | | | 6.83 | |
| 12/31/2022 | | | 9.30 | | | | .52 | | | | (1.65 | ) | | | (1.13 | ) | | | (.49 | ) | | | — | | | | (.09 | ) | | | (.58 | ) | | | 7.59 | | | | (12.05 | ) | | | 6 | | | | .71 | | | | .69 | | | | 6.68 | |
| 12/31/2021 | | | 10.15 | | | | .48 | | | | (.85 | ) | | | (.37 | ) | | | (.40 | ) | | | — | | | | (.08 | ) | | | (.48 | ) | | | 9.30 | | | | (3.71 | ) | | | 6 | | | | .77 | | | | .77 | | | | 4.99 | |
| 12/31/20207,8 | | | 9.39 | | | | .08 | | | | .76 | | | | .84 | | | | (.03 | ) | | | — | | | | (.05 | ) | | | (.08 | ) | | | 10.15 | | | | 8.95 | 9 | | | 5 | | | | .14 | 9 | | | .11 | 9 | | | .82 | 9 |
| Class 529-F-3: | | | | | | | | | | | | | | | | | | | | | | | | | | | | | | | | | | | | | | | | | | | | | | | | | | | | | | | | |
| 12/31/2023 | | | 7.59 | | | | .52 | | | | .48 | | | | 1.00 | | | | (.40 | ) | | | — | | | | (.15 | ) | | | (.55 | ) | | | 8.04 | | | | 13.76 | | | | — | 6 | | | .63 | | | | .63 | | | | 6.85 | |
| 12/31/2022 | | | 9.30 | | | | .52 | | | | (1.65 | ) | | | (1.13 | ) | | | (.49 | ) | | | — | | | | (.09 | ) | | | (.58 | ) | | | 7.59 | | | | (12.02 | ) | | | — | 6 | | | .64 | | | | .63 | | | | 6.68 | |
| 12/31/2021 | | | 10.15 | | | | .49 | | | | (.85 | ) | | | (.36 | ) | | | (.41 | ) | | | — | | | | (.08 | ) | | | (.49 | ) | | | 9.30 | | | | (3.66 | ) | | | — | 6 | | | .73 | | | | .71 | | | | 5.02 | |
| 12/31/20207,8 | | | 9.39 | | | | .08 | | | | .77 | | | | .85 | | | | (.03 | ) | | | — | | | | (.06 | ) | | | (.09 | ) | | | 10.15 | | | | 8.97 | 9 | | | — | 6 | | | .16 | 9 | | | .10 | 9 | | | .84 | 9 |
| Class R-1: | | | | | | | | | | | | | | | | | | | | | | | | | | | | | | | | | | | | | | | | | | | | | | | | | | | | | | | | |
| 12/31/2023 | | | 7.59 | | | | .45 | | | | .48 | | | | .93 | | | | (.35 | ) | | | — | | | | (.13 | ) | | | (.48 | ) | | | 8.04 | | | | 12.75 | 5 | | | — | 6 | | | 1.54 | 5 | | | 1.54 | 5 | | | 5.96 | 5 |
| 12/31/2022 | | | 9.30 | | | | .45 | | | | (1.65 | ) | | | (1.20 | ) | | | (.43 | ) | | | — | | | | (.08 | ) | | | (.51 | ) | | | 7.59 | | | | (12.80 | )5 | | | — | 6 | | | 1.57 | 5 | | | 1.55 | 5 | | | 5.85 | 5 |
| 12/31/2021 | | | 10.15 | | | | .40 | | | | (.85 | ) | | | (.45 | ) | | | (.34 | ) | | | — | | | | (.06 | ) | | | (.40 | ) | | | 9.30 | | | | (4.42 | )5 | | | — | 6 | | | 1.54 | 5 | | | 1.52 | 5 | | | 4.26 | 5 |
| 12/31/2020 | | | 9.94 | | | | .45 | | | | .20 | | | | .65 | | | | (.14 | ) | | | — | | | | (.30 | ) | | | (.44 | ) | | | 10.15 | | | | 7.08 | 5 | | | — | 6 | | | 1.62 | 5 | | | 1.57 | 5 | | | 4.73 | 5 |
| 12/31/2019 | | | 9.35 | | | | .58 | | | | .62 | | | | 1.20 | | | | (.33 | ) | | | (.03 | ) | | | (.25 | ) | | | (.61 | ) | | | 9.94 | | | | 13.11 | 5 | | | — | 6 | | | 1.56 | 5 | | | 1.52 | 5 | | | 5.94 | 5 |
Refer to the end of the table for footnotes.
| 38 | American Funds Emerging Markets Bond Fund |
Financial highlights (continued)
| | | | | | Income (loss) from
investment operations1 | | | Dividends, distributions and return of capital | | | | | | | | | | | | | | | | | | | |
| Year ended | | Net asset
value,
beginning
of year | | | Net
investment
income | | | Net gains
(losses) on
securities
(both
realized and
unrealized) | | | Total from
investment
operations | | | Dividends
(from net
investment
income) | | | Distributions
(from capital
gains) | | | Return of
capital | | | Total
dividends,
distributions
and return
of capital | | | Net assets
value, end
of year | | | Total return2,3 | | | Net assets,
end of year
(in millions) | | | Ratio of
expenses to
average net
assets before
waivers/
reimburse-
ments4 | | | Ratio of
expenses to
average net
assets after
waivers/
reimburse-
ments3,4 | | | Ratio of
net income
to average
net assets3 | |
| Class R-2: | | | | | | | | | | | | | | | | | | | | | | | | | | | | | | | | | | | | | | | | | | | | | | | | | | | | | | | | |
| 12/31/2023 | | $ | 7.59 | | | $ | .45 | | | $ | .48 | | | $ | .93 | | | $ | (.35 | ) | | $ | — | | | $ | (.13 | ) | | $ | (.48 | ) | | $ | 8.04 | | | | 12.72 | % | | $ | 2 | | | | 1.57 | % | | | 1.56 | % | | | 5.95 | % |
| 12/31/2022 | | | 9.30 | | | | .45 | | | | (1.65 | ) | | | (1.20 | ) | | | (.43 | ) | | | — | | | | (.08 | ) | | | (.51 | ) | | | 7.59 | | | | (12.84 | ) | | | 1 | | | | 1.61 | | | | 1.60 | | | | 5.76 | |
| 12/31/2021 | | | 10.15 | | | | .39 | | | | (.85 | ) | | | (.46 | ) | | | (.33 | ) | | | — | | | | (.06 | ) | | | (.39 | ) | | | 9.30 | | | | (4.55 | ) | | | 2 | | | | 1.65 | | | | 1.65 | | | | 4.11 | |
| 12/31/2020 | | | 9.94 | | | | .43 | | | | .22 | | | | .65 | | | | (.14 | ) | | | — | | | | (.30 | ) | | | (.44 | ) | | | 10.15 | | | | 6.93 | | | | 2 | | | | 1.73 | | | | 1.70 | | | | 4.54 | |
| 12/31/2019 | | | 9.35 | | | | .56 | | | | .62 | | | | 1.18 | | | | (.32 | ) | | | (.03 | ) | | | (.24 | ) | | | (.59 | ) | | | 9.94 | | | | 12.90 | | | | 1 | | | | 1.73 | | | | 1.70 | | | | 5.74 | |
| Class R-2E: | | | | | | | | | | | | | | | | | | | | | | | | | | | | | | | | | | | | | | | | | | | | | | | | | | | | | | | | |
| 12/31/2023 | | | 7.59 | | | | .48 | | | | .48 | | | | .96 | | | | (.37 | ) | | | — | | | | (.14 | ) | | | (.51 | ) | | | 8.04 | | | | 13.10 | 5 | | | — | 6 | | | 1.23 | 5 | | | 1.23 | 5 | | | 6.27 | 5 |
| 12/31/2022 | | | 9.30 | | | | .48 | | | | (1.65 | ) | | | (1.17 | ) | | | (.45 | ) | | | — | | | | (.09 | ) | | | (.54 | ) | | | 7.59 | | | | (12.54 | )5 | | | — | 6 | | | 1.26 | 5 | | | 1.25 | 5 | | | 6.13 | 5 |
| 12/31/2021 | | | 10.15 | | | | .45 | | | | (.85 | ) | | | (.40 | ) | | | (.38 | ) | | | — | | | | (.07 | ) | | | (.45 | ) | | | 9.30 | | | | (4.01 | )5 | | | — | 6 | | | 1.21 | 5 | | | 1.20 | 5 | | | 4.62 | 5 |
| 12/31/2020 | | | 9.94 | | | | .49 | | | | .21 | | | | .70 | | | | (.16 | ) | | | — | | | | (.33 | ) | | | (.49 | ) | | | 10.15 | | | | 7.56 | 5 | | | — | 6 | | | 1.46 | 5 | | | 1.39 | 5 | | | 5.12 | 5 |
| 12/31/2019 | | | 9.35 | | | | .58 | | | | .62 | | | | 1.20 | | | | (.33 | ) | | | (.03 | ) | | | (.25 | ) | | | (.61 | ) | | | 9.94 | | | | 13.20 | | | | 1 | | | | 1.46 | | | | 1.43 | | | | 6.02 | |
| Class R-3: | | | | | | | | | | | | | | | | | | | | | | | | | | | | | | | | | | | | | | | | | | | | | | | | | | | | | | | | |
| 12/31/2023 | | | 7.59 | | | | .48 | | | | .48 | | | | .96 | | | | (.37 | ) | | | — | | | | (.14 | ) | | | (.51 | ) | | | 8.04 | | | | 13.13 | | | | 2 | | | | 1.20 | | | | 1.20 | | | | 6.29 | |
| 12/31/2022 | | | 9.30 | | | | .48 | | | | (1.65 | ) | | | (1.17 | ) | | | (.45 | ) | | | — | | | | (.09 | ) | | | (.54 | ) | | | 7.59 | | | | (12.52 | ) | | | 2 | | | | 1.24 | | | | 1.23 | | | | 6.11 | |
| 12/31/2021 | | | 10.15 | | | | .43 | | | | (.85 | ) | | | (.42 | ) | | | (.36 | ) | | | — | | | | (.07 | ) | | | (.43 | ) | | | 9.30 | | | | (4.19 | ) | | | 2 | | | | 1.28 | | | | 1.28 | | | | 4.47 | |
| 12/31/2020 | | | 9.94 | | | | .47 | | | | .21 | | | | .68 | | | | (.15 | ) | | | — | | | | (.32 | ) | | | (.47 | ) | | | 10.15 | | | | 7.38 | | | | 2 | | | | 1.31 | | | | 1.29 | | | | 5.02 | |
| 12/31/2019 | | | 9.35 | | | | .60 | | | | .62 | | | | 1.22 | | | | (.34 | ) | | | (.03 | ) | | | (.26 | ) | | | (.63 | ) | | | 9.94 | | | | 13.37 | | | | 2 | | | | 1.30 | | | | 1.28 | | | | 6.15 | |
| Class R-4: | | | | | | | | | | | | | | | | | | | | | | | | | | | | | | | | | | | | | | | | | | | | | | | | | | | | | | | | |
| 12/31/2023 | | | 7.59 | | | | .50 | | | | .48 | | | | .98 | | | | (.38 | ) | | | — | | | | (.15 | ) | | | (.53 | ) | | | 8.04 | | | | 13.47 | | | | 1 | | | | .90 | | | | .90 | | | | 6.59 | |
| 12/31/2022 | | | 9.30 | | | | .50 | | | | (1.65 | ) | | | (1.15 | ) | | | (.47 | ) | | | — | | | | (.09 | ) | | | (.56 | ) | | | 7.59 | | | | (12.27 | ) | | | 1 | | | | .95 | | | | .95 | | | | 6.37 | |
| 12/31/2021 | | | 10.15 | | | | .46 | | | | (.85 | ) | | | (.39 | ) | | | (.39 | ) | | | — | | | | (.07 | ) | | | (.46 | ) | | | 9.30 | | | | (3.91 | ) | | | 1 | | | | .99 | | | | .99 | | | | 4.78 | |
| 12/31/2020 | | | 9.94 | | | | .50 | | | | .21 | | | | .71 | | | | (.16 | ) | | | — | | | | (.34 | ) | | | (.50 | ) | | | 10.15 | | | | 7.69 | | | | 1 | | | | 1.02 | | | | 1.00 | | | | 5.35 | |
| 12/31/2019 | | | 9.35 | | | | .63 | | | | .62 | | | | 1.25 | | | | (.36 | ) | | | (.03 | ) | | | (.27 | ) | | | (.66 | ) | | | 9.94 | | | | 13.67 | | | | 1 | | | | 1.04 | | | | 1.02 | | | | 6.44 | |
| Class R-5E: | | | | | | | | | | | | | | | | | | | | | | | | | | | | | | | | | | | | | | | | | | | | | | | | | | | | | | | | |
| 12/31/2023 | | | 7.59 | | | | .52 | | | | .48 | | | | 1.00 | | | | (.40 | ) | | | — | | | | (.15 | ) | | | (.55 | ) | | | 8.04 | | | | 13.73 | | | | 1 | | | | .67 | | | | .67 | | | | 6.82 | |
| 12/31/2022 | | | 9.30 | | | | .51 | | | | (1.65 | ) | | | (1.14 | ) | | | (.48 | ) | | | — | | | | (.09 | ) | | | (.57 | ) | | | 7.59 | | | | (12.08 | ) | | | 1 | | | | .74 | | | | .73 | | | | 6.67 | |
| 12/31/2021 | | | 10.15 | | | | .51 | | | | (.85 | ) | | | (.34 | ) | | | (.43 | ) | | | — | | | | (.08 | ) | | | (.51 | ) | | | 9.30 | | | | (3.40 | ) | | | 1 | | | | .44 | | | | .44 | | | | 5.32 | |
| 12/31/2020 | | | 9.94 | | | | .55 | | | | .21 | | | | .76 | | | | (.18 | ) | | | — | | | | (.37 | ) | | | (.55 | ) | | | 10.15 | | | | 8.23 | | | | 1 | | | | .49 | | | | .47 | | | | 5.82 | |
| 12/31/2019 | | | 9.35 | | | | .65 | | | | .62 | | | | 1.27 | | | | (.37 | ) | | | (.03 | ) | | | (.28 | ) | | | (.68 | ) | | | 9.94 | | | | 14.05 | | | | — | 6 | | | .77 | | | | .75 | | | | 6.81 | |
|
| Class R-5: | | | | | | | | | | | | | | | | | | | | | | | | | | | | | | | | | | | | | | | | | | | | | | | | | | | | | | | | |
| 12/31/2023 | | | 7.59 | | | | .53 | | | | .47 | | | | 1.00 | | | | (.40 | ) | | | — | | | | (.15 | ) | | | (.55 | ) | | | 8.04 | | | | 13.83 | | | | 1 | | | | .58 | | | | .58 | | | | 6.94 | |
| 12/31/2022 | | | 9.30 | | | | .53 | | | | (1.65 | ) | | | (1.12 | ) | | | (.49 | ) | | | — | | | | (.10 | ) | | | (.59 | ) | | | 7.59 | | | | (11.98 | ) | | | 1 | | | | .63 | | | | .62 | | | | 6.73 | |
| 12/31/2021 | | | 10.15 | | | | .49 | | | | (.85 | ) | | | (.36 | ) | | | (.41 | ) | | | — | | | | (.08 | ) | | | (.49 | ) | | | 9.30 | | | | (3.61 | ) | | | 1 | | | | .67 | | | | .67 | | | | 5.09 | |
| 12/31/2020 | | | 9.94 | | | | .53 | | | | .21 | | | | .74 | | | | (.17 | ) | | | — | | | | (.36 | ) | | | (.53 | ) | | | 10.15 | | | | 8.01 | | | | 1 | | | | .73 | | | | .70 | | | | 5.59 | |
| 12/31/2019 | | | 9.35 | | | | .66 | | | | .62 | | | | 1.28 | | | | (.38 | ) | | | (.03 | ) | | | (.28 | ) | | | (.69 | ) | | | 9.94 | | | | 14.01 | | | | 1 | | | | .74 | | | | .71 | | | | 6.73 | |
| Class R-6: | | | | | | | | | | | | | | | | | | | | | | | | | | | | | | | | | | | | | | | | | | | | | | | | | | | | | | | | |
| 12/31/2023 | | | 7.59 | | | | .53 | | | | .48 | | | | 1.01 | | | | (.40 | ) | | | — | | | | (.16 | ) | | | (.56 | ) | | | 8.04 | | | | 13.86 | | | | 115 | | | | .55 | | | | .55 | | | | 6.96 | |
| 12/31/2022 | | | 9.30 | | | | .53 | | | | (1.65 | ) | | | (1.12 | ) | | | (.49 | ) | | | — | | | | (.10 | ) | | | (.59 | ) | | | 7.59 | | | | (11.95 | ) | | | 136 | | | | .60 | | | | .59 | | | | 6.74 | |
| 12/31/2021 | | | 10.15 | | | | .49 | | | | (.85 | ) | | | (.36 | ) | | | (.41 | ) | | | — | | | | (.08 | ) | | | (.49 | ) | | | 9.30 | | | | (3.58 | ) | | | 194 | | | | .64 | | | | .64 | | | | 5.12 | |
| 12/31/2020 | | | 9.94 | | | | .54 | | | | .20 | | | | .74 | | | | (.17 | ) | | | — | | | | (.36 | ) | | | (.53 | ) | | | 10.15 | | | | 8.07 | | | | 167 | | | | .67 | | | | .65 | | | | 5.67 | |
| 12/31/2019 | | | 9.35 | | | | .66 | | | | .62 | | | | 1.28 | | | | (.38 | ) | | | (.03 | ) | | | (.28 | ) | | | (.69 | ) | | | 9.94 | | | | 14.07 | | | | 173 | | | | .68 | | | | .66 | | | | 6.80 | |
Refer to the end of the table for footnotes.
| American Funds Emerging Markets Bond Fund | 39 |
Financial highlights (continued)
| | | Year ended December 31, |
| | | 2023 | | 2022 | | 2021 | | 2020 | | 2019 |
| Portfolio turnover rate for all share classes10 | | | 56 | % | | | 63 | % | | | 52 | % | | | 70 | % | | | 54 | % |
| 1 | Based on average shares outstanding. |
| 2 | Total returns exclude any applicable sales charges, including contingent deferred sales charges. |
| 3 | This column reflects the impact, if any, of certain waivers/reimbursements from AFS and/or CRMC. During some of the years shown, AFS waived a portion of transfer agent services fees for Class F-3 shares. In addition, during some of the years shown, CRMC reimbursed a portion of transfer agent services fees for certain share classes and/or reimbursed a portion of miscellaneous fees and expenses. |
| 4 | Ratios do not include expenses of any Central Funds. The fund indirectly bears its proportionate share of the expenses of any Central Funds. |
| 5 | All or a significant portion of assets in this class consisted of seed capital invested by CRMC and/or its affiliates. Fees for distribution services are not charged or accrued on these seed capital assets. If such fees were paid by the fund on seed capital assets, fund expenses would have been higher and net income and total return would have been lower. |
| 6 | Amount less than $1 million. |
| 7 | Based on operations for a period that is less than a full year. |
| 8 | Class 529-F-2 and 529-F-3 shares began investment operations on October 30, 2020. |
| 9 | Not annualized. |
| 10 | Rates do not include the fund’s portfolio activity with respect to any Central Funds. |
Refer to the notes to financial statements.
| 40 | American Funds Emerging Markets Bond Fund |
Report of Independent Registered Public Accounting Firm
To the Shareholders and Board of Trustees of American Funds Emerging Markets Bond Fund:
Opinion on the Financial Statements and Financial Highlights
We have audited the accompanying statement of assets and liabilities of American Funds Emerging Markets Bond Fund (the “Fund”), including the investment portfolio, as of December 31, 2023, the related statement of operations for the year then ended, the statements of changes in net assets for each of the two years in the period then ended, the financial highlights for each of the five years in the period then ended, and the related notes. In our opinion, the financial statements and financial highlights present fairly, in all material respects, the financial position of the Fund as of December 31, 2023, and the results of its operations for the year then ended, the changes in its net assets for each of the two years in the period then ended, and the financial highlights for each of the five years in the period then ended in conformity with accounting principles generally accepted in the United States of America.
Basis for Opinion
These financial statements and financial highlights are the responsibility of the Fund’s management. Our responsibility is to express an opinion on the Fund’s financial statements and financial highlights based on our audits. We are a public accounting firm registered with the Public Company Accounting Oversight Board (United States) (PCAOB) and are required to be independent with respect to the Fund in accordance with the U.S. federal securities laws and the applicable rules and regulations of the Securities and Exchange Commission and the PCAOB.
We conducted our audits in accordance with the standards of the PCAOB. Those standards require that we plan and perform the audit to obtain reasonable assurance about whether the financial statements and financial highlights are free of material misstatement, whether due to error or fraud. The Fund is not required to have, nor were we engaged to perform, an audit of its internal control over financial reporting. As part of our audits we are required to obtain an understanding of internal control over financial reporting but not for the purpose of expressing an opinion on the effectiveness of the Fund’s internal control over financial reporting. Accordingly, we express no such opinion.
Our audits included performing procedures to assess the risks of material misstatement of the financial statements and financial highlights, whether due to error or fraud, and performing procedures that respond to those risks. Such procedures included examining, on a test basis, evidence regarding the amounts and disclosures in the financial statements and financial highlights. Our audits also included evaluating the accounting principles used and significant estimates made by management, as well as evaluating the overall presentation of the financial statements and financial highlights. Our procedures included confirmation of securities owned as of December 31, 2023, by correspondence with the custodian and brokers; when replies were not received from brokers, we performed other auditing procedures. We believe that our audits provide a reasonable basis for our opinion.
/s/ Deloitte & Touche LLP
Costa Mesa, California
February 9, 2024
We have served as the auditor of one or more American Funds investment companies since 1956.
| American Funds Emerging Markets Bond Fund | 41 |
As a fund shareholder, you incur two types of costs: (1) transaction costs, such as initial sales charges on purchase payments and contingent deferred sales charges on redemptions (loads), and (2) ongoing costs, including management fees, distribution and service (12b-1) fees, and other expenses. This example is intended to help you understand your ongoing costs (in dollars) of investing in the fund so you can compare these costs with the ongoing costs of investing in other mutual funds. The example is based on an investment of $1,000 invested at the beginning of the period and held for the entire six-month period (July 1, 2023, through December 31, 2023).
Actual expenses:
The first line of each share class in the table on the following page provides information about actual account values and actual expenses. You may use the information in this line, together with the amount you invested, to estimate the expenses that you paid over the period. Simply divide your account value by $1,000 (for example, an $8,600 account value divided by $1,000 = 8.6), then multiply the result by the number in the first line under the heading titled “Expenses paid during period” to estimate the expenses you paid on your account during this period.
Hypothetical example for comparison purposes:
The second line of each share class in the table on the following page provides information about hypothetical account values and hypothetical expenses based on the actual expense ratio for the share class and an assumed rate of return of 5.00% per year before expenses, which is not the actual return of the share class. The hypothetical account values and expenses may not be used to estimate the actual ending account balance or expenses you paid for the period. You may use this information to compare the ongoing costs of investing in the fund and other funds. To do so, compare this 5.00% hypothetical example with the 5.00% hypothetical examples that appear in the shareholder reports of the other funds.
Notes:
Retirement plan participants may be subject to certain fees charged by the plan sponsor, and Class F-1, F-2, F-3, 529-F-1, 529-F-2 and 529-F-3 shareholders may be subject to fees charged by financial intermediaries, typically ranging from 0.75% to 1.50% of assets annually depending on services offered. You can estimate the impact of these fees by adding the amount of the fees to the total estimated expenses you paid on your account during the period as calculated above. In addition, your ending account value would be lower by the amount of these fees.
Note that the expenses shown in the table on the following page are meant to highlight your ongoing costs only and do not reflect any transactional costs, such as sales charges (loads). Therefore, the second line of each share class in the table is useful in comparing ongoing costs only and will not help you determine the relative total costs of owning different funds. In addition, if these transactional costs were included, your costs would have been higher.
| 42 | American Funds Emerging Markets Bond Fund |
Expense example (continued)
| | | Beginning
account value
7/1/2023 | | | Ending
account value
12/31/2023 | | | Expenses paid
during period* | | | Annualized
expense ratio | |
| Class A – actual return | | $ | 1,000.00 | | | $ | 1,058.41 | | | $ | 5.08 | | | | .98 | % |
| Class A – assumed 5% return | | | 1,000.00 | | | | 1,020.27 | | | | 4.99 | | | | .98 | |
| Class C – actual return | | | 1,000.00 | | | | 1,054.64 | | | | 8.75 | | | | 1.69 | |
| Class C – assumed 5% return | | | 1,000.00 | | | | 1,016.69 | | | | 8.59 | | | | 1.69 | |
| Class T – actual return | | | 1,000.00 | | | | 1,060.11 | | | | 3.58 | | | | .69 | |
| Class T – assumed 5% return | | | 1,000.00 | | | | 1,021.73 | | | | 3.52 | | | | .69 | |
| Class F-1 – actual return | | | 1,000.00 | | | | 1,058.62 | | | | 4.88 | | | | .94 | |
| Class F-1 – assumed 5% return | | | 1,000.00 | | | | 1,020.47 | | | | 4.79 | | | | .94 | |
| Class F-2 – actual return | | | 1,000.00 | | | | 1,060.14 | | | | 3.43 | | | | .66 | |
| Class F-2 – assumed 5% return | | | 1,000.00 | | | | 1,021.88 | | | | 3.36 | | | | .66 | |
| Class F-3 – actual return | | | 1,000.00 | | | | 1,060.69 | | | | 2.86 | | | | .55 | |
| Class F-3 – assumed 5% return | | | 1,000.00 | | | | 1,022.43 | | | | 2.80 | | | | .55 | |
| Class 529-A – actual return | | | 1,000.00 | | | | 1,058.51 | | | | 4.98 | | | | .96 | |
| Class 529-A – assumed 5% return | | | 1,000.00 | | | | 1,020.37 | | | | 4.89 | | | | .96 | |
| Class 529-C – actual return | | | 1,000.00 | | | | 1,054.37 | | | | 9.01 | | | | 1.74 | |
| Class 529-C – assumed 5% return | | | 1,000.00 | | | | 1,016.43 | | | | 8.84 | | | | 1.74 | |
| Class 529-E – actual return | | | 1,000.00 | | | | 1,057.36 | | | | 6.12 | | | | 1.18 | |
| Class 529-E – assumed 5% return | | | 1,000.00 | | | | 1,019.26 | | | | 6.01 | | | | 1.18 | |
| Class 529-T – actual return | | | 1,000.00 | | | | 1,059.54 | | | | 3.89 | | | | .75 | |
| Class 529-T – assumed 5% return | | | 1,000.00 | | | | 1,021.42 | | | | 3.82 | | | | .75 | |
| Class 529-F-1 – actual return | | | 1,000.00 | | | | 1,059.57 | | | | 3.95 | | | | .76 | |
| Class 529-F-1 – assumed 5% return | | | 1,000.00 | | | | 1,021.37 | | | | 3.87 | | | | .76 | |
| Class 529-F-2 – actual return | | | 1,000.00 | | | | 1,060.01 | | | | 3.48 | | | | .67 | |
| Class 529-F-2 – assumed 5% return | | | 1,000.00 | | | | 1,021.83 | | | | 3.41 | | | | .67 | |
| Class 529-F-3 – actual return | | | 1,000.00 | | | | 1,060.23 | | | | 3.22 | | | | .62 | |
| Class 529-F-3 – assumed 5% return | | | 1,000.00 | | | | 1,022.08 | | | | 3.16 | | | | .62 | |
| Class R-1 – actual return | | | 1,000.00 | | | | 1,055.42 | | | | 8.03 | | | | 1.55 | |
| Class R-1 – assumed 5% return | | | 1,000.00 | | | | 1,017.39 | | | | 7.88 | | | | 1.55 | |
| Class R-2 – actual return | | | 1,000.00 | | | | 1,055.29 | | | | 8.13 | | | | 1.57 | |
| Class R-2 – assumed 5% return | | | 1,000.00 | | | | 1,017.29 | | | | 7.98 | | | | 1.57 | |
| Class R-2E – actual return | | | 1,000.00 | | | | 1,057.08 | | | | 6.38 | | | | 1.23 | |
| Class R-2E – assumed 5% return | | | 1,000.00 | | | | 1,019.00 | | | | 6.26 | | | | 1.23 | |
| Class R-3 – actual return | | | 1,000.00 | | | | 1,057.23 | | | | 6.22 | | | | 1.20 | |
| Class R-3 – assumed 5% return | | | 1,000.00 | | | | 1,019.16 | | | | 6.11 | | | | 1.20 | |
| Class R-4 – actual return | | | 1,000.00 | | | | 1,058.81 | | | | 4.67 | | | | .90 | |
| Class R-4 – assumed 5% return | | | 1,000.00 | | | | 1,020.67 | | | | 4.58 | | | | .90 | |
| Class R-5E – actual return | | | 1,000.00 | | | | 1,060.06 | | | | 3.48 | | | | .67 | |
| Class R-5E – assumed 5% return | | | 1,000.00 | | | | 1,021.83 | | | | 3.41 | | | | .67 | |
| Class R-5 – actual return | | | 1,000.00 | | | | 1,060.51 | | | | 3.01 | | | | .58 | |
| Class R-5 – assumed 5% return | | | 1,000.00 | | | | 1,022.28 | | | | 2.96 | | | | .58 | |
| Class R-6 – actual return | | | 1,000.00 | | | | 1,060.68 | | | | 2.86 | | | | .55 | |
| Class R-6 – assumed 5% return | | | 1,000.00 | | | | 1,022.43 | | | | 2.80 | | | | .55 | |
| * | The “expenses paid during period” are equal to the “annualized expense ratio,” multiplied by the average account value over the period, multiplied by the number of days in the period, and divided by 365 (to reflect the one-half year period). |
| American Funds Emerging Markets Bond Fund | 43 |
We are required to advise you of the federal tax status of certain distributions received by shareholders during the fiscal year. The fund hereby designates the following amounts for the fund’s fiscal year ended December 31, 2023:
| Foreign source income | $0.52 per share |
| Qualified dividend income | $168,000 |
| Section 163(j) interest dividends | $49,281,000 |
| U.S. government income that may be exempt from state taxation | $1,961,000 |
Individual shareholders should refer to their Form 1099 or other tax information, which was mailed in January 2024, to determine the calendar year amounts to be included on their 2023 tax returns. Shareholders should consult their tax advisors.
| 44 | American Funds Emerging Markets Bond Fund |
| Liquidity Risk Management Program | unaudited |
The fund has adopted a liquidity risk management program (the “program”). The fund’s board has designated Capital Research and Management Company (“CRMC”) as the administrator of the program. Personnel of CRMC or its affiliates conduct the day-to-day operation of the program pursuant to policies and procedures administered by the Capital Group Liquidity Risk Management Committee.
Under the program, CRMC manages the fund’s liquidity risk, which is the risk that the fund could not meet shareholder redemption requests without significant dilution of remaining shareholders’ interests in the fund. This risk is managed by monitoring the degree of liquidity of the fund’s investments, limiting the amount of the fund’s illiquid investments, and utilizing various risk management tools and facilities available to the fund for meeting shareholder redemptions, among other means. CRMC’s process of determining the degree of liquidity of the fund’s investments is supported by one or more third-party liquidity assessment vendors.
The fund’s board reviewed a report prepared by CRMC regarding the operation and effectiveness of the program for the period October 1, 2022, through September 30, 2023. No significant liquidity events impacting the fund were noted in the report. In addition, CRMC provided its assessment that the program had been effective in managing the fund’s liquidity risk.
| American Funds Emerging Markets Bond Fund | 45 |
Board of trustees and other officers
Independent trustees1
| Name and year of birth | | Year first
elected
a trustee
of the series2 | | Principal occupation(s) during past five years | | Number of
portfolios in
fund complex
overseen by
trustee | | Other directorships3
held by trustee |
| Francisco G. Cigarroa, MD, 1957 | | 2021 | | Professor of Surgery, University of Texas Health San Antonio; Trustee, Ford Foundation; Clayton Research Scholar, Clayton Foundation for Biomedical Research | | 88 | | None |
| Nariman Farvardin, 1956 | | 2018 | | President, Stevens Institute of Technology | | 93 | | None |
| Jennifer C. Feikin, 1968 | | 2022 | | Business Advisor; previously held positions at Google, AOL, 20th Century Fox and McKinsey & Company; Trustee, The Nature Conservancy of Utah; former Trustee, The Nature Conservancy of California | | 102 | | Hertz Global Holdings, Inc. |
| Leslie Stone Heisz, 1961 | | 2022 | | Former Managing Director, Lazard (retired, 2010); Director, Kaiser Permanente (California public benefit corporation); former Lecturer, UCLA Anderson School of Management | | 102 | | Edwards Lifesciences; Public Storage, Inc. |
| Mary Davis Holt, 1950 | | 2015-2016;
2017 | | Principal, Mary Davis Holt Enterprises, LLC (leadership development consulting); former COO, Time Life Inc. (1993–2003) | | 89 | | None |
| Merit E. Janow, 1958 | | 2015 | | Dean Emerita and Professor of Practice, International Economic Law & International Affairs, Columbia University, School of International and Public Affairs | | 99 | | Aptiv (autonomous and green vehicle technology); Mastercard Incorporated |
Margaret Spellings, 1957
Chair of the Board
(Independent and
Non-Executive) | | 2015 | | President and CEO, Bipartisan Policy Center; former President and CEO, Texas 2036; former President, Margaret Spellings & Company (public policy and strategic consulting); former President, The University of North Carolina | | 93 | | None |
| Alexandra Trower, 1964 | | 2018 | | Former Executive Vice President, Global Communications and Corporate Officer, The Estée Lauder Companies | | 88 | | None |
| Paul S. Williams, 1959 | | 2020 | | Former Partner/Managing Director, Major, Lindsey & Africa (executive recruiting firm) | | 88 | | Air Transport Services Group, Inc. (aircraft leasing and air cargo transportation); Public Storage, Inc. |
Interested trustees4,5
Name, year of birth and
position with series | | Year first
elected
a trustee
or officer
of the series2 | | Principal occupation(s) during past five years
and positions held with affiliated entities or
the principal underwriter of the series | | Number of
portfolios in
fund complex
overseen by
trustee | | Other directorships3
held by trustee |
| Michael C. Gitlin, 1970 | | 2015 | | Partner – Capital Fixed Income Investors, Capital Research and Management Company; President, Chief Executive Officer and Director, The Capital Group Companies, Inc.6; Vice Chairman and Director, Capital Research and Management Company | | 88 | | None |
| Karl J. Zeile, 1966 | | 2019 | | Partner — Capital Fixed Income Investors, Capital Research and Management Company | | 23 | | None |
The fund’s statement of additional information includes further details about fund trustees and is available without charge upon request by calling American Funds Service Company at (800) 421-4225 or refer to the Capital Group website at capitalgroup.com. The address for all trustees and officers of the fund is 333 South Hope Street, Los Angeles, CA 90071, Attention: Secretary.
| 46 | American Funds Emerging Markets Bond Fund |
Other officers5
Name, year of birth and
position with fund | | Year first
elected
an officer
of the fund2 | | Principal occupation(s) during past five years and positions held with affiliated entities
or the principal underwriter of the fund |
Kirstie Spence, 1973
President | | 2015 | | Partner — Capital Fixed Income Investors, Capital International Limited6; Vice President and Director, Capital International Limited6; Director, Capital Research Company6; Director, The Capital Group Companies, Inc.6 |
Kristine M. Nishiyama, 1970
Principal Executive Officer | | 2015 | | Senior Vice President and Senior Counsel — Fund Business Management Group, Capital Research and Management Company; Chair, Senior Vice President, General Counsel and Director, Capital Bank and Trust Company6 |
Michael W. Stockton, 1967
Executive Vice President | | 2021 | | Senior Vice President — Fund Business Management Group, Capital Research and Management Company |
Luis Freitas de Oliveira, 1967
Senior Vice President | | 2018 | | Partner — Capital Fixed Income Investors, Capital International Sàrl6; Chairman and Corporate Manager, Capital International Sàrl6 |
Robert Burgess, 1969
Vice President | | 2023 | | Vice President — Capital Fixed Income Investors, Capital Research Company6 |
Courtney R. Taylor, 1975
Secretary | | 2023 | | Assistant Vice President — Fund Business Management Group, Capital Research and Management Company |
Becky L. Park, 1979
Treasurer | | 2021 | | Vice President — Investment Operations, Capital Research and Management Company |
Jane Y. Chung, 1974
Assistant Secretary | | 2015 | | Associate — Fund Business Management Group, Capital Research and Management Company |
Sandra Chuon, 1972
Assistant Treasurer | | 2019 | | Vice President — Investment Operations, Capital Research and Management Company |
Brian C. Janssen, 1972
Assistant Treasurer | | 2015 | | Senior Vice President — Investment Operations, Capital Research and Management Company |
| 1 | The term independent trustee refers to a trustee who is not an “interested person” of the fund within the meaning of the Investment Company Act of 1940. |
| 2 | Trustees and officers of the fund serve until their resignation, removal or retirement. |
| 3 | This includes all directorships/trusteeships (other than those in the American Funds or other funds managed by Capital Research and Management Company or its affiliates) that are held by each trustee as a trustee or director of a public company or a registered investment company. |
| 4 | The term interested trustee refers to a trustee who is an “interested person” within the meaning of the Investment Company Act of 1940, on the basis of their affiliation with the fund’s investment adviser, Capital Research and Management Company, or affiliated entities (including the fund’s principal underwriter). |
| 5 | All of the trustees and/or officers listed, with the exception of Robert Burgess and Luis Freitas de Oliveira, are officers and/or directors/trustees of one or more of the other funds for which Capital Research and Management Company serves as investment adviser. |
| 6 | Company affiliated with Capital Research and Management Company. |
| American Funds Emerging Markets Bond Fund | 47 |
Office of the fund
6455 Irvine Center Drive
Irvine, CA 92618-4518
Investment adviser
Capital Research and Management Company
333 South Hope Street
Los Angeles, CA 90071-1406
Transfer agent for shareholder accounts
American Funds Service Company
(Write to the address nearest you.)
P.O. Box 6007
Indianapolis, IN 46206-6007
P.O. Box 2280
Norfolk, VA 23501-2280
Custodian of assets
JPMorgan Chase Bank
270 Park Avenue
New York, NY 10017-2070
Counsel
Morgan, Lewis & Bockius LLP
One Federal Street
Boston, MA 02110-1726
Independent registered public accounting firm
Deloitte & Touche LLP
695 Town Center Drive
Suite 1000
Costa Mesa, CA 92626-7188
Principal underwriter
American Funds Distributors, Inc.
333 South Hope Street
Los Angeles, CA 90071-1406
| 48 | American Funds Emerging Markets Bond Fund |
Investors should carefully consider investment objectives, risks, charges and expenses. This and other important information is contained in the fund prospectus and summary prospectus, which can be obtained from your financial professional and should be read carefully before investing. You may also call American Funds Service Company (AFS) at (800) 421-4225 or refer to the Capital Group website at capitalgroup.com.
“American Funds Proxy Voting Procedures and Principles” — which describes how we vote proxies relating to portfolio securities — is available on our website or upon request by calling AFS. The fund files its proxy voting record with the U.S. Securities and Exchange Commission (SEC) for the 12 months ended June 30 by August 31. The proxy voting record is available free of charge on the SEC website at sec.gov and our website.
American Funds Emerging Markets Bond Fund files a complete list of its portfolio holdings with the SEC for the first and third quarters of each fiscal year on Form NPORT-P. The list of portfolio holdings is available free of charge on the SEC website and on our website.
This report is for the information of shareholders of American Funds Emerging Markets Bond Fund, but it also may be used as sales literature when preceded or accompanied by the current prospectus or summary prospectus, which gives details about charges, expenses, investment objectives and operating policies of the fund. If used as sales material after March 31, 2024, this report must be accompanied by an American Funds statistical update for the most recently completed calendar quarter.
American Funds Distributors, Inc.
The Capital Advantage®
Since 1931, Capital Group, home of American Funds, has helped investors pursue long-term investment success. Our consistent approach — in combination with The Capital SystemTM — has resulted in superior outcomes.
Aligned with investor success
We base our decisions on a long-term perspective, which we believe aligns our goals with the interests of our clients. Our portfolio managers average 28 years of investment industry experience, including 22 years at our company, reflecting a career commitment to our long-term approach.1
The Capital System
The Capital System combines individual accountability with teamwork. Funds using The Capital System are divided into portions that are managed independently by investment professionals with diverse backgrounds, ages and investment approaches. An extensive global research effort is the backbone of our system.
American Funds’ superior outcomes
Equity-focused funds have beaten their Lipper peer indexes in 90% of 10-year periods and 99% of 20-year periods.2 Relative to their peers, our fixed income funds have helped investors achieve better diversification through attention to correlation between bonds and equities.3 Fund management fees have been among the lowest in the industry.4
| | 1 | Investment industry experience as of December 31, 2022. |
| | 2 | Based on Class F-2 share results for rolling monthly 10- and 20-year periods starting with the first 10- or 20-year period after each mutual fund’s inception through December 31, 2022. Periods covered are the shorter of the fund’s lifetime or since the comparable Lipper index inception date (except Capital Income Builder and SMALLCAP World Fund, for which the Lipper average was used). Expenses differ for each share class, so results will vary. Past results are not predictive of results in future periods. |
| | 3 | Based on Class F-2 share results as of December 31, 2022. Sixteen of the 18 fixed income American Funds that have been in existence for the three-year period showed a three-year correlation lower than their respective Morningstar peer group averages. S&P 500 Index was used as an equity market proxy. Correlation based on monthly total returns. Correlation is a statistical measure of how two securities move in relation to each other. A correlation ranges from –1 to 1. A positive correlation close to 1 implies that as one security moves, either up or down, the other security will move in “lockstep,” in the same direction. A negative correlation close to –1 indicates that the securities have moved in the opposite direction. |
| | 4 | On average, our mutual fund management fees were in the lowest quintile 62% of the time, based on the 20-year period ended December 31, 2022, versus comparable Lipper categories, excluding funds of funds. |
Class F-2 shares were first offered on August 1, 2008. Class F-2 share results prior to the date of first sale are hypothetical based on the results of the original share class of the fund without a sales charge, adjusted for typical estimated expenses. Results for certain funds with an inception date after August 1, 2008, also include hypothetical returns because those funds’ Class F-2 shares sold after the funds’ date of first offering. Refer to capitalgroup.com for more information on specific expense adjustments and the actual dates of first sale.
All Capital Group trademarks mentioned are owned by The Capital Group Companies, Inc., an affiliated company or fund. All other company and product names mentioned are the property of their respective companies.

ITEM 2 – Code of Ethics
The Registrant has adopted a Code of Ethics that applies to its Principal Executive Officer and Principal Financial Officer. The Registrant undertakes to provide to any person without charge, upon request, a copy of the Code of Ethics. Such request can be made by calling 800/421-4225 or to the Secretary of the Registrant, 6455 Irvine Center Drive, Irvine, California 92618.
ITEM 3 – Audit Committee Financial Expert
The Registrant’s board has determined that Paul S. Williams, a member of the Registrant’s audit committee, is an “audit committee financial expert” and "independent," as such terms are defined in this Item. This designation will not increase the designee’s duties, obligations or liability as compared to his or her duties, obligations and liability as a member of the audit committee and of the board, nor will it reduce the responsibility of the other audit committee members. There may be other individuals who, through education or experience, would qualify as "audit committee financial experts" if the board had designated them as such. Most importantly, the board believes each member of the audit committee contributes significantly to the effective oversight of the Registrant’s financial statements and condition.
ITEM 4 – Principal Accountant Fees and Services
| a) Audit Fees: | | |
| Audit | 2022 | 99,000 |
| | 2023 | 3,000 |
| | | |
| b) Audit-Related Fees: | | |
| | 2022 | None |
| | 2023 | None |
| | | |
| c) Tax Fees: | | |
| | 2022 | 11,000 |
| | 2023 | 11,000 |
| | The tax fees consist of professional services relating to the preparation of the Registrant’s tax returns. | |
| | | |
| d) All Other Fees: | | |
| | 2022 | None |
| | 2023 | None |
| | | |
| | Adviser and affiliates (includes only fees for non-audit services billed to the adviser and affiliates for engagements that relate directly to the operations and financial reporting of the Registrant and were subject to the pre-approval policies described below): | |
| a) Audit Fees: | | |
| | Not Applicable | |
| | | |
| b) Audit-Related Fees: | | |
| | 2022 | 2,394,000 |
| | 2023 | 1,979,000 |
| | The audit-related fees consist of assurance and related services relating to the examination of the Registrant’s transfer agent, principal underwriter and investment adviser conducted in accordance with Statement on Standards for Attestation Engagements Number 18 issued by the American Institute of Certified Public Accountants. | |
| | | |
| c) Tax Fees: | | |
| | 2022 | 394,000 |
| | 2023 | None |
| | The tax fees consist of consulting services relating to the Registrant’s investments. | |
| | | |
| | | |
| d) All Other Fees: | | |
| | 2022 | None |
| | 2023 | None |
| | The other fees consist of subscription services related to an accounting research tool. | |
| | | |
| | | |
| | All audit and permissible non-audit services that the Registrant’s audit committee considers compatible with maintaining the independent registered public accounting firm’s independence are required to be pre-approved by the committee. The pre-approval requirement will extend to all non-audit services provided to the Registrant, the investment adviser, and any entity controlling, controlled by, or under common control with the investment adviser that provides ongoing services to the Registrant, if the engagement relates directly to the operations and financial reporting of the Registrant. The committee will not delegate its responsibility to pre-approve these services to the investment adviser. The committee may delegate to one or more committee members the authority to review and pre-approve audit and permissible non-audit services. Actions taken under any such delegation will be reported to the full committee at its next meeting. The pre-approval requirement is waived with respect to non-audit services if certain conditions are met. The pre-approval requirement was not waived for any of the non-audit services listed above provided to the Registrant, adviser and affiliates. | |
| | | |
| | Aggregate non-audit fees paid to the Registrant’s auditors, including fees for all services billed to the Registrant, adviser and affiliates that provide ongoing services to the Registrant, were $2,800,000 for fiscal year 2022 and $1,991,000 for fiscal year 2023. The non-audit services represented by these amounts were brought to the attention of the committee and considered to be compatible with maintaining the auditors’ independence. | |
ITEM 5 – Audit Committee of Listed Registrants
Not applicable to this Registrant, insofar as the Registrant is not a listed issuer as defined in Rule 10A-3 under the Securities Exchange Act of 1934.
ITEM 6 – Schedule of Investments
Not applicable, insofar as the schedule is included as part of the report to shareholders filed under Item 1 of this Form.
ITEM 7 – Disclosure of Proxy Voting Policies and Procedures for Closed-End Management Investment Companies
Not applicable to this Registrant, insofar as the Registrant is not a closed-end management investment company.
ITEM 8 – Portfolio Managers of Closed-End Management Investment Companies
Not applicable to this Registrant, insofar as the Registrant is not a closed-end management investment company.
ITEM 9 – Purchases of Equity Securities by Closed-End Management Investment Company and Affiliated Purchasers
Not applicable to this Registrant, insofar as the Registrant is not a closed-end management investment company.
ITEM 10 – Submission of Matters to a Vote of Security Holders
There have been no material changes to the procedures by which shareholders may recommend nominees to the Registrant’s board of trustees since the Registrant last submitted a proxy statement to its shareholders. The procedures are as follows. The Registrant has a nominating and governance committee comprised solely of persons who are not considered ‘‘interested persons’’ of the Registrant within the meaning of the Investment Company Act of 1940, as amended. The committee periodically reviews such issues as the board’s composition, responsibilities, committees, compensation and other relevant issues, and recommends any appropriate changes to the full board of trustees. While the committee normally is able to identify from its own resources an ample number of qualified candidates, it will consider shareholder suggestions of persons to be considered as nominees to fill future vacancies on the board. Such suggestions must be sent in writing to the nominating and governance committee of the Registrant, c/o the Registrant’s Secretary, and must be accompanied by complete biographical and occupational data on the prospective nominee, along with a written consent of the prospective nominee for consideration of his or her name by the nominating and governance committee.
ITEM 11 – Controls and Procedures
| (a) | The Registrant’s Principal Executive Officer and Principal Financial Officer have concluded, based on their evaluation of the Registrant’s disclosure controls and procedures (as such term is defined in Rule 30a-3 under the Investment Company Act of 1940), that such controls and procedures are adequate and reasonably designed to achieve the purposes described in paragraph (c) of such rule. |
| | |
| (b) | There were no changes in the Registrant’s internal controls over financial reporting (as defined in Rule 30a-3(d) under the Investment Company Act of 1940) that occurred during the Registrant’s semi-annual period covered by this report that has materially affected, or is reasonably likely to materially affect, the Registrant’s internal control over financial reporting. |
ITEM 12 – Exhibits
| (a)(1) | The Code of Ethics that is the subject of the disclosure required by Item 2 is attached as an exhibit hereto. |
| | |
| (a)(2) | The certifications required by Rule 30a-2 of the Investment Company Act of 1940 and Sections 302 and 906 of the Sarbanes-Oxley Act of 2002 are attached as exhibits hereto. |
SIGNATURES
Pursuant to the requirements of the Securities Exchange Act of 1934 and the Investment Company Act of 1940, the Registrant has duly caused this report to be signed on its behalf by the undersigned, thereunto duly authorized.
| | AMERICAN FUNDS EMERGING MARKETS BOND FUND |
| | |
| | By __/s/ Kristine M. Nishiyama_____________ |
| | Kristine M. Nishiyama, Principal Executive Officer |
| | |
| | Date: February 29, 2024 |
Pursuant to the requirements of the Securities Exchange Act of 1934 and the Investment Company Act of 1940, this report has been signed below by the following persons on behalf of the Registrant and in the capacities and on the dates indicated.
| By _ /s/ Kristine M. Nishiyama_____________ |
Kristine M. Nishiyama, Principal Executive Officer |
| |
| Date: February 29, 2024 |
| By ___/s/ Becky L. Park__________________ |
Becky L. Park, Treasurer and Principal Financial Officer |
| |
| Date: February 29, 2024 |