Filed Pursuant to Rule 253(g)(2)
File No. 024-10843
FUNDRISE GROWTH EREIT II, LLC
SUPPLEMENT NO. 4 DATED JULY 1, 2020
TO THE OFFERING CIRCULAR DATED MARCH 11, 2020
This document supplements, and should be read in conjunction with, the offering circular of Fundrise Growth eREIT II, LLC (“we”, “our” or “us”), dated March 11, 2020 and filed by us with the Securities and Exchange Commission (the “Commission”) on March 11, 2020 (the “Offering Circular”). Unless otherwise defined in this supplement, capitalized terms used in this supplement shall have the same meanings as set forth in the Offering Circular.
The purpose of this supplement is to disclose:
| · | Our Semi-Annual Net Asset Value (“NAV”) Per Share as of June 30, 2020; |
| · | Historical NAV Information; |
| · | Update to July 2020 Distribution; |
| · | Status of Our Share Redemption Plan; and |
| · | The letter sent to investors on or about July 1, 2020. |
Net Asset Value as of June 30, 2020
As of June 30, 2020, our net asset value (“NAV”) per common share is $10.06. This NAV per common share shall be effective until updated by us on or about December 31, 2020 (or as soon as commercially reasonable thereafter), unless updated by us prior to that time.
Components of NAV
The following sets forth the calculation of NAV for our common shares:
BALANCE SHEETS (UNAUDITED)
| (In thousands, except share and per share amounts) | June 30, 2020 [1] | December 31, 2019 [1] | ||||||
| ASSETS | ||||||||
| Investments, at fair value | $ | 53,398 | $ | 50,520 | ||||
| Real estate properties, at fair value | 16,313 | 16,134 | ||||||
| Loans and debt securities related to real estate (inclusive of accrued interest), at fair value | 6,821 | 6,423 | ||||||
| Other real estate investments, at fair value | 30,264 | 27,963 | ||||||
| Non-real estate-related investments, at fair value | - | - | ||||||
| Cash and cash equivalents | 8,002 | 1,817 | ||||||
| Other assets [4] | 112 | 97 | ||||||
| Total Assets | $ | 61,512 | $ | 52,434 | ||||
| LIABILITIES | ||||||||
| Accounts payable | $ | 107 | $ | 117 | ||||
| Due to related party | 461 | 107 | ||||||
| Note payable | 3,000 | 3,637 | ||||||
| Dividends payable [2] | - | 1,405 | ||||||
| Settling subscriptions | - | 57 | ||||||
| Total Liabilities | $ | 3,568 | $ | 5,323 | ||||
| NET ASSETS CONSIST OF: | ||||||||
| Fundrise Growth eREIT II, LLC Members’ Equity: | ||||||||
| Common shares; 5,761,681 and 4,708,823 shares outstanding, net of offering costs, on June 30, 2020 and December 31, 2019, respectively | $ | 53,853 | $ | 44,475 | ||||
| Retained Earnings (Accumulated deficit) | (1,748 | ) | 836 | |||||
| Net adjustments to fair value | 5,839 | 1,800 | ||||||
| NET ASSETS | $ | 57,944 | $ | 47,111 | ||||
| NET ASSET VALUE PER SHARE, on 5,761,681 and 4,708,823 shares outstanding for the periods ended June 30, 2020 and December 31, 2019, respectively [3] | $ | 10.06 | $ | 10.00 | ||||
[1]Estimated Balance Sheets as of June 30, 2020 and December 31, 2019.
[2]This amount does not include accrual for dividends payable that were declared before June 30, 2020 that relate to the second semi-annual period of 2020 or dividends payable that were declared before December 31, 2019 that relate to the first semi-annual period of 2020, respectively.
[3]The total shares issued and outstanding used in the computation of net asset value per share is the estimated amount of shares immediately prior to the processing of any redemption requests outstanding as June 30, 2020 and December 31, 2019, respectively.
[4]Certain amounts in the prior period’s estimated balance sheet have been reclassified to conform to the current presentation. Amounts on the balance sheets related to our investment in National Lending, LLC have been reclassified from “Other assets” to “Other real estate investments, at fair value”.
On July 1, 2020, the Company announced that its net asset value per share (“NAV”) as of June 30, 2020 is $10.06 per share of our Common Shares. This NAV per common share shall be effective until on or about December 31, 2020 (or as soon as commercially reasonable thereafter), unless updated by us prior to that time.
As described in the section titled “Valuation Policies” of our Offering Circular, our goal is to provide a reasonable estimate of the value of our shares on a periodic, ongoing basis. However, the majority of our assets consist of commercial real estate loans and other commercial real estate assets and, as with any commercial real estate valuation protocol, the conclusions reached by us are based on a number of judgments, assumptions and opinions about future events that may or may not prove to be correct. The use of different judgments, assumptions or opinions would likely result in different estimates of the value of our commercial real estate assets and investments. In addition, for any given period, our published NAV per share may not fully reflect certain material events, to the extent that the financial impact of such events on our portfolio is not immediately quantifiable. As a result, the calculation of our NAV per share may not reflect the precise amount that might be paid for your shares in an arm’s length transaction with an unrelated third party, and any potential disparity in our NAV per share may be in favor of either shareholders who redeem their shares, or shareholders who buy new shares, or existing shareholders. However, to the extent quantifiable, if a material event occurs in between updates of NAV that would cause our NAV per share to change by 5% or more from the last disclosed NAV, we will disclose the updated price and the reason for the change in an offering circular supplement filed on the SEC’s EDGAR website as promptly as reasonably practicable, and will update the NAV information provided on our website.
Our internal accountants calculated our NAV per common share using a process that reflects (1) estimated values of each of our commercial real estate assets and investments, including related liabilities, which may be updated upon the occurrence of certain material events, (2) the price of liquid assets for which third party market quotes are available, (3) accruals of our periodic distributions, and (4) estimated accruals of our operating revenues and expenses. The determination of our NAV is not based on, nor intended to comply with, fair value standards under U.S. Generally Accepted Accounting Principles (“GAAP”), and our NAV may not be indicative of the price that we would receive for our assets at current market conditions.
We generally receive financial and other reporting from our borrowers or unconsolidated subsidiaries on a monthly or quarterly basis, so the estimated values of each of our commercial real estate assets and investments included on each NAV reporting date are generally based on the latest financial and other information reported to us or otherwise available to us, which has been rolled forward through the NAV reporting date for accruals and other items. For investments made within the previous or current reporting period where we have not received our first set of reporting data from our investments, our NAV is generally based on the information we used during our regular underwriting processes and in consideration of other market data available to us. We are not aware of any events that would have a material impact on the estimated values included herein that occurred between the date of the latest information we received with respect to our investments and the NAV reporting date.
Beginning on July 1, 2020 the per share purchase price of our Common Shares will be $10.06 per share, as the per share purchase price shall be the greater of the then-current NAV per common share or $10.00. This price per share shall be effective until the next announcement of price per share by the Company, which is expected to happen within a commercially reasonable time after December 31, 2020, unless updated by us prior to that time. Redemptions of Common Shares shall be made pursuant to our redemption plan based on the then-current NAV per Common Share.
Historical NAV Information
Below is the NAV per common share, as determined in accordance with our valuation policies, for each semi-annual period from December 31, 2018 to June 30, 2020.
| Date | NAV Per Share |
| December 31, 2018 | $10.00 |
| June 30, 2019 | $10.00 |
| December 31, 2019 | $10.00 |
| June 30, 2020 | $10.06 |
Update to July 2020 Distribution
On June 30, 2020, we announced adaily distribution of $0.0004109589 per share (the “July 2020 Daily Distribution Amount”) for shareholders of record as of the close of business on each day of the period commencing on July 1, 2020 and ending on July 31, 2020 (the “July 2020 Distribution Period”). As of July 1, 2020, the July 2020 Daily Distribution Amount equates to approximately 1.49% on an annualized basis calculated at the current rate, assuming a $10.06 per share purchase price.
Share Redemption Plan Status
Effective as of June 30, 2020, our Manager has determined to resume the processing and payment of redemptions under our redemption plan as well as the processing and payment of redemptions under the redemption plans of each of the sponsor’s other programs that had been previously suspended as of March 31, 2020.
Investor Letter sent on or about July 1, 2020
The following letter was sent by our Manager to our shareholders on or about July 1, 2020, and is included as an appendix to the Offering Circular. All references to “we,” “our,” and “us” in the following letter refer to our Sponsor, Rise Companies Corp.
Appendix
First half of 2020 performance analysis
Despite the unprecedented disruption to the economy caused by the COVID-19 pandemic, the Fundrise portfolio has performed well over the first half of the year.
Key takeaways:
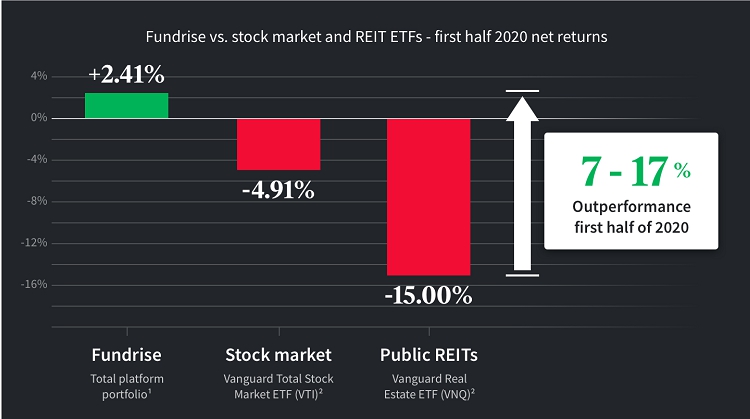
| ● | The Fundrise net platform return for the first six months of 2020 was approximately+2.41%1in comparison to-4.91%2for stocks (VTI) and-15.00%2for public REITs (VNQ). |
1Fundrise platform performance for the first half of 2020 consists of the time-weighted, weighted-average returns of the real estate investing programs sponsored by Rise Companies Corp., and is not representative of the performance of any individual Fundrise investor. Individual investment results may vary depending on the mix of investments owned by any investor on the Fundrise platform. Fundrise platform performance does not include investments in Rise Companies Corp itself (The Fundrise iPO) or the Fundrise Opportunity Fund, the inclusion of either of which could potentially have a negative effect on the total performance of the Fundrise platform. Past performance is not indicative of future results, and all investments may result in total or partial loss. All prospective investors should consult their personal tax and investment advisors before making any investment on the Fundrise platform. All estimated performance figures presented are net of fees and inclusive of dividend reinvestment. For more information, please see our full performance disclosure, as well as the offering circulars available at fundrise.com/oc.
2Performance of the Vanguard Total Stock Market ETF and Vanguard Real Estate ETF for the first half of 2020 specifically refers to the Total return by NAV of each ETF, and was sourced from Yahoo Finance on June 30, 2020.
| ● | This top-line performance is supported by strong fundamentals, with a number of our stabilized properties actually experiencing positive rent growth in spite of the larger economic contraction. |
| ● | We attribute this success primarily to having maintained a disciplined value investment approach, led by our most active strategy of owning and lending to affordable apartment communities in growing cities throughout the Sunbelt. |
| ● | While we believe there is still the potential for hard times ahead, because of the stability exhibited by the broader portfolio over the last six months, we have chosen to resume normal operations of the redemption programs and expect to ramp up new acquisitions through the rest of the year as opportunities present themselves. |
Although we’ve traditionally reserved this kind of in-depth analysis for our year-end review, given the nature of the times, we felt that it was both appropriate and important to share a detailed look at the overall performance of the portfolio through the first half of 2020.
Real estate is (as we like to reiterate) a long-term investment that should be measured in years...not months or days. Though, in certain very rare instances, years or even decades worth of change can seem to occur in a matter of weeks.
Stability in the face of unprecedented volatility
After a start to the year that saw the stock market continuously setting new all-time highs, “normal” life, as we all knew it, came to a crashing halt as the COVID-19 pandemic unleashed a once in a century global health crisis along with the largest and most rapid economic downturn since the Great Depression. Today, in the US alone, more than 125,000 individuals have already lost their lives to the virus, while approximately 30 million more have lost their jobs. Businesses large and small are struggling to figure out how to survive in an environment where the basic paradigms of consumer behavior are for the moment effectively paused with the very real potential that some of these seemingly “temporary” trends become permanent. At the same time, the country is also experiencing a once-in-a-generation social movement where many Americans are calling into question the true values upon which our civil society (and our economy) are built, as they demand greater racial justice and equality.
It is within the context of these pivotal world events that we then take measure of our investment performance over the last six months and continue to be encouraged by the strength and stability of the overall portfolio, particularly in relative comparison to what can only be described as extreme volatility in nearly every other investment class. While it is by no means a surprise to us that the assets overall have maintained their integrity — thestress test we shared in early April outlined the high degree of confidence that we had in being able to withstand a severe economic contraction — there is still nothing more reassuring than seeing actual performance in the face of such unprecedented headwinds.
In short, over the first six months of the year, Fundrise net platform returns have averaged approximately+2.41%in comparison to-4.91% for the Vanguard Total Stock Market ETF (VTI) and-15.00%for the Vanguard Real Estate ETF (VNQ).
However, this single measure of performance alone is arguably insufficient in understanding the truly differentiated nature of our returns during this time period. Since the onset of the coronavirus in the US, public stocks have experienced one of their most volatile periods in history, with the Dow plunging 37% from February 12 to March 25, then recovering 48% to its most recent peak on June 8 — to now be down for the year -9.8%. Meanwhile, Fundrise net platform returns were up approximately 1.15% for the first quarter and approximately 1.26% for the second quarter. During the first half of the year, we paid out an average dividend equivalent to a 3.63% annualized yield.Note that this is not necessarily representative of any one individual investor’s account, which islikely to vary depending on a variety of factors, including primary investment objective (i.e. income vs. growth) and age of the investments.

The public market liquidity crisis
Investors are always told not to react to sharp swings in the market, but as human beings, we have evolved a strong urge to cut our losses and run when the odds seem insurmountable. This survival mechanism usually serves us well, but when it comes to keeping one’s finger off the “sell” button in the face of double-digit losses, it’s often easier said than done. Perhaps it's unsurprising then that the market saw record outflows from both stocks and bonds during March, as investors fled for the safety of cash and government treasuries. The downside of course being that those investors who did sell off a substantial portion of their portfolios likely wiped out several years’ worth of gains, only to then miss the subsequent record-breaking comeback.
Liquidity is, of course, valuable when there’s a genuine need for it (e.g., to buy a home or to retire), but when emotions are running high, it can be a dangerous temptation that leads to painful losses.
In contrast to publicly traded stocks or ETFs, the inherent illiquidity of private real estate investments — with a far more limited pool of buyers and a due diligence process that typically takes weeks if not months before a transaction occurs — can act as an effective shield against the value destruction caused by panic selling.
It’s apparent that at the end of March, when the US was scarcely one month into the crisis and the facts (though alarming) were still very much unknown, selling a commercial building at the 35 – 40% discount needed to find a buyer would have been a poorly informed and unwise investment decision. Yet in the public markets, many investors did precisely that, effectively forcing the sale of the underlying assets in which they were invested at eye-watering losses.
Driven by the innate human desire to take action,however inadvisable, this behavior occurred across markets in March as investors dumped stocks, mutual funds, and ETFs of all kinds, creating a liquidity crisis that affected even those assets that would typically be considered the safest, such as US treasuries.
Ultimately, were it not for the Federal Reserve taking the extraordinary step to drop interest rates to 0% on the evening of Sunday, March 16, and then announce that it intended to purchase up to $700 billion of assets, it’s unclear how severe or catastrophic the near-term liquidity crisis may have become.
Safeguarding our investor community
As all of our investors are of course aware, it was shortly after this time that we chose tosuspend the redemption programs to ensure that we were able to maintain sufficient cash reserves, as well as have the time necessary to determine how the effects of the pandemic might play out both within the portfolio and more broadly in the economy. Coupled with the modest leverage we had employed across the entirety of the portfolio, this decision meant that during a highly uncertain period, where panic selling was creating genuine concerns about liquidity in all markets,we were never at risk of having to consider selling any assets.
In addition, we also made the choice to reduce dividends over the second quarter based on the belief that rental income would decrease at most properties. In nearly every asset type, whether it be retail, office, or multifamily, tenants were quickly expressing concerns about their ability to pay their rents and we concluded that holding back more cash would prove valuable both in terms of allowing us to be flexible landlords in the midst of a health crisis where millions of people were losing jobs, and also as an additional buffer to cover any operating shortfalls should they arise.
Together with the decision to suspend redemptions, these actions created what we believed was the closest thing to a fortress for our investors, positioning us to withstand the worst potential outcome that we could imagine.
An in-depth look at property level performance
As detailed in ourstress test, more than 80% of the current Fundrise portfolio is invested in residential real estate assets (either as equity or debt), with approximately 50% of the entire portfolio held as equity or preferred equity investments in stabilized apartment properties.
Equity investments

These assets, which serve as the foundation of the portfolio, have proven (as we had anticipated) to be resilient in the face of such challenging circumstances. Our confidence in this asset type is driven by the belief that even in periods of economic distress where people are forced to cut back on discretionary spending, they still need a safe place to live, which creates a baseline level of demand, particularly for well-located and reasonably-priced apartments, something we’ve shared often in other discussions of our investment strategy.
This core thesis, into which we’ve invested over the past five years, has proven itself out yet again over the past few months, as both occupancy and rental income have more or less maintained themselves across the whole portfolio (with only a couple exceptions). In fact, despite the extent of the negative impact caused by the pandemic, on average,we’ve actually seen demand for our apartment properties increase during this time, driving continued growth in rental income, as more and more individuals choose to move to Sunbelt cities like Orlando, Jacksonville, Tampa, Charlotte, Dallas, or Nashville.
| Stabilized properties | May 2019 | May 2020 |
| Occupancy3 | 95.1% | 93.9% |
| Delinquencies4 | 1.5% | 5.0% |
| Rent growth5 | +3.9% | +2.4% |
While it’s true that apartments generally have fared better than most other assets through this period, the Fundrise portfolio has actually performed better than many of the large publicly traded apartment REITs in several key areas. Rent collections for example, one of the primary measures of health at an apartment property, were approximately 93.9% at April and May month-end, ahead of the industry average of 93.3%6 reported by NAREIT, and close to the 94.6%7 reported by Equity Residential (NYSE: EQR), often considered to be a “blue chip” public apartment REIT8.
Additionally, unlike many public REITs, whose portfolios are concentrated in high-end apartments in gateway cities such as New York, Chicago, Boston, and San Francisco, our focus has almost exclusively been on reasonably-priced apartments in high-growth cities, from the Southeast through Texas to Los Angeles.
As a result, whereas the largest apartment REITs are now seeing rents falling as young knowledge workers decamp from these high-density, high-cost central business districts (-5.7% in San Francisco and -3.6% in Boston from March to June, according to CoStar),we’ve seen rent growth across the portfolio with the ten apartment communities purchased in 2019 achieving average rent growth (as measured by gross property income or GPR) of 5.88% from January through May 2020. This average is inclusive of the hardest-hit asset in the portfolio: theClass-A Las Vegas apartments acquired at the end of 2019.
3Month-end physical occupancy reported for 23 properties for May 2020, 13 owned properties with data available for May 2019.
4Late rent as percentage of gross potential rent (“GPR”) reported for 23 properties for May 2020, 8 properties with data available for May 2019.
5Rent growth is based on percentage increase in reported gross potential rent (“GPR”) for the 3-month average March, April, May for all joint venture assets (10) owned since the start of 2018. Of note, properties purchased in 2019 feature measurably higher rent growth, but comparable data for 2018 and 2019 were not available given the timing of acquisition.
6“Updated REIT Industry April Rent Collections”,nareit.com, May 4, 2020
7“Equity Residential in Line For 1Q FFO But Delinquencies Rise to 5.4%”,morningstar.com, May 5, 2020
8Based on its membership in the S&P 500 and maintenance of an investment-grade credit rating
Fixed-income real estate investments

Preferred structure investments
The preferred equity investments that make up about 25% of the total portfolio (approximately $300 million across 48 properties) have seen some of the best returns of the entire real estate industry. As a reminder, these debt-like structured investments are generally senior to 15 – 25% of common equity, and so benefit from the contractually required 9 – 12% interest rates being largely insulated from external economic shocks to property operations.At an average investment basis of $140,000 per unit, our portfolio of preferred equity investments in apartments is at a 25% to 50% discount to comparable public REIT NAVs9 (in other words we’re effectively investing at 25-50% less for a materially similar asset). This ability to earn a relatively high return for a relatively low risk has not gone unnoticed, and of late, preferred equity has become the darling of institutional investors seeking new ways to deploy their capital. We expect that competition in this space will heat up over the next several months, making it more challenging to find new deals.
9Compare with Mid-America Apartment Communities (NYSE:MAA) at $190,000 per unit, and Camden Property Trust (NYSE:CPT) at $260,000 per unit. Source: Green Street Advisors “Residential Sector Update”, published May 28, 2020
Senior construction or bridge loans
Of the remainder of the portfolio, close to 15% is senior debt, again, the large majority of which is tied to residential assets and senior to 15 - 25% of common equity. All but three of our 31 loans are currently performing and paying their quarterly interest payments on time. Of the three loans currently in default (representing 7.7% of the total senior debt portfolio), in each case, we’ve taken proactive steps to ensure that our position is well protected and we feel confident that we will end up recovering the principal invested.
Looking at the portfolio holistically
When looking at the portfolio in its entirety, of the limited instances (less than 4% total) where we have seen a material decline in asset performance (as defined by a change in property value of more than 5%), nearly all can be attributed to either the asset itself being a hotel (oursingle investment in a hotel, fortunately, is structured as preferred equity) or the location being within a market that is primarily hospitality-driven. In these few instances, we do expect that the heavy reliance on hospitality will hinder overall performance in the short-term but still remain optimistic about the fundamental return prospects of these investments based upon both the relatively affordable basis at which we are invested and the long-term growth potential in the market once more normal operations are able to commence.
While we would all enjoy investing in a world without downturns or economic distress, we do not believe it’s realistic to make investments that are completely immune from any short-term challenges. So rather than deluding ourselves into chasing that which does not exist (carefree returns),we instead work to build a portfolio that can function as a resilient and self-sufficient ecosystem, capable of surviving even the darkest periods and succeeding over the long-term.
To this point, of the 16 different funds that reportednet asset value (NAV) this quarter (which together constitute approximately 92% of the total portfolio value) all but two produced either neutral or positive change in NAV, and only a single fund (the Heartland eREIT) experiencing negative returns driven by the assets it holds, owing to it having the greatest exposure to the Las Vegas market. Despite the 30% unemployment in Las Vegas, the fund overall still only saw a net asset value change of -1.9%.
Understanding valuations and their impact on performance
As a reminder, the NAV is an estimated valuation of all the assets in our eREITs and eFunds and generally occurs on either a quarterly or semi-annual basis. As we’ve discussed previously, such valuation methodology, although based upon actual historical performance and broadly available market projections, is ultimately an estimate of value. Therefore, any single quarter’s valuation is inherently representative of arange of values within which the asset is likely to fall.
It’s worthwhile to point out that because these valuations are based upon actual operations over the previous three to six month period, to a certain extent they are backward-looking. In other words, the second quarter NAV valuations are taking into consideration the effect that the pandemic has actually had on operations at each property from the end of March through June. This is then paired with our viewpoint as to what may occur at each property over the next few months and years, along with data projections from various third-party sources.
We also feel it’s important to highlight how this methodology for determining value compares to the stock market, which we would argue (at least in the short term) tends to be intrinsically driven by investor sentiment with pricing based more on momentum than what is actually occurring in the real economy (seeHertz). As a result, whereas the stock market may swing wildly as sentiment changes, our valuation approach tends to be (by design) less prone to such volatility.

Ultimately, we believe that our investors are better served by this approach of taking conservative assumptions and not over-extrapolating what may end up being only short-term fluctuations in the assets (either positive or negative). While it may make monthly or quarterly returns less “exciting” than seeing 30%+ swings in value over 90 days, it should reward those investors who are genuinely intending to invest for the long-term.
Looking ahead
We feel fortunate that some of our “worst possible outcome” scenarios from the pandemic, at least in regards to the economic fallout, have largely been avoidedthus far. This is not intended to downplay the hardships that so many people have already experienced or will experience going forward. Rather, it’s an acknowledgment that regardless of one’s personal opinions on the federal government’s response to the economic crisis,we believe that the near term effect of all the stimulus measures has been to calm markets; reducing fears about a lack of liquidity and creating an effective floor on asset prices.
Thankfully, we have not needed to draw on our cash reserves thus far, as the portfolio has not only maintained strong operations but has actually seen positive growth, both in terms of rental income as well as new dollars flowing in from our investor base. This does not change our view on the necessity of the protective measures we put into place, though. We will happily err on the side of being habitually over-prepared rather than risk losing a property due to being caught off-guard even one time.
This also does not mean that we do not expect there to be additional periods of difficulty. As any of our more seasoned investors are now well aware, we try to live by the advice of legendary value investors like Warren Buffett or Seth Klarman, perhaps best paraphrased by the words“Take care of the downside, and the upside will take care of itself.” And given how broadly and deeply this pandemic has disrupted our lives in such a short period of time, we have a hard time believing that someextended and unpredictable consequences will not manifest themselves in the coming months or years ahead.
Still, we feel confident in the current position of the portfolio and accordinglyhave chosen to resume normal operations of the redemption programs (across all eREITs and eFunds) effective immediately, including processing all outstanding redemption requests in the eREITs and eFunds that were on hold, with funds expected to be distributed over the next two to three business days. We are also exploring ways to continue to improve economies of scale and minimize operating costs, including a potential merger of theNational andLos Angeles eFunds (we expect to have more updates on the eFunds over the next 60 days).
As discussed previously, we believe that the number of attractive opportunities for new investment will only continue to increase going forward, with the obvious caveat that the future is unpredictable and, as always, we can make no guarantees. However, if the economy can continue to improve on its current trajectory and the country can minimize the number of additional waves of the virus that are large enough to necessitate additional sweeping shutdowns, much of the recent positive momentum (which we were hesitant to incorporate into the forward-looking assumptions in the latest NAV updates) is likely to result in further value gains for the portfolio. (It’s also worth noting thatper IRS regulations, our eREITs are required to distribute at least 90% of their taxable income each year, meaning that even though we’ve been conservative in our dividend declarations up to this point, to the extent that we have not met that 90% threshold as a result of holding back dividends, we may “catch up” on income distributions towards the end of the year.)
Regardless, as the public markets seem destined to further disconnect from reality, we believe that (to an even greater extent than usual) the best opportunities to invest at good value will exist for those investors who are both able to access the private markets and have had the patience and discipline to maintain strong defensive positions and the large cash reserves needed to capitalize on opportunities quickly. Together, we are well situated to do exactly that.
Onward,
The Fundrise Team
P.S. —As always, we want to hear from you. Please take a moment to share your thoughts using thequick feedback form, or email us atinvestments@fundrise.com. (Specifically, if you have questions for CEO Ben Miller about anything in this letter or other recent letters, please let us know and we’ll select a few of the most common questions for him to answer as part of a follow-up over the next few weeks.)