UNITED STATES
SECURITIES AND EXCHANGE COMMISSION
Washington, D.C. 20549
FORM 1-K
ANNUAL REPORT
ANNUAL REPORT PURSUANT TO REGULATION A OF THESECURITIES ACT OF 1933
For the fiscal year ended December 31, 2016
FUNDRISE MIDLAND OPPORTUNISTIC REIT, LLC
(Exact name of registrant as specified in its charter)
Commission File Number: 024-10567
| Delaware | 32-0479856 | |
| (State or other jurisdiction of incorporation or organization) | (I.R.S. Employer Identification No.) | |
1601 Connecticut Ave., NW, Suite 300 Washington, DC | 20009 (Zip Code) |
(202) 584-0550
Registrant’s telephone number, including area code
Common Shares
(Title of each class of securities issued pursuant to Regulation A)
TABLE OF CONTENTS
| 2 |
Part II.
STATEMENTS REGARDING FORWARD-LOOKING INFORMATION
We make statements in this Annual Report on Form 1-K (“Annual Report”) that are forward-looking statements within the meaning of the federal securities laws. The words “believe,” “estimate,” “expect,” “anticipate,” “intend,” “plan,” “seek,” “may,” and similar expressions or statements regarding future periods are intended to identify forward-looking statements. These forward-looking statements involve known and unknown risks, uncertainties and other important factors that could cause our actual results, performance or achievements, or industry results, to differ materially from any predictions of future results, performance or achievements that we express or imply in this Annual Report or in the information incorporated by reference into this Annual Report.
The forward-looking statements included in this Annual Report are based upon our current expectations, plans, estimates, assumptions and beliefs that involve numerous risks and uncertainties. Assumptions relating to the foregoing involve judgments with respect to, among other things, future economic, competitive and market conditions and future business decisions, all of which are difficult or impossible to predict accurately and many of which are beyond our control. Although we believe that the expectations reflected in such forward-looking statements are based on reasonable assumptions, our actual results and performance could differ materially from those set forth in the forward-looking statements. Factors which could have a material adverse effect on our operations and future prospects include, but are not limited to:
| • | our ability to effectively deploy the proceeds raised in our initial public offering (the “Offering”); |
| • | our ability to attract and retain members to our sponsor’s online crowdfunding platform (the “Fundrise Platform”); |
| • | risks associated with breaches of our data security; |
| • | changes in economic conditions generally and the real estate and securities markets specifically; |
| • | limited ability to dispose of assets because of the relative illiquidity of real estate investments; |
| • | intense competition in the real estate market that may limit our ability to attract or retain tenants or re-lease space; |
| • | defaults on or non-renewal of leases by tenants; |
| • | increased interest rates and operating costs; |
| • | our failure to obtain necessary outside financing; |
| • | decreased rental rates or increased vacancy rates; |
| • | the risk associated with potential breach or expiration of a ground lease, if any; |
| • | difficulties in identifying properties to complete, and consummating, real estate acquisitions, developments, joint ventures and dispositions; |
| • | our failure to successfully operate acquired properties and operations; |
| • | exposure to liability relating to environmental and health and safety matters; |
| 3 |
| • | changes in real estate and zoning laws and increases in real property tax rates; |
| • | our failure to maintain our status as a REIT; |
| • | failure of acquisitions to yield anticipated results; |
| • | risks associated with breaches of our data security; |
| • | risks associated with derivatives or hedging activity; |
| • | our level of debt and the terms and limitations imposed on us by our debt agreements; |
| • | the need to invest additional equity in connection with debt refinancings as a result of reduced asset values; |
| • | our ability to retain our executive officers and other key personnel of our advisor, our property manager and their affiliates; |
| • | expected rates of return provided to investors; |
| • | the ability of our sponsor and its affiliates to source, originate and service our loans and other assets, and the quality and performance of these assets; |
| • | our ability to retain and hire competent employees and appropriately staff our operations; |
| • | legislative or regulatory changes impacting our business or our assets (including changes to the laws governing the taxation of real estate investment trusts (“REITs”) and the Securities and Exchange Commission (“SEC”) guidance related to Regulation A or the JOBS Act); |
| • | changes in business conditions and the market value of our assets, including changes in interest rates, prepayment risk, operator or borrower defaults or bankruptcy, and generally the increased risk of loss if our investments fail to perform as expected; |
| • | our ability to implement effective conflicts of interest policies and procedures among the various real estate investment opportunities sponsored by our sponsor; |
| • | our ability to access sources of liquidity when we have the need to fund redemptions of common shares in excess of the proceeds from the sales of our common shares in our continuous offering and the consequential risk that we may not have the resources to satisfy redemption requests; |
| • | our failure to maintain our status as a REIT; |
| • | our compliance with applicable local, state and federal laws, including the Investment Advisers Act of 1940, as amended (the “Advisers Act”), the Investment Company Act and other laws; and |
| • | changes to generally accepted accounting principles, or GAAP. |
| 4 |
Any of the assumptions underlying forward-looking statements could be inaccurate. You are cautioned not to place undue reliance on any forward-looking statements included in this Annual Report. All forward-looking statements are made as of the date of this Annual Report and the risk that actual results will differ materially from the expectations expressed in this Annual Report will increase with the passage of time. Except as otherwise required by the federal securities laws, we undertake no obligation to publicly update or revise any forward-looking statements after the date of this Annual Report, whether as a result of new information, future events, changed circumstances or any other reason. In light of the significant uncertainties inherent in the forward-looking statements included in this Annual Report, including, without limitation, the risks described under “Risk Factors,” the inclusion of such forward-looking statements should not be regarded as a representation by us or any other person that the objectives and plans set forth in this Annual Report will be achieved.
| 5 |

FUNDRISE MIDLAND OPPORTUNISTIC REIT, LLC
(the “Heartland eREITTM”)
| Item 1. | Business |
The Company
Fundrise Midland Opportunistic REIT, LLC is a Delaware limited liability company formed on November 19, 2015 to originate, invest in and manage a diversified portfolio primarily consisting of investments in multifamily rental properties and development projects located primarily in the Houston, TX, Dallas, TX, Austin, TX, Chicago, IL, and Denver, CO metropolitan statistical areas (“MSAs”), with such investments consisting of equity interests in such properties or debt, as well as commercial real estate debt securities and other select real estate-related assets, where the underlying assets primarily consist of such properties. We define development projects to include a range of activities from major renovation and lease-up of existing buildings to ground up construction. With demand stoked by demographic trends and supply constrained by economic forces, our Manager believes that Texas, Chicago and Denver multifamily rental units have displayed strong performance and are expected to be well positioned to see continued low vacancies and healthy rent growth moving forward. While we intend to primarily invest in multifamily rental properties and development projects located in the Houston, TX, Dallas, TX, Austin, TX, Chicago, IL, and Denver, CO MSAs, we may invest in other asset classes as well as other locations, depending on the availability of suitable investment opportunities. We may also invest in commercial real estate-related debt securities (including commercial mortgage-backed securities, or CMBS, collateralized debt obligations, or CDOs, and REIT senior unsecured debt) and other real estate-related assets. We may make our investments through majority-owned subsidiaries, some of which may have rights to receive preferred economic returns. The use of the terms “Fundrise Midland Opportunistic REIT”, the “Company”, “we”, “us” or “our” in this Annual Report refer to Fundrise Midland Opportunistic REIT, LLC unless the context indicates otherwise.
We have elected to be taxed as a REIT under the Internal Revenue Code of 1986, as amended (“the Code”), commencing with our taxable year ending December 31, 2016. As of April 1, 2017 and December 31, 2016, our portfolio was comprised of $4,175,000 and $1,000,000 worth of controlled subsidiaries, respectively, that in the opinion of our Manager, meets our investment objectives. SeeItem 2,“Management’s Discussion and Analysis of Financial Condition and Results of Operations - Recent Developments” for information concerning our investments since December 31, 2016. We will seek to create and maintain a portfolio of multifamily rental properties and development project investments that generate a low volatility income stream of attractive and consistent cash distributions. Our focus on investing in debt and equity instruments will emphasize the payment of current returns to investors and preservation of invested capital as our primary investment objectives, as well as emphasizing capital appreciation from our investments, as is typically the case with strategies focused exclusively on opportunistic or equity oriented investments.
Fundrise Advisors, LLC, our Manager, manages our day-to-day operations. Our Manager is an investment adviser registered with the SEC and a wholly-owned subsidiary of our sponsor. A team of real estate and debt finance professionals, acting through our Manager, makes all the decisions regarding the selection, negotiation, financing and disposition of our investments, subject to the limitations in our operating agreement. Our Manager also provides asset management, marketing, investor relations and other administrative services on our behalf with the goal of maximizing our operating cash flow and preserving our invested capital. Rise Companies Corp., our sponsor, is able to exercise significant control over our business.
| 6 |
We have offered, are offering, and will continue to offer up to $50,000,000 in our common shares, which represent limited liability company interests in our company (the “Offering”). SeeItem 2, “Management’s Discussion and Analysis of Financial Condition and Results of Operations – Overview” for more information concerning the current status of the Offering.
We expect to offer common shares in our Offering until we raise the maximum amount being offered, unless terminated by our Manager at an earlier time. Until December 31, 2017, the per share purchase price for our common shares will be $10.00 per share, an amount that was arbitrarily determined by our Manager. Thereafter, the per share purchase price will be adjusted every fiscal quarter and, as of January 1st, April 1st, July 1st and October 1st of each year (or as soon as commercially reasonable and announced by us thereafter), will equal the greater of (i) $10.00 per share or (ii) the sum of our net asset value, or NAV, divided by the number of our common shares outstanding as of the end of the prior fiscal quarter (NAV per share). Although we do not intend to list our common shares for trading on a stock exchange or other trading market, we have adopted a redemption plan designed to provide our shareholders with limited liquidity on a quarterly basis for their investment in our shares.
Investment Strategy
We originate, acquire, asset manage, operate, selectively leverage, syndicate and opportunistically sell multifamily rental properties and development projects through the acquisition of equity interests in such properties or debt (including senior mortgage loans, subordinated mortgage loans (also referred to as B Notes), mezzanine loans, and participations in such loans), as well as commercial real estate debt securities and other real estate-related assets, where the underlying assets primarily consist of such properties. Our management has extensive experience investing in numerous types of properties. While we focus our investments primarily in multifamily rental properties and development projects, in the event that appropriate investment opportunities are not available, we may acquire a wide variety of commercial properties, including office, industrial, retail, recreation and leisure, single-tenant residential and other real properties. These properties may be existing, income-producing properties, newly constructed properties or properties under development or construction and may include multifamily rental properties purchased for conversion into condominiums and single-tenant properties that may be converted for multifamily use. We focus on acquiring properties with significant possibilities for capital appreciation, such as those requiring development, redevelopment or repositioning, those located in markets with high growth potential and those available from sellers who are distressed or face time-sensitive deadlines. We also may invest in real estate-related securities, including securities issued by other real estate companies, either for investment or in change of control transactions completed on a negotiated basis or otherwise, and in bridge and mezzanine loans that may lead to an opportunity to purchase a real estate interest. In addition, to the extent that our Manager and its investment committee determines that it is advantageous, we also may make or invest in commercial mortgage-backed securities, mortgage loans and Code Section 1031 tenant-in-common interests. Our portfolio of debt investments is secured primarily by U.S. based collateral, primarily multifamily rental properties and development projects, and diversified by security type.
We seek to create and maintain a portfolio of multifamily rental properties and development project investments that generate a low volatility income stream of attractive and consistent cash distributions. Our focus on investing in debt and equity instruments emphasizes the payment of current returns to investors and preservation of invested capital as our primary investment objectives, as well as emphasizing capital appreciation from our investments, as is typically the case with strategies focused exclusively on opportunistic or equity-oriented investments.
| 7 |
For debt investments, our Manager directly structures, underwrites and originates many of the debt products in which we invest, as doing so provides for the best opportunity to control our borrower and partner relationships and optimize the terms of our investments. Our proven underwriting process, which our management team has successfully developed over their extensive real estate careers in a variety of market conditions and implemented at our sponsor, involves comprehensive financial, structural, operational and legal due diligence of our borrowers and partners in order to optimize pricing and structuring and mitigate risk. We feel the current and future market environment for multifamily rental properties and development projects (including any existing or future government-sponsored programs) provides a wide range of opportunities to generate compelling investments with strong risk-return profiles for our shareholders.
Investment Objectives
Our primary investment objectives are:
| · | to realize growth in the value of our investment within approximately five years of the termination of our Offering; |
| · | to grow net cash from operations so that an increasing amount of cash flow is available for distributions to investors over the long term; |
| · | to pay attractive and consistent cash distributions; |
| · | to enable investors to realize a return on their investment by beginning the process of liquidating and distributing cash to investors within approximately five years of the termination of our Offering, or providing liquidity through alternative means such as in-kind distributions of our own securities or other assets; and |
| · | to preserve, protect and return shareholders’ capital contributions. |
We also seek to realize growth in the value of our investments by timing their sale to maximize value. There can be no assurance that we will be able to achieve these objectives.
Competition
Our net income depends, in large part, on our ability to source, acquire and manage investments with attractive risk-adjusted yields. We compete with many other entities engaged in real estate investment activities, including individuals, corporations, bank and insurance company investment accounts, other REITs, private real estate funds, and other entities engaged in real estate investment activities as well as online lending platforms that compete with the Fundrise Platform, many of which have greater financial resources and lower costs of capital available to them than we have. In addition, there are numerous REITs with asset acquisition objectives similar to ours, and others may be organized in the future, which may increase competition for the investments suitable for us. Competitive variables include market presence and visibility, amount of capital to be invested per project and underwriting standards. To the extent that a competitor is willing to risk larger amounts of capital in a particular transaction or to employ more liberal underwriting standards when evaluating potential investments than we are, our investment volume and profit margins for our investment portfolio could be impacted. Our competitors may also be willing to accept lower returns on their investments and may succeed in buying the assets that we have targeted for acquisition. Although we believe that we are well positioned to compete effectively in each facet of our business, there is enormous competition in our market sector and there can be no assurance that we will compete effectively or that we will not encounter increased competition in the future that could limit our ability to conduct our business effectively.
| 8 |
Risk Factors
We face risks and uncertainties that could affect us and our business as well as the real estate industry generally. These risks are outlined under the heading “Risk Factors” contained in our Offering Circular dated September 30, 2016 and filed with the SEC on October 5, 2016, as supplemented, (the “Offering Circular”) which may be accessedhere, as the same may be updated from time to time by our future filings under Regulation A. In addition, new risks may emerge at any time and we cannot predict such risks or estimate the extent to which they may affect our financial performance. These risks could result in a decrease in the value of our common shares.
| 9 |
| Item 2. | Management’s Discussion and Analysis of Financial Condition and Results of Operations |
Overview
Fundrise Midland Opportunistic REIT, LLC is a newly organized Delaware limited liability company formed tooriginate, invest in and manage a diversified portfolio primarily consisting of investments in multifamily rental properties and development projects located primarily in the Houston, TX, Dallas, TX, Austin, TX, Chicago, IL, and Denver, CO metropolitan statistical areas (“MSAs”), with such investments consisting of equity interests in such properties or debt, as well as commercial real estate debt securities and other select real estate-related assets, where the underlying assets primarily consist of such properties. We are externally managed by Fundrise Advisors, LLC, or our Manager, which is an investment adviser registered with the Securities and Exchange Commission, or SEC, and a wholly-owned subsidiary of our sponsor, Rise Companies Corp., the parent company of Fundrise, LLC, our affiliate. Fundrise, LLC owns and operates an online investment platform www.fundrise.com. On October 25, 2016, we commenced operations upon our satisfying the $1 million minimum offering requirement (not including the $100,000 received in the private placements to our sponsor and Fundrise, LP).
We have offered, are offering, and will continue to offer up to $50,000,000 in our common shares in our Offering. As of April 1, 2017 and December 31, 2016, we had raised total gross offering proceeds of approximately $10.6 million and $5.5 million, respectively, from settled subscriptions (including the $100,000 received in the private placements to our sponsor, Rise Companies Corp., and Fundrise, LP, an affiliate of our sponsor), and had settled subscriptions in our Offering and private placements for an aggregate of approximately 1,057,000, and 550,000, respectively, of our common shares. Assuming the settlement for all subscriptions received as of April 1, 2017, approximately 3,943,000 of our common shares remained available for sale to the public under our Offering.
To mitigate the effect of our lack of assets, revenue and operating history, our Manager agreed, for a period until December 31, 2016 (the “fee waiver period”), to waive its asset management fee during the fee waiver period if the average annualized non-compounded return to investors is less than eight percent (8%). Following the conclusion of the fee waiver period, our Manager may, in its sole discretion, waive its asset management fee, in whole or in part. The Manager will forfeit any portion of the asset management fee that is waived. As of April 1, 2017, our Manager has not waived the asset management fee since the end of the fee waiver period. For more information regarding the fee waiver support of our common shares, please see “Description of Our Common Shares – Distributions” in our Offering Circularhere.
We have operated in a manner intended to qualify as a REIT for federal income tax purposes beginning with the year ended December 31, 2016.
Our Investments
During the year ended December 31, 2016, we entered into the following investments. SeeItem 2, “Management’s Discussion and Analysis of Financial Condition and Results of Operations – Recent Developments” below for a description of investments we have made since December 31, 2016.
| Investment Type | Date | Description | ||
| Acquisitions of Controlled Subsidiaries | 11/11/16 | Acquired ownership of a “majority-owned subsidiary”, Waypoint Austin Falcon Owner, LLC (the “Waypoint Austin Controlled Subsidiary”), in which we have the right to receive a preferred economic return, which is managed by Waypoint Residential LLC, in an assumption agreement in which no proceeds were transferred currently but with a deferred equity commitment of $3,000,000. The initial proceeds are anticipated to be used for the construction of a 324-unit, class-A multifamily project located at |
| 10 |
| the intersection of Intersection of Colorado Sands Rd. and E. Pflugerville Parkway in Pflugerville, TX. More information on the Waypoint Austin Controlled Subsidiary acquisition can be foundhere. | ||||
| 12/6/16 | Acquired ownership of a “majority-owned subsidiary”, VCM Aviator Apartment Homes, LP (the “Aviator Controlled Subsidiary”), in which we have the right to receive a preferred economic return for a purchase price of $1,000,000, which is the initial stated value of our equity interest in the Aviator Controlled Subsidiary. The Aviator Controlled Subsidiary used the proceeds to acquire a stabilized, 147-unit garden-style multifamily property, Aviator Apartments, located at 1670 North Murray Blvd., Colorado Springs, CO 80915. More information on the Aviator Controlled Subsidiary acquisition can be foundhere. | |||
| 12/30/16 | Acquired ownership of a “majority-owned subsidiary”, Waypoint Antonio Westover Owner, LLC (the “RSE Waypoint San Antonio Controlled Subsidiary”), in which we have the right to receive a preferred economic return, in which no proceeds were transferred currently but with a deferred equity commitment of $7,025,000. The initial proceeds are anticipated to be used for the construction of a 278-unit, class-A multifamily property, La Escala, located at the corner of Military Drive and North Ellison Way, San Antonio, TX. More information on the RSE Waypoint San Antonio Controlled Subsidiary acquisition can be foundhere. |
Distributions
While we are under no obligation to do so, we have in the past and expect in the future to declare and pay distributions quarterly in arrears; however, our Manager may declare other periodic distributions as circumstances dictate. In order that investors may generally begin receiving distributions immediately upon our acceptance of their subscription, we expect to authorize and declare distributions based on daily record dates.
On December 31, 2016, we declared our first distribution to shareholders of record as of the close of business on each day of the period commencing on December 1, 2016 and ending on December 31, 2016. Our Manager has declared daily distributions for shareholders of record as of the close of business on each day from December 1, 2016 through June 30, 2017. The distributions are payable to shareholders of record as of the close of business on each day of the distribution period. The below chart details the distributions that we have declared since we commenced operations:
| Distribution Period | Daily Distribution Amount/Common Share | Date of Declaration | Payment Date (1) | Annualized Yield (2) | ||||||||||||
| 01/01/17 – 03/31/17 | 0.0022602740 | 12/31/16 | 4/21/17 | 8.25 | % | |||||||||||
| 04/01/17 – 06/30/17 | 0.0021917808 | 03/21/17 | 7/21/17 | 8.00 | % | |||||||||||
| Weighted Average (01/01/17 through 06/30/17) | 0.0022258382 | (3) | - | - | 8.12 | %(4) | ||||||||||
(1) Dates presented are the dates on which the distributions were, or are, scheduled to be distributed; actual distribution dates may vary.
(2) Annualized yield numbers represent the annualized yield amount of each distribution calculated on an annualized basis at the then current rate, assuming a $10.00 per share purchase price. While the Manager is under no obligation to do so, each annualized basis return assumes that the Manager would declare distributions in the future similar to
| 11 |
the distributions for each period presented, and there can be no assurance that the Manager will declare such distributions in the future or, if declared, that such distributions would be of a similar amount.
(3) Weighted average daily distribution amount per common share is calculated as the average of the daily declared distribution amounts from January 1, 2017 through June 30, 2017.
(4) Weighted average annualized yield is calculated as the annualized yield of the average daily distribution amount for the periods presented, assuming a $10.00 per share purchase price.While the Manager is under no obligation to do so, the average annualized basis return assumes that the Manager would declare distributions in the future similar to the average distributions for the period from January 1, 2017 through June 30, 2017, and there can be no assurance that the Manager will declare such distributions in the future or, if declared, that such distributions would be of a similar amount.
Redemption Plan
We have adopted a redemption plan whereby, on a quarterly basis, a shareholder may obtain liquidity as described in detail in our Offering Circular, which may be accessedhere, Our Manager may in its sole discretion, amend, suspend, or terminate the redemption plan at any time, including to protect our operations and our non-redeemed shareholders, to prevent an undue burden on our liquidity, to preserve our status as a REIT, following any material decrease in our NAV, or for any other reason.
As of December 31, 2016, 15,250 common shares have been submitted for redemption through our redemption plan and 100% of such redemption requests have been honored.
| 12 |
Sources of Operating Revenues and Cash Flows
We generate revenues from net interest income on our commercial real estate debt and unconsolidated joint ventures. Our income is primarily derived through the difference between revenue and the cost at which we are able to finance our investments. We may also seek to acquire investments which generate attractive returns without any leverage.
Outlook and Recent Trends
We believe that the near and intermediate-term market for investment in select Texas, Chicago and Denver commercial real estate properties, joint venture equity investments, and other real estate-related assets is compelling from a risk-return perspective, particularly with regard to multifamily rental units. While we intend to focus on the Texas, Chicago, IL and Denver, CO real estate markets, we may also invest in other real estate markets, particularly those located outside of the east and west coasts of the United States.
For purposes of this Annual Report, when discussing Texas, we are primarily referring to the Houston, Dallas, and Austin metropolitan statistical areas (“MSAs”), and when discussing Chicago and Denver, we are primarily referring to the Chicago, IL and Denver, CO MSAs. Our investment strategy is weighted toward senior debt, mezzanine debt and preferred equity that maximize current income, and equity investments with significant potential value creation but below the radar of institutional-sized investors. This strategy is based on the area’s stable economy, filled with pockets of high growth, coupled with housing supply constraints.
We pursue a variety of tactics to identify multifamily investment opportunities including: (i) acquiring value-add and lease-up properties; (ii) acquiring assets that require repositioning or redevelopment; (iii) investing in ground-up new development projects; and (iv) providing mezzanine debt and recapitalization equity capital for existing transactions.
We believe that our investment strategy, combined with both our unique web-based origination platform and the experience and expertise of our Manager’s team, provides opportunities to originate investments with attractive current and accrued returns, long-term equity returns and strong structural features with local real estate companies. This strategy expects to take advantage of changing market conditions to achieve favorable risk adjusted returns.
Texas Market Overview and Opportunity
Texas’s multifamily rental market is benefitting from demographic changes, improved job growth, and strong economic dynamics in the State. Low cost construction and permanent financing along with a favorable cap-interest rate spread provide a modest margin of safety for asset valuations. Although employment growth was strong after the sector, particular attention should be paid to the struggling oil market.
| 13 |
Key statistics, as of December 2015, provided by the Bureau of Labor Statistics are set forth below:
Key Statistics | Houston | Dallas | Austin | Texas | US | |||||||||||||||
| Population | 2,239,558 | 1,281,047 | 912,791 | 27,469,114 | 318,900,000 | |||||||||||||||
| Pop. Growth Since 2000 | 1.0 | % | 0.6 | % | 2.8 | % | 2.3 | % | 0.9 | % | ||||||||||
| Number of Employed | 2,925,000 | 3,272,700 | 914,200 | 11,550,200 | 139,023,000 | |||||||||||||||
| Unemployment Rate | 4.5 | % | 4.0 | % | 3.3 | % | 4.5 | % | 5.3 | % | ||||||||||
| Job Growth (Y-O-Y) | 0.8 | % | 3.3 | % | 4.0 | % | 1.6 | % | 2.0 | % | ||||||||||
| Three Yr. Avg. Employment Growth | 2.6 | % | 3.5 | % | 4.0 | % | 2.6 | % | 1.9 | % | ||||||||||
As shown in the table above, Texas only lost 4% of its employment base in the recent recession compared to 6% in the United States, and it recovered all of its jobs by August 2011, whereas it took until March 2014 for the United States to recover all jobs lost. This started Texas on a fast recovery that has fed multifamily fundamentals. Population and employment growth has driven the Texas recovery. Employment is growing due to low corporate taxes, and affordable housing make the state an attractive place to relocate.
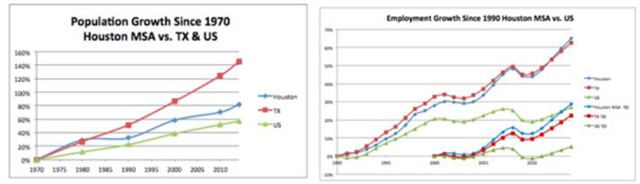
Houston
With nearly three million people, relaxed zoning restrictions and affordable construction, Houston continues to be a popular city for real estate developments. Houston saw 3.4% average employment growth from 2011-2014 when many of the multifamily projects that are now delivering were planned and began construction. Because of oil prices that are lower than they have been since 2002, the energy sector is slowing significantly, which we believe will have major effects on the Houston economy, and is believed to have already caused 2015 employment growth to slow to 0.8%.
| Nov ’15 Nonfarm | % of | US % of | US 3 Yr Avg. | |||||||||||||||||
| Houston MSA Employment Breakdown | Employment | Total | 3 Yr Avg. Increase | Total | Increase | |||||||||||||||
| Trade, Transportation, and Utilities | 612.6 | 63.5 | % | 2.1 | % | 18.9 | % | 1.8 | % | |||||||||||
| Professional and Business Services | 471.5 | 48.8 | % | 2.4 | % | 14.0 | % | 3.3 | % | |||||||||||
| Education and Health Services | 375.7 | 38.9 | % | 4.0 | % | 15.5 | % | 2.2 | % | |||||||||||
| Government | 394.4 | 40.9 | % | 2.1 | % | 15.3 | % | 0.1 | % | |||||||||||
| Leisure and Hospitality | 308.8 | 32.0 | % | 6.4 | % | 10.8 | % | 3.4 | % | |||||||||||
| Financial Activities | 144.9 | 15.0 | % | 0.2 | % | 5.7 | % | 1.5 | % | |||||||||||
| Manufacturing | 240.5 | 24.9 | % | -0.8 | % | 8.7 | % | 1.0 | % | |||||||||||
| Other Services | 34 | 3.5 | % | 2.9 | % | 3.9 | % | 1.2 | % | |||||||||||
| Information | 321.2 | 33.3 | % | -1.4 | % | 2.0 | % | 1.3 | % | |||||||||||
| Mining and Logging | 3007.3 | 311.5 | % | 7.1 | % | 5.2 | % | 3.4 | % | |||||||||||
| Total Nonfarm | 965 | 2.6 | % | 1.9 | % | |||||||||||||||
Numbers reported in 1,000’s
Source: BLS (not seasonally adjusted)
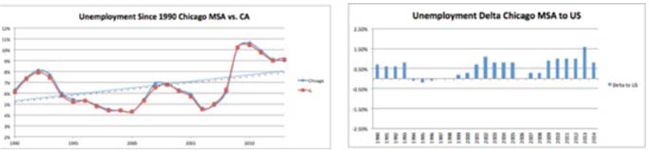
Like other Texas cities, Houston has seen employment growth above the growth experienced by United States as a whole, while having roughly equivalent population growth rates, leading to the unemployment rate being below that of the United States at the end of 2015. It is important to note that this trend is not stable, and we believe this instability may present opportunity.
| 14 |
Source: BLS
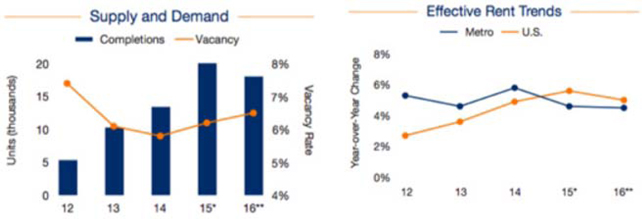
According to Marcus and Millichap’s 2016 Market Forecast, they predict relatively flat rent growth with increasing multifamily vacancy. As of November 2015 the Houston market had absorbed 13,144 units, down from 14,760 units over the same period in 2014, but still significantly higher than the historical average of 9,940 units.
We plan to focus on either Class B/C apartments that are insulated from oversupply, or select submarkets for new developments with either a growth story or an insulated position in the capital stack.
Source: Marcus & Millichap
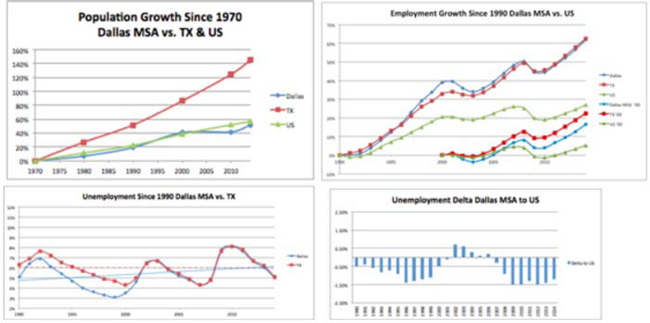
Dallas
As Marcus & Millichap points out in its 2016 Market Forecast, Dallas/Fort Worth’s vigorous job formation and economic diversity have been the dynamic force behind Dallas/Fort Worth’s growth, and they are expected to play a major role in the apartment market’s continued progression this year. Job creation in many high-paying industries is driving demand for the thousands of luxury Class A apartments coming to market. Despite the delivery of more than 20,000 rentals last year, builders should continue developing and are expected to complete an additional 23,000 units over the next four quarters in an attempt to keep pace with demand. As new Class A rentals come to market, demand is expected to be satiated and some softening will likely occur in this asset class. In contrast, demand for Class B/C housing is expected to rise as the Dallas MSA’s employment base continues to diversify amid strong hiring in retail, restaurants, hotels and the transportation industry. As a result, conditions are expected to remain tight for properties in this segment, spurring record rent growth in the months to come.
| 15 |
| Nov ’15 Nonfarm | % of | US % of | US 3 Yr Avg. | |||||||||||||||||
| Dallas MSA Employment Breakdown | Employment | Total | 3 Yr Avg. Increase | Total | Increase | |||||||||||||||
| Trade, Transportation, and Utilities | 731.3 | 21.2 | % | 3.7 | % | 18.9 | % | 1.8 | % | |||||||||||
| Professional and Business Services | 576.4 | 16.7 | % | 5.3 | % | 14.0 | % | 3.3 | % | |||||||||||
| Education and Health Services | 431.9 | 12.6 | % | 4.5 | % | 15.5 | % | 2.2 | % | |||||||||||
| Government | 419.3 | 12.2 | % | 2.0 | % | 15.3 | % | 0.1 | % | |||||||||||
| Leisure and Hospitality | 359 | 10.4 | % | 5.6 | % | 10.8 | % | 3.4 | % | |||||||||||
| Financial Activities | 277.9 | 8.1 | % | 3.0 | % | 5.7 | % | 1.5 | % | |||||||||||
| Manufacturing | 257.8 | 7.5 | % | -0.7 | % | 8.7 | % | 1.0 | % | |||||||||||
| Other Services | 118.9 | 3.4 | % | 2.3 | % | 3.9 | % | 1.2 | % | |||||||||||
| Information | 82.4 | 2.4 | % | 0.9 | % | 2.0 | % | 1.3 | % | |||||||||||
| Mining and Logging | 193.7 | 5.6 | % | 3.8 | % | 5.2 | % | 3.4 | % | |||||||||||
| Total Nonfarm | 3,451 | 3.5 | % | 1.9 | % | |||||||||||||||
Numbers reported in 1,000’s
Source: BLS (not seasonally adjusted)
Dallas’s employment growth, which generally has matched Texas as a whole, has been a leading driver behind its growth. Like other Texas markets, Dallas sees strong growth in high paying job sectors, specifically Professional and Business Services, Leisure and Hospitality and Education and Health Services. Although Dallas’s employment growth has exceeded that of the United States, population growth since 1970 has not, leading to an unemployment rate that is typically lower than the US.
Employment in Dallas/Fort Worth has pushed well above pre-recession levels and a consistent pace of growth appears to be emerging. Following the addition of 82,000 workers in 2015, it is expected that companies will generate 78,000 positions this year, increasing payrolls 2.3 percent.
Source: BLS
Due to the significant Class A supply that is expected to continue this year, effective rents are falling, meaning particular attention must be paid to underwriting standards and overall basis.
| 16 |
Source: Marcus & Millichap
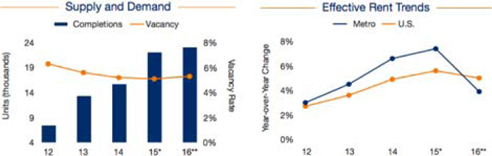
Austin
Marcus and Millichap predicts in their 2016 Forecast steadily rising home prices and a growing population base is expected to facilitate strong demand for apartments in Austin in 2016. It is expected that more than 60,000 individuals will move to the metro in 2016, supporting the creation of 23,000 households in the area. With single-family and multifamily construction expected to slow during the next 12 months, the need for affordable-housing options for these new residents will rise. The median single-family home price surpassed $250,000, making Austin the most expensive housing market in the state. Though median household income justifies housing affordability in some parts of the Austin MSA, homes in urban areas near popular employment and cultural districts are well out of range for many would-be homeowners. As a result, demand for apartments in these areas remains intense, with conditions tightening below 3 percent in select submarkets. Rent growth should remain robust this year, climbing faster than the national average for the sixth consecutive year, as vacancy constricts further.
| Nov ’15 Nonfarm | % of | US % of | US 3 Yr Avg. | |||||||||||||||||
| Austin MSA Employment Breakdown | Employment | Total | 3 Yr Avg. Increase | Total | Increase | |||||||||||||||
| Trade, Transportation, and Utilities | 167.7 | 17.4 | % | 3.6 | % | 18.9 | % | 1.8 | % | |||||||||||
| Professional and Business Services | 163.9 | 17.0 | % | 7.7 | % | 14.0 | % | 3.3 | % | |||||||||||
| Education and Health Services | 111.1 | 11.5 | % | 3.8 | % | 15.5 | % | 2.2 | % | |||||||||||
| Government | 174.8 | 18.1 | % | 0.8 | % | 15.3 | % | 0.1 | % | |||||||||||
| Leisure and Hospitality | 115.7 | 12.0 | % | 6.0 | % | 10.8 | % | 3.4 | % | |||||||||||
| Financial Activities | 54.3 | 5.6 | % | 4.3 | % | 5.7 | % | 1.5 | % | |||||||||||
| Manufacturing | 56.8 | 5.9 | % | 0.2 | % | 8.7 | % | 1.0 | % | |||||||||||
| Other Services | 41.2 | 4.3 | % | 3.9 | % | 3.9 | % | 1.2 | % | |||||||||||
| Information | 26.4 | 2.7 | % | 3.6 | % | 2.0 | % | 1.3 | % | |||||||||||
| Mining and Lagging | 53.5 | 5.5 | % | 6.9 | % | 5.2 | % | 3.4 | % | |||||||||||
| Total Nonfarm | 965 | 4.0 | % | 1.9 | % | |||||||||||||||
Numbers reported in 1,000’s
Source: BLS (not seasonally adjusted)
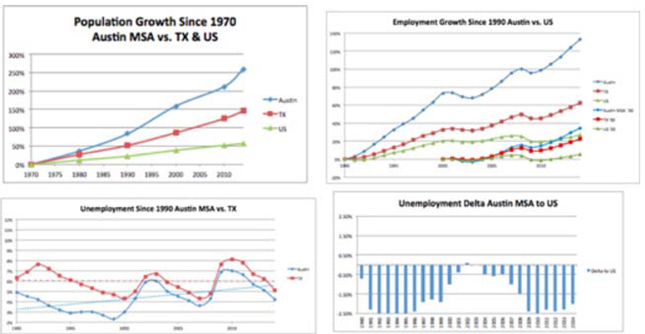
From 2012 – 2015 Austin has seen tremendous growth in high paying job sectors, supporting high population growth and a demand for new housing units. As can be seen below, employment and population growth in Austin are both well above both the United States and Texas as a whole, and area unemployment is consistently below the national level.
| 17 |
Source: BLS
Austin is becoming known for its culture, outdoors and technology scenes, and we believe it should continue to attract the nation’s best and brightest individuals, affording strong absorption across many real estate asset types. Our hope is to remain competitive in this market in the sub-institutional size range, as the market fundamentals should cause a high appetite for most large deals from institutional players.
Marcus and Millichap reported in their 2016 Forecast the construction pipeline thinning. After builders delivered more than 12,000 units in each of the last two years, deliveries are expected to fall to 9,000 in 2016. Vacancy is expected to decrease slightly, while effective rent growth is predicted to slow to a more moderate 5.4% (down from 7.3% in 2015)
Source: Marcus & Millichap
Chicago and Denver Market Overview and Opportunity
Key population and employment statistics provided by the Bureau of Labor Statistics and set forth below:
| 18 |
| Key Statistics | Chicago | Denver | US | |||||||||
| Population | 9,554,598 | 2,754,258 | 318,900,000 | |||||||||
| Pop. Growth Since 2000 | 0.4 | % | 2.0 | % | 0.9 | % | ||||||
| Number of Employed | 4,580,000 | 1,392,200 | 139,023 | |||||||||
| Unemployment Rate | 4.9 | % | 3.2 | % | 5.5 | % | ||||||
| Job Growth (Y-O-Y) | 1.0 | % | 2.3 | % | 1.9 | % | ||||||
| Three Yr. Avg. Employment Growth | 1.3 | % | 3.4 | % | 1.9 | % | ||||||
Chicago MSA
The Chicago, Naperville, Elgin, IL-IN-WI Metropolitan Statistical Area area includes Cook, DeKalb, DuPage, Grundy, Kane, Kendall, McHenry, Will, Jasper, Lake, Newton, Porter and Kenosha Counties (collectively, the “Chicago MSA”). We plan to evaluate individual opportunities in the Chicago MSA taking the below factors into consideration:
1. The Chicago MSA is the third largest MSA in the United States, and the economic center of the Midwest.
Chicago is a popular headquarters site for national and international companies seeking a relatively low-cost, central US location for operations. Fortune Magazine reported that Illinois housed 31 headquarters of Fortune 500 companies. According to World Business Chicago, there are over 400 major corporations headquartered in the Chicago area. Site Selection magazine awarded the Chicago MSA the distinction of being the nation’s top metropolitan area in terms of corporate investment, with 385 expansion or relocation projects recorded in 2014.
In addition to a strong corporate presence, Chicago is the nation’s second-most important financial center and the world leader in commodities trading. Chicago is the national leader in stock options trading, currency trading, currency futures, and interest rate futures. Trading of these commodities is done at three Chicago-based exchanges: the Chicago Board Options Exchange, the Chicago Stock Exchange, and the Chicago Mercantile Exchange Group. Crain’s Chicago Business reported Chicago’s tech-related jobs increased 26% from 2010 to 2013, outpacing Silicon Valley’s 21% increase and, nationwide, lagging behind only Houston.
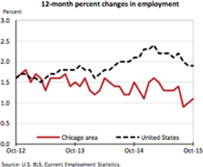
Like the nation, the Chicago MSA has charted a measured economic recovery over the past few quarters. However, Chicago’s recovery has not matched the employment growth of the United States as a whole. While some improvement has been observed, the regional housing market recovery remains relatively weak and employment growth remains below average. Economic forecasts call for the region to continue to improve at a modest pace over the next few quarters. Over the long term, however, economic forecasts indicate that the region should continue to grow, as the Chicago metropolitan area has made a successful transition from a manufacturing- to a service-based economy over the past two decades. However, the state's massive debts and underfunded pension programs are of particular concern as the city’s financial situation is in question.
As the epicenter of the Midwest, we expect Chicago to benefit from a continued national urbanization shift, attracting some of the nation’s best and brightest individuals. These individuals are attracted by world class universities, low cost of living and a good pace of life. Large corporations are acknowledging the urbanization shift, with the likes of Motorola and Kraft Heinz moving their headquarters in from the suburbs to the heart of the city.
| 19 |
2. The Chicago for-sale housing market still has room to grow, and prices are well below their pre-recession 2007 peak.
Major inland cities (including Dallas, Houston, and Chicago) all lag both the US and coastal cities in regards to home price appreciation.
Home values in the greater Chicago MSA are relatively inexpensive, compared to rents. This is partially driven by the majority of rentals being focused in the core city, while average home values pull from a wider area. Home values are still well below their 2007 peak, a trend that is likely to continue because of Chicago’s recent property tax increase, which seeks to address public employee unfunded pension liability, which is discussed in greater detail below.
The Marcus and Millichap graph below from the fourth quarter 2015 suggests an uptick in home prices.

Source: Marcus & Millichap
As reported by Curbed, a real estate publication, in November 2015, demand for new single-family homes and condos has been high in the Chicago area as inventory remains low. With the new rental market becoming increasingly saturated, more developers are looking to build new single-family homes, townhouses and condos, which could provide an opportunity for the Company to participate.
3. Chicago’s Financial Stability is in question
Large unfunded pensions caused Chicago’s ratings on outstanding municipal debt to be lowered to junk status by Moody’s in May 2015. Chicago’s multiple public employee pension systems have approximately $111 billion in unfunded liabilities. In October 2015 the Chicago City Council voted in favor of a budget that will include an unprecedented property tax hike of $589 million to help fund Chicago’s police and fire department pensions. North Chicago real estate is predicted to be hit the hardest by the increase as a result of increasing property values, with people questioning if the increase will hurt renters the most by forcing people in these hot rental neighborhoods
| 20 |
(including the West Loop, South Loop, Wicker Park, Logan Square, Humboldt Park and Avondale) to rent longer before being able to afford a home.

4. With multifamily supply growing in Chicago, it is unclear if absorption will be able to keep up in the face of low population and employment growth.
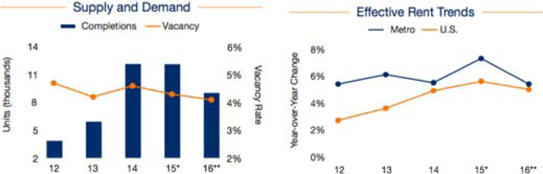
Developers are expected to remain active in Chicago with Marcus and Millichap counting 6,800 apartments under construction in Chicago, with more than 20,000 additional units proposed and in Chicago’s entitlement pipeline. During 2015, approximately 3,700 new apartments are expected to be brought into service in Chicago, a 2.2% rise in inventory, the largest delivery in 15 years. The Streeterville/River North submarket is expected to realize nearly 70% of the total. Strong tenant demand is expected to move vacancy down to 3.6% from 4.3% during 2015. During this period, many new luxury buildings are expected to push up the average effective rent 8.3% to approximately $1,672 per month. Chicago’s ability to absorb the 2015 deliveries may provide optimism for the future supply wave.
Approximately 13,000 multifamily rental units have been completed since 2012. Since the beginning of 2006, more than 48,000 new condo units were completed and almost 12,000 apartments have converted to condo units, resulting in a potential large supply of shadow rental inventory.
Chicago’s zoning committee recently approved a new measure to expand the radius where transit-oriented development can be built from 600 feet to 1,320 feet from a transit station. The constraint of providing one parking space per residential unit will be lifted allowing developers to construct denser projects in major commercial and residential corridors. With the flexibility to build, a spike in multifamily construction may occur as potential development sites are being purchased by apartment developers.
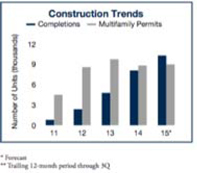
The following chart sets forth housing units completed in Chicago and its suburbs over the past five years.
| 21 |
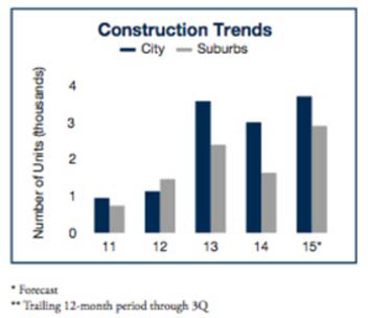
Source: Marcus & Millichap
Vacancies are currently believed to be at a cyclical low. However, the new supply hitting the market may have an effect. Across the entire market, vacancies are expected to rise slightly and rent growth is expected to moderate. Despite budgetary woes, Chicago’s educational facilities and cultural amenities are expected to continue attracting the Midwest’s best and brightest. With the exception of the urban core, apartment fundamentals have shown progress indicating that the metro area should be able to accommodate the moderate amount of planned rental inventory additions to satisfy its expected near-term demand.
The chart below shows vacancy and asking rent changes over the past 10 years as reported by Fannie Mae.

| 22 |
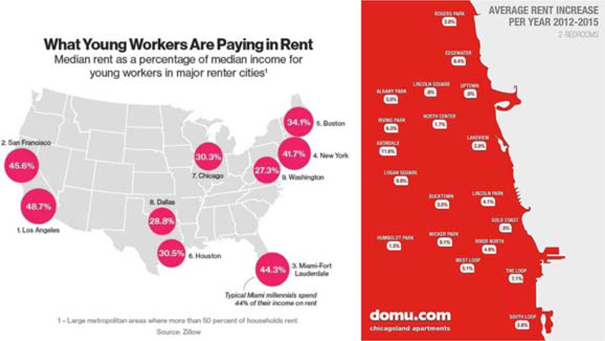
With workers paying the third lowest percent of their income on rent of the below listed 10 major cities, there may be room for renters to pay more for apartments in Chicago. Although Chicago has not seen a rent boom, it has shown steady gains in the face of large supply. However, it is unclear how long these gains will remain with continued supply and below average population and employment gains.
Strong rent growth (greater than 7% annually since 2012) has occurred in both select core and secondary Chicago in-fill locations.
After completing 3,101 units downtown in 2015—a record—developers are on track to finish about 3,500 in 2016 and another 4,500 in 2017, according to Appraisal Research, a Chicago-based consulting firm. Appraisal Research predicts absorption to be approximately 2,500 units per year, well below the 4,000 per year of supply. This should cause vacancies to increase. Downside analysis for multifamily development should either incorporate higher vacancy or lower rents than are currently present in the market, which could make it difficult to complete a high volume of transactions.
ApartmentList.com Same-Store Rental Increase July 2015
| City | Avg Price – 1 Bed | YY Change – 1 Bed | Avg Price – 2 Bed | YY Change – 2 Bed | ||||||||||||
| San Francisco, CA | $ | 3,350 | 3.70 | % | $ | 4,750 | 4.10 | % | ||||||||
| New York, NY | $ | 2,600 | 1.00 | % | $ | 3,390 | 0.80 | % | ||||||||
| Miami, FL | $ | 2,050 | 4.80 | % | $ | 2,730 | 9.30 | % | ||||||||
| San Jose, CA | $ | 2,050 | 9.30 | % | $ | 2,590 | 6.30 | % | ||||||||
| Boston, MA | $ | 2,050 | -1.20 | % | $ | 2,500 | -1.40 | % | ||||||||
| Washington, DC | $ | 1,980 | -2.40 | % | $ | 2,880 | -4.30 | % | ||||||||
| Los Angeles, CA | $ | 1,520 | 6.60 | % | $ | 2,110 | 3.40 | % | ||||||||
| Seattle, WA | $ | 1,500 | 6.60 | % | $ | 2,100 | 8.50 | % | ||||||||
| San Diego, CA | $ | 1,450 | 6.00 | % | $ | 1,900 | 5.70 | % | ||||||||
| Chicago, IL | $ | 1,330 | 2.40 | % | $ | 1,610 | 0.10 | % | ||||||||
| Average | $ | 1,988 | 3.68 | % | $ | 2,656 | 3.25 | % | ||||||||
| 23 |

Source: Appraisal Research Counselors
5. Chicago has seen below average population and employment growth over the past three years, causing concern for the overall health of the real estate market.
Cook Country contains approximately 55% of the Chicago MSA’s total population. The county realized a slight population decline from 2000 to 2015 due to migration from the city into the suburbs and collar counties, but very modest population growth is projected through 2020.
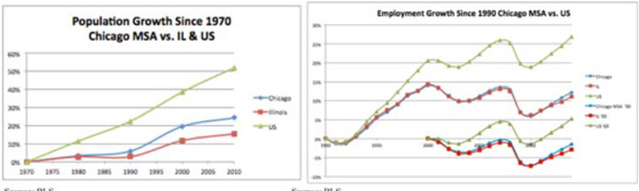
Population and employment in both Chicago and Illinois has significantly lagged the United States.
| Percent of total employment | Mean hourly wage | |||||||||||||||||||
| Major occupational group | United States | Chicago | United States | Chicago | Percent difference (1) | |||||||||||||||
| Total, all occupations | 100.0 | % | 100.0 | % | $ | 22.71 | $ | 24.48 | * | 8 | ||||||||||
| Management | 5.0 | 6.6 | * | 54.08 | 53.84 | 0 | ||||||||||||||
| Business and financial operations | 5.1 | 5.7 | * | 35.97 | * | 3 | ||||||||||||||
| Computer and mathematical | 2.8 | 3.3 | * | 40.37 | 38.67 | * | -4 | |||||||||||||
| Architecture and engineering | 1.8 | 1.4 | * | 39.19 | 37.48 | * | -4 | |||||||||||||
| Life, physical, and social science | 0.8 | 0.5 | * | 33.69 | 33.77 | 0 | ||||||||||||||
| Community and social services | 1.4 | 1.3 | * | 21.79 | 23.63 | * | 8 | |||||||||||||
| Legal | 0.8 | 1.0 | * | 48.61 | 48.07 | -1 | ||||||||||||||
| Education, training, and library | 6.2 | 6.7 | * | 25.10 | 26.92 | * | 7 | |||||||||||||
| Arts, design, entertainment, sports, and media | 1.3 | 1.3 | 26.82 | 28.10 | 5 | |||||||||||||||
| Healthcare practitioners and technical | 5.8 | 5.4 | * | 36.54 | 36.40 | 0 | ||||||||||||||
| Healthcare support | 2.9 | 2.8 | 13.86 | 13.90 | 0 | |||||||||||||||
| Protective service | 2.4 | 2.7 | * | 21.14 | 23.58 | 12 | ||||||||||||||
| Food preparation and serving related | 9.1 | 7.9 | * | 10.57 | 10.67 | 1 | ||||||||||||||
| Building and grounds cleaning and maintenance | 3.2 | 3.1 | 12.68 | 13.89 | * | 10 | ||||||||||||||
| Personal care and service | 3.1 | 2.9 | * | 12.01 | 12.83 | * | 7 | |||||||||||||
| Sales and related | 10.5 | 10.6 | 18.59 | 21.10 | * | 14 | ||||||||||||||
| Office and administrative support | 16.0 | 15.5 | * | 17.08 | 18.16 | * | 6 | |||||||||||||
| Farming, fishing, and forestry | 0.3 | 0.1 | * | 12.09 | 15.01 | * | 24 | |||||||||||||
| Construction and extraction | 3.9 | 2.8 | * | 22.40 | 31.88 | * | 42 | |||||||||||||
| Installation, maintenance, and repair | 3.9 | 3.0 | * | 21.74 | 24.03 | * | 11 | |||||||||||||
| Production | 6.6 | 7.0 | * | 17.06 | 16.82 | -1 | ||||||||||||||
| Transportation and material moving | 6.8 | 8.3 | * | 16.57 | 17.26 | 4 | ||||||||||||||
| 24 |
Footnotes:
(1) A positive percent difference measures how much the mean wage in Chicago is above the national mean wage, while a negative difference reflects a lower
* The percent share of employment or mean hourly wage for this area is significantly different from the national average of all areas at the 90-percent confidence level.
Source: BLS
Compared to other major metros, Chicago’s 8% wage differential to the United States is relatively anemic, while cost of living in the city is the fourth highest in the nation (behind New York, San Francisco and Washington, DC). Virtually all employment sectors have lagged the United States’ growth over the past 3 years, leading to an average growth rate that is 32% less than the nation. Chicago’s Professional and Business Services sector makes up 18% of the workforce 28.5% more than its national share, and has matched the United States’ 3.3% growth. A large part of the employment growth has been driven by technology hiring in the urban core, which is helpful for the absorption of Class A multifamily developments.
During the past four quarters, the highest growth was recorded in the professional and business services and health services sectors with the creation of 14,400 and 10,300 positions, respectively. Trade, transportation and utilities followed with 9,800 jobs generated.
Similar to other Midwest MSAs, Chicago’s manufacturing base has declined. Currently, manufacturing jobs comprise 8.8 percent of the job base, just under the national average. However, Chicago has been able to diversify its job base: 18 percent of jobs are in the well-paying professional and business services sector compared to just 14 percent for the U.S. In addition, 15 percent of jobs are in the fairly stable education and healthcare sectors, which is in line with the national rate. Chicago still faces possible headwinds, however. It is expected to have only half of the national rate of population growth through 2020. In addition, unresolved state and local budget problems, which are among the nation’s most severe, may subdue growth, leaving it slightly below the national average for the U.S. Nevertheless, as a regional center, the Chicago MSA is expected to still attract young, well-educated professionals. On an absolute basis, the Chicago MSA is expected to add approximately 290,000 jobs through 2019.
| Sep ‘15 Nonfarm | % of | US % of | US 3 Yr Avg. | |||||||||||||||||
| Chicago MSA Employment Breakdown | Employment | Total | 3 Yr Avg. Increase | Total | Increase | |||||||||||||||
| Trade, Transportation and Utilities | 917.8 | 20.0 | % | 1.2 | % | 18.9 | % | 1.8 | % | |||||||||||
| Professional and Business Services | 826.1 | 18.0 | % | 3.3 | % | 14.0 | % | 3.3 | % | |||||||||||
| Education and Health Services | 695.4 | 15.2 | % | 1.6 | % | 15.5 | % | 2.2 | % | |||||||||||
| Government | 552.7 | 12.1 | % | 0.1 | % | 15.3 | % | 0.1 | % | |||||||||||
| Leisure and Hospitality | 446.4 | 9.7 | % | 1.8 | % | 10.8 | % | 3.4 | % | |||||||||||
| Financial Activities | 288 | 6.3 | % | 0.0 | % | 5.7 | % | 1.5 | % | |||||||||||
| Manufacturing | 406.6 | 8.9 | % | -0.4 | % | 8.7 | % | 1.0 | % | |||||||||||
| Construction | 170.8 | 3.7 | % | 2.6 | % | 4.6 | % | 4.1 | % | |||||||||||
| Other Services | 194.9 | 4.3 | % | 0.9 | % | 3.9 | % | 1.2 | % | |||||||||||
| Information | 79.8 | 1.7 | % | -0.4 | % | 2.0 | % | 1.3 | % | |||||||||||
| Mining and Logging | 1.5 | 0.0 | % | 0.0 | % | 0.6 | % | -2.3 | % | |||||||||||
| Total Nonfarm | 4,580 | 1.3 | % | 1.9 | % | |||||||||||||||
| 25 |
Numbers reported in 1,000’s
Source: BLS (not seasonally adjusted)
Denver MSA
The Denver-Aurora-Lakewood, Colorado Metropolitan Statistical area includes Adams, Arapahoe, Broomfield, Denver, Douglas and Jefferson Counties (collectively, the “Denver MSA”). We believe that the Denver MSA provides a strong investment environment as a result of the following factors:
1. High employment and population growth will continue to be the leading contributors to the tight housing market in the Denver MSA.
The following chart, prepared in 2015 by Lang LaSalle, shows why Denver has increased in popularity among multifamily institutional investors. Strong population and employment growth are directly correlated to the need for more housing units.

Denver, and Colorado as a whole, has experienced robust population growth, well outpacing the United States. Population growth since 2000 has averaged 2% per year, double the rate of US growth. As can be seen below in charts prepared by the Bureau of Labor Statistics, both Colorado’s and Denver’s populations are approximately 125% higher than they were in 1970.
| 26 |
Strong job opportunities have attracted new residents to the Denver MSA. The total population increased by 51,200 people in 2015. This 1.7 percent increase was achieved through a natural increase (births less deaths) of 20,300 people and net migration (people moving in less people moving out) of 30,900 people. About 60 percent of the Denver MSA population growth has been due to net migration in recent years, a higher percentage than most other western US employment centers.

Source: BLS
Related to Denver’s construction boom, the Mining, Logging and Construction sector of Denver’s economy has seen an average increase of 12.1% annually over the past three years. This, combined with a 5.4% average increase in Education and Health Services and a 3.6% increase in Leisure and Hospitality have been major contributors to the 3.4% three year average employment increase, which is 78% greater than the strong increase seen in the United States as a whole. Both Denver and Colorado have recovered all jobs lost in the recession considerably faster than the United States.
| Sep ‘15 Nonfarm | % of | US % of | ||||||||||||||||
| Denver MSA Employment Breakdown | Employment | Total | 3 Yr Avg. Increase | Total | US 3 Yr Avg. Increase | |||||||||||||
| Trade, Transportation, and Utilities | 253.2 | 18.2 | % | 1.9 | % | 18.9 | % | 1.8% | ||||||||||
| Professional and Business Services | 246.3 | 17.7 | % | 2.5 | % | 14.0 | % | 3.3% | ||||||||||
| Education ana Health Services | 177.7 | 12.8 | % | 5.4 | % | 15.5 | % | 2.2% | ||||||||||
| Government | 195.8 | 14.1 | % | 3.0 | % | 15.3 | % | 0.1% | ||||||||||
| Leisure and Hospitality | 154.5 | 11.1 | % | 3.6 | % | 10.8 | % | 3.4% | ||||||||||
| Financial Activities | 96.6 | 7.1 | % | 1.9 | % | 5.7 | % | 1.5% | ||||||||||
| Manufacturing | 67.2 | 4.8 | % | 2.2 | % | 8.7 | % | 1.0% | ||||||||||
| Mining, Logging, and Construction | 101.5 | 7.3 | % | 12.1 | % | 5.2 | % | 3.4% | ||||||||||
| Other Services | 55.5 | 4.0 | % | 4.2 | % | 3.9 | % | 1.2% | ||||||||||
| Information | 41.9 | 3.0 | % | -1.2 | % | 2.0 | % | 1.3% | ||||||||||
| Total Nonfarm | 1,392 | 3.4 | % | 1.9% | ||||||||||||||
Numbers reported in 1,000's
Source: BLS (not seasonally adjusted)
Table A. Occupational employment and wages by major occupational group, United States and the Denver-Aurora-Bromfield Metropolitan Statistical Area, and measures of statistical significance, May 2013
| 27 |
| Percent of total employment | Mean hourly wage | |||||||||||||||||||
| Major occupational group | United States | Denver | United States | Denver | Percent difference (1) | |||||||||||||||
| Total, all occupations | 100.0 | % | 100.0 | % | $ | 22.33 | $ | 25.05 | * | 12 | ||||||||||
| Management | 4.9 | 4.7 | * | 53.15 | 59.62 | * | 12 | |||||||||||||
| Business and financial operations | 5.0 | 8.2 | * | 34.14 | 35.68 | * | 5 | |||||||||||||
| Computer and mathematical | 2.8 | 4.6 | * | 39.43 | 41.26 | * | 5 | |||||||||||||
| Architecture and engineering | 1.8 | 2.5 | * | 38.51 | 41.84 | * | 9 | |||||||||||||
| Life, physical, and social science | 0.9 | 1.1 | * | 33.37 | 34.74 | 4 | ||||||||||||||
| Community and social services | 1.4 | 1.2 | * | 21.50 | 22.27 | 4 | ||||||||||||||
| Legal | 0.8 | 1.2 | * | 47.89 | 52.65 | * | 10 | |||||||||||||
| Education, training, and library | 6.3 | 5.3 | * | 24.76 | 25.96 | 5 | ||||||||||||||
| Arts, design, entertainment, sports, and media | 1.3 | 1.5 | * | 26.72 | 25.45 | * | -5 | |||||||||||||
| Healthcare practitioner and technical | 5.8 | 5.1 | * | 35.93 | 37.42 | * | 4 | |||||||||||||
| Healthcare support | 3.0 | 2.3 | * | 13.61 | 15.56 | * | 14 | |||||||||||||
| Protective service | 2.5 | 2.2 | * | 20.92 | 21.60 | 3 | ||||||||||||||
| Food preparation and serving related | 9.0 | 8.7 | 10.38 | 10.90 | * | 5 | ||||||||||||||
| Building and grounds cleaning and maintenance | 3.2 | 3.1 | 12.51 | 12.47 | 0 | |||||||||||||||
| Personal care and service | 3.0 | 3.1 | 11.88 | 12.53 | * | 5 | ||||||||||||||
| Sales and related | 10.6 | 11.5 | * | 18.37 | 21.55 | * | 17 | |||||||||||||
| Office and administrative support | 16.2 | 16.2 | 16.78 | 18.24 | * | 9 | ||||||||||||||
| Farming, fishing, and forestry | 0.3 | 0.1 | * | 11.70 | 13.55 | * | 16 | |||||||||||||
| Construction and extraction | 3.8 | 4.2 | * | 21.94 | 21.33 | * | -3 | |||||||||||||
| Installation, maintenance, and repair | 3.9 | 3.6 | * | 21.35 | 22.84 | * | 7 | |||||||||||||
| Production | 6.6 | 3.7 | * | 16.79 | 17.72 | * | 6 | |||||||||||||
| Transportation and material moving | 6.8 | 5.9 | * | 16.28 | 17.82 | * | 9 | |||||||||||||
Footnotes:
(1) A positive percent difference measures how much the mean wage in Denver is above the national mean wage, while a negative difference reflects a lower wage.
* The percent share of employment or mean hourly wage for this area is significantly different from the national average of all areas at the 90-percent confidence level.
Under current market conditions, employees on average make 12% more in Denver than in the United States as a whole, with a standout being Sales and related jobs, which make up 11.5% of the workforce, making on average 17% more than comparable jobs nationally. These are the workers that can afford to live in newly constructed multifamily and for-sale product.
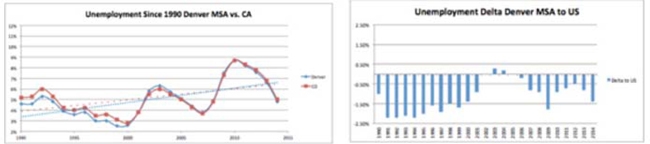
Although the recent recession caused Denver’s unemployment rate since 1990 to trend upward, it is currently at 4.2%, and the Denver MSA has more people employed than at any point in its history. Aside from 2003 and 2004, Denver’s unemployment rate has been consistently lower than the United States.
Source: BLS
| 28 |

Source: Marcus & Millichap
2. Denver has experienced steep rent increases in the face of heavy supply and average vacancy rates
Source: Marcus & Millichap
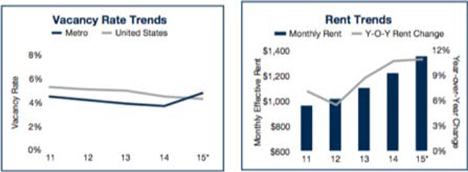
Marcus and Millichap reports that vacancy rates for apartments in the third quarter 2015 sat at 4%, a 50-basis-point rise from the same period a year ago. A boost in apartments coming online contributed to the rise. Vacancy rates are highest in the Denver core submarkets that experienced a large addition of new supply. The Downtown/Highlands/Lincoln Park vacancy rate was 7.0% in the third quarter, but this is due to recent supply that is available. The market is extremely tight in North Lakewood/Wheat Ridge where vacancy was only 1.1%. Apartments built in the 1970s posted the lowest vacancy at 2.9%. Marcus and Millichap predicts the supply of new rentals will outpace growth in demand through 2015 suggesting vacancy to rise to 4.8%.
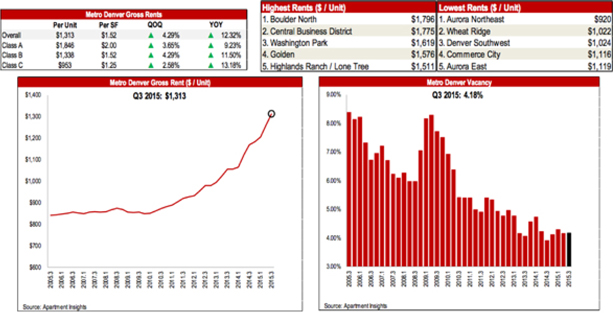
While vacancy is increasing, rent is growing even faster, with the average monthly rent increasing 10.6% year-over-year in 2015, exceeding the 9.6% increase last year (Marcus & Millichap). Jones Lang LaSalle reported even higher rent growth, showing a 12.32% year-over-year growth at the end of the third quarter 2015.
| 29 |
Source: Jones Lang LaSalle

Source: Apartment Association of Metro Denver
Although ticking up recently, Denver’s vacancy rate has held around the national average, while the metro area has delivered approximately 18,000 multifamily units over the past two years. Strong population growth dictates the need for additional housing units, yet the approximately 21,600 multifamily units in various stages of planning will need to be closely watched if for sale housing development increases.
Marcus and Millichap historic construction trends are set forth below along with Jones Lang Lasalles’ recent construction projections.
| 30 |
 |  |
| Source: Marcus & Millichap | Source: Jones Lang LaSalle |
3. Denver home price inflation has well outpaced the United States largely because of demand increasing significantly faster than supply.
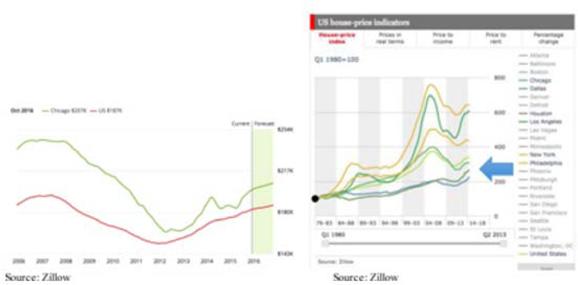
Denver housing inventory is low relative to current demand. As of December 2015, developers and builders of apartments had been unable to deliver new inventory quickly enough to keep up with the Denver MSA’s growing population, which has grown at double the rate of the United States, as a whole, since 2000. In a report published in August by the Downtown Denver Partnership, it was reported that 45 times as many apartments as for-sale units are in the planning pipeline. This is partially because of strict Colorado condominium defect laws that have curbed home ownership development in Denver for fear that developers would be sued by residents claiming their units were defective. In November 2015, a State legislative reform was passed severely limiting residents’ rights to sue developers assuming condominiums are built according to the then current building code. This reform should open up development opportunities for for-sale product, and potentially provide new opportunities for real estate investors.
Starbuck Realty Group reported in July 2015 that the median sale price of homes in Denver had increased an average of 12.17% per year since 2008. In May 2015, median sale prices rose 7.5% over April alone, and the median price for a detached, single-family home hit $400,000 in Denver.
Two charts from Zillow illustrate for sale housing prices in Denver currently as well as over the past several years. Zillow also forecasts continued appreciation in 2016.
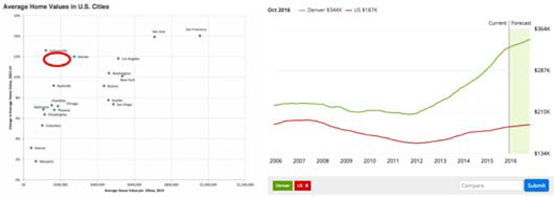
Source: Zillow
| 31 |
Denver has experienced steep home price appreciation since 2012, well outpacing the trend for the country as a whole. Nationally construction prices have been rising, making it challenging to finance new development in many markets, but this is not the case in Denver.
Denver is a desirable place to live, and is pulling people from traditional, core, coastal cities as job opportunities for the time being are abundant and the relative cost of housing is to Denver’s advantage compared to the California coast. With strong underlying dynamics, we expect real estate investment opportunities to continue in Denver.
General Market Considerations
For general market considerations, please see “Investment Objectives and Strategy – Market Overview and Opportunity” in our Offering Circularhere.
| 32 |
Our Strategy
We may employ leverage to enhance total returns to our shareholders through a combination of senior financing on our real estate acquisitions, secured facilities, and capital markets financing transactions. Our target portfolio-wide leverage after we have acquired an initial substantial portfolio of diversified investments is between 50-85% of the greater of cost (before deducting depreciation or other non-cash reserves) or fair market value of our assets. As we acquire our initial portfolio, we employ greater leverage on individual assets (that will also result in greater leverage of the interim portfolio) in order to quickly build a diversified portfolio of multifamily rental properties and development project assets. We seek to secure conservatively structured leverage that is long-term, non-recourse, non-market-to-market financing to the extent obtainable on a cost effective basis. To the extent a higher level of leverage is employed it may come either in the form of government-sponsored programs or other long-term, non-recourse, non-market-to-market financing. Our Manager may from time to time modify our leverage policy in its discretion. However, other than during our initial period of operations, it is our policy to not borrow more than 85% of the greater of cost (before deducting depreciation or other non-cash reserves) or fair market value of our assets. We cannot exceed the leverage limit of our leverage policy unless any excess in borrowing over such level is approved by our Manager’s investment committee
In executing on our business strategy, we believe that we benefit from our Manager’s affiliation with our sponsor given our sponsor’s strong track record and extensive experience and capabilities as an online real estate origination and funding platform. These competitive advantages include:
| · | our sponsor’s experience and reputation as a leading real estate investment manager, which historically has given it access to a large investment pipeline similar to our targeted assets and the key market data we use to underwrite and portfolio manage assets; |
| · | our sponsor’s direct and online origination capabilities, which are amplified by a proprietary crowdfunding technology platform, business process automation, and a large user base, of which a significant portion are seeking capital for real estate projects; |
| · | our sponsor’s relationships with financial institutions and other lenders that originate and distribute commercial real estate debt and other real estate-related products and that finance the types of assets we intend to acquire and originate; |
| · | our sponsor’s experienced portfolio management team which actively monitors each investment through an established regime of analysis, credit review and protocol; and |
| · | our sponsor’s management team, which has a successful track record of making commercial real estate investments in a variety of market conditions. |
| 33 |
Critical Accounting Policies
Our accounting policies have been established to conform with U.S. Generally Accepted Accounting Principles (“GAAP”). The preparation of financial statements in conformity with GAAP requires us to use judgment in the application of accounting policies, including making estimates and assumptions. These judgments affect the reported amounts of assets and liabilities and disclosure of contingent assets and liabilities at the dates of the financial statements and the reported amounts of revenue and expenses during the reporting periods. Management believes that we have made these estimates and assumptions in an appropriate manner and in a way that accurately reflects our financial condition. We continually test and evaluate these estimates and assumptions using our historical knowledge of the business, as well as other factors, to ensure that they are reasonable for reporting purposes. However, actual results may differ from these estimates and assumptions. If our judgment or interpretation of the facts and circumstances relating to various transactions had been different, it is possible that different accounting policies would have been applied, thus resulting in a different presentation of the financial statements.
We believe the following critical accounting policies govern the significant judgments and estimates used in the preparation of our financial statements. Please refer toNote 2, “Summary of Significant Accounting Policies” included in the financial statements contained in this report below, for a more thorough discussion of our accounting policies and procedures. We consider our critical accounting policies to be the following:
Commercial Real Estate Debt Investments
Our commercial real estate debt investments are generally classified as held to maturity as we have both the intent and ability to hold these investments to maturity and, accordingly, are carried at cost, net of unamortized loan fees, premium, discount and unfunded commitments. We review our real estate debt investments on a quarterly basis, or more frequently when such an evaluation is warranted, to determine if an impairment exists. A real estate debt investment is impaired when, based on current information and events (including economic, industry and geographical factors), it is probable that we will be unable to collect all amounts due, both principal and interest, according to the contractual terms of the agreement. Commercial real estate debt investments that are deemed to be impaired are carried at amortized cost less a loan loss reserve, if deemed appropriate, which approximates fair value.
We have certain investments that are legally structured as equity investments with rights to receive preferred economic returns (seeItem 2, “Management’s Discussion and Analysis of Financial Condition and Results of Operations – Our Investments”above). We report these investments as real estate debt securities when the common equity holders have a contractual obligation to redeem our preferred equity interest at a specified date.
We have invested in three real estate debt investments, only one of which had funded as of December 31, 2016. SeeNote 2, “Summary of Significant Accounting Policies - Real Estate Debt Investments” in our financial statements for further detail. The following table describes our real estate debt investment activity as of December 31, 2016 (amounts in thousands):
| Investments in Real Estate Debt: | For the Year Ended December 31, 2016 | For the Period November 19, 2015 (Inception) through December 31, 2015 | ||||||
| Beginning balance | $ | — | — | |||||
| Investments(1) | 1,000 | — | ||||||
| Principal repayments | — | — | ||||||
| Amortization of deferred fees, costs, and discounts/premiums | — | — | ||||||
| Ending balance | $ | 1,000 | — | |||||
| 34 |
| (1) | Investments include one preferred equity investment with contractually required redemption or maturity dates. |
Principles of Consolidation
Certain of our investments are considered “majority-owned subsidiaries” within the meaning of the Investment Company Act of 1940. Our ownership interest in an investee referred to as such does not necessarily exceed 50% of the capital of the investee, and the definition under the Investment Company Act differs from the considerations provided by GAAP for whether an investee should be consolidated. We analyze our investments to determine whether they should be consolidated using the voting interest and variable interest models provided by generally accepted accounting principles. SeeNote 2, “Summary of Significant Accounting Policies - Principles of Consolidation” in our financial statements for further detail.
Certain of our investments are considered to be “majority-owned subsidiaries” within the meaning of the Investment Company Act of 1940. This definition differs from the GAAP definition of the primary beneficiary of a variable interest entity.
Fair Value Disclosures
We are required to disclose an estimate of fair value of our financial instruments for which it is practicable to estimate the value. The fair value of a financial instrument is the amount at which such financial instrument could be exchanged in a current transaction between willing parties, other than in a forced sale or liquidation. For certain of our financial instruments, fair values are not readily available since there are no active trading markets as characterized by current exchanges by willing parties.
We determine the fair value of certain investments in accordance with the fair value hierarchy that requires an entity to maximize the use of observable inputs.
The Company’s financial instruments consist of cash, three debt securities, and accounts payable. The carrying values of cash and cash equivalents, receivables, and accounts payable are reasonable estimates of their fair value. The aggregate fair value of our debt investments is based on unobservable Level 3 inputs which management has determined to be its best estimate of current market values. The methods utilized generally included a discounted cash flow method (an income approach) and recent investment method (a market approach). Significant inputs and assumptions include the market based interest or preferred return rate, loan to value ratios and expected repayment and prepayment dates.
As a result of this assessment, as of December 31, 2016, management estimated the carrying value of our debt investment is a reasonable estimate of its fair value.
Recent Accounting Pronouncements
The Financial Accounting Standards Board has released several Accounting Standards Updates (“ASU”) that may have an impact on our financial statements. SeeNote 2, “Summary of Significant Accounting Policies - Recent Accounting Pronouncements” in our financial statements for a discussion of the relevant ASUs. We are currently evaluating the impact of the various ASUs on our financial statements and determining our plan for adoption.
| 35 |
Results of Operations
Revenue
On October 25, 2016, we commenced operations upon our satisfying the $1 million minimum offering requirement (not including the $100,000 received in the private placements to our sponsor and Fundrise, LP). For the year ended December 31, 2016, we had total net loss of approximately $77,000 primarily attributable to general and administrative expenses incurred. For the period November 19, 2015 (Inception) through December 31, 2015, we incurred net income of approximately $0.
The Company had no investments as of December 31, 2015. Investments were added during Q4 2016. Additionally, not all commitments had been funded as of December 31, 2016.We expect cash flows from operating activities to increase in future periods as a result of adding more investments to our portfolio, and funding future commitments, in addition to operating for a full calendar year.
Interest Income
For the years ended December 31, 2016 and for the period November 19, 2015 (Inception) through December 31, 2015, we incurred earned interest income of approximately $8,000 and $0 from our investments, respectively.
Expenses
General and Administrative
For the years ended December 31, 2016 and the period November 19, 2015 (Inception) through December 31, 2015, we incurred general and administrative expenses of approximately $85,000 and $0, respectively, which includes auditing and professional fees, bank fees, organizational costs and other costs associated with operating our business.
Liquidity and Capital Resources
We require capital to fund our investment activities and operating expenses. Our capital sources may include net proceeds from our Offering, cash flow from operations, net proceeds from asset repayments and sales, borrowings under credit facilities, other term borrowings and securitization financing transactions.
We are dependent upon the net proceeds from our Offering to conduct our operations. We obtain the capital required to primarily originate,invest in and manage a diversified portfolio of commercial real estate investments and conduct our operations from the proceeds of our Offering and from secured or unsecured financings from banks and other lenders and from any undistributed funds from our operations. As of December 31, 2016, we had made three investments for approximately $1 million, and had approximately $4,727,000 in cash. In addition to our investments of approximately $1 million, we had future funding commitments up to an additional $10 million related to our investments. We anticipate that proceeds from our Offering will provide sufficient liquidity to meet future funding commitments as of December 31, 2016 and costs of operations.
We currently have no outstanding debt and have not received a commitment from any lender to provide us with financing. Our targeted portfolio-wide leverage after we have acquired an initial substantial portfolio of diversified investments is between 50-85% of the greater of the cost (before deducting depreciation or other non-cash reserves) or fair market value of our assets. During the period when we are acquiring our initial portfolio, we may employ greater leverage on individual assets (that will also result in greater leverage of the interim portfolio) in order to quickly build a diversified portfolio of multifamily rental properties and development project assets. Our Manager may from time to time modify our leverage policy in its discretion in light of then-current economic conditions, relative costs of debt and equity capital, market values of our assets, general conditions in the market for debt and equity securities, growth and acquisition opportunities or other factors. However, other than during our initial period of operations, it is our policy to not borrow more than 85% of the greater of cost (before deducting depreciation or other non-cash reserves) or fair market value of our assets. We cannot exceed the leverage limit of
| 36 |
our leverage policy unless any excess in borrowing over such level is approved by our Manager’s investment committee. As of December 31, 2016, we had no outstanding borrowings.
If we are unable to fully raise $50,000,000 in common shares, we will make fewer investments resulting in less diversification in terms of the type, number and size of investments we make and the value of an investment in us will fluctuate with the performance of the specific assets we acquire. Further, we have certain direct and indirect operating expenses. Our inability to raise substantial funds would increase our fixed operating expenses as a percentage of gross income, reducing our net income and limiting our ability to make distributions.
In addition to making investments in accordance with our investment objectives, we use our capital resources to make certain payments to our Manager. During our organization and offering stage, these payments have and will continue to include payments for reimbursement of certain organization and offering expenses. As of December 31, 2016, organization and offering expenses have totaled approximately $474,000. We expect total offering costs to be less than 2% of our total offering. In addition, borrowers and real estate sponsors may make payments to our sponsor or its affiliates in connection with the selection and origination or purchase of investments.The amount of the asset management fee may vary from time to time, and we will publicly report any changes in the asset management fee. No asset management fees have been paid or accrued to our Manager as of December 31, 2016.
We have elected to be taxed as a REIT and to operate as a REIT commencing with our taxable year ending December 31, 2016. To maintain our qualification as a REIT, we will be required to make aggregate annual distributions to our shareholders of at least 90% of our REIT taxable income (computed without regard to the dividends paid deduction and excluding net capital gain), and to avoid federal income and excise taxes on retained taxable income and gains we must distribute 100% of such income and gains annually. Our Manager may authorize distributions in excess of those required for us to maintain REIT status and/or avoid such taxes on retained taxable income and gains depending on our financial condition and such other factors as our Manager deems relevant. Provided we have sufficient available cash flow, we intend to authorize and declare distributions based on daily record dates and pay distributions on a quarterly or other periodic basis. We have not established a minimum distribution level.
Cash Flows
The following presents our statements of cash flows for the year ended December 31, 2016 and for the period November 19, 2015 (Inception) through December 31, 2015 (in thousands):
| Cash Flows | For the Year Ended December 31, 2016 | For the Period November 19, 2015 (Inception) Through December 31, 2015 | ||||||
| Operating activities: | $ | (12 | ) | $ | — | |||
| Investing activities: | (1,000 | ) | — | |||||
| Financing activities: | 5,734 | 5 | ||||||
| Net increase (decrease) in cash and cash equivalents | $ | 4,722 | $ | 5 | ||||
| Cash and cash equivalents, beginning of period | $ | 5 | $ | — | ||||
| Cash and cash equivalents, end of period | $ | 4,727 | $ | 5 | ||||
| 37 |
Off-Balance Sheet Arrangements
As of December 31, 2016 and December 31, 2015, we had no off-balance sheet arrangements.
Related Party Arrangements
For further information regarding “Related Party Arrangements,” please seeItem 5, “Interest of Management and Others in Certain Transactions” below.
Recent Developments
| Event | Date | Description | ||
| Change of Principal Address | 1/3/17 | The Company moved its headquarters to 1601 Connecticut Ave., NW, Suite 300, Washington, DC 20009. | ||
| Acceptance of IRA Investments | 1/31/17 | Announced that we would begin accepting subscriptions from investment retirement accounts (IRAs) maintained with certain custodians. | ||
| Amended and Restated Promissory Grid Note | 1/31/17 | Entered into an Amended and Restated Promissory Grid Note (the “Amended and Restated Promissory Grid Note”), as borrower, with Rise Companies Corp., as lender. The Amended and Restated Promissory Grid Note is an unsecured line of credit in the aggregate principal amount of $10 million that bears an interest rate of 3% per annum, calculated on a 30-day month/360-day year basis. All outstanding principal and interest on the Amended and Restated Promissory Grid Note is due and payable on April 30, 2017. | ||
| Acquisitions of Controlled Subsidiaries | 3/28/17 | Directly acquired ownership ofWRE Harbor House LLC (the “RSE Wickfield Controlled Subsidiary”), in which we have the right to receive a preferred economic return for a purchase price of $3,175,000, which is the initial stated value of our equity interest in theRSE Wickfield Controlled Subsidiary.TheRSE Wickfield Controlled Subsidiary used the proceeds to acquire a two- and three-story, 208-unit garden style apartment complex built in 1990 and situated on a 201,172 square foot property (the “RSE Wickfield Property”). The RSE Wickfield Property is located on Harbor Way along S Main St, which is within three miles from Downtown Ann Arbor. | ||
Declaration of Q2 2017 Dividends
| 3/21/17 | On March 21, 2017, our Manager declared a daily distribution of $0.0021917808 per share for shareholders of record as of the close of business on each day of the period commencing on April 1, 2017 and ending on June 30, 2017. |
| 38 |
| Item 3. | Directors and Officers |
Our Manager
We operate under the direction of our Manager, which is responsible for directing the management of our business and affairs, managing our day-to-day affairs, and implementing our investment strategy. Our Manager has established an investment committee that makes decisions with respect to all acquisitions and dispositions. The Manager and its officers and directors are not required to devote all of their time to our business and are only required to devote such time to our affairs as their duties require.
We follow investment guidelines adopted by our Manager and the investment and borrowing policies set forth in our Offering Circular, which may be accessedhere, unless they are modified by our Manager. Our Manager may establish further written policies on investments and borrowings and will monitor our administrative procedures, investment operations and performance to ensure that the policies are fulfilled. Our Manager may change our investment objectives at any time without approval of our shareholders.
Our Manager performs its duties and responsibilities pursuant to our operating agreement. Our Manager maintains a contractual, as opposed to a fiduciary relationship, with us and our shareholders. Furthermore, we have agreed to limit the liability of our Manager and to indemnify our Manager against certain liabilities.
Executive Officers of Our Manager
As of the date of this Annual Report, the executive officers of our Manager and their positions and offices are as follows:
| Name | Age | Position | ||
| Benjamin S. Miller | 40 | Chief Executive Officer and Interim Chief Financial Officer and Treasurer | ||
| Brandon T. Jenkins | 31 | Chief Operating Officer | ||
| Bjorn J. Hall | 36 | General Counsel, Chief Compliance Officer and Secretary |
Benjamin S. Millercurrently serves as Chief Executive Officer of our Manager and has served as Chief Executive Officer and Director of our sponsor since its inception on March 14, 2012. As of February 9, 2016, Ben is also serving as Interim Chief Financial Officer and Treasurer of our Manager. Since June 2012, Ben has been Managing Partner of Rise Development LLC, a real estate company focused in the Mid-Atlantic. In December 2011, Ben started Popularise LLC, a real estate crowdsourcing website, which he currently manages. Prior to Rise Development, Ben had been a Managing Partner of the real estate company WestMill Capital Partners from October 2010 to June 2012, and before that, was President of Western Development Corporation from April 2006 to October 2010, after joining our Company in early 2003 as a board advisor and then as COO in 2005. Western Development Corp. is one of the largest retail, mixed-use real estate companies in Washington, DC, most notably known for developing Gallery Place, Washington Harbour, Georgetown Park, and Potomac Mills. While at Western Development, Ben led the development activities of over 1.5 million square feet of property, including more than $300.0 million of real estate acquisition and financing. Ben was an Associate and part of the founding team of Democracy Alliance, a progressive investment collaborative, from 2003 until he joined Western Development in 2005. From 1999 to 2001, Ben was an associate in business development at Lyte Inc., a retail technology start-up. Starting in 1997 until 1999, Ben worked as an analyst at a private equity real estate fund, Lubert-Adler, and for venture capital firm IL Management. Ben has a Bachelor of Arts from the University of Pennsylvania. Ben is on the Board of Trustees of the National Center for Children and Families.
| 39 |
Brandon T. Jenkinscurrently serves as Chief Operating Officer of our Manager and has served in such capacities with the sponsor since February of 2014, prior to which time he served as Head of Product Development and Director of Real Estate which he continues to do currently. Additionally, Brandon has served as Director of Real Estate for WestMill Capital Partners since March of 2011. Previously, Brandon spent two and a half years as an investment advisor and sales broker at Marcus & Millichap, the largest real estate investment sales brokerage in the country. Prior to his time in brokerage, Brandon also worked for Westfield Corporation, a leading shopping center owner. Brandon earned is BA in Public Policy and Economics from Duke University.
Bjorn J. Hallcurrently serves as the General Counsel, Chief Compliance Officer and Secretary of our Manager and has served in such capacities with our sponsor since February 2014. Prior to joining our sponsor in February 2014, Bjorn was a counsel at the law firm of O’Melveny & Myers LLP, where he was a member of the Corporate Finance and Securities Group. Bjorn has a Bachelor of Arts from the University of North Dakota and received a J.D. from Georgetown University Law Center.
Compensation of Executive Officers
We do not currently have any employees nor do we currently intend to hire any employees who will be compensated directly by us. Each of the executive officers of our sponsor also serves as an executive officer of our Manager. Each of these individuals receives compensation for his services, including services performed for us on behalf of our Manager, from our sponsor. As executive officers of our Manager, these individuals serve to manage our day-today affairs, oversee the review, selection and recommendation of investment opportunities, service acquired investments and monitor the performance of these investments to ensure that they are consistent with our investment objectives. Although we indirectly bear some of the costs of the compensation paid to these individuals, through fees and reimbursements we pay to our Manager, we do not pay any compensation directly to these individuals.
Compensation of our Manager
For information regarding the compensation of our Manager, please see “Management Compensation” in our Offering Circularhere.
| 40 |
| Item 4. | Security Ownership of Management and Certain Securityholders |
Principal Shareholders
The following table sets forth the beneficial ownership of our common shares as of March 31, 2017 for each person or group that holds more than 5% of our common shares, for each director and executive officer of our Manager and for the directors and executive officers of our Manager as a group. To our knowledge, each person that beneficially owns our common shares has sole voting and disposition power with regard to such shares.
Each person or entity has an address in care of our principal executive offices at 1601 Connecticut Ave., NW, Suite 300, Washington, DC 20009.
| Number of Shares Beneficially | Percent of | |||||||
| Name of Beneficial Owner (1) | Owned | All Shares | ||||||
| Benjamin S. Miller | 500 | * | ||||||
| Brandon T. Jenkins | 0 | * | ||||||
| Bjorn J. Hall | 0 | * | ||||||
| All directors and executive officers of our Manager as a group (3 persons) | 500 | * | ||||||
| * | Represents less than 1% of our outstanding common shares. |
| (1) | Under SEC rules, a person is deemed to be a “beneficial owner” of a security if that person has or shares “voting power,” which includes the power to dispose of or to direct the disposition of such security. A person also is deemed to be a beneficial owner of any securities which that person has a right to acquire within 60 days. Under these rules, more than one person may be deemed to be a beneficial owner of the same securities and a person may be deemed to be a beneficial owner of securities as to which he or she has no economic or pecuniary interest. |
| 41 |
| Item 5. | Interest of Management and Others in Certain Transactions |
For further details, please seeNote 6, “Related Party Arrangements” in our financial statements.
| Item 6. | Other Information |
None.
| 42 |
INDEX TO FINANCIAL STATEMENTS OFFundrise Midland opportunistic Reit, LLC
| F-1 | |
| Balance Sheets | F-2 |
| Statements of Operations | F-3 |
| Statements of Members’ Equity | F-4 |
| Statements of Cash Flows | F-5 |
| Notes to Financial Statements | F-6 to F-19 |
| 43 |
![]()
RSM US LLP
To the Members
Fundrise Midland Opportunistic REIT, LLC
Washington, D.C.
Report on the Financial Statements
We have audited the accompanying financial statements of Fundrise Midland Opportunistic REIT, LLC (the Company), which comprise the balance sheets as of December 31, 2016 and 2015, and the related statements of operations, changes in members’ equity, and cash flows for the year ended December 31, 2016 and for the period from November 19, 2015 (inception) through December 31, 2015, and the related notes to the financial statements.
Management’s Responsibility for the Financial Statements
Management is responsible for the preparation and fair presentation of these financial statements in accordance with accounting principles generally accepted in the United States of America; this includes the design, implementation, and maintenance of internal control relevant to the preparation and fair presentation of financial statements that are free from material misstatement, whether due to fraud or error.
Auditor’s Responsibility
Our responsibility is to express an opinion on these financial statements based on our audits. We conducted our audit in accordance with auditing standards generally accepted in the United States of America. Those standards require that we plan and perform the audit to obtain reasonable assurance about whether the financial statements are free from material misstatement.
An audit involves performing procedures to obtain audit evidence about the amounts and disclosures in the financial statements. The procedures selected depend on the auditor’s judgment, including the assessment of the risks of material misstatement of the financial statements, whether due to fraud or error. In making those risk assessments, the auditor considers internal control relevant to the entity’s preparation and fair presentation of the financial statements in order to design audit procedures that are appropriate in the circumstances, but not for the purpose of expressing an opinion on the effectiveness of the entity’s internal control. Accordingly, we express no such opinion. An audit also includes evaluating the appropriateness of accounting policies used and the reasonableness of significant accounting estimates made by management, as well as evaluating the overall presentation of the financial statements.
We believe that the audit evidence we have obtained is sufficient and appropriate to provide a basis for our audit opinion.
Opinion
In our opinion, the financial statements referred to above present fairly, in all material respects, the financial position of Fundrise Midland Opportunistic REIT, LLC as of December 31, 2016 and 2015, and the results of its operations and its cash flows for the year ended December 31, 2016 and for the period from November 19, 2015 (inception) through December 31, 2015, in accordance with accounting principles generally accepted in the United States of America.
/s/ RSM US LLP
McLean, Virginia
March 17, 2017
THE POWER OF BEING UNDERSTOOD
AUDIT | TAX | CONSULTING
RSM US LLP is the U.S. member firm of RSM International, a global network of independent audit, tax, and consulting firms. Visit rsmus.com/aboutus for more information regarding RSM US LLP and RSM International.
| F-1 |
Fundrise Midland Opportunistic REIT, LLC
Balance Sheets
As of December 31, 2016 and December 31, 2015
(Amounts in thousands, except share and per share data)
| 2016 | 2015 | |||||||
| ASSETS | ||||||||
| Cash and cash equivalents | $ | 4,727 | $ | 5 | ||||
| Interest receivable | 8 | — | ||||||
| Other assets | 2 | — | ||||||
| Real estate debt investments | 1,000 | — | ||||||
| Deferred costs, net of accumulated amortization of $49 and $0 as of December 31, 2016 and December 31, 2015, respectively | 396 | — | ||||||
| Total Assets | $ | 6,133 | $ | 5 | ||||
| LIABILITIES AND MEMBERS’ EQUITY | ||||||||
| Liabilities: | ||||||||
| Accounts payable and accrued expenses | $ | 51 | $ | — | ||||
| Due to related party | 435 | — | ||||||
| Settling subscriptions | 272 | — | ||||||
| Distributions payable | 113 | — | ||||||
| Redemptions payable | 152 | — | ||||||
| Total Liabilities | 1,023 | — | ||||||
| Members’ Equity: | ||||||||
| Fundrise Midland Opportunistic REIT, LLC Members’ Equity: Common shares, $10 per share; unlimited shares authorized; 534,898 and 500 shares issued and outstanding as of December 31, 2016 and December 31, 2015, respectively, net of accumulated amortization of deferred offering costs of $49 and $0 as of December 31, 2016 and December 31, 2015, respectively | 5,300 | 5 | ||||||
| Retained Earnings (Accumulated deficit) | (190 | ) | — | |||||
| Total Members’ Equity | 5,110 | 5 | ||||||
| Total Liabilities and Members’ Equity | $ | 6,133 | $ | 5 | ||||
The accompanying notes are an integral part of these financial statements.
| F-2 |
Fundrise Midland Opportunistic REIT, LLC
Statements of Operations
For the Year Ended December 31, 2016 and for the Period November 19, 2015 (Inception) through
December 31, 2015
(Amounts in thousands, except share and per share data)
| 2016 | 2015 | |||||||
| Investment income | ||||||||
| Interest income | $ | 8 | $ | — | ||||
| Net investment income | 8 | — | ||||||
| Expenses | ||||||||
| Asset management and other fees- related party | — | — | ||||||
| General and administrative expenses | 85 | — | ||||||
| Total expenses | 85 | — | ||||||
| Net (loss) | $ | (77 | ) | $ | — | |||
| Net (loss) per basic and diluted common share | $ | (1.02 | )[1] | $ | — | |||
| Weighted average number of common shares outstanding, basic and diluted | 75,632 | [1] | — | |||||
[1]In this initial year of operations we have recalculated the weighted average of common shares outstanding and net loss per basic share over the period from commencement of operations through December 31, 2016 at 404,896 and $(0.19), respectively.
The accompanying notes are an integral part of these financial statements.
| F-3 |
Fundrise Midland Opportunistic REIT, LLC
Statements of Members’ Equity
For the Year Ended December 31, 2016 and for the Period November 19, 2015 (Inception) through
December 31, 2015
(Amounts in thousands, except share data)
| Common Shares | Retained Earnings (Accumulated | Total Company’s Shareholders’ | ||||||||||||||
| Shares | Amount | Deficit) | Equity | |||||||||||||
| November 19, 2015 (Inception) | — | $ | — | $ | — | $ | — | |||||||||
| Proceeds from issuance of common shares | 500 | 5 | — | 5 | ||||||||||||
| Accumulated amortization of deferred offering costs | — | — | — | — | ||||||||||||
| Distributions declared on common shares | — | — | — | — | ||||||||||||
| Redemptions of common shares | — | — | — | — | ||||||||||||
| Net (loss) | — | — | — | — | ||||||||||||
| Balance as of December 31, 2015 | 500 | 5 | — | 5 | ||||||||||||
| Proceeds from issuance of common shares | 549,648 | 5,496 | — | 5,496 | ||||||||||||
| Accumulated amortization of deferred offering costs | — | (49 | ) | — | (49 | ) | ||||||||||
| Distributions declared on common shares | — | — | (113 | ) | (113 | ) | ||||||||||
| Redemptions of common shares | (15,250 | ) | (152 | ) | — | (152 | ) | |||||||||
| Net (loss) | — | — | (77 | ) | (77 | ) | ||||||||||
| Balance as of December 31, 2016 | 534,898 | $ | 5,300 | $ | (190 | ) | $ | (5,110 | ) | |||||||
The accompanying notes are an integral part of these financial statements.
| F-4 |
Fundrise Midland Opportunistic REIT, LLC
Statements of Cash Flows
For the Year Ended December 31, 2016 and for the Period November 19, 2015 (Inception) through
December 31, 2015
(Amounts in thousands)
| 2016 | 2015 | |||||||
| OPERATING ACTIVITIES: | ||||||||
| Net (loss) | $ | (77 | ) | $ | — | |||
| Adjustments to reconcile net income to net cash provided by (used in) operating activities: | ||||||||
| Net increase in interest receivable | (8 | ) | — | |||||
| Net increase in other assets | (2 | ) | — | |||||
| Net increase in accounts payable and accrued expenses | 51 | — | ||||||
| Increase in due to related party | 24 | — | ||||||
| Net cash (used in) operating activities | (12 | ) | — | |||||
| INVESTING ACTIVITIES: | ||||||||
| Investment in real estate debt related investments | (1,000 | ) | — | |||||
| Net cash (used in) investing activities | (1,000 | ) | — | |||||
| FINANCING ACTIVITIES: | ||||||||
| Proceeds from issuance of common shares | 5,496 | 5 | ||||||
| Proceeds from subscriptions not settled | 272 | — | ||||||
| Deferred offering costs | (445 | ) | — | |||||
| Advances from related party | 445 | — | ||||||
| Repayments of advances from related party | (34 | ) | — | |||||
| Net cash provided by financing activities | 5,734 | 5 | ||||||
| Net increase in cash and cash equivalents | 4,722 | 5 | ||||||
| Cash and cash equivalents, beginning of period | 5 | — | ||||||
| Cash and cash equivalents, end of period | $ | 4,727 | $ | 5 | ||||
| SUPPLEMENTAL DISCLOSURE OF NON-CASH ACTIVITY: | ||||||||
| Amortization of deferred offering costs | $ | 49 | $ | — | ||||
| Distributions payable | $ | 113 | $ | — | ||||
| Redemptions payable | $ | 152 | $ | — | ||||
The accompanying notes are an integral part of these financial statements.
| F-5 |
FUNDRISE MIDLAND OPPORTUNISTIC REIT, LLC
NOTES TO FINANCIAL STATEMENTS
For the Year Ended December 31, 2016 and for the Period November 19, 2015 (Inception) through
December 31, 2015
| 1. | Formation and Organization |
Fundrise Midland Opportunistic REIT, LLC was formed on November 19, 2015, as a Delaware limited liability company to invest in a diversified portfolio of commercial real estate assets and securities. Operations commenced October 25, 2016. As used herein, the “Company,” “we,” “our,” and “us” refer to Fundrise Midland Opportunistic REIT, LLC except where the context otherwise requires.
The Company was organized primarily to originate, invest in and manage a diversified portfolio of commercial real estate loans, commercial real estate, and may also invest in commercial real estate-related debt securities and other real estate-related assets. Substantially all of the Company’s business is externally managed by Fundrise Advisors, LLC (the “Manager”), a Delaware limited liability company and an investment adviser registered with the Securities and Exchange Commission (the “SEC”).
The Company’s origination, investing and management activities related to commercial real estate are all considered a single reportable business segment for financial reporting purposes. All of the investments the Company has made to date have been in domestic commercial real estate assets with similar economic characteristics, and the Company evaluates the performance of all of its investments using similar criterion.
We believe we have operated in such a manner as to qualify as a real estate investment trust (“REIT”) for federal income tax purposes as of the year ended December 31, 2016. We hold substantially all of our assets directly, and as of the date of this filing have not established an operating partnership or any taxable REIT subsidiary (“TRS”) or qualified REIT subsidiary (“QRS”), though we may form such entities as required in the future to facilitate certain transactions that might otherwise have an adverse impact on our status as a REIT.
A maximum of $50 million in the Company’s common shares may be sold to the public in this Offering (as defined below). The Manager has the authority to issue an unlimited number of common shares. As of December 31, 2016 and December 31, 2015, the Company has issued 534,898 and 500 shares, including shares to Rise Companies Corp. (the “Sponsor”), an indirect owner of the Manager, in an amount of 500 common shares for an aggregate purchase price of $5,000 as of December 31, 2015. In addition, as of December 31, 2016, Fundrise, L.P., an affiliate of the Sponsor, has purchased an aggregate of 9,500 common shares at $10.00 per share in a private placement for an aggregate purchase price of $95,000. At December 31, 2015, Fundrise, L.P. had committed to purchase but had not purchased any common shares.
Pursuant to the Form 1-A filed with the SEC with respect to our offering (the “Offering”) of up to $50 million in common shares, the purchase price for all shares was $10.00 per share as of December 31, 2016 and December 31, 2015. The Offering was declared qualified by the SEC on September 30, 2016.
| 2. | Summary of Significant Accounting Policies |
Basis of Presentation
The accompanying balance sheets, statements of operations and statements of cash flows and related notes to the financial statements of the Company are prepared on the accrual basis of accounting
| F-6 |
and conform to accounting principles generally accepted in the United States of America (“GAAP”) and Article 8 of Regulation S-X of the rules and regulations of the SEC.
Estimates
The preparation of the financial statements in conformity with accounting principles generally accepted in the United States of America requires management to make estimates and assumptions that affect reported amounts of assets and liabilities and the disclosures of contingent assets and liabilities at the date of the financial statements and the reported amounts of revenues and expenses during the reporting period. Actual results could materially differ from those estimates.
Cash and Cash Equivalents
Cash and cash equivalents consist of money market funds, demand deposits and highly liquid investments with original maturities of three months or less. Cash and cash equivalents are carried at cost which approximates fair value.
Concentration of Credit Risk
Cash may at times exceed the Federal Deposit Insurance Corporation deposit insurance limit of $250,000 per institution. The Company mitigates credit risk by placing cash with major financial institutions. To date, the Company has not experienced any losses on cash.
Organizational, Offering and Related Costs
Organizational and offering costs of the Company are initially being paid by the Manager on behalf of the Company. These organizational and offering costs include all expenses to be paid by the Company in connection with the formation of the Company and the qualification of the Offering, and the marketing and distribution of shares, including, without limitation, expenses for printing, and amending offering statements or supplementing offering circulars, mailing and distributing costs, telephones, internet and other telecommunications costs, all advertising and marketing expenses, charges of experts and fees, expenses and taxes related to the filing, registration and qualification of the sale of shares under federal and state laws, including taxes and fees and accountants’ and attorneys’ fees. Pursuant to the Company’s amended and restated operating agreement (the “Operating Agreement”), the Company will be obligated to reimburse the Manager, or its affiliates, as applicable, for organization and offering costs paid by them on behalf of the Company, subject to a minimum offering raise, as described below.
The Sponsor intends to establish a number of programs as real estate investment trusts that will be similar in structure to ours. As the Company is one of the Sponsor’s initial such programs, it is anticipated that the legal fees and other formation and structuring expenses incurred by the Manager in qualifying this offering may be substantially higher than those of future similar programs. Accordingly, the Manager has agreed to allocate legal fees incurred in establishing the first ten such programs (including us) that exceed the estimated legal fees of $312,500 per program, to other programs sponsored by the Sponsor. As a result, we and each of the other nine programs will be required to reimburse the Manager for up to $312,500 in legal fees incurred in preparing such offerings. The Sponsor believes that this allocation of legal fees to future similar programs is the most equitable way to ensure that all of the first ten programs bear the burden of establishing a working framework for similar offerings under the newly revised rules of Regulation A. If the Sponsor is not successful in organizing an offering for each of the other nine programs, the Sponsor will bear the legal costs that exceed the portion allocated to us.
After the Company raised $1,000,000 in this offering (not including the $100,000 received or to be received in the private placements to the Sponsor and Fundrise, L.P.), beginning on the date that the
| F-7 |
Company started its operations, it started to reimburse the Manager, without interest, for these organization and offering costs incurred both before and after that date. Reimbursement payments are made in monthly installments; however, the aggregate monthly amount reimbursed can never exceed 0.50% of the aggregate gross offering proceeds from the Offering. If the sum of the total unreimbursed amount of such organization and offering costs, plus new costs incurred since the last reimbursement payment, exceeds the reimbursement limit described above for the applicable monthly installment, the excess is eligible for reimbursement in subsequent months (subject to the 0.50% limit), calculated on an accumulated basis, until the Manager has been reimbursed in full. As of December 31, 2016 and December 31, 2015 the Company had reimbursed the Manager $33,712 and $0, respectively.
As of December 31, 2016 and December 31, 2015, the Manager had incurred organizational and offering costs of approximately $469,000 and $53,000, respectively, on behalf of the Company. These costs are not recorded in the financial statements of the Company as of December 31, 2015 because such costs were not a liability of the Company until the Company had raised $1,000,000 in its offering, which occurred subsequent to December 31, 2015.
Organizational costs are expensed as incurred, and offering costs are amortized ratably as a reduction to members’ equity based on the proportion of gross proceeds raised to the total gross proceeds expected to be raised when the Offering is complete. As of December 31, 2016 and December 31, 2015, $28,615 and $0, respectively, of organizational expenses were included as a general and administrative expenses in the statements of operations, and $48,953 and $0, respectively, of offering costs had been amortized and were included in the statements of members’ equity.
Settling Subscriptions
Settling subscriptions presented on the balance sheet represent equity subscriptions for which funds have been received but common shares have not yet been issued. Under the terms of the Offering Circular for our common shares, subscriptions will be accepted or rejected within thirty days of receipt by us. Once a subscription agreement is accepted, settlement of the shares may occur up to fifteen days later, depending on the volume of subscriptions received; however, we generally issue shares the later of five business days from the date that an investor’s subscription is approved by our Manager or when funds settle in our bank account. We rely on our Automated Clearing House (ACH) provider to notify us that funds have settled for this purpose, which may differ from the time that cash is posted to our bank statement.
As of December 31, 2016 and December 31, 2015, the total amount of equity issued by the Company on a gross basis before considering amortization of offering costs was $5,501,480 and $5,000, respectively, and the total amount of settling subscriptions was $272,300 and $0, respectively. Both of these amounts were based on a $10 per share price.
Principles of Consolidation
As of December 31, 2016 and December 31, 2015, the Company does not consolidate any separate legal entities in which we own equity interests. We do not own, directly or indirectly, a majority voting interest in any other entity as of the date of these financial statements. We generally consolidate variable interest entities (“VIE”) where the Company is the primary beneficiary of a VIE in which we have a variable interest and voting interest entities where the Company is the majority owner or otherwise controls the voting interest entity.
| F-8 |
Investments in Unconsolidated Joint Ventures
Non-controlling, unconsolidated ownership interests in an entity may be accounted for using the equity method, at fair value or the cost method.
Under the equity method, the investment is adjusted each period for capital contributions and distributions and its share of the entity’s net income (loss). Capital contributions, distributions and net income (loss) of such entities are recorded in accordance with the terms of the governing documents. An allocation of net income (loss) may differ from the stated ownership percentage interest in such entity as a result of preferred returns and allocation formulas, if any, as described in such governing documents. Equity method investments are recognized using a cost accumulated model in which the investment is recognized based on the cost to the investor, which includes acquisition fees. Acquisition fees incurred directly in connection with the investments in a joint venture are capitalized and amortized using the straight-line method over the estimated useful life of the underlying joint venture assets. The Company does not currently account for any of its investments under the equity method, and no amortization of acquisition fees is currently reflected on the financial statements.
The Company may account for an investment in an unconsolidated entity at fair value by electing the fair value option. In general, if the fair value election is made, the Company’s share of changes in fair value from one period to another are recorded in the statement of operations. Any change in fair value attributable to market related assumptions is considered an unrealized gain or loss.
The Company may account for an investment that does not qualify for the equity method, or for which the fair value option has not been elected, by using the cost method. Under the cost method, equity in earnings is recorded as distributions are received to the extent they are not considered a return of capital, which is recorded as a reduction of cost of the investment.
As of December 31, 2016 and December 31, 2015, respectively, the Company has not elected the fair value option with respect to any of its investments, nor do we treat any of our investments in unconsolidated joint ventures as equity investments for purposes of GAAP. The Company’s investments that are legally structured as preferred equity are treated as debt securities on these financial statements in accordance with GAAP.
Real Estate Debt Investments
Our debt related investments are considered to be classified as held to maturity, as we have both the intent and ability to hold these investments until maturity. Accordingly, these assets are carried at cost, net of unamortized loan origination costs and fees, discounts, repayments and unfunded commitments, if applicable, unless such loans or investments are deemed to be impaired. The Company’s real estate debt investments are subject to continual analysis for potential loan impairment.
A debt related investment is impaired when, based on current information and events (including economic, industry and geographical factors), it is probable that we will be unable to collect all amounts due, both principal and interest, according to the contractual terms of the agreement. When an investment is deemed impaired, the impairment is measured based on the expected future cash flows discounted at the investment’s effective interest rate. As a practical expedient, the Financial Accounting Standards Board (the “FASB”) issued ASC Topic 310,Receivables, which permits a creditor to measure an observable market price for the impaired debt related investment as an alternative to discounting expected future cash flows. Regardless of the measurement method, a creditor should measure impairment based on the fair value of the collateral when the creditor determines that foreclosure is probable. A debt related investment is also considered impaired if its terms are modified in a troubled debt restructuring (“TDR”). A TDR occurs when we grant a concession to a borrower in financial difficulty by modifying the original terms of the loan. Impairments on TDR loans are generally measured based on
| F-9 |
the present value of expected future cash flows discounted at the effective interest rate of the original loan.
We have certain investments that are legally structured as equity investments with rights to receive preferred economic returns (referred to throughout these Notes as “preferred equity” investments). We report these investments as real estate debt securities when the common equity holders have a contractual obligation to redeem our preferred equity interest at a specified date.
As of December 31, 2016 and December 31, 2015, none of our debt related investments are considered impaired, and no impairment charges have been recorded in these financial statements. We have invested in one debt related investment as of the date of these financial statements. The following table describes our debt related investment activity for the year ended December 31, 2016 and for the period November 19, 2015 (Inception) through December 31, 2015 (amounts in thousands):
| Investments in Real Estate Debt: | For the Year | For the Period | ||||||
| Beginning balance | $ | — | $ | — | ||||
| Investments(1) | 1,000 | — | ||||||
| Principal repayments | — | — | ||||||
| Amortization of deferred fees, costs, and discounts/premiums | — | — | ||||||
| Ending balance | $ | 1,000 | $ | — | ||||
| (1) | Investments include one preferred equity investment with contractually required redemption or maturity dates. |
Share Redemptions
The Company has adopted a redemption plan whereby on a quarterly basis, shareholders may request that the Company redeem at least 25% or more of their shares. Based on an assessment of the Company’s liquid resources and redemption requests, the Company’s Manager has the authority, in its sole discretion, to limit redemptions by each shareholder during any quarter, including if the Manager deems such action to be in the best interest of the shareholders as a whole.
Pursuant to the program, for the first eighty-nine (89) days following the settlement of the common shares subject to the redemption request (the “Introductory Period”), the per share redemption price will be equal to the purchase price of the shares being redeemed less any distributions received during that period. Shareholders that redeemed during the introductory period will not be allocated any distributions that were declared but unpaid during this period.
Beginning on the ninetieth day following the settlement of the common shares the Company may redeem shares with a per share redemption price calculated based on the most current Net Asset Value (“NAV”) per share. The redemption price is subject to the following discounts, depending upon when the shares are redeemed:
| F-10 |
| Holding Period from Date of Purchase | Effective Redemption Price(1) (as percentage of per share redemption price) | |||
| Less than 90 days (Introductory Period) | 100 | % | ||
| 90 days until 3 years | 97 | % | ||
| 3 years to 4 years | 98 | % | ||
| 4 years to 5 years | 99 | % | ||
| More than 5 years | 100 | % | ||
(1) The Effective Redemption Price will be rounded down to the nearest $0.01.
In addition, the redemption price will be reduced by the aggregate sum of distributions, if any, declared on the shares subject to the redemption request with record dates during the period between the quarter-end redemption request date and the redemption date.
Because the Company’s NAV per share will be calculated at the end of each quarter beginning at the end of the fourth quarter of 2017, the redemption price may change between the date the Company receives the redemption request and the date on which redemption proceeds are paid. As a result, the redemption price that a shareholder will receive may be different from the redemption price on the day the redemption request is made.
The Manager may amend, suspend, or terminate the redemption plan at any time in its sole discretion, without notice, including if it believes that such action is in the best interest of the shareholders as a whole.
Income Taxes
The Company operates in a manner intended to qualify for treatment as a REIT under the Internal Revenue Code of 1986, commencing with the taxable year ending December 31, 2016. To qualify as a REIT, the Company must meet certain organizational and operational requirements, including a requirement to distribute at least 90% of the Company’s annual REIT taxable income to its shareholders (which is computed without regard to the distributions paid deduction or net capital gain and which does not necessarily equal net income as calculated in accordance with generally accepted accounting principles). As a REIT, the Company generally will not be subject to U.S. federal income tax to the extent it distributes qualifying distributions to its shareholders. Even if the Company qualifies for taxation as a REIT, it may be subject to certain state and local taxes on its income and property, and federal income and excise taxes on its undistributed income. No material provisions have been made for federal income taxes in the accompanying financial statements, and no gross deferred tax assets or liabilities have been recorded as of December 31, 2016 or December 31, 2015.
All tax periods since inception remain open to examination by the major taxing authorities in all jurisdictions where we are subject to taxation.
Distributions
Our distributions are characterized for federal income tax purposes as (i) ordinary income, (ii) non-taxable return of capital, or (iii) long-term capital gain. Distributions that exceed current or accumulated tax earnings and profits constitute a return of capital for tax purposes and reduce the shareholders’ basis in the common shares. To the extent that distributions exceed both current and accumulated earnings and profits and the shareholders’ basis in the common shares, they will generally be treated as a gain or loss upon the sale or exchange of our shareholders’ common shares. We will report the taxability of our distributions in information returns that will be provided to our shareholders
| F-11 |
and filed with the Internal Revenue Service in the year following the distributions. This information will be provided annually beginning with the year ended December 31, 2016.
The Company declared one distribution during the year ended December 31, 2016. This distribution was or will be calculated based on shareholders of record each day during these periods.
The table below outlines the Company’s total distributions declared to shareholders and distributions relating to the Sponsor and its affiliates for each of the period(all amounts are in thousands except per share data):
| Shareholders | Related Parties(1) | |||||||||||||||
| Distributions for the Period: | Daily Distribution Per-Share Amount | Total Declared | Total Paid as of December 31, 2016 | Total | ||||||||||||
| January 1, 2017 through March 31, 2017 | 0.002260274 | $ | 113 | (2) | $ | — | $ | 2 | ||||||||
| Total | $ | 113 | $ | — | $ | 2 | ||||||||||
(1) Total distributions declared to related parties is included in total distributions declared to all shareholders.
(2) The liability for the first quarter 2017 distribution was estimated based on the daily distribution per-share amount multiplied by the number of shareholders as of the date of the preparation of the December 31, 2016 financial statements, and is scheduled to be paid within three weeks after the end of March 31, 2017.
Revenue Recognition
Interest income is recognized on an accrual basis and any related premium, discount, origination costs and fees are amortized over the life of the investment using the effective interest method. Interest income is recognized on senior debt investments classified as held to maturity securities, and investments in joint ventures that are accounted for using the cost method if the terms of the equity investment includes terms that are akin to interest on a debt instrument. As of December 31, 2016 and December 31, 2015, no amortization of premium, discount, origination costs or fees has been recognized.
Recent Accounting Pronouncements
In January 2016, the FASB issued Accounting Standards Update 2016-01 (“ASU 2016-01”),Financial Instruments – Overall, which changes the accounting for equity investments, financial liabilities under the fair value option, and the presentation and disclosure requirements for financial instruments. The FASB also clarifies the guidance related to the valuation allowance assessment when recognizing deferred tax assets resulting from unrealized losses on available-for-sale debt securities. The guidance will be effective for annual reporting periods (including interim periods within those periods) beginning after December 15, 2017. The guidance should be applied prospectively from that date. Early adoption is permitted regarding the guidance on the presentation of the change in fair value of financial liabilities under the fair value option for financial statements that have not been issued. We do not anticipate the adoption will have a significant impact on the presentation of these financial statements.
In February 2016, the FASB issued Accounting Standards Update 2016-02 (“ASU 2016-02”),Leases, which changes the accounting for leases for both lessors and lessees. The guidance requires lessees to recognize right-of-use assets and lease liabilities for virtually all of their leases, including leases embedded in other contractual arrangements, among other changes. The guidance will be effective for annual reporting periods (including interim periods within those periods) beginning after December 15, 2018, with early adoption permitted. We are currently assessing the impact of this update on the presentation of these financial statements.
In March 2016, the FASB issued Accounting Standards Update 2016-07 (“ASU 2016-07”),Investments – Equity Method and Joint Ventures, which eliminates the requirement to retrospectively apply the equity method in previous periods when an investor initially obtains significant influence over an investee. The new guidance requires an investor to apply the equity method prospectively from the date the investment qualifies for the equity method. The guidance will be effective for annual reporting periods (including interim periods within those periods) beginning after December 15, 2016, with early adoption permitted. We do not anticipate the adoption will have a significant impact on the presentation of these financial statements.
| F-12 |
In June 2016, the FASB issued Accounting Standards Update 2016-13 (“ASU 2016-13”),Financial Instruments-Credit Losses: Measurement of Credit Losses on Financial Instruments, which requires the measurement and recognition of expected credit losses for financial assets held at amortized cost. ASU 2016-13 replaces the existing incurred loss impairment model with an expected loss methodology, which will result in more timely recognition of credit losses. ASU 2016-13 is effective for annual reporting periods, and interim periods within those years beginning after December 15, 2019. We are currently in the process of evaluating the impact of the adoption of this standard on our financial statements.
In August 2016, the FASB issued Accounting Standards Updated 2016-1 (“ASU 2016-15”),Statement of Cash Flows: Classification of Certain Cash Receipts and Cash Payments, which provides guidance on the presentation and classification in the statement of cash flows for specific cash receipt and payment transactions, including debt prepayment or extinguishment costs, contingent consideration payments made after a business combination, proceeds from the settlement of insurance claims and corporate-owned life insurance policies, and distributions received from equity method investees. This standard is effective for fiscal years beginning after December 15, 2017, including interim periods within that reporting period. We are currently in the process of evaluating the impact of the adoption of this standard on our financial statements.
In November 2016, the FASB issued Accounting Standards Updated 2016-18 (“ASU 2016-18”)Statement of Cash Flows: Restricted Cash, which clarifies the presentation requirements of restricted cash within the statement of cash flows. The changes in restricted cash and restricted cash equivalents during the period should be included in the beginning and ending cash and cash equivalents balance reconciliation on the statement of cash flows. When cash, cash equivalents, restricted cash or restricted cash equivalents are presented in more than one line item within the statement of financial position, an entity shall calculate a total cash amount in a narrative or tabular format that agrees to the amount shown on the statement of cash flows. Details on the nature and amounts of restricted cash should also be disclosed. This standard is effective for fiscal years beginning after December 15, 2017, including interim periods within that reporting period. We are currently in the process of evaluating the impact of the adoption of this standard on our financial statements.
In January 2017, the FASB issued Accounting Standards Update 2017-01 (“ASU 2017-01”),Business Combinations, which clarifies the definition of a business, particularly when evaluating whether transactions should be accounted for as acquisitions or dispositions of assets or businesses. The first part of the guidance provides a screen to determine when a set is not a business; the second part of the guidance provides a framework to evaluate whether both an input and a substantive process are present. The guidance will be effective for annual reporting periods (including interim periods within those periods) beginning after December 15, 2017. Early adoption is permitted for transactions that have not been reported in issued financial statements. We are currently assessing the impact of this update on the presentation of these financial statements.
The Company evaluated subsequent events through March 17, 2017, which is the date the financial statements were available to be issued.
| F-13 |
| 3. | Investments in Real Estate Related Assets |
The following table presents the Company’s investments in real estate related assets, as of December 31, 2016, all of which were acquired during the fourth quarter of 2016 (dollars in thousands):
| Asset Type | Number | Principal Amount or Cost | Future Funding Commitments | Carrying Value | Allocation by Investment Type(1) | |||||||||||||||
| Preferred Equity | 3 | $ | 1,000 | $ | 10,025 | $ | 1,000 | 100 | % | |||||||||||
Balance as of December 31, 2016 | 3 | $ | 1,000 | $ | 10,025 | $ | 1,000 | 100 | % | |||||||||||
| (1) | This allocation is based on the principal amount of debt actually disbursed to date and interest that was contractually converted to principal and preferred equity investments at cost. It does not include future funding commitments that are not yet drawn. |
The following table presents certain information about the Company’s investments in real estate related assets, as of December 31, 2016, by contractual maturity grouping(dollar amounts in thousands):
| Asset Type | Number | Amounts Maturing Within One Year | Amounts Maturing After One Year Through Five Years | Amounts Maturing After Five Years Through Ten Years | Amounts Maturing After Ten Years | |||||||||||||
| Preferred Equity | 3 | $ | — | $ | — | $ | 1,000 | $ | — | |||||||||
Balance as of December 31, 2016 | 3 | $ | — | $ | — | $ | — | $ | — | |||||||||
Credit Quality Monitoring
The Company’s debt investments and preferred equity investments that earn interest based on debt-like terms are typically secured by senior liens on real estate properties, mortgage payments, mortgage loans, or interests in entities that have interests in real estate similar to the interests just described. The Company evaluates its debt investments at least quarterly and differentiates the relative credit quality principally based on: (i) whether the borrower is currently paying contractual debt service or guaranteed preferred equity payments in accordance with its contractual terms; and (ii) whether the Company believes the borrower will be able to perform under its contractual terms in the future, as well as the Company’s expectations as to the ultimate recovery of principal at maturity. The Company considered investments for which it expects to receive full payment of contractual principal and interest payments as “performing.” As of December 31, 2016, all investments are considered to be performing. In the event that an investment is deemed other than performing, the Company will evaluate the instrument for any required impairment.
| 4. | Fair Value of Financial Instruments |
We are required to disclose an estimate of fair value of our financial instruments for which it is practicable to estimate the value. The fair value of a financial instrument is the amount at which such financial instrument could be exchanged in a current transaction between willing parties, other than in a
| F-14 |
forced sale or liquidation. For certain of our financial instruments, fair values are not readily available since there are no active trading markets as characterized by current exchanges by willing parties.
We determine the fair value of certain investments in accordance with the fair value hierarchy that requires an entity to maximize the use of observable inputs. The fair value hierarchy includes the following three levels based on the objectivity of the inputs, which were used for categorizing the assets or liabilities for which fair value is being measured and reported:
Level 1 – Quoted market prices in active markets for identical assets or liabilities.
Level 2 – Significant other observable inputs (e.g., quoted prices for similar items in active markets, quoted prices for identical or similar items in markets that are not active, inputs other than quoted prices that are observable such as interest rate and yield curves, and market-corroborated inputs).
Level 3 – Valuation generated from model-based techniques that use inputs that are significant and
unobservable in the market. These unobservable assumptions reflect estimates of inputs that market participants would use in pricing the asset or liability. Valuation techniques include use of option pricing models, discounted cash flow methodologies or similar techniques, which incorporate management’s own estimates of assumptions that market participants would use in pricing the instrument or valuations that require significant management judgment or estimation.
The Company’s financial instruments consist of cash, three debt securities, and accounts payable. The carrying values of cash and cash equivalents, receivables, and accounts payable are reasonable estimates of their fair value. The aggregate fair value of our debt investments is based on unobservable Level 3 inputs which management has determined to be its best estimate of current market values. The methods utilized generally included a discounted cash flow method (an income approach) and recent investment method (a market approach). Significant inputs and assumptions include the market based interest or preferred return rate, loan to value ratios, and expected repayment and prepayment dates.
As a result of this assessment, as of December 31, 2016, management estimated the carrying value of our debt investment is a reasonable estimate of its fair value.
| 5. | Borrowings |
As of December 31, 2016, the Company has not entered into any credit agreements from which it has drawn funds. The Company has entered into a promissory grid note arrangement with a related party, but has not drawn funds from such note. See Note 6 – Related Party Arrangements –Rise Companies Corp.
| 6. | Related Party Arrangements |
Fundrise Advisors, LLC, Manager
Subject to certain restrictions and limitations, the Manager is responsible for managing the Company’s affairs on a day-to-day basis and for identifying and making acquisitions and investments on behalf of the Company.
The Manager and certain affiliates of the Manager receive fees and compensation in connection with the Company’s public offering, and the acquisition, management and sale of the Company’s real estate investments.
The Manager will be reimbursed for organizational and offering expenses incurred in conjunction with the Offering. The Company will reimburse the Manager, subject to the reimbursement limit
| F-15 |
previously described, for actual expenses incurred on behalf of the Company in connection with the selection, acquisition or origination of an investment, to the extent not reimbursed by the borrower, whether or not the Company ultimately acquires or originates the investment. The Company will reimburse the Manager for out-of-pocket expenses paid to third parties in connection with providing services to the Company. This does not include the Manager’s overhead, employee costs borne by the Manager, utilities or technology costs. Expense reimbursements payable to the Manager also may include expenses incurred by the Sponsor in the performance of services pursuant to a shared services agreement between the Manager and the Sponsor, including any increases in insurance attributable to the management or operation of the Company. See Note 2 – Summary of Significant Accounting Policies – Organizational, Offering and Related Costs.
The following table summarizes reimbursable costs incurred by the Company during the year ended December 31, 2016 and for the period November 19, 2015 (Inception) through December 31, 2015(amounts in thousands)
| Reimbursable Organizational and Offering Costs Due to Fundrise Advisors, LLC: | As of December 31, 2016 | For the Period November 19, 2015 (Inception) through December 31, 2015 | ||||||
| Organizational costs | $ | 24 | $ | — | ||||
| Offering costs(1) | 445 | — | ||||||
| Reimbursements made | (34 | ) | — | |||||
| Balance as of December 31, 2016 | $ | 435 | $ | — | ||||
| (1) | As of December 31, 2016, $48,953 of offering costs were amortized against members’ equity, which represents the ratable portion of proceeds raised to date to the total amount of proceeds expected to be raised from the Offering. |
The Company will pay the Manager a quarterly asset management fee of one-fourth of 1.00%, which, until December 31, 2017, will be based on our net offering proceeds as of the end of each quarter, unless the Manager does not require reimbursement in any particular quarter, and thereafter will be based on our NAV at the end of each prior quarter.
The Company’s Manager has agreed, for a period until December 31, 2016 (the “fee waiver period”), to waive its asset management fee during the fee waiver period if the average annualized non-compounded return to investors is less than eight percent (8%). Following the conclusion of the fee waiver period, our Manager may, in its sole discretion, waive its asset management fee, in whole or in part. The Manager will forfeit any portion of the asset management fee that is waived. Accordingly, during the year ended December 31, 2016 and the period November 19, 2015 (Inception) through December 31, 2015, no asset management fees have been paid or accrued to the Manager.
The Company will also pay the Manager a special servicing fee for any non-performing asset at an annualized rate of 2.00%, which will be based on the original value of such non-performing asset. The Manager will determine, in its sole discretion, whether an asset is non-performing. As of December 31, 2016 and December 31, 2015, the Manager has not designated any asset as non-performing and no special servicing fees have been paid to the Manager.
The Company will also pay the Manager a disposition fee from the liquidation of any of our equity investments in real estate equal to 0.5% of the gross proceeds after repayment of any property level debt. As of December 31, 2016 and December 31, 2015, no equity investments had been acquired or disposed of, and accordingly no disposition fees were incurred.
| F-16 |
Fundrise Servicing, LLC
Fundrise Servicing, LLC may receive a fee from 0.00% to 0.50% for the ongoing servicing and administration of certain loans and investments held by us. The fee is calculated as an annual percentage of the stated value of the loan and is deducted at the time that payments on the loan are made. The fee is deducted from payments in proportion to the split between current and accrued payments. Servicing fees may be waived at Fundrise Servicing, LLC’s sole discretion. As of December 31, 2016 and December 31, 2015, the Company had not paid any servicing fees nor had any servicing fees been accrued to Fundrise Servicing, LLC.
Fundrise Lending, LLC
As an alternative means of acquiring loans or other investments for which we do not yet have sufficient funds, and in order to comply with certain state lending requirements, Fundrise Lending, LLC or its affiliates may close and fund a loan or other investment prior to it being acquired by us. The ability to warehouse investments allows us the flexibility to deploy our offering proceeds as funds are raised. We then will acquire such investment at a price equal to the fair market value of the loan or other investment (including reimbursements for servicing fees and accrued interest, if any), so there is no mark-up (or mark-down) at the time of our acquisition. During the year ended December 31, 2016, the Company purchased one investment that was warehoused or owned by Fundrise Lending, LLC.
For situations where our sponsor, Manager or their affiliates have a conflict of interest with us that is not otherwise covered by an existing policy we have adopted or a transaction is deemed to be a “principal transaction”, the Manager has appointed an independent representative (the “Independent Representative”) to protect the interests of the shareholders and review and approve such transactions. Any compensation payable to the Independent Representative for serving in such capacity on our behalf will be payable by us. Principal transactions are defined as transactions between our Sponsor, Manager or their affiliates, on the one hand, and us or one of our subsidiaries, on the other hand. Our Manager is only authorized to execute principal transactions with the prior approval of the Independent Representative and in accordance with applicable law. Such prior approval may include but not be limited to pricing methodology for the acquisition of assets and/or liabilities for which there are no readily observable market prices. During the year ended December 31, 2016 and the period November 19, 2015 (Inception) through December 31, 2015 fees of $4,000 and $0, respectively, were paid to the Independent Representative as compensation for those services.
Fundrise, L.P., Member
As an alternative means of acquiring loans or other investments for which we do not yet have sufficient funds, Fundrise L.P. may provide capital to Fundrise Lending, LLC for the purposes of acquiring investments where there would otherwise be insufficient capital. During the year ended December 31, 2016, Fundrise, L.P. did not provide capital to Fundrise Lending, LLC for the purposes of acquiring investments on behalf of the company.
Fundrise, L.P. is a member of the Company and holds 9,500 shares as of December 31, 2016. Fundrise, L.P. did not hold any shares at December 31, 2015, but was committed to purchase 9,500 shares. One of our Sponsor’s wholly-owned subsidiaries is the general partner of Fundrise L.P.
Rise Companies Corp, Member and Sponsor
As a means to provide liquidity during capital raising periods, Rise Companies Corp. issued a promissory grid note to the Company and its affiliates in the amount of $10,000,000. The loan bears a 2.5% interest rate and expires on January 31, 2017. The total drawn between the five noteholders may
| F-17 |
not exceed $10,000,000. As of December 31, 2016, the Company had not drawn against the promissory grid note and had not paid any interest to Rise Companies Corp.
Rise Companies Corp is a member of the Company and holds 500 shares as of December 31, 2016 and as of December 31, 2015.
Executive Officers of Our Manager
As of the date of these financial statements, the executive officers of our Manager and their positions and offices are as follows:
| Name | Position | |
| Benjamin S. Miller | Chief Executive Officer and Interim Chief Financial Officer and Treasurer | |
| Brandon T. Jenkins | Chief Operating Officer | |
| Bjorn J. Hall | General Counsel, Chief Compliance Officer, and Secretary |
Benjamin S. Millercurrently serves asChief Executive Officer of our Manager and has served as Chief Executive Officer and Director of our Sponsor since its inception on March 14, 2012. As of February 9, 2016, Ben is also serving as Interim Chief Financial Officer and Treasurer of our Manager.
Brandon T. Jenkinscurrently serves as Chief Operating Officer of our Manager and has served in the same role for our Sponsor since February of 2014, prior to which time he served as Head of Product Development and Director of Real Estate.
Bjorn J. Hallcurrently serves as the General Counsel, Chief Compliance Officer and Secretary of our Manager and has served in such capacities with our Sponsor since February 2014.
| 7. | Economic Dependency |
Under various agreements, the Company has engaged or will engage Fundrise Advisors, LLC and its affiliates to provide certain services that are essential to the Company, including asset management services, asset acquisition and disposition decisions, the sale of the Company’s common shares available for issue, as well as other administrative responsibilities for the Company including accounting services and investor relations. As a result of these relationships, the Company is dependent upon Fundrise Advisors, LLC and its affiliates. In the event that these companies were unable to provide the Company with the respective services, the Company would be required to find alternative providers of these services.
| 8. | Commitments and Contingencies |
Legal Proceedings
As of the date of the financial statements we are not currently named as a defendant in any active or pending litigation. However, it is possible that the company could become involved in various litigation matters arising in the ordinary course of our business. Although we are unable to predict with certainty the eventual outcome of any litigation, management is not aware of any litigation likely to occur that we currently assess as being significant to us.
| F-18 |
| 9. | Subsequent Events |
Offering
As of March 17, 2017, we had raised total gross offering proceeds of approximately $9,619,800 from settled subscriptions (including the $100,000 received in the private placements to our sponsor, Rise Companies Corp., and Fundrise, L.P., an affiliate of our sponsor), and had settled subscriptions in our Offering and private placements for a gross aggregate of approximately 961,980 of our common shares.
Organizational, Offering and Related Costs
As a result of the Offering raising in excess of the $1,000,000 threshold, the organizational, offering and related costs paid by the Manager or its affiliates on behalf of the Company are required to be reimbursed by the Company. As of March 17, 2017 $96,064 of reimbursement payments have been made.
Distributions Payable
On December 31, 2016, the Manager of the Company ratified a daily distribution of $0.0022602740 per share (the “Q1 2017 Daily Distribution Amount”) for shareholders of record as of the close of business on each day of the period commencing on January 1, 2017 and ending on March 31, 2017 (the “Q1 2017 Distribution Period”). The distributions are payable to shareholders of record as of the close of business on each day of the Q1 2017 Distribution Period and the distributions are scheduled to be paid within the first three weeks of the end of the Q1 2017 Distribution Period. The aggregate estimated amount of cash to be distributed related to the Q1 2017 Distribution Period is approximately $113,000. We will begin processing Q1 2017 distributions prior to April 21, 2017.
Settling Subscriptions
The entire amount of the $272,300 of settling subscriptions that existed as of December 31, 2016 were subsequently settled and common shares were issued by January 7, 2017.
Amended and Restated Promissory Grid Note
On October 25, 2016, the Company entered into an amended and restated promissory grid note, as borrower, with Rise Companies Corp, our Sponsor, as lender. The amended and restated note provides up to $10,000,000 in credit. On January 31, 2017, the expiration date was extended to April 30, 2017, and the interest rate increased to 3%. The Company did not pay any extension or other fees related to the amendment of this note.
| F-19 |
| Item 8. | Exhibits |
INDEX OF EXHIBITS
| Exhibit No. | Description | |
| 2.1** | Certificate of Formation (incorporated by reference to the copy thereof submitted as Exhibit 2.1 to the Company’s DOS/A filed as Exhibit 15.3 of Form 1-A) | |
| 2.2** | Certificate of Amendment (incorporated by reference to the copy thereof submitted as Exhibit 2.2 to the Company’s DOS/A filed as Exhibit 15.3 of Form 1-A) | |
| 2.3** | Amended and Restated Operating Agreement (incorporated by reference to the copy thereof submitted as Exhibit 2.3 to the Company’s DOS/A filed as Exhibit 15.3 of Form 1-A) | |
| 4.1** | Form of Subscription Package (incorporated by reference to the copy thereof submitted as Exhibit 4.1 of Form 1-A) | |
| 6.1** | Form of License Agreement between Fundrise Midland Opportunistic REIT, LLC and Fundrise, LLC (incorporated by reference to the copy thereof submitted as Exhibit 6.1 to the Company’s DOS/A filed as Exhibit 15.3 of Form 1-A) | |
| 6.2** | Form of Fee Waiver Support Agreement between Fundrise Midland Opportunistic REIT, LLC and Fundrise Advisors, LLC (incorporated by reference to the copy thereof submitted as Exhibit 6.2 to the Company’s DOS/A filed as Exhibit 15.3 of Form 1-A) | |
| 6.3** | Form of Shared Services Agreement between Rise Companies Corp. and Fundrise Advisors, LLC (incorporated by reference to the copy thereof submitted as Exhibit 6.3 to the Company’s DOS/A filed as Exhibit 15.3 of Form 1-A) | |
| 6.4** | Form of Servicing Agreement between Fundrise Midland Opportunistic REIT, LLC and Fundrise Servicing, LLC (incorporated by reference to the copy thereof submitted as Exhibit 6.4 to the Company’s DOS/A filed as Exhibit 15.3 of Form 1-A) | |
| 11.1* | Consent of RSM US LLP | |
| 15.1** | Draft offering statement previously submitted pursuant to Rule 252(d) (incorporated by reference to the copy thereof previously made public pursuant to Rule 301 of Regulation S-T) | |
| 15.2** | Draft amended offering statement previously submitted pursuant to Rule 252(d) (incorporated by reference to the copy thereof previously made public pursuant to Rule 301 of Regulation S-T) | |
| 15.3** | Draft amended offering statement previously submitted pursuant to Rule 252(d) (incorporated by reference to the copy thereof previously made public pursuant to Rule 301 of Regulation S-T) | |
| 15.4** | Correspondence by or on behalf of the issuer previously submitted pursuant to Rule 252(d) (incorporated by reference to the copy thereof previously made public pursuant to Rule 301 of Regulation S-T) |
| * | Filed herewith |
| ** | Filed previously |
| 44 |
SIGNATURES
Pursuant to the requirements of Regulation A, the issuer has duly caused this Annual Report to be signed on its behalf by the undersigned, thereunto duly authorized, in Washington, D.C. on April 13, 2017.
| Fundrise Midland Opportunistic REIT, LLC | ||
| By: | Fundrise Advisors, LLC, a Delaware limited liability company, its Manager | |
| By: | /s/ Benjamin S. Miller | ||
| Name: | Benjamin S. Miller | ||
| Title: | Chief Executive Officer | ||
Pursuant to the requirements of Regulation A, this report has been signed below by the following persons on behalf of the issuer in the capacities and on the dates indicated.
| Signature | Title | Date | ||
| /s/ Benjamin S. Miller | Chief Executive Officer, | April 13, 2017 | ||
| Benjamin S. Miller | Interim Chief Financial Officer | |||
| and Treasurer of | ||||
| Fundrise Advisors, LLC (Principal Executive Officer, Principal Financial Officer and Principal Accounting Officer) |
| 45 |