2007 Annul Repot
One Team, Building Relationships, Providing Solutions.
Camco Financial Corporation
TABLE OF CONTENTS
| | | | | |
| Introduction | | | 3 / 4 | |
| Customer Focus | | | 5 / 6 | |
| Financial Highlights | | | 7 | |
| Market Footprint | | | 8 | |
| Board of Directors | | | 9 | |
| Senior Management | | | 10 | |
| Letter to Stockholders | | | 11 / 12 | |
| Stockholder Information | | | 13 / 14 | |
| Financials | | Insert |
One Team, Building Relationships, Providing Solutions.
Working together toward shared goals.
With the right processes and procedures in place, it is possible for an organization of individuals with unique skills and talents to work as one. At Advantage Bank, we have developed and implemented a comprehensive approach to maintain our focus on key goals and objectives.
It begins with standardized training modules that are applied throughout the company. A complete training calendar is available to all employees, as well as customized, yet consistent, training to meet individual needs.
A thorough internal communication system also plays a key role in achieving common goals. In addition to company-wide bulletins, schedules and calendars, a monthly message from the president reaches every employee. The information shared in the president’s message serves as an important touch point and brings perspective and clarity to what we are trying to achieve on a daily basis.
Collaboration is part of our culture and has always been an important component of our One Team concept. Management and employees at all levels work together to achieve the best possible results. In fact, it is standard practice for employees to visit markets and banking offices other than their own to offer fresh perspectives and strengthen best practices. In addition, we form cross-functional teams to develop new processes and procedures to ensure all voices are heard.
Collaboration also extends beyond internal boundaries, as we invite our customers to join us and work side-by-side with us on community service projects, including Habitat for Humanity and Relay For Life. We believe this collaborative approach not only strengthens our team, but helps us build long-lasting customer relationships.
“My business card says I work for Advantage Bank, but really, I work for our customers. We ask our customers to tell us what we can do to improve their experience with Advantage Bank. Their input helps us to develop new and unique ideas for delivering financial solutions to meet their needs. “
Rick Baylor
Every customer is our top priority.
As a community bank, we are keenly aware that the relationships we build with our customers are vital to our future success. While many aspects of our relationship building are simply the result of good people who truly care about their customers, there is also a structured component to how we go about building long lasting relationships.
We make every effort to gain a full understanding of the needs of our customers by asking the right questions on an ongoing basis. By maintaining a relationship with each one of our customers, we are in a position to recommend the appropriate financial products and services based on their current, yet ever changing needs.
Of course, we understand that relationships are about more than people. Competitive and contemporary financial products are also a key component to maintaining long-term customers. So we develop meaningful financial products designed to meet customer needs and offer special product pricing incentives for customers with multiple accounts.
Naturally, every successful relationship is built on trust. So we strive to become trusted advisors for our customers by providing sound advice and guidance. When customers know they can count on you, they look to you time and time again. That’s how relationships are built. And that’s how we will continue to build success.
PROVIDING SOLUTIONS.
Our goal is helping our customers reach theirs.
There are two key components to providing customers with quality solutions. Knowledgeable people and a comprehensive product suite. At Advantage Bank, we are fortunate to have both.
We are not in the business of selling banking products to our customers. Rather, our business is all about getting to know our customers, so we can provide them with solutions that will help them reach their goals.
It begins with thorough product understanding. Our associates have the benefit of a training program that helps them connect product features and benefits to customer needs. We don’t just emphasize how our products work, we emphasize what our products can do.
With this knowledge in place, conversations become much more productive. We ask the appropriate questions to uncover our customers’ true needs. Then we follow through on a regular basis to ensure those needs are being met.
The One Team concept, relationship building and working to provide solutions are all interrelated. Together, these key initiatives provide the foundation for our future success.
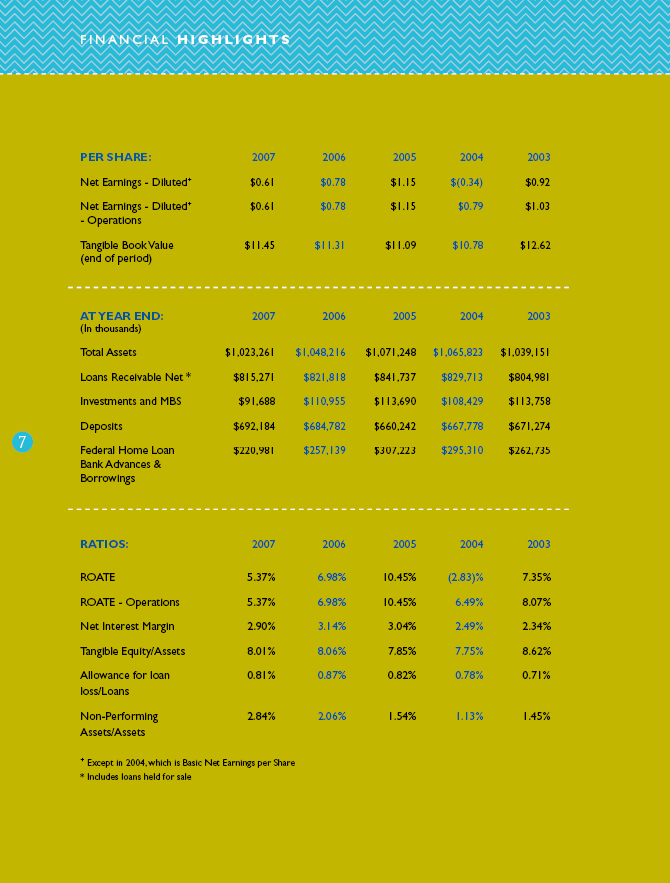
FINANCIAL HIGHLIGHTS
| | | | | | | | | | | | | | | | | | | | | |
| PER SHARE: | | 2007 | | | 2006 | | | 2005 | | | 2004 | | | 2003 | |
| | | | | | | | | | | | | | | | | | | | | |
Net Earnings — Diluted+ | | $ | 0.61 | | | $ | 0.78 | | | $ | 1.15 | | | $ | (0.34 | ) | | $ | 0.92 | |
Net Earnings — Diluted+ | | $ | 0.61 | | | $ | 0.78 | | | $ | 1.15 | | | $ | 0.79 | | | $ | 1.03 | |
| - Operations | | | | | | | | | | | | | | | | | | | | |
| Tangible Book Value | | $ | 11.45 | | | $ | 11.31 | | | $ | 11.09 | | | $ | 10.78 | | | $ | 12.62 | |
| (end of period) | | | | | | | | | | | | | | | | | | | | |
| | | | | | | | | | | | | | | | | | | | | |
| AT YEAR END: | | 2007 | | | 2006 | | | 2005 | | | 2004 | | | 2003 | |
| (In Thousand) | | | | | | | | | | | | | | | | | | | | |
| Total Assets | | $ | 1,023,261 | | | $ | 1,048,216 | | | $ | 1,071,248 | | | $ | 1,065,823 | | | $ | 1,039,151 | |
| Loans Receivable Net * | | $ | 815,271 | | | $ | 821,818 | | | $ | 841,737 | | | $ | 829,713 | | | $ | 804,981 | |
| Investments and MBS | | $ | 91,688 | | | $ | 110,955 | | | $ | 113,690 | | | $ | 108,429 | | | $ | 113,758 | |
| Deposits | | $ | 692,184 | | | $ | 684,782 | | | $ | 660,242 | | | $ | 667,778 | | | $ | 671,274 | |
| Federal Home Loan | | $ | 220,981 | | | $ | 257,139 | | | $ | 307,223 | | | $ | 295,310 | | | $ | 262,735 | |
| Bank Advances & Borrowings | | | | | | | | | | | | | | | | | | | | |
| | | | | | | | | | | | | | | | | | | | | |
| RATIOS: | | 2007 | | | 2006 | | | 2005 | | | 2004 | | | 2003 | |
| ROATE | | | 5.37 | % | | | 6.98 | % | | | 10.45 | % | | | (2.83 | )% | | | 7.35 | % |
| ROATE — Operations | | | 5.37 | % | | | 6.98 | % | | | 10.45 | % | | | 6.49 | % | | | 8.07 | % |
| Net Interest Margin | | | 2.90 | % | | | 3.14 | % | | | 3.04 | % | | | 2.49 | % | | | 2.34 | % |
| Tangible Equity/Assets | | | 8.01 | % | | | 8.06 | % | | | 7.85 | % | | | 7.75 | % | | | 8.62 | % |
| Allowance for loan | | | 0.81 | % | | | 0.87 | % | | | 0.82 | % | | | 0.78 | % | | | 0.71 | % |
| loss/Loans | | | | | | | | | | | | | | | | | | | | |
| Non-Performing | | | 2.84 | % | | | 2.06 | % | | | 1.54 | % | | | 1.13 | % | | | 1.45 | % |
| Assets/Assets | | | | | | | | | | | | | | | | | | | | |
| | |
| + | | Except in 2004, which is Basic Net Earnings per Share
|
| |
| * | | Includes loans held for sale |
MARKET FOOTPRINT
OHIO
Belpre
Byesville
Cambridge
Downtown
N. 11th St.
Cincinnati
Westwood
Glencrossing
Mason
Mt. Adams
Dover
Germantown
London
Downtown
Eagleton Center
marietta
Downtown
Lafayette Center
New Lebanon
Uhrichsville
Washington Court House
Downtown
Washington Ave.
Worthington
KENTUCKY
Covington
Florence
Ft. mitchell
WEST Virginia
vienna
Corporate Headquarters
Banking Offices
Title Offices
Camco Financial Corporation, Holding Company of Advantage Bank, is a multi-state financial services Holding Company headquartered in Cambridge, Ohio. Advantage Bank and its affiliate, Camco Title Agency, offer relationship banking that includes commercial, small business and consumer financial services, internet banking and title insurance services from 28 offices in Ohio, Kentucky and West Virginia.
BOARD OF DIRECTORS
FRONT ROW — LEFT TO RIGHT:
Susan J. Insley, Lead Director, Retired EVP,
Cochran Group inc. (2, 3, 5)
Richard C. Baylor, Chairman / CEO / President,
Camco Financial Corporation (4, 5)
Robert C. Dix, Jr., Publisher, The Daily Jeffersonian (1, 3)
Jeffrey T. Tucker,CPA& Partner, Tucker & Tucker (1, 4, 5)
Dr. Samuel W. Speck, Director, Ohio Department of Natural Resources
2007 COMMITTEES
(1) Audit & Risk Management Committee:
Jeffrey T. Tucker, Chair
(2) Compensation Committee:
Terry A. Feick Chair
(3) Corporate Governance and Nominating Committee:
Susan J. Insley, Chair
(4) Executive Loan Committee:
Carson K. Miller, Chair
(5) Executive Committee:
Richard C. Baylor, Chair
BACK ROW — LEFT TO RIGHT:
Paul D. Leake, retired President / CEO, First Federal bank for Savings (4)
Terry A. Feick, retired Superintendent, Washington Court House City Schools (2, 3, 5)
Carson K. Miller, retired President, Washington State Community College (2, 4)
J. Timothy Young, Senior Vice President, Hamilton Capital management, Inc. (1, 3)
Edward D. Goodyear, Treasurer, The Dispatch Printing Company (1)
Douglas F. Mock, President, Mock Woodworking Company (2, 4)
BOARDRETIREMENTS
Dr. Samuel W. Speck
Retired from the board on January 23, 2007.
Sam joined the Camco Financial Board of Directors in 1991, serving for 16 years. He is a former Ohio State Representative and State Senator. He served
as president of Muskingum College in New Concord, Ohio for 11 years and recently retired as the
Director of the Ohio Department of Natural Resources.
Robert C. Dix, Jr.
Retired from the board on December 7, 2007.
Bob was a member of the Camco Financial board of directors for 13 years. He recently retired as
publisher of the Daily Jeffersonian and as Chairman of the Board of Dix Communications in
Cambridge, Ohio. He continues to serve on the Board of Directors of Dix Communications, which
operates newspapers in Ohio and Kentucky as well as radio stations in Florida, Maryland and Ohio.
He also serves on the Sun-Journal Newspapers Board of Directors in Lewiston, Maine.
SENIOR MANAGEMENT
BOARDADDITIONS
Andrew S. Dix named to the board on December 7, 2007
Since 2006 Andrew S. dix has been the publisher of the
daily & Sunday Jeffersonian and vice president of dix
Communications which operates seven daily newspapers and
25 weekly newspapers in Ohio and Kentucky and nine radio
stations in Florida, Maryland and Ohio.
RICHARD C. BAYLOR
CHAIRMAN / CEO / President
ERIC S. NADEAU
SVP / CFO / TREASURER
EDWARD A. WRIGHT
SVP / OPERATIONS
JAMES W . CHUGG
VP / Human RESOURCES
D. EDWARD RUGG
EVP / CHIEF Credit OFFICER
DAVID S. CALDWELL
SVP / RETAIL BANKING
KEMPER C. ALLISON
SVP / SENIOR LENDING OFFICER
LETTER TO STOCKHOLDERS
Dear Fellow Stockholders,
Camco Financial Corporation (“Camco”) reported net earnings for the year 2007 of $4.50 million or $0.61 per share as compared with net earnings of $5.87 million or $0.78 per share for the year 2006. The decrease in earnings was mainly caused by the deteriorating credit quality throughout the Midwest as real estate related loans were adversely affected with slower property sales, higher foreclosure and bankruptcy flings and higher unemployment throughout our operating footprint. We prudently adjusted our credit standards during the year to be more cautious lenders in what has quickly become a distressed economic environment. Additionally, our net interest margin contracted from 3.16% in the fourth quarter, 2006 to 2.94% in the fourth quarter, 2007 due to continued competition with other banks to attract deposits, and thus our net interest income declined as well during the year.
2007 has been the proverbial roller coaster ride. We began 2007 with growth in loans and deposits, only to see both diminish as economic turmoil surfaced in the second half of the year. What a change the last six months of 2007 had on Midwest banking, due not only to continuing economic challenges in Ohio but also to the ongoing fallout from the subprime lending debacle that certainly has burst the housing bubble. That the economic picture in our markets, already weakened in recent years by job losses, could be worsened by the subprime lending practices mainly of Wall Street frms, certainly wasn’t what we foresaw coming into 2007. Ohio currently ranks third in the country in the number of foreclosures and these numbers are increasing. Regrettably, our bank — and others — may well suffer from this circumstance into 2008 and possibly 2009 as foreclosures continue on properties in an effort to recover dollars loaned. These issues and the associated costs they carry have depressed banks’ earnings and stock prices.
Publicly traded Ohio banks have seen their stock prices fall an average of 42% by year end 2007 from year end 2006. Camco’s stock price fell 13% during that same time period. Our financial results for 2007 reflect our economic environment and were very disappointing.
We did not stand still in 2007 as we began to experience that “roller coaster” ride. In the second quarter of 2007, we undertook a thorough review of our operations to determine where we could make changes to reduce costs or increase revenues. Generally, we have controlled operating costs well in the past and have compared favorably to other banks, but we know it is important to make continuous improvement in operating efficiencies. We identified about $750,000 of pretax profit from revenue enhancing or cost reduction initiatives that should help our bottom-line for 2008.
These initiatives included:
| • | | Closing three underperforming offices and consolidating several consumer lending functions with commensurate staff reductions, |
| • | | Reducing four banking divisions to two, |
| • | | Implementing a variety of fee income generating actions, and |
| |
| • | | Strengthening our ability to grow business banking with the addition of several experienced commercial bank lenders in our markets. |
We continued to work hard to achieve other improvements, even as the 2007 environment toughened:
| • | | Our loan delinquency year over year for residential mortgages actually decreased about 18% and foreclosures in process are down 49% from previous year levels, counter to the trend in Ohio. |
| • | | Deposits grew by $7.40 million, or 1.08%, and business-related deposits grew by $7.6 million — an 18.5% increase. Not an exact time period comparison, but the FDIC reported that deposits in Ohio grew only .23% from June 2006 to June 2007. Growing our deposits helped us achieve an internal goal to reduce our borrowed funds, which in our opinion, don’t carry the same value as depositor relationships over the long term. Growing deposits will be an ongoing challenge for banks, especially in slower growth markets of the Midwest. Yet, stable deposit growth allows us to grow our bank and serve the financial needs of our customers. |
| • | | We offered enhanced electronic banking products and services, including a redesigned Internet Banking website (www.advantagebank.com) and a suite of business checking products. We introduced Advantage Deposit 24 to provide our business banking customers with the ability to conveniently deposit checks electronically at their place of business. All of these products and services are designed to enhance customer service and increase banking relationships — with the added result of increasing fee income and deposits for the bank. |
| • | | We revised our organization structure to assure strategic focus on lending and credit operations, to promote a more direct flow of information to and from me, as CEO, and to enhance communications and execution throughout our organization. |
| • | | We enhanced employee training with a focus on meeting and exceeding customer needs and remain committed to the development of what we believe are the best people in banking. |
| • | | While closing three underperforming offices, we opened a new banking center in London, Ohio, to expand our existing presence in this community located near Columbus in Central Ohio. Central Ohio remains one of the better growth opportunity markets in our footprint. We will continue to assess our footprint to improve our locations whenever appropriate to better serve customers. |
Your Board of Directors remains committed to building stockholder value. To that end, in 2007 the Board approved a continuation of our Stock Repurchase program to enhance the value of stockholders. We also added a new director, Andrew S. Dix. Mr. Dix is publisher of the Daily Jeffersonian newspaper in Cambridge, Ohio and brings experience in the communications industry. We believe that adding involved community leaders with necessary skills to the Board creates value for our bank now and in the future. We would like to offer our gratitude and appreciation to two retired directors. Dr. Samuel W. Speck and Robert C. Dix, Jr. retired from our Board in 2007, and after serving 16 years and 13 years respectively, we would recognize here that their service and leadership served Camco well.
We must be realistic about 2008. The subprime lending issue will continue to negatively affect our economy and real estate markets for some time to come. Increases in foreclosed real estate on top of an already overstocked real estate market will add excess supply and hold real estate values down until the excess is absorbed. The quantity of new loan volume has been reduced in Advantage Bank’s markets, which will impede earnings growth. Our commercial loan portfolio, secured primarily by real estate, experienced a steady increase in delinquency in 2007, with some foreclosures and losses. We have identified and are working closely with those loan customers to seek workout initiatives and find solutions that reduce losses whenever possible. Our net charge-offs on loans in 2007 was a manageable ..24% of average net loans outstanding versus .15% for 2006. We have historically demonstrated our ability to mitigate losses, but in 2008 we anticipate higher than historical losses as we work through this very tough business cycle, although we feel we are adequately reserved against those potential losses.
Our overall loan delinquencies are at a level that is historically high. In large part, this is due to loans made appropriately to good customers but which customers’ circumstances have now changed. We are very much aware that the region in which we operate is currently experiencing a strained economy. The reasons for the economic strains are many and include the indirect effect of the various subprime lending programs that were operated in the United States by some lenders other than Advantage Bank.
Although we have not yet seen evidence that the economic downturn in real estate has run its course, we know that eventually it will improve. We will mitigate the bumpy ride as much as possible by sticking to our knitting and not reaching for results using high risk tactics. Instead, we will continue to manage the things we can — such as overhead, prudent lending and excellence in customer service. Every one of us would like to show better results for our work. We remain hopeful and are committed to achieving better results for our stockholders.
I am confident in our team’s ability to build strong banking relationships, which will increase the number of customers and subsequent profits for Camco Financial Corporation. In fact, our employees’ collective commitment to working as One Team, Building Relationships and Providing Solutions, bolsters the dedication needed for attaining and sustaining growth.
Thank you for your investment in Camco Financial Corporation, and I hope you will continue to refer people you know to our people at Advantage Bank.
Sincerely,
/s/ Richard C. Baylor
Richard C. Baylor
Chairman, Chief Executive Officer and President
Advantage Bank is a Member FDIC and an Equal Housing Lender.
STOCKHOLDER INFORMATION
QUESTIONS OR INFORMATION
Questions or inquiries regarding Camco Financial Corporation should be directed to:
Richard C. Baylor, Chairman / CEO / President
Camco Financial Corporation
6901 Glenn Highway
Cambridge, Ohio 43725
740-435-2020
E-mail:schorey@advantagebank.com
TRANSFER AGENT AND REGISTRAR
Communications regarding change of address, transfer of shares, lost
certificates and dividends should be directed to:
Registrar and Transfer Company
10 Commerce Drive
Cranford, New Jersey 07016-3572
800-368-5948
ANNUAL REPORT ON FORM 10-K
The Camco Financial Corporation Annual Report on Form 10-K filed with
the Securities and Exchange Commission and the Code of Ethics are available on Camco’s website or
free of charge upon written request directed to:
Camco Financial Corporation
Eric S. Nadeau
Chief Financial Officer
6901 Glenn Highway
Cambridge, Ohio 43725
740-435-2055
Fax: 740-435-2021
E-mail:ir@advantagebank.com
ANNUAL MEETING
Stockholders are cordially invited to attend the
Annual Meeting of Stockholders of Camco Financial
Corporation which will be held on Tuesday, April 22, 2008
at 3:00 PM Eastern Daylight Time at the Corporate
Headquarters, 6901 Glenn Highway, Cambridge, Ohio.
NASDAQ SYMBOL — CAFI
Internet Home Page Address: www.camcofinancial.com
CAMCO’S DIVIDEND REINVESTMENT PLAN Camco has arranged with its transfer agent, Registrar and
Transfer Company, to offer record holders of Camco common stock an opportunity to participate in
Camco’s Dividend Reinvestment Plan, which includes a Voluntary Cash Contribution Feature (the
“Plan”).
The Plan provides a flexible and convenient way to increase your ownership in Camco through the
investment of either part or all of your dividends in shares of Camco common stock or through
optional cash purchases of shares of Camco common stock.
If your shares in Camco common stock are not held in your name but are held by a broker or nominee
and you wish to participate in the Plan, the ownership of your shares must be transferred into your
name. Your broker or nominee will have to make such a transfer on your behalf before you may
complete the Authorization Card to enroll in the Plan. You may request an Authorization Card by
contacting Camco at 6901 Glenn Highway, Cambridge, Ohio 43725.
Your participation in the dividend reinvestment portion of the Plan will begin with the next cash
dividend payable after receipt of your completed Authorization Card, provided it is received at
least five (5) days before the record date for the dividend. Voluntary cash contributions can be
made immediately upon Registrar and Transfer Company’s receipt of your completed Authorization
Card.
You may withdraw from the Plan and rejoin at a later time as long as you
are a Camco stockholder.
Camco Financial Corporation
6901 Glenn Highway • Cambridge, Ohio 43725
2007 ANNUAL REPORT
Audited Financial Statements and Management’s Discussion and Analysis
Camco Financial Corporation
SELECTED CONSOLIDATED FINANCIAL DATA
The following tables set forth certain information concerning the consolidated financial position and results of operations of Camco for the periods indicated. This selected consolidated financial data should be read in conjunction with the consolidated financial statements appearing elsewhere in this report.
SELECTED CONSOLIDATED FINANCIAL DATA: (1)
| | | | | | | | | | | | | | | | | | | | | |
| | | As of December 31: | |
| | | 2007 | | | 2006 | | | 2005 | | | 2004 | | | 2003 | |
| |
| | | (In thousands) | |
| |
| Total amount of: | | | | | | | | | | | | | | | | | | | | |
| Assets | | $ | 1,023,261 | | | $ | 1,048,216 | | | $ | 1,071,248 | | | $ | 1,065,823 | | | $ | 1,039,151 | |
| Interest-bearing deposits in other financial institutions | | | 5,432 | | | | 12,673 | | | | 11,299 | | | | 17,045 | | | | 30,904 | |
| Securities available for sale – at market | | | 88,919 | | | | 107,506 | | | | 109,514 | | | | 100,160 | | | | 104,924 | |
| Securities held to maturity | | | 2,769 | | | | 3,449 | | | | 4,176 | | | | 8,269 | | | | 8,834 | |
| Loans receivable – net (2) | | | 815,271 | | | | 821,818 | | | | 841,737 | | | | 829,713 | | | | 804,981 | |
| Deposits | | | 692,184 | | | | 684,782 | | | | 660,242 | | | | 667,778 | | | | 671,274 | |
| FHLB advances and other borrowings | | | 220,981 | | | | 257,139 | | | | 307,223 | | | | 295,310 | | | | 262,735 | |
| Stockholders’ equity | | | 88,634 | | | | 91,092 | | | | 90,763 | | | | 89,321 | | | | 92,543 | |
SELECTED CONSOLIDATED OPERATING DATA: (1)
| | | | | | | | | | | | | | | | | | | | | |
| | | For the year ended December 31: | |
| | | 2007 | | | 2006 | | | 2005 | | | 2004 | | | 2003 | |
| |
| | | (In thousands, except per share data) | |
| |
| Total interest income | | $ | 65,317 | | | $ | 62,689 | | | $ | 57,078 | | | $ | 52,948 | | | $ | 54,875 | |
| Total interest expense | | | 36,421 | | | | 32,771 | | | | 26,529 | | | | 27,512 | | | | 31,327 | |
| | | |
| | | |
| Net interest income | | | 28,896 | | | | 29,918 | | | | 30,549 | | | | 25,436 | | | | 23,638 | |
| Provision for losses on loans | | | 1,495 | | | | 1,440 | | | | 1,480 | | | | 1,620 | | | | 1,446 | |
| | | |
| | | |
| Net interest income after provision for losses on loans | | | 27,401 | | | | 28,478 | | | | 29,069 | | | | 23,816 | | | | 22,192 | |
| Other income | | | 5,850 | | | | 5,033 | | | | 6,584 | | | | 7,082 | | | | 11,411 | |
| Sale of branch deposits and premises, net | | | — | | | | — | | | | 8 | | | | 6,626 | | | | — | |
| General, administrative and other expense | | | 26,985 | | | | 24,910 | | | | 22,754 | | | | 22,841 | | | | 22,404 | |
| FHLB advance prepayment fees | | | — | | | | — | | | | — | | | | 18,879 | | | | 1,292 | |
| | | |
| | | |
| Earnings (loss) before federal income taxes (credits) | | | 6,266 | | | | 8,601 | | | | 12,907 | | | | (4,196 | ) | | | 9,907 | |
| Federal income taxes (credits) | | | 1,765 | | | | 2,727 | | | | 4,141 | | | | (1,660 | ) | | | 3,051 | |
| | | |
| | | |
| Net earnings (loss) | | | 4,501 | | | | 5,874 | | | | 8,766 | | | | (2,536 | ) | | | 6,856 | |
| Prepayment fees, restructuring charges (credits) and gain on sale of Ashland branches (net of related tax effects) | | | — | | | | — | | | | — | | | | 8,440 | | | | 853 | |
| | | |
| | | |
| Net earnings from operations | | $ | 4,501 | | | $ | 5,874 | | | $ | 8,766 | | | $ | 5,904 | | | $ | 7,709 | |
| | | |
| | | |
1
SELECTED CONSOLIDATED FINANCIAL DATA (continued)
| | | | | | | | | | | | | | | | | | | | | |
| | | For the year ended December 31: | |
| | | 2007 | | | 2006 | | | 2005 | | | 2004 | | | 2003 | |
| |
| | | (In thousands, except per share data) | |
| |
| Earnings (loss) per share: | | | | | | | | | | | | | | | | | | | | |
| Basic | | $ | .61 | | | $ | .78 | | | $ | 1.15 | | | $ | (.34 | ) | | $ | .92 | |
Basic from operations (3) | | $ | .61 | | | $ | .78 | | | $ | 1.15 | | | $ | .79 | | | $ | 1.03 | |
| Diluted | | $ | .61 | | | $ | .78 | | | $ | 1.15 | | | | N/A | | | $ | .91 | |
Diluted from operations (3) | | $ | .61 | | | $ | .78 | | | $ | 1.15 | | | $ | .79 | | | $ | 1.02 | |
| Dividends declared per share | | $ | .60 | | | $ | .60 | | | $ | .58 | | | $ | .58 | | | $ | .57 | |
| Return on average assets (4) | | | 0.43 | % | | | 0.55 | % | | | 0.82 | % | | | (0.24 | )% | | | 0.65 | % |
| Return on average assets from operations(4) | | | 0.43 | | | | 0.55 | | | | 0.82 | | | | 0.56 | | | | 0.73 | |
| Return on average equity (4) | | | 4.98 | | | | 6.46 | | | | 9.73 | | | | (2.79 | ) | | | 7.17 | |
| Return on average equity from operations (4) | | | 4.98 | | | | 6.46 | | | | 9.73 | | | | 6.49 | | | | 8.07 | |
| Average equity to average assets (4) | | | 8.67 | | | | 8.58 | | | | 8.43 | | | | 8.64 | | | | 9.01 | |
| Dividend payout ratio (5) | | | 98.36 | | | | 76.92 | | | | 50.43 | | | | N/A | (6) | | | 61.96 | |
| | |
| (1) | | The information as of December 31, 2004 reflects the acquisition of London Financial Corporation. This combination was accounted for using the purchase method of accounting. |
| |
| (2) | | Includes loans held for sale, excludes capitalized mortgage servicing rights, which are reported in Other Assets. Prior-period financial statements were reclassified to conform to the current period’s presentation. |
| |
| (3) | | Represents a pro-forma presentation based upon net earnings from operations divided by weighted-average basic and diluted shares outstanding. For 2007, diluted earnings per share from operations is based on 7,328,494 diluted shares assumed to be outstanding. |
| |
| (4) | | Ratios are based upon the mathematical average of the balances at the end of each month. |
| |
| (5) | | Represents dividends per share divided by basic earnings per share. |
| |
| (6) | | Not meaningful. |
2
DESCRIPTION OF BUSINESS
Camco Financial Corporation (“Camco”) is a financial holding company that was organized under Delaware law in 1970. Camco is engaged in the financial services business in Ohio, Kentucky and West Virginia, through its wholly-owned subsidiaries, Advantage Bank and Camco Title Agency, Inc. In June 2001, Camco completed a reorganization in which it combined its banking activities under one Ohio savings bank charter known as Advantage Bank (“Advantage” or the “Bank”). Prior to the reorganization, Camco operated five separate banking subsidiaries serving distinct geographic areas. The branch office groups in each of the regions previously served by the five subsidiary banks now operate as regions of Advantage. In 2003, Camco dissolved its second tier subsidiary, Camco Mortgage Corporation, and converted its offices into branch offices of the Bank. In August 2004, Camco completed a business combination with London Financial Corporation of London, Ohio, and its wholly-owned subsidiary, The Citizens Bank of London. The acquisition was accounted for using the purchase method of accounting and, therefore, the financial statements for prior periods have not been restated. At the time of the merger, Advantage Bank merged into The Citizens Bank of London and changed the name of the resulting institution to Advantage Bank. As a result, Camco’s subsidiary financial institution is now an Ohio-chartered commercial bank instead of an Ohio savings bank. Further, Camco converted from an OTS regulated thrift holding company to a financial holding company regulated by the Federal Reserve Board.
In December 2004, Advantage sold its Ashland, Kentucky division, consisting of two branches.
Advantage is primarily regulated by the State of Ohio Department of Commerce, Division of Financial Institutions (the “Division”), and the Federal Deposit Insurance Corporation (the “FDIC”). Advantage is a member of the Federal Home Loan Bank (the “FHLB”) of Cincinnati, and its deposit accounts are insured up to applicable limits by the Deposit Insurance Fund (the “DIF”) administered by the FDIC. Camco is regulated by the Federal Reserve Board.
Advantage’s lending activities include the origination of commercial real estate and business loans, consumer, and residential conventional fixed-rate and variable-rate mortgage loans for the acquisition, construction or refinancing of single-family homes located in Camco’s primary market areas. Camco also originates construction and permanent mortgage loans on condominiums, two- to four-family, multi-family (over four units) and nonresidential properties. Camco continues to diversify the balance sheet through increasing commercial, commercial real estate, and consumer loan portfolios as well as checking and money market deposit accounts.
The financial statements for Camco and its subsidiaries are prepared on a consolidated basis. The principal source of revenue for Camco on an unconsolidated basis has historically been dividends from the Bank. Payment of dividends to Camco by the Bank is subject to various regulatory restrictions and tax considerations.
References in this report to various aspects of the business, operations and financial condition of Camco may be limited to Advantage, as the context requires.
Camco’s Internet site,http://www.camcofinancial.com, provides Camco’s annual report onForm 10-K, quarterly reports onForm 10-Q, current reports onForm 8-K and amendments to those reports filed or furnished pursuant to Section 13(a) or 15(d) of the Securities Exchange Act of 1934 free of charge as soon as reasonably practicable after Camco has filed the report with the Securities and Exchange Commission.
3
STOCK INFORMATION
At January 31, 2008, Camco had 7,155,595 shares of common stock outstanding with approximately 1,827 holders of record. Camco’s common stock is listed on The Nasdaq Global Market (“Nasdaq”) under the symbol “CAFI.” The table below sets forth the high and low daily closing price for the common stock of Camco, together with the dividends declared per share of common stock, for each quarter of 2007 and 2006.
| | | | | | | | | | | | | |
| | | | | | | | | Cash
| |
| | | | | | | | | dividends
| |
| | | High | | | Low | | | declared | |
| |
| |
Year ended December 31, 2007 | | | | | | | | | | | | |
| Quarter ending: | | | | | | | | | | | | |
| December 31, 2007 | | $ | 13.50 | | | $ | 11.05 | | | $ | 0.150 | |
| September 30, 2007 | | | 13.50 | | | | 12.62 | | | | 0.150 | |
| June 30, 2007 | | | 12.80 | | | | 12.10 | | | | 0.150 | |
| March 31, 2007 | | | 12.84 | | | | 12.20 | | | | 0.150 | |
| | | | | | | | | | | | | |
| | | | | | | | | | | | | |
Year ended December 31, 2006 | | | | | | | | | | | | |
| Quarter ending: | | | | | | | | | | | | |
| December 31, 2006 | | $ | 14.29 | | | $ | 12.64 | | | $ | 0.150 | |
| September 30, 2006 | | | 13.97 | | | | 13.14 | | | | 0.150 | |
| June 30, 2006 | | | 14.17 | | | | 13.40 | | | | 0.150 | |
| March 31, 2006 | | | 14.58 | | | | 13.86 | | | | 0.150 | |
4
ISSUER PURCHASES OF EQUITY SECURITIES
The following table shows the total number of shares of Camco’s common stock repurchased during 2007:
| | | | | | | | | | | | | | | | | |
| | | | | | | | | Total number of
| | | | |
| | | | | | | | | shares purchased
| | | Maximum number
| |
| | | | | | | | | as part of publicly
| | | of shares that may
| |
| | | Number of shares
| | | Average price paid
| | | announced plans
| | | yet be repurchased
| |
| Period of Repurchase | | repurchased | | | per share | | | or programs | | | under the program | |
| |
| |
| January 1 – 31 | | | 0 | | | | N/A | | | | 0 | | | | 300,936 | |
| February 1 – 28 | | | 0 | | | | N/A | | | | 0 | | | | 300,936 | |
March 1 – 31 (1) | | | 43,510 | | | | 12.36 | | | | 43,510 | | | | 362,902 | |
| April 1 – 30 | | | 0 | | | | N/A | | | | 8,500 | | | | 362,902 | |
| May 1 – 31 | | | 38,061 | | | | 12.46 | | | | 46,561 | | | | 324,841 | |
| June 1 – 30 | | | 53,650 | | | | 12.48 | | | | 100,211 | | | | 271,191 | |
| July 1 – 31 | | | 6,550 | | | | 12.55 | | | | 106,761 | | | | 264,641 | |
| August 1 – 31 | | | 75,817 | | | | 13.06 | | | | 182,578 | | | | 188,824 | |
| September 1 – 30 | | | 45,800 | | | | 13.30 | | | | 228,878 | | | | 143,024 | |
| October 1 – 31 | | | 0 | | | | N/A | | | | 228,378 | | | | 143,024 | |
| November 1 – 30 | | | 46,500 | | | | 12.05 | | | | 274,878 | | | | 96,524 | |
| December 1 – 31 | | | 0 | | | | N/A | | | | 274,878 | | | | 96,524 | |
| | | | | | | | | | | | | | | | | |
Total | | | 309,888 | | | | 12.66 | | | | 274,878 | | | | 96,524 | |
On March 27, 2007 the Board of Directors of Camco Financial Corporation approved a stock repurchase plan under which Camco may repurchase up to 5% of its outstanding common stock. 274,878 shares during the year were purchased under the new plan.
5
PERFORMANCE GRAPH
The following graph compares the cumulative total return on Camco’s common stock with the cumulative total return of an index of companies whose shares are traded on Nasdaq and the SNL All Bank & Thrift Index for the same period.
CAMCO FINANCIAL CORPORATION
TOTAL RETURN PERFORMANCE
| | | | | | | | | | | | | | | | | | | | | | | | | |
| | | Period ending | |
| Index | | 12/31/02 | | | 12/31/03 | | | 12/31/04 | | | 12/31/05 | | | 12/31/06 | | | 12/31/07 | |
| |
| |
| Camco Financial Corporation | | | 100.00 | | | | 126.26 | | | | 117.49 | | | | 113.27 | | | | 104.72 | | | | 95.11 | |
| NASDAQ Composite | | | 100.00 | | | | 150.01 | | | | 162.89 | | | | 165.13 | | | | 180.85 | | | | 198.60 | |
| SNL Bank and Thrift Index | | | 100.00 | �� | | | 135.57 | | | | 151.82 | | | | 154.20 | | | | 180.17 | | | | 137.40 | |
6
MANAGEMENT’S DISCUSSION AND ANALYSIS OF FINANCIAL CONDITION AND RESULTS OF OPERATIONS
GENERAL
Since its incorporation in 1970, Camco Financial Corporation (“Camco” or the “Corporation”) has evolved into a full-service provider of financial products through its subsidiaries, Advantage Bank (“Advantage or “Bank”) and Camco Title Agency. Utilizing a common marketing theme based on Camco’s commitment to personalized customer service, Camco has grown from $22.4 million of consolidated assets in 1970 to $1.0 billion of consolidated assets at December 31, 2007. Camco’s rate of growth is largely attributable to its acquisitions and its continued expansion of product lines from the limited deposit and loan offerings which the Bank could offer in the heavily regulated environment of the 1970s to the wider array of financial service products that commercial banks traditionally offer. Additionally, Camco has enhanced its operational growth, to a lesser extent, by chartering a title insurance agency.
We believe that continued success in the financial services industry will be achieved by those institutions with a rigorous dedication to building value-added customer-oriented organizations. Toward this end, each of the Bank’s regions has the ability to make local decisions for customer contacts and services, however back-office operations are consolidated and centralized. Based on consumer and business preferences, we design financial service products with a view towards differentiating each of the constituent regions from its competition. We believe that the Bank regions’ ability to rapidly adapt to consumer and business needs and preferences is essential to them as community-based financial institutions competing against the larger regional and money-center bank holding companies.
Camco’s profitability depends primarily on its level of net interest income, which is the difference between interest income on interest-earning assets, principally loans, mortgage-backed securities and investment securities, and interest expense on deposit accounts and borrowings. In recent years, Camco’s operations have also been heavily influenced by its level of other income, including mortgage banking income and other fee income. Camco’s operations are also affected by general, administrative and other expenses, including employee compensation and benefits, occupancy expense, data processing, franchise taxes, advertising, other operating expenses and federal income tax expense.
OVERVIEW
During 2007, despite the most disruptive economic environment for financial services companies in over ten years, we continued to execute and manage our long-term strategic plan to diversify the balance sheet by increasing our commercial, commercial real estate and consumer loan portfolios and improve our funding mix by reducing borrowings and increasing transaction-based deposits. The following table summarizes our progress:
| | | | | | | | | | | | | | | | | |
| | | 2007 | | | 2006 | |
| | | Balance | | | Mix | | | Balance | | | Mix | |
| |
| | | (dollars in thousands) | |
| |
| Loans | | | | | | | | | | | | | | | | |
| Residential real estate and multifamily | | $ | 476,020 | | | | 58 | % | | $ | 517,501 | | | | 63 | % |
| Nonresidential real estate and commercial | | | 167,988 | | | | 20 | | | | 140,864 | | | | 17 | |
| Home equity lines of credit and consumer | | | 128,874 | | | | 16 | | | | 124,287 | | | | 15 | |
| Construction | | | 45,677 | | | | 6 | | | | 42,654 | | | | 5 | |
| | | | | | | | | | | | | | | | | |
| Deposits | | | | | | | | | | | | | | | | |
| Checking accounts | | $ | 126,887 | | | | 18 | % | | $ | 126,428 | | | | 19 | % |
| Money market and savings | | | 148,703 | | | | 22 | | | | 137,380 | | | | 20 | |
| Certificates | | | 416,594 | | | | 60 | | | | 420,974 | | | | 61 | |
| | | | | | | | | | | | | | | | | |
| Federal Home Loan Bank advances | | $ | 199,064 | | | | | | | $ | 245,288 | | | | | |
We have found that deposit growth continues to be challenging. According to the Federal Deposit Insurance Corporation, total deposits in Ohio grew only 0.23% between June 2006 and June 2007, reflecting the state’s faltering economy and weak population growth. Competition for deposits continues to put upward pressure on marginal funding costs, despite falling market rates in the second half of 2007. During fiscal 2007, we were able to increase deposits 1.08%. However, we allowed $10.0 million of public auction certificate accounts to mature in 2007 and did not rebid on them due to the collateral requirements, which means that our retail deposits actually grew 2.58% during the year.
7
MANAGEMENT’S DISCUSSION AND
ANALYSIS OF FINANCIAL CONDITION AND
RESULTS OF OPERATIONS (continued)
During 2007, we undertook a number of franchise-enhancing initiatives to lay the foundation for growth in business and consumer deposits. We launched a branch in London, Ohio, near Columbus, in April 2007 which came on the heels of our launch of a banking office in Mason, Ohio, near Cincinnati, in September 2006. We implemented a branch renovation and merchandising program and initiated an internal and external review of our branch network and sales delivery channels. We launched a new suite of checking accounts for small and medium-sized businesses and AdvantageDeposit 24©, which allows businesses to deposit checks remotely from their home offices. We dispatched a project team to address, plan and implement the operational and communicative tasks necessary to improve fee collection and address pricing of deposit and loan services. Lastly, we realigned our Retail Banking line of business through which we consolidated retail banking regions from four to two, announced the closing of one underperforming branch in our Greater Cincinnati market, and created positions for business development officers who are primarily charged with outside sales of deposit and loan products. Internal and cross-sell initiatives will be driven by personal bankers and office managers at each of our banking offices. We are continuing to assess the performance of each branch in our footprint and the skills of individuals in key positions. We believe this realignment, coupled with a new sales incentive program and new deposit products will allow us to improve our funding structure through core deposit growth.
The real estate market in the Midwest continues to create a very challenging environment for most financial institutions. Bankruptcies, foreclosures and unemployment continue to rise in Ohio. We are working diligently to manage delinquencies and work with our loan customers in order to reduce losses for them, as well as our company. The total loan portfolio decreased $6.5 million for the full year of 2007 as we tightened credit standards and became more selective in underwriting new loans in the second half of the year, which reduced new loan production. During the second half of 2007, we closed our residential loan production offices in Canton, Ohio, and Huntington, West Virginia, as unprecedented slowdowns in residential real estate construction and home sales made this line of business unprofitable and outside of our key strategic initiatives. We hired several commercial lenders during the year, supporting our strategic plan to increase our commercial and small business loan portfolios, and we increased the number of experienced commercial credit underwriters to manage that line of business as it becomes a larger share of our loan portfolio.
Nonperforming loans increased to $24.0 million at the end of 2007 compared to $17.7 million at the end of 2006. We saw improvement in nonperforming loans secured by residential real estate, but a significant increase in nonperforming commercial real estate and land development loans. We are aggressively working with these borrowers to mitigate losses. Net charge offs totaled $2.0 million during 2007, or a manageable 0.25% as a percentage of average loans. We hired additional workout and collection personnel and asked our lenders to assist with loss mitigation and collection duties. Our lenders will continue to assist with reducing our nonperforming loan levels throughout the new year, but we expect them to also build their loan portfolios during 2008.
In April 2007, we announced the renewal of a share repurchase plan that authorized the buyback of up to 5% of Camco’s common stock. During 2007, we repurchased 309,888 shares and paid dividends of $0.60 per share. Together, those programs returned $8.3 million to shareholders during 2007. In July 2007, we issued $5.0 million of trust preferred securities, which is included in regulatory capital, to fund the share repurchase plan and general corporate purposes. Realizing we are in a weak and very uncertain economic environment, we are monitoring our capital levels very closely in the face of deteriorating credit quality, lower earnings and a possible recession and will take steps necessary in order to preserve capital and improve liquidity.
We believe we are taking significant steps forward in managing our operational efficiency. We are focusing on improving noninterest income and controlling noninterest expense by exiting unprofitable lines of business and refining our operations. We continue to analyze new products to deepen relationships with our customers and improve the structure of our balance sheet.
FORWARD-LOOKING STATEMENTS
This Management’s Discussion and Analysis of Financial Condition and Results of Operations (MD&A) and this annual report include forward-looking statements within the meaning of Section 27A of the Securities Act of 1933, as amended, and Section 21E of the Securities Exchange Act of 1934 (Exchange Act), as amended, which can be identified by the use of forward-looking terminology, such as may, might, could, would, believe, expect, intend, plan, seek, anticipate, estimate, project or continue or the negative thereof or comparable terminology. All statements other than statements of historical fact included in this document regarding our outlook, financial position and results of operation, liquidity, capital resources
8
and interest rate sensitivity are forward-looking statements. These forward-looking statements also include, but are not limited to:
| | |
| | • | anticipated changes in industry conditions created by state and federal legislation and regulations; |
| |
| | • | anticipated changes in general interest rates and the impact of future interest rate changes on our profitability, capital adequacy and the fair value of our financial assets and liabilities; |
| |
| | • | retention of our existing customer base and our ability to attract new customers; |
| |
| | • | the development of new products and services and their success in the marketplace; |
| |
| | • | the adequacy of the allowance for loan losses; and, |
| |
| | • | statements regarding our anticipated loan and deposit account growth, expense levels, liquidity and capital resources and projections of earnings. |
These forward-looking statements involve known and unknown risks, uncertainties and other factors which may cause our actual results to be materially different from any future results expressed or implied by such forward-looking statements. Although we believe the expectations reflected in such forward-looking statements are reasonable, we can give no assurance such expectations will prove to have been correct. Important factors that could cause actual results to differ materially from those in the forward-looking statements included herein include, but are not limited to:
| | |
| | • | competition in the industry and markets in which we operate; |
| |
| | • | changes in general interest rates; |
| |
| | • | rapid changes in technology affecting the financial services industry; |
| |
| | • | changes in government regulation; and |
| |
| | • | general economic and business conditions. |
This MD&A is intended to give stockholders a more comprehensive review of the issues facing management than could be obtained from an examination of the financial statements alone. This analysis should be read in conjunction with the consolidated financial statements and related footnotes and the selected financial data elsewhere in this annual report. As used herein and except as the context may otherwise require, references to “Camco,” “the Corporation”, “we,” “us,” or “our” means, collectively, Camco Financial Corporation and its wholly owned subsidiaries, Advantage Bank and Camco Title Agency.
NON-GAAP FINANCIAL MEASURES
This report includes one or more non-GAAP financial measures within the meaning of Regulation G. With respect to each, Camco has disclosed the most directly comparable financial measure calculated and presented in accordance with GAAP and reconciled the differences between the non-GAAP financial measure and the most comparable financial measure presented in accordance with GAAP.
Camco believes that the presentation of the non-GAAP financial measures in this report assist management and investors to compare results period-to-period in a more meaningful and consistent manner and provide a better measure of results for Camco’s ongoing operations.
CRITICAL ACCOUNTING POLICIES
This MD&A, as well as disclosures found elsewhere in this annual report, are based upon Camco’s consolidated financial statements, which are prepared in accordance with accounting principles generally accepted in the United States of America (“US GAAP”). The preparation of these financial statements requires Camco to make estimates and judgments that affect the reported amounts of assets, liabilities, revenues and expenses. Several factors are considered in determining whether or not a policy is critical in the preparation of financial statements. These factors include, among other things, whether the estimates are significant to the financial statements, the nature of the estimates, the ability to readily validate the estimates with other information including third parties or available prices, and sensitivity of the estimates to changes in economic conditions and whether alternative accounting methods may be utilized under US GAAP.
9
MANAGEMENT’S DISCUSSION AND
ANALYSIS OF FINANCIAL CONDITION AND
RESULTS OF OPERATIONS (continued)
Material estimates that are particularly susceptible to significant change in the near term relate to the determination of the allowance for loan losses, the valuation of mortgage servicing rights and goodwill impairment. Actual results could differ from those estimates.
Allowance for Loan Losses. The procedures for assessing the adequacy of the allowance for loan losses reflect our evaluation of credit risk after careful consideration and interpretation of relevant information available to us. In developing this assessment, we must rely on estimates and exercise judgment regarding matters where the ultimate outcome is unknown such as economic factors, developments affecting companies in specific industries and issues with respect to single borrowers. Depending on changes in circumstances, future assessments of credit risk may yield materially different results, which may require an increase or a decrease in the allowance for loan losses.
The allowance is regularly reviewed by management to determine whether the amount is considered adequate to absorb probable, incurred losses. This evaluation includes specific loss estimates on certain individually reviewed loans, statistical loss estimates for loan pools that are based on historical loss experience, and general loss estimates that are based upon the size, quality, and concentration characteristics of the various loan portfolios, adverse situations that may affect a borrower’s ability to repay, and current economic and industry conditions, including real estate and collateral valuations. Also considered as part of that judgment is a review of the Bank’s trends in delinquencies and loan losses, as well as trends in delinquencies and losses for the region and nationally, and economic factors.
The allowance for loan losses is maintained at a level that management believes to be adequate to absorb probable, incurred losses inherent in the loan portfolio at the balance sheet dates presented. Our evaluation of the adequacy of the allowance for loan losses is an estimate based on management’s current judgment about the credit quality of the loan portfolio. While we strive to reflect all known risk factors in our evaluations, actual results may differ significantly from our estimates.
Mortgage Servicing Rights. To determine the fair value of our mortgage servicing rights (“MSRs”) each reporting quarter, we transmit information to a third party provider who assists us with determining the possible impairment of MSRs, as described below.
Servicing assets are recognized as separate assets when loans are sold with servicing retained. A pooling methodology to the servicing valuation, in which loans with similar characteristics are “pooled” together, is applied for valuation purposes. Once pooled, each grouping of loans is evaluated on a discounted earnings basis to determine the present value of future earnings that a purchaser could expect to realize from the portfolio. Earnings are projected from a variety of sources including loan service fees, interest earned on float, net interest earned on escrow balances, miscellaneous income and costs to service the loans. The present value of future earnings is the estimated market value for the pool, calculated using consensus assumptions that a third party purchaser would utilize in evaluating a potential acquisition of the servicing. Events that may significantly affect the estimates used are changes in interest rates and the related impact on mortgage loan prepayment speeds and the payment performance of the underlying loans. The interest rate for float, which we estimate, takes into consideration the investment portfolio average yield as well as current short duration investment yields. We believe this methodology provides a reasonable estimate. Mortgage loan prepayment speeds are calculated by the third party provider utilizing the Economic Outlook as published by the Office of Chief Economist of Freddie Mac in estimating prepayment speeds and provides a specific scenario with each evaluation. Based on the assumptions discussed, pre-tax projections are prepared for each pool of loans serviced. These earning figures approximate the cash flow that could be received from the servicing portfolio. Valuation results are presented quarterly to management. At that time, we review the information and MSRs are marked to the lower of amortized cost or fair value for the current quarter.
Goodwill. We have developed procedures to test goodwill for impairment on an annual basis using June 30 financial information. This testing procedure is performed with the assistance of a third party that evaluates possible impairment based on the following:
The test involves assigning tangible assets and liabilities, identified intangible assets and goodwill to a reporting unit and comparing the fair value of this reporting unit to its carrying value including goodwill. The value is determined assuming a freely negotiated transaction between a willing buyer and a willing seller, neither being under any compulsion to buy or sell and both having reasonable knowledge of relevant facts. Accordingly, to derive the fair value of the reporting unit, the following common approaches to valuing business combination transactions involving financial institutions are utilized by a third party selected by Camco: (1) the comparable transactions approach — specifically based on earnings, book, assets and deposit premium multiples received in recent sales of comparable thrift franchises; and (2) the discounted cash flow approach. The application of these valuation techniques takes into account the reporting unit’s operating history, the current market environment and future prospects. As of the most recent quarter, the only reporting unit carrying goodwill is the Bank.
10
If the fair value of a reporting unit exceeds its carrying amount, goodwill of the reporting unit is considered not impaired and no second step is required. If not, a second test is required to measure the amount of goodwill impairment. The second test of the overall goodwill impairment compares the implied fair value of the reporting unit goodwill with the carrying amount of the goodwill. The impairment loss shall equal the excess of carrying value over fair value.
After each testing period, the third party compiles a summary of the test that is then provided to the Audit and Risk Management Committee of the Board of Directors for review. As of the most recent testing date, June 30, 2007, the fair value of the reporting unit exceeded its carrying amount; therefore, no impairment was recorded.
Summary. We believe the accounting estimates related to the allowance for loan losses, the capitalization, amortization, and valuation of mortgage servicing rights and the goodwill impairment test are “critical accounting estimates” because: (1) the estimates are highly susceptible to change from period to period because they require us to make assumptions concerning the changes in the types and volumes of the portfolios, rates of future prepayments, and anticipated economic conditions, and (2) the impact of recognizing an impairment or loan loss could have a material effect on Camco’s assets reported on the balance sheet as well as its net earnings. Management has discussed the development and selection of these critical accounting estimates with the Audit and Risk Management Committee of the Board of Directors and they have reviewed Camco’s disclosures relating to such matters in this MD&A.
DISCUSSION OF FINANCIAL CONDITION CHANGES FROM DECEMBER 31, 2006, TO DECEMBER 31, 2007
At December 31, 2007, Camco’s consolidated assets totaled $1.0 billion, a decrease of $25.0 million, or 2.4%, from the December 31, 2006, total. The decrease in total assets was comprised primarily of decreases in loans receivable, securities available for sale and cash and cash equivalents, offset partially by the increase of prepaid expenses and other assets. We expect total asset growth to be limited in the near term as growth in deposits would most likely be used to reduce outstanding borrowings and an uncertain and distressed regional economic environment is expected to reduce the demand for loans in 2008. Further deterioration of the residential loan market in the Midwest may result in a shift in the loan portfolio toward commercial and consumer loans.
Cash and interest-bearing deposits in other financial institutions totaled $23.0 million at December 31, 2007, a decrease of $3.5 million, or 13.3%, from December 31, 2006, levels. Securities totaled $91.7 million at December 31, 2007, a decrease of $19.3 million, or 17.4%, from the total at December 31, 2006. Investment purchases totaled $43.7 million while maturities, principal repayments, and calls totaled $64.7 million during 2007. Purchases were comprised primarily of intermediate-term callable notes and mortgage-backed securities issued by U.S. Government sponsored enterprises with an average yield of 4.93% and 5.54%, respectively. All of the securities purchased were classified as available for sale.
During 2007, we used cash flows from the securities portfolio to reduce borrowings. Approximately 50% of the portfolio is expected to mature or prepay during 2008. We have kept the duration and average life of the securities portfolio very short in order to provide liquidity and to reduce borrowings, when available.
At December 31, 2007, other than $779,000 of municipal bonds, all of our debt securities were issued and guaranteed by US Government sponsored enterprises such as Freddie Mac, Fannie Mae and the Federal Home Loan Banks. We held no private-label mortgage-backed securities or collateralized debt obligations.
Loans receivable and loans held for sale totaled $815.3 million at December 31, 2007, a decrease of $6.5 million, or 0.8%, from the total at December 31, 2006. The decrease resulted primarily from repayments of $249.9 million and loan sales of $50.0 million, partially offset by loan disbursements and purchases totaling $298.3 million. Loan origination volume, including purchases of loans, was greater than that of the comparable 2006 period by $11.8 million, or 4.1%, while the volume of loan sales decreased by $971,000 year to year. The number of loans originated for sale in the secondary market continues to decline as unprecedented disruptions in the residential real estate market have significantly slowed home sales and new home construction. Instead of selling adjustable rate loans, we have typically held adjustable-rate mortgage loans for investment as an integral part of our strategy to manage interest rate risk. Loan originations during the 12 month period were comprised primarily of $122.2 million of loans secured by one- to four-family residential real estate, $80.1 million in consumer and other loans and $96.0 million in loans secured by commercial real estate. We intend to expand our consumer and commercial lending in future periods as a means of increasing the yield on our loan portfolio, obtain a higher return on risk-adjusted capital and to improve our interest rate risk position.
During 2007, the yield on loans was 7.03%, and the portfolio mix continued to shift to higher yielding consumer and commercial loans. This shift is offsetting lower effective rates in the loan portfolio during the second half of 2007 due to rapidly falling interest rates, primarily the Prime rate. At December 31, 2007, approximately 19% of our loan portfolio had
11
MANAGEMENT’S DISCUSSION AND
ANALYSIS OF FINANCIAL CONDITION AND
RESULTS OF OPERATIONS (continued)
interest rates tied to the Prime rate. Only 32% of our loan portfolio was fixed rate. Loan portfolio balances fell $22.19 million during the fourth quarter with conventional mortgage loans comprising 51% of this decrease. The overall loan portfolio decreased for the full year of 2007 as we tightened credit standards and became more selective in underwriting new loans in the second half of the year, which significantly reduced new loan production. Additionally, our lenders assisted with credit and collections duties and some commercial loans were not renewed due to concerns about future performance of the loan, which resulted in those loans being refinanced at other institutions.
The allowance for loan losses totaled $6.6 million and $7.1 million at December 31, 2007 and 2006, respectively, representing 26.0% and 38.5% of nonperforming loans at those dates. Nonperforming loans (three months or more delinquent plus nonaccrual loans) totaled $25.5 million and $18.5 million at December 31, 2007 and 2006, respectively, constituting 3.13% and 2.26% of total net loans, including loans held for sale, at those dates. Net charge-offs totaled $2.0 million for 2007. Net charge offs were comprised mainly of multi-family loans, 1-4 family loans and home equity lines of credit, which totaled $739,000, $752,000 and $250,000 respectively.
The following table details delinquent and nonaccrual loans at December 31, 2007 and 2006:
| | | | | | | | | | | | | | | | | | | | | | | | | |
| | | December 31, 2007 | | | December 31, 2006 | |
| | | | | | 90+ days
| | | | | | | | | 90+ days
| | | | |
| | | 30-89 days
| | | delinquent,
| | | | | | 30-89 days
| | | delinquent,
| | | | |
| | | delinquent | | | accruing | | | Nonaccrual | | | delinquent | | | accruing | | | Nonaccrual | |
| |
| | | (In thousands) | |
| |
| Construction/Development | | $ | 11 | | | $ | — | | | $ | 5,568 | | | $ | 14 | | | $ | — | | | $ | 92 | |
| HELOC and second mortgage | | | 1,152 | | | | — | | | | 1,026 | | | | 1,398 | | | | — | | | | 805 | |
| 1-4 Family | | | 6,652 | | | | 1,520 | | | | 8,310 | | | | 7,363 | | | | 728 | | | | 9,563 | |
| Multifamily | | | — | | | | — | | | | 871 | | | | — | | | | 143 | | | | 4,682 | |
| Commercial | | | 2,036 | | | | — | | | | 7,603 | | | | 4,911 | | | | — | | | | 2,387 | |
| Consumer and other | | | 2,561 | | | | — | | | | 617 | | | | 147 | | | | — | | | | 136 | |
| | | | | | | | | | | | | | | | | | | | | | | | | |
| Total | | $ | 12,412 | | | $ | 1,520 | | | $ | 23,995 | | | $ | 13,833 | | | $ | 871 | | | $ | 17,665 | |
| | | | | | | | | | | | | | | | | | | | | | | | | |
Although we believe that the allowance for loan losses at December 31, 2007, is adequate to cover probable, incurred losses inherent in the loan portfolio at that date based upon the available facts and circumstances, there can be no assurance that additions to the allowance for loan losses will not be necessary in future periods, which could adversely affect our results of operations. Unemployment rates in our markets, and Ohio in general, are higher than the national average and bankruptcy and foreclosure filings in Ohio during 2007 were very high compared to the rest of the nation. Additionally, Ohio is experiencing declining values of residential real estate. However, Ohio in general has not experienced significant increases in home values over the past five years like many regions in the U.S., which should comparatively mitigate losses on loans. Nonetheless, these factors, compounded by a very uncertain national economic outlook, may increase the level of future losses beyond our current expectations.
Deposits totaled $692.1 million at December 31, 2007 an increase of $7.4 million, or 1.1% from December 31, 2006 levels despite the reduction of $10.0 million of auctioned public funds that were not renewed during the year due to collateral requirements. The increase resulted from increases of $22.4 million in money market accounts, $4.0 million in non-interest bearing demand deposit accounts offset partially by a decrease of $11.0 million in savings accounts, $4.4 million in certificates of deposit and $3.6 million in interest bearing demand deposit accounts.
The increase in money market accounts during 2007 is a result of savings account customers shifting to higher-yielding money market accounts. Additionally, a public fund moved approximately $6.6 million from a maturing certificate of deposit to a money market account. The Bank has moved to reduce its money market account yields in conjunction with Federal Reserve Bank discount rate and Federal Funds rate decreases during the second half of 2007.
We anticipate using brokered deposits in early 2008 in order to reduce borrowings and improve the Bank’s liquidity position. However, we acknowledge that brokered deposits are not core, franchise-enhancing deposits, and we do not intend to stray from our strategy of improving the long-term funding mix of the Bank’s deposit portfolio by aggregating small business, commercial and retail checking accounts. To that end, we implemented a number of organizational and product development initiatives in 2007. These initiatives included the launch of a new suite of commercial and small business checking accounts, enhancements to our online business cash management system, and the launch of a remote deposit
12
capture solution. We believe these new products will help us penetrate a very competitive market for business checking accounts. See “Liquidity and Capital Resources” in this MD&A for further discussion on our deposit strategy and additional liquidity risks.
Advances from the FHLB and other borrowings decreased by $36.2 million, or 14.1%, to a total of $221.0 million at December 31, 2007. We were able to reduce borrowings as a result of the increase in deposits and a net decrease in the loan and investment portfolios. A reduction in cash balances at December 31, 2007, of $3.5 million reflects cash used to reduce FHLB borrowings. We plan to reduce FHLB advances further when possible in 2008 and beyond. In July 2007, we issued $5.0 million of trust preferred securities through an unconsolidated subsidiary. The proceeds from this offering were used in our stock repurchase program and for general corporate purposes.
Stockholders’ equity totaled $88.6 million at December 31, 2007, a decrease of $2.5 million, or 2.7% decrease from December 31, 2006. The decrease resulted primarily from dividends of $4.4 million and the purchase of $3.9 million in treasury stock, which was offset partially by net earnings of $4.5 million and a decrease of $1.2 million in unrealized losses on securities, net of tax effects.
The Bank is required to maintain minimum regulatory capital pursuant to federal regulations. At December 31, 2007, the regulatory capital of the Bank exceeded all regulatory capital requirements.
COMPARISON OF RESULTS OF OPERATIONS FOR THE YEARS ENDED DECEMBER 31, 2007 AND DECEMBER 31, 2006
General. Camco’s net earnings for the year ended December 31, 2007, totaled $4.5 million, a decrease of $1.4 million, or 23.4%, from the $5.9 million of net income reported in 2006. The decrease in earnings was primarily due to the increase of $2.1 million in general, administrative and other expenses coupled with the decrease of $1.0 million in net interest income which was offset partially by an $817,000 increase in other income and a $962,000 decrease in the provision for federal taxes.
Net Interest Income. Net interest income for the year ended December 31, 2007, amounted to $28.9 million, a decrease of $1.0 million, or 3.4%, compared to 2006, generally reflecting the effects of an increase of 51 basis points in the cost of funds. This was offset partially by a $26.1 million decrease in the average balance of interest-bearing liabilities. An increase of 42 basis points in the average yield on interest-earning assets, from 6.26% in 2006 to 6.68% in 2007, was offset partially by a $23.4 million decrease in the average balance of interest-earning assets outstanding year to year.
The increase in the yield on assets resulted from a higher rate environment during most of 2007, compared to 2006, and a shift in the loan portfolio composition from conventional single family residential loans to higher-yielding commercial and consumer loans. Additionally, loans comprised 83.5% and 82.5% of interest-earning assets in 2007 and 2006, respectively.
Interest income on loans totaled $57.4 million for the year ended December 31, 2007, an increase of $2.7 million, or 4.9%, from the comparable 2006 total. The increase resulted primarily from a 40 basis point increase in the average yield, from 6.63% in 2006, to 7.03% in 2007, offset partially by a $9.3 million, or 1.1%, decrease in the average balance of loans outstanding year to year. Interest income on securities totaled $4.6 million for the year ended December 31, 2007, a $55,000, or 1.1%, decrease from the 2006 period. The decrease was due primarily to an $8.6 million, or 7.7%, decrease in the average balance outstanding, partially offset by a 29 basis point increase in the average yield, to 4.41% in 2007. Interest income on FHLB stock increased by $283,000, or 17.6%, due primarily to an 80 basis point increase in the average yield, to 6.60% in 2007 coupled with a $945,000 increase in the average balance outstanding year to year. Interest income on cash surrender value of life insurance increased $28,000 or 3.0%, due primarily to a 4 basis point increase in the average yield, to 4.45% coupled with a $451,000, or 2.2% increase in the average balance outstanding year to year. Interest income on other interest-bearing deposits decreased by $312,000, or 41.4%, due primarily to a $6.9 million, or 48.3% decrease in the average outstanding year to year offset partially by a 71 basis points increase in the average yield, to 6.02% in 2007.
Interest expense on deposits totaled $25.4 million for the year ended December 31, 2007, an increase of $4.2 million, or 19.7%, compared to the year ended December 31, 2006, due primarily to an 61 basis point increase in the average cost of deposits, to 3.9% for 2007, coupled with a $6.4 million, or 1.0%, increase in the average balance of interest-bearing deposits outstanding year to year. Interest expense on borrowings totaled $11.0 million for the year ended December 31, 2007, a decrease of $531,000, or 4.6%, from 2006. The decrease resulted primarily from a $32.5 million, or 11.5%, decrease in the average balance outstanding year to year offset partially by a 32 basis point increase in the average rate to 4.40% in 2007.
Approximately $303.1 million, or 73.3%, of our certificate of deposit portfolio will mature during 2008. While this presents an opportunity to reduce our cost of funds since these deposits are repricing in a generally lower interest rate environment,
13
MANAGEMENT’S DISCUSSION AND
ANALYSIS OF FINANCIAL CONDITION AND
RESULTS OF OPERATIONS (continued)
we continue to experience strong competition for deposits in our market areas, which is limiting our ability to quickly reduce the marginal cost of deposits to a level reflective of the general rate environment at the end of 2007. Continued decreases in the Prime rate will likely compress our net interest margin due to the lag in repricing between our loan and deposit portfolios, at least in the first half of 2008. At the same time, the loan portfolio has not grown at a fast enough pace to offset these tighter spreads. As noted earlier, we plan to continue to diversify the loan portfolio by encouraging growth in commercial and consumer loan balances. This strategy should slow net interest margin compression as these types of loans are normally higher-yielding assets than conventional mortgage loans and investment securities.
Provision for Losses on Loans. A provision for losses on loans is charged to earnings to bring the total allowance for loan losses to a level considered appropriate by management based on historical experience, the volume and type of lending conducted by the Bank, the status of past due principal and interest payments, general economic conditions, particularly as such conditions relate to the Bank’s market areas, and other factors related to the collectibility of the Bank’s loan portfolio. Based upon an analysis of these factors, management recorded a provision for losses on loans totaling $1.5 million for the year ended December 31, 2007, an increase of $55,000, or 3.8%, from the provision recorded in 2006.
Other Income. Other income totaled $5.9 million for the year ended December 31, 2007, an increase of $817,000, or 16.2%, compared to 2006. The increase in other income was primarily attributable to a $481,000 decrease in the net amortization of mortgage servicing rights, a $385,000 increase in service charges and other fees on deposits and a $222,000 increase in late charges, rent and other income which was offset partially by a $225,000 increase in the net loss on the sale of real estate acquired through foreclosure.
In fourth quarter of 2006, we updated some of the assumptions used in estimating the value of capitalized mortgage servicing rights. We reduced the estimated cost to service a loan and we reduced the estimated ancillary income to be earned per loan. As a result, we recorded a $553,000 impairment on capitalized mortgage servicing rights in 2006. Excluding the 2006 impairment, amortization increased $49,000 and income from new servicing rights decreased $24,000 during 2007.
The increase in service charges and other fees on deposits was primarily due to increased service, overdraft and non-sufficient fund fees and more checking accounts in 2007. Initiatives to increase fee collection and improve the Company’s current fee structure are being implemented to place more emphasis on this vital revenue stream.
The increase in late charges, rent and other income in 2007 was due to an increase in loan prepayment penalties of $171,000 and an increase in surcharge and interchange income from automated teller machine (ATM) activity of $137,000. Additionally, we decided in the first quarter of 2006 to discontinue the accrual of late charges on commercial loans and recognize late charges as income when collected. This decision resulted in a decrease in other income of $166,000 for the 2006 period. Other income from our title insurance agency fell $47,000 in 2007 due to the significant slowdown in home sales and related mortgage loan volume.
At December 31, 2007, we serviced $516.0 million of one-to-four family residential mortgage loans for other financial institutions, primarily Freddie Mac and Fannie Mae, which declined from $536.0 million at December 31, 2006. As a result of this shrinking servicing portfolio, loan servicing income decreased $37,000 in 2007.
In 2007, the net loss on real estate acquired through foreclosure can be attributed primarily to a $334,000 loss on a single commercial property that secured a loan to which we were a participant. We were unable to directly control the actions of the bank that originated the loan and subsequently executed a sale of that property. Excluding this single event, we realized a net gain on the sale of foreclosed real estate of $37,000 in 2007. This reflects the diligence of our Credit Administration team to mitigate losses on foreclosures. However, approximately 1.8% of the households in Ohio were in foreclosure at December 31, 2007, an increase of 64% from December 31, 2006. Additionally, as noted earlier, home values in Ohio are declining from 2006 levels. These factors, compounded by an uncertain economic outlook and increasing unemployment, may result in higher losses on real estate acquired through foreclosure in 2008 and beyond.
General, Administrative and Other Expense. General, administrative and other expense totaled $27.0 million for the year ended December 31, 2007, an increase of $2.1 million, or 8.3%, compared to 2006. The increase was due primarily to a $602,000, or 4.9%, increase in employee compensation and benefits and a $282,000, or 8.9%, increase in occupancy and equipment. Other operating expense increased $1.1 million, or 19.6%, due primarily to a $567,000, increase in real estate owned expense, a $279,000, or 23.9%, increase in loan and deposit expense.
The increase in employee compensation and benefits is due to several key hires within mid-management of the Corporation, including commercial lenders. Loan collection staff was hired in 2007 to improve our monitoring and collection of delinquent loans. The Company has launched two banking offices since the third quarter of 2006, which increased personnel expenses in 2007. We combined two of our retail banking regions and closed two loan production
14
offices in the third quarter of 2007. While these closings are expected to decrease compensation expense in the future, one-time severance costs related to these closings totaled $181,000 in 2007. These increases were offset partially by the adjustment of a post-retirement accrual due to the departure of a member of senior management in June 2007.
The occupancy and equipment expense increase is primarily due to the opening of two banking offices located in Mason and London, Ohio. Advertising is also higher in 2007 as a result of the banking office launches coupled with new deposit products and direct mail campaigns. Management has undertaken a branch merchandising program to standardize and improve the look and feel, and ultimately the sales process in the Bank’s offices. The increase in deposit expenses was primarily due to correspondent bank service charges and transaction account expenses.
While expenses have increased due to the addition of a number of revenue producing positions and the opening of two banking offices, we believe these investments in personnel and property are imperative to Camco’s growth strategy. However, when new banking offices are opened, some time is needed to absorb the cost and create more revenue in these new markets.
Data processing expense is lower in 2007 as the Bank underwent a core processing conversion in 2006. We have also implemented cost saving initiatives in our telecommunications and information technology services.
The increase in other operating expenses was driven by increases in professional services, loan expenses and expenses on real estate acquired through foreclosure. Professional services increased $148,000, primarily due to recruiting costs for commercial lenders and consulting fees incurred with the review of our operations and our fee collection processes. Other loan expenses increased $279,000 primarily due to a charge of $174,000 taken during 2007 related to the repurchase of $1.3 million of residential real estate loans and a $98,000 increase in insurance premiums for private mortgage and collateral loss insurance on our mortgage and home equity loans. The increase in real estate owned and other expenses was due to higher levels of foreclosures in 2007, which increased maintenance expenses on those properties, and due to write-downs of real estate owned. We also commenced the amortization of our investment in affordable housing partnerships. We receive tax credits and other tax benefits through our investment in these partnerships.
Federal Income Taxes. Federal income tax totaled $1.8 million for the year ended December 31, 2007, a decrease of $962,000, or 35.3%, compared to the provision recorded in 2006. The effective tax rates amounted to 28.2% and 31.7% for the years ended December 31, 2007 and 2006, respectively. The decrease in federal income tax expense was primarily attributable to a $2.3 million, or 27.2%, decrease in pre-tax earnings. Tax credits related to our investment in affordable housing partnerships totaled $110,000 in 2007. We did not record tax credits in 2006. The tax-exempt character of earnings on bank-owned life insurance is another reason for the difference between the effective rate of tax expense and the statutory corporate tax rate for the years ended December 31, 2007 and 2006.
COMPARISON OF RESULTS OF OPERATIONS FOR THE YEARS ENDED DECEMBER 31, 2006 AND DECEMBER 31, 2005
General. Camco’s net earnings for the year ended December 31, 2006, totaled $5.9 million, a decrease of $2.9 million, or 33.0%, from the $8.8 million of net income reported in 2005. The decrease in earnings was primarily due to the increase of $2.2 million in general, administrative and other expenses coupled with the decrease of $1.6 million in other income which was offset partially by a $1.4 million, or 34.2%, decrease in the provision for federal taxes.
Net Interest Income. Net interest income for the year ended December 31, 2006, amounted to $29.9 million, a decrease of $631,000, or 2.1%, compared to 2005, generally reflecting the effects of an increase of 70 basis points in the cost of funds. This was offset partially by a $9.2 million decrease in the average balance of cost of funds and an increase of interest earning assets of 58 basis points in the average yield, from 5.68% in 2005 to 6.26% in 2006, offset partially by a $3.8 million decrease in the average balance of interest-earning assets outstanding year to year.
Interest income on loans totaled $54.8 million for the year ended December 31, 2006, an increase of $4.6 million, or 9.2%, from the comparable 2005 total. The increase resulted primarily from a 62 basis point increase in the average yield, from 6.01% in 2005, to 6.63% in 2006, offset partially by a $9.1 million, or 1.0%, decrease in the average balance of loans outstanding year to year. Interest income on securities totaled $4.6 million for the year ended December 31, 2006, a $547,000, or 13.4%, increase from the 2005 period. The increase was due primarily to a $2.0 million, or 1.8%, increase in the average balance outstanding, coupled with a 42 basis point increase in the average yield, to 4.12% in 2006. Interest income on FHLB stock increased by $296,000, or 22.5%, due primarily to a $1.5 million increase in the average balance outstanding year to year, coupled with an 80 basis point increase in the average yield, to 5.80% in 2006. Interest income on cash surrender value of life insurance increased by $21,000, or 2.3% due primarily to an increase of $444,000, or 2.2% in
15
MANAGEMENT’S DISCUSSION AND
ANALYSIS OF FINANCIAL CONDITION AND
RESULTS OF OPERATIONS (continued)
the average balance outstanding year to year coupled with a 1 basis point increase in the average yield, to 4.41% in 2006. Interest income on other interest-earning assets increased by $148,000, or 24.4%, due primarily to an increase in the yield of 58 basis points, to 5.31% in 2006, coupled with an increase of $1.4 million, or 11.0%, in the average balance outstanding year to year.
Interest expense on deposits totaled $21.2 million for the year ended December 31, 2006, an increase of $5.8 million, or 37.7%, compared to the year ended December 31, 2005, due primarily to an 88 basis point increase in the average cost of deposits, to 3.29% for 2006, coupled with a $5.8 million, or .9%, increase in the average balance of interest-bearing deposits outstanding year to year. Interest expense on borrowings totaled $11.5 million for the year ended December 31, 2006, an increase of $428,000, or 3.9%, from 2005. The increase resulted primarily from a 35 basis point increase in the average rate to 4.08% in 2006, partially offset by a $15.6 million, or 5.2%, decrease in the average balance outstanding year to year.
As a result of the foregoing changes in interest income and interest expense, net interest income decreased by $631,000, or 2.1%, to a total of $29.9 million for the year ended December 31, 2006. The interest rate spread decreased to approximately 2.73% at December 31, 2006, from 2.85% at December 31, 2005, while the net interest margin increased to approximately 2.99% for the year ended December 31, 2006, compared to 3.04% for the 2005 period.
Provision for Losses on Loans. A provision for losses on loans is charged to earnings to bring the total allowance for loan losses to a level considered appropriate by management based on historical experience, the volume and type of lending conducted by the Bank, the status of past due principal and interest payments, general economic conditions, particularly as such conditions relate to the Bank’s market areas, and other factors related to the collectibility of the Bank’s loan portfolio. Based upon an analysis of these factors, management recorded a provision for losses on loans totaling $1.4 million for the year ended December 31, 2006, a decrease of $40,000, or 2.7%, from the provision recorded in 2005.
Other Income. Other income totaled $5.0 million for the year ended December 31, 2006, a decrease of $1.6 million, or 23.7%, compared to 2005. The decrease in other income was primarily attributable to a $569,000 decrease in mortgage servicing rights, a $388,000, or 56.8%, decrease in gain on sale of loans and a $390,000 or 24.6% decrease in late charges, rent and other income. The decrease in mortgage servicing rights was attributable to the increase of loan prepayments in the servicing portfolio for the period coupled with the decrease of loans sold. The decrease in gain on sale of loans was due primarily to a decrease in the volume of loans sold of $18.8 million, or 27.0%, from the volume of loans sold in 2005. During 2006, the Bank recorded MSR’s on new loan sales totaling $703,000 and amortization of MSR’s totaling $1.3 million, which resulted in net loss in revenue item of $549,000. The decrease in late charges, rent and other was due primarily to a management decision to discontinue the accrual of late charges on commercial loans and move to a method that would recognize late charges as income when collected. This decision to reverse accrued late charges resulted in a decrease in other income of $166,000 for the period coupled with decreased commercial prepayment fees of $211,300 and $78,600 in title and search fees earned by Camco Title Agency.
General, Administrative and Other Expense. General, administrative and other expense totaled $24.9 million for the year ended December 31, 2006, an increase of $2.2 million, or 9.5%, compared to 2005. The increase was due primarily to a $760,000, or 284.6%, increase in franchise taxes and a $770,000, or 6.6%, increase in employee compensation and benefits and a $579,000 or 11.1% increase in other operating costs. The increase in franchise tax was due to incurring a normal level of expense after realizing a one-time savings which occurred in 2005 from the acquisition of London Financial Corporation in August 2004, when the bank adopted a state commercial bank charter. The increase in employee compensation and benefits is primarily due to several key hires within the mid-management level of the Corporation as well as revenue generating commercial lenders in the markets we serve, recruiting expense, merit increases and increases in health insurance expense. The increase in other operating costs relates to increases of $105,000 in ATM processing expense, $74,000 in courier and overnight delivery charges, $126,000 in audit and other professional services and $56,000 in bank service charges relating to changing our depository bank at the time of conversion.
Federal Income Taxes. Federal income tax totaled $2.7 million for the year ended December 31, 2006, a decrease of $1.4 million, or 34.2%, compared to the provision recorded in 2005. This decrease was primarily attributable to a $4.3 million, or 33.4%, decrease in pre-tax earnings. The Corporation’s effective tax rates amounted to 31.7% and 32.1% for the years ended December 31, 2006 and 2005, respectively. The tax-exempt character of earnings on bank-owned life insurance is the principal difference between the effective rate of tax expense and the statutory corporate tax rate for the years ended December 31, 2006 and 2005.
16
AVERAGE BALANCE, YIELD, RATE AND VOLUME DATA
The following table presents for the periods indicated the total dollar amount of interest income from average interest-earning assets and the resulting yields, and the interest expense on average interest-bearing liabilities, expressed both in dollars and rates, and the net interest margin. The table does not reflect any effect of income taxes. Balances are based on the average of month-end balances which, in the opinion of management, do not differ materially from daily balances. Some items in the prior-year financial statements were reclassified to conform to the current year’s presentation, including the reclassification of nonaccrual loans, mortgage servicing rights and the allowance for loan losses from Loans receivable to Noninterest-earning assets.
| | | | | | | | | | | | | | | | | | | | | | | | | | | | | | | | | | | | | |
| | | Year ended December 31, | |
| | | | | | 2007 | | | | | | | | | 2006 | | | | | | | | | 2005 | | | | |
| | | Average
| | | Interest
| | | Average
| | | Average
| | | Interest
| | | Average
| | | Average
| | | Interest
| | | Average
| |
| | | outstanding
| | | earned/
| | | yield/
| | | outstanding
| | | earned/
| | | yield/
| | | outstanding
| | | earned/
| | | yield/
| |
| | | balance | | | paid | | | rate | | | balance | | | paid | | | rate | | | balance | | | paid | | | rate | |
| |
| | | (Dollars in thousands) | |
| |
| Interest-earning assets: | | | | | | | | | | | | | | | | | | | | | | | | | | | | | | | | | | | | |
Loans receivable (1) | | $ | 816,637 | | | $ | 57,448 | | | | 7.03 | % | | $ | 825,915 | | | $ | 54,764 | | | | 6.63 | % | | $ | 835,017 | | | $ | 50,165 | | | | 6.01 | % |
Securities (2) | | | 103,962 | | | | 4,585 | | | | 4.41 | | | | 112,584 | | | | 4,640 | | | | 4.12 | | | | 110,613 | | | | 4,093 | | | | 3.70 | |
| FHLB Stock | | | 28,722 | | | | 1,894 | | | | 6.60 | | | | 27,777 | | | | 1,611 | | | | 5.80 | | | | 26,317 | | | | 1,315 | | | | 5.00 | |
| Cash surrender value of life insurance | | | 21,312 | | | | 948 | | | | 4.45 | | | | 20,861 | | | | 920 | | | | 4.41 | | | | 20,417 | | | | 899 | | | | 4.40 | |
| Interest-bearing deposits and other | | | 7,341 | | | | 442 | | | | 6.02 | | | | 14,211 | | | | 754 | | | | 5.31 | | | | 12,808 | | | | 606 | | | | 4.73 | |
| | | | | | | | | | | | | | | | | | | | | | | | | | | | | | | | | | | | | |
| | | | | | | | | | | | | | | | | | | | | | | | | | | | | | | | | | | | | |
| Total interest-earning assets | | | 977,974 | | | | 65,317 | | | | 6.68 | | | | 1,001,348 | | | | 62,689 | | | | 6.26 | | | | 1,005,172 | | | | 57,078 | | | | 5.68 | |
Noninterest-earning assets (3) | | | 67,337 | | | | | | | | | | | | 60,290 | | | | | | | | | | | | 63,561 | | | | | | | | | |
| | | | | | | | | | | | | | | | | | | | | | | | | | | | | | | | | | | | | |
| | | | | | | | | | | | | | | | | | | | | | | | | | | | | | | | | | | | | |
| Total Average Assets | | $ | 1,045,311 | | | | | | | | | | | $ | 1,061,638 | | | | | | | | | | | $ | 1,068,733 | | | | | | | | | |
| | | | | | | | | | | | | | | | | | | | | | | | | | | | | | | | | | | | | |
| | | | | | | | | | | | | | | | | | | | | | | | | | | | | | | | | | | | | |
| Interest-bearing liabilities: | | | | | | | | | | | | | | | | | | | | | | | | | | | | | | | | | | | | |
| Deposits | | $ | 652,711 | | | | 25,429 | | | | 3.90 | | | | 646,269 | | | | 21,248 | | | | 3.29 | | | | 640,469 | | | | 15,434 | | | | 2.41 | |
| FHLB advances and other | | | 249,793 | | | | 10,992 | | | | 4.40 | | | | 282,325 | | | | 11,523 | | | | 4.08 | | | | 297,304 | | | | 11,095 | | | | 3.73 | |
| | | | | | | | | | | | | | | | | | | | | | | | | | | | | | | | | | | | | |
| | | | | | | | | | | | | | | | | | | | | | | | | | | | | | | | | | | | | |
| Total interest-bearing liabilities | | | 902,504 | | | | 36,421 | | | | 4.04 | | | | 928,594 | | | | 32,771 | | | | 3.53 | | | | 937,773 | | | | 26,529 | | | | 2.83 | |
| | | | | | | | | | | | | | | | | | | | | | | | | | | | | | | | | | | | | |
| Noninterest-bearing deposits | | | 35,919 | | | | | | | | | | | | 30,163 | | | | | | | | | | | | 28,627 | | | | | | | | | |
| Noninterest-bearing liabilities | | | 16,418 | | | | | | | | | | | | 11,991 | | | | | | | | | | | | 11,731 | | | | | | | | | |
| | | | | | | | | | | | | | | | | | | | | | | | | | | | | | | | | | | | | |
| | | | | | | | | | | | | | | | | | | | | | | | | | | | | | | | | | | | | |
| Total Average Liabilities | | | 954,841 | | | | | | | | | | | | 970,748 | | | | | | | | | | | | 978,131 | | | | | | | | | |
| | | | | | | | | | | | | | | | | | | | | | | | | | | | | | | | | | | | | |
| Total Average Shareholders’ Equity | | | 90,470 | | | | | | | | | | | | 90,890 | | | | | | | | | | | | 90,602 | | | | | | | | | |
| | | | | | | | | | | | | | | | | | | | | | | | | | | | | | | | | | | | | |
| Total Average Liabilities and Shareholders’ Equity | | $ | 1,045,311 | | | | | | | | | | | $ | 1,061,638 | | | | | | | | | | | $ | 1,068,733 | | | | | | | | | |
| | | | | | | | | | | | | | | | | | | | | | | | | | | | | | | | | | | | | |
| Net interest income/ Interest rate spread | | | | | | $ | 28,896 | | | | 2.64 | % | | | | | | $ | 29,918 | | | | 2.73 | % | | | | | | $ | 30,549 | | | | 2.85 | % |
| | | | | | | | | | | | | | | | | | | | | | | | | | | | | | | | | | | | | |
| | | | | | | | | | | | | | | | | | | | | | | | | | | | | | | | | | | | | |
| Net interest margin (4) | | | | | | | | | | | 2.95 | % | | | | | | | | | | | 2.99 | % | | | | | | | | | | | 3.04 | % |
| | | | | | | | | | | | | | | | | | | | | | | | | | | | | | | | | | | | | |
| | | | | | | | | | | | | | | | | | | | | | | | | | | | | | | | | | | | | |
| Average interest-earning assets to average interest-bearing liabilities | | | | | | | | | | | 108.3 | % | | | | | | | | | | | 107.8 | % | | | | | | | | | | | 107.2 | % |
| | | | | | | | | | | | | | | | | | | | | | | | | | | | | | | | | | | | | |
| | |
| (1) | | Includes loans held for sale. Loan fees are immaterial. |
| |
| (2) | | Includes securities designated as available for sale |
| |
| (3) | | Includes nonaccrual loans, mortgage servicing rights and allowance for loan losses |
| |
| (4) | | Net interest income as a percent of average interest-earning assets |
17
AVERAGE BALANCE, YIELD, RATE AND
VOLUME DATA (continued)
Rate/Volume Table
The following table describes the extent to which changes in interest rates and changes in the volume of interest-earning assets and interest-bearing liabilities have affected Camco’s interest income and expense during the periods indicated. For each category of interest-earning assets and interest-bearing liabilities, information is provided on changes attributable to (i) changes in volume (change in volume multiplied by prior year rate), (ii) changes in rate (change in rate multiplied by prior year volume) and (iii) total changes in rate and volume.
| | | | | | | | | | | | | | | | | | | | | | | | | |
| | | Year ended December 31 | |
| | | 2007
| | | 2006
| |
| | | Increase/(decrease) due to | | | Increase/(decrease) due to | |
| | | Volume | | | Rate | | | Total | | | Volume | | | Rate | | | Total | |
| |
| | | (In thousands) | |
| |
| Interest income attributable to: | | | | | | | | | | | | | | | | | | | | | | | | |
Loans receivable (1) | | $ | (607 | ) | | $ | 3,291 | | | $ | 2,684 | | | $ | (307 | ) | | $ | 4,906 | | | $ | 4,599 | |
| Securities | | | (649 | ) | | | 594 | | | | (55 | ) | | | 3 | | | | 544 | | | | 547 | |
| Interest-bearing deposits and other | | | (357 | ) | | | 356 | | | | (1 | ) | | | 162 | | | | 303 | | | | 465 | |
| | | | | | | | | | | | | | | | | | | | | | | | | |
| Total interest income | | | (1,613 | ) | | | 4,241 | | | | 2,628 | | | | (142 | ) | | | 5,753 | | | | 5,611 | |
| | | | | | | | | | | | | | | | | | | | | | | | | |
| Interest expense attributable to: | | | | | | | | | | | | | | | | | | | | | | | | |
| Deposits | | | 214 | | | | 3,967 | | | | 4,181 | | | | 141 | | | | 5,673 | | | | 5,814 | |
| Borrowings | | | (1,650 | ) | | | 1,119 | | | | (531 | ) | | | (498 | ) | | | 926 | | | | 428 | |
| | | | | | | | | | | | | | | | | | | | | | | | | |
| Total Interest expense | | | (1,436 | ) | | | 5,086 | | | | 3,650 | | | | (357 | ) | | | 6,599 | | | | 6,242 | |
| | | | | | | | | | | | | | | | | | | | | | | | | |
| Increase (decrease) in net interest income | | $ | (177 | ) | | $ | (845 | ) | | $ | (1,022 | ) | | $ | 215 | | | $ | (846 | ) | | $ | (631 | ) |
| | | | | | | | | | | | | | | | | | | | | | | | | |
| | |
| (1) | | Includes loans held for sale. |
Yields Earned and Rates Paid
The following table sets forth the weighted-average yields earned on Camco’s interest-earning assets, the weighted-average interest rates paid on Camco’s interest-bearing liabilities and the interest rate spread between the weighted-average yields earned and rates paid by Camco at the dates indicated. This does not reflect the spread that may eventually be achieved in 2008 or beyond due to possible changes in weighted-average yields earned on interest-earning assets and paid on interest-bearing liabilities in the upcoming year.
| | | | | | | | | | | | | |
| | | At December 31, | |
| | | 2007 | | | 2006 | | | 2005 | |
| |
| |
| Weighted-average yield on: | | | | | | | | | | | | |
Loan portfolio (1) | | | 7.05 | % | | | 6.97 | % | | | 6.36 | % |
Investment portfolio (2) | | | 5.30 | | | | 4.62 | | | | 4.53 | |
| Total interest-earning assets | | | 6.77 | | | | 6.56 | | | | 6.02 | |
| | | | | | | | | | | | | |
| Weighted-average rate paid on: | | | | | | | | | | | | |
| Deposits | | | 3.88 | | | | 3.52 | | | | 2.60 | |
| FHLB advances | | | 4.42 | | | | 4.28 | | | | 3.94 | |
| Total interest-bearing liabilities | | | 4.02 | | | | 3.73 | | | | 3.01 | |
| | | |
| | | |
| | | | | | | | | | | | | |
| Interest rate spread | | | 2.75 | % | | | 2.83 | % | | | 3.01 | % |
| | | |
| | | |
| | |
| (1) | | Includes loans held for sale and excludes the allowance for loan losses. |
| |
| (2) | | Includes earnings on FHLB stock, investment securities and cash surrender value of life insurance. Taxable equivalent yield used. |
18
QUANTITATIVE AND QUALITATIVE DISCLOSURES ABOUT MARKET RISK
The objective of our interest rate risk management function is to maintain consistent growth in net interest income within the Board’s policy limits. This objective is accomplished through management of balance sheet composition, liquidity, and interest rate risk exposures arising from changing economic conditions, interest rates and customer preferences.
The goal of liquidity management is to provide adequate funds to meet changes in loan demand or unexpected deposit withdrawals. This is accomplished by maintaining liquid assets in the form of investment securities, maintaining sufficient unused borrowing capacity and achieving consistent growth in core deposits. See “Liquidity and Capital Resources” for additional discussion on liquidity.
We consider interest rate risk to be Camco’s most significant market risk. Interest rate risk is the exposure to adverse changes in net interest income due to changes in interest rates. Consistency of Camco’s net interest income is largely dependent upon the effective management of interest rate risk.
To identify and manage interest rate risk, we employ an earnings simulation model to analyze net interest income sensitivity to changing interest rates. The model is based on estimated cash flows and repricing characteristics and incorporates market-based assumptions regarding the effect of changing interest rates on the prepayment rates of certain assets and liabilities. The model also includes projections for activity levels in each of the product lines offered. Assumptions based on the historical behavior of deposit rates and balances in relation to changes in interest rates are also incorporated into the model. Assumptions are inherently uncertain and the measurement of net interest income or the impact of rate fluctuations on net interest income cannot be precisely predicted. Actual results may differ from simulated results due to timing, magnitude, and frequency of interest rate changes as well as changes in market conditions and management strategies.
The Bank’s Asset/Liability Management Committee (“ALCO”), which includes senior management representatives and reports to the Bank’s Board of Directors, monitors and manages interest rate risk within Board-approved policy limits. The interest rate risk position of Camco presented below is determined by measuring the anticipated change in net interest income over a twelve month horizon assuming an instantaneous and parallel shift (linear) increase or decrease in all interest rates.
For example, the tables below assume that a decrease in market rates of 100 basis points will result in an immediate reduction of our money market deposit accounts rates of 100 basis points. Competitive pressures such as the environment we are in currently, may limit our ability to actually reduce money market rates by 100 basis points. The table below also includes assumptions on loan production and deposit growth over the next twelve months. Actual results may significantly differ from those presented below due to the uncertainty of our estimates.
The following table shows the Corporation’s estimated earnings sensitivity profile as of December 31, 2007:
| | | | | | | |
Change in
| | Percentage Change in
|
Interest Rates
| | Net Interest Income
|
| (basis points) | | 12 Months Forward |
|
| |
| | +200 | | | | -9.55% | |
| | +100 | | | | -4.53% | |
| | -100 | | | | 0.11% | |
| | -200 | | | | 0.20% | |
The ALCO also monitors the sensitivity of the Corporation’s economic value of equity (“EVE”) due to sudden and sustained changes in market rates. The ALCO monitors the sensitivity of EVE on a percentage change basis.
The following table shows the EVE ratios as of December 31, 2007:
| | | | | | | |
Change in
| | |
Interest Rates
| | Percentage
|
| (basis points) | | Change in EVE |
|
| |
| | +200 | | | | -4.50 | % |
| | +100 | | | | -1.43 | % |
| | -100 | | | | 5.18 | % |
| | -200 | | | | 12.64 | % |
These estimated changes in net interest income and EVE are within the policy guidelines established by the Board of Directors. In order to reduce the exposure to interest rate fluctuations and to manage liquidity, we have developed sale
19
QUANTITATIVE AND QUALITATIVE DISCLOSURES
ABOUT MARKET RISK (continued)
procedures for several types of interest-sensitive assets. Generally, all long-term, fixed-rate single family residential mortgage loans underwritten according to Freddie Mac and Fannie guidelines are sold for cash upon origination. A total of $50.0 million and $50.9 million of such loans were sold to Freddie Mac, Fannie Mae and other parties during 2007 and 2006, respectively.
20
LIQUIDITY AND CAPITAL RESOURCES
“Liquidity” refers to our ability to fund loan demand and deposit withdrawal requests, to pay dividends to shareholders and to meet other commitments and contingencies. The purpose of liquidity management is to ensure sufficient cash flow to meet all of Camco’s financial commitments and to capitalize on opportunities for business expansion in the context of managing interest rate risk exposure. This ability depends on Camco’s financial strength, asset quality and the types of deposit and loan instruments offered to customers.
We monitor and assess liquidity needs daily in order to meet deposit withdrawals, loan commitments and expenses. Camco’s liquidity contingency funding plan identifies liquidity thresholds and red flags that may evidence liquidity concerns or future crises. The contingency plan details specific actions to be taken by management and the Board of Directors. It also identifies sources of emergency liquidity, both asset and liability-based, should we encounter a liquidity crisis. In conjunction with the Corporation’s asset/liability and interest rate risk management activities, we actively monitor liquidity risk and analyze various scenarios that could impact or impair Camco’s ability to access emergency funding during a liquidity crisis.
Liquid assets consist of cash and interest-bearing deposits in other financial institutions, investments and mortgage-backed securities. Approximately $45.1 million, or 49.4%, of our investment portfolio is expected to mature or prepay during 2008. While these maturities could provide a significant source of liquidity in the short term, public unit deposits and repurchase agreements limit our ability to use these funds freely due to the collateral requirements of such accounts. State and local political subdivision deposits equaled $57.5 million at December 31, 2007, and $65.8 million at December 31, 2006. We are implementing a product strategy to attract public fund deposits without the need for collateral.
Additional sources of liquidity include deposits, borrowings and principal and interest repayments on loans. While scheduled loan repayments and maturing investments are relatively predictable, deposit flows and early loan and security prepayments are more influenced by interest rates, general economic conditions, and competition and are difficult to predict.
Approximately $303.1 million of the Corporation’s certificate of deposit portfolio is scheduled to mature during 2008. Depositors have shown a preference toward short-term certificates or other terms of less than 18 months due to the inverted yield curve environment that persisted through most of 2007. This places additional liquidity pressure on the Corporation as competition for deposits is very strong in Ohio, Kentucky and West Virginia. A material loss of these short-term deposits could force us to seek funding through contingency sources, which may negatively impact earnings.
Federal Home Loan Bank (FHLB) advances are another funding source. In the past, Camco has depended heavily on borrowings to fund balance sheet growth. While significant strategic and tactical focus is currently being placed on deposit growth, borrowings and additional borrowing capacity at the FHLB are still vital sources of liquidity and growth funding. We have approximately $97.7 million of additional borrowing capacity available as of December 31, 2007. However, our total borrowing capacity at the FHLB is dependent on the level of eligible collateral assets held by the Bank and the Bank’s credit rating with the FHLB. Our total borrowing capacity with the FHLB decreased to $296.8 million at December 31, 2007, from $300.8 million at December 31, 2006. This capacity has decreased as our one to four- family loan portfolio, the primary collateral for FHLB borrowings, has shrunk and the increase in nonperforming loans has reduced our credit rating (and thereby increased our collateral requirements) in 2007 compared to 2006. While we could pledge additional assets as collateral, the inability of the Bank to access contingency funding from the FHLB may significantly limit our growth and negatively affect earnings.
During the third and fourth quarters of 2007, credit markets and money markets endured unprecedented disruption in daily activity. Caused primarily by the impairment of securities backed by “subprime loans,” many financial institutions found they were unable to fund their normal secondary market operations (the sale of loans to other investors). While this event did not interrupt our normal liquidity management process, nor did it directly impact our liquidity position, we nonetheless are indirectly impacted by this liquidity event through the resultant interest rate environment and competition for deposits, explained more fully below.
In order to provide liquidity to banks in response to this crisis, the Federal Reserve Bank’s Federal Open Markets Committee lowered the Discount Rate and their target for the Federal Funds rate several times during the second half of 2007 and into 2008, which caused decreases in the Prime rate to which 19% of our loans are tied. Additionally, many super-regional and money center banks have been forced to seek short-term funding through retail deposits as access to their normal sources of wholesale funding is now materially impaired. These banks have offered deposit rates significantly in excess of normal deposit rates, when historically compared to U.S. Treasury and FHLB borrowing rates, exacerbating the effects of an already highly-competitive deposit market. As a result, we have not been able to reduce our marginal cost of deposits as quickly as we would need to in order to preserve our current level of net interest margin in the wake of decreasing loan yields. Additionally, our liquidity risk exposure has increased as our inability to retain and attract deposits due to higher rates offered by competitors may cause us to seek funding from additional sources, such as the FHLB or other wholesale sources, such as brokered deposits.
21
LIQUIDITY AND CAPITAL RESOURCES (continued)
We plan to increase the level of brokered deposits in early 2008 in order to reduce FHLB borrowings and secure funds that do not require collateral. Funds in excess of loan demand and available borrowing repayments will be held in short-term investments or federal funds sold. We are taking these actions to proactively prepare for the possibility of continued deterioration in the credit markets and increases in our nonperforming loans, which may reduce our borrowing capacity at the FHLB further.
The following table sets forth information regarding the Bank’s obligations and commitments to make future payments under contract as of December 31, 2007.
| | | | | | | | | | | | | | | | | | | | | |
| | | Payments due by period | |
| | | Less
| | | | | | | | | More
| | | | |
| | | than
| | | 1-3
| | | 3-5
| | | than 5
| | | | |
| | | 1 year | | | years | | | years | | | years | | | Total | |
| |
| | | (In thousands) | |
| Contractual obligations: | | | | | | | | | | | | | | | | | | | | |
| Operating lease obligations | | $ | 298 | | | $ | 485 | | | $ | 302 | | | $ | 444 | | | $ | 1,529 | |
| Advances from the Federal Home Loan Bank | | | 71,933 | | | | 77,197 | | | | 13,637 | | | | 36,297 | | | | 199,064 | |
| Repurchase agreements | | | 16,597 | | | | 320 | | | | — | | | | — | | | | 16,917 | |
| Certificates of deposit | | | 303,081 | | | | 107,742 | | | | 5,039 | | | | 732 | | | | 416,594 | |
Subordinated debentures (1) | | | — | | | | — | | | | — | | | | 5,000 | | | | 5,000 | |
| Ohio Equity Funds for Affordable Housing | | | 789 | | | | 2,777 | | | | 700 | | | | 540 | | | | 4,806 | |
| | | | | | | | | | | | | | | | | | | | | |
| Amount of commitments per period | | | | | | | | | | | | | | | | | | | | |
| Commitments to originate loans: | | | | | | | | | | | | | | | | | | | | |
| Overdraft lines of credit | | | 857 | | | | — | | | | — | | | | — | | | | 857 | |
| Home equity | | | 80,008 | | | | — | | | | — | | | | — | | | | 80,008 | |
| One- to four- family and multi-family loans includes Loans in process | | | 13,991 | | | | — | | | | — | | | | — | | | | 13,991 | |
| Commercial includes Loans in process & | | | | | | | | | | | | | | | | | | | | |
| Lines of credit | | | 19,882 | | | | — | | | | — | | | | — | | | | 19,882 | |
| Letters of credit | | | 714 | | | | — | | | | — | | | | — | | | | 714 | |
| | | |
| | | |
| Total contractual obligations | | $ | 508,150 | | | $ | 188,521 | | | $ | 19,678 | | | $ | 43,013 | | | $ | 759,362 | |
| | | |
| | | |
| | |
| (1) | | The subordinated debentures are redeemable, at Camco’s option, commencing September 15, 2008. The debentures mature on September 15, 2037. |
We anticipate that we will have sufficient funds available to meet our current loan commitments. Based upon historical deposit flow data, the Bank’s competitive pricing in our markets and management’s experience, we believe that a significant portion of our maturing certificates of deposit in 2008 will remain with the Bank, but we also recognize the significance of the risks discussed above.
We engage in off-balance sheet credit-related activities that could require us to make cash payments in the event that specified future events occur. The contractual amounts of these activities represent the maximum exposure to the Bank (as further described in financial statement footnote “Note I — Commitments”). However, certain off-balance sheet commitments are expected to expire or be only partially used; therefore, the total amount of commitments does not necessarily represent future cash requirements. These off-balance sheet activities are necessary to meet the financing needs of the Bank’s customers.
Ohio statutes impose certain limitations on the payment of dividends and other capital distributions by banks. Generally, absent approval of the Superintendent of Banks, such statutes limit dividend and capital distributions to earnings of the current and two preceding years. Additionally, our ability to pay dividends to stockholders is dependent on our net earnings. A continued decline in earnings, increases in loan losses, or higher regulatory capital reserve requirements may jeopardize our ability to pay dividends at current or historical levels.
22
MANAGEMENT’S REPORT ON INTERNAL CONTROL OVER FINANCIAL REPORTING
Management of the Company is responsible for establishing and maintaining adequate internal control over financial reporting, as such term is defined inRule 13a-15(f) andRule 15d-15(f) under the Securities Exchange Act of 1934.
The Company’s internal control over financial reporting is a process designed under the supervision of the Chief Executive Officer and Chief Financial Officer to provide reasonable assurance regarding the reliability of financial reporting and the preparation of the Company’s financial statements for external reporting purposes in accordance with U.S. generally accepted accounting principles. Because of its inherent limitations, internal control over financial reporting may not prevent or detect misstatements. Also, projections of any evaluation of effectiveness to future periods are subject to the risk that controls may become inadequate because of changes in conditions, or that the degree of compliance with the policies or procedures may deteriorate.
The Company’s management, including the Chief Executive Officer and Chief Financial Officer, assessed the effectiveness of the Company’s internal control over financial reporting as of December 31, 2007. In making this assessment, management used the criteria set forth by the Committee of Sponsoring Organizations of the Treadway Commission in Internal Control — Integrated Framework. Based on the assessment, management believes that the Company’s internal control over financial reporting was effective as of December 31, 2007.
The Company’s independent auditors have issued an attestation report on management’s assessment of the Company’s internal control over financial reporting. That report appears on page 24.
23
REPORT OF INDEPENDENT REGISTERED PUBLIC ACCOUNTING FIRM
To the Board of Directors and Stockholders
Camco Financial Corporation
We have audited the accompanying consolidated statement of financial condition of Camco Financial Corporation as of December 31, 2007 and 2006, and the related consolidated statements of operations, comprehensive income, stockholders’ equity, and cash flows for each of the years in the three-year period ended December 31, 2007. We also have audited the Company’s internal control over financial reporting as of December 31, 2007, based on criteria established in Internal Control — Integrated Framework issued by the Committee of Sponsoring Organizations of the Treadway Commission (COSO). Management is responsible for these financial statements, for maintaining effective internal control over financial reporting, and for its assessment of the effectiveness of internal control over financial reporting, included in the accompanying financial statements. Our responsibility is to express an opinion on these financial statements and an opinion on the company’s internal control over financial reporting based on our audits.
We conducted our audits in accordance with the standards of the Public Company Accounting Oversight Board (United States). Those standards require that we plan and perform the audits to obtain reasonable assurance about whether the financial statements are free of material misstatement and whether effective internal control over financial reporting was maintained in all material respects. Our audits of the financial statements included examining, on a test basis, evidence supporting the amounts and disclosures in the financial statements, assessing the accounting principles used and significant estimates made by management, and evaluating the overall financial statement presentation. Our audit of internal control over financial reporting included obtaining an understanding of internal control over financial reporting, assessing the risk that a material weakness exists, and testing and evaluating the design and operating effectiveness of internal control based on the assessed risk. Our audits also included performing such other procedures as we considered necessary in the circumstances. We believe that our audits provide a reasonable basis for our opinions.
A company’s internal control over financial reporting is a process designed to provide reasonable assurance regarding the reliability of financial reporting and the preparation of financial statements for external purposes in accordance with generally accepted accounting principles. A company’s internal control over financial reporting includes those policies and procedures that (1) pertain to the maintenance of records that, in reasonable detail, accurately and fairly reflect the transactions and dispositions of the assets of the company; (2) provide reasonable assurance that transactions are recorded as necessary to permit preparation of financial statements in accordance with generally accepted accounting principles, and that receipts and expenditures of the company are being made only in accordance with authorizations of management and directors of the company; and (3) provide reasonable assurance regarding prevention or timely detection of unauthorized acquisition, use, or disposition of the company’s assets that could have a material effect on the financial statements.
Because of its inherent limitations, internal control over financial reporting may not prevent or detect misstatements. Also, projections of any evaluation of effectiveness to future periods are subject to the risk that controls may become inadequate because of changes in conditions, or that the degree of compliance with the policies or procedures may deteriorate.
In our opinion, the financial statements referred to above present fairly, in all material respects, the consolidated financial position of Camco Financial Corporation as of December 31, 2007 and 2006, and the consolidated results of its operations and its cash flows for each of the years in the three-year period ended December 31, 2007 in conformity with accounting principles generally accepted in the United States of America. Also in our opinion, Camco Financial Corporation maintained, in all material respects, effective internal control over financial reporting as of December 31, 2007, based on criteria established in Internal Control — Integrated Framework issued by the Committee of Sponsoring Organizations of the Treadway Commission (COSO).
February 20, 2008
Auburn Hills, Michigan
24
CAMCO FINANCIAL CORPORATION
CONSOLIDATED STATEMENTS OF FINANCIAL CONDITION
| | | | | | | | | |
| | | December 31, | |
| | | 2007 | | | 2006 | |
| |
| | |
(In thousands, except share data) | |
| | | | | | | | | |
| ASSETS | | | | | | | | |
| Cash and due from banks | | $ | 17,572 | | | $ | 13,869 | |
| Interest-bearing deposits in other financial institutions | | | 5,432 | | | | 12,673 | |
| | | |
| | | |
| Cash and cash equivalents | | | 23,004 | | | | 26,542 | |
| | | | | | | | | |
| Securities available-for-sale, at market | | | 88,919 | | | | 107,506 | |
| Securities held-to-maturity, at cost, approximate market value of $2,793 and $3,470 as of December 31, 2007 and 2006, respectively | | | 2,769 | | | | 3,449 | |
| Loans held for sale – at lower of cost or market | | | 3,169 | | | | 3,664 | |
| Loans receivable – net | | | 812,102 | | | | 818,154 | |
| Office premises and equipment – net | | | 12,856 | | | | 13,200 | |
| Real estate acquired through foreclosure | | | 5,034 | | | | 3,956 | |
| Federal Home Loan Bank stock – at cost | | | 28,722 | | | | 28,722 | |
| Accrued interest receivable | | | 6,034 | | | | 6,502 | |
| Mortgage servicing rights – at lower of cost or market | | | 6,356 | | | | 6,424 | |
| Prepaid expenses and other assets | | | 5,231 | | | | 1,537 | |
| Cash surrender value of life insurance | | | 21,707 | | | | 20,921 | |
| Goodwill | | | 6,683 | | | | 6,683 | |
| Prepaid and refundable federal income taxes | | | 675 | | | | 956 | |
| | | |
| | | |
| Total assets | | $ | 1,023,261 | | | $ | 1,048,216 | |
| | | |
| | | |
| | | | | | | | | |
| LIABILITIES AND STOCKHOLDERS’ EQUITY | | | | | | | | |
| Deposits | | $ | 692,184 | | | $ | 684,782 | |
| Advances from the Federal Home Loan Bank and other borrowings | | | 220,981 | | | | 257,139 | |
| Advances by borrowers for taxes and insurance | | | 3,627 | | | | 3,484 | |
| Accounts payable and accrued liabilities | | | 11,331 | | | | 6,350 | |
| Dividends payable | | | 1,081 | | | | 1,120 | |
| Deferred federal income taxes | | | 5,423 | | | | 4,249 | |
| | | |
| | | |
| Total liabilities | | | 934,627 | | | | 957,124 | |
| Commitments | | | — | | | | — | |
| Stockholders’ equity | | | | | | | | |
| Preferred stock – $1 par value; authorized 100,000 shares; no shares outstanding | | | — | | | | — | |
| Common stock – $1 par value; authorized 14,900,000 shares; 8,834,508 and 8,832,082 shares issued at December 31, 2007 and 2006, respectively | | | 8,835 | | | | 8,832 | |
| Additional paid-in capital | | | 59,842 | | | | 59,722 | |
| Retained earnings | | | 44,083 | | | | 43,954 | |
| Accumulated other comprehensive (loss) net of related tax effects | | | (12 | ) | | | (1,225 | ) |
| Treasury stock – 1,678,913 and 1,369,025 shares at December 31, 2007 and 2006, respectively, at cost | | | (24,114 | ) | | | (20,191 | ) |
| | | |
| | | |
| Total stockholders’ equity | | | 88,634 | | | | 91,092 | |
| | | |
| | | |
| Total liabilities and stockholders’ equity | | $ | 1,023,261 | | | $ | 1,048,216 | |
| | | |
| | | |
The accompanying notes are an integral part of these statements.
25
CAMCO FINANCIAL CORPORATION
CONSOLIDATED STATEMENTS OF OPERATIONS
| | | | | | | | | | | | | |
| | | For the years ended December 31,
| |
| | | 2007, 2006 and 2005 | |
| | | 2007 | | | 2006 | | | 2005 | |
| |
| | |
(In thousands, except per share data) | |
| |
| Interest and dividend income | | | | | | | | | | | | |
| Loans | | $ | 57,448 | | | $ | 54,764 | | | $ | 50,165 | |
| Investment securities | | | 4,585 | | | | 4,640 | | | | 4,093 | |
| Other interest-bearing accounts | | | 3,284 | | | | 3,285 | | | | 2,820 | |
| | | |
| | | |
| Total interest income | | | 65,317 | | | | 62,689 | | | | 57,078 | |
| | | | | | | | | | | | | |
| Interest expense | | | | | | | | | | | | |
| Deposits | | | 25,429 | | | | 21,248 | | | | 15,434 | |
| Borrowings | | | 10,992 | | | | 11,523 | | | | 11,095 | |
| | | |
| | | |
| Total interest expense | | | 36,421 | | | | 32,771 | | | | 26,529 | |
| | | |
| | | |
| Net interest income | | | 28,896 | | | | 29,918 | | | | 30,549 | |
| Provision for losses on loans | | | 1,495 | | | | 1,440 | | | | 1,480 | |
| | | |
| | | |
| Net interest income after provision for losses on loans | | | 27,401 | | | | 28,478 | | | | 29,069 | |
| | | | | | | | | | | | | |
| Other income | | | | | | | | | | | | |
| Late charges, rent and other | | | 1,418 | | | | 1,196 | | | | 1,586 | |
| Title fees | | | 652 | | | | 673 | | | | 752 | |
| Loan servicing fees | | | 1,375 | | | | 1,412 | | | | 1,480 | |
| Gain on sale of loans | | | 353 | | | | 295 | | | | 683 | |
| Mortgage servicing rights – net | | | (68 | ) | | | (549 | ) | | | 20 | |
| Service charges and other fees on deposits | | | 2,441 | | | | 2,056 | | | | 1,973 | |
| Gain on sale of investment and mortgage-backed securities | | | 1 | | | | 0 | | | | 113 | |
| Loss on sale of real estate acquired through foreclosure | | | (297 | ) | | | (72 | ) | | | (23 | ) |
| Gain (loss) on sale of premises and equipment, net | | | (25 | ) | | | 22 | | | | 8 | |
| | | |
| | | |
| Total other income | | | 5,850 | | | | 5,033 | | | | 6,592 | |
| | | | | | | | | | | | | |
| General, administrative and other expense | | | | | | | | | | | | |
| Employee compensation and benefits | | | 13,012 | | | | 12,410 | | | | 11,640 | |
| Occupancy and equipment | | | 3,464 | | | | 3,182 | | | | 3,051 | |
| Data processing | | | 1,186 | | | | 1,344 | | | | 1,368 | |
| Advertising | | | 1,299 | | | | 1,158 | | | | 1,218 | |
| Franchise taxes | | | 1,103 | | | | 1,027 | | | | 267 | |
| Other operating | | | 6,921 | | | | 5,789 | | | | 5,210 | |
| | | |
| | | |
| Total general, administrative and other expense | | | 26,985 | | | | 24,910 | | | | 22,754 | |
| | | |
| | | |
| Earnings before federal income taxes | | | 6,266 | | | | 8,601 | | | | 12,907 | |
| Federal income taxes | | | | | | | | | | | | |
| Current | | | 1,216 | | | | 2,043 | | | | 3,965 | |
| Deferred | | | 549 | | | | 684 | | | | 176 | |
| | | |
| | | |
| Total federal income taxes | | | 1,765 | | | | 2,727 | | | | 4,141 | |
| | | |
| | | |
| NET EARNINGS | | $ | 4,501 | | | $ | 5,874 | | | $ | 8,766 | |
| | | |
| | | |
| EARNINGS PER SHARE | | | | | | | | | | | | |
| Basic | | $ | 0.61 | | | $ | 0.78 | | | $ | 1.15 | |
| | | |
| | | |
| Diluted | | $ | 0.61 | | | $ | 0.78 | | | $ | 1.15 | |
| | | |
| | | |
The accompanying notes are an integral part of these statements.
26
CAMCO FINANCIAL CORPORATION
CONSOLIDATED STATEMENTS OF
COMPREHENSIVE INCOME
| | | | | | | | | | | | | |
| | | For the years ended December 31, | |
| | | 2007 | | | 2006 | | | 2005 | |
| |
| | |
(In thousands) | |
| |
| Net earnings | | $ | 4,501 | | | $ | 5,874 | | | $ | 8,766 | |
| Other comprehensive income (loss), net of tax effects: | | | | | | | | | | | | |
| Unrealized holding gains (losses) on securities during the period, net of taxes (benefits) of $625, $226 and $(683) in 2007, 2006 and 2005, respectively | | | 1,213 | | | | 438 | | | | (1,325 | ) |
| Reclassification adjustment for realized gains included in operations, net of taxes of $1, $0 and $38 for the years ended December 31, 2007, 2006 and 2005, respectively | | | (1 | ) | | | — | | | | (75 | ) |
| | | |
| | | |
| Comprehensive income | | $ | 5,713 | | | $ | 6,312 | | | $ | 7,366 | |
| | | |
| | | |
The accompanying notes are an integral part of these statements.
27
CAMCO FINANCIAL CORPORATION
CONSOLIDATED STATEMENTS OF
STOCKHOLDERS’ EQUITY
| | | | | | | | | | | | | | | | | | | | | | | | | | | | | | | |
| | | | For the years ended December 31, 2007, 2006 and 2005 | |
| | | | | | | | | | | | | | | | | Accumulated
| | | | | | | |
| | | | | | | | | | | Additional
| | | | | | other
| | | | | | Total
| |
| | | | Shares
| | | | Common
| | | paid-in
| | | Retained
| | | comprehensive
| | | Treasury
| | | stockholders’
| |
| | | | outstanding | | | | stock | | | capital | | | earnings | | | income (loss) | | | stock | | | equity | |
| |
| | | | (Dollars in thousands, except per share data) | |
| Balance at January 1, 2005 | | | | 7,663,153 | | | | $ | 8,760 | | | $ | 58,935 | | | $ | 38,234 | | | $ | (263 | ) | | $ | (16,345 | ) | | $ | 89,321 | |
| | | | | | | | | | | | | | | | | | | | | | | | | | | | | | | |
| Stock options exercised | | | | 70,162 | | | | | 70 | | | | 632 | | | | — | | | | — | | | | — | | | | 702 | |
| Cash dividends declared – $0.58 per share | | | | — | | | | | — | | | | — | | | | (4,431 | ) | | | — | | | | — | | | | (4,431 | ) |
| Net earnings for the year ended December 31, 2005 | | | | — | | | | | — | | | | — | | | | 8,766 | | | | — | | | | — | | | | 8,766 | |
| Purchase of treasury shares | | | | (154,602 | ) | | | | — | | | | — | | | | — | | | | — | | | | (2,195 | ) | | | (2,195 | ) |
| Unrealized losses on securities designated as available for sale, net of related tax benefits | | | | — | | | | | — | | | | — | | | | — | | | | (1,400 | ) | | | — | | | | (1,400 | ) |
| | | | | | | | | | | | | | | | | | | | | | | | | | | | | | | |
| | | | | | | | | | | | | | | | | | | | | | | | | | | | | | | |
| Balance at December 31, 2005 | | | | 7,578,713 | | | | | 8,830 | | | | 59,567 | | | | 42,569 | | | | (1,663 | ) | | | (18,540 | ) | | | 90,763 | |
| | | | | | | | | | | | | | | | | | | | | | | | | | | | | | | |
| Stock options exercised | | | | 2,243 | | | | | 2 | | | | 18 | | | | — | | | | — | | | | — | | | | 20 | |
| Cash dividends declared – $0.60 per share | | | | — | | | | | — | | | | — | | | | (4,489 | ) | | | — | | | | — | | | | (4,489 | ) |
| FAS 123 R – Stock Option Expense | | | | — | | | | | — | | | | 137 | | | | — | | | | — | | | | — | | | | 137 | |
| Net earnings for the year ended December 31, 2006 | | | | — | | | | | — | | | | — | | | | 5,874 | | | | — | | | | — | | | | 5,874 | |
| Purchase of treasury shares | | | | (117,900 | ) | | | | — | | | | — | | | | — | | | | — | | | | (1,651 | ) | | | (1,651 | ) |
| Unrealized gains on securities designated as available for sale, net of related tax benefits | | | | — | | | | | — | | | | — | | | | — | | | | 438 | | | | — | | | | 438 | |
| | | | | | | | | | | | | | | | | | | | | | | | | | | | | | | |
| | | | | | | | | | | | | | | | | | | | | | | | | | | | | | | |
| Balance at December 31, 2006 | | | | 7,463,056 | | | | | 8,832 | | | | 59,722 | | | | 43,954 | | | | (1,225 | ) | | | (20,191 | ) | | | 91,092 | |
| | | | | | | | | | | | | | | | | | | | | | | | | | | | | | | |
| Stock options exercised | | | | 2,427 | | | | | 3 | | | | 28 | | | | — | | | | — | | | | — | | | | 31 | |
| Cash dividends declared – $0.60 per share | | | | — | | | | | — | | | | — | | | | (4,372 | ) | | | — | | | | — | | | | (4,372 | ) |
| FAS 123R – Stock Option Expense | | | | — | | | | | — | | | | 92 | | | | — | | | | — | | | | — | | | | 92 | |
| Net earnings for the year ended December 31, 2007 | | | | — | | | | | — | | | | — | | | | 4,501 | | | | — | | | | — | | | | 4,501 | |
| Purchase of treasury shares | | | | (309,888 | ) | | | | — | | | | — | | | | — | | | | — | | | | (3,923 | ) | | | (3,923 | ) |
| Unrealized gains of securities designated as available for sale, net of related tax benefits | | | | — | | | | | — | | | | — | | | | — | | | | 1,213 | | | | — | | | | 1,213 | |
| | | | | | | | | | | | | | | | | | | | | | | | | | | | | | | |
| | | | | | | | | | | | | | | | | | | | | | | | | | | | | | | |
| Balance at December 31, 2007 | | | | 7,155,595 | | | | $ | 8,835 | | | $ | 59,842 | | | $ | 44,083 | | | $ | (12 | ) | | $ | (24,114 | ) | | $ | 88,634 | |
| | | | | | | | | | | | | | | | | | | | | | | | | | | | | | | |
| | | | | | | | | | | | | | | | | | | | | | | | | | | | | | | |
The accompanying notes are an integral part of these statements.
28
CAMCO FINANCIAL CORPORATION
CONSOLIDATED STATEMENTS OF CASH FLOWS
| | | | | | | | | | | | | |
| | | For the years ended December 31, | |
| | | 2007 | | | 2006 | | | 2005 | |
| |
| | | (In thousands) | |
| |
| Cash flows from operating activities: | | | | | | | | | | | | |
| | | | | | | | | | | | | |
| Net earnings for the year | | $ | 4,501 | | | $ | 5,874 | | | $ | 8,766 | |
| | | | | | | | | | | | | |
| Adjustments to reconcile net earnings to net cash provided by operating activities: | | | | | | | | | | | | |
| Amortization of premiums and discounts on investment and mortgage-backed securities – net | | | 115 | | | | 188 | | | | 466 | |
| Amortization of mortgage servicing rights – net | | | 747 | | | | 1,252 | | | | 972 | |
| Depreciation and amortization | | | 1,434 | | | | 1,247 | | | | 1,198 | |
| Amortization of purchase accounting adjustments – net | | | — | | | | 89 | | | | 89 | |
| Stock option expense (FAS 123R) | | | 92 | | | | 137 | | | | — | |
| Provision for losses on loans | | | 1,495 | | | | 1,440 | | | | 1,480 | |
| Provision for losses on real estate acquired through foreclosure | | | — | | | | 99 | | | | 95 | |
| Amortization of deferred loan origination fees | | | 84 | | | | 176 | | | | 96 | |
| Loss on sale of real estate acquired through foreclosure | | | 297 | | | | 72 | | | | 23 | |
| Gain on sale of investment securities | | | (1 | ) | | | — | | | | (113 | ) |
| (Gain) loss on sale of branch deposits, premises and equipment, net | | | 25 | | | | (22 | ) | | | (8 | ) |
| Federal Home Loan Bank stock dividends | | | — | | | | (1,610 | ) | | | (1,315 | ) |
| Net increase in cash surrender value of life insurance | | | (786 | ) | | | (769 | ) | | | (751 | ) |
| Gain on sale of loans | | | (353 | ) | | | (295 | ) | | | (683 | ) |
| Loans originated for sale in the secondary market | | | (49,458 | ) | | | (52,641 | ) | | | (68,844 | ) |
| Proceeds from sale of mortgage loans in the secondary market | | | 50,306 | | | | 51,219 | | | | 70,417 | |
| Tax benefits related to exercise of stock options | | | — | | | | — | | | | 111 | |
| Increase (decrease) in cash, net of acquisitions, due to changes in: | | | | | | | | | | | | |
| Accrued interest receivable | | | 468 | | | | (1,204 | ) | | | (794 | ) |
| Prepaid expenses and other assets | | | (4,092 | ) | | | (181 | ) | | | 5,101 | |
| Accounts payable and other liabilities | | | (250 | ) | | | 435 | | | | (7 | ) |
| Federal income taxes | | | 358 | | | | 684 | | | | 176 | |
| | | |
| | | |
| Net cash provided by operating activities | | | 4,982 | | | | 6,190 | | | | 16,475 | |
| | | | | | | | | |
| Cash flows provided by (used in) investing activities: | | | | | | | | |
| | | | | | | | | | | | | |
| Proceeds from maturities of investment securities | | | 52,720 | | | | 6,260 | | | | 10,375 | |
| Proceeds from sale of investment securities designated as available for sale | | | 3 | | | | — | | | | 302 | |
| Purchase of securities designated as available for sale | | | (43,729 | ) | | | (15,881 | ) | | | (39,443 | ) |
| Principal repayments on mortgage-backed securities | | | 11,997 | | | | 12,832 | | | | 21,030 | |
| Loan disbursements | | | (245,835 | ) | | | (230,127 | ) | | | (331,469 | ) |
| Purchases of loans | | | (3,021 | ) | | | (3,698 | ) | | | (11,141 | ) |
| Principal repayments on loans | | | 249,922 | | | | 250,409 | | | | 323,314 | |
| Purchase of premises and equipment | | | (1,131 | ) | | | (3,014 | ) | | | (1,121 | ) |
| Proceeds from sale of office premises and equipment | | | 16 | | | | 158 | | | | 9 | |
| Proceeds from sale of real estate acquired through foreclosure | | | 2,454 | | | | 1,119 | | | | 3,362 | |
| Additions to real estate acquired through foreclosure | | | — | | | | (21 | ) | | | (56 | ) |
| Proceeds from redemption of life insurance | | | — | | | | 641 | | | | — | |
| Net cash provided by (used in) investing activities | | | 23,396 | | | | 18,678 | | | | (24,838 | ) |
| | | |
| | | |
| Net cash provided by (used in) operating and investing activities (balance carried forward) | | | 28,378 | | | | 24,868 | | | | (8,363 | ) |
| | | |
| | | |
29
CAMCO FINANCIAL CORPORATION
CONSOLIDATED STATEMENTS OF CASH FLOWS (continued)
| | | | | | | | | | | | | |
| | | For the years ended December 31, | |
| | | 2007 | | | 2006 | | | 2005 | |
| |
| | | (In thousands) | |
| |
| Net cash provided by (used in) operating and investing activities (balance brought forward) | | $ | 28,378 | | | $ | 24,868 | | | $ | (8,363 | ) |
| | | |
| | | |
| Cash flows provided by financing activities: | | | | | | | | | | | | |
| | | | | | | | | | | | | |
| Net increase (decrease) in deposits | | | 7,402 | | | | 24,540 | | | | (7,536 | ) |
| Proceeds from Federal Home Loan Bank advances | | | 79,000 | | | | 55,500 | | | | 56,500 | |
| Proceeds from subordinated debentures | | | 5,000 | | | | — | | | | — | |
| Repayment of Federal Home Loan Bank advances | | | (125,224 | ) | | | (104,569 | ) | | | (57,453 | ) |
| Net change in repurchase agreements | | | 10,066 | | | | (1,015 | ) | | | 12,866 | |
| Dividends paid on common stock | | | (4,411 | ) | | | (4,471 | ) | | | (4,438 | ) |
| Proceeds from exercise of stock options | | | 31 | | | | 20 | | | | 591 | |
| Purchase of treasury stock | | | (3,923 | ) | | | (1,651 | ) | | | (2,195 | ) |
| Decrease in advances by borrowers for taxes and insurance | | | 143 | | | | 235 | | | | 219 | |
| | | |
| | | |
| Net cash used in financing activities | | | (31,916 | ) | | | (31,411 | ) | | | (1,446 | ) |
| | | |
| | | |
| Net decrease in cash and cash equivalents | | | (3,538 | ) | | | (6,543 | ) | | | (9,809 | ) |
| Cash and cash equivalents at beginning of year | | | 26,542 | | | | 33,085 | | | | 42,894 | |
| | | |
| | | |
| Cash and cash equivalents at end of year | | $ | 23,004 | | | $ | 26,542 | | | $ | 33,085 | |
| | | |
| | | |
| | | | | | | | | | | | | |
| Supplemental disclosure of cash flow information: | | | | | | | | | | | | |
| Cash paid during the year for: | | | | | | | | | | | | |
| Interest on deposits and borrowings | | $ | 36,687 | | | $ | 32,473 | | | $ | 26,511 | |
| | | |
| | | |
| Income taxes | | $ | 1,125 | | | $ | 2,499 | | | $ | (947 | ) |
| | | |
| | | |
| | | | | | | | | | | | | |
| Supplemental disclosure of noncash investing activities: | | | | | | | | | | | | |
| Transfers from loans to real estate acquired through foreclosure | | $ | 5,490 | | | $ | 4,092 | | | $ | 3,725 | |
| | | |
| | | |
| Issuance of mortgage loans upon sale of real estate acquired through foreclosure | | $ | 2,083 | | | $ | 1,448 | | | $ | 1,137 | |
| | | |
| | | |
| Unrealized gains (losses) on securities designated as available for sale, net of related tax effects | | $ | 1,213 | | | $ | 438 | | | $ | (1,325 | ) |
| | | |
| | | |
| Recognition of mortgage servicing rights in accordance with SFAS No. 140 | | $ | 680 | | | $ | 1,252 | | | $ | 992 | |
| | | |
| | | |
| | | | | | | | | | | | | |
| Supplemental disclosure of noncash financing activities: | | | | | | | | | | | | |
| Dividends declared but unpaid | | $ | 1,081 | | | $ | 1,120 | | | $ | 1,102 | |
| | | |
| | | |
The accompanying notes are an integral part of these statements.
30
CAMCO FINANCIAL CORPORATION
NOTES TO CONSOLIDATED FINANCIAL STATEMENTS
December 31, 2007, 2006 and 2005
NOTE A - SUMMARY OF SIGNIFICANT ACCOUNTING POLICIES
Camco Financial Corporation (“Camco” or the “Corporation”) is a financial holding company whose business activities are limited primarily to holding the common stock of Advantage Bank (“Advantage” or the “Bank”) and Camco Title Agency (“Camco Title”). Advantage conducts a general banking business within Ohio, West Virginia and northern Kentucky which consists of attracting deposits from the general public and applying those funds to the origination of loans for residential, consumer and nonresidential purposes. Advantage’s profitability is significantly dependent on net interest income, which is the difference between interest income generated from interest-earning assets (i.e. loans and investments) and the interest expense paid on interest-bearing liabilities (i.e. customer deposits and borrowed funds). Net interest income is affected by the relative amounts of interest-earning assets and interest-bearing liabilities and the interest received or paid on these balances. The level of interest rates paid or received by Advantage can be significantly influenced by a number of factors, such as governmental monetary policy, that are outside of management’s control.
The consolidated financial information presented herein has been prepared in accordance with accounting principles generally accepted in the United States of America (“U.S. GAAP”) and general accounting practices within the financial services industry. In preparing financial statements in accordance with U.S. GAAP, management is required to make estimates and assumptions that affect the reported amounts of assets and liabilities and the disclosure of contingent assets and liabilities at the date of the financial statements and revenues and expenses during the reporting period. Actual results could differ from such estimates.
The following is a summary of the Corporation’s significant accounting policies which have been consistently applied in the preparation of the accompanying consolidated financial statements. Some items in the prior-year financial statements were reclassified to conform to the current year’s presentation.
1. Principles of Consolidation
The consolidated financial statements include the accounts of the Corporation and its wholly-owned subsidiaries. All significant intercompany balances and transactions have been eliminated.
2. Investment Securities and Mortgage-Backed Securities
The Corporation accounts for investment and mortgage-backed securities in accordance with Statement of Financial Accounting Standards (“SFAS”) No. 115 “Accounting for Certain Investments in Debt and Equity Securities.” SFAS No. 115 requires that investments be categorized as held to maturity, trading, or available for sale. Securities classified as held to maturity are carried at cost only if the Corporation has the positive intent and ability to hold these securities to maturity. Securities designated as available for sale are carried at fair value with resulting unrealized gains or losses recorded to stockholders’ equity. Investment and mortgage-backed securities are classified as held to maturity or available for sale upon acquisition. Realized gains and losses on sales of securities are recognized using the specific identification method. In estimating other-than-temporary impairment losses, management considers (1) the length of time and the extent to which the fair value has been less than cost, (2) the financial condition and near-term prospects of the issuer, and (3) the intent and ability of the Corporation to retain its investment in the issuer for a period of time sufficient to allow for any anticipated recovery in fair value.
3. Loans Receivable
Loans held in portfolio are stated at the principal amount outstanding, adjusted for deferred loan origination fees and costs and the allowance for loan losses.
Interest is accrued as earned unless the collectability of the loan is in doubt. Uncollectible interest on loans that are contractually past due is charged off, or an allowance is established based on management’s periodic evaluation. The allowance is established by a charge to interest income equal to all interest previously accrued and not received, and income is subsequently recognized only to the extent that cash payments are received until, in management’s judgment, the borrower’s ability to make periodic interest and principal payments has returned to normal, in which case the loan is returned to accrual status.
Loans held for sale are carried at the lower of cost (less principal payments received) or fair value (market value), calculated on an aggregate basis. At December 31, 2007 and 2006, loans held for sale were carried at cost.
31
CAMCO FINANCIAL CORPORATION
NOTES TO CONSOLIDATED FINANCIAL STATEMENTS (continued)
December 31, 2007, 2006 and 2005
NOTE A - SUMMARY OF SIGNIFICANT ACCOUNTING POLICIES (continued)
| |
| 4. | Loan Origination and Commitment Fees |
The Corporation accounts for loan origination fees and costs in accordance with SFAS No. 91, “Accounting for Nonrefundable Fees and Costs Associated with Originating or Acquiring Loans and Initial Direct Costs of Leases.” Pursuant to the provisions of SFAS No. 91, all loan origination fees received, net of certain direct origination costs, are deferred on aloan-by-loan basis and amortized to interest income using the interest method, giving effect to actual loan prepayments. Additionally, SFAS No. 91 generally limits the definition of loan origination costs to the direct costs attributable to originating a loan, i.e., principally actual personnel costs.
Fees received for loan commitments are deferred and amortized over the life of the related loan using the interest method.
5. Allowance for Loan Losses
It is the Corporation’s policy to provide valuation allowances for estimated losses on loans based upon past loss experience, current trends in the level of delinquent and problem loans, adverse situations that may affect the borrower’s ability to repay, the estimated value of any underlying collateral and current economic conditions in the Bank’s primary market areas. When the collection of a loan becomes doubtful, or otherwise troubled, the Corporation records a charge-off or an allowance equal to the difference between the fair value of the property securing the loan and the loan’s carrying value. Such provision is based on management’s estimate of the fair value of the underlying collateral, taking into consideration the current and currently anticipated future operating or sales conditions. As a result, such estimates are particularly susceptible to changes that could result in a material adjustment to results of operations in the near term. Recovery of the carrying value of such loans is dependent to a great extent on economic, operating, and other conditions that may be beyond the Corporation’s control.
The Corporation accounts for impaired loans in accordance with SFAS No. 114, “Accounting by Creditors for Impairment of a Loan.” SFAS No. 114 requires that impaired loans be measured based upon the present value of expected future cash flows discounted at the loan’s effective interest rate or, as an alternative, at the loan’s observable market price or fair value of the collateral.
A loan is defined under SFAS No. 114 as impaired when, based on current information and events, it is probable that a creditor will be unable to collect all amounts due according to the contractual terms of the loan agreement. In applying the provisions of SFAS No. 114, the Corporation considers its investment in owner-occupied one- to four-family residential loans, home equity lines of credit and consumer installment loans to be homogeneous and therefore excluded from separate identification for evaluation of impairment. With respect to the Corporation’s investment in multi-family, commercial and nonresidential loans, and its evaluation of any impairment thereon, such loans are generally collateral-dependent and as a result are carried as a practical expedient at the lower of cost or fair value. It is the Corporation’s policy to charge off unsecured credits that are more than ninety days delinquent.
The Bank’s impaired loan information is as follows at December 31:
| | | | | | | | | |
| | | 2007 | | | 2006 | |
| |
| |
| At December 31: | | | | | | | | |
| Impaired loans with related allowance | | $ | 12,580 | | | $ | 2,838 | |
| Impaired loans with no related allowance | | | 1,643 | | | | 4,678 | |
| | | |
| | | |
| Total impaired loans | | $ | 14,223 | | | $ | 7,516 | |
| | | |
| | | |
| Allowance on impaired loans | | $ | 1,876 | | | $ | 753 | |
| | | |
| | | |
| | | | | | | | | | | | | |
| | | 2007 | | | 2006 | | | 2005 | |
| |
| |
| For the year ended December 31: | | | | | | | | | | | | |
| Average balance of impaired loans | | $ | 11,467 | | | $ | 4,213 | | | $ | 2,770 | |
| Cash basis interest income recognized on impaired loans | | $ | 674 | | | $ | 192 | | | $ | 189 | |
The allowance for impaired loans is included in the Bank’s overall allowance for credit losses. The provision necessary to increase this allowance is included in the Bank’s overall provision for losses on loans.
32
6. Real Estate Acquired Through Foreclosure
Real estate acquired through foreclosure is carried at the lower of the loan’s unpaid principal balance (cost) or fair value less estimated selling expenses at the date of acquisition. Real estate loss provisions are recorded if the fair value of the property subsequently declines below the amount determined at the recording date. In determining the lower of cost or fair value at acquisition, costs relating to development and improvement of property are capitalized. Costs relating to holding real estate acquired through foreclosure, net of rental income, are charged against earnings as incurred.
7. Office Premises and Equipment
Office premises and equipment are carried at cost and include expenditures which extend the useful lives of existing assets. Maintenance, repairs and minor renewals are expensed as incurred. For financial reporting, depreciation and amortization are provided on the straight-line method over the useful lives of the assets, estimated to be ten to fifty years for buildings and improvements and three to twenty-five years for furniture, fixtures and equipment. An accelerated depreciation method is used for tax reporting purposes.
8. Mortgage Servicing Rights
The Corporation accounts for mortgage servicing rights in accordance with SFAS No. 140 “Accounting for Transfers and Servicing of Financial Assets and Extinguishments of Liabilities,” which requires that the Corporation recognize, as separate assets, rights to service mortgage loans for others, regardless of how those servicing rights are acquired. An institution that acquires mortgage servicing rights through either the purchase or origination of mortgage loans and sells those loans with servicing rights retained must allocate some of the cost of the loans to the mortgage servicing rights.
SFAS No. 140 requires that capitalized mortgage servicing rights and capitalized excess servicing receivables be assessed for impairment. Impairment is measured based on fair value. The mortgage servicing rights recorded by the Bank, calculated in accordance with the provisions of SFAS No. 140, segregated into pools for valuation purposes, using as pooling criteria the loan term and coupon rate.
Once pooled, each grouping of loans is evaluated on a discounted earnings basis to determine the present value of future earnings that a purchaser could expect to realize from each portfolio. Earnings are projected from a variety of sources including loan servicing fees, interest earned on float, net interest earned on escrows, miscellaneous income, and costs to service the loans. The present value of future earnings is the “economic” value for the pool, i.e., the net realizable present value to an acquirer of the acquired servicing.
The Corporation recorded amortization related to mortgage servicing rights totaling approximately $748,000, $1.3 million and $972,000, for the years ended December 31, 2007, 2006 and 2005, respectively. The carrying value of the Corporation’s mortgage servicing rights, which approximated their fair value, totaled approximately $6.4 million for the years ended December 31, 2007 and 2006 respectively. Fair value was determined using discount rates ranging from 9.0% to 12.0% each year, and prepayment speeds ranging from 4.2% to 24.6% in 2007 and from 3.7% to 25.4% in 2006.
At December 31, 2007 and 2006, the Bank was servicing mortgage loans of approximately $516.0 and $536.0 million, respectively, that have been sold to the Federal Home Loan Mortgage Corporation, Federal National Mortgage Association and other investors.
9. Goodwill
The Corporation accounts for acquisitions pursuant to SFAS No. 142 “Goodwill and Intangible Assets,” which prescribes accounting for all purchased goodwill and intangible assets. In accordance with that Statement, acquired goodwill is not amortized, but is tested for impairment at the reporting unit level annually and whenever an impairment indicator arises. Goodwill has been assigned to Advantage Bank as the reporting unit that is expected to benefit from the goodwill.
Camco evaluated the unamortized goodwill balance during 2007, 2006 and 2005 in accordance with the provisions of SFAS No. 142 via independent third-party appraisal. The evaluations showed no indication of impairment.
10. Federal Income Taxes
The Corporation accounts for federal income taxes in accordance with SFAS No. 109, “Accounting for Income Taxes.” In accordance with SFAS No. 109, a deferred tax liability or deferred tax asset is computed by applying the current statutory
33
CAMCO FINANCIAL CORPORATION
NOTES TO CONSOLIDATED FINANCIAL STATEMENTS (continued)
December 31, 2007, 2006 and 2005
NOTE A - SUMMARY OF SIGNIFICANT ACCOUNTING POLICIES (continued)
10. Federal Income Taxes (continued)
tax rates to net taxable or deductible temporary differences between the tax basis of an asset or liability and its reported amount in the financial statements that will result in taxable or deductible amounts in future periods. Deferred tax assets are recorded only to the extent that the amount of net deductible temporary differences or carryforward attributes may be utilized against current period earnings, carried back against prior years’ earnings, offset against taxable temporary differences reversing in future periods, or utilized to the extent of management’s estimate of future taxable income. A valuation allowance is provided for deferred tax assets to the extent that the value of net deductible temporary differences and carryforward attributes exceeds management’s estimates of taxes payable on future taxable income. Deferred tax liabilities are provided on the total amount of net temporary differences taxable in the future.
Deferral of income taxes results primarily from different methods of accounting for deferred loan origination fees and costs, mortgage servicing rights, Federal Home Loan Bank stock dividends, deferred compensation and the general loan loss allowance. A temporary difference is also recognized for depreciation expense computed using accelerated methods for federal income tax purposes.
11. Earnings Per Share
Basic earnings per common share is computed based upon the weighted-average number of common shares outstanding during the year. Diluted earnings per common share is computed including the dilutive effect of additional potential common shares issuable under outstanding stock options. Diluted earnings per share is not computed for periods in which an operating loss is sustained. The computations were as follows for the years ended December 31:
| | | | | | | | | | | | | |
| | | For the years ended | |
| | | 2007 | | | 2006 | | | 2005 | |
| |
| | |
(In thousands, except per share information) | |
| |
| BASIC: | | | | | | | | | | | | |
| Net Earnings | | $ | 4,501 | | | $ | 5,874 | | | $ | 8,766 | |
| Weighted average common shares outstanding | | | 7,327 | | | | 7,506 | | | | 7,645 | |
| | | |
| | | |
| Earnings per share - Basic | | $ | 0.61 | | | $ | 0.78 | | | $ | 1.15 | |
| | | |
| | | |
| DILUTED: | | | | | | | | | | | | |
| Net Earnings | | $ | 4,501 | | | $ | 5,874 | | | $ | 8,766 | |
| Weighted average common shares outstanding | | | 7,327 | | | | 7,506 | | | | 7,645 | |
| Dilutive effect of stock options | | | 1 | | | | 2 | | | | 4 | |
| | | |
| | | |
| Total common shares and dilutive potential common shares | | | 7,328 | | | | 7,508 | | | | 7,649 | |
| | | |
| | | |
| | | | | | | | | | | | | |
| Earnings per share - Diluted | | $ | 0.61 | | | $ | 0.78 | | | $ | 1.15 | |
| | | |
| | | |
Options to purchase 283,557, 287,752 and 207,771 shares of common stock at respective weighted-average exercise prices of $15.48, $15.52 and $16.08 were outstanding at December 31, 2007, 2006 and 2005, respectively, but were excluded from the computation of diluted earnings per share for those years because the exercise price was greater than the average market price of the common shares.
12. Stock Option Plans
Effective January 1, 2006, the Corporation adopted SFAS No. 123R, “Accounting for Stock-Based Compensation,” which contains a fair-value based method for valuing stock-based compensation that measures compensation cost at the grant date based on the fair value of the award. Compensation is then recognized over the service period, which is usually the vesting period. Prior to January 1, 2006, the Corporation utilized APB Opinion No. 25 and related Interpretations in accounting for its stock option plans. Accordingly, no compensation cost was recognized for the plans in 2005. Had compensation cost for the Corporation’s stock option plans been determined based on the fair value at the grant dates for awards under the plans
34
consistent with SFAS No. 123R, the Corporation’s net earnings and earnings per share for the year ended December 31, 2005, would have been reported as the pro forma amounts indicated below:
| | | | | |
| | | 2005 | |
| |
| | |
(In thousands,
| |
| | | except per share data) | |
| |
| Net earnings As reported | | $ | 8,766 | |
| | | | | |
Add: Stock-based compensation, expense
included in reported income, net of tax | | | — | |
| | | | | |
Deduct: Total Stock-based compensation
expense determined under fair value based
method for awards, net of tax | | | (121 | ) |
| | | | | |
| Pro-forma | | $ | 8,645 | |
| | | | | |
| Earnings per share | | | | |
Basic As reported | | $ | 1.15 | |
| | | | | |
| Stock-based compensation, net of tax | | | (.02 | ) |
| | | | | |
| Pro-forma | | $ | 1.13 | |
| | | | | |
Diluted As reported | | | 1.15 | |
| | | | | |
| Stock-based compensation, net of tax | | | (.02 | ) |
| | | | | |
| Pro-forma | | $ | 1.13 | |
| | | | | |
The fair value of each option grant is estimated on the date of grant using the modified Black-Scholes options-pricing model with the following assumptions used for grants during 2007, 2006 and 2005: dividend yield of 4.8%, 4.0% and 3.8%, respectively; expected volatility of 11.98%, 15.16%, and 18.76%, respectively; a risk-free interest rate of 4.81%, 4.57% and 4.22%, respectively; and an expected life of ten years for all grants.
A summary of the status of the Corporation’s stock option plans as of December 31, 2007, 2006 and 2005, and changes during the years ending on those dates is presented below:
| | | | | | | | | | | | | | | | | | | | | | | | | |
| | | 2007 | | | 2006 | | | 2005 | |
| | | | | | Weighted
| | | | | | Weighted
| | | | | | Weighted
| |
| | | | | | average
| | | | | | average
| | | | | | average
| |
| | | | | | exercise
| | | | | | exercise
| | | | | | exercise
| |
| | | Shares | | | price | | | Shares | | | price | | | Shares | | | price | |
| |
| |
| Outstanding at beginning of year | | | 304,874 | | | $ | 15.20 | | | | 224,636 | | | $ | 15.71 | | | | 218,324 | | | $ | 12.91 | |
| Granted | | | 26,920 | | | | 12.34 | | | | 87,013 | | | | 14.08 | | | | 87,240 | | | | 16.51 | |
| Exercised | | | (2,427 | ) | | | 12.50 | | | | (2,243 | ) | | | 8.92 | | | | (70,162 | ) | | | 8.43 | |
| Forfeited | | | (11,129 | ) | | | 14.67 | | | | (4,532 | ) | | | 15.23 | | | | (10,766 | ) | | | 12.85 | |
| | | |
| | | |
| Outstanding at end of year | | | 318,238 | | | $ | 15.10 | | | | 304,874 | | | $ | 15.20 | | | | 224,636 | | | $ | 15.71 | |
| | | |
| | | |
| Options exercisable at year-end | | | 254,717 | | | $ | 15.32 | | | | 222,333 | | | $ | 15.37 | | | | 138,305 | | | $ | 15.22 | |
| | | |
| | | |
| Weighted-average fair value of options granted during the year | | | | | | $ | 1.22 | | | | | | | $ | 2.09 | | | | | | | $ | 2.89 | |
| | | |
| | | |
35
CAMCO FINANCIAL CORPORATION
NOTES TO CONSOLIDATED FINANCIAL STATEMENTS (continued)
December 31, 2007, 2006 and 2005
NOTE A - SUMMARY OF SIGNIFICANT ACCOUNTING POLICIES (continued)
| |
| 12. | Stock Option Plans (continued) |
The following information applies to options outstanding at December 31, 2007:
| | | | | | | | | | | | | | | | | | | | | |
| | | Options outstanding | | | Options exercisable | |
| | | | | | Weighted-average
| | | Weighted-
| | | | | | Weighted-
| |
| | | | | | remaining
| | | average
| | | | | | average
| |
Range of
| | Number
| | | contractual
| | | exercise
| | | Number
| | | exercise
| |
| exercise prices | | outstanding | | | life (years) | | | price | | | exercisable | | | price | |
| |
| |
| $8.92-$9.75 | | | 2,884 | | | | 2.5 | | | $ | 9.64 | | | | 2,884 | | | $ | 9.64 | |
| $11.36-$14.16 | | | 116,717 | | | | 8.0 | | | | 13.52 | | | | 67,615 | | | | 13.54 | |
| $14.55-$17.17 | | | 198,637 | | | | 5.1 | | | | 16.10 | | | | 184,218 | | | | 16.06 | |
| | | |
| | | |
| | | | 318,238 | | | | 6.1 | | | $ | 15.10 | | | | 254,717 | | | $ | 15.32 | |
| | | |
| | | |
A summary of unvested options as of, and changes during the year ended, December 31, 2007, were as follows:
| | | | | |
| | | Number | |
| |
| |
| Unvested options: | | | | |
| Beginning of period | | | 82,541 | |
| Granted | | | 26,920 | |
| Forfeited | | | (5,831 | ) |
| Vested during the period | | | (40,109 | ) |
| | | | | |
| Unvested options at December 31 | | | 63,521 | |
| | | | | |
The total intrinsic value of options exercised during the years ended December 31, 2007, 2006, and 2005, was $2,000, $11,000, and $421,000, respectively.
As of December 31, 2007, there was $126,600 of total unrecognized compensation cost related to nonvested stock options. The unrecognized compensation cost is expected to be recognized over a weighted-average period of 2.6 years.
13. Fair Value of Financial Instruments
SFAS No. 107, “Disclosures about Fair Value of Financial Instruments,” requires disclosure of fair value information about financial instruments, whether or not recognized in the consolidated statement of financial condition, for which it is practicable to estimate that value. In cases where quoted market prices are not available, fair values are based on estimates using present value or other valuation techniques. Those techniques are significantly affected by the assumptions used, including the discount rate and estimates of future cash flows. In that regard, the derived fair value estimates cannot be substantiated by comparison to independent markets and, in many cases, could not be realized in immediate settlement of the instrument. SFAS No. 107 excludes certain financial instruments and all non-financial instruments from its disclosure requirements. Accordingly, the aggregate fair value amounts presented do not represent the underlying value of the Corporation.
The following methods and assumptions were used by the Corporation in estimating its fair value disclosures for financial instruments. The use of different market assumptionsand/or estimation methodologies may have a material effect on the estimated fair value amounts.
Cash and Cash Equivalents: The carrying amount reported in the consolidated statements of financial condition for cash and cash equivalents is deemed to approximate fair value.
Investment Securities and Mortgage-backed Securities: Fair values for investment securities and mortgage-backed securities are based on quoted market prices and dealer quotes.
Loans Held for Sale: Fair value for loans held for sale is the contracted sales price of loans committed for delivery, which is determined on the date of sale commitment.
36
Loans Receivable: The loan portfolio has been segregated into categories with similar characteristics, such as one- to four-family residential real estate, multi-family residential real estate, installment and other. These loan categories were further delineated into fixed-rate and adjustable-rate loans. The fair values for the resultant loan categories were computed via discounted cash flow analysis, using current interest rates offered for loans with similar terms to borrowers of similar credit quality.
Federal Home Loan Bank stock: The carrying amount presented in the consolidated statements of financial condition is deemed to approximate fair value.
Cash Surrender Value of Life Insurance: The carrying amount presented in the consolidated statements of financial condition is deemed to approximate fair value.
Mortgage Servicing Rights: See item 8 in Note A.
Deposits: The fair values of deposits with no stated maturity, such as money market demand deposits, savings and NOW accounts, are deemed to equal the amount payable on demand as of December 31, 2007 and 2006. The fair value of fixed-rate certificates of deposit is based on the discounted value of contractual cash flows. The discount rate is estimated using the rates currently offered for deposits of similar remaining maturities.
Advances from the Federal Home Loan Bank: The fair value of these advances is estimated using the rates currently offered for similar advances of similar remaining maturities or, when available, quoted market prices.
Repurchase Agreements and Subordinated Debentures: The fair value is based on the discounted value of contractual cash flows using rates currently offered for similar maturities.
Accrued Interest and Advances by Borrowers for Taxes and Insurance: The carrying amount is deemed to approximate fair value.
Commitments to Extend Credit: For fixed-rate and adjustable-rate loan commitments, the fair value estimate considers the difference between current levels of interest rates and committed rates. At December 31, 2007 and 2006, the fair value of loan commitments was not material.
Based on the foregoing methods and assumptions, the carrying value and fair value of the Corporation’s financial instruments are as follows:
| | | | | | | | | | | | | | | | | |
| | | December 31, | |
| | | 2007 | | | 2006 | |
| | | Carrying
| | | Fair
| | | Carrying
| | | Fair
| |
| | | value | | | value | | | value | | | value | |
| |
| | | (In thousands) | |
| Financial assets | | | | | | | | | | | | | | | | |
| Cash and cash equivalents | | $ | 23,004 | | | $ | 23,004 | | | $ | 26,542 | | | $ | 26,542 | |
| Investment securities available for sale | | | 88,919 | | | | 88,919 | | | | 107,506 | | | | 107,506 | |
| Investment securities held to maturity | | | 2,769 | | | | 2,793 | | | | 3,449 | | | | 3,470 | |
| Loans held for sale | | | 3,169 | | | | 3,194 | | | | 3,664 | | | | 3,691 | |
| Loans receivable | | | 812,102 | | | | 814,210 | | | | 818,154 | | | | 826,389 | |
| Federal Home Loan Bank stock | | | 28,722 | | | | 28,722 | | | | 28,722 | | | | 28,722 | |
| Cash surrender value of life insurance | | | 21,707 | | | | 21,707 | | | | 20,921 | | | | 20,921 | |
| Accrued interest receivable | | | 6,034 | | | | 6,034 | | | | 6,502 | | | | 6,502 | |
| Mortgage servicing rights | | | 6,356 | | | | 6,642 | | | | 6,424 | | | | 6,519 | |
| | | | | | | | | | | | | | | | | |
| Financial liabilities | | | | | | | | | | | | | | | | |
| Deposits | | $ | 692,184 | | | $ | 694,484 | | | $ | 684,782 | | | $ | 686,317 | |
| Advances from the Federal Home Loan Bank | | | 199,064 | | | | 202,483 | | | | 245,288 | | | | 244,403 | |
| Repurchase agreements | | | 16,917 | | | | 16,917 | | | | 11,851 | | | | 11,857 | |
| Subordinated debentures | | | 5,000 | | | | 4,830 | | | | — | | | | — | |
| Advances by borrowers for taxes and insurance | | | 3,627 | | | | 3,627 | | | | 3,484 | | | | 3,484 | |
| Accrued interest payable | | | 1,215 | | | | 1,215 | | | | 1,480 | | | | 1,480 | |
37
CAMCO FINANCIAL CORPORATION
NOTES TO CONSOLIDATED FINANCIAL STATEMENTS (continued)
December 31, 2007, 2006 and 2005
NOTE A - SUMMARY OF SIGNIFICANT ACCOUNTING POLICIES (continued)
14. Cash and Cash Equivalents
Cash and cash equivalents consist of cash and due from banks and interest-bearing deposits in other financial institutions with original maturities of three months or less.
15. Advertising
Advertising costs are expensed when incurred.
16. Effects of Recent Accounting Pronouncements
In July 2006, the FASB issued FASB Interpretation No. 48, Accounting for Uncertainty in Income Taxes: An Interpretation of FASB Statement No. 109,” (FIN 48) which attempts to set out a consistent framework to determine the appropriate level of tax reserves to maintain for uncertain tax positions. This interpretation of FASB Statement No. 109 uses a two-step approach wherein a tax benefit is recognized if a position is more likely than not to be sustained. The amount of the benefit is then measured to be the highest tax benefit that is greater than 50 percent likely to be realized. FIN 48 also sets out disclosure requirements to enhance transparency of an entity’s tax reserves. The Corporation adopted FIN 48 on January 1, 2007 with no impact on opening retained earnings or earnings during 2007.
In September 2006, the FASB issued SFAS No. 157, “Fair Value Measurements.” This statement clarifies the definition of fair value, establishes a framework for measuring fair value, and expands the disclosures on fair value measurements. This Statement applies to other accounting pronouncements that require or permit fair value measurements and does not require any new fair value measurements. SFAS No. 157 is effective for fiscal years beginning after November 15, 2007. The Corporation has not determined the impact the adoption of SFAS 157 will have on the financial statements.
In September 2006, the FASB ratified the Emerging Issues Task Force’s (EITF) Issue06-4,Accounting for Deferred Compensation and Postretirement Benefit Aspects of Endorsement Split-Dollar Life Insurance Arrangements,which requires companies to recognize a liability and related compensation costs for endorsement split-dollar life insurance policies that provide a benefit to an employee extending to postretirement periods. The liability should be recognized based on the substantive agreement with the employee. This Issue is effective beginning January 1, 2008. The Issue can be applied as either a change in accounting principle through a cumulative-effect adjustment to retained earnings as of the beginning of the year of adoption, or a change in accounting principle through retrospective application to all periods. The Corporation has estimated the impact the adoption of Issue06-4 will reduce retained earnings by $832,000 upon adoption. Related compensation cost in 2008 is estimated to be $45,000.
38
NOTE B - INVESTMENT SECURITIES
The amortized cost, gross unrealized gains, gross unrealized losses and estimated fair values of investment securities at December 31, 2007 and 2006 are as follows:
| | | | | | | | | | | | | | | | | |
| | | 2007 | |
| | | | | | Gross
| | | Gross
| | | Estimated
| |
| | | Amortized
| | | unrealized
| | | unrealized
| | | fair
| |
| | | cost | | | gains | | | losses | | | value | |
| |
| | | (In thousands) | |
| |
| Available for sale: | | | | | | | | | | | | | | | | |
| U.S. Government sponsored enterprises | | $ | 37,519 | | | $ | 267 | | | $ | 4 | | | $ | 37,782 | |
| Municipal bonds | | | 210 | | | | 2 | | | | — | | | | 212 | |
| Corporate equity securities | | | 157 | | | | 11 | | | | 4 | | | | 164 | |
| Mortgage-backed securities | | | 51,051 | | | | 167 | | | | 457 | | | | 50,761 | |
| | | | | | | | | | | | | | | | | |
| Total investment securities available for sale | | $ | 88,937 | | | $ | 447 | | | $ | 465 | | | $ | 88,919 | |
| | | | | | | | | | | | | | | | | |
| Held to maturity: | | | | | | | | | | | | | | | | |
| Municipal bonds | | $ | 567 | | | $ | 24 | | | $ | — | | | $ | 591 | |
| Mortgage-backed securities | | | 2,202 | | | | 13 | | | | 13 | | | | 2,202 | |
| | | | | | | | | | | | | | | | | |
| Total investment securities held to maturity | | $ | 2,769 | | | $ | 37 | | | $ | 13 | | | $ | 2,793 | |
| | | | | | | | | | | | | | | | | |
| | | | | | | | | | | | | | | | | |
| | | 2006 | |
| | | | | | Gross
| | | Gross
| | | Estimated
| |
| | | Amortized
| | | unrealized
| | | unrealized
| | | fair
| |
| | | cost | | | gains | | | losses | | | value | |
| |
| | | (In thousands) | |
| |
| Available for sale: | | | | | | | | | | | | | | | | |
| U.S. Government sponsored enterprises | | $ | 55,962 | | | $ | 2 | | | $ | 386 | | | $ | 55,578 | |
| Municipal bonds | | | 291 | | | | — | | | | — | | | | 291 | |
| Corporate equity securities | | | 159 | | | | 25 | | | | — | | | | 184 | |
| Mortgage-backed securities | | | 52,950 | | | | 24 | | | | 1,521 | | | | 51,453 | |
| | | | | | | | | | | | | | | | | |
| Total investment securities available for sale | | $ | 109,362 | | | $ | 51 | | | $ | 1,907 | | | $ | 107,506 | |
| | | | | | | | | | | | | | | | | |
| Held to maturity: | | | | | | | | | | | | | | | | |
| Municipal bonds | | $ | 710 | | | $ | 26 | | | $ | — | | | $ | 736 | |
| Mortgage-backed securities | | | 2,739 | | | | 12 | | | | 17 | | | | 2,734 | |
| | | | | | | | | | | | | | | | | |
| Total investment securities held to maturity | | $ | 3,449 | | | $ | 38 | | | $ | 17 | | | $ | 3,470 | |
| | | | | | | | | | | | | | | | | |
The amortized cost and estimated fair value of investment securities at December 31, 2007 by contractual term to maturity are shown below.
39
CAMCO FINANCIAL CORPORATION
NOTES TO CONSOLIDATED FINANCIAL STATEMENTS (continued)
December 31, 2007, 2006 and 2005
NOTE B - INVESTMENT SECURITIES (continued)
| | | | | | | | | | | | | | | | | |
| | | Available for sale | | | Held to maturity | |
| | | | | | Estimated
| | | | | | Estimated
| |
| | | Amortized
| | | fair
| | | Amortized
| | | fair
| |
| | | cost | | | value | | | cost | | | value | |
| |
| | |
(In thousands) | |
| |
| Due in one year or less | | $ | 23,625 | | | $ | 23,652 | | | $ | 225 | | | $ | 227 | |
| Due after one year through five years | | | 14,104 | | | | 14,342 | | | | 252 | | | | 261 | |
| Due after five years through ten years | | | — | | | | — | | | | — | | | | — | |
| Due after ten years | | | — | | | | — | | | | 90 | | | | 103 | |
| | | | | | | | | | | | | | | | | |
| Total U.S. Government sponsored enterprises | | $ | 37,729 | | | $ | 37,994 | | | $ | 567 | | | $ | 591 | |
| | | | | | | | | | | | | | | | | |
| Due in one year or less | | $ | 4,585 | | | $ | 4,558 | | | $ | — | | | $ | — | |
| Due after one year through five years | | | 9,547 | | | | 9,485 | | | | — | | | | — | |
| Due after five years through ten years | | | 20,410 | | | | 20,319 | | | | 174 | | | | 174 | |
| Due after ten years | | | 16,509 | | | | 16,399 | | | | 2,028 | | | | 2,028 | |
| | | | | | | | | | | | | | | | | |
| Total mortgage-backed securities | | $ | 51,051 | | | $ | 50,761 | | | $ | 2,202 | | | $ | 2,202 | |
| | | | | | | | | | | | | | | | | |
| Corporate equity securities | | $ | 157 | | | $ | 164 | | | $ | — | | | $ | — | |
| | | | | | | | | | | | | | | | | |
| Total | | $ | 88,937 | | | $ | 88,919 | | | $ | 2,769 | | | $ | 2,793 | |
| | | | | | | | | | | | | | | | | |
Proceeds from sales of investment securities during the years ended December 31, 2007, 2006 and 2005, totaled $3,000, $0 and $302,000 respectively, resulting in gross realized gains of $1,000, $0 and $113,000 in those respective years.
The table below indicates the length of time individual securities have been in a continuous unrealized loss position at December 31, 2007 and 2006, are as follows:
| | | | | | | | | | | | | | | | | |
| | | 2007 | |
| | | Less than 12 months | | | More than 12 months | |
| | | Fair
| | | Unrealized
| | | Fair
| | | Unrealized
| |
| Description of securities: | | value | | | losses | | | value | | | losses | |
| |
| | | (In thousands) | |
| |
| Available for sale: | | | | | | | | | | | | | | | | |
| U.S. Government sponsored enterprises | | $ | 3,493 | | | $ | 2 | | | $ | 2,997 | | | $ | 2 | |
| Corporate equity securities | | | 164 | | | | 4 | | | | — | | | | — | |
| Mortgage-backed securities | | | 36 | | | | — | | | | 36,202 | | | | 457 | |
| | | | | | | | | | | | | | | | | |
| Held to maturity: | | | | | | | | | | | | | | | | |
| Mortgage-backed securities | | | 348 | | | | 2 | | | | 674 | | | | 11 | |
| | | |
| | | |
| Total temporarily impaired securities | | $ | 4,041 | | | $ | 8 | | | $ | 39,873 | | | $ | 470 | |
| | | |
| | | |
Management has the intent and ability to hold these securities for the foreseeable future and the decline in the fair value is primarily due to an increase in market interest rates. The fair values are expected to recover as securities approach maturity dates.
40
| | | | | | | | | | | | | | | | | |
| | | 2006 | |
| | | Less than 12 months | | | More than 12 months | |
| | | Fair
| | | Unrealized
| | | Fair
| | | Unrealized
| |
| Description of securities: | | value | | | losses | | | value | | | losses | |
| |
| | | (In thousands) | |
| |
| Available for sale: | | | | | | | | | | | | | | | | |
| U.S. Government sponsored enterprises | | $ | 9,957 | | | $ | 15 | | | $ | 43,623 | | | $ | 371 | |
| Mortgage-backed securities | | | 42 | | | | — | | | | 43,524 | | | | 1,521 | |
| | | | | | | | | | | | | | | | | |
| Held to maturity: | | | | | | | | | | | | | | | | |
| Mortgage-backed securities | | | 293 | | | | — | | | | 6,103 | | | | 17 | |
| Municipal bonds | | | 141 | | | | — | | | | 80 | | | | — | |
| | | |
| | | |
| Total temporarily impaired securities | | $ | 10,433 | | | $ | 15 | | | $ | 93,330 | | | $ | 1,909 | |
| | | |
| | | |
Management has the intent and ability to hold these securities for the foreseeable future and the decline in the fair value is primarily due to an increase in market interest rates. The fair values are expected to recover as securities approach maturity dates.
At December 31, 2007 and 2006, approximately $86.2 million and $90.8 million of securities, respectively, was pledged in accordance with federal and state requirements to secure deposits and repurchase agreements .
NOTE C - LOANS RECEIVABLE
| | | | | | | | | |
| | | 2007 | | | 2006 | |
| |
| | |
(In thousands) | |
| |
| Conventional real estate loans: | | | | | | | | |
| Existing residential properties | | $ | 435,431 | | | $ | 474,109 | |
| Multi-family | | | 40,589 | | | | 43,392 | |
| Nonresidential real estate | | | 126,437 | | | | 105,577 | |
| Construction | | | 45,677 | | | | 42,654 | |
| Commercial | | | 41,551 | | | | 35,287 | |
| Home equity lines of credit | | | 121,619 | | | | 116,436 | |
| Consumer, education and other loans | | | 7,255 | | | | 7,851 | |
| | | |
| | | |
| Total | | | 818,559 | | | | 825,306 | |
| | | | | | | | | |
| Increase (decrease) due to: | | | | | | | | |
| Unamortized yield adjustments | | | 166 | | | | (8 | ) |
| Allowance for loan losses | | | (6,623 | ) | | | (7,144 | ) |
| | | |
| | | |
| Loans receivable – net | | $ | 812,102 | | | $ | 818,154 | |
| | | |
| | | |
The Bank, in the ordinary course of business, has granted loans to certain of its directors, executive officers, and their related interests. Such loans are made on the same terms, including interest rates and collateral, as those prevailing at the time for comparable transactions with unrelated persons and do not involve more than normal risk of collectability. The aggregate dollar amount of these loans totaled approximately $1.1 million and $924,000 at December 31, 2007 and 2006, respectively. During 2007, $5,000 of new related party loans were made and repayments totaled $55,000. In 2007, the related party loans increased by $251,000 due to additions of executive officers.
Approximately $304.6 million and $367.9 million of1-4 family loans were pledged as collateral for Federal Home Loan Bank advances at December 31, 2007 and 2006, respectively.
41
CAMCO FINANCIAL CORPORATION
NOTES TO CONSOLIDATED FINANCIAL STATEMENTS (continued)
December 31, 2007, 2006 and 2005
NOTE D - ALLOWANCE FOR LOAN LOSSES
Activity in the allowance for loan losses is summarized as follows for the years ended December 31:
| | | | | | | | | | | | | |
| | | 2007 | | | 2006 | | | 2005 | |
| |
| | |
(In thousands) | |
| |
| Balance at beginning of year | | $ | 7,144 | | | $ | 6,959 | | | $ | 6,476 | |
| Provision for losses on loans | | | 1,495 | | | | 1,440 | | | | 1,480 | |
| Charge-offs of loans | | | (2,097 | ) | | | (1,439 | ) | | | (1,280 | ) |
| Recoveries | | | 81 | | | | 184 | | | | 283 | |
| | | |
| | | |
| Balance at end of year | | $ | 6,623 | | | $ | 7,144 | | | $ | 6,959 | |
| | | |
| | | |
Nonaccrual and nonperforming loans totaled approximately $24.0 million, $17.7 million and $13.9 million at December 31, 2007, 2006 and 2005, respectively. Interest income that would have been recognized had such nonaccrual loans performed pursuant to contractual terms totaled approximately $1.5 million, $865,000 and $685,000 for the years ended December 31, 2007, 2006 and 2005, respectively.
NOTE E - OFFICE PREMISES AND EQUIPMENT
Office premises and equipment at December 31, is summarized as follows:
| | | | | | | | | |
| | | 2007 | | | 2006 | |
| |
| | |
(In thousands) | |
| |
| Land | | $ | 2,120 | | | $ | 2,120 | |
| Buildings and improvements | | | 13,205 | | | | 13,140 | |
| Furniture, fixtures and equipment | | | 9,530 | | | | 9,434 | |
| | | |
| | | |
| | | | 24,855 | | | | 24,694 | |
| Less accumulated depreciation and amortization | | | 11,999 | | | | 11,494 | |
| | | |
| | | |
| | | $ | 12,856 | | | $ | 13,200 | |
| | | |
| | | |
NOTE F - DEPOSITS
Deposit balances by type and weighted-average interest rate at December 31, 2007 and 2006, are summarized as follows:
| | | | | | | | | | | | | | | | | |
| | | 2007 | | | 2006 | |
| | | Amount | | | Rate | | | Amount | | | Rate | |
| |
| | |
(Dollars in thousands) | |
| |
| Noninterest-bearing checking accounts | | $ | 35,755 | | | | — | % | | $ | 31,706 | | | | — | % |
| NOW accounts | | | 91,132 | | | | 1.57 | | | | 94,722 | | | | 1.36 | |
| Money market demand accounts | | | 111,740 | | | | 3.57 | | | | 89,383 | | | | 3.59 | |
| Passbook and statement savings accounts | | | 36,963 | | | | 0.27 | | | | 47,997 | | | | 0.26 | |
| Certificates of deposit | | | 416,594 | | | | 4.80 | | | | 420,974 | | | | 4.62 | |
| | | |
| | | |
| Total deposits | | $ | 692,184 | | | | 3.68 | % | | $ | 684,782 | | | | 3.52 | % |
| | | |
| | | |
At December 31, 2007 and 2006, the Corporation had certificate of deposit accounts with balances in excess of $100,000 totaling $106.3 million and $101.1 million, respectively.
42
The contractual maturities of outstanding certificates of deposit are summarized as follows at December 31, 2007:
| | | | | |
| Year ending December 31: | | | |
| |
| | |
(In thousands) | |
| |
| 2008 | | $ | 303,081 | |
| 2009 | | | 99,520 | |
| 2010 | | | 8,222 | |
| 2011 | | | 2,765 | |
| 2012 | | | 2,274 | |
| Thereafter | | | 732 | |
| | | | | |
| Total certificate of deposit accounts | | $ | 416,594 | |
| | | | | |
| |
| NOTE G - | ADVANCES FROM THE FEDERAL HOME LOAN BANK AND OTHER BORROWINGS |
The following table summarizes the types of advances from the Federal Home Loan Bank of Cincinnati (FHLB) at December 31:
| | | | | | | | | | | | | |
| | | | | | Weighted-
| | | | |
| | | Weighted-
| | | average
| | | | |
| 2007 | | average rate | | | maturity (years) | | | Balance | |
| |
| | | | | | | | |
(In thousands) | |
| |
| Overnight repurchase-based | | | 4.10 | % | | | — | | | $ | 18,700 | |
| Fixed-rate, interest only | | | 4.52 | | | | 1.18 | | | | 104,000 | |
| Fixed-rate, amortizing | | | 5.77 | | | | 5.89 | | | | 5,364 | |
| Fixed-rate, interest only, convertible | | | 3.85 | | | | 4.86 | | | | 46,000 | |
| Fixed-rate, interest only, putable | | | 4.39 | | | | 5.43 | | | | 25,000 | |
| | | | | | | | | | | | | |
| Total | | | 4.34 | % | | | 2.58 | | | $ | 199,064 | |
| | | | | | | | | | | | | |
| | | | | | | | | | | | | |
| | | | | | Weighted-
| | | | |
| | | Weighted-
| | | average
| | | | |
| 2006 | | average rate | | | maturity (years) | | | Balance | |
| |
| | | | | | | | |
(In thousands) | |
| |
| Overnight repurchase-based | | | 5.18 | % | | | — | | | $ | 42,500 | |
| Fixed-rate, interest only | | | 4.14 | | | | 1.51 | | | | 123,000 | |
| Fixed-rate, amortizing | | | 5.84 | | | | 5.28 | | | | 8,788 | |
| Fixed-rate, interest only, convertible | | | 3.81 | | | | 6.09 | | | | 71,000 | |
| | | | | | | | | | | | | |
| Total | | | 4.28 | % | | | 2.71 | | | $ | 245,288 | |
| | | | | | | | | | | | | |
Convertible fixed-rate advances may be converted to floating-rate advances, on a quarterly basis, at the option of the FHLB. Putable fixed-rate advances may be terminated, on a quarterly basis after a fixed period of time, at the option of the FHLB. The Corporation may only repay convertible and putable advances upon conversion or termination by the FHLB without penalty, prior to maturity.
43
CAMCO FINANCIAL CORPORATION
NOTES TO CONSOLIDATED FINANCIAL STATEMENTS (continued)
December 31, 2007, 2006 and 2005
| |
| NOTE G - | ADVANCES FROM THE FEDERAL HOME LOAN BANK AND OTHER BORROWINGS (continued) |
The following table summarizes short-term overnight borrowings from the FHLB during the years ended December 31:
| | | | | | | | | | | | | |
| | | | | | Average
| | | Highest month
| |
| | | Weighted-
| | | balance
| | | end balance
| |
| | | average rate | | | outstanding | | | outstanding | |
| |
| | | | | |
(In thousands) | |
| |
| 2007 | | | 5.18 | % | | $ | 36,381 | | | $ | 55,300 | |
| 2006 | | | 4.96 | | | | 38,566 | | | | 63,000 | |
Advances from the FHLB were collateralized at December 31, 2007, by a blanket agreement using 100% of the Bank’s one- to four- family and multi-family mortgage portfolios, the Bank’s investment in FHLB stock, and the Bank’s home equity line of credit portfolio. The contractual maturities of FHLB advances at December 31, 2007 are as follows:
| | | | | | | | | |
Maturing year
| | | | | | |
| ending December 31, | | Interest rate range | | | | |
| |
| | | | | |
(Dollars in thousands) | |
| |
| 2008 | | | 2.90%-7.00% | | | $ | 71,933 | |
| 2009 | | | 2.78%-7.00% | | | | 56,840 | |
| 2010 | | | 3.01%-7.00% | | | | 20,357 | |
| 2011 | | | 3.25%-7.00% | | | | 3,330 | |
| 2012 | | | 3.25%-7.00% | | | | 10,307 | |
| Thereafter | | | 2.66%-7.00% | | | | 36,297 | |
| | | | | | | | | |
| | | | | | | $ | 199,064 | |
| | | | | | | | | |
In July 2007, the Corporation formed a special purpose entity, Camco Statutory Trust I (Trust), for the sole purpose of issuing $5.0 million trust preferred securities. Additionally, Camco issued subordinated debentures to the Trust in exchange for the proceeds of the offering of the trust preferred securities. The subordinated debentures represent the sole asset of the Trust. The subordinated debentures are due on September 15, 2037 (Due Date). The subordinated debentures carry a fixed rate of interest of 6.648% until September 15, 2012, at which point the interest rate becomes variable at 133 basis points over the three month LIBOR rate. The Corporation may redeem the subordinated debentures any time prior to the Due Date as follows:
| | | |
| Call date | | Terms |
|
| |
| Prior to 9/15/2008 | | Callable at 103.525% of par |
| 9/15/2008 | | Callable at 103.140% of par |
| 9/15/2009 | | Callable at 102.355% of par |
| 9/15/2010 | | Callable at 101.570% of par |
| 9/15/2011 | | Callable at 100.785% of par |
| 9/15/2012 | | Callable until Due Date at par |
Obligations for securities sold under agreements to repurchase were collateralized at December 31, 2007 and 2006, by investment securities with a book value including accrued interest of approximately $18.8 million and $14.9 million and a market value of approximately $18.8 million and $14.7 million, respectively. The maximum balance of repurchase agreements outstanding at any month-end during the years ended December 31, 2007 and 2006, was $16.9 million and $14.3 million, respectively, and the average month-end balance outstanding for 2007 and 2006 was approximately $13.7 million and $12.3 million, respectively.
44
NOTE H - FEDERAL INCOME TAXES
A reconciliation of the rate of taxes which are payable at the federal statutory rate are summarized as follows:
| | | | | | | | | | | | | |
| | | 2007 | | | 2006 | | | 2005 | |
| |
| | |
(In thousands) | |
| |
| Federal income taxes computed at the expected statutory rate | | $ | 2,130 | | | $ | 2,924 | | | $ | 4,389 | |
| Increase (decrease) in taxes resulting from: | | | | | | | | | | | | |
| Nontaxable dividend and interest income | | | (13 | ) | | | (17 | ) | | | (25 | ) |
| Tax credits (low income housing) | | | (110 | ) | | | — | | | | — | |
| Increase in cash surrender value of life insurance – net | | | (267 | ) | | | (304 | ) | | | (255 | ) |
| Other | | | 25 | | | | 124 | | | | 32 | |
| | | |
| | | |
| Federal income tax provision per consolidated financial statements | | $ | 1,765 | | | $ | 2,727 | | | $ | 4,141 | |
| | | |
| | | |
The components of the Corporation’s net deferred tax liability at December 31 is as follows:
| | | | | | | | | |
| Taxes (payable) refundable on temporary differences at statutory rate: | | 2007 | | | 2006 | |
| |
| | |
(In thousands) | |
| |
| Deferred tax liabilities: | | | | | | | | |
| FHLB stock dividends | | $ | (4,621 | ) | | $ | (4,621 | ) |
| Mortgage servicing rights | | | (2,161 | ) | | | (2,184 | ) |
| Book versus tax depreciation | | | (1,087 | ) | | | (1,031 | ) |
| Original issue discount | | | (826 | ) | | | (678 | ) |
| Purchase price adjustments | | | (162 | ) | | | (173 | ) |
| Other liabilities, net | | | — | | | | (9 | ) |
| Deferred loan fees | | | (57 | ) | | | — | |
| | | |
| | | |
| Total deferred tax liabilities | | | (8,914 | ) | | | (8,696 | ) |
| | | | | | | | | |
| Deferred tax assets: | | | | | | | | |
| General loan loss allowance | | | 2,252 | | | | 2,429 | |
| Deferred income | | | 21 | | | | 358 | |
| Deferred compensation | | | 1,075 | | | | 1,007 | |
| Deferred loan fees | | | — | | | | 5 | |
| Other assets | | | 137 | | | | 17 | |
| Unrealized losses on securities designated as available for sale | | | 6 | | | | 631 | |
| | | |
| | | |
| Total deferred tax assets | | | 3,491 | | | | 4,447 | |
| | | |
| | | |
| Net deferred tax liability | | $ | (5,423 | ) | | $ | (4,249 | ) |
| | | |
| | | |
For years prior to 1996, the Bank was allowed a special bad debt deduction generally limited to 8% of otherwise taxable income, subject to certain limitations based on aggregate loans and savings account balances at the end of the year. If the amounts that qualified as deductions for federal income taxes are later used for purposes other than for bad debt losses, including distributions in liquidation, such distributions will be subject to federal income taxes at the then current corporate income tax rate. The percentage of earnings bad debt deduction had accumulated to approximately $12.1 million as of December 31, 2007. The amount of the unrecognized deferred tax liability relating to the cumulative bad debt deduction was approximately $4.1 million at December 31, 2007.
NOTE I - COMMITMENTS
The Bank is a party to financial instruments with off-balance-sheet risk in the normal course of business to meet the financing needs of its customers, including commitments to extend credit. Such commitments involve, to varying degrees,
45
CAMCO FINANCIAL CORPORATION
NOTES TO CONSOLIDATED FINANCIAL STATEMENTS (continued)
December 31, 2007, 2006 and 2005
NOTE I - COMMITMENTS(continued)
elements of credit and interest-rate risk in excess of the amount recognized in the consolidated statement of financial condition. The contract or notional amounts of the commitments reflect the extent of the Bank’s involvement in such financial instruments.
The Bank’s exposure to credit loss in the event of nonperformance by the other party to the financial instrument for commitments to extend credit is represented by the contractual notional amount of those instruments. The Bank uses the same credit policies in making commitments and conditional obligations as those utilized for on-balance-sheet instruments.
At December 31, 2007, the Bank had outstanding commitments to originate fixed-rate loans of approximately $17.3 million and adjustable-rate loans of approximately $17.4 million. Additionally, the Bank had unused lines of credit under home equity and other loans of $80.0 million at December 31, 2007, and stand-by letters of credit of $714,000. Management believes that all loan commitments are able to be funded through cash flow from operations and existing liquidity. Fees received in connection with these commitments have not been recognized in earnings.
Commitments to extend credit are agreements to lend to a customer as long as there is no violation of any condition established in the contract. Commitments generally have fixed expiration dates or other termination clauses and may require payment of a fee. Since many of the commitments may expire without being drawn upon, the total commitment amounts do not necessarily represent future cash requirements. The Bank evaluates each customer’s creditworthiness on acase-by-case basis. The amount of collateral obtained, if it is deemed necessary by the Bank upon extension of credit, is based on management’s credit evaluation of the counterparty. Collateral on loans may vary but the preponderance of loans granted generally include a mortgage interest in real estate as security.
The Corporation has entered into lease agreements for office premises and equipment under operating leases which expire at various dates through the year ended December 31, 2017. The following table summarizes minimum payments due under lease agreements by year:
| | | | | |
| Year ending December 31, | | | |
| |
| | |
(In thousands) | |
| |
| 2008 | | $ | 298 | |
| 2009 | | | 254 | |
| 2010 | | | 231 | |
| 2011 | | | 159 | |
| 2012 | | | 143 | |
| 2013 and thereafter | | | 444 | |
| | | | | |
| | | $ | 1,529 | |
| | | | | |
Rental expense under operating leases totaled approximately $423,000, $346,000 and $274,000 for the years ended December 31, 2007, 2006 and 2005, respectively.
NOTE J - REGULATORY CAPITAL
Camco and Advantage are subject to the regulatory capital requirements of the Federal Reserve Board (the “FRB”) and Advantage is subject to the requirements of the Federal Deposit Insurance Corporation (the “FDIC”). Failure to meet minimum capital requirements can initiate certain mandatory – and possibly additional discretionary – actions by regulators that, if undertaken, could have a direct material effect on the Corporation’s consolidated financial statements. Under capital adequacy guidelines and the regulatory framework for prompt corrective action, the Corporation and the Bank must meet specific capital guidelines that involve quantitative measures of assets, liabilities, and certain off-balance-sheet items as calculated under regulatory accounting practices. The Corporation and Bank’s capital amounts and classification are also subject to qualitative judgments by the regulators about components, risk weightings, and other factors.
The FRB and FDIC have adopted risk-based capital ratio guidelines to which the Corporation is subject. The guidelines establish a systematic analytical framework that makes regulatory capital requirements more sensitive to differences in risk profiles among banking organizations. Risk-based capital ratios are determined by allocating assets and specified off-balance
46
sheet commitments to four risk-weighting categories, with higher levels of capital being required for the categories perceived as representing greater risk.
These guidelines divide the capital into two tiers. The first tier (“Tier I”) includes common equity, certain non-cumulative perpetual preferred stock (excluding auction rate issues) and minority interests in equity accounts of consolidated subsidiaries, less goodwill and certain other intangible assets (except mortgage servicing rights and purchased credit card relationships, subject to certain limitations). Supplementary (“Tier II”) capital includes, among other items, cumulative perpetual and long-term limited-life preferred stock, mandatory convertible securities, certain hybrid capital instruments, term subordinated debt and the allowance for loan losses, subject to certain limitations, less required deductions. Banks and financial holding companies are required to maintain a total risk-based capital ratio of 8%, of which 4% must be Tier I capital. The regulatory agencies may, however, set higher capital requirements when particular circumstances warrant. Banks experiencing or anticipating significant growth are expected to maintain capital ratios, including tangible capital positions, well above the minimum levels.
During 2007, management was notified by the FDIC that Advantage was categorized as “well-capitalized” under the regulatory framework for prompt corrective action. To be categorized as “well-capitalized” Camco and Advantage must maintain minimum capital ratios as set forth in the table that follows.
As of December 31, 2007, management believes that the Corporation met all capital adequacy requirements to which it was subject.
Camco:
| | | | | | | | | | | | | | | | | | | | | | | | | |
| | | At December 31, 2007 |
| | | | | | | | To be “well-
|
| | | | | | | | capitalized” under
|
| | | | | | For capital
| | prompt corrective
|
| | | Actual | | | adequacy purposes | | action provisions |
| | | Amount | | | Ratio | | | Amount | | Ratio | | Amount | | Ratio |
|
| | |
(Dollars in thousands) |
| |
| Total capital | | | | | | | | | | | | | | | | | | | | | | | | |
| (to risk-weighted assets) | | $ | 92,958 | | | | 12.39% | | | | ³ $60,037 | | | | 8.0% | | | | ³ $75,047 | | | | 10.0% | |
| | | | | | | | | | | | | | | | | | | | | | | | | |
| Tier I capital | | | | | | | | | | | | | | | | | | | | | | | | |
| (to risk-weighted assets) | | $ | 86,335 | | | | 11.50% | | | | ³ $30,019 | | | | 4.0% | | | | ³ $45,028 | | | | 6.0% | |
| | | | | | | | | | | | | | | | | | | | | | | | | |
| Tier I leverage | | $ | 86,335 | | | | 8.36% | | | | ³ $41,286 | | | | 4.0% | | | | ³ $51,607 | | | | 5.0% | |
Advantage:
| | | | | | | | | | | | | | | | | | | | | | | | | |
| | | At December 31, 2007 |
| | | | | | | | To be “well-
|
| | | | | | | | capitalized” under
|
| | | | | | For capital
| | prompt corrective
|
| | | Actual | | | adequacy purposes | | action provisions |
| | | Amount | | | Ratio | | | Amount | | Ratio | | Amount | | Ratio |
|
| | | (Dollars in thousands) |
| |
| Total capital | | | | | | | | | | | | | | | | | | | | | | | | |
| (to risk-weighted assets) | | $ | 86,414 | | | | 11.54% | | | | ³ $59,931 | | | | 8.0% | | | | ³ $74,914 | | | | 10.0% | |
| | | | | | | | | | | | | | | | | | | | | | | | | |
| Tier I capital | | | | | | | | | | | | | | | | | | | | | | | | |
| (to risk-weighted assets) | | $ | 79,791 | | | | 10.65% | | | | ³ $29,966 | | | | 4.0% | | | | ³ $44,948 | | | | 6.0% | |
| | | | | | | | | | | | | | | | | | | | | | | | | |
| Tier I leverage | | $ | 79,791 | | | | 7.80% | | | | ³ $40,943 | | | | 4.0% | | | | ³ $51,179 | | | | 5.0% | |
47
CAMCO FINANCIAL CORPORATION
NOTES TO CONSOLIDATED FINANCIAL STATEMENTS (continued)
December 31, 2007, 2006 and 2005
NOTE J - REGULATORY CAPITAL (continued)
Camco:
| | | | | | | | | | | | | | | | | | | | | | | | | |
| | | At December 31, 2006 |
| | | | | | | | To be “well-
|
| | | | | | For capital
| | capitalized” under prompt corrective
|
| | | Actual | | | adequacy purposes | | action provisions |
| | | Amount | | | Ratio | | | Amount | | Ratio | | Amount | | Ratio |
|
| | | (Dollars in thousands) |
| |
| Total capital | | | | | | | | | | | | | | | | | | | | | | | | |
| (to risk-weighted assets) | | $ | 92,135 | | | | 12.46% | | | | ³$59,135 | | | | ³8.0% | | | | ³$73,919 | | | | ³10.0% | |
| | | | | | | | | | | | | | | | | | | | | | | | | |
| Tier I capital | | | | | | | | | | | | | | | | | | | | | | | | |
| (to risk-weighted assets) | | $ | 84,991 | | | | 11.50% | | | | ³$29,568 | | | | ³4.0% | | | | ³$44,351 | | | | ³ 6.0% | |
| | | | | | | | | | | | | | | | | | | | | | | | | |
| Tier I leverage | | $ | 84,991 | | | | 8.22% | | | | ³$41,351 | | | | ³4.0% | | | | ³$51,689 | | | | ³ 5.0% | |
Advantage:
| | | | | | | | | | | | | | | | | | | | | | | | | |
| | | At December 31, 2006 |
| | | | | | | | To be “well-
|
| | | | | | For capital
| | capitalized” under prompt corrective
|
| | | Actual | | | adequacy purposes | | action provisions |
| | | Amount | | | Ratio | | | Amount | | Ratio | | Amount | | Ratio |
|
| | | (Dollars in thousands) |
| |
| Total capital | | | | | | | | | | | | | | | | | | | | | | | | |
| (to risk-weighted assets) | | $ | 84,859 | | | | 11.48% | | | | ³$59,130 | | | | ³8.0% | | | | ³$73,913 | | | | ³10.0% | |
| | | | | | | | | | | | | | | | | | | | | | | | | |
| Tier I capital | | | | | | | | | | | | | | | | | | | | | | | | |
| (to risk-weighted assets) | | $ | 77,715 | | | | 10.51% | | | | ³$29,577 | | | | ³4.0% | | | | ³$44,347 | | | | ³ 6.0% | |
| | | | | | | | | | | | | | | | | | | | | | | | | |
| Tier I leverage | | $ | 77,715 | | | | 7.52% | | | | ³$41,351 | | | | ³4.0% | | | | ³$51,689 | | | | ³ 5.0% | |
The Corporation’s management believes that, under the current regulatory capital regulations, Camco will continue to meet its minimum capital requirements in the foreseeable future. However, events beyond the control of the Corporation, such as increased interest rates or a downturn in the economy in the Bank’s market areas, could adversely affect future earnings and, consequently, the ability to meet future minimum regulatory capital requirements.
NOTE K - BENEFIT PLANS
The Corporation has a non-contributory retirement plan which provides benefits to certain key officers. The Corporation’s future obligations under the plan have been provided for via the purchase of single premium key man life insurance of which the Corporation is the beneficiary. The Corporation recorded expense related to the plan totaling approximately $101,000, $356,000 and $320,000 during the years ended December 31, 2007, 2006 and 2005, respectively.
The Corporation also has a 401(k) Salary Savings Plan covering substantially all employees. Contributions by the employees are voluntary and are subject to matching contributions by the employer under a fixed percentage, which may be increased at the discretion of the Board of Directors. Total expense under this plan was $360,000, $293,000 and $298,000 for the years ended December 31, 2007, 2006 and 2005, respectively.
48
| |
| NOTE L - | CAMCO FINANCIAL CORPORATION CONDENSED FINANCIAL INFORMATION |
The following condensed financial statements summarize the financial position of the Corporation as of December 31, 2007 and 2006, and the results of its operations and its cash flows for each of the years ended December 31, 2007, 2006 and 2005:
CAMCO FINANCIAL CORPORATION STATEMENTS OF FINANCIAL CONDITION
| | | | | | | | | |
| | | December 31, | |
| | | 2007 | | | 2006 | |
| |
| | |
(In thousands) | |
| |
| ASSETS | | | | | | | | |
| Cash in Advantage | | $ | 4,403 | | | $ | 123 | |
| Interest-bearing deposits in other financial institutions | | | 100 | | | | 5,172 | |
| Investment securities designated as available for sale | | | 164 | | | | 184 | |
| Investment in Advantage | | | 87,094 | | | | 83,799 | |
| Investment in Camco Title | | | 852 | | | | 1,056 | |
| Office premises and equipment – net | | | 1,207 | | | | 1,248 | |
| Cash surrender value of life insurance | | | 1,172 | | | | 1,136 | |
| Prepaid expenses and other assets | | | 319 | | | | 281 | |
| | | |
| | | |
| Total assets | | $ | 95,311 | | | $ | 92,999 | |
| | | |
| | | |
| | | | | | | | | |
| LIABILITIES AND STOCKHOLDERS’ EQUITY | | | | | | | | |
| Accounts payable and other accrued liabilities | | $ | 335 | | | $ | 381 | |
| Borrowings | | | 5,000 | | | | — | |
| Dividends payable | | | 1,080 | | | | 1,120 | |
| Accrued federal income taxes | | | 261 | | | | 406 | |
| Deferred federal income taxes | | | 1 | | | | — | |
| | | |
| | | |
| Total liabilities | | | 6,677 | | | | 1,907 | |
| Stockholders’ equity | | | | | | | | |
| Common stock | | | 8,835 | | | | 8,832 | |
| Additional paid-in capital | | | 59,842 | | | | 59,722 | |
| Retained earnings | | | 44,083 | | | | 43,954 | |
| Unrealized gains (losses) on securities designated as available for sale, net of related tax effects | | | (12 | ) | | | (1,225 | ) |
| Treasury stock, at cost | | | (24,114 | ) | | | (20,191 | ) |
| | | |
| | | |
| Total stockholders’ equity | | | 88,634 | | | | 91,092 | |
| | | |
| | | |
| Total liabilities and stockholders’ equity | | $ | 95,311 | | | $ | 92,999 | |
| | | |
| | | |
49
CAMCO FINANCIAL CORPORATION
NOTES TO CONSOLIDATED FINANCIAL STATEMENTS (continued)
December 31, 2007, 2006 and 2005
| |
| NOTE L - | CAMCO FINANCIAL CORPORATION CONDENSED FINANCIAL INFORMATION (continued) |
CAMCO FINANCIAL CORPORATION STATEMENTS OF OPERATIONS
| | | | | | | | | | | | | |
| | | Year ended December 31, | |
| | | 2007 | | | 2006 | | | 2005 | |
| |
| | |
(In thousands) | |
| |
| Income | | | | | | | | | | | | |
| Dividends from Advantage | | $ | 3,000 | | | $ | 4,800 | | | $ | 7,000 | |
| Dividends from Camco Title | | | 350 | | | | — | | | | 250 | |
| Interest and other income | | | 157 | | | | 366 | | | | 239 | |
| Gain on sale of investments | | | 1 | | | | — | | | | 113 | |
| Gain on sale of fixed assets | | | — | | | | 7 | | | | — | |
| Undistributed earnings of Advantage | | | 2,069 | | | | 1,568 | | | | 2,145 | |
| Undistributed earnings of Camco Title | | | (204 | ) | | | 148 | | | | (61 | ) |
| | | |
| | | |
| Total income | | | 5,373 | | | | 6,889 | | | | 9,686 | |
| Interest Expense | | | 139 | | | | — | | | | — | |
| General, administrative and other expense | | | 1,107 | | | | 1,357 | | | | 1,233 | |
| | | |
| | | |
| Earnings before federal income tax credits | | | 4,127 | | | | 5,532 | | | | 8,453 | |
| Federal income tax credits | | | (374 | ) | | | (342 | ) | | | (313 | ) |
| | | |
| | | |
| Net earnings | | $ | 4,501 | | | $ | 5,874 | | | $ | 8,766 | |
| | | |
| | | |
CAMCO FINANCIAL CORPORATION STATEMENTS OF CASH FLOWS
| | | | | | | | | | | | | |
| | | Year ended December 31, | |
| | | 2007 | | | 2006 | | | 2005 | |
| |
| | |
(In thousands) | |
| |
| Cash flows from operating activities: | | | | | | | | | | | | |
| Net earnings for the year | | $ | 4,501 | | | $ | 5,874 | | | $ | 8,766 | |
| Adjustments to reconcile net earnings to net cash flows provided by operating activities: | | | | | | | | | | | | |
| Undistributed earnings of Advantage | | | (2,069 | ) | | | (1,568 | ) | | | (2,145 | ) |
| Undistributed earnings of Camco Title | | | 204 | | | | (148 | ) | | | 61 | |
| Gain on sale of office premises and equipment | | | — | | | | (7 | ) | | | — | |
| Gain on sale of investments | | | (1 | ) | | | — | | | | (113 | ) |
| Depreciation and amortization | | | 41 | | | | 49 | | | | 53 | |
| Increase (decrease) in cash due to changes in: | | | | | | | | | | | | |
| Prepaid expenses and other assets | | | 54 | | | | 17 | | | | 5 | |
| Accounts payable and other liabilities | | | (47 | ) | | | (32 | ) | | | 9 | |
| Accrued federal income taxes | | | (145 | ) | | | (35 | ) | | | (70 | ) |
| Deferred federal income taxes | | | 6 | | | | 54 | | | | 92 | |
| Tax benefits related to exercise of stock options | | | — | | | | — | | | | 111 | |
| | | |
| | | |
| Net cash provided by operating activities [balance carried forward] | | | 2,544 | | | | 4,204 | | | | 6,769 | |
50
| | | | | | | | | | | | | |
| | | Year ended December 31, | |
| | | 2007 | | | 2006 | | | 2005 | |
| |
| | |
(In thousands) | |
| |
| Net cash provided by operating activities [balance brought forward] | | | 2,544 | | | | 4,204 | | | | 6,769 | |
| | | |
| | | |
| Cash flows from investing activities: | | | | | | | | | | | | |
| Purchase of investment securities | | | — | | | | — | | | | (100 | ) |
| Proceeds from redemption of available for sale securities | | | 3 | | | | — | | | | 302 | |
| Net increase in cash surrender value of life insurance | | | (36 | ) | | | (37 | ) | | | (38 | ) |
| Purchase of office premises and equipment | | | — | | | | (29 | ) | | | — | |
| Proceeds from sale of office premises and equipment | | | — | | | | 24 | | | | — | |
| Proceeds from redemption of life insurance | | | — | | | | 126 | | | | — | |
| (Increase) decrease in interest-bearing deposits in other financial institutions | | | 5,072 | | | | 1,838 | | | | (1,015 | ) |
| | | |
| | | |
| Net cash provided by (used in) investing activities | | | 5,039 | | | | 1,922 | | | | (851 | ) |
| | | | | | | | | | | | | |
| Cash flows from financing activities: | | | | | | | | | | | | |
| Proceeds from exercise of stock options | | | 31 | | | | 20 | | | | 591 | |
| Proceeds from subordinated debentures | | | 5,000 | | | | — | | | | — | |
| Dividends paid | | | (4,411 | ) | | | (4,471 | ) | | | (4,438 | ) |
| Purchase of treasury shares | | | (3,923 | ) | | | (1,651 | ) | | | (2,195 | ) |
| | | |
| | | |
| Net cash used in financing activities | | | (3,303 | ) | | | (6,102 | ) | | | (6,042 | ) |
| | | |
| | | |
| Net increase (decrease) in cash and cash equivalents | | | 4,280 | | | | 24 | | | | (124 | ) |
| Cash and cash equivalents at beginning of year | | | 123 | | | | 99 | | | | 223 | |
| | | |
| | | |
| Cash and cash equivalents at end of year | | $ | 4,403 | | | $ | 123 | | | $ | 99 | |
| | | |
| | | |
Ohio statutes impose certain limitations on the payment of dividends and other capital distributions by banks. Generally, absent approval of the Superintendent of Banks, such statutes limit dividend and capital distributions to earnings of the current and two preceding years.
51
CAMCO FINANCIAL CORPORATION
NOTES TO CONSOLIDATED FINANCIAL STATEMENTS (continued)
December 31, 2007, 2006 and 2005
NOTE N - QUARTERLY RESULTS OF OPERATIONS (UNAUDITED)
The following table summarizes the Corporation’s quarterly results for the years ended December 31, 2007 and 2006.
| | | | | | | | | | | | | | | | | |
| | | Three months ended | |
| 2007: | | December 31, | | | September 30, | | | June 30, | | | March 31, | |
| | |
| | |
(In thousands, except per share date) | |
| |
| Total interest income | | $ | 16,159 | | | $ | 16,434 | | | $ | 16,535 | | | $ | 16,189 | |
| Total interest expense | | | 9,089 | | | | 9,445 | | | | 9,085 | | | | 8,802 | |
| | | | | | | | | | | | | | | | | |
| | | | | | | | | | | | | | | | | |
| Net interest income | | | 7,070 | | | | 6,989 | | | | 7,450 | | | | 7,387 | |
| Provision for losses on loans | | | 980 | | | | 200 | | | | 120 | | | | 195 | |
| Other income | | | 1,724 | | | | 1,495 | | | | 1,063 | | | | 1,568 | |
| General, administrative and other expenses | | | 6,763 | | | | 7,223 | | | | 6,436 | | | | 6,563 | |
| | | | | | | | | | | | | | | | | |
| Earnings before income taxes | | | 1,051 | | | | 1,061 | | | | 1,957 | | | | 2,197 | |
| Federal income taxes | | | 244 | | | | 218 | | | | 610 | | | | 693 | |
| | | | | | | | | | | | | | | | | |
| Net earnings | | $ | 807 | | | $ | 843 | | | $ | 1,347 | | | $ | 1,504 | |
| | | | | | | | | | | | | | | | | |
| Earnings per share: | | | | | | | | | | | | | | | | |
| Basic | | $ | .11 | | | $ | .12 | | | $ | .18 | | | $ | .20 | |
| | | | | | | | | | | | | | | | | |
| Diluted | | $ | .11 | | | $ | .12 | | | $ | .18 | | | $ | .20 | |
| | | | | | | | | | | | | | | | | |
| | | | | | | | | | | | | | | | | |
| | | Three months ended | |
| 2006: | | December 31, | | | September 30, | | | June 30, | | | March 31, | |
| | |
| | |
(In thousands, except per share date) | |
| |
| Total interest income | | $ | 16,174 | | | $ | 15,900 | | | $ | 15,463 | | | $ | 15,152 | |
| Total interest expense | | | 8,742 | | | | 8,648 | | | | 8,008 | | | | 7,373 | |
| | | | | | | | | | | | | | | | | |
| Net interest income | | | 7,432 | | | | 7,252 | | | | 7,455 | | | | 7,779 | |
| Provision for losses on loans | | | 360 | | | | 360 | | | | 360 | | | | 360 | |
| Other income | | | 1,016 | | | | 1,246 | | | | 1,465 | | | | 1,306 | |
| General, administrative and other expenses | | | 6,295 | | | | 6,410 | | | | 5,943 | | | | 6,262 | |
| | | | | | | | | | | | | | | | | |
| Earnings before income taxes | | | 1,793 | | | | 1,728 | | | | 2,617 | | | | 2,463 | |
| Federal income taxes | | | 533 | | | | 608 | | | | 802 | | | | 784 | |
| | | | | | | | | | | | | | | | | |
| Net earnings | | $ | 1,260 | | | $ | 1,120 | | | $ | 1,815 | | | $ | 1,679 | |
| | | | | | | | | | | | | | | | | |
| Earnings per share: | | | | | | | | | | | | | | | | |
| Basic | | $ | 0.17 | | | $ | 0.15 | | | $ | 0.24 | | | $ | 0.22 | |
| | | | | | | | | | | | | | | | | |
| Diluted | | $ | 0.17 | | | $ | 0.15 | | | $ | 0.24 | | | $ | 0.22 | |
| | | | | | | | | | | | | | | | | |
52
CAMCO FINANCIAL CORPORATION
6901 GLENN HIGHWAY
CAMBRIDGE, OHIO 43725
www.camcofinancial.com