Semi-Annual Report
May 31, 2017
GoodHaven Fund
Ticker: GOODX
GoodHaven Capital Management, LLC
GoodHaven Fund
Table of Contents
| Shareholder Letter | | | 1 |
| Portfolio Management Discussion and Analysis | | | 13 |
| Sector Allocation | | | 19 |
| Schedule of Investments | | | 20 |
| Statement of Assets and Liabilities | | | 23 |
| Statement of Operations | | | 24 |
| Statements of Changes in Net Assets | | | 25 |
| Financial Highlights | | | 26 |
| Notes to Financial Statements | | | 27 |
| Expense Example | | | 36 |
| Additional Information | | | 38 |
| Privacy Notice | | | 39 |
GoodHaven Fund
PERFORMANCE as of May 31, 2017 |
| | 6 Mos | 6 Mos | 12 Mos | Calendar | 5 | Since | Since |
| | Ended | Ended | Ended | YE | Years | Incept.1 | Incept.1 |
| | 5/31/17 | 6/30/17 | 5/31/17 | 12/31/16 | Annualized | Cumulative | Annualized |
| GOODX | -3.51% | -4.00% | 4.25% | 20.13% | 3.01% | 24.87% | 3.68% |
S&P 500 Index2 | 10.80% | 9.34% | 17.46% | 11.95% | 15.40% | 107.02% | 12.56% |
| Wilshire 5000 | | | | | | | |
| Total Market Index | 8.92% | 7.70% | 15.41% | 10.67% | 12.75% | 77.38% | 9.77% |
| HFRI Fundamental | | | | | | | |
Growth Index3 | 8.35% | 9.30% | 12.61% | 4.16% | 5.49% | 12.15% | 1.87% |
| HFRI Fundamental | | | | | | | |
Value Index3 | 5.98% | 5.93% | 12.65% | 7.26% | 7.90% | 36.00% | 5.11% |
CS Hedge Fund Index3 | 4.35% | 2.85% | 6.25% | 1.25% | 4.49% | 21.92% | 3.26% |
1 | The Fund commenced operations on April 8, 2011. |
2 | with dividends reinvested |
3 | Hedge Fund Index performance figures are supplied on a month end basis and are provided for illustrative purposes as a broad equity alternative asset class only. Accordingly, “since inception” hedge fund index performance figures reflect a start date of 3/31/11 and an end date of 5/31/17. Source: Bloomberg Terminal |
Performance data quoted represents past performance; past performance does not guarantee future results. The investment return and principal value of an investment will fluctuate so that an investor’s shares, when redeemed, may be worth more or less than their original cost. Current performance of the Fund may be lower or higher than the performance quoted. Performance data current to the most recent month-end may be obtained by calling (855) OK-GOODX or (855) 654-6639. The Fund imposes a 2.00% redemption fee on shares redeemed within 60 days of purchase. Performance data for an individual shareholder will be reduced by redemption fees that apply, if any. Redemption fees are paid directly into the Fund and do not reduce overall performance of the Fund. The annualized gross expense ratio of the GoodHaven Fund is 1.10%.
Additional table data are provided for disclosure of calendar period results, which are more commonly referenced.
July 5, 2017
To Our Fellow Shareholders of the GoodHaven Fund (the “Fund”):
After gaining 20.13% in calendar 2016 compared to 11.95% for the S&P 500 over the same period, and after a modestly positive first calendar quarter of 2017, we suffered a poor second calendar quarter primarily due to a rapid and significant price decline in two large energy related holdings. Despite a number of positive business developments across most of the portfolio, these energy declines have led to modest losses in the overall portfolio year-to-date. Importantly, we think the portfolio’s intrinsic value – including our energy holdings – actually increased during this period – which should be reflected in stock price performance over time. A concentrated approach lends itself to volatility and it’s worth recalling that in 2016, we started that year down
GoodHaven Fund
roughly 5% as energy plunged in early January and ended the calendar year up just over 20%. We work hard not to be influenced by volatility, and believe that taking advantage of volatility is part of a sound long-term investment approach.
First, let’s address the issue of our energy-related holdings, which currently total a bit less than 14% of the portfolio. As Yogi Berra might have said, “it feels like déjà vu all over again.” After a big bounce off the late 2015 lows last year, oil rapidly declined over just the past several weeks from about $52 per barrel to a recent low of about $42, apparently in response to high inventory levels and bearish headlines about production. Oil equities have generally followed suit, regardless of hedges, growth profiles, business progress in growing values, or cost positioning. We estimate that our energy exposure negatively affected the portfolio by approximately 7-8% in the six calendar months ended June 30, 2017 (mostly over the last couple of months), yet our research says these companies are deeply undervalued. Insider buying in 2017 suggests that management teams agree.1
Our largest energy investments, WPX Energy and Birchcliff Energy, are predicated on several factors: research suggesting that they are undervalued today based on what we believe a competitor would pay in a negotiated transaction (based on comparable industry deals); management teams that have a track record of excellent operating expertise and skill in capital allocation; material production growth profiles over the next two or three years regardless of short-term oil and gas prices; significant above-market hedges protecting near-term cash flows; an unprecedented collapse in energy industry capital spending over the last three years; and the lowest level of new oil discoveries in nearly seventy years.
Nearly forty years ago, energy accounted for 25% of the value of the S&P 500. Today, energy appears to be less than 6% of the index and deeply undervalued relative to other sectors, despite continuing to occupy a large and critical economic role. Merger activity and insider buying has picked up in recent months as informed industry insiders see value even as energy headlines are relentlessly negative. In brief and irrespective of short-term market behavior, we believe the intrinsic values of both WPX and Birchcliff are more than double their current respective share prices (and potentially higher should a supply crunch develop) while the broader indexes seem richly valued by common historic metrics.2
__________
1 | In addition to multiple executive open-market buys at WPX Energy and Birchcliff Energy, well-known Birchliff anchor investor Seymour Schulich bought an additional five million shares of Birchcliff in recent months at prices well above recent quotes. Across the industry, there have been recent and widespread insider buying in many other energy firms. |
| | |
2 | Although we do our own research and are skeptical of much of what we read, a June 2017 research report issued by Credit Suisse suggested that the net asset value of WPX could be as high as $43 per share, based primarily on an assessment of its Permian assets. |
GoodHaven Fund
Barrick Gold remains our largest investment (with a material unrealized gain on cost as we write). After a strong 2016, Barrick was roughly flat in the first half of the year, despite two unforced errors: a need to fix leaking pipes at one of its core mines (Veladero) which had caused Argentinian regulators to temporarily halt production (now resumed) and a setback in Tanzania where the government put severe restrictions on two of the three properties in Tanzania owned by Acacia Mining (a Barrick spin-off formerly known as African Barrick.) While Barrick Gold owns approximately 64% of Acacia, it does not control that business and it receives negligible cash flow from it. Nevertheless, it remains part of the company’s guidance for forecasting production and costs, as well as reserves. Negotiating with national sovereign partners is part of any mining company’s operations and we believe Barrick and its Chairman understand this process and its importance and will be able to guide Acacia to some sort of rational solution.
On the positive side, Barrick recently closed its deal to sell half of the Veladero property to strategic partner Shandong Gold Mining of China for nearly $1 billion, most of which will be used to further reduce debt. With the highest grade and most extensive reserves in the industry, Barrick has been successfully executing on the strategy overseen by Chairman John Thornton to repair and create a strong balance sheet, allocate capital to benefit shareholders, and transform the company’s operations into the most technically advanced and efficient in the industry. At current prices, and on a steady-state basis, we believe Barrick generates close to $2 per share in pre-tax cash flow – a level suggesting significant undervaluation absent large commodity price declines. After a period of retrenchment, debt reduction, and management changes, we think the company is now positioned to play offense as well as defense.
While we recognize that operating leverage creates significant optionality in any gold miner, we note that gold supplies have barely increased in recent years compared to central bank assets, which have risen by nearly $20 trillion. Moreover, the industry as whole has poorly correlated to the S&P 500 Index, remains out of favor with most investors, and sells for a fraction of its value five years ago. Insiders have noticed: unlike the market as a whole, there has been insider buying among gold mining executives across the industry. In addition to a $4 million purchase by Chairman Thornton of Barrick at a price of $19 per share in March (well above recent market value), insiders at Kirkland Lake, Alamos Gold, Detour Gold, Goldcorp, Yamana, and Pretium Resources have all bought shares in recent months.
Earlier in the year, we established two new investments in companies operating in less than “exuberant” industries: American Airlines and Builders FirstSource. Combined, they account for about four percent of our current portfolio and are modestly profitable thus far. Over the last decade, several large airline mergers materially reduced competition. Carriers rationalized routes and adjusted schedules, raising load factors dramatically (planes that were roughly 60% full ten years ago are roughly 80% full today). The large carriers have also established lucrative affinity
GoodHaven Fund
credit card relationships.3 While we had looked at some of these companies closely over a year ago or so, we focused more intently on these changes after Berkshire Hathaway took several large investment stakes across the airline industry.4
American is leveraged, but has good liquidity, with about $6 billion in cash. About half of the company’s $25 billion debt is recourse to the company while the other half represents non-recourse equipment and aircraft financings for one of the youngest (and most valuable) fleets in the air. The CEO, Doug Parker, is paid entirely in common shares – a strong vote of confidence that he himself has admitted would have been a terrible strategy prior to what he believes is a sea-change in industry behavior. In addition, the company has repurchased nearly 30% of the shares outstanding in recent years, with the average repurchase price near our per share cost.
While the airline business is still subject to cyclical swings, we believe the cycle lows will be well above those of the past. The industry is behaving rationally, the affinity card business reduces the volatility of earnings, and the current valuation – less than 9 times expected 2017 earnings – should cushion the risk. On the upside, share repurchases continue to accrete value when accomplished at low multiples. If we are correct, the market should begin to award a higher valuation to increasing earnings across the industry as these changes become more widely recognized.
Builders FirstSource is a company that acts as a wholesaler/distributor to commercial accounts in the homebuilding business. After a significant merger, the company is rapidly realizing efficiencies and benefitting from reduced competition. We paid about eight times our estimate of steady-state free cash flow, which assumes modest improvements in single family home construction. Near term, we expect free cash flow to be used to reduce existing leverage resulting from the merger.
The recent annual run rate of housing starts approximates 800,000 – up from less than 500,000 at the bottom of the crisis, but far below the 1,100,000 or so average that prevailed for decades before the real-estate crash of 2008 began (unadjusted for population growth). Given an increased population, additional household formation, low mortgage rates, and tight inventories of existing homes, we expect slow but continued improvement in new construction. While a rapid increase in interest rates would probably cause a slowdown, a moderate rise is unlikely to dramatically affect current levels of activity.
__________
3 | The business of selling miles to card companies is not well understood. While not broken out in detail, we believe more than 30% of American’s pre-tax earnings in the last year may have come from its credit relationships. |
| | |
4 | Berkshire Hathaway’s investment in most of the major carriers in 2016 may turn out to have a beneficial effect on competition. Over many years, one of the common refrains heard from CEOs of companies in which Berkshire has invested is a profound desire not to disappoint Berkshire by making foolish business decisions. |
GoodHaven Fund
From late March to the end of June, Systemax more than doubled in price. Although not a large position, we profited in this investment by identifying a series of investment factors that were not obvious. The company is family controlled with a strong balance sheet (significant net cash per share and virtually no debt). However, it had two businesses: one losing significant money and one profitable and growing. Unfortunately and for some time, the stock price was depressed as the money-losing business overshadowed the profitable business. The company had significant value well above market; it was just not evident in the stock quote for an extended period.
Around the end of the first calendar quarter, the company was able to sell the bulk of the money-losing business without incurring additional liability or support payments. The market quickly recognized what we had already figured out - that the remaining company was generating earnings at a run-rate of close to $40 million before taxes and usual items with over $140 million in cash and no debt and that these characteristics were worth far more than the $300 million value the market had previously assigned. Given that earnings are expected to grow, today’s market value of $700 million does not seem excessive. (We also note that a buyer of the business could probably save more than $20 million in additional expenses from large shareholder compensation, public company expenses, and other outlays.) We remain as owners, believing there are several qualitative factors suggesting that the “cleaned-up” business may become an acquisition target. Our current size allows us the flexibility to find opportunities in smaller capitalization situations in addition to larger companies. We intend to continue to try and exploit this advantage to benefit us all.
At the end of June, Staples, a roughly 2% holding with a profitable, but slowly shrinking business and a good balance sheet, received a definitive proposal to be acquired by a leveraged buyout firm. We are disappointed in the price, which we believe undervalues the $10 billion revenue core business, one of the largest on-line retailers in the United States with next day delivery to 97% of the country. In particular, the company appears to be approaching an inflection point where the decline in its retail business slows and is more than offset by modest growth in its core online/delivery business.
In many ways, the deal looks like the highly profitable going-private deal for Dell Computer a few years ago that also occurred at a time of great pessimism about an industry (then, personal computers, now retailing). If the Staples deal goes through at its current price, we will have earned a modest (but inadequate) total return over our holding period. As other large investors have also expressed disappointment, there is a small possibility that a higher bid surfaces. We may add to our position or sell out entirely, depending on developments.
This year, we have also cut back some investments that performed well in recent years and exited some others that did not – contributing to a large cash position that has affected relative results this year when compared to rapidly rising (and more
GoodHaven Fund
expensively valued) broad equity indexes (we estimate the drag to be roughly 2-3% during the calendar year to date). While we consider the current cash level to be temporarily high, our fund is not mandated to be fully invested and this characteristic should have the potential to help future returns when stress appears.5 However, cash feels especially painful when short-term, low-risk investments yield almost nothing and index prices appear to be in a permanent uptrend. Nevertheless, it makes no sense to assume outsized risks for a low incremental return. Ian Cumming, former Chairman of Leucadia National, used to call that strategy “picking up pennies in front of a steamroller – highly dangerous and not very profitable.” It makes more sense to exercise patience, wait for a higher prospective return with lower estimated risk, and employ liquidity under stress as we have in the past.
While patient with liquidity, we have also redoubled our efforts to find some one-off and non-index correlated investments where we can earn respectable returns commensurate with avoiding large risk. For example, we recently bought a short-dated and infrequently traded bond of Homefed Corporation (70% owned by Leucadia National Corporation) yielding about 6% to its maturity about a year from now, where we know the company well, the risk of default appears extremely low, and returns are far above those of cash.
We also initiated and subsequently added to a stake in New York REIT, a real-estate investment trust currently executing a plan of liquidation. After an activist got control of the company by advocating a liquidation, and prior to our investment, new management put forth its estimate of liquidating value which was sharply lower than many had assumed. The market was deeply disappointed, and the share price sold off to the point where our research suggested the price was an attractive discount to a reasonably conservative estimate of value. The company expects to fully liquidate its assets by early-to-mid 2018, offering a decent prospective return with what our research suggests is a significant “margin of safety.” We continue to look for more short-dated investments offering largely market-independent returns.
As mentioned in our prior letter, there were several positions where we noted changes might occur. In the first calendar half of the year, we reduced investments in Alphabet, Inc. and White Mountains Insurance Group and exited entirely positions in Hewlett Packard Enterprise (“HPE”), Sears Holdings, Seritage Growth Properties, and Walter Investment Management.
Although Alphabet remains our third largest investment at market value, we sold down the position as its market value climbed and the company became a larger percentage of our portfolio. Since we first bought shares in 2011, we have sold
__________
5 | Bob Rodriguez, formerly the admired (and now retired) manager of the FPA Funds, recently warned that huge money flows in recent years away from active managers, who usually have a cash cushion to meet redemptions, and into index funds and ETFs, which typically have no cash at all, may lead to an abrupt bout of rapid selling should index investors be spooked by some exigent event. |
GoodHaven Fund
enough to recoup roughly 45% of our original cost, which is now about $250 to $275 per remaining share (depending on the share class) compared to a recent quote of $950 per share or more. Although no longer dirt cheap, we continue to believe that Alphabet is one of the more reasonably valued large cap tech companies, given its balance sheet (over $100 per share in cash with little debt), significant and understated cash generation, growth profile, and optionality. It is, however, also well represented in every index fund in existence and we may reduce it further.
We also cut our White Mountains investment in half at a price of about $930, well above adjusted book value per share, following the sale or liquidation of a sizeable percentage of assets as well as a change in senior management. While we retain a roughly 2% position, much of the future value of this highly liquid business will depend on the capital allocation skills of new management. For now, we are content to patiently watch with a reduced investment in a highly liquid company with a history of shareholder friendly behavior. The company has enormous flexibility in buying back shares, paying dividends, or acquiring new businesses. White Mountains has been a successful investment that we first purchased for about $370 per share in 2011.
Our overall investment in Hewlett-Packard (which split last year into Hewlett Packard Enterprise and HP Inc.) has been rewarding, with the pieces (including those spun out and/or sold) worth about two and one half times our average purchase price. In the case of HPE, we believed the shares were approaching fair value at a time that risk was increasing, notably in the divisions selling servers and storage. For now, we retain our interest in HP Inc., a seller of personal computers and printers, which trades at a modest 12 times estimated earnings, yields about 3%, and is repurchasing shares out of cash flow rather than by increasing its leverage.
After its share price spiked higher in early 2017 (following a long period of decline), we sold our small Sears position at a loss. Never a large investment, we treated Sears as an option on the ability of the company and its management to monetize large net asset values. To date, the rapid decline in unprofitable retail operations has offset any benefit of sold real estate or distributed assets. At a modest profit, we also sold our stake in Seritage, the related real-estate investment trust, where we believed the price had moved closer to fair value despite increased risks associated with faster store closings by Sears and the need to increase its capital spending faster than expected.
Prior to the end of the second calendar quarter, we completely exited our remaining investment in Walter Investment Management. We made this decision after a weak Q1 earnings report under new management led us to conclude that a debt restructuring seemed inevitable. While the position was not large at calendar year-end, it still affected calendar 2017 year-to-date performance in a modestly negative way, and crystallized a material tax loss from cost. While no investment manager is immune from mistakes, this was a material unforced error that cost us far too much time, effort, and money.
GoodHaven Fund
Even with decades of experience, it is important to dissect failures in order to improve process and results. We did not size the Walter position properly, did not correctly evaluate changes to the business model forced by new regulations, and did not dig deep enough to understand certain unfavorable capital allocation moves by prior management. Given our backgrounds, we should have reacted much sooner. We have carefully examined and noted our errors here and have amended our process to avoid any similar misjudgments.
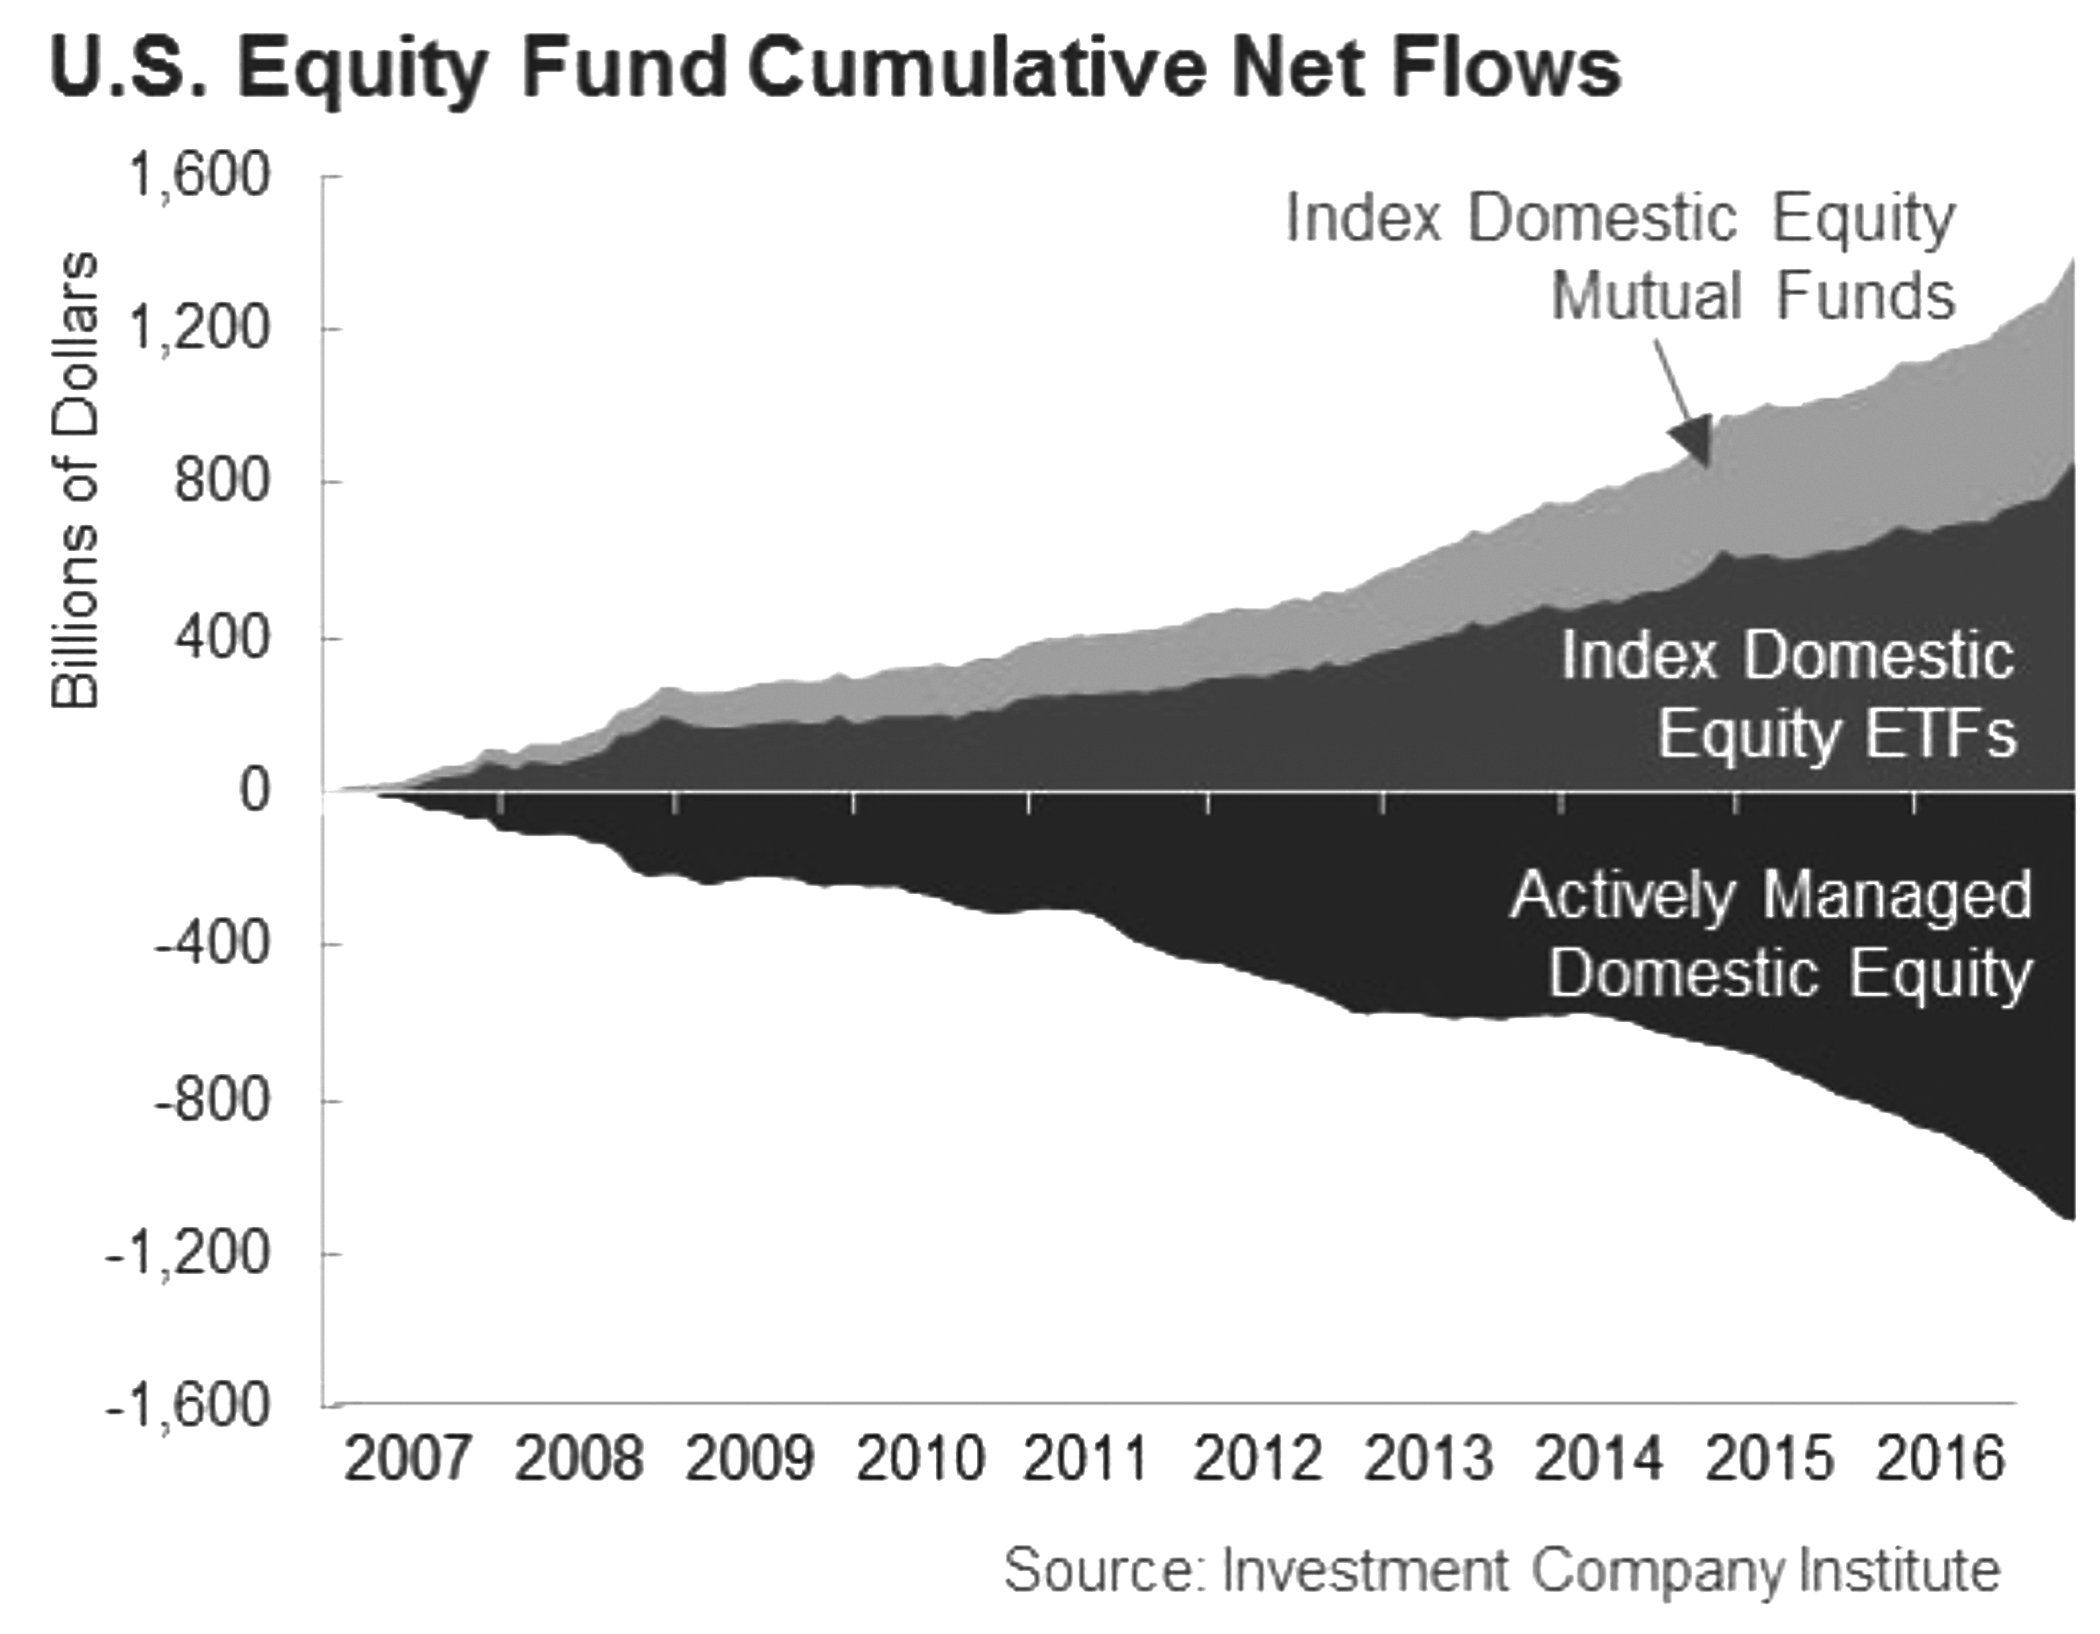
The juggernaut of passive investing and ETFs continues to inflate indexes as investors pour into these vehicles regardless of price. After setting records for inflows in 2015 and 2016, index fund leader Vanguard has set a new record so far this year. Vanguard passive funds held a 5% ownership position in only three S&P 500 companies in 2005. That number is now four hundred and ninety-one – and Vanguard is only one of a few enormous index and ETF fund sponsors. We continue to think that the rush into passive investing is showing signs of mania. Indexes have been propelled higher by extraordinarily low rates and speculative trading in companies whose businesses have rapidly grown revenues without commensurate profit growth, but which are valued at levels that suggest the potential for significant capital loss.
Clearly, quantitative easing and central bank asset purchases have also helped to inflate both bond and stock prices. Who would have imagined that nearly a decade after a crisis, aggregate central bank balance sheets would still be expanding? The European Central Bank owns huge chunks of sovereign debt, has purchased roughly 14% of all European corporate debt, and continues to add assets. The Swiss National Bank has been a large recent buyer of equities and owns $80 billion of U.S. equities and is one of the largest shareholders of Apple Computer. At the end of May 2017, the Bank of Japan, which continues to add assets held a total of 500.8 trillion yen in assets (about US$ 4.4 trillion), of which Japanese government securities accounted for 427.2 trillion yen (about US$ 3.8 trillion). The balance appears to represent equity securities and according to estimates compiled by Bloomberg, the Japanese
GoodHaven Fund
Central Bank is a top 10 owner in about 90% of Japanese stocks through its purchases of ETFs. Taken to a logical extreme, either these activities must start to taper off, or there will be no real markets left in short order.
For those who doubt the impact of quantitative easing and indexation, look at the MSCI World Index, which in the five years ended 2016 was up 87% according to an article in Barron’s earlier this year. Of that 87%, 74 percentage points were from the expansion of P/E multiples. Dividends were up about 15%, but actual earnings declined roughly 2%, meaning that almost all of the return came from revaluation upwards of businesses that had not improved much at all. In the last four years, a similar dynamic appears in the S&P 500, where earnings have appreciated at a low single digit rate while market prices have risen five times faster. That rate is mathematically unsustainable, as anyone with a basic knowledge of compound returns easily understands.
Although we believe our recent performance can be specifically attributed primarily to weak energy securities, other “value investors” have also suffered this year – so much so that Goldman Sachs recently issued a commentary titled the “Death of Value Investing,” which recalls the famous (at least to old investors) 1974 Business Week cover proclaiming the “Death of Equities” only weeks before a major cyclical low in the stock market. The Goldman commentary reflects a sense today that value investing is in crisis, that the discipline no longer works, and that the only sensible path for investors is to stop fighting the trend and join the masses flocking
GoodHaven Fund
to index funds and ETFs.6 We suggest that such refrains tend to be loudest near significant turning points – something we saw quite obviously in 2000 as the tech bubble collapsed, although the peak was only visible with hindsight.
In today’s world, we are confident we own an aggregate portfolio trading at a sizeable discount to intrinsic value with a significant reserve of cash and equivalents as part of the portfolio compared to indexes that appear historically expensive and which have virtually no cash by design. As has happened previously, the initial shift back towards value is likely to happen unnoticed and only become obvious after the crowd has lost significant net worth. Standing apart today is emotionally difficult yet critical. Our biggest investments are in areas that are not overly popular or highly valued. We have the firepower to behave opportunistically, and the patience not to get sucked into doing something outside our circle of competence.
Rarely have we seen as large a disconnect between value and performance as we have in the last few months, as cheap seemed to get cheaper while expensive continued to rise. The positive business progress we see in the portfolio overall combined with lower aggregate market value of our holdings suggests that our portfolio is more undervalued than it’s been (a subject we intend to expand upon in our year-end letter). We have behaved accordingly, and both of us have added to our personal Fund holdings during the period. Further, we are pleased to note that our minority partner, Markel Corporation, recently made a significant investment in the Fund for its own account. We are grateful for all our fellow shareholders who see the same opportunity we do.
There is an old saying on Wall Street equating the markets with the weather on Mt. Washington in New Hampshire (the windiest place in the U.S.). If you don’t like the weather, wait fifteen minutes – and it will change dramatically. We believe we are close to an inflection point where the weather seems about to change in a beneficial way. If we are correct, a shift in investor preference could favor our approach and offer a jolt to those who have been throwing money at securities and funds with little or no attempt at analysis, and little or no concern for capital preservation.
Sincerely,
| | |
 |  |
| | |
| Larry Pitkowsky | Keith Trauner |
__________
6 | Every bad idea on Wall Street typically starts as a good idea. For many, there is nothing inherently wrong with indexation, provided that the market is inexpensive or moderately valued. To paraphrase Warren Buffett, “even the best business in the world will be a poor investment at too high a price”. Index funds ignore valuation, buying when money flows in and selling when it leaves. With many index valuation measures at or close to all-time highs, investors are trying to buy what has been working but at a much higher price than what we feel is sensible. |
GoodHaven Fund
Mutual fund investing involves risk. Principal loss is possible. The Fund is non-diversified, meaning it may concentrate its assets in fewer individual holdings than a diversified fund. Therefore, the Fund is more exposed to individual stock volatility than a diversified fund. The Fund invests in midcap and smaller capitalization companies, which involve additional risks such as limited liquidity and greater volatility. The Fund may invest in foreign securities which involve political, economic and currency risks, greater volatility and differences in accounting methods. These risks are enhanced in emerging markets. The Fund may invest in REITs, which are subject to additional risks associated with direct ownership of real property including decline in value, economic conditions, operating expenses, and property taxes. Investments in debt securities typically decrease in value when interest rates rise. This risk is usually greater for longer-term debt securities. Investments in lower-rated, non-rated and distressed securities present a greater risk of loss to principal and interest than higher-rated securities.
The opinions expressed are those of Larry Pitkowsky and/or Keith Trauner through the end of the period for this report, are subject to change, and are not intended to be a forecast of future events, a guarantee of future results, nor investment advice. This material may include statements that constitute “forward-looking statements” under the U.S. securities laws. Forward-looking statements include, among other things, projections, estimates, and information about possible or future results related to the Fund, market or regulatory developments. The views expressed herein are not guarantees of future performance or economic results and involve certain risks, uncertainties and assumptions that could cause actual outcomes and results to differ materially from the views expressed herein. The views expressed herein are subject to change at any time based upon economic, market, or other conditions and GoodHaven undertakes no obligation to update the views expressed herein. While we have gathered this information from sources believed to be reliable, GoodHaven cannot guarantee the accuracy of the information provided. Any discussions of specific securities or sectors should not be considered a recommendation to buy or sell those securities. The views expressed herein (including any forward-looking statement) may not be relied upon as investment advice or as an indication of the Fund’s trading intent. Information included herein is not an indication of the Fund’s future portfolio composition.
Must be preceded or accompanied by a prospectus. It is not possible to invest directly in an index.
Cash flow is generally defined as the cash a company generates from its business operations, before capital or securities investments.
Free cash flow is generally defined as cash revenues less all normal operating expenses (including interest expense) and less an estimate of the capital spending necessary to maintain the business in its current state.
Book Value represents the accounting value remaining after a corporation’s liabilities are subtracted from its assets.
Intrinsic value is defined as the value that a rational and well-informed buyer would pay for the entire enterprise.
Tangible Book Value represents the accounting value remaining after a corporation’s liabilities are subtracted from its assets (but excluding the value of any intangible assets, such as goodwill).
Price-to-earnings ratio is a valuation ratio of a company’s current share price compared to its per-share earnings.
SNB is the Swiss National Bank.
BOE is the Bank of England.
BOJ is the Bank of Japan.
PBOC is the People’s Bank of China.
ECB is the European Central Bank.
FED is the Federal Reserve System.
GoodHaven Fund
The MSCI World Index is a broad global equity benchmark that represents large and mid-cap equity performance across 23 developed markets countries.
The S&P 500 Index is a capitalization weighted index of 500 large capitalization stocks which is designed to measure broad domestic securities markets.
The Wilshire 5000 Total Market Index (full-cap) measures the performance of all U.S. equity securities with readily available price data. Over 5,000 capitalization weighted security returns are used to adjust the index.
HFRI Fundamental Growth Index strategies employ analytical techniques in which the investment thesis is predicated on assessment of the valuation characteristics on the underlying companies which are expected to have prospects for earnings growth and capital appreciation exceeding those of the broader equity market. Investment theses are focused on characteristics of the firm’s financial statements in both an absolute sense and relative to other similar securities and more broadly, market indicators. Strategies employ investment processes designed to identify attractive opportunities in securities of companies which are experiencing or expected to experience abnormally high levels of growth compared with relevant benchmarks growth in earnings, profitability, sales or market share.
HFRI Fundamental Value Index strategies employ investment processes designed to identify attractive opportunities in securities of companies which trade a valuation metrics by which the manager determines them to be inexpensive and undervalued when compared with relevant benchmarks. Investment theses are focused on characteristics of the firm’s financial statements in both an absolute sense and relative to other similar securities and more broadly, market indicators. Relative to Fundamental Growth strategies, in which earnings growth and capital appreciation is expected as a function of expanding market share & revenue increases, Fundamental Value strategies typically focus on equities which currently generate high cash flow, but trade at discounted valuation multiples, possibly as a result of limited anticipated growth prospects or generally out of favor conditions, which may be specific to sector or specific holding.
CS Hedge Fund Index is an asset-weighted hedge fund index derived from the TASS database of more than 5000 funds. The index consists of funds with a minimum of US $10 million under management and a current audited financial statement. Funds are separated into primary subcategories based on investment style. The index in all cases represents at least 85% of the assets under management in the universe. The index is rebalanced monthly, and funds are reselected on a quarterly basis. Index NAVs are updated on the 15th of each month.
GoodHaven Fund
PORTFOLIO MANAGEMENT DISCUSSION AND ANALYSIS (Unaudited) |
The Net Asset Value (“NAV”) of the GoodHaven Fund was $22.55 at May 31, 2017 based on 10,418,911 shares outstanding. This compares to the Fund’s NAV of $21.63 at May 31, 2016, an NAV of $23.37 at November 30, 2016, and an NAV of $20.00 at inception on April 8, 2011. Although the Fund did not pay a taxable distribution of capital gains or income in 2016, shareholders should be aware that the Fund has paid capital gains and income distributions in prior years that reduced NAV by the amount of a distribution on the ex-dividend date. Please note that except where otherwise indicated, discussions in this MD&A relate to the period ended May 31, 2017. For the calendar six months ended June 30, 2017, the Fund’s performance was a loss of 4.00% compared to a gain of 9.34% for the S&P 500 Index and for six-months ended May 31, 2017 was a loss of 3.51% compared to a gain of 10.80% for the S&P 500 Index. Since inception on April 8, 2011 and through May 31, 2017, the Fund’s annualized performance is a gain of 3.68% compared to an increase of 12.56% for the S&P 500 Index. The Fund gained 3.01% annualized for the five year period ending May 31, 2017 compared to 15.40% for the S&P 500 Index. Please see the portfolio manager’s letter to shareholders for additional information regarding performance and comparisons to other indexes. All comparisons assume reinvested dividends.
After a strong calendar 2016 and a modestly positive first calendar quarter in 2017, the Fund’s performance lagged materially in the second calendar quarter of 2017, primarily due to a sharp decline in energy holdings in May and June. Please refer to the discussion in the Letter to Shareholders from the Fund’s portfolio managers for more details. The external environment continues to be challenging for active managers as enormous industry reallocations away from actively managed mutual funds and into passively managed index funds (including ETFs) have continued – in the short run reinforcing the performance of the largest members of the S&P 500 (as the index is capitalization-weighted) or certain other indexes. We note that many valuation indicators for the S&P appear highly elevated and have been associated with poor forward returns in the past when viewed over a ten-year timeframe. We continue to believe the industry may be approaching an inflection point (at least in the intermediate term) where that trend will slow or perhaps reverse. As with almost all trends on Wall Street, we suspect the intense desire for index products is rearward looking, has gone too far, and may lead to significant investor losses in index funds and certain ETFs in coming years.
GoodHaven Fund
PORTFOLIO MANAGEMENT DISCUSSION AND ANALYSIS (Unaudited) (Continued) |
The portfolio managers believe that short-term performance figures are less meaningful than a comparison of longer periods and that a long-term investment strategy should be properly judged over a period of years rather than weeks or months. Furthermore, the S&P 500 Index is an unmanaged index incurring no fees, expenses, or taxes and is shown solely for the purpose of comparing the Fund’s portfolio to an unmanaged and diversified index of large companies. Below is a table of the Fund’s top ten holdings and categories as of May 31, 2017.1
Top 10 Holdings* | | | % | | Top Categories** | | | % |
| Barrick Gold Corp. | | | 10.9 | % | | Cash and Equivalents | | | 28.9 | % |
| WPX Energy, Inc. | | | 9.3 | % | | Oil & Gas Exploration | | | | |
| Alphabet, Inc. *** | | | 6.1 | % | | & Production | | | 13.1 | % |
| Leucadia National Corp. | | | 5.0 | % | | Metals & Mining | | | 10.9 | % |
| Spectrum Brands | | | | | | Diversified Holding | | | | |
| Holdings, Inc. | | | 4.0 | % | | Companies | | | 8.3 | % |
| HP, Inc. | | | 4.0 | % | | Computers & Peripheral | | | | |
| Birchcliff Energy Ltd. | | | 3.7 | % | | Equipment | | | 6.3 | % |
| Federated Investors, Inc. – | | | | | | Computer & Internet Software | | | 6.1 | % |
| Class B | | | 3.3 | % | | Property/Casualty Insurance | | | 4.5 | % |
| Verizon Communications, Inc. | | | 3.2 | % | | Consumer Products | | | 4.0 | % |
| Berkshire Hathaway, Inc. – | | | | | | Financial Services | | | 3.3 | % |
| Class B | | | 2.8 | % | | Telecommunications | | | 3.2 | % |
| Total | | | 52.3 | % | | | | | 88.6 | % |
| * | | Top ten holdings excludes cash, money market funds and Government and Agency Obligations |
| ** | | Where applicable, includes money market funds and short-term Government and Agency Obligations |
| *** | | Issuer totals |
1 | | Fund holdings and/or sector allocations are subject to change at any time and are not recommendations to buy or sell any security. |
Although the Fund experienced strong performance in 2016, asset flows continue to be negative. We believe that most of the actively managed fund industry has continued to experience significant negative outflows in early 2017, primarily benefitting passive index funds and ETFs. In order to see significant net inflows resume into the Fund, management believes that the Fund must experience an extended period of better performance or investors must decide to rethink the desirability of pouring money into passive vehicles at near record levels of historic valuation.
Nevertheless, since inception of the Fund, there have been periods where there were large new shareholder subscriptions and periods with significant net withdrawals. We believe this is primarily caused by shareholders who are attracted by the potential for better performance in a concentrated value fund but which are negatively and emotionally affected by volatility in results – resulting in short-term behavior that tends to reduce returns among mutual fund investors. It may be interesting to note that neither of the portfolio managers of the Fund, whose shareholdings total in the millions of dollars, has ever sold shares of the Fund.
GoodHaven Fund
PORTFOLIO MANAGEMENT DISCUSSION AND ANALYSIS (Unaudited) (Continued) |
Material swings in shareholder subscriptions and redemptions can make management of the portfolio more difficult. During the most recent fiscal year, the portfolio managers were able to undertake actions to avoid creating taxable gains during 2016 without materially affecting portfolio values. As of the writing of this management discussion and while subject to change based on future portfolio decisions, we currently believe we will incur no taxable dividends in 2017. Prior to year-end, management will provide an estimate of any expected distributions as it has in prior years. The Fund’s investments are stated as of May 31, 2017, and the amounts and rankings of the Fund’s holdings today may vary significantly from the data disclosed above and the managers may have taken actions that would result in material changes to the portfolio.
The Fund’s investments having the most positive impact on portfolio performance for the annual period ended May 31, 2017 were Systemax, Alphabet, Inc., Barrick Gold Corp., Leucadia National Corp., HP Inc., and White Mountains Insurance Group. Systemax more than doubled in price as it was able to exit its money losing technology division, leaving its profitable industrial supplies business more visible. Alphabet climbed in response to strong earnings and a strong environment for technology shares, Barrick rose as gold prices strengthened through much of the period and operations continued to improve, Leucadia and HP Inc. both rose in response to stronger than expected earnings results and forward prospects, and White Mountains increased after it agreed to sell additional assets.
The Fund’s investments having the most negative impact on the portfolio for the annual period ended May 31, 2017 were WPX Energy, Walter Investment Management, Birchcliff Energy, Dundee Corporation, and Verizon Communications. Despite significant hedges and strong production growth profiles, WPX and Birchcliff both fell sharply in response to lower energy prices, Walter declined (primarily in the calendar year ended 2016) in response to weaker financial results than expected and we completely exited the position by the end of the second calendar quarter of 2017, Dundee fell in response to lower expectations for its energy and real estate investments as well as a weaker Canadian dollar and Verizon fell as competitors became promotional in the wireless phone business.
During the six-month calendar period ended June 30, 2017, the Fund initiated investments in American Airlines, Builders FirstSource, and New York REIT and disposed of its entire investments in Hewlett Packard Enterprise, Sears Holdings, Walter Investment Management, and Seritage Growth Properties. The Fund further materially reduced its investment in Alphabet and White Mountains. Some changes in other holdings may reflect adjustment relating to position sizing respective of fund flows and may not be reflective of a change in the thinking of the Fund’s portfolio managers regarding specific investments.
GoodHaven Fund
PORTFOLIO MANAGEMENT DISCUSSION AND ANALYSIS (Unaudited) (Continued) |
The managers of the Fund do not believe that a decline in a security price necessarily means that the security is a less attractive investment. The opposite may be the case in that price declines may represent significant investment opportunities. During the first six months of the year, the largest single factors affecting performance was a significant decline in energy prices and related companies, which we believe negatively affected performance by 7-8% of average capital. We note that our two largest energy holdings both have significant above-market hedges, as well as strong production growth profiles and management teams with a history of execution. But for now, these factors are being ignored amid inventories of oil that are perceived as too high. The Fund also owns a number of businesses with exposure to economies outside the United States. Generally we do not try to hedge such exposures, but note that changes in the value of non-U.S. currencies against the U.S. dollar can impact earnings, both positively and negatively in any give reporting period. The portfolio managers generally do not try to predict macroeconomic or market swings and prefer instead to try to react to what happens.
The Fund’s turnover rate, a measure of how frequently assets within a fund are bought and sold by the managers, remains at reasonably low levels and is consistent with the strategies, generally long-term in nature, of GoodHaven Capital Management, the Fund’s investment advisor. Turnover rates continue to be modestly influenced by the need to meet shareholder redemptions rather than a change in the portfolio strategy of the Fund. Based on public statistics with respect to most funds, turnover remains low. Importantly, there may be times when turnover rates rise, however, we do not anticipate rapid turnover of the portfolio under normal circumstances.
The portfolio managers believe that a significant liquidity position is an important part of portfolio management. After certain security sales in the first half of 2017 that exceeded the amount of new purchases, the Fund’s liquidity position is significant. We expect to be able, as we have in the past, to invest opportunistically given the cyclical nature of the stock market. Importantly, we note that many funds, notably index funds and ETFs, typically have little or no cash, and thus no cushion to meet redemptions or to behave opportunistically with respect to new purchases. Should money flow out of funds with de minimus cash reserves, they will be forced to sell securities, even potentially into a declining market.
Since inception, the Fund has continued to have significant liquidity available both in cash holdings as well as short-term fixed income investments. In order to ensure that we have sufficient resources to behave opportunistically, the Fund has sold or reduced certain investments and may hold some modest hedges from time to time. There is no guarantee that such hedges will protect against loss and the Fund may lose money should volatility be reduced in future months. In the last year, the Fund experienced modest losses as a result of hedge transactions. Over time, we expect the Fund’s level of cash to vary significantly and could be higher or lower than shown on the most recent Schedule of Investments.
GoodHaven Fund
PORTFOLIO MANAGEMENT DISCUSSION AND ANALYSIS (Unaudited) (Continued) |
As of the end of the fiscal year, the Fund is operating with a significant position in cash and equivalent investments. This position reflects high average equity valuations, the opportunity set we see, and other factors. Additionally, the continued rise in general stock prices has made bargains more difficult to find and slowed reinvestment, with some measures of valuation bumping up against historic highs. Thirdly, for a variety of factors, we believe that having a cash cushion at a time of generally elevated prices and investor ebullience is a strategic advantage. Although not obvious in results, cash has allowed us to meet redemptions in an efficient manner while mostly avoiding forced liquidation of investments.
It is our intention to invest a significant portion of current liquidity in an opportunistic manner when bargains meeting our investment criteria appear. However, it is possible that the Fund may have a significant cash position for an extended period of time if, in the opinion of the portfolio managers, market conditions are unfavorable. At times when liquidity is high, the Fund may underperform a strongly rising stock market. We believe this factor impacted the Fund’s relative performance in the first half of 2017.
Over time, management believes that there has been a significant negative effect on Fund performance from the impact of very large cash inflows via new subscriptions and very large cash outflows via shareholder redemptions (withdrawals) particularly during a time of strong index performance. We note that although the Fund had significant liquidity during the period from Inception in April 2011 through May of 2014 (including a sizeable amount related to a large cash influx due to new Fund share subscriptions), performance was still reasonable by relative and absolute standards over that time frame, though we believe large inflows reduced returns during a period when indexes performed strongly, such as in 2013. In the last calendar year, the Fund significantly outperformed most equity indexes, despite having significant liquidity during a period when indexes significantly appreciated. However, we believe extraordinary cash withdrawals negatively affected performance in 2014 and 2015 (and in 2016 on a relative basis). The portfolio managers’ letter to shareholders contains additional discussion about performance.
Generally, we do not expect significant realized capital gain or loss from any particular short-term, non-U.S. investments when viewed over an extended period. However, we own or have owned a number of equity investments domiciled outside of the U.S. or with significant non-U.S. revenues. A strong dollar typically results in currency translation losses and may serve to reduce reported earnings of companies with significant non-U.S. revenues when reported in dollar terms. Such reduced earnings could negatively affect those companies’ market prices, although we would expect such negative effects to be primarily a short-term phenomenon.
To reiterate our view on liquidity, the portfolio managers believe that a certain amount of liquidity may benefit shareholders in several ways – by preventing liquidation of securities to meet modest levels of redemptions, by providing
GoodHaven Fund
PORTFOLIO MANAGEMENT DISCUSSION AND ANALYSIS (Unaudited) (Continued) |
ammunition to purchase existing or new holdings in declining markets without being forced to sell existing holdings, and by lessening the chance that shareholders will blindly seek liquidations during periods of market stress that could adversely impact the Fund. That said, if bargains meeting our criteria seem plentiful, we are likely to have significantly less liquidity under such conditions than has been the case since inception.
The Fund is subject to certain risks as disclosed in the Prospectus and Statement of Additional Information, both of which may be obtained from the Fund’s website at www.goodhavenfunds.com or by calling 1-855-654-6639. Some of these risks include, but are not limited to, adverse market conditions that negatively affect the price of securities owned by the Fund, a high level of cash, which may result in underperformance during periods of robust price appreciation, adverse movements in foreign currency relationships as a number of the Fund’s holdings have earnings resulting from operations outside the United States, and the fact that the Fund is non-diversified, meaning that its holdings are more concentrated than a diversified Fund and that adverse price movements in a particular security may affect the Fund’s Net Asset Value more negatively than would occur in a more diversified fund.
As of May 31, 2017, the members, officers, and employees of GoodHaven Capital Management, LLC, the investment advisor to the GoodHaven Fund, owned approximately 259,941 shares of the Fund. The portfolio managers added to personal holdings during the fiscal year. It is management’s intention to disclose such holdings (in the aggregate) in this section of the Fund’s Annual and Semi-Annual reports on an ongoing basis.
GoodHaven Fund
SECTOR ALLOCATION at May 31, 2017 (Unaudited) |
| Sector | | % of Net Assets |
| | | | |
Cash & Equivalents1 | | | 28.9 | % |
| Oil & Gas Exploration & Production | | | 13.1 | % |
| Metals & Mining | | | 10.9 | % |
| Diversified Holding Companies | | | 8.3 | % |
| Computers & Peripheral Equipment | | | 6.3 | % |
| Computer & Internet Software | | | 6.1 | % |
| Property/Casualty Insurance | | | 4.5 | % |
| Consumer Products | | | 4.0 | % |
| Financial Services | | | 3.3 | % |
| Telecommunications | | | 3.2 | % |
| Air Transportation | | | 2.5 | % |
| Marine Services & Equipment | | | 2.3 | % |
| Guernsey Investment Fund | | | 2.2 | % |
| Retailing | | | 2.0 | % |
| General Building Materials | | | 1.2 | % |
| Real Estate Investment Trusts | | | 0.5 | % |
| Property Management | | | 0.4 | % |
| Loan Servicing | | | 0.2 | % |
| Miscellaneous | | | 0.1 | % |
| Total | | | 100.0 | % |
| | 1 | Represents cash and other assets in excess of liabilities. |
GoodHaven Fund
SCHEDULE OF INVESTMENTS at May 31, 2017 (Unaudited) |
| Shares | | COMMON STOCKS – 67.9% | | Value | |
| | | | | | |
| | | Air Transportation – 2.5% | | | |
| | 120,000 | | American Airlines Group, Inc. | | $ | 5,809,200 | |
| | | | | | | | |
| | | | Computer & Internet Software – 6.1% | | | | |
| | 3,200 | | Alphabet, Inc. – Class A1 | | | 3,158,688 | |
| | 11,500 | | Alphabet, Inc. – Class C1 | | | 11,095,890 | |
| | | | | | | 14,254,578 | |
| | | | | | | | |
| | | | Computers & Peripheral Equipment – 6.3% | | | | |
| | 498,400 | | HP, Inc. | | | 9,349,984 | |
| | 343,742 | | Systemax, Inc.2 | | | 5,475,810 | |
| | | | | | | 14,825,794 | |
| | | | Consumer Products – 4.0% | | | | |
| | 70,000 | | Spectrum Brands Holdings, Inc. | | | 9,411,500 | |
| | | | | | | | |
| | | | Diversified Holding Companies – 8.3% | | | | |
| | 39,200 | | Berkshire Hathaway, Inc. – Class B1 | | | 6,478,976 | |
| | 631,220 | | Dundee Corp.1,2 | | | 1,439,210 | |
| | 477,512 | | Leucadia National Corp. | | | 11,646,518 | |
| | | | | | | 19,564,704 | |
| | | | | | | | |
| | | | Financial Services – 3.3% | | | | |
| | 290,300 | | Federated Investors, Inc. – Class B | | | 7,710,368 | |
| | | | | | | | |
| | | | General Building Materials – 1.2% | | | | |
| | 200,000 | | Builders FirstSource, Inc.1 | | | 2,732,000 | |
| | | | | | | | |
| | | | Loan Servicing – 0.2% | | | | |
| | 510,285 | | Walter Investment Management Corp.1,3 | | | 540,902 | |
| | | | | | | | |
| | | | Marine Services & Equipment – 2.3% | | | | |
| | 376,694 | | Stolt-Nielsen Ltd.2 | | | 5,461,401 | |
| | | | | | | | |
| | | | Metals & Mining – 10.9% | | | | |
| | 1,547,150 | | Barrick Gold Corp. | | | 25,589,861 | |
| | | | | | | | |
| | | | Oil & Gas Exploration & Production – 13.1% | | | | |
| | 1,868,100 | | Birchcliff Energy Ltd. | | | 8,795,290 | |
| | 2,028,055 | | WPX Energy, Inc.1 | | | 21,943,555 | |
| | | | | | | 30,738,845 | |
The accompanying notes are an integral part of these financial statements.
GoodHaven Fund
SCHEDULE OF INVESTMENTS at May 31, 2017 (Unaudited) (Continued) |
| Shares | | COMMON STOCKS – 67.9% (Continued) | | Value | |
| | | | | | |
| | | Property/Casualty Insurance – 4.5% | | | |
| | 8,482 | | Alleghany Corp.1 | | $ | 4,981,818 | |
| | 6,532 | | White Mountains Insurance Group | | | 5,618,042 | |
| | | | | | | 10,599,860 | |
| | | | | | | | |
| | | | Retailing – 2.0% | | | | |
| | 525,000 | | Staples, Inc. | | | 4,767,000 | |
| | | | | | | | |
| | | | Telecommunications – 3.2% | | | | |
| | 160,000 | | Verizon Communications, Inc. | | | 7,462,400 | |
| | | | TOTAL COMMON STOCKS | | | | |
| | | | (Cost $131,904,062) | | | 159,468,413 | |
| | | | | | | | |
| | | | | | | | |
| | | | GUERNSEY INVESTMENT FUND – 2.2% | | | | |
| | 711,487 | | JZ Capital Partners Limited2 | | | 5,188,585 | |
| | | | TOTAL GUERNSEY INVESTMENT FUND | | | | |
| | | | (Cost $3,886,197) | | | 5,188,585 | |
| | | | | | | | |
| | | | | | | | |
| | | | REAL ESTATE INVESTMENT TRUSTS – 0.5% | | | | |
| | 150,000 | | New York REIT, Inc.1 | | | 1,288,500 | |
| | | | TOTAL REAL ESTATE INVESTMENT TRUSTS | | | | |
| | | | (Cost $1,293,359) | | | 1,288,500 | |
| | | | | | | | |
| | | | | | | |
| Principal | | | | | | |
| Amount | | CORPORATE BONDS – 0.4% | | | | |
| | | | | | | | |
| | | | Property Management – 0.4% | | | | |
| $ | 1,050,000 | | HomeFed Corp. 6.500% due 6/30/2018 | | | 1,056,563 | |
| | | | TOTAL CORPORATE BONDS | | | | |
| | | | (Cost $1,051,969) | | | 1,056,563 | |
The accompanying notes are an integral part of these financial statements.
GoodHaven Fund
SCHEDULE OF INVESTMENTS at May 31, 2017 (Unaudited) (Continued) |
| | MISCELLANEOUS SECURITIES – 0.1%1,4 | | Value | |
| | TOTAL MISCELLANEOUS SECURITIES | | | |
| | (Cost $705,853) | | $ | 186,750 | |
| | Total Investments | | | | |
| | (Cost $138,841,440) – 71.1% | | | 167,188,811 | |
| | Cash and Other Assets in | | | | |
| | Excess of Liabilities – 28.9% | | | 67,799,456 | |
| | TOTAL NET ASSETS – 100.0% | | $ | 234,988,267 | |
1 | Non-income producing security. |
2 | A portion of these securities are considered illiquid. As of May 31, 2017, the total value of illiquid securities was 7,723,580 or 3.3% of net assets. |
3 | Affiliated company as defined by the Investment Company Act of 1940. |
4 | Represents previously undisclosed securities which the Fund has held for less than one year. |
The accompanying notes are an integral part of these financial statements.
GoodHaven Fund
STATEMENT OF ASSETS AND LIABILITIES at May 31, 2017 (Unaudited) |
| ASSETS | |
| Investments in securities, at value | | | |
| (Cost $138,841,440) (Note 2) | | $ | 167,188,811 | |
| Cash | | | 72,791,559 | |
| Receivables: | | | | |
| Fund shares sold | | | 96,674 | |
| Investment securities sold | | | 299,166 | |
| Dividends and interest | | | 98,048 | |
| Total assets | | | 240,474,258 | |
| | | | | |
| LIABILITIES | |
| Payables: | | | | |
| Investment securities purchased | | | 4,083,900 | |
| Fund shares redeemed | | | 1,182,294 | |
| Management fees | | | 179,834 | |
| Support services fees | | | 39,963 | |
| Total liabilities | | | 5,485,991 | |
| | | | | |
| NET ASSETS | | $ | 234,988,267 | |
| | | | | |
| COMPONENTS OF NET ASSETS | |
| Paid-in capital | | $ | 235,051,377 | |
| Accumulated net investment loss | | | (1,316,192 | ) |
| Accumulated net realized loss on investments | | | (27,094,289 | ) |
| Net unrealized appreciation on: | | | | |
| Investments | | | 28,347,371 | |
| Net assets | | $ | 234,988,267 | |
| | | | | |
| Net Asset Value (unlimited shares authorized): | | | | |
| Net assets | | $ | 234,988,267 | |
| Shares of beneficial interest issued and outstanding | | | 10,418,911 | |
| Net asset value, offering and redemption price per share | | $ | 22.55 | |
The accompanying notes are an integral part of these financial statements.
GoodHaven Fund
STATEMENT OF OPERATIONS For the Six Months Ended May 31, 2017 (Unaudited) |
| INVESTMENT INCOME | |
| Dividends from unaffiliated securities | | | |
| (net of $8,844 in foreign withholding taxes) | | $ | 1,239,246 | |
| Interest | | | 4,036 | |
| Total investment income | | | 1,243,282 | |
| | | | | |
| EXPENSES | |
| Management fees | | | 1,163,603 | |
| Support services fees | | | 258,578 | |
| Total expenses | | | 1,422,181 | |
| Net investment loss | | | (178,899 | ) |
| | | | | |
| REALIZED AND UNREALIZED GAIN (LOSS) ON INVESTMENTS, | |
| OPTIONS WRITTEN & FOREIGN CURRENCY | |
| Net realized gain (loss) on transactions from: | | | | |
| Unaffiliated investments & foreign currency | | | (1,184,767 | ) |
| Affiliated investments | | | (24,140,603 | ) |
| Options written | | | 114,199 | |
| Net realized loss | | | (25,211,171 | ) |
| Net change in unrealized appreciation/depreciation on: | | | | |
| Investments | | | 16,407,650 | |
| Options written | | | 40,801 | |
| Net unrealized appreciation/depreciation | | | 16,448,451 | |
| Net realized and unrealized loss | | | (8,762,720 | ) |
| Net decrease in net assets resulting from operations | | $ | (8,941,619 | ) |
The accompanying notes are an integral part of these financial statements.
GoodHaven Fund
| STATEMENTS OF CHANGES IN NET ASSETS |
| | | Six Months Ended | | | | |
| | | May 31, 2017 | | | Year Ended | |
| | | (Unaudited) | | | November 30, 2016 | |
| INCREASE (DECREASE) IN NET ASSETS FROM: | |
| | |
| OPERATIONS | |
| Net investment income (loss) | | $ | (178,899 | ) | | $ | 183,859 | |
| Net realized loss on unaffiliated | | | | | | | | |
| investments, affiliated investments, | | | | | | | | |
| options written & foreign currency | | | (25,211,171 | ) | | | (617,573 | ) |
| Change in unrealized appreciation/ | | | | | | | | |
| depreciation on investments, options | | | | | | | | |
| written & foreign currency | | | 16,448,451 | | | | 35,187,313 | |
| Net increase (decrease) in net assets | | | | | | | | |
| resulting from operations | | | (8,941,619 | ) | | | 34,753,599 | |
| | | | | | | | | |
| CAPITAL SHARE TRANSACTIONS | |
| Net decrease in net assets derived from | | | | | | | | |
net change in outstanding shares1 | | | (27,709,776 | ) | | | (30,963,999 | ) |
| Total increase (decrease) in net assets | | | (36,651,395 | ) | | | 3,789,600 | |
| | | | | | | | | |
| NET ASSETS | |
| Beginning of period/year | | | 271,639,662 | | | | 267,850,062 | |
| End of period/year | | $ | 234,988,267 | | | $ | 271,639,662 | |
| Accumulated net investment loss | | $ | (1,316,192 | ) | | $ | (1,137,293 | ) |
1 | Summary of capital share transactions is as follows: |
| | | | Six Months Ended | | | Year Ended | |
| | | | May 31, 2017 (Unaudited) | | | November 30, 2016 | |
| | | | Shares | | | Value | | | Shares | | | Value | |
| | Shares sold | | | 1,127,091 | | | $ | 26,069,472 | | | | 2,248,759 | | | $ | 44,719,478 | |
| | Shares redeemed2 | | | (2,331,280 | ) | | | (53,779,248 | ) | | | (3,678,675 | ) | | | (75,683,477 | ) |
| | Net decrease | | | (1,204,189 | ) | | $ | (27,709,776 | ) | | | (1,429,916 | ) | | $ | (30,963,999 | ) |
2 | Net of redemption fees of $4,555 and $8,723, respectively. |
The accompanying notes are an integral part of these financial statements.
GoodHaven Fund
FINANCIAL HIGHLIGHTS For a capital share outstanding throughout each period/year |
| | | Six Months | | | | | | | | | | | | | | | | |
| | | Ended | | | | | | | | | | | | | | | | |
| | | May 31, | | | | | | | | | | | | | | | | |
| | | 2017 | | | Year Ended November 30, | |
| | | (Unaudited) | | | 2016 | | | 2015 | | | 2014 | | | 2013 | | | 2012 | |
| Net asset value at | | | | | | | | | | | | | | | | | | |
| beginning of period/year | | $ | 23.37 | | | $ | 20.52 | | | $ | 26.77 | | | $ | 28.26 | | | $ | 24.00 | | | $ | 20.52 | |
| | | | | | | | | | | | | | | | | | | | | | | | | |
| INCOME FROM INVESTMENT OPERATIONS | |
Net investment income (loss)1 | | | (0.02 | ) | | | 0.02 | | | | 0.01 | | | | (0.03 | ) | | | 0.02 | | | | 0.21 | |
| Net realized and unrealized | | | | | | | | | | | | | | | | | | | | | | | | |
| gain (loss) on investments | | | (0.80 | ) | | | 2.83 | | | | (4.40 | ) | | | (1.16 | ) | | | 4.65 | | | | 3.29 | |
| Total from | | | | | | | | | | | | | | | | | | | | | | | | |
| investment operations | | | (0.82 | ) | | | 2.85 | | | | (4.39 | ) | | | (1.19 | ) | | | 4.67 | | | | 3.50 | |
| | | | | | | | | | | | | | | | | | | | | | | | | |
| LESS DISTRIBUTIONS | |
| From net investment income | | | — | | | | — | | | | — | | | | — | | | | (0.32 | ) | | | (0.01 | ) |
| From net realized gain | | | — | | | | — | | | | (1.87 | ) | | | (0.30 | ) | | | (0.09 | ) | | | (0.01 | ) |
| Total distributions | | | — | | | | — | | | | (1.87 | ) | | | (0.30 | ) | | | (0.41 | ) | | | (0.02 | ) |
| Paid-in capital from | | | | | | | | | | | | | | | | | | | | | | | | |
| redemption fees | | $ | 0.00 | 2 | | $ | 0.00 | 2 | | $ | 0.01 | | | $ | 0.00 | 2 | | $ | 0.00 | 2 | | $ | 0.00 | 2 |
| | | | | | | | | | | | | | | | | | | | | | | | | |
| Net asset value, | | | | | | | | | | | | | | | | | | | | | | | | |
| end of period/year | | $ | 22.55 | | | $ | 23.37 | | | $ | 20.52 | | | $ | 26.77 | | | $ | 28.26 | | | $ | 24.00 | |
| | | | | | | | | | | | | | | | | | | | | | | | | |
| Total return | | | (3.51 | )%3 | | | 13.89 | % | | | (17.49 | )% | | | (4.26 | )% | | | 19.74 | % | | | 17.08 | % |
| | | | | | | | | | | | | | | | | | | | | | | | | |
| RATIOS/SUPPLEMENTAL DATA | |
| Net assets at end of | | | | | | | | | | | | | | | | | | | | | | | | |
| period/year (millions) | | $ | 235.0 | | | $ | 271.6 | | | $ | 267.9 | | | $ | 443.7 | | | $ | 553.5 | | | $ | 223.7 | |
| Portfolio turnover rate | | | 7 | %3 | | | 8 | % | | | 18 | % | | | 37 | % | | | 12 | % | | | 11 | % |
| | | | | | | | | | | | | | | | | | | | | | | | | |
| Ratio of expenses to | | | | | | | | | | | | | | | | | | | | | | | | |
| average net assets | | | 1.10 | %4 | | | 1.10 | % | | | 1.10 | % | | | 1.10 | % | | | 1.10 | % | | | 1.10 | % |
| Ratio of net investment | | | | | | | | | | | | | | | | | | | | | | | | |
| income (loss) to average | | | | | | | | | | | | | | | | | | | | | | | | |
| net assets | | | (0.14 | )%4 | | | 0.07 | % | | | 0.06 | % | | | (0.11 | )% | | | 0.08 | % | | | 0.92 | % |
1 | Calculated using the average shares outstanding method. |
2 | Amount does not round to $0.01 per share. |
3 | Not annualized. |
4 | Annualized. |
The accompanying notes are an integral part of these financial statements.
GoodHaven Fund
NOTES TO FINANCIAL STATEMENTS May 31, 2017 (Unaudited) |
The GoodHaven Funds Trust (the “Trust”) is registered under the Investment Company Act of 1940, as amended (the “1940 Act”) as a non-diversified, open-end management investment company. The Fund is an investment company and accordingly follows the investment company accounting and reporting guidance of the Financial Accounting Standards Board (“FASB”) Accounting Standard Codification Topic 946 “Financial Services – Investment Companies.” The Fund commenced operations on April 8, 2011.
The Fund’s investment objective is to seek long-term growth of capital.
| NOTE 2 – SIGNIFICANT ACCOUNTING POLICIES |
The following is a summary of significant accounting policies consistently followed by the Fund. These policies are in conformity with accounting principles generally accepted in the United States of America (“U.S. GAAP”).
| | A. | Security Valuation. All equity securities, which may include Real Estate Investment Trusts (“REIT’s”), Business Development Companies (“BDC’s”) and Master Limited Partnerships (“MLP’s”), that are traded on U.S. national or foreign securities exchanges are valued at the last reported sale price on the exchange on which the security is principally traded or the exchange’s official closing price, if applicable. If, on a particular day, an exchange-traded security does not trade, then the mean between the most recent quoted bid and asked prices will be used. All equity securities, which may include REIT’s, BDC’s and MLP’s, that are not traded on a listed exchange are valued at the last sale price in the over-the-counter market. If a non-exchange traded security does not trade on a particular day, then the mean between the last quoted closing bid and asked price will be used. |
| | | |
| | | Debt securities are valued by using the evaluated mean price supplied by an approved independent pricing service. The independent pricing service may use various valuation methodologies, including matrix pricing and other analytical pricing models as well as market transactions and dealer quotations. These models generally consider such factors as yields or prices of bonds of comparable quality, type of issue, coupon, maturity, ratings and general market conditions. In the absence of a price from a pricing service, securities are valued at their respective fair values in accordance with policies approved by the Valuation Committee of the Trust. |
| | | |
| | | Exchange traded options are valued at the composite price, using the National Best Bid and Offer quotes (“NBBO”). NBBO consists of the highest bid price and lowest ask price across any of the exchanges on which an option is quoted, thus providing a view across the entire U.S. options |
GoodHaven Fund
NOTES TO FINANCIAL STATEMENTS May 31, 2017 (Unaudited) (Continued) |
| | | marketplace. Composite option pricing calculates the mean of the highest bid price and lowest ask price across the exchanges where the option is traded. |
| | | |
| | | Securities for which quotations are not readily available are valued at their respective fair values as determined in accordance with policies approved by the Valuation Committee of the Trust. When a security is “fair valued,” consideration is given to the facts and circumstances relevant to the particular situation, including a review of various factors set forth in the pricing procedures adopted by the Board of Trustees. Fair value pricing is an inherently subjective process, and no single standard exists for determining fair value. Different funds could reasonably arrive at different values for the same security. The use of fair value pricing by a fund may cause the net asset value of its shares to differ significantly from the net asset value that would be calculated without regard to such considerations. |
| | | |
| | | As described above, the Fund utilizes various methods to measure the fair value of its investments on a recurring basis. U.S. GAAP establishes a hierarchy that prioritizes inputs to valuation methods. The three levels of inputs are: |
| | | Level 1 – | Unadjusted quoted prices in active markets for identical assets or liabilities that the Fund has the ability to access. |
| | | | |
| | | Level 2 – | Observable inputs other than quoted prices included in Level 1 that are observable for the asset or liability, either directly or indirectly. These inputs may include quoted prices for the identical instrument on an inactive market, prices for similar instruments, interest rates, prepayment speeds, credit risk, yield curves, default rates and similar data. |
| | | | |
| | | Level 3 – | Unobservable inputs for the asset or liability, to the extent relevant observable inputs are not available, representing the Fund’s own assumptions about the assumptions a market participant would use in valuing the asset or liability, and would be based on the best information available. |
| | | The availability of observable inputs can vary from security to security and is affected by a wide variety of factors, including, for example, the type of security, whether the security is new and not yet established in the marketplace, the liquidity of markets, and other characteristics particular to the security. To the extent that valuation is based on models or inputs that are less observable or unobservable in the market, the determination of fair value requires more judgment. Accordingly, the degree of judgment exercised in determining fair value is greatest for instruments categorized in Level 3. |
GoodHaven Fund
NOTES TO FINANCIAL STATEMENTS May 31, 2017 (Unaudited) (Continued) |
| | | The inputs used to measure fair value may fall into different levels of the fair value hierarchy. In such cases, for disclosure purposes, the level in the fair value hierarchy within which the fair value measurement falls in its entirety, is determined based on the lowest level input that is significant to the fair value measurement in its entirety. |
| | | |
| | | The following is a summary of the inputs used to value the Fund’s investments as of May 31, 2017. See the Schedule of Investments for the industry breakouts. |
| | | | | Level 1 | | | Level 2 | | | Level 3 | | | Total | |
| | | Common Stocks | | $ | 159,468,413 | | | $ | — | | | $ | — | | | $ | 159,468,413 | |
| | | Guernsey | | | | | | | | | | | | | | | | |
| | | Investment Fund | | | 5,188,585 | | | | — | | | | — | | | | 5,188,585 | |
| | | Real Estate | | | | | | | | | | | | | | | | |
| | | Investment Trusts | | | 1,288,500 | | | | — | | | | — | | | | 1,288,500 | |
| | | Corporate Bonds | | | — | | | | 1,056,563 | | | | — | | | | 1,056,563 | |
| | | Miscellaneous | | | | | | | | | | | | | | | | |
| | | Securities | | | — | | | | 186,750 | | | | — | | | | 186,750 | |
| | | Total Investments | | $ | 165,945,498 | | | $ | 1,243,313 | | | $ | — | | | $ | 167,188,811 | |
| | | It is the Fund’s policy to recognize transfers between levels at the end of the Fund’s reporting period. |
| | | |
| | | There were no transfers into or out of Level 1 or 2 during the period ended May 31, 2017. |
| | | |
| | | The Fund has adopted financial reporting rules and regulations that require enhanced disclosure regarding derivatives and hedging activity intending to improve financial reporting of derivative instruments by enabling investors to understand how and why an entity uses derivatives, how derivatives are accounted for, and how derivative instruments affect an entity’s results of operations and financial position. |
| | | |
| | | The Fund may invest, at the time of purchase, up to 10% of the Fund’s net assets in options, which are a type of derivative and employ specialized trading techniques such as options trading to increase the Fund’s exposure to certain selected securities. The Fund may employ these techniques as hedging tools as well as speculatively to enhance returns. Other than when used for hedging, these techniques may be riskier than many investment strategies and may result in greater volatility for the Fund, particularly in periods of market declines. As a hedging tool, options may help cushion the impact of market declines, but may reduce the Fund’s participation in a market advance. |
GoodHaven Fund
NOTES TO FINANCIAL STATEMENTS May 31, 2017 (Unaudited) (Continued) |
| | | Balance Sheet |
| | | |
| | | Fair values of derivative instruments as of May 31, 2017: |
| | | | Asset Derivatives as of | | Liability Derivatives as of | |
| | | | May 31, 2017 | | May 31, 2017 | |
| | | Derivative | Balance Sheet | | Fair | | Balance Sheet | | Fair | |
| | | Instruments | Location | | Value | | Location | | Value | |
| | | Equity Contracts: | | | | | | | | |
| | | Put Options | Investments in | | | | | | | |
| | | Purchased | securities, at value | | $ | 186,750 | | None | | $ | — | |
| | | Total | | | $ | 186,750 | | | | $ | — | |
| | | Statement of Operations |
| | | |
| | | The effect of derivative instruments on the Statement of Operations for the six months ended May 31, 2017: |
| | | | | | | Change in | |
| | Location of | | Realized | | | Unrealized | |
| | Gain (Loss) | | Gain (Loss) | | | Appreciation/ | |
| | on Derivatives | | on Derivatives | | | Depreciation | |
| Derivative | Recognized | | Recognized | | | on Derivatives | |
Instruments | in Income | | in Income | | | in Income | |
| Equity Contracts: | | | | | | | |
| Options Written | Realized and Unrealized | | | | | | |
| | Gain (Loss) on Investments, | | | | | | |
| | Options Written | | | | | | |
| | & Foreign Currency | | $ | 114,199 | | | $ | 40,801 | |
| | | | | | | | | | |
| Put Options | Realized and Unrealized | | | | | | | | |
| Purchased | Gain (Loss) on Investments | | | | | | | | |
| | & Foreign Currency | | $ | (1,211,349 | ) | | $ | (96,193 | ) |
| | B. | Foreign Currency. Foreign currency amounts, other than the cost of investments, are translated into U.S. dollar values based upon the spot exchange rate prior to the close of regular trading. The cost of investments is translated at the rates of exchange prevailing on the dates the portfolio securities were acquired. The Fund includes foreign exchange gains and losses from dividends receivable and other foreign currency denominated payables and receivables in realized and unrealized gain (loss) on investments and foreign currency. The Fund does not isolate that portion of realized gain (loss) or unrealized gain (loss) on investments resulting from changes in foreign exchange rates on investments from fluctuations arising from changes in the market price of securities for financial reporting purposes. Fluctuations in foreign exchange rates on investments are thus included with net realized gain (loss) on investments and foreign currency and with net unrealized gain (loss) on investments and foreign currency. |
GoodHaven Fund
NOTES TO FINANCIAL STATEMENTS May 31, 2017 (Unaudited) (Continued) |
| | C. | Federal Income Taxes. The Fund has elected to be taxed as a “regulated investment company” and intends to distribute substantially all taxable income to its shareholders and otherwise comply with the provisions of the Internal Revenue Code applicable to regulated investment companies. Therefore, no provision for federal income taxes or excise taxes has been made. |
| | | |
| | | In order to avoid imposition of the excise tax applicable to regulated investment companies, the Fund intends to declare each year as dividends in each calendar year at least 98.0% of its net investment income (earned during the calendar year) and at least 98.2% of its net realized capital gains (earned during the twelve months ended November 30) plus undistributed amounts, if any, from prior years. |
| | | |
| | | Net capital losses incurred after November 30, and within the taxable year are deemed to arise on the first business day of the Fund’s next taxable year. As of November 30, 2016, the Fund had $(473,070) in late year losses. For the year ended November 30, 2016, the Fund had short-term capital loss carryovers of $(1,006,355), with unlimited expiration. |
| | | |
| | | As of May 31, 2017, the Fund did not have any tax positions that did not meet the “more likely-than-not” threshold of being sustained by the applicable tax authority. Generally, tax authorities can examine all the tax returns filed for the last three years. The Fund identifies their major tax jurisdictions as U.S. Federal, State of Delaware and the Commonwealth of Massachusetts (as a series of Professionally Managed Portfolios). As of May 31, 2017, the Fund was not aware of any tax positions for which it is reasonably possible that the total amounts of unrecognized tax benefits will change materially. |
| | | |
| | D. | Security Transactions and Investment Income. Investment securities transactions are accounted for on the trade date. Gains and losses realized on sales of securities are determined on a specific identification basis. Discounts/premiums on debt securities purchased are accreted/amortized over the life of the respective securities using the effective interest method. Dividend income is recorded on the ex-dividend date. Dividends from REIT’s generally are comprised of income, capital gains and may include return of capital. Interest income is recorded on an accrual basis. Withholding taxes on foreign dividends have been provided for in accordance with the Trust’s understanding of the applicable country’s tax rules and rates. |
| | | |
| | E. | Distributions to Shareholders. Distributions to shareholders from net investment income and net realized gains for the Fund normally are declared and paid on an annual basis. Distributions are recorded on the ex- dividend date. |
GoodHaven Fund
NOTES TO FINANCIAL STATEMENTS May 31, 2017 (Unaudited) (Continued) |
| | F. | Use of Estimates. The preparation of financial statements in conformity with U.S. GAAP requires management to make estimates and assumptions that affect the reported amounts of assets and liabilities at the date of the financial statements, as well as the reported amounts of revenues and expenses during the period. Actual results could differ from those estimates. |
| | | |
| | G. | Share Valuation. The net asset value (“NAV”) per share of the Fund is calculated by dividing the sum of the value of the securities held by the Fund, plus cash and other assets, minus all liabilities by the total number of shares outstanding for the Fund, rounded to the nearest cent. The Fund’s shares will not be priced on the days on which the New York Stock Exchange is closed for trading. The offering and redemption price per share for the Fund is equal to the Fund’s net asset value per share. The Fund charges a 2.00% redemption fee on shares held less than 60 days. This fee is deducted from the redemption proceeds otherwise payable to the shareholder. The Fund will retain the fee charged as paid-in capital and such fees become part of that Fund’s daily NAV calculation. |
| | | |
| | H. | Guarantees and Indemnifications. In the normal course of business, the Fund enters into contracts with service providers that contain general indemnification clauses. The Fund’s maximum exposure under these arrangements is unknown as this would involve future claims that may be made against the Fund that have not yet occurred. However, based on experience, the Fund expects the risk of loss to be remote. |
| | | |
| | I. | Options Contracts. When the Fund purchases an option, an amount equal to the premium paid by the Fund is recorded as an investment and is subsequently adjusted to the current value of the option purchased. If an option expires on the stipulated expiration date or if the Fund enters into a closing sale transaction, a gain or loss is realized. If a call option is exercised, the cost of the security acquired is increased by the premium paid for the call. If a put option is exercised, a gain or loss is realized from the sale of the underlying security, and the proceeds from such sale are decreased by the premium originally paid. Written and purchased options are non-income producing securities. |
| | | |
| | | When the Fund writes an option, an amount equal to the premium received by the Fund is recorded as a liability and is subsequently adjusted to the current fair value of the option written. Premiums received from writing options that expire unexercised are treated by the Fund on the expiration date as realized gains from investments. The difference between the premium and the amount paid on effecting a closing purchase transaction, including brokerage commissions, is also treated as a realized gain, or, if the premium is less that the amount paid for the closing purchase transaction, as a realized loss. If a call option is exercised, the premium is added to the |
GoodHaven Fund
NOTES TO FINANCIAL STATEMENTS May 31, 2017 (Unaudited) (Continued) |
| | | proceeds from the sale of the underlying security or currency in determining whether the Fund has realized a gain or loss. If a put option is exercised, the premium reduces the cost basis of the securities purchased by the Fund. The Fund as writer of an option bears the market risk of an unfavorable change in the price of the security underlying the written option. |
| | | |
| | | The following table indicates the average volume for the six months ended May 31, 2017: |
| | Average market value of: | |
| | Options written | | $ | (11,387 | ) |
| | Options purchased | | $ | 235,221 | |
| | | The activity in options written during the six months ended May 31, 2017, is as follows: |
| | | | | Amount of | | | Number of | |
| | | | | Premiums | | | Contracts | |
| | | Outstanding at 11/30/16 | | $ | 114,199 | | | | 1,000 | |
| | | Options expired | | | (114,199 | ) | | | (1,000 | ) |
| | | Outstanding at 5/31/17 | | $ | — | | | | — | |
| | J. | Subsequent Events. In preparing these financial statements, the Fund has evaluated events and transactions for potential recognition or disclosure through the date the financial statements were issued. The Fund has determined that there were no subsequent events that would need to be disclosed in the Fund’s financial statements. |
| NOTE 3 – COMMITMENTS AND OTHER RELATED PARTY TRANSACTIONS |
GoodHaven Capital Management, LLC (the “Advisor”) provides the Fund with investment management services under an Investment Advisory Agreement (the “Advisory Agreement”). Under the Agreement, the Advisor provides all investment advice, office space and certain administrative services, and most of the personnel needed by the Fund. Under the Advisory Agreement, the Advisor is entitled to receive a monthly management fee calculated daily and payable monthly equal to 0.90% of the Fund’s average daily net assets. The amount of Management fees incurred by the Fund for the six months ended May 31, 2017, is disclosed in the Statement of Operations.
The Fund has also entered into a Support Services Agreement (the “Support Agreement”) with the Advisor. Under this agreement, the Advisor is responsible for paying all of the Fund’s other normal day-to-day operational expenses, such as administrative, custody, transfer agency, fund accounting, legal and audit. The support services fee does not cover the following other expenses: (a) any charges associated with the execution of portfolio transactions, such as brokerage
GoodHaven Fund
NOTES TO FINANCIAL STATEMENTS May 31, 2017 (Unaudited) (Continued) |
commissions, transaction charges or other transaction-related expenses (such as stamp taxes), (b) taxes, acquired fund fees and expenses, if any, imposed on the Fund, (c) interest, if any, on any Fund borrowings, or (d) extraordinary Fund legal expenses incurred outside of the normal operation of the Fund, such as legal fees, arbitration fees, or related expenses in connection with any actual or threatened arbitration, mediation, or litigation. Under the Support Agreement, the Advisor is entitled to receive a monthly fee calculated daily and payable monthly equal to 0.20% of the Fund’s average daily net assets. The amount of support services fees incurred by the Fund for the six months ended May 31, 2017, is disclosed in the Statement of Operations.
U.S. Bancorp Fund Services, LLC (“USBFS”), an indirect wholly-owned subsidiary of U.S. Bancorp, serves as the Fund’s administrator, fund accountant and transfer agent. In those capacities USBFS maintains the Fund’s books and records, calculates the Fund’s NAV, prepares various federal and state regulatory filings, coordinates payment of fund expenses, prepares expense accruals and prepares materials supplied to the Board of Trustees.
Quasar Distributors, LLC (the “Distributor”) acts as the Fund’s principal underwriter in a continuous public offering of the Fund’s shares. U.S. Bank NA (the “Custodian”) serves as custodian to the Fund.
| NOTE 4 – PURCHASES AND SALES OF SECURITIES |
Investment transactions (excluding short-term investments) for the six months ended May 31, 2017 were as follows:
| Purchases | Sales or Maturity |
at Cost | Proceeds |
| $14,283,477 | $50,630,199 |
There were no purchases or sales of long-term U.S. Government securities for the period ended May 31, 2017.
| NOTE 5 – DISTRIBUTIONS TO SHAREHOLDERS |
There were no distributions paid during the six months ended May 31, 2017, or the year ended November 30, 2016.
GoodHaven Fund
NOTES TO FINANCIAL STATEMENTS May 31, 2017 (Unaudited) (Continued) |
As of November 30, 2016, the components of distributable earnings on a tax basis were as follows:
| | Cost of investments | | $ | 200,384,010 | |
| | Gross tax unrealized appreciation | | | 64,619,169 | |
| | Gross tax unrealized depreciation | | | (53,717,049 | ) |
| | Net tax unrealized appreciation | | | 10,902,120 | |
| | Unrealized currency appreciation | | | — | |
| | Undistributed ordinary income | | | — | |
| | Undistributed long-term capital gain | | | — | |
| | Total distributable earnings | | | — | |
| | Other accumulated loss | | | (2,023,611 | ) |
| | Total accumulated earnings | | $ | 8,878,509 | |
The difference between book basis and tax basis unrealized appreciation was primarily attributable to wash sale adjustments and Passive Foreign Investment Companies. The difference between components of distributable earnings on a tax basis and the amounts reflected in the Statements of Assets and Liabilities are primarily due to the tax treatment of Passive Foreign Investment Companies held by the Fund.
| NOTE 6 – INVESTMENTS IN AFFILIATES |
Affiliated companies, as defined in Section 2(a)(3) of the 1940 Act, are companies 5% or more of whose outstanding voting shares are held by the Fund and the Advisor. As of May 31, 2017, the Fund did not hold securities of affiliated companies. For the six months ended May 31, 2017, the Fund had the following transactions in the shares of affiliated companies:
| | | Share | | | | | | | | | Share | | | | | | | | | | | | | |
| | | Balance | | | | | | | | | Balance | | | Realized | | | | | | Value | | | | |
| | | Nov. 30, | | | | | | | | | May 31, | | | Gain | | | Dividend | | | May 31, | | | Acquisition | |
Issuer | | 2016 | | | Purchases | | | Sales | | | 2017 | | | (Loss) | | | Income | | | 2017 | | | Cost | |
| Walter | | | | | | | | | | | | | | | | | | | | | | | | |
| Investment | | | | | | | | | | | | | | | | | | | | | | | | |
| Management | | | | | | | | | | | | | | | | | | | | | | | | |
| Corp.* | | | 1,613,429 | | | | — | | | | 1,103,144 | | | | 510,285 | | | $ | (24,140,603 | ) | | $ | — | | | $ | 540,902 | | | $ | 7,313,382 | |
| Total | | | | | | | | | | | | | | | | | | $ | (24,140,603 | ) | | $ | — | | | $ | 540,902 | | | $ | 7,313,382 | |
* This security was considered an affiliate during the period.
GoodHaven Fund
EXPENSE EXAMPLE For the Six Months Ended May 31, 2017 (Unaudited) |
As a shareholder of the Fund you incur two types of costs: (1) transaction costs, including redemption fees and (2) ongoing costs, including management fees and support service fees. This example is intended to help you understand your ongoing costs (in dollars) of investing in the Fund and to compare these costs with the ongoing costs of investing in other mutual funds. The example is based on an investment of $1,000 invested at the beginning of the period and held for the entire period (December 1, 2016 – May 31, 2017).
Actual Expenses
The first line of the table provides information about actual account values based on actual returns and actual expenses. Although the Fund charges no sales load or other transaction fees, you will be assessed fees for outgoing wire transfers, returned checks and stop payment orders at prevailing rates charged by U.S. Bancorp Fund Services, LLC, the Fund’s transfer agent. If you request that a redemption be made by wire transfer, currently, the Fund’s transfer agent charges a $15.00 fee. You will be charged a redemption fee equal to 2.00% of the net amount of the redemption if you redeem shares that have been held for less than 60 days. Individual Retirement Accounts will be charged a $15.00 annual maintenance fee. To the extent the Fund invests in shares of other investment companies as part of its investment strategy, you will indirectly bear your proportionate share of any fees and expenses charged by the underlying funds in which the Fund invests in addition to the expenses of the Fund. Actual expenses of the underlying funds may vary. These expenses are not included in the example. The example includes, but is not limited to, management fees and support services. However, the example does not include portfolio trading commissions and related expenses. You may use the information in this line, together with the amount you invested, to estimate the expenses that you paid over the period. Simply divide your account value by $1,000 (for example, an $8,600 account value divided by $1,000 = 8.6). Then, multiply the result by the number in the first line under the heading entitled “Expenses Paid During the Period” to estimate the expenses you paid on your account during this period.
Hypothetical Example for Comparison Purposes
The second line of the table provides information about hypothetical account values based on a hypothetical return and hypothetical expenses based on the Fund’s actual expense ratio and an assumed rate of return of 5% per year before expenses, which is not the Fund’s actual return. The hypothetical account values and expenses may not be used to estimate the actual ending account balance or expenses you paid for the period. You may use this information to compare the ongoing costs of investing in the Fund and other funds. To do so, compare this 5% hypothetical example with the 5% hypothetical examples that appear in the shareholder reports of the other funds. Please note that the expenses shown in the table are meant to highlight your ongoing costs only and do not reflect any
GoodHaven Fund
EXPENSE EXAMPLE For the Six Months Ended May 31, 2017 (Unaudited) (Continued) |
transactional costs, such as redemption fees. Therefore, the second line of the table is useful in comparing ongoing costs only and will not help you determine the relative total costs of owning different funds. If these transactional costs were included, your costs would have been higher.
| | | | Expenses Paid |
| | Beginning | Ending | During the Period |
| | Account Value | Account Value | December 1, 2016 – |
| | December 1, 2016 | May 31, 2017 | May 31, 20171 |
| Actual | $1,000.00 | $ 964.90 | $5.39 |
| Hypothetical | | | |
| (5% annual return | | | |
| before expenses) | $1,000.00 | $1,019.45 | $5.54 |
1 | The calculations are based on expenses incurred during the most recent six month period. The annualized six month expense ratio for the Fund during that period was 1.10%. The dollar amounts shown as expenses paid during the period are equal to the annualized six month expense ratio multiplied by the average account value during the period, multiplied by 182/365 (to reflect the half-year period). |
GoodHaven Fund
ADDITIONAL INFORMATION (Unaudited) |
| INFORMATION ABOUT PROXY VOTING |
A description of the policies and procedures that the Fund uses to determine how to vote proxies relating to portfolio securities is available without charge, upon request, by calling toll-free at (855) 654-6639 and on the Fund’s website at www.goodhavenfunds.com. Furthermore, you can obtain the description on the SEC’s website at www.sec.gov.
Information regarding how the Fund voted proxies relating to portfolio securities during the most recent 12-month period ended June 30 is available without charge, upon request, by calling (855) 654-6639 or through the SEC’s website at www.sec.gov.
| INFORMATION ABOUT THE PORTFOLIO HOLDINGS |
The Fund files its complete schedule of portfolio holdings for the first and third quarters with the SEC on Form N-Q. The Fund’s Form N-Q may be reviewed and copied at the SEC’s Public Reference Room in Washington D.C. Information on the operation of the Public Reference Room may be obtained by calling (800) SEC-0330. The Fund’s Form N-Q is available without charge, upon request, by calling (855) 654-6639. Furthermore, you can obtain the Form N-Q on the SEC’s website at www.sec.gov.
In an effort to decrease costs, the Fund will reduce the number of duplicate Prospectuses and annual and semi-annual reports that you receive by sending only one copy of each to those addresses shown by two or more accounts. Please call the transfer agent toll free at (855) 654-6639 to request individual copies of these documents. The Fund will begin sending individual copies thirty days after receiving your request. This policy does not apply to account statements.
| INFORMATION ABOUT THE FUND’S TRUSTEES |
The Statement of Additional Information (“SAI”) includes additional information about the Fund’s Trustees and is available without charge, upon request, by calling (855) 654-6639. Furthermore, you can obtain the SAI on the SEC’s website at www.sec.gov or the Fund’s website at www.goodhavenfunds.com.
GoodHaven Fund
PRIVACY NOTICE (Unaudited) |
| FACTS | WHAT DOES GOODHAVEN CAPITAL MANAGEMENT, LLC & GOODHAVEN FUND DO WITH YOUR PERSONAL INFORMATION? |
| | |
| Why? | Financial companies choose how they share your personal information. Federal law gives consumers the right to limit some but not all sharing. Federal law also requires us to tell you how we collect, share, and protect your personal information. Please read this notice carefully to understand what we do. |
| | |
| What? | The types of personal information we collect and share depend on the product or service you have with us. This information can include: |
| | • Social Security number and Income |
| | • Account Balances and Employment Information |
| | • Assets and Investment Experience |
| | When you are no longer our customer, we continue to share your information as described in this notice. |
| | |
| How? | All financial companies need to share customer’s personal information to run their everyday business. In the section below, we list the reasons financial companies can share their customer’s personal information; the reasons GoodHaven chooses to share; and whether you can limit this sharing. |
| Reasons we can share your | Does GoodHaven | Can you limit |
| personal information | share? | this sharing? |
| For our everyday business purposes— | | |
| such as to process your transactions, maintain | | |
| your account(s), respond to court orders and | Yes | No |
| legal investigations, or report to credit bureaus | | |
| For our marketing purposes— | | |
| to offer our products and services to you | Yes | No |
| For joint marketing with | | |
| other financial companies | No | We don’t share |
| For our affiliates’ everyday | | |
| business purposes— | | |
| information about your | Yes | Yes |
| transactions and experiences | | |
| For our affiliates’ everyday | | |
| business purposes— | | |
| information about your creditworthiness | Yes | Yes |
| For nonaffiliates to market to you | No | We don’t share |
| Questions? | Call (305) 677-7650 or email info@goodhavenllc.com |
GoodHaven Fund
PRIVACY NOTICE (Unaudited) (Continued) |
| Who we are |
| Who is providing | GoodHaven Capital Management, LLC |
| this notice? | GoodHaven Fund (collectively “GoodHaven”) |
| | |
| What we do |
| How does | To protect your personal information from unauthorized |
| GoodHaven | access and use, we use security measures that comply |
| protect | with federal law. These measures include computer safeguards |
my personal information? | and secured files and buildings. |
|
Our service providers must represent to us that they will protect any personal information through similar safeguards and security. |
| How does | We collect your personal information, for example, when you |
| GoodHaven | • open an account or give us your income |
| collect my | • give us contact information or seek advice about your investments |
| personal | • tell us about your investments or retirement portfolio |
| information? | |
| Why can’t I | Federal law gives you the right to limit only |
| limit all sharing? | • sharing for affiliates’ everyday business purposes—information about your creditworthiness |
| | • affiliates from using your information to market to you |
| | • sharing for nonaffiliates to market you |
| | |
| | State laws and individual companies may give you additional rights to limit sharing. |
| Definitions |
| Affiliates | Companies related by common ownership or control. They can be financial and nonfinancial companies. |
| | • Our affiliates include: a series of a registered investment company called the GoodHaven Fund (a no-load mutual fund). |
| Nonaffiliates | Companies not related by common ownership or control. They can be financial and nonfinancial companies. |
| | • We do not share with nonaffiliates so they can market to you. |
| Joint marketing | A formal agreement between nonaffiliated financial companies that together market financial products or services to you. |
| | • We do not jointly market with nonaffiliated financial companies. |
| Other important information |
(This Page Intentionally Left Blank.)
GoodHaven Fund
Advisor
GOODHAVEN CAPITAL MANAGEMENT, LLC
4940 SW 83rd Street
Miami, Florida 33143
Distributor
QUASAR DISTRIBUTORS, LLC
777 East Wisconsin Avenue
Milwaukee, Wisconsin 53202
Custodian
U.S. BANK NA
Custody Operations
1555 N. RiverCenter Drive, Suite 302
Milwaukee, Wisconsin 53212
Transfer Agent, Fund Accountant & Fund Administrator
U.S. BANCORP FUND SERVICES, LLC
615 East Michigan Street
Milwaukee, Wisconsin 53202
1-800-536-3230
Independent Registered Public Accounting Firm
TAIT, WELLER & BAKER LLP
1818 Market Street, Suite 2400
Philadelphia, Pennsylvania 19103
Legal Counsel
BLANK ROME LLP
405 Lexington Ave
New York, New York 10174
GoodHaven Fund
855-OK-GOODX (855-654-6639)
www.goodhavenfunds.com
Symbol – GOODX
CUSIP – 38217G103
Item 2. Code of Ethics.
Not applicable for semi-annual reports.
Item 3. Audit Committee Financial Expert.
Not applicable for semi-annual reports.
Item 4. Principal Accountant Fees and Services.
Not applicable for semi-annual reports.
Item 5. Audit Committee of Listed Registrants.
Not applicable to registrants who are not listed issuers (as defined in Rule 10A-3 under the Securities Exchange Act of 1934).
Item 6. Investments.
Schedule of Investments is included as part of the report to shareholders filed under Item 1 of this Form.
Item 7. Disclosure of Proxy Voting Policies and Procedures for Closed-End Management Investment Companies.
Not applicable to open-end investment companies.
Item 8. Portfolio Managers of Closed-End Management Investment Companies.
Not applicable to open-end investment companies.
Item 9. Purchases of Equity Securities by Closed‑End Management Investment Company and Affiliated Purchasers.
Not applicable to open-end investment companies.
Item 10. Submission of Matters to a Vote of Security Holders.
The registrant has adopted a nominating committee charter that contains the procedures by which shareholders may recommend nominees to the registrant’s board of trustees. There have been no material changes to the procedures by which shareholders may recommend nominees to the registrant’s board of trustees for the period.
Item 11. Controls and Procedures.
| (a) | The Registrant’s President and Treasurer have reviewed the Registrant's disclosure controls and procedures (as defined in Rule 30a-3(c) under the Investment Company Act of 1940 (the “Act”)) as of a date within 90 days of the filing of this report, as required by Rule 30a-3(b) under the Act and Rules 13a-15(b) or 15d‑15(b) under the Securities Exchange Act of 1934. Based on their review, such officers have concluded that the disclosure controls and procedures are effective in ensuring that information required to be disclosed in this report is appropriately recorded, processed, summarized and reported and made known to them by others within the Registrant and by the Registrant’s service provider. |
| (b) | There were no changes in the Registrant's internal control over financial reporting (as defined in Rule 30a-3(d) under the Act) that occurred during the second fiscal quarter of the period covered by this report that has materially affected, or is reasonably likely to materially affect, the Registrant's internal control over financial reporting. |
Item 12. Exhibits.
| (a) | (1) Any code of ethics or amendment thereto, that is subject of the disclosure required by Item 2, to the extent that the registrant intends to satisfy Item 2 requirements through filing an exhibit. |
(2) Certifications pursuant to Section 302 of the Sarbanes-Oxley Act of 2002. Filed herewith.
(3) Any written solicitation to purchase securities under Rule 23c‑1 under the Act sent or given during the period covered by the report by or on behalf of the registrant to 10 or more persons. Not applicable to open-end investment companies.
| (b) | Certification pursuant to Section 906 of the Sarbanes‑Oxley Act of 2002. Furnished herewith. |
SIGNATURES
Pursuant to the requirements of the Securities Exchange Act of 1934 and the Investment Company Act of 1940, the registrant has duly caused this report to be signed on its behalf by the undersigned, thereunto duly authorized.
(Registrant) GoodHaven Funds Trust
By (Signature and Title) /s/ Larry Pitkowsky
Larry Pitkowsky, Principal Executive Officer and Principal Financial and Accounting Officer
Date July 27, 2017
Pursuant to the requirements of the Securities Exchange Act of 1934 and the Investment Company Act of 1940, this report has been signed below by the following persons on behalf of the registrant and in the capacities and on the dates indicated.
By (Signature and Title) /s/ Larry Pitkowsky
Larry Pitkowsky, Principal Executive Officer and Principal Financial and Accounting Officer
Date July 27, 2017
* Print the name and title of each signing officer under his or her signature.
