
Lonestar Resources US, Inc. Second Quarter Conference Call August 22th, 2016 Exhibit 99.1
Forward-Looking Statements Safe Harbor & Disclaimer Lonestar Resources US, Inc. cautions that this presentation (including oral commentary that accompanies this presentation) contains forward-looking statements, including, but not limited to, statements about our business strategy and operations; discovery and development of crude oil, natural gas liquid (“NGL”) and natural gas reserves; drilling and completion of wells; and cash flows, liquidity, and availability and terms of capital. These statements involve substantial known and unknown risks, uncertainties and other important factors that may cause our actual results, levels of activity, performance or achievements to be materially different from the information expressed or implied by these forward-looking statements. These risks and uncertainties include, but are not limited to, the following: volatility of oil, natural gas and NGL prices, and potential write-down of the carrying values of crude oil and natural gas properties; inability to successfully replace proved producing reserves; substantial capital expenditures required for exploration, development and exploitation projects; potential liabilities resulting from operating hazards, natural disasters or other interruptions; risks related using the latest available horizontal drilling and completion techniques; uncertainties tied to lengthy period of development of identified drilling locations; unexpected delays and cost overrun related to the development of estimated proved undeveloped reserves; concentration risk related to properties, which are located primarily in the Eagle Ford Shale of South Texas; loss of lease on undeveloped leasehold acreage that may result from lack of development or commercialization; inaccuracies in assumptions made in estimating proved reserves; our limited control over activities in properties Lonestar does not operate; potential inconsistency between the present value of future net revenues from our proved reserves and the current market value of our estimated oil and natural gas reserves; risks related to derivative activities; losses resulting from title deficiencies; risks related to health, safety and environmental laws and regulations; additional regulation of hydraulic fracturing; reduced demand for crude oil, natural gas and NGLs resulting from conservation measures and technological advances; inability to acquire adequate supplies of water for our drilling operations or to dispose of or recycle the used water economically and in an environmentally safe manner; climate change laws and regulations restricting emissions of “greenhouse gases” that may increase operating costs and reduce demand for the crude oil and natural gas; fluctuations in the differential between benchmark prices of crude oil and natural gas and the reference or regional index price used to price actual crude oil and natural gas sales; and the other important factors discussed under the caption “Risk Factors” in our Registration Statement on Form 10, as amended and filed with the Securities and Exchange Commission, or the SEC, on June 9, 2016, as well as other documents that we may file from time to time with the SEC. We may not actually achieve the plans, intentions or expectations disclosed in our forward-looking statements, and you should not place undue reliance on our forward-looking statements. Actual results or events could differ materially from the plans, intentions and expectations disclosed in the forward-looking statements we make. The forward-looking statements in this presentation represent our views as of the date of this presentation. We anticipate that subsequent events and developments will cause our views to change. However, while we may elect to update these forward-looking statements at some point in the future, we have no current intention of doing so except to the extent required by applicable law. You should, therefore, not rely on these forward-looking statements as representing our views as of any date subsequent to the date of this presentation. This presentation also contains estimates and other statistical data made by independent parties and by us relating to well performance, finding and development costs, recycle ratio and other data about our industry. This data involves a number of assumptions and limitations, and you are cautioned not to give undue weight to such estimates. In addition, projections, assumptions and estimates of our future performance and the future performance of the markets in which we operate are necessarily subject to a high degree of uncertainty and risk. Lonestar Resources US, Inc. cautions that this presentation (including oral commentary that accompanies this presentation) contains forward-looking statements, including, but not limited to, statements about our business strategy and operations; discovery and development of crude oil, natural gas liquid (“NGL”) and natural gas reserves; drilling and completion of wells; and cash flows, liquidity, and availability and terms of capital. These statements involve substantial known and unknown risks, uncertainties and other important factors that may cause our actual results, levels of activity, performance or achievements to be materially different from the information expressed or implied by these forward-looking statements. These risks and uncertainties include, but are not limited to, the following: volatility of oil, natural gas and NGL prices, and potential write-down of the carrying values of crude oil and natural gas properties; inability to successfully replace proved producing reserves; substantial capital expenditures required for exploration, development and exploitation projects; potential liabilities resulting from operating hazards, natural disasters or other interruptions; risks related using the latest available horizontal drilling and completion techniques; uncertainties tied to lengthy period of development of identified drilling locations; unexpected delays and cost overrun related to the development of estimated proved undeveloped reserves; concentration risk related to properties, which are located primarily in the Eagle Ford Shale of South Texas; loss of lease on undeveloped leasehold acreage that may result from lack of development or commercialization; inaccuracies in assumptions made in estimating proved reserves; our limited control over activities in properties Lonestar does not operate; potential inconsistency between the present value of future net revenues from our proved reserves and the current market value of our estimated oil and natural gas reserves; risks related to derivative activities; losses resulting from title deficiencies; risks related to health, safety and environmental laws and regulations; additional regulation of hydraulic fracturing; reduced demand for crude oil, natural gas and NGLs resulting from conservation measures and technological advances; inability to acquire adequate supplies of water for our drilling operations or to dispose of or recycle the used water economically and in an environmentally safe manner; climate change laws and regulations restricting emissions of “greenhouse gases” that may increase operating costs and reduce demand for the crude oil and natural gas; fluctuations in the differential between benchmark prices of crude oil and natural gas and the reference or regional index price used to price actual crude oil and natural gas sales; and the other important factors discussed under the caption “Risk Factors” in our Registration Statement on Form 10, as amended and filed with the Securities and Exchange Commission, or the SEC, on June 9, 2016, as well as other documents that we may file from time to time with the SEC. We may not actually achieve the plans, intentions or expectations disclosed in our forward-looking statements, and you should not place undue reliance on our forward-looking statements. Actual results or events could differ materially from the plans, intentions and expectations disclosed in the forward-looking statements we make. The forward-looking statements in this presentation represent our views as of the date of this presentation. We anticipate that subsequent events and developments will cause our views to change. However, while we may elect to update these forward-looking statements at some point in the future, we have no current intention of doing so except to the extent required by applicable law. You should, therefore, not rely on these forward-looking statements as representing our views as of any date subsequent to the date of this presentation. This presentation also contains estimates and other statistical data made by independent parties and by us relating to well performance, finding and development costs, recycle ratio and other data about our industry. This data involves a number of assumptions and limitations, and you are cautioned not to give undue weight to such estimates. In addition, projections, assumptions and estimates of our future performance and the future performance of the markets in which we operate are necessarily subject to a high degree of uncertainty and risk.
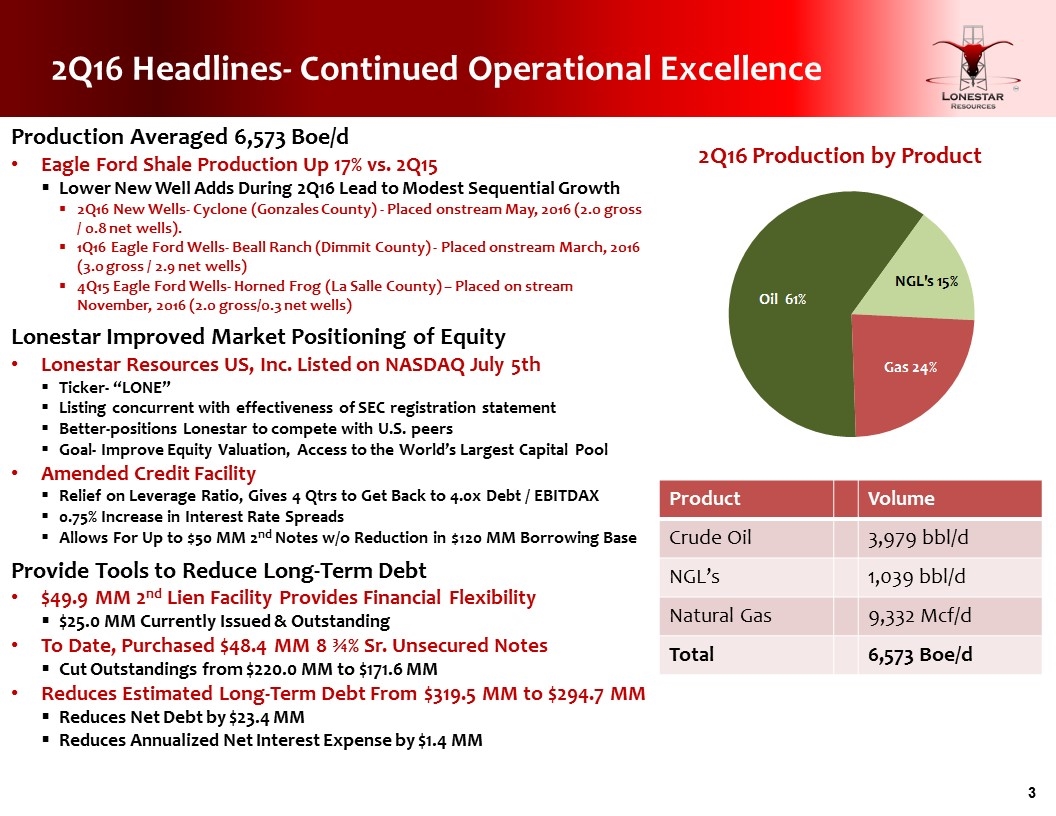
2Q16 Headlines- Continued Operational Excellence 2Q16 Production by Product Production Averaged 6,573 Boe/d Eagle Ford Shale Production Up 17% vs. 2Q15 Lower New Well Adds During 2Q16 Lead to Modest Sequential Growth 2Q16 New Wells- Cyclone (Gonzales County) - Placed onstream May, 2016 (2.0 gross / 0.8 net wells). 1Q16 Eagle Ford Wells- Beall Ranch (Dimmit County) - Placed onstream March, 2016 (3.0 gross / 2.9 net wells) 4Q15 Eagle Ford Wells- Horned Frog (La Salle County) – Placed on stream November, 2016 (2.0 gross/0.3 net wells) Lonestar Improved Market Positioning of Equity Lonestar Resources US, Inc. Listed on NASDAQ July 5th Ticker- “LONE” Listing concurrent with effectiveness of SEC registration statement Better-positions Lonestar to compete with U.S. peers Goal- Improve Equity Valuation, Access to the World’s Largest Capital Pool Amended Credit Facility Relief on Leverage Ratio, Gives 4 Qtrs to Get Back to 4.0x Debt / EBITDAX 0.75% Increase in Interest Rate Spreads Allows For Up to $50 MM 2nd Notes w/o Reduction in $120 MM Borrowing Base Provide Tools to Reduce Long-Term Debt $49.9 MM 2nd Lien Facility Provides Financial Flexibility $25.0 MM Currently Issued & Outstanding To Date, Purchased $48.4 MM 8 ¾% Sr. Unsecured Notes Cut Outstandings from $220.0 MM to $171.6 MM Reduces Estimated Long-Term Debt From $319.5 MM to $294.7 MM Reduces Net Debt by $23.4 MM Reduces Annualized Net Interest Expense by $1.4 MM Product Volume Crude Oil 3,979 bbl/d NGL’s 1,039 bbl/d Natural Gas 9,332 Mcf/d Total 6,573 Boe/d
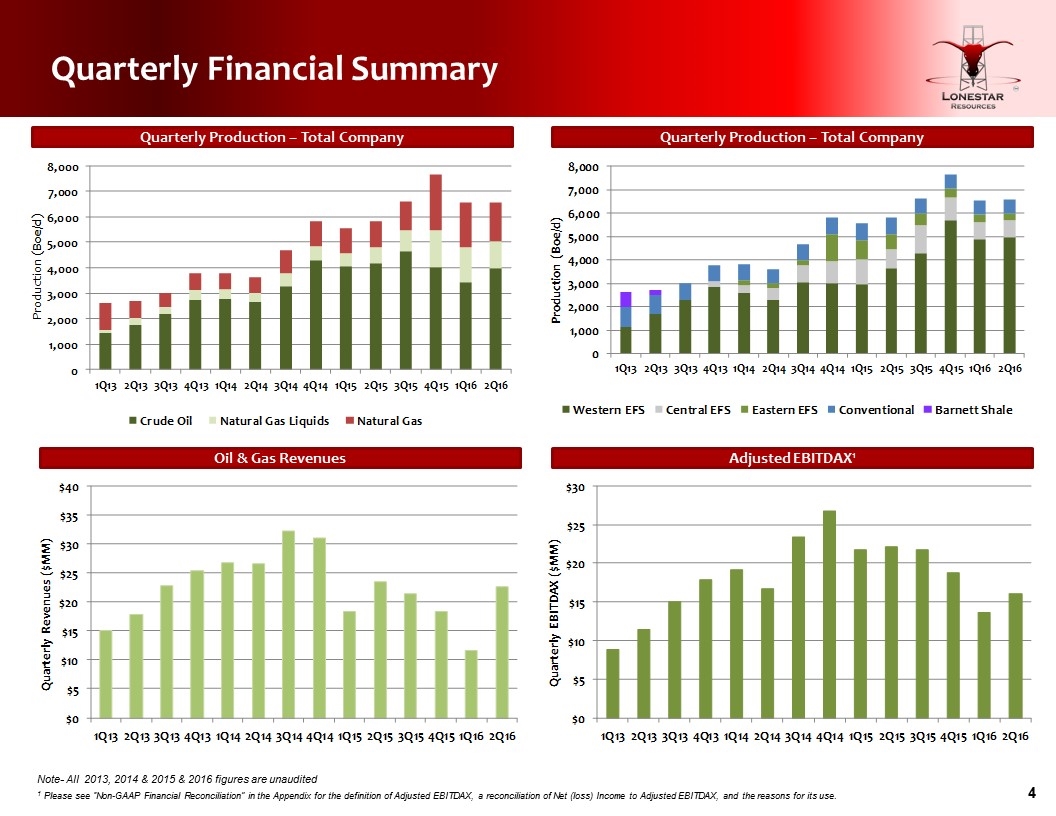
Quarterly Financial Summary Quarterly Production – Total Company Quarterly Production – Total Company Adjusted EBITDAX1 Oil & Gas Revenues Note- All 2013, 2014 & 2015 & 2016 figures are unaudited 1 Please see “Non-GAAP Financial Reconciliation” in the Appendix for the definition of Adjusted EBITDAX, a reconciliation of Net (loss) Income to Adjusted EBITDAX, and the reasons for its use.
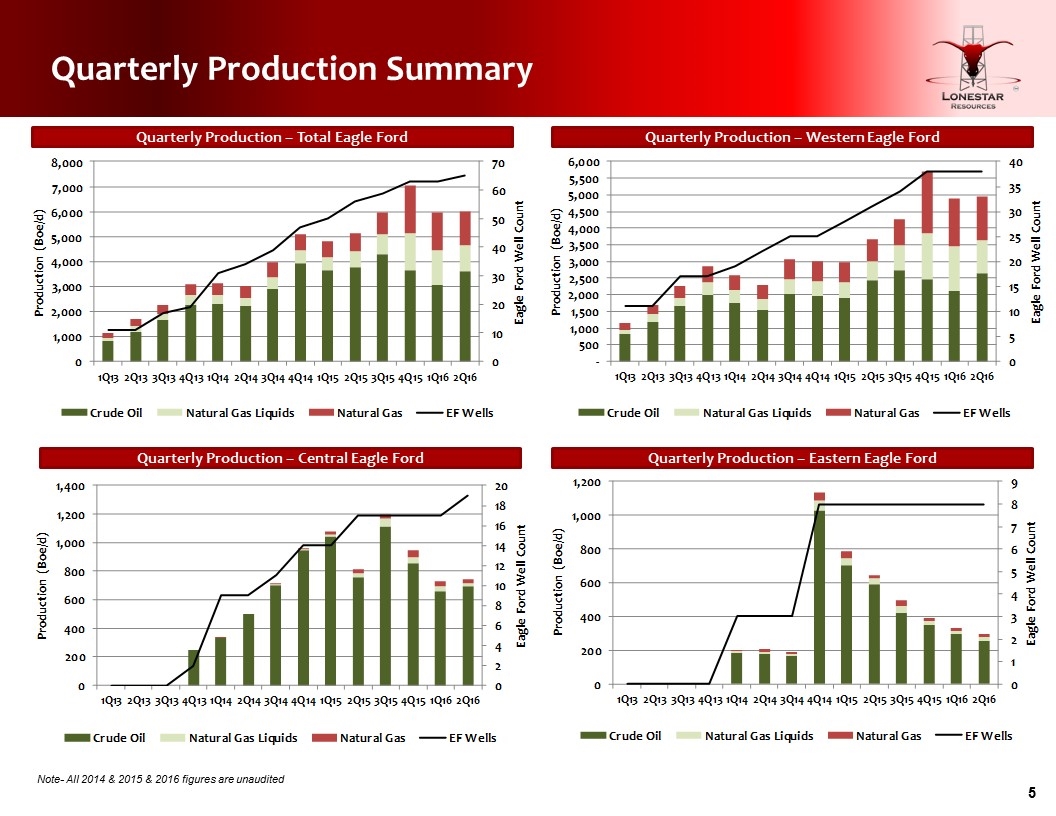
Quarterly Production Summary Quarterly Production – Total Eagle Ford Quarterly Production – Western Eagle Ford Quarterly Production – Eastern Eagle Ford Quarterly Production – Central Eagle Ford Note- All 2014 & 2015 & 2016 figures are unaudited
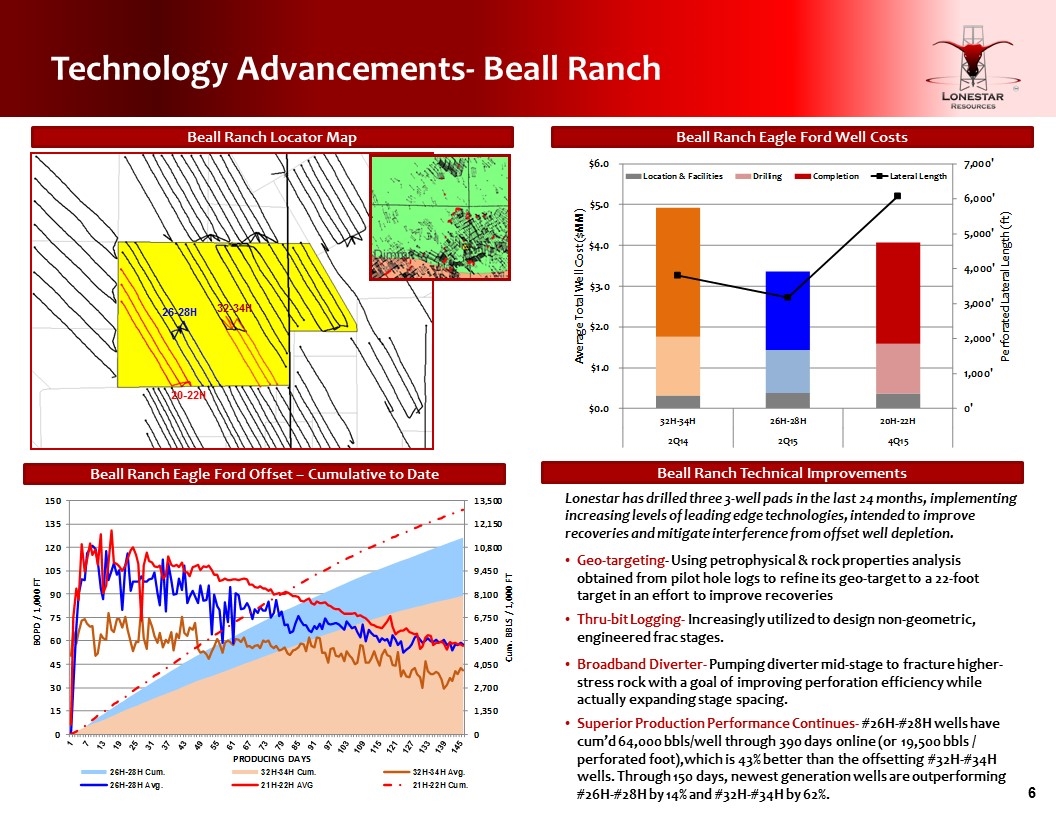
Technology Advancements- Beall Ranch Beall Ranch Locator Map Beall Ranch Eagle Ford Well Costs Beall Ranch Eagle Ford Offset – Cumulative to Date Beall Ranch Technical Improvements 26-28H 32-34H 20-22H Lonestar has drilled three 3-well pads in the last 24 months, implementing increasing levels of leading edge technologies, intended to improve recoveries and mitigate interference from offset well depletion. Geo-targeting- Using petrophysical & rock properties analysis obtained from pilot hole logs to refine its geo-target to a 22-foot target in an effort to improve recoveries Thru-bit Logging- Increasingly utilized to design non-geometric, engineered frac stages. Broadband Diverter- Pumping diverter mid-stage to fracture higher-stress rock with a goal of improving perforation efficiency while actually expanding stage spacing. Superior Production Performance Continues- #26H-#28H wells have cum’d 64,000 bbls/well through 390 days online (or 19,500 bbls / perforated foot),which is 43% better than the offsetting #32H-#34H wells. Through 150 days, newest generation wells are outperforming #26H-#28H by 14% and #32H-#34H by 62%.
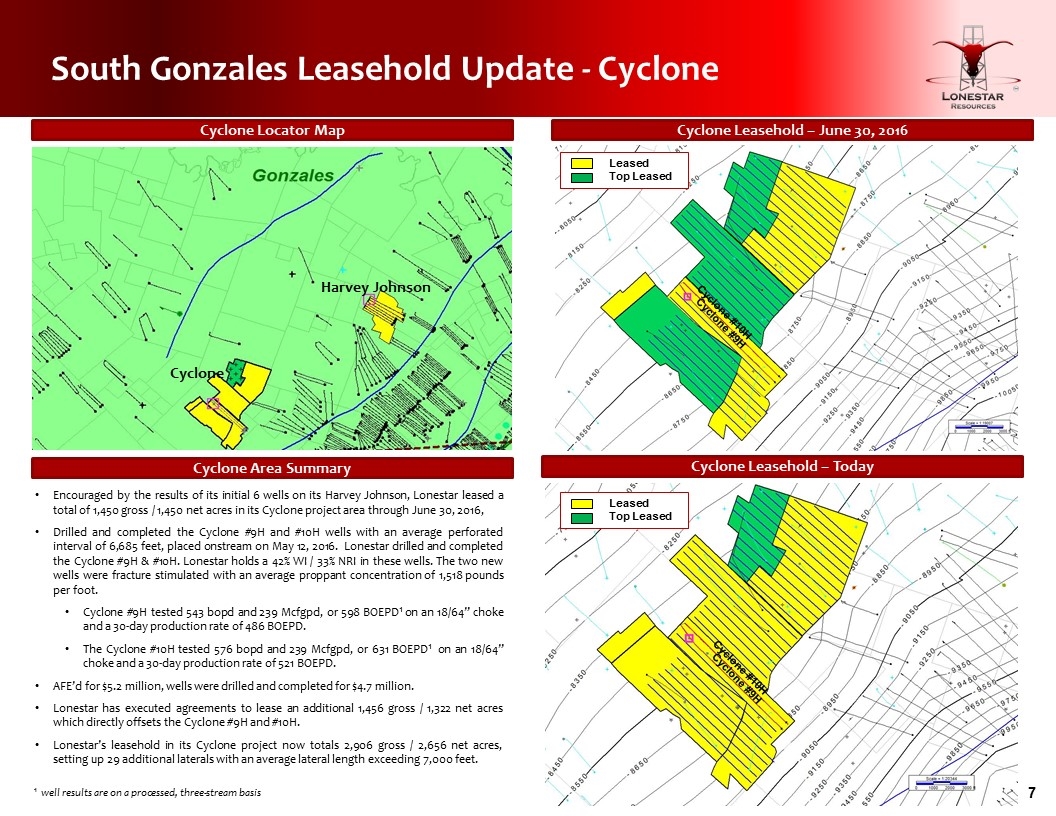
South Gonzales Leasehold Update - Cyclone Cyclone Locator Map Cyclone Leasehold – June 30, 2016 Cyclone Area Summary Cyclone Leasehold – Today Harvey Johnson Cyclone Encouraged by the results of its initial 6 wells on its Harvey Johnson, Lonestar leased a total of 1,450 gross / 1,450 net acres in its Cyclone project area through June 30, 2016, Drilled and completed the Cyclone #9H and #10H wells with an average perforated interval of 6,685 feet, placed onstream on May 12, 2016. Lonestar drilled and completed the Cyclone #9H & #10H. Lonestar holds a 42% WI / 33% NRI in these wells. The two new wells were fracture stimulated with an average proppant concentration of 1,518 pounds per foot. Cyclone #9H tested 543 bopd and 239 Mcfgpd, or 598 BOEPD1 on an 18/64” choke and a 30-day production rate of 486 BOEPD. The Cyclone #10H tested 576 bopd and 239 Mcfgpd, or 631 BOEPD1 on an 18/64” choke and a 30-day production rate of 521 BOEPD. AFE’d for $5.2 million, wells were drilled and completed for $4.7 million. Lonestar has executed agreements to lease an additional 1,456 gross / 1,322 net acres which directly offsets the Cyclone #9H and #10H. Lonestar’s leasehold in its Cyclone project now totals 2,906 gross / 2,656 net acres, setting up 29 additional laterals with an average lateral length exceeding 7,000 feet. 1 well results are on a processed, three-stream basis Leased Top Leased Leased Top Leased Cyclone #10H Cyclone #9H Cyclone #10H Cyclone #9H

Lonestar Resources, Ltd. Appendix
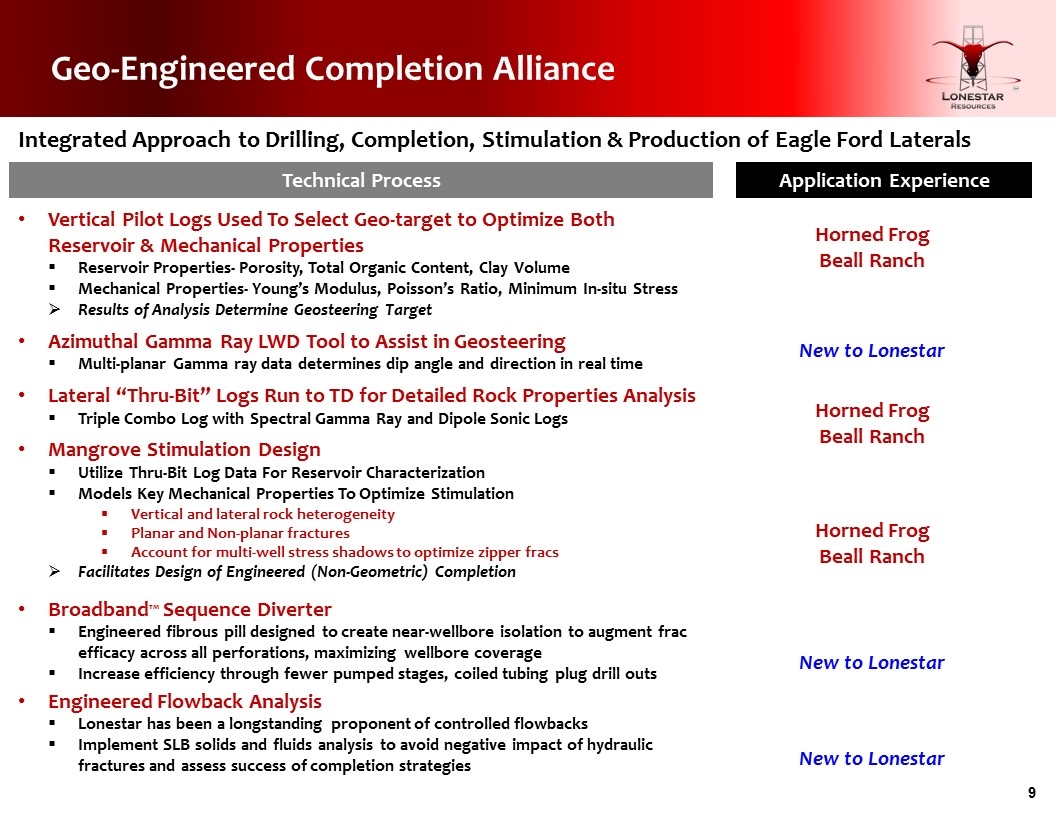
Geo-Engineered Completion Alliance Vertical Pilot Logs Used To Select Geo-target to Optimize Both Reservoir & Mechanical Properties Reservoir Properties- Porosity, Total Organic Content, Clay Volume Mechanical Properties- Young’s Modulus, Poisson’s Ratio, Minimum In-situ Stress Results of Analysis Determine Geosteering Target Azimuthal Gamma Ray LWD Tool to Assist in Geosteering Multi-planar Gamma ray data determines dip angle and direction in real time Lateral “Thru-Bit” Logs Run to TD for Detailed Rock Properties Analysis Triple Combo Log with Spectral Gamma Ray and Dipole Sonic Logs Mangrove Stimulation Design Utilize Thru-Bit Log Data For Reservoir Characterization Models Key Mechanical Properties To Optimize Stimulation Vertical and lateral rock heterogeneity Planar and Non-planar fractures Account for multi-well stress shadows to optimize zipper fracs Facilitates Design of Engineered (Non-Geometric) Completion BroadbandTM Sequence Diverter Engineered fibrous pill designed to create near-wellbore isolation to augment frac efficacy across all perforations, maximizing wellbore coverage Increase efficiency through fewer pumped stages, coiled tubing plug drill outs Engineered Flowback Analysis Lonestar has been a longstanding proponent of controlled flowbacks Implement SLB solids and fluids analysis to avoid negative impact of hydraulic fractures and assess success of completion strategies Integrated Approach to Drilling, Completion, Stimulation & Production of Eagle Ford Laterals Technical Process Application Experience Horned Frog Beall Ranch Horned Frog Beall Ranch Horned Frog Beall Ranch New to Lonestar New to Lonestar New to Lonestar
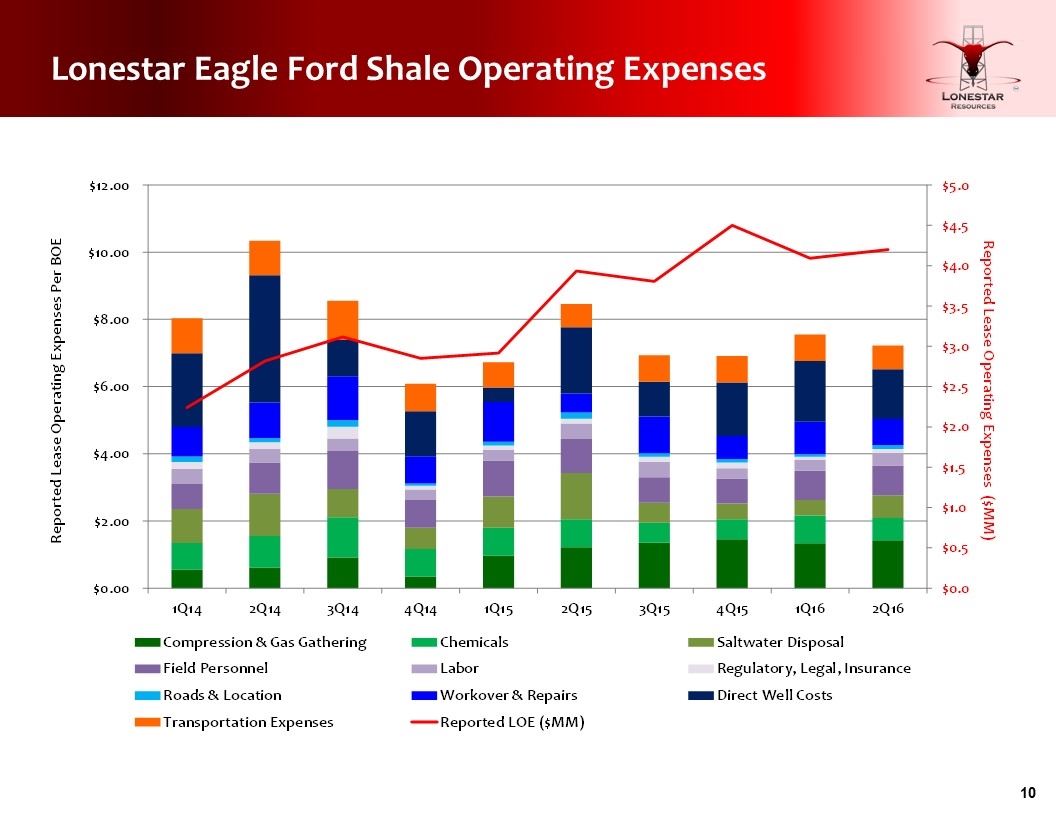
Lonestar Eagle Ford Shale Operating Expenses
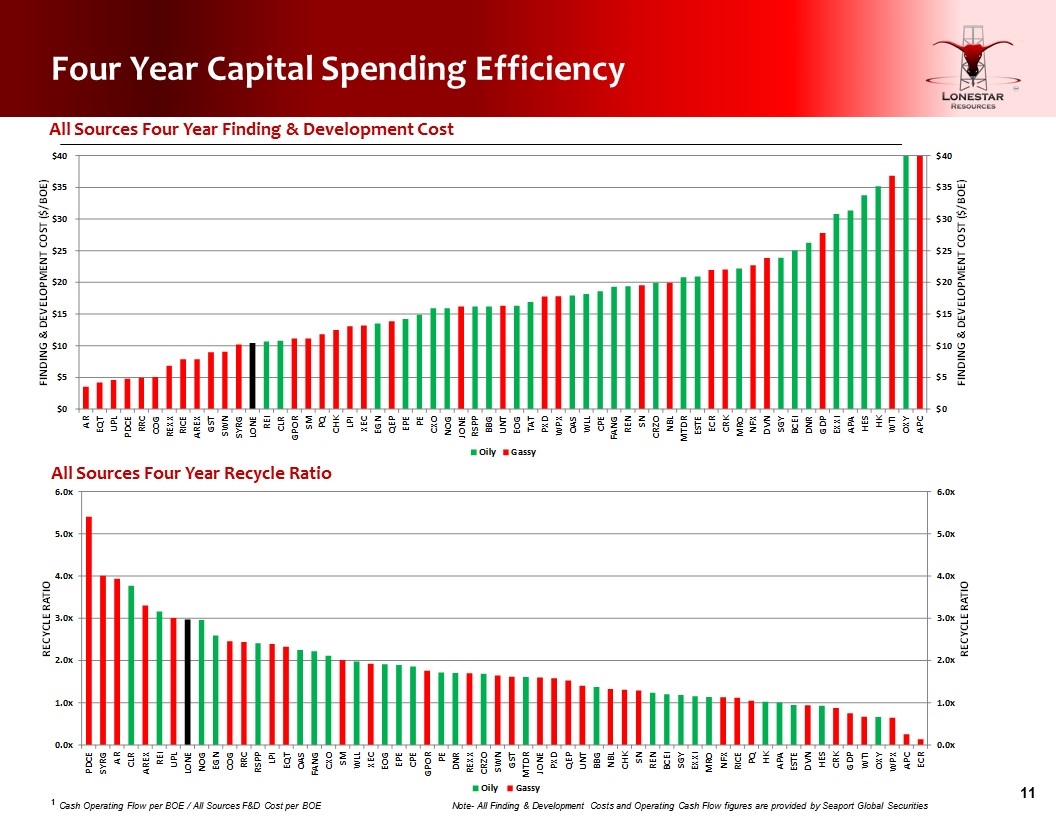
Four Year Capital Spending Efficiency All Sources Four Year Finding & Development Cost All Sources Four Year Recycle Ratio 1 Cash Operating Flow per BOE / All Sources F&D Cost per BOE Note- All Finding & Development Costs and Operating Cash Flow figures are provided by Seaport Global Securities
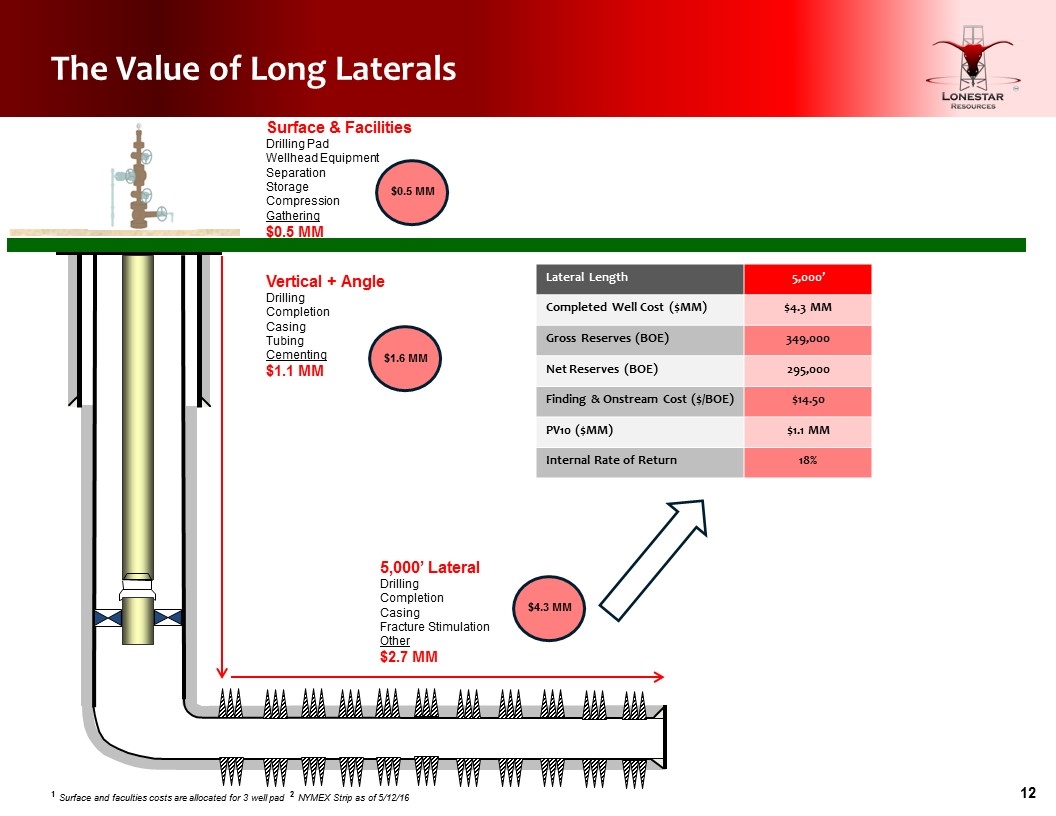
The Value of Long Laterals Vertical + Angle Drilling Completion Casing Tubing Cementing $1.1 MM Surface & Facilities Drilling Pad Wellhead Equipment Separation Storage Compression Gathering $0.5 MM 5,000’ Lateral Drilling Completion Casing Fracture Stimulation Other $2.7 MM $0.5 MM $1.6 MM $4.3 MM Lateral Length 5,000’ Completed Well Cost ($MM) $4.3 MM Gross Reserves (BOE) 349,000 Net Reserves (BOE) 295,000 Finding & Onstream Cost ($/BOE) $14.50 PV10 ($MM) $1.1 MM Internal Rate of Return 18% 1 Surface and faculties costs are allocated for 3 well pad 2 NYMEX Strip as of 5/12/16
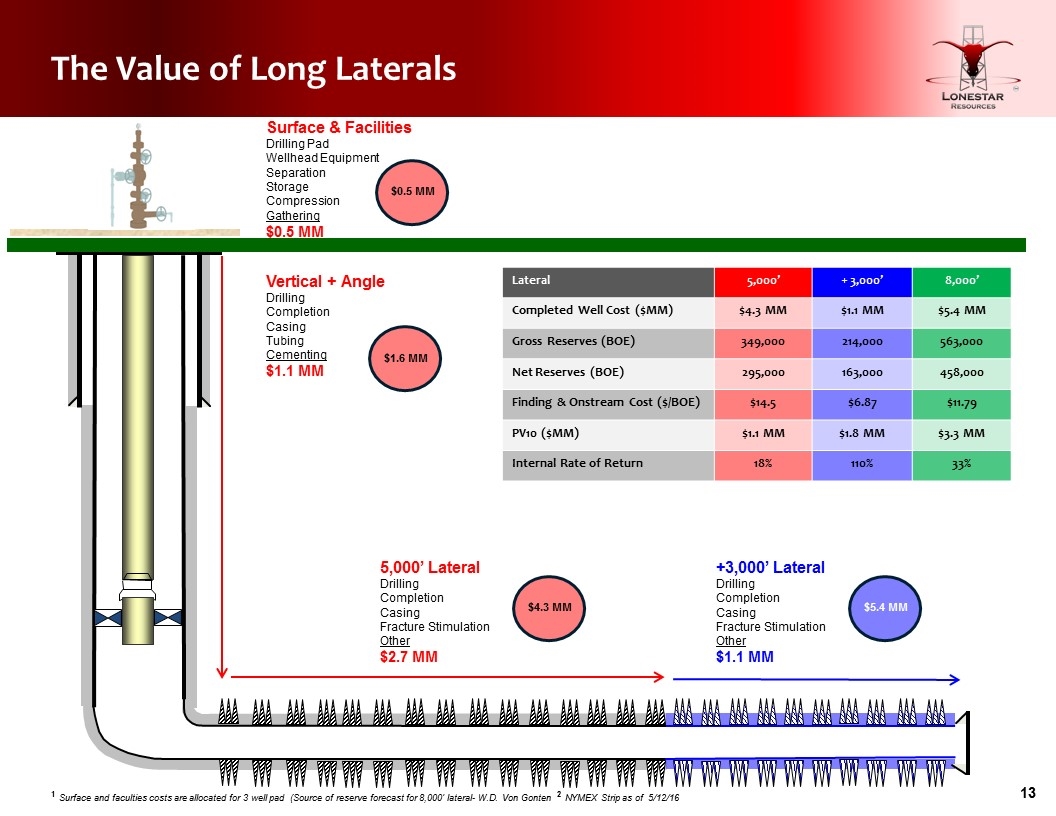
The Value of Long Laterals Vertical + Angle Drilling Completion Casing Tubing Cementing $1.1 MM Surface & Facilities Drilling Pad Wellhead Equipment Separation Storage Compression Gathering $0.5 MM 5,000’ Lateral Drilling Completion Casing Fracture Stimulation Other $2.7 MM $0.5 MM $1.6 MM $4.3 MM +3,000’ Lateral Drilling Completion Casing Fracture Stimulation Other $1.1 MM $5.4 MM Lateral 5,000’ + 3,000’ 8,000’ Completed Well Cost ($MM) $4.3 MM $1.1 MM $5.4 MM Gross Reserves (BOE) 349,000 214,000 563,000 Net Reserves (BOE) 295,000 163,000 458,000 Finding & Onstream Cost ($/BOE) $14.5 $6.87 $11.79 PV10 ($MM) $1.1 MM $1.8 MM $3.3 MM Internal Rate of Return 18% 110% 33% 1 Surface and faculties costs are allocated for 3 well pad (Source of reserve forecast for 8,000’ lateral- W.D. Von Gonten 2 NYMEX Strip as of 5/12/16
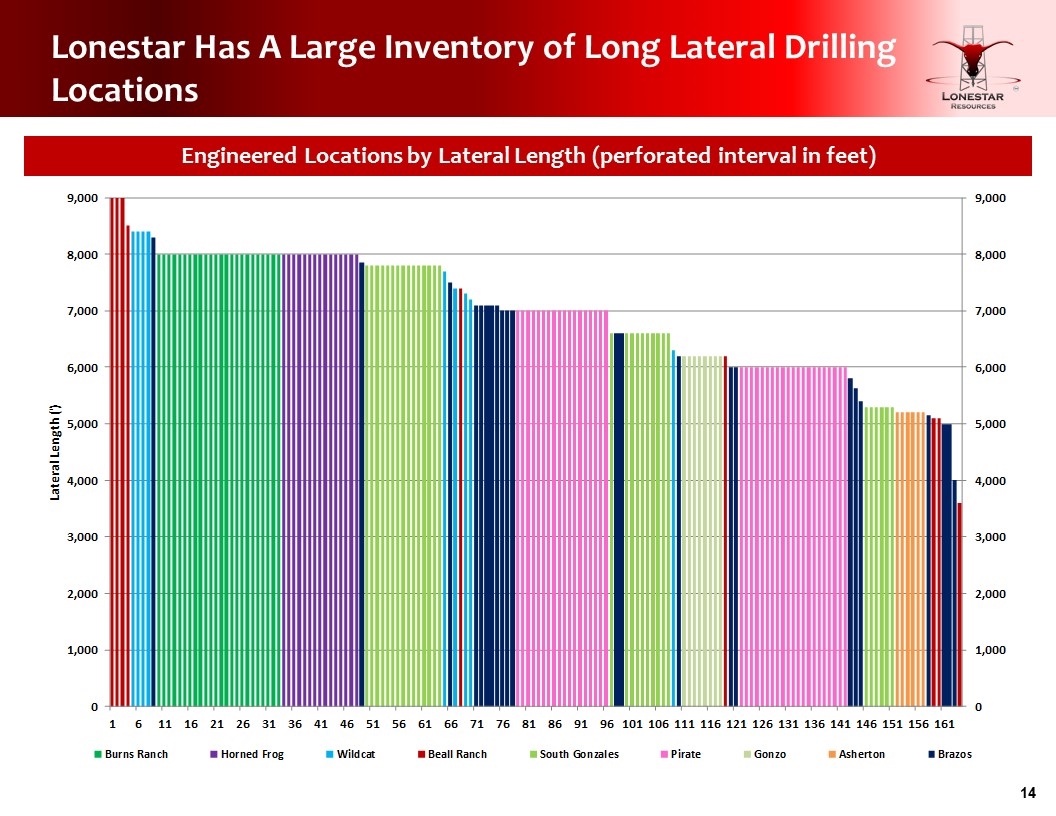
Lonestar Has A Large Inventory of Long Lateral Drilling Locations Engineered Locations by Lateral Length (perforated interval in feet)
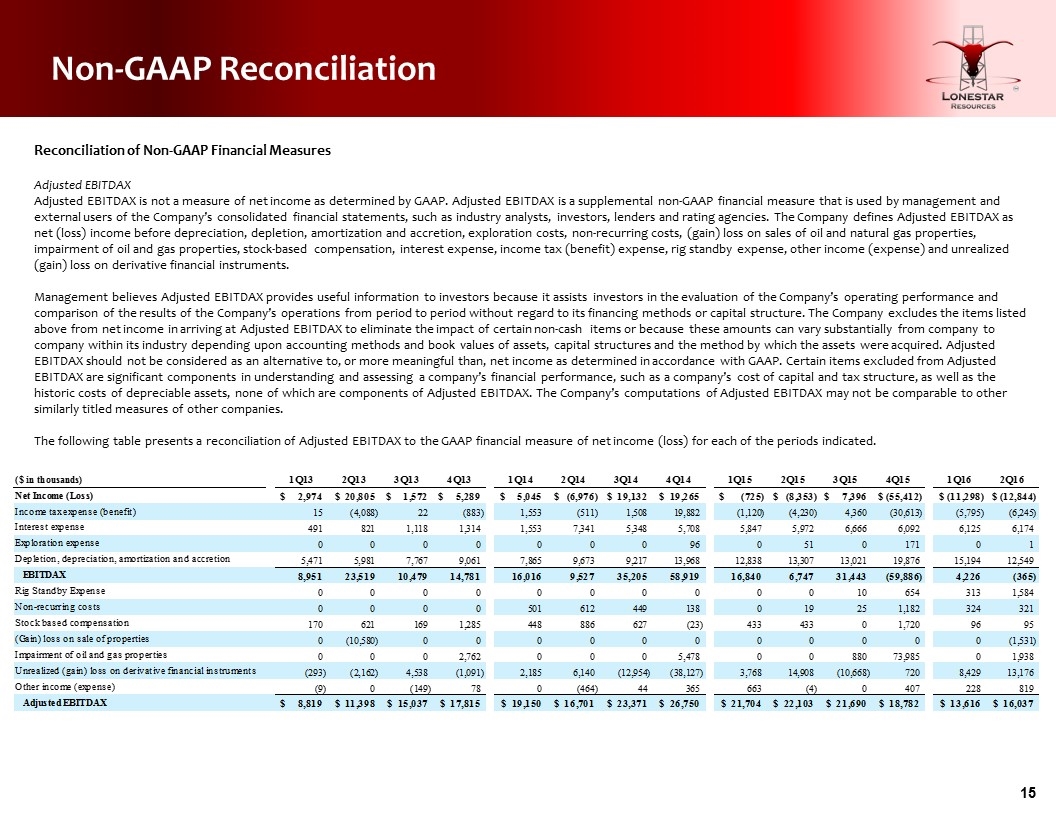
Non-GAAP Reconciliation Reconciliation of Non-GAAP Financial Measures Adjusted EBITDAX Adjusted EBITDAX is not a measure of net income as determined by GAAP. Adjusted EBITDAX is a supplemental non-GAAP financial measure that is used by management and external users of the Company’s consolidated financial statements, such as industry analysts, investors, lenders and rating agencies. The Company defines Adjusted EBITDAX as net (loss) income before depreciation, depletion, amortization and accretion, exploration costs, non-recurring costs, (gain) loss on sales of oil and natural gas properties, impairment of oil and gas properties, stock-based compensation, interest expense, income tax (benefit) expense, rig standby expense, other income (expense) and unrealized (gain) loss on derivative financial instruments. Management believes Adjusted EBITDAX provides useful information to investors because it assists investors in the evaluation of the Company’s operating performance and comparison of the results of the Company’s operations from period to period without regard to its financing methods or capital structure. The Company excludes the items listed above from net income in arriving at Adjusted EBITDAX to eliminate the impact of certain non-cash items or because these amounts can vary substantially from company to company within its industry depending upon accounting methods and book values of assets, capital structures and the method by which the assets were acquired. Adjusted EBITDAX should not be considered as an alternative to, or more meaningful than, net income as determined in accordance with GAAP. Certain items excluded from Adjusted EBITDAX are significant components in understanding and assessing a company’s financial performance, such as a company’s cost of capital and tax structure, as well as the historic costs of depreciable assets, none of which are components of Adjusted EBITDAX. The Company’s computations of Adjusted EBITDAX may not be comparable to other similarly titled measures of other companies. The following table presents a reconciliation of Adjusted EBITDAX to the GAAP financial measure of net income (loss) for each of the periods indicated.
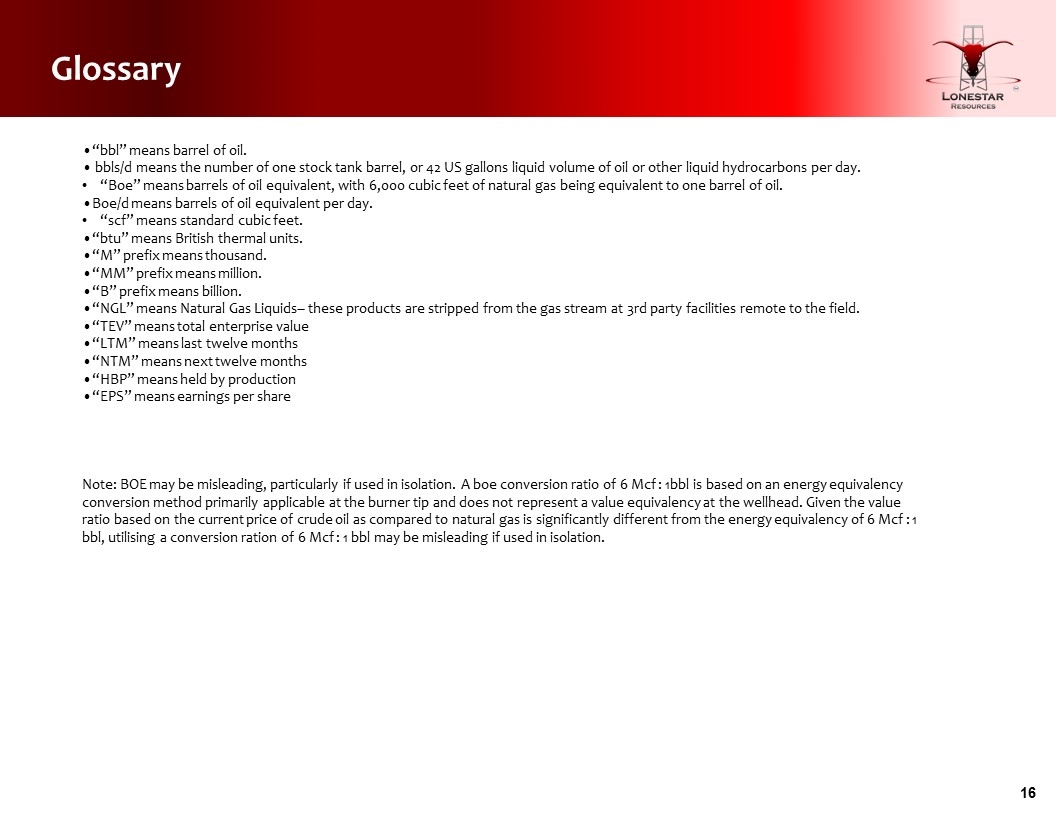
Glossary •“bbl” means barrel of oil. • bbls/d means the number of one stock tank barrel, or 42 US gallons liquid volume of oil or other liquid hydrocarbons per day. “Boe” means barrels of oil equivalent, with 6,000 cubic feet of natural gas being equivalent to one barrel of oil. •Boe/d means barrels of oil equivalent per day. “scf” means standard cubic feet. •“btu” means British thermal units. •“M” prefix means thousand. •“MM” prefix means million. •“B” prefix means billion. •“NGL” means Natural Gas Liquids– these products are stripped from the gas stream at 3rd party facilities remote to the field. •“TEV” means total enterprise value •“LTM” means last twelve months •“NTM” means next twelve months •“HBP” means held by production •“EPS” means earnings per share Note: BOE may be misleading, particularly if used in isolation. A boe conversion ratio of 6 Mcf : 1bbl is based on an energy equivalency conversion method primarily applicable at the burner tip and does not represent a value equivalency at the wellhead. Given the value ratio based on the current price of crude oil as compared to natural gas is significantly different from the energy equivalency of 6 Mcf : 1 bbl, utilising a conversion ration of 6 Mcf : 1 bbl may be misleading if used in isolation.


