UNITED STATES
SECURITIES AND EXCHANGE COMMISSION
Washington, D.C. 20549
FORM 8-K
CURRENT REPORT
Pursuant to Section 13 or 15(d)
of the Securities Exchange Act of 1934
Date of Report (Date of earliest event reported): October 25, 2022
Blackstone Real Estate Income Trust, Inc.
(Exact Name of Registrant as Specified in its Charter)
| Maryland | 000-55931 | 81-0696966 | ||
(State or Other Jurisdiction of Incorporation) | (Commission File Number) | (IRS. Employer Identification No.) |
345 Park Avenue
New York, New York 10154
(Address of Principal Executive Offices) (Zip Code)
Registrant’s telephone number, including area code:
(212) 583-5000
Not Applicable
(Former Name or Former Address, if Changed Since Last Report)
Check the appropriate box below if the Form 8-K filing is intended to simultaneously satisfy the filing obligation of the registrant under any of the following provisions:
| ☐ | Written communications pursuant to Rule 425 under the Securities Act (17 CFR 230.425) |
| ☐ | Soliciting material pursuant to Rule 14a-12 under the Exchange Act (17 CFR 240.14a-12) |
| ☐ | Pre-commencement communications pursuant to Rule 14d-2(b) under the Exchange Act (17 CFR 240.14d-2(b)) |
| ☐ | Pre-commencement communications pursuant to Rule 13e-4(c) under the Exchange Act (17 CFR 240.13e-4(c)) |
Securities registered pursuant to Section 12(b) of the Act: None
Title of each class | Trading | Name of each exchange | ||
Indicate by check mark whether the registrant is an emerging growth company as defined in Rule 405 of the Securities Act of 1933 (§230.405 of this chapter) or Rule 12b-2 of the Securities Exchange Act of 1934 (§240.12b-2 of this chapter).
Emerging growth company ☐
If an emerging growth company, indicate by check mark if the registrant has elected not to use the extended transition period for complying with any new or revised financial accounting standards provided pursuant to Section 13(a) of the Exchange Act. ☐
| Item 7.01 | Regulation FD Disclosure. |
A summary of a presentation providing certain information regarding Blackstone Real Estate Income Trust, Inc., a Maryland corporation (“BREIT” or the “Company”), is set forth below in this Current Report on Form 8-K (the “Current Report”) under this Item 7.01. In addition, the Company has posted the full presentation on its website at www.breit.com under the resources section.
Portfolio Update
BREIT had another strong quarter, demonstrating our ability to deliver positive returns and consistent, tax-advantaged distributions against a more challenging backdrop. Class I shares delivered a 9.3% return year to date and a 4.4% annualized distribution rate, equivalent to a 6.9% tax-equivalent yield.1,4 As the broader investment environment is feeling the effects of rising interest rates and slowing growth, we believe BREIT continues to be well positioned, with a high-quality real estate portfolio that is concentrated in growth sectors and markets with strong, secular tailwinds.5 BREIT’s exceptional cash flow growth, with 13% estimated same property net operating income (“NOI”) growth year to date, as well as value increases from our interest rate hedges, have powered performance in this more volatile environment despite increasing our valuation exit cap rates (reducing valuation multiples) in our highest conviction sectors by 13% this year.2,6,7
We identified high and persistent inflation early, and oriented BREIT’s portfolio to outperform in the current rising rate, inflationary environment. Real estate has historically been an attractive place to invest during periods of elevated inflation, but sector and market selection matter. BREIT is approximately 80% concentrated in high growth sectors, rental housing and industrial, and over 70% invested in the Southern and Western regions of the United States, which are experiencing outsized population, job and wage growth.5,8 Market rents are 20% above BREIT’s in-place rental housing and industrial portfolio rents, and we expect shorter duration leases in these sectors to allow BREIT to capture this embedded growth over time.9 BREIT’s balance sheet remains strong in this rising rate environment, with modest leverage of 46% and 87% fixed rate financing for the next 6 years.10,11,12
Rental housing and industrial fundamentals remain healthy as secular shifts continue to drive attractive supply and demand dynamics. Rental housing, BREIT’s largest sector exposure representing 55% of the portfolio, is supported by a structural shortage of 4-6 million housing units which continues to persist, with aggregate housing permits falling 19% since December.5,13,14 Demand for rental housing also continues to increase as owning a home is 50% more expensive than renting one today due in large part to a 380 basis point spike in mortgage rates this year alone.15,16
Similarly, industrial, which represents 23% of BREIT’s portfolio, continues to benefit from frictional low vacancy at just 2.9% nationally, with new supply further constrained by a 114% increase in replacement costs.5,17,18 BREIT’s high-quality industrial assets are in dense population centers, ideally located given many companies are looking to reduce high-cost transportation and labor expenses while providing quick delivery to customers.
We believe BREIT is very different from publicly traded REITs, which were down 28% this year.19 We designed BREIT to track private real estate values and our portfolio concentration in high growth sectors has resulted in stronger NOI growth and a higher distribution rate than publicly traded REITs.4,5,20 In fact, BREIT’s NOI growth in the first half of the year was twice that of publicly traded REITs, and our distribution yield is not just higher but also more tax-advantaged.4,20 In comparing valuations, publicly traded REITs can also be highly volatile and may trade at a discount to NAV for extended periods of time. For example, multifamily publicly traded REITs have traded at a discount to NAV approximately 90% of the time over the last decade.21 With respect to many non-traded REIT peers, BREIT’s valuations are more conservative. We believe we have been significantly more responsive to changing market conditions, increasing our valuation exit cap rates (decreasing valuation multiples) by 13% year to date in our highest conviction sectors while non-traded REIT peers have left their valuation exit cap rates unchanged.7,22
In moments of volatility, manager selection and experience are critical. BREIT benefits from Blackstone Real Estate’s seasoned and stable team that has successfully navigated market cycles for over 30+ years, including delivering a 2x multiple on invested capital in its opportunistic real estate funds invested during the Global Financial Crisis.23 Protecting investor capital and generating strong performance are always our top objectives, and we remain committed to that today.
Spotlight on Valuations
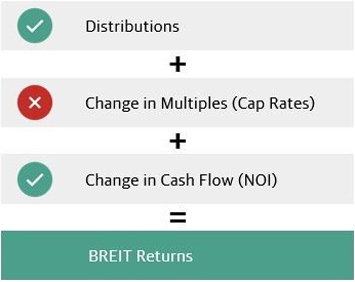
Strong cash flow growth can help offset rising cap rates
Real estate returns are a function of income (distributions) and appreciation (valuation multiples and cash flow). As cap rates have risen this year (valuation multiples decreased), BREIT’s steady distributions, exceptional cash flow growth and value increases from our interest rate hedges have powered strong YTD performance.2.4,6
| • 67 months of uninterrupted distributions4
• 4.4% Class I annualized distribution yield4
= 6.9% tax-equivalent yield4 | |
• Rising borrowing costs
• Rising cap rates
• Mitigated by interest rate hedges6 | ||
• Short supply + strong demand
• 13% estimated same property NOI growth2 | ||
9% Class I net return YTD1
|
BREIT has led the industry in adjusting valuations to reflect changing market conditions
BREIT’s valuations are more conservative than many non-traded REIT peers. We believe proprietary real time insights from Blackstone’s vast global portfolio allow BREIT to more quickly and accurately reflect current market conditions. BREIT’s values are the product of a highly disciplined and robust monthly valuation process and are reviewed by an independent valuation advisor.
Exit Cap Rates7,22
Rental Housing & Industrial
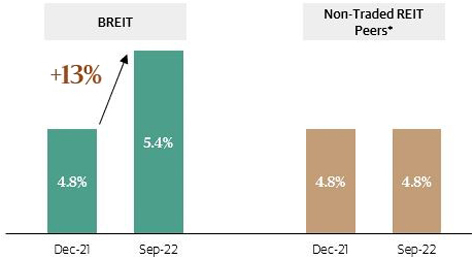
Note: SEC Filings as of September 30, 2022. Increase in exit cap rates reflects a reduction of valuation multiples; decrease reflects an expansion of valuation multiples. The differences in exit cap rates above is not meant to suggest that any party’s valuation is inaccurate.
| * | Peer group consists of Ares Real Estate Income Trust, Ares Industrial Real Estate Income Trust, Brookfield Real Estate Income Trust, JLL Income Property Trust, Nuveen Real Estate Income Fund and Starwood Real Estate Income Trust. Weighted average for each peer calculated based on the peers’ asset value in each sector for the respective time period. The cap rates for each peer vary; some peers have higher cap rates than the average shown in this chart and have increased them over this period. Please refer to the public filings for each issuer for its financial information. This group of issuers was selected by us as our peer set given they are the current larger and more active group of net asset value based non-traded REITs (“NAV REITs”) sponsored by other large investment managers. This peer set does not represent all of the NAV REITs or other non-traded REITs in existence. |
The following table reconciles preliminary estimated GAAP net loss to preliminary estimated same property NOI for the nine months ended September 30, 2022 and 2021 ($ in thousands). Same property NOI growth is estimated to be 13% year to date based on the midpoint of the estimated year-over-year increase.
| Nine Months Ended September 30, 2022 Estimated | 2021 Actual | |||||||||||
| Low | High | |||||||||||
| (Unaudited) | ||||||||||||
Net loss | ($ | 267,126 | ) | ($ | 241,686 | ) | ($ | 514,852 | ) | |||
Adjustments to reconcile to same property NOI | ||||||||||||
Depreciation and amortization | 3,001,101 | 3,001,101 | 1,282,053 | |||||||||
Management fee | 621,556 | 621,556 | 288,144 | |||||||||
Performance participation allocation | 817,527 | 817,527 | 892,410 | |||||||||
Loss (income) from investments in real estate debt | 70,051 | 77,425 | (344,440 | ) | ||||||||
Change in net assets of consolidated securitization vehicles | 64,529 | 71,322 | (94,546 | ) | ||||||||
Net gain on dispositions of real estate | (777,415 | ) | (703,376 | ) | (13,216 | ) | ||||||
Interest expense | 1,259,358 | 1,391,922 | 567,549 | |||||||||
Other income | (1,960,937 | ) | (1,774,181 | ) | (411,160 | ) | ||||||
Income from unconsolidated entities | (175,035 | ) | (158,365 | ) | (183,155 | ) | ||||||
NOI attributable to non-controlling interests in third party joint ventures | (79,675 | ) | (72,087 | ) | (28,487 | ) | ||||||
NOI from unconsolidated entities | 480,893 | 531,513 | 163,175 | |||||||||
Other | 213,393 | 235,855 | 51,409 | |||||||||
|
|
|
|
|
| |||||||
NOI attributable to BREIT stockholders | 3,268,220 | 3,798,526 | 1,654,884 | |||||||||
Less: Non-same property NOI attributable to BREIT stockholders | 1,760,164 | 2,131,728 | 250,968 | |||||||||
|
|
|
|
|
| |||||||
Same property NOI attributable to BREIT stockholders | $ | 1,508,056 | $ | 1,666,798 | $ | 1,403,916 | ||||||
|
|
|
|
|
| |||||||
The following table reconciles GAAP net loss to same property NOI for the six months ended June 30, 2022 and 2021 ($ in thousands). Same property NOI growth for the six months ended June 30, 2022 was 16%.
| Six Months Ended June 30, | Change | |||||||||||
| 2022 | 2021 | $ | ||||||||||
Net loss | ($ | 714,487 | ) | ($ | 147,698 | ) | ($ | 566,789 | ) | |||
Adjustments to reconcile to same property NOI | ||||||||||||
Depreciation and amortization | 1,873,400 | 800,008 | 1,073,392 | |||||||||
Straight-line rental income and expense | (66,981 | ) | (52,195 | ) | (14,786 | ) | ||||||
Amortization of above- and below-market lease intangibles | (28,645 | ) | (12,464 | ) | (16,181 | ) | ||||||
Lease termination fees | (1,646 | ) | (2,383 | ) | 737 | |||||||
Non-core property expenses | 171,592 | 70,310 | 101,282 | |||||||||
General and administrative | 24,859 | 14,749 | 10,110 | |||||||||
Management fee | 401,778 | 165,278 | 236,500 | |||||||||
Performance participation allocation | 623,166 | 442,588 | 180,578 | |||||||||
Incentive compensation awards(1) | 19,323 | 1,869 | 17,454 | |||||||||
Loss (income) from investments in real estate debt | 159,750 | (284,873 | ) | 444,623 | ||||||||
Change in net assets of consolidated securitization vehicles | 59,609 | (71,061 | ) | 130,670 | ||||||||
Net gain on dispositions of real estate | (422,414 | ) | (22,802 | ) | (399,612 | ) | ||||||
Interest expense | 722,223 | 363,052 | 359,171 | |||||||||
Loss on extinguishment of debt | 7,399 | 6,173 | 1,226 | |||||||||
Other income | (824,567 | ) | (233,529 | ) | (591,038 | ) | ||||||
Income from unconsolidated entities | (124,511 | ) | (104,710 | ) | (19,801 | ) | ||||||
NOI attributable to non-controlling interests in third party joint ventures | (27,565 | ) | (15,714 | ) | (11,851 | ) | ||||||
NOI from unconsolidated entities | 285,999 | 90,578 | 195,421 | |||||||||
|
|
|
|
|
| |||||||
NOI attributable to BREIT stockholders | 2,138,282 | 1,007,176 | 1,131,106 | |||||||||
Less: Non-same property NOI attributable to BREIT stockholders | 1,071,139 | 85,372 | 985,767 | |||||||||
|
|
|
|
|
| |||||||
Same property NOI attributable to BREIT stockholders | $ | 1,067,143 | $ | 921,804 | $ | 145,339 | ||||||
|
|
|
|
|
| |||||||
| 1. | Included in rental property operating and hospitality operating expense on our Condensed Consolidated Statements of Operations. |
Past performance does not guarantee future results. Financial data is estimated and unaudited. All figures as of September 30, 2022 unless otherwise noted. Opinions expressed reflect the current opinions of BREIT as of the date appearing in the materials only and are based on BREIT’s opinions of the current market environment, which is subject to change. Certain information contained in the materials discusses general market activity, industry or sector trends, or other broad-based economic, market or political conditions and should not be construed as research or investment advice.
Blackstone Proprietary Data. Certain information and data provided herein is based on Blackstone proprietary knowledge and data. Portfolio companies may provide proprietary market data to Blackstone, including about local market supply and demand conditions, current market rents and operating expenses, capital expenditures and valuations for multiple assets. Such proprietary market data is used by Blackstone to evaluate market trends as well as to underwrite potential and existing investments. While Blackstone currently believes that such information is reliable for purposes used herein, it is subject to change, and reflects Blackstone’s opinion as to whether the amount, nature and quality of the data is sufficient for the applicable conclusion, and no representations are made as to the accuracy or completeness thereof.
Tax Information. The tax information herein is provided for informational purposes only, is subject to material change, and should not be relied upon as a guarantee or prediction of tax effects. This material also does not constitute tax advice to, and should not be relied upon by, potential investors, who should consult their own tax advisors regarding the matters discussed herein and the tax consequences of an investment. A portion of REIT ordinary income distributions may be tax deferred given the ability to characterize ordinary income as Return of Capital (“ROC”). ROC distributions reduce the stockholder’s tax basis in the year the distribution is received, and generally defer taxes on that portion until the stockholder’s stock is sold via redemption. Upon redemption, the investor may be subject to higher capital gains taxes as a result of a lower cost basis due to the return of capital distributions. Certain non-cash deductions, such as depreciation and amortization, lower the taxable income for REIT distributions. Investors should be aware that a REIT’s Return of Capital (ROC) percentage may vary significantly in a given year and, as a result, the impact of the tax law and any related advantages may vary significantly from year to year. While we currently believe that the estimations and assumptions referenced herein are reasonable under the circumstances, there is no guarantee that the conditions upon which such assumptions are based will materialize or are otherwise applicable. This information does not constitute a forecast, and all assumptions herein are subject to uncertainties, changes and other risks, any of which may cause the relevant actual, financial and other results to be materially different from the results expressed or implied by the information presented herein. No assurance, representation or warranty is made by any person that any of the estimations herein will be achieved, and no recipient of this example should rely on such estimations. Investors may also be subject to net investment income taxes of 3.8% and/or state income tax in their state of residence which would lower the after-tax yield received by the investor.
| 1. | Represents Class I shares. Please refer to page 3 for performance for BREIT’s other share classes. Returns shown reflect the percent change in the NAV per share from the beginning of the applicable period, plus the amount of any distribution per share declared in the period. All returns shown assume reinvestment of distributions pursuant to BREIT’s distribution reinvestment plan, are derived from unaudited financial information, and are net of all BREIT expenses, including general and administrative expenses, transaction-related expenses, management fees, performance participation allocation, and share class-specific fees, but exclude the impact of early repurchase deductions on the repurchase of shares that have been outstanding for less than one year. The inception dates for the Class I, D, S and T shares are January 1, 2017, May 1, 2017, January 1, 2017 and June 1, 2017, respectively. 1-year and 3-year refer to the twelve and thirty-six months, respectively, ended September 30, 2022. The returns have been prepared using unaudited data and valuations of the underlying investments in BREIT’s portfolio, which are estimates of fair value and form the basis for BREIT’s NAV. Valuations based upon unaudited reports from the underlying investments may be subject to later adjustments, may not correspond to realized value and may not accurately reflect the price at which assets could be liquidated. As return information is calculated based on NAV, return information presented will be impacted should the assumptions on which NAV was determined prove to be different. Past performance is not necessarily indicative of future results. 3-year and inception to date (“ITD”) returns are annualized consistent with the IPA Practice Guideline 2018. Year to date returns are not annualized. |
| 2. | Represents BREIT’s preliminary estimated year to date same property NOI growth for the period ended September 30, 2022 compared to the same period in the prior year (based on the midpoint of the preliminary estimated range of same property NOI). This data is not a comprehensive statement of our financial results for the nine months ended September 30, 2022, and our actual results may differ materially from this preliminary estimated data. Net Operating Income (“NOI”) is a supplemental non-generally accepted accounting principles (“GAAP”) measure of our property operating results that we believe is meaningful because it enables management to evaluate the impact of occupancy, rents, leasing activity and other controllable property operating results at our real estate. We define NOI as operating revenues less operating expenses, which exclude (i) impairment of investments in real estate, (ii) depreciation and amortization, (iii) straight-line rental income and expense, (iv) amortization of above- and below-market lease intangibles, (v) lease termination fees, (vi) property expenses not core to the operations of such properties, and (vii) other non-property related revenue and expense items such as (a) general and administrative expenses, (b) management fee paid to the Adviser, (c) performance participation allocation paid to the Special Limited Partner, (d) incentive compensation awards, |
| (e) income (loss) from investments in real estate debt, (f) change in net assets of consolidated securitization vehicles, (g) net gain (loss) on dispositions of real estate, (h) interest expense, (i) gain (loss) on extinguishment of debt, (j) other income (expense), and (k) similar adjustments for NOI attributable to non-controlling interests and unconsolidated entities. We evaluate our consolidated results of operations on a same property basis, which allows us to analyze our property operating results excluding acquisitions and dispositions during the periods under comparison. Properties in our portfolio are considered same property if they were owned for the full periods presented, otherwise they are considered non-same property. Recently developed properties are not included in same property results until the properties have achieved stabilization for both full periods presented. Properties held for sale and properties that are being redeveloped are excluded from same property results and are considered non-same property. We do not consider our investments in the real estate debt segment or equity securities to be same property. For more information, please refer to BREIT’s Current Report on Form 8-K filed with the Securities and Exchange Commission on October 19, 2022 and the prospectus. Additionally, please refer to page 7 for a reconciliation of estimated GAAP net (loss) income to same property NOI for the year to date periods ended September 30, 2022 and 2021. |
| 3. | Intentionally Omitted. |
| 4. | Reflects Class I shares. Annualized distribution rates for all BREIT share classes can be found on page 3. Reflects the current month’s distribution annualized and divided by the prior month’s NAV, which is inclusive of all fees and expenses. All distribution rates shown are historical. BREIT has delivered 67, 65, 67 and 64 months of consecutive distributions for the Class I, D, S and T shares, respectively. Tax-equivalent yield reflects the pretax yield an investor in a theoretical taxable bond would need to receive to match the after-tax yield of BREIT’s applicable share class in the current tax year and assumes that 92% of BREIT’s distributions is treated as return of capital and qualified for tax deferral without taking into account taxes that would be payable upon redemption. Tax-equivalent yield for the other share classes: Class D: 6.6%, Class S: 5.6%, Class T: 5.7%. The entire yield on the theoretical taxable bond investment is assumed to be ordinary income and taxed at 37%. This tax rate could change in the future. The tax-equivalent yield would be reduced by 1.3%, 1.2%, 1.0% and 1.1% for Class I, D, S, and T shares, respectively, taking into account deferred capital gains tax that would be payable upon redemption. This assumes a one-year holding period and includes the impact of deferred capital gains tax incurred in connection with a redemption of BREIT shares. Upon redemption, an investor is assumed to be subject to tax on all prior return of capital distributions at the current maximum capital gains rate of 20%. The capital gains rate could change in the future. Distributions are not guaranteed and may be funded from sources other than cash flow from operations, including, without limitation, borrowings, offering proceeds, the sale of our assets, and repayments of our real estate debt investments. We have no limits on the amounts we may fund from such sources. As of June 30, 2022, 100% of inception to date distributions were funded from cash flows from operations. Other fixed income products with different characteristics may also provide tax advantages, such as government bonds. Investors should consult their own tax advisors. See “Tax Information” above. |
| 5. | “Property Sector” weighting is measured as the asset value of real estate investments for each sector category (Rental Housing, Industrial, Net Lease, Data Centers, Hospitality, Self Storage, Office, Retail) divided by the total asset value of all real estate investments, excluding the value of any third-party interests in such real estate investments (“Real Estate TAV”). The following sectors each have subsectors comprising over 1.0% of Real Estate TAV. Rental Housing: multifamily (36%, including affordable housing, which accounts for 8%), student housing (10%), single family rental housing (8%) and manufactured housing (1%); Industrial: warehouses (22%); and Hospitality: select service hotels (2%). Please see the prospectus for more information on BREIT’s investments. “Region Concentration” represents regions as defined by NCREIF and the weighting is measured as the asset value of real estate properties and unconsolidated property investments for each regional category (South, West, East, Midwest, Non-U.S.) divided by the total asset value of all (i) real estate properties, excluding the value of any third-party interests in such real estate properties, and (ii) unconsolidated property investments. “Non-U.S.” reflects investments in Europe and Canada. While BREIT generally seeks to acquire real estate properties located in growth markets, certain properties may not be located in such markets. Although a market may be a growth market as of the date of the publication of this material, demographics and trends may change and investors are cautioned on relying upon the data presented as there is no guarantee that historical trends will continue or that BREIT could benefit from such trends. |
| 6. | Value increases from BREIT’s fixed rate liabilities and corporate and real estate interest rate hedges are $4.4 billion year to date as of September 30, 2022. Excludes value associated with floating rate debt and interest rate swaps against debt investments. |
| 7. | Reflects the percent change in BREIT’s weighted average rental housing and industrial exit cap rates from December 31, 2021 to September 30, 2022, weighted by BREIT’s asset value in each sector for the respective time period. |
| 8. | Reflects comparison between the South and West regions versus the rest of the United States as defined by NCREIF. Population growth reflects U.S. Bureau of Economic Analysis, as of June 22, 2022. Represents 5-year compounded annual growth rate of population from mid-quarter Q1 2017 to mid-quarter Q1 2022. Job growth reflects U.S. Bureau of Labor Statistics data as of September 16, 2022. Represents 5-year compounded annual growth rate of seasonally adjusted employees on nonfarm payrolls from August 2017 to August 2022. Higher wage growth reflects U.S. Bureau of Labor Statistics, as of August 24, 2022. Represents 5-year compounded annual growth rate of employment-weighted average weekly wages from Q1 2017 to Q1 2022. |
| 9. | Represents the estimated embedded growth potential between BREIT’s in-place multifamily and industrial portfolio rents and achievable market rents. BREIT’s multifamily (excluding affordable housing) in-place rent roll has an estimated 6% embedded growth potential, and BREIT’s industrial in-place rent roll has an estimated 37% embedded growth potential. Any expectations that in-place rents have the potential to increase are based on certain assumptions that may not be correct and on certain variables that may change, are presented for illustrative purposes only and do not constitute forecasts. There can be no assurance that any such results will actually be achieved. BREIT’s rental housing assets have an approximately 0.5-year weighted average lease length and BREIT’s industrial assets have a 4.4-year weighted average lease length. BREIT’s total real estate properties have a 4.4-year weighted average lease length. For a complete list of BREIT’s real estate investments (excluding equity in public and private real estate-related companies), visit www.breit.com/properties. |
| 10. | Our leverage ratio is measured by dividing (1) consolidated property level and entity level debt net of cash and loan related restricted cash, by (2) the asset value of real estate investments (measured using the greater of fair market value and cost) plus the equity in our settled real estate debt investments. “Real estate investments” include wholly-owned property investments, BREIT’s share of property investments held through joint ventures and equity in public and private real estate-related companies. “Real estate debt investments” include BREIT‘s investments in commercial mortgage-backed securities, residential mortgage-backed securities, mortgage loans and other debt secured by real estate and real estate related assets, as described in BREIT‘s prospectus. The Consolidated GAAP Balance Sheet included in our annual and interim financial statements reflects the loan collateral underlying certain of our real estate debt investments on a gross basis. These amounts are excluded from our real estate debt investments as they do not reflect our economic interest in such assets. Indebtedness incurred (1) in connection with funding a deposit in advance of the closing of an investment or (2) as other working capital advances will not be included as part of the calculation above. The leverage ratio would be higher if the indebtedness on our real estate debt investments and the pro rata share of debt within our unconsolidated investments were taken into account. |
| 11. | Percentage fixed rate financing is measured by dividing (i) the sum of our consolidated fixed rate debt, secured financings on investments in real estate debt with matched underlying interest rate exposure, and the outstanding notional principal amount of corporate and consolidated investment interest rate swaps, by (ii) total consolidated debt outstanding. |
| 12. | Reflects the weighted average duration of fixed and swapped consolidated property level and entity level debt, and excludes BREIT’s pro rata share of debt within its unconsolidated real estate investments. |
| 13. | Housing shortage reflects U.S. Census Bureau data as of December 31, 2021. Based on 2021 levels of new privately-owned housing units completed. |
| 14. | Housing permits reflect U.S. Census Bureau data as of August 31, 2022 compared to December 31, 2021 and represents seasonally-adjusted new privately-owned housing units authorized in permit-issuing places. |
| 15. | Axiometrics, Zillow and Blackstone Proprietary Data, as of September 30, 2022. Represents the difference between monthly mortgage payments and monthly multifamily rents. Reflects the 30-year fixed rate mortgage, as of October 13, 2022. Monthly mortgage payments assume median home prices are financed at 80% loan-to-value and include closing costs, insurance, taxes and monthly capital expenditure. |
| 16. | Mortgage rates reflect Freddie Mac data as of October 13, 2022 and represent the average 30-year fixed rate mortgage rate. |
| 17. | CBRE, as of September 30, 2022. Represents vacant U.S. industrial space weighted by total U.S. industrial stock. |
| 18. | Blackstone Proprietary Data, as of September 30, 2022. Represents estimated percent change in the costs of new development by sector between December 31, 2019 and September 30, 2022 and comprises land, hard costs and soft costs. Industrial development cost increase reflects industrial properties in 5 representative U.S. markets. |
| 19. | Year to date return reflects total returns for the period ending September 30, 2022. Publicly traded REITs represented by the MSCI U.S. REIT Index. The volatility and risk profile of the indices presented are likely to be materially different from that of BREIT including those related to fees and expenses, liquidity, safety, and tax features. BREIT does not trade on a national securities exchange, and therefore, is generally liquid. Your ability to redeem shares in BREIT through BREIT’s share repurchase plan may be limited and our board may make exceptions to, modify or suspend the plan. In addition, the indices employ different investment guidelines and criteria than BREIT; as a result, the holdings in BREIT may differ significantly from the holdings of the securities |
| that comprise the indices. The performance of the indices has not been selected to represent an appropriate benchmark to compare to BREIT’s performance, but rather is disclosed to allow for comparison of BREIT’s performance to that of well-known and widely recognized indices. |
| 20. | BREIT’s year to date same property NOI growth for the period ended June 30, 2022 compared to the same period in the prior year was 16%. Please refer to note 2 for additional information on same property NOI growth and page 8 for a reconciliation of GAAP net (loss) income to same property NOI for the year to date periods ended June 30, 2022 and 2021. Publicly traded REIT NOI growth reflects NAREIT data and represents the Total REIT Industry Tracker for the year to date period ended June 30, 2022 compared to the same period in the prior year. Publicly traded REIT distributions reflects Morningstar data as of September 30, 2022 and represents the MSCI U.S. REIT Index annualized year to date distribution yield. |
| 21. | Publicly traded REITs may also trade at a premium to NAV. Publicly traded REIT performance reflects the daily return of the MSCI U.S. REIT Index using rolling 14-day forward-looking periods, as of July 5, 2022. Multifamily publicly traded REITs reflect Green Street Advisors data and represents the Green Street Advisors apartment REIT premium/discount to NAV. |
| 22. | Peer exit cap rates calculated as the simple average of the following peer set: Ares Real Estate Income Trust, Ares Industrial Real Estate Income Trust, Brookfield Real Estate Income Trust, JLL Income Property Trust, Nuveen Real Estate Income Fund and Starwood Real Estate Income Trust. Weighted average for each peer calculated based on the peers’ asset value in each sector for the respective time period. The cap rates for each peer vary; some peers have higher cap rates than the average shown in this chart and have increased them over this period. Please refer to the public filings for each issuer for its financial information. This group of issuers was selected by us as our peer set given they are the current larger and more active group of net asset value based non-traded REITs (“NAV REITs”) sponsored by other large investment managers. This peer set does not represent all of the NAV REITs or other non-traded REITs in existence. |
| 23. | Blackstone Inc. (“Blackstone”) is a premier global investment manager. The real estate group of Blackstone, Blackstone Real Estate, is our sponsor and an affiliate of our advisor. Information regarding Blackstone and Blackstone Real Estate is included to provide information regarding the experience of our sponsor and its affiliates. An investment in BREIT is not an investment in Blackstone as BREIT is a separate and distinct legal entity. Past performance does not guarantee future results. There can be no assurance that any Blackstone fund or investment will achieve its objectives or avoid substantial losses. Multiple on invested capital (“MOIC”) reflects a composite or combined calculation. Represents BREP V and BREP VI which were invested between 2005-2007 and 2007-2011, respectively. BREP V generated a 2.3x gross MOIC and BREP VI generated a 2.5x gross MOIC. The calculation of combined or composite net returns pertaining to Blackstone’s opportunistic real estate private equity funds takes the aggregate limited partner cash flows by actual date from inception of the strategy through the current quarter end and uses the terminal value (including unrealized investments) as of the current quarter end to comprise an overall return for the strategy. The actual realized returns on the unrealized investments used in this calculation may differ materially from the returns indicated herein. In addition, the actual returns of each Blackstone fund, account or investment vehicle included in such combined or composite returns may be higher or lower than the aggregated returns presented. Furthermore, no limited partner has necessarily achieved the combined or composite returns presented in such performance information, because a limited partner’s participation in the applicable funds, accounts and/or investment vehicles may have varied. |
The information in this Current Report is being furnished and shall not be deemed “filed” for purposes of Section 18 of the Securities Exchange Act of 1934, as amended (the “Exchange Act”), or otherwise subject to the liabilities of such section. The information in this Current Report shall not be incorporated by reference into any filing under the Securities Act of 1933, as amended, or the Exchange Act, except as shall be expressly set forth by specific reference in any such filing. This Current Report on Form 8-K shall not be deemed an admission as to the materiality of any information in this Current Report on Form 8-K that is required to be disclosed solely by Regulation FD.
The information in this Current Report on Form 8-K is neither an offer to sell nor a solicitation of an offer to buy any securities.
FORWARD-LOOKING STATEMENT DISCLOSURE
Certain information contained in this communication constitutes “forward-looking statements” within the meaning of the federal securities laws and the Private Securities Litigation Reform Act of 1995. These forward-looking statements can be identified by the use of forward-looking terminology, such as “outlook,” “indicator,” “believes,” “expects,” “potential,” “continues,” “identified,” “may,” “will,” “should,” “seeks,” “approximately,” “predicts,” “intends,” “plans,” “estimates,” “anticipates”, “confident,” “conviction” or the negative versions of these words or other comparable words thereof. These may include our financial estimates and their underlying assumptions, statements about plans, objectives and expectations with respect to future operations, statements with respect to acquisitions, statements regarding future performance and statements regarding identified but not yet closed acquisitions. Such forward-looking statements are inherently uncertain and there are or may be important factors that could cause actual outcomes or results to differ materially from those indicated in such statements. BREIT believes these factors also include but are not limited to those described under the section entitled “Risk Factors” in its prospectus and annual report for the most recent fiscal year, and any
such updated factors included in its periodic filings with the SEC, which are accessible on the SEC’s website at www.sec.gov. These factors should not be construed as exhaustive and should be read in conjunction with the other cautionary statements that are included in this document (or BREIT’s prospectus and other filings). Except as otherwise required by federal securities laws, we undertake no obligation to publicly update or revise any forward-looking statements, whether as a result of new information, future developments or otherwise.
SIGNATURE
Pursuant to the requirements of the Securities Exchange Act of 1934, the registrant has duly caused this report to be signed on its behalf by the undersigned hereunto duly authorized.
| BLACKSTONE REAL ESTATE INCOME TRUST, INC. | |||||
| Date: October 25, 2022 | By: | /s/ Leon Volchyok | ||||
| Name: | Leon Volchyok | ||||
| Title: | Chief Legal Officer and Secretary | ||||