UNITED STATES
SECURITIES AND EXCHANGE COMMISSION
Washington, D.C. 20549
________________________________________________________________________
FORM 10-K
| | | | | |
| (Mark One) | |
| þ | ANNUAL REPORT PURSUANT TO SECTION 13 OR 15(d) OF THE SECURITIES EXCHANGE ACT OF 1934 |
| For the fiscal year ended December 31, 2024 |
| or |
| ¨ | TRANSITION REPORT PURSUANT TO SECTION 13 OR 15(d) OF THE SECURITIES EXCHANGE ACT OF 1934 |
| For the transition period from ____________to ____________ |
Commission File Number: 001-38598
________________________________________________________________________
BLOOM ENERGY CORPORATION
(Exact name of registrant as specified in its charter)
________________________________________________________________________
| | | | | |
| Delaware | 77-0565408 |
| (State or other jurisdiction of incorporation or organization) | (I.R.S. Employer Identification No.) |
| |
| 4353 North First Street, San Jose, California | 95134 |
| (Address of principal executive offices) | (Zip Code) |
| |
| (408) 543-1500 |
| (Registrant’s telephone number, including area code) |
| | | | | | | | |
| Securities registered pursuant to Section 12(b) of the Act: |
| Title of Each Class | Trading Symbol(s) | Name of each exchange on which registered |
| Class A Common Stock, $0.0001 par value | BE | New York Stock Exchange |
Securities registered pursuant to Section 12(g) of the Act: None.
________________________________________________________________________
Indicate by check mark if the registrant is a well-known seasoned issuer, as defined in Rule 405 of the Securities Act. Yes þ No ¨
Indicate by check mark if the registrant is not required to file reports pursuant to Section 13 or 15(d) of the Act. Yes ¨ No þ
Indicate by check mark whether the registrant (1) has filed all reports required to be filed by Section 13 or 15(d) of the Securities Exchange Act of 1934 during the preceding 12 months (or for such shorter period that the registrant was required to file such reports), and (2) has been subject to such filing requirements for the past 90 days. Yes þ No ¨
Indicate by check mark whether the registrant has submitted electronically every Interactive Data File required to be submitted pursuant to Rule 405 of Regulation S-T (§232.405 of this chapter) during the preceding 12 months (or for such shorter period that the registrant was required to submit such files). Yes þ No ¨
Indicate by check mark whether the registrant is a large accelerated filer, an accelerated filer, a non-accelerated filer, a smaller reporting company, or an emerging growth company. See the definitions of “large accelerated filer,” “accelerated filer,” “smaller reporting company,” and “emerging growth company” in Rule 12b-2 of the Exchange Act.
Large accelerated filer þ Accelerated filer ¨ Non-accelerated filer ¨ Smaller reporting company ¨ Emerging growth company ¨
If an emerging growth company, indicate by check mark if the registrant has elected not to use the extended transition period for complying with any new or revised financial accounting standards provided pursuant to Section 13(a) of the Exchange Act. ¨
Indicate by check mark whether the registrant has filed a report on and attestation to its management’s assessment of the effectiveness of its internal control over financial reporting under Section 404(b) of the Sarbanes-Oxley Act (15 U.S.C. 7262(b)) by the registered public accounting firm that prepared or issued its audit report. ☑
If securities are registered pursuant to Section 12(b) of the Act, indicate by check mark whether the financial statements of the registrant included in the filing reflect the correction of an error to previously issued financial statements. ¨
Indicate by check mark whether any of those error corrections are restatements that required a recovery analysis of incentive-based compensation received by any of the registrant’s executive officers during the relevant recovery period pursuant to §240.10D-1(b). ¨
Indicate by check mark whether the registrant is a shell company (as defined in Rule 12b-2 of the Exchange Act). Yes ¨ No þ
The aggregate market value of the registrant’s Class A common stock held by non-affiliates of the registrant was approximately $1.7 billion based upon the closing price of $12.24 per share of our Class A common stock on the New York Stock Exchange on June 30, 2024 (the last trading day of the registrant’s most recently completed second quarter). Shares of Class A common stock held by each executive officer, director and holder of 10% or more of the outstanding Class A common stock have been excluded in that such persons may be deemed to be affiliates. This determination of affiliate status is not necessarily a conclusive determination for other purposes.
As of February 24, 2025, there were 230,398,527 shares of the registrant’s Class A common stock, $0.0001 par value, outstanding.
________________________________________________________________________
DOCUMENTS INCORPORATED BY REFERENCE
Portions of the registrant’s definitive proxy statement for the 2025 Annual Meeting of Stockholders (the “2025 Proxy Statement”) are incorporated into Part III of this Annual Report on Form 10-K. The 2025 Proxy Statement will be filed with the U.S. Securities and Exchange Commission (“SEC”) within 120 days after the registrant’s year ended December 31, 2024.
Bloom Energy Corporation
Annual Report on Form 10-K for the Year Ended December 31, 2024
Table of Contents
| | | | | |
| | Page |
| Part I | |
| |
| Item 1A — Risk Factors | |
| |
| |
| |
| |
| |
| |
| Part II | |
| |
| |
| |
| |
| |
| |
| |
| |
| |
| |
| |
| |
| |
| |
| |
| |
| |
| Part III | |
| |
| |
| |
| |
| |
| |
| Part IV | |
| |
| |
| |
Unless the context otherwise requires, the terms “we,” “us,” “our,” “Bloom Energy,” “Bloom” and the “Company” each refer to Bloom Energy Corporation and all of its subsidiaries.
SPECIAL NOTE ABOUT FORWARD-LOOKING STATEMENTS
This Annual Report on Form 10-K contains forward-looking statements within the meaning of Section 27A of the Securities Act of 1933, as amended (the “Securities Act”), and Section 21E of the Securities Exchange Act of 1934, as amended (the “Exchange Act”). All statements contained in this Annual Report on Form 10-K other than statements of historical fact, including statements regarding our future operating results and financial position, our business strategy and plans and our objectives for future operations, are forward-looking statements. The words “believe,” “may,” “will,” “estimate,” “continue,” “anticipate,” “predict,” “project,” “potential,” “seek,” “intend,” “could,” “would,” “should,” “expect,” “plan” and similar expressions are intended to identify forward-looking statements.
Forward-looking statements in this Annual Report on Form 10-K include, but are not limited to, our plans and expectations regarding future financial results, including our expectations regarding: our ability to expand into and be successful in new markets, including the hydrogen market; our expanded strategic partnership with SK ecoplant Co., Ltd.; statements about our supply chain (including any direct or indirect effects from the Russia-Ukraine war, armed conflict in the Middle East, or geopolitical developments in China); operating results; the sufficiency of our cash and our liquidity and our ability to obtain financing; projected costs and cost reductions; development of new products and improvements to our existing products; our manufacturing capacity and manufacturing costs; the adequacy of our agreements with our suppliers; legislative actions and regulatory and environmental compliance; impact of the Inflation Reduction Act of 2022 (the “IRA”), including expiration of the Investment Tax Credit (“ITC”) with respect to fuel cells running on non-zero carbon fuels and transferability of tax credits on our business; competitive position; management’s plans and objectives for future operations; our ability to comply with debt covenants or cure defaults, if any; our ability to repay our debt obligations as they come due; trends in average selling prices; the success of our customer financing arrangements and ability to secure financiers; capital expenditures; warranty matters; outcomes of litigation; our exposure to foreign exchange, interest and credit risk; general business and economic conditions in our markets; industry trends; the impact of changes in government incentives; risks related to cybersecurity breaches, privacy and data security; the likelihood of any impairment of project assets, long-lived assets and investments; trends in revenue, cost of revenue and gross profit (loss); trends in operating expenses including research and development expense, sales and marketing expense and general and administrative expense and expectations regarding these expenses as a percentage of revenue; future deployment of our Bloom Energy Server systems, Bloom Electrolyzers, and other solutions; our ability to expand our business, including our ability to secure large data center customers; our ability to increase efficiency of our products; our ability to market our products successfully in connection with the global energy transition and shifting attitudes around climate change; our business strategy and plans and our objectives for future operations; and the impact of recently adopted accounting pronouncements.
You should not rely upon forward-looking statements as predictions of future events. We have based the forward-looking statements contained in this Annual Report on Form 10-K primarily on our current expectations and projections about future events and trends that we believe may affect our business, financial condition, operating results and prospects. The outcome of the events described in these forward-looking statements is subject to risks, uncertainties and other factors including those discussed in Part I, Item 1A, Risk Factors and elsewhere in this Annual Report on Form 10-K. Moreover, we operate in a very competitive and rapidly changing environment. New risks and uncertainties emerge from time to time, and it is not possible for us to predict all risks and uncertainties or the extent to which any factor or combination of factors may cause actual results to differ materially from those contained in any forward-looking statements we may make in this Annual Report on Form 10-K. We cannot assure you that the results, events and circumstances reflected in the forward-looking statements will be achieved or occur. Actual results, events or circumstances could differ materially and adversely from those described or anticipated in the forward-looking statements.
The forward-looking statements made in this Annual Report on Form 10-K relate only to events as of the date on which the statements are made. We undertake no obligation to update any forward-looking statements made in this Annual Report on Form 10-K to reflect events or circumstances after the date of this Annual Report on Form 10-K or to reflect new information or the occurrence of unanticipated events, except as required by law. We may not actually achieve the plans, intentions or expectations disclosed in our forward-looking statements and you should not place undue reliance on our forward-looking statements.
Our actual results and timing of selected events may differ materially from those anticipated in these forward-looking statements as a result of many factors including those discussed under Part I, Item 1A, Risk Factors and elsewhere in this Annual Report on Form 10-K.
Part I
ITEM 1 — BUSINESS
Overview
Description of Bloom Energy
Bloom Energy is the world leader in stationary fuel cell power generation by market share. The company provides innovative distributed energy technology solutions to customers at an important moment in the world’s energy transition. We manufacture one of the most advanced and versatile fuel cell energy platforms, supporting the commercial availability of two products: the Bloom Energy Server® for generating electricity and the Bloom Electrolyzer™ for producing hydrogen. With approximately 1.4 gigawatts (“GW”) of Energy Server systems deployed in more than 1,000 locations and 9 countries, our fuel cell platform empowers businesses, essential services, critical infrastructure, utilities, and communities with resilient, reliable, and sustainable energy solutions. Our employees are driven by our mission: to make clean, reliable energy affordable for everyone in the world.
Key Macro Trends
In 2024, our power-generation business capitalized on the following key trends:
•Demand for Power is Increasing, Driven by Data Centers and Artificial Intelligence
•Time to Power is Growing in Importance as Demand Outstrips Supply
•Co-locating Large Loads with Distributed Generation Configured as Islanded Microgrids are Gaining in Traction as Energy Solutions to Bypass Long Interconnection Queues and Transmission Upgrades
•Utilities are Turning to Distributed Energy Solutions to Decrease their Customers’ Time to Power
•Fuel Flexible Solutions Address Reliability Concerns as well as Near- and Long-term Sustainability Considerations
Demand for Power is Increasing, Driven by Data Centers and Artificial Intelligence. According to North American Electric Reliability Corporation’s (“NERC”) 2024 Long Term Reliability Assessment (“LTRA”), peak power demand is expected to grow by 151 GW (17%) over the next 10 years, and these peak demand and energy forecasts are at their highest levels in decades, reversing an almost two-decade trend of falling or flat rate trajectories. This spike in demand is driven by several factors, including electricity use by data centers, reflecting the large power consumption requirements of artificial intelligence (“AI”), cloud computing, and crypto-mining operations; the re-shoring of manufacturing in the U.S. in key sectors such as semiconductors, fueled in part by the CHIPS and Science Act; electric vehicle growth; and electrification of household goods and appliances. The power needs of data centers are expected to continue to grow significantly over the course of the decade as a result of these factors.
Time to Power is Growing in Importance as Demand Outstrips Supply. As demand for power grows, utility companies are struggling to keep pace. A Lawrence Berkeley National Laboratory report in 2024 found that there is nearly 2,600 GW of new electric capacity in existing interconnection queues. Even if the Federal Energy Regulatory Commission’s (“FERC”) recent interconnection reforms shorten the backlog for studies and interconnection agreements, the time to complete significant transmission and distribution system upgrades that are necessary to ensure grid reliability and deliverability remain bottlenecks to entry. Independent estimates indicate that to meet growing electricity demands, there may need to be a 60 percent increase in transmission capacity by 2030. Yet only 55 miles of new transmission lines were built in 2023 and 125 miles added from January to May 2024. We believe behind-the-meter, on-site distributed power generation is critical to provide power quickly to customers.
Co-locating Large Loads with Distributed Generation Configured as Islanded Microgrids are Gaining in Traction as Energy Solutions to Bypass Long Interconnection Queues and Transmission Upgrades. Our islanded microgrid solutions allow data center and other customers the ability to skip the interconnection queue and start construction as transmission and distribution grid upgrades are not needed. Our Be Flexible™ load following capability allows us to serve customers with variable loads without the need to export excess power to the grid. We believe avoiding these lengthy interconnection queues is key to unlocking time to power for our customers. Our distributed generation solutions, deployable today, can serve as an energy transmission asset, helping utility companies continue to serve their customers, avoid or delay certain costs to build new transmission and distribution infrastructure, and better allocate the costs of supplying energy to their largest power users rather than ratepayers generally. Utility companies also can use our energy solutions to provide islanded power to a specific customer for a specific tolling rate that avoids burdening its other ratepayers.
Utilities are Turning to Distributed Energy Solutions to Decrease their Customers’ Time to Power. Our utility customers are recognizing the challenge of keeping pace with the growing demand for power. Aging infrastructure, coupled with transmission and distribution bottlenecks, are making it more difficult for utilities to integrate additional sources of energy to add capacity. Building new transmission and distribution infrastructure is expensive, takes many years, and would likely cause utility rates to increase. As demand for power continues to grow, and time to power becomes increasingly important, utilities are exploring alternative means of producing and supplying energy to their end customers, including our Energy Server systems. We entered into multiple agreements with utilities in 2024. We expect more utility customers in the future to supplement their power generation with the Bloom Energy Server system either as a front of the meter solution for their entire rate base or as an onsite power solution for a specific customer. As we reduce our product costs, and with utility rates expected to increase, we expect our energy solutions to become more cost competitive in more countries, communities and industries around the world.
Fuel Flexible Solutions Address Reliability Concerns as well as Near- and Long-term Sustainability Considerations. Both the current lack of transmission buildout necessary to meet the influx of intermittent renewables and ongoing grid reliability impacts from extreme weather events have placed further strain on aging utility grids, leading to periods of power outages for those reliant on the grid. Recognizing the threat of climate change, companies and governments have set ambitious emissions goals to reduce the release of carbon dioxide to the atmosphere. However, projected large increases in demand for power and limited new transmission infrastructure are challenging prevailing carbon reduction trajectories. These constraints have created demand for reliable off-grid power. Data centers, critical facilities and many industrial customers are excited to learn that our Energy Server systems have up to “five nines” (99.999%) availability using a microgrid solution. This level of availability is necessary for supporting large, critical customers and key infrastructure by ensuring consistent energy supply even in demanding applications like AI. The Energy Server systems also can displace dirtier and less efficient conventional combustion solutions like turbines and engines. Deeper decarbonization potential on our Energy Server systems is enabled through fuel flexibility (as in addition to natural gas, our non-combustion power solutions are designed to run on biofuels or hydrogen), combined heat and power (“CHP”) offerings and carbon capture utilization and storage (“CCUS”) capability. In addition, our non-combustion systems emit near-zero criteria pollutants, and use no water during steady state operation.
Our Markets
The market conditions for our platform are promising. Customers are demanding lower carbon and resilient energy today with the flexibility to move to net-zero solutions. Our platform is designed to meet these demands and solve these challenges. Global electricity systems are now facing a range of significant challenges, including threats from extreme weather events, aging transmission and distribution systems, a wave of retiring generation assets, difficult integration of intermittent renewables, and load growth that is far outpacing the installation of new resources.
The value propositions for our fuel cell solutions are compelling. Built on the same solid oxide platform, we develop the Energy Server system and the Bloom Electrolyzer with predominantly the same supply chain, manufacturing, and engineering expertise. These solutions share reliability, cost-down and efficiency advantages. We have driven down our costs through our relentless commitment to innovation and discipline. By delivering either molecules of fuel or electrons, we can serve two different markets with one platform. We have made significant progress developing our flexible platform to be utilized in a variety of new applications. Today, Bloom’s energy transition technology is helping organizations and communities achieve their energy objectives.
To date, nearly all of our product revenue has been attributable to sales of our power generating Energy Server system. In 2024, we increased our Energy Server system sales to utility companies seeking alternative sources of power to meet the increasing power demand coming from their customers. Operating in an islanded microgrid mode, we can be onsite and operating in months, while other power providers are quoting deliveries in years. With our Bloom Energy Server system, we are also partnering with developers for significant opportunities in waste-to-energy. In some instances, we are providing power solutions to enable lower carbon intensity renewable fuels, and in other cases, we are providing solutions to use biogas for resilient power across dairies, landfills, and wastewater treatment facilities.
The U.S. is currently our largest market in terms of revenue and installed base of the Energy Server system. Our major customers include companies in industries such as utilities, data centers, agriculture, retail, hospitals, higher education, biotech, and manufacturing. Many of our customers are looking to solve time-to-power issues where they cannot get energy fast enough from the grid or current energy providers to meet their commercial objectives. Our utility customers are using our Energy Server system as an alternative source of on-site power that they can supply to their end customers, including AI data centers. Moreover, our resilient technology provides secure power to critical facilities, including data centers, hospitals and high-tech
manufacturing, while also serving to reduce greenhouse gas (“GHG”) emissions. We also work with several global financing and distribution partners who purchase and deploy our systems at end-customers’ facilities to provide “electricity-as-a-service.”
Our second-largest market in terms of revenue and installed base of the Energy Server systems is South Korea. We began commercial operation in South Korea in 2018 and have grown our footprint to nearly 600 megawatts of deployed Energy Server equipment across South Korea. SK ecoplant Co., Ltd. (“SK ecoplant”) and SK eternix Co., Ltd. (“SK eternix”) serve as distributors of our systems in the Republic of Korea. The volatility of the Korean Won, as experienced in the past several months, may impact our commercial efforts in the region.
The Bloom Electrolyzer leverages 20+ years of expertise we have accumulated from building, installing and operating fuel cell systems. The electrolyzer produces hydrogen, which has opened new markets, partnerships, and geographies for the company. At its high efficiency, the Bloom Electrolyzer uses less electricity to produce hydrogen than other electrolyzers on the market today, potentially lowering the overall cost of producing hydrogen, a critical factor in accelerating the transition to hydrogen as a fuel. In 2023, the Idaho National Laboratory (“INL”) concluded it was the most efficient electrolyzer that they had tested.
Products & Services
Solid Oxide Platform
Our solid oxide fuel cell (“SOFC”) technology platform is the foundation for our Energy Server system and Bloom Electrolyzer. Our modular and configurable solid oxide platform is capable of providing a variety of sustainable energy solutions — from zero carbon electricity to clean hydrogen. We continue to evolve and expand our offerings as we pursue our mission to make clean, reliable energy affordable for all. Our solid oxide platform has four core attributes that span our portfolio:
•Shared Solid Oxide Technology. Our products leverage the same proprietary fuel cell technology, including cell printing, stack and column configurations that drive high efficiency energy production across products and applications.
•Common Product Architecture. The same enclosures and skid mounted installation methods are common across our products and the modular, fault tolerant design enables resilient operation and service capability.
•Shared Supply Chain and Manufacturing Process. Our core technology components and supplier network are shared across products. The same manufacturing lines, personnel and processes are leveraged at our Fremont, California cell print factory and Delaware assembly facility which enables manufacturing stability and expandability. Remote monitoring, repair and overhaul (“R&O”) operations are also combined to support consistent and data driven end of life recovery.
•Flexible Offerings. Our products allow for a variety of deployment configurations and applications to serve our customers’ operational and sustainability goals.
The Bloom Energy Server System
Our power generation platform, the Bloom Energy Server system, is designed to deliver reliable, resilient, clean and affordable energy for utilities and organizations alike. Suitable to operate parallel with the grid, independent of the grid, or as part of a larger microgrid ecosystem, the Bloom Energy Server system is based on our proprietary solid oxide technology that converts fuel, such as natural gas, biogas, hydrogen, or a blend of these fuels, into electricity through an electrochemical process without combustion. The electrical output of our Energy Server system is designed to be connected to the customer’s main electrical feed, thereby avoiding the transmission and distribution losses associated with a centralized grid system. The modular nature of our solution enables any number of Energy Server systems to be clustered together in various configurations, providing solutions from hundreds of kilowatts to hundreds of megawatts. The Energy Server system is designed to be easily integrated into community environments due to its aesthetically attractive design, compact space requirement, minimal noise profile, low water consumption, and near-zero criteria air pollutant emissions.
The platform’s fuel flexibility combined with a skid mounted and modular package means that the Bloom Energy Server system is well situated to serve as a rapidly deployable electricity transition technology and solution today, without creating a stranded asset in the future. It performs at significantly higher efficiency than traditional, combustion-based resources. When operating on natural gas, the Energy Server system reduces carbon dioxide and air pollutants by using a non-combustion process — and applications such as CCUS or CHP further reduce these emissions.
Our Energy Server system is designed to deliver reliable electricity. Our microgrids continue to deliver power to our customers even when the grid is not available. Our system is capable of operating at a 99%+ availability due to its modular and fault-tolerant design, which includes multiple independent power generation modules that can be concurrently replaced during maintenance to provide uninterrupted service. Our Energy Server system also has proven resilient when faced with weather events, cybersecurity attacks, and other grid outages, providing reliable power while the grid has grappled with the proliferation of intermittent wind and solar generation. Our systems can be deployed and installed far quicker than building new transmission lines or adding other forms of large-scale power generation. This value proposition is particularly meaningful for manufacturers, data centers, hospitals, and retailers with strong markets and aggressive growth plans amid a constrained grid.
The Bloom Energy Server system is often configured as primary power, where the system operates in parallel to the grid and provides additional base load power for customers at potentially lower prices than the grid, or as microgrids, where the system operates in islanded or grid-connected configurations that offer superior power quality with minimal downtime. Our systems can be deployed mounted on skids for easy installation and movement, providing site flexibility and cost savings. Where land is expensive or in low supply, these skids can be stacked to provide additional power density that can exceed the power density of traditional power plants.
The Energy Server system can be utilized in the following applications bringing additional value to the energy market:
•CCUS. Our Energy Server system, when combined with third-party carbon capture technology, can provide near zero-carbon electricity. During normal operations using natural gas or biogas-fuel sources, the Energy Server system vents CO2 into the atmosphere as a byproduct. When used in conjunction with carbon capture equipment, the Energy Server is configured to output CO2 for consolidation, compression, and processing for sequestration or utilization in other consumer or industrial applications. The compression and processing of the anode exhaust can be performed by industrial gas companies that specialize in carbon capture technology and techniques. Bloom’s anode exhaust, once dried, has 95% purity of CO2. This produces a relatively pure stream of CO2, making it comparatively simple and inexpensive to capture. Carbon capture from the Energy Server system operating on natural gas or biogas can improve the project economics and help with a customer's decarbonization goals.
•CHP. High-temperature cathode exhaust from the Energy Server system can be channeled, allowing the resulting exhaust heat to be fed to one or more heat recovery devices, such as a heat exchanger or an absorption chiller to support both heating applications as well as air conditioning, refrigeration, and/or process fluid cooling for use in commercial buildings or other industrial plants. The increased overall system efficiency provided by CHP produces both financial savings in fuel charges and additional sustainability benefits. In 2024, we improved our CHP offering increasing the combined efficiency of our technology to 85% with a goal of reaching, through continuous improvement, a 90% efficiency threshold.
•Waste to Energy. Bloom Energy’s SOFCs provide an electrochemical pathway to convert biogas to electricity without combustion, producing carbon-neutral electricity with near-zero air pollution and water usage. The Energy Server system can utilize proven, off-the-shelf gas conditioning equipment to process raw biogas into suitable fuel for power generation. Using biogas feedstocks with our Energy Server system can provide industry leading carbon intensity scores and other decarbonization benefits.
Value Proposition
•Scalable, Modular, Fault Tolerant Designs. The modular nature of the Energy Server system design allows for design flexibility, producing operational and serviceability advantages over other technologies. Our systems have design flexibility to support power needs from kW to hundreds of MWs, and include a wide range of reliability and output guarantees. The system is capable of operating at very high availability as independent power generation modules can be easily replaced to provide uninterrupted service and our redundant architecture reduces single points of failure. As a result, unlike traditional combustion generation, our Energy Server system can be serviced and maintained without powering down the system. Modularity also provides for ease of scalability as customers grow their power needs over time. Our Energy Server system is often configured as a microgrid solution without any dependency on transmission or distribution lines. These microgrids can be configured to support all or a portion of a customer’s load and are often installed alongside batteries to increase flexibility and reliability.
•Resilient. Our Energy Server system avoids the vulnerabilities of conventional transmission and distribution lines by generating power on-site. Importantly, Bloom Energy Server systems that utilize existing natural gas infrastructure rely on a redundant underground mesh network, intended to provide extremely high fuel availability that helps to mitigate some exposure to certain natural disasters, extreme weather events, and other environmental conditions that often disrupt the power grid.
•Reliable Generation for Mission Critical Facilities. The modular design of the Energy Server system can be configured into large scale Energy Server farms. Using a customized approach for each customer, these farms can be configured to have minimal redundancy to produce reliable power output that can meet or exceed grid reliability depending on the needs of the customer. Our Energy Server systems are designed to deliver 24x7 power with very high availability, mission-critical reliability and grid-independent capabilities. Our Energy Server system exhibits high levels of mean time between failure and with concurrent maintenance has low mean time to repair which yields a 99.9% availability. Adding redundancy results in a higher availability of 99.999% availability, which is suited to meet the most critical load requirements on the market.
•Flexible Deployment Configurations. The Energy Server system can operate independently as a distributed energy resource, or in combination with other energy resources like the grid, renewables, and generators. The Be Flexible™ platform and system enhancements support ramping and load following capability without compromising service life. The operational flexibility of the Energy Server system allows it to handle many types of customer loads, including the peak loads associated with AI data centers.
•Future Proof for the Energy Transition. Our Energy Server systems can convert hydrogen into electricity, but it is optimized based on fuels that are readily available like natural gas and biogas. If and when hydrogen becomes more readily and economically available, the Energy Server system use hydrogen as a feedstock-helping to prevent the system from becoming a stranded asset. Combined with CCUS capability, Bloom offers its customers sustainability benefits today with multiple pathways to long-term decarbonization.
Competition
In addition to centralized utility grids, and other utility and non-utility owned generation sources, we primarily compete against:
•Gas reciprocating engines. Reciprocating internal combustion engines that are powered by natural gas to generate electricity directly onsite, often for backup power, load balancing, or CHP applications. The Bloom Energy Server system has a higher power density, lower emissions, higher reliability, and better flexibility to adapt to load fluctuations.
•Small gas turbines. Turbines operate on carbon-based fuels including diesel and natural gas and typically require greater redundancy than the Energy Server system to achieve a similar level of availability for large data center customers. The Bloom Energy Server system has lower emissions and higher reliability.
•Combined cycle plants. Combined cycle plants use gas and steam turbines together to produce more electricity from the same fuel than a traditional simple-cycle plant. Waste heat from the gas turbine is routed to the nearby steam turbine to generate extra power. The Bloom Energy Server system can achieve similar efficiencies as combined cycle plants with the distribution losses due to onsite deployment.
We believe our Energy Server systems compete favorably against these products, with our systems capability to adapt to variable oscillating workloads. Furthermore, due to its relative ease in permitting and installation compared to the above mentioned products, the Energy Server can be deployed rapidly, giving us a competitive advantage when customers have an urgent need for power. The Energy Server system has a negligible impact on air quality, no noise pollution, and the ability to produce more megawatt hours per acre. The Energy Server system's modular design provides superior reliability compared to these products as the system can be serviced with no downtime. Finally, the Energy Server system has a high efficiency that allows for a low operating cost and emissions profile.
Other sources of competition — and the attributes that differentiate us — include:
•Intermittent solar power paired with storage. Solar power is intermittent and better suited for addressing daytime peak power requirements, while our Energy Server system is designed to provide stable high availability generation. Energy storage technology is intended to address the intermittency of solar power. However, the low power density of the combined technologies and the challenges of extended poor weather events that sharply decrease solar power production and battery recharging make the solution impractical for most commercial and industrial customers looking for on-site solutions to offset a significant amount of power. As a point of comparison, to provide the same energy output as our Energy Server systems, a photovoltaic solar installation typically requires 125 times more space. This allows us to serve a bigger portion of a customer’s energy requirements on-site based on their available and typically limited space.
•Intermittent wind power paired with storage. Power from wind turbines is intermittent, similar to solar power. Typically, wind power is deployed for utility-side, grid-scale applications in remote locations but not as a customer-side, distributed power alternative due to prohibitive space requirements and permitting issues. Wind turbines also can be co-located with storage, with similar benefits and challenges to solar-and-storage combinations. Remote wind farms feeding into the grid do not help end customers avoid the vulnerabilities and costs of the transmission and distribution system.
•Traditional co-generation systems. These systems deliver a combination of electric power and heat from combustion sources. We believe we compete favorably because of our non-combustion platform, superior electrical efficiencies, significantly less complex deployment (avoiding heating systems integration and requiring less space), superior availability, aesthetic appeal, and reliability. Unlike these systems, which depend on the full and concurrent utilization of waste heat to achieve high efficiencies, we can provide highly efficient systems to customers based solely on their power needs.
•Traditional backup equipment. As our Energy Server systems deliver reliable power, particularly in grid-independent configurations where our Energy Server system can operate during grid outages, they can prevent the need for traditional backup equipment, such as diesel generators. By providing a solution that is designed to deliver a combustion-free power 24x7 rather than just as a backup source of power, we can generally offer a better integrated, more reliable, cleaner, and more cost-effective solution than these grid-plus-backup systems.
•Other commercially available fuel cells. Our Energy Server systems use advanced SOFC technology, which produces electricity directly from oxidizing fuel. The advantages of our technology include higher efficiency, long-term stability, elimination of the need for an external fuel reformer, ability to use biogas, natural gas, or hydrogen as a fuel, low emissions, and relatively low cost. There are a variety of fuel cell technologies, characterized by their electrolyte material, including:
◦Proton exchange membrane fuel cells (“PEM”). PEM fuel cells are typically used in onboard mobility applications, such as powering forklifts, because of their compactness and ability for quick starts and stops. However, PEM technology requires an expensive platinum catalyst, which is susceptible to poisoning by trace amounts of impurities in the fuel or exhaust products. These fuel cells require high-cost fuel input energy sources or an external fuel reformer, which adds to the product’s cost, complexity, and electrical inefficiency. As a result, they are not typically an economically viable option for stationary power generation.
◦Molten carbonate fuel cells (“MCFC”). MCFCs are high-temperature fuel cells that use an electrolyte composed of a molten carbonate salt mixture suspended in a porous, chemically inert ceramic matrix of beta-alumina solid electrolyte. The primary disadvantages of current MCFC technology are durability and lower electrical efficiency compared to solid oxide fuel cells. Current versions of the product are built for 300 kilowatt systems and are monolithic rather than modular. Smaller sizes are typically not economically viable. In many applications where the heat produced by these fuel cells is not commercially or internally useable continuously, mitigating the heat buildup also becomes a liability.
◦Phosphoric acid fuel cells (“PAFC”). PAFCs use liquid phosphoric acid as an electrolyte. Developed in the mid-1960s and field-tested since the 1970s, they were the first fuel cells to be commercialized. PAFCs have been used for stationary power generators with output in the 100 kilowatts to 400 kilowatts range. PAFCs are better suited for combined heat and power output applications that require carefully matching and constant monitoring of power and heat requirements (heat is typically not required all year long thus significant efficiency is lost), often making the technology difficult to implement. Further, disadvantages include low power density and poor system output stability.
Bloom Electrolyzer
The Bloom Electrolyzer is designed to produce scalable and cost-effective hydrogen using the same solid oxide platform as our Energy Server system. The Bloom Electrolyzer supplants the conventional way of making hydrogen. Our electrolyzer efficiently uses electricity to split water into hydrogen and oxygen. The Bloom Electrolyzer can be paired with a variety of clean energy inputs, including renewable or nuclear feedstocks, and can be sited flexibly—delivering hydrogen to a variety of end users such as industrial, transportation and power sector applications. Our solid oxide, higher-temperature Electrolyzer is designed to produce hydrogen onsite more efficiently than lower-temperature PEM and alkaline electrolyzers. Because it operates at higher temperatures, the Bloom Electrolyzer requires less electric energy to break up water molecules and produce hydrogen.
Value Proposition
•Higher Efficiency. Fuel (steam) supplied to the Bloom Electrolyzer undergoes an electrochemical reaction at 700-900 degrees Celsius which is higher than other currently available technologies. This leads to a fundamental efficiency advantage to produce hydrogen by consuming less electricity. As electricity accounts for most of the cost of producing hydrogen from electrolysis, using less electricity improves the economics of producing hydrogen and aids adoption.
•Proven with Decades of Experience. Although the Bloom Electrolyzer is a new product that opens up a new market for us, our Energy Server system and Bloom Electrolyzer share the same solid oxide platform, so our commercial field experience in power generation directly transfers to our hydrogen production and products. We build upon the same core platform, supply chain, manufacturing process, and advanced remote software monitoring across all our products and applications. Our experience working closely with developer partners, in addition to our role as an original equipment manufacturer (“OEM”), enables us to successfully engage with customers and ecosystem partners.
Electrolyzer Competition
Given that the clean hydrogen industry is at an early stage of development, no single technology has gained a leadership position. The Bloom Electrolyzer is differentiated from Alkaline, PEM, and Anion Exchange Membrane (“AEM”) electrolysis which are low temperature technologies using liquid water. With high temperature electrolysis, water needs to be heated, vaporized, and brought to operating temperature. The thermal energy requirements are reduced by using steam at or near operating temperature as the input to the Electrolyzer. Integrating a solid oxide electrolyzer cell with other energy feedstocks with available waste heat to provide thermal energy, like nuclear or concentrated solar, provides additional efficiency gains.
Research and Development
Our research and development efforts have addressed complex applied materials, processing and packaging challenges by inventing many proprietary advanced material science solutions. Over more than a decade, Bloom has sought to build a world-class team of solid oxide fuel cell scientists and technology experts. Our team comprises technologists with degrees in Materials Science, Electrical Engineering, Chemical Engineering, Mechanical Engineering, Civil Engineering and Nuclear Engineering, and includes 59 PhDs within these or related fields. This team has continued to develop innovative technological improvements for our Energy Server system. Since our first-generation technology, we have reduced the costs, increased the output of our systems, and increased the life of our fuel cells by over two and half times.
We have invested and plan to continue to invest a significant amount in research and development. See our discussion of research and development expenses in Part II, Item 7, Management’s Discussion and Analysis of Financial Condition and Results of Operations of this Annual Report on Form 10-K for further information.
Intellectual Property
Intellectual property is an essential differentiator for our business, and we seek to protect our intellectual property through a combination of patents, copyrights, trade secrets, trademarks, employee and third-party non-disclosure agreements, and other contractual restrictions.
We protect our trade secrets and confidentiality know-how by enforcing our internal policies for data classification, authentication and protection and by requiring and enforcing non-disclosure and other agreements. We also utilize cybersecurity tools and systems, as well as physical security measures to safeguard our most valuable data from insider threats and third party efforts to misappropriate our intellectual property. See Part I, Item 1C, Cybersecurity of this Annual Report on Form 10-K for further information.
We have developed a significant patent portfolio to protect elements of our proprietary technology. As of December 31, 2024, we had 358 active patents and 148 patent applications pending in the U.S., and we had an international patent portfolio comprising 177 active patents (counting patents by where enforceable) and 430 patent applications pending. Our U.S. patents are expected to expire between 2025 and 2044. While patents are an essential element of our intellectual property strategy, our business is not dependent on any one patent or pending patent application.
We regularly review our development efforts to assess the existence and patentability of new intellectual property. We pursue the registration of our domain names, trademarks, and service marks in the U.S. and some international locations. “Bloom Energy” and the “BE” logos are our registered trademarks in certain countries for use with the Energy Server system
and our other products. We also hold registered trademarks for, among others, “Bloom Box,” “BloomConnect,” “BloomEnergy,” and “Energy Server” in various countries. Bloom has several trademark applications pending, including applications directed to new product categories, expanded use applications, and applications on several logos used by the Company.
When appropriate, we enforce our intellectual property rights against other parties. For more information about risks related to our intellectual property, please see the risk factors set forth under the caption Part I, Item 1A, Risk Factors — Risks Related to Our Intellectual Property.
Manufacturing Facilities
Our primary manufacturing facilities are in Fremont, California, and Newark, Delaware. We own our 178,000 square-foot manufacturing facility in Newark, which was our first purpose-built Bloom Energy manufacturing center and was designed specifically for copy-exact duplication as we expand, which we believe will help us scale more efficiently. Our Newark facility includes an additional 25 acres available for factory expansion and/or the co-location of supplier plants.
In September 2023, as part of the approved restructuring plan (the “Restructuring Plan”), we initiated a closure of a 50,000 square-foot manufacturing, warehousing, research and development (“R&D”) facility in Sunnyvale, California, which lease expired in December 2023. Under the Restructuring Plan, we consolidated this Sunnyvale facility with our manufacturing facility in Fremont, California, and performed an optimization of our manufacturing workforce. The restructuring activities were completed in the first quarter of fiscal year 2024. For more information about the restructuring, please see Part II, Item 8, Note 12 — Restructuring.
We lease various manufacturing facilities in California and Delaware. We lease an 89,000 square-foot R&D and manufacturing facility in Fremont, California, which became operational in April 2021. Additionally, in Fremont, California, in June 2022, we opened a new research and technical center and a global hydrogen development facility with a total space of 73,000 square feet, and, since July 2022, we leased a 164,000 square-foot manufacturing facility that expires in February 2036. The lease terms of our Repair & Overhaul (“R&O”) manufacturing facilities in Newark, Delaware, with a total area of 56,000 square feet expire in December 2026 and April 2027.
On December 31, 2024, the lease of our 60,000 square-foot manufacturing, warehousing, and R&D facility in Sunnyvale, California, ended. We plan to vacate this facility in the first quarter of fiscal year 2025 and consolidate these operations with our manufacturing facility in Fremont, California.
We maintain a light-assembly facility in the Republic of Korea, in connection with our efforts to develop a local supplier ecosystem through a joint venture with SK ecoplant.
Please see Part I, Item 2, Properties for additional information regarding our facilities.
Supply Chain
Our supply chain has been developed since our founding, with a group of high-quality suppliers that support automotive, semiconductors and other traditional manufacturing organizations. The production of fuel cells requires rare earth elements, specialty alloys and industrial commodities. Our operations require raw materials, and in certain cases, third-party services that require special manufacturing processes. We generally have multiple sources of supply for our raw materials and services except in cases where we have specialized technology and material property requirements. Our supply base is spread around many geographies in Asia, Europe and India, consisting of suppliers with multiple areas of expertise in compaction, sintering, brazing and dealing with specialty material manufacturing techniques. Where possible, we responsibly source components like interconnects and balance of system components from various manufacturers on both a contracted and a purchase order basis. We have multi-year supply agreements with some of our supply partners for supply continuity and pricing stability. We are working with our suppliers and partners along all steps of the value chain to reduce costs by improving manufacturing technologies and expanding economies of scale.
There have been a number of disruptions throughout the global supply chain; demand for certain components has outpaced the return of the global supply chain to full production. Though the supply constraints for a majority of our raw materials and components are expected to ease in 2025, we have experienced an increase in lead times with respect to the delivery of some of our components due to a variety of factors, including supply shortages, shipping delays and labor shortages. Additional new trade tariffs or other trade protection measures that are being considered by the new U.S. administration could have a disruptive impact on our supply chain. While our supply chain does not have significant exposure to China, significant
tariffs on imports from other countries where we do source materials could materially impact our costs. For example, we expect the 25% tariffs imposed on U.S. imports of steel and aluminum to adversely impact our cost of raw materials for our products. Though we experienced delays from certain vendors and suppliers as a result of these factors, we have been able to mitigate the impact so that we did not experience significant delays in the manufacturing of our platforms. For additional information on our supply chain, please see Part II, Item 7, Management’s Discussion and Analysis of Financial Condition and Results of Operations — Overview — Certain Factors Affecting our Performance.
Services
We execute operations and maintenance agreements (“O&M Agreements”) for our projects. The customer agrees to pay an ongoing service fee, and in return, we monitor, maintain, and operate the Bloom systems on the customer’s or owner’s behalf. We currently service and maintain every Energy Server system installed worldwide.
As of December 31, 2024, our in-house service organization had 182 dedicated field service personnel distributed across multiple locations in both the U.S. and internationally. Our standard O&M Agreements include full remote monitoring and 24x7 operational capability over the systems as well as scheduled and unscheduled maintenance, which in practice includes preventative maintenance, such as filter and adsorbents replacements and on-site part and periodic fuel cell replacements.
Our two Remote Monitoring and Control Centers (“RMCC”) are responsible for providing 24x7 coverage of every installation worldwide. By situating our RMCC centers in the U.S. and India, we are able to provide coverage cost effectively and also provide a dual redundant system with either site designed to operate continuously should an issue arise. Each Energy Server system we ship includes instrumentation and a secure telemetry connection that enables RMCC to monitor over 500 system performance parameters in real time. This comprehensive monitoring capability enables the RMCC operators to have a detailed understanding of the internal operation of our products. Using proprietary, internally developed software, the RMCC operators can detect changes and override the onboard automated control systems to remotely adjust parameters to maintain optimum system performance. In addition, we undertake advanced predictive analytics to identify potential issues before they arise and undertake adjustments prior to a failure occurring.
Our services organization also has a dedicated R&O facility, which is currently based in Delaware. The facility undertakes full refurbishment of returned products with the capability to restore them to service with a less than three-week turnaround.
Purchase and Financing Options
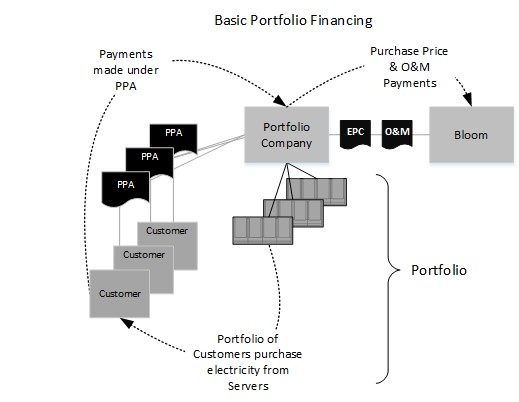
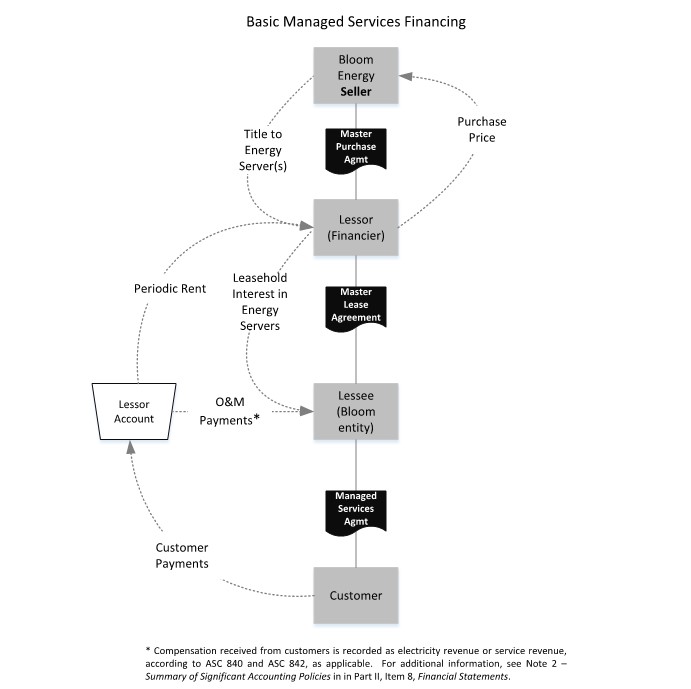
Both in the U.S. and internationally, we sell our products directly to customers. To appeal to a wide range of customers, we offer several financing options. In the U.S., we also provide access to our Energy Server system through a Power Purchase Agreement, which is the purchase of electricity generated by the Energy Server system in exchange for a scheduled dollars per kilowatt hour rate, through a Capacity Agreement where the customer pays a capacity-based flat payment, through a Lease Agreement where the customer pays a monthly fixed fee for the use of the equipment, and through a Managed Services Agreement, whereby we sell and lease-back the Energy Server system to supply energy services to our customers. Each of the foregoing are made possible through third-party financing arrangements by assembling such contracts into portfolios which are sold to investors.
Often, our offerings are designed to take advantage of local incentives. In the U.S., our financing arrangements are structured to optimize both federal and local incentives, including tax credits made available through the Inflation Reduction Act of 2022 (the “IRA”) and accelerated depreciation. As of December 31, 2024, the investment tax credit and accelerated depreciation previously available for our U.S. offerings expired, which will affect purchasing offerings. Internationally, our sales are made primarily direct to customers as a direct product sale.
For additional information about our different financing options, please see Part II, Item 7, Management’s Discussion and Analysis of Financial Condition and Results of Operations — Purchase and Financing Options.
Sales, Marketing and Partnerships
We sell our products through a combination of direct and indirect sales channels. At present, most of our U.S. sales are through our direct sales force, which is segmented by vertical and type of account. We are expanding our relationship with utilities and other commercial customers across the U.S., and our utility relationships have become important partners in our sales activities. We have developed a network of strategic advisors that create new opportunities and referrals to Bloom Energy, which has been a valuable source of high-quality leads.
We pursue relationships with other companies in areas where collaboration can produce product advancement and acceleration of entry into new geographic and vertical markets. The objectives and goals of these relationships can include one or more of the following: technology exchange, joint sales and marketing, installation, customer financing or service.
As we have cultivated sales as well as strategic and financing partners over the past several years, our sales have been concentrated among a few large customers and distributors each year. During the year ended December 31, 2024, revenue from three customers, the first of which is our related party (see Part II, Item 8, Note 11 — Related Party Transactions), accounted for approximately 23%, 16% and 14% of our total revenue, respectively. Please see Part II, Item 8, Note 1 — Nature of Business, Liquidity and Basis of Presentation — Concentration of Risk — Customer Risk.
SK ecoplant in the Republic of Korea is a strategic power generation and distribution partner. In October 2021, we announced an expansion of our existing partnership with SK ecoplant, that includes purchase commitments for at least 500 megawatts of our Energy Server systems between 2022 and 2024, the creation of hydrogen innovation centers in the U.S. and the Republic of Korea to advance green hydrogen commercialization, and an equity investment in Bloom Energy. In September 2023, SK ecoplant became a related party to us with the beneficial ownership of 10.5% of our outstanding Class A common stock. In December 2023, we further expanded our business partnership with SK ecoplant through the increase of SK ecoplant’s purchase commitments for Bloom Energy products of 250 megawatts through 2027 and extended the timing of delivery of the remaining commitment under the original agreement. For additional information, please see Part II, Item 8, Note 17 — SK ecoplant Strategic Investment.
Sustainability
We are driven by the promise of our contribution to the transformation and decarbonization of energy and mobility sectors globally. We are working to make our technology available across a growing list of applications including biogas, carbon capture, hydrogen, combined heat and power, and microgrid projects critical to aligning with a 1.5 degree warming trajectory. Our natural gas-based Energy Server systems are also an important source of near-term emission reductions, and we are committed to evolving the gas sector through our technological development and leading market-based activity.
As a manufacturer, our commitment to sustainability is reflected not only through the impacts of our products in operation but also through our internal commitment to resource efficiency, responsible design, materials management and recycling. We endeavor to consistently increase our supply chain responsibility and approach to human capital management in ways that help us to continue to deliver products that add long-term societal value.
We take a cradle-to-grave perspective on product design and use. We strive to reuse components and recoverable materials where feasible and use conflict-free, non-toxic new resources where needed. We design our equipment so that components can be refurbished as needed instead of requiring new equipment. Finally, we seek to cover as many materials and components as practicable during end-of-life management, reusing these materials and components.
Global Climate Issues
Climate change and resulting extreme weather are having significant economic, environmental and social impacts around the world. These effects and anticipated future impacts have resulted in a wide array of market and regulatory responses, and we expect that these types of responses will continue. Our business can be impacted by climate change, and by those market and regulatory responses, in a variety of ways. We closely follow the impacts of climate change on the energy system, as well as the regulatory, policy and voluntary measures taken in response to those impacts, so that we may understand and respond to changing conditions that may affect our Company, our customers, and our investors and business partners. Our sustainability disclosures have been responsive to the recommendations from the Task Force on Climate-related Financial Disclosures (“TCFD”), as well as disclosure guidance from the Sustainability Accounting Standards Board (“SASB”) that is now incorporated into the International Financial Reporting Standards (“IFRS”) Framework with which we intend to align moving forward.
We issued our first Sustainability Report in 2021 and have since issued dedicated sustainability reports annually.
The direct impacts of climate change on energy systems, including the increased risk they pose to energy service disruption, may provide an opportunity for our extremely reliable and resilient energy generation. New or more stringent international accords, national or state legislation, or regulation of GHG emissions may increase demand for our bioenergy and hydrogen-based products, but they may also make it more expensive or impractical to deploy natural gas-fueled Energy Server systems in some markets, notwithstanding their enhanced environmental performance relative to combustion-based technologies or may cause the loss of regulatory or policy incentives for those deployments. Examples include new climate
emissions restrictions or the introduction of carbon pricing, and the adoption of bans or restrictions on new natural gas interconnections by some local jurisdictions. For more on climate and environmental related risks, see Part I, Item 1A, Risk Factors — Risks Related to Legal Matters and Regulations.
Permits and Approvals
Each Energy Server system and Electrolyzer installation must be designed, constructed and operated in compliance with applicable federal, state, international and local regulations, codes, standards, guidelines, policies and laws. To operate our systems, we, our customers and our partners are each required to obtain applicable permits and approvals for the installation, which may include federal, state, and local authority approvals; interconnection agreements with the local electrical utility; and, where the gas distribution system is used, the gas utility as well.
Government Policies and Incentives
There are varying policy frameworks across the U.S. and internationally designed to support and accelerate the adoption of clean and/or reliable distributed power generation and hydrogen technologies, such as the manufacturing and deployment of our Energy Server systems and our Electrolyzers. These policy initiatives can come in the form of tax incentives, cash grants, performance incentives, environmental attribute credits, permitting regimes, interconnection policies and/or applicable gas or electric tariffs.
The U.S. federal government provides businesses with the Investment Tax Credit (the “ITC”) under Section 48 of the Internal Revenue Code, which has been available to the owners of our Energy Server systems for the tax year in which the systems are placed into service. The ITC for fuel cells operating on non-zero carbon fuels expired at the end of fiscal year 2024. Although the ITC for qualified fuel cell property expired on December 31, 2024, we entered into qualifying transactions that will allow certain of our customers to benefit from the ITC for projects placed into service by December 31, 2028.
The IRA includes numerous investments in climate protection, and, among them, an extension and expansion of the ITC and the Production Tax Credit under Section 45 of the Internal Revenue Code, the addition of expanded tax credits for other technologies and for manufacturing of clean energy equipment, as well as terms allowing parties to more easily monetize the tax credits. The IRA contains a multi-tiered credit-amount structure for many applicable tax credits. Specifically, for projects that qualified before the expiration, many of the credits have a lower base credit amount that can be increased up to five times if the taxpayer can satisfy applicable prevailing wage or apprenticeship requirements. The IRA also creates certain bonus tax credit amounts relevant to projects involving Bloom products that are placed in service, or of which construction began, in 2023 and 2024 and that satisfy domestic content criteria and/or are located within an “energy community.” The IRA also creates tax credits for the production of hydrogen and carbon capture, as well as incentives for clean energy manufacturing. By implementing the IRA, the U.S. federal government aims to make an impact on energy markets so that cleaner options are more affordable to consumers.
Our Energy Server systems are currently installed at customer sites in various states across the U.S., each of which has its own enabling policy framework. Some states have utility procurement programs and/or renewable or alternative portfolio standards for which our technology is eligible. Our Energy Server systems currently qualify for a variety of state benefits and incentives, such as tax exemptions, interconnection benefits, relief from utility charges and other forms of economic and energy benefits.
Some municipal jurisdictions are considering or have recently enacted building codes or local ordinances that limit access to the natural gas pipeline distribution network, primarily in California and the Northeast. Specific policies vary widely as to whether or not they impact our ability to do business in a given jurisdiction and the vast majority apply only to new, rather than existing, buildings. While these jurisdictions comprise a small minority of our current and prospective business footprint, local consideration of such codes and ordinances continues to evolve. Other jurisdictions are considering enacting restrictions on data centers based on their electricity consumption, which is an evolving policy at both state and local levels.
Government Regulations
Our business is subject to a changing patchwork of energy and environmental laws and regulations that prevail at the federal, state, regional and local level as well as in those foreign jurisdictions in which we operate. Most existing energy and environmental laws and regulations preceded the introduction of our innovative fuel cell technology and were adopted to apply to technologies existing at the time, namely large coal, oil or gas-fired power plants, and more recently solar and wind plants.
Although we generally are not regulated as a utility, existing and future federal, state, international and local government statutes and regulations concerning electricity heavily influence the market for our products and services. These statutes and regulations often relate to electricity pricing, net metering, incentives, taxation, competition with utilities, the interconnection of customer-owned electricity generation, interconnection to the gas distribution system, and other issues relevant to the deployment and operation of our products, as applicable. Federal, state, international and local governments frequently modify these statutes and regulations. Governments, often acting through state utility or public service commissions, change and adopt or approve different requirements for regulated entities and rates for commercial customers on a regular basis. These changes can have a positive or negative impact on our ability to deliver cost savings to customers.
At the federal level, the FERC has authority to regulate, under various federal energy regulatory laws, wholesale sales of electric energy, capacity, and ancillary services, and the delivery of natural gas in interstate commerce. To operate our systems, we obtain interconnection agreements from the applicable local primary electricity and gas utilities. In almost all cases, interconnection agreements are standard form agreements that have been pre-approved by the bodies with jurisdiction over interconnection agreements, including FERC, state utility commissions, and municipal or cooperative utilities. As such, no additional regulatory approvals are typically required for the deployment of our systems once interconnection agreements are signed, although they may be required for the export and subsequent sale of electricity or other regulated products.
Product safety standards for stationary fuel cell generators have been established by the American National Standards Institute (the “ANSI”). These standards are known as ANSI/CSA FC-1. Our products are designed to meet these standards. Further, we utilize Underwriters’ Laboratory, or UL, to certify compliance with these standards. The Energy Server system installation guidance is provided by NFPA 853: Standard for the Installation of Stationary Fuel Cell Power Systems. Installations at sites are carried out to meet the requirements of these standards.
Environmental laws and regulations can give rise to liability for administrative oversight costs, cleanup costs, property damage, bodily injury, fines, and penalties. Capital and operating expenses needed to comply with environmental laws and regulations can be significant, and violations may result in substantial fines and penalties or third-party damages. In addition, maintaining compliance with applicable environmental laws, such as the Resource Conservation and Recovery Act (“RCRA”) and the Clean Air Act (“CAA”), requires significant time and management resources.
Several states and regions in which we currently operate require permits where emissions of air pollutants would exceed applicable thresholds. In most states and regions where this is the case, permits have only been required for larger Energy Server system installations. Other states and regions in which we operate, including New York, New Jersey and North Carolina, have specific air permitting exemptions for fuel cells.
As a publicly traded company in the U.S., we are subject to laws and regulations of the SEC as well as the rules of the New York Stock Exchange, on which our company is listed. As a global enterprise operating in multiple countries, we must abide by laws and regulations applicable to entities across many jurisdictions, including those governing antitrust and competition, cybersecurity, data privacy, artificial intelligence, anti-bribery and anti-competition.
As an employer of full-time and part-time employees, our operations are subject to global labor and employment laws, including wage and hour laws, health and safety laws, such as Occupational Safety and Health Administration (“OSHA”), and immigration laws. In addition, there are diverse global regulations regarding our contractor workforce. These laws and regulations are subject to change at any time and compliance with the requirements can impose significant costs. For more information about the regulations to which we are subject and the related risks to our costs and operations, please see the risk factors set forth under the caption Part I, Item 1A, Risk Factors — Risks Related to Legal Matters and Regulations.
Backlog
The timing of delivery and installation of our products has a significant impact on the timing of the recognition of our product and installation revenues. Many factors can cause a lag between the time a customer signs a contract and our recognition of product revenue. These factors include the number of Energy Server systems installed per site, local permitting and utility requirements, environmental, health and safety requirements, weather, and customer facility construction schedules. Many of these factors are unpredictable and their resolution is often outside of our or our customers’ control. Customers may also ask us to delay installation for reasons unrelated to the foregoing, including operational considerations or delays in their financing arrangements. Further, due to unexpected delays, deployments may require unanticipated expenses to expedite delivery of materials or labor to ensure the installation meets our timing objectives. These unexpected delays and expenses can be exacerbated in periods in which we deliver and install a larger number of smaller projects. In addition, if even relatively short delays occur, there may be a significant shortfall between the revenue we expect to generate in a particular period and the revenue that we are able to recognize. For our installations, revenue and cost of revenue can fluctuate significantly on a periodic
basis depending on the timing of acceptance and the type of financing used by the customer. Over the past twelve months, in light of time to power needs that we expect to continue in 2025, we have seen an increasing number of transactions move from a booking to revenue in less than twelve months.
Human Capital Management
We are committed to attracting and retaining exceptional talent. Investing in and inspiring our people to do their best work is critical for our success. As of December 31, 2024, we had 2,127 full-time employees worldwide, of which 1,716 were located in the U.S., 362 were located in India, and 49 were located in other countries. During 2024, our workforce decreased by 11% through voluntary and involuntary attrition not being replaced as compared to fiscal year 2023, predominantly because of the tail-end of the restructuring actions we initiated in September 2023 with one of the goals being an optimization of our workforce across multiple functions.
In order to attract and retain our employees, we strive to maintain an inclusive, diverse and safe workplace, with opportunities for our employees to grow and develop in their careers. This is supported by strong compensation, benefits, and health and wellness programs. We are mission driven and hire and develop talent with a passion toward achieving our mission. We believe that, together, we can create a brighter, more sustainable future while tackling the most pressing challenges of the 21st century.
Culture of Innovation & Inclusion
Our cultural foundation is that of innovation, results, respect, and desire to do the right thing. One of our greatest strengths is a talented and diverse employee population. We believe this leads to better decision making and best positions us to meet the needs of our customers, stockholders, and the communities in which we live and work.
Our goal is to attract and retain the most qualified talent based on our technology, and a strong employer brand in the energy industry, while providing competitive compensation and benefits. We actively source candidates from various networks globally through job postings, networking, employee referrals and job fairs. We foster an inclusive, respectful work culture, and provide career development and growth opportunities that help in retaining talent. In the past year, we have invested in development opportunities for employees including a diverse set of learning offerings designed to enhance our leadership and talent capabilities.
Compensation and Benefits
Our talent strategy is integral to our business success, and we design competitive and innovative compensation and benefits programs to help meet the needs of our employees. In addition to salaries, these programs (which vary by country/region) include annual bonuses, stock awards, an employee stock purchase plan, a 401(k) plan, healthcare and insurance benefits, health savings and flexible spending accounts, paid time off, parental leave, flexible work schedules, an extensive mental health program and fitness center. In fiscal year 2024, we also announced matching employee contributions to our 401(k) Plan, which triggered an increase in participation in our 401(k) plan from 41% to 57%, mostly from our hourly employees. In addition to our broad-based equity award programs, we have used targeted equity-based grants to facilitate retention of critical talent with specialized skills and experience. In December 2024, Bloom granted all worldwide employees below Director-level and including hourly manufacturing employees with one year or more tenure (excluding China) a special recognition grant in Restricted Stock Units, which are designed to make all of them shareholders of the company in 2025, subject to the vesting conditions of the awards.
Seasonal Trends and Economic Incentives
Our business and results of financial operations are subject to industry-specific seasonal fluctuations with the majority of bookings completed in the second half of a fiscal year. The desirability of our solution can be impacted by the availability and value of various governmental, regulatory and tax-based incentives which may change over time.
Corporate Facilities
Our corporate headquarters and principal executive offices are located at 4353 North First Street, San Jose, CA 95134, and our telephone number is (408) 543-1500. Our headquarters is used for administration, research and development, and sales and marketing and also houses one of our RMCC facilities.
Please see Part I, Item 2, Properties for additional information regarding our facilities.
Available Information
Our website address is www.bloomenergy.com and our investor relations website address is https://investor.bloomenergy.com. Websites are provided throughout this document for convenience only. The information contained on the referenced websites does not constitute a part of, and is not incorporated by reference into, this Annual Report on Form 10-K. Through a link on our website, we make available the following filings as soon as reasonably practicable after they are electronically filed with or furnished to the SEC: our Annual Reports on Form 10-K, Quarterly Reports on Form 10-Q, Current Reports on Form 8-K, and any amendments to those reports filed or furnished pursuant to Section 13(a) or 15(d) of the Exchange Act, as well as proxy statements and certain filings relating to beneficial ownership of our securities. The SEC also maintains a website at www.sec.gov that contains all reports that we file or furnish with the SEC electronically. All such filings, including those on our website, are available free of charge.
ITEM 1A — RISK FACTORS
Investing in our securities involves a high degree of risk. You should carefully consider the material risks and uncertainties described below that make an investment in us speculative or risky, as well as the other information in this Annual Report on Form 10-K, including our consolidated financial statements and the related notes and “Management’s Discussion and Analysis of Financial Condition and Results of Operations” before you decide to purchase our securities. Some of the factors, events and contingencies discussed below may have occurred in the past, but the disclosures below are not representations as to whether or not the factors, events, or contingencies have occurred in the past, and instead reflect our beliefs and opinions as to the factors, events, or contingencies that could materially and adversely affect us in the future. A manifestation of any of the following risks could, in circumstances we may or may not be able to accurately predict, render us unable to conduct our business as currently planned and materially and adversely affect our reputation, business, prospects, growth, financial condition, cash flows, liquidity, and operating results. In addition, the occurrence of one or more of these risks may cause the market price of our common stock to decline, and you could lose all or part of your investment. It is not possible to predict or identify all such risks and uncertainties, as our operations could also be affected by factors, events, or uncertainties that are not presently known to us or that we currently do not consider presenting significant risks to our operations. Therefore, you should not consider the following risks to be a complete statement of all the potential risks or uncertainties that we face.
Risk Factor Summary
The following summarizes the more complete risk factors that follow. It should be read in conjunction with the complete Risk Factors section and should not be relied upon as an exhaustive summary of all the material risks facing our business.
Risks Related to Our Business, Industry, and Sales
•Distributed energy generation and hydrogen production are emerging markets that may not receive widespread acceptance or demand.
•Our products involve a lengthy sales and installation cycle, which may lengthen further as we seek larger transactions.
•Our products have significant upfront costs, and, for some customers, we need to attract financiers to help customers finance purchases.
•The economic benefits of our solutions depend on both the price and availability of gas and electricity.
•If we are not able to reduce our costs or meet service performance expectations with respect to our products, our profitability may be impaired.
•Deployment of our fuel cell products can be affected by interconnection requirements, export tariff arrangements and utility tariff requirements that are subject to change.
•Deployment of our Energy Server systems relies on fuel supply and specification requirements, which may change.
•We face significant competition.
•We derive a substantial portion of our revenue and backlog from a limited number of customers.
•Our future growth will depend on expanding and diversifying our products and market opportunities.
•Our ability to develop new solutions and enter new markets could be negatively impacted by regulatory restrictions, market acceptance, or our ability to engage with partners to assist in such development or expansion.
•Our products may not be successful if we are unable to maintain alignment with industry standards and requirements.
Risks Related to Our Products and Manufacturing
•Our future success depends in part on our ability to increase production capacity for our products.
•If our products contain manufacturing defects, our business and financial results could be harmed.
•The performance of our products may be affected by factors outside of our control.
•If our estimates of useful life for our products are inaccurate or we do not meet our performance warranties and guaranties, our business and financial results could be harmed.
•Our business is subject to risks associated with construction, utility interconnection study and transmission upgrade delays, cost overruns and delays, including those related to permits, regulatory approvals, and other contingencies.
•The failure of our suppliers or other third parties to continue to deliver necessary raw materials or other components of our solutions in a timely manner and to specification could prevent us from delivering our solutions.
•We have long-term supply agreements that could result in excess or, if one or more suppliers do not produce for any reason, insufficient inventory, above market pricing or higher costs, and negatively affect our results of operations.
•We face supply chain competition which could result in insufficient inventory and affect our results of operations.
•We, and some of our suppliers, obtain capital equipment and other components from sole suppliers and, if this equipment is damaged or otherwise unavailable, our ability to deliver our products on time will suffer.
•Possible new trade tariffs could have a material adverse effect on our business.
•A failure to properly comply with foreign trade zone laws and regulations could increase the cost of duties and tariffs.
•Significant disruption to the operations at our headquarters or manufacturing facilities could delay product production.
•We may introduce and promote new technologies that have not yet been proven at commercial scale, and which may not work as intended, be delivered on a timely basis or at all, be developed according to specifications, and/or received well by customers.
•We have a limited history of manufacturing new products, such as our Electrolyzers.
Risks Related to Government Incentive Programs
•Our business currently benefits from the availability of rebates, tax credits and other financial programs and incentives, and changes to such benefits could cause our revenue to decline and harm our financial results.
•We rely on tax equity financing arrangements to realize the benefits provided by U.S. federal tax benefits and accelerated tax depreciation and we also rely on incentives in the Korean, European and other international markets.
Risks Related to Legal Matters and Regulations
•We are subject to laws and regulations, including environmental laws and regulations, regarding our products.
•We are in an unsettled regulatory and legal environment with increasing compliance complexity and costs.
•As we expand into international markets, we may be subject to local content requirements or pressures which could increase costs or reduce demand for our products.
•With respect to our products that run on fossil fuel, we may be subject to a heightened risk of regulation, the loss of certain incentives, and to changes in our customers’ energy procurement policies.
•Existing regulations and changes to such regulations may create technical, regulatory, and economic barriers, which could significantly reduce demand for our products or affect the financial performance of current sites.
•We may become subject to product liability claims.
•Litigation or administrative proceedings could have a material adverse effect on our business.
Risks Related to Our Intellectual Property
•Our failure to effectively protect and enforce our intellectual property rights may undermine our competitive position, and litigation to protect our intellectual property rights may be costly.
•Our patent applications may not result in issued patents, and our issued patents may be successfully challenged.
•We may need to defend ourselves against intellectual property claims which may be time-consuming and costly.
Risks Related to Our Financial Condition and Operating Results
•We have incurred significant losses in the past and we may not be profitable in future periods.
•Our financial condition and results of operations and other key metrics are likely to fluctuate.
•If we fail to manage our growth effectively, our business and operating results may suffer.
•If we fail to maintain effective internal controls, our financial reporting may be adversely affected.
•Our ability to use deferred tax assets to offset future taxable income may be subject to limitations.
Risks Related to Our Liquidity
•We must maintain the confidence of our customers in our liquidity, including our ability to timely service our debt obligations and grow our business over the long term.
•Our indebtedness, and restrictions imposed by the agreements governing our outstanding indebtedness, may limit our financial and operating activities and may adversely affect our ability to incur additional debt to fund future needs.
•We may not be able to generate sufficient cash to meet our debt service obligations or growth plans.
Risks Related to Our Operations
•Expanding operations internationally could expose us to additional risks.
•Data security breaches and cyberattacks could compromise our intellectual property or other confidential information and cause significant damage to our business, product performance, brand and reputation.
•If we are unable to attract and retain key employees and hire qualified management, technical, engineering, finance and sales personnel, our ability to compete and successfully grow our business could be harmed.
•Competition for manufacturing employees is intense, and we may not be able to attract and retain skilled employees.
Risks Related to Ownership of Our Common Stock
•The stock price of our common stock has been and may continue to be volatile.
•We may issue additional shares of our common stock in connection with future conversions of the Green Notes, which may dilute our existing stockholders and potentially adversely affect the market price of our common stock.
•Future sales of our common stock by SK ecoplant Co., Ltd. or its affiliates, or the perception that such sales could occur, may adversely affect the market price of our common stock.
•We do not intend to pay dividends for the foreseeable future.
•Provisions in our charter documents and under Delaware law could make an acquisition of us more difficult, limit stockholders’ rights, and limit the market price of our common stock.
•Scrutiny regarding ESG could result in additional costs and adversely impact our business.
Risks Related to Our Business, Industry and Sales
Distributed energy generation and hydrogen production are emerging markets, and they may not receive widespread market acceptance or demand may be lower than we expect, which may make evaluating our business and future prospects difficult.
Distributed energy generation and hydrogen production are still emerging markets. It is uncertain whether potential customers will embrace distributed generation or hydrogen production in general, or our solutions in particular. Enterprises may be unwilling to adopt our solutions over traditional or competing power sources such as distributed solar or electricity from the grid, or alternative means of producing hydrogen. This could be due to the perception that our technology or our company is unproven, lack of confidence in our business model, unavailability of third-party service providers to operate and maintain our solutions, lack of awareness of our products, or their perception of regulatory or political challenges, including challenges pertaining to technologies that use natural gas fuels or have carbon emissions.
The viability and demand for our solutions may be impacted by many factors outside of our control, including:
•market acceptance of our products (including, for example, anti-natural gas sentiment or misalignment with renewable and zero carbon procurement goals);
•cost competitiveness, reliability, and performance of our products compared to traditional or competing power sources;
•availability and amount of government subsidies and incentives;
•the emergence, continuance, or success of, or increased government support for, other alternative energy generation or hydrogen production technologies and products;
•prices and availability of traditional or competing power solutions;
•geopolitical and macroeconomic instability, including wars, terrorism, political unrest, actual or threatened public health emergencies and outbreak of disease, inflation, the recessionary environment, boycotts, adoption or expansion of government trade restrictions, and other business restrictions which may negatively impact the demand for our products, or which may cause our customers to push out, cancel, or refrain from placing orders; and
•an increase in interest rates or tightening of the supply of capital in the global financial markets (including a reduction in total tax equity availability) which could make it difficult to finance our products.
If the market for our solutions does not continue to develop as we anticipate, our business will be harmed. As a result, predicting our future revenue and appropriately budgeting for our expenses is difficult, and we have limited insight into trends that may emerge and affect our business. If actual results differ from our estimates or if we adjust our estimates in future periods, our operating results and financial position could be materially and adversely affected.
Our products involve a lengthy sales and installation cycle, and if we fail to close sales on a regular and timely basis, our business could be harmed.
Our sales cycle is typically 12 to 18 months but can vary considerably. To make a sale, we must typically provide a significant level of education to prospective customers regarding the use and benefits of our products and technology. The period between initial discussions with a potential customer and the eventual sale usually depends on a number of factors, including the potential customer’s budget, selection of financing type, and term of the contract. In addition, we have started to focus on larger projects, which tend to have longer sales cycles. Prospective customers often undertake a significant evaluation process that may further extend the sales cycle, and which evaluation may be negatively impacted by general market and economic conditions such as inflation, rising interest rates, availability of capital, a recessionary environment, geopolitical instability, energy availability and costs, and the availability and effects of government initiatives. Once a customer decides to purchase our product, it takes a significant amount of time for us to fulfill the sales order. Generally, it takes between nine to eighteen months or more from the entry into a sales contract until the installation of our products. The lengthy sales and installation cycles are subject to a number of significant risks, some of which are outside of our control. Due to the long sales and installation cycles, we may expend significant resources without being certain of generating a sale.
The delivery and installation of our products has a significant impact on the timing of the recognition of our product and installation revenue. Many factors can cause a lag between the time that a customer signs a contract and our recognition of product revenue. These factors include the number of the Energy Server systems installed per site, local permitting and utility requirements, utility interconnection queues and any identified transmission and distribution upgrades, environmental, health and safety requirements, weather, customer facility construction schedules, customers’ operational considerations, and the timing of financing. Many of these factors are unpredictable and their resolution is often outside of our or our customers’ control. Customers may also ask us to delay installation for reasons unrelated to the foregoing, such as for operational considerations or delays in their financing arrangements. Further, due to unexpected delays, deployments may require unanticipated expenses to expedite delivery of materials or labor to ensure the installation meets the timing objectives. These unexpected delays and expenses can be exacerbated in periods in which we deliver and install a larger number of smaller projects. In addition, if even relatively short delays occur, there may be a significant shortfall between the revenue we expect to generate in a particular period and the revenue that we are able to recognize.
Our products have significant upfront costs, and, for some customers, we need to attract investors to help them finance purchases.
Our products have significant upfront costs, which may be a barrier for some customers who may not have the financial capability to purchase our products directly. To address this, we have developed various financing options that allow customers to use our products through third-party financing arrangements. These options enable our customers to access our products without making a direct purchase. For more information on the different financing arrangements available, please see Part II, Item 7, Management’s Discussion and Analysis of Financial Condition and Results of Operations — Purchase and Financing Options. If in any given quarter we or our customers are not able to secure funding, our financial condition and results of operations would be harmed. To attract new customers, we regularly innovate our customer contracts which may have different terms and financing conditions from prior transactions.
We rely on and need to grow committed project financing capacity with existing partners or attract additional partners to support our growth, finance new projects, and expand our product offerings. Additionally, our ability to deploy our backlog is directly tied to our ability to secure project financing, which is often an unpredictable process. Attracting third-party financing is a complex process that is influenced by factors beyond our control, including the fluctuations of interest and currency exchange rates, the availability of tax credits and government incentives for investors, our perceived creditworthiness and the prevailing condition of credit markets. We arrange financing for our customers’ purchases of our products based on certain conditions, such as their credit quality and the expected minimum internal rate of return on the customer engagement. If these conditions are not met, we may not be able to find financing for their purchases of our products, which would have a negative impact on our revenue in a particular period. If we are unable to arrange financing for our products, our business could be harmed. Additionally, certain financing options, as with all leases, are also limited by the customer’s willingness to commit to making fixed payments, regardless of the products’ performance or our performance of our obligations under the customer agreement. If we are unable to arrange future financing for any of our current projects, it could negatively impact our business.
In the U.S., our capacity to offer our Energy Server systems through financed arrangements depends in large part on the ability of financing parties to optimize the tax benefits associated with the Energy Server systems, such as the recently expired ITC for fuel cells running on a non-zero carbon fuel or accelerated depreciation. Interest rate fluctuations, and internationally, currency exchange rate fluctuations, may also impact the attractiveness of any financing offerings for our customers. Our ability to finance a PPA or a lease is also related to, and may be limited by, the creditworthiness of the customer.
In our sales process for transactions that require financing, we make certain assumptions regarding the cost of financing capital. Actual financing costs may differ materially from our estimates and financing may be more difficult or costly to secure, or may not be available, due to factors beyond our control, such as changes in customer creditworthiness, macroeconomic factors, like inflation, interest rates, a recessionary environment, geopolitical instability, and capital market volatility. The returns offered by other investment opportunities available to our financing partners and other factors may further affect financing availability. If the cost of financing ultimately exceeds our estimates, or we or our customers are unable to secure financing, we may not be able to proceed with some or all of the impacted projects, or our revenue from such projects may be less than our estimates.
The economic benefits of our Energy Server systems to our customers depend on both the price of gas available from the local gas utilities and the cost of electricity available from alternative sources, including local electric utility companies, and such cost structure is subject to change.
We believe that the customer’s decision to purchase our Energy Server system is significantly influenced by its price, the price predictability of electricity generated by our Energy Server systems in comparison to the retail price, and the future price outlook of electricity from the local utility grid and other energy sources. These prices are subject to change and may affect the relative benefits of our Energy Server systems. Factors that could influence these prices and are beyond our control include the impact of energy conservation initiatives that reduce electricity consumption; construction of additional power generation plants (including renewables, storage, nuclear, coal or natural gas); technological developments by others in the electric power industry; the imposition of interconnection, “departing load,” “standby,” power factor charges, greenhouse gas emissions charges, or other charges by local electric utility or regulatory authorities; and changes in the rates offered by local electric utilities and/or in the applicability or amounts of charges and other fees imposed or incentives granted by such utilities on customers. In addition, even with available subsidies for our products, in those areas where the current cost of grid electricity is low, including in some states in the U.S. and some foreign countries, our Energy Server systems may not be economically attractive.
Furthermore, actual or perceived potential increases in the price of natural gas or other fuels or curtailment of availability (e.g., as a consequence of physical limitations or adverse regulatory conditions for the delivery or production of natural gas or other fuels) or the inability to obtain natural gas or other fuel services could make our Energy Server systems less economically attractive to potential customers and reduce demand. While our Energy Server systems can operate using hydrogen or biofuels, the availability and current high cost of those natural gas alternatives in a particular location may make them less attractive to potential customers, reducing the demand for our products.
If we are not able to reduce our costs or meet service performance expectations with respect to our products, our profitability may be impaired.
We need to reduce the manufacturing costs for our products to expand our markets. Additionally, certain of our existing service contracts rely on projections regarding service cost reductions that may not be realized. Increases in component and raw material costs could offset our cost-cutting efforts, slowing our growth and causing our financial results and operational metrics to suffer. In the past, we have experienced price increases in raw materials, which are used in our components and subassemblies for our fuel cell products.
Our expenses have increased and may increase in the future due to factors such as increases in wages or other labor costs, marketing and sales. We need to reduce costs to expand into new markets (in which the price of electricity from the grid is lower) while maintaining our current margins. Any failure to achieve cost reductions could adversely affect our results of operations and financial condition and harm our business and prospects. Our inability to reduce product costs may impact our profitability, which could have a material adverse effect on our business and prospects.
Deployment of our fuel cell products can be affected by interconnection requirements, export tariff arrangements and utility tariff requirements that are each subject to change.
Because our fuel cell systems are designed to be able to operate at a constant output 24x7, while our customers’ demand for electricity typically fluctuates over the course of the day or week, there are often periods when our Energy Server systems
are producing more electricity than a customer may require, and such excess electricity can be exported to the local electric utility. Export of customer-generated power from our Energy Server systems is generally provided for in the markets in which we offer our fuel cells pursuant to applicable laws, regulations and tariffs, but not under all circumstances, and may be restricted or made costlier due to interconnection, relevant tariff or other issues. Many, but not all, local electric utilities provide compensation to our customers for such electricity under “fuel cell net metering” (which often differs from solar net metering) or other customer generation programs.
Fuel cell net metering can be affected by local utility tariffs and fees, changes to interconnection agreement terms and fuel cell net metering requirements, and some jurisdictions do not allow export of excess electricity. At times in the past, such changes have had the effect of significantly reducing or eliminating the benefits of such programs. Changes in the availability of, or benefits offered by, utility tariffs, the applicable net metering requirements or interconnection agreements could adversely affect the demand for our Energy Server systems. For example, in California, the fuel cell net metering tariff expressly addressing fuel cells and providing certain incentives and export capability (referred to as the “Fuel Cell Net Energy Metering” (“FC NEM”)) expired at the end of 2023 and is no longer available to new customers. Existing customers can remain on the tariff if they comply with greenhouse gas emission standards that are intended to ensure they operate at a rate that is the same or better than the grid resources they are displacing. If at some point fuel cell resources cease to operate at a rate that is the same or better than the grid resources they are displacing, this may result in increased cost. There are also some more generally applicable tariffs available for customers deploying fuel cells, however, they have limitations, and while the loss of FC NEM has not yet impacted our ability to sell our Energy Server systems for use in California, that could change at some point in the future. We cannot predict the outcome of the many regulatory proceedings addressing tariffs that would include customers utilizing fuel cells. If an economical tariff for customers utilizing fuel cells is not available in a given jurisdiction, it may limit or end our ability to sell and install our Energy Server systems in that jurisdiction. Further, permits and other requirements applicable to electric and gas interconnections are subject to change. For example, some jurisdictions are limiting new gas interconnections, although others are allowing new gas interconnections for non-combustion resources like our Energy Server systems.
Deployment of our Energy Server systems relies on fuel supply and fuel specification requirements, which are subject to change.
Our Energy Server systems are designed to operate at a constant output 24x7. Therefore, they need a constant source of fuel such as natural gas, biogas, or hydrogen to keep them running. Fuel for our Energy Server systems is typically provided by local gas utilities. Our customers rely on such utilities to provide a constant supply of fuel that meets our specifications. However, if new regulations require a switch to different fuel for which there may be limited availability, such as biogas, it can create challenges for our products and their sales. Adverse fuel supply constraints or fuel outside of our fuel specifications may delay or prevent the deployment of our Energy Server systems.
We face significant competition.
We compete for customers, financing partners and incentive dollars from other electric power providers. Our Bloom Energy Server systems compete with a broad range of companies and technologies, including traditional energy suppliers, such as public utilities, and other energy providers utilizing traditional co-generation systems, nuclear, hydro, coal or geothermal power, companies utilizing intermittent solar or wind power paired with storage, and other commercially available fuel cell companies. We also compete with traditional backup energy equipment such as diesel generators. Our Electrolyzers compete with low temperature electrolyzer companies using Alkaline, Proton, PEM or AEM electrolysis.
Many of our competitors, such as traditional utilities and other companies offering distributed generation products, have longer operating histories, customer incumbency advantages, access to and influence with local and state governments, and access to more capital resources than us. Significant developments in alternative technologies, such as energy storage, wind, solar or hydro power generation, or improvements in the efficiency or cost of traditional energy sources, including coal, oil, natural gas used in combustion, or nuclear power, may materially and adversely affect our business and prospects in ways we cannot anticipate. We may also face new competitors with better technologies, products, or resources. If we fail to adapt to changing market conditions and to compete successfully with grid electricity or new competitors, our growth will be limited, which would adversely affect our business results.
We derive a substantial portion of our revenue and backlog from a limited number of customers, and the loss of or a significant reduction in orders from a large customer could have a material adverse effect on our operating results and other key metrics.
In any particular period, a substantial amount of our total revenue has and could continue to come from a relatively small number of customers. As an example, in the year ended December 31, 2024, three customers accounted for approximately 23%, 16% and 14% of our total revenue. The loss of any large customer order or any delays in installations of new products with any large customer would materially and adversely affect our business results.
Our future growth will depend on expanding and diversifying our products and market opportunities, and if we are not successful, our operating results and future growth prospects could be adversely affected.
We plan to enhance our future growth opportunities by expanding our energy and hydrogen solutions. This includes expanding the features of and uses for our Energy Server systems, including providing options for carbon capture and heat output, by expanding our production and sales of our Electrolyzer, and by expanding the markets in which we sell our products. These opportunities will demand our focus, including the allocation of personnel, financial resources, and management oversight. If we fail to effectively allocate our resources or follow through on these opportunities, our business and operational results may be adversely affected.
Our investments may not result in the growth we expect, or the timing of when we expect it, for a variety of reasons, including changes in growth trends, evolving and changing markets and increasing competition, market opportunities, technology and product innovation, and changes in policy support, taxation and subsidies, and regulation. We may introduce new technologies or products that do not work, are not delivered on a timely basis, are not developed according to product or cost specifications, are not well received by customers, or do not receive the policy, taxation and subsidies, or other regulatory support that was anticipated. Moreover, there may be fewer opportunities than we expect due to a decline in business or economic conditions or a decreased demand in these markets or for our new products from our expectations, our inability to successfully execute our sales and marketing plans, or for other reasons. In addition to our current growth opportunities, our growth may be reliant on our ability to identify and develop new opportunities. This process is inherently risky and may result in investments in time and resources for which we do not achieve any return or value. These risks are enhanced by attempting to introduce multiple breakthrough technologies and products simultaneously.
Our growth opportunities are subject to constant and rapidly changing and evolving technologies and evolving industry standards and may be replaced by new technological concepts or platforms. If we do not develop innovative and reliable product offerings and enhancements in a cost-effective and timely manner that are attractive to customers in these markets, if we are otherwise unsuccessful entering and competing in these new product categories, if the new product categories in which we invest our limited resources do not emerge as opportunities or do not produce the growth or profitability we expect, or when we expect it, or if we do not correctly anticipate changes and evolutions in technology and platforms, our business and results of operations could be adversely affected.
Our ability to develop new solutions and enter into new markets could be negatively impacted by regulatory restrictions, market acceptance, or if we are unable to identify and successfully engage with partners to assist in such development or expansion.
Our ability to develop new solutions and successfully enter new markets relies heavily on navigating regulatory landscapes and gaining market acceptance. Regulatory restrictions, such as stringent compliance requirements, can delay the launch of new solutions, increase development costs, or limit the scope of our innovations. Additionally, achieving market acceptance depends on factors such as customer trust, perceived value, and compatibility with existing systems and behaviors. If we fail to anticipate or address these challenges, our growth potential could be significantly hindered.
As we continue to develop new solutions, features and products and expand into new markets, including international markets, we may need to identify business partners, suppliers, and other third parties to facilitate such development and expansion. Identifying such partners, suppliers, and other third parties is a lengthy process and is subject to significant risks and uncertainties, such as an inability to negotiate mutually acceptable terms or such partner’s inability to execute as negotiated. In addition, there could be delays in the design, manufacture and installation of new products or the incorporation of third party components into our solutions such as CHP, CCUS, microgrids, batteries, and other distributed energy resources, and we may not be timely in the development of new solutions, products or entry into new markets, limiting our ability to expand our business and harming our financial condition and results of operations.
Our products may not be successful if we are unable to maintain alignment with evolving industry standards and requirements.
As we invest in research and development to sustain or enhance our existing products, it is possible that the introduction of new technologies and the emergence of new industry standards or requirements could make our products less desirable or obsolete. Further, in developing our products, we make assumptions with respect to which standards, requirements, or policies will be demanded by our customers, standards-setting organizations and applicable law. If market acceptance of our products is reduced or delayed or the standards-setting organizations or legislative or regulatory authorities fail to develop timely, commercially viable standards that support our products, our business would be harmed.
Risks Related to Our Products and Manufacturing
Our future success depends in part on our ability to increase production capacity for our products, and we may not be able to do so in a timely or cost-effective manner.
To the extent we are successful in growing our business, we may need to increase the production capacity of our products. Our ability to plan, construct and equip additional manufacturing facilities is subject to significant risks and uncertainties, including delays, cost overruns, geopolitical instability, and labor shortages. Expanding manufacturing capacity internationally may also expose us to new laws and regulations and carries risks. There is also a possibility that we may not be able to achieve our production targets for a variety of reasons, including reliance on third parties who do not fulfill their obligations to us.
If we are unable to expand our manufacturing facilities or develop our existing facilities in a timely manner, we may be unable to further scale our business, which would negatively affect our results of operations and financial condition. Conversely, if the demand for our products or our production output does not rise as expected, we may not be able to spread a significant amount of our fixed costs over the production volume, resulting in a greater than expected per unit fixed cost, which would have a negative impact on our financial condition and results of operations.
If our products contain manufacturing defects, our business and financial results could be harmed.
Our products are complex, and they may contain undetected or latent errors or defects. We have experienced latent defects that were discovered once the Energy Server system was deployed in the field. Changes in our supply chain or the failure of our suppliers to otherwise provide us with components or materials that meet our specifications could introduce defects in our products. As we grow our manufacturing volume, the chance of manufacturing defects could increase. In addition, new feature launches, product introductions or design changes could introduce new design defects that may impact product performance and life. Any design or manufacturing defects or other failures of our products, including catastrophic or pervasive product failures, could cause us to incur significant costs, a large field recall, divert the attention of our engineering personnel from product development efforts, and significantly and adversely affect customer satisfaction, market acceptance, and our business reputation.
If any of our solutions are defective or fail because of their design, including those incorporating third party hardware such as CCUS, CHP, microgrids, batteries and other distributed energy resources, or if changes in applicable laws or regulations, or in the enforcement thereof, require us to redesign or recall our products, we may incur additional costs and expenses. The process of identifying and recalling a product may be lengthy and require significant resources, and we may incur significant replacement costs, contract damage claims from our customers, product liability, property damage, personal injury or other claims and liabilities, and brand and reputational harm. In addition, applications such as CCUS may impact the overall risk profile of our solutions, which could impact where our systems can be located to comply with various zoning and permit restrictions. Significant costs or payments made in connection with warranty and product liability claims and product recalls could harm our financial condition and results of operations.
Furthermore, we may be unable to correct manufacturing defects or other failures of our products in a manner satisfactory to our customers, which could adversely affect customer satisfaction, market acceptance, and our business reputation.
The performance of our products may be affected by factors outside of our control, which could result in harm to our business and financial results.
Field conditions, such as the quality of the fuel supply and environmental factors, can impact the performance of our products in unpredictable ways. As we move into new geographies and deploy new features, products and service
configurations, we encounter new field conditions from time to time (including as a result of climate change). Adverse impacts on performance may require us to incur significant service and re-engineering costs or divert the attention of our engineering personnel from product development efforts. Furthermore, we may be unable to adequately address the impacts of factors outside of our control in a manner satisfactory to our customers. Any of these circumstances could significantly and adversely affect customer satisfaction, market acceptance, and our business reputation.
If our estimates of useful life for our products are inaccurate or we do not meet our performance warranties and guaranties, our business and financial results could be harmed.
We provide performance warranties and guaranties covering the efficiency and output performance of our products. Our pricing of these contracts and our reserves for warranty and replacement are based upon our estimates of the useful life of our products and those components that are replaced as a part of standard maintenance, including assumptions regarding improvements in power module life that may fail to materialize. We do not have a long history at a large scale, and our estimates may prove to be incorrect. Failure to meet these warranty and performance requirements may require us to replace the products or to make cash payments to customers. Actual warranty expenses may exceed estimates. If our estimates are inaccurate or we fail to accrue adequate reserves to make cash payments as required, our business and financial results could be harmed.
Our business is subject to risks associated with construction, utility interconnection, fuel supply, cost overruns and delays, including those related to obtaining government permits and other contingencies that may arise in the course of completing installations.
Our financial results depend on the timely installation of our products, which may be on a fixed price basis, subjecting us to the risk of cost overruns or other unforeseen expenses in the installation process. Our products are subject to regulation and oversight in compliance with laws and ordinances relating to building codes, safety, environmental protection, and related matters in the jurisdictions where we operate, and typically require various local and other governmental approvals and permits, including environmental approvals and permits. Delays in obtaining these approvals and permits could stall the installation process of our products and adversely affect our revenue. For more information regarding these restrictions, please see the risk factors in the section titled “Risks Related to Legal Matters and Regulations.”
In addition, the completion of some of our installations depends on the availability of and timely connection to the natural gas grid and the local electric grid. In some cases, interconnection may be conditioned on the construction by the local utility company of new transmission and distribution facilities and may also require construction of new natural gas pipelines to connect a project to the interstate pipeline system. Transmission and distribution upgrades found to be required in interconnection studies may cause planned projects to be deemed uneconomic to be constructed or may result in the size of the project itself being reduced in order to avoid significant upgrade costs. In addition, some municipalities have recently adopted restrictions that prohibit the installation of natural gas services to new construction. For more information regarding these restrictions, please see the risk factor titled “With respect to our products that run, in part, on fossil fuel, we may be subject to a heightened risk of regulation, the loss of certain incentives, and to changes in our customers’ energy procurement policies.” Delays in our ability to connect with utilities, delays in the performance of installation-related services, or poor performance of installation-related services by our general contractors or sub-contractors could have a material adverse effect on our results and could cause operating results to vary materially from period to period.
As our business grows and we increase the number of distributors selling our products, delays in project development, interconnection and permitting may affect our distributors’ ability to sell their inventories of our products and they may decide to decrease future orders of our products or we may choose to support deployment of their inventory with our end customers, either of which could adversely affect revenue and cash flows.
Furthermore, we rely on the ability of our third-party contractors to install products at our customers’ sites and to meet our installation requirements. We particularly rely on third-party installation resources and contractors for projects in Asia and Europe. We currently work with a limited number of contractors, which could impact our ability to make installations as planned in the future. Our work with contractors may have the effect of our being required to comply with additional rules unique to our customers, site remediation, and other requirements, which can add costs and complexity to an installation project. The timeliness, thoroughness, and quality of the installation-related services performed by some of our contractors in the past have not always met our expectations or standards and may not meet our expectations and standards in the future.
Lengthy sales and installation cycles can increase the risk of customer disputes or delayed or incomplete installations. Sometimes, a customer may cancel an order prior to installation, meaning we may be unable to recover some, or all of our costs incurred in connection with design, permitting, installation and site preparations. Cancellation rates can be as high as 5% to
10% in any given period due to factors outside of our control, such as permitting or regulatory issues, delays or unexpected costs in securing interconnection approvals, utility infrastructure, cost changes, or other reasons unique to each customer. Our operating expenses are based on anticipated sales levels, and many of our expenses are fixed. If we are unsuccessful in closing sales after expending significant resources or if we experience customer disputes, delays or cancellations, our reputation, business, financial condition, results of operations or cash flows could be materially and adversely affected. Additionally, under our revenue recognition policy, we do not recognize revenue on product sales until delivery or complete installation. Therefore, a small fluctuation in the timing of the sales transaction’s completion could cause our operating results to vary materially from period to period.
The failure of our suppliers or other third parties to continue to deliver necessary raw materials or other components of our solutions in a timely manner and to specification could prevent us from delivering our solutions within required time frames and could cause installation delays, cancellations, penalty payments and damage to our brand and reputation.
We rely on a limited number of suppliers and other third parties, and in some cases sole suppliers, for some of the raw materials and components used to manufacture our products, including certain rare earth materials and other materials that are in limited supply. If our suppliers provide insufficient inventory to meet customer demand, or such inventory is not at the level of quality required to meet our standards, or if our suppliers are unable or unwilling to provide us with the contracted quantities (as we have limited or in some case no alternatives for supply), our results of operations could be materially and negatively impacted. We are also reliant on other third-party providers of storage equipment, infrastructure equipment and pipelines, and other materials and technologies that work with our products to provide an energy solution for customers. If we fail to develop or maintain our relationships with suppliers or other third party providers, or if there is otherwise a shortage or lack of availability of any required raw materials or components, we may be unable to manufacture our products, or our solutions may be available only at a higher cost or after a long delay.
The global supply chain for certain raw materials and components, including semiconductor components and specialty metals, has experienced significant strain in recent years. The macroeconomic environment and geopolitical instability have also contributed to and exacerbated this strain. There can be no assurance that the impact of these issues on the supply chain will not continue, or worsen, in the future. Significant delays and shortages could prevent us from delivering our solutions to customers within the required time frames and cause order cancellations, and could increase our costs, which would adversely impact our cash flows and the results of operations.
In some cases, we have had to create our own supply chain for some of the components and materials utilized in our fuel cells. We have made significant expenditures to expand and bolster our supply chain. In many cases, we entered into contractual relationships with suppliers to jointly develop the components we needed. These activities are time and capital intensive. In addition, some of our suppliers use proprietary processes to manufacture components. We may be unable to obtain comparable components from alternative suppliers without considerable delay, expense, or at all, as replacing these suppliers could require us either to make significant investments to bring the capability in-house or to invest in a new supply chain partner. Some of our suppliers are smaller, private companies, which are heavily dependent on us as a customer. If our suppliers face difficulties obtaining the credit or capital necessary to expand their operations when needed, they could be unable to supply necessary raw materials and components to meet our requirements, which would negatively impact our sales volumes and cash flows.
The failure by us to obtain raw materials or components in a timely manner or to obtain raw materials or components that meet our requirements could impair our ability to manufacture our products, increase the costs of our products or solutions, or increase the costs of servicing our existing portfolio of products. If we cannot obtain substitute materials or components on a timely basis or on acceptable terms, we could be prevented from delivering our solutions to our customers or service our existing fleet of products, which could result in sales and installation delays, cancellations, penalty payments, warranty breaches, or damage to our brand and reputation, any of which could have a material adverse effect on our business and results of operations. In addition, we rely on our suppliers to meet quality standards, and the failure of our suppliers to meet those quality standards could cause delays in the delivery of our solutions, unanticipated service costs, and damage to our brand and reputation.
We have, in some instances, entered into long-term supply agreements that could result in excess or, if one or more suppliers do not produce for any reason, insufficient inventory, above market pricing or higher costs, and negatively affect our results of operations.
We have long-term supply agreements with certain suppliers. Some of these supply agreements provide for fixed or inflation-adjusted pricing, substantial prepayment obligations and in a few cases, supplier purchase commitments. These
arrangements could mean that we end up paying for inventory that we do not need or that is at a higher price than the market. Further, we face significant specific counterparty risk under long-term supply agreements when dealing with suppliers without a long, stable production and financial history. Given the uniqueness of our products, many of our suppliers do not have a long operating history and are private companies that may not have substantial capital resources. In the event any such supplier experiences financial difficulties, it may be difficult or impossible, or may require substantial time and expense, for us to recover any or all of our prepayments. We do not know whether we will be able to maintain long-term supply relationships with our critical suppliers or whether we may secure new long-term supply agreements. Additionally, many of our parts and materials are procured from foreign suppliers, which exposes us to risks including unforeseen increases in costs or interruptions in supply arising from changes in applicable international trade regulations such as taxes, tariffs, or quotas. Any of the foregoing could materially harm our financial condition and results of operations.
We face supply chain competition, including competition from businesses in other industries, which could result in insufficient inventory and negatively affect our results of operations.
Certain of our suppliers also supply parts and materials to other businesses, including businesses engaged in the production of consumer electronics and other industries unrelated to fuel cells. As a relatively low-volume purchaser of certain of these parts and materials, we may be unable to procure a sufficient supply of the items in the event that our suppliers fail to produce sufficient quantities to satisfy the demands of all of their customers, which could materially harm our financial condition and results of operations.
We, and some of our suppliers, obtain capital equipment used in our manufacturing process from sole suppliers, and if this equipment is damaged or otherwise unavailable, our ability to deliver our products on time will suffer.
Some of the capital equipment used to manufacture our products and some of the capital equipment used by our suppliers has been developed and made specifically for us, are not readily available from multiple vendors, and would be difficult to repair or replace if they did not function properly. If any of these suppliers were to experience financial difficulties or go out of business or if there was any damage to, or a breakdown of, our manufacturing equipment and we could not obtain replacement equipment in a timely manner, our business would suffer. In addition, a supplier’s failure to supply this equipment in a timely manner of adequate quality and on terms acceptable to us could disrupt our production schedule or increase our costs of production and service.
Possible new trade tariffs could have a material adverse effect on our business.
Our business is dependent on the availability of raw materials and components for our products. Prior tariffs imposed on steel and aluminum imports increased the cost of raw materials for our products and decreased the available supply, and, accordingly, we expect the 25% tariffs imposed on U.S. imports of steel and aluminum to adversely impact our costs. Additional new trade tariffs or other trade protection measures that are being considered or threatened by the new U.S. federal administration and possible reciprocating tariffs from other countries in which we operate or do business in response to any such U.S. tariffs or other trade protection measures could have a material adverse effect on our business, results of operations and financial condition, particularly if the countries where we source a significant amount of our components or where we sell or seek to sell our solutions are impacted.
A failure to properly comply with foreign trade zone laws and regulations could increase the cost of our duties and tariffs.
We have established foreign trade zones in California and Delaware, through qualification with U.S. Customs and Border Protection, which allow for “zone to zone” transfers between our facilities located in those states. Materials received in a foreign trade zone are not subject to certain U.S. duties or tariffs until the material enters U.S. commerce. We benefit from the adoption of foreign trade zones by reduced duties, deferral of certain duties and tariffs, and reduced processing fees, which help us realize a reduction in duty and tariff costs. However, the operation of our foreign trade zones requires compliance with applicable regulations and continued support of U.S. Customs and Border Protection with respect to the foreign trade zone program. If we are unable to maintain the qualifications of our foreign trade zones, or if foreign trade zones are limited or unavailable to us in the future, our duty and tariff costs would increase, which could have an adverse effect on our business and results of operations.
Any significant disruption to the operations at our headquarters or manufacturing facilities could delay the production of our products, which would harm our business and results of operations.
We manufacture our products in a limited number of facilities, any of which could become unavailable either temporarily or permanently for any number of reasons, including equipment failure, material supply, public health emergencies, cyber-attacks or catastrophic weather, including extreme weather events or flooding resulting from the effects of climate change, or geologic events. Our headquarters and our Fremont manufacturing facility are located in the San Francisco Bay Area, an area that is susceptible to earthquakes, floods and other natural disasters. The occurrence of a natural disaster such as an earthquake, drought, extreme heat, flood, fire, localized extended outages of critical utilities (such as California’s public safety power shut-offs) or transportation systems, or any critical resource shortages could cause a significant interruption in our business, damage or destroy our facilities, our manufacturing equipment, or our inventory, and cause us to incur significant costs, any of which could harm our business, financial condition and results of operations. Our disaster recovery plans, and insurance may not be sufficient to restore our operations and to cover our losses, respectively.
We may introduce and promote new technologies that have not yet been proven at commercial scale, and which may not work as intended, be delivered on a timely basis or at all, be developed according to specifications and/or received well by customers.
We may introduce and promote new technologies or products that are still in the early stages of development or have not been fully realized. These solutions may face unforeseen technical challenges, rendering them non-functional, delayed, or incapable of meeting the specifications or performance standards initially promised. Additionally, market dynamics, shifting consumer preferences, or a lack of adequate customer education may result in products that fail to gain traction or resonate with the intended audience. Delays in delivery or deviations from promised features can also damage customer trust and our reputation. If any of these risks are realized, they could harm our brand and reputation, lead to increased costs, potential legal or contractual liabilities, and the inability to recoup investments, which could adversely affect our financial performance and strategic objectives.
Our limited history of manufacturing new products, such as our Electrolyzers, makes it difficult to evaluate our future prospects and the challenges we may encounter.
While we have a history of manufacturing and selling our Energy Server systems, we have a limited history with regard to our Electrolyzers, which are based in part on the same technology. As a result, there is little historical basis to make judgments on the capabilities associated with our enterprise, management, and ability to produce Electrolyzers. Our ability to generate the profits we expect to achieve from the sale of Electrolyzers will depend, in part, on our ability to effectively manufacture Electrolyzers, respond to market demand, and add new manufacturing capacity in an efficient, cost-effective manner.
Risks Related to Government Incentive Programs
Our business currently benefits from the availability of rebates, tax credits and other financial programs and incentives, and changes to such benefits could cause our revenue to decline and harm our financial results.
We utilize governmental rebates, tax credits, and other financial incentives to lower the effective price of our products to customers in the U.S. and Japan, India, Republic of Korea, and Taiwan (collectively, our “Asia Pacific region”).
The U.S. federal government and some state and local governments provide incentives to current and future end users and purchasers of our solutions in the form of rebates, tax credits and other financial incentives, such as system performance payments and payments for renewable energy credits associated with renewable energy generation. Our solutions have qualified for tax exemptions, incentives, or other customer incentives in many states. Some states have utility procurement programs, Renewables Portfolio Standards (“RPSs”) or Clean Energy Standards (“CESs”) for which our technologies are eligible; our solutions may not be eligible for other RPSs and CESs, particularly when fueled in whole or in part with natural gas. Financiers and Equity Investors (as defined below) may also take advantage of these financial incentives, lowering the cost of capital and energy to our customers.
For example, many of our installations in California interconnect with investor-owned utilities on FC NEM tariffs. FC NEM tariffs were available for new California installations until December 31, 2023. To remain eligible for those FC NEM tariffs, installations currently on those tariffs will be required to meet greenhouse gas emissions standards that are intended to support operations at a rate that is the same or better than the grid resources they are displacing. Other generally applicable tariffs are available for customers deploying fuel cells, and do not impose greenhouse gas standards. If, and when, installations
cannot meet any applicable GHG standards, there are alternative tariffs available for our customers. If the cost to remain on the FC NEM tariffs increase significantly or suitable alternatives are not available, it may negatively impact our existing customer base and future demand for our products. Additionally, the uncertainty regarding requirements for service under any of these tariffs could negatively impact the perceived value of, or risks associated with, our products, which could also negatively impact demand.
Through the end of 2024, the U.S. federal government offered certain federal tax benefits, including the Production Tax Credit under Section 45 of the Internal Revenue Code (the “PTC”) and the Investment Tax Credit under Section 48 of the Internal Revenue Code (the “ITC”), both of which are succeeded by “technology-neutral” versions set forth in Sections 45Y and 48E, respectively. These federal tax benefits have certain legal and operational requirements. There may be uncertainty as to how such requirements promulgated under the IRA are interpreted. If IRS guidance regarding implementation of the IRA is viewed by investors as unclear, tax credit financing may be delayed or downsized, harming our ability to secure financing for customers. Our failure to either (i) interpret the new requirements under the IRA regarding among other things, prevailing wage, apprenticeship, domestic content, siting in an “energy community,” accurately or (ii) adequately update our supply-chain, manufacturing, installation, and record-keeping processes to meet such requirements, may result a partial or full reduction in the related federal tax benefit, and our customers, financiers and Equity Investors may require us to indemnify them for certain of such reductions. Changes in federal tax benefits over time also may affect our future performance. For example, currently commercial purchasers of fuel cells are eligible to claim the federal bonus depreciation benefit. However, under current rules it will be phased down, which began in 2023 and will continue until expiring at the end of 2026 in the absence of legislation. Similarly, commercial fuel cell purchasers can claim the ITC. Under current law, fuel cell projects must have begun construction on or before December 31, 2024, in order to claim up to 50% ITC, after which part of this benefit will expire unless extended. Our ability to attract future sales in the U.S. could be reduced by the absence of ITC benefits.
Some countries outside the U.S. also provide incentives to current and future end users and purchasers of our solutions. For example, in the Republic of Korea, RPSs and CESs are in place to promote the adoption of renewable, low- or zero-carbon power generation. The Korean RPSs were replaced in 2023 with the Clean Hydrogen Portfolio Standard (“CHPS”). This may impact the demand for our products in the Republic of Korea. Initially, we do not expect the CHPS to require 100% hydrogen as a feedstock for fuel cell projects.
Changes in the availability of rebates, tax credits, and other financial programs and incentives could reduce demand for our products, impair sales financing, and adversely impact our business results. Additionally, these incentives and procurement programs or obligations may expire on a particular date, end when the allocated funding is exhausted, or be reduced or terminated as a matter of regulatory or legislative policy. The continuation of these programs and incentives depends upon continued political support.
In the U.S., we rely on tax equity financing arrangements to realize the benefits provided by federal tax benefits and accelerated tax depreciation and in the event these programs are terminated, our financial results could be harmed. We also rely on incentives in the Korean, European and other international markets.
U.S. Equity Investors typically derive a significant portion of their economic returns through tax benefits when they finance a product. Equity Investors are generally entitled to substantially all of the project’s tax benefits, such as those provided by the ITC and Modified Accelerated Cost Recovery System (“MACRS”) or bonus depreciation. We expect that future Equity Investors will also be interested in taking the benefit of the PTC in connection with financing our Electrolyzers. The number of and available capital from potential Equity Investors is limited, we compete with other energy companies eligible for these tax benefits to access such investors, and the availability of capital from Equity Investors is subject to fluctuations based on factors outside of our control such as macroeconomic trends and changes in applicable taxation regimes. Concerns regarding our limited operating history at a large scale, lack of profitability and that we are the only party who can perform operations and maintenance on our products have made it difficult to attract investors in the past. Our ability to obtain additional financing depends on the continued confidence of banks and other financing sources in our business model, the market for our solutions, and the continued availability of tax benefits applicable to our solutions, regardless of whether we arrange the financing, or our customers finance the products themselves. In addition, conditions in the general economy and financial and credit markets may result in the contraction of available tax equity financing. Similarly, in international markets such as Korea and Europe, economic benefits applicable to fuel cells may include subsidies for deployment as well as exemptions or reductions from taxes and fees. If as a result of changes to these benefits we, or in some cases our customers, are unable to enter into tax equity or other financing agreements with attractive pricing terms, or at all, neither we nor our customers, may be able to obtain the capital needed to finance the purchase of our products. Such circumstances could also require us to reduce the price at which we are able to sell our products in the applicable markets and therefore harm our business, financial condition, and results of operations.
Risks Related to Legal Matters and Regulations
We are subject to laws and regulations that could impose substantial costs upon us and cause delays in the delivery and installation of our products.
The construction, installation, and operation of our products are generally subject to oversight and regulation in accordance with laws and ordinances relating to building codes, safety, environmental and climate protection, domestic content requirements and related matters, as well as energy market rules, regulations and tariffs, and typically require governmental approvals and permits, including environmental approvals and permits, that vary by jurisdiction. In some cases, these approvals and permits change or require periodic renewal. These laws and regulations can affect the markets for our products and the costs and time required for their installation and may give rise to liability for administrative oversight costs, compliance costs, clean-up costs, property damage, bodily injury, fines, and penalties. Capital and operating expenses needed to comply with these laws and regulations can be significant, and violations may result in substantial fines and penalties or third-party damages.
It is difficult and costly to track the requirements of every individual authority having jurisdiction over our installations, to design our products to comply with these varying standards, and to obtain all applicable approvals and permits. We cannot predict whether or when all approvals or permits required for a given project will be granted or whether the conditions associated with the approvals or permits will be achievable. The denial of a permit essential to a project or the imposition of impractical conditions or excessive transmission or distribution facility upgrade costs as a condition of interconnection, would impair our ability to develop the project. In addition, we cannot predict whether the approval or permitting process will be lengthened due to complexities and appeals. The interconnection study process likewise can be a lengthy process. A delay in the review and approval of permits for a project and any interconnection studies, if required, can impair or delay our and our customers’ abilities to develop that project or may increase the cost so substantially that the project is no longer attractive to us or our customers. Furthermore, unforeseen delays in the review and permitting process could delay the timing of the installation of our products and could therefore adversely affect the timing of the recognition of revenue related to the installation, which could harm our operating results in a particular period. In many cases we contractually commit to performing all necessary installation work on a fixed-price basis, and unanticipated costs associated with approval, permitting or compliance expenses may cause the cost of performing such work to exceed our revenue. In addition, emerging federal and state emissions disclosure requirements may pose a burden to existing or potential customers. The costs of complying with all the various laws, regulations and customer requirements, and any claims concerning non-compliance, could have a material adverse effect on our financial condition or operating results.
In addition, the rules and regulations regarding the production, transportation, storage, and use of hydrogen, including with respect to safety, environmental and market regulations and policies, are in flux and may limit the market for our products that utilize hydrogen as a fuel source.
The installation and operation of our products are subject to environmental laws and regulations in various jurisdictions, and there has been in the past and could continue to be uncertainty with respect to both how these laws and regulations may change over time and the interpretation of these environmental laws and regulations to our products.
We are committed to compliance with applicable environmental laws and regulations including health and safety standards, and we continuously review the operation of our products for health, safety, and environmental compliance. Our products produce small amounts of hazardous waste and air pollutants, and we seek to address these in accordance with applicable regulatory standards. In addition, environmental laws and regulations in the U.S., such as the Comprehensive Environmental Response and Compensation and Liability Act, impose liability on several grounds including for the investigation and clean-up of contaminated soil and ground water, impacts to human health and damages to natural resources. If contamination is discovered at properties currently or formerly owned or operated by us, or properties to which hazardous substances were sent by us, it could result in our liability under environmental laws and regulations. Many of our customers who purchase our products have high sustainability standards, and any environmental non-compliance by us could harm our brand and reputation and impact customers’ buying decisions.
Maintaining environmental compliance can be challenging given the changing patchwork of environmental laws and regulations that prevail at the U.S. federal, state, regional, and local level and internationally. Most existing environmental laws and regulations preceded the introduction of our innovative fuel cell technology and were adopted to apply to technologies existing at the time (i.e., large coal, oil, or gas-fired power plants). Guidance from these agencies on how certain environmental laws and regulations may or may not be applied to our technology can be inconsistent.
In most jurisdictions where air permits and various land use permits are required for installation of larger Energy Server system installations, the length of time to obtain these permits has increased. Moreover, the level of certainty around the
issuance of such permits has decreased and where issued, the cost of compliance has been and can be prohibitive. We have experienced a reluctance in certain areas to issue permits for natural gas Energy Server systems and, even when that reluctance is overcome, we have seen conditions imposed, including a requirement to blend costly renewable fuels or other similar measures that might advance climate goals. The timing associated with these processes and the cost associated with related conditions have impacted our selling activities.
Our technology is moving faster than the regulatory process in many instances and there are inconsistencies between how we are regulated in different jurisdictions. It is possible that regulators could delay or prevent us from conducting our business in some way pending agreement on, and compliance with, shifting regulatory requirements. Such actions could delay the installation of our products, could result in penalties, could require modification or replacement or could trigger claims of performance warranties and defaults under customer contracts that could require us to repurchase equipment, any of which could adversely affect our business, financial performance, and brand and reputation. In addition, new energy or environmental laws or regulations or new interpretations of existing laws or regulations could present marketing, political or regulatory challenges and could require us to upgrade or retrofit existing equipment, which could result in materially increased capital and operating expenses.
We are in an unsettled regulatory and legal environment with increasing compliance complexity and costs associated with legal and compliance matters.
We operate in a dynamic and increasingly complex regulatory and legal environment, characterized by evolving policies, geopolitical pressures, and the global push toward energy transition. Governments worldwide are enacting stricter regulations to meet net-zero and emissions reduction targets, leading to frequent changes in environmental and energy policies. The shift from fossil fuels to renewable energy sources has introduced new rules, subsidies, and mandates, creating uncertainty for companies managing both legacy and emerging energy systems. Trade disputes, sanctions, and conflicts affecting supply chains and resource availability add unpredictability to the global regulatory landscape.
As governments and regulatory bodies introduce stricter requirements, the compliance burden continues to grow. Navigating these changes requires substantial investment in monitoring, adapting to, and implementing new compliance frameworks. Additionally, this heightened regulatory scrutiny increases the likelihood of audits, investigations, and litigation, which can result in significant legal costs, operational delays, or penalties. These factors not only elevate our operational complexity and cost structure but also pose risks to our ability to execute projects, innovate, and maintain stakeholder confidence.
As we expand into international markets, we may be subject to local content requirements or pressures which could increase costs or reduce demand for our products.
Foreign jurisdictions where we conduct or wish to conduct our business may impose domestic content requirements (requiring goods, materials, components, services or labor to be supplied from or made in the country). Domestic or local content requirements favor domestic industry over foreign competitors and there has been a significant increase in the use of these programs in recent years. For example, in the Republic of Korea, customers and prospective customers may be incentivized to select domestic competitors over Bloom.
With respect to our products that run, in part, on fossil fuel, we may be subject to a heightened risk of regulation, the loss of certain incentives, and to changes in our customers’ energy procurement policies.
The current generation of our Energy Server systems that run on natural gas generally produce fewer carbon emissions than the average U.S. marginal power generation sources that our projects displace. However, the operation of our current Energy Server systems does produce some carbon dioxide (“CO2”), which contributes to global climate change. As such, we may be negatively impacted by CO2-related changes in applicable laws, regulations, ordinances, rules, including carbon pricing, or the requirements of the incentive programs on which we and our customers currently rely, as well as potential scrutiny around voluntary or regulatory carbon emissions reporting by our existing or potential customers. Changes in any of the laws, regulations, or ordinances, or rules that apply to our installations and new technology could make it more difficult or costly to install and operate our Energy Server systems, thereby negatively affecting our ability to deliver cost savings to our customers. Certain municipalities in which we operate have banned or are considering banning new interconnections with gas utilities, while others have adopted bans that allow new interconnections for non-combustion resources, such as our Energy Server systems. Some local municipalities have also banned or are considering banning the use of distributed generation products that utilize fossil fuel. Additionally, our customers’ and potential customers’ energy procurement policies may prohibit or limit their willingness to procure our natural gas-fueled Energy Server systems. Our business prospects may be negatively impacted if we are prevented from completing new installations or our installations become more costly as a result of laws, regulations, or
ordinances, or rules applicable to our Energy Server systems, or by our customers’ and potential customers’ energy procurement policies.
Existing regulations and changes to such regulations may create technical, regulatory, and economic barriers, which could significantly reduce demand for our products or affect the financial performance of current sites.
The markets for our products are heavily influenced by laws, regulations and policies, including customers’ voluntary procurement standards, as well as by tariffs, internal policies and practices of electric utility providers. These regulations, tariffs, standards, and policies often relate to electricity pricing and technical interconnection of electricity generation. These regulations, tariffs, standards, and policies are often modified and could continue to change, which could result in a significant reduction in demand for our products. For example, utility companies commonly charge fees to industrial customers for disconnecting from the electric grid. These fees could change, thereby increasing the cost to our customers of using our products and making them less economically attractive.
At the federal level in the U.S., the FERC has authority to regulate under various federal energy regulatory laws, wholesale sales of electric energy, capacity, and ancillary services, and the delivery of natural gas in interstate commerce. Also, several of the tax equity partnerships we are involved with are subject to regulation under FERC with respect to market-based sales of electricity, which requires us to file notices and make other periodic filings with FERC, which increases our costs and subjects us to additional regulatory oversight.
Although we generally are not regulated as a utility, statutes, regulations, tariffs and market rules often relate to electricity and natural gas pricing, fuel cell net metering, incentives, taxation, and the rules surrounding the interconnection of electricity generation for specific technologies. In the U.S., governments and market operators frequently modify these statutes, regulations, tariffs and market rules. Governments, often acting through state utility or public service commissions, as well as market operators, change, adopt or approve different utility requirements and rates for commercial and industrial customers on a regular basis. Rules adopted by FERC and state public utility commissions may also create new requirements that affect commercial and industrial customers, including the potential direct assignment of energy and transmission-system upgrade costs to new data center customers as a class. Changes, or in some cases a lack of change, in any of the laws, regulations, tariffs ordinances, or other rules that apply to our installations and new technology could make it more costly for us or our customers to install and operate our products and could negatively affect our ability to deliver cost savings to customers.
In addition, the recent change in U.S. federal administration has led and is expected to continue to lead to changes in the leadership of various U.S. federal regulatory agencies and changes or proposed or threatened changes to U.S. federal government policy that have led to, in some cases, legal challenges as well as uncertainty around the funding, functioning and policy priorities of U.S. federal regulatory agencies and the status of current and future regulations. U.S. federal government policy changes have included seeking to temporarily broadly halt federal funding, seeking to aggressively downsize the U.S. federal government’s workforce and instructing federal agencies to reprioritize or to cease operating or enforcing certain laws or regulations. We are unable to predict the extent to which the current U.S. federal administration may impose or seek to impose leadership or policy changes at the U.S. federal regulatory agencies responsible for regulating our business or changes to rules and policies impacting our operations. Any such changes could impose additional costs, require the attention of senior management or result in other changes to or limitations on our business.
We may become subject to product liability claims, which could harm our financial condition and liquidity if we are not able to successfully defend or insure against such claims.
We may become subject to product liability claims. Our Energy Server systems are considered high energy systems because they consume or produce flammable fuels and may operate up to 480 volts. High-voltage electricity poses potential shock hazards, while natural gas and hydrogen, associated with use of our products, are flammable gases and therefore are potentially dangerous fuels capable of causing fires and other harm. There can be no assurance that our products will continue to be certified to meet certain design and safety standards, and if our equipment is not properly handled or if there are undiscovered issues with our equipment, there could be system failure and resulting damage, injury or liability.
These claims could require us to incur significant costs to defend. Furthermore, any successful product liability claim could require us to pay a substantial monetary award. Moreover, a product liability claim could generate substantial negative publicity about us and could materially impede widespread market acceptance and demand for our products, which could harm our brand, business prospects, and operating results. Our product liability insurance may not be sufficient to cover all potential product liability claims. Any lawsuit seeking significant monetary damages either in excess of or outside of our coverage may have a material adverse effect on our business and financial condition.
Litigation or administrative proceedings could have a material adverse effect on our business, financial condition and results of operations.
We have been and continue to be involved in legal proceedings, administrative proceedings, claims, and other litigation that arise in the ordinary course of business. For information regarding pending legal proceedings, please see Part I, Item 3, Legal Proceedings and Part II, Item 8, Financial Statements and Supplementary Data, Note 13 — Commitments and Contingencies. In addition, since our fuel cell products are new types of products in nascent markets, we have in the past needed and may in the future need to seek administrative guidance, the amendment of existing regulations, or the development of new regulations, to operate our business in some jurisdictions. Such regulatory processes may require public hearings concerning our business, which could lead to subsequent litigation.
Unfavorable outcomes or developments relating to proceedings to which we are a party or transactions involving our products such as judgments for monetary damages, injunctions, or denial or revocation of permits, could have a material adverse effect on our business, financial condition, and results of operations. In addition, settlement of claims could adversely affect our financial condition and results of operations.
Risks Related to Our Intellectual Property
Our failure to effectively protect and enforce our intellectual property rights may undermine our competitive position, and litigation to protect our intellectual property rights may be costly.
Policing unauthorized use of proprietary technology can be difficult and expensive, and the measures we have taken to protect our intellectual property rights, including our trade secrets, may not be sufficient to prevent such use. For example, many of our engineers reside in California where it is not legally permissible to prevent them from leaving employment with us and working for a competitor. Similarly, the outcome of legal challenges to the FTC’s non-compete rule, a rule that would have broadly banned virtually all non-compete clauses between employers and workers in the U.S., may impact our ability to prevent our employees from leaving employment with us and working for a competitor. Also, litigation may be necessary to enforce our intellectual property rights, including protecting our trade secrets, or to determine the validity and scope of the proprietary rights of others. Such litigation may result in our intellectual property rights being challenged, limited in scope, or declared invalid or unenforceable. We cannot be certain that the outcome of any litigation will be in our favor, and adverse determination in any such litigation could impair our intellectual property rights, business, prospects, brand, and reputation.
We rely primarily on patents, trade secrets, copyrights, and trademarks, and non-disclosure, confidentiality, and other types of contractual restrictions to establish, maintain, and enforce our intellectual property and proprietary rights. However, our rights under these intellectual property laws and agreements afford us only limited protection and the actions we take to establish, maintain, and enforce our intellectual property rights may not be adequate. For example, our trade secrets and other confidential information could be discovered by or disclosed in an unauthorized manner to third parties. Additionally, our owned or licensed intellectual property rights could be challenged, invalidated, or declared unenforceable in judicial or administrative proceedings, or circumvented, designed around by our competitors, infringed, or misappropriated. Competitors could copy or reverse engineering our products or develop and market products that are substantially equivalent to or superior to our own. Any of these issues, including the unauthorized use of our intellectual property by others, could reduce our competitive advantage and have a material adverse effect on our business, financial condition, or operating results. In addition, the laws of some countries do not protect intellectual property rights as fully as do the laws of the U.S. Many U.S.-based companies have encountered substantial intellectual property infringement in foreign countries, including countries where we sell products. Even if foreign patents are granted, effective enforcement in foreign countries may not be available. We may not be able to effectively protect our intellectual property rights in these markets or elsewhere. If an impermissible use of our intellectual property or trade secrets were to occur, our ability to sell our products at competitive prices may be adversely affected and our business, financial condition, operating results, and cash flows could be adversely affected.
In connection with our expansion into new markets, we may need to develop relationships with new partners, including project developers and/or financiers who may require access to certain of our intellectual property in order to mitigate perceived risks regarding our ability to service their projects over the contracted project duration. If we are unable to come to agreement regarding the terms of such access or find alternative means to address this perceived risk, such failure may negatively impact our ability to expand into new markets. Alternatively, we may be required to develop new strategies for the protection of our intellectual property, which may be less protective than our current strategies and could therefore erode our competitive position.
Our patent applications may not result in issued patents, and our issued patents may be successfully challenged in litigation or post-grant proceedings, either of which may have a material adverse effect on our ability to prevent others from commercially exploiting products similar to ours.
We cannot be certain that our pending patent applications will result in issued patents or that any of our issued patents will afford protection against a competitor. The status of patents involves complex legal and factual questions, and the breadth of claims allowed is subject to disagreement. As a result, we cannot be certain that the patent applications that we file will result in patents being issued or that our patents and any patents that may be issued to us in the future will afford protection against competitors with similar technology. In addition, patent applications filed in foreign countries are subject to laws, rules, and procedures that differ from those of the U.S., and thus we cannot be certain that foreign patent applications related to issued U.S. patents will be issued in other regions. Furthermore, even if these patent applications are accepted and the associated patents issued, some foreign countries provide significantly less effective patent enforcement than the U.S.
In addition, patents issued to us may be infringed upon or designed around by others and others may obtain patents that we need to license or design around, either of which would increase costs and may adversely affect our business, prospects, and operating results.
We may need to defend ourselves against claims that we infringed, misappropriated, or otherwise violated the intellectual property rights of others, which may be time-consuming and would cause us to incur substantial costs.
Companies, organizations, or individuals, including our competitors, may hold or obtain patents, trademarks, or other proprietary rights that they believe are infringed by our products or services. These companies holding patents or other intellectual property rights could make claims or bring suits alleging infringement, misappropriation, or other violations of such rights, or otherwise assert their rights by seeking royalties or injunctions. Several of the proprietary components used in our products have been subjected to infringement challenges in the past. We generally indemnify our customers against claims that the products we supply do not infringe, misappropriate, or otherwise violate third-party intellectual property rights, and we therefore may be required to defend our customers against such claims. If a claim is successfully brought in the future and we or our products are determined to have infringed, misappropriated, or otherwise violated a third-party’s intellectual property rights, we may be required to do one or more of the following:
•cease selling or using our products that incorporate the challenged intellectual property;
•pay substantial damages (including treble damages and attorneys’ fees if our infringement is determined to be willful);
•obtain a license from the holder of the intellectual property right, which may not be available on reasonable terms or at all;
•redesign our products or means of production, which may not be possible or cost-effective; or
•in some instances, re-purchase products from our customers.
Any of the foregoing could adversely affect our business, prospects, operating results, and financial condition. In addition, any litigation or claims, whether or not valid, could harm our brand and reputation, result in substantial costs and divert resources and management attention.
We also license technology from third parties and incorporate components supplied by third parties into our products. We may face claims that our use of such technology or components infringes or otherwise violates the rights of others, which would subject us to the risks described above. We may seek indemnification from our licensors or suppliers under our contracts with them, but our right to indemnification or our suppliers’ resources may be unavailable or insufficient to cover our costs and losses.
Risks Related to Our Financial Condition and Operating Results
We have incurred significant losses in the past and we may not be profitable in future periods.
Since our inception in 2001, we have incurred significant net losses and have used significant cash in our business. As of December 31, 2024, we had an accumulated deficit of $3.9 billion. We expect to continue to expand our operations domestically and internationally, including by investing in manufacturing, sales and marketing, research and development, staffing, and infrastructure to support our growth. We may continue to incur net losses in future periods. Our ability to achieve profitability will depend on a number of factors, including our ability to:
•grow our sales volume;
•expand into new geographical markets and industry market sectors;
•attract and retain financing partners;
•continue to improve the useful life of our technology and reduce our warranty servicing costs;
•reduce the cost of producing our products;
•improve the efficiency and predictability of our installation process;
•introduce new products, including products for the hydrogen market;
•improve the effectiveness of our sales and marketing activities; and
•attract and retain key talent in a competitive labor marketplace.
Even if we do achieve profitability, we may be unable to sustain or increase our profitability in the future.
Our financial condition and results of operations and other key metrics are likely to fluctuate, which could cause our results for a particular period to fall below expectations, resulting in a severe decline in the price of our common stock.
Our financial condition and results of operations and other key metrics have fluctuated significantly in the past and may continue to fluctuate in the future due to a variety of factors, many of which are beyond our control. For example, the amount of product revenue we recognize in a given period is materially dependent on the volume of installations of our products in that period and the type of financing used by the customer.
In addition to the other risks described herein, the following factors subject us to quarterly fluctuations in our financial condition and results of operations:
•the timing of installations, which may depend on many factors such as availability of inventory, product quality or performance issues, local permitting requirements, utility requirements, environmental, health, and safety requirements, weather, availability of labor, health emergencies, and customer facility construction schedules;
•size of particular installations and number of sites involved in any particular quarter;
•the mix in purchase or financing options used by customers, the geographical mix of customer sales, and the rates of return required by financing parties;
•disruptions in our supply chain;
•whether we are able to structure our sales agreements in a manner that would allow for the product and installation revenue to be recognized upfront;
•delays or cancellations of product installations;
•fluctuations in our service costs, particularly due to unexpected costs and rising labor costs;
•fluctuations in our research and development expense, including periodic increases associated with the pre-production qualification of additional tools as we expand our production capacity;
•the length of the sales and installation cycle for a particular customer;
•the timing and level of additional purchases by new and existing customers, which may be impacted by macroeconomic factors including inflation, interest rates, the recessionary environment, and availability of capital;
•the timing of the development of the market for our new features and products, including our Electrolyzer;
•unanticipated expenses or installation delays associated with changes in governmental regulations, permitting requirements, utility requirements and environmental, health and safety requirements;
•disruptions in our sales, production, service or other business activities resulting from disagreements with our labor force or our inability to attract and retain qualified personnel; and
•unanticipated changes in government incentive programs available for us, our customers, and tax equity financing parties.
Fluctuations in our operating results and cash flow could, among other things, give rise to short-term liquidity issues. In addition, our revenue, key operating metrics, and other operating results in future quarters may fall short of our projections or the expectations of investors and financial analysts, which could have an adverse effect on the price of our common stock.
If we fail to manage our growth effectively, our business and operating results may suffer.
In order to grow effectively, we must efficiently operate our business, manage our capital expenditures and control our costs. If we experience a significant growth in orders without improvements in automation and efficiency, we may not be able to meet product demand in a timely manner. We may need additional manufacturing capacity and we and some of our suppliers may need additional capital-intensive equipment. Any growth in manufacturing must include scaling quality control as the increase in production increases the possible impact of manufacturing defects. In addition, any growth in the volume of sales of
our products may outpace our ability to engage sufficient and experienced personnel to manage the higher number of installations and to engage contractors to complete installations on a timely basis and in accordance with our expectations and standards. Any failure to manage our growth effectively could materially and adversely affect our business, prospects, operating results, and financial condition. Our future operating results depend to a large extent on our ability to manage this growth successfully.
If we fail to maintain effective internal control over financial reporting in the future, the accuracy and timing of our financial reporting may be adversely affected.
We are required to comply with Section 404 of the Sarbanes-Oxley Act of 2002. The provisions of the act require, among other things, that we maintain effective internal control over financial reporting and disclosure controls and procedures. Preparing our financial statements involves a number of complex processes, many of which are done manually and are dependent upon individual data input or review. These processes include calculating revenue, deferred revenue and inventory costs. While we continue to automate our processes and enhance our review and put in place controls to reduce the likelihood for errors, we expect that for the foreseeable future many of our processes will remain manually intensive and thus subject to human error. If we are unable to successfully maintain effective internal control over financial reporting, we may fail to prevent or detect material misstatements in our financial statements, in which case investors may lose confidence in the accuracy and completeness of our financial reports. Any failure to maintain effective disclosure controls and procedures or internal control over financial reporting could have a material adverse effect on our business and operating results and cause a decline in the price of our common stock.
Our ability to use deferred tax assets to offset future taxable income may be subject to limitations that could subject our business to higher tax liability.
Our ability to use net operating loss carryforwards (“NOLs”) to offset future taxable income may be limited due to expiration, lack of taxable income in the future, changes in our stock ownership, and other factors that may be outside of our control. Our deferred tax assets may also expire or be underutilized, which could prevent us from offsetting future taxable income.
Risks Related to Our Liquidity
We must maintain the confidence of our customers in our liquidity, including our ability to timely service our debt obligations and grow our business over the long term.
Currently, we are the only provider able to fully support and maintain our products. If potential customers believe we do not have sufficient capital or liquidity to operate our business over the long-term or that we will be unable to maintain or support our products, customers may be less likely to purchase or lease our products, particularly in light of the significant financial commitment required. In addition, financing sources may be unwilling to provide financing on reasonable terms. Similarly, suppliers, financing partners, and other third parties may be less likely to invest time and resources in developing business relationships with us if they have concerns about the success of our business.
Accordingly, in order to grow our business, we must maintain confidence in our liquidity and long-term business prospects among customers, suppliers, financing partners and other parties. This may be particularly complicated by factors such as:
•our limited operating history at a large scale;
•the size of our debt obligations;
•profitability concerns;
•unfamiliarity with or uncertainty about our products and the overall perception of the distributed generation market;
•prices for electricity or natural gas;
•competition from alternate sources of energy;
•warranty or unanticipated service issues we may experience;
•the perceived value of environmental programs to our customers;
•the size of our expansion plans in comparison to our existing capital base and the scope and history of operations;
•the availability and amount of tax incentives, credits, subsidies or other incentive programs; and
•the other factors set forth in this “Risk Factors” section.
Several of these factors are largely outside our control, and any negative perceptions about our liquidity or long-term business prospects would likely harm our business.
Our indebtedness, and restrictions imposed by the agreements governing our outstanding indebtedness, may limit our financial and operating activities and may adversely affect our ability to incur additional debt to fund future needs.
Given our substantial level of indebtedness, it may be difficult for us to secure additional debt financing at an attractive cost, which may in turn impact our ability to expand or maintain our operations, develop our products, and remain competitive in the market. Our liquidity needs could vary significantly and may be affected by general economic conditions, industry trends, performance, and many other factors not within our control.
The agreements governing our outstanding indebtedness contain, and other future debt agreements may contain, covenants imposing operating and financial restrictions on our business that limit our flexibility including, among other things:
•borrow money;
•pay dividends or make other distributions;
•incur liens;
•make asset dispositions;
•make loans or investments;
•issue or sell share capital of our subsidiaries;
•issue guaranties;
•enter into transactions with affiliates;
•merge, consolidate or sell, lease or transfer all or substantially all of our assets;
•require us to dedicate a substantial portion of cash flow from operations to the payment of principal and interest on indebtedness, thereby reducing the funds available for other purposes such as working capital and capital expenditures;
•make it more difficult for us to satisfy and comply with our obligations with respect to our indebtedness;
•subject us to increased sensitivity to interest rate increases;
•make us more vulnerable to economic downturns, adverse industry conditions, or catastrophic external events;
•limit our ability to withstand competitive pressures;
•reduce our flexibility in planning for or responding to changing business, industry and economic conditions; and/or
•place us at a competitive disadvantage to competitors that have relatively less debt than we have.
Upon the occurrence of certain events to us, including a change in control, a significant asset sale or merger or similar transaction, our liquidation or dissolution or the cessation of our stock exchange listing, each of which may constitute a fundamental change under the outstanding notes, holders of certain of the notes have the right to cause us to repurchase for cash any or all of such outstanding notes. We cannot provide assurance that we would have sufficient liquidity to repurchase such notes. Furthermore, our financing and debt agreements contain events of default. If an event of default were to occur, the trustee or the lenders could, among other things, terminate their commitments and declare outstanding amounts due and payable and our cash may become restricted. We cannot provide assurance that we would have sufficient liquidity to repay or refinance our indebtedness if such amounts were accelerated upon an event of default. Borrowings under other debt instruments that contain cross-acceleration or cross-default provisions may, as a result, be accelerated and become due and payable as a consequence. We may be unable to pay these debts in such circumstances. We cannot provide assurance that the operating and financial restrictions and covenants in these agreements will not adversely affect our ability to finance our future operations or capital needs, or our ability to engage in other business activities that may be in our interest or our ability to react to adverse market developments.
We may not be able to generate sufficient cash to meet our debt service obligations or our growth plans.
Our ability to generate sufficient cash to meet our debt obligations will depend on our future financial performance, which will be affected by a range of economic, competitive, and business factors. If we do not generate sufficient cash to satisfy our debt obligations, we may have to undertake alternative financing plans such as refinancing or restructuring our debt, selling assets, reducing or delaying capital investments, or seeking to raise additional capital. We cannot provide assurance that any of these alternatives would be available or permitted under the terms of our debt instruments then in effect. Furthermore, the ability to refinance indebtedness would depend upon the condition of the finance and credit markets at the time. Our inability to generate sufficient cash to satisfy our debt obligations or to refinance our obligations on commercially reasonable terms or on a timely basis would have an adverse effect on our business, results of operations and financial condition.
Risks Related to Our Operations
Expanding operations internationally could expose us to additional risks.
Although we currently operate primarily in the U.S., we continue to expand our business internationally. We currently have operations in the Asia Pacific region and Europe. Any expansion internationally could subject our business to risks associated with international operations, including:
•increased complexity and costs of managing international operations;
•conformity with applicable business customs, including translation into foreign languages and associated expenses;
•lack of availability of government incentives and subsidies;
•financing challenges for our customers;
•potential changes to our established business model, including installation and/or service challenges that we may have not encountered before;
•cost of alternative power sources, which could be meaningfully lower outside the U.S.;
•availability and cost of natural gas;
•variability in gas specifications from jurisdiction to jurisdiction;
•effects of adverse changes in currency exchange rates and rising interest rates;
•difficulties in staffing and managing foreign operations in an environment of diverse culture, laws and regulations, and customers, and the increased travel, infrastructure, and legal and compliance costs associated with international operations;
•our ability to develop and maintain relationships with suppliers and other local businesses;
•compliance with product safety requirements and standards;
•our ability to obtain business licenses that may be needed in international locations to support expanded operations;
•compliance with local laws and regulations and unanticipated changes in local laws and regulations, including tax laws and regulations;
•challenges in managing taxation in cross-border transactions;
•greater difficulties in securing or enforcing our intellectual property rights in certain jurisdictions;
•difficulties in enforcing contracts in certain jurisdictions;
•risk of nationalization or other expropriation of private enterprises;
•trade barriers such as export requirements, tariffs, taxes, local content requirements, anti-dumping regulations and requirements, and other restrictions and expenses, which could increase the effective price of our products and make us less competitive in some countries or increase the costs to perform under our existing contracts;
•difficulties in collecting payments in foreign currencies and associated foreign currency exposure;
•restrictions on repatriation of earnings;
•natural disasters (including as a result of climate change), acts of war or terrorism, regional conflicts, and public health emergencies; and
•adverse social, political and economic conditions, including inflation, a recessionary environment, and disruptions in capital markets.
We utilize a sourcing strategy that emphasizes global procurement of materials that have direct or indirect dependencies upon a number of vendors with operations in the Asia Pacific region. Physical, regulatory, technological, market, reputational, and legal risks related to climate change in these regions and globally are increasing in impact and diversity and the magnitude of any short-term or long-term adverse impact on our business or results of operations remains unknown. The physical impacts of climate change, including as a result of certain types of natural disasters occurring more frequently or with more intensity or changing weather patterns, could disrupt our supply chain, result in damage to or closures of our facilities, and could otherwise have an adverse impact on our business, operating results and financial condition. In addition, the war in Ukraine resulted in increased sanctions that affected the price of raw materials used in our products, which had and could continue to have an adverse impact on our operating results.
Our cross-border transactions and international operations are subject to complex foreign and U.S. laws and regulations, including anti-bribery and corruption laws, antitrust or competition laws, data privacy laws, such as the GDPR, and environmental regulations, among others. In particular, recent years have seen a substantial increase in anti-bribery law enforcement activity by U.S. regulators, and we currently operate and seek to operate in many parts of the world that are
recognized as having greater potential for corruption. Violations of any of these laws and regulations could result in fines and penalties, criminal sanctions against us or our employees, prohibitions on the conduct of our business and on our ability to offer our products and services in certain geographies, and significant harm to our business reputation. Our policies and procedures to promote compliance with these laws and regulations and to mitigate these risks may not protect us from all acts committed by our employees or third-party vendors, including contractors, agents and services partners. Additionally, the costs of complying with these laws (including the costs of investigations, auditing and monitoring) could adversely affect our current or future business.
The success of our international sales and operations will depend, in large part, on our ability to anticipate and manage these risks effectively. Our failure to manage any of these risks could harm our international operations, reduce our international sales, and could give rise to liabilities, costs or other business difficulties that could adversely affect our operations and financial results.
Data security breaches and cyberattacks could compromise our intellectual property or other confidential information and cause significant damage to our business, product performance, brand, and reputation.
We maintain information that is confidential, proprietary or otherwise sensitive in nature on our information technology systems, and on the systems of our third-party providers. This information includes intellectual property, financial information and other confidential information related to us and our employees, prospects, customers, suppliers and other business partners. Additionally, our information technology provides us with the ability to remotely control some variables of our products; they are connected to, controlled and monitored by our centralized remote monitoring service. We rely on our internal software applications for many of the functions we use to operate our business generally. Cyberattacks are increasing in frequency and evolving in nature. We and our third-party providers are at risk of attack through the use of increasingly sophisticated methods, including malware, phishing and the deployment of artificial intelligence to find and exploit vulnerabilities.
Our information technology systems, and those maintained by our third-party providers, have been in the past, and may be in the future, subjected to attempts to gain unauthorized access, disable, destroy, maliciously control or cause other system disruptions. In some cases, it is difficult to anticipate or to detect immediately such incidents and the damage they caused. While these types of incidents have not had a material effect on our business to date, future incidents involving access to our network or improper use of our systems, or those of our third parties, could compromise confidential, proprietary or otherwise sensitive information, as well as the operation of our products.
There is no assurance that any measures we may take to combat known and unknown cybersecurity risks will be sufficient to prevent future security breaches and cyberattacks. The security of our infrastructure, including the network that connects our products to our remote monitoring service, may be vulnerable to breaches, unauthorized access, misuse, computer viruses, or other malicious code and cyberattacks that could have a material adverse impact on our business and our products in the field, and the protective measures we have taken may be insufficient to prevent such events. A breach or failure of our networks or computer or data management systems due to intentional actions such as cyberattacks, including ransomware attacks, phishing or denial-of-service attacks, negligence, or other reasons, whether as a result of actions by third-parties or our employees, could seriously disrupt our operations or could affect our ability to control or to assess the performance in the field of our products and could result in disruption to our business and legal liability.
In addition, security breaches and cyberattacks could negatively impact our brand and reputation and our competitive position and could result in litigation with third parties, regulatory action and increased remediation costs, any of which could adversely impact our business, our financial condition, and our operating results. Although we maintain insurance coverage that may cover certain liabilities in connection with some security breaches and cyberattacks, we cannot be certain it will be adequate for liabilities actually incurred or that any insurer will not deny coverage of future claims.
If we are unable to attract and retain key employees and hire qualified management, technical, engineering, finance and sales personnel, our ability to compete and successfully grow our business could be harmed.
We believe that our success and our ability to reach our strategic objectives are highly dependent on the contributions of our key management, technical, engineering, finance and sales personnel. The loss of the services of any of our key employees could disrupt our operations, delay the development and introduction of our products and services and negatively impact our business, prospects and operating results. In particular, we are highly dependent on the services of Dr. Sridhar, our Founder, President, Chief Executive Officer and Director, and other certain key employees. None of our key employees are bound by employment agreements for any specific term and we cannot assure you that we will be able to successfully attract and retain the senior leadership necessary to grow our business. There is intense competition for talented individuals in our industry, particularly in the San Francisco Bay Area where our principal offices are located. Our failure to attract and retain our executive
officers and other key management, technical, engineering, finance and sales personnel, could adversely impact our business, our financial condition and our operating results.
Competition for manufacturing employees is intense, and we may not be able to attract and retain the qualified and skilled employees needed to support our business.
We believe part of our success depends on the efforts and talent of our manufacturing employees and our ability to attract, develop, motivate and retain such employees. Competition for manufacturing employees is extremely intense. We may not be able to hire and retain these personnel at compensation levels consistent with our existing compensation and salary structure. Some of the companies with which we compete for experienced employees have greater resources than we have and may be able to offer more attractive terms of employment.
Risks Related to Ownership of Our Common Stock
The stock price of our common stock has been and may continue to be volatile.
The market price of our common stock has been and may continue to be volatile. In addition to factors discussed in this Risk Factors section, the market price of our common stock may fluctuate significantly in response to numerous variables, many of which are beyond our control, including:
•overall performance of the equity markets;
•actual or anticipated fluctuations in our revenue and other operating results;
•changes in the financial projections we may provide to the public or our failure to meet these projections;
•changing market and economic conditions, including a recessionary environment, rising interest rates and inflationary pressures;
•failure of securities analysts to initiate or maintain coverage of us, changes in financial estimates by any securities analysts who follow us or our failure to meet these estimates or the expectations of investors;
•the issuance of negative reports from short sellers;
•recruitment or departure of key personnel;
•new laws, regulations, subsidies or credits, or new interpretations of them, applicable to our business;
•negative publicity related to problems in our manufacturing or the real or perceived quality of our products;
•rumors and market speculation involving us or other companies in our industry;
•the failure or distress of competitors in our industry;
•announcements by us or our competitors of significant technical innovations, acquisitions, strategic partnerships or capital commitments;
•lawsuits threatened or filed against us; and
•other events or factors including those resulting from war, natural disasters (including as result of climate change), incidents of terrorism or responses to these events.
In addition, the stock markets have experienced extreme price and volume fluctuations that have affected and continue to affect the market prices of equity securities of many companies. Stock prices of many companies have fluctuated in a manner unrelated or disproportionate to the operating performance of those companies. In the past, stockholders have instituted securities class action litigation following periods of market volatility. We are currently involved in securities litigation, which may subject us to substantial costs, divert resources and the attention of management from our business, and adversely affect our business.
We may issue additional shares of our common stock in connection with future conversions of the Green Notes, which may dilute our existing stockholders and potentially adversely affect the market price of our common stock.
In the event that some or all of the Green Notes are converted, and we elect to deliver shares of common stock, the ownership interests of existing stockholders will be diluted, and any sales in the public market of any shares of our common stock issuable upon such conversion could adversely affect the prevailing market price of our common stock.
Future sales of our common stock by SK ecoplant Co., Ltd. or its affiliates, or the perception that such sales could occur, may adversely affect the market price of our common stock.
SK ecoplant Co., Ltd. and its affiliates (“SK ecoplant”) hold 23,491,701 shares of our common stock, equaling 10.3% of the shares outstanding as of December 31, 2024 (see Part II, Item 8, Note 17 — SK ecoplant Strategic Investment). As part of its initial investment, SK ecoplant agreed that it would be prohibited from disposing any of the purchased securities for a period ending on the second anniversary of the Second Closing Date, which is March 23, 2025. The sale of a substantial number of shares of our common stock by SK ecoplant, or the perception that such sales could occur, could adversely affect the market price of our common stock. These sales, or the possibility of these sales, could also make it more difficult for us to sell equity securities or securities convertible into equity securities in the future at a time and at a price that we deem appropriate.
We do not intend to pay dividends for the foreseeable future.
We have never declared or paid any cash dividends on our capital stock and do not intend to pay cash dividends in the foreseeable future. We anticipate that we will retain all of our future earnings for use in the development of our business and for general corporate purposes. Any determination to pay dividends in the future will be at the discretion of our board of directors. Accordingly, investors must rely on sales of their common stock after price appreciation, which may never occur, as the only way to realize any future gains on their investments.
Provisions in our charter documents and under Delaware law could make an acquisition of us more difficult, limit stockholders’ rights, and limit the market price of our common stock.
Provisions in our restated certificate of incorporation and amended and restated bylaws may have the effect of delaying or preventing a change of control or changes in our management. Our restated certificate of incorporation and amended and restated bylaws include provisions that:
•require that our board of directors is classified into three classes of directors with staggered three-year terms;
•permit the board of directors to establish the number of directors and fill in any vacancies and newly created directorships;
•require super-majority voting to amend some provisions in our restated certificate of incorporation and amended and restated bylaws;
•authorize the issuance of “blank check” preferred stock that our board of directors could use to implement a stockholder rights plan;
•authorize only the chairman of our board of directors, our chief executive officer, or a majority of our board of directors to call a special meeting of stockholders;
•prohibit stockholder action by written consent;
•expressly authorize the board of directors to make, alter, or repeal our bylaws; and
•establish advance notice requirements for nominations for election to our board of directors or for proposing matters that can be acted upon by stockholders at annual stockholder meetings.
In addition, our restated certificate of incorporation and our amended and restated bylaws provide that the Court of Chancery of the State of Delaware will be the exclusive forum for: any derivative action or proceeding brought on our behalf; any action asserting a breach of fiduciary duty; any action asserting a claim against us arising pursuant to the Delaware General Corporation Law, our restated certificate of incorporation or our amended and restated bylaws; or any action asserting a claim against us that is governed by the internal affairs doctrine. Our restated certificate of incorporation and our amended and restated bylaws provide that unless we consent in writing to the selection of an alternative forum, the federal district courts of the U.S. shall be the exclusive forum for the resolution of any complaint asserting a cause of action arising under the Securities Act. These choice of forum provisions may limit a stockholder’s ability to bring a claim in a judicial forum that it finds favorable for disputes with us or any of our directors, officers, or other employees, which thereby may discourage lawsuits with respect to such claims. Alternatively, if a court were to find the choice of forum provision contained in our restated certificate of incorporation and our amended and restated bylaws to be inapplicable or unenforceable in an action, we may incur additional costs associated with resolving such action in other jurisdictions, which could harm our business, our operating results, and our financial condition.
Moreover, Section 203 of the Delaware General Corporation Law may discourage, delay, or prevent a change in control of our Company. Section 203 imposes certain restrictions on mergers, business combinations, and other transactions between us and holders of 15% or more of our common stock.
Scrutiny regarding ESG practices and disclosures could result in additional costs and adversely impact our business, brand and reputation.
Like many companies, we face scrutiny relating to our Environmental, Social and Governance (“ESG”) practices and disclosures. Many investors use ESG screening criteria for making investment decisions, and ESG standards, frameworks and regulations continue to evolve. Our ESG practices and disclosures may not satisfy, appropriately respond to the concerns of, or be supported by all investors, customers, partners, regulators, enforcement authorities, or other stakeholders (including those in support of or in opposition to ESG practices), whose expectations are evolving and varied. Any violation of, non-compliance with, or failure to meet such expectations, or negative publicity related to our ESG practices or disclosures, could harm our brand and reputation and adversely impact employee retention, our access to capital, or our attractiveness as a business partner, and could expose us to increased scrutiny or criticism or to government enforcement actions and private litigation.
Our ability to achieve any ESG goal, target, or objective, is subject to numerous risks, many of which are outside of our control. Examples of such risks include the availability and cost of environmental commodities, technologies and products, evolving regulatory requirements affecting ESG standards or disclosures, our ability to recruit, develop, and retain diverse talent in our labor markets, and our ability to develop and maintain reporting processes and controls that comply with evolving standards for identifying, measuring and reporting ESG metrics. As ESG stakeholder expectations, reporting standards, and disclosure requirements continue to develop, we may incur increasing costs related to ESG monitoring and reporting.
ITEM 1B — UNRESOLVED STAFF COMMENTS
None.
ITEM 1C — CYBERSECURITY
Cybersecurity Risk Management and Strategy
We have developed and implemented a cybersecurity risk management program designed to assess, identify, and manage risks from potential unauthorized occurrences on or through our information technology systems that may result in adverse effects on the confidentiality, integrity, or availability of our information technology systems or any information residing therein. Our cybersecurity risk management program includes a cybersecurity incident response plan.
We design and assess our program based on the Center for Internet Security (“CIS”) 18 Framework. This does not imply that we meet any particular technical standards, specifications, or requirements, only that we use the CIS 18 Framework as a guide to help us identify, assess, and manage cybersecurity risks relevant to our business.
Our cybersecurity risk management program is integrated into our overall enterprise risk management program, and shares common methodologies, reporting channels and governance processes that apply across the enterprise risk management program to other legal, compliance, strategic, operational, and financial risk areas.
Our cybersecurity risk management program includes:
•Periodic risk assessments designed to help identify material cybersecurity risks to our critical systems, information, products, services, and our broader enterprise IT environment.
•A security team principally responsible for managing our cybersecurity risk assessment processes, security controls, and response to cybersecurity incidents, supported by a virtual Chief Information Security Officer (“vCISO”) that we have engaged through a third-party IT security firm.
•The use of external service providers, where appropriate, to assess, test, or otherwise assist with aspects of our security controls.
•Our Internal Audit department, which monitors certain IT systems controls that are integrated into our larger Sarbanes-Oxley control environment.
•Periodic cybersecurity awareness training for our employees and contractors with access to our information technology systems.
•A cybersecurity incident response plan that includes procedures for responding to cybersecurity incidents, including incidents that could be indicators of attack against availability, integrity and confidentiality of information systems.
•A third-party risk management process for service providers, suppliers, and vendors that includes examining their security postures and assessing their data and system protection controls.
Since the beginning of the last fiscal year, we have not identified risks from known cybersecurity threats, including as a result of any prior cybersecurity incidents, that have materially affected us, but we face certain ongoing cybersecurity threats that, if realized, are reasonably likely to materially affect us. For a discussion of how cybersecurity risks could materially affect us in the future, please see the risk factors set forth under the caption Part I, Item 1A, Risk Factors — Risks Related to our Operations.
Cybersecurity Governance
Our Board considers cybersecurity risk as part of its risk oversight function and has delegated to the Audit Committee oversight of cybersecurity and other information technology risks. The Audit Committee oversees management’s implementation of our cybersecurity risk management program. The Board receives periodic reports from the Audit Committee and management on these and other activities. The Audit Committee receives periodic reports from management on our cybersecurity risks, including presentations from our Chief Information Officer, vCISO, internal security staff, and external experts. This includes updates to the Audit Committee, as appropriate, regarding any significant cybersecurity incidents, or multiple incidents that could be significant in the aggregate. These updates may occur in between regularly scheduled Audit Committee meetings.
At the management level, the Enterprise and Risk Management Committee (the “ERM Committee”) discusses cybersecurity topics, including any potentially material cybersecurity incidents, as part of its oversight of the company’s significant risks. Our Chief Information Officer, collaborating with the broader management team, is responsible for assessing and managing our material risks from cybersecurity threats. The team has primary responsibility for our overall cybersecurity risk management program and supervises both our internal cybersecurity personnel and our retained external cybersecurity consultants.
Our management team supervises efforts to prevent, detect, mitigate, and remediate cybersecurity risks and incidents through various means, including:
•periodic briefings from internal security personnel;
•periodic reviews of risk management measures implemented to prevent, detect, mitigate, and remediate cybersecurity risks and incidents, including our incident response plan;
•threat intelligence and other information obtained from governmental, public or private sources, including external consultants engaged by us; and
•alerts and periodic reports produced by security tools deployed in our IT environment.
Our Chief Information Officer has more than 20 years of cybersecurity and information technology experience and she has served as the Chief Information Officer for multiple technology companies. Our vCISO and their third-party IT security firm includes a global team of cybersecurity professionals with significant industry experience. Similarly, the members of the ERM Committee possess significant risk management experience obtained by their collective years of experience at Bloom and other companies of similar or greater complexity.
ITEM 2 — PROPERTIES
The table below presents details for our principal properties:
| | | | | | | | | | | | | | |
| Facility | Location | Approximate Square Footage | Held | Lease Term |
| | | | |
Corporate headquarters1 | San Jose, CA | 183,000 | Leased | 2031 |
Manufacturing, warehousing, research and development2 | Sunnyvale, CA | 60,000 | Leased | 2024 |
Research and development2 | Mountain View, CA | 44,000 | Leased | 2024 |
| Manufacturing, research and development | Fremont, CA | 326,000 | Leased | * |
| Manufacturing and warehousing | Newark, DE | 377,000 | Leased | ** |
Manufacturing and warehousing3 | Newark, DE | 178,000 | Owned | n/a |
| | | | |
* Lease terms expire in December 2027, February 2036 and November 2037.
** Lease terms expire in February 2026, December 2026, April 2027, June 2028 and October 2028.
1 Our corporate headquarters is used for administration, research and development, and sales and marketing.
2 As of December 31, 2024, lease agreements for the 60,000 sq. ft. manufacturing, warehousing and R&D facility in Sunnyvale, CA, and the 44,000 sq. ft. R&D facility in Mountain View, CA, expired and were not renewed.
3 Our first purpose-built Bloom Energy manufacturing center for the fuel cells and Energy Server systems assembly and was designed specifically for copy-exact duplication as we expand, which we believe will help us scale more efficiently.
We lease additional office space as field offices in the U.S. and office and manufacturing space around the world including in India, Germany, Ireland, Japan, the Republic of Korea, Taiwan, China, and Singapore. To support our growth expectations, we invested in additional manufacturing capacity at a new facility in Fremont, California. In July 2022, we announced the grand opening of this multi-gigawatt manufacturing facility, representing a $200 million investment. It followed the expansion of the company’s global headquarters in San Jose in June 2021 as well as the opening of a new research and technical center and a global hydrogen development facility in Fremont. This facility provides additional capacity necessary for future growth.
ITEM 3 — LEGAL PROCEEDINGS
We are, and from time to time, we may become, involved in legal proceedings or subject to claims arising in the ordinary course of our business. For a discussion of legal proceedings, see Part II, Item 8, Note 13 — Commitments and Contingencies. We are not presently a party to any other legal proceedings that, in the opinion of our management and if determined adversely to us, would individually or taken together have a material adverse effect on our business, operating results, financial condition or cash flows.
ITEM 4 — MINE SAFETY DISCLOSURES
Not applicable.
Part II
ITEM 5 — MARKET FOR REGISTRANT’S COMMON EQUITY, RELATED STOCKHOLDERS MATTERS AND ISSUER PURCHASES OF EQUITY SECURITIES
Our Class A common stock is listed on The New York Stock Exchange (“NYSE”) under the symbol “BE.” On February 24, 2025, there were 520 registered holders of record of our Class A common stock.
We have not declared or paid any cash dividends on our capital stock and do not intend to pay any cash dividends in the foreseeable future.
STOCK PERFORMANCE GRAPH
The following graph compares the cumulative total return since our initial public offering of our common stock relative to the cumulative total returns of the NYSE Composite Index and the Nasdaq Clean Edge Green Energy Total Return Index. An investment of $100 (with reinvestment of all dividends, if any) is assumed to have been made in our common stock and in each of the indexes on December 31, 2019, and its relative performance is tracked through December 31, 2024.
This graph shall not be deemed to be “filed” with the SEC or subject to the liabilities of Section 18 of the Exchange Act, and the graph shall not be deemed to be incorporated by reference into any prior or subsequent filing by us under the Securities Act. Note that past stock price performance is not necessarily indicative of future stock price performance.
| | | | | | | | | | | | | | | | | | | | | | | | | | | | | | | | | | | |
| (in cumulative $) | December 31, 2019 | March 31, 2020 | June 30, 2020 | September 30, 2020 | December 31, 2020 | March 31, 2021 | June 30, 2021 | September 30, 2021 | December 31, 2021 | March 31, 2022 | June 30, 2022 |
| Bloom Energy Corporation | $100.00 | $70.01 | $145.64 | $240.54 | $383.62 | $362.06 | $359.64 | $250.55 | $293.50 | $323.20 | $220.81 |
| NYSE Composite Index | $100.00 | $74.55 | $86.64 | $93.06 | $106.99 | $115.60 | $123.24 | $120.87 | $129.11 | $126.13 | $110.32 |
| NASDAQ Clean Edge Green Energy Total Return Index | $100.00 | $81.00 | $119.79 | $179.19 | $284.83 | $278.54 | $281.58 | $254.96 | $277.31 | $263.75 | $213.58 |
| | | | | | | | | | | | | | | | | | | | | | | | | | | | | | | | |
| (in cumulative $) | September 30, 2022 | December 31, 2022 | March 31, 2023 | June 30, 2023 | September 30, 2023 | December 31, 2023 | March 31, 2024 | June 30, 2024 | September 30, 2024 | December 31, 2024 |
| Bloom Energy Corporation | $267.51 | $255.86 | $266.69 | $218.78 | $177.42 | $198.02 | $150.39 | $163.76 | $141.28 | $297.13 |
| NYSE Composite Index | $103.24 | $117.04 | $119.26 | $123.96 | $120.95 | $133.16 | $145.52 | $144.09 | $156.81 | $154.19 |
| NASDAQ Clean Edge Green Energy Total Return Index | $233.01 | $193.70 | $214.46 | $211.16 | $176.04 | $174.52 | $143.49 | $141.36 | $149.59 | $141.58 |
Unregistered Sales of Equity Securities
None.
Issuer’s Purchases of Equity Securities
None.
ITEM 6 — [RESERVED]
ITEM 7 — MANAGEMENT’S DISCUSSION AND ANALYSIS OF FINANCIAL CONDITION AND RESULTS OF
OPERATIONS
Overview
Description of Bloom Energy
Our mission is to make clean, reliable energy affordable for everyone in the world. We developed the first large-scale, commercially viable solid oxide fuel cell based power generation platform that empowers businesses, essential services, critical infrastructure and communities to responsibly take charge of their energy.
Our technology, invented and manufactured in the U.S., is one of the most advanced electricity and hydrogen producing technologies on the market today. Our fuel-flexible Bloom Energy Server systems can use biogas, hydrogen, natural gas, or a blend of fuels to create resilient, reliable and sustainable power at typically significantly higher efficiencies than traditional, combustion-based resources. In addition, the same fuel cell based platform that powers our Energy Server systems can be used to create hydrogen with our Bloom Electrolyzer. Hydrogen is increasingly recognized as a critically important tool for the decarbonization of the energy economy. Our enterprise customers include some of the largest multinational corporations in the world. We also have relationships with some of the largest utility companies in the U.S. and the Republic of Korea, with a growing presence in various international markets in Europe and Asia.
At Bloom Energy, we look forward to a net-zero future. Our technology is designed to help enable this future by delivering reliable, low-carbon electricity in a world facing unacceptable levels of power disruptions. Our resilient solid oxide fuel cell platform has kept electricity available for our customers through hurricanes, earthquakes, typhoons, forest fires, extreme heat and grid failures. Unlike traditional combustion power generation, our platform is community-friendly — emitting no noise, installed on movable skids and designed to significantly reduce emissions of criteria air pollutants. Our Energy Server systems provide electricity using natural gas, biofuels or hydrogen as feedstock and have applications that can provide both heat and power as well as enable carbon capture. We provide energy solutions that help organizations obtain reliable, resilient, lower emissions power today, thereby supporting net-zero objectives.
We market and sell our Energy Server systems primarily through our direct sales organization in the U.S. and in certain international markets. We also work with utilities to offer our energy solutions to their end customers, which can be either in front of the meter or on-site. Recognizing that deploying our solutions requires significant financial commitment, we have developed a number of financing options to support sales of our Energy Server systems to customers who may prefer to finance the acquisition using third-party financing and ownership.
Our typical target commercial or industrial customer has historically been either an investment-grade entity or a customer with investment-grade attributes such as size, assets and revenue, liquidity, geographically diverse operations and general financial stability. Given that our customers are typically large institutions with multi-level decision-making processes, we generally experience a lengthy sales process. Once the sale is completed, we are able to deploy our Energy Server systems in a matter of months, subject to permitting requirements. We have a large multi-disciplinary team to facilitate the deployment of our projects in a wide variety of locations under a myriad of regulatory environments.
We continue to innovate our solid oxide platform to offer energy solutions to our customers. In February 2024, we announced our Be FlexibleTM offering which introduced load following capabilities on our Bloom Energy Server system to enable customers and utilities to meet variable electricity load and demand. We believe that our Be Flexible offering is critical for data centers, as their power needs typically vary widely throughout the day. Our products are also designed to work with existing carbon capture utilization and storage (“CCUS”) and combined heat and power (“CHP”) technologies offered by third parties. CCUS can mitigate emissions from natural gas as an Energy Server system generates a relatively pure stream of CO2 that can be used or sequestered. In our experience, CCUS is an important capability for customers who need reliable power beyond what can be provided by renewable sources, while also reducing their greenhouse gas emissions. CHP allows the exhaust heat generated by an Energy Server system to be channeled and made available for use, including for heating and cooling, further increasing the efficiency of the system. This capability is important to data centers and other large power users seeking to repurpose generated heat to improve efficiency.
Energy Market Conditions
The global energy transition towards a net-zero environment has created new challenges and opportunities for utilities, suppliers of energy solutions, and customers. Shifts and uncertainty in market and regulatory dynamics and corporate and governmental policies are currently impacting the selling process and impacting sales cycles and timelines for our products. Increasing electricity rates, decreasing energy security and reliability, and delays in the development of transmission infrastructure and grid interconnection as well as other time-to-power challenges have led to increased customer interest in our
power solutions. At the same time, ongoing natural gas supply and pricing concerns due to geopolitical stresses, as well as customers’ interest in meeting sustainability targets, have led to increased caution from potential customers in their buying decision for energy solutions. Increasing demand for power has forced utilities, states and countries to revisit less clean sources of baseload and intermediate power, which our technology is designed to replace. This supply and demand mismatch globally has threatened energy security, reliability, and availability.
Bloom enables customers to address these energy market challenges by offering fuel flexible solutions that are designed to provide cost predictable, resilient, and reliable energy in a timely fashion. As customers and utilities navigate the energy transition and evolving landscape, the ability of our power solutions to fit their economic, regulatory, and policy needs depends on a number of factors, including natural gas availability and pricing, electrical interconnection needs and availability, redundant back up power requirements, cost requirements, and sustainability profiles. These factors may impact a customer’s buying decision for an alternative power solution such as ours, even in those situations where the time to power from a utility is measured in years because the total cost to interconnect, including the cost to build out energy transmission infrastructure, is unknown before all interconnection studies are completed.
Policy changes commencing in 2025 may also affect customers’ demand for power solutions. Changes in permitting rules could boost domestic fossil fuel production and infrastructure, while proposals to limit environmental reviews under the National Environmental Policy Act and other statutes could incentivize investment in, and lower the cost of, fossil fuels, including natural gas. At the same time, proposals to halt new permits for wind projects, particularly offshore wind, could slow renewable energy adoption and the projected available supply of renewable energy. Bloom stands ready to meet these new opportunities with our low-emission Energy Server systems.
Many data center customers and other large power users have signed exclusivity arrangements with their utilities, and this often creates a more complicated dynamic for them to move to an on-site solution. The rising cost of natural gas in some locations, increases in gas distribution rates, limited availability of natural gas supply, as well as disruptions to the world’s gas markets, has increased the cost of our power solutions for customers and, in certain cases where there is a lack of fuel supply, a complete inability to operate the systems. In the U.S., the lack or slow development of pipeline infrastructure in the past has impacted the timing of customers being able to take advantage of our power solution opportunities. In certain jurisdictions in the U.S. and Europe, natural gas bans have prevented the use of our power solutions unless alternative fuels are available.
In addition, many of our potential data center and industrial customers are pursuing greenfield opportunities where the development cycle is long and laden with permitting requirements, and the uncertainty of these factors is leading to a more complex customer decision-making process and longer sales cycles. Data center greenfield projects require significant investments in real estate, facility costs, and technology, among other elements, in addition to the investment in our power solutions, and the timing and sequencing of those investments is largely outside of our control.
Key Macro Trends
Increases in Demand for Power, Driven by Data Centers and Artificial Intelligence (AI)
Demand for power has continued to significantly outpace the available power generation supply from the grid, with the need for power becoming more acute in 2024. Key factors driving the increasing demand include the transition towards the electrification of transportation and buildings, the rapid adoption of AI that has led to the expansion of existing data centers and plans for new greenfield data centers, and Federal incentives for domestic manufacturing, including semiconductor and battery production. These factors along with economic growth have put significant stress on the supply from the grid and has led companies to consider on-site distributed power, including Bloom Energy Server systems, to meet their power needs.
Time to Power Increases as Power Demand/Supply Mismatch Grows
In part because of the increases in demand for power, the importance of time to power has increased. According to a study published in April 2024 by the Lawrence Berkeley National Laboratory, the time from initiating a request for interconnection to the grid to the start of commercial operations has more than doubled from less than two years during the period from 2000-2007, to more than four years from 2018-2023. Bloom Energy Server systems can be configured as on-site fully-islanded, microgrid solutions that are not interconnected to the grid, which often can provide a customer power in months instead of years. Many utilities have informed data center and manufacturing customers that they cannot interconnect for a period of years because the utility has no power available to serve a customer’s needs, thus making the Bloom Energy Server system an attractive alternative. In addition, our fully-islanded microgrid solutions can provide power on-site, without the need for costly transmission and distribution system upgrades that often are required before a customer can interconnect to the electrical grid. We are seeing greater interest in fully-islanded, microgrid solutions among data center customers because of these interconnection-related delays. If a customer desires back up power or a “grid parallel” solution in combination with the
Bloom Energy Server system, required interconnection studies and lengthy interconnection queues may remain, eroding the time to power value proposition.
Co-locating Large Loads with Distributed Generation Configured as Islanded Microgrids are Gaining in Traction as Energy Solutions to Bypass Long Interconnection Queues and Transmission Upgrades
Our islanded microgrid solution allow data center and other customers the ability to skip the interconnection queue and start construction. A key to this solution is that our Be FlexibleTM load following capability allows us to follow a customer’s variable loads without the need to import power from the transmission grid. We believe avoiding lengthy interconnection queues is key to unlocking time to power for our customers. Our islanded microgrid solution also creates ratepayer savings by reducing congestion charges resulting from constraints on the transmission grid and avoiding the need for network transmission investments and upgrades that may be allocated to all ratepayers. In addition to our distributed generation microgrid solution serving a single customer, utility companies can employ it to serve as an energy transmission asset, helping utility companies to serve their customers while avoiding the costs of new transmission and distribution infrastructure.
Utilities are Turning to Distributed Energy Solutions to Decrease their Customers’ Time to Power
Our utility customers are recognizing the challenge of keeping pace with the growing demand for power. Aging infrastructure, coupled with transmission and distribution bottlenecks, are making it more difficult for utilities to integrate additional sources of energy to add capacity. Building new transmission and distribution infrastructure is expensive, takes many years, and would likely cause utility rates to increase. As demand for power continues to grow, utility companies are struggling to meet the soaring demand of data centers, while customers’ time to power becomes increasingly important. Utility companies are exploring alternative means of producing and supplying energy to their end customers, including our Energy Server systems. We entered into multiple agreements with utilities in 2024, including a landmark 1 GW supply agreement with a customer that included a 100 MW order in 2024. We expect more utility customers in the future to supplement their power generation with the Bloom Energy Server system. As we work to reduce our product costs, and with utility rates expected to increase with new significant infrastructure investments projected to be needed over the next five years to meet rapid demand growth, we expect our energy solutions to become more cost competitive in more countries, communities, and industries around the world.
Fuel Flexible Solutions Address Reliability Concerns as well as Near- and Long-term Sustainability Considerations
The impacts of climate change, including more severe and unpredictable weather events, have placed further strain on aging utility grids and led to periods of power outages for those reliant on the grid. In addition, the recognition of the threat of climate change has led companies and governments to set ambitious emissions goals to reduce the release of carbon dioxide to the atmosphere. Large increases in demand for power are expected to challenge prevailing carbon reduction trajectories when large power users turn to conventional solutions to meet their needs. The Energy Server system is able to provide highly available power to displace dirtier and less efficient conventional combustion solutions like turbines and engines. Deeper decarbonization potential is enabled through fuel flexibility, CHP offerings and CCUS capability. In addition to natural gas, our non-combustion power solutions are designed to run on biofuels or hydrogen, emit near-zero criteria pollutants, and use no water during steady state operation.
Other Factors Affecting our Performance
Delayed Project
In the fourth quarter of 2022, we entered into a Power Purchase Agreement (the “Project PPA”) for the sale of electricity to a customer for three greenfield sites that were at various stages of development (the “Project”). The first site was expected to be operational with power by the third quarter of 2024. We sold 73 megawatts of the Energy Server systems to a distributor with the expectation that the distributor would support installation on the Project and install the Energy Server systems at the three Project sites. For site specific reasons, in the first quarter of 2024, the end customer decided not to deploy the Energy Server systems at the originally selected sites (the “Project Servers”) and commenced exploring alternative sites for deployment of the Energy Server systems. In the interim, the end customer commenced payments under the Project PPA and agreed to continue such payments for the earlier of the full term of the Project PPA or deployment of the Energy Server systems. During the fourth quarter of 2024, the end customer identified an alternative location to deploy the Project Servers (the “Alternative Project”) that is expected to be operational in 2027. Bloom and the end customer have agreed that the payments under the Project PPA will be suspended unless the end customer terminates the Alternative Project prior to it becoming operational in 2027, at which point, all suspended payments will be due and payable to us.
Shifting Regulatory Environment
In the U.S., the Investment Tax Credit (“ITC”) for fuel cells running on a non-zero carbon fuel expired at the end of fiscal year 2024. Although the Company and its customers utilized compliant safe harbor mechanisms to secure deployment of a certain dollar amount of Energy Server systems through 2028, since the ITC was not extended for fuel cells running on a non-zero carbon fuel, U.S. bookings, revenue and gross margins could be materially impacted in 2025 and beyond. Also, it is possible that the expiration of the ITC increased demand for ITC-compliant sales of our solutions in 2024 due to customer desire to secure ITC for their projects through safe harboring.
The Inflation Reduction Act of 2022 (“IRA”) established a new clean electricity production credit and a clean electricity investment credit. Although the U.S. Treasury Department developed rules to implement credits and incentives for clean energy resources under President Biden’s administration, there is considerable uncertainty around whether, or the conditions under which such credits will be available for transactions involving our solutions in the future. In addition, delays in adoption of Renewable Fuel Standard regulations in the U.S. for the use of biogas to generate electricity for electric vehicles, along with minimal governmental focus on utilization of biogas outside of use by methane-fueled vehicles, have created uncertainty in prospects for broader biogas availability for industrial uses, including our power solutions. Furthermore, in most jurisdictions, air permits and various land use permits are required for installation of our solutions over a certain amount of megawatts, and generally the length of time to obtain these permits increased, while the level of certainty of issuance has decreased and if issued, the cost of compliance requirements can be cost prohibitive. We have experienced a reluctance in certain states to issue permits for gas generation equipment. Even if issued, states may require a blend of costly renewable fuels or other measures to advance climate goals.
In Ireland, which is a large data center market, a directive from the Minister of the Department of the Environment, Climate and Communications under the former administration to restrict grid connections to data centers and other large power users, along with a halt in high-pressure gas installations has delayed our selling activities. In 2023, the South Korean government moved to a new, government-run bidding process for fuel cell purchases, which has adversely impacted and may continue to impact demand for our power solutions.
Working with Utilities
The imbalance between power demand and supply has contributed to utilities seeking alternative sources of power to supply to their end customers. Utilities have been unable to meet this demand through the deployment of renewable sources of energy such as solar and wind power. Bloom Energy Server systems can be installed at the utility’s point of distribution or directly on the customer’s site. The energy produced by our systems can be utilized by utilities to provide power to a specific customer or customers or may be used by customers generally. As demand for power continues to grow, and time to power becomes increasingly important, utilities are exploring alternative means of producing and supplying energy to their end customers, including our Energy Server systems. We entered into multiple agreements with utilities in 2024, including a landmark 1 GW supply agreement with a customer that included a 100 MW order in 2024. We expect more utility customers in the future to supplement their power generation with the Bloom Energy Server system. Increasing the supply of available power can allow utilities to encourage end customers to remain in their current locations rather than relocating to areas where power is more available. In addition, co-locating our Energy Server systems on-site with large loads, can enable a utility to provide power to a large energy user without impacting its rate base and providing the onsite power as an islanded microgrid can avoid interconnection studies and wait times.
Hydrogen Market Developments
The interest, investment, and stimulation of clean hydrogen in the U.S., Europe and in many other regions across the globe have not yet had significant impacts on the supply of hydrogen. To date, while the number of proposed hydrogen production projects has grown rapidly, only a small fraction has reached the final investment decision stage, and an even smaller fraction has been deployed. In addition, the infrastructure needed to transport hydrogen, whether through pipelines or maritime or land-based tankers, is currently only sufficient for existing uses, and has not begun to be significantly extended for anticipated future uses, with hydrogen blending and other approaches remaining at pilot stages. It remains unclear whether regulators in some jurisdictions will allow hydrogen to be introduced into gas distribution systems, which could limit our customers’ ability to transport hydrogen from the point of production to the point of consumption. Additionally, while U.S. Treasury Department rules regarding the use of market-based renewable energy have been clarified, hurdles remain that could make it more difficult for hydrogen projects to scale significantly, and uncertainty exists as potential changes may be sought by the new U.S. federal administration and U.S. Congress.
Lengthening Sales Cycles
Many of the factors discussed above have lengthened the selling cycles for our products and we have experienced delays in our anticipated bookings as a result. Our revenue, margins, and cash flow in any given year are dependent on bookings during previous years in addition to current bookings. Historically, the majority of our bookings occurred in the second half of the year, with a significant portion occurring in the fourth quarter, and this occurred once again in 2024. However, if a substantial portion of our anticipated bookings are delayed beyond our expectations, our revenue, margins, and cash flow in a particular period could be materially adversely impacted.
Supply Chain Constraints
We continue to see effects from global supply chain tightness due to the current inflationary environment, war in Ukraine, and trade tensions between the U.S. and China. We are not aware of, and do not expect any significant direct impact on our business or supply chain from the armed conflict in Israel and neighboring areas. While we have not experienced any significant component shortages to date, we are facing pressures from inflation. These dynamics could worsen as a result of continued geopolitical instability or escalation of current military conflicts or trade tensions. The new U.S. federal administration has implemented tariffs on steel and aluminum and has discussed implementing a number of other trade tariffs which may impact our operations. Our supply chain does not have significant exposure to China, but significant tariffs on imports from other countries where we do source materials could materially impact our costs. We are also reliant on third party providers of storage equipment, infrastructure equipment and pipelines, and other materials and technologies that work with our products to provide an energy solution for customers. In the event we are unable to mitigate the impacts of delays and/or price increases in raw materials and components, including as a result of new tariffs, it could delay the manufacturing and installation of, and increase the costs of, our products, which would adversely impact our cash flows and results of operations, including our revenues and gross margin. For example, we expect the 25% tariffs imposed on U.S. imports of steel and aluminum to adversely impact our cost of raw materials for our products.
Installations and Maintenance of our Products
In fiscal year 2024, our installation projects experienced some delays relating to, among other things, permitting, utility delays, and access to customer facilities. However, these delays did not significantly impact our revenue. If we are delayed in or unable to perform maintenance, our previously installed products would likely experience adverse performance impacts, including reduced output and/or efficiency, which could result in warranty and/or guaranty claims by our customers. If we experience a significant increase of product failure in the future, our service expense may increase and we may fail to achieve the performance commitments to our customers, which could result in warranty and/or guaranty claims. Additionally, product failure and service costs may increase as we initially deploy new applications for our Energy Server system, including Be FlexibleTM load following, CCUS, and CHP.
Financing Constraints
As we grow our business globally and increase the size and number of customer orders, we will need to secure new customer financing options, the amount of financing available as well as the number of financing partners. As we offer an innovative new technology solution, obtaining new financing partners and available funds for customer financings often involves a rigorous and timely due diligence process on our technology, manufacturing and service capabilities. If we are unable to obtain adequate financing for our customers who desire to use third-party financing rather than purchasing the Energy Server systems for their own balance sheet, our revenue could be delayed or impacted. In addition, our ability to arrange financing for our products depends partly on the creditworthiness of our customers, and deterioration of our customers’ credit ratings could impact this financing. When interest rates rise, the cost of financing for our customers also increases, and the financiers of our installations demand a higher rate of return, putting pressure on our margins.
Manufacturing and Labor Market Constraints
As recently as 2022, we experienced impacts from labor shortages and challenges in hiring for our manufacturing facilities. While these constraints have since abated, and we reduced headcount as part of the Restructuring Plan adopted in September 2023, we may still experience difficulties with hiring and retention and may face additional labor shortages in the future. For details on the Restructuring Plan refer to Part II, Item 8, Note 12 — Restructuring. In addition, the current inflationary environment has led to rising wages and labor costs as well as increased competition for labor.
Strategic Investment
On October 23, 2021, we entered into a Securities Purchase Agreement (the “SPA”) with SK ecoplant in connection with our strategic partnership. Pursuant to the SPA, on December 29, 2021, we sold to SK ecoplant 10,000,000 shares of our zero coupon, non-voting redeemable convertible Series A preferred stock, par value $0.0001 per share (the “Series A RCPS”), at a purchase price of $25.50 per share for an aggregate purchase price of $255.0 million (the “Initial Investment”). On November 8, 2022, each share of Series A RCPS was converted into 10,000,000 shares of Class A common stock.
Simultaneous with the execution of the SPA, we and SK ecoplant executed an amendment to the Joint Venture Agreement (the “JVA”), an amendment and restatement to our Preferred Distribution Agreement (“PDA Restatement”), and a new Commercial Cooperation Agreement regarding initiatives pertaining to the hydrogen market and general market expansion for Bloom solutions.
On March 20, 2023, SK ecoplant entered into an amendment of the SPA (the “Amended SPA”) with us, pursuant to which on March 23, 2023, we issued and sold to SK ecoplant 13,491,701 shares of non-voting Series B redeemable convertible preferred stock, par value $0.0001 per share (the “Series B RCPS”), at a purchase price of $23.05 per share for cash proceeds of $311.0 million, excluding issuance cost of $0.5 million.
On March 20, 2023, in connection with the Amended SPA, we also entered into a Shareholders’ Loan Agreement with SK ecoplant (the “Loan Agreement”), pursuant to which we had the option to draw on a loan from SK ecoplant with a maximum principal amount of $311.0 million, a maturity of five years and an interest rate of 4.6%, should SK ecoplant have sent a redemption notice to us under the Amended SPA. As of September 30, 2023, the loan commitment asset from SK ecoplant was derecognized as a result of automatic conversion of all shares of the Series B RCPS into shares of our Class A common stock.
On September 15, 2023, we entered into the Amended and Restated JVA and the Share Purchase Agreement (together, the “Amended JV Agreements”) with SK ecoplant which allowed SK ecoplant to increase its share of the voting rights in the Korean JV to 60% and increased the scope of assembly done by the joint venture facility in the Republic of Korea to full assembly. In January 2024, according to the Amended JV Agreements, SK ecoplant made a capital contribution to Korean JV of $4.0 million.
On September 23, 2023, all 13,491,701 shares of the Series B RCPS were automatically converted into shares of our Class A common stock pursuant to the Certificate of Designation, dated as of March 20, 2023, setting forth the rights, preferences, privileges, and restrictions of the Series B RCPS, as amended by the Certificate of Amendment to the Certificate of Designation, dated as of April 18, 2023. Upon conversion of all the Series B RCPS into shares of our Class A common stock, SK ecoplant became a related party to us.
Pursuant to that certain Investor Agreement, dated as of December 29, 2021, by and between us and SK ecoplant, as amended from time to time (the “Investor Agreement”), SK ecoplant has granted an irrevocable proxy to our Chief Executive Officer and Chief Financial Officer, as our designees, to vote all of SK ecoplant’s shares, in their sole discretion on all matters to be voted upon by stockholders. The proxy will terminate upon the earlier of the expiration or termination of the standstill term and the voting agreement set forth in Section 4.1 of the Investor Agreement. The standstill term continues until the later of (i) March 23, 2025, (ii) the date on which SK ecoplant ceases to have the right to designate a director to our board of directors, and (iii) the date on which SK ecoplant and its subsidiaries beneficially own less than five percent of the shares of our Class A common stock then issued and outstanding.
For additional details about the transaction with SK ecoplant, please see Part II, Item 8, Note 17 — SK ecoplant Strategic Investment, and for more information about our joint venture with SK ecoplant, please see Part II, Item 8, Note 11 — Related Party Transactions.
Sustainability
We are committed to the goal of providing consistent returns to our stockholders with a focus on corporate citizenship that places a high value on the environment, the welfare of our employees, the communities in which we operate, and the customers we serve. We believe that effectively managing our sustainability-related risks, opportunities, and programs provides financial and reputational benefits that create long-term value for our investors.
We strive to empower businesses and communities to responsibly take charge of their energy while addressing both the causes and consequences of climate change. We aim to serve our customers with products that are resilient, providing uninterrupted power with predictable pricing over the long-term, while developing an increasingly broad portfolio of decarbonized solutions.
In April 2024, we released our 2023 Sustainability Report, Transforming Energy for the Digital Age (the “Sustainability Report”), using generally accepted sustainability frameworks and standards, including alignment with Sustainability Accounting Standards Board standards and the Task Force on Climate-related Financial Disclosures recommendations. In addition, the Sustainability Report also utilized certain Global Reporting Initiative Standards and was mapped against the United Nations Sustainable Development Goals. We plan to issue a sustainability report on an annual basis.
The Sustainability Report can be found on our website at https://www.bloomenergy.com/sustainibility. Website references throughout this document are provided for convenience only, and the content on the referenced websites is not incorporated by reference into this report.
Inflation Reduction Act of 2022
On August 16, 2022, President Biden signed into law the IRA. It contains provisions that have had a significant impact on the development and financing of clean energy projects in the U.S. However, President Trump has expressed skepticism about the IRA and clean energy projects, thus creating uncertainty about its future. The IRA includes expanded tax credits for projects across the Bloom product portfolio as well as for manufacturing of clean energy equipment. It also introduces new mechanisms for tax credit monetization and transferability. The IRA includes targeted incentives intended to encourage development in low-income communities, the use of domestically produced materials, and compliance with certain labor-related requirements. We believe that the programs and credits included in the IRA align well with our business model and could provide significant benefits for our projects. Some or all of these benefits, however, may be at risk from the new U.S. Congress and federal administration, which have expressed interest in repealing, restricting or clawing back IRA funding and expanded tax credits.
The IRA introduces and updates several crediting mechanisms and incentive provisions that are relevant for us including:
•Section 48E — Clean Electricity Investment Credit, which starting December 31, 2024, replaces the previous investment tax credit framework for named clean energy technologies with a “tech neutral” framework anchored around the net carbon neutrality of energy generation from qualifying facilities. It provides incentives of up to 50% for qualifying energy property meeting domestic content and labor requirements.
•Section 45V — Credit for the Production of Clean Hydrogen, which provides a PTC of up to $3 per kg of qualified clean hydrogen produced at qualified facilities in the US, including Bloom’s Electrolyzer projects.
•Section 45Q — Credit for Carbon Oxide Sequestration, which provides up to a $60/tonne credit for carbon utilization and $85/tonne credit for geologic sequestration and can improve the cost effectiveness of Bloom’s carbon capture offerings.
•Section 45Z — Clean Fuel Production Credit, which provides a tax credit for the production of clean transportation fuels with lifecycle GHG emissions below certain levels. The credit can reach levels of up to $1.00/gallon for non-aviation fuel and $1.75/gallon for non-aviation fuel and is influenced by emissions associated with energy use including on-site power provided by Bloom.
•Section 48C — Qualified Advanced Energy Project, which provides an ITC through a competitive application process administered through the Department of Energy equal to 6% or 30% of the investment with respect to advanced energy projects
On December 21, 2023, we submitted the application for qualifying advanced energy project credit allocation under Internal Revenue Code Section 48C(e) for the manufacturing facility in Fremont, California (the “Facility”). On March 29, 2024, we received notification from the Internal Revenue Service (the “IRS”) of the acceptance of our application for a Qualifying Advanced Energy Project Credit of up to $75.3 million. After a technical review of Bloom’s Section 48C(e) application, the Department of Energy provided a recommendation to the IRS to grant a $75.3 million credit allocation for the Facility. The approval is subject to satisfaction of the underlying certification requirements, including the prevailing wage and apprenticeship requirements, within two years from the date of the application acceptance, and potential clearance by the Office of Management and Budget due to President Trump’s executive order halting the disbursement of funds under the IRA.
The U.S. Treasury Department has issued implementation guidance, and we intend to engage with the new U.S. federal administration to understand how shifting policy priorities might impact the revised guidance or changes to the law itself. Current Section 48E guidance places Bloom Energy Server systems running on natural gas in a class of Combustion and Gasification facilities required to demonstrate net-zero emissions in the production of electricity. If the U.S. federal administration does not clarify key aspects of the guidance related to our unique technology, our projects will no longer be
beneficiaries of the ITC. If the ITC is not extended for fuel cells, U.S. bookings, revenue and gross margins could be materially impacted in 2025 and beyond. Also, it is possible that the expiration of the ITC may have increased demand for ITC-compliant sales of our Energy Server systems in 2024 due to customer desire to secure ITC for their projects through safe harboring. Bloom, its customers and financing partners executed safe harbor mechanisms in 2024 that permit deployment of Energy Server systems with the ITC Section 48 credit through 2028. However, if our customers or project-level investors prove reluctant to make sufficient cash outlays for purchases of Energy Server systems for future projects based on their safe harbor, our sales could be negatively impacted in future years.
The IRA also creates certain bonus tax credits relevant to our products placed in service in fiscal years 2023 and 2024, available by satisfying domestic content criteria and/or other criteria if such products are located within an “energy community,” as defined by the IRA. In fiscal years 2023 and 2024, contracts that included price adjustments related to the domestic content bonus tax credit were evaluated as variable consideration and we estimated variable consideration by using the most likely amount method of meeting the IRA domestic content criteria. When recognizing revenue, we constrained the estimate of variable consideration to an amount that was not probable of a significant revenue reversal.
New Foreign Tax Rules
In 2021, the OECD announced an Inclusive Framework on Base Erosion and Profit Shifting including Pillar Two Model Rules defining the global minimum tax, which calls for the taxation of large multinational corporations at a minimum rate of 15%. Subsequently multiple sets of administrative guidance have been issued. Many non-US tax jurisdictions have either recently enacted legislation to adopt certain components of the Pillar Two Model Rules beginning in 2024 (including the European Union Member States) with the adoption of additional components in later years or announced their plans to enact legislation in future years. We are continuing to evaluate the impacts of enacted legislation and pending legislation to enact Pillar Two Model Rules in the non-US tax jurisdictions we operate in. However, no material impact to our financial statements is expected due to the relatively small operations outside the U.S.
Liquidity and Capital Resources
A discussion regarding our liquidity and capital resources for 2024 compared to 2023 is presented in this section. A discussion of our liquidity and capital resources for 2023 compared to 2022 can be found under Item 7, Management’s Discussion and Analysis of Financial Condition and Results of Operations of Part II of our Annual Report on Form 10-K for the year ended December 31, 2023.
We raised cash and supplemented liquidity by issuing the 3% Green Convertible Senior Notes due June 2029 (the “3% Green Notes due June 2029”) in the second quarter of 2024, as well as through financing activities with SK ecoplant in the first quarter of 2023 and issuing the 3% Green Convertible Senior Notes due June 2028 (the “3% Green Notes due June 2028”) in the second quarter of 2023. We expanded our warehouse space in Delaware and California to store more inventory to meet the anticipated increase in demand. If this increase in demand does not materialize to the degree we anticipated, our liquidity and financial condition may be adversely impacted.
On May 29, 2024, we issued the 3% Green Notes due June 2029 in an aggregate principal amount of $402.5 million due June 2029, unless earlier repurchased, redeemed or converted, less the initial purchasers’ discount of $12.1 million and other issuance costs of $0.7 million, resulting in net cash proceeds of $389.7 million. On May 29, 2024, we used approximately $141.8 million of the net proceeds from this issuance to repurchase $115.0 million, or 50%, of the outstanding principal amount of our 2.5% Green Convertible Senior Notes due August 2025 (the “2.5% Green Notes”) in privately negotiated transactions. The repurchase amount equaled 122.6% of the principal amount repurchased plus related accrued and unpaid interest.
As of December 31, 2024, we had unrestricted cash and cash equivalents of $802.9 million. Our cash and cash equivalents consist of highly liquid investments with maturities of three months or less, including money market funds of $749.4 million. We seek to maintain these balances with high credit quality counterparties, regularly monitor the amount of our credit exposure to any one issuer and diversify our investments in order to minimize our exposure.
As of December 31, 2024, we had $1,124.7 million of recourse debt, $4.1 million of non-recourse debt, and $9.2 million of other long-term liabilities. As of December 31, 2024, $114.4 million and $1,014.4 million of our debt were classified as short-term and long-term, respectively. For a complete description of our outstanding debt, please see Part II, Item 8, Note 7 — Outstanding Loans and Security Agreements.
The combination of our cash and cash equivalents and cash flow to be generated by our operations is expected to be sufficient to meet our anticipated cash flow needs for at least the next 12 months. If these sources of cash are insufficient or are not received in a timely manner to satisfy our near-term or future cash needs, we may require additional capital from equity or
debt financings to fund our operations, our manufacturing capacity, product development, and market expansion requirements and to timely respond to competitive market pressures or strategic opportunities, among other things. We may, from time to time, engage in a variety of financing transactions for such purposes, including factoring our accounts receivable. During the year ended December 31, 2024, we factored $184.2 million of accounts receivable. However, we may not be able to secure timely additional financing on favorable terms, or at all. The terms of any additional financing may place limits on our financial and operating flexibility. Although currently we do not have any floating-rate notes on the balance sheet, our overall cost of capital may increase if interest rates rise, if and when we refinance our fixed-rate convertible notes. If we raise additional funds through further issuances of equity or equity-linked securities, our existing stockholders could suffer dilution in their percentage ownership of us, and any new securities we issue could have rights, preferences, and privileges senior to those of holders of our common stock.
Our future capital requirements depend on many factors, including our rate of revenue growth, the timing and extent of spending on research and development efforts and other business initiatives, the rate of growth in the volume of system builds and the need for additional working capital, the expansion of sales and marketing activities both in domestic and international markets, market acceptance of our products, our ability to secure financing for customer use of our products, the timing of installations and of inventory build in anticipation of future sales and installations, and overall economic conditions. In order to support and achieve our future growth plans, we may need or seek advantageously to obtain additional funding through equity or debt financing. Failure to obtain this financing in future quarters may affect our results of operations, including our revenues and cash flows.
A summary of our consolidated sources and uses of cash, cash equivalents, and restricted cash was as follows (in thousands):
| | | | | | | | | | | | | | | | | | | | |
| | | Years Ended December 31, | | | | |
| | | 2024 | | 2023 | | | | | |
| Net cash provided by (used in): | | | | | | | | | | |
| Operating activities | | $ | 91,998 | | | $ | (372,531) | | | | | | | |
| Investing activities | | (58,782) | | | (83,725) | | | | | | | |
| Financing activities | | 175,207 | | | 683,349 | | | | | | | |
| | | | | | | | | | |
Operating Activities
Our operating activities consisted of net loss adjusted for certain non-cash items plus changes in our operating assets and liabilities or working capital. Net cash provided by operating activities for the year ended December 31, 2024, related primarily to the changes in our working capital of $66.4 million predominantly due to an increase in deferred revenue and customer deposits by $115.9 million driven primarily by receipt of new customer deposits, partially offset by (1) an increase in contract assets by $103.8 million triggered by timing of achieving billing milestones, (2) an increase in inventory levels by $44.5 million to support future demand, (3) an increase in deferred cost of revenue by $12.9 million, and (4) the timing of payments to vendors.
Net cash provided by operating activities during the year ended December 31, 2024, was $92.0 million, an improvement of $464.5 million compared to the prior year period. The change in cash provided by operating activities during the year ended December 31, 2024, as compared to the prior year period, was primarily driven by an increase of $187.2 million and $97.0 million attributable to inventories and accounts receivable, respectively, a $182.5 million increase attributable to deferred revenue and customer deposits, partially offset by a decrease of $109.2 million and $14.7 million attributable to contract assets and deferred cost of revenue, respectively.
Investing Activities
Our investing activities have consisted of capital expenditures, including investments to increase our production capacity. Cash used in investing activities during the year ended December 31, 2024, was $58.8 million, an improvement of $24.9 million compared to the prior year period, and was primarily due to the decrease in expenditures on tenant improvements for a newly leased engineering and manufacturing building in Fremont, California, which opened in July 2022. We expect to continue to make capital investments over the next few quarters to expand production capacity at our new manufacturing facility in Fremont, California, which includes the purchase of new equipment and other tenant improvements. We intend to fund these capital expenditures from cash on hand as well as cash flow to be generated from operations or through equity or debt financing. We may also evaluate and arrange equipment lease financing to fund this capital expenditures.
Financing Activities
Our financing activities consist of borrowings and repayments of debt, proceeds, and repayments of financing obligations, distributions paid to noncontrolling interests, contributions from noncontrolling interests, payments of dividends, proceeds from the issuances of our common stock, and other financing activities. Net cash provided by financing activities during the year ended December 31, 2024, was $175.2 million, a decrease of $508.1 million compared to the prior year period, predominantly due to (1) a decrease in the proceeds from the issuance of redeemable convertible preferred stock of $311.0 million, net of paid issuance costs, as a result of the SK ecoplant Second Tranche Closing in the year ended December 31, 2023, (2) a decrease in proceeds from the issuance of debt by $234.6 million, and (3) an increase in repayment of financing obligations by $71.8 million. The decrease was partially offset by (1) the purchase in fiscal year 2023 of the capped call options of $54.5 million related to the 3% Green Notes due June 2028 issued in the second quarter of fiscal year 2023, and (2) a decrease in the repayment of debt by $50.4 million.
Net cash provided by financing activities for the year ended December 31, 2024, consisted of (1) the proceeds from issuance of the 3% Green Notes due June 2029 of $402.5 million, (2) the proceeds from issuance of common stock of $12.4 million, (3) the contribution from a noncontrolling interest of $4.0 million, (4) the proceeds from financing obligations of $1.8 million, (5) the partial repurchase of the 2.5% Green Notes of $141.0 million, (6) the repayment of financing obligations of $90.2 million, (7) the repayment of debt issuance costs of $12.8 million pertaining to the 3% Green Notes due June 2029, and (8) a dividend payment of $1.5 million.
We believe we have sufficient capital to operate our business over the next 12 months. Our working capital was strengthened with the supplemented liquidity through issuing the 3% Green Notes due June 2029 and the 3% Green Notes due June 2028 in the second quarter of 2024 and 2023, respectively, as well as financing activities with SK ecoplant in the first quarter of 2023. In addition, we may still enter the equity or debt market as needed to support the expansion of our business. Please refer to Part II, Item 8, Note 7 — Outstanding Loans and Security Agreements, and Part I, Item 1A, Risk Factors — Risks Related to Our Liquidity — Our indebtedness, and restrictions imposed by the agreements governing our outstanding indebtedness, may limit our financial and operating activities and may adversely affect our ability to incur additional debt to fund future needs, for more information regarding the terms of and risks associated with our debt.
Purchase and Financing Options
Overview
In order to appeal to the largest variety of customers, we make available several options to them. Both in the U.S. and abroad, we sell our solutions directly to customers.
To appeal to a wide range of customers, we arrange several financing options. In the U.S., we also provide access to our Energy Server system through a Power Purchase Agreement, which is the purchase of electricity generated by the Energy Server system in exchange for a scheduled dollars per kilowatt hour rate, through a Capacity Agreement where the customer pays a capacity based flat payment, through a Lease Agreement where the customer pays for a monthly fixed fee for the use of the equipment, and through a Managed Services Agreement, whereby we sell and lease back the Energy Server system to supply energy services to our customers. Each of the foregoing are made possible through third-party financing arrangements by assembling such contracts into portfolios which are sold to investors.
Often our offerings take advantage of local incentives. In the U.S., our financing arrangements are structured to optimize both federal and local incentives, including the ITC (when available) and accelerated depreciation.
Whichever option is selected by a customer in the U.S. or internationally, the contract structure will include obligations (“O&M Obligations”) on our part to operate and maintain our products (“O&M Agreement”). In the U.S., the contract structure often includes obligations on our part to install our products (“Installation Obligations”). Consequently, our transactions may generate revenue from the sale of our products and electricity, the performance of the O&M Obligations, and performance of the Installation Obligations.
In addition to customary workmanship and materials warranties offered with the sale of our products, we provide warranties and guaranties regarding the efficiency and output of our products to the customer and, in certain financing structures, to the financing parties as well. We refer to a “performance warranty” as an obligation to repair or replace Bloom products as necessary to return performance of our products to the warranted performance level. We refer to a “performance guaranty” as an obligation to make a payment to compensate for the failure of our products to meet the guaranteed performance level. Our obligation to make payments under a performance guaranty is always contractually capped.
Energy Server System Sales
There are customers who purchase our Energy Server systems directly from us pursuant to customary equipment sales contracts. In connection with the purchase of the Energy Server systems, the customers also enter into a contract with us for the O&M Obligations. The customer may elect to engage us to provide the Installation Obligations or engage a third-party provider. Internationally, we are sometimes required to use a local construction company to perform the Installation Obligations, as is the case in the Republic of Korea, and we contract directly with the customer to provide the O&M Obligations.
Customer Financing Options
With respect to the third-party financing options in the U.S., a customer may choose to contract for the purchase of electricity generated by the Energy Server systems in exchange for a scheduled dollars per kilowatt hour rate (a “Power Purchase Agreement” or “PPA”), or the use of our Energy Server systems owned by a financing party in exchange for a capacity-based payment (a “Capacity Agreement”) or the use of our Energy Server systems via an equipment lease (a “Lease Agreement”) or energy services provided via a sale-lease back structure (each, a “Managed Services Agreement”).
PPAs are typically financed on a portfolio basis. In the past, we have financed portfolios through tax equity partnerships, acquisition financings and direct sales to investors (each, a “Portfolio Financing”). Capacity-based payments in a Managed Services Agreement or Capacity Agreement are required regardless of the level of performance of the Energy Server system. Managed Services Agreements are then financed pursuant to a sale-leaseback with a financial institution (a “Managed Services Financing”).
In the U.S., our capacity to offer our Energy Server systems through these financed arrangements depends in large part on the ability of financing parties to optimize the tax benefits associated with the Energy Server systems, such as the ITC (when available) or accelerated depreciation. Interest rate fluctuations, and internationally, currency exchange rate fluctuations, may also impact the attractiveness of any financing offerings for our customers. Our ability to finance a PPA, a Capacity Agreement, or a Managed Services Agreement is also related to, and may be limited by, the creditworthiness of the customer. Additionally, a Capacity Agreement or Managed Services Financing option is limited by a customer’s willingness to commit to making the capacity-based payment to a financing party regardless of performance.
In each of our financing options, we typically perform the functions of a project developer, including identifying end customers and financiers, leading the negotiations of the customer agreements and financing agreements, securing all necessary permitting and interconnections approvals, and overseeing the design and construction of the project up to and including commissioning the Energy Server systems.
Each of our financing transaction structures is described in further detail below.
Portfolio Financings
In the past, we financed the Energy Server systems subject to our PPAs through two types of Portfolio Financings. In one type of transaction, we sold a portfolio of PPAs to a tax equity partnership in which we held a managing member interest (such partnership in which we hold an interest, a “PPA Entity”). In these transactions, we sold the portfolio of the Energy Server systems to a limited liability project company (such portfolio owner, a “Portfolio Company”) of which the PPA Entity was the sole member. Whether an investor, a tax equity partnership, or a single member limited liability company, the Portfolio Company was the entity that directly owned the portfolio. The Portfolio Company sold the electricity generated by the Energy Server systems contemplated by the PPAs to the customers. We recognized revenue as the electricity was produced. Our current practices no longer contemplate these types of transactions. In fiscal year 2023, we completed the process of restructuring our PPA Entities by (i) acquiring the outstanding equity interests of our previous investors and tax equity partners, (ii) selling 100% of the equity interests in the PPA Entities or the Portfolio Companies to new investors or tax equity partnerships in which we do not have an equity interest, and (iii) entering into new equipment supply and installation agreements and related agreements to repower and/or replace the Energy Server systems. In August 2023, we sold our last consolidated PPA Entity, 2015 ESA Project Company, LLC (“PPA V”), in connection with the repowering of its portfolio of the Energy Server systems. For further discussion, see Part II, Item 8, Note 10 — Portfolio Financings. The second type of Portfolio financing and our current practice consists of our selling a portfolio of PPAs, or Capacity Agreements or Managed Service Agreements or some combination thereof to a tax equity partnership in which we hold no interest (a “Third-Party Financing”).
Managed Services Financing
Under our Managed Services Financing option, we enter into a Managed Services Agreement with a customer for a certain term. We sell the Energy Server systems to the financier who then leases it back to us pursuant to a sale-leaseback transaction. In the past, certain sale-leaseback transactions failed to achieve all of the criteria for sale accounting and consequently the proceeds from the transaction were recognized as financing obligations within our consolidated balance sheets. For successful sale-and-leaseback transactions, the financier of the Managed Services Agreement typically pays the purchase price for the Energy Server systems at or around acceptance, and we recognize the fair market value of the Energy Server systems sold and respective installation services provided to the financier within product and install revenue, respectively, and recognize an operating lease right-of-use (“ROU”) asset and an operating lease liability on our consolidated balance sheets. Any proceeds in excess of the fair value of the Energy Server systems are recognized as financing obligations.
The duration of our current Managed Services Agreement offerings is between five and ten years. Under some Managed Services Agreements, we agree to provide remarketing assistance in the event a customer does not renew its agreement. Our Managed Services Agreements typically provide for performance warranties of both the efficiency and output of the Energy Server systems and may include other warranties depending on the type of deployment. We often structure payments from the customer as a dollar per kilowatt flat payment. In some cases, the structure may also include variable payment based on the Energy Server systems’ performance or a performance-related set-off. As of December 31, 2024, we had incurred no liabilities due to failure to repair or replace our Energy Server systems pursuant to these performance warranties.
Purchase Alternatives
Our customers have several purchase alternatives for our Energy Server systems. The portion of total revenue attributable to each purchase option in the years ended December 31, 2024, and 2023, was as follows:
| | | | | | | | | | | | | | | | | | |
| | | | | Years Ended
December 31, |
| | | | | | | 2024 | | 2023 |
| | | | | | | | | |
| Direct purchase (including third-party PPAs and international channels) | | | | | | 95 | % | | 90 | % |
| Traditional lease | | | | | | — | % | | 1 | % |
| Managed services | | | | | | 5 | % | | 7 | % |
| Portfolio financings | | | | | | — | % | | 2 | % |
| | | | | | 100 | % | | 100 | % |
Delivery and Installation
Installation is required in order for our Energy Server systems to reach full power. Our role in the installation process varies based on the terms of the contract and/or the country of installation which can include, but is not limited to, design, engineering, permitting, procurement, construction, installation, start-up, performance testing, and commissioning of the systems. Bloom may contract with subcontractors to provide all or any part of the work. Depending on the acceptance milestones, we recognize installation revenue once the project has reached full power, or mechanical completion or on a percentage of completion basis.
Performance Guarantees
As of December 31, 2024, we had incurred no liabilities due to failure to repair or replace the Energy Server systems pursuant to any performance warranties made under the O&M Agreements.
For the O&M Agreements that are subject to renewal, our future service revenue from such agreements are subject to our obligations to make payments for underperformance against the performance guaranties, which are capped at an aggregate total of approximately $587.5 million (including $460.3 million related to portfolio financing entities and $127.2 million related to all other transactions, and include payments for both low output and low efficiency) and our aggregate remaining potential payment related to these underperformance obligations was approximately $489.4 million as of December 31, 2024. For the years ended December 31, 2024, and 2023 we made performance guarantee payments of $21.2 million and $25.9 million, respectively.
International Channel Partners
India. In India, sales activities are currently conducted by Bloom Energy (India) Pvt. Ltd., our wholly owned subsidiary; however, we continue to evaluate the Indian market to determine whether the use of channel partners would be a beneficial go-to-market strategy to grow our India market sales.
Japan. In Japan, sales activities are currently conducted by Bloom Energy Japan Limited, our wholly owned subsidiary.
The Republic of Korea. In 2018, Bloom Energy Japan consummated a sale of our products in the Republic of Korea to Korea South-East Power Company. Following this sale, we entered into a Preferred Distributor Agreement (“PDA”) in November 2018 with SK ecoplant for the marketing and sale of Bloom products for the stationary utility and commercial and industrial South Korean power market. In 2019, we entered into a PDA with SK D&D Co., Ltd. that in 2024 was transferred to SK eternix. The PDA with SK eternix has a term ending December 31, 2027.
As part of our expanded strategic partnership with SK ecoplant, the parties executed the PDA Restatement in October 2021, which incorporates previously amended terms and establishes: (i) SK ecoplant’s purchase commitments of at least 500 megawatts of power for our Energy Server systems between 2022 and 2024 on a take-or-pay basis; (ii) rollover procedures; (iii) premium pricing for product and services; (iv) termination procedures for material breaches; and (v) procedures if there are material changes to the Republic of Korea Hydrogen Portfolio Standard. In December 2023, we further expanded our business partnership with SK ecoplant through the increase of SK ecoplant’s purchase commitments for Bloom Energy products of 250
megawatts through 2027 and extended the timing of delivery of the remaining take-or-pay commitment under the original agreement. For additional information, please see Part II, Item 8, Note 17 — SK ecoplant Strategic Investment.
Under the terms of the PDA Restatement, we (or our subsidiary) contract directly with the customer to provide operations and maintenance services for the Energy Server systems. We have established a subsidiary in the Republic of Korea, Bloom Energy Korea, LLC, to which we subcontract such operations and maintenance services. The terms of the operations and maintenance are negotiated on a case-by-case basis with each customer but are generally expected to provide the customer with the option to receive services for at least 10 years, and for up to the life of the Energy Server systems.
SK ecoplant Joint Venture Agreement. In September 2019, we entered into a joint venture agreement with SK ecoplant to establish a light-assembly facility in the Republic of Korea for sales of certain portions of our Energy Server system for the stationary utility and commercial and industrial market in the Republic of Korea. The joint venture is a variable interest entity (“VIE”) of Bloom, and we consolidate it in our financial statements as we are the primary beneficiary and therefore have the power to direct activities which are most significant to the joint venture. The joint venture facility became operational in July 2020. Other than a nominal initial capital contribution by Bloom Energy, the joint venture is funded by SK ecoplant. SK ecoplant is our primary customer for the products assembled by the joint venture. In October 2021, as part of our expanded strategic partnership with SK ecoplant, the parties agreed to amend the joint venture agreement (“JVA”) to increase the scope of assembly work done in the joint venture facility.
On September 15, 2023, we entered into the Amended and Restated JVA and the Share Purchase Agreement (together, the “Amended JV Agreements”) with SK ecoplant which allowed SK ecoplant to increase its share of the voting rights in the Korean JV to 60% and increased the scope of assembly done by the joint venture facility in the Republic of Korea to full assembly. In January 2024, according to the Amended JV Agreements SK ecoplant made a capital contribution to Korean JV of $4.0 million.
Neither the Amended JV Agreements, nor the fact that SK ecoplant is considered to be our related party after the conversion of Series B RCPS into shares of our Class A common stock (for additional information, please see Note 11 — Related Party Transactions) changed our status as the primary beneficiary of the Korean JV. Therefore, we continue to consolidate this VIE in our financial statements as of December 31, 2024.
Comparison of the Years Ended December 31, 2024, and 2023
A discussion regarding our results of operations for 2024 compared to 2023 is presented in this section. A discussion of our results of operations for 2023 compared to 2022 can be found under Item 7 of Part II of our Annual Report on Form 10-K for the year ended December 31, 2023.
Key Operating Metrics
In addition to the measures presented in the consolidated financial statements, we have historically used the key operating metrics below to evaluate business activity, to measure performance, to develop financial forecasts, and to make strategic decisions:
•Product accepted — the number of customer acceptances of our Energy Server systems in any period. We recognize revenue when an acceptance is achieved. We used this metric to measure the volume of deployment activity. We measured each Energy Server system manufactured, shipped, and accepted in terms of 100 kilowatt equivalents.
•Product costs of product accepted in the period (per kilowatt) — the average unit product cost for the Energy Server systems that are accepted in a period. We used this metric to provide insight into the trajectory of product costs and, in particular, the effectiveness of cost reduction activities.
•Period costs of manufacturing related expenses not included in product costs — the manufacturing and related operating costs that are incurred to procure parts and manufacture the Energy Server systems that are not included as part of product costs. We used this metric to measure any costs incurred to run our manufacturing operations that were not capitalized into inventory and therefore, expensed to our consolidated statements of operations in the period that they were incurred.
•Installation costs on product accepted in the period (per kilowatt) — the average unit installation cost for the Energy Server systems that are accepted in a given period. This metric was used to provide insight into the trajectory of installation costs and, in particular, to evaluate whether our installation costs were in line with our installation billings.
We have determined that the foregoing metrics no longer reflect key operating metrics of the company and therefore we will no longer report on these metrics in our reports for the following reasons. We are increasingly transitioning from selling our Energy Server system as a standalone product to offering energy and hydrogen solutions to our customers. This trend is occurring across our offerings, as we find ways to deliver additional value to customers. We are solving critical problems for our customers and bringing new technologies to the market. This requires us to expand the scope of what is delivered beyond our conventional “electricity-only” solution to electricity, heat, carbon capture, storage, and molecule solutions. As a result of these developments, our Energy Server product (electricity-only power module) cost is becoming a widely varying portion of the overall value of the energy solution we provide, and trends in costs and selling prices per kilowatt are less representative of our overall business performance. In management’s view, this trend will only continue to get stronger in the future. Specific highlights of our business evolution to offering energy and hydrogen solutions include:
•Time to power. Customers are looking for energy solutions that can be provided quickly. In order to speed up installation, we are now shipping solutions that are pre-packaged Energy Server systems mounted on pre-fabricated skids in the factory. This minimizes the sitework that is needed and allows us to deploy the solution quickly, giving the customer a faster path to power. This effort requires more factory costs, but it reduces installation costs and increases the value delivered to the customer.
•Power Density solutions. We have improved our power density for certain customer sites by factory building pre-packaged stackable Energy Server systems. This increases costs and requires us to add more hardware at the factory but delivers more value to customers who have space constraints.
•Combined heat and power. The CHP solution allows customers to take advantage of waste heat, boosting efficiency and economic return of the project. The CHP solution, however, requires significant infrastructure to deliver the waste heat from the Energy Server system to the customer. This infrastructure cost is additive to reported product costs but allows us to deliver more value to customers. Moreover, a kilowatt of heat does not have the same cost or value as a kilowatt of electricity. We optimize our solutions depending on the relevant project requirements, and as a result our cost structure can vary widely depending on the solution provided.
•Carbon Capture solutions. Our technology is well-suited to carbon capture when running on natural gas, the exhaust is a concentrated stream of CO2 relative to other energy generation technologies. This means our solution requires less energy and hardware to separate out the CO2 for capture and sequestration. However, this does require additional infrastructure onsite to separate the CO2 from the rest of the exhaust and to condition it appropriately for the application. This infrastructure cost is additive to reported product costs but allows us to deliver more value to customers by delivering low carbon power.
•Microgrid solutions. As the reliability of the electrical grid becomes more challenging in multiple geographies, customers are turning to our solutions in the form of grid-connected or islanded microgrids. The cost of the ancillary equipment associated with establishing a microgrid is significant, and thus further skews cost metrics measured on a per kilowatt basis.
•Bloom Electrolyzer. The Bloom Electrolyzer is designed to provide scalable and cost-effective hydrogen solutions based on the same solid oxide platform as our Energy Server systems. The Bloom Electrolyzer produces hydrogen rather than electricity, and a kilowatt measure attributable to an electrolyzer is not equivalent to a kilowatt measure attributable to a solid oxide fuel cell. Costs of solutions designed to produce hydrogen could vary widely depending on project specifics.
As our business has evolved to meet the energy needs of the market, ‘product accepted’ is no longer as relevant as an operating metric for our business due to the nature of the complexity in the solutions offered. For example, a solution offered to a customer who wants islanded power, which creates additional reliability, would carry additional costs due to the microgrids and other ancillary equipment needed to provide the solution. Similarly, a customer utilizing our Be FlexibleTM solution would need ancillary equipment such as storage. These factors can distort the cost or revenue per kilowatt metrics. Management relies primarily on revenue, non-GAAP gross and operating margins, as well as cash flows from operating activities to manage operations.
Results of Operations
A discussion regarding the comparison of our financial condition and results of operations for the years ended December 31, 2024, and 2023 is presented below.
Revenue
| | | | | | | | | | | | | | | | | | | | | | | | | | | | | | | | | | |
| | | | | | | Years Ended
December 31, | | Change |
| | | | | | | | | | | 2024 | | 2023 | | Amount | | % |
| | | | (dollars in thousands) | | |
| Product | | | | | | | | | | $ | 1,085,153 | | $ | 975,245 | | $ | 109,908 | | 11.3 | % |
| Installation | | | | | | | | | | 122,318 | | 92,796 | | 29,522 | | 31.8 | % |
| Service | | | | | | | | | | 213,542 | | 183,065 | | 30,477 | | 16.6 | % |
| Electricity | | | | | | | | | | 52,843 | | 82,364 | | (29,521) | | (35.8) | % |
| Total revenue | | | | | | | | | | $ | 1,473,856 | | $ | 1,333,470 | | $ | 140,386 | | 10.5 | % |
| | | | | | | | | | | | | | | | |
| | | | | | | | | | | | | | | | |
| | | | | | | | | | | | | | | | |
| | | | | | | | | | | | | | | | |
| | | | | | | | | | | | | | | | |
| | | | | | | | | | | | | | | | |
| | | | | | | | | | | | | | | | |
| | | | | | | | | | | | | | | | |
| | | | | | | | | | | | | | | | |
| | | | | | | | | | | | | | | | |
| | | | | | | | | | | | | | | | |
| | | | | | | | | | | | | | | | |
| | | | | | | | | | | | | | | | |
| | | | | | | | | | | | | | | | |
| | | | | | | | | | | | | | | | |
| | | | | | | | | | | | | | | | |
PPA Portfolio Repowering
On August 25, 2023, November 22, 2022, and June 14, 2022, we sold PPA V, PPA IV, and PPA IIIa, respectively, and simultaneously entered into respective repowering agreements to upgrade the old Energy Server systems by replacing them with the new Energy Server systems and to provide related installation services (i.e., repowering of our PPA portfolios). These PPA portfolios repowering transactions had a material impact on our financial results for the year ended December 31, 2023, but did not repeat in the year ended December 31, 2024.
Total Revenue
Total revenue increased by $140.4 million, or 10.5%, for the year ended December 31, 2024, as compared to the prior year period. This increase was driven by a $109.9 million increase in product revenue, a $30.5 million increase in service revenue and a $29.5 million increase in installation revenue, partially offset by a $29.5 million decrease in electricity revenue.
Product Revenue
Product revenue increased by $109.9 million, or 11.3%, for the year ended December 31, 2024, as compared to the prior year period. This increase was primarily due to the increase in demand for our products, predominantly in the fourth quarter of fiscal year 2024, partially offset by (1) lower volume and pricing resulting from our PPA portfolios which contributed $172.5 million net decrease in revenue recognized in fiscal year 2024 compared to the prior year period, and (2) a large transaction in the first and the second quarters of fiscal year 2023 that did not repeat in fiscal year 2024.
Installation Revenue
Installation revenue increased by $29.5 million, or 31.8%, for the year ended December 31, 2024, as compared to the prior year period. The increase was primarily driven by the timing of achieving key project milestones on sites requiring installations by us in the year ended December 31, 2024, partially offset by the effect of repowering our PPA portfolios, which decreased revenue recognized in fiscal year 2024 by $25.2 million, as compared to the prior year period.
Service Revenue
Service revenue increased by $30.5 million, or 16.6%, for the year ended December 31, 2024, as compared to the prior year period. The increase was primarily driven by (1) a $21.2 million increase in revenue from maintenance contracts associated with our fleet of Energy Server systems, and (2) a decrease of $9.9 million in product performance guarantees that resulted from improved fleet performance. The overall increase was partially offset by the timing of revenue recognition on certain contracts. The repowering of our PPA portfolios decreased revenue recognized in fiscal year 2024 by $7.6 million, as compared to the prior year period.
Electricity Revenue
Electricity revenue includes both revenue from contracts with customers and revenue from contracts that contain leases.
Electricity revenue decreased by $29.5 million, or 35.8%, for the year ended December 31, 2024, as compared to the prior year period. The decrease was predominantly due to the decrease in installed units, as a result of repowering of some PPA and Managed Service portfolios, which decreased revenue recognized in fiscal year 2024 by $12.2 million, as compared to the prior year period.
Cost of Revenue
| | | | | | | | | | | | | | | | | | | | | | | | | | | | | | | | | | |
| | | | | | | Years Ended
December 31, | | Change |
| | | | | | | | | | | 2024 | | 2023 | | Amount | | % |
| | | | | (dollars in thousands) |
| Product | | | | | | | | | | $ | 685,847 | | | $ | 630,105 | | | $ | 55,742 | | | 8.8 | % |
| Installation | | | | | | | | | | 129,446 | | | 105,735 | | | 23,711 | | | 22.4 | % |
| Service | | | | | | | | | | 214,961 | | | 220,927 | | | (5,966) | | | (2.7) | % |
| Electricity | | | | | | | | | | 38,954 | | | 178,909 | | | (139,955) | | | (78.2) | % |
| Total cost of revenue | | | | | | | | | | $ | 1,069,208 | | | $ | 1,135,676 | | | $ | (66,468) | | | (5.9) | % |
Total Cost of Revenue
Total cost of revenue decreased by $66.5 million, or 5.9%, for the year ended December 31, 2024, as compared to the prior year period. The decrease was driven by a $140.0 million decrease in cost of electricity revenue, and a $6.0 million decrease in cost of service revenue, partially offset by a $55.7 million increase in cost of product revenue, and a $23.7 million increase in installation revenue.
Cost of Product Revenue
Cost of product revenue increased by $55.7 million, or 8.8%, for the year ended December 31, 2024, as compared to the prior year period. The increase in cost of product revenue was primarily driven by (1) the increase in demand for our products, predominantly in the fourth quarter of fiscal year 2024, and (2) by the release of $3.1 million of grant liability recognized against payroll related costs incurred in the third quarter of fiscal year 2023. The increase was partially offset by (1) (i) lower volume resulting from our PPA portfolios, which decreased cost of product revenue recognized in fiscal year 2024 by $75.4 million, as compared to the prior year period, and (ii) the effect of a large transaction in the first and the second quarters of fiscal year 2023 that did not repeat in fiscal year 2024, (2) our ongoing efforts to reduce material costs, (3) reduced labor and overhead costs through restructuring programs executed in fiscal year 2023, and (4) improved processes and automation at our manufacturing facilities.
Cost of Installation Revenue
Cost of installation revenue increased by $23.7 million, or 22.4%, for the year ended December 31, 2024, as compared to the prior year period. The increase was primarily driven by the timing of achieving key project milestones on sites requiring installations by us in the year ended December 31, 2024, partially offset by the effect of repowering our PPA portfolios, which decreased cost of installation revenue recognized in fiscal year 2024 by $20.9 million, as compared to the prior year period.
Cost of Service Revenue
Cost of service revenue decreased by $6.0 million, or 2.7%, for the year ended December 31, 2024, as compared to the prior year period. This decrease was primarily due to (1) a decrease in the deployment of field replacement units, contributing to a decrease of $8.8 million, (2) a $7.0 million decrease in repair and overhaul expenses, partially as a result of repowering our PPA portfolios in fiscal year 2023 which resulted in a relatively newer fleet that required less service, and (3) our cost reduction efforts to proactively manage fleet optimizations. The decrease was partially offset by an increase in maintenance material and labor and overhead costs of $10.0 million.
Cost of Electricity Revenue
Cost of electricity revenue includes both cost of revenue from contracts with customers and cost of revenue from contracts that contain leases.
Cost of electricity revenue decreased by $140.0 million, or 78.2%, for the year ended December 31, 2024, as compared to the prior year period. This decrease was predominantly due to a decrease in installed units, driven primarily by a $123.7 million impairment of the Energy Server systems as a result of the PPA V Repowering, which commenced in the third quarter of fiscal year 2023.
Gross Profit (Loss) and Gross Margin
| | | | | | | | | | | | | | | | | | | | | | | | | | |
| | | | | | | Years Ended
December 31, | | Change |
| | | | | | | | 2024 | | 2023 | |
| | | | | | | | (dollars in thousands) |
| Gross profit (loss): | | | | | | | | | | | | |
| Product | | | | | | | | $ | 399,306 | | $ | 345,140 | | $ | 54,166 |
| Installation | | | | | | | | (7,128) | | (12,939) | | 5,811 |
| Service | | | | | | | | (1,419) | | (37,862) | | 36,443 |
| Electricity | | | | | | | | 13,889 | | (96,545) | | 110,434 |
| Total gross profit | | | | | | | | $ | 404,648 | | $ | 197,794 | | $ | 206,854 |
| | | | | | | | | | | | |
| Gross margin: | | | | | | | | | | | | |
| Product | | | | | | | | 37 | % | | 35 | % | | |
| Installation | | | | | | | | (6) | % | | (14) | % | | |
| Service | | | | | | | | (1) | % | | (21) | % | | |
| Electricity | | | | | | | | 26 | % | | (117) | % | | |
| Total gross margin | | | | | | | | 27 | % | | 15 | % | | |
Total Gross Profit
Total gross profit increased by $206.9 million in the year ended December 31, 2024, as compared to the prior year period. This increase was predominantly driven by (1) a $110.4 million improvement of electricity gross profit (loss), primarily due to a $123.7 million impairment charge that resulted from the PPA V Repowering, which commenced in the third quarter of fiscal year 2023, (2) a $54.2 million increase in product gross profit, predominantly driven by higher demand for our products, leading to a 11.3% increase in product revenue and only an 8.8% increase in respective cost of revenue, (3) a $36.4 million improvement in service gross loss, due to our efforts to proactively manage fleet optimizations, and our ongoing efforts to reduce product costs, as well as (4) a $5.8 million improvement in installation gross loss.
Product Gross Profit
Product gross profit increased by $54.2 million in the year ended December 31, 2024, as compared to the prior year period. The increase was primarily driven by (1) the increase in demand for our products, predominantly in the fourth quarter of fiscal year 2024, (2) reduced labor and overhead costs through restructuring programs executed in fiscal year 2023, and (3) improved processes and automation at our manufacturing facilities. The overall increase was partially offset by (1) lower volume and pricing resulting from our PPA portfolios, which decreased product gross profit recognized in fiscal year 2024 by $97.1 million, as compared to the prior year period, (2) the effect of a large transaction in the first and the second quarters of fiscal year 2023 that did not repeat in fiscal year 2024, and (3) the release of $3.1 million of grant liability recognized against payroll related costs incurred in the third quarter of fiscal year 2023.
Installation Gross Loss
Installation gross loss improved by $5.8 million in the year ended December 31, 2024, as compared to the prior year period. The change for the period was primarily driven by (1) the timing of achieving key project milestones on sites requiring installations by us in the year ended December 31, 2024, and (2) other site related factors such as site complexity, size, local ordinance requirements, and location of the utility interconnect. The repowering of our PPA portfolios increased installation gross loss recognized in fiscal year 2024 by $4.3 million, as compared to the prior year period.
Service Gross Loss
Service gross loss improved by $36.4 million in the year ended December 31, 2024, as compared to the prior year period. This was primarily driven by (1) a $21.2 million increase in revenue from maintenance contracts associated with our fleet of Energy Server systems, and (2) a decrease of $9.9 million in product performance guarantees that resulted from improved fleet performance, (3) a decrease in the deployment of field replacement units, contributing to a decrease of $8.8 million, (4) repair
and overhaul cost reductions of $7.0 million, and (5) our cost reduction efforts to proactively manage fleet optimizations. The improvement was partially offset by (1) an increase in maintenance material and labor and overhead costs of $10.0 million, and (2) the timing of revenue recognition on certain contracts. The repowering of our PPA portfolios increased service gross loss recognized in fiscal year 2024 by $7.6 million, as compared to the prior year period.
Electricity Gross Profit (Loss)
Electricity gross profit (loss) improved by $110.4 million in the year ended December 31, 2024, as compared to the prior year period. The improvement for the period was predominantly driven by a $123.7 million impairment charge as a result of the PPA V Repowering, which commenced in the third quarter of fiscal year 2023, partially offset by the effect of repowering our PPA portfolios, which decreased electricity gross profit recognized in fiscal year 2024 by $12.2 million, as compared to the prior year period.
Operating Expenses
| | | | | | | | | | | | | | | | | | | | | | | | | | | | | | | | | | |
| | | | | | | Years Ended
December 31, | | Change |
| | | | | | | | | | | 2024 | | 2023 | | Amount | | % |
| | | | | (dollars in thousands) |
| Research and development | | | | | | | | | | $ | 148,629 | | | $ | 155,865 | | | $ | (7,236) | | | (4.6) | % |
| Sales and marketing | | | | | | | | | | 68,005 | | | 89,961 | | | (21,956) | | | (24.4) | % |
| General and administrative | | | | | | | | | | 165,105 | | | 160,875 | | | 4,230 | | | 2.6 | % |
| Total operating expenses | | | | | | | | | | $ | 381,739 | | | $ | 406,701 | | | $ | (24,962) | | | (6.1) | % |
| | | | | | | | | | | | | | | | |
| | | | | | | | | | | | | | | | |
| | | | | | | | | | | | | | | | |
| | | | | | | | | | | | | | | | |
| | | | | | | | | | | | | | | | |
| | | | | | | | | | | | | | | | |
| | | | | | | | | | | | | | | | |
| | | | | | | | | | | | | | | | |
| | | | | | | | | | | | | | | | |
| | | | | | | | | | | | | | | | |
| | | | | | | | | | | | | | | | |
| | | | | | | | | | | | | | | | |
Total Operating Expenses
Total operating expenses decreased by $25.0 million in the year ended December 31, 2024, as compared to the prior year period. This decrease was primarily attributable to (1) a decrease in consulting, advisory and other professional services costs of $8.8 million, (2) a decrease in office expenses of $8.5 million, (3) a decrease in consumable laboratory supplies and other laboratory related costs of $8.0 million, (4) a decrease in employee compensation and benefits of $4.6 million, predominantly as a consequence of the restructuring efforts in the second half of fiscal year 2023, as well as the voluntary resignation of certain of our executives in the second half of fiscal year 2023, partially offset by an increase in employee compensation for executive new hires and an increase in compensation expenses related to new awards to our Chief Executive Officer, and (5) a decrease in facility costs of $3.6 million, primarily due to reduction in rent and utility costs. The overall decrease was partially offset by an increase in (1) depreciation expenses of $4.0 million, (2) computer equipment maintenance expenses of $3.2 million, and (3) other operating expenses of $1.4 million.
Research and Development
Research and development expenses decreased by $7.2 million in the year ended December 31, 2024, as compared to the prior year period. This overall decrease was primarily driven by (1) a decrease in consumable laboratory supplies and other laboratory related costs of $7.9 million as a result of our cost reduction efforts initiated in fiscal year 2023, and (2) a decrease in employee compensation and benefits of $1.8 million, predominantly as a consequence of the restructuring efforts in the second half of fiscal year 2023. The decrease was partially offset by an increase in depreciation and amortization expenses and other research and development expenses of $0.5 million and $2.7 million, respectively.
Sales and Marketing
Sales and marketing expenses decreased by $22.0 million in the year ended December 31, 2024, as compared to the prior year period. The decrease was primarily driven by (1) a decrease in employee compensation and benefits of $13.2 million, predominantly as a consequence of the restructuring efforts in the second half of fiscal year 2023, as well as the voluntary resignation of our Executive Vice President and Chief Business Development and Marketing Officer on September 1, 2023, and (2) a decrease in consulting, advisory and other professional services costs of $7.1 million as a result of our cost reduction efforts initiated in fiscal year 2023.
General and Administrative
General and administrative expenses increased by $4.2 million in the year ended December 31, 2024, as compared to the prior year period. This increase was primarily driven by (1) an increase in employee compensation and benefits of $10.3 million, predominantly due to (i) stock-based compensation expenses recognized in the fourth quarter of fiscal year 2024 as a result of an equity grant to our Chief Executive Officer, and (ii) an increase in employee compensation for executive new hires, partially offset by an effect of the restructuring efforts in the second half of fiscal year 2023, as well as the voluntary resignation of certain of our executives in the second half of fiscal year 2023, (2) an increase in depreciation expenses of $3.5 million, and (3) an increase in computer equipment maintenance expenses of $3.1 million. The overall increase was partially offset by (1) a decrease in office expenses of $8.0 million, (2) a decrease in facility costs of $3.2 million, primarily due to reduction in rent and utility costs, (3) a decrease in (i) consulting, advisory and other professional services costs, (ii) travel and entertainment, and (iii) other operating expenses of $0.7 million, $0.4 million, and $0.4 million, respectively, as a result of our cost reduction efforts initiated in fiscal year 2023.
Stock-Based Compensation
| | | | | | | | | | | | | | | | | | | | | | | | | | | | | | | | | | |
| | | | | | | Years Ended
December 31, | | Change |
| | | | | | | | | | | 2024 | | 2023 | | Amount | | % |
| | | | | (dollars in thousands) |
| Cost of revenue | | | | | | | | | | $ | 16,579 | | | $ | 17,504 | | | $ | (925) | | | (5.3) | % |
| Research and development | | | | | | | | | | 22,150 | | | 27,620 | | | (5,470) | | | (19.8) | % |
| Sales and marketing | | | | | | | | | | 11,224 | | | 16,415 | | | (5,191) | | | (31.6) | % |
| General and administrative | | | | | | | | | | 33,042 | | | 25,556 | | | 7,486 | | | 29.3 | % |
| Total stock-based compensation | | | | | | | | | | $ | 82,995 | | | $ | 87,095 | | | $ | (4,100) | | | (4.7) | % |
Total stock-based compensation for the year ended December 31, 2024, decreased by $4.1 million, as compared to the prior year period, and the decrease was predominantly related to a decrease in stock-based compensation costs related to the 2018 ESPP of $9.6 million and a decrease of stock-based compensation related to PSUs and RSUs of $1.1 million , partially offset by an increase of stock-based compensation costs related to stock options of $2.8 million; the remaining $3.8 million of the overall decrease includes capitalized stock-based compensation expenses and stock-based compensation cash component. The decrease was primarily driven by (1) the separation of full-time employees holding equity awards as a result of the restructuring in the second half of fiscal year 2023, (2) the change in the mix of award types, (3) a decrease in contributions to 2018 ESPP, and (4) the voluntary resignation of certain executives, including the former CFO, in fiscal years 2023 and 2024. The decrease was partially offset by (1) stock-based compensation expenses recognized in the fourth quarter of fiscal year 2024 as a result of a grant to our Chief Executive Officer, (2) stock-based compensation expenses related to granted RSUs, PSUs and the stock option awards (the “2024 Executive Awards”) in March, May and August 2024, and (3) stock-based compensation expense related to granted awards to new executive hires.
Other Income and Expense
| | | | | | | | | | | | | | | | | | | | | | | | | | |
| | | | | | | Years Ended
December 31, | | Change |
| | | | | | | | 2024 | | 2023 | |
| | | | | | | | | (dollars in thousands) |
| Interest income | | | | | | | | $ | 25,342 | | | $ | 19,885 | | | $ | 5,457 | |
| Interest expense | | | | | | | | (62,636) | | | (108,299) | | | 45,663 | |
| Other income (expense), net | | | | | | | | 15,904 | | | (2,793) | | | 18,697 | |
| Loss on extinguishment of debt | | | | | | | | (27,182) | | | (4,288) | | | (22,894) | |
| Loss on revaluation of embedded derivatives | | | | | | | | (694) | | | (1,641) | | | 947 | |
| Total | | | | | | | | $ | (49,266) | | | $ | (97,136) | | | $ | 47,870 | |
Interest Income
Interest income is derived from investment earnings on our cash balances, primarily from money market funds. The increase in interest income of $5.5 million for the year ended December 31, 2024, was primarily due to an increase in average cash balance in our money market funds for the respective period, as compared to the prior year period.
Interest Expense
Interest expense for the year ended December 31, 2024, decreased by $45.7 million, as compared to the prior year period. The decrease was primarily as a result of the redemption on June 1, 2023, of the 10.25% Senior Secured Notes due March 2027, the repayment of the 3.04% Senior Secured Notes due June 2031, on August 24, 2023, and the partial repurchase of the 2.5% Green Notes, on May 29, 2024. The decrease was partially offset by an increase in interest expense related to the 3% Green Notes due June 2028, and the 3% Green Notes due June 2029, issued on May 16, 2023, and May 29, 2024, respectively.
Other income (expense), net
Other income (expense), net is primarily derived from net gain (loss) on failed sale-and-leaseback transactions and foreign currency transactions. Other income (expense), net for the year ended December 31, 2024, improved by $18.7 million, as compared to the prior year period, primarily as a result of a $17.4 million net gain on failed sale-and-leaseback transactions in the fiscal year 2024 and an increase in loss from foreign currency transactions of $2.7 million.
For additional information regarding the failed sale-and-leaseback transactions, please see Part II, Item 8, Financial Statements and Supplementary Data, Note 10 — Portfolio Financings.
Loss on Extinguishment of Debt
Loss on extinguishment of debt for the year ended December 31, 2024, was $27.2 million, which was recognized as a result of a partial repurchase on May 29, 2024, of the 2.5% Green Notes, and consisted of repayment of the 22.6% premium of $26.0 million and the write off of $1.2 million in debt issuance costs.
Loss on extinguishment of debt for the year ended December 31, 2023, was $4.3 million, which was recognized as a result of the redemption on June 1, 2023, of the 10.25% Senior Secured Notes due March 2027, and the repayment on August 24, 2023, of the 3.04% Senior Secured Notes due June 2031 as part of the PPA V Repowering, and included the repayment of the 4% premium upon redemption of the 10.25% Senior Secured Notes due March 2027 of $2.3 million and derecognition of debt issuance costs of $2.0 million.
Loss on revaluation of embedded derivatives
(Loss) gain on revaluation of embedded derivatives is derived from the change in fair value of our sales contracts of embedded EPP derivatives valued using historical grid prices and available forecasts of future electricity prices to estimate future electricity prices. (Loss) gain on revaluation of embedded derivatives for the year ended December 31, 2024, as compared to the prior year period, was immaterial.
Provision for Income Taxes
| | | | | | | | | | | | | | | | | | | | | | | | | | | | | | | | | | |
| | | | | | | Years Ended
December 31, | | Change |
| | | | | | | | | | | 2024 | | 2023 | | Amount | | % |
| | | | | | | | | | | (dollars in thousands) |
| Income tax provision | | | | | | | | | | $ | 846 | | | $ | 1,894 | | | $ | (1,048) | | | (55.3) | % |
Income tax provision consists primarily of income taxes in foreign jurisdictions in which we conduct business. We maintain a full valuation allowance for domestic deferred tax assets, including net operating loss and certain tax credit carryforwards. The income tax provision for the year ended December 31, 2024, decreased by $1.0 million, as compared to the prior year period. The change was primarily due to fluctuations in the effective tax rate on income earned by international entities.
Net Income (Loss) Attributable to Noncontrolling Interests and Redeemable Noncontrolling Interests
| | | | | | | | | | | | | | | | | | | | | | | | | | | | | | | | | | |
| | | | | | | Years Ended
December 31, | | Change |
| | | | | | | | | | | 2024 | | 2023 | | Amount | | % |
| | | | | | | | | | | (dollars in thousands) |
| Net income (loss) attributable to noncontrolling interests | | | | | | | | | | $ | 2,024 | | | $ | (5,821) | | | $ | 7,845 | | | (134.8) | % |
Net income (loss) attributable to noncontrolling interests is the result of allocating profits and losses to noncontrolling interests under the hypothetical liquidation at book value (“HLBV”) method. HLBV is a balance sheet-oriented approach for applying the equity method of accounting when there is a complex structure, such as the flip structure of the PPA Entities as discussed below.
Net income (loss) attributable to noncontrolling interests for the year ended December 31, 2024, as compared to the prior year period, improved by $7.8 million due to a $6.9 million decrease in losses attributable to PPA V, which was sold in the third quarter of fiscal year 2023, and an $0.9 million increase in income related to Korean JV, which is allocated to our noncontrolling interest.
Critical Accounting Estimates
The consolidated financial statements have been prepared in accordance with generally accepted accounting principles as applied in the U.S. (“U.S. GAAP”). The preparation of the consolidated financial statements requires us to make estimates and assumptions that affect the reported amounts of assets, liabilities, revenues, costs and expenses and related disclosures. Our discussion and analysis of our financial results under Results of Operations above are based on our audited results of operations, which we have prepared in accordance with U.S. GAAP. In preparing these consolidated financial statements, we make assumptions, judgments and estimates that can affect the reported amounts of assets, liabilities, revenues and expenses, and net income. On an ongoing basis, we base our estimates on historical experience, as appropriate, and on various other assumptions that we believe to be reasonable under the circumstances. Changes in the accounting estimates are representative of estimation uncertainty and are reasonably likely to occur from period to period. Accordingly, actual results could differ significantly from the estimates made by our management. We evaluate our estimates and assumptions on an ongoing basis. To the extent that there are material differences between these estimates and actual results, our future financial statement presentation, financial condition, results of operations and cash flows will be affected. We believe that the following critical accounting policies involve a greater degree of judgment and complexity than our other accounting policies. Accordingly, these are the policies we believe are the most critical to understanding and evaluating the consolidated financial condition and results of operations.
The accounting policies that most frequently require us to make assumptions, judgments and estimates, and therefore are critical to understanding our results of operations, include:
Revenue Recognition
We apply Accounting Standards Codification (“ASC”) Topic 606, Revenue from Contracts with Customers (“ASC 606”). We identify our contracts with customers, determine our performance obligations and the transaction price, and after allocating the transaction price to the performance obligations, we recognize revenue as we satisfy our performance obligations and transfer control of our products and services to our customers. Most of our contracts with customers contain performance obligations with a combination of our solutions. For these performance obligations, we allocate the total transaction price to each performance obligation based on the relative standalone selling price using a cost-plus margin approach.
We generally recognize product revenue from contracts with customers at the point that control is transferred to the customers. This occurs when we achieve customer acceptance and typically occurs upon transfer of control to our customers, which depending on the contract terms is when the product is shipped and delivered to our customers, when the product is shipped and delivered and is physically ready for startup and commissioning (“Mechanical Completion”), or when the product is shipped and delivered and is turned on and operational (“COO”).
For certain installations, control of installations transfers to the customer over time, and the related revenue is recognized over time as the performance obligation is satisfied using the cost-to-total cost (percentage-of-completion) method. We use an
input measure of progress to determine the amount of revenue to recognize during each reporting period when such revenue is recognized over time, based on the costs incurred to satisfy the performance obligation.
Service revenue is recognized ratably over the term of the first or renewed one-year service period. Given our customers’ renewal history, we anticipate that most of them will continue to renew their maintenance services agreements each year for the period of their expected use of Bloom products. The contractual renewal price may be less than the stand-alone selling price of the maintenance services and consequently the contract renewal option may provide the customer with a material right. We estimate the standalone selling price for customer renewal options that give rise to material rights using the practical alternative by reference to optional maintenance services renewal periods expected to be provided and the corresponding expected consideration for these services. This reflects the fact that our additional performance obligations in any contractual renewal period are consistent with the services provided under the standard first-year warranty. Where we have determined that a customer has a material right as a result of their contract renewal option, we recognize that portion of the transaction price allocated to the material right over the period in which such rights are exercised.
Given that we typically sell our products with a maintenance service agreement and have not provided maintenance services to a customer who does not have use of our products, standalone selling prices are estimated using a cost-plus approach. Costs relating to Bloom products include all direct and indirect manufacturing costs, applicable overhead costs and costs for normal production inefficiencies (i.e., variances). We then apply a margin to the products which may vary with the size of the customer, geographic region and the scale of the products deployment. Costs relating to installation include all direct and indirect installation costs. The margin we apply reflects our profit objectives relating to installation. Costs for maintenance service arrangements are estimated over the life of the maintenance contracts and include estimated future service costs and future material costs. Material costs over the period of the service arrangement are impacted significantly by the longevity of the fuel cells themselves. After considering the total service costs, we apply a lower margin to our service costs than to our products as it best reflects our long-term service margin expectations and comparable historical industry service margins. As a result, our estimate of our selling price is driven primarily by our expected margin on both the products and the maintenance service agreements based on their respective costs or, in the case of maintenance service agreements, the estimated costs to be incurred.
The total transaction price is determined based on the total consideration specified in the contract, including variable consideration in the form of a performance guaranty payment that represents potential amounts payable to customers. The expected value method is generally used when estimating variable consideration, which typically reduces the total transaction price due to the nature of the performance obligations to which the variable consideration relates. These estimates reflect our historical experience and current contractual requirements which cap the maximum amount that may be paid. The expected value method requires judgment and considers multiple factors that may vary over time depending upon the unique facts and circumstances related to each performance obligation. Depending on the facts and circumstances, a change in variable consideration estimate will either be accounted for at the contract level or using the portfolio method.
For successful sales-leaseback arrangements, we recognize product and installation revenue upon meeting criteria, demonstrating we have transferred control to the customer (the Buyer-Lessor). When control of the Energy Server systems is transferred to the financier, and we determine the leaseback qualifies as an operating lease in accordance with ASC 842, Leases (“ASC 842”), we record an operating lease ROU asset and an operating lease liability, and recognize revenue based on the fair value of the Energy Server systems with an allocation to product revenue and installations revenue based on the relative standalone selling prices. We recognize as financing obligations any proceeds received to finance our ongoing costs to operate the Energy Server systems.
Valuation of Assets and Liabilities of the SK ecoplant Strategic Investment
On March 20, 2023, the Company amended its SPA (the “Amended SPA”) with SK ecoplant and simultaneously entered into the Loan Agreement (collectively “the Agreements”). On March 23, 2023, pursuant to the Amended SPA, we issued and sold to SK ecoplant shares of non-voting Series B RCPS. The Amended SPA triggered the modification of the equity-classified forward contract on Class A common stock, which resulted in the derecognition of the pre-modified fair value of the forward contract given to SK ecoplant. The Series B RCPS was accounted for as a stock award with liability and equity components. The liability component of the Series B RCPS was recognized at the redemption value net of issuance costs, and the equity component was recognized at its fair value on March 20, 2023, and represented the option of SK ecoplant to convert the Series B RCPS to Class A common stock (the “Conversion Option”). Pursuant to the Loan Agreement we had the option to draw on a loan from SK ecoplant, should SK ecoplant have sent a redemption notice to us under the Amended SPA. The Agreements provided us with a loan commitment asset from SK ecoplant.
The liability component of the Series B RCPS, the Conversion Option, and the loan commitment asset were accounted for under the guidance of Topic 718, Compensation – Stock Compensation (“ASC 718”), and applicable subsections of ASC 480, Distinguishing Liabilities from Equity (“ASC 480”). We used third-party valuation experts to provide us with (i) the pre-modified fair value of the forward contract given to SK ecoplant, (ii) the fair value of the issued Series B RCPS equity component, and (iii) the fair value of the loan commitment asset from SK ecoplant.
Pre-modified forward contract. We valued the forward contract as the difference between (i) our Class A common stock trading price adjusted by a discount for lack of marketability (“DLOM”) as of the date of Amended SPA (the “Valuation Date”) and (ii) the present value of the strike price, with further reduction associated with the expected outcome of the Second Tranche Closing.
Series B RCPS equity component (the Conversion Option). We valued the conversion feature of the Series B RCPS as a European-type call option under the guidance of ASC 718 by applying the Black-Scholes valuation model using inputs of the strike price, maturity, risk-free rate, and volatility. In addition, DLOM was applied to the Class A common stock price.
Loan commitment asset from SK ecoplant. We concluded that the loan commitment was a freestanding financial instrument as of the Valuation Date. We valued the loan commitment asset based on the difference between the present value of cash flows associated with a loan with a market-participant based interest rate (i.e., the rate for which the value of the hypothetical loan agreement equals the face value of the Loan Agreement) and the cash flows associated with the loan committed to by SK ecoplant, and applied a redemption probability to the difference. The Series B RCPS redemption probability was obtained from a lattice model used to value the Series B preferred stock. As of September 30, 2023, the loan commitment asset from SK ecoplant was derecognized as a result of automatic conversion of all shares of the Series B RCPS into shares of our Class A common stock.
We determined our final estimates of fair values based on internal reviews and in consideration of the estimates received. The objective of the fair value measurement of our estimate was to represent the price that would be received to sell an asset or paid to transfer a liability in an orderly transaction between market participants at the measurement date. We determined the reasonableness of our valuation methodology and underlying assumptions and reviewed the mathematical accuracy of the calculations before recording in our consolidated statements of operations and consolidated balance sheets.
For additional details about the transaction with SK ecoplant, please refer to Part II, Item 8, Note 17 — SK ecoplant Strategic Investment.
Modification of Performance-Based Stock Unit Awards
On December 18, 2024, the board of directors of the Company cancelled 1,150,000 Performance-Based Stock Unit (“PSU”) awards from the equity package the Chief Executive Officer (the “CEO”) received on May 12, 2021 (the “2021 PSU awards”), accompanied by the concurrent grant of replacement awards (the “Replacement Awards”) consisting of: (i) 1,500,000 PSU awards and (ii) 500,000 Restricted Stock Unit (“RSU”) awards (together, the “2025 Equity Package”), and (iii) a one-time award of 600,000 PSU awards (the “One-Time Grant”). The cancellation of the 2021 PSUs accompanied by the concurrent grant of the Replacement Awards was accounted for as a modification of the terms of the cancelled award according to ASC 718. On December 18, 2024, the Company recognized incremental compensation cost of $42.4 million measured as the excess of the fair value of the Replacement Awards over the fair value of the cancelled awards immediately before the terms were modified. This incremental compensation cost, along with the remaining unamortized original expense of the 2021 PSU awards of $2.3 million, will be recognized over the period from the modification date through the end of the requisite service period of the Replacement Awards of approximately 3 years.
The Company has engaged a third-party valuation expert to provide us with the fair value of the 2021 PSU awards under the original terms of the award in order to determine the incremental expense associated with issuing the Replacement Awards. To determine the pre-modification fair value of the 2021 PSU awards, a Monte Carlo simulation technique was used with the following assumptions: (i) valuation date of December 18, 2024, (ii) valuation date stock price of $23.46 per share of our Class A common stock, (iii) simulation term of 5.4 years, (iv) expected volatility of 93.83%, (v) risk-free interest rate of 4.36%, and (vi) no expected dividend yield. In order to allow for the impact of the post-vesting restrictions, represented by a two-year holding period, on the fair value of the 2021 PSU awards immediately before modification, the third-party valuation expert estimated the magnitude of the discount for illiquid awards of 10% using a Finnerty Method.
The cancellation of the 2021 PSU awards on December 18, 2024, was considered a Type I modification because the 2021 PSU awards were expected to vest under both the original award terms and the terms of the Replacement Awards.
Income Taxes
We account for income taxes using the liability method under ASC 740, Income Taxes (“ASC 740”). Under this method, deferred tax assets and liabilities are determined based on net operating loss carryforwards, research and development credit carryforwards and temporary differences resulting from the different treatment of items for tax and financial reporting purposes. Deferred items are measured using the enacted tax rates and laws that are expected to be in effect when the differences reverse. We must assess the likelihood that deferred tax assets will be recovered as deductions from future taxable income. This determination is based on expected future results and the future reversals of existing taxable temporary differences. Furthermore, uncertain tax positions are evaluated by management and amounts are recorded when it is more likely than not that the position will be sustained upon examination, including resolution of any related appeals or litigation processes, based on the technical merits. Significant judgement is required throughout management’s process in evaluating each uncertain tax position including future taxable income expectations and tax-planning strategies to determine whether the more likely than not recognition threshold has been met. We have provided a full valuation allowance on our domestic deferred tax assets because we believe it is more likely than not that our deferred tax assets will not be realized.
Principles of Consolidation
Our consolidated financial statements include the operations of our subsidiaries in which we have a controlling financial interest. We use a qualitative approach in assessing the consolidation requirements for our VIEs. This approach focuses on determining whether we have the power to direct those activities that significantly affect their economic performance and whether we have the obligation to absorb losses, or the right to receive benefits that could potentially be significant to the VIEs. The consideration for VIE consolidation is a complex analysis that requires us to determine whether we are the primary beneficiary and therefore have the power to direct activities which are most significant to the VIEs.
ITEM 7A — QUANTITATIVE AND QUALITATIVE DISCLOSURES ABOUT MARKET RISK
We are exposed to market risks as part of our ongoing business operations, primarily from exposure to changes in interest rates and in foreign currency.
Interest Rate Risk
We are exposed to interest rate risk primarily in relation to our outstanding debt obligations. As of December 31, 2024, we had three outstanding convertible notes, each bearing a fixed-rate coupon (please see Part II, Item 8, Note 7 — Outstanding Loans and Security Agreements). As a result, our interest expense is not directly affected by fluctuations in market interest rates. However, changes in market interest rates could affect the fair value of our convertible notes. Generally, an increase in market interest rates may result in a decline in the market value of fixed-rate debt securities, while a decrease in market interest rates may increase their market value.
While our fixed-rate debt structure provides stability in interest expense, we may be exposed to interest rate risk if we seek to refinance or issue new debt in the future. If interest rates increase, any future borrowings could carry higher costs, which may negatively impact our financial condition and results of operations.
We regularly monitor market conditions and our capital structure to evaluate potential risks and opportunities related to interest rate movements. However, we do not currently engage in hedging activities to mitigate interest rate risk, as our exposure remains limited due to our fixed-rate debt obligations.
Our cash and cash equivalents are primarily invested in interest-bearing accounts and money market funds. The risk associated with fluctuating interest rates is primarily limited to the yield we make on these investments. Due to the short-term investment nature of our cash and cash equivalents, we believe that we do not have material financial statement exposure to changes in fair value as a result of changes in interest rates. Since we believe we can liquidate substantially all of our short-term investment portfolio, we do not expect our operating results or cash flows to be materially affected to any significant degree by a sudden change in market interest rates on our investment portfolio.
To provide a meaningful assessment of the interest rate risk associated with our cash and cash equivalents, we performed a sensitivity analysis to determine the impact a change in interest rates would have on our income statement and in investment fair values, assuming a 1% decline in yield. Based on our investment positions on both December 31, 2024, and 2023, a hypothetical 1% decrease in interest rates across all maturities would result in $9.4 million and $7.3 million declines in interest income and/or an increase in other expenses on an annualized basis, respectively. As these investments have maturities of less
than twelve months, changes with respect to the portfolio fair value would be limited to these amounts and only be realized if we were to terminate the investments prior to maturity.
As all of our debt is fixed-rate convertible debt, interest rate changes do not affect our earnings or cash flows, but it does lead to refinancing risk. In case we end up issuing new debt or refinancing our current debt, the overall interest expense can materially increase.
Foreign Currency Risk
Our sales contracts are primarily denominated in U.S. dollars and, therefore, substantially all of our revenue is not subject to foreign currency market risk. Our supply contracts are primarily denominated in U.S. dollars, and our corporate operations are domiciled in the U.S. However, we conduct some international field operations and therefore find it necessary to transact in foreign currencies for limited operational purposes, necessitating that we hold foreign currency bank accounts.
To provide a meaningful assessment of the risk associated with our foreign currency holdings, we performed a sensitivity analysis to determine the impact a currency devaluation would have on our balance sheet, assuming a 10% decline in the value of the U.S. dollar. Based on our foreign currency holdings as of December 31, 2024 and 2023, a hypothetical 10% devaluation of the U.S. dollar against foreign currencies would not be material to our reported cash position.
However, an increasing portion of our operating expenses are incurred outside the U.S., are denominated in foreign currencies and are subject to such risk. Although not yet material, if we are not able to successfully hedge against the risks associated with currency fluctuations in our future activities, our financial condition and operating results could be adversely affected.
Actual future gains and losses associated with our investment portfolio, debt and derivative positions and foreign currency may differ materially from the sensitivity analyses performed as of December 31, 2024, and 2023, due to the inherent limitations associated with predicting the timing and amount of changes in interest rates, foreign currency exchange rates and our actual commodity derivative exposures and positions.
ITEM 8 — FINANCIAL STATEMENTS AND SUPPLEMENTARY DATA
| | | | | |
| Index to Consolidated Financial Statements and Supplementary Data | |
| Page |
| |
| |
| |
| |
| |
| |
| |
| |
REPORT OF INDEPENDENT REGISTERED PUBLIC ACCOUNTING FIRM
To the stockholders and the Board of Directors of Bloom Energy Corporation
Opinion on the Financial Statements
We have audited the accompanying Consolidated Balance Sheets of Bloom Energy Corporation and subsidiaries (the “Company”) as of December 31, 2024, and 2023, the related Consolidated Statements of Operations, Comprehensive Loss, Changes in Stockholders’ Equity (Deficit) and Cash Flows, for each of the three years in the period ended December 31, 2024, and the related notes (collectively referred to as the “financial statements”). In our opinion, the financial statements present fairly, in all material respects, the financial position of the Company as of December 31, 2024, and 2023, and the results of its operations and its cash flows for each of the three years in the period ended December 31, 2024, in conformity with accounting principles generally accepted in the United States of America.
We have also audited, in accordance with the standards of the Public Company Accounting Oversight Board (United States) (PCAOB), the Company’s internal control over financial reporting as of December 31, 2024, based on criteria established in Internal Control — Integrated Framework (2013) issued by the Committee of Sponsoring Organizations of the Treadway Commission and our report dated February 27, 2025, expressed an unqualified opinion on the Company's internal control over financial reporting.
Basis for Opinion
These financial statements are the responsibility of the Company’s management. Our responsibility is to express an opinion on the Company’s financial statements based on our audits. We are a public accounting firm registered with the PCAOB and are required to be independent with respect to the Company in accordance with the U.S. federal securities laws and the applicable rules and regulations of the Securities and Exchange Commission and the PCAOB.
We conducted our audits in accordance with the standards of the PCAOB. Those standards require that we plan and perform the audit to obtain reasonable assurance about whether the financial statements are free of material misstatement, whether due to error or fraud. Our audits included performing procedures to assess the risks of material misstatement of the financial statements, whether due to error or fraud, and performing procedures that respond to those risks. Such procedures included examining, on a test basis, evidence regarding the amounts and disclosures in the financial statements. Our audits also included evaluating the accounting principles used and significant estimates made by management, as well as evaluating the overall presentation of the financial statements. We believe that our audits provide a reasonable basis for our opinion.
Critical Audit Matter
The critical audit matter communicated below is a matter arising from the current-period audit of the financial statements that was communicated or required to be communicated to the audit committee and that (1) relates to accounts or disclosures that are material to the financial statements and (2) involved our especially challenging, subjective, or complex judgments. The communication of critical audit matters does not alter in any way our opinion on the financial statements, taken as a whole, and we are not, by communicating the critical audit matter below, providing a separate opinion on the critical audit matter or on the accounts or disclosures to which it relates.
Product Revenue Recognition – Refer to Notes 2 and 3 to the financial statements
Critical Audit Matter Description
Product revenue for the sale of energy servers is recognized upon transfer of control to customers which typically occurs at customer acceptance, which, depending on the contract terms, is when the product is shipped and delivered to a customer, is physically ready for startup and commissioning, or when the product is shipped, delivered, turned on, and producing power.
We identified the timing of product revenue recognition (i.e., customer acceptance), as a critical audit matter because of the degree of auditor judgment and increased extent of effort when performing audit procedures to evaluate the appropriateness of the timing of product revenue recognized during the year.
How the Critical Audit Matter Was Addressed in the Audit
Our audit procedures related to the timing of product revenue recognition included the following:
•We obtained an understanding of the nature of the product revenue recognition process through inquiry with Company personnel and inspection of executed contracts with customers.
•We tested the design and operating effectiveness of internal controls over the Company’s timing of product revenue recognition.
•For a sample of product revenue acceptances during the year ended December 31, 2024, we performed the following:
a.We inspected the executed contracts to identify the relevant terms and conditions which would impact the Company’s accounting conclusions, including the timing of the transfer of control of products to customers.
b.We inspected source documents to test the timing of revenue recognition, or customer acceptance, such as agreed-upon sales orders, shipping records, mechanical completion certifications, commencement of operation certifications, as well as the related invoices generated and evaluated any differences. We corroborated our inspection of source documents by sending written confirmations to customers confirming the period of customer acceptance.
/s/ Deloitte & Touche LLP
San Jose, California
February 27, 2025
We have served as the Company’s auditor since 2020.
REPORT OF INDEPENDENT REGISTERED PUBLIC ACCOUNTING FIRM
To the stockholders and the Board of Directors of Bloom Energy Corporation
Opinion on Internal Control over Financial Reporting
We have audited the internal control over financial reporting of Bloom Energy Corporation and subsidiaries (the “Company”) as of December 31, 2024, based on criteria established in Internal Control — Integrated Framework (2013) issued by the Committee of Sponsoring Organizations of the Treadway Commission (COSO). In our opinion, the Company maintained, in all material respects, effective internal control over financial reporting as of December 31, 2024, based on criteria established in Internal Control — Integrated Framework (2013) issued by COSO.
We have also audited, in accordance with the standards of the Public Company Accounting Oversight Board (United States) (PCAOB), the consolidated financial statements as of and for the year ended December 31, 2024, of the Company and our report dated February 27, 2025, expressed an unqualified opinion on those financial statements.
Basis for Opinion
The Company’s management is responsible for maintaining effective internal control over financial reporting and for its assessment of the effectiveness of internal control over financial reporting, included in the accompanying Management’s Report on Internal Control over Financial Reporting. Our responsibility is to express an opinion on the Company’s internal control over financial reporting based on our audit. We are a public accounting firm registered with the PCAOB and are required to be independent with respect to the Company in accordance with the U.S. federal securities laws and the applicable rules and regulations of the Securities and Exchange Commission and the PCAOB.
We conducted our audit in accordance with the standards of the PCAOB. Those standards require that we plan and perform the audit to obtain reasonable assurance about whether effective internal control over financial reporting was maintained in all material respects. Our audit included obtaining an understanding of internal control over financial reporting, assessing the risk that a material weakness exists, testing and evaluating the design and operating effectiveness of internal control based on the assessed risk, and performing such other procedures as we considered necessary in the circumstances. We believe that our audit provides a reasonable basis for our opinion.
Definition and Limitations of Internal Control over Financial Reporting
A company’s internal control over financial reporting is a process designed to provide reasonable assurance regarding the reliability of financial reporting and the preparation of financial statements for external purposes in accordance with generally accepted accounting principles. A company’s internal control over financial reporting includes those policies and procedures that (1) pertain to the maintenance of records that, in reasonable detail, accurately and fairly reflect the transactions and dispositions of the assets of the company; (2) provide reasonable assurance that transactions are recorded as necessary to permit preparation of financial statements in accordance with generally accepted accounting principles, and that receipts and expenditures of the company are being made only in accordance with authorizations of management and directors of the company; and (3) provide reasonable assurance regarding prevention or timely detection of unauthorized acquisition, use, or disposition of the company’s assets that could have a material effect on the financial statements.
Because of its inherent limitations, internal control over financial reporting may not prevent or detect misstatements. Also, projections of any evaluation of effectiveness to future periods are subject to the risk that controls may become inadequate because of changes in conditions, or that the degree of compliance with the policies or procedures may deteriorate.
/s/ Deloitte & Touche LLP
San Jose, California
February 27, 2025
Bloom Energy Corporation
Consolidated Balance Sheets
(in thousands, except share data)
| | | | | | | | | | | | | | | |
| | December 31, | |
| | 2024 | | 2023 | |
| Assets | | | | | |
| Current assets: | | | | | |
Cash and cash equivalents1 | | $ | 802,851 | | | $ | 664,593 | | |
Restricted cash1 | | 110,622 | | | 46,821 | | |
Accounts receivable, less allowance for credit losses of $119 as of December 31, 2024, and 20231, 2 | | 335,841 | | | 340,740 | | |
Contract assets3 | | 145,162 | | | 41,366 | | |
Inventories1 | | 544,656 | | | 502,515 | | |
Deferred cost of revenue4 | | 58,792 | | | 45,984 | | |
Prepaid expenses and other current assets1, 5 | | 46,203 | | | 51,148 | | |
| Total current assets | | 2,044,127 | | | 1,693,167 | | |
Property, plant and equipment, net1 | | 403,475 | | | 493,352 | | |
Operating lease right-of-use assets1, 6 | | 122,489 | | | 139,732 | | |
Restricted cash1 | | 37,498 | | | 33,764 | | |
| Deferred cost of revenue | | 3,629 | | | 3,454 | | |
Other long-term assets1, 7 | | 46,136 | | | 50,208 | | |
| Total assets | | $ | 2,657,354 | | | $ | 2,413,677 | | |
| Liabilities and stockholders’ equity | | | | | |
| Current liabilities: | | | | | |
Accounts payable1, 8 | | $ | 92,704 | | | $ | 132,078 | | |
Accrued warranty9 | | 16,559 | | | 19,326 | | |
Accrued expenses and other current liabilities1, 10 | | 138,450 | | | 130,879 | | |
Deferred revenue and customer deposits1, 11 | | 243,314 | | | 128,922 | | |
Operating lease liabilities1, 12 | | 19,642 | | | 20,245 | | |
| Financing obligations | | 11,704 | | | 38,972 | | |
| Recourse debt | | 114,385 | | | — | | |
| | | | | |
| Total current liabilities | | 636,758 | | | 470,422 | | |
Deferred revenue and customer deposits1, 13 | | 43,105 | | | 19,140 | | |
Operating lease liabilities1, 14 | | 124,523 | | | 141,939 | | |
| Financing obligations | | 244,132 | | | 405,824 | | |
| Recourse debt | | 1,010,350 | | | 842,006 | | |
Non-recourse debt1, 15 | | 4,057 | | | 4,627 | | |
| Other long-term liabilities | | 9,213 | | | 9,049 | | |
| Total liabilities | | $ | 2,072,138 | | | $ | 1,893,007 | | |
| Commitments and contingencies (Note 13) | | | | | |
| Stockholders’ equity: | | | | | |
Common stock: 0.0001 par value; Class A shares — 600,000,000 shares and 600,000,000 shares authorized, and 229,142,474 shares and 224,717,533 shares issued and outstanding, and Class B shares — 470,092,742 shares and 600,000,000 shares authorized, and no shares issued and outstanding at December 31, 2024, and 2023, respectively. | | 23 | | | 21 | | |
| Additional paid-in capital | | 4,462,659 | | | 4,370,343 | | |
| Accumulated other comprehensive loss | | (2,593) | | | (1,687) | | |
| Accumulated deficit | | (3,897,618) | | | (3,866,599) | | |
| Total stockholders’ equity attributable to common stockholders | | 562,471 | | | 502,078 | | |
| Noncontrolling interest | | 22,745 | | | 18,592 | | |
| Total stockholders’ equity | | $ | 585,216 | | | $ | 520,670 | | |
| Total liabilities and stockholders’ equity | | $ | 2,657,354 | | | $ | 2,413,677 | | |
1 We have variable interest entity related to a joint venture in the Republic of Korea (see Note 17 — SK ecoplant Strategic Investment), which represents a portion of the consolidated balances recorded within these financial statement line items.
2 Including amounts from related parties of $93.5 million and $262.0 million as of December 31, 2024, and 2023, respectively.
3 Including amounts from related parties of $0.8 million and $6.9 million as of December 31, 2024, and 2023, respectively.
4 Including amounts from related parties of $0.9 million as of December 31, 2023. There were no related party balances as of December 31, 2024.
5 Including amounts from related parties of $1.2 million and $2.3 million as of December 31, 2024, and 2023, respectively.
6 Including amounts from related parties of $1.4 million and $2.0 million as of December 31, 2024, and 2023, respectively.
7 Including amounts from related parties of $8.8 million and $9.1 million as of December 31, 2024, and 2023, respectively.
8 Including amounts from related parties of $0.1 million as of December 31, 2023. There were no related party balances as of December 31, 2024.
9 Including amounts from related parties of $1.2 million and $1.3 million as of December 31, 2024, and 2023, respectively.
10 Including amounts from related parties of $4.0 million and $3.4 million as of December 31, 2024, and 2023, respectively.
11 Including amounts from related parties of $8.9 million and $1.7 million as of December 31, 2024, and 2023, respectively.
12 Including amounts from related parties of $0.4 million and $0.4 million as of December 31, 2024, and 2023, respectively.
13 Including amounts from related parties of $3.3 million and $6.7 million as of December 31, 2024, and 2023, respectively.
14 Including amounts from related parties of $1.0 million and $1.6 million as of December 31, 2024, and 2023, respectively.
15 Including amounts from related parties of $4.1 million and $4.6 million as of December 31, 2024, and 2023, respectively.
The accompanying notes are an integral part of these consolidated financial statements.
Bloom Energy Corporation
Consolidated Statements of Operations
(in thousands, except per share data)
| | | | | | | | | | | | | | | | | | | | | | | | | |
| | | | | Years Ended December 31, | |
| | | | | | | 2024 | | 2023 | | 2022 | |
| | | | | | | | | | | | |
| Revenue: | | | | | | | | | | | |
| Product | | | | | | $ | 1,085,153 | | | $ | 975,245 | | | $ | 880,664 | | |
| Installation | | | | | | 122,318 | | | 92,796 | | | 92,120 | | |
| Service | | | | | | 213,542 | | | 183,065 | | | 150,954 | | |
| Electricity | | | | | | 52,843 | | | 82,364 | | | 75,387 | | |
Total revenue1 | | | | | | 1,473,856 | | | 1,333,470 | | | 1,199,125 | | |
| Cost of revenue: | | | | | | | | | | | |
| Product | | | | | | 685,847 | | | 630,105 | | | 616,178 | | |
| Installation | | | | | | 129,446 | | | 105,735 | | | 104,111 | | |
| Service | | | | | | 214,961 | | | 220,927 | | | 168,491 | | |
| Electricity | | | | | | 38,954 | | | 178,909 | | | 162,057 | | |
Total cost of revenue2 | | | | | | 1,069,208 | | | 1,135,676 | | | 1,050,837 | | |
| Gross profit | | | | | | 404,648 | | | 197,794 | | | 148,288 | | |
| Operating expenses: | | | | | | | | | | | |
| Research and development | | | | | | 148,629 | | | 155,865 | | | 150,606 | | |
| Sales and marketing | | | | | | 68,005 | | | 89,961 | | | 90,934 | | |
General and administrative3 | | | | | | 165,105 | | | 160,875 | | | 167,740 | | |
| Total operating expenses | | | | | | 381,739 | | | 406,701 | | | 409,280 | | |
| Income (loss) from operations | | | | | | 22,909 | | | (208,907) | | | (260,992) | | |
| Interest income | | | | | | 25,342 | | | 19,885 | | | 3,887 | | |
Interest expense4 | | | | | | (62,636) | | | (108,299) | | | (53,493) | | |
| Other income (expense), net | | | | | | 15,904 | | | (2,793) | | | 4,998 | | |
| Loss on extinguishment of debt | | | | | | (27,182) | | | (4,288) | | | (8,955) | | |
| (Loss) gain on revaluation of embedded derivatives | | | | | | (694) | | | (1,641) | | | 566 | | |
| Loss before income taxes | | | | | | (26,357) | | | (306,043) | | | (313,989) | | |
| Income tax provision | | | | | | 846 | | | 1,894 | | | 1,097 | | |
| Net loss | | | | | | (27,203) | | | (307,937) | | | (315,086) | | |
| Less: Net income (loss) attributable to noncontrolling interest | | | | | | 2,024 | | | (5,821) | | | (13,378) | | |
| Net loss attributable to common stockholders | | | | | | (29,227) | | | (302,116) | | | (301,708) | | |
| Less: Net loss attributable to redeemable noncontrolling interest | | | | | | — | | | — | | | (300) | | |
| Net loss before portion attributable to redeemable noncontrolling interest and noncontrolling interest | | | | | | $ | (29,227) | | | $ | (302,116) | | | $ | (301,408) | | |
| Net loss per share available to common stockholders, basic and diluted | | | | | | $ | (0.13) | | | $ | (1.42) | | | $ | (1.62) | | |
| Weighted average shares used to compute net loss per share available to common stockholders, basic and diluted | | | | | | 227,365 | | | 212,681 | | | 185,907 | | |
1 Including related party revenue of $338.6 million, $487.2 million and $36.3 million for the years ended December 31, 2024, 2023 and 2022, respectively.
2 Including related party cost of revenue of $0.2 million and $0.1 million for the years ended December 31, 2024, and 2023, respectively. There was no related party cost of revenue for the year ended December 31, 2022.
3 Including related party general and administrative expenses of $0.7 million and $0.8 million for the years ended December 31, 2024, and 2023, respectively. There were no related party general and administrative expenses for the year ended December 31, 2022.
4 Including related party interest expense of $0.2 million and $0.1 million for the years ended December 31, 2024, and 2023, respectively. There was no related party interest expense for the year ended December 31, 2022.
The accompanying notes are an integral part of these consolidated financial statements.
Bloom Energy Corporation
Consolidated Statements of Comprehensive Loss
(in thousands)
| | | | | | | | | | | | | | | | | | | | |
| | Years Ended December 31, |
| | | 2024 | | 2023 | | 2022 |
| | | | | | | |
| Net loss | | $ | (27,203) | | | $ | (307,937) | | | $ | (315,086) | |
| Other comprehensive loss, net of taxes: | | | | | | |
| Foreign currency translation adjustment | | (2,735) | | | (430) | | | (794) | |
| Other comprehensive loss, net of taxes | | (2,735) | | | (430) | | | (794) | |
| Comprehensive loss | | (29,938) | | | (308,367) | | | (315,880) | |
| Less: Comprehensive income (loss) attributable to noncontrolling interest | | 195 | | | (5,815) | | | (13,271) | |
| Comprehensive loss attributable to common stockholders | | $ | (30,133) | | | $ | (302,552) | | | $ | (302,609) | |
| Less: Comprehensive loss attributable to redeemable noncontrolling interest | | — | | | — | | | (300) | |
| Comprehensive loss before portion attributable to redeemable noncontrolling interest and noncontrolling interest | | $ | (30,133) | | | $ | (302,552) | | | $ | (302,309) | |
The accompanying notes are an integral part of these consolidated financial statements.
Bloom Energy Corporation
Consolidated Statements of Stockholders’ Equity (Deficit)
(in thousands, except share data)
| | | | | | | | | | | | | | | | | | | | | | | | | | | | | | | | | | | | | | | | | | | | | | | | | | | | | | |
| | | | | | Common Stock | | Additional Paid-In Capital | | Accumulated Other Comprehensive Loss | | Accumulated Deficit | | Total Equity Attributable to Common Stockholders | | Noncontrolling Interest | | Total Stockholders’ Equity |
| | | | | | | | Shares | | Amount | | | | | | |
| Balances at December 31, 2023 | | | | | | | | 224,717,533 | | | $ | 21 | | | $ | 4,370,343 | | | $ | (1,687) | | | $ | (3,866,599) | | | $ | 502,078 | | | $ | 18,592 | | | $ | 520,670 | |
| Issuance of restricted stock awards | | | | | | | | 3,067,129 | | | 2 | | | — | | | — | | | — | | | 2 | | | — | | | 2 | |
| ESPP purchase | | | | | | | | 1,049,955 | | | — | | | 10,344 | | | — | | | — | | | 10,344 | | | — | | | 10,344 | |
| Exercise of stock options | | | | | | | | 307,857 | | | — | | | 2,021 | | | — | | | — | | | 2,021 | | | — | | | 2,021 | |
| Stock-based compensation | | | | | | | | — | | | — | | | 79,951 | | | — | | | — | | | 79,951 | | | — | | | 79,951 | |
| Contributions from noncontrolling interest | | | | | | | | — | | | — | | | — | | | — | | | — | | | — | | | 3,958 | | | 3,958 | |
| Accrued dividend | | | | | | | | — | | | — | | | — | | | — | | | (1,620) | | | (1,620) | | | — | | | (1,620) | |
| Legal reserve | | | | | | | | — | | | — | | | — | | | — | | | 147 | | | 147 | | | — | | | 147 | |
| Subsidiary liquidation | | | | | | | | — | | | — | | | — | | | — | | | (319) | | | (319) | | | — | | | (319) | |
| Foreign currency translation adjustment | | | | | | | | — | | | — | | | — | | | (906) | | | — | | | (906) | | | (1,829) | | | (2,735) | |
| Net (loss) income | | | | | | | | — | | | — | | | — | | | — | | | (29,227) | | | (29,227) | | | 2,024 | | | (27,203) | |
| Balances at December 31, 2024 | | | | | | | | 229,142,474 | | | $ | 23 | | | $ | 4,462,659 | | | $ | (2,593) | | | $ | (3,897,618) | | | $ | 562,471 | | | $ | 22,745 | | | $ | 585,216 | |
| | | | | | | | | | | | | | | | | | | | | | | | | | | | | | | | | | | | | | | | | | | | | | | | |
| | Common Stock | | Additional Paid-In Capital | | Accumulated Other Comprehensive Loss | | Accumulated
Deficit | | Total Equity Attributable to Common Stockholders | | Noncontrolling
Interest | | Total Stockholders’ Equity |
| | Shares | | Amount | | | | | | |
| Balances at December 31, 2022 | | 205,664,690 | | | $ | 20 | | | $ | 3,906,491 | | | $ | (1,251) | | | $ | (3,564,483) | | | $ | 340,777 | | | $ | 38,039 | | | $ | 378,816 | |
| Issuance of restricted stock awards | | 4,160,416 | | | — | | | — | | | — | | | — | | | — | | | — | | | — | |
| ESPP purchase | | 875,695 | | | — | | | 13,363 | | | — | | | — | | | 13,363 | | | — | | | 13,363 | |
| Exercise of stock options | | 525,031 | | | — | | | 3,582 | | | — | | | — | | | 3,582 | | | — | | | 3,582 | |
| Stock-based compensation | | — | | | — | | | 87,076 | | | — | | | — | | | 87,076 | | | — | | | 87,076 | |
| Contributions from noncontrolling interest | | — | | | — | | | — | | | — | | | — | | | — | | | 6,979 | | | 6,979 | |
| Distributions and payments to noncontrolling interest | | — | | | — | | | — | | | — | | | — | | | — | | | (2,265) | | | (2,265) | |
| Buyout of noncontrolling interest | | — | | | — | | | 11,482 | | | — | | | — | | | 11,482 | | | (18,346) | | | (6,864) | |
| Derecognition of the pre-modification forward contract fair value | | — | | | — | | | 76,242 | | | — | | | — | | | 76,242 | | | — | | | 76,242 | |
| Equity component of redeemable convertible preferred stock | | — | | | — | | | 16,145 | | | — | | | — | | | 16,145 | | | — | | | 16,145 | |
| Purchase of capped call related to convertible notes | | — | | | — | | | (54,522) | | | — | | | — | | | (54,522) | | | — | | | (54,522) | |
| Conversion of redeemable convertible preferred stock | | 13,491,701 | | | 1 | | | 310,484 | | | — | | | — | | | 310,485 | | | — | | | 310,485 | |
| Foreign currency translation adjustment | | — | | | — | | | — | | | (436) | | | — | | | (436) | | | 6 | | | (430) | |
| Net loss | | — | | | — | | | — | | | — | | | (302,116) | | | (302,116) | | | (5,821) | | | (307,937) | |
| Balances at December 31, 2023 | | 224,717,533 | | | $ | 21 | | | $ | 4,370,343 | | | $ | (1,687) | | | $ | (3,866,599) | | | $ | 502,078 | | | $ | 18,592 | | | $ | 520,670 | |
| | | | | | | | | | | | | | | | | | | | | | | | | | | | | | | | | | | | | | | | | | | | | | | | | | | |
| | | Common Stock | | Additional Paid-In Capital | | Accumulated Other Comprehensive Loss | | Accumulated
Deficit | | Total (Deficit) Equity attributable to Common Stockholders | | Noncontrolling
Interest | | Total Stockholders’ (Deficit) Equity |
| | | Shares | | Amount | | | | | | |
| Balances at December 31, 2021 | | | 176,460,407 | | | $ | 18 | | | $ | 3,219,081 | | | $ | (350) | | | $ | (3,263,075) | | | $ | (44,326) | | | $ | 42,499 | | | $ | (1,827) | |
| Issuance of restricted stock awards | | | 2,957,215 | | | — | | | — | | | — | | | — | | | — | | | — | | | — | |
| ESPP purchase | | | 759,744 | | | — | | | 11,600 | | | — | | | — | | | 11,600 | | | — | | | 11,600 | |
| Exercise of stock options | | | 537,324 | | | — | | | 3,679 | | | — | | | — | | | 3,679 | | | — | | | 3,679 | |
| Stock-based compensation | | | — | | | — | | | 112,722 | | | — | | | — | | | 112,722 | | | — | | | 112,722 | |
| Contributions from noncontrolling interest | | | — | | | — | | | — | | | — | | | — | | | — | | | 2,815 | | | 2,815 | |
| Distributions and payments to noncontrolling interest | | | — | | | — | | | (500) | | | — | | | — | | | (500) | | | (6,354) | | | (6,854) | |
| Buyout of noncontrolling interest | | | — | | | — | | | (24,350) | | | — | | | — | | | (24,350) | | | 12,350 | | | (12,000) | |
| Public share offering | | | 14,950,000 | | | 1 | | | 371,526 | | | — | | | — | | | 371,527 | | | — | | | 371,527 | |
| Forward to purchase Class A common stock | | | — | | | — | | | 4,183 | | | — | | | — | | | 4,183 | | | — | | | 4,183 | |
| Conversion of redeemable convertible preferred stock | | | 10,000,000 | | | 1 | | | 208,550 | | | — | | | — | | | 208,551 | | | — | | | 208,551 | |
| Foreign currency translation adjustment | | | — | | | — | | | — | | | (901) | | | — | | | (901) | | | 107 | | | (794) | |
Net loss1 | | | — | | | — | | | — | | | — | | | (301,408) | | | (301,408) | | | (13,378) | | | (314,786) | |
| Balances at December 31, 2022 | | | 205,664,690 | | | $ | 20 | | | $ | 3,906,491 | | | $ | (1,251) | | | $ | (3,564,483) | | | $ | 340,777 | | | $ | 38,039 | | | $ | 378,816 | |
1 Excludes $300 attributable to redeemable noncontrolling interest.
Note: Beginning redeemable NCI of $300 — Net loss attributable to redeemable NCI of $300 = Ending redeemable NCI of Nil.
The accompanying notes are an integral part of these consolidated financial statements.
Bloom Energy Corporation
Consolidated Statements of Cash Flows
(in thousands)
| | | | | | | | | | | | | | | | | | | | | |
| | | Years Ended December 31, | |
| | | 2024 | | 2023 | | 2022 | |
| Cash flows from operating activities: | | | | | | | |
| Net loss | | $ | (27,203) | | | $ | (307,937) | | | $ | (315,086) | | |
| Adjustments to reconcile net loss to net cash provided by (used in) operating activities: | | | | | | | |
| Depreciation and amortization | | 53,048 | | | 62,609 | | | 61,608 | | |
| Non-cash lease expense | | 35,898 | | | 33,619 | | | 20,155 | | |
| Loss on disposal of property, plant and equipment | | 161 | | | 411 | | | — | | |
| Revaluation of derivative contracts | | 694 | | | 1,641 | | | (9,583) | | |
| Impairment of assets | | — | | | 130,088 | | | 113,514 | | |
| Derecognition of loan commitment asset related to SK ecoplant Second Tranche Closing | | — | | | 52,792 | | | — | | |
| Stock-based compensation expense | | 82,424 | | | 84,480 | | | 112,259 | | |
| Amortization of debt issuance costs | | 6,797 | | | 4,772 | | | 3,032 | | |
| Loss on extinguishment of debt | | 27,182 | | | 4,288 | | | 8,955 | | |
| Net (gain) loss on failed sale-and-leaseback transactions | | (17,390) | | | 403 | | | — | | |
| Unrealized foreign currency exchange loss (gain) | | 3,756 | | | 618 | | | (3,267) | | |
| Other | | 69 | | | 47 | | | 3,532 | | |
| Changes in operating assets and liabilities: | | | | | | | |
Accounts receivable1 | | 7,133 | | | (89,888) | | | (162,864) | | |
Contract assets2 | | (103,796) | | | 5,361 | | | (21,525) | | |
| Inventories | | (44,527) | | | (231,689) | | | (124,878) | | |
Deferred cost of revenue3 | | (13,070) | | | 1,655 | | | (24,282) | | |
| Customer financing receivable | | — | | | — | | | 2,510 | | |
Prepaid expenses and other assets4 | | 3,790 | | | (5,754) | | | (17,590) | | |
Other long-term assets5 | | 4,072 | | | (3,366) | | | (2,617) | | |
| Operating lease right-of-use assets and operating lease liabilities | | (36,675) | | | (32,801) | | | 3,016 | | |
| Financing lease liabilities | | 1,644 | | | 1,011 | | | 896 | | |
Accounts payable6 | | (36,629) | | | (29,080) | | | 86,498 | | |
Accrued warranty7 | | (2,767) | | | 1,994 | | | 5,586 | | |
Accrued expenses and other current liabilities8 | | 8,662 | | | (13,785) | | | 43,243 | | |
Deferred revenue and customer deposits9 | | 139,868 | | | (42,635) | | | 35,156 | | |
| Other long-term liabilities | | (1,143) | | | (1,385) | | | (9,991) | | |
| Net cash provided by (used in) operating activities | | 91,998 | | | (372,531) | | | (191,723) | | |
| Cash flows from investing activities: | | | | | | | |
| Purchase of property, plant and equipment | | (58,852) | | | (83,739) | | | (116,823) | | |
| Proceeds from sale of property, plant and equipment | | 70 | | | 14 | | | — | | |
| Net cash used in investing activities | | (58,782) | | | (83,725) | | | (116,823) | | |
| Cash flows from financing activities: | | | | | | | |
Proceeds from issuance of debt10 | | 402,500 | | | 637,127 | | | — | | |
| Payment of debt issuance costs | | (12,761) | | | (19,736) | | | — | | |
| Repayment of debt | | (140,990) | | | (191,390) | | | (120,586) | | |
| Make-whole payment related to PPAs’ debt | | — | | | — | | | (6,553) | | |
| Purchase of capped call options related to convertible notes | | — | | | (54,522) | | | — | | |
| Proceeds from financing obligations | | 1,798 | | | 4,993 | | | 3,261 | | |
| Repayment of financing obligations | | (90,197) | | | (18,445) | | | (35,543) | | |
| Distributions and payments to noncontrolling interest | | — | | | (2,265) | | | (6,854) | | |
| Proceeds from issuance of common stock | | 12,367 | | | 16,945 | | | 15,279 | | |
| Proceeds from public share offering | | — | | | — | | | 385,396 | | |
| Payment of public share offering costs | | — | | | (35) | | | (13,775) | | |
| Buyout of noncontrolling interest | | — | | | (6,864) | | | (12,000) | | |
| Proceeds from issuance of redeemable convertible preferred stock | | — | | | 310,957 | | | — | | |
| Payment of issuance costs related to redeemable convertible preferred stock | | — | | | (395) | | | — | | |
| Dividend paid | | (1,468) | | | — | | | — | | |
| Contributions from noncontrolling interest | | 3,958 | | | 6,979 | | | 2,815 | | |
| Other | | — | | | — | | | (76) | | |
| Net cash provided by financing activities | | 175,207 | | | 683,349 | | | 211,364 | | |
| Effect of exchange rate changes on cash, cash equivalent, and restricted cash | | (2,630) | | | (281) | | | 434 | | |
| Net increase (decrease) in cash, cash equivalents, and restricted cash | | 205,793 | | | 226,812 | | | (96,748) | | |
| Cash, cash equivalents, and restricted cash: | | | | | | | |
| Beginning of period | | 745,178 | | | 518,366 | | | 615,114 | | |
| End of period | | $ | 950,971 | | | $ | 745,178 | | | $ | 518,366 | | |
| | | | | | | |
| Supplemental disclosure of cash flow information: | | | | | | | |
| Cash paid during the period for interest | | $ | 55,699 | | | $ | 49,929 | | | $ | 48,980 | | |
| Cash paid for amounts included in the measurement of lease liabilities: | | | | | | | |
| Operating cash flows from operating leases | | 36,416 | | | 32,538 | | | 14,001 | | |
| Operating cash flows from finance leases | | 259 | | | 1,097 | | | 1,085 | | |
| Cash paid during the period for income taxes | | 1,424 | | | 1,455 | | | 1,439 | | |
| Non-cash investing and financing activities: | | | | | | | |
| Transfer from customer financing receivable to property, plant and equipment, net | | — | | | — | | | 42,758 | | |
| Forward to purchase Class A common stock | | — | | | — | | | 4,183 | | |
| Liabilities recorded for property, plant and equipment, net | | 1,647 | | | 9,297 | | | 10,988 | | |
| Recognition of operating lease right-of-use asset during the year-to-date period | | 2,936 | | | 29,823 | | | 36,402 | | |
| Recognition of finance lease right-of-use asset during the year-to-date period | | 1,644 | | | 1,011 | | | 896 | | |
| Derecognition of financing obligations | | 101,683 | | | — | | | — | | |
| Conversion of redeemable convertible preferred stock | | — | | | 310,484 | | | 208,551 | | |
| Derecognition of the pre-modified forward contract fair value | | — | | | 76,242 | | | — | | |
| Equity component of redeemable convertible preferred stock | | — | | | 16,145 | | | — | | |
1 Including changes in related party balances of $168.5 million, $257.8 million and $0.1 million for the years ended December 31, 2024, 2023 and 2022, respectively.
2 Including change in related party balances of $6.1 million and $6.9 million for the years ended December 31, 2024, and 2023, respectively. There were no associated related party balances as of December 31, 2022.
3 Including change in related party balances of $0.9 million and $0.9 million for the years ended December 31, 2024, and 2023, respectively. There were no associated related party balances as of December 31, 2022.
4 Including change in related party balances of $1.0 million and $2.3 million for the years ended December 31, 2024, and 2023, respectively. There were no associated related party balances as of December 31, 2022.
5 Including change in related party balances of $0.3 million and $9.1 million for the years ended December 31, 2024, and 2023, respectively. There were no associated related party balances as of December 31, 2022.
6 Including change in related party balances of $0.1 million and $0.1 million for the years ended December 31, 2024, and 2023, respectively. There were no associated related party balances as of December 31, 2022.
7 Including change in related party balances of $0.1 million and $1.3 million for the years ended December 31, 2024, and 2023, respectively. There were no associated related party balances as of December 31, 2022.
8 Including change in related party balances of $0.6 million and $3.4 million for the years ended December 31, 2024, and 2023, respectively. There were no associated related party balances as of December 31, 2022.
9 Including change in related party balances of $3.8 million and $8.4 million for the years ended December 31, 2024, and 2023, respectively. There were no associated related party balances as of December 31, 2022.
10 Including change in related party balances of $0.6 million and $4.6 million for the years ended December 31, 2024, and 2023, respectively. There were no associated related party balances as of December 31, 2022.
The accompanying notes are an integral part of these consolidated financial statements.
Bloom Energy Corporation
Notes to Consolidated Financial Statements
1. Nature of Business, Liquidity and Basis of Presentation
Nature of Business
We design, manufacture, sell and, in certain cases, install solid oxide fuel cell systems (the “Energy Server systems”) for on-site power generation. Our Energy Server systems utilize innovative fuel cell technology and provide efficient energy generation with reduced operating costs and lower greenhouse gas emissions as compared to conventional fossil fuel generation. The solid oxide platform that powers our fuel cells can be used to create hydrogen with our Bloom Electrolyzer. In addition, the Energy Server systems allow us to provide energy solutions for customers, as our products are designed to work with existing carbon capture utilization and storage (“CCUS”) and combined heat and power (“CHP”) technologies. By generating power where it is consumed, our energy producing systems offer increased electrical reliability and improved energy security, while providing a path to energy independence. Our corporate headquarters are located in San Jose, California.
Liquidity
While we have generally incurred operating losses and negative cash flows from operations since our inception, we generated $92.0 million of positive cash flows from operations in fiscal year 2024. With the series of new debt offerings, debt extinguishments, and conversions to equity that we completed since 2021, we had $1,124.7 million and $4.1 million of total outstanding recourse and non-recourse debt, respectively, as of December 31, 2024, $114.4 million and $1,014.4 million of which was classified as short-term debt and long-term debt, respectively.
On October 23, 2021, we entered into the Securities Purchase Agreement (the “SPA”) with SK ecoplant Co., Ltd. (“SK ecoplant”, formerly known as SK Engineering & Construction Co., Ltd.) in connection with a strategic partnership. For more information on the strategic investment with SK ecoplant, please see Note 17 — SK ecoplant Strategic Investment and Note 11 — Related Party Transactions.
On August 19, 2022, we completed an underwritten public offering (the “Offering”), pursuant to which we issued and sold 13,000,000 shares of Class A common stock at the price of $26.00 per share. As a part of the Offering, the underwriters were provided a 30-day option to purchase an additional 1,950,000 shares of our Class A common stock at the same price, less underwriting discounts and commissions, which was exercised contemporaneously with the Offering. The aggregate net proceeds received by us from the Offering were $371.5 million after deducting underwriting discounts and commissions of $16.5 million and incremental costs directly attributable to the Offering of $0.7 million.
On May 29, 2024, we issued the 3% Green Convertible Senior Notes (the “3% Green Notes due June 2029”) in an aggregate principal amount of $402.5 million due June 2029, unless earlier repurchased, redeemed or converted, resulting in net cash proceeds of $389.7 million. On May 29, 2024, we used approximately $141.8 million of the net cash proceeds from this issuance to repurchase $115.0 million, or 50%, of the outstanding principal amount of our 2.5% Green Convertible Senior Notes due August 2025 (the “2.5% Green Notes”) in privately negotiated transactions. The repurchase amount equaled 122.6% of the principal amount repurchased, plus related accrued and unpaid interest. For more information on our recourse and non-recourse debt and purchase of Capped Calls, please see Note 7 — Outstanding Loans and Security Agreements.
Our future capital requirements depend on many factors, including our rate of revenue growth, the timing and extent of spending on research and development efforts and other business initiatives, the rate of growth in the volume of system builds and the need for additional working capital, the expansion of sales and marketing activities both in domestic and international markets, market acceptance of our products, our ability to secure financing for customer use of our products, the timing of installations and of inventory build in anticipation of future sales and installations, and overall economic conditions. In order to support and achieve our future growth plans, we may need or seek advantageously to obtain additional funding through equity or debt financing. Failure to obtain this financing on favorable terms or at all in future quarters may affect our financial position and results of operations, including our revenues and cash flows.
In the opinion of management, the combination of our cash and cash equivalents and cash flow to be generated by our operations is expected to be sufficient to meet our anticipated cash flow needs for at least the next 12 months from the date of issuance of this Annual Report on Form 10-K.
Inflation Reduction Act of 2022
On August 16, 2022, President Biden signed into law the Inflation Reduction Act of 2022 (the “IRA”). It contains provisions that have had a significant impact on the development and financing of clean energy projects in the U.S. However, President Trump has expressed skepticism about the IRA and clean energy projects, thus creating uncertainty about its future. The IRA includes expanded tax credits for projects across the Bloom product portfolio as well as for manufacturing of clean energy equipment. It also introduces new mechanisms for tax credit monetization and transferability. The IRA includes targeted incentives intended to encourage development in low-income communities, the use of domestically produced materials, and compliance with certain labor-related requirements. We believe that the programs and credits included in the IRA align well with our business model and could provide significant benefits for our projects.
The IRA introduces and updates several crediting mechanisms and incentive provisions that are relevant for us including:
•Section 48E — Clean Electricity Investment Credit, which starting December 31, 2024, replaces the previous investment tax credit framework for named clean energy technologies with a “tech neutral” framework anchored around the net carbon neutrality of energy generation from qualifying facilities. It provides incentives of up to 50% for qualifying energy property meeting domestic content and labor requirements.
•Section 45V — Credit for the Production of Clean Hydrogen, which provides a Production Tax Credit (the “PTC”) of up to $3 per kg of qualified clean hydrogen produced at qualified facilities in the US, including Bloom’s Electrolyzer projects. Bloom is also positioned to provide near-zero carbon power to natural gas based low carbon hydrogen facilities.
•Section 45Q — Credit for Carbon Oxide Sequestration, which provides up to a $60/tonne credit for carbon utilization and $85/tonne credit for geologic sequestration and can improve the cost effectiveness of Bloom’s carbon capture offerings.
•Section 45Z — Clean Fuel Production Credit, which provides a tax credit for the production of clean transportation fuels with lifecycle GHG emissions below certain levels. The credit can reach levels of up to $1.00/gallon for non-aviation fuel and $1.75/gallon for non-aviation fuel and is influenced by emissions associated with energy use including on-site power provided by Bloom.
•Section 48C — Qualified Advanced Energy Project, which provides an Investment Tax Credit (the “ITC”) through a competitive application process administered through the Department of Energy equal to 6% or 30% of the investment with respect to advanced energy projects
We believe that the programs and credits included in the IRA align well with our business model and could provide significant benefits with respect to incentivizing the purchase of our current product offerings and technologies. In particular, the IRA authorized a competitive process to apply for credits to expand or enhance manufacturing capacity under IRC 48C. On December 21, 2023, we submitted the application for qualifying advanced energy project credit allocation under Internal Revenue Code Section 48C(e) for the manufacturing facility in Fremont, California (the “Facility”). On March 29, 2024, we received notification from the Internal Revenue Service (the “IRS”) of the acceptance of our application for a Qualifying Advanced Energy Project Credit of up to $75.3 million. After a technical review of Bloom’s Section 48C(e) application, the Department of Energy provided a recommendation to the IRS to grant a $75.3 million credit allocation for the Facility. The approval is subject to satisfaction of the underlying certification requirements, including the prevailing wage and apprenticeship requirements, within two years from the date of the application acceptance and potential clearance by the Office of Management and Budget due to President Trump’s executive order halting the disbursement of funds under the IRA.
The U.S. Treasury Department has issued implementation guidance, and we intend to engage with the new U.S. federal administration to understand how shifting policy priorities might impact the revised guidance or changes to the law itself. Current Section 48E guidance places Bloom Energy Server systems running on natural gas in a class of Combustion and Gasification facilities required to demonstrate net-zero emissions in the production of electricity. If the U.S. federal administration does not clarify key aspects of the guidance related to our unique technology, our projects will no longer be beneficiaries of the ITC. If the ITC is not extended for fuel cells, U.S. bookings, revenue and gross margins could be materially impacted in 2025 and beyond. Also, it is possible that the expiration of the ITC may have increased demand for ITC-compliant sales of our Energy Server systems in 2024 due to customer desire to secure ITC for their projects through safe harboring. However, if our customers or project-level investors prove reluctant to make sufficient cash outlays for purchases of Energy Server systems for future projects, our sales could be negatively impacted in future years.
Also, the PTC for qualified clean hydrogen and credit for carbon capture could result in increased demand for commercial solutions to hydrogen production technology and carbon capture, including our solid oxide fuel cell-based products.
At the time of IRA implementation in August 2022, some of our existing contracts contemplated price adjustments at the inception of the contract for the change in the ITC rate to 30%. As a result, we recognized $8.7 million in product revenue and $1.3 million in installation revenue for the year ended December 31, 2022, from such existing contracts, as a change in variable consideration estimate for Energy Server systems placed in service during the eligible periods under the IRA and which qualified for the 30% ITC rate. In fiscal years 2024 and 2023, all of our contract prices included the impact of the 30% ITC rate under the IRA provisions.
The IRA also creates certain bonus tax credits relevant to our products placed in service in fiscal years 2024 and 2023, available by satisfying domestic content criteria and/or other criteria if such products are located within an “energy community,” as defined by the IRA. In fiscal years 2024 and 2023 contracts that included price adjustments related to the domestic content bonus tax credit were evaluated as variable consideration and we estimated variable consideration by using the most likely amount method of meeting the IRA domestic content criteria. When recognizing revenue, we constrained the estimate of variable consideration to an amount that was not probable of a significant revenue reversal.
Basis of Presentation
We have prepared the consolidated financial statements included herein pursuant to the rules and regulations of the U. S. Securities and Exchange Commission (“SEC”), and as permitted by those rules, including all disclosures required by generally accepted accounting principles as applied in the U.S. (“U.S. GAAP”). Certain prior period amounts have been reclassified to conform to the current period presentation.
Principles of Consolidation
These consolidated financial statements reflect our accounts and operations and those of our subsidiaries in which we have a controlling financial interest. We use a qualitative approach in assessing the consolidation requirement for our variable interest entities (“VIEs”), which we refer to as tax equity partnerships (each such VIE, also referred to as our power purchase agreement, or PPA Entities) and a joint venture in the Republic of Korea (the “Korean JV”). This approach focuses on determining whether we have the power to direct those activities of the PPA Entities and the Korean JV that most significantly affect their economic performance and whether we have the obligation to absorb losses, or the right to receive benefits, which could potentially be significant to the PPA Entities and the Korean JV. For all periods presented, we have determined that we are the primary beneficiary in all of our operational PPA Entities and the Korean JV, as discussed in Note 10 — Portfolio Financings and Note 17 — SK ecoplant Strategic Investment, respectively. We evaluate our relationships with the PPA Entities and the Korean JV on an ongoing basis to ensure that we continue to be the primary beneficiary. In August 2023, we sold our last consolidated PPA Entity, 2015 ESA Project Company, LLC (“PPA V”), as a result of the PPA V Repowering of the Energy Server systems (see Note 10 — Portfolio Financings). All intercompany transactions and balances have been eliminated upon consolidation. The sale of an operating company with a portfolio of the PPAs in which we do not have an equity interest is called a “Third-Party PPA.” We have determined that, although these entities are VIEs, we do not have the power to direct those activities of the Third-Party PPAs that most significantly affect their economic performance. We also do not have the obligation to absorb losses, or the right to receive benefits, which could potentially be significant to the Third-Party PPAs. Because we are not the primary beneficiary of these activities, we do not consolidate Third-Party PPAs.
Use of Estimates
The preparation of consolidated financial statements in conformity with U.S. GAAP requires us to make estimates and assumptions that affect the amounts reported in the consolidated financial statements and the accompanying notes. The most significant estimates include the determination of the stand-alone selling price, valuation of financial instruments associated with the Amended SPA with SK ecoplant, inventory valuation, specifically excess and obsolescence provisions for obsolete or unsellable inventory and, in relation to property, plant and equipment (specifically Energy Server systems), assumptions relating to economic useful lives and impairment assessments.
Other accounting estimates include variable consideration relating to product performance guaranties, lease and non-lease components and related financing obligations such as incremental borrowing rates, estimated output, efficiency and residual value of our products, product performance warranties and guaranties and extended maintenance, derivative valuations,
estimates relating to contractual indemnities provisions, estimates for income taxes and deferred tax asset valuation allowances, stock-based compensation expense, estimates of fair value of preferred stock and equity and non-equity items in relation to the SK ecoplant strategic investment, and financing obligation allocations in managed service transactions. In addition, certain of such estimates could require further judgment or modification and therefore carry a higher degree of variability and volatility. Actual results could differ materially from these estimates under different assumptions and conditions.
Concentration of Risk
Geographic Risk — The majority of our revenue and long-lived assets are attributable to operations in the U.S. for all periods presented. In addition to shipments in the U.S., we also ship our products to other countries, primarily to the Republic of Korea, Japan, India, and Taiwan (collectively referred to as the “Asia Pacific region”). In the years ended December 31, 2024, 2023 and 2022, total revenue in the U.S. was 74%, 70% and 56%, respectively, of our total revenue.
Credit Risk — At December 31, 2024, three customers, the first of which is our related party (see Note 11 — Related Party Transactions), accounted for approximately 28%, 28%, and 20% of accounts receivable. At December 31, 2023, one customer, who is our related party, accounted for approximately 74% of accounts receivable. To date, we have not experienced any material credit losses from these customers.
Customer Risk — During the year ended December 31, 2024, revenue from three customers, the first of which is our related party (see Note 11 — Related Party Transactions), accounted for approximately 23%, 16% and 14% of our total revenue. During the year ended December 31, 2023, two customers, the first of which is our related party, represented approximately 37% and 26% of our total revenue. In the year ended December 31, 2022, revenue from two customers, the first of which is our related party, accounted for approximately 38% and 37% of our total revenue.
2. Summary of Significant Accounting Policies
Revenue Recognition
We primarily earn product and installation revenue from the sale and installation of our Energy Server systems and other products, service revenue by providing services under operations and maintenance services contracts, and electricity revenue by selling electricity to customers under PPAs and Managed Services Agreements. We offer our customers several ways to finance their use of our Energy Server systems. Customers, including some of our international channel providers and the Third-Party PPAs, may choose to purchase our Energy Server systems outright. Customers may also enter into contracts with us for the purchase of electricity generated by our Energy Server systems (i.e., Managed Services Agreements), which is then financed through one of our financing partners (i.e., Managed Services Financings). Finally, customers may purchase electricity through our PPA Entities (i.e., Portfolio Financings). For additional information, please see Part I, Item 7, Section Purchase and Financing Options.
Revenue Recognition under ASC 606 Revenue from Contracts with Customers
In applying Accounting Standards Codification (“ASC”) 606 revenue is recognized by following a five-step process:
1.Identify the contract(s) with a customer. Evidence of a contract generally consists of an agreement, or a purchase order issued pursuant to the terms and conditions of a distributor, reseller, purchase, use and maintenance agreement, maintenance services agreements or energy supply agreement.
2.Identify the performance obligations in the contract. Performance obligations are identified in our contracts and primarily include transferring control of our products, installation of the Energy Server systems, providing maintenance services and maintenance services renewal options which, in certain situations, provide customers with material rights.
3.Determine the transaction price. The purchase price stated in an agreed-upon purchase order or contract is generally representative of the transaction price. When determining the transaction price, we consider the effects of any variable consideration, which include performance guarantees that may be payable to our customers.
4.Allocate the transaction price to the performance obligations in the contract. The transaction price in a contract is allocated based upon the relative standalone selling price of each distinct performance obligation identified in the contract.
5.Recognize revenue when (or as) we satisfy a performance obligation. We satisfy performance obligations either over time or at a point in time as discussed in further detail below. Revenue is recognized at the time the related performance obligation is satisfied by transferring control of the promised products or services to a customer.
We sometimes combine contracts governing the sale and installation of our Energy Server systems with the related maintenance services contracts and account for them as a single contract at contract inception to the extent the contracts are with the same customer. These contracts are not combined when the customer for the sale and installation of the Energy Server systems is different to the maintenance services contract customer. We also assess whether any contract terms including default provisions, put or call options result in components of our contracts being accounted for as financing or leasing transactions outside of the scope of ASC 606.
Most of our contracts contain performance obligations with a combination of our products, installation and maintenance services. For these performance obligations, we allocate the total transaction price to each performance obligation based on the relative standalone selling price. Our maintenance services contracts are typically subject to renewal by customers on an annual basis. We assess these maintenance services renewal options at contract inception to determine whether they provide customers with material rights that give rise to separate performance obligations.
The total transaction price is determined based on the total consideration specified in the contract, including variable consideration in the form of a performance guaranty payment that represents potential amounts payable to customers. The expected value method is generally used when estimating variable consideration, which typically reduces the total transaction price due to the nature of the performance obligations to which the variable consideration relates. These estimates reflect our historical experience and current contractual requirements which cap the maximum amount that may be paid. The expected value method requires judgment and considers multiple factors that may vary over time depending upon the unique facts and circumstances related to each performance obligation. Depending on the facts and circumstances, a change in variable consideration estimate will either be accounted for at the contract level or using the portfolio method.
We exclude from the transaction price all taxes assessed by governmental authorities that are both (i) imposed on and concurrent with a specific revenue-producing transaction and (ii) collected from customers. Accordingly, such tax amounts are not included as a component of net sales or cost of sales. These tax amounts are recorded in the cost of electricity revenue, cost of service revenue, and general and administrative operating expenses.
We allocate the transaction price to each distinct performance obligation based on relative stand-alone selling prices. Given that we typically sell our products together with the related installation and maintenance services, standalone selling prices are not directly observable. We estimate standalone selling prices by using a cost-plus approach. Costs relating to our products include all direct and indirect manufacturing costs, applicable overhead costs and costs for normal production inefficiencies (i.e., variances). We then apply a margin to our products based on our Company’s pricing strategy. As our business offerings and eligibility for the ITC evolve over time, we may be required to modify the expected margin in subsequent periods and our revenue could be materially affected. Costs relating to installation include all direct and indirect installation costs. The margin we apply reflects our profit objectives relating to installation. Costs for maintenance services arrangements are estimated over the life of the maintenance contracts and include estimated future material costs and non-material costs. Material costs over the period of the service arrangement are impacted significantly by the longevity of the fuel cells themselves. We apply a lower margin to our total service costs than to our products as it best reflects our long-term service margin expectations and comparable historical industry service margins.
We generally recognize product and installation revenue at a point in time that our customers obtain control of our products. For certain instances, control of the installations is transferred to the customers over time, and the related revenue is recognized over time as the performance obligation is satisfied using the cost-to-cost (percentage-of-completion) method. We use an input measure of progress to determine the amount of revenue to be recognized during each reporting period. We recognize maintenance services revenue, including revenue associated with any related customer material rights, over time as we perform service maintenance activities.
Amounts billed to our customers for shipping and handling activities are considered contract fulfillment activities and not a separate performance obligation of the contract. Shipping and handling costs are recorded within the cost of revenue.
The following is a description of the principal activities from which we generate revenue. Our four revenue streams are classified as follows:
Product Revenue — All of our product revenue is generated from the sale of our products to direct purchase customers, including financing partners on the Third-Party PPAs and sale-and-leaseback transactions, and international channel providers.
We generally recognize product revenue from contracts with customers at the point that control is transferred to the customers. This occurs when we achieve customer acceptance, which depending on the contract terms is when the product is shipped and delivered to our customers, when the product is shipped and delivered and is physically ready for startup and commissioning (i.e., Mechanical Completion), or when the product is shipped and delivered and is turned on and operational (i.e., Commencement of Operations or “COO”), if required.
Under our traditional lease financing option, we sell our Energy Server systems through a direct sale to a financing partner who, in turn, lease the Energy Server systems to the customer under a lease agreement. With our sales to our international channel providers, our international channel providers typically sell the Energy Server systems to, or sometimes provide a PPA to, an end customer. In both traditional lease and international channel providers’ transactions, we contract directly with the end customer to provide extended maintenance services after the end of the standard warranty period. As a result, since the customer that purchases the server is a different and unrelated party to the customer that purchases extended warranty services, the product and maintenance services contract are not combined.
Installation Revenue — Nearly all of our installation revenue relates to the installation of the Energy Server systems sold to the customers as part of a direct purchase and to financing parties as part of a traditional lease or Portfolio Financings. Generally, we recognize installation revenue when the product is physically ready for startup and commissioning (i.e., Mechanical Completion), or when the product is turned on and operational (i.e., COO). For instances when control for installation services is transferred over time, we use an input measure of progress to determine the amount of revenue to recognize during each reporting period based on the costs incurred to satisfy the performance obligation.
Payments received from customers are recorded within deferred revenue and customer deposits in the consolidated balance sheets until control is transferred. The related cost of such product and installation is also deferred as a component of deferred cost of revenue in the consolidated balance sheets until control is transferred.
Service Revenue — Service revenue is generated from operations and maintenance agreements (“O&M Agreements”). As part of the first year of O&M services, we also monitor the operations of the underlying products and provide output and efficiency warranties and guaranties. We have determined that this standard first-year O&M services (including the warranties and guaranties) is a distinct performance obligation — being a promise to stand-ready to maintain our products when and if required during the first year following installation. We also sell to our customers extended annual maintenance services that effectively extend the standard first-year warranty coverage at the customer’s option. These customers generally have an option to renew or cancel the extended maintenance services on an annual basis and nearly every customer has renewed historically. Similar to the standard first-year O&M services, the optional extended annual maintenance services are considered a distinct performance obligation – being a promise to stand-ready to maintain the products when and if required during the renewal service year.
Given our customers’ renewal history, we anticipate that most of them will continue to renew their maintenance services agreements each year for the period of their expected use of the products. The contractual renewal price may be less than the stand-alone selling price of the maintenance services and consequently the contract renewal option may provide the customer with a material right. We estimate the standalone selling price for customer renewal options that give rise to material rights using the practical alternative by reference to optional maintenance services renewal periods expected to be provided and the corresponding expected consideration for these services. This reflects the fact that our additional performance obligations in any contractual renewal period are consistent with the services provided under the standard first-year warranty. Where we have determined that the customers have material rights as a result of their contract renewal option, we recognize that portion of the transaction price allocated to the material rights over the period in which such rights are exercised.
Payments from customers for the extended maintenance contracts are generally received at the beginning of each service year. Accordingly, the customer payment received is recorded as a customer deposit and revenue is recognized over the related service period as the services are performed.
Electricity Revenue — We sell electricity produced by Energy Server systems owned directly by us. Before the sale in August 2023 of our last consolidated PPA Entity, PPA V, we also were selling electricity produced by our Energy Server systems owned by our consolidated PPA Entities. Our PPA Entities purchased the Energy Server systems from us and sold electricity produced by these systems to customers through long-term PPAs. Customers were required to purchase all of the electricity produced by those Energy Server systems at agreed-upon rates over the course of the PPAs’ contractual term.
In addition, in certain Managed Services Financings pursuant to which we are party to a Managed Services Agreement with a customer in a sale-leaseback-sublease arrangement, we may recognize electricity revenue. We first determine whether the Energy Server systems under the sale-leaseback arrangement of a Managed Services Financing were “integral equipment.”
As the Energy Server systems were determined not to be integral equipment, we determined if the leaseback was classified as a financing lease or an operating lease.
Starting in the second half of fiscal year 2021, we completed several successful sale-and-leaseback transactions in which we transferred control of the Energy Server system to the financier and leased it back as an operating lease to provide electricity to the end customer.
In order for the transaction to meet the criteria for successful sale-leaseback accounting, control of the Energy Server systems must transfer to the financier, which requires, among other criteria, the leaseback to meet the criteria for an operating lease in accordance with ASC 842, Leases (“ASC 842”). Accordingly, for such transactions where control transfers and the leaseback is classified as an operating lease, the proceeds from the sale to the financier are recognized as revenue based on the fair value of the Energy Server systems sold and are allocated between product revenue and installation revenue based on the relative standalone selling prices.
We recognize an operating lease liability for the Energy Server systems leaseback obligation based on the present value of the future payments to the financier that are attributed to the Energy Server systems leaseback using our incremental borrowing rate (“IBR”). We also record an operating lease right-of-use asset, which is amortized over the term of the leaseback, and is included as a cost of electricity revenue on the consolidated statements of operations.
For certain sale-and-leaseback transactions, we receive proceeds from the financier in excess of the fair value of the Energy Server systems in order to finance our ongoing costs associated with the operation of the Energy Server systems during the term of the end customer agreement to provide electricity. Such proceeds are recognized as financing obligations.
We allocate payments we are obligated to make under the leaseback agreement with the financier between the operating lease liability and the financing obligation based on the proportion of the financing obligation to the total proceeds to be received.
We recognize revenue from the satisfaction of performance obligations under our PPAs and Managed Services Financings to provide electricity to our end customers as the electricity is provided over the term of the agreement in the amount invoiced, which reflects the amount of consideration to which we have the right to invoice, and which corresponds to the value transferred under such arrangements.
Modifications
Contract modifications are accounted for as separate contracts if the additional products and services are distinct and priced at stand-alone selling prices. If the additional products and services are distinct, but not priced at standalone selling prices, the modification is treated as a termination of the existing contract and the creation of a new contract. If the additional products and services are not distinct within the context of the contract, the modification is combined with the original contract and either an increase or decrease in revenue is recognized on the modification date.
Deferred Revenue
We recognize a contract liability (referred to as deferred revenue in our consolidated financial statements, excluding customer deposits) when we have an obligation to transfer products or services to a customer in advance of us satisfying a performance obligation and the contract liability is reduced as performance obligations are satisfied and revenue is recognized. The related costs are deferred as a component of deferred cost of revenue in the consolidated balance sheets. Prior to shipment of the product or the commencement of performance of maintenance services, any prepayment made by the customer is recorded as a customer deposit. Deferred revenue related to material rights for options to renew are recognized in revenue over the maintenance services period.
A description of the principal activities from which we recognize the cost of revenues associated with each of our revenue streams are classified as follows:
Cost of Product Revenue — Cost of product revenue consists of costs of our products that we sell to direct purchase, including financing partners on the Third-Party PPAs, international channel providers and traditional lease customers. It includes costs paid to our materials suppliers, direct labor, manufacturing and other overhead costs, shipping costs, provisions for excess and obsolete inventory and the depreciation costs of our equipment. For the Energy Server systems sold to customers pending installation, we provide warranty reserves as a part of product costs for the period from transfer of control of the Energy Server systems to the earlier of one year or Commencement of Operations.
Cost of Installation Revenue — Cost of installation revenue primarily consists of the costs to install our Energy Server systems that we sell to direct purchase, including financing partners on the Third-Party PPAs and traditional lease and successful sale-leaseback customers. It includes the cost of materials and service providers, personnel costs, shipping costs and allocated costs.
Cost of Service Revenue — Cost of service revenue consists of costs incurred under maintenance service contracts for all customers. It includes the cost of field replacement units, personnel costs for our customer support organization, certain allocated costs, and extended maintenance-related product repair and replacement costs.
Cost of Electricity Revenue — Cost of electricity revenue primarily consists of the depreciation of the cost of the Energy Server systems owned by us or the consolidated PPA Entities. The cost of electricity revenue is generally recognized over the term of the Managed Services Agreement or customer’s PPA contract. In August 2023, we sold our last consolidated PPA Entity, PPA V.
Revenue Recognized from Portfolio Financings Through the PPA Entities (See Note 10 — Portfolio Financings) In 2010, we began selling our Energy Server systems to tax equity partnerships in which we held an equity interest as a managing member, or a PPA Entity. The investors in a PPA Entity contribute cash to the PPA Entity in exchange for an equity interest, which then allows the PPA Entity to purchase the Operating Company and the Energy Server systems.
The cash contributions held are classified as short-term or long-term restricted cash according to the terms of each PPA Entity’s governing documents. As we identified customers, the Operating Company entered into a PPA with the customer pursuant to which the customer agreed to purchase the power generated by one or more Energy Server systems at a specified rate per kilowatt hour for a specified term, which can range from 10 to 21 years. The Operating Company, wholly owned by the PPA Entity, typically entered into a maintenance services agreement with us following the first year of service to extend the standard one-year performance warranties and guaranties. This intercompany arrangement is eliminated on consolidation. Those PPAs that qualify as leases are classified as either sales-type leases or operating leases and those that do not qualify as leases are classified as tariff agreements or revenue arrangements with customers. For arrangements classified as operating leases, tariff agreements, or revenue arrangements with customers, income is recognized as contractual amounts are due when the electricity is generated and presented within electricity revenue on the consolidated statements of operations.
In August 2023, we sold our last consolidated PPA Entity, PPA V. Please refer to Note 10 — Portfolio Financings for details.
Sales-type Leases — Certain Portfolio Financings with the PPA Entities entered into prior to our adoption of ASC 842 qualified as sales-type leases in accordance with ASC 840, Leases (“ASC 840”). The classification for such arrangements were carried over and accounted for as sales-type leases under ASC 842.
In the fiscal year 2022 we sold PPA IIIa. Please refer to Note 10 — Portfolio Financings for details. We have not entered into any new Portfolio Financing arrangements through the PPA Entities during the last four years.
Operating Leases — Certain Portfolio Financings with the PPA Entities entered into prior to the adoption of ASC 842 that were deemed leases in substance but did not meet the criteria of sales-type leases or direct financing leases in accordance with ASC 840, were accounted for as operating leases. The classification for such arrangements was carried over and accounted for as operating leases under ASC 842. Revenue under these arrangements was recognized as electricity sales and service revenue and was provided to the customer at rates specified under the PPAs. During the years ended December 31, 2023, and 2022, revenue from electricity sales from these Portfolio Financings with the PPA Entities amounted to $14.3 million and $25.9 million, respectively. There was no revenue from electricity sales from the Portfolio Financings with the PPA Entities during the year ended December 31, 2024. During the years ended December 31, 2023, and 2022, service revenue from operating leases amounted to $3.1 million, and $13.1 million, respectively. There was no service revenue from operating leases during the year ended December 31, 2024. Service revenue related to sales-type leases was immaterial for the year ended December 31, 2022. There was no service revenue related to sales-type leases for the years ended December 31, 2024, and 2023.
Investment Tax Credits — Under our Portfolio Financings with PPA Entities, ITCs were primarily passed through to Equity Investors with approximately 1% to 10% of incentives received by us. These incentives were accounted for by using the flow-through method.
The ITC program has operational criteria for the first five years after the qualified equipment is placed in service. If the qualified energy property is disposed of or otherwise ceases to be investment credit property before the close of the five-year
recapture period is fulfilled, it could result in a partial reduction of the federal tax incentives. No recapture occurred during the years ended December 31, 2024, 2023 and 2022.
In August 2022, the IRA was signed into law. The IRA includes numerous investments in climate protection, among them the extension and expansion of the ITC and the PTC, the addition of expanded tax credits for other technologies and for manufacturing clean energy equipment, as well as terms allowing parties to more easily monetize the tax credits. The IRA contains a two-tiered credit-amount structure for many applicable tax credits. Specifically, many of the credits have a lower base credit amount that can be increased up to five times if the taxpayer can satisfy applicable prevailing wage or apprenticeship requirements. The IRA also creates certain bonus tax credit amounts relevant to Bloom products placed in service in 2023 and 2024, available by satisfying domestic content criteria and/or locating within an “energy community,” as defined by the IRA. The IRA also creates tax credits for the production of hydrogen and carbon capture.
On August 16, 2022, the IRA enacted provisions to enable our Energy Server systems to be qualified for 30% or more ITCs. If a contract consideration subject to changes due to the underlying ITC rate assumption changes, we will consider such potential ITC benefit changes as a variable consideration and will generally estimate the variable consideration by using the most likely amount method. When recognizing revenue, we will constrain the estimate of variable consideration to an amount that is not probable of a significant revenue reversal. The ITC expired at the end of fiscal year 2024 with respect to fuel cells running on a non-zero carbon fuel.
Recapture of Federal Tax Incentives, Including the ITC
Until the ITC expired at the end of fiscal year 2024 with respect to fuel cells running on a non-zero carbon fuel, our Energy Server systems were eligible for federal ITCs that accrued to qualified property under Internal Revenue Code Section 48 when placed into service. However, the ITC program has operational criteria that extends for five years. If the energy property is disposed of or otherwise ceases to be qualified investment credit property before the close of the five-year recapture period is fulfilled, it could result in a partial reduction of the ITC. Our sale of Energy Server systems to the PPA Entities and pursuant to the Third-Party PPAs, in each case pursuant to Portfolio Financings, generates ITCs benefiting the third-party owners of the PPA Entities or tax equity partnerships (the tax equity partnership purchaser, an “Investment Company”) and, therefore, the third-party owners of the PPA Entities or Investment Companies, as the case may be, bear the risk of recapture if the assets placed in service do not meet the ITC operational criteria in the future.
Warranty Costs
We generally provide a manufacturer’s warranty to our products sold to our customers, international channel providers, and financing parties for up to one year following the date of COO of the Energy Server systems. This standard warranty covers defects in materials, workmanship and manufacturing or performance conditions under normal use and service conditions for the first year following COO. Such standard warranty is considered to be assurance-type warranty and consequently does not give rise to performance obligations under ASC 606 and are accounted for as warranty cost accruals under ASC 460 — Guarantees.
We recognize warranty costs for those contracts that are considered to be assurance-type warranties and consequently do not give rise to performance obligations or for those maintenance service contracts that were previously in the scope of ASC 605-20-25, Separately Priced Extended Warranty and Product Maintenance Contracts.
In addition, as part of our standard warranty period and Managed Services Agreement obligations, we monitor the operations of the underlying systems and provide output and efficiency guaranties (collectively “product performance guaranties”). If the Energy Server systems run at a lower efficiency or power output than we committed under our performance warranty or guaranty, we will reimburse the customer for this underperformance. Our performance obligation includes ensuring the Energy Server systems operate at least at the efficiency and/or power output levels set forth in the customer agreement. Our aggregate reimbursement obligation for a performance guaranty for each customer is capped based on the purchase price of the underlying Energy Server systems. Product performance guaranty payments are accounted for as a reduction in service revenue. We accrue for performance guaranties based on the actual or estimated amounts (when actual data is not available) reimbursable at each reporting period and recognize the costs as a reduction to revenue.
Shipping and Handling Costs
We record costs related to shipping and handling in cost of product revenue, cost of installation revenue and cost of service as they are incurred.
Sales and Utility Taxes
We recognize revenue on a net basis for taxes charged to our customers and collected on behalf of the taxing authorities.
Sales Tax — Sales tax collected from customers is recorded as a liability, pending remittance to the taxing jurisdiction. Consequently, sales taxes have been excluded from revenues and costs. It is recognized as a liability until remitted to the applicable state.
Operating Expenses
Advertising and Promotion Costs — Expenses related to advertising and promotion of products are charged to sales and marketing expenses as incurred. Advertising and promotion expenses for the year ended December 31, 2024, was $1.4 million. We did not incur any material advertising or promotion expenses during the years ended December 31, 2023, and 2022.
Research and Development — We conduct internally funded research and development activities to improve anticipated product performance and reduce product life-cycle costs. Research and development costs are expensed as incurred and include salaries and expenses related to employees conducting research and development and other costs.
Stock-Based Compensation — We account for time-based and performance-based stock options, restricted stock units (“RSUs”) and performance-based stock units (“PSUs”) awarded to employees and non-employee directors under the provisions of ASC 718, Compensation – Stock Compensation (“ASC 718”).
Stock-based compensation costs for time-based and performance-based stock options are measured using the Black-Scholes valuation model. The Black-Scholes valuation model uses as inputs the fair value of our common stock and assumptions we make for the volatility of our common stock, the expected term of the award, the risk-free interest rate for a period that approximates the expected term of the stock options and the expected dividend yield. In developing estimates used to calculate assumptions, we established the expected term for employee options as well as expected forfeiture rates based on the historical settlement experience and after giving consideration to vesting schedules. For options with a vesting condition tied to the attainment of service and market conditions, stock-based compensation costs are recognized using Monte Carlo simulations. Recognition of stock-based compensation expense associated with the performance-based stock options commences when the performance condition is considered probable of achievement, using management’s best estimates, which consider the inherent risk and uncertainty regarding the future outcomes of the milestones. Stock-based compensation costs are recorded net of estimated forfeitures such that expense is recorded only for those stock-based awards that are expected to vest. We typically record stock-based compensation costs for time-based and performance-based stock options under the straight-line attribution method over the requisite service period, which is generally the vesting term, which is generally three to four years for options.
Stock-based compensation costs for RSUs and PSUs are measured based on the fair value of the underlying shares on the date of grant. We recognize the compensation cost for RSUs using a straight-line basis over the requisite service period of the RSUs, which is generally three to four years. We recognize the compensation cost for PSUs over the expected performance period using the graded vesting method as the achievement of the milestones become probable, which is generally one to three years.
We also use the Black-Scholes valuation model to estimate the fair value of stock purchase rights under the Bloom Energy Corporation 2018 Employee Stock Purchase Plan (the “2018 ESPP”). The fair value of the 2018 ESPP purchase rights is recognized as an expense under the multiple options approach. Forfeitures are estimated at the time of grant and revised in subsequent periods, if necessary, if actual forfeitures differ from initial estimates.
Stock issued to grantees in our stock-based compensation is from authorized and previously unissued shares. Stock-based compensation costs are recorded in the consolidated statements of operations based on the employees’ respective functions. Stock-based compensation costs directly associated with the product manufacturing operations process are capitalized into inventory and deferred cost of revenue and expensed when the capitalized asset is used in the normal course of the sales or services process.
We record deferred tax assets for awards that result in deductions on our income tax returns, unless we cannot realize the deduction (i.e., we are in a net operating loss position), based on the amount of compensation cost recognized and our statutory tax rate.
Refer to Note 9 — Stock-Based Compensation and Employee Benefit Plans for further discussion of our stock-based compensation arrangements.
Income Taxes
We account for income taxes using the liability method under ASC 740, Income Taxes (“ASC 740”). Under this method, deferred tax assets and liabilities are determined based on net operating loss carryforwards, research and development credit carryforwards and temporary differences resulting from the different treatment of items for tax and financial reporting purposes. Deferred items are measured using the enacted tax rates and laws that are expected to be in effect when the differences reverse. Additionally, we must assess the likelihood that deferred tax assets will be recovered as deductions from future taxable income. We have provided a full valuation allowance on our domestic deferred tax assets because we believe it is more likely than not that our deferred tax assets will not be realized.
We follow the accounting guidance in ASC 740, which requires a more-likely-than-not threshold for financial statement recognition and measurement of tax positions taken or expected to be taken in a tax return. We record a liability for the difference between the benefit recognized and measured pursuant to ASC 740-10 and the tax position taken or expected to be taken on our tax return. To the extent that the assessment of such tax positions changes, the change in estimate is recorded in the period in which the determination is made. We established reserves for tax-related uncertainties based on estimates of whether, and the extent to which additional taxes will be due. These reserves are established when we believe that certain positions might be challenged despite our belief that the tax return positions are fully supportable. The reserves are adjusted in light of changing facts and circumstances such as the outcome of a tax audit. The provision for income taxes includes the impact of reserve provisions and changes to reserves that are considered appropriate. We recognize interest and penalties related to unrecognized tax benefits in income tax expense.
Refer to Note 15 — Income Taxes for further discussion of our income tax expense.
Comprehensive Loss
Our comprehensive loss is comprised of net loss attributable to common stockholders, foreign currency translation adjustment, and comprehensive loss attributable to noncontrolling interest and redeemable noncontrolling interest.
Fair Value Measurement
ASC 820, Fair Value Measurement (“ASC 820”), defines fair value, establishes a framework for measuring fair value under U.S. GAAP and enhances disclosures about fair value measurements. Fair value is defined under ASC 820 as the exchange price that would be received for an asset or paid to transfer a liability (an exit price) in the principle or most advantageous market for the asset or liability in an orderly transaction between market participants on the measurement date. Valuation techniques used to measure fair value under ASC 820 must maximize the use of observable inputs and minimize the use of unobservable inputs. The guidance describes a fair value hierarchy based on three levels of inputs, of which the first two are considered observable and the last unobservable, that may be used to measure fair value:
| | | | | | | | |
| Level 1 | | Quoted prices in active markets for identical assets or liabilities. Financial assets utilizing Level 1 inputs typically include money market securities and U.S. Treasury securities. |
| | |
| Level 2 | | Inputs other than Level 1 that are observable, either directly or indirectly, such as quoted prices for similar assets or liabilities, quoted prices in markets that are not active or other inputs that are observable or can be corroborated by observable market data for substantially the full term of the assets or liabilities. There were neither financial assets, nor financial liabilities as of December 31, 2024, and 2023, utilizing Level 2 inputs. |
| | |
| Level 3 | | Unobservable inputs that are supported by little or no market activity and that are significant to the fair value of the assets or liabilities. Financial liabilities utilizing Level 3 inputs include contract embedded derivatives. Their valuations are performed using a Monte Carlo simulation model which considers various potential electricity price curves over the sales contract terms. |
Other Balance Sheet Components
Cash, Cash Equivalents, and Restricted Cash — Cash equivalents consist of highly liquid short-term investments with maturities of 90 days or less at the date of purchase.
Restricted cash is held as collateral to provide financial assurance that we will fulfill obligations and commitments primarily related to the Third-Party PPAs and Managed Services Agreements. Restricted cash also includes debt service reserves, maintenance service reserves and facility lease agreements. Restricted cash that is expected to be used within one year
of the balance sheet date is classified as a current asset, whereas restricted cash expected to be used more than one year from the balance sheet date is classified as a non-current asset.
Derivatives — We account for our derivative instruments as a liability which are carried at fair value on the consolidated balance sheets. Changes in the fair value of those derivatives are recorded through earnings in the consolidated statements of operations, as they do not qualify neither as cash flow hedges, nor for hedge accounting.
Accounts Receivable — Accounts receivable primarily represent trade receivables from sales to customers recorded at amortized cost less allowance for credit losses. The allowance for credit losses reflects our best estimate about future losses over the contractual life of outstanding accounts receivable taking into consideration historical experience, specific allowances for known troubled accounts, other currently available information including customer financial condition, and both current and forecasted economic conditions.
Inventories — Inventories consist principally of raw materials, work-in-process and finished goods and are stated on a first-in, first-out basis at a lower of cost or net realizable value. We record inventory excess and obsolescence provisions for estimated obsolete or unsellable inventory, equal to the difference between the cost of inventory and estimated net realizable value based upon assumptions about market conditions and future demand for products generally expected to be utilized over the next 12 to 24 months, including product needed to fulfill our warranty obligations. If actual future demand for our products is less than currently forecasted, additional inventory provisions may be required. Once a provision is recorded, it is maintained until the product to which it relates is sold or otherwise disposed.
Property, Plant and Equipment — Property, plant and equipment, including leasehold improvements, are stated at cost less accumulated depreciation. The Energy Server systems are depreciated to their residual values over their useful economic lives which reflect consideration of the terms of their related PPA and tariff agreements. These useful lives are reassessed when there is an expected change in the use of the Energy Server systems. Leasehold improvements are depreciated over the shorter of the lease term or their estimated depreciable lives. Buildings are amortized over the shorter of the lease or property term or their estimated depreciable lives. Assets under construction are capitalized as costs are incurred and depreciation commences after the assets are put into service within their respective asset class.
Depreciation is calculated using the straight-line method over the estimated depreciable lives of the respective assets as follows: | | | | | | | | |
| | Depreciable Lives |
| | |
| Energy Server systems | | 15-21 years |
| Computers, software and hardware | | 3-5 years |
| Vehicles, machinery and equipment | | 5-10 years |
| Furniture and fixtures | | 3-5 years |
| Leasehold improvements | | 1-10 years |
| Buildings | | * |
* Lesser of 35 years or the term of the underlying land lease.
When assets are retired or disposed of, the assets and related accumulated depreciation and amortization are removed from our consolidated financial statements and the resulting gain or loss is reflected in the consolidated statements of operations.
Impairment of Long-Lived Assets — Our long-lived assets include property, plant and equipment and the Energy Server systems capitalized in connection with our Managed Services Financing Program, Portfolio Financings and other similar arrangements. The carrying amounts of our long-lived assets are periodically reviewed for impairment whenever events or changes in circumstances indicate that the carrying value of these assets may not be recoverable or that the useful life is shorter than originally estimated. Impairment charges for the year ended December 31, 2024, amounted to $87.0 million related to the termination of failed sale-and-leaseback transactions and were recorded in other income (expense), net on our consolidated statements of operations. Impairment charges for the year ended December 31, 2023, amounted to $123.7 million related to the PPA V Repowering and $2.3 million related to the termination of a failed sale-and-leaseback transaction, and were recorded in cost of electricity revenue and in other income (expense), net on our consolidated statements of operations, respectively. Impairment charges for the year ended December 31, 2022, amounted to $44.8 million and $64.0 million related to the PPA IIIa
and PPA IV Repowerings, respectively, and were recorded in cost of electricity revenue on our consolidated statements of operations.
Allocation of Profits and Losses of Consolidated Entities to Noncontrolling Interests — We generally allocate profits and losses to noncontrolling interests under the hypothetical liquidation at book value (“HLBV”) method. The determination of equity in earnings under the HLBV method requires management to determine how proceeds, upon a hypothetical liquidation of the entity at book value, would be allocated between our investors. The noncontrolling interest balance is presented as a component of permanent equity in the consolidated balance sheets.
For income tax purposes, the Equity Investors of the PPA Entities receive a greater proportion of the share of losses and other income tax benefits. This includes the allocation of investment tax credits which are distributed to the Equity Investors through an Investment Company subsidiary of Bloom. Allocations are initially based on the terms specified in each respective partnership agreement until either a specific date or the Equity Investors’ targeted rate of return specified in the partnership agreement is met (the “flip” of the flip structure) whereupon the allocations change. In some cases, after the Equity Investors receive their contractual rate of return, we receive substantially all of the remaining value attributable to the long-term recurring customer payments and the other incentives. In August 2023, we sold our last consolidated PPA Entity being our VIE, PPA V, as a result of the PPA V Repowering of the Energy Server systems (see Note 10 — Portfolio Financings). As of December 31, 2024, and 2023, we had one VIE which we consolidate, Korean JV, which profit and loss are allocated to noncontrolling interests under the HLBV method.
Foreign Currency Considerations
Items included in the financial statements of each of the Company’s entities are measured using the currency of the primary economic environment in which the entity operates (the “functional currency”). The functional currency of the Company’s parent entity is the U.S. dollar.
The functional currencies of our foreign subsidiaries are local currencies. The functional currency of our joint venture in the Republic of Korea is the local currency, the South Korean won (“KRW”), since the joint venture is financially independent of its U.S. parent and the KRW is the currency in which the joint venture generates and expends cash. The assets and liabilities of these entities are translated at the rate of exchange at the balance sheet date. Revenue and expenses are translated at the weighted average rate of exchange during the period. For these entities, translation adjustments resulting from the process of translating the local currency financial statements into the U.S. dollars are included in other comprehensive loss. Translation adjustments attributable to noncontrolling interests are allocated to and reported as part of the noncontrolling interests in the consolidated financial statements.
Transactions made in a currency other than the functional currency are remeasured to the functional currency at exchange rates at the dates of the transactions. Monetary assets and liabilities denominated in foreign currencies at the reporting date are remeasured to the functional currency at the exchange rate at that date and non-monetary assets and liabilities are measured at historical rates. Foreign currency transaction gains and losses are included as a component of other income (expense), net in our consolidated statements of operations.
The reporting currency for these consolidated financial statements is the U.S. dollar.
Accounting Guidance Not Yet Adopted
In November 2024, the FASB issued ASU 2024-04 Debt — Debt with Conversion and Other Options (Subtopic 470-20) (“ASU 2024-04”). ASU 2024-04 clarifies the requirements for determining whether certain settlements of convertible debt instruments should be accounted for as an induced conversion. The standard is effective for annual reporting periods beginning after December 15, 2025, and interim periods within those annual reporting periods. Early adoption is permitted for all entities that have adopted the amendments in ASU 2020-06. We are currently evaluating this guidance, but do not expect the adoption of this guidance to have a material impact on our consolidated financial statements.
In November 2024, the FASB issued ASU 2024-03, Income Statement — Reporting Comprehensive Income — Expense Disaggregation Disclosures (Subtopic 220-40): Disaggregation of Income Statement Expenses (“ASU 2024-03”). ASU 2024-03 is intended to enhance transparency of income statement disclosures primarily through additional disaggregation of relevant expense captions. The standard is effective for annual reporting periods beginning after December 15, 2026, and interim periods beginning after December 15, 2027, with prospective or retrospective application permitted. We are currently evaluating this guidance, but do not expect the adoption of this guidance to have a material impact on our consolidated financial statements.
In March 2024, the FASB issued ASU 2024-02, Codification Improvements — Amendments to Remove References to the Concepts Statements (“ASU 2024-02”). This guidance is intended to remove references to various FASB Concepts Statements. The Board has a standing project on its agenda to address suggestions received from stakeholders on the Accounting Standards Codification and other incremental improvements to U.S. GAAP. This effort facilitates Codification updates for technical corrections such as conforming amendments, clarifications to guidance, simplifications to wording or the structure of guidance, and other minor improvements. The resulting amendments are referred to as Codification improvements. The amendments in ASU 2024-02 are not intended to result in significant accounting change for most entities. We are currently evaluating this guidance, but do not expect the adoption of this guidance to have a material impact on our consolidated financial statements.
In March 2024, the FASB issued ASU 2024-01, Compensation — Stock Compensation (Topic 718): Scope Application of Profits Interest and Similar Awards (“ASU 2024-01”). This guidance is intended to improve U.S. GAAP. by adding an illustrative example to demonstrate how an entity should apply the scope guidance in paragraph 718-10-15-3 to determine whether profits interest and similar awards (“profits interest awards”) should be accounted for in accordance with Topic 718, Compensation — Stock Compensation. The amendments in ASU 2024-01 are effective for annual periods beginning after December 15, 2024, and interim periods within those annual periods. The amendments in ASU 2024-01 should be applied either (1) retrospectively to all prior periods presented in the financial statements or (2) prospectively to profits interest and similar awards granted or modified on or after the date at which the entity first applies the amendments. We are currently evaluating this guidance, but do not expect the adoption of this guidance to have a material impact on our consolidated financial statements.
In August 2023, the FASB issued ASU 2023-05, Business Combinations — Joint Venture Formations (Subtopic 805-60): Recognition and Initial Measurement (“ASU 2023-05”), which addresses the accounting for contributions made to a joint venture. ASU 2023-05 requires joint ventures to measure all assets and liabilities upon formation at fair value. This guidance will be applied prospectively to all joint venture formations with a formation date on or after January 1, 2025. We have evaluated this guidance, and do not expect the adoption of this guidance to have a material impact on our consolidated financial statements.
In December 2023, the FASB issued ASU 2023-09, Income Taxes (Topic 740): Improvements to Income Tax Disclosures (“ASU 2023-09”). ASU 2023-09 addresses investor requests for more transparency about income tax information through improvements to income tax disclosures primarily related to the rate reconciliation and income taxes paid information. This guidance will be applied on a prospective basis and is effective for annual reporting periods in fiscal years beginning after December 15, 2024. Retrospective application is permitted. We are currently evaluating the potential impact, but we do not expect the adoption of this guidance to have a material impact on our consolidated financial statements.
Recent Accounting Pronouncements
In November 2023, the FASB issued ASU 2023-07, Segment Reporting (Topic 280): Improvements to Reportable Segment Disclosures (“ASU 2023-07”). ASU 2023-07 requires disclosure of significant segment expenses that are regularly provided to the chief operating decision maker and included within the segment measure of profit or loss, and a description of how the chief operating decision maker utilizes segment operating profit or loss to assess segment performance. We adopted this accounting standard in fiscal year 2024. While the adoption has no impact on our financial statements, it has resulted in incremental disclosures within the footnotes to our consolidated financial statements.
There have been no significant changes in our reported financial position or results of operations and cash flows resulting from the adoption of new accounting pronouncements.
3. Revenue Recognition
Contract Balances
The following table provides information about accounts receivables, contract assets, customer deposits and deferred revenue from contracts with customers (in thousands):
| | | | | | | | | | | | | | |
| | December 31, |
| | | 2024 | | 2023 |
| | | | |
| Accounts receivable | | $ | 335,841 | | | $ | 340,740 | |
| Contract assets | | 145,162 | | | 41,366 | |
| Customer deposits | | 220,115 | | | 75,734 | |
| Deferred revenue | | 66,304 | | | 72,328 | |
Contract assets relate to contracts for which revenue is recognized upon transfer of control of performance obligations, but where billing milestones have not been reached. Contract liabilities are represented by deferred revenue. Customer deposits and deferred revenue include payments received from customers or invoiced amounts prior to transfer of goods or services.
Contract assets and contract liabilities are reported in a net position on an individual contract basis at the end of each reporting period. Contract assets are classified as current in the consolidated balance sheets when the milestones other than the passage of time, are expected to be complete and the customer is invoiced within one year of the balance sheet date, and as long-term when both the above-mentioned milestones are expected to be complete, and the customer is invoiced more than one year from the balance sheet date. Contract liabilities are classified as current in the consolidated balance sheets when the revenue recognition associated with the related customer payments and invoicing is expected to occur within one year of the balance sheet date and as long-term when the revenue recognition associated with the related customer payments and invoicing is expected to occur in more than one year from the balance sheet date.
In the fourth quarter of fiscal year 2024, our related party settled $223.9 million of accounts receivable (see Note 11 — Related Party Transactions).
The increase in contract assets of $103.8 million for the year ended December 31, 2024, was driven by the timing of achieving billing milestones.
The increase in customer deposits of $144.4 million for the year ended December 31, 2024, was driven by receipt of new deposits, partially offset by certain deposits becoming non-refundable.
Contract Assets
| | | | | | | | | | | | | | | | | | |
| | | | Years Ended
December 31, |
| | | | | | 2024 | | 2023 |
| | | | | | | | |
| Beginning balance | | | | | | $ | 41,366 | | | $ | 46,727 | |
| Transferred to accounts receivable from contract assets recognized at the beginning of the period, net of other adjustments | | | | | | (34,314) | | | (41,064) | |
Revenue recognized and not billed as of the end of the period1 | | | | | | 138,110 | | | 35,703 | |
| Ending balance | | | | | | $ | 145,162 | | | $ | 41,366 | |
1 Included $9.6 million that have already been paid to customer’s customer for the year ended December 31, 2024. There were no other adjustments for the year ended December 31, 2023.
Deferred Revenue
Deferred revenue activity during the years ended December 31, 2024, and 2023, consisted of the following (in thousands):
| | | | | | | | | | | | | | | | | | |
| | | | Years Ended
December 31, |
| | | | | | 2024 | | 2023 |
| | | | | | | | |
| Beginning balance | | | | | | $ | 72,328 | | | $ | 94,355 | |
| Additions | | | | | | 1,142,599 | | | 1,014,175 | |
| Revenue recognized | | | | | | (1,148,623) | | | (1,036,202) | |
| Ending balance | | | | | | $ | 66,304 | | | $ | 72,328 | |
Deferred revenue is equivalent to the total transaction price allocated to the performance obligations that are unsatisfied, or partially unsatisfied, as of the end of the period. The primary component of deferred revenue at the end of the period consists of performance obligations relating to the provision of maintenance services under current contracts and future renewal periods. Some of these obligations provide customers with material rights over a period that we estimate to be largely commensurate with the period of their expected use of the associated products. As a result, we expect to recognize these amounts as revenue over a period of up to 21 years, predominantly on a relative stand-alone selling price basis that reflects the cost of providing these services. Deferred revenue also includes performance obligations relating to product acceptance and installation. A significant amount of this deferred revenue is reflected as additions and revenue recognized in the same 12-month period, and a portion of this deferred revenue is expected to be recognized beyond this 12-month period mainly due to deployment schedules.
We do not disclose the value of the unsatisfied performance obligations for (i) contracts with an original expected length of one year or less and (ii) contracts for which we recognize revenue at the amount to which we have the right to invoice for services performed.
Disaggregated Revenue
We disaggregate revenue from contracts with customers into four revenue categories: product, installation, service and electricity (in thousands):
| | | | | | | | | | | | | | | | | | | | | | | | |
| | | | Years Ended December 31, |
| | | | | | 2024 | | 2023 | | 2022 |
| | | | | | | | | | |
| Revenue from contracts with customers: | | | | | | | | | | |
| Product revenue | | | | | | $ | 1,085,153 | | | $ | 975,245 | | | $ | 880,664 | |
| Installation revenue | | | | | | 122,318 | | | 92,796 | | | 92,120 | |
| Service revenue | | | | | | 213,542 | | | 183,065 | | | 150,954 | |
| Electricity revenue | | | | | | 20,381 | | | 17,676 | | | 11,608 | |
| Total revenue from contracts with customers | | | | | | 1,441,394 | | | 1,268,782 | | | 1,135,346 | |
| Revenue from contracts that contain leases: | | | | | | | | | | |
| Electricity revenue | | | | | | 32,462 | | | 64,688 | | | 63,779 | |
| Total revenue | | | | | | $ | 1,473,856 | | | $ | 1,333,470 | | | $ | 1,199,125 | |
4. Financial Instruments
Cash, Cash Equivalents, and Restricted Cash
The carrying values of cash, cash equivalents, and restricted cash approximate fair values and were as follows (in thousands):
| | | | | | | | | | | | | | |
| | December 31, |
| | | 2024 | | 2023 |
| As Held: | | | | |
| Cash | | $ | 201,613 | | | $ | 144,102 | |
| Money market funds | | 749,358 | | | 601,076 | |
| | $ | 950,971 | | | $ | 745,178 | |
| As Reported: | | | | |
| Cash and cash equivalents | | $ | 802,851 | | | $ | 664,593 | |
| Restricted cash | | 148,120 | | | 80,585 | |
| | $ | 950,971 | | | $ | 745,178 | |
Restricted cash consisted of the following (in thousands):
| | | | | | | | | | | | | | |
| | December 31, |
| | | 2024 | | 2023 |
| | | | |
| Restricted cash, current | | $ | 110,622 | | | $ | 46,821 | |
| Restricted cash, non-current | | 37,498 | | | 33,764 | |
| | $ | 148,120 | | | $ | 80,585 | |
Factoring Arrangements
We sell certain customer trade receivables on a non-recourse basis under factoring arrangements with certain financial institutions. These transactions are accounted for as sales and cash proceeds are included in cash used in operating activities. We derecognized $184.2 million, $291.4 million, and $283.3 million of accounts receivable during the years ended December 31, 2024, 2023 and 2022, respectively.
The cost of factoring such accounts receivable on our consolidated statements of operations for the years ended December 31, 2024, 2023 and 2022, was $4.0 million, $5.5 million, and $4.0 million, respectively. The cost of factoring is recorded in general and administrative expenses.
5. Fair Value
Our accounting policy for the fair value measurement of cash equivalents is described in Note 2 — Summary of Significant Accounting Policies.
Financial Assets and Liabilities Measured at Fair Value on a Recurring Basis
The tables below set forth, by level, our financial assets and liabilities that are accounted for at fair value for the respective periods. The table does not include assets and liabilities that are measured at historical cost or any basis other than fair value (in thousands):
| | | | | | | | | | | | | | | | | | | | | | | | | | |
| | Fair Value Measured at Reporting Date Using |
| December 31, 2024 | | Level 1 | | Level 2 | | Level 3 | | Total |
| | | | | | | | |
| Assets | | | | | | | | |
| Cash equivalents: | | | | | | | | |
| Money market funds | | $ | 749,358 | | | $ | — | | | $ | — | | | $ | 749,358 | |
| | | | | | | | |
| | | | | | | | |
| Liabilities | | | | | | | | |
| Derivatives: | | | | | | | | |
| Embedded EPP derivatives | | $ | — | | | $ | — | | | $ | 5,070 | | | $ | 5,070 | |
| | | | | | | | |
| | | | | | | | | | | | | | | | | | | | | | | | | | |
| | | Fair Value Measured at Reporting Date Using |
| December 31, 2023 | | Level 1 | | Level 2 | | Level 3 | | Total |
| | | | | | | | |
| Assets | | | | | | | | |
| Cash equivalents: | | | | | | | | |
| Money market funds | | $ | 601,076 | | | $ | — | | | $ | — | | | $ | 601,076 | |
| | | | | | | | |
| | | | | | | | |
| Liabilities | | | | | | | | |
| Derivatives: | | | | | | | | |
| Embedded EPP derivatives | | $ | — | | | $ | — | | | $ | 4,376 | | | $ | 4,376 | |
| | | | | | | | |
Money Market Funds — Money market funds are valued using quoted market prices for identical securities and are therefore classified as Level 1 financial assets.
Embedded Escalation Protection Plan Derivative Liability in Sales Contracts — We estimate the fair value of the embedded EPP derivatives in certain sales contracts using a Monte Carlo simulation model, which considers various potential electricity price curves over the sales contracts’ terms. We use historical grid prices and available forecasts of future electricity prices to estimate future electricity prices. We have classified these derivatives as Level 3 financial liability.
The changes in the Level 3 financial liabilities during the years ended December 31, 2024, 2023 and 2022, were as follows (in thousands):
| | | | | |
| Embedded EPP Derivative Liability |
| Liabilities at December 31, 2022 | $ | 5,895 | |
| EPP liability settlement | (3,160) | |
| Changes in fair value | 1,641 | |
| Liabilities at December 31, 2023 | 4,376 | |
| Changes in fair value | 694 | |
| Liabilities at December 31, 2024 | $ | 5,070 | |
To estimate the liabilities related to the EPP contracts, an option pricing method was implemented through a Monte Carlo simulation, which considers various potential electricity price forward curves over the sales contracts’ terms. We use historical grid prices and available forecasts to estimate future electricity prices. The grid pricing EPP guarantees that we provided in some of our sales arrangements represent an embedded derivative, with the initial value accounted for as a reduction in product revenue and any changes, reevaluated quarterly, in the fair market value of the derivative recorded in (Loss) gain on revaluation of embedded derivatives.
The unobservable inputs were simulated based on the available values for avoided cost and cost of electricity as calculated for December 31, 2024, and 2023, using an expected growth rate of 7% over the contracts’ life and volatility of 15%. The estimated growth rate and volatility were estimated based on the historical tariff changes for the period 2008 to 2024. Avoided cost is the transmission and distribution cost expressed in dollars per kilowatt hours avoided in the given year of the contract, calculated using the billing rates of the effective utility tariff applied during the year to the host account for which usage is offset by the generator. If the billing rates within the utility tariff change during the measurement period, the average amount of charge for each rate shall be weighted by the number of effective months for each amount.
The inputs listed above would have had a direct impact on the fair values of the EPP derivatives if they were adjusted. Generally, a decrease in electric grid prices would result in an increase in the estimated fair value of our EPP derivative liabilities.
For the years ended December 31, 2024, 2023 and 2022, we recorded the fair value of the embedded EPP derivatives with no material unrealized gains or losses in either of the three years ended December 31, 2024, 2023 and 2022, in our consolidated statements of operations. The fair value of these derivatives was $5.1 million and $4.4 million as of December 31, 2024, and 2023, respectively.
In June 2023, according to an EPP agreement with one of our customers, we paid $3.2 million, which was recorded as a reduction to our balance of embedded EPP derivative liability as of December 31, 2023.
Financial Assets and Liabilities Not Measured at Fair Value on a Recurring Basis
Debt Instruments — The term loans and convertible senior notes are based on rates currently offered for instruments with similar maturities and terms (Level 2). The following table presents the estimated fair values and carrying values of debt instruments (in thousands):
| | | | | | | | | | | | | | | | | | | | | | | | | | |
| | | December 31, 2024 | | December 31, 2023 |
| | | Net Carrying
Value | | Fair Value | | Net Carrying
Value | | Fair Value |
| | | | | | | | | |
| Debt instruments | | | | | | | | |
| Recourse: | | | | | | | | |
| 3% Green Convertible Senior Notes due June 2029 | | $ | 391,239 | | | $ | 532,789 | | | $ | — | | | $ | — | |
| 3% Green Convertible Senior Notes due June 2028 | | 619,111 | | | 872,344 | | | 615,205 | | | 673,613 | |
| 2.5% Green Convertible Senior Notes due August 2025 | | 114,385 | | | 163,875 | | | 226,801 | | | 260,820 | |
| Non-recourse: | | | | | | | | |
| 4.6% Term Loan due October 2026 | | 2,705 | | | 2,856 | | | 3,085 | | | 2,866 | |
| 4.6% Term Loan due April 2026 | | $ | 1,352 | | | $ | 1,482 | | | $ | 1,542 | | | $ | 1,479 | |
6. Balance Sheet Components
Inventories
The components of inventory consist of the following (in thousands):
| | | | | | | | | | | | | | |
| | December 31, |
| | | 2024 | | 2023 |
| | | | |
| Raw materials | | $ | 315,735 | | | $ | 270,414 | |
| Work-in-progress | | 79,601 | | | 50,632 | |
| Finished goods | | 149,320 | | | 181,469 | |
| | $ | 544,656 | | | $ | 502,515 | |
The inventory reserves were $15.9 million and $18.7 million as of December 31, 2024, and 2023, respectively.
Prepaid Expenses and Other Current Assets
Prepaid expenses and other current assets consist of the following (in thousands):
| | | | | | | | | | | | | | |
| | December 31, |
| | | 2024 | | 2023 |
| | | | |
| Prepaid hardware and software maintenance | | $ | 7,972 | | | $ | 5,202 | |
| Prepaid workers compensation | | 7,394 | | | 6,851 | |
| Prepaid managed services | | 5,230 | | | 5,636 | |
| Tax receivables | | 4,981 | | | 3,231 | |
| Receivables from employees | | 3,259 | | | 6,538 | |
| Interest receivable | | 1,316 | | | 1,697 | |
| Deferred expenses (Note 17) | | 1,215 | | | 2,257 | |
| Prepaid deferred commissions | | 1,123 | | | 1,178 | |
| Deposits made | | 348 | | | 1,702 | |
| Prepaid rent | | 21 | | | 1,232 | |
| Advance income tax provision | | — | | | 2,557 | |
| Other prepaid expenses and other current assets | | 13,344 | | | 13,067 | |
| | $ | 46,203 | | | $ | 51,148 | |
Property, Plant and Equipment, Net
Property, plant and equipment, net, consists of the following (in thousands):
| | | | | | | | | | | | | | |
| | December 31, |
| | | 2024 | | 2023 |
| | | | | |
| Vehicles, machinery and equipment | | $ | 200,004 | | | $ | 174,549 | |
| Energy Server systems | | 165,629 | | | 309,770 | |
| Leasehold improvements | | 122,413 | | | 94,646 | |
| Construction-in-progress | | 86,731 | | | 104,650 | |
| Buildings | | 53,221 | | | 49,477 | |
| Computers, software and hardware | | 33,910 | | | 28,901 | |
| Furniture and fixtures | | 10,943 | | | 12,541 | |
| | 672,851 | | | 774,534 | |
| Less: accumulated depreciation | | (269,376) | | | (281,182) | |
| | $ | 403,475 | | | $ | 493,352 | |
Depreciation expense related to property, plant and equipment was $53.0 million, $62.6 million and $61.6 million for the years ended December 31, 2024, 2023, and 2022, respectively.
Depreciation expense for property, plant and equipment under operating leases by PPA V (sold in August 2023) was $10.9 million for the year ended December 31, 2023. Depreciation expense for property, plant and equipment under operating leases by PPA V, PPA IV (sold in November 2022), and PPA IIIa (sold in June 2022) was $12.1 million for the year ended December 31, 2022. There was no depreciation expense for such assets for the year ended December 31, 2024.
PPA IIIa Repowering
In June 2022, we started a project (the “PPA IIIa Repowering”) to replace 9.8 megawatts of the Energy Server systems (the “old PPA IIIa Energy Servers”) at PPA IIIa Investment Company and Operating Company (“PPA IIIa”) with current
generation Energy Server systems (the “new PPA IIIa Energy Servers”). The replacement was completed in the fourth quarter of fiscal year 2022. See Note 10 — Portfolio Financings for additional information.
PPA IV Repowering
In November 2022, we started a project (the “PPA IV Repowering”) to replace 19.3 megawatts of the Energy Server systems (the “old PPA IV Energy Servers”) at PPA IV Investment Company and Operating Company (“PPA IV”) with current generation Energy Server systems (the “new PPA IV Energy Servers”). The replacement was completed in the first quarter of fiscal year 2024. See Note 10 — Portfolio Financings for additional information.
PPA V Repowering
In August 2023, we started a project (the “PPA V Repowering”) to replace 37.1 megawatts of the Energy Server systems (the “old PPA V Energy Servers”) at PPA V with current generation Energy Server systems (the “new PPA V Energy Servers”). The replacement was completed in the first quarter of fiscal year 2024. See Note 10 — Portfolio Financings for additional information.
Assets Buyout and Repowering
In fiscal years 2024 and 2023, we terminated certain of our legacy managed services agreements, previously recorded as failed sale and lease-back transactions upon inception and bought back the old Energy Server systems from the respective legacy financiers. Total cost of Energy Server systems bought back was $144.1 million and $3.3 million, respectively. See Note 8 — Leases for failed sale and lease-back transactions termination accounting.
Title for certain Energy Server systems bought back in December 2024, was simultaneously transferred to a Bloom-owned special purpose vehicle (the “SPV”, “New Project Company”), subsequently sold to the new financier. Upon sale, we entered into the EPC Agreement and the O&M Agreement with the New Project Company. See Note 10 — Portfolio Financings for additional information.
Other Long-Term Assets
Other long-term assets consist of the following (in thousands):
| | | | | | | | | | | | | | |
| | December 31, |
| | 2024 | | 2023 |
| | | | | |
| Deferred commissions | | $ | 13,372 | | | $ | 9,373 | |
| Deferred expenses (Note 17) | | 8,776 | | | 9,069 | |
| Long-term lease receivable | | 3,159 | | | 7,335 | |
| Deposits made | | 3,123 | | | 3,157 | |
| Deferred tax asset | | 1,888 | | | 1,385 | |
| Prepaid managed services | | 1,317 | | | 1,646 | |
| Prepaid and other long-term assets | | 14,501 | | | 18,243 | |
| | $ | 46,136 | | | $ | 50,208 | |
Accrued Warranty and Product Performance Liabilities
Accrued warranty and product performance liabilities consist of the following (in thousands):
| | | | | | | | | | | | | | |
| | December 31, |
| | | 2024 | | 2023 |
| | | | | |
| Product performance | | $ | 13,697 | | | $ | 18,066 | |
| Product warranty | | 2,862 | | | 1,260 | |
| | | | |
| | $ | 16,559 | | | $ | 19,326 | |
Changes in the product warranty and product performance liabilities were as follows (in thousands):
| | | | | |
| Balances at December 31, 2022 | $ | 17,332 | |
| Accrued warranty, net and product performance liabilities | 27,845 | |
| Product performance expenditures during the year | (25,851) | |
| Balances at December 31, 2023 | 19,326 | |
| Accrued warranty, net and product performance liabilities | 18,407 | |
| Product performance expenditures during the year | (21,174) | |
| Balances at December 31, 2024 | $ | 16,559 | |
Accrued Expenses and Other Current Liabilities
Accrued expenses and other current liabilities consist of the following (in thousands):
| | | | | | | | | | | | | | |
| | December 31, |
| | | 2024 | | 2023 |
| | | | | |
| Compensation and benefits | | $ | 67,682 | | | $ | 47,901 | |
| General invoice and purchase order accruals | | 43,652 | | | 36,266 | |
| Sales tax liabilities | | 10,215 | | | 17,412 | |
| | | | |
| Sales-related liabilities | | 4,714 | | | 5,121 | |
| Interest payable | | 3,927 | | | 3,823 | |
| Accrued installation | | 1,660 | | | 4,939 | |
| Accrued consulting expenses | | 1,254 | | | 3,244 | |
| Accrued legal expenses | | 1,198 | | | 1,359 | |
| Finance lease liability | | 981 | | | 1,072 | |
| Provision for income tax | | 637 | | | 3,374 | |
| Current portion of derivative liabilities | | 482 | | | — | |
| Accrued restructuring costs (Note 12) | | 341 | | | 3,793 | |
| Other | | 1,707 | | | 2,575 | |
| | $ | 138,450 | | | $ | 130,879 | |
Preferred Stock
As of December 31, 2024, and 2023, we had 20,000,000 shares of preferred stock authorized. 13,491,701 of these shares (the “Second Tranche Shares”) were designated as the Series B redeemable convertible preferred stock, par value $0.0001 per share (the “Series B RCPS”) and were converted to Class A common stock as of September 23, 2023, as a result of the SK ecoplant Second Tranche Closing. For additional information, please see Note 17 — SK ecoplant Strategic Investment.
The preferred stock had $0.0001 par value. There were no shares of preferred stock issued and outstanding as of December 31, 2024, and December 31, 2023.
Conversion of Class B Common Stock
On July 27, 2023, in accordance with our Restated Certificate of Incorporation, each share of our Class B common stock entitled to ten votes per share automatically converted into one share of our Class A common stock entitled to one vote per share.
7. Outstanding Loans and Security Agreements
The following is a summary of our debt as of December 31, 2024 (in thousands, except percentage data):
| | | | | | | | | | | | | | | | | | | | | | | | | | | | | | | | | | | | | | | | | | | | | | |
| | | Unpaid
Principal
Balance | | Net Carrying Value | | | | Interest
Rate | | Maturity Dates | | Entity |
| | | Current | | Long-
Term | | Total | |
| | | | | | | | | | | | | | | | |
| 3.0% Green Convertible Senior Notes due June 2029 | | $ | 402,500 | | | $ | — | | | $ | 391,239 | | | $ | 391,239 | | | | | 3.0% | | June 2029 | | Company |
| 3.0% Green Convertible Senior Notes due June 2028 | | 632,500 | | | — | | | 619,111 | | | 619,111 | | | | | 3.0% | | June 2028 | | Company |
| 2.5% Green Convertible Senior Notes due August 2025 | | 115,000 | | | 114,385 | | | — | | | 114,385 | | | | | 2.5% | | August 2025 | | Company |
| Total recourse debt | | 1,150,000 | | | 114,385 | | | 1,010,350 | | | 1,124,735 | | | | | | | | | |
| 4.6% Term Loan due October 2026 | | 2,705 | | | — | | | 2,705 | | | 2,705 | | | | | 4.6% | | October 2026 | | Korean JV |
| 4.6% Term Loan due April 2026 | | 1,352 | | | — | | | 1,352 | | | 1,352 | | | | | 4.6% | | April 2026 | | Korean JV |
| Total non-recourse debt | | 4,057 | | | — | | | 4,057 | | | 4,057 | | | | | | | | | |
| Total debt | | $ | 1,154,057 | | | $ | 114,385 | | | $ | 1,014,407 | | | $ | 1,128,792 | | | | | | | | | |
The following is a summary of our debt as of December 31, 2023 (in thousands, except percentage data):
| | | | | | | | | | | | | | | | | | | | | | | | | | | | | | | | | | | | | | | | | | | | |
| | | Unpaid
Principal
Balance | | Net Carrying Value | | Interest
Rate | | Maturity Dates | | Entity |
| | | Current | | Long-
Term | | Total | |
| | | | | | | | | | | | | | |
| 3.0% Green Convertible Senior Notes due June 2028 | | $ | 632,500 | | | $ | — | | | $ | 615,205 | | | $ | 615,205 | | | 3.0% | | June 2028 | | Company |
| 2.5% Green Convertible Senior Notes due August 2025 | | 230,000 | | | — | | | 226,801 | | | 226,801 | | | 2.5% | | August 2025 | | Company |
| Total recourse debt | | 862,500 | | | — | | | 842,006 | | | 842,006 | | | | | | | |
| 4.6% Term Loan due October 2026 | | 3,085 | | | — | | | 3,085 | | | 3,085 | | | 4.6% | | October 2026 | | Korean JV |
| 4.6% Term Loan due April 2026 | | 1,542 | | | — | | | 1,542 | | | 1,542 | | | 4.6% | | April 2026 | | Korean JV |
| Total non-recourse debt | | 4,627 | | | — | | | 4,627 | | | 4,627 | | | | | | | |
| Total debt | | $ | 867,127 | | | $ | — | | | $ | 846,633 | | | $ | 846,633 | | | | | | | |
Recourse debt refers to debt that we have an obligation to pay. Non-recourse debt refers to debt that is recourse to only our subsidiary, Korean JV. The differences between the unpaid principal balances and the net carrying values apply to the deferred financing costs. We and all of our subsidiaries were in compliance with all financial covenants as of December 31, 2024, and December 31, 2023.
Recourse Debt Facilities
3% Green Convertible Senior Notes due June 2029
On May 29, 2024, we issued the 3% Green Notes due June 2029 in an aggregate principal amount of $402.5 million due on June 1, 2029, unless earlier repurchased, redeemed or converted, less an initial purchasers’ discount of $12.1 million and other issuance costs of $0.7 million (together, the “3% Green Notes due June 2029 Transaction Costs”), resulting in net proceeds of $389.7 million. The 3% Green Notes due June 2029 were issued pursuant to, and are governed by, an indenture, dated as of May 29, 2024, between us and U.S. Bank Trust Company, National Association, as Trustee (the “3% Green Notes due June 2029 Indenture”), in private placements to qualified institutional buyers pursuant to Rule 144A of the Securities Act of 1933, as amended (the “Securities Act”).
Pursuant to the purchase agreement among the Company and the representatives of the initial purchasers of the 3% Green Notes due June 2029, the Company granted the initial purchasers an option to purchase up to an additional $52.5 million
aggregate principal amount of the 3% Green Notes due June 2029 (the “3% Green Notes due June 2029 Greenshoe Option”). The 3% Green Notes due June 2029 issued on May 29, 2024, included $52.5 million aggregate principal amount pursuant to the full exercise by the initial purchasers of the 3% Green Notes due June 2029 Greenshoe Option.
The 3% Green Notes due June 2029 are senior, unsecured obligations accruing interest at a rate of 3% per annum, payable semi-annually in arrears on June 1 and December 1 of each year, beginning on December 1, 2024.
We may not redeem the 3% Green Notes due June 2029 prior to June 7, 2027, subject to a partial redemption limitation. We may elect to redeem, at face value, all or any portion of the 3% Green Notes due June 2029 at any time, and from time to time, on or after June 7, 2027, and on or before the twenty-first scheduled trading day immediately before the maturity date, provided the share price for our Class A common stock exceeds 130% of the conversion price at redemption.
Before March 1, 2029, the noteholders have the right to convert their 3% Green Notes due June 2029 only upon the occurrence of certain events, including satisfaction of a condition relating to the closing price of our common stock (the “3% Green Notes due June 2029 Closing Price Condition”) or the trading price of the 3% Green Notes due June 2029 (the “3% Green Notes due June 2029 Trading Price Condition”), a redemption event, or other specified corporate events. If the 3% Green Notes due June 2029 Closing Price Condition is met on at least 20 (whether or not consecutive) of the last 30 consecutive trading days in any calendar quarter, and only during such calendar quarter, the noteholders may convert their 3% Green Notes due June 2029 at any time during the immediately following quarter, commencing after the calendar quarter ending on September 30, 2024, subject to the partial redemption limitation. The 3% Green Notes due June 2029 Closing Price Condition was not met during the three months ended September 30, 2024, and accordingly, the noteholders could not convert their 3% Green Notes due June 2029 during the quarter ended December 31, 2024.
Subject to the 3% Green Notes due June 2029 Trading Price Condition, the noteholders may convert their 3% Green Notes due June 2029 during the five business days immediately after any five consecutive trading day period in which the trading price per $1,000 principal amount of the 3% Green Notes due June 2029, as determined following a request by a holder of the 3% Green Notes due June 2029, for each day of that period is less than 98% of the product of the closing price of our common stock and the then applicable conversion rate. From and after March 1, 2029, the noteholders may convert their 3% Green Notes due June 2029 at any time at their election until the close of business on the second scheduled trading day immediately before the maturity date. Should the noteholders elect to convert their 3% Green Notes due June 2029, we may elect to settle the conversion by paying or delivering, as applicable, cash, shares of our Class A common stock, $0.0001 par value per share, or a combination thereof, at our election.
The initial conversion rate is 47.9795 shares of Class A common stock per $1,000 principal amount of notes, which represents an initial conversion price of approximately $20.84 per share of Class A common stock. The conversion rate and conversion price are subject to customary adjustments upon the occurrence of certain events. Also, we may increase the conversion rate at any time if our Board of Directors determines it is in the best interests of the Company or to avoid or diminish income tax to holders of common stock. In addition, if certain corporate events that constitute a Make-Whole Fundamental Change, as defined below, occur, then the conversion rate applicable to the conversion of the 3% Green Notes due June 2029 will, in certain circumstances, increase by up to 15.5932 shares of Class A common stock per $1,000 principal amount of notes for a specified period of time. At December 31, 2024, the maximum number of shares into which the 3% Green Notes due June 2029 could have been potentially converted if the conversion features were triggered was 25,588,011 shares of Class A common stock.
According to the 3% Green Notes due June 2029 Indenture, a Make-Whole Fundamental Change means (i) a Fundamental Change, that includes certain change-of-control events relating to us, certain business combination transactions involving us and certain delisting events with respect to our Class A common stock, or (ii) the sending of a redemption notice with respect to the 3% Green Notes due June 2029.
The 3% Green Notes due June 2029 contain certain customary provisions relating to the occurrence of Events of Default, as defined in the 3% Green Notes due June 2029 Indenture. If an Event of Default involving bankruptcy, insolvency or reorganization events with respect to us occurs, then the principal amount of, and all accrued and unpaid interest on, all of the 3% Green Notes due June 2029 then outstanding will immediately become due and payable without any further action or notice by any person. However, notwithstanding the foregoing, we may elect, at our option, that the sole remedy for an Event of Default relating to certain failures by us to comply with certain reporting covenants in the 3% Green Notes due June 2029 Indenture consists exclusively of the right of the noteholders to receive special interest on the 3% Green Notes due June 2029 for up to 180 days at a specified rate per annum not exceeding 0.5% on the principal amount of the 3% Green Notes due June 2029.
The 3% Green Notes due June 2029 Transaction Costs were recorded as debt issuance costs and presented a reduction to the 3% Green Notes due June 2029 on our consolidated balance sheets and are amortized to interest expense at an effective interest rate of 3.8%.
Total interest expense recognized related to the 3% Green Notes due June 2029 for the year ended December 31, 2024, was $8.6 million, and was comprised of (i) contractual interest expense and (ii) amortization of the initial purchasers’ discount and other issuance costs of $7.1 million and $1.5 million, respectively. We have not recognized any special interest expense related to the 3% Green Notes due June 2029 to date. The amount of unamortized debt issuance costs as of December 31, 2024, was $11.3 million.
Although the 3% Green Notes due June 2029 contain embedded conversion features, we account for the 3% Green Notes due June 2029 in its entirety as a liability. As of December 31, 2024, the net carrying value of the 3% Green Notes due June 2029 was classified as a long-term liability in our consolidated balance sheets.
3% Green Convertible Senior Notes due June 2028
On May 16, 2023, we issued the 3% Green Convertible Senior Notes (the “3% Green Notes due June 2028”) in an aggregate principal amount of $632.5 million due on June 1, 2028, unless earlier repurchased, redeemed or converted, less an initial purchasers’ discount of $15.8 million and other issuance costs of $3.9 million (together, the “3% Green Notes due June 2028 Transaction Costs”), resulting in net proceeds of $612.8 million. The 3% Green Notes due June 2028 were issued pursuant to, and are governed by, an indenture, dated as of May 16, 2023, between us and U.S. Bank Trust Company, National Association, as Trustee (the “3% Green Notes due June 2028 Indenture”), in private placements to qualified institutional buyers pursuant to the Securities Act.
Pursuant to the purchase agreement among us and the representatives of the initial purchasers of the 3% Green Notes due June 2028, we granted the initial purchasers an option to purchase up to an additional $82.5 million aggregate principal amount of the 3% Green Notes due June 2028 (the “3% Green Notes due June 2028 Greenshoe Option”). The 3% Green Notes due June 2028 issued on May 16, 2023, included $82.5 million aggregate principal amount pursuant to the full exercise by the initial purchasers of the 3% Green Notes due June 2028 Greenshoe Option.
The 3% Green Notes due June 2028 are senior, unsecured obligations accruing interest at a rate of 3% per annum, payable semi-annually in arrears on June 1 and December 1 of each year, beginning on December 1, 2023.
We may not redeem the 3% Green Notes due June 2028 prior to June 5, 2026, subject to a partial redemption limitation. We may elect to redeem, at face value, all or any portion of the 3% Green Notes due June 2028 at any time, and from time to time, on or after June 5, 2026, and on or before the forty-sixth scheduled trading day immediately before the maturity date, provided the share price for our Class A common stock exceeds 130% of the conversion price at redemption.
Before March 1, 2028, the noteholders have the right to convert their 3% Green Notes due June 2028 only upon the occurrence of certain events, including satisfaction of a condition relating to the closing price of our common stock (the “3% Green Notes due June 2028 Closing Price Condition”) or the trading price of the 3% Green Notes due June 2028 (the “3% Green Notes due June 2028 Trading Price Condition”), a redemption event, or other specified corporate events. If the 3% Green Notes due June 2028 Closing Price Condition is met on at least 20 (whether or not consecutive) of the last 30 consecutive trading days in any calendar quarter, and only during such calendar quarter, the noteholders may convert their 3% Green Notes due June 2028 at any time during the immediately following quarter, commencing after the calendar quarter ending on September 30, 2023, subject to partial redemption limitation. The 3% Green Notes due June 2028 Closing Price Condition was not met during the three months ended September 30, 2024, and accordingly, the noteholders could not convert their 3% Green Notes due June 2028 during the quarter ended December 31, 2024.
Subject to the 3% Green Notes due June 2028 Trading Price Condition, the noteholders may convert their 3% Green Notes due June 2028 during the five business days immediately after any five consecutive trading day period in which the trading price per $1,000 principal amount of the 3% Green Notes, as determined following a request by a holder of the 3% Green Notes due June 2028, for each day of that period is less than 98% of the product of the closing price of our common stock and the then applicable conversion rate. From and after March 1, 2028, the noteholders may convert their 3% Green Notes due June 2028 at any time at their election until the close of business on the second scheduled trading day immediately before the maturity date. Should the noteholders elect to convert their 3% Green Notes due June 2028, we may elect to settle the conversion by paying or delivering, as applicable, cash, shares of our Class A common stock, $0.0001 par value per share, or a combination thereof, at our election.
The initial conversion rate is 53.0427 shares of Class A common stock per $1,000 principal amount of notes, which represents an initial conversion price of approximately $18.85 per share of Class A common stock. The conversion rate and conversion price are subject to customary adjustments upon the occurrence of certain events. Also, we may increase the conversion rate at any time if our Board of Directors determines it is in the best interests of the Company or to avoid or diminish income tax to holders of common stock. In addition, if certain corporate events that constitute a Make-Whole Fundamental Change, as defined below, occur, then the conversion rate applicable to the conversion of the 3% Green Notes due June 2028 may, in certain circumstances, be increased by up to 22.5430 shares of Class A common stock per $1,000 principal amount of notes for a specified period of time. On December 31, 2024, the maximum number of shares into which the 3% Green Notes due June 2028 could have been potentially converted if the conversion features were triggered was 47,807,955 shares of Class A common stock.
According to the 3% Green Notes due June 2028 Indenture, a Make-Whole Fundamental Change means (i) a Fundamental Change, that includes certain change-of-control events relating to us, certain business combination transactions involving us and certain delisting events with respect to our Class A common stock, or (ii) the sending of a redemption notice with respect to the 3% Green Notes due June 2028.
The 3% Green Notes due June 2028 contain certain customary provisions relating to the occurrence of Events of Default, as defined in the 3% Green Notes due June 2028 Indenture. If an Event of Default involving bankruptcy, insolvency or reorganization events with respect to us occurs, then the principal amount of, and all accrued and unpaid interest on, all of the 3% Green Notes due June 2028 then outstanding will immediately become due and payable without any further action or notice by any person. However, notwithstanding the foregoing, we may elect, at our option, that the sole remedy for an Event of Default relating to certain failures by us to comply with certain reporting covenants in the 3% Green Notes due June 2028 Indenture consists exclusively of the right of the noteholders to receive special interest on the 3% Green Notes due June 2028 for up to 180 days at a specified rate per annum not exceeding 0.50% on the principal amount of the 3% Green Notes due June 2028.
The 3% Green Notes due June 2028 Transaction Costs were recorded as debt issuance costs and presented a reduction to the 3% Green Notes due June 2028 on our consolidated balance sheets and are amortized to interest expense at an effective interest rate of 3.8%.
The total interest expense recognized related to the 3% Green Notes due June 2028 for the years ended December 31, 2024, and 2023, was $22.9 million and $14.4 million, respectively and was comprised of contractual interest expense of $19.0 million and $12.0 million and amortization of the initial purchasers’ discount and other issuance costs of $3.9 million and $2.4 million, respectively. We have not recognized any special interest expense related to the 3% Green Notes to date. The amount of unamortized debt issuance costs as of December 31, 2024, and 2023, was $13.4 million and $17.3 million.
Although the 3% Green Notes due June 2028 contain embedded conversion features, we account for the 3% Green Notes due June 2028 in its entirety as a liability. As of December 31, 2024, and 2023, the net carrying value of the 3% Green Notes due June 2028 was classified as a long-term liability in our consolidated balance sheets.
Capped Calls
On May 11, 2023, in connection with the pricing of the 3% Green Notes due June 2028, and on May 15, 2023, in connection with initial purchasers’ exercise of the 3% Green Notes due June 2028 Greenshoe Option, we entered into privately negotiated capped call transactions (the “Capped Calls”) with certain counterparties (the “Option Counterparties”). The Capped Calls cover, subject to customary anti-dilution adjustments substantially similar to those applicable to the 3% Green Notes due June 2028, the aggregate number of shares of our Class A common stock that initially underlie the 3% Green Notes due June 2028, and are expected generally to reduce potential dilution to holders of our common stock upon any conversion of the 3% Green Notes due June 2028 and at our election (subject to certain conditions), offset any cash payments we would be required to make in excess of the principal amount of converted 3% Green Notes due June 2028.
The Capped Calls expire on June 1, 2028, and are exercisable only at maturity, but may be early terminated in various circumstances, including if the 3% Green Notes due June 2028 are early converted or repurchased. The default settlement method for the Capped Calls is net share settlement. However, we may elect to settle the Capped Calls in cash.
The Capped Calls have an initial strike price of approximately $18.85 per share of Class A common stock, subject to certain adjustments. The strike price of $18.85 corresponds to the initial conversion price of the 3% Green Notes due June 2028. The number of shares underlying the Capped Calls is 33,549,508 shares of Class A common stock. The cap price of the
Capped Calls is initially $26.46 per share of Class A common stock, which represents a premium of 100% over the last reported sale price of our common stock on May 11, 2023.
The Capped Calls are freestanding financial instruments. We used a portion of the proceeds from the issuance of the 3% Green Notes due June 2028 to pay for the Capped Calls’ premium. As the Capped Calls meet certain accounting criteria, they are recorded in stockholders’ equity and are not accounted for as derivatives. The cost of $54.5 million incurred to purchase the Capped Calls was recorded as a reduction to additional paid-in capital on our consolidated balance sheets and will not be remeasured.
2.5% Green Convertible Senior Notes due August 2025
In August 2020, we issued the 2.5% Green Convertible Senior Notes due August 2025 (the “2.5% Green Notes”) in an aggregate principal amount of $230.0 million, unless earlier repurchased, redeemed or converted, less an initial purchaser’s discount of $6.9 million and other issuance costs of $3.0 million (together, the “2.5% Green Notes Transaction Costs”), resulting in net proceeds of $220.1 million. The 2.5% Green Notes were issued pursuant to, and are governed by, an indenture, dated as of August 11, 2020, between us and U.S. Bank National Association, as trustee (the “2.5% Green Notes Indenture”),
The 2.5% Green Notes are senior, unsecured obligations accruing interest at a rate of 2.5% per annum, payable semi-annually in arrears on February 15 and August 15 of each year, beginning on February 15, 2021.
We may elect to redeem, at face value, all or any portion of the 2.5% Green Notes at any time on or after August 21, 2023, and on or before the twenty-sixth trading day immediately before the maturity date, provided certain conditions are met. In December 2024, the optional redemption feature of the 2.5% Green Notes was satisfied as the last reported sale price of the Company’s common stock exceeded 130% of the conversion price on each of at least 20 trading days (whether or not consecutive) during the 30 consecutive trading day period. However, we did not issue a notice of redemption as of December 31, 2024.
Before May 15, 2025, the noteholders have the right to convert their 2.5% Green Notes only upon the occurrence of certain events, including satisfaction of a condition relating to the closing price of our common stock (the “2.5% Green Notes Closing Price Condition”). If the 2.5% Green Notes Closing Price Condition is met on at least 20 of the last 30 consecutive trading days in any quarter, the noteholders may convert their 2.5% Green Notes at any time during the immediately following quarter. The 2.5% Green Notes Closing Price Condition was not met during the three months ended September 30, 2024, and accordingly, the noteholders could not convert their 2.5% Green Notes during the quarter ended December 31, 2024. From and after May 15, 2025, the noteholders may convert their 2.5% Green Notes at any time at their election until the close of business on the second trading day immediately before the maturity date. Should the noteholders elect to convert their 2.5% Green Notes, we may elect to settle the conversion by paying or delivering, as applicable, cash, shares of our Class A common stock or a combination thereof.
The initial conversion rate is 61.6808 shares of Class A common stock per $1,000 principal amount of notes, which represents an initial conversion price of approximately $16.21 per share of Class A common stock. The conversion rate and conversion price are subject to customary adjustments upon the occurrence of certain events. In addition, if certain corporate events that constitute a “Make-Whole Fundamental Change”, as defined in the 2.5% Green Notes Indenture, occur, the conversion rate applicable to the conversion of the 2.5% Green Notes may, in certain circumstances, be increased by up to 15.4202 shares of Class A common stock per $1,000 principal amount of notes for a specified period of time.
On May 29, 2024, we used approximately $141.8 million of the net proceeds from the 3% Green Notes due June 2029 offering to repurchase $115.0 million of the outstanding principal amount of our 2.5% Green Notes in privately negotiated transactions. Half of the original principal balance, $115.0 million of the 2.5% Green Notes, was called and repurchased at 122.6% during the second quarter of fiscal year 2024. The 22.6% premium of $26.0 million and unpaid accrued interest of $0.8 million related to the repurchased amount were included in the final payment to the noteholders. As a result of the partial repurchase of the 2.5% Green Notes, we recognized a loss on extinguishment of debt of $27.2 million.
On December 31, 2024, and 2023, the maximum number of shares into which the 2.5% Green Notes could have been potentially converted if the conversion features were triggered was 8,866,615 and 17,733,230 shares of Class A common stock, respectively.
The 2.5% Green Notes Transaction Costs were recorded as debt issuance costs and presented a reduction to the 2.5% Green Notes on our consolidated balance sheets and were amortized to interest expense at an effective interest rate of 3.5% before the partial repurchase. The effective interest rate of the 2.5% Green Notes after the partial repurchase was 3.3%.
The total interest expense recognized related to the 2.5% Green Notes for the years ended December 31, 2024, 2023, and 2022, was $5.5 million, $7.7 million, and $7.7 million, respectively, and was comprised of contractual interest expense of $4.1 million, $5.7 million, and $5.7 million and amortization of issuance costs of $1.4 million, $2.0 million, and $2.0 million, respectively. We have not recognized any special interest expense related to the 2.5% Green Notes to date. The amount of unamortized debt issuance costs as of December 31, 2024, and 2023, was $0.6 million and $3.2 million, respectively.
Although the 2.5% Green Notes contain embedded conversion features, we account for the 2.5% Green Notes in its entirety as a liability. As of December 31, 2024, and 2023, the net carrying value of the 2.5% Green Notes was classified as a short-term liability and as a long-term liability in our consolidated balance sheets, respectively.
Non-recourse Debt Facilities
4.6% Term Loans due April 2026 and October 2026
On April 11, 2023, and October 5, 2023, Korean JV entered into three-year $1.5 million and three-year $3.1 million credit agreements with SK ecoplant, respectively, to help fund its working capital. Both loans bear a fixed interest rate of 4.6% payable upon maturity along with the principal. Neither loan requires us to maintain a debt service reserve.
Repayment Schedule and Interest Expense
The following table presents details of our outstanding loan principal repayment schedule as of December 31, 2024 (in thousands):
| | | | | |
| 2025 | $ | 115,000 | |
| 2026 | 4,057 | |
| 2027 | — | |
| 2028 | 632,500 | |
| 2029 | 402,500 | |
| Thereafter | — | |
| $ | 1,154,057 | |
Interest expense of $62.6 million, $108.3 million, and $53.5 million for the years ended December 31, 2024, 2023 and 2022, respectively, was recorded in interest expense on the consolidated statements of operations. Interest expense for the year ended December 31, 2023, included $52.8 million as a result of the SK ecoplant Second Tranche Closing. For additional information, please see Note 17 — SK ecoplant Strategic Investment.
8. Leases
Facilities, Energy Server Systems, and Vehicles
We lease most of our facilities, the Energy Server systems, and vehicles under operating and finance leases that expire at various dates through November 2037. We lease various manufacturing facilities in California and Delaware. We lease additional office space as field offices in the U.S. and around the world including in India, Germany, Ireland, Japan, the Republic of Korea, Taiwan, China, and Singapore.
Some of the lease arrangements have free rent periods or escalating rent payment provisions. We recognize lease cost under such arrangements on a straight-line basis over the life of the leases. For the years ended December 31, 2024, 2023 and 2022, rent expenses for all occupied facilities were $22.4 million, $23.0 million and $21.4 million, respectively.
At inception of the contract, we assess whether a contract is a lease based on whether the contract conveys the right to control the use of an identified asset for a period of time in exchange for consideration. Lease classification, measurement, and recognition are determined at lease commencement, which is the date the underlying asset is available for use by us. The accounting classification of a lease is based on whether the arrangement is effectively a financed purchase of the underlying asset (financing lease) or not (operating lease). Our operating leases are comprised primarily of leases for facilities, the Energy Server systems, office buildings, and vehicles, and our financing leases are comprised primarily of vehicles.
Our leases have lease terms ranging from less than 1 year to 15 years, some of which include options to extend the leases. The lease term is the non-cancelable period of the lease and includes options to extend the lease when it is reasonably certain that an option will be exercised.
Lease liabilities are measured at the lease commencement date as the present value of future lease payments. Lease right-of-use assets are measured as the lease liability plus unamortized initial direct costs and prepaid (accrued) lease payments less unamortized balance lease incentives received. In measuring the present value of the future lease payments, the discount rate for the lease is the rate implicit in the lease unless that rate cannot be readily determined. In that case, the lessee is required to use its IBR. In computing our lease liabilities, we use the IBR based on the information available on the commencement date using an estimate of company-specific rate in the U.S. on a collateralized basis and consistent with the lease term for each lease. The lease term is the non-cancelable period of the lease and includes options to extend or terminate the lease when it is reasonably certain that an option will be exercised.
Operating and financing lease right-of-use assets and lease liabilities as of December 31, 2024, and 2023, were as follows (in thousands):
| | | | | | | | | | | | | | |
| | Years Ended
December 31, |
| | 2024 | | 2023 |
| | | | |
| Operating Leases: | | | | |
Operating lease right-of-use assets, net 1, 2 | | $ | 122,489 | | | $ | 139,732 | |
| Current operating lease liabilities | | (19,642) | | | (20,245) | |
| Non-current operating lease liabilities | | (124,523) | | | (141,939) | |
| Total operating lease liabilities | | (144,165) | | | (162,184) | |
| | | | |
| Finance Leases: | | | | |
Finance lease right-of-use assets, net 2, 3, 4 | | 3,214 | | | 2,708 | |
Current finance lease liabilities 5 | | (981) | | | (1,072) | |
Non-current finance lease liabilities 6 | | (2,450) | | | (1,837) | |
| Total finance lease liabilities | | (3,431) | | | (2,909) | |
| Total lease liabilities | | $ | (147,596) | | | $ | (165,093) | |
1 These assets primarily include leases for facilities, the Energy Server systems, and vehicles.
2 Net of accumulated amortization.
3 These assets primarily include leases for vehicles.
4 Included in property, plant and equipment, net in the consolidated balance sheets.
5 Included in accrued expenses and other current liabilities in the consolidated balance sheets.
6 Included in other long-term liabilities in the consolidated balance sheets.
The components of our lease costs for the years ended December 31, 2024, 2023 and 2022, were as follows (in thousands):
| | | | | | | | | | | | | | | | | | | | | | | | |
| | | | Years Ended December 31, |
| | | | | | 2024 | | 2023 | | 2022 |
| | | | | | | | | | |
| Operating lease costs | | | | | | $ | 35,814 | | | $ | 33,190 | | | $ | 25,503 | |
| Financing lease costs: | | | | | | | | | | |
| Amortization of right-of-use assets | | | | | | 675 | | | 891 | | | 968 | |
| Interest on lease liabilities | | | | | | 263 | | | 273 | | | 220 | |
| Total financing lease costs | | | | | | 938 | | | 1,164 | | | 1,188 | |
| Short-term lease costs | | | | | | 98 | | | 517 | | | 974 | |
| Total lease costs | | | | | | $ | 36,850 | | | $ | 34,871 | | | $ | 27,665 | |
Weighted average remaining lease terms and discount rates for our leases as of December 31, 2024, and 2023, were as follows:
| | | | | | | | | | | | | | |
| | December 31, |
| | 2024 | | 2023 |
| | | | |
| Weighted average remaining lease term: | | | | |
| Operating leases | | 6.7 years | | 7.4 years |
| Finance leases | | 3.7 years | | 3.2 years |
| Weighted average discount rate: | | | | |
| Operating leases | | 10.6 | % | | 10.6 | % |
| Finance leases | | 9.2 | % | | 9.5 | % |
Future lease payments under lease agreements as of December 31, 2024, were as follows (in thousands):
| | | | | | | | | | | | | | |
| | Operating Leases | | Finance Leases |
| | | | |
| 2025 | | $ | 33,295 | | | $ | 1,255 | |
| 2026 | | 33,158 | | | 1,036 | |
| 2027 | | 32,675 | | | 875 | |
| 2028 | | 26,793 | | | 546 | |
| 2029 | | 20,056 | | | 317 | |
| Thereafter | | 59,268 | | | — | |
| Total minimum lease payments | | 205,245 | | | 4,029 | |
| Less: amounts representing interest or imputed interest | | (61,080) | | | (598) | |
| Present value of lease liabilities | | $ | 144,165 | | | $ | 3,431 | |
Managed Services Financing
Certain of our customers enter into Managed Services Financing to finance their lease of Bloom Energy Server systems. Customer arrangements under Managed Services Financing entered into after January 1, 2020, do not contain a lease under ASC 842 and are accounted for under ASC 606 as revenue arrangements.
Lease agreements under our Managed Services Financing include non-cancellable lease terms, during which terms the majority of our investment in the Energy Server systems under lease are typically recovered. We mitigate the remaining residual value risk of the Energy Server systems through provision of maintenance on the Energy Server systems during the lease term and through insurance which proceeds are payable in the event of theft, loss, damage, or destruction.
Our Managed Services Financing with financiers that result in failed sale-and-leaseback transactions are accounted for as financing transactions. Payments received from the financier are recognized as financing obligations in our consolidated balance sheets. Proceeds from the financiers in excess of fair value of the Energy Server systems under successful sale-and-leaseback transactions are also accounted for as financing obligations. These financing obligations are included in each agreement’s contract value and are recognized as short-term or long-term financing obligations based on the estimated payment dates. The lease agreements expire on various dates through 2034. For successful sale-and-leaseback transactions, we record operating lease right-of-use assets and operating lease liabilities and record operating lease expenses over the lease term.
We recognized $9.4 million, $28.7 million, and $20.4 million of product revenue, and $4.5 million, $8.4 million, and $11.3 million of installation revenue from successful sale-and-leaseback transactions for the years ended December 31, 2024, 2023, and 2022, respectively. The recognized operating lease expense from successful sale-and-leaseback transactions for the years ended December 31, 2024, 2023 and 2022, was $12.8 million, $9.7 million, and $5.6 million, respectively.
Operating lease right-of-use assets from successful sale-and-leaseback transactions as of December 31, 2024, and 2023, were $47.2 million and $47.6 million, respectively. Operating lease liability from successful sale-and-leaseback transactions as of December 31, 2024, and 2023, was $50.4 million and $50.1 million, including long-term operating lease liability of $42.1 million and $43.7 million, respectively. Financing obligations from successful sale-and-leaseback transactions as of December 31, 2024, and 2023, were $11.0 million and $10.9 million, including long-term financing obligations of $8.9 million and $9.3 million, respectively.
At December 31, 2024, future lease payments under the Managed Services Agreements financing obligations were as follows (in thousands):
| | | | | | | | | | |
| | Financing Obligations | | |
| | | | |
| 2025 | | $ | 29,571 | | | |
| 2026 | | 23,447 | | | |
| 2027 | | 17,576 | | | |
| 2028 | | 11,913 | | | |
| 2029 | | 7,267 | | | |
| Thereafter | | 19,647 | | | |
| Total minimum lease payments | | 109,421 | | | |
| Less: imputed interest | | (54,123) | | | |
| Present value of net minimum lease payments | | 55,298 | | | |
| Less: current financing obligations | | (11,702) | | | |
| Long-term financing obligations | | $ | 43,596 | | | |
The total financing obligations, as reflected in our consolidated balance sheets, were $255.8 million and $444.8 million as of December 31, 2024, and 2023, respectively. We expect the difference between these obligations and the principal obligations in the table above to be offset against the carrying value of the related Energy Server systems at the end of the lease and the remainder recognized as either a net gain or net loss at that point. For the years ended December 31, 2024, and 2023, we recognized a $17.4 million net gain and $0.4 million net loss on failed sale-and-leaseback transactions in other income (expense), net on our consolidated statements of operations, respectively.
9. Stock-Based Compensation and Employee Benefit Plans
Share-based grants are designed to reward employees for their long-term contributions to us and provide incentives for them to remain with us.
2012 Equity Incentive Plan
Our 2012 Equity Incentive Plan (the “2012 Plan”) was approved in August 2012. The 2012 Plan provided for the grant
of incentive stock options, non-statutory stock options, stock appreciation rights and RSUs, all of which may be granted to employees, including officers, and to non-employee directors and consultants except we may grant incentive stock options only to employees.
Grants under the 2012 Plan generally vest ratably over a four-year period from the vesting commencement date and expire ten years from the grant date. As of December 31, 2024, and 2023, stock options to purchase of 3,691,919 and 4,511,074 shares of Class A common stock were outstanding with a weighted average exercise price of $27.38 and $27.28 per share, respectively, and no shares were available for future grant. The 2012 Equity Incentive Plan has been canceled but continues to govern outstanding option grants under the 2012 Plan.
2018 Equity Incentive Plan
The 2018 Equity Incentive Plan (the “2018 Plan”) was approved in April 2018. The 2018 Plan became effective upon our initial public offering (“IPO”) and serves as the successor to the 2012 Plan. The 2018 Plan authorizes the award of stock options, restricted stock awards, stock appreciation rights, RSUs, PSUs and stock bonuses. The 2018 Plan provides for the grant of awards to employees, directors, consultants, independent contractors and advisors provided the consultants, independent contractors, directors and advisors render services not in connection with the offer and sale of securities in a capital-raising transaction. The exercise price of stock options is at least equal to the fair market value of Class A common stock on the date of grant. Grants under the 2018 Plan generally vest ratably over three or four years from the vesting commencement date and expire ten years from the grant date.
The 2018 Plan allows for an annual increase on January 1, of each of 2019 through 2028, by the lesser of (a) four percent (4%) of the number of Class A common stock and common stock equivalents (including options, RSUs, warrants and preferred stock on an as-converted basis) issued and outstanding on each December 31 immediately prior to the date of increase, and (b) such number of shares determined by the Board of Directors.
As of December 31, 2024, and 2023, stock options to purchase 3,740,902 and 2,736,550 shares of Class A common stock were outstanding, respectively, with a weighted average exercise price of $10.14 and $10.42 per share, respectively. As of December 31, 2024, and 2023, 12,896,465 and 9,887,706 RSUs and PSUs that may be settled for Class A common stock, which were granted pursuant to the 2018 Plan, respectively, were outstanding. As of December 31, 2024, and 2023, we had 35,263,475 and 32,877,906 shares reserved for issuance under the 2018 Plan, respectively.
Stock-Based Compensation Expense
The following table summarizes the components of stock-based compensation expense in the consolidated statements of operations (in thousands):
| | | | | | | | | | | | | | | | | | | | | | | | |
| | | | | Years Ended
December 31, |
| | | | | | | 2024 | | 2023 | | 2022 |
| | | | | | | | | | |
| Cost of revenue | | | | | | $ | 16,579 | | | $ | 17,504 | | | $ | 18,955 | |
| Research and development | | | | | | 22,150 | | | 27,620 | | | 33,956 | |
| Sales and marketing | | | | | | 11,224 | | | 16,415 | | | 18,651 | |
| General and administrative | | | | | | 33,042 | | | 25,556 | | | 42,404 | |
| | | | | | $ | 82,995 | | | $ | 87,095 | | | $ | 113,966 | |
During the years ended December 31, 2024, 2023 and 2022, stock-based compensation expense capitalized on inventory and deferred cost of goods sold was immaterial.
Stock Option and Stock Award Activity
Stock Options
The following table summarizes the stock option activity under our stock plans during the reporting period:
| | | | | | | | | | | | | | | | | | | | | | | | | | |
| | | Outstanding Options |
| | | Number of
Shares | | Weighted
Average
Exercise
Price | | Remaining
Contractual
Life (Years) | | Aggregate
Intrinsic
Value |
| | | | | | | | | (in thousands) |
| Balances at December 31, 2022 | | 8,748,309 | | | $ | 20.70 | | | 4.6 | | $ | 40,532 | |
| Exercised | | (525,031) | | | 6.76 | | | | | |
| Forfeited / Expired | | (975,654) | | | 26.58 | | | | | |
| Balances at December 31, 2023 | | 7,247,624 | | | 20.93 | | | 3.8 | | 19,446 | |
| Exercised | | (307,857) | | | 7.01 | | | | | |
| Granted | | 1,364,348 | | | 9.96 | | | | | |
| Forfeited / Expired | | (871,294) | | | 27.45 | | | | | |
| Balances at December 31, 2024 | | 7,432,821 | | | 18.72 | | | 4.1 | | 53,453 | |
| Vested and expected to vest at December 31, 2024 | | 7,143,140 | | | 19.09 | | | 3.9 | | 49,764 | |
| Exercisable at December 31, 2024 | | 6,093,473 | | | $ | 20.65 | | | 3.0 | | $ | 37,014 | |
During the years ended December 31, 2024, 2023 and 2022, we recognized $3.2 million, $0.4 million and $7.1 million of stock-based compensation costs for stock options, respectively.
During the year ended December 31, 2024, we granted 1,364,348 stock options, including 1,135,000 stock options granted to certain executives to purchase shares of common stock that contain certain performance-based vesting criteria related to corporate milestones (the “performance-based stock options”). The performance-based stock options were granted “at-the-money” and have a term of 10 years. The performance-based stock options vest based over a three-year or a four-year requisite service period. We did not grant options in the years ended December 31, 2023, and 2022.
We used the following weighted-average assumptions in applying the Black-Scholes valuation model for determination of the stock options valuation:
| | | | | | | | | | |
| Risk-free interest rate | | 3.7% - 4.4% | | |
| Expected term (years) | | 6 years | | |
| Expected dividend yield | | — | | |
| Expected volatility | | 95.3% - 97.1% | | |
During the years ended December 31, 2024, 2023 and 2022, the intrinsic value of stock options exercised was $2.1 million, $3.6 million and $3.8 million, respectively.
As of December 31, 2024, and 2023, we had unrecognized compensation costs related to unvested stock options of $7.2 million and $0.1 million, respectively. This cost is expected to be recognized over the remaining weighted-average period of 2.1 years and 0.3 years, respectively. Cash received from stock options exercised totaled $2.0 million, $3.6 million and $3.7 million and for the years ended December 31, 2024, 2023 and 2022, respectively.
Stock Awards
A summary of our stock awards activity and related information is as follows:
| | | | | | | | | | | | | | |
| | Number of
Awards
Outstanding | | Weighted
Average Grant
Date Fair
Value |
| | | | |
| Unvested Balance at December 31, 2022 | | 9,549,035 | | | $ | 19.99 | |
| Granted | | 6,369,823 | | | 17.33 | |
| Vested | | (4,160,416) | | | 19.55 | |
| Forfeited | | (1,869,101) | | | 21.12 | |
| Unvested Balance at December 31, 2023 | | 9,889,341 | | | $ | 18.25 | |
| Granted | | 8,574,481 | | | 15.66 | |
| Vested | | (3,067,129) | | | 19.61 | |
| Forfeited | | (1,350,228) | | | 18.60 | |
| Cancelled | | (1,150,000) | | | 17.44 | |
| Unvested Balance at December 31, 2024 | | 12,896,465 | | | $ | 16.29 | |
The estimated fair value of RSUs and PSUs is based on the fair value of our Class A common stock on the date of grant. For the years ended December 31, 2024, 2023 and 2022, we recognized $70.1 million, $71.2 million and $89.4 million of stock-based compensation costs for stock awards, respectively.
As of December 31, 2024, and 2023, we had $161.8 million and $113.5 million of unrecognized stock-based compensation cost related to unvested stock awards, expected to be recognized over a weighted average period of 2.2 years and 2.0 years, respectively.
Executive Awards
Fiscal Year 2024
On December 18, 2024, the Company’s board of directors cancelled 1,150,000 PSU awards from the equity package the Chief Executive Officer (the “CEO”) received on May 12, 2021 (the “2021 PSUs”), under the 2018 Plan. The 2021 PSUs were cancelled due to the lack of their retention value and the change in the Company’s strategic goals. Also, on December 18, 2024, the Company’s board of directors granted the CEO replacement awards that included (1) a front-loaded three-year equity award consisting of: (i) 1,500,000 PSU awards and (ii) 500,000 RSU awards (the “2025 Equity Package”), and (2) a one-time award of 600,000 PSU awards (the “One-Time Grant”, and together with the 2025 Equity Package, the “Replacement Awards”).
The 2025 Equity Package RSU awards have time-based vesting schedule of three years and started vesting on December 18, 2024. The performance criteria under the 2025 Equity Package PSU awards are equally weighted between product revenue growth and adjusted product gross margin. The CEO is eligible to receive up to 300% of the target PSUs under the 2025 Equity Package, which is intended to provide a meaningful retention incentive for the CEO over the next several years. The 2025 Equity Package PSUs have a three-year cliff performance vesting period.
The One-Time Grant consists of two awards: (i) a grant of 300,000 PSUs that fully vested on December 18, 2024, and (ii) a grant of 300,000 PSUs that will be earned and vest following the Compensation and Organizational Development Committee’s certification that the CEO has achieved specific, objective criteria tied to strategic priorities prior to December 31, 2027. The maximum amount of shares the CEO can earn under the One-Time Grant is 600,000 shares of our Class A common stock.
The cancellation of the 2021 PSUs accompanied by the concurrent grant of the Replacement Awards was accounted for as a modification of the terms of the cancelled award according to the ASC 718. On December 18, 2024, the Company determined the incremental compensation cost of $42.4 million measured as the excess of the fair value of the Replacement Awards over the fair value of the cancelled award immediately before the terms were modified. These compensation costs will be recognized over the requisite service period of the Replacement Awards. The total fair value of the Replacement Awards of $57.6 million measured at the date of a cancellation and replacement consisted of (1) the grant-date fair value of the original award for which the service has already been rendered and is expected to be rendered at that date, and (2) the incremental cost resulting from the cancellation and replacement. For the year ended December 31, 2024, we recognized $7.6 million of
compensation costs related to the Replacement Awards.
On March 1, 2024, the Company granted RSUs, PSUs, time-based and performance-based stock option awards to certain executive staff; on May 6, 2024, the Company granted RSUs and PSUs to new executive hires, including our new Chief Financial Officer; and on August 29, 2024, the Company granted additional performance-based stock option awards to our Chief Commercial Officer (collectively, the “2024 Executive Awards”), pursuant to the 2018 Plan.
The RSUs have time-based vesting schedules that range from two to four years, and started vesting on February 15, 2024 (May 15, 2024, for new hires).
The time-based stock options started vesting on February 15, 2024, and shall vest over three years. The PSUs have vesting schedules that range from one to three years. The performance-based stock options have vesting schedules that range from three to four years. Both the PSUs and the performance-based stock options have a threshold target for vesting of 50% of the number of awards, a target for 100% of earned awards and a maximum of 150% of granted awards earned, for each of the performance periods.
The PSUs and performance-based stock options will vest based on a combination of time and achievement against performance metrics targets assuming continued employment and service through each vesting date. Stock-based compensation costs associated with the 2024 Executive Awards are recognized over the service period as we evaluate the probability of the achievement of the performance conditions. As of December 31, 2024, the unamortized compensation expense for the RSUs, the PSUs, the time-based and the performance-based stock options per the 2024 Executive Awards and the Replacement Awards was $66.8 million.
Fiscal Year 2023
On February 15, 2023, and July 11, 2023, the Company granted RSU and PSU awards (the “2023 Executive Awards”) to certain executive staff pursuant to the 2018 Plan. The RSU awards have time-based vesting schedules, started vesting on February 15, 2023, and shall vest over a three-year period. The PSU awards which started vesting on February 15, 2023, have either a three-year or one-year cliff vesting period, and the PSU awards which started vesting on July 11, 2023, cliff vest on February 15, 2024. The PSU awards will vest based on a combination of time and achievement against performance metrics targets assuming continued employment and service through each vesting date. Stock-based compensation costs associated with the 2023 Executive Awards are recognized over the service period as we evaluate the probability of the achievement of the performance conditions. As of December 31, 2024, and 2023, the unamortized compensation expense for the 2023 Executive Awards was $1.8 million and $7.0 million, respectively.
Fiscal Year 2022
In 2022, the Company granted RSU and PSU awards (the “2022 Executive Awards”) to certain executive staff, including our CEO, pursuant to the 2018 Plan. The RSUs have time-based vesting schedules. The PSUs consist of three vesting tranches during 2023-2025 with an annual vesting schedule based on the attainment of performance conditions related to fiscal year 2022 and assuming continued employment and service through each vesting date. Stock-based compensation costs associated with the 2022 Executive Awards are recognized over the service period. As of December 31, 2024, and 2023, the unamortized compensation expense for the 2022 Executive Awards was $1.0 million and $6.2 million, respectively. Actual compensation expense is determined by the attained performance condition of the PSUs in fiscal year 2022.
Fiscal Year 2021
In 2021, the Company granted RSU and PSU awards (the “2021 Executive Awards”) to certain executive staff, other than our Chief Executive Officer, pursuant to the 2018 Plan. The RSUs have time-based vesting schedules. The PSUs consist of annual vesting tranches based on the attainment of performance conditions and assuming continued employment and service through each vesting date. Stock-based compensation costs associated with the 2021 Executive Awards are recognized over the service period as we evaluate the probability of the achievement of the performance conditions.
In 2021, the Company also granted RSU and PSU awards to our CEO pursuant to the 2018 Plan. The RSUs will vest in equal annual installments over five years from the grant date. A portion of the PSUs can be earned based on achieving certain financial performance goals and another portion can be earned based upon achieving certain progressive stock price hurdles. Any shares issued under the PSU awards will be subject to a two-year post-vest holding period in which the award holder will be restricted from selling any shares (net of shares settled for taxes).
Actual compensation expense is dependent on the performance of the PSUs that vest based upon a performance condition. We estimated the fair value of the PSUs that vest based on a market condition on the date of grant using a Monte
Carlo simulation with the following assumptions: (i) expected volatility of 71.2%, (ii) risk-free interest rate of 1.6%, and (iii) no expected dividend yield.
On December 18, 2024, the Company cancelled 1,150,000 PSU awards from the 2021 Executive Awards and replaced them with the 2025 Equity Package.
As of December 31, 2024, and 2023, the unamortized compensation expense for 2021 Executive Awards was $3.7 million, and $8.2 million, respectively.
The following table presents the stock activity and the total number of shares available for grant under our stock plans:
| | | | | | | | |
| | | Plan Shares Available
for Grant |
| | | |
| Balances at December 31, 2022 | | 28,340,641 | |
| Added to plan | | 8,948,255 | |
| Granted | | (6,290,060) | |
| Cancelled/Forfeited | | 2,774,990 | |
| Expired | | (895,920) | |
| Balances at December 31, 2023 | | 32,877,906 | |
| Added to plan | | 9,674,114 | |
| Granted | | (9,933,957) | |
| Cancelled/Forfeited | | 3,371,522 | |
| Expired | | (726,110) | |
| Balances at December 31, 2024 | | 35,263,475 | |
2018 Employee Stock Purchase Plan
In April 2018, we adopted the 2018 ESPP. The 2018 ESPP became effective upon our IPO in July 2018. The 2018 ESPP is intended to qualify under Section 423 of the Internal Revenue Code. The aggregate number of our shares that may be issued over the term of our ESPP is 33,333,333 Class A common stock. A total of 3,333,333 shares of our Class A common stock were initially reserved for issuance under the plan. The number of shares reserved for issuance under the 2018 ESPP will increase automatically on the 1st day of January of each of the first nine years following the first offering date by the number of shares equal to one percent (1%) of the total number of Class A common stock, Class B common stock (automatically converted to Class A common stock on July 27, 2023) and common stock equivalents (including options, RSUs, warrants and preferred stock on an as converted basis) issued and outstanding on the immediately preceding December 31 (rounded down to the nearest whole share); provided, that the Board of Directors or the Compensation Committee may in its sole discretion reduce the amount of the increase in any particular year.
The 2018 ESPP allows eligible employees to purchase shares, subject to purchase limits of 2,500 shares during each six-month period or $25,000 worth of stock for each calendar year, of our Class A common stock through payroll deductions at a price per share equal to 85% of the lesser of the fair market value of our Class A common stock (i) on the first trading day of the applicable offering date and (ii) the last trading day of each purchase date.
During the years ended December 31, 2024, 2023 and 2022, we recognized $5.9 million, $15.5 million and $16.2 million of stock-based compensation costs for the 2018 ESPP, respectively. We issued 1,049,955, 875,695 and 759,744 shares in the years ended December 31, 2024, 2023 and 2022, respectively. During the years ended December 31, 2024, 2023 and 2022, we added an additional 2,418,528, 2,239,563 and 12,055,792 shares, respectively. There were 16,573,157 and 15,204,584 shares available for issuance as of December 31, 2024, and 2023, respectively.
As of December 31, 2024, and 2023, we had $5.9 million and $8.8 million of unrecognized stock-based compensation costs, expected to be recognized over a weighted average period of 0.8 years and 0.8 years, respectively.
We used the following weighted-average assumptions in applying the Black-Scholes valuation model for determination of the 2018 ESPP share valuation:
| | | | | | | | | | | | | | | | |
| | Years Ended
December 31, |
| | 2024 | | 2023 | | |
| | | | | | |
| Risk-free interest rate | | 4.1% - 5.6% | | 4.9% - 5.6% | | |
| Expected term (years) | | 0.5 - 2.0 | | 0.5 - 2.0 | | |
| Expected dividend yield | | — | | — | | |
| Expected volatility | | 54.1% - 78.7% | | 54.1% - 74.1% | | |
10. Portfolio Financings
Overview
We have developed various financing options that enable customers’ use of the Energy Server systems through third-party ownership financing arrangements.
In the past, we and our third-party equity investors (together, the “Equity Investors”) contributed funds into a limited liability investment entity (the “Investment Company”) that owns and is parent to the Operating Company (together, the “PPA Entities”). The contributed funds were restricted for use by the Operating Company to the purchase of our Energy Server systems manufactured by us in our normal course of operations. All six PPA Entities established in the past utilized their entire available financing capacity and have completed the purchase of their Energy Server systems. Any debt incurred by the Operating Companies was non-recourse to us. Under these structures, each Investment Company was treated as a partnership for U.S. federal income tax purposes. Equity Investors received investment tax credits and accelerated tax depreciation benefits.
In June 2022, November 2022, and August 2023, we sold PPA IIIa, PPA IV, and PPA V, respectively, which were accounted as our consolidated VIEs, as a result of the repowering of the Energy Server systems. The other three PPA Entities — PPA II, PPA IIIb and PPA VI — are not considered VIEs (the Third-Party PPAs).
PPA IIIa Repowering of the Energy Server Systems
PPA IIIa was established in 2012 and we, through a special purpose subsidiary (the “Project Company”), had previously entered into certain agreements for the purpose of developing, financing, owning, operating, maintaining and managing a portfolio of 9.8 megawatts of the Energy Server systems.
On March 31, 2022, we entered into a Membership Interest Purchase Agreement (the “MIPA”) where we bought out the equity interest of the third-party investor, wherein the PPA IIIa became wholly owned by us (the “PPA IIIa Buyout”).
Following the PPA IIIa Buyout and prior to June 14, 2022, we repaid all outstanding debt of the Project Company of $30.6 million, and recognized loss on extinguishment of debt in an amount of $4.2 million, which includes the write-off of the debt discount related to warrants of $1.8 million and a make-whole payment of $2.4 million associated with the debt extinguishment.
On June 14, 2022, we sold our 100% interest in the Project Company to the financier through the MIPA. Simultaneously, we entered into an agreement with the Project Company to repower the old 9.8 megawatts of the old PPA IIIa Energy Servers by replacing them with the new PPA IIIa Energy Servers and providing related installation services, which were financed by the financier (the “EPC Agreement”). The plan was to remove the old PPA IIIa Energy Servers prior to installing the new PPA IIIa Energy Servers and return the old PPA IIIa Energy Servers to Bloom. We also amended and restated our O&M Agreement with the Project Company to cover all the new PPA IIIa Energy Servers and the old PPA IIIa Energy Servers prior to their repowering. The operations and maintenance fees under the O&M Agreement are paid on a fixed dollar per kilowatt basis.
Certain power purchase agreements within the PPA IIIa portfolio were classified as sales-type leases under ASC 840, while some were classified as operating leases. We elected the practical expedient package with the adoption of ASC 842, which allowed us to carry forward the lease classification upon adoption of ASC 842 on January 1, 2020. The leases were
modified prior to the sale of PPA IIIa to the financier. Such modified leases were reassessed and determined to not be leases under ASC 842 because customers have no control over the identified assets. Accordingly, on the date of modification, the customer financing receivables were derecognized and recognized as property, plant, and equipment (the “PPA IIIa PP&E”).
Due to our repurchase option on the old PPA IIIa Energy Servers, we concluded there was no transfer of control of the old PPA IIIa Energy Servers upon sale of the membership interest to the financier. Accordingly, we continued to recognize the old PPA IIIa Energy Servers, despite the legal ownership of such assets under the MIPA. Upon reclassification of the lease assets to property, plant and equipment, net, we assessed the recorded assets for impairment. The carrying amount of the PPA IIIa PP&E was determined to be not recoverable as the net undiscounted cash flows were less than the carrying amounts for PPA IIIa PP&E. Therefore, we recognized the asset impairment charge as electricity cost, consistent with depreciation expense classification for property, plant and equipment under leases.
The PPA IIIa Repowering was completed in the fourth quarter of fiscal year 2022. It resulted in the following summarized impacts on our consolidated statements of operations for the year ended December 31, 2024: (i) service revenue recognized of $2.3 million related to the O&M Agreements, (ii) immaterial amount of cost of installation revenue recognized.
The PPA IIIa Repowering resulted in the following summarized impacts on our consolidated statements of operations for the year ended December 31, 2023: (i) service revenue recognized of $3.5 million related to the O&M Agreements, (ii) installation revenue recognized of $0.4 million, and (iii) cost of installation revenue of $0.1 million. The PPA IIIa Repowering had the following impacts on our consolidated statements of operations for the year ended December 31, 2022: (i) product, installation and service revenue recognized of $49.8 million, $4.6 million, and $0.7 million, respectively, as a result of the sale of the new PPA IIIa Energy Servers; (ii) cost of electricity revenue of $45.0 million, including the impairment of the old PPA IIIa Energy Servers of $44.8 million and accelerated depreciation of $0.2 million prior to the completion of installation; (iii) cost of product and installation revenue of $21.8 million and $3.2 million, respectively, due to the sale of the new PPA IIIa Energy Servers; and (iv) $4.2 million of loss on extinguishment of debt.
Impacts on our consolidated statements of cash flows for the year ended December 31, 2022, are summarized as follows: net cash provided by financing activities decreased by $32.6 million due to the repayment of debt of $30.2 million and cash fee of $2.4 million associated with debt extinguishment. There were no impacts on cash flows from financing activities for the years ended December 31, 2024, and 2023.
PPA IV Repowering of the Energy Server Systems
PPA IV was established in 2014 and we, through the Project Company, had previously entered into certain agreements for the purpose of developing, financing, owning, operating, maintaining and managing a portfolio of 19.3 megawatts of the Energy Server systems.
On November 2, 2022, we entered into the MIPA where we bought out the equity interest of the third-party investor for $4.0 million, wherein the PPA IV became wholly owned by us (the “PPA IV Buyout”).
Following the PPA IV Buyout and prior to November 22, 2022, we repaid all outstanding debt of the Project Company of $70.9 million and recognized a loss on extinguishment of debt in an amount of $4.7 million, which includes the write-off of the debt discount of $0.6 million and a make-whole payment of $4.1 million associated with the debt extinguishment.
On November 22, 2022, we sold our 100% interest in the Project Company to the financier through the MIPA. Simultaneously, we entered into an agreement with the Project Company to repower the 19.3 megawatts of the old PPA IV Energy Servers by replacing them with the new PPA IV Energy Servers and providing related installation services, which were financed by the financier under the EPC Agreement. The old PPA IV Energy Servers were removed prior to installing the new PPA IV Energy Servers, whereby upon completion of installation the old PPA IV Energy Servers are returned to Bloom. We also amended and restated our O&M Agreement with the Project Company to cover all the new PPA IV Energy Servers and the old PPA IV Energy Servers prior to their repowering. The operations and maintenance fees under the O&M Agreement are paid on a fixed dollar per kilowatt basis.
The power purchase agreements within the PPA IV portfolio were classified as operating leases under ASC 840. We elected the practical expedient package with the adoption of ASC 842, which allowed us to carry forward the lease classification upon adoption of ASC 842 on January 1, 2020. The leases were modified prior to the sale of PPA IV to the financier. Such modified leases were reassessed and determined to not be leases under ASC 842 because customers have no control over the identified assets. Accordingly, on the date of modification, the operating leases were recognized as property, plant, and equipment (the “PPA IV PP&E”).
Due to our repurchase option on the old PPA IV Energy Servers, we concluded there was no transfer of control of the old PPA IV Energy Servers upon sale of the membership interest to the financier. Accordingly, we continued to recognize the old PPA IV Energy Servers, despite the legal ownership of such assets under the MIPA. We assessed the recorded assets for impairment. The carrying amount of the PPA IV PP&E was determined to be not recoverable as the net undiscounted cash flows are less than the carrying amounts for the PPA IV PP&E. Therefore, we recognized the asset impairment charge as electricity cost, consistent with depreciation expense classification for property, plant and equipment under leases.
The PPA IV Repowering was completed in the first quarter of fiscal year 2024. It resulted in the following summarized impacts on our consolidated statements of operations for the year ended December 31, 2024: (i) service revenue recognized of $2.3 million related to the O&M Agreements, (ii) product revenue recognized of $0.4 million, (iii) a decrease of cost of installation revenue of $0.2 million due to accrual reversal, and (iv) immaterial amount of installation revenue recognized due to revenue adjustment.
The PPA IV Repowering had the following impacts on our consolidated statements of operations for the year ended December 31, 2023: (i) installation revenue recognized of $10.0 million, (ii) service revenue recognized of $1.8 million related to the O&M Agreements, (iii) electricity revenue recognized of $6.1 million, (iv) product revenue decreased by $3.4 million due to the revenue adjustment, (v) cost of installation revenue of $6.6 million, and (vi) cost of product revenue of $0.1 million. The PPA IV Repowering had the following impacts on our consolidated statements of operations for the year ended December 31, 2022: (i) product and electricity revenue recognized of $102.3 million and $1.4 million, respectively, as a result of the sale of new Energy Servers; (ii) cost of electricity revenue of $64.3 million, including the impairment of old Energy Servers of $64.0 million and accelerated depreciation of $0.3 million prior to the completion of installation; (iii) cost of product revenue of $37.4 million, due to the sale of the new PPA IV Energy Servers; (iv) general and administrative expenses of $4.7 million primarily due to the impairment of prepaid insurance, and; (v) $4.7 million of loss on extinguishment of debt.
As a result of the equity interest buyout from the third-party investor, noncontrolling interest related to PPA IV of $23.7 million was eliminated and recorded as part of additional paid-in capital in our consolidated statements of stockholders’ equity (deficit).
Impacts on our consolidated statements of cash flows for the year ended December 31, 2022, are summarized as follows: net cash provided by financing activities decreased by $74.6 million due to the repayment of debt of $70.5 million and cash fee of $4.1 million associated with debt extinguishment. There were no impacts on cash flows from financing activities for the years ended December 31, 2024, and 2023.
PPA V Interest Buyout
On November 2, 2022, we acquired all of Constellation Energy Generation, LLC’s (“Constellation”) interest in PPA V (the “2022 PPA V Buyout”), as set forth in the Purchase and Sale Agreement. The aggregate purchase price of the transaction amounted to $8.0 million. After the acquisition our interest in PPA V increased from 10% to 70%.
On August 10, 2023, we acquired all of Solar TC Corp’s (“Intel”) interest in PPA V, as set forth in the Purchase and Sale Agreement (the “2023 PPA V Buyout”). The aggregate purchase price of the transaction amounted to $6.9 million. After the acquisition, PPA V became wholly owned by us.
The changes in our ownership interest in PPA V were accounted for as equity transactions in accordance with ASC 810, Consolidations (“ASC 810”). The carrying amounts of the noncontrolling interest were eliminated to reflect the changes in our ownership interest in PPA V, and the differences between the fair values of the considerations paid and the carrying amounts of the noncontrolling interest immediately prior to the 2022 PPA V Buyout on November 2, 2022, and immediately prior to the 2023 PPA V Buyout on August 10, 2023, of $48.1 million and $11.5 million, respectively, were recognized as additional paid-in capital in our consolidated statements of stockholders’ equity (deficit).
PPA V Repowering of the Energy Server Systems
PPA V was established in 2015 and we, through the Project Company, had previously entered into certain agreements for the purpose of developing, financing, owning, operating, maintaining and managing a portfolio of 37.1 megawatts of the Energy Server systems.
On August 24, 2023, we entered into the MIPA with the financier. Following the 2023 PPA V Buyout and prior to signing the MIPA, we repaid all of the outstanding debt of the Project Company of $119.0 million, including accrued interest of $0.5 million, and recognized a loss on extinguishment of debt in an amount of $1.4 million, represented in its entirety by the
derecognition of the related debt issuance costs. Refer to Note 7 — Outstanding Loans and Security Agreements, Non-recourse Debt Facilities section.
On August 25, 2023, we sold our 100% interest in the Project Company to the financier through the MIPA. Simultaneously, we entered into an agreement with the Project Company to repower the 37.1 megawatts of the old PPA V Energy Servers by replacing them with the new PPA V Energy Servers and to provide related installation services, which were financed by the financier (i.e., EPC Agreement). We also amended and restated our O&M Agreement with the Project Company to cover all the new PPA V Energy Servers and the old PPA V Energy Servers prior to their Repowering. The operations and maintenance fees under the O&M Agreement are paid on a fixed dollar per kilowatt basis.
Due to our repurchase option on the old PPA V Energy Servers, we concluded there was no transfer of control of the old PPA V Energy Servers upon sale of the membership interest to the financier. Accordingly, we continued to recognize the old PPA Energy Servers, despite the legal ownership of such assets having been transferred under the MIPA. We assessed the recorded assets for impairment. The carrying amount of the PPA V property, plant and equipment was determined to be not recoverable as the net undiscounted cash flows were less than the carrying amounts for PPA V property, plant and equipment. Therefore, we recognized the asset impairment charge as electricity cost, consistent with our depreciation expense classification for property, plant and equipment under leases.
The PPA V Repowering was complete in the first quarter of fiscal year 2024, and resulted in the following summarized impacts on our consolidated statements of operations for the year ended December 31, 2024: (i) service revenue recognized of $10.9 million related to the O&M Agreements, (ii) a decrease in cost of installation revenue of $0.8 million due to accrual reversal, (iii) product revenue decreased by $0.1 million due to the revenue adjustment, and (iv) immaterial amount of installation revenue recognized.
The PPA V Repowering had the following impacts on our consolidated statements of operations for the year ended December 31, 2023: (i) product revenue and installation revenue recognized of $176.2 million and $14.8 million, respectively, as a result of the sale of the new PPA V Energy Servers; (ii) electricity revenue recognized of $6.1 million related to the old PPA V Energy Servers and the release of deferred incentive revenue of $5.0 million, (iii) service revenue recognized of $2.6 million related to the O&M Agreements, (iv) cost of electricity revenue of $125.6 million, primarily including the impairment of the old PPA V Energy Servers of $123.7 million and accelerated depreciation of $0.4 million prior to the completion of installation; (v) cost of product revenue and cost of installation revenue of $75.3 million and $13.2 million, respectively, due to the sale of the new PPA V Energy Servers; (vi) general and administrative expenses of $6.4 million due to the impairment of non-recoverable production insurance; (vii) loss on extinguishment of debt of $1.4 million, (viii) interest expense of $0.3 million, and (ix) net loss attributable to noncontrolling interest of $1.0 million.
Impacts on our consolidated statements of cash flows for the year ended December 31, 2023, are summarized as follows: net cash provided by financing activities decreased by $109.3 million due to the repayment of debt related to PPA V of $118.5 million, and acquisition of all of interest in PPA V from Intel for $6.9 million net of distributions to Intel’s noncontrolling interest of $2.3 million. There were no impacts on cash flows from financing activities for the year ended December 31, 2024.
Assets Buyout and Repowering
In December 2024, we terminated certain of our legacy managed services agreements, previously recorded as failed sale and lease-back transactions upon inception. At termination, we bought back the old Energy Server systems from the respective legacy financiers (the “Buyout”). Upon the Buyout, title for these Energy Server systems was transferred to a Bloom-owned SPV. The SPV was a VIE of Bloom under ASC 810, and we consolidated it in our financial statements as we were the primary beneficiary and therefore had the power to direct activities which were most significant to this entity.
Simultaneously with the Buyout, we sold our 100% interest in the SPV to the new financier. Upon the sale, the SPV is no longer a part of our consolidated financial statements. We also entered into two agreements with the New Project Company: (1) the EPC Agreement to repower its fleet of the old Energy Server systems by replacing them with the new Energy Server systems and to provide related installation services, which was financed by the new financier (the “old Energy Server systems Repowering”); and (2) the O&M Agreement for the operations and maintenance of the new Energy Server systems with fees payable on a fixed dollar per kilowatt basis. The old Energy Server systems Repowering was scheduled for the first half of fiscal year 2025.
At the time of the Buyout, we assessed the old Energy Server systems for impairment. As a result, the carrying amount of the assets, recorded as property, plant and equipment on our consolidated balance sheet, was adjusted to $1.5 million, to represent the new remaining useful life. The asset impairment charge of $74.4 million, along with the amount of the Buyout of
$59.4 million, net of refund received from the financier, was offset against the gain from derecognition of financing obligations related to the terminated legacy managed services agreements of $146.2 million, and the net effect of $12.4 million was recorded in other income (expense), net on our consolidated statements of operations (see Note 8 — Leases).
Under the EPC Agreement, Bloom has a right to repurchase the old Energy Server systems. Due to such repurchase right, we concluded there was no transfer of control of the old Energy Server systems upon sale of the SPV to the new financier. Consequently, the sale of the old Energy Server systems was recorded as a sales-type lease. Accordingly, we derecognized the old Energy Server systems with the carrying amount of $1.5 million, as determined at the time of the Buyout, resulting in the selling profit from the sales-type lease of $3.6 million, which was recorded in other income (expense), net on our consolidated statements of operations. Instead of recording the respective lease receivable for the sales-type lease, we adjusted customer deposits received from the new financier as part of the EPC Agreement by $5.1 million. The sales-type lease will have a term ending upon completion of the old Energy Server systems Repowering, which is expected to be completed by the end of the second quarter of fiscal year 2025.
11. Related Party Transactions
On September 23, 2023, all 13,491,701 shares of the Series B RCPS (i.e., the Second Tranche Shares) were automatically converted into shares of our Class A common stock. For more information on the Second Tranche Closing, see Note 17 — SK ecoplant Strategic Investment. Consequently, SK ecoplant became a principal owner of an aggregate of 23,491,701 shares of our Class A common stock, including (i) 10,000,000 shares held with sole voting and investment power (as a result of the conversion of 10,000,000 shares of our Series A preferred stock, par value $0.0001 per share (the “Series A RCPS”) into 10,000,000 shares of our Class A common stock on November 8, 2022) and (ii) 13,491,701 shares held with shared voting and investing power with Econovation, LLC, 51.67% and 48.33% of which is owned by SK ecoplant and Blooming Green Energy Limited, respectively, as the assignee of the Second Tranche Shares. SK ecoplant is considered to be a related party as of September 23, 2023, and became entitled to nominate a member to the Board of Directors of Bloom. As of December 31, 2024, and 2023, SK ecoplant’s beneficial ownership of our Class A common stock represented 10.3% and 10.5% of our outstanding Class A common stock, respectively.
Our operations included the following related party transactions (in thousands):
| | | | | | | | | | | | | | | | | | | | | | | | |
| | | | | Years Ended
December 31, |
| | | | | | | 2024 | | 2023 | | 2022 |
| | | | | | | | | | |
Total revenue from related parties1 | | | | | | $ | 338,602 | | | $ | 487,240 | | | $ | 36,281 | |
Cost of product revenue2 | | | | | | 163 | | | 133 | | | — | |
General and administrative expenses3 | | | | | | 683 | | | 812 | | | — | |
Interest expense4 | | | | | | 203 | | | 84 | | | — | |
1 Total revenue from related parties for the years ended December 31, 2024, and 2023, includes revenue from (a) Korean JV and (b) SK ecoplant, which became a related party on September 23, 2023; however, we had transactions with SK ecoplant in prior periods (see Note 17 — SK ecoplant Strategic Investment). Revenue from related parties for the year ended December 31, 2022, relate to Korean JV in its entirety.
2 Includes expenses billed by SK ecoplant to Korean JV for headcount support, maintenance and other services.
3 Includes rent expenses per operating lease agreements entered between Korean JV and SK ecoplant and miscellaneous expenses billed by SK ecoplant to Korean JV.
4 Interest expense per two term loans entered into between Korean JV and SK ecoplant in fiscal year 2023 (see Note 7 — Outstanding Loans and Security Agreements).
Below is the summary of outstanding related party balances as of December 31, 2024, and 2023 (in thousands):
| | | | | | | | | | | | | | |
| | | December 31, |
| | 2024 | | 2023 |
| | | | | |
| Accounts receivable | | $ | 93,510 | | | $ | 262,031 | |
| Contract assets | | 800 | | | 6,872 | |
| Deferred cost of revenue, current | | — | | | 875 | |
| Prepaid expenses and other current assets (Note 17) | | 1,215 | | | 2,257 | |
Operating lease right-of-use assets1 | | 1,385 | | | 2,031 | |
| Other long-term assets (Note 17) | | 8,776 | | | 9,069 | |
| Accounts payable | | — | | | 77 | |
| Accrued warranty | | 1,205 | | | 1,260 | |
| Accrued expenses and other current liabilities | | 3,989 | | | 3,427 | |
| Deferred revenue and customer deposits, current | | 8,857 | | | 1,707 | |
Operating lease liabilities, current1 | | 442 | | | 440 | |
| Deferred revenue and customer deposits, long-term | | 3,335 | | | 6,709 | |
Operating lease liabilities, non-current1 | | 977 | | | 1,617 | |
Non-recourse debt2 (Note 7) | | 4,057 | | | 4,627 | |
1 Balances relate to operating leases entered between Korean JV and SK ecoplant.
2 Represents the total balance of two term loans entered between Korean JV and SK ecoplant in fiscal year 2023 (see Note 7 — Outstanding Loans and Security Agreements).
SK ecoplant Joint Venture and Strategic Partnership
In September 2019, we entered into a joint venture agreement with SK ecoplant to establish a light-assembly facility in the Republic of Korea for sales of certain portions of our Energy Server systems for the stationary utility and commercial and industrial market in the Republic of Korea. The joint venture is a VIE of Bloom and we consolidate it in our financial statements as we are the primary beneficiary and therefore have the power to direct activities which are most significant to the joint venture. For the years ended December 31, 2024, 2023 and 2022, we recognized related party revenue of $40.2 million, $37.3 million and $36.3 million, respectively. As of December 31, 2024, and 2023, we had outstanding accounts receivable from related parties of $2.5 million and $19.6 million, and non-recourse debt of $4.1 million and $4.6 million, respectively.
For additional information, see Note 17 — SK ecoplant Strategic Investment.
12. Restructuring
In September 2023, as a result of a review of current strategic priorities and resource allocation, we approved the restructuring plan (the “Restructuring Plan”) intended to realign our operational focus to support our multi-year growth, scale the business, and improve our cost structure and operating margins. The Restructuring Plan included (i) an optimization of our workforce across multiple functions, (ii) a relocation of our Repair & Overhaul (“R&O”) department from our manufacturing and warehousing facility in Newark, Delaware, to Mexico, and (iii) a closure of a manufacturing, warehousing, research and development (“R&D”) facility in Sunnyvale, California (i.e., facility closure). We began executing the Restructuring Plan in September 2023. The restructuring activities related to an optimization of our workforce and the facility closure were completed in fiscal year 2024. As of December 31, 2024, we have paused our plan to relocate our R&O department from our manufacturing and warehousing facility in Newark, Delaware, to Mexico.
The determination of when we accrue for involuntary termination benefits under restructuring plans depends on whether the termination benefits are provided under an ongoing benefit arrangement or under a one-time benefit arrangement. We account for one-time benefit arrangements in accordance with ASC 420, Exit or Disposal Cost Obligations (“ASC 420”) and account for ongoing benefit arrangements in accordance with ASC 712, Nonretirement Postemployment Benefits. For
involuntary termination benefits that are not provided under the terms of an ongoing benefit arrangement, the liability for the current fair value of expected future costs associated with a management-approved restructuring plan is recognized in the period in which the plan is communicated to the employees and the plan is not expected to change significantly. For ongoing benefit arrangements, inclusive of statutory requirements, employee termination costs are accrued when the existing situation or set of circumstances indicates that an obligation has been incurred, it is probable the benefits will be paid, and the amount can be reasonably estimated. The restructuring charges that have been incurred but not yet paid are recorded in accrued expenses and other current liabilities in our consolidated balance sheets, as they are expected to be settled within the next twelve months. Other costs associated with restructuring or exit activities may include contract termination costs, relocation costs and impairments of long-lived assets, which are expensed in accordance with ASC 420 and ASC 360, Property, Plant and Equipment.
According to the Restructuring Plan, 74 full-time employees and 48 contractors were separated from the Company in September 2023. An additional 71 full-time employees and 8 contractors separated from the Company in October 2023. Both full-time employees and contractors who were impacted by the restructuring were eligible to receive severance benefits.
On October 28, 2023, we communicated to an additional 61 full-time employees about their separation from the Company on January 2, 2024. These employees were sent on paid leave from the communication date through January 2, 2024, and were eligible for one-time employee termination benefits represented by the base salary they earned through the term of the leave.
For the year ended December 31, 2023, we incurred $9.3 million in restructuring costs recorded as severance expenses of $5.3 million, facility closure costs of $2.6 million, and other restructuring costs of $1.4 million. For the year ended December 31, 2024, the impact from the restructuring on our consolidated statements of operations was not material. We do not expect to incur material restructuring costs in subsequent quarters.
The following table presents our current liability as accrued for restructuring charges on our consolidated balance sheets. The table sets forth an analysis of the components of the restructuring charges (releases) and payments made against the accrual for the year ended December 31, 2024 (in thousands):
| | | | | | | | | | | | | | | | | | | | | | | | | | | | | | | | |
| | | Facility Closure | | Severance | | Other | | Total | | | | | | | |
| | | | | | | | | | | | | | | | |
| Balance at December 31, 2022 | | | $ | — | | | $ | — | | | $ | — | | | $ | — | | | | | | | | |
| Restructuring accruals | | | 2,611 | | | 5,306 | | | 1,249 | | | 9,166 | | | | | | | | |
| Payments | | | (34) | | | (4,842) | | | (497) | | | (5,373) | | | | | | | | |
| Balance at December 31, 2023 | | | 2,577 | | | 464 | | | 752 | | | 3,793 | | | | | | | | |
| Restructuring accruals (releases) | | | (35) | | | (385) | | | 472 | | | 52 | | | | | | | | |
| Payments | | | (2,542) | | | (79) | | | (883) | | | (3,504) | | | | | | | | |
| Balance at December 31, 2024 | | | $ | — | | | $ | — | | | $ | 341 | | | $ | 341 | | | | | | | | |
Facility closure costs (accrual releases) recorded in accordance with ASC 420 related to the closure of a manufacturing, warehousing, R&D facility in Sunnyvale, California, which was consolidated with our manufacturing facility in Fremont, California. As of December 31, 2023, $2.6 million of accrued facility closure costs were included in accrued expenses and other current liabilities in our consolidated balance sheets. There were no accrued facility closure costs as of December 31, 2024.
Severance expense (accrual releases) recorded in accordance with ASC 420 was a result of the separation of 145 full-time employees and 56 contractors associated with the Restructuring Plan. As of December 31, 2023, $0.5 million of accrued severance-related costs were included in accrued expenses and other current liabilities in our consolidated balance sheets. There were no accrued severance-related costs as of December 31, 2024.
Other costs are represented by performance bonuses, stock-based compensation expense, and other one-time employee termination benefits. As of December 31, 2024, and 2023, $0.3 million and $0.8 million of accrued other costs were included in accrued expenses and other current liabilities in our consolidated balance sheets, respectively.
The following table summarizes restructuring costs included in the accompanying consolidated statements of operations for the year ended December 31, 2023 (in thousands):
| | | | | | | | | | | | | |
| | | Year ended December 31, 2023 | | | | | | | |
| | | | | | | | | |
| Cost of product revenue | | $ | 2,976 | | | | | | | | |
| Cost of installation revenue | | 71 | | | | | | | | |
| Cost of service revenue | | 521 | | | | | | | | |
| Operating expenses: | | | | | | | | | |
| Research and development | | 1,609 | | | | | | | | |
| Sales and marketing | | 1,679 | | | | | | | | |
| General and administrative | | 2,467 | | | | | | | | |
| Total | | $ | 9,323 | | | | | | | | |
Restructuring costs included in our consolidated statements of operations for the year ended December 31, 2024, were immaterial.
13. Commitments and Contingencies
Commitments
Purchase Commitments with Suppliers and Contract Manufacturers — In order to reduce manufacturing lead-times for an adequate supply of inventories, we have agreements with our component suppliers and contract manufacturers to allow long lead-time component inventory procurement based on a rolling production forecast. We are contractually obligated to purchase long lead-time component inventory procured by certain manufacturers in accordance with our forecasts. We can generally give notice of order cancellation at least 90 days prior to the delivery date. However, we occasionally issue purchase orders to our component suppliers and third-party manufacturers that may not be cancellable. As of December 31, 2024, and 2023, we had no material open purchase orders with our component suppliers and third-party manufacturers that are expected to be realized within more than a 12-month period and are not cancellable.
Performance Guarantees — We guarantee the performance of the Energy Server systems at certain levels of output and efficiency to our customers over the contractual term. We monitor the need for any accruals arising from such guaranties, which are calculated as the difference between committed and actual power output or between natural gas consumption at warranted efficiency levels and actual consumption, multiplied by the contractual rates with the customer. Amounts payable under these guaranties are accrued in periods when the guaranties are not met and are recorded as service revenue in the consolidated statements of operations. We paid $21.2 million, $25.9 million and $12.1 million for the years ended December 31, 2024, 2023 and 2022, respectively, for such performance guarantees.
Letters of Credit — In 2019, pursuant to the PPA II repowering of the Energy Server systems, we agreed to indemnify our financing partner for losses that may be incurred in the event of certain regulatory, legal or legislative developments and established a cash-collateralized letter of credit facility for this purpose. As of December 31, 2024, and 2023, the balance of this cash-collateralized letter of credit was $9.5 million and $40.4 million, respectively.
In December 2024, we issued a $100.0 million letter of credit in favor of one of our major customers to guarantee the performance in accordance with the limited indemnity and cooperation agreement dated November 14, 2024, related to the supply of 100 MW of Energy Server systems. This letter of credit was released in the first quarter of fiscal year 2025.
In addition, we have other outstanding letters of credit issued to our customers and other counterparties in the U.S. and international locations under different performance and financial obligations. These letters of credit are collateralized through cash deposited in the controlled bank accounts with the issuing banks and are classified as restricted cash in our consolidated balance sheets. In September 2023, we canceled certain existing cash-collateralized letters of credit with an approximate value of $60.4 million issued to our customers in the Republic of Korea under long-term service agreements and replaced them with surety bonds on a non-collateralized basis. As of December 31, 2024, and 2023, the balances of the cash-collateralized letters of
credit issued to our customers and other counterparties in the U.S. and international locations other than PPA II were $131.2 million and $32.6 million, respectively.
Pledged Funds — In 2019, pursuant to the PPA IIIb repowering of the Energy Server systems, we established a restricted cash fund of $20.0 million, which had been pledged for a seven-year period to secure our operations and maintenance obligations with respect to the totality of our obligations to the financier. These funds will be released to us by the end of 2026 as long as the Energy Server systems continue to perform in compliance with our warranty obligations. As of December 31, 2024, and 2023, the balance of the restricted cash fund was $7.4 million and $7.6 million, respectively.
Contingencies
Indemnification Agreements — We enter into standard indemnification agreements with our customers and certain other business partners in the ordinary course of business. Our exposure under these agreements is unknown because it involves future claims that may be made against us but have not yet been made. To date, we have not paid any claims or been required to defend any action related to our indemnification obligations. However, we may record charges in the future as a result of these indemnification obligations.
Investment Tax Credits — Until the end of fiscal year 2024, our Energy Server systems running on a non-zero carbon fuel were eligible for federal ITCs that accrued to qualified property under Internal Revenue Code Section 48 when placed into service. However, the ITC program has operational criteria that extends for five years. If the energy property is disposed of or otherwise ceases to be qualified investment credit property before the close of the five-year recapture period is fulfilled, it could result in a partial reduction of the incentives.
Legal Matters — We are involved in various legal proceedings that arise in the ordinary course of business. We review all legal matters at least quarterly and assess whether an accrual for loss contingencies needs to be recorded. We record an accrual for loss contingencies when management believes that it is both probable that a liability has been incurred and the amount of the loss can be reasonably estimated. Legal matters are subject to uncertainties and are inherently unpredictable, so the actual liability in any such matter may be materially different from our estimates. If an unfavorable resolution were to occur, there exists the possibility of a material adverse impact on our consolidated financial condition, results of operations or cash flows for the period in which the resolution occurs or in future periods.
In March 2019, the Lincolnshire Police Pension Fund filed a class action complaint in the Superior Court of the State of California, County of Santa Clara, against us, certain members of our senior management, certain of our directors and the underwriters in our July 25, 2018 IPO alleging violations under Sections 11 and 15 of the Securities Act for alleged misleading statements or omissions in our Registration Statement on Form S-1 filed with the SEC in connection with the IPO. Two related class action cases were subsequently filed in the Santa Clara County Superior Court against the same defendants containing the same allegations.
On January 6, 2023, Bloom and the plaintiffs’ entered into an agreement in principle to settle the claims against Bloom, its executives and directors, and the IPO underwriters for a payment of $3.0 million, which was funded entirely by our insurers. On May 9, 2024, in light of the stipulated settlement, the court issued an order dismissing the lawsuit with prejudice.
In February 2022, Plansee SE/Global Tungsten & Powders Corp. (“Plansee/GTP”), a former supplier, filed a request for expedited arbitration with the World Intellectual Property Organization Arbitration and Mediation Center in Geneva Switzerland (“WIPO”), for various claims allegedly in relation to an Intellectual Property and Confidential Disclosure Agreement between Plansee/GTP and Bloom Energy Corporation. Plansee/GTP’s statement of claims includes allegations of infringement of U.S. Patent Nos. 8,802,328, 8,753,785 and 9,434,003. On April 3, 2022, we filed a complaint against Plansee/GTP in the Eastern District of Texas to address the dispute between Plansee/GTP and Bloom Energy Corporation in a proper forum before a U.S. Federal District Court. Our complaint seeks the correction of inventorship of U.S. Patent Nos. 8,802,328, 8,753,785 and 9,434,003 (the “Patents-in-Suit”); declaratory judgment of invalidity, unenforceability, and non-infringement of the Patents-in-Suit; and declaratory judgment of no misappropriation. Further, our complaint seeks to recover damages we have suffered in relation to Plansee/GTP’s business dealings that, as alleged, constitute acts of unfair competition, tortious interference contract, breach of contract, violations of the Racketeer Influenced and Corrupt Organizations (RICO) Act and violations of the Clayton Antitrust Act. On June 9, 2022, Plansee/GTP filed a motion to dismiss the complaint filed in the Eastern District of Texas and compel arbitration (or alternatively to stay). We filed our opposition on June 30, 2022, Plansee/GTP filed its reply on July 14, 2022, and we filed our sur-reply on July 22, 2022. On February 9, 2023, Magistrate Judge Payne issued a report and recommendation to stay the district court action pending an arbitrability determination by the arbitrator for each claim.
On February 23, 2023, we filed an amended complaint adding additional causes of action and filed objections to the Magistrate’s report and recommendation. On April 26, 2023, Judge Gilstrap overruled our objections to the Magistrate’s report and recommendation and stayed the district court action pending arbitrability determinations by the arbitrator in the WIPO proceeding. The arbitration had been held in abeyance awaiting the decision of the Eastern District of Texas. A hearing by the arbitrator in WIPO on arbitrability took place on June 27, 2023. On October 2, 2023, the arbitrator in the WIPO proceeding issued a ruling concluding that all the parties’ claims were arbitrable. On November 18, 2023, the arbitrator bifurcated the arbitration into a first phase that will focus on Bloom’s claims directed to improper inventorship of the Patents-in-Suit and Bloom’s defective product claims. Briefing on the first phase took place throughout 2024 with a potential evidentiary hearing to be scheduled in 2025. We are unable to predict the ultimate outcome of the arbitration at this time.
14. Segment Information
ASC 280, Segment Reporting, (“ASC 280”) establishes standards for companies to report in their financial statement information about operating segments, products, services, geographic areas, and major customers. Based on the criteria established by ASC 280, our chief operating decision maker (“CODM”) has been identified as the Chief Executive Officer. The CODM reviews consolidated results when making decisions about allocating resources and assessing the performance of the Company as a whole and hence, we have only one reportable segment. We do not distinguish between markets or segments for the purpose of internal reporting.
Significant segment expenses that are provided to CODM on a regular basis and are included within reported measure of segment profit or loss are:
•cost of product revenue,
•cost of installation revenue,
•cost of service revenue,
•cost of electricity revenue,
•research and development expenses,
•sales and marketing expenses, and;
•general and administrative expenses.
Other segment items are represented by interest income, interest expense, other (expenses) income, net, loss (gain) on extinguishment of debt, (loss) gain on revaluation of embedded derivatives, and income tax provision.
Please refer to the consolidated statements of operations for the years ended December 31, 2024, 2023 and 2022, for significant segment expenses and other segment items.
The Company’s primary measure of segment profitability is non-GAAP gross profit margin. Non-GAAP gross profit margin is defined by the Company as non-GAAP gross profit divided by total revenue. Non-GAAP gross profit is the difference between total revenue and non-GAAP total cost of revenue, which represents the total cost of revenue adjusted by items that do not contribute directly to management’s evaluation of its operating results. These items include stock-based compensation, impairment charges, restructuring accruals (releases), and other adjustments. This presentation is consistent with how the Company’s CODM evaluates the results of operations and makes strategic decisions about the business. For these reasons, the Company believes that non-GAAP gross profit margin represents the most relevant measure of segment profit and loss.
For information on the Company’s geographic risk, please refer to Note 1 — Nature of Business, Liquidity and Basis of Presentation, Concentration of Risk.
15. Income Taxes
The components of loss before the provision for income taxes are as follows (in thousands):
| | | | | | | | | | | | | | | | | | | | | | | | |
| | | | | | | Years Ended
December 31, |
| | | | | | 2024 | | 2023 | | 2022 |
| | | | | | | | | | |
| United States | | | | | | $ | (29,969) | | | $ | (310,243) | | | $ | (320,107) | |
| Foreign | | | | | | 3,612 | | | 4,200 | | | 6,118 | |
| Total | | | | | | $ | (26,357) | | | $ | (306,043) | | | $ | (313,989) | |
The provision for income taxes consists of the following (in thousands):
| | | | | | | | | | | | | | | | | | | | | | | | |
| | | | | | Years Ended
December 31, |
| | | | | | 2024 | | 2023 | | 2022 |
| | | | | | | | | | |
| Current: | | | | | | | | | | |
| | | | | | | | | | |
| State | | | | | | $ | (13) | | | $ | 246 | | | $ | 374 | |
| Foreign | | | | | | 1,182 | | | 1,640 | | | 1,158 | |
| Total current | | | | | | 1,169 | | | 1,886 | | | 1,532 | |
| Deferred: | | | | | | | | | | |
| | | | | | | | | | |
| | | | | | | | | | |
| Foreign | | | | | | (323) | | | 8 | | | (435) | |
| Total deferred | | | | | | (323) | | | 8 | | | (435) | |
| Total provision for income taxes | | | | | | $ | 846 | | | $ | 1,894 | | | $ | 1,097 | |
A reconciliation of the U.S. federal statutory income tax rate to our effective tax rate is as follows (in thousands):
| | | | | | | | | | | | | | | | | | | | | | | | |
| | | | | | Years Ended
December 31, |
| | | | | | 2024 | | 2023 | | 2022 |
| | | | | | | | | | |
| Tax at federal statutory rate | | | | | | $ | (5,534) | | | $ | (64,270) | | | $ | (65,922) | |
| State taxes, net of federal effect | | | | | | (13) | | | 246 | | | 374 | |
| Impact of noncontrolling interest | | | | | | (425) | | | 1,222 | | | 2,872 | |
| | | | | | | | | | |
| Non-U.S. tax effect | | | | | | 392 | | | 1,067 | | | (387) | |
| Nondeductible expenses and losses | | | | | | 1,349 | | | 5,239 | | | 2,258 | |
| Stock-based compensation | | | | | | 9,479 | | | 3,222 | | | 7,019 | |
| Loss on debt extinguishment | | | | | | 5,458 | | | — | | | — | |
| U.S. tax on foreign earnings (GILTI) | | | | | | 428 | | | 86 | | | 2,525 | |
| (Gain) loss on SK Equity Transaction | | | | | | — | | | 11,811 | | | (3,932) | |
| | | | | | | | | | |
| Change in valuation allowance | | | | | | (10,288) | | | 43,271 | | | 56,290 | |
| Provision for income taxes | | | | | | $ | 846 | | | $ | 1,894 | | | $ | 1,097 | |
For the year ended December 31, 2024, the Company recognized a provision for income taxes of $0.8 million on a pre-tax loss of $26.4 million, for an effective tax rate of (3.2)%. For the year ended December 31, 2023, we recognized a provision for income taxes of $1.9 million on a pre-tax loss of $306.0 million, for an effective tax rate of (0.6)%. For the year ended December 31, 2022, we recognized a provision for income taxes of $1.1 million on a pre-tax loss of $314.0 million, for an
effective tax rate of (0.3)%. The effective tax rate for 2024, 2023 and 2022, is lower than the statutory federal tax rate primarily due to a full valuation allowance against U.S. deferred tax assets.
Significant components of our deferred tax assets and liabilities consist of the following (in thousands):
| | | | | | | | | | | | | | | | | | |
| | | | | | December 31, |
| | | | | | 2024 | | 2023 |
| | | | | | | | |
| Tax credits and net operating loss carryforwards | | | | | | $ | 604,681 | | | $ | 574,679 | |
| Lease liabilities | | | | | | 103,313 | | | 151,470 | |
| Depreciation and amortization | | | | | | 14,131 | | | 59,790 | |
| Deferred revenue | | | | | | 9,603 | | | 13,580 | |
| Accruals and reserves | | | | | | 29,509 | | | 36,096 | |
| Research and development expenditures capitalization | | | | | | 71,229 | | | 53,991 | |
| Stock-based compensation | | | | | | 18,808 | | | 19,698 | |
| Disallowed Interest expenses | | | | | | 27,873 | | | 29,581 | |
| | | | | | | | |
| Other items — deferred tax assets | | | | | | 2,544 | | | 1,695 | |
| Gross deferred tax assets | | | | | | 881,691 | | | 940,580 | |
| Valuation allowance | | | | | | (816,257) | | | (831,597) | |
| Net deferred tax assets | | | | | | 65,434 | | | 108,983 | |
| Managed services — deferred costs | | | | | | — | | | (16,826) | |
| Right-of-use assets and leased assets | | | | | | (60,043) | | | (88,391) | |
| Capitalized Commission | | | | | | (3,503) | | | (2,381) | |
| Gross deferred tax liabilities | | | | | | (63,546) | | | (107,598) | |
| Net deferred tax asset | | | | | | $ | 1,888 | | | $ | 1,385 | |
Income taxes are recorded using the asset and liability method. Deferred tax assets and liabilities are recognized for the future tax consequences attributable to differences between the financial statement carrying amounts of existing assets and liabilities and their respective tax bases and operating loss and tax credit carryforwards. Deferred tax assets and liabilities are measured using enacted tax rates expected to apply to taxable income (or loss) in the years in which those temporary differences are expected to be recovered or settled. The effect on deferred tax assets and liabilities of a change in tax rates is recognized in income in the period that includes the enactment date.
A valuation allowance is provided for the amount of deferred tax assets that, based on available evidence, is not more-likely-than-not to be realized. Management believes that, based on available evidence, both positive and negative, it is not more likely than not that the net U.S. deferred tax assets will be utilized. As a result, a full valuation allowance has been recorded.
The valuation allowance for deferred tax assets was $816.3 million and $831.6 million as of December 31, 2024, and 2023, respectively. The net change in the total valuation allowance for the years ended December 31, 2024, and 2023, was a decrease of $15.3 million and an increase of $73.4 million, respectively.
At December 31, 2024, we had federal and California net operating loss carryforwards of $2.2 billion and $1.5 billion, respectively, to reduce future taxable income. The expiration of federal and California net operating loss carryforwards is summarized as follows (in billions):
| | | | | | | | | | | | | | |
| | | Federal | | California |
| Expire in 2025 - 2029 | | $ | 0.2 | | | $ | 0.2 | |
| Expire in 2030 - 2034 | | 0.9 | | | 0.6 | |
| Expire beginning in 2035 | | 0.5 | | | 0.7 | |
| Carryforward indefinitely | | 0.6 | | | — | |
| Total | | $ | 2.2 | | | $ | 1.5 | |
At December 31, 2024, we also had other state net operating loss carryforwards of $403.9 million, that begin to expire in fiscal year 2025, and Japanese net operating loss carryforwards of $7.9 million, that will begin to expire in fiscal 2025. Korea had operating loss of $0.5 million, that will begin to expire in fiscal year 2039. In addition, at December 31, 2024, we had approximately $43.4 million of federal research credit, $6.6 million of federal investment tax credit, and $20.6 million of state research credit carryforwards.
The expiration of the federal and California credit carryforwards is summarized as follows (in millions):
| | | | | | | | | | | | | | |
| | Federal | | California |
| Expire in 2025 - 2029 | | $ | 5.3 | | | $ | — | |
| Expire in 2030 - 2034 | | 8.8 | | | — | |
| Expire beginning in 2035 | | 36.0 | | | — | |
| Carryforward indefinitely | | — | | | 20.6 | |
| Total | | $ | 50.1 | | | $ | 20.6 | |
We have not reflected deferred tax assets for the federal and state research credit carryforwards as the entire amount of the carryforwards represents unrecognized tax benefits.
Internal Revenue Code Section 382 (“Section 382”) limits the use of net operating loss and tax credit carryforwards in certain situations in which changes occur in our capital stock ownership. Any annual limitation may result in the expiration of net operating losses and credits before utilization. If we should have an ownership change, as defined by the tax law, utilization of the net operating loss and credit carryforwards could be significantly reduced. Based on our analysis, Section 382 limitations will not have a material impact on our net operating loss and credit carryforwards related to any ownership changes.
During the year ended December 31, 2024, the amount of uncertain tax positions an increase by $5.8 million. We have not recorded any uncertain tax liabilities associated with our tax positions.
A reconciliation of the beginning and ending amounts of unrecognized tax benefits were as follows (in thousands):
| | | | | | | | | | | | | | | | | | | | | | | | |
| | | | | | Years Ended
December 31, |
| | | | | | 2024 | | 2023 | | 2022 |
| | | | | | | | | | |
| Unrecognized tax benefits beginning balance | | | | | | $ | 58,157 | | | $ | 48,389 | | | $ | 42,010 | |
| Gross decrease for tax positions of prior year | | | | | | (145) | | | (152) | | | (55) | |
| Gross increase for tax positions of prior year | | | | | | — | | | 1,307 | | | — | |
| Gross increase for tax positions of current year | | | | | | 5,939 | | | 8,613 | | | 6,434 | |
| Unrecognized tax benefits end balance | | | | | | $ | 63,951 | | | $ | 58,157 | | | $ | 48,389 | |
If fully recognized in the future, there would be no impact to the effective tax rate, and $59.6 million would result in adjustments to the valuation allowance. We do not have any tax positions that are expected to significantly increase or decrease within the next 12 months.
Interest and penalties, to the extent there are any, would be included in income tax expense. There were no material interest or penalties accrued during or for the years ended December 31, 2024, and 2023.
The Company is subject to taxation in the U.S. and various state and foreign jurisdictions. All of the Company’s tax years will remain open for examination by federal and state authorities for three and four years, respectively, from the date of utilization of any net operating losses and tax credits. There are currently no pending income tax examinations in the United States. The Company currently has an Indian income tax examination in progress. Although the timing of the resolution of an income tax examination is highly uncertain, we believe the final determination will not have a material impact to our financial position.
The Tax Cuts and Jobs Act of 2017 (“Tax Act”) includes a provision referred to as Global Intangible Low-Taxed Income (“GILTI”) which generally imposes a tax on foreign income in excess of a deemed return on tangible assets. Guidance issued by the Financial Accounting Standards Board in January 2018 allows companies to make an accounting policy election to either
(i) account for GILTI as a component of tax expense in the period in which the tax is incurred (“period cost method”), or (ii) account for GILTI in the measurement of deferred taxes (“deferred method”). We elected to account for the tax effects of this provision using the period cost method.
On August 16, 2022, the U.S. government enacted the IRA. The IRA establishes a new corporate alternative minimum tax based on financial statement income adjusted for certain items. The new minimum tax is effective for tax years beginning after December 31, 2022. The enactment of the IRA did not have a material impact on our tax expense for the years ended December 31, 2024, and 2023.
The accumulated undistributed foreign earnings of the Company as of December 31, 2024, have been subject to either the deemed one-time mandatory repatriation under the Tax Act or the current year income inclusion under GILTI regime for U.S. tax purposes. If we were to make actual distributions of some or all of these earnings, including earnings accumulated after December 31, 2017, we would generally incur no additional U.S. income tax but could incur U.S. state income tax and foreign withholding taxes. We have not accrued for these potential U.S. state income tax and foreign withholding taxes because we intend to indefinitely reinvest our foreign earnings in our international operations. However, any additional income tax associated with the distribution of these earnings would be immaterial.
16. Net Loss per Share Available to Common Stockholders
Net loss per share (basic) available to common stockholders is calculated by dividing net loss available to common stockholders by the weighted-average shares of common stock outstanding for the period. Net loss per share is the same for each class of common stock as they are entitled to the same liquidation and dividend rights. As a result, net loss per share (basic) and net loss per share (diluted) available to common stockholders are the same for both Class A and Class B common stock and are combined for presentation. On July 27, 2023, each share of our Class B common stock automatically converted into one share of our Class A common stock.
Net loss per share (diluted) is computed by using (i) the if-converted method when calculating the potentially dilutive effect, if any, of our convertible notes, and our redeemable convertible preferred stock, and (ii) the treasury stock method when calculating the potentially dilutive effect, if any, of our outstanding stock options and awards, and shares issued in conjunction with the Company’s ESPP. Net loss per share (diluted) available to common stockholders is then calculated by dividing the resulting adjusted net loss available to common stockholders by the combined weighted-average number of fully diluted common shares outstanding. There were no adjustments to net loss available to common stockholders (diluted). Equally, there were no adjustments to the weighted average number of outstanding shares of common stock (basic) in arriving at the weighted average number of outstanding shares (diluted), as such adjustments would have been antidilutive.
The following table sets forth the computation of our net loss per share available to common stockholders, basic and diluted (in thousands, except per share amounts):
| | | | | | | | | | | | | | | | | | | | | | | | |
| | | | Years Ended
December 31, |
| | | | | | | 2024 | | 2023 | | 2022 |
| Numerator: | | | | | | | | | | |
| Net loss available to common stockholders | | | | | | $ | (29,227) | | | $ | (302,116) | | | $ | (301,708) | |
| Denominator: | | | | | | | | | | |
| Weighted average shares of common stock, basic and diluted | | | | | | 227,365 | | | 212,681 | | | 185,907 | |
| Net loss per share available to common stockholders, basic and diluted | | | | | | $ | (0.13) | | | $ | (1.42) | | | $ | (1.62) | |
The following common stock equivalents (in thousands) were excluded from the computation of our net loss per share available to common stockholders, diluted, for the years presented as their inclusion would have been antidilutive (in thousands):
| | | | | | | | | | | | | | | | | | | | | | | | |
| | | | | Years Ended
December 31, |
| | | | | | | 2024 | | 2023 | | 2022 |
| | | | | | | | | | | |
| Convertible notes | | | | | | 55,020 | | | 35,327 | | | 14,187 | |
| Redeemable convertible preferred stock | | | | | | — | | | 9,795 | | | 8,521 | |
| Stock options and awards | | | | | | 6,325 | | | 4,011 | | | 5,683 | |
| | | | | | | | | | |
| | | | | | | | | | |
| | | | | | 61,345 | | | 49,133 | | | 28,391 | |
As of December 31, 2022, pursuant to the notice received from SK ecoplant of its intent to exercise its option to purchase additional shares of our Class A common stock, there were an additional 13,491,701 common stock equivalents that were excluded from the table above.
17. SK ecoplant Strategic Investment
In October 2021, we expanded our existing relationship with SK ecoplant. As part of this arrangement, we amended the previous Preferred Distribution Agreement (the “Restated PDA”) and the Joint Venture Agreement (the “JVA”) with SK ecoplant. The Restated PDA establishes SK ecoplant’s purchase commitments for our Energy Server systems for the three-year period on a take-or-pay basis as well as the basis for determining the prices at which the Energy Server systems and related components will be sold. The restated JVA increases the scope of assembly done by the joint venture facility in the Republic of Korea, which was established in 2019, for the procurement of local parts for our Energy Server systems and the assembly of certain portions of the Energy Server systems for the South Korean market. The joint venture is a VIE of Bloom and we consolidate it in our financial statements as we are the primary beneficiary and therefore have the power to direct activities which are most significant to the joint venture.
In October 2021, we also entered into a new Commercial Cooperation Agreement (the “CCA”) regarding initiatives pertaining to the hydrogen market and general market expansion for our products.
In September 23, 2023, we entered into the Amended and Restated Joint Venture Agreement (the “JVA”) and the Share Purchase Agreement (together, the “Amended JV Agreements”) with SK ecoplant which allowed SK ecoplant to increase its share of the voting rights in the Korean JV to 60% and increased the scope of assembly done by the joint venture facility in the Republic of Korea to full assembly. In January 2024, in accordance with the Amended JV Agreements, SK ecoplant made a capital contribution to Korean JV of $4.0 million.
Neither the Amended JV Agreements, nor the fact that SK ecoplant is considered to be our related party after the conversion of Series B RCPS into shares of our Class A common stock (for additional information, please see Note 11 — Related Party Transactions) changed our status as the primary beneficiary of the Korean JV. Therefore, we continue to consolidate this VIE in our financial statements as of December 31, 2024.
The following are the aggregate carrying values of the Korean JV’s assets and liabilities in our consolidated balance sheets, after eliminations of intercompany transactions and balances, as of December 31, 2024, and 2023 (in thousands):
| | | | | | | | | | | | | | |
| | December 31, |
| | 2024 | | 2023 |
| Assets | | | | |
| Current assets: | | | | |
| Cash and cash equivalents | | $ | 15,767 | | | $ | 3,003 | |
| Accounts receivable | | 2,515 | | | 19,567 | |
| Inventories | | 15,020 | | | 8,156 | |
| Prepaid expenses and other current assets | | 3,361 | | | 644 | |
| Total current assets | | 36,663 | | | 31,370 | |
| Property and equipment, net | | 1,796 | | | 2,519 | |
| Operating lease right-of-use assets | | 1,663 | | | 2,138 | |
| Other long-term assets | | 40 | | | 46 | |
| Total assets | | $ | 40,162 | | | $ | 36,073 | |
| Liabilities | | | | |
| Current liabilities: | | | | |
| Accounts payable | | $ | 7,693 | | | $ | 3,480 | |
| Accrued expenses and other current liabilities | | 2,154 | | | 2,347 | |
| | | | |
| Operating lease liabilities | | 442 | | | 440 | |
| Total current liabilities | | 10,289 | | | 6,267 | |
| Operating lease liabilities | | 977 | | | 1,617 | |
| Non-recourse debt | | 4,057 | | | 4,627 | |
| Total liabilities | | $ | 15,323 | | | $ | 12,511 | |
In September 2023, and December 2023, we entered into the First and the Second Amendments to the Restated PDA, respectively (the “First Amended Restated PDA” and the “Second Amended Restated PDA”, respectively). The First Amended Restated PDA amends the delivery terms. The Second Amended Restated PDA extends the initial term of the Restated PDA to December 31, 2027, and increases SK ecoplant’s purchase commitments for Bloom Energy products.
The Second Amended Restated PDA adds a new minimum purchase commitment of 250 megawatts and extends the timing of delivery of the remaining take-or- pay commitment under the original agreement. For the four-year period from January 1, 2024, to December 31, 2027, the total purchase commitment under the Second Amended Restated PDA is 500 megawatts, including a re-commitment of 250 megawatts from the Restated PDA and an additional 250 megawatts commitment.
Under the Second Amended Restated PDA SK ecoplant can fulfill its volume commitments with both our Energy Server systems and the Electrolyzer and this enables SK ecoplant to pursue opportunities globally outside of the Republic of Korea. The purchase commitments are expressed on a quarterly and annual basis. Should SK ecoplant fail to meet these purchase commitments, this would constitute an event of default and we would be entitled to damages equivalent to the lost profit.
The Initial Investment
In October 2021, we entered into the SPA pursuant to which we agreed to sell and issue to SK ecoplant 10,000,000 shares of Series A RCPS at a purchase price of $25.50 per share for an aggregate purchase price of $255.0 million. On December 29, 2021, the closing of the sale of the Series A RCPS was completed, and we issued 10,000,000 shares of the Series A RCPS (the “Initial Investment”).
In addition to the Initial Investment, the SPA provided SK ecoplant with an option to acquire a variable number of shares of Class A common stock (the “Option”). According to the SPA, SK ecoplant was entitled to exercise the Option through August 31, 2023, and the transaction must have been completed by November 30, 2023.
The sale of Series A RCPS was recorded at its fair value of $218.0 million on the date of issuance. Accordingly, we
allocated the excess of the cash proceeds received of $255.0 million plus the change in fair value of the Series A RCPS between October 23, 2021, and December 29, 2021, of $9.7 million, over the fair value of the Series A RCPS on December 29, 2021, and the fair value of the Option on October 23, 2021, to the PDA. This excess amounted to $37.0 million and was recorded in deferred revenue and customer deposits. Accordingly, during the year ended December 31, 2022, we recognized product revenue of $9.6 million in connection with this arrangement. No product revenue was recognized during the first quarter of fiscal year 2023 in connection with this arrangement. As of March 31, 2023, the unrecognized amount of deferred revenue and customer deposits of $24.6 million was reduced to zero as a result of the Second Tranche Closing (see details below in section “The Second Tranche Closing”).
Restated PDA, JVA, CCA and the SPA entered into with SK ecoplant concurrently were evaluated as a combined contract in accordance with ASC 606 and, to the extent applicable for separated components, under the guidance of Topic 815 Derivatives and Hedging and applicable subsections and ASC 480, Distinguishing Liabilities from Equity.
We concluded that the Option was a freestanding financial instrument that should have been separately recorded at fair value on the date the SPA was executed. We determined the fair value of the Option on that date to be $9.6 million.
On August 10, 2022, pursuant to the SPA, SK ecoplant notified us of its intent to exercise its option to purchase additional shares of our Class A common stock, pursuant to a Second Tranche Exercise Notice (as defined in the SPA) electing to purchase 13,491,701 shares at a purchase price of $23.05 per share. The Option was fairly valued as of the notice date at $4.2 million and gain on revaluation of $9.0 million was recorded under other income (expense), net in our consolidated statements of operations. Upon the receipt of the notice from SK ecoplant the Option met the criteria of equity award and was classified as a forward contract as part of additional paid-in capital.
On November 8, 2022, each share of the Series A RCPS was converted into 10,000,000 shares of Class A common stock.
On December 6, 2022, SK and Bloom mutually agreed to delay the Second Tranche Closing until March 31, 2023. The mutual agreement to modify the closing date did not change the accounting or valuation of the equity-classified forward recorded.
The Second Tranche Closing
On March 20, 2023, SK ecoplant entered into the Amended SPA with us, pursuant to which on March 23, 2023, we issued and sold to SK ecoplant 13,491,701 shares of non-voting Series B RCPS, par value $0.0001 per share, at a purchase price of $23.05 per share for cash proceeds of $311.0 million, excluding issuance cost of $0.5 million.
The Amended SPA triggered the modification of the equity-classified forward contract on Class A common stock, which resulted in the derecognition of the pre-modified fair value of the forward contract given to SK ecoplant of $76.2 million. We valued the forward contract as the difference between our Class A common stock trading price adjusted by a discount for lack of marketability (“DLOM”) as of the date of Amended SPA (the “Valuation Date”) and the present value of the strike price, with further reduction associated with the expected outcome of the Second Tranche Closing. The derecognition of the pre-modified fair value was recorded in additional paid-in capital in our consolidated balance sheets as of December 31, 2024, and 2023.
The Series B RCPS was accounted for as a stock award with liability and equity components. The liability component of the Series B RCPS was recognized at the redemption value of $311.0 million, less issuance costs of $0.5 million, and was recorded in current liabilities in our consolidated balance sheets as of March 31, 2023. The equity component of the Series B RCPS (the “Conversion Option”) was valued as a European-type call option under the guidance of ASC 718 by applying the Black-Scholes valuation model using inputs of the strike price, maturity, risk-free rate, and volatility. In addition, DLOM was applied to the Class A common stock price. The Conversion Option was recognized at its fair value of $16.1 million on March 20, 2023, and recorded in additional paid-in capital in our consolidated balance sheets as of December 31, 2024, and 2023.
On March 20, 2023, in connection with the Amended SPA we also entered into the Loan Agreement, pursuant to which we had the option to draw on a loan from SK ecoplant with a maximum principal amount of $311.0 million, a maturity of five years and an interest rate of 4.6%, should SK ecoplant have sent a redemption notice to us under the Amended SPA (i.e., loan commitment asset). We concluded that the loan commitment was a freestanding financial instrument as of the Valuation Date, as such its fair value was based on the difference between the present value of cash flows associated with a loan with a market-participant based interest rate (i.e., the rate for which the value of the hypothetical loan agreement equals the face value of the
Loan Agreement) and the cash flows associated with the loan committed to by SK ecoplant, and applied a redemption probability to the difference. The Series B RCPS redemption probability was obtained from a lattice model used to value the Series B preferred stock. As of September 30, 2023, the loan commitment asset from SK ecoplant was derecognized as a result of automatic conversion of all shares of the Series B RCPS into shares of our Class A common stock.
The Amended SPA and the Loan Agreement provided us with cash proceeds of $311.0 million and a loan commitment asset of $52.8 million from SK ecoplant for total consideration of $363.8 million. In return, SK ecoplant received consideration of $403.3 million, consisting of the release from the obligation to close on the original transaction fair valued at $76.2 million, the obligation from us to issue the Series B RCPS at redemption value of $311.0 million, and the option to convert the Series B RCPS to Class A common stock, which had an estimated fair value of $16.1 million. The excess consideration provided by us amounted to $39.5 million, which resulted in a reduction of our deferred revenue and customer deposits by $24.6 million related to the Initial Investment, as of March 31, 2023. The net excess consideration of $14.9 million was recognized as $8.2 million in prepaid expenses and other current assets and $6.7 million was classified as other long-term assets in our consolidated balance sheets as of March 31, 2023. The deferred expense is recognized as contra-revenue based on the remaining purchase commitments under the Second Amended Restated PDA. During the years ended December 31, 2024, and 2023, the deferred expense recognized as contra-revenue was $4.9 million and $3.5 million, respectively. As a result, as of December 31, 2024, and 2023, we recognized the net excess consideration of $10.0 million and $11.4 million, of which $1.2 million and $2.3 million were classified as prepaid expenses and other current assets and $8.8 million and $9.1 million was classified as other long-term assets, in our consolidated balance sheets, respectively.
On September 23, 2023, all 13,491,701 shares of the Series B RCPS were automatically converted into shares of our Class A common stock pursuant to the Certificate of Designation, dated as of March 20, 2023, setting forth the rights, preferences, privileges, and restrictions of the Series B RCPS, as amended by the Certificate of Amendment to the Certificate of Designation, dated as of April 18, 2023. As a result of the conversion: (i) the liability component of the Series B RCPS $310.5 million was reclassified to additional paid-in capital, less par value of the issued 13,491,701 shares of our Class A common stock, and (ii) the loan commitment asset was recorded at its fair value of $52.8 million, of which $5.3 million was classified as current and $47.5 million was classified as non-current in our consolidated balance sheets, and was expensed immediately and recognized in interest expense in our consolidated statements of operations for the year ended December 31, 2023.
Upon conversion of all Series B RCPS into shares of our Class A common stock, SK ecoplant is considered to be a related party. For additional information, please see Note 11 — Related Party Transactions.
18. Subsequent Events
There have been no material subsequent events that occurred during the period subsequent to the date of these consolidated financial statements that would require adjustment to our disclosure in the consolidated financial statements as presented.
ITEM 9 — CHANGES IN AND DISAGREEMENTS WITH ACCOUNTANTS ON ACCOUNTING AND FINANCIAL DISCLOSURE
None.
ITEM 9A — CONTROLS AND PROCEDURES
Evaluation of Disclosure Controls and Procedures
We maintain disclosure controls and procedures that are designed to ensure that information required to be disclosed in our reports that we file or submit under the Exchange Act, is recorded, processed, summarized and reported within the time periods specified in SEC rules and forms, and that such information is accumulated and communicated to our management,
including our Chief Executive Officer (our principal executive officer) and Chief Financial Officer (our principal financial and accounting officer) as appropriate, to allow for timely decisions regarding required disclosure.
Our management, with the participation of our Chief Executive Officer and Chief Financial Officer, has evaluated the effectiveness of our disclosure controls and procedures (as defined in Rules 13a-15(e) and 15d-15(e) under the Exchange Act), as of December 31, 2024. Based on such evaluation, our Chief Executive Officer and Chief Financial Officer have concluded that as of December 31, 2024, our disclosure controls and procedures were effective.
Inherent Limitations on Effectiveness of Internal Controls
Our management, including the Chief Executive Officer and Chief Financial Officer, does not expect that our disclosure controls or our internal controls over financial reporting will prevent or detect all errors and all fraud. A control system, no matter how well designed and operated, can provide only reasonable, not absolute, assurance that the control system’s objectives will be met. The design of a control system must reflect the fact that there are resource constraints, and the benefits of controls must be considered relative to their costs. Further, because of the inherent limitations in all control systems, no evaluation of controls can provide absolute assurance that misstatements due to error or fraud will not occur or that all control issues and instances of fraud, if any, have been detected. The design of any system of controls is based in part on certain assumptions about the likelihood of future events, and there can be no assurance that any design will succeed in achieving its stated goals under all potential future conditions. Projections of any evaluation of the effectiveness of controls to future periods are subject to risks. Over time, controls may become inadequate because of changes in business conditions or deterioration in the degree of compliance with policies or procedures.
Changes in Internal Control over Financial Reporting
During the three months ended December 31, 2024, there were no changes in our internal control over financial reporting, which were identified in connection with management’s evaluation required by paragraphs (d) of Rules 13a-15 and 15d-15 under the Exchange Act, that have materially affected, or are reasonably likely to materially affect, our internal control over financial reporting.
Management’s Report on Internal Control over Financial Reporting
Our management, with the participation of our Chief Executive Officer and Chief Financial Officer, is responsible for establishing and maintaining adequate internal control over financial reporting (as defined in Rules 13a-15(f) and 15d15(f) under the Exchange Act) to provide reasonable assurance regarding the reliability of our financial reporting and the preparation of consolidated financial statements for external reporting purposes in accordance with U.S. GAAP.
Management assessed the effectiveness of our internal control over financial reporting as of December 31, 2024, the end of our fiscal year. Management based its assessment on the framework established in the 2013 Internal Control — Integrated Framework issued by the Committee of Sponsoring Organizations of the Treadway Commission (“2013 COSO framework”). Management’s assessment included evaluation of elements such as the design and operating effectiveness of key financial reporting controls, process documentation, accounting policies, and our overall control environment. This assessment is supported by testing and monitoring performed by our internal audit and finance personnel utilizing the 2013 COSO framework.
Based on its assessment, management has concluded that our internal control over financial reporting was effective as of the end of fiscal year 2024 to provide reasonable assurance regarding the reliability of financial reporting and the preparation of consolidated financial statements for external reporting purposes in accordance with U.S. GAAP.
The effectiveness of our internal control over financial reporting as of the end of fiscal year 2024 has been audited by Deloitte & Touche LLP, an independent registered public accounting firm, as stated in their report, which is included elsewhere herein.
ITEM 9B — OTHER INFORMATION
(c) Trading Plans
During the fourth quarter ended December 31, 2024, KR Sridhar, Founder, Chairman, and Chief Executive Officer,
adopted a trading arrangement intended to satisfy the affirmative defense provisions of Rule 10b5-1(c). The plan was adopted on November 30, 2024, and the plan ends on March 1, 2026. The aggregate number of shares that may be sold under the plan is a) up to 285,714 shares, subject to certain pricing conditions, and b) the number of shares necessary to cover withholding taxes resulting from the vesting of RSUs or PSUs.
ITEM 9C — DISCLOSURE REGARDING FOREIGN JURISDICTIONS THAT PREVENT INSPECTIONS
Not applicable.
Part III
ITEM 10 — DIRECTORS, EXECUTIVE OFFICERS AND CORPORATE GOVERNANCE
Except as indicated below, the information required by this Item 10 is incorporated herein by reference to our Proxy Statement for the 2025 Annual Meeting of Stockholders to be filed with the SEC within 120 days of the year ended December 31, 2024 (the “2025 Annual Meeting”), including under the headings “Corporate Governance,” “Information about Our Executive Officers,” “Business Ethics and Compliance,” and “Delinquent Section 16(a) Reports,” if applicable.
We have adopted a Global Code of Business Conduct and Ethics (the “Code of Conduct”) that applies to all of our and our subsidiaries’ directors, officers, employees, and contractors, including our principal executive, principal financial and principal accounting officers, or persons performing similar functions. Our Code of Conduct is posted on our website located at https://investor.bloomenergy.com under “Corporate Governance”. We intend to disclose future amendments to certain provisions of the Code of Conduct, and waivers of the Code of Conduct granted to executive officers and directors, on the website within four business days following the date of the amendment or waiver.
We have adopted an insider trading policy that provides guidelines to all directors, officers, employees, and their family members, as well as consultants and contractors, with respect to the purchase, sale, and/or other dispositions in our securities. The policy generally prohibits these individuals from trading in our securities while in possession of material, nonpublic information, or disclosing material, nonpublic information to others who may trade on the basis of that information. Directors, officers, and certain other employees generally may transact in our securities only during designated trading windows (other than pursuant to a Rule 10b5-1 plan), and a subset of these individuals generally must also receive advance approval before transacting in our securities.
We believe the policy is reasonably designed to promote compliance with insider trading laws, rules, and regulations, and the exchange listing standards applicable to us. It is the company's policy to comply with all applicable securities laws when engaging in transactions in our securities.
ITEM 11 — EXECUTIVE COMPENSATION
The information required by this Item 11 is incorporated herein by reference to our Proxy Statement for the 2025 Annual Meeting, including under the headings “Executive Compensation”, “Compensation Committee Interlocks and Insider Participation”, and “Compensation Committee Report”.
ITEM 12 — SECURITY OWNERSHIP OF CERTAIN BENEFICIAL OWNERS AND MANAGEMENT AND RELATED STOCKHOLDER MATTERS
The information required by this Item 12 is incorporated herein by reference to our Proxy Statement for the 2025 Annual Meeting, including under the headings “Security Ownership of Certain Beneficial Owners and Management and Related Stockholder Matters” and “Equity Compensation Plan Information”.
ITEM 13 — CERTAIN RELATIONSHIPS AND RELATED TRANSACTIONS, AND DIRECTOR INDEPENDENCE
The information required by this Item 13 is incorporated herein by reference to our Proxy Statement for the 2025 Annual Meeting, including under the headings “Related-Party Transactions” and “Director Independence”.
ITEM 14 — PRINCIPAL ACCOUNTANT FEES AND SERVICES
The information required by this Item 14 is incorporated herein by reference to our Proxy Statement for the 2025 Annual Meeting, including under the heading “Principal Accountant Fees and Services”.
Part IV
ITEM 15 — EXHIBITS AND FINANCIAL STATEMENT SCHEDULES
(a) The following documents are filed as part of this report:
1. Financial Statements
See “Index to Consolidated Financial Statements and Supplementary Data” within the Consolidated Financial Statements herein.
2. Financial Statement Schedules
All financial statement schedules have been omitted since the required information was not applicable or was not present in amounts sufficient to require submission of the schedules, or because the information required is included in the consolidated financial statements or the accompanying notes.
3. Exhibits
See the following Index to Exhibits.
Index to Exhibits
The exhibits listed below are filed or incorporated by reference as part of this Annual Report on Form 10-K.
| | | | | | | | | | | | | | | | | | | | |
| | | Incorporated by Reference |
| Exhibit Number | | Description | Form | File No. | Exhibit | Filing Date |
| | Restated Certificate of Incorporation | 10-Q | 001-38598 | 3.1 | 9/7/2018 |
| | Certificate of Amendment to the Restated Certificate of Incorporation of Bloom Energy Corporation | 10-Q | 001-38598 | 3.1 | 8/9/2022 |
| | Certificate of Amendment to the Certificate of Designation of Series B Redeemable Convertible Preferred Stock | 8-K | 001-38598 | 3.1 | 4/18/2023 |
| | Certificate of Retirement for Class B Common Stock | 10-Q | 001-38598 | 3.2 | 11/8/2023 |
| | Certificate of Elimination of Certificate of Designations of Series B Convertible Preferred Stock | 10-Q | 001-38598 | 3.3 | 11/8/2023 |
| | Certificate of Withdrawal of Certificate of Designation of Series A Redeemable Convertible Preferred Stock | 10-Q | 001-38598 | 3.3 | 5/9/2023 |
| | Amended and Restated Bylaws, as effective August 7, 2024 | 10-Q | 001-38598 | 3.8 | 8/8/2024 |
| | Form of Common Stock Certificate of the Registrant | S-1/A | 333-225571 | 4.1 | 7/9/2018 |
| | Description of Company’s securities registered pursuant to Section 12 of the Securities Exchange Act of 1934, as amended | 10-K | 001-38598 | 4.7 | 2/25/2022 |
| | Indenture, dated as of August 11, 2020, between Bloom Energy Corporation and U.S. Bank National Association, as trustee | 8-K | 001-38598 | 4.1 | 8/11/2020 |
| | Form of certificate representing the 2.50% Green Convertible Senior Notes due 2025 (included as Exhibit A to Exhibit 4.1 hereto) | 8-K | 001-38598 | 4.1 | 8/11/2020 |
| | Indenture, dated as of May 16, 2023, between Bloom Energy Corporation and U.S. Bank Trust Company, National Association, as trustee | 8-K | 001-38598 | 4.1 | 5/16/2023 |
| | | | | | | | | | | | | | | | | | | | |
| | Form of certificate representing the 3.00% Green Convertible Senior Notes due 2028 (included as Exhibit A to Exhibit 4.1) | 8-K | 001-38598 | 4.1 | 5/16/2023 |
| | Irrevocable Proxy of SK ecoplant Co., LTD. | | | | Filed herewith |
| | Indenture, dated as of May 29, 2024, between Bloom Energy Corporation and U.S. Bank Trust Company, National Association, as trustee | 8-K | 001-38598 | 4.1 | 5/29/2024 |
| | Form of certificate representing the 3.00% Green Convertible Senior Notes due 2029 (included as Exhibit A to Exhibit 4.1) | 8-K | 001-38598 | 4.1 | 5/29/2024 |
| ^ | 2012 Equity Incentive Plan and form of agreements used thereunder | S-1 | 333-225571 | 10.3 | 6/12/2018 |
| ^ | 2018 Equity Incentive Plan and form of agreements used thereunder | S-1/A | 333-225571 | 10.4 | 7/9/2018 |
| ^ | Amended and Restated 2018 Employee Stock Purchase Plan | 8-K | 001-38598 | 10.1 | 5/16/2022 |
| | Ground Lease by and between 1743 Holdings, LLC and the Registrant dated as of March 2012 | S-1 | 333-225571 | 10.8 | 6/12/2018 |
| | Net Lease Agreement, dated as of April 4, 2018, by and between the Registrant and 237 North First Street Holdings, LLC | S-1 | 333-225571 | 10.29 | 6/12/2018 |
| ^ | Form of Indemnification Agreement | 10-Q | 001-38598 | 10.1 | 9/7/2018 |
| * | Preferred Distributor Agreement by and between Registrant and SK Engineering & Construction Co., Ltd dated November 14, 2018 | 10-K | 001-38598 | 10.28 | 3/22/2019 |
| * | Annex 1 (Definitions) to Equity Capital Contribution Agreement (Ex 10.1) and Limited Liability Agreements (Exs. 10.2 and 10.6) | 10-Q | 001-38598 | 10.7 | 8/14/2019 |
| ^ | Bloom Energy Corporation 2021 Deferred Compensation Plan | 10-K | 001-38598 | 10.26 | 2/26/2021 |
| ^ | Offer Letter between the Company and Gregory Cameron, dated March 20, 2020 | 8-K | 001-38598 | 10.1 | 4/2/2020 |
| | Note Purchase Agreement among the Registrant, the guarantor named therein, and the purchasers listed therein, dated as of March 30, 2020 | 10-Q | 001-38598 | 10.3 | 5/11/2020 |
| | Amendment Support Agreement by and among the Registrant and the investors named therein, dated as of March 31, 2020 | 10-Q | 001-38598 | 10.4 | 5/11/2020 |
| * | Preferred Distributor Agreement by and between Registrant and SK D&D Co., Ltd dated January 30, 2019 | 10-K | 001-38598 | 10.44 | 2/26/2021 |
| | Lease Agreement between Pacific Commons Owner, LP, and Bloom Energy Corporation entered into as of March 13, 2021 | 10-Q | 001-38598 | 10.1 | 5/6/2021 |
| ^ | Offer Letter between the Registrant and Guillermo Brooks dated May 31, 2021 | 10-Q | 001-38598 | 10.1 | 8/6/2021 |
| | Third Amendment to Net Lease Agreement, dated as of June 6, 2021, by and between the Registrant and SPUS9 at First Street, LP | 10-Q | 001-38598 | 10.2 | 8/6/2021 |
| ^ | Form of Employment, Change in Control and Severance Agreement | 10-Q | 001-38598 | 10.5 | 8/6/2021 |
| ^ | Form of Performance-Based Stock Unit Agreement under 2018 Equity Incentive Plan | 10-K | 001-38598 | 10.46 | 2/25/2022 |
| | | | | | | | | | | | | | | | | | | | |
| | Securities Purchase Agreement, dated October 23, 2021, by and among the Company and SK ecoplant Co., Ltd. | 8-K | 001-38598 | 10.1 | 10/25/2021 |
| * | Amended and Restated Preferred Distributor Agreement, dated October 23, 2021, by and among the Registrant, Bloom SK Fuel Cell, LLC, and SK ecoplant Co., Ltd. | 10-Q | 001-38598 | 10.2 | 11/5/2021 |
| | Amendment to the Joint Venture Agreement, dated October 23, 2021, by and between the Registrant and SK ecoplant Co., Ltd. | 10-Q | 001-38598 | 10.3 | 11/5/2021 |
| | Investor Agreement, dated December 29, 2021, by and among the Registrant and SK ecoplant Co., Ltd. | 8-K | 001-38598 | 10.1 | 12/30/2021 |
| * | Master Supply Agreement, dated December 24, 2021, by and between Registrant and SK E&C BETEK Corporation | 10-K | 001-38598 | 10.51 | 2/25/2022 |
| | Form of Confirmation of Call Option Transaction, between Bloom Energy Corporation and each Option Counterparty | 8-K | 001-38598 | 10.1 | 5/16/2023 |
| | Amendments to Securities Purchase Agreement and Investor Agreement, dated March 20, 2023, between the Company and SK ecoplant Co., Ltd. | 8-K | 001-38598 | 10.1 | 3/23/2023 |
| | Shareholder’s Loan Agreement dated as of March 20, 2023, between the Company and SK ecoplant Co., Ltd. | 8-K | 001-38598 | 10.2 | 3/23/2023 |
| | First Amendment to the Amended and Restated Preferred Distributor Agreement, dated September 29, 2023, among the Company, SK Fuel Cell, LLC, and SK ecoplant Co., Ltd. | 8-K | 001-38598 | 10.1 | 12/22/2023 |
| * | Second Amendment to the Amended and Restated Preferred Distributor Agreement, dated December 21, 2023, among the Company, SK Fuel Cell, LLC, and SK ecoplant Co., Ltd. | 8-K | 001-38598 | 10.2 | 12/22/2023 |
| ^ | Offer Letter between the Company and Aman Joshi, dated January 5, 2024 | 8-K | 001-38598 | 10.1 | 1/9/2024 |
| ^ | Separation and General Release Agreement, dated January 8, 2024 | 8-K | 001-38598 | 10.2 | 1/9/2024 |
| ^ | Offer Letter between the Company and Daniel Berenbaum, dated April 15, 2024 | 8-K | 001-38598 | 10.1 | 4/17/2024 |
| | Third Amendment to the Amended and Restated Preferred Distribution Agreement, dated March 27, 2024, among the Company, SK Fuel Cell, LLC, and SK ecoplant Co., Ltd. | 10-Q | 001-38598 | 10.1 | 5/9/2024 |
| ^ | Form of Performance Stock Option Agreement under 2018 Equity Incentive Plan | 10-Q | 001-38598 | 10.3 | 5/9/2024 |
| | Insider Trading Policies and Procedures | | | | Filed herewith |
| | List of Subsidiaries | | | | Filed herewith |
| | Consent of Independent Registered Public Accounting Firm, Deloitte & Touche LLP | | | | Filed herewith |
| | Certification of Chief Executive Officer pursuant to Rules 13a-14(a) and 15d-14(a) of the Securities and Exchange Act of 1934, as amended, as adopted pursuant to Section 302 of the Sarbanes-Oxley Act of 2002 | | | | Filed herewith |
| | | | | | | | | | | | | | | | | | | | |
| | Certification of Chief Financial Officer pursuant to Rules 13a-14(a) and 15d-14(a) of the Securities and Exchange Act of 1934, as amended, as adopted pursuant to Section 302 of the Sarbanes-Oxley Act of 2002 | | | | Filed herewith |
| ** | Certifications of the Chief Executive Officer and Chief Financial Officer pursuant to 18 U.S.C. Section 1350, as adopted pursuant to Section 906 of the Sarbanes-Oxley Act of 2002 | | | | Furnished herewith |
| | Policy on Recoupment and Forfeiture of Incentive Compensation Following a Restatement (Officers) | | | | Filed herewith |
| 101.INS | | XBRL Instance Document- the instance document does not appear in the Interactive Data File because its XBRL tags are embedded within the Inline XBRL document | | | | Filed herewith |
| 101.SCH | | Inline XBRL Taxonomy Extension Schema Document | | | | Filed herewith |
| 101.CAL | | Inline XBRL Taxonomy Extension Calculation Linkbase Document | | | | Filed herewith |
| 101.DEF | | Inline XBRL Taxonomy Extension Definition Linkbase Document | | | | Filed herewith |
| 101.LAB | | Inline XBRL Taxonomy Extension Label Linkbase Document | | | | Filed herewith |
| 101.PRE | | Inline XBRL Taxonomy Extension Presentation Linkbase Document | | | | Filed herewith |
| 104 | | Cover Page Interactive Data File (formatted as Inline XBRL and contained in Exhibit 101) | | | | |
| | | | | |
| ^ | Management contracts or compensation plans or arrangements in which directors or executive officers are eligible to participate. |
| * | Certain identified information has been omitted by means of marking such information with asterisks in reliance on Item 601(b)(10)(iv) of Regulation S-K because it is both (i) not material and (ii) the type that the registrant treats as private or confidential. |
| ** | The certifications furnished in Exhibit 32.1 hereto are deemed to accompany this Annual Report on Form 10-K and will not be deemed “filed” for purposes of Section 18 of the Securities Exchange Act of 1934, as amended, or otherwise subject to the liability of that section, nor shall it be deemed incorporated by reference into any filing under the Securities Act of 1933, as amended, or the Securities Exchange Act of 1934, as amended. |
ITEM 16 — FORM 10-K SUMMARY
None.
SIGNATURES
Pursuant to the requirements of Section 13 or 15(d) of the Securities Exchange Act of 1934, the registrant has duly caused this report to be signed on its behalf by the undersigned, thereunto duly authorized.
| | | | | | | | | | | | | | |
| | | | BLOOM ENERGY CORPORATION |
| | | | |
| | | | |
| Date: | February 27, 2025 | By: | | /s/ KR Sridhar |
| | | | KR Sridhar |
| | | | Founder, Chief Executive Officer, Chairman and Director |
| | | | (Principal Executive Officer) |
| | | | |
| Date: | February 27, 2025 | By: | | /s/ Daniel Berenbaum |
| | | | Daniel Berenbaum |
| | | | Chief Financial Officer |
| | | | (Principal Financial and Accounting Officer) |
| | | | |
POWER OF ATTORNEY
KNOW ALL PERSONS BY THESE PRESENTS, that each person whose signature appears below constitutes and appoints KR Sridhar and Daniel Berenbaum, and each of them individually, as his or her attorney-in-fact, each with full power of substitution, for him or her in any and all capacities, to sign any and all amendments to this Annual Report on Form 10-K, and to file the same, with exhibits thereto and all other documents in connection therewith, with the Securities and Exchange Commission, hereby ratifying and confirming all that said attorney-in-fact, or his substitute or substitutes, may do or cause to be done by virtue hereof. Pursuant to the requirements of the Securities Exchange Act of 1934, this report has been signed by the following persons on behalf of the registrant in the capacities and on the dates indicated.
| | | | | | | | | | | | | | |
| Date: | February 27, 2025 | | | /s/ KR Sridhar |
| | | | KR Sridhar |
| | | | Founder, Chief Executive Officer, Chairman and Director |
| | | | (Principal Executive Officer) |
| | | | |
| Date: | February 27, 2025 | | | /s/ Daniel Berenbaum |
| | | | Daniel Berenbaum |
| | | | Chief Financial Officer |
| | | | (Principal Financial and Accounting Officer) |
| | | | |
| Date: | February 27, 2025 | | | /s/ Barbara Burger |
| | | | Barbara Burger |
| | | | Director |
| | | | |
| Date: | February 27, 2025 | | | /s/ Michael Boskin |
| | | | Michael Boskin |
| | | | Director |
| | | | |
| Date: | February 27, 2025 | | | /s/ Mary K. Bush |
| | | | Mary K. Bush |
| | | | Director |
| | | | |
| Date: | February 27, 2025 | | | /s/ John T. Chambers |
| | | | John T. Chambers |
| | | | Director |
| | | | |
| Date: | February 27, 2025 | | | /s/ Jeffrey Immelt |
| | | | Jeffrey Immelt |
| | | | Director |
| | | | |
| Date: | February 27, 2025 | | | /s/ Gary Pinkus |
| | | | Gary Pinkus |
| | | | Director |
| | | | |
| Date: | February 27, 2025 | | | /s/ Cynthia J. Warner |
| | | | Cynthia J. Warner |
| | | | Director |
| | | | |
| Date: | February 27, 2025 | | | /s/ Eddy Zervigon |
| | | | Eddy Zervigon |
| | | | Director |