The information in this preliminary pricing supplement is not complete and may be changed. This preliminary pricing supplement is not an offer to sell nor does it seek an offer to buy these securities in any jurisdiction where the offer or sale is not permitted.
Subject to completion dated November 11, 2022
| November , 2022 | Registration Statement Nos. 333-236659 and 333-236659-01; Rule 424(b)(2) |

JPMorgan Chase Financial Company LLC
Structured Investments
Auto Callable Contingent Interest Notes Linked to the Lesser Performing of the iShares® Global Clean Energy ETF and the Invesco Solar ETF due May 17, 2024
Fully and Unconditionally Guaranteed by JPMorgan Chase & Co.
| · | The notes are designed for investors who seek a Contingent Interest Payment with respect to each Review Date for which the closing price of one share of each of the iShares® Global Clean Energy ETF and the Invesco Solar ETF, which we refer to as the Funds, is greater than or equal to 70.00% of its Initial Value, which we refer to as an Interest Barrier. |
| · | The notes will be automatically called if the closing price of one share of each Fund on any quarterly Autocall Review Date is greater than or equal to its Initial Value. |
| · | The earliest date on which an automatic call may be initiated is February 14, 2023. |
| · | Investors should be willing to accept the risk of losing some or all of their principal and the risk that no Contingent Interest Payment may be made with respect to some or all Interest Review Dates. |
| · | Investors should also be willing to forgo fixed interest and dividend payments, in exchange for the opportunity to receive Contingent Interest Payments. |
| · | Despite their names, there is no guarantee that either Fund will provide exposure to companies that exhibit positive or favorable clean energy characteristics. If the clean energy characteristics of either Fund are a factor in your decision to invest in the notes, you should consult with your legal or other advisers before making an investment in the notes. |
| · | The notes are unsecured and unsubordinated obligations of JPMorgan Chase Financial Company LLC, which we refer to as JPMorgan Financial, the payment on which is fully and unconditionally guaranteed by JPMorgan Chase & Co. Any payment on the notes is subject to the credit risk of JPMorgan Financial, as issuer of the notes, and the credit risk of JPMorgan Chase & Co., as guarantor of the notes. |
| · | Payments on the notes are not linked to a basket composed of the Funds. Payments on the notes are linked to the performance of each of the Funds individually, as described below. |
| · | Minimum denominations of $1,000 and integral multiples thereof |
| · | The notes are expected to price on or about November 14, 2022 and are expected to settle on or about November 17, 2022. |
| · | CUSIP: 48133PUJ0 |
Investing in the notes involves a number of risks. See “Risk Factors” beginning on page S-2 of the accompanying prospectus supplement, “Risk Factors” beginning on page PS-12 of the accompanying product supplement, “Risk Factors” beginning on page US-3 of the accompanying underlying supplement and “Selected Risk Considerations” beginning on page PS-5 of this pricing supplement.
Neither the Securities and Exchange Commission (the “SEC”) nor any state securities commission has approved or disapproved of the notes or passed upon the accuracy or the adequacy of this pricing supplement or the accompanying product supplement, underlying supplement, prospectus supplement and prospectus. Any representation to the contrary is a criminal offense.
| Price to Public (1) | Fees and Commissions (2) | Proceeds to Issuer | |
| Per note | $1,000 | $ | $ |
| Total | $ | $ | $ |
(1) See “Supplemental Use of Proceeds” in this pricing supplement for information about the components of the price to public of the notes. (2) J.P. Morgan Securities LLC, which we refer to as JPMS, acting as agent for JPMorgan Financial, will pay all of the selling commissions it receives from us to other affiliated or unaffiliated dealers. In no event will these selling commissions exceed $8.00 per $1,000 principal amount note. See “Plan of Distribution (Conflicts of Interest)” in the accompanying product supplement. | |||
If the notes priced today, the estimated value of the notes would be approximately $963.00 per $1,000 principal amount note. The estimated value of the notes, when the terms of the notes are set, will be provided in the pricing supplement and will not be less than $940.00 per $1,000 principal amount note. See “The Estimated Value of the Notes” in this pricing supplement for additional information.
The notes are not bank deposits, are not insured by the Federal Deposit Insurance Corporation or any other governmental agency and are not obligations of, or guaranteed by, a bank.
Pricing supplement to product supplement no. 4-II dated November 4, 2020, underlying supplement no. 1-II dated November 4, 2020
and the prospectus and prospectus supplement, each dated April 8, 2020
Key Terms
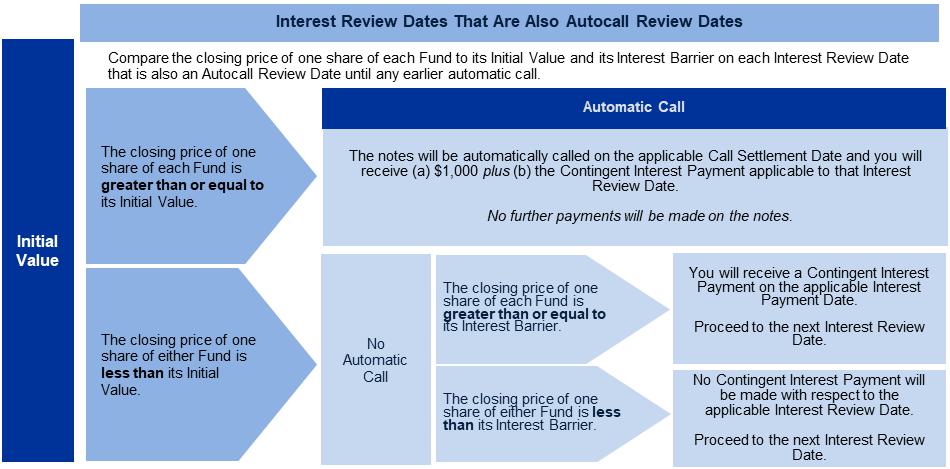
Issuer: JPMorgan Chase Financial Company LLC, an indirect, wholly owned finance subsidiary of JPMorgan Chase & Co. Guarantor: JPMorgan Chase & Co. Funds: The iShares® Global Clean Energy ETF (Bloomberg ticker: ICLN) and the Invesco Solar ETF (Bloomberg ticker: TAN) Contingent Interest Payments: If the notes have not been automatically called and the closing price of one share of each Fund on any Interest Review Date is greater than or equal to its Interest Barrier, you will receive on the applicable Interest Payment Date for each $1,000 principal amount note a Contingent Interest Payment equal to at least $10.8333 (equivalent to a Contingent Interest Rate of at least 13.00% per annum, payable at a rate of at least 1.08333% per month) (to be provided in the pricing supplement). If the closing price of one share of either Fund on any Interest Review Date is less than its Interest Barrier, no Contingent Interest Payment will be made with respect to that Interest Review Date. Contingent Interest Rate: At least 13.00% per annum, payable at a rate of at least 1.08333% per month (to be provided in the pricing supplement) Interest Barrier: With respect to each Fund, 70.00% of its Initial Value Trigger Value: With respect to each Fund, 50.00% of its Initial Value Pricing Date: On or about November 14, 2022 Original Issue Date (Settlement Date): On or about November 17, 2022 Interest Review Dates*: December 14, 2022, January 17, 2023, February 14, 2023, March 14, 2023, April 14, 2023, May 15, 2023, June 14, 2023, July 14, 2023, August 14, 2023, September 14, 2023, October 16, 2023, November 14, 2023, December 14, 2023, January 16, 2024, February 14, 2024, March 14, 2024, April 15, 2024 and May 14, 2024 (the “final Review Date”) Autocall Review Dates*: February 14, 2023, May 15, 2023, August 14, 2023, November 14, 2023 and February 14, 2024 Interest Payment Dates*: December 19, 2022, January 20, 2023, February 17, 2023, March 17, 2023, April 19, 2023, May 18, 2023, June 20, 2023, July 19, 2023, August 17, 2023, September 19, 2023, October 19, 2023, November 17, 2023, December 19, 2023, January 19, 2024, February 20, 2024, March 19, 2024, April 18, 2024 and the Maturity Date Maturity Date*: May 17, 2024 Call Settlement Date*: If the notes are automatically called on any Autocall Review Date, the first Interest Payment Date immediately following that Autocall Review Date * Subject to postponement in the event of a market disruption event and as described under “General Terms of Notes — Postponement of a Determination Date — Notes Linked to Multiple Underlyings” and “General Terms of Notes — Postponement of a Payment Date” in the accompanying product supplement | Automatic Call: If the closing price of one share of each Fund on any Autocall Review Date is greater than or equal to its Initial Value, the notes will be automatically called for a cash payment, for each $1,000 principal amount note, equal to (a) $1,000 plus (b) the Contingent Interest Payment applicable to the Interest Review Date corresponding to that Autocall Review Date, payable on the applicable Call Settlement Date. No further payments will be made on the notes. Payment at Maturity: If the notes have not been automatically called and the Final Value of each Fund is greater than or equal to its Trigger Value, you will receive a cash payment at maturity, for each $1,000 principal amount note, equal to (a) $1,000 plus (b) the Contingent Interest Payment, if any, applicable to the final Review Date. If the notes have not been automatically called and the Final Value of either Fund is less than its Trigger Value, your payment at maturity per $1,000 principal amount note will be calculated as follows: $1,000 + ($1,000 × Lesser Performing Fund Return) If the notes have not been automatically called and the Final Value of either Fund is less than its Trigger Value, you will lose more than 50.00% of your principal amount at maturity and could lose all of your principal amount at maturity. Lesser Performing Fund: The Fund with the Lesser Performing Fund Return Lesser Performing Fund Return: The lower of the Fund Returns of the Funds Fund Return: With respect to each Fund, (Final Value – Initial Value) Initial Value: With respect to each Fund, the closing price of one share of that Fund on the Pricing Date Final Value: With respect to each Fund, the closing price of one share of that Fund on the final Review Date Share Adjustment Factor: With respect to each Fund, the Share Adjustment Factor is referenced in determining the closing price of one share of that Fund and is set equal to 1.0 on the Pricing Date. The Share Adjustment Factor of each Fund is subject to adjustment upon the occurrence of certain events affecting that Fund. See “The Underlyings — Funds — Anti-Dilution Adjustments” in the accompanying product supplement for further information.
|
PS-1 | Structured Investments Auto Callable Contingent Interest Notes Linked to the Lesser Performing of the iShares® Global Clean Energy ETF and the Invesco Solar ETF | |
How the Notes Work
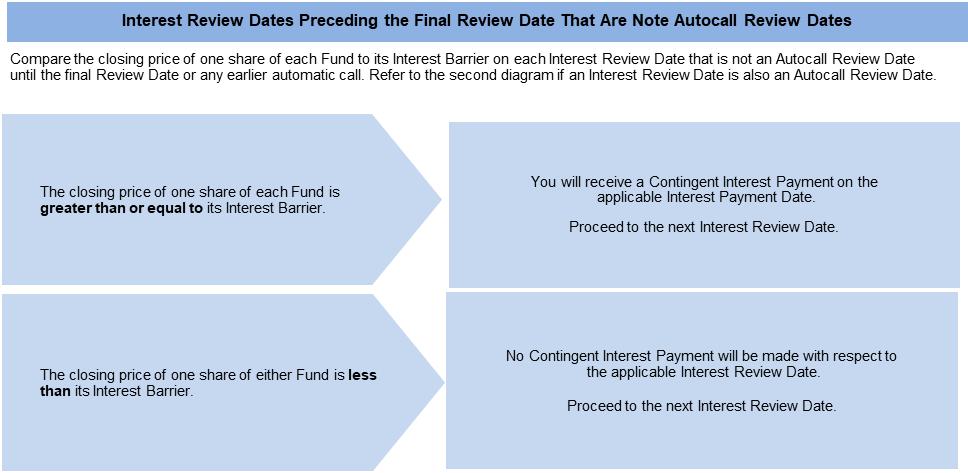
Payments in Connection with Interest Review Dates Preceding the Final Review Date
PS-2 | Structured Investments Auto Callable Contingent Interest Notes Linked to the Lesser Performing of the iShares® Global Clean Energy ETF and the Invesco Solar ETF | |
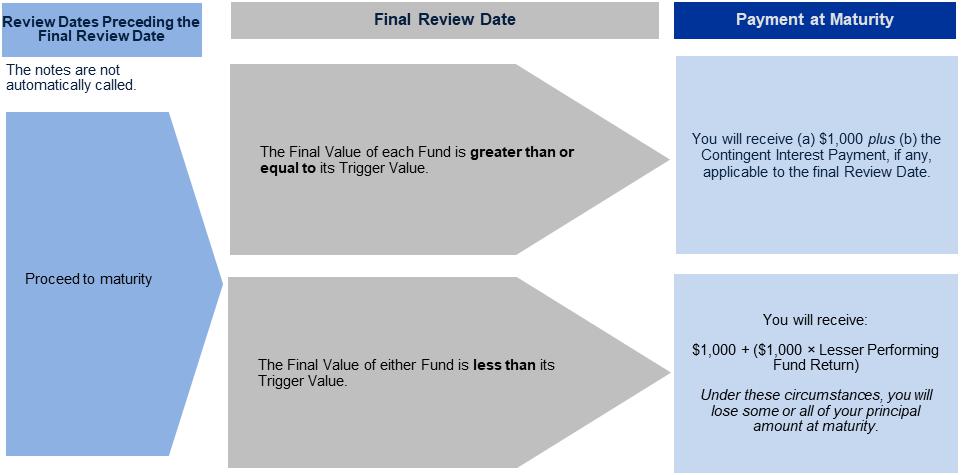
Payment at Maturity If the Notes Have Not Been Automatically Called
Total Contingent Interest Payments
The table below illustrates the hypothetical total Contingent Interest Payments per $1,000 principal amount note over the term of the notes based on a hypothetical Contingent Interest Rate of 13.00% per annum, depending on how many Contingent Interest Payments are made prior to automatic call or maturity. The actual Contingent Interest Rate will be provided in the pricing supplement and will be at least 13.00% per annum.
| Number of Contingent Interest Payments | Total Contingent Interest Payments |
| 18 | $195.0000 |
| 17 | $184.1667 |
| 16 | $173.3333 |
| 15 | $162.5000 |
| 14 | $151.6667 |
| 13 | $140.8333 |
| 12 | $130.0000 |
| 11 | $119.1667 |
| 10 | $108.3333 |
| 9 | $97.5000 |
| 8 | $86.6667 |
| 7 | $75.8333 |
| 6 | $65.0000 |
| 5 | $54.1667 |
| 4 | $43.3333 |
| 3 | $32.5000 |
| 2 | $21.6667 |
| 1 | $10.8333 |
| 0 | $0.0000 |
PS-3 | Structured Investments Auto Callable Contingent Interest Notes Linked to the Lesser Performing of the iShares® Global Clean Energy ETF and the Invesco Solar ETF | |
Hypothetical Payout Examples
The following examples illustrate payments on the notes linked to two hypothetical Funds, assuming a range of performances for the hypothetical Lesser Performing Fund on the Interest Review Dates and the Autocall Review Dates. Each hypothetical payment set forth below assumes that the closing price of one share of the Fund that is not the Lesser Performing Fund on (i) each Autocall Review Date is greater than or equal to its Initial Value and (ii) on each Interest Review Date is greater than or equal to its Interest Barrier (and therefore its Trigger Value).
In addition, the hypothetical payments set forth below assume the following:
| · | an Initial Value for the Lesser Performing Fund of $100.00; |
| · | an Interest Barrier for the Lesser Performing Fund of $70.00 (equal to 70.00% of its hypothetical Initial Value); |
| · | a Trigger Value for the Lesser Performing Fund of $50.00 (equal to 50.00% of its hypothetical Initial Value); and |
| · | a Contingent Interest Rate of 13.00% per annum (payable at a rate of 1.08333% per month). |
The hypothetical Initial Value of the Lesser Performing Fund of $100.00 has been chosen for illustrative purposes only and may not represent a likely actual Initial Value of either Fund. The actual Initial Value of each Fund will be the closing price of one share of that Fund on the Pricing Date and will be provided in the pricing supplement. For historical data regarding the actual closing prices of one share of each Fund, please see the historical information set forth under “The Funds” in this pricing supplement.
Each hypothetical payment set forth below is for illustrative purposes only and may not be the actual payment applicable to a purchaser of the notes. The numbers appearing in the following examples have been rounded for ease of analysis.
Example 1 — Notes are automatically called on the first Autocall Review Date.
| Date | Closing Price of One Share of Lesser Performing Fund | Payment (per $1,000 principal amount note) |
| First Interest Review Date | $105.00 | $10.8333 |
| Second Interest Review Date | $50.00 | $0 |
| Third Interest Review Date (first Autocall Review Date) | $110.00 | $1,010.8333 |
| Total Payment | $1,021.6667 (2.16667% return) |
Because the closing price of one share of each Fund on the first Autocall Review Date, which is also the third Interest Review Date, is greater than or equal to its Initial Value, the notes will be automatically called for a cash payment, for each $1,000 principal amount note, of $1,010.8333 (or $1,000 plus the Contingent Interest Payment applicable to the third Interest Review Date), payable on the applicable Call Settlement Date. When added to the Contingent Interest Payment received with respect to the prior Interest Review Dates, the total amount paid, for each $1,000 principal amount note, is $1,021.6667. No further payments will be made on the notes.
Example 2 — Notes have NOT been automatically called and the Final Value of the Lesser Performing Fund is greater than or equal to its Trigger Value and its Interest Barrier.
| Date | Closing Price of One Share of Lesser Performing Fund | Payment (per $1,000 principal amount note) |
| First Interest Review Date | $95.00 | $10.8333 |
| Second Interest Review Date | $85.00 | $10.8333 |
| Third through Seventeenth Interest Review Dates | Less than Interest Barrier | $0 |
| Final Review Date | $90.00 | $1,010.8333 |
| Total Payment | $1,032.50 (3.25% return) |
Because the notes have not been automatically called and the Final Value of the Lesser Performing Fund is greater than or equal to its Trigger Value and its Interest Barrier, the payment at maturity, for each $1,000 principal amount note, will be $1,010.8333 (or $1,000 plus the Contingent Interest Payment applicable to the final Review Date). When added to the Contingent Interest Payments received with respect to the prior Interest Review Dates, the total amount paid, for each $1,000 principal amount note, is $1,051.125.
PS-4 | Structured Investments Auto Callable Contingent Interest Notes Linked to the Lesser Performing of the iShares® Global Clean Energy ETF and the Invesco Solar ETF | |
Example 3 — Notes have NOT been automatically called and the Final Value of the Lesser Performing Fund is less than its Interest Barrier but is greater than or equal to its Trigger Value.
| Date | Closing Price of One Share of Lesser Performing Fund | Payment (per $1,000 principal amount note) |
| First Interest Review Date | $95.00 | $10.8333 |
| Second Interest Review Date | $80.00 | $10.8333 |
| Third through Seventeenth Interest Review Dates | Less than Interest Barrier | $0 |
| Final Review Date | $60.00 | $1,000.00 |
| Total Payment | $1,021.6667 (2.16667% return) |
Because the notes have not been automatically called and the Final Value of the Lesser Performing Fund is less than its Interest Barrier but is greater than or equal to its Trigger Value, the payment at maturity, for each $1,000 principal amount note, will be $1,000.00. When added to the Contingent Interest Payments received with respect to the prior Interest Review Dates, the total amount paid, for each $1,000 principal amount note, is $1,021.6667.
Example 4 — Notes have NOT been automatically called and the Final Value of the Lesser Performing Fund is less than its Trigger Value.
| Date | Closing Price of One Share of Lesser Performing Fund | Payment (per $1,000 principal amount note) |
| First Interest Review Date | $40.00 | $0 |
| Second Interest Review Date | $45.00 | $0 |
| Third through Seventeenth Interest Review Dates | Less than Interest Barrier | $0 |
| Final Review Date | $40.00 | $400.00 |
| Total Payment | $400.00 (-60.00% return) |
Because the notes have not been automatically called, the Final Value of the Lesser Performing Fund is less than its Trigger Value and the Lesser Performing Fund Return is -60.00%, the payment at maturity will be $400.00 per $1,000 principal amount note, calculated as follows:
$1,000 + [$1,000 × (-60.00%)] = $400.00
The hypothetical returns and hypothetical payments on the notes shown above apply only if you hold the notes for their entire term or until automatically called. These hypotheticals do not reflect the fees or expenses that would be associated with any sale in the secondary market. If these fees and expenses were included, the hypothetical returns and hypothetical payments shown above would likely be lower.
Selected Risk Considerations
An investment in the notes involves significant risks. These risks are explained in more detail in the “Risk Factors” sections of the accompanying prospectus supplement, product supplement and underlying supplement.
Risks Relating to the Notes Generally
| · | YOUR INVESTMENT IN THE NOTES MAY RESULT IN A LOSS — |
The notes do not guarantee any return of principal. If the notes have not been automatically called and the Final Value of either Fund is less than its Trigger Value, you will lose 1% of the principal amount of your notes for every 1% that the Final Value of the Lesser Performing Fund is less than its Initial Value. Accordingly, under these circumstances, you will lose more than 50.00% of your principal amount at maturity and could lose all of your principal amount at maturity.
PS-5 | Structured Investments Auto Callable Contingent Interest Notes Linked to the Lesser Performing of the iShares® Global Clean Energy ETF and the Invesco Solar ETF | |
| · | THE NOTES DO NOT GUARANTEE THE PAYMENT OF INTEREST AND MAY NOT PAY ANY INTEREST AT ALL — |
If the notes have not been automatically called, we will make a Contingent Interest Payment with respect to an Interest Review Date only if the closing price of one share of each Fund on that Interest Review Date is greater than or equal to its Interest Barrier. If the closing price of one share of either Fund on that Interest Review Date is less than its Interest Barrier, no Contingent Interest Payment will be made with respect to that Interest Review Date. Accordingly, if the closing price of one share of either Fund on each Interest Review Date is less than its Interest Barrier, you will not receive any interest payments over the term of the notes.
| · | CREDIT RISKS OF JPMORGAN FINANCIAL AND JPMORGAN CHASE & CO. — |
Investors are dependent on our and JPMorgan Chase & Co.’s ability to pay all amounts due on the notes. Any actual or potential change in our or JPMorgan Chase & Co.’s creditworthiness or credit spreads, as determined by the market for taking that credit risk, is likely to adversely affect the value of the notes. If we and JPMorgan Chase & Co. were to default on our payment obligations, you may not receive any amounts owed to you under the notes and you could lose your entire investment.
| · | AS A FINANCE SUBSIDIARY, JPMORGAN FINANCIAL HAS NO INDEPENDENT OPERATIONS AND HAS LIMITED ASSETS — |
As a finance subsidiary of JPMorgan Chase & Co., we have no independent operations beyond the issuance and administration of our securities. Aside from the initial capital contribution from JPMorgan Chase & Co., substantially all of our assets relate to obligations of our affiliates to make payments under loans made by us or other intercompany agreements. As a result, we are dependent upon payments from our affiliates to meet our obligations under the notes. If these affiliates do not make payments to us and we fail to make payments on the notes, you may have to seek payment under the related guarantee by JPMorgan Chase & Co., and that guarantee will rank pari passu with all other unsecured and unsubordinated obligations of JPMorgan Chase & Co.
| · | THE APPRECIATION POTENTIAL OF THE NOTES IS LIMITED TO THE SUM OF ANY CONTINGENT INTEREST PAYMENTS THAT MAY BE PAID OVER THE TERM OF THE NOTES, |
regardless of any appreciation of either Fund, which may be significant. You will not participate in any appreciation of either Fund.
| · | YOU ARE EXPOSED TO THE RISK OF DECLINE IN THE PRICE OF ONE SHARE OF EACH FUND — |
Payments on the notes are not linked to a basket composed of the Funds and are contingent upon the performance of each individual Fund. Poor performance by either of the Funds over the term of the notes may result in the notes not being automatically called on an Autocall Review Date, may negatively affect whether you will receive a Contingent Interest Payment on any Interest Payment Date and your payment at maturity and will not be offset or mitigated by positive performance by the other Fund.
| · | YOUR PAYMENT AT MATURITY WILL BE DETERMINED BY THE LESSER PERFORMING FUND. |
| · | THE BENEFIT PROVIDED BY THE TRIGGER VALUE MAY TERMINATE ON THE FINAL REVIEW DATE — |
If the Final Value of either Fund is less than its Trigger Value and the notes have not been automatically called, the benefit provided by the Trigger Value will terminate and you will be fully exposed to any depreciation of the Lesser Performing Fund.
| · | THE AUTOMATIC CALL FEATURE MAY FORCE A POTENTIAL EARLY EXIT — |
If your notes are automatically called, the term of the notes may be reduced to as short as approximately three months and you will not receive any Contingent Interest Payments after the applicable Call Settlement Date. There is no guarantee that you would be able to reinvest the proceeds from an investment in the notes at a comparable return and/or with a comparable interest rate for a similar level of risk. Even in cases where the notes are called before maturity, you are not entitled to any fees and commissions described on the front cover of this pricing supplement.
| · | YOU WILL NOT RECEIVE DIVIDENDS ON EITHER FUND OR THE SECURITIES HELD BY EITHER FUND OR HAVE ANY RIGHTS WITH RESPECT TO EITHER FUND OR THOSE SECURITIES. |
| · | THE RISK OF THE CLOSING PRICE OF ONE SHARE OF A FUND FALLING BELOW ITS INTEREST BARRIER OR TRIGGER VALUE IS GREATER IF THE PRICE OF ONE SHARE OF THAT FUND IS VOLATILE. |
| · | LACK OF LIQUIDITY — |
The notes will not be listed on any securities exchange. Accordingly, the price at which you may be able to trade your notes is likely to depend on the price, if any, at which JPMS is willing to buy the notes. You may not be able to sell your notes. The notes are not designed to be short-term trading instruments. Accordingly, you should be able and willing to hold your notes to maturity.
PS-6 | Structured Investments Auto Callable Contingent Interest Notes Linked to the Lesser Performing of the iShares® Global Clean Energy ETF and the Invesco Solar ETF | |
| · | THE FINAL TERMS AND VALUATION OF THE NOTES WILL BE PROVIDED IN THE PRICING SUPPLEMENT — |
You should consider your potential investment in the notes based on the minimums for the estimated value of the notes and the Contingent Interest Rate.
Risks Relating to Conflicts of Interest
| · | POTENTIAL CONFLICTS — |
We and our affiliates play a variety of roles in connection with the notes. In performing these duties, our and JPMorgan Chase & Co.’s economic interests are potentially adverse to your interests as an investor in the notes. It is possible that hedging or trading activities of ours or our affiliates in connection with the notes could result in substantial returns for us or our affiliates while the value of the notes declines. Please refer to “Risk Factors — Risks Relating to Conflicts of Interest” in the accompanying product supplement.
Risks Relating to the Estimated Value and Secondary Market Prices of the Notes
| · | THE ESTIMATED VALUE OF THE NOTES WILL BE LOWER THAN THE ORIGINAL ISSUE PRICE (PRICE TO PUBLIC) OF THE NOTES — |
The estimated value of the notes is only an estimate determined by reference to several factors. The original issue price of the notes will exceed the estimated value of the notes because costs associated with selling, structuring and hedging the notes are included in the original issue price of the notes. These costs include the selling commissions, the projected profits, if any, that our affiliates expect to realize for assuming risks inherent in hedging our obligations under the notes and the estimated cost of hedging our obligations under the notes. See “The Estimated Value of the Notes” in this pricing supplement.
| · | THE ESTIMATED VALUE OF THE NOTES DOES NOT REPRESENT FUTURE VALUES OF THE NOTES AND MAY DIFFER FROM OTHERS’ ESTIMATES — |
See “The Estimated Value of the Notes” in this pricing supplement.
| · | THE ESTIMATED VALUE OF THE NOTES IS DERIVED BY REFERENCE TO AN INTERNAL FUNDING RATE — |
The internal funding rate used in the determination of the estimated value of the notes may differ from the market-implied funding rate for vanilla fixed income instruments of a similar maturity issued by JPMorgan Chase & Co. or its affiliates. Any difference may be based on, among other things, our and our affiliates’ view of the funding value of the notes as well as the higher issuance, operational and ongoing liability management costs of the notes in comparison to those costs for the conventional fixed income instruments of JPMorgan Chase & Co. This internal funding rate is based on certain market inputs and assumptions, which may prove to be incorrect, and is intended to approximate the prevailing market replacement funding rate for the notes. The use of an internal funding rate and any potential changes to that rate may have an adverse effect on the terms of the notes and any secondary market prices of the notes. See “The Estimated Value of the Notes” in this pricing supplement.
| · | THE VALUE OF THE NOTES AS PUBLISHED BY JPMS (AND WHICH MAY BE REFLECTED ON CUSTOMER ACCOUNT STATEMENTS) MAY BE HIGHER THAN THE THEN-CURRENT ESTIMATED VALUE OF THE NOTES FOR A LIMITED TIME PERIOD — |
We generally expect that some of the costs included in the original issue price of the notes will be partially paid back to you in connection with any repurchases of your notes by JPMS in an amount that will decline to zero over an initial predetermined period. See “Secondary Market Prices of the Notes” in this pricing supplement for additional information relating to this initial period. Accordingly, the estimated value of your notes during this initial period may be lower than the value of the notes as published by JPMS (and which may be shown on your customer account statements).
| · | SECONDARY MARKET PRICES OF THE NOTES WILL LIKELY BE LOWER THAN THE ORIGINAL ISSUE PRICE OF THE NOTES — |
Any secondary market prices of the notes will likely be lower than the original issue price of the notes because, among other things, secondary market prices take into account our internal secondary market funding rates for structured debt issuances and, also, because secondary market prices may exclude selling commissions, projected hedging profits, if any, and estimated hedging costs that are included in the original issue price of the notes. As a result, the price, if any, at which JPMS will be willing to buy the notes from you in secondary market transactions, if at all, is likely to be lower than the original issue price. Any sale by you prior to the Maturity Date could result in a substantial loss to you.
PS-7 | Structured Investments Auto Callable Contingent Interest Notes Linked to the Lesser Performing of the iShares® Global Clean Energy ETF and the Invesco Solar ETF | |
| · | SECONDARY MARKET PRICES OF THE NOTES WILL BE IMPACTED BY MANY ECONOMIC AND MARKET FACTORS — |
The secondary market price of the notes during their term will be impacted by a number of economic and market factors, which may either offset or magnify each other, aside from the selling commissions, projected hedging profits, if any, estimated hedging costs and the prices of one share of the Funds. Additionally, independent pricing vendors and/or third party broker-dealers may publish a price for the notes, which may also be reflected on customer account statements. This price may be different (higher or lower) than the price of the notes, if any, at which JPMS may be willing to purchase your notes in the secondary market. See “Risk Factors — Risks Relating to the Estimated Value and Secondary Market Prices of the Notes — Secondary market prices of the notes will be impacted by many economic and market factors” in the accompanying product supplement.
Risks Relating to the Funds
| · | THERE ARE RISKS ASSOCIATED WITH THE FUNDS — |
The Funds are subject to management risk, which is the risk that the investment strategies of the applicable Fund’s investment adviser, the implementation of which is subject to a number of constraints, may not produce the intended results. These constraints could adversely affect the market prices of the shares of the Funds and, consequently, the value of the notes.
| · | THE PERFORMANCE AND MARKET VALUE OF EACH FUND, PARTICULARLY DURING PERIODS OF MARKET VOLATILITY, MAY NOT CORRELATE WITH THE PERFORMANCE OF THAT FUND’S UNDERLYING INDEX AS WELL AS THE NET ASSET VALUE PER SHARE — |
Each Fund does not fully replicate its Underlying Index (as defined under “The Funds” below) and may hold securities different from those included in its Underlying Index. In addition, the performance of each Fund will reflect additional transaction costs and fees that are not included in the calculation of its Underlying Index. All of these factors may lead to a lack of correlation between the performance of each Fund and its Underlying Index. In addition, corporate actions with respect to the equity securities underlying a Fund (such as mergers and spin-offs) may impact the variance between the performances of that Fund and its Underlying Index. Finally, because the shares of each Fund are traded on a securities exchange and are subject to market supply and investor demand, the market value of one share of each Fund may differ from the net asset value per share of that Fund.
During periods of market volatility, securities underlying each Fund may be unavailable in the secondary market, market participants may be unable to calculate accurately the net asset value per share of that Fund and the liquidity of that Fund may be adversely affected. This kind of market volatility may also disrupt the ability of market participants to create and redeem shares of a Fund. Further, market volatility may adversely affect, sometimes materially, the prices at which market participants are willing to buy and sell shares of a Fund. As a result, under these circumstances, the market value of shares of a Fund may vary substantially from the net asset value per share of that Fund. For all of the foregoing reasons, the performance of each Fund may not correlate with the performance of its Underlying Index as well as the net asset value per share of that Fund, which could materially and adversely affect the value of the notes in the secondary market and/or reduce any payment on the notes.
| · | RISKS ASSOCIATED WITH THE CLEAN ENERGY SECTOR WITH RESPECT TO THE iSHARES® GLOBAL CLEAN ENERGY ETF — |
All or substantially all of the equity securities held by the iShares® Global Clean Energy ETF are issued by companies whose primary line of business is directly associated with the clean energy sector. As a result, the value of the notes may be subject to greater volatility and be more adversely affected by a single economic, political or regulatory occurrence affecting this sector than a different investment linked to securities of a more broadly diversified group of issuers. The risks of investing in the clean energy sector include the risks of focusing investments in the water, energy and environmental sectors, and adverse developments in these sectors may significantly affect the price of the iShares® Global Clean Energy ETF. Clean energy companies may be highly dependent upon government subsidies, contracts with government entities and the successful development of new and proprietary technologies. In addition, seasonal weather conditions, fluctuations in the supply of and demand for clean energy products, changes in energy prices, international political events, the success of project development and tax and other governmental regulatory policies may cause fluctuations in the performance of clean energy companies and the prices of their securities. Weak demand for the companies’ products or services or for clean energy products and services in general, may adversely affect the iShares® Global Clean Energy ETF’s performance. Obsolescence of existing technology, short product cycles, legislation resulting in more strict government regulations and enforcement policies, falling prices and profits, energy conservation, the supply of, and demand for, oil and gas, the price of oil and gas, competition from new market entrants and general economic conditions can significantly affect the clean energy sector. The clean energy sector is relatively nascent and under-researched in comparison to more established and mature sectors, and should therefore be regarded as having greater investment risk. Therefore, shares of companies in this sector maybe more volatile and, historically, have been more volatile than shares of companies operating in other, more established industries. In addition, certain methods used to value companies involved in the alternative power and power technology sectors, particularly those companies that have not yet traded profitably, have not been in widespread use for a
PS-8 | Structured Investments Auto Callable Contingent Interest Notes Linked to the Lesser Performing of the iShares® Global Clean Energy ETF and the Invesco Solar ETF | |
significant period of time. As a result, the use of these valuation methods may serve to increase further the volatility of certain alternative power and power technology company share prices. These factors could affect the clean energy sector and could affect the value of the equity securities held by the iShares® Global Clean Energy ETF and the price of the iShares® Global Clean Energy ETF during the term of the notes, which may adversely affect the value of your notes.
| · | RISKS ASSOCIATED WITH THE SOLAR INDUSTRY WITH RESPECT TO THE INVESCO SOLAR ETF — |
All or substantially all of the equity securities held by the Invesco Solar ETF are issued by companies whose primary line of business is directly associated with the solar industry. As a result, the value of the notes may be subject to greater volatility and be more adversely affected by a single economic, political or regulatory occurrence affecting this industry than a different investment linked to securities of a more broadly diversified group of issuers. The value of stocks that comprise the energy sector and the prices of energy may decline. The alternative energy industry can be significantly affected by obsolescence of existing technology, short product lifecycles, falling prices and profits, competition from new market entrants and general economic conditions. This industry can also be significantly affected by fluctuations in energy prices and supply and demand of alternative energy fuels, energy conservation, the success of exploration projects, tax incentives, subsidies and other government regulations and policies. Companies in this industry may be adversely affected by commodity price volatility, changes in exchange rates, imposition of import controls, availability of certain inputs and materials required for production, depletion of resources, technological developments and labor relations. Recently, the price of oil has declined significantly and experienced significant volatility, which may materially impact companies operating in the solar energy sector. Shares of companies involved in the solar energy sector have historically been more volatile than shares of companies operating in more established industries. These factors could affect the solar industry and could affect the value of the equity securities held by the Invesco Solar ETF and the price of the Invesco Solar ETF during the term of the notes, which may adversely affect the value of your notes.
| · | AN INVESTMENT IN THE NOTES IS SUBJECT TO RISKS ASSOCIATED WITH MID-SIZE, SMALL AND MICRO-CAPITALIZATION STOCKS WITH RESPECT TO THE INVESCO SOLAR ETF — |
Some of the equity securities held by the Invesco Solar ETF have been issued by mid-size, small or micro-capitalization companies. Mid-size, small and micro-capitalization companies may be less able to withstand adverse economic, market, trade and competitive conditions relative to larger companies. Mid-size, small and micro-capitalization companies are less likely to pay dividends on their stocks, and the presence of a dividend payment could be a factor that limits downward stock price pressure under adverse market conditions.
| · | NON-U.S. SECURITIES RISK — |
Some of the equity securities held by the Funds have been issued by non-U.S. companies. Investments in securities linked to the value of such non-U.S. equity securities involve risks associated with the home countries and/or the securities markets in the home countries of the issuers of those non-U.S. equity securities. Also, there is generally less publicly available information about companies in some of these jurisdictions than there is about U.S. companies that are subject to the reporting requirements of the SEC.
| · | EMERGING MARKETS RISK — |
Some of the equity securities held by the Funds have been issued by non-U.S. companies located in emerging markets countries. Countries with emerging markets may have relatively unstable governments, may present the risks of nationalization of businesses, restrictions on foreign ownership and prohibitions on the repatriation of assets, and may have less protection of property rights than more developed countries. The economies of countries with emerging markets may be based on only a few industries, may be highly vulnerable to changes in local or global trade conditions, and may suffer from extreme and volatile debt burdens or inflation rates. Local securities markets may trade a small number of securities and may be unable to respond effectively to increases in trading volume, potentially making prompt liquidation of holdings difficult or impossible at times.
| · | THE NOTES ARE SUBJECT TO CURRENCY EXCHANGE RISK — |
Because the prices of the non-U.S. equity securities held by each Fund are converted into U.S. dollars for purposes of calculating the net asset value of that Fund, holders of the notes will be exposed to currency exchange rate risk with respect to each of the currencies in which the non-U.S. equity securities held by that Fund trade. Your net exposure will depend on the extent to which those currencies strengthen or weaken against the U.S. dollar and the relative weight of equity securities held by the relevant Fund denominated in each of those currencies. If, taking into account the relevant weighting, the U.S. dollar strengthens against those currencies, the price of the relevant Fund will be adversely affected and any payment on the notes may be reduced.
| · | RECENT EXECUTIVE ORDERS MAY ADVERSELY AFFECT THE PERFORMANCE OF THE FUNDS — |
Pursuant to recent executive orders, U.S. persons are prohibited from engaging in transactions in, or possession of, publicly traded securities of certain companies that are determined to be linked to the People’s Republic of China military, intelligence and security
PS-9 | Structured Investments Auto Callable Contingent Interest Notes Linked to the Lesser Performing of the iShares® Global Clean Energy ETF and the Invesco Solar ETF | |
apparatus, or securities that are derivative of, or are designed to provide investment exposure to, those securities. The sponsor of the Underlying Index for the iShares® Global Clean Energy ETF has recently removed the equity securities of a small number of companies from the index from which the constituents of the Underlying Index are drawn in response to these executive orders. If the issuer of any of the equity securities held by the Funds is in the future designated as such a prohibited company, the value of that company may be adversely affected, perhaps significantly, which would adversely affect the performance of the relevant Fund. In addition, under these circumstances, each of the sponsor of the relevant Underlying Index and the relevant Fund is expected to remove the equity securities of that company from that Underlying Index and that Fund, respectively. Any changes to the composition of either Fund in response to these executive orders could adversely affect the performance of that Fund.
| · | THE ANTI-DILUTION PROTECTION FOR THE FUNDS IS LIMITED — |
The calculation agent will make adjustments to the Share Adjustment Factor for each Fund for certain events affecting the shares of that Fund. However, the calculation agent will not make an adjustment in response to all events that could affect the shares of the Funds. If an event occurs that does not require the calculation agent to make an adjustment, the value of the notes may be materially and adversely affected.
PS-10 | Structured Investments Auto Callable Contingent Interest Notes Linked to the Lesser Performing of the iShares® Global Clean Energy ETF and the Invesco Solar ETF | |
The Funds
The iShares® Global Clean Energy ETF is an exchange-traded fund of iShares® Trust, a registered investment company, that seeks to track the investment results, before fees and expenses, of an index composed of global equities in the clean energy sector, which we refer to as the Underlying Index with respect to the iShares® Global Clean Energy ETF. The Underlying Index for the iShares® Global Clean Energy ETF is currently the S&P Global Clean Energy IndexTM. The S&P Global Clean Energy IndexTM is a modified market capitalization-weighted index that is designed to measure the performance of companies in global clean energy related businesses from both developed and emerging markets, with a target constituent count of 100. For additional information about the iShares® Global Clean Energy ETF, see Annex A in this pricing supplement.
The Invesco Solar ETF is an exchange-traded fund of Invesco Exchange-Traded Fund Trust II, a registered investment company, that seeks to track the investment results (before fees and expenses) of the MAC Global Solar Energy Index, which we refer to as the Underlying Index with respect to the Invesco Solar ETF. The MAC Global Solar Energy Index is a modified market capitalization-weighted index that is designed to track the global solar energy equity sector. For additional information about the Invesco Solar ETF, see Annex B in this pricing supplement.
Despite their names, there is no guarantee that either Fund will provide exposure to companies that exhibit positive or favorable clean energy characteristics. If the clean energy characteristics of either Fund are a factor in your decision to invest in the notes, you should consult with your legal or other advisers before making an investment in the notes.
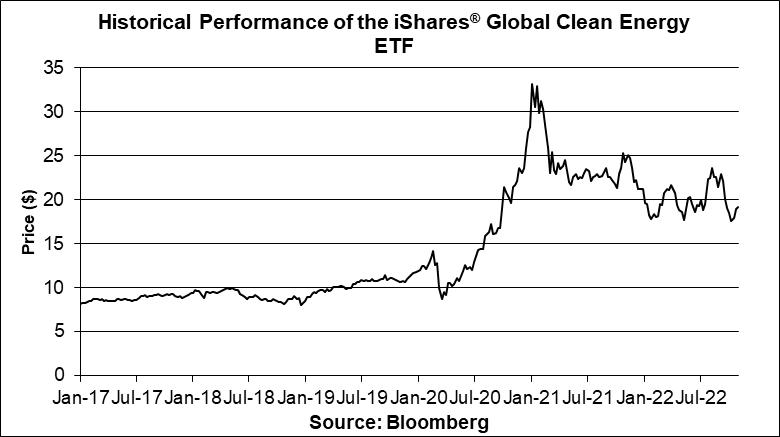
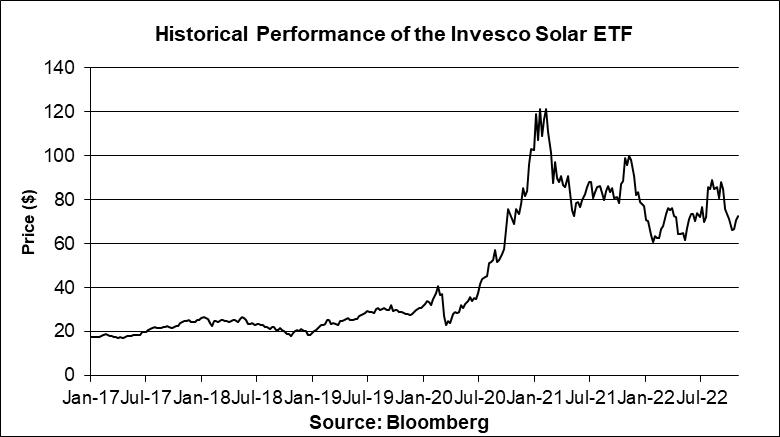
Historical Information
The following graphs set forth the historical performance of each Fund based on the weekly historical closing prices of one share of each Fund from January 6, 2017 through November 4, 2022. The closing price of one share of the iShares® Global Clean Energy ETF on November 10, 2022 was $20.66. The closing price of one share of the Invesco Solar ETF on November 10, 2022 was $81.48. We obtained the closing prices above and below from the Bloomberg Professional® service (“Bloomberg”), without independent verification. The closing prices above and below may have been adjusted by Bloomberg for actions taken by the Funds, such as stock splits.
The historical closing prices of one share of each Fund should not be taken as an indication of future performance, and no assurance can be given as to the closing price of one share of either Fund on the Pricing Date, any Interest Review Date or any Autocall Review Date. There can be no assurance that the performance of the Funds will result in the return of any of your principal amount or the payment of any interest.
PS-11 | Structured Investments Auto Callable Contingent Interest Notes Linked to the Lesser Performing of the iShares® Global Clean Energy ETF and the Invesco Solar ETF | |
Tax Treatment
You should review carefully the section entitled “Material U.S. Federal Income Tax Consequences” in the accompanying product supplement no. 4-II. In determining our reporting responsibilities we intend to treat (i) the notes for U.S. federal income tax purposes as prepaid forward contracts with associated contingent coupons and (ii) any Contingent Interest Payments as ordinary income, as described in the section entitled “Material U.S. Federal Income Tax Consequences — Tax Consequences to U.S. Holders — Notes Treated as Prepaid Forward Contracts with Associated Contingent Coupons” in the accompanying product supplement. Based on the advice of Davis Polk & Wardwell LLP, our special tax counsel, we believe that this is a reasonable treatment, but that there are other reasonable treatments that the IRS or a court may adopt, in which case the timing and character of any income or loss on the notes could be materially affected. In addition, in 2007 Treasury and the IRS released a notice requesting comments on the U.S. federal income tax treatment of “prepaid forward contracts” and similar instruments. The notice focuses in particular on whether to require investors in these instruments to accrue income over the term of their investment. It also asks for comments on a number of related topics, including the character of income or loss with respect to these instruments and the relevance of factors such as the nature of the underlying property to which the instruments are linked. While the notice requests comments on appropriate transition rules and effective dates, any Treasury regulations or other guidance promulgated after consideration of these issues could materially affect the tax consequences of an investment in the notes, possibly with retroactive effect. The discussions above and in the accompanying product supplement do not address the consequences to taxpayers subject to special tax accounting rules under Section 451(b) of the Code. You should consult your tax adviser regarding the U.S. federal income tax consequences of an investment in the notes, including possible alternative treatments and the issues presented by the notice described above.
Non-U.S. Holders — Tax Considerations. The U.S. federal income tax treatment of Contingent Interest Payments is uncertain, and although we believe it is reasonable to take a position that Contingent Interest Payments are not subject to U.S. withholding tax (at least if an applicable Form W-8 is provided), it is expected that withholding agents will (and we, if we are the withholding agent, intend to) withhold on any Contingent Interest Payment paid to a Non-U.S. Holder generally at a rate of 30% or at a reduced rate specified by an applicable income tax treaty under an “other income” or similar provision. We will not be required to pay any additional amounts with respect to amounts withheld. In order to claim an exemption from, or a reduction in, the 30% withholding tax, a Non-U.S. Holder of the notes must comply with certification requirements to establish that it is not a U.S. person and is eligible for such an exemption or reduction under an applicable tax treaty. If you are a Non-U.S. Holder, you should consult your tax adviser regarding the tax treatment of the notes, including the possibility of obtaining a refund of any withholding tax and the certification requirement described above.
Section 871(m) of the Code and Treasury regulations promulgated thereunder (“Section 871(m)”) generally impose a 30% withholding tax (unless an income tax treaty applies) on dividend equivalents paid or deemed paid to Non-U.S. Holders with respect to certain financial instruments linked to U.S. equities or indices that include U.S. equities. Section 871(m) provides certain exceptions to this withholding regime, including for instruments linked to certain broad-based indices that meet requirements set forth in the applicable Treasury regulations. Additionally, a recent IRS notice excludes from the scope of Section 871(m) instruments issued prior to January 1, 2025 that do not have a delta of one with respect to underlying securities that could pay U.S.-source dividends for U.S. federal income tax purposes (each an “Underlying Security”). Based on certain determinations made by us, we expect that Section 871(m) will not apply to the notes with regard to Non-U.S. Holders. Our determination is not binding on the IRS, and the IRS may disagree with this determination. Section 871(m) is complex and its application may depend on your particular circumstances, including whether you
PS-12 | Structured Investments Auto Callable Contingent Interest Notes Linked to the Lesser Performing of the iShares® Global Clean Energy ETF and the Invesco Solar ETF | |
enter into other transactions with respect to an Underlying Security. If necessary, further information regarding the potential application of Section 871(m) will be provided in the pricing supplement for the notes. You should consult your tax adviser regarding the potential application of Section 871(m) to the notes.
In the event of any withholding on the notes, we will not be required to pay any additional amounts with respect to amounts so withheld.
The Estimated Value of the Notes
The estimated value of the notes set forth on the cover of this pricing supplement is equal to the sum of the values of the following hypothetical components: (1) a fixed-income debt component with the same maturity as the notes, valued using the internal funding rate described below, and (2) the derivative or derivatives underlying the economic terms of the notes. The estimated value of the notes does not represent a minimum price at which JPMS would be willing to buy your notes in any secondary market (if any exists) at any time. The internal funding rate used in the determination of the estimated value of the notes may differ from the market-implied funding rate for vanilla fixed income instruments of a similar maturity issued by JPMorgan Chase & Co. or its affiliates. Any difference may be based on, among other things, our and our affiliates’ view of the funding value of the notes as well as the higher issuance, operational and ongoing liability management costs of the notes in comparison to those costs for the conventional fixed income instruments of JPMorgan Chase & Co. This internal funding rate is based on certain market inputs and assumptions, which may prove to be incorrect, and is intended to approximate the prevailing market replacement funding rate for the notes. The use of an internal funding rate and any potential changes to that rate may have an adverse effect on the terms of the notes and any secondary market prices of the notes. For additional information, see “Selected Risk Considerations — Risks Relating to the Estimated Value and Secondary Market Prices of the Notes — The Estimated Value of the Notes Is Derived by Reference to an Internal Funding Rate” in this pricing supplement.
The value of the derivative or derivatives underlying the economic terms of the notes is derived from internal pricing models of our affiliates. These models are dependent on inputs such as the traded market prices of comparable derivative instruments and on various other inputs, some of which are market-observable, and which can include volatility, dividend rates, interest rates and other factors, as well as assumptions about future market events and/or environments. Accordingly, the estimated value of the notes is determined when the terms of the notes are set based on market conditions and other relevant factors and assumptions existing at that time.
The estimated value of the notes does not represent future values of the notes and may differ from others’ estimates. Different pricing models and assumptions could provide valuations for the notes that are greater than or less than the estimated value of the notes. In addition, market conditions and other relevant factors in the future may change, and any assumptions may prove to be incorrect. On future dates, the value of the notes could change significantly based on, among other things, changes in market conditions, our or JPMorgan Chase & Co.’s creditworthiness, interest rate movements and other relevant factors, which may impact the price, if any, at which JPMS would be willing to buy notes from you in secondary market transactions.
The estimated value of the notes will be lower than the original issue price of the notes because costs associated with selling, structuring and hedging the notes are included in the original issue price of the notes. These costs include the selling commissions paid to JPMS and other affiliated or unaffiliated dealers, the projected profits, if any, that our affiliates expect to realize for assuming risks inherent in hedging our obligations under the notes and the estimated cost of hedging our obligations under the notes. Because hedging our obligations entails risk and may be influenced by market forces beyond our control, this hedging may result in a profit that is more or less than expected, or it may result in a loss. A portion of the profits, if any, realized in hedging our obligations under the notes may be allowed to other affiliated or unaffiliated dealers, and we or one or more of our affiliates will retain any remaining hedging profits. See “Selected Risk Considerations — Risks Relating to the Estimated Value and Secondary Market Prices of the Notes — The Estimated Value of the Notes Will Be Lower Than the Original Issue Price (Price to Public) of the Notes” in this pricing supplement.
Secondary Market Prices of the Notes
For information about factors that will impact any secondary market prices of the notes, see “Risk Factors — Risks Relating to the Estimated Value and Secondary Market Prices of the Notes — Secondary market prices of the notes will be impacted by many economic and market factors” in the accompanying product supplement. In addition, we generally expect that some of the costs included in the original issue price of the notes will be partially paid back to you in connection with any repurchases of your notes by JPMS in an amount that will decline to zero over an initial predetermined period. These costs can include selling commissions, projected hedging profits, if any, and, in some circumstances, estimated hedging costs and our internal secondary market funding rates for structured debt issuances. This initial predetermined time period is intended to be the shorter of six months and one-half of the stated term of the notes. The length of any such initial period reflects the structure of the notes, whether our affiliates expect to earn a profit in connection with our hedging activities, the estimated costs of hedging the notes and when these costs are incurred, as determined by our affiliates. See “Selected Risk Considerations — Risks Relating to the Estimated Value and Secondary Market Prices
PS-13 | Structured Investments Auto Callable Contingent Interest Notes Linked to the Lesser Performing of the iShares® Global Clean Energy ETF and the Invesco Solar ETF | |
of the Notes — The Value of the Notes as Published by JPMS (and Which May Be Reflected on Customer Account Statements) May Be Higher Than the Then-Current Estimated Value of the Notes for a Limited Time Period” in this pricing supplement.
Supplemental Use of Proceeds
The notes are offered to meet investor demand for products that reflect the risk-return profile and market exposure provided by the notes. See “How the Notes Work” and “Hypothetical Payout Examples” in this pricing supplement for an illustration of the risk-return profile of the notes and “The Funds” in this pricing supplement for a description of the market exposure provided by the notes.
The original issue price of the notes is equal to the estimated value of the notes plus the selling commissions paid to JPMS and other affiliated or unaffiliated dealers, plus (minus) the projected profits (losses) that our affiliates expect to realize for assuming risks inherent in hedging our obligations under the notes, plus the estimated cost of hedging our obligations under the notes.
Supplemental Plan of Distribution
We expect that delivery of the notes will be made against payment for the notes on or about the Original Issue Date set forth on the front cover of this pricing supplement, which will be the third business day following the Pricing Date of the notes (this settlement cycle being referred to as “T+3”). Under Rule 15c6-1 of the Securities Exchange Act of 1934, as amended, trades in the secondary market generally are required to settle in two business days, unless the parties to that trade expressly agree otherwise. Accordingly, purchasers who wish to trade notes on any date prior to two business days before delivery will be required to specify an alternate settlement cycle at the time of any such trade to prevent a failed settlement and should consult their own advisors.
Supplemental Information About the Form of the Notes
The notes will initially be represented by a type of global security that we refer to as a master note. A master note represents multiple securities that may be issued at different times and that may have different terms. The trustee and/or paying agent will, in accordance with instructions from us, make appropriate entries or notations in its records relating to the master note representing the notes to indicate that the master note evidences the notes.
Additional Terms Specific to the Notes
You may revoke your offer to purchase the notes at any time prior to the time at which we accept such offer by notifying the applicable agent. We reserve the right to change the terms of, or reject any offer to purchase, the notes prior to their issuance. In the event of any changes to the terms of the notes, we will notify you and you will be asked to accept such changes in connection with your purchase. You may also choose to reject such changes, in which case we may reject your offer to purchase.
You should read this pricing supplement together with the accompanying prospectus, as supplemented by the accompanying prospectus supplement relating to our Series A medium-term notes of which these notes are a part, and the more detailed information contained in the accompanying product supplement and the accompanying underlying supplement. This pricing supplement, together with the documents listed below, contains the terms of the notes and supersedes all other prior or contemporaneous oral statements as well as any other written materials including preliminary or indicative pricing terms, correspondence, trade ideas, structures for implementation, sample structures, fact sheets, brochures or other educational materials of ours. You should carefully consider, among other things, the matters set forth in the “Risk Factors” sections of the accompanying prospectus supplement, the accompanying product supplement and the accompanying underlying supplement, as the notes involve risks not associated with conventional debt securities. We urge you to consult your investment, legal, tax, accounting and other advisers before you invest in the notes.
You may access these documents on the SEC website at www.sec.gov as follows (or if such address has changed, by reviewing our filings for the relevant date on the SEC website):
| · | Product supplement no. 4-II dated November 4, 2020: http://www.sec.gov/Archives/edgar/data/19617/000095010320021467/crt_dp139322-424b2.pdf |
| · | Underlying supplement no. 1-II dated November 4, 2020: http://www.sec.gov/Archives/edgar/data/19617/000095010320021471/crt_dp139381-424b2.pdf |
| · | Prospectus supplement and prospectus, each dated April 8, 2020: http://www.sec.gov/Archives/edgar/data/19617/000095010320007214/crt_dp124361-424b2.pdf |
Our Central Index Key, or CIK, on the SEC website is 1665650, and JPMorgan Chase & Co.’s CIK is 19617. As used in this pricing supplement, “we,” “us” and “our” refer to JPMorgan Financial.
PS-14 | Structured Investments Auto Callable Contingent Interest Notes Linked to the Lesser Performing of the iShares® Global Clean Energy ETF and the Invesco Solar ETF | |
Annex A
The iShares® Global Clean Energy ETF
All information contained in this pricing supplement regarding the iShares® Global Clean Energy ETF (the “ICLN Fund”) has been derived from publicly available information, without independent verification. This information reflects the policies of, and is subject to change by iShares® Trust and BlackRock Fund Advisors (“BFA”). The ICLN Fund is an investment portfolio of iShares® Trust. BFA is currently the investment adviser to the ICLN Fund. The ICLN Fund is an exchange-traded fund that trades on The NASDAQ Stock Market under the ticker symbol “ICLN.”
The ICLN Fund seeks to track the investment results, before fees and expenses, of an index composed of global equities in the clean energy sector, which is currently the S&P Global Clean Energy IndexTM. For additional information about the ICLN Fund, see the information set forth under “Fund Descriptions — The iShares® ETFs” in the accompanying underlying supplement. For the purposes of the accompanying underlying supplement, the ICLN Fund is an “iShares® ETF.”
The S&P Global Clean Energy IndexTM
All information contained in this pricing supplement regarding the S&P Global Clean Energy IndexTM, including, without limitation, its make-up, method of calculation and changes in its components, has been derived from publicly available information, without independent verification. This information reflects the policies of, and is subject to change by, S&P Dow Jones Indices LLC (“S&P Dow Jones”). The S&P Global Clean Energy IndexTM is calculated, maintained and published by S&P Dow Jones. S&P Dow Jones has no obligation to continue to calculate and publish, and may discontinue calculation and publication of, the S&P Global Clean Energy IndexTM.
The S&P Global Clean Energy IndexTM is a modified market capitalization-weighted index that is designed to measure the performance of companies in global clean energy related businesses from both developed and emerging markets, with a target constituent count of 100. The S&P Global Clean Energy IndexTM is reported by Bloomberg L.P. under the ticker symbol “SPGTCLEN.”
The S&P Global Clean Energy IndexTM Eligibility
To be eligible for inclusion in the S&P Global Clean Energy IndexTM, an eligible stock must have a minimum total market capitalization of US$300 million and a minimum float-adjusted market capitalization (“FMC”) of US$100 million. Eligible stocks must also maintain a 6-month median daily value traded (“MDVT”) liquidity threshold of US$3 million for new constituents and US$2 million for current constituents. If a stock has traded for less than six months, the MDVT amount for as long as the stock has been trading is used. Eligible stocks must be trading on a developed market exchange and included in the S&P® Global BMI in order to be considered for inclusion in the S&P Global Clean Energy IndexTM. For more information about the S&P® Global BMI’s constituent selection process, please see “The S&P® Global BMI Constituent Selection” below.
The S&P® Global BMI Constituent Selection
The S&P® Global BMI is designed to measure global stock market performance. Securities issued by companies domiciled in countries classified as developed or emerging markets are eligible for inclusion in the S&P® Global BMI. The S&P® Global BMI covers all publicly listed equities with FMCs of at least US$100 million. At the S&P® Global BMI reconstitution, an S&P® Global BMI constituent is removed if its FMC falls below US$75 million.
At the annual reconstitution, the liquidity of each stock being considered for inclusion is evaluated using two median daily value traded metrics:
| 1. | Eligible stocks must have a minimum US$12 month median value traded ratio (“MVTR”) to be eligible. The ratio is calculated by taking the US$ MDVT amount for each of the 12 months preceding the rebalancing reference date, multiplying the monthly amount by the number of days that the stock traded during that month, and then dividing by its end-of-month FMC, also calculated in US$. The sum of the 12 monthly values is the MVTR for that stock. If a stock has traded for less than 12 months, the average of the available monthly values is taken and multiplied by 12. Monthly MDVT is defined as the median of the daily value traded for a given company in a given month. The value traded is calculated by multiplying the number of shares traded by each stock’s price. |
PS-15 | Structured Investments Auto Callable Contingent Interest Notes Linked to the Lesser Performing of the iShares® Global Clean Energy ETF and the Invesco Solar ETF | |
| 2. | Eligible stocks must have a minimum US$ MDVT over the six months prior to the rebalancing reference date to be eligible. If a stock has traded for less than six months, the MDVT amount for as long as the stock has been trading is used. The requirements vary based on a stock’s country classification, whether emerging or developed. These requirements are summarized in the following table: |
| Liquidity Thresholds for Potential Constituents | ||
| Region | 12-Month MVTR (%) | 6-Month MDVT (US$M) |
| Emerging | 10 | 0.1 |
| Developed | 20 | 0.25 |
At annual reconstitution, current constituents of the S&P® Global BMI are removed if either of the liquidity metrics fall below the thresholds in the following table:
| Liquidity Thresholds for Current Constituents | ||
| Region | 12-Month MVTR (%) | 6-Month MDVT (US$M) |
| Emerging | 7 | 0.07 |
| Developed | 14 | 0.175 |
S&P® Global BMI candidates must be common shares or other securities that have the characteristics of common equities. All classes of common shares, both fully and partially paid, are eligible. Temporary issues arising from corporate actions, such as “when-issued shares,” are considered on a case-by-case basis when necessary to maintain continuity in a company’s index membership. Real estate investment trusts (“REITs”), listed property trusts and similar real-property-owning pass-through structures taxed as REITs by their domiciles are eligible. In Canada, income trusts (including Canadian REITs) are eligible, however, income-participating securities that combine stock and debt ownership are ineligible. All publicly listed multiple share class lines are eligible for inclusion in the S&P® Global BMI, subject to meeting the eligibility criteria and foreign investors may hold shares in the class.
If the practical available limit for an existing constituent (as defined by the known shares actually available to foreign investors) falls below 5%, then it will be removed from the S&P® Global BMI at the next quarterly rebalancing. A stock can be added only if the practical available limit is 10% or more. All stocks are reviewed for this at each quarterly rebalancing.
Initial Public Offerings (“IPOs”), as well as new listings on eligible exchanges and issues that emerged from bankruptcy status can be added to the S&P® Global BMI on a quarterly basis. The criteria for inclusion are the same as that used at the annual reconstitution. In addition, the stock must have a trading history of at least three months as of the reference date. The reference date for quarterly inclusions is five weeks prior to the effective rebalancing date, and additions are effective at the open of Monday following the third Friday of March, June, September and December. Market cap and liquidity are evaluated as of the reference date. Since the stocks will have traded less than a full year, the trading value data that is available is annualized to determine S&P® Global BMI eligibility.
Certain large IPOs are eligible for fast track entry to the S&P® Global BMI subject to the following conditions:
| · | Only newly public IPOs and direct placement listings will be considered eligible for fast track entry. Formerly bankrupt companies that switch from Over-the-Counter Exchange or a non-covered exchange to an S&P Dow Jones covered exchange are ineligible. |
| · | Fast track IPO additions must meet a minimum FMC threshold of US$2 billion, calculated using the shares offered (excluding over-allotment options) and the closing price on the first day of trading on an eligible exchange. The threshold level is reviewed from time to time and updated as needed to assure consistency with market conditions. |
| · | In addition, the IPO will need to meet all other applicable S&P® Global BMI eligibility rules except for the liquidity requirement. If all necessary public information is available, S&P Dow Jones verifies that the fast track conditions have been met. Once S&P Dow Jones announces that the IPO is eligible for fast track addition, it is added to the S&P® Global BMI with five business days lead time. Fast track IPO additions eligible to be added during a quarterly rebalancing freeze period will be added on the rebalancing effective date. |
Between rebalancings, a company can be deleted from the S&P® Global BMI due to corporate events such as mergers, acquisitions, delistings or bankruptcies. Companies that fall below US$25 million FMC are removed from the S&P® Global BMI. Evaluations are made quarterly using data from the reference date which is five weeks prior to the effect rebalancing date. Deletions are effective at the open of Monday following the third Friday in March, June, September and December.
A company is deleted from the S&P® Global BMI if it is involved in a merger, acquisition or significant restructuring such that it no longer meets the eligibility criteria. If a company’s shares are no longer available or are no longer trading, the company is deleted from the
PS-16 | Structured Investments Auto Callable Contingent Interest Notes Linked to the Lesser Performing of the iShares® Global Clean Energy ETF and the Invesco Solar ETF | |
S&P® Global BMI as soon as reasonably possible providing that five days’ notice is given. In the event the information of delisting, bankruptcy or ineligible status becomes public after the fact, the stock may be removed with a one-day notice period.
The S&P Global Clean Energy IndexTM Construction
Stocks that meet the eligibility criteria are reviewed for specific practices related to clean energy.
The preliminary universe of companies is identified based on any of the following screens:
| · | Companies that derive at least 25% in aggregate revenue from clean energy-related businesses as defined by FactSet’s Revere Business Industry Classification System (“RBICS”) data. |
| · | Companies from “General Utilities,” as defined by the following GICS® sub-industries, that generate at least 20% of their power (as measured by S&P Trucost Limited (“Trucost”) data) from renewable sources (i.e., Wind, Solar, Hydroelectric, Biomass, and Geothermal): Electric Utilities, Multi-Utilities and Independent Power Producers & Energy Traders. |
| · | Companies from “Renewable Utilities” as defined by the GICS® sub-industry Renewable Electricity |
| · | Companies that had an exposure score of at least 0.5 in the universe for consideration as of the previous rebalancing. |
Exclusion Criteria
The index methodology employs the three following exclusion criteria:
| 1. | Sustainalytics Business Activity Screenings. As of each rebalancing reference date, companies with specific levels of involvement and/or significant ownership thresholds, as specified and measured by Sustainalytics, are excluded from the eligible universe. The following product involvements, as defined by Sustainalytics, are subject to this screen: Controversial Weapons; Small Arms; Military Contracting; Tobacco; Thermal Coal; Oil Sands; Shale Energy; and Arctic Oil & Gas Exploration. |
| 2. | Exclusions Based on Sustainalytics’ Global Standards Screening. Sustainalytics’ Global Standards Screening (“GSS”) provides an assessment of a company’s impact on stakeholders and the extent to which a company causes, contributes or is linked to violations of international norms and standards. The basis of the GSS assessments are the United Nations Global Compact (“UNGC”) Principles. Information regarding related standards is also provided in the screening, including the Organization for Economic Co-operation and Development Guidelines for Multinational Enterprises and the UN Guiding Principles on Business and Human Rights, as well as their underlying conventions. Sustainalytics classifies companies into the following three statuses: |
| · | Non-Compliant. Classification given to companies that do not act in accordance with the UNGC principles and its associated standards, conventions and treaties. |
| · | Watchlist. Classification given to companies that are at risk of violating one or more principles, for which all dimensions for Non-Compliant status could not be established or confirmed. |
| · | Compliant. Classification given to companies that act in accordance with the UNGC principles and its associated standards, conventions, and treaties. |
As of each rebalancing reference date, companies classified as Non-Compliant, according to Sustainalytics, are ineligible for S&P Global Clean Energy IndexTM inclusion. Companies without Sustainalytics coverage are ineligible for index inclusion until they receive such coverage.
| 3. | Media and Stakeholder Analysis Overlay. S&P Global uses RepRisk, a provider of business intelligence on environmental, social, and governance risks, for daily filtering, screening and analysis of controversies related to companies within the S&P Global Clean Energy IndexTM. In cases where risks are presented, S&P Global releases a Media and Stakeholder Analysis (“MSA”) which includes a range of issues such as economic crime and corruption, fraud, illegal commercial practices, human rights issues, labor disputes, workplace safety, catastrophic accidents, and environmental disasters. An S&P Dow Jones index committee (the “Index Committee”) will review constituents that have been flagged by S&P Global’s MSA to evaluate the potential impact of controversial company activities on the composition of the S&P Global Clean Energy IndexTM. If the Index Committee decides to remove a company in question, that company would not be eligible for re-entry into the S&P Global Clean Energy IndexTM for one full calendar year, beginning with the subsequent rebalancing. |
Constituent Selection
After determining the eligible universe, the S&P Global Clean Energy IndexTM components are selected as follows:
| 1. | S&P Dow Jones defines exposure scores for each company based on RBICS classifications and Trucost’s Power Generation Data for Utility companies. Please see “Exposure Score Calculations: Exposure Score Assignment Steps” below. |
| 2. | For all companies with an exposure score of 1, 0.75, and 0.5, after introducing the exclusion criteria described above, those with a Trucost carbon-to-revenue footprint standard score greater than three are excluded from index inclusion. Companies without Trucost coverage are eligible for index inclusion. |
PS-17 | Structured Investments Auto Callable Contingent Interest Notes Linked to the Lesser Performing of the iShares® Global Clean Energy ETF and the Invesco Solar ETF | |
| 3. | For all remaining stocks from the previous step, stocks are first ranked by the exposure scores then by FMC. All exposure score 1 stocks are selected, with a target constituent count of 100. If more than 100 exposure score 1 stocks are eligible, all exposure score 1 stocks are selected. If fewer than 100 exposure score 1 stocks are eligible the following selection steps are performed. |
| 4. | If, after step 3 there are still not 100 constituents, the highest-ranking stock with an exposure score of 0.75 is selected until the target constituent count of 100 is reached. This process continues iteratively until the target constituent count is reached. |
| 5. | If, after step 4 there are still not 100 constituents, the highest-ranking stock with an exposure score of 0.5 is selected until the target constituent count of 100 is reached. |
| 6. | If, after step 5, the S&P Global Clean Energy IndexTM’s weighted average exposure score falls below 0.85, the lowest ranking stock with an exposure score of 0.5 is removed until the S&P Global Clean Energy IndexTM’s weighted average exposure score reaches 0.85. If after removing all stocks with an exposure score of 0.5 and the weighted average exposure score is still below 0.85, the lowest ranking stock with an exposure score of 0.75 is removed until the S&P Global Clean Energy IndexTM’s weighted average exposure score reaches 0.85. Therefore, it is possible for the final S&P Global Clean Energy IndexTM constituent count to be below 100. |
Exposure Score Calculations: Exposure Score Assignment Steps
| Exposure Scores | |||
| 0 | 0.5 | 0.75 | 1 |
| Eliminated, no exposure | Moderate clean energy exposure | Significant clean energy exposure | Maximum clean energy exposure |
The calculation and thresholds used to determine the Exposure Scores used in the constituent selection and weighting are as follows:
| 1. | Calculate a Clean Revenue Score. Calculate a revenue score for all eligible companies by aggregating the percentage of revenue across all in-scope sub-industries based on RBICS data. |
| 2. | Calculate Clean Power Generation Score for Utilities/Power Generation companies. Calculate the percentage of clean power generation for companies that are involved in power generation businesses. These are companies that belong to “General Utilities” or “Renewable Utilities.” Adjust the percentage of clean power generation for each company by multiplying into “Relevant Revenue”. “Relevant Revenue” is considered revenue sourced from power generation and distribution activities, as defined by RBICS data. |
| 3. | Calculate Final Exposure Score. |
For non-power generation companies, assign scores based on the following clean revenue thresholds:
| Exposure Scores | ||||
| Non-Power Generation Companies Clean Revenue Score (x) | 1 | 0.75 | .0.50 | 0 |
| x ≥ 75% | 50% ≤ x < 75% | 25% ≤ x < 50% | x < 25% | |
For power generation-related companies, including companies classified as “General Utilities” and “Renewable Utilities”, there are two scores available for each company: Clean Revenue Score and Clean Power Generation Score. Score assignment is based on the maximum of the two scores:
Clean Score = Max (Clean Revenue Score, Clean Power Generation Score)
| Exposure Scores | ||||
| Power Generation Companies (Utilities) Clean Revenue Score (x) | 1 | 0.75 | .0.50 | 0 |
| x ≥ 75% | 50% ≤ x < 75% | 25% ≤ x < 50% | x < 25% | |
| 4. | Companies with zero clean revenue score or clean power generation score but had an exposure score of at least 0.5 as of the previous rebalancing are possible being assigned a non-zero score based on factors such as a company’s business description and its most recent reported revenue by segment. |
PS-18 | Structured Investments Auto Callable Contingent Interest Notes Linked to the Lesser Performing of the iShares® Global Clean Energy ETF and the Invesco Solar ETF | |
The carbon-to-revenue footprint data used in the methodology is calculated by Trucost, and is defined as the company’s annual greenhouse gas (“GHG”) emissions (direct and first tier indirect), expressed as metric tons of carbon dioxide equivalent (tCO2e) emissions, divided by annual revenues for the corresponding year, expressed in millions of US dollars. Trucost’s annual research process evaluates environmental performance of a given company with one output of this process being its annual GHG emissions profile.
Trucost Environmental Register Research Process
| 1. | Map company business segments. Trucost maps company business segments to more than 450 business activities in the Trucost model. The model is based on the North American Industry Classification System, but goes into greater granularity in some areas, such as power generating utilities. |
| 2. | Estimate data-modelled profile. Once company business segments have been mapped to Trucost sectors and their share of revenue apportioned to each, Trucost is able to generate a data-modelled profile for the company. Trucost uses its environmentally extended input-output model to estimate data for over 800 environmental and operational metrics across the entire operations of companies; from the raw materials they depend on in their supply chains to the electricity they purchase to power their operations. |
| 3. | Collect public disclosure. Trucost searches for environmental performance information in annual reports, sustainability reports, websites and other publicly disclosed sources. Third party datasets, like disclosures to the Carbon Disclosure Project (“CDP”), are also reviewed. Trucost then standardizes reported environmental performance data to best practice guidelines so that it can be compared across companies, regions and business activities. To correct errors in company reporting, data control procedures are applied, including sector specialist data reviews, automated outlier identifications and year-on-year comparisons. Wherever a material metric is not disclosed, Trucost uses the modelled value, to estimate the missing data fields. CDP is a not-for-profit charity that surveys companies on Climate, Water and Forestry issues and aggregates the collected disclosures. |
| 4. | Engage with company. Trucost then conducts an annual engagement with each company, providing the opportunity to verify environmental performance and provide additional information. Companies are further welcomed to contact Trucost analysts at any point in their environmental reporting cycle to provide their most recently available data. This supports Trucost’s efforts to utilize the most up-to-date company information and to maximize data quality. |
Greenhouse Gas Emissions Data
The S&P Global Clean Energy IndexTM uses Trucost’s greenhouse gas emissions data set. Quantities of greenhouse gas emissions are normalized by sales to calculate the company’s carbon intensity, or “carbon-to-revenue footprint.” The S&P Global Clean Energy IndexTM uses direct and first-tier indirect emissions in the carbon-to-revenue footprints.
Constituent Weighting
At each rebalancing, constituents are weighted based on the product of each constituent’s FMC and exposure score, subject to the below constraints. This is done by using an optimization procedure that chooses final weights in such a way to minimize the sum of the squared difference of capped weight and uncapped weight, divided by uncapped weight for each stock, subject to the following constraints:
| · | Constituents with an exposure score of 1 are capped at the lower of 8% or five times the constituent’s liquidity weight. |
| · | Constituents with an exposure score of 0.75 are capped at the lower of 6% or five times the constituent’s liquidity weight. |
| · | Constituents with an exposure score of 0.5 are capped at the lower of 4% or five times the constituent’s liquidity weight. |
| · | The cumulative weight of all constituents within the S&P Global Clean Energy IndexTM that have a weight greater than 4.5% cannot exceed 40%. |
The liquidity weight of a given stock is defined as the stock liquidity of that stock divided by the aggregate stock liquidity of all selected stocks, where the stock liquidity of a given stock is the 6-month MDVT of that stock, calculated as the median of the number of shares traded each day multiplied by that day’s closing price over the six months prior to the relevant rebalancing reference date.
PS-19 | Structured Investments Auto Callable Contingent Interest Notes Linked to the Lesser Performing of the iShares® Global Clean Energy ETF and the Invesco Solar ETF | |
The S&P Global Clean Energy IndexTM Calculation
The S&P Global Clean Energy IndexTM is a modified market capitalization-weighted index where index constituents have a defined weight in the S&P Global Clean Energy IndexTM. The index value of the S&P Global Clean Energy IndexTM is simply the market value of the S&P Global Clean Energy IndexTM divided by the index divisor:
Index Value = (Index Market Value) / Divisor
Index Market Value = × Sharesi × IWFi × FxRateI × AWFi
where, Pi the price of stock i, Sharesi are the outstanding shares of stock i, IWFi is the float factor of stock i (as defined below), AWFi is the adjustment factor of stock i assigned at each index rebalancing date, t, which adjusts the market capitalization for all index constituents to achieve the user-defined weight, while maintaining the total market value of the overall index and FxRatei is the exchange rate from the local currency into index currency for stock i. The AWF for each index constituent, i, at rebalancing date, t, is calculated as:
AWFi,t = Z / FloatAdjustedMarketValuei,t × Wi,t× FxRatei
where Z is an index specific constant set for the purpose of deriving the AWF and, therefore, each stock’s share count used in the index calculation (often referred to as modified index shares). Wi,t is the user-defined weight of stock i on rebalancing date t and FxRate is the exchange rate from the local currency into index currency for stock i.
Float Adjustment. Float adjustment means that the number of shares outstanding is reduced to exclude closely held shares from the calculation of the index value because such shares are not available to investors. The goal of float adjustment is to adjust each company’s total shares outstanding for long-term, strategic shareholders, whose holdings are not considered to be available to the market.
For each component, S&P Dow Jones calculates an Investable Weight Factor (“IWF”), which represents the portion of the total shares outstanding that are considered part of the public float for purposes of the S&P Global Clean Energy IndexTM.
The purpose of the S&P Global Clean Energy IndexTM divisor is to maintain continuity of the S&P Global Clean Energy IndexTM level following the implementation of corporate actions, index rebalancing events, or other non-market driven actions. To assure that the S&P Global Clean Energy IndexTM’s value, or level, does not change when stocks are added or deleted, the divisor is adjusted to offset the change in market value of the S&P Global Clean Energy IndexTM. Thus, the divisor plays a critical role in the S&P Global Clean Energy IndexTM’s ability to provide a continuous measure of market valuation when faced with changes to the stocks included in the S&P Global Clean Energy IndexTM. In a similar manner, some corporate actions that cause changes in the market value of the stocks in the S&P Global Clean Energy IndexTM should not be reflected in the S&P Global Clean Energy IndexTM level. Adjustments are made to the divisor to eliminate the impact of these corporate actions on the S&P Global Clean Energy IndexTM value.
The S&P Global Clean Energy IndexTM Maintenance and Adjustments
Semi-annual reconstitutions of the S&P Global Clean Energy IndexTM occur after the close of trading on the third Friday of April and October. The reference date is after the close of trading on the third Friday of March and September, respectively. In addition, quarterly reweightings occur after the close on the third Friday of January and July.
The table below summarizes the type of index maintenance adjustments and indicate whether or not an index adjustment is required.
| Type of Corporate Action | Comments | Divisor Adjustment | ||
| Spin-off | All spun-off companies are added to and remain in the S&P Global Clean Energy IndexTM until the subsequent rebalancing. | No | ||
| There are no intra-rebalancing additions with the exception of spin-offs. | - | |||
| Constituent Change | Deletions due to delistings, acquisition or any other corporate event resulting in the deletion of the stock from the S&P Global Clean Energy IndexTM will cause the weights of the rest of the stocks in the S&P Global Clean Energy IndexTM to change. Relative weights will stay the same. | Yes |
PS-20 | Structured Investments Auto Callable Contingent Interest Notes Linked to the Lesser Performing of the iShares® Global Clean Energy ETF and the Invesco Solar ETF | |
| Type of Corporate Action | Comments | Divisor Adjustment | ||
Constituents changing their GICS® classification to a non-eligible GICS® classification will be removed at the next rebalancing. | - | |||
| Rebalancing changes including additions, deletions and weight changes. | Yes |
Index Committee
The S&P Global Clean Energy IndexTM is maintained by the Index Committee. The Index Committee meets regularly. At each meeting, the Index Committee may review pending corporate actions that may affect the S&P Global Clean Energy IndexTM constituents, statistics comparing the composition of the S&P Global Clean Energy IndexTM to the market, companies that are being considered as candidates for addition to the S&P Global Clean Energy IndexTM and any significant market events. In addition, the Index Committee may revise index policy covering rules for selecting companies, treatment of dividends, share counts or other matters.
S&P Dow Jones considers information about changes to the S&P Global Clean Energy IndexTM and related matters to be potentially market moving and material. Therefore, all Index Committee discussions are confidential.
The Index Committee reserves the right to make exceptions when applying the methodology if the need arises. In any scenario where the treatment differs from the general rules S&P Dow Jones will provide sufficient notice, whenever possible.
In addition to the daily governance of the S&P Global Clean Energy IndexTM and maintenance of index methodologies, at least once within any 12-month period, the Index Committee reviews the methodology to ensure the S&P Global Clean Energy IndexTM continues to achieve the stated objectives, and that the data and methodology remain effective. In certain instances, S&P Dow Jones may publish a consultation inviting comments from external parties.
PS-21 | Structured Investments Auto Callable Contingent Interest Notes Linked to the Lesser Performing of the iShares® Global Clean Energy ETF and the Invesco Solar ETF | |
Annex B
The Invesco Solar ETF
All information contained in this document regarding the Invesco Solar ETF (the “Solar Fund”) has been derived from publicly available information, without independent verification. This information reflects the policies of, and is subject to change by, Invesco Exchange-Traded Fund Trust II (the “Invesco Trust”) and Invesco Capital Management LLC (“Invesco”). Invesco is currently the investment adviser to the Solar Fund. The Solar Fund is an exchange-traded fund that trades on NYSE Arca, Inc. under the ticker symbol “TAN.”
The Solar Fund seeks to track the investment results (before fees and expenses) of the MAC Global Solar Energy Index. For additional information about the MAC Global Solar Energy Index, see “— The MAC Global Solar Energy Index” below.
The Solar Fund uses an “indexing” investment approach to seek to track the investment results, before fees and expenses, of the MAC Global Solar Energy Index. The Solar Fund employs a “full replication” methodology in seeking to track the MAC Global Solar Energy Index, meaning that it generally invests in all of the securities (including American Depositary receipts) composing the MAC Global Solar Energy Index in proportion to their weightings in the MAC Global Solar Energy Index. However, under various circumstances, it may not be possible or practicable to purchase all of those securities in those same weightings. In those circumstances, the Solar Fund may purchase a sample of securities in the MAC Global Solar Energy Index. A “sampling” methodology means that Invesco uses quantitative analysis to select securities from the MAC Global Solar Energy Index universe to obtain a representative sample of securities that have, in the aggregate, investment characteristics similar to the MAC Global Solar Energy Index in terms of key risk factors, performance attributes and other characteristics. These include industry weightings, market capitalization, return variability, earnings valuation, yield and other financial characteristics of securities. When employing a sampling methodology, Invesco bases the quantity of holdings in the Solar Fund on a number of factors, including asset size of the Solar Fund, and generally expects the Solar Fund to hold less than the total number of securities in the MAC Global Solar Energy Index. However, Invesco reserves the right to invest the Solar Fund in as many securities as it believes necessary to achieve the Solar Fund’s investment objective.
The Solar Fund’s return may not match the return of the MAC Global Solar Energy Index for a number of reasons. For example, the Solar Fund incurs operating expenses not applicable to the MAC Global Solar Energy Index and incurs costs in buying and selling securities, especially when rebalancing the Solar Fund’s securities holdings to reflect changes in the composition of the MAC Global Solar Energy Index. In addition, the performance of the Solar Fund and the MAC Global Solar Energy Index may vary due to asset valuation differences and differences between the Solar Fund’s portfolio and the MAC Global Solar Energy Index resulting from legal restrictions, cost or liquidity constraints.
The Invesco Trust is a registered investment company that consists of numerous separate investment portfolios, including the Solar Fund. Information provided to or filed with the SEC by the Invesco Trust pursuant to the Securities Act of 1933, as amended, and the Investment Company Act of 1940, as amended, can be located by reference to SEC file numbers 333-138490 and 811-21977, respectively, through the SEC’s website at http://www.sec.gov.
The MAC Global Solar Energy Index
All information contained in this pricing supplement regarding the MAC Global Solar Energy Index, including, without limitation, its make-up, method of calculation and changes in its components, has been derived from publicly available information, without independent verification. This information reflects the policies of, and is subject to change by, MAC Indexing, LLC (“MAC Indexing”). The MAC Global Solar Energy Index was developed by MAC Indexing and is calculated, maintained and published by S&P DJI Netherlands B.V., a subsidiary of S&P Dow Jones Indices LLC (“S&P Dow Jones”). Neither MAC Indexing nor S&P Dow Jones has any obligation to continue to publish, and may discontinue publication of, the MAC Global Solar Energy Index. The MAC Global Solar Energy Index is reported by Bloomberg L.P. under the ticker symbol “SUNIDX.”
The MAC Global Solar Energy Index is a modified market capitalization-weighted index that is designed to track the global solar energy equity sector. The MAC Global Solar Energy Index is calculated in U.S. dollars.
The MAC Global Solar Energy Index Eligibility Criteria
Solar Stock Universe List
The first step is to create a Solar Stock Universe List. Once each year, with an information reference date of April 30, the Solar Stock Universe List is reconstituted consisting of solar stocks that are selected in accordance with the below eligibility criteria. For each subsequent quarterly index rebalance, stocks from the Solar Stock Universe List will be eligible for inclusion in the MAC Global Solar Energy Index. Only IPOs may be added to the solar stock universe at subsequent quarterly rebalances as noted below.
Solar Business Activities
Companies with revenue, or other relevant metric (see Index Construction below), from solar business activities of at least one-third of total revenue are selected for the Solar Stock Universe List. An algorithm is used to conduct an automated scan of company
PS-22 | Structured Investments Auto Callable Contingent Interest Notes Linked to the Lesser Performing of the iShares® Global Clean Energy ETF and the Invesco Solar ETF | |
description and segment data as reported on S&P Capital IQ for relevant search terms to identify a universe of solar stocks. Only the securities of those companies identified in this step qualify for inclusion in the Solar Stock Universe List. Companies that do not include in their company description or segment data a reference to a product or business service that is explicitly related to a search term are excluded from the universe even if they may be identified as engaging in solar business activities through other sources. Examples of solar business activities include, but are not limited to:
| · | solar power equipment producers, including ancillary or enabling products, such as tracking systems, inverters, batteries, or other solar energy storage systems; |
| · | suppliers of raw materials, components or services to solar producers or developers; |
| · | companies that produce solar equipment fabrication systems; |
| · | companies involved in solar power system installation, development, integration, maintenance or finance; |
| · | companies that produce hydrogen using solar energy; |
| · | companies that provide solar-powered charging systems for electric vehicles or other electrical devices; |
| · | companies selling systems that use solar thermal energy to produce heat or electricity; and |
| · | companies that sell electricity derived from solar power. |
Country Inclusion Criteria
Stocks must be listed on a primary exchange in one of the countries as shown in in one of the following countries: Australia, Austria, Belgium, Canada, Denmark, Finland, France, Germany, Hong Kong, Ireland, Israel, Italy, Japan, Luxembourg, the Netherlands, New Zealand, Norway, Portugal, Singapore, South Korea, Spain, Sweden, Switzerland, Taiwan, the United Kingdom or the United States. There is no imitation on the country where a company's headquarters or legal domicile may be located, which may differ from where a company's stock is listed as of the Rebalance Observation Date (as defined below).
Security types
Eligible securities for inclusion in the MAC Global Solar Energy Index are common stocks, ADRs, GDRs, and REITs.
Multiple Share Classes and Dual-Listed Companies
Each company is listed once by the Designated Listing, chosen as the share class listed on an eligible exchange with both the highest float-adjusted market capitalization and 1-year median daily trading value.
Liquidity Screens
The minimum threshold for inclusion in the Solar Stock Universe List as of April 30 reference date is float-adjusted market capitalization of at least US$75 million and a 3-month average daily trading value of at least US$250,000.
Business Activity Exclusions
A stock will be excluded from the Solar Stock Universe List at its annual reconstitution, and therefore from the MAC Global Solar Energy Index, if the company is engaged in the business of the extraction of coal, petroleum, or natural gas, or if the company is engaged in the business of generating electricity for sale to third parties using coal, petroleum (oil), or nuclear fuel, according to S&P Trucost Limited (“Trucost”) business activity data as noted in the table below, as of the information reference date of April 30. If a stock is not covered by all the necessary Trucost data to test for exclusionary business activities, then the stock will be included in the annual Solar Stock Universe List and therefore otherwise qualifies for inclusion in the MAC Global Solar Energy Index. Any IPOs or other stocks that may otherwise qualify to be added to the Solar Stock Universe List at the quarterly index rebalance will be included in the Solar Stock Universe List if the stock does not have the necessary Trucost data coverage, but will be excluded from the Solar Stock Universe List and the MAC Global Solar Energy Index if the stock has Trucost data coverage and the Trucost data flags an excluded business activity as noted in the table below.
| Business Activity Exclusions | ||
| Exclusion Type | Trucost Revenue Sector | Revenue Threshold |
| Power Generation | Coal Power Generation Petroleum Power Generation Nuclear Power Generation | > 0 |
| Fossil Fuel Extraction | Crude Petroleum and Natural Gas Extraction Bituminous Coal Underground Mining Bituminous Coal and Lignite Surface Mining | > 0 |
Governance Screen
At the annual reconstitution of the Solar Stock Universe List, stocks with an S&P Global Governance & Economic Score of zero as of the April 30 reference date will be excluded from the Solar Stock Universe List and therefore cannot qualify for inclusion in the MAC
PS-23 | Structured Investments Auto Callable Contingent Interest Notes Linked to the Lesser Performing of the iShares® Global Clean Energy ETF and the Invesco Solar ETF | |
Global Solar Energy Index. If a stock is not covered by S&P Global and does not have a S&P Global Governance & Economic score, that stock will be included in the Solar Stock Universe List and therefore qualifies for inclusion in the MAC Global Solar Energy Index, provided the stock meets the eligibility criteria detailed above. Any IPOs or other stocks that may qualify to be added to the Solar Stock Universe List at the quarterly index rebalance will be included in the Solar Stock Universe List if the stock does not have an S&P Global Governance and Economic score, but will be excluded from the Solar Stock Universe List if the stock has a current S&P Global Governance & Economic score of zero.
Calculating the Solar Exposure Scores
Companies that derive approximately two-thirds to 100% of their revenue, or other relevant metric as described below, from solar business activities are assigned a Solar Exposure Score of 1.0. Companies that derive between approximately one-third and two-thirds of their revenue, or other relevant metric as described below, from solar business activities are assigned a Solar Exposure Score of 0.5. Companies that derive less than approximately one-third of their revenue, or other relevant metric as described below, from solar business activities are excluded from consideration for inclusion in the MAC Global Solar Energy Index. Solar Exposure Scores are assigned at the annual index reconstitution of April 30. Solar Exposure Scores are typically based on information provided in a company's most recent annual report as of the information reference date of April 30, although other company information sources may be used if necessary.
Segment revenue is the primary metric used to determine a company's solar business activity exposure, but if a company does not report a solar revenue breakdown, then other metrics may be used for determining solar exposure, with an order of preference of EBITDA, net income, earnings, cash available for distribution (CAFD), cash flow, balance sheet assets, portfolio holdings, or solar electricity capacity or production in energy terms.
A company will be excluded from the Solar Stock Universe List at the annual reconstitution if that company does not provide sufficient publicly-available information for a determination to be made of whether the company derives more than approximately one-third of its revenue, or other relevant metric stated above, from solar business activities.
IPOs
An algorithm is used to search company description and segment data as reported by S&P Capital IQ to identify IPOs. Stocks that are not in the group identified by the search algorithm will not be included in the MAC Global Solar Energy Index even if that company may be identified as engaging in solar business activities through other sources. As of the Rebalance Observation Date at each quarterly rebalance, a company that recently completed an initial public offering, a direct public offering, or a reverse merger of a private company into a publicly traded company is considered for addition into the Solar Stock Universe List if it meets the following criteria:
| · | The stock has at least two months of trading history prior to the Rebalance Observation Date. This trading history requirement does not apply to companies that were spun off from an existing index constituent. |
| · | The stock satisfies all the eligibility criteria listed under Solar Stock Universe List, with an exception for stocks with less than three months of trading history listed below. |
If a stock considered for addition into the Solar Stock Universe List under this section has traded for less than three months, then the minimum average daily trading value will be for the number of days that the stock has actually traded, rather than the normal 3-month period specified in the Liquidity Screens section above. For a reverse merger, the trading value day count shall begin on the day that the merger takes effect.
The MAC Global Solar Energy Index Construction
Minimum Number of Stocks
The MAC Global Solar Energy Index seeks to have 20 or more constituent stocks. If there is a risk of the number of stocks falling below 20, the eligibility criteria for the inclusion of a constituent in the MAC Global Solar Energy Index will be relaxed as specified in the Liquidity Screens section.
Liquidity Screens
The minimum threshold for initial inclusion of a stock in the MAC Global Solar Energy Index is US$250 million of float-adjusted market capitalization and a 3-month average daily trading value of US$750,000 as of the quarterly Data Reference Date, which is the market close on the first business day of March, June, September, and December. The minimum threshold for the continued inclusion of a constituent in the MAC Global Solar Energy Index at the quarterly index rebalance is US$125 million of float-adjusted market capitalization and a 3-month average daily trading value of US$375,000 as of the quarterly Data Reference Date. If this leads to the stock count dropping under 20 stocks, the minimum thresholds for initial and continued inclusion will be relaxed such that the 20-stock minimum can be met by progressively adding otherwise eligible stocks from the annual Solar Stock Universe list in the order of the stocks with the highest float-adjusted market capitalization first. If there are no eligible stocks to choose from, the stocks identified to be dropped will be retained in the MAC Global Solar Energy Index to meet the 20-stock minimum rule.
PS-24 | Structured Investments Auto Callable Contingent Interest Notes Linked to the Lesser Performing of the iShares® Global Clean Energy ETF and the Invesco Solar ETF | |
Stock Weights
At each quarterly rebalance, the MAC Global Solar Energy Index is rebalanced according to the following weighting methodology:
| · | The new rebalance weights are determined as of the reweighting reference date, which is the market close on the first business day of the rebalance month (i.e., March, June, September, and December) before the index rebalance's effective date of the third Friday in March, June, September, and December. The stocks in the MAC Global Solar Energy Index are first assigned a raw weight based on a standard float-adjusted market capitalization weighting scheme, with any stock having a Solar Exposure Score of 0.5 first having its float-adjusted market capitalization multiplied by 0.5 to reduce its raw weight by half. |
| · | If necessary, the raw weighting factors are modified through a weighting-gap rebalancing algorithm to ensure that, at the time of the reweighting reference date, a Diversification Rule applies such that the aggregate weighting of securities in the MAC Global Solar Energy Index with individual weightings of more than 4.5% is no more than 45.0% of the MAC Global Solar Energy Index. The weight of each individual stock is capped at 10%, with any excess weight distributed pro-rata to the other stocks in the MAC Global Solar Energy Index. The weighting-gap rebalancing algorithm progressively reduces the weighting gap between adjacent securities, as ranked by their raw weighting factors, on a proportional basis, until the weighting parameters specified above are met. If the algorithm is unable to produce a result that meets the Diversification Rule, then the weighting outcome that is available with the lowest total weight of stocks above 4.5% will be used, and the Diversification Rule will be relaxed so that the total weight of stocks over 4.5% can exceed 45% for that quarterly index rebalance. |
| · | The MAC Global Solar Energy Index shall also seek to meet a rule (70% Minimum Liquidity Rule) that constituent stocks, that in the aggregate account for at least 70% of the weight of the MAC Global Solar Energy Index, each have a minimum global monthly trading volume of 250,000 shares, or minimum global notional volume traded per month of US$25,000,000, averaged over the last six months. If this rule is not met, then individual stocks that do not meet this rule will be progressively dropped from the MAC Global Solar Energy Index beginning with the stocks that have the smallest trading volume, until the rule is met, subject to the constraint that the number of the stocks in the MAC Global Solar Energy Index do not drop below 20. |
| · | The index follows an "80% investment policy" whereby at least 80% of the combined weight of the index constituents will be represented by companies that derive at least 50% of their revenue from solar business activities. In order to comply with this policy, if necessary, stocks with less than 50% solar revenue will not be initially included in the MAC Global Solar Energy Index, and if still necessary, stocks with less than 50% solar revenue will be progressively dropped from the MAC Global Solar Energy Index in the order of the smallest float-adjusted market capitalization stocks first, until the policy requirement is met, subject to the constraint that the number of stocks in the MAC Global Solar Energy Index do not drop below 20. |
The stock weights will always be determined to satisfy the constraints specified in the following order: the minimum number of stocks, the Diversification Rule, the 70% Minimum Liquidity Rule and the 80% investment policy.
The MAC Global Solar Energy Index Calculation
The MAC Global Solar Energy Index is a modified market capitalization-weighted index where index constituents have a defined weight in the MAC Global Solar Energy Index . The index value of the MAC Global Solar Energy Index is simply the market value of the MAC Global Solar Energy Index divided by the index divisor:
Index Value = (Index Market Value) / Divisor
Index Market Value = × Sharesi × IWFi × FxRateI × AWFi
where, Pi the price of stock i, Sharesi are the outstanding shares of stock i, IWFi is the float factor of stock i (as defined below), AWFi is the adjustment factor of stock i assigned at each index rebalancing date, t, which adjusts the market capitalization for all index constituents to achieve the user-defined weight, while maintaining the total market value of the overall index and FxRatei is the exchange rate from the local currency into index currency for stock i. The AWF for each index constituent, i, at rebalancing date, t, is calculated as:
AWFi,t = Z / FloatAdjustedMarketValuei,t × Wi,t× FxRatei
where Z is an index specific constant set for the purpose of deriving the AWF and, therefore, each stock’s share count used in the index calculation (often referred to as modified index shares). Wi,t is the user-defined weight of stock i on rebalancing date t and FxRate is the exchange rate from the local currency into index currency for stock i.
Float Adjustment. Float adjustment means that the number of shares outstanding is reduced to exclude closely held shares from the calculation of the index value because such shares are not available to investors. The goal of float adjustment is to adjust each company’s total shares outstanding for long-term, strategic shareholders, whose holdings are not considered to be available to the market.
PS-25 | Structured Investments Auto Callable Contingent Interest Notes Linked to the Lesser Performing of the iShares® Global Clean Energy ETF and the Invesco Solar ETF | |
For each component, S&P Dow Jones calculates an Investable Weight Factor (“IWF”), which represents the portion of the total shares outstanding that are considered part of the public float for purposes of the MAC Global Solar Energy Index.
The purpose of the MAC Global Solar Energy Index divisor is to maintain continuity of the MAC Global Solar Energy Index level following the implementation of corporate actions, index rebalancing events, or other non-market driven actions. To assure that the MAC Global Solar Energy Index’s value, or level, does not change when stocks are added or deleted, the divisor is adjusted to offset the change in market value of the MAC Global Solar Energy Index. Thus, the divisor plays a critical role in the MAC Global Solar Energy Index’s ability to provide a continuous measure of market valuation when faced with changes to the stocks included in the MAC Global Solar Energy Index. In a similar manner, some corporate actions that cause changes in the market value of the stocks in the MAC Global Solar Energy Index should not be reflected in the MAC Global Solar Energy Index level. Adjustments are made to the divisor to eliminate the impact of these corporate actions on the MAC Global Solar Energy Index value.
The MAC Global Solar Energy Index Maintenance
Rebalancing
The MAC Global Solar Energy Index is rebalanced on a quarterly basis as of the close of the 3rd Friday of in March, June, September, and December. The S&P Dow Jones’ SP MAC Custom Index Committee (the “Index Committee”) at each quarterly rebalance will (1) determine any new additions or deletions of index constituents and (2) implement a rebalancing of the constituent weights as defined by the index methodology.
To determine new index constituents and deletions and to rebalance index constituent weights, the Index Committee at each quarterly index rebalance will add to the annual Solar Stock Universe List any solar company IPOs, direct listings or reverse mergers that took place since the last review and that otherwise meet the eligibility criteria. Also, any new stock for inclusion in the MAC Global Solar Energy Index will first be reassessed with the latest available information to determine the percentage of its solar business activities, and if that percentage is below one-third of total revenue or other relevant metric, it will not be included in the MAC Global Solar Energy Index and will be dropped from the Solar Stock Universe List. At the June quarterly review, the Index Committee will implement the new annual Solar Stock Universe List that was compiled with information that was current as of the reference date of April 30.
After any revisions are made to the Solar Stock Universe List, then stocks are added to or deleted from the MAC Global Solar Energy Index using the Solar Stock Universe List and the eligibility requirements for the minimum float-adjusted market cap and average daily trading value, subject to the other methodology constraints described above.
Proforma data will be generated starting as of the Reference Date (i.e., the close of the second Friday of the relevant rebalance month), based on data as of the market close on the first business day of the relevant rebalance month (i.e., March, June, September, and December)
The “Rebalance Observation Date” is as of the market close on the first business day of the relevant rebalance month (i.e., March, June, September, and December).
The “Rebalancing Reference Date” or “Reference Date” for weighting occurs as of the close of the second Friday of the relevant Rebalance month and if that day is not a business day then the immediately following Business Day.
The “Rebalancing Effective Date” or “Rebalancing Date” is after the close of the third Friday of the Rebalance Month effective at next day market open, or if that Friday is not an Index Business Day, the immediately following Index Business Day.
The “Rebalance Month” is March, June, September, and December.
An “Index Business Day” is any day where an index constituent is open for trading.
Stocks are assigned index shares and rebalance weights using the closing prices as of the Reference Date. Because index shares are assigned based on prices a number of days prior to the Rebalancing Date, the actual weight of each stock at the Rebalancing Date differs from its final stock weight due to market movements.
Additions and Deletions
Except for spin-offs, companies can only be added to the MAC Global Solar Energy Index during the rebalancing. Between Rebalancing Dates, deletions can occur due to acquisitions, mergers and spin-offs, or due to bankruptcies or suspensions. As the MAC Global Solar Energy Index does not have a fixed number of constituents, additions to and deletions from the MAC Global Solar Energy Index may not be equal in number.
Corporate Actions
Between two Rebalancing Dates the maintenance of index constituents is based on the following principle: all share and price adjustments that do not alter the membership of stocks in the universe or their risk characteristics do not lead to changes in the index value or composition. The follow describes the maintenance rules for the most common corporate actions.
PS-26 | Structured Investments Auto Callable Contingent Interest Notes Linked to the Lesser Performing of the iShares® Global Clean Energy ETF and the Invesco Solar ETF | |
| Type of Corporate Action | Comments | Divisor Adjustment | ||
| Stock Split, Forward/Reverse | Market capital neutral treatment, share change offset by price adjustment | No | ||
| IWF Change | IWF changes do not affect index market capitalization as the AWF will adjust to negate any IWF changes. | No | ||
| Share Issuance | Share changes do not affect index market capitalization as the AWF will adjust to negate any share changes. | No | ||
| Rights Offering | If the rights are in the money, the spot price of the underlying security will be adjusted after market close of the day prior to the ex-date and the index shares of the underlying security will adjust to offset the price adjustment, thus making the event a market cap neutral event. | No | ||
| Special Dividend | Price adjustment will be applied after market close on ex-date minus 1. | Yes | ||
| Delisting | The delisted security will be deleted from the MAC Global Solar Energy Index (at either the last traded price of a zero price). | Yes | ||
| Spin-Off | S&P DJI practice is to follow a zero price spin off treatment. No price adjustment applied to the parent, the spinoff company is added to the MAC Global Solar Energy Index at price of zero and at the terms of the spinoff so it is market capitalization neutral on the ex-date (no divisor change). The spun-offs are added to the MAC Global Solar Energy Index. In the event that S&P DJI applies the event as a non-ZPSO event, the spun-off company is added to the MAC Global Solar Energy Index with respect to spinoff ratio. The spot price of the underlying security is adjusted after market close of the day prior to the ex-date by the closing spot price of the spun-off company multiplied by the spin-off ratio, thus making it a market cap neutral event. The divisor will not be adjusted. | No | ||
| M&A (constituent acquired for cash) | The acquired company is deleted from the MAC Global Solar Energy Index. | Yes | ||
| M&A (constituent acquired by another constituent for stock or cash and stock) | The acquired company is deleted from the MAC Global Solar Energy Index. The shares outstanding and IWF of the acquirer will be adjusted with respect to the stock terms of the acquisition. | Yes |
A distribution by an existing index constituent to its shareholders of a publicly-traded spin-off will automatically be included in the MAC Global Solar Energy Index initially, but will be dropped from the MAC Global Solar Energy Index at the next quarterly review if the spun-off company does not meet the standard index constituent criteria. The average daily trading value for testing whether a spin-off should remain in the MAC Global Solar Energy Index will be for the number of days the spin-off has actually been trading, which is likely to be less than the normal 3-month period specified in the Liquidity Screens section. The parent company that conducted the spin-off will also be reevaluated at the next quarterly index rebalance and will be dropped from the MAC Global Solar Energy Index if it no longer meets the index criteria, including the required minimum of one-third of its revenue derived from solar business activities. The Solar Exposure Scores for the parent and the spun-off company will also be reevaluated at the quarterly rebalance.
Exchange Rate
WM/Reuters foreign exchange rates are taken daily at 04:00 PM London time and used in the calculation of the MAC Global Solar Energy Index. These mid-market fixings are calculated by the WM Company based on Reuters' data and appear on Reuters pages WMRA.
PS-27 | Structured Investments Auto Callable Contingent Interest Notes Linked to the Lesser Performing of the iShares® Global Clean Energy ETF and the Invesco Solar ETF | |
Other Adjustments
In cases where there is no achievable market price for a stock being deleted, it can be removed at a zero or minimal price at the Index Committee’s discretion, in recognition of the constraints faced by investors in trading bankrupt or suspended stocks.
Index Committee
The Index Committee maintains the MAC Global Solar Energy Index. The Index Committee meets at regular intervals. At each meeting, the Index Committee reviews matters that may affect the MAC Global Solar Energy Index, including the index methodology, constituents and any significant market events. In addition, the Index Committee may revise index policy and procedures.
S&P Dow Jones considers information regarding changes to the MAC Global Solar Energy Index and related matters to be potentially market moving and material; therefore, all Index Committee discussions are confidential.
PS-28 | Structured Investments Auto Callable Contingent Interest Notes Linked to the Lesser Performing of the iShares® Global Clean Energy ETF and the Invesco Solar ETF | |