UNITED STATES
SECURITIES AND EXCHANGE COMMISSION
Washington, D.C. 20549
FormN-CSR
CERTIFIED SHAREHOLDER REPORT OF REGISTERED
MANAGEMENT INVESTMENT COMPANIES
Investment Company Act File Number:811-23136
Eaton Vance High Income 2021 Target Term Trust
(Exact Name of Registrant as Specified in Charter)
Two International Place, Boston, Massachusetts 02110
(Address of Principal Executive Offices)
Maureen A. Gemma
Two International Place, Boston, Massachusetts 02110
(Name and Address of Agent for Services)
(617)482-8260
(Registrant’s Telephone Number)
March 31
Date of Fiscal Year End
March 31, 2019
Date of Reporting Period
Item 1. Reports to Stockholders

Eaton Vance
High Income 2021 Target Term Trust (EHT)
Annual Report
March 31, 2019
Important Note. Beginning on January 1, 2021, as permitted by regulations adopted by the Securities and Exchange Commission, paper copies of the Fund’s annual and semi-annual shareholder reports will no longer be sent by mail unless you specifically request paper copies of the reports. Instead, the reports will be made available on the Fund’s website(funds.eatonvance.com/closed-end-fund-and-term-trust-documents.php), and you will be notified by mail each time a report is posted and provided with a website address to access the report.
If you already elected to receive shareholder reports electronically, you will not be affected by this change and you need not take any action. If you hold shares at the Fund’s transfer agent, American Stock Transfer & Trust Company, LLC (“AST”), you may elect to receive shareholder reports and other communications from the Fund electronically by contacting AST. If you own your shares through a financial intermediary (such as a broker-dealer or bank), you must contact your financial intermediary to sign up.
You may elect to receive all future Fund shareholder reports in paper free of charge. If you hold shares at AST, you can inform AST that you wish to continue receiving paper copies of your shareholder reports by calling1-866-439-6787. If you own these shares through a financial intermediary, you must contact your financial intermediary or follow instructions included with this disclosure, if applicable, to elect to continue to receive paper copies of your shareholder reports. Your election to receive reports in paper will apply to all funds held with AST or to all funds held through your financial intermediary, as applicable.

Commodity Futures Trading Commission Registration. Effective December 31, 2012, the Commodity Futures Trading Commission (“CFTC”) adopted certain regulatory changes that subject registered investment companies and advisers to regulation by the CFTC if a fund invests more than a prescribed level of its assets in certain CFTC-regulated instruments (including futures, certain options and swap agreements) or markets itself as providing investment exposure to such instruments. The Fund has claimed an exclusion from the definition of the term “commodity pool operator” under the Commodity Exchange Act. Accordingly, neither the Fund nor the adviser with respect to the operation of the Fund is subject to CFTC regulation. Because of its management of other strategies, the Fund’s adviser is registered with the CFTC as a commodity pool operator and a commodity trading advisor.
Fund shares are not insured by the FDIC and are not deposits or other obligations of, or guaranteed by, any depository institution. Shares are subject to investment risks, including possible loss of principal invested.
Annual ReportMarch 31, 2019
Eaton Vance
High Income 2021 Target Term Trust
Table of Contents
| | | | |
Management’s Discussion of Fund Performance | | | 2 | |
| |
Performance | | | 3 | |
| |
Fund Profile | | | 4 | |
| |
Endnotes and Additional Disclosures | | | 5 | |
| |
Financial Statements | | | 6 | |
| |
Report of Independent Registered Public Accounting Firm | | | 19 | |
| |
Federal Tax Information | | | 20 | |
| |
Annual Meeting of Shareholders | | | 21 | |
| |
Dividend Reinvestment Plan | | | 22 | |
| |
Management and Organization | | | 24 | |
| |
Important Notices | | | 27 | |
Eaton Vance
High Income 2021 Target Term Trust
March 31, 2019
Management’s Discussion of Fund Performance1
Economic and Market Conditions
For the12-month period ended March 31, 2019, the high yield bond market delivered solidly positive performance, but with some bumps in the road along the way. As the period opened in April 2018, high yield bonds were buoyed by positive earnings reports from the quarter just ended and ongoing strength in the U.S. economy. By late April, however, high yield bond prices were under pressure from global trade tensions, rising input costs for manufacturers, and weak demand from retail bond investors. The energy sector, the largest in the U.S. high yield market, fell into a pattern of volatility that would last throughout the period, as investors seesawed between concerns about a global oil glut and geopolitical tensions that threatened to restrict oil and gas supply.
High yield returns improved in the third quarter of 2018. Drivers included low unemployment, rising consumer confidence, and higher corporate profits as a result of tax cuts legislated the previous year. Second quarter gross domestic product (GDP) growth, reported during the third quarter, came in at a blistering 4.2% annualized rate, the strongest growth in nearly four years.
In the final quarter of 2018, however, the high yield market appeared to go briefly off the rails. Fears of a U.S.-China trade war, Brexit uncertainty, slowing global growth and a more-than-40% drop in oil prices all conspired to push high yield returns into negative territory for the quarter. But the situation reversed dramatically in the first quarter of 2019, the final three months of the fiscal year, as the U.S. high yield bond market posted its strongest first quarter performance since 2003. Primary drivers of the turnaround included the perception of progress in U.S.-China trade talks, a rebound in oil prices, an equity market rally, and dovish remarks from the U.S. Federal Reserve Board (the Fed), indicating the potential for a halt in Fed rate hikes for the rest of 2019.
For the12-month period as a whole, the short duration9 ICE BofAML U.S. High Yield Cash PayBB-B 1–3 Year Index2 returned 5.83%, only slightly less than the 5.94% return of the broader and longer duration ICE BofAML U.S. High Yield Index. High yield bonds in general outperformed the overall bond market, as represented by the Bloomberg Barclays U.S. Aggregate Bond Index, which advanced 4.48% during the same period. Corporate fundamentals in general remained strong throughout the period, and the trailing12-month default rate for high yield bonds was 0.94% as ofperiod-end on March 31, 2019 — well below the long-term average.
Fund Performance
For the12-month period ended March 31, 2019, Eaton Vance High Income 2021 Target Term Trust (the Fund) had a total return of 4.84% at net asset value (NAV). The Fund is managed against the stated objectives of delivering high current income and returning the initial NAV of $9.85 (before deduction of offering costs) per common share to shareholders after five years. At period end, the Fund’s NAV was $9.95.
Contributors to returns during the period included sector positions and holdings in specific credit rating8 and duration categories. With regard to sectors, the top contributors to total return were holdings in health care, technology and diversified financial services. In health care, the top contributor was the Fund’s position in a provider of negative pressure wound therapy that benefited from large market share and a strong support and distribution network. The top contributor in technology was a large position in a multinational computer technology company. The firm’s credit position appeared to improve during the period, as it continued efforts to migrate toward a full investment-grade rating.
By credit rating tiers, the top contributor to returns was the Fund’s allocation toB-rated bonds, which on average accounted for more than 40% of Fund assets during the period. The Fund’s gross leverage of about 23% aided performance during the period as well. Leverage has the effect of magnifying a fund’s exposure to its underlying investments in both up and down markets, and thus helped Fund performance during this period of positive performance by high yield bonds.
By duration segment, the largest contribution to returns came from bonds with durations between one and three years. In general, the Fund’s duration approach — a result of the Fund’s 2021 termination date — was a net positive for returns during the period. Shorter duration dragged on returns in the final quarter of the period, when longer duration segments of the broad high yield market outperformed. However, that negative effect was outweighed by the benefits of shorter duration in the final quarter of 2018, when the Fund’s shorter duration helped mitigate the negative effects of volatility and falling prices in the high yield market during the quarter.
In contrast, the Fund’s allocation toCCC-rated bonds dragged on performance during the period. The return of this segment was modestly negative for the period, largely as a result of the declining high yield market in the fourth quarter of 2018. Security selection in the automotive & auto parts sector detracted from returns as well. The main detractor in the sector was exposure to a North American tire distributor that lost its distribution agreement with two key manufacturers — which combined had accounted for a significant portion of the firm’s revenue.
See Endnotes and Additional Disclosures in this report.
Past performance is no guarantee of future results. Returns are historical and are calculated by determining the percentage change in net asset value (NAV) or market price (as applicable) with all distributions reinvested and include management fees and other expenses. Fund performance at market price will differ from its results at NAV due to factors such as changing perceptions about the Fund, market conditions, fluctuations in supply and demand for Fund shares, or changes in Fund distributions. Investment return and principal value will fluctuate so that shares, when sold, may be worth more or less than their original cost. Performance less than or equal to one year is cumulative. Performance is for the stated time period only; due to market volatility, current Fund performance may be lower or higher than the quoted return. For performance as of the most recentmonth-end, please refer to eatonvance.com.
Eaton Vance
High Income 2021 Target Term Trust
March 31, 2019
Performance3
Portfolio ManagersMichael W. Weilheimer, CFA, Stephen C. Concannon, CFA and Kelley G. Baccei
| | | | | | | | | | | | | | | | |
| % Average Annual Total Returns | | Inception Date | | | One Year | | | Five Years | | | Since
Inception | |
Fund at NAV | | | 05/31/2016 | | | | 4.84 | % | | | — | | | | 6.20 | |
Fund at Market Price | | | — | | | | 4.08 | % | | | — | | | | 5.33 | |
| | | | |
| | | | | | | | | | | | | | | | |
| % Premium/Discount to NAV4 | | | | | | | | | | | | |
| | | | | | | | | | | | | | | –2.31 | % |
| | | | |
| | | | | | | | | | | | | | | | |
| Distributions5 | |
Total Distributions per share for the period | | | | | | | | | | | | | | $ | 0.544 | |
Distribution Rate at NAV | | | | | | | | | | | | | | | 4.94 | % |
Distribution Rate at Market Price | | | | | | | | | | | | | | | 5.06 | % |
| | | | | | | | | | | | | | | | |
| | | | |
| | | | | | | | | | | | | | | | |
| % Total Leverage6 | |
Borrowings | | | | | | | | | | | | | | | 22.50 | % |
See Endnotes and Additional Disclosures in this report.
Past performance is no guarantee of future results. Returns are historical and are calculated by determining the percentage change in net asset value (NAV) or market price (as applicable) with all distributions reinvested and include management fees and other expenses. Fund performance at market price will differ from its results at NAV due to factors such as changing perceptions about the Fund, market conditions, fluctuations in supply and demand for Fund shares, or changes in Fund distributions. Investment return and principal value will fluctuate so that shares, when sold, may be worth more or less than their original cost. Performance less than or equal to one year is cumulative. Performance is for the stated time period only; due to market volatility, current Fund performance may be lower or higher than the quoted return. For performance as of the most recentmonth-end, please refer to eatonvance.com.
Eaton Vance
High Income 2021 Target Term Trust
March 31, 2019
Fund Profile
Top 10 Sectors (% of total investments)7
| | | | |
| |
Energy | | | 11.1 | % |
| |
Telecommunications | | | 9.2 | |
| |
Diversified Financial Services | | | 8.9 | |
| |
Health Care | | | 8.7 | |
| |
Technology | | | 7.5 | |
| |
Gaming | | | 6.8 | |
| |
Cable/Satellite TV | | | 5.4 | |
| |
Containers | | | 4.3 | |
| |
Metals/Mining | | | 3.8 | |
| |
Air Transportation | | | 3.7 | |
| |
Total | | | 69.4 | % |
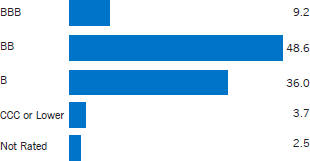
Credit Quality (% of bond and loan holdings)8
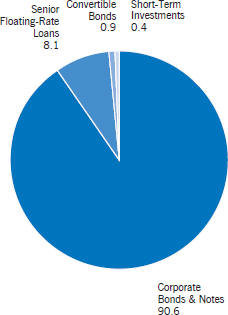
Asset Allocation (% of total investments)
See Endnotes and Additional Disclosures in this report.
Eaton Vance
High Income 2021 Target Term Trust
March 31, 2019
Endnotes and Additional Disclosures
| 1 | The views expressed in this report are those of the portfolio manager(s) and are current only through the date stated at the top of this page. These views are subject to change at any time based upon market or other conditions, and Eaton Vance and the Fund(s) disclaim any responsibility to update such views. These views may not be relied upon as investment advice and, because investment decisions are based on many factors, may not be relied upon as an indication of trading intent on behalf of any Eaton Vance fund. This commentary may contain statements that are not historical facts, referred to as “forward looking statements.” The Fund’s actual future results may differ significantly from those stated in any forward looking statement, depending on factors such as changes in securities or financial markets or general economic conditions, the volume of sales and purchases of Fund shares, the continuation of investment advisory, administrative and service contracts, and other risks discussed from time to time in the Fund’s filings with the Securities and Exchange Commission. |
| 2 | ICE BofAML U.S. High Yield Cash PayBB-B 1–3 Year Index is an unmanaged index of U.S. corporate bonds currently paying a coupon, rated BB1 through B3, and having a maturity less than 3 years. ICE BofAML U.S. High Yield Index is an unmanaged index of below-investment grade U.S. corporate bonds. ICE® BofAML® indices are not for redistribution or other uses; provided “as is”, without warranties, and with no liability. Eaton Vance has prepared this report and ICE Data Indices, LLC does not endorse it, or guarantee, review, or endorse Eaton Vance’s products. BofAML® is a licensed registered trademark of Bank of America Corporation in the United States and other countries. Bloomberg Barclays U.S. Aggregate Bond Index is an unmanaged index of domestic investment-grade bonds, including corporate, government and mortgage-backed securities. Unless otherwise stated, index returns do not reflect the effect of any applicable sales charges, commissions, expenses, taxes or leverage, as applicable. It is not possible to invest directly in an index. |
| 3 | Performance results reflect the effects of leverage. Performance since inception for an index, if presented, is the performance since the Fund’s or oldest share class’ inception, as applicable. |
| 4 | The shares of the Fund often trade at a discount or premium from their net asset value. The discount or premium of the Fund may vary over time and may be higher or lower than what is quoted in this report. Forup-to-date premium/discount information, please refer to http://eatonvance.com/closedend. |
| 5 | The Distribution Rate is based on the Fund’s last regular distribution per share in the period (annualized) divided by the Fund’s NAV or market price at the end of the period. The Fund’s distributions may be comprised of amounts characterized for federal income tax purposes as qualified andnon-qualified ordinary dividends, capital gains and nondividend distributions, also known as return of capital. For additional information about nondividend distributions, please refer to Eaton VanceClosed-End Fund Distribution Notices (19a) posted on our website, eatonvance.com. The Fund will determine the federal income tax character of distributions paid to a shareholder after the end of the calendar year. This is reported on the IRS form1099-DIV and provided to the shareholder shortly after eachyear-end. For information about the tax character of distributions made in prior calendar years, please refer toPerformance-Tax Character of Distributions on the Fund’s webpage available at eatonvance.com. The Fund’s distributions are determined by the investment adviser based on its current assessment of the Fund’s long-term return potential. Fund distributions may be affected by numerous factors including changes in Fund performance, the cost of financing for leverage, portfolio holdings, realized and projected returns, and other factors. As portfolio and market conditions change, the rate of distributions paid by the Fund could change. |
| 6 | Total leverage is shown as a percentage of the Fund’s aggregate net assets plus borrowings outstanding. The Fund employs leverage through borrowings. Use of leverage creates an opportunity for income, but creates risks including greater price volatility. The cost of borrowings rises and falls with changes in short-term interest rates. The Fund may be required to maintain prescribed asset coverage for its leverage and may be required to reduce its leverage at an inopportune time. |
| 7 | Excludes cash and cash equivalents. |
| 8 | Credit ratings are categorized using S&P Global Ratings (“S&P”). If S&P does not publish a rating, then the Moody’s Investors Service, Inc. (“Moody’s”) rating is applied. Ratings, which are subject to change, apply to the creditworthiness of the issuers of the underlying securities and not to the Fund or its shares. Credit ratings measure the quality of a bond based on the issuer’s creditworthiness, with ratings ranging from AAA, being the highest, to D, being the lowest based on S&P’s measures. Ratings of BBB or higher by S&P or Baa or higher by Moody’s are considered to be investment-grade quality. Credit ratings are based largely on the ratings agency’s analysis at the time of rating. The rating assigned to any particular security is not necessarily a reflection of the issuer’s current financial condition and does not necessarily reflect its assessment of the volatility of a security’s market value or of the liquidity of an investment in the security. Holdings designated as “Not Rated” (if any) are not rated by the national ratings agencies stated above. |
| 9 | Duration is a measure of the expected change in price of a bond — in percentage terms — given a one percent change in interest rates, all else being constant. Securities with lower durations tend to be less sensitive to interest rate changes. |
| | Fund profile subject to change due to active management. |
Eaton Vance
High Income 2021 Target Term Trust
March 31, 2019
Portfolio of Investments
| | | | | | | | |
| Corporate Bonds & Notes — 117.7% | |
| Security | | Principal Amount (000’s omitted) | | | Value | |
|
| Aerospace — 2.3% | |
| | |
Bombardier, Inc., 8.75%, 12/1/21(1) | | $ | 4,500 | | | $ | 4,989,375 | |
| | |
| | | | | | | $ | 4,989,375 | |
|
| Air Transportation — 2.5% | |
| | |
Air Canada, 7.75%, 4/15/21(1) | | $ | 5,000 | | | $ | 5,381,250 | |
| | |
| | | | | | | $ | 5,381,250 | |
|
| Automotive & Auto Parts — 1.0% | |
| | |
Ford Motor Credit Co., LLC, 5.875%, 8/2/21 | | $ | 2,000 | | | $ | 2,072,866 | |
| | |
| | | | | | | $ | 2,072,866 | |
|
| Banks & Thrifts — 0.5% | |
| | |
Ally Financial, Inc., 4.25%, 4/15/21 | | $ | 1,000 | | | $ | 1,016,250 | |
| | |
| | | | | | | $ | 1,016,250 | |
|
| Broadcasting — 2.7% | |
| | |
Netflix, Inc., 5.375%, 2/1/21 | | $ | 5,500 | | | $ | 5,725,156 | |
| | |
| | | | | | | $ | 5,725,156 | |
|
| Cable / Satellite TV — 7.0% | |
| | |
Cablevision Systems Corp., 8.00%, 4/15/20 | | $ | 3,500 | | | $ | 3,666,250 | |
| | |
CSC Holdings, LLC, 5.125%, 12/15/21(1) | | | 5,070 | | | | 5,089,012 | |
| | |
CSC Holdings, LLC, 6.75%, 11/15/21 | | | 4,925 | | | | 5,275,906 | |
| | |
DISH DBS Corp., 6.75%, 6/1/21 | | | 845 | | | | 873,308 | |
| | |
| | | | | | | $ | 14,904,476 | |
|
| Capital Goods — 1.7% | |
| | |
Anixter, Inc., 5.125%, 10/1/21 | | $ | 3,500 | | | $ | 3,622,500 | |
| | |
| | | | | | | $ | 3,622,500 | |
|
| Chemicals — 1.2% | |
| | |
W.R. Grace & Co., 5.125%, 10/1/21(1) | | $ | 2,500 | | | $ | 2,594,250 | |
| | |
| | | | | | | $ | 2,594,250 | |
|
| Consumer Products — 3.4% | |
| | |
Edgewell Personal Care Co., 4.70%, 5/19/21 | | $ | 1,500 | | | $ | 1,531,875 | |
| | |
Mattel, Inc., 2.35%, 8/15/21 | | | 6,150 | | | | 5,827,125 | |
| | |
| | | | | | | $ | 7,359,000 | |
| | | | | | | | |
| Security | | Principal Amount (000’s omitted) | | | Value | |
|
| Containers — 4.0% | |
| | |
Ball Corp., 4.375%, 12/15/20 | | $ | 4,000 | | | $ | 4,070,000 | |
| | |
Reynolds Group Issuer, Inc./Reynolds Group Issuer, LLC, 6.287%, (3 mo. USD LIBOR + 3.50%), 7/15/21(1)(2) | | | 1,500 | | | | 1,509,375 | |
| | |
Reynolds Group Issuer, Inc./Reynolds Group Issuer, LLC, 6.875%, 2/15/21 | | | 2,946 | | | | 2,960,295 | |
| | |
| | | | | | | $ | 8,539,670 | |
|
| Diversified Financial Services — 11.6% | |
| | |
AerCap Ireland Capital, Ltd./AerCap Global Aviation Trust, 4.50%, 5/15/21 | | $ | 1,000 | | | $ | 1,022,129 | |
| | |
Alliance Data Systems Corp., 5.875%, 11/1/21(1) | | | 3,894 | | | | 3,991,350 | |
| | |
DAE Funding, LLC, 5.25%, 11/15/21(1) | | | 4,000 | | | | 4,090,000 | |
| | |
Icahn Enterprises, L.P./Icahn Enterprises Finance Corp., 6.00%, 8/1/20 | | | 3,585 | | | | 3,623,539 | |
| | |
Jefferies Finance, LLC/JFINCo-Issuer Corp., 7.50%, 4/15/21(1) | | | 1,650 | | | | 1,683,000 | |
| | |
Navient Corp., 4.875%, 6/17/19 | | | 690 | | | | 691,294 | |
| | |
Navient Corp., 6.625%, 7/26/21 | | | 4,000 | | | | 4,190,000 | |
| | |
Park Aerospace Holdings, Ltd.,
3.625%, 3/15/21(1) | | | 5,500 | | | | 5,472,500 | |
| | |
| | | | | | | $ | 24,763,812 | |
|
| Diversified Media — 0.9% | |
| | |
Nielsen Co. Luxembourg S.a.r.l. (The), 5.50%, 10/1/21(1) | | $ | 1,871 | | | $ | 1,880,355 | |
| | |
| | | | | | | $ | 1,880,355 | |
|
| Energy — 14.4% | |
| | |
Antero Resources Corp., 5.375%, 11/1/21 | | $ | 3,450 | | | $ | 3,475,875 | |
| | |
Canbriam Energy, Inc., 9.75%, 11/15/19(1) | | | 2,595 | | | | 2,114,925 | |
| | |
Denbury Resources, Inc., 9.00%, 5/15/21(1) | | | 20 | | | | 19,550 | |
| | |
Energy Transfer Equity, L.P., 7.50%, 10/15/20 | | | 2,000 | | | | 2,130,130 | |
| | |
Great Western Petroleum, LLC/Great Western Finance Corp., 9.00%, 9/30/21(1) | | | 3,185 | | | | 2,468,375 | |
| | |
Sabine Pass Liquefaction, LLC, 5.625%, 2/1/21 | | | 4,500 | | | | 4,677,097 | |
| | |
Tervita Escrow Corp., 7.625%, 12/1/21(1) | | | 4,070 | | | | 4,059,825 | |
| | |
Transocean, Inc., 8.375%, 12/15/21 | | | 4,000 | | | | 4,230,000 | |
| | |
Whiting Petroleum Corp., 5.75%, 3/15/21 | | | 3,760 | | | | 3,822,040 | |
| | |
Williams Cos., Inc. (The), 7.875%, 9/1/21 | | | 2,000 | | | | 2,211,607 | |
| | |
Williams Partners, L.P., 4.00%, 11/15/21 | | | 1,500 | | | | 1,540,385 | |
| | |
| | | | | | | $ | 30,749,809 | |
|
| Environmental — 1.0% | |
| | |
Clean Harbors, Inc., 5.125%, 6/1/21 | | $ | 2,230 | | | $ | 2,238,363 | |
| | |
| | | | | | | $ | 2,238,363 | |
| | | | |
| | 6 | | See Notes to Financial Statements. |
Eaton Vance
High Income 2021 Target Term Trust
March 31, 2019
Portfolio of Investments — continued
| | | | | | | | |
| Security | | Principal Amount (000’s omitted) | | | Value | |
|
| Food & Drug Retail — 2.4% | |
| | |
Safeway, Inc., 3.95%, 8/15/20 | | $ | 344 | | | $ | 342,280 | |
| | |
Safeway, Inc., 4.75%, 12/1/21 | | | 4,782 | | | | 4,727,007 | |
| | |
| | | | | | | $ | 5,069,287 | |
|
| Gaming — 8.5% | |
| | |
GLP Capital, L.P./GLP Financing II, Inc., 4.875%, 11/1/20 | | $ | 2,500 | | | $ | 2,553,750 | |
| | |
Jack Ohio Finance, LLC/Jack Ohio Finance 1 Corp., 6.75%, 11/15/21(1) | | | 2,940 | | | | 3,035,550 | |
| | |
MGM Resorts International, 6.625%, 12/15/21 | | | 5,000 | | | | 5,356,250 | |
| | |
MGM Resorts International, 6.75%, 10/1/20 | | | 895 | | | | 940,869 | |
| | |
Rivers Pittsburgh Borrower, L.P./Rivers Pittsburgh Finance Corp.,
6.125%, 8/15/21(1) | | | 1,490 | | | | 1,497,450 | |
| | |
Scientific Games International, Inc., 6.625%, 5/15/21 | | | 2,000 | | | | 2,030,000 | |
| | |
Studio City Co., Ltd., 7.25%, 11/30/21(1) | | | 2,750 | | | | 2,851,722 | |
| | |
| | | | | | | $ | 18,265,591 | |
|
| Health Care — 11.3% | |
| | |
Centene Corp., 5.625%, 2/15/21 | | $ | 5,500 | | | $ | 5,589,375 | |
| | |
HCA Healthcare, Inc., 6.25%, 2/15/21 | | | 4,500 | | | | 4,740,075 | |
| | |
Kinetic Concepts, Inc./KCI USA, Inc., 7.875%, 2/15/21(1) | | | 2,188 | | | | 2,242,634 | |
| | |
Kinetic Concepts, Inc./KCI USA, Inc., 12.50%, 11/1/21(1) | | | 2,230 | | | | 2,419,550 | |
| | |
Tenet Healthcare Corp., 6.00%, 10/1/20 | | | 4,000 | | | | 4,155,000 | |
| | |
Teva Pharmaceutical Finance Co., B.V., 3.65%, 11/10/21 | | | 3,000 | | | | 2,941,976 | |
| | |
Teva Pharmaceutical Finance Netherlands III B.V., 2.20%, 7/21/21 | | | 2,200 | | | | 2,098,645 | |
| | |
| | | | | | | $ | 24,187,255 | |
|
| Homebuilders / Real Estate — 3.2% | |
| | |
iStar, Inc., 6.50%, 7/1/21 | | $ | 500 | | | $ | 511,250 | |
| | |
Taylor Morrison Communities, Inc./Taylor Morrison Holdings II, Inc., 5.25%, 4/15/21(1) | | | 2,663 | | | | 2,670,456 | |
| | |
TRI Pointe Group, Inc., 4.875%, 7/1/21 | | | 3,750 | | | | 3,764,063 | |
| | |
| | | | | | | $ | 6,945,769 | |
|
| Leisure — 2.1% | |
| | |
NCL Corp., Ltd., 4.75%, 12/15/21(1) | | $ | 4,337 | | | $ | 4,396,634 | |
| | |
| | | | | | | $ | 4,396,634 | |
|
| Metals / Mining — 4.9% | |
| | |
Eldorado Gold Corp., 6.125%, 12/15/20(1) | | $ | 4,110 | | | $ | 4,032,732 | |
| | |
First Quantum Minerals, Ltd., 7.00%, 2/15/21(1) | | | 3,320 | | | | 3,382,250 | |
| | |
Freeport-McMoRan, Inc., 4.00%, 11/14/21 | | | 2,000 | | | | 2,017,500 | |
| | |
Hecla Mining Co., 6.875%, 5/1/21 | | | 1,000 | | | | 1,001,875 | |
| | |
| | | | | | | $ | 10,434,357 | |
| | | | | | | | |
| Security | | Principal Amount (000’s omitted) | | | Value | |
|
| Restaurants — 1.2% | |
| | |
Yum! Brands, Inc., 3.75%, 11/1/21 | | $ | 2,500 | | | $ | 2,515,625 | |
| | |
| | | | | | | $ | 2,515,625 | |
|
| Retail — 2.7% | |
| | |
Michaels Stores, Inc., 5.875%, 12/15/20(1) | | $ | 2,725 | | | $ | 2,731,812 | |
| | |
Penske Automotive Group, Inc., 3.75%, 8/15/20 | | | 3,000 | | | | 3,000,000 | |
| | |
| | | | | | | $ | 5,731,812 | |
|
| Services — 3.0% | |
| | |
ADT Corp. (The), 6.25%, 10/15/21 | | $ | 6,000 | | | $ | 6,324,300 | |
| | |
| | | | | | | $ | 6,324,300 | |
|
| Steel — 2.7% | |
| | |
Allegheny Technologies, Inc., 5.95%, 1/15/21 | | $ | 4,155 | | | $ | 4,279,650 | |
| | |
Steel Dynamics, Inc., 5.125%, 10/1/21 | | | 1,500 | | | | 1,515,000 | |
| | |
| | | | | | | $ | 5,794,650 | |
|
| Technology — 9.7% | |
| | |
CommScope, Inc., 5.00%, 6/15/21(1) | | $ | 4,000 | | | $ | 4,012,000 | |
| | |
Dell International, LLC/EMC Corp., 4.42%, 6/15/21(1) | | | 2,500 | | | | 2,566,197 | |
| | |
Dell International, LLC/EMC Corp., 5.875%, 6/15/21(1) | | | 5,500 | | | | 5,605,342 | |
| | |
Infor Software Parent, LLC/Infor Software Parent, Inc., 7.125%, (7.125% cash or 7.875% PIK), 5/1/21(1)(3) | | | 6,000 | | | | 6,038,160 | |
| | |
NXP B.V./NXP Funding, LLC, 4.125%, 6/1/21(1) | | | 2,500 | | | | 2,553,150 | |
| | |
| | | | | | | $ | 20,774,849 | |
|
| Telecommunications — 9.7% | |
| | |
CenturyLink, Inc., 6.45%, 6/15/21 | | $ | 4,500 | | | $ | 4,696,875 | |
| | |
Digicel, Ltd., 6.00%, 4/15/21(1) | | | 4,055 | | | | 3,407,051 | |
| | |
GCI, LLC, 6.75%, 6/1/21 | | | 1,367 | | | | 1,375,544 | |
| | |
Hughes Satellite Systems Corp., 7.625%, 6/15/21 | | | 3,500 | | | | 3,771,285 | |
| | |
Sprint Corp., 7.25%, 9/15/21 | | | 7,000 | | | | 7,367,500 | |
| | |
| | | | | | | $ | 20,618,255 | |
|
| Utilities — 2.1% | |
| | |
AES Corp. (The), 4.00%, 3/15/21 | | $ | 4,400 | | | $ | 4,470,004 | |
| | |
| | | | | | | $ | 4,470,004 | |
| |
Total Corporate Bonds & Notes
(identified cost $249,735,933) | | | $ | 251,365,520 | |
| | | | |
| | 7 | | See Notes to Financial Statements. |
Eaton Vance
High Income 2021 Target Term Trust
March 31, 2019
Portfolio of Investments — continued
| | | | | | | | |
| Senior Floating-Rate Loans — 10.6%(4) | |
| Borrower/Tranche Description | | Principal Amount (000’s omitted) | | | Value | |
|
| Air Transportation — 2.3% | |
| | |
| American Airlines, Inc. | | | | | | |
| | |
Term Loan, 4.49%, (1 mo. USD LIBOR + 2.00%), Maturing October 12, 2021 | | $ | 5,000 | | | $ | 4,976,250 | |
| | |
| | | | | | | $ | 4,976,250 | |
|
| Containers — 1.7% | |
| | |
| Berry Global, Inc. | | | | | | |
| | |
Term Loan, 4.24%, (1 mo. USD LIBOR + 1.75%), Maturing January 6, 2021 | | $ | 3,500 | | | $ | 3,491,754 | |
| | |
| | | | | | | $ | 3,491,754 | |
|
| Gaming — 0.3% | |
| | |
| GLP Financing, LLC | | | | | | |
| | |
Term Loan, 3.99%, (1 mo. USD LIBOR + 1.50%), Maturing April 28, 2021 | | $ | 636 | | | $ | 631,591 | |
| | |
| | | | | | | $ | 631,591 | |
|
| Lodging and Casinos — 1.1% | |
| | |
| CCM Merger, Inc. | | | | | | |
| | |
Term Loan, 4.75%, (1 mo. USD LIBOR + 2.25%), Maturing August 8, 2021 | | $ | 2,319 | | | $ | 2,311,112 | |
| | |
| | | | | | | $ | 2,311,112 | |
|
| Services — 1.4% | |
| | |
| KAR Auction Services, Inc. | | | | | | |
| | |
Term Loan, 4.88%, (3 mo. USD LIBOR + 2.25%), Maturing March 11, 2021 | | $ | 3,000 | | | $ | 2,993,751 | |
| | |
| | | | | | | $ | 2,993,751 | |
|
| Steel — 1.5% | |
| | |
Zekelman Industries, Inc., Term Loan,
6/14/21(5) | | $ | 3,241 | | | $ | 3,213,402 | |
| | |
| | | | | | | $ | 3,213,402 | |
|
| Telecommunications — 2.3% | |
| | |
| Zayo Group, LLC | | | | | | |
| | |
Term Loan, 4.50%, (1 mo. USD LIBOR + 2.00%), Maturing January 19, 2021 | | $ | 4,987 | | | $ | 4,967,238 | |
| | |
| | | | | | | $ | 4,967,238 | |
| |
Total Senior Floating-Rate Loans
(identified cost $22,485,290) | | | $ | 22,585,098 | |
| | | | | | | | |
| Convertible Bonds — 1.1% | |
| Security | | Principal Amount (000’s omitted) | | | Value | |
|
| Utilities — 1.1% | |
| | |
Pattern Energy Group, Inc., 4.00%, 7/15/20 | | $ | 2,455 | | | $ | 2,471,878 | |
| | |
| | | | | | | $ | 2,471,878 | |
| |
Total Convertible Bonds
(identified cost $2,461,526) | | | $ | 2,471,878 | |
|
| Short-Term Investments — 0.5% | |
| Description | | Units | | | Value | |
| | |
Eaton Vance Cash Reserves Fund, LLC, 2.59%(6) | | | 982,298 | | | $ | 982,298 | |
| |
Total Short-Term Investments
(identified cost $982,298) | | | $ | 982,298 | |
| |
Total Investments — 129.9%
(identified cost $275,665,047) | | | $ | 277,404,794 | |
| |
Other Assets, Less Liabilities — (29.9)% | | | $ | (63,797,164 | ) |
| |
Net Assets — 100.0% | | | $ | 213,607,630 | |
The percentage shown for each investment category in the Portfolio of Investments is based on net assets.
| (1) | Security exempt from registration pursuant to Rule 144A under the Securities Act of 1933, as amended. These securities may be sold in certain transactions in reliance on an exemption from registration (normally to qualified institutional buyers). At March 31, 2019, the aggregate value of these securities is $98,785,832 or 46.2% of the Trust’s net assets. |
| (2) | Variable rate security. The stated interest rate represents the rate in effect at March 31, 2019. |
| (3) | Represents apayment-in-kind security which may pay interest in additional principal at the issuer’s discretion. |
| (4) | Senior floating-rate loans (Senior Loans) often require prepayments from excess cash flows or permit the borrowers to repay at their election. The degree to which borrowers repay, whether as a contractual requirement or at their election, cannot be predicted with accuracy. As a result, the actual remaining maturity may be substantially less than the stated maturities shown. However, Senior Loans will typically have an expected average life of approximately two to four years. Senior Loans typically have rates of interest which are redetermined periodically by reference to a base lending rate, plus a spread. These base lending rates are primarily the London Interbank Offered Rate (“LIBOR”) and secondarily, the prime rate offered by one or more major United States banks (the “Prime Rate”). Base lending rates may be subject to a floor, or minimum rate. |
| (5) | This Senior Loan will settle after March 31, 2019, at which time the interest rate will be determined. |
| | | | |
| | 8 | | See Notes to Financial Statements. |
Eaton Vance
High Income 2021 Target Term Trust
March 31, 2019
Portfolio of Investments — continued
| (6) | Affiliated investment company, available to Eaton Vance portfolios and funds, which invests in high quality, U.S. dollar denominated money market instruments. The rate shown is the annualizedseven-day yield as of March 31, 2019. |
Abbreviations:
| | | | |
| | |
| LIBOR | | – | | London Interbank Offered Rate |
| | |
| PIK | | – | | Payment In Kind |
Currency Abbreviations:
| | | | |
| | |
| USD | | – | | United States Dollar |
| | | | |
| | 9 | | See Notes to Financial Statements. |
Eaton Vance
High Income 2021 Target Term Trust
March 31, 2019
Statement of Assets and Liabilities
| | | | |
| Assets | | March 31, 2019 | |
| |
Unaffiliated investments, at value (identified cost, $274,682,749) | | $ | 276,422,496 | |
| |
Affiliated investment, at value (identified cost, $982,298) | | | 982,298 | |
| |
Cash | | | 146,015 | |
| |
Interest receivable | | | 4,484,977 | |
| |
Dividends receivable from affiliated investment | | | 6,099 | |
| |
Receivable for investments sold | | | 710,267 | |
| |
Prepaid upfront fees on notes payable | | | 7,927 | |
| |
Prepaid expenses | | | 1,781 | |
| |
Total assets | | $ | 282,761,860 | |
| |
| Liabilities | | | | |
| |
Notes payable | | $ | 62,000,000 | |
| |
Payable for investments purchased | | | 6,664,319 | |
| |
Payable to affiliate: | | | | |
| |
Investment adviser fee | | | 165,254 | |
| |
Interest expense and fees payable | | | 232,086 | |
| |
Accrued expenses | | | 92,571 | |
| |
Total liabilities | | $ | 69,154,230 | |
| |
Net Assets | | $ | 213,607,630 | |
|
| Sources of Net Assets | |
| |
Common shares, $0.01 par value, unlimited number of shares authorized, 21,460,961 shares issued and outstanding | | $ | 214,610 | |
| |
Additionalpaid-in capital | | | 210,946,133 | |
| |
Distributable earnings | | | 2,446,887 | |
| |
Net Assets | | $ | 213,607,630 | |
| |
| Net Asset Value | | | | |
| |
($213,607,630 ÷ 21,460,961 common shares issued and outstanding) | | $ | 9.95 | |
| | | | |
| | 10 | | See Notes to Financial Statements. |
Eaton Vance
High Income 2021 Target Term Trust
March 31, 2019
Statement of Operations
| | | | |
| Investment Income | | Year Ended
March 31, 2019 | |
| |
Interest and other income | | $ | 14,593,034 | |
| |
Dividends from affiliated investment | | | 53,403 | |
| |
Total investment income | | $ | 14,646,437 | |
| |
| Expenses | | | | |
| |
Investment adviser fee | | $ | 1,946,113 | |
| |
Trustees’ fees and expenses | | | 14,011 | |
| |
Custodian fee | | | 93,406 | |
| |
Transfer and dividend disbursing agent fees | | | 18,005 | |
| |
Legal and accounting services | | | 47,394 | |
| |
Printing and postage | | | 28,668 | |
| |
Interest expense and fees | | | 2,236,361 | |
| |
Miscellaneous | | | 74,731 | |
| |
Total expenses | | $ | 4,458,689 | |
| |
Net investment income | | $ | 10,187,748 | |
| |
| Realized and Unrealized Gain (Loss) | | | | |
| |
Net realized gain (loss) — | | | | |
| |
Investment transactions | | $ | (819,833 | ) |
| |
Investment transactions — affiliated investment | | | 1,441 | |
| |
Net realized loss | | $ | (818,392 | ) |
| |
Change in unrealized appreciation (depreciation) — | | | | |
| |
Investments | | $ | 479,617 | |
| |
Net change in unrealized appreciation (depreciation) | | $ | 479,617 | |
| |
Net realized and unrealized loss | | $ | (338,775 | ) |
| |
Net increase in net assets from operations | | $ | 9,848,973 | |
| | | | |
| | 11 | | See Notes to Financial Statements. |
Eaton Vance
High Income 2021 Target Term Trust
March 31, 2019
Statements of Changes in Net Assets
| | | | | | | | |
| | | Year Ended March 31, | |
| Increase (Decrease) in Net Assets | | 2019 | | | 2018 | |
| | |
From operations — | | | | | | | | |
| | |
Net investment income | | $ | 10,187,748 | | | $ | 11,512,409 | |
| | |
Net realized gain (loss) | | | (818,392 | ) | | | 2,708,046 | |
| | |
Net change in unrealized appreciation (depreciation) | | | 479,617 | | | | (6,634,250 | ) |
| | |
Net increase in net assets from operations | | $ | 9,848,973 | | | $ | 7,586,205 | |
| | |
Distributions to shareholders(1) | | $ | (11,674,763 | ) | | $ | (12,876,577 | ) |
| | |
Net decrease in net assets | | $ | (1,825,790 | ) | | $ | (5,290,372 | ) |
| | |
| Net Assets | | | | | | | | |
| | |
At beginning of year | | $ | 215,433,420 | | | $ | 220,723,792 | |
| | |
At end of year | | $ | 213,607,630 | | | $ | 215,433,420 | (2) |
| (1) | For the year ended March 31, 2018, the source of distributions was from net investment income. The current year presentation of distributions conforms with the Disclosure Update and Simplification Rule issued by the Securities and Exchange Commission, effective November 5, 2018. |
| (2) | Includes accumulated undistributed net investment income of $256,723 at March 31, 2018. The requirement to disclose the corresponding amount as of March 31, 2019 was eliminated. |
| | | | |
| | 12 | | See Notes to Financial Statements. |
Eaton Vance
High Income 2021 Target Term Trust
March 31, 2019
Statement of Cash Flows
| | | | |
| Cash Flows From Operating Activities | | Year Ended
March 31, 2019 | |
| |
Net increase in net assets from operations | | $ | 9,848,973 | |
| |
Adjustments to reconcile net increase in net assets from operations to net cash provided by operating activities: | | | | |
| |
Investments purchased | | | (93,591,046 | ) |
| |
Investments sold and principal repayments | | | 97,867,065 | |
| |
Decrease in short-term investments, net | | | 178,478 | |
| |
Net amortization/accretion of premium (discount) | | | 1,801,943 | |
| |
Amortization of prepaid upfront fees on notes payable | | | 45,600 | |
| |
Decrease in interest receivable | | | 253,357 | |
| |
Increase in dividends receivable from affiliated investment | | | (3,693 | ) |
| |
Decrease in prepaid expenses | | | 10,245 | |
| |
Decrease in payable to affiliate for investment adviser fee | | | (3,986 | ) |
| |
Increase in interest expense and fees payable | | | 47,191 | |
| |
Increase in accrued expenses | | | 13,381 | |
| |
Net change in unrealized (appreciation) depreciation from investments | | | (479,617 | ) |
| |
Net realized loss from investments | | | 818,392 | |
| |
Net cash provided by operating activities | | $ | 16,806,283 | |
| |
| Cash Flows From Financing Activities | | | | |
| |
Cash distributions paid | | $ | (11,674,763 | ) |
| |
Proceeds from notes payable | | | 43,000,000 | |
| |
Repayments of notes payable | | | (48,000,000 | ) |
| |
Net cash used in financing activities | | $ | (16,674,763 | ) |
| |
Net increase in cash | | $ | 131,520 | |
| |
Cash at beginning of year | | $ | 14,495 | |
| |
Cash at end of year | | $ | 146,015 | |
| |
| Supplemental disclosure of cash flow information: | | | | |
| |
Cash paid for interest and fees on borrowings | | $ | 2,143,570 | |
| | | | |
| | 13 | | See Notes to Financial Statements. |
Eaton Vance
High Income 2021 Target Term Trust
March 31, 2019
Financial Highlights
| | | | | | | | | | | | |
| | | Year Ended March 31, | | | Period Ended
March 31, 2017(1) | |
| | | 2019 | | | 2018 | |
| | | | |
Net asset value — Beginning of period | | $ | 10.040 | | | $ | 10.280 | | | $ | 9.850 | (2) |
| | | |
| Income (Loss) From Operations | | | | | | | | | | | | |
| | | |
Net investment income(3) | | $ | 0.475 | | | $ | 0.536 | | | $ | 0.483 | |
| | | |
Net realized and unrealized gain (loss) | | | (0.021 | ) | | | (0.176 | ) | | | 0.439 | |
| | | |
Total income from operations | | $ | 0.454 | | | $ | 0.360 | | | $ | 0.922 | |
| | | |
| Less Distributions | | | | | | | | | | | | |
| | | |
From net investment income | | $ | (0.472 | ) | | $ | (0.600 | ) | | $ | (0.450 | ) |
| | | |
From net realized gain | | | (0.072 | ) | | | — | | | | — | |
| | | |
Total distributions | | $ | (0.544 | ) | | $ | (0.600 | ) | | $ | (0.450 | ) |
| | | |
Offering costs charged topaid-in capital | | $ | — | | | $ | — | | | $ | (0.020 | )(3) |
| | | |
Discount related to exercise of underwriters’ over-allotment option | | $ | — | | | $ | — | | | $ | (0.022 | )(3) |
| | | |
Net asset value — End of period | | $ | 9.950 | | | $ | 10.040 | | | $ | 10.280 | |
| | | |
Market value — End of period | | $ | 9.720 | | | $ | 9.880 | | | $ | 10.030 | |
| | | |
Total Investment Return on Net Asset Value(4) | | | 4.84 | % | | | 3.64 | % | | | 9.14 | %(5)(6) |
| | | |
Total Investment Return on Market Value(4) | | | 4.08 | % | | | 4.53 | % | | | 6.49 | %(5)(6) |
| | | |
| Ratios/Supplemental Data | | | | | | | | | | | | |
| | | |
Net assets, end of period (000’s omitted) | | $ | 213,608 | | | $ | 215,433 | | | $ | 220,724 | |
| | | |
Ratios (as a percentage of average daily net assets): | | | | | | | | | | | | |
| | | |
Expenses excluding interest and fees | | | 1.04 | % | | | 1.03 | % | | | 1.04 | %(7) |
| | | |
Interest and fee expense(8) | | | 1.05 | % | | | 0.74 | % | | | 0.52 | %(7) |
| | | |
Total expenses | | | 2.09 | % | | | 1.77 | % | | | 1.56 | %(7) |
| | | |
Net investment income | | | 4.78 | % | | | 5.23 | % | | | 5.71 | %(7) |
| | | |
Portfolio Turnover | | | 36 | % | | | 53 | % | | | 40 | %(5) |
| (1) | For the period from the start of business, May 31, 2016, to March 31, 2017. |
| (2) | Net asset value at beginning of period reflects the deduction of the sales charge of $0.15 per share paid by the shareholders from the $10.00 offering price. |
| (3) | Computed using average shares outstanding. |
| (4) | Returns are historical and are calculated by determining the percentage change in net asset value or market value with all distributions reinvested. Distributions are assumed to be reinvested at prices obtained under the Trust’s dividend reinvestment plan. |
| (6) | Total investment return on net asset value is calculated assuming a purchase at the offering price of $10.00 less the sales load of $0.15 per share paid by the shareholder on the first day and a sale at the net asset value on the last day of the period reported with all distributions reinvested. Total investment return on market value is calculated assuming a purchase at the offering price of $10.00 less the sales load of $0.15 per share paid by the shareholder on the first day and a sale at the current market price on the last day of the period reported with all distributions reinvested. |
| (8) | Interest and fee expense relates to borrowings for the purpose of financial leverage (see Note 6). |
| | | | |
| | 14 | | See Notes to Financial Statements. |
Eaton Vance
High Income 2021 Target Term Trust
March 31, 2019
Notes to Financial Statements
1 Significant Accounting Policies
Eaton Vance High Income 2021 Target Term Trust (the Trust) is a Massachusetts business trust registered under the Investment Company Act of 1940, as amended (the 1940 Act), as a diversified,closed-end management investment company. The Trust’s investment objectives are high current income and to return $9.85 per share, the original net asset value per common share before deducting offering costs of $0.02 per common share (“Original NAV”), to holders of common shares on or about July 1, 2021 (the “Termination Date”). On or about the Termination Date, the Trust intends to cease its investment operations, liquidate its portfolio, retire or redeem its leverage facilities, and seek to return Original NAV to common shareholders, unless the term is extended for one period of up to six months by a vote of the Trust’s Board of Trustees.
The following is a summary of significant accounting policies of the Trust. The policies are in conformity with accounting principles generally accepted in the United States of America (U.S. GAAP). The Trust is an investment company and follows accounting and reporting guidance in the Financial Accounting Standards Board (FASB) Accounting Standards Codification Topic 946.
A Investment Valuation — The following methodologies are used to determine the market value or fair value of investments.
Debt Obligations.Debt obligations are generally valued on the basis of valuations provided by third party pricing services, as derived from such services’ pricing models. Inputs to the models may include, but are not limited to, reported trades, executable bid and ask prices, broker/dealer quotations, prices or yields of securities with similar characteristics, interest rates, anticipated prepayments, benchmark curves or information pertaining to the issuer, as well as industry and economic events. The pricing services may use a matrix approach, which considers information regarding securities with similar characteristics to determine the valuation for a security.Short-term debt obligations purchased with a remaining maturity of sixty days or less for which a valuation from a third party pricing service is not readily available may be valued at amortized cost, which approximates fair value.
Senior Floating-Rate Loans. Interests in senior floating-rate loans (Senior Loans) for which reliable market quotations are readily available are valued generally at the average mean of bid and ask quotations obtained from a third party pricing service. Other Senior Loans are valued at fair value by the investment adviser under procedures approved by the Trustees. In fair valuing a Senior Loan, the investment adviser utilizes one or more of the valuation techniques described in (i) through (iii) below to assess the likelihood that the borrower will make a full repayment of the loan underlying such Senior Loan relative to yields on other Senior Loans issued by companies of comparable credit quality. If the investment adviser believes that there is a reasonable likelihood of full repayment, the investment adviser will determine fair value using a matrix pricing approach that considers the yield on the Senior Loan. If the investment adviser believes there is not a reasonable likelihood of full repayment, the investment adviser will determine fair value using analyses that include, but are not limited to: (i) a comparison of the value of the borrower’s outstanding equity and debt to that of comparable public companies; (ii) a discounted cash flow analysis; or (iii) when the investment adviser believes it is likely that a borrower will be liquidated or sold, an analysis of the terms of such liquidation or sale. In certain cases, the investment adviser will use a combination of analytical methods to determine fair value, such as when only a portion of a borrower’s assets are likely to be sold. In conducting its assessment and analyses for purposes of determining fair value of a Senior Loan, the investment adviser will use its discretion and judgment in considering and appraising relevant factors. Fair value determinations are made by the portfolio managers of the Trust based on information available to such managers. The portfolio managers of other funds managed by the investment adviser that invest in Senior Loans may not possess the same information about a Senior Loan borrower as the portfolio managers of the Trust. At times, the fair value of a Senior Loan determined by the portfolio managers of other funds managed by the investment adviser that invest in Senior Loans may vary from the fair value of the same Senior Loan determined by the portfolio managers of the Trust. The fair value of each Senior Loan is periodically reviewed and approved by the investment adviser’s Valuation Committee and by the Trustees based upon procedures approved by the Trustees. Junior Loans (i.e., subordinated loans and second lien loans) are valued in the same manner as Senior Loans.
Affiliated Fund.The Trust may invest in Eaton Vance Cash Reserves Fund, LLC (Cash Reserves Fund), an affiliated investment company managed by Eaton Vance Management (EVM). While Cash Reserves Fund is not a registered money market mutual fund, it conducts all of its investment activities in accordance with the requirements of Rule2a-7 under the 1940 Act. Investments in Cash Reserves Fund are valued at the closing net asset value per unit on the valuation day. Cash Reserves Fund generally values its investment securities based on available market quotations provided by a third party pricing service.
Fair Valuation.Investments for which valuations or market quotations are not readily available or are deemed unreliable are valued at fair value using methods determined in good faith by or at the direction of the Trustees of the Trust in a manner that fairly reflects the security’s value, or the amount that the Trust might reasonably expect to receive for the security upon its current sale in the ordinary course. Each such determination is based on a consideration of relevant factors, which are likely to vary from one pricing context to another. These factors may include, but are not limited to, the type of security, the existence of any contractual restrictions on the security’s disposition, the price and extent of public trading in similar securities of the issuer or of comparable companies or entities, quotations or relevant information obtained from broker/dealers or other market participants, information obtained from the issuer, analysts, and/or the appropriate stock exchange (for exchange-traded securities), an analysis of the company’s or entity’s financial condition, and an evaluation of the forces that influence the issuer and the market(s) in which the security is purchased and sold.
B Investment Transactions — Investment transactions for financial statement purposes are accounted for on a trade date basis. Realized gains and losses on investments sold are determined on the basis of identified cost.
C Income — Interest income is recorded on the basis of interest accrued, adjusted for amortization of premium or accretion of discount. Fees associated with loan amendments are recognized immediately. Dividend income is recorded on theex-dividend date for dividends received in cash and/or securities.
Eaton Vance
High Income 2021 Target Term Trust
March 31, 2019
Notes to Financial Statements — continued
D Federal Taxes — The Trust intends to make monthly distributions of net investment income and any net realized capital gains in amounts necessary to maintain its taxation as a regulated investment company for U.S. federal income tax purposes. For the purpose of pursuing its investment objective of returning Original NAV, the Trust may retain a portion of its net investment income and some or all of its net capital gains, which would result in the Trust paying U.S. federal excise and corporate income taxes.
As of March 31, 2019, the Trust had no uncertain tax positions that would require financial statement recognition,de-recognition, or disclosure. The Trust files a U.S. federal income tax return annually after its fiscalyear-end, which is subject to examination by the Internal Revenue Service for a period of three years from the date of filing.
E Use of Estimates — The preparation of the financial statements in conformity with U.S. GAAP requires management to make estimates and assumptions that affect the reported amounts of assets and liabilities at the date of the financial statements and the reported amounts of income and expense during the reporting period. Actual results could differ from those estimates.
F Indemnifications — Under the Trust’s organizational documents, its officers and Trustees may be indemnified against certain liabilities and expenses arising out of the performance of their duties to the Trust. Under Massachusetts law, if certain conditions prevail, shareholders of a Massachusetts business trust (such as the Trust) could be deemed to have personal liability for the obligations of the Trust. However, the Trust’s Declaration of Trust contains an express disclaimer of liability on the part of Trust shareholders and theBy-laws provide that the Trust shall assume the defense on behalf of any Trust shareholders. Moreover, theBy-laws also provide for indemnification out of Trust property of any shareholder held personally liable solely by reason of being or having been a shareholder for all loss or expense arising from such liability. Additionally, in the normal course of business, the Trust enters into agreements with service providers that may contain indemnification clauses. The Trust’s maximum exposure under these arrangements is unknown as this would involve future claims that may be made against the Trust that have not yet occurred.
2 Distributions to Shareholders and Income Tax Information
The Trust intends to make monthly distributions of net investment income to common shareholders. The Trust may also distribute net realized capital gains, if any, generally not more than once per year. Distributions are recorded on theex-dividend date. Distributions to shareholders are determined in accordance with income tax regulations, which may differ from U.S. GAAP. As required by U.S. GAAP, only distributions in excess of tax basis earnings and profits are reported in the financial statements as a return of capital. Permanent differences between book and tax accounting relating to distributions are reclassified topaid-in capital. For tax purposes, distributions from short-term capital gains are considered to be from ordinary income.
The tax character of distributions declared for the years ended March 31, 2019 and March 31, 2018 was as follows:
| | | | | | | | |
| | | Year Ended March 31, | |
| | | 2019 | | | 2018 | |
| | |
Ordinary income | | $ | 10,119,846 | | | $ | 12,876,577 | |
| | |
Long-term capital gains | | $ | 1,554,917 | | | $ | — | |
During the year ended March 31, 2019, distributable earnings was decreased by $250,259 andpaid-in capital was increased by $250,259 due to differences between book and tax accounting. These reclassifications had no effect on the net assets or net asset value per share of the Trust.
As of March 31, 2019, the components of distributable earnings (accumulated loss) on a tax basis were as follows:
| | | | |
| | |
Undistributed ordinary income | | $ | 872,399 | |
| |
Deferred capital losses | | $ | (817,327 | ) |
| |
Net unrealized appreciation | | $ | 2,391,815 | |
At March 31, 2019, the Trust, for federal income tax purposes, had deferred capital losses of $817,327 which would reduce its taxable income arising from future net realized gains on investment transactions, if any, to the extent permitted by the Internal Revenue Code, and thus would reduce the amount of distributions to shareholders, which would otherwise be necessary to relieve the Trust of any liability for federal income or excise tax. The deferred capital losses are treated as arising on the first day of the Trust’s next taxable year and retain the same short-term or long-term character as when originally deferred. Of the deferred capital losses at March 31, 2019, $449,675 are short-term and $367,652 are long-term.
Eaton Vance
High Income 2021 Target Term Trust
March 31, 2019
Notes to Financial Statements — continued
The cost and unrealized appreciation (depreciation) of investments of the Trust at March 31, 2019, as determined on a federal income tax basis, were as follows:
| | | | |
| |
Aggregate cost | | $ | 275,012,979 | |
| |
Gross unrealized appreciation | | $ | 4,173,880 | |
| |
Gross unrealized depreciation | | | (1,782,065 | ) |
| |
Net unrealized appreciation | | $ | 2,391,815 | |
3 Investment Adviser Fee and Other Transactions with Affiliates
The investment adviser fee is earned by EVM as compensation for investment advisory services rendered to the Trust. The fee is computed at an annual rate of 0.70% of the Trust’s average daily managed assets and is payable monthly. Managed assets as referred to herein represent total assets of the Trust (including assets attributable to borrowings, any outstanding preferred shares, or other forms of leverage) less accrued liabilities (other than liabilities representing borrowings or such other forms of leverage). For the year ended March 31, 2019, the investment adviser fee amounted to $1,946,113. The Trust invests its cash in Cash Reserves Fund. EVM does not currently receive a fee for investment advisory services provided to Cash Reserves Fund. EVM also serves as administrator of the Trust, but receives no compensation.
Trustees and officers of the Trust who are members of EVM’s organization receive remuneration for their services to the Trust out of the investment adviser fee. Trustees of the Trust who are not affiliated with EVM may elect to defer receipt of all or a percentage of their annual fees in accordance with the terms of the Trustees Deferred Compensation Plan. For the year ended March 31, 2019, no significant amounts have been deferred. Certain officers and Trustees of the Trust are officers of EVM.
4 Purchases and Sales of Investments
Purchases and sales of investments, other than short-term obligations and including maturities and principal repayments on Senior Loans, aggregated $100,255,365 and $98,577,332, respectively, for the year ended March 31, 2019.
5 Common Shares of Beneficial Interest
The Trust may issue common shares pursuant to its dividend reinvestment plan. There were no common shares issued by the Trust for the years ended March 31, 2019 and March 31, 2018.
6 Credit Agreement
The Trust has entered into a Credit Agreement (the Agreement) with a bank to borrow up to a limit of $75 million. Borrowings under the Agreement are secured by the assets of the Trust. Interest is charged at a rate above the London Interbank Offered Rate (LIBOR) and is payable monthly. Under the terms of the Agreement, in effect through June 3, 2019, the Trust pays a facility fee of 0.25% (0.35% if the Trust’s outstanding borrowings are less than 65% of the borrowing limit) per annum on the borrowing limit. The Trust paid upfront fees of $135,000 which are being amortized to interest expense over a period of three years through June 2019. The unamortized balance at March 31, 2019 is approximately $8,000 and is included in prepaid upfront fees on notes payable in the Statement of Assets and Liabilities. The Trust is required to maintain certain net asset levels during the term of the Agreement. At March 31, 2019, the Trust had borrowings outstanding under the Agreement of $62,000,000 at an interest rate of 3.31%. Based on the short-term nature of the borrowings under the Agreement and the variable interest rate, the carrying amount of the borrowings at March 31, 2019 approximated its fair value. If measured at fair value, borrowings under the Agreement would have been considered as Level 2 in the fair value hierarchy (see Note 8) at March 31, 2019. Facility fees for the year ended March 31, 2019 totaled $190,105 and are included in interest expense and fees on the Statement of Operations. For the year ended March 31, 2019, the average borrowings under the Agreement and average interest rate (excluding fees) were $64,816,438 and 3.06%, respectively.
7 Credit Risk
The Trust primarily invests in lower rated and comparable quality unrated high yield securities. These investments have different risks than investments in debt securities rated investment grade. Risk of loss upon default by the borrower is significantly greater with respect to such debt than with other debt securities because these securities are generally unsecured and are more sensitive to adverse economic conditions, such as recession or increasing interest rates, than are investment grade issuers.
Eaton Vance
High Income 2021 Target Term Trust
March 31, 2019
Notes to Financial Statements — continued
8 Fair Value Measurements
Under generally accepted accounting principles for fair value measurements, a three-tier hierarchy to prioritize the assumptions, referred to as inputs, is used in valuation techniques to measure fair value. The three-tier hierarchy of inputs is summarized in the three broad levels listed below.
| • | | Level 1 – quoted prices in active markets for identical investments |
| • | | Level 2 – other significant observable inputs (including quoted prices for similar investments, interest rates, prepayment speeds, credit risk, etc.) |
| • | | Level 3 – significant unobservable inputs (including a fund’s own assumptions in determining the fair value of investments) |
In cases where the inputs used to measure fair value fall in different levels of the fair value hierarchy, the level disclosed is determined based on the lowest level input that is significant to the fair value measurement in its entirety. The inputs or methodology used for valuing securities are not necessarily an indication of the risk associated with investing in those securities.
At March 31, 2019, the hierarchy of inputs used in valuing the Trust’s investments, which are carried at value, were as follows:
| | | | | | | | | | | | | | | | |
| Asset Description | | Level 1 | | | Level 2 | | | Level 3 | | | Total | |
| | | | |
Corporate Bonds & Notes | | $ | — | | | $ | 251,365,520 | | | $ | — | | | $ | 251,365,520 | |
| | | | |
Senior Floating-Rate Loans | | | — | | | | 22,585,098 | | | | — | | | | 22,585,098 | |
| | | | |
Convertible Bonds | | | — | | | | 2,471,878 | | | | — | | | | 2,471,878 | |
| | | | |
Short-Term Investments | | | — | | | | 982,298 | | | | — | | | | 982,298 | |
| | | | |
Total Investments | | $ | — | | | $ | 277,404,794 | | | $ | — | | | $ | 277,404,794 | |
Eaton Vance
High Income 2021 Target Term Trust
March 31, 2019
Report of Independent Registered Public Accounting Firm
To the Trustees and Shareholders of Eaton Vance High Income 2021 Target Term Trust:
Opinion on the Financial Statements and Financial Highlights
We have audited the accompanying statement of assets and liabilities of Eaton Vance High Income 2021 Target Term Trust (the “Trust”), including the portfolio of investments, as of March 31, 2019, the related statements of operations and cash flows for the year then ended, the statements of changes in net assets for each of the two years in the period then ended, the financial highlights for each of the two years in the period then ended and for the period from the start of business, May 31, 2016, to March 31, 2017, and the related notes. In our opinion, the financial statements and financial highlights present fairly, in all material respects, the financial position of the Trust as of March 31, 2019, and the results of its operations and its cash flows for the year then ended, the changes in its net assets for each of the two years in the period then ended, and the financial highlights for each of the two years in the period then ended and for the period from the start of business, May 31, 2016, to March 31, 2017, in conformity with accounting principles generally accepted in the United States of America.
Basis for Opinion
These financial statements and financial highlights are the responsibility of the Trust’s management. Our responsibility is to express an opinion on the Trust’s financial statements and financial highlights based on our audits. We are a public accounting firm registered with the Public Company Accounting Oversight Board (United States) (PCAOB) and are required to be independent with respect to the Trust in accordance with the U.S. federal securities laws and the applicable rules and regulations of the Securities and Exchange Commission and the PCAOB.
We conducted our audits in accordance with the standards of the PCAOB. Those standards require that we plan and perform the audit to obtain reasonable assurance about whether the financial statements and financial highlights are free of material misstatement, whether due to error or fraud. The Trust is not required to have, nor were we engaged to perform, an audit of its internal control over financial reporting. As part of our audits we are required to obtain an understanding of internal control over financial reporting but not for the purpose of expressing an opinion on the effectiveness of the Trust’s internal control over financial reporting. Accordingly, we express no such opinion.
Our audits included performing procedures to assess the risks of material misstatement of the financial statements and financial highlights, whether due to error or fraud, and performing procedures that respond to those risks. Such procedures included examining, on a test basis, evidence regarding the amounts and disclosures in the financial statements and financial highlights. Our audits also included evaluating the accounting principles used and significant estimates made by management, as well as evaluating the overall presentation of the financial statements and financial highlights. Our procedures included confirmation of securities and senior loans owned as of March 31, 2019, by correspondence with the custodian, brokers and selling or agent banks; when replies were not received from brokers and selling or agent banks, we performed other auditing procedures. We believe that our audits provide a reasonable basis for our opinion.
/s/ Deloitte & Touche LLP
Boston, Massachusetts
May 17, 2019
We have served as the auditor of one or more Eaton Vance investment companies since 1959.
Eaton Vance
High Income 2021 Target Term Trust
March 31, 2019
Federal Tax Information (Unaudited)
The Form1099-DIV you receive in February 2020 will show the tax status of all distributions paid to your account in calendar year 2019. Shareholders are advised to consult their own tax adviser with respect to the tax consequences of their investment in the Trust.
Eaton Vance
High Income 2021 Target Term Trust
March 31, 2019
Annual Meeting of Shareholders (Unaudited)
The Trust held its Annual Meeting of Shareholders on January 17, 2019. The following action was taken by the shareholders:
Item 1: The election of Mark R. Fetting, Helen Frame Peters, Keith Quinton and Susan J. Sutherland as Class III Trustees of the Trust, each for athree-year term expiring in 2022.
| | | | | | | | |
Nominee for Trustee Elected by All Shareholders | | Number of Shares | |
| | For | | | Withheld | |
| | |
Mark R. Fetting | | | 18,814,396 | | | | 288,415 | |
| | |
Helen Frame Peters | | | 18,802,279 | | | | 300,532 | |
| | |
Keith Quinton | | | 18,814,121 | | | | 288,690 | |
| | |
Susan J. Sutherland | | | 18,798,186 | | | | 304,625 | |
Eaton Vance
High Income 2021 Target Term Trust
March 31, 2019
Dividend Reinvestment Plan
The Trust offers a dividend reinvestment plan (Plan) pursuant to which shareholders automatically have distributions reinvested in common shares (Shares) of the Trust unless they elect otherwise through their investment dealer. On the distribution payment date, if the NAV per Share is equal to or less than the market price per Share plus estimated brokerage commissions, then new Shares will be issued. The number of Shares shall be determined by the greater of the NAV per Share or 95% of the market price. Otherwise, Shares generally will be purchased on the open market by American Stock Transfer & Trust Company, LLC, the Plan agent (Agent). Distributions subject to income tax (if any) are taxable whether or not Shares are reinvested.
If your Shares are in the name of a brokerage firm, bank, or other nominee, you can ask the firm or nominee to participate in the Plan on your behalf. If the nominee does not offer the Plan, you will need to request that the Trust’s transfer agentre-register your Shares in your name or you will not be able to participate.
The Agent’s service fee for handling distributions will be paid by the Trust. Plan participants will be charged their pro rata share of brokerage commissions on all open-market purchases.
Plan participants may withdraw from the Plan at any time by writing to the Agent at the address noted on the following page. If you withdraw, you will receive Shares in your name for all Shares credited to your account under the Plan. If a participant elects by written notice to the Agent to sell part or all of his or her Shares and remit the proceeds, the Agent is authorized to deduct a $5.00 fee plus brokerage commissions from the proceeds.
If you wish to participate in the Plan and your Shares are held in your own name, you may complete the form on the following page and deliver it to the Agent. Any inquiries regarding the Plan can be directed to the Agent at1-866-439-6787.
Eaton Vance
High Income 2021 Target Term Trust
March 31, 2019
Application for Participation in Dividend Reinvestment Plan
This form is for shareholders who hold their common shares in their own names. If your common shares are held in the name of a brokerage firm, bank, or other nominee, you should contact your nominee to see if it will participate in the Plan on your behalf. If you wish to participate in the Plan, but your brokerage firm, bank, or nominee is unable to participate on your behalf, you should request that your common shares bere-registered in your own name which will enable your participation in the Plan.
The following authorization and appointment is given with the understanding that I may terminate it at any time by terminating my participation in the Plan as provided in the terms and conditions of the Plan.
Please print exact name on account
Shareholder signature Date
Shareholder signature Date
Please sign exactly as your common shares are registered. All persons whose names appear on the share certificate must sign.
YOU SHOULD NOT RETURN THIS FORM IF YOU WISH TO RECEIVE YOUR DISTRIBUTIONS IN CASH. THIS IS NOT A PROXY.
This authorization form, when signed, should be mailed to the following address:
Eaton Vance High Income 2021 Target Term Trust
c/o American Stock Transfer & Trust Company, LLC
P.O. Box 922
Wall Street Station
New York, NY 10269-0560
Eaton Vance
High Income 2021 Target Term Trust
March 31, 2019
Management and Organization
Fund Management. The Trustees of Eaton Vance High Income 2021 Target Term Trust (the Trust) are responsible for the overall management and supervision of the Trust’s affairs. The Trustees and officers of the Trust are listed below. Except as indicated, each individual has held the office shown or other offices in the same company for the last five years. The “Noninterested Trustees” consist of those Trustees who are not “interested persons” of the Trust, as that term is defined under the 1940 Act. The business address of each Trustee and officer is Two International Place, Boston, Massachusetts 02110. As used below, “EVC” refers to Eaton Vance Corp., “EV” refers to Eaton Vance, Inc., “EVM” refers to Eaton Vance Management, “BMR” refers to Boston Management and Research and “EVD” refers to Eaton Vance Distributors, Inc. EVC and EV are the corporate parent and trustee, respectively, of EVM and BMR. EVD is a wholly-owned subsidiary of EVC. Each officer affiliated with Eaton Vance may hold a position with other Eaton Vance affiliates that is comparable to his or her position with EVM listed below. Each Trustee oversees 172 portfolios in the Eaton Vance Complex (including all master and feeder funds in a master feeder structure). Each officer serves as an officer of certain other Eaton Vance funds. Each Trustee serves for a three year term. Each officer serves until his or her successor is elected.
| | | | | | |
| Name and Year of Birth | | Position(s)
with the
Trust | | Term
Expiring;
Trustee
Since(1) | | Principal Occupation(s) and Directorships
During Past Five Years and Other Relevant Experience |
|
| Interested Trustee |
| | | |
Thomas E. Faust Jr. 1958 | | Class I
Trustee | | Until 2020.
Trustee since 2007. | | Chairman, Chief Executive Officer and President of EVC, Director and President of EV, Chief Executive Officer and President of EVM and BMR, and Director of EVD. Trustee and/or officer of 172 registered investment companies. Mr. Faust is an interested person because of his positions with EVM, BMR, EVD, EVC and EV, which are affiliates of the Trust. Directorships in the Last Five Years.(2)Director of EVC and Hexavest Inc. (investment management firm). |
|
| Noninterested Trustees |
| | | |
Mark R. Fetting 1954 | | Class III
Trustee | | Until 2022.
Trustee since 2016. | | Private investor. Formerly held various positions at Legg Mason, Inc. (investment management firm) (2000-2012), including President, Chief Executive Officer, Director and Chairman (2008-2012), Senior Executive Vice President (2004-2008) and Executive Vice President (2001-2004). Formerly, President of Legg Mason family of funds (2001-2008). Formerly, Division President and Senior Officer of Prudential Financial Group, Inc. and related companies (investment management firm)(1991-2000). Directorships in the Last Five Years. None. |
| | | |
Cynthia E. Frost 1961 | | Class I
Trustee | | Until 2020.
Trustee since 2014. | | Private investor. Formerly, Chief Investment Officer of Brown University (university endowment) (2000-2012). Formerly, Portfolio Strategist for Duke Management Company (university endowment manager) (1995-2000). Formerly, Managing Director, Cambridge Associates (investment consulting company) (1989-1995). Formerly, Consultant, Bain and Company (management consulting firm) (1987-1989). Formerly, Senior Equity Analyst, BA Investment Management Company (1983-1985). Directorships in the Last Five Years.None. |
| | | |
George J. Gorman 1952 | | Class II
Trustee | | Until 2021.
Trustee since 2014. | | Principal at George J. Gorman LLC (consulting firm). Formerly, Senior Partner at Ernst & Young LLP (a registered public accounting firm) (1974-2009). Directorships in the Last Five Years.Formerly, Trustee of the BofA Funds Series Trust (11 funds) (2011-2014) and of the Ashmore Funds (9 funds) (2010-2014). |
| | | |
Valerie A. Mosley 1960 | | Class II
Trustee | | Until 2021.
Trustee since 2014. | | Chairwoman and Chief Executive Officer of Valmo Ventures (a consulting and investment firm). Former Partner and Senior Vice President, Portfolio Manager and Investment Strategist at Wellington Management Company, LLP (investment management firm) (1992-2012). Former Chief Investment Officer, PG Corbin Asset Management(1990-1992). Formerly worked in institutional corporate bond sales at Kidder Peabody(1986-1990). Directorships in the Last Five Years.(2)Director of Envestnet, Inc. (provider of intelligent systems for wealth management and financial wellness) (since 2018). Director of Dynex Capital, Inc. (mortgage REIT) (since 2013). |
Eaton Vance
High Income 2021 Target Term Trust
March 31, 2019
Management and Organization — continued
| | | | | | |
| Name and Year of Birth | | Position(s)
with the
Trust | | Term
Expiring;
Trustee
Since(1) | | Principal Occupation(s) and Directorships
During Past Five Years and Other Relevant Experience |
|
| Noninterested Trustees (continued) |
| | | |
William H. Park 1947 | | Chairperson of the Board and Class II
Trustee | | Until 2021.
Chairperson of the
Board since 2016
and Trustee
since 2003. | | Private investor. Formerly, Consultant (management and transactional)(2012-2014). Formerly, Chief Financial Officer, Aveon Group L.P. (investment management firm) (2010-2011). Formerly, Vice Chairman, Commercial Industrial Finance Corp. (specialty finance company) (2006-2010). Formerly, President and Chief Executive Officer, Prizm Capital Management, LLC (investment management firm) (2002-2005). Formerly, Executive Vice President and Chief Financial Officer, United Asset Management Corporation (investment management firm) (1982-2001). Formerly, Senior Manager, Price Waterhouse (now PricewaterhouseCoopers) (a registered public accounting firm) (1972-1981). Directorships in the Last Five Years.(2)None. |
| | | |
Helen Frame Peters 1948 | | Class III
Trustee | | Until 2022.
Trustee since 2008. | | Professor of Finance, Carroll School of Management, Boston College. Formerly, Dean, Carroll School of Management, Boston College (2000-2002). Formerly, Chief Investment Officer, Fixed Income, Scudder Kemper Investments (investment management firm) (1998-1999). Formerly, Chief Investment Officer, Equity and Fixed Income, Colonial Management Associates (investment management firm) (1991-1998). Directorships in the Last Five Years.(2)None. |
| | | |
Keith Quinton(3) 1958 | | Class III
Trustee | | Until 2022.
Trustee since 2018. | | Independent Investment Committee Member at New Hampshire Retirement System (since 2017). Advisory Committee member at Northfield Information Services, Inc. (risk management analytics provider) (since 2016). Formerly, Portfolio Manager and Senior Quantitative Analyst at Fidelity Investments (investment management firm)(2001-2014). Directorships in the Last Five Years. Director of New Hampshire Municipal Bond Bank (since 2016). |
| | | |
Marcus L. Smith(3) 1966 | | Class II
Trustee | | Until 2021.
Trustee since 2018. | | Member of Posse Boston Advisory Board (foundation) (since 2015); Trustee at University of Mount Union (since 2008). Formerly, Portfolio Manager at MFS Investment Management (investment management firm) (1994-2017). Directorships in the Last Five Years. Director of MSCI Inc. (global provider of investment decision support tools) (since 2017). Formerly, Director of DCT Industrial Trust Inc. (logistics real estate company) (2017-2018). |
| | | |
Susan J. Sutherland 1957 | | Class III
Trustee | | Until 2022.
Trustee since 2015. | | Private investor. Formerly, Associate, Counsel and Partner at Skadden, Arps, Slate, Meagher & Flom LLP (law firm) (1982-2013). Directorships in the Last Five Years. Formerly, Director of Montpelier Re Holdings Ltd. (global provider of customized insurance and reinsurance products) (2013-2015). |
| | | |
Scott E. Wennerholm 1959 | | Class I
Trustee | | Until 2020.
Trustee since 2016. | | Formerly, Trustee at Wheelock College (postsecondary institution) (2012-2018). Formerly, Consultant at GF Parish Group (executive recruiting firm) (2016-2017). Formerly, Chief Operating Officer and Executive Vice President at BNY Mellon Asset Management (investment management firm) (2005-2011). Formerly, Chief Operating Officer and Chief Financial Officer at Natixis Global Asset Management (investment management firm) (1997-2004). Formerly, Vice President at Fidelity Investments Institutional Services (investment management firm) (1994-1997). Directorships in the Last Five Years. None. |
| | | | | | |
| Name and Year of Birth | | Position(s)
with the
Trust | | Officer
Since(4) | | Principal Occupation(s) During Past Five Years |
|
| Principal Officers who are not Trustees |
| | | |
Payson F. Swaffield 1956 | | President | | 2003 | | Vice President and Chief Income Investment Officer of EVM and BMR. Also Vice President of Calvert Research and Management (“CRM”). |
| | | |
Maureen A. Gemma 1960 | | Vice President, Secretary and Chief Legal Officer | | 2005 | | Vice President of EVM and BMR. Also Vice President of CRM. |
Eaton Vance
High Income 2021 Target Term Trust
March 31, 2019
Management and Organization — continued
| | | | | | |
| Name and Year of Birth | | Position(s)
with the
Trust | | Officer
Since(4) | | Principal Occupation(s) During Past Five Years |
|
| Principal Officers who are not Trustees (continued) |
| | | |
James F. Kirchner 1967 | | Treasurer | | 2007 | | Vice President of EVM and BMR. Also Vice President of CRM. |
| | | |
Richard F. Froio 1968 | | Chief Compliance Officer | | 2017 | | Vice President of EVM and BMR since 2017. Formerly, Deputy Chief Compliance Officer (Adviser/Funds) and Chief Compliance Officer (Distribution) at PIMCO (2012-2017) and Managing Director at BlackRock/Barclays Global Investors (2009-2012). |
| (1) | Year first appointed to serve as Trustee for a fund in the Eaton Vance family of funds. Each Trustee has served continuously since appointment unless indicated otherwise. Each Trustee holds office until the annual meeting for the year in which his or her term expires and until his or her successor is elected and qualified, subject to a prior death, resignation, retirement, disqualification or removal. |
| (2) | During their respective tenures, the Trustees (except for Mmes. Frost and Sutherland and Messrs. Fetting, Gorman, Quinton, Smith and Wennerholm) also served as Board members of one or more of the following funds (which operated in the years noted): eUnitsTM 2 Year U.S. Market Participation Trust: Upside to Cap / Buffered Downside (launched in 2012 and terminated in 2014); and eUnitsTM 2 Year U.S. Market Participation Trust II: Upside to Cap / Buffered Downside (launched in 2012 and terminated in 2014). However, Ms. Mosley did not serve as a Board member of eUnitsTM 2 Year U.S. Market Participation Trust: Upside to Cap / Buffered Downside (launched in 2012 and terminated in 2014). |
| (3) | Messrs. Quinton and Smith began serving as Trustees effective October 1, 2018. |
| (4) | Year first elected to serve as officer of a fund in the Eaton Vance family of funds when the officer has served continuously. Otherwise, year of most recent election as an officer of a fund in the Eaton Vance family of funds. Titles may have changed since initial election. |
Eaton Vance Funds
IMPORTANT NOTICES
Privacy. The Eaton Vance organization is committed to ensuring your financial privacy. Each of the financial institutions identified below has in effect the following policy (“Privacy Policy”) with respect to nonpublic personal information about its customers:
| • | | Only such information received from you, through application forms or otherwise, and information about your Eaton Vance fund transactions will be collected. This may include information such as name, address, social security number, tax status, account balances and transactions. |
| • | | None of such information about you (or former customers) will be disclosed to anyone, except as permitted by law (which includes disclosure to employees necessary to service your account). In the normal course of servicing a customer’s account, Eaton Vance may share information with unaffiliated third parties that perform various required services such as transfer agents, custodians and broker-dealers. |
| • | | Policies and procedures (including physical, electronic and procedural safeguards) are in place that are designed to protect the confidentiality of such information. |
| • | | We reserve the right to change our Privacy Policy at any time upon proper notification to you. Customers may want to review our Privacy Policy periodically for changes by accessing the link on our homepage: www.eatonvance.com. |
Our pledge of privacy applies to the following entities within the Eaton Vance organization: the Eaton Vance Family of Funds, Eaton Vance Management, Eaton Vance Investment Counsel, Eaton Vance Distributors, Inc., Eaton Vance Trust Company, Eaton Vance Management (International) Limited, Eaton Vance Advisers International Ltd., Eaton Vance Management’s Real Estate Investment Group and Boston Management and Research. In addition, our Privacy Policy applies only to those Eaton Vance customers who are individuals and who have a direct relationship with us. If a customer’s account (i.e., fund shares) is held in the name of a third-party financial advisor/broker-dealer, it is likely that only such advisor’s privacy policies apply to the customer. This notice supersedes all previously issued privacy disclosures. For more information about Eaton Vance’s Privacy Policy, please call1-800-262-1122.
Delivery of Shareholder Documents. The Securities and Exchange Commission (SEC) permits funds to deliver only one copy of shareholder documents, including prospectuses, proxy statements and shareholder reports, to fund investors with multiple accounts at the same residential or post office box address. This practice is often called “householding” and it helps eliminate duplicate mailings to shareholders. American Stock Transfer & Trust Company, LLC (“AST”), theclosed-end funds transfer agent, or your financial advisor, may household the mailing of your documents indefinitely unless you instruct AST, or your financial advisor, otherwise. If you would prefer that your Eaton Vance documents not be householded, please contact AST or your financial advisor. Your instructions that householding not apply to delivery of your Eaton Vance documents will typically be effective within 30 days of receipt by AST or your financial advisor.
Portfolio Holdings. Each Eaton Vance Fund and its underlying Portfolio(s) (if applicable) files a schedule of portfolio holdings on Part F toForm N-PORT with the SEC for the first and third quarters of each fiscal year. The FormN-PORT will be available on the Eaton Vance website at www.eatonvance.com, by calling Eaton Vance at1-800-262-1122 or in the EDGAR database on the SEC’s website at www.sec.gov.
Proxy Voting. From time to time, funds are required to vote proxies related to the securities held by the funds. The Eaton Vance Funds or their underlying Portfolios (if applicable) vote proxies according to a set of policies and procedures approved by the Funds’ and Portfolios’ Boards. You may obtain a description of these policies and procedures and information on how the Funds or Portfolios voted proxies relating to portfolio securities during the most recent12-month period ended June 30, without charge, upon request, by calling1-800-262-1122 and by accessing the SEC’s website at www.sec.gov.
Additional Notice to Shareholders. If applicable, a Fund may also redeem or purchase its outstanding preferred shares in order to maintain compliance with regulatory requirements, borrowing or rating agency requirements or for other purposes as it deems appropriate or necessary.
Closed-End Fund Information. Eaton Vanceclosed-end funds make fund performance data and certain information about portfolio characteristics available on the Eaton Vance website shortly after the end of each month. Other information about the funds is available on the website. The funds’ net asset value per share is readily accessible on the Eaton Vance website. Portfolio holdings for the most recentmonth-end are also posted to the website approximately 30 days following the end of the month. This information is available at www.eatonvance.com on the fund information pages under “Individual Investors —Closed-End Funds”.
This Page Intentionally Left Blank
Investment Adviser and Administrator
Eaton Vance Management
Two International Place
Boston, MA 02110
Custodian
State Street Bank and Trust Company
State Street Financial Center, One Lincoln Street
Boston, MA 02111
Transfer Agent
American Stock Transfer & Trust Company, LLC
6201 15th Avenue
Brooklyn, NY 11219
Independent Registered Public Accounting Firm
Deloitte & Touche LLP
200 Berkeley Street
Boston, MA 02116-5022
Fund Offices
Two International Place
Boston, MA 02110

23363 3.31.19
Item 2. Code of Ethics
The registrant has adopted a code of ethics applicable to its Principal Executive Officer, Principal Financial Officer and Principal Accounting Officer. The registrant undertakes to provide a copy of such code of ethics to any person upon request, without charge, by calling1-800-262-1122. The registrant has not amended the code of ethics as described in FormN-CSR during the period. The registrant has not granted any waiver, including an implicit waiver, from a provision of the code of ethics as described in FormN-CSR during the period covered by this report.
Item 3. Audit Committee Financial Expert
The registrant’s Board has designated George J. Gorman and William H. Park, each an independent trustee, as audit committee financial experts. Mr. Gorman is a certified public accountant who is the Principal at George J. Gorman LLC (a consulting firm). Previously, Mr. Gorman served in various capacities at Ernst & Young LLP (a registered public accounting firm), including as Senior Partner. Mr. Gorman also has experience serving as an independent trustee and audit committee financial expert of other mutual fund complexes. Mr. Park is a certified public accountant who is a private investor. Previously, he served as a consultant, as the Chief
Financial Officer of Aveon Group, L.P. (an investment management firm), as the Vice Chairman of Commercial Industrial Finance Corp. (specialty finance company), as President and Chief Executive Officer of Prizm Capital Management, LLC (investment management firm), as Executive Vice President and Chief Financial Officer of United Asset Management Corporation (an institutional investment management firm) and as a Senior Manager at Price Waterhouse (now PricewaterhouseCoopers) (a registered public accounting firm).
Item 4. Principal Accountant Fees and Services
(a)-(d)
The following table presents the aggregate fees billed to the registrant for the fiscal periods ending March 31, 2018 to March 31, 2019 by the registrant’s principal accountant, Deloitte & Touche LLP (“D&T”), for professional services rendered for the audit of the registrant’s annual financial statements and fees billed for other services rendered by D&T during such period.
| | | | | | | | |
Fiscal Period Ended | | 3/31/18 | | | 3/31/19 | |
Audit Fees | | $ | 35,725 | | | $ | 35,550 | |
Audit-Related Fees(1) | | $ | 0 | | | $ | 0 | |
Tax Fees(2) | | $ | 11,165 | | | $ | 11,165 | |
All Other Fees(3) | | $ | 0 | | | $ | 0 | |
| | | | | | | | |
Total | | $ | 46,890 | | | $ | 46,715 | |
| | | | | | | | |
| (1) | Audit-related fees consist of the aggregate fees billed for assurance and related services that are reasonably related to the performance of the audit of financial statements and are not reported under the category of audit fees and specifically include fees related to comfort letter and bring down letters in conjunction with the initial public offering. |
| (2) | Tax fees consist of the aggregate fees billed for professional services rendered by the principal accountant relating to tax compliance, tax advice, and tax planning and specifically include fees for tax return preparation and other related tax compliance/planning matters. |
| (3) | All other fees consist of the aggregate fees billed for products and services provided by the principal accountant other than audit, audit-related, and tax services. |
(e)(1) The registrant’s audit committee has adopted policies and procedures relating to thepre-approval of services provided by the registrant’s principal accountant (the“Pre-Approval Policies”). ThePre-Approval Policies establish a framework intended to assist the audit committee in the proper discharge of itspre-approval responsibilities. As a general matter, thePre-Approval Policies (i) specify certain types of audit, audit-related, tax, and other services determined to bepre-approved by the audit committee; and (ii) delineate specific procedures governing the mechanics of thepre-approval process, including the approval and monitoring of audit andnon-audit service fees. Unless a service is specificallypre-approved under thePre-Approval Policies, it must be separatelypre-approved by the audit committee.
ThePre-Approval Policies and the types of audit andnon-audit servicespre-approved therein must be reviewed and ratified by the registrant’s audit committee at least annually. The registrant’s audit committee maintains full responsibility for the appointment, compensation, and oversight of the work of the registrant’s principal accountant.
(e)(2) No services described in paragraphs (b)-(d) above were approved by the registrant’s audit committee pursuant to the “de minimis exception” set forth in Rule2-01(c)(7)(i)(C) of RegulationS-X.
(f) Not applicable.
(g) The following table presents (i) the aggregatenon-audit fees (i.e., fees for audit-related, tax, and other services) billed to the registrant by D&T for the fiscal periods ending March 31, 2018 to March 31, 2019; and (ii) the aggregatenon-audit fees (i.e., fees for audit-related, tax, and other services) billed to the Eaton Vance organization by D&T for the same time periods.
| | | | | | | | |
Fiscal Period Ended | | 3/31/18 | | | 3/31/19 | |
Registrant | | $ | 11,165 | | | $ | 11,165 | |
Eaton Vance(1) | | $ | 155,208 | | | $ | 87,482 | |
| (1) | Eaton Vance Management, a subsidiary of Eaton Vance Corp., acts as the registrant’s investment adviser and administrator. |
(h) The registrant’s audit committee has considered whether the provision by the registrant’s principal accountant ofnon-audit services to the registrant’s investment adviser and any entity controlling, controlled by, or under common control with the adviser that provides ongoing services to the registrant that were notpre-approved pursuant to Rule2-01(c)(7)(ii) of RegulationS-X is compatible with maintaining the principal accountant’s independence.
Item 5. Audit Committee of Listed Registrants
The registrant has a separately-designated standing audit committee established in accordance with Section 3(a)(58)(A) of the Securities and Exchange Act of 1934, as amended. George J. Gorman (Chair), Valerie A. Mosley, William H. Park and Scott E. Wennerholm are the members of the registrant’s audit committee.
Item 6. Schedule of Investments
Please see schedule of investments contained in the Report to Stockholders included under Item 1 of this FormN-CSR.
Item 7. Disclosure of Proxy Voting Policies and Procedures forClosed-End Management Investment Companies
The Board of Trustees of the Trust has adopted a proxy voting policy and procedure (the “Fund Policy”), pursuant to which the Trustees have delegated proxy voting responsibility to the Fund’s investment adviser and adopted the investment adviser’s proxy voting policies and procedures (the “Policies”) which are described below. The Trustees will review the Fund’s proxy voting records from time to time and will annually consider approving the Policies for the upcoming year. In the event that a conflict of interest arises between the Fund’s shareholders and the investment adviser, the administrator, or any of their affiliates or any affiliate of the Fund, the investment adviser will generally refrain from voting the proxies related to the companies giving rise to such conflict until it consults with the Board’s Special Committee except as contemplated under the Fund Policy. The Board’s Special Committee will instruct the investment adviser on the appropriate course of action.
The Policies are designed to promote accountability of a company’s management to its shareholders and to align the interests of management with those shareholders. An independent proxy voting service (“Agent”), currently Institutional Shareholder Services, Inc., has been retained to assist in the voting of proxies through the provision of vote analysis, implementation and recordkeeping and disclosure services. The investment adviser will generally vote proxies through the Agent. The Agent is required to vote all proxies and/or refer them back to the investment adviser pursuant to the Policies. It is generally the policy of the investment adviser to vote in accordance with the recommendation of the Agent. The Agent shall refer to the investment adviser proxies relating to mergers and restructurings, and the disposition of assets, termination, liquidation and mergers
contained in mutual fund proxies. The investment adviser will normally vote against anti-takeover measures and other proposals designed to limit the ability of shareholders to act on possible transactions, except in the case ofclosed-end management investment companies. The investment adviser generally supports management on social and environmental proposals. The investment adviser may abstain from voting from time to time where it determines that the costs associated with voting a proxy outweighs the benefits derived from exercising the right to vote or the economic effect on shareholders interests or the value of the portfolio holding is indeterminable or insignificant.
In addition, the investment adviser will monitor situations that may result in a conflict of interest between the Fund’s shareholders and the investment adviser, the administrator, or any of their affiliates or any affiliate of the Fund by maintaining a list of significant existing and prospective corporate clients. The investment adviser’s personnel responsible for reviewing and voting proxies on behalf of the Fund will report any proxy received or expected to be received from a company included on that list to the personnel of the investment adviser identified in the Policies. If such personnel expects to instruct the Agent to vote such proxies in a manner inconsistent with the guidelines of the Policies or the recommendation of the Agent, the personnel will consult with members of senior management of the investment adviser to determine if a material conflict of interests exists. If it is determined that a material conflict does exist, the investment adviser will seek instruction on how to vote from the Special Committee.
Information on how the Fund voted proxies relating to portfolio securities during the most recent 12 month period ended June 30 is available (1) without charge, upon request, by calling1-800-262-1122, and (2) on the Securities and Exchange Commission’s website athttp://www.sec.gov.
Item 8. Portfolio Managers ofClosed-End Management Investment Companies
Eaton Vance Management (“EVM” or “Eaton Vance”) is the investment adviser of the Trust. Kelley G. Baccei, Stephen C. Concannon and Michael W. Weilheimer comprise the investment team responsible for the overall management of the Trust’s investments.
Ms. Baccei is a Vice President of EVM and has been a portfolio manager of the Trust since May 2016. Mr. Concannon is a Vice President of EVM and has been a portfolio manager of the Trust since May 2016. Mr. Weilheimer is a Vice President of EVM, has been a portfolio manager of the Trust since May 2016 and is Director of EVM’s High Yield Investments Group. Messrs. Concannon and Weilheimer have managed other Eaton Vance portfolios for more than five years. This information is provided as of the date of filing this report.
The following table shows, as of the Trust’s most recent fiscal year end, the number of accounts each portfolio manager managed in each of the listed categories and the total assets (in millions of dollars) in the accounts managed within each category. The table also shows the number of accounts with respect to which the advisory fee is based on the performance of the account, if any, and the total assets (in millions of dollars) in those accounts.
| | | | | | | | | | | | | | | | |
| | | Number of All
Accounts | | | Total Assets of All
Accounts | | | Number of
Accounts
Paying a
Performance Fee | | | Total Assets
of Accounts
Paying
a Performance Fee | |
Kelley G. Baccei | | | | | | | | | | | | | | | | |
Registered Investment Companies | | | 7 | | | $ | 5,684.1 | | | | 0 | | | $ | 0 | |
Other Pooled Investment Vehicles | | | 1 | | | $ | 169.2 | | | | 0 | | | $ | 0 | |
Other Accounts | | | 0 | | | $ | 0 | | | | 0 | | | $ | 0 | |
| | | | | | | | | | | | | | | | |
| | | Number of All
Accounts | | | Total Assets of All
Accounts | | | Number of
Accounts
Paying a
Performance Fee | | | Total Assets
of Accounts
Paying
a Performance Fee | |
Stephen C. Concannon | | | | | | | | | | | | | | | | |
Registered Investment Companies | | | 4 | | | $ | 7,838.4 | | | | 0 | | | $ | 0 | |
Other Pooled Investment Vehicles | | | 0 | | | $ | 0 | | | | 0 | | | $ | 0 | |
Other Accounts | | | 0 | | | $ | 0 | | | | 0 | | | $ | 0 | |
Michael W. Weilheimer | | | | | | | | | | | | | | | | |
Registered Investment Companies | | | 6 | | | $ | 6,613.1 | | | | 0 | | | $ | 0 | |
Other Pooled Investment Vehicles | | | 3 | | | $ | 571.8 | | | | 0 | | | $ | 0 | |
Other Accounts | | | 25 | | | $ | 3,926.4 | | | | 0 | | | $ | 0 | |
The following table shows the dollar range of Trust shares beneficially owned by each portfolio manager as of the Trust’s most recent fiscal year end.
| | |
Portfolio Manager | | Dollar Range of Equity Securities
Beneficially Owned in the Trust |
Kelley G. Baccei | | None |
Stephen C. Concannon | | None |
Michael W. Weilheimer | | None |
Potential for Conflicts of Interest. It is possible that conflicts of interest may arise in connection with a portfolio manager’s management of the Fund’s investments on the one hand and the investments of other accounts for which a portfolio manager is responsible on the other. For example, a portfolio manager may have conflicts of interest in allocating management time, resources and investment opportunities among the Fund and other accounts he or she advises. In addition, due to differences in the investment strategies or restrictions between the Fund and the other accounts, the portfolio manager may take action with respect to another account that differs from the action taken with respect to the Fund. In some cases, another account managed by a portfolio manager may compensate the investment adviser based on the performance of the securities held by that account. The existence of such a performance based fee may create additional conflicts of interest for the portfolio manager in the allocation of management time, resources and investment opportunities. Whenever conflicts of interest arise, the portfolio manager will endeavor to exercise his or her discretion in a manner that he or she believes is equitable to all interested persons. EVM has adopted several policies and procedures designed to address these potential conflicts including a code of ethics and policies that govern the investment adviser’s trading practices, including among other things the aggregation and allocation of trades among clients, brokerage allocations, cross trades and best execution.
Compensation Structure for EVM
Compensation of EVM’s portfolio managers and other investment professionals has the following primary components: (1) a base salary, (2) an annual cash bonus, (3) annualnon-cash compensation consisting of options to purchase shares of EVC nonvoting common stock and/or restricted shares of EVC nonvoting common stock that generally are subject to a vesting schedule and (4) (for equity portfolio managers) a Deferred Alpha Incentive Plan, which pays a deferred cash award tied to future excess returns in certain equity strategy portfolios. EVM’s investment professionals also receive certain retirement, insurance and other benefits that are broadly available to EVM’s employees. Compensation of EVM’s investment professionals is
reviewed primarily on an annual basis. Cash bonuses, stock-based compensation awards, and adjustments in base salary are typically paid or put into effect at or shortly after the October 31st fiscal year end of EVC.
Method to Determine Compensation. EVM compensates its portfolio managers based primarily on the scale and complexity of their portfolio responsibilities and the total return performance of managed funds and accounts versus the benchmark(s) stated in the prospectus, as well as an appropriate peer group (as described below). In addition to rankings within peer groups of funds on the basis of absolute performance, consideration may also be given to relative risk-adjusted performance. Risk-adjusted performance measures include, but are not limited to, the Sharpe ratio (Sharpe ratio uses standard deviation and excess return to determine reward per unit of risk). Performance is normally based on periods ending on the September 30th preceding fiscal year end. Fund performance is normally evaluated primarily versus peer groups of funds as determined by Lipper Inc. and/or Morningstar, Inc. When a fund’s peer group as determined by Lipper or Morningstar is deemed by EVM’s management not to provide a fair comparison, performance may instead be evaluated primarily against a custom peer group or market index. In evaluating the performance of a fund and its manager, primary emphasis is normally placed on three-year performance, with secondary consideration of performance over longer and shorter periods. For funds that aretax-managed or otherwise have an objective ofafter-tax returns, performance is measured net of taxes. For other funds, performance is evaluated on apre-tax basis. For funds with an investment objective other than total return (such as current income), consideration will also be given to the fund’s success in achieving its objective. For managers responsible for multiple funds and accounts, investment performance is evaluated on an aggregate basis, based on averages or weighted averages among managed funds and accounts. Funds and accounts that have performance-based advisory fees are not accorded disproportionate weightings in measuring aggregate portfolio manager performance. A portion of the compensation payable to equity portfolio managers and investment professionals will be determined based on the ability of one or more accounts managed by such manager to achieve a specified target average annual gross return over a three year period in excess of the account benchmark. The cash award to be payable at the end of the three year term will be established at the inception of the term and will be adjusted positively or negatively to the extent that the average annual gross return varies from the specified target return.
The compensation of portfolio managers with other job responsibilities (such as heading an investment group or providing analytical support to other portfolios) will include consideration of the scope of such responsibilities and the managers’ performance in meeting them.
EVM seeks to compensate portfolio managers commensurate with their responsibilities and performance, and competitive with other firms within the investment management industry. EVM participates in investment-industry compensation surveys and utilizes survey data as a factor in determining salary, bonus and stock-based compensation levels for portfolio managers and other investment professionals. Salaries, bonuses and stock-based compensation are also influenced by the operating performance of EVM and its parent company. The overall annual cash bonus pool is generally based on a substantially fixed percentage ofpre-bonus adjusted operating income. While the salaries of EVM’s portfolio managers are comparatively fixed, cash bonuses and stock-based compensation may fluctuate significantly from year to year, based on changes in manager performance and other factors as described herein. For a high performing portfolio manager, cash bonuses and stock-based compensation may represent a substantial portion of total compensation.
Item 9. Purchases of Equity Securities byClosed-End Management Investment Company and Affiliated Purchasers
No such purchases this period.
Item 10. Submission of Matters to a Vote of Security Holders
No material changes.
Item 11. Controls and Procedures
(a) It is the conclusion of the registrant’s principal executive officer and principal financial officer that the effectiveness of the registrant’s current disclosure controls and procedures (such disclosure controls and procedures having been evaluated within 90 days of the date of this filing) provide reasonable assurance that the information required to be disclosed by the registrant has been recorded, processed, summarized and reported within the time period specified in the Commission’s rules and forms and that the information required to be disclosed by the registrant has been accumulated and communicated to the registrant’s principal executive officer and principal financial officer in order to allow timely decisions regarding required disclosure.
(b) There have been no changes in the registrant’s internal controls over financial reporting during the second fiscal quarter of the period covered by this report that has materially affected, or is reasonably likely to materially affect, the registrant’s internal control over financial reporting.
Item 12. Disclosure of Securities Lending Activities forClosed-End Management Investment Companies
The Trust does not engage in securities lending.
Item 13. Exhibits
| (a)(1) | Registrant’s Code of Ethics – Not applicable (please see Item 2). |
| (a)(2)(i) | Treasurer’s Section 302 certification. |
| (a)(2)(ii) | President’s Section 302 certification. |
| (b) | Combined Section 906 certification. |
Signatures
Pursuant to the requirements of the Securities Exchange Act of 1934 and the Investment Company Act of 1940, the registrant has duly caused this report to be signed on its behalf by the undersigned, thereunto duly authorized.
Eaton Vance High Income 2021 Target Term Trust
| | |
By: | | /s/ Payson F. Swaffield |
| | Payson F. Swaffield |
| | President |
| |
Date: | | May 24, 2019 |
Pursuant to the requirements of the Securities Exchange Act of 1934 and the Investment Company Act of 1940, this report has been signed below by the following persons on behalf of the registrant and in the capacities and on the dates indicated.
| | |
| By: | | /s/ James F. Kirchner |
| | James F. Kirchner |
| | Treasurer |
| |
| Date: | | May 24, 2019 |
| |
| By: | | /s/ Payson F. Swaffield |
| | Payson F. Swaffield |
| | President |
| |
| Date: | | May 24, 2019 |