ICR Conference January 11, 2021 Exhibit 99.1
In this presentation, we refer to certain organic and legacy financial results. Except where indicated, organic financial results exclude contributions during the respective period from Smart Stores Holding Corp. (“Smart Foodservice”), which was acquired April 24, 2020 and from the Food Group of Companies (the "Food Group"), which was acquired on Sept. 13, 2019. Legacy case volume refers to US Foods locations on a pre-acquisition basis only and does not include Food Group or Smart Foodservice locations. Cautionary statements regarding forward-looking information Presentation of organic and legacy financial results This presentation contains “forward-looking statements” within the meaning of the federal securities laws concerning, among other things, our liquidity, our possible or assumed results of operations and our business strategies. These forward-looking statements, including any statements regarding EBITDA guidance, rely on a number of assumptions and our experience in the industry and are subject to risks, uncertainties and other important factors, many of which are beyond our control. Some of the factors that could cause our results to differ materially from those anticipated or expressed in any forward-looking statements include, among others, impacts of, and associated responses to, the COVID-19 pandemic; cost inflation/deflation and commodity volatility; competition; reliance on third party suppliers; interruption of product supply or increases in product costs; effective integration of acquisitions; achievement of expected benefits from cost savings initiatives; fluctuations in fuel costs; economic factors affecting consumer confidence and discretionary spending; changes in consumer eating habits; and extreme weather conditions, and natural disasters and other catastrophic events. For a detailed discussion of these risks, uncertainties and other factors, see the section entitled “Risk Factors” in our Annual Report on Form 10-K for the fiscal year ended December 28, 2019, which was filed with the Securities and Exchange Commission (“SEC”) on February 13, 2020, and in our Quarterly Report on Form 10-Q, for the quarterly period ended September 26, 2020, which was filed with the SEC on November 2, 2020. The forward-looking statements contained in this presentation speak only as of the date of this presentation. We undertake no obligation to update or revise any forward-looking statements.
Executive summary Resilient industry that is poised to recover Large, national distributor with scale advantages Differentiated Great Food. Made Easy.™ strategy drives profitable growth 1 2 3
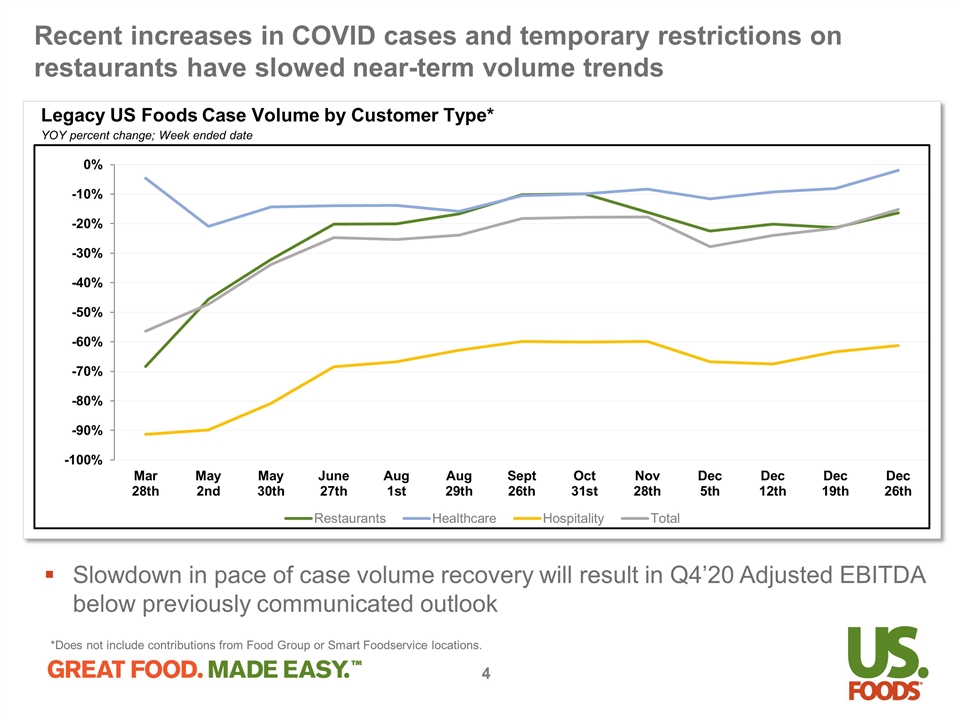
Legacy US Foods Case Volume by Customer Type* YOY percent change; Week ended date Recent increases in COVID cases and temporary restrictions on restaurants have slowed near-term volume trends *Does not include contributions from Food Group or Smart Foodservice locations. Slowdown in pace of case volume recovery will result in Q4’20 Adjusted EBITDA below previously communicated outlook
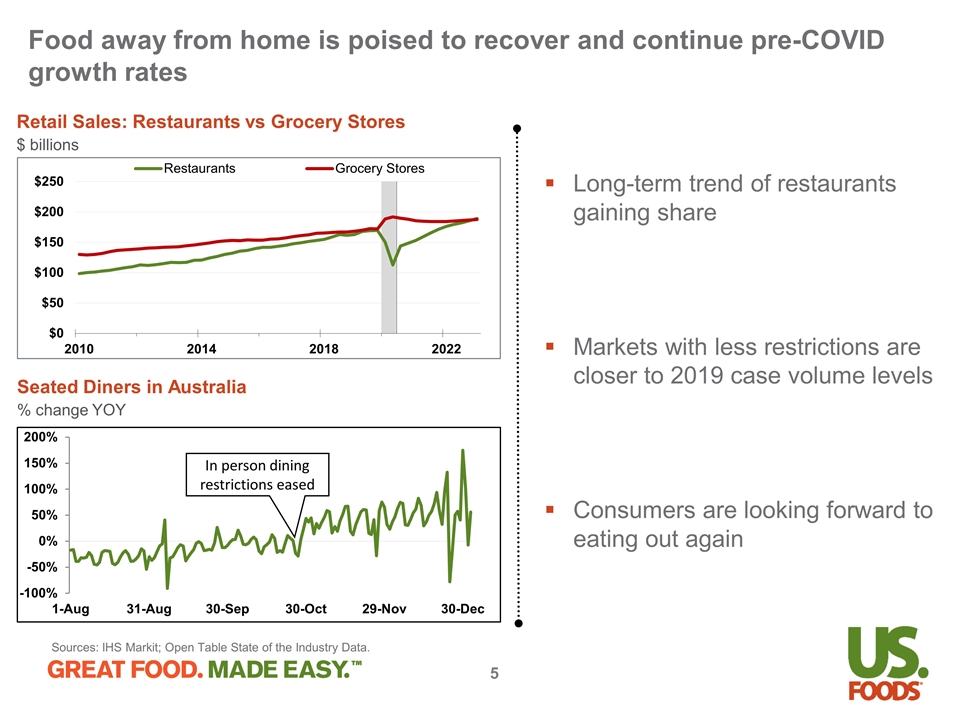
Food away from home is poised to recover and continue pre-COVID growth rates Sources: IHS Markit; Open Table State of the Industry Data. Seated Diners in Australia % change YOY Long-term trend of restaurants gaining share Markets with less restrictions are closer to 2019 case volume levels Consumers are looking forward to eating out again In person dining restrictions eased Retail Sales: Restaurants vs Grocery Stores $ billions
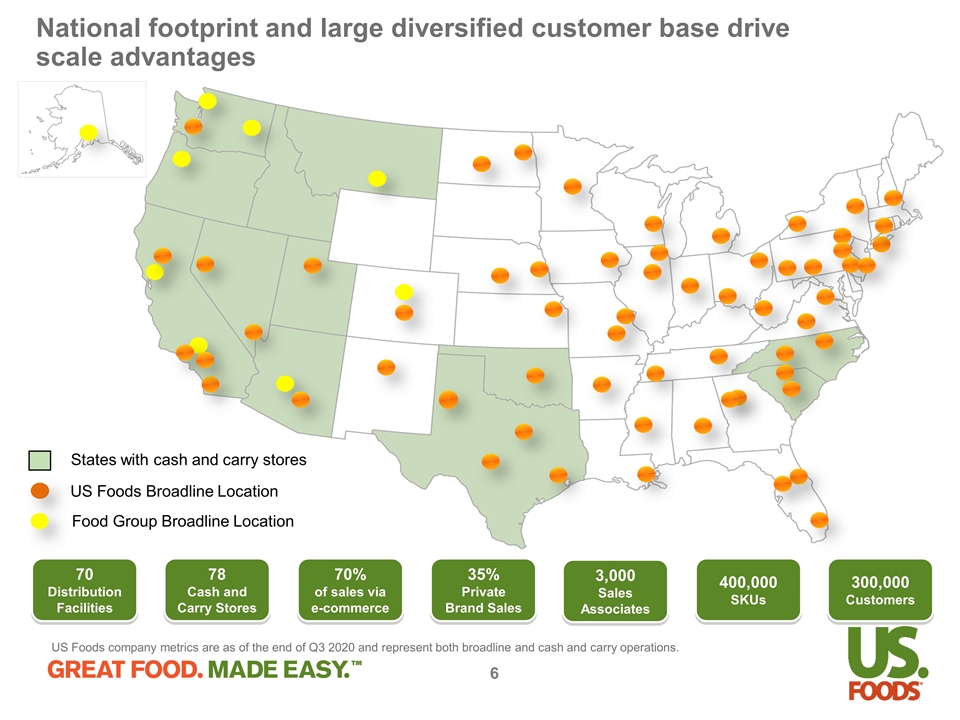
70 Distribution Facilities 35% Private Brand Sales 78 Cash and Carry Stores 70% of sales via e-commerce 3,000 Sales Associates 400,000 SKUs 300,000 Customers National footprint and large diversified customer base drive scale advantages US Foods Broadline Location Food Group Broadline Location States with cash and carry stores US Foods company metrics are as of the end of Q3 2020 and represent both broadline and cash and carry operations.
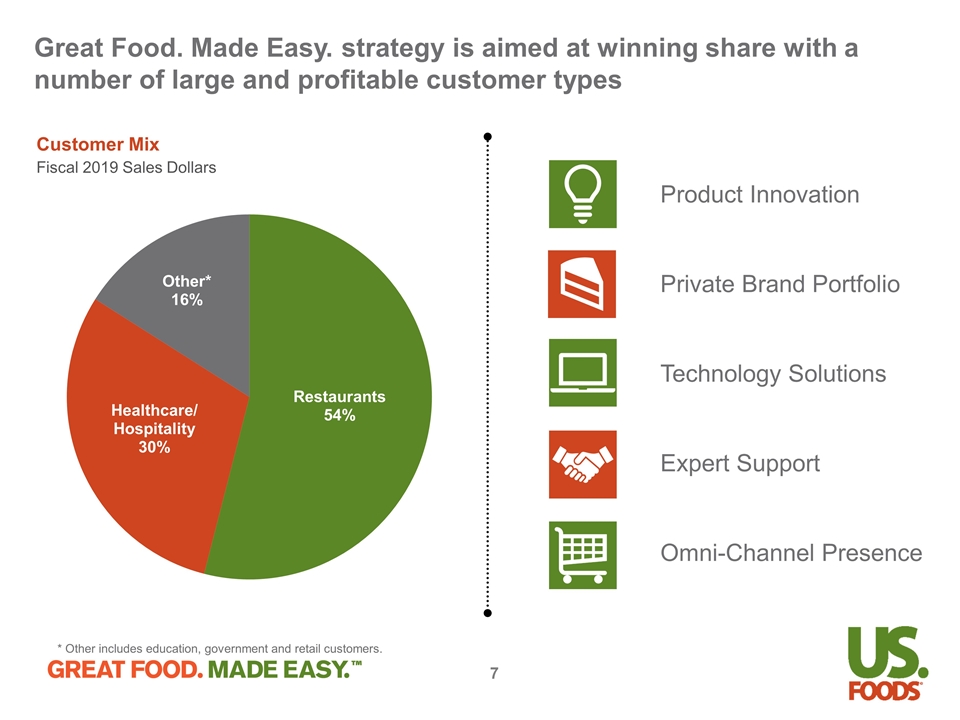
Great Food. Made Easy. strategy is aimed at winning share with a number of large and profitable customer types Customer Mix Fiscal 2019 Sales Dollars * Other includes education, government and retail customers. Product Innovation Private Brand Portfolio Technology Solutions Expert Support Omni-Channel Presence
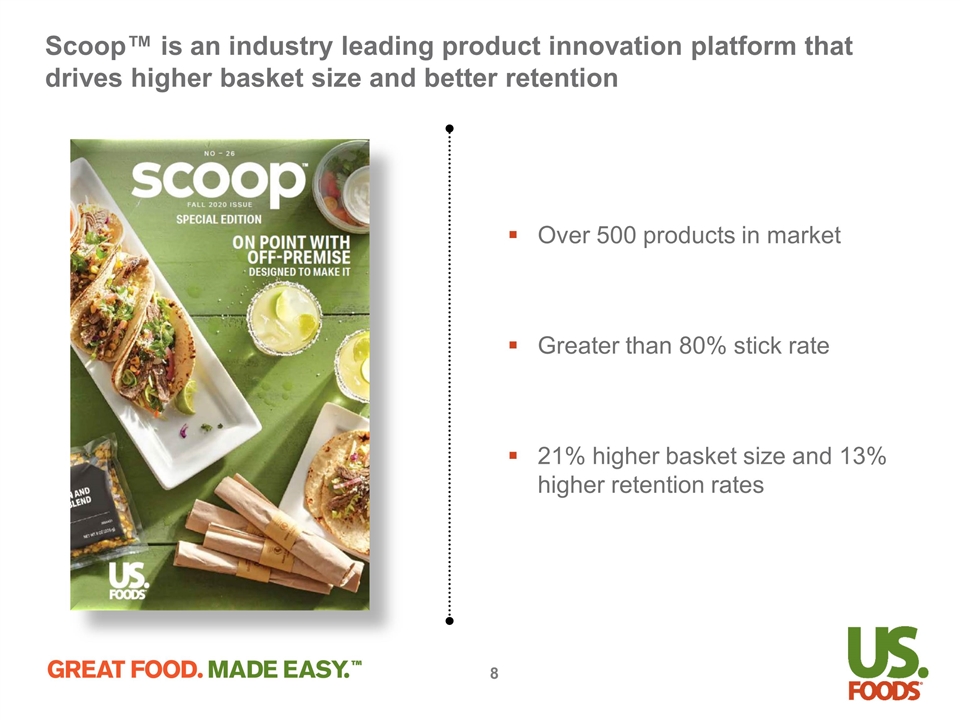
Scoop™ is an industry leading product innovation platform that drives higher basket size and better retention Over 500 products in market Greater than 80% stick rate 21% higher basket size and 13% higher retention rates
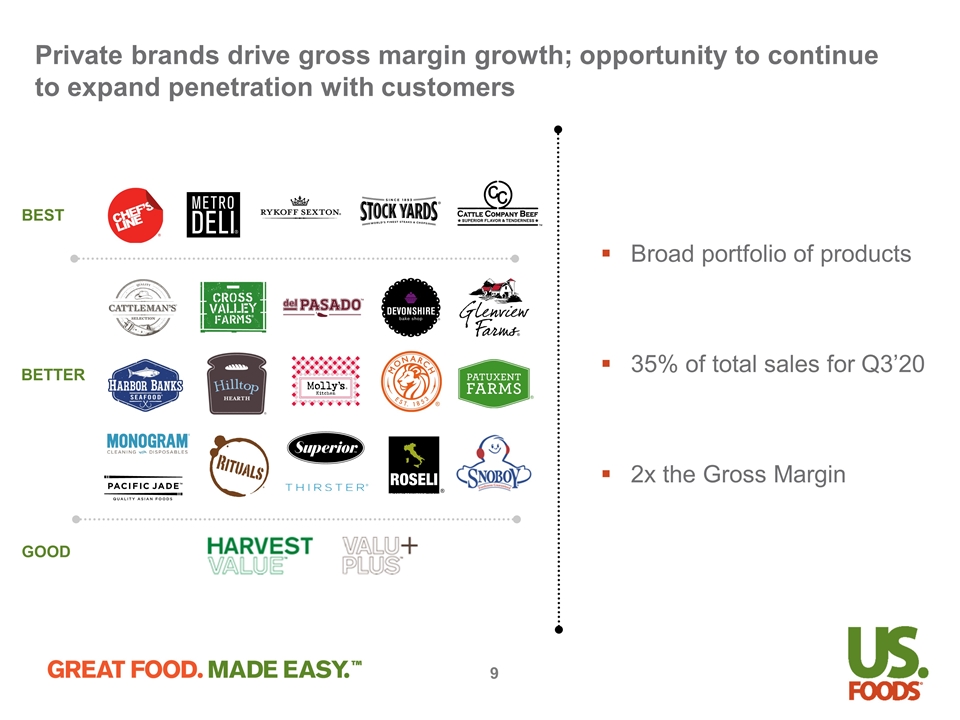
Private brands drive gross margin growth; opportunity to continue to expand penetration with customers Broad portfolio of products 35% of total sales for Q3’20 2x the Gross Margin BEST GOOD BETTER
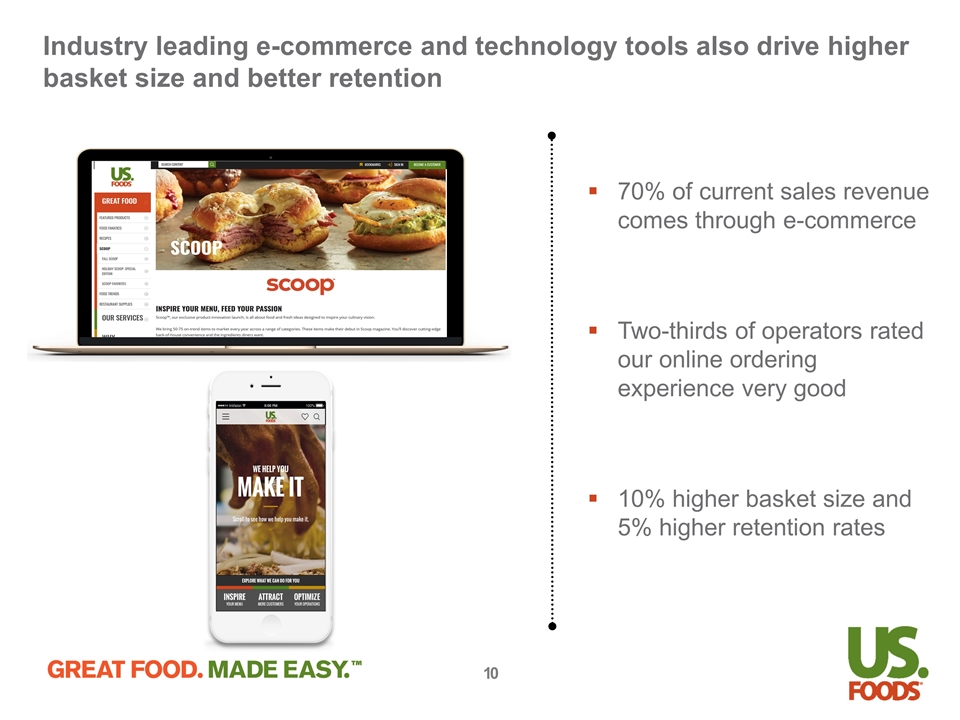
Industry leading e-commerce and technology tools also drive higher basket size and better retention 70% of current sales revenue comes through e-commerce Two-thirds of operators rated our online ordering experience very good 10% higher basket size and 5% higher retention rates
Our value-added services and team based selling are aimed at helping customers succeed while driving better retention Broad portfolio of leading tools and services Expert support from our team-based selling model: Food Fanatic Chefs Restaurant Operations Consultants Product Specialists Reduce Waste Simplify Staffing Drive Traffic Cookbook provides advanced pricing analytics and cross-selling opportunities
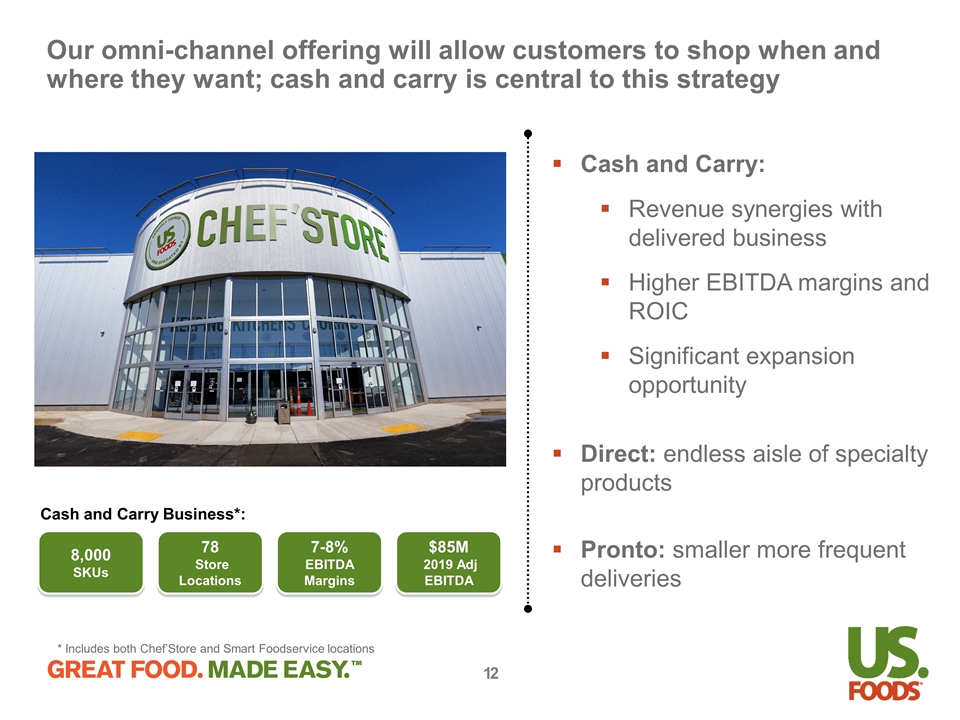
78 Store Locations 8,000 SKUs Our omni-channel offering will allow customers to shop when and where they want; cash and carry is central to this strategy 7-8% EBITDA Margins $85M 2019 Adj EBITDA Cash and Carry: Revenue synergies with delivered business Higher EBITDA margins and ROIC Significant expansion opportunity Direct: endless aisle of specialty products Pronto: smaller more frequent deliveries Cash and Carry Business*: * Includes both Chef’Store and Smart Foodservice locations
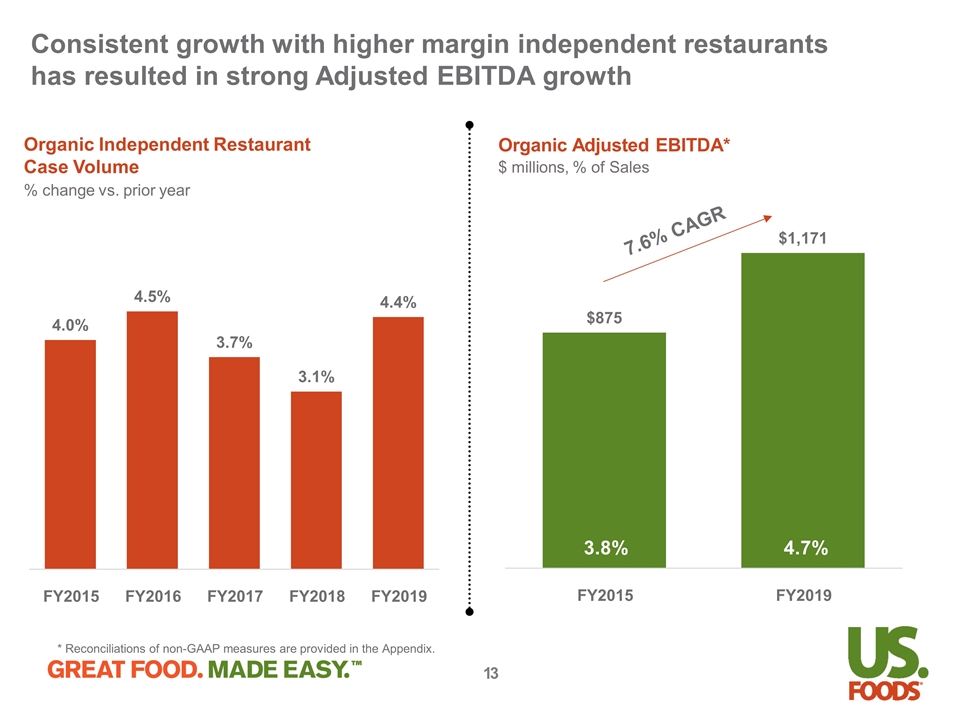
Consistent growth with higher margin independent restaurants has resulted in strong Adjusted EBITDA growth Organic Adjusted EBITDA* $ millions, % of Sales 3.8% 7.6% CAGR 4.7% * Reconciliations of non-GAAP measures are provided in the Appendix. Organic Independent Restaurant Case Volume % change vs. prior year
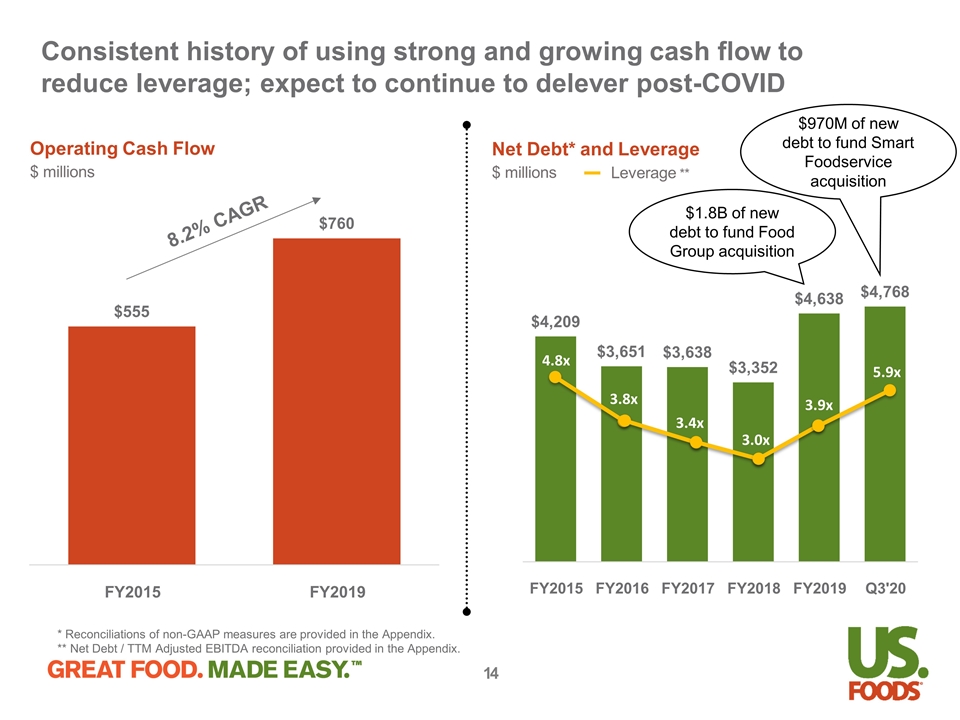
Consistent history of using strong and growing cash flow to reduce leverage; expect to continue to delever post-COVID Net Debt* and Leverage $ millions 4.8x 3.8x 3.4x 3.0x 3.9x $1.8B of new debt to fund Food Group acquisition Leverage ** * Reconciliations of non-GAAP measures are provided in the Appendix. ** Net Debt / TTM Adjusted EBITDA reconciliation provided in the Appendix. Operating Cash Flow $ millions 8.2% CAGR 5.9x $970M of new debt to fund Smart Foodservice acquisition
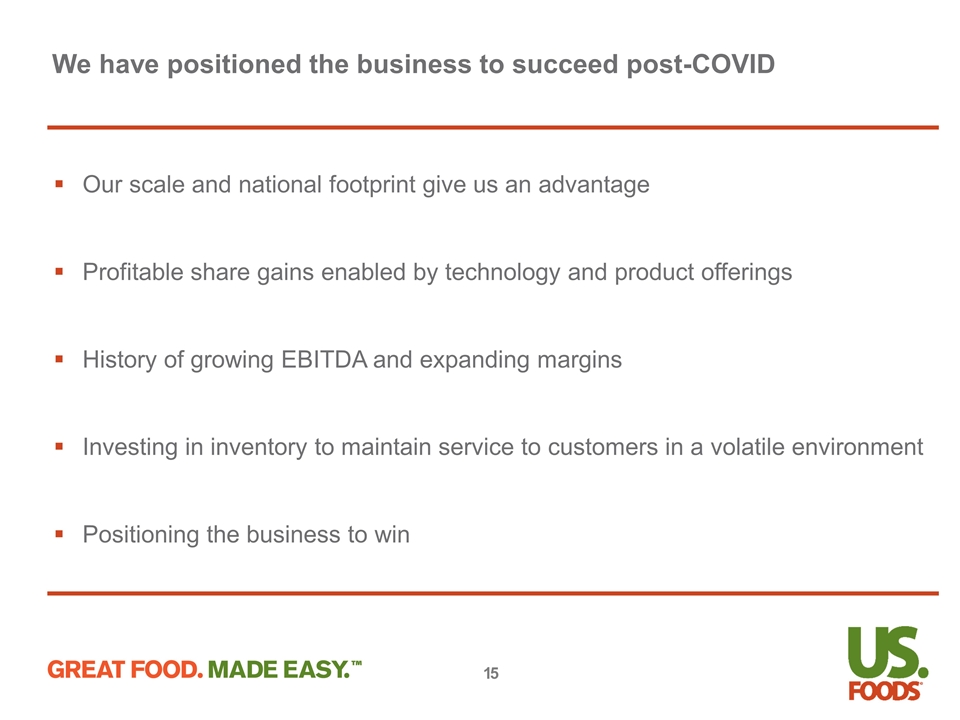
We have positioned the business to succeed post-COVID 1 Our scale and national footprint give us an advantage Profitable share gains enabled by technology and product offerings History of growing EBITDA and expanding margins Investing in inventory to maintain service to customers in a volatile environment Positioning the business to win
Appendix Non-GAAP Reconciliations
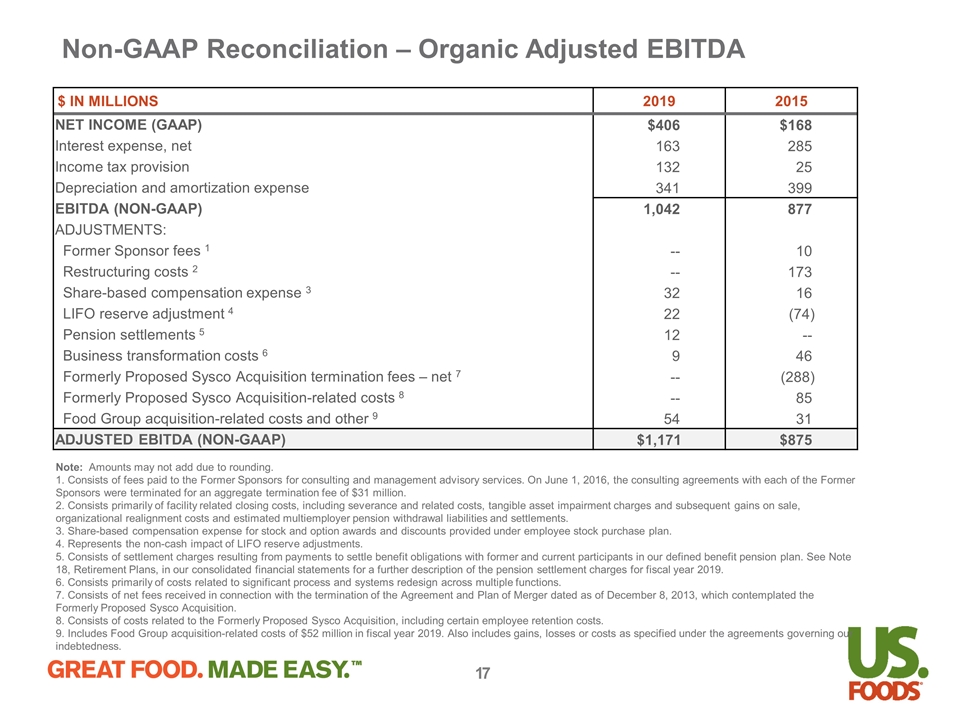
Non-GAAP Reconciliation – Organic Adjusted EBITDA $ IN MILLIONS 2019 2015 NET INCOME (GAAP) $406 $168 Interest expense, net 163 285 Income tax provision 132 25 Depreciation and amortization expense 341 399 EBITDA (NON-GAAP) 1,042 877 ADJUSTMENTS: Former Sponsor fees 1 -- 10 Restructuring costs 2 -- 173 Share-based compensation expense 3 32 16 LIFO reserve adjustment 4 22 (74) Pension settlements 5 12 -- Business transformation costs 6 9 46 Formerly Proposed Sysco Acquisition termination fees – net 7 -- (288) Formerly Proposed Sysco Acquisition-related costs 8 -- 85 Food Group acquisition-related costs and other 9 54 31 ADJUSTED EBITDA (NON-GAAP) $1,171 $875 Note: Amounts may not add due to rounding. 1. Consists of fees paid to the Former Sponsors for consulting and management advisory services. On June 1, 2016, the consulting agreements with each of the Former Sponsors were terminated for an aggregate termination fee of $31 million. 2. Consists primarily of facility related closing costs, including severance and related costs, tangible asset impairment charges and subsequent gains on sale, organizational realignment costs and estimated multiemployer pension withdrawal liabilities and settlements. 3. Share-based compensation expense for stock and option awards and discounts provided under employee stock purchase plan. 4. Represents the non-cash impact of LIFO reserve adjustments. 5. Consists of settlement charges resulting from payments to settle benefit obligations with former and current participants in our defined benefit pension plan. See Note 18, Retirement Plans, in our consolidated financial statements for a further description of the pension settlement charges for fiscal year 2019. 6. Consists primarily of costs related to significant process and systems redesign across multiple functions. 7. Consists of net fees received in connection with the termination of the Agreement and Plan of Merger dated as of December 8, 2013, which contemplated the Formerly Proposed Sysco Acquisition. 8. Consists of costs related to the Formerly Proposed Sysco Acquisition, including certain employee retention costs. 9. Includes Food Group acquisition-related costs of $52 million in fiscal year 2019. Also includes gains, losses or costs as specified under the agreements governing our indebtedness.
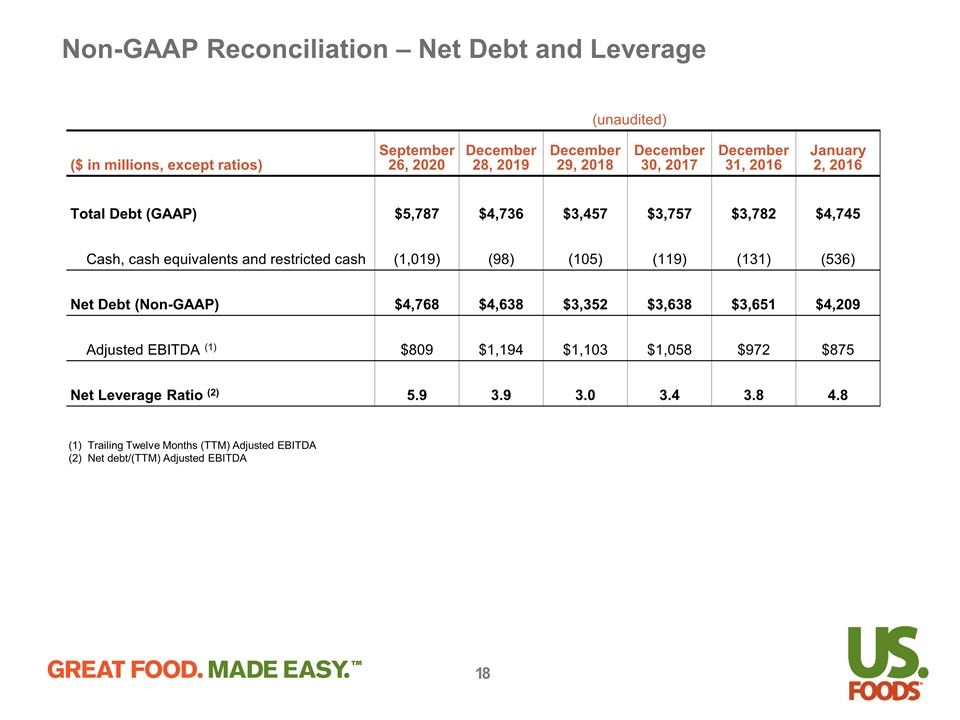
Non-GAAP Reconciliation – Net Debt and Leverage (unaudited) ($ in millions, except ratios) September 26, 2020 December 28, 2019 December 29, 2018 December 30, 2017 December 31, 2016 January 2, 2016 Total Debt (GAAP) $5,787 $4,736 $3,457 $3,757 $3,782 $4,745 Cash, cash equivalents and restricted cash (1,019) (98) (105) (119) (131) (536) Net Debt (Non-GAAP) $4,768 $4,638 $3,352 $3,638 $3,651 $4,209 Adjusted EBITDA (1) $809 $1,194 $1,103 $1,058 $972 $875 Net Leverage Ratio (2) 5.9 3.9 3.0 3.4 3.8 4.8 (1) Trailing Twelve Months (TTM) Adjusted EBITDA (2) Net debt/(TTM) Adjusted EBITDA


