
November 12, 2019 Earnings Presentation Q3 2019
Disclaimer This presentation includes forward-looking statements. All statements contained in this presentation other than statements of historical facts, including statements regarding future results of operations and the financial position of Cardlytics, Inc. (“Cardlytics,” “we,” “us” or “our”), our business strategy and plans, our objectives for future operations, including our long-term model, our target adjusted EBITDA in 2020 and our target MAUs and ARPU in 2021 and our financial guidance for the quarter and year ended December 31, 2019 are forward-looking statements. The words “anticipate,” believe,” “continue,” “estimate,” “expect,” “intend,” “may,” “will” and similar expressions are intended to identify forward-looking statements. We have based these forward-looking statements largely on our current expectations and projections about future events and financial trends that we believe may affect our financial condition, results of operations, business strategy, short-term and long-term business operations and objectives, and financial needs. These forward-looking statements are subject to a number of risks and uncertainties. The future events and trends discussed in this presentation may not occur and actual results could differ materially and adversely from those anticipated or implied in the forward-looking statements. Although we believe that the expectations reflected in the forward-looking statements are reasonable, we cannot guarantee future results, levels of activity, performance, achievements or events and circumstances reflected in the forward-looking statements will occur. We are under no duty to update any of these forward-looking statements after the date of this presentation to conform these statements to actual results or revised expectations, except as required by law. In addition to U.S. GAAP financial information, this presentation includes billings, adjusted contribution, adjusted FI Share and other third-party costs, adjusted EBITDA, adjusted EBITDA margin, non-GAAP net (loss) income and non-GAAP net (loss) income per share, each of which is a non-GAAP financial measure. These non-GAAP financial measures are in addition to, and not a substitute for or superior to, measures of financial performance prepared in accordance with U.S. GAAP. Reconciliations of billings, adjusted contribution, adjusted FI Share and other third-party costs, adjusted EBITDA, adjusted EBITDA margin, non-GAAP net (loss) income and non-GAAP net (loss) income per share to the most directly comparable GAAP measures are included in the appendix to this presentation.

We power a native ad platform for marketers in banks’ digital channels.
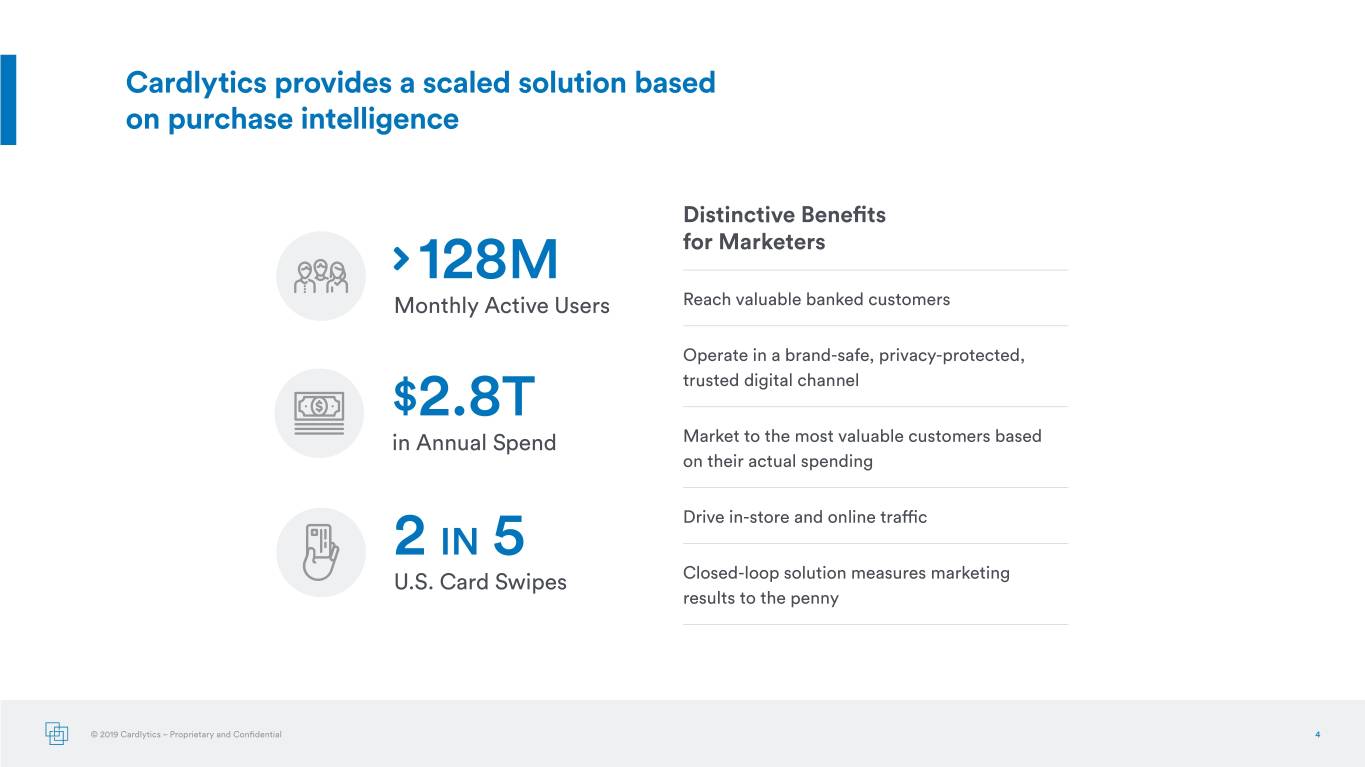
Cardlytics provides a scaled solution based on purchase intelligence Distinctive Benefits 128M for Marketers Monthly Active Users Reach valuable banked customers Operate in a brand-safe, privacy-protected, $2.8T trusted digital channel in Annual Spend Market to the most valuable customers based on their actual spending Drive in-store and online traffic 2 IN 5 U.S. Card Swipes Closed-loop solution measures marketing results to the penny © 2019 Cardlytics – Proprietary and Confidential 4
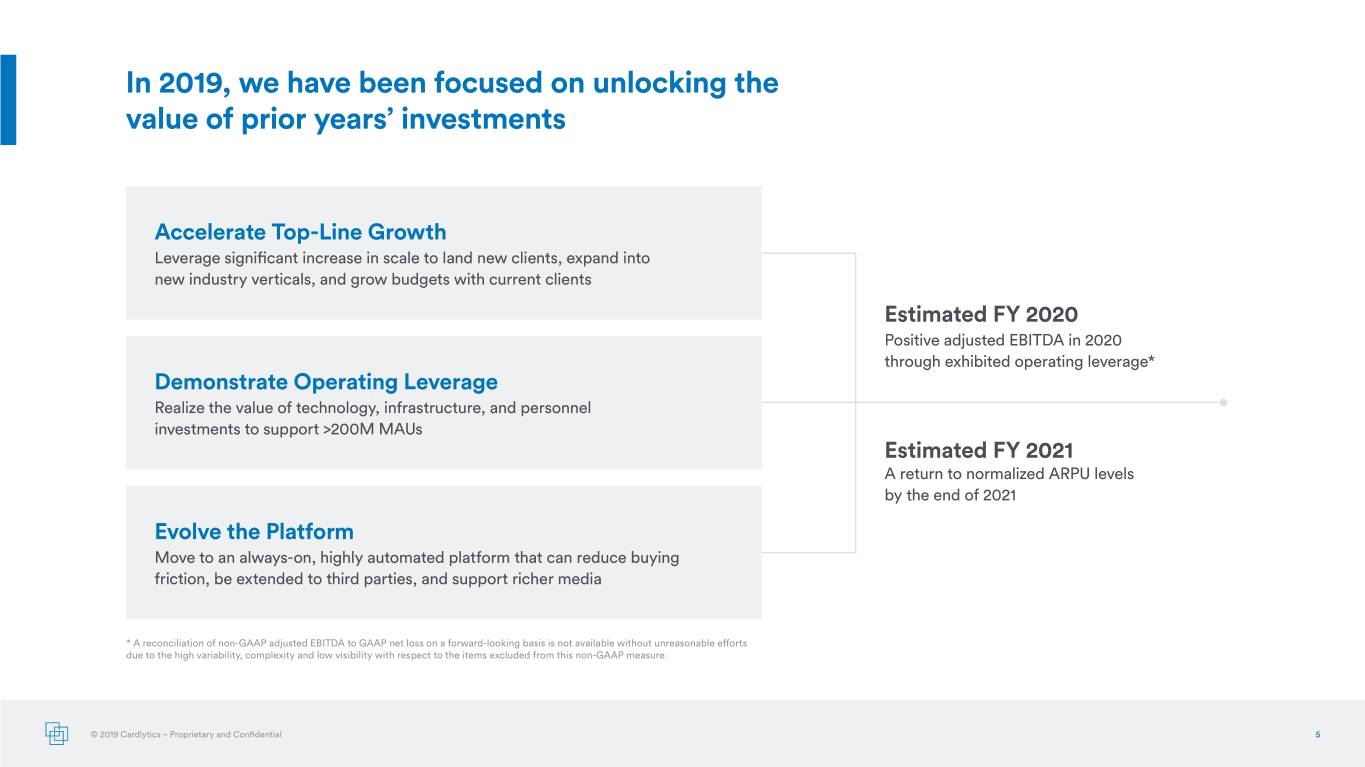
In 2019, we have been focused on unlocking the value of prior years’ investments Accelerate Top-Line Growth Leverage significant increase in scale to land new clients, expand into new industry verticals, and grow budgets with current clients Estimated FY 2020 Positive adjusted EBITDA in 2020 through exhibited operating leverage* Demonstrate Operating Leverage Realize the value of technology, infrastructure, and personnel investments to support >200M MAUs Estimated FY 2021 A return to normalized ARPU levels by the end of 2021 Evolve the Platform Move to an always-on, highly automated platform that can reduce buying friction, be extended to third parties, and support richer media * A reconciliation of non-GAAP adjusted EBITDA to GAAP net loss on a forward-looking basis is not available without unreasonable efforts due to the high variability, complexity and low visibility with respect to the items excluded from this non-GAAP measure. © 2019 Cardlytics – Proprietary and Confidential 5

Financial Information & Operating Metrics
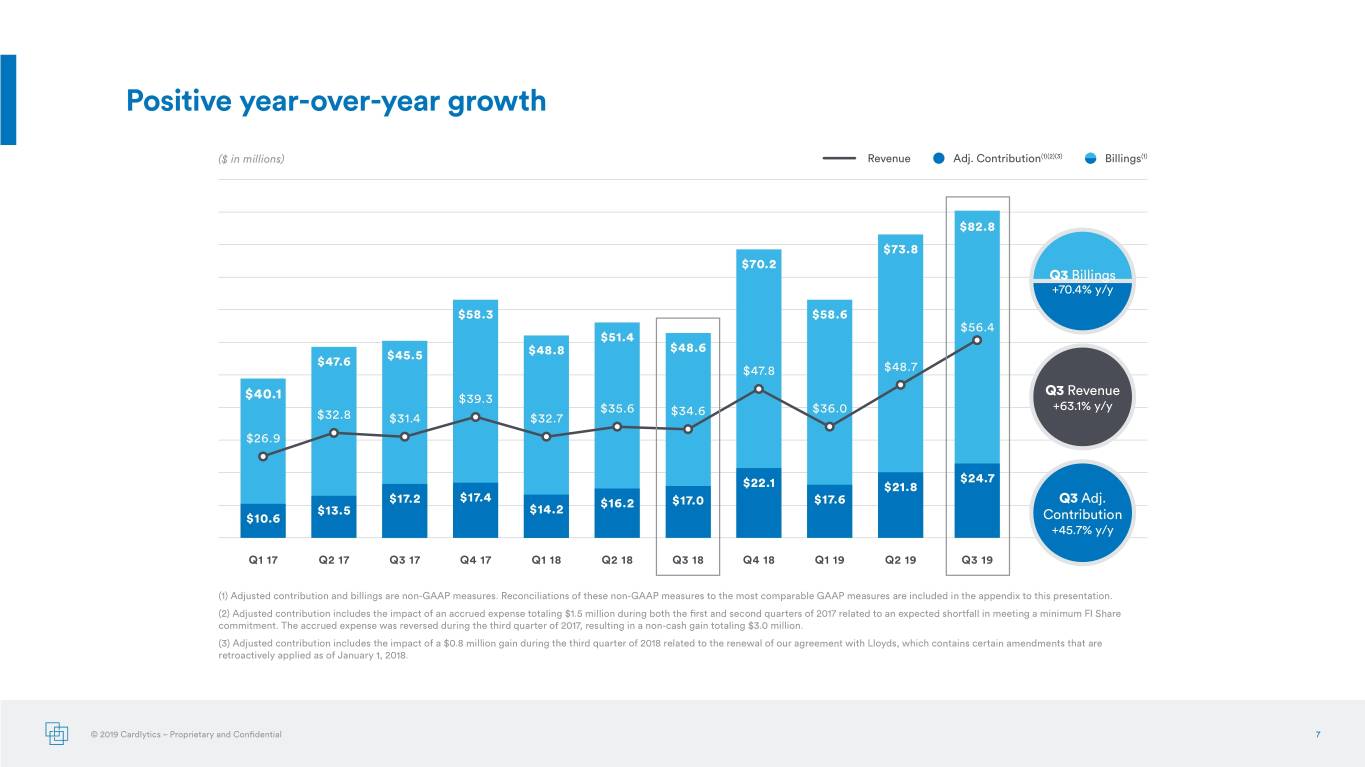
Positive year-over-year growth ($ in millions) Revenue Adj. Contribution(1)(2)(3) Billings(1) $82.8 $73.8 $70.2 Q3 Billings +70.4% y/y $58.3 $58.6 $56.4 $51.4 $48.6 $45.5 $48.8 $ 47.6 $47.8 $48.7 Q3 Revenue $40.1 $39.3 $35.6 $34.6 $36.0 +63.1% y/y $32.8 $31.4 $32.7 $26.9 $24.7 $22.1 $21.8 $1 7. 2 $1 7.4 $16.2 $1 7.0 $1 7.6 Q3 Adj. $13.5 $14.2 $10.6 Contribution +45.7% y/y Q1 17 Q2 17 Q3 17 Q4 17 Q1 18 Q2 18 Q3 18 Q4 18 Q1 19 Q2 19 Q3 19 (1) Adjusted contribution and billings are non-GAAP measures. Reconciliations of these non-GAAP measures to the most comparable GAAP measures are included in the appendix to this presentation. (2) Adjusted contribution includes the impact of an accrued expense totaling $1.5 million during both the first and second quarters of 2017 related to an expected shortfall in meeting a minimum FI Share commitment. The accrued expense was reversed during the third quarter of 2017, resulting in a non-cash gain totaling $3.0 million. (3) Adjusted contribution includes the impact of a $0.8 million gain during the third quarter of 2018 related to the renewal of our agreement with Lloyds, which contains certain amendments that are retroactively applied as of January 1, 2018. © 2019 Cardlytics – Proprietary and Confidential 7
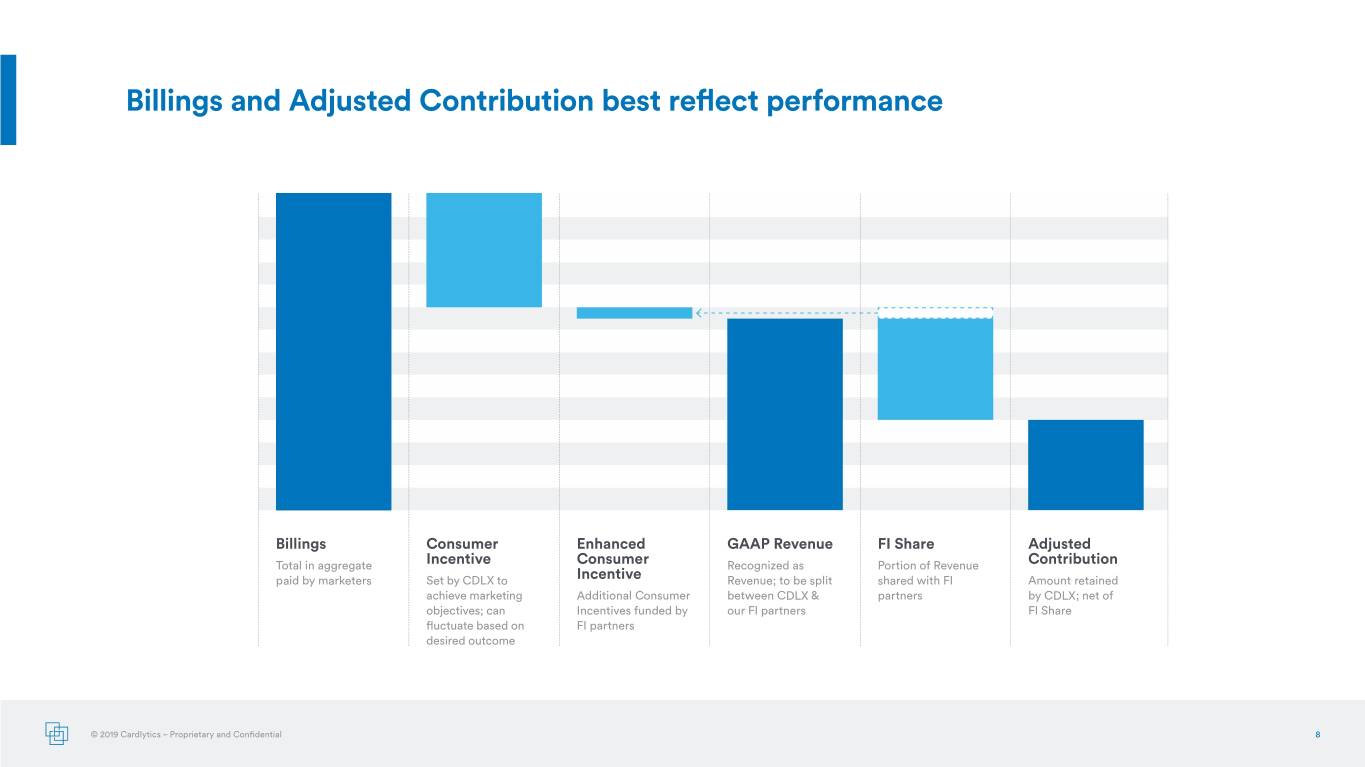
Billings and Adjusted Contribution best reflect performance Billings Consumer Enhanced GAAP Revenue FI Share Adjusted Total in aggregate Incentive Consumer Recognized as Portion of Revenue Contribution paid by marketers Set by CDLX to Incentive Revenue; to be split shared with FI Amount retained achieve marketing Additional Consumer between CDLX & partners by CDLX; net of objectives; can Incentives funded by our FI partners FI Share fluctuate based on FI partners desired outcome © 2019 Cardlytics – Proprietary and Confidential 8
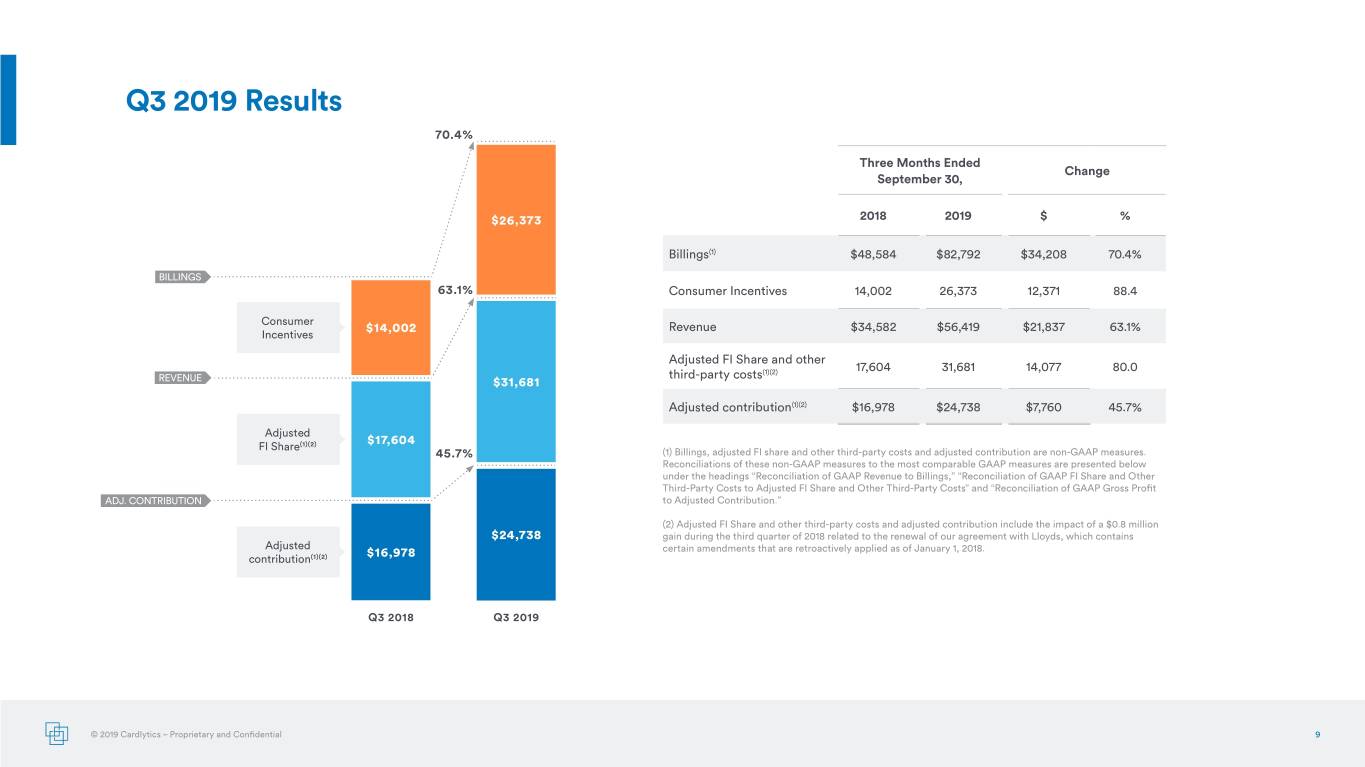
Q3 2019 Results 70.4% Three Months Ended Change September 30, $26,373 2018 2019 $ % Billings(1) $48,584 $82,792 $34,208 70.4% BILLINGS 63.1% Consumer Incentives 14,002 26,373 12,371 88.4 Consumer $14,002 Revenue $34,582 $56,419 $21,837 63.1% Incentives Adjusted FI Share and other 17,604 31,681 14,077 80.0 third-party costs(1)(2) REVENUE $31,681 Adjusted contribution(1)(2) $16,978 $24,738 $7,760 45.7% Adjusted FI Share(1)(2) $17,604 45.7% (1) Billings, adjusted FI share and other third-party costs and adjusted contribution are non-GAAP measures. Reconciliations of these non-GAAP measures to the most comparable GAAP measures are presented below under the headings “Reconciliation of GAAP Revenue to Billings,” “Reconciliation of GAAP FI Share and Other REVENUE Third-Party Costs to Adjusted FI Share and Other Third-Party Costs” and “Reconciliation of GAAP Gross Profit ADJ. CONTRIBUTION to Adjusted Contribution.” (2) Adjusted FI Share and other third-party costs and adjusted contribution include the impact of a $0.8 million $24,738 gain during the third quarter of 2018 related to the renewal of our agreement with Lloyds, which contains Adjusted certain amendments that are retroactively applied as of January 1, 2018. contribution(1)(2) $16,978 Q3 2018 Q3 2019 © 2019 Cardlytics – Proprietary and Confidential 9
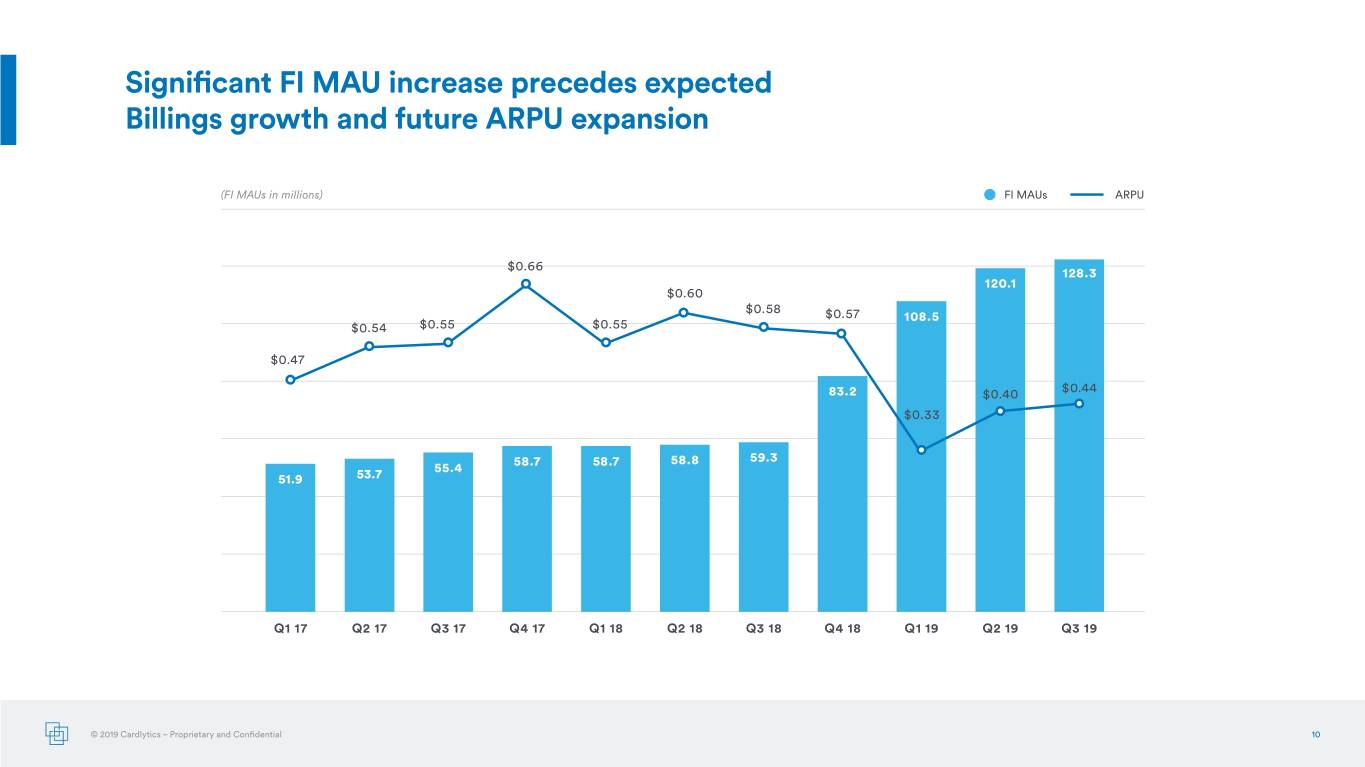
Significant FI MAU increase precedes expected Billings growth and future ARPU expansion (FI MAUs in millions) FI MAUs ARPU $0.66 128.3 120.1 $0.60 $0.58 $0.57 108.5 $0.54 $0.55 $0.55 $0.47 83.2 $0.40 $0.44 $0.33 58.7 58.7 58.8 59.3 55.4 51.9 53.7 Q1 17 Q2 17 Q3 17 Q4 17 Q1 18 Q2 18 Q3 18 Q4 18 Q1 19 Q2 19 Q3 19 © 2019 Cardlytics – Proprietary and Confidential 10
Appendix
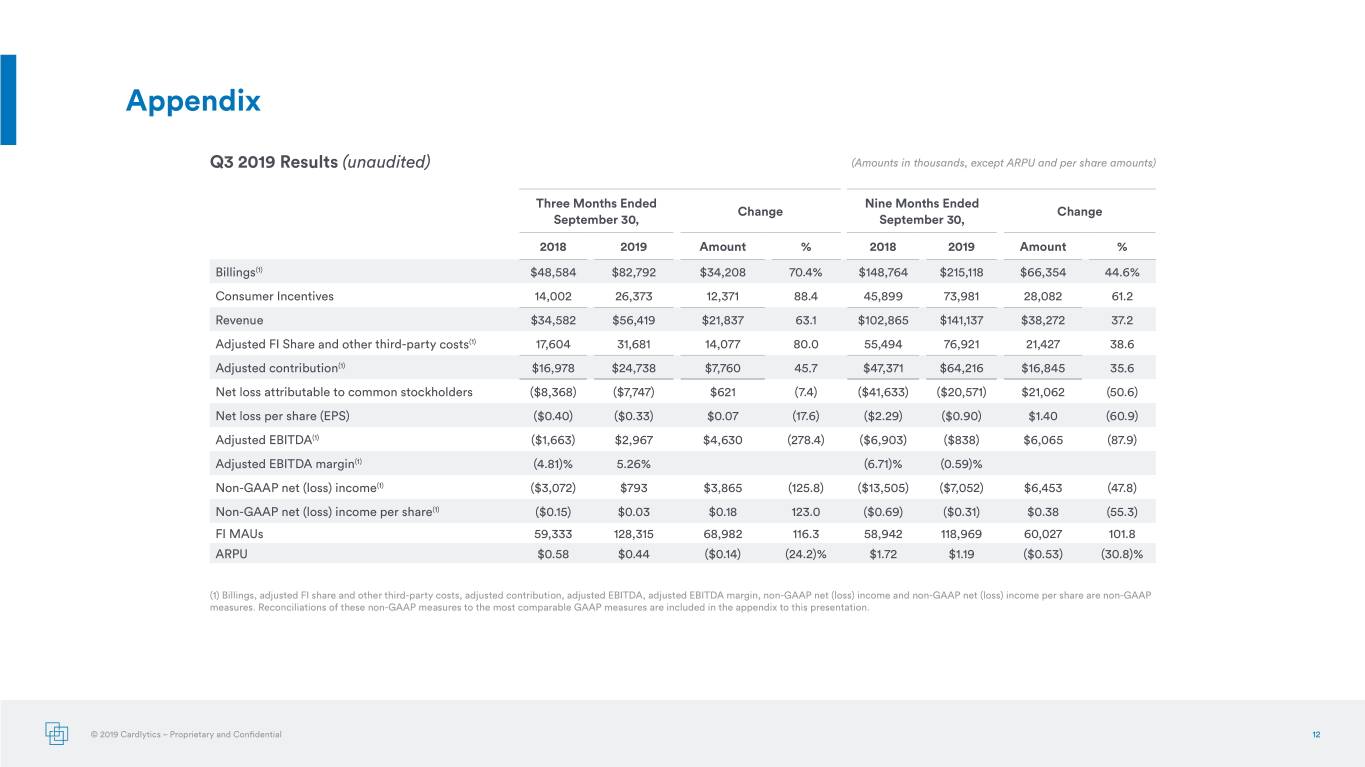
Appendix Q3 2019 Results (unaudited) (Amounts in thousands, except ARPU and per share amounts) Three Months Ended Nine Months Ended Change Change September 30, September 30, 2018 2019 Amount % 2018 2019 Amount % Billings(1) $48,584 $82,792 $34,208 70.4% $148,764 $215,118 $66,354 44.6% Consumer Incentives 14,002 26,373 12,371 88.4 45,899 73,981 28,082 61.2 Revenue $34,582 $56,419 $21,837 63.1 $102,865 $141,137 $38,272 37.2 Adjusted FI Share and other third-party costs(1) 17,604 31,681 14,077 80.0 55,494 76,921 21,427 38.6 Adjusted contribution(1) $16,978 $24,738 $7,760 45.7 $47,371 $64,216 $16,845 35.6 Net loss attributable to common stockholders ($8,368) ($7,747) $621 ( 7.4) ($41,633) ($20,571) $21,062 (50.6) Net loss per share (EPS) ($0.40) ($0.33) $0.07 (17.6) ($2.29) ($0.90) $1.40 (60.9) Adjusted EBITDA(1) ($1,663) $2,967 $4,630 (278.4) ($6,903) ($838) $6,065 (87.9) Adjusted EBITDA margin(1) (4.81)% 5.26% (6.71)% (0.59)% Non-GAAP net (loss) income(1) ($3,072) $793 $3,865 (125.8) ($13,505) ($7,052) $6,453 (47.8) Non-GAAP net (loss) income per share(1) ($0.15) $0.03 $0.18 123.0 ($0.69) ($0.31) $0.38 (55.3) FI MAUs 59,333 128,315 68,982 116.3 58,942 118,969 60,027 101.8 ARPU $0.58 $0.44 ($0.14) (24.2)% $1.72 $1.19 ($0.53) (30.8)% (1) Billings, adjusted FI share and other third-party costs, adjusted contribution, adjusted EBITDA, adjusted EBITDA margin, non-GAAP net (loss) income and non-GAAP net (loss) income per share are non-GAAP measures. Reconciliations of these non-GAAP measures to the most comparable GAAP measures are included in the appendix to this presentation. © 2019 Cardlytics – Proprietary and Confidential 12
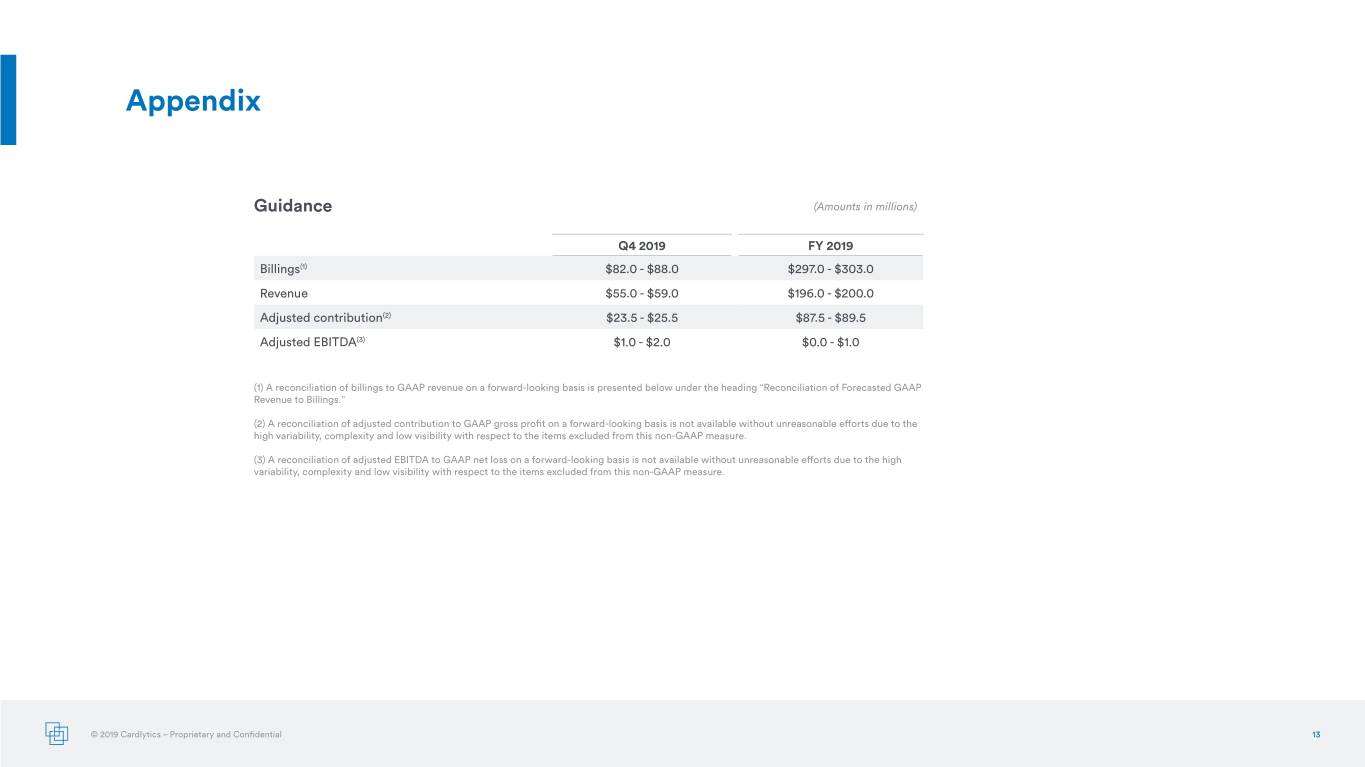
Appendix Guidance (Amounts in millions) Q4 2019 FY 2019 Billings(1) $82.0 - $88.0 $297.0 - $303.0 Revenue $55.0 - $59.0 $196.0 - $200.0 Adjusted contribution(2) $23.5 - $25.5 $87.5 - $89.5 Adjusted EBITDA(3) $1.0 - $2.0 $0.0 - $1.0 (1) A reconciliation of billings to GAAP revenue on a forward-looking basis is presented below under the heading “Reconciliation of Forecasted GAAP Revenue to Billings.” (2) A reconciliation of adjusted contribution to GAAP gross profit on a forward-looking basis is not available without unreasonable efforts due to the high variability, complexity and low visibility with respect to the items excluded from this non-GAAP measure. (3) A reconciliation of adjusted EBITDA to GAAP net loss on a forward-looking basis is not available without unreasonable efforts due to the high variability, complexity and low visibility with respect to the items excluded from this non-GAAP measure. © 2019 Cardlytics – Proprietary and Confidential 13
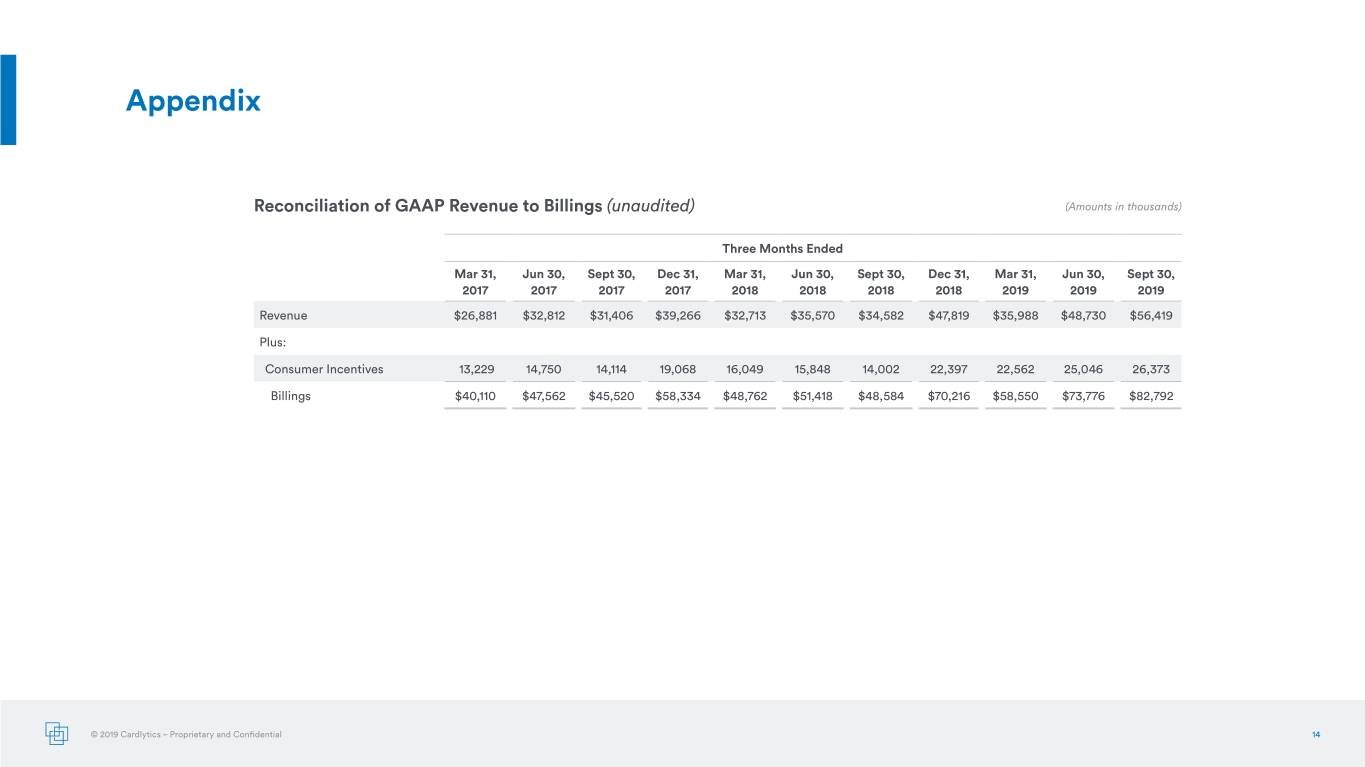
Appendix Reconciliation of GAAP Revenue to Billings (unaudited) (Amounts in thousands) Three Months Ended Mar 31, Jun 30, Sept 30, Dec 31, Mar 31, Jun 30, Sept 30, Dec 31, Mar 31, Jun 30, Sept 30, 2017 2017 2017 2017 2018 2018 2018 2018 2019 2019 2019 Revenue $26,881 $32,812 $31,406 $39,266 $32,713 $35,570 $34,582 $47,819 $35,988 $48,730 $56,419 Plus: Consumer Incentives 13,229 14,750 14,114 19,068 16,049 15,848 14,002 22,397 22,562 25,046 26,373 Billings $40,110 $47,562 $45,520 $58,334 $48,762 $51,418 $48,584 $70,216 $58,550 $73,776 $82,792 © 2019 Cardlytics – Proprietary and Confidential 14
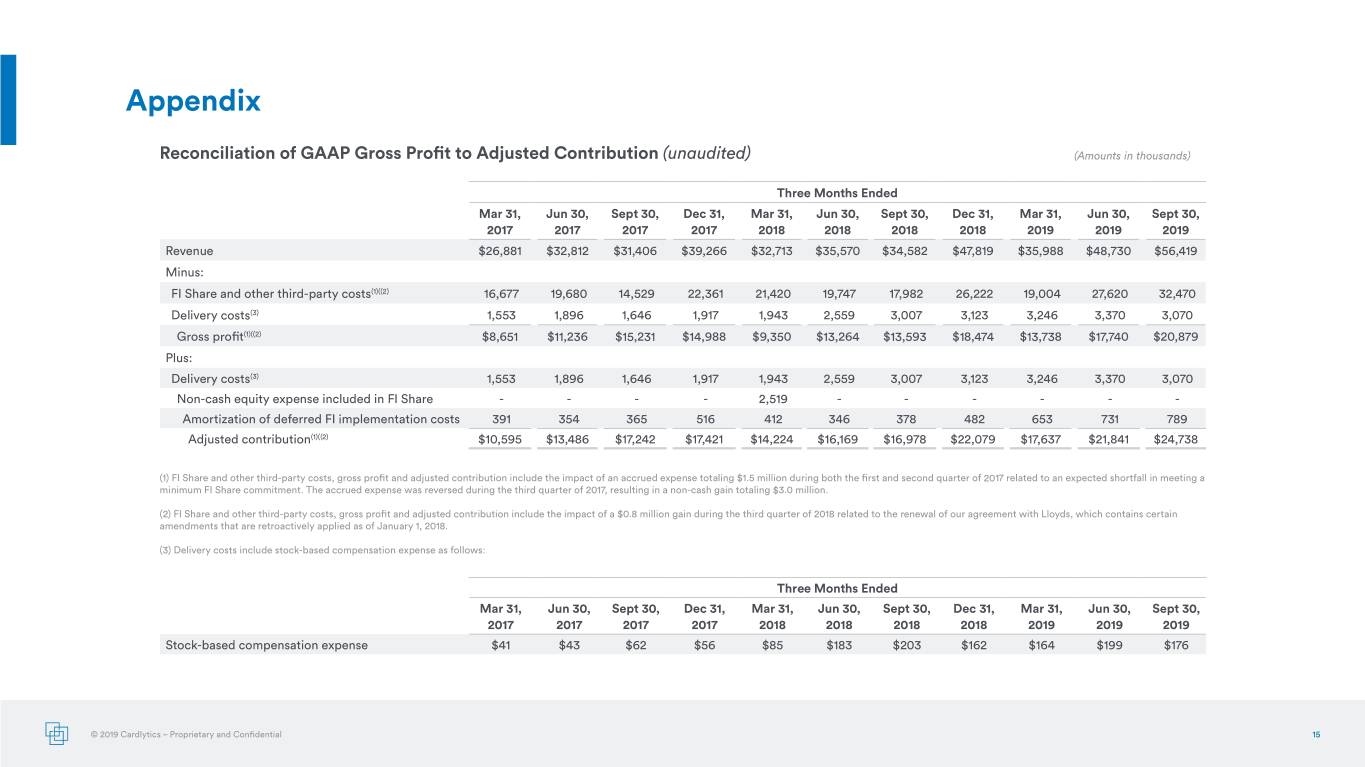
Appendix Reconciliation of GAAP Gross Profit to Adjusted Contribution(unaudited) (Amounts in thousands) Three Months Ended Mar 31, Jun 30, Sept 30, Dec 31, Mar 31, Jun 30, Sept 30, Dec 31, Mar 31, Jun 30, Sept 30, 2017 2017 2017 2017 2018 2018 2018 2018 2019 2019 2019 Revenue $26,881 $32,812 $31,406 $39,266 $32,713 $35,570 $34,582 $47,819 $35,988 $48,730 $56,419 Minus: FI Share and other third-party costs(1)((2) 16,677 19,680 14,529 22,361 21,420 19,747 17,982 26,222 19,004 27,620 32,470 Delivery costs(3) 1,553 1,896 1,646 1,917 1,943 2,559 3,007 3,123 3,246 3,370 3,070 Gross profit(1)((2) $8,651 $11,236 $15,231 $14,988 $9,350 $13,264 $13,593 $18,474 $13,738 $17,740 $20,879 Plus: Delivery costs(3) 1,553 1,896 1,646 1,917 1,943 2,559 3,007 3,123 3,246 3,370 3,070 Non-cash equity expense included in FI Share - - - - 2,519 - - - - - - Amortization of deferred FI implementation costs 391 354 365 516 412 346 378 482 653 731 789 Adjusted contribution(1)((2) $10,595 $13,486 $17,242 $17,421 $14,224 $16,169 $16,978 $22,079 $17,637 $21,841 $24,738 (1) FI Share and other third-party costs, gross profit and adjusted contribution include the impact of an accrued expense totaling $1.5 million during both the first and second quarter of 2017 related to an expected shortfall in meeting a minimum FI Share commitment. The accrued expense was reversed during the third quarter of 2017, resulting in a non-cash gain totaling $3.0 million. (2) FI Share and other third-party costs, gross profit and adjusted contribution include the impact of a $0.8 million gain during the third quarter of 2018 related to the renewal of our agreement with Lloyds, which contains certain amendments that are retroactively applied as of January 1, 2018. (3) Delivery costs include stock-based compensation expense as follows: Three Months Ended Mar 31, Jun 30, Sept 30, Dec 31, Mar 31, Jun 30, Sept 30, Dec 31, Mar 31, Jun 30, Sept 30, 2017 2017 2017 2017 2018 2018 2018 2018 2019 2019 2019 Stock-based compensation expense $41 $43 $62 $56 $85 $183 $203 $162 $164 $199 $176 © 2019 Cardlytics – Proprietary and Confidential 15
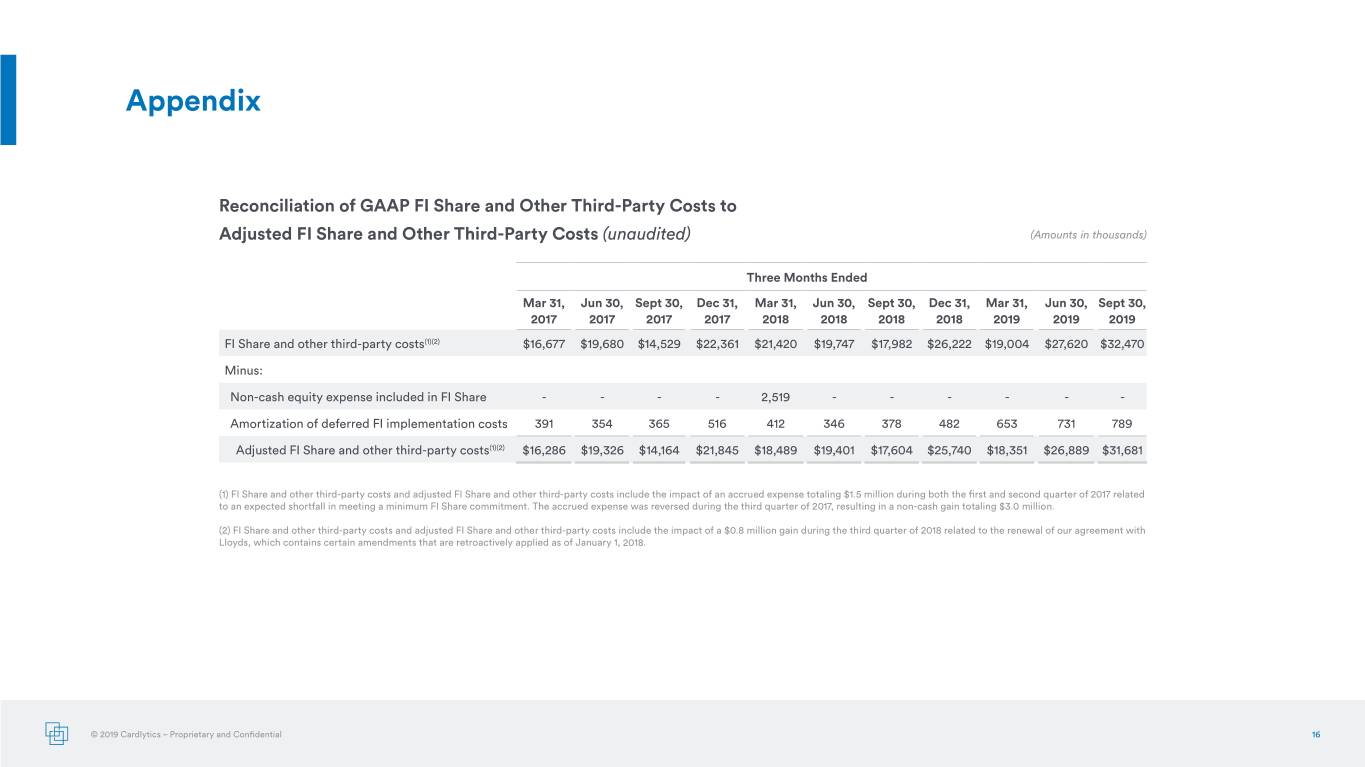
Appendix Reconciliation of GAAP FI Share and Other Third-Party Costs to Adjusted FI Share and Other Third-Party Costs (unaudited) (Amounts in thousands) Three Months Ended Mar 31, Jun 30, Sept 30, Dec 31, Mar 31, Jun 30, Sept 30, Dec 31, Mar 31, Jun 30, Sept 30, 2017 2017 2017 2017 2018 2018 2018 2018 2019 2019 2019 FI Share and other third-party costs(1)(2) $16,677 $19,680 $14,529 $22,361 $21,420 $19,747 $17,982 $26,222 $19,004 $27,620 $32,470 Minus: Non-cash equity expense included in FI Share - - - - 2,519 - - - - - - Amortization of deferred FI implementation costs 391 354 365 516 412 346 378 482 653 731 789 Adjusted FI Share and other third-party costs(1)(2) $16,286 $19,326 $14,164 $21,845 $18,489 $19,401 $17,604 $25,740 $18,351 $26,889 $31,681 (1) FI Share and other third-party costs and adjusted FI Share and other third-party costs include the impact of an accrued expense totaling $1.5 million during both the first and second quarter of 2017 related to an expected shortfall in meeting a minimum FI Share commitment. The accrued expense was reversed during the third quarter of 2017, resulting in a non-cash gain totaling $3.0 million. (2) FI Share and other third-party costs and adjusted FI Share and other third-party costs include the impact of a $0.8 million gain during the third quarter of 2018 related to the renewal of our agreement with Lloyds, which contains certain amendments that are retroactively applied as of January 1, 2018. © 2019 Cardlytics – Proprietary and Confidential 16
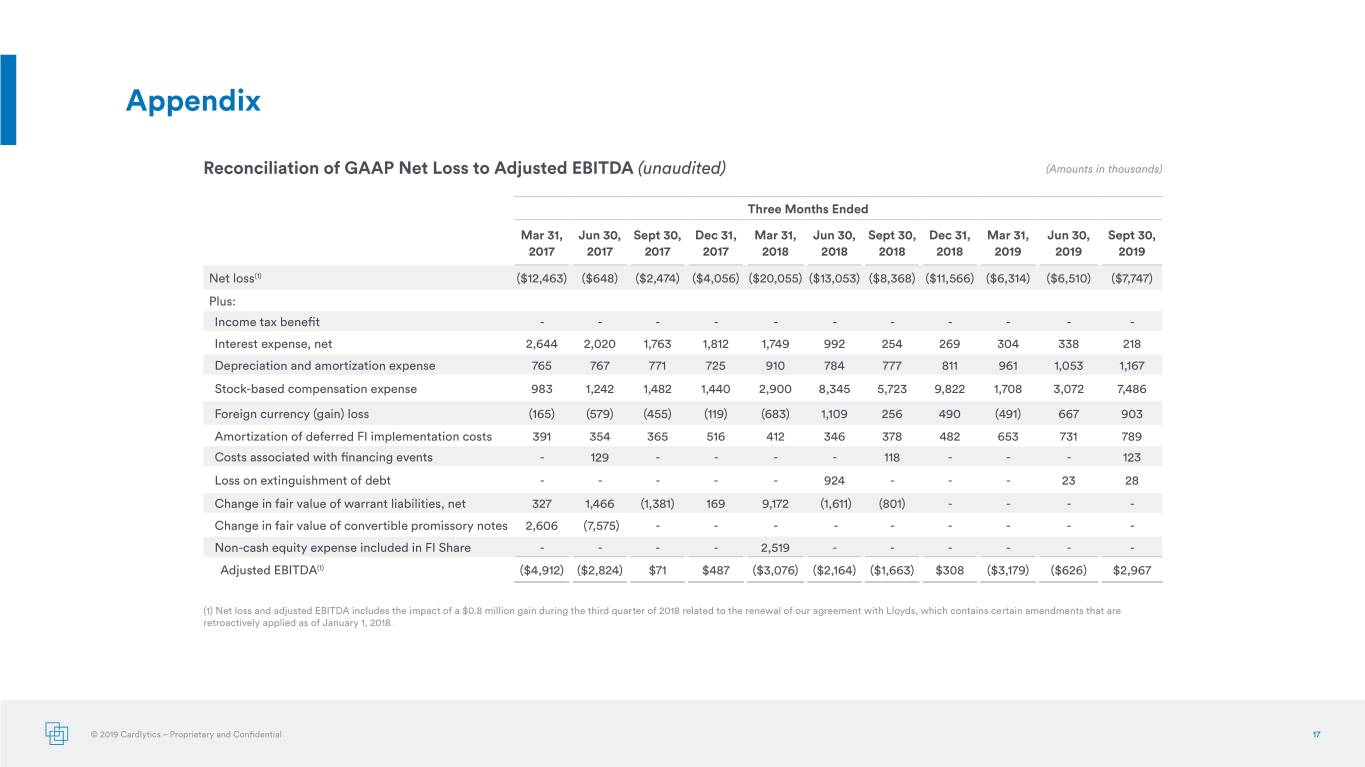
Appendix Reconciliation of GAAP Net Loss to Adjusted EBITDA (unaudited) (Amounts in thousands) Three Months Ended Mar 31, Jun 30, Sept 30, Dec 31, Mar 31, Jun 30, Sept 30, Dec 31, Mar 31, Jun 30, Sept 30, 2017 2017 2017 2017 2018 2018 2018 2018 2019 2019 2019 Net loss(1) ($12,463) ($648) ($2,474) ($4,056) ($20,055) ($13,053) ($8,368) ($11,566) ($6,314) ($6,510) ($7,747) Plus: Income tax benefit - - - - - - - - - - - Interest expense, net 2,644 2,020 1,763 1,812 1,749 992 254 269 304 338 218 Depreciation and amortization expense 765 767 771 725 910 784 777 811 961 1,053 1,167 Stock-based compensation expense 983 1,242 1,482 1,440 2,900 8,345 5,723 9,822 1,708 3,072 7,486 Foreign currency (gain) loss (165) (579) (455) (119) (683) 1,109 256 490 (491) 667 903 Amortization of deferred FI implementation costs 391 354 365 516 412 346 378 482 653 731 789 Costs associated with financing events - 129 - - - - 118 - - - 123 Loss on extinguishment of debt - - - - - 924 - - - 23 28 Change in fair value of warrant liabilities, net 327 1,466 (1,381) 169 9,172 (1,611) (801) - - - - Change in fair value of convertible promissory notes 2,606 (7,575) - - - - - - - - - Non-cash equity expense included in FI Share - - - - 2,519 - - - - - - Adjusted EBITDA(1) ($4,912) ($2,824) $71 $487 ($3,076) ($2,164) ($1,663) $308 ($3,179) ($626) $2,967 (1) Net loss and adjusted EBITDA includes the impact of a $0.8 million gain during the third quarter of 2018 related to the renewal of our agreement with Lloyds, which contains certain amendments that are retroactively applied as of January 1, 2018. © 2019 Cardlytics – Proprietary and Confidential 17
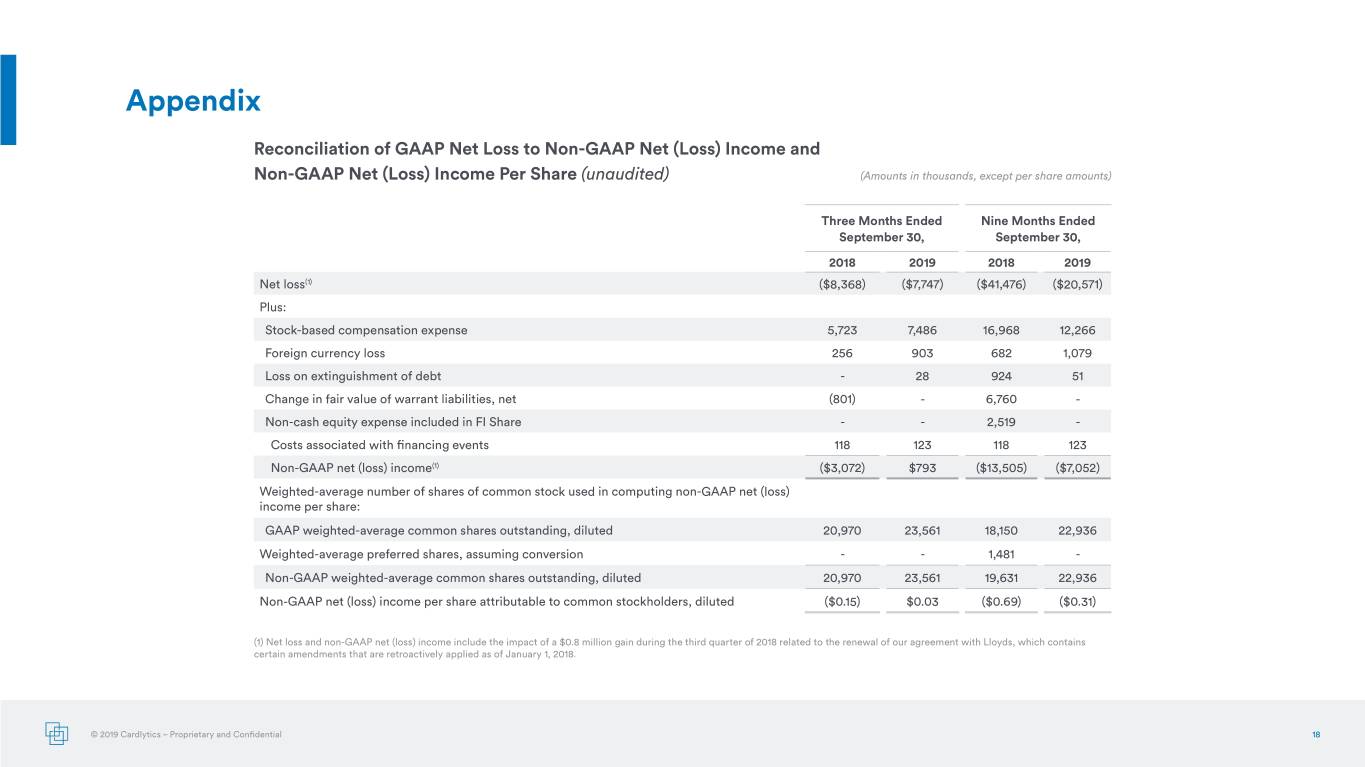
Appendix Reconciliation of GAAP Net Loss to Non-GAAP Net (Loss) Income and Non-GAAP Net (Loss) Income Per Share (unaudited) (Amounts in thousands, except per share amounts) Three Months Ended Nine Months Ended September 30, September 30, 2018 2019 2018 2019 Net loss(1) ($8,368) ($7,747) ($41,476) ($20,571) Plus: Stock-based compensation expense 5,723 7,486 16,968 12,266 Foreign currency loss 256 903 682 1,079 Loss on extinguishment of debt - 28 924 51 Change in fair value of warrant liabilities, net (801) - 6,760 - Non-cash equity expense included in FI Share - - 2,519 - Costs associated with financing events 118 123 118 123 Non-GAAP net (loss) income(1) ($3,072) $793 ($13,505) ($7,052) Weighted-average number of shares of common stock used in computing non-GAAP net (loss) income per share: GAAP weighted-average common shares outstanding, diluted 20,970 23,561 18,150 22,936 Weighted-average preferred shares, assuming conversion - - 1,481 - Non-GAAP weighted-average common shares outstanding, diluted 20,970 23,561 19,631 22,936 Non-GAAP net (loss) income per share attributable to common stockholders, diluted ($0.15) $0.03 ($0.69) ($0.31) (1) Net loss and non-GAAP net (loss) income include the impact of a $0.8 million gain during the third quarter of 2018 related to the renewal of our agreement with Lloyds, which contains certain amendments that are retroactively applied as of January 1, 2018. © 2019 Cardlytics – Proprietary and Confidential 18
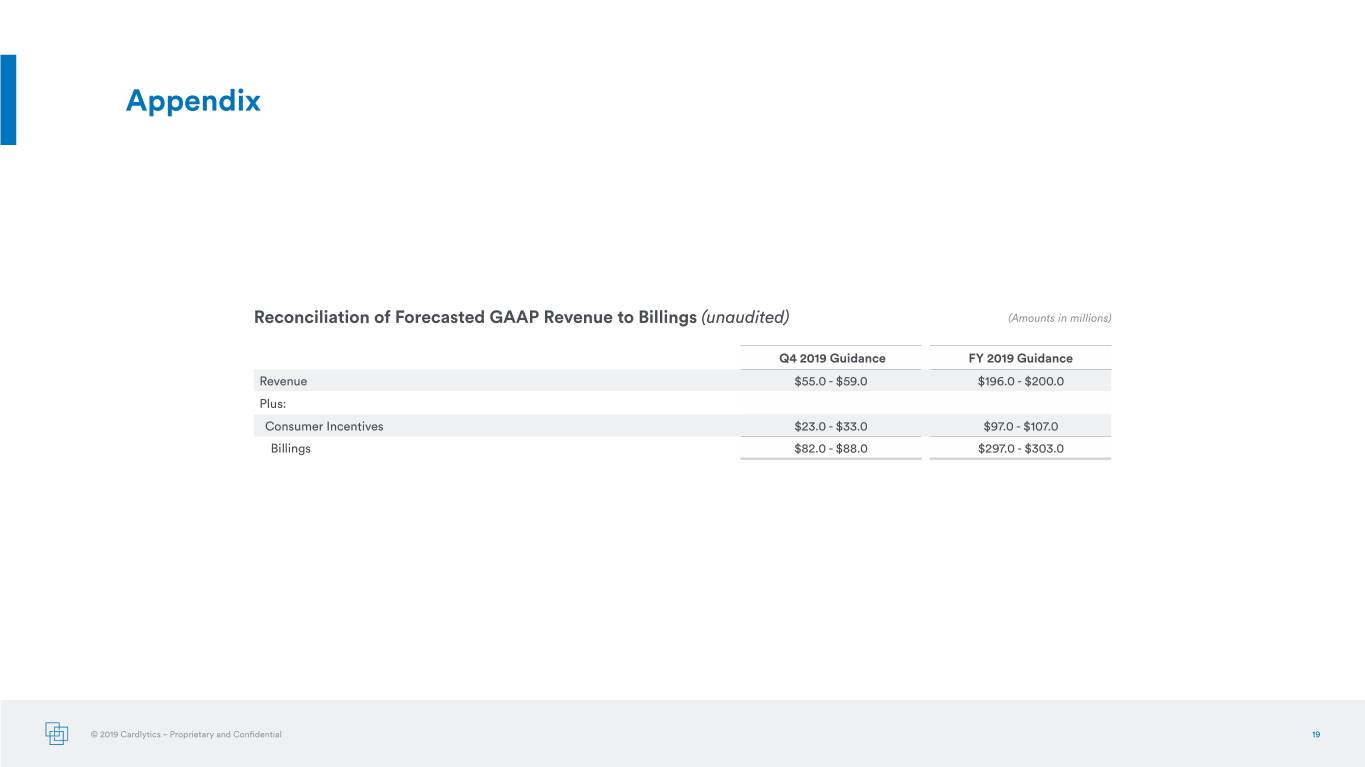
Appendix Reconciliation of Forecasted GAAP Revenue to Billings (unaudited) (Amounts in millions) Q4 2019 Guidance FY 2019 Guidance Revenue $55.0 - $59.0 $196.0 - $200.0 Plus: Consumer Incentives $23.0 - $33.0 $97.0 - $107.0 Billings $82.0 - $88.0 $297.0 - $303.0 © 2019 Cardlytics – Proprietary and Confidential 19


