© Atkore Inc. Fourth Quarter and Full Year 2021 Earnings November 18, 2021

© Atkore Cautionary Statements This presentation is provided for general informational purposes only and it does not include every item which may be of interest, nor does it purport to present full and fair disclosure with respect to Atkore Inc. (“Atkore”) or its operational and financial information. Atkore expressly disclaims any current intention to update any forward-looking statements contained in this presentation as a result of new information or future events or developments or otherwise, except as required by federal securities laws. This presentation is not a prospectus and is not an offer to sell securities. This presentation contains forward-looking statements that are subject to known and unknown risks and uncertainties, many of which are beyond our control. All statements other than statements of historical fact included in this presentation are forward-looking statements. Forward-looking statements appearing throughout this presentation include, without limitation, statements regarding our intentions, beliefs, assumptions or current expectations concerning, among other things, financial position; results of operations; cash flows; prospects; growth strategies or expectations; customer retention; the outcome (by judgment or settlement) and costs of legal, administrative or regulatory proceedings, investigations or inspections, including, without limitation, collective, representative or any other litigation; and the impact of prevailing economic conditions. You can identify forward-looking statements by the fact that they do not relate strictly to historical or current facts. These statements may include words such as “believes,” “expects,” “may,” “will,” “shall,” “should,” “would,” “could,” “seeks,” “aims,” “projects,” “is optimistic,” “intends,” “plans,” “estimates,” “anticipates” and other comparable terms. We caution you that forward-looking statements are not guarantees of future performance or outcomes and that actual performance and outcomes, including, without limitation, our actual results of operations, financial condition and liquidity, and the development of the market in which we operate, may differ materially from those made in or suggested by the forward-looking statements contained in this presentation. In addition, even if our results of operations, financial condition and cash flows, and the development of the market in which we operate, are consistent with the forward-looking statements contained in this presentation, those results or developments may not be indicative of results or developments in subsequent periods. A number of important factors, including, without limitation, the risks and uncertainties discussed under the captions “Risk Factors” and “Management’s Discussion and Analysis of Financial Condition and Results of Operations” in our Annual Report on Form 10-K and the Quarterly Report on Form 10-Q filed with the U.S. Securities and Exchange Commission, could cause actual results and outcomes to differ materially from those reflected in the forward-looking statements. Because of these risks, we caution that you should not place undue reliance on any of our forward-looking statements. New risks and uncertainties arise from time to time, and it is impossible for us to predict those events or how they may affect us. Further, any forward-looking statement speaks only as of the date on which it is made. We undertake no obligation to revise the forward-looking statements in this presentation after the date of this presentation. Market data and industry information used throughout this presentation are based on management’s knowledge of the industry and the good faith estimates of management. We also relied, to the extent available, upon management’s review of independent industry surveys, forecasts and publications and other publicly available information prepared by a number of third party sources. All of the market data and industry information used in this presentation involves a number of assumptions and limitations which we believe to be reasonable, but you are cautioned not to give undue weight to such estimates. Although we believe that these sources are reliable, we cannot guarantee the accuracy or completeness of this information, and we have not independently verified this information. While we believe the estimated market position, market opportunity and market size information included in this presentation are generally reliable, such information, which is derived in part from management’s estimates and beliefs, is inherently uncertain and imprecise. Projections, assumptions and estimates of our future performance and the future performance of the industry in which we operate are subject to a high degree of uncertainty and risk due to a variety of factors, including those described above. These and other factors could cause results to differ materially from those expressed in our estimates and beliefs and in the estimates prepared by independent parties. This presentation should be read along with the historical financial statements of Atkore, including the most recent audited financial statements. Historical results may not be indicative of future results. We use non-GAAP financial measures to help us describe our operating and financial performance. These measures may include Adjusted EBITDA, Adjusted EBITDA margin (Adjusted EBITDA over Net Sales), Net debt (total debt less cash and cash equivalents), Adjusted Net Income Per Share, Leverage ratio (net debt or total debt less cash and cash equivalents, over Adjusted EBITDA on trailing twelve month (“TTM”) basis), Free Cash Flow (net cash provided by operating activities less capital expenditures) and Return on Capital to help us describe our operating and financial performance. These non-GAAP financial measures are commonly used in our industry and have certain limitations and should not be construed as alternatives to net income, total debt, net cash provided by operating activities, return on assets, and other income data measures as determined in accordance with generally accepted accounting principles in the United States, or GAAP, or as better indicators of operating performance. These non-GAAP financial measures as defined by us may not be comparable to similarly-titled non-GAAP measures presented by other companies. Our presentation of such non-GAAP financial measures should not be construed as an inference that our future results will be unaffected by unusual or non-recurring items. See the appendix to this presentation for a reconciliation of the non-GAAP financial measures presented herein to the most comparable financial measures as determined in accordance with GAAP. Fiscal Periods - The Company has a fiscal year that ends on September 30th. It is the Company's practice to establish quarterly closings using a 4-5-4 calendar. The Company's fiscal quarters typically end on the last Friday in December, March and June. 2
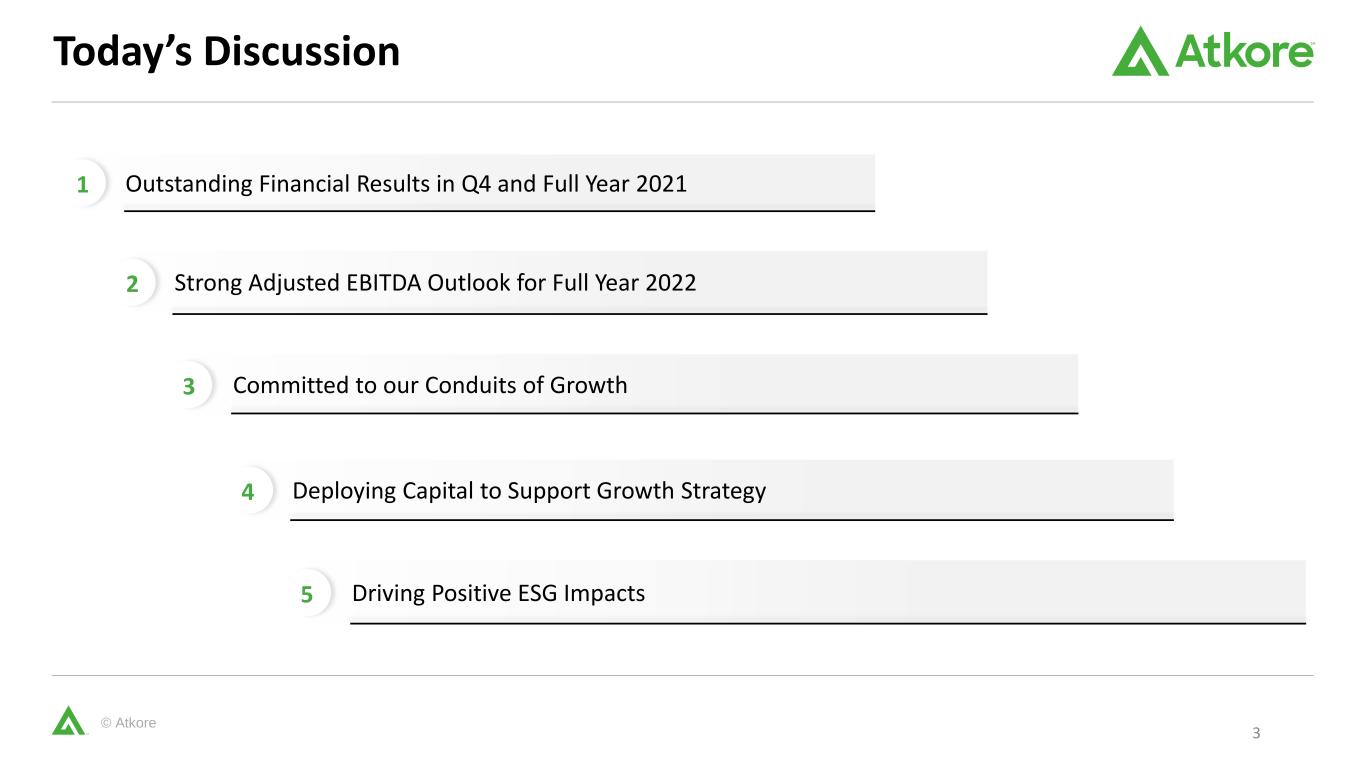
© Atkore Today’s Discussion 3 Outstanding Financial Results in Q4 and Full Year 2021 Strong Adjusted EBITDA Outlook for Full Year 2022 Committed to our Conduits of Growth Deploying Capital to Support Growth Strategy Driving Positive ESG Impacts 1 2 3 4 5
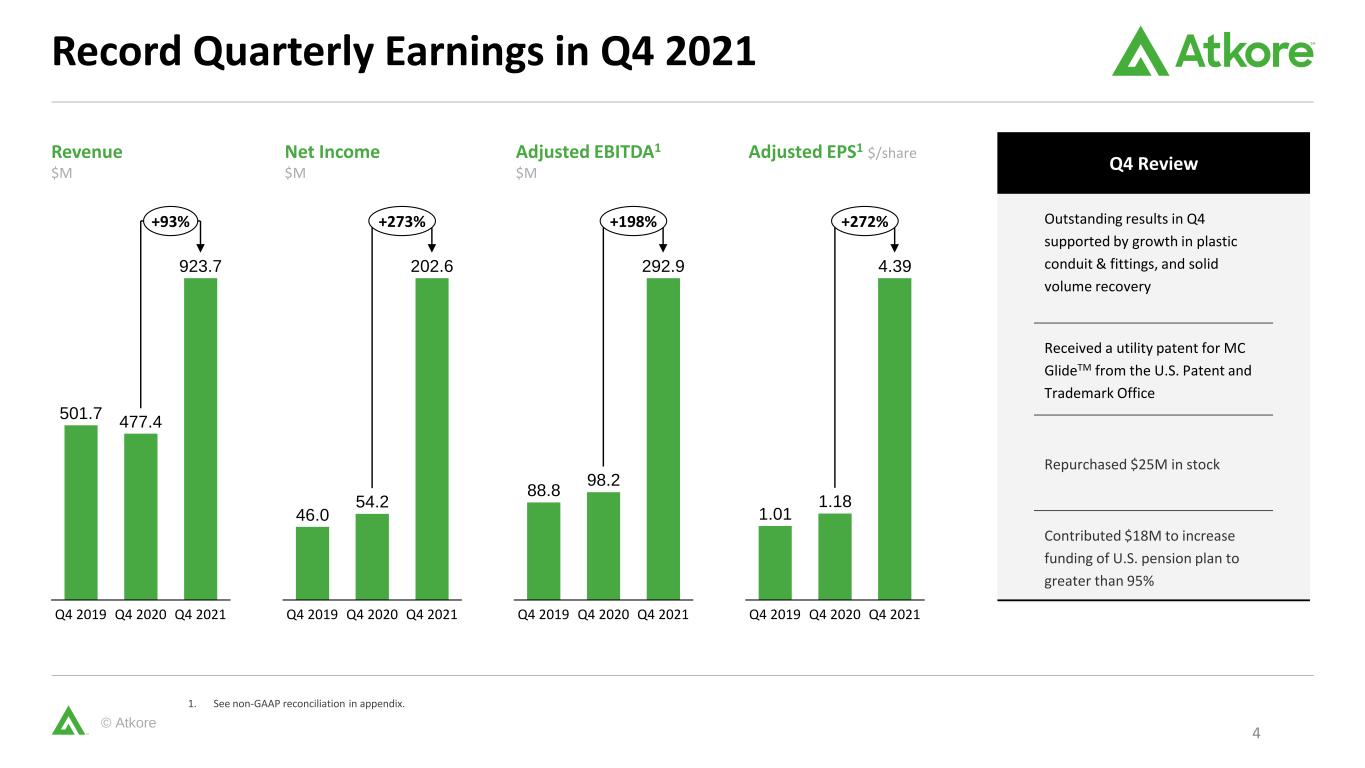
© Atkore Record Quarterly Earnings in Q4 2021 1. See non-GAAP reconciliation in appendix. 501.7 477.4 923.7 Q4 2021Q4 2019 Q4 2020 +93% 46.0 54.2 202.6 Q4 2019 Q4 2020 Q4 2021 +273% 88.8 98.2 292.9 Q4 2019 Q4 2020 Q4 2021 +198% 1.01 1.18 4.39 Q4 2019 Q4 2020 Q4 2021 +272% Revenue $M Net Income $M Adjusted EBITDA1 $M Adjusted EPS1 $/share Outstanding results in Q4 supported by growth in plastic conduit & fittings, and solid volume recovery Received a utility patent for MC GlideTM from the U.S. Patent and Trademark Office Repurchased $25M in stock Contributed $18M to increase funding of U.S. pension plan to greater than 95% Q4 Review 4

© Atkore Q4 Income Statement Summary 5 1. See non-GAAP reconciliation in appendix 2. Adjusted EBITDA Margin is Adjusted EBITDA as a percentage of Net sales ($’s in millions) Q4 2021 Q4 2020 Y/Y Change Y/Y % Change Net Sales $923.7 $477.4 $446.3 93.5% Operating Income $266.0 $84.2 $181.7 215.7% Net Income $202.6 $54.2 $148.3 273.4% Adjusted EBITDA1 $292.9 $98.2 $194.7 198.3% Adjusted EBITDA Margin2 31.7% 20.6% +1,110 bps - Net Income per Share (Diluted) $4.26 $1.11 $3.15 283.8% Adjusted Net Income per Share1 (Diluted) $4.39 $1.18 $3.21 272.0%

© Atkore Consolidated Atkore Q4 2021 Bridges 6 Volume/Mix +5.2% Price +82.0% Acquisitions / F/X / Other +6.3% Total +93.5% $25 $391 $31 Price2020 Volume/Mix 2021M&A / F/X / Other $477M $924M Delivered outstanding results despite a challenging supply chain environment Positive volume growth both in the U.S. and globally supported by demand recovery Continued to invest in new product innovation, marketing and business development to strengthen position for 2022 and beyond $10 $1 2020 Volume/Mix $205 Input Cost Changes $391 Price M&A / Productivity / Investment / Inflation / F/X / Other 2021 $98M $293M Net Sales % Change HighlightsQ4 Adjusted EBITDA Bridge Q4 Net Sales Bridge

© Atkore Q4 2021 Segment Results 7 Electrical Safety & Infrastructure ($’s in millions) Q4 2021 Q4 2020 Y/Y Change Net Sales $697.5 $350.6 98.9% Adjusted EBITDA $283.9 $91.9 208.9% Adjusted EBITDA Margin 40.7% 26.2% +1,450 bps ($’s in millions) Q4 2021 Q4 2020 Y/Y Change Net Sales $227.4 $127.5 78.3% Adjusted EBITDA $29.0 $17.1 70.1% Adjusted EBITDA Margin 12.8% 13.4% (60 bps) $11 $304 $32 2020 M&A / F/X / OtherVolume/Mix Price 2021 $697M $350M $14 $87 $1 M&A / F/X / OtherVolume/Mix2020 Price 2021 $127M $227M Q4 Net Sales Bridge Q4 Net Sales Bridge
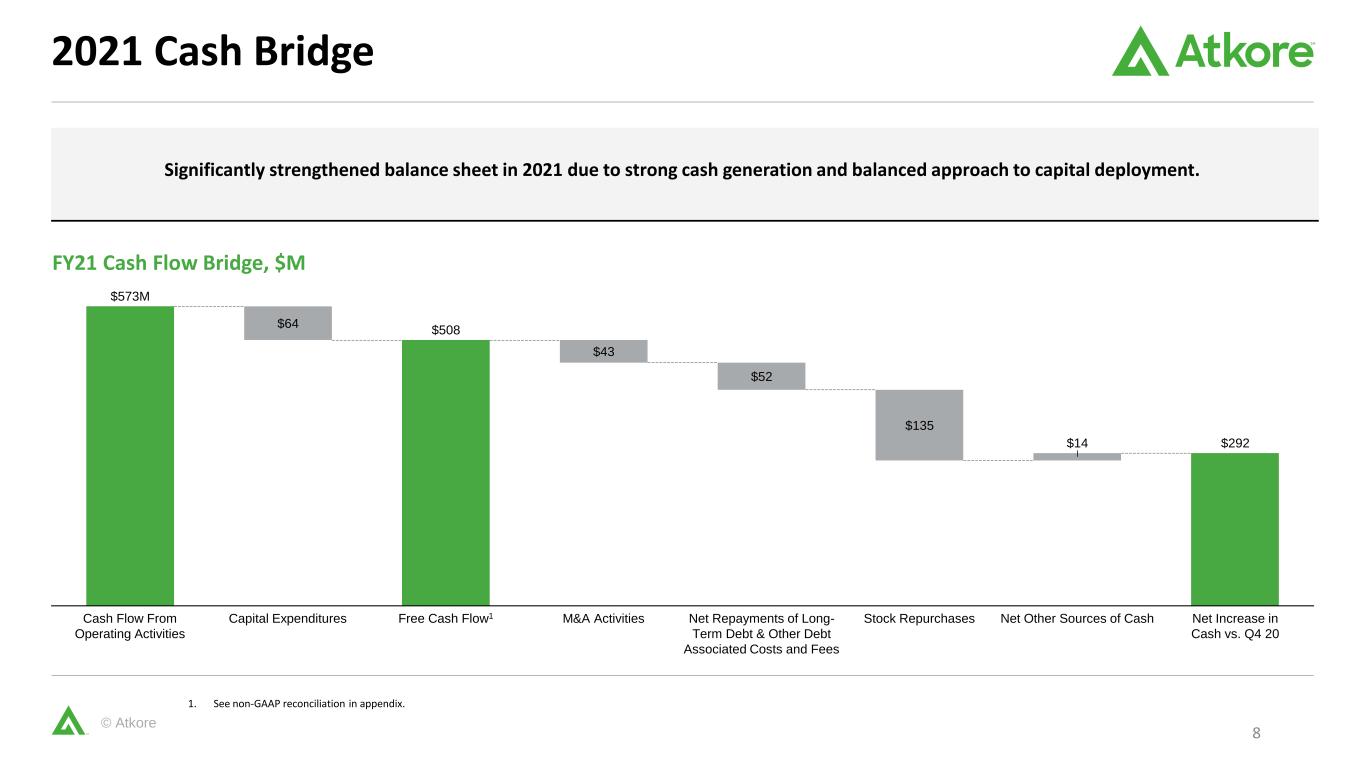
© Atkore 2021 Cash Bridge 8 1. See non-GAAP reconciliation in appendix. Significantly strengthened balance sheet in 2021 due to strong cash generation and balanced approach to capital deployment. $508 $292 $64 $43 $52 $135 $14 Stock RepurchasesCash Flow From Operating Activities Capital Expenditures Free Cash Flow1 Net Repayments of Long- Term Debt & Other Debt Associated Costs and Fees Net Other Sources of CashM&A Activities Net Increase in Cash vs. Q4 20 $573M FY21 Cash Flow Bridge, $M
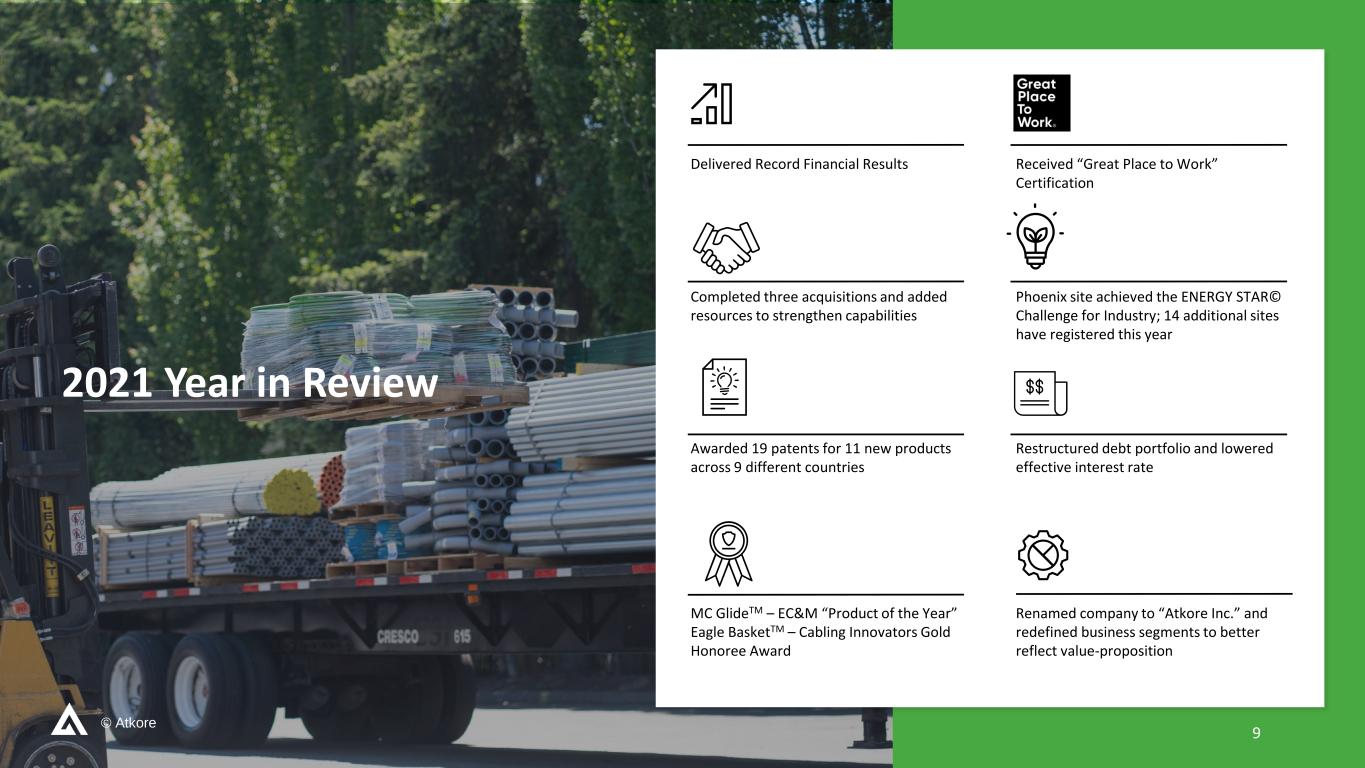
© Atkore 2021 Year in Review 9 Delivered Record Financial Results Received “Great Place to Work” Certification Completed three acquisitions and added resources to strengthen capabilities Phoenix site achieved the ENERGY STAR© Challenge for Industry; 14 additional sites have registered this year Awarded 19 patents for 11 new products across 9 different countries Restructured debt portfolio and lowered effective interest rate MC GlideTM – EC&M “Product of the Year” Eagle BasketTM – Cabling Innovators Gold Honoree Award Renamed company to “Atkore Inc.” and redefined business segments to better reflect value-proposition
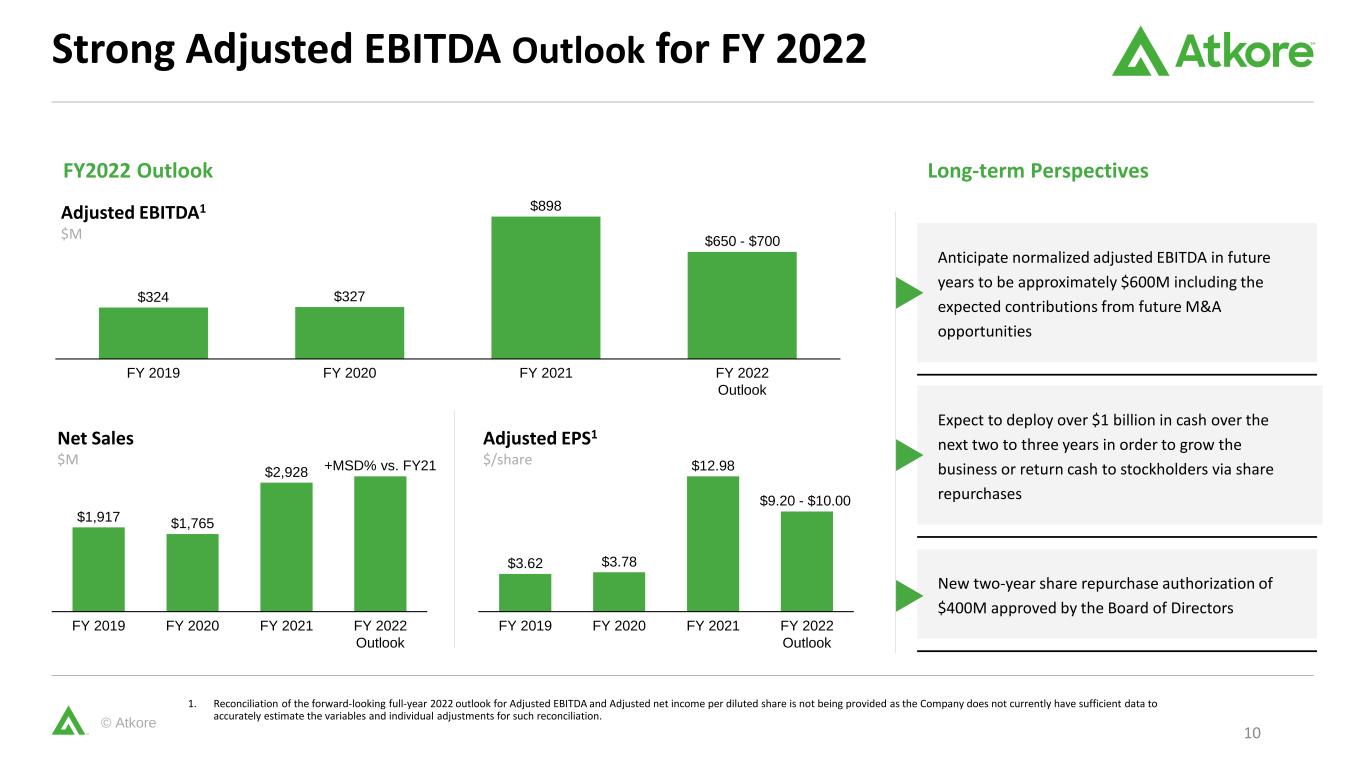
© Atkore Strong Adjusted EBITDA Outlook for FY 2022 10 1. Reconciliation of the forward-looking full-year 2022 outlook for Adjusted EBITDA and Adjusted net income per diluted share is not being provided as the Company does not currently have sufficient data to accurately estimate the variables and individual adjustments for such reconciliation. Anticipate normalized adjusted EBITDA in future years to be approximately $600M including the expected contributions from future M&A opportunities Expect to deploy over $1 billion in cash over the next two to three years in order to grow the business or return cash to stockholders via share repurchases New two-year share repurchase authorization of $400M approved by the Board of Directors FY2022 Outlook Long-term Perspectives $324 $327 $898 FY 2019 FY 2020 FY 2021 FY 2022 Outlook $650 - $700 Adjusted EBITDA1 $M $1,917 $1,765 $2,928 FY 2019 FY 2021FY 2020 FY 2022 Outlook +MSD% vs. FY21 $3.62 $3.78 $12.98 FY 2022 Outlook FY 2019 FY 2020 FY 2021 $9.20 - $10.00 Net Sales $M Adjusted EPS1 $/share
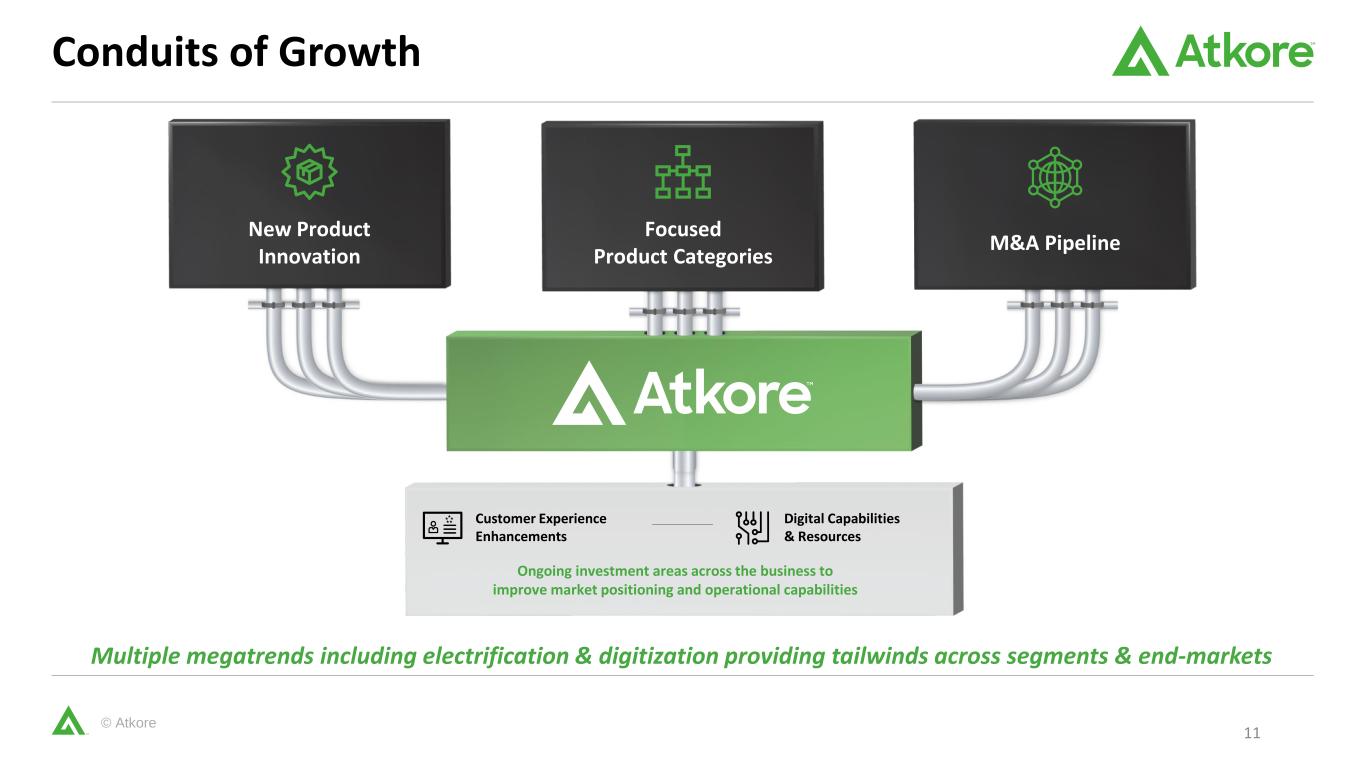
© Atkore Customer Experience Enhancements Multiple megatrends including electrification & digitization providing tailwinds across segments & end-markets Digital Capabilities & Resources Ongoing investment areas across the business to improve market positioning and operational capabilities New Product Innovation Focused Product Categories M&A Pipeline Conduits of Growth 11
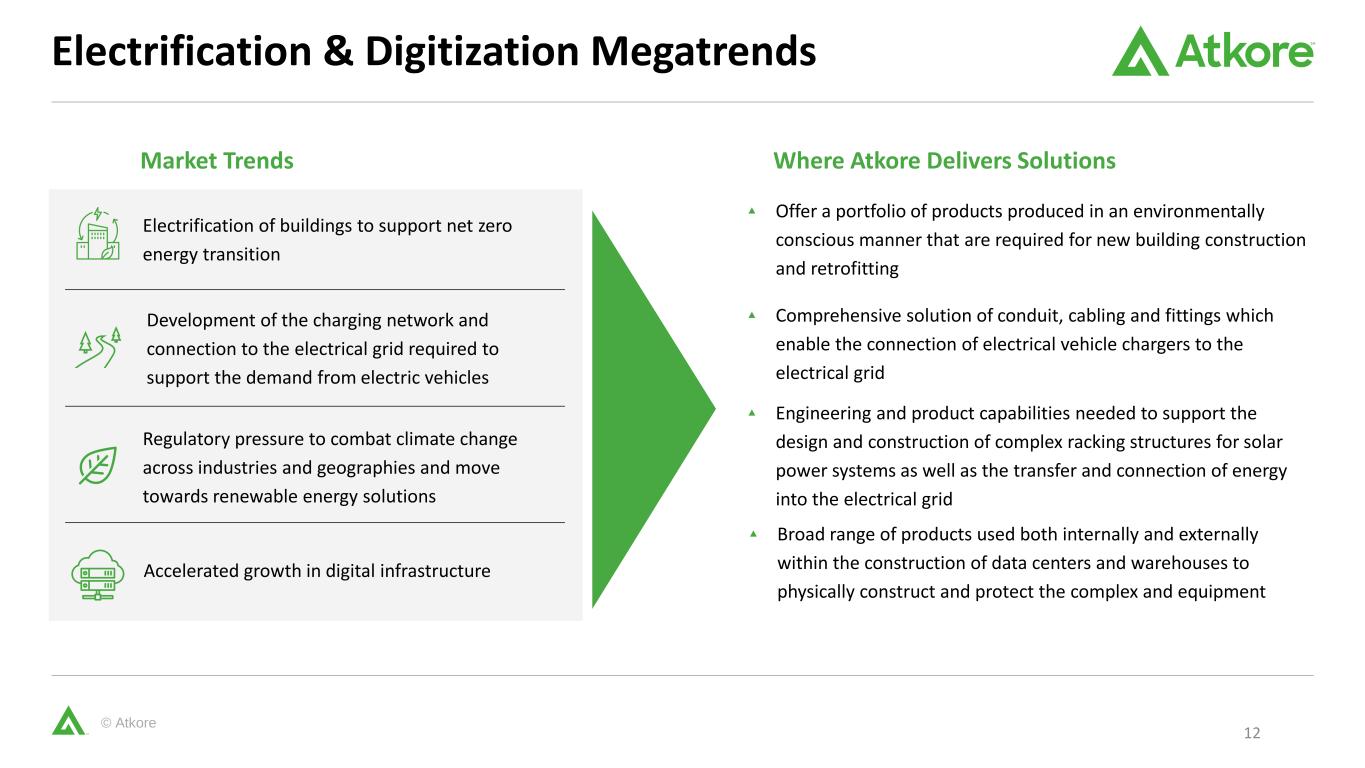
© Atkore Electrification of buildings to support net zero energy transition 12 ▴ Offer a portfolio of products produced in an environmentally conscious manner that are required for new building construction and retrofitting Regulatory pressure to combat climate change across industries and geographies and move towards renewable energy solutions Accelerated growth in digital infrastructure Electrification & Digitization Megatrends Development of the charging network and connection to the electrical grid required to support the demand from electric vehicles Market Trends Where Atkore Delivers Solutions ▴ Comprehensive solution of conduit, cabling and fittings which enable the connection of electrical vehicle chargers to the electrical grid ▴ Engineering and product capabilities needed to support the design and construction of complex racking structures for solar power systems as well as the transfer and connection of energy into the electrical grid ▴ Broad range of products used both internally and externally within the construction of data centers and warehouses to physically construct and protect the complex and equipment
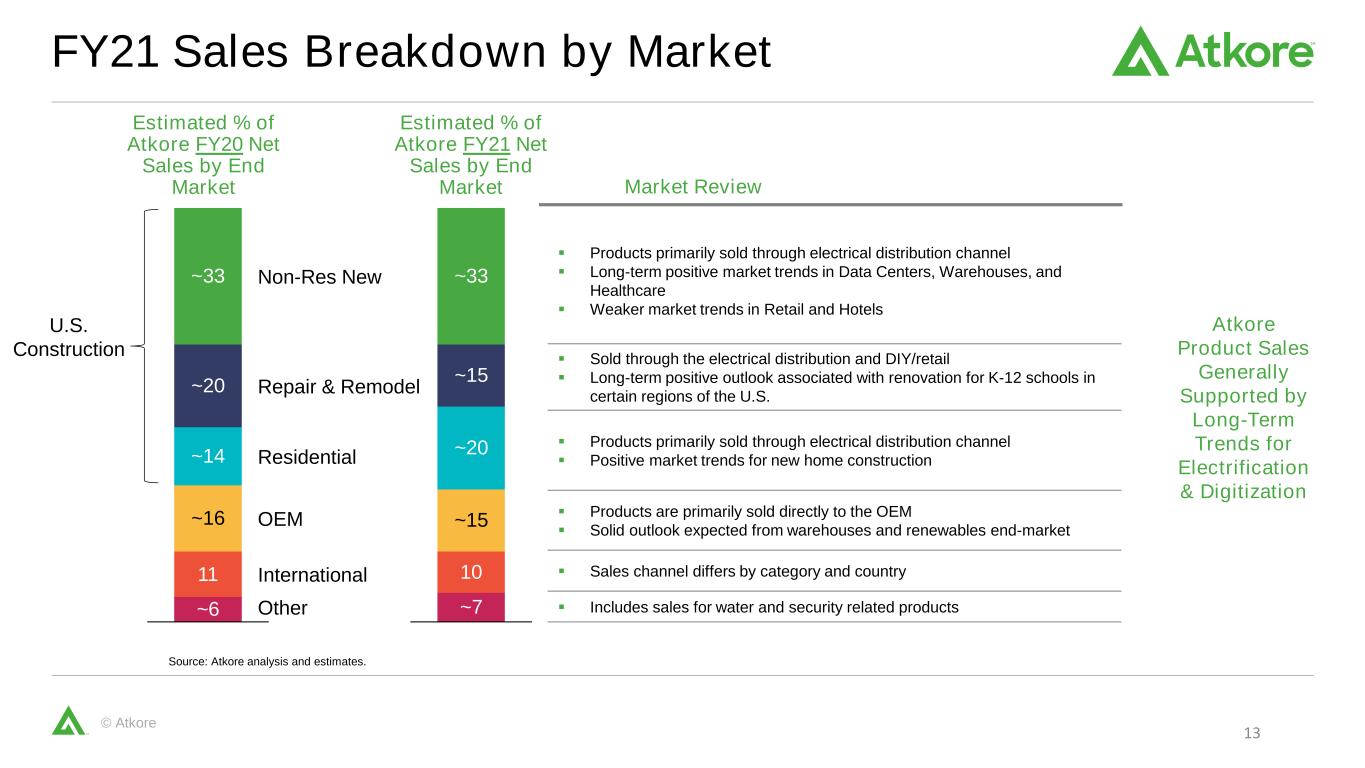
© Atkore FY21 Sales Breakdown by Market Source: Atkore analysis and estimates. 11 OEM ~14 ~33 ~20 ~16 Repair & Remodel Non-Res New Residential International Other~6 U.S. Construction Estimated % of Atkore FY20 Net Sales by End Market 10 ~20 ~33 ~15 ~15 ~7 Estimated % of Atkore FY21 Net Sales by End Market Market Review ▪ Products primarily sold through electrical distribution channel ▪ Long-term positive market trends in Data Centers, Warehouses, and Healthcare ▪ Weaker market trends in Retail and Hotels ▪ Sold through the electrical distribution and DIY/retail ▪ Long-term positive outlook associated with renovation for K-12 schools in certain regions of the U.S. ▪ Products primarily sold through electrical distribution channel ▪ Positive market trends for new home construction ▪ Products are primarily sold directly to the OEM ▪ Solid outlook expected from warehouses and renewables end-market ▪ Sales channel differs by category and country ▪ Includes sales for water and security related products Atkore Product Sales Generally Supported by Long-Term Trends for Electrification & Digitization 13

© Atkore Leveraging strong position entering FY2022 to invest in organic and inorganic opportunities to drive growth Capital Deployment Focused on Driving Growth Capital Deployment Model Capital Expenditures, Organic Growth, and Capacity Investments M&A Stock Repurchases Priority Uses for Capital Maintain Gross Debt to normalized Adj. EBITDA ratio at ~2x or below Planned investments in FY22 for digital tools and capabilities, as well as new equipment to support the solar market Maintaining a solid pipeline of targets in both our current product categories as well as near adjacent markets New 2-year $400M buyback authorization provides ample capacity and flexibility for use of funds not deployed to either organic or inorganic growth investments Expect to deploy over $1 billion in cash over the next two to three years 14

© Atkore M&A Strategy Focused on Profitable Growth Proven Ability to Acquire, Integrate and Successfully Manage the Portfolio Fiscal Year Related Segment Electrical Safety & Infrastructure 2013 Acquired Heritage Plastics Closed manufacturing location in France Closed manufacturing location in Brazil 2015 Acquired American Pipe & Plastics Acquired SCI 2017 Acquired Marco Acquired Flexicon Closed manufacturing location in Ohio Acquired Cobra Systems 2019 Acquired Vergokan Acquired Rocky Mountain Colby Pipe Acquired FlyTec Systems Acquired U.S. Tray 2021 Acquired Queen City Plastics Acquired FRE Composites Acquired Sign Support Systems 2020 Consolidated manufacturing location in Wales 2018 Acquired CalPipe Acquired Cii Divested Flexhead 2016 Ceased operations for fence & sprinkler business 2014 Acquired Ridgeline Pipe Manufacturing ▴ Strengthens leadership position in current product categories or fills a portfolio gap ▴ Sales and distribution through similar or existing channels to strengthen “One order. One delivery. One invoice.” strategy ▴ Management bandwidth to successfully execute ▴ Identified path to synergy & value creation ▴ Projected returns above our cost of capital ▴ Debt responsible Strategic Criteria Financial Criteria 15
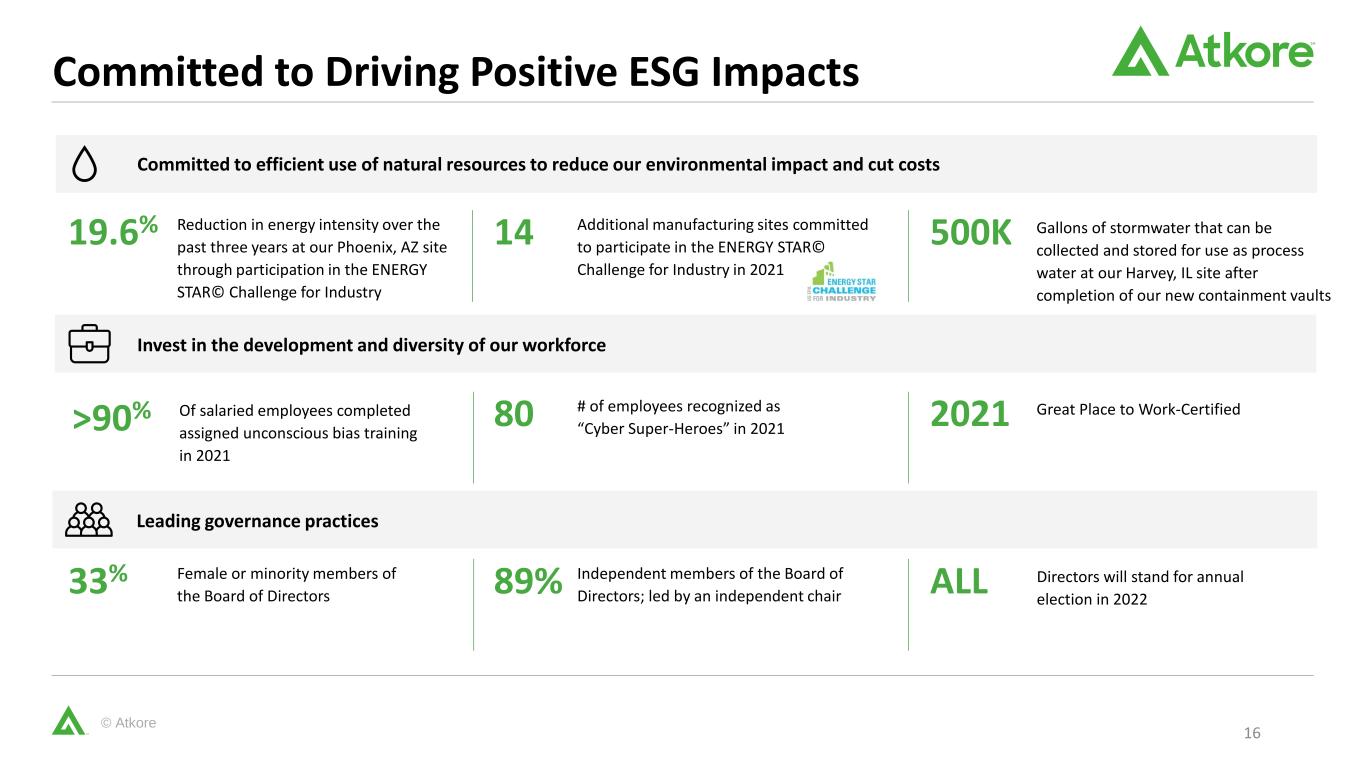
© Atkore Committed to Driving Positive ESG Impacts 16 Committed to efficient use of natural resources to reduce our environmental impact and cut costs Invest in the development and diversity of our workforce Leading governance practices 19.6% Reduction in energy intensity over the past three years at our Phoenix, AZ site through participation in the ENERGY STAR© Challenge for Industry 14 Additional manufacturing sites committed to participate in the ENERGY STAR© Challenge for Industry in 2021 500K Gallons of stormwater that can be collected and stored for use as process water at our Harvey, IL site after completion of our new containment vaults 80 # of employees recognized as “Cyber Super-Heroes” in 2021 2021 Great Place to Work-Certified 33% Female or minority members of the Board of Directors 89% Independent members of the Board of Directors; led by an independent chair ALL Directors will stand for annual election in 2022 >90% Of salaried employees completed assigned unconscious bias training in 2021

© Atkore FY2022 Outlook Outlook Summary 17 1. Reconciliation of the forward-looking quarterly and full-year 2022 outlook for Adjusted EBITDA and Adjusted EPS is not being provided as the Company does not currently have sufficient data to accurately estimate the variables and individual adjustments for such reconciliation. 2. Represents weighted-average shares outstanding in millions used in calculation of Adjusted EPS outlook. Outlook Items for Consolidated Atkore Q1 2022 Outlook FY2022 Outlook Net Sales + ~50% +MSD% Adjusted EBITDA1 $230 – $250M $650 – $700M Adjusted EPS1 $3.30 – $3.60 $9.20 – $10.00 Interest Expense $30 – $32M Tax Rate 25% – 27% Capital Expenditures $80 – $90M Stock Buybacks ≥ $100M Diluted Shares Outstanding2 ~46.5M

© Atkore Atkore: a Compelling Investment Disciplined Operational Focus Values-based organization driven by the Atkore Business System Market Leadership Leading market share in key product categories with a portfolio of must-stock products for electrical distributors Opportunities for Growth Multiple levers and opportunities to drive sustainable growth through both organic and inorganic investments Track Record of Success Strong track record of earnings growth, increasing free cash flow and excellent return on capital Strong Financial Profile Strong liquidity position with a balance sheet ready to support and help drive future growth 18
© Atkore Appendix
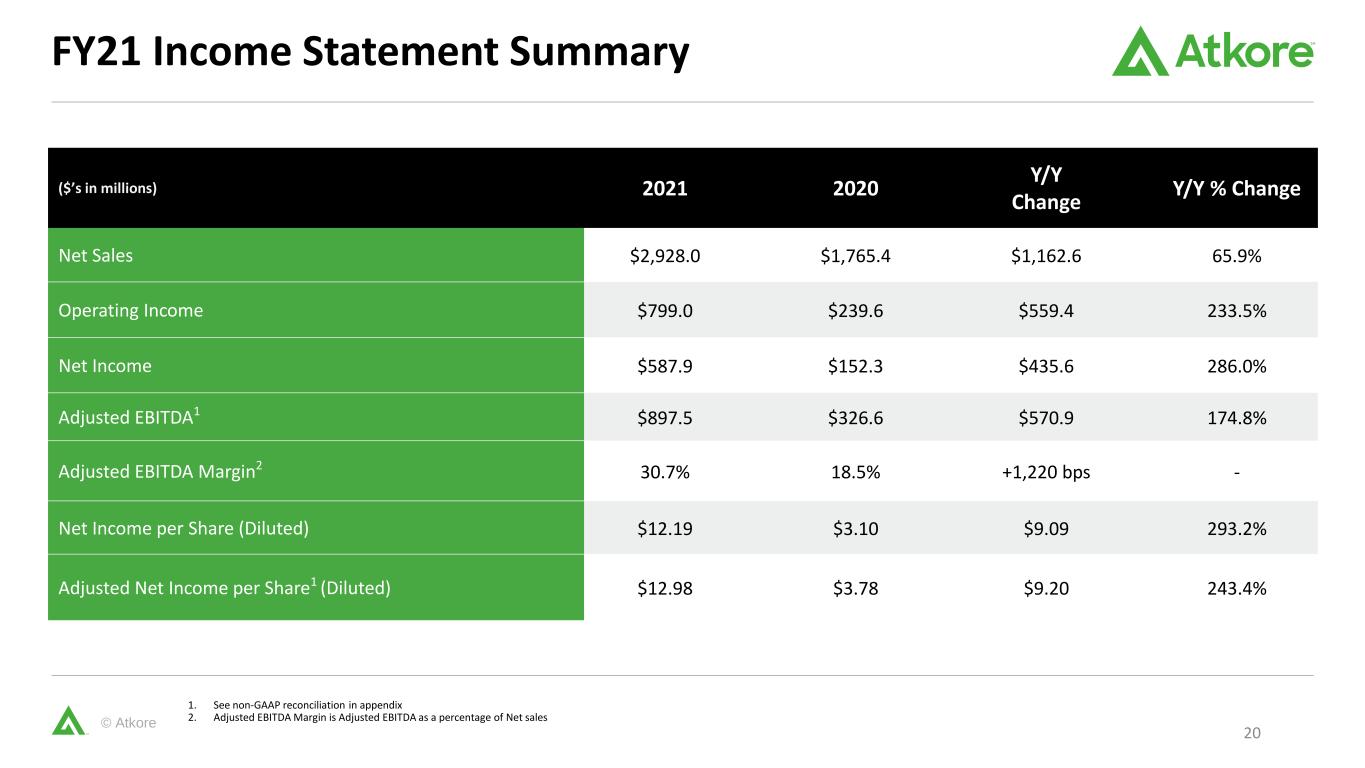
© Atkore FY21 Income Statement Summary 20 1. See non-GAAP reconciliation in appendix 2. Adjusted EBITDA Margin is Adjusted EBITDA as a percentage of Net sales ($’s in millions) 2021 2020 Y/Y Change Y/Y % Change Net Sales $2,928.0 $1,765.4 $1,162.6 65.9% Operating Income $799.0 $239.6 $559.4 233.5% Net Income $587.9 $152.3 $435.6 286.0% Adjusted EBITDA1 $897.5 $326.6 $570.9 174.8% Adjusted EBITDA Margin2 30.7% 18.5% +1,220 bps - Net Income per Share (Diluted) $12.19 $3.10 $9.09 293.2% Adjusted Net Income per Share1 (Diluted) $12.98 $3.78 $9.20 243.4%

© Atkore Consolidated Atkore FY 2021 Bridges 21 Volume/Mix +5.0% Price +55.4% Acquisitions / F/X / Other +5.5% Total +65.9% $88 $978 $97 M&A / F/X / Other2020 PriceVolume/Mix 2021 $1,765M $2,928M $30 $437 Volume/Mix2020 Input Cost Changes $978 Price $0 M&A / Productivity / Investment / Inflation / F/X / Other 2021 $327M $898M Net Sales % Change Full Year Adjusted EBITDA Bridge Full Year Net Sales Bridge
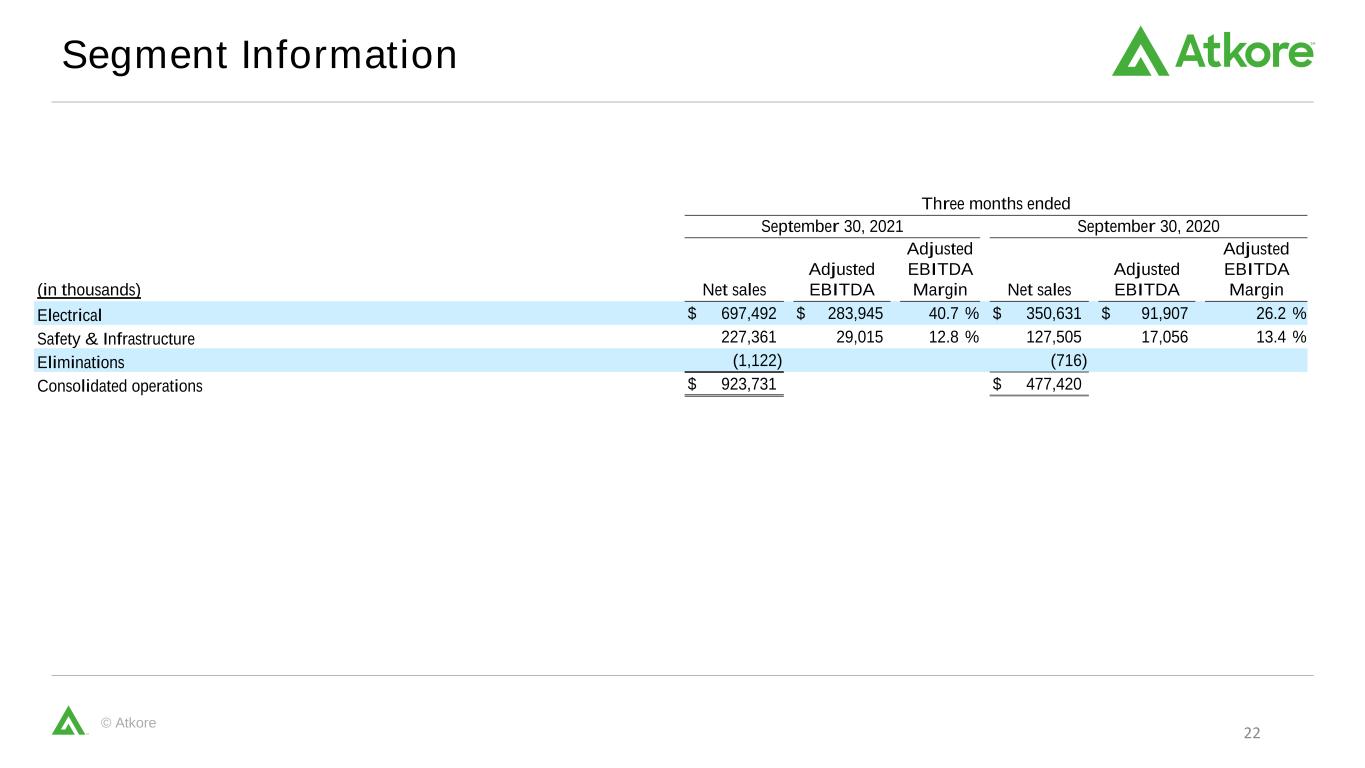
© Atkore Adjusted Earnings Per Share Reconciliation Segment Information 22 Three months ended September 30, 2021 September 30, 2020 (in thousands) Net sales Adjusted EBITDA Adjusted EBITDA Margin Net sales Adjusted EBITDA Adjusted EBITDA Margin Electrical $ 697,492 $ 283,945 40.7 % $ 350,631 $ 91,907 26.2 % Safety & Infrastructure 227,361 29,015 12.8 % 127,505 17,056 13.4 % Eliminations (1,122) (716) Consolidated operations $ 923,731 $ 477,420
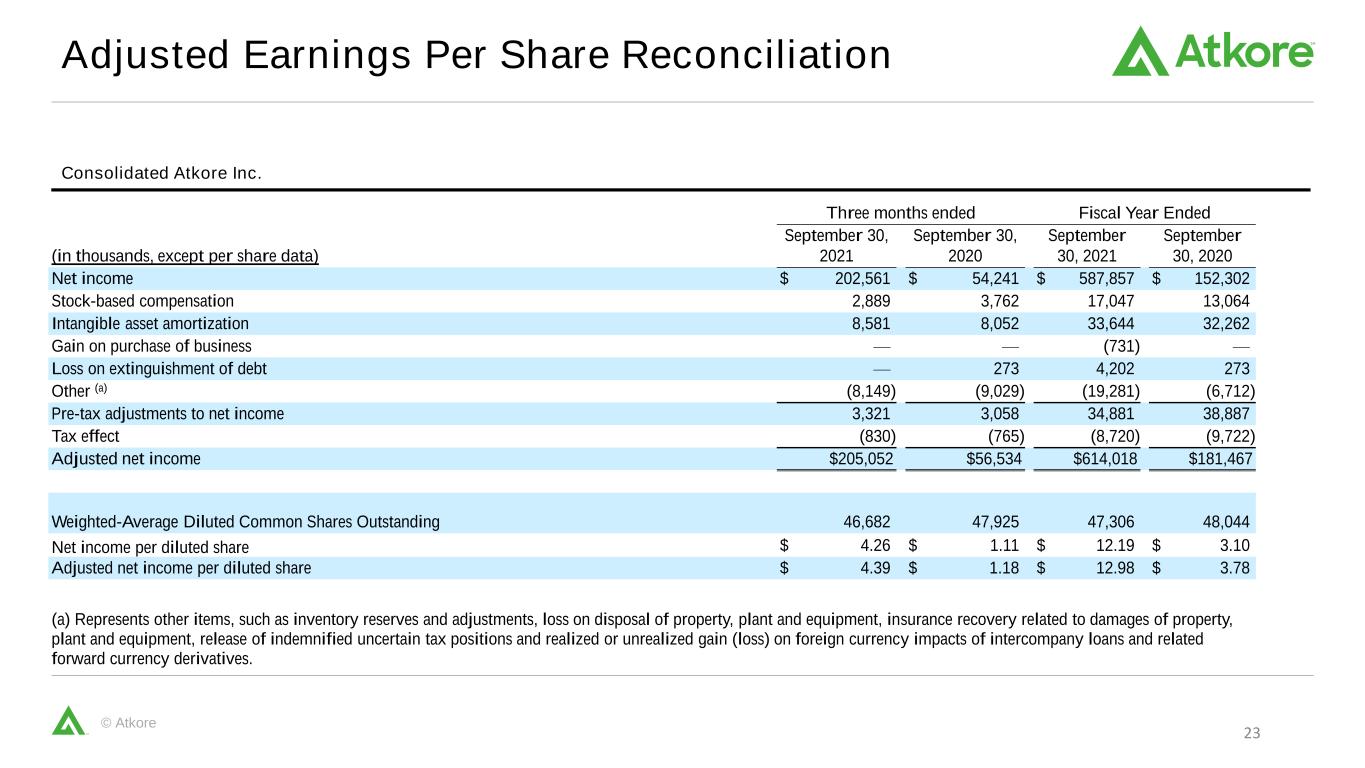
© Atkore Adjusted Earnings Per Share Reconciliation Consolidated Atkore Inc. 23 Three months ended Fiscal Year Ended (in thousands, except per share data) September 30, 2021 September 30, 2020 September 30, 2021 September 30, 2020 Net income $ 202,561 $ 54,241 $ 587,857 $ 152,302 Stock-based compensation 2,889 3,762 17,047 13,064 Intangible asset amortization 8,581 8,052 33,644 32,262 Gain on purchase of business — — (731) — Loss on extinguishment of debt — 273 4,202 273 Other (a) (8,149) (9,029) (19,281) (6,712) Pre-tax adjustments to net income 3,321 3,058 34,881 38,887 Tax effect (830) (765) (8,720) (9,722) Adjusted net income $205,052 $56,534 $614,018 $181,467 Weighted-Average Diluted Common Shares Outstanding 46,682 47,925 47,306 48,044 Net income per diluted share $ 4.26 $ 1.11 $ 12.19 $ 3.10 Adjusted net income per diluted share $ 4.39 $ 1.18 $ 12.98 $ 3.78 (a) Represents other items, such as inventory reserves and adjustments, loss on disposal of property, plant and equipment, insurance recovery related to damages of property, plant and equipment, release of indemnified uncertain tax positions and realized or unrealized gain (loss) on foreign currency impacts of intercompany loans and related forward currency derivatives.
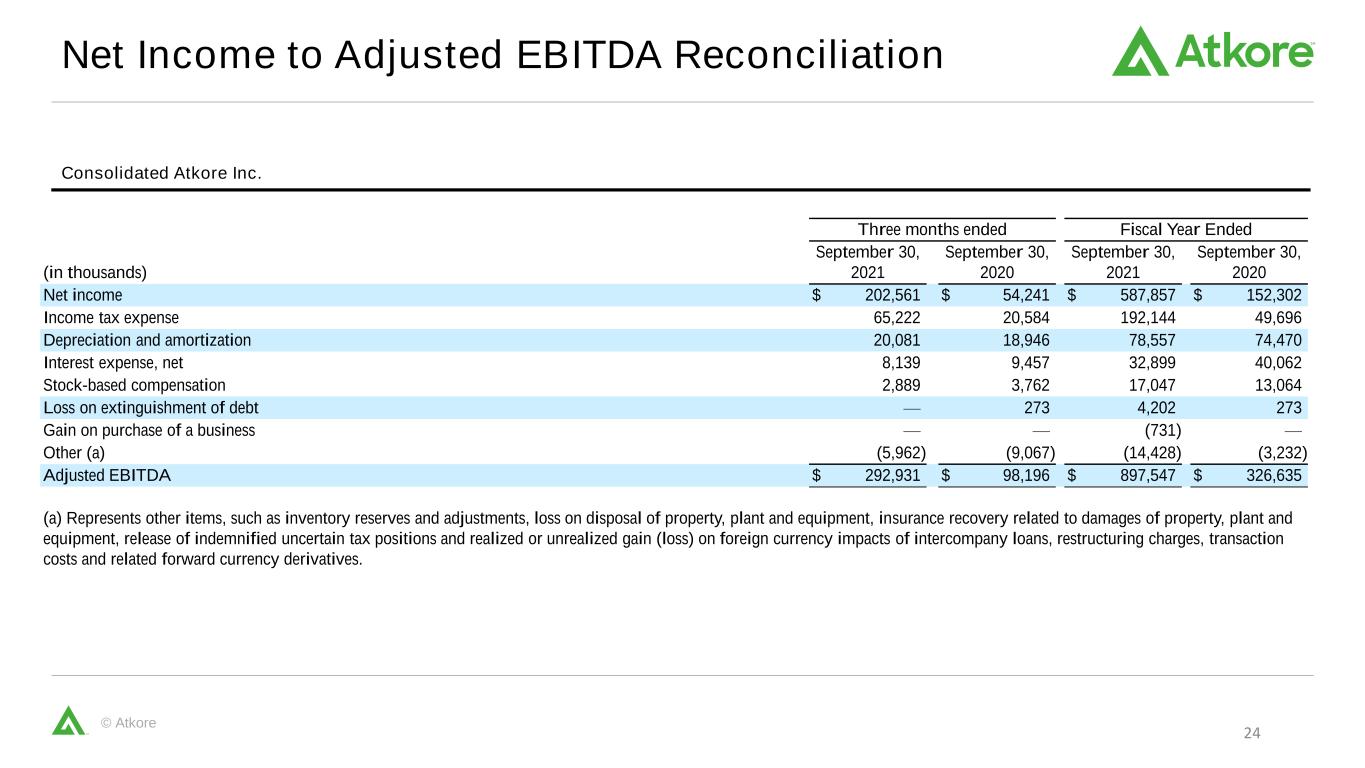
© Atkore Net Income to Adjusted EBITDA Reconciliation Consolidated Atkore Inc. 24 Three months ended Fiscal Year Ended (in thousands) September 30, 2021 September 30, 2020 September 30, 2021 September 30, 2020 Net income $ 202,561 $ 54,241 $ 587,857 $ 152,302 Income tax expense 65,222 20,584 192,144 49,696 Depreciation and amortization 20,081 18,946 78,557 74,470 Interest expense, net 8,139 9,457 32,899 40,062 Stock-based compensation 2,889 3,762 17,047 13,064 Loss on extinguishment of debt — 273 4,202 273 Gain on purchase of a business — — (731) — Other (a) (5,962) (9,067) (14,428) (3,232) Adjusted EBITDA $ 292,931 $ 98,196 $ 897,547 $ 326,635 (a) Represents other items, such as inventory reserves and adjustments, loss on disposal of property, plant and equipment, insurance recovery related to damages of property, plant and equipment, release of indemnified uncertain tax positions and realized or unrealized gain (loss) on foreign currency impacts of intercompany loans, restructuring charges, transaction costs and related forward currency derivatives.
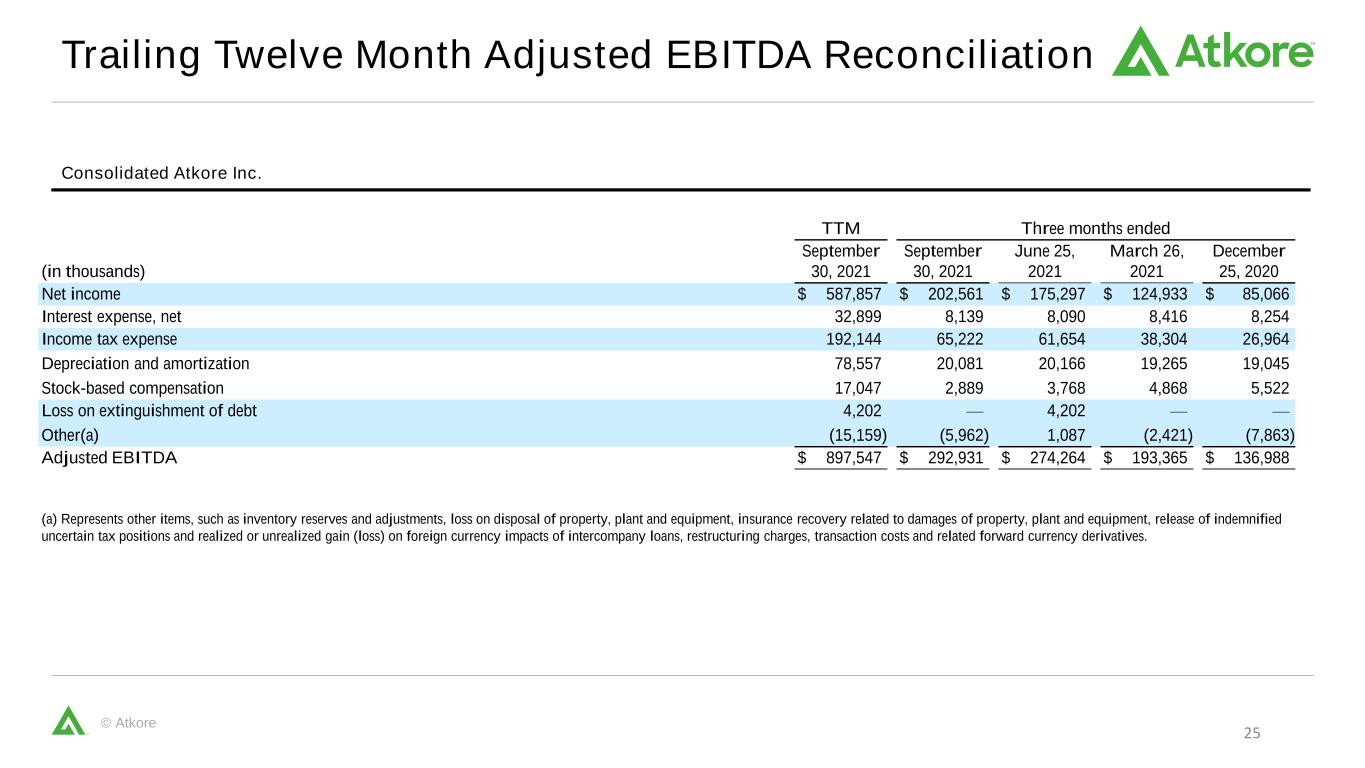
© Atkore Adjusted Earnings Per Share Reconciliation Trailing Twelve Month Adjusted EBITDA Reconciliation Consolidated Atkore Inc. 25 TTM Three months ended (in thousands) September 30, 2021 September 30, 2021 June 25, 2021 March 26, 2021 December 25, 2020 Net income $ 587,857 $ 202,561 $ 175,297 $ 124,933 $ 85,066 Interest expense, net 32,899 8,139 8,090 8,416 8,254 Income tax expense 192,144 65,222 61,654 38,304 26,964 Depreciation and amortization 78,557 20,081 20,166 19,265 19,045 Stock-based compensation 17,047 2,889 3,768 4,868 5,522 Loss on extinguishment of debt 4,202 — 4,202 — — Other(a) (15,159) (5,962) 1,087 (2,421) (7,863) Adjusted EBITDA $ 897,547 $ 292,931 $ 274,264 $ 193,365 $ 136,988 (a) Represents other items, such as inventory reserves and adjustments, loss on disposal of property, plant and equipment, insurance recovery related to damages of property, plant and equipment, release of indemnified uncertain tax positions and realized or unrealized gain (loss) on foreign currency impacts of intercompany loans, restructuring charges, transaction costs and related forward currency derivatives.
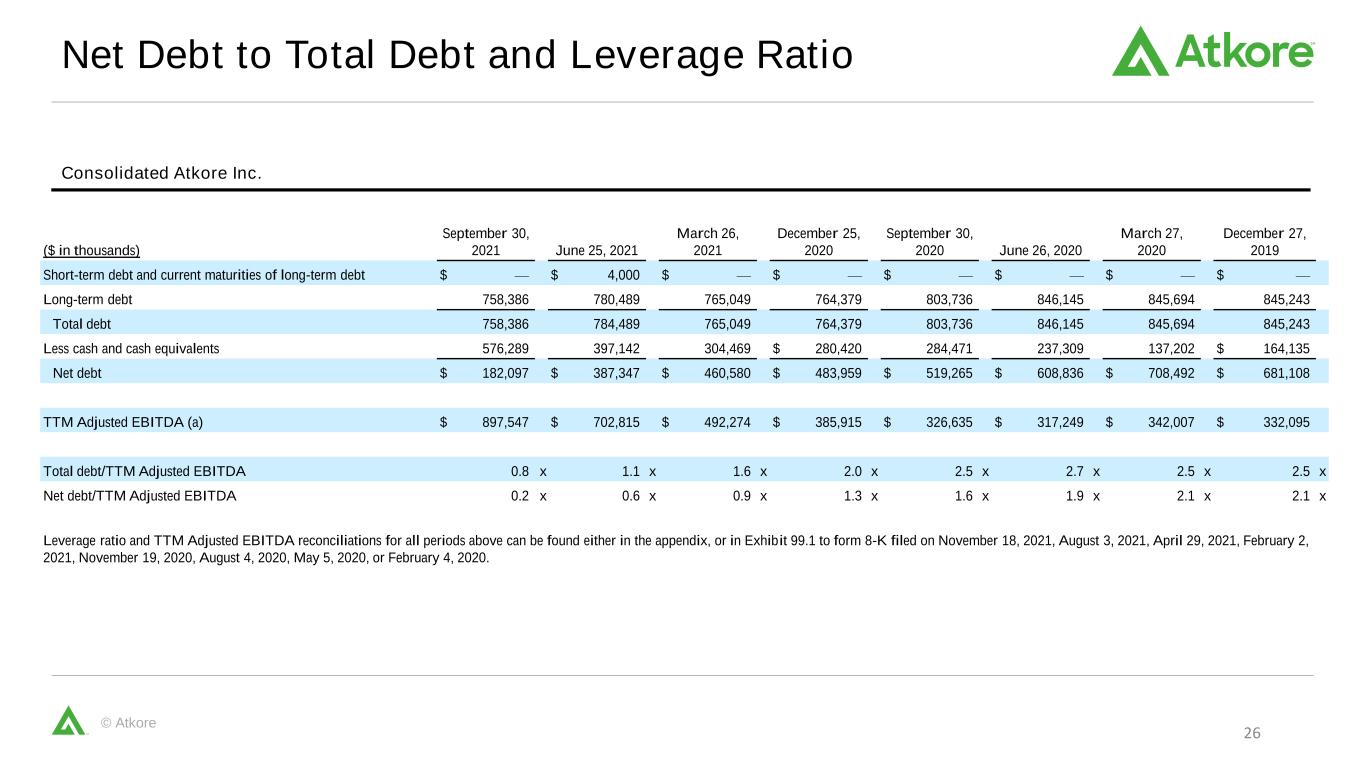
© Atkore Adjusted Earnings Per Share Reconciliation Net Debt to Total Debt and Leverage Ratio Consolidated Atkore Inc. 26 ($ in thousands) September 30, 2021 June 25, 2021 March 26, 2021 December 25, 2020 September 30, 2020 June 26, 2020 March 27, 2020 December 27, 2019 Short-term debt and current maturities of long-term debt $ — $ 4,000 $ — $ — $ — $ — $ — $ — Long-term debt 758,386 780,489 765,049 764,379 803,736 846,145 845,694 845,243 Total debt 758,386 784,489 765,049 764,379 803,736 846,145 845,694 845,243 Less cash and cash equivalents 576,289 397,142 304,469 $ 280,420 284,471 237,309 137,202 $ 164,135 Net debt $ 182,097 $ 387,347 $ 460,580 $ 483,959 $ 519,265 $ 608,836 $ 708,492 $ 681,108 TTM Adjusted EBITDA (a) $ 897,547 $ 702,815 $ 492,274 $ 385,915 $ 326,635 $ 317,249 $ 342,007 $ 332,095 Total debt/TTM Adjusted EBITDA 0.8 x 1.1 x 1.6 x 2.0 x 2.5 x 2.7 x 2.5 x 2.5 x Net debt/TTM Adjusted EBITDA 0.2 x 0.6 x 0.9 x 1.3 x 1.6 x 1.9 x 2.1 x 2.1 x Leverage ratio and TTM Adjusted EBITDA reconciliations for all periods above can be found either in the appendix, or in Exhibit 99.1 to form 8-K filed on November 18, 2021, August 3, 2021, April 29, 2021, February 2, 2021, November 19, 2020, August 4, 2020, May 5, 2020, or February 4, 2020.
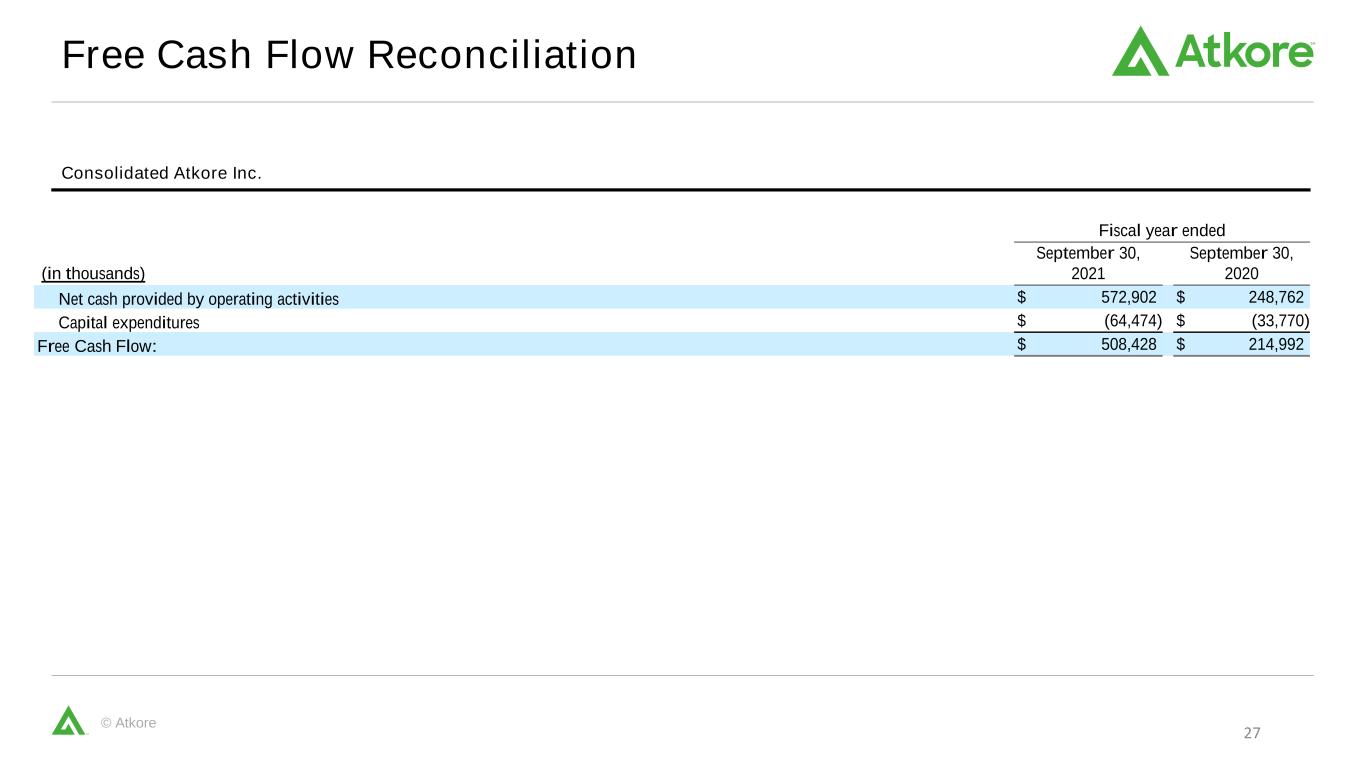
© Atkore Free Cash Flow Reconciliation Consolidated Atkore Inc. 27 Fiscal year ended (in thousands) September 30, 2021 September 30, 2020 Net cash provided by operating activities $ 572,902 $ 248,762 Capital expenditures $ (64,474) $ (33,770) Free Cash Flow: $ 508,428 $ 214,992
Atkore.com © Atkore Thank You!


