Exhibit 99.1

1 2017 INVESTOR DAY 2017 Fourth Quarter Earnings Conference Call February 15, 2018

2 2017 INVESTOR DAY 2 Forward - Looking Information Fortis includes "forward - looking information" in this presentation within the meaning of applicable Canadian securities laws and "forward - looking statements" within the meaning of the U.S. Private Securities Litigation Reform Act of 1995, collectively referred to as "for war d - looking information". Forward - looking information included in this presentation reflects expectations of Fortis management regarding future growth, re sults of operations, performance and business prospects and opportunities. Wherever possible, words such as "anticipates", "believes", "budgets", "c ould", "estimates", "expects", "forecasts", "intends", "may", "might", "plans", "projects", "schedule", "should", "target", "will", "would" and the negative of these terms and other similar terminology or expressions have been used to identify the forward - looking information, which include, without limitation: the Co rporation's forecast gross consolidated and segmented capital expenditures for 2018 and for the period 2018 through 2022; the nature, timing and expecte d c osts of certain capital projects including, without limitation, the ITC Multi - Value Regional Transmission Projects and 34.6 to 69 kV Conversion Project, UNS Energy flexible generation reciprocating engines investment and Gila River Generating Station Unit 2, FortisBC Lower Mainland System Upgrade , E agle Mountain Woodfibre Gas Pipeline Project and Pipeline Integrity Management Program and additional opportunities beyond the base capital plan incl udi ng, among others, the Wataynikaneyap Power Project; targeted average annual dividend growth through 2022; the impact of US tax reform on the Corpor ati on's near - term cash flows, earnings, credit metrics, financing structures and EBITDA; statements related to the at - the - market equity program, includ ing the timing, the receipt of regulatory approvals and the Corporation’s expected use of the net proceeds; the Corporation's forecast consolidated and segm ent ed rate base for 2018 and for the period 2018 through 2022; and the expected timing of filing of regulatory applications and receipt and outcome of reg ula tory decisions. Forward - looking information involves significant risks, uncertainties and assumptions. Certain material factors or assumptions h ave been applied in drawing the conclusions contained in the forward - looking information. These factors or assumptions are subject to inherent risks and unc ertainties surrounding future expectations generally, including those identified from time to time in the forward - looking information. Such risk factors or as sumptions include, but are not limited to: uncertainty regarding the outcome of regulatory proceedings of the Corporation’s utilities and the expectation of re gulatory stability; no material capital project and financing cost overrun related to any of the Corporation’s capital projects; sufficient human resources t o d eliver service and execute the capital program; the Board of Directors exercising its discretion to declare dividends, taking into account the business perf orm ance and financial conditions of the Corporation; risk associated with the impact of less favorable economic conditions on the Corporation’s results of operat ion s; no significant changes in laws and regulations that may materially negatively affect the Corporation and its subsidiaries; and currency exchange rates. Fo rtis cautions readers that a number of factors could cause actual results, performance or achievements to differ materially from the results discussed or imp lied in the forward - looking information. These factors should be considered carefully and undue reliance should not be placed on the forward - looking informa tion. For additional information with respect to certain of these risks or factors, reference should be made to the continuous disclosure material s f iled from time to time by Fortis with Canadian securities regulatory authorities and the Securities and Exchange Commission. All forward - looking information in t his presentation is given as of the date of this presentation and Fortis disclaims any intention or obligation to update or revise any forward - looking inform ation, whether as a result of new information, future events or otherwise. Unless otherwise specified, all financial information referenced is in Canadian dollars and references to rate base refers to mi d - year rate base.

3 2017 INVESTOR DAY Barry Perry President & CEO
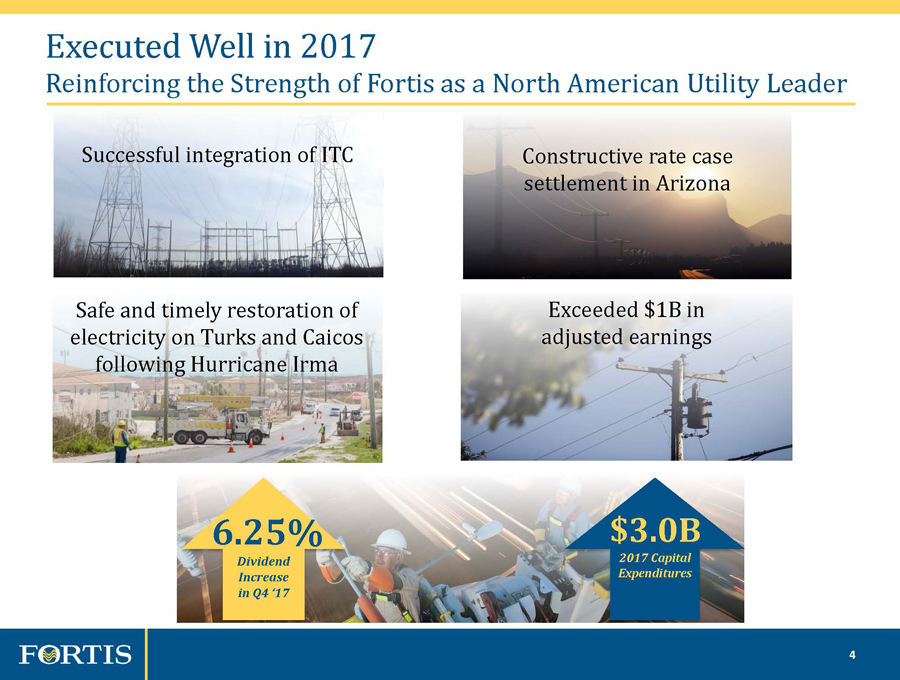
4 2017 INVESTOR DAY 4 Executed Well in 2017 Reinforcing the Strength of Fortis as a North American Utility Leader Constructive rate case settlement in Arizona Successful integration of ITC Exceeded $1B in adjusted earnings Safe and timely restoration of electricity on Turks and Caicos following Hurricane Irma $3.0B 2017 Capital Expenditures 6.25% Dividend Increase in Q4 ‘17
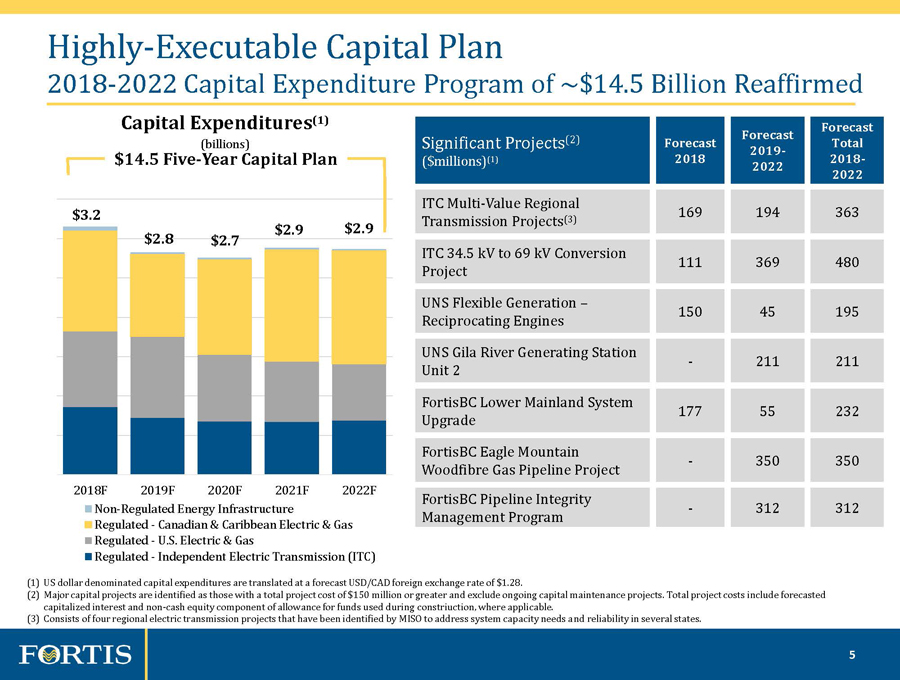
5 2017 INVESTOR DAY 5 2018F 2019F 2020F 2021F 2022F Non-Regulated Energy Infrastructure Regulated - Canadian & Caribbean Electric & Gas Regulated - U.S. Electric & Gas Regulated - Independent Electric Transmission (ITC) $3.2 $2.8 $2.7 $2.9 $2.9 Capital Expenditures (1) $14.5 Five - Year Capital Plan (billions) (3) Highly - Executable Capital Plan 2018 - 2022 Capital Expenditure Program of ~$14.5 Billion Reaffirmed Significant Projects (2) ($millions) (1) Forecast 2018 Forecast 2019 - 2022 Forecast Total 2018 - 2022 ITC Multi - Value Regional Transmission Projects (3) 169 194 363 ITC 34.5 kV to 69 kV Conversion Project 111 369 480 UNS Flexible Generation – Reciprocating Engines 150 45 195 UNS Gila River Generating Station Unit 2 - 211 211 FortisBC Lower Mainland System Upgrade 177 55 232 FortisBC Eagle Mountain Woodfibre Gas Pipeline Project - 350 350 FortisBC Pipeline Integrity Management Program - 312 312 (1) US dollar denominated capital expenditures are translated at a forecast USD/CAD foreign exchange rate of $1.28. (2) Major capital projects are identified as those with a total project cost of $150 million or greater and exclude ongoing capital maintenance projects . Total project costs include forecasted capitalized interest and non - cash equity component of allowance for funds used during constriuction , where applicable. (3) Consists of four regional electric transmission projects that have been identified by MISO to address system capacity needs a nd reliability in several states.
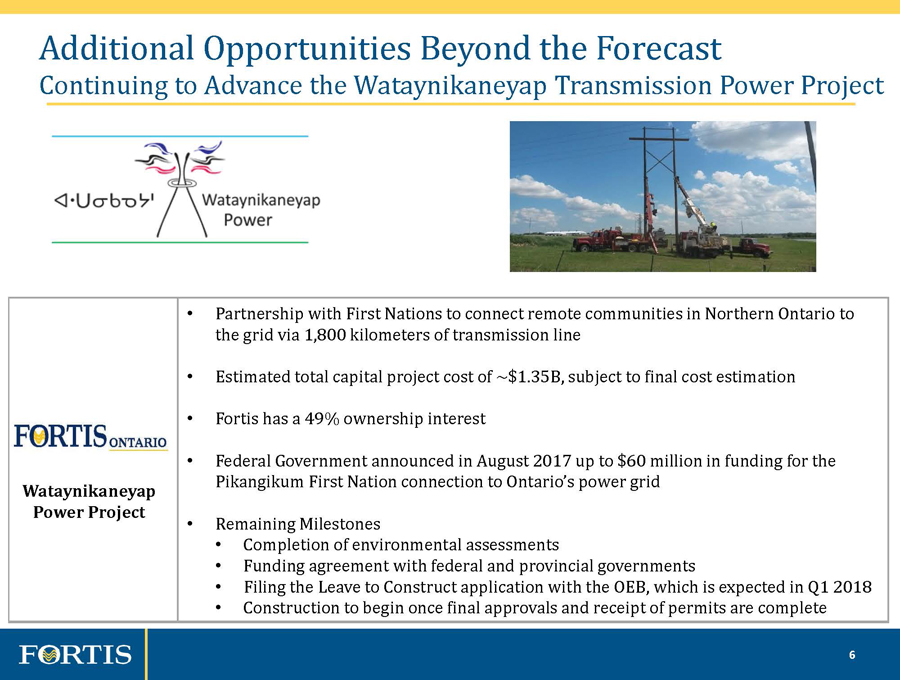
6 2017 INVESTOR DAY 6 • Partnership with First Nations to connect remote communities in Northern Ontario to the grid via 1,800 kilometers of transmission line • Estimated total capital project cost of ~$1.35B, subject to final cost estimation • Fortis has a 49% ownership interest • Federal Government announced in August 2017 up to $60 million in funding for the Pikangikum First Nation connection to Ontario’s power grid • Remaining Milestones • Completion of environmental assessments • Funding agreement with federal and provincial governments • Filing the Leave to Construct application with the OEB, which is expected in Q1 2018 • Construction to begin once final approvals and receipt of permits are complete Additional Opportunities Beyond the Forecast Continuing to Advance the Wataynikaneyap Transmission Power Project Wataynikaneyap Power Project
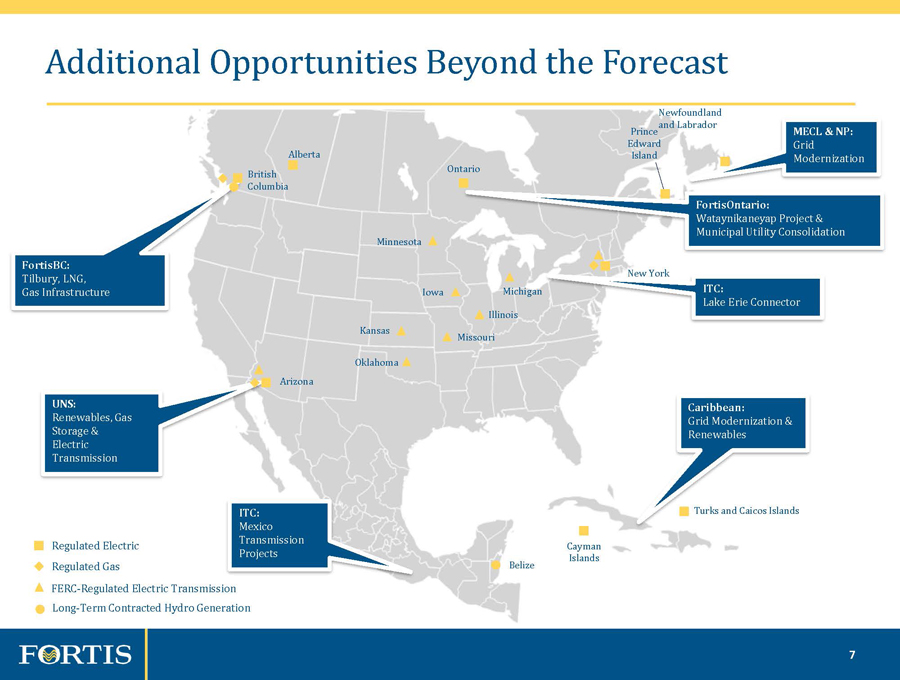
7 2017 INVESTOR DAY 7 Additional Opportunities Beyond the Forecast Turks and Caicos Islands Regulated Electric Regulated Gas Cayman Islands Newfoundland and Labrador Prince Edward Island Alberta British Columbia Arizona Ontario New York FERC - Regulated Electric Transmission Oklahoma Kansas Missouri Michigan Iowa Illinois FortisOntario: Wataynikaneyap Project & Municipal Utility Consolidation FortisBC: Tilbury, LNG, Gas Infrastructure UNS: Renewables, Gas Storage & Electric Transmission ITC: Mexico Transmission Projects Minnesota Long - Term Contracted Hydro Generation Belize ITC: Lake Erie Connector MECL & NP: Grid Modernization Caribbean: Grid Modernization & Renewables
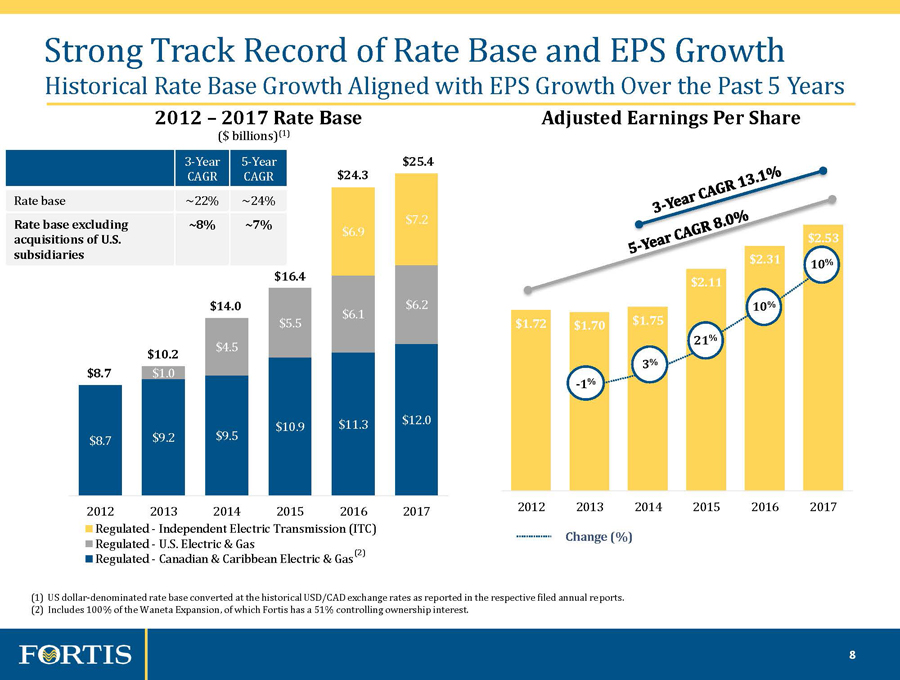
8 2017 INVESTOR DAY 8 Strong Track Record of Rate Base and EPS Growth Historical Rate Base Growth Aligned with EPS Growth Over the Past 5 Years $1.72 $1.70 $1.75 $2.11 $2.31 $2.53 2012 2013 2014 2015 2016 2017 3 % 21 % 10 % 10 % Adjusted Earnings Per Share Change (%) - 1 % $8.7 $9.2 $9.5 $10.9 $11.3 $12.0 $1.0 $4.5 $5.5 $6.1 $6.2 $6.9 $7.2 2012 2013 2014 2015 2016 2017 Regulated - Independent Electric Transmission (ITC) Regulated - U.S. Electric & Gas Regulated - Canadian & Caribbean Electric & Gas 2012 – 2017 Rate Base ($ billions) (1) $8.7 $10.2 $14.0 $25.4 $24.3 $16.4 3 - Year CAGR 5 - Year CAGR Rate base ~22% ~24% Rate base excluding acquisitions of U.S. subsidiaries ~8% ~7% (1) US dollar - denominated rate base converted at the historical USD/CAD exchange rates as reported in the respective filed annual re ports. (2) Includes 100% of the Waneta Expansion, of which Fortis has a 51% controlling ownership interest. (2)
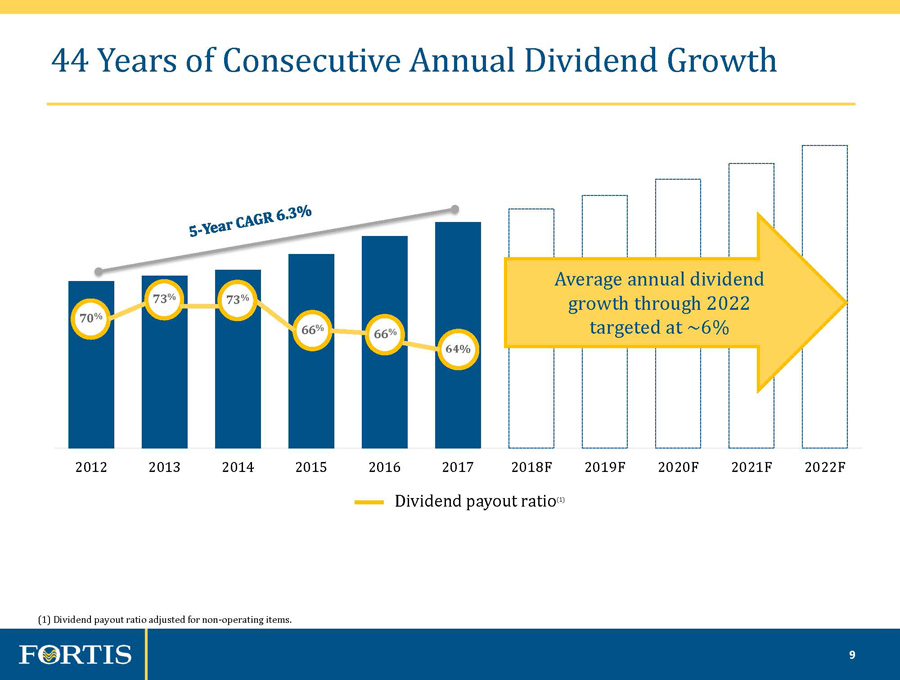
9 2017 INVESTOR DAY 9 2012 2013 2014 2015 2016 2017 2018F 2019F 2020F 2021F 2022F Dividend payout ratio (1) 70 % 73 % 66 % 66 % 73 % 44 Years of Consecutive Annual Dividend Growth Average annual dividend growth through 2022 targeted at ~6% (1) Dividend payout ratio adjusted for non - operating items. 64%

10 2017 INVESTOR DAY Karl Smith Executive Vice President, Chief Financial Officer

11 2017 INVESTOR DAY 11 $2.31 $2.53 2.20 2.30 2.40 2.50 2.60 2016 2017 Fortis Delivers Strong Results in 2017 $715 $1,053 100 300 500 700 900 1100 1300 2016 2017 Adjusted Earnings Adjusted EPS Q4 $0.63 $0.62 0.45 0.50 0.55 0.60 0.65 0.70 2016 2017 ($) ($ millions) Annual Q4 $243 $259 200 250 300 2016 2017 Annual
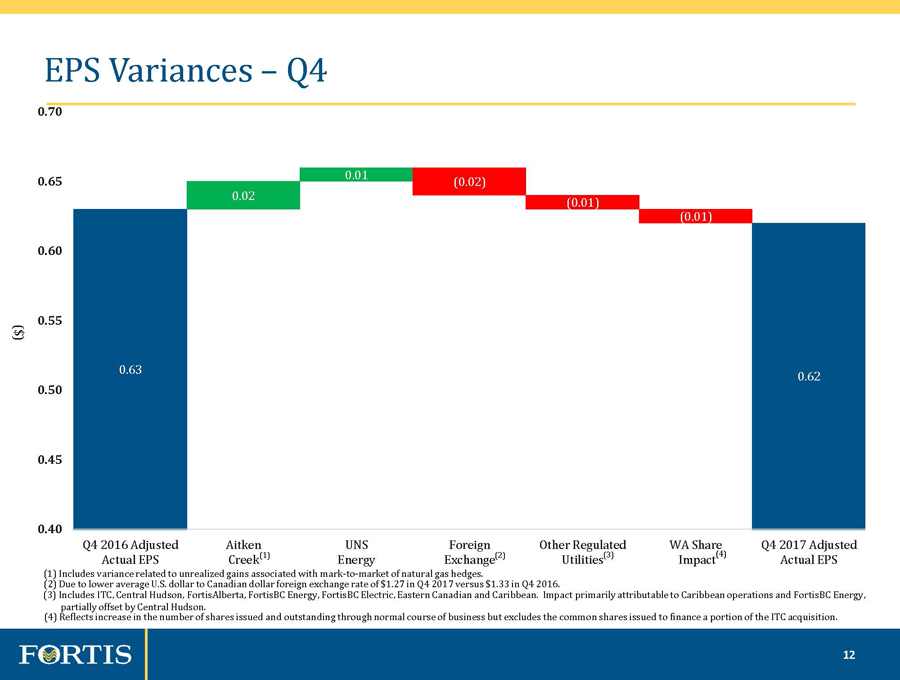
12 2017 INVESTOR DAY 12 0.63 0.02 0.01 ( 0.02 ) (0.01) ( 0.01 ) 0.62 0.40 0.45 0.50 0.55 0.60 0.65 0.70 Q4 2016 Adjusted Actual EPS Aitken Creek UNS Energy Foreign Exchange Other Regulated Utilities WA Share Impact Q4 2017 Adjusted Actual EPS (2) (1) ($) EPS Variances – Q4 (2) Due to lower average U.S. dollar to Canadian dollar foreign exchange rate of $1.27 in Q4 2017 versus $1.33 in Q4 2016. (1) Includes variance related to unrealized gains associated with mark - to - market of natural gas hedges. . (4) (3) Includes ITC, Central Hudson, FortisAlberta, FortisBC Energy, FortisBC Electric, Eastern Canadian and Caribbean. Impact pri marily attributable to Caribbean operations and FortisBC Energy, partially offset by Central Hudson. . (3) (4) Reflects increase in the number of shares issued and outstanding through normal course of business but excludes the commo n s hares issued to finance a portion of the ITC acquisition.

13 2017 INVESTOR DAY 13 2.31 0.16 0.09 0.06 ( 0.04 ) ( 0.03 ) (0.02) 2.53 1.90 2.00 2.10 2.20 2.30 2.40 2.50 2.60 2.70 2016 Adjusted Actual EPS UNS Energy Aitken Creek ITC WA Share Impact Foreign Exchange Other Regulated Utilities 2017 Adjusted Actual EPS ($) Multiple Drivers of EPS Growth – Full Year 2017 (5) Includes Central Hudson, FortisBC Energy, FortisAlberta , FortisBC Electric, Eastern Canadian and Caribbean. Impact primarily attributable to Caribbean operations, partially offset by Central Hudson and FortisBC Energy. (2) Inclusive of finance charges and common share issuance related to ITC acquisition. (1) Variance mainly driven by unrealized gains associated with mark - to - market of natural gas hedges. (3) Reflects increase in the number of shares issued and outstanding through normal course of business but excludes the commo n s hares issued to finance a portion of the ITC acquisition. (1) (3) (4) (5) (2) (4) Due to lower average U.S. dollar to Canadian dollar foreign exchange rate of $1.30 in 2017 versus $1.33 in 2016.
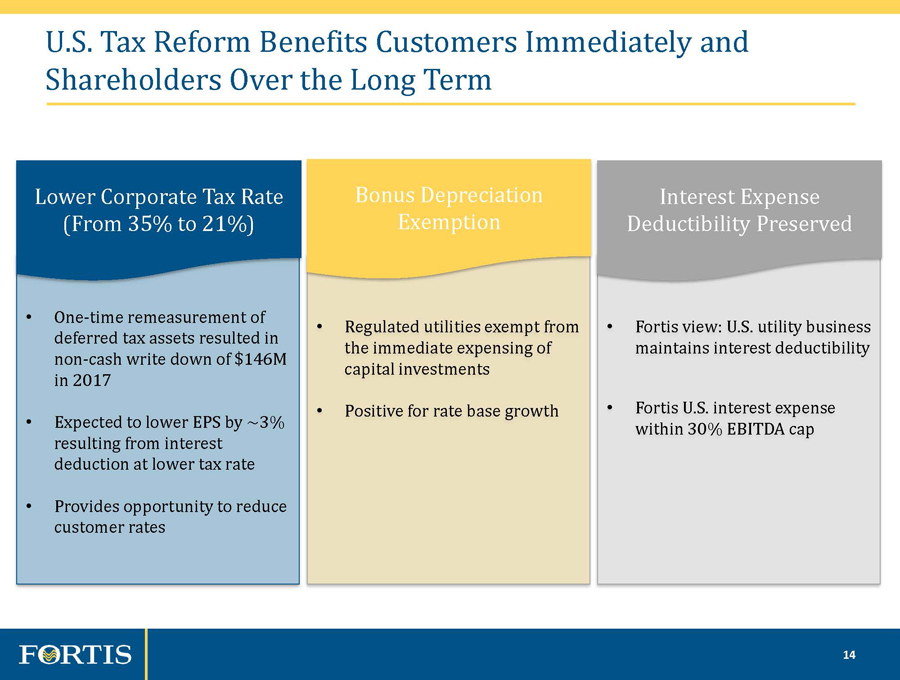
14 2017 INVESTOR DAY 14 U.S. Tax Reform Benefits Customers Immediately and Shareholders Over the Long Term • One - time remeasurement of deferred tax assets resulted in non - cash write down of $146M in 2017 • Expected to lower EPS by ~3% resulting from interest deduction at lower tax rate • Provides opportunity to reduce customer rates Lower Corporate Tax Rate (From 35% to 21%) • Regulated utilities exempt from the immediate expensing of capital investments • Positive for rate base growth Bonus Depreciation Exemption • Fortis view: U.S. utility business maintains interest deductibility • Fortis U.S. interest expense within 30% EBITDA cap Interest Expense Deductibility Preserved
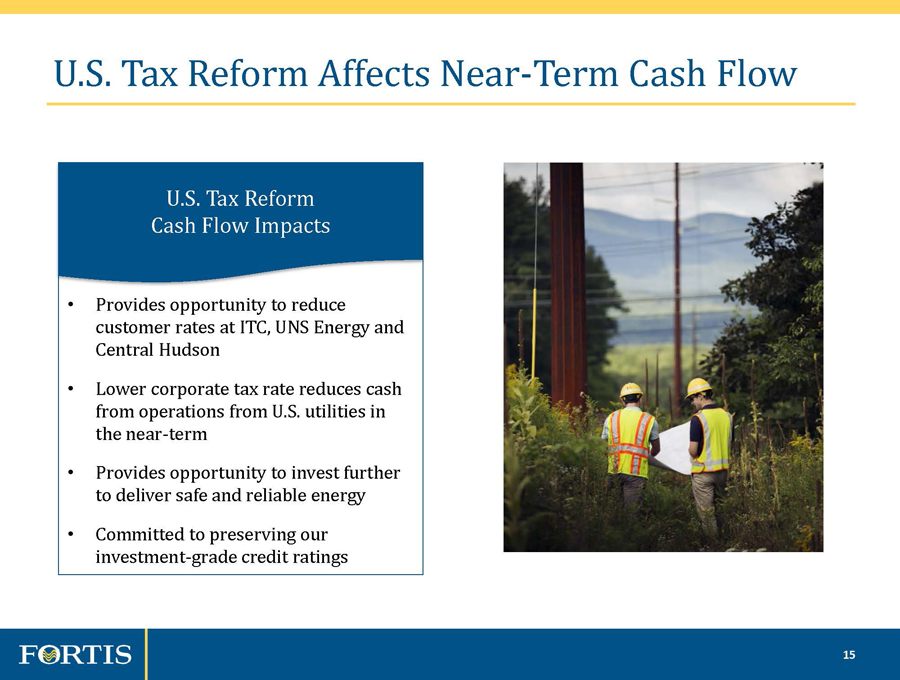
15 2017 INVESTOR DAY 15 U.S. Tax Reform Affects Near - Term Cash Flow • Provides opportunity to reduce customer rates at ITC, UNS Energy and Central Hudson • Lower corporate tax rate reduces cash from operations from U.S. utilities in the near - term • Provides opportunity to invest further to deliver safe and reliable energy • Committed to preserving our investment - grade credit ratings U.S. Tax Reform Cash Flow Impacts
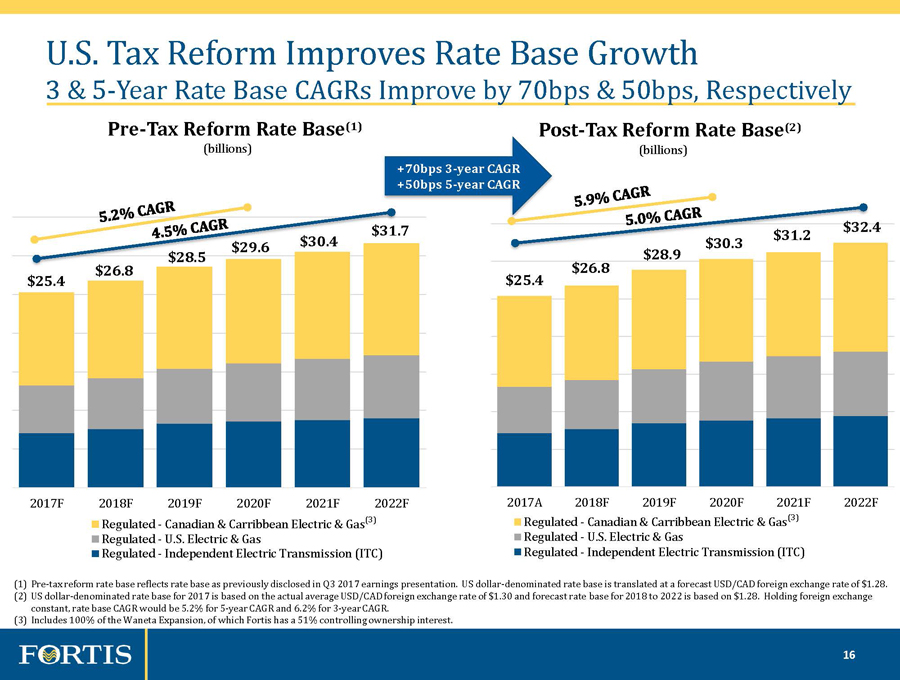
16 2017 INVESTOR DAY 16 2017F 2018F 2019F 2020F 2021F 2022F Regulated - Canadian & Carribbean Electric & Gas Regulated - U.S. Electric & Gas Regulated - Independent Electric Transmission (ITC) $25.4 $26.8 $28.5 $29.6 $30.4 $31.7 2017A 2018F 2019F 2020F 2021F 2022F Regulated - Canadian & Carribbean Electric & Gas Regulated - U.S. Electric & Gas Regulated - Independent Electric Transmission (ITC) $25.4 $26.8 $28.9 $30.3 $31.2 $32.4 U.S. Tax Reform Improves Rate Base Growth 3 & 5 - Year Rate Base CAGRs Improve by 70bps & 50bps, Respectively (1) Pre - tax reform rate base reflects rate base as previously disclosed in Q3 2017 earnings presentation. US dollar - denominated rat e base is translated at a forecast USD/CAD foreign exchange rate of $1.28. (2) US dollar - denominated rate base for 2017 is based on the actual average USD/CAD foreign exchange rate of $1.30 and forecast rate base for 2018 to 2022 is based on $1.28. Holding foreign exchange constant, rate base CAGR would be 5.2% for 5 - year CAGR and 6.2% for 3 - year CAGR. (3) Includes 100% of the Waneta Expansion, of which Fortis has a 51% controlling ownership interest. Post - Tax Reform Rate Base (2) (billions) Pre - Tax Reform Rate Base (1) (billions) +70bps 3 - year CAGR +50bps 5 - year CAGR (3) (3)
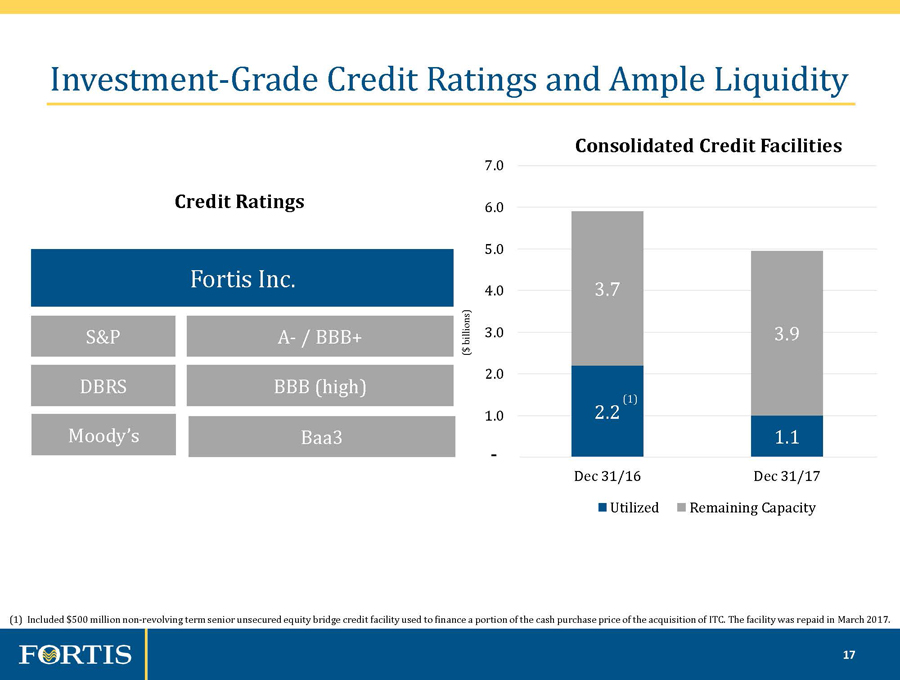
17 2017 INVESTOR DAY 17 2.2 1.1 3.7 3.9 0.0 1.0 2.0 3.0 4.0 5.0 6.0 7.0 Dec 31/16 Dec 31/17 Utilized Remaining Capacity Credit Ratings Fortis Inc. DBRS BBB (high) S&P A - / BBB+ Consolidated Credit Facilities ($ billions) Moody’s Baa3 Investment - Grade Credit Ratings and Ample Liquidity (1) Included $500 million non - revolving term senior unsecured equity bridge credit facility used to finance a portion of the cash purchase pr ice of the acquisition of ITC. The facility was repaid in March 2017. (1) -
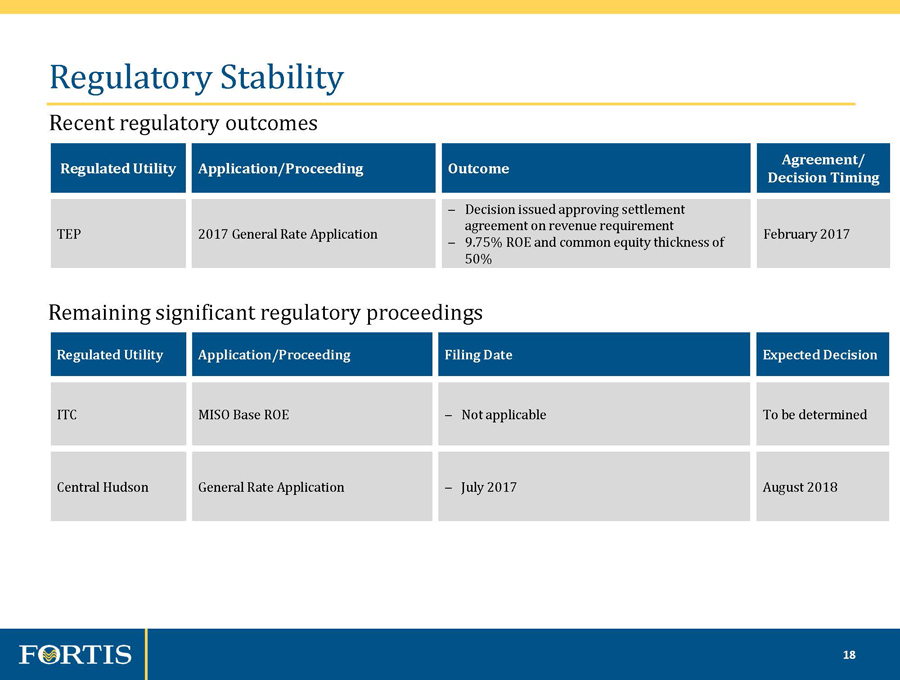
18 2017 INVESTOR DAY 18 Regulatory Stability Recent regulatory outcomes Remaining significant regulatory proceedings Regulated Utility Application/Proceeding Filing Date Expected Decision ITC MISO Base ROE ‒ Not applicable To be determined Central Hudson General Rate Application ‒ July 2017 August 2018 Regulated Utility Application/Proceeding Outcome Agreement/ Decision Timing TEP 2017 General Rate Application ‒ Decision issued approving s ettlement agreement on revenue requirement ‒ 9.75% ROE and common equity thickness of 50% February 2017

19 2017 INVESTOR DAY Barry Perry President & CEO

20 2017 INVESTOR DAY 20 Strategic Initiatives Strategy Leverage the operating model, footprint of our utilities, operating expertise, reputation and financial strength to develop growth opportunities Execute Utility CAPEX Plan Deliver Cleaner Energy Enhance Customer & Regulatory Relationships Unlock LNG Value ITC Transmission Growth Dividend Growth Target: 6% Average Annual Growth Through 2021 Investment - Grade Credit Ratings Dividend Growth Target: 6% Average Annual Growth Through 2022 Our Strategy – Simple, Effective, Proven Pursue Energy Infrastructure in and Near Existing Service Territories
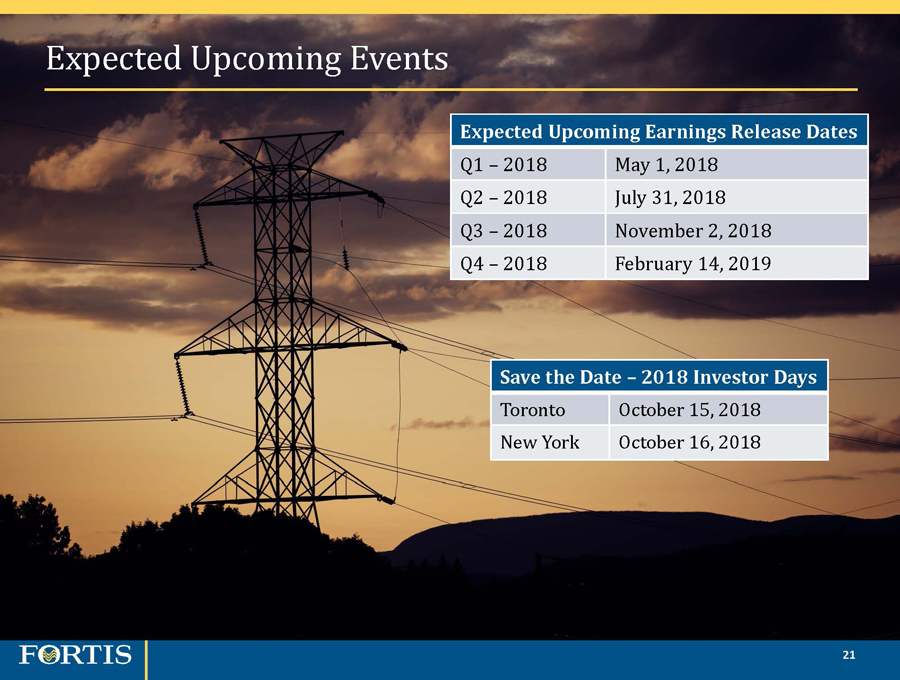
21 2017 INVESTOR DAY 21 Expected Upcoming Events Save the Date – 2018 Investor Days Toronto October 15, 2018 New York October 16, 2018 Expected Upcoming Earnings Release Dates Q1 – 2018 May 1, 2018 Q2 – 2018 July 31, 2018 Q3 – 2018 November 2, 2018 Q4 – 2018 February 14, 2019
22 2017 INVESTOR DAY 2017 Fourth Quarter Earnings Conference Call February 15, 2018
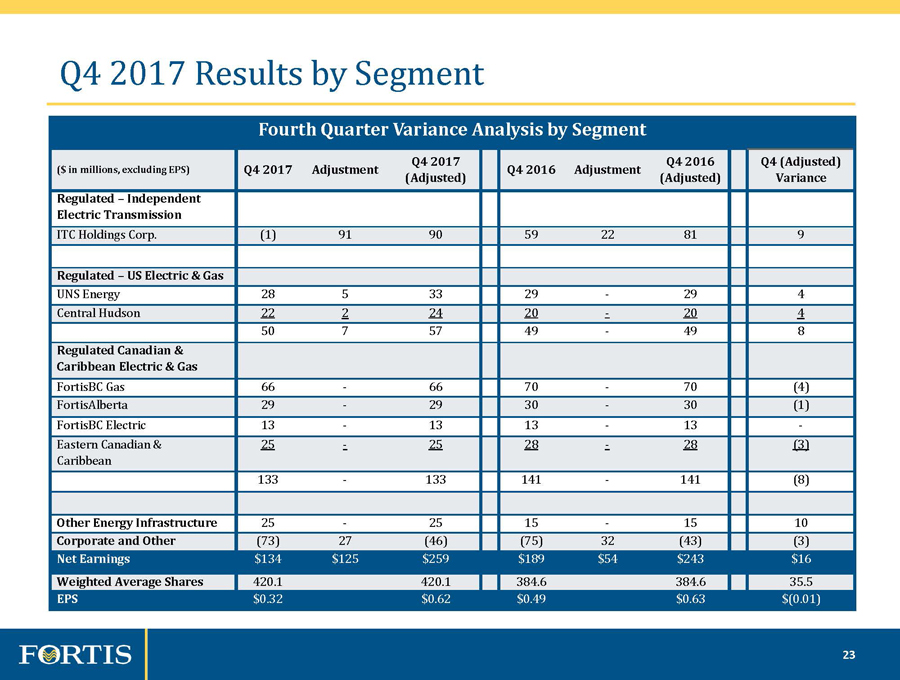
23 2017 INVESTOR DAY 23 Fourth Quarter Variance Analysis by Segment ($ in millions, excluding EPS) Q4 2017 Adjustment Q4 2017 (Adjusted) Q4 2016 Adjustment Q4 2016 (Adjusted) Q4 (Adjusted) Variance Regulated – Independent Electric Transmission ITC Holdings Corp. (1) 91 90 59 22 81 9 Regulated – US Electric & Gas UNS Energy 28 5 33 29 - 29 4 Central Hudson 22 2 24 20 - 20 4 50 7 57 49 - 49 8 Regulated Canadian & Caribbean Electric & Gas FortisBC Gas 66 - 66 70 - 70 (4) FortisAlberta 29 - 29 30 - 30 (1) FortisBC Electric 13 - 13 13 - 13 - Eastern Canadian & Caribbean 25 - 25 28 - 28 (3) 133 - 133 141 - 141 (8) Other Energy Infrastructure 25 - 25 15 - 15 10 Corporate and Other (73) 27 (46) (75) 32 (43) (3) Net Earnings $134 $125 $259 $189 $54 $243 $16 Weighted Average Shares 420.1 420.1 384.6 384.6 35.5 EPS $0.32 $0.62 $0.49 $0.63 $(0.01) Q4 2017 Results by Segment

24 2017 INVESTOR DAY 24 Annual Variance Analysis by Segment ($ in millions, excluding EPS) Annual 2017 Adjustment Annual 2017 (Adjusted) Annual 2016 Adjustment Annual 2016 (Adjusted) Annual (Adjusted) Variance Regulated – Independent Electric Transmission ITC Holdings Corp. 272 91 363 59 22 81 282 Regulated – US Electric & Gas UNS Energy 270 (6) 264 199 18 217 47 Central Hudson 70 2 72 70 - 70 2 340 (4) 336 269 18 287 49 Regulated Canadian & Caribbean Electric & Gas FortisBC Gas 154 - 154 151 - 151 3 FortisAlberta 120 - 120 121 - 121 (1) FortisBC Electric 55 - 55 54 - 54 1 Eastern Canadian & Caribbean 98 - 98 110 - 110 (12) 427 - 427 436 - 436 (9) Other Energy Infrastructure 94 - 94 60 - 60 34 Corporate and Other (170) 3 (167) (239) 90 (149) (18) Net Earnings $963 $1,053 $585 $715 $338 Weighted Average Shares 415.5 415.5 308.9 308.9 106.6 EPS $2.32 $2.53 $1.89 $2.31 $0.22 Annual 2017 Results by Segment
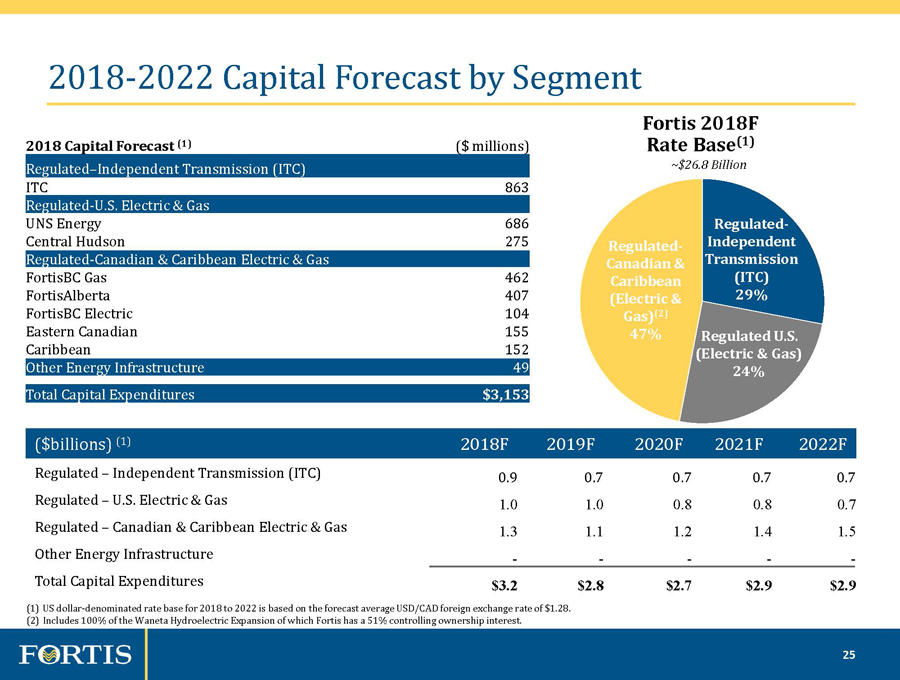
25 2017 INVESTOR DAY 25 Regulated U.S. (Electric & Gas) 24% Regulated - Independent Transmission (ITC) 29% Regulated - Canadian & Caribbean (Electric & Gas) (2) 47% 2018 - 2022 Capital Forecast by Segment 2018 Capital Forecast (1) ($ millions) Regulated – Independent Transmission (ITC) ITC 863 Regulated - U.S. Electric & Gas UNS Energy 686 Central Hudson 275 Regulated - Canadian & Caribbean Electric & Gas FortisBC Gas 462 FortisAlberta 407 FortisBC Electric 104 Eastern Canadian 155 Caribbean 152 Other Energy Infrastructure 49 Total Capital Expenditures $3,153 ($ billions) (1) 2018F 2019F 2020F 2021F 2022F Regulated – Independent Transmission (ITC) 0.9 0.7 0.7 0.7 0.7 Regulate d – U.S. Electric & Gas 1.0 1.0 0.8 0.8 0.7 Regulated – Canadian & Caribbean Electric & Gas 1.3 1.1 1.2 1.4 1.5 Other Energy Infrastructure - - - - - Total Capital Expenditures $3.2 $2.8 $2.7 $2.9 $2.9 Fortis 2018F Rate Base (1) ~$26.8 Billion (1) US dollar - denominated rate base for 2018 to 2022 is based on the forecast average USD/CAD foreign exchange rate of $1.28. (2) Includes 100% of the Waneta Hydroelectric Expansion of which Fortis has a 51% controlling ownership interest.
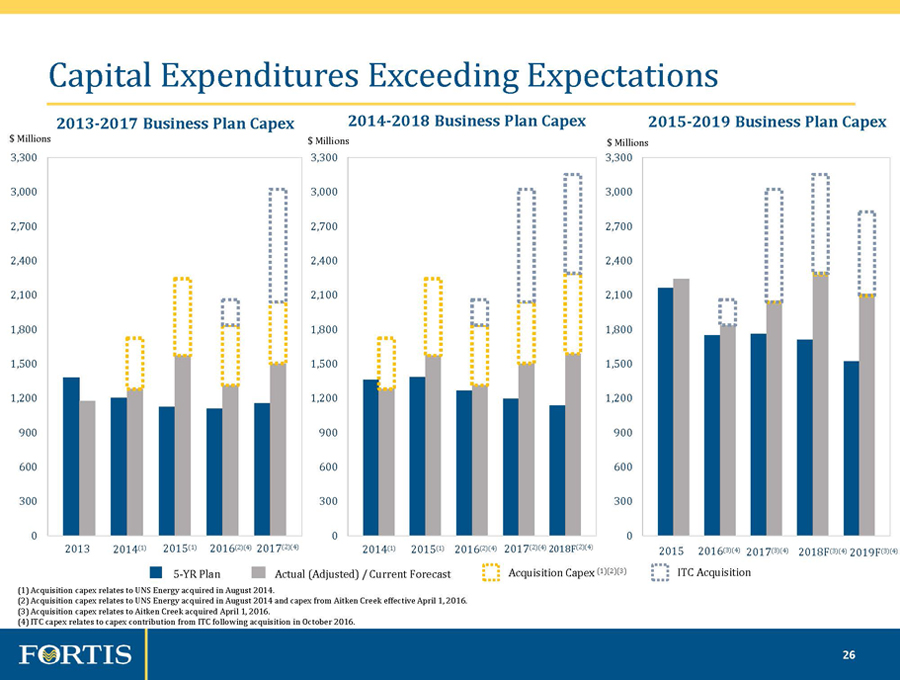
26 2017 INVESTOR DAY 26 Capital Expenditures Exceeding Expectations 0 300 600 900 1,200 1,500 1,800 2,100 2,400 2,700 3,000 3,300 2013 2014 (1) 2015 (1) 2016 (2)(4) 2017 (2)(4) 0 300 600 900 1,200 1,500 1,800 2,100 2,400 2,700 3,000 3,300 2015 2016 (3)(4) 2017 (3)(4) 2018F (3)(4) 2019F (3)(4) 0 300 600 900 1,200 1,500 1,800 2,100 2,400 2,700 3,000 3,300 2014 (1) 2015 (1) 2016 (2)(4) 2017 (2)(4) 2018F (2)(4 ) 2013 - 2017 Business Plan Capex 2014 - 2018 Business Plan Capex 2015 - 2019 Business Plan Capex (1) Acquisition capex relates to UNS Energy acquired in August 2014. (2) Acquisition capex relates to UNS Energy acquired in August 2014 and capex from Aitken Creek effective April 1, 2016. (3) Acquisition capex relates to Aitken Creek acquired April 1, 2016. (4) ITC capex relates to capex contribution from ITC following acquisition in October 2016. Acquisition Capex (1)(2)(3) 5 - YR Plan Actual (Adjusted) / Current Forecast ITC Acquisition $ Millions $ Millions $
Millions