Exhibit 99.1

First Quarter 2020 Earnings Conference Call May 6, 2020
Fortis includes forward - looking information in this presentation within the meaning of applicable Canadian securities laws and forward - looking statements within the meaning of the Private Securities Litigation Reform Act of 1995 (collectively referred to as "forward - looking information") . Forward - looking information reflects expectations of Fortis management regarding future growth, results of operations, performance and business prospects and opportunities . Wherever possible, words such as anticipates, believes, budgets, could, estimates, expects, forecasts, intends, may, might, plans, projects, schedule, should, target, will, would and the negative of these terms and other similar terminology or expressions have been used to identify the forward - looking information, which includes, without limitation : the expectation that ITC will recover lost revenues associated with lower peak loads ; forecast capital expenditures for the period from 2020 through 2024 ; the expectation that certain planned 2020 capital projects may be delayed or postponed until subsequent years ; forecast rate base for the period 2020 through 2024 ; the expectation that Fortis' long - term strategy will create shareholder value ; targeted average annual dividend growth through 2024 ; the expectation that the delay in the TEP rate case may temper earnings in 2020 ; the expected timing of regulatory decisions including at TEP and FortisBC ; forecast debt maturities for the period 2020 through 2024 ; the expectation that some of the Corporation's utilities may seek future rate recovery of credit losses associated with this pandemic ; the nature, timing, benefits and costs of certain capital projects including, without limitation, the Wataynikaneyap Transmission Power Project, ITC Multi - Value Regional Transmission Projects and 34 . 5 to 69 kV Transmission Conversion Project, UNS Energy Southline Transmission Project and Oso Grande Wind Project, FortisBC Lower Intermediate Pressure System Upgrade, Eagle Mountain Woodfibre Gas Line Project, Transmission Integrity Management Capabilities Project, Inland Gas Upgrades Project and Tilbury 1 B . Forward - looking information involves significant risks, uncertainties and assumptions . Certain material factors or assumptions have been applied in drawing the conclusions contained in the forward - looking information . These factors or assumptions are subject to inherent risks and uncertainties surrounding future expectations generally, including those identified from time to time in the forward - looking information . Such assumptions include, but are not limited to : no material impact from the COVID - 19 pandemic ; reasonable outcomes for regulatory proceedings and the expectation of regulatory stability ; the successful execution of the five - year capital expenditure plan ; no material capital project or financing cost overruns ; sufficient human resources to deliver service and execute the capital expenditure plan ; no significant variability in interest rates ; and the Board exercising its discretion to declare dividends, taking into account the business performance and financial condition of the Corporation . Fortis cautions readers that a number of factors could cause actual results, performance or achievements to differ materially from the results discussed or implied in the forward - looking information . These factors should be considered carefully and undue reliance should not be placed on the forward - looking information . For additional information with respect to certain of these risks or factors, reference should be made to the continuous disclosure materials filed from time to time by the Corporation with Canadian securities regulatory authorities and the Securities and Exchange Commission . All forward - looking information herein is given as of the date of this presentation . Fortis disclaims any intention or obligation to update or revise any forward - looking information, whether as a result of new information, future events or otherwise . Unless otherwise specified, all financial information is in Canadian dollars and rate base refers to midyear rate base . Forward Looking Information 2

Barry Perry President and Chief Executive Officer
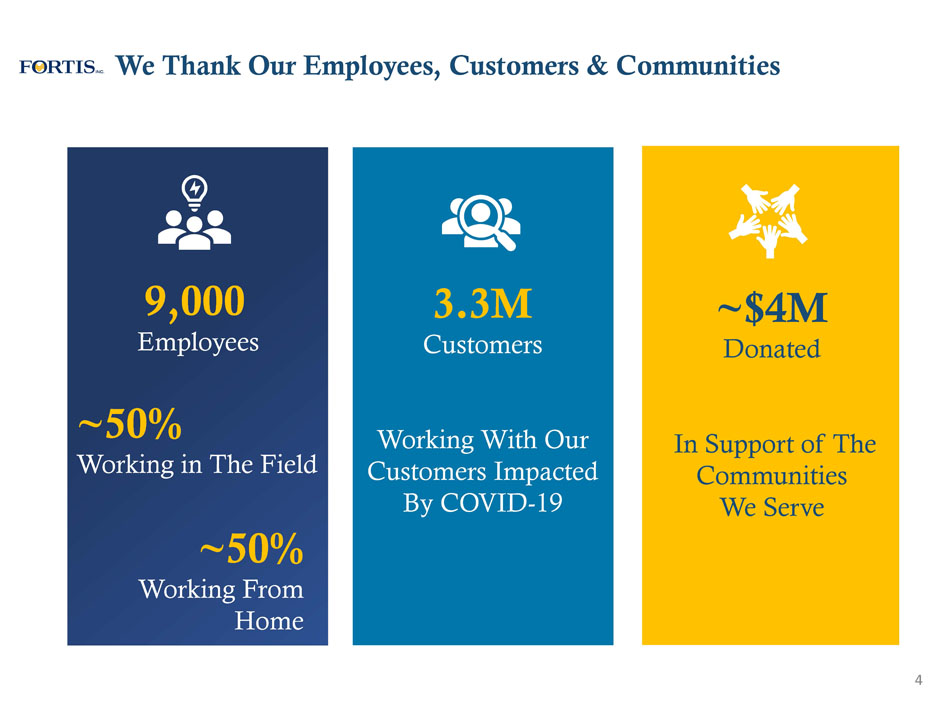
We Thank Our Employees, Customers & Communities 4 9,000 Employees ~50% Working in The Field ~50% Working From Home 3.3M Customers Working With Our Customers Impacted By COVID - 19 ~$4M Donated In Support of The Communities We Serve
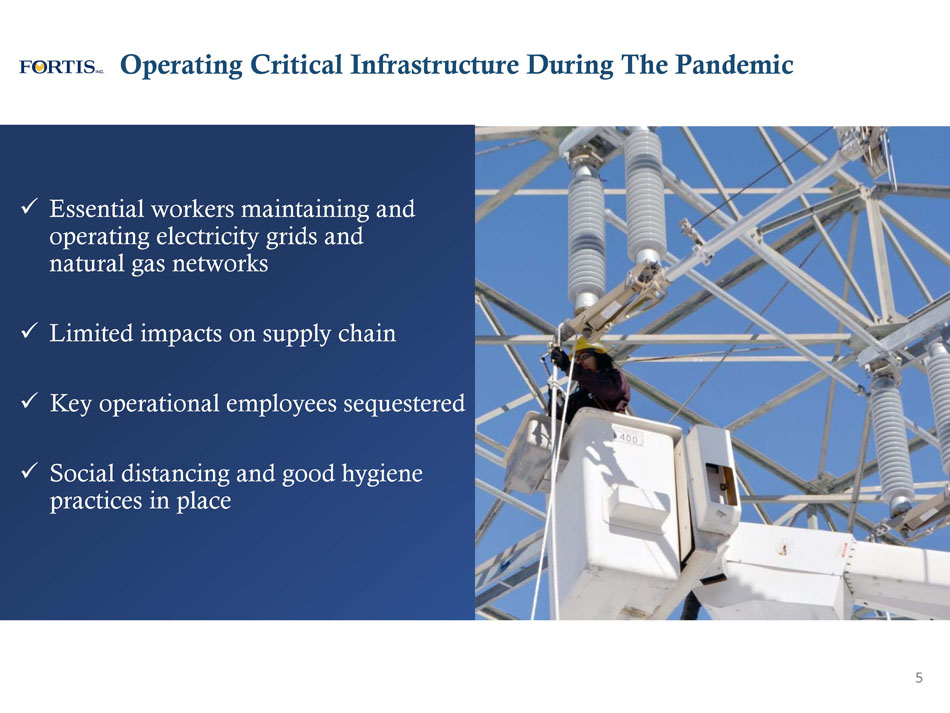
x Essential workers maintaining and operating electricity grids and natural gas networks x Limited impacts on supply chain x Key operational employees sequestered x Social distancing and good hygiene practices in place Operating Critical Infrastructure During The Pandemic 5 5
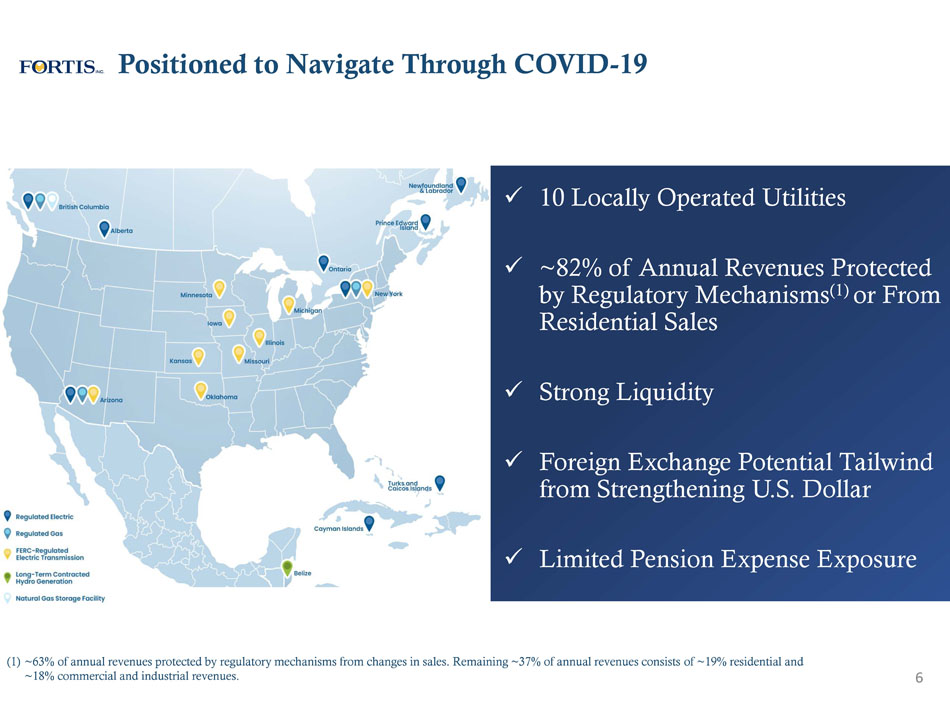
Positioned to Navigate Through COVID - 19 6 (1) ~63% of annual revenues protected by regulatory mechanisms from changes in sales. Remaining ~37% of annual revenues consists of ~19% residential and ~18% commercial and industrial revenues. x 10 Locally Operated Utilities x ~82% of Annual Revenues Protected by Regulatory Mechanisms (1) or From Residential Sales x Strong Liquidity x Foreign Exchange Potential Tailwind from Strengthening U.S. Dollar x Limited Pension Expense Exposure
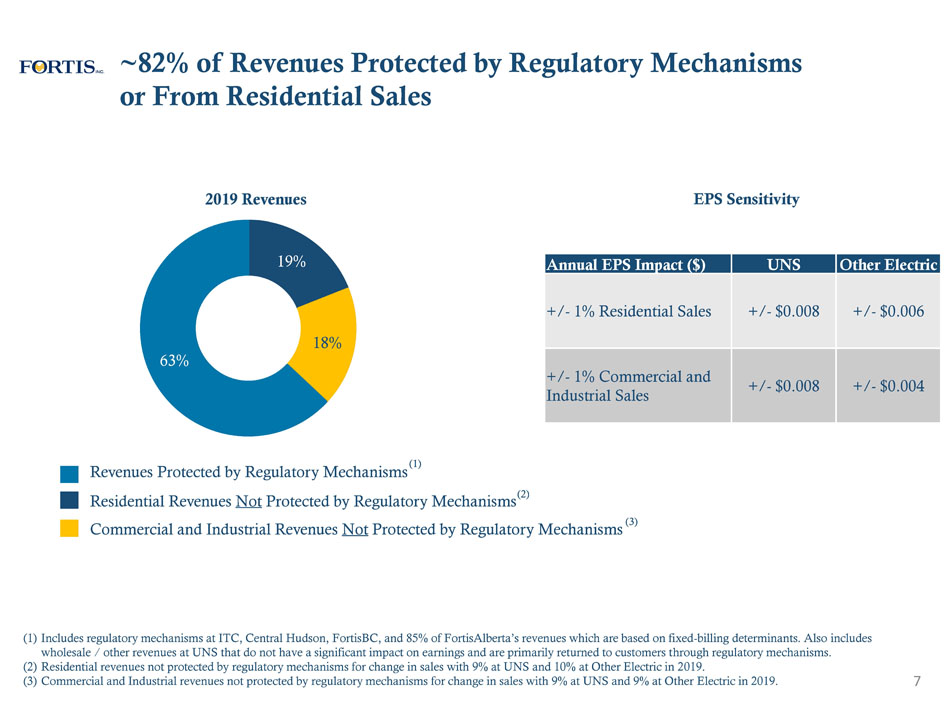
Annual EPS Impact ($) UNS Other Electric +/ - 1% Residential Sales +/ - $0.008 +/ - $0.006 +/ - 1% Commercial and Industrial Sales +/ - $0.008 +/ - $0.004 7 (1) Includes regulatory mechanisms at ITC, Central Hudson, FortisBC, and 85% of FortisAlberta’s revenues which are based on fixed - bi lling determinants. Also includes wholesale / other revenues at UNS that do not have a significant impact on earnings and are primarily returned to customers t hro ugh regulatory mechanisms. (2) Residential revenues not protected by regulatory mechanisms for change in sales with 9% at UNS and 10% at Other Electric in 2 019 . (3) Commercial and Industrial revenues not protected by regulatory mechanisms for change in sales with 9% at UNS and 9% at Other Ele ctric in 2019. 19% 18% 63% 2019 Revenues Revenues Protected by Regulatory Mechanisms Residential Revenues Not Protected by Regulatory Mechanisms EPS Sensitivity (1) ~82% of Revenues Protected by Regulatory Mechanisms or From Residential Sales Commercial and Industrial Revenues Not Protected by Regulatory Mechanisms (2) (3)

• Residential sales unchanged • Minimal exposure to commercial and industrial sales Local Economic Overview 8 Western Canada Other Electric Commentary on Local Economy 1 st Month into Pandemic Regulatory Mechanisms Protecting Changes in Sales x x x x x • Residential sales increased ~7% due to weather • Commercial and industrial sales down ~10% • Overall sales decreased ~4% • Peak load down ~18 - 25%; Strict Stay - at - Home Order in Michigan • Auto manufacturers and suppliers considering reopening mid - May • On a combined basis, residential and commercial sales up slightly in B.C.; Industrial sales slightly down • Alberta hit by collapse in oil prices; Residential sales up ~4%; Commercial/Industrial sales down ~32%; ~85% of revenue based on fixed - billing determinants • Minimal sales impacts for Eastern Canadian utilities • Travel restrictions impacting Caribbean economy Takeaway System Trends: Residential Sales Up Commercial & Industrial Sales Down ~3% Decline in Sales at Utilities Without Regulatory Mechanisms
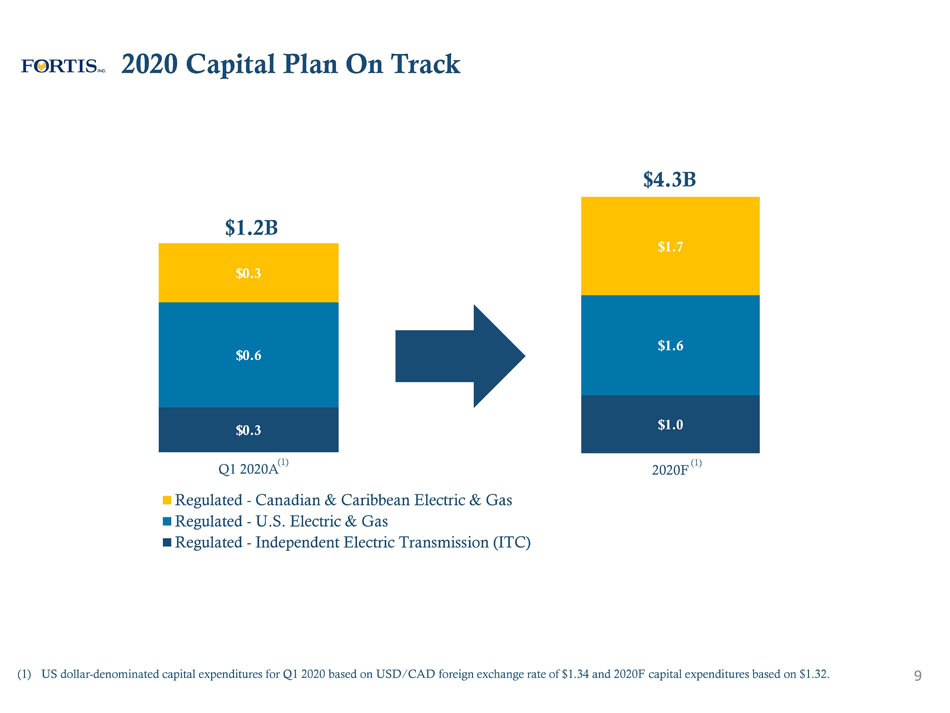
$0.3 $0.6 $0.3 Q1 2020A Regulated - Canadian & Caribbean Electric & Gas Regulated - U.S. Electric & Gas Regulated - Independent Electric Transmission (ITC) $1.0 $1.6 $1.7 2020F 2020 Capital Plan On Track 9 $1.2B $4.3B (1) (1) (1) US dollar - denominated capital expenditures for Q1 2020 based on USD/CAD foreign exchange rate of $1.34 and 2020F capital expendi tures based on $1.32.

5 - Year Capital Plan & Rate Base Growth Outlook 2019A 2024F Regulated - Canadian & Caribbean Electric & Gas Regulated - U.S. Electric & Gas Regulated - Independent Electric Transmission (ITC) $38.4B $28.0B 10 (1) US dollar - denominated rate base for 2019 is based on the actual average USD/CAD foreign exchange rate of $1.33 and forecast rate base for 2020 - 2024 is based on $1.32. $18.8B 5 - Year Capital Plan MIDYEAR RATE BASE (1)
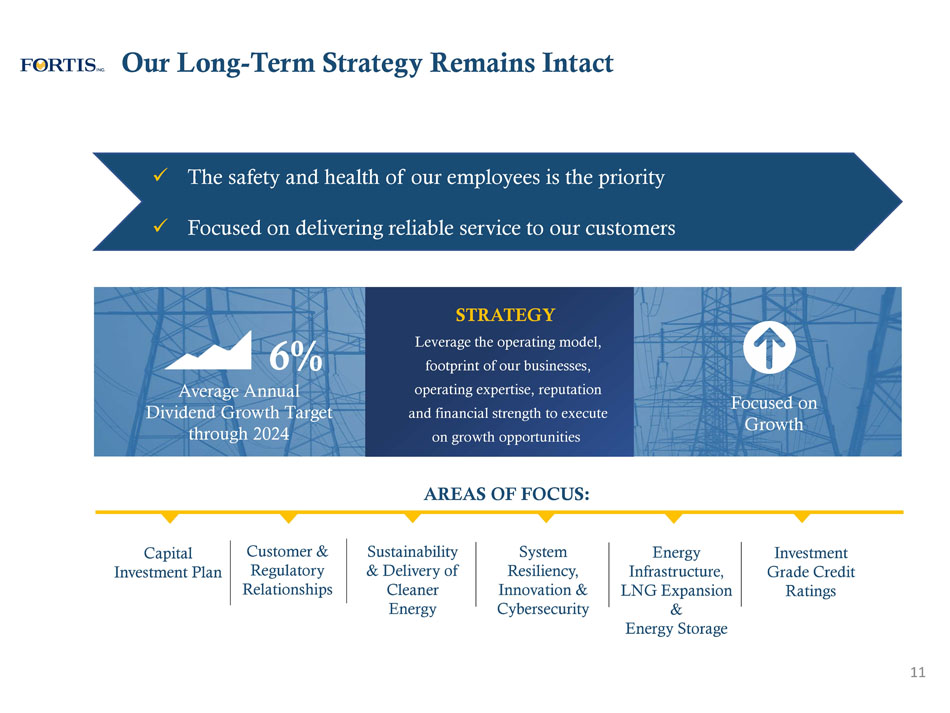
Our Long - Term Strategy Remains Intact Leverage the operating model, footprint of our businesses, operating expertise, reputation and financial strength to execute on growth opportunities Investment Grade Credit Ratings STRATEGY Focused on Growth Average Annual Dividend Growth Target through 2024 6% AREAS OF FOCUS: Capital Investment Plan Sustainability & Delivery of Cleaner Energy Customer & Regulatory Relationships Energy Infrastructure, LNG Expansion & Energy Storage System Resiliency, Innovation & Cybersecurity 11 x The safety and health of our employees is the priority x Focused on delivering reliable service to our customers

Dividend Guidance Supported by Long - Term Growth Strategy 73 75 77 79 81 83 85 87 89 91 93 95 97 99 01 03 05 07 09 11 13 15 17 19 Dividend Payments 46 Years Of Consecutive Dividend Increases 12 $0.5 $1.0 $1.5 $2.0 6 % Average Annual Dividend Growth Guidance to 2024
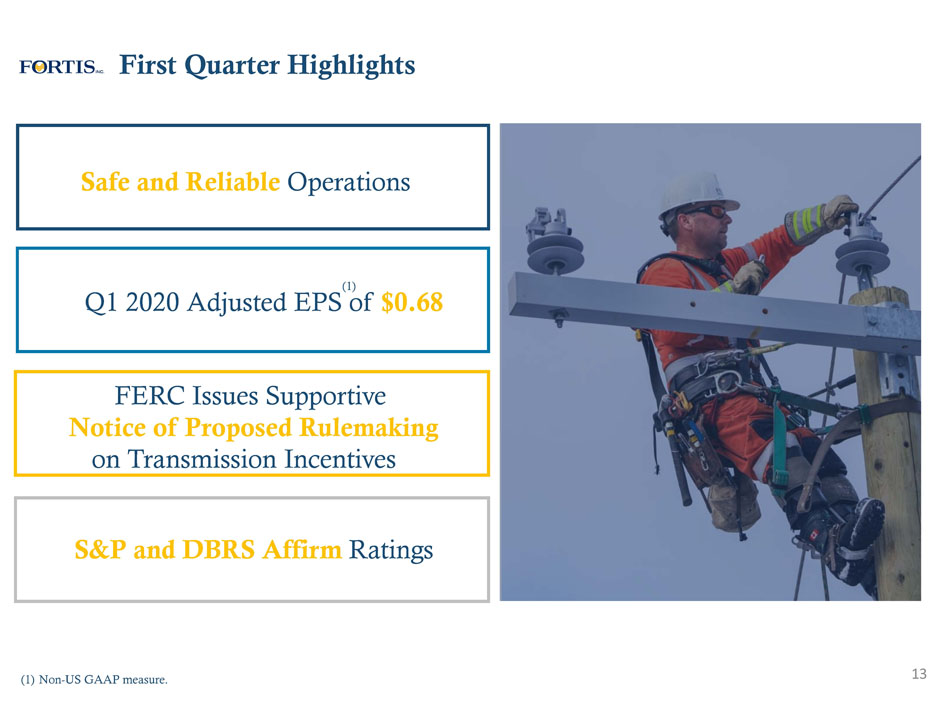
First Quarter Highlights 13 (1) Non - US GAAP measure. Safe and Reliable Operations FERC Issues Supportive Notice of Proposed Rulemaking on Transmission Incentives Q1 2020 Adjusted EPS of $0.68 S&P and DBRS Affirm Ratings (1)

Jocelyn Perry Executive Vice President and Chief Financial Officer
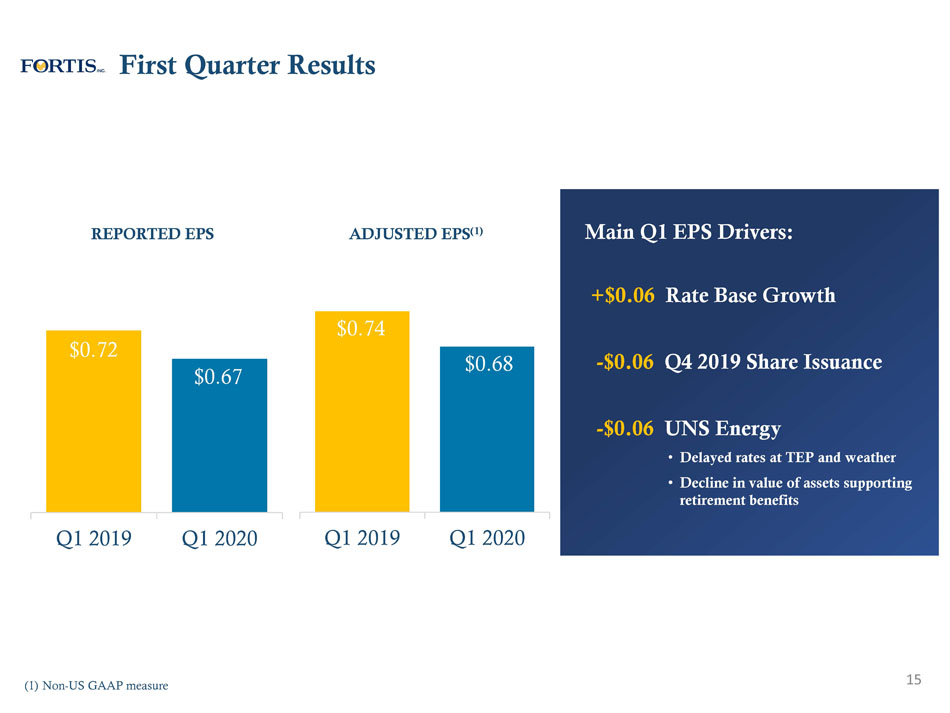
First Quarter Results 15 Main Q1 EPS Drivers: +$0.06 Rate Base Growth - $0.06 Q4 2019 Share Issuance - $0.06 UNS Energy • Delayed rates at TEP and weather • Decline in value of assets supporting retirement benefits $0.72 $0.67 Q1 2019 Q1 2020 REPORTED EPS ADJUSTED EPS (1) $0.74 $0.68 Q1 2019 Q1 2020 (1) Non - US GAAP measure
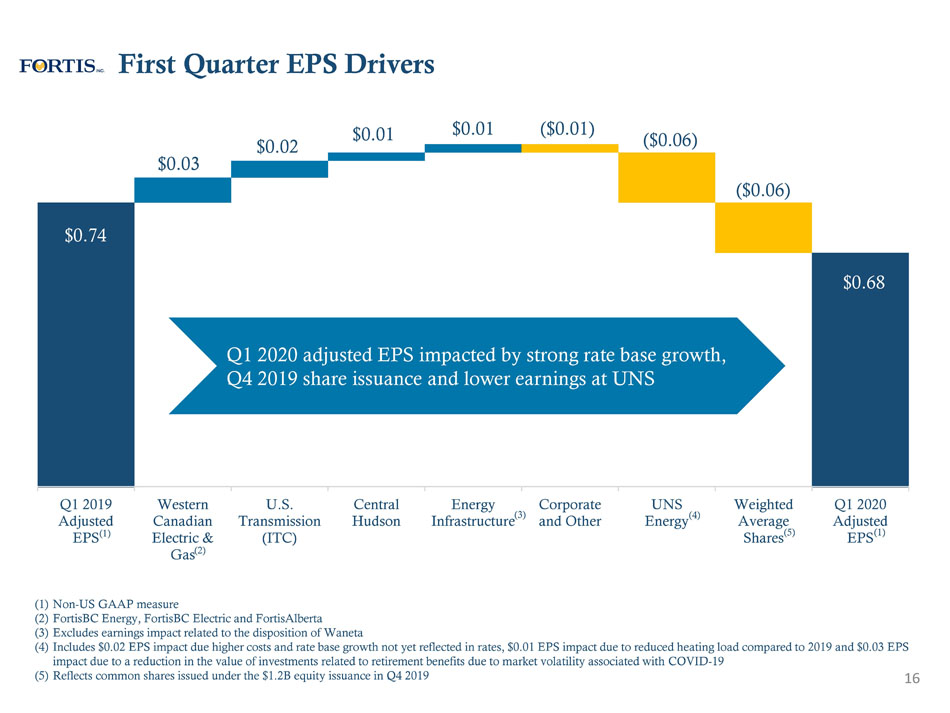
(1) Non - US GAAP measure (2) FortisBC Energy, FortisBC Electric and FortisAlberta (3) Excludes earnings impact related to the disposition of Waneta (4) Includes $0.02 EPS impact due higher costs and rate base growth not yet reflected in rates, $0.01 EPS impact due to reduced h eat ing load compared to 2019 and $0.03 EPS impact due to a reduction in the value of investments related to retirement benefits due to market volatility associated with CO VID - 19 (5) Reflects common shares issued under the $1.2B equity issuance in Q4 2019 $0.74 $0.03 $0.02 $0.01 $0.01 ( $0.01 ) ( $0.06 ) ( $0.06 ) $0.68 Q1 2019 Adjusted EPS Western Canadian Electric & Gas U.S. Transmission (ITC) Central Hudson Energy Infrastructure Corporate and Other UNS Energy Weighted Average Shares Q1 2020 Adjusted EPS (3) First Quarter EPS Drivers 16 (1) (1) (2) Q1 2020 adjusted EPS impacted by strong rate base growth, Q4 2019 share issuance and lower earnings at UNS (4) (5)
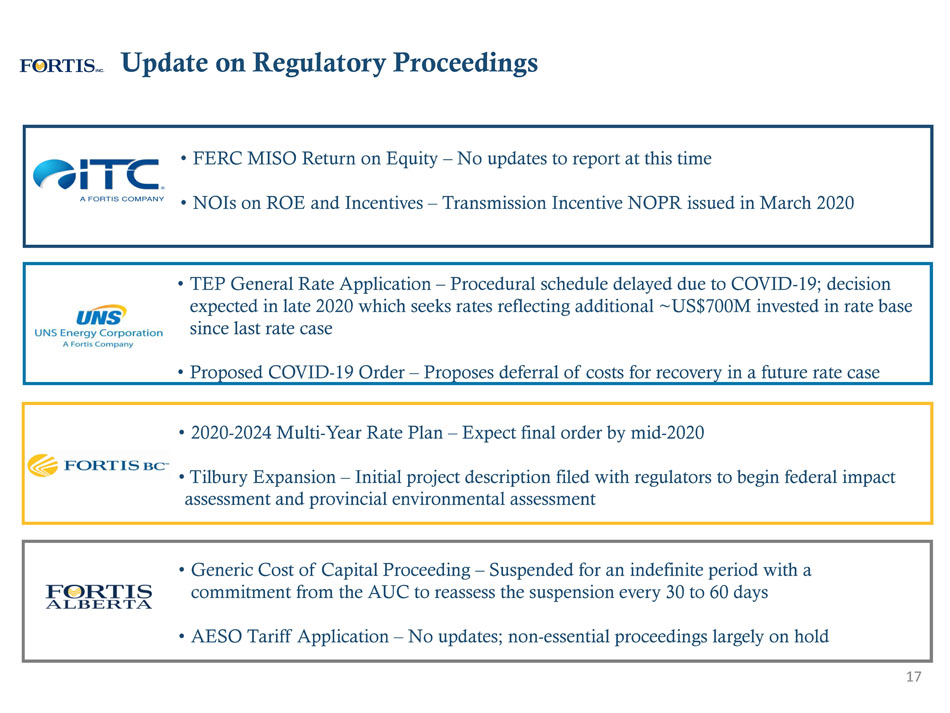
Update on Regulatory Proceedings 17 • TEP General Rate Application – Procedural schedule delayed due to COVID - 19; decision expected in late 2020 which seeks rates reflecting additional ~US$700M invested in rate base since last rate case • Proposed COVID - 19 Order – Proposes deferral of costs for recovery in a future rate case • 2020 - 2024 Multi - Year Rate Plan – Expect final order by mid - 2020 • Tilbury Expansion – Initial project description filed with regulators to begin federal impact assessment and provincial environmental assessment • FERC MISO Return on Equity – No updates to report at this time • NOIs on ROE and Incentives – Transmission Incentive NOPR issued in March 2020 • Generic Cost of Capital Proceeding – Suspended for an indefinite period with a commitment from the AUC to reassess the suspension every 30 to 60 days • AESO Tariff Application – No updates; non - essential proceedings largely on hold
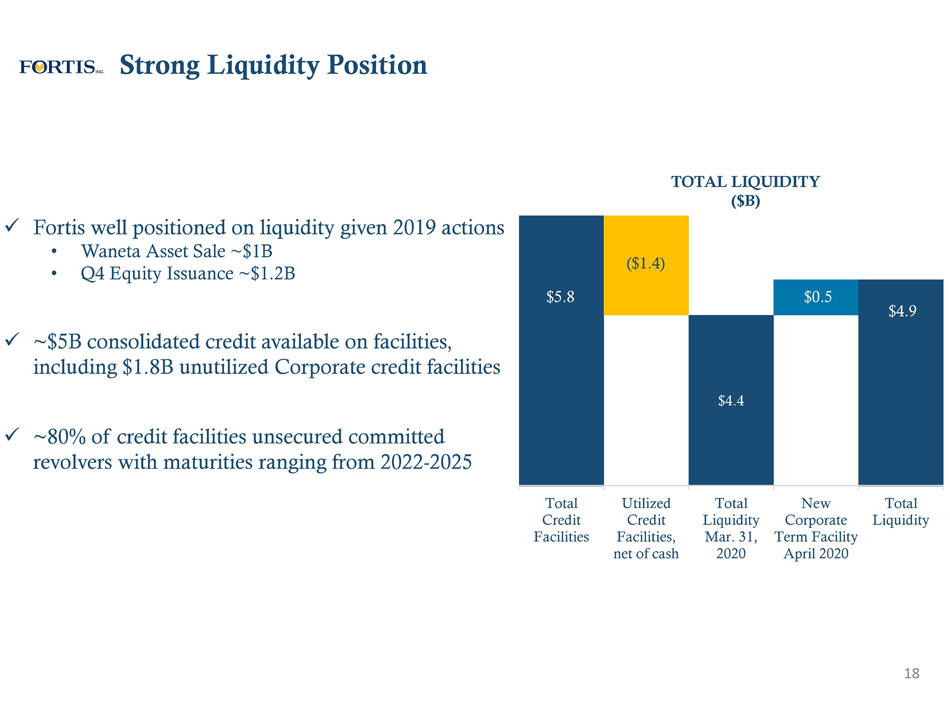
x Fortis well positioned on liquidity given 2019 actions • Waneta Asset Sale ~$1B • Q4 Equity Issuance ~$1.2B x ~$5B consolidated credit available on facilities, including $1.8B unutilized Corporate credit facilities x ~80% of credit facilities unsecured committed revolvers with maturities ranging from 2022 - 2025 Strong Liquidity Position 18 $4.3 Billions TOTAL LIQUIDITY ($B) $6.6 $4.4 $5.8 ( $1.4 ) $0.5 $4.9 Total Credit Facilities Utilized Credit Facilities, net of cash Total Liquidity Mar. 31, 2020 New Corporate Term Facility April 2020 Total Liquidity

x ITC • US$200M term loan • US$75M term loan x UNS • US$350M 30 - year 4.00% notes x Newfoundland Power • $100M 40 - year 3.61% bonds 19 (1) Debt as at March 31, 2020 and excludes any new debt issuances during the forecast period. Excludes repayments of finance leas es along with the current portion of credit facilities, which are assumed to be extended by one - year annually. Strong Access to Debt Markets & Manageable Maturities 2020 COMPLETED DEBT ISSUANCES $0.0 $0.5 $1.0 $1.5 $2.0 2020F 2021F 2022F 2023F 2024F Thousands FIXED - TERM DEBT MATURITIES (1) ($B) 5 - Year Average ~$1.1B
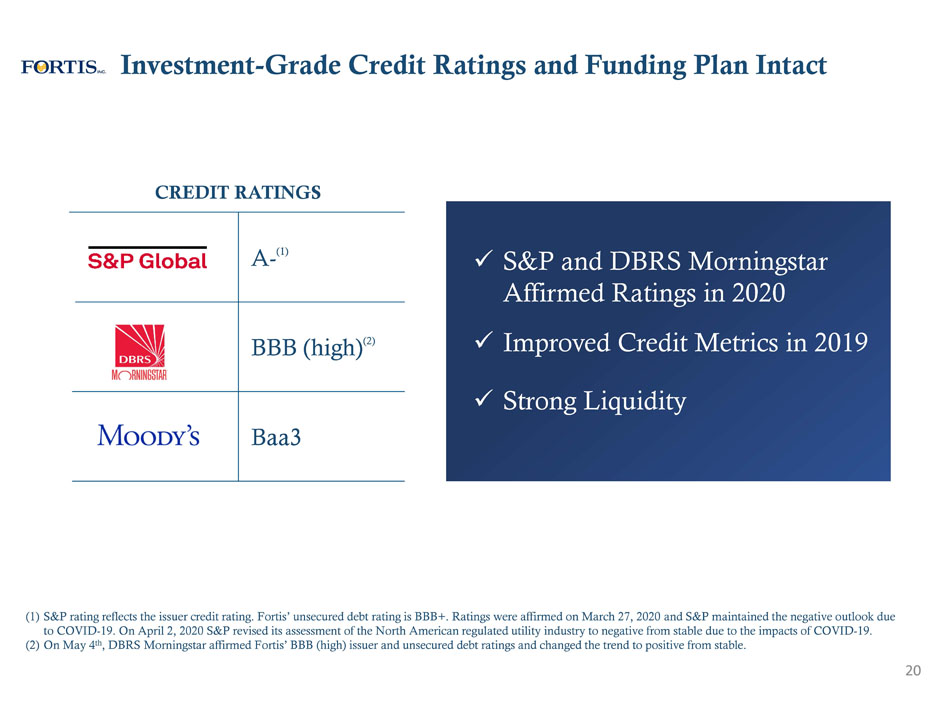
A - (1) BBB (high) (2) Baa3 CREDIT RATINGS Investment - Grade Credit Ratings and Funding Plan Intact 20 (1) S&P rating reflects the issuer credit rating. Fortis’ unsecured debt rating is BBB+. Ratings were affirmed on March 27, 2020 and S&P maintained the negative outlook due to COVID - 19. On April 2, 2020 S&P revised its assessment of the North American regulated utility industry to negative from stabl e due to the impacts of COVID - 19. (2) On May 4 th , D BRS Morningstar affirmed Fortis’ BBB (high) issuer and unsecured debt ratings and changed the trend to positive from stable. x S&P and DBRS Morningstar Affirmed Ratings in 2020 x Improved Credit Metrics in 2019 x Strong Liquidity

x ~46% of assets invested in fixed income x ~88% of $3.2B plan assets funded at December 31, 2019 x ~80% of pension assets subject to regulatory mechanisms • UNS pension plan assets (~$0.6B) not subject to automatic regulatory mechanisms • Impact of asset valuation on future pension expense depends on asset valuations as of December 31 st x 65% (1) of earnings and 60% of 5 - year $18.8B capital plan from U.S. x Expect tailwind due to higher USD/CAD exchange rate x Foreign exchange sensitivity for every 5 cent change in USD/CAD exchange rate: • Annual EPS – $0.06 • 5 - year Capital Plan – $400M 21 x Too early to assess impacts; continue to evaluate potential credit losses associated with pandemic x Potential for recovery of credit losses through extraordinary riders in regulatory mechanisms x FortisAlberta and ITC collect revenues from retail energy providers and distribution utilities reducing collection risk vs. end - use customers • Together they represent ~30% of annual revenues COVID - 19: Other Financial Implications Defined Benefit Pension Plan Certain U.S. Retirement Benefits Foreign Exchange – Earnings & Capital Plan Credit Losses x Certain retirement benefits funded through trusts and are subject to market volatility each quarter • Decline in market values in Q1 resulted in ~$0.03 EPS decline in earnings quarter - over - quarter for UNS • Minimal impact at other utilities as assets are more heavily invested in fixed income (1) Non - US GAAP Measure. Data as of December 31, 2019.
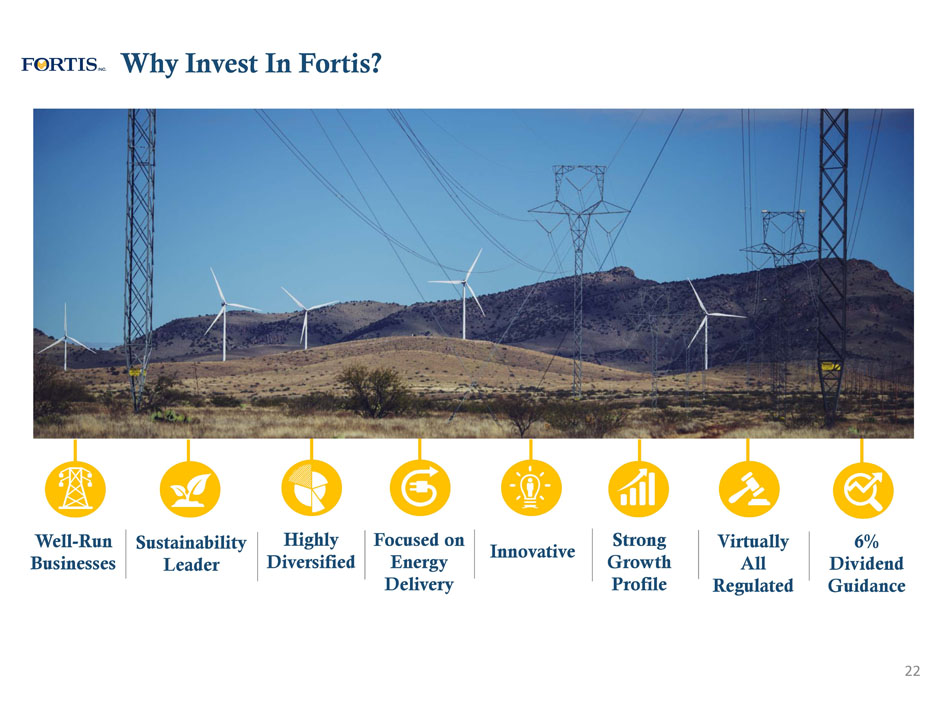
22 Why Invest In Fortis? Strong Growth Profile Well - Run Businesses Virtually All Regulated Focused on Energy Delivery Sustainability Leader 6% Dividend Guidance Highly Diversified Innovative
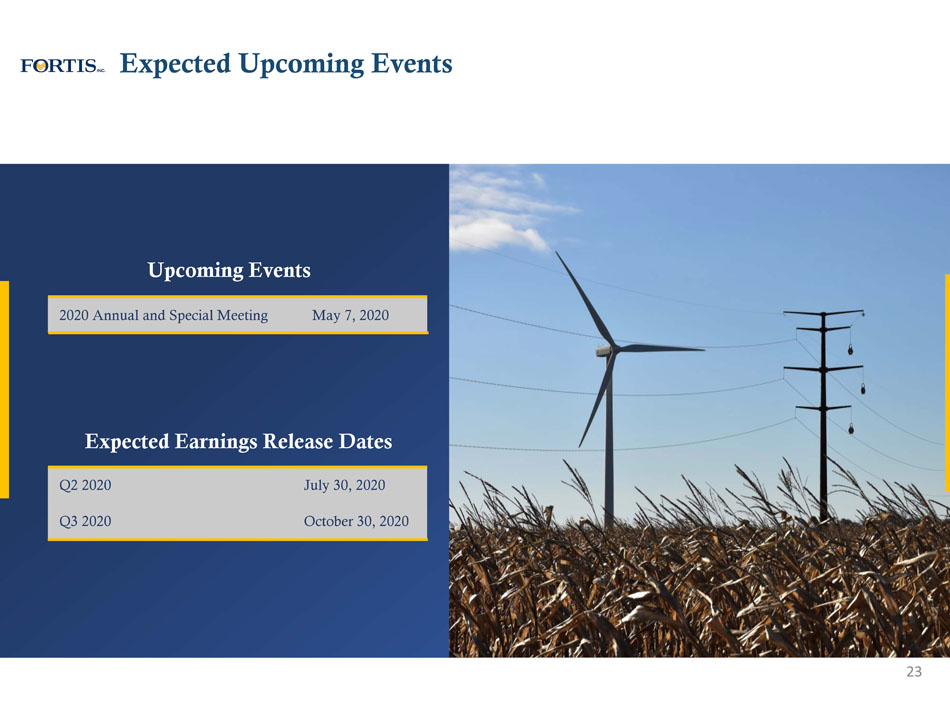
23 Expected Upcoming Events Expected Earnings Release Dates Q2 2020 July 30, 2020 Q3 2020 October 30, 2020 Upcoming Events 2020 Annual and Special Meeting May 7, 2020

First Quarter 2020 Earnings Conference Call May 6, 2020

Appendix
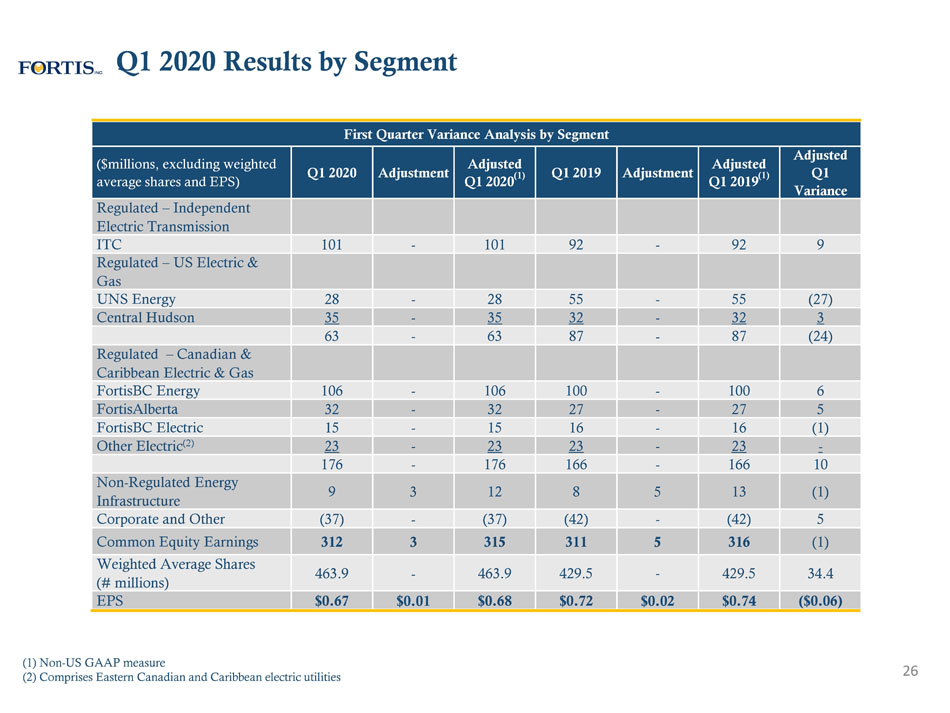
26 Q1 2020 Results by Segment First Quarter Variance Analysis by Segment ($millions, excluding weighted average shares and EPS) Q1 2020 Adjustment Adjusted Q1 2020 (1) Q1 2019 Adjustment Adjusted Q1 2019 (1) Adjusted Q1 Variance Regulated – Independent Electric Transmission ITC 101 - 101 92 - 92 9 Regulated – US Electric & Gas UNS Energy 28 - 28 55 - 55 (27) Central Hudson 35 - 35 32 - 32 3 63 - 63 87 - 87 (24) Regulated – Canadian & Caribbean Electric & Gas FortisBC Energy 106 - 106 100 - 100 6 FortisAlberta 32 - 32 27 - 27 5 FortisBC Electric 15 - 15 16 - 16 (1) Other Electric (2) 23 - 23 23 - 23 - 176 - 176 166 - 166 10 Non - Regulated Energy Infrastructure 9 3 12 8 5 13 (1) Corporate and Other (37) - (37) (42) - (42) 5 Common Equity Earnings 312 3 315 311 5 316 (1) Weighted Average Shares (# millions) 463.9 - 463.9 429.5 - 429.5 34.4 EPS $0.67 $0.01 $0.68 $0.72 $0.02 $0.74 ($0.06) (1) Non - US GAAP measure (2) Comprises Eastern Canadian and Caribbean electric utilities
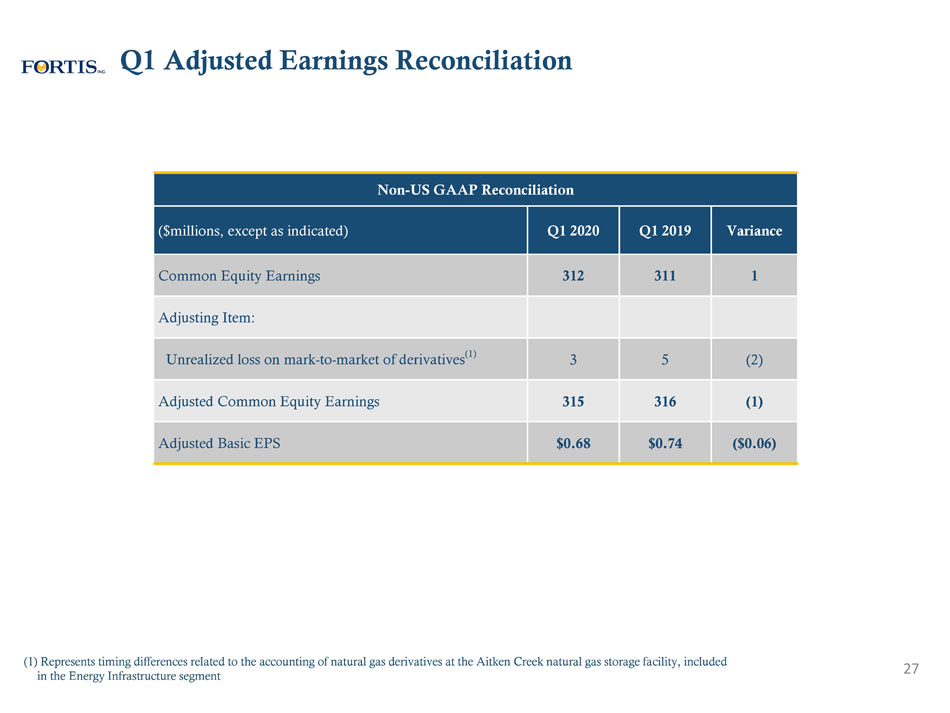
27 Q1 Adjusted Earnings Reconciliation Non - US GAAP Reconciliation ($millions, except as indicated) Q1 2020 Q1 2019 Variance Common Equity Earnings 312 311 1 Adjusting Item: Unrealized loss on mark - to - market of derivatives (1) 3 5 (2) Adjusted Common Equity Earnings 315 316 (1) Adjusted Basic EPS $0.68 $0.74 ($0.06) (1) Represents timing differences related to the accounting of natural gas derivatives at the Aitken Creek natural gas storage fa ci lity, included in the Energy Infrastructure segment
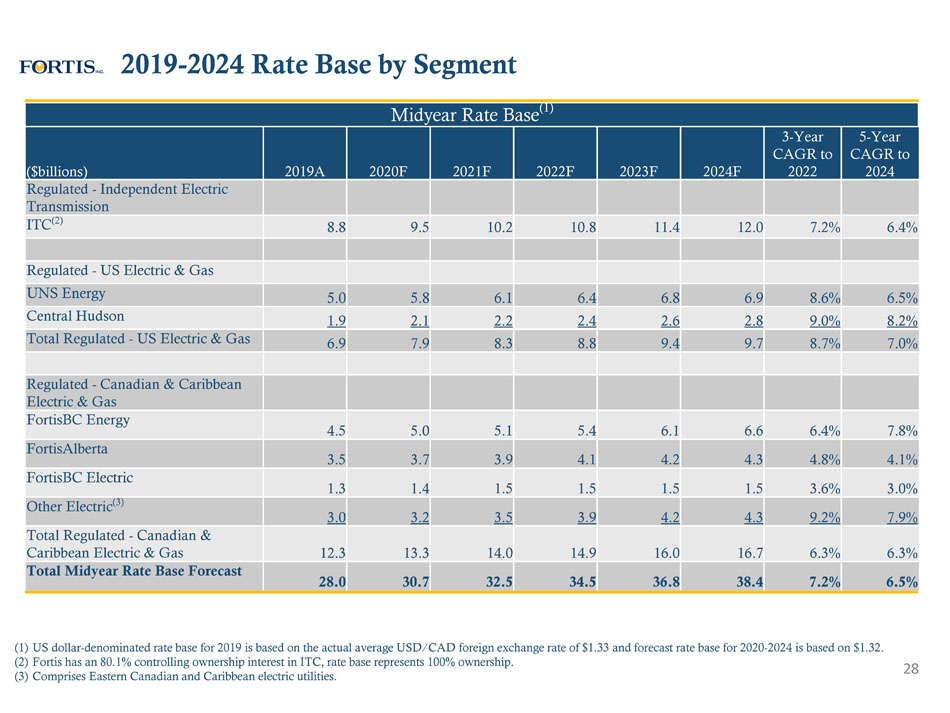
Midyear Rate Base (1) ($billions) 2019A 2020F 2021F 2022F 2023F 2024F 3 - Year CAGR to 2022 5 - Year CAGR to 2024 Regulated - Independent Electric Transmission ITC (2) 8.8 9.5 10.2 10.8 11.4 12.0 7.2% 6.4% Regulated - US Electric & Gas UNS Energy 5.0 5.8 6.1 6.4 6.8 6.9 8.6% 6.5% Central Hudson 1.9 2.1 2.2 2.4 2.6 2.8 9.0% 8.2% Total Regulated - US Electric & Gas 6.9 7.9 8.3 8.8 9.4 9.7 8.7% 7.0% Regulated - Canadian & Caribbean Electric & Gas FortisBC Energy 4.5 5.0 5.1 5.4 6.1 6.6 6.4% 7.8% FortisAlberta 3.5 3.7 3.9 4.1 4.2 4.3 4.8% 4.1% FortisBC Electric 1.3 1.4 1.5 1.5 1.5 1.5 3.6% 3.0% Other Electric (3) 3.0 3.2 3.5 3.9 4.2 4.3 9.2% 7.9% Total Regulated - Canadian & Caribbean Electric & Gas 12.3 13.3 14.0 14.9 16.0 16.7 6.3% 6.3% Total Midyear Rate Base Forecast 28.0 30.7 32.5 34.5 36.8 38.4 7.2% 6.5% 2019 - 2024 Rate Base by Segment 28 (1) US dollar - denominated rate base for 2019 is based on the actual average USD/CAD foreign exchange rate of $1.33 and forecast rate base for 2020 - 2024 is based on $1.32. (2) Fortis has an 80.1% controlling ownership interest in ITC, rate base represents 100% ownership. (3) Comprises Eastern Canadian and Caribbean electric utilities.

Capital Forecast (1) ($millions) 2020F 2021F 2022F 2023F 2024F 2020 - 2024 TOTAL Regulated - Independent Electric Transmission ITC 976 987 1,043 1,018 922 4,946 Regulated - US Electric & Gas UNS Energy 1,390 828 710 575 371 3,874 Central Hudson 292 309 359 306 292 1,558 Total Regulated - US Electric & Gas 1,682 1,137 1,069 881 663 5,432 Regulated - Canadian & Caribbean Electric & Gas FortisBC Energy 507 546 648 850 688 3,239 FortisAlberta 436 460 421 420 417 2,154 FortisBC Electric 141 139 110 109 108 607 Other Electric (2) 566 473 485 438 348 2,310 Total Regulated - Canadian & Caribbean Electric & Gas 1,650 1,618 1,664 1,817 1,561 8,310 Non - Regulated 32 13 35 10 36 126 Total Capital Forecast 4,340 3,755 3,811 3,726 3,182 18,814 (1) Capital expenditures are translated at a USD/CAD foreign exchange rate of $1.32. (2) Comprises Eastern Canadian and Caribbean electric utilities. 2020 - 2024 Capital Plan by Segment 29
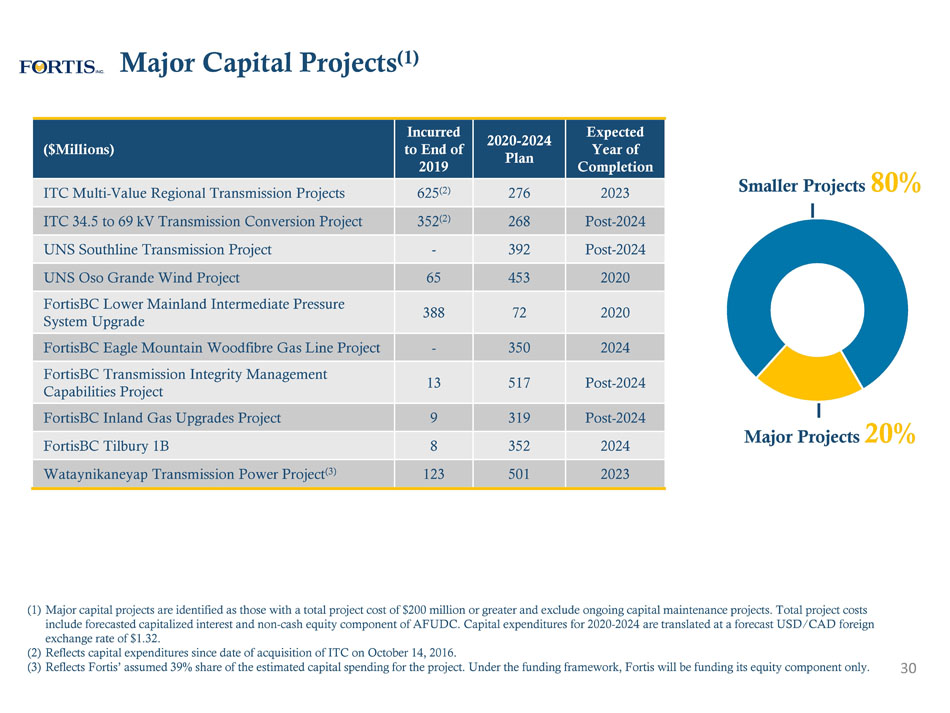
($Millions) Incurred to End of 2019 2020 - 2024 Plan Expected Year of Completion ITC Multi - Value Regional Transmission Projects 625 (2) 276 2023 ITC 34.5 to 69 kV Transmission Conversion Project 352 (2) 268 Post - 2024 UNS Southline Transmission Project - 392 Post - 2024 UNS Oso Grande Wind Project 65 453 2020 FortisBC Lower Mainland Intermediate Pressure System Upgrade 388 72 2020 FortisBC Eagle Mountain Woodfibre Gas Line Project - 350 2024 FortisBC Transmission Integrity Management Capabilities Project 13 517 Post - 2024 FortisBC Inland Gas Upgrades Project 9 319 Post - 2024 FortisBC Tilbury 1B 8 352 2024 Wataynikaneyap Transmission Power Project (3) 123 501 2023 30 Major Capital Projects (1) (1) Major capital projects are identified as those with a total project cost of $200 million or greater and exclude ongoing capit al maintenance projects. Total project costs include forecasted capitalized interest and non - cash equity component of AFUDC. Capital expenditures for 2020 - 2024 are translate d at a forecast USD/CAD foreign exchange rate of $1.32. (2) Reflects capital expenditures since date of acquisition of ITC on October 14, 2016. (3) Reflects Fortis’ assumed 39% share of the estimated capital spending for the project. Under the funding framework, Fortis wil l b e funding its equity component only. Smaller Projects 80% Major Projects 20%
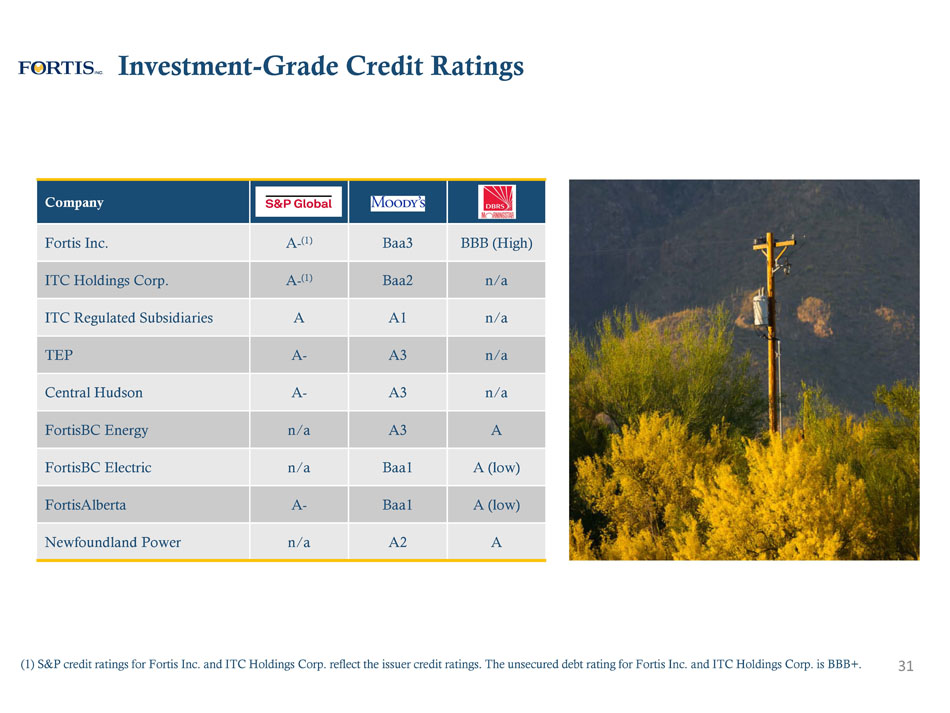
Investment - Grade Credit Ratings 31 Company Fortis Inc. A - (1) Baa3 BBB (High) ITC Holdings Corp. A - (1) Baa2 n/a ITC Regulated Subsidiaries A A1 n/a TEP A - A3 n/a Central Hudson A - A3 n/a FortisBC Energy n/a A3 A FortisBC Electric n/a Baa1 A (low) FortisAlberta A - Baa1 A (low) Newfoundland Power n/a A2 A (1) S&P credit ratings for Fortis Inc. and ITC Holdings Corp. reflect the issuer credit ratings. The unsecured debt rating for Fo rt is Inc. and ITC Holdings Corp. is BBB+.