Exhibit 99.1

Q3 2021 EARNINGS CONFERENCE CALL OCTOBER 29, 2021
Fortis includes forward - looking information in this presentation within the meaning of applicable Canadian securities laws and forward - looking statements within the meaning of the Private Securities Litigation Reform Act of 1995 (collectively referred to as "forward - looking information") . Forward - looking information reflects expectations of Fortis management regarding future growth, results of operations, performance and business prospects and opportunities . Wherever possible, words such as anticipates, believes, budgets, could, estimates, expects, forecasts, intends, may, might, plans, projects, schedule, should, target, will, would and the negative of these terms and other similar terminology or expressions have been used to identify the forward - looking information, which includes, without limitation : forecast capital expenditures for 2021 and 2022 - 2026 , including cleaner energy investments ; forecast rate base and rate base growth through 2026 ; targeted average annual dividend growth through 2025 ; the nature, timing, benefits and costs of certain capital projects and additional opportunities beyond the capital plan ; carbon emissions reduction targets and projected asset mix ; expected impacts of changes in commodity prices and supply chains ; expected funding sources for the capital plan ; expected debt metrics and support of credit ratings ; the expected timing, outcome and impacts of regulatory proceedings ; and the expected debt issuance by ITC in May 2022 . Forward looking information involves significant risks, uncertainties and assumptions . Certain material factors or assumptions have been applied in drawing the conclusions contained in the forward - looking information, including, without limitation : no material adverse effects from the COVID - 19 pandemic ; reasonable regulatory decisions and the expectation of regulatory stability ; the successful execution of the capital plan ; no material capital project or financing cost overrun ; no material changes in the assumed U . S . dollar to Canadian dollar exchange rate ; sufficient human resources to deliver service and execute the capital plan ; no significant variability in interest rates ; and the Board exercising its discretion to declare dividends, taking into account the business performance and financial condition of the Corporation . Fortis cautions readers that a number of factors could cause actual results, performance or achievements to differ materially from the results discussed or implied in the forward - looking information . These factors should be considered carefully and undue reliance should not be placed on the forward - looking information . For additional information with respect to certain of these risks or factors, reference should be made to the continuous disclosure materials filed from time to time by the Corporation with Canadian securities regulatory authorities and the Securities and Exchange Commission . All forward - looking information herein is given as of the date of this presentation . Fortis disclaims any intention or obligation to update or revise any forward - looking information, whether as a result of new information, future events or otherwise . Unless otherwise specified, all financial information is in Canadian dollars and rate base refers to midyear rate base . 2 FORWARD - LOOKING INFORMATION

DAVID HUTCHENS PRESIDENT AND CEO
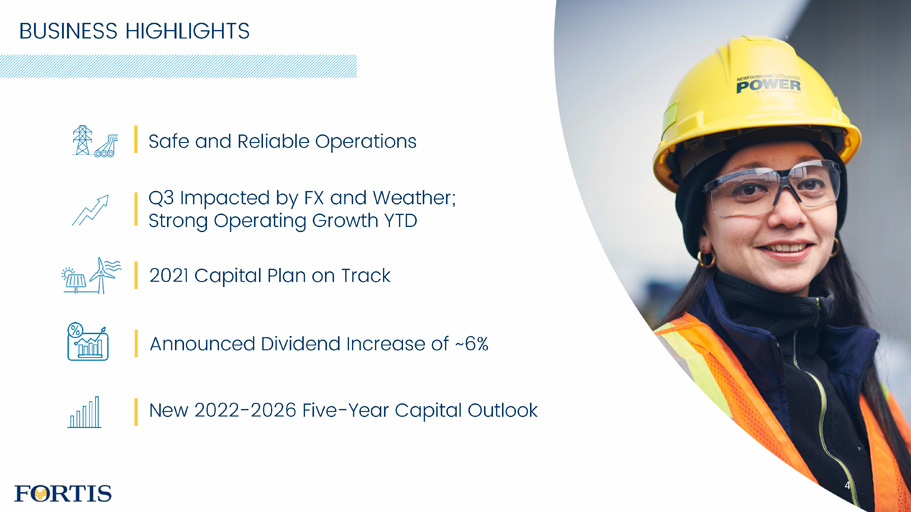
BUSINESS HIGHLIGHTS Safe and Reliable Operations Q3 Impacted by FX and Weather; Strong Operating Growth YTD 2021 Capital Plan on Track Announced Dividend Increase of ~6% New 2022 - 2026 Five - Year Capital Outlook 4
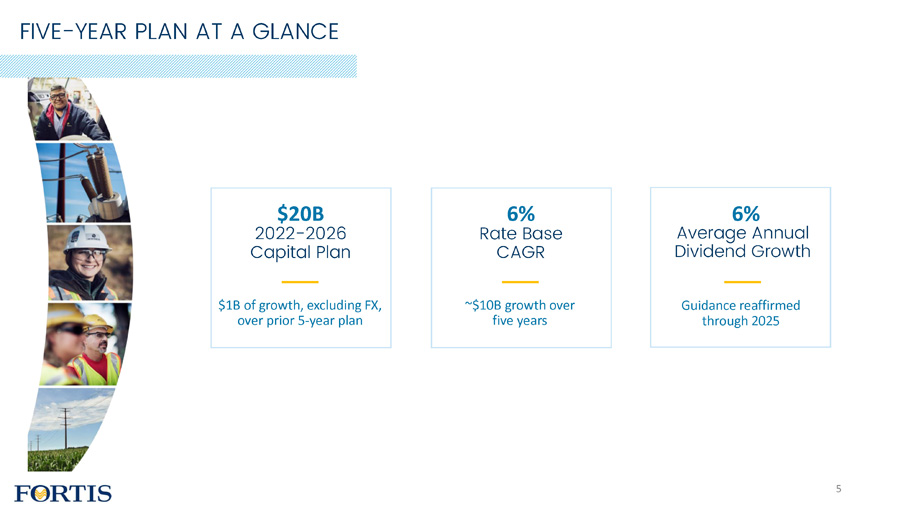
FIVE - YEAR PLAN AT A GLANCE $20B 20 2 2 - 20 2 6 Capital Plan $1B of growth, excluding FX, over prior 5 - year plan 6% Rate Base CAGR ~$10B growth over five years 5 Average Annual Dividend Growth Guidance reaffirmed through 2025 6%
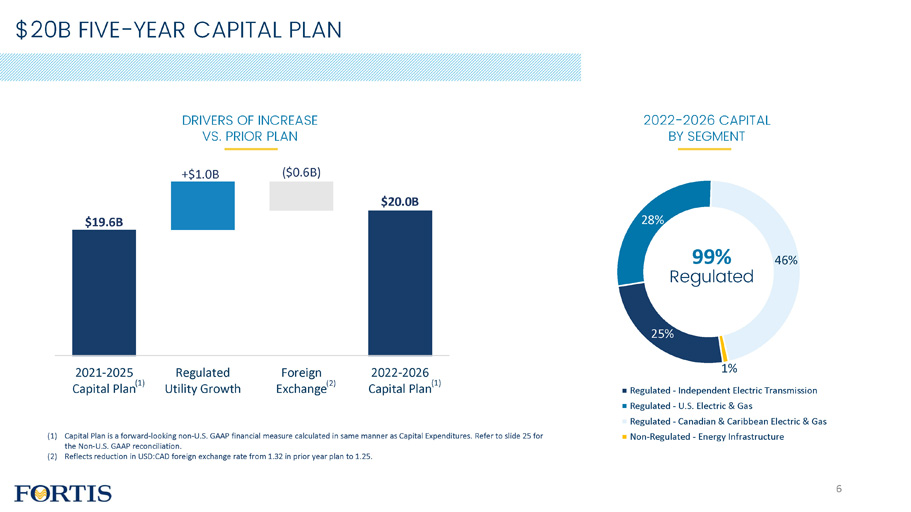
25% 28% 46% 1% Regulated - Independent Electric Transmission Regulated - U.S. Electric & Gas Regulated - Canadian & Caribbean Electric & Gas Non - Regulated - Energy Infrastructure $20B FIVE - YEAR CAPITAL PLAN DRIVERS OF INCREASE VS. PRIOR PL AN (1) Capital Plan is a forward - looking non - U.S. GAAP financial measure calculated in same manner as Capital Expenditures. Refer to slide 25 for the Non - U.S. GAAP reconciliation. (2) Reflects reduction in USD:CAD foreign exchange rate from 1.32 in prior year plan to 1.25. $19.6B 6 +$1.0B ( $0.6 B ) $20.0B 2021 - 2025 Capital Plan (1) Regulated Utility Growth Foreign Exc h a n g e (2) 2022 - 2026 Capital Plan (1) 2022 - 2026 CAPITAL B Y SEGME NT 99% Regulated
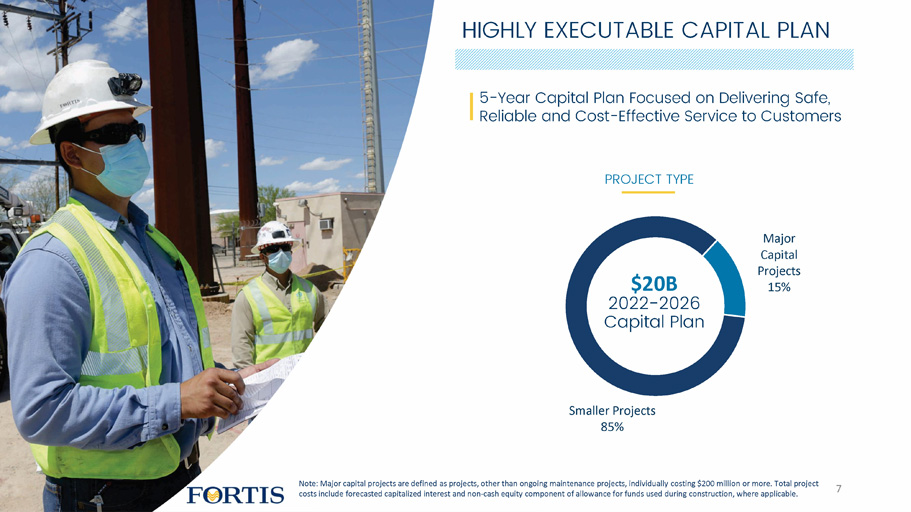
Smalle r P r o je c ts 85% Major C a p i t al P r o je c ts 15% HIGHLY EXECUTABLE CAPITAL PLAN Note: Major capital projects are defined as projects, other than ongoing maintenance projects, individually costing $200 million or more. Total project costs include forecasted capitalized interest and non - cash equity component of allowance for funds used during construction, where applicable. $20B 2022 - 2026 Capital Plan 5 - Year Capital Plan Focused on Delivering Safe, Reliable and Cost - Effective Service to Customers PR OJECT TY PE 7
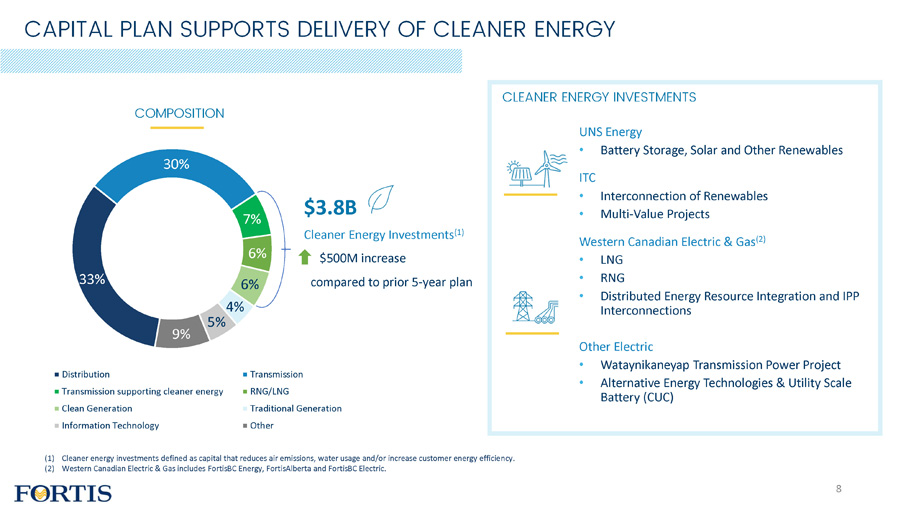
33% 30% 7% 6% 6% 4% 5% 9% Distribution Transmission supporting cleaner energy Clean Generation Information Technology T r a n s m i s s i o n RNG/LNG Traditional Generation Other CAPITAL PLAN SUPPORTS DELIVERY OF CLEANER ENERGY (1) Cleaner energy investments defined as capital that reduces air emissions, water usage and/or increase customer energy efficiency. (2) Western Canadian Electric & Gas includes FortisBC Energy, FortisAlberta and FortisBC Electric. $3.8B Cleaner Energy Investments (1) $500M increase compared to prior 5 - year plan CLEANER ENERGY INVESTMENTS UNS Energy • Battery Storage, Solar and Other Renewables ITC • Interconnection of Renewables • Multi - Value Projects Western Canadian Electric & Gas (2) • LNG • RNG • Distributed Energy Resource Integration and IPP Interconnections Other Electric • Wataynikaneyap Transmission Power Project • Alternative Energy Technologies & Utility Scale Battery (CUC) C O M POSIT ION 8
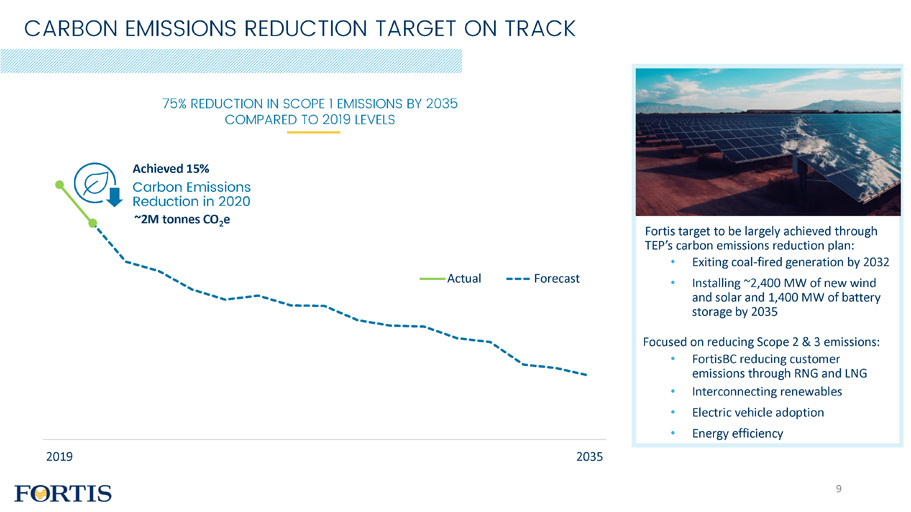
2019 2035 Ac tu al Forecast CARBON EMISSIONS REDUCTION TARGET ON TRACK 7 5% R EDU C TI O N IN SC O PE 1 E M ISSI O NS BY 20 3 5 COMPAR ED TO 20 19 LEVELS Achi e v e d 1 5 % Ca r b on E m iss io n s R e d u ction in 2020 ~2M tonnes CO 2 e Fortis target to be largely achieved through TEP’s carbon emissions reduction plan: • Exiting coal - fired generation by 2032 • Installing ~2,400 MW of new wind and solar and 1,400 MW of battery storage by 2035 Focused on reducing Scope 2 & 3 emissions: • FortisBC reducing customer emissions through RNG and LNG • Interconnecting renewables • Electric vehicle adoption • Energy efficiency 9
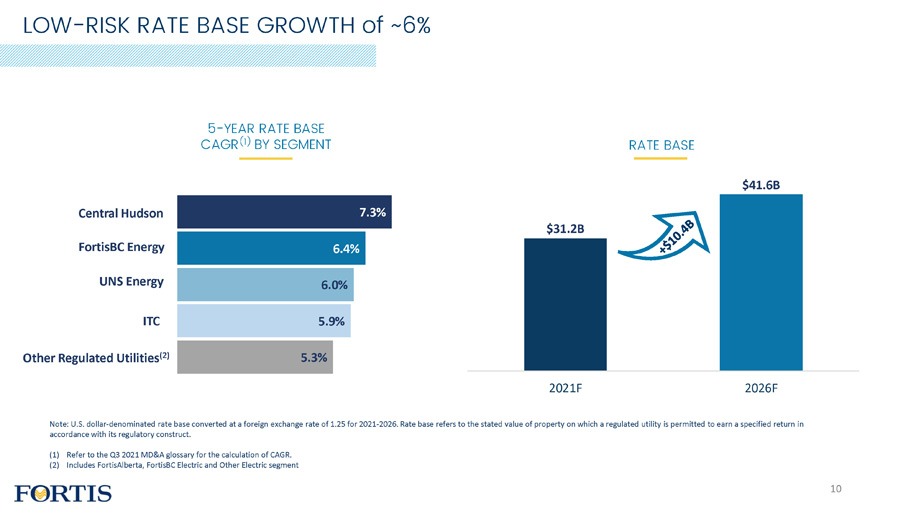
5.3% 5.9% 6.0% 6.4% 7.3% 5 - YEAR RATE BASE CAGR (1) BY SEGMENT Ce n t r al Hudson I T C F orti s BC Ener g y U NS Ener g y Other Regulated Utilities (2) RATE BASE $31.2 B $41.6 B 2021F 2026F Note: U.S. dollar - denominated rate base converted at a foreign exchange rate of 1.25 for 2021 - 2026. Rate base refers to the stated value of property on which a regulated utility is permitted to earn a specified return in accordance with its regulatory construct. (1) Refer to the Q3 2021 MD&A glossary for the calculation of CAGR. (2) Includes FortisAlberta, FortisBC Electric and Other Electric segment LOW - RISK RATE BASE GROWTH of ~6% 10
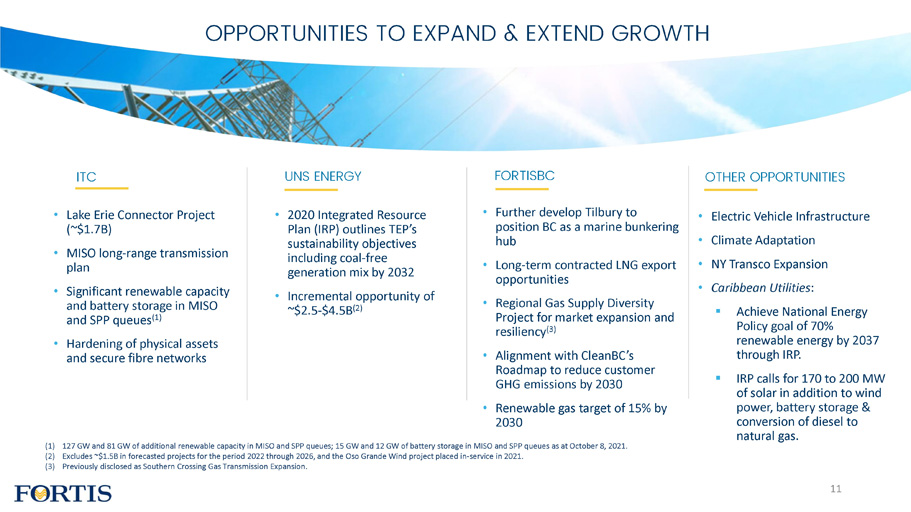
(1) 127 GW and 81 GW of additional renewable capacity in MISO and SPP queues; 15 GW and 12 GW of battery storage in MISO and SPP queues as at October 8, 2021. (2) Excludes ~$1.5B in forecasted projects for the period 2022 through 2026, and the Oso Grande Wind project placed in - service in 2021. (3) Previously disclosed as Southern Crossing Gas Transmission Expansion. UNS ENERGY ITC FORTISBC OTHER OPPORTUNITIES • Lake Erie Connector Project (~$1.7B) • MISO long - range transmission plan • Significant renewable capacity and battery storage in MISO and SPP queues (1) • Hardening of physical assets and secure fibre networks • 2020 Integrated Resource Plan (IRP) outlines TEP’s sustainability objectives including coal - free generation mix by 2032 • Incremental opportunity of ~$2.5 - $4.5B (2) • Further develop Tilbury to position BC as a marine bunkering hub • Long - term contracted LNG export opportunities • Regional Gas Supply Diversity Project for market expansion and resiliency (3) • Alignment with CleanBC’s Roadmap to reduce customer GHG emissions by 2030 • Renewable gas target of 15% by 2030 • Electric Vehicle Infrastructure • Climate Adaptation • NY Transco Expansion • Caribbean Utilities : ▪ Achieve National Energy Policy goal of 70% renewable energy by 2037 through IRP. ▪ IRP calls for 170 to 200 MW of solar in addition to wind power, battery storage & conversion of diesel to natural gas. O P P O RT UNITIES TO E X PA N D & E X TE N D GROW T H 11
COMMODITY & SUPPLY CHAIN CONSIDERATIONS 12 HIGHER NATURAL GAS PRICES • Impacts fuel and power costs at electric utilities and gas supply costs for gas utilities • Recovered from customers through regulatory mechanisms • Causes upward bill pressure MITIGATING CUSTOMER IMPACTS • Promoting energy efficiency and conservation • Managing costs through innovation and process improvements • Over the past 5 years, average operating expenses per customer tracked below inflation SUPPLY CHAIN • Proactively managing supply chain requirements with coordinated buying and supplier alliances to ensure reliable service • Fluctuations in commodity prices such as steel and copper not fully reflected in new five - year plan
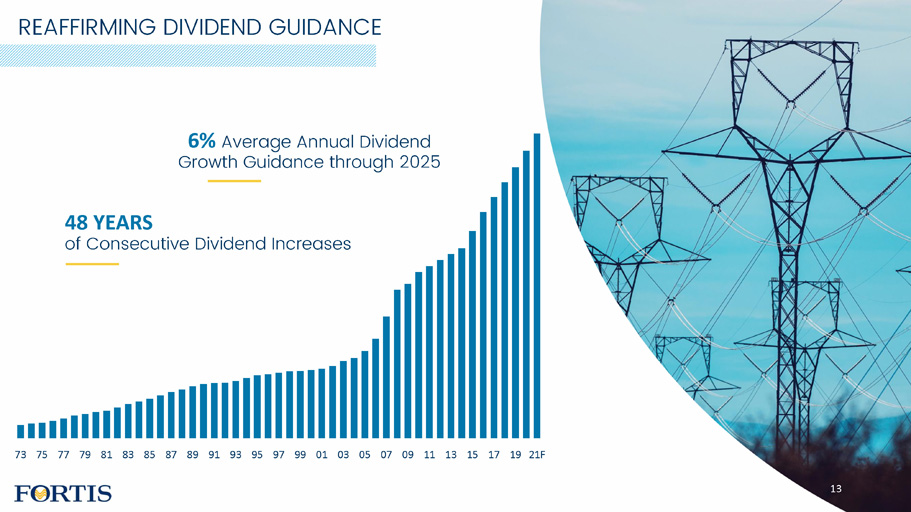
REAFFIRMING DIVIDEND GUIDANCE 73 75 77 79 81 83 85 87 89 91 93 95 97 99 01 03 05 07 09 11 13 15 17 19 21F 6% Average Annual Dividend Growth Guidance through 2025 48 YEARS of Consecutive Dividend Increases 13

JOCELYN PERRY EXECUTIVE VICE PRESIDENT AND CFO
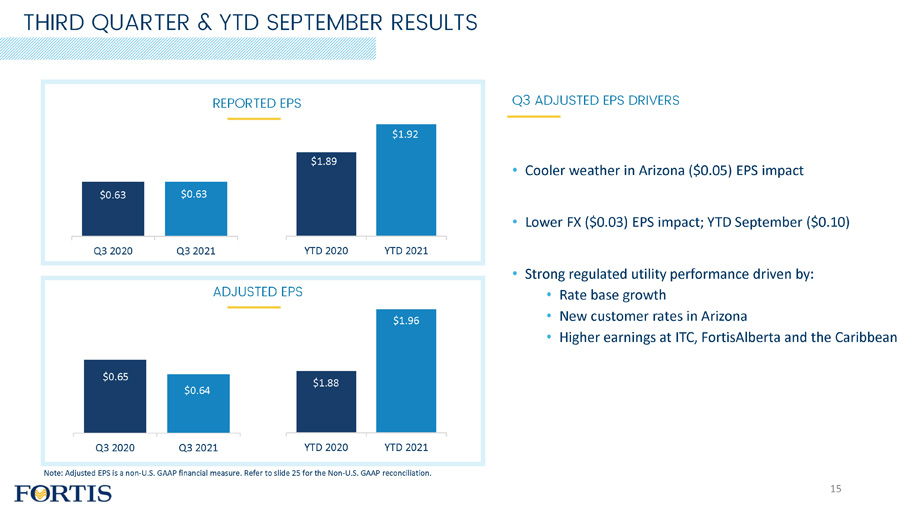
• Cooler weather in Arizona ($0.05) EPS impact • Lower FX ($0.03) EPS impact; YTD September ($0.10) • Strong regulated utility performance driven by: • Rate base growth • New customer rates in Arizona • Higher earnings at ITC, FortisAlberta and the Caribbean $0.65 $0.64 Q3 ADJUSTED EPS DRIVERS THIR D QUART ER & YTD S EPT E MBER RESULTS $1.89 $1.92 YTD 2020 YTD 2021 $0.63 $0.63 Q3 2020 Q3 2021 $1.88 $1.96 Q3 2 0 2 0 Q3 2 02 1 Y TD 2 020 Y TD 2 021 Note: Adjusted EPS is a non - U.S. GAAP financial measure. Refer to slide 25 for the Non - U.S. GAAP reconciliation. REPORTED EPS ADJUSTED EPS 15
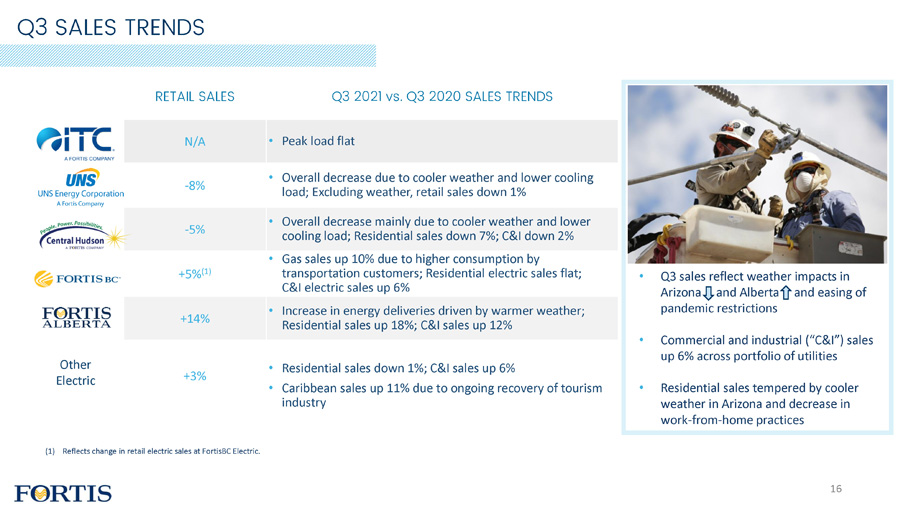
Q3 SALES TRENDS • Q3 sales reflect weather impacts in Arizona and Alberta and easing of pandemic restrictions • Commercial and industrial (“C&I”) sales up 6% across portfolio of utilities • Residential sales tempered by cooler weather in Arizona and decrease in work - from - home practices RETAIL SALES Q3 2021 vs. Q3 2020 SALES TRENDS N/A • Peak load flat - 8% • Overall decrease due to cooler weather and lower cooling load; Excluding weather, retail sales down 1% - 5% • Overall decrease mainly due to cooler weather and lower cooling load; Residential sales down 7%; C&I down 2% +5% (1) • Gas sales up 10% due to higher consumption by transportation customers; Residential electric sales flat; C&I electric sales up 6% +14% • Increase in energy deliveries driven by warmer weather; Residential sales up 18%; C&I sales up 12% +3% • Residential sales down 1%; C&I sales up 6% • Caribbean sales up 11% due to ongoing recovery of tourism industry Other Ele c tric (1) Reflects change in retail electric sales at FortisBC Electric. 16
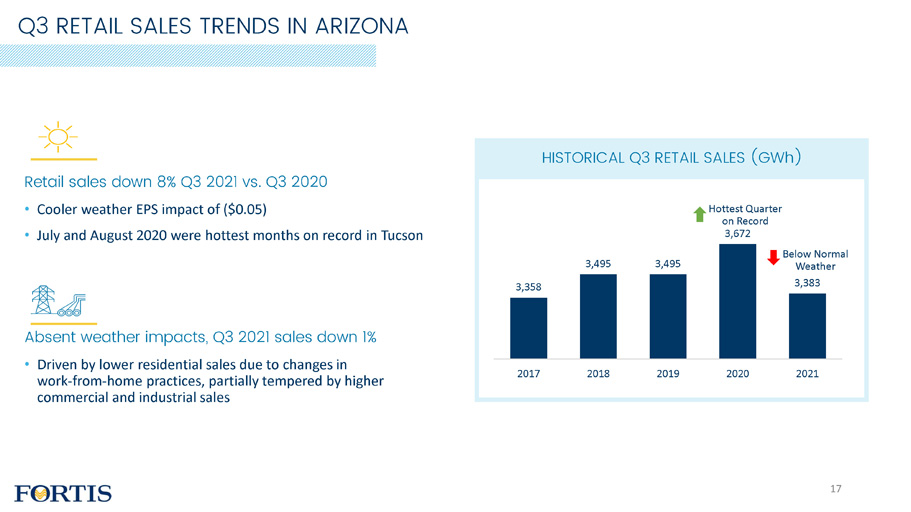
HISTORICAL Q3 RETAIL SALES (GWh) 3,495 3,495 Hottest Quarter on Record 3,672 Below Normal Weather 3,383 2020 2021 3,358 2017 2018 2019 Q3 RETAIL SALES TRENDS IN ARIZONA Retail sales down 8% Q3 2021 vs. Q3 2020 • Cooler weather EPS impact of ($0.05) • July and August 2020 were hottest months on record in Tucson Absent weather impacts, Q3 2021 sales down 1% • Driven by lower residential sales due to changes in work - from - home practices, partially tempered by higher commercial and industrial sales 17
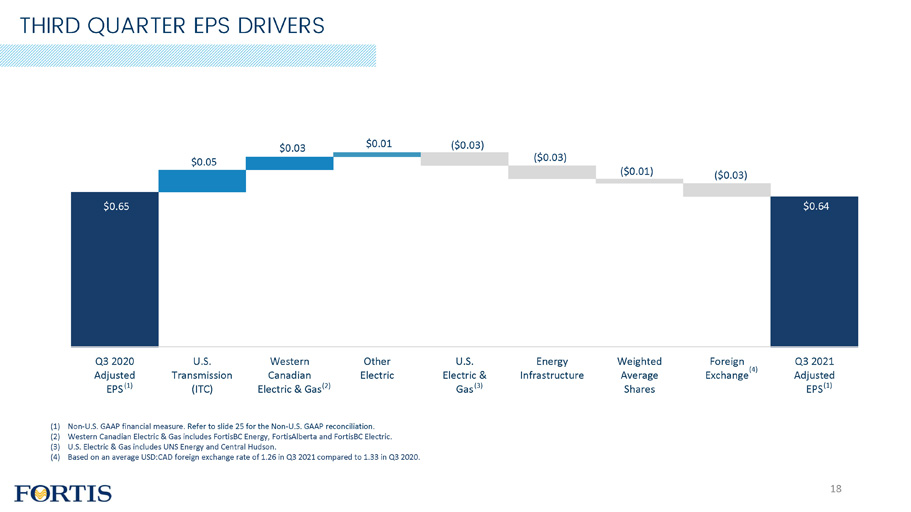
$ 0 .65 $ 0 .05 $0 .03 $ 0 .01 ($0.03) ($0.03) ($0.01) ($0.03) $0 .64 Q3 2021 A dj u s t e d EPS (1) (1) Non - U.S. GAAP financial measure. Refer to slide 25 for the Non - U.S. GAAP reconciliation. (2) Western Canadian Electric & Gas includes FortisBC Energy, FortisAlberta and FortisBC Electric. (3) U.S. Electric & Gas includes UNS Energy and Central Hudson. (4) Based on an average USD:CAD foreign exchange rate of 1.26 in Q3 2021 compared to 1.33 in Q3 2020. 4) Q3 2 0 2 0 Adjusted U.S. Transmission Western Canadian Other Electric U.S. Electric & Energy Infrastructure Weighted Average Foreign ( Exchange EPS (1) (ITC) Electric & Gas (2) Gas (3) Shares THIRD QUARTER EPS DRIVERS 18
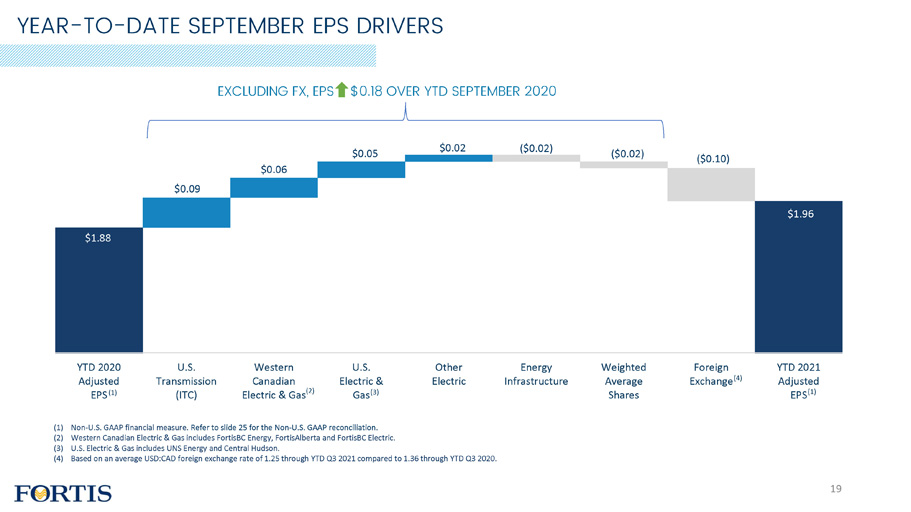
$1 .88 $0 .06 $0.09 $ 0 .05 $ 0 .02 ($0.02) ( $0.02) ($0.10) $1.96 Y T D 2 0 2 0 Adjusted U.S. Transmission Western Canadian U.S. Electric & Other Electric Energy Infrastructure Weighted Average Foreign Exchange (4) Y T D 2 0 2 1 Adjusted E PS ( 1) (ITC) Electric & Gas (2) Gas (3) Shares EPS (1) EXCLUDING FX, EPS $0.18 OVER YTD SEPTEMBER 2020 YEAR - TO - DATE SEPTEMBER EPS DRIVERS (1) Non - U.S. GAAP financial measure. Refer to slide 25 for the Non - U.S. GAAP reconciliation. (2) Western Canadian Electric & Gas includes FortisBC Energy, FortisAlberta and FortisBC Electric. (3) U.S. Electric & Gas includes UNS Energy and Central Hudson. (4) Based on an average USD:CAD foreign exchange rate of 1.25 through YTD Q3 2021 compared to 1.36 through YTD Q3 2020. 19
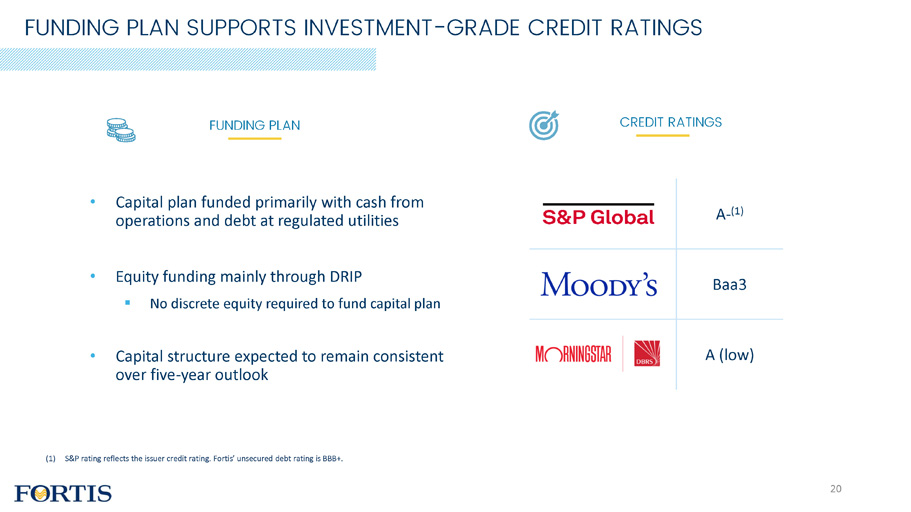
FUNDING PLAN SUPPORTS INVESTMENT - GRADE CREDIT RATINGS A - (1) B a a3 A (low) CR EDIT RAT INGS FUN DING PL AN (1) S&P rating reflects the issuer credit rating. Fortis’ unsecured debt rating is BBB+. • Capital plan funded primarily with cash from operations and debt at regulated utilities • Equity funding mainly through DRIP ▪ No discrete equity required to fund capital plan • Capital structure expected to remain consistent over five - year outlook 20
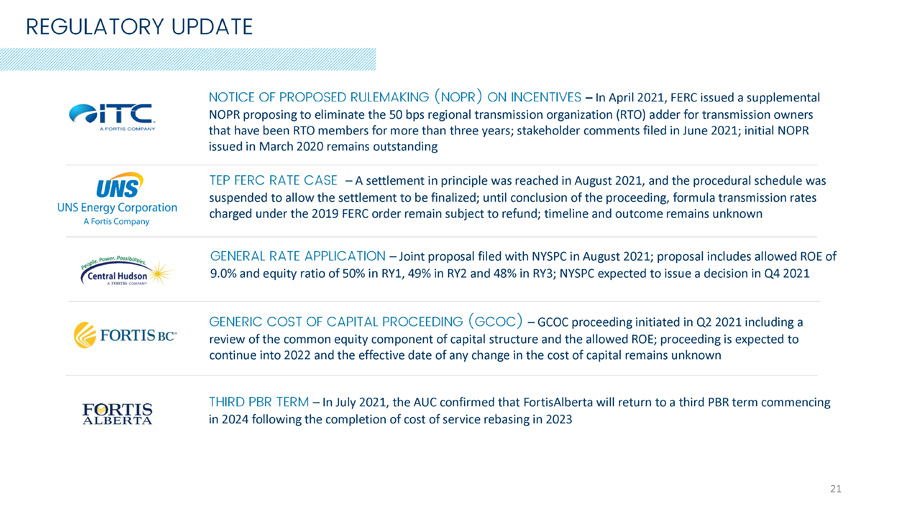
REGULATORY UPDATE NOTICE OF PROPOSED RULEMAKING (NOPR) ON INCENTIVES – In April 2021, FERC issued a supplemental NOPR proposing to eliminate the 50 bps regional transmission organization (RTO) adder for transmission owners that have been RTO members for more than three years; stakeholder comments filed in June 2021; initial NOPR issued in March 2020 remains outstanding TEP FERC RATE CASE – A settlement in principle was reached in August 2021, and the procedural schedule was suspended to allow the settlement to be finalized; until conclusion of the proceeding, formula transmission rates charged under the 2019 FERC order remain subject to refund; timeline and outcome remains unknown GENERAL RATE APPLICATION – Joint proposal filed with NYSPC in August 2021; proposal includes allowed ROE of 9.0% and equity ratio of 50% in RY1, 49% in RY2 and 48% in RY3; NYSPC expected to issue a decision in Q4 2021 GENERIC COST OF CAPITAL PROCEEDING (GCOC) – GCOC proceeding initiated in Q2 2021 including a review of the common equity component of capital structure and the allowed ROE; proceeding is expected to continue into 2022 and the effective date of any change in the cost of capital remains unknown THIRD PBR TERM – In July 2021, the AUC confirmed that FortisAlberta will return to a third PBR term commencing in 2024 following the completion of cost of service rebasing in 2023 21
WHY INVEST IN FORTIS? LOW - RISK Growth Profile WELL - RUN Local Utilities Virtually All REGULATED Focused on ENERGY DELIVERY ESG Leader 6% DIVIDEND Growth Guidance Geographic & Regulatory DIVERSITY Inn o v a ti v e 22

UPCOMING EVENTS • Q4 2021 - February 11, 2022 EXPECTED EARNINGS RELEASE DATES 23

Q3 2021 EARNINGS CONFERENCE CALL OCTOBER 29, 2021
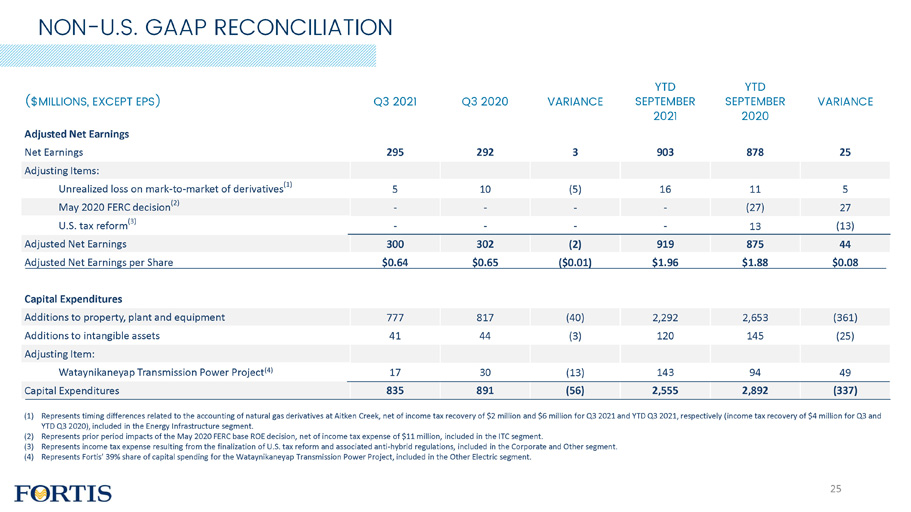
Note: Refer to Non - GAAP Financial Measures section of the Q3 2021 MD&A for additional det ils surrounding the Non - U S GAAP reconciliation ( $ MILLI O NS, EXCEPT EPS) Q3 2 0 21 Q 3 2 0 20 VARIANCE YTD SEP T EM BE R 2021 YTD SEP T EM BE R 2020 VARIANCE Adjusted Net Earnings Net Earnings 295 292 3 903 878 25 Adjusting Items: Unrealized loss on mark - to - market of derivatives (1) 5 10 (5) 16 11 5 May 2020 FERC decision (2) - - - - (27) 27 U.S. tax reform (3) - - - - 13 (13) Adjusted Net Earnings 300 302 (2) 919 875 44 Adjusted Net Earnings per Share $0.64 $0.65 ($0.01) $1.96 $1.88 $0.08 Capital Expenditures Additions to property, plant and equipment 777 817 (40) 2,292 2,653 (361) Additions to intangible assets 41 44 (3) 120 145 (25) Adjusting Item: Wataynikaneyap Transmission Power Project (4) 17 30 (13) 143 94 49 C a p i t al Ex pe n di t u r es a 835 891 (56) 2,555 2,892 (337) (1) Represents timing differences related to the accounting of natural gas derivatives at Aitken Creek, net of income tax recovery of $2 million and $6 million for Q3 2021 and YTD Q3 2021, respectively (income tax recovery of $4 million for Q3 and YTD Q3 2020), included in the Energy Infrastructure segment. (2) Represents prior period impacts of the May 2020 FERC base ROE decision, net of income tax expense of $11 million, included in the ITC segment. (3) Represents income tax expense resulting from the finalization of U.S. tax reform and associated anti - hybrid regulations, included in the Corporate and Other segment. (4) Represents Fortis’ 39% share of capital spending for the Wataynikaneyap Transmission Power Project, included in the Other Electric segment. NON - U.S. GAAP RECONCILIATION 25
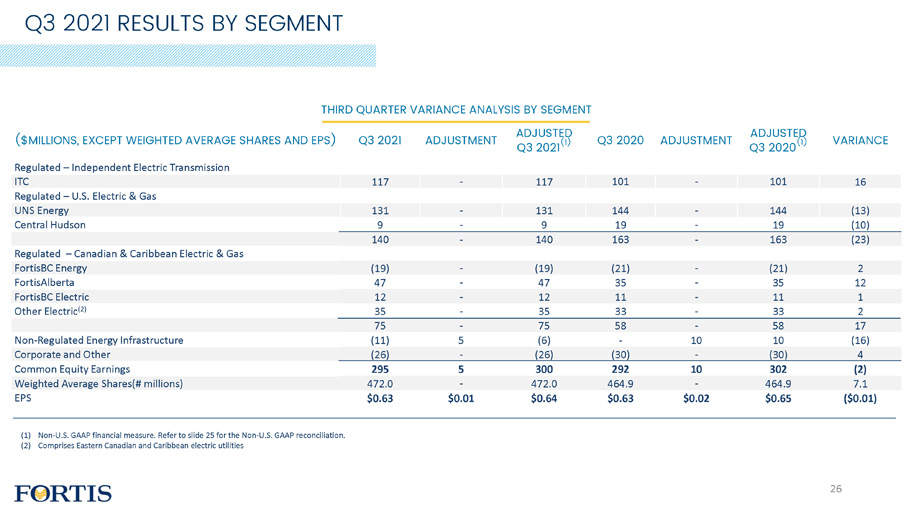
THIRD QUARTER VARIANCE ANALYSIS BY SEGMENT ( $ MILLI O NS, EXCEPT WEIGHTED AVERAGE SHARES AND EP S ) Q3 2 0 21 ADJUSTMENT ADJUSTE ( D 1) Q3 2 0 21 Q3 2 0 20 ADJUSTMENT ADJUSTE ( D 1) Q3 2 0 20 VARIANCE Regulated – Independent Electric Transmission ITC 117 - 117 101 - 101 16 Regulated – U.S. Electric & Gas UNS Energy 131 - 131 144 - 144 (13) Central Hudson 9 - 9 19 - 19 (10) 140 - 140 163 - 163 (23) Regulated – Canadian & Caribbean Electric & Gas FortisBC Energy (19) - (19) (21) - (21) 2 FortisAlberta 47 - 47 35 - 35 12 FortisBC Electric 12 - 12 11 - 11 1 Other Electric (2) 35 - 35 33 - 33 2 75 - 75 58 - 58 17 Non - Regulated Energy Infrastructure (11) 5 (6) - 10 10 (16) Corporate and Other (26) - (26) (30) - (30) 4 Common Equity Earnings 295 5 300 292 10 302 (2) Weighted Average Shares(# millions) 472.0 - 472.0 464.9 - 464.9 7.1 EPS $0.63 $0.01 $0.64 $0.63 $0.02 $0.65 ($0.01) (1) Non - U.S. GAAP financial measure. Refer to slide 25 for the Non - U.S. GAAP reconciliation. (2) Comprises Eastern Canadian and Caribbean electric utilities Q3 2021 RESULTS BY SEGMENT 26
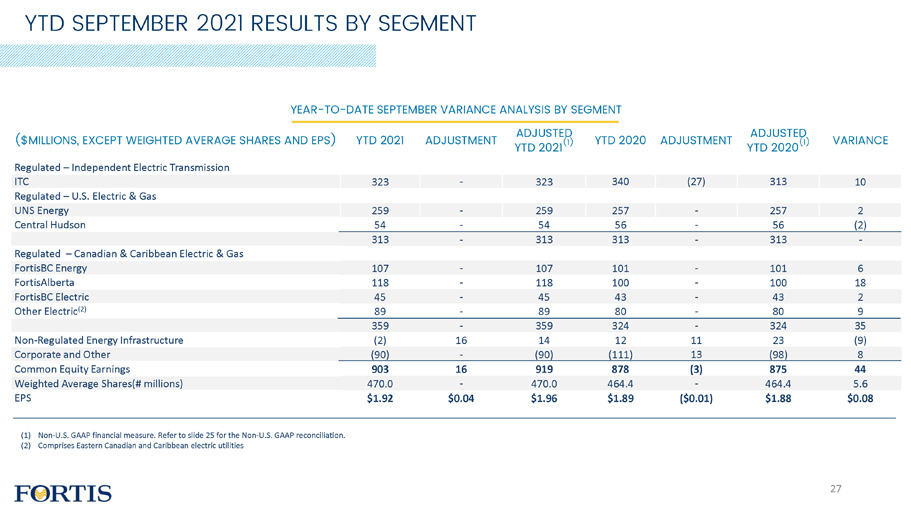
YEAR - TO - DATE SEPTEMBER VARIANCE ANALYSIS BY SEGMENT ( $ MILLI O NS, EXCEPT WEIGHTED AVERAGE SHARES AND EP S ) YTD 2021 ADJUSTMENT ADJUSTE ( D 1) YTD 2021 YTD 2020 ADJUSTMENT ADJUSTED (1) YTD 2020 VARIANCE Regulated – Independent Electric Transmission ITC 323 - 323 340 (27) 313 10 Regulated – U.S. Electric & Gas UNS Energy 259 - 259 257 - 257 2 Central Hudson 54 - 54 56 - 56 (2) 313 - 313 313 - 313 - Regulated – Canadian & Caribbean Electric & Gas FortisBC Energy 107 - 107 101 - 101 6 FortisAlberta 118 - 118 100 - 100 18 FortisBC Electric 45 - 45 43 - 43 2 Other Electric (2) 89 - 89 80 - 80 9 359 - 359 324 - 324 35 Non - Regulated Energy Infrastructure (2) 16 14 12 11 23 (9) Corporate and Other (90) - (90) (111) 13 (98) 8 Common Equity Earnings 903 16 919 878 (3) 875 44 Weighted Average Shares(# millions) 470.0 - 470.0 464.4 - 464.4 5.6 EPS $1.92 $0.04 $1.96 $1.89 ($0.01) $1.88 $0.08 YTD SEPTEMBER 2021 RESULTS BY SEGMENT (1) Non - U.S. GAAP financial measure. Refer to slide 25 for the Non - U.S. GAAP reconciliation. (2) Comprises Eastern Canadian and Caribbean electric utilities 27
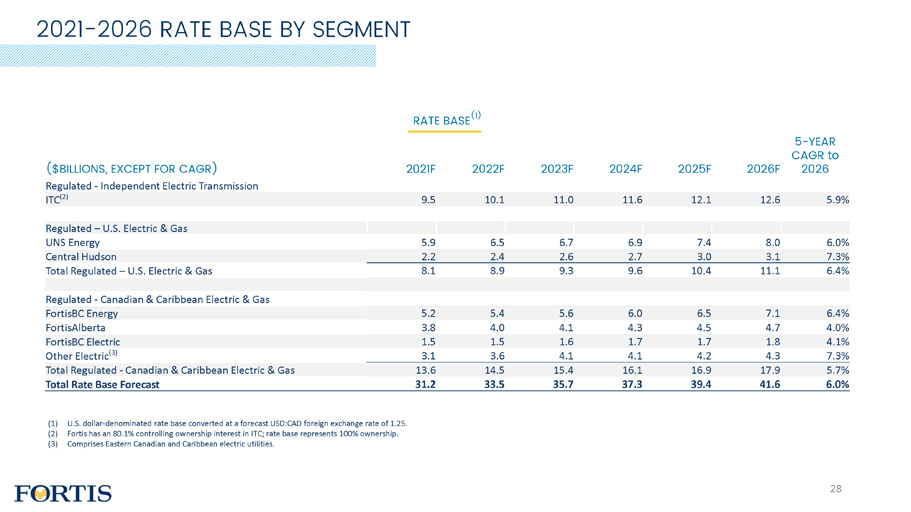
(1) U.S. dollar - denominated rate base converted at a forecast USD:CAD foreign exchange rate of 1.25. (2) Fortis has an 80.1% controlling ownership interest in ITC; rate base represents 100% ownership. (3) Comprises Eastern Canadian and Caribbean electric utilities. Total Regulated – U.S. Electric & Gas 8.1 8.9 9.3 9.6 10.4 11.1 6.4% Regulated - Canadian & Caribbean Electric & Gas FortisBC Energy 5.2 5.4 5.6 6.0 6.5 7.1 6.4% FortisAlberta 3.8 4.0 4.1 4.3 4.5 4.7 4.0% FortisBC Electric 1.5 1.5 1.6 1.7 1.7 1.8 4.1% Other Electric (3) 3.1 3.6 4.1 4.1 4.2 4.3 7.3% Total Regulated - Canadian & Caribbean Electric & Gas 13.6 14.5 15.4 16.1 16.9 17.9 5.7% Total Rate Base Forecast 31.2 33.5 35.7 37.3 39.4 41.6 6.0% RATE B AS E (1) ( $ BILLI O NS , E XC E PT FOR C AGR ) Regulated - Independent Electric Transmission ITC (2) 9.5 10.1 11.0 11.6 12.1 12.6 5.9% Regulated – U.S. Electric & Gas UNS Energy 5.9 6.5 6.7 6.9 7.4 8.0 6.0% Central Hudson 2.2 2.4 2.6 2.7 3.0 3.1 7.3% 20 21F 20 22F 20 23F 20 2 4 F 20 2 5 F 5 - YEAR CAG R t o 2026F 2026 2021 - 2026 RATE BASE BY SEGMENT 28
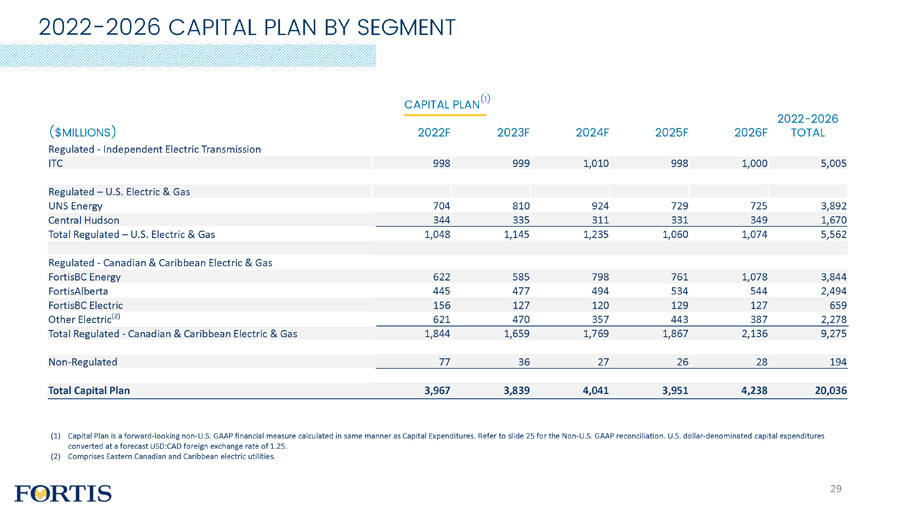
CAPITAL PLAN (1) ($MILLIONS) 2022F 2023F 2024F 2025F 2026F 2022 - 2026 TOTAL Regulated - Independent Electric Transmission ITC 998 999 1,010 998 1,000 5,005 Regulated – U.S. Electric & Gas UNS Energy 704 810 924 729 725 3,892 Central Hudson 344 335 311 331 349 1,670 Total Regulated – U.S. Electric & Gas 1,048 1,145 1,235 1,060 1,074 5,562 Regulated - Canadian & Caribbean Electric & Gas FortisBC Energy 622 585 798 761 1,078 3,844 FortisAlberta 445 477 494 534 544 2,494 FortisBC Electric 156 127 120 129 127 659 Other Electric (2) 621 470 357 443 387 2,278 Total Regulated - Canadian & Caribbean Electric & Gas 1,844 1,659 1,769 1,867 2,136 9,275 Non - Regulated 77 36 27 26 28 194 Total Capital Plan 3,967 3,839 4,041 3,951 4,238 20,036 (1) Capital Plan is a forward - looking non - U.S. GAAP financial measure calculated in same manner as Capital Expenditures. Refer to slide 25 for the Non - U.S. GAAP reconciliation. U.S. dollar - denominated capital expenditures converted at a forecast USD:CAD foreign exchange rate of 1.25. (2) Comprises Eastern Canadian and Caribbean electric utilities. 2022 - 2026 CAPITAL PLAN BY SEGMENT 29
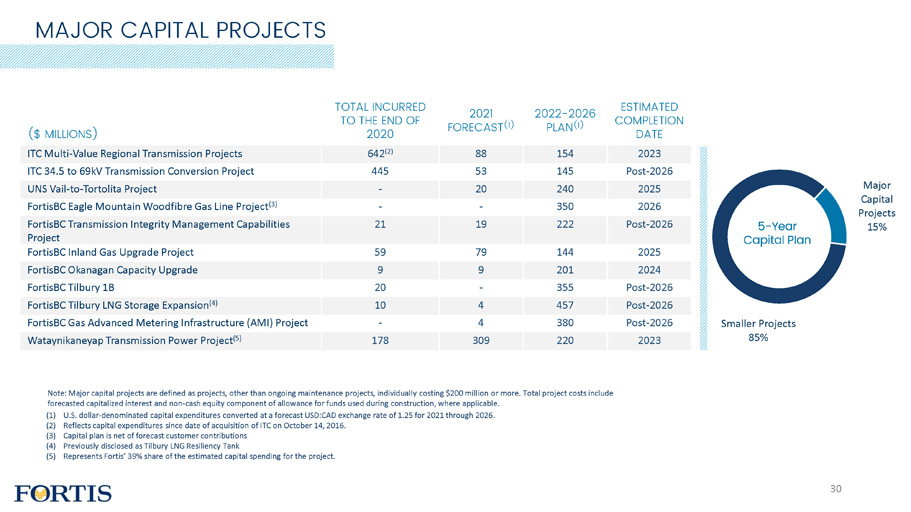
MAJOR CAPITAL PROJECTS ($ MILLIONS) TOTAL INCURRED TO THE END OF 2020 2021 FORECAST (1) 2022 - 2026 PLAN (1) ESTIMATED CO M PLETIO N DATE ITC Multi - Value Regional Transmission Projects 642 (2) 88 154 2023 ITC 34.5 to 69kV Transmission Conversion Project 445 53 145 Post - 2026 UNS Vail - to - Tortolita Project - 20 240 2025 FortisBC Eagle Mountain Woodfibre Gas Line Project (3) - - 350 2026 FortisBC Transmission Integrity Management Capabilities Project 21 19 222 Post - 2026 FortisBC Inland Gas Upgrade Project 59 79 144 2025 FortisBC Okanagan Capacity Upgrade 9 9 201 2024 FortisBC Tilbury 1B 20 - 355 Post - 2026 FortisBC Tilbury LNG Storage Expansion (4) 10 4 457 Post - 2026 FortisBC Gas Advanced Metering Infrastructure (AMI) Project - 4 380 Post - 2026 Wataynikaneyap Transmission Power Project (5) 178 309 220 2023 Smaller Projects 85% Major Capital P r o j e c ts 15% 5 - Year C a p i t al P l a n 30 Note: Major capital projects are defined as projects, other than ongoing maintenance projects, individually costing $200 million or more. Total project costs include forecasted capitalized interest and non - cash equity component of allowance for funds used during construction, where applicable. (1) U.S. dollar - denominated capital expenditures converted at a forecast USD:CAD exchange rate of 1.25 for 2021 through 2026. (2) Reflects capital expenditures since date of acquisition of ITC on October 14, 2016. (3) Capital plan is net of forecast customer contributions (4) Previously disclosed as Tilbury LNG Resiliency Tank (5) Represents Fortis’ 39% share of the estimated capital spending for the project.
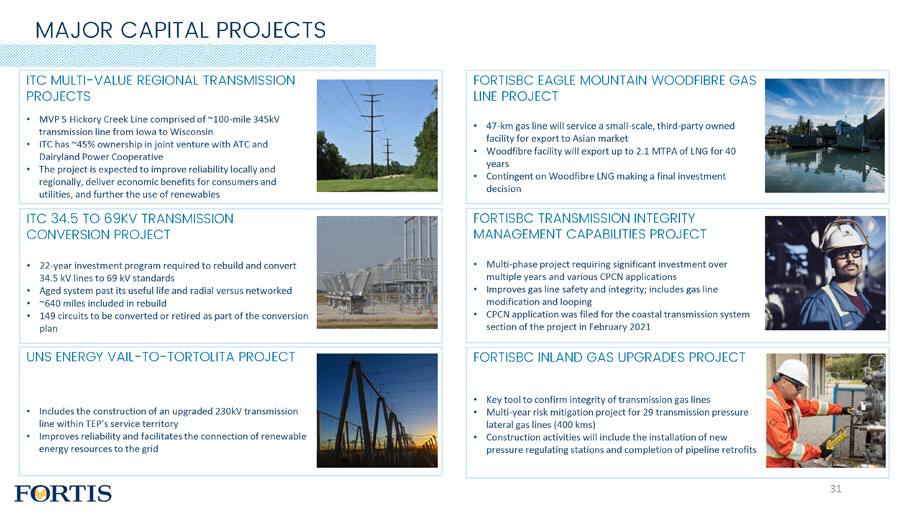
MAJOR CAPITAL PROJECTS ITC MULTI - VALUE REGIONAL TRANSMISSION PROJECTS • MVP 5 Hickory Creek Line comprised of ~ 100 - mile 345 kV transmission line from Iowa to Wisconsin • ITC has ~ 45 % ownership in joint venture with ATC and Dairyland Power Cooperative • The project is expected to improve reliability locally and regionally, deliver economic benefits for consumers and utilities, and further the use of renewables FORTISBC EAGLE MOUNTAIN WOODFIBRE GAS LINE PROJECT • 47 - km gas line will service a small - scale, third - party owned facility for export to Asian market • Woodfibre facility will export up to 2.1 MTPA of LNG for 40 years • Contingent on Woodfibre LNG making a final investment decision ITC 34.5 TO 69KV TRANSMISSION CONVERSION PROJECT • 22 - year investment program required to rebuild and convert 34.5 kV lines to 69 kV standards • Aged system past its useful life and radial versus networked • ~640 miles included in rebuild • 149 circuits to be converted or retired as part of the conversion plan UNS ENERGY VAIL - TO - TORTOLITA PROJECT • Includes the construction of an upgraded 230kV transmission line within TEP’s service territory • Improves reliability and facilitates the connection of renewable energy resources to the grid FORTISBC TRANSMISSION INTEGRITY MANAGEMENT CAPABILITIES PROJECT • Multi - phase project requiring significant investment over multiple years and various CPCN applications • Improves gas line safety and integrity; includes gas line modification and looping • CPCN application was filed for the coastal transmission system section of the project in February 2021 FORTISBC INLAND GAS UPGRADES PROJECT • Key tool to confirm integrity of transmission gas lines • Multi - year risk mitigation project for 29 transmission pressure lateral gas lines (400 kms) • Construction activities will include the installation of new pressure regulating stations and completion of pipeline retrofits 31
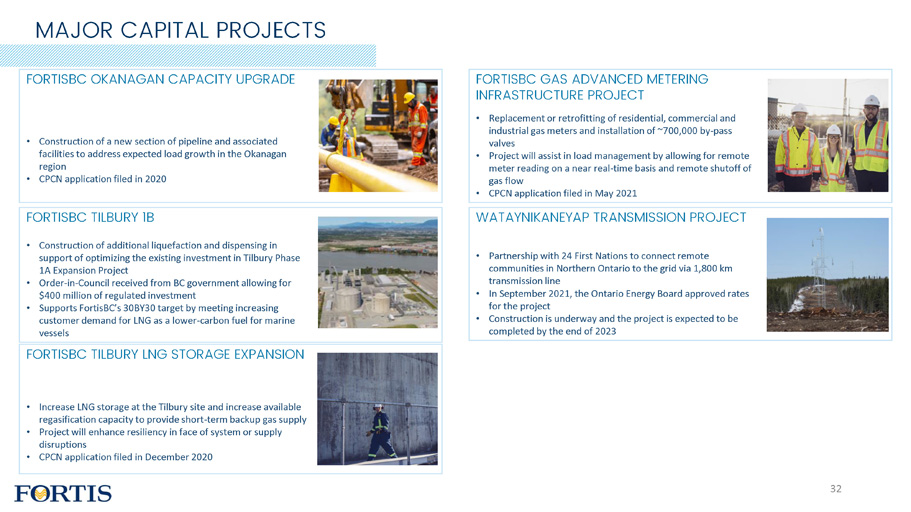
MAJOR CAPITAL PROJECTS FORTISBC OKANAGAN CAPACITY UPGRADE • Construction of a new section of pipeline and associated facilities to address expected load growth in the Okanagan region • CPCN application filed in 2020 FORTISBC GAS ADVANCED METERING INFRASTRUCTURE PROJECT • Replacement or retrofitting of residential, commercial and industrial gas meters and installation of ~700,000 by - pass valves • Project will assist in load management by allowing for remote meter reading on a near real - time basis and remote shutoff of gas flow • CPCN application filed in May 2021 FORTISBC TILBURY 1B • Construction of additional liquefaction and dispensing in support of optimizing the existing investment in Tilbury Phase 1A Expansion Project • Order - in - Council received from BC government allowing for $400 million of regulated investment • Supports FortisBC’s 30BY30 target by meeting increasing customer demand for LNG as a lower - carbon fuel for marine vessels FORTISBC TILBURY LNG STORAGE EXPANSION • Increase LNG storage at the Tilbury site and increase available regasification capacity to provide short - term backup gas supply • Project will enhance resiliency in face of system or supply disruptions • CPCN application filed in December 2020 WATAYNIKANEYAP TRANSMISSION PROJECT • Partnership with 24 First Nations to connect remote communities in Northern Ontario to the grid via 1,800 km transmission line • In September 2021, the Ontario Energy Board approved rates for the project • Construction is underway and the project is expected to be completed by the end of 2023 32
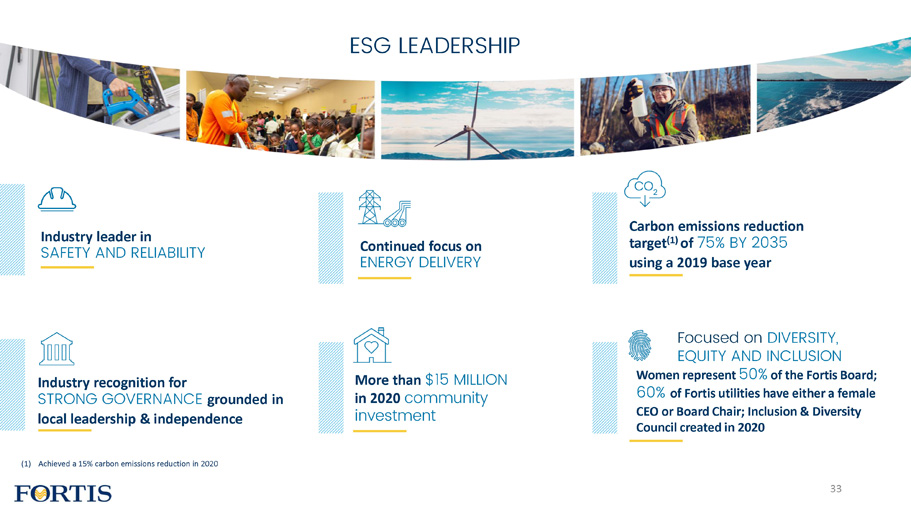
ESG LEADERSHIP More than $15 MILLION in 2020 community investment Continued focus on ENERGY DE L IVE R Y Industry leader in SAFETY AND RELIABILITY (1) Achieved a 15% carbon emissions reduction in 2020 Carbon emissions reduction target (1) of 75% BY 2035 using a 2019 base year Industry recognition for STRONG GOVERNANCE grounded in local leadership & independence Focused on DIVERSITY, EQUITY AND INCLUSION Women represent 50 % of the Fortis Board ; 60 % of Fortis utilities have either a female CEO or Board Chair ; Inclusion & Diversity Council created in 2020 33
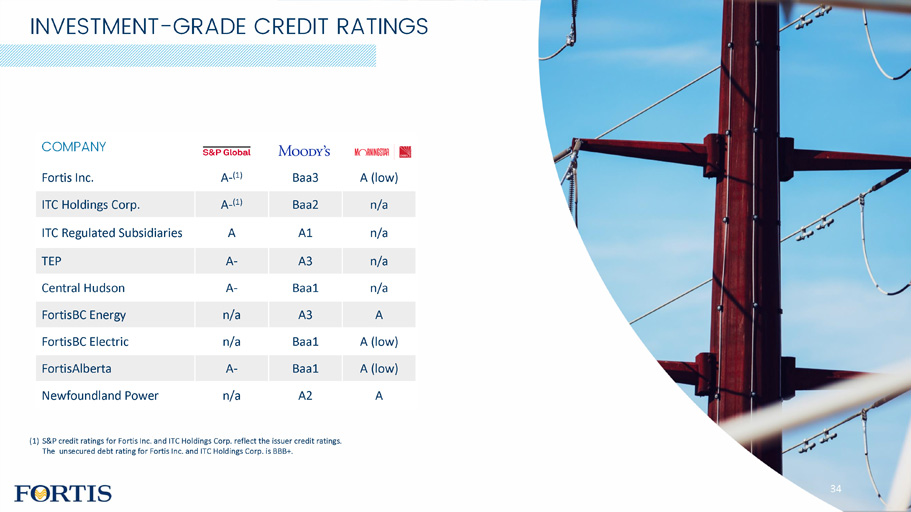
INVESTMENT - GRADE CREDIT RATINGS COMPANY Fortis Inc. A - (1) Baa3 A (low) ITC Holdings Corp. A - (1) Baa2 n/a ITC Regulated Subsidiaries A A1 n/a TEP A - A3 n/a Central Hudson A - Baa1 n/a FortisBC Energy n/a A3 A FortisBC Electric n/a Baa1 A (low) FortisAlberta A - Baa1 A (low) Newfoundland Power n/a A2 A (1) S&P credit ratings for Fortis Inc. and ITC Holdings Corp. reflect the issuer credit ratings. The unsecured debt rating for Fortis Inc. and ITC Holdings Corp. is BBB+. 34
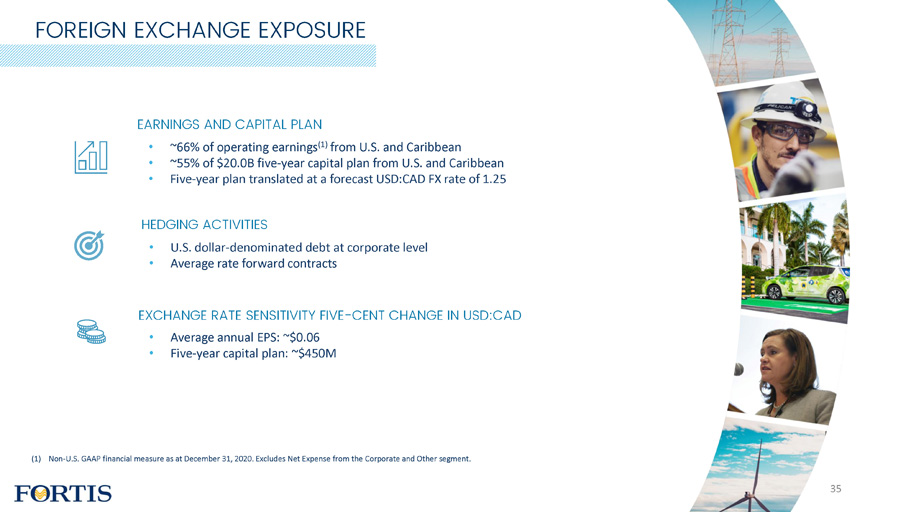
FOREIGN EXCHANGE EXPOSURE EARNINGS AND CAPITAL PLAN • ~66% of operating earnings (1) from U.S. and Caribbean • ~55% of $20.0B five - year capital plan from U.S. and Caribbean • Five - year plan translated at a forecast USD:CAD FX rate of 1.25 HEDGING ACTIVITIES • U.S. dollar - denominated debt at corporate level • Average rate forward contracts EXCHANGE RATE SENSITIVITY FIVE - CENT CHANGE IN USD:CAD • Average annual EPS: ~$0.06 • Five - year capital plan: ~$450M (1) Non - U.S. GAAP financial measure as at December 31, 2020. Excludes Net Expense from the Corporate and Other segment. 35
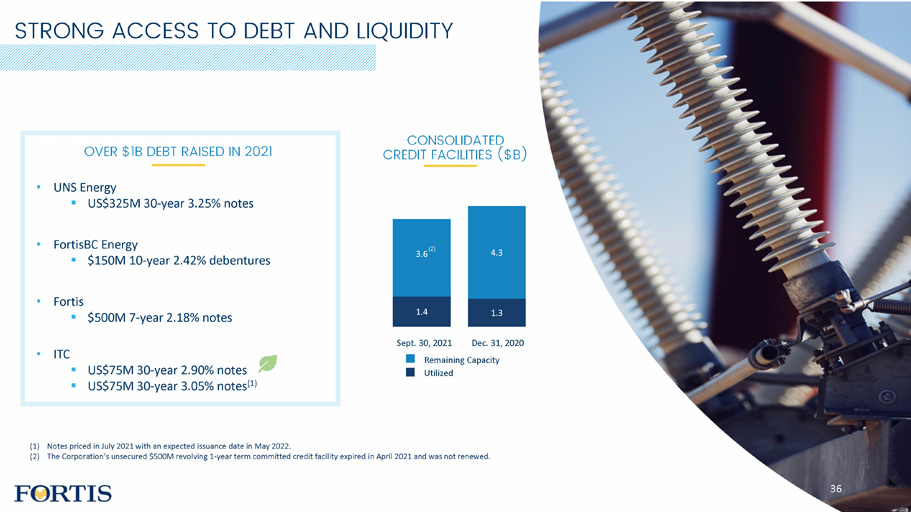
STRONG ACCESS TO DEBT AND LIQUIDITY 1.4 1.3 3.6 4.3 CONSOLIDATED CREDIT FACILITIES ($B) Sept. 30, 2021 Dec. 31, 2020 R em ai n ing Ca p acity Utilized OVER $1B D EBT RAIS ED IN 2021 • UNS Energy ▪ US$325M 30 - year 3.25% notes • FortisBC Energy ▪ $150M 10 - year 2.42% debentures • Fortis ▪ $500M 7 - year 2.18% notes • ITC ▪ US$75M 30 - year 2.90% notes ▪ US$75M 30 - year 3.05% notes (1) (1) Notes priced in July 2021 with an expected issuance date in May 2022. (2) The Corporation’s unsecured $500M revolving 1 - year term committed credit facility expired in April 2021 and was not renewed. (2 ) 36
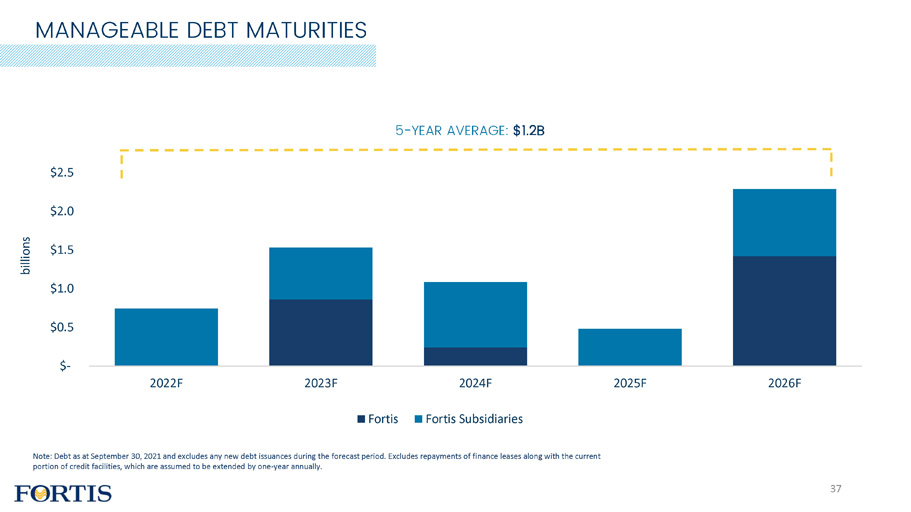
MANAGEABLE DEBT MATURITIES $ 2 . 5 $ 2. 0 $ 1 . 5 $ 1 . 0 $ 0 . 5 $ - 2 0 22F 2 0 23F 2 0 24F 2 0 25F 2 0 26F Fortis Fortis Subsidiaries Note: Debt as at September 30, 2021 and excludes any new debt issuances during the forecast period. Excludes repayments of finance leases along with the current portion of credit facilities, which are assumed to be extended by one - year annually. 5 - YEAR AVERAGE: $1.2B billions 37