Exhibit 99.1
Q3 2022 EARNINGS CONFERENCE CALL October 28, 2022 1

Fortis includes forward - looking information in this presentation within the meaning of applicable Canadian securities laws and forward - looking statements within the meaning of the Private Securities Litigation Reform Act of 1995 (collectively referred to as "forward - looking information") . Forward - looking information reflects expectations of Fortis management regarding future growth, results of operations, performance and business prospects and opportunities . Wherever possible, words such as anticipates, believes, budgets, could, estimates, expects, forecasts, intends, may, might, plans, projects, schedule, should, target, will, would, and the negative of these terms, and other similar terminology or expressions have been used to identify the forward - looking information, which includes, without limitation : forecast capital expenditures for 2022 and 2023 - 2027 , including cleaner energy investments ; targeted annual dividend growth through 2027 ; forecast rate base and rate base growth for 2022 through 2027 ; the nature, timing, benefits and expected costs of certain capital projects, including ITC's transmission projects associated with the MISO Long - Range Transmission Project, UNS Vail - to - Tortolita Transmission Project, UNS renewable energy and storage projects ; FortisBC Tilbury LNG Storage Expansion, FortisBC Gas AMI Project, FortisBC Eagle Mountain Woodfibre Gas Line Project, FortisBC Tilbury 1 B, FortisBC Okanagan Capacity Upgrade, Wataynikaneyap Transmission Power Project, and additional opportunities beyond the capital plan, including investments related to the Inflation Reduction Act, the MISO Long - Range Transmission Plan, climate adaptation and grid resiliency, and renewable fuel solutions and LNG infrastructure in British Columbia ; the anticipated impacts of the Inflation Reduction Act on the transition to a cleaner energy future and on the MISO Long - Range Transmission Plan and TEP's Integrated Resource Plan ; the 2035 GHG emissions reduction target and the projected asset mix ; the 2050 net - zero GHG emissions target ; FortisBC’s GHG emissions reduction target ; TEP's Integrated Resource Plan ; planned coal retirements and the expectation to exit coal by 2032 ; the expectation that the long - term dividend guidance will provide flexibility to fund more capital internally and reduce the dividend payout ratio over time to be in line with historical levels ; the expectation of delivering stable and compelling total returns to shareholders over the long - term ; expected sources of funding for the 2023 - 2027 capital plan ; expected capital structure stability through 2027 ; the expectation that Fortis is well - positioned to execute on the capital plan and pursue incremental growth opportunities ; forecast credit metrics through 2027 ; the expectation that the introduction of a corporate alternative minimum income tax will not have a material impact on credit metrics over the planning period with limited near - term impacts ; the expected timing, outcome and impact of regulatory proceedings and decisions ; and forecast debt maturities for 2023 - 2032 . Forward looking information involves significant risks, uncertainties and assumptions . Certain material factors or assumptions have been applied in drawing the conclusions contained in the forward - looking information, including, without limitation : no material impact from volatility in energy prices, the global supply chain and rising inflation ; the return of inflation levels to historical averages in 2025 ; reasonable regulatory decisions and the expectation of regulatory stability ; the successful execution of the capital plan ; no material capital project or financing cost overrun ; no material changes in the assumed U . S . dollar to Canadian dollar exchange rate ; sufficient human resources to deliver service and execute the capital plan ; no significant variability in interest rates ; and the Board exercising its discretion to declare dividends, taking into account the business performance and financial condition of the Corporation . Fortis cautions readers that a number of factors could cause actual results, performance or achievements to differ materially from the results discussed or implied in the forward - looking information . These factors should be considered carefully, and undue reliance should not be placed on the forward - looking information . For additional information with respect to certain of these risks or factors, reference should be made to the continuous disclosure materials filed from time to time by the Corporation with Canadian securities regulatory authorities and the Securities and Exchange Commission . All forward - looking information herein is given as of the date of this presentation . Fortis disclaims any intention or obligation to update or revise any forward - looking information, whether as a result of new information, future events or otherwise . Unless otherwise specified, all financial information is in Canadian dollars and rate base refers to midyear rate base . FORWARD - LOOKING INFORMATION 2

President and CEO David Hutchens 3

Q3 BUSINESS HIGHLIGHTS 4 Hurricane Fiona Response Impacts of Historic Hurricane $0.71 Q3 2022 Adjusted EPS Compared to $0.64 in Q3 2021 $ $2.9B Invested Through September 2022 Capital Plan on Track $22.3B 2023 - 2027 Capital Plan Largest in Fortis History ~6% Q4 2022 Dividend Increase 4 - 6% Annual Dividend Growth Guidance Through 2027 4

$34.0 B $46.1 B 2022F 2027F FIVE - YEAR PLAN AT A GLANCE Note: U.S. dollar - denominated rate base converted at a foreign exchange rate of 1.29 for 2022 and 1.30 for 2023 - 2027. CAGR, as d efined in the Q3 2022 MD&A, assumes a constant USD:CAD foreign exchange rate. Continued Focus on Customer Affordability $22.3B Capital Plan Supports Low - Risk Rate Base Growth 2023 - 2027 Capital Plan Up $2.3B From Prior Plan $20.0B +$1.8B +$0.5B $22.3B 2022-2026 Plan Regulated Utility Growth Foreign Exchange 2023-2027 Plan • Targeting controllable operating cost increases below inflation, consistent with historical practice • Focused on preventative maintenance and innovation to reduce operating costs • Cleaner energy investments with fuel savings for customers • Energy efficiency programs 5
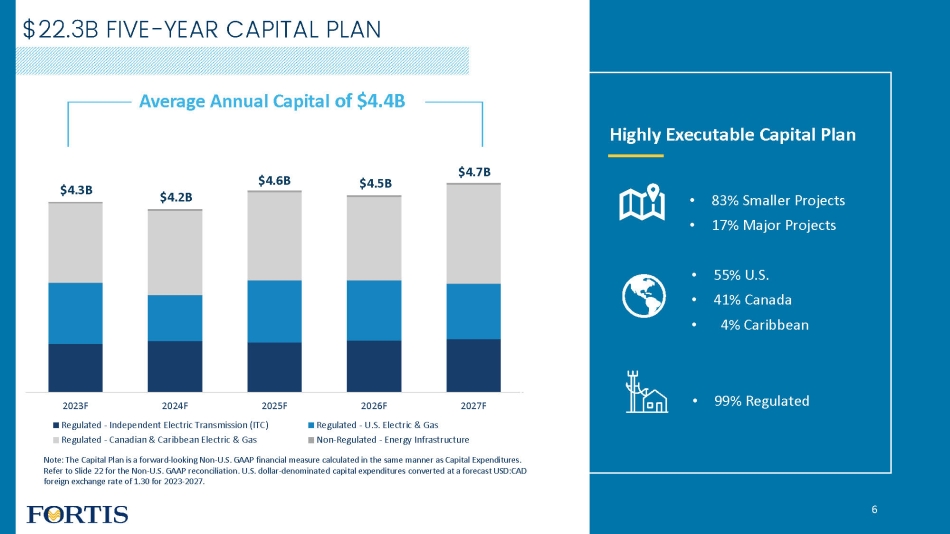
2023F 2024F 2025F 2026F 2027F Regulated - Independent Electric Transmission (ITC) Regulated - U.S. Electric & Gas Regulated - Canadian & Caribbean Electric & Gas Non-Regulated - Energy Infrastructure $4.7B $4.5B $4.6B $4.2B $4.3B $ 22.3B FIVE - YEAR CAPITAL PLAN Average Annual Capital of $4.4B • 99% Regulated • 55% U.S. • 41% Canada • 4% Caribbean • 83% Smaller Projects • 17% Major Projects Highly Executable Capital Plan Note: The Capital Plan is a forward - looking Non - U.S. GAAP financial measure calculated in the same manner as Capital Expenditure s. Refer to Slide 22 for the Non - U.S. GAAP reconciliation. U.S. dollar - denominated capital expenditures converted at a forecast USD :CAD foreign exchange rate of 1.30 for 2023 - 2027. 6

CAPITAL PLAN CONCENTRATED AT THREE LARGEST UTILITIES $2.3B • Infrastructure investments including reliability and resiliency upgrades, increased capacity, etc. • ~US$0.7B included in plan for MISO Long - Range Transmission Plan (LRTP). Estimated transmission investments of US$1.4 - $1.8B through 2030 associated with six of 18 LRTP projects • Economic development, load and changes in generation interconnections • Grid security investments • Reliability and integrity investments • Natural gas infrastructure including LNG resiliency tank, Tilbury 1B and Eagle Mountain Woodfibre gas line projects • Automated Gas Metering Infrastructure and Okanagan Capacity Upgrade • Renewable gas projects and natural gas for transportation • Includes ~$1.2B of renewable and storage investments to transition to cleaner energy aligned with TEP’s Integrated Resource Plan (IRP) • Distribution investments including customer meter infrastructure and grid resiliency and modernization • Vail - to - Tortolita Transmission Project ($378M) 7
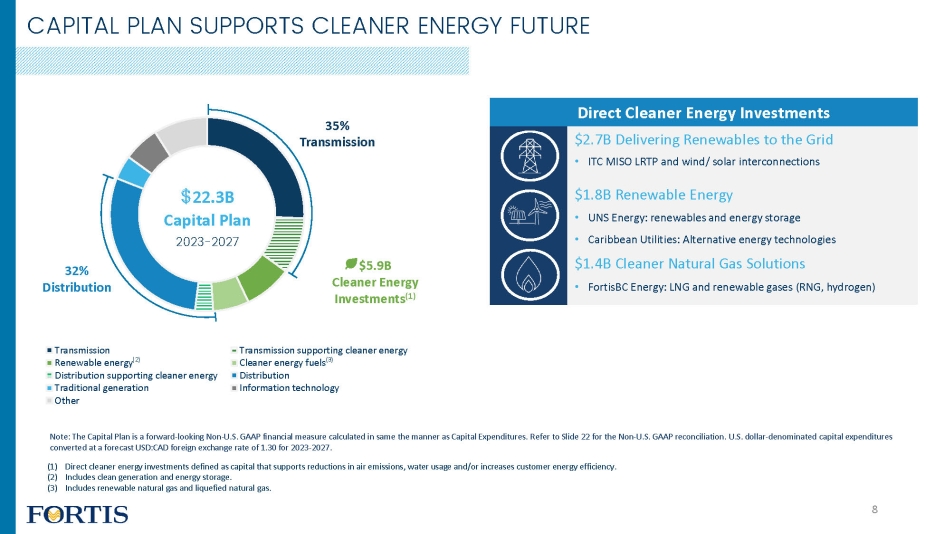
Transmission Transmission supporting cleaner energy Renewable energy Cleaner energy fuels Distribution supporting cleaner energy Distribution Traditional generation Information technology Other CAPITAL PLAN SUPPORTS CLEANER ENERGY FUTURE Note: The Capital Plan is a forward - looking Non - U.S. GAAP financial measure calculated in same the manner as Capital Expenditure s. Refer to Slide 22 for the Non - U.S. GAAP reconciliation. U.S. dollar - denominated capital expenditures converted at a forecast USD:CAD foreign exchange rate of 1.30 for 2023 - 2027. 35% Transmission 32% Distribution (1) Direct cleaner energy investments defined as capital that supports reductions in air emissions, water usage and/or increases cus tomer energy efficiency. (2) Includes clean generation and energy storage. (3) Includes renewable natural gas and liquefied natural gas. Direct Cleaner Energy Investments $2.7B Delivering Renewables to the Grid • ITC MISO LRTP and wind/ solar interconnections $1.8B Renewable Energy • UNS Energy: renewables and energy storage • Caribbean Utilities: Alternative energy technologies $1.4B Cleaner Natural Gas Solutions • FortisBC Energy: LNG and renewable gases (RNG, hydrogen) $5.9B Cleaner Energy Investments (1) (2) (3) $ 22.3B Capital Plan 2023 - 2027 8

BEYOND THE PLAN Shift to Cleaner Energy Renewable Fuel Solutions and LNG • RNG & hydrogen to support British Columbia • Develop Canadian LNG resources to aid in international energy security and GHG reductions Climate Adaptation & Grid Resiliency • Investing to withstand more severe weather • Under various climate scenarios and geographies Inflation Reduction Act • A catalyst for MISO’s LRTP Tranche 2 • Renewable generation including TEP’s IRP (1) • Interconnecting renewables to the grid • Electric vehicle infrastructure • Funding for community transition from fossil fuels (1) Incremental opportunity of ~US$2 - $4 billion through 2035. Excludes ~US$1B for projects included in the 2023 - 2027 capital plan, a nd US$0.5B invested previously, including the Oso Grande Wind project. 9

72 74 76 78 80 82 84 86 88 90 92 94 96 98 00 02 04 06 08 10 12 14 16 18 20 22F DIVIDEND GUIDANCE SUPPORTED BY LONG - TERM GROWTH STRATEGY 49 YEARS of Consecutive Dividend Increases 4 - 6% Annual Dividend Growth Guidance through 2027 10

Executive Vice President and CFO JOCELYN PERRY 11

12 THIRD QUARTER AND YTD REPORTED RESULTS $903 $960 YTD 2021 YTD 2022 $295 $326 Q3 2021 Q3 2022 EARNINGS ($M) EPS EARNINGS ($M) EPS $1.92 $2.01 YTD 2021 YTD 2022 $0.63 $0.68 Q3 2021 Q3 2022

THIRD QUARTER AND YTD ADJUSTED RESULTS Note: Adjusted EPS is a Non - U.S. GAAP financial measure and excludes: (1) timing differences related to the accounting of natura l gas derivatives at Aitken Creek, net of income tax; (2) costs incurred upon the suspension of the Lake Erie Connector project, net of income tax; and (3) the revaluation of deferred income tax assets due to a reduction in the co rpo rate income tax rate in the state of Iowa. Refer to Slide 22 for the Non - U.S. GAAP reconciliation. $919 $982 YTD 2021 YTD 2022 $300 $341 Q3 2021 Q3 2022 EARNINGS ($M) EPS EARNINGS ($M) EPS $1.96 $2.06 YTD 2021 YTD 2022 Q3 EPS DRIVERS: • Rate base growth • Higher earnings in Arizona and New York • Lower stock - based compensation • Increased production in Belize $0.64 $0.71 Q3 2021 Q3 2022 13

$0.64 $0.08 $0.02 $0.01 $0.02 ( $0.05 ) ( $0.01 ) $0.71 Q3 2021 Adjusted EPS U.S. Electric & Gas Energy Infrastructure U.S. Transmission (ITC) Foreign Exchange Corporate and Other Weighted Average Shares Q3 2022 Adjusted EPS (2) (3) (1) Non - U.S. GAAP financial measure. Refer to Slide 22 for the Non - U.S. GAAP reconciliation. (2) Includes UNS Energy and Central Hudson. (3) Impact of average USD:CAD foreign exchange rate of 1.31 in Q3 2022 compared to 1.26 in Q3 2021. THIRD QUARTER EPS DRIVERS (1) (1) Rate base growth, higher earnings in Arizona and New York, lower stock - based compensation and increased production in Belize 14
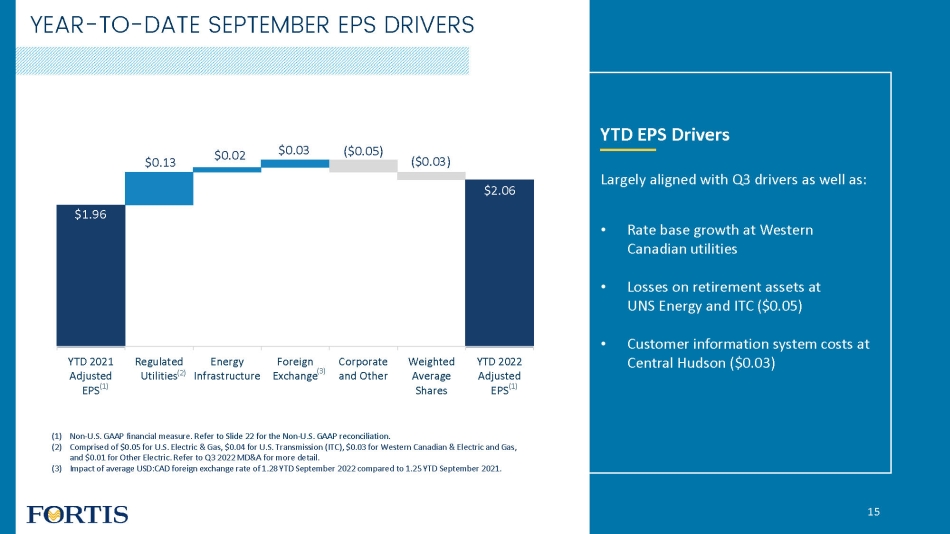
$1.96 $0.13 $0.02 $0.03 ( $0.05 ) ( $0.03 ) $2.06 YTD 2021 Adjusted EPS Regulated Utilities Energy Infrastructure Foreign Exchange Corporate and Other Weighted Average Shares YTD 2022 Adjusted EPS 15 (1) Non - U.S. GAAP financial measure. Refer to Slide 22 for the Non - U.S. GAAP reconciliation. (2) Comprised of $0.05 for U.S. Electric & Gas, $0.04 for U.S. Transmission (ITC), $0.03 for Western Canadian & Electric and Gas, and $0.01 for Other Electric. Refer to Q3 2022 MD&A for more detail. (3) Impact of average USD:CAD foreign exchange rate of 1.28 YTD September 2022 compared to 1.25 YTD September 2021. YEAR - TO - DATE SEPTEMBER EPS DRIVERS YTD EPS Drivers Largely aligned with Q3 drivers as well as: • Rate base growth at Western Canadian utilities • Losses on retirement assets at UNS Energy and ITC ($0.05) • Customer information system costs at Central Hudson ($0.03) (1) (1) (3) (2)
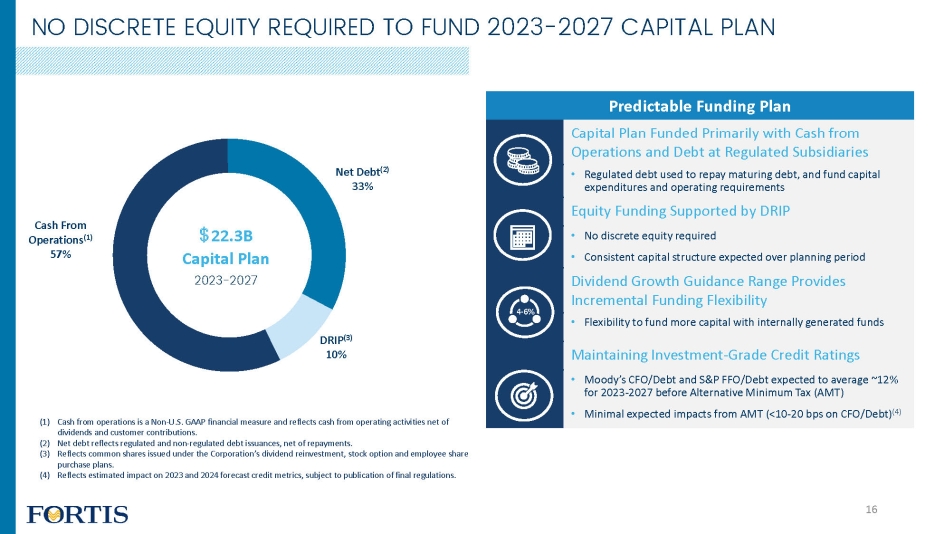
NO DISCRETE EQUITY REQUIRED TO FUND 2023 - 2027 CAPITAL PLAN Cash From Operations (1) 57% Net Debt (2) 33% DRIP (3) 10% $ 22.3B Capital Plan 2023 - 2027 (1) Cash from operations is a Non - U.S. GAAP financial measure and reflects cash from operating activities net of dividends and customer contributions. (2) Net debt reflects regulated and non - regulated debt issuances, net of repayments. (3) Reflects common shares issued under the C orporation’s dividend reinvestment, stock option and employee share purchase plans. (4) Reflects estimated impact on 2023 and 2024 forecast credit metrics , s ubject to publication of final regulations. Predictable Funding Plan Capital Plan Funded Primarily with Cash from Operations and Debt at Regulated Subsidiaries • Regulated debt used to repay maturing debt, and fund capital expenditures and operating requirements Equity Funding Supported by DRIP • No discrete equity required • Consistent capital structure expected over planning period Dividend Growth Guidance Range Provides Incremental Funding Flexibility • Flexibility to fund more capital with internally generated funds Maintaining Investment - Grade Credit Ratings • Moody’s CFO/Debt and S&P FFO/Debt expected to average ~12% for 2023 - 2027 before Alternative Minimum Tax (AMT) • Minimal expected impacts from AMT (<10 - 20 bps on CFO/Debt) (4) 4 - 6% 16

FERC MISO Base ROE • In August 2022, the DC Circuit Court vacated certain FERC orders that established the methodology used to calculate the MISO base ROE • Matter dates back to complaints filed at FERC in 2013 and 2015 • DC Circuit noted FERC did not adequately explain why it reintroduced the risk - premium model in its methodology which increased the MISO Base ROE from 9.88% to 10.02% • Timing and outcome remains unknown Q3 REGULATORY UPDATE & OUTLOOK • In July 2022, the AUC issued a decision largely accepting the forecast requested in FortisAlberta's 2023 COS Rebasing application • FortisAlberta refiled its 2023 revenue requirement in September reflecting 5% increase in distribution rates • Final decision expected in Q4 2022 Cost of Service Application (COS) REGULATORY CALENDAR CURRENT REGULATORY CALENDAR (1) Ongoing FERC proceedings relating to MISO base ROE, RTO adder and ITC Midwest capital structure. (2) Generic cost of capital proceeding. (3) Third performance - based rate - setting (PBR) term will begin in 2024 with going - in rates based on the 2023 COS rebasing. (4) Tucson Electric Power rate case decision expected in Q3 2023. (5) FortisAlberta generic cost of capital proceeding. (1) (2) (3) (4) (3) 2023 2024 Q3 UPDATE 17 (5)
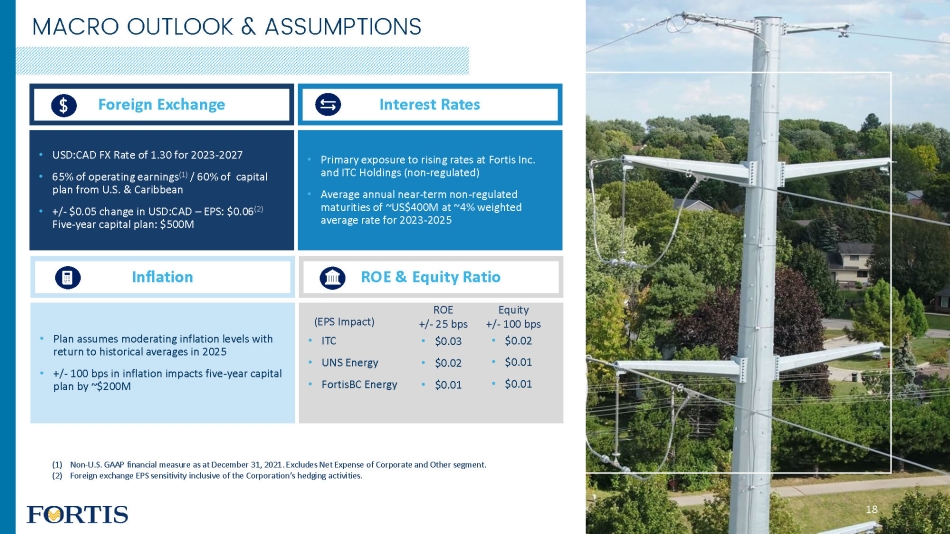
MACRO OUTLOOK & ASSUMPTIONS (1) Non - U.S. GAAP financial measure as at December 31, 2021. Excludes Net Expense of Corporate and Other segment. (2) Foreign exchange EPS sensitivity inclusive of the Corporation’s hedging activities. Foreign Exchange • USD:CAD FX Rate of 1.30 for 2023 - 2027 • 65% of operating earnings (1) / 60% of capital plan from U.S. & Caribbean • +/ - $0.05 change in USD:CAD – EPS: $0.06 (2) Five - year capital plan: $500M Inflation • Plan assumes moderating inflation levels with return to historical averages in 2025 • +/ - 100 bps in inflation impacts five - year capital plan by ~$200M Interest Rates • Primary exposure to rising rates at Fortis Inc. and ITC Holdings (non - regulated) • Average annual near - term non - regulated maturities of ~US$400M at ~4% weighted average rate for 2023 - 2025 ROE & Equity Ratio • ITC • UNS Energy • FortisBC Energy ROE +/ - 25 bps Equity +/ - 100 bps • $0.03 • $0.02 • $0.01 • $0.02 • $0.01 • $0.01 (EPS Impact) 18
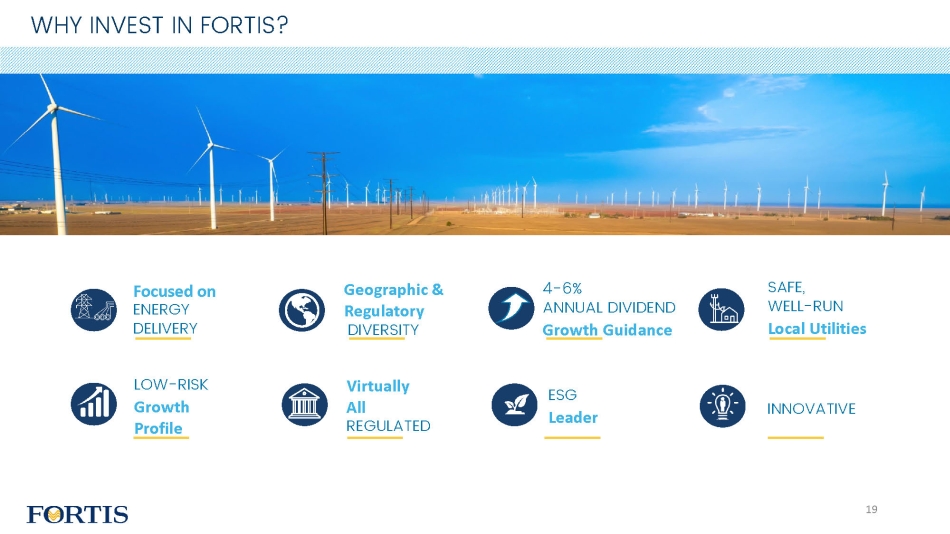
WHY INVEST IN FORTIS? Focused on ENERGY DELIVERY Geographic & Regulatory DIVERSITY 4 - 6% ANNUAL DIVIDEND Growth Guidance SAFE, WELL - RUN Local Utilities LOW - RISK Growth Profile Virtually All REGULATED ESG Leader INNOVATIVE 19

UPCOMING EVENTS • Q4 2022 – February 10, 2023 EXPECTED EARNINGS RELEASE DATES 20

Q3 2022 EARNINGS CONFERENCE CALL October 28, 2022 21

($MILLIONS, EXCEPT EPS) Q3 2022 Q3 2021 VARIANCE YTD September 2022 YTD September 2021 VARIANCE Adjusted Net Earnings Net Earnings 326 295 31 960 903 57 Adjusting Items: Unrealized (gain) loss on mark - to - market of derivatives (1) (4) 5 (9) 3 16 (13) Lake Erie Connector project suspension costs (2) 10 - 10 10 - 10 Revaluation of deferred income tax assets (3) 9 - 9 9 - 9 Adjusted Net Earnings 341 300 41 982 919 63 Adjusted Net Earnings per Share $0.71 $0.64 $0.07 $2.06 $1.96 $0.10 Capital Expenditures Additions to property, plant and equipment 907 777 130 2,600 2,292 308 Additions to intangible assets 44 41 3 151 120 31 Adjusting Item: Wataynikaneyap Transmission Power Project (4) 41 17 24 135 143 (8) Capital Expenditures 992 835 157 2,886 2,555 331 (1) Represents timing differences related to the accounting of natural gas derivatives at Aitken Creek, net of income tax (expens e) recovery of ($2M) and $1M for Q3 2022 and YTD September 2022, respectively (income tax recovery of $2M and $6M for Q3 2021 and YTD September 2021, respectively), included in the Energy Infrastructure seg ment. (2) Represents costs incurred upon the suspension of the Lake Erie Connector project, net of income tax recovery of $4M for Q3 20 22 and YTD September 2022, included in the ITC segment. (3) Represents the remeasurement of deferred income tax assets resulting from the reduction in the corporate income tax rate in t he state of Iowa, included in the ITC segment. (4) Represents Fortis’ 39% share of capital spending for the Wataynikaneyap Transmission Power Project, included in the Other Ele ctr ic Segment. NON - U.S. GAAP RECONCILIATION 22
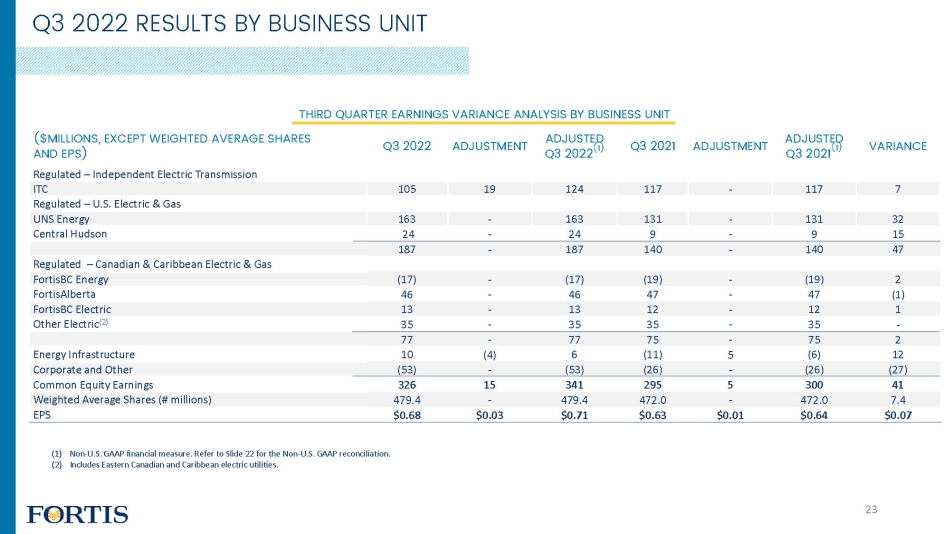
THIRD QUARTER EARNINGS VARIANCE ANALYSIS BY BUSINESS UNIT ($MILLIONS, EXCEPT WEIGHTED AVERAGE SHARES AND EPS) Q3 2022 ADJUSTMENT ADJUSTED Q3 2022 (1) Q3 2021 ADJUSTMENT ADJUSTED Q3 2021 (1) VARIANCE Regulated – Independent Electric Transmission ITC 105 19 124 117 - 117 7 Regulated – U.S. Electric & Gas UNS Energy 163 - 163 131 - 131 32 Central Hudson 24 - 24 9 - 9 15 187 - 187 140 - 140 47 Regulated – Canadian & Caribbean Electric & Gas FortisBC Energy (17) - (17) (19) - (19) 2 FortisAlberta 46 - 46 47 - 47 (1) FortisBC Electric 13 - 13 12 - 12 1 Other Electric (2) 35 - 35 35 - 35 - 77 - 77 75 - 75 2 Energy Infrastructure 10 (4) 6 (11) 5 (6) 12 Corporate and Other (53) - (53) (26) - (26) (27) Common Equity Earnings 326 15 341 295 5 300 41 Weighted Average Shares (# millions) 479.4 - 479.4 472.0 - 472.0 7.4 EPS $0.68 $0.03 $0.71 $0.63 $0.01 $0.64 $0.07 (1) Non - U.S. GAAP financial measure. Refer to Slide 22 for the Non - U.S. GAAP reconciliation. (2) Includes Eastern Canadian and Caribbean electric utilities. Q3 2022 RESULTS BY BUSINESS UNIT 23

YEAR - TO - DATE SEPTEMBER EARNINGS VARIANCE ANALYSIS BY BUSINESS UNIT ($MILLIONS, EXCEPT WEIGHTED AVERAGE SHARES AND EPS) YTD 2022 ADJUSTMENT ADJUSTED YTD 2022 (1) YTD 2021 ADJUSTMENT ADJUSTED YTD 2021 (1) VARIANCE Regulated – Independent Electric Transmission ITC 328 19 347 323 - 323 24 Regulated – U.S. Electric & Gas UNS Energy 283 - 283 259 - 259 24 Central Hudson 66 - 66 54 - 54 12 349 - 349 313 - 313 36 Regulated – Canadian & Caribbean Electric & Gas FortisBC Energy 119 - 119 107 - 107 12 FortisAlberta 117 - 117 118 - 118 (1) FortisBC Electric 50 - 50 45 - 45 5 Other Electric (2) 94 - 94 89 - 89 5 380 - 380 359 - 359 21 Energy Infrastructure 23 3 26 (2) 16 14 12 Corporate and Other (120) - (120) (90) - (90) (30) Common Equity Earnings 960 22 982 903 16 919 63 Weighted Average Shares (# millions) 477.7 - 477.7 470.0 - 470.0 7.7 EPS $2.01 $0.05 $2.06 $1.92 $0.04 $1.96 $0.10 (1) Non - U.S. GAAP financial measure. Refer to Slide 22 for the Non - U.S. GAAP reconciliation. (2) Includes Eastern Canadian and Caribbean electric utilities. YTD SEPTEMBER 2022 RESULTS BY BUSINESS UNIT 24

(1) Fortis has an 80.1% controlling ownership interest in ITC; rate base represents 100% ownership. (2) Comprises Eastern Canadian and Caribbean electric utilities. RATE BASE ($BILLIONS, EXCEPT FOR CAGR) 2022F 2023F 2024F 2025F 2026F 2027F 5 - YEAR CAGR to 2027 Regulated - Independent Electric Transmission ITC (1) 10.4 11.1 11.9 12.5 13.2 14.1 6.1% Regulated – U.S. Electric & Gas UNS Energy 6.7 7.1 7.4 7.8 8.5 9.1 6.0% Central Hudson 2.5 2.6 2.9 3.1 3.4 3.6 7.5% Total Regulated – U.S. Electric & Gas 9.2 9.7 10.3 10.9 11.9 12.7 6.4% Regulated - Canadian & Caribbean Electric & Gas FortisBC Energy 5.4 5.8 6.0 6.5 7.0 7.6 6.9% FortisAlberta 4.0 4.2 4.4 4.6 4.8 5.0 4.7% FortisBC Electric 1.6 1.7 1.7 1.8 1.9 2.0 4.3% Other Electric (2) 3.4 3.8 4.1 4.4 4.5 4.7 7.1% Total Regulated - Canadian & Caribbean Electric & Gas 14.4 15.5 16.2 17.3 18.2 19.3 6.1% Total Rate Base Forecast 34.0 36.3 38.4 40.7 43.3 46.1 6.2% 2022 - 2027 RATE BASE BY BUSINESS UNIT Note: U.S. dollar - denominated rate base converted at a foreign exchange rate of 1.29 for 2022 and 1.30 for 2023 - 2027. CAGR, as d efined in the Q3 2022 MD&A, assumes a constant USD:CAD foreign exchange rate. 25
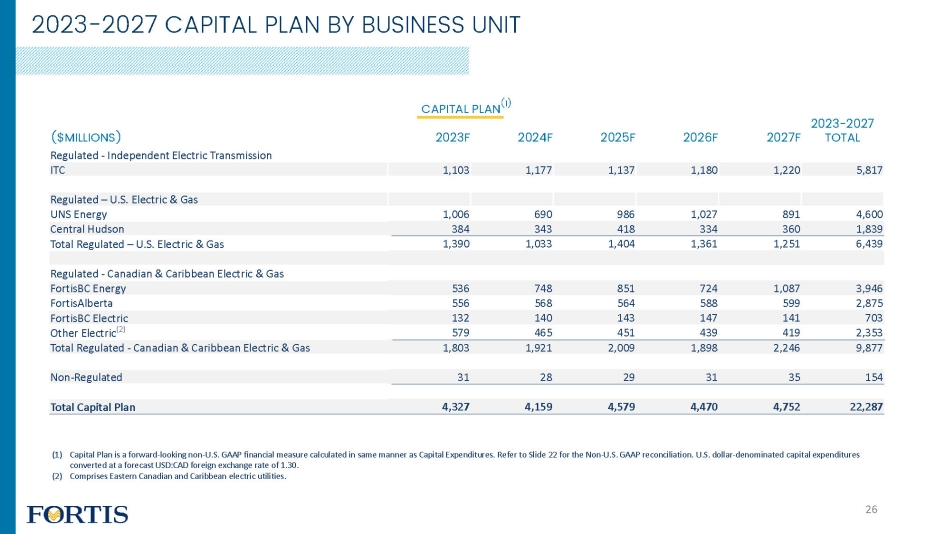
CAPITAL PLAN (1) ($MILLIONS) 2023F 2024F 2025F 2026F 2027F 2023 - 2027 TOTAL Regulated - Independent Electric Transmission ITC 1,103 1,177 1,137 1,180 1,220 5,817 Regulated – U.S. Electric & Gas UNS Energy 1,006 690 986 1,027 891 4,600 Central Hudson 384 343 418 334 360 1,839 Total Regulated – U.S. Electric & Gas 1,390 1,033 1,404 1,361 1,251 6,439 Regulated - Canadian & Caribbean Electric & Gas FortisBC Energy 536 748 851 724 1,087 3,946 FortisAlberta 556 568 564 588 599 2,875 FortisBC Electric 132 140 143 147 141 703 Other Electric (2) 579 465 451 439 419 2,353 Total Regulated - Canadian & Caribbean Electric & Gas 1,803 1,921 2,009 1,898 2,246 9,877 Non - Regulated 31 28 29 31 35 154 Total Capital Plan 4,327 4,159 4,579 4,470 4,752 22,287 (1) Capital Plan is a forward - looking non - U.S. GAAP financial measure calculated in same manner as Capital Expenditures. Refer to Sl ide 22 for the Non - U.S. GAAP reconciliation. U.S. dollar - denominated capital expenditures converted at a forecast USD:CAD foreign exchange rate of 1.30. (2) Comprises Eastern Canadian and Caribbean electric utilities. 2023 - 2027 CAPITAL PLAN BY BUSINESS UNIT 26
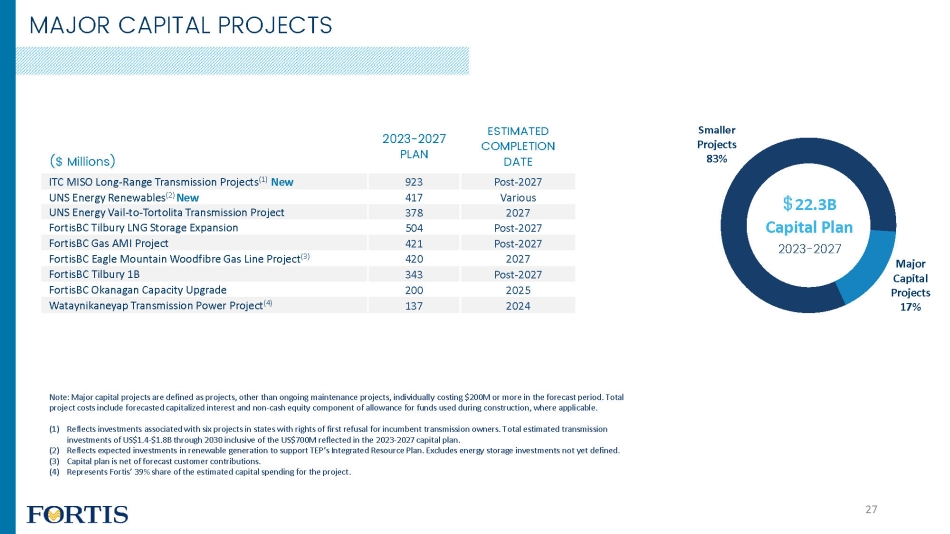
MAJOR CAPITAL PROJECTS ($ Millions) 2023 - 2027 PLAN ESTIMATED COMPLETION DATE ITC MISO Long - Range Transmission Projects (1) New 923 Post - 2027 UNS Energy Renewables (2) New 417 Various UNS Energy Vail - to - Tortolita Transmission Project 378 2027 FortisBC Tilbury LNG Storage Expansion 504 Post - 2027 FortisBC Gas AMI Project 421 Post - 2027 FortisBC Eagle Mountain Woodfibre Gas Line Project (3) 420 2027 FortisBC Tilbury 1B 343 Post - 2027 FortisBC Okanagan Capacity Upgrade 200 2025 Wataynikaneyap Transmission Power Project (4) 137 2024 Major Capital Projects 17% Smaller Projects 83% Note: Major capital projects are defined as projects, other than ongoing maintenance projects, individually costing $200M or mor e in the forecast period. Total project costs include forecasted capitalized interest and non - cash equity component of allowance for funds used during construct ion, where applicable. (1) Reflects investments associated with six projects in states with rights of first refusal for incumbent transmission owners. T ota l estimated transmission investments of US$1.4 - $1.8B through 2030 inclusive of the US$700M reflected in the 2023 - 2027 capital plan. (2) Reflects expected investments in renewable generation to support TEP’s Integrated Resource Plan. Excludes energy storage inve stm ents not yet defined. (3) Capital plan is net of forecast customer contributions. (4) Represents Fortis’ 39% share of the estimated capital spending for the project. $ 22.3B Capital Plan 2023 - 2027 27

EXECUTING ON A CLEANER ENERGY FUTURE PLANNED COAL RETIREMENTS Achieved 20% GHG Emissions Reduction Since 2019 2021 2019 2050 2030 2032 2035 Net - Zero Target (Scope 1) 2022 - 170 MW 2027 - 387 MW 2031 - 110 MW 2032 - 406 MW San Juan Springerville Unit #1 Four Corners Springerville Unit #2 PATHWAY TO 2050 NET - ZERO TARGET 50% GHG Emissions Reduction Target Coal - Free Generation Mix 75% GHG Emissions Reduction Target by 2035 Compared to 2019 Levels 3,400 MW Planned Additions of Wind, Solar and Storage from 2022 - 2035 ADDING CLEAN GENERATION Actual GHG Emissions Reduction Forecast GHG Emissions Reduction Illustrative Emissions Reduction 28

• Strong safety culture and commitment to employee well - being • More than $10M of community investment in 2021 • Economic and business development in the communities we serve • Focus on Indigenous partnerships and businesses • Focused on just transition • Fortis - wide Diversity, Equity and Inclusion Advisory Council established • Signatory of the BlackNorth Initiative in efforts to end anti - Black systemic racism ESG LEADERSHIP ENVIRONMENTAL GOVERNANCE • 93% energy delivery assets • Scope 1 GHG emissions reduction target of 75% by 2035 compared to 2019 levels and net zero by 2050 • In 2021, 4% of rate base and 5% of total revenues related to coal - fired electricity; TEP retired 170 i MW of coal generation capacity in June 2022; expect to be coal - free by 2032 • Five - year capital plan includes $5.9B for cleaner energy investments • Executive compensation linked to climate targets • In 2021, TEP added 450 MW of wind and solar power and 30 MW of battery energy storage system • FortisBC has targeted to reduce customer emissions 30% by 2030 relative to 2007 levels • Independent chair; 12 of 13 directors are independent • 54% of directors are female; 16% identify as a visible minority • Average board tenure of 4.9 years • 70% of Fortis utilities have either a female president or female board chair • Board - shareholder engagement ongoing with Board and committee chairs • Decentralized business model and focus on independent governance with each subsidiary governed by its own board of directors SOCIAL 29
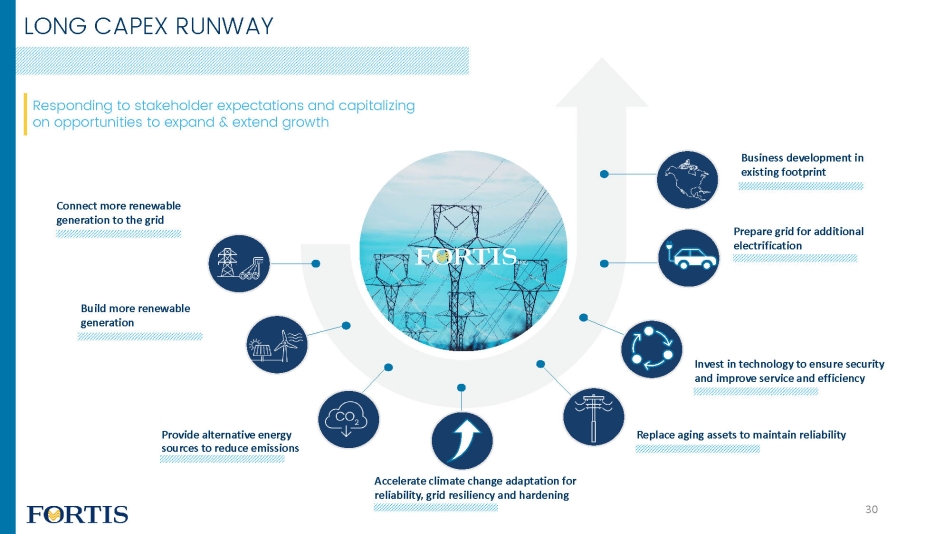
Responding to stakeholder expectations and capitalizing on opportunities to expand & extend growth LONG CAPEX RUNWAY Connect more renewable generation to the grid Build more renewable generation Provide alternative energy sources to reduce emissions Accelerate climate change adaptation for reliability, grid resiliency and hardening Replace aging assets to maintain reliability Invest in technology to ensure security and improve service and efficiency Prepare grid for additional electrification Business development in existing footprint 30
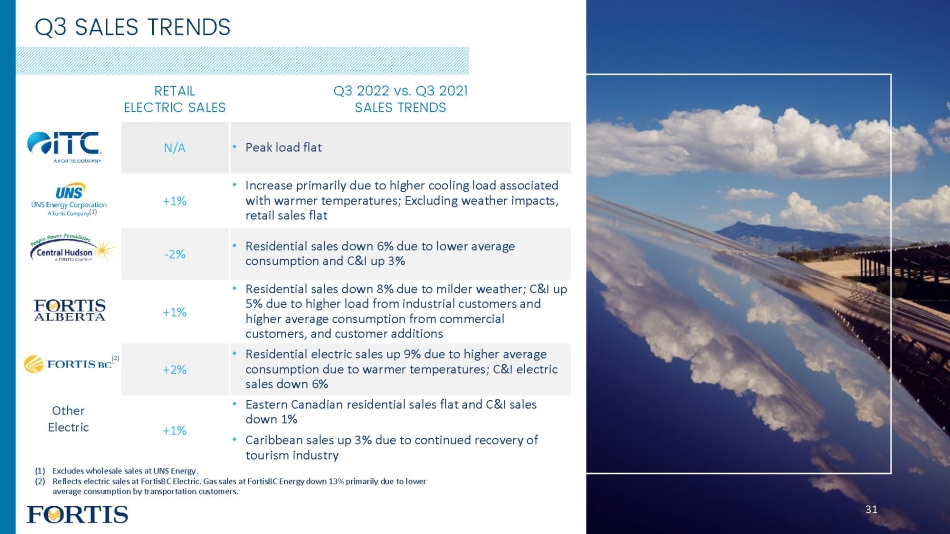
Q3 SALES TRENDS Other Electric (1) Excludes wholesale sales at UNS Energy. (2) Reflects electric sales at FortisBC Electric. Gas sales at FortisBC Energy down 13% primarily due to lower average consumption by transportation customers. RETAIL ELECTRIC SALES Q3 2022 vs. Q3 2021 SALES TRENDS N/A • Peak load flat +1% • Increase primarily due to higher cooling load associated with warmer temperatures; Excluding weather impacts, retail sales flat - 2% • Residential sales down 6% due to lower average consumption and C&I up 3% +1% • Residential sales down 8% due to milder weather; C&I up 5% due to higher load from industrial customers and higher average consumption from commercial customers, and customer additions +2% • Residential electric sales up 9% due to higher average consumption due to warmer temperatures; C&I electric sales down 6% +1% • Eastern Canadian residential sales flat and C&I sales down 1% • Caribbean sales up 3% due to continued recovery of tourism industry (1) (2) 31
LIMITED PENSION EXPOSURE DEFINED BENEFIT PENSION PLANS • 95% of $3.9B pension benefit obligation funded at December 31, 2021 • Allocation of plan assets at December 31, 2021 ▪ Equities – 48% ▪ Fixed income – 45% ▪ Other – 7% • ~80% of pension assets subject to regulatory mechanisms ▪ UNS pension plan assets (~$0.7B) not subject to automatic regulatory mechanisms ▪ Future pension expense depends on actuarial calculations and asset valuations at December 31 st CERTAIN U.S. RETIREMENT BENEFITS • Certain retirement benefits funded through trusts are subject to market volatility each quarter • Decline in market values in 2022 resulted in year - over - year unfavourable EPS impact of $0.05 for YTD September 2022 • ~US$140M in assets at September 30, 2022 32

INVESTMENT - GRADE CREDIT RATINGS COMPANY Fortis Inc. A - (1) Baa3 A (low) ITC Holdings Corp. A - (1) Baa2 n/a ITC Regulated Subsidiaries A A1 n/a TEP A - A3 n/a Central Hudson A - Baa1 n/a FortisBC Energy n/a A3 A FortisBC Electric n/a Baa1 A (low) FortisAlberta A - Baa1 A (low) Newfoundland Power n/a A2 A (1) S&P credit ratings for Fortis Inc. and ITC Holdings Corp. reflect the issuer credit ratings. The unsecured debt rating for Fortis Inc. and ITC Holdings Corp. is BBB+. 33
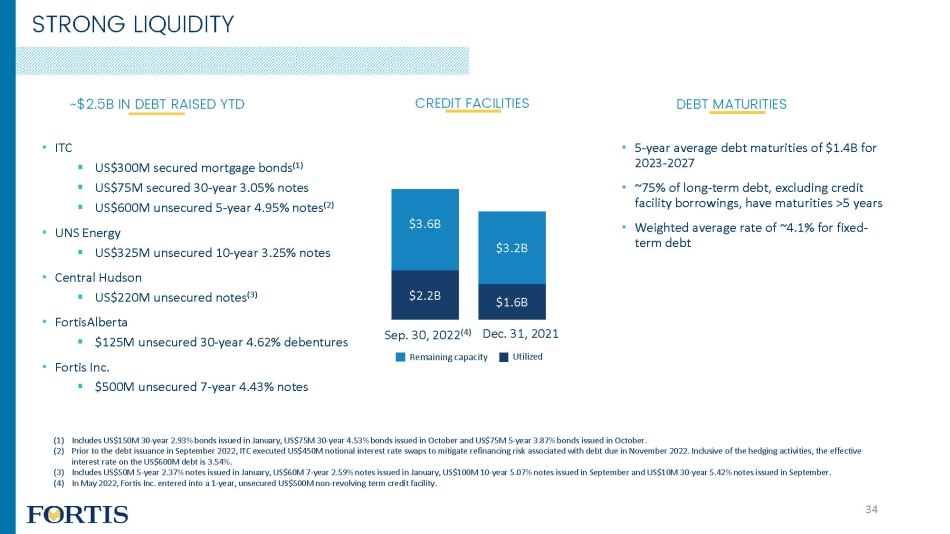
• ITC ▪ US$300M secured mortgage bonds (1) ▪ US$75M secured 30 - year 3.05% notes ▪ US$600M unsecured 5 - year 4.95% notes (2) • UNS Energy ▪ US$325M unsecured 10 - year 3.25% notes • Central Hudson ▪ US$220M unsecured notes (3) • FortisAlberta ▪ $125M unsecured 30 - year 4.62% debentures • Fortis Inc. ▪ $500M unsecured 7 - year 4.43% notes $ 2.2 B $ 1.6 B $ 3.6 B $ 3.2 B Sep. 30, 2022 (4) Dec. 31, 2021 Remaining capacity STRONG LIQUIDITY ~$2.5B IN DEBT RAISED YTD (1) Includes US$150M 30 - year 2.93% bonds issued in January, US$75M 30 - year 4.53% bonds issued in October and US$75M 5 - year 3.87% bon ds issued in October. (2) Prior to the debt issuance in September 2022, ITC executed US$450M notional interest rate swaps to mitigate refinancing risk ass ociated with debt due in November 2022. Inclusive of the hedging activities, the effective interest rate on the US$600M debt is 3.54%. (3) Includes US$50M 5 - year 2.37% notes issued in January, US$60M 7 - year 2.59% notes issued in January, US$100M 10 - year 5.07% notes i ssued in September and US$10M 30 - year 5.42% notes issued in September. (4) In May 2022, Fortis Inc. entered into a 1 - year, unsecured US$500M non - revolving term credit facility. Utilized CREDIT FACILITIES DEBT MATURITIES • 5 - year average debt maturities of $1.4B for 2023 - 2027 • ~75% of long - term debt, excluding credit facility borrowings, have maturities >5 years • Weighted average rate of ~4.1% for fixed - term debt 34

$- $0.5 $1.0 $1.5 $2.0 $2.5 $3.0 2023F 2024F 2025F 2026F 2027F 2028F 2029F 2030F 2031F 2032F Non-Regulated Regulated 10 - YEAR AVERAGE: $1.2B billions Note: Debt as at September 30, 2022 and excludes any new debt issuances during the forecast period. Excludes repayments of fi nan ce leases along with the current portion of credit facilities, which are assumed to be extended by one - year annually. (1) Includes non - regulated debt issued at Fortis Inc. and ITC Holdings. (1) DEBT MATURITIES 35