Exhibit 99.1
Q4 2022 EARNINGS CONFERENCE CALL February 10, 2023 1
Fortis includes forward - looking information in this presentation within the meaning of applicable Canadian securities laws and forward - looking statements within the meaning of the Private Securities Litigation Reform Act of 1995 (collectively referred to as "forward - looking information") . Forward - looking information reflects expectations of Fortis management regarding future growth, results of operations, performance and business prospects and opportunities . Wherever possible, words such as anticipates, believes, budgets, could, estimates, expects, forecasts, intends, may, might, plans, projects, schedule, should, target, will, would, and the negative of these terms, and other similar terminology or expressions have been used to identify the forward - looking information, which includes, without limitation : forecast capital expenditures for 2023 - 2027 , including cleaner energy investments ; forecast rate base and rate base growth for 2023 - 2027 ; dividend growth guidance through 2027 ; the expectation of delivering stable and compelling total returns to shareholders over the long - term ; the 2030 GHG emissions reduction target ; the 2035 GHG emissions reduction target and projected asset mix ; the 2050 net - zero GHG emission target ; TEP's Integrated Resource Plan ; planned coal retirements and the expectation to exit coal by 2032 ; the expected timing, outcome and impact of regulatory proceedings and decisions ; the nature, timing, benefits and expected costs of certain capital projects, including ITC MISO Long - Range Transmission Plan, UNS Energy Renewable Generation ; UNS Energy Vail - to - Tortolita Transmission Project, FortisBC Tilbury LNG Storage Expansion, FortisBC AMI Project, FortisBC Eagle Mountain Woodfibre Gas Line Project, FortisBC Tilbury 1 B Project, FortisBC Okanagan Capacity Upgrade, Wataynikaneyap Transmission Power Project, and additional opportunities beyond the capital plan, including investments related to the Inflation Reduction Act, the MISO Long - Range Transmission Plan, climate adaptation and grid resiliency, and renewable fuel solutions and LNG infrastructure in British Columbia ; the anticipated impacts of the Inflation Reduction Act on the transition to a cleaner energy future, the MISO Long - Range Transmission Plan and TEP's Integrated Resource Plan ; and forecast debt maturities for 2023 - 2032 . Forward looking information involves significant risks, uncertainties and assumptions . Certain material factors or assumptions have been applied in drawing the conclusions contained in the forward - looking information, including, without limitation : no material impact from volatility in energy prices, the global supply chain and rising inflation ; reasonable regulatory decisions and the expectation of regulatory stability ; the successful execution of the capital plan ; no material capital project or financing cost overrun ; no material changes in the assumed U . S . dollar to Canadian dollar exchange rate ; sufficient human resources to deliver service and execute the capital plan ; no significant variability in interest rates ; and the Board exercising its discretion to declare dividends, taking into account the business performance and financial condition of the Corporation . Fortis cautions readers that a number of factors could cause actual results, performance or achievements to differ materially from the results discussed or implied in the forward - looking information . These factors should be considered carefully, and undue reliance should not be placed on the forward - looking information . For additional information with respect to certain of these risks or factors, reference should be made to the continuous disclosure materials filed from time to time by the Corporation with Canadian securities regulatory authorities and the Securities and Exchange Commission . All forward - looking information herein is given as of the date of this presentation . Fortis disclaims any intention or obligation to update or revise any forward - looking information, whether as a result of new information, future events or otherwise . Unless otherwise specified, all financial information is in Canadian dollars and rate base refers to midyear rate base . FORWARD - LOOKING INFORMATION 2

DAVID HUTCHENS President and CEO 3
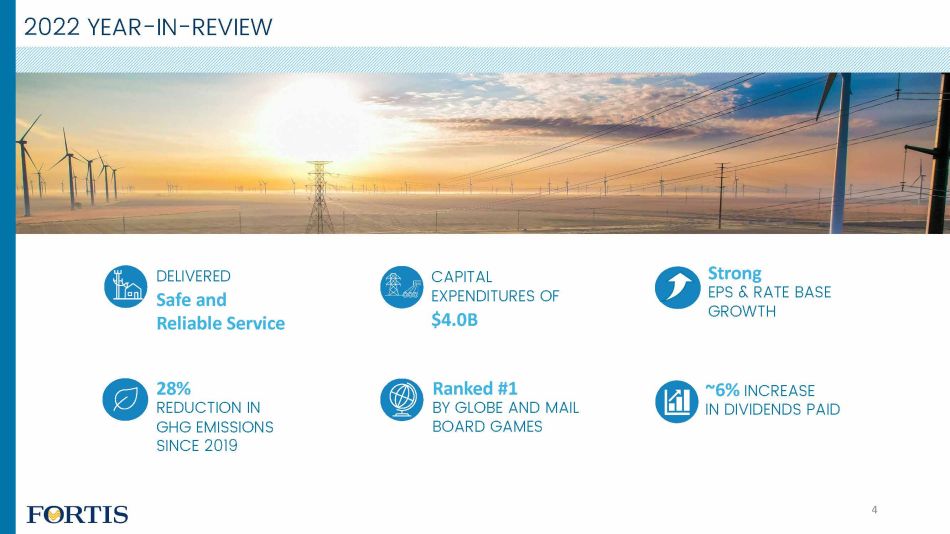
2022 YEAR - IN - REVIEW 28% REDUCTION IN GHG EMISSIONS SINCE 2019 CAPITAL EXPENDITURES OF $4.0B Strong EPS & RATE BASE GROWTH DELIVERED Safe and Reliable Service Ranked #1 BY GLOBE AND MAIL BOARD GAMES 4 ~6% INCREASE IN DIVIDENDS PAID
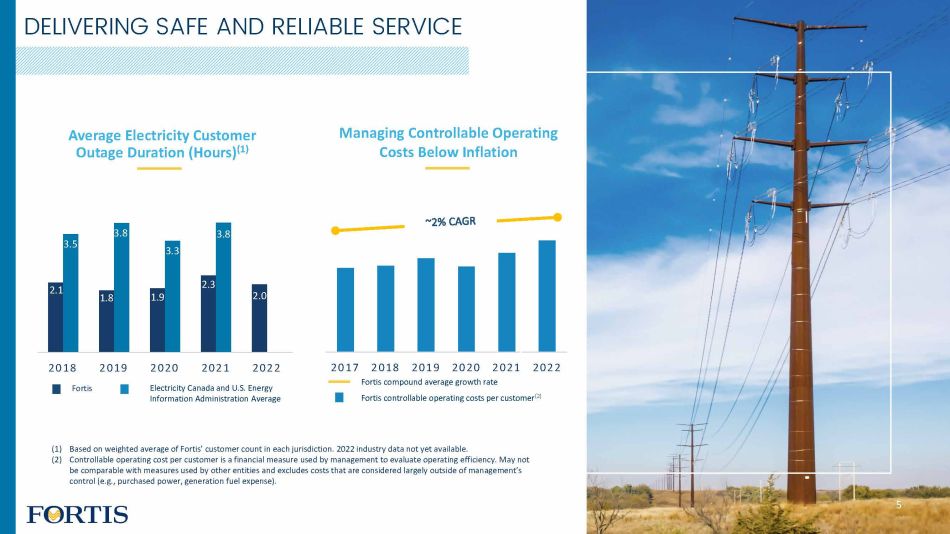
2.1 1.8 1.9 2.3 2.0 3.5 3.8 3.3 3.8 2018 2019 Fortis 2020 2021 2022 Electricity Canada and U.S. Energy Information Administration Average DELIVERING SAFE AND RELIABLE SERVICE Managing Controllable Operating Costs Below Inflation Average Electricity Customer Outage Duration (Hours) (1) (1) Based on weighted average of Fortis’ customer count in each jurisdiction. 2022 industry data not yet available. (2) Controllable operating cost per customer is a financial measure used by management to evaluate operating efficiency. May not be comparable with measures used by other entities and excludes costs that are considered largely outside of management’s control (e.g., purchased power, generation fuel expense). 2017 2018 2019 2020 2021 2022 Fortis compound average growth rate Fortis controllable operating costs per customer (2) 5
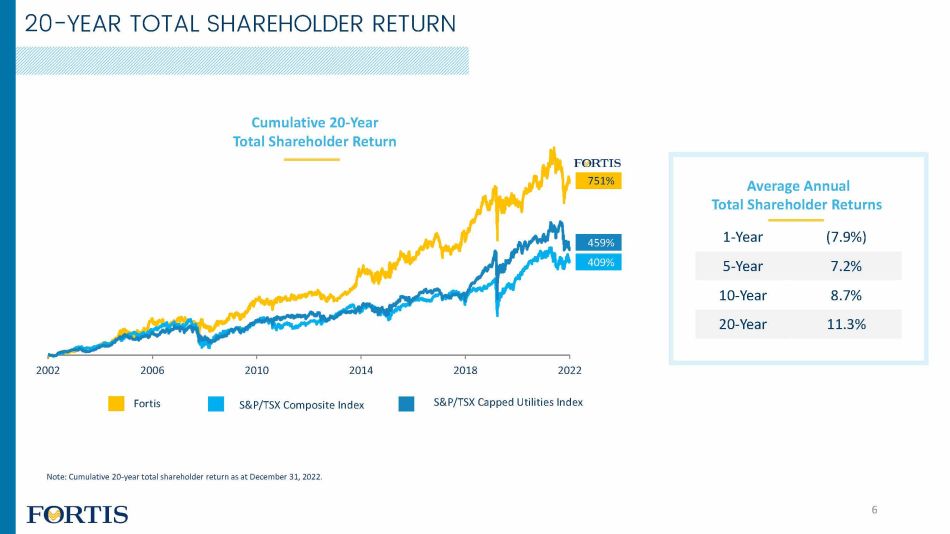
20 - YEAR TOTAL SHAREHOLDER RETURN Average Annual Total Shareholder Returns 1 - Year (7.9%) 5 - Year 7.2% 10 - Year 8.7% 20 - Year 11.3% 2002 2006 751% 459% 409% Note: Cumulative 20 - year total shareholder return as at December 31, 2022. 2010 2014 S&P/TSX Composite Index 2018 2022 S&P/TSX Capped Utilities Index Fortis Cumulative 20 - Year Total Shareholder Return 6
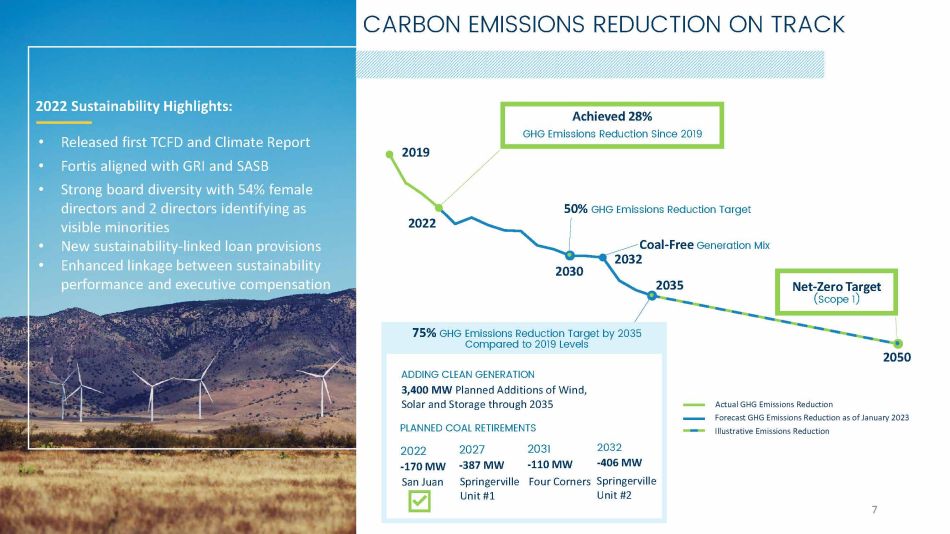
CARBON EMISSIONS REDUCTION ON TRACK 2022 Sustainability Highlights: • Released first TCFD and Climate Report • Fortis aligned with GRI and SASB • Strong board diversity with 54% female directors and 2 directors identifying as visible minorities • New sustainability - linked loan provisions • Enhanced linkage between sustainability performance and executive compensation 2022 2019 2050 2030 2035 2027 - 387 MW 2031 - 110 MW 2032 - 406 MW 2022 - 170 MW San Juan Springerville Four Corners Springerville Unit #1 Unit #2 50% GHG Emissions Reduction Target Coal - Free Generation Mix 2032 75% GHG Emissions Reduction Target by 2035 Compared to 2019 Levels ADDING CLEAN GENERATION 3,400 MW Planned Additions of Wind, Solar and Storage through 2035 PLANNED COAL RETIREMENTS Actual GHG Emissions Reduction Forecast GHG Emissions Reduction as of January 2023 Illustrative Emissions Reduction Net - Zero Target (Scope 1) Achieved 28% GHG Emissions Reduction Since 2019 7
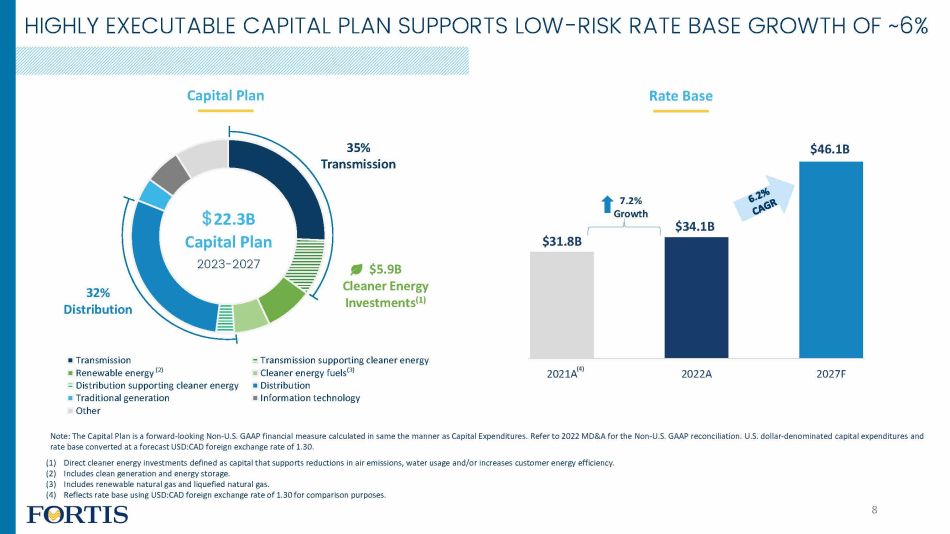
$31.8B $34.1B $46.1B 2021A (4) 2022A 2027F HIGHLY EXECUTABLE CAPITAL PLAN SUPPORTS LOW - RISK RATE BASE GROWTH OF ~6% Note: The Capital Plan is a forward - looking Non - U.S. GAAP financial measure calculated in same the manner as Capital Expenditures. Refer to 2022 MD&A for the Non - U.S. GAAP reconciliation. U.S. dollar - denominated capital expenditures and rate base converted at a forecast USD:CAD foreign exchange rate of 1.30. (1) Direct cleaner energy investments defined as capital that supports reductions in air emissions, water usage and/or increases customer energy efficiency. (2) Includes clean generation and energy storage. (3) Includes renewable natural gas and liquefied natural gas. (4) Reflects rate base using USD:CAD foreign exchange rate of 1.30 for comparison purposes. 35% Transmission 32% Distribution $5.9B Cleaner Energy Investments (1) Transmission Renewable energy (2) Distribution supporting cleaner energy Traditional generation Other Transmission supporting cleaner energy Cleaner energy fuels (3) Distribution Information technology $ 22.3B Capital Plan 2023 - 2027 Rate Base Capital Plan 7.2% Growth 8
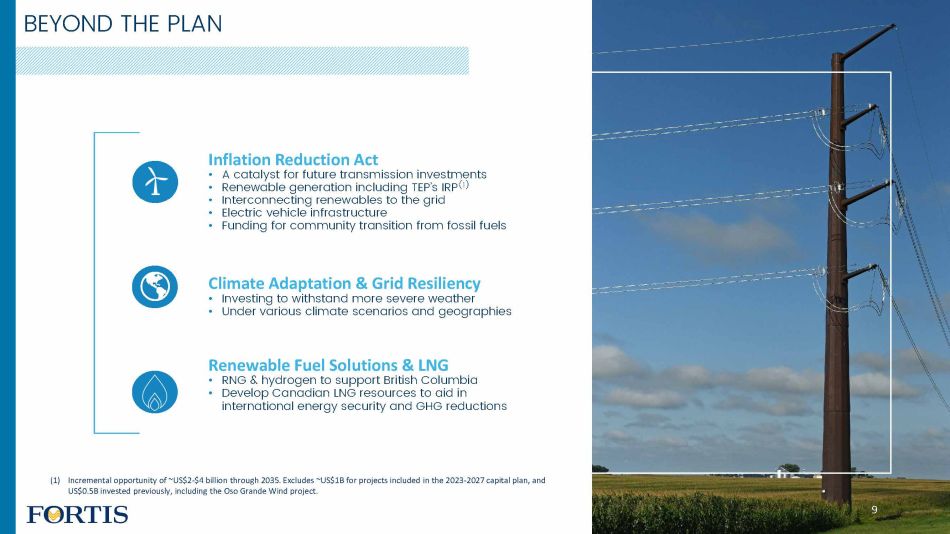
BEYOND THE PLAN Climate Adaptation & Grid Resiliency • Investing to withstand more severe weather • Under various climate scenarios and geographies Renewable Fuel Solutions & LNG • RNG & hydrogen to support British Columbia • Develop Canadian LNG resources to aid in international energy security and GHG reductions Inflation Reduction Act • A catalyst for future transmission investments • Renewable generation including TEP’s IRP (1) • Interconnecting renewables to the grid • Electric vehicle infrastructure • Funding for community transition from fossil fuels (1) Incremental opportunity of ~US$2 - $4 billion through 2035. Excludes ~US$1B for projects included in the 2023 - 2027 capital plan, and US$0.5B invested previously, including the Oso Grande Wind project. 9
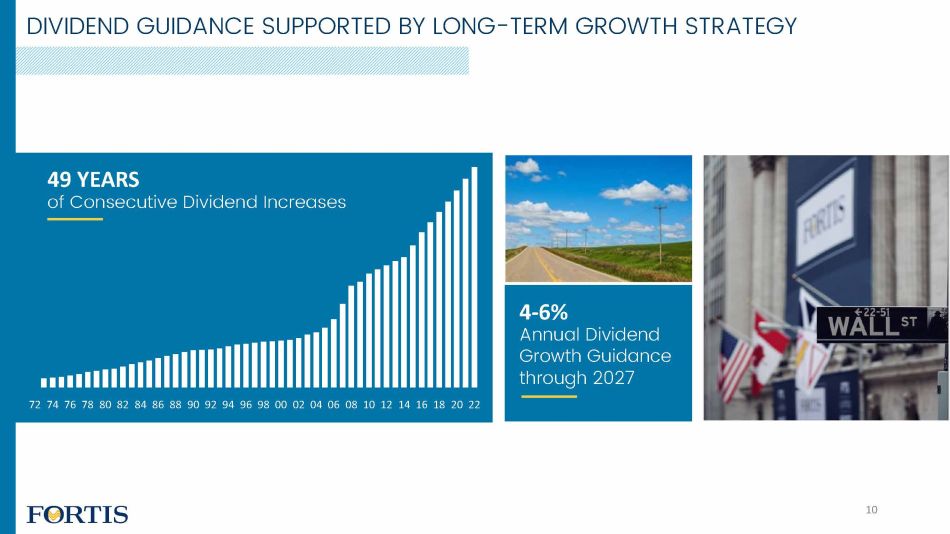
DIVIDEND GUIDANCE SUPPORTED BY LONG - TERM GROWTH STRATEGY 49 YEARS of Consecutive Dividend Increases 72 74 76 78 80 82 84 86 88 90 92 94 96 98 00 02 04 06 08 10 12 14 16 18 20 22 4 - 6% Annual Dividend Growth Guidance through 2027 10

JOCELYN PERRY Executive Vice President and CFO 11
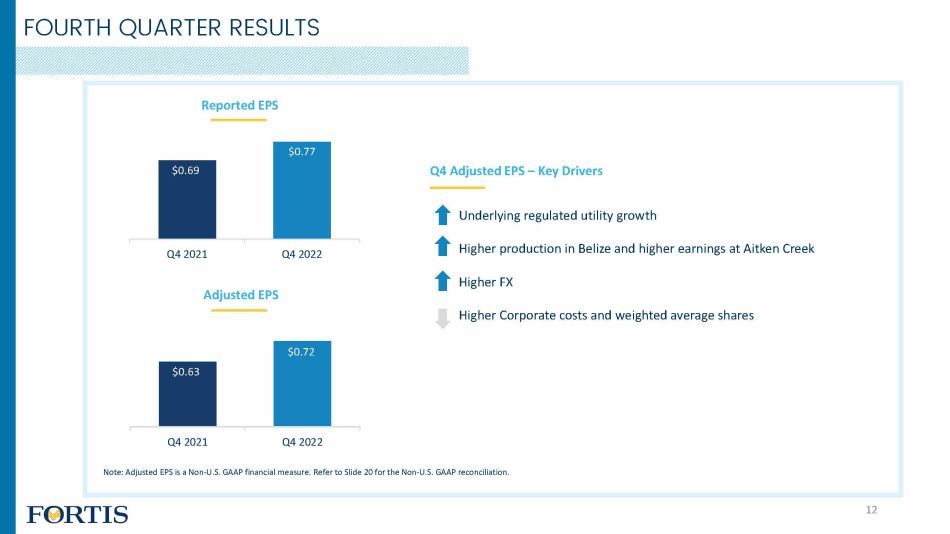
FOURTH QUARTER RESULTS Reported EPS Adjusted EPS $0.69 $0.77 Q4 2021 Q4 2022 Q4 Adjusted EPS – Key Drivers Underlying regulated utility growth 12 Higher production in Belize and higher earnings at Aitken Creek Higher FX Higher Corporate costs and weighted average shares $0.63 $0.72 Q4 2021 Q4 2022 Note: Adjusted EPS is a Non - U.S. GAAP financial measure. Refer to Slide 20 for the Non - U.S. GAAP reconciliation.
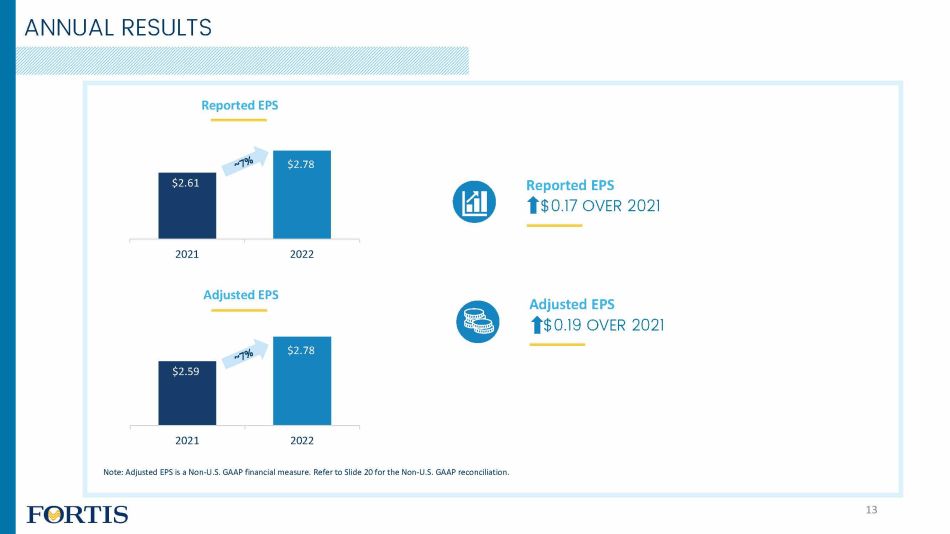
ANNUAL RESULTS Reported EPS Adjusted EPS $2.61 $2.78 2021 2022 Adjusted EPS $0.19 OVER 2021 Reported EPS $0.17 OVER 2021 $2.59 $2.78 2021 2022 Note: Adjusted EPS is a Non - U.S. GAAP financial measure. Refer to Slide 20 for the Non - U.S. GAAP reconciliation. 13

$2.59 $0.07 $0.07 $0.06 $0.05 $0.03 $0.06 ($0.11) ($0.04) $2.78 2021 Adjusted EPS (1) U.S. Transmission (ITC) Western Canadian Electric & Gas (2) U.S. Electric & Gas (3) Energy Infrastructure Other Electric Foreign Exchange (4) Corporate and Other Weighted Average Shares 2022 Adjusted EPS (1) (1) Non - U.S. GAAP financial measure. Refer to Slide 20 for the Non - U.S. GAAP reconciliation. (2) Includes FortisBC Energy, FortisAlberta and FortisBC Electric. (3) Includes UNS Energy and Central Hudson. (4) Impact of average USD:CAD foreign exchange rate of 1.30 in 2022 compared to 1.25 in 2021. ANNUAL EPS DRIVERS 2022 Adjusted EPS $0.19 Over 2021 14
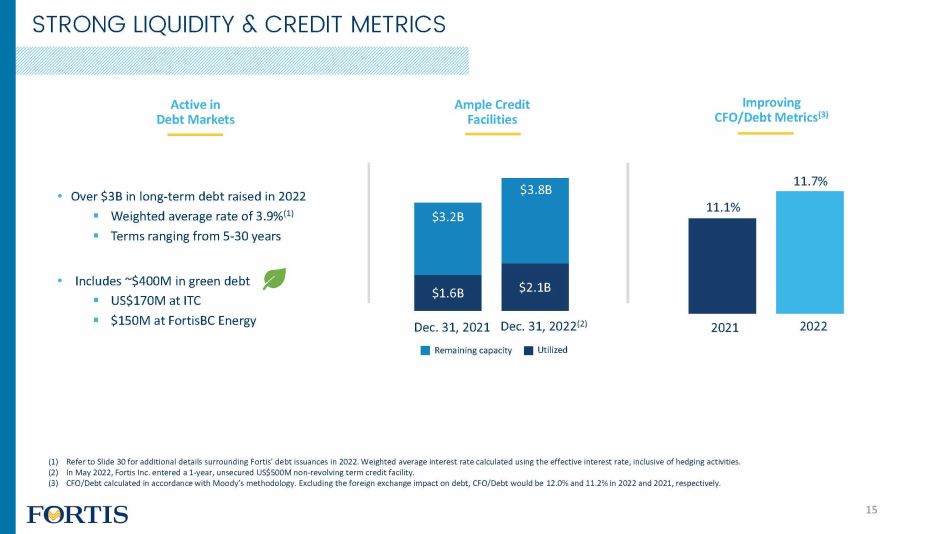
• Over $3B in long - term debt raised in 2022 ▪ Weighted average rate of 3.9% (1) ▪ Terms ranging from 5 - 30 years • Includes ~$400M in green debt ▪ US$170M at ITC ▪ $150M at FortisBC Energy $1.6B $2.1B $3.2B $3.8B Dec. 31, 2022 (2) Dec. 31, 2021 Remaining capacity Utilized STRONG LIQUIDITY & CREDIT METRICS (1) Refer to Slide 30 for additional details surrounding Fortis’ debt issuances in 2022. Weighted average interest rate calculated using the effective interest rate, inclusive of hedging activities. (2) In May 2022, Fortis Inc. entered a 1 - year, unsecured US$500M non - revolving term credit facility. (3) CFO/Debt calculated in accordance with Moody’s methodology. Excluding the foreign exchange impact on debt, CFO/Debt would be 12.0% and 11.2% in 2022 and 2021, respectively. Improving CFO/Debt Metrics (3) 2021 2022 11.1% 11.7% Active in Debt Markets 15 Ample Credit Facilities
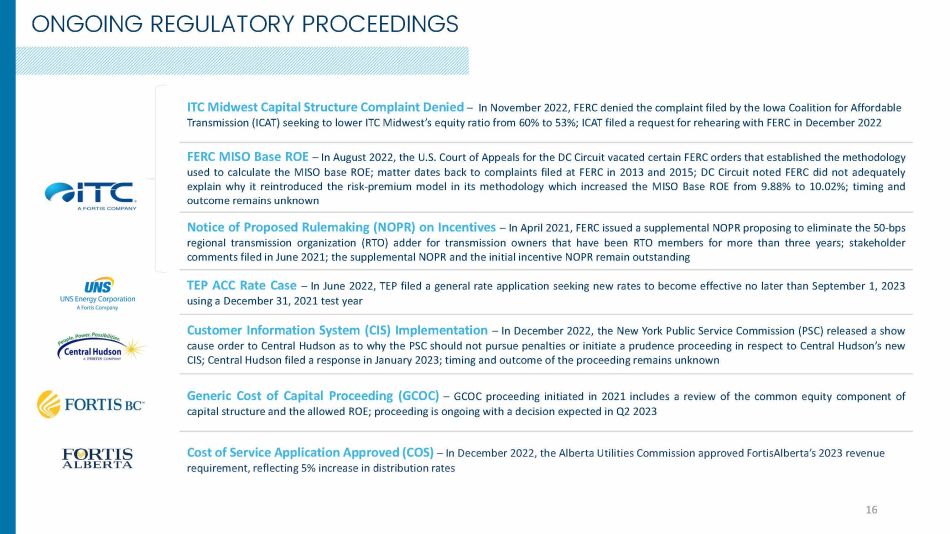
ITC Midwest Capital Structure Complaint Denied – In November 2022, FERC denied the complaint filed by the Iowa Coalition for Affordable Transmission (ICAT) seeking to lower ITC Midwest’s equity ratio from 60% to 53%; ICAT filed a request for rehearing with FERC in December 2022 FERC MISO Base ROE – In August 2022 , the U . S . Court of Appeals for the DC Circuit vacated certain FERC orders that established the methodology used to calculate the MISO base ROE ; matter dates back to complaints filed at FERC in 2013 and 2015 ; DC Circuit noted FERC did not adequately explain why it reintroduced the risk - premium model in its methodology which increased the MISO Base ROE from 9 . 88 % to 10 . 02 % ; timing and outcome remains unknown Notice of Proposed Rulemaking (NOPR) on Incentives – In April 2021 , FERC issued a supplemental NOPR proposing to eliminate the 50 - bps regional transmission organization (RTO) adder for transmission owners that have been RTO members for more than three years ; stakeholder comments filed in June 2021 ; the supplemental NOPR and the initial incentive NOPR remain outstanding TEP ACC Rate Case – In June 2022, TEP filed a general rate application seeking new rates to become effective no later than September 1, 2023 using a December 31, 2021 test year Customer Information System (CIS) Implementation – In December 2022 , the New York Public Service Commission (PSC) released a show cause order to Central Hudson as to why the PSC should not pursue penalties or initiate a prudence proceeding in respect to Central Hudson’s new CIS ; Central Hudson filed a response in January 2023 ; timing and outcome of the proceeding remains unknown Generic Cost of Capital Proceeding (GCOC) – GCOC proceeding initiated in 2021 includes a review of the common equity component of capital structure and the allowed ROE; proceeding is ongoing with a decision expected in Q2 2023 Cost of Service Application Approved (COS) – In December 2022, the Alberta Utilities Commission approved FortisAlberta’s 2023 revenue requirement, reflecting 5% increase in distribution rates ONGOING REGULATORY PROCEEDINGS 16
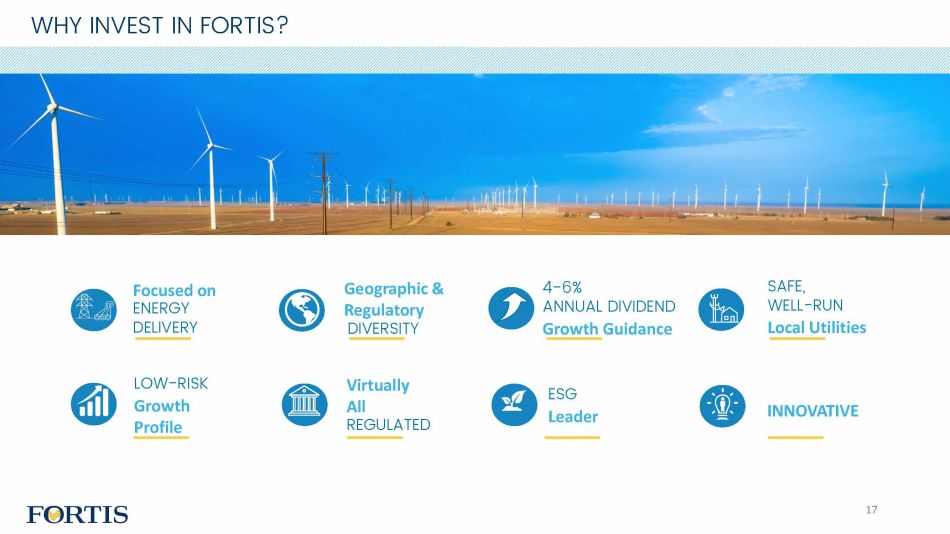
WHY INVEST IN FORTIS? Focused on ENERGY DELIVERY Geographic & Regulatory DIVERSITY 4 - 6% ANNUAL DIVIDEND Growth Guidance SAFE, WELL - RUN Local Utilities LOW - RISK Growth Profile Virtually All REGULATED ESG Leader INNOVATIVE 17
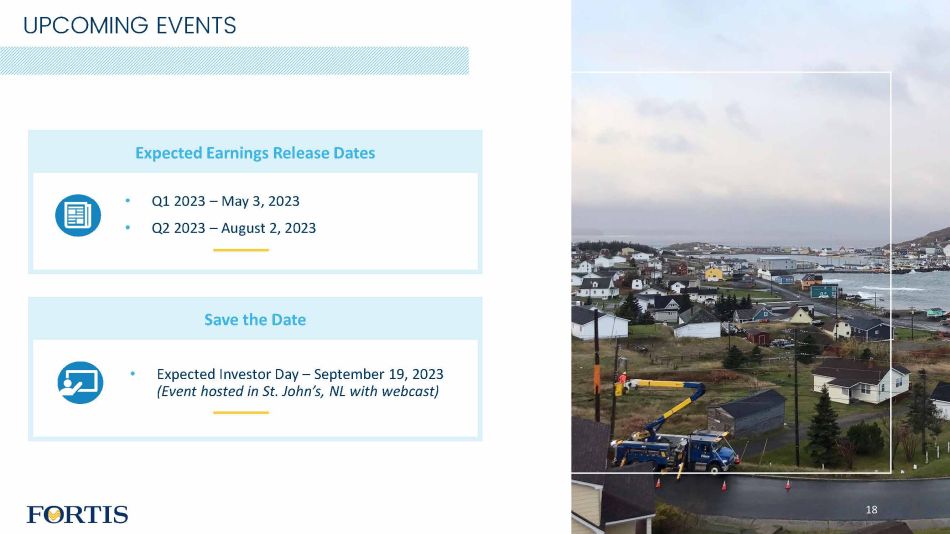
• Expected Investor Day – September 19, 2023 (Event hosted in St. John’s, NL with webcast) • Q1 2023 – May 3, 2023 • Q2 2023 – August 2, 2023 Expected Earnings Release Dates Save the Date UPCOMING EVENTS 18

Q4 2022 EARNINGS CONFERENCE CALL February 10, 2023 19
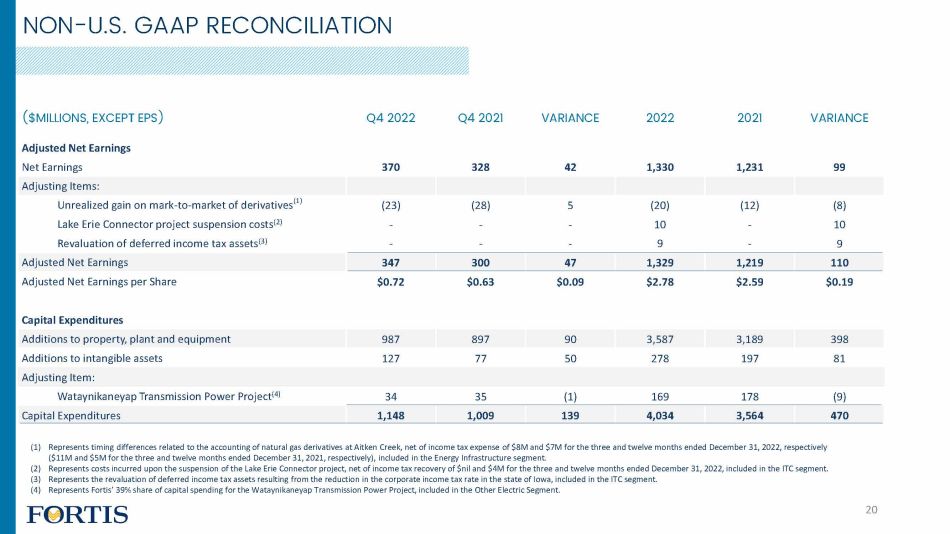
($MILLIONS, EXCEPT EPS) Q4 2022 Q4 2021 VARIANCE 2022 2021 VARIANCE Adjusted Net Earnings Net Earnings 370 328 42 1,330 1,231 99 Adjusting Items: Unrealized gain on mark - to - market of derivatives (1) (23) (28) 5 (20) (12) (8) Lake Erie Connector project suspension costs (2) - - - 10 - 10 Revaluation of deferred income tax assets (3) - - - 9 - 9 Adjusted Net Earnings 347 300 47 1,329 1,219 110 Adjusted Net Earnings per Share $0.72 $0.63 $0.09 $2.78 $2.59 $0.19 Capital Expenditures Additions to property, plant and equipment 987 897 90 3,587 3,189 398 Additions to intangible assets 127 77 50 278 197 81 Adjusting Item: Wataynikaneyap Transmission Power Project (4) 34 35 (1) 169 178 (9) Capital Expenditures 1,148 1,009 139 4,034 3,564 470 (1) Represents timing differences related to the accounting of natural gas derivatives at Aitken Creek, net of income tax expense of $8M and $7M for the three and twelve months ended December 31, 2022, respectively ($11M and $5M for the three and twelve months ended December 31, 2021, respectively), included in the Energy Infrastructure segment. (2) Represents costs incurred upon the suspension of the Lake Erie Connector project, net of income tax recovery of $nil and $4M for the three and twelve months ended December 31, 2022, included in the ITC segment. (3) Represents the revaluation of deferred income tax assets resulting from the reduction in the corporate income tax rate in the state of Iowa, included in the ITC segment. (4) Represents Fortis’ 39% share of capital spending for the Wataynikaneyap Transmission Power Project, included in the Other Electric Segment. 20 NON - U.S. GAAP RECONCILIATION
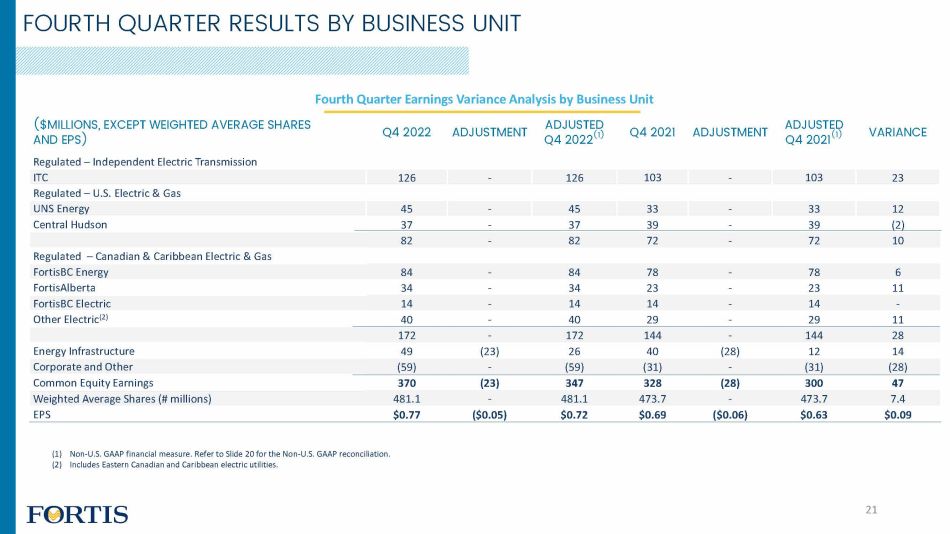
Fourth Quarter Earnings Variance Analysis by Business Unit ($MILLIONS, EXCEPT WEIGHTED AVERAGE SHARES AND EPS) Q4 2022 ADJUSTMENT ADJUSTED Q4 2022 (1) Q4 2021 ADJUSTMENT ADJUSTED Q4 2021 (1) VARIANCE Regulated – Independent Electric Transmission ITC 126 - 126 103 - 103 23 Regulated – U.S. Electric & Gas UNS Energy 45 - 45 33 - 33 12 Central Hudson 37 - 37 39 - 39 (2) 82 - 82 72 - 72 10 Regulated – Canadian & Caribbean Electric & Gas FortisBC Energy 84 - 84 78 - 78 6 FortisAlberta 34 - 34 23 - 23 11 FortisBC Electric 14 - 14 14 - 14 - Other Electric (2) 40 - 40 29 - 29 11 172 - 172 144 - 144 28 Energy Infrastructure 49 (23) 26 40 (28) 12 14 Corporate and Other (59) - (59) (31) - (31) (28) Common Equity Earnings 370 (23) 347 328 (28) 300 47 Weighted Average Shares (# millions) 481.1 - 481.1 473.7 - 473.7 7.4 EPS $0.77 ($0.05) $0.72 $0.69 ($0.06) $0.63 $0.09 (1) Non - U.S. GAAP financial measure. Refer to Slide 20 for the Non - U.S. GAAP reconciliation. (2) Includes Eastern Canadian and Caribbean electric utilities. 21 FOURTH QUARTER RESULTS BY BUSINESS UNIT
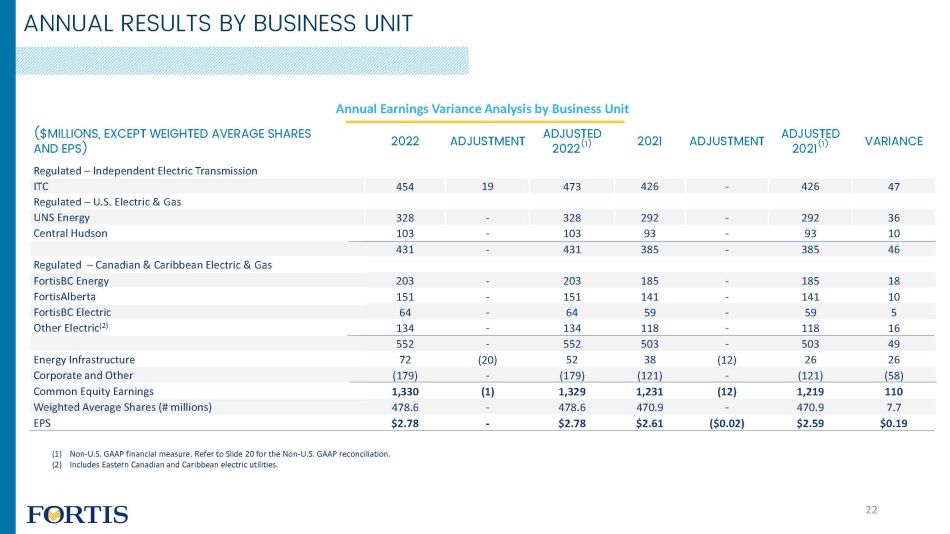
Annual Earnings Variance Analysis by Business Unit ($MILLIONS, EXCEPT WEIGHTED AVERAGE SHARES AND EPS) 2022 ADJUSTMENT ADJUSTED 2022 (1) 2021 ADJUSTMENT ADJUSTED 2021 (1) VARIANCE Regulated – Independent Electric Transmission ITC 454 19 473 426 - 426 47 Regulated – U.S. Electric & Gas UNS Energy 328 - 328 292 - 292 36 Central Hudson 103 - 103 93 - 93 10 431 - 431 385 - 385 46 Regulated – Canadian & Caribbean Electric & Gas FortisBC Energy 203 - 203 185 - 185 18 FortisAlberta 151 - 151 141 - 141 10 FortisBC Electric 64 - 64 59 - 59 5 Other Electric (2) 134 - 134 118 - 118 16 552 - 552 503 - 503 49 Energy Infrastructure 72 (20) 52 38 (12) 26 26 Corporate and Other (179) - (179) (121) - (121) (58) Common Equity Earnings 1,330 (1) 1,329 1,231 (12) 1,219 110 Weighted Average Shares (# millions) 478.6 - 478.6 470.9 - 470.9 7.7 EPS $2.78 - $2.78 $2.61 ($0.02) $2.59 $0.19 (1) Non - U.S. GAAP financial measure. Refer to Slide 20 for the Non - U.S. GAAP reconciliation. (2) Includes Eastern Canadian and Caribbean electric utilities. 22 ANNUAL RESULTS BY BUSINESS UNIT
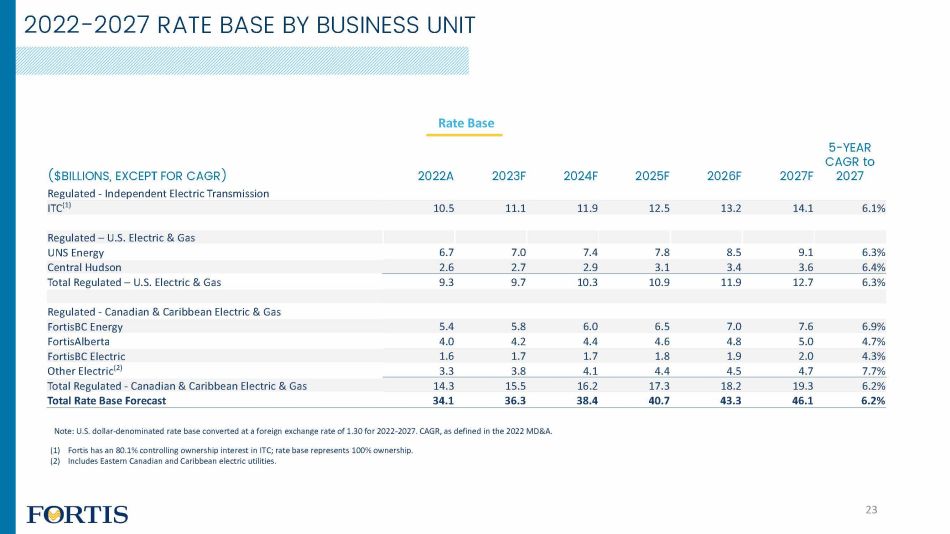
Rate Base 2022A ($BILLIONS, EXCEPT FOR CAGR) Regulated - Independent Electric Transmission ITC (1) 10.5 11.1 11.9 12.5 13.2 14.1 6.1% Regulated – U.S. Electric & Gas UNS Energy 6.7 7.0 7.4 7.8 8.5 9.1 6.3% Central Hudson 2.6 2.7 2.9 3.1 3.4 3.6 6.4% Total Regulated – U.S. Electric & Gas 9.3 9.7 10.3 10.9 11.9 12.7 6.3% Regulated - Canadian & Caribbean Electric & Gas FortisBC Energy 5.4 5.8 6.0 6.5 7.0 7.6 6.9% FortisAlberta 4.0 4.2 4.4 4.6 4.8 5.0 4.7% FortisBC Electric 1.6 1.7 1.7 1.8 1.9 2.0 4.3% Other Electric (2) 3.3 3.8 4.1 4.4 4.5 4.7 7.7% Total Regulated - Canadian & Caribbean Electric & Gas 14.3 15.5 16.2 17.3 18.2 19.3 6.2% Total Rate Base Forecast 34.1 36.3 38.4 40.7 43.3 46.1 6.2% 2023F 2024F 2025F 2026F 5 - YEAR CAGR to 2027F 2027 2022 - 2027 RATE BASE BY BUSINESS UNIT Note: U.S. dollar - denominated rate base converted at a foreign exchange rate of 1.30 for 2022 - 2027. CAGR, as defined in the 2022 MD&A. (1) Fortis has an 80.1% controlling ownership interest in ITC; rate base represents 100% ownership. (2) Includes Eastern Canadian and Caribbean electric utilities. 23
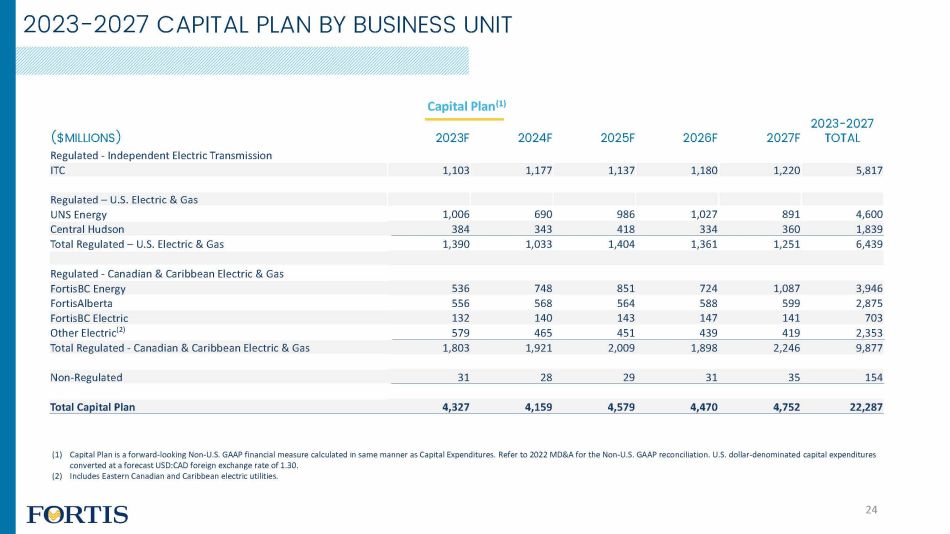
Capital Plan (1) ($MILLIONS) 2023F 2024F 2025F 2026F 2027F 2023 - 2027 TOTAL Regulated - Independent Electric Transmission ITC 1,103 1,177 1,137 1,180 1,220 5,817 Regulated – U.S. Electric & Gas UNS Energy 1,006 690 986 1,027 891 4,600 Central Hudson 384 343 418 334 360 1,839 Total Regulated – U.S. Electric & Gas 1,390 1,033 1,404 1,361 1,251 6,439 Regulated - Canadian & Caribbean Electric & Gas FortisBC Energy 536 748 851 724 1,087 3,946 FortisAlberta 556 568 564 588 599 2,875 FortisBC Electric 132 140 143 147 141 703 Other Electric (2) 579 465 451 439 419 2,353 Total Regulated - Canadian & Caribbean Electric & Gas 1,803 1,921 2,009 1,898 2,246 9,877 Non - Regulated 31 28 29 31 35 154 Total Capital Plan 4,327 4,159 4,579 4,470 4,752 22,287 (1) Capital Plan is a forward - looking Non - U.S. GAAP financial measure calculated in same manner as Capital Expenditures. Refer to 2022 MD&A for the Non - U.S. GAAP reconciliation. U.S. dollar - denominated capital expenditures converted at a forecast USD:CAD foreign exchange rate of 1.30. (2) Includes Eastern Canadian and Caribbean electric utilities. 24 2023 - 2027 CAPITAL PLAN BY BUSINESS UNIT
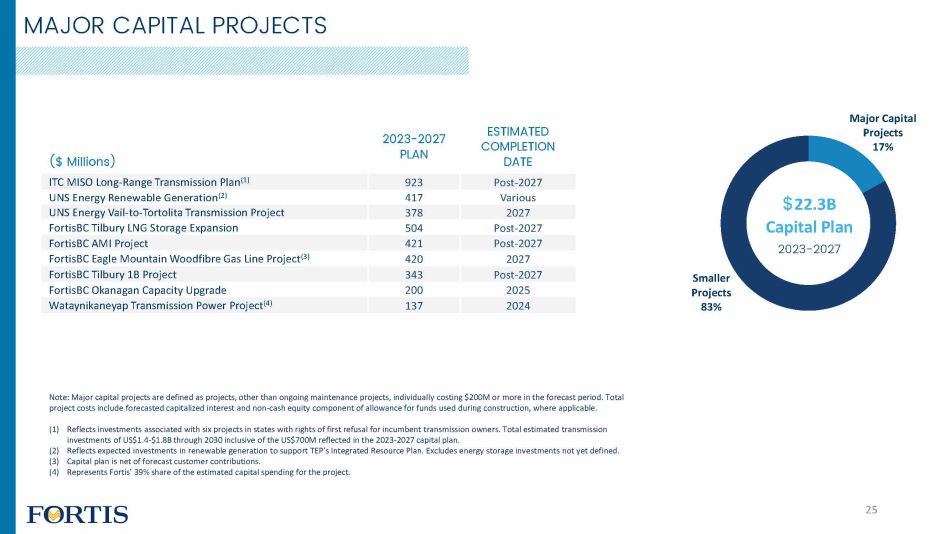
MAJOR CAPITAL PROJECTS ($ Millions) 2023 - 2027 PLAN ESTIMATED COMPLETION DATE ITC MISO Long - Range Transmission Plan (1) 923 Post - 2027 UNS Energy Renewable Generation (2) 417 Various UNS Energy Vail - to - Tortolita Transmission Project 378 2027 FortisBC Tilbury LNG Storage Expansion 504 Post - 2027 FortisBC AMI Project 421 Post - 2027 FortisBC Eagle Mountain Woodfibre Gas Line Project (3) 420 2027 FortisBC Tilbury 1B Project 343 Post - 2027 FortisBC Okanagan Capacity Upgrade 200 2025 Wataynikaneyap Transmission Power Project (4) 137 2024 $ 22.3B Capital Plan 2023 - 2027 Smaller Projects 83% 25 Note: Major capital projects are defined as projects, other than ongoing maintenance projects, individually costing $200M or more in the forecast period. Total project costs include forecasted capitalized interest and non - cash equity component of allowance for funds used during construction, where applicable. (1) Reflects investments associated with six projects in states with rights of first refusal for incumbent transmission owners. Total estimated transmission investments of US$1.4 - $1.8B through 2030 inclusive of the US$700M reflected in the 2023 - 2027 capital plan. (2) Reflects expected investments in renewable generation to support TEP’s Integrated Resource Plan. Excludes energy storage investments not yet defined. (3) Capital plan is net of forecast customer contributions. (4) Represents Fortis’ 39% share of the estimated capital spending for the project. Major Capital Projects 17%
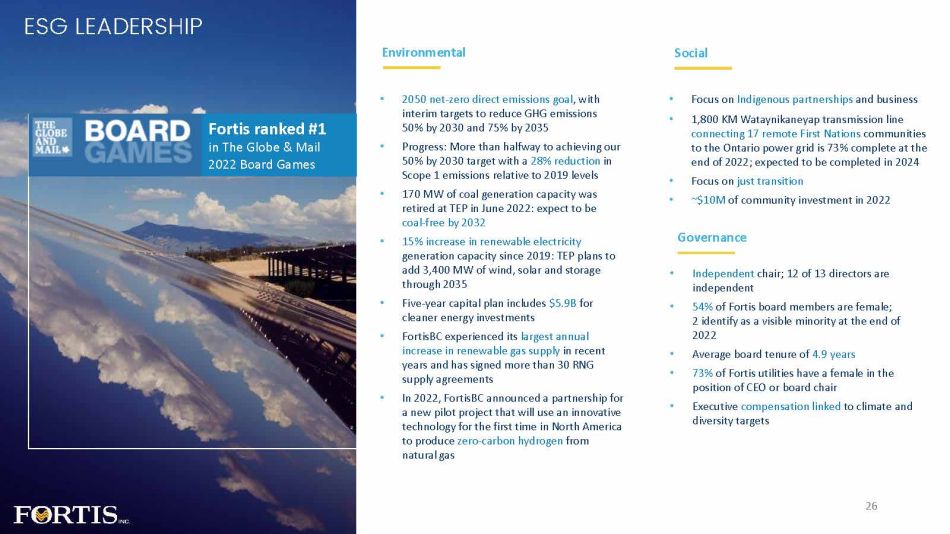
ESG LEADERSHIP Environmental Fortis ranked #1 in The Globe & Mail 2022 Board Games • 2050 net - zero direct emissions goal , with interim targets to reduce GHG emissions 50 % by 2030 and 75 % by 2035 • Progress: More than halfway to achieving our 50% by 2030 target with a 28% reduction in Scope 1 emissions relative to 2019 levels • 170 MW of coal generation capacity was retired at TEP in June 2022 : expect to be coal - free by 2032 • 15% increase in renewable electricity generation capacity since 2019: TEP plans to add 3,400 MW of wind, solar and storage through 2035 • Five - year capital plan includes $5.9B for cleaner energy investments • FortisBC experienced its largest annual increase in renewable gas supply in recent years and has signed more than 30 RNG supply agreements • In 2022, FortisBC announced a partnership for a new pilot project that will use an innovative technology for the first time in North America to produce zero - carbon hydrogen from natural gas • Focus on Indigenous partnerships and business • 1,800 KM Wataynikaneyap transmission line connecting 17 remote First Nations communities to the Ontario power grid is 73% complete at the end of 2022; expected to be completed in 2024 • Focus on just transition • ~$10M of community investment in 2022 • Independent chair; 12 of 13 directors are independent • 54% of Fortis board members are female; 2 identify as a visible minority at the end of 2022 • Average board tenure of 4.9 years • 73% of Fortis utilities have a female in the position of CEO or board chair • Executive compensation linked to climate and diversity targets Social Governance 26
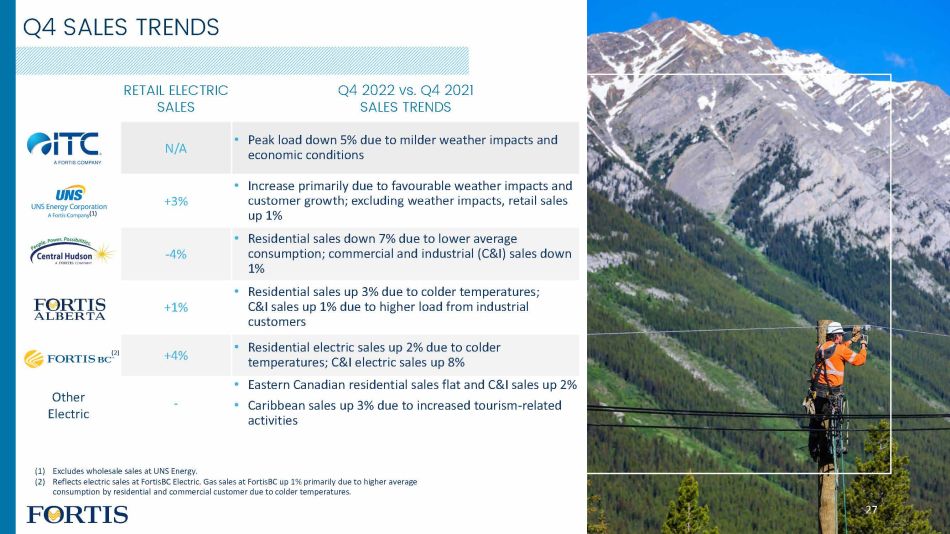
Q4 SALES TRENDS Other Electric (1) Excludes wholesale sales at UNS Energy. (2) Reflects electric sales at FortisBC Electric. Gas sales at FortisBC up 1% primarily due to higher average consumption by residential and commercial customer due to colder temperatures. RETAIL ELECTRIC SALES Q4 2022 vs. Q4 2021 SALES TRENDS N/A • Peak load down 5% due to milder weather impacts and economic conditions +3% • Increase primarily due to favourable weather impacts and customer growth; excluding weather impacts, retail sales up 1% - 4% • Residential sales down 7% due to lower average consumption; commercial and industrial (C&I) sales down 1% +1% • Residential sales up 3% due to colder temperatures; C&I sales up 1% due to higher load from industrial customers +4% • Residential electric sales up 2% due to colder temperatures; C&I electric sales up 8% - • Eastern Canadian residential sales flat and C&I sales up 2% • Caribbean sales up 3% due to increased tourism - related activities (1) 27 (2)

2022 SALES TRENDS Other Electric (1) Excludes wholesale sales at UNS Energy. (2) Reflects electric sales at FortisBC Electric. Gas sales at FortisBC Energy up 1% primarily due to higher average consumption by residential and commercial customer due to colder temperatures. RETAIL ELECTRIC SALES 2022 vs. 2021 SALES TRENDS N/A • Peak load up 1% due to favourable weather impacts +1% • Increase primarily due to higher cooling load associated with warmer temperatures and customer growth; Excluding weather impacts, retail sales flat - • Residential sales down 1% due to lower average consumption and C&I up 2% +2% • Residential sales down 2% due to milder weather in Q3; C&I up 3% due to higher load from industrial customers, higher average consumption from commercial customers, and customer additions +2% • Residential electric sales flat; C&I electric sales up 5% due to higher average consumption by industrial customers +2% • Eastern Canadian residential and C&I sales each up 2% • Caribbean sales up 3% due to increased tourism - related activities (1) 28 (2)
LIMITED PENSION EXPOSURE Defined Benefit Pension Plans • 101% of $3.1B pension benefit obligation funded at December 31, 2022 • Allocation of plan assets at December 31, 2022 ▪ Equities – 48% ▪ Fixed income – 43% ▪ Other – 9% • ~80% of pension assets subject to regulatory mechanisms ▪ UNS pension plan assets (~$0.6B) not subject to automatic regulatory mechanisms ▪ No significant change expected in UNS’ 2023 pension expense based on actuarial calculations and asset valuations at December 31, 2022 Certain U.S. Retirement Benefits • Certain retirement benefits funded through trusts are subject to market changes each quarter • Decline in market values in 2022 resulted in year - over - year unfavourable EPS impact of $0.04 • ~US$150M in assets at December 31, 2022 29
LONG - TERM DEBT ISSUANCES Over $3B in Long - Term Debt issued in 2022 • Fortis Inc. – $500M unsecured 7 - year 4.43% notes (1) • ITC ▪ US$300M secured mortgage bonds (2) ▪ US$75M secured 30 - year 3.05% notes ▪ US$600M unsecured 5 - year 4.95% notes (3) • UNS Energy – US$325M unsecured 10 - year 3.25% notes • Central Hudson – US$220M unsecured notes (4) • FortisBC Energy – $150M unsecured 30 - year 4.67% debentures • FortisAlberta – $125M unsecured 30 - year 4.62% debentures • FortisBC Electric – $100M unsecured 30 - year 4.16% debentures • Newfoundland Power - $75M first mortgage 30 - year 4.20% bonds • Caribbean Utilities – US$80M unsecured 30 - year 5.88% notes (1) The Corporation entered into cross - currency interest rate swaps to effectively convert the debt into US$391M with an interest rate of 4.34%. (2) Includes US$150M 30 - year 2.93% bonds issued in January, US$75M 30 - year 4.53% bonds issued in October and US$75M 5 - year 3.87% bonds issued in October. US$170M of the US$300M secured mortgage bonds proceeds used to fund eligible green projects. (3) Prior to the issuance in September 2022, ITC executed US$450M in interest rate swaps to manage refinancing risk associated with the debt issuance. Inclusive of the hedging activities, the effective interest rate on the US$600M debt is 3.54%. (4) Includes US$50M 5 - year 2.37% notes issued in January, US$60M 7 - year 2.59% notes issued in January, US$100M 10 - year 5.07% notes issued in September and US$10M 30 - year 5.42% notes issued in September. 30

$3.0 $2.5 $2.0 $1.5 $1.0 $0.5 $ - 2023F 2024F 2025F 2026F 2027F 2028F 2029F 2030F 2031F 2032F Regulated 10 - Year Average : $1.2B billions Note: Debt as at December 31, 2022 and excludes any new debt issuances during the forecast period. Excludes repayments of finance leases along with the current portion of credit facilities, which are assumed to be extended by one - year annually. (1) Includes non - regulated debt issued at Fortis Inc. and ITC Holdings. 31 Non - Regulated (1) DEBT MATURITIES
INVESTMENT - GRADE CREDIT RATINGS COMPANY Fortis Inc. A - (1) Baa3 A (low) ITC Holdings Corp. A - (1) Baa2 n/a ITC Regulated Subsidiaries A A1 n/a TEP A - A3 n/a Central Hudson BBB+ Baa1 n/a FortisBC Energy n/a A3 A FortisBC Electric n/a Baa1 A (low) FortisAlberta A - Baa1 A (low) Newfoundland Power n/a A2 A (1) S&P credit ratings for Fortis Inc. and ITC Holdings Corp. reflect the issuer credit ratings. The unsecured debt rating for Fortis Inc. and ITC Holdings Corp. is BBB+. 32