Exhibit 99.3
| | | | | | | | |
| Management Discussion and Analysis |
| | | | | | | | | | | | | | |
| | | | |
| Contents |
| About Fortis | 1 | | Cash Flow Summary | 15 |
| Performance at a Glance | 2 | | Contractual Obligations | 17 |
| The Industry | 5 | | Capital Structure and Credit Ratings | 18 |
| Operating Results | 6 | | Capital Plan | 19 |
| Business Unit Performance | 7 | | Business Risks | 22 |
| ITC | 7 | | Accounting Matters | 30 |
| UNS Energy | 7 | | Financial Instruments | 33 |
| Central Hudson | 8 | | Long-Term Debt and Other | 33 |
| FortisBC Energy | 8 | | Derivatives | 33 |
| FortisAlberta | 9 | | Selected Annual Financial Information | 36 |
| FortisBC Electric | 9 | | Fourth Quarter Results | 37 |
| Other Electric | 10 | | Summary of Quarterly Results | 38 |
| Corporate and Other | 10 | | Related-Party and Inter-Company Transactions | 39 |
| Non-U.S. GAAP Financial Measures | 10 | | Management's Evaluation of Controls and Procedures | 39 |
| Regulatory Highlights | 11 | | Outlook | 40 |
| Financial Position | 13 | | Forward-Looking Information | 40 |
| Liquidity and Capital Resources | 14 | | Glossary | 41 |
| Cash Flow Requirements | 14 | | Annual Consolidated Financial Statements | F-1 |
| | | | |
Dated February 13, 2025
This MD&A has been prepared in accordance with National Instrument 51-102 - Continuous Disclosure Obligations. It should be read in conjunction with the 2024 Annual Financial Statements and is subject to the cautionary statement and disclaimer provided under "Forward-Looking Information" on page 40. Further information about Fortis, including its Annual Information Form, can be accessed at www.fortisinc.com, www.sedarplus.ca, or www.sec.gov.
Financial information herein has been prepared in accordance with U.S. GAAP (except for indicated Non-U.S. GAAP Financial Measures) and, unless otherwise specified, is presented in Canadian dollars based, as applicable, on the following U.S. dollar-to-Canadian dollar exchange rates: (i) average of 1.37 and 1.35 for the years ended December 31, 2024 and 2023, respectively; (ii) 1.44 and 1.32 as at December 31, 2024 and 2023, respectively; (iii) average of 1.40 and 1.36 for the quarters ended December 31, 2024 and 2023, respectively; and (iv) 1.30 for all forecast periods. Certain terms used in this MD&A are defined in the "Glossary" on page 41.
ABOUT FORTIS
Fortis (TSX/NYSE: FTS) is a well-diversified leader in the North American regulated electric and gas utility industry, with revenue of $12 billion in 2024 and total assets of $73 billion as at December 31, 2024.
Regulated utilities account for virtually all of the Corporation's assets. The Corporation's 9,800 employees serve 3.5 million utility customers in five Canadian provinces, ten U.S. states and three Caribbean countries. As at December 31, 2024, 66% of the Corporation's assets were located in the U.S., 31% in Canada and the remaining 3% in the Caribbean. Operations in the U.S. accounted for 57% of the Corporation's 2024 revenue, with the remaining 38% in Canada, and 5% in the Caribbean.
Fortis is principally an energy delivery company, with 93% of its assets related to transmission and distribution. The business is characterized by low-risk, stable and predictable earnings and cash flows. Earnings, EPS and TSR are the primary measures of financial performance.
| | | | | | | | |
| 1 | FORTIS INC. | DECEMBER 31, 2024 |
| | | | | | | | |
| Management Discussion and Analysis |
Fortis' regulated utility businesses are: ITC (electric transmission - Michigan, Iowa, Minnesota, Illinois, Missouri, Kansas, Oklahoma and Wisconsin); UNS Energy (integrated electric and natural gas distribution - Arizona); Central Hudson (electric transmission and distribution, and natural gas distribution - New York State); FortisBC Energy (natural gas transmission and distribution - British Columbia); FortisAlberta (electric distribution - Alberta); FortisBC Electric (integrated electric - British Columbia); Newfoundland Power (integrated electric - Newfoundland and Labrador); Maritime Electric (integrated electric - Prince Edward Island); FortisOntario (integrated electric - Ontario); Caribbean Utilities (integrated electric - Grand Cayman); and FortisTCI (integrated electric - Turks and Caicos Islands). Fortis also holds equity investments in Wataynikaneyap Power (electric transmission - Ontario) and Belize Electricity (integrated electric - Belize).
The Corporation's non-regulated business is limited to Fortis Belize (three hydroelectric generation facilities - Belize). The Aitken Creek natural gas storage facility in British Columbia was sold on November 1, 2023 with a March 31, 2023 effective date.
Fortis has a unique operating model with a small corporate office in St. John's, Newfoundland and Labrador and business units that operate on a substantially autonomous basis. Each utility has its own management team and board of directors, with most having a majority of independent board members, which provides effective oversight within the broad parameters of Fortis policies and best practices. Subsidiary autonomy supports constructive relationships with regulators, policy makers, customers and communities. Fortis believes this model enhances accountability, opportunity and performance across the Corporation's businesses, and positions Fortis well for future investment opportunities.
Fortis is focused on providing safe, reliable and cost-effective service to customers. Delivering a cleaner energy future is the Corporation's core purpose. In addition, management is focused on delivering long-term profitable growth for shareholders through the execution of its capital plan and the pursuit of investment opportunities within and proximate to its service territories.
Additional information about the Corporation's business and reporting units is provided in Note 1 in the 2024 Annual Financial Statements.
| | | | | | | | | | | | | | | | | |
| PERFORMANCE AT A GLANCE | | | | | |
| Key Financial Metrics | | | | | |
| ($ millions, except as indicated) | 2024 | | | 2023 | | | Variance |
| Common Equity Earnings | | | | | |
| Actual | 1,606 | | | 1,506 | | | 100 | |
Adjusted (1) | 1,626 | | | 1,502 | | | 124 | |
Basic EPS ($) | | | | | |
| Actual | 3.24 | | | 3.10 | | | 0.14 | |
Adjusted (1) | 3.28 | | | 3.09 | | | 0.19 | |
| Dividends | | | | | |
Paid per common share ($) | 2.39 | | | 2.29 | | | 0.10 | |
Actual Payout Ratio (%) | 73.6 | | | 73.7 | | | (0.1) | |
Adjusted Payout Ratio (%) (1) | 72.7 | | | 73.9 | | | (1.2) | |
Weighted average number of common shares outstanding (# millions) | 495.0 | | | 486.3 | | | 8.7 | |
| Operating Cash Flow | 3,882 | | | 3,545 | | | 337 | |
Capital Expenditures (1) | 5,247 | | | 4,329 | | | 918 | |
(1)See "Non-U.S. GAAP Financial Measures" on page 10
Earnings and EPS
Common Equity Earnings increased by $100 million in comparison to 2023. The increase was due to: (i) Rate Base growth; (ii) higher earnings in Arizona, largely reflecting new customer rates at TEP effective September 1, 2023 and higher production tax credits; (iii) new customer rates and a higher allowed ROE at Central Hudson effective July 1, 2024; and (iv) an unfavourable deferred income tax adjustment recognized by ITC in 2023. The increase was partially offset by higher holding company finance costs, unrealized losses on derivative contracts, and a $10 million gain realized upon the disposition of Aitken Creek in 2023. The recognition of a refund liability at ITC in 2024, due to the reduction in the MISO base ROE as approved by FERC and largely reflecting the retroactive impact to prior periods, also unfavourably impacted earnings.
In addition to the above-noted items impacting earnings, the change in EPS also reflected an increase in the weighted average number of common shares outstanding, largely associated with the Corporation's DRIP.
| | | | | | | | |
| 2 | FORTIS INC. | DECEMBER 31, 2024 |
| | | | | | | | |
| Management Discussion and Analysis |
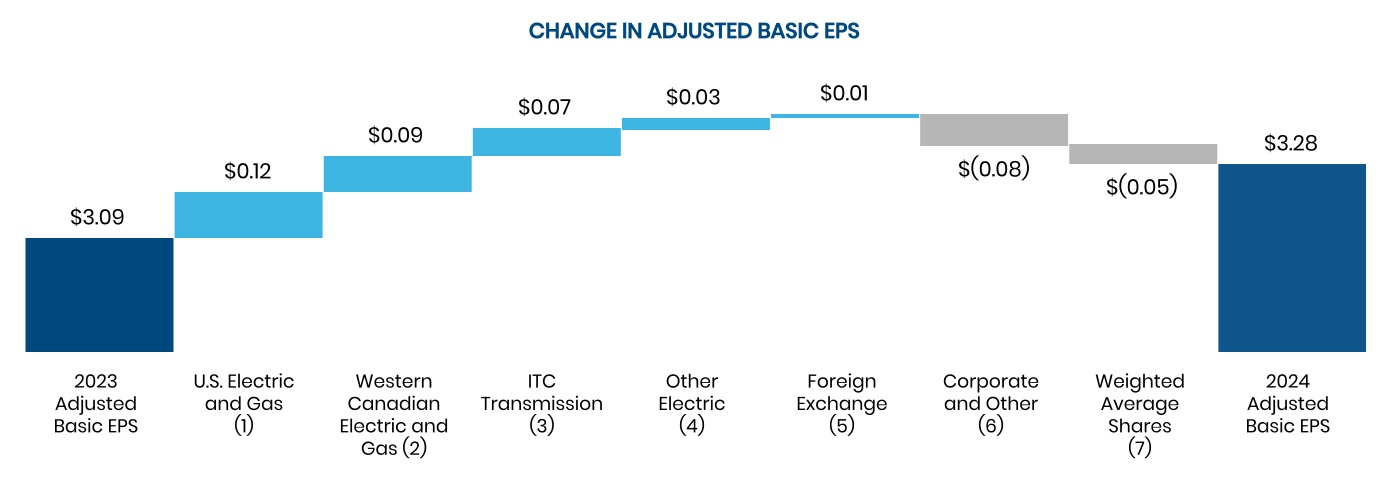
Adjusted Common Equity Earnings and Adjusted Basic EPS increased by $124 million and $0.19, respectively. Refer to "Non-U.S. GAAP Financial Measures" on page 10 for a reconciliation of these measures. The change in Adjusted Basic EPS is illustrated in the following chart.
(1) Includes UNS Energy and Central Hudson. Reflects higher earnings at UNS Energy due to new customer rates at TEP effective September 1, 2023, higher production tax credits, and favourable margins on wholesale sales, partially offset by higher operating costs. Also reflects higher earnings at Central Hudson due to Rate Base growth as well as new customer rates and a higher allowed ROE effective July 1, 2024, partially offset by favourable regulatory adjustments recognized in 2023
(2) Includes FortisBC Energy, FortisAlberta and FortisBC Electric. Primarily reflects Rate Base growth, as well as higher earnings at FortisAlberta due to an increase in the allowed ROE, higher demand charges and customer growth, partially offset by higher operating expenses
(3) Primarily reflects Rate Base growth, partially offset by higher holding company finance costs
(4) Primarily reflects Rate Base growth and higher electricity sales
(5) Reflects average foreign exchange rate of 1.37 in 2024 compared to 1.35 in 2023, partially offset by a foreign exchange loss associated with the revaluation of U.S. dollar denominated liabilities at a rate of 1.44 at December 31, 2024
(6) Reflects higher holding company finance costs and unrealized losses on derivative contracts, partially offset by higher hydroelectric production in Belize
(7) Weighted average shares of 495.0 million in 2024 compared to 486.3 million in 2023
Dividends
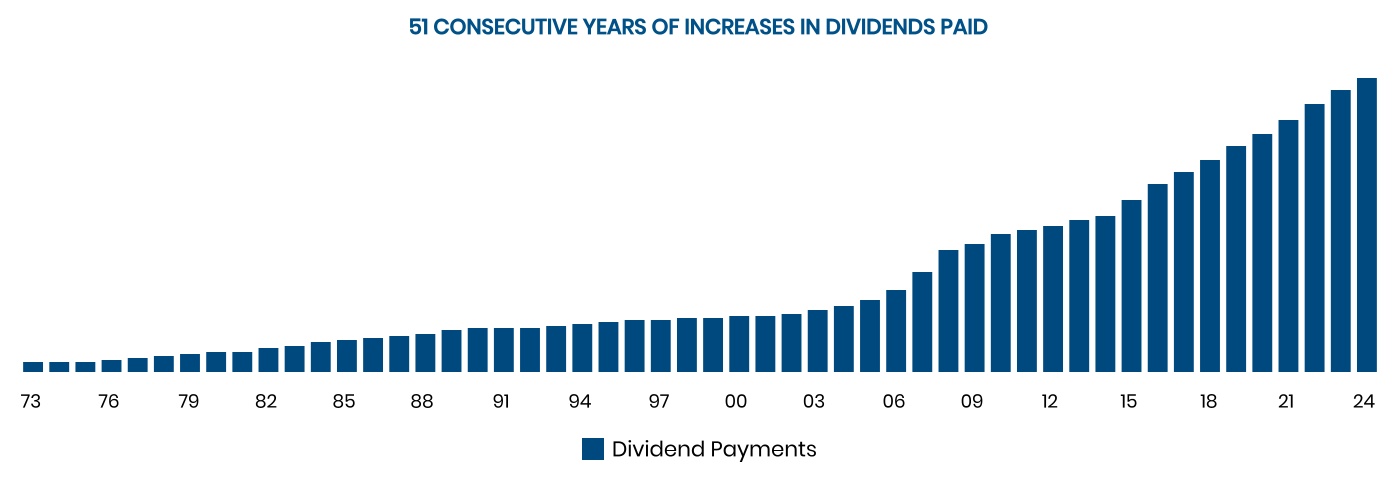
Fortis paid a dividend of $0.615 per common share in the fourth quarter of 2024, up 4.2% from $0.59 paid in each of the previous four quarters. This marked the Corporation's 51st consecutive year of increases in dividends paid. The Adjusted Payout Ratio was 73% in 2024 and an average of 76% over the five-year period of 2020 through 2024.
Fortis is targeting annual dividend growth of approximately 4-6% through 2029. See "Outlook" on page 40.
Growth in dividends and changes in the market price of the Corporation's common shares have yielded the following TSRs.
| | | | | | | | | | | | | | | | | | | | | | | |
TSR (1) (%) | 1-Year | | 5-Year | | 10-Year | | 20-Year |
| Fortis | 14.1 | | | 6.1 | | | 8.4 | | | 10.3 | |
(1)Annualized TSR per Bloomberg, as at December 31, 2024
| | | | | | | | |
| 3 | FORTIS INC. | DECEMBER 31, 2024 |
| | | | | | | | |
| Management Discussion and Analysis |
Operating Cash Flow
The $337 million increase in Operating Cash Flow was due to: (i) higher cash earnings, reflecting Rate Base growth, as well as new customer rates and higher sales at TEP; and (ii) the higher collection of flow-through costs at UNS Energy. Deposits received related to the construction of the Eagle Mountain Pipeline project and the receipt of an income tax refund at FortisBC Energy also favourably impacted Operating Cash Flow. The increase was partially offset by: (i) the timing of flow-through costs in customer rates as well as other changes in working capital balances at FortisBC Energy; (ii) the timing of flow-through transmission costs at FortisAlberta; (iii) higher interest payments; and (iv) the disposition of Aitken Creek in November 2023, which contributed approximately $110 million of operating cash flow in 2023.
Capital Expenditures
Capital Expenditures in 2024 were $5.2 billion, consistent with expectations and $0.9 billion higher than 2023. The increase compared to 2023 was primarily due to investments associated with the Eagle Mountain Pipeline project at FortisBC Energy, expenditures on various transmission reliability projects at ITC, and construction of the Roadrunner Reserve battery storage projects at UNS Energy.
Capital Expenditures is a Non-U.S. GAAP financial measure. Refer to "Non-U.S. GAAP Financial Measures" on page 10.
New Five-Year Capital Plan
The Corporation's 2025-2029 capital plan of $26.0 billion is the largest in the Corporation’s history and is $1.0 billion higher than the previous five-year plan. The increase is driven by projects associated with the MISO LRTP and resiliency investments at ITC, as well as distribution investments largely due to customer growth at FortisAlberta. For a detailed discussion of the Corporation's capital expenditure program, see "Capital Plan" on page 19.
Funding of the capital plan is expected to be primarily through Operating Cash Flow and debt issued at the regulated utilities. Common equity proceeds are expected to be sourced from the Corporation's DRIP assuming current participation levels. The Corporation's $500 million ATM Program remains available and provides funding flexibility as required.
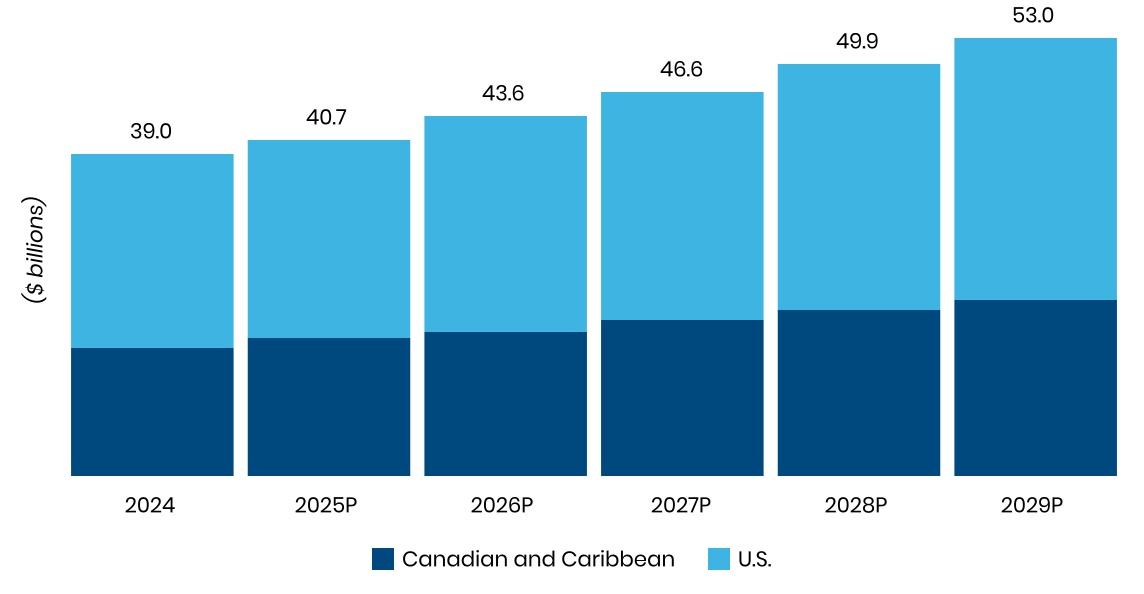
The five-year capital plan is expected to increase midyear Rate Base from $39.0 billion in 2024 to $53.0 billion by 2029, translating into a five-year CAGR of 6.5%.
PROJECTED RATE BASE (1)
(1) Reflects average exchange rate of 1.37 for 2024 and exchange rate of 1.30 for 2025-2029. On average, Fortis estimates that a five-cent increase or decrease in the U.S. dollar relative to the Canadian dollar would increase or decrease Rate Base by approximately $1.1 billion over the five-year planning period
Beyond the five-year capital plan, opportunities to expand and extend growth include: further expansion of the electric transmission grid in the U.S. to support load growth and facilitate the interconnection of cleaner energy; transmission investments associated with the MISO LRTP tranches 1, 2.1 and 2.2 as well as regional transmission in New York; grid resiliency and climate adaptation investments; renewable gas solutions and LNG infrastructure in British Columbia; and the acceleration of load growth and cleaner energy infrastructure investments across our jurisdictions.
| | | | | | | | |
| 4 | FORTIS INC. | DECEMBER 31, 2024 |
| | | | | | | | |
| Management Discussion and Analysis |
THE INDUSTRY
The North American utility industry is undergoing significant transformation due to the need for energy security, the impacts of climate change, the transition to cleaner energy, and projected growth in load driven by data centers, manufacturing and electrification. These factors are creating significant investment opportunities for the sector.
Policy makers and regulators at the federal, state, and provincial levels are increasingly prioritizing matters of energy security, with many continuing to support the transition to cleaner energy. The conjunction of policy and forecasted load growth has resulted in opportunities to invest in renewable and natural gas generation, energy storage systems and transmission infrastructure. Electrification of transportation and heating continues to grow and represents another opportunity to reduce carbon emissions while increasing the output and efficiency of the grid.
Grid resilience continues to grow in importance with the increasing frequency and intensity of weather events such as extreme heat and cold, hurricanes, wildfires, floods and storms. With electricity expected to represent a larger portion of society's energy mix, investments in resiliency are necessary to improve the grid's ability to withstand and recover from climate events.
Diversity of energy supply and enhanced integration of energy systems are vital to deliver the resilience, energy, and capacity needed to support economic growth and energy demand. Electric transmission is a critical enabler of load growth, interconnecting large-scale generation while improving system resilience. Natural gas generation provides a reliable source of energy and capacity that will be an essential resource to meet growing energy needs. Natural gas investments, as well as energy storage solutions, will enable the adoption of additional renewable energy. Increased adoption of RNG and, in the longer-term, hydrogen will further contribute to carbon emissions reduction. The Corporation's utilities are well positioned and actively involved in pursuing these opportunities, which will drive significant capital investment, particularly at ITC, UNS Energy and in Western Canada.
New technology is stimulating change across the Corporation's service territories. Energy delivery systems are becoming more intelligent, with advanced meters, remote sensing, and grid automation. More capable operational technology provides utilities with detailed usage data, enhanced inspection capabilities, and predictive maintenance information, contributing to increased efficiency and more reliable energy delivery. Energy management capabilities are expanding through emerging storage, demand response, and distributed energy management systems.
Fortis' culture of innovation underlies a continuous drive to find better ways to safely, reliably and affordably deliver the energy and services that customers need. Fortis is a partner in Energy Impact Partners, a strategic private venture fund that invests in emerging technologies, products, services and business models that are transforming the industry. The Corporation is also involved in the Low Carbon Resources Initiative, a collaboration between EPRI and GTI Energy, along with other major utilities, to develop and demonstrate the low- and zero-carbon energy technologies needed to enable pathways to decarbonization. Fortis is also a member of EPRI's Climate READi, an initiative involving major North American utilities, regulators, policy makers, and other stakeholders focused on developing an industry-wide best practice framework for managing physical climate risk.
Meaningful customer engagement is important for utilities as customer expectations change. Customers want to make informed energy choices and become active participants in the delivery of their energy. They also expect personalized service, customized self-service offerings, and more real-time, digital communication. To respond to these changes, Fortis' utilities are enhancing customer information systems, adopting digital technologies including AI, and advancing new and modern approaches to customer engagement. At the same time, increased investment in cybersecurity is an ongoing priority in the context of an ever-changing threat landscape. Upgrades to the physical security environment are also required to keep pace with evolving challenges. These technological advancements and challenges offer strategic investment opportunities for Fortis' utilities.
The Corporation's culture and decentralized structure support our utilities' efforts to meet changing customer expectations, and to work constructively with regulators and all stakeholders on policy, energy and service solutions. Fortis is well positioned to support energy security, load growth and the clean energy transition across the Corporation's footprint.
| | | | | | | | |
| 5 | FORTIS INC. | DECEMBER 31, 2024 |
| | | | | | | | |
| Management Discussion and Analysis |
| | | | | | | | | | | | | | | | | | | | | | | |
| OPERATING RESULTS | | | | | | | |
| | | | | Variance |
| ($ millions) | 2024 | | | 2023 | | | FX | | Other |
| Revenue | 11,508 | | | 11,517 | | | 108 | | | (117) | |
| Energy supply costs | 3,249 | | | 3,771 | | | 32 | | | (554) | |
| Operating expenses | 3,040 | | | 2,889 | | | 29 | | | 122 | |
| Depreciation and amortization | 1,927 | | | 1,773 | | | 16 | | | 138 | |
| | | | | | | |
| Other income, net | 288 | | | 291 | | | (10) | | | 7 | |
| Finance charges | 1,406 | | | 1,305 | | | 13 | | | 88 | |
| Income tax expense | 346 | | | 360 | | | 1 | | | (15) | |
| | | | | | | |
| | | | | | | |
| Net earnings | 1,828 | | | 1,710 | | | 7 | | | 111 | |
| | | | | | | |
| Net earnings attributable to: | | | | | | | |
| Non-controlling interests | 148 | | | 137 | | | 2 | | | 9 | |
| Preference equity shareholders | 74 | | | 67 | | | — | | | 7 | |
| Common equity shareholders | 1,606 | | | 1,506 | | | 5 | | | 95 | |
| Net earnings | 1,828 | | | 1,710 | | | 7 | | | 111 | |
Revenue
The decrease in revenue, net of foreign exchange, was due to lower flow-through commodity costs in customer rates at FortisBC Energy and Central Hudson. The decrease was also due to a reduction in the MISO base ROE at ITC, approved by FERC in October 2024, including retroactive application to prior periods (see "Regulatory Highlights - Significant Regulatory Matters" on page 12), and lower short-term wholesale sales revenue at UNS Energy. The decrease was partially offset by Rate Base growth and new customer rates at TEP and Central Hudson, effective September 1, 2023 and July 1, 2024, respectively.
Energy Supply Costs
The decrease in energy supply costs, net of foreign exchange, was due primarily to lower commodity costs, mainly at FortisBC Energy, Central Hudson, and UNS Energy.
Operating Expenses
The increase in operating expenses, net of foreign exchange, was due primarily to general inflationary and employee-related cost increases.
Depreciation and Amortization
The increase in depreciation and amortization, net of foreign exchange, was due to continued investment in energy infrastructure at the Corporation's regulated utilities, and new depreciation rates approved for TEP in September 2023 as part of its general rate application.
Other Income, Net
Other Income, net of foreign exchange, was relatively consistent with 2023. An increase in other income associated with higher AFUDC at UNS Energy and FortisBC Energy was largely offset by the pre-tax gain recognized in 2023 on the sale of Aitken Creek and net unrealized losses on derivative contracts.
Finance Charges
The increase in finance charges, net of foreign exchange, was due to higher debt levels to support the Corporation's capital plan, as well as higher interest rates on new debt issuances.
Income Tax Expense
The decrease in income tax expense, net of foreign exchange, was driven by higher production tax credits at UNS Energy, and the unfavourable $9 million deferred income tax adjustment recognized at ITC in 2023 following a reduction in the corporate income tax rate in the state of Iowa. The decrease was partially offset by higher earnings before taxes.
Net Earnings
See "Performance at a Glance - Earnings and EPS" on page 2.
| | | | | | | | |
| 6 | FORTIS INC. | DECEMBER 31, 2024 |
| | | | | | | | |
| Management Discussion and Analysis |
| | | | | | | | | | | | | | | | | | | | | | | |
| BUSINESS UNIT PERFORMANCE | | | | | | | |
| Common Equity Earnings | | | | | Variance |
| ($ millions) | 2024 | | | 2023 | | | FX (1) | | Other |
| Regulated Utilities | | | | | | | |
| ITC | 542 | | | 508 | | | 8 | | | 26 | |
| UNS Energy | 448 | | | 400 | | | 6 | | | 42 | |
| Central Hudson | 128 | | | 105 | | | 3 | | | 20 | |
| FortisBC Energy | 293 | | | 274 | | | — | | | 19 | |
| FortisAlberta | 181 | | | 162 | | | — | | | 19 | |
| FortisBC Electric | 72 | | | 68 | | | — | | | 4 | |
Other Electric (2) | 163 | | | 146 | | | — | | | 17 | |
| 1,827 | | | 1,663 | | | 17 | | | 147 | |
| Non-Regulated | | | | | | | |
Corporate and Other (3) | (221) | | | (157) | | | (12) | | | (52) | |
| Common Equity Earnings | 1,606 | | | 1,506 | | | 5 | | | 95 | |
(1)The reporting currency of ITC, UNS Energy, Central Hudson, Caribbean Utilities, FortisTCI and Fortis Belize is the U.S. dollar. The reporting currency of Belize Electricity is the Belizean dollar, which is pegged to the U.S. dollar at BZ$2.00=US$1.00. Certain corporate and non-regulated holding company transactions, included in the Corporate and Other segment, are denominated in U.S. dollars
(2)Consists of the utility operations in eastern Canada and the Caribbean: Newfoundland Power; Maritime Electric; FortisOntario; Wataynikaneyap Power; Caribbean Utilities; FortisTCI; and Belize Electricity
(3)Consists of non-regulated holding company expenses, as well as earnings from long-term contracted generation assets in Belize. Also includes earnings from Aitken Creek up to the November 1, 2023 date of disposition
| | | | | | | | | | | | | | | | | | | | | | | |
| ITC | | | | | Variance |
| ($ millions) | 2024 | | | 2023 | | | FX | | Other |
Revenue (1) | 2,229 | | | 2,085 | | | 33 | | | 111 | |
Earnings (1) | 542 | | | 508 | | | 8 | | | 26 | |
(1)Revenue represents 100% of ITC. Earnings represent the Corporation's 80.1% controlling ownership interest in ITC and reflect consolidated purchase price accounting adjustments.
Revenue
The increase in revenue, net of foreign exchange, was due primarily to Rate Base growth and higher flow-through costs in customer rates. The increase was partially offset by a decrease in the MISO base ROE from 10.02% to 9.98%, as approved by FERC in October 2024, for the 15-month period from November 2013 through February 2015 and prospectively from September 2016 (See "Regulatory Highlights - Significant Regulatory Matters" on page 12).
Earnings
The increase in earnings, net of foreign exchange, was due primarily to Rate Base growth as well as an unfavourable $9 million deferred income tax adjustment recognized in 2023 following a reduction in the corporate income tax rate in the state of Iowa. The increase was partially offset by: (i) a decrease in the MISO base ROE from 10.02% to 9.98% as discussed above, which resulted in a $22 million reduction in earnings in 2024, including $20 million associated with the retroactive impact to prior periods; and (ii) higher holding company finance costs.
| | | | | | | | | | | | | | | | | | | | | | | |
| UNS Energy | | | | | Variance |
| ($ millions, except as indicated) | 2024 | | | 2023 | | | FX | | Other |
Retail electricity sales (GWh) | 10,870 | | | 10,786 | | | — | | | 84 | |
Wholesale electricity sales (GWh) (1) | 5,810 | | | 5,387 | | | — | | | 423 | |
Gas sales (PJ) | 17 | | | 17 | | | — | | | — | |
| Revenue | 3,007 | | | 3,006 | | | 45 | | | (44) | |
| Earnings | 448 | | | 400 | | | 6 | | | 42 | |
(1) Primarily short-term wholesale sales
Sales
The increase in retail electricity sales was due primarily to warmer weather and customer additions.
| | | | | | | | |
| 7 | FORTIS INC. | DECEMBER 31, 2024 |
| | | | | | | | |
| Management Discussion and Analysis |
The increase in wholesale electricity sales was driven by higher short-term wholesale sales, due to market conditions, partially offset by lower long-term wholesale sales due to the expiration of certain contracts. Revenue from short-term wholesale sales, which relate to contracts that are less than one-year in duration, is primarily credited to customers through the PPFAC mechanism and, therefore, does not materially impact earnings.
Gas sales were consistent with 2023.
Revenue
The decrease in revenue, net of foreign exchange, was due primarily to: (i) lower wholesale sales revenue, largely driven by unfavourable pricing on short-term wholesale sales; (ii) the recovery of overall lower fuel and non-fuel costs through the normal operation of regulatory mechanisms; and (iii) lower transmission revenue. The decrease was partially offset by new customer rates at TEP effective September 1, 2023.
Earnings
The increase in earnings, net of foreign exchange, was due primarily to: (i) new customer rates at TEP effective September 1, 2023, following the conclusion of the general rate application; (ii) higher production tax credits related to the Oso Grande generating facility; and (iii) higher margins on long-term wholesale sales. The increase was partially offset by: (i) higher depreciation expense, due to new depreciation rates also approved as part of the rate application; (ii) higher operating expenses, reflecting labour costs as well as an increase in planned generation maintenance in 2024; and (iii) lower transmission revenue.
| | | | | | | | | | | | | | | | | | | | | | | |
| Central Hudson | | | | | Variance |
| ($ millions, except as indicated) | 2024 | | | 2023 | | | FX | | Other |
Electricity sales (GWh) | 5,060 | | | 4,921 | | | — | | | 139 | |
Gas sales (PJ) | 25 | | | 24 | | | — | | | 1 | |
| Revenue | 1,372 | | | 1,360 | | | 22 | | | (10) | |
| Earnings | 128 | | | 105 | | | 3 | | | 20 | |
Sales
The increase in electricity sales was due primarily to higher average consumption by residential and commercial customers due to warmer weather.
Gas sales were relatively consistent with 2023.
Changes in electricity and gas sales at Central Hudson are subject to regulatory revenue decoupling mechanisms and, therefore, do not materially impact earnings.
Revenue
The decrease in revenue, net of foreign exchange, was due primarily to the flow-through of lower energy supply costs driven by commodity prices, partially offset by the conclusion of Central Hudson's 2024 general rate application and related rebasing of customer rates effective July 1, 2024. Favourable regulatory adjustments recognized in 2023 that did not reoccur in 2024 also contributed to the decrease in revenue.
Earnings
The increase in earnings, net of foreign exchange, was due to Rate Base growth, as well as new customer rates reflecting the rebasing of costs and a higher allowed ROE effective July 1, 2024. The increase was partially offset by favourable regulatory adjustments recognized in 2023 that did not reoccur in 2024.
| | | | | | | | | | | | | | | | | |
| FortisBC Energy | | | | | |
| ($ millions, except as indicated) | 2024 | | | 2023 | | | Variance |
Gas sales (PJ) | 220 | | | 213 | | | 7 | |
| Revenue | 1,665 | | | 1,955 | | | (290) | |
| Earnings | 293 | | | 274 | | | 19 | |
Sales
The increase in gas sales was due primarily to higher average consumption by industrial, residential and commercial customers.
| | | | | | | | |
| 8 | FORTIS INC. | DECEMBER 31, 2024 |
| | | | | | | | |
| Management Discussion and Analysis |
Revenue
The decrease in revenue was due primarily to the recovery of lower flow-through commodity costs and the normal operation of regulatory mechanisms.
Earnings
The increase in earnings was due primarily to higher net investments in regulated assets.
FortisBC Energy earns approximately the same margin regardless of whether a customer contracts for the purchase and delivery of natural gas or only for delivery. Due to regulatory deferral mechanisms, changes in consumption levels and commodity costs do not materially impact earnings.
| | | | | | | | | | | | | | | | | |
| FortisAlberta | | | | | |
| ($ millions, except as indicated) | 2024 | | | 2023 | | | Variance |
Electricity deliveries (GWh) | 17,324 | | | 16,976 | | | 348 | |
| Revenue | 817 | | | 738 | | | 79 | |
| Earnings | 181 | | | 162 | | | 19 | |
Deliveries
The increase in electricity deliveries was due primarily to customer additions and higher average consumption by industrial customers.
As approximately 85% of FortisAlberta's revenue is derived from fixed or largely fixed billing determinants, changes in quantities of energy delivered are not entirely correlated with changes in revenue. Revenue is a function of numerous variables, many of which are independent of actual energy deliveries. Significant variations in weather conditions, however, can impact revenue and earnings.
Revenue
The increase in revenue was due to: (i) Rate Base growth, including changes associated with the third PBR term beginning January 1, 2024; (ii) an increase in the allowed ROE from 8.50% to 9.28%, as approved by the AUC, effective January 1, 2024; and (iii) higher industrial and commercial demand charges, as well as customer additions.
Earnings
The increase in earnings was due to the higher allowed ROE, Rate Base growth, higher demand charges and customer additions, as discussed above. The increase was partially offset by higher operating expenses, primarily reflecting operational requirements driven by customer growth, including higher labour costs.
| | | | | | | | | | | | | | | | | |
| FortisBC Electric | | | | | |
| ($ millions, except as indicated) | 2024 | | | 2023 | | | Variance |
Electricity sales (GWh) | 3,513 | | | 3,478 | | | 35 | |
| Revenue | 545 | | | 528 | | | 17 | |
| Earnings | 72 | | | 68 | | | 4 | |
Sales
The increase in electricity sales was due to higher average consumption by industrial customers, partially offset by lower average consumption by commercial customers.
Revenue
The increase in revenue was due primarily to higher electricity sales and Rate Base growth, as well as higher energy supply costs recovered from customers. The increase was partially offset by the normal operation of regulatory mechanisms.
Earnings
The increase in earnings was due primarily to Rate Base growth.
Due to regulatory deferral mechanisms, changes in consumption levels do not materially impact earnings.
| | | | | | | | |
| 9 | FORTIS INC. | DECEMBER 31, 2024 |
| | | | | | | | |
| Management Discussion and Analysis |
| | | | | | | | | | | | | | | | | | | | | | | |
| Other Electric | | | | | Variance |
| ($ millions, except as indicated) | 2024 | | | 2023 | | | FX | | Other |
Electricity sales (GWh) | 9,879 | | | 9,753 | | | — | | | 126 | |
| Revenue | 1,838 | | | 1,761 | | | 8 | | | 69 | |
| Earnings | 163 | | | 146 | | | — | | | 17 | |
Sales
The increase in electricity sales was mainly due to higher average consumption by residential and commercial customers, as well as customer additions. Higher average consumption was largely due to the conversion of home heating systems from oil to electric in Eastern Canada and increased tourism-related activities in the Caribbean.
Revenue
The increase in revenue, net of foreign exchange, was due to Rate Base growth, higher electricity sales and the flow-through of higher energy supply costs.
Earnings
The increase in earnings, net of foreign exchange, was due primarily to Rate Base growth and higher electricity sales.
| | | | | | | | | | | | | | | | | | | | | | | |
| Corporate and Other | | | | | Variance |
| ($ millions) | 2024 | | | 2023 | | | FX | | Other |
Electricity sales (GWh) (1) | 215 | | | 164 | | | — | | | 51 | |
Revenue (2) | 35 | | | 84 | | | — | | | (49) | |
Net loss (3) | (221) | | | (157) | | | (12) | | | (52) | |
(1) Reflects electricity sales at Fortis Belize
(2) Includes revenue for Fortis Belize as well as revenue for Aitken Creek up to the November 1, 2023 date of disposition
(3) Includes non-regulated holding company expenses, earnings for Fortis Belize, as well as earnings for Aitken Creek up to the November 1, 2023 date of disposition
Sales
The increase in electricity sales reflected higher hydroelectric production in Belize associated with rainfall levels.
Revenue
The decrease in revenue reflected the disposition of Aitken Creek in November 2023, partially offset by higher hydroelectric production in Belize.
Net Loss
The increase in net loss was due to: (i) higher holding company finance costs; (ii) net unrealized losses on derivative contracts, reflecting losses on foreign exchange contracts partially offset by gains on total return swaps; and (iii) the $10 million gain on disposition of Aitken Creek recognized in 2023. The increase in net loss was partially offset by higher hydroelectric production in Belize.
The $12 million foreign exchange impact was largely due to the revaluation of U.S. dollar denominated liabilities following the significant depreciation in the Canadian dollar relative to the U.S. dollar in the fourth quarter of 2024.
NON-U.S. GAAP FINANCIAL MEASURES
Adjusted Common Equity Earnings, Adjusted Basic EPS, Adjusted Payout Ratio and Capital Expenditures are Non-U.S. GAAP Financial Measures and may not be comparable with similar measures used by other entities. They are presented because management and external stakeholders use them in evaluating the Corporation's financial performance and prospects.
Net earnings attributable to common equity shareholders (i.e., Common Equity Earnings) and basic EPS are the most directly comparable U.S. GAAP measures to Adjusted Common Equity Earnings and Adjusted Basic EPS, respectively. The Actual Payout Ratio calculated using Common Equity Earnings is the most comparable U.S. GAAP measure to the Adjusted Payout Ratio. These adjusted measures reflect the removal of items that management excludes in its key decision-making processes and evaluation of operating results.
Capital Expenditures include additions to property, plant and equipment and additions to intangible assets, as shown on the consolidated statements of cash flows. It also included Fortis' 39% share of capital spending for the Wataynikaneyap Transmission Power Project, consistent with Fortis' evaluation of operating results and its role as project manager during the construction of the project.
| | | | | | | | |
| 10 | FORTIS INC. | DECEMBER 31, 2024 |
| | | | | | | | |
| Management Discussion and Analysis |
| | | | | | | | | | | | | | | | | |
| Non-U.S. GAAP Reconciliation | | | | | |
| ($ millions, except as indicated) | 2024 | | | 2023 | | | Variance |
Adjusted Common Equity Earnings, Adjusted Basic EPS and Adjusted Payout Ratio | | | | | |
| Common Equity Earnings | 1,606 | | | 1,506 | | | 100 | |
| Adjusting items: | | | | | |
October 2024 MISO base ROE decision (1) | 20 | | | — | | | 20 | |
Disposition of Aitken Creek (2) | — | | | (15) | | | 15 | |
Unrealized loss on mark-to-market of derivatives (3) | — | | | 2 | | | (2) | |
Revaluation of deferred income tax assets (4) | — | | | 9 | | | (9) | |
| Adjusted Common Equity Earnings | 1,626 | | | 1,502 | | | 124 | |
Adjusted Basic EPS (5) ($) | 3.28 | | | 3.09 | | | 0.19 | |
Adjusted Payout Ratio (6) (%) | 72.7 | | | 73.9 | | | (1.2) | |
| | | | | |
| Capital Expenditures | | | | | |
| Additions to property, plant and equipment | 5,012 | | | 3,986 | | | 1,026 | |
| Additions to intangible assets | 206 | | | 183 | | | 23 | |
| Adjusting item: | | | | | |
Wataynikaneyap Transmission Power Project (7) | 29 | | | 160 | | | (131) | |
| Capital Expenditures | 5,247 | | | 4,329 | | | 918 | |
(1) Represents the prior period impact of FERC's October 2024 MISO base ROE decision (see "Regulatory Highlights - Significant Regulatory Matters" on page 12), net of income tax recovery of $7 million, included in the ITC segment
(2) Aitken Creek was sold on November 1, 2023, with a March 31, 2023 effective date. For the year ended December 31, 2023, the adjustment represents: (i) the $10 million gain on disposition, net of income tax expense of $13 million; and (ii) $5 million of net earnings at Aitken Creek, recognized in accordance with U.S. GAAP, during the March 31, 2023 to November 1, 2023 stub period, net of income tax expense of $2 million, included in the Corporate and Other segment
(3) Represents the impact of mark-to-market accounting of natural gas derivatives at Aitken Creek through the March 31, 2023 effective date of disposition, net of income tax recovery $1 million, included in the Corporate and Other segment
(4) Represents the revaluation of deferred income tax assets resulting from the reduction in the corporate income tax rate in the state of Iowa, included in the ITC segment
(5) Calculated using Adjusted Common Equity Earnings divided by weighted average common shares of 495.0 million in 2024 (2023 - 486.3 million)
(6) Calculated using dividends paid per common share of $2.39 in 2024 (2023 - $2.29) divided by Adjusted Basic EPS
(7) Represents Fortis' 39% share of capital spending for the Wataynikaneyap Transmission Power Project, included in the Other Electric segment. Construction was completed in the second quarter of 2024
REGULATORY HIGHLIGHTS
General
The earnings of the Corporation's regulated utilities are determined under COS regulation, with some using PBR mechanisms.
Under COS regulation, the regulator sets customer rates to permit a reasonable opportunity for the timely recovery of the estimated costs of providing service, including a fair rate of return on a deemed or targeted capital structure applied to an approved Rate Base. PBR mechanisms generally apply a formula that incorporates inflation and assumed productivity improvements for a set term.
The ability to recover prudently incurred costs of providing service and earn the regulator‑approved ROE or ROA may depend on achieving the forecasts established in the rate-setting process. There can be varying degrees of regulatory lag between when costs are incurred and when they are recovered in customer rates. As well, the Corporation's regulated utilities, where applicable, are permitted by their respective regulators to flow through to customers, without markup, the cost of natural gas, fuel and/or purchased power through base customer rates and/or the use of rate stabilization and other mechanisms.
Transmission operations in the U.S. are regulated federally by FERC. Remaining utility operations in the U.S. and Canada are regulated by state or provincial regulators. Utility operations in the Caribbean are regulated by regulatory and governmental authorities.
Additional information about regulation and the regulatory matters discussed below is provided in Note 2 in the 2024 Annual Financial Statements. Also refer to "Business Risks - Utility Regulation" on page 22.
| | | | | | | | |
| 11 | FORTIS INC. | DECEMBER 31, 2024 |
| | | | | | | | |
| Management Discussion and Analysis |
Significant Regulatory Matters
ITC
MISO Base ROE: In 2022, the D.C. Circuit Court issued a decision vacating certain FERC orders that had established the methodology for setting the base ROE for transmission owners operating in the MISO region, including ITC, and remanded the matter to FERC for further process. This matter dates back to complaints filed at FERC in 2013 and 2015 challenging the MISO base ROE then in effect.
In October 2024, FERC issued an order that removed the use of the risk premium model from the calculation of the base ROE, while maintaining other modifications to the methodology. The updated methodology revised the base ROE from 10.02% to 9.98%, with a maximum ROE inclusive of incentives not to exceed 12.58%. The order also directed the payment of certain refunds, with interest, by December 2025, for the 15-month period from November 2013 through February 2015, and prospectively from September 2016. A regulatory liability of $39 million (US$27 million) associated with the refunds has been recognized by ITC as of December 31, 2024. Fortis' 80.1% share of the related after-tax earnings impact was approximately $22 million, of which $20 million related to periods prior to January 1, 2024.
Certain MISO transmission owners, including ITC, filed a request for rehearing with FERC in November 2024, and filed an appeal of the order with the D.C. Circuit Court in January 2025. The requests for rehearing and appeal primarily focus on the refund period and the related interest. The timing and outcome of these filings are unknown.
Transmission Incentives: In 2021, FERC issued a supplemental NOPR on transmission incentives modifying the proposal in the initial NOPR released by FERC in 2020. The supplemental NOPR proposes to eliminate the 50-basis point RTO ROE incentive adder for RTO members that have been members for longer than three years. Although the timing and outcome of this proceeding remain unknown, every 10-basis point change in ROE at ITC impacts Fortis' annual EPS by approximately $0.01.
Transmission ROFR: In December 2023, the Iowa District Court ruled that the manner in which Iowa's ROFR statute was passed was unconstitutional. The statute granted incumbent electric transmission owners, including ITC, a ROFR to construct, own and maintain certain electric transmission assets in the state. The District Court did not make any determination on the merits of the ROFR itself, but did issue a permanent injunction preventing ITC and others from taking further action to construct the MISO LRTP tranche 1 Iowa projects in reliance on the ROFR.
MISO's decision with respect to the assignment of the tranche 1 LRTP projects was finalized on July 25, 2022. MISO is the only entity charged with determining what projects are to be competitively bid pursuant to its tariff. In May 2024, MISO commenced a variance analysis process as a result of the inability to construct a portion of the tranche 1 LRTP projects in Iowa due to the injunction imposed by the District Court. In August 2024, MISO concluded the variance analysis, which reaffirmed the original allocation of projects to ITC and other incumbent transmission owners. Approximately US$800 million of capital expenditures associated with the first tranche of MISO's LRTP in Iowa is reflected in Fortis' 2025-2029 capital plan. While the results of MISO's variance analysis process allow ITC to move forward with the development of its portion of tranche 1 LRTP projects in Iowa, various legal proceedings with respect to this matter are ongoing for which the timing and outcome are unknown.
UNS Energy
Generic Regulatory Lag Docket: In December 2024, the ACC approved a formula rate plan policy statement which allows utilities to propose formula rates in future rate cases. A formula rate plan, if approved by the ACC, would adjust rates annually based on a predetermined formula. A formula rate plan is expected to improve rate stability for customers, while also reducing regulatory lag and the number of existing rate adjusters.
UNS Gas General Rate Application: In November 2024, UNS Gas filed a general rate application with the ACC requesting an increase in gas delivery rates effective February 1, 2026. The application includes a request to set its ROE at 10.25% and a 56% common equity component of capital structure. In January 2025, UNS Gas filed supplemental material proposing an annual rate adjustment mechanism as a result of the ACC's formula rate policy statement discussed above. The timing and outcome of this proceeding are unknown.
Central Hudson
2025 General Rate Application: In August 2024, Central Hudson filed a general rate application with the PSC requesting an increase in electric and gas delivery rates effective July 1, 2025. The application includes a request to set Central Hudson's allowed ROE at 10% and a 48% common equity component of capital structure. The timing and outcome of this proceeding are unknown.
Show Cause Order: In October 2024, the PSC issued a Show Cause Order which directed Central Hudson to explain why the PSC should not initiate an enforcement proceeding in connection with a gas-related explosion that occurred in November 2023. Central Hudson filed its response in November 2024. The timing and outcome of the Show Cause Order are unknown.
| | | | | | | | |
| 12 | FORTIS INC. | DECEMBER 31, 2024 |
| | | | | | | | |
| Management Discussion and Analysis |
FortisBC Energy and FortisBC Electric
2025-2027 Rate Framework: In April 2024, FortisBC filed an application with the BCUC requesting approval of a rate framework for the period 2025 through 2027. The rate framework builds upon the current multi-year rate plan and includes, amongst other items, updates to depreciation and capitalized overhead rates, a revised level of operation and maintenance expense per customer indexed for inflation less a fixed productivity adjustment factor, a similar approach to growth capital, a forecast approach to sustaining and other capital, continued collection of an innovation fund recognizing the need to accelerate investment in clean energy innovation, and the continued sharing with customers of variances from the allowed ROE. The rate framework also proposes the continuation of deferral mechanisms currently in place. A decision from the BCUC is expected in mid-2025.
FortisAlberta
GCOC Decision: In October 2023, the AUC issued a decision on the 2024 GCOC proceeding. In November 2023, FortisAlberta sought permission to appeal the GCOC decision to the Court of Appeal on the basis that the AUC erred in its decision to not adjust FortisAlberta's ROE and common equity component of capital structure to address incremental business risk associated with competition from REAs located in FortisAlberta's service area, as well as heightened regulatory risk due to the non-recovery of costs attributable to REAs. In April 2024, the Court of Appeal granted FortisAlberta permission to appeal, and a decision is expected in the first quarter of 2025.
Third PBR Term Decision: In October 2023, the AUC issued a decision establishing the parameters for the third PBR term for the period of 2024 through 2028. In November 2023, FortisAlberta sought permission to appeal the decision to the Court of Appeal on the basis that the AUC erred in its decision to determine capital funding using 2018-2022 historical capital investments without consideration for funding of new capital programs included in the company's 2023 cost of service revenue requirement as approved by the AUC. FortisAlberta's application for permission to appeal the decision was heard by the Court of Appeal in December 2024 and a decision is expected in the first quarter of 2025.
FINANCIAL POSITION
| | | | | | | | | | | |
| Significant Changes between December 31, 2024 and 2023 |
| | | |
| Balance Sheet Account | Variance | |
| ($ millions) | FX | Other | Explanation |
| Cash and cash equivalents | 44 | | (449) | | Reflects the timing of a debt issuance at ITC in 2023, with proceeds reinvested in operating and capital requirements in 2024. |
| | | |
| | | |
| Other assets | 87 | | 268 | | Due primarily to an increase in employee future benefit assets, driven by higher discount rates as well as investment returns on DBP and OPEB plans. |
| Regulatory assets (current and long-term) | 126 | | 121 | | Due to changes associated with various regulatory mechanisms, including an increase in deferred income taxes and deferred energy management costs. |
| Property, plant and equipment, net | 2,423 | | 3,648 | | Reflects capital investments, partially offset by depreciation. |
| | | |
| | | |
| | | |
| Accounts payable & other current liabilities | 119 | | 262 | | Due to an increase in trade accounts payable related to the Corporation's capital program, and an increase in customer deposits for the Eagle Mountain Pipeline project. |
| | | |
| Regulatory liabilities (current and long-term) | 214 | | 119 | | Due to changes associated with various regulatory mechanisms including employee future benefit and future cost of removal deferrals, partially offset by the normal operation of rate stabilization accounts. |
| Deferred income taxes | 238 | | 383 | | Primarily due to higher temporary differences associated with ongoing capital investments. |
| Long-term debt (including current portion) | 1,655 | | 2,028 | | Reflects debt issuances, partially offset by debt repayments, as well as higher borrowings under committed credit facilities, in support of the Corporation's capital plan. |
| | | |
| Shareholders' equity | 1,405 | | 898 | | Due primarily to: (i) Common Equity Earnings for 2024, less dividends declared on common shares; and (ii) the issuance of common shares, largely under the DRIP. |
| | | |
| | | | | | | | |
| 13 | FORTIS INC. | DECEMBER 31, 2024 |
| | | | | | | | |
| Management Discussion and Analysis |
LIQUIDITY AND CAPITAL RESOURCES
Cash Flow Requirements
At the subsidiary level, it is expected that operating expenses and interest costs will be paid from Operating Cash Flow, with varying levels of residual cash flow available for capital expenditures and/or dividend payments to Fortis. Remaining capital expenditures are expected to be financed primarily from borrowings under credit facilities, long-term debt offerings and equity injections from Fortis. Borrowings under credit facilities may be required periodically to support seasonal working capital requirements.
Cash required of Fortis to support subsidiary growth is generally derived from borrowings under the Corporation's credit facilities, the operation of the DRIP, as well as issuances of long-term debt, preference equity, and common shares including those issued through the ATM Program. The subsidiaries pay dividends to Fortis and receive equity injections from Fortis when required. Both Fortis and its subsidiaries initially borrow through their credit facilities and periodically replace these borrowings with long-term financing. Financing needs also arise to refinance maturing debt.
Credit facilities are syndicated primarily with large banks in Canada and the U.S., with no one bank holding more than approximately 20% of the Corporation's total revolving credit facilities. Approximately $5.8 billion of the total credit facilities are committed with maturities ranging from 2025 through 2029. Available credit facilities are summarized in the following table.
| | | | | | | | | | | | | | | | | | | | | | | |
| Credit Facilities | | | | | | | |
| As at December 31 | Regulated | | Corporate | | | | |
| ($ millions) | Utilities | | and Other | | 2024 | | 2023 | |
Total credit facilities (1) | 4,396 | | | 1,946 | | | 6,342 | | | 6,176 | |
| Credit facilities utilized: | | | | | | | |
| Short-term borrowings | (98) | | | — | | | (98) | | | (119) | |
| Long-term debt (including current portion) | (1,335) | | | (881) | | | (2,216) | | | (1,572) | |
| Letters of credit outstanding | (81) | | | (21) | | | (102) | | | (101) | |
| Credit facilities unutilized | 2,882 | | | 1,044 | | | 3,926 | | | 4,384 | |
(1)Additional information about the Corporation's credit facilities is provided in Note 14 in the 2024 Annual Financial Statements
In April 2024, FortisBC Energy increased its operating credit facility from $700 million to $900 million and extended the maturity to July 2028. In May 2024, FortisBC Electric increased its operating credit facility from $150 million to $200 million and extended the maturity to April 2028.
In May 2024, the Corporation extended the maturity on its unsecured US$500 million non-revolving term credit facility to May 2025. Half of the term credit facility was repaid in the third quarter of 2024 and the remaining US$250 million has been fully utilized as at December 31, 2024. The facility is repayable at any time without penalty. In June 2024, the Corporation amended its $1.3 billion revolving term committed credit facility to extend the maturity to July 2029.
In August 2024, Newfoundland Power increased its operating credit facility from $100 million to $130 million and extended the maturity to August 2029.
The Corporation's ability to service debt and pay dividends is dependent on the financial results of, and the related cash payments from, its subsidiaries. Certain regulated subsidiaries are subject to restrictions that limit their ability to distribute cash to Fortis, including restrictions by certain regulators limiting annual dividends and restrictions by certain lenders limiting debt to total capitalization. There are also practical limitations on using the net assets of the regulated subsidiaries to pay dividends, based on management's intent to maintain the subsidiaries' regulator-approved capital structures. Fortis does not expect that maintaining such capital structures will impact its ability to pay dividends in the foreseeable future.
As at December 31, 2024, consolidated fixed-term debt maturities/repayments are expected to average $1,484 million annually over the next five years and approximately 76% of the Corporation's consolidated long-term debt, excluding credit facility borrowings, had maturities beyond five years.
In December 2024, Fortis filed a short-form base shelf prospectus with a 25-month life under which it may issue common or preference shares, subscription receipts, or debt securities in an aggregate principal amount of up to $2.0 billion. Fortis also reestablished the ATM Program pursuant to the short-form base shelf prospectus, which allows the Corporation to issue up to $500 million of common shares from treasury to the public from time to time, at the Corporation's discretion, effective until January 10, 2027. As at December 31, 2024, $500 million remained available under the ATM Program and $1.5 billion remained available under the short-form base shelf prospectus.
| | | | | | | | |
| 14 | FORTIS INC. | DECEMBER 31, 2024 |
| | | | | | | | |
| Management Discussion and Analysis |
Fortis is well positioned with strong liquidity. This combination of available credit facilities and manageable annual debt maturities/repayments provides flexibility in the timing of access to capital markets. Given current credit ratings and capital structures, the Corporation and its subsidiaries currently expect to continue to have reasonable access to long-term capital in 2025.
Fortis and its subsidiaries were in compliance with debt covenants as at December 31, 2024 and are expected to remain compliant in 2025.
| | | | | | | | | | | | | | | | | |
| Cash Flow Summary | | | | | |
| Summary of Cash Flows | | | | | |
| Years ended December 31 | | | | | |
| ($ millions) | 2024 | | | 2023 | | | Variance |
| Cash and cash equivalents, beginning of year | 625 | | | 209 | | | 416 | |
| Cash from (used in): | | | | | |
| Operating activities | 3,882 | | | 3,545 | | | 337 | |
| Investing activities | (5,395) | | | (3,742) | | | (1,653) | |
| Financing activities | 1,064 | | | 613 | | | 451 | |
| Effect of exchange rate changes on cash and cash equivalents | 44 | | | — | | | 44 | |
| | | | | |
| Cash and cash equivalents, end of year | 220 | | | 625 | | | (405) | |
Operating Activities
See "Performance at a Glance - Operating Cash Flow" on page 4.
Investing Activities
The increase in cash used in investing activities primarily reflects higher capital expenditures in 2024, as well as the proceeds received in 2023 related to the disposition of Aitken Creek. See "Capital Plan" on page 19. Lower customer contributions in aid of construction also contributed to the year over year variance.
Financing Activities
Cash flows related to financing activities will fluctuate largely as a result of changes in the subsidiaries' capital expenditures and the amount of Operating Cash Flow available to fund those capital expenditures, which together impact the amount of funding required from debt and common equity issuances. See "Cash Flow Requirements" on page 14. The year over year increase in cash from financing activities also reflects the repayment of credit facility borrowings in 2023 with the proceeds received from the sale of Aitken Creek.
| | | | | | | | |
| 15 | FORTIS INC. | DECEMBER 31, 2024 |
| | | | | | | | |
| Management Discussion and Analysis |
| | | | | | | | | | | | | | | | | | | | | | | | | | | | | |
| Debt Financing | Month
Issued | | Interest Rate (%) | | Maturity | | Amount ($ millions) | | Use of Proceeds |
| Significant Long-Term Debt Issuances | | | | |
Year ended December 31, 2024
| | | | |
| ITC | | | | | | | | | |
| Secured senior notes | January | | 5.98 | | | 2034 | | US | 85 | | | (1) (2) (3) |
| First mortgage bonds | January | | 5.11 | | | 2029 | | US | 75 | | | (1) (2) (3) |
| First mortgage bonds | January | | 5.38 | | | 2034 | | US | 75 | | | (1) (2) (3) |
| Unsecured senior notes | May | | 5.65 | | | 2034 | | US | 400 | | | (3) (4) |
| First mortgage bonds | December | | 4.88 | | | 2035 | | US | 125 | | | (1) (2) (3) |
| First mortgage bonds | December | | 5.25 | | | 2043 | | US | 125 | | | (1) (2) (3) |
| UNS Energy | | | | | | | | | |
| Unsecured senior notes | May | | 5.60 | | | 2036 | | US | 30 | | | (1) (3) |
| Unsecured senior notes | August | | 5.20 | | | 2034 | | US | 400 | | | (3) (4) |
| Central Hudson | | | | | | | | | |
| Senior notes | April | | 5.59 | | | 2031 | | US | 25 | | | (1) (3) |
| Senior notes | April | | 5.69 | | | 2034 | | US | 35 | | | (1) (3) |
| Senior notes | October | | 4.88 | | | 2029 | | US | 25 | | | (3) (4) |
| Senior notes | October | | 5.30 | | | 2034 | | US | 44 | | | (3) (4) |
| Senior notes | October | | 5.40 | | | 2036 | | US | 35 | | | (3) (4) |
| FortisBC Electric | | | | | | | | | |
| Unsecured debentures | August | | 4.92 | | | 2054 | | 100 | | | (1) |
| FortisAlberta | | | | | | | | | |
| Unsecured debentures | May | | 4.90 | | | 2054 | | 300 | | | (1) (2) (3) (4) |
| Caribbean Utilities | | | | | | | | | |
| Unsecured senior notes | May | | 6.17 | | | 2039 | | US | 40 | | | (1) (2) (3) |
| Unsecured senior notes | May | | 6.37 | | | 2049 | | US | 40 | | | (1) (2) (3) |
| FortisOntario | | | | | | | | | |
| Unsecured senior notes | August | | 5.05 | | | 2054 | | 55 | | | (1) |
| Fortis | | | | | | | | | |
| Unsecured senior notes | September | | 4.17 | | | 2031 | | 500 | | | (1) (3) (4) |
(1) Repay short-term and/or credit facility borrowings(2) Fund capital expenditures
(3) General corporate purposes
(4) Repay maturing long-term debt
| | | | | | | | | | | | | | | | | |
| Common Equity Financing | | | | | |
| Common Equity Issuances and Dividends Paid |
| Years ended December 31 |
| ($ millions, except as indicated) | 2024 | | | 2023 | | | Variance |
| Common shares issued: | | | | | |
Cash (1) | 46 | | | 43 | | | 3 | |
Non-cash (2) | 435 | | | 409 | | | 26 | |
| Total common shares issued | 481 | | | 452 | | | 29 | |
Number of common shares issued (# millions) | 8.7 | | | 8.4 | | 0.3 | |
| Common share dividends paid: | | | | | |
| Cash | (744) | | | (701) | | | (43) | |
Non-cash (3) | (434) | | | (408) | | | (26) | |
| Total common share dividends paid | (1,178) | | | (1,109) | | | (69) | |
Dividends paid per common share ($) | 2.39 | | 2.29 | | | 0.10 | |
(1) Includes common shares issued under stock option and employee share purchase plans
(2) Common shares issued under the DRIP and stock option plan
(3) Common share dividends reinvested under the DRIP
| | | | | | | | |
| 16 | FORTIS INC. | DECEMBER 31, 2024 |
| | | | | | | | |
| Management Discussion and Analysis |
On December 4, 2024 and February 13, 2025, Fortis declared a dividend of $0.615 per common share payable on March 1, 2025 and June 1, 2025, respectively. The payment of dividends is at the discretion of the Board and depends on the Corporation's financial condition and other factors.
On March 1, 2024, the annual fixed dividend per share for the First Preference Shares, Series K was reset from $0.9823 to $1.3673 for the five-year period up to but excluding March 1, 2029.
On December 1, 2024, the annual fixed dividend per share for the First Preference Shares, Series M was reset from $0.9783 to $1.3733 for the five-year period up to but excluding December 1, 2029.
| | | | | | | | | | | | | | | | | | | | | | | |
| Contractual Obligations | | | | | | | |
| Contractual Obligations | | | | | |
| As at December 31, 2024 | | |
| ($ millions) | Total | Year 1 | Year 2 | Year 3 | Year 4 | Year 5 | Thereafter |
| Long-term debt: | | | | | | | |
Principal (1) | 33,405 | | 1,990 | | 2,585 | | 2,541 | | 1,499 | | 1,024 | | 23,766 | |
| Interest | 19,630 | | 1,371 | | 1,343 | | 1,252 | | 1,162 | | 1,116 | | 13,386 | |
Finance leases (2) | 1,139 | | 37 | | 37 | | 37 | | 37 | | 37 | | 954 | |
Other obligations (3) | 464 | | 127 | | 110 | | 100 | | 22 | | 21 | | 84 | |
Other commitments: (4) | | | | | | | |
| Gas and fuel purchase obligations | 6,299 | | 763 | | 571 | | 520 | | 465 | | 393 | | 3,587 | |
| Renewable power purchase agreements | 2,628 | | 139 | | 166 | | 182 | | 182 | | 173 | | 1,786 | |
| Waneta Expansion capacity agreement | 2,362 | | 56 | | 58 | | 59 | | 60 | | 61 | | 2,068 | |
| Power purchase obligations | 1,335 | | 302 | | 217 | | 131 | | 124 | | 122 | | 439 | |
| | | | | | | |
| ITC easement agreement | 370 | | 14 | | 14 | | 14 | | 14 | | 14 | | 300 | |
| TEP EPC agreements | 308 | | 307 | | 1 | | — | | — | | — | | — | |
| Debt collection agreement | 99 | | 3 | | 3 | | 3 | | 3 | | 3 | | 84 | |
| Renewable energy credit purchase agreements | 58 | | 18 | | 7 | | 6 | | 6 | | 6 | | 15 | |
| Other | 140 | | 32 | | 11 | | 11 | | 12 | | 10 | | 64 | |
| 68,237 | | 5,159 | | 5,123 | | 4,856 | | 3,586 | | 2,980 | | 46,533 | |
(1)Amounts not reduced by unamortized deferred financing and discount costs of $191 million. Additional information is provided in Note 14 of the 2024 Annual Financial Statements
(2)Additional information is provided in Note 15 of the 2024 Annual Financial Statements
(3)Primarily includes commitments with respect to long-term compensation and employee future benefit arrangements
(4)Represents unrecorded commitments. Additional information is provided in Note 27 of the 2024 Annual Financial Statements
Other Contractual Obligations
The Corporation's regulated utilities are obligated to provide service to customers within their respective service territories. Capital Expenditures are forecast to be approximately $5.2 billion for 2025 and approximately $26.0 billion for the five-year 2025-2029 capital plan. See "Capital Plan" on page 19.
Under a funding framework with the Governments of Ontario and Canada, Fortis will contribute a minimum of approximately $165 million of equity capital to Wataynikaneyap Power, based on Fortis' proportionate 39% ownership interest and the final regulatory-approved capital cost of the related project. Wataynikaneyap Power has construction financing loan agreements in place and it is expected that long-term operating financing will replace the construction financing. In the event a lender under the loan agreements realizes security on the loans, Fortis may be required to accelerate its equity capital contributions, which may be in excess of the amount otherwise required of Fortis under the funding framework, to a maximum total funding of $235 million. Equity of $137 million has been contributed as of December 31, 2024.
UNS Energy has joint generation performance guarantees with participants at Four Corners and Luna, with agreements expiring in 2041 and 2046 respectively, and at San Juan and Navajo through decommissioning. The participants have guaranteed that in the event of payment default, each non-defaulting participant will bear its proportionate share of expenses otherwise payable by the defaulting participant. In exchange, the non-defaulting participants are entitled to receive their proportionate share of the generation capacity of the defaulting participant. In the case of San Juan and Navajo, participants would seek financial recovery from the defaulting party. There is no maximum amount under these guarantees, except for a maximum of $360 million for Four Corners. As at December 31, 2024, there was no obligation under these guarantees.
Off-Balance Sheet Arrangements
With the exception of letters of credit outstanding of $102 million as at December 31, 2024 and the unrecorded commitments in the table above, the Corporation had no off-balance sheet arrangements.
| | | | | | | | |
| 17 | FORTIS INC. | DECEMBER 31, 2024 |
| | | | | | | | |
| Management Discussion and Analysis |
Capital Structure and Credit Ratings
Fortis requires ongoing access to capital and, therefore, targets a consolidated long-term capital structure that will enable it to maintain investment-grade credit ratings. The regulated utilities maintain their own capital structures in line with those reflected in customer rates.
| | | | | | | | | | | | | | | | | | | | | | | |
| Consolidated Capital Structure | 2024 | | 2023 |
| As at December 31 | ($ millions) | | (%) | | ($ millions) | | (%) |
Debt (1) | 33,435 | | | 56.4 | | | 29,364 | | | 55.7 | |
| Preference shares | 1,623 | | | 2.7 | | | 1,623 | | | 3.1 | |
Common shareholders' equity and non-controlling interests (2) | 24,230 | | | 40.9 | | | 21,709 | | | 41.2 | |
| 59,288 | | | 100.0 | | | 52,696 | | | 100.0 | |
(1)Includes long-term debt and finance leases, including current portion, and short-term borrowings, net of cash
(2)Includes shareholders' equity, excluding preference shares, and non-controlling interests. Non-controlling interests represented 3.4% as at December 31, 2024 (December 31, 2023 - 3.5%)
Outstanding Share Data
As at February 13, 2025, the Corporation had issued and outstanding 499.3 million common shares and the following First Preference Shares: 5.0 million Series F; 9.2 million Series G; 7.7 million Series H; 2.3 million Series I; 8.0 million Series J; 10.0 million Series K; and 24.0 million Series M.
The common shares of the Corporation have voting rights. The Corporation's first preference shares do not have voting rights unless and until Fortis fails to pay eight quarterly dividends, whether or not consecutive or declared.
If all outstanding stock options were converted as at February 13, 2025, an additional 1.5 million common shares would be issued and outstanding.
Credit Ratings
The Corporation's credit ratings shown below reflect its low business risk profile, diversity of operations, the stand-alone nature and financial separation of each regulated subsidiary, and the level of holding company debt.
| | | | | | | | | | | | | | | | | |
| As at December 31, 2024 | Rating | | Type | | Outlook |
| S&P | A- | | Issuer | | Negative |
| BBB+ | | Unsecured debt | | |
| Morningstar DBRS | A (low) | | Issuer | | Stable |
| A (low) | | Unsecured debt | | Stable |
| Moody's | Baa3 | | Issuer | | Stable |
| Baa3 | | Unsecured debt | | |
| | | | | | | | |
| 18 | FORTIS INC. | DECEMBER 31, 2024 |
| | | | | | | | |
| Management Discussion and Analysis |
Capital Plan
Capital investment in energy infrastructure is required to ensure the continued and enhanced performance, reliability and safety of the electricity and gas systems, to meet customer growth, and to deliver cleaner energy.
Capital Expenditures in 2024 were $5.2 billion, consistent with expectations and $0.9 billion higher than 2023. The increase compared to 2023 was primarily due to investments associated with the Eagle Mountain Pipeline project at FortisBC Energy, expenditures on various transmission reliability projects at ITC, and construction of the Roadrunner Reserve battery storage projects at UNS Energy.
| | | | | | | | | | | | | | | | | | | | | | | | | | | | | | | | | | | | | | | | | | | | | | | | | | | | | | | | | | | |
2024 Capital Expenditures (1)(2) |
| Regulated Utilities | | Total
Regulated
Utilities | | Non-Regulated Corporate and Other | | Total |
| ($ millions, except as indicated) | ITC | | UNS
Energy | | Central
Hudson | | FortisBC
Energy | | Fortis
Alberta | | FortisBC
Electric | | Other Electric | | | |
| Total | 1,456 | | | 1,151 | | | 431 | | | 1,035 | | | 554 | | | 132 | | | 483 | | | 5,242 | | | 5 | | | 5,247 | |
| | | | | | | | | | | | | | | | | | | | | | | | | | | | | | | | | | | | | | | | | | | | | | | | | | | | | | | | | | | |
Forecast 2025 Capital Expenditures (2) |
| Regulated Utilities | | Total
Regulated
Utilities | | Non-Regulated Corporate and Other | | Total (3) |
| ($ millions, except as indicated) | ITC | | UNS Energy | | Central Hudson | | FortisBC Energy | | Fortis Alberta | | FortisBC Electric | | Other Electric | | | |
| Total | 1,403 | | | 1,276 | | | 462 | | | 687 | | | 624 | | | 179 | | | 540 | | | 5,171 | | | 7 | | | 5,178 | |
| | | | | | | | | | | | | | | | | | | | | | | | | | | | | | | | | | | |
2025-2029 Capital Plan (2) |
| ($ billions) | 2025 | | 2026 | | 2027 | | 2028 | | 2029 | | Total (3) |
| Five-year capital plan | 5.2 | | | 5.2 | | | 5.6 | | | 5.4 | | | 4.6 | | | 26.0 | |
(1)See "Non-U.S. GAAP Financial Measures" on page 10. Reflects a U.S. dollar-to-Canadian dollar exchange rate of 1.37 for 2024
(2)Excludes the non-cash equity component of AFUDC
(3)Reflects an assumed U.S. dollar-to-Canadian dollar exchange rate of 1.30. On average, Fortis estimates that a five-cent increase or decrease in the U.S. dollar relative to the Canadian dollar would increase or decrease Capital Expenditures by approximately $600 million over the five-year planning period
The Corporation's 2025-2029 capital plan of $26.0 billion is $1.0 billion higher than the previous five-year plan. The increase is driven by projects associated with the MISO LRTP and resiliency investments at ITC, as well as distribution investments largely due to customer growth at FortisAlberta.
The five-year capital plan is low risk and highly executable, with nearly all investments being regulated and only 23% relating to Major Capital Projects. Geographically, 58% of planned expenditures are expected in the U.S., including 29% at ITC, with 38% in Canada and the remaining 4% in the Caribbean.
The five-year capital plan is expected to be funded primarily by cash from operations and regulated utility debt. Common equity proceeds are expected to be provided by the Corporation's DRIP, assuming current participation levels. The Corporation's $500 million ATM Program remains available and provides funding flexibility as required.
Planned capital expenditures are based on detailed forecasts of energy demand as well as labour and material costs, including inflation, supply chain availability, general economic conditions, foreign exchange rates and other factors. These factors, including potential new or revised tariffs, could change and cause actual expenditures to differ from forecast. Fortis remains focused on maintaining customer affordability by controlling costs, investing in cleaner energy resulting in fuel savings for customers, utilizing available tax credits, and implementing innovative practices, among other initiatives.
| | | | | | | | |
| 19 | FORTIS INC. | DECEMBER 31, 2024 |
| | | | | | | | |
| Management Discussion and Analysis |
| | | | | | | | | | | | | | | | | |
Midyear Rate Base (1) |
| ($ billions) | 2024(2) | | 2025(2) | | 2029(2) |
| ITC | 12.5 | | | 12.8 | | | 16.5 | |
| UNS Energy | 7.6 | | | 7.7 | | | 10.7 | |
| Central Hudson | 3.2 | | | 3.4 | | | 4.3 | |
| FortisBC Energy | 5.8 | | | 6.3 | | | 8.7 | |
| FortisAlberta | 4.4 | | | 4.7 | | | 5.7 | |
| FortisBC Electric | 1.7 | | | 1.8 | | | 2.1 | |
| Other Electric | 3.8 | | | 4.0 | | | 5.0 | |
| Total | 39.0 | | | 40.7 | | | 53.0 | |
(1) Simple average of Rate Base at beginning and end of the year
(2) Reflects a U.S. dollar-to-Canadian dollar average exchange rate of 1.37 for 2024. 2025 and 2029 reflect an assumed U.S. dollar-to-Canadian dollar exchange rate of 1.30 consistent with the Corporation's 2025-2029 capital plan. On average, Fortis estimates that a five-cent increase or decrease in the U.S. dollar relative to the Canadian dollar would increase or decrease Rate Base by approximately $1.1 billion over the five-year planning period
Total midyear Rate Base is forecast to grow to $53.0 billion by 2029 underpinned by the five-year capital plan, translating to a CAGR of 6.5%.
| | | | | | | | | | | | | | | | | | | | | | | | | | |
| Major Capital Projects | | | | | | | Plan | | Expected | |
| ($ millions) | Pre-2024 | | Actual 2024 | | | | 2025-2029 | | Completion | |
| ITC | | | | | | | | | | |
| MISO LRTP | 25 | | | 64 | | | | | 1,704 | | | Post-2029 | |
| UNS Energy | | | | | | | | | | |
| IRP Related Generation | — | | | 1 | | | | | 1,620 | | | Various | |
| Roadrunner Reserve Battery Storage Project 1 | 137 | | | 286 | | | | | 51 | | | 2025 | | |
| Roadrunner Reserve Battery Storage Project 2 | 1 | | | 115 | | | | | 325 | | | 2026 | | |
| Vail-to-Tortolita Transmission Project | 152 | | | 47 | | | | | 253 | | | 2027 | | |
| FortisBC Energy | | | | | | | | | | |
Eagle Mountain Pipeline Project (1) | 50 | | | 386 | | | | | 314 | | | 2027 | | |
| Tilbury LNG Storage Expansion | 29 | | | 6 | | | | | 585 | | | 2029 | | |
| AMI Project | 7 | | | 30 | | | | | 733 | | | 2028 | | |
| Tilbury 1B Project | 44 | | | 5 | | | | | 339 | | | 2029 | | |
| Total | | | 940 | | | | | 5,924 | | | | |
(1)Net of customer contributions
MISO LRTP
Reflects investments associated with two tranches of the MISO LRTP. In 2022, the MISO board approved the first tranche of projects representing 18 transmission projects across the MISO Midwest subregion with total associated costs estimated at US$10 billion. Six of these projects run through ITC's MISO operating companies' service territories. ITC estimates transmission investments of US$1.4 billion to US$1.8 billion through 2030 associated with six of the 18 projects, with investments of approximately $1.6 billion (US$1.2 billion) included in the Corporation's 2025-2029 capital plan.
Investments of approximately $0.2 billion (US$0.1 billion) have been included in the Corporation's 2025-2029 capital plan associated with tranche 2.1. Significant additional investment opportunities remain for tranche 2.1 (see "Additional Investment Opportunities" on page 21).
IRP Related Generation
Includes capital expenditures supporting the energy transition as outlined in the 2023 IRPs for TEP and UNS Electric including renewable generation, energy storage systems and natural gas generation. Investments support approximately 950 MW of generation, subject to all-source requests for proposals.
Roadrunner Reserve Battery Storage Projects
Consists of two, 200 MW, battery energy storage systems which will facilitate the integration of renewable energy into the electric grid. Each system is capable of storing 800 MW hours of energy, enough to serve approximately 42,000 homes for four hours when deployed at full capacity. TEP will own and operate the systems.
Construction of Roadrunner Reserve 1 has commenced and is scheduled for completion in 2025. In October 2024, TEP filed an application with the ACC requesting approval to defer certain costs associated with owning and operating Roadrunner Reserve 1 for future recovery. TEP cannot predict the timing or outcome of this application.
In August 2024, TEP entered into an EPC agreement to develop Roadrunner Reserve 2, which is scheduled for completion in 2026.
| | | | | | | | |
| 20 | FORTIS INC. | DECEMBER 31, 2024 |
| | | | | | | | |
| Management Discussion and Analysis |
Vail-to-Tortolita Transmission Project
Includes investment in one circuit of a new double circuit 230 kilovolt transmission line to tie infrastructure into the TEP system, improving service and reliability to customers. Construction commenced in late 2023, and is scheduled for completion in 2027.
Eagle Mountain Pipeline Project
The project consists of a 50-km pipeline expansion to a small-scale LNG facility owned by Woodfibre LNG near Squamish, British Columbia. FortisBC Energy commenced construction of the project in 2023 which is scheduled for completion in 2027.
Tilbury LNG Storage Expansion Project
This project replaces the original LNG storage tank at the Tilbury site and increases the available regasification capacity to provide backup gas supply for lower mainland customers. The regulatory process was adjourned in 2023 in order for FortisBC Energy to prepare further information in support of the CPCN application. In October 2024, FortisBC Energy filed the additional information requested. A decision from the BCUC is expected in late 2025.
AMI Project
The project includes replacement of residential, commercial and industrial meters with advanced gas meters to support the safety, resiliency, and efficient operation of FortisBC Energy's gas distribution system. The project will enable remote meter reading and remote shutoff of gas. The CPCN application was approved by the BCUC in 2023, and installation of the advanced meters is expected to commence in 2025 and be substantially complete in 2028.
Tilbury 1B Project
Construction of additional liquefaction and dispensing, including on-shore piping, in support of marine bunkering and to further optimize the Tilbury Phase 1A Expansion Project. This FortisBC Energy project received an Order in Council from the Government of British Columbia in 2017. An initial project scope has been filed with regulators to support the federal impact assessment and provincial environmental assessment required to further expand the Tilbury site.
Additional Investment Opportunities
Fortis is pursuing additional investment opportunities within existing service territories that are not yet included in the five-year capital plan.
ITC
The MISO LRTP is expected to consist of several tranches. The opportunity associated with the first tranche of projects is outlined above. In December 2024, the MISO board of directors approved a portfolio of tranche 2.1 LRTP projects with estimated transmission costs of approximately US$22 billion. ITC now estimates a range of US$3.7 billion to US$4.2 billion in capital expenditures for the MISO tranche 2.1 projects located in Michigan and Minnesota where ROFRs are in effect and for projects requiring system upgrades in Iowa which are not subject to a competitive bidding process. A majority of the tranche 2.1 investment is expected beyond 2029.
In October 2024, ITC in collaboration with another Midwest U.S. energy company, received MISO approval for the Big Cedar Load Expansion Project in Iowa. The project will consist of two phases and includes transmission upgrades to serve up to 1,600 MW of new data center load at the Big Cedar Industrial Center. The first phase of the project requires transmission upgrades to support 800 MW of new load with a targeted in-service date of 2027, and phase two requires an additional 800 MW with an expected in-service date of 2028. The project requires franchise approvals from the Iowa Utilities Commission prior to construction. The project has a potential investment of up to US$400 million.
UNS Energy
TEP is experiencing significant interest from potential new large retail customers in the manufacturing, data center, and mining sectors with energy demands that could create substantial new energy needs. TEP continues to work with the potential companies to assess capital requirements and associated timelines.
FortisBC Energy - LNG
During 2024, provincial and federal environmental assessment certificates were issued for the Tilbury Marine Jetty project. The construction of the jetty supports further expansion of FortisBC's Tilbury LNG facility, which is uniquely positioned to meet customer demand for LNG. The site is scalable, can accommodate additional storage and liquefaction equipment and is close to international shipping lanes. Once constructed, the jetty would utilize FortisBC Energy's assets at the Tilbury site, including the Tilbury Phase 1B Project yet to be constructed, to service marine bunkering.
Other Opportunities
Includes incremental transmission investment and grid modernization projects at ITC; projects related to the 2023 IRPs as well as transmission investments at UNS Energy; regional transmission in New York; further renewable gas and LNG infrastructure opportunities in British Columbia; grid resiliency and climate adaptation investments; and the acceleration of load growth and cleaner energy infrastructure investments across our jurisdictions.
| | | | | | | | |
| 21 | FORTIS INC. | DECEMBER 31, 2024 |
| | | | | | | | |
| Management Discussion and Analysis |
GHG Emissions Reduction Targets
Fortis is primarily an energy delivery company with 93% of its assets related to transmission and distribution. This limits the impact of the Corporation’s utilities on the environment when compared to more generation-intensive businesses. Fortis has a relatively small amount of fossil-fuel generation in its portfolio and plans to transition to more renewable sources of energy for its customers.
Fortis continues to lower its already low emissions profile, and has set a 2050 net-zero direct GHG emissions target. This goal is in addition to the Corporation's interim targets to reduce direct GHG emissions 50% by 2030 and 75% by 2035 from a 2019 base year. Fortis expects to achieve its targets primarily through TEP's plan to exit from coal, as well as clean energy initiatives across the Corporation's other utilities. The Corporation's ability to achieve the GHG targets may be impacted by federal, state and provincial energy policies, as well as external factors, including significant customer and load growth and the development of clean energy technology. Reliability and affordability will remain key priorities as Fortis works to meet its emissions reduction targets.
Through 2024, Fortis has made significant progress on its emissions reduction targets with the Corporation's Scope 1 emissions 34% lower compared to 2019 levels. The retirement of certain coal generating stations, the commencement of seasonal operations at other generating stations, and the introduction of renewable wind and solar energy in Arizona, have supported our carbon emissions reduction to date.
Climate-Related Disclosure Standards
In December 2024, the CSSB issued CSDS S1, General Requirements for Disclosure of Sustainability-Related Financial Information, and CSDS S2, Climate-Related Disclosures, which require an entity to disclose information about its sustainability-related and climate-related risks and opportunities, including the disclosure of material Scope 1, 2 and 3 GHG emissions. The CSSB standards are voluntary and must be adopted by the CSA to become mandatory for Canadian reporting issuers, including Fortis. The CSA continues to work towards a revised climate-related disclosure rule that will consider the CSSB standards and may include modifications considered appropriate for Canadian capital markets. The content and timing of the CSA's revised climate-related disclosure rule are unknown. Fortis will continue to monitor updates from the CSA to assess any potential impact on the Corporation's disclosures.
In March 2024, the SEC released Rule No. 33-11275, The Enhancement and Standardization of Climate-Related Disclosures for Investors, which outlines climate-related disclosure requirements. The rule requires disclosure of the financial effects of severe weather events and other natural conditions, as well as other climate-related financial information, in the notes to the financial statements. In addition, the rule requires disclosure of risk management, governance and oversight activities, the impact of material climate-related risks on a company's strategy, business model and outlook, and details of material climate-related targets or goals. Disclosure of material Scope 1 and 2 GHG emissions is also required for certain filers. The SEC subsequently voluntarily stayed the rule pending completion of judicial review by the Court of Appeals for the Eighth Circuit. While the rule does not apply to Fortis as a foreign private issuer filing in the U.S. using Form 40-F, management is reviewing the standard to assess the potential impact on the Corporation's disclosures.
BUSINESS RISKS
Fortis has an ERM program that identifies and evaluates the severity and probability of risks to its business. The Fortis Board, through its audit committee, oversees Fortis' ERM program ensuring that management has an effective risk management system to support strategic planning. The ERM program at the subsidiary level is overseen by each subsidiary's board of directors and any material risks identified form part of Fortis' ERM program. Materiality thresholds are reviewed annually. Systems of internal controls are used by management to monitor and manage identified risks. A summary of the Corporation's significant business risks follows.
Utility Regulation
Regulated utility assets represented virtually all of the Corporation's total assets as at December 31, 2024. Regulatory jurisdictions include five Canadian provinces, ten U.S. states and three Caribbean countries, as well FERC regulation for transmission assets in the U.S.
Regulators administer legislation covering material aspects of the utilities' business including: customer rates, allowed ROEs and deemed capital structures; capital expenditures; the terms and conditions for the provision of energy and capacity, ancillary services and affiliate services; securities issuances; and certain accounting matters. Regulatory or legislative changes and decisions, and delays in the recovery of costs in rates due to regulatory lag, could have a Material Adverse Effect. The risk of regulatory lag may be significant for UNS Energy given the past practice of its regulator to use historical test years in setting customer rates.
The ability to recover the actual cost of service and earn the approved ROE or ROA typically depends upon achieving the forecasts established in the rate-setting process. For those utilities subject to PBR mechanisms, rates reflect assumed inflation rates and productivity improvement factors, and variances therefrom could adversely affect rates of return. Failure to recover costs and/or earn a return could have a Material Adverse Effect.
| | | | | | | | |
| 22 | FORTIS INC. | DECEMBER 31, 2024 |
| | | | | | | | |
| Management Discussion and Analysis |
For transmission operations, the underlying elements of FERC-established formula rates can be challenged by third parties which could result in rate reductions and customer refunds. These underlying elements include the ROE, ROE adders and deemed capital structure, as well as operating and capital expenditures.
In addition, the U.S. Congress periodically considers enacting energy legislation that could assign new responsibilities to FERC, modify provisions of the U.S. Federal Power Act or the Natural Gas Act, or provide FERC or another entity with increased authority to regulate U.S. federal energy matters.
While Fortis is well-positioned to maintain constructive regulatory relationships through local management teams and subsidiary boards of directors comprised mostly of independent local members, it cannot predict future legislative or regulatory changes, whether caused by economic, political or other factors. The Corporation and its utilities may experience challenges and compliance costs in responding to such regulatory changes in an effective and timely manner. Any such regulatory changes or operational impacts could have a Material Adverse Effect.
Physical Risks
The provision of electric and gas service is subject to physical risks, including impacts from severe weather and natural disasters, wars, terrorism, vandalism, critical equipment failure and other catastrophic events, including wildfires, within and outside the Corporation's service territories.
Electric utilities face risk of loss or damage from wildfires, floods, hurricanes, storm surges, washouts, landslides, earthquakes, avalanches, snow or ice storms, and other acts of nature. Further, certain utilities operate in remote or mountainous terrain that can be difficult to access for timely repairs and maintenance.
Gas utilities are exposed to operational risks associated with natural gas, including fires, explosions, pipeline corrosion and leaks, accidental damage to mains and service lines, equipment failure, damage and destruction from earthquakes, fires, floods and other natural disasters.
Accidents or natural disasters affecting any of the Corporation's electricity or gas utilities can lead to service disruption, spills and commensurate environmental or other liability.
In addition, the operation of electric and gas systems has the potential to cause fires, including wildfires as a result of equipment failure, falling trees, lightning strikes to lines or equipment, or otherwise. The risks associated with fire damage vary depending on weather, forestation, the proximity of habitation and third-party facilities to utility facilities, and other factors. Failure to adequately address the risk of fire and wildfires could result in civil actions and government enforcement proceedings and utilities may become liable for fire-suppression costs, regeneration and timber value costs, and third-party losses if their facilities are determined to have been responsible for, or contributed to, a fire or wildfire.
Generating equipment and facilities are subject to physical risks, including equipment breakdown or damage from fire, floods or other natural disasters, that may result in the uncontrolled release of water, interruption of fuel supply, lower-than-expected operational efficiency or performance, and service disruption.
Electricity and gas systems require ongoing maintenance, improvement and replacement. The utilities are responsible for operating and maintaining their assets in a safe manner, including the development and application of appropriate standards, system processes and/or procedures to ensure the safety of employees, contractors and the general public.
If service disruption, or damage arising from, or caused by, the failure to properly implement or complete approved maintenance and capital expenditures, severe weather or other physical risks, is not mitigated through insurance policies or the recovery of such costs in customer rates, such service disruption or damage could result in loss.
Any of the foregoing potential impacts of physical risk could have a Material Adverse Effect.
The foregoing physical risks can be exacerbated by the "Climate Change" risks discussed below.
Climate Change
Climate-Related Physical Risk
Climate change may negatively impact the ability to provide reliable and safe electric and gas service. A changing climate that leads to higher temperatures and more frequent and severe weather events may impact or disrupt the reliability of electric or gas systems. The physical risks associated with a changing climate requires the Corporation’s utilities to adapt and respond to continue delivering reliable service to customers.
Severe weather and events related to severe weather impact the Corporation's service territories, primarily in the form of thunderstorms, flooding, drought, extreme heat, wildfires, hurricanes, storm surges, atmospheric rivers and snow, or ice storms. Increased frequency of such events could increase the cost of providing service through increased repairs and use of contingency plans. Extreme weather conditions and changes in air temperature require system backup and can result in system stress, including service disruptions, and decreased efficiency of operating facilities over time. Changes in precipitation that impact soil moisture and water levels, or result in droughts, could increase the risk of wildfire caused by the Corporation's electricity assets or may cause water shortages that could adversely affect operations.
| | | | | | | | |
| 23 | FORTIS INC. | DECEMBER 31, 2024 |
| | | | | | | | |
| Management Discussion and Analysis |
Longer-term climate change impacts, such as sustained higher temperatures, higher sea levels, larger storm surges and floods, could result in service disruption, shortened asset life, increased repair and replacement costs, and costs associated with strengthened design standards and systems. The impacts of climate change can intensify the "Physical Risks" (see "Physical Risks" on page 23).
The physical risks posed by the impacts of climate change and resultant damage to assets, service disruption repair and replacement costs, and liability for third party damages could have a Material Adverse Effect if not resolved in a timely and effective manner and/or mitigated through insurance policies or regulatory cost recovery. An increase in business risk associated with climate change can also impact credit ratings, which could affect credit risk spreads on new long-term debt and credit facilities, as well as their availability (see "Access to Capital" on page 28).
Climate-Related Transition Risk
A transition towards decarbonization and further renewable energy use elevates risks associated with policy, legal, technological and market changes which may have capital and financial implications for the Corporation and its utilities.
The transition to cleaner energy will require the Corporation's utilities to effectively manage, among other things, evolving regulatory and legislative requirements, new resiliency standards, the integration of new technologies and impacts on customer demand and rates. Failure to appropriately respond to climate change and decarbonize may disrupt the ability of the utilities to provide safe and cost-effective service, which could cause reputational harm and other impacts.
Fortis expects changes to government policy and regulation to continue in the coming years (see "Environmental Regulation" on page 25). Further, the emergence of initiatives designed to reduce GHG emissions, increase renewable energy use, and control or limit the effects of climate change has increased the incentive for the development of new technologies that produce renewable energy, enable more efficient storage of energy and reduce energy consumption. As new technologies become widely available, infrastructure design risks and time delays may emerge. Utility energy delivery systems will require technological changes and updates in order to effectively deliver increasing amounts of renewable energy to customers (see "Technology Developments and AI" on page 25).
The availability of regulatory mechanisms or the ability of the Corporation's utilities to pass related costs on to customers remains uncertain. Regulatory lag in relation to the adoption of climate change initiatives and/or the availability of regulatory recovery mechanisms in certain jurisdictions could contribute to financial harm to Fortis and its utilities (see "Utility Regulation" on page 22).
Technological advancements will be required in order for the Corporation to achieve its net-zero target while preserving system reliability and customer affordability. In addition to the development and implementation of relevant energy technologies, the Corporation's ability to achieve its GHG targets depends upon many factors, including the impact of federal, provincial and state energy policies, significant load and customer growth, the size of the Corporation's service territory, or the adoption of alternative energy products by the public, any of which could cause actual results and the ability to achieve such targets to materially differ from expectations. The ultimate impact of achieving or failing to achieve such targets could cause reputational damage which could result in a Material Adverse Effect.
Cybersecurity and Information and Operations Technology
As operators of critical energy infrastructure, the Corporation's utilities are at risk of cybercrime, including cyberattacks, data breaches, cyber extortion, and similar compromises. As with other businesses, our information systems and the information systems of our third-party vendors are targeted by malware, phishing efforts, and other cyberattacks. Certain of the information systems of the Corporation's utilities have been subjected to direct and/or third-party cybersecurity breaches, including unauthorized access, none of which have been material. We expect to be targeted by similar attacks in the future. The ability of the Corporation's utilities to operate effectively is dependent upon using and maintaining complex information systems and infrastructure that: (i) support the operation of generation, transmission and distribution facilities, including electric and gas facilities; (ii) provide customers with billing, consumption and load settlement information, where applicable; and (iii) support financial and general operations.
Information and operations technology systems, including those of the Corporation's third-party service providers, may be vulnerable to unauthorized access or disruption due to cyber and other attacks, including hacking, malware, acts of war or terrorism, and acts of vandalism, among others. Further, geopolitical conflicts and the advancement of AI and generative AI may further increase the scale, sophistication or frequency of cyberattacks from malicious actors, some of which actions may even be initiated by or connected with nation-state actors.
Any such event could result in the disruption of energy service and other business operations, including safety disruptions, disruption of internal control processes, property damage, reputational damage, corruption or unavailability of critical data, loss of assets, and the theft, loss, misappropriation and/or disclosure of sensitive, confidential and proprietary business information, intellectual property, or personal information of customers and/or employees. The Corporation's exposure to these risks increases as the Corporation continues to partner with third-party providers (see "Reliance on Supply Chain and Third Parties" on page 28).
| | | | | | | | |
| 24 | FORTIS INC. | DECEMBER 31, 2024 |
| | | | | | | | |
| Management Discussion and Analysis |
A material cybersecurity breach of the Corporation's information security systems or those of a third-party service provider, or any delay or failure in assessing the materiality of such breach and related reporting/disclosure, could expose the Corporation to significant remediation costs and/or adversely affect the operations and financial performance of the Corporation, its reputation and standing with customers, regulators and financial markets, and expose it to claims for third-party damages or regulatory penalties. The resultant financial impacts may not be fully covered by insurance policies or, in the case of utilities, through regulatory cost recovery, and could have a Material Adverse Effect.
Growth
Fortis has a history of both growth through acquisitions and organic growth from capital investment in existing service territories. The Corporation's dividend growth guidance is significantly dependent upon achieving the Rate Base growth expected from the execution of the five-year capital plan as described under "Capital Plan" on page 19. Projects, particularly Major Capital Projects, are subject to risks of delay and cost overruns during construction caused by commodity price fluctuations, supply and labour costs, potential new or revised tariffs, supply chain constraints, supplier non-performance, weather, geologic conditions or other factors beyond the Corporation's control. There is no assurance that regulators will approve: (i) all of the planned projects or their amounts or timing; (ii) permits in a timely manner, or with reasonable terms and conditions; or (iii) the recovery of cost overruns in customer rates, which may have a Material Adverse Effect.
Health and Safety
The operations of the Corporation's utilities inherently involve risk to the health and safety of both employees and the public. Personal injury or loss of life could result from failure to implement or observe appropriate health and safety procedures and gives rise to operational, reputational or financial impacts, any of which could have a Material Adverse Effect. In addition, failure to comply with health and safety regulations could result in fines, penalties, reputational damage, litigation, increased capital and operating costs or adverse regulatory outcomes.
Political Environment
The political environment, at the local, national or global level, may impact energy laws, governmental energy policies or regulatory decisions. For example, political pressure or intervention to address energy prices and customer affordability concerns may impact regulatory decisions, as well as the period over which the Corporation’s utilities recover allowed costs.
The business is further exposed to risks associated with international relations and geopolitical events. Political, economic or social instability or events, trade disputes, new or revised tariffs, changes in laws or the imposition of onerous regulations applicable to existing operations, currency restrictions, and the impacts of changes in political leadership could lead to an increase in commodity prices, impact the availability and cost of energy or generally affect global economic conditions, any of which could have a Material Adverse Effect (see "Environmental Regulation" below and "General Economic Conditions" on page 27).
Technology Developments and AI
New technology developments in distributed generation, particularly solar, and energy efficiency products and services, as well as the implementation of renewable energy and energy efficiency standards, will continue to impact retail sales. Heightened awareness of energy costs and environmental concerns have increased demand for products that reduce energy consumption. The Corporation's utilities are also promoting demand-side management programs. New technologies available to customers include energy derived from renewable sources, customer-owned generation, energy-efficient appliances, battery storage and control systems. Advances in these or other technologies could have a significant impact on retail sales with a potential Material Adverse Effect. Additionally, advances in AI or generative AI could cause disruption to our business and, if we are unable to acquire, develop, implement or adopt new technology, we may suffer a competitive disadvantage, which could also have an adverse effect on our results of operations, financial condition and/or liquidity.
Further, the implementation of new information technology systems and emerging technologies, such as cloud computing, AI and generative AI into the business, including those impacting utility operations, customer billing systems and cybersecurity threat monitoring, carries risk that any such technology or system will not operate as expected. Failure to maintain, upgrade, replace or properly implement such new technology or systems could result in increased risk of a cybersecurity incident and have an adverse effect on operational efficiency, revenue or reputation (see "Cybersecurity and Information and Operations Technology" on page 24).
Environmental Regulation
The Corporation's businesses are subject to environmental laws and regulations, including those which concern emissions into the air, discharges into water or soil, use of water, hazardous waste disposal and containment, and the investigation and remediation of contamination, among others.
The risk of contamination of air, soil and water associated with electricity operations primarily relates to: (i) the transportation, handling, storage and combustion of fuel; (ii) the use of petroleum-based products, mainly transformer and lubricating oil; (iii) the management and disposal of coal combustion residuals and other wastes; and (iv) accidents resulting in hazardous release at or from coal mines that supply generating facilities. Contamination risks at gas operations primarily relate to leaks and other accidents involving gas systems. The key environmental risks for hydroelectric generation operations include dam failures and the creation of artificial water flows that may disrupt natural habitats.
| | | | | | | | |
| 25 | FORTIS INC. | DECEMBER 31, 2024 |
| | | | | | | | |
| Management Discussion and Analysis |
Failure to comply with environmental laws and regulations, or to obtain or comply with any necessary environmental permits pursuant to such laws and regulations, could result in injunctions, fines or other penalties. Further, liabilities relating to contamination investigation and remediation, and related claims for personal injury or property damage, may arise at many locations, including formerly and currently owned/operated properties and waste treatment or disposal sites, regardless of whether such contamination was caused by the business at the time it owned the property, whether it resulted from non-compliance with applicable environmental laws and regulations, or whether it resulted from any act or omission of the business. These liabilities could result in substantial monetary judgments for clean-up costs, damages, fines and/or penalties. To the extent not fully covered by insurance or through regulatory mechanisms, these foregoing costs could have a Material Adverse Effect.
Environmental laws and regulations continue to develop and may result in significant additional expense. In particular, the management of GHG emissions and related decarbonization requirements is a concern due to new and emerging federal, state and provincial GHG laws, regulations and guidelines. Regulation and the pace of regulatory change to address reliability, resiliency, resource planning and safety is expected to increase. Future legislation could impact generation assets, operations, energy supply, operational costs, reporting obligations and other material aspects of the Corporation's business. Increased compliance costs or additional operating restrictions from revised or additional regulation could have a Material Adverse Effect (see "Climate Change" at page 23).
Natural Gas Competitiveness
Approximately 18% of the Corporation's revenue is derived from the delivery of natural gas. In British Columbia, which accounts for 79% of the Corporation's natural gas revenue, natural gas primarily competes with electricity for space and hot water heating load. Upfront capital costs for gas service continue to present competitive challenges for natural gas compared to electricity service. If gas becomes less competitive due to price or other factors, such as government policy or public perception of natural gas or its carbon intensity relative to other energy sources, the ability to add new customers could be impaired. Existing customers could also reduce their consumption or switch to electricity, placing further pressure on rates and, in the extreme, could ultimately lead to an inability to recover the utility's cost of service through customer rates.
Government policy could further impact the competitiveness of natural gas in British Columbia. As governments develop policies to address climate change, any resultant changes to energy policy may impact the competitiveness of natural gas relative to other energy sources.
Additionally, there are other competitive challenges that are impacting the penetration of natural gas into new housing stock such as the carbon intensity of the energy source and the type of housing stock being built. As part of their own climate change policy plans, local governments may use various tools at their disposal such as franchise agreements, permits, building codes and zoning bylaws to impose limitations on energy sources permitted in new and existing developments. Municipalities can also provide incentives, such as higher density allowance, to builders to adopt carbon free energy options for their developments. These actions and policies may hinder the Corporation's ability to attract new natural gas customers or retain existing customers.
A decrease in the competitiveness of natural gas due to pricing, government policy or other factors could have a Material Adverse Effect.
Weather Variability and Seasonality
Electricity consumption varies significantly in response to seasonal weather changes which have been and will continue to be impacted by climate change (see "Climate Change" on page 23). Cool summers may reduce the use of air conditioning and other cooling equipment, while warmer and less severe winters may reduce heating load. Alternatively, severe weather could unexpectedly increase heating and cooling loads, negatively impacting system reliability. Hydroelectric generation is sensitive to rainfall levels and unexpected variations in seasonal rainfall levels can negatively impact operations.
Weather and seasonality have a significant impact on gas distribution volumes as a major portion of natural gas is used for space heating by residential customers. The earnings of the Corporation's gas utilities are typically highest in the first and fourth quarters. Regulatory deferral and revenue decoupling mechanisms are in place at certain of the Corporation's utilities to minimize the volatility in earnings that would otherwise be caused by variations in weather conditions. The absence or the discontinuance of key regulatory mechanisms could result in significant and prolonged weather variations from seasonal norms having a Material Adverse Effect.
Required Approvals
The acquisition, ownership and operation of electric and gas businesses require numerous licences, permits, agreements, orders, certificates, consultations, and other approvals from various levels of government, regulators, government agencies and/or other third parties. There is no assurance that: (i) such approvals will be obtained, continuously maintained or renewed without delay; and (ii) the terms and conditions thereof will be fully complied with at all times and will not change in a material adverse manner. Significant failures in these regards could prevent the operation of the businesses and have a Material Adverse Effect.
| | | | | | | | |
| 26 | FORTIS INC. | DECEMBER 31, 2024 |
| | | | | | | | |
| Management Discussion and Analysis |
Reliability Standards
The Energy Policy Act of 2005 provides for a regulatory framework which requires owners, operators and users of the bulk electric system in the U.S. to meet mandatory reliability standards developed by the North American Electric Reliability Corporation and its regional entities, which are approved and enforced by FERC. Many of these, or similar, standards have been adopted in certain Canadian provinces including British Columbia and Alberta. The failure to develop, implement and maintain appropriate operating practices/systems and capital plans to address reliability obligations could lead to compliance violations and a Material Adverse Effect, including as a result of the exclusion of related costs from customer rates and other potentially significant penalties.
Indigenous Peoples' Land Claims
In British Columbia, the Corporation's utilities provide service to customers on Indigenous Peoples' lands and maintain facilities on lands that are subject to Indigenous Peoples' land claims. Various treaty negotiation processes involving Indigenous Peoples and the Governments of British Columbia and Canada are underway, but the basis for potential settlements is unclear and not all Indigenous Peoples are participating in such processes. To date, the policy of the Government of British Columbia has been to structure settlements without prejudicing existing third-party rights; however, there is no assurance that the settlement processes will not have a Material Adverse Effect.
FortisAlberta has distribution assets on Indigenous Peoples' lands in Alberta with access permits held by a third party. Some of these permits require approvals from First Nations and Crown-Indigenous Relations and Northern Affairs Canada. FortisAlberta may be unable to obtain such approvals or negotiate land-use agreements with reasonable terms. Significant failures in these regards could have a Material Adverse Effect.
Certain jointly owned facilities and portions of TEP's transmission lines are located on tribal lands pursuant to leases, land easements and other rights-of-way that are effective for specified time periods. The inability to receive future approvals for continued access to the facilities and land could have a Material Adverse Effect.
Joint-Ownership Interests and Third-Party Operators
Certain generating facilities from which TEP receives power are jointly owned with, or are operated by, third parties. TEP may not have sole discretion or any ability to affect the management or operations of such facilities, including how to best address changing economic conditions or environmental requirements. A divergence in the interests of TEP and those of the joint owners or operators could have a Material Adverse Effect.
General Economic Conditions
Fluctuations in general economic conditions, inflation, energy prices, employment levels, personal disposable incomes, housing starts, industrial activity and other factors, including potential new or revised tariffs, may lower energy demand and sales and reduce capital spending, particularly to the extent that related customer and Rate Base growth are impacted. A severe and prolonged economic downturn could also impair customers' ability to pay their bills in a timely manner. Each of these factors could lead to the impairment of goodwill or other long-term assets, and could have a Material Adverse Effect. Further, the impact of macroeconomic factors, including, but not limited to, international relations and geopolitical events, could cause weaker economic conditions or increase the volatility of the equity capital markets, which could impact the business and financial condition of the Corporation or adversely impact the Corporation's share price.
Commodity Price Volatility
Purchased power and gas, and generation fuel costs are subject to commodity price volatility, which is managed through regulator-approved: (i) mechanisms that permit the flow through in customer rates of commodity price changes and/or that provide for rate-stabilization and other deferral accounts; and (ii) price-risk management strategies such as the use of derivative contracts that effectively fix costs (see "Financial Instruments - Derivatives" on page 33).
There is no assurance that current regulator-approved mechanisms or strategies will continue to exist in the future. Additionally, despite these mechanisms and strategies, severe and prolonged commodity price increases could result in rates that customers are unable to pay and/or could affect consumption and sales growth, which could have a Material Adverse Effect.
Purchased Power Supply
A significant portion of electricity and gas sold by the Corporation's utilities is purchased through the wholesale energy markets or pursuant to contracts with energy suppliers and is not being produced by the Corporation's utilities. A disruption in the wholesale energy markets, or a failure on the part of energy or fuel suppliers or operators of energy delivery systems that connect to the Corporation's utilities, could result in a loss and/or increase in the cost of purchased power and gas, which could have a Material Adverse Effect. The cost and availability of purchased power and gas may be adversely impacted by factors discussed under "Climate Change" on page 23, "Environmental Regulation" on page 25 and "Commodity Price Volatility" above.
| | | | | | | | |
| 27 | FORTIS INC. | DECEMBER 31, 2024 |
| | | | | | | | |
| Management Discussion and Analysis |
Counterparty Credit Risk
ITC has a concentration of credit risk as approximately 70% of its revenue is derived from three customers. These customers have investment-grade credit ratings and credit risk is further managed by MISO by requiring a letter of credit or cash deposit equal to the credit exposure, which is determined by a credit-scoring model and other factors.
FortisAlberta has a concentration of credit risk as its distribution service billings are to a relatively small group of retailers. Credit risk is managed by obtaining from the retailers either a cash deposit, letter of credit, an investment-grade credit rating, or a financial guarantee from an entity with an investment-grade credit rating.
Central Hudson has seen an increase in accounts receivable since the suspension of collection efforts initially required in response to the COVID-19 pandemic. Central Hudson continues to contact customers regarding past-due balances and collection efforts continue to expand. Under its regulatory framework, Central Hudson can defer uncollectible write-offs above the amounts collected in customer rates for future recovery.
UNS Energy, Central Hudson, FortisBC Energy, and Fortis may be exposed to credit risk from non‑performance by counterparties to derivative contracts. Credit risk is managed by net settling payments, when possible, and dealing only with counterparties that have investment-grade credit ratings. At UNS Energy, Central Hudson and FortisBC Energy, certain contractual arrangements require counterparties to post collateral.
There is no assurance that credit risk management strategies will continue to be effective. Significant counterparty defaults could have a Material Adverse Effect.
Reliance on Supply Chain and Third Parties
Domestic and global supply chain disruptions, as a result of either physical or cyberattacks or geopolitical issues, may delay the delivery or result in shortages of certain materials, equipment and other resources that are critical to the operation of the Corporation's utilities, or impact the services and performance of the operation of the Corporation's utilities. Failure to eliminate or manage constraints in, or performance of, the supply chain may impact the availability of items or service that are necessary to support operations as well as materials that are required for continued infrastructure growth and could have a Material Adverse Effect. Further, cybersecurity incidents in the Corporation's supply chain or cyberattacks originating from the Corporation's supply chain may further result in disruption of energy service and other business operations which could have a Material Adverse Effect.
Interest Rates
Generally, the market price of the Corporation's common shares is inversely correlated to interest rate changes. Additionally, allowed ROEs are exposed to changes in long-term interest rates, such that a decreasing interest rate environment can result in lower allowed ROEs over time. While a rising interest rate environment could result in higher allowed ROEs, such ROE changes tend to lag as a result of regulatory timelines. Borrowings under variable-rate credit facilities and long-term debt, as well as new debt issuances, are also exposed to interest rate changes. Although interest costs at the regulated utilities are generally recovered through customer rates, the discontinuance of regulatory mechanisms that permit the flow-through of actual interest costs, the impact of regulatory lag at UNS Energy, and higher finance costs on holding company debt could have a Material Adverse Effect.
Foreign Exchange Exposure
As at December 31, 2024, 69% of the Corporation's assets were located outside Canada and 62% of 2024 revenue was derived from foreign operations. The reporting currency of ITC, UNS Energy, Central Hudson, Caribbean Utilities, FortisTCI, Fortis Belize and Belize Electricity is, or is pegged to, the U.S. dollar. The earnings and cash flow from, and net investments in, these entities are exposed to fluctuations in the U.S. dollar-to-Canadian dollar exchange rate. The Corporation’s $26.0 billion five-year capital plan for 2025 through 2029 also includes exposure to foreign exchange.
Fortis has reduced its U.S. dollar currency exposure through hedging. The Corporation has issued and designated U.S. dollar-denominated long-term debt as an effective hedge of foreign net investments. Fortis has also entered into foreign exchange contracts and cross-currency swaps to manage a portion of its exposure to foreign currency risk.
Given only partial hedging, earnings and cash flow continue to be impacted by exchange rate fluctuations. In addition, there is no assurance that existing hedging strategies will continue to be effective, and therefore a significant, prolonged decrease in the U.S dollar-to-Canadian dollar exchange rate could have a Material Adverse Effect.
Access to Capital
The Corporation and certain of its subsidiaries have incurred material amounts of indebtedness. Ongoing access to cost-effective capital is required to fund, among other things, capital expenditures and the repayment of maturing debt.
Operating Cash Flow may not be sufficient to fund the repayment of all outstanding liabilities when due or fund anticipated capital expenditures.
| | | | | | | | |
| 28 | FORTIS INC. | DECEMBER 31, 2024 |
| | | | | | | | |
| Management Discussion and Analysis |
The ability to meet long-term debt repayments is dependent upon obtaining sufficient and cost-effective financing to replace maturing indebtedness. The ability to arrange financing is subject to numerous factors, including the results of operations and financial condition of Fortis and its subsidiaries, the regulatory environments including decisions regarding capital structure and allowed ROEs, capital market conditions, general economic conditions, credit ratings, and the environmental, social and governance profile of Fortis and its subsidiaries. Changes in credit ratings could affect credit risk spreads on new long-term debt and credit facilities, as well as their availability.
Fortis is a holding company and, as such, has no revenue-generating operations of its own. The Corporation’s subsidiaries are separate legal entities and have no independent obligation to pay dividends to Fortis. Prior to paying dividends to the Corporation, the subsidiaries have financial obligations that must be satisfied, including, among others, their operating expenses and obligations to creditors. Furthermore, the Corporation’s utilities are required by regulation to maintain a minimum equity-to-total capital ratio that may restrict their ability to pay dividends to the Corporation or may require the Corporation to contribute capital to such subsidiaries. The future enactment of laws or regulations may prohibit or further restrict the ability of the Corporation's subsidiaries to pay dividends or to repay intercorporate indebtedness. In addition, in the event of a subsidiary’s liquidation or reorganization, the Corporation’s right to participate in a distribution of assets is subject to the prior claims of the subsidiary’s creditors. As a result, the Corporation’s ability to generate cash flow to service its debt obligations and pay dividends is reliant on the ability of its subsidiaries to generate sustained earnings and cash flows and to pay dividends and repay loans.
There is no assurance that sufficient capital will continue to be available on acceptable terms. For further information see "Liquidity and Capital Resources" on page 14.
Taxation
Earnings at Fortis and its subsidiaries could be impacted by changes in income tax rates and other tax legislation in Canada, the U.S. and other international jurisdictions. The nature, timing or impact of changes in tax laws cannot be predicted and could have a Material Adverse Effect. Although income taxes at the regulated utilities are generally recovered in customer rates, tax-related regulatory lag can result in recovery delays or non-recovery for certain periods. At the non-regulated level, changes in income tax rates and other tax legislation could materially affect the after-tax cost of existing and future debt which is not recoverable in customer rates.
Insurance
Insurance is maintained with reputable industry insurers for property damage, potential liabilities and business interruption for coverage considered appropriate and in accordance with industry practice.
A significant portion of transmission and distribution assets is uninsured, as is customary in North America, as the cost to insure such assets is prohibitive. Insurance is subject to coverage limits and deductibles, as well as time-sensitive claims discovery and reporting provisions. There is no assurance that: (i) the amounts and types of losses from actual damage, liabilities or business interruption will be fully covered by insurance; (ii) regulatory relief would be obtained for coverage shortfalls; (iii) adequate insurance at reasonable rates will continue to be available; or (iv) insurers will fulfill their obligations. Significant actual shortfalls in insurance coverage or claims payment could have a Material Adverse Effect. The availability and cost of certain types of insurance may be adversely impacted by the risks described under "Climate Change" on page 23.
Pandemics and Public Health Crises
The Corporation could be negatively impacted by widespread outbreaks of communicable diseases or other public health crises that cause economic and/or other disruptions. Outbreaks of communicable diseases, as well as efforts to reduce the health impacts and control disease spread, can lead to restrictions on business operations, including business closures and the potential impacts of reduced labour availability and productivity, supply chain disruptions, project construction delays, disruptions to capital markets, governmental and regulatory action, and a prolonged reduction in economic activity. An extended economic slowdown could reduce energy sales and adversely impact the ability of customers, contractors and suppliers to fulfill their obligations and could disrupt operations and capital expenditure programs or cause impairment of goodwill (see "General Economic Conditions" on page 27).
The Corporation's utilities provide essential services and must be operational and maintained throughout any pandemic or other public health crisis, though such events can challenge operations and increase operating costs. The duration and severity of a pandemic or other public health crisis could have a Material Adverse Effect.
Talent Management
The delivery of safe, reliable and cost-effective service depends on the attraction, development and retention of a skilled workforce as well as filling strategic positions. Like its peers, Fortis faces demographic challenges and competitive markets relating to trades, technical and professional staff, particularly considering its significant capital plan. ITC relies heavily on agreements with third parties to provide services for the construction, maintenance and operation of certain aspects of its business. Significant failures in attracting or retaining a skilled workforce or filling strategic positions within the Corporation or its utilities could have a Material Adverse Effect.
| | | | | | | | |
| 29 | FORTIS INC. | DECEMBER 31, 2024 |
| | | | | | | | |
| Management Discussion and Analysis |
Labour Relations
Most of the Corporation's utilities employ members of labour unions or associations under collective bargaining agreements. Fortis considers its labour relationships to be satisfactory, but there is no assurance that this will continue or that existing collective bargaining agreements will be renewed on reasonable terms without work disruption or other job action. Significant failures in these regards could cause service interruptions and/or labour cost increases for which regulators may not allow full recovery in customer rates, and could have a Material Adverse Effect.
Post-Retirement Obligations
Fortis and most of its subsidiaries maintain a combination of DBP and/or OPEB plans for certain employees and retirees. The most significant cost drivers for these plans are investment performance and interest rates, which are affected by global financial markets. Regulatory deferral mechanisms are in place at many of the Corporation’s utilities that permit the flow through in customer rates of certain impacts associated with market fluctuations. Severe and prolonged market disruptions, significant declines in the market values of investments held to meet plan obligations, discount rate changes, participant demographics, changes in laws and regulations, as well as changes in existing regulatory treatment of post-retirement benefit costs, may increase plan expenses or require additional plan funding and could have a Material Adverse Effect.
Reputation, Relationships and Stakeholder Activism
There can be no assurance that internal processes, controls or audits, including those related to the preparation and presentation of financial statements, will ensure compliance with the Corporation's internal policies, including its Code of Conduct, or anti-bribery and anti-corruption laws. Employees, affiliates, independent contractors or agents may violate such policies and laws, which may potentially lead to reputational damage, in addition to potential fines, penalties or litigation, any of which could have a Material Adverse Effect.
The Corporation's operations and growth prospects require strong relationships with key stakeholders, including regulators, governments and agencies, Indigenous communities, landowners, and environmental organizations. Inadequately managing expectations and issues important to stakeholders, including those arising during construction of Major Capital Projects, could affect the Corporation's reputation as well as have a significant impact on its operations and infrastructure development. See "Required Approvals" and "Indigenous Peoples' Land Claims" on page 27.
External stakeholders have been challenging companies regarding climate change, sustainability, diversity, returns (including ROEs and ROAs), executive compensation, and other matters. Public opposition to larger infrastructure projects is becoming increasingly common, which can challenge capital plans and resultant organic growth. While the Corporation actively monitors such activism and is committed to developing stronger relationships with its external stakeholders, failure to effectively manage or respond to stakeholder activism could have a Material Adverse Effect.
Legal, Administrative and Other Proceedings
Legal, administrative and other proceedings arise in the ordinary course of business and may include environmental claims, employment-related claims, securities-based litigation, contractual disputes, personal injury or property damage claims, actions by regulatory or tax authorities, and other matters. Unfavourable outcomes such as judgments or settlements for monetary or other damages, injunctions, denial or revocation of permits, reputational harm, and other results could have a Material Adverse Effect.
ACCOUNTING MATTERS
New Accounting Policies
Segment Reporting: The Corporation adopted ASU No. 2023-07, Improvements to Reportable Segment Disclosures, for the year ended December 31, 2024 and will adopt it for interim periods beginning in 2025. This update requires disclosure of incremental segment information, including significant segment expenses and other items that are included in segment profit or loss. This adoption of this standard did not materially impact Fortis' disclosures.
Future Accounting Pronouncements
Income Taxes: ASU No. 2023-09, Improvements to Income Tax Disclosures, is effective for Fortis on January 1, 2025 on a prospective basis, with retrospective application and early adoption permitted. The ASU requires additional disclosure of income tax information by jurisdiction to reflect an entity's exposure to potential changes in tax legislation, and associated risks and opportunities. Fortis does not expect the ASU to materially impact its disclosures.
Expense Disaggregation: ASU No. 2024-03, Disaggregation of Income Statement Expenses, is effective for Fortis on January 1, 2027 for annual periods and on January 1, 2028 for interim periods, on a prospective basis, with retrospective application and early adoption permitted. The ASU requires detailed disclosure of certain expense categories included on the consolidated statements of earnings, including energy supply costs, operating expenses, and depreciation and amortization expense. Fortis is assessing the impact on its disclosures.
| | | | | | | | |
| 30 | FORTIS INC. | DECEMBER 31, 2024 |
| | | | | | | | |
| Management Discussion and Analysis |
Critical Accounting Estimates
General
The preparation of the 2024 Annual Financial Statements required management to make estimates and judgments that affect the reported amounts of, and disclosures related to, assets, liabilities, revenues, expenses, gains, losses and contingencies. Management evaluates these estimates on an ongoing basis based upon historical experience, current conditions, and assumptions believed to be reasonable at the time they are made, with any adjustments recognized in the period they become known. Actual results may differ significantly from these estimates.
Regulatory Assets and Liabilities
As at December 31, 2024, Fortis recognized regulatory assets of $4.6 billion (2023 - $4.4 billion) and regulatory liabilities of $4.3 billion (2023 - $4.0 billion).
Regulatory assets represent future revenues and/or receivables associated with certain costs incurred that will be, or are expected to be, recovered from customers in future periods through the rate-setting process. Regulatory liabilities represent: (i) future reductions or limitations of increases in revenue associated with amounts that will be, or are expected to be, refunded to customers through the rate-setting process; or (ii) obligations to provide future service that customers have paid for in advance.
The recognition of regulatory assets and liabilities and the period(s) of settlement are often estimates based on past, existing or expected regulatory orders in relation to the nature of the underlying amounts, and are subject to regulatory approval. There is no assurance that actual settlement amounts and the related settlement periods will not be materially different from those estimated. Differences arising from the regulator's orders would be recognized in accordance with those orders, whereby any amounts disallowed would be immediately recognized in earnings with the remainder recognized in earnings in accordance with their inclusion in customer rates.
| | | | | | | | | | | | | | | | | | | | | | | |
| Employee Future Benefits | | | | | | | |
| Key Estimates and Assumptions | DBP Plans | | OPEB Plans |
| Years ended December 31 | |
| ($ millions, except as indicated) | 2024 | | | 2023 | | | 2024 | | | 2023 | |
Funded status: (1) | | | | | | | |
Benefit obligation (2) | (3,440) | | | (3,347) | | | (603) | | | (596) | |
| Plan assets | 3,613 | | | 3,313 | | | 506 | | | 430 | |
| 173 | | | (34) | | | (97) | | | (166) | |
Net benefit cost (2) | 11 | | | 21 | | | 12 | | | 15 | |
Key assumptions: (weighted average %) | | | | | | | |
| | | | | | | |
| | | | | | | |
Discount rate as at December 31 (3) | 5.25 | | | 4.84 | | | 5.43 | | | 4.94 | |
Expected long-term rate of return on plan assets (4) | 6.51 | | | 6.58 | | | 6.05 | | | 5.92 | |
| Rate of compensation increase | 3.52 | | | 3.37 | | | — | | | — | |
Health care cost trend increase rate (5) | — | | | — | | | 4.53 | | | 4.52 | |
(1)Periodic actuarial valuations determine funding contributions for the DBP plans and U.S. OPEB plans, while Canadian OPEB plans are unfunded
(2)Actuarially determined using the projected benefits method prorated on service and management's best estimate of expected plan investment performance, salary escalation, average remaining service life of employees, mortality rates and, for OPEB plans, expected health care costs
(3)Reflects market interest rates on high‑quality bonds with cash flows that match the timing and amount of expected pension payments. The discount rate used during the year for DBP plans is 4.84% (2023 - 5.36%) and 4.96% (2023 - 5.39%) for OPEB plans
(4)Developed using best estimates of expected returns, volatilities and correlations for each class of asset. Estimates are based on historical performance, future expectations and periodic portfolio rebalancing among the diversified asset classes
(5)Actuarially determined, the projected 2025 rate is 6.51% and is assumed to decrease over the next 10 years to the ultimate rate of 4.53% in 2034 and thereafter
| | | | | | | | | | | | | | | | | | | | | | | | | | | | | | | | | | | |
| Sensitivity Analysis | Rate of Return | | Discount Rate | | Health Care Costs
Trend Rate |
| Year ended December 31, 2024 | 1% change | | 1% change | | 1% change |
| ($ millions) | Increase | | Decrease | | Increase | | Decrease | | Increase | | Decrease |
| DBP plans: | | | | | | | | | | | |
| Net benefit cost | (33) | | | 29 | | | (24) | | | 41 | | | n/a | | n/a |
| Projected benefit obligation | (2) | | | (66) | | | (378) | | | 453 | | | n/a | | n/a |
| OPEB plans: | | | | | | | | | | | |
| Net benefit cost | (4) | | | 4 | | | (9) | | | 11 | | | 14 | | | (11) | |
| Accumulated benefit obligation | — | | | — | | | (68) | | | 84 | | | 62 | | | (52) | |
| | | | | | | | |
| 31 | FORTIS INC. | DECEMBER 31, 2024 |
| | | | | | | | |
| Management Discussion and Analysis |
At the regulated utilities, changes in net benefit cost are generally expected to be reflected in customer rates, subject to regulatory lag and forecast risk at certain utilities.
ITC, Central Hudson, FortisBC Energy, FortisBC Electric and Newfoundland Power have regulator‑approved mechanisms to defer variations between actual net pension cost and that forecast and reflected in customer rates. There is no assurance that these deferral mechanisms will continue in the future.
Depreciation and Amortization
As at December 31, 2024, Fortis recognized property, plant and equipment and intangible assets of $51.1 billion (2023 - $44.9 billion) representing 70% of total assets (2023 - 68%). Depreciation and amortization of these assets totalled $1.8 billion for 2024 (2023 - $1.7 billion).
Depreciation and amortization reflect the estimated useful lives of the underlying assets, which considers historical experience, manufacturers' ratings and specifications, the past and expected future pattern and nature of usage, and other factors.
At the regulated utilities, depreciation rates require regulatory approval and include a provision for estimated future removal costs, not identified as a legal obligation. Estimates primarily reflect historical experience and expected cost trends. The provision is recognized as a long-term regulatory liability against which actual removal costs are netted when incurred. As at December 31, 2024, this regulatory liability was $1.7 billion (2023 - $1.5 billion).
Depreciation rates at the regulated utilities are typically determined through periodic depreciation studies performed by external experts. Where actual experience differs from previous estimates, resultant differences are generally reflected in future depreciation rates and thereby recovered or refunded through customer rates in the manner prescribed by the regulator.
Goodwill Impairment
As at December 31, 2024, Fortis recognized goodwill of $13.1 billion (2023 - $12.2 billion), representing 18% of total assets (2023 - 18%). The increase in goodwill was due to a higher U.S. dollar-to-Canadian dollar exchange rate at December 31, 2024 in comparison to December 31, 2023, and the associated impact on the translation of U.S. dollar-denominated goodwill.
Goodwill at each of the Corporation's reporting units is tested for impairment annually and whenever an event or change in circumstances indicates that fair value may be below carrying value. If so determined, goodwill is written down to estimated fair value and an impairment loss is recognized.
The Corporation performs a qualitative assessment on each reporting unit and if it is determined that it is not likely that fair value is less than carrying value, then a quantitative estimate of fair value is not required. When a quantitative assessment is performed, the primary method for estimating fair value of the reporting units is the income approach, whereby net cash flow projections are discounted. Underlying estimates and assumptions, with varying degrees of uncertainty, include the amount and timing of expected future cash flows, growth rates, and discount rates. A secondary valuation, the market approach along with a reconciliation of the total estimated fair value of all the reporting units to the Corporation's market capitalization, is also performed and evaluated.
The recognition of impairment losses could have a Material Adverse Effect. Such losses are not recoverable in regulated utility rates. To the extent impairment losses signal lower expected future cash flows to support interest payments on unregulated holding company debt and dividends on common shares, they could adversely affect the future cost of such capital, expressed as higher interest rates on such debt, which is not recoverable in regulated utility rates, and lower common share market prices.
Income Tax
As at December 31, 2024, deferred income tax liabilities, income tax receivable, deferred income taxes included in regulatory assets, income tax payable, and deferred income taxes included in regulatory liabilities totalled $5.0 billion, $nil, $2.2 billion, $33 million and $1.3 billion, respectively (2023 - $4.4 billion, $78 million, $2.1 billion, $nil, and $1.3 billion, respectively). Income tax expense was $346 million in 2024 (2023 - $360 million).
Current income taxes reflect the estimated taxes payable/receivable in the current year based on enacted tax rates and laws, and the estimated proportion of taxable earnings/loss attributable to various jurisdictions.
Deferred income tax assets and liabilities reflect temporary differences between the tax and accounting basis of assets and liabilities. A deferred income tax asset or liability is determined for each temporary difference based on enacted income tax rates and laws in effect when the temporary differences are expected to be recovered or settled. A valuation allowance is recognized in earnings to the extent that future tax recovery is not assessed as "more likely than not".
| | | | | | | | |
| 32 | FORTIS INC. | DECEMBER 31, 2024 |
| | | | | | | | |
| Management Discussion and Analysis |
At the regulated utilities, differences between the income tax expense or recovery recognized under U.S. GAAP and reflected in customer rates, which is expected to be recovered from, or refunded to, customers in future rates, are recognized as regulatory assets or liabilities. These are subsequently amortized to earnings in accordance with their inclusion in customer rates pursuant to the regulator's orders. Otherwise, changes in expectations and resultant estimates arising from changes in tax rates, tax laws, jurisdictional earnings allocations and other factors are recognized in earnings upon occurrence.
The Corporation and certain of its subsidiaries are subject to taxation in Canada, the United States and other foreign jurisdictions. The material jurisdictions in which the Corporation is subject to potential income tax compliance examinations include the United States (Federal, Arizona, Kansas, Iowa, Michigan, Minnesota and New York) and Canada (Federal, British Columbia and Alberta). The Corporation's 2020 to 2024 taxation years are still open for audit in Canadian jurisdictions, and its 2020 to 2024 taxation years are still open for audit in U.S. jurisdictions. The impact of such income tax compliance examinations could be material to the Corporation (see "Business Risks - Taxation" on page 29).
In June 2024, the Government of Canada enacted legislation with respect to interest deductibility limitations and global minimum tax, both of which were applicable to Fortis as of January 1, 2024. There was no material impact to Fortis in 2024 and the Corporation does not expect a material impact on its financial results, Operating Cash Flow or credit metrics over the five-year planning period.
Derivatives
The fair values of derivatives are based on estimates that cannot be determined with precision as they involve uncertainties and matters of judgment and, therefore, may not be relevant in predicting future earnings or cash flows.
Contingencies
The Corporation and its subsidiaries are subject to various legal proceedings and claims arising in the ordinary course of business, including those generally described under "Business Risks - Legal, Administrative and Other Proceedings" on page 30, for which no amounts have been accrued because the outcomes currently cannot be reasonably determined. Further information is provided in Note 27 in the 2024 Annual Financial Statements.
FINANCIAL INSTRUMENTS
Long-Term Debt and Other
As at December 31, 2024, the carrying value of long-term debt, including the current portion, was $33.4 billion (2023 - $29.7 billion) compared to an estimated fair value of $31.3 billion (2023 - $27.9 billion).
The consolidated carrying value of the remaining financial instruments, other than derivatives, approximates fair value, reflecting their short-term maturity, normal trade credit terms and/or nature.
Derivatives
The Corporation generally limits the use of derivatives to those that qualify as accounting, economic or cash flow hedges, or those that are approved for regulatory recovery. Derivatives are recorded at fair value, with certain exceptions, including those derivatives that qualify for the normal purchase and normal sale exception.
Energy contracts subject to regulatory deferral
UNS Energy holds electricity power purchase contracts, customer supply contracts and gas swap contracts to reduce its exposure to energy price risk. Fair values are measured primarily under the market approach using independent third-party information, where possible. When published prices are not available, adjustments are applied based on historical price curve relationships, transmission costs and line losses.
Central Hudson holds swap contracts for electricity and natural gas to minimize price volatility by fixing the effective purchase price. Fair values are measured using forward pricing provided by independent third-party information.
FortisBC Energy holds gas supply contracts to fix the effective purchase price of natural gas. Fair values reflect the present value of future cash flows based on published market prices and forward natural gas curves.
Unrealized gains or losses associated with changes in the fair value of these energy contracts are deferred as a regulatory asset or liability for recovery from, or refund to, customers in future rates, as permitted by the regulators. As at December 31, 2024, unrealized losses of $175 million (2023 - $197 million) were recognized as regulatory assets and unrealized gains of $41 million (2023 - $37 million) were recognized as regulatory liabilities.
| | | | | | | | |
| 33 | FORTIS INC. | DECEMBER 31, 2024 |
| | | | | | | | |
| Management Discussion and Analysis |
Energy contracts not subject to regulatory deferral
UNS Energy holds wholesale trading contracts to fix power prices and realize potential margin, of which 10% of any realized gains is shared with customers through rate stabilization accounts. Fair values are measured using a market approach incorporating, where possible, independent third-party information.
Aitken Creek, which was sold on November 1, 2023, held gas swap contracts to manage exposure to changes in natural gas prices, capture natural gas price spreads, and manage the financial risk posed by physical transactions. Fair values were measured using forward pricing from published market sources.
Gains or losses associated with changes in the fair value of these energy contracts are recognized in revenue. In 2024, gains of $48 million (2023 - losses of $28 million) were recognized in revenue.
Total return swaps
The Corporation holds total return swaps to manage the cash flow risk associated with forecast future cash and/or share settlements of certain stock-based compensation obligations. The swaps have a combined notional amount of $134 million and terms up to three years expiring at varying dates through January 2027. Fair value is measured using an income valuation approach based on forward pricing curves. Unrealized gains and losses associated with changes in fair value are recognized in other income, net. In 2024, unrealized gains of $12 million (2023 - $nil) were recognized in other income, net.
Foreign exchange contracts
The Corporation holds U.S. dollar-denominated foreign exchange contracts to help mitigate exposure to foreign exchange rate volatility. The contracts expire at varying dates through September 2026 and have a combined notional amount of $608 million. Fair value was measured using independent third-party information. Unrealized gains and losses associated with changes in fair value are recognized in other income, net. In 2024, unrealized losses of $17 million (2023 - unrealized gains of $10 million) were recognized in other income, net.
Interest rate contracts
During 2024, ITC entered into and settled interest rate locks with a combined notional value of US$300 million. These contracts were used to manage interest rate risk associated with the issuance of US$400 million unsecured senior notes in May 2024. Realized losses of US$3 million were recognized in other comprehensive income, which will be reclassified to earnings as a component of interest expense over five years.
ITC also entered into five-year interest rate swap contracts in 2024 with a combined notional value of US$135 million. The swaps will be used to manage interest rate risk associated with forecasted debt issuances. Fair value was measured using a discounted cash flow method based on SOFR. Unrealized gains and losses associated with the changes in fair value are recognized in other comprehensive income, and will be reclassified to earnings as a component of interest expense over the life of the debt. Unrealized gains of US$4 million were recorded in 2024.
In 2025, ITC entered into five-year interest rate swap contracts with a notional value of US$95 million to manage interest rate risk associated with forecasted debt issuances, increasing the total notional amount of interest rate swaps outstanding to US$230 million.
During 2024, the Corporation entered into and settled interest rate locks with a combined notional value of $250 million. These contract were used to manage interest rate risk associated with the issuance of $500 million unsecured senior notes in September 2024. Realized losses of $2 million were recognized in other comprehensive income, which will be reclassified to earnings as a component of interest expense over seven years.
Cross-Currency interest rate swaps
The Corporation holds cross-currency interest rate swaps, maturing in 2029, to effectively convert its $500 million, 4.43% unsecured senior notes to US$391 million, 4.34% debt. The Corporation has designated this notional U.S. debt as an effective hedge of its foreign net investments and unrealized gains and losses associated with exchange rate fluctuations on the notional U.S. debt are recognized in other comprehensive income, consistent with the translation adjustment related to the foreign net investments. Other changes in the fair value of the swaps are also recognized in other comprehensive income but are excluded from the assessment of hedge effectiveness. Fair value is measured using a discounted cash flow method based on SOFR. In 2024, unrealized losses of $29 million (2023 - unrealized gains of $15 million) were recorded in other comprehensive income.
| | | | | | | | |
| 34 | FORTIS INC. | DECEMBER 31, 2024 |
| | | | | | | | |
| Management Discussion and Analysis |
Derivative Fair Values
The following table presents derivative assets and liabilities that are accounted for at fair value on a recurring basis.
| | | | | | | | | | | | | | | | | | | | | | | |
| ($ millions) | Level 1 (1) | | Level 2 (1) | | Level 3 (1) | | Total |
| As at December 31, 2024 | | | | | | | |
Assets (2) | | | | | | | |
| Energy contracts subject to regulatory deferral | — | | | 63 | | | — | | | 63 | |
| Energy contracts not subject to regulatory deferral | — | | | 7 | | | — | | | 7 | |
| Total return swaps and interest rate contracts | — | | | 16 | | | — | | | 16 | |
| Other investments | 150 | | | — | | | — | | | 150 | |
| 150 | | | 86 | | | — | | | 236 | |
| | | | | | | |
Liabilities (3) | | | | | | | |
| Energy contracts subject to regulatory deferral | — | | | (197) | | | — | | | (197) | |
| Energy contracts not subject to regulatory deferral | — | | | (2) | | | — | | | (2) | |
| Foreign exchange contracts and cross-currency interest rate swaps | — | | | (45) | | | — | | | (45) | |
| — | | | (244) | | | — | | | (244) | |
| | | | | | | |
| As at December 31, 2023 | | | | | | | |
Assets (2) | | | | | | | |
| Energy contracts subject to regulatory deferral | — | | | 49 | | | — | | | 49 | |
| Energy contracts not subject to regulatory deferral | — | | | 6 | | | — | | | 6 | |
| Foreign exchange contracts | — | | | 5 | | | — | | | 5 | |
| Other investments | 145 | | | — | | | — | | | 145 | |
| 145 | | | 60 | | | — | | | 205 | |
| | | | | | | |
Liabilities (3) | | | | | | | |
| Energy contracts subject to regulatory deferral | — | | | (209) | | | — | | | (209) | |
| Energy contracts not subject to regulatory deferral | — | | | (3) | | | — | | | (3) | |
| Total return and cross-currency interest rate swaps | — | | | (6) | | | — | | | (6) | |
| — | | | (218) | | | — | | | (218) | |
(1)Under the hierarchy, fair value is determined using: (i) Level 1 - unadjusted quoted prices in active markets; (ii) Level 2 - other pricing inputs directly or indirectly observable in the marketplace; and (iii) Level 3 - unobservable inputs, used when observable inputs are not available. Classifications reflect the lowest level of input that is significant to the fair value measurement.
(2)Included in cash and cash equivalents, accounts receivable and other current assets, or other assets
(3)Included in accounts payable and other current liabilities or other liabilities
| | | | | | | | | | | |
| Derivative Volumes | | | |
| As at December 31 | 2024 | | | 2023 | |
Energy contracts subject to regulatory deferral (1) | | | |
Electricity swap contracts (GWh) | 774 | | | 628 | |
Electricity power purchase contracts (GWh) | 430 | | | 588 | |
Gas swap contracts (PJ) | 236 | | | 228 | |
Gas supply contracts (PJ) | 105 | | | 134 | |
Energy contracts not subject to regulatory deferral (1) | | | |
Wholesale trading contracts (GWh) | 1,499 | | | 1,310 | |
Gas swap contracts (PJ) | 3 | | | 3 | |
(1)Energy contracts settle on various dates through 2029
| | | | | | | | |
| 35 | FORTIS INC. | DECEMBER 31, 2024 |
| | | | | | | | |
| Management Discussion and Analysis |
SELECTED ANNUAL FINANCIAL INFORMATION
| | | | | | | | | | | | | | | | | |
| Years ended December 31 | | | | | |
| ($ millions, except as indicated) | 2024 | | | 2023 | | | 2022 | |
| Revenue | 11,508 | | | 11,517 | | | 11,043 | |
| Net earnings | 1,828 | | | 1,710 | | | 1,514 | |
| Common Equity Earnings | 1,606 | | | 1,506 | | | 1,330 | |
EPS: ($) | | | | | |
| Basic | 3.24 | | | 3.10 | | | 2.78 | |
| Diluted | 3.24 | | | 3.10 | | | 2.78 | |
| Total assets | 73,486 | | | 65,920 | | | 64,252 | |
| Long-term debt (excluding current portion) | 31,224 | | | 27,235 | | | 25,931 | |
Dividends declared: ($) | | | | | |
| Per common share | 2.41 | | | 2.31 | | | 2.20 | |
| Per first preference share: | | | | | |
| Series F | 1.2250 | | | 1.2250 | | | 1.2250 | |
Series G (1) | 1.5308 | | | 1.3145 | | | 1.0983 | |
| Series H | 0.4588 | | | 0.4588 | | | 0.4588 | |
Series I (2) | 1.4902 | | | 1.5619 | | | 0.9157 | |
| Series J | 1.1875 | | | 1.1875 | | | 1.1875 | |
Series K (3) | 1.3673 | | | 0.9823 | | | 0.9823 | |
Series M (4) | 1.0770 | | | 0.9783 | | | 0.9783 | |
(1)The annual dividend per share was reset to $1.5308 for the five-year period from September 1, 2023 up to but excluding September 1, 2028
(2)Floating quarterly dividend rate is reset every quarter based on the then current three-month Government of Canada Treasury Bill rate plus the applicable reset dividend yield
(3)The annual dividend per share was reset from $0.9823 to $1.3673 for the five-year period from March 1, 2024 up to but excluding March 1, 2029
(4)The annual dividend per share was reset from $0.9783 to $1.3733 for the five-year period from December 1, 2024 up to but excluding December 1, 2029
2024/2023
For a discussion of the changes in revenue, Common Equity Earnings, EPS, total assets and long-term debt see "Performance at a Glance" on page 2, "Operating Results" on page 6, and "Financial Position" on page 13.
2023/2022
The increase in revenue was due primarily to: (i) a higher U.S. dollar-to-Canadian dollar exchange rate; (ii) Rate Base growth; (iii) higher retail revenue at UNS Energy driven by new customer rates effective September 1, 2023, customer additions, and warmer weather; and (iv) the recognition of a regulatory deferral at FortisBC associated with the new cost of capital parameters approved by the BCUC effective January 1, 2023. The increase was partially offset by the flow-through of lower commodity costs in customer rates.
Common Equity Earnings increased by $176 million in comparison to 2022. The increase was primarily driven by Rate Base growth across our utilities and the new cost of capital parameters approved for FortisBC effective January 1, 2023. Higher earnings in Arizona also contributed to earnings growth, reflecting higher retail electricity sales, new customer rates at TEP effective September 1, 2023, and lower depreciation expense associated with retirement of the San Juan generating station in 2022. An increase in the market value of certain investments that support retirement benefits, and the higher U.S. dollar-to-Canadian dollar exchange rate, also favourably impacted earnings year over year. The increase was partially offset by higher corporate finance costs and lower earnings from Aitken Creek.
In addition to the above-noted items impacting earnings, the change in EPS also reflected an increase in the weighted average number of common shares outstanding, largely associated with the Corporation's DRIP.
The increase in total assets was primarily due to capital expenditures in 2023 and an increase in regulatory assets, largely due to an increase in deferred income taxes and unrealized losses on energy derivatives. The increase was partially offset by the translation of U.S. dollar-denominated assets at a lower U.S. dollar-to-Canadian dollar exchange rate.
| | | | | | | | |
| 36 | FORTIS INC. | DECEMBER 31, 2024 |
| | | | | | | | |
| Management Discussion and Analysis |
FOURTH QUARTER RESULTS
| | | | | | | | | | | | | | | | | |
| Sales | | | | | |
| (GWh, except as indicated) | 2024 | | | 2023 | | | Variance |
| Regulated Utilities | | | | | |
| UNS Energy | | | | | |
| Retail Electricity | 2,348 | | | 2,302 | | | 46 | |
| Wholesale Electricity | 1,295 | | | 1,349 | | | (54) | |
Gas (PJ) | 5 | | | 5 | | | — | |
| Central Hudson | | | | | |
| Electricity | 1,187 | | | 1,196 | | | (9) | |
Gas (PJ) | 6 | | | 6 | | | — | |
FortisBC Energy (PJ) | 67 | | | 66 | | | 1 | |
| FortisAlberta | 4,428 | | | 4,273 | | | 155 | |
| FortisBC Electric | 916 | | | 901 | | | 15 | |
| Other Electric | 2,533 | | | 2,525 | | | 8 | |
| Non-Regulated | | | | | |
| Corporate and Other | 80 | | | 58 | | | 22 | |
Electricity sales for the fourth quarter were largely consistent with the comparable period in 2023 for most of Fortis' utilities. The increase in retail sales at UNS Energy was due primarily to customer additions, while the decrease in wholesale sales was related to lower long-term wholesale sales due to the expiration of certain contracts. As well, the increase in sales at FortisAlberta was due to customer additions and higher average consumption from industrial and residential customers.
Gas sales for the fourth quarter were consistent with the comparable period in 2023.
| | | | | | | | | | | | | | | | | | | | | | | | | | | | | | | | | | | |
| Revenue and Common Equity Earnings | Revenue | | Earnings |
| ($ millions, except as indicated) | 2024 | | | 2023 | | | Variance | | 2024 | | | 2023 | | | Variance |
| Regulated Utilities | | | | | | | | | | | |
| ITC | 567 | | | 527 | | | 40 | | | 127 | | | 136 | | | (9) | |
| UNS Energy | 659 | | | 706 | | | (47) | | | 52 | | | 62 | | | (10) | |
| Central Hudson | 356 | | | 311 | | | 45 | | | 66 | | | 36 | | | 30 | |
| FortisBC Energy | 522 | | | 544 | | | (22) | | | 120 | | | 105 | | | 15 | |
| FortisAlberta | 207 | | | 188 | | | 19 | | | 42 | | | 36 | | | 6 | |
| FortisBC Electric | 149 | | | 145 | | | 4 | | | 18 | | | 15 | | | 3 | |
| Other Electric | 479 | | | 457 | | | 22 | | | 52 | | | 35 | | | 17 | |
| Non-regulated | | | | | | | | | | | |
| Corporate and Other | 10 | | | 7 | | | 3 | | | (81) | | | (44) | | | (37) | |
| | | | | | | | | | | |
| Total | 2,949 | | | 2,885 | | | 64 | | | 396 | | | 381 | | | 15 | |
| | | | | | | | | | | |
Weighted average number of common shares outstanding (# millions) | | 498.2 | | | 489.4 | | | 8.8 | |
Basic EPS ($) | | | | | | | 0.79 | | | 0.78 | | | 0.01 | |
The increase in revenue was due primarily to Rate Base growth, a higher U.S. dollar-to-Canadian dollar exchange rate, and new customer rates at Central Hudson effective July 1, 2024. The implementation of Central Hudson's new customer rates has shifted the timing of quarterly rate recovery in comparison to related costs, resulting in higher revenue and earnings in the fourth quarter of 2024. The increase was partially offset by: (i) lower flow-through costs at UNS Energy and FortisBC Energy; and (ii) the recognition of a refund liability at ITC in 2024, largely reflecting the prior period impact of the reduction in the MISO base ROE approved by FERC (see "Regulatory Highlights - Significant Regulatory Matters" on page 12).
The increase in Common Equity Earnings was driven by Rate Base growth as well as higher earnings at Central Hudson due to new customer rates and a higher allowed ROE effective July 1, 2024. The increase was partially offset by the refund liability recognized at ITC, discussed above, and lower earnings in Arizona, largely reflecting higher operating expenses. Unrealized losses on derivative contracts and the $10 million gain on disposition of Aitken Creek recognized in 2023 also unfavourably impacted fourth quarter earnings in comparison to the prior year.
The favourable earnings impact resulting from the translation of U.S. dollar denominated earnings at the higher average U.S. dollar-to-Canadian dollar exchange rate was largely offset by foreign exchange losses associated with the revaluation of U.S. dollar denominated liabilities at a rate of US$1.00=CA$1.44 at December 31, 2024.
| | | | | | | | |
| 37 | FORTIS INC. | DECEMBER 31, 2024 |
| | | | | | | | |
| Management Discussion and Analysis |
The increase in basic EPS reflects higher Common Equity Earnings, as discussed above, partially offset by an increase in the weighted average number of common shares outstanding, largely associated with the Corporation's DRIP.
| | | | | | | | | | | | | | | | | |
| Cash Flows | | | | | |
| ($ millions) | 2024 | | | 2023 | | | Variance |
| Cash and cash equivalents, beginning of period | 896 | | | 765 | | | 131 | |
| Cash from (used in): | | | | | |
| Operating activities | 962 | | | 746 | | | 216 | |
| Investing activities | (1,796) | | | (748) | | | (1,048) | |
| Financing activities | 125 | | | (134) | | | 259 | |
| Effect of exchange rate changes on cash and cash equivalents | 33 | | | (13) | | | 46 | |
| Change in cash associated with assets held for sale | — | | | 9 | | | (9) | |
| Cash and cash equivalents, end of period | 220 | | | 625 | | | (405) | |
Operating Activities
The increase in Operating Cash Flow was largely driven by FortisBC Energy reflecting higher deposits received, net of expenditures incurred, associated with the Eagle Mountain Pipeline project, as well as other changes in working capital balances. The increase was partially offset by the timing of flow-through transmission amounts at FortisAlberta as well as higher interest payments.
Investing Activities
The increase in cash used in investing activities primarily reflects higher capital expenditures in 2024, as well as the proceeds received in 2023 related to the disposition of Aitken Creek. Lower customer contributions in aid of construction also contributed to the variance.
Financing Activities
The increase in cash from financing activities reflects changes in the subsidiaries' capital expenditures and the amount of Operating Cash Flow available to fund those capital expenditures, as well as the repayment of credit facility borrowings in the fourth quarter of 2023 associated with the proceeds received from the sale of Aitken Creek. See "Cash Flow Summary" on page 15.
SUMMARY OF QUARTERLY RESULTS
| | | | | | | | | | | | | | | | | | | | | | | |
| | | Common Equity | | | | |
| Revenue | | Earnings | | Basic EPS | | Diluted EPS |
| Quarter ended | ($ millions) | | ($ millions) | | ($) | | ($) |
| December 31, 2024 | 2,949 | | | 396 | | | 0.79 | | | 0.79 | |
| September 30, 2024 | 2,771 | | | 420 | | | 0.85 | | | 0.85 | |
| June 30, 2024 | 2,670 | | | 331 | | | 0.67 | | | 0.67 | |
| March 31, 2024 | 3,118 | | | 459 | | | 0.93 | | | 0.93 | |
| December 31, 2023 | 2,885 | | | 381 | | | 0.78 | | | 0.78 | |
| September 30, 2023 | 2,719 | | | 394 | | | 0.81 | | | 0.81 | |
| June 30, 2023 | 2,594 | | | 294 | | | 0.61 | | | 0.61 | |
| March 31, 2023 | 3,319 | | | 437 | | | 0.90 | | | 0.90 | |
Generally, within each calendar year, quarterly results fluctuate in accordance with seasonality. Given the diversified nature of the Corporation's subsidiaries, seasonality varies. Earnings of the gas utilities tend to be highest in the first and fourth quarters due to space-heating requirements. Earnings of the electric distribution utilities in the U.S. tend to be highest in the second and third quarters due to the use of air conditioning and other cooling equipment.
Generally, from one calendar year to the next, quarterly results reflect: (i) continued organic growth driven by the Corporation's capital plan; (ii) any significant temperature fluctuations from seasonal norms; (iii) the impact of market conditions, particularly with respect to long-term wholesale sales at UNS Energy; (iv) the timing and significance of any regulatory decisions; (v) changes in the U.S. dollar-to-Canadian dollar exchange rate; (vi) for revenue, the flow through in customer rates of commodity costs; and (vii) for EPS, increases in the weighted average number of common shares outstanding.
December 2024/December 2023
See "Fourth Quarter Results" on page 37.
| | | | | | | | |
| 38 | FORTIS INC. | DECEMBER 31, 2024 |
| | | | | | | | |
| Management Discussion and Analysis |
September 2024/September 2023
Common Equity Earnings increased by $26 million and basic EPS increased by $0.04 in comparison to the third quarter of 2023. The increase was driven by: (i) Rate Base growth; and (ii) strong earnings in Arizona, reflecting new customer rates at TEP effective September 1, 2023, an increase in the market value of investments that support retirement benefits and higher production tax credits. Unrealized gains on derivative contracts recognized in the third quarter of 2024, and an unfavourable deferred income tax adjustment recognized by ITC in the third quarter of 2023, also contributed to the growth in earnings. The increase was partially offset by the timing of recognition of new cost of capital parameters approved for FortisBC in 2023, which included $26 million associated with the retroactive impact to January 1, 2023, as well as higher holding company finance costs. The change in basic EPS also reflected an increase in the weighted average number of common shares outstanding, largely associated with the Corporation's DRIP.
June 2024/June 2023
Common Equity Earnings increased by $37 million and basic EPS increased by $0.06 in comparison to the second quarter of 2023. The increase was driven by strong earnings in Arizona, reflecting new customer rates at TEP effective September 1, 2023 and higher retail electricity sales associated with warmer weather. Rate Base growth across our utilities and the timing of recognition of new cost of capital parameters approved for FortisBC in 2023 also contributed to earnings growth. The increase was partially offset by lower earnings for Central Hudson and the Other Electric segment, largely reflecting higher operating costs. The change in basic EPS also reflected an increase in the weighted average number of common shares outstanding, largely associated with the Corporation's DRIP.
March 2024/March 2023
Common Equity Earnings increased by $22 million and basic EPS increased by $0.03 in comparison to the first quarter of 2023. The increase was due to the timing of recognition of new cost of capital parameters approved for FortisBC in 2023 and Rate Base growth across our utilities. The increase was partially offset by higher holding company costs, including finance charges and unrealized losses on derivative contracts, and the November 1, 2023 disposition of Aitken Creek. In addition, the change in EPS reflected an increase in the weighted average number of common shares outstanding, largely associated with the Corporation's DRIP.
RELATED-PARTY AND INTER-COMPANY TRANSACTIONS
Related-party transactions are in the normal course of operations and are measured at the amount of consideration agreed to by the related parties. There were no material related-party transactions in 2024 or 2023.
As of December 31, 2024, accounts receivable included $18 million due from Belize Electricity (December 31, 2023 - $8 million).
Fortis periodically provides short-term financing to subsidiaries to support capital expenditures and seasonal working capital requirements, the impacts of which are eliminated on consolidation. As at December 31, 2024 and 2023, there were no inter-segment loans outstanding. Interest charged on inter-segment loans was not material in 2024 and 2023.
MANAGEMENT'S EVALUATION OF CONTROLS AND PROCEDURES
Disclosure Controls and Procedures
DCP are designed to provide reasonable assurance that information required to be disclosed in reports filed with, or submitted to, securities regulatory authorities is recorded, processed, summarized and reported within the time periods specified under Canadian and U.S. securities laws. As of December 31, 2024, an evaluation was carried out under the supervision of, and with the participation of, the Corporation's management, including the CEO and CFO, of the effectiveness of the Corporation's DCP, as defined in the applicable Canadian and U.S. securities laws. Based on that evaluation, the CEO and CFO concluded that such DCP are effective as of December 31, 2024.
Internal Control over Financial Reporting
ICFR is designed by, or under the supervision of, the Corporation's CEO and CFO and effected by the Corporation's Board, management and other personnel to provide reasonable assurance regarding the reliability of financial reporting and the preparation of financial statements for external purposes in accordance with U.S. GAAP. Because of its inherent limitations, ICFR may not prevent or detect misstatements. Also, projections of any evaluation of effectiveness to future periods are subject to the risk that controls may become inadequate because of changes in conditions, or that the degree of compliance with the policies or procedures may deteriorate.
The Corporation's management, including the Corporation's CEO and CFO, assessed the effectiveness of the Corporation's ICFR as of December 31, 2024, based on the criteria set forth in Internal Control - Integrated Framework (2013) issued by the Committee of Sponsoring Organizations of the Treadway Commission. Based on this assessment, management concluded that, as of December 31, 2024, the Corporation's ICFR was effective.
During the year ended December 31, 2024, there have been no changes in the Corporation's ICFR that have materially affected, or are reasonably likely to materially affect, the Corporation's ICFR.
| | | | | | | | |
| 39 | FORTIS INC. | DECEMBER 31, 2024 |
| | | | | | | | |
| Management Discussion and Analysis |
OUTLOOK
Fortis continues to enhance shareholder value through the execution of its capital plan, the balance and strength of its diversified portfolio of regulated utility businesses, and growth opportunities within and proximate to its service territories. The Corporation's $26.0 billion five-year capital plan is expected to increase midyear Rate Base from $39.0 billion in 2024 to $53.0 billion by 2029, translating into a five-year CAGR of 6.5%.
Beyond the five-year capital plan, opportunities to expand and extend growth include: further expansion of the electric transmission grid in the U.S. to support load growth and facilitate the interconnection of cleaner energy; transmission investments associated with the MISO LRTP tranches 1, 2.1, and 2.2 as well as regional transmission in New York; grid resiliency and climate adaptation investments; renewable gas solutions and LNG infrastructure in British Columbia; and the acceleration of load growth and cleaner energy infrastructure investments across our jurisdictions.
Fortis expects its long-term growth in Rate Base will drive earnings that support dividend growth guidance of 4-6% annually through 2029, and is premised on the assumptions and material factors listed under "Forward-Looking Information".
Fortis has reduced its corporate-wide direct GHG emissions by 34% from a 2019 base year, and has targets to further reduce such GHG emissions by 50% by 2030 and 75% by 2035. The Corporation's additional 2050 net-zero direct GHG emissions target reinforces Fortis' commitment to further decarbonize over the long-term, while continuing our focus on reliability and affordability. The Corporation's ability to achieve the GHG targets may be impacted by federal, state and provincial energy policies, as well as external factors, including significant customer and load growth and the development of clean energy technology.
FORWARD-LOOKING INFORMATION
Fortis includes forward-looking information in the MD&A within the meaning of applicable Canadian securities laws and forward-looking statements within the meaning of the U.S. Private Securities Litigation Reform Act of 1995, (collectively referred to as "forward-looking information"). Forward-looking information reflects expectations of Fortis management regarding future growth, results of operations, performance, business prospects and opportunities. Wherever possible, words such as anticipates, believes, budgets, could, estimates, expects, forecasts, intends, may, might, plans, projects, schedule, should, target, will, would, and the negative of these terms, and other similar terminology or expressions, have been used to identify the forward-looking information, which includes, without limitation: the expectation that Fortis is well-positioned for future investment opportunities; annual dividend growth guidance through 2029; forecast Capital Expenditures for 2025 through 2029; the expected sources of funding for the capital plan, including the source of common equity proceeds; forecast midyear Rate Base for 2029 and projected Rate Base growth from 2024 through to 2029; the expected nature, timing and benefits of additional opportunities beyond the capital plan, including further expansion of the electric transmission grid in the U.S. to support load growth and facilitate the interconnection of cleaner energy, transmission investments associated with the MISO LRTP tranches 1, 2.1 and 2.2 as well as regional transmission in New York, grid resiliency and climate adaptation investments, renewable gas solutions and LNG infrastructure in British Columbia, and the acceleration of load growth and cleaner energy infrastructure investments; expected implications of utility industry trends on the utility sector and on the Corporation's capital investments; the expected timing, outcome and impact of legal and regulatory proceedings and decisions; the expected or potential funding sources for operating expenses, interest costs and capital expenditures; the expectation that maintaining the targeted capital structure of the regulated operating subsidiaries will not have an impact on the Corporation's ability to pay dividends in the foreseeable future; the expected consolidated fixed-term debt maturities and repayments over the next five years; the expectation that the Corporation and its subsidiaries will continue to have reasonable access to long-term capital and will remain compliant with debt covenants in 2025; the expected uses of proceeds from debt financings; the performance of contractual obligations to provide equity capital to Wataynikaneyap Power; the potential impact of new or revised tariffs on forecast and actual capital expenditures; forecast midyear Rate Base for 2025 and 2029 by segment; the nature, timing, benefits and expected costs of certain capital projects, including ITC's transmission projects associated with the MISO LRTP, IRP Related Generation, the Roadrunner Reserve Battery Storage Projects 1 and 2, the Vail-to-Tortolita Transmission Project, the Eagle Mountain Pipeline Project, the Tilbury LNG Storage Expansion, the AMI Project, and the Tilbury 1B Project, and additional investment opportunities; the 2050 net-zero direct GHG emissions target; the 2030 and 2035 direct GHG emissions reduction targets; how the Corporation's GHG emissions targets are expected to be achieved, including TEP's plan to exit coal; the potential impact of federal, state and provincial energy policies and other factors, including significant customer and load growth and the development of clean energy technology, on the Corporation's ability to achieve its GHG emissions reduction targets; the expected impacts of future accounting pronouncements on the Corporation's disclosures; the potential impact of the recognition of goodwill impairment losses; the potential and expected impacts of income tax compliance examinations and legislation with respect to interest deductibility limitations and global minimum tax; and the expectation that long-term growth in Rate Base will drive earnings that support dividend growth guidance of 4-6% annually through 2029.
Forward-looking information involves significant risks, uncertainties and assumptions. Certain material factors or assumptions have been applied in drawing the conclusions contained in the forward-looking information including, without limitation: reasonable legal and regulatory decisions and the expectation of regulatory stability; the successful execution of the capital plan; no material capital project or financing cost overrun; sufficient human resources to deliver service and execute the capital plan; the realization of additional opportunities beyond the capital plan; no significant variability in interest rates; no material changes in the assumed U.S. dollar- to- Canadian dollar exchange rate; the continuation of current participation levels in the Corporation's DRIP; the Board exercising its discretion to declare dividends, taking into account the financial performance and condition of the Corporation; no significant operational disruptions or environmental liability or upset; the continued ability to maintain the performance of the electricity and gas systems; no severe and prolonged economic downturn; sufficient liquidity and capital resources; the ability to hedge exposures to fluctuations in foreign exchange rates, natural gas prices and electricity prices; the continued availability of natural gas, fuel, coal and electricity supply; continuation of power supply and capacity purchase contracts; no significant changes in government energy plans, environmental laws and regulations that could have a material negative impact; maintenance of adequate insurance coverage; the ability to obtain and maintain licences and permits; retention of existing service areas; no significant changes in tax laws and the continued tax deferred treatment of earnings from the Corporation's foreign operations; continued maintenance of information technology infrastructure and no material breach of cybersecurity; continued favourable relations with Indigenous Peoples; and favourable labour relations.
Fortis cautions readers that a number of factors could cause actual results, performance or achievements to differ materially from those discussed or implied in the forward-looking information. These factors should be considered carefully and undue reliance should not be placed on the forward-looking information. Risk factors which could cause results or events to differ from current expectations are detailed under the heading "Business Risks" in this MD&A and in other continuous disclosure materials filed from time to time with Canadian securities regulatory authorities and the Securities and Exchange Commission. Key risk factors for 2025 include, but are not limited to: uncertainty regarding changes in utility regulation, including the outcome of regulatory proceedings at the Corporation's utilities; the physical risks associated with the provision of electric and gas service, which can be exacerbated by the impacts of climate change; risks related to environmental laws and regulations; risks associated with capital projects and the impact on the Corporation's continued growth; risks associated with cybersecurity and information and operations technology; the impact of weather variability and seasonality on heating and cooling loads, gas distribution volumes and hydroelectric generation; risks associated with commodity price volatility and supply of purchased power; and risks related to general economic conditions, including inflation, interest rate and foreign exchange risks.
All forward-looking information herein is given as of February 13, 2025. Fortis disclaims any intention or obligation to update or revise any forward-looking information, whether as a result of new information, future events or otherwise.
| | | | | | | | |
| 40 | FORTIS INC. | DECEMBER 31, 2024 |
| | | | | | | | |
| Management Discussion and Analysis |
GLOSSARY
2024 Annual Financial Statements: the Corporation's audited consolidated financial statements and notes thereto for the year ended December 31, 2024
Actual Payout Ratio: dividends paid per common share divided by basic EPS
Adjusted Basic EPS: Adjusted Common Equity Earnings divided by the basic weighted average number of common shares outstanding
Adjusted Common Equity Earnings: net earnings attributable to common equity shareholders adjusted as shown under "Non-U.S. GAAP Financial Measures" on page 10
Adjusted Payout Ratio: dividends paid per common share divided by Adjusted Basic EPS as shown under "Non-U.S. GAAP Financial Measures" on page 10
AFUDC: allowance for funds used during construction
AI: artificial intelligence
Aitken Creek: Aitken Creek Gas Storage ULC, a 93.8%-owned subsidiary of FortisBC Holdings Inc., sold on November 1, 2023
AMI: advanced metering infrastructure
ATM Program: at-the-market equity program
ACC: Arizona Corporation Commission
ASU: accounting standards update
AUC: Alberta Utilities Commission
BCUC: British Columbia Utilities Commission
Belize Electricity: Belize Electricity Limited, in which Fortis indirectly holds a 33% equity interest
Board: Board of Directors of the Corporation
CAGR(s): compound annual growth rate of a particular item. CAGR = (EV/BV)(1/n)-1, where: (i) EV is the ending value of the item; (ii) BV is the beginning value of the item; and (iii) n is the number of periods. Calculated on a constant U.S. dollar-to-Canadian dollar exchange rate
Capital Expenditures: cash outlay for additions to property, plant and equipment and intangible assets as shown in the Annual Financial Statements, as well as Fortis' 39% share of capital spending for the Wataynikaneyap Transmission Power project. See "Non-U.S. GAAP Financial Measures" on page 10
Caribbean Utilities: Caribbean Utilities Company, Ltd., an indirect approximately 60%-owned (as at December 31, 2024) subsidiary of Fortis, together with its subsidiary
Central Hudson: CH Energy Group, Inc., an indirect wholly-owned subsidiary of Fortis, together with its subsidiaries, including Central Hudson Gas & Electric Corporation
CEO: Chief Executive Officer of Fortis
CFO: Chief Financial Officer of Fortis
Common Equity Earnings: net earnings attributable to common equity shareholders
Corporation: Fortis Inc.
COS: cost of service
Court of Appeal: Court of Appeal of Alberta
CPCN: Certificate of Public Convenience and Necessity
CSA: Canadian Securities Administrators
CSDS: Canadian Sustainability Disclosure Standard
CSSB: Canadian Sustainability Standards Board
DBP: defined benefit pension
D.C. Circuit Court: U.S. Court of Appeals for the District of Columbia Circuit
DCP: disclosure controls and procedures
DRIP: dividend reinvestment plan
EPC: engineering, procurement and construction
EPRI: Electric Power Research Institute
EPS: earnings per common share
ERM: enterprise risk management
FERC: Federal Energy Regulatory Commission
Fortis: Fortis Inc.
FortisAlberta: FortisAlberta Inc., an indirect wholly-owned subsidiary of Fortis
FortisBC: FortisBC Energy and FortisBC Electric
FortisBC Electric: FortisBC Inc., an indirect wholly-owned subsidiary of Fortis, together with its subsidiaries
FortisBC Energy: FortisBC Energy Inc., an indirect wholly-owned subsidiary of Fortis, together with its subsidiaries
FortisOntario: FortisOntario Inc., a direct wholly-owned subsidiary of Fortis, together with its subsidiaries
FortisTCI: FortisTCI Limited, an indirect wholly-owned subsidiary of Fortis, together with its subsidiary
Fortis Belize: Fortis Belize Limited, an indirect wholly-owned subsidiary of Fortis
Four Corners: Four Corners Generating Station, Units 4 and 5
FX: foreign exchange associated with the translation of U.S. dollar-denominated amounts. Foreign exchange is calculated by applying the change in the U.S. dollar-to-Canadian dollar FX rates to the prior period U.S. dollar balance
| | | | | | | | |
| 41 | FORTIS INC. | DECEMBER 31, 2024 |
| | | | | | | | |
| Management Discussion and Analysis |
GCOC: generic cost of capital
GHG: greenhouse gas
GWh: gigawatt hour(s)
ICFR: internal control over financial reporting
IRP: integrated resource plan
ITC: ITC Investment Holdings Inc., an indirect 80.1%-owned subsidiary of Fortis, together with its subsidiaries, including International Transmission Company, Michigan Electric Transmission Company, LLC, ITC Midwest LLC, and ITC Great Plains, LLC
LNG: liquefied natural gas
LRTP: long range transmission plan
Luna: Luna Energy Facility
Major Capital Projects: projects, other than ongoing maintenance projects, individually costing $200 million or more in the forecast/planning period
Maritime Electric: Maritime Electric Company, Limited, an indirect wholly- owned subsidiary of Fortis
Material Adverse Effect: a material adverse effect on the Corporation's business, results of operations, financial position or liquidity, on a consolidated basis
MD&A: the Corporation's management discussion and analysis for the year ended December 31, 2024
MISO: Midcontinent Independent System Operator, Inc.
Moody's: Moody's Investor Services, Inc.
Morningstar DBRS: DBRS Limited
MW: megawatt(s)
Navajo: Navajo Generating Station
Newfoundland Power: Newfoundland Power Inc., a direct wholly-owned subsidiary of Fortis
Non-U.S. GAAP Financial Measures: financial measures that do not have a standardized meaning prescribed by U.S. GAAP
NOPR: notice of proposed rulemaking
NYSE: New York Stock Exchange
OPEB: other post-employment benefits
Operating Cash Flow: cash from operating activities
PBR: performance-based rate-setting
PJ: petajoule(s)
PPFAC: purchased power and fuel adjustment clause
PSC: New York State Public Service Commission
Rate Base: the stated value of property on which a regulated utility is permitted to earn a specified return in accordance with its regulatory construct
REA: Rural Electrification Association
RNG: renewable natural gas
ROA: rate of return on Rate Base
ROE: rate of return on common equity
ROFR: right of first refusal
RTO: regional transmission organization
S&P: Standard & Poor's Financial Services LLC
San Juan: San Juan Generating Station Unit 1
SEC: U.S. Securities and Exchange Commission
SEDAR+: Canadian System for Electronic Document Analysis and Retrieval
SOFR: secured overnight financing rates
TEP: Tucson Electric Power Company
TSR: total shareholder return, which is a measure of the return to common equity shareholders in the form of share price appreciation and dividends (assuming reinvestment) over a specified time period in relation to the share price at the beginning of the period.
TSX: Toronto Stock Exchange
UNS Electric: UNS Electric, Inc.
UNS Energy: UNS Energy Corporation, an indirect wholly-owned subsidiary of Fortis, together with its subsidiaries, including TEP, UNS Electric and UNS Gas
UNS Gas: UNS Gas, Inc.
U.S.: United States of America
U.S. GAAP: accounting principles generally accepted in the U.S.
Waneta Expansion: Waneta Expansion hydroelectric generation facility
Wataynikaneyap Power: Wataynikaneyap Power Limited Partnership, in which Fortis indirectly holds a 39% equity interest
| | | | | | | | |
| 42 | FORTIS INC. | DECEMBER 31, 2024 |