Investor Presentation Claros Mortgage Trust, Inc. (CMTG) November 2022 The properties above are not representative of all transactions.
The information herein generally speaks as of the date hereof or such earlier date referred to on specific pages herein. In furnishing this document, Claros Mortgage Trust, Inc. and its consolidated subsidiaries (the “Company” or “CMTG”) do not undertake to update the information herein. No legal commitment or obligation shall arise by the provision of this presentation. All financial information is provided for general reference purposes only and is superseded by, and is qualified in its entirety by reference to, CMTG’s financial statements. No Offer or Solicitation This document does not constitute (i) an offer to sell or a solicitation of an offer to purchase any securities in CMTG, (ii) a means by which any other investment may be offered or sold or (iii) advice or an expression of our view as to whether an investment in CMTG is suitable for any person. Portfolio Metrics; Basis of Accounting The performance information set forth in this document has generally been prepared on the basis of generally accepted accounting principles in the United States (U.S. GAAP). The basis on which CMTG’s operating metrics are presented in this document may vary from other reports or documents that CMTG prepares from time to time for internal or external use. Net Debt / Equity Ratio, Total Leverage Ratio, and Distributable Earnings Net Debt / Equity Ratio, Total Leverage Ratio, and Distributable Earnings are non-GAAP measures used to evaluate the Company’s performance excluding the effects of certain transactions, non-cash items and GAAP adjustments, as determined by our Manager, which the Company believes are not necessarily indicative of the Company’s current performance and operations. Net Debt / Equity Ratio is a non-GAAP measure, which the Company defines as the ratio of asset-specific debt and Secured Term Loan, less cash and cash equivalents, to total equity. Total Leverage Ratio is a non-GAAP measure, which the Company defines as the ratio of asset-specific debt and Secured Term Loan, plus non-consolidated senior interests held by third parties, less cash and cash equivalents, to total equity. Distributable Earnings is a non-GAAP measure, which the Company defines as net income as determined in accordance with GAAP, excluding (i) non-cash equity compensation expense (income), (ii) incentive fees, (iii) real estate depreciation and amortization, (iv) any unrealized gains or losses from mark-to-market valuation changes (other than permanent impairments) that are included in net income for the applicable period, (v) one-time events pursuant to changes in GAAP and (vi) certain non-cash items, which in the judgment of the Company’s Manager, should not be included in Distributable Earnings. Distributable Earnings is substantially the same as Core Earnings, excluding incentive fees, as defined in the Management Agreement, for the periods presented. The Company believes that Net Debt / Equity Ratio and Total Leverage Ratio provide meaningful information to consider in addition to the Company’s total liabilities and balance sheets. Net Debt / Equity Ratio and Total Leverage Ratio are used to evaluate the Company’s financial leverage. The Company believes that Distributable Earnings provides meaningful information to consider in addition to the Company’s net income and cash flows from operating activities determined in accordance with GAAP. The Company believes the Distributable Earnings measure helps it to evaluate the Company’s performance excluding the effects of certain transactions, non-cash items and GAAP adjustments, as determined by the Company’s Manager, that it believes are not necessarily indicative of the Company’s current performance and operations. Distributable Earnings does not represent net income or cash flows from operating activities and should not be considered as an alternative to GAAP net income, an indication of the Company’s cash flows from operating activities, a measure of the Company’s liquidity or an indication of funds available for the Company’s cash needs. In addition, the Company’s methodology for calculating Net Debt / Equity Ratio, Total Leverage Ratio, and Distributable Earnings may differ from the methodologies employed by other companies to calculate the same or similar supplemental performance measures and, accordingly, the Company’s reported Distributable Earnings may not be comparable to the Distributable Earnings reported by other companies. In order to maintain the Company’s status as a REIT, the Company is required to distribute at least 90% of its REIT taxable income, determined without regard to the deduction for dividends paid and excluding net capital gain, as dividends. Distributable Earnings, and other similar measures, have historically been a useful indicator of mortgage REITs’ ability to cover their dividends, and to mortgage REITs themselves in determining the amount of any dividends. Distributable Earnings is a key factor considered by the board of directors in setting the dividend and as such the Company believes Distributable Earnings is useful to investors. Accordingly, the Company believes providing Distributable Earnings on a supplemental basis to the Company’s net income as determined in accordance with GAAP is helpful to its stockholders in assessing the overall performance of its business. While Distributable Earnings excludes the impact of the Company’s unrealized current provision for credit losses, loan losses are charged off and recognized through Distributable Earnings when deemed non-recoverable. Non-recoverability is determined (i) upon the resolution of a loan (i.e. when the loan is repaid, fully or partially, or in the case of foreclosure, when the underlying asset is sold), or (ii) with respect to any amount due under any loan, when such amount is determined to be non-collectible. The information provided herein is as of September 30, 2022 unless otherwise noted. Important Notices
Important Notices (cont’d) Determinations of Loan-to-Value / Loan-to-Cost LTV’s stated herein represent CMTG’s total loan commitment from time to time, as if fully funded, plus any financings that are pari passu with or senior to CMTG’s loan, divided by the Company’s estimate of either (i) the value of the underlying real estate, determined in accordance with our underwriting process (typically consistent with, if not less than, the value set forth in a third party appraisal) or (ii) the borrower’s projected, fully funded cost basis in the asset, in each case as we deem appropriate for the relevant loan and other loans with similar characteristics. Underwriting is generally not updated after origination and generally does not take into consideration the potential impact of the Covid-19 pandemic on asset values or project costs. However, it should be noted that certain LTV/LTCs have been updated in the case of (i) partial loan paydowns and/or releases of underlying collateral, (ii) material identified changes to expected project costs, (iii) the receipt of a new appraisal (typically in connection with financing or refinancing activity), (iv) certain loan modifications or (v) other facts or circumstances that warrant a change in the reported loan-to-value or loan-to-cost as we deem appropriate. Forward-Looking Statements This document and oral statements made in connection therewith contain forward-looking statements within the meaning of U.S. federal securities laws. Forward-looking statements express CMTG’s views regarding future plans, expectations and the potential impact of the COVID-19 pandemic. They include statements that include words such as “may,” “could,” “would,” “should,” “believe,” “expect,” “anticipate,” “plan,” “estimate,” “target,” “project,” “plan,” “intend” and similar words or expressions. Forward-looking statements in this presentation include, but are not limited to, statements regarding future operations, business strategy, cash flows, income, costs, expenses, liabilities and profits of CMTG. These statements are based on numerous assumptions and are subject to risks, uncertainties or change in circumstances that are difficult to predict or quantify, in particular due to the uncertainties created by the COVID-19 pandemic, including the projected impact of COVID-19 on our business, financial performance and operating results. Actual future results may vary materially from those expressed or implied in these forward-looking statements, and CMTG’s business, financial condition and results of operations could be materially and adversely affected by numerous factors, including such known and unknown risks and uncertainties. As a result, forward-looking statements should be understood to be only predictions and statements of our current beliefs, and are not guarantees of performance. Statements regarding the following subjects, among others, may be forward-looking: expected investments by CMTG or any other parties; CMTG’s business and investment strategy; CMTG’s projected operating results; the timing of cash flows from CMTG’s investments; the state of the U.S. economy generally or in specific geographic regions; actions and initiatives of the U.S. government and changes to U.S. government policies; CMTG’s ability to obtain financing arrangements; CMTG’s expected leverage; general volatility of the markets in which CMTG may invest; the return or impact of current and future investments; changes in interest rates; rates of default or decreased recovery rates on CMTG’s target assets; changes in governmental regulations, tax law and rates, and similar matters (including interpretation thereof); CMTG’s ability to maintain its qualification as a REIT; availability of investment opportunities in mortgage-related and real estate-related investments and securities; the ability to locate suitable investments for CMTG, monitor, service, and administer CMTG’s investments and execute its investment strategy; availability of qualified personnel; estimates relating to CMTG’s ability to make distributions to its stockholders in the future; projections of net equity investment, yield, internal rate of return, and loan-to-value or loan-to-cost ratios; continuing impact of COVID-19; CMTG’s understanding of its competition; and market trends in CMTG’s industry, interest rates, real estate values, the debt securities markets or the general economy. The forward-looking statements are based on beliefs, assumptions, and expectations about future performance, taking into account all information currently available. You should not place undue reliance on these forward-looking statements. These beliefs, assumptions, and expectations can change as a result of many possible events or factors, not all of which are known. If a change occurs, CMTG’s business, financial condition, liquidity, and results of operations may vary materially from those expressed in any forward-looking statements. Any forward-looking statement speaks only as of the date on which it is made. New risks and uncertainties arise over time, and it is not possible to predict those events or how they may affect CMTG. Except as required by law, CMTG is not obligated to, and does not intend to, update or revise any forward-looking statements, whether as a result of new information, future events or otherwise.
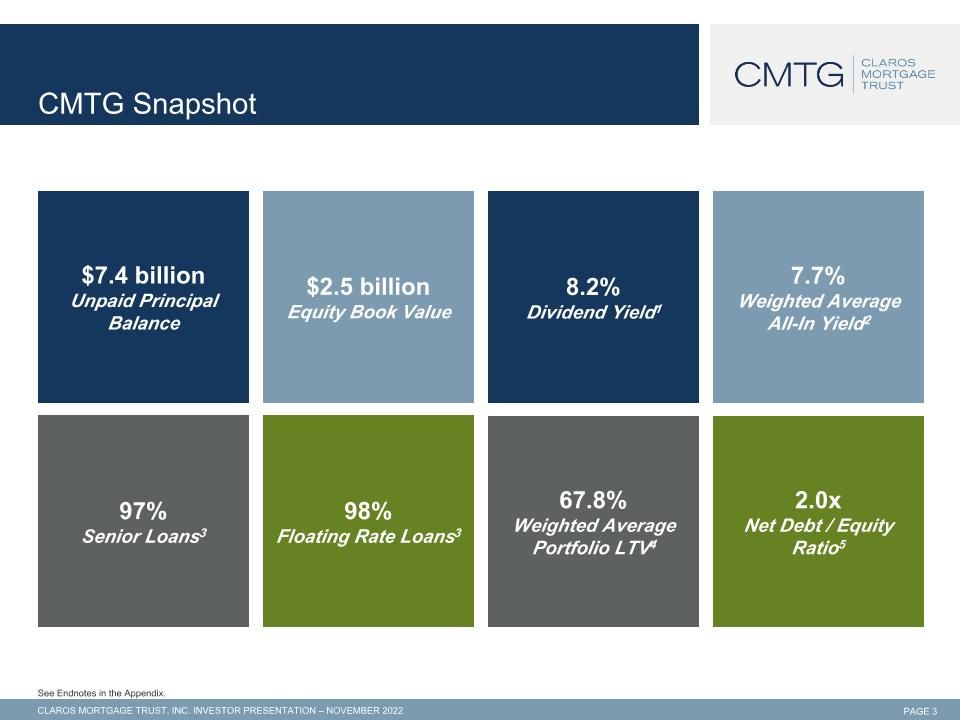
CMTG Snapshot See Endnotes in the Appendix. $7.4 billion Unpaid Principal Balance $2.5 billion Equity Book Value 8.2% Dividend Yield1 7.7% Weighted Average All-In Yield2 97% Senior Loans3 98% Floating Rate Loans3 67.8% Weighted Average Portfolio LTV4 2.0x Net Debt / Equity Ratio5
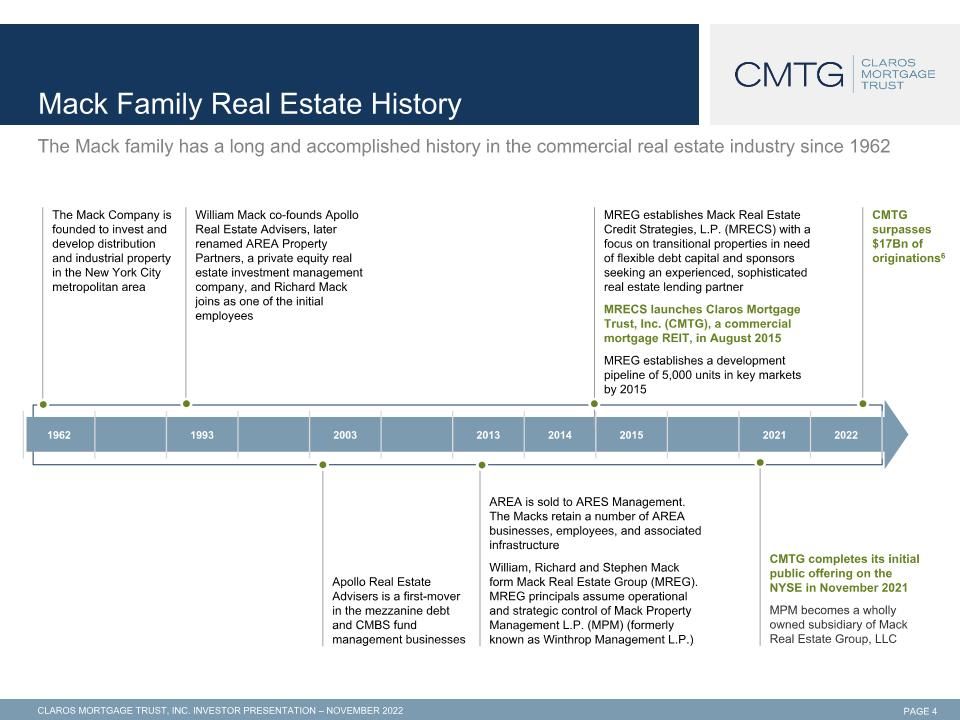
AREA is sold to ARES Management. The Macks retain a number of AREA businesses, employees, and associated infrastructure William, Richard and Stephen Mack form Mack Real Estate Group (MREG). MREG principals assume operational and strategic control of Mack Property Management L.P. (MPM) (formerly known as Winthrop Management L.P.) The Mack family has a long and accomplished history in the commercial real estate industry since 1962 Mack Family Real Estate History 1962 1993 2003 2013 2014 2015 2021 2022 Apollo Real Estate Advisers is a first-mover in the mezzanine debt and CMBS fund management businesses MREG establishes Mack Real Estate Credit Strategies, L.P. (MRECS) with a focus on transitional properties in need of flexible debt capital and sponsors seeking an experienced, sophisticated real estate lending partner MRECS launches Claros Mortgage Trust, Inc. (CMTG), a commercial mortgage REIT, in August 2015 MREG establishes a development pipeline of 5,000 units in key markets by 2015 CMTG surpasses $17Bn of originations6 The Mack Company is founded to invest and develop distribution and industrial property in the New York City metropolitan area William Mack co-founds Apollo Real Estate Advisers, later renamed AREA Property Partners, a private equity real estate investment management company, and Richard Mack joins as one of the initial employees CMTG completes its initial public offering on the NYSE in November 2021 MPM becomes a wholly owned subsidiary of Mack Real Estate Group, LLC
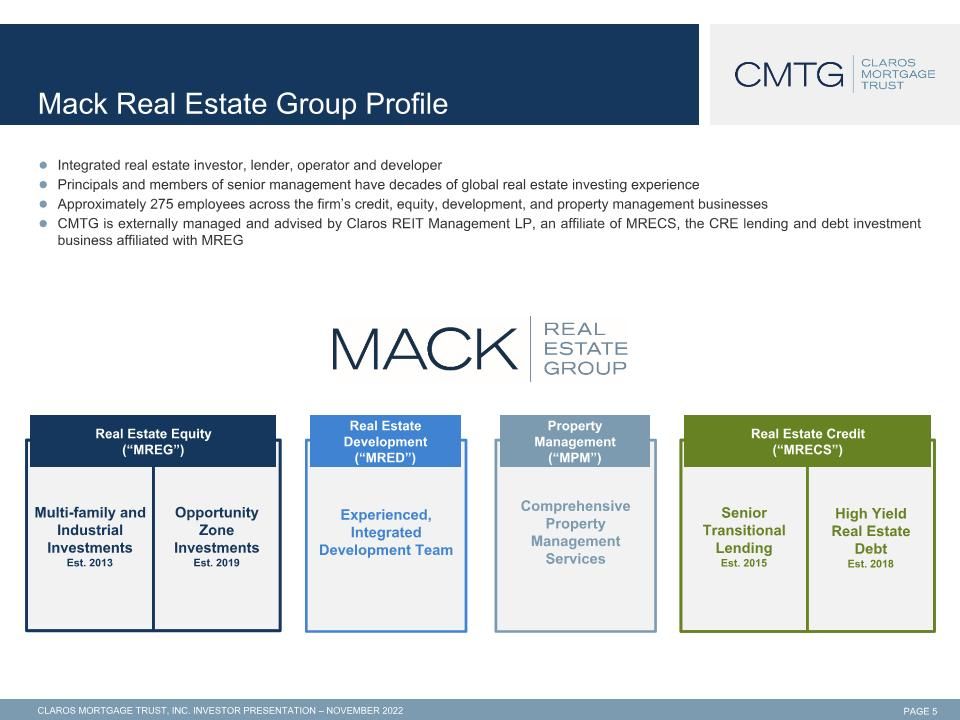
Integrated real estate investor, lender, operator and developer Principals and members of senior management have decades of global real estate investing experience Approximately 275 employees across the firm’s credit, equity, development, and property management businesses CMTG is externally managed and advised by Claros REIT Management LP, an affiliate of MRECS, the CRE lending and debt investment business affiliated with MREG Mack Real Estate Group Profile Opportunity Zone Investments Est. 2019 Multi-family and Industrial Investments Est. 2013 Real Estate Equity (“MREG”) Comprehensive Property Management Services Property Management (“MPM”) Senior Transitional Lending Est. 2015 High Yield Real Estate Debt Est. 2018 Real Estate Credit (“MRECS”) Experienced, Integrated Development Team Real Estate Development (“MRED”)
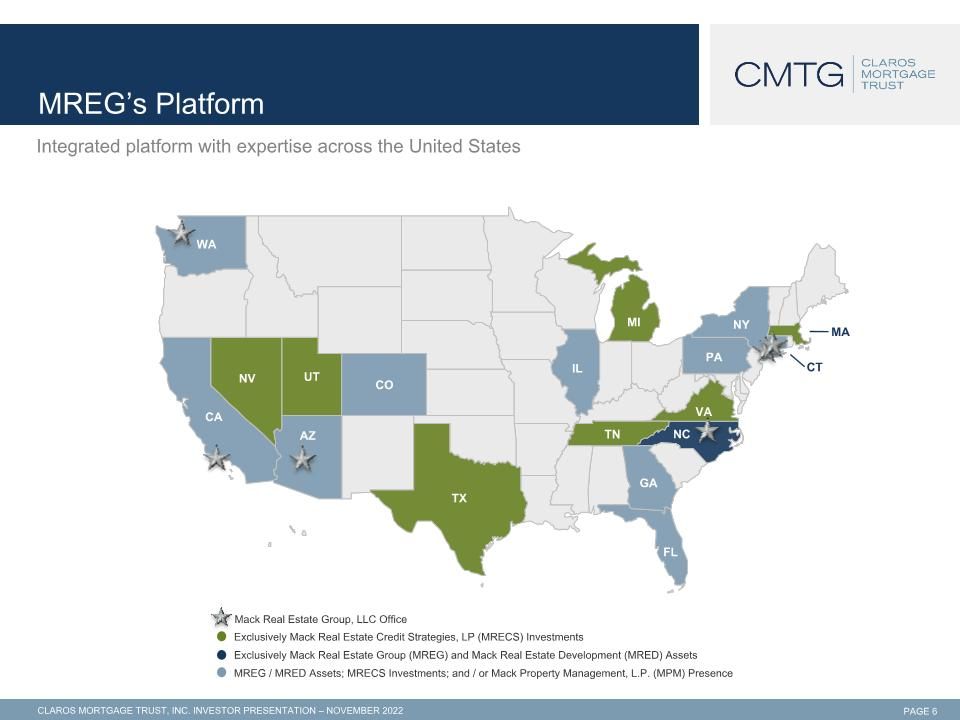
MREG’s Platform Integrated platform with expertise across the United States UT Exclusively Mack Real Estate Credit Strategies, LP (MRECS) Investments Exclusively Mack Real Estate Group (MREG) and Mack Real Estate Development (MRED) Assets MREG / MRED Assets; MRECS Investments; and / or Mack Property Management, L.P. (MPM) Presence Mack Real Estate Group, LLC Office WA NV CA AZ CO TX IL MI TN NC FL GA VA PA CT MA NY
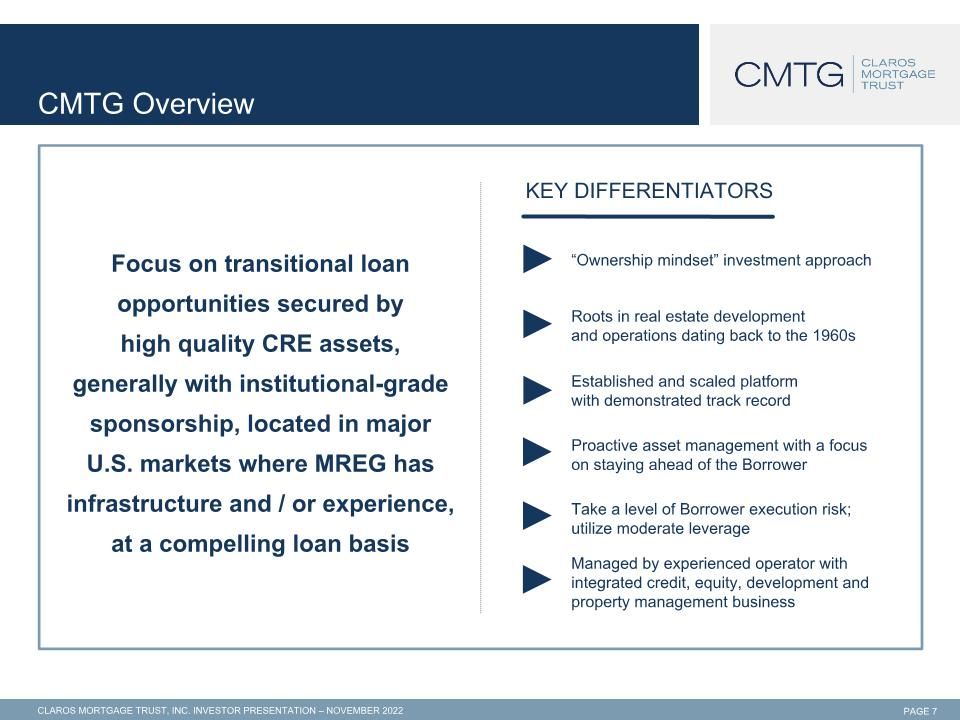
CMTG Overview Focus on transitional loan opportunities secured by high quality CRE assets, generally with institutional-grade sponsorship, located in major U.S. markets where MREG has infrastructure and / or experience, at a compelling loan basis KEY DIFFERENTIATORS “Ownership mindset” investment approach Roots in real estate development �and operations dating back to the 1960s Established and scaled platform�with demonstrated track record Take a level of Borrower execution risk; utilize moderate leverage Proactive asset management with a focus on staying ahead of the Borrower Managed by experienced operator with integrated credit, equity, development and property management business
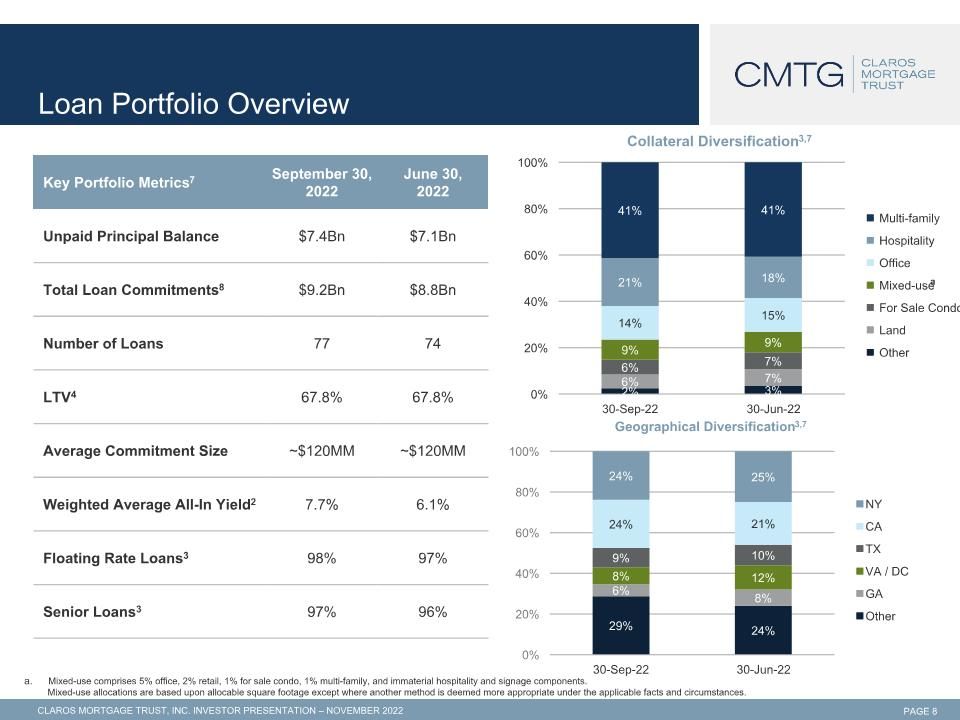
Loan Portfolio Overview Key Portfolio Metrics7 September 30, 2022 June 30, 2022 Unpaid Principal Balance $7.4Bn $7.1Bn Total Loan Commitments8 $9.2Bn $8.8Bn Number of Loans 77 74 LTV4 67.8% 67.8% Average Commitment Size ~$120MM ~$120MM Weighted Average All-In Yield2 7.7% 6.1% Floating Rate Loans3 98% 97% Senior Loans3 97% 96% Mixed-use comprises 5% office, 2% retail, 1% for sale condo, 1% multi-family, and immaterial hospitality and signage components. Mixed-use allocations are based upon allocable square footage except where another method is deemed more appropriate under the applicable facts and circumstances. a
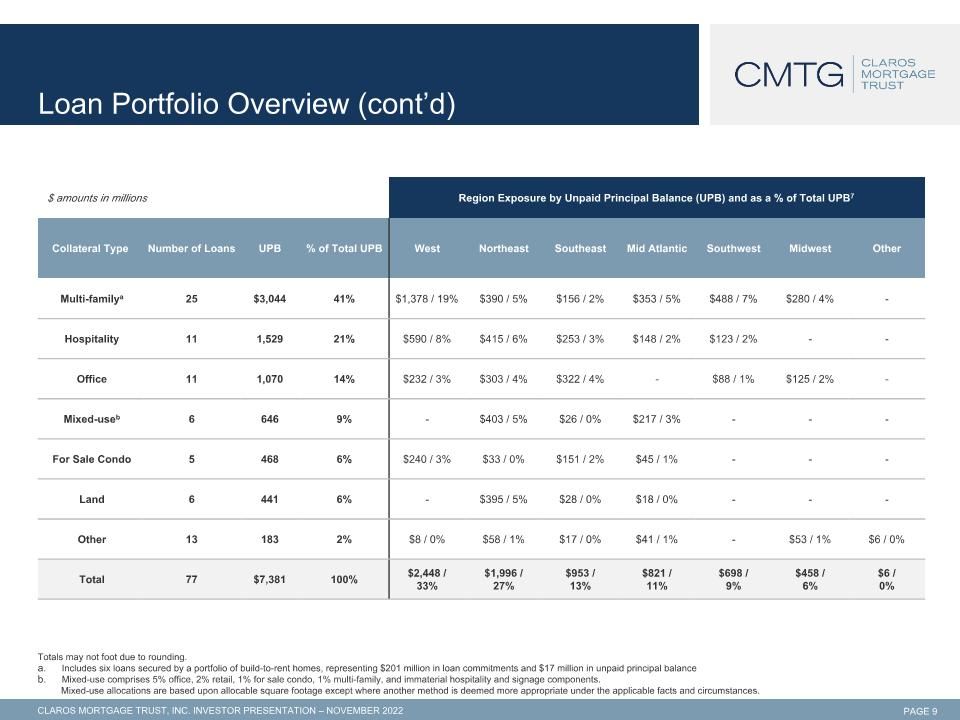
$ amounts in millions Region Exposure by Unpaid Principal Balance (UPB) and as a % of Total UPB7 Collateral Type Number of Loans UPB % of Total UPB West Northeast Southeast Mid Atlantic Southwest Midwest Other Multi-familya 25 $3,044 41% $1,378 / 19% $390 / 5% $156 / 2% $353 / 5% $488 / 7% $280 / 4% - Hospitality 11 1,529 21% $590 / 8% $415 / 6% $253 / 3% $148 / 2% $123 / 2% - - Office 11 1,070 14% $232 / 3% $303 / 4% $322 / 4% - $88 / 1% $125 / 2% - Mixed-useb 6 646 9% - $403 / 5% $26 / 0% $217 / 3% - - - For Sale Condo 5 468 6% $240 / 3% $33 / 0% $151 / 2% $45 / 1% - - - Land 6 441 6% - $395 / 5% $28 / 0% $18 / 0% - - - Other 13 183 2% $8 / 0% $58 / 1% $17 / 0% $41 / 1% - $53 / 1% $6 / 0% Total 77 $7,381 100% $2,448 / �33% $1,996 / �27% $953 / �13% $821 / �11% $698 / �9% $458 / �6% $6 / �0% Loan Portfolio Overview (cont’d) Totals may not foot due to rounding. Includes six loans secured by a portfolio of build-to-rent homes, representing $201 million in loan commitments and $17 million in unpaid principal balance Mixed-use comprises 5% office, 2% retail, 1% for sale condo, 1% multi-family, and immaterial hospitality and signage components. Mixed-use allocations are based upon allocable square footage except where another method is deemed more appropriate under the applicable facts and circumstances.
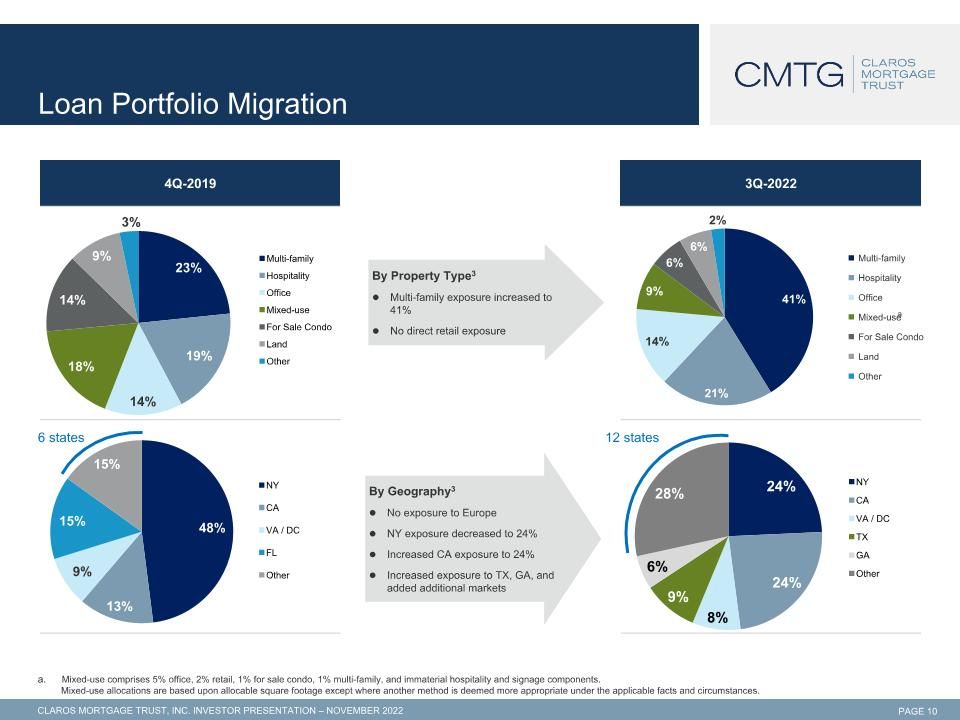
3Q-2022 4Q-2019 By Property Type3 Multi-family exposure increased to 41% No direct retail exposure By Geography3 No exposure to Europe NY exposure decreased to 24% Increased CA exposure to 24% Increased exposure to TX, GA, and added additional markets Loan Portfolio Migration 6 states 12 states Mixed-use comprises 5% office, 2% retail, 1% for sale condo, 1% multi-family, and immaterial hospitality and signage components. Mixed-use allocations are based upon allocable square footage except where another method is deemed more appropriate under the applicable facts and circumstances. a
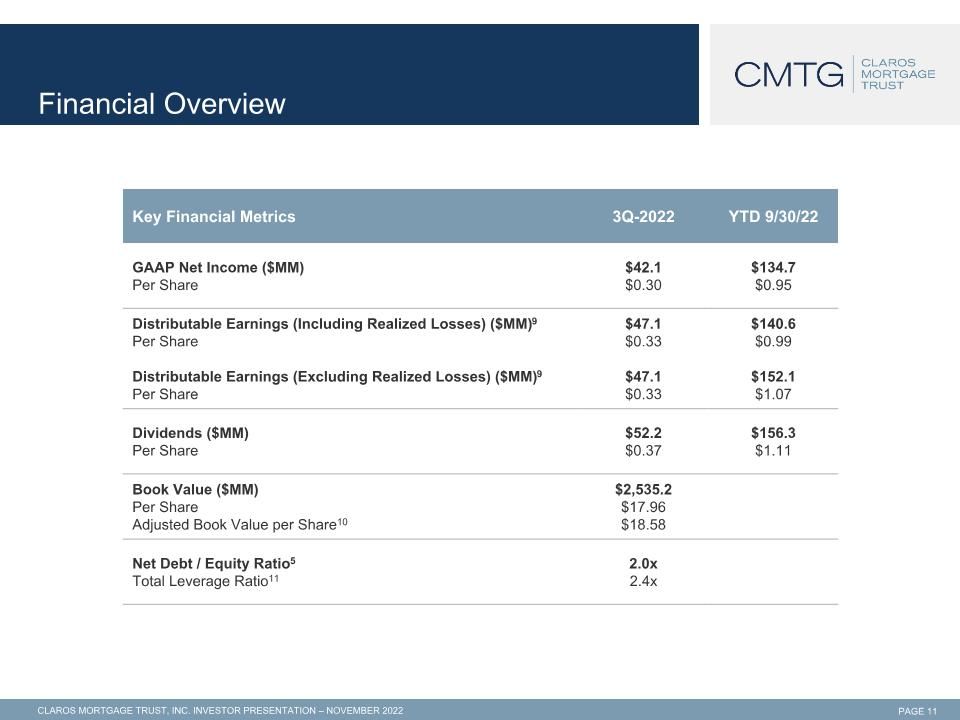
Financial Overview Key Financial Metrics 3Q-2022 YTD 9/30/22 GAAP Net Income ($MM) Per Share $42.1 $0.30 $134.7 $0.95 Distributable Earnings (Including Realized Losses) ($MM)9 Per Share Distributable Earnings (Excluding Realized Losses) ($MM)9 Per Share $47.1 $0.33 $47.1 $0.33 $140.6 $0.99 $152.1 $1.07 Dividends ($MM) Per Share $52.2 $0.37 $156.3 $1.11 Book Value ($MM) Per Share Adjusted Book Value per Share10 $2,535.2 $17.96 $18.58 Net Debt / Equity Ratio5 Total Leverage Ratio11 2.0x 2.4x
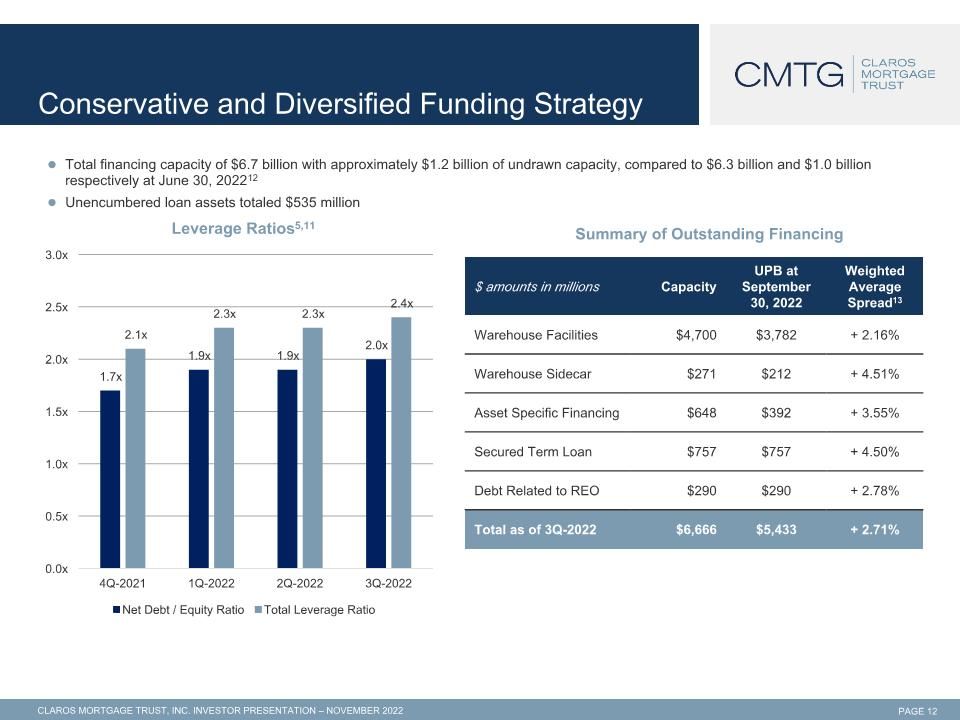
Conservative and Diversified Funding Strategy Total financing capacity of $6.7 billion with approximately $1.2 billion of undrawn capacity, compared to $6.3 billion and $1.0 billion respectively at June 30, 202212 Unencumbered loan assets totaled $535 million Summary of Outstanding Financing $ amounts in millions Capacity UPB at September 30, 2022 Weighted Average Spread13 Warehouse Facilities $4,700 $3,782 + 2.16% Warehouse Sidecar $271 $212 + 4.51% Asset Specific Financing $648 $392 + 3.55% Secured Term Loan $757 $757 + 4.50% Debt Related to REO $290 $290 + 2.78% Total as of 3Q-2022 $6,666 $5,433 + 2.71%
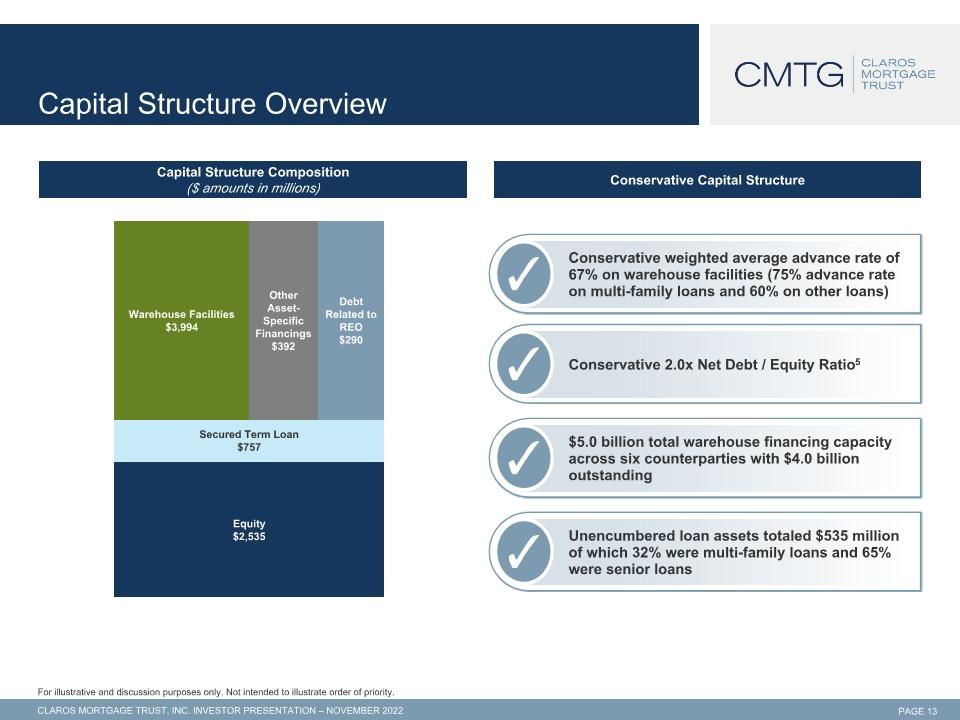
Capital Structure Overview Conservative Capital Structure Capital Structure Composition ($ amounts in millions) Conservative 2.0x Net Debt / Equity Ratio5 $5.0 billion total warehouse financing capacity across six counterparties with $4.0 billion outstanding Conservative weighted average advance rate of 67% on warehouse facilities (75% advance rate on multi-family loans and 60% on other loans) For illustrative and discussion purposes only. Not intended to illustrate order of priority. Warehouse Facilities $3,919 Other Asset- Specific Financings $375 Debt Related to REO $290 Unencumbered loan assets totaled $535 million of which 32% were multi-family loans and 65% were senior loans Equity $2,535 Secured Term Loan $757 Warehouse Facilities $3,994 Other Asset-Specific Financings $392 Debt Related to REO $290
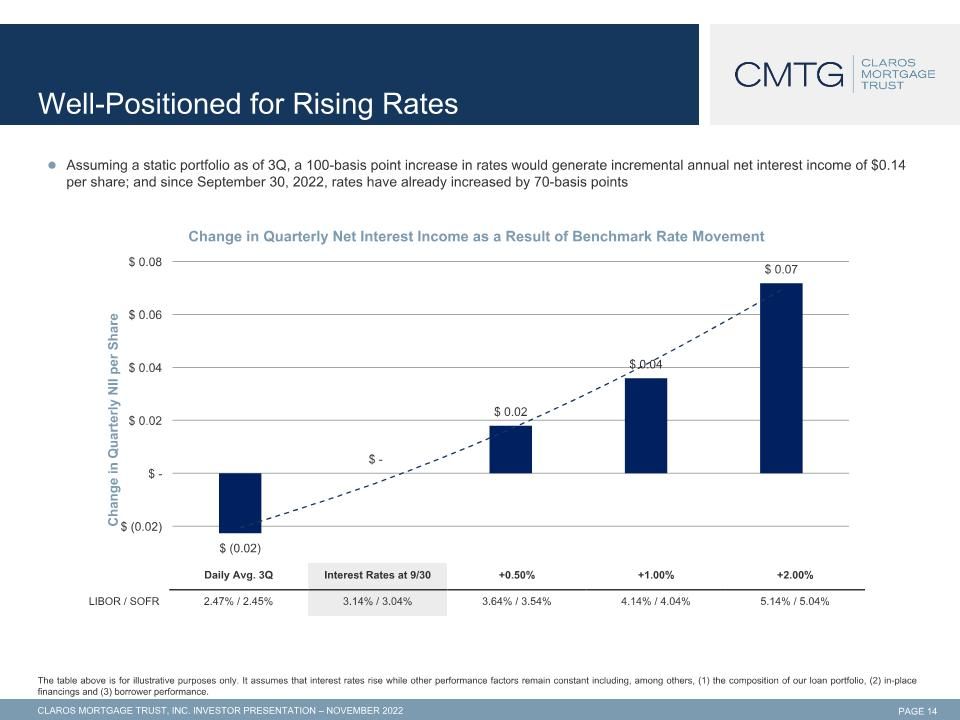
Well-Positioned for Rising Rates Assuming a static portfolio as of 3Q, a 100-basis point increase in rates would generate incremental annual net interest income of $0.14 per share; and since September 30, 2022, rates have already increased by 70-basis points Daily Avg. 3Q Interest Rates at 9/30 +0.50% +1.00% +2.00% LIBOR / SOFR 2.47% / 2.45% 3.14% / 3.04% 3.64% / 3.54% 4.14% / 4.04% 5.14% / 5.04% The table above is for illustrative purposes only. It assumes that interest rates rise while other performance factors remain constant including, among others, (1) the composition of our loan portfolio, (2) in-place financings and (3) borrower performance.
Appendix A The properties above are not representative of all transactions.
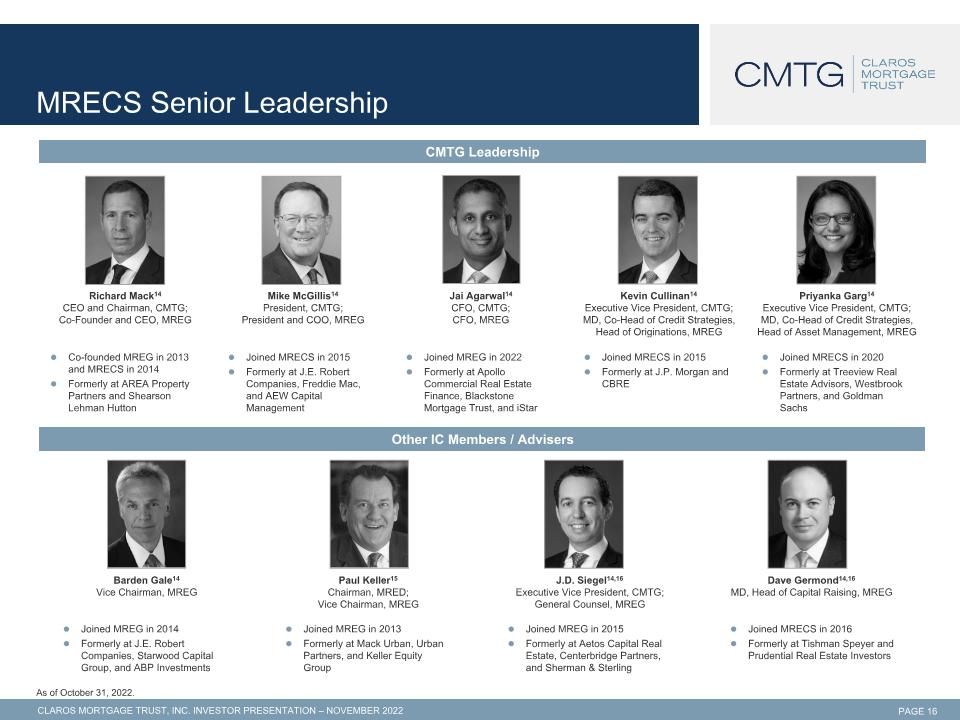
Richard Mack14 CEO and Chairman, CMTG; Co-Founder and CEO, MREG Mike McGillis14 President, CMTG; President and COO, MREG Jai Agarwal14 CFO, CMTG; CFO, MREG Kevin Cullinan14 Executive Vice President, CMTG; MD, Co-Head of Credit Strategies, Head of Originations, MREG Priyanka Garg14 Executive Vice President, CMTG; MD, Co-Head of Credit Strategies, Head of Asset Management, MREG Barden Gale14 Vice Chairman, MREG Paul Keller15 Chairman, MRED; Vice Chairman, MREG J.D. Siegel14,16 Executive Vice President, CMTG; General Counsel, MREG Dave Germond14,16 MD, Head of Capital Raising, MREG As of October 31, 2022. MRECS Senior Leadership CMTG Leadership Other IC Members / Advisers Co-founded MREG in 2013 and MRECS in 2014 Formerly at AREA Property Partners and Shearson Lehman Hutton Joined MRECS in 2015 Formerly at J.E. Robert Companies, Freddie Mac, and AEW Capital Management Joined MREG in 2022 Formerly at Apollo Commercial Real Estate Finance, Blackstone Mortgage Trust, and iStar Joined MRECS in 2015 Formerly at J.P. Morgan and CBRE Joined MRECS in 2020 Formerly at Treeview Real Estate Advisors, Westbrook Partners, and Goldman Sachs Joined MREG in 2014 Formerly at J.E. Robert Companies, Starwood Capital Group, and ABP Investments Joined MREG in 2013 Formerly at Mack Urban, Urban Partners, and Keller Equity Group Joined MREG in 2015 Formerly at Aetos Capital Real Estate, Centerbridge Partners, and Sherman & Sterling Joined MRECS in 2016 Formerly at Tishman Speyer and Prudential Real Estate Investors
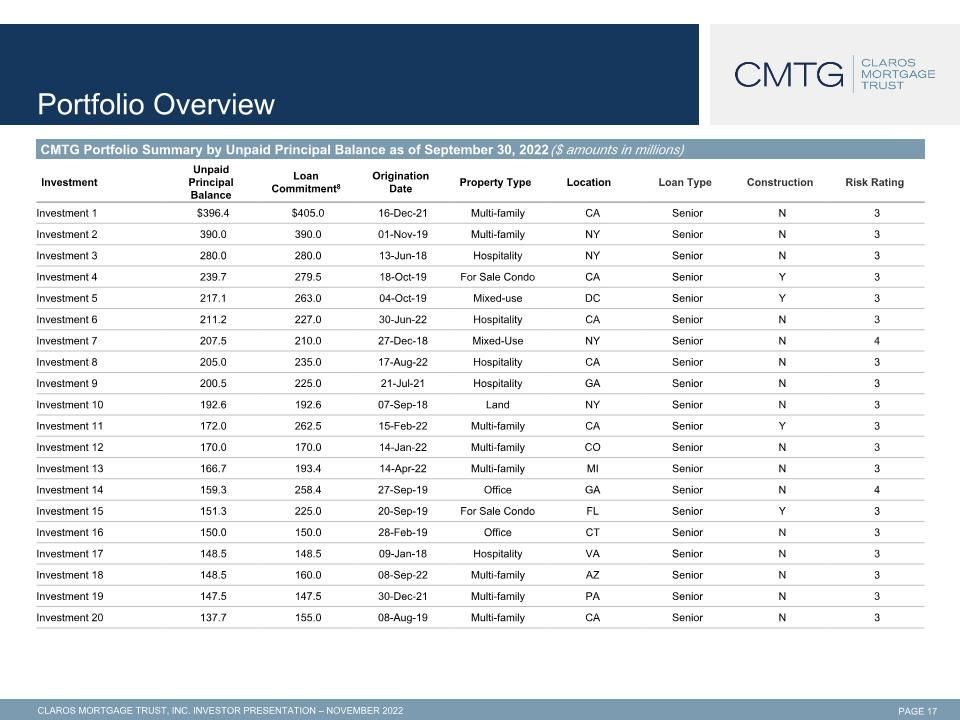
Portfolio Overview Investment Unpaid Principal Balance Loan Commitment8 Origination Date Property Type Location Loan Type Construction Risk Rating Investment 1 $396.4 $405.0 16-Dec-21 Multi-family CA Senior N 3 Investment 2 390.0 390.0 01-Nov-19 Multi-family NY Senior N 3 Investment 3 280.0 280.0 13-Jun-18 Hospitality NY Senior N 3 Investment 4 239.7 279.5 18-Oct-19 For Sale Condo CA Senior Y 3 Investment 5 217.1 263.0 04-Oct-19 Mixed-use DC Senior Y 3 Investment 6 211.2 227.0 30-Jun-22 Hospitality CA Senior N 3 Investment 7 207.5 210.0 27-Dec-18 Mixed-Use NY Senior N 4 Investment 8 205.0 235.0 17-Aug-22 Hospitality CA Senior N 3 Investment 9 200.5 225.0 21-Jul-21 Hospitality GA Senior N 3 Investment 10 192.6 192.6 07-Sep-18 Land NY Senior N 3 Investment 11 172.0 262.5 15-Feb-22 Multi-family CA Senior Y 3 Investment 12 170.0 170.0 14-Jan-22 Multi-family CO Senior N 3 Investment 13 166.7 193.4 14-Apr-22 Multi-family MI Senior N 3 Investment 14 159.3 258.4 27-Sep-19 Office GA Senior N 4 Investment 15 151.3 225.0 20-Sep-19 For Sale Condo FL Senior Y 3 Investment 16 150.0 150.0 28-Feb-19 Office CT Senior N 3 Investment 17 148.5 148.5 09-Jan-18 Hospitality VA Senior N 3 Investment 18 148.5 160.0 08-Sep-22 Multi-family AZ Senior N 3 Investment 19 147.5 147.5 30-Dec-21 Multi-family PA Senior N 3 Investment 20 137.7 155.0 08-Aug-19 Multi-family CA Senior N 3 CMTG Portfolio Summary by Unpaid Principal Balance as of September 30, 2022 ($ amounts in millions)
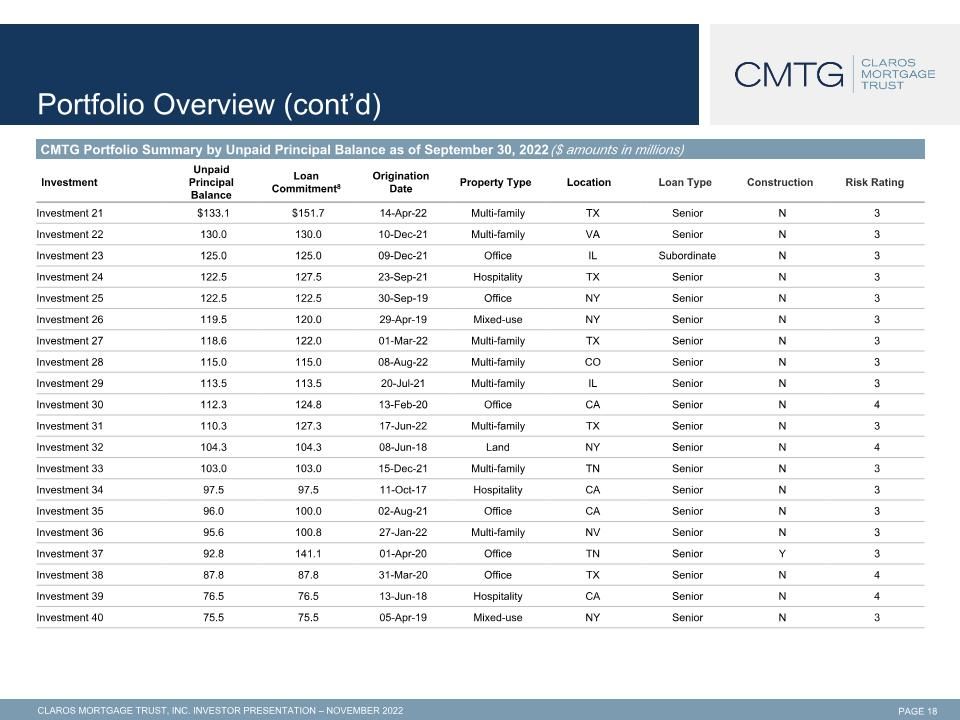
Portfolio Overview (cont’d) Investment Unpaid Principal Balance Loan Commitment8 Origination Date Property Type Location Loan Type Construction Risk Rating Investment 21 $133.1 $151.7 14-Apr-22 Multi-family TX Senior N 3 Investment 22 130.0 130.0 10-Dec-21 Multi-family VA Senior N 3 Investment 23 125.0 125.0 09-Dec-21 Office IL Subordinate N 3 Investment 24 122.5 127.5 23-Sep-21 Hospitality TX Senior N 3 Investment 25 122.5 122.5 30-Sep-19 Office NY Senior N 3 Investment 26 119.5 120.0 29-Apr-19 Mixed-use NY Senior N 3 Investment 27 118.6 122.0 01-Mar-22 Multi-family TX Senior N 3 Investment 28 115.0 115.0 08-Aug-22 Multi-family CO Senior N 3 Investment 29 113.5 113.5 20-Jul-21 Multi-family IL Senior N 3 Investment 30 112.3 124.8 13-Feb-20 Office CA Senior N 4 Investment 31 110.3 127.3 17-Jun-22 Multi-family TX Senior N 3 Investment 32 104.3 104.3 08-Jun-18 Land NY Senior N 4 Investment 33 103.0 103.0 15-Dec-21 Multi-family TN Senior N 3 Investment 34 97.5 97.5 11-Oct-17 Hospitality CA Senior N 3 Investment 35 96.0 100.0 02-Aug-21 Office CA Senior N 3 Investment 36 95.6 100.8 27-Jan-22 Multi-family NV Senior N 3 Investment 37 92.8 141.1 01-Apr-20 Office TN Senior Y 3 Investment 38 87.8 87.8 31-Mar-20 Office TX Senior N 4 Investment 39 76.5 76.5 13-Jun-18 Hospitality CA Senior N 4 Investment 40 75.5 75.5 05-Apr-19 Mixed-use NY Senior N 3 CMTG Portfolio Summary by Unpaid Principal Balance as of September 30, 2022 ($ amounts in millions)
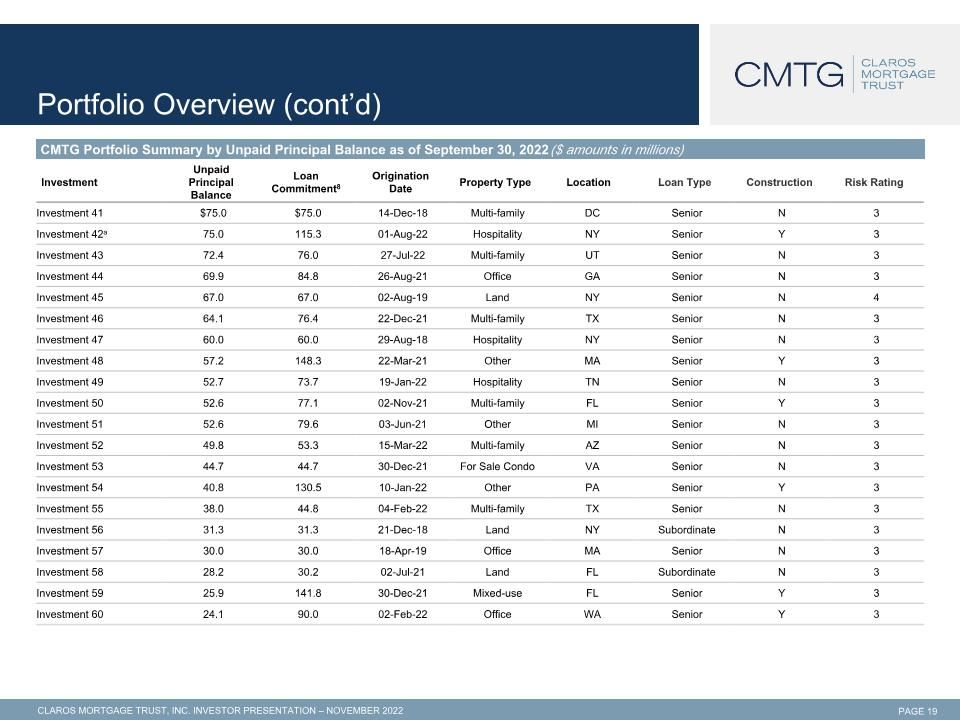
Portfolio Overview (cont’d) Investment Unpaid Principal Balance Loan Commitment8 Origination Date Property Type Location Loan Type Construction Risk Rating Investment 41 $75.0 $75.0 14-Dec-18 Multi-family DC Senior N 3 Investment 42a 75.0 115.3 01-Aug-22 Hospitality NY Senior Y 3 Investment 43 72.4 76.0 27-Jul-22 Multi-family UT Senior N 3 Investment 44 69.9 84.8 26-Aug-21 Office GA Senior N 3 Investment 45 67.0 67.0 02-Aug-19 Land NY Senior N 4 Investment 46 64.1 76.4 22-Dec-21 Multi-family TX Senior N 3 Investment 47 60.0 60.0 29-Aug-18 Hospitality NY Senior N 3 Investment 48 57.2 148.3 22-Mar-21 Other MA Senior Y 3 Investment 49 52.7 73.7 19-Jan-22 Hospitality TN Senior N 3 Investment 50 52.6 77.1 02-Nov-21 Multi-family FL Senior Y 3 Investment 51 52.6 79.6 03-Jun-21 Other MI Senior N 3 Investment 52 49.8 53.3 15-Mar-22 Multi-family AZ Senior N 3 Investment 53 44.7 44.7 30-Dec-21 For Sale Condo VA Senior N 3 Investment 54 40.8 130.5 10-Jan-22 Other PA Senior Y 3 Investment 55 38.0 44.8 04-Feb-22 Multi-family TX Senior N 3 Investment 56 31.3 31.3 21-Dec-18 Land NY Subordinate N 3 Investment 57 30.0 30.0 18-Apr-19 Office MA Senior N 3 Investment 58 28.2 30.2 02-Jul-21 Land FL Subordinate N 3 Investment 59 25.9 141.8 30-Dec-21 Mixed-use FL Senior Y 3 Investment 60 24.1 90.0 02-Feb-22 Office WA Senior Y 3 CMTG Portfolio Summary by Unpaid Principal Balance as of September 30, 2022 ($ amounts in millions)
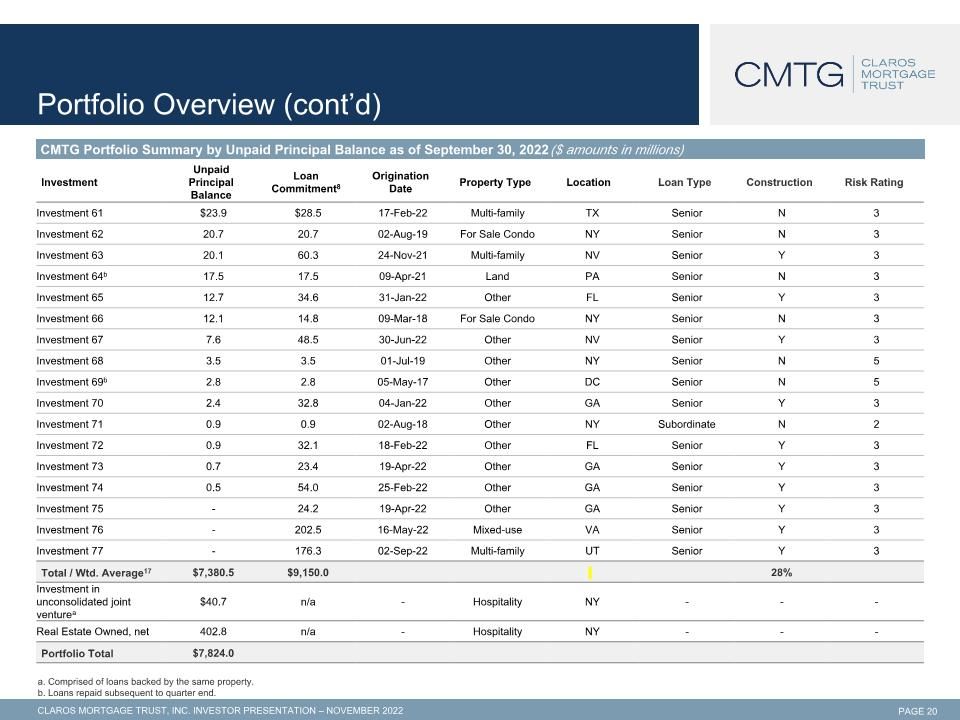
Portfolio Overview (cont’d) Investment Unpaid Principal Balance Loan Commitment8 Origination Date Property Type Location Loan Type Construction Risk Rating Investment 61 $23.9 $28.5 17-Feb-22 Multi-family TX Senior N 3 Investment 62 20.7 20.7 02-Aug-19 For Sale Condo NY Senior N 3 Investment 63 20.1 60.3 24-Nov-21 Multi-family NV Senior Y 3 Investment 64b 17.5 17.5 09-Apr-21 Land PA Senior N 3 Investment 65 12.7 34.6 31-Jan-22 Other FL Senior Y 3 Investment 66 12.1 14.8 09-Mar-18 For Sale Condo NY Senior N 3 Investment 67 7.6 48.5 30-Jun-22 Other NV Senior Y 3 Investment 68 3.5 3.5 01-Jul-19 Other NY Senior N 5 Investment 69b 2.8 2.8 05-May-17 Other DC Senior N 5 Investment 70 2.4 32.8 04-Jan-22 Other GA Senior Y 3 Investment 71 0.9 0.9 02-Aug-18 Other NY Subordinate N 2 Investment 72 0.9 32.1 18-Feb-22 Other FL Senior Y 3 Investment 73 0.7 23.4 19-Apr-22 Other GA Senior Y 3 Investment 74 0.5 54.0 25-Feb-22 Other GA Senior Y 3 Investment 75 - 24.2 19-Apr-22 Other GA Senior Y 3 Investment 76 - 202.5 16-May-22 Mixed-use VA Senior Y 3 Investment 77 - 176.3 02-Sep-22 Multi-family UT Senior Y 3 Total / Wtd. Average17 $7,380.5 $9,150.0 28% Investment in unconsolidated joint venturea $40.7 n/a - Hospitality NY - - - Real Estate Owned, net 402.8 n/a - Hospitality NY - - - Portfolio Total $7,824.0 CMTG Portfolio Summary by Unpaid Principal Balance as of September 30, 2022 ($ amounts in millions) a. Comprised of loans backed by the same property. b. Loans repaid subsequent to quarter end.
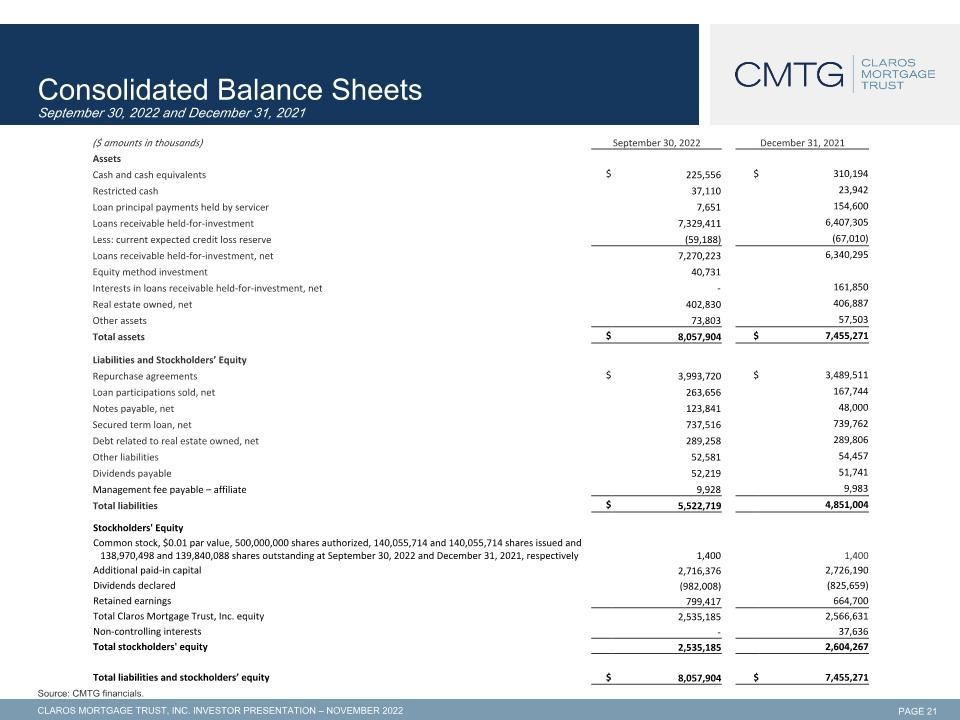
($ amounts in thousands) September 30, 2022 March 31, 2022 December 31, 2021 December 31, 2021 Assets Cash and cash equivalents $ 225,556 $ 310,194 Restricted cash 37,110 23,942 Loan principal payments held by servicer 7,651 154,600 Loans receivable held-for-investment 7,329,411 6,407,305 Less: current expected credit loss reserve (59,188) (67,010) Loans receivable held-for-investment, net 7,270,223 6,340,295 Equity method investment 40,731 Interests in loans receivable held-for-investment, net - 161,850 Real estate owned, net 402,830 406,887 Other assets 73,803 57,503 Total assets $ 8,057,904 $ 7,455,271 Liabilities and Stockholders’ Equity Repurchase agreements $ 3,993,720 $ 3,489,511 Loan participations sold, net 263,656 167,744 Notes payable, net 123,841 48,000 Secured term loan, net 737,516 739,762 Debt related to real estate owned, net 289,258 289,806 Other liabilities 52,581 54,457 Dividends payable 52,219 51,741 Management fee payable – affiliate 9,928 9,983 Total liabilities $ 5,522,719 4,851,004 Stockholders' Equity Common stock, $0.01 par value, 500,000,000 shares authorized, 140,055,714 and 140,055,714 shares issued and 138,970,498 and 139,840,088 shares outstanding at September 30, 2022 and December 31, 2021, respectively 1,400 1,400 Additional paid-in capital 2,716,376 2,726,190 Dividends declared (982,008) (825,659) Retained earnings 799,417 664,700 Total Claros Mortgage Trust, Inc. equity 2,535,185 2,566,631 Non-controlling interests - 37,636 Total stockholders' equity 2,535,185 2,604,267 Total liabilities and stockholders’ equity $ 8,057,904 $ 7,455,271 Consolidated Balance Sheets�September 30, 2022 and December 31, 2021 Source: CMTG financials.
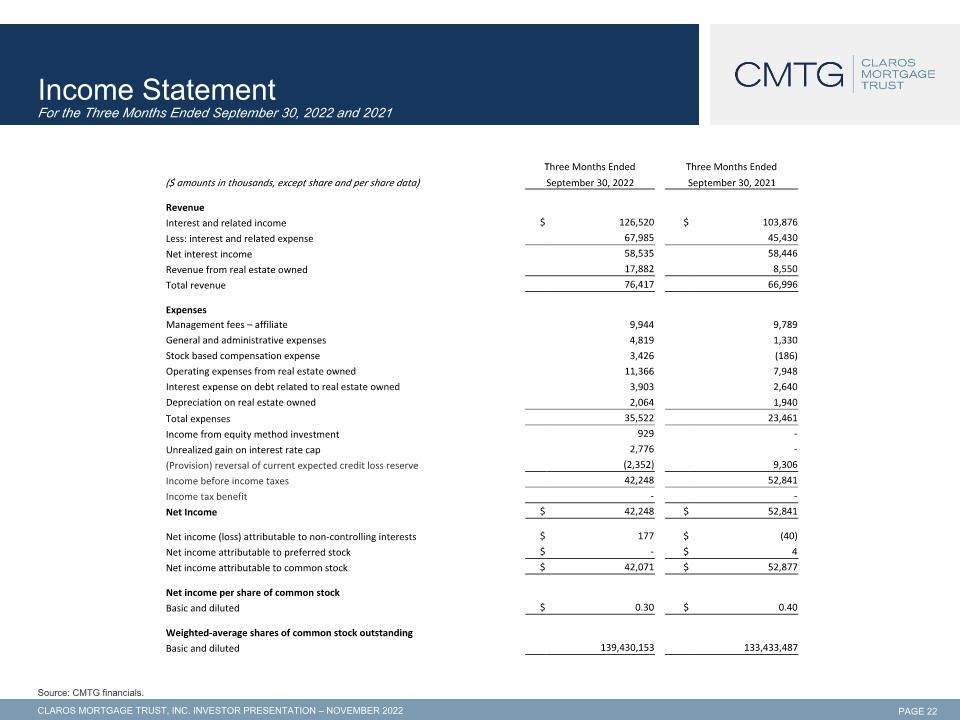
Income Statement�For the Three Months Ended September 30, 2022 and 2021 Source: CMTG financials. Three Months Ended Three Months Ended Three Months Ended Three Months Ended ($ amounts in thousands, except share and per share data) September 30, 2022 March 31, 2022 September 30, 2021 March 31, 2021 Revenue Interest and related income $ 126,520 $ 103,876 Less: interest and related expense 67,985 45,430 Net interest income 58,535 58,446 Revenue from real estate owned 17,882 8,550 Total revenue 76,417 66,996 Expenses Management fees – affiliate 9,944 9,789 General and administrative expenses 4,819 1,330 Stock based compensation expense 3,426 (186) Operating expenses from real estate owned 11,366 7,948 Interest expense on debt related to real estate owned 3,903 2,640 Depreciation on real estate owned 2,064 1,940 Total expenses 35,522 23,461 Income from equity method investment 929 - Unrealized gain on interest rate cap 2,776 - (Provision) reversal of current expected credit loss reserve (2,352) 9,306 Income before income taxes 42,248 52,841 Income tax benefit - - Net Income $ 42,248 $ 52,841 Net income (loss) attributable to non-controlling interests $ 177 $ (40) Net income attributable to preferred stock $ - $ 4 Net income attributable to common stock $ 42,071 $ 52,877 Net income per share of common stock Basic and diluted $ 0.30 $ 0.40 Weighted-average shares of common stock outstanding Basic and diluted 139,430,153 133,433,487
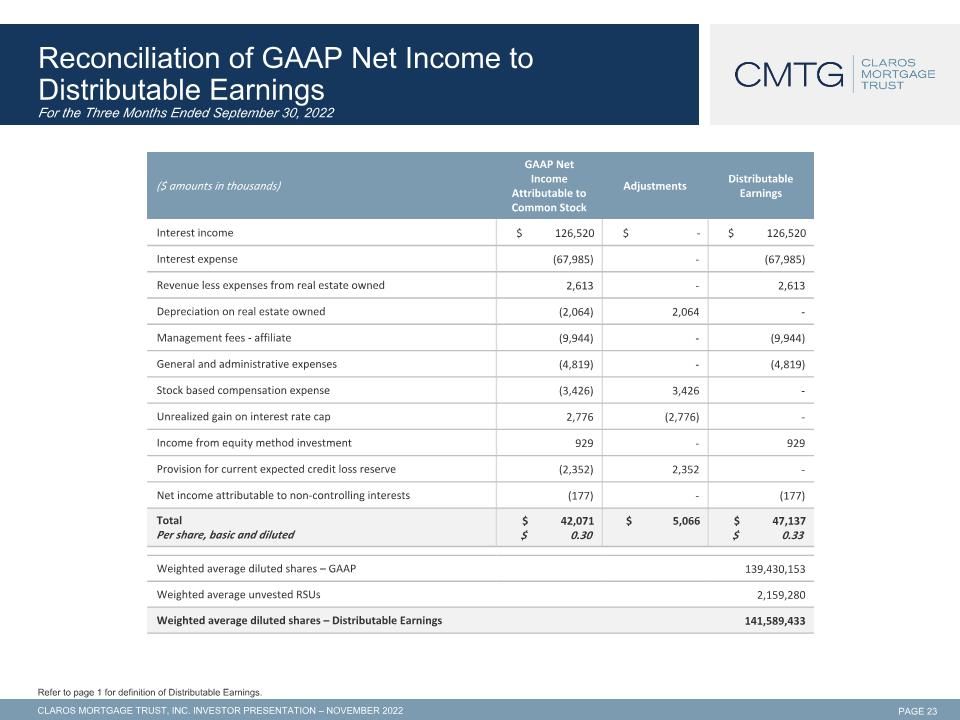
($ amounts in thousands) GAAP Net Income Attributable to Common Stock Adjustments Distributable Earnings Interest income $ 126,520 $ - $ 126,520 Interest expense (67,985) - (67,985) Revenue less expenses from real estate owned 2,613 - 2,613 Depreciation on real estate owned (2,064) 2,064 - Management fees - affiliate (9,944) - (9,944) General and administrative expenses (4,819) - (4,819) Stock based compensation expense (3,426) 3,426 - Unrealized gain on interest rate cap 2,776 (2,776) - Income from equity method investment 929 - 929 Provision for current expected credit loss reserve (2,352) 2,352 - Net income attributable to non-controlling interests (177) - (177) Total Per share, basic and diluted $ 42,071 $ 0.30 $ 5,066 $ 47,137 $ 0.33 Reconciliation of GAAP Net Income to�Distributable Earnings�For the Three Months Ended September 30, 2022 Refer to page 1 for definition of Distributable Earnings. Weighted average diluted shares – GAAP 139,430,153 Weighted average unvested RSUs 2,159,280 Weighted average diluted shares – Distributable Earnings 141,589,433
Endnotes Calculated as the annualized quarterly dividend per share divided by book value per share. All-in yield represents the weighted average annualized yield to initial maturity of each loan, inclusive of coupon and fees, based on the applicable floating benchmark rate / floors (if applicable), in-place, as of the reporting date. This includes loans on non-accrual status. Based on unpaid principal balance. Senior loans include senior mortgages and similar loans, including related contiguous subordinate loans (if any), and pari passu participations in senior mortgage loans. LTV represents underwritten “loan-to-value” or “loan-to-cost.” Underwritten values and projected costs should not be assumed to reflect our judgment of current market values or project costs, which may have changed materially since the date of origination. See Important Notices beginning on page 1 for additional information. Net Debt / Equity Ratio is calculated as the ratio of asset-specific debt and Secured Term Loan, less cash and cash equivalents, to total equity. Includes originations, co-originations, and acquisitions made by CMTG and its JV subsidiaries in which CMTG owns a 51% interest. Excludes our one real estate owned (REO) investment, unless otherwise noted. Loan commitment represents principal outstanding plus remaining unfunded loan commitments. Refer to page 23 for a reconciliation of Distributable Earnings to GAAP Net Income attributable to its common stock. Adjusted book value per share includes general CECL and depreciation. Total Leverage Ratio is calculated as the ratio of asset-specific debt and Secured Term Loan, plus non-consolidated senior interests held by third parties, less cash and cash equivalents, to total equity. Subject to approval of financing counterparty as well as pledging of additional unencumbered assets. Weighted average spreads exclude LIBOR / SOFR floors. Fixed-rate financings are presented as a spread over the relevant floating benchmark rate. MRECS Investment Committee Member. Paul Keller is an Adviser to the MRECS Investment Committee for construction investments. J.D. Siegel and Dave Germond are non-voting members of the MRECS Investment Committee. Based on total loan commitments.


