
Randolph Bancorp, Inc. Investor Presentation July 30, 2019 Exhibit 99.1
Forward-Looking Statements ………………………………… 3 Key Strategic Objectives ……………………………………… 4 Initiatives to Grow Retail Deposits …………………………… 5 Mortgage Banking ……………………………………………... 6 Loan Portfolio …………………………………………………… 7 Commercial Real Estate Lending …………………………….. 8 Asset Quality ……………………………………………………. 9 Second Quarter 2019 Highlights ………………………………10 Capital Management ……………………………………….......11
Forward-Looking Statements This presentation includes “forward looking statements” within the meaning of Section 27A of the Securities Act of 1933, as amended, and Section 21E of the Securities Exchange Act of 1934, as amended, and is intended to be covered by the safe harbor provisions of the Private Securities Litigation Reform Act of 1995. Forward-looking statements, which are based on certain current assumptions and describe our future plans, strategies and expectations, can generally be identified by the use of the words “may,” “will,” “should,” “could,” “would,” “plan,” “potential,” “estimate,” “project,” “believe,” “intend,” “anticipate,” “expect,” “target” and similar expressions. These statements include, among others, statements regarding our strategy, goals and expectations; evaluations of future interest rate trends and liquidity; expectations as to growth in assets, deposits and results of operations, future operations, market position and financial position; and prospects, plans and objectives of management. You should exercise caution in interpreting and relying on forward-looking statements because they are subject to significant risks, uncertainties and other factors which are, in some cases, beyond the control of the Bank. Forward-looking statements are based on the current assumptions and beliefs of management and are only expectations of future results. Our actual results could differ materially from those projected in the forward-looking statements as a result of, among others, factors referenced under the section captioned “Risk Factors” in our Annual Report on Form 10-K and quarterly reports on Form 10-Q as filed with the SEC; adverse conditions in the capital and debt markets and the impact of such conditions on our business activities; changes in interest rates; competitive pressures from other financial institutions; the effects of weakness in general economic conditions on a national basis or in the local markets in which we operate, including changes that adversely affect borrowers’ ability to service and repay our loans; changes in the value of securities in our investment portfolio; changes in loan default and charge-off rates; fluctuations in real estate values; the adequacy of loan loss reserves; decreases in deposit levels necessitating increased borrowing to fund loans and investments; changes in government regulation; changes in accounting standards and practices; the risk that intangible assets recorded in our financial statements will become impaired; demand for loans in our market area; our ability to attract and maintain deposits; risks related to the implementation of acquisitions, dispositions, and restructurings; the risk that we may not be successful in the implementation of our business strategy; and changes in assumptions used in making such forward-looking statements. Readers are cautioned not to place undue reliance on these forward-looking statements, which speak only as of the date on which they are made. We do not undertake any obligation to update any forward-looking statement to reflect circumstances or events that occur after the date the forward-looking statements are made.
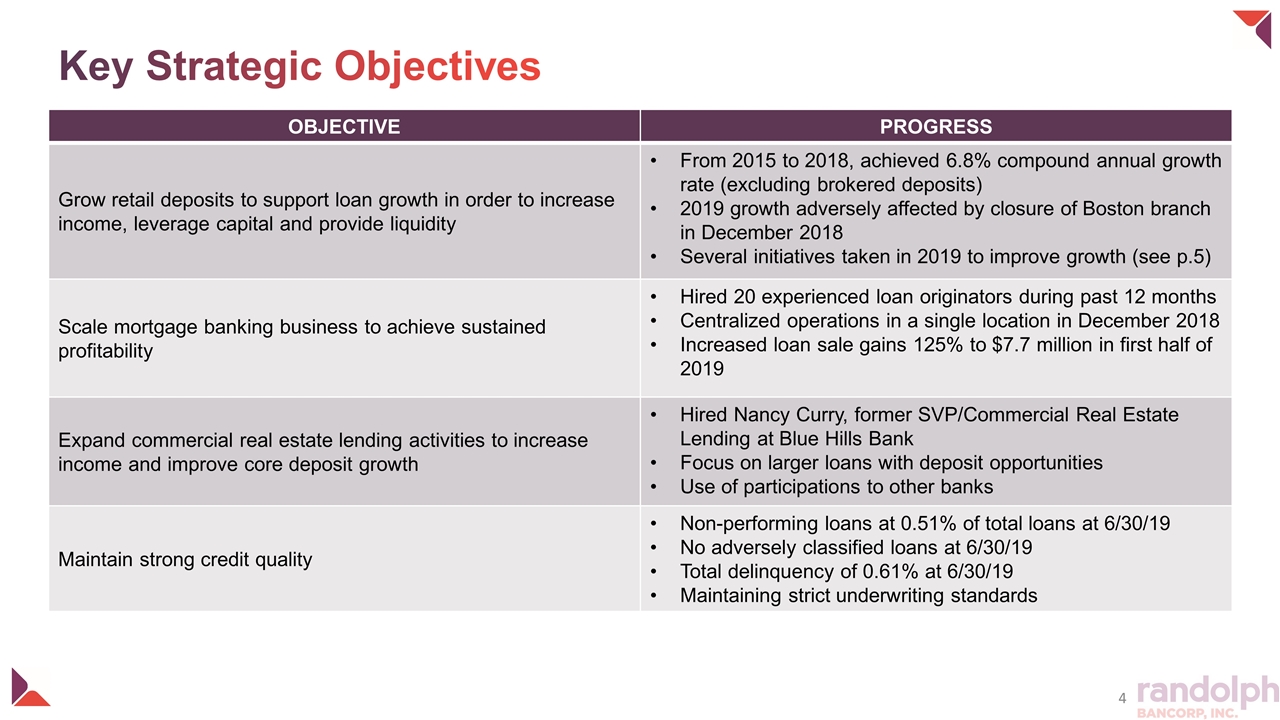
Key Strategic Objectives OBJECTIVE PROGRESS Grow retail deposits to support loan growth in order to increase income, leverage capital and provide liquidity From 2015 to 2018, achieved 6.8% compound annual growth rate (excluding brokered deposits) 2019 growth adversely affected by closure of Boston branch in December 2018 Several initiatives taken in 2019 to improve growth (see p.5) Scale mortgage banking business to achieve sustained profitability Hired 20 experienced loan originators during past 12 months Centralized operations in a single location in December 2018 Increased loan sale gains 125% to $7.7 million in first half of 2019 Expand commercial real estate lending activities to increase income and improve core deposit growth Hired Nancy Curry, former SVP/Commercial Real Estate Lending at Blue Hills Bank Focus on larger loans with deposit opportunities Use of participations to other banks Maintain strong credit quality Non-performing loans at 0.51% of total loans at 6/30/19 No adversely classified loans at 6/30/19 Total delinquency of 0.61% at 6/30/19 Maintaining strict underwriting standards
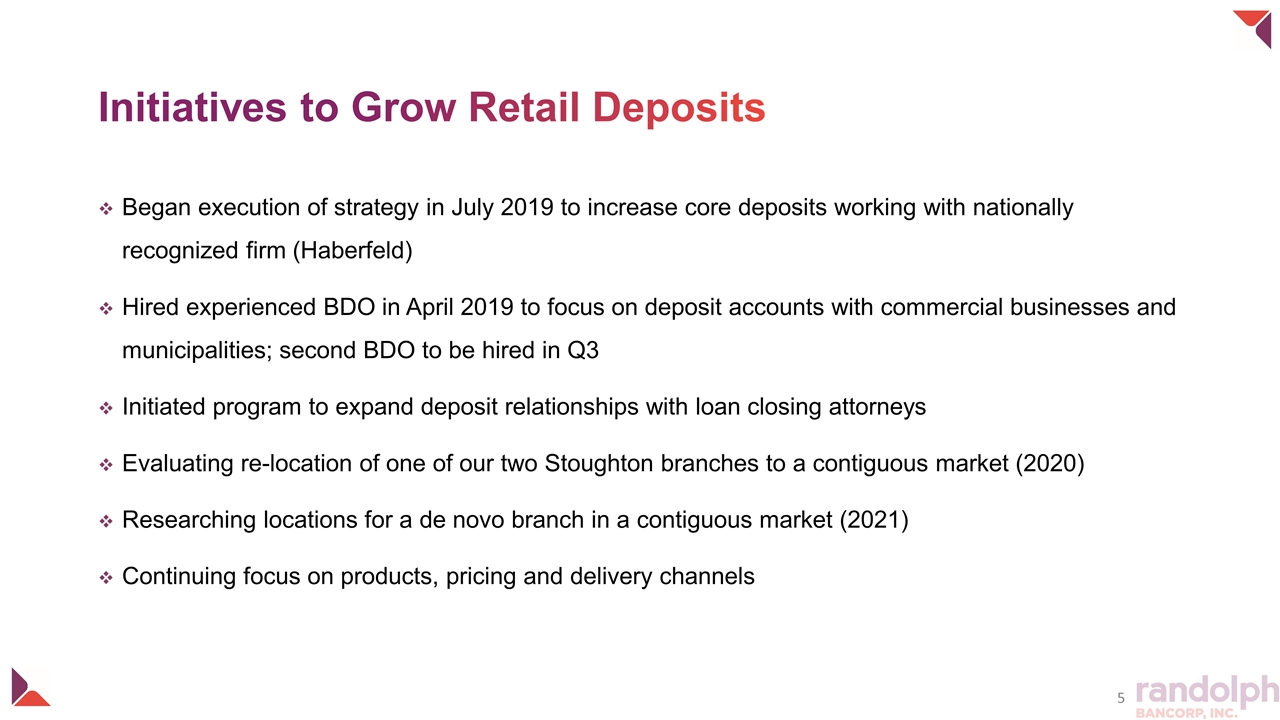
Initiatives to Grow Retail Deposits Began execution of strategy in July 2019 to increase core deposits working with nationally recognized firm (Haberfeld) Hired experienced BDO in April 2019 to focus on deposit accounts with commercial businesses and municipalities; second BDO to be hired in Q3 Initiated program to expand deposit relationships with loan closing attorneys Evaluating re-location of one of our two Stoughton branches to a contiguous market (2020) Researching locations for a de novo branch in a contiguous market (2021) Continuing focus on products, pricing and delivery channels
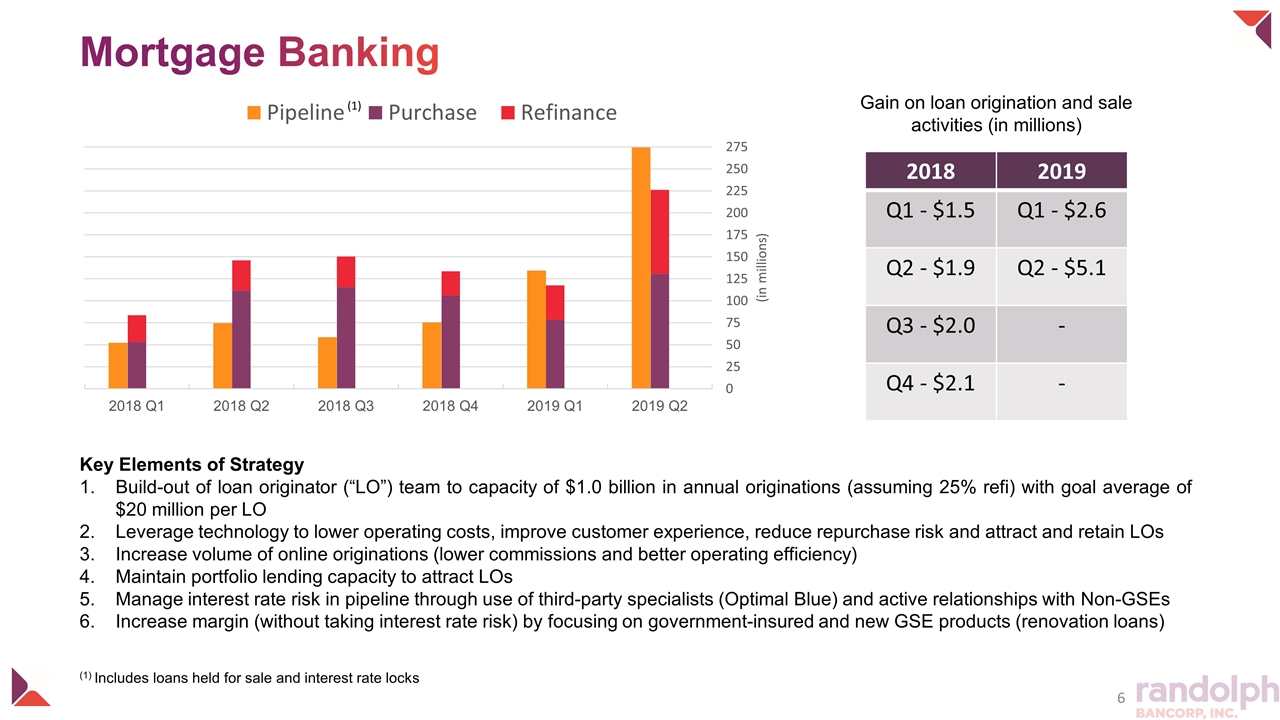
Mortgage Banking Gain on loan origination and sale activities (in millions) 2018 2019 Q1 - $1.5 Q1 - $2.6 Q2 - $1.9 Q2 - $5.1 Q3 - $2.0 - Q4 - $2.1 - Key Elements of Strategy Build-out of loan originator (“LO”) team to capacity of $1.0 billion in annual originations (assuming 25% refi) with goal average of $20 million per LO Leverage technology to lower operating costs, improve customer experience, reduce repurchase risk and attract and retain LOs Increase volume of online originations (lower commissions and better operating efficiency) Maintain portfolio lending capacity to attract LOs Manage interest rate risk in pipeline through use of third-party specialists (Optimal Blue) and active relationships with Non-GSEs Increase margin (without taking interest rate risk) by focusing on government-insured and new GSE products (renovation loans) (1) (1) Includes loans held for sale and interest rate locks
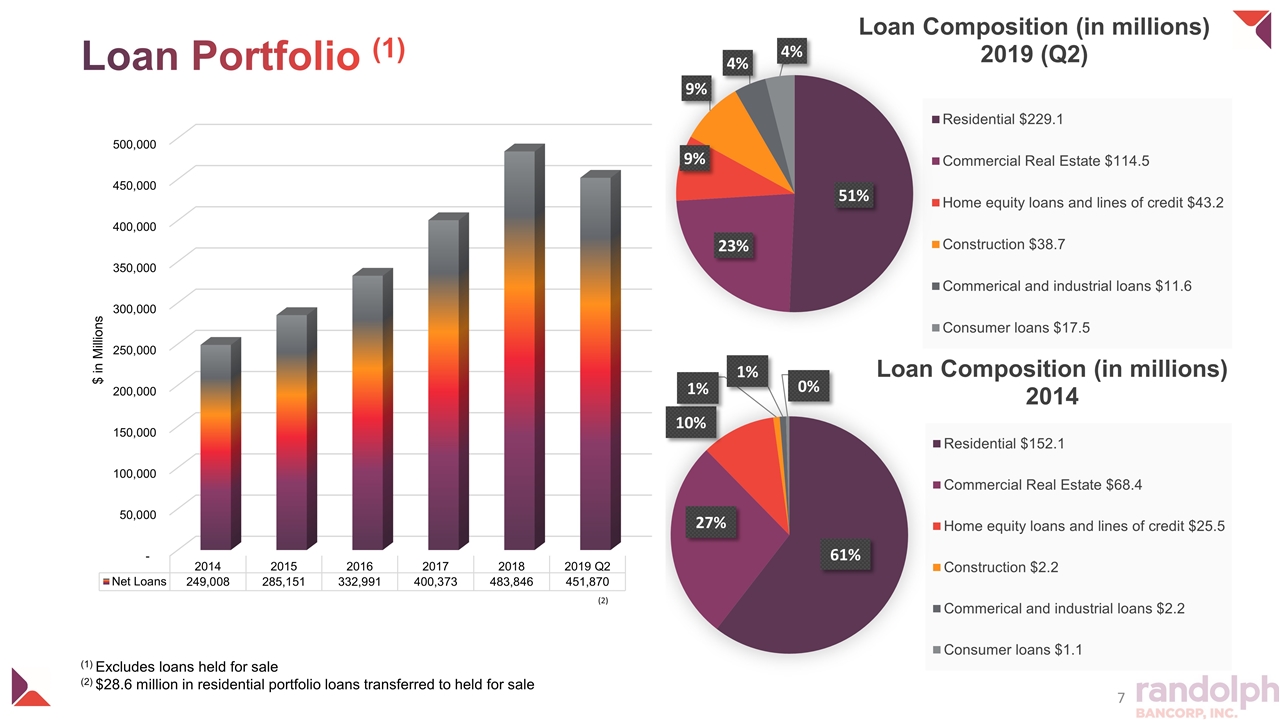
Loan Portfolio (1) (1) Excludes loans held for sale (2) $28.6 million in residential portfolio loans transferred to held for sale (2)
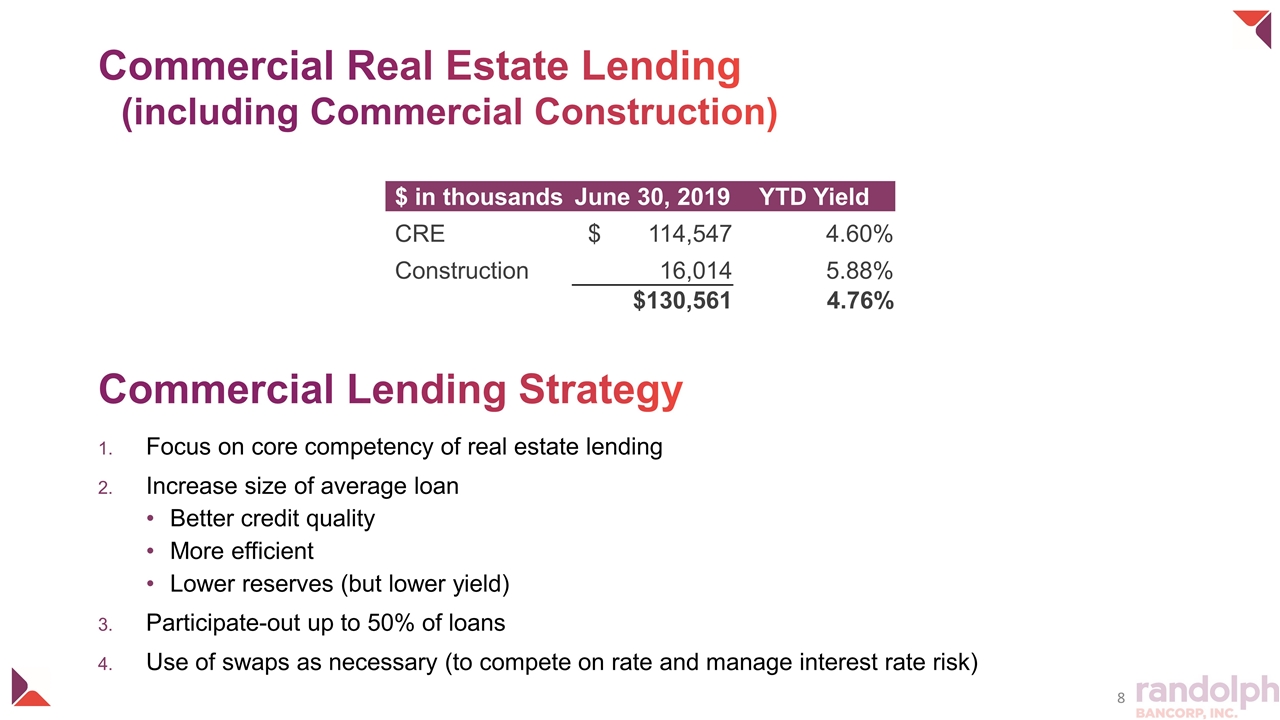
Commercial Real Estate Lending (including Commercial Construction) Focus on core competency of real estate lending Increase size of average loan Better credit quality More efficient Lower reserves (but lower yield) Participate-out up to 50% of loans Use of swaps as necessary (to compete on rate and manage interest rate risk) Commercial Lending Strategy $ in thousands June 30, 2019 YTD Yield CRE $ 114,547 4.60% Construction 16,014 5.88% $130,561 4.76%
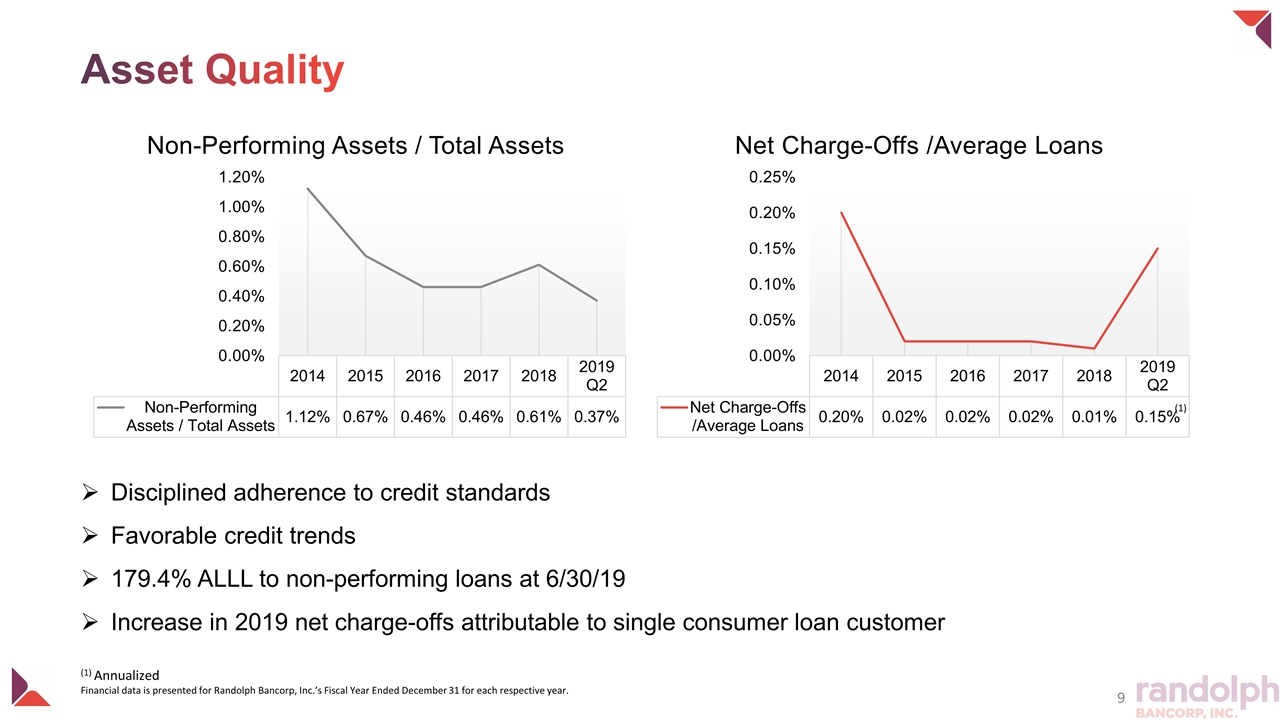
Asset Quality Disciplined adherence to credit standards Favorable credit trends 179.4% ALLL to non-performing loans at 6/30/19 Increase in 2019 net charge-offs attributable to single consumer loan customer (1) Annualized Financial data is presented for Randolph Bancorp, Inc.’s Fiscal Year Ended December 31 for each respective year. (1)
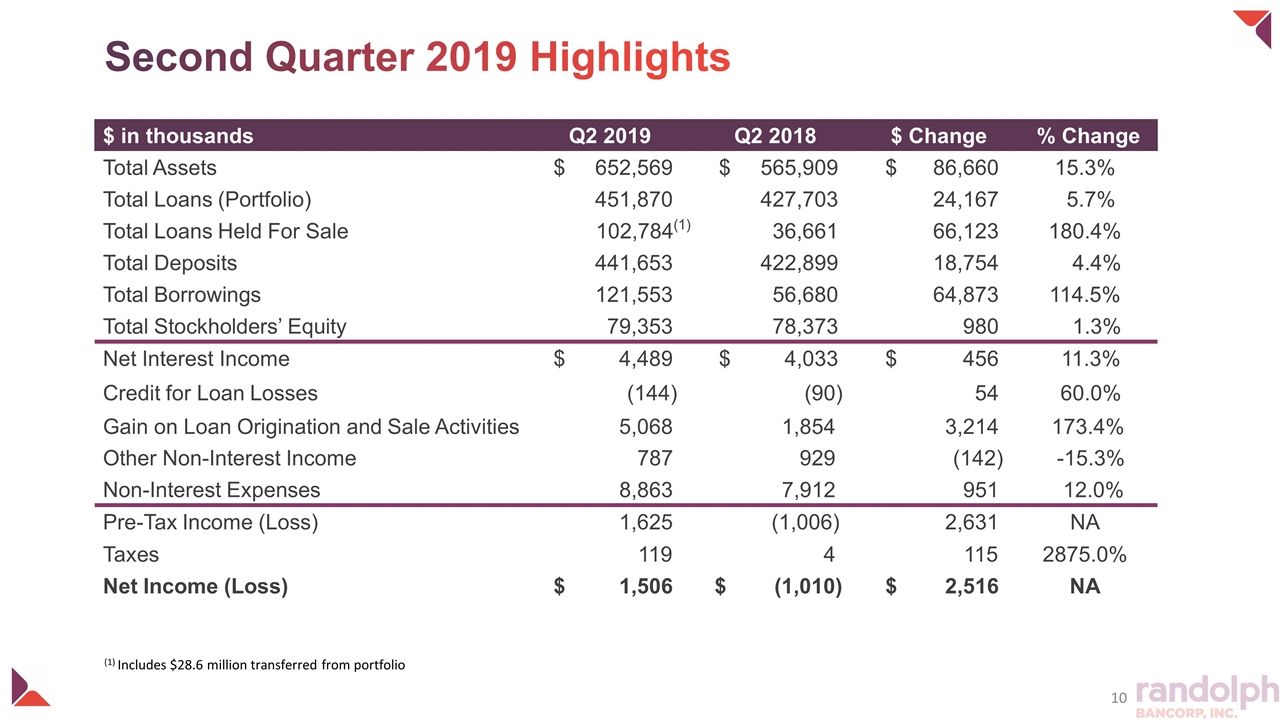
Second Quarter 2019 Highlights $ in thousands Q2 2019 Q2 2018 $ Change % Change Total Assets $ 652,569 $ 565,909 $ 86,660 15.3% Total Loans (Portfolio) 451,870 427,703 24,167 5.7% Total Loans Held For Sale 102,784(1) 36,661 66,123 180.4% Total Deposits 441,653 422,899 18,754 4.4% Total Borrowings 121,553 56,680 64,873 114.5% Total Stockholders’ Equity 79,353 78,373 980 1.3% Net Interest Income $ 4,489 $ 4,033 $ 456 11.3% Credit for Loan Losses (144) (90) 54 60.0% Gain on Loan Origination and Sale Activities 5,068 1,854 3,214 173.4% Other Non-Interest Income 787 929 (142) -15.3% Non-Interest Expenses 8,863 7,912 951 12.0% Pre-Tax Income (Loss) 1,625 (1,006) 2,631 NA Taxes 119 4 115 2875.0% Net Income (Loss) $ 1,506 $ (1,010) $ 2,516 NA (1) Includes $28.6 million transferred from portfolio
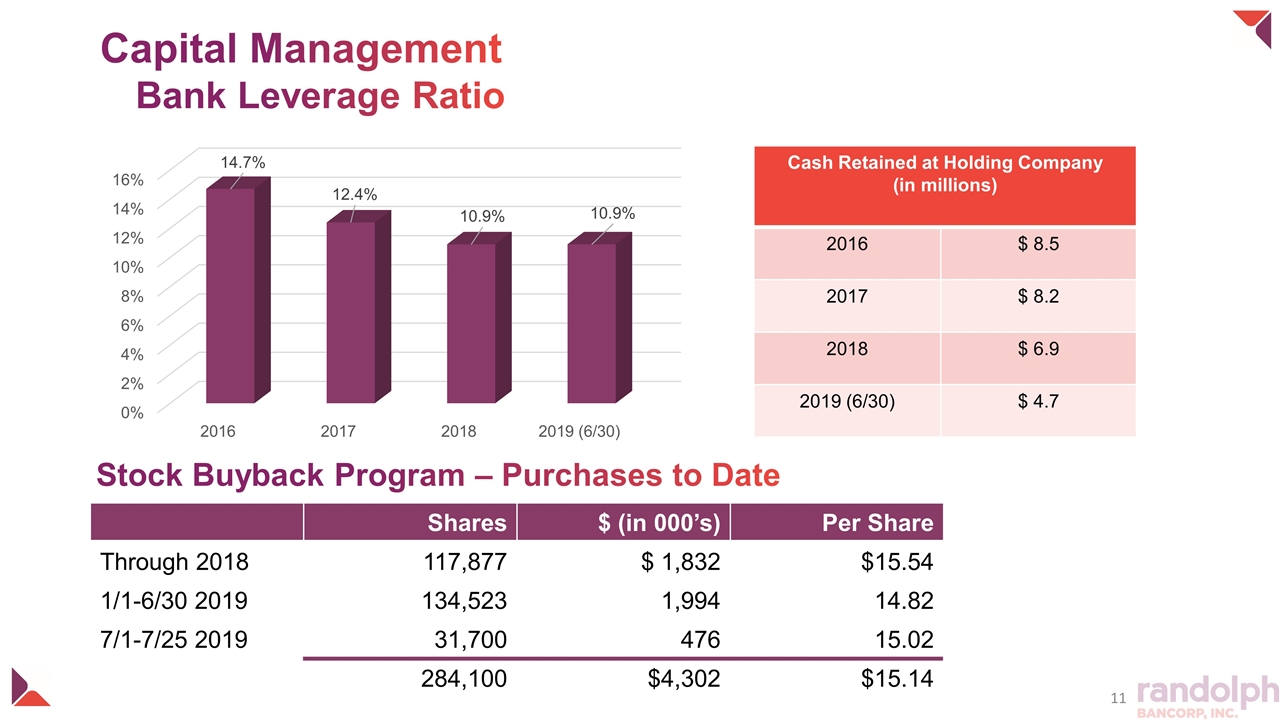
Capital Management Bank Leverage Ratio Cash Retained at Holding Company (in millions) 2016 $ 8.5 2017 $ 8.2 2018 $ 6.9 2019 (6/30) $ 4.7 Shares $ (in 000’s) Per Share Through 2018 117,877 $ 1,832 $15.54 1/1-6/30 2019 134,523 1,994 14.82 7/1-7/25 2019 31,700 476 15.02 284,100 $4,302 $15.14 Stock Buyback Program – Purchases to Date


