UNITED STATES
SECURITIES AND EXCHANGE COMMISSION
Washington, D.C. 20549
FORM N-CSR
CERTIFIED SHAREHOLDER REPORT OF REGISTERED
MANAGEMENT INVESTMENT COMPANIES
Investment Company Act file number: 811-23139
FS Global Credit Opportunities Fund—T
(Exact name of registrant as specified in charter)
| | |
201 Rouse Boulevard Philadelphia, Pennsylvania | | 19112 |
| (Address of principal executive offices) | | (Zip code) |
Michael C. Forman
FS Global Credit Opportunities Fund—T
201 Rouse Boulevard
Philadelphia, Pennsylvania 19112
(Name and address of agent for service)
Registrant’s telephone number, including area code: (215) 495-1150
Date of fiscal year end: December 31
Date of reporting period: December 31, 2016
| Item 1. | Reports to Stockholders. |
The annual report (the “Annual Report”) of FS Global Credit Opportunities Fund—T (the “Company”) for the period from February 16, 2016 (Inception) through December 31, 2016 transmitted to shareholders pursuant to Rule 30e-1 promulgated under the Investment Company Act of 1940, as amended (the “1940 Act”), is as follows:

| | |
| | | Fellow Shareholder, I am pleased to report that FS Global Credit Opportunities Fund’s (FSGCO) focus on select, value-based credit strategies helped deliver strong total returns for our shareholders in 2016. One of the benefits of FSGCO’s non-traded, closed-end fund structure is that it allows us to capitalize on short-term market sell-offs to buy assets at prices that we believe are below intrinsic value. Against the backdrop of the market dislocation and subsequent rally that took place in 2015 and 2016, our ability to opportunistically buy and hold assets through complete market cycles contributed to meaningful portfolio appreciation over the past twelve months. |
OUR ABILITY TO OPPORTUNISTICALLY BUY AND HOLD ASSETS THROUGH COMPLETE MARKET CYCLES LED TO MEANINGFUL PORTFOLIO APPRECIATION. | | Corporate credit rallied in 2016 amid rising U.S. equities and higher commodity prices, with momentum building toward year-end as investors increasingly sought out investments whose values are less affected by rising interest rates. High yield bond mutual funds and bank loan mutual funds recorded inflows of more than $8.6 billion and $7.8 billion, respectively, in 2016.1 Meanwhile, U.S. default activity remained relatively modest, with the trailing 12-month high yield bond and senior secured loan default rates declining to 3.32% and 1.94%, respectively, in December.2 Notably, excluding the energy and metals and mining sectors, high yield bond and senior secured loan default rates declined to 0.68% and 0.51%, respectively.2 The generally positive market tone and rising risk appetite led to a significant rally across the corporate credit markets. For high yield bonds and senior secured loans, 2016 provided a marked turnaround from the declines of 2015. High yield bonds generated an annual return of 17.5% in 2016, boosted by rising oil prices and an improved macroeconomic environment.3 Senior secured loans generated an annual return of 9.9% in 2016 on the back of improved market sentiment, prospects of a near-term interest rate hike and rising LIBOR rates.4 The value-oriented areas of the market also benefited from the ongoing rally in credit, with value-oriented high yield bonds and value-oriented senior secured loans returning approximately 54.2% and 23.3%, respectively, in 2016.5,6 |

| | |
| 2016 SHAREHOLDER RETURNS |
| FSGCO–A | | 27.8% |
| |
| FSGCO–D | | 27.8% |
| |
| FSGCO–T | | 14.4% |
| | (6/1/16–12/31/16) |
| |
| FSGCO–ADV | | 14.4% |
| | (7/6/16–12/31/16) |
FSGCO’S SHAREHOLDER RETURNS OUTPERFORMED VALUE-ORIENTED SENIOR SECURED LOANS AND MEANINGFULLY OUTPERFORMED HIGH YIELD BONDS AND SENIOR SECURED LOANS IN 2016. |
A REVIEW OF 2016
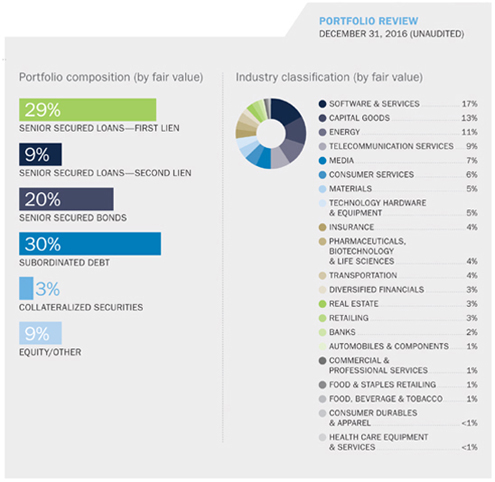
Given the Fund’s focus on investing in value-based credit strategies, such as event-driven opportunities, special situations and market-price inefficiencies, we expect that over the long term the Fund generally should provide total returns that are largely uncorrelated to events in the broader economy. By focusing on selective, value-based opportunities, we aim to build a portfolio that offers high potential returns when compared to more traditional investment strategies.
Fund–A’s, Fund–D’s, Fund–T’s and Fund–ADV’s shareholder returns outperformed value-oriented senior secured loans during 2016 and meaningfully outperformed the high yield bond and senior secured loan indices.3,4,6,7 Distributions continued to provide a meaningful portion of Fund–A’s, Fund–D’s, Fund–T’s and Fund–ADV’s shareholder returns.8
The top three contributors to the Fund’s performance in 2016 were one event-driven investment, one market-price inefficiency investment and one special situation. Event-driven investments seek to capitalize on market dislocations resulting from specific corporate events, such as mergers, corporate reorganizations or debt maturities that are expected to impact the value of a company’s securities. A market-price inefficiency opportunity is an investment made in a security that trades below what the Fund believes to be its intrinsic value. Special situations represent investments in companies we believe offer compelling value as a result of financial stress.
Regarding the event-driven investment, the Fund holds investments in the securities of Fannie Mae and Freddie Mac with the view that a catalyst, such as congressional action, would ultimately unlock value for those companies’ shareholders following an adverse court ruling. During the fourth quarter, the Fund’s positions appreciated meaningfully as optimism grew over the likelihood that shareholders may be successful on an appeal of a previously adverse court decision. Regarding the market-price inefficiency investment, the Fund invested in the senior secured debt of Aspect Software, Inc., a call center software provider, that traded at a significant discount to face value. Subsequently, the Fund’s position appreciated meaningfully following the completion of a restructuring of the company’s balance sheet that reduced debt and infused additional capital to facilitate growth. Regarding the special situation investment, the Fund owns equity in Warrior Met Coal, LLC, which had to restructure in the depths of the commodity downturn in 2015. During the fourth quarter, metallurgical coal prices rebounded strongly, which contributed to the appreciation in the price of the equity of the company.
Key negative contributors to the Fund’s performance included a special situation investment in a lifestyle jewelry company that saw a year-over-year decline in sales, and a market-price inefficiency investment in a grocery retailer that completed a restructuring earlier in the year. The Fund is cautiously optimistic that these businesses are currently taking the necessary steps to improve their operations in order to maximize long-term value for investors.

|
| |
| |
WE BELIEVE INVESTING IN A SELECT NUMBER OF VALUE-BASED OPPORTUNITIES ACROSS THE CAPITAL STRUCTURE OFFERS THE POTENTIAL FOR STRONGER RISK-ADJUSTED RETURNS. |
TRENDS AND OPPORTUNITIES
Looking forward to 2017, we believe there are several specific trends in the current investing environment that are beneficial to the Fund’s long-term strategy. Amid significant yield compression in both the high yield and senior secured loan markets, we believe investing in a select number of value-based opportunities across the capital structure offers the potential for stronger risk-adjusted returns relative to today’s low-yield market environment.
We anticipate generally low levels of secondary market liquidity, combined with uncertainty around future U.S. monetary and fiscal policy prescriptions, will continue to give rise to short-term price swings in 2017. To help mitigate volatility associated with any rise in short-term interest rates, the Fund is focused on investments with floating interest rates, which have the potential to provide the Fund with higher interest income if interest rates rise, and low duration, fixed income assets.
Poor market liquidity is likely to contribute to periods of increased credit market volatility ahead, and we will continue to seek to capitalize on any dislocations that arise in the credit markets to invest in assets we believe are undervalued. We believe that the long-term nature of the Fund’s strategy and the benefits of its unlisted, continuously offered closed-end fund structure position the Fund to generate attractive total returns, consisting of a high level of current income and capital appreciation, for its shareholders over the long term.
We look forward to an exciting 2017. Thank you for your continued support and trust in us.
Sincerely,

MICHAEL C. FORMAN
Chairman & Chief Executive Officer
FS Global Credit Opportunities Fund

THE FUND INVESTS PRIMARILY IN SECURED AND UNSECURED FLOATING AND FIXED RATE LOANS, BONDS AND OTHER CREDIT INSTRUMENTS.

| 2 | J.P. Morgan Default Monitor, January 1, 2017. |
| 3 | Bank of America Merrill Lynch High Yield Master II Index. |
| 4 | Credit Suisse Leveraged Loan Index. |
| 5 | Value-oriented high yield bonds are represented by the Bank of America Merrill Lynch U.S. High Yield Distressed Index, which is a subset of the Bank of America Merrill Lynch U.S. High Yield Master II Index that includes all high yield bonds that trade with a spread over U.S. Treasuries greater than or equal to 10%. |
| 6 | Value-oriented loans are represented by the Credit Suisse Distressed Loan Index, which is a subset of the Credit Suisse Leveraged Loan Index that contains only loan facilities that trade at a price of 90% or below. |
| 7 | Shareholder returns shown are the total returns an investor received for the period taking into account all distributions paid during such period, compounded monthly. Shareholder return calculations do not include upfront selling commissions and dealer manager fees. Had such selling commissions and dealer manager fees been included, performance would be lower. Upon liquidation or redemption, market conditions may cause the actual values to be more or less than the values shown. |
| | For Fund–A and Fund–D, the calculation assumes that the investor purchased shares at Fund–A’s or Fund–D’s public offering price, excluding selling commissions and dealer manager fees, if applicable, at the beginning of the year. For Fund–T and Fund–ADV, the calculation assumes that the investor purchased shares at Fund–T’s or Fund–ADV’s public offering price, excluding selling commissions and dealer manager fees, if applicable, at the beginning of the applicable period. Each fund’s calculations assume that investors reinvested all cash distributions pursuant to the applicable fund’s distribution reinvestment plan. |
| | Valuation as of the end of each period is the redemption price pursuant to such fund’s share repurchase program on such date. Shareholder returns do not include selling commissions and dealer manager fees, which could have totaled up to 8% of Fund–A’s public offering price and 2% of Fund–D’s public offering price, and could total up to 4% of Fund–T’s public offering price. |
| 8 | The payment of future distributions on Fund–A’s, Fund–D’s, Fund–T’s and Fund–ADV’s common shares is subject to the discretion of their boards of trustees and applicable legal restrictions and, therefore, there can be no assurance as to the amount or timing of any such future distributions. |

Officers
MICHAEL C. FORMAN
Chairman & Chief Executive Officer
WILLIAM GOEBEL
Chief Financial Officer
GERALD F. STAHLECKER
Executive Vice President
ZACHARY KLEHR
Executive Vice President
STEPHEN S. SYPHERD
Vice President, Treasurer & Secretary
JAMES F. VOLK
Chief Compliance Officer
Board of Trustees
MICHAEL C. FORMAN
Chairman & Chief Executive Officer
DAVID J. ADELMAN
Vice-Chairman
President & Chief Executive Officer, Campus Apartments, Inc.
THOMAS J. GRAVINA
Trustee
Executive Chairman, GPX Enterprises, L.P.
WALTER W. BUCKLEY, III
Trustee
Chairman & Chief Executive Officer,
Actua Corporation
BARBARA J. FOUSS
Trustee
Former Director of Strategic Initiatives & Chief Credit Policy Officer, Sun National Bank
DAVID L. COHEN
Trustee
Senior Executive Vice President, Comcast Corporation
PHILIP E. HUGHES, JR.
Trustee
Vice-Chairman of Keystone Industries
OLIVER C. MITCHELL, JR.
Trustee
Attorney & Consultant
CHARLES P. PIZZI
Trustee
Retired President, Director & Chief Executive Officer, Tasty Baking Company
TABLE OF CONTENTS
i
REPORT OF INDEPENDENT REGISTERED PUBLIC ACCOUNTING FIRM
The Board of Trustees and Shareholders of FS Global Credit Opportunities Fund—T
We have audited the accompanying statement of assets and liabilities of FS Global Credit Opportunities Fund—T (the Fund), as of December 31, 2016, and the related statements of operations and cash flows, the statement of changes in net assets and the financial highlights for the period June 1, 2016 (Commencement of Operations) to December 31, 2016. These financial statements and financial highlights are the responsibility of the Fund’s management. Our responsibility is to express an opinion on these financial statements and financial highlights based on our audits.
We conducted our audits in accordance with the standards of the Public Company Accounting Oversight Board (United States). Those standards require that we plan and perform the audit to obtain reasonable assurance about whether the financial statements and financial highlights are free of material misstatement. We were not engaged to perform an audit of the Fund’s internal control over financial reporting. Our audits included consideration of internal control over financial reporting as a basis for designing audit procedures that are appropriate in the circumstances, but not for the purpose of expressing an opinion on the effectiveness of the Fund’s internal control over financial reporting. Accordingly, we express no such opinion. An audit also includes examining, on a test basis, evidence supporting the amounts and disclosures in the financial statements and financial highlights, assessing the accounting principles used and significant estimates made by management, and evaluating the overall financial statement presentation. Our procedures included confirmation of securities owned as of December 31, 2016, by correspondence with the custodian. We believe that our audits provide a reasonable basis for our opinion.
In our opinion, the financial statements and financial highlights referred to above present fairly, in all material respects, the financial position of FS Global Credit Opportunities Fund—T at December 31, 2016, the results of its operations and its cash flows, the changes in its net assets and the financial highlights for the period June 1, 2016 (Commencement of Operations) to December 31, 2016, in conformity with U.S. generally accepted accounting principles.

Philadelphia, Pennsylvania
March 1, 2017
1
FS Global Credit Opportunities Fund—T
Statement of Assets and Liabilities
(in thousands, except share and per share amounts)
| | | | |
| | | December 31, 2016 | |
Assets | | | | |
Investment in FS Global Credit Opportunities Fund, at fair value (cost—$66,146) | | $ | 68,914 | |
Cash | | | 60 | |
Distributions receivable from FS Global Credit Opportunities Fund | | | 67 | |
Deferred offering costs | | | 524 | |
| | | | |
Total assets | | $ | 69,565 | |
| | | | |
Liabilities | | | | |
Shareholder distributions payable | | $ | 58 | |
Administrative services expense payable | | | 3 | |
Transfer agent fees payable | | | 8 | |
Professional fees payable | | | 27 | |
Other accrued expenses and liabilities | | | 4 | |
| | | | |
Total liabilities | | $ | 100 | |
| | | | |
Net assets | | $ | 69,465 | |
| | | | |
Commitments and contingencies—($1,592)(1) | | | | |
| |
Composition of net assets | | | | |
Common shares, $0.001 par value, unlimited shares authorized, 8,605,273 shares issued and outstanding | | $ | 9 | |
Capital in excess of par value | | | 66,502 | |
Accumulated net investment income(2) | | | 186 | |
Net unrealized appreciation (depreciation) on investment | | | 2,768 | |
| | | | |
Net assets | | $ | 69,465 | |
| | | | |
Net asset value per common share at period end | | $ | 8.07 | |
| (1) | See Note 6 for a discussion of FS Global Credit Opportunities Fund—T’s (the “Company”) commitments and contingencies. |
| (2) | See Note 5 for a discussion of the sources of distributions declared by the Company. |
See notes to financial statements.
2
FS Global Credit Opportunities Fund—T
Statement of Operations
(in thousands)
| | | | |
| | | Period from
June 1, 2016
(Commencement
of Operations) to
December 31, 2016 | |
Investment income | | | | |
Distributions from FS Global Credit Opportunities Fund | | $ | 1,399 | |
| | | | |
Total investment income | | | 1,399 | |
| | | | |
Operating expenses | | | | |
Administrative services expenses | | | 4 | |
Transfer agent fees | | | 34 | |
Accounting and administrative fees | | | 1 | |
Professional fees | | | 27 | |
Printing fees | | | 28 | |
Offering costs | | | 136 | |
Other general and administrative expenses | | | 11 | |
| | | | |
Total operating expenses | | | 241 | |
Less: Expense reimbursement from sponsor(1) | | | (2 | ) |
| | | | |
Net operating expenses | | | 239 | |
| | | | |
Net investment income before taxes | | | 1,160 | |
Excise taxes | | | 3 | |
| | | | |
Net investment income (loss) | | | 1,157 | |
| | | | |
Realized and unrealized gain/loss from FS Global Credit Opportunities Fund | | | | |
Net realized gain (loss) on investment | | | — | |
Net change in unrealized appreciation (depreciation) on investment | | | 2,768 | |
| | | | |
Total net realized gain (loss) and unrealized appreciation (depreciation) on investment | | | 2,768 | |
| | | | |
Net increase (decrease) in net assets resulting from operations | | $ | 3,925 | |
| | | | |
| (1) | See Note 4 for a discussion of reimbursements and other amounts paid to the Company by its sponsor and affiliates. |
See notes to financial statements.
3
FS Global Credit Opportunities Fund—T
Statement of Changes in Net Assets
(in thousands)
| | | | |
| | | Period from
June 1, 2016
(Commencement
of Operations) to
December 31, 2016 | |
Operations | | | | |
Net investment income (loss) | | $ | 1,157 | |
Net realized gain (loss) on investment | | | — | |
Net change in unrealized appreciation (depreciation) on investment | | | 2,768 | |
| | | | |
Net increase (decrease) in net assets resulting from operations | | | 3,925 | |
| | | | |
Shareholder distributions(1) | | | | |
Distributions from net investment income | | | (1,110 | ) |
| | | | |
Net decrease in net assets resulting from shareholder distributions | | | (1,110 | ) |
| | | | |
Capital share transactions | | | | |
Issuance of common shares(2) | | | 66,121 | |
Reinvestment of shareholder distributions(2) | | | 529 | |
| | | | |
Net increase in net assets resulting from capital share transactions | | | 66,650 | |
| | | | |
Total increase in net assets | | | 69,465 | |
Net assets at beginning of period | | | — | |
| | | | |
Net assets at end of period | | $ | 69,465 | |
| | | | |
Accumulated net investment income(1) | | $ | 186 | |
| | | | |
| (1) | See Note 5 for a discussion of the sources of distributions declared by the Company. |
| (2) | See Note 3 for a discussion of transactions with respect to the Company’s common shares during the period from June 1, 2016 (Commencement of Operations) to December 31, 2016. |
See notes to financial statements.
4
FS Global Credit Opportunities Fund—T
Statement of Cash Flows
(in thousands)
| | | | |
| | | Period from
June 1, 2016
(Commencement
of Operations) to
December 31, 2016 | |
Cash flows from operating activities | | | | |
Net increase (decrease) in net assets resulting from operations | | $ | 3,925 | |
Adjustments to reconcile net increase (decrease) in net assets resulting from operations to net cash used in operating activities: | | | | |
Purchases of common shares of FS Global Credit Opportunities Fund | | | (66,146 | ) |
Net change in unrealized (appreciation) depreciation on investment | | | (2,768 | ) |
Amortization of deferred offering costs | | | 136 | |
(Increase) decrease in distributions receivable from FS Global Credit Opportunities Fund | | | (67 | ) |
Increase (decrease) in administrative services expense payable | | | 3 | |
Increase (decrease) in transfer agent fees payable | | | 8 | |
Increase (decrease) in professional fees payable | | | 27 | |
Increase (decrease) in other accrued expenses and liabilities | | | 4 | |
| | | | |
Net cash used in operating activities | | | (64,878 | ) |
| | | | |
Cash flows from financing activities | | | | |
Issuance of common shares | | | 66,121 | |
Reinvestment of shareholder distributions | | | 529 | |
Offering costs incurred | | | (660 | ) |
Shareholder distributions | | | (1,052 | ) |
| | | | |
Net cash provided by financing activities | | | 64,938 | |
| | | | |
Total increase in cash | | | 60 | |
Cash at beginning of period | | | — | |
| | | | |
Cash at end of period | | $ | 60 | |
| | | | |
See notes to financial statements.
5
FS Global Credit Opportunities Fund—T
Financial Highlights
(in thousands, except share and per share amounts)
| | | | |
| | | Period from
June 1, 2016
(Commencement
of Operations) to
December 31, 2016 | |
Per Share Data:(1) | | | | |
Net asset value, beginning of period | | $ | 7.38 | |
Results of operations | | | | |
Net investment income (loss)(2) | | | 0.38 | |
Net realized gain (loss) and unrealized appreciation (depreciation) on investment | | | 0.67 | |
| | | | |
Net increase (decrease) in net assets resulting from operations | | | 1.05 | |
| | | | |
Shareholder distributions(3) | | | | |
Distributions from net investment income | | | (0.36 | ) |
| | | | |
Net decrease in net assets resulting from shareholder distributions | | | (0.36 | ) |
| | | | |
Net asset value, end of period | | $ | 8.07 | |
| | | | |
Shares outstanding, end of period | | | 8,605,273 | |
| | | | |
Total return(4)(5) | | | 14.51 | % |
| | | | |
Ratio/Supplemental Data: | | | | |
Net assets, end of period | | $ | 69,465 | |
| | | | |
Ratio of net investment income (loss) to average net assets(5)(6)(7) | | | 4.82 | % |
| | | | |
Ratio of total operating expenses to average net assets(5)(6) | | | 1.00 | % |
Ratio of expense reimbursement from sponsor to average net assets(5)(6) | | | (0.01 | )% |
| | | | |
Ratio of net operating expenses to average net assets(5)(6) | | | 0.99 | % |
| | | | |
Portfolio turnover of FS Global Credit Opportunities Fund(5)(8) | | | 92.36 | % |
| | | | |
| (1) | Per share data may be rounded in order to compute the ending net asset value per share. |
| (2) | The per share data was derived by using the average number of common shares outstanding during the applicable period. |
| (3) | The per share data for distributions reflects the actual amount of distributions declared per common share during the applicable period. |
See notes to financial statements.
6
FS Global Credit Opportunities Fund—T
Financial Highlights (continued)
(in thousands, except share and per share amounts)
| (4) | The total return is historical and is calculated by determining the percentage change in net asset value, assuming the reinvestment of all distributions in additional common shares of the Company at the Company’s net asset value per share as of the share closing date occurring on or immediately following the distribution payment date. The total return does not consider the effect of the sales load from the sale of the Company’s common shares. The historical calculation of total return in the table should not be considered a representation of the Company’s future total return, which may be greater or less than the total return shown in the table due to a number of factors, including, among others, FS Global Credit Opportunities Fund’s (the “Fund”) ability or inability to make investments that meet its investment criteria, the interest rates payable on the debt securities the Fund acquires, the level of the Fund’s expenses, variations in and the timing of the recognition of realized and unrealized gains or losses, the degree to which the Fund encounters competition in its markets and general economic conditions. As a result of these and other factors, results for any previous period should not be relied upon as being indicative of performance in future periods. The total return calculations set forth above represent the total return on the Company’s investment in the Fund during the applicable period and do not represent an actual return to shareholders. |
| (5) | The period from June 1, 2016 (Commencement of Operations) to December 31, 2016 is not annualized. |
| (6) | Average daily net assets for the period from June 1, 2016 (Commencement of Operations) to December 31, 2016 is used for this calculation. Does not reflect the proportionate share of income and expenses accrued by the Fund. |
| (7) | Had the sponsor not reimbursed certain operating expenses, the ratio of net investment income (loss) to average net assets would have been 4.81% for the period from June 1, 2016 (Commencement of Operations) to December 31, 2016. |
| (8) | Portfolio turnover of FS Global Credit Opportunities Fund is for the year ended December 31, 2016. |
See notes to financial statements.
7
FS Global Credit Opportunities Fund—T
Notes to Financial Statements
(in thousands, except share and per share amounts)
Note 1. Principal Business and Organization
FS Global Credit Opportunities Fund—T, or the Company, was organized as a Delaware statutory trust on February 16, 2016. The Company’s primary investment objective is to generate an attractive total return consisting of a high level of current income and capital appreciation, with a secondary objective of capital preservation. The Company invests substantially all of its net assets in FS Global Credit Opportunities Fund, or the Fund. The investment objectives and strategies of the Fund are identical to the Company’s. The Company’s financial statements should be read in conjunction with the consolidated financial statements of the Fund included herein. As of December 31, 2016, the Company held approximately 4.9% of the outstanding common shares of the Fund. The Company commenced investment operations on June 1, 2016, when the Company held the initial closing in its continuous public offering.
The Company is a non-diversified, closed-end management investment company registered under the 1940 Act that intends to elect to be treated for U.S. federal income tax purposes, and intends to qualify annually, as a regulated investment company, or RIC, under Subchapter M of the Internal Revenue Code of 1986, as amended, or the Code.
Note 2. Summary of Significant Accounting Policies
Basis of Presentation: The accompanying financial statements of the Company have been prepared in accordance with U.S. generally accepted accounting principles, or GAAP. The Company is considered an investment company under GAAP and follows the accounting and reporting guidance applicable to investment companies under Accounting Standards Update No. 2013-08, Financial Services—Investment Companies. The Company has evaluated the impact of subsequent events through the date the financial statements were issued and filed with the U.S. Securities and Exchange Commission, or the SEC.
Investment in the Fund: The Company’s investment in the Fund is recorded at fair value and is based upon the Company’s percentage ownership of the common shares of the Fund. The performance of the Company is directly affected by the performance of the Fund.
Use of Estimates: The preparation of the Company’s financial statements in conformity with GAAP requires management to make estimates and assumptions that affect the reported amounts of assets and liabilities, and disclosure of contingent assets and liabilities, at the date of the financial statements and the reported amounts of revenues and expenses during the reporting period. Actual results could differ from those estimates. Many of the amounts have been rounded and all amounts are in thousands, except share and per share amounts.
Cash and Cash Equivalents: The Company considers all highly liquid investments with original maturities of three months or less to be cash equivalents. The Company’s cash and cash equivalents are maintained with high credit quality financial institutions.
Valuation of Portfolio Investment: The Company invests substantially all of its net assets in the Fund. As such, the Company determines the net asset value, or NAV, of its common shares of beneficial interest, par value $0.001 per share, or its common shares, daily based on the NAV of its interest in the Fund (as provided by the Fund). The Company calculates NAV per common share by subtracting liabilities (including accrued expenses and distributions) from the total assets of the Company (the value of its interest in the Fund, plus cash and other assets, including interest and distributions accrued but not yet received) and dividing the result by the total number of its outstanding common shares. The Company’s investment in the Fund is considered Level 3 as
8
FS Global Credit Opportunities Fund—T
Notes to Financial Statements (continued)
(in thousands, except share and per share amounts)
Note 2. Summary of Significant Accounting Policies (continued)
defined under fair value accounting standards. See Note 2 to the Fund’s consolidated financial statements included herein for detailed information on the Fund’s policies regarding the valuation of its portfolio investments.
Revenue Recognition: Realized gains and losses from Fund transactions are calculated on the specific share identification basis. Fund transactions are recorded on the effective date of the subscription in or the redemption from the Fund. Distributions received from the Fund are recorded on the record date.
Organization and Offering Costs: Organization costs include, among other things, the cost of formation, including the cost of legal services and other fees pertaining to the Company’s organization. During the period from February 16, 2016 (Inception) to December 31, 2016, the Company incurred organization costs of $27, which were paid on behalf of the Company by Franklin Square Holdings, L.P., or FS Investments, an affiliate of FS Global Advisor, LLC, the Fund’s investment adviser, or FS Global Advisor (see Note 4). Organization costs are expensed on the Company’s statement of operations. Offering costs include, among other things, legal fees and other costs pertaining to the preparation of the Company’s Registration Statement on Form N-2 relating to the continuous public offering of its common shares. During the period from February 16, 2016 (Inception) to December 31, 2016, the Company incurred offering costs of $2,223, which were paid on behalf of the Company by FS Investments (see Note 4). Offering costs are capitalized on the Company’s statement of assets and liabilities as deferred offering costs and are amortized to deferred offering expense on the Company’s statement of operations over a twelve month period.
Income Taxes: The Company intends to elect to be treated for U.S. federal income tax purposes, and intends to qualify annually, as a RIC under Subchapter M of the Code. Because the Company invests substantially all of its net assets in the Fund, the Company will generally qualify as a RIC if the Fund qualifies as a RIC. To qualify and maintain qualification as a RIC, the Company and the Fund must, among other things, meet certain source-of-income and asset diversification requirements and distribute to their respective shareholders, for each taxable year, at least 90% of their “investment company taxable income” and their net tax-exempt interest income. In general, a RIC’s “investment company taxable income” for any taxable year is its taxable income, determined without regard to net capital gains and with certain other adjustments. As a RIC, the Company will not have to pay corporate-level U.S. federal income taxes on any income that it distributes to its shareholders. The Company and the Fund intend to distribute all or substantially all of their “investment company taxable income,” net tax-exempt interest income (if any) and net capital gains on an annual basis in order to maintain their RIC status each year and to avoid any U.S. federal income taxes on income so distributed. The Company also will be subject to nondeductible U.S. federal excise taxes if it does not distribute at least 98% of its net ordinary income, 98.2% of net capital gain income, if any, and any recognized and undistributed income from prior years for which it paid no U.S. federal income taxes.
Uncertainty in Income Taxes: The Company evaluates its tax positions to determine if the tax positions taken meet the minimum recognition threshold in connection with accounting for uncertainties in income tax positions taken or expected to be taken for the purposes of measuring and recognizing tax benefits or liabilities in the Company’s financial statements. Recognition of a tax benefit or liability with respect to an uncertain tax position is required only when the position is “more likely than not” to be sustained assuming examination by taxing authorities. The Company recognizes interest and penalties, if any, related to unrecognized tax liabilities as income tax expense on its statement of operations. During the period from February 16, 2016 (Inception) to December 31, 2016, the Company did not incur any interest or penalties.
9
FS Global Credit Opportunities Fund—T
Notes to Financial Statements (continued)
(in thousands, except share and per share amounts)
Note 2. Summary of Significant Accounting Policies (continued)
Distributions: Distributions to the Company’s shareholders are recorded as of the record date. Subject to the discretion of the Company’s board of trustees, or the Board, and applicable legal restrictions, the Company intends to authorize and declare ordinary cash distributions on a weekly, semi-monthly or monthly basis and to pay such distributions on a monthly or quarterly basis. Such ordinary cash distributions are expected to be paid using ordinary cash distributions received from the Fund, net of any Company operating expenses. At least annually, the Company intends to authorize and declare special cash distributions of net realized long-term capital gains, if any, and any other income, gains and dividends and other distributions not previously distributed. Such special cash distributions are expected to be paid using special cash distributions received from the Fund.
Note 3. Share Transactions
Below is a summary of transactions with respect to the Company’s common shares during the period from February 16, 2016 (Inception) to December 31, 2016:
| | | | | | | | |
| | | Period from
February 16, 2016
(Inception) to
December 31, 2016 | |
| | | Shares | | | Amount | |
Gross Proceeds from Offering | | | 8,538,257 | | | $ | 68,844 | |
Reinvestment of Distributions | | | 67,016 | | | | 529 | |
| | | | | | | | |
Total Gross Proceeds | | | 8,605,273 | | | | 69,373 | |
Commissions and Dealer Manager Fees | | | — | | | | (2,723 | ) |
| | | | | | | | |
Net Proceeds to Company | | | 8,605,273 | | | | 66,650 | |
Share Repurchase Program | | | — | | | | — | |
| | | | | | | | |
Net Proceeds from Share Transactions | | | 8,605,273 | | | $ | 66,650 | |
| | | | | | | | |
Status of Continuous Public Offering
Since commencing its continuous public offering and through February 21, 2017, the Company sold 12,178,858 common shares for gross proceeds of $99,770, including common shares issued pursuant to its distribution reinvestment plan, or DRP. As of February 21, 2017, the Company raised total gross proceeds of $99,870, including $100 of seed capital contributed by Michael C. Forman in March 2016 (see Note 4).
Immediately prior to the initial weekly closing in the Company’s continuous public offering on June 1, 2016, the Company effected a share split to ensure that the per share price paid by Mr. Forman for the common shares purchased by him in the private placement was equal to the net asset value per common share of the Fund on the date of the initial weekly closing. Mr. Forman received approximately 1.354 common shares per existing common share.
During the period from February 16, 2016 (Inception) to December 31, 2016, the Company sold 8,605,273 common shares for gross proceeds of $69,373 at an average price per share of $8.06. The gross proceeds received during the period from February 16, 2016 (Inception) to December 31, 2016 included reinvested shareholder distributions of $529 for which the Company issued 67,016 common shares. During the period from January 1,
10
FS Global Credit Opportunities Fund—T
Notes to Financial Statements (continued)
(in thousands, except share and per share amounts)
Note 3. Share Transactions (continued)
2017 to February 21, 2017, the Company sold 3,587,129 common shares for gross proceeds of $30,497 at an average price per share of $8.50. The gross proceeds received during the period from January 1, 2017 to February 21, 2017 include reinvested shareholder distributions of $278, for which the Company issued 33,942 common shares.
The proceeds from the issuance of common shares as presented on the Company’s statement of changes in net assets and statement of cash flows are presented net of selling commissions and dealer manager fees of $2,723 for the period from February 16, 2016 (Inception) to December 31, 2016.
Share Repurchase Program
To provide shareholders with limited liquidity, the Company intends to conduct quarterly repurchases of common shares. In months in which the Company repurchases common shares, the Company will conduct repurchases on the same date that the Company holds its first weekly closing for the sale of common shares in its continuous public offering. Any offer to repurchase common shares will be conducted solely through written tender offer materials mailed to each shareholder.
The Company’s quarterly repurchases will be conducted on such terms as may be determined by the Board in its complete and absolute discretion unless, in the judgment of the independent trustees, such repurchases would not be in the best interests of shareholders or would violate applicable law. The Board also will consider the following factors, among others, in making its determination regarding whether to cause the Company to offer to repurchase common shares and under what terms:
| | • | | the effect of such repurchases on the Company’s and/or the Fund’s qualification as a RIC (including the consequences of any necessary asset sales); |
| | • | | the liquidity of the Fund’s assets (including fees and costs associated with disposing of assets); |
| | • | | the Fund’s investment plans; |
| | • | | the Company’s and the Fund’s working capital requirements; |
| | • | | the Company’s history in repurchasing common shares or portions thereof; and |
| | • | | the condition of the securities markets. |
The Company currently intends to limit the number of common shares to be repurchased on each date of repurchase to the number of common shares the Company can repurchase with (1) the aggregate proceeds it has received from the beginning of the calendar year through, but not including, such date of repurchase from the issuance of common shares under the DRP, less the amount of any such proceeds used to repurchase common shares on each previous repurchase date for tender offers conducted during the calendar year, and (2) the aggregate proceeds it has received from the sale of common shares at the previous two weekly closings that occurred immediately prior to the date of repurchase. In addition, the Company will limit the number of common shares to be repurchased in any calendar year to 20% of the weighted average number of common shares outstanding in the prior calendar year, or 5% in each quarter, though the actual number of common shares that the Company offers to repurchase may be less in light of the limitations noted above. The Company will offer to repurchase such common shares at a price equal to the NAV per common share in effect on each date of repurchase.
11
FS Global Credit Opportunities Fund—T
Notes to Financial Statements (continued)
(in thousands, except share and per share amounts)
Note 3. Share Transactions (continued)
Common shares of the Company are subject to an annual distribution fee of 1.33% of the NAV of the common shares, which will accrue daily, beginning on the first day of July 2017, and will be paid on a monthly basis. If a shareholder wishes to tender his or her common shares for repurchase by the Company at any time prior to the third anniversary of the date on which the distribution fee begins to accrue, such common shares will be subject to a contingent deferred sales charge. The contingent deferred sales charge will be calculated based upon the lesser of the NAV of such common shares and the public offering price at the time such common shares were purchased. The contingent deferred sales charge is payable on a declining basis as follows: if common shares are tendered for repurchase by the Company (i) at any time prior to the first anniversary of the date on which the distribution fee begins to accrue, the contingent deferred sales charge is 1.00%; (ii) on or after the first anniversary but prior to the second anniversary of the date on which the distribution fee begins to accrue, the contingent deferred sales charge is 0.67%; and (iii) on or after the second anniversary but prior to the third anniversary of the date on which the distribution fee begins to accrue, the contingent deferred sales charge is 0.33%. Common shares issued pursuant to the DRP are not subject to a contingent deferred sales charge. If a shareholder tenders a portion of his or her common shares, common shares received pursuant to the DRP will be repurchased first. After all such common shares have been repurchased, common shares will be repurchased on a first-in, first-out basis.
No common shares were repurchased by the Company under its share repurchase program during the period from February 16, 2016 (Inception) to December 31, 2016. The first offer to repurchase common shares from shareholders was processed in the first quarter of 2017. On January 4, 2017, the Company repurchased approximately 2,590 common shares (representing 100% of the common shares tendered for repurchase and 0.03% of the shares outstanding as of such date) at $8.075 per common share for aggregate consideration totaling $21. Repurchased shares that were not issued under the Company’s distribution reinvestment plan were subject to a contingent deferred sales charge as described above, which amount was paid to FS Investment Solutions, LLC (formerly FS2 Capital Partners, LLC), or FS Investment Solutions, the dealer manager for the Company’s continuous public offering and an affiliate of the Company.
Note 4. Related Party Transactions
Compensation of FS Global Advisor and its Affiliates
The Company does not incur a separate management fee or incentive fee, but the Company is indirectly subject to the Fund’s management fee and incentive fee incurred pursuant to the amended and restated investment advisory agreement, dated as of October 9, 2013, by and between the Fund and FS Global Advisor. For the services it provides to the Fund, FS Global Advisor is entitled to a fee consisting of two parts—a management fee and an incentive fee. The management fee is calculated and payable quarterly in arrears at the annual rate of 2.0% of the Fund’s average daily gross assets during such period. The incentive fee is calculated and payable quarterly in arrears based upon the Fund’s “pre-incentive fee net investment income” for the immediately preceding quarter, and is subject to a hurdle rate, expressed as a rate of return on the Fund’s “adjusted capital,” equal to 2.25% per quarter (or an annualized hurdle rate of 9.00%), subject to a “catch-up” feature. See Note 4 to the Fund’s consolidated financial statements included herein for a detailed description of the management fee and incentive fee payable by the Fund to FS Global Advisor.
Under the administration agreement, dated as of March 15, 2016, by and between the Company and FS Global Advisor, or the administration agreement, the Company reimburses FS Global Advisor for its actual costs incurred in providing administrative services to the Company, including FS Global Advisor’s allocable portion of
12
FS Global Credit Opportunities Fund—T
Notes to Financial Statements (continued)
(in thousands, except share and per share amounts)
Note 4. Related Party Transactions (continued)
the compensation and related expenses of certain personnel of FS Investments providing administrative services to the Fund on behalf of FS Global Advisor. Such services include general ledger accounting, fund accounting, legal services, investor relations and other administrative services. FS Global Advisor also performs, or oversees the performance of, the Company’s corporate operations and required administrative services, which includes being responsible for the financial records that the Company is required to maintain and preparing reports to the Company’s shareholders and reports filed with the SEC. In addition, FS Global Advisor assists the Company in calculating NAV, overseeing the preparation and filing of tax returns and the printing and dissemination of reports to the Company’s shareholders, and generally overseeing the payment of the Company’s expenses and the performance of administrative and professional services rendered to the Company by others. FS Global Advisor is required to allocate the cost of these services to the Company based on factors such as assets, revenues and/or time allocations. At least annually, the Board reviews the methodology employed in determining how the expenses are allocated to the Fund and the proposed allocation of administrative expenses among the Fund and certain affiliates of FS Global Advisor. The Board then assesses the reasonableness of such reimbursements for expenses allocated to the Fund based on the breadth, depth and quality of such services as compared to the estimated cost to the Fund of obtaining similar services from third-party service providers known to be available. In addition, the Board considers whether any single third-party service provider would be capable of providing all such services at comparable cost and quality. Finally, the Board compares the total amount paid to FS Global Advisor for such services as a percentage of the Fund’s net assets to the same ratio as reported by other comparable investment companies. The Company will not reimburse FS Global Advisor for any services for which it receives a separate fee or for any administrative expenses allocated to a controlling person of FS Global Advisor.
Under the administration agreement, the Company, either directly or through reimbursement to FS Global Advisor or its affiliates, is responsible for its organization and offering costs in an amount up to 1.0% of aggregate proceeds raised in the Company’s continuous public offering, after payment of selling commissions and dealer manager fees. Organization and offering costs primarily include legal, accounting, printing and other expenses relating to the Company’s continuous public offering, including costs associated with technology integration between the Company’s systems and those of its selected broker-dealers, marketing expenses, salaries and direct expenses of FS Global Advisor’s personnel, employees of its affiliates and others while engaged in registering and marketing the Company’s common shares, which includes the development of marketing materials and presentations, training and educational meetings, and generally coordinating the marketing process for the Company.
FS Investments funded certain of the Company’s organization and offering costs. The Company reimburses FS Global Advisor for certain offering costs incurred by FS Global Advisor on the Company’s behalf, including marketing expenses, salaries and other direct expenses of FS Global Advisor’s personnel and employees of its affiliates while engaged in registering and marketing the Company’s common shares. Organization costs funded directly by FS Investments are recorded as an expense on the Company’s statement of operations. Offering costs incurred directly by the Company, including offering costs reimbursed to FS Global Advisor, are recorded as a deferred asset and amortized to expense on a straight-line basis over twelve months (see Note 2).
During the period from February 16, 2016 (Inception) to December 31, 2016, FS Investments funded $2,250 in organization and offering costs. As of December 31, 2016, $1,590 remains reimbursable to FS Global Advisor and its affiliates under this arrangement.
The dealer manager for the Company’s continuous public offering is FS Investment Solutions, which is an affiliate of FS Investments. Under the dealer manager agreement, as amended and restated as of June 7, 2016, by
13
FS Global Credit Opportunities Fund—T
Notes to Financial Statements (continued)
(in thousands, except share and per share amounts)
Note 4. Related Party Transactions (continued)
and between the Company and FS Investment Solutions, or the dealer manager agreement, FS Investment Solutions is entitled to receive selling commissions, dealer manager fees and distribution fees in connection with the sale of common shares in the Company’s continuous public offering, all or a portion of which may be re-allowed to selected broker-dealers.
The following table describes the fees and expenses incurred under the administration agreement and the dealer manager agreement during the period from June 1, 2016 (Commencement of Operations) to December 31, 2016:
| | | | | | | | |
Related Party | | Source Agreement | | Description | | Period from
June 1, 2016
(Commencement
of Operations) to
December 31, 2016 | |
FS Global Advisor | | Administration Agreement | | Administrative Services Expenses(1) | | $ | 4 | |
FS Global Advisor | | Administration Agreement | | Offering Costs(2) | | $ | 660 | |
FS Investment Solutions | | Dealer Manager Agreement | | Dealer Manager Fee(3) | | $ | 681 | |
| (1) | During the period from June 1, 2016 (Commencement of Operations) to December 31, 2016, $2 in administrative services expenses were incurred and have been or may in the future be applied to offset the liability of FS Investments under the expense reimbursement agreement (as defined below) (see “—Expense Reimbursement Agreements”). |
| (2) | Represents amounts reimbursed to FS Global Advisor and its affiliates for offering costs incurred on the Company’s behalf, including marketing expenses, salaries and other direct expenses of FS Global Advisor’s personnel and employees of its affiliates while engaged in registering and marketing the Company’s common shares. |
| (3) | Represents aggregate dealer manager fees retained by FS Investment Solutions. |
Distribution Fees
Common shares of the Company are subject to an annual distribution fee of 1.33% of the NAV of the common shares. Distribution fees will be paid by the Company to the dealer manager pursuant to a distribution plan adopted by the Board in compliance with Rules 12b-1 and 17d-3 under the 1940 Act, as if those rules applied to the Company. Among other requirements, such distribution plan must be approved annually by a vote of the Board, including the trustees who are not “interested persons” as defined in the 1940 Act and have no direct or indirect financial interest in the operation of such distribution plan or in any agreements related to such distribution plan.
Up to 1.00% of the 1.33% annual distribution fee may be re-allowed to selected broker-dealers and financial representatives participating in the Company’s continuous public offering. The amount and timing of any such reallowance will be based on such factors as the number of common shares they sold in the offering, the assistance they provide in marketing the Company’s continuous public offering and due diligence expenses incurred. The distribution fee is intended to compensate the Company’s affiliated dealer manager, selected broker-dealers and financial representatives participating in the Company’s continuous public offering for services rendered in connection with the ongoing marketing, sale and distribution of the common shares.
14
FS Global Credit Opportunities Fund—T
Notes to Financial Statements (continued)
(in thousands, except share and per share amounts)
Note 4. Related Party Transactions (continued)
The distribution fee will accrue daily, beginning on the first day of July 2017, and will be paid on a monthly basis. The distribution fee is payable with respect to all common shares, other than common shares issued under the DRP. The distribution fee will terminate for all shareholders on the earliest to occur of the following: (i) the occurrence of a liquidity event; (ii) the Company’s affiliated dealer manager advising the Company that the aggregate underwriting compensation from all sources (determined in accordance with applicable FINRA rules), including upfront selling commissions, dealer manager fees, distribution fees, contingent deferred sales charges and any other underwriting compensation with respect to the common shares would be in excess of 8.0% of the gross offering proceeds received in the Company’s continuous public offering; and (iii) when the total upfront sales load and distribution fees attributable to any common share equals 8.0% of the gross offering proceeds from the sale of such common share (the “Sales Charge Cap”). The Sales Charge Cap for any common share will be reduced by the amount of any portion of the upfront sales load that is waived for such common share.
Capital Contribution by FS Global Advisor
In March 2016, Michael C. Forman contributed $100 to purchase 10,000 common shares of the Company at a price of $10.00 per share. Immediately prior to the initial weekly closing, the Company effected a share split to ensure that the per share price paid by Mr. Forman for the common shares purchased by him in the private placement was equal to the NAV per common share of the Fund on the date of the initial weekly closing. The Company, in turn, purchased 13,544 common shares of the Fund at $7.38 per share, which represents the initial public offering price of $7.69 per share, net of selling commissions and dealer manager fees. Mr. Forman will not tender these common shares for repurchase as long as FS Global Advisor remains the Fund’s investment adviser.
As of February 21, 2017, the Company sold an aggregate of 14,285 common shares for aggregate gross proceeds of $106 to members of the Board and individuals and entities affiliated with FS Global Advisor, including common shares sold to Mr. Forman in March 2016.
Potential Conflicts of Interest
FS Global Advisor, GSO Capital Partners LP, or GSO, the investment sub-adviser to FS Global Advisor and certain of their affiliates may experience conflicts of interest in connection with the management of the Company and the Fund, including, but not limited to: the allocation of FS Global Advisor’s and GSO’s time and resources between the Fund and other investment activities; compensation payable by the Fund to FS Global Advisor and its affiliates; competition with certain affiliates of FS Global Advisor or GSO for investment opportunities; the due diligence review of the Company and the Fund by FS Investment Solutions, which is an affiliate of FS Global Advisor; investments at different levels of an entity’s capital structure by the Fund and other clients of FS Global Advisor and GSO, subject to the limitations of the 1940 Act; differing recommendations given by FS Global Advisor or GSO to the Fund versus other clients; restrictions on FS Global Advisor’s and GSO’s existing business relationships or use of material, non-public information with respect to potential investments by the Fund; the formation of additional investment funds or entrance into other investment advisory relationships by FS Global Advisor, GSO or their affiliates; and limitations on purchasing or selling securities to other clients of FS Global Advisor, GSO or their respective affiliates and on entering into “joint” transactions with certain of the Company’s and the Fund’s affiliates; and the payment of the distribution fee by the Company to FS Investment Solutions, which will terminate for all shareholders upon the occurrence of a liquidity event.
15
FS Global Credit Opportunities Fund—T
Notes to Financial Statements (continued)
(in thousands, except share and per share amounts)
Note 4. Related Party Transactions (continued)
Expense Reimbursement Agreements
Pursuant to an expense support and conditional reimbursement agreement, dated as of March 30, 2016, as amended to date, by and between the Company and FS Investments, or the expense reimbursement agreement, FS Investments has agreed to reimburse the Company for expenses to ensure that the Company bears a reasonable level of expenses in relation to its income. The purpose of this arrangement is to ensure that no portion of any ordinary cash distributions made by the Company will be paid from offering proceeds or borrowings. Such ordinary cash distributions are expected to be paid using distributions received from the Fund.
The Fund has entered into a separate expense support and conditional reimbursement agreement with FS Investments to ensure that no portion of any ordinary cash distributions made by the Fund to the Company are paid from offering proceeds or borrowings of the Fund. However, because certain investments the Fund may make may generate dividends and other distributions to the Fund that are treated for tax purposes as a return of capital, a portion of the Fund’s ordinary cash distributions (and therefore a portion of the Company’s ordinary cash distributions) may also be deemed to constitute a return of capital for tax purposes to the extent that the Company may use such dividends or other distribution proceeds as a source of distributions. Under those circumstances, FS Investments will not reimburse the Company for the portion of the Fund’s or the Company’s ordinary cash distributions that represent a return of capital for tax purposes, as the purpose of the expense reimbursement arrangement is not to prevent tax-advantaged distributions.
Under the expense reimbursement agreement, FS Investments will reimburse the Company quarterly for expenses and/or provide additional support payments to the extent that (x) the sum of the cumulative ordinary cash distributions paid by the Company in such quarter plus the aggregate Company operating expenses in such quarter exceeds (y) the cumulative cash distributions from the Fund that are received by the Company in such quarter.
Pursuant to the expense reimbursement agreement, the Company has a conditional obligation to reimburse FS Investments for any amounts funded by FS Investments under this arrangement if (and only to the extent that), during any fiscal quarter occurring within three years of the date on which FS Investments funded such amount, (x) the cumulative ordinary cash distributions from the Fund that are received by the Company in such quarter exceed (y) the sum of the cumulative ordinary cash distributions paid by the Company in such quarter plus the aggregate Company operating expenses in such quarter; provided, however, that (i) the Company will only reimburse FS Investments for expense support payments made by FS Investments to the extent that the payment of such reimbursement (together with any other reimbursement paid during such fiscal year) does not cause “other operating expenses” (as defined below) (on an annualized basis and net of any expense support payments received by the Company during such fiscal year) to exceed the lesser of (A) 1.75% of the Company’s average net assets attributable to its common shares for the fiscal year-to-date period after taking such expense reimbursement payments into account and (B) the percentage of the Company’s average net assets attributable to its common shares represented by “other operating expenses” during the fiscal year in which such expense support payment from FS Investments was made (provided, however, that this clause (B) shall not apply to any reimbursement payment which relates to an expense support payment from FS Investments made during the same fiscal year) and (ii) the Company will not reimburse FS Investments for expense support payments made by FS Investments if the annualized rate of distributions per common share declared by the Company at the time of such expense reimbursement payment is less than the annualized rate of distributions per common share declared by the Company at the time FS Investments made the expense support payment to which such reimbursement
16
FS Global Credit Opportunities Fund—T
Notes to Financial Statements (continued)
(in thousands, except share and per share amounts)
Note 4. Related Party Transactions (continued)
relates. “Other operating expenses” means the Company’s total operating expenses, excluding organization and offering costs, distribution fees and extraordinary expenses. “Operating expenses” means all operating costs and expenses incurred, as determined in accordance with GAAP for investment companies.
The Company or FS Investments may terminate the expense reimbursement agreement at any time. FS Investments has indicated that it expects to continue such reimbursements until it deems that the Company has achieved economies of scale sufficient to ensure that the Company bears a reasonable level of expenses in relation to its income.
The specific amount of expenses reimbursed by FS Investments pursuant to the expense reimbursement agreement, if any, is determined at the end of each fiscal quarter. Upon termination of the expense reimbursement agreement by FS Investments, FS Investments will be required to fund any amounts accrued thereunder as of the date of termination. Similarly, the conditional obligation of the Company to reimburse FS Investments pursuant to the terms of the expense reimbursement agreement shall survive the termination of such agreement by either party.
The following table reflects the expense reimbursements accrued from FS Investments to the Company as of December 31, 2016 that may be subject to reimbursement to FS Investments:
| | | | | | | | | | | | | | | | |
Quarter Ended | | Amount of Expense
Reimbursement | | | Annualized “Other Operating
Expenses” Ratio as of the Date of
Support Payment | | | Annualized Rate
of Distributions
Per Common
Share(1) | | | Reimbursement
Eligibility
Expiration | |
June 30, 2016 | | $ | 2 | | | | 3.02 | % | | | 8.19 | % | | | June 30, 2019 | |
| (1) | The annualized rate of distributions per common share is expressed as a percentage equal to the projected annualized distribution amount as of the end of the applicable quarter (which is calculated by annualizing the regular weekly cash distribution per common share as of such date without compounding), divided by the Company’s public offering price per common share as of such date. |
FS Investments is controlled by the Company’s chairman, president and chief executive officer, Michael C. Forman, and the Company’s vice-chairman, David J. Adelman. There can be no assurance that the expense reimbursement agreement will remain in effect or that FS Investments will reimburse any portion of the Company’s expenses in future years.
Note 5. Distributions
The following table reflects the cash distributions per common share that the Company declared on its common shares during the period from June 1, 2016 (Commencement of Operations) to December 31, 2016:
| | | | | | | | |
| | | Distribution | |
For the Period Ended | | Per Share | | | Amount | |
December 31, 2016 | | $ | 0.3618 | | | $ | 1,110 | |
On December 22, 2016, January 30, 2017 and February 24, 2017, the Board declared regular weekly cash distributions for January, February and March 2017, respectively. The regular weekly cash distributions, each in the amount of $0.011833 per common share, have been or will be paid monthly to shareholders of record as of weekly record dates previously determined by the Board. The timing and amount of any future distributions to shareholders are subject to applicable legal restrictions and the sole discretion of the Board.
17
FS Global Credit Opportunities Fund—T
Notes to Financial Statements (continued)
(in thousands, except share and per share amounts)
Note 5. Distributions (continued)
The Company has adopted an “opt in” distribution reinvestment plan for its shareholders. As a result, if the Company makes a cash distribution, its shareholders will receive distributions in cash unless they specifically “opt in” to the distribution reinvestment plan so as to have their cash distributions reinvested in additional common shares.
The Company’s distributions to shareholders may be funded from offering proceeds or borrowings, which may constitute a return of capital and reduce the amount of capital available to the Company for investment. Any capital returned to shareholders through distributions will be distributed after payment of fees and expenses, as well as the sales load.
The Company expects that for a period of time, which time period may be significant, substantial portions of the Company’s distributions may be funded through the reimbursement of certain expenses and additional support payments by FS Investments and its affiliates, including through the waiver of certain fees and expenses by FS Global Advisor, that may be subject to repayment by the Company within three years. The purpose of this arrangement is to ensure that no portion of the Company’s distributions to shareholders will be paid from offering proceeds or borrowings. Any such distributions funded through support payments or waivers of fees and expenses are not based on the Fund’s investment performance and the Company’s distributions can only be sustained if the Fund achieves positive investment performance in future periods and/or FS Investments continues to make such payments or waivers of such fees and expenses. The Company’s future repayments of amounts reimbursed or waived by FS Investments and its affiliates will reduce the distributions that shareholders would otherwise receive in the future. There can be no assurance that the Company or the Fund will achieve the performance necessary to sustain its distributions or that the Company will be able to pay distributions at a specific rate or at all. FS Investments and its affiliates have no obligation to waive fees and expenses or otherwise reimburse expenses in future periods. For the period from June 1, 2016 (Commencement of Operations) to December 31, 2016, if FS Investments had not reimbursed certain of the Company’s expenses, less than 1% of the cash distributions declared during such period would have been funded from offering proceeds or borrowings. See Note 4 to the consolidated financial statements of the Fund included herein for information about the reimbursement of Fund expenses provided by FS Investments to the Fund.
The following table reflects the sources of the cash distributions on a tax basis that the Company declared on its common shares during the period from June 1, 2016 (Commencement of Operations) to December 31, 2016:
| | | | | | | | |
| | | Period from
June 1, 2016
(Commencement of
Operations) to
December 31, 2016 | |
Source of Distribution | | Distribution
Amount | | | Percentage | |
Offering proceeds | | $ | — | | | | — | |
Borrowings | | | — | | | | — | |
Net investment income (prior to expense reimbursement from sponsor) | | | 1,108 | | | | 100 | % |
Capital gains proceeds from the sale of assets | | | — | | | | — | |
Expense reimbursement from sponsor | | | 2 | | | | 0 | % |
| | | | | | | | |
Total | | $ | 1,110 | | | | 100 | % |
| | | | | | | | |
18
FS Global Credit Opportunities Fund—T
Notes to Financial Statements (continued)
(in thousands, except share and per share amounts)
Note 5. Distributions (continued)
The Company’s net investment income on a tax basis for the period from June 1, 2016 (Commencement of Operations) to December 31, 2016 was $1,296. As of December 31, 2016, the Company had undistributed net investment income on a tax basis of $186. For the period from June 1, 2016 (Commencement of Operations) to December 31, 2016, the difference between the Company’s tax-basis net investment income and its GAAP-basis net investment income (including the expense reimbursement from sponsor) is due to the treatment of offering costs and excise taxes.
The following table sets forth a reconciliation between GAAP-basis net investment income and tax-basis net investment income for the period from June 1, 2016 (Commencement of Operations) to December 31, 2016:
| | | | |
| | | Period from
June 1, 2016
(Commencement
of Operations) to
December 31, 2016 | |
GAAP-basis net investment income (loss) | | $ | 1,157 | |
Offering costs | | | 136 | |
Excise taxes | | | 3 | |
| | | | |
Tax-basis net investment income (loss) | | $ | 1,296 | |
| | | | |
The Company may make certain adjustments to the classification of net assets as a result of permanent book-to-tax differences. During the period from June 1, 2016 (Commencement of Operations) to December 31, 2016, the Company increased undistributed net investment income by $139 and decreased capital in excess of par value by $139. These reclassifications have no impact on the net assets of the Company.
The determination of the tax attributes of the Company’s distributions is made annually as of the end of the Company’s fiscal year based upon the Company’s taxable income for the full year and distributions paid for the full year. The actual tax characteristics of distributions to shareholders are reported to shareholders annually on Form 1099-DIV.
As of December 31, 2016, the components of accumulated earnings (loss) on a tax basis were as follows:
| | | | |
| | | December 31, 2016 | |
Distributable ordinary income | | $ | 186 | |
Net unrealized appreciation (depreciation) on investment(1) | | | 2,768 | |
| | | | |
| | $ | 2,954 | |
| | | | |
| (1) | As of December 31, 2016, gross unrealized appreciation on the Company’s investment in the Fund was $2,768. |
The aggregate cost of the Company’s investment for U.S. federal income tax purposes totaled $66,146 as of December 31, 2016. Aggregate net unrealized appreciation (depreciation) on a tax basis was $2,768 as of December 31, 2016.
19
FS Global Credit Opportunities Fund—T
Notes to Financial Statements (continued)
(in thousands, except share and per share amounts)
Note 6. Commitments and Contingencies
The Company enters into contracts that contain a variety of indemnification provisions. The Company’s maximum exposure under these arrangements is unknown; however, the Company has not had prior claims or losses pursuant to these contracts. Management of FS Global Advisor has reviewed the Company’s existing contracts and expects the risk of loss to the Company to be remote.
The Company is not currently subject to any material legal proceedings and, to the Company’s knowledge, no material legal proceedings are threatened against the Company. From time to time, the Company may be a party to certain legal proceedings in the ordinary course of business. While the outcome of any legal proceedings cannot be predicted with certainty, the Company does not expect that any such proceedings will have a material adverse effect upon its financial condition or results of operations.
See Note 4 for a discussion of the Company’s commitments to FS Investments and its affiliates.
20
Supplemental Information (Unaudited)
Changes in Accountants and Disagreements with Accountants on Accounting and Financial Disclosure
The Company has not had any changes in its independent registered public accounting firm or disagreements with its independent registered public accounting firm on accounting or financial disclosure matters since its inception.
Board of Trustees
Information regarding the members of the Board is set forth below. The trustees have been divided into two groups—interested trustees and independent trustees. The address for each trustee is c/o FS Global Credit Opportunities Fund—T, 201 Rouse Boulevard, Philadelphia, Pennsylvania 19112. As set forth in the Company’s amended and restated declaration of trust, each trustee’s term of office shall continue until his or her death, resignation or removal.
| | | | | | | | | | | | |
Name | | Age | | Trustee Since | | Title | | Principal Occupations During the Past Five Years | | Number of
Registered
Investment
Companies in
Fund Complex
Overseen by
Trustee | | Other
Directorships
Held by Trustee |
| | | | | | |
| Interested Trustees | | | | | | | | | | | | |
| | | | | | |
Michael C. Forman(1) | | 55 | | February 2016 | | Chairman, President and Chief Executive Officer | | President and Chief Executive Officer of Fund—ADV (since 2016), FS Investment Corporation IV (since 2015), FS Investment Corporation III (since 2013), FSIC III Advisor, LLC (since 2013), the Fund (since 2013), Fund—A (since 2013), Fund—D (since 2013), FS Global Advisor (since 2013), FS Investment Corporation II (since 2011), FSIC II Advisor, LLC (since 2011), FS Energy and Power Fund (since 2010), FS Investment Advisor, LLC (since 2010) and FB Income Advisor, LLC (since 2007); Chief Executive Officer of FSIC IV Advisor, LLC (since 2015), FS Investment Corporation (since 2007) and FS Investments (since 2007); President of FS Investment Corporation (2007 – 2013); and Managing General Partner of FB Capital Partners, L.P. (since 2005) | | 5 | | FS Investment Corporation IV (since 2015); FS Investment Corporation III (since 2013); FS Investment Corporation II (since 2011); FS Energy and Power Fund (since 2010); and FS Investment Corporation (since 2007) |
| | | | | | |
David J. Adelman(2) | | 44 | | February 2016 | | Vice-Chairman | | Chief Executive Officer of Campus Technologies, Inc. (since 2001); and President and Chief Executive Officer of Campus Apartments, Inc. (since 1997) | | 5 | | FS Investment Corporation IV (since 2015); FS Investment Corporation III (since 2013); Actua Corporation (since 2011); FS Investment Corporation II (since 2011); FS Energy and Power Fund (since 2010); and FS Investment Corporation (since 2007) |
21
| | | | | | | | | | | | |
Name | | Age | | Trustee Since | | Title | | Principal Occupations During the Past Five Years | | Number of
Registered
Investment
Companies in
Fund Complex
Overseen by
Trustee | | Other
Directorships
Held by Trustee |
| | | | | | |
Thomas J. Gravina(3) | | 55 | | February 2016 | | Trustee | | Chairman and Chief Executive Officer of EvolveIP Holdings, LLC (since 2007); and Executive Chairman of GPX Enterprises, L.P. (since 2006) | | 5 | | FS Investment Corporation IV (since 2015); FS Energy and Power Fund (since 2010); and FS Investment Corporation (since 2009) |
| | | | | | |
| Independent Trustees | | | | | | | | | | | | |
| | | | | | |
Walter W. Buckley, III | | 56 | | February 2016 | | Trustee | | Chief Executive Officer of Actua Corporation (since 1996); and President of Actua Corporation (1996 – 2001; 2002 – 2009) | | 5 | | Actua Corporation (since 1996) |
| | | | | | |
David L. Cohen | | 61 | | February 2016 | | Trustee | | Senior Executive Vice President of Comcast Corporation (since 2015); and Executive Vice President of Comcast Corporation (2002 – 2015) | | 5 | | NBCUniversal Media, LLC (since 2013) |
| | | | | | |
Barbara J. Fouss | | 47 | | February 2016 | | Trustee | | Director of Strategic Initiatives of Sun National Bank (2012 – 2013); Chief Credit Policy Officer of Sun National Bank (2011 – 2012); and Deputy Chief Credit Policy Officer of Sun National Bank (2008 – 2011) | | 5 | | FS Investment Corporation IV (since 2015) |
| | | | | | |
Philip E. Hughes, Jr. | | 67 | | February 2016 | | Trustee | | Vice-Chairman of Keystone Industries (since 2011); Principal of Philip E. Hughes, Jr., CPA, Esq. Accounting, Tax and Business Services (since 2011); President of Fox Park Corporation (since 2005) and Sovereign Developers, LP (since 1999); and Partner of LarsonAllen LLP (2000 – 2011) | | 5 | | FS Investment Corporation (since 2015) |
| | | | | | |
Oliver C. Mitchell, Jr. | | 62 | | February 2016 | | Trustee | | Attorney and Consultant – Litigation Avoidance, Corporate Governance and Internal Investigations (since 2014); Senior Vice President, General Counsel and Secretary of American Cybersystems, Inc. (2013 – 2014); and Vice President, General Counsel and Secretary of Carpenter Technology Corporation (2007 – 2009) | | 5 | | National Commercial Bank Jamaica Limited (since 2015) |
| | | | | | |
Charles P. Pizzi | | 66 | | February 2016 | | Trustee | | President and Chief Executive Officer of Tasty Baking Company (2002 – 2011) | | 5 | | Pennsylvania Real Estate Investment Trust (since 2013); PHH Corporation (since 2012); FS Energy and Power Fund (since 2012); and Brandywine Realty Trust (since 1996) |
22
| (1) | Mr. Forman is deemed to be an “interested person” of the Company, as defined in Section 2(a)(19) of the 1940 Act, due to his role as a controlling person of FS Global Advisor. |
| (2) | Mr. Adelman is deemed to be an “interested person” of the Company, as defined in Section 2(a)(19) of the 1940 Act, due to his role as a controlling person of FS Global Advisor. |
| (3) | Mr. Gravina is deemed to be an “interested person” of the Company, as defined in Section 2(a)(19) of the 1940 Act, due to Mr. Gravina’s joint ownership with Mr. Forman of an entity engaged in the management of certain real estate assets. |
Executive Officers
Information regarding the executive officers of the Company is set forth below. The address for each executive officer is c/o FS Global Credit Opportunities Fund—T, 201 Rouse Boulevard, Philadelphia, Pennsylvania 19112.
| | | | | | | | |
Name | | Age | | Position Held with Registrant | | Length of
Time Served | | Principal Occupations During the
Past Five Years |
| | | | |
| Michael C. Forman | | 55 | | Chairman, President and Chief Executive Officer | | Since February
2016 | | President and Chief Executive Officer of Fund—ADV (since 2016), FS Investment Corporation IV (since 2015), FS Investment Corporation III (since 2013), FSIC III Advisor, LLC (since 2013), the Fund (since 2013), Fund—A (since 2013), Fund—D (since 2013), FS Global Advisor (since 2013), FS Investment Corporation II (since 2011), FSIC II Advisor, LLC (since 2011), FS Energy and Power Fund (since 2010), FS Investment Advisor, LLC (since 2010) and FB Income Advisor, LLC (since 2007); Chief Executive Officer of FSIC IV Advisor, LLC (since 2015), FS Investment Corporation (since 2007) and FS Investments (since 2007); President of FS Investment Corporation (2007 – 2013); and Managing General Partner of FB Capital Partners, L.P. (since 2005) |
| | | | |
| James F. Volk | | 54 | | Chief Compliance Officer | | Since February
2016 | | Chief Compliance Officer of Fund—ADV (since 2016), FS Investment Corporation (since 2015), FS Energy and Power Fund (since 2015), FS Investment Corporation II (since 2015), the Fund (since 2015), Fund—A (since 2015), Fund—D (since 2015), FS Investment Corporation III (since 2015) and FS Investment Corporation IV (since 2015); and Chief Compliance Officer, Chief Accounting Officer and Head of Traditional Fund Operations at SEI’s Investment Manager Services market unit (1996 – 2014) |
| | | | |
| William Goebel | | 42 | | Chief Financial Officer | | Since February
2016 | | Chief Financial Officer of Fund—ADV (since 2016), the Fund (since 2013), Fund—A (since 2013), Fund—D (since 2013), FS Investment Corporation II (2011 – 2014), FS Energy and Power Fund (2011 – 2012) and FS Investment Corporation (since 2011); and Senior Manager at Ernst & Young LLP (2003 – 2011) |
| | | | |
| Gerald F. Stahlecker | | 51 | | Executive Vice President | | Since February
2016 | | President of FS Investment Corporation (since 2013); Executive Vice President of Fund—ADV (since 2016), FS Investment |
23
| | | | | | | | |
Name | | Age | | Position Held with Registrant | | Length of
Time Served | | Principal Occupations During the
Past Five Years |
| | | | | | | | Corporation IV (since 2015), FSIC IV Advisor, LLC (since 2015), FS Investment Corporation III (since 2013), FSIC III Advisor, LLC (since 2013), the Fund (since 2013), Fund—A (since 2013), Fund—D (since 2013), FS Global Advisor (since 2013), FS Investment Corporation II (since 2011), FSIC II Advisor, LLC (since 2011), FS Energy and Power Fund (since 2010), FS Investment Advisor, LLC (since 2010), FS Investment Corporation (2010 – 2013), FB Income Advisor, LLC (since 2010) and FS Investments (since 2010); and Managing Director and Chief Operating Officer of Radcliffe Capital Management, L.P. (2002 – 2009) |
| | | | |
| Zachary Klehr | | 38 | | Executive Vice President | | Since February
2016 | | Executive Vice President of Fund—ADV (since 2016), FS Investment Corporation IV (since 2015), FSIC IV Advisor, LLC (since 2015), FS Investment Corporation III (since 2013), FSIC III Advisor, LLC (since 2013), the Fund (since 2013), Fund—A (since 2013), Fund—D (since 2013), FS Global Advisor (since 2013), FS Investment Corporation II (since 2013), FS Energy and Power Fund (since 2013), FS Investment Corporation (since 2013), FSIC II Advisor, LLC (since 2012), FS Investment Advisor, LLC (since 2012), FB Income Advisor, LLC (since 2012) and FS Investments (since 2012); Senior Vice President of FSIC II Advisor, LLC (2011 – 2012), FS Investment Advisor, LLC (2011 – 2012), FB Income Advisor, LLC (2011 – 2012) and FS Investments (2011 – 2012); and Vice President of Versa Capital Management (2007 – 2011) |
| | | | |
| Stephen S. Sypherd | | 39 | | Vice President, Treasurer and Secretary | | Since February
2016 | | Managing Director and General Counsel of FSIC IV Advisor, LLC (since 2015), FSIC III Advisor, LLC (since 2014), FS Global Advisor (since 2014), FSIC II Advisor, LLC (since 2014), FS Investment Advisor, LLC (since 2014), FB Income Advisor, LLC (since 2014) and FS Investments (since 2014); Vice President, Treasurer and Secretary of Fund—ADV (since 2016), FS Investment Corporation IV (since 2015), FS Investment Corporation III (since 2013), the Fund (since 2013), Fund—A (since 2013), Fund—D (since 2013), FS Investment Corporation II (since 2013), FS Energy and Power Fund (since 2013) and FS Investment Corporation (since 2013); Senior Vice President of FSIC II Advisor, LLC (2011 – 2014), FS Investment Advisor, LLC (2011 – 2014), FB Income Advisor, LLC (2011 – 2014) and FS Investments (2011 – 2014); Vice President of FS Investment Advisor, LLC (2010 – 2011), FB Income Advisor, LLC (2010 – 2011) and FS Investments (2010 – 2011); and Associate of Skadden, Arps, Slate, Meagher & Flom LLP (2002 – 2010) |
24
Statement of Additional Information
The Company’s statement of additional information, dated as of April 29, 2016, as amended and supplemented to date, contains additional information regarding the Company’s trustees and executive officers and is available upon request and without charge by calling the Company collect at 215-495-1150 or by accessing the Company’s “SEC Filings” page on FS Investments’ website at www.fsinvestments.com.
Form N-Q Filings
The Company files its complete schedule of portfolio holdings with the SEC for the first and third quarters of each fiscal year on Form N-Q. The Company’s Forms N-Q are available on the SEC’s website at http://www.sec.gov. The Company’s Forms N-Q may also be reviewed and copied at the SEC’s Public Reference Room located at 100 F Street, NE, Washington, DC 20549. Shareholders may obtain information on the operation of the SEC’s Public Reference Room by calling the SEC at 1-800-SEC-0330.
Proxy Voting Policies and Procedures
The Fund has delegated its proxy voting responsibility to FS Global Advisor, the Fund’s investment adviser. Shareholders may obtain a copy of FS Global Advisor’s proxy voting policies and procedures upon request and without charge by calling the Fund collect at 215-495-1150 or on the SEC’s website at http://www.sec.gov.
Proxy Voting Record
The Company invests substantially all of its assets in the Fund. All investments in portfolio companies are made at the Fund level. Information regarding how FS Global Advisor voted proxies relating to the Fund’s portfolio securities during the most recent twelve-month period ended June 30 is available upon request and without charge by making a written request to the Fund’s Chief Compliance Officer at FS Global Credit Opportunities Fund, 201 Rouse Boulevard, Philadelphia, Pennsylvania 19112, Attn: Chief Compliance Officer, by calling the Fund collect at 215-495-1150 or on the SEC’s website at http://www.sec.gov.
Board Considerations in Approving the Continuation of the Fund’s Amended and Restated Investment Advisory Agreement and Investment Sub-Advisory Agreement
At meetings of the Board of Trustees of the Fund (the “Fund Board”) held on May 2, 2016 and May 17, 2016 (the “Meetings”), the Fund Board, including a majority of Trustees who are not “interested persons” (as that term is defined in the 1940 Act) of the Fund, FS Global Advisor or GSO, (the “Independent Trustees”), considered and approved for an additional year the continuation of: (i) the amended and restated investment advisory agreement, dated as of October 9, 2013 (the “Advisory Agreement”), by and between the Fund and FS Global Advisor, and (ii) the investment sub-advisory agreement for the Fund, dated as of August 12, 2013 (the “Sub-Advisory Agreement” and, together with the Advisory Agreement, the “Advisory Agreements”), by and between FS Global Advisor and GSO.
In connection with its consideration of the Advisory Agreements, the Fund Board considered the information furnished and discussed throughout the year at Fund Board and Committee meetings and the information provided specifically in relation to the annual consideration of the approval of the Advisory Agreements in response to requests of the Independent Trustees and their independent legal counsel.
In their deliberations, the Fund Board considered a range of materials and information regarding the nature, extent and quality of services provided by FS Global Advisor and GSO; the investment performance of the Fund and its affiliated feeder funds (collectively, the “Companies”), compared to relevant indices and peer funds; the fees and expenses of the Fund and the Companies compared to those of other registered investment companies that FS Global Advisor believed were relatively comparable to the Fund in terms of structure, investment objectives, assets under management, portfolio mix and/or other similar criteria; and the profitability of FS Global Advisor and the profitability of GSO. The Fund Board also considered information related to potential
25
ancillary benefits enjoyed by FS Global Advisor and GSO (and their affiliates) as a result of their relationships with the Fund and the Companies. In addition, the Fund Board took note of the Fund’s “master-feeder” structure and the fact that FS Global Advisor and GSO serve as investment adviser and sub-adviser, respectively, to the Fund and not the Companies. In addition to evaluating, among other things, the written information provided by FS Global Advisor and GSO, the Fund Board also considered the answers to questions posed by the Fund Board to representatives of FS Global Advisor at various meetings. The Independent Trustees also met separately in executive sessions with their independent legal counsel to review and consider the information provided regarding the Advisory Agreements.
Based on their review, the Independent Trustees and the Fund Board concluded that it was in the best interest of the Fund to approve the continuation of the Advisory Agreements. In their deliberations, the Fund Board did not identify any single factor or group of factors as all-important or controlling, but considered all factors together. The material factors and conclusions that formed the basis for the Fund Board’s determinations are discussed below.
Nature, Extent and Quality of Services
In evaluating the nature, extent and quality of the services provided by FS Global Advisor and GSO, the Fund Board reviewed information describing the financial strength, experience, resources, compliance programs, and key personnel of FS Global Advisor and GSO, including the personnel who provide investment management services to the Fund. With respect to FS Global Advisor, the Fund Board recognized the significant investment of time, capital and human resources provided by Franklin Square Holdings, L.P., the Fund’s sponsor, and its affiliates that has resulted in the successful operation of the Fund and FS Global Advisor’s role in, among other things, setting investment guidelines for the Fund’s portfolio; determining the composition and allocation of the Fund’s portfolio, and identifying, evaluating, and negotiating the structure of the Fund’s investments. The Fund Board then considered FS Global Advisor’s ongoing management of the Fund’s assets and collaboration with and oversight of GSO, including the robust level of communication and collaboration between FS Global Advisor and GSO during the process of considering and taking action with respect to potential investment opportunities. The Fund Board also noted the administrative services FS Global Advisor provides to the Fund and the Companies, including general ledger accounting, fund accounting, legal services, investor relations and other administrative services, as compared to the administrative expenses paid by comparable investment companies. With respect to GSO, the Fund Board considered GSO’s role in, among other things, identifying and conducting due diligence on prospective investment opportunities for the Fund; making investment recommendations for the Fund; implementing the directives of FS Global Advisor; and providing ongoing monitoring of the Fund’s investments.
The Fund Board and the Independent Trustees determined that they were satisfied with the nature, quality and extent of the services provided by FS Global Advisor and GSO to the Fund, the expertise and capabilities of FS Global Advisor’s and GSO’s personnel, FS Global Advisor’s collaboration with and oversight of GSO, and FS Global Advisor’s and GSO’s financial strength and continued efforts to develop and allocate resources necessary to continue to manage the Fund’s portfolio.
Review of Fund Performance
With respect to the Fund’s investment performance, the Fund Board and the Independent Trustees noted that the Fund’s performance was reasonable as compared to the performance of comparable funds that FS Global Advisor believed to be generally comparable to the Fund in terms of structure, investment objectives, assets under management, portfolio mix and/or similar criteria. In addition, the Fund Board and the Independent Trustees considered the Fund’s performance compared to certain indices spanning the spectrum of primary asset classes in which the Fund invests. The Trustees noted FS Global Advisor’s explanation of the relevance of each comparable index and FS Global Advisor’s explanation of the impact of the broader market dislocation on the Fund’s performance. The Fund Board also considered the steps FS Global Advisor and GSO have taken to
26
determine the optimal composition of the Fund’s portfolio and to position the Fund, particularly during periods of credit market volatility and market dislocation, in order to capitalize upon potential investment opportunities.
The Fund Board determined that it was generally satisfied with the Fund’s performance and would continue to monitor the Fund’s and the Companies’ performance results.
Costs of Services Provided and Profits Realized
The Fund Board then considered FS Global Advisor’s management fee and income incentive fee (together, the “Advisor’s Fees”) and the Companies’ expense ratios. The Fund Board considered the Advisor’s Fees and the Companies’ expense ratios as compared to a group of investment companies that FS Global Advisor believed to be relatively comparable to the Fund and/or the Companies in terms of structure, investment objectives, assets under management, portfolio mix and/or similar criteria. The Trustees acknowledged FS Global Advisor’s and its affiliates’ financial support of the Fund and the Companies through the provision of expense reimbursement and additional support payments, noting that the Fund accrued significantly more in management fees since inception than FS Global Advisor collected. The Trustees also took into consideration that FS Global Advisor had agreed to waive its right to recoup expense reimbursement and additional support payments made to the Fund through December 31, 2015, including any unpaid management fees.
With respect to the Companies’ gross expense ratios, the Fund Board considered the expense ratios compared to a group of investment companies that FS Global Advisor believed to be relatively comparable to the Fund in terms of structure, investment objectives, assets under management, portfolio mix and/or similar criteria. The Fund Board considered FS Global Advisor’s explanation as to the comparability of the expenses, noting that, among other things, the Fund and the Companies are subject to different requirements because they are in a master-feeder structure and are non-traded, continuously-offered, closed-end investment companies, whereas the peers are publicly-traded investment companies.
The Fund Board then reviewed the profitability information provided by FS Global Advisor and GSO and FS Global Advisor’s methodology for determining profitability. The profitability data included detail on historical profitability and anticipated future profitability of the relationship between the Fund, the Companies and FS Global Advisor and GSO. The Trustees also noted FS Global Advisor’s efforts to continuously leverage its capabilities and resources for the benefit of the Fund, the Companies and their respective shareholders.
The Fund Board determined that, based on the amount of management fees actually paid by the Fund to FS Global Advisor, FS Global Advisor’s fees are reasonable in relation to the services rendered and within the range of what would have been negotiated at arm’s length in similar circumstances. With respect to the renewal of the Sub-Advisory Agreement, the Fund Board determined that it was satisfied with the level of fees paid by FS Global Advisor to GSO given the quality and extent of services it provides and that GSO’s fees are reasonable in relation to the services rendered.
Economies of Scale
The Fund Board considered the extent to which economies of scale would be realized as the Funds grow and whether the Fund’s fee levels reflect these economies of scale for the benefit of Fund shareholders. The Fund Board considered the fact that such economies are less likely to be significant given the Fund’s and the Companies’ structure and related focus on event-driven, special situations and market price inefficiency investments.
Other Benefits
The Fund Board considered other benefits that may accrue to FS Global Advisor, GSO and their affiliates from their relationships with the Fund, including that FS Global Advisor and GSO may potentially benefit from their relationship with the Fund in the sense that the success of the Fund could attract other business to FS Global Advisor and GSO.
27
Overall Conclusions
Based on all of the information considered and the conclusions reached, the Fund Board, including a majority of the Independent Trustees, determined that the terms of the Advisory Agreements are fair and reasonable and that the approval of the continuation of the Advisory Agreement and the Sub-Advisory Agreement is in the best interests of the Fund, the Companies and their respective shareholders. The Fund Board approved the renewal of Advisory Agreements for an additional year, subject to earlier termination in accordance with their terms.
Distribution Reinvestment Plan
The Company has adopted an “opt in” distribution reinvestment plan pursuant to which the Company’s shareholders may elect to have the full amount of their cash distributions reinvested in additional common shares of the Company. Participants in the Company’s distribution reinvestment plan are free to elect to participate or terminate participation in the distribution reinvestment plan within a reasonable time as specified in the distribution reinvestment plan. If a shareholder does not elect to participate in the Company’s distribution reinvestment plan, the shareholder will automatically receive any distributions the Company declares in cash. For example, if the Board authorizes, and the Company declares, a cash distribution, then if a shareholder has “opted in” to the Company’s distribution reinvestment plan, the shareholder will have the cash distribution reinvested in additional common shares of the Company, rather than receiving the cash distribution. The Company expects to issue common shares pursuant to the distribution reinvestment plan on the date of the weekly closing occurring on or immediately following each distribution payment date at a price equal to the NAV per common share that is used to determine the public offering price of the Company’s common shares on the date of such weekly closing. Common shares issued pursuant to the distribution reinvestment plan will have the same voting rights as common shares offered in the Company’s continuous public offering.
If a shareholder wishes to receive distributions in cash, no action is required by the shareholder. If a shareholder is a registered shareholder, the shareholder may elect to have their entire distribution reinvested in common shares by notifying DST Systems, Inc., the plan administrator and the Company’s transfer agent, in writing at the address set forth below so that such notice is received by the plan administrator no later than the record date for distributions to shareholders. If a shareholder elects to reinvest their distributions in additional common shares, the plan administrator will set up an account for common shares acquired through the distribution reinvestment plan and will hold such common shares in non-certificated form. If common shares are held by a broker or other financial intermediary, a shareholder may “opt in” to the distribution reinvestment plan by notifying their broker or other financial intermediary of their election.
The Company uses newly issued common shares under the distribution reinvestment plan. The number of common shares the Company issues to a shareholder is determined by dividing the total dollar amount of the cash distribution payable to the shareholder by a price equal to the Company’s NAV per common share on the date of the weekly closing on or immediately following the distribution payment date. There are no selling commissions, dealer manager fees or other sales charges to a shareholder if they elect to participate in the distribution reinvestment plan. The Company pays the plan administrator’s fees under the distribution reinvestment plan. If a shareholder receives their cash distributions in the form of common shares, the shareholder generally is subject to the same U.S. federal, state and local tax consequences as the shareholder would have had if the shareholder elected to receive their distributions in cash. A shareholder’s basis for determining gain or loss upon the sale of common shares received in a distribution from the Company will be equal to the total dollar amount of the distribution payable in cash. Any common shares received in a distribution will have a holding period for tax purposes commencing on the day following the day on which the common shares are credited to the shareholder’s account.
The Company reserves the right to amend, suspend or terminate the distribution reinvestment plan. A shareholder may terminate their account under the distribution reinvestment plan by calling the plan administrator at 877-628-8575. All correspondence concerning the distribution reinvestment plan should be directed to the plan administrator by mail at FS Global Credit Opportunities Fund—T, c/o DST Systems, Inc., P.O. Box 219095, Kansas City, Missouri 64121-9095. A shareholder may obtain a copy of the distribution reinvestment plan by request to the plan administrator or by contacting the Company.
28

| | |
| | | Fellow Shareholder, I am pleased to report that FS Global Credit Opportunities Fund’s (FSGCO) focus on select, value-based credit strategies helped deliver strong total returns for our shareholders in 2016. One of the benefits of FSGCO’s non-traded, closed-end fund structure is that it allows us to capitalize on short-term market sell-offs to buy assets at prices that we believe are below intrinsic value. Against the backdrop of the market dislocation and subsequent rally that took place in 2015 and 2016, our ability to opportunistically buy and hold assets through complete market cycles contributed to meaningful portfolio appreciation over the past twelve months. |
OUR ABILITY TO OPPORTUNISTICALLY BUY AND HOLD ASSETS THROUGH COMPLETE MARKET CYCLES LED TO MEANINGFUL PORTFOLIO APPRECIATION. | | Corporate credit rallied in 2016 amid rising U.S. equities and higher commodity prices, with momentum building toward year-end as investors increasingly sought out investments whose values are less affected by rising interest rates. High yield bond mutual funds and bank loan mutual funds recorded inflows of more than $8.6 billion and $7.8 billion, respectively, in 2016.1 Meanwhile, U.S. default activity remained relatively modest, with the trailing 12-month high yield bond and senior secured loan default rates declining to 3.32% and 1.94%, respectively, in December.2 Notably, excluding the energy and metals and mining sectors, high yield bond and senior secured loan default rates declined to 0.68% and 0.51%, respectively.2 The generally positive market tone and rising risk appetite led to a significant rally across the corporate credit markets. For high yield bonds and senior secured loans, 2016 provided a marked turnaround from the declines of 2015. High yield bonds generated an annual return of 17.5% in 2016, boosted by rising oil prices and an improved macroeconomic environment.3 Senior secured loans generated an annual return of 9.9% in 2016 on the back of improved market sentiment, prospects of a near-term interest rate hike and rising LIBOR rates.4 The value-oriented areas of the market also benefited from the ongoing rally in credit, with value-oriented high yield bonds and value-oriented senior secured loans returning approximately 54.2% and 23.3%, respectively, in 2016.5,6 |

| | |
| 2016 SHAREHOLDER RETURNS |
| FSGCO–A | | 27.8% |
| |
| FSGCO–D | | 27.8% |
| |
| FSGCO–T | | 14.4% |
| | (6/1/16–12/31/16) |
| |
| FSGCO–ADV | | 14.4% |
| | (7/6/16–12/31/16) |
| |
FSGCO’S SHAREHOLDER RETURNS OUTPERFORMED VALUE-ORIENTED SENIOR SECURED LOANS AND MEANINGFULLY OUTPERFORMED HIGH YIELD BONDS AND SENIOR SECURED LOANS IN 2016. |
A REVIEW OF 2016
Given the Fund’s focus on investing in value-based credit strategies, such as event-driven opportunities, special situations and market-price inefficiencies, we expect that over the long term the Fund generally should provide total returns that are largely uncorrelated to events in the broader economy. By focusing on selective, value-based opportunities, we aim to build a portfolio that offers high potential returns when compared to more traditional investment strategies.
Fund–A’s, Fund–D’s, Fund–T’s and Fund–ADV’s shareholder returns outperformed value-oriented senior secured loans during 2016 and meaningfully outperformed the high yield bond and senior secured loan indices.3,4,6,7 Distributions continued to provide a meaningful portion of Fund–A’s, Fund–D’s, Fund–T’s and Fund–ADV’s shareholder returns.8
The top three contributors to the Fund’s performance in 2016 were one event-driven investment, one market-price inefficiency investment and one special situation. Event-driven investments seek to capitalize on market dislocations resulting from specific corporate events, such as mergers, corporate reorganizations or debt maturities that are expected to impact the value of a company’s securities. A market-price inefficiency opportunity is an investment made in a security that trades below what the Fund believes to be its intrinsic value. Special situations represent investments in companies we believe offer compelling value as a result of financial stress.
Regarding the event-driven investment, the Fund holds investments in the securities of Fannie Mae and Freddie Mac with the view that a catalyst, such as congressional action, would ultimately unlock value for those companies’ shareholders following an adverse court ruling. During the fourth quarter, the Fund’s positions appreciated meaningfully as optimism grew over the likelihood that shareholders may be successful on an appeal of a previously adverse court decision. Regarding the market-price inefficiency investment, the Fund invested in the senior secured debt of Aspect Software, Inc., a call center software provider, that traded at a significant discount to face value. Subsequently, the Fund’s position appreciated meaningfully following the completion of a restructuring of the company’s balance sheet that reduced debt and infused additional capital to facilitate growth. Regarding the special situation investment, the Fund owns equity in Warrior Met Coal, LLC, which had to restructure in the depths of the commodity downturn in 2015. During the fourth quarter, metallurgical coal prices rebounded strongly, which contributed to the appreciation in the price of the equity of the company.
Key negative contributors to the Fund’s performance included a special situation investment in a lifestyle jewelry company that saw a year-over-year decline in sales, and a market-price inefficiency investment in a grocery retailer that completed a restructuring earlier in the year. The Fund is cautiously optimistic that these businesses are currently taking the necessary steps to improve their operations in order to maximize long-term value for investors.

|
| |
| |
WE BELIEVE INVESTING IN A SELECT NUMBER OF VALUE-BASED OPPORTUNITIES ACROSS THE CAPITAL STRUCTURE OFFERS THE POTENTIAL FOR STRONGER RISK-ADJUSTED RETURNS. |
TRENDS AND OPPORTUNITIES
Looking forward to 2017, we believe there are several specific trends in the current investing environment that are beneficial to the Fund’s long-term strategy. Amid significant yield compression in both the high yield and senior secured loan markets, we believe investing in a select number of value-based opportunities across the capital structure offers the potential for stronger risk-adjusted returns relative to today’s low-yield market environment.
We anticipate generally low levels of secondary market liquidity, combined with uncertainty around future U.S. monetary and fiscal policy prescriptions, will continue to give rise to short-term price swings in 2017. To help mitigate volatility associated with any rise in short-term interest rates, the Fund is focused on investments with floating interest rates, which have the potential to provide the Fund with higher interest income if interest rates rise, and low duration, fixed income assets.
Poor market liquidity is likely to contribute to periods of increased credit market volatility ahead, and we will continue to seek to capitalize on any dislocations that arise in the credit markets to invest in assets we believe are undervalued. We believe that the long-term nature of the Fund’s strategy and the benefits of its unlisted, continuously offered closed-end fund structure position the Fund to generate attractive total returns, consisting of a high level of current income and capital appreciation, for its shareholders over the long term.
We look forward to an exciting 2017. Thank you for your continued support and trust in us.
Sincerely,

MICHAEL C. FORMAN
Chairman & Chief Executive Officer
FS Global Credit Opportunities Fund

THE FUND INVESTS PRIMARILY IN SECURED AND UNSECURED FLOATING AND FIXED RATE LOANS, BONDS AND OTHER CREDIT INSTRUMENTS.
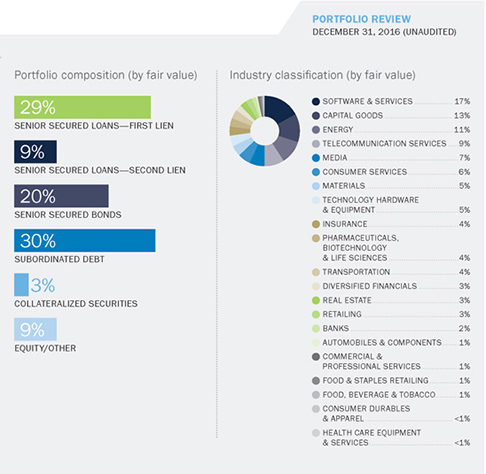

| | | | |
| | 1 | | Thomson Reuters Lipper. |
| | | 2 | | J.P. Morgan Default Monitor, January 1, 2017. |
| | | 3 | | Bank of America Merrill Lynch High Yield Master II Index. |
| | | 4 | | Credit Suisse Leveraged Loan Index. |
| | | 5 | | Value-oriented high yield bonds are represented by the Bank of America Merrill Lynch U.S. High Yield Distressed Index, which is a subset of the Bank of America Merrill Lynch U.S. High Yield Master II Index that includes all high yield bonds that trade with a spread over U.S. Treasuries greater than or equal to 10%. |
| | | 6 | | Value-oriented loans are represented by the Credit Suisse Distressed Loan Index, which is a subset of the Credit Suisse Leveraged Loan Index that contains only loan facilities that trade at a price of 90% or below. |
| | | 7 | | Shareholder returns shown are the total returns an investor received for the period taking into account all distributions paid during such period, compounded monthly. Shareholder return calculations do not include upfront selling commissions and dealer manager fees. Had such selling commissions and dealer manager fees been included, performance would be lower. Upon liquidation or redemption, market conditions may cause the actual values to be more or less than the values shown. For Fund–A and Fund–D, the calculation assumes that the investor purchased shares at Fund–A’s or Fund–D’s public offering price, excluding selling commissions and dealer manager fees, if applicable, at the beginning of the year. For Fund–T and Fund–ADV, the calculation assumes that the investor purchased shares at Fund–T’s or Fund–ADV’s public offering price, excluding selling commissions and dealer manager fees, if applicable, at the beginning of the applicable period. Each fund’s calculations assume that investors reinvested all cash distributions pursuant to the applicable fund’s distribution reinvestment plan. Valuation as of the end of each period is the redemption price pursuant to such fund’s share repurchase program on such date. Shareholder returns do not include selling commissions and dealer manager fees, which could have totaled up to 8% of Fund–A’s public offering price and 2% of Fund–D’s public offering price, and could total up to 4% of Fund–T’s public offering price. |
| | | 8 | | The payment of future distributions on Fund–A’s, Fund–D’s, Fund–T’s and Fund–ADV’s common shares is subject to the discretion of their boards of trustees and applicable legal restrictions and, therefore, there can be no assurance as to the amount or timing of any such future distributions. |

| | | | |
| | | Officers MICHAEL C. FORMAN Chairman & Chief Executive Officer WILLIAM GOEBEL Chief Financial Officer GERALD F. STAHLECKER Executive Vice President ZACHARY KLEHR Executive Vice President STEPHEN S. SYPHERD Vice President, Treasurer & Secretary JAMES F. VOLK Chief Compliance Officer | | Board of Trustees MICHAEL C. FORMAN Chairman & Chief Executive Officer DAVID J. ADELMAN Vice-Chairman President & Chief Executive Officer, Campus Apartments, Inc. THOMAS J. GRAVINA Trustee Executive Chairman, GPX Enterprises, L.P. WALTER W. BUCKLEY, III Trustee Chairman & Chief Executive Officer, Actua Corporation BARBARA J. FOUSS Trustee Former Director of Strategic Initiatives & Chief Credit Policy Officer, Sun National Bank DAVID L. COHEN Trustee Senior Executive Vice President, Comcast Corporation PHILIP E. HUGHES, JR. Trustee Vice-Chairman of Keystone Industries OLIVER C. MITCHELL, JR. Trustee Attorney & Consultant CHARLES P. PIZZI Trustee Retired President, Director & Chief Executive Officer, Tasty Baking Company |
TABLE OF CONTENTS
FS Global Credit Opportunities Fund
i
REPORT OF INDEPENDENT REGISTERED PUBLIC ACCOUNTING FIRM
The Board of Trustees and Shareholders of FS Global Credit Opportunities Fund
We have audited the accompanying consolidated statement of assets and liabilities of FS Global Credit Opportunities Fund (the Fund), including the consolidated schedule of investments, as of December 31, 2016, and the related consolidated statements of operations and cash flows for the year then ended, the consolidated statements of changes in net assets for each of the two years in the period then ended and the financial highlights for each of the periods indicated therein. These financial statements and financial highlights are the responsibility of the Fund’s management. Our responsibility is to express an opinion on these financial statements and financial highlights based on our audits.
We conducted our audits in accordance with the standards of the Public Company Accounting Oversight Board (United States). Those standards require that we plan and perform the audit to obtain reasonable assurance about whether the financial statements and financial highlights are free of material misstatement. We were not engaged to perform an audit of the Fund’s internal control over financial reporting. Our audits included consideration of internal control over financial reporting as a basis for designing audit procedures that are appropriate in the circumstances, but not for the purpose of expressing an opinion on the effectiveness of the Fund’s internal control over financial reporting. Accordingly, we express no such opinion. An audit also includes examining, on a test basis, evidence supporting the amounts and disclosures in the financial statements and financial highlights, assessing the accounting principles used and significant estimates made by management, and evaluating the overall financial statement presentation. Our procedures included confirmation of securities owned as of December 31, 2016, by correspondence with the custodian and brokers, or by other appropriate auditing procedures where replies from brokers were not received. We believe that our audits provide a reasonable basis for our opinion.
In our opinion, the financial statements and financial highlights referred to above present fairly, in all material respects, the consolidated financial position of FS Global Credit Opportunities Fund at December 31, 2016, the consolidated results of its operations and its cash flows for the year then ended, the changes in its net assets for each of the two years in the period then ended and the financial highlights for each of the periods indicated therein, in conformity with U.S. generally accepted accounting principles.

Philadelphia, Pennsylvania
March 1, 2017
1
FS Global Credit Opportunities Fund
Consolidated Schedule of Investments
As of December 31, 2016
(in thousands, except share amounts)
| | | | | | | | | | | | | | | | | | | | | | | | | | |
Portfolio Company(a) | | Footnotes | | Industry | | Rate(b) | | | Floor | | | Maturity | | Principal
Amount(c) | | | Amortized
Cost | | | Fair
Value(d) | |
Senior Secured Loans—First Lien—37.7% | | | | | | | | | | | | | | | | | | | | | | | | | | |
American Bath Group, LLC | | | | Capital Goods | | | L+575 | | | | 1.0% | | | 9/30/23 | | $ | 13,602 | | | $ | 13,071 | | | $ | 13,653 | |
Aspect Software, Inc. | | (t) | | Software & Services | | | L+1000 | | | | 1.0% | | | 5/25/18 | | | 2,276 | | | | 2,276 | | | | 2,276 | |
Aspect Software, Inc. | | (g)(t) | | Software & Services | | | L+1000 | | | | 1.0% | | | 5/25/18 | | | 78 | | | | 78 | | | | 78 | |
Aspect Software, Inc. | | (t) | | Software & Services | | | L+1000 | | | | 1.0% | | | 5/25/20 | | | 7,093 | | | | 7,093 | | | | 7,173 | |
Avant Credit III Trust | | (n) | | Diversified Financials | | | L+1000 | | | | 1.0% | | | 4/15/18 | | | 496 | | | | 496 | | | | 496 | |
Avant Credit III Trust | | (n) | | Diversified Financials | | | L+1000 | | | | 1.0% | | | 5/15/18 | | | 191 | | | | 191 | | | | 191 | |
Avant Credit III Trust | | (n) | | Diversified Financials | | | L+1000 | | | | 1.0% | | | 6/15/18 | | | 101 | | | | 101 | | | | 101 | |
Avant Credit III Trust | | (n) | | Diversified Financials | | | L+1000 | | | | 1.0% | | | 7/15/18 | | | 169 | | | | 169 | | | | 169 | |
Avant Credit III Trust | | (n) | | Diversified Financials | | | L+1000 | | | | 1.0% | | | 8/15/18 | | | 175 | | | | 175 | | | | 175 | |
Avant Credit III Trust | | (n) | | Diversified Financials | | | L+1000 | | | | 1.0% | | | 9/15/18 | | | 268 | | | | 268 | | | | 269 | |
Avant Credit III Trust | | (n) | | Diversified Financials | | | L+1000 | | | | 1.0% | | | 10/15/18 | | | 264 | | | | 264 | | | | 265 | |
Avant Credit III Trust | | (n) | | Diversified Financials | | | L+1000 | | | | 1.0% | | | 11/15/18 | | | 274 | | | | 274 | | | | 275 | |
Avant Credit III Trust | | (n) | | Diversified Financials | | | L+1000 | | | | 1.0% | | | 12/15/18 | | | 308 | | | | 308 | | | | 309 | |
Avant Credit III Trust | | (n) | | Diversified Financials | | | L+1000 | | | | 1.0% | | | 1/15/19 | | | 336 | | | | 336 | | | | 337 | |
Avant Credit III Trust | | (n) | | Diversified Financials | | | L+1000 | | | | 1.0% | | | 2/15/19 | | | 348 | | | | 348 | | | | 349 | |
Avaya Inc. | | (e) | | Technology Hardware & Equipment | | | L+525 | | | | 1.0% | | | 5/29/20 | | | 88 | | | | 62 | | | | 76 | |
BakerCorp International, Inc. | | (e) | | Capital Goods | | | L+300 | | | | 1.3% | | | 2/7/20 | | | 2,913 | | | | 2,634 | | | | 2,793 | |
Bioplan USA, Inc. | | (e) | | Materials | | | L+475 | | | | 1.0% | | | 9/23/21 | | | 15,978 | | | | 14,101 | | | | 15,459 | |
Caesars Entertainment Operating Co., Inc. | | (i) | | Consumer Services | | | L+575 | | | | | | | 3/1/17 | | | 3,009 | | | | 2,981 | | | | 2,943 | |
Caesars Entertainment Operating Co., Inc. | | (i) | | Consumer Services | | | L+675 | | | | | | | 3/1/17 | | | 3,002 | | | | 2,835 | | | | 3,240 | |
Caesars Entertainment Operating Co., Inc. | | (f)(i) | | Consumer Services | | | L+875 | | | | 1.0% | | | 3/1/17 | | | 4,070 | | | | 3,880 | | | | 4,402 | |
Caesars Entertainment Operating Co., Inc. | | (i) | | Consumer Services | | | L+850 | | | | 2.0% | | | 10/31/17 | | | 832 | | | | 811 | | | | 830 | |
CEVA Group Plc | | (g) | | Transportation | | | L+500 | | | | | | | 3/19/19 | | | 30,000 | | | | 28,296 | | | | 24,000 | |
CEVA Group Plc | | (e) | | Transportation | | | L+550 | | | | 1.0% | | | 3/19/21 | | | 1,372 | | | | 1,159 | | | | 1,123 | |
CEVA Intercompany BV | | (e) | | Transportation | | | L+550 | | | | 1.0% | | | 3/19/21 | | | 1,407 | | | | 1,189 | | | | 1,152 | |
CEVA Logistics Canada, ULC | | (e) | | Transportation | | | L+550 | | | | 1.0% | | | 3/19/21 | | | 243 | | | | 205 | | | | 199 | |
CEVA Logistics U.S. Holdings, Inc. | | (e) | | Transportation | | | L+550 | | | | 1.0% | | | 3/19/21 | | | 1,941 | | | | 1,639 | | | | 1,589 | |
CITGO Holding, Inc. | | (e) | | Energy | | | L+850 | | | | 1.0% | | | 5/12/18 | | | 19,492 | | | | 19,506 | | | | 19,825 | |
CLP Issuer, LLC | | | | Diversified Financials | | | L+1000 | | | | 1.0% | | | 2/19/17 | | | 74 | | | | 74 | | | | 74 | |
CLP Issuer, LLC | | | | Diversified Financials | | | L+1000 | | | | 1.0% | | | 3/24/17 | | | 126 | | | | 126 | | | | 126 | |
CLP Issuer, LLC | | | | Diversified Financials | | | L+1000 | | | | 1.0% | | | 4/22/17 | | | 87 | | | | 87 | | | | 87 | |
CLP Issuer, LLC | | (g) | | Diversified Financials | | | L+1000 | | | | 1.0% | | | 5/2/17 | | | 11,824 | | | | 11,824 | | | | 11,824 | |
CLP Issuer, LLC | | | | Diversified Financials | | | L+1000 | | | | 1.0% | | | 5/20/17 | | | 8 | | | | 8 | | | | 8 | |
CLP Issuer, LLC | | | | Diversified Financials | | | L+1000 | | | | 1.0% | | | 6/24/17 | | | 367 | | | | 367 | | | | 367 | |
CLP Issuer, LLC | | | | Diversified Financials | | | L+1000 | | | | 1.0% | | | 7/22/17 | | | 782 | | | | 782 | | | | 782 | |
CLP Issuer, LLC | | | | Diversified Financials | | | L+1000 | | | | 1.0% | | | 8/19/17 | | | 917 | | | | 917 | | | | 917 | |
CLP Issuer, LLC | | | | Diversified Financials | | | L+1000 | | | | 1.0% | | | 9/23/17 | | | 794 | | | | 794 | | | | 794 | |
CLP Issuer, LLC | | | | Diversified Financials | | | L+1000 | | | | 1.0% | | | 10/21/17 | | | 1,582 | | | | 1,582 | | | | 1,582 | |
CLP Issuer, LLC | | | | Diversified Financials | | | L+1000 | | | | 1.0% | | | 11/18/17 | | | 814 | | | | 814 | | | | 814 | |
CLP Issuer, LLC | | | | Diversified Financials | | | L+1000 | | | | 1.0% | | | 12/30/17 | | | 2,625 | | | | 2,625 | | | | 2,625 | |
Commercial Barge Line Company | | | | Transportation | | | L+875 | | | | 1.0% | | | 11/12/20 | | | 52,479 | | | | 49,606 | | | | 49,680 | |
Compuware Corp. | | (e) | | Software & Services | | | L+525 | | | | 1.0% | | | 12/15/21 | | | 17,615 | | | | 16,979 | | | | 17,750 | |
Concordia Healthcare Corp. | | (e) | | Pharmaceuticals, Biotechnology & Life Sciences | | | L+500 | | | | 1.0% | | | 10/21/21 | | £ | 29,700 | | | | 43,427 | | | | 29,498 | |
See notes to consolidated financial statements.
2
FS Global Credit Opportunities Fund
Consolidated Schedule of Investments (continued)
As of December 31, 2016
(in thousands, except share amounts)
| | | | | | | | | | | | | | | | | | | | | | | | | | | | | | |
Portfolio Company(a) | | Footnotes | | | Industry | | Rate(b) | | | Floor | | | Maturity | | | Principal
Amount(c) | | | Amortized
Cost | | | Fair
Value(d) | |
Dayton Superior Corp. | | | | | | Materials | | | L+800 | | | | 1.0% | | | | 11/15/21 | | | $ | 7,000 | | | $ | 6,794 | | | $ | 7,053 | |
Diamond Resorts International, Inc. | | | (e) | | | Consumer Services | | | L+600 | | | | 1.0% | | | | 9/2/23 | | | | 19,950 | | | | 19,472 | | | | 20,041 | |
Drillships Ocean Ventures Inc. | | | | | | Transportation | | | L+450 | | | | 1.0% | | | | 7/25/21 | | | | 4,063 | | | | 3,473 | | | | 3,217 | |
Emerging Markets Communications, LLC | | | (e) | | | Telecommunication Services | | | L+575 | | | | 1.0% | | | | 7/1/21 | | | | 9,850 | | | | 9,220 | | | | 9,702 | |
Fairway Group Acquisition Co. | | | | | | Food & Staples Retailing | |
| 10.0% PIK
(10.0% Max PIK) |
| | | | | | | 1/3/20 | | | | 3,890 | | | | 3,890 | | | | 3,540 | |
Fairway Group Acquisition Co. | | | | | | Food & Staples Retailing | | | L+800 | | | | 1.0% | | | | 1/3/20 | | | | 6,029 | | | | 6,029 | | | | 6,089 | |
Forterra Finance, LLC | | | (e) | | | Materials | | | L+350 | | | | 1.0% | | | | 10/25/23 | | | | 5,134 | | | | 5,109 | | | | 5,204 | |
Getty Images, Inc. | | | (e) | | | Media | | | L+350 | | | | 1.3% | | | | 10/18/19 | | | | 20,891 | | | | 15,355 | | | | 18,297 | |
iHeartCommunications, Inc. | | | (e)(f) | | | Media | | | L+675 | | | | | | | | 1/30/19 | | | | 13,040 | | | | 10,152 | | | | 10,660 | |
iHeartCommunications, Inc. | | | | | | Media | | | L+750 | | | | | | | | 7/30/19 | | | | 9,229 | | | | 9,108 | | | | 7,552 | |
JSS Holdings, Inc. | | | | | | Capital Goods | | | L+650 | | | | 1.0% | | | | 8/31/21 | | | | 22,266 | | | | 21,120 | | | | 22,154 | |
LD Intermediate Holdings, Inc. | | | (e) | | | Software & Services | | | L+588 | | | | 1.0% | | | | 12/9/22 | | | | 30,000 | | | | 27,009 | | | | 27,900 | |
Meldrew Participations B.V. | | | (h) | | | Food, Beverage & Tobacco | |
| L+400, 350 PIK
(350 Max PIK) |
| | | 1.0% | | | | 10/31/19 | | | £ | 95 | | | | 144 | | | | 69 | |
MORSCO, Inc. | | | | | | Capital Goods | | | L+700 | | | | 1.0% | | | | 10/31/23 | | | $ | 20,000 | | | | 19,217 | | | | 20,200 | |
Neiman Marcus Group LTD LLC | | | (e) | | | Retailing | | | L+325 | | | | 1.0% | | | | 10/25/20 | | | | 5,786 | | | | 5,357 | | | | 5,052 | |
Novitex Acquisition, LLC | | | | | | Software & Services | | | L+675 | | | | 1.3% | | | | 7/7/20 | | | | 30,692 | | | | 29,568 | | | | 29,694 | |
Origami Owl, LLC | | | (i)(q) | | | Consumer Durables & Apparel | |
| L+650, 50 PIK
(50 Max PIK) |
| | | 3.0% | | | | 12/5/19 | | | | 21,894 | | | | 21,167 | | | | 6,459 | |
Origami Owl, LLC | | | (i)(q) | | | Consumer Durables & Apparel | |
| L+650, 50 PIK
(50 Max PIK) |
| | | 3.0% | | | | 12/5/19 | | | | 1,752 | | | | 1,676 | | | | 517 | |
Origami Owl, LLC | | | (g)(i)(q) | | | Consumer Durables & Apparel | |
| L+650, 50 PIK
(50 Max PIK) |
| | | 3.0% | | | | 12/5/19 | | | | 968 | | | | 968 | | | | 286 | |
Polycom, Inc. | | | (e) | | | Technology Hardware & Equipment | | | L+650 | | | | 1.0% | | | | 9/27/23 | | | | 9,671 | | | | 9,293 | | | | 9,755 | |
Precyse Acquisition Corp. | | | | | | Health Care Equipment & Services | | | L+550 | | | | 1.0% | | | | 10/19/22 | | | | 3,609 | | | | 3,561 | | | | 3,663 | |
Propulsion Acquisition, LLC | | | | | | Commercial & Professional Services | | | L+600 | | | | 1.0% | | | | 7/13/21 | | | | 17,883 | | | | 16,883 | | | | 17,526 | |
Reddy Ice Corp. | | | (e) | | | Food, Beverage & Tobacco | | | L+550 | | | | 1.3% | | | | 5/1/19 | | | | 2,420 | | | | 2,258 | | | | 2,374 | |
Scientific Games International, Inc. | | | (e) | | | Consumer Services | | | L+500 | | | | 1.0% | | | | 10/18/20 | | | | 9,898 | | | | 9,690 | | | | 10,039 | |
Scientific Games International, Inc. | | | (e) | | | Consumer Services | | | L+500 | | | | 1.0% | | | | 10/1/21 | | | | 9,912 | | | | 9,678 | | | | 10,050 | |
Seadrill Operating LP | | | (f) | | | Energy | | | L+300 | | | | 1.0% | | | | 2/21/21 | | | | 21,834 | | | | 16,800 | | | | 15,175 | |
SunGard Availability Services Capital, Inc. | | | (e) | | | Software & Services | | | L+500 | | | | 1.0% | | | | 3/29/19 | | | | 25,292 | | | | 23,677 | | | | 24,554 | |
Toys “R” Us-Delaware, Inc. | | | (e) | | | Retailing | | | L+875 | | | | 1.0% | | | | 4/24/20 | | | | 50,781 | | | | 46,363 | | | | 44,751 | |
Varsity Brands Holding Co., Inc. | | | (e) | | | Media | | | L+400 | | | | 1.0% | | | | 12/11/21 | | | | 9,188 | | | | 9,121 | | | | 9,339 | |
Victory Capital Operating, LLC | | | (e) | | | Diversified Financials | | | L+750 | | | | 1.0% | | | | 10/29/21 | | | | 2,187 | | | | 2,175 | | | | 2,222 | |
| | | | | | | | | | | | | | | | | | | | | | | | | | | | | | |
Total Senior Secured Loans—First Lien | | | | | | | | | | | | | | | | | | | | | | | | | 599,085 | | | | 573,809 | |
Unfunded Loan Commitments | | | | | | | | | | | | | | | | | | | | | | | | | (41,166 | ) | | | (41,166 | ) |
| | | | | | | | | | | | | | | | | | | | | | | | | | | | | | |
Net Senior Secured Loans—First Lien | | | | | | | | | | | | | | | | | | | | | | | | | 557,919 | | | | 532,643 | |
| | | | | | | | |
Senior Secured Loans—Second Lien—11.7% | | | | | | | | | | | | | | | | | | | | | | | | | | | | | | |
American Bath Group, LLC | | | | | | Capital Goods | | | L+975 | | | | 1.0% | | | | 9/30/24 | | | | 24,000 | | | | 22,111 | | | | 23,160 | |
BBB Industries US Holdings, Inc. | | | | | | Automobiles & Components | | | L+875 | | | | 1.0% | | | | 11/3/22 | | | | 10,000 | | | | 9,612 | | | | 9,750 | |
Colouroz Investment 2 LLC | | | (e) | | | Materials | | | L+725 | | | | 1.0% | | | | 9/5/22 | | | | 3,429 | | | | 3,409 | | | | 3,397 | |
Compuware Corp. | | | | | | Software & Services | | | L+825 | | | | 1.0% | | | | 12/15/22 | | | | 23,476 | | | | 20,989 | | | | 23,593 | |
DTZ U.S. Borrower, LLC | | | (e) | | | Real Estate | | | L+825 | | | | 1.0% | | | | 11/4/22 | | | | 533 | | | | 536 | | | | 534 | |
See notes to consolidated financial statements.
3
FS Global Credit Opportunities Fund
Consolidated Schedule of Investments (continued)
As of December 31, 2016
(in thousands, except share amounts)
| | | | | | | | | | | | | | | | | | | | | | |
Portfolio Company(a) | | Footnotes | | Industry | | Rate(b) | | Floor | | Maturity | | Principal
Amount(c) | | | Amortized
Cost | | | Fair
Value(d) | |
Fairway Group Acquisition Co. | | | | Food & Staples Retailing | | 11.0% PIK
(11.0% Max PIK) | | | | 10/3/21 | | $ | 3,388 | | | $ | 3,388 | | | $ | 2,778 | |
Inmar, Inc. | | | | Software & Services | | L+700 | | 1.0% | | 1/27/22 | | | 11,783 | | | | 11,715 | | | | 11,297 | |
IPS Intermediate Holdings Corporation | | (e)(f) | | Materials | | L+950 | | 1.0% | | 12/20/24 | | | 22,500 | | | | 21,263 | | | | 22,275 | |
Neff Rental LLC | | | | Capital Goods | | L+625 | | 1.0% | | 6/9/21 | | | 30,060 | | | | 28,705 | | | | 29,943 | |
Renaissance Learning, Inc. | | (e) | | Software & Services | | L+700 | | 1.0% | | 4/11/22 | | | 2,473 | | | | 2,454 | | | | 2,462 | |
Stadium Management Corp. | | | | Consumer Services | | L+825 | | 1.0% | | 2/27/21 | | | 987 | | | | 987 | | | | 985 | |
TNS, Inc. | | (e) | | Software & Services | | L+800 | | 1.0% | | 8/14/20 | | | 8,820 | | | | 8,787 | | | | 8,768 | |
UFC Holdings, LLC | | | | Media | | L+750 | | 1.0% | | 8/18/24 | | | 25,000 | | | | 24,761 | | | | 25,766 | |
| | | | | | | | | | | | | | | | | | | | | | |
Total Senior Secured Loans—Second Lien | | | | | | | | | | | | | | | | | 158,717 | | | | 164,708 | |
| | | | | | | | |
Senior Secured Bonds—26.2% | | | | | | | | | | | | | | | | | | | | | | |
Atrium Windows and Doors, Inc. | | (o)(p) | | Capital Goods | | 7.8% | | | | 5/1/19 | | | 11,658 | | | | 10,174 | | | | 10,820 | |
Avaya Inc. | | (o)(p) | | Technology Hardware & Equipment | | 7.0% | | | | 4/1/19 | | | 45,336 | | | | 34,740 | | | | 39,839 | |
Avaya Inc. | | (o)(p) | | Technology Hardware & Equipment | | 9.0% | | | | 4/1/19 | | | 408 | | | | 285 | | | | 362 | |
BlueLine Rental Finance Corp. | | (n)(o) | | Capital Goods | | 7.0% | | | | 2/1/19 | | | 11,458 | | | | 9,955 | | | | 11,248 | |
Caesars Entertainment Resort Properties, LLC | | (p) | | Consumer Services | | 8.0% | | | | 10/1/20 | | | 22,000 | | | | 21,695 | | | | 23,086 | |
CEDC Finance Corporation International, Inc. | | (i)(p)(q) | | Food, Beverage & Tobacco | | 10.0% | | | | 4/30/18 | | | 26,069 | | | | 25,093 | | | | 22,647 | |
CEVA Group Plc | | (o)(p) | | Transportation | | 7.0% | | | | 3/1/21 | | | 18,330 | | | | 18,218 | | | | 14,964 | |
CEVA Group Plc | | (o)(p) | | Transportation | | 9.0% | | | | 9/1/21 | | | 18,369 | | | | 17,666 | | | | 12,032 | |
CITGO Holding, Inc. | | (o)(p) | | Energy | | 10.8% | | | | 2/15/20 | | | 25,460 | | | | 24,559 | | | | 27,284 | |
EP Energy LLC | | (n)(o) | | Energy | | 8.0% | | | | 11/29/24 | | | 15,330 | | | | 15,493 | | | | 16,526 | |
Gogo Intermediate Holdings LLC | | (f)(n)(o) | | Software & Services | | 12.5% | | | | 7/1/22 | | | 74,000 | | | | 74,893 | | | | 80,660 | |
iHeartCommunications, Inc. | | (n) | | Media | | 9.0% | | | | 12/15/19 | | | 214 | | | | 171 | | | | 177 | |
iHeartCommunications, Inc. | | (n)(p) | | Media | | 9.0% | | | | 3/1/21 | | | 19,497 | | | | 14,933 | | | | 14,397 | |
iHeartCommunications, Inc. | | (p) | | Media | | 11.3% | | | | 3/1/21 | | | 2,143 | | | | 1,576 | | | | 1,643 | |
iHeartCommunications, Inc. | | (n)(p) | | Media | | 9.0% | | | | 9/15/22 | | | 16,448 | | | | 12,000 | | | | 12,108 | |
iHeartCommunications, Inc. | | (n)(p) | | Media | | 10.6% | | | | 3/15/23 | | | 19,701 | | | | 14,424 | | | | 14,924 | |
Intelsat Jackson Holdings S.A. | | (n)(o)(p) | | Telecommunication Services | | 8.0% | | | | 2/15/24 | | | 39,719 | | | | 39,728 | | | | 40,836 | |
Momentive Performance Materials Inc. | | (n) | | Materials | | 4.7% | | | | 4/24/22 | | | 11,408 | | | | 9,812 | | | | 9,968 | |
NES Rentals Holdings, Inc. | | (n)(o)(p) | | Capital Goods | | 7.9% | | | | 5/1/18 | | | 14,900 | | | | 13,106 | | | | 14,872 | |
Ridgeback Resources Inc. | | (n) | | Energy | | 12.0% | | | | 12/29/20 | | | 794 | | | | 778 | | | | 794 | |
| | | | | | | | | | | | | | | | | | | | | | |
Total Senior Secured Bonds | | | | | | | | | | | | | | | | | 359,299 | | | | 369,187 | |
| | | | | | | | |
Subordinated Debt—39.4% | | | | | | | | | | | | | | | | | | | | | | |
Aldermore Group PLC | | (r) | | Banks | | 8.5% | | | | 10/28/26 | | £ | 30,000 | | | | 36,636 | | | | 37,384 | |
Alta Mesa Holdings, LP | | (n)(o) | | Energy | | 7.9% | | | | 12/15/24 | | $ | 5,900 | | | | 5,900 | | | | 6,136 | |
Apex Tool Group, LLC | | (n)(o)(p) | | Capital Goods | | 7.0% | | | | 2/1/21 | | | 16,659 | | | | 13,368 | | | | 14,931 | |
Chesapeake Energy Corp. | | (o)(p) | | Energy | | 8.0% | | | | 1/15/25 | | | 16,280 | | | | 16,108 | | | | 16,616 | |
CIS General Insurance Ltd. | | (n) | | Insurance | | 12.0% | | | | 5/8/25 | | £ | 51,987 | | | | 79,160 | | | | 70,556 | |
Community Health Systems, Inc. | | (p) | | Health Care Equipment & Services | | 6.9% | | | | 2/1/22 | | $ | 6,633 | | | | 5,097 | | | | 4,635 | |
Diamond Resorts International, Inc. | | (n)(o) | | Consumer Services | | 10.8% | | | | 9/1/24 | | | 27,360 | | | | 26,700 | | | | 26,836 | |
Eclipse Resources Corp. | | (n) | | Energy | | 8.9% | | | | 7/15/23 | | | 4,150 | | | | 4,024 | | | | 4,330 | |
Enviva Partners, LP | | (n)(o) | | Energy | | 8.5% | | | | 11/1/21 | | | 25,000 | | | | 25,000 | | | | 26,187 | |
Frontier Communications Corp. | | (n)(p) | | Telecommunication Services | | 10.5% | | | | 9/15/22 | | | 13,000 | | | | 13,372 | | | | 13,622 | |
Frontier Communications Corp. | | (p) | | Telecommunication Services | | 11.0% | | | | 9/15/25 | | | 41,000 | | | | 42,003 | | | | 42,256 | |
See notes to consolidated financial statements.
4
FS Global Credit Opportunities Fund
Consolidated Schedule of Investments (continued)
As of December 31, 2016
(in thousands, except share amounts)
| | | | | | | | | | | | | | | | | | | | | | | | | | | | | | |
Portfolio Company(a) | | Footnotes | | | Industry | | Rate(b) | | | Floor | | | Maturity | | | Principal
Amount(c) | | | Amortized
Cost | | | Fair
Value(d) | |
iHeartCommunications, Inc. | | | (n)(p) | | | Media | |
| 12.0%, 2.0% PIK
(2.0% Max PIK) |
| | | | | | | 2/1/21 | | | $ | 39,767 | | | $ | 17,634 | | | $ | 15,186 | |
Intelsat Jackson Holdings S.A. | | | (p) | | | Telecommunication Services | | | 7.3% | | | | | | | | 10/15/20 | | | | 19,324 | | | | 14,133 | | | | 15,061 | |
Intelsat Jackson Holdings S.A. | | | (n)(p) | | | Telecommunication Services | | | 7.5% | | | | | | | | 4/1/21 | | | | 18,136 | | | | 13,590 | | | | 13,840 | |
Intelsat Jackson Holdings S.A. | | | (n)(p) | | | Telecommunication Services | | | 5.5% | | | | | | | | 8/1/23 | | | | 35,482 | | | | 23,600 | | | | 24,150 | |
Northern Oil and Gas, Inc. | | | (n)(p) | | | Energy | | | 8.0% | | | | | | | | 6/1/20 | | | | 33,443 | | | | 27,972 | | | | 27,327 | |
Ocean Rig UDW Inc. | | | (m)(n)(o) | | | Energy | | | 7.3% | | | | | | | | 4/1/19 | | | | 10,000 | | | | 9,642 | | | | 3,825 | |
PriSo Acquisition Corp. | | | (o)(p) | | | Capital Goods | | | 9.0% | | | | | | | | 5/15/23 | | | | 36,867 | | | | 36,564 | | | | 37,051 | |
Samson Investment Co. | | | (i)(n)(q) | | | Energy | | | 9.8% | | | | | | | | 2/15/20 | | | | 113,884 | | | | 6,154 | | | | 5,769 | |
SolarCity Corporation | | | (p) | | | Capital Goods | | | 1.6% | | | | | | | | 11/1/19 | | | | 50,619 | | | | 37,194 | | | | 42,994 | |
SunGard Availability Services Capital, Inc. | | | (n)(o)(p) | | | Software & Services | | | 8.8% | | | | | | | | 4/1/22 | | | | 40,449 | | | | 27,756 | | | | 27,858 | |
Valeant Pharmaceuticals International, Inc. | | | (o)(p) | | | Pharmaceuticals, Biotechnology & Life Sciences | | | 6.8% | | | | | | | | 8/15/18 | | | | 8,000 | | | | 7,617 | | | | 7,593 | |
Valeant Pharmaceuticals International, Inc. | | | (n)(o) | | | Pharmaceuticals, Biotechnology & Life Sciences | | | 5.4% | | | | | | | | 3/15/20 | | | | 6,250 | | | | 5,421 | | | | 5,301 | |
Valeant Pharmaceuticals International, Inc. | | | (n)(o)(p) | | | Pharmaceuticals, Biotechnology & Life Sciences | | | 5.5% | | | | | | | | 3/1/23 | | | | 6,035 | | | | 5,053 | | | | 4,541 | |
Valeant Pharmaceuticals International, Inc. | | | (o)(p) | | | Pharmaceuticals, Biotechnology & Life Sciences | | | 5.9% | | | | | | | | 5/15/23 | | | | 7,163 | | | | 5,624 | | | | 5,421 | |
Valeant Pharmaceuticals International, Inc. | | | (o)(p) | | | Pharmaceuticals, Biotechnology & Life Sciences | | | 6.1% | | | | | | | | 4/15/25 | | | | 20,545 | | | | 16,438 | | | | 15,499 | |
Western Digital Corp. | | | (o)(p) | | | Technology Hardware & Equipment | | | 10.5% | | | | | | | | 4/1/24 | | | | 34,290 | | | | 34,449 | | | | 40,524 | |
| | | | | | | | | | | | | | | | | | | | | | | | | | | | | | |
Total Subordinated Debt | | | | | | | | | | | | | | | | | | | | | | | | | 556,209 | | | | 555,429 | |
| | | | | | | | |
Collateralized Securities—3.4% | | | | | | | | | | | | | | | | | | | | | | | | | | | | | | |
Cedar Funding IV CLO Ltd. 2014-4A Class Subord. | | | (n)(o) | | | Diversified Financials | | | 16.7% | | | | | | | | 10/23/26 | | | | 1,000 | | | | 700 | | | | 864 | |
CGMS CLO 2014-1A, Ltd. Class Subord. | | | (n)(o) | | | Diversified Financials | | | 12.9% | | | | | | | | 4/17/25 | | | | 8,000 | | | | 5,240 | | | | 6,167 | |
CGMS CLO 2015-1A, Ltd. Class Subord. | | | (n)(o) | | | Diversified Financials | | | 15.8% | | | | | | | | 4/20/27 | | | | 5,000 | | | | 3,094 | | | | 3,333 | |
Deutsche Bank AG Frankfurt Credit-Linked Notes | | | (n)(o) | | | Diversified Financials | | | 13.4% | | | | | | | | 1/28/24 | | | | 30,000 | | | | 29,844 | | | | 30,300 | |
Palmer Square CLO 2015-1A, Ltd. Class Subord. | | | (n)(o) | | | Diversified Financials | | | 17.9% | | | | | | | | 5/21/27 | | | | 1,000 | | | | 672 | | | | 780 | |
THL Credit Wind River 2013-2A CLO Ltd. Income Notes | | | (n)(o) | | | Diversified Financials | | | 16.8% | | | | | | | | 1/18/26 | | | | 6,000 | | | | 3,437 | | | | 4,012 | |
VOYA CLO 2014-3A, Ltd. Class Subord. | | | (n)(o) | | | Diversified Financials | | | 14.7% | | | | | | | | 7/25/26 | | | | 5,000 | | | | 2,889 | | | | 2,800 | |
| | | | | | | | | | | | | | | | | | | | | | | | | | | | | | |
Total Collateralized Securities | | | | | | | | | | | | | | | | | | | | | | | | | 45,876 | | | | 48,256 | |
See notes to consolidated financial statements.
5
FS Global Credit Opportunities Fund
Consolidated Schedule of Investments (continued)
As of December 31, 2016
(in thousands, except share amounts)
| | | | | | | | | | | | | | | | | | | | | | | | |
Portfolio Company(a) | | Footnotes | | | Industry | | | Rate(b) | | | Number of
Shares /
Contracts | | | Cost | | | Fair
Value(d) | |
Equity/Other—11.6% | | | | | | | | | | | | | | | | |
Aspect Software, Inc., Common Equity | | | (i)(t) | | | | Software & Services | | | | | | | | 795,816 | | | $ | 38,419 | | | $ | 43,452 | |
Cheniere Energy Partners LP Holdings, LLC, Common Equity | | | (n) | | | | Energy | | | | | | | | 190,077 | | | | 3,580 | | | | 4,252 | |
Enviva Partners, LP, Common Equity | | | (n) | | | | Energy | | | | | | | | 656,974 | | | | 11,243 | | | | 17,607 | |
Fairway Group Acquisition Co., Common Equity | | | (i) | | | | Food & Staples Retailing | | | | | | | | 76,517 | | | | 2,458 | | | | 1,989 | |
Federal Home Loan Mortgage Corp., Preferred Equity | | | (i)(n) | | | | Real Estate | | | | 5.1% | | | | 5,915 | | | | 44 | | | | 68 | |
Federal Home Loan Mortgage Corp., Series F Preferred Equity | | | (i)(n) | | | | Real Estate | | | | 5.0% | | | | 18,232 | | | | 303 | | | | 218 | |
Federal Home Loan Mortgage Corp., Series S Preferred Equity | | | (i)(n) | | | | Real Estate | | | | 4.0% | | | | 27,893 | | | | 204 | | | | 321 | |
Federal Home Loan Mortgage Corp., Series V Preferred Equity | | | (i)(n) | | | | Real Estate | | | | 5.6% | | | | 66,000 | | | | 632 | | | | 389 | |
Federal Home Loan Mortgage Corp., Series X Preferred Equity | | | (i)(n) | | | | Real Estate | | | | 6.0% | | | | 235,388 | | | | 1,018 | | | | 1,459 | |
Federal Home Loan Mortgage Corp., Series Z Preferred Equity | | | (i)(n) | | | | Real Estate | | | | 7.9% | | | | 2,994,355 | | | | 12,520 | | | | 22,638 | |
Federal National Mortgage Association, Series 2004-1 Preferred Equity | | | (i)(n) | | | | Real Estate | | | | 5.4% | | | | 48 | | | | 810 | | | | 1,224 | |
Federal National Mortgage Association, Series F Preferred Equity | | | (i)(n) | | | | Real Estate | | | | CMT-16 | | | | 15,106 | | | | 263 | | | | 196 | |
Federal National Mortgage Association, Series H Preferred Equity | | | (i)(n) | | | | Real Estate | | | | 5.8% | | | | 25,804 | | | | 392 | | | | 325 | |
Federal National Mortgage Association, Series R Preferred Equity | | | (i)(n) | | | | Real Estate | | | | 7.6% | | | | 66,000 | | | | 624 | | | | 525 | |
Federal National Mortgage Association, Series S Preferred Equity | | | (i)(n) | | | | Real Estate | | | | 7.8% | | | | 2,193,127 | | | | 9,407 | | | | 17,545 | |
Federal National Mortgage Association, Series T Preferred Equity | | | (i)(n) | | | | Real Estate | | | | 8.3% | | | | 146,326 | | | | 862 | | | | 1,156 | |
iStar Inc., Series D Preferred Equity | | | (n) | | | | Real Estate | | | | 8.0% | | | | 69,228 | | | | 1,558 | | | | 1,695 | |
iStar Inc., Series G Preferred Equity | | | (n) | | | | Real Estate | | | | 7.7% | | | | 7,045 | | | | 159 | | | | 169 | |
iStar Inc., Series I Preferred Equity | | | (n) | | | | Real Estate | | | | 7.5% | | | | 155,730 | | | | 3,466 | | | | 3,738 | |
Ridgeback Resources Inc., Common Equity | | | (i) | | | | Energy | | | | | | | | 1,960,162 | | | | 12,044 | | | | 12,044 | |
TE Holdings, LLC, 8.0% PIK, Preferred Equity | | | (i) | | | | Energy | | |
| 8.0% PIK (8.0%
Max PIK) |
| | | 216,711 | | | | 2,164 | | | | 3,251 | |
TE Holdings, LLC, Common Equity | | | (i)(s) | | | | Energy | | | | | | | | 326,925 | | | | 2,779 | | | | 2,452 | |
Warrior Met Coal, LLC, Common Equity, Class A Units | | | (i) | | | | Materials | | | | | | | | 20,804 | | | | 2,278 | | | | 7,281 | |
Warrior Met Coal, LLC, Common Equity, Class B Units | | | (i) | | | | Materials | | | | | | | | 47,983 | | | | 3,398 | | | | 17,034 | |
White Star Petroleum Holdings, LLC, Common Equity | | | (i)(s) | | | | Energy | | | | | | | | 2,969,914 | | | | 2,524 | | | | 2,896 | |
| | | | | | | | | | | | | | | | | | | | | | | | |
Total Equity/Other | | | | | | | | | | | | | | | | | | | 113,149 | | | | 163,924 | |
| | | | | | | | | | | | | | | | | | | | | | | | |
TOTAL INVESTMENTS—130.0% | | | | | | | | | | | | | | | | | | $ | 1,791,169 | | | | 1,834,147 | |
| | | | | | | | | | | | | | | | | | | | | | | | |
Liabilities in Excess of Other Assets—(30.0%) | | | (j) | | | | | | | | | | | | | | | | | | | | (423,474 | ) |
| | | | | | | | | | | | | | | | | | | | | | | | |
NET ASSETS—100.0% | | | | | | | | | | | | | | | | | | | | | | $ | 1,410,673 | |
| | | | | | | | | | | | | | | | | | | | | | | | |
See notes to consolidated financial statements.
6
FS Global Credit Opportunities Fund
Consolidated Schedule of Investments (continued)
As of December 31, 2016
(in thousands, except share amounts)
| | | | | | | | | | | | | | | | | | | | | | | | |
Forward Foreign Currency Exchange Contracts | | | | | | | | |
Counterparty | | Contract Settlement
Date | | | Currency to be
Received | | | Value | | | Currency to be
Delivered | | | Value | | | Unrealized
Appreciation
(Depreciation) | |
JPMorgan Chase Bank, N.A. | | | 1/17/17 | | | | USD | | | | 12,236 | | | | CAD | | | | 16,450 | | | $ | (18 | ) |
JPMorgan Chase Bank, N.A. | | | 1/17/17 | | | | USD | | | | 43,029 | | | | EUR | | | | 40,000 | | | $ | 782 | |
JPMorgan Chase Bank, N.A. | | | 1/17/17 | | | | USD | | | | 117,934 | | | | GBP | | | | 95,000 | | | $ | 676 | |
| | | | | | | | | | | | | | | | | | | | |
Credit Default Swaps on Corporate Issues—Buy Protection | | | | | | | | | | |
Reference Entity | | Counterparty | | Implied Credit
Spread at
December 31, 2016(k) | | | Industry | | Fixed
Deal
Pay
Rate | | Maturity | | Notional(l) | | Fair
Value(d) | | Unamortized
Premiums
Paid | | Unrealized
Appreciation
(Depreciation) |
Hovnanian Enterprises, Inc. | | JPMorgan Chase Bank, N.A. | | | 13.2 | % | | Consumer Durables & Apparel | | 5.0% | | 9/20/19 | | $(5,000) | | $859 | | $796 | | $63 |
Hovnanian Enterprises, Inc. | | JPMorgan Chase Bank, N.A. | | | 13.7 | % | | Consumer Durables & Apparel | | 5.0% | | 12/20/19 | | (2,000) | | 388 | | 371 | | 17 |
| (a) | Security may be an obligation of one or more entities affiliated with the named company. |
| (b) | Certain variable rate securities in FS Global Credit Opportunities Fund’s (the “Fund”) portfolio bear interest at a rate determined by a publicly disclosed base rate plus a basis point spread. As of December 31, 2016, the three-month London Interbank Offered Rate (“L”) was 1.00% and the two-year Constant Maturity Treasury Rate (“CMT”) was 1.20%. |
| (c) | Denominated in U.S. dollars, unless otherwise noted. |
| (d) | Fair value is determined by the Fund’s board of trustees. See Note 2 for information on the Fund’s policy regarding valuation of investments, fair value hierarchy levels and other significant accounting policies. |
| (e) | Security or portion thereof held by Dauphin Funding LLC (“Dauphin Funding”), a wholly-owned subsidiary of the Fund, and is pledged as collateral supporting the amounts outstanding under Dauphin Funding’s revolving credit facility with Deutsche Bank AG, New York Branch (see Note 9). |
| (f) | Position or portion thereof unsettled as of December 31, 2016. |
| (g) | Security is an unfunded loan commitment. |
| (h) | Security or portion thereof held by FS Global Credit Opportunities (Luxembourg) S.à r.l., a wholly-owned subsidiary of the Fund. |
See notes to consolidated financial statements.
7
FS Global Credit Opportunities Fund
Consolidated Schedule of Investments (continued)
As of December 31, 2016
(in thousands, except share amounts)
| (i) | Security is non-income producing. |
| (j) | Includes the effect of credit default swap positions and forward foreign currency exchange contracts. |
| (k) | Implied credit spread, represented in absolute terms, utilized in determining the fair value of the credit default swap agreements as of period end serves as an indicator of the current status of the payment/performance risk and represents the likelihood or risk of default for the credit derivative. The implied credit spread of a particular reference entity reflects the cost of buying/selling protection and may include upfront payments required in connection with the entrance into the agreement. Wider credit spreads generally represent a deterioration of the reference entity’s credit soundness and a greater likelihood or risk of default or other credit event occurring, as defined under the terms of the applicable agreement. |
| (l) | The maximum potential amount the Fund could receive as a buyer of credit protection if a credit event occurs, as defined under the terms of the applicable agreement. |
| (m) | Security or portion thereof on loan as of December 31, 2016. |
| (n) | Security or portion thereof pledged as collateral supporting the amounts outstanding under the Fund’s prime brokerage facility with JPMorgan Chase Bank, N.A. |
| (o) | Restricted security as to resale. As of December 31, 2016, the Fund held 39.4% of its net assets, with a fair value of $556,018, in restricted securities. |
| (p) | Security or portion thereof held by Bucks Funding, a wholly-owned subsidiary of the Fund, and is pledged as collateral supporting the amounts outstanding under Bucks Funding’s prime brokerage facility with BNP Paribas Prime Brokerage International, Ltd. (“BNP PBIL”). Securities held by Bucks Funding may be rehypothecated from time to time as permitted by Rule 15c-1(a)(1) promulgated under the Securities Exchange Act of 1934, as amended, subject to the terms and conditions governing Bucks Funding’s prime brokerage facility with BNP PBIL (see Note 9). |
| (q) | Security was on non-accrual status as of December 31, 2016. |
| (r) | Security or portion thereof held by FS Global Credit Opportunities Fund (Cayman), a wholly-owned subsidiary of the Fund. |
| (s) | Security held within FS Global Investments, Inc., a wholly-owned subsidiary of the Fund. |
| (t) | Under the Investment Company Act of 1940, as amended, the Fund generally is deemed to be an “affiliated person” of a portfolio company if it owns 5% or more of the portfolio company’s voting securities and generally is deemed to “control” a portfolio company if it owns more than 25% of the portfolio company’s voting securities or it has the power to exercise control over the management or policies of such portfolio company. As of December 31, 2016, the Fund held investments in one portfolio company of which it is deemed to be an “affiliated person” but is not deemed to “control”. The following table presents certain information with respect to such portfolio company for the year ended December 31, 2016: |
See notes to consolidated financial statements.
8
FS Global Credit Opportunities Fund
Consolidated Schedule of Investments (continued)
As of December 31, 2016
(in thousands, except share amounts)
| | | | | | | | | | | | | | | | | | | | | | | | | | | | | | | | | | | | | | | | |
Portfolio Company | | Fair Value at
December 31,
2015 | | | Purchases and
Paid-in-kind
Interest | | | Sales and
Redemptions | | | Accretion of
Discount | | | Net Realized
Gain (Loss) | | | Net Change in
Unrealized
Appreciation
(Depreciation) | | | Fair Value at
December 31,
2016 | | | Interest
Income | | | Fee
Income | | | Dividend
Income | |
Senior Secured Loans—First Lien | | | | | | | | | | | | | | | | | | | | | | | | | | | | | | | | | | | | | | | | |
Aspect Software, Inc.(1) | | | — | | | $ | 2,276 | | | | — | | | | — | | | | — | | | | — | | | $ | 2,276 | | | $ | 78 | | | $ | 149 | | | | — | |
Aspect Software, Inc. | | | — | | | $ | 7,183 | | | $ | (90 | ) | | | — | | | | — | | | $ | 80 | | | $ | 7,173 | | | $ | 468 | | | | — | | | | — | |
Subordinated Debt | | | | | | | | | | | | | | | | | | | | | | | | | | | | | | | | | | | | | | | | |
Aspect Software, Inc. | | | — | | | $ | 5,709 | | | $ | (8,420 | ) | | | | | | $ | 2,711 | | | | — | | | | — | | | $ | 86 | | | | — | | | | — | |
Equity/Other | | | | | | | | | | | | | | | | | | | | | | | | | | | | | | | | | | | | | | | | |
Aspect Software, Inc., Common Equity | | | — | | | $ | 38,419 | | | | — | | | | — | | | | — | | | $ | 5,033 | | | $ | 43,452 | | | | — | | | | — | | | | — | |
| (1) | Security includes a partially unfunded commitment with an amortized cost of $78 and a fair value of $78. |
See notes to consolidated financial statements.
9
FS Global Credit Opportunities Fund
Consolidated Statement of Assets and Liabilities
(in thousands, except share and per share amounts)
| | | | |
| | | December 31, 2016 | |
Assets | | | | |
Investments, at fair value—unaffiliated (amortized cost—$1,743,381)(1) | | $ | 1,781,246 | |
Investments, at fair value—affiliated (amortized cost—$47,788) | | | 52,901 | |
Cash | | | 39,141 | |
Foreign currency (cost—$45,629) | | | 44,349 | |
Interest receivable | | | 31,853 | |
Collateral held at broker for open swap contracts | | | 3,745 | |
Receivable for investments sold and repaid | | | 14,872 | |
Collateral held for securities loaned | | | 109 | |
Expense reimbursement due from sponsor(2) | | | 124 | |
Unamortized swap premiums paid | | | 1,167 | |
Unrealized appreciation on credit default swaps | | | 80 | |
Unrealized appreciation on forward foreign currency exchange contracts | | | 1,458 | |
Deferred financing costs | | | 405 | |
| | | | |
Total assets | | $ | 1,971,450 | |
| | | | |
Liabilities | | | | |
Obligation to return collateral held for securities loaned | | $ | 109 | |
Payable for investments purchased | | | 34,084 | |
Credit facilities payable (net of deferred financing costs—$25) | | | 320,575 | |
Cash due to broker | | | 186,630 | |
Interest expense payable | | | 4,377 | |
Shareholder distributions payable | | | 1,370 | |
Management fees payable | | | 10,057 | |
Administrative services expense payable | | | 225 | |
Accounting and administrative fees payable | | | 89 | |
Professional fees payable | | | 263 | |
Trustees’ fees payable | | | 221 | |
Unrealized depreciation on forward foreign currency exchange contracts | | | 18 | |
Other accrued expenses and liabilities | | | 2,759 | |
| | | | |
Total liabilities | | $ | 560,777 | |
| | | | |
Net assets | | $ | 1,410,673 | |
| | | | |
Commitments and contingencies—($8,607)(3) | | | | |
| |
Composition of net assets | | | | |
Common shares, $0.001 par value, unlimited shares authorized, 174,763,703 shares issued and outstanding | | $ | 175 | |
Capital in excess of par value | | | 1,499,469 | |
Accumulated net realized gain (loss)(4) | | | (154,354 | ) |
Accumulated net investment income(4) | | | 16,891 | |
Net unrealized appreciation (depreciation) | | | 48,492 | |
| | | | |
Net assets | | $ | 1,410,673 | |
| | | | |
Net asset value per common share at period end | | $ | 8.07 | |
| (1) | Includes fair value of securities on loan of $104. |
| (2) | See Note 4 for a discussion of reimbursements payable to the Fund by its investment adviser and affiliates. |
| (3) | See Note 11 for a discussion of the Fund’s commitments and contingencies. |
| (4) | See Note 5 for a discussion of the sources of distributions declared by the Fund. |
See notes to consolidated financial statements.
10
FS Global Credit Opportunities Fund
Consolidated Statement of Operations
(in thousands)
| | | | |
| | | Year Ended
December 31, 2016 | |
Investment income | | | | |
Interest income—unaffiliated | | $ | 160,330 | |
Interest income—affiliated | | | 632 | |
Dividend income—unaffiliated | | | 1,332 | |
Fee income—unaffiliated | | | 8,077 | |
Fee income—affiliated | | | 149 | |
Securities lending income—unaffiliated | | | 293 | |
| | | | |
Total investment income | | | 170,813 | |
| | | | |
Operating expenses | | | | |
Management fees | | | 34,722 | |
Incentive fees | | | 3,301 | |
Administrative services expenses | | | 1,315 | |
Accounting and administrative fees | | | 1,180 | |
Interest expense | | | 10,615 | |
Professional fees | | | 236 | |
Trustees’ fees | | | 504 | |
Other general and administrative expenses | | | 1,412 | |
| | | | |
Total operating expenses | | | 53,285 | |
Less: Expense reimbursement from sponsor(1) | | | (8,585 | ) |
| | | | |
Net operating expenses | | | 44,700 | |
| | | | |
Net investment income before taxes | | | 126,113 | |
Excise taxes | | | 843 | |
| | | | |
Net investment income (loss) | | | 125,270 | |
| | | | |
Realized and unrealized gain/loss | | | | |
Net realized gain (loss) on investments—unaffiliated | | | (81,697 | ) |
Net realized gain (loss) on investments—affiliated | | | 2,711 | |
Net realized gain (loss) on credit default swaps | | | (7,218 | ) |
Net realized gain (loss) on forward foreign currency exchange contracts | | | 11,586 | |
Net realized gain (loss) on foreign currency | | | 5,747 | |
Net change in unrealized appreciation (depreciation) on investments—unaffiliated | | | 229,481 | |
Net change in unrealized appreciation (depreciation) on investments—affiliated | | | 5,113 | |
Net change in unrealized appreciation (depreciation) on credit default swaps | | | (1,190 | ) |
Net change in unrealized appreciation (depreciation) on forward foreign currency exchange contracts | | | 1,440 | |
Net change in unrealized gain (loss) on foreign currency | | | 818 | |
| | | | |
Total net realized gain (loss) and unrealized appreciation (depreciation) | | | 166,791 | |
| | | | |
Net increase (decrease) in net assets resulting from operations | | $ | 292,061 | |
| | | | |
| (1) | See Note 4 for a discussion of reimbursements paid to the Fund by its investment adviser and affiliates. |
See notes to consolidated financial statements.
11
FS Global Credit Opportunities Fund
Consolidated Statements of Changes in Net Assets
(in thousands)
| | | | | | | | |
| | | Year Ended
December 31, | |
| | | 2016 | | | 2015 | |
Operations | | | | | | | | |
Net investment income (loss) | | $ | 125,270 | | | $ | 86,589 | |
Net realized gain (loss) | | | (68,871 | ) | | | (67,269 | ) |
Net change in unrealized appreciation (depreciation) on investments | | | 234,594 | | | | (141,410 | ) |
Net change in unrealized appreciation (depreciation) on credit default swaps | | | (1,190 | ) | | | 2,486 | |
Net change in unrealized appreciation (depreciation) on options written | | | — | | | | 1,333 | |
Net change in unrealized appreciation (depreciation) on forward foreign currency exchange contracts | | | 1,440 | | | | — | |
Net change in unrealized gain (loss) on foreign currency | | | 818 | | | | 1,249 | |
Net change in unrealized appreciation (depreciation) on investments sold short | | | — | | | | (185 | ) |
| | | | | | | | |
Net increase (decrease) in net assets resulting from operations | | | 292,061 | | | | (117,207 | ) |
| | | | | | | | |
Shareholder distributions(1) | | | | | | | | |
Distributions from net investment income | | | (126,479 | ) | | | (86,589 | ) |
| | | | | | | | |
Net decrease in net assets resulting from shareholder distributions | | | (126,479 | ) | | | (86,589 | ) |
| | | | | | | | |
Capital share transactions | | | | | | | | |
Issuance of common shares(2) | | | 331,426 | | | | 545,947 | |
Repurchases of common shares(2) | | | (12,105 | ) | | | — | |
| | | | | | | | |
Net increase in net assets resulting from capital share transactions | | | 319,321 | | | | 545,947 | |
| | | | | | | | |
Total increase in net assets | | | 484,903 | | | | 342,151 | |
Net assets at beginning of period | | | 925,770 | | | | 583,619 | |
| | | | | | | | |
Net assets at end of period | | $ | 1,410,673 | | | $ | 925,770 | |
| | | | | | | | |
Accumulated net investment income(1) | | $ | 16,891 | | | $ | 6,713 | |
| | | | | | | | |
| (1) | See Note 5 for a discussion of the sources of distributions declared by the Fund. |
| (2) | See Note 3 for a discussion of transactions with respect to the Fund’s common shares for the years ended December 31, 2016 and 2015. |
See notes to consolidated financial statements.
12
FS Global Credit Opportunities Fund
Consolidated Statement of Cash Flows
(in thousands)
| | | | |
| | | Year Ended
December 31, 2016 | |
Cash flows from operating activities | | | | |
Net increase (decrease) in net assets resulting from operations | | $ | 292,061 | |
Adjustments to reconcile net increase (decrease) in net assets resulting from operations to net cash used in operating activities: | | | | |
Purchases of investments | | | (1,959,810 | ) |
Paid-in-kind interest | | | (997 | ) |
Proceeds from sales and repayments of investments | | | 1,350,215 | |
Premiums paid on credit default swaps—buy, net | | | 12,243 | |
Premiums received on credit default swaps—sell, net | | | (1,374 | ) |
Net realized (gain) loss on investments | | | 78,986 | |
Net change in unrealized (appreciation) depreciation on investments | | | (234,594 | ) |
Net change in unrealized (appreciation) depreciation on credit default swaps | | | 1,190 | |
Net change in unrealized (appreciation) depreciation on forward foreign currency exchange contracts | | | (1,440 | ) |
Accretion of discount | | | (32,191 | ) |
Amortization of deferred financing costs | | | 705 | |
(Gain) loss on borrowings in foreign currency | | | (5,283 | ) |
(Increase) decrease in collateral held at broker for open swap contracts | | | (2,251 | ) |
(Increase) decrease in expense reimbursement due from sponsor(1) | | | 6,980 | |
(Increase) decrease in receivable for investments sold and repaid | | | (1,622 | ) |
(Increase) decrease in interest receivable | | | (13,216 | ) |
(Increase) decrease in receivable on credit default swaps | | | 22 | |
(Increase) decrease in prepaid expenses | | | 5 | |
Increase (decrease) in payable for investments purchased | | | 24,366 | |
Increase (decrease) in cash due to broker | | | 150,988 | |
Increase (decrease) in interest expense payable | | | 3,579 | |
Increase (decrease) in management fees payable | | | 3,141 | |
Increase (decrease) in administrative services expense payable | | | (32 | ) |
Increase (decrease) in accounting and administrative fees payable | | | (136 | ) |
Increase (decrease) in professional fees payable | | | (301 | ) |
Increase (decrease) in trustees’ fees payable | | | (244 | ) |
Increase (decrease) in other accrued expenses and liabilities | | | 1,898 | |
| | | | |
Net cash used in operating activities | | | (327,112 | ) |
| | | | |
Cash flows from financing activities | | | | |
Issuance of common shares | | | 343,489 | |
Repurchases of common shares | | | (12,105 | ) |
Shareholder distributions | | | (125,731 | ) |
Borrowings under credit facilities(2) | | | 65,000 | |
Repayments under credit facilities | | | (50,000 | ) |
Deferred financing costs paid | | | (700 | ) |
| | | | |
Net cash provided by financing activities | | | 219,953 | |
| | | | |
Total increase (decrease) in cash(3) | | | (107,159 | ) |
Cash at beginning of period | | | 190,649 | |
| | | | |
Cash at end of period(4) | | $ | 83,490 | |
| | | | |
| (1) | See Note 4 for a discussion of reimbursements paid to the Fund by its investment adviser and affiliates. |
| (2) | See Note 9 for a discussion of the Fund’s financing arrangements. During the year ended December 31, 2016, the Fund paid $3,679 of interest expense on the financing arrangements and paid $2,652 on amounts due to broker. |
| (3) | Includes net change in unrealized gain (loss) on foreign currency of $3,292. |
| (4) | Balance includes foreign currency. |
See notes to consolidated financial statements.
13
FS Global Credit Opportunities Fund
Consolidated Financial Highlights
(in thousands, except share and per share amounts)
| | | | | | | | | | | | | | | | |
| | | Year Ended
December 31, 2016 | | | Year Ended
December 31, 2015 | | | Year Ended
December 31, 2014 | | | Period from
December 12, 2013
(Commencement
of Operations) to
December 31, 2013 | |
Per Share Data:(1) | | | | | | | | | | | | | | | | |
Net asset value, beginning of period | | $ | 7.11 | | | $ | 8.91 | | | $ | 10.02 | | | $ | 10.00 | |
Results of operations | | | | | | | | | | | | | | | | |
Net investment income (loss)(2)(3) | | | 0.80 | | | | 0.87 | | | | 0.87 | | | | — | |
Net realized gain (loss) and unrealized appreciation (depreciation) | | | 0.97 | | | | (1.80 | ) | | | (1.11 | ) | | | 0.07 | |
| | | | | | | | | | | | | | | | |
Net increase (decrease) in net assets resulting from operations | | | 1.77 | | | | (0.93 | ) | | | (0.24 | ) | | | (0.07 | ) |
| | | | | | | | | | | | | | | | |
Shareholder distributions(4) | | | | | | | | | | | | | | | | |
Distributions from net investment income | | | (0.81 | ) | | | (0.87 | ) | | | (0.87 | ) | | | (0.05 | ) |
| | | | | | | | | | | | | | | | |
Net decrease in net assets resulting from shareholder distributions | | | (0.81 | ) | | | (0.87 | ) | | | (0.87 | ) | | | (0.05 | ) |
| | | | | | | | | | | | | | | | |
Net asset value, end of period | | $ | 8.07 | | | $ | 7.11 | | | $ | 8.91 | | | $ | 10.02 | |
| | | | | | | | | | | | | | | | |
Shares outstanding, end of period | | | 174,763,703 | | | | 130,181,842 | | | | 65,529,194 | | | | 4,857,035 | |
| | | | | | | | | | | | | | | | |
Total return(5)(6) | | | 26.66 | % | | | (11.37 | )% | | | (2.94 | )% | | | 0.65 | % |
| | | | | | | | | | | | | | | | |
Ratio/Supplemental Data: | | | | | | | | | | | | | | | | |
Net assets, end of period | | $ | 1,410,673 | | | $ | 925,770 | | | $ | 583,619 | | | $ | 48,644 | |
| | | | | | | | | | | | | | | | |
Ratio of net investment income (loss) to average net assets(7)(8) | | | 10.84 | % | | | 10.53 | % | | | 9.01 | % | | | (0.41 | )% |
| | | | | | | | | | | | | | | | |
Ratio of total operating expenses to average net assets(7) | | | 4.61 | % | | | 4.69 | % | | | 3.72 | % | | | 9.36 | % |
Ratio of expense reimbursement from sponsor to average net assets(7) | | | (0.74 | )% | | | (1.51 | )% | | | (3.10 | )% | | | (8.53 | )% |
| | | | | | | | | | | | | | | | |
Ratio of net operating expenses to average net assets(7) | | | 3.87 | % | | | 3.18 | % | | | 0.62 | % | | | 0.83 | % |
| | | | | | | | | | | | | | | | |
Portfolio turnover(6) | | | 92.36 | % | | | 124.78 | % | | | 165.25 | % | | | — | % |
| | | | | | | | | | | | | | | | |
Total amount of senior securities outstanding exclusive of treasury securities | | $ | 507,230 | | | $ | 346,525 | | | $ | 157,721 | | | $ | — | |
| | | | | | | | | | | | | | | | |
Asset coverage per unit(9) | | | 3.78 | | | | 3.63 | | | | 4.45 | | | | — | |
| | | | | | | | | | | | | | | | |
| (1) | Per share data may be rounded in order to compute the ending net asset value per share. |
| (2) | The per share data was derived by using the average number of common shares outstanding during the applicable period. |
See notes to consolidated financial statements.
14
FS Global Credit Opportunities Fund
Consolidated Financial Highlights (continued)
(in thousands, except share and per share amounts)
| (3) | Net investment loss for the period from December 12, 2013 (Commencement of Operations) to December 31, 2013 was less than $0.005 per common share. |
| (4) | The per share data for distributions reflects the actual amount of distributions declared per common share during the applicable period. |
| (5) | The total return for each period presented is historical and is calculated by determining the percentage change in net asset value, assuming the reinvestment of all distributions in additional common shares of the Fund at the Fund’s net asset value per share as of the share closing date occurring on or immediately following the distribution payment date. The historical calculation of total return in the table should not be considered a representation of the Fund’s future total return, which may be greater or less than the total return shown in the table due to a number of factors, including, among others, the Fund’s ability or inability to make investments that meet its investment criteria, the interest rates payable on the debt securities the Fund acquires, the level of the Fund’s expenses, variations in and the timing of the recognition of realized and unrealized gains or losses, the degree to which the Fund encounters competition in its markets and general economic conditions. As a result of these and other factors, results for any previous period should not be relied upon as being indicative of performance in future periods. The total return calculations set forth above represent the total return on the Fund’s investment portfolio during the applicable period and do not represent an actual return to shareholders. |
| (6) | The period from December 12, 2013 (Commencement of Operations) to December 31, 2013 is not annualized. |
| (7) | Average daily net assets for the applicable period is used for this calculation. The period from December 12, 2013 (Commencement of Operations) to December 31, 2013 is annualized. |
| (8) | Had the sponsor not reimbursed certain operating expenses, the ratio of net investment income (loss) to average net assets would have been 10.10%, 9.02%, 5.91% and (8.94)% for the years ended December 31, 2016, 2015 and 2014 and the period from December 12, 2013 (Commencement of Operations) to December 31, 2013, respectively. |
| (9) | Asset coverage per unit is the ratio of the carrying value of the Fund’s total consolidated assets available to cover senior securities, less all liabilities and indebtedness not represented by senior securities, to the aggregate amount of senior securities representing indebtedness. |
See notes to consolidated financial statements.
15
FS Global Credit Opportunities Fund
Notes to Consolidated Financial Statements
(in thousands, except share and per share amounts)
Note 1. Principal Business and Organization
FS Global Credit Opportunities Fund, or the Fund, was organized as a Delaware statutory trust on January 28, 2013 and commenced investment operations on December 12, 2013 upon FS Global Credit Opportunities Fund—A, or Fund—A, and FS Global Credit Opportunities Fund—D, or Fund—D, and, together with Fund—A, the Companies, collectively raising net offering proceeds of $2,500 in the aggregate, or the minimum offering requirement, from the sale of common shares in their continuous public offerings to persons who were not affiliated with the Fund, the Companies, the Fund’s investment adviser, FS Global Advisor, LLC, or FS Global Advisor, or the investment sub-adviser to FS Global Advisor, GSO Capital Partners LP, or GSO. FS Global Advisor is a private investment firm that is registered as an investment adviser under the Investment Advisers Act of 1940, as amended, and an affiliate of the Fund’s sponsor, Franklin Square Holdings, L.P., or FS Investments.
The Companies each closed their respective continuous public offerings to new investors in April 2016. Two new feeder funds of the Fund, FS Global Credit Opportunities Fund—T, or Fund—T, and FS Global Credit Opportunities Fund—ADV, or Fund—ADV, and collectively with the Companies and Fund—T and Fund—ADV, the Feeder Funds, were formed in February 2016. Fund—T commenced its investment operations in June 2016 and Fund—ADV commenced its investment operations in July 2016. As of December 31, 2016, approximately 79.0%, 15.2%, 4.9% and 0.9% of the Fund’s outstanding common shares of beneficial interest, par value $0.001 per share, or its common shares, were held by Fund—A, Fund—D, Fund—T and Fund—ADV, respectively.
The Fund is a non-diversified, closed-end management investment company registered under the Investment Company Act of 1940, as amended, or the 1940 Act, that has elected to be treated for U.S. federal income tax purposes, and intends to qualify annually, as a regulated investment company, or RIC, under Subchapter M of the Internal Revenue Code of 1986, as amended, or the Code. As of December 31, 2016, the Fund had two wholly-owned financing subsidiaries and three wholly-owned subsidiaries through which it holds interests in certain portfolio companies. The consolidated financial statements include both the Fund’s accounts and the accounts of its wholly-owned subsidiaries as of December 31, 2016. All significant intercompany transactions have been eliminated in consolidation. Certain of the Fund’s consolidated subsidiaries may be subject to foreign income taxes. Additionally, one of the Fund’s consolidated subsidiaries is subject to U.S. federal and state income taxes.
The Fund’s primary investment objective is to generate an attractive total return consisting of a high level of current income and capital appreciation, with a secondary objective of capital preservation.
Note 2. Summary of Significant Accounting Policies
Basis of Presentation: The accompanying consolidated financial statements of the Fund have been prepared in accordance with U.S. generally accepted accounting principles, or GAAP. The Fund is considered an investment company under GAAP and follows the accounting and reporting guidance applicable to investment companies under Accounting Standards Update No. 2013-08, Financial Services—Investment Companies. The Fund has evaluated the impact of subsequent events through the date the consolidated financial statements were issued and filed with the U.S. Securities and Exchange Commission, or the SEC.
Use of Estimates: The preparation of the Fund’s consolidated financial statements in conformity with GAAP requires management to make estimates and assumptions that affect the reported amounts of assets and liabilities, and disclosure of contingent assets and liabilities, at the date of the consolidated financial statements and the
16
FS Global Credit Opportunities Fund
Notes to Consolidated Financial Statements (continued)
(in thousands, except share and per share amounts)
Note 2. Summary of Significant Accounting Policies (continued)
reported amounts of revenues and expenses during the reporting period. Actual results could differ from those estimates. Many of the amounts have been rounded and all amounts are in thousands, except share and per share amounts.
Cash and Cash Equivalents: The Fund considers all highly liquid investments with original maturities of three months or less to be cash equivalents. The Fund’s cash and cash equivalents are maintained with high credit quality financial institutions.
Valuation of Portfolio Investments: The Fund determines the net asset value, or NAV, of its common shares on each day that the New York Stock Exchange, or the NYSE, is open for business as of the close of the regular trading session on the NYSE. The Fund calculates the NAV of its common shares by subtracting liabilities (including accrued expenses and distributions) from the total assets of the Fund (the value of securities, plus cash and other assets, including interest and distributions accrued but not yet received) and dividing the result by the total number of its outstanding common shares. The Fund’s assets and liabilities are valued in accordance with the principles set forth below.
Accounting Standards Codification Topic 820, Fair Value Measurements and Disclosures, or ASC Topic 820, issued by the Financial Accounting Standards Board, or the FASB, clarifies the definition of fair value and requires companies to expand their disclosure about the use of fair value to measure assets and liabilities in interim and annual periods subsequent to initial recognition. ASC Topic 820 defines fair value as the price that would be received from the sale of an asset or paid to transfer a liability in an orderly transaction between market participants at the measurement date. ASC Topic 820 also establishes a three-tier fair value hierarchy, which prioritizes the inputs used in measuring fair value. These tiers include: Level 1, defined as observable inputs such as quoted prices in active markets; Level 2, which includes inputs such as quoted prices for similar securities in active markets and quoted prices for identical securities where there is little or no activity in the market; and Level 3, defined as unobservable inputs for which little or no market data exists, therefore requiring an entity to develop its own assumptions.
The Fund expects that its portfolio will primarily consist of securities listed or traded on a recognized securities exchange or automated quotation system, or exchange-traded securities, or securities traded on a privately negotiated over-the-counter secondary market for institutional investors for which indicative dealer quotes are available, or OTC securities.
For purposes of calculating NAV, the Fund uses the following valuation methods:
| | • | | The market value of each exchange-traded security is the last reported sale price at the relevant valuation date on the composite tape or on the principal exchange on which such security is traded. |
| | • | | If no sale is reported for an exchange-traded security on the valuation date or if a security is an OTC security, the Fund values such investments using quotations obtained from an approved independent third-party pricing service, which provides prevailing bid and ask prices that are screened for validity by such service from dealers on the valuation date. For investments for which an approved independent third-party pricing service is unable to obtain quoted prices, the Fund will obtain bid and ask prices directly from dealers who make a market in such securities. In all such cases, investments are valued at the mid-point of the average bid and ask prices obtained from such sources. |
17
FS Global Credit Opportunities Fund
Notes to Consolidated Financial Statements (continued)
(in thousands, except share and per share amounts)
Note 2. Summary of Significant Accounting Policies (continued)
| | • | | To the extent that the Fund holds investments for which no active secondary market exists and, therefore, no bid and ask prices can be readily obtained, the Fund will value such investments at fair value as determined in good faith by the Fund’s board of trustees, or the Board, in accordance with the Fund’s valuation policy. In making such determination, the Board may rely upon valuations obtained from an approved independent third-party valuation service. With respect to these investments for which market quotations are not readily available, the Fund undertakes a multi-step valuation process each quarter, as described below: |
| | • | | The quarterly fair valuation process begins with FS Global Advisor’s management team reviewing and documenting preliminary valuations for each investment, which valuations may be obtained from an approved independent third-party valuation service, if applicable; |
| | • | | FS Global Advisor’s management team then provides the valuation committee of the Board with preliminary valuations for each investment; |
| | • | | The preliminary valuations are then presented to and discussed with the valuation committee of the Board; |
| | • | | The valuation committee of the Board then reviews the preliminary valuations and FS Global Advisor’s management team, together with any approved independent third-party valuation service, if applicable, respond to and supplement the preliminary valuations to reflect any comments provided by the valuation committee of the Board; |
| | • | | Following its review, the valuation committee of the Board approves the fair valuation of the Fund’s investments and recommends that the Board similarly approve the fair valuation of the Fund’s investments; and |
| | • | | The Board discusses the valuation of the Fund’s investments and determines the fair value of each such investment in the portfolio in good faith based on various statistical and other factors, including the input and recommendation of FS Global Advisor, the valuation committee of the Board and any approved independent third-party valuation service, if applicable. |
Determination of fair value involves subjective judgments and estimates. Accordingly, the notes to the Fund’s consolidated financial statements refer to the uncertainty with respect to the possible effect of such valuations and any change in such valuations on the Fund’s consolidated financial statements. In making its determination of fair value, the Board may use any approved independent third-party pricing or valuation service; provided that the Board shall not be required to determine fair value in accordance with the valuation provided by any single source, and the Board shall retain the discretion to use any relevant data, including information obtained from FS Global Advisor, GSO or any approved independent third-party valuation or pricing service, that the Board deems to be reliable in determining fair value under the circumstances.
Below is a description of factors that FS Global Advisor, any approved independent third-party valuation service and the Board may consider when determining the fair value of the Fund’s investments.
Valuation of fixed income investments, such as loans and debt securities, depends upon a number of factors, including prevailing interest rates for like securities, expected volatility in future interest rates, call features, put features and other relevant terms of the debt. For investments without readily available market prices, the Fund may incorporate these factors into discounted cash flow models to arrive at fair value. Other factors that may be
18
FS Global Credit Opportunities Fund
Notes to Consolidated Financial Statements (continued)
(in thousands, except share and per share amounts)
Note 2. Summary of Significant Accounting Policies (continued)
considered include the borrower’s ability to adequately service its debt, the fair market value of the borrower in relation to the face amount of its outstanding debt and the quality of collateral securing the borrower’s debt.
For convertible debt securities, fair value will generally approximate the fair value of the debt plus the fair value of an option to purchase the underlying security (i.e., the security into which the debt may convert) at the conversion price. To value such an option, a standard option pricing model may be used.
The Fund’s equity interests in companies for which no active secondary market exists and, therefore, no bid and ask prices can be readily obtained, are valued at fair value. The Board, in its determination of fair value, may consider various factors, including, but not limited to, multiples of earnings before interest, taxes, depreciation and amortization, or EBITDA, cash flows, net income, revenues or, in limited instances, book value or liquidation value. All of these factors may be subject to adjustments based upon the particular circumstances of a company or the Fund’s actual investment position. For example, adjustments to EBITDA may take into account compensation to previous owners or an acquisition, recapitalization, restructuring or other related items.
FS Global Advisor, any approved independent third-party valuation service and the Board may also consider private merger and acquisition statistics, public trading multiples discounted for illiquidity and other factors, valuations implied by third-party investments in the companies, the acquisition price of such investment or industry practices in determining fair value. FS Global Advisor, any approved independent third-party valuation service and the Board may also consider the size and scope of a company and its specific strengths and weaknesses, and may apply discounts or premiums, where and as appropriate, due to the higher (or lower) financial risk and/or the size of the companies relative to comparable firms, as well as such other factors as the Board, in consultation with FS Global Advisor and any approved independent third-party valuation service, if applicable, may consider relevant in assessing fair value.
When the Fund receives warrants or other equity securities at nominal or no additional cost in connection with an investment in a debt security, the cost basis in the investment will be allocated between the debt securities and any such warrants or other equity securities received at the time of origination. The Board will subsequently value the warrants or other equity securities received at fair value.
Securities that carry certain restrictions on sale typically will be valued at a discount from the public market value of the security, where applicable.
If events materially affecting the price of foreign portfolio securities occur between the time when their price was last determined on such foreign securities exchange or market and the time when the Fund’s NAV was last calculated (e.g., movements in certain U.S. securities indices which demonstrate strong correlation to movements in certain foreign securities markets), such securities may be valued at their fair value as determined in good faith by the Board in consultation with FS Global Advisor and any approved independent third-party valuation service, if applicable.
Forward foreign currency exchange contracts typically will be valued at their quoted daily prices obtained from an independent third party. The aggregate settlement values and notional amounts of the contracts are not recorded in the consolidated statement of assets and liabilities. Fluctuations in the value of the contracts are recorded in the consolidated statement of assets and liabilities as an asset (liability) and in the consolidated statement of operations as unrealized appreciation (depreciation) until the contracts are closed, when they are recorded as realized gains (losses) on forward foreign currency exchange contracts.
19
FS Global Credit Opportunities Fund
Notes to Consolidated Financial Statements (continued)
(in thousands, except share and per share amounts)
Note 2. Summary of Significant Accounting Policies (continued)
Swaps typically will be valued using valuations provided by an approved independent third-party pricing service. Such valuations generally will be based on the present value of fixed and projected floating rate cash flows over the term of the swap contract and, in the case of credit default swaps, generally will be based on credit spread quotations obtained from broker-dealers and expected default recovery rates determined by the approved independent third-party pricing service using proprietary models. Future cash flows will be discounted to their present value using swap rates provided by electronic data services or by broker-dealers.
The Board is solely responsible for the valuation of the Fund’s portfolio investments at fair value as determined in good faith pursuant the Fund’s valuation policy and consistently applied valuation process. The Board has delegated day-to-day responsibility for implementing the Fund’s valuation policy to FS Global Advisor’s management team, and has authorized FS Global Advisor’s management team to utilize independent third-party valuation and pricing services that have been approved by the Board. The valuation committee of the Board is responsible for overseeing FS Global Advisor’s implementation of the Fund’s valuation process.
Revenue Recognition: Security transactions are accounted for on the trade date. The Fund records interest income on an accrual basis to the extent that it expects to collect such amounts. The Fund records dividend income on the ex-dividend date. The Fund does not accrue as a receivable interest or dividends on loans and securities if it has reason to doubt its ability to collect such income. The Fund’s policy is to place investments on non-accrual status when there is reasonable doubt that interest income will be collected. The Fund considers many factors relevant to an investment when placing it on or removing it from non-accrual status, including, but not limited to, the delinquency status of the investment, economic and business conditions, the overall financial condition of the underlying investment, the value of the underlying collateral, bankruptcy status, if any, and any other facts or circumstances relevant to the investment. If there is reasonable doubt that the Fund will receive any previously accrued interest, then the previously recognized interest income will be written-off. Payments received on non-accrual investments may be recognized as income or applied to principal depending upon the collectability of the remaining principal and interest. Non-accrual investments may be restored to accrual status when principal and interest become current and are likely to remain current based on the Fund’s judgment.
Loan origination fees, original issue discount and market discount are capitalized and such amounts are amortized as interest income over the respective term of the loan or security. Upon the prepayment of a loan or security, any unamortized loan origination fees and original issue discount are recorded as interest income. Structuring and other non-recurring upfront fees are recorded as fee income when earned. The Fund records prepayment premiums on loans and securities as fee income when it receives such amounts.
Net Realized Gains or Losses, Net Change in Unrealized Appreciation or Depreciation and Net Change in Unrealized Gains or Losses on Foreign Currency: Gains or losses on the sale of investments are calculated by using the specific identification method. The Fund measures realized gains or losses by the difference between the net proceeds from the repayment or sale and the amortized cost basis of the investment, without regard to unrealized appreciation or depreciation previously recognized, but considering unamortized fees. Net change in unrealized appreciation or depreciation reflects the change in portfolio investment values during the reporting period, including any reversal of previously recorded unrealized gains or losses, when gains or losses are realized, and the respective unrealized gain or loss on foreign currency for any foreign denominated investments. Net change in unrealized gains or losses on foreign currency reflects the change in the value of receivables or accruals during the reporting period due to the impact of foreign currency fluctuations.
20
FS Global Credit Opportunities Fund
Notes to Consolidated Financial Statements (continued)
(in thousands, except share and per share amounts)
Note 2. Summary of Significant Accounting Policies (continued)
Income Taxes: The Fund has elected to be treated for U.S. federal income tax purposes, and intends to qualify annually, as a RIC under Subchapter M of the Code. To qualify and maintain qualification as a RIC, the Fund must, among other things, meet certain source-of-income and asset diversification requirements and distribute to its shareholders, for each taxable year, at least 90% of its “investment company taxable income,” which is generally the Fund’s net ordinary income plus the excess, if any, of realized net short-term capital gains over realized net long-term capital losses. As a RIC, the Fund will not have to pay corporate-level U.S. federal income taxes on any income that it distributes to its shareholders. The Fund intends to make distributions in an amount sufficient to maintain its RIC status each year and to avoid any U.S. federal income taxes on income so distributed. The Fund also will be subject to nondeductible U.S. federal excise taxes if it does not distribute at least 98% of net ordinary income, 98.2% of capital gain net income, if any, and any recognized and undistributed income from prior years for which it paid no U.S. federal income taxes.
Uncertainty in Income Taxes: The Fund evaluates its tax positions to determine if the tax positions taken meet the minimum recognition threshold in connection with accounting for uncertainties in income tax positions taken or expected to be taken for the purposes of measuring and recognizing tax benefits or liabilities in the Fund’s consolidated financial statements. Recognition of a tax benefit or liability with respect to an uncertain tax position is required only when the position is “more likely than not” to be sustained assuming examination by taxing authorities. The Fund recognizes interest and penalties, if any, related to unrecognized tax liabilities as income tax expense on its consolidated statement of operations. During the year ended December 31, 2016, the Fund did not incur any interest or penalties.
The Fund has analyzed the tax positions taken on U.S. federal and state income tax returns for all open tax years, and has concluded that no provision for income tax is required in the Fund’s consolidated financial statements. The Fund’s U.S. federal and state income and U.S. federal excise tax returns for tax years for which the applicable statutes of limitations have not yet expired are subject to examination by the Internal Revenue Service and state departments of revenue.
Forward Foreign Currency Exchange Contracts: The Fund enters into forward foreign currency exchange contracts as an economic hedge against either specific transactions or portfolio instruments or to obtain exposure to, or hedge exposure away from, foreign currencies (foreign currency exchange rate risk). A forward foreign currency exchange contract is an agreement between two parties to buy and sell a currency at a set exchange rate on a future date. Forward foreign currency exchange contracts, when used by the Fund, helps to manage the overall exposure to the currencies in which some of the investments and borrowings held by the Fund are denominated. Non-deliverable forward foreign currency exchange contracts are settled with the counterparty in cash without the delivery of foreign currency. The contract is marked-to-market daily and the change in market value is recorded by the Fund as an unrealized gain or loss. When the contract is closed, the Fund records a realized gain or loss equal to the difference between the value at the time it was opened and the value at the time it was closed. The use of forward foreign currency exchange contracts contains the risk that the value of a forward foreign currency exchange contract changes unfavorably due to movements in the value of the referenced foreign currencies.
Credit Default Swaps: When the Fund is the buyer of a credit default swap contract, the Fund is entitled to receive the par (or other agreed-upon) value of a referenced debt obligation (or basket of debt obligations) from the counterparty to the contract if a specified credit event with respect to the issuer of the debt obligation, such as a U.S. or foreign corporate issuer or sovereign issuer, occurs. In return, the Fund pays the counterparty a periodic
21
FS Global Credit Opportunities Fund
Notes to Consolidated Financial Statements (continued)
(in thousands, except share and per share amounts)
Note 2. Summary of Significant Accounting Policies (continued)
stream of payments over the term of the contract provided that no credit event has occurred. If no specified credit event occurs, the Fund would have paid the stream of payments and received no proceeds from the contract. When the Fund is the seller of a credit default swap contract, it receives the stream of payments, but is obligated to pay to the buyer of the protection an amount up to the notional amount of the swap and in certain instances take delivery of securities of the reference entity upon the occurrence of a credit event, as defined under the terms of that particular swap agreement. Credit events are contract specific but may include bankruptcy, failure to pay principal or interest, restructuring, obligation acceleration and repudiation or moratorium. If the Fund is a seller of protection and a credit event occurs, the maximum potential amount of future payments that the Fund could be required to make would be an amount equal to the notional amount of the agreement. This potential amount would be partially offset by any recovery value of the respective referenced obligation, or net amount received from the settlement of a buy protection credit default swap agreement entered into by the Fund for the same referenced obligation. As the seller of a credit default swap contract, the Fund may create economic leverage because, in addition to its net assets, the Fund is subject to investment exposure on the notional amount of the swap. The interest fee paid or received on the swap contract, which is based on a specified interest rate on a fixed notional amount, is accrued daily and is recorded as realized loss or gain. The Fund records an increase or decrease to unrealized appreciation (depreciation) on credit default swaps in an amount equal to the change in daily valuation. Upfront payments or receipts, if any, are recorded as unamortized swap premiums paid or received, respectively, and are amortized over the life of the swap contract as realized losses or gains. For financial reporting purposes, unamortized upfront payments, if any, are netted with unrealized appreciation (depreciation) on credit default swaps to determine the market value of swaps as presented in Note 6 and Note 8. The Fund will segregate assets in the form of cash and/or liquid securities in an amount equal to any unrealized depreciation on the credit default swaps of which it is the buyer, marked-to-market on a daily basis. The Fund segregates assets in the form of cash and/or liquid securities in an amount equal to the notional amount of the credit default swaps of which it is the seller. These transactions involve certain risks, including the risk that the seller may be unable to fulfill the transaction.
Options Written: The Fund may write call and put options in an effort to manage risk and/or generate gains from options premiums. When the Fund writes a call option, it gives the purchaser (holder) of the option the right (but not the obligation) to buy, and obligates the Fund to sell (when the option is exercised), the underlying instrument at the exercise or strike price at any time or at a specified time during the option period. When the Fund writes a put option, it gives the holder the right to sell and obligates the Fund to buy the underlying instrument at the exercise or strike price at any time or at a specified time during the option period. When the Fund writes an option, an amount equal to the premium received by the Fund is reflected as a liability. The amount of the liability is subsequently marked-to-market to reflect the current fair value of the option written. When an instrument is purchased or sold through an exercise of an option, the related premium received is deducted from the basis of the instrument acquired or added to the proceeds of the instrument sold. When an option expires, the Fund realizes a gain on the option to the extent of the premiums received. When an option is exercised, the Fund realizes a loss to the extent the cost of closing the option exceeds the premiums received, or a gain to the extent the premiums received exceed the cost of closing the option.
Securities Lending: The Fund may make secured loans of its marginable securities to brokers, dealers and other financial institutions to the extent permitted by the 1940 Act. The risks in lending portfolio securities, as with other extensions of credit, consist of possible delay in recovery of the securities or possible loss of rights in the collateral should the borrower fail financially. However, such loans will be made only to broker-dealers and other financial institutions that are believed by FS Global Advisor to be of relatively high credit standing. Loans
22
FS Global Credit Opportunities Fund
Notes to Consolidated Financial Statements (continued)
(in thousands, except share and per share amounts)
Note 2. Summary of Significant Accounting Policies (continued)
of securities are made to broker-dealers pursuant to agreements requiring that loans be continuously secured by collateral consisting of U.S. government securities, cash or cash equivalents (negotiable certificates of deposit, bankers’ acceptances or letters of credit) maintained on a daily mark-to-market basis in an amount at least equal at all times to the market value of the securities lent. The borrower pays to the Fund, as the lender, an amount equal to any dividends or interest received on the securities lent. The collateral must have a market value at least equal to 100% of the market value of the loaned securities at all times during the duration of the loan. The Fund invests the cash collateral received in accordance with its investment objectives, subject to the Fund’s agreement with the borrower of the securities. In the case of cash collateral, the Fund typically pays a rebate to the borrower. The reinvestment of cash collateral will result in a form of effective leverage for the Fund. Although voting rights or rights to consent with respect to the loaned securities pass to the borrower, the Fund, as the lender, retains the right to call the loans and obtain the return of the securities loaned at any time on reasonable notice, and it will do so in order that the securities may be voted by the Fund if the holders of such securities are asked to vote upon or consent to matters materially affecting the investment. The Fund may also call such loans in order to sell the securities involved. When engaged in securities lending, the Fund’s performance will continue to reflect changes in the value of the securities loaned and will also reflect the receipt of interest through investment of cash collateral by the Fund in permissible investments. As of December 31, 2016, the Fund had securities on loan valued at $104 and received cash collateral with a value of $109 representing 0.01% and 0.01% of the Fund’s net assets, respectively.
Distributions: Distributions to the Fund’s shareholders are recorded as of the record date. Subject to the discretion of the Board and applicable legal restrictions, the Fund intends to authorize and declare ordinary cash distributions on a weekly, semi-monthly or monthly basis and to pay such distributions on a monthly or quarterly basis. Net realized capital gains, if any, will be distributed or deemed distributed at least annually.
Recently Issued Accounting Standards: In April 2015, the Financial Accounting Standards Board, or the FASB, issued Accounting Standards Update No. 2015-03, Interest—Imputation of Interest, or ASU 2015-03, to simplify the presentation of debt issuance costs in financial statements. Under pre-existing guidance, debt issuance costs were recognized as a deferred charge and presented as an asset on the balance sheet. ASU 2015-03 requires that debt issuance costs related to a recognized liability for indebtedness be presented in the balance sheet as a direct deduction from the carrying amount of that liability, consistent with debt discounts. In August 2015, the FASB issued Accounting Standards Update No. 2015-15, Interest—Imputation of Interest, or ASU 2015-15, to update the guidance to include SEC staff views regarding the presentation and subsequent measurement of debt issuance costs related to line-of-credit arrangements. Given the absence of authoritative guidance within ASU 2015-03 for debt issuance costs related to line-of-credit arrangements, the SEC indicated that it would not object to an entity deferring and presenting debt issuance costs as an asset and subsequently amortizing the deferred debt issuance costs ratably over the term of the line-of-credit arrangement, regardless of whether there are any outstanding borrowings on the line-of-credit arrangement.
Commencing January 1, 2016, the Fund adopted ASU 2015-03 and changed its method of disclosing debt issuance costs for its repurchase agreement and unsecured notes. ASU 2015-03 affects the presentation and disclosure of such costs in the Fund’s financial statements. There is no change to the Fund’s recognition and measurement of debt issuance costs. In accordance with ASU 2015-15, the Fund elected to continue to present debt issuance costs associated with line-of-credit arrangements as an asset, unchanged from its prior method of disclosure.
23
FS Global Credit Opportunities Fund
Notes to Consolidated Financial Statements (continued)
(in thousands, except share and per share amounts)
Note 2. Summary of Significant Accounting Policies (continued)
Comparative financial statements of prior interim and annual periods have been adjusted to apply the new method retrospectively. The adoption and retrospective adjustment of ASU 2015-03 had no material impact on the Fund’s consolidated financial position, results of operations or cash flows as previously reported.
Note 3. Share Transactions
Below is a summary of transactions with respect to the Fund’s common shares during the years ended December 31, 2016 and 2015:
| | | | | | | | | | | | | | | | |
| | | Year Ended December 31, | |
| | | 2016 | | | 2015 | |
| | | Shares | | | Amount | | | Shares | | | Amount | |
Gross Proceeds from Issuance of Common Shares | | | 46,193,099 | | | $ | 331,426 | | | | 64,652,648 | | | $ | 545,947 | |
Aggregate Consideration for Repurchased Shares | | | (1,611,238 | ) | | | (12,105 | ) | | | — | | | | — | |
| | | | | | | | | | | | | | | | |
Net Proceeds from Share Transactions | | | 44,581,861 | | | $ | 319,321 | | | | 64,652,648 | | | $ | 545,947 | |
| | | | | | | | | | | | | | | | |
Common shares of the Fund are issued solely to Fund—A, Fund—D, Fund—T and Fund—ADV in private placement transactions that do not involve any “public offering” within the meaning of Section 4(a)(2) of, and/or Regulation D under, the Securities Act of 1933, as amended. During the year ended December 31, 2016, the Fund issued 30,272,343 common shares to Fund—A, 5,788,060 common shares to Fund—D, 8,537,443 common shares to Fund—T and 1,595,253 common shares to Fund—ADV for gross proceeds of $212,003, $40,865, $66,146 and $12,412, respectively. During the year ended December 31, 2015, the Fund issued 54,458,519 common shares to Fund—A and 10,194,129 common shares to Fund—D for gross proceeds of $460,415 and $85,532, respectively. During the period from January 1, 2017 to February 21, 2017, the Fund issued 627,000 common shares to Fund—A, 139,873 common shares to Fund—D, 3,561,716 common shares to Fund—T and 866,717 common shares to Fund—ADV for gross proceeds of $5,125, $1,143, $29,129 and $7,100, respectively.
The Fund intends to repurchase common shares held by Fund—A, Fund—D, Fund—T and Fund—ADV to the extent necessary to accommodate repurchase requests under each Feeder Fund’s share repurchase program. During the year ended December 31, 2016, the Fund repurchased 1,306,205 common shares from Fund—A and 305,033 common shares from Fund—D for aggregate consideration totaling $9,809 and $2,296, respectively. During the year ended December 31, 2016, the Fund did not repurchase any of its common shares to accommodate repurchase requests under Fund—T and Fund—ADV repurchase programs. On January 4, 2017, the Fund repurchased approximately 759,806 common shares from Fund—A and 79,636 common shares from Fund—D at $8.074 per common share for aggregate consideration totaling $6,135 and $643, respectively.
Note 4. Related Party Transactions
Compensation of the Investment Adviser and its Affiliates
Pursuant to the amended and restated investment advisory agreement, dated as of October 9, 2013, by and between the Fund and FS Global Advisor, or the investment advisory agreement, FS Global Advisor is entitled to (a) an annual management fee of 2.0% of the Fund’s average daily gross assets and (b) an incentive fee based on the Fund’s performance. The Fund commenced accruing fees under the investment advisory agreement on December 12, 2013, upon commencement of the Fund’s investment operations. Management fees are calculated and payable quarterly in arrears.
24
FS Global Credit Opportunities Fund
Notes to Consolidated Financial Statements (continued)
(in thousands, except share and per share amounts)
Note 4. Related Party Transactions (continued)
The incentive fee is calculated and payable quarterly in arrears based upon the Fund’s “pre-incentive fee net investment income” for the immediately preceding quarter, and is subject to a hurdle rate, expressed as a rate of return on the Fund’s “adjusted capital,” equal to 2.25% per quarter (or an annualized hurdle rate of 9.00%), subject to a “catch-up” feature. For this purpose, “pre-incentive fee net investment income” means interest income, dividend income and any other income (including any other fees, such as commitment, origination, structuring, diligence and consulting fees or other fees that the Fund receives from portfolio companies) accrued during the calendar quarter, minus the Fund’s operating expenses for the quarter (including the management fee, expenses reimbursed to FS Global Advisor under the administration agreement, dated as of July 15, 2013, by and between the Fund and FS Global Advisor, or the administration agreement, and any interest expense and distributions paid on any issued and outstanding preferred shares, but excluding the incentive fee). Pre-incentive fee net investment income includes, in the case of investments with a deferred interest feature (such as original issue discount, debt instruments with paid-in-kind interest and zero coupon securities), accrued income that the Fund has not yet received in cash. Pre-incentive fee net investment income does not include any realized capital gains, realized capital losses or unrealized capital appreciation or depreciation. “Adjusted capital” means the cumulative gross proceeds received by the Fund from the issuance of common shares (including common shares issued in respect of reinvested distributions), reduced by amounts paid in connection with repurchases of common shares to accommodate repurchase requests under the Companies’ share repurchase programs.
The calculation of the incentive fee for each quarter is as follows:
| | • | | No incentive fee is payable in any calendar quarter in which the Fund’s pre-incentive fee net investment income does not exceed the quarterly hurdle rate of 2.25% (9.00% annualized); |
| | • | | 100% of the Fund’s pre-incentive fee net investment income, if any, that exceeds the hurdle rate but is less than or equal to 2.8125% in any calendar quarter (11.25% annualized) is payable to FS Global Advisor. This portion of the Fund’s pre-incentive fee net investment income which exceeds the hurdle rate but is less than or equal to 2.8125% is referred to as the “catch-up.” The “catch-up” provision is intended to provide FS Global Advisor with an incentive fee of 20.0% on all of the Fund’s pre-incentive fee net investment income when the Fund’s pre-incentive fee net investment income reaches 2.8125% in any calendar quarter; and |
| | • | | 20.0% of the amount of the Fund’s pre-incentive fee net investment income, if any, that exceeds 2.8125% in any calendar quarter (11.25% annualized) is payable to FS Global Advisor once the hurdle rate and catch-up have been achieved (20.0% of all the Fund’s pre-incentive fee net investment income thereafter is allocated to FS Global Advisor). |
Pursuant to an investment sub-advisory agreement, or the investment sub-advisory agreement, between FS Global Advisor and GSO Capital Partners, LP, or GSO, GSO will receive 50% of all management and incentive fees paid to FS Global Advisor under the investment advisory agreement with respect to each year.
Under the administration agreement, the Fund reimburses FS Global Advisor for its actual costs incurred in providing administrative services to the Fund, including FS Global Advisor’s allocable portion of the compensation and related expenses of certain personnel of FS Investments providing administrative services to the Fund on behalf of FS Global Advisor. Such services include general ledger accounting, fund accounting, legal services, investor relations and other administrative services. FS Global Advisor also performs, or oversees the performance of, the Fund’s corporate operations and required administrative services, which includes being responsible for the financial records that the Fund is required to maintain and preparing reports to the Fund’s
25
FS Global Credit Opportunities Fund
Notes to Consolidated Financial Statements (continued)
(in thousands, except share and per share amounts)
Note 4. Related Party Transactions (continued)
shareholders and reports filed with the SEC. In addition, FS Global Advisor assists the Fund in calculating NAV, overseeing the preparation and filing of tax returns and the printing and dissemination of reports to the Fund’s shareholders, and generally overseeing the payment of the Fund’s expenses and the performance of administrative and professional services rendered to the Fund by others. FS Global Advisor is required to allocate the cost of these services to the Fund based on factors such as assets, revenues and/or time allocations. At least annually, the Board reviews the methodology employed in determining how the expenses are allocated to the Fund and the proposed allocation of administrative expenses among the Fund and certain affiliates of FS Global Advisor. The Board then assesses the reasonableness of such reimbursements for expenses allocated to the Fund based on the breadth, depth and quality of such services as compared to the estimated cost to the Fund of obtaining similar services from third-party service providers known to be available. In addition, the Board considers whether any single third-party service provider would be capable of providing all such services at comparable cost and quality. Finally, the Board compares the total amount paid to FS Global Advisor for such services as a percentage of the Fund’s net assets to the same ratio as reported by other comparable investment companies. The Fund will not reimburse FS Global Advisor for any services for which it receives a separate fee or for any administrative expenses allocated to a controlling person of FS Global Advisor.
FS Investments funded organization costs in the amount of $22 for the period from January 28, 2013 (Inception) to December 31, 2013. These costs were recorded by the Fund as a contribution to capital. The organization costs were charged to expense as incurred by the Fund. Under the terms of the administration agreement, upon satisfaction of the minimum offering requirement, FS Global Advisor became entitled to receive 1.5% of offering proceeds from the issuance of the Fund’s common shares until all organization and offering costs funded by FS Global Advisor and its affiliates (including FS Investments) have been recovered. Any such reimbursements will be recorded by the Fund as a reduction of capital. During the period from December 12, 2013 (Commencement of Investment Operations) through December 31, 2016, the Fund did not reimburse FS Global Advisor or its affiliates for organization costs previously funded.
The following table describes the fees and expenses incurred under the investment advisory agreement and the administration agreement during the year ended December 31, 2016:
| | | | | | | | |
Related Party | | Source Agreement | | Description | | Year Ended
December 31,
2016 | |
| | | |
FS Global Advisor | | Investment Advisory Agreement | | Management Fee(1) | | $ | 34,722 | |
| | | |
FS Global Advisor | | Investment Advisory Agreement | | Incentive Fee(2) | | $ | 3,301 | |
| | | |
FS Global Advisor | | Administration Agreement | | Administrative Services Expenses(3) | | $ | 1,315 | |
| (1) | During the year ended December 31, 2016, $16,016 in management fees were paid to FS Global Advisor and $15,565 of expense reimbursements due from sponsor were used to offset management fees payable. As of December 31, 2016, $10,057 in management fees were payable to FS Global Advisor. |
| (2) | During the year ended December 31, 2016, $3,301 in incentive fees were incurred and paid to FS Global Advisor. |
| (3) | During the year ended December 31, 2016, the Fund paid $1,347 in administrative services expenses to FS Global Advisor. |
26
FS Global Credit Opportunities Fund
Notes to Consolidated Financial Statements (continued)
(in thousands, except share and per share amounts)
Note 4. Related Party Transactions (continued)
Capital Contribution by FS Global Advisor
In March 2013, Michael C. Forman and David J. Adelman, the principals of FS Global Advisor, each contributed approximately $100 to purchase 5,000 common shares of beneficial interest of Fund—A and 5,000 common shares of beneficial interest of Fund—D, in each case at a price of $10.00 per share. The Companies, in turn, each purchased 10,000 common shares of the Fund at $10.00 per share. The principals will not tender for repurchase the common shares of the Companies held by them as long as FS Global Advisor remains the Fund’s investment adviser.
In March 2016, Michael C. Forman contributed an aggregate of $200 to purchase 10,000 common shares of beneficial interest of Fund—T and 10,000 common shares of beneficial interest of Fund—ADV, in each case at a price of $10.00 per share. Immediately prior to the initial weekly closings of Fund—T and Fund—ADV, each Company effected a share split to ensure that the per share price paid by Mr. Forman for the common shares purchased by him in the private placement was equal to the NAV per common share of the Fund on the dates of the initial weekly closings of the Feeder Funds. On the date of the applicable weekly closing, Fund—T purchased 13,544 common shares of the Fund at $7.38 per share and Fund—ADV purchased 13,664 common shares of the Fund at $7.32 per share. Mr. Forman will not tender the common shares of the Feeder Funds for repurchase as long as FS Global Advisor remains the Fund’s investment adviser.
Potential Conflicts of Interest
FS Global Advisor’s senior management team is comprised of substantially the same personnel as the senior management teams of the investment advisers to FS Investments’ other sponsored investment funds. As a result, these members provide investment advisory services to the Fund and such other accounts. While the investment personnel of FS Global Advisor are not currently making private corporate debt investments for clients other than the FS Investments funds, they may do so in the future. In the event that FS Global Advisor provides investment advisory services to other clients in the future, it intends to allocate investment opportunities in a fair and equitable manner consistent with the Fund’s investment objectives and strategies, so that the Fund will not be disadvantaged in relation to any other client of FS Global Advisor or its management team. In addition, even in the absence of FS Global Advisor retaining additional clients, it is possible that some investment opportunities may be provided to FS Investment Corporation, FS Energy and Power Fund, FS Investment Corporation II, FS Investment Corporation III and/or FS Investment Corporation IV, rather than to the Fund.
Expense Reimbursement Agreement
Pursuant to an expense support and conditional reimbursement agreement, dated as of August 20, 2013, by and between the Fund and FS Investments, or the expense reimbursement agreement, FS Investments has agreed to reimburse the Fund for expenses to ensure that the Fund bears a reasonable level of expenses in relation to its income. The purpose of this arrangement is to ensure that no portion of any ordinary cash distributions made by the Fund will be paid from offering proceeds or borrowings. However, because certain investments the Fund may make, including preferred and common equity investments, may generate dividends and other distributions to the Fund that are treated for tax purposes as a return of capital, a portion of the Fund’s ordinary cash distributions may also be deemed to constitute a return of capital for tax purposes to the extent that the Fund may use such dividends or other distribution proceeds as a source of distributions. Under those circumstances, FS Investments will not reimburse the Fund for the portion of the Fund’s ordinary cash distributions that represent a return of capital for tax purposes, as the purpose of the expense reimbursement arrangement is not to prevent tax-advantaged distributions.
27
FS Global Credit Opportunities Fund
Notes to Consolidated Financial Statements (continued)
(in thousands, except share and per share amounts)
Note 4. Related Party Transactions (continued)
Under the expense reimbursement agreement, FS Investments will reimburse the Fund quarterly in an amount equal to the difference between the cumulative ordinary cash distributions paid to the Fund’s shareholders in such quarter, less the sum of the Fund’s net investment income, net short-term capital gains and dividends and other distributions paid to the Fund on account of investments in portfolio companies (to the extent such amounts are not included in net investment income or net short-term capital gains) in such quarter.
Pursuant to the expense reimbursement agreement, the Fund has a conditional obligation to reimburse FS Investments for any amounts funded by FS Investments under this arrangement if (and only to the extent that), during any fiscal quarter occurring within three years of the date on which FS Investments funded such amount, the sum of the Fund’s net investment income, net short-term capital gains and the amount of any dividends and other distributions paid to the Fund on account of investments in portfolio companies (to the extent not included in net investment income or net short-term capital gains) exceeds the ordinary cash distributions paid by the Fund to shareholders in such quarter; provided, however, that (i) the Fund will only reimburse FS Investments for expense support payments made by FS Investments to the extent that the payment of such reimbursement (together with any other reimbursement paid during such fiscal year) does not cause “other operating expenses” (as defined below) (on an annualized basis and net of any expense support payments received by the Fund during such fiscal year) to exceed the lesser of (A) 1.75% of the Fund’s average net assets attributable to its common shares for the fiscal year-to-date period after taking such expense reimbursement payments into account and (B) the percentage of the Fund’s average net assets attributable to its common shares represented by “other operating expenses” during the fiscal year in which such expense support payment from FS Investments was made (provided, however, that this clause (B) shall not apply to any reimbursement payment which relates to an expense support payment from FS Investments made during the same fiscal year) and (ii) the Fund will not reimburse FS Investments for expense support payments made by FS Investments if the annualized rate of distributions per common share declared by the Fund at the time of such expense reimbursement payment is less than the annualized rate of distributions per common share declared by the Fund at the time FS Investments made the expense support payment to which such reimbursement relates. “Other operating expenses” means the Fund’s total operating expenses, excluding the management fee, the incentive fee, organization and offering expenses, financing fees and costs, interest expense and extraordinary expenses. “Operating expenses” means all operating costs and expenses incurred, as determined in accordance with GAAP for investment companies.
The Fund or FS Investments may terminate the expense reimbursement agreement at any time. FS Investments has indicated that it expects to continue such reimbursements until it deems that the Fund has achieved economies of scale sufficient to ensure that the Fund bears a reasonable level of expenses in relation to its income.
The specific amount of expenses reimbursed by FS Investments pursuant to the expense reimbursement agreement, if any, is determined at the end of each fiscal quarter. Upon termination of the expense reimbursement agreement by FS Investments, FS Investments will be required to fund any amounts accrued thereunder as of the date of termination. Similarly, the conditional obligation of the Fund to reimburse FS Investments pursuant to the terms of the expense reimbursement agreement shall survive the termination of such agreement by either party.
FS Investments agreed to forgo reimbursement of all expense reimbursements made by it to the Fund through December 31, 2015. As such, as of December 31, 2015, there were no amounts subject to reimbursement by the Fund to FS Investments under the expense reimbursement agreement.
28
FS Global Credit Opportunities Fund
Notes to Consolidated Financial Statements (continued)
(in thousands, except share and per share amounts)
Note 4. Related Party Transactions (continued)
The following table reflects the expense reimbursements accrued from FS Investments to the Fund during the year ended December 31, 2016 that may be subject to reimbursement to FS Investments:
| | | | | | | | | | | | | | |
Quarter Ended | | Amount of
Expense
Reimbursements | | | Annualized
“Other Operating
Expenses”
Ratio as of the Date of
Support Payment | | | Annualized Rate of
Distributions Per
Common Share(1) | | | Reimbursement
Eligibility Expiration |
March 31, 2016 | | $ | 6,071 | | | | 0.47 | % | | | 12.69 | % | | March 31, 2019 |
June 30, 2016 | | $ | 2,123 | | | | 0.42 | % | | | 9.77 | % | | June 30, 2019 |
September 30, 2016 | | $ | 267 | | | | 0.42 | % | | | 9.24 | % | | September 30, 2019 |
December 31, 2016 | | $ | 124 | | | | 0.33 | % | | | 8.84 | % | | December 31, 2019 |
| (1) | The annualized rate of distributions per common share is expressed as a percentage equal to the projected annualized distribution amount as of the end of the applicable quarter (which is calculated by annualizing the regular weekly cash distribution per common share as of such date without compounding), divided by the Fund’s NAV per common share as of such date. |
FS Investments is controlled by the Fund’s chairman, president and chief executive officer, Michael C. Forman, and the Fund’s vice-chairman, David J. Adelman. There can be no assurance that the expense reimbursement agreement will remain in effect or that FS Investments will reimburse any portion of the Fund’s expenses in future years.
Note 5. Distributions
The following table reflects the cash distributions per common share that the Fund declared on its common shares during the years ended December 31, 2016 and 2015:
| | | | | | | | |
| | | Distribution | |
For the Year Ended December 31, | | Per Share | | | Amount | |
2015 | | $ | 0.8719 | | | $ | 86,589 | |
2016 | | $ | 0.8107 | | | $ | 126,479 | |
On December 22, 2016, January 30, 2017 and February 24, 2017, the Board declared regular weekly cash distributions for January, February and March 2017, respectively. The regular weekly cash distributions, each in the amount of $0.013721 per common share, have been or will be paid monthly to shareholders of record as of weekly record dates previously determined by the Board. The timing and amount of any future distributions to shareholders are subject to applicable legal restrictions and the sole discretion of the Board.
Each of the Feeder Funds has adopted an “opt in” distribution reinvestment plan for its shareholders pursuant to which shareholders of each Feeder Fund can elect to have their cash distributions reinvested in additional common shares of such Feeder Fund. To the extent that a Feeder Fund’s shareholders reinvest their cash distributions, such Feeder Fund will use the proceeds to purchase additional common shares of the Fund. As such, a portion of the cash distributions paid by the Fund (and subsequently paid by the Feeder Funds to their respective shareholders) may be reinvested in additional common shares of the Fund.
The Fund may fund its cash distributions to shareholders from any sources of funds legally available to it, including offering proceeds, borrowings, net investment income, short-term and long-term capital gains proceeds
29
FS Global Credit Opportunities Fund
Notes to Consolidated Financial Statements (continued)
(in thousands, except share and per share amounts)
Note 5. Distributions (continued)
from the sale of assets, gains from credit default swaps, non-capital gains proceeds from the sale of assets, distributions on account of preferred and common equity and expense reimbursements and additional support payments from FS Investments. The Fund has not established limits on the amount of funds it may use from available sources to make distributions.
The Fund expects that for a period of time, which time period may be significant, substantial portions of the Fund’s distributions may be funded through the reimbursement of certain expenses and additional support payments by FS Investments and its affiliates, including through the waiver of certain investment advisory fees by FS Global Advisor, that may be subject to repayment by the Fund within three years. The purpose of this arrangement is to ensure that no portion of the Fund’s distributions to shareholders will be paid from offering proceeds or borrowings. Any such distributions funded through support payments or waivers of advisory fees are not based on the Fund’s investment performance and the Fund’s distributions can only be sustained if the Fund achieves positive investment performance in future periods and/or FS Investments continues to make such payments or waivers of such fees. The Fund’s future repayments of amounts reimbursed or waived by FS Investments and its affiliates will reduce the distributions that shareholders would otherwise receive in the future. There can be no assurance that the Fund will achieve the performance necessary to sustain its distributions or that the Fund will be able to pay distributions at a specific rate or at all. FS Investments and its affiliates have no obligation to waive advisory fees or otherwise reimburse expenses in future periods. For the year ended December 31, 2016, if FS Investments had not reimbursed certain of the Fund’s expenses, 7% of the cash distributions declared during such period would have been funded from offering proceeds or borrowings. For the year ended December 31, 2015, if FS Investments had not reimbursed certain of the Fund’s expenses, 14% of the cash distributions declared during such period would have been funded from offering proceeds or borrowings.
The following table reflects the sources of the cash distributions on a tax basis that the Fund declared on its common shares during the years ended December 31, 2016 and 2015:
| | | | | | | | | | | | | | | | |
| | | Year Ended December 31, | |
| | | 2016 | | | 2015 | |
Source of Distribution | | Distribution
Amount | | | Percentage | | | Distribution
Amount | | | Percentage | |
Offering proceeds | | $ | — | | | | — | | | $ | — | | | | — | |
Borrowings | | | — | | | | — | | | | — | | | | — | |
Net investment income (prior to expense reimbursement from sponsor)(1) | | | 117,528 | | | | 93 | % | | | 74,127 | | | | 86 | % |
Short-term capital gains proceeds from the sale of assets | | | — | | | | — | | | | — | | | | — | |
Long-term capital gains proceeds from the sale of assets | | | — | | | | — | | | | — | | | | — | |
Non-capital gains proceeds from the sale of assets | | | — | | | | — | | | | — | | | | — | |
Distributions on account of preferred and common equity | | | 366 | | | | 0 | % | | | — | | | | — | |
Expense reimbursement from sponsor | | | 8,585 | | | | 7 | % | | | 12,462 | | | | 14 | % |
| | | | | | | | | | | | | | | | |
Total | | $ | 126,479 | | | | 100 | % | | $ | 86,589 | | | | 100 | % |
| | | | | | | | | | | | | | | | |
| (1) | During the years ended December 31, 2016 and 2015, 81.9% and 86.0% of the Fund’s gross investment income, respectively, was attributable to cash income earned, 17.5% and 13.5%, respectively, was attributable to non-cash accretion of discount and 0.6% and 0.5%, respectively, was attributable to paid-in-kind, or PIK, interest. |
30
FS Global Credit Opportunities Fund
Notes to Consolidated Financial Statements (continued)
(in thousands, except share and per share amounts)
Note 5. Distributions (continued)
The Fund’s net investment income on a tax basis for the years ended December 31, 2016 and 2015 was $136,906 and $87,790, respectively. As of December 31, 2016, the Fund had $19,644 of undistributed net investment income on a tax basis.
The difference between the Fund’s GAAP-basis net investment income and its tax-basis net investment income is primarily due to the tax treatment of unrealized gains (losses) and certain payments on credit default swaps, realized foreign currency gains (losses), unrealized gains (losses) on forward foreign currency exchange contracts, unamortized original issue discount and prepayment fees recognized upon prepayment of loans, distributions from real estate investment trusts (REITs), distributions from publicly traded partnerships (PTPs) and excise taxes.
The following table sets forth a reconciliation between GAAP-basis net investment income and tax-basis net investment income for the year ended December 31, 2016:
| | | | |
| | | Year Ended
December 31, 2016 | |
GAAP-basis net investment income (loss) | | $ | 125,270 | |
Reclassification of the mark-to-market of unrealized gains on credit default swaps | | | (1,190 | ) |
Reclassification of credit default swap payments and amortization to income for tax purposes from realized gains for book purposes | | | (1,422 | ) |
Foreign currency gains and losses | | | 17,333 | |
Excise taxes | | | 843 | |
Reclassification of the mark-to-market unrealized gains on forward foreign currency exchange contracts | | | 1,440 | |
Non-taxable distributions from partnerships and real estate investment trusts | | | (921 | ) |
Reclassification of unamortized original issue discount and prepayment fees | | | (4,478 | ) |
Other miscellaneous differences | | | 31 | |
| | | | |
Tax-basis net investment income (loss) | | $ | 136,906 | |
| | | | |
The Fund may make certain adjustments to the classification of net assets as a result of permanent book-to-tax differences. During the year ended December 31, 2016, the Fund increased undistributed net investment income by $11,387 and decreased accumulated net realized gain (loss) and capital in excess of par value by $1,717 and $9,670, respectively. These reclassifications have no impact on the net assets of the Fund.
As of December 31, 2016, the components of accumulated earnings (loss) on a tax basis were as follows:
| | | | |
| | | Year Ended
December 31, 2016 | |
Distributable ordinary income | | $ | 19,644 | |
Capital loss carryover(1) | | | (143,516 | ) |
Net unrealized appreciation (depreciation) | | | 34,901 | |
| | | | |
| | $ | (88,971 | ) |
| | | | |
31
FS Global Credit Opportunities Fund
Notes to Consolidated Financial Statements (continued)
(in thousands, except share and per share amounts)
Note 5. Distributions (continued)
| (1) | The capital loss carryover is available to reduce capital gain distribution requirements in future years and does not expire. As of December 31, 2016, the Fund had long-term and short-term capital loss carryovers of $76,719 and $66,797, respectively. |
The aggregate cost of the Fund’s investments for U.S. federal income tax purposes totaled $1,803,240 as of December 31, 2016. Aggregate net unrealized appreciation (depreciation) on a tax basis was $30,907, which was comprised of gross unrealized appreciation of $114,604 and gross unrealized depreciation of $83,697, as of December 31, 2016.
Note 6. Financial Instruments
The Fund may trade in financial instruments with off-balance sheet risk in the normal course of its investing activities. These financial instruments may include forward contracts, futures contracts, swap contracts and written options and may involve, to a varying degree, elements of risk in excess of the amounts recognized for financial statement purposes. The notional or contractual amounts of these instruments represent the investment the Fund has in particular classes of financial instruments and do not necessarily represent the amounts potentially subject to risk. The measurement of the risks associated with these instruments is meaningful only when all related and offsetting transactions are considered.
The Fund is subject to foreign currency exchange rate risk in the normal course of pursuing its investment objectives. The Fund may enter into forward foreign currency exchange contracts to gain or reduce exposure, to foreign currencies. A forward foreign currency exchange contract is an agreement between two parties to buy and sell a currency at a set exchange rate on a specified date. These contracts help to manage the overall exposure to the currencies in which some of the investments and borrowings held by the Fund are denominated and in some cases, may be used to obtain exposure to a particular market.
Each contract is marked-to-market daily and the change in market value is recorded as unrealized appreciation (depreciation) in the consolidated statement of assets and liabilities. When a contract is closed, a realized gain or loss is recorded in the consolidated statement of operations equal to the difference between the value at the time it was opened and the value at the time it was closed. Non-deliverable forward foreign currency exchange contracts are settled with the counterparty in cash without the delivery of foreign currency. The use of forward foreign currency exchange contracts contains the risk that the value of a forward foreign currency exchange contract changes unfavorably due to movements in the value of the referenced foreign currencies.
The Fund is subject to credit risk in the normal course of pursuing its investment objectives. The Fund may enter into credit default swap contracts to manage its credit risk, to gain exposure to a credit in which it may otherwise invest or to enhance its returns. The Fund may also purchase and write call and put options in an effort to manage risk and/or generate gains from options premiums.
The Fund may enter into swap contracts containing provisions allowing the counterparty to terminate the contract under certain conditions, including, but not limited to, a decline in the Fund’s NAV below a certain level over a certain period of time, which would trigger a payment by the Fund for those swaps in a liability position. A call option gives the purchaser (holder) of the option the right (but not the obligation) to buy, and obligates the writer to sell (if the option is exercised), the underlying instrument at the exercise or strike price at any time or at
32
FS Global Credit Opportunities Fund
Notes to Consolidated Financial Statements (continued)
(in thousands, except share and per share amounts)
Note 6. Financial Instruments (continued)
a specified time during the option period. A put option gives the holder the right to sell and obligates the writer to buy the underlying instrument at the exercise or strike price at any time or at a specified time during the option period. The fair value of open derivative instruments (which are not considered to be hedging instruments for accounting disclosure purposes) whose primary underlying risk exposure is credit risk as of December 31, 2016 was as follows:
| | | | | | | | |
| | | Fair Value | |
Derivative | | Asset Derivative | | | Liability Derivative | |
Forward foreign currency exchange contracts | | $ | 1,458 | (1) | | $ | 18 | (2) |
Credit default swap contracts | | $ | 1,247 | (3) | | $ | — | |
| (1) | Consolidated statement of assets and liabilities location: Unrealized appreciation on forward foreign currency exchange contracts. |
| (2) | Consolidated statement of assets and liabilities location: Unrealized depreciation on forward foreign currency exchange contracts. |
| (3) | Consolidated statement of assets and liabilities location: Unamortized swap premiums paid and unrealized appreciation on credit default swaps. |
The Fund’s derivative assets and liabilities at fair value by risk, which are reported on a gross basis on its consolidated statement of assets and liabilities, are presented in the table above.
The following tables present the Fund’s derivative assets and liabilities by counterparty, net of amounts available for offset under a master netting agreement and net of the related collateral received by the Fund for assets or pledged by the Fund for liabilities as of December 31, 2016:
| | | | | | | | | | | | | | | | | | | | |
Counterparty | | Derivative Assets
Subject to Master
Netting Agreement | | | Derivatives
Available
for Offset | | | Non-cash
Collateral
Received(1) | | | Cash
Collateral
Received(1) | | | Net
Amount of
Derivative
Assets(2) | |
JPMorgan Chase Bank, N.A. | | $ | 1,247 | | | $ | — | | | $ | — | | | $ | — | | | $ | 1,247 | |
JPMorgan Chase Bank, N.A. | | | 1,458 | | | | 18 | | | | — | | | | — | | | | 1,440 | |
| | | | | |
Counterparty | | Derivative Liabilities
Subject to Master
Netting Agreement | | | Derivatives
Available
for Offset | | | Non-cash
Collateral
Pledged(1) | | | Cash
Collateral
Pledged(1) | | | Net
Amount of
Derivative
Liabilities(3) | |
JPMorgan Chase Bank, N.A. | | $ | 18 | | | $ | 18 | | | $ | — | | | $ | — | | | $ | — | |
| (1) | In some instances, the actual amount of the collateral received and/or pledged may be more than the amount shown due to overcollateralization. |
| (2) | Net amount of derivative assets represents the net amount due from the counterparty to the Fund in the event of default. |
| (3) | Net amount of derivative liabilities represents the net amount due from the Fund to the counterparty in the event of default. |
33
FS Global Credit Opportunities Fund
Notes to Consolidated Financial Statements (continued)
(in thousands, except share and per share amounts)
Note 6. Financial Instruments (continued)
The effect of derivative instruments (which are not considered to be hedging instruments for accounting disclosure purposes) on the Fund’s consolidated statement of operations whose primary underlying risk exposure is credit risk for the year ended December 31, 2016 was as follows:
| | | | | | | | |
Derivative | | Realized Gain (Loss) on
Derivatives Recognized
in Income | | | Net Change in Unrealized
Appreciation
(Depreciation) on
Derivatives Recognized
in Income | |
Forward foreign currency exchange contracts | | $ | 11,586 | (1) | | $ | 1,440 | (2) |
Credit default swap contracts | | $ | (7,218 | )(3) | | $ | (1,190 | )(4) |
| (1) | Consolidated statement of operations location: Net realized gain (loss) on forward foreign currency exchange contracts. |
| (2) | Consolidated statement of operations location: Net change in unrealized appreciation (depreciation) on forward foreign currency exchange contracts. |
| (3) | Consolidated statement of operations location: Net realized gain (loss) on credit default swaps. |
| (4) | Consolidated statement of operations location: Net change in unrealized appreciation (depreciation) on credit default swaps. |
The average notional amounts of credit default swap contracts and forward foreign currency exchange contracts outstanding during the year ended December 31, 2016, which are indicative of the volumes of these derivative types, were $18,448 and $132,643, respectively.
Note 7. Investment Portfolio
The following table summarizes the composition of the Fund’s investment portfolio at cost and fair value as of December 31, 2016:
| | | | | | | | | | | | |
| | | December 31, 2016 | |
| | | Amortized Cost(1) | | | Fair Value | | | Percentage of
Portfolio | |
Senior Secured Loans—First Lien | | $ | 557,919 | | | $ | 532,643 | | | | 29 | % |
Senior Secured Loans—Second Lien | | | 158,717 | | | | 164,708 | | | | 9 | % |
Senior Secured Bonds | | | 359,299 | | | | 369,187 | | | | 20 | % |
Subordinated Debt | | | 556,209 | | | | 555,429 | | | | 30 | % |
Collateralized Securities | | | 45,876 | | | | 48,256 | | | | 3 | % |
Equity/Other | | | 113,149 | | | | 163,924 | | | | 9 | % |
| | | | | | | | | | | | |
Total | | $ | 1,791,169 | | | $ | 1,834,147 | | | | 100 | % |
| | | | | | | | | | | | |
| (1) | Amortized cost represents the original cost adjusted for the amortization of premiums and/or accretion of discounts, as applicable, on investments. |
As of December 31, 2016, the Fund did not “control” any of its portfolio companies and except for Aspect Software, Inc., in which the Fund has two senior secured loans, one of which includes a partially unfunded
34
FS Global Credit Opportunities Fund
Notes to Consolidated Financial Statements (continued)
(in thousands, except share and per share amounts)
Note 7. Investment Portfolio (continued)
commitment, and an equity/other investment, the Fund was not an “affiliated person” of any of its portfolio companies, each as defined in the 1940 Act.
In general, under the 1940 Act, the Fund would be presumed to “control” a portfolio company if it owned more than 25% of its voting securities or had the power to exercise control over the management or policies of such portfolio company, and would be an “affiliated person” of a portfolio company if it owned 5% or more of its voting securities.
The Fund’s investment portfolio may contain loans that are in the form of lines of credit or revolving credit facilities, which require the Fund to provide funding when requested by portfolio companies in accordance with the terms of the underlying loan agreements. As of December 31, 2016, the Fund had four senior secured loan investments with aggregate unfunded commitments of $41,166. The Fund maintains sufficient cash on hand and/or available borrowings to fund such unfunded commitments should the need arise.
The table below describes investments by industry classification and enumerates the percentage, by fair value, of the total portfolio assets in such industries as of December 31, 2016:
| | | | | | | | |
| | | December 31, 2016 | |
Industry Classification | | Fair Value | | | Percentage of
Portfolio | |
Automobiles & Components | | $ | 9,750 | | | | 1 | % |
Banks | | | 37,384 | | | | 2 | % |
Capital Goods | | | 243,819 | | | | 13 | % |
Commercial & Professional Services | | | 17,526 | | | | 1 | % |
Consumer Durables & Apparel | | | 6,294 | | | | 0 | % |
Consumer Services | | | 102,452 | | | | 6 | % |
Diversified Financials | | | 61,590 | | | | 3 | % |
Energy | | | 212,296 | | | | 11 | % |
Food & Staples Retailing | | | 14,396 | | | | 1 | % |
Food, Beverage & Tobacco | | | 25,090 | | | | 1 | % |
Health Care Equipment & Services | | | 8,298 | | | | 0 | % |
Insurance | | | 70,556 | | | | 4 | % |
Materials | | | 87,671 | | | | 5 | % |
Media | | | 130,049 | | | | 7 | % |
Pharmaceuticals, Biotechnology & Life Sciences | | | 67,853 | | | | 4 | % |
Real Estate | | | 52,200 | | | | 3 | % |
Retailing | | | 49,803 | | | | 3 | % |
Software & Services | | | 307,437 | | | | 17 | % |
Technology Hardware & Equipment | | | 90,556 | | | | 5 | % |
Telecommunication Services | | | 159,467 | | | | 9 | % |
Transportation | | | 79,660 | | | | 4 | % |
| | | | | | | | |
Total | | $ | 1,834,147 | | | | 100 | % |
| | | | | | | | |
35
FS Global Credit Opportunities Fund
Notes to Consolidated Financial Statements (continued)
(in thousands, except share and per share amounts)
Note 7. Investment Portfolio (continued)
The table below describes the geographic concentration of the Fund’s investment portfolio and enumerates the percentage, by fair value, of the total portfolio assets in such geographic locations as of December 31, 2016:
| | | | | | | | |
| | | December 31, 2016 | |
Geographic Locations(1) | | Fair Value | | | Percentage of
Portfolio | |
United States | | $ | 1,447,315 | | | | 79 | % |
Europe | | | 287,987 | | | | 16 | % |
Other | | | 98,845 | | | | 5 | % |
| | | | | | | | |
Total | | $ | 1,834,147 | | | | 100 | % |
| | | | | | | | |
| (1) | Geographic location based on the portfolio company’s headquarters or principal place of business. |
Purchases and sales of securities during the year ended December 31, 2016, other than short-term securities and U.S. government obligations, were $1,959,810 and $1,350,215, respectively.
Note 8. Fair Value of Financial Instruments
Under existing accounting guidance, fair value is defined as the price that the Fund would receive upon selling an asset or pay to transfer a liability in an orderly transaction to a market participant in the principal or most advantageous market for the investment. This accounting guidance emphasizes that valuation techniques maximize the use of observable market inputs and minimize the use of unobservable inputs. Inputs refer broadly to the assumptions that market participants would use in pricing an asset or liability, including assumptions about risk. Inputs may be observable or unobservable. Observable inputs are inputs that reflect the assumptions market participants would use in pricing an asset or liability developed based on market data obtained from sources independent of the Fund. Unobservable inputs are inputs that reflect the assumptions market participants would use in pricing an asset or liability developed based on the best information available in the circumstances. The Fund classifies the inputs used to measure these fair values into the following hierarchy as defined by current accounting guidance:
Level 1: Inputs that are quoted prices (unadjusted) in active markets for identical assets or liabilities.
Level 2: Inputs that are quoted prices for similar assets or liabilities in active markets.
Level 3: Inputs that are unobservable for an asset or liability.
A financial instrument’s categorization within the valuation hierarchy is based upon the lowest level of input that is significant to the fair value measurement.
As of December 31, 2016, the Fund’s investments were categorized as follows in the fair value hierarchy:
| | | | |
Valuation Inputs | | December 31, 2016 | |
Level 1—Price quotations in active markets | | $ | 73,525 | |
Level 2—Significant other observable inputs | | | — | |
Level 3—Significant unobservable inputs | | | 1,760,622 | |
| | | | |
Total | | $ | 1,834,147 | |
| | | | |
36
FS Global Credit Opportunities Fund
Notes to Consolidated Financial Statements (continued)
(in thousands, except share and per share amounts)
Note 8. Fair Value of Financial Instruments (continued)
As of December 31, 2016, the Fund’s forward foreign currency exchange contracts and credit default swaps were categorized as follows in the fair value hierarchy:
| | | | | | | | |
| | | December 31, 2016 | |
Valuation Inputs | | Asset | | | Liability | |
Level 1—Price quotations in active markets | | $ | — | | | $ | — | |
Level 2—Significant other observable inputs | | | 1,458 | | | | 18 | |
Level 3—Significant unobservable inputs | | | 1,247 | | | | — | |
| | | | | | | | |
Total | | $ | 2,705 | | | $ | 18 | |
| | | | | | | | |
The Fund’s investments as of December 31, 2016 consisted primarily of debt securities that are traded on a private over-the-counter market for institutional investors. Except as described below, the Fund valued its investments, forward foreign currency exchange contracts and credit default swaps by using the midpoint of the prevailing bid and ask prices from dealers on the date of the period end, which were provided by an independent third-party pricing service approved by the Board and screened for validity by such service. Seventeen equity/other investments which were traded on an active public market were valued at their closing price as of December 31, 2016. Twenty-nine senior secured loan investments, one senior secured bond investment and one collateralized loan obligation investment were valued by an independent third-party valuation service approved by the Board, which determined the fair value of such investments by considering, among other factors, the borrower’s ability to adequately service its debt, prevailing interest rates for like investments, expected cash flows, call features, anticipated prepayments and other relevant terms of the debt. Three of the Fund’s equity/other investments were valued by the same independent valuation firm, which determined the fair value of such investments by considering, among other factors, contractual rights ascribed to such investments, as well as various income scenarios and multiples of earnings before interest, taxes, depreciation and amortization, or EBITDA, cash flows, net income, revenues or, in limited instances, book value or liquidation value.
The Fund periodically benchmarks the bid and ask prices it receives from the third-party pricing service and/or dealers against the actual prices at which the Fund purchases and sells its investments. Based on the results of the benchmark analysis and the experience of the Fund’s management in purchasing and selling these investments in other investment funds managed by the sponsor, the Fund believes that these prices are reliable indicators of fair value. However, because of the private nature of this marketplace (meaning actual transactions are not publicly reported), the Fund believes that these valuation inputs are classified as Level 3 within the fair value hierarchy. The Fund may also use other methods, including the use of an independent third-party valuation service approved by the Board, to determine fair value for securities for which it cannot obtain prevailing bid and ask prices through independent third-party pricing services or independent dealers, or where the Board otherwise determines that the use of such other methods is appropriate. The Fund will periodically benchmark the valuations provided by the independent third-party valuation service against the actual prices at which the Fund purchases and sells its investments. The Fund’s valuation committee and Board reviewed the valuation determinations made with respect to these investments and determined that they were made in a manner consistent with the Fund’s valuation process.
37
FS Global Credit Opportunities Fund
Notes to Consolidated Financial Statements (continued)
(in thousands, except share and per share amounts)
Note 8. Fair Value of Financial Instruments (continued)
The following is a reconciliation for the year ended December 31, 2016 of investments for which significant unobservable inputs (Level 3) were used in determining fair value:
| | | | | | | | | | | | | | | | | | | | | | | | | | | | |
| | | For the Year Ended December 31, 2016 | |
| | | Senior
Secured
Loans—First
Lien | | | Senior Secured
Loans—Second
Lien | | | Senior
Secured
Bonds | | | Subordinated
Debt | | | Collateralized
Securities | | | Equity/
Other | | | Total | |
Fair value at beginning of period | | $ | 429,918 | | | $ | 116,853 | | | $ | 201,436 | | | $ | 220,165 | | | $ | 14,615 | | | $ | 6 | | | $ | 982,993 | |
Accretion of discount (amortization of premium) | | | 11,640 | | | | 1,314 | | | | 7,744 | | | | 11,493 | | | | — | | | | — | | | | 32,191 | |
Net realized gain (loss) | | | (1,735 | ) | | | (7,716 | ) | | | (53,139 | ) | | | (15,432 | ) | | | — | | | | (43 | ) | | | (78,065 | ) |
Net change in unrealized appreciation (depreciation) | | | 19,510 | | | | 23,322 | | | | 66,316 | | | | 61,917 | | | | 4,721 | | | | 24,342 | | | | 200,128 | |
Purchases | | | 457,742 | | | | 115,458 | | | | 459,450 | | | | 737,806 | | | | 31,454 | | | | 68,794 | | | | 1,870,704 | |
Paid-in-kind interest | | | 310 | | | | 210 | | | | 286 | | | | 191 | | | | — | | | | — | | | | 997 | |
Sales and redemptions | | | (384,742 | ) | | | (84,733 | ) | | | (312,906 | ) | | | (460,711 | ) | | | (2,534 | ) | | | (2,700 | ) | | | (1,248,326 | ) |
Net transfers in or out of Level 3 | | | — | | | | — | | | | — | | | | — | | | | — | | | | — | | | | — | |
| | | | | | | | | | | | | | | | | | | | | | | | | | | | |
Fair value at end of period | | $ | 532,643 | | | $ | 164,708 | | | $ | 369,187 | | | $ | 555,429 | | | $ | 48,256 | | | $ | 90,399 | | | $ | 1,760,622 | |
| | | | | | | | | | | | | | | | | | | | | | | | | | | | |
The amount of total gains or losses for the period included in changes in net assets attributable to the change in unrealized gains or losses relating to investments still held at the reporting date | | $ | 812 | | | $ | 11,033 | | | $ | 27,657 | | | $ | 28,875 | | | $ | 4,721 | | | $ | 24,335 | | | $ | 97,433 | |
| | | | | | | | | | | | | | | | | | | | | | �� | | | | | | |
The following is a reconciliation for the year ended December 31, 2016 of credit default swaps—sell protection for which significant unobservable inputs (Level 3) were used in determining fair value:
| | | | |
| | | For the Year Ended
December 31, 2016 | |
Fair value at beginning of period | | $ | (5,045 | ) |
Net realized gain (loss) | | | (2,735 | ) |
Net change in unrealized appreciation (depreciation) | | | 3,671 | |
Swap premiums received | | | — | |
Coupon payments received | | | (121 | ) |
Premiums paid on exit | | | 4,230 | |
Net transfers in or out of Level 3 | | | — | |
| | | | |
Fair value at end of period | | $ | — | |
| | | | |
The amount of total gains or losses for the period included in changes in net assets attributable to the change in unrealized gains or losses relating to credit default swaps—sell protection still held at the reporting date | | $ | — | |
| | | | |
38
FS Global Credit Opportunities Fund
Notes to Consolidated Financial Statements (continued)
(in thousands, except share and per share amounts)
Note 8. Fair Value of Financial Instruments (continued)
The following is a reconciliation for the year ended December 31, 2016 of credit default swaps—buy protection for which significant unobservable inputs (Level 3) were used in determining fair value:
| | | | |
| | | For the Year Ended
December 31, 2016 | |
Fair value at beginning of period | | $ | 18,351 | |
Net realized gain (loss) | | | (4,483 | ) |
Net change in unrealized appreciation (depreciation) | | | (4,861 | ) |
Swap premiums paid | | | 8,324 | |
Coupon payments paid | | | 725 | |
Premiums received on exit | | | (16,809 | ) |
Net transfers in or out of Level 3 | | | — | |
| | | | |
Fair value at end of period | | $ | 1,247 | |
| | | | |
The amount of total gains or losses for the period included in changes in net assets attributable to the change in unrealized gains or losses relating to credit default swaps—buy protection still held at the reporting date | | $ | (727 | ) |
| | | | |
The valuation techniques and significant unobservable inputs used in recurring Level 3 fair value measurements as of December 31, 2016 are as follows:
| | | | | | | | | | | | | | | | |
Type of Investment | | Fair Value at
December 31,
2016 | | | Valuation
Technique(1) | | Unobservable Input | | Range | | | Weighted
Average | |
Senior Secured Loans—First Lien | | $ | 505,790 | | | Market Quotes | | Indicative Dealer Quotes | | | 58.3% - 108.2% | | | | 94.4% | |
| | | 20,560 | | | Market Comparables | | Market Yield (%) | | | 10.5% - 11.5% | | | | 11.1% | |
| | | 6,293 | | | Market Comparables | | EBITDA Multiples (x) | | | 4.3x - 4.8x | | | | 4.5x | |
Senior Secured Loans—Second Lien | | | 164,708 | | | Market Quotes | | Indicative Dealer Quotes | | | 80.0% - 103.5% | | | | 99.1% | |
Senior Secured Bonds | | | 368,393 | | | Market Quotes | | Indicative Dealer Quotes | | | 65.0% - 109.5% | | | | 95.9% | |
| | | 794 | | | Market Comparables | | EBITDA Multiples (x) | | | 6.8x - 7.3x | | | | 7.0x | |
| | | | | | | | Production Multiples
(Mboe/d) | | | $45,000.00 - $50,000.00 | | | | $47,500.00 | |
| | | | | | | | Proved Reserves
Multiples (Mmboe) | | | $14.50 - $15.00 | | | | $14.75 | |
| | | | | | | | PV-10 Multiples (x) | | | 0.8x - 0.9x | | | | 0.9x | |
Subordinated Debt | | | 555,429 | | | Market Quotes | | Indicative Dealer Quotes | | | 5.0% - 118.4% | | | | 92.1% | |
Collateralized Securities | | | 17,956 | | | Market Quotes | | Indicative Dealer Quotes | | | 56.0% - 86.4% | | | | 70.1% | |
| | | 30,300 | | | Market Comparables | | Market Yield (%) | | | 14.0% - 14.0% | | | | 14.0% | |
Equity/Other | | | 32,007 | | | Market Quotes | | Indicative Dealer Quotes | | | $7.00 - $380.00 | | | | $272.26 | |
| | | 58,392 | | | Market Comparables | | EBITDA Multiples (x) | | | 6.8x - 10.3x | | | | 9.3x | |
| | | | | | | | Production Multiples
(Mboe/d) | | | $45,000.00 - $55,000.00 | | | | $48,711.41 | |
| | | | | | | | Proved Reserves
Multiples (Mmboe) | | | $10.50 - $15.00 | | | | $13.97 | |
| | | | | | | | PV-10 Multiples (x) | | | 0.8x - 2.1x | | | | 1.1x | |
| | | | | | | | | | | | | | | | |
Total | | $ | 1,760,622 | | | | | | | | | | | | | |
| | | | | | | | | | | | | | | | |
Credit Default Swaps—Buy Protection | | $ | 1,247 | | | Market Quotes | | Indicative Dealer Quotes | | | (19.4)% - (17.2)% | | | | (17.9)% | |
39
FS Global Credit Opportunities Fund
Notes to Consolidated Financial Statements (continued)
(in thousands, except share and per share amounts)
Note 8. Fair Value of Financial Instruments (continued)
| (1) | Investments using a market quotes valuation technique were valued by using the midpoint of the prevailing bid and ask prices from dealers on the date of the period end, which were provided by an independent third-party pricing service and screened for validity by such service. For investments utilizing a market comparables valuation technique, a significant increase (decrease) in the market yield, in isolation, would result in a significantly lower (higher) fair value measurement, and a significant increase (decrease) in any of the valuation multiples, in isolation, would result in a significantly higher (lower) fair value measurement. For investments utilizing a discounted cash flow valuation technique, a significant increase (decrease) in the discount rate, in isolation, would result in a significantly lower (higher) fair value measurement. |
Note 9. Financing Arrangements
The following table presents summary information with respect to the Fund’s outstanding financing arrangements as of December 31, 2016:
| | | | | | | | | | | | | | |
Arrangement | | Type of Arrangement | | Rate | | Amount
Outstanding | | | Amount
Available | | | Maturity Date |
Dauphin Funding Facility | | Revolving Credit Facility | | L+1.80% | | $ | 124,418 | | | $ | 125,582 | | | August 25, 2017 |
Bucks Funding Facility(1) | | Prime Brokerage Facility | | L+1.10% | | $ | 196,182 | | | $ | 3,818 | | | September 27, 2017(2) |
| (1) | On February 15, 2017, Bucks Funding, the Fund’s wholly-owned financing subsidiary, entered into an amendment to the Bucks Funding facility (as defined below) to, among other things, increase the maximum commitment available to Bucks Funding under the facility by $50,000 to $250,000. |
| (2) | As described below, this facility generally is terminable upon 270 days’ notice by either party. As of December 31, 2016, neither party to the facility had provided notice of its intent to terminate the facility. |
Dauphin Funding Facility
On August 26, 2014, the Fund’s wholly-owned, special-purpose financing subsidiary, Dauphin Funding, entered into a revolving credit facility, or the Dauphin Funding facility, with Deutsche Bank AG, New York Branch, or Deutsche Bank, as administrative agent and a lender, and the other lenders party thereto. The Dauphin Funding facility originally provided for borrowings in an aggregate principal amount up to $150,000 on a committed basis. On December 9, 2014, the Dauphin Funding facility was amended to increase the maximum commitment available under the facility to $250,000.
On August 25, 2016, the Dauphin Funding facility was further amended to, among other things, (i) extend the maturity date of the Dauphin Funding facility to August 25, 2017, (ii) increase the applicable spread over LIBOR for a three-month period to 1.80% per annum, (iii) provide for a commitment fee of 0.75% per annum on the unborrowed portion of the Dauphin Funding facility, (iv) provide for an excess unused fee of 1.05% per annum payable on any unborrowed portion of the Dauphin Funding facility in excess of $125,000 and (v) provide for a commitment reduction fee in an amount equal to the commitment fee and, as applicable, excess unused fee that would have accrued through scheduled maturity on any amount by which the commitments are reduced.
The Fund may contribute assets to Dauphin Funding from time to time, subject to certain restrictions set forth in the Dauphin Funding facility, and will retain a residual interest in any assets contributed through its
40
FS Global Credit Opportunities Fund
Notes to Consolidated Financial Statements (continued)
(in thousands, except share and per share amounts)
Note 9. Financing Arrangements (continued)
ownership of Dauphin Funding or will receive fair market value for any assets sold to Dauphin Funding. Dauphin Funding may purchase additional assets from various sources. Dauphin Funding has appointed the Fund to manage its portfolio of assets pursuant to the terms of an investment management agreement. Dauphin Funding’s obligations to Deutsche Bank under the Dauphin Funding facility are secured by a first priority security interest in substantially all of the assets of Dauphin Funding, including its portfolio of assets. The obligations of Dauphin Funding under the Dauphin Funding facility are non-recourse to the Fund and the Fund’s exposure under the Dauphin Funding facility is limited to the value of the Fund’s investment in Dauphin Funding.
Borrowings under the Dauphin Funding facility accrue interest at a rate equal to the three-month London Interbank Offered Rate, or LIBOR, plus a spread of 1.80% per annum. Any amounts borrowed under the Dauphin Funding facility will mature, and all accrued and unpaid interest thereunder will be due and payable, on August 25, 2017. Borrowings under the Dauphin Funding facility are subject to compliance with a borrowing base, pursuant to which the amount of funds advanced to Dauphin Funding varies depending upon the types of assets in Dauphin Funding’s portfolio.
Under the Dauphin Funding facility, Dauphin Funding has made certain representations and warranties and is required to comply with various covenants and reporting requirements customary for facilities of this type. The Dauphin Funding facility contains the following events of default: (a) the failure to make principal payments when due or interest payments within three business days of when due; (b) the purchase by Dauphin Funding of certain ineligible assets; (c) the insolvency or bankruptcy of Dauphin Funding or the Fund; (d) the Fund ceasing to act as investment manager of Dauphin Funding’s assets; (e) the decline of the Fund’s NAV below a specified threshold; (f) fraud or other illicit acts by the Fund, FS Global Advisor or GSO in their respective investment advisory capacities; and (g) the occurrence of a default or similar condition under certain third-party contracts by the Fund or Dauphin Funding. Upon the occurrence of an event of default, Deutsche Bank may declare the outstanding principal and interest and all other amounts owing under the Dauphin Funding facility immediately due and payable. During the continuation of an event of default, Dauphin Funding must pay interest at a default rate.
As of December 31, 2016, $124,418 was outstanding under the Dauphin Funding facility. The carrying amount outstanding under the Dauphin Funding facility approximates its fair value. The Fund incurred costs of $1,876 in connection with obtaining and amending the Dauphin Funding facility, which the Fund has recorded as deferred financing costs on its consolidated statement of assets and liabilities and amortizes to interest expense over the life of the facility. As of December 31, 2016, $405 of such deferred financing costs had yet to be amortized to interest expense.
For the year ended December 31, 2016, the components of total interest expense for the Dauphin Funding facility were as follows:
| | | | |
| | | Year Ended
December 31, 2016 | |
Direct interest expense | | $ | 3,674 | |
Non-usage fees | | | 311 | |
Amortization of deferred financing costs | | | 626 | |
| | | | |
Total interest expense | | $ | 4,611 | |
| | | | |
41
FS Global Credit Opportunities Fund
Notes to Consolidated Financial Statements (continued)
(in thousands, except share and per share amounts)
Note 9. Financing Arrangements (continued)
For the year ended December 31, 2016, the cash paid for interest expense, average borrowings, effective interest rate and weighted average interest rate for the Dauphin Funding facility were as follows:
| | | | |
| | | Year Ended
December 31, 2016 | |
Cash paid for interest expense(1) | | $ | 3,679 | |
Average borrowings under the facility | | $ | 161,818 | |
Effective interest rate on borrowings (including the effect of non-usage fees) | | | 3.21 | % |
Weighted average interest rate (including the effect of non-usage fees) | | | 2.43 | % |
| (1) | Interest under the Dauphin Funding facility is payable quarterly in arrears. |
Borrowings of Dauphin Funding are considered borrowings of the Fund for purposes of complying with the asset coverage requirements under the 1940 Act applicable to closed-end management investment companies.
Bucks Funding Facility
On March 10, 2015, the Fund’s wholly-owned financing subsidiary, Bucks Funding, entered into a committed facility arrangement, or the Bucks Funding facility, with BNP Paribas Prime Brokerage, Inc., or BNPP, on behalf of itself and as agent for BNP Paribas, BNP Paribas Prime Brokerage International, Ltd. and BNPP, or, collectively, the BNPP Entities. The Bucks Funding facility was amended on October 15, 2015 to provide BNPP with the cancellation right described below. Effective June 30, 2016, Bucks Funding entered into an amendment to the Bucks Funding facility to increase the maximum commitment available to Bucks Funding under the facility to $200,000. The Bucks Funding facility was effected through a committed facility agreement by and between Bucks Funding and BNPP, or the committed facility agreement, a U.S. Prime Brokerage agreement by and between Bucks Funding and BNPP and a special custody and pledge agreement by and among Bucks Funding, BNPP and State Street Bank and Trust Company, or State Street, as custodian, each dated as of March 10, 2015, and which are collectively referred to herein as the BNP financing agreements.
The Fund may contribute securities to Bucks Funding from time to time, subject to certain restrictions set forth in the committed facility agreement, and will retain a residual interest in any securities contributed through its ownership of Bucks Funding or will receive fair market value for any securities sold to Bucks Funding. Bucks Funding may purchase additional securities from various sources. Bucks Funding has appointed the Fund to manage its portfolio of securities pursuant to the terms of an investment management agreement. Bucks Funding’s obligations to BNP PBIL under the Bucks Funding facility are secured by a first priority security interest in substantially all of the assets of Bucks Funding, including its portfolio of securities. Such pledged portfolio of securities is held in a segregated custody account with State Street. The value of securities required to be pledged by Bucks Funding is determined in accordance with the margin requirements described in the BNP financing agreements. The obligations of Bucks Funding under the Bucks Funding facility are non-recourse to the Fund, and the Fund’s exposure under the Bucks Funding facility is limited to the value of its investment in Bucks Funding.
Borrowings under the Bucks Funding facility accrue interest at a rate equal to three-month LIBOR plus 1.10% per annum. Interest is payable monthly in arrears. Bucks Funding is required to pay a non-usage fee of 0.55% per annum to the extent the aggregate principal amount available under the Bucks Funding facility has not been utilized. Bucks Funding may terminate the committed facility agreement upon 270 days’ notice. Absent a default or facility termination event (or the ratings decline described in the following sentence), BNP PBIL is required to provide Bucks Funding with 270 days’ notice prior to terminating or materially amending the
42
FS Global Credit Opportunities Fund
Notes to Consolidated Financial Statements (continued)
(in thousands, except share and per share amounts)
Note 9. Financing Arrangements (continued)
committed facility agreement. BNP PBIL has a cancellation right if BNP Paribas’ long-term credit rating declines three or more notches below its highest rating by any of Standard & Poor’s Ratings Services, Moody’s Investors Service, Inc. or Fitch Ratings, Inc. during the term of the Bucks Funding facility. Upon any such termination, BNP PBIL is required to pay Bucks Funding a fee equal to 0.50% of the maximum amount of financing available on the termination date. Bucks Funding paid an arrangement fee and incurred certain other customary costs and expenses in connection with obtaining and amending the Bucks Funding facility.
In connection with the Bucks Funding facility, Bucks Funding has made certain representations and warranties and is required to comply with various covenants and reporting requirements customary for facilities of this type. The BNP financing agreements contain the following events of default and termination events, among others: (a) the occurrence of a default or similar condition under certain third-party contracts of the Fund or Bucks Funding; (b) any change in BNP PBIL’s interpretation of applicable law that, in the reasonable opinion of counsel to BNP PBIL, has the effect of impeding or prohibiting the Bucks Funding facility; (c) certain events of insolvency or bankruptcy by the Fund or Bucks Funding; (d) specified material reductions in the Fund’s or Bucks Funding’s NAV; (e) any change in the Fund’s fundamental or material investment policies; and (f) the termination of the investment advisory agreement or if FS Global Advisor otherwise ceases to act as the Fund’s investment adviser and is not immediately replaced by an affiliate or other investment adviser acceptable to BNP PBIL.
Under the terms of the BNP financing agreements, BNP PBIL has the ability to borrow a portion of the pledged collateral, or collectively, the rehypothecated securities, subject to certain limits. Bucks Funding will receive a fee from BNP PBIL in connection with any rehypothecated securities. Bucks Funding may designate any security within the pledged collateral as ineligible to be a rehypothecated security, provided there are eligible securities within the segregated custody account in an amount equal to the outstanding borrowings owed by Bucks Funding to BNP PBIL. Bucks Funding may recall any rehypothecated security at any time, and BNP PBIL must return such security or equivalent security within a commercially reasonable period. In the event BNP PBIL does not return the security, Bucks Funding will have the right to, among other things, apply and set off an amount equal to 100% of the then-current fair market value of such unreturned rehypothecated security against any outstanding borrowings owed to BNP PBIL under the BNP financing agreements. Rehypothecated securities are marked-to-market daily and if the value of all rehypothecated securities exceeds 100% of the outstanding borrowings owed by Bucks Funding under the BNP financing agreements, BNP PBIL may either reduce the amount of rehypothecated securities to eliminate such excess or deposit into the segregated custody account an amount of cash equal to such excess. Bucks Funding will continue to receive interest and the scheduled repayment of principal balances on rehypothecated securities.
As of December 31, 2016, $196,182 was outstanding under the Bucks Funding facility. The carrying amount outstanding under the Bucks Funding facility approximates its fair value. The Fund incurred costs of $300 in connection with obtaining and amending the Bucks Funding facility, which the Fund has recorded as deferred financing costs on its consolidated statement of assets and liabilities and amortizes to interest expense over the life of the facility. As of December 31, 2016, $25 of such deferred financing costs had yet to be amortized to interest expense.
43
FS Global Credit Opportunities Fund
Notes to Consolidated Financial Statements (continued)
(in thousands, except share and per share amounts)
Note 9. Financing Arrangements (continued)
For the year ended December 31, 2016, the components of total interest expense for the Bucks Funding facility were as follows:
| | | | |
| | | Year Ended
December 31, 2016 | |
Direct interest expense | | $ | 3,243 | |
Non-usage fees | | | 30 | |
Amortization of deferred financing costs | | | 79 | |
| | | | |
Total interest expense | | $ | 3,352 | |
| | | | |
For the year ended December 31, 2016, the cash paid for interest expense, average borrowings, effective interest rate and weighted average interest rate for the Bucks Funding facility were as follows:
| | | | |
| | | Year Ended
December 31, 2016 | |
Cash paid for interest expense(1) | | $ | — | |
Average borrowings under the facility | | $ | 176,080 | |
Effective interest rate on borrowings (including the effect of non-usage fees) | | | 2.11 | % |
Weighted average interest rate (including the effect of non-usage fees) | | | 1.87 | % |
| (1) | Interest under the Bucks Funding facility is payable monthly or may be capitalized on the principal balance as additional cash borrowing. |
Borrowings of Bucks Funding are considered borrowings of the Fund for purposes of complying with the asset coverage requirements under the 1940 Act applicable to closed-end management investment companies.
Note 10. Concentration of Risk
Investing in the Fund involves risks, including, but not limited to, those set forth below. The risks described below are not, and are not intended to be, a complete enumeration or explanation of the risks involved in an investment in the Fund. For a more complete discussion of the risks of investing in the Fund, see the section entitled “Types of Investments and Related Risks” in the Companies’ prospectuses and the Companies’ and the Fund’s other filings with the SEC.
Credit Risk: The Fund’s debt investments are subject to the risk of non-payment of scheduled interest or principal by the borrowers with respect to such investments. Such non-payment would likely result in a reduction of income to the Fund and a reduction in the value of the debt investments experiencing non-payment.
Although the Fund may invest in investments that FS Global Advisor believes are secured by specific collateral, the value of which may exceed the principal amount of the investments at the time of initial investment, there can be no assurance that the liquidation of any such collateral would satisfy the borrower’s obligation in the event of non-payment of scheduled interest or principal payments with respect to such investment, or that such collateral could be readily liquidated. In addition, in the event of bankruptcy of a borrower, the Fund could experience delays or limitations with respect to its ability to realize the benefits of the collateral securing an investment. Under certain circumstances, collateral securing an investment may be released without the consent of the Fund. Moreover, the Fund’s investments in secured debt may be unperfected for a
44
FS Global Credit Opportunities Fund
Notes to Consolidated Financial Statements (continued)
(in thousands, except share and per share amounts)
Note 10. Concentration of Risk (continued)
variety of reasons, including the failure to make required filings by lenders, trustees or other responsible parties and, as a result, the Fund may not have priority over other creditors as anticipated. The Fund’s right to payment and its security interest, if any, may be subordinated to the payment rights and security interests of more senior creditors. Certain of these investments may have an interest-only payment schedule, with the principal amount remaining outstanding and at risk until the maturity of the investment. In this case, a portfolio company’s ability to repay the principal of an investment may be dependent upon a liquidity event or the long-term success of the company, the occurrence of which is uncertain.
Companies in which the Fund invests could deteriorate as a result of, among other factors, an adverse development in their business, a change in the competitive environment or an economic downturn. As a result, companies that the Fund expected to be stable may operate, or expect to operate, at a loss or have significant variations in operating results, may require substantial additional capital to support their operations or maintain their competitive position, or may otherwise have a weak financial condition or be experiencing financial distress.
Non-U.S. Securities Risk: Investments in certain securities and other instruments of non-U.S. issuers or borrowers, or non-U.S. securities, involve factors not typically associated with investing in the United States or other developed countries, including, but not limited to, risks relating to: (i) differences between U.S. and non-U.S. securities markets, including potential price volatility in and relative illiquidity of some non-U.S. securities markets; the absence of uniform accounting, auditing and financial reporting standards, practices and disclosure requirements; and less government supervision and regulation; (ii) other differences in law and regulation, including fewer investor protections, less stringent fiduciary duties, less developed bankruptcy laws and difficulty in enforcing contractual obligations; (iii) certain economic and political risks, including potential economic, political or social instability; exchange control regulations; restrictions on foreign investment and repatriation of capital, possibly requiring government approval; expropriation or confiscatory taxation; other government restrictions by the United States or other governments; higher rates of inflation; higher transaction costs; and reliance on a more limited number of commodity inputs, service providers and/or distribution mechanisms; and (iv) the possible imposition of local taxes on income and gains recognized with respect to securities and assets. Certain non-U.S. markets may rely heavily on particular industries or non-U.S. capital and are more vulnerable to diplomatic developments, the imposition of economic sanctions against a particular country or countries, organizations, entities and/or individuals, changes in international trading patterns, trade barriers and other protectionist or retaliatory measures. International trade barriers or economic sanctions against non-U.S. countries, organizations, entities and/or individuals may adversely affect the Fund’s non-U.S. holdings or exposures. Certain non-U.S. investments may become less liquid in response to social, political or market developments or adverse investor perceptions, or become illiquid after purchase by the Fund, particularly during periods of market turmoil. Certain non-U.S. investments may become illiquid when, for instance, there are few, if any, interested buyers and sellers or when dealers are unwilling to make a market for certain securities. When the Fund holds illiquid investments, its portfolio may be harder to value, especially in changing markets. The risks of investments in emerging markets, including the risks described above, are usually greater than the risks involved in investing in more developed markets. Because non-U.S. securities may trade on days when the Fund’s common shares are not priced, NAV may change at times when common shares cannot be sold.
Foreign Currency Risk: Investments made by the Fund, and the income received by the Fund with respect to such investments, may be denominated in various non-U.S. currencies. However, the books of the Fund are maintained in U.S. dollars. Accordingly, changes in currency values may adversely affect the U.S. dollar value of
45
FS Global Credit Opportunities Fund
Notes to Consolidated Financial Statements (continued)
(in thousands, except share and per share amounts)
Note 10. Concentration of Risk (continued)
portfolio investments, interest and other revenue streams received by the Fund, gains and losses realized on the sale of portfolio investments and the amount of distributions, if any, made by the Fund. In addition, the Fund may incur substantial costs in converting investment proceeds from one currency to another. The Fund may enter into derivative transactions designed to reduce such currency risks. Furthermore, the portfolio companies in which the Fund invests may be subject to risks relating to changes in currency values. If a portfolio company suffers adverse consequences as a result of such changes, the Fund may also be adversely affected as a result.
Note 11. Commitments and Contingencies
The Fund enters into contracts that contain a variety of indemnification provisions. The Fund’s maximum exposure under these arrangements is unknown; however, the Fund has not had prior claims or losses pursuant to these contracts. Management of FS Global Advisor has reviewed the Fund’s existing contracts and expects the risk of loss to the Fund to be remote.
The Fund is not currently subject to any material legal proceedings and, to the Fund’s knowledge, no material legal proceedings are threatened against the Fund. From time to time, the Fund may be a party to certain legal proceedings in the ordinary course of business, including proceedings related to the enforcement of the Fund’s rights under contracts with its portfolio companies. While the outcome of any legal proceedings cannot be predicted with certainty, the Fund does not expect that any such proceedings will have a material adverse effect upon its financial condition or results of operations.
See Note 4 for a discussion of the Fund’s commitments to FS Global Advisor and its affiliates (including FS Investments).
See Note 7 for a discussion of the Fund’s unfunded commitments.
Note 12. Subsequent Events
On February 15, 2017, Bucks Funding entered into an amendment to the Bucks Funding facility to, among other things, increase the maximum commitment available to Bucks Funding under the facility by $50,000 to $250,000.
46
Supplemental Information (Unaudited)
Changes in Accountants and Disagreements with Accountants on Accounting and Financial Disclosure
The Fund has not had any changes in its independent registered public accounting firm or disagreements with its independent registered public accounting firm on accounting or financial disclosure matters since its inception.
Board of Trustees
Information regarding the members of the Board is set forth below. The trustees have been divided into two groups—interested trustees and independent trustees. The address for each trustee is c/o FS Global Credit Opportunities Fund, 201 Rouse Boulevard, Philadelphia, Pennsylvania 19112. As set forth in the Fund’s amended and restated declaration of trust, each trustee’s term of office shall continue until his or her death, resignation or removal.
| | | | | | | | | | | | |
Name | | Age | | Trustee Since | | Title | | Principal Occupations During the Past Five Years | | Number of
Registered
Investment
Companies in
Fund Complex
Overseen by
Trustee | | Other Directorships Held by Trustee |
| | | | | | |
| Interested Trustees | | | | | | | | | | | | |
| | | | | | |
| Michael C. Forman(1) | | 55 | | January 2013 | | Chairman, President and Chief Executive Officer | | President and Chief Executive Officer of Fund—T (since 2016), Fund—ADV (since 2016), FS Investment Corporation IV (since 2015), FS Investment Corporation III (since 2013), FSIC III Advisor, LLC (since 2013), Fund—A (since 2013), Fund—D (since 2013), FS Global Advisor (since 2013), FS Investment Corporation II (since 2011), FSIC II Advisor, LLC (since 2011), FS Energy and Power Fund (since 2010), FS Investment Advisor, LLC (since 2010) and FB Income Advisor, LLC (since 2007); Chief Executive Officer of FSIC IV Advisor, LLC (since 2015), FS Investment Corporation (since 2007) and FS Investments (since 2007); President of FS Investment Corporation (2007 – 2013); and Managing General Partner of FB Capital Partners, L.P. (since 2005) | | 5 | | FS Investment Corporation IV (since 2015); FS Investment Corporation III (since 2013); FS Investment Corporation II (since 2011); FS Energy and Power Fund (since 2010); and FS Investment Corporation (since 2007) |
47
| | | | | | | | | | | | |
Name | | Age | | Trustee Since | | Title | | Principal
Occupations During the Past Five Years | | Number of
Registered
Investment
Companies in
Fund Complex
Overseen by
Trustee | | Other
Directorships
Held by Trustee |
| David J. Adelman(2) | | 44 | | January 2013 | | Vice-Chairman | | Chief Executive Officer of Campus Technologies, Inc. (since 2001); and President and Chief Executive Officer of Campus Apartments, Inc. (since 1997) | | 5 | | FS Investment Corporation IV (since 2015); FS Investment Corporation III (since 2013); Actua Corporation (since 2011); FS Investment Corporation II (since 2011); FS Energy and Power Fund (since 2010); and FS Investment Corporation (since 2007) |
| | | | | | |
| Thomas J. Gravina(3) | | 55 | | June 2013 | | Trustee | | Chairman and Chief Executive Officer of EvolveIP Holdings, LLC (since 2007); and Executive Chairman of GPX Enterprises, L.P. (since 2006) | | 5 | | FS Investment Corporation IV (since 2015); FS Energy and Power Fund (since 2010); and FS Investment Corporation (since 2009) |
| | | | | | |
| Independent Trustees | | | | | | | | | | | | |
| | | | | | |
| Walter W. Buckley, III | | 56 | | June 2013 | | Trustee | | Chief Executive Officer of Actua Corporation (since 1996); and President of Actua Corporation (1996 – 2001; 2002 – 2009) | | 5 | | Actua Corporation (since 1996) |
| | | | | | |
| David L. Cohen | | 61 | | June 2013 | | Trustee | | Senior Executive Vice President of Comcast Corporation (since 2015); and Executive Vice President of Comcast Corporation (2002 – 2015) | | 5 | | NBCUniversal Media, LLC (since 2013) |
| | | | | | |
| Barbara J. Fouss | | 47 | | November 2013 | | Trustee | | Director of Strategic Initiatives of Sun National Bank (2012 – 2013); Chief Credit Policy Officer of Sun National Bank (2011 – 2012); and Deputy Chief Credit Policy Officer of Sun National Bank (2008 – 2011) | | 5 | | FS Investment Corporation IV (since 2015) |
| | | | | | |
| Philip E. Hughes, Jr. | | 67 | | June 2013 | | Trustee | | Vice-Chairman of Keystone Industries (since 2011); Principal of Philip E. Hughes, Jr., CPA, Esq. Accounting, Tax and Business Services (since 2011); President of Fox Park Corporation | | 5 | | FS Investment Corporation (since 2015) |
48
| | | | | | | | | | | | |
Name | | Age | | Trustee Since | | Title | | Principal
Occupations During the Past Five Years | | Number of
Registered
Investment
Companies in
Fund Complex
Overseen by
Trustee | | Other
Directorships
Held by Trustee |
| | | | | | | | (since 2005) and Sovereign Developers, LP (since 1999); and Partner of LarsonAllen LLP (2000 – 2011) | | | | |
| Oliver C. Mitchell, Jr. | | 62 | | June 2013 | | Trustee | | Attorney and Consultant—Litigation Avoidance, Corporate Governance and Internal Investigations (since 2014); Senior Vice President, General Counsel and Secretary of American Cybersystems, Inc. (2013 – 2014); and Vice President, General Counsel and Secretary of Carpenter Technology Corporation (2007 – 2009) | | 5 | | National Commercial Bank Jamaica Limited (since 2015) |
| | | | | | |
| Charles P. Pizzi | | 66 | | June 2013 | | Trustee | | President and Chief Executive Officer of Tasty Baking Company (2002 – 2011) | | 5 | | Pennsylvania Real Estate Investment Trust (since 2013); PHH Corporation (since 2012); FS Energy and Power Fund (since 2012); and Brandywine Realty Trust (since 1996) |
| (1) | Mr. Forman is deemed to be an “interested person” of the Fund, as defined in Section 2(a)(19) of the 1940 Act, due to his role as a controlling person of FS Global Advisor. |
| (2) | Mr. Adelman is deemed to be an “interested person” of the Fund, as defined in Section 2(a)(19) of the 1940 Act, due to his role as a controlling person of FS Global Advisor. |
| (3) | Mr. Gravina is deemed to be an “interested person” of the Fund, as defined in Section 2(a)(19) of the 1940 Act, due to Mr. Gravina’s joint ownership with Mr. Forman of an entity engaged in the management of certain real estate assets. |
49
Executive Officers
Information regarding the executive officers of the Fund is set forth below. The address for each executive officer is c/o FS Global Credit Opportunities Fund, 201 Rouse Boulevard, Philadelphia, Pennsylvania 19112.
| | | | | | | | |
Name | | Age | | Position Held with Registrant | | Length of
Time Served | | Principal Occupations During the Past Five Years |
| | | | |
| Michael C. Forman | | 55 | | Chairman, President and Chief
Executive Officer | | Since
2013 | | President and Chief Executive Officer of Fund—T (since 2016), Fund—ADV (since 2016), FS Investment Corporation IV (since 2015), FS Investment Corporation III (since 2013), FSIC III Advisor, LLC (since 2013), Fund—A (since 2013), Fund—D (since 2013), FS Global Advisor (since 2013), FS Investment Corporation II (since 2011), FSIC II Advisor, LLC (since 2011), FS Energy and Power Fund (since 2010), FS Investment Advisor, LLC (since 2010) and FB Income Advisor, LLC (since 2007); Chief Executive Officer of FSIC IV Advisor, LLC (since 2015), FS Investment Corporation (since 2007) and FS Investments (since 2007); President of FS Investment Corporation (2007 – 2013); and Managing General Partner of FB Capital Partners, L.P. (since 2005) |
| | | | |
| James F. Volk | | 54 | | Chief Compliance Officer | | Since
2015 | | Chief Compliance Officer of Fund—T (since 2016), Fund—ADV (since 2016), FS Investment Corporation (since 2015), FS Energy and Power Fund (since 2015), FS Investment Corporation II (since 2015), Fund—A (since 2015), Fund—D (since 2015), FS Investment Corporation III (since 2015) and FS Investment Corporation IV (since 2015); and Chief Compliance Officer, Chief Accounting Officer and Head of Traditional Fund Operations at SEI’s Investment Manager Services market unit (1996 – 2014) |
| | | | |
| William Goebel | | 42 | | Chief Financial Officer | | Since
2013 | | Chief Financial Officer of Fund—T (since 2016), Fund—ADV (since 2016), Fund—A (since 2013), Fund—D (since 2013), FS Investment Corporation II (2011 – 2014), FS Energy and Power Fund (2011 – 2012) and FS Investment Corporation (since 2011); and Senior Manager at Ernst & Young LLP (2003 – 2011) |
| | | | |
| Gerald F. Stahlecker | | 51 | | Executive Vice President | | Since
2013 | | President of FS Investment Corporation (since 2013); Executive Vice President of Fund—T (since 2016), Fund—ADV (since 2016), FS Investment Corporation IV (since 2015), FSIC IV Advisor, LLC (since 2015), FS Investment Corporation III (since 2013), FSIC III Advisor, LLC (since 2013), Fund—A (since 2013), Fund—D (since 2013), FS Global Advisor (since 2013), FS Investment Corporation II (since 2011), FSIC II Advisor, LLC (since 2011), FS Energy and Power Fund (since 2010), FS Investment Advisor, LLC (since 2010), FS Investment Corporation (2010 – 2013), FB Income Advisor, LLC (since 2010) and FS Investments (since 2010); and Managing Director and Chief Operating Officer of Radcliffe Capital Management, L.P. (2002 – 2009) |
50
| | | | | | | | |
Name | | Age | | Position Held with Registrant | | Length of
Time Served | | Principal Occupations During the Past Five Years |
| | | | |
| Zachary Klehr | | 38 | | Executive
Vice
President | | Since 2013 | | Executive Vice President of Fund—T (since 2016), Fund—ADV (since 2016), FS Investment Corporation IV (since 2015), FSIC IV Advisor, LLC (since 2015), FS Investment Corporation III (since 2013), FSIC III Advisor, LLC (since 2013), Fund—A (since 2013), Fund—D (since 2013), FS Global Advisor (since 2013), FS Investment Corporation II (since 2013), FS Energy and Power Fund (since 2013), FS Investment Corporation (since 2013), FSIC II Advisor, LLC (since 2012), FS Investment Advisor, LLC (since 2012), FB Income Advisor, LLC (since 2012) and FS Investments (since 2012); Senior Vice President of FSIC II Advisor, LLC (2011 – 2012), FS Investment Advisor, LLC (2011 – 2012), FB Income Advisor, LLC (2011 – 2012) and FS Investments, (2011 – 2012) and Vice President of Versa Capital Management (2007 – 2011) |
| | | | |
| Stephen S. Sypherd | | 39 | | Vice
President,
Treasurer
and
Secretary | | Since 2013 | | Managing Director and General Counsel of FSIC IV Advisor, LLC (since 2015), FSIC III Advisor, LLC (since 2014), FS Global Advisor (since 2014), FSIC II Advisor, LLC (since 2014), FS Investment Advisor, LLC (since 2014), FB Income Advisor, LLC (since 2014) and FS Investments (since 2014); Vice President, Treasurer and Secretary of Fund—T (since 2016), Fund—ADV (since 2016), FS Investment Corporation IV (since 2015), FS Investment Corporation III (since 2013), Fund—A (since 2013), Fund—D (since 2013), FS Investment Corporation II (since 2013), FS Energy and Power Fund (since 2013) and FS Investment Corporation (since 2013); Senior Vice President of FSIC II Advisor, LLC (2011 – 2014), FS Investment Advisor, LLC (2011 – 2014), FB Income Advisor, LLC (2011 – 2014) and FS Investments (2011 – 2014); Vice President of FS Investment Advisor, LLC (2010 – 2011), FB Income Advisor, LLC (2010 – 2011) and FS Investments (2010 – 2011); and Associate of Skadden, Arps, Slate, Meagher & Flom LLP (2002 – 2010) |
Statements of Additional Information
Fund—T’s and Fund—ADV’s statements of additional information, each dated as of April 29, 2016, as amended and supplemented to date, contain additional information regarding the Companies’ (as defined below) and the Fund’s trustees and executive officers and are available upon request and without charge by calling the Fund collect at 215-495-1150 or by accessing FS Investments’ website at www.fsinvestments.com.
Form N-Q Filings
The Fund files its complete schedule of portfolio holdings with the SEC for the first and third quarters of each fiscal year on Form N-Q. The Fund’s Forms N-Q are available on the SEC’s website at http://www.sec.gov.
51
The Fund’s Forms N-Q may also be reviewed and copied at the SEC’s Public Reference Room located at 100 F Street, NE, Washington, DC 20549. Shareholders may obtain information on the operation of the SEC’s Public Reference Room by calling the SEC at 1-800-SEC-0330.
Proxy Voting Policies and Procedures
The Fund has delegated its proxy voting responsibility to FS Global Advisor, the Fund’s investment adviser. Shareholders may obtain a copy of FS Global Advisor’s proxy voting policies and procedures upon request and without charge by calling the Fund collect at 215-495-1150 or on the SEC’s website at http://www.sec.gov.
Proxy Voting Record
Information regarding how FS Global Advisor voted proxies relating to the Fund’s portfolio securities during the most recent twelve-month period ended June 30 is available upon request and without charge by making a written request to the Fund’s Chief Compliance Officer at FS Global Credit Opportunities Fund, 201 Rouse Boulevard, Philadelphia, Pennsylvania 19112, Attn: Chief Compliance Officer, by calling the Fund collect at 215-495-1150 or on the SEC’s website at http://www.sec.gov.
Board Considerations in Approving the Continuation of the Fund’s Amended and Restated Investment Advisory Agreement and Investment Sub-Advisory Agreement
At meetings of the Board held on May 2, 2016 and May 17, 2016 (the “Meetings”), the Board, including a majority of Trustees who are not “interested persons” (as that term is defined in the 1940 Act) of the Fund, FS Global Advisor or GSO, (the “Independent Trustees”), considered and approved for an additional year the continuation of: (i) the amended and restated investment advisory agreement, dated as of October 9, 2013 (the “Advisory Agreement”), by and between the Fund and FS Global Advisor, and (ii) the investment sub-advisory agreement for the Fund, dated as of August 12, 2013 (the “Sub-Advisory Agreement” and, together with the Advisory Agreement, the “Advisory Agreements”), by and between FS Global Advisor and GSO.
In connection with its consideration of the Advisory Agreements, the Board considered the information furnished and discussed throughout the year at Board and Committee meetings and the information provided specifically in relation to the annual consideration of the approval of the Advisory Agreements in response to requests of the Independent Trustees and their independent legal counsel.
In their deliberations, the Board considered a range of materials and information regarding the nature, extent and quality of services provided by FS Global Advisor and GSO; the investment performance of the Fund and its affiliated feeder funds (collectively, the “Companies”), compared to relevant indices and peer funds; the fees and expenses of the Fund and the Companies compared to those of other registered investment companies that FS Global Advisor believed were relatively comparable to the Fund in terms of structure, investment objectives, assets under management, portfolio mix and/or other similar criteria; and the profitability of FS Global Advisor and the profitability of GSO. The Board also considered information related to potential ancillary benefits enjoyed by FS Global Advisor and GSO (and their affiliates) as a result of their relationships with the Fund and the Companies. In addition, the Board took note of the Fund’s “master-feeder” structure and the fact that FS Global Advisor and GSO serve as investment adviser and sub-adviser, respectively, to the Fund and not the Companies. In addition to evaluating, among other things, the written information provided by FS Global Advisor and GSO, the Board also considered the answers to questions posed by the Board to representatives of FS Global Advisor at various meetings. The Independent Trustees also met separately in executive sessions with their independent legal counsel to review and consider the information provided regarding the Advisory Agreements.
Based on their review, the Independent Trustees and the Board concluded that it was in the best interest of the Fund to approve the continuation of the Advisory Agreements. In their deliberations, the Board did not identify any single factor or group of factors as all-important or controlling, but considered all factors together. The material factors and conclusions that formed the basis for the Board’s determinations are discussed below.
52
Nature, Extent and Quality of Services
In evaluating the nature, extent and quality of the services provided by FS Global Advisor and GSO, the Board reviewed information describing the financial strength, experience, resources, compliance programs, and key personnel of FS Global Advisor and GSO, including the personnel who provide investment management services to the Fund. With respect to FS Global Advisor, the Board recognized the significant investment of time, capital and human resources provided by Franklin Square Holdings, L.P., the Fund’s sponsor, and its affiliates that has resulted in the successful operation of the Fund and FS Global Advisor’s role in, among other things, setting investment guidelines for the Fund’s portfolio; determining the composition and allocation of the Fund’s portfolio, and identifying, evaluating, and negotiating the structure of the Fund’s investments. The Board then considered FS Global Advisor’s ongoing management of the Fund’s assets and collaboration with and oversight of GSO, including the robust level of communication and collaboration between FS Global Advisor and GSO during the process of considering and taking action with respect to potential investment opportunities. The Board also noted the administrative services FS Global Advisor provides to the Fund and the Companies, including general ledger accounting, fund accounting, legal services, investor relations and other administrative services, as compared to the administrative expenses paid by comparable investment companies. With respect to GSO, the Board considered GSO’s role in, among other things, identifying and conducting due diligence on prospective investment opportunities for the Fund; making investment recommendations for the Fund; implementing the directives of FS Global Advisor; and providing ongoing monitoring of the Fund’s investments.
The Board and the Independent Trustees determined that they were satisfied with the nature, quality and extent of the services provided by FS Global Advisor and GSO to the Fund, the expertise and capabilities of FS Global Advisor’s and GSO’s personnel, FS Global Advisor’s collaboration with and oversight of GSO, and FS Global Advisor’s and GSO’s financial strength and continued efforts to develop and allocate resources necessary to continue to manage the Fund’s portfolio.
Review of Fund Performance
With respect to the Fund’s investment performance, the Board and the Independent Trustees noted that the Fund’s performance was reasonable as compared to the performance of comparable funds that FS Global Advisor believed to be generally comparable to the Fund in terms of structure, investment objectives, assets under management, portfolio mix and/or similar criteria. In addition, the Board and the Independent Trustees considered the Fund’s performance compared to certain indices spanning the spectrum of primary asset classes in which the Fund invests. The Trustees noted FS Global Advisor’s explanation of the relevance of each comparable index and FS Global Advisor’s explanation of the impact of the broader market dislocation on the Fund’s performance. The Board also considered the steps FS Global Advisor and GSO have taken to determine the optimal composition of the Fund’s portfolio and to position the Fund, particularly during periods of credit market volatility and market dislocation, in order to capitalize upon potential investment opportunities.
The Board determined that it was generally satisfied with the Fund’s performance and would continue to monitor the Fund’s and the Companies’ performance results.
Costs of Services Provided and Profits Realized
The Board then considered FS Global Advisor’s management fee and income incentive fee (together, the “Advisor’s Fees”) and the Companies’ expense ratios. The Board considered the Advisor’s Fees and the Companies’ expense ratios as compared to a group of investment companies that FS Global Advisor believed to be relatively comparable to the Fund and/or the Companies in terms of structure, investment objectives, assets under management, portfolio mix and/or similar criteria. The Trustees acknowledged FS Global Advisor’s and its affiliates’ financial support of the Fund and the Companies through the provision of expense reimbursement and additional support payments, noting that the Fund accrued significantly more in management fees since inception than FS Global Advisor collected. The Trustees also took into consideration that FS Global Advisor had agreed to waive its right to recoup expense reimbursement and additional support payments made to the Fund through December 31, 2015, including any unpaid management fees.
53
With respect to the Companies’ gross expense ratios, the Board considered the expense ratios compared to a group of investment companies that FS Global Advisor believed to be relatively comparable to the Fund in terms of structure, investment objectives, assets under management, portfolio mix and/or similar criteria. The Board considered FS Global Advisor’s explanation as to the comparability of the expenses, noting that, among other things, the Fund and the Companies are subject to different requirements because they are in a master-feeder structure and are non-traded, continuously-offered, closed-end investment companies, whereas the peers are publicly-traded investment companies.
The Board then reviewed the profitability information provided by FS Global Advisor and GSO and FS Global Advisor’s methodology for determining profitability. The profitability data included detail on historical profitability and anticipated future profitability of the relationship between the Fund, the Companies and FS Global Advisor and GSO. The Trustees also noted FS Global Advisor’s efforts to continuously leverage its capabilities and resources for the benefit of the Fund, the Companies and their respective shareholders.
The Board determined that, based on the amount of management fees actually paid by the Fund to FS Global Advisor, FS Global Advisor’s fees are reasonable in relation to the services rendered and within the range of what would have been negotiated at arm’s length in similar circumstances. With respect to the renewal of the Sub-Advisory Agreement, the Board determined that it was satisfied with the level of fees paid by FS Global Advisor to GSO given the quality and extent of services it provides and that GSO’s fees are reasonable in relation to the services rendered.
Economies of Scale
The Board considered the extent to which economies of scale would be realized as the Funds grow and whether the Fund’s fee levels reflect these economies of scale for the benefit of Fund shareholders. The Board considered the fact that such economies are less likely to be significant given the Fund’s and the Companies’ structure and related focus on event-driven, special situations and market price inefficiency investments.
Other Benefits
The Board considered other benefits that may accrue to FS Global Advisor, GSO and their affiliates from their relationships with the Fund, including that FS Global Advisor and GSO may potentially benefit from their relationship with the Fund in the sense that the success of the Fund could attract other business to FS Global Advisor and GSO.
Overall Conclusions
Based on all of the information considered and the conclusions reached, the Board, including a majority of the Independent Trustees, determined that the terms of the Advisory Agreements are fair and reasonable and that the approval of the continuation of the Advisory Agreement and the Sub-Advisory Agreement is in the best interests of the Fund, the Companies and their respective shareholders. The Board approved the renewal of Advisory Agreements for an additional year, subject to earlier termination in accordance with their terms.
Distribution Reinvestment Plans
The Feeder Funds have adopted “opt in” distribution reinvestment plans (together, the “DRPs”) pursuant to which the Feeder Funds’ shareholders may elect to have the full amount of their cash distributions reinvested in additional common shares of the applicable Company. Participants in each Feeder Fund’s DRP are free to elect to participate or terminate participation in the DRP within a reasonable time as specified in the applicable DRP. If a shareholder does not elect to participate in the applicable Feeder Fund’s DRP, the shareholder will automatically receive any distributions the applicable Feeder Fund declares in cash. For example, if the board of trustees of a Feeder Fund authorizes, and such Feeder Fund declares, a cash distribution, then if a shareholder has “opted in” to the Feeder Fund’s DRP, the shareholder will have the cash distribution reinvested in additional
54
common shares of the Feeder Fund, rather than receiving the cash distribution. The Feeder Funds expect to issue common shares pursuant to the DRPs on the date of the weekly closing occurring on or immediately following each distribution payment date at a price equal to the NAV per common share that is used to determine the public offering price of such Feeder Fund’s common shares on the date of such weekly closing. Common shares issued pursuant to the DRPs will have the same voting rights as common shares offered in the Feeder Funds’ continuous public offerings.
If a shareholder wishes to receive distributions in cash, no action is required by the shareholder. If a shareholder is a registered shareholder, the shareholder may elect to have their entire distribution reinvested in common shares by notifying DST Systems, Inc., the plan administrator and the Feeder Funds’ transfer agent, in writing at the address set forth below so that such notice is received by the plan administrator no later than the record date for distributions to shareholders. If a shareholder elects to reinvest their distributions in additional common shares, the plan administrator will set up an account for common shares acquired through the applicable DRP and will hold such common shares in non-certificated form. If common shares are held by a broker or other financial intermediary, a shareholder may “opt in” to the applicable DRP by notifying their broker or other financial intermediary of their election.
The Feeder Funds use newly issued common shares under their DRPs. The number of common shares the Feeder Funds issue to a shareholder is determined by dividing the total dollar amount of the cash distribution payable to the shareholder by a price equal to the applicable Feeder Fund’s NAV per common share on the date of the Fund’s weekly closing on or immediately following the distribution payment date. There are no selling commissions, dealer manager fees or other sales charges to a shareholder if they elect to participate in the DRP. The Feeder Funds pay the plan administrator’s fees under the DRPs. If a shareholder receives their cash distributions in the form of common shares, the shareholder generally is subject to the same federal, state and local tax consequences as the shareholder would have had if the shareholder elected to receive their distributions in cash. A shareholder’s basis for determining gain or loss upon the sale of common shares received in a distribution from a Feeder Fund will be equal to the total dollar amount of the distribution payable in cash. Any common shares received in a distribution will have a holding period for tax purposes commencing on the day following the day on which the common shares are credited to the shareholder’s account.
The Feeder Funds reserve the right to amend, suspend or terminate their DRPs. A shareholder may terminate their account under a Feeder Fund’s DRP by calling the plan administrator at 877-628-8575. All correspondence concerning the Feeder Funds’ DRPs should be directed to the plan administrator by mail at FS Global Credit Opportunities Fund, c/o DST Systems, Inc., P.O. Box 219095, Kansas City, Missouri 64121-9095. A shareholder may obtain a copy of the applicable DRP by request to the plan administrator or by contacting the applicable Feeder Fund.
55
| | (a) | On March 11, 2016, the Company’s board of trustees (the “Board”) adopted a Code of Business Conduct and Ethics that applies to all officers, trustees, directors and employees of the Company and FS Global Advisor, LLC (the “Advisor”), the investment adviser to FS Global Credit Opportunities Fund (the “Fund”), including the Company’s principal executive officer, principal financial officer, principal accounting officer or controller and persons performing similar functions. The Company adopted an amended Code of Business Conduct and Ethics (as amended, the “Code of Ethics”) on August 15, 2016. |
| | (c) | On August 15, 2016, the Board approved the Code of Ethics, which clarified the scope of the confidentiality obligations imposed on officers, trustees, directors and other personnel of the Company and FS Global Advisor by the Code of Ethics. A copy of the Code of Ethics is included herein as Exhibit (a)(1) and also is available on the Company’s “Corporate Governance” page on FS Investments’ website at www.fsinvestments.com. |
| | (d) | During the period covered by the Annual Report included in Item 1 of this Form N-CSR, the Company did not grant any waiver from a provision of the Code of Ethics to its principal executive officer, principal financial officer, principal accounting officer or controller or persons performing similar functions. The amendments reflected in the Code of Ethics and discussed above did not relate to or result in any waiver, explicit or implicit, of any provision of the Company’s previous Code of Business Conduct and Ethics. |
| | (f) | A copy of the Code of Ethics is included herein as Exhibit (a)(1) and also is available on the Company’s “Corporate Governance” page on FS Investments’ website at www.fsinvestments.com. |
| Item 3. | Audit Committee Financial Expert. |
| | (a)(1) | The Board has determined that the Company has at least one “audit committee financial expert” serving on the audit committee of the Board (the “Audit Committee”), as such term is defined for purposes of Item 3 of Form N-CSR. |
| | (a)(2) | The Board has determined that Philip E. Hughes, Jr. is an “audit committee financial expert” and “independent,” as such terms are defined for purposes of Item 3 of Form N-CSR. |
| Item 4. | Principal Accountant Fees and Services. |
| | (a) | Audit Fees. The Company was formed as a Delaware statutory trust during February 2016. As such, no audit fees were incurred for the fiscal year ended December 31, 2015. The aggregate fees billed to the Company for the fiscal year ended December 31, 2016 for professional services rendered by Ernst & Young LLP, the Company’s independent registered public accounting firm (“Ernst & Young”), for the audit of the Company’s annual financial statements and services that are normally provided by Ernst & Young in connection with statutory and regulatory filings or engagements were $25,000. |
| | (b) | Audit-Related Fees. The Company was formed as a Delaware statutory trust during February 2016. As such, no audit-related fees were incurred for the fiscal year ended December 31, 2015. The aggregate fees billed to the Company for the fiscal year ended December 31, 2016 for assurance and related services by Ernst & Young that were reasonably related to the performance of the audit of the Company’s financial statements and not reported in Item 4(a) above were $30,000. Audit-related fees for the year ended December 31, 2016 represent fees billed for services provided in connection with comfort letter procedures performed. |
| | (c) | Tax Fees. The Company was formed as a Delaware statutory trust during February 2016. As such, no tax fees were incurred for the fiscal year ended December 31, 2015. The aggregate fees billed to the |
| | Company for the fiscal year ended December 31, 2016 for professional services rendered by Ernst & Young for tax compliance, tax advice and tax planning were $2,290. Tax fees for the year ended December 31, 2016 represent fees billed for tax compliance services provided in connection with the review of the Company’s tax returns. |
| | (d) | All Other Fees. The Company was formed as a Delaware statutory trust during February 2016. As such, no other fees were incurred for the fiscal year ended December 31, 2015. No fees were billed to the Company for the fiscal year ended December 31, 2016 for products and services provided by Ernst & Young, other than the services reported in Items 4(a) through (c) above. |
| | (e) | Audit Committee Pre-Approval Policies and Procedures. |
| | (1) | The Audit Committee has adopted, and the Board has approved, a Policy on Pre-Approval of Audit and Non-Audit Services (the “Policy”), which is intended to comply with Rule 2-01 of Regulation S-X and sets forth guidelines and procedures to be followed by the Company when retaining an auditor to perform audit, audit-related, tax and other services for the Company. The Policy permits such services to be pre-approved by the Audit Committee pursuant to either a general pre-approval or specific pre-approval. Unless a type of service provided by the auditor has received general pre-approval, it requires specific pre-approval by the Audit Committee. Any proposed services exceeding pre-approved cost levels require specific pre-approval by the Audit Committee. |
| | (2) | All services described in paragraphs (b) and (c) of this Item 4 were pre-approved before the engagement by the Audit Committee pursuant to paragraph (c)(7)(i)(A) of Rule 2-01 of Regulation S-X. Consequently, none of such services were required to be approved by the Audit Committee pursuant to paragraph (c)(7)(i)(C) of Rule 2-01 of Regulation S-X. |
| | (g) | The aggregate non-audit fees billed by Ernst & Young for services rendered to the Company, FS Global Advisor and any entity controlling, controlled by or under common control with FS Global Advisor that provides ongoing services to the Company for the fiscal years ended December 31, 2016 and 2015 were $165,805 and $73,640, respectively. |
| Item 5. | Audit Committee of Listed Registrants. |
| | (a) | Not applicable. The Company is not a listed issuer as defined in Rule 10A-3 under the Securities Exchange Act of 1934, as amended (the “Exchange Act”). |
| | (b) | Not applicable. The Company is not a listed issuer as defined in Rule 10A-3 under the Exchange Act. |
| | (a) | The Company invests substantially all of its assets in FS Global Credit Opportunities Fund (the “Fund”), a separate non-diversified, closed-end management investment company with the same investment objectives and strategies as the Company. All investments in portfolio companies are made at the Fund level. The Fund’s consolidated schedule of investments as of December 31, 2016 is included as part of the Annual Report included in Item 1 of this Form N-CSR. |
| Item 7. | Disclosure of Proxy Voting Policies and Procedures for Closed-End Management Investment Companies. |
The Company invests substantially all of its assets in the Fund, a separate non-diversified, closed-end management investment company with the same investment objectives and strategies as the Company. All
investments in portfolio companies are made at the Fund level. The Fund has delegated the responsibility for voting proxies relating to its voting securities to FS Global Advisor, pursuant to the proxy voting policies and procedures of FS Global Advisor. FS Global Advisor’s proxy voting policies and procedures are included herein as Exhibit (a)(4).
| Item 8. | Portfolio Managers of Closed-End Management Investment Companies. |
(a)(1) Information regarding the portfolio managers primarily responsible for the day-to-day management of the Fund’s portfolio as of the date hereof is set forth below.
Michael C. Forman has served as the chairman, president and chief executive officer of the Company and FS Global Advisor since each entity’s inception in January 2013. Mr. Forman also currently serves as chairman, president and chief executive officer of FB Income Advisor, LLC, FS Energy and Power Fund, FS Investment Advisor, LLC, FS Investment Corporation II, FSIC II Advisor, LLC, the Fund, FS Global Credit Opportunities Fund—A (“Fund—A”), FS Global Credit Opportunities Fund—D (“Fund—D”), FS Global Credit Opportunities Fund—ADV (“Fund—ADV”), FS Investment Corporation III, FSIC III Advisor, LLC and FS Investment Corporation IV and has presided in such roles since each entity’s inception in October 2007, September 2010, September 2010, July 2011, November 2011, January 2013, January 2013, January 2013, February 2016, June 2013, October 2013 and February 2015, respectively. Mr. Forman also currently serves as the chairman and chief executive officer of FS Investment Corporation and FSIC IV Advisor, LLC and has presided in such roles since each entity’s inception in December 2007 and September 2015, respectively. Mr. Forman served as president of FS Investment Corporation from its inception in December 2007 until April 2013. In 2007, Mr. Forman co-founded FS Investments. In 2005, Mr. Forman co-founded FB Capital Partners, L.P., an investment firm that previously invested in private equity, senior and mezzanine debt and real estate, and has served as managing general partner since its inception. Prior to co-founding FB Capital Partners, L.P., Mr. Forman spent nearly 20 years as an attorney in the Corporate and Securities Department at the Philadelphia-based law firm of Klehr Harrison Harvey Branzburg LLP, where he was a partner from 1991 until leaving the firm to focus exclusively on investments.
In addition to his career as an attorney and investor, Mr. Forman has been an active entrepreneur and has founded several companies, including companies engaged in the gaming, specialty finance and asset management industries. Mr. Forman serves as a member of the board of directors of a number of private companies. He is also a member of a number of civic and charitable boards, including The Franklin Institute (Executive Committee Member), the Vetri Foundation for Children (Chairman), the executive committee of the Greater Philadelphia Alliance for Capital and Technologies (PACT), and Murex Investments, Inc., a Pennsylvania-based economic development/venture capital firm, where he chairs the investment committee. Mr. Forman received his B.A., summa cum laude, from the University of Rhode Island, where he was elected Phi Beta Kappa, and received his J.D. from Rutgers University.
Gerald F. Stahlecker has served as executive vice president of the Company and FS Global Advisor since each entity’s inception in January 2013. Mr. Stahlecker also currently serves as executive vice president of FB Income Advisor, LLC, FS Energy and Power Fund, FS Investment Advisor, LLC, FS Investment Corporation II, FSIC II Advisor, LLC, the Fund, Fund—A, Fund—D, Fund—ADV, FS Investment Corporation III, FSIC III Advisor, LLC, FS Investment Corporation IV and FSIC IV Advisor, LLC, and has presided in such roles since January 2010, September 2010, September 2010, July 2011, November 2011, January 2013, January 2013, January 2013, February 2016, June 2013, October 2013, February 2015 and September 2015, respectively. Mr. Stahlecker also has served as president of FS Investment Corporation since April 2013 and previously served as its executive vice president from March 2010 to April 2013. Mr. Stahlecker also serves as executive vice president of FS Investments and has presided in such role since January 2010. Mr. Stahlecker was an independent director of FS Investment Corporation and served as a member of its audit committee and as chairman of its valuation committee from FS Investment Corporation’s inception in December 2007 to December 2009 when he resigned as a director in order to join the Company’s and the Fund’s affiliates, FB Income Advisor, LLC and FS Investments. Mr. Stahlecker is a former founding partner of Radcliffe Capital Management, L.P. (“Radcliffe”), an investment advisory firm registered with the U.S. Securities and Exchange Commission (the “SEC”) that
manages the Radcliffe Funds, a family of Cayman Islands-based, master-feeder structured hedge funds, as well as separately managed accounts for an institutional investor base. Radcliffe pursues convertible arbitrage, high-yield debt, special situations and event-driven investment strategies. From its founding in 2002 until selling his interest in Radcliffe in July 2009, Mr. Stahlecker served as managing director and chief operating officer of Radcliffe and was the co-chair of its investment committee. Prior to co-founding Radcliffe and its affiliated entities, from May 1998 through October 2002, Mr. Stahlecker served as an officer and director of Rose Glen Capital Management, L.P. (“Rose Glen”), a predecessor to Radcliffe. Rose Glen managed hedge funds focusing on directly negotiated, structured debt and equity investments in public companies. Mr. Stahlecker has extensive experience in structuring and negotiating investment transactions on behalf of investors and issuers and has participated in numerous distressed and special situation restructurings on behalf of investors.
From 1992 to 1998, Mr. Stahlecker was an attorney at Klehr Harrison Harvey Branzburg LLP, where he practiced corporate and securities law. While at Klehr Harrison, Mr. Stahlecker represented hedge funds, venture capital funds and other institutional investors pursuing structured equity and debt investments in public and private companies. Prior to attending law school, from 1987 to 1989, Mr. Stahlecker worked as a senior analyst at Furash & Company, a consulting boutique in Washington, D.C., where he advised banks and other financial institutions regarding mergers and acquisitions, restructurings, asset/liability management and strategic planning. Mr. Stahlecker received his B.S. in Industrial Management, with concentrations in Finance and Strategic Planning, from Carnegie Mellon University and his J.D. from Villanova University Law School, where he was an editor of the Villanova University Environmental Law Journal. Mr. Stahlecker is a member of the board of directors of the Greater Philadelphia Chamber of Commerce and previously served on the board of directors of the Investment Program Association, an industry trade group, and the board of trustees of The Philadelphia School, where he served as a member of its advancement, finance and investment committees.
Zachary Klehr has served as executive vice president of the Company and FS Global Advisor since each entity’s inception in January 2013. In this role, he focuses on fund administration, portfolio management, fund operations, research, education and communications. Mr. Klehr also currently serves as executive vice president of FS Investment Corporation, FS Energy and Power Fund, FS Investment Corporation II, the Fund, Fund—A, Fund—D, Fund—ADV, FS Investment Corporation III and FS Investment Corporation IV and has presided in such roles since the later of January 2013 or such entity’s inception date. Mr. Klehr has also served in various senior officer capacities for FS Investments and its affiliated investment advisers, FB Income Advisor, LLC, FS Investment Advisor, LLC, FSIC II Advisor, LLC, FSIC III Advisor, LLC and FSIC IV Advisor, LLC, since the later of February 2011 or such entity’s inception date, including as executive vice president since the later of September 2012 or such entity’s inception date. Prior to joining FS Investments, Mr. Klehr served as a Vice President at Versa Capital Management (“Versa”), a private equity firm with approximately $1 billion in assets under management, from 2007 to February 2011. At Versa, he sourced, underwrote, negotiated, structured and managed investments in middle-market distressed companies, special situations and distressed debt. Prior to Versa, Mr. Klehr spent five years at Goldman, Sachs & Co., starting as an analyst in the Investment Banking Division, then in the Executive Office working on firm-wide strategy covering hedge funds and other complex multi-faceted clients of the firm. Later, he joined the Financial Sponsors Group as an Associate where he focused on leveraged buyouts, acquisitions and equity and debt financings for private equity clients. Mr. Klehr received his M.B.A., with honors, from the Wharton School of the University of Pennsylvania and his B.A., cum laude, also from the University of Pennsylvania. He is active in his community and previously served on the board of trustees of The Philadelphia School, where he was a member of the executive, governance, advancement, finance and investment committees.
Robert Hoffman has served as executive director of FS Global Advisor since July 2013 and previously served as its vice president from its inception in January 2013 to July 2013. Mr. Hoffman also serves as executive director of FS Investments and its affiliated investment advisers, FB Income Advisor, LLC, FS Investment Advisor, LLC, FSIC II Advisor, LLC, FSIC III Advisor, LLC and FSIC IV Advisor, LLC and has presided in such roles since the later of July 2013 or such entity’s inception date. Mr. Hoffman previously served as vice president of such entities in existence from January 2012 to July 2013. Mr. Hoffman is responsible for fund management and fund team education. Prior to joining FS Investments, Mr. Hoffman served at Nomura Corporate Research and Asset Management Inc. (“Nomura”) for over eleven years, most recently holding the
position of Executive Director. At Nomura, Mr. Hoffman was responsible for loan portfolio management and trading and he and his team managed nearly $3 billion in loan assets for retail and institutional clients. Mr. Hoffman is a graduate of Columbia University and holds the CFA Institute’s Chartered Financial Analyst designation.
(a)(2) The portfolio managers primarily responsible for the day-to-day management of the Company and the Fund also manage other registered investment companies, other pooled investment vehicles and other accounts, as indicated below. The following table identifies, as of December 31, 2016: (i) the number of other registered investment companies, other pooled investment vehicles and other accounts managed by each portfolio manager; (ii) the total assets of such companies, vehicles and accounts; and (iii) the number and total assets of such companies, vehicles and accounts that are subject to an advisory fee based on performance:
| | | | | | | | | | | | | | | | |
| | | Number of
Accounts | | | Assets of
Accounts | | | Number of Accounts
Subject to a
Performance Fee | | | Assets Subject to a
Performance Fee | |
| | | | | | (in thousands) | | | | | | (in thousands) | |
Michael C. Forman | | | | | | | | |
Registered Investment Companies | | | — | | | $ | — | | | | — | | | $ | — | |
Other Pooled Investment Vehicles | | | 5 | | | $ | 17,185,859 | | | | 5 | | | $ | 17,185,859 | |
Other Accounts | | | — | | | $ | — | | | | — | | | $ | — | |
Gerald F. Stahlecker | | | | | | | | |
Registered Investment Companies | | | — | | | $ | — | | | | — | | | $ | — | |
Other Pooled Investment Vehicles | | | 5 | | | $ | 17,185,859 | | | | 5 | | | $ | 17,185,859 | |
Other Accounts | | | — | | | $ | — | | | | — | | | $ | — | |
Zachary Klehr | | | | | | | | |
Registered Investment Companies | | | — | | | $ | — | | | | — | | | $ | — | |
Other Pooled Investment Vehicles | | | 5 | | | $ | 17,185,859 | | | | 5 | | | $ | 17,185,859 | |
Other Accounts | | | — | | | $ | — | | | | — | | | $ | — | |
Robert Hoffman | | | | | | | | |
Registered Investment Companies | | | — | | | $ | — | | | | — | | | $ | — | |
Other Pooled Investment Vehicles | | | — | | | $ | — | | | | — | | | $ | — | |
Other Accounts | | | — | | | $ | — | | | | — | | | $ | — | |
Potential Conflicts of Interest
FS Global Advisor, GSO Capital Partners LP, the investment sub-adviser to the Fund (“GSO”), and certain of their affiliates may experience conflicts of interest in connection with the management of the Company and the Fund, including, but not limited to, the following:
| | • | | The directors, officers and other personnel of FS Global Advisor allocate their time between advising the Company and the Fund and managing other investment activities and business activities in which they may be involved, including managing and operating FS Investment Corporation, FS Energy and Power Fund, FS Investment Corporation II, FS Investment Corporation III and FS Investment Corporation IV; |
| | • | | The Fund may compete with certain affiliates for investments, including FS Investment Corporation, FS Energy and Power Fund, FS Investment Corporation II, FS Investment Corporation III and FS Investment Corporation IV, subjecting FS Global Advisor and its affiliates to certain conflicts of interest in evaluating the suitability of investment opportunities and making or recommending acquisitions on the Fund’s behalf; |
| | • | | Regardless of the quality of the assets acquired by the Fund, the services provided to the Fund or whether the Fund makes distributions to its shareholders, FS Global Advisor and GSO will receive a management fee in connection with the management of the Fund’s portfolio and may receive an incentive fee to the extent the Fund’s “pre-incentive fee net investment income” exceeds the hurdle rate; |
| | • | | Because FS Investment Solutions, LLC (formerly FS2 Capital Partners, LLC), the dealer manager for the continuous public offerings of common shares by the Company and Fund—ADV, is an affiliate of FS Global Advisor, its due diligence review and investigation of the Company, the Fund and Fund—ADV cannot be considered to be an independent review; |
| | • | | The personnel of GSO allocate their time between assisting FS Global Advisor in identifying investment opportunities and making investment recommendations and performing similar functions for other business activities in which they may be involved, including in connection with GSO’s role as sub-adviser to FS Energy and Power Fund and as parent to the sub-adviser to FS Investment Corporation, FS Investment Corporation II, FS Investment Corporation III and FS Investment Corporation IV; |
| | • | | The Fund may compete with other funds managed by affiliates of GSO for investment opportunities, subjecting GSO and its affiliates to certain conflicts of interest in evaluating the suitability of investment opportunities and recommending investments to FS Global Advisor; |
| | • | | From time to time, to the extent consistent with the 1940 Act and the rules and regulations promulgated thereunder, the Fund and other clients for which FS Global Advisor or GSO provides investment management services or carry on investment activities may make investments at different levels of an investment entity’s capital structure or otherwise in different classes of an issuer’s securities, as may be permitted by law and subject to compliance with appropriate procedures. These investments may give rise to inherent conflicts of interest or perceived conflicts of interest between or among the various classes of securities that may be held by the Fund and such other clients; |
| | • | | FS Global Advisor, GSO and their respective affiliates may give advice and recommend securities to other clients, in accordance with the investment objectives and strategies of such other clients, which may differ from advice given to, or the timing or nature of the action taken with respect to, the Fund so long as it is their policy, to the extent practicable, to recommend for allocation and/or allocate investment opportunities to the Fund on a fair and equitable basis relative to their other clients, even though their investment objectives may overlap with those of the Fund; |
| | • | | GSO and its affiliates may have existing business relationships or access to material non-public information that would prevent GSO from recommending certain investment opportunities that would otherwise fit within the Fund’s investment objectives and strategies; |
| | • | | FS Global Advisor, GSO and their respective affiliates are not restricted from forming additional investment funds, from entering into other investment advisory relationships or from engaging in other business activities, even though such activities may compete with the Fund and/or may involve substantial time and resources of FS Global Advisor and GSO. These activities could be viewed as creating a conflict of interest in that the time and effort of the members of FS Global Advisor, GSO and their respective officers and employees will not be devoted exclusively to the business of the Fund but will be allocated between the business of the Fund and the management of the monies of other advisees of FS Global Advisor and GSO. Affiliates of GSO engage in investment advisory business with accounts that compete with the Fund and have no obligation to make their investment opportunities available to the Fund; |
| | • | | To the extent permitted by the 1940 Act and interpretations of the staff of the SEC, and subject to the allocation policies of FS Global Advisor, GSO and any of their respective affiliates, as applicable, FS Global Advisor, GSO and any of their respective affiliates may determine it appropriate for the Fund and one or more other investment accounts managed by FS Global Advisor, GSO or any of their respective affiliates to participate in an investment opportunity. The Fund may seek exemptive relief from the SEC to engage in co-investment opportunities with FS Global Advisor and its affiliates, including FS Investment Corporation, FS Energy and Power Fund, FS Investment Corporation II, FS Investment Corporation III and FS Investment Corporation IV. However, there can be no assurance that the Fund will obtain such exemptive relief. Any of these co-investment opportunities may give rise to conflicts of interest or perceived conflicts of interest among the Fund and the other participating accounts. To mitigate these conflicts, FS Global Advisor and/or GSO, as applicable, will seek to |
| | execute such transactions for all of the participating investment accounts, including the Fund, on a fair and equitable basis and in accordance with their respective allocation policies, taking into account such factors as the relative amounts of capital available for new investments and the investment programs and portfolio positions of the Fund, the clients for which participation is appropriate and any other factors deemed appropriate; and |
| | • | | The 1940 Act prohibits certain “joint” transactions with certain of the Fund’s affiliates, which could include investments in the same portfolio company (whether at the same or different times), without the prior approval of the SEC. If a person, directly or indirectly, acquires more than 5% of the voting securities of the Fund, FS Global Advisor or GSO, the Fund will be prohibited from buying any securities or other property from or selling any securities or other property to such person or certain of that person’s affiliates, or entering into joint transactions with such persons, absent the availability of an exemption or prior approval of the SEC. Similar restrictions limit the Fund’s ability to transact business with its officers or trustees or their affiliates. The SEC has interpreted the 1940 Act rules governing transactions with affiliates to prohibit certain “joint transactions” involving entities that share a common investment adviser. As a result of these restrictions, the scope of investment opportunities that would otherwise be available to the Fund may be limited. |
(a)(3) FS Global Advisor’s investment personnel are not employed by the Company or the Fund and receive no direct compensation from the Company or the Fund in connection with their investment management activities.
Consistent with FS Investments’ integrated culture, FS Investments has one firm-wide compensation and incentive structure, which covers investment personnel who render services to the Company and the Fund on behalf of FS Global Advisor. FS Investments’ compensation structure is designed to align the interests of the investment personnel serving the Company and the Fund with those of shareholders and to give everyone a direct financial incentive to ensure that all of FS Investments’ resources, knowledge and relationships are utilized to maximize risk-adjusted returns for each strategy.
Each of FS Investments’ senior executives, including each of the investment personnel who render services to the Company and the Fund on behalf of FS Global Advisor (other than Michael C. Forman, who is compensated through his ownership interests in FS Global Advisor and FS Investments’ other investment adviser entities), receives a base salary and is eligible for a discretionary bonus.
All final compensation decisions are made by the management committee of FS Investments based on input from managers. Compensation and other incentives are not formulaic, but rather are judgment and merit driven, and are determined based on a combination of overall firm performance, individual contribution and performance and relevant market and competitive compensation practices for other businesses.
(a)(4) The following table shows the dollar range of equity securities in the Company beneficially owned by each member of FS Global Advisor’s investment committee as of December 31, 2016, based on the public offering price of the Company’s common shares as of December 31, 2016.
| | |
Name of Investment Committee Member | | Dollar Range of Equity Securities
in the Company(1) |
Michael C. Forman | | None |
Gerald F. Stahlecker | | None |
Zachary Klehr | | None |
Robert Hoffman | | None |
| (1) | Dollar ranges are as follows: None, $1—$10,000, $10,001—$50,000, $50,001—$100,000, $100,001—$500,000, $500,001—$1,000,000 or Over $1,000,000. |
(b) Not applicable.
| Item 9. | Purchases of Equity Securities by Closed-End Management Investment Company and Affiliated Purchasers. |
No such purchases were made by or on behalf of the Company during the period covered by the annual report included in Item 1 of this Form N-CSR.
| Item 10. | Submission of Matters to a Vote of Security Holders. |
There were no material changes to the procedures by which the Company’s shareholders may recommend nominees to the Board during the period covered by the Annual Report included in Item 1 of this Form N-CSR.
| Item 11. | Controls and Procedures. |
| | (a) | The Company’s principal executive officer and principal financial officer have evaluated the Company’s disclosure controls and procedures (as defined in Rule 30a-3(c) under the 1940 Act) as of a date within 90 days of the filing of this Form N-CSR and have concluded that the Company’s disclosure controls and procedures were effective, as of that date, in ensuring that information required to be disclosed by the Company in this Form N-CSR was recorded, processed, summarized and reported timely. |
| | (b) | There was no change in the Company’s internal control over financial reporting (as defined in Rule 30a-3(d) under the 1940 Act) that occurred during the Company’s second fiscal quarter of the period covered by this Form N-CSR that has materially affected, or is reasonably likely to materially affect, the Company’s internal control over financial reporting. |
| | (a)(1) | The Company’s Code of Business Conduct and Ethics is included herein in response to Item 2(f). |
| | (a)(2) | The certifications of the Company’s Chief Executive Officer and Chief Financial Officer required by Rule 30a-2(a) under the 1940 Act are included herein. |
| | (a)(4) | The Proxy Voting Policies and Procedures of FS Global Advisor are included herein in response to Item 7. |
| | (b) | The certifications of the Company’s Chief Executive Officer and Chief Financial Officer required by Rule 30a-2(b) under the 1940 Act are included herein. |
SIGNATURES
Pursuant to the requirements of the Securities Exchange Act of 1934 and the Investment Company Act of 1940, the registrant has duly caused this report to be signed on its behalf by the undersigned, thereunto duly authorized.
| | |
| FS Global Credit Opportunities Fund—T |
| |
| By: | | /S/ MICHAEL C. FORMAN |
| | Michael C. Forman |
| | President and Chief Executive Officer |
| | Date: March 1, 2017 |
Pursuant to the requirements of the Securities Exchange Act of 1934 and the Investment Company Act of 1940, this report has been signed below by the following persons on behalf of the registrant and in the capacities and on the dates indicated.
| | |
| |
| By: | | /S/ MICHAEL C. FORMAN |
| | Michael C. Forman |
| | President and Chief Executive Officer |
| | (Principal Executive Officer) |
| | Date: March 1, 2017 |
| |
| By: | | /S/ WILLIAM GOEBEL |
| | William Goebel |
| | Chief Financial Officer |
| | (Principal Financial Officer) |
| | Date: March 1, 2017 |