Exhibit 99.1
Investor Presentation Ap r il 15, 2 0 21
SAFE HARBOR S T A TEMENT 2 This presentation contains statements that are, or may be considered to be, forward - looking statements. All statements that are not historical facts are forward - looking statements and such forward - looking statements are statements made pursuant to the Safe Harbor Provisions of the Private Securities Litigation Reform Act of 1995. Examples of forward - looking statements include: • sta t em ents about Z edg e ’ s futu r e per f o r man c e; • projections of Zedge’s results of operations or financial condition; • statements regarding Zedge’s plans, objectives or goals, including those relating to its strategies ,initiatives, competition, acquisitions, dispositions and/or its products; and Words such as "believe," "anticipate," "plan," "expect," "intend," "target," "estimate," "project," "predict," "forecast," "guideline," "aim," "will," "should," “likely,” "continue" and similar expressions are intended to identify forward - looking statements but are not the exclusive means of identifying such statements. Readers are cautioned not to place undue reliance on these forward - looking statements and all such forward - looking statements are qualified in their entirety by reference to the following cautionary statements. Forward - looking statements are based on Zedge’s current expectations, estimates and assumptions and because forward - looking statements address future results, events and conditions, they, by their very nature, involve inherent risks and uncertainties, many of which are unforeseeable and beyond Zedge’s control. Such known and unknown risks, uncertainties and other factors may cause Zedge’s actual results, performance or other achievements to differ materially from the anticipated results, performance or achievements expressed, projected or implied by these forward - looking statements. These factors include those discussed under the headings "Risk Factors" and “Management’s Discussion and Analysis of Financial Condition and Results of Operations” in Zedge’s periodic reports filed with the Securities and Exchange Commission . Zedge cautions that such factors are not exhaustive and that other risks and uncertainties may cause actual results to differ materially from those in forward - looking statements. Forward - looking statements speak only as of the date they are made and are statements of current expectations concerning future results, events and conditions and Zedge is under no obligation to update any of the forward - looking statements, whether as a result of new information, future events or otherwise.
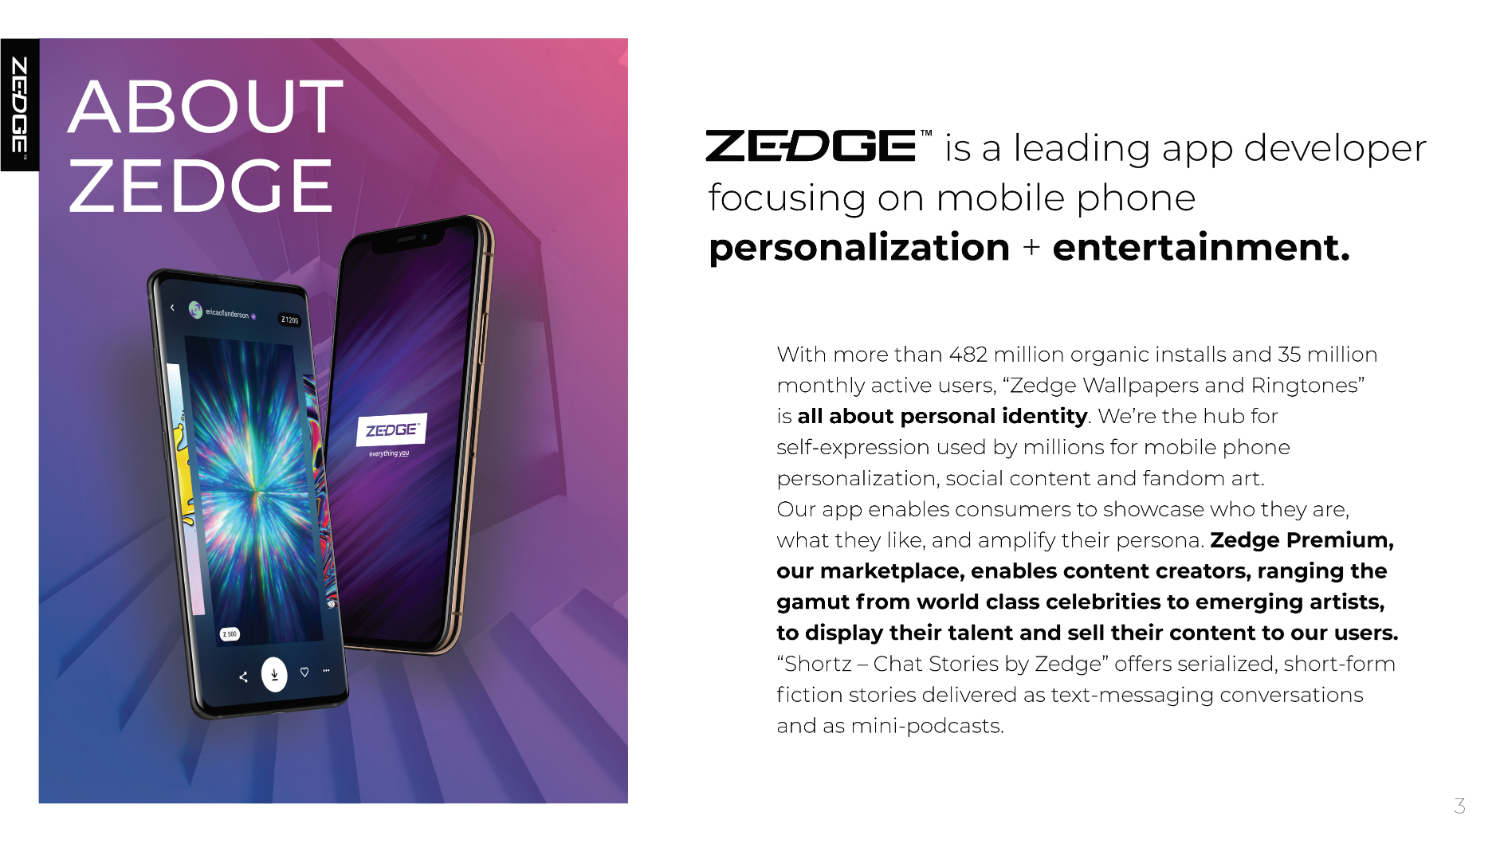
W ith m o r e than 4 82 million o r ganic installs an d 3 5 million monthly active users, “Zedge Wallpapers and Ringtones” is all about personal identity . We’re the hub for sel f - e xp r ession used b y millions f or m obile ph on e personalization, social content and fandom art. Our app enables consumers to showcase who they are, what th e y li k e, an d ampli f y th eir pe r sona. Z edge P r emium, our marketplace, enables content creators, ranging the gamut from world class celebrities to emerging artists, to display their talent and sell their content to our users. “Shortz – Chat Stories by Zedge” offers serialized, short - form fi c tion s t o ries deli v e r ed as t e xt - m essa gin g c o n v er sations an d as mini - podcasts. 3 ABO U T ZEDGE is a l e a din g app d e v eloper f ocusin g on m obile ph on e pe rsonalization + en t e r tain m en t .
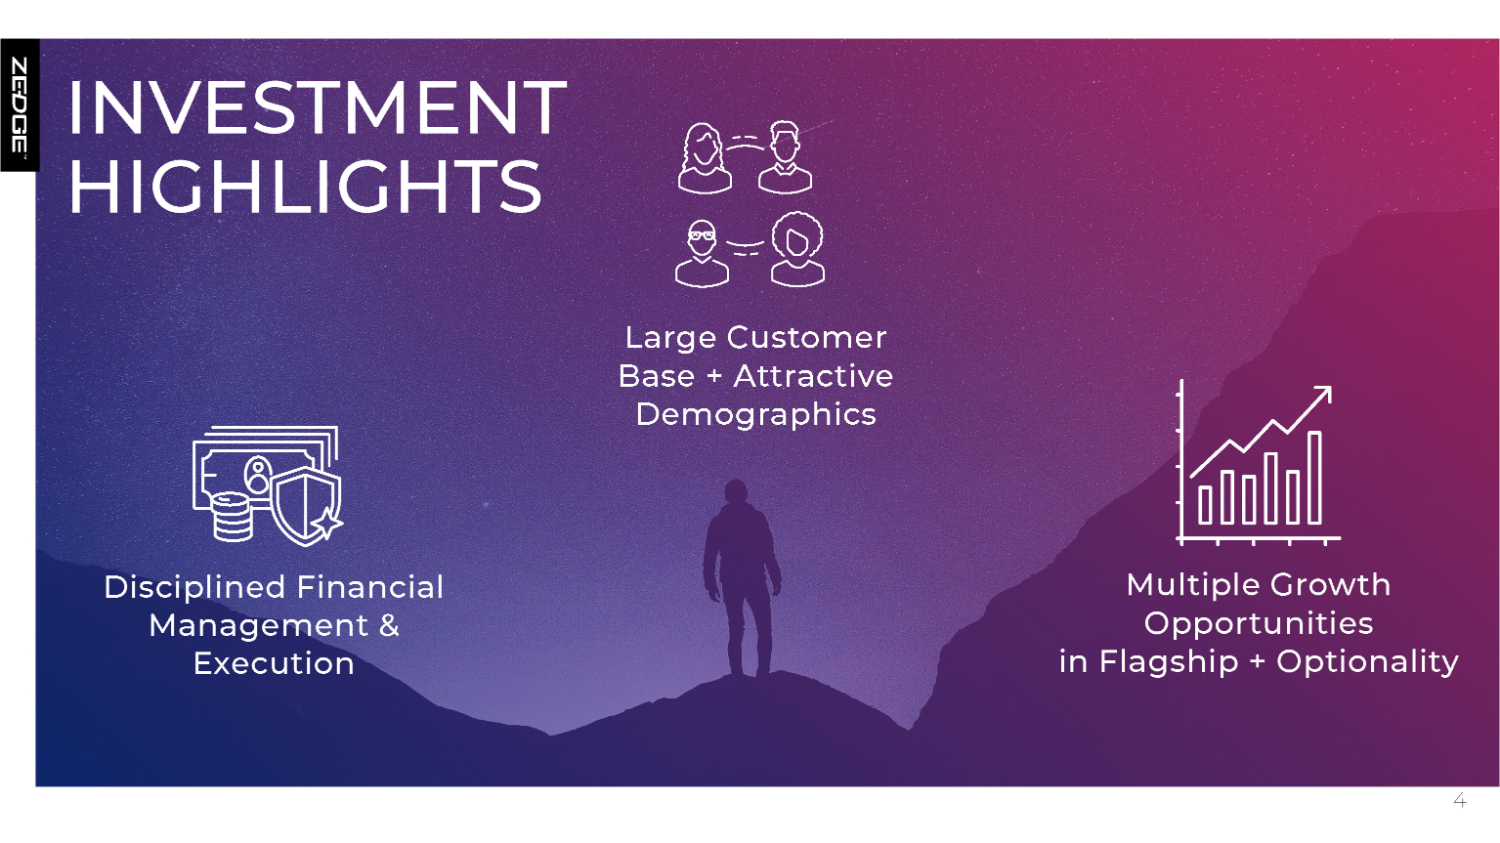
I N V E S TMEN T HIGHLIGHTS 4 Multiple Growth Opportunities i n Fl a gshi p + Optionali t y Disciplined Financial Management & Execution Large Customer Bas e + A t t r a c ti v e Demographics
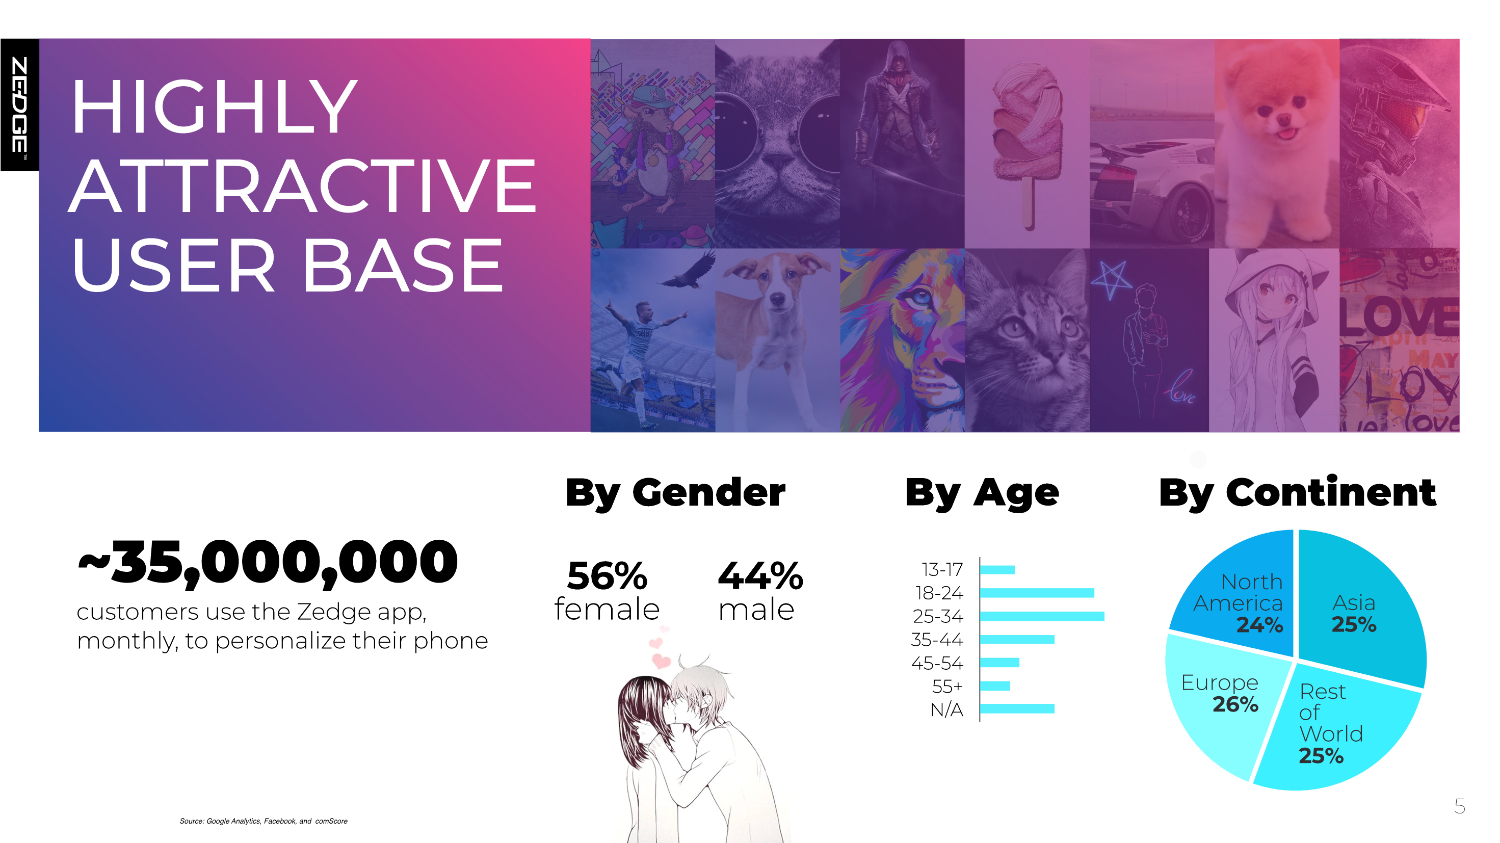
5 ~35,000,000 cus t om er s use th e Z edge ap p , m onthl y , t o pe r sonali z e th eir ph on e By Gender 5 6 % 4 4 % female male By Age 13 - 17 18 - 2 4 25 - 34 35 - 44 4 5 - 54 5 5+ N / A By Continent Source: Google Analytics, Facebook, and comScore No r th Am e r ica 2 4 % Rest of W o r ld 25% E u r ope 2 6 % Asia 25 % HIGHLY A T TR A C T I V E USER BASE
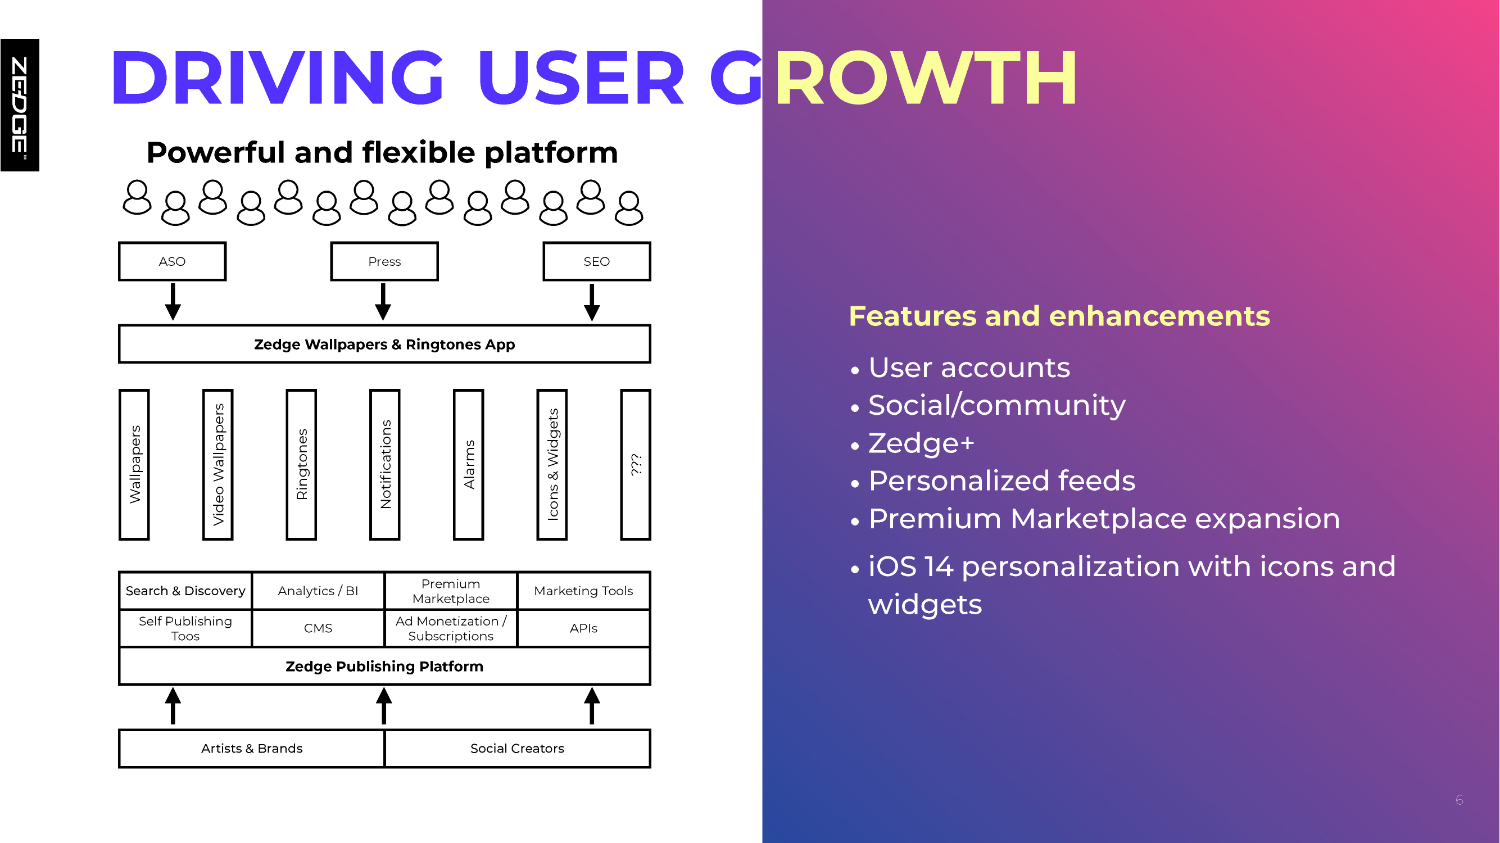
Wallpapers V ideo W all p ape r s Ringtones Notifications Alarms I c ons & W idgets ??? DRIVING USER G ROWTH Powerful and flexible platform 6 S e a r c h & Dis c ov e r y Anal y tics / BI Premium Ma r k etpla c e Ma r k eting T ools Self Publishing Toos CMS A d Monetization / Subscriptions APIs Zedge Publishing Platform A r tists & Br an ds Social C r e at o r s ASO Press SEO Zedge Wallpapers & Ringtones App Features and enhancements • User a cc ounts • Social/community • Zedge+ • P e r sonali z ed f eeds • P r emium Ma r k etpl a c e e x p ansion • iOS 14 pe r sonalization with i c ons a n d widgets

ZEDGE PREMIUM MARKET P L A CE A Publishing & Revenue Generating Platform Made For Artists Ma r k etpl a c e • • • • Hub for personalization, social, and fandom art Id e al f or establish ed an d up an d c omin g a r tists, ali k e E a s y t o use self se r v e plat f o r m T o k en - b ased e c on o m y
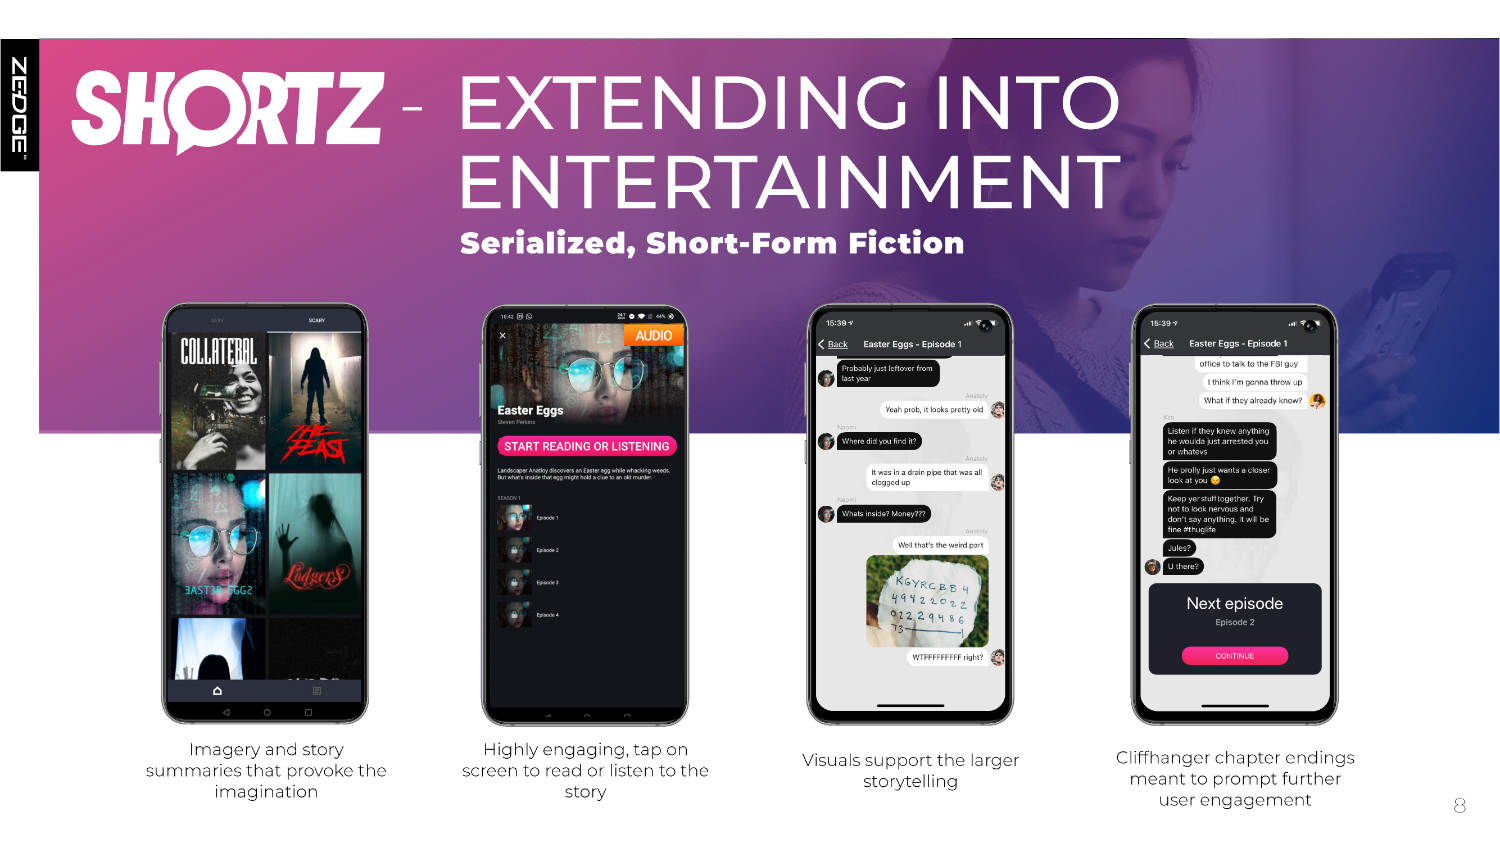
- E X TENDING IN T O ENTERTAINMENT 8 Cliffhan ger chap t er en din gs m e ant t o p r ompt fu r th er user enga gem ent Highly enga gin g, tap on sc r een t o r e a d or lis t en t o th e story Ima ge r y an d s t o r y summa r ies that p r o v o k e th e imagination Serialized, Short - Form Fiction Visuals suppo r t th e la r ger storytelling
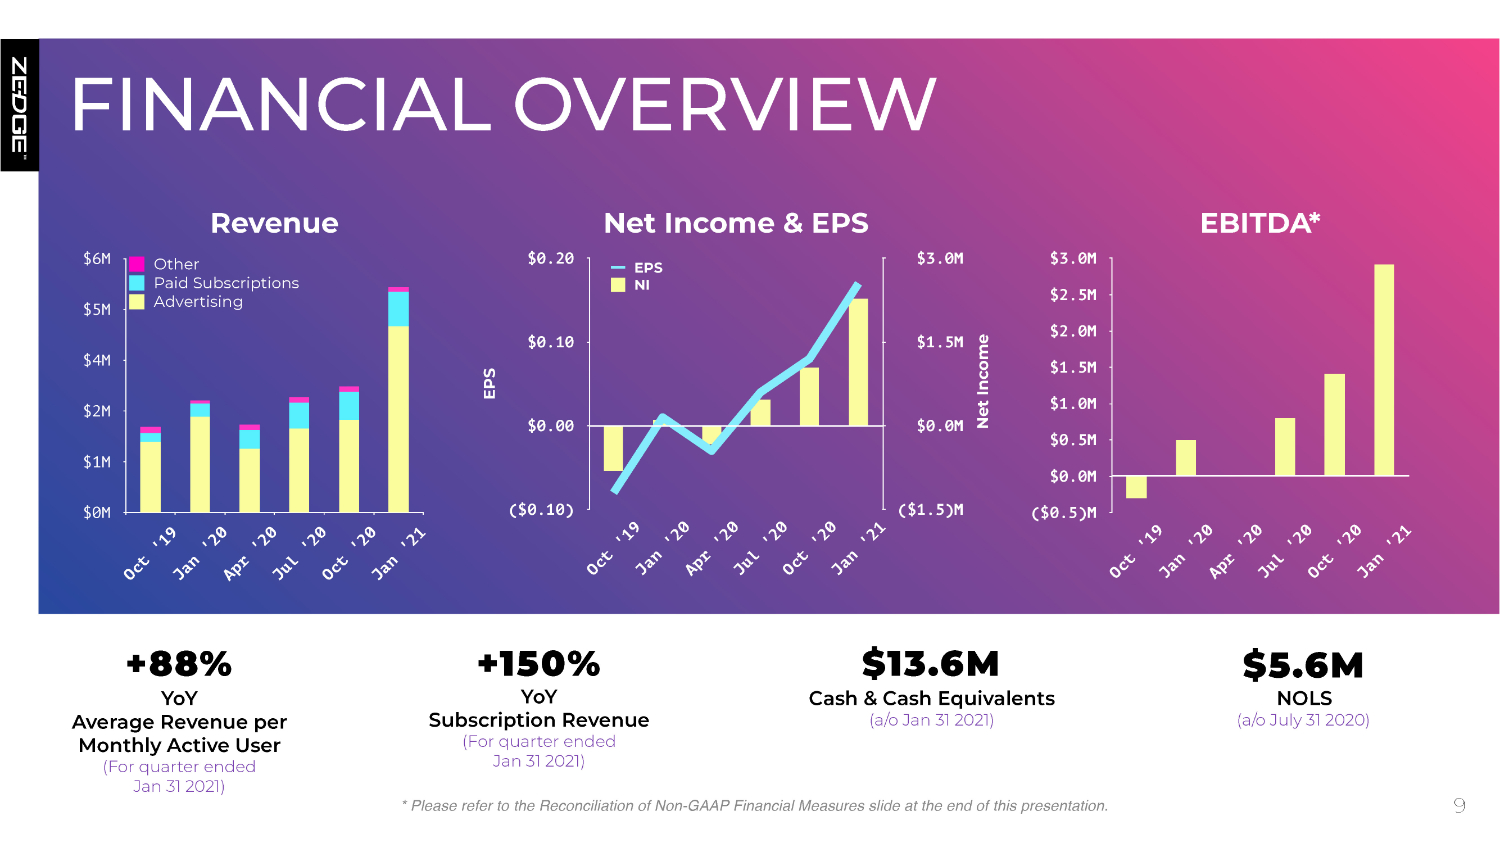
9 +88% YoY Average Revenue per Monthly Active User ( F or qua r t er en ded Jan 31 2 0 21) +150% YoY Subscription Revenue ( F or qua r t er en ded Jan 31 2 0 21) $13.6M Cash & Cash Equivalents (a / o Jan 31 2 0 21) $5.6M NOLS (a / o July 31 2 0 2 0) * Please refer to the Reconciliation of Non - GAAP Financial Measures slide at the end of this presentation. FINANCIAL O V ER V I E W Revenue $0M $1M $2M $4M $5M $6M Other P aid Subsc r iptions Advertising EBIT D A * ($0.5)M $0.0M $0.5M $1.0M $1.5M $2.0M $2.5M $3.0M Net Income ($1.5)M $0.0M $1.5M $3.0M EP S ($0.10) $0.00 $0.10 $0.20 Net Income & EPS EPS NI
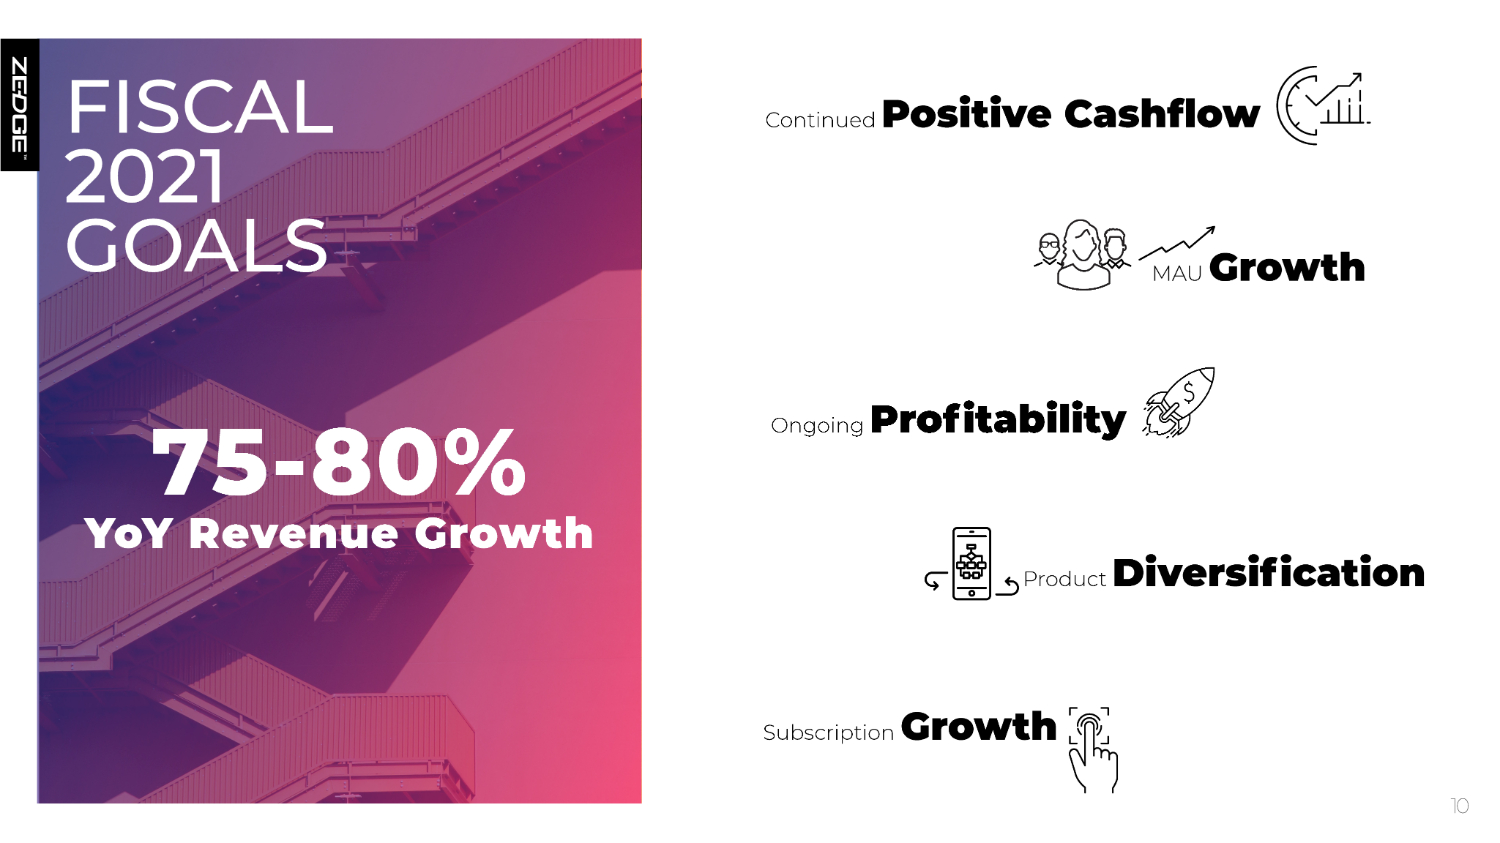
FIS C AL 2021 GOALS 75 - 80% On goin g P r o fi tabili t y C ontinued P ositi v e Cash fl ow 10 P r odu c t Di v ersi fi cation M A U G r o w th Subsc r iption G r o w th YoY Revenue Growth

G O V ERNANC E AND INVESTOR PROFILE Renowned Board Members With Pedigree In Mobile, Entertainment + Value Creation Michael Jonas 1 4 . 1 % Howard Jonas 1 . 2 % Mgmt & Employees 4 . 2 % Board of Directors 2 . 4 % 21.9% O t h er 56% Institutional 22% Inside r s 22% Mi c h a el Jonas Executive Chai r man H o w a r d Jonas V i ce Chai r man F oun der & Chai rman, I D T C o r p . Mark Ghermezian C o - C E O , Am e r ican D r e am C o - F oun de r , B r a z e Elliot Gibber P r esident & C E O Deb El F ood P r odu c ts Paul Packer Founder, Globis C apital A dviso r s Greg Suess F oun din g P a r tn e r , A c ti v e A r tists Mgm t , L L C P a r tn e r , Glasier W eil F ink H o w a r d A v c h en & Shapi r o Insider Ownership* *As of October 31, 2020, on a fully diluted basis Jonathan Reich CEO Zedge Yi T s a i CFO Zedge

Thank you! Jonathan Rei c h, Chief E x ecuti v e Of fi c er jonathan.reich@zedge.net + 1 3 30 5 77 3 4 2 4 B r ian Siegel Mana gin g Di r ec t o r , H a y den IR brian@haydenir.com + 1 346 396 8696 KEY T AKE A W A Y S Mu l tiple Growth Drivers Discipli n ed Financial Management Large + Loyal Customer Base Sha r e h older Returns
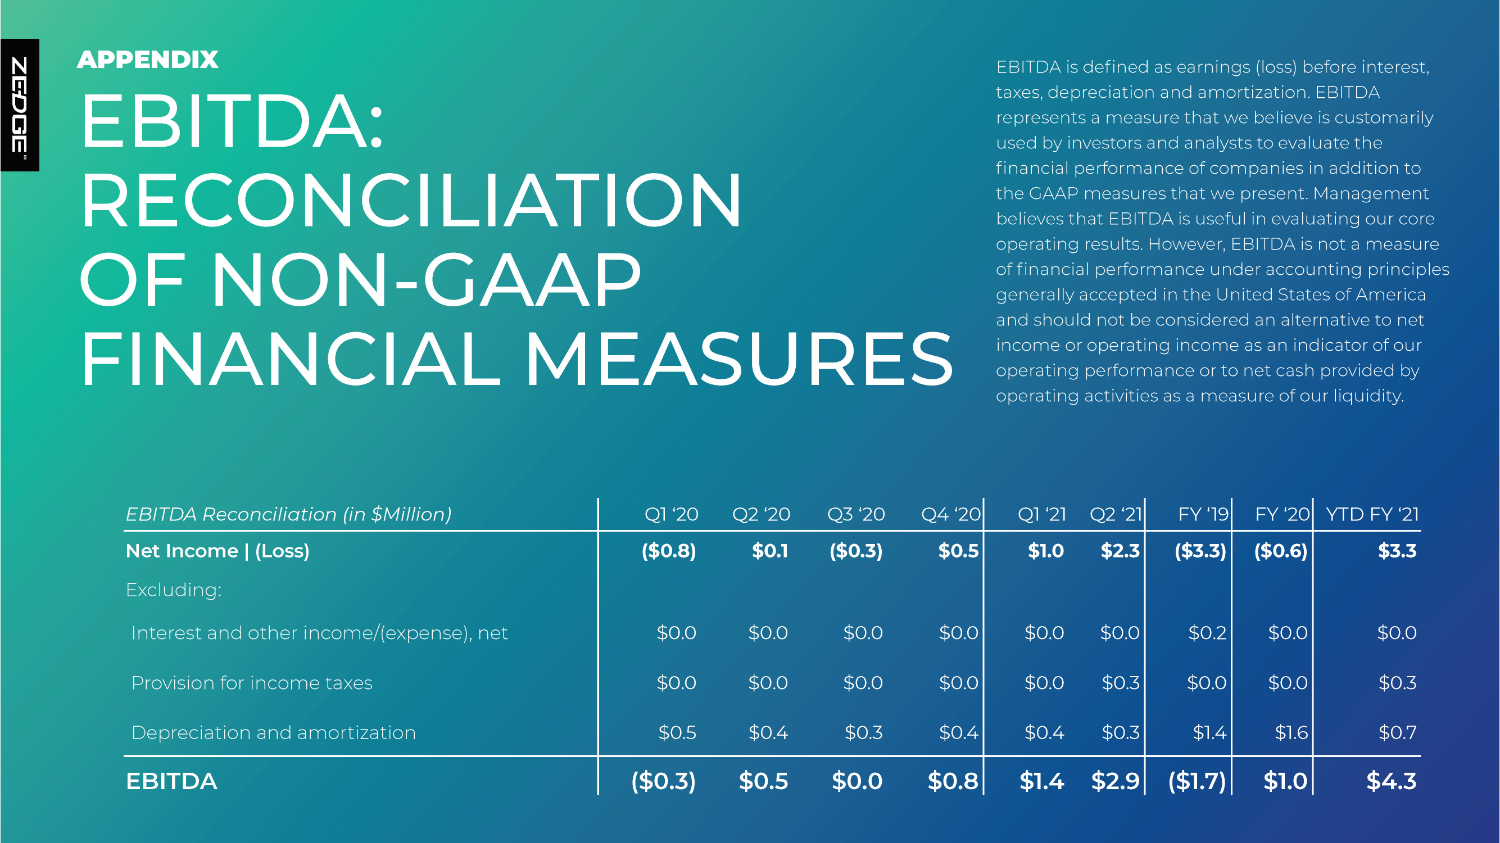
EBIT D A is de fi n ed as e a r nin gs (loss) be f o r e in t e r es t , taxes, depreciation and amortization. EBITDA r ep r esents a m easu r e that w e beli e v e is cus t oma r ily used b y i n v es t o r s an d anal y sts t o e v alua t e th e financial performance of companies in addition to th e G A AP m easu r es that w e p r esen t . Mana gem ent believes that EBITDA is useful in evaluating our core ope r atin g r esu l ts. H o w e v e r , EBIT D A is n ot a m easu r e of fi nan cial per f o r man c e un der a cc ountin g p r in ciples generally accepted in the United States of America and should not be considered an alternative to net in c om e or ope r atin g in c om e as an in dica tor of our operating performance or to net cash provided by ope r atin g a c tivities as a m easu r e of our liquidi t y . EBIT D A Re c onciliation (in $Million) Q 1 ‘ 2 0 Q 2 ‘ 2 0 Q 3 ‘ 2 0 Q4 ‘ 2 0 Q 1 ‘ 21 Q 2 ‘ 21 FY ‘ 19 FY ‘ 2 0 Y TD FY ‘ 21 Net Income | (Loss) Excluding: ($0.8) $0.1 ($0.3) $0.5 $1.0 $2.3 ($3.3) ($0.6) $3.3 Interest and other income/(expense), net $0.0 $0.0 $0.0 $0.0 $0.0 $0.0 $0.2 $0.0 $0.0 P ro vision f or in c ome ta x es $0.0 $0.0 $0.0 $0.0 $0.0 $0.3 $0.0 $0.0 $0.3 Dep r eciation and amo r tization $0.5 $0.4 $0.3 $0.4 $0.4 $0.3 $1.4 $1.6 $0.7 EBITDA ($0.3) $0.5 $0.0 $0.8 $1.4 $2.9 ($1.7) $1.0 $4.3 APPENDIX EBITDA: R E C ONCILI A TIO N OF NON - GAAP FINANCIAL MEASURES