UNITED STATES
SECURITIES AND EXCHANGE COMMISSION
Washington, D.C. 20549
FORM 10-Q
☒ QUARTERLY REPORT PURSUANT TO SECTION 13 OR 15(d) OF THE SECURITIES EXCHANGE ACT OF 1934
FOR THE QUARTERLY PERIOD ENDED OCTOBER 31, 2024
or
☐ TRANSITION REPORT PURSUANT TO SECTION 13 OR 15(d) OF THE SECURITIES EXCHANGE ACT OF 1934
Commission File Number: 1-37782
ZEDGE, INC.
(Exact Name of Registrant as Specified in its Charter)
| Delaware | | 26-3199071 |
(State or other jurisdiction of incorporation or organization) | | (I.R.S. Employer Identification Number) |
| 1178 Broadway, 3rd Floor #1450, New York, NY | | 10001 |
| (Address of principal executive offices) | | (Zip Code) |
(330) 577-3424
(Registrant’s telephone number, including area code)
Securities registered pursuant to Section 12(b) of the Act:
| Title of each class | | Name of each exchange on which registered |
| Class B common stock, par value $.01 per share | | NYSE American |
Indicate by check mark whether the registrant (1) has filed all reports required to be filed by Section 13 or 15(d) of the Securities Exchange Act of 1934 during the preceding 12 months (or for such shorter period that the registrant was required to file such reports), and (2) has been subject to such filing requirements for the past 90 days. Yes ☒ No ☐
Indicate by check mark whether the registrant has submitted electronically and posted on its corporate Web site, if any, every Interactive Data File required to be submitted and posted pursuant to Rule 405 of Regulation S-T (§ 232.405 of this chapter) during the preceding 12 months (or for such shorter period that the registrant was required to submit and post such files). Yes ☒ No ☐
Indicate by check mark whether the registrant is a large accelerated filer, an accelerated filer, a non-accelerated filer, smaller reporting company, or an emerging growth company. See the definitions of “large accelerated filer,” “accelerated filer,” “smaller reporting company,” and “emerging growth company” in Rule 12b-2 of the Exchange Act.
| Large accelerated filer | ☐ | Accelerated filer | ☐ |
| Non-accelerated filer | ☒ | Smaller reporting company | ☒ |
| Emerging growth company | ☐ | | |
If an emerging growth company, indicate by check mark if the registrant has elected not to use the extended transition period for complying with any new or revised financial accounting standards provided pursuant to Section 13(a) of the Exchange Act. ☐
Indicate by check mark whether the registrant is a shell company (as defined in Rule 12b-2 of the Exchange Act.): Yes ☐ No ☒
As of December 12, 2024, the registrant had the following shares outstanding:
| Class A common stock, $.01 par value: | 524,775 shares |
| Class B common stock, $.01 par value: | 13,618,761 shares |
ZEDGE, INC.
TABLE OF CONTENTS
PART I. FINANCIAL INFORMATION
Item 1. Condensed Consolidated Financial Statements
ZEDGE, INC.
CONDENSED CONSOLIDATED BALANCE SHEETS
(in thousands, except par value data)
| | | October 31, | | | July 31, | |
| | | 2024 | | | 2024 | |
| | | (Unaudited) | | | | |
| Assets | | | | | | |
| Current assets: | | | | | | |
| Cash and cash equivalents | | $ | 20,196 | | | $ | 19,998 | |
| Trade accounts receivable | | | 3,213 | | | | 3,406 | |
| Prepaid expenses and other receivables | | | 754 | | | | 593 | |
| Total current assets | | | 24,163 | | | | 23,997 | |
| Property and equipment, net | | | 2,194 | | | | 2,306 | |
| Intangible assets, net | | | 5,257 | | | | 5,369 | |
| Goodwill | | | 1,812 | | | | 1,824 | |
| Deferred tax assets, net | | | 4,344 | | | | 4,344 | |
| Other assets | | | 428 | | | | 355 | |
| Total assets | | $ | 38,198 | | | $ | 38,195 | |
| Liabilities and stockholders’ equity | | | | | | | | |
| Current liabilities: | | | | | | | | |
| Trade accounts payable | | $ | 1,389 | | | $ | 1,113 | |
| Accrued expenses and other current liabilities | | | 2,865 | | | | 2,969 | |
| Deferred revenues | | | 2,425 | | | | 2,168 | |
| Total current liabilities | | | 6,679 | | | | 6,250 | |
| Deferred revenues--non-current | | | 1,266 | | | | 931 | |
| Other liabilities | | | 150 | | | | 118 | |
| Total liabilities | | | 8,095 | | | | 7,299 | |
| Commitments and contingencies (Note 9) | | | | | | | | |
| Stockholders’ equity: | | | | | | | | |
| Preferred stock, $.01 par value; authorized shares—2,400; no shares issued and outstanding | | | - | | | | - | |
| Class A common stock, $.01 par value; authorized shares—2,600; 525 shares issued and outstanding at October 31, 2024 and July 31, 2024 | | | 5 | | | | 5 | |
| Class B common stock, $.01 par value; authorized shares—40,000; 14,896 shares issued and 13,619 shares outstanding at October 31, 2024, and 14,866 shares issued and 13,815 outstanding at July 31, 2024 | | | 149 | | | | 149 | |
| Additional paid-in capital | | | 48,642 | | | | 48,263 | |
| Accumulated other comprehensive loss | | | (1,861 | ) | | | (1,832 | ) |
| Accumulated deficit | | | (13,452 | ) | | | (13,113 | ) |
| Treasury stock, 1,277 shares at October 31, 2024 and 1,051 shares at July 31, 2024, at cost | | | (3,380 | ) | | | (2,576 | ) |
| Total stockholders’ equity | | | 30,103 | | | | 30,896 | |
| Total liabilities and stockholders’ equity | | $ | 38,198 | | | $ | 38,195 | |
See accompanying notes to unaudited condensed consolidated financial statements.
ZEDGE, INC.
CONDENSED CONSOLIDATED STATEMENTS OF OPERATIONS AND COMPREHENSIVE LOSS
(in thousands, except for per share data)
(Unaudited)
| | | Three Months Ended | |
| | | October 31, | |
| | | 2024 | | | 2023 | |
| Revenues | | $ | 7,194 | | | $ | 7,081 | |
| Costs and expenses: | | | | | | | | |
| Direct cost of revenues (excluding amortization of capitalized software and technology development costs which is included below) | | | 461 | | | | 486 | |
| Selling, general and administrative | | | 6,809 | | | | 5,499 | |
| Depreciation and amortization | | | 381 | | | | 775 | |
| (Loss) income from operations | | | (457 | ) | | | 321 | |
| Interest and other income, net | | | 181 | | | | 81 | |
| Net loss resulting from foreign exchange transactions | | | (14 | ) | | | (219 | ) |
| (Loss) income before income taxes | | | (290 | ) | | | 183 | |
| Provision for income taxes | | | 49 | | | | 198 | |
| Net loss | | $ | (339 | ) | | $ | (15 | ) |
| Other comprehensive loss: | | | | | | | | |
| Changes in foreign currency translation adjustment | | | (29 | ) | | | (367 | ) |
| Total other comprehensive loss | | | (29 | ) | | | (367 | ) |
| Total comprehensive loss | | $ | (368 | ) | | $ | (382 | ) |
| Loss per share attributable to Zedge, Inc. common stockholders: | | | | | | | | |
| Basic | | $ | (0.02 | ) | | $ | 0.00 | |
| Diluted | | $ | (0.02 | ) | | $ | 0.00 | |
| Weighted-average number of shares used in calculation of loss per share: | | | | | | | | |
| Basic | | | 14,086 | | | | 13,975 | |
| Diluted | | | 14,086 | | | | 13,975 | |
See accompanying notes to unaudited condensed consolidated financial statements.
ZEDGE, INC.
CONDENSED CONSOLIDATED STATEMENTS OF CHANGES IN STOCKHOLDERS’ EQUITY
(in thousands)
(Unaudited)
| | | Class A
Common Stock | | | Class B
Common Stock | | | Additional Paid-in | | | Accumulated Other Comprehensive | | | Accumulated | | | Treasury Stock | | | Total Stockholders’ | |
| | | Shares | | | Amount | | | Shares | | | Amount | | | Capital | | | Loss | | | Deficit | | | Shares | | | Amount | | | Equity | |
| Balance – July 31, 2024 | | | 525 | | | $ | 5 | | | | 14,866 | | | $ | 149 | | | $ | 48,263 | | | $ | (1,832 | ) | | $ | (13,113 | ) | | | 1,051 | | | $ | (2,576 | ) | | $ | 30,896 | |
| Exercise of stock options | | | - | | | | - | | | | - | | | | - | | | | - | | | | - | | | | - | | | | - | | | | - | | | | - | |
| Stock-based compensation | | | - | | | | - | | | | 30 | | | | - | | | | 379 | | | | - | | | | - | | | | - | | | | - | | | | 379 | |
| Purchase of treasury stock | | | - | | | | - | | | | - | | | | - | | | | - | | | | - | | | | - | | | | 226 | | | | (804 | ) | | | (804 | ) |
| Foreign currency translation adjustment | | | - | | | | - | | | | - | | | | - | | | | - | | | | (29 | ) | | | - | | | | - | | | | - | | | | (29 | ) |
| Net loss | | | - | | | | - | | | | - | | | | - | | | | - | | | | - | | | | (339 | ) | | | - | | | | - | | | | (339 | ) |
| Balance – October 31, 2024 | | | 525 | | | $ | 5 | | | | 14,896 | | | $ | 149 | | | $ | 48,642 | | | $ | (1,861 | ) | | $ | (13,452 | ) | | | 1,277 | | | $ | (3,380 | ) | | $ | 30,103 | |
| | | Class A
Common Stock | | | Class B
Common Stock | | | Additional Paid-in | | | Accumulated Other Comprehensive | | | Accumulated | | | Treasury Stock | | | Total Stockholders’ | |
| | | Shares | | | Amount | | | Shares | | | Amount | | | Capital | | | Loss | | | Deficit | | | Shares | | | Amount | | | Equity | |
| Balance – July 31, 2023 | | | 525 | | | $ | 5 | | | | 14,634 | | | $ | 146 | | | $ | 46,122 | | | $ | (1,537 | ) | | $ | (3,942 | ) | | | 833 | | | $ | (1,930 | ) | | $ | 38,864 | |
| Exercise of stock options | | | - | | | | - | | | | 2 | | | | - | | | | 3 | | | | - | | | | - | | | | - | | | | - | | | | 3 | |
| Stock-based compensation | | | - | | | | - | | | | 33 | | | | 1 | | | | 506 | | | | - | | | | - | | | | - | | | | - | | | | 507 | |
| Purchase of treasury stock | | | - | | | | - | | | | - | | | | - | | | | - | | | | - | | | | - | | | | 6 | | | | (13 | ) | | | (13 | ) |
| Foreign currency translation adjustment | | | - | | | | - | | | | - | | | | - | | | | - | | | | (367 | ) | | | - | | | | - | | | | - | | | | (367 | ) |
| Net loss | | | - | | | | - | | | | - | | | | - | | | | - | | | | - | | | | (15 | ) | | | - | | | | - | | | | (15 | ) |
| Balance – October 31, 2023 | | | 525 | | | $ | 5 | | | | 14,669 | | | $ | 147 | | | $ | 46,631 | | | $ | (1,904 | ) | | $ | (3,957 | ) | | | 839 | | | $ | (1,943 | ) | | $ | 38,979 | |
See accompanying notes to unaudited condensed consolidated financial statements.
ZEDGE, INC.
CONDENSED CONSOLIDATED STATEMENTS OF CASH FLOWS
(in thousands)
(Unaudited)
| | | Three Months Ended | |
| | | October 31, | |
| | | 2024 | | | 2023 | |
| | | | | | | |
| Operating activities | | | | | | |
| Net loss | | $ | (339 | ) | | $ | (15 | ) |
| Adjustments to reconcile net loss to net cash provided by operating activities: | | | | | | | | |
| Depreciation | | | 16 | | | | 14 | |
| Amortization of intangible assets | | | 112 | | | | 579 | |
| Amortization of capitalized software and technology development costs | | | 253 | | | | 182 | |
| Amortization of deferred financing costs | | | - | | | | 1 | |
| Stock-based compensation | | | 379 | | | | 507 | |
| Impairment of investment in privately-held company | | | - | | | | 50 | |
| | | | | | | | | |
| Change in assets and liabilities: | | | | | | | | |
| Trade accounts receivable | | | 193 | | | | (300 | ) |
| Prepaid expenses and other current assets | | | (161 | ) | | | (66 | ) |
| Other assets | | | (41 | ) | | | 14 | |
| Trade accounts payable and accrued expenses | | | 166 | | | | 384 | |
| Deferred revenue | | | 592 | | | | (90 | ) |
| Net cash provided by operating activities | | | 1,170 | | | | 1,260 | |
| Investing activities | | | | | | | | |
| Capitalized software and technology development costs | | | (146 | ) | | | (423 | ) |
| Purchase of property and equipment | | | (11 | ) | | | (22 | ) |
| Net cash used in investing activities | | | (157 | ) | | | (445 | ) |
| Financing activities | | | | | | | | |
| Proceeds from exercise of stock options | | | - | | | | 3 | |
| Purchase of treasury stock in connection with share buyback program and stock awards vesting | | | (804 | ) | | | (13 | ) |
| Net cash used in financing activities | | | (804 | ) | | | (10 | ) |
| Effect of exchange rate changes on cash and cash equivalents | | | (11 | ) | | | (185 | ) |
| Net increase in cash and cash equivalents | | | 198 | | | | 620 | |
| Cash and cash equivalents at beginning of period | | | 19,998 | | | | 18,125 | |
| Cash and cash equivalents at end of period | | $ | 20,196 | | | $ | 18,745 | |
| | | | | | | | | |
| SUPPLEMENTAL DISCLOSURE OF CASH FLOW INFORMATION | | | | | | | | |
| Cash payments made for income taxes | | $ | 88 | | | $ | 36 | |
| Cash payments made for interest expenses | | $ | - | | | $ | 46 | |
See accompanying notes to unaudited condensed consolidated financial statements.
ZEDGE, INC.
NOTES TO CONDENSED CONSOLIDATED FINANCIAL STATEMENTS
(Unaudited)
Note 1—Basis of Presentation and Summary of Significant Accounting Policies
Description of Business
Zedge, Inc. builds digital marketplaces and friendly competitive games around content that people use to express themselves. Our leading products include Zedge Ringtones and Wallpapers, which we refer to as our Zedge App, a freemium digital content marketplace offering mobile phone wallpapers, video wallpapers, ringtones, and notification sounds as well as pAInt, a suite of tools that can be used to render images from text or image prompts powered by generative AI, GuruShots, a skill-based photo challenge game, and Emojipedia, the #1 trusted source for ‘all things emoji’. Our vision is to enable and connect creators who enjoy friendly competitions with a community of prospective consumers in order to drive commerce. Except where the context clearly indicates otherwise, the terms the “Company,” “Zedge” “we,” “us” or “our” refer to Zedge, Inc. and its consolidated subsidiaries.
Basis of Presentation
The accompanying unaudited condensed consolidated financial statements of Zedge, Inc. and its subsidiaries: GuruShots Ltd. (“GuruShots”); Zedge Europe AS; and Zedge Lithuania UAB (the “Company”), have been prepared in accordance with accounting principles generally accepted in the United States of America (“U.S. GAAP”) for interim financial information and with the instructions to Form 10-Q and Article 8 of Regulation S-X. Accordingly, they do not include all of the information and footnotes required by U.S. GAAP for complete financial statements. In the opinion of management, all adjustments (consisting of normal recurring accruals) considered necessary for a fair presentation have been included. Operating results for the three months ended October 31, 2024 are not necessarily indicative of the results that may be expected for the fiscal year ending July 31, 2025 or any other period. The balance sheet at July 31, 2024 has been derived from the Company’s audited financial statements at that date but does not include all of the information and footnotes required by U.S. GAAP for complete financial statements. For further information, please refer to the consolidated financial statements and footnotes thereto included in the Company’s Annual Report on Form 10-K for the fiscal year ended July 31, 2024 (the “2024 Form 10-K”), as filed with the U.S. Securities and Exchange Commission (the “SEC”).
The Company’s fiscal year ends on July 31 of each calendar year. Each reference below to a fiscal year refers to the fiscal year ending in the calendar year indicated (e.g., fiscal 2024 refers to the fiscal year ended July 31, 2024).
Significant Accounting Policies and Estimates
There have been no material changes to the Company’s significant accounting policies and critical accounting estimates described in the 2024 Form 10-K.
Use of Estimates
The preparation of our unaudited condensed consolidated financial statements in conformity with U.S. GAAP requires management to make estimates and assumptions that affect the reported amounts of assets, liabilities, revenue and expenses, as well as related disclosure of contingent assets and liabilities. Actual results could differ materially from our estimates due to risks and uncertainties, including uncertainty in the economic environment due to various global events. To the extent that there are material differences between these estimates and actual results, our financial condition or operating results will be affected. We base our estimates on past experience and other assumptions that we believe are reasonable under the circumstances, and we evaluate these estimates on an ongoing basis.
Recently Issued Accounting Pronouncements
Segment Reporting: In November 2023, the Financial Accounting Standards Board (“FASB”) issued Accounting Standards Update (“ASU”) 2023-07 Segment Reporting (Topic 280): Improvements to Reportable Segment Disclosures. The guidance in ASU 2023-07 seeks to improve reportable segment disclosure requirements, primarily through enhanced disclosures about significant segment expenses. The amendments in this ASU require a public entity to disclose the following: significant segment expenses that are regularly provided to the chief operating decision maker (“CODM”) and included within each reported measure of segment profit or loss; an amount for other segment items by reportable segment and a description of its composition; and the title and position of the CODM and how the CODM uses the reported measure(s) of segment profit or loss in assessing segment performance and deciding how to allocate resources. This ASU requires public entities to provide all annual disclosures about a reportable segment’s profit or loss and assets currently required by Topic 280 in interim periods. ASU 2023-07 clarifies that, if the CODM uses more than one measure of a segment’s profit or loss in assessing segment performance and deciding how to allocate resources, a public entity may report one or more of those additional measures of segment profit. ASU 2023-07 is effective for fiscal years beginning after December 15, 2023, and interim periods within fiscal years beginning after December 15, 2024, with early adoption permitted. A retrospective approach is required to be applied to all prior periods presented in the financial statements. We plan to adopt the provisions of ASU 2023-07 in the third quarter of fiscal 2025 (the three months ending April 30, 2025), which will result in additional disclosures in the notes to our consolidated financial statements. The adoption of the provisions of ASU 2023-07 will not impact our financial position or results of operations.
Income Taxes: In December 2023, the FASB issued ASU 2023-09 Income Taxes (Topic 740): Improvements to Income Tax Disclosures. The guidance in this ASU enhances the transparency and decision functionality of income tax disclosures to provide investors information to better assess how an entity’s operations and related tax risks, tax planning and operational opportunities affect its tax rate and prospects for future cash flow. The amendments in this ASU require public entities to disclose the following specific categories in the rate reconciliation by both percentages and reporting currency amounts: the effect of state and local income tax, net of federal (national) income tax, foreign tax effects, effects of changes in tax laws or rates enacted in the current period, effects of cross-border tax laws, tax credits, changes in valuation allowances, nontaxable or nondeductible items and changes in unrecognized tax benefits. The amendments in ASU 2023-09 also require public entities to provide additional information for reconciling items that meet the qualitative threshold (if the effect of those reconciling items is equal to or greater than five percent of the amount computed by multiplying pre-tax income (loss) by the applicable statutory income tax rate). This ASU requires reporting entities to annually disclose the year-to-date amount of income taxes paid (net of refunds received) disaggregated by federal, state and foreign localities. The amendments in this ASU should be applied on a prospective basis and retrospective application is permitted. For public business entities, ASU 2023-09 is effective for annual periods beginning after December 15, 2024, with early adoption permitted. We plan to adopt the provisions of ASU 2023-09 in fiscal 2026 and we are evaluating the disclosure requirements related to the new standard.
Income Statement-Reporting Comprehensive Income-Expense Disaggregation Disclosures (Subtopic 220-40): Disaggregation of Income Statement Expenses. In November 2024, the FASB issued ASU 2024-03, Income Statement (Subtopic 220-40): Disaggregation of Income Statement Expenses, which requires public entities to disclose, in the notes to the financial statements, specified information about certain costs and expenses at each interim and annual reporting period. This ASU is effective for fiscal years beginning after December 15, 2026, and interim periods beginning after December 15, 2027, with early adoption permitted. We are currently evaluating the impact of the standard on our condensed consolidated financial statements.
All other new accounting pronouncements that have been issued but not yet effective are currently being evaluated and at this time are not expected to have a material impact on our financial position or results of operations.
Related Party Transactions
The Company was formerly a majority-owned subsidiary of IDT Corporation (“IDT”). On June 1, 2016, IDT’s interest in the Company was spun-off by IDT to IDT’s stockholders and the Company became an independent public-held company. IDT charges the Company for services it provides, and the Company charges IDT for services it provides, pursuant to a Transition Services Agreement (“TSA”).
The Company is party to a consulting agreement with Activist Artist Management, LLC (“Activist”), which assists the Company in strategic business development. A member of the Company’s Board of Directors owns a significant minority stake in Activist.
The Company is party to a revenue sharing agreement with National Retail Services, Inc. (“NRS”), a wholly owned subsidiary of IDT, under which Zedge and certain of its subsidiaries (Emojipedia and GuruShots) provide a selection of their digital content for display on NR screens and share in the revenue generated from the resulting advertisements.
Transactions with these related parties did not have a material impact on the consolidated balance sheets as of October 31, 2024 or July 31, 2024, or the consolidated statements of operations and comprehensive loss for the three months ended October 31, 2024 or 2023.
Note 2—Revenue
Disaggregation of Revenue
The following table presents revenue disaggregated by segment and type (in thousands):
| | | Three Months Ended
October 31, | |
| | | 2024 | | | 2023 | |
| Zedge Marketplace | | | | | | |
| Advertising revenue | | $ | 4,874 | | | $ | 4,939 | |
| Paid subscription revenue | | | 1,182 | | | | 976 | |
| Other revenues | | | 494 | | | | 222 | |
| Total Zedge Marketplace revenue | | | 6,550 | | | | 6,137 | |
| GuruShots | | | | | | | | |
| Digital goods and services | | | 644 | | | | 944 | |
| Total revenue | | $ | 7,194 | | | $ | 7,081 | |
Contract Balances
Contract liabilities consist of deferred revenue, which are recorded for payments received in advance of the satisfaction of performance obligations.
The Company records deferred revenues related to the unsatisfied performance obligations with respect to subscription revenue. The Company’s deferred revenue balance for paid subscriptions was approximately $3.4 million related to approximately 698,000 active subscribers, and approximately $2.9 million, related to approximately 669,000 active subscribers, as of October 31, 2024 and July 31, 2024, respectively.
The Company also records deferred revenues when users purchase or earn Zedge Credits. Unused Zedge Credits represent the value of the Company’s unsatisfied performance obligation to its users. Revenue is recognized when Zedge App users use Zedge Credits to acquire Zedge Premium content or upon expiration of the Zedge Credits upon 180 days of account inactivity (“Breakage”). As of October 31, 2024, and July 31, 2024, the Company’s deferred revenue balance related to Zedge Premium was approximately $247,000 and $251,000, respectively.
The amount of deferred revenue recognized in the three months ended October 31, 2024 that was included in the deferred revenue balance at July 31, 2024 was $0.7 million.
Unsatisfied Performance Obligations
Substantially all of the Company’s unsatisfied performance obligations relate to contracts with an original expected length of 30 months or less.
Significant Judgments
The advertising networks and advertising exchanges to which the Company sells its inventory track and report the impressions and revenues to Zedge, and Zedge recognizes revenues based on these reports. The networks and exchanges base their payments off of those reports and Zedge independently compares the data to each of the client sites to validate the imported data and identify any differences. The number of impressions and revenues delivered by the advertising networks and advertising exchanges is determined at the end of each month, which resolves any uncertainty in the transaction price during the reporting period.
Note 3—Fair Value Measurements
The following tables present the balance of assets and liabilities measured at fair value on a recurring basis (in thousands):
| | | Level 1 | | | Level 2 | | | Level 3 | | | Total | |
| October 31, 2024 | | | | | | | | | | | | |
| Liabilities: | | | | | | | | | | | | |
| Foreign exchange forward contracts | | $ | - | | | $ | 58 | | | $ | - | | | $ | 58 | |
| | | | | | | | | | | | | | | | | |
| July 31, 2024 | | | | | | | | | | | | | | | | |
| Liabilities: | | | | | | | | | | | | | | | | |
| Foreign exchange forward contracts | | $ | - | | | $ | 51 | | | $ | - | | | $ | 51 | |
(1) – quoted prices in active markets for identical assets or liabilities
(2) – observable inputs other than quoted prices in active markets for identical assets and liabilities
(3) – no observable pricing inputs in the market
Fair Value of Other Financial Instruments
Fair value of the outstanding foreign exchange forward contracts are marked to market price at the end of each measurement period.
The Company’s other financial instruments at October 31, 2024 and July 31, 2024 included trade accounts receivable and trade accounts payable. The carrying amounts of other assets and liabilities such as prepaid expenses, trade accounts receivable and trade accounts payable approximated fair value due to their short-term nature.
Note 4—Derivative Instruments
The primary risk managed by the Company using derivative instruments is foreign exchange risk. Foreign exchange forward contracts are entered into as hedges against unfavorable fluctuations in the U.S. Dollar (USD) to Norwegian Kroner (NOK) and USD to Euro (EUR) exchange rates. The Company is party to a Foreign Exchange Agreement with Western Alliance Bank (“WAB”) allowing the Company to enter into foreign exchange contracts under its revolving credit facility with the bank (see Note 10 Term Loan and Revolving Credit Facility). The Company does not apply hedge accounting to these contracts, and therefore the changes in fair value are recorded in unaudited condensed consolidated statements of operations and comprehensive loss. By using derivative instruments to mitigate exposures to changes in foreign exchange rates, the Company is exposed to credit risk from the failure of the counterparty to perform under the terms of the contract. The credit or repayment risk is minimized by entering into transactions with high-quality counterparties.
The outstanding contracts at October 31, 2024, were as follows:
| Settlement Date | | U.S. Dollar Amount | | | NOK Amount | |
| Nov-24 | | | 225,000 | | | | 2,349,801 | |
| Dec-24 | | | 225,000 | | | | 2,415,510 | |
| Jan-25 | | | 225,000 | | | | 2,414,669 | |
| Feb-25 | | | 225,000 | | | | 2,413,827 | |
| Mar-25 | | | 225,000 | | | | 2,413,035 | |
| Apr-25 | | | 225,000 | | | | 2,411,421 | |
| May-25 | | | 225,000 | | | | 2,410,245 | |
| Total | | | 1,575,000 | | | | 16,828,508 | |
| Settlement Date | | U.S. Dollar Amount | | | EUR Amount | |
| Nov-24 | | | 250,000 | | | | 226,296 | |
| Dec-24 | | | 275,000 | | | | 250,500 | |
| Jan-25 | | | 275,000 | | | | 250,086 | |
| Feb-25 | | | 275,000 | | | | 249,836 | |
| Mar-25 | | | 275,000 | | | | 249,487 | |
| Apr-25 | | | 275,000 | | | | 248,863 | |
| May-25 | | | 275,000 | | | | 248,307 | |
| Total | | | 1,900,000 | | | | 1,723,375 | |
The fair value of outstanding derivative instruments recorded in the accompanying unaudited condensed consolidated balance sheets were as follows (in thousands):
| | | | | October 31, | | | July 31, | |
| (in thousands) | | | | 2024 | | | 2024 | |
| Assets and Liabilities Derivatives: | | Balance Sheet Location | | | | | | | | |
| Derivatives not designated or not qualifying as hedging instruments | | | | | | | | | | |
| Foreign exchange forward contracts | | Accrued expenses and other current liabilities | | $ | 58 | | | $ | 51 | |
The effects of derivative instruments on the condensed consolidated statements of operations and comprehensive loss were as follows (in thousands):
| | | | | Three Months Ended
October 31, | |
| Amount of Loss Recognized on Derivatives | | | | 2024 | | | 2023 | |
| Derivatives not designated or not qualifying as hedging instruments | | Location of loss recognized on derivatives | | | | | | |
| Foreign exchange forward contracts | | Net loss resulting from foreign exchange transactions | | $ | (18 | ) | | $ | (282 | ) |
Note 5—Intangible Assets and Goodwill
The following table presents the detail of intangible assets, net as of October 31, 2024 and July 31, 2024 (in thousands):
| | | October 31, 2024 | | | July 31, 2024 | |
| | | Gross
Carrying
Value | | | Accumulated
Amortization | | | Allocation of
Impairment
Loss | | | Net Carrying
Value | | | Gross
Carrying
Value | | | Accumulated
Amortization | | | Allocation of
Impairment
Loss | | | Net Carrying
Value | |
| | | | | | | | | | | | | | | | | | | | | | | | | |
| Emojipedia.org and other internet domains acquired | | | 6,711 | | | | 1,454 | | | | - | | | | 5,257 | | | | 6,711 | | | $ | 1,342 | | | | - | | | | 5,369 | |
| Acquired developed technology | | | - | | | | - | | | | - | | | | - | | | | 3,950 | | | | 1,422 | | | | 2,528 | | | | - | |
| Customer relationships | | | - | | | | - | | | | - | | | | - | | | | 7,800 | | | | 1,403 | | | | 6,397 | | | | - | |
| Trade names | | | - | | | | - | | | | - | | | | - | | | | 3,570 | | | | 537 | | | | 3,033 | | | | - | |
| Total intangible assets | | $ | 6,711 | | | $ | 1,454 | | | | - | | | $ | 5,257 | | | $ | 22,031 | | | $ | 4,704 | | | | 11,958 | | | $ | 5,369 | |
Estimated future amortization expense as of October 31, 2024 is as follows (in thousands):
| Fiscal 2025 | | $ | 336 | |
| Fiscal 2026 | | | 447 | |
| Fiscal 2027 | | | 447 | |
| Fiscal 2028 | | | 447 | |
| Fiscal 2029 | | | 447 | |
| Thereafter | | | 3,133 | |
| Total | | $ | 5,257 | |
The Company’s amortization expense for intangible assets were $112,000 and $579,000 for the three months ended October 31, 2024 and 2023, respectively.
Goodwill
The following table summarizes the changes in the carrying amount of goodwill for the three months ended October 31, 2024 (in thousands).
| | | Carrying Amounts | |
| | | | |
| Balance as of July 31, 2024 | | $ | 1,824 | |
| Impact of currency translation | | | (12 | ) |
| Balance as of October 31, 2024 | | $ | 1,812 | |
The total accumulated impairment loss of the Company’s goodwill as of October 31, 2024 was $8.7 million.
Note 6—Accrued Expenses and Other Current Liabilities
Accrued expenses and other current liabilities consist of the following (in thousands):
| | | October 31, | | | July 31, | |
| | | 2024 | | | 2024 | |
| | | | |
| Accrued payroll and bonuses | | $ | 1,248 | | | $ | 1,416 | |
| Accrued vacation | | | 698 | | | | 690 | |
| Accrued payroll taxes | | | 113 | | | | 59 | |
| Due to artists | | | 203 | | | | 242 | |
| Accrued expenses | | | 326 | | | | 301 | |
| Operating lease liability-current portion | | | 128 | | | | 85 | |
| Derivative liability for foreign exchange contracts | | | 58 | | | | 51 | |
| Accrued income taxes payable | | | 76 | | | | 123 | |
| Due to related party - IDT | | | 15 | | | | 2 | |
| Total accrued expenses and other current liabilities | | $ | 2,865 | | | $ | 2,969 | |
Note 7—Stock-Based Compensation
The Company recognizes stock-based compensation for stock-based awards, including stock options, restricted stock and deferred stock units (“DSUs”) based on the estimated fair value of the awards and recognized over the relevant service period and/or market conditions. The Company estimates the fair value of stock options on the measurement date using the Black-Scholes option valuation model. The Company estimates the fair value of the restricted stock and DSU’s with service conditions only using the current market price of the stock. The Company estimates the fair value of the DSU’s with both service and market conditions using the Monte Carlo Simulation valuation model.
The Black-Scholes and Monte Carlo Simulation valuation models incorporate assumptions as to stock price volatility, the expected life of options or awards, a risk-free interest rate and dividend yield. The Company recognizes stock-based compensation expense related to options and restricted stock units on a straight-line basis over the service period of the award, which is generally 4 years for options and 3 years for restricted stock units.
In our accompanying unaudited condensed consolidated statements of operations and comprehensive loss, the Company recognized stock-based compensation expense for our employees and non-employees as follows (in thousands):
| | | Three Months Ended
October 31, | |
| | | 2024 | | | 2023 | |
| Stock-based compensation expense | | $ | 379 | | | $ | 507 | |
As of October 31, 2024, the Company’s unrecognized stock-based compensation expense was $161,000 for unvested stock options, $3,000 for unvested DSUs and $766,000 for unvested restricted stock including the remaining unpaid amounts portion from the equity portion (in the original aggregate amount of $4 million) of the GuruShots retention bonus pool.
In the three months ended October 31, 2024 and 2023, awards of restricted stock and DSUs with respect to 119,000 shares and 124,000 shares, respectively, vested, and in connection with these vesting events, the Company purchased 6,903 shares and 6,328 shares respectively, of our Class B common stock from certain employees for $22,000 and $13,000, respectively, to satisfy tax withholding obligations.
On September 7, 2024, DSUs award with both service and market condition with respect to approximately 170,000 shares were canceled without the reversal of compensation expenses of approximately $1.2 million because the market condition was not achieved.
Note 8—Earnings Per Share
Basic earnings per share is computed by dividing net income attributable to all classes of common stockholders of the Company by the weighted average number of shares of all classes of common stock outstanding during the applicable period. Diluted earnings per share is computed in the same manner as basic earnings per share, except that the number of shares is increased to include restricted stock still subject to risk of forfeiture, issuances to be made on the vesting of unvested DSUs and the exercise of potentially dilutive stock options using the treasury stock method, unless the effect of such increase is anti-dilutive.
The rights of holders of Class A common stock and Class B common stock are identical except for certain voting and conversion rights and restrictions on transferability. As such, the Company is not required to break out earnings per share by class.
The weighted-average number of shares used in the calculation of basic and diluted earnings per share attributable to the Company’s common stockholders consists of the following (in thousands):
| | | Three Months Ended | |
| | | October 31, | |
| | | 2024 | | | 2023 | |
| Basic weighted-average number of shares | | | 14,086 | | | | 13,975 | |
| Effect of dilutive securities: | | | | | | | | |
| Stock options | | | - | | | | - | |
| Non-vested restricted Class B common stock | | | - | | | | - | |
| Deferred stock units | | | - | | | | - | |
| Diluted weighted-average number of shares | | | 14,086 | | | | 13,975 | |
The following shares were excluded from the dilutive earnings per share computations because their inclusion would have been anti-dilutive (in thousands):
| | | Three Months Ended | |
| | | October 31, | |
| | | 2024 | | | 2023 | |
| Stock options | | | 868 | | | | 855 | |
| Non-vested restricted Class B common stock | | | 208 | | | | 308 | |
| Deferred stock units | | | 2 | | | | 203 | |
| Shares excluded from the calculation of diluted earnings per share | | | 1,078 | | | | 1,366 | |
For the three months ended October 31, 2024 and 2023, the diluted earnings per share equals basic earnings per share because the Company incurred a net loss during those periods and the impact of the assumed exercise of stock options and vesting of restricted stock and DSUs would have been anti-dilutive.
Note 9—Commitments and Contingencies
Legal Proceedings
The Company may from time to time be subject to other legal proceedings that arise in the ordinary course of business. Although there can be no assurance in this regard, the Company does not expect any of those legal proceedings to have a material adverse effect on the Company’s results of operations, cash flows or financial condition.
Note 10—Term Loan and Revolving Credit Facility
On October 28, 2022, the Company entered into an Amended and Restated Loan and Security Agreement (“Amended Loan Agreement”) with WAB. Pursuant to the Amended Loan Agreement, WAB agreed to provide the Company with a new term loan facility in the maximum principal amount of $7 million for a four-year term and a $4 million revolving credit facility for a two-year term expiring October 28, 2024. Amounts outstanding under the term loan and credit facility of the Amended Loan Agreement bear interest at a per annum rate equal to the Prime Rate (as published in The Wall Street Journal) plus 0.5%, with a Prime “floor” rate of 4.00%.
Pursuant to the Amended Loan Agreement, $2 million was advanced in a single-cash advance on the closing date, with the remaining $5 million available for drawdown during twenty-four (24) months after closing. On May 11, 2023, the Company entered into a Modification Agreement pursuant to which the Company agreed to modify the Amended Loan Agreement to reduce the remaining $5 million availability to $0.
On November 15, 2023, the Company elected to prepay the entire principal amount of $2 million.
On October 28, 2024, the Company entered into an Amended and Restated Loan and Security Agreement Modification Agreement with WAB. Pursuant to the modification agreement, WAB agreed to renew the $4 million revolving credit facility for another four-year term through October 28, 2028 and remove certain provisions, including financial covenants, in respect of the $2 million term loan which has been repaid.
The Amended Loan Agreement includes customary negative covenants, subject to exceptions, which limit transfers, capital expenditures, indebtedness, certain liens, investments, acquisitions, dispositions of assets, restricted payments and the business activities of the Company, as well as customary representations and warranties, affirmative covenants and events of default, including cross defaults and a change of control default.
As of November 16, 2016, the Company entered into a Foreign Exchange Agreement with WAB to allow the Company to enter into foreign exchange contracts not to exceed $5.0 million in the aggregate at any point in time under its revolving credit facility. This limit was raised to approximately $7.5 million pursuant to the Loan and Security Modification Agreement dated May 30, 2018. The available borrowing under the revolving credit facility is reduced by an applicable foreign exchange reserve percentage as determined by WAB, in its reasonable discretion from time to time, which was set at 10% of the nominal amount of the foreign exchange contracts in effect at the relevant time. At October 31, 2024, there were $3.48 million of outstanding foreign exchange contracts, which reduced the available borrowing under the revolving credit facility by approximately $348,000.
Note 11—Segment and Geographic Information
Segment Information
Operating segments are components of an enterprise about which separate financial information is available that is evaluated regularly by the CODM, or decision-making group, in deciding how to allocate resources and in assessing performance. The Company’s chief operating decision maker is its Chief Executive Officer as of October 31, 2024.
There are two reportable segments, which are the Zedge Marketplace and GuruShots.
The CODM evaluates the performance of each operating segment using revenue and income (loss) from operations. The following table provides information about the Company’s two reportable segments (in thousands):
| | | Three Months Ended
October 31, | |
| | | 2024 | | | 2023 | |
| Revenues: | | | | | | |
| Zedge Marketplace | | $ | 6,550 | | | $ | 6,137 | |
| GuruShots | | | 644 | | | | 944 | |
| Total | | $ | 7,194 | | | $ | 7,081 | |
| | | | | | | | | |
| Segment income (loss) from operations: | | | | | | | | |
| Zedge Marketplace | | $ | 934 | | | $ | 1,654 | |
| GuruShots | | | (1,391 | ) | | | (1,333 | ) |
| Total | | $ | (457 | ) | | $ | 321 | |
The CODM does not evaluate operating segments using asset information and, accordingly, the Company does not report asset information by segment.
Geographic Information
Net long-lived assets and total assets held outside of the United States, which are located primarily in Israel and Norway, were as follows (in thousands):
| | | United States | | | Foreign | | | Total | |
| Long-lived assets, net: | | | | | | | | | |
| October 31, 2024 | | $ | 6,453 | | | $ | 1,426 | | | $ | 7,879 | |
| July 31, 2024 | | $ | 6,570 | | | $ | 1,460 | | | $ | 8,030 | |
| | | | | | | | | | | | | |
| Total assets: | | | | | | | | | | | | |
| October 31, 2024 | | $ | 32,259 | | | $ | 5,939 | | | $ | 38,198 | |
| July 31, 2024 | | $ | 32,412 | | | $ | 5,783 | | | $ | 38,195 | |
Note 12—Operating Leases
The Company has operating leases primarily for office space. Operating lease right-of-use assets recorded and included in other assets were $287,000 and $214,000 at October 31, 2024 and July 31, 2024, respectively.
On August 7, 2024, the Company renewed its lease for the office space in Tel Aviv, Israel for a two-year term.
Future minimum lease payments related to this lease renewal are as follows (in thousands):
| Years ending July 31, | | Operating Leases | |
| 2025 | | $ | 48 | |
| 2026 | | | 58 | |
| 2027 | | | 9 | |
| Total future minimum lease payments | | | 115 | |
| Less imputed interest | | | 9 | |
| Total | | $ | 106 | |
There were no other material changes in the Company’s operating and finance leases in the three months ended October 31, 2024, as compared to the disclosure regarding such leases in the 2024 Form 10-K.
Note 13—Income Taxes
The Company’s tax provision or benefit from income taxes for interim periods has generally been determined using an estimate of its annual effective tax rate applied to year-to-date income and records the discrete tax items in the period to which they relate. In each quarter, the Company updates the estimated annual effective tax rate and makes a year-to-date adjustment to the tax provision as necessary.
The Company’s estimated annual effective tax rate for the fiscal year ending July 31, 2025 differs from the U.S. federal statutory tax rate due to certain items primarily related to stock-based compensation expense, jurisdictional mix of earnings, foreign derived intangible income deduction, global intangible low-taxed income and the change in basis differences associated with tax deductible intangible assets and goodwill.
As of October 31, 2024, the Company had $6.1 million of deferred tax assets, for which it has established a valuation allowance of $1.8 million, related to U.S. federal and state taxes and for a certain international subsidiary.
The Company is subject to taxation in the United States and certain foreign jurisdictions. Earnings from non-U.S. activities are subject to local country income tax. The material jurisdictions where the Company is subject to potential examination by tax authorities include the United States, Norway, Lithuania and Israel.
Item 2. Management’s Discussion and Analysis of Financial Condition and Results of Operations
The following information should be read in conjunction with the accompanying unaudited condensed consolidated financial statements and the associated notes thereto of this Quarterly Report, and the audited consolidated financial statements and the notes thereto and our Management’s Discussion and Analysis of Financial Condition and Results of Operations contained in our Annual Report on Form 10-K for the fiscal year ended July 31, 2024 (the “2024 Form 10-K”), as filed with the U.S. Securities and Exchange Commission (the “SEC”).
As used below, unless the context otherwise requires, the terms “the Company,” “Zedge,” “we,” “us,” and “our” refer to Zedge, Inc., a Delaware corporation and its subsidiaries, GuruShots Ltd., Zedge Europe AS and Zedge Lithuania UAB, collectively.
Forward-Looking Statements
This Quarterly Report on Form 10-Q contains forward-looking statements within the meaning of Section 27A of the Securities Act of 1933 and Section 21E of the Securities Exchange Act of 1934, including statements that contain the words “believes,” “anticipates,” “expects,” “plans,” “intends,” and similar words and phrases. These forward-looking statements are subject to risks and uncertainties that could cause actual results to differ materially from future results. Factors that may cause such differences include, but are not limited to: (1) economic, geopolitical and market conditions can adversely affect our business, results of operations and financial condition, including our revenue growth and profitability, which in turn could adversely affect our stock price; (2) our ability to successfully make acquisitions and/or successfully integrate acquisitions that we have made into Zedge without incurring unanticipated costs or without being subject to other integration issues that may disrupt our existing operations; (3) delay or failure to realize the expected synergies and benefits of the GuruShots acquisition; (4) the impact of the Covid-19 pandemic on our employees, customers, partners, and the global financial markets; (5) Russia’s invasion of Ukraine, and the international community’s response; and (6) recent attack by Hamas and other terrorist organizations from the Gaza Strip and Lebanon and Israel’s war against them. For further information regarding risks and uncertainties associated with our business, please refer to Item 1A to Part I “Risk Factors” in the 2024 Form 10-K. The forward-looking statements are made as of the date of this report and we assume no obligation to update the forward-looking statements, or to update the reasons why actual results could differ from those projected in the forward-looking statements. Investors should consult all of the information set forth in this report and the other information set forth from time to time in our reports filed with the SEC pursuant to the Securities Act of 1933 and the Securities Exchange Act of 1934, including the 2024 Form 10-K.
Trends and Uncertainties
Current Economic Conditions
The majority of our users and employees are located outside of the United States exposing us to a range of economic factors and regulations including foreign exchange fluctuations. There is uncertainty surrounding macroeconomic factors in the U.S. and globally. We believe these macroeconomic conditions coupled with the global political climate and unrest, including the ongoing wars between Ukraine and Russia and Israel and Hamas, may negatively impact our performance.
The Israel-Hamas and Israel-Hezbollah Conflicts
Given our operations in Israel, the impact of economic, political, geopolitical, and military conditions in the region directly affects us, including conflicts involving missile strikes, infiltrations, and terrorism. Notably, on October 7, 2023, Hamas launched attacks in southern Israel, resulting in casualties and military engagement. In addition, Hezbollah, another terrorist organization based in Lebanon has been indiscriminately shelling Israel since October 8, 2023. The extent and duration of this conflict remain uncertain, potentially involving other groups. Israel’s response led to the mobilization of reservists, affecting our workforce. Prior to this, changes in Israel’s judicial system had already raised concerns about the business environment, compounded by recent events, potentially impacting foreign investment, currency fluctuations, credit ratings, interest rates, and security markets. Furthermore, regional political unrest and threats from extremist groups, notably Iran, pose additional risks. Management and our Board of Directors are closely monitoring the situation in Israel to address potential business disruptions and implications.
Overview
Zedge builds digital marketplaces and friendly competitive games around content that people use to express themselves. Our leading products include Zedge Ringtones and Wallpapers, which we refer to as our “Zedge App,” a freemium digital content marketplace offering mobile phone wallpapers, video wallpapers, ringtones, and notification sounds as well as pAInt, a generative AI wallpaper maker, GuruShots, a skill-based photo challenge game, and Emojipedia, the #1 trusted source for ‘all things emoji’. Our vision is to enable and connect creators who enjoy friendly competitions with a community of prospective consumers in order to drive commerce.
We are part of the ‘Creator Economy,’ which Goldman Sachs estimates is worth $250 billion globally.1 According to Linktree, over 200 million individuals identify as creators, people who use their influence, skill, and creativity to amass an audience and monetize it.2 Furthermore, Influencer Marketing Hub reports that out of 2,000 surveyed creators, 44.9% identify as full-time creators,3 and Exploding Topics reports that 10% of influencers earn more than $100,000 per year.4 We view the Creator Economy as an opportunity for Zedge to expand our business, especially as we execute by connecting our gamers with our marketplace.
Our Zedge app (which is named “Zedge Wallpapers” in the App Store) offers a wide array of mobile personalization content including wallpapers, video wallpapers, ringtones, and notification sounds, and is available both in Google Play and the App Store. As of October 31, 2024, our Zedge App had been installed nearly 686 million times since inception and, over the past two fiscal years, has had between 25.0 million and 32.2 million monthly active users (“MAU”), ending with 25.0 million MAU as of October 31, 2024. MAU is a key performance indicator (“KPI”) for our Zedge app that captures the number of unique users that used our Zedge App during the final 30 days of the relevant period. Our platform allows creators to upload content to our marketplace and avail it to our users either for free or, via ‘Zedge Premium,’ the section of our marketplace where we offer premium content for purchase. In turn, our users utilize the content to personalize their phones and express their individuality.
In fiscal 2023, we introduced pAInt, a generative AI wallpaper maker in the Zedge App. A generative AI wallpaper maker is an implementation of artificial intelligence software that can create images from text descriptions. To interface with a generative AI image maker, a user enters a text description of the image they want to create, and the software generates an image based on that description. In addition, we upgraded Zedge+, our paid subscription offering by bundling together an ad-free experience with value adds making the offering more compelling.
We often refer to our freemium ringtones and wallpapers, our subscription offering, the functionality for creators to market their products and ancillary offering and features both in our Zedge App and website, as our Zedge Marketplace.
The Zedge Marketplace’s monetization stack consists of advertising revenue generated when users view advertisements when using the Zedge App (and the related functionality under the zedge.net website), the in-app sale of Zedge Credits, our virtual currency, that is used to purchase Zedge Premium content, and a paid-subscription offering that provides an ad-free experience to users that purchase a monthly, annual or lifetime subscription. In April 2023, we introduced a subscription tier in the iOS version of the app. As of October 31, 2024, we had approximately 698,000 active subscribers.
In April 2022, we acquired GuruShots Ltd, a recognized category leader focused on gamifying the photography vertical. GuruShots offers a platform spanning iOS, Android, and the web that provides a fun, educational and structured way for amateur photographers to compete in a wide variety of contests showcasing their photos while gaining recognition with votes, badges, and awards. We estimate that the total addressable market of amateur photographers using their smartphones to take and publicly share artistic photos is 30-40 million people per month and that the market is still in its infancy. Every month, GuruShots stages more than 300 competitions that result in players uploading in excess of 600,000 photographs and casting close to 2.4 billion “perceived votes,” which are calculated by multiplying the number of votes that each player casts by a weighting factor based on various factors related to that user. To improve engagement, GuruShots has adopted a set of retention dynamics focused on individual, team and community dynamics that create a sense of belonging, inspiration, recognition, improvement, and competition.
GuruShots utilizes a ‘Free-to-Play’ business model and generates revenue through in-app purchases of virtual currency. Players can use this currency to unlock competitions or gain an edge by purchasing resources and participating in additional gameplay. Over the past seven years, the monthly average paying player spend has increased in excess of 8.4% annually to more than $49.0 per player.
| 1 | https://www.latimes.com/business/story/2024-01-08/creator-influencer-economy-2024-predictions-social-media-stars |
| 2 | https://linktr.ee/creator-report |
| 3 | https://influencermarketinghub.com/creator-earnings-benchmark-report |
| 4 | https://explodingtopics.com/blog/creator-economy-stats# |
In fiscal 2024, we revamped GuruShots’ customer onboarding experience by guiding new players through simplified photo competitions of limited size and duration. The upgrade was designed to enhance the gaming experience for new players by increasing their potential for winning and providing immediate gratification. The new onboarding has shown improvements in engagement, retention, and revenue from new users. In addition, we migrated to a coin-based economy with multiple currencies in order to enable more players to earn and spend their currency on in-game resources.
We market GuruShots to prospective players, primarily via paid user acquisition channels, and utilize a host of creative formats including static and video ads in order to promote the game. Our marketing team invests material resources in analyzing all attributes of a campaign ranging from, among others, the creative assets, offer acquisition channel and platform (i.e., iOS, Android, and web), with the goal of determining whether a specific campaign is likely to yield a profitable customer. When we unearth a successful combination of these variables we scale up until we experience diminishing returns. Ultimately, we believe that the efforts we are making to advance the product coupled with the investment in user acquisition can significantly increase GuruShots’ player base.
Since the start of fiscal 2025 Cost per Install (CPI) have trended down leading us to believe that our efforts are yielding fruit. It’s too early to say with conviction whether this trend is sustainable as we scale user acquisition and whether these users will provide sufficient long-term ROI; however, we believe that these early results are encouraging.
Beyond our commitment to growing both the Zedge App and GuruShots on a standalone basis, we believe that there are many potential synergies that we can capitalize on that exist between the two businesses. Specifically, we plan to enable GuruShots players to become Zedge Premium artists and sell their photos to our audience of 25+ million MAU (as of October 31, 2024) as standard digital images. In addition, we are benefitting from the experience that the GuruShots team possesses in gamifying the Zedge App. We believe that successful gamification can contribute to increasing engagement, retention, and lifetime value, all critical KPIs for our business. Longer term, we believe that there are complementary content verticals that lend themselves to gamification. One example is our hybrid casual title, ‘AI Art Master,’ which has been in soft-launch in the Philippines, Poland, and India, that enables players to create generative AI images and compete in themed-based competitions with these images. Based on analyzing user data and performing extensive user testing, we will determine whether to refine the user experience and scale or cease development of this title
In August 2021, we acquired Emojipedia Pty Ltd, the world’s leading authority dedicated to providing up-to-date and well-researched emoji definitions, information, and news, as well as World Emoji Day and the annual World Emoji Awards. In October 2024, Emojipedia received approximately 38.8 million monthly page views and has approximately 10.3 million monthly active users as of October 31, 2024 of which approximately 48.9% are located in well-developed markets. It is the top resource for all things emoji, offering insights into data and cultural trends. As a member of the Unicode Consortium, the standards body responsible for approving new emojis, Emojipedia works alongside major emoji creators including Apple, Google, Meta, and X, formerly known as Twitter.
We believe that Emojipedia provides growth potential to the Zedge App, and it was immediately accretive to earnings post acquisition in August 2021. In the past year, we have made many changes to Emojipedia including overhauling its backend, redesigning the Emojipedia website, and introducing new entertainment-focused features to the site. We will continue to enhance this offering and are exploring additional new features which use artificial intelligence, some of which will be released before the end of the calendar year.
Critical Accounting Policies
Our unaudited condensed consolidated financial statements and accompanying notes are prepared in accordance with accounting principles generally accepted in the United States of America, or U.S. GAAP. Our significant accounting policies are described in Note 1 to the consolidated financial statements included in the 2024 Form 10-K. The preparation of financial statements requires management to make estimates and assumptions that affect the reported amounts of assets, liabilities, revenues and expenses as well as the disclosure of contingent assets and liabilities. Critical accounting policies are those that require application of management’s most subjective or complex judgments, often as a result of matters that are inherently uncertain and may change in subsequent periods. Our critical accounting policies include those related to revenue recognition, intangible assets, goodwill, capitalized software and technology development costs, stock-based compensation and income taxes. Management bases its estimates and judgments on historical experience and other factors that are believed to be reasonable under the circumstances. Actual results may differ from these estimates under different assumptions or conditions. For additional discussion of our critical accounting policies, see our Management’s Discussion and Analysis of Financial Condition and Results of Operations in the 2024 Form 10-K.
Recently Issued Accounting Pronouncements
Please refer to Note 1 to the unaudited condensed consolidated financial statements included in Item 1 to Part I of this Quarterly Report on Form 10-Q.
Key Performance Indicators (KPIs)
Zedge App-MAU and ARPMAU
The presentation of our results of operations related to our Zedge App includes disclosure of two key performance indicators – Monthly Active Users (MAU) and Average Revenue Per Monthly Active User (ARPMAU). MAU is a key performance indicator that we define as the number of unique users that used our Zedge App during the previous 30-day period, which is important to understanding the size of our active user base which is a main driver of our revenue. Changes and trends in MAU are useful for measuring the general health of our business, gauging both present and potential users/customers’ experience, assessing the efficacy of product improvements and marketing campaigns and overall user engagement.
ARPMAU is defined as (i) the total revenue derived from Zedge App in a monthly period, divided by (ii) MAU in that same period. ARPMAU for a particular time period longer than one month is the average ARPMAU for each month during that period. ARPMAU is valuable because it provides insight into how well we monetize our users and, changes and trends in ARPMAU are indications of how effective our monetization investments are.
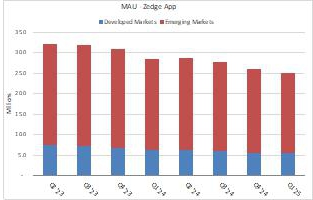
MAU decreased 12.3% in the three months ended October 31, 2024 when compared to the same period a year ago. As of October 31, 2024, users in emerging markets represented about 78.0% of our MAU, as compared to 78.2% from the same period a year ago.
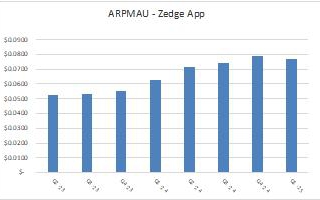
ARPMAU for the three months ended October 31, 2024 increased 22.1% when compared to the same period a year ago, primarily due to the increase in price per advertising impression from the same period a year ago, which was driven by increased competition for our ad inventory as well as strong year-over-year subscription revenue growth. Subscription revenue and subscription billings for the three months ended October 31, 2024 increased 21.1% and 56.0%, respectively, when compared to the same period a year ago, as discussed below.
The following tables present the MAU – Zedge App and ARPMAU – Zedge App for the three months ended October 31, 2024 as compared to the same period in the prior year:
| | | Three Months Ended
October 31, | | | | |
| (in millions, except ARPMAU - Zedge App) | | 2024 | | | 2023 | | | % Change | |
| MAU - Zedge App | | | 25.0 | | | | 28.5 | | | | -12.3 | % |
| Developed Markets MAU - Zedge App | | | 5.5 | | | | 6.2 | | | | -11.3 | % |
| Emerging Markets MAU - Zedge App | | | 19.5 | | | | 22.3 | | | | -12.6 | % |
| Emerging Markets MAU - Zedge App/Total MAU - Zedge App | | | 78.0 | % | | | 78.2 | % | | | -0.3 | % |
| | | | | | | | | | | | | |
| ARPMAU - Zedge App | | $ | 0.0767 | | | $ | 0.0628 | | | | 22.1 | % |
The following charts present the MAU – Zedge App and ARPMAU – Zedge App for the consecutive eight fiscal quarters ended October 31, 2024:
GuruShots-MAPs and ARPMAP
The presentation of our results of operations related to our GuruShots segment includes disclosure of two key performance indicators as discussed below:
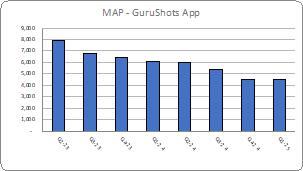
Monthly Active Payers (“MAPs”). We define a MAP as a unique active user on the GuruShots app or GuruShots.com in a month who completed at least one in-app purchase (“IAP”) during that time period. MAPs for a time period longer than one month are the average MAPs for each month during that period. We estimate the number of MAPs by aggregating certain data from third-party attribution platforms. MAP is a key performance indicator because it shows the size of GuruShots’ active paying user base which is a main driver of GuruShots’ revenue. Changes and trends in MAP are useful for measuring the general health of GuruShots’ business, gauging both present and potential users/customers’ experience, assessing the efficacy of product improvements and marketing campaigns and overall user engagement.
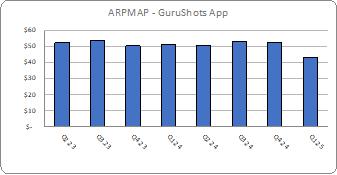
Average Revenue Per Monthly Active Payer (“ARPMAP”). We define ARPMAP as (i) the total revenue from IAPs derived from GuruShots and GuruShots.com in a monthly period, divided by (ii) MAPs in that same period. ARPMAP for a particular time period longer than one month is the average ARPMAP for each month during that period. ARPMAP shows how efficiently we are monetizing each MAP.
MAP decreased 25.9% in the three months ended October 31, 2024 when compared to the same period a year ago, primarily attributable to Apple’s App Tracking Transparence (“ATT”) framework which impedes our ability to invest in paid user acquisition (“PUA”) campaigns profitably in terms of return on ad spend or (“ROAS”). As such, we continued to scale back our PUA spend for GuruShots while testing new campaigns and creatives in order to unearth attractive ROAS scaling opportunities. ARPMAP decreased 15.4% to $43.3 in the three months ended October 31, 2024 from $51.2 in the three months ended October 31, 2023
The following table shows our MAP and ARPMAP for the three months ended October 31, 2024 and 2023.
| | | Three Months Ended
October 31, | | | | |
| | | 2024 | | | 2023 | | | % Change | |
| Monthly Active Payers | | | 4,524 | | | | 6,106 | | | | -25.9 | % |
| Average Revenue per Monthly Active Payer | | $ | 43.3 | | | $ | 51.2 | | | | -15.4 | % |
The following charts present the MAP and ARPMAP – GuruShots for the consecutive eight quarters ended October 31, 2024:
Our KPIs related to GuruShots are not based on any standardized industry methodology and are not necessarily calculated in the same manner that other companies or third parties may use to calculate these or similarly titled measures. The numbers that we use to calculate MAP and ARPMAP are derived from data that we generate internally. While these numbers are based on what we believe to be reasonable judgments and estimates for the applicable period of measurement, there are inherent challenges in measuring usage and engagement. We regularly review and may adjust our processes for calculating our internal metrics to improve their accuracy.
Results of Operations
The following table summarizes our historical condensed consolidated statements of operations data:
| | | Three Months Ended | | | |
| | | October 31, | | Change | |
| | | 2024 | | | 2023 | | | $ | | | % | |
| | | | (in thousands, except percentages) | |
| Revenues | | $ | 7,194 | | | $ | 7,081 | | | $ | 113 | | | | 1.6 | % |
| Direct cost of revenues | | | 461 | | | | 486 | | | | (25 | ) | | | -5.1 | % |
| Selling, general and administrative | | | 6,809 | | | | 5,499 | | | | 1,310 | | | | 23.8 | % |
| Depreciation and amortization | | | 381 | | | | 775 | | | | (394 | ) | | | -50.8 | % |
| (Loss) income from operations | | | (457 | ) | | | 321 | | | | (778 | ) | | | -242.4 | % |
| Interest and other income, net | | | 181 | | | | 81 | | | | 100 | | | | 123.5 | % |
| Net loss resulting from foreign exchange transactions | | | (14 | ) | | | (219 | ) | | | 205 | | | | -93.6 | % |
| Provision for income taxes | | | 49 | | | | 198 | | | | (149 | ) | | | -75.3 | % |
| Net loss | | $ | (339 | ) | | $ | (15 | ) | | $ | (324 | ) | | | nm | |
Comparison of Our Results of Operations for the Three months ended October 31, 2024 and 2023
Revenues
The following table sets forth the composition of our revenues for the three months ended October 31, 2024 and 2023 (in thousands):
| | | Three Months Ended
October 31, | | | | |
| | | 2024 | | | 2023 | | | % Changes | |
| Zedge Marketplace | | | | | | | | | |
| Advertising revenue | | $ | 4,874 | | | $ | 4,939 | | | | -1.3 | % |
| Paid subscription revenue | | | 1,182 | | | | 976 | | | | 21.1 | % |
| Other revenues | | | 494 | | | | 222 | | | | 122.5 | % |
| Total Zedge Marketplace revenue | | | 6,550 | | | | 6,137 | | | | 6.7 | % |
| GuruShots | | | | | | | | | | | | |
| Digital goods and services | | | 644 | | | | 944 | | | | -31.8 | % |
| Total revenue | | $ | 7,194 | | | $ | 7,081 | | | | 1.6 | % |
nm-not meaningful
The following table summarizes our subscription revenue for the three months ended October 31, 2024 and 2023:
| | | Three Months Ended
October 31, | | | | |
| | | 2024 | | | 2023 | | | % Change | |
| | | (in thousands, except revenue per subscriber and percentages) | |
| Subscription Revenue | | $ | 1,182 | | | $ | 976 | | | | 21.1 | % |
| Active subscriptions net increase | | | 29 | | | | 1 | | | | nm | |
| Active subscriptions at end of period | | | 698 | | | | 648 | | | | 7.7 | % |
| Average active subscriptions during the period | | | 680 | | | | 653 | | | | 4.0 | % |
| Average monthly revenue per active subscription | | $ | 0.58 | | | $ | 0.50 | | | | 16.4 | % |
nm-not meaningful
The following table presents a reconciliation of subscription billings to the most directly comparable GAAP financial measures, for each of the periods indicated. We calculate subscription billings by adding the change in subscription deferred revenue between the start and end of the period to subscription revenue recognized in the same period. Subscription billings is a performance measure that we believe provides useful information to our management and investors as it allows us to better track the growth of the subscription-based portion of our business, which is a critical part of our business plan.
| | | Three Months Ended
October 31, | | | | |
| | | 2024 | | | 2023 | | | % Change | |
| | | (in thousands, except percentages) | |
| Subscription Revenue | | $ | 1,182 | | | $ | 976 | | | | | |
| Changes in subscription deferred revenue | | | 595 | | | | 163 | | | | | |
| Subscription Billings (Non-GAAP) | | $ | 1,777 | | | $ | 1,139 | | | | 56.0 | % |
The following table summarizes Zedge Premium gross and net revenue for the three months ended October 31, 2024 and 2023:
| | | Three Months Ended
October 31, | | | | |
| | | 2024 | | | 2023 | | | % Changes | |
| | | (in thousands, except percentages) | |
| Zedge Premium-gross revenue (“GTV”) | | $ | 681 | | | $ | 421 | | | | 61.8 | % |
| Zedge Premium-net revenue | | | 493 | | | $ | 204 | | | | 141.7 | % |
| Gross margin | | | 72 | % | | | 48 | % | | | | |
Three months Ended October 31, 2024 Compared to Three months Ended October 31, 2023
For the three months ended October 31, 2024, our advertising revenue decreased 1.3% compared to the same period in the prior year primarily due to a 12.3% decrease in MAU partially offset by an increase in price per advertising impression paid by the advertisers on our platform when compared to the same period a year ago, which was driven by increased competition for our ad inventory.
For the three months ended October 31, 2024, our subscription revenue increased 21.1%, and our subscription billings increased 56.0% compared to the same period in the prior year primarily due to the introduction of our iOS subscription offering in April 2023 and the lifetime subscription product for Android users we rolled out in August 2023.
For the three months ended October 31, 2024, our other revenue increased 122.5% compared to the same period in the prior year primarily due to the increase in Zedge Premium net revenue. For the three months ended October 31, 2024, Zedge Premium net revenue increased 141.7% compared to the same period in the prior year primarily attributable to additional revenue from certain AI generative features we rolled out in our Zedge App in fiscal 2024.
For the three months ended October 31, 2024, digital goods and services revenue declined 31.8% compared to the same period in the prior year primarily due to the 25.9% decrease in GuruShots’ MAP coupled with 15.4% decrease in ARPMAP for the corresponding periods.
Direct cost of revenues. Direct cost of revenues consists primarily of content hosting and content delivery costs.
| | | Three Months Ended
October 31, | | | | |
| | | 2024 | | | 2023 | | | % Change | |
| | | (in thousands, except percentages) | |
| Direct cost of revenues | | $ | 461 | | | $ | 486 | | | | -5.1 | % |
| As a percentage of revenues | | | 6.4 | % | | | 6.9 | % | | | | |
Direct cost of revenues decreased 5.1% in the three months ended October 31, 2024 compared to the same period in the prior year primarily due to the revamping of our backend infrastructure implemented during fiscal 2023. As a percentage of revenue, direct cost of revenues in the three months ended October 31, 2024 declined to 6.4% from 6.9% for the same period in the prior year.
Selling, general and administrative expense. Selling, general and administrative expense (“SG&A”) consists mainly of payroll and benefits, stock-based compensation expense (as discussed below), PUA expenses, third-party payment processing fee relate to in-app purchases, marketing, consulting, professional fees, software licensing (“SaaS”), recruiting fees, facilities and public company related expenses.
| | | Three Months Ended
October 31, | | | | |
| | | 2024 | | | 2023 | | | % Change | |
| | | (in thousands, except percentages) | |
| Selling, general and administrative | | $ | 6,809 | | | $ | 5,499 | | | | 23.8 | % |
| As a percentage of revenues | | | 94.6 | % | | | 77.7 | % | | | | |
SG&A expense increased 23.8% in the three months ended October 31, 2024 compared to the same period in the prior year primarily due to higher PUA, higher compensation expenses (resulting primarily from lower capitalized software and technology development costs) and higher platform fee paid to Google and Apple offset by lower discretionary spends and lower stock-based compensation expense. In the three months ended October 31, 2024, we ramped up PUA for our Zedge App significantly but scaled back PUA spend for GuruShots as compared to the same period in the prior year. We expect to continue our investment in PUA for our Zedge App in the near term provided that the ROAS remains compelling. As a percentage of revenue, SG&A expense in the three months ended October 31, 2024 was 94.6% compared to 77.7% in the three months ended October 31, 2023.
Global headcount as of October 31, 2024 totaled 102 (including 28 at GuruShots) compared to 95 (including 29 at GuruShots) as of October 31, 2023 with the majority of our employees currently based in Lithuania and Israel.
The following table summarizes stock-based compensation expense included in the SG&A for the three months ended October 31, 2024 and 2023:
| | | Three Months Ended
October 31, | | | | |
| | | 2024 | | | 2023 | | | % Change | |
| Stock-based compensation expense | | $ | 379 | | | $ | 507 | | | | -25.2 | % |
Stock-based compensation expenses decreased 25.2% in the three months ended October 31, 2024 compared to the same period in the prior year. The decrease was primarily attributable to the lower compensation expense related to the DSU grants with both service and market conditions which are recognized based on the graded vesting method. Certain stock options, DSUs and restricted stock grants are more fully described in Note 7 Stock-Based Compensation to the unaudited condensed consolidated financial statements included in Item 1 to Part I of this Quarterly Report on Form 10-Q.
Depreciation and amortization. Depreciation and amortization consist mainly of amortization of intangible assets in connection with the GuruShots and Emojipedia acquisitions and capitalized software and technology development costs of our internal developers on various projects that we invested in specific to the various platforms on which we operate our service.
| | | Three Months Ended
October 31, | | | | |
| | | 2024 | | | 2023 | | | % Change | |
| | | (in thousands, except percentages) | |
| Depreciation and amortization | | $ | 381 | | | $ | 775 | | | | -50.8 | % |
| As a percentage of revenues | | | 5.3 | % | | | 10.9 | % | | | | |
Depreciation and amortization expenses decreased 50.8% in three months ended October 31, 2024 compared to the same period in the prior year primarily due to the $11.9 million impairment charge recorded in Q2 of fiscal 2024
Interest and other income, net.
| | | Three Months Ended
October 31, | | | | |
| | | 2024 | | | 2023 | | | % Change | |
| | | (in thousands, except percentages) | |
| Interest and other income, net | | $ | 181 | | | $ | 81 | | | | 123.5 | % |
| As a percentage of revenues | | | 2.5 | % | | | 1.1 | % | | | | |
In the three months ended October 31, 2024, interest and other income, net increased by $101,000 compared to the same period in the prior year, which included a deduction of $46,000 in interest expense related to the $2 million term loan which was repaid in November 2023 and a $50,000 impairment charge related to our investment in a privately held company of which the carrying value was reduced to $0 as of October 30, 2023.
Net loss resulting from foreign exchange transactions. Net loss resulting from foreign exchange transactions is comprised of gains and losses generated from movements in NOK and EUR relative to the U.S. Dollar, including gains or losses from our hedging activities.
| | | Three Months Ended
October 31, | | | | |
| | | 2024 | | | 2023 | | | % Change | |
| | | (in thousands, except percentages) | |
| Net loss resulting from foreign exchange transactions | | $ | (14 | ) | | $ | (219 | ) | | | -93.6 | % |
| As a percentage of revenues | | | -0.2 | % | | | -3.1 | % | | | | |
In the three months ended October 31, 2024, net loss resulting from foreign exchange transactions decreased by $215,000 or 93.6% compared to the same period in the prior year primarily due to higher Mark to Market (“MTM”) loss recorded in prior period.
We recognized MTM losses of $58,000 and $208,000 from NOK and EUR hedging activities for the three months ended October 31, 2024 and 2023, respectively, as more fully described in Note 4, Derivative Instruments, to the unaudited condensed consolidated financial statements included in Item 1 to Part I of this Quarterly Report on Form 10-Q.
Provision for Income taxes
| | | Three Months Ended
October 31, | | | | |
| | | 2024 | | | 2023 | | | % Change | |
| | | (in thousands, except percentages) | |
| Provision for income taxes | | $ | 49 | | | $ | 198 | | | | -75.3 | % |
| As a percentage of revenues | | | 0.7 | % | | | 2.8 | % | | | | |
In the three months ended October 31, 2024, we had pretax loss of $290,000 in respect of which we accrued $49,000 in income tax expense, primarily due to discrete tax items of $115,000 associated with the vesting of restricted stock and DSUs in the current period more than offsetting the accrued tax benefit of $66,000 based on an estimated effective tax rate of 22.7%.
In the three months ended October 31, 2023, we had pretax income of $183,000 in respect of which we accrued $198,000 in income tax expense, an effective tax rate of 108% which is higher than the statutory rate primarily due to discrete tax items of $128,000 associated with the vesting of restricted stock and DSUs in the prior period.
Comparison of our Segment Results of Operations
The following table presents the results for our Zedge Marketplace and GuruShots segment income (loss) from operations for the three months ended October 31, 2024 and 2023:
| | | Three Months Ended
October 31, | | | Change | |
| | | 2024 | | | 2023 | | | % | |
| | | (in thousands, except percentages) | |
| Segment income (loss) from operations: | | | | | | | | | | | | |
| Zedge Marketplace | | $ | 934 | | | $ | 1,654 | | | | -43.5 | % |
| GuruShots | | | (1,391 | ) | | | (1,333 | ) | | | 4.4 | % |
| Total | | $ | (457 | ) | | $ | 321 | | | | -242.4 | % |
Three months Ended October 31, 2024 Compared to Three months Ended October 31, 2023
For the three months ended October 31, 2024, our income from operations related to the Zedge Marketplace decreased to $0.9 million from $1.7 million for the same period in the prior year, primarily due to higher SG&A expenses incurred in the current period.
For the three months ended October 31, 2024, our loss from operations related to GuruShots was $1.4 million compared to a loss of $1.3 million for the same period in the prior year, primarily due to lower revenue in the current period coupled with higher SG&A (primarily attributable to lower capitalized software and technology development costs) and offset by the decrease in amortization expenses related to intangible assets impairment as discussed above.
Liquidity and Capital Resources
General
At October 31, 2024, we had cash and cash equivalents of $20.2 million and working capital (current assets less current liabilities) of $17.5 million, compared to $20.0 million and $17.7 million, respectively, at July 31, 2024. We expect that our cash and cash equivalents on hand and our cash flow from operations will be sufficient to meet our anticipated cash requirements for the twelve-month period ending December 16, 2025. We maintain a revolving credit facility of $4 million, including a foreign exchange contract facility of up to $7.5 million with WAB, as discussed below under Financing Activities and in Note 10, Term Loan and Revolving Credit Facility, to the unaudited condensed consolidated financial statements included in Item 1 to Part I of this Quarterly Report on Form 10-Q.
The following tables present selected financial information for the three months ended October 31, 2024 and 2023:
| | | Three Months Ended
October 31, | | | | |
| (in thousands) | | 2024 | | | 2023 | | | $ Changes | |
| Cash flows provided by (used in): | | | | | | | | | |
| Operating activities | | $ | 1,170 | | | $ | 1,260 | | | $ | (90 | ) |
| Investing activities | | | (157 | ) | | | (445 | ) | | | 288 | |
| Financing activities | | | (804 | ) | | | (10 | ) | | | (794 | ) |
| Effect of exchange rate changes on cash and cash equivalents | | | (11 | ) | | | (185 | ) | | | 174 | |
| Increase in cash and cash equivalents | | $ | 198 | | | $ | 620 | | | $ | (422 | ) |
Operating Activities
Our cash flow from operations varies significantly from quarter to quarter and from year to year, depending on our operating results and the timing of operating cash receipts and payments, specifically trade accounts receivable and trade accounts payable. Cash provided by operating activities decreased by $90,000 in the three months ended October 31, 2024 to $1.2 million compared to $1.3 million in the same period in the prior year, primarily attributable to a higher net loss before accounting for the acquisition related charges and changes in assets and liabilities.
Changes in Trade Accounts Receivable
Gross trade accounts receivable decreased $0.2 million to $3.2 million at October 31, 2024 from $3.4 million at July 31, 2024, primarily due to lower revenue in the preceding two months ended October 31, 2024 when compared to the same period ended July 31, 2024.
Investing Activities
Cash used in investing activities in the three months ended October 31, 2024 and 2024 consisted primarily of capitalized software and technology development costs related to various projects that we invested in specific to the various platforms on which we operate our service.
Financing Activities
In the three months ended October 31, 2024 and 2023, we purchased 6,903 shares and 6,328 shares, respectively, of our Class B common stock from certain employees for $22,000 and $13,000, respectively, to satisfy tax withholding obligations in connection with the vesting of DSUs.
In the three months ended October 31, 2024 and 2023, we repurchased - in connection with the share repurchase program - 219,573 shares and 0 shares, respectively, of our Class B common stock for approximately $782,000 and $0, respectively.
We do not anticipate paying dividends on our common stock until we achieve sustainable profitability and retain certain minimum cash reserves. The payment of dividends in any specific period will be at the sole discretion of our Board of Directors.
Concentration of Credit Risk and Significant Customers
Historically, we have had very little or no bad debt, which is common with other platforms of our size that derive their revenue from mobile advertising, as we aggressively manage our collections and perform due diligence on our customers. In addition, the majority of our revenue is derived from large, credit-worthy customers, e.g. Google, Facebook, Vungle and AppLovin, and we terminate our services with smaller customers immediately upon balances becoming past due. Since these smaller customers rely on us to derive their own revenue, they generally pay their outstanding balances on a timely basis.
In the three months ended October 31, 2024, we had only one large customer, and that customer represented 30% of our revenue for the period. In the three months ended October 31, 2023, there were two customers that represented 30% and 11% of our revenue, respectively. At October 31, 2024, three customers represented 43%, 12% and 11% of our accounts receivable balance, respectively. At July 31, 2024, three customers represented 37%, 15% and 10% of our accounts receivable balance, respectively. All of these significant customers were advertising exchanges operated by leading companies, and the receivables represent many smaller amounts due from their advertisers.
Contractual Obligations and Other Commercial Commitments
Smaller reporting companies are not required to provide the information required by this item.
Off-Balance Sheet Arrangements
At October 31, 2024, we did not have any “off-balance sheet arrangements,” as defined in relevant SEC regulations that are reasonably likely to have a current or future effect on our financial condition, results of operations, liquidity, capital expenditures or capital resources.
Item 3. Quantitative and Qualitative Disclosures About Market Risks
Smaller reporting companies are not required to provide the information required by this item.
Item 4. Controls and Procedures
Evaluation of Disclosure Controls and Procedures. Our Chief Executive Officer and Chief Financial Officer have evaluated the effectiveness of our disclosure controls and procedures (as defined in Rules 13a-15(e) and 15d-15(e) of the Securities Exchange Act of 1934, as amended), as of the end of the period covered by this Quarterly Report on Form 10-Q. Based on this evaluation, our Chief Executive Officer and Chief Financial Officer have concluded that, as of such date, our disclosure controls and procedures were effective at a reasonable assurance level as of October 31, 2024.
Changes in Internal Control over Financial Reporting. There were no changes in our internal control over financial reporting during the quarter ended October 31, 2024 that have materially affected, or are reasonably likely to materially affect, our internal control over financial reporting.
PART II. OTHER INFORMATION
Item 1. Legal Proceedings
Legal proceedings in which we are involved are more fully described in Note 9, Commitments and Contingencies, to the unaudited condensed consolidated financial statements included in Item 1 to Part I of this Quarterly Report on Form 10-Q.
Item 1A. Risk Factors
There are no material changes from the risk factors previously disclosed in Item 1A to Part I of the 2024 Form 10-K.
Item 2. Unregistered Sales of Equity Securities and Use of Proceeds
In October 2021, our Board of Directors authorized a repurchase program of up to 1.5 million shares of our Class B common stock at a maximum aggregate purchase price of $3 million. In September 2024, upon the completion of the initial $3.0 million repurchase program, our Board of Directors authorized additional $5 million for the repurchase program with no limitation on the number of shares that may be repurchased. Repurchases may be made from time to time through open market purchases or through privately negotiated transactions, subject to market conditions, applicable legal requirements and other relevant factors. Open market repurchases may be structured to occur in accordance with the requirements of Rule 10b-18. We may also, from time to time, enter into Rule 10b5-1 trading plans to facilitate repurchases of its shares. The repurchase program does not obligate us to acquire any particular amount of our Class B common stock, has no expiration date and may be modified, suspended, or terminated at any time at our discretion.
The following table summarizes the share repurchase activity for the first quarter of fiscal 2025:
| Period | | Total Number
of Shares
Purchased (1) | | | Average
Price Paid
Per Share (2) | | | Shares
Purchased as
Part of Publicly
Announced
Programs | | | Dollar Value
of Shares
that May
Yet Be
Purchased Under
the Program | |
| | | (in thousands) | | | | | | (in thousands) | | | (in thousands) | |
| August 1, 2024 to August 31, 2024 | | | 219 | | | $ | 3.56 | | | | 219 | | | $ | 6 | |
| September 1, 2024 to September 30, 2024 | | | 7 | | | $ | 3.16 | | | | - | | | $ | 5,006 | |
| October 1, 2024 - October 31, 2024 | | | - | | | $ | - | | | | - | | | $ | 5,006 | |
| Total | | | 226 | | | | | | | | 219 | | | | | |
| (1) | The total number of shares purchased includes shares repurchased as part of publicly announced programs and shares repurchased in connection with tax payments due upon vesting of DSUs. |
| (2) | The average price paid per share includes any broker commissions. |
Item 3. Defaults Upon Senior Securities
None
Item 4. Mine Safety Disclosures
Not applicable
Item 5. Other Information
None
Item 6. Exhibits
| * | Filed or furnished herewith. |
SIGNATURES
Pursuant to the requirements of the Securities Exchange Act of 1934, the Registrant has duly caused this report to be signed on its behalf by the undersigned thereunto duly authorized.
| | ZEDGE, INC. |
| | | |
| December 16, 2024 | By: | /s/ JONATHAN REICH |
| | | Jonathan Reich
Chief Executive Officer |
| | | |
| December 16, 2024 | By: | /s/ YI TSAI |
| | | Yi Tsai
Chief Financial Officer |
http://fasb.org/us-gaap/2024#AccountsPayableAndAccruedLiabilitiesCurrent http://fasb.org/us-gaap/2024#AccountsPayableAndAccruedLiabilitiesCurrent http://fasb.org/us-gaap/2024#OtherAssetsNoncurrent http://fasb.org/us-gaap/2024#OtherAssetsNoncurrent false --07-31 Q1 2025 0001667313