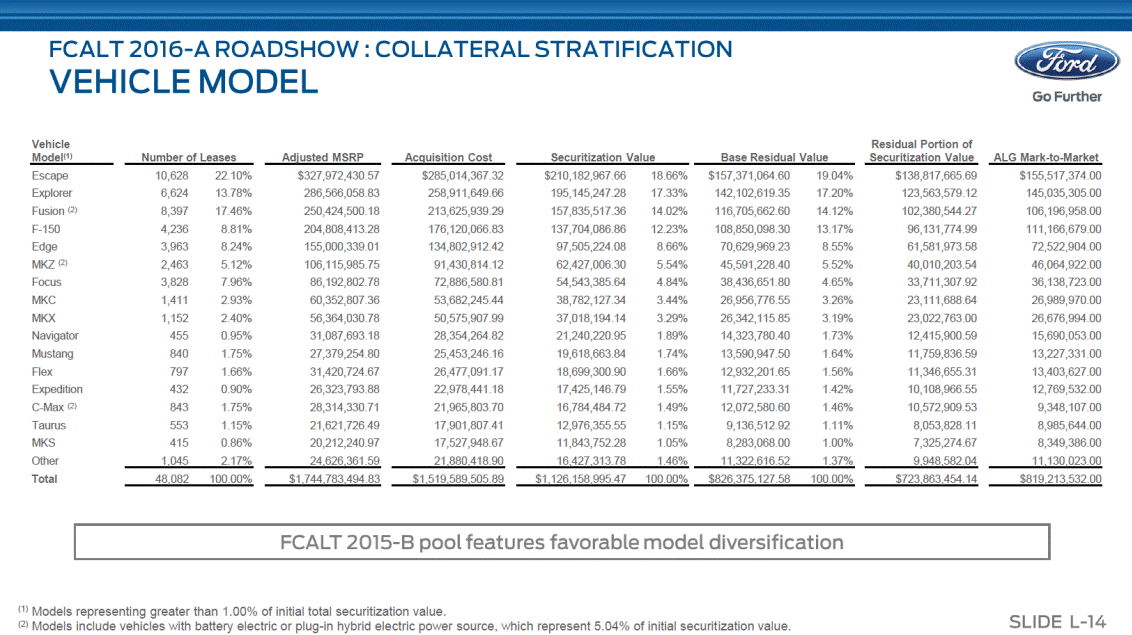
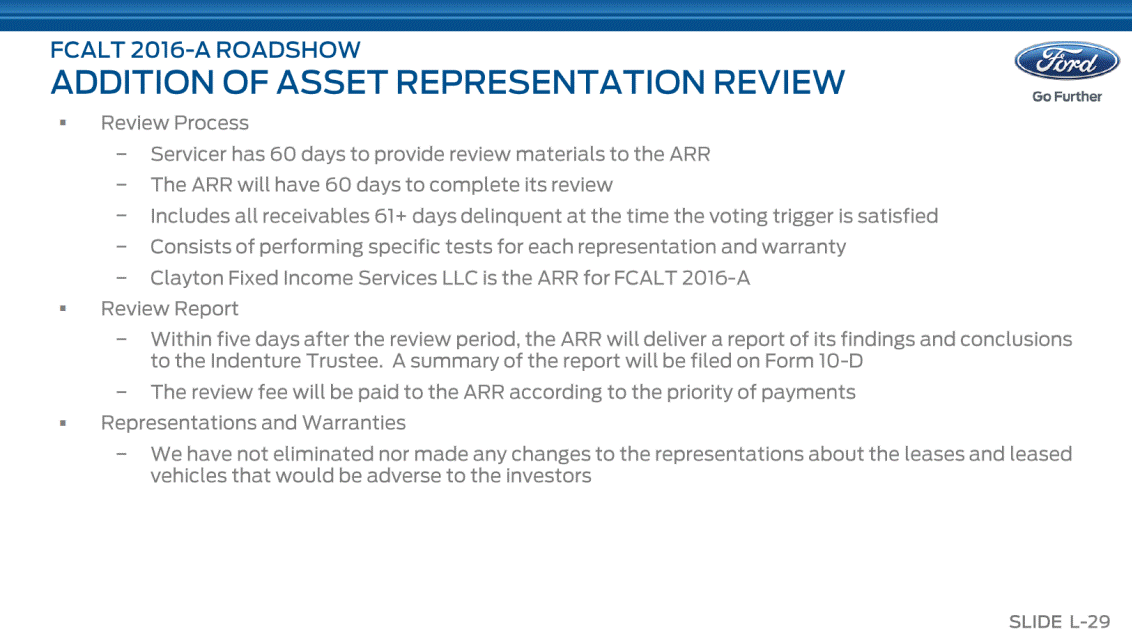
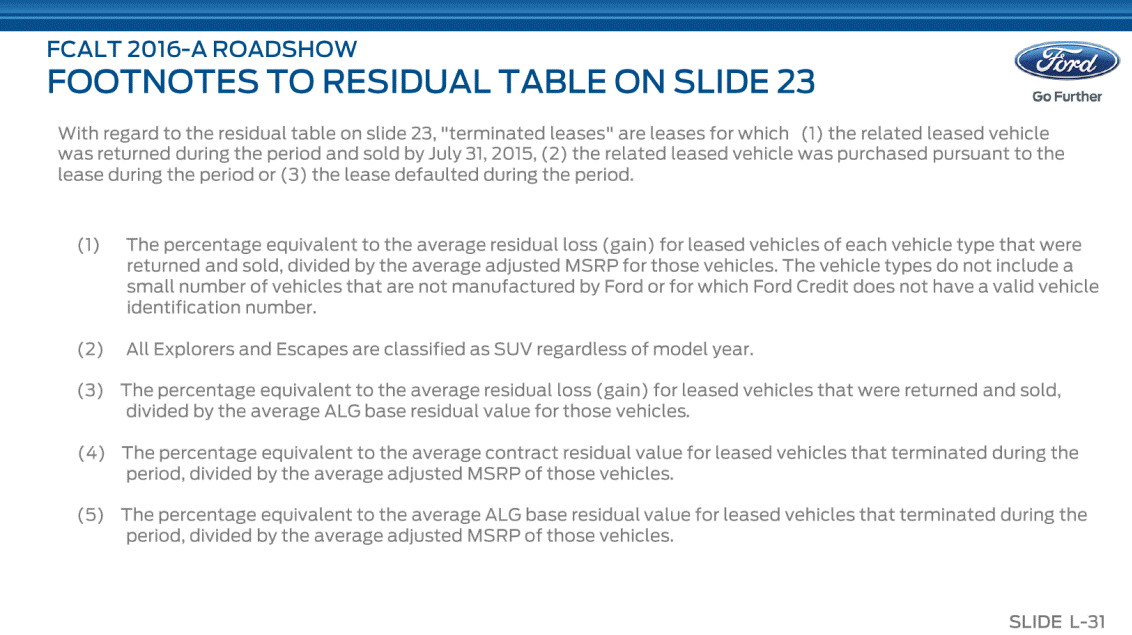
Vehicle Model(1) Residual Portion of Securitization Value Number of Leases Adjusted MSRP Acquisition Cost Securitization Value Base Residual Value ALG Mark-to-Market Escape Explorer Fusion (2) F-150 Edge MKZ (2) Focus MKC MKX Navigator Mustang Flex Expedition C-Max (2) Taurus MKS Other Total 10,628 6,624 8,397 4,236 3,963 2,463 3,828 1,411 1,152 455 840 797 432 843 553 415 22.10% 13.78% 17.46% 8.81% 8.24% 5.12% 7.96% 2.93% 2.40% 0.95% 1.75% 1.66% 0.90% 1.75% 1.15% 0.86% $327,972,430.57 286,566,058.83 250,424,500.18 204,808,413.28 155,000,339.01 106,115,985.75 86,192,802.78 60,352,807.36 56,364,030.78 31,087,693.18 27,379,254.80 31,420,724.67 26,323,793.88 28,314,330.71 21,621,726.49 20,212,240.97 24,626,361.59 $285,014,367.32 258,911,649.66 213,625,939.29 176,120,066.83 134,802,912.42 91,430,814.12 72,886,580.81 53,682,245.44 50,575,907.99 28,354,264.82 25,453,246.16 26,477,091.17 22,978,441.18 21,965,803.70 17,901,807.41 17,527,948.67 21,880,418.90 $210,182,967.66 195,145,247.28 157,835,517.36 137,704,086.86 97,505,224.08 62,427,006.30 54,543,385.64 38,782,127.34 37,018,194.14 21,240,220.95 19,618,663.84 18,699,300.90 17,425,146.79 16,784,484.72 12,976,355.55 11,843,752.28 18.66% 17.33% 14.02% 12.23% 8.66% 5.54% 4.84% 3.44% 3.29% 1.89% 1.74% 1.66% 1.55% 1.49% 1.15% 1.05% $157,371,064.60 142,102,619.35 116,705,662.60 108,850,098.30 70,629,969.23 45,591,228.40 38,436,651.80 26,956,776.55 26,342,115.85 14,323,780.40 13,590,947.50 12,932,201.65 11,727,233.31 12,072,580.60 9,136,512.92 8,283,068.00 19.04% 17.20% 14.12% 13.17% 8.55% 5.52% 4.65% 3.26% 3.19% 1.73% 1.64% 1.56% 1.42% 1.46% 1.11% 1.00% $138,817,665.69 123,563,579.12 102,380,544.27 96,131,774.99 61,581,973.58 40,010,203.54 33,711,307.92 23,111,688.64 23,022,763.00 12,415,900.59 11,759,836.59 11,346,655.31 10,108,966.55 10,572,909.53 8,053,828.11 7,325,274.67 9,948,582.04 $155,517,374.00 145,035,305.00 106,196,958.00 111,166,679.00 72,522,904.00 46,064,922.00 36,138,723.00 26,989,970.00 26,676,994.00 15,690,053.00 13,227,331.00 13,403,627.00 12,769,532.00 9,348,107.00 8,985,644.00 8,349,386.00 11,130,023.00 1,045 2.17% 16,427,313.78 1.46% 11,322,616.52 1.37% 48,082 100.00% $1,744,783,494.83 $1,519,589,505.89 $1,126,158,995.47 100.00% $826,375,127.58 100.00% $723,863,454.14 $819,213,532.00 (1) Models representing greater than 1.00% of initial total securitization value. (2) Models include vehicles with battery electric or plug-in hybrid electric power source, which represent 5.04% of initial securitization value.
