Table of Contents
UNITED STATES
SECURITIES AND EXCHANGE COMMISSION
Washington, D.C. 20549
FORMN-CSR
CERTIFIED SHAREHOLDER REPORT OF REGISTERED
MANAGEMENT INVESTMENT COMPANIES
Investment Company Act file number811-23148
Guardian Variable Products Trust
(Exact name of registrant as specified in charter)
10 Hudson Yards New York, N.Y. 10001
(Address of principal executive offices) (Zip code)
Gordon Dinsmore
President
Guardian Variable Products Trust
10 Hudson Yards
New York, N.Y. 10001
(Name and address of agent for service)
Registrant’s telephone number, including area code:212-598-8000
Date of fiscal year end: December 31
Date of reporting period: June 30, 2019
Table of Contents
| Item 1. | Reports to Stockholders. |
Table of Contents
Guardian Variable
Products Trust
2019
Semiannual Report
All Data as of June 30, 2019
Guardian Large Cap Fundamental Growth VIP Fund
Important Notice
Beginning on January 1, 2021, as permitted by regulations adopted by the Securities and Exchange Commission, paper copies of the Fund’s shareholder reports will no longer be sent by mail from The Guardian Insurance & Annuity Company, Inc. (“GIAC”). Instead, GIAC will mail you a notice when copies of the shareholder reports are made available on a website. You will be notified by mail each time a report is posted and provided with a website link to access the report.
If you have already elected to receive shareholder reports electronically, you will not be affected by this change and you need not take any action. If you have not yet elected electronic delivery, at any time, you may elect to receive the Fund’s shareholder reports and certain other communications from GIAC electronically, by going to www.guardianlife.com and registering for e-delivery.
You may instead elect to receive all future shareholder reports in paper free of charge. If you wish to receive paper copies of your shareholder reports, please call GIAC’s Customer Service Office Contact Center at 1-888-GUARDIAN (1-888-482-7342). Your election to receive reports in paper will apply to all the underlying funds available.

| Not FDIC insured. May lose value. No bank guarantee. | www.guardianlife.com |
Table of Contents
Guardian Large Cap Fundamental Growth VIP Fund
| 1 | ||||
| 2 | ||||
Financial Information | ||||
| Schedule of Investments | 3 | |||
| Statement of Assets and Liabilities | 5 | |||
| Statement of Operations | 5 | |||
| Statements of Changes in Net Assets | 6 | |||
| Financial Highlights | 8 | |||
| Notes to Financial Statements | 10 | |||
Supplemental Information | ||||
| Approval of Investment Advisory andSub-advisory Agreements | 15 | |||
| Portfolio Holdings and Proxy Voting Procedures | 19 | |||
Except as otherwise specifically stated, all information, including portfolio security positions, is as of June 30, 2019. Fund holdings will vary. Information contained herein has been obtained from sources believed reliable, but is not guaranteed.
Table of Contents
GUARDIAN LARGE CAP FUNDAMENTAL GROWTH VIP FUND
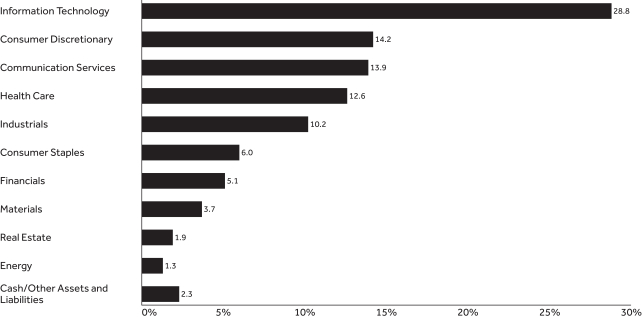
Fund Characteristics (unaudited)
| Total Net Assets: $243,215,594 |
Sector Allocation1 As of June 30, 2019 |
 |
Top Ten Holdings2 As of June 30, 2019 | ||||
| Holding | % of Total Net Assets | |||
| Amazon.com, Inc. | 6.49% | |||
| Facebook, Inc., Class A | 5.30% | |||
| Microsoft Corp. | 4.85% | |||
| Visa, Inc., Class A | 4.43% | |||
| UnitedHealth Group, Inc. | 3.08% | |||
| Adobe, Inc. | 2.96% | |||
| Alphabet, Inc., Class C | 2.75% | |||
| The Walt Disney Co. | 2.72% | |||
| Zoetis, Inc. | 2.47% | |||
| Thermo Fisher Scientific, Inc. | 2.36% | |||
| Total | 37.41% | |||
| 1 | The Fund’s holdings are allocated to each sector based on the MSCI Global Industry Classification Standard (GICS®). Cash includes short-term investments and net other assets and liabilities. |
| 2 | Portfolio holdings are subject to change and should not be considered a recommendation to buy or sell individual securities. |
| 1 |
Table of Contents
UNDERSTANDING YOUR FUND’S EXPENSES(UNAUDITED)
By investing in the Fund, you incur two types of costs: (1) transaction costs and (2) ongoing costs, including, as applicable, investment advisory fees, distribution and/or service(12b-1) fees and other Fund expenses. The example below is intended to help you understand your ongoing costs (in dollars) of investing in the Fund and to compare these costs with the ongoing costs of investing in other mutual funds.
The example is based on an investment of $1,000 invested at the beginning of the period and held for the entire period from January 1, 2019 to June 30, 2019. The table below shows the Fund’s expenses in two ways:
Expenses based on actual return
This section of the table provides information about actual account values and actual expenses. You may use the information in this section, together with the amount you invested, to estimate the expenses that you paid over the period. Simply divide your account value by $1,000 (for example, an $8,600 account value divided by $1,000 = 8.6), then multiply the result by the number in the section under the heading entitled “Expenses Paid During Period” to estimate the expenses you paid on your account during this period.
Expenses based on hypothetical 5% return for comparison purposes
This section of the table provides information about hypothetical account values and hypothetical expenses based on the Fund’s actual expense ratio and an assumed rate of return of 5% per year before expenses, which is not the Fund’s actual return. The hypothetical account values and expenses may not be used to estimate the actual ending account balance or expenses you paid for the period. You may use this information to compare the ongoing costs of investing in the Fund with the cost of investing in other mutual funds. To do so, compare this 5% hypothetical example with the 5% hypothetical examples that appear in the shareholder reports of the other funds.
Note that the expenses shown in the table are meant to highlight your ongoing costs only and do not reflect any transactional costs, such as sales charges (loads), redemption fees, or exchange fees. Therefore the second section is useful in comparing ongoing costs only, and will not help you determine the relative total costs of owning different funds. If these transactional costs were included, your costs would have been higher. Charges and expenses at the insurance company separate account level are not reflected in the table.
Beginning 1/1/19 | Ending Account Value 6/30/19 | Expenses Paid During Period* 1/1/19-6/30/19 | Expense Ratio During Period 1/1/19-6/30/19 | |||||||||||
| Based on Actual Return | $1,000.00 | $1,219.80 | $5.50 | 1.00% | ||||||||||
| Based on Hypothetical Return (5% Return Before Expenses) | $1,000.00 | $1,019.84 | $5.01 | 1.00% | ||||||||||
| * | Expenses are equal to the Fund’s annualized expense ratio as indicated, multiplied by the average account value over the period, multiplied by 181/365 (to reflect theone-half year period). |
| 2 |
Table of Contents
SCHEDULE OF INVESTMENTS — GUARDIAN LARGE CAP FUNDAMENTAL GROWTH VIP FUND
| June 30, 2019(unaudited) | Shares | Value | ||||||
| Common Stocks – 97.7% |
| |||||||
| Air Freight & Logistics – 2.3% |
| |||||||
CH Robinson Worldwide, Inc. | 17,850 | $ | 1,505,647 | |||||
United Parcel Service, Inc., Class B | 39,740 | 4,103,950 | ||||||
|
| |||||||
| 5,609,597 | ||||||||
| Beverages – 3.2% |
| |||||||
Anheuser-Busch InBev S.A., ADR | 53,070 | 4,697,225 | ||||||
The Coca-Cola Co. | 61,940 | 3,153,985 | ||||||
|
| |||||||
| 7,851,210 | ||||||||
| Biotechnology – 2.9% |
| |||||||
Alexion Pharmaceuticals, Inc.(1) | 33,290 | 4,360,324 | ||||||
BioMarin Pharmaceutical, Inc.(1) | 31,970 | 2,738,231 | ||||||
|
| |||||||
| 7,098,555 | ||||||||
| Capital Markets – 3.3% |
| |||||||
BlackRock, Inc. | 8,170 | 3,834,181 | ||||||
The Charles Schwab Corp. | 106,410 | 4,276,618 | ||||||
|
| |||||||
| 8,110,799 | ||||||||
| Chemicals – 3.7% |
| |||||||
Ecolab, Inc. | 24,440 | 4,825,434 | ||||||
Linde PLC | 20,960 | 4,208,768 | ||||||
|
| |||||||
| 9,034,202 | ||||||||
| Consumer Finance – 1.8% |
| |||||||
American Express Co. | 34,730 | 4,287,071 | ||||||
|
| |||||||
| 4,287,071 | ||||||||
| Entertainment – 2.7% |
| |||||||
The Walt Disney Co. | 47,390 | 6,617,540 | ||||||
|
| |||||||
| 6,617,540 | ||||||||
| Equity Real Estate Investment – 1.9% |
| |||||||
Equinix, Inc. REIT | 9,340 | 4,710,069 | ||||||
|
| |||||||
| 4,710,069 | ||||||||
| Food & Staples Retailing – 1.8% |
| |||||||
Costco Wholesale Corp. | 16,780 | 4,434,283 | ||||||
|
| |||||||
| 4,434,283 | ||||||||
| Food Products – 1.0% |
| |||||||
McCormick & Co., Inc. | 15,813 | 2,451,173 | ||||||
|
| |||||||
| 2,451,173 | ||||||||
| Health Care Providers & Services – 3.1% |
| |||||||
UnitedHealth Group, Inc. | 30,670 | 7,483,787 | ||||||
|
| |||||||
| 7,483,787 | ||||||||
| Hotels, Restaurants & Leisure – 1.5% |
| |||||||
Chipotle Mexican Grill, Inc.(1) | 4,980 | 3,649,742 | ||||||
|
| |||||||
| 3,649,742 | ||||||||
| Industrial Conglomerates – 2.2% |
| |||||||
Honeywell International, Inc. | 30,570 | 5,337,216 | ||||||
|
| |||||||
| 5,337,216 | ||||||||
| Interactive Media & Services – 9.2% |
| |||||||
Alphabet, Inc., Class A(1) | 2,466 | 2,670,185 | ||||||
Alphabet, Inc., Class C(1) | 6,182 | 6,682,185 | ||||||
Facebook, Inc., Class A(1) | 66,810 | 12,894,330 | ||||||
|
| |||||||
| 22,246,700 | ||||||||
| June 30, 2019(unaudited) | Shares | Value | ||||||
| Internet & Direct Marketing Retail – 9.2% |
| |||||||
Alibaba Group Holding Ltd., ADR(1) | 23,780 | $ | 4,029,521 | |||||
Amazon.com, Inc.(1) | 8,332 | 15,777,725 | ||||||
GrubHub, Inc.(1) | 34,130 | 2,661,799 | ||||||
|
| |||||||
| 22,469,045 | ||||||||
| IT Services – 7.0% |
| |||||||
Akamai Technologies, Inc.(1) | 62,490 | 5,007,948 | ||||||
PayPal Holdings, Inc.(1) | 10,560 | 1,208,698 | ||||||
Visa, Inc., Class A | 62,040 | 10,767,042 | ||||||
|
| |||||||
| 16,983,688 | ||||||||
| Life Sciences Tools & Services – 2.4% |
| |||||||
Thermo Fisher Scientific, Inc. | 19,540 | 5,738,507 | ||||||
|
| |||||||
| 5,738,507 | ||||||||
| Machinery – 1.2% |
| |||||||
Caterpillar, Inc. | 20,830 | 2,838,921 | ||||||
|
| |||||||
| 2,838,921 | ||||||||
| Media – 2.0% |
| |||||||
Comcast Corp., Class A | 114,540 | 4,842,751 | ||||||
|
| |||||||
| 4,842,751 | ||||||||
| Oil, Gas & Consumable Fuels – 1.3% |
| |||||||
Pioneer Natural Resources Co. | 21,195 | 3,261,063 | ||||||
|
| |||||||
| 3,261,063 | ||||||||
| Pharmaceuticals – 4.2% |
| |||||||
Johnson & Johnson | 30,020 | 4,181,186 | ||||||
Zoetis, Inc. | 53,040 | 6,019,509 | ||||||
|
| |||||||
| 10,200,695 | ||||||||
| Professional Services – 1.7% |
| |||||||
IHS Markit Ltd.(1) | 64,487 | 4,109,112 | ||||||
|
| |||||||
| 4,109,112 | ||||||||
| Road & Rail – 1.1% |
| |||||||
Uber Technologies, Inc.(1) | 56,190 | 2,606,092 | ||||||
|
| |||||||
| 2,606,092 | ||||||||
| Semiconductors & Semiconductor Equipment – 4.6% |
| |||||||
NVIDIA Corp. | 16,450 | 2,701,584 | ||||||
QUALCOMM, Inc. | 58,640 | 4,460,745 | ||||||
Texas Instruments, Inc. | 35,240 | 4,044,142 | ||||||
|
| |||||||
| 11,206,471 | ||||||||
| Software – 15.1% |
| |||||||
Adobe, Inc.(1) | 24,430 | 7,198,300 | ||||||
Microsoft Corp. | 88,110 | 11,803,216 | ||||||
Nutanix, Inc., Class A(1) | 69,610 | 1,805,683 | ||||||
Oracle Corp. | 94,800 | 5,400,756 | ||||||
Palo Alto Networks, Inc.(1) | 17,940 | 3,655,454 | ||||||
Splunk, Inc.(1) | 30,615 | 3,849,836 | ||||||
VMware, Inc., Class A | 17,500 | 2,926,175 | ||||||
|
| |||||||
| 36,639,420 | ||||||||
| Specialty Retail – 3.5% |
| |||||||
Advance Auto Parts, Inc. | 24,010 | 3,700,901 | ||||||
The Home Depot, Inc. | 22,840 | 4,750,035 | ||||||
|
| |||||||
| 8,450,936 | ||||||||
| The accompanying notes are an integral part of these financial statements. | 3 |
Table of Contents
SCHEDULE OF INVESTMENTS — GUARDIAN LARGE CAP FUNDAMENTAL GROWTH VIP FUND
| June 30, 2019(unaudited) | Shares | Value | ||||||
| Technology Hardware, Storage & Peripherals – 2.1% |
| |||||||
Apple, Inc. | 25,900 | $ | 5,126,128 | |||||
|
| |||||||
| 5,126,128 | ||||||||
| Trading Companies & Distributors – 1.7% |
| |||||||
WW Grainger, Inc. | 15,840 | 4,248,763 | ||||||
|
| |||||||
| 4,248,763 | ||||||||
| Total Common Stocks (Cost $201,377,666) |
| 237,643,536 | ||||||
| Principal Amount | Value | |||||||
| Short–Term Investment – 1.9% |
| |||||||
| Repurchase Agreements – 1.9% |
| |||||||
Fixed Income Clearing Corp., 0.50%, dated 6/28/2019, proceeds at maturity value of $4,582,191, due | $ | 4,582,000 | 4,582,000 | |||||
| Total Repurchase Agreements (Cost $4,582,000) |
| 4,582,000 | ||||||
| Total Investments – 99.6% (Cost $205,959,666) |
| 242,225,536 | ||||||
| Assets in excess of other liabilities – 0.4% |
| 990,058 | ||||||
| Total Net Assets – 100.0% |
| $ | 243,215,594 | |||||
| (1) | Non–income–producing security. |
| (2) | The table below presents collateral for repurchase agreements. |
| Security | Coupon | Maturity Date | Principal Amount | Value | ||||||||||||
| U.S. Treasury Note | 2.75% | 8/15/2021 | $ | 4,535,000 | $ | 4,674,161 | ||||||||||
Legend:
ADR — American Depositary Receipt
REIT — Real Estate Investment Trust
The following is a summary of the inputs used as of June 30, 2019 in valuing the Fund’s investments. For more information on valuation inputs, please refer to Note 2a of the accompanying Notes to Financial Statements.
| Valuation Inputs | ||||||||||||||||
| Investments in Securities(unaudited) | Level 1 | Level 2 | Level 3 | Total | ||||||||||||
| Common Stocks | $ | 237,643,536 | $ | — | $ | — | $ | 237,643,536 | ||||||||
| Repurchase Agreements | — | 4,582,000 | — | 4,582,000 | ||||||||||||
| Total | $ | 237,643,536 | $ | 4,582,000 | $ | — | $ | 242,225,536 | ||||||||
| 4 | The accompanying notes are an integral part of these financial statements. |
Table of Contents
FINANCIAL INFORMATION — GUARDIAN LARGE CAP FUNDAMENTAL GROWTH VIP FUND
For the Six Months Ended June 30, 2019 (unaudited) | ||||
Investment Income | ||||
Dividends | $ | 1,189,984 | ||
Interest | 14,289 | |||
Withholding taxes on foreign dividends | (7,901 | ) | ||
|
| |||
Total Investment Income | 1,196,372 | |||
|
| |||
Expenses | ||||
Investment advisory fees | 716,433 | |||
Distribution fees | 303,350 | |||
Trustees’ and officers’ fees | 57,605 | |||
Professional fees | 33,312 | |||
Administrative fees | 23,535 | |||
Custodian and accounting fees | 21,227 | |||
Shareholder reports | 20,888 | |||
Transfer agent fees | 10,152 | |||
Other expenses | 15,507 | |||
|
| |||
Total Expenses | 1,202,009 | |||
|
| |||
Net expenses before Adviser recoupment | 1,202,009 | |||
Expenses recouped by Adviser | 11,391 | |||
|
| |||
Total Expenses, Net | 1,213,400 | |||
|
| |||
Net Investment Income/(Loss) | (17,028 | ) | ||
|
| |||
Realized Gain/(Loss) and Change in Unrealized Appreciation/(Depreciation) on Investments | ||||
Net realized gain/(loss) from investments | 5,171,373 | |||
Net change in unrealized appreciation/(depreciation) on investments | 42,999,732 | |||
|
| |||
Net Gain on Investments | 48,171,105 | |||
|
| |||
Net Increase in Net Assets Resulting from Operations | $ | 48,154,077 | ||
|
| |||
| The accompanying notes are an integral part of these financial statements. | 5 |
Table of Contents
FINANCIAL INFORMATION — GUARDIAN LARGE CAP FUNDAMENTAL GROWTH VIP FUND
| 6 | The accompanying notes are an integral part of these financial statements. |
Table of Contents
This Page Intentionally Left Blank
| 7 |
Table of Contents
FINANCIAL INFORMATION — GUARDIAN LARGE CAP FUNDAMENTAL GROWTH VIP FUND
The Financial Highlights table is intended to help you understand the Fund’s financial performance for the past six reporting periods (or, if shorter, the period since inception). Certain information reflects financial results for a single Fund share. The total returns in the table represent the rate that an investor would have earned (or lost) on an investment in the Fund.
Financial Highlights Six Months Ended Numbers are unaudited | ||||||||||||||||||||||||
| Per Share Operating Performance | ||||||||||||||||||||||||
Net Asset Value, | Net Investment Income/(Loss)(1) | Net Realized and Unrealized Gain/(Loss) | Total Operations | Net Asset Value, End of Period | Total Return(2) | |||||||||||||||||||
Six Months Ended 6/30/19 | $ | 12.51 | $ | (0.00 | )(4) | $ | 2.75 | $ | 2.75 | $ | 15.26 | 21.98% | (5) | |||||||||||
Year Ended 12/31/18 | 12.74 | 0.03 | (0.26 | ) | (0.23 | ) | 12.51 | (1.81)% | ||||||||||||||||
Year Ended 12/31/17 | 10.19 | 0.01 | 2.54 | 2.55 | 12.74 | 25.02% | ||||||||||||||||||
Period Ended 12/31/16(7) | 10.00 | 0.01 | 0.18 | 0.19 | 10.19 | 1.90% | (5) | |||||||||||||||||
| 8 | The accompanying notes are an integral part of these financial statements. |
Table of Contents
FINANCIAL INFORMATION — GUARDIAN LARGE CAP FUNDAMENTAL GROWTH VIP FUND
| Ratios/Supplemental Data | ||||||||||||||||||||||
| Net Assets, End of Period (000s) | Net Ratio of | Gross Ratio of Expenses to Average Net Assets | Net Ratio of Net Investment Income/ (Loss) to Average Net Assets(3) | Gross Ratio of Net (Loss) to Average | Portfolio Turnover Rate | |||||||||||||||||
| $ | 243,216 | 1.00% | (5) | 0.99% | (5) | (0.01)% | (5) | (0.00)% | (5),(6) | 11% | (5) | |||||||||||
| 223,264 | 1.00% | 1.02% | 0.26% | 0.24% | 33% | |||||||||||||||||
| 11,946 | 1.00% | 1.95% | 0.09% | (0.86)% | 51% | |||||||||||||||||
| 9,778 | 1.00% | (5) | 3.08% | (5) | 0.26% | (5) | (1.82)% | (5) | 4% | (5) | ||||||||||||
| (1) | Calculated based on the average shares outstanding during the period. |
| (2) | Total returns do not reflect the effects of charges deducted pursuant to the terms of The Guardian Insurance & Annuity Company, Inc.’s variable contracts. Inclusion of such charges would reduce the total returns for all periods shown. |
| (3) | Net Ratio of Expenses to Average Net Assets and Net Ratio of Net Investment Income/(Loss) to Average Net Assets include the effect of fee waivers, expense limitations, and recoupments. |
| (4) | Rounds to $(0.00) per share. |
| (5) | Ratios for periods less than one year have been annualized, except for total return and portfolio turnover rate. For the period ended December 31, 2016, certainnon-recurring fees (i.e., audit fees) are not annualized. |
| (6) | Rounds to (0.00)%. |
| (7) | Commenced operations on September 1, 2016. |
| The accompanying notes are an integral part of these financial statements. | 9 |
Table of Contents
NOTES TO FINANCIAL STATEMENTS — GUARDIAN LARGE CAP FUNDAMENTAL GROWTH VIP FUND
June 30, 2019 (unaudited)
1. Organization
Guardian Variable Products Trust (the “Trust”), a Delaware statutory trust organized on January 12, 2016, is registered under the Investment Company Act of 1940, as amended (the “1940 Act”), as anopen-end management investment company. The Trust currently has sixteen series. Guardian Large Cap Fundamental Growth VIP Fund (the “Fund”) is a series of the Trust. The Fund is a diversified fund and commenced operations on September 1, 2016. The financial statements for other series of the Trust are presented in separate reports.
The Trust has authorized an unlimited number of shares of beneficial interest with no par value. Shares are bought and sold at closing net asset value (“NAV”). Shares of the Fund are only sold to certain separate accounts of The Guardian Insurance & Annuity Company, Inc. (“GIAC”) that fund certain variable annuity contracts and variable life insurance policies issued by GIAC. GIAC is a wholly-owned subsidiary of The Guardian Life Insurance Company of America (“Guardian Life”).
The Fund seeks long-term growth of capital.
2. Significant Accounting Policies
The following is a summary of significant accounting policies followed by the Fund in the preparation of its financial statements. The Fund follows the investment company accounting and reporting guidance of the Financial Accounting Standards Board (“FASB”) Accounting Standards Codification Topic 946 Financial Services — Investment Companies. The following policies are in conformity with accounting principles generally accepted in the United States of America (“GAAP”). The preparation of financial statements in accordance with GAAP requires management to make estimates and assumptions that affect the reported amounts and disclosures in the financial statements. Actual results could differ from those estimates.
a. Investment Valuations Equity securities traded on an exchange other than NASDAQ Stock Market, LLC (“NASDAQ”) are valued at the last reported sale price on the principal exchange or market on which they are traded; or, if there were no sales that day, at the mean between the closing bid and ask prices. Securities traded on the NASDAQ are generally valued at the NASDAQ official closing price, which may not be the last sale price. If the NASDAQ official closing price is not available
for a security, that security is generally valued at the mean between the closing bid and ask prices. Repurchase agreements are carried at cost, which approximates fair value (see Note 5d). Foreign securities are valued in the currencies of the markets in which they trade and then converted to U.S. dollars by the application of foreign exchange rates at the close of the New York Stock Exchange (“NYSE”). Forward foreign currency contracts, if any, are valued at the mean between the bid and ask rates for the specified time interpolated from rates for proximate time periods. Securities for which market quotations are not readily available or for which market quotations may be considered unreliable are valued at their fair values as determined in accordance with policies and procedures adopted by the Board of Trustees.
Under the policies and procedures approved by the Board of Trustees, Park Avenue Institutional Advisers LLC (“Park Avenue”), the Fund’s investment adviser, has established a Fair Valuation Committee to assist the Board of Trustees with the oversight and monitoring of the valuation of the Fund’s investments. This includes monitoring the appropriateness of fair values based on results of ongoing valuation oversight, including but not limited to consideration of security specific events, market events, and pricing vendor and broker-dealer due diligence. The Fair Valuation Committee oversees and carries out the policies for the valuation of investments held in the Fund. The Fair Valuation Committee is responsible for discussing and assessing the potential impacts to the fair values on an ongoing basis, and at least on a quarterly basis with the Board of Trustees.
Securities whose values have been materially affected by events occurring before the Fund’s valuation time but after the close of the securities’ principal exchange or market may be fair valued in accordance with policies and procedures adopted by the Board of Trustees. In addition, the values of the Fund’s investments in foreign securities are generally determined by a pricing service using pricing models designed to estimate likely changes in the values of those securities. Certain foreign equity instruments are valued by applying international fair value factors provided by approved pricing services. The factors seek to adjust the local closing price for movements of local markets post closing, but prior to the time the NAVs are calculated. Valuations reflected in this report are as of the report date. As a result, changes in valuation due to market events and/or issuer related events after the report date and prior to issuance of the report are not reflected herein.
| 10 |
Table of Contents
NOTES TO FINANCIAL STATEMENTS — GUARDIAN LARGE CAP FUNDAMENTAL GROWTH VIP FUND
Various inputs are used in determining the valuation of the Fund’s investments. These inputs are summarized in three broad levels listed below.
| • | Level 1 — unadjusted inputs using quoted prices in active markets for identical investments. |
| • | Level 2— other significant observable inputs, including, but not limited to, quoted prices for similar investments, inputs other than quoted prices that are observable for investments (such as interest rates, prepayment speeds, credit risks, etc.) or other market corroborated inputs. |
| • | Level 3 — significant unobservable inputs (including the Fund’s own assumptions in determining the fair value of investments) |
Inputs may include price information, volatility statistics, specific and broad credit data, liquidity statistics, and other factors. A financial instrument’s level within the fair value hierarchy is based on the lowest level of any input; both individually and in aggregate, that is significant to the fair value measurement. However, the determination of what constitutes “observable” requires significant judgment by the Trust. The Trust considers observable data to be that market data which is readily available, regularly distributed or updated, reliable and verifiable, and provided by independent sources that are actively involved in the relevant market. The inputs or methodology used for valuing securities are not necessarily an indication of the risk associated with investing in those securities. Changes in valuation techniques may result in transfers into or out of a financial instrument’s assigned level within the hierarchy.
The FASB requires reporting entities to make disclosures about purchases, sales, issuances and settlements of Level 3 securities on a gross basis. For the six months ended June 30, 2019, there were no transfers into or out of Level 3 of the fair value hierarchy.
In determining a financial instrument’s placement within the hierarchy, the Trust separates the Fund’s investment portfolio into two categories: investments and derivatives (e.g., futures). A summary of inputs used to value the Fund’s assets and liabilities carried at fair value as of June 30, 2019 is included in the Schedule of Investments.
Investments Investments whose values are based on quoted market prices in active markets, and are therefore classified within Level 1, include active listed equities. Investments that trade in markets that are not considered to be active, but are valued based on quoted
market prices, dealer quotations or alternative pricing sources supported by observable inputs are classified within Level 2. These include certain U.S. government and sovereign obligations, most government agency securities, investment-grade corporate bonds, certain mortgage products, state, municipal and provincial obligations, and certain foreign equity securities, including securities whose prices may have been affected by events occurring after the close of trading on their principal exchange or market and, as a result, whose values are determined by a pricing service as described above, or securities whose values are otherwise determined using fair valuation methods approved by the Fund’s Board of Trustees.
Investments classified within Level 3 have significant unobservable inputs, as they trade infrequently or not at all. Level 3 investments include, among others, private placement securities. When observable prices are not available for these securities, the Trust uses one or more valuation techniques for which sufficient and reliable data is available. The inputs used by the Trust in estimating the value of Level 3 investments include, for example, the original transaction price, recent transactions in the same or similar instruments, completed or pending third-party transactions in the underlying investment or comparable issuers, subsequent rounds of financing, recapitalizations, and other transactions across the capital structure. Level 3 investments may also be adjusted to reflect illiquidity and/ornon-transferability, with the amount of such discount estimated by the Trust in the absence of market information. Assumptions used by the Trust due to the lack of observable inputs may significantly impact the resulting fair value and therefore the Fund’s results of operations. As of June 30, 2019, the Fund had no securities classified as Level 3.
Derivatives Exchange-traded derivatives, such as futures contracts, exchange-traded option contracts and certain swaps, are typically classified within Level 1 or Level 2 of the fair value hierarchy depending on whether or not they are deemed to be actively traded. Certainnon-exchange-traded derivatives, such as generic forwards, certain swaps and options, have inputs which can generally be corroborated by market data and are therefore classified within Level 2. During the six months ended June 30, 2019, the Fund did not hold any derivatives.
b. Securities Transactions Securities transactions are accounted for on the date securities are purchased or sold (trade date). Realized gains or losses on securities transactions are determined on the basis of specific identification.
| 11 |
Table of Contents
NOTES TO FINANCIAL STATEMENTS — GUARDIAN LARGE CAP FUNDAMENTAL GROWTH VIP FUND
c. Foreign Currency Translation The accounting records of the Fund are maintained in U.S. dollars. Investment securities and all other assets and liabilities of the Fund denominated in a foreign currency are generally translated into U.S. dollars at the exchange rates quoted at the close of the NYSE on each business day. The market value of investment securities and other assets and liabilities are translated at the exchange rate as of the valuation date. Purchases and sales of securities, income receipts, and expense payments are translated into U.S. dollars at the exchange rates in effect on the dates of the respective transactions. The Fund does not isolate the portion of the fluctuations on investments resulting from changes in foreign currency exchange rates from the fluctuations in market prices of investments held. Such fluctuations are included in the Net change in net realized and unrealized gain/(loss) from investments on the Statement of Operations.
Reported realized foreign currency gains and losses arise from the disposition of foreign currency, currency gains or losses realized between the trade and settlement dates on securities transactions, and the difference between the amounts of dividends, interest and foreign withholding taxes recorded on the Fund’s books on the transaction date and the U.S. dollar equivalent of the amounts actually received or paid. These reported realized foreign currency gains and losses, if any, are included in Net realized gain/(loss) from foreign currency transactions on the Statement of Operations. Unrealized foreign currency gains and losses arise from changes (due to changes in exchange rates) in the value of foreign currency and other assets and liabilities denominated in foreign currencies, which are held at period end, if any, and are included in Net change in unrealized appreciation/(depreciation) on translation of assets and liabilities in foreign currencies on the Statement of Operations.
d. Foreign Capital Gains Tax The Fund may be subject to foreign taxes on income, gains on investments or currency purchases/repatriation, a portion of which may be recoverable. The Fund will accrue such taxes and recoveries as applicable, based upon their current interpretation of tax rules and regulations that exist in the markets in which they invest.
e. Investment Income Dividend income net of foreign taxes withheld, if any, is generally recorded on theex-dividend date. Interest income, which includes amortization/accretion of premium/discount, is determined using the interest income accrual method, and is accrued and recorded daily.
f. Allocation of Income and Expenses Many of the expenses of the Trust can be directly attributed to a specific series of the Trust. Expenses that cannot be directly attributed to a specific series of the Trust are generally apportioned among all the series in the Trust, based on relative net assets. In calculating net asset value per share for each series of the Trust, investment income, realized and unrealized gains and losses, and expenses other than series-specific expenses are allocated daily to each series based upon the proportion of net assets attributable to each series.
3. Transactions with Affiliates
a. Investment Advisory Fee and Expense LimitationUnder the terms of the advisory agreement, which, after its two year initial term, is reviewed and approved annually by the Board of Trustees, the Fund pays an investment advisory fee to Park Avenue. Park Avenue is a wholly-owned subsidiary of Guardian Life and receives an investment advisory fee at an annual rate of 0.62% up to $100 million, 0.57% up to $300 million, 0.52% up to $500 million, and 0.50% in excess of $500 million of the Fund’s average daily net assets. The fee is accrued daily and paid monthly.
Park Avenue has contractually agreed through April 30, 2020 to waive certain fees and/or reimburse certain expenses incurred by the Fund to the extent necessary to limit the Fund’s total annual operating expenses after fee waiver and/or expense reimbursement to 1.01% of the Fund’s average daily net assets (excluding, if applicable, any acquired fund fees and expenses, taxes, interest, transaction costs and brokerage commissions, litigation and extraordinary expenses). Prior to April 9, 2018, the expense limitation was 1.00%. The limitation may not be increased or terminated prior to this time without action by the Board of Trustees, may be terminated only upon approval of the Board of Trustees, and is subject to Park Avenue’s recoupment rights.
Park Avenue may be entitled to recoupment of previously waived fees and reimbursed expenses from the Fund for three years from the date of the waiver or reimbursement, subject to the expense limitation in effect at the time of the waiver or reimbursement and at the time of the recoupment, if any. Amounts waived or reimbursed by Park Avenue pursuant to any expense limitation after April 9, 2018 will not be subject to Park Avenue’s recoupment rights. During the six months ended June 30, 2019, Park Avenue recouped previously waived or reimbursed expenses in the amount of $11,391. The amount available for potential future recoupment by Park Avenue from the Fund under the
| 12 |
Table of Contents
NOTES TO FINANCIAL STATEMENTS — GUARDIAN LARGE CAP FUNDAMENTAL GROWTH VIP FUND
Expense Limitation Agreement and the expiration schedule at June 30, 2019 are as follows:
Potential Recoupment Amounts Expiring | ||||||||||
Total Potential Recoupment Amounts | 2021 | 2020 | 2019 | |||||||
| $227,607 | $47,223 | $146,810 | $33,574 | |||||||
Park Avenue has entered into aSub-Advisory Agreement with ClearBridge Investments LLC (“ClearBridge”). ClearBridge is responsible for providingday-to-day investment advisory services to the Fund, subject to the supervision of Park Avenue and the oversight of the Board of Trustees.Sub-advisory fees are paid by Park Avenue and do not represent a separate or additional expense to the Fund.
b. Compensation of Trustees and Officers Trustees and officers who are interested persons of the Trust, as defined in the 1940 Act, receive no compensation from the Fund, except for the Chief Compliance Officer of the Trust. Trustees of the Trust who are not interested persons of the Trust, and the Chief Compliance Officer, receive compensation and reimbursement of expenses from the Trust.
c. Distribution Fees Park Avenue Securities LLC (“PAS”), a wholly-owned subsidiary of Guardian Life, is the principal underwriter of Fund shares. The Trust has entered into a distribution and service agreement with PAS, which governs the sale and distribution of shares of the Fund. Under a distribution and service plan adopted by the Trust(“12b-1 plan”), PAS is compensated for services in such capacity, including its expenses in connection with the promotion and distribution of shares of the Fund, at an annual rate of 0.25% of the Fund’s average daily net assets. For the six months ended June 30, 2019, the Fund paid distribution fees in the amount of $303,350 to PAS.
PAS has directed that certain payments under the12b-1 plan be used to compensate GIAC for shareholder services provided to contract owners.
4. Federal Income Taxes
a. Distributions to Shareholders For federal income tax purposes, the Fund is treated as a disregarded entity (“DRE”). As a DRE, the Fund is not subject to an entity-level income tax; and any income, gains, losses, deductions, taxes, and credits of the Fund would instead be “passed through” directly to the separate accounts of GIAC that invest in the Fund and retain the same
character for U.S. federal income tax purposes. In addition, the Fund is not required to distribute taxable income and capital gains for U.S. federal income tax purposes. Therefore, no dividends and capital gains distributions were paid by the Fund.
5. Investments
a. Investment Purchases and Sales The cost of investments purchased and the proceeds from investments sold (excluding short-term investments) amounted to $26,947,354 and $56,664,688, respectively, for the six months ended June 30, 2019. During the six months ended June 30, 2019, there were no purchases or sales of U.S. government securities.
b. Foreign Securities Foreign securities investments involve special risks and considerations not typically associated with U.S. investments. These risks include, but are not limited to, currency risk; adverse political, regulatory, social, and economic developments; and less reliable information about issuers. Moreover, securities of some foreign issuers may be less liquid and their prices more volatile than those of comparable U.S. issuers.
c. Industry or Sector Concentration In its normal course of business, the Fund may invest a significant portion of its assets in companies within a limited number of industries or sectors. As a result, the Fund may be subject to a greater risk of loss than that of a fund invested in a wider spectrum of industries or sectors because the stocks of many or all of the companies in the industry, group of industries, sector, or sectors may decline in value due to developments adversely affecting the industry, group of industries, sector, or sectors.
d. Repurchase Agreements The Fund may invest in repurchase agreements to maintain liquidity and earn income over periods of time as short as overnight. The collateral for repurchase agreements is either cash or fully negotiable U.S. government securities (including U.S. government agency securities). Repurchase agreements are fully collateralized (including the interest accrued thereon) and such collateral is marked to market daily while the agreements remain in force. If the value of the collateral falls below the repurchase price plus accrued interest, the Fund will typically require the seller to deposit additional collateral by the next business day. If the request for additional collateral is not met, or the seller defaults, the Fund maintains the right to sell the collateral (although it may be prevented or delayed from doing so in certain circumstances) and
| 13 |
Table of Contents
NOTES TO FINANCIAL STATEMENTS — GUARDIAN LARGE CAP FUNDAMENTAL GROWTH VIP FUND
may be required to claim any resulting loss against the seller. Park Avenue monitors the creditworthiness of the seller with which the Fund enters into repurchase agreements.
6. Temporary Borrowings
The Fund, with other funds managed by Park Avenue, is party to a $10 million committed revolving credit facility from State Street Bank and Trust Company for temporary borrowing purposes, including the meeting of redemption requests that otherwise might require the untimely disposition of securities. Interest is calculated based on the higher of the dailyone-month LIBOR rate and the Federal Funds rate plus 1.25% at the time of borrowing. In addition to the interest charged on any borrowings by the Fund, each fund pays a commitment fee of 0.30% per annum on its share of the unused portion of the credit facility. The agreement is in
place until December 10, 2019. The Fund did not utilize the credit facility during the six months ended June 30, 2019.
7. Indemnifications
Under the Trust’s organizational documents and, in some cases, by contract, its officers and trustees are indemnified against certain liabilities arising out of the performance of their duties to the Fund. In addition, in the normal course of business, the Fund enters into contracts with its vendors and others that provide general indemnifications. The Fund’s maximum exposure under these arrangements is unknown as this would involve future claims that may be made against the Fund that have not yet occurred. However, based on experience, the Fund expects the risk of loss to be remote.
| 14 |
Table of Contents
SUPPLEMENTAL INFORMATION(UNAUDITED)
Approval of Investment Advisory andSub-advisory Agreements
Section 15(c) of the Investment Company Act of 1940, as amended (the “1940 Act”), requires that a fund’s investment advisory andsub-advisory agreements be approved initially by the fund’s board of trustees. Section 15(c) also requires that the continuation of these agreements, after an initial term of up to two years, be annually reviewed and approved by the board. Any such agreement must be approved by a vote of a majority of the trustees who are not parties to the agreement or “interested persons” (as defined in the 1940 Act) of a party to the agreement at anin-person meeting of the board called for the purpose of voting on such approval.
At a meeting of the Board of Trustees (the “Board”) of Guardian Variable Products Trust (the “Trust”) held on March27-28, 2019 (the “Meeting”), the Board, including the trustees who are not parties to the agreement or “interested persons” as defined in the 1940 Act (the “Independent Trustees”), considered and voted unanimously to renew the existing investment management agreement (the “Management Agreement”) between the Trust, on behalf of Guardian Diversified Research VIP Fund, Guardian Growth & Income VIP Fund, Guardian Integrated Research VIP Fund, Guardian International Growth VIP Fund, Guardian International Value VIP Fund, Guardian Large Cap Disciplined Growth VIP Fund, Guardian Large Cap Disciplined Value VIP Fund, Guardian Large Cap Fundamental Growth VIP Fund, Guardian Mid Cap Traditional Growth VIP Fund, Guardian Mid Cap Relative Value VIP Fund and Guardian Core Plus Fixed Income VIP Fund (the “Funds”), and Park Avenue Institutional Advisers LLC (the “Manager”) for aone-term.
The Board, including the Independent Trustees, also considered and voted unanimously to renew the existingsub-advisory agreements (the“Sub-advisory Agreements,” collectively with the Management Agreement, the “Agreements”) between the Manager and investment advisory firms engaged to serve assub-advisers to certain of the Funds, namely Putnam Investment Management, LLC, AllianceBernstein L.P., Massachusetts Financial Services Company, J.P. Morgan Investment Management Inc., Lazard Asset Management LLC, Wellington Management Company LLP, Boston Partners Global Investors, Inc., ClearBridge Investments, LLC, Janus Capital Management LLC, Wells Capital Management Incorporated and Lord, Abbett & Co. LLC (the“Sub-advisers”) for aone-year term.
The Board is responsible for overseeing the management of each Fund. In determining whether to renew its approval of the Agreements, the Trustees evaluated information and factors that they considered to be relevant and appropriate through the exercise of their own business judgment. The Trustees considered certain information and factors in light of advice furnished to them by legal counsel to the Trust and, in the case of the Independent Trustees, their independent legal counsel. In advance of the Meeting, the Trustees received materials and information designed to assist their consideration of the Agreements. The Trustees received written responses from the Manager and eachSub-adviser to a series of questions and requests for information encompassing a wide variety of topics provided by independent counsel on behalf of the Independent Trustees. The Independent Trustees discussed the Funds with independent counsel during a telephonic meeting and executive session in advance of the Meeting. The Trustees also received materials and information regarding the legal standards applicable to their consideration of the Agreements and the process and criteria used by the Manager to identify and select theSub-advisers.
During the course of their deliberations, the Independent Trustees met to discuss and evaluate the Agreements in executive session with their independent legal counsel, outside of the presence of the Trustees who are not Independent Trustees and representatives from Fund management, the Manager or anySub-adviser.
In reaching its decisions to renew its approval of the Agreements, the Board took into account the materials and information described above as well as other materials and information provided to the Board and discussed with and among the Trustees. Individual Trustees may have given different weight to different factors and information with respect to each Agreement, and the Trustees did not identify any single factor or information that, in isolation, would be controlling in deciding to approve the Agreements. The discussion below is intended to summarize the broad factors that figured prominently in the Board’s decisions to approve the Agreements rather than to beall-inclusive. These broad factors included: (i) the nature, extent and quality of the services provided to the Funds by the Manager and theSub-advisers; (ii) the investment performance of each Fund; (iii) the fees charged and estimated profitability; (iv) the extent to which economies of scale exist for a Fund, and the extent to which a Fund benefits from economies of scale; and
| 15 |
Table of Contents
SUPPLEMENTAL INFORMATION(UNAUDITED)
(v) any other benefits derived by the Manager or theSub-advisers (or their respective affiliates) from their relationships with the Funds.
Nature, Extent and Quality of Services
The Trustees considered information regarding the nature, extent and quality of services provided to the Funds by the Manager. The Trustees also considered, among other things, the terms of the Management Agreement and the range of investment advisory services provided by the Manager. In addition, the Trustees reviewed the range ofnon-investment advisory services provided by the Manager consistent with the terms of the Management Agreement, notably coordinating the preparation and filing of various regulatory documents, coordinating the preparation and assembly of Board meeting materials and assisting the Board with certain valuation matters.
The Trustees considered that the Funds operate in a“manager-of-managers” structure and reviewed the responsibilities that the Manager has under this structure, including monitoring and evaluating the performance of theSub-advisers, monitoring theSub-advisers for adherence to the stated investment objectives, strategies, policies and restrictions of the Funds and supervising theSub-advisers with respect to the services that theSub-advisers would provide under theSub-advisory Agreements. The Trustees also considered the process used by the Manager, consistent with this structure, to identify and recommendsub-advisers, and the Manager’s ability to monitor and overseesub-advisers and recommend replacementsub-advisers, when necessary, and provide other services under the Management Agreement. The Board noted that investment management staff of the Manager and the Trust’s Chief Compliance Officer conductin-person oversight visits of theSub-advisers on a periodic basis, follow through with additional inquiry on any questions or concerns that arise during the visit and then report the results of the visit to the Board. The Trustees reviewed information regarding the experience and background of the Manager’s key personnel and the Manager’s organizational structure and resources, including investment, legal and administrative capabilities of the Manager. In this regard, the Trustees recognized that the Funds may benefit from the Manager’s ability to use similar resources and capabilities of its affiliates in providing services to the Funds.
The Trustees considered information regarding the nature, extent and quality of services provided to the Funds by theSub-advisers. The Trustees also
considered, among other things, the terms of theSub-advisory Agreements and the range of investment advisory services provided by theSub-advisers under the oversight of the Manager. In evaluating these investment advisory services, the Trustees considered, among other things, theSub-advisers’ investment philosophies, styles and/or processes and approach to managing the Funds. The Trustees received and evaluated information regarding the background, education, expertise and/or experience of the investment professionals that serve as portfolio managers for the Funds and the capabilities and resources of theSub-advisers.
Based upon these considerations, the Trustees concluded, within the context of their full deliberations, that the nature, extent and quality of services provided to the Funds by the Manager and eachSub-adviser were appropriate.
Investment Performance
In connection with each of its regular quarterly meetings, the Board receives information on the performance of each Fund, including net performance, relative performance rankings within each Fund’s Lipper peer group, Morningstar ratings, and performance as compared to benchmark index returns. At each quarterly Board meeting, members of the Manager’s senior investment team reviewed with the Board the economic and market environment, risk management, and style consistency in connection with management of the Funds. The Board considered investment performance for each Fund over theone-year and since inception periods.
The Board also received and reviewed a report prepared by Broadridge Financial Solutions (“Broadridge”), an independent provider of mutual fund industry data. The Board reviewed the investment performance of each Fund on an absolute basis and in comparison to an appropriate benchmark index and each Fund’s respective peer group as independently selected by Broadridge. The Board noted that, except for Guardian Growth & Income VIP Fund, Guardian Large Cap Disciplined Value VIP Fund and Guardian Mid Cap Traditional Growth VIP Fund, each of the Fund’s performance for theone-year and since inception periods was below the median of its respective peer group median and benchmark index. With respect to Guardian Large Cap Disciplined Value VIP Fund, the Board noted that the performance for theone-year period was lower than the peer group median and benchmark index and performance since inception was
| 16 |
Table of Contents
SUPPLEMENTAL INFORMATION(UNAUDITED)
higher than the peer group median and benchmark index. With respect to Guardian Growth & Income VIP Fund and Guardian Mid Cap Traditional Growth VIP Fund, the Board noted that the performance for both theone-year and since inception periods was higher than each Fund’s peer group median and benchmark index.
The Manager discussed with the Board factors contributing to the Funds’ performance results. In addition, for certain Funds, the Manager discussed with the Board longer term performance records of theSub-advisers for strategies used in managing the Funds. The Board concluded that the investment performance generated by eachSub-adviser was generally satisfactory, or, that any steps being taken by the Manager andSub-advisers to address any performance issues were satisfactory. The Board also noted the short operational history of each Fund.
Costs and Profitability
The Trustees considered the management fees paid by the Funds to the Manager under the Management Agreement and evaluated the reasonableness of these fees. The Trustees received and reviewed comparative information with respect to the management fees and the management fees paid by other funds offered as investment options underlying variable contracts within the applicable peer group based on data obtained from Broadridge. The Board noted that the contractual and actual (effective) management fees reported for each of the Funds were below or equal to its peer group in all cases except for the Guardian Mid Cap Traditional Growth VIP Fund. The Board noted that the actual (effective) management fee for this Fund exceeded the peer group median by a modest amount.
The Trustees considered thesub-advisory fees paid under theSub-advisory Agreements and evaluated the reasonableness of those fees. The Trustees also considered that the fees paid to theSub-advisers would be paid by the Manager and not the Funds and that the Manager had negotiated the fees with theSub-advisers atarm’s-length.
The Trustees received comparative information relating to each Fund’s operating expense ratios and the operating expense ratios of a peer group of funds. In this regard, the Board noted that each Fund’s operating expense ratio was equal to or lower than the operating expense ratio of its respective peer group median, except for Guardian Diversified Research VIP Fund, Guardian Growth & Income VIP Fund and Guardian Integrated Research VIP Fund. The Board noted that the operating expense ratio for these Funds exceeded the
peer group median by a modest amount. The Trustees considered the Manager’s commitment to limit each Fund’s operating expenses through an expense limitation agreement with the Trust. Although the Board recognized that the comparisons between the management fees and operating expenses of the Funds and those of identified peer funds are imprecise, given different terms of agreements and variations in fund strategies, the Trustees found that the comparative information supported their consideration and approval of the management fees and evaluation of the operating expenses.
The Board considered the Manager’s estimates of its profitability, which included allocations by the Manager of its costs in providing management services to the Funds. The Board considered the estimated profitability of the Manager both overall and on aFund-by-Fund basis. The Board did not consider any profitability information from theSub-advisers because the Manager would be responsible for payment of thesub-advisory fees and had negotiated the fees with theSub-advisers atarm’s-length.
Based on the consideration of the information and factors summarized above, as well as other relevant information and factors, the Board concluded that the proposed management andsub-advisory fees were reasonable in light of the nature, extent and quality of services rendered to the Funds by the Manager and theSub-advisers. The Board also concluded that the profitability of the Funds to the Manager was acceptable and the Board determined it was appropriate to revisit estimated Manager profitability in connection with future reviews of the Agreements.
Economies of Scale
The Board considered whether the Funds’ fee structure is designed to share economies of scale with shareholders as the Funds’ assets grow. In this regard, the Board noted that for ten of eleven Funds, the management andsub-advisory fee included breakpoints that are tiered based on growth in asset levels of each such Fund. The Board also noted that the Funds’ expenses were subject to an expense limitation provided by the Manager. The Board noted that expected economies of scale, where they exist, may be shared through the use of fee breakpoints, expense limitations by the Manager, and/or a lower overall fee.
Ancillary Benefits
The Board considered the potential benefits, other than management fees, that the Manager and/or its affiliates
| 17 |
Table of Contents
SUPPLEMENTAL INFORMATION(UNAUDITED)
may receive because of the Manager’s relationship with the Funds. The Trustees acknowledged that the Funds were designed to serve as investment options under variable contracts issued by affiliates of the Manager that would receive fees under those contracts and that Park Avenue Securities LLC, an affiliate of the Manager and principal underwriter of the Funds, and participating insurance companies, including insurance companies affiliated with the Manager, would be entitled to receive fees from the Funds under a plan of distribution adopted pursuant to Rule12b-1 under the 1940 Act. The Trustees considered the benefits to the Manager from increased assets under management. The Trustees considered that the Manager and its affiliates may benefit from (i) greater efficiencies in annuity administration and operations and potential cost savings due to a reduction in the number of unaffiliated funds available as annuity contract investment options, and (ii) increased dividends-received deductions due to
the Funds’ status under the tax laws as disregarded
entities. In addition, the Trustees considered the potential benefits, other thansub-advisory fees, that theSub-advisers and their affiliates may receive because of their relationships with the Funds, including the potential increased ability to use soft dollars consistent with Trust policies and other benefits from increases in assets under management. The Trustees concluded that benefits that may accrue to the Manager and its affiliates are reasonable and the benefits that may accrue to theSub-advisers and their affiliates are consistent with those expected for asub-adviser to a mutual fund such as the applicable Fund.
Conclusion
Based on a comprehensive consideration and evaluation of all of the information and factors summarized above, among others, the Board as a whole, including the Independent Trustees, approved the Agreements.
| 18 |
Table of Contents
SUPPLEMENTAL INFORMATION(UNAUDITED)
The Statement of Additional Information (“SAI”) includes additional information about the Trust’s Trustees and Officers and is available, without charge, upon request by calling toll-free1-888-GUARDIAN(1-888-482-7342) or by visiting our website at http://guardianvpt.onlineprospectus.net/GuardianVPT/Prospectuses.
Portfolio Holdings and Proxy Voting Procedures
The Fund files its complete schedule of portfolio holdings with the Securities and Exchange Commission for the first and third quarters of each fiscal year as an exhibit to its reports on FormN-PORT. The Fund’s FormN-PORT reports are available on the Securities and Exchange Commission’s website at https://www.sec.gov. The Fund’s FormN-PORT information is also available, without charge, upon request, by calling toll-free1-888-GUARDIAN(1-888-482-7342) or by visiting our website at http://guardianvpt.onlineprospectus.net/GuardianVPT/
Prospectuses.
A description of the policies and procedures that the Fund uses to determine how to vote proxies relating to portfolio securities is included in the SAI. The SAI and information regarding how the Fund voted proxies relating to portfolio securities during the most recent12-month period ended June 30 may be obtained (i) without charge, upon request, by calling toll-free1-888-GUARDIAN(1-888-482-7342) or by visiting our website at http://guardianvpt.onlineprospectus.net/GuardianVPT/
Prospectuses; and (ii) on the Securities and Exchange Commission’s website at https://www.sec.gov.
| 19 |
Table of Contents
This report is transmitted to shareholders only. It is not authorized for use as an offer of sale or a solicitation of an offer to buy shares of the Fund unless accompanied or preceded by the Fund’s current prospectus. Past performance results shown in this report should not be considered a representation of future performance. Investment returns and principal value of shares will fluctuate so that shares, when redeemed, may be worth more or less than their original cost. Statements and other information herein are as dated and are subject to change.

The Guardian Life Insurance Company of America New York, NY 10001-2159
PUB8175
Table of Contents
Guardian Variable
Products Trust
2019
Semiannual Report
All Data as of June 30, 2019
Guardian Large Cap Disciplined Growth VIP Fund
Important Notice
Beginning on January 1, 2021, as permitted by regulations adopted by the Securities and Exchange Commission, paper copies of the Fund’s shareholder reports will no longer be sent by mail from The Guardian Insurance & Annuity Company, Inc. (“GIAC”). Instead, GIAC will mail you a notice when copies of the shareholder reports are made available on a website. You will be notified by mail each time a report is posted and provided with a website link to access the report.
If you have already elected to receive shareholder reports electronically, you will not be affected by this change and you need not take any action. If you have not yet elected electronic delivery, at any time, you may elect to receive the Fund’s shareholder reports and certain other communications from GIAC electronically, by going to www.guardianlife.com and registering for e-delivery.
You may instead elect to receive all future shareholder reports in paper free of charge. If you wish to receive paper copies of your shareholder reports, please call GIAC’s Customer Service Office Contact Center at 1-888-GUARDIAN (1-888-482-7342). Your election to receive reports in paper will apply to all the underlying funds available.

| Not FDIC insured. May lose value. No bank guarantee. | www.guardianlife.com |
Table of Contents
TABLE OF CONTENTS
Guardian Large Cap Disciplined Growth VIP Fund
| 1 | ||||
| 2 | ||||
Financial Information | ||||
| Schedule of Investments | 3 | |||
| Statement of Assets and Liabilities | 5 | |||
| Statement of Operations | 5 | |||
| Statements of Changes in Net Assets | 6 | |||
| Financial Highlights | 8 | |||
| Notes to Financial Statements | 10 | |||
| Shareholder Meeting Results | 15 | |||
Supplemental Information | ||||
| Approval of Investment Advisory andSub-advisory Agreements | 16 | |||
| Portfolio Holdings and Proxy Voting Procedures | 20 | |||
Except as otherwise specifically stated, all information, including portfolio security positions, is as of June 30, 2019. Fund holdings will vary. Information contained herein has been obtained from sources believed reliable, but is not guaranteed.
Table of Contents
GUARDIAN LARGE CAP DISCIPLINED GROWTH VIP FUND
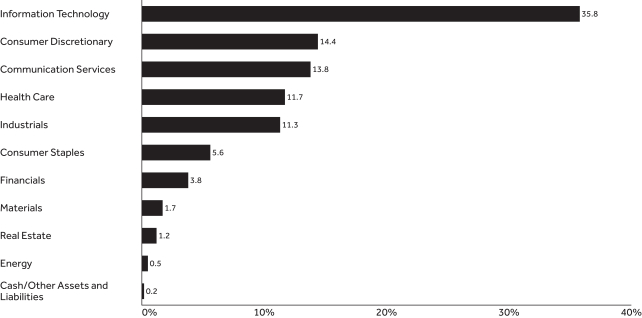
Fund Characteristics (unaudited)
Total Net Assets: $195,286,954
Sector Allocation1 As of June 30, 2019 |
 |
Top Ten Holdings2 As of June 30, 2019 | ||||
| Holding | % of Total Net Assets | |||
| Microsoft Corp. | 6.28% | |||
| Amazon.com, Inc. | 6.04% | |||
| Apple, Inc. | 5.32% | |||
| Alphabet, Inc., Class A | 4.35% | |||
| MasterCard, Inc., Class A | 3.05% | |||
| Facebook, Inc., Class A | 2.59% | |||
| UnitedHealth Group, Inc. | 2.39% | |||
| salesforce.com, Inc. | 1.97% | |||
| NIKE, Inc., Class B | 1.95% | |||
| Alphabet, Inc., Class C | 1.80% | |||
| Total | 35.74% | |||
| 1 | The Fund’s holdings are allocated to each sector based on the MSCI Global Industry Classification Standard (GICS®). Cash includes short-term investments and net other assets and liabilities. |
| 2 | Portfolio holdings are subject to change and should not be considered a recommendation to buy or sell individual securities. |
| 1 |
Table of Contents
UNDERSTANDING YOUR FUND’S EXPENSES(UNAUDITED)
By investing in the Fund, you incur two types of costs: (1) transaction costs and (2) ongoing costs, including, as applicable, investment advisory fees, distribution and/or service(12b-1) fees and other Fund expenses. The example below is intended to help you understand your ongoing costs (in dollars) of investing in the Fund and to compare these costs with the ongoing costs of investing in other mutual funds.
The example is based on an investment of $1,000 invested at the beginning of the period and held for the entire period from January 1, 2019 to June 30, 2019. The table below shows the Fund’s expenses in two ways:
Expenses based on actual return
This section of the table provides information about actual account values and actual expenses. You may use the information in this section, together with the amount you invested, to estimate the expenses that you paid over the period. Simply divide your account value by $1,000 (for example, an $8,600 account value divided by $1,000 = 8.6), then multiply the result by the number in the section under the heading entitled “Expenses Paid During Period” to estimate the expenses you paid on your account during this period.
Expenses based on hypothetical 5% return for comparison purposes
This section of the table provides information about hypothetical account values and hypothetical expenses based on the Fund’s actual expense ratio and an assumed rate of return of 5% per year before expenses, which is not the Fund’s actual return. The hypothetical account values and expenses may not be used to estimate the actual ending account balance or expenses you paid for the period. You may use this information to compare the ongoing costs of investing in the Fund with the cost of investing in other mutual funds. To do so, compare this 5% hypothetical example with the 5% hypothetical examples that appear in the shareholder reports of the other funds.
Note that the expenses shown in the table are meant to highlight your ongoing costs only and do not reflect any transactional costs, such as sales charges (loads), redemption fees, or exchange fees. Therefore the second section is useful in comparing ongoing costs only, and will not help you determine the relative total costs of owning different funds. If these transactional costs were included, your costs would have been higher. Charges and expenses at the insurance company separate account level are not reflected in the table.
Beginning 1/1/19 | Ending Account Value 6/30/19 | Expenses Paid During Period* 1/1/19-6/30/19 | Expense Ratio During Period 1/1/19-6/30/19 | |||||||||||
| Based on Actual Return | $1,000.00 | $1,238.80 | $4.83 | 0.87% | ||||||||||
| Based on Hypothetical Return (5% Return Before Expenses) | $1,000.00 | $1,020.48 | $4.36 | 0.87% | ||||||||||
| * | Expenses are equal to the Fund’s annualized expense ratio as indicated, multiplied by the average account value over the period, multiplied by181/365 (to reflect theone-half year period). |
| 2 |
Table of Contents
SCHEDULE OF INVESTMENTS — GUARDIAN LARGE CAP DISCIPLINED GROWTH VIP FUND
| June 30, 2019(unaudited) | Shares | Value | ||||||
| Common Stocks – 99.8% | ||||||||
| Aerospace & Defense – 1.3% | ||||||||
Raytheon Co. | 14,254 | $ | 2,478,486 | |||||
|
| |||||||
| 2,478,486 | ||||||||
| Banks – 0.6% | ||||||||
SVB Financial Group(1) | 4,889 | 1,098,021 | ||||||
|
| |||||||
| 1,098,021 | ||||||||
| Beverages – 2.5% | ||||||||
Constellation Brands, Inc., Class A | 13,826 | 2,722,893 | ||||||
Monster Beverage Corp.(1) | 34,398 | 2,195,624 | ||||||
|
| |||||||
| 4,918,517 | ||||||||
| Biotechnology – 2.2% | ||||||||
Neurocrine Biosciences, Inc.(1) | 17,239 | 1,455,489 | ||||||
Seattle Genetics, Inc.(1) | 17,261 | 1,194,634 | ||||||
Vertex Pharmaceuticals, Inc.(1) | 8,758 | 1,606,042 | ||||||
|
| |||||||
| 4,256,165 | ||||||||
| Building Products – 1.2% | ||||||||
Fortune Brands Home & Security, Inc. | 41,258 | 2,357,070 | ||||||
|
| |||||||
| 2,357,070 | ||||||||
| Capital Markets – 1.6% | ||||||||
BlackRock, Inc. | 2,609 | 1,224,404 | ||||||
Intercontinental Exchange, Inc. | 21,977 | 1,888,703 | ||||||
|
| |||||||
| 3,113,107 | ||||||||
| Chemicals – 1.7% | ||||||||
PPG Industries, Inc. | 19,253 | 2,247,017 | ||||||
The Sherwin-Williams Co. | 2,468 | 1,131,060 | ||||||
|
| |||||||
| 3,378,077 | ||||||||
| Commercial Services & Supplies – 0.8% |
| |||||||
Copart, Inc.(1) | 20,734 | 1,549,659 | ||||||
|
| |||||||
| 1,549,659 | ||||||||
| Consumer Finance – 0.8% | ||||||||
Capital One Financial Corp. | 16,552 | 1,501,928 | ||||||
|
| |||||||
| 1,501,928 | ||||||||
| Diversified Telecommunication Services – 1.3% |
| |||||||
Verizon Communications, Inc. | 43,119 | 2,463,388 | ||||||
|
| |||||||
| 2,463,388 | ||||||||
| Electrical Equipment – 1.7% | ||||||||
AMETEK, Inc. | 21,717 | 1,972,772 | ||||||
Eaton Corp. PLC | 16,219 | 1,350,719 | ||||||
|
| |||||||
| 3,323,491 | ||||||||
| Electronic Equipment, Instruments & Components – 0.9% |
| |||||||
CDW Corp. | 16,465 | 1,827,615 | ||||||
|
| |||||||
| 1,827,615 | ||||||||
| Entertainment – 3.8% | ||||||||
Activision Blizzard, Inc. | 39,195 | 1,850,004 | ||||||
Electronic Arts, Inc.(1) | 11,089 | 1,122,872 | ||||||
Netflix, Inc.(1) | 5,892 | 2,164,250 | ||||||
| June 30, 2019(unaudited) | Shares | Value | ||||||
| Entertainment(continued) | ||||||||
The Walt Disney Co. | 16,161 | $ | 2,256,722 | |||||
|
| |||||||
| 7,393,848 | ||||||||
| Equity Real Estate Investment – 1.2% |
| |||||||
American Tower Corp. REIT | 11,817 | 2,415,986 | ||||||
|
| |||||||
| 2,415,986 | ||||||||
| Food & Staples Retailing – 1.7% |
| |||||||
Costco Wholesale Corp. | 12,777 | 3,376,450 | ||||||
|
| |||||||
| 3,376,450 | ||||||||
| Health Care Equipment & Supplies – 4.7% |
| |||||||
Baxter International, Inc. | 36,695 | 3,005,320 | ||||||
Boston Scientific Corp.(1) | 54,464 | 2,340,863 | ||||||
Edwards Lifesciences Corp.(1) | 9,979 | 1,843,520 | ||||||
Teleflex, Inc. | 5,984 | 1,981,602 | ||||||
|
| |||||||
| 9,171,305 | ||||||||
| Health Care Providers & Services – 2.4% |
| |||||||
UnitedHealth Group, Inc. | 19,165 | 4,676,452 | ||||||
|
| |||||||
| 4,676,452 | ||||||||
| Hotels, Restaurants & Leisure – 1.3% |
| |||||||
Hilton Worldwide Holdings, Inc. | 25,181 | 2,461,191 | ||||||
|
| |||||||
| 2,461,191 | ||||||||
| Household Products – 1.4% | ||||||||
Colgate-Palmolive Co. | 37,538 | 2,690,348 | ||||||
|
| |||||||
| 2,690,348 | ||||||||
| Insurance – 0.8% | ||||||||
The Allstate Corp. | 16,068 | 1,633,955 | ||||||
|
| |||||||
| 1,633,955 | ||||||||
| Interactive Media & Services – 8.7% |
| |||||||
Alphabet, Inc., Class A(1) | 7,839 | 8,488,069 | ||||||
Alphabet, Inc., Class C(1) | 3,251 | 3,514,039 | ||||||
Facebook, Inc., Class A(1) | 26,245 | 5,065,285 | ||||||
|
| |||||||
| 17,067,393 | ||||||||
| Internet & Direct Marketing Retail – 7.6% |
| |||||||
Amazon.com, Inc.(1) | 6,227 | 11,791,634 | ||||||
Booking Holdings, Inc.(1) | 993 | 1,861,587 | ||||||
Wayfair, Inc., Class A(1) | 8,187 | 1,195,302 | ||||||
|
| |||||||
| 14,848,523 | ||||||||
| IT Services – 10.4% | ||||||||
EPAM Systems, Inc.(1) | 9,526 | 1,648,950 | ||||||
FleetCor Technologies, Inc.(1) | 12,182 | 3,421,315 | ||||||
Global Payments, Inc. | 19,908 | 3,187,868 | ||||||
GoDaddy, Inc., Class A(1) | 41,671 | 2,923,221 | ||||||
MasterCard, Inc., Class A | 22,488 | 5,948,750 | ||||||
PayPal Holdings, Inc.(1) | 28,528 | 3,265,315 | ||||||
|
| |||||||
| 20,395,419 | ||||||||
| Life Sciences Tools & Services – 1.6% |
| |||||||
Thermo Fisher Scientific, Inc. | 10,587 | 3,109,190 | ||||||
|
| |||||||
| 3,109,190 | ||||||||
| The accompanying notes are an integral part of these financial statements. | 3 |
Table of Contents
SCHEDULE OF INVESTMENTS — GUARDIAN LARGE CAP DISCIPLINED GROWTH VIP FUND
| June 30, 2019(unaudited) | Shares | Value | ||||||
| Machinery – 3.6% | ||||||||
Illinois Tool Works, Inc. | 14,881 | $ | 2,244,204 | |||||
Nordson Corp. | 13,619 | 1,924,501 | ||||||
Snap-on, Inc. | 8,869 | 1,469,061 | ||||||
The Middleby Corp.(1) | 10,090 | 1,369,213 | ||||||
|
| |||||||
| 7,006,979 | ||||||||
| Oil, Gas & Consumable Fuels – 0.5% |
| |||||||
Continental Resources, Inc.(1) | 25,493 | 1,073,000 | ||||||
|
| |||||||
| 1,073,000 | ||||||||
| Pharmaceuticals – 0.8% | ||||||||
Allergan PLC | 9,415 | 1,576,353 | ||||||
|
| |||||||
| 1,576,353 | ||||||||
| Professional Services – 1.4% |
| |||||||
Equifax, Inc. | 8,794 | 1,189,301 | ||||||
IHS Markit Ltd.(1) | 23,173 | 1,476,583 | ||||||
|
| |||||||
| 2,665,884 | ||||||||
| Road & Rail – 1.3% | ||||||||
Norfolk Southern Corp. | 8,856 | 1,765,266 | ||||||
Uber Technologies, Inc.(1) | 15,049 | 697,973 | ||||||
|
| |||||||
| 2,463,239 | ||||||||
| Semiconductors & Semiconductor Equipment – 3.3% |
| |||||||
Advanced Micro Devices, Inc.(1) | 71,883 | 2,183,087 | ||||||
Marvell Technology Group Ltd. | 65,638 | 1,566,779 | ||||||
Micron Technology, Inc.(1) | 38,962 | 1,503,544 | ||||||
ON Semiconductor Corp.(1) | 57,368 | 1,159,407 | ||||||
|
| |||||||
| 6,412,817 | ||||||||
| Software – 15.1% | ||||||||
Adobe, Inc.(1) | 10,980 | 3,235,257 | ||||||
DocuSign, Inc.(1) | 26,076 | 1,296,238 | ||||||
Guidewire Software, Inc.(1) | 20,590 | 2,087,414 | ||||||
Microsoft Corp. | 91,640 | 12,276,094 | ||||||
salesforce.com, Inc.(1) | 25,340 | 3,844,838 | ||||||
ServiceNow, Inc.(1) | 9,093 | 2,496,665 | ||||||
SS&C Technologies Holdings, Inc. | 38,963 | 2,244,659 | ||||||
Workday, Inc., Class A(1) | 9,438 | 1,940,264 | ||||||
|
| |||||||
| 29,421,429 | ||||||||
| June 30, 2019(unaudited) | Shares | Value | ||||||
| Specialty Retail – 1.3% | ||||||||
The TJX Cos., Inc. | 48,712 | $ | 2,575,891 | |||||
|
| |||||||
| 2,575,891 | ||||||||
| Technology Hardware, Storage & Peripherals – 6.1% |
| |||||||
Apple, Inc. | 52,472 | 10,385,258 | ||||||
NetApp, Inc. | 24,836 | 1,532,381 | ||||||
|
| |||||||
| 11,917,639 | ||||||||
| Textiles, Apparel & Luxury Goods – 4.2% |
| |||||||
NIKE, Inc., Class B | 45,344 | 3,806,629 | ||||||
Under Armour, Inc., Class C(1) | 91,928 | 2,040,801 | ||||||
VF Corp. | 26,699 | 2,332,158 | ||||||
|
| |||||||
| 8,179,588 | ||||||||
Total Common Stocks (Cost $161,110,340) |
| 194,798,403 | ||||||
| Principal Amount | Value | |||||||
| Short–Term Investment – 0.3% |
| |||||||
| Repurchase Agreements – 0.3% |
| |||||||
Fixed Income Clearing Corp., 0.50%, dated 6/28/2019, proceeds at maturity value of $603,025, due 7/1/2019(2) | $ | 603,000 | 603,000 | |||||
Total Repurchase Agreements (Cost $603,000) |
| 603,000 | ||||||
Total Investments – 100.1% (Cost $161,713,340) |
| 195,401,403 | ||||||
| Liabilities in excess of other assets – (0.1)% |
| (114,449 | ) | |||||
| Total Net Assets – 100.0% |
| $ | 195,286,954 | |||||
| (1) | Non–income–producing security. |
| (2) | The table below presents collateral for repurchase agreements. |
| Security | Coupon | Maturity Date | Principal Amount | Value | ||||||||||||
| U.S. Treasury Note | 2.75% | 8/15/2021 | $ | 600,000 | $ | 618,412 | ||||||||||
Legend:
REIT — Real Estate Investment Trust
The following is a summary of the inputs used as of June 30, 2019 in valuing the Fund’s investments. For more information on valuation inputs, please refer to Note 2a of the accompanying Notes to Financial Statements.
| Valuation Inputs | ||||||||||||||||
| Investments in Securities(unaudited) | Level 1 | Level 2 | Level 3 | Total | ||||||||||||
| Common Stocks | $ | 194,798,403 | $ | — | $ | — | $ | 194,798,403 | ||||||||
| Repurchase Agreements | — | 603,000 | — | 603,000 | ||||||||||||
| Total | $ | 194,798,403 | $ | 603,000 | $ | — | $ | 195,401,403 | ||||||||
| 4 | The accompanying notes are an integral part of these financial statements. |
Table of Contents
FINANCIAL INFORMATION — GUARDIAN LARGE CAP DISCIPLINED GROWTH VIP FUND
For the Six Months Ended June 30, 2019 (unaudited) | ||||
Investment Income | ||||
Dividends | $ | 835,542 | ||
Interest | 4,478 | |||
|
| |||
Total Investment Income | 840,020 | |||
|
| |||
Expenses | ||||
Investment advisory fees | 582,409 | |||
Distribution fees | 244,568 | |||
Trustees’ and officers’ fees | 47,734 | |||
Professional fees | 29,648 | |||
Administrative fees | 23,535 | |||
Custodian and accounting fees | 22,668 | |||
Shareholder reports | 19,802 | |||
Transfer agent fees | 9,011 | |||
Other expenses | 12,946 | |||
|
| |||
Total Expenses | 992,321 | |||
Less: Fees waived | (141,226 | ) | ||
|
| |||
Total Expenses, Net | 851,095 | |||
|
| |||
Net Investment Income/(Loss) | (11,075 | ) | ||
|
| |||
Realized Gain/(Loss) and Change in Unrealized Appreciation/(Depreciation) on Investments | ||||
Net realized gain/(loss) from investments | 3,988,899 | |||
Net change in unrealized appreciation/(depreciation) on investments | 37,785,919 | |||
|
| |||
Net Gain on Investments | 41,774,818 | |||
|
| |||
Net Increase in Net Assets Resulting from Operations | $ | 41,763,743 | ||
|
| |||
| The accompanying notes are an integral part of these financial statements. | 5 |
Table of Contents
FINANCIAL INFORMATION — GUARDIAN LARGE CAP DISCIPLINED GROWTH VIP FUND
| 6 | The accompanying notes are an integral part of these financial statements. |
Table of Contents
This Page Intentionally Left Blank
| 7 |
Table of Contents
FINANCIAL INFORMATION — GUARDIAN LARGE CAP DISCIPLINED GROWTH VIP FUND
The Financial Highlights table is intended to help you understand the Fund’s financial performance for the past six reporting periods (or, if shorter, the period since inception). Certain information reflects financial results for a single Fund share. The total returns in the table represent the rate that an investor would have earned (or lost) on an investment in the Fund.
Financial Highlights Six Months Ended Numbers are unaudited | ||||||||||||||||||||||||
| Per Share Operating Performance | ||||||||||||||||||||||||
Net Asset Value, | Net Investment Income/(Loss)(1) | Net Realized and Unrealized Gain/(Loss) | Total Operations | Net Asset Value, End of Period | Total Return(2) | |||||||||||||||||||
Six Months Ended 6/30/19 | $ | 12.52 | $ | (0.00 | )(4) | $ | 2.99 | $ | 2.99 | $ | 15.51 | 23.88% | (5) | |||||||||||
Year Ended 12/31/18 | 12.67 | (0.01 | ) | (0.14 | ) | (0.15 | ) | 12.52 | (1.18)% | |||||||||||||||
Year Ended 12/31/17 | 9.85 | 0.03 | 2.79 | 2.82 | 12.67 | 28.63% | ||||||||||||||||||
Period Ended 12/31/16(6) | 10.00 | 0.01 | (0.16 | ) | (0.15 | ) | 9.85 | (1.50)% | (5) | |||||||||||||||
| 8 | The accompanying notes are an integral part of these financial statements. |
Table of Contents
FINANCIAL INFORMATION — GUARDIAN LARGE CAP DISCIPLINED GROWTH VIP FUND
| Ratios/Supplemental Data | ||||||||||||||||||||||
| Net Assets, End of Period (000s) | Net Ratio of Expenses to Average Net Assets(3) | Gross Ratio of Expenses to Average Net Assets | Net Ratio of Net Investment Income/(Loss) to Average Net Assets(3) | Gross Ratio of Net Investment Loss to Average Net Assets | Portfolio Turnover Rate | |||||||||||||||||
| $ | 195,287 | 0.87% | (5) | 1.01% | (5) | (0.01)% | (5) | (0.15)% | (5) | 10% | (5) | |||||||||||
| 181,144 | 0.87% | 1.04% | (0.05)% | (0.22)% | 47% | |||||||||||||||||
| 8,521 | 1.00% | 2.08% | 0.27% | (0.81)% | 77% | |||||||||||||||||
| 8,165 | 1.00% | (5) | 3.16% | (5) | 0.39% | (5) | (1.77)% | (5) | 42% | (5) | ||||||||||||
| (1) | Calculated based on the average shares outstanding during the period. |
| (2) | Total returns do not reflect the effects of charges deducted pursuant to the terms of The Guardian Insurance & Annuity Company, Inc.’s variable contracts. Inclusion of such charges would reduce the total returns for all periods shown. |
| (3) | Net Ratio of Expenses to Average Net Assets and Net Ratio of Net Investment Income/(Loss) to Average Net Assets include the effect of fee waivers and expense limitations. |
| (4) | Rounds to $(0.00) per share. |
| (5) | Ratios for periods less than one year have been annualized, except for total return and portfolio turnover rate. For the period ended December 31, 2016, certainnon-recurring fees (i.e., audit fees) are not annualized. |
| (6) | Commenced operations on September 1, 2016. |
| The accompanying notes are an integral part of these financial statements. | 9 |
Table of Contents
NOTES TO FINANCIAL STATEMENTS — GUARDIAN LARGE CAP DISCIPLINED GROWTH VIP FUND
June 30, 2019(unaudited)
1. Organization
Guardian Variable Products Trust (the “Trust”), a Delaware statutory trust organized on January 12, 2016, is registered under the Investment Company Act of 1940, as amended (the “1940 Act”), as anopen-end management investment company. The Trust currently has sixteen series. Guardian Large Cap Disciplined Growth VIP Fund (the “Fund”) is a series of the Trust. The Fund is a diversified fund and commenced operations on September 1, 2016. The financial statements for other series of the Trust are presented in separate reports.
The Trust has authorized an unlimited number of shares of beneficial interest with no par value. Shares are bought and sold at closing net asset value (“NAV”). Shares of the Fund are only sold to certain separate accounts of The Guardian Insurance & Annuity Company, Inc. (“GIAC”) that fund certain variable annuity contracts and variable life insurance policies issued by GIAC. GIAC is a wholly-owned subsidiary of The Guardian Life Insurance Company of America (“Guardian Life”).
The Fund seeks to maximize long-term growth.
2. Significant Accounting Policies
The following is a summary of significant accounting policies followed by the Fund in the preparation of its financial statements. The Fund follows the investment company accounting and reporting guidance of the Financial Accounting Standards Board (“FASB”) Accounting Standards Codification Topic 946 Financial Services — Investment Companies. The following policies are in conformity with accounting principles generally accepted in the United States of America (“GAAP”). The preparation of financial statements in accordance with GAAP requires management to make estimates and assumptions that affect the reported amounts and disclosures in the financial statements. Actual results could differ from those estimates.
a. Investment Valuations Equity securities traded on an exchange other than NASDAQ Stock Market, LLC (“NASDAQ”) are valued at the last reported sale price on the principal exchange or market on which they are traded; or, if there were no sales that day, at the mean between the closing bid and ask prices. Securities traded on the NASDAQ are generally valued at the NASDAQ official closing price, which may not be the last sale price. If the NASDAQ official closing price is not available
for a security, that security is generally valued at the mean between the closing bid and ask prices. Repurchase agreements are carried at cost, which approximates fair value (see Note 5d). Foreign securities are valued in the currencies of the markets in which they trade and then converted to U.S. dollars by the application of foreign exchange rates at the close of the New York Stock Exchange (“NYSE”). Forward foreign currency contracts, if any, are valued at the mean between the bid and ask rates for the specified time interpolated from rates for proximate time periods. Securities for which market quotations are not readily available or for which market quotations may be considered unreliable are valued at their fair values as determined in accordance with policies and procedures adopted by the Board of Trustees.
Under the policies and procedures approved by the Board of Trustees, Park Avenue Institutional Advisers LLC (“Park Avenue”), the Fund’s investment adviser, has established a Fair Valuation Committee to assist the Board of Trustees with the oversight and monitoring of the valuation of the Fund’s investments. This includes monitoring the appropriateness of fair values based on results of ongoing valuation oversight, including but not limited to consideration of security specific events, market events, and pricing vendor and broker-dealer due diligence. The Fair Valuation Committee oversees and carries out the policies for the valuation of investments held in the Fund. The Fair Valuation Committee is responsible for discussing and assessing the potential impacts to the fair values on an ongoing basis, and at least on a quarterly basis with the Board of Trustees.
Securities whose values have been materially affected by events occurring before the Fund’s valuation time but after the close of the securities’ principal exchange or market may be fair valued in accordance with policies and procedures adopted by the Board of Trustees. In addition, the values of the Fund’s investments in foreign securities are generally determined by a pricing service using pricing models designed to estimate likely changes in the values of those securities. Certain foreign equity instruments are valued by applying international fair value factors provided by approved pricing services. The factors seek to adjust the local closing price for movements of local markets post closing, but prior to the time the NAVs are calculated. Valuations reflected in this report are as of the report date. As a result, changes in valuation due to market events and/or issuer related events after the report date and prior to issuance of the report are not reflected herein.
| 10 |
Table of Contents
NOTES TO FINANCIAL STATEMENTS — GUARDIAN LARGE CAP DISCIPLINED GROWTH VIP FUND
Various inputs are used in determining the valuation of the Fund’s investments. These inputs are summarized in three broad levels listed below.
| • | Level 1 — unadjusted inputs using quoted prices in active markets for identical investments. |
| • | Level 2 — other significant observable inputs, including, but not limited to, quoted prices for similar investments, inputs other than quoted prices that are observable for investments (such as interest rates, prepayment speeds, credit risks, etc.) or other market corroborated inputs. |
| • | Level 3 — significant unobservable inputs (including the Fund’s own assumptions in determining the fair value of investments) |
Inputs may include price information, volatility statistics, specific and broad credit data, liquidity statistics, and other factors. A financial instrument’s level within the fair value hierarchy is based on the lowest level of any input; both individually and in aggregate, that is significant to the fair value measurement. However, the determination of what constitutes “observable” requires significant judgment by the Trust. The Trust considers observable data to be that market data which is readily available, regularly distributed or updated, reliable and verifiable, and provided by independent sources that are actively involved in the relevant market. The inputs or methodology used for valuing securities are not necessarily an indication of the risk associated with investing in those securities. Changes in valuation techniques may result in transfers into or out of a financial instrument’s assigned level within the hierarchy.
The FASB requires reporting entities to make disclosures about purchases, sales, issuances and settlements of Level 3 securities on a gross basis. For the six months ended June 30, 2019, there were no transfers into or out of Level 3 of the fair value hierarchy.
In determining a financial instrument’s placement within the hierarchy, the Trust separates the Fund’s investment portfolio into two categories: investments and derivatives (e.g., futures). A summary of inputs used to value the Fund’s assets and liabilities carried at fair value as of June 30, 2019 is included in the Schedule of Investments.
Investments Investments whose values are based on quoted market prices in active markets, and are therefore classified within Level 1, include active listed equities. Investments that trade in markets that are not considered to be active, but are valued based on quoted
market prices, dealer quotations or alternative pricing sources supported by observable inputs are classified within Level 2. These include certain U.S. government and sovereign obligations, most government agency securities, investment-grade corporate bonds, certain mortgage products, state, municipal and provincial obligations, and certain foreign equity securities, including securities whose prices may have been affected by events occurring after the close of trading on their principal exchange or market and, as a result, whose values are determined by a pricing service as described above, or securities whose values are otherwise determined using fair valuation methods approved by the Fund’s Board of Trustees.
Investments classified within Level 3 have significant unobservable inputs, as they trade infrequently or not at all. Level 3 investments include, among others, private placement securities. When observable prices are not available for these securities, the Trust uses one or more valuation techniques for which sufficient and reliable data is available. The inputs used by the Trust in estimating the value of Level 3 investments include, for example, the original transaction price, recent transactions in the same or similar instruments, completed or pending third-party transactions in the underlying investment or comparable issuers, subsequent rounds of financing, recapitalizations, and other transactions across the capital structure. Level 3 investments may also be adjusted to reflect illiquidity and/ornon-transferability, with the amount of such discount estimated by the Trust in the absence of market information. Assumptions used by the Trust due to the lack of observable inputs may significantly impact the resulting fair value and therefore the Fund’s results of operations. As of June 30, 2019, the Fund had no securities classified as Level 3.
Derivatives Exchange-traded derivatives, such as futures contracts, exchange-traded option contracts and certain swaps, are typically classified within Level 1 or Level 2 of the fair value hierarchy depending on whether or not they are deemed to be actively traded. Certainnon-exchange-traded derivatives, such as generic forwards, certain swaps and options, have inputs which can generally be corroborated by market data and are therefore classified within Level 2. During the six months ended June 30, 2019, the Fund did not hold any derivatives.
b. Securities Transactions Securities transactions are accounted for on the date securities are purchased or sold (trade date). Realized gains or losses on securities transactions are determined on the basis of specific identification.
| 11 |
Table of Contents
NOTES TO FINANCIAL STATEMENTS — GUARDIAN LARGE CAP DISCIPLINED GROWTH VIP FUND
c. Foreign Currency Translation The accounting records of the Fund are maintained in U.S. dollars. Investment securities and all other assets and liabilities of the Fund denominated in a foreign currency are generally translated into U.S. dollars at the exchange rates quoted at the close of the NYSE on each business day. The market value of investment securities and other assets and liabilities are translated at the exchange rate as of the valuation date. Purchases and sales of securities, income receipts, and expense payments are translated into U.S. dollars at the exchange rates in effect on the dates of the respective transactions. The Fund does not isolate the portion of the fluctuations on investments resulting from changes in foreign currency exchange rates from the fluctuations in market prices of investments held. Such fluctuations are included in the Net change in net realized and unrealized gain/(loss) from investments on the Statement of Operations.
Reported realized foreign currency gains and losses arise from the disposition of foreign currency, currency gains or losses realized between the trade and settlement dates on securities transactions, and the difference between the amounts of dividends, interest and foreign withholding taxes recorded on the Fund’s books on the transaction date and the U.S. dollar equivalent of the amounts actually received or paid. These reported realized foreign currency gains and losses, if any, are included in Net realized gain/(loss) from foreign currency transactions on the Statement of Operations. Unrealized foreign currency gains and losses arise from changes (due to changes in exchange rates) in the value of foreign currency and other assets and liabilities denominated in foreign currencies, which are held at period end, if any, and are included in Net change in unrealized appreciation/(depreciation) on translation of assets and liabilities in foreign currencies on the Statement of Operations.
d. Foreign Capital Gains Tax The Fund may be subject to foreign taxes on income, gains on investments or currency purchases/repatriation, a portion of which may be recoverable. The Fund will accrue such taxes and recoveries as applicable, based upon their current interpretation of tax rules and regulations that exist in the markets in which they invest.
e. Investment Income Dividend income net of foreign taxes withheld, if any, is generally recorded on theex-dividend date. Interest income, which includes amortization/accretion of premium/discount, is determined using the interest income accrual method, and is accrued and recorded daily.
f. Allocation of Income and Expenses Many of the expenses of the Trust can be directly attributed to a specific series of the Trust. Expenses that cannot be directly attributed to a specific series of the Trust are generally apportioned among all the series in the Trust, based on relative net assets. In calculating net asset value per share for each series of the Trust, investment income, realized and unrealized gains and losses, and expenses other than series-specific expenses are allocated daily to each series based upon the proportion of net assets attributable to each series.
3. Transactions with Affiliates
a. Investment Advisory Fee and Expense LimitationUnder the terms of the advisory agreement, which, after its two year initial term, is reviewed and approved annually by the Board of Trustees, the Fund pays an investment advisory fee to Park Avenue. Park Avenue is a wholly-owned subsidiary of Guardian Life and receives an investment advisory fee at an annual rate of 0.62% up to $100 million, 0.57% up to $300 million, 0.52% up to $500 million, and 0.50% in excess of $500 million of the Fund’s average daily net assets. The fee is accrued daily and paid monthly.
Park Avenue has contractually agreed through April 30, 2020 to waive certain fees and/or reimburse certain expenses incurred by the Fund to the extent necessary to limit the Fund’s total annual operating expenses after fee waiver and/or expense reimbursement to 0.87% of the Fund’s average daily net assets (excluding, if applicable, any acquired fund fees and expenses, taxes, interest, transaction costs and brokerage commissions, litigation and extraordinary expenses). Prior to April 9, 2018, the expense limitation was 1.00%. The limitation may not be increased or terminated prior to this time without action by the Board of Trustees, may be terminated only upon approval of the Board of Trustees, and is subject to Park Avenue’s recoupment rights. For the six months ended June 30, 2019, Park Avenue waived fees and/or paid Fund expenses in the amount of $141,226.
Park Avenue may be entitled to recoupment of previously waived fees and reimbursed expenses from the Fund for three years from the date of the waiver or reimbursement, subject to the expense limitation in effect at the time of the waiver or reimbursement and at the time of the recoupment, if any. Amounts waived or reimbursed by Park Avenue pursuant to any expense limitation after April 9, 2018 will not be subject to Park Avenue’s recoupment rights. The amount available for potential future recoupment by Park Avenue from the
| 12 |
Table of Contents
NOTES TO FINANCIAL STATEMENTS — GUARDIAN LARGE CAP DISCIPLINED GROWTH VIP FUND
Fund under the Expense Limitation Agreement and the expiration schedule at June 30, 2019 are as follows:
| Potential Recoupment Amounts Expiring | ||||||||||||
Total Potential | 2021 | 2020 | 2019 | |||||||||
| $230,335 | $ | 38,387 | $ | 134,778 | $ | 57,170 | ||||||
Park Avenue has entered into aSub-Advisory Agreement with Wellington Management Company LLP (“Wellington”). Wellington is responsible for providingday-to-day investment advisory services to the Fund, subject to the supervision of Park Avenue and the oversight of the Board of Trustees.Sub-advisory fees are paid by Park Avenue and do not represent a separate or additional expense to the Fund.
b. Compensation of Trustees and Officers Trustees and officers who are interested persons of the Trust, as defined in the 1940 Act, receive no compensation from the Fund, except for the Chief Compliance Officer of the Trust. Trustees of the Trust who are not interested persons of the Trust, and the Chief Compliance Officer, receive compensation and reimbursement of expenses from the Trust.
c. Distribution Fees Park Avenue Securities LLC (“PAS”), a wholly-owned subsidiary of Guardian Life, is the principal underwriter of Fund shares. The Trust has entered into a distribution and service agreement with PAS, which governs the sale and distribution of shares of the Fund. Under a distribution and service plan adopted by the Trust(“12b-1 plan”), PAS is compensated for services in such capacity, including its expenses in connection with the promotion and distribution of shares of the Fund, at an annual rate of 0.25% of the Fund’s average daily net assets. For the six months ended June 30, 2019, the Fund paid distribution fees in the amount of $244,568 to PAS.
PAS has directed that certain payments under the12b-1 plan be used to compensate GIAC for shareholder services provided to contract owners.
4. Federal Income Taxes
a. Distributions to Shareholders For federal income tax purposes, the Fund is treated as a disregarded entity (“DRE”). As a DRE, the Fund is not subject to an entity-level income tax; and any income, gains, losses, deductions, taxes, and credits of the Fund would instead be “passed through” directly to the separate accounts of GIAC that invest in the Fund and retain the same
character for U.S. federal income tax purposes. In addition, the Fund is not required to distribute taxable income and capital gains for U.S. federal income tax purposes. Therefore, no dividends and capital gains distributions were paid by the Fund.
5. Investments
a. Investment Purchases and Sales The cost of investments purchased and the proceeds from investments sold (excluding short-term investments) amounted to $20,161,834 and $47,942,915, respectively, for the six months ended June 30, 2019. During the six months ended June 30, 2019, there were no purchases or sales of U.S. government securities.
b. Foreign Securities Foreign securities investments involve special risks and considerations not typically associated with U.S. investments. These risks include, but are not limited to, currency risk; adverse political, regulatory, social, and economic developments; and less reliable information about issuers. Moreover, securities of some foreign issuers may be less liquid and their prices more volatile than those of comparable U.S. issuers.
c. Industry or Sector Concentration In its normal course of business, the Fund may invest a significant portion of its assets in companies within a limited number of industries or sectors. As a result, the Fund may be subject to a greater risk of loss than that of a fund invested in a wider spectrum of industries or sectors because the stocks of many or all of the companies in the industry, group of industries, sector, or sectors may decline in value due to developments adversely affecting the industry, group of industries, sector, or sectors.
d. Repurchase Agreements The Fund may invest in repurchase agreements to maintain liquidity and earn income over periods of time as short as overnight. The collateral for repurchase agreements is either cash or fully negotiable U.S. government securities (including U.S. government agency securities). Repurchase agreements are fully collateralized (including the interest accrued thereon) and such collateral is marked to market daily while the agreements remain in force. If the value of the collateral falls below the repurchase price plus accrued interest, the Fund will typically require the seller to deposit additional collateral by the next business day. If the request for additional collateral is not met, or the seller defaults, the Fund maintains the right to sell the collateral (although it may be prevented or delayed from doing so in certain circumstances) and
| 13 |
Table of Contents
NOTES TO FINANCIAL STATEMENTS — GUARDIAN LARGE CAP DISCIPLINED GROWTH VIP FUND
may be required to claim any resulting loss against the seller. Park Avenue monitors the creditworthiness of the seller with which the Fund enters into repurchase agreements.
6. Temporary Borrowings
The Fund, with other funds managed by Park Avenue, is party to a $10 million committed revolving credit facility from State Street Bank and Trust Company for temporary borrowing purposes, including the meeting of redemption requests that otherwise might require the untimely disposition of securities. Interest is calculated based on the higher of the dailyone-month LIBOR rate and the Federal Funds rate plus 1.25% at the time of borrowing. In addition to the interest charged on any borrowings by the Fund, each fund pays a commitment fee of 0.30% per annum on its share of the unused portion of the credit facility. The agreement is in
place until December 10, 2019. The Fund did not utilize the credit facility during the six months ended June 30, 2019.
7. Indemnifications
Under the Trust’s organizational documents and, in some cases, by contract, its officers and trustees are indemnified against certain liabilities arising out of the performance of their duties to the Fund. In addition, in the normal course of business, the Fund enters into contracts with its vendors and others that provide general indemnifications. The Fund’s maximum exposure under these arrangements is unknown as this would involve future claims that may be made against the Fund that have not yet occurred. However, based on experience, the Fund expects the risk of loss to be remote.
| 14 |
Table of Contents
SHAREHOLDER MEETING RESULTS(UNAUDITED)
At a meeting held on March27-28, 2019, the Board of Trustees of Guardian Variable Products Trust approved submitting the following proposal (“Proposal”) to shareholders of the Fund at a special meeting to be held on May 24, 2019 (with any postponements or adjournments, “Special Meeting”):
1. To permit Park Avenue Institutional Advisers LLC, under certain circumstances, to enter into and/or materially amend investmentsub-advisory agreements with affiliated and unaffiliated sub-advisers on behalf of the Fund without obtaining shareholder approval.
On or about May 1, 2019, shareholders of record of the Fund as of the close of business on March 29, 2019 were sent a proxy statement containing information regarding the Proposal. The proxy statement also included information about the Special Meeting, at which shareholders of the Fund were asked to consider and approve the Proposal. In addition, the proxy statement included information about voting (or providing voting instructions) on the Proposal and options shareholders had to do so.
The Special Meeting was held on June 26, 2019, and the Proposal passed.
The results of the Special Meeting were as follows:
Proposal 1. To permit Park Avenue Institutional Advisers LLC, under certain circumstances, to enter into and/or materially amend investmentsub-advisory agreements with affiliated and unaffiliated sub-advisers on behalf of the Fund without obtaining shareholder approval:
Votes For | Votes Against | Abstentions | ||||||
| 10,871,341.576 | 1,633,554.980 | 1,015,805.062 | ||||||
| 15 |
Table of Contents
SUPPLEMENTAL INFORMATION(UNAUDITED)
Approval of Investment Advisory andSub-advisory Agreements
Section 15(c) of the Investment Company Act of 1940, as amended (the “1940 Act”), requires that a fund’s investment advisory andsub-advisory agreements be approved initially by the fund’s board of trustees. Section 15(c) also requires that the continuation of these agreements, after an initial term of up to two years, be annually reviewed and approved by the board. Any such agreement must be approved by a vote of a majority of the trustees who are not parties to the agreement or “interested persons” (as defined in the 1940 Act) of a party to the agreement at anin-person meeting of the board called for the purpose of voting on such approval.
At a meeting of the Board of Trustees (the “Board”) of Guardian Variable Products Trust (the “Trust”) held on March27-28, 2019 (the “Meeting”), the Board, including the trustees who are not parties to the agreement or “interested persons” as defined in the 1940 Act (the “Independent Trustees”), considered and voted unanimously to renew the existing investment management agreement (the “Management Agreement”) between the Trust, on behalf of Guardian Diversified Research VIP Fund, Guardian Growth & Income VIP Fund, Guardian Integrated Research VIP Fund, Guardian International Growth VIP Fund, Guardian International Value VIP Fund, Guardian Large Cap Disciplined Growth VIP Fund, Guardian Large Cap Disciplined Value VIP Fund, Guardian Large Cap Fundamental Growth VIP Fund, Guardian Mid Cap Traditional Growth VIP Fund, Guardian Mid Cap Relative Value VIP Fund and Guardian Core Plus Fixed Income VIP Fund (the “Funds”), and Park Avenue Institutional Advisers LLC (the “Manager”) for aone-term.
The Board, including the Independent Trustees, also considered and voted unanimously to renew the existingsub-advisory agreements (the“Sub-advisory Agreements,” collectively with the Management Agreement, the “Agreements”) between the Manager and investment advisory firms engaged to serve assub-advisers to certain of the Funds, namely Putnam Investment Management, LLC, AllianceBernstein L.P., Massachusetts Financial Services Company, J.P. Morgan Investment Management Inc., Lazard Asset Management LLC, Wellington Management Company LLP, Boston Partners Global Investors, Inc., ClearBridge Investments, LLC, Janus Capital Management LLC, Wells Capital Management Incorporated and Lord, Abbett & Co. LLC (the“Sub-advisers”) for aone-year term.
The Board is responsible for overseeing the management of each Fund. In determining whether to renew its approval of the Agreements, the Trustees evaluated information and factors that they considered to be relevant and appropriate through the exercise of their own business judgment. The Trustees considered certain information and factors in light of advice furnished to them by legal counsel to the Trust and, in the case of the Independent Trustees, their independent legal counsel. In advance of the Meeting, the Trustees received materials and information designed to assist their consideration of the Agreements. The Trustees received written responses from the Manager and eachSub-adviser to a series of questions and requests for information encompassing a wide variety of topics provided by independent counsel on behalf of the Independent Trustees. The Independent Trustees discussed the Funds with independent counsel during a telephonic meeting and executive session in advance of the Meeting. The Trustees also received materials and information regarding the legal standards applicable to their consideration of the Agreements and the process and criteria used by the Manager to identify and select theSub-advisers.
During the course of their deliberations, the Independent Trustees met to discuss and evaluate the Agreements in executive session with their independent legal counsel, outside of the presence of the Trustees who are not Independent Trustees and representatives from Fund management, the Manager or anySub-adviser.
In reaching its decisions to renew its approval of the Agreements, the Board took into account the materials and information described above as well as other materials and information provided to the Board and discussed with and among the Trustees. Individual Trustees may have given different weight to different factors and information with respect to each Agreement, and the Trustees did not identify any single factor or information that, in isolation, would be controlling in deciding to approve the Agreements. The discussion below is intended to summarize the broad factors that figured prominently in the Board’s decisions to approve the Agreements rather than to beall-inclusive. These broad factors included: (i) the nature, extent and quality of the services provided to the Funds by the Manager and theSub-advisers; (ii) the investment performance of each Fund; (iii) the fees charged and estimated profitability; (iv) the extent to which economies of scale exist for a Fund, and the extent to
| 16 |
Table of Contents
SUPPLEMENTAL INFORMATION(UNAUDITED)
which a Fund benefits from economies of scale; and (v) any other benefits derived by the Manager or theSub-advisers (or their respective affiliates) from their relationships with the Funds.
Nature, Extent and Quality of Services
The Trustees considered information regarding the nature, extent and quality of services provided to the Funds by the Manager. The Trustees also considered, among other things, the terms of the Management Agreement and the range of investment advisory services provided by the Manager. In addition, the Trustees reviewed the range ofnon-investment advisory services provided by the Manager consistent with the terms of the Management Agreement, notably coordinating the preparation and filing of various regulatory documents, coordinating the preparation and assembly of Board meeting materials and assisting the Board with certain valuation matters.
The Trustees considered that the Funds operate in a“manager-of-managers” structure and reviewed the responsibilities that the Manager has under this structure, including monitoring and evaluating the performance of theSub-advisers, monitoring theSub-advisers for adherence to the stated investment objectives, strategies, policies and restrictions of the Funds and supervising theSub-advisers with respect to the services that theSub-advisers would provide under theSub-advisory Agreements. The Trustees also considered the process used by the Manager, consistent with this structure, to identify and recommendsub-advisers, and the Manager’s ability to monitor and overseesub-advisers and recommend replacementsub-advisers, when necessary, and provide other services under the Management Agreement. The Board noted that investment management staff of the Manager and the Trust’s Chief Compliance Officer conductin-person oversight visits of theSub-advisers on a periodic basis, follow through with additional inquiry on any questions or concerns that arise during the visit and then report the results of the visit to the Board. The Trustees reviewed information regarding the experience and background of the Manager’s key personnel and the Manager’s organizational structure and resources, including investment, legal and administrative capabilities of the Manager. In this regard, the Trustees recognized that the Funds may benefit from the Manager’s ability to use similar resources and capabilities of its affiliates in providing services to the Funds.
The Trustees considered information regarding the nature, extent and quality of services provided to the
Funds by theSub-advisers. The Trustees also considered, among other things, the terms of theSub-advisory Agreements and the range of investment advisory services provided by theSub-advisers under the oversight of the Manager. In evaluating these investment advisory services, the Trustees considered, among other things, theSub-advisers’ investment philosophies, styles and/or processes and approach to managing the Funds. The Trustees received and evaluated information regarding the background, education, expertise and/or experience of the investment professionals that serve as portfolio managers for the Funds and the capabilities and resources of theSub-advisers.
Based upon these considerations, the Trustees concluded, within the context of their full deliberations, that the nature, extent and quality of services provided to the Funds by the Manager and eachSub-adviser were appropriate.
Investment Performance
In connection with each of its regular quarterly meetings, the Board receives information on the performance of each Fund, including net performance, relative performance rankings within each Fund’s Lipper peer group, Morningstar ratings, and performance as compared to benchmark index returns. At each quarterly Board meeting, members of the Manager’s senior investment team reviewed with the Board the economic and market environment, risk management, and style consistency in connection with management of the Funds. The Board considered investment performance for each Fund over theone-year and since inception periods.
The Board also received and reviewed a report prepared by Broadridge Financial Solutions (“Broadridge”), an independent provider of mutual fund industry data. The Board reviewed the investment performance of each Fund on an absolute basis and in comparison to an appropriate benchmark index and each Fund’s respective peer group as independently selected by Broadridge. The Board noted that, except for Guardian Growth & Income VIP Fund, Guardian Large Cap Disciplined Value VIP Fund and Guardian Mid Cap Traditional Growth VIP Fund, each of the Fund’s performance for theone-year and since inception periods was below the median of its respective peer group median and benchmark index. With respect to Guardian Large Cap Disciplined Value VIP Fund, the Board noted that the performance for theone-year period was lower than the peer group median and benchmark index and performance since inception was
| 17 |
Table of Contents
SUPPLEMENTAL INFORMATION(UNAUDITED)
higher than the peer group median and benchmark index. With respect to Guardian Growth & Income VIP Fund and Guardian Mid Cap Traditional Growth VIP Fund, the Board noted that the performance for both theone-year and since inception periods was higher than each Fund’s peer group median and benchmark index.
The Manager discussed with the Board factors contributing to the Funds’ performance results. In addition, for certain Funds, the Manager discussed with the Board longer term performance records of theSub-advisers for strategies used in managing the Funds. The Board concluded that the investment performance generated by eachSub-adviser was generally satisfactory, or, that any steps being taken by the Manager andSub-advisers to address any performance issues were satisfactory. The Board also noted the short operational history of each Fund.
Costs and Profitability
The Trustees considered the management fees paid by the Funds to the Manager under the Management Agreement and evaluated the reasonableness of these fees. The Trustees received and reviewed comparative information with respect to the management fees and the management fees paid by other funds offered as investment options underlying variable contracts within the applicable peer group based on data obtained from Broadridge. The Board noted that the contractual and actual (effective) management fees reported for each of the Funds were below or equal to its peer group in all cases except for the Guardian Mid Cap Traditional Growth VIP Fund. The Board noted that the actual (effective) management fee for this Fund exceeded the peer group median by a modest amount.
The Trustees considered thesub-advisory fees paid under theSub-advisory Agreements and evaluated the reasonableness of those fees. The Trustees also considered that the fees paid to theSub-advisers would be paid by the Manager and not the Funds and that the Manager had negotiated the fees with theSub-advisers atarm’s-length.
The Trustees received comparative information relating to each Fund’s operating expense ratios and the operating expense ratios of a peer group of funds. In this regard, the Board noted that each Fund’s operating expense ratio was equal to or lower than the operating expense ratio of its respective peer group median, except for Guardian Diversified Research VIP Fund, Guardian Growth & Income VIP Fund and Guardian Integrated Research VIP Fund. The Board noted that the operating expense ratio for these Funds exceeded the
peer group median by a modest amount. The Trustees considered the Manager’s commitment to limit each Fund’s operating expenses through an expense limitation agreement with the Trust. Although the Board recognized that the comparisons between the management fees and operating expenses of the Funds and those of identified peer funds are imprecise, given different terms of agreements and variations in fund strategies, the Trustees found that the comparative information supported their consideration and approval of the management fees and evaluation of the operating expenses.
The Board considered the Manager’s estimates of its profitability, which included allocations by the Manager of its costs in providing management services to the Funds. The Board considered the estimated profitability of the Manager both overall and on aFund-by-Fund basis. The Board did not consider any profitability information from theSub-advisers because the Manager would be responsible for payment of thesub-advisory fees and had negotiated the fees with theSub-advisers atarm’s-length.
Based on the consideration of the information and factors summarized above, as well as other relevant information and factors, the Board concluded that the proposed management andsub-advisory fees were reasonable in light of the nature, extent and quality of services rendered to the Funds by the Manager and theSub-advisers. The Board also concluded that the profitability of the Funds to the Manager was acceptable and the Board determined it was appropriate to revisit estimated Manager profitability in connection with future reviews of the Agreements.
Economies of Scale
The Board considered whether the Funds’ fee structure is designed to share economies of scale with shareholders as the Funds’ assets grow. In this regard, the Board noted that for ten of eleven Funds, the management andsub-advisory fee included breakpoints that are tiered based on growth in asset levels of each such Fund. The Board also noted that the Funds’ expenses were subject to an expense limitation provided by the Manager. The Board noted that expected economies of scale, where they exist, may be shared through the use of fee breakpoints, expense limitations by the Manager, and/or a lower overall fee.
Ancillary Benefits
The Board considered the potential benefits, other than management fees, that the Manager and/or its affiliates
| 18 |
Table of Contents
SUPPLEMENTAL INFORMATION(UNAUDITED)
may receive because of the Manager’s relationship with the Funds. The Trustees acknowledged that the Funds were designed to serve as investment options under variable contracts issued by affiliates of the Manager that would receive fees under those contracts and that Park Avenue Securities LLC, an affiliate of the Manager and principal underwriter of the Funds, and participating insurance companies, including insurance companies affiliated with the Manager, would be entitled to receive fees from the Funds under a plan of distribution adopted pursuant to Rule12b-1 under the 1940 Act. The Trustees considered the benefits to the Manager from increased assets under management. The Trustees considered that the Manager and its affiliates may benefit from (i) greater efficiencies in annuity administration and operations and potential cost savings due to a reduction in the number of unaffiliated
funds available as annuity contract investment options, and (ii) increased dividends-received deductions due to the Funds’ status under the tax laws as disregarded entities. In addition, the Trustees considered the potential benefits, other thansub-advisory fees, that theSub-advisers and their affiliates may receive because of their relationships with the Funds, including the potential increased ability to use soft dollars consistent with Trust policies and other benefits from increases in assets under management. The Trustees concluded that benefits that may accrue to the Manager and its affiliates are reasonable and the benefits that may accrue to theSub-advisers and their affiliates are consistent with those expected for asub-adviser to a mutual fund such as the applicable Fund.
Conclusion
Based on a comprehensive consideration and evaluation of all of the information and factors summarized above, among others, the Board as a whole, including the Independent Trustees, approved the Agreements.
| 19 |
Table of Contents
SUPPLEMENTAL INFORMATION(UNAUDITED)
The Statement of Additional Information (“SAI”) includes additional information about the Trust’s Trustees and Officers and is available, without charge, upon request by calling toll-free1-888-GUARDIAN(1-888-482-7342) or by visiting our website at http://guardianvpt.onlineprospectus.net/GuardianVPT/Prospectuses.
Portfolio Holdings and Proxy Voting Procedures
The Fund files its complete schedule of portfolio holdings with the Securities and Exchange Commission for the first and third quarters of each fiscal year as an exhibit to its reports on FormN-PORT. The Fund’sForm N-PORT reports are available on the Securities and Exchange Commission’s website at https://www.sec.gov. The Fund’s FormN-PORT information is also available, without charge, upon request, by calling toll-free1-888-GUARDIAN(1-888-482-7342) or by visiting our website at http://guardianvpt.onlineprospectus.net/GuardianVPT/
Prospectuses.
A description of the policies and procedures that the Fund uses to determine how to vote proxies relating to portfolio securities is included in the SAI. The SAI and information regarding how the Fund voted proxies relating to portfolio securities during the most recent12-month period ended June 30 may be obtained (i) without charge, upon request, by calling toll-free1-888-GUARDIAN(1-888-482-7342) or by visiting our website at http://guardianvpt.onlineprospectus.net/GuardianVPT/
Prospectuses; and (ii) on the Securities and Exchange Commission’s website at https://www.sec.gov.
| 20 |
Table of Contents
This report is transmitted to shareholders only. It is not authorized for use as an offer of sale or a solicitation of an offer to buy shares of the Fund unless accompanied or preceded by the Fund’s current prospectus. Past performance results shown in this report should not be considered a representation of future performance. Investment returns and principal value of shares will fluctuate so that shares, when redeemed, may be worth more or less than their original cost. Statements and other information herein are as dated and are subject to change.

The Guardian Life Insurance Company of America New York, NY 10001-2159
PUB8173
Table of Contents
Guardian Variable
Products Trust
2019
Semiannual Report
All Data as of June 30, 2019
Guardian Integrated Research VIP Fund
Important Notice
Beginning on January 1, 2021, as permitted by regulations adopted by the Securities and Exchange Commission, paper copies of the Fund’s shareholder reports will no longer be sent by mail from The Guardian Insurance & Annuity Company, Inc. (“GIAC”). Instead, GIAC will mail you a notice when copies of the shareholder reports are made available on a website. You will be notified by mail each time a report is posted and provided with a website link to access the report.
If you have already elected to receive shareholder reports electronically, you will not be affected by this change and you need not take any action. If you have not yet elected electronic delivery, at any time, you may elect to receive the Fund’s shareholder reports and certain other communications from GIAC electronically, by going to www.guardianlife.com and registering for e-delivery.
You may instead elect to receive all future shareholder reports in paper free of charge. If you wish to receive paper copies of your shareholder reports, please call GIAC’s Customer Service Office Contact Center at 1-888-GUARDIAN (1-888-482-7342). Your election to receive reports in paper will apply to all the underlying funds available.

| Not FDIC insured. May lose value. No bank guarantee. | www.guardianlife.com |
Table of Contents
Guardian Integrated Research VIP Fund
Except as otherwise specifically stated, all information, including portfolio security positions, is as of June 30, 2019. Fund holdings will vary. Information contained herein has been obtained from sources believed reliable, but is not guaranteed.
Table of Contents
GUARDIAN INTEGRATED RESEARCH VIP FUND
Fund Characteristics (unaudited)
| Total Net Assets: $11,167,158 |
Sector Allocation1 As of June 30, 2019 |
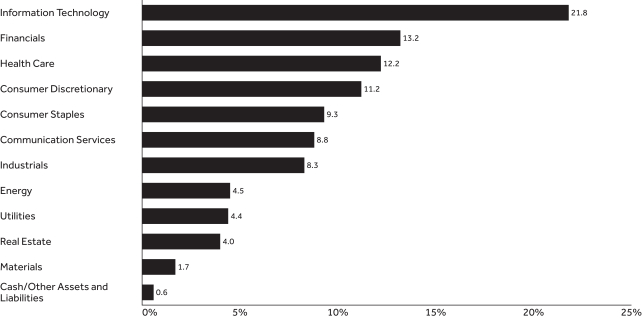 |
Top Ten Holdings2 As of June 30, 2019 | ||||
| Holding | % of Total Net Assets | |||
| Microsoft Corp. | 5.83% | |||
| Amazon.com, Inc. | 3.97% | |||
| Apple, Inc. | 3.49% | |||
| Johnson & Johnson | 2.91% | |||
| Cisco Systems, Inc. | 2.58% | |||
| Comcast Corp., Class A | 2.21% | |||
| Intel Corp. | 2.07% | |||
| Bank of America Corp. | 2.05% | |||
| Citigroup, Inc. | 2.05% | |||
| Union Pacific Corp. | 1.95% | |||
| Total | 29.11% | |||
| 1 | The Fund’s holdings are allocated to each sector based on the MSCI Global Industry Classification Standard (GICS®). Cash includes short-term investments and net other assets and liabilities. |
| 2 | Portfolio holdings are subject to change and should not be considered a recommendation to buy or sell individual securities. |
| 1 |
Table of Contents
UNDERSTANDING YOUR FUND’S EXPENSES(UNAUDITED)
By investing in the Fund, you incur two types of costs: (1) transaction costs and (2) ongoing costs, including, as applicable, investment advisory fees, distribution and/or service(12b-1) fees and other Fund expenses. The example below is intended to help you understand your ongoing costs (in dollars) of investing in the Fund and to compare these costs with the ongoing costs of investing in other mutual funds.
The example is based on an investment of $1,000 invested at the beginning of the period and held for the entire period from January 1, 2019 to June 30, 2019. The table below shows the Fund’s expenses in two ways:
Expenses based on actual return
This section of the table provides information about actual account values and actual expenses. You may use the information in this section, together with the amount you invested, to estimate the expenses that you paid over the period. Simply divide your account value by $1,000 (for example, an $8,600 account value divided by $1,000 = 8.6), then multiply the result by the number in the section under the heading entitled “Expenses Paid During Period” to estimate the expenses you paid on your account during this period.
Expenses based on hypothetical 5% return for comparison purposes
This section of the table provides information about hypothetical account values and hypothetical expenses based on the Fund’s actual expense ratio and an assumed rate of return of 5% per year before expenses, which is not the Fund’s actual return. The hypothetical account values and expenses may not be used to estimate the actual ending account balance or expenses you paid for the period. You may use this information to compare the ongoing costs of investing in the Fund with the cost of investing in other mutual funds. To do so, compare this 5% hypothetical example with the 5% hypothetical examples that appear in the shareholder reports of the other funds.
Note that the expenses shown in the table are meant to highlight your ongoing costs only and do not reflect any transactional costs, such as sales charges (loads), redemption fees, or exchange fees. Therefore the second section is useful in comparing ongoing costs only, and will not help you determine the relative total costs of owning different funds. If these transactional costs were included, your costs would have been higher. Charges and expenses at the insurance company separate account level are not reflected in the table.
| Beginning Account Value 1/1/19 | Ending Account Value 6/30/19 | Expenses Paid During Period* 1/1/19-6/30/19 | Expense Ratio During Period 1/1/19-6/30/19 | |||||||||||
| Based on Actual Return | $1,000.00 | $1,153.60 | $5.13 | 0.96% | ||||||||||
| Based on Hypothetical Return (5% Return Before Expenses) | $1,000.00 | $1,020.03 | $4.81 | 0.96% | ||||||||||
| * | Expenses are equal to the Fund’s annualized expense ratio as indicated, multiplied by the average account value over the period, multiplied by 181/365 (to reflect theone-half year period). |
| 2 |
Table of Contents
SCHEDULE OF INVESTMENTS — GUARDIAN INTEGRATED RESEARCH VIP FUND
| June 30, 2019(unaudited) | Shares | Value | ||||||
| Electrical Equipment – 1.5% |
| |||||||
Eaton Corp. PLC | 1,972 | $ | 164,228 | |||||
|
| |||||||
| 164,228 | ||||||||
| Entertainment – 0.4% |
| |||||||
Electronic Arts, Inc.(1) | 457 | 46,276 | ||||||
|
| |||||||
| 46,276 | ||||||||
| Equity Real Estate Investment – 4.0% |
| |||||||
American Tower Corp. REIT | 169 | 34,552 | ||||||
EPR Properties REIT | 1,007 | 75,112 | ||||||
Medical Properties Trust, Inc. REIT | 6,171 | 107,622 | ||||||
Simon Property Group, Inc. REIT | 575 | 91,862 | ||||||
STORE Capital Corp. REIT | 3,994 | 132,561 | ||||||
|
| |||||||
| 441,709 | ||||||||
| Food & Staples Retailing – 3.0% |
| |||||||
Costco Wholesale Corp. | 745 | 196,874 | ||||||
Walgreens Boots Alliance, Inc. | 2,491 | 136,183 | ||||||
|
| |||||||
| 333,057 | ||||||||
| Food Products – 1.2% |
| |||||||
Ingredion, Inc. | 616 | 50,814 | ||||||
Tyson Foods, Inc., Class A | 997 | 80,498 | ||||||
|
| |||||||
| 131,312 | ||||||||
| Health Care Equipment & Supplies – 2.5% |
| |||||||
Boston Scientific Corp.(1) | 1,674 | 71,949 | ||||||
Medtronic PLC | 2,180 | 212,310 | ||||||
|
| |||||||
| 284,259 | ||||||||
| Health Care Providers & Services – 2.6% |
| |||||||
Cigna Corp. | 109 | 17,173 | ||||||
HCA Healthcare, Inc. | 1,183 | 159,906 | ||||||
McKesson Corp. | 857 | 115,172 | ||||||
|
| |||||||
| 292,251 | ||||||||
| Hotels, Restaurants & Leisure – 2.5% |
| |||||||
Chipotle Mexican Grill, Inc.(1) | 68 | 49,836 | ||||||
Planet Fitness, Inc., Class A(1) | 349 | 25,282 | ||||||
Starbucks Corp. | 2,493 | 208,988 | ||||||
|
| |||||||
| 284,106 | ||||||||
| Household Durables – 0.5% |
| |||||||
Toll Brothers, Inc. | 1,596 | 58,445 | ||||||
|
| |||||||
| 58,445 | ||||||||
| Household Products – 0.7% |
| |||||||
Kimberly-Clark Corp. | 488 | 65,041 | ||||||
The Procter & Gamble Co. | 80 | 8,772 | ||||||
|
| |||||||
| 73,813 | ||||||||
| Independent Power and Renewable Electricity Producers – 2.2% |
| |||||||
AES Corp. | 8,418 | 141,086 | ||||||
NRG Energy, Inc. | 3,103 | 108,977 | ||||||
|
| |||||||
| 250,063 | ||||||||
| Industrial Conglomerates – 0.7% |
| |||||||
Honeywell International, Inc. | 474 | 82,756 | ||||||
|
| |||||||
| 82,756 | ||||||||
| The accompanying notes are an integral part of these financial statements. | 3 |
Table of Contents
SCHEDULE OF INVESTMENTS — GUARDIAN INTEGRATED RESEARCH VIP FUND
| June 30, 2019(unaudited) | Shares | Value | ||||||
| Insurance – 3.3% |
| |||||||
MetLife, Inc. | 3,308 | $ | 164,308 | |||||
Prudential Financial, Inc. | 1,346 | 135,946 | ||||||
The Allstate Corp. | 517 | 52,574 | ||||||
The Hartford Financial Services Group, Inc. | 208 | 11,590 | ||||||
|
| |||||||
| 364,418 | ||||||||
| Interactive Media & Services – 4.6% |
| |||||||
Alphabet, Inc., Class A(1) | 198 | 214,394 | ||||||
Alphabet, Inc., Class C(1) | 188 | 203,211 | ||||||
Facebook, Inc., Class A(1) | 481 | 92,833 | ||||||
|
| |||||||
| 510,438 | ||||||||
| Internet & Direct Marketing Retail – 4.0% |
| |||||||
Amazon.com, Inc.(1) | 234 | 443,109 | ||||||
|
| |||||||
| 443,109 | ||||||||
| IT Services – 5.1% |
| |||||||
DXC Technology Co. | 1,278 | 70,482 | ||||||
Fidelity National Information Services, Inc. | 1,092 | 133,967 | ||||||
FleetCor Technologies, Inc.(1) | 39 | 10,953 | ||||||
Global Payments, Inc. | 591 | 94,637 | ||||||
Leidos Holdings, Inc. | 1,763 | 140,775 | ||||||
MasterCard, Inc., Class A | 374 | 98,934 | ||||||
Visa, Inc., Class A | 98 | 17,008 | ||||||
|
| |||||||
| 566,756 | ||||||||
| Machinery – 1.9% |
| |||||||
AGCO Corp. | 1,119 | 86,801 | ||||||
Cummins, Inc. | 408 | 69,907 | ||||||
Ingersoll-Rand PLC | 454 | 57,508 | ||||||
|
| |||||||
| 214,216 | ||||||||
| Media – 2.9% |
| |||||||
Charter Communications, Inc., Class A(1) | 185 | 73,108 | ||||||
Comcast Corp., Class A | 5,849 | 247,296 | ||||||
|
| |||||||
| 320,404 | ||||||||
| Multiline Retail – 1.4% |
| |||||||
Dollar General Corp. | 925 | 125,023 | ||||||
Target Corp. | 326 | 28,235 | ||||||
|
| |||||||
| 153,258 | ||||||||
| Multi-Utilities – 0.1% |
| |||||||
CenterPoint Energy, Inc. | 376 | 10,765 | ||||||
|
| |||||||
| 10,765 | ||||||||
| Oil, Gas & Consumable Fuels – 4.5% |
| |||||||
EOG Resources, Inc. | 1,398 | 130,238 | ||||||
Equitrans Midstream Corp. | 1,389 | 27,377 | ||||||
Exxon Mobil Corp. | 532 | 40,767 | ||||||
Kinder Morgan, Inc. | 3,874 | 80,889 | ||||||
Phillips 66 | 1,441 | 134,791 | ||||||
Pioneer Natural Resources Co. | 109 | 16,771 | ||||||
Valero Energy Corp. | 855 | 73,197 | ||||||
|
| |||||||
| 504,030 | ||||||||
| June 30, 2019(unaudited) | Shares | Value | ||||||
| Pharmaceuticals – 5.8% |
| |||||||
Bristol-Myers Squibb Co. | 930 | $ | 42,175 | |||||
Eli Lilly & Co. | 1,571 | 174,051 | ||||||
Johnson & Johnson | 2,337 | 325,497 | ||||||
Pfizer, Inc. | 2,555 | 110,683 | ||||||
|
| |||||||
| 652,406 | ||||||||
| Road & Rail – 1.9% |
| |||||||
Union Pacific Corp. | 1,288 | 217,814 | ||||||
|
| |||||||
| 217,814 | ||||||||
| Semiconductors & Semiconductor Equipment – 3.7% |
| |||||||
Applied Materials, Inc. | 3,051 | 137,020 | ||||||
Intel Corp. | 4,827 | 231,069 | ||||||
Lam Research Corp. | 237 | 44,518 | ||||||
|
| |||||||
| 412,607 | ||||||||
| Software – 6.9% |
| |||||||
Adobe, Inc.(1) | 120 | 35,358 | ||||||
Microsoft Corp. | 4,858 | 650,778 | ||||||
ServiceNow, Inc.(1) | 295 | 80,998 | ||||||
|
| |||||||
| 767,134 | ||||||||
| Specialty Retail – 1.4% |
| |||||||
AutoZone, Inc.(1) | 93 | 102,251 | ||||||
Best Buy Co., Inc. | 780 | 54,389 | ||||||
|
| |||||||
| 156,640 | ||||||||
| Technology Hardware, Storage & Peripherals – 3.5% |
| |||||||
Apple, Inc. | 1,967 | 389,309 | ||||||
|
| |||||||
| 389,309 | ||||||||
| Textiles, Apparel & Luxury Goods – 0.2% |
| |||||||
NIKE, Inc., Class B | 296 | 24,849 | ||||||
|
| |||||||
| 24,849 | ||||||||
| Tobacco – 1.8% |
| |||||||
Philip Morris International, Inc. | 2,494 | 195,854 | ||||||
|
| |||||||
| 195,854 | ||||||||
| Trading Companies & Distributors – 0.1% |
| |||||||
HD Supply Holdings, Inc.(1) | 411 | 16,555 | ||||||
|
| |||||||
| 16,555 | ||||||||
| Total Common Stocks (Cost $9,598,828) | 11,104,244 | |||||||
| Total Investments – 99.4% (Cost $9,598,828) | 11,104,244 | |||||||
| Assets in excess of other liabilities – 0.6% | 62,914 | |||||||
| Total Net Assets – 100.0% | $ | 11,167,158 | ||||||
| (1) | Non–income–producing security. |
Legend:
REIT — Real Estate Investment Trust
| 4 | The accompanying notes are an integral part of these financial statements. |
Table of Contents
SCHEDULE OF INVESTMENTS — GUARDIAN INTEGRATED RESEARCH VIP FUND
The following is a summary of the inputs used as of June 30, 2019 in valuing the Fund’s investments. For more information on valuation inputs, please refer to Note 2a of the accompanying Notes to Financial Statements.
| Valuation Inputs | ||||||||||||||||
| Investments in Securities(unaudited) | Level 1 | Level 2 | Level 3 | Total | ||||||||||||
| Common Stocks | $ | 11,104,244 | $ | — | $ | — | $ | 11,104,244 | ||||||||
| Total | $ | 11,104,244 | $ | — | $ | — | $ | 11,104,244 | ||||||||
| The accompanying notes are an integral part of these financial statements. | 5 |
Table of Contents
FINANCIAL INFORMATION — GUARDIAN INTEGRATED RESEARCH VIP FUND
For the Six Months Ended June 30, 2019 (unaudited) | ||||
Investment Income | ||||
Dividends | $ | 116,413 | ||
Interest | 66 | |||
|
| |||
Total Investment Income | 116,479 | |||
|
| |||
Expenses | ||||
Investment advisory fees | 29,819 | |||
Custodian and accounting fees | 24,399 | |||
Administrative fees | 23,535 | |||
Professional fees | 15,510 | |||
Distribution fees | 13,554 | |||
Shareholder reports | 9,753 | |||
Transfer agent fees | 6,133 | |||
Trustees’ and officers’ fees | 3,494 | |||
Other expenses | 2,028 | |||
|
| |||
Total Expenses | 128,225 | |||
Less: Fees waived | (76,177 | ) | ||
|
| |||
Total Expenses, Net | 52,048 | |||
|
| |||
Net Investment Income/(Loss) | 64,431 | |||
|
| |||
Realized Gain/(Loss) and Change in Unrealized Appreciation/(Depreciation) on Investments | ||||
Net realized gain/(loss) from investments | 3,430 | |||
Net change in unrealized appreciation/(depreciation) on investments | 1,452,237 | |||
|
| |||
Net Gain on Investments | 1,455,667 | |||
|
| |||
Net Increase in Net Assets Resulting From Operations | $ | 1,520,098 | ||
|
| |||
| 6 | The accompanying notes are an integral part of these financial statements. |
Table of Contents
FINANCIAL INFORMATION — GUARDIAN INTEGRATED RESEARCH VIP FUND
| The accompanying notes are an integral part of these financial statements. | 7 |
Table of Contents
FINANCIAL INFORMATION — GUARDIAN INTEGRATED RESEARCH VIP FUND
The Financial Highlights table is intended to help you understand the Fund’s financial performance for the past six reporting periods (or, if shorter, the period since inception). Certain information reflects financial results for a single Fund share. The total returns in the table represent the rate that an investor would have earned (or lost) on an investment in the Fund.
Financial Highlights Six Months Ended Numbers are unaudited | ||||||||||||||||||||||||
| Per Share Operating Performance | ||||||||||||||||||||||||
| Net Asset Value, Beginning of Period | Net Investment Income(1) | Net Realized and Unrealized Gain/(Loss) | Total Operations | Net Asset Value, End of Period | Total Return(2) | |||||||||||||||||||
Six Months Ended 6/30/19 | $ | 11.26 | $ | 0.07 | $ | 1.66 | $ | 1.73 | $ | 12.99 | 15.36% | (4) | ||||||||||||
Year Ended 12/31/18 | 12.28 | 0.12 | (1.14 | ) | (1.02 | ) | 11.26 | (8.31)% | ||||||||||||||||
Year Ended 12/31/17 | 10.24 | 0.09 | 1.95 | 2.04 | 12.28 | 19.92% | ||||||||||||||||||
Period Ended 12/31/16(5) | 10.00 | 0.03 | 0.21 | 0.24 | 10.24 | 2.40% | (4) | |||||||||||||||||
| 8 | The accompanying notes are an integral part of these financial statements. |
Table of Contents
FINANCIAL INFORMATION — GUARDIAN INTEGRATED RESEARCH VIP FUND
| Ratios/Supplemental Data | ||||||||||||||||||||||
| Net Assets, End of Period (000s) | Net Ratio of Expenses to Average Net Assets(3) | Gross Ratio of Expenses to Average Net Assets | Net Ratio of Net Investment Income to Average Net Assets(3) | Gross Ratio of Net Investment Loss to Average Net Assets | Portfolio Turnover Rate | |||||||||||||||||
| $ | 11,167 | 0.96% | (4) | 2.37% | (4) | 1.19% | (4) | (0.22)% | (4) | 24% | (4) | |||||||||||
| 9,814 | 0.96% | 2.39% | 0.93% | (0.50)% | 58% | |||||||||||||||||
| 12,171 | 0.96% | 1.91% | 0.84% | (0.11)% | 80% | |||||||||||||||||
| 14,915 | 0.96% | (4) | 2.65% | (4) | 0.92% | (4) | (0.77)% | (4) | 15% | (4) | ||||||||||||
| (1) | Calculated based on the average shares outstanding during the period. |
| (2) | Total returns do not reflect the effects of charges deducted pursuant to the terms of The Guardian Insurance & Annuity Company, Inc.’s variable contracts. Inclusion of such charges would reduce the total returns for all periods shown. |
| (3) | Net Ratio of Expenses to Average Net Assets and Net Ratio of Net Investment Income to Average Net Assets include the effect of fee waivers and expense limitations. |
| (4) | Ratios for periods less than one year have been annualized, except for total return and portfolio turnover rate. For the period ended December 31, 2016, certainnon-recurring fees (i.e., audit fees) are not annualized. |
| (5) | Commenced operations on September 1, 2016. |
| The accompanying notes are an integral part of these financial statements. | 9 |
Table of Contents
NOTES TO FINANCIAL STATEMENTS — GUARDIAN INTEGRATED RESEARCH VIP FUND
June 30, 2019(unaudited)
1. Organization
Guardian Variable Products Trust (the “Trust”), a Delaware statutory trust organized on January 12, 2016, is registered under the Investment Company Act of 1940, as amended (the “1940 Act”), as anopen-end management investment company. The Trust currently has sixteen series. Guardian Integrated Research VIP Fund (the “Fund”) is a series of the Trust. The Fund is a diversified fund and commenced operations on September 1, 2016. The financial statements for other series of the Trust are presented in separate reports.
The Trust has authorized an unlimited number of shares of beneficial interest with no par value. Shares are bought and sold at closing net asset value (“NAV”). Shares of the Fund are only sold to certain separate accounts of The Guardian Insurance & Annuity Company, Inc. (“GIAC”) that fund certain variable annuity contracts and variable life insurance policies issued by GIAC. GIAC is a wholly-owned subsidiary of The Guardian Life Insurance Company of America (“Guardian Life”).
The Fund seeks capital appreciation.
2. Significant Accounting Policies
The following is a summary of significant accounting policies followed by the Fund in the preparation of its financial statements. The Fund follows the investment company accounting and reporting guidance of the Financial Accounting Standards Board (“FASB”) Accounting Standards Codification Topic 946 Financial Services — Investment Companies. The following policies are in conformity with accounting principles generally accepted in the United States of America (“GAAP”). The preparation of financial statements in accordance with GAAP requires management to make estimates and assumptions that affect the reported amounts and disclosures in the financial statements. Actual results could differ from those estimates.
a. Investment Valuations Equity securities traded on an exchange other than NASDAQ Stock Market, LLC (“NASDAQ”) are valued at the last reported sale price on the principal exchange or market on which they are traded; or, if there were no sales that day, at the mean between the closing bid and ask prices. Securities traded on the NASDAQ are generally valued at the NASDAQ official closing price, which may not be the last sale price. If the NASDAQ official closing price is not available for a security, that security is generally valued at the
mean between the closing bid and ask prices. Repurchase agreements are carried at cost, which approximates fair value (see Note 5d). Foreign securities are valued in the currencies of the markets in which they trade and then converted to U.S. dollars by the application of foreign exchange rates at the close of the New York Stock Exchange (“NYSE”). Forward foreign currency contracts, if any, are valued at the mean between the bid and ask rates for the specified time interpolated from rates for proximate time periods. Securities for which market quotations are not readily available or for which market quotations may be considered unreliable are valued at their fair values as determined in accordance with policies and procedures adopted by the Board of Trustees.
Under the policies and procedures approved by the Board of Trustees, Park Avenue Institutional Advisers LLC (“Park Avenue”), the Fund’s investment adviser, has established a Fair Valuation Committee to assist the Board of Trustees with the oversight and monitoring of the valuation of the Fund’s investments. This includes monitoring the appropriateness of fair values based on results of ongoing valuation oversight, including but not limited to consideration of security specific events, market events, and pricing vendor and broker-dealer due diligence. The Fair Valuation Committee oversees and carries out the policies for the valuation of investments held in the Fund. The Fair Valuation Committee is responsible for discussing and assessing the potential impacts to the fair values on an ongoing basis, and at least on a quarterly basis with the Board of Trustees.
Securities whose values have been materially affected by events occurring before the Fund’s valuation time but after the close of the securities’ principal exchange or market may be fair valued in accordance with policies and procedures adopted by the Board of Trustees. In addition, the values of the Fund’s investments in foreign securities are generally determined by a pricing service using pricing models designed to estimate likely changes in the values of those securities. Certain foreign equity instruments are valued by applying international fair value factors provided by approved pricing services. The factors seek to adjust the local closing price for movements of local markets post closing, but prior to the time the NAVs are calculated. Valuations reflected in this report are as of the report date. As a result, changes in valuation due to market events and/or issuer related events after the report date and prior to issuance of the report are not reflected herein.
| 10 |
Table of Contents
NOTES TO FINANCIAL STATEMENTS — GUARDIAN INTEGRATED RESEARCH VIP FUND
Various inputs are used in determining the valuation of the Fund’s investments. These inputs are summarized in three broad levels listed below.
| • | Level 1 — unadjusted inputs using quoted prices in active markets for identical investments. |
| • | Level 2 — other significant observable inputs, including, but not limited to, quoted prices for similar investments, inputs other than quoted prices that are observable for investments (such as interest rates, prepayment speeds, credit risks, etc.) or other market corroborated inputs. |
| • | Level 3 — significant unobservable inputs (including the Fund’s own assumptions in determining the fair value of investments) |
Inputs may include price information, volatility statistics, specific and broad credit data, liquidity statistics, and other factors. A financial instrument’s level within the fair value hierarchy is based on the lowest level of any input; both individually and in aggregate, that is significant to the fair value measurement. However, the determination of what constitutes “observable” requires significant judgment by the Trust. The Trust considers observable data to be that market data which is readily available, regularly distributed or updated, reliable and verifiable, and provided by independent sources that are actively involved in the relevant market. The inputs or methodology used for valuing securities are not necessarily an indication of the risk associated with investing in those securities. Changes in valuation techniques may result in transfers into or out of a financial instrument’s assigned level within the hierarchy.
The FASB requires reporting entities to make disclosures about purchases, sales, issuances and settlements of Level 3 securities on a gross basis. For the six months ended June 30, 2019, there were no transfers into or out of Level 3 of the fair value hierarchy.
In determining a financial instrument’s placement within the hierarchy, the Trust separates the Fund’s investment portfolio into two categories: investments and derivatives (e.g., futures). A summary of inputs used to value the Fund’s assets and liabilities carried at fair value as of June 30, 2019 is included in the Schedule of Investments.
InvestmentsInvestments whose values are based on quoted market prices in active markets, and are therefore classified within Level 1, include active listed equities. Investments that trade in markets that are not considered to be active, but are valued based on quoted market prices, dealer quotations or alternative pricing
sources supported by observable inputs are classified within Level 2. These include certain U.S. government and sovereign obligations, most government agency securities, investment-grade corporate bonds, certain mortgage products, state, municipal and provincial obligations, and certain foreign equity securities, including securities whose prices may have been affected by events occurring after the close of trading on their principal exchange or market and, as a result, whose values are determined by a pricing service as described above, or securities whose values are otherwise determined using fair valuation methods approved by the Fund’s Board of Trustees.
Investments classified within Level 3 have significant unobservable inputs, as they trade infrequently or not at all. Level 3 investments include, among others, private placement securities. When observable prices are not available for these securities, the Trust uses one or more valuation techniques for which sufficient and reliable data is available. The inputs used by the Trust in estimating the value of Level 3 investments include, for example, the original transaction price, recent transactions in the same or similar instruments, completed or pending third-party transactions in the underlying investment or comparable issuers, subsequent rounds of financing, recapitalizations, and other transactions across the capital structure. Level 3 investments may also be adjusted to reflect illiquidity and/ornon-transferability, with the amount of such discount estimated by the Trust in the absence of market information. Assumptions used by the Trust due to the lack of observable inputs may significantly impact the resulting fair value and therefore the Fund’s results of operations. As of June 30, 2019, the Fund had no securities classified as Level 3.
Derivatives Exchange-traded derivatives, such as futures contracts, exchange-traded option contracts and certain swaps, are typically classified within Level 1 or Level 2 of the fair value hierarchy depending on whether or not they are deemed to be actively traded. Certainnon-exchange-traded derivatives, such as generic forwards, certain swaps and options, have inputs which can generally be corroborated by market data and are therefore classified within Level 2. During the six months ended June 30, 2019, the Fund did not hold any derivatives.
b. Securities Transactions Securities transactions are accounted for on the date securities are purchased or sold (trade date). Realized gains or losses on securities transactions are determined on the basis of specific identification.
| 11 |
Table of Contents
NOTES TO FINANCIAL STATEMENTS — GUARDIAN INTEGRATED RESEARCH VIP FUND
c. Foreign Currency Translation The accounting records of the Fund are maintained in U.S. dollars. Investment securities and all other assets and liabilities of the Fund denominated in a foreign currency are generally translated into U.S. dollars at the exchange rates quoted at the close of the NYSE on each business day. The market value of investment securities and other assets and liabilities are translated at the exchange rate as of the valuation date. Purchases and sales of securities, income receipts, and expense payments are translated into U.S. dollars at the exchange rates in effect on the dates of the respective transactions. The Fund does not isolate the portion of the fluctuations on investments resulting from changes in foreign currency exchange rates from the fluctuations in market prices of investments held. Such fluctuations are included in the Net change in net realized and unrealized gain/(loss) from investments on the Statement of Operations.
Reported realized foreign currency gains and losses arise from the disposition of foreign currency, currency gains or losses realized between the trade and settlement dates on securities transactions, and the difference between the amounts of dividends, interest and foreign withholding taxes recorded on the Fund’s books on the transaction date and the U.S. dollar equivalent of the amounts actually received or paid. These reported realized foreign currency gains and losses, if any, are included in Net realized gain/(loss) from foreign currency transactions on the Statement of Operations. Unrealized foreign currency gains and losses arise from changes (due to changes in exchange rates) in the value of foreign currency and other assets and liabilities denominated in foreign currencies, which are held at period end, if any, and are included in Net change in unrealized appreciation/(depreciation) on translation of assets and liabilities in foreign currencies on the Statement of Operations.
d. Foreign Capital Gains TaxThe Fund may be subject to foreign taxes on income, gains on investments or currency purchases/repatriation, a portion of which may be recoverable. The Fund will accrue such taxes and recoveries as applicable, based upon their current interpretation of tax rules and regulations that exist in the markets in which they invest.
e. Investment Income Dividend income net of foreign taxes withheld, if any, is generally recorded on theex-dividend date. Interest income, which includes amortization/accretion of premium/discount, is determined using the interest income accrual method, and is accrued and recorded daily.
f. Allocation of Income and Expenses Many of the expenses of the Trust can be directly attributed to a specific series of the Trust. Expenses that cannot be directly attributed to a specific series of the Trust are generally apportioned among all the series in the Trust, based on relative net assets. In calculating net asset value per share for each series of the Trust, investment income, realized and unrealized gains and losses, and expenses other than series-specific expenses are allocated daily to each series based upon the proportion of net assets attributable to each series.
3. Transactions with Affiliates
a. Investment Advisory Fee and Expense LimitationUnder the terms of the advisory agreement, which, after its two year initial term, is reviewed and approved annually by the Board of Trustees, the Fund pays an investment advisory fee to Park Avenue. Park Avenue is a wholly-owned subsidiary of Guardian Life and receives an investment advisory fee at an annual rate of 0.55% up to $100 million, 0.50% up to $300 million, and 0.40% in excess of $300 million of the Fund’s average daily net assets. The fee is accrued daily and paid monthly.
Park Avenue has contractually agreed through April 30, 2020 to waive certain fees and/or reimburse certain expenses incurred by the Fund to the extent necessary to limit the Fund’s total annual operating expenses after fee waiver and/or expense reimbursement to 0.96% of the Fund’s average daily net assets (excluding, if applicable, any acquired fund fees and expenses, taxes, interest, transaction costs and brokerage commissions, litigation and extraordinary expenses). The limitation may not be increased or terminated prior to this time without action by the Board of Trustees, may be terminated only upon approval of the Board of Trustees, and is subject to Park Avenue’s recoupment rights. For the six months ended June 30, 2019, Park Avenue waived fees and/or paid Fund expenses in the amount of $76,177.
Park Avenue may be entitled to recoupment of previously waived fees and reimbursed expenses from the Fund for three years from the date of the waiver or reimbursement, subject to the expense limitation in effect at the time of the waiver or reimbursement and at the time of the recoupment, if any. The amount available for potential future recoupment by Park Avenue from the Fund under the Expense Limitation Agreement and the expiration schedule at June 30, 2019 are as follows:
| Potential Recoupment Amounts Expiring | ||||||||||||||||
Total Potential Recoupment Amounts | 2022 | 2021 | 2020 | 2019 | ||||||||||||
| $513,070 | $ | 76,177 | $ | 162,831 | $ | 194,792 | $ | 79,270 | ||||||||
| 12 |
Table of Contents
NOTES TO FINANCIAL STATEMENTS — GUARDIAN INTEGRATED RESEARCH VIP FUND
Park Avenue has entered into aSub-Advisory Agreement with Massachusetts Financial Services Company (“MFS”). MFS is responsible for providingday-to-day investment advisory services to the Fund, subject to the supervision of Park Avenue and the oversight of the Board of Trustees.Sub-advisory fees are paid by Park Avenue and do not represent a separate or additional expense to the Fund.
b. Compensation of Trustees and Officers Trustees and officers who are interested persons of the Trust, as defined in the 1940 Act, receive no compensation from the Fund, except for the Chief Compliance Officer of the Trust. Trustees of the Trust who are not interested persons of the Trust, and the Chief Compliance Officer, receive compensation and reimbursement of expenses from the Trust.
c. Distribution Fees Park Avenue Securities LLC (“PAS”), a wholly-owned subsidiary of Guardian Life, is the principal underwriter of Fund shares. The Trust has entered into a distribution and service agreement with PAS, which governs the sale and distribution of shares of the Fund. Under a distribution and service plan adopted by the Trust(“12b-1 plan”), PAS is compensated for services in such capacity, including its expenses in connection with the promotion and distribution of shares of the Fund, at an annual rate of 0.25% of the Fund’s average daily net assets. For the six months ended June 30, 2019, the Fund paid distribution fees in the amount of $13,554 to PAS.
PAS has directed that certain payments under the12b-1 plan be used to compensate GIAC for shareholder services provided to contract owners.
4. Federal Income Taxes
a. Distributions to Shareholders For federal income tax purposes, the Fund is treated as a disregarded entity (“DRE”). As a DRE, the Fund is not subject to an entity-level income tax; and any income, gains, losses, deductions, taxes, and credits of the Fund would instead be “passed through” directly to the separate accounts of GIAC that invest in the Fund and retain the same character for U.S. federal income tax purposes. In addition, the Fund is not required to distribute taxable income and capital gains for U.S. federal income tax purposes. Therefore, no dividends and capital gains distributions were paid by the Fund.
5. Investments
a. Investment Purchases and Sales The cost of investments purchased and the proceeds from investments sold (excluding short-term investments)
amounted to $2,618,591 and $2,695,948, respectively, for the six months ended June 30, 2019. During the six months ended June 30, 2019, there were no purchases or sales of U.S. government securities.
b. Foreign Securities Foreign securities investments involve special risks and considerations not typically associated with U.S. investments. These risks include, but are not limited to, currency risk; adverse political, regulatory, social, and economic developments; and less reliable information about issuers. Moreover, securities of some foreign issuers may be less liquid and their prices more volatile than those of comparable U.S. issuers.
c. Industry or Sector Concentration In its normal course of business, the Fund may invest a significant portion of its assets in companies within a limited number of industries or sectors. As a result, the Fund may be subject to a greater risk of loss than that of a fund invested in a wider spectrum of industries or sectors because the stocks of many or all of the companies in the industry, group of industries, sector, or sectors may decline in value due to developments adversely affecting the industry, group of industries, sector, or sectors.
d. Repurchase Agreements The Fund may invest in repurchase agreements to maintain liquidity and earn income over periods of time as short as overnight. The collateral for repurchase agreements is either cash or fully negotiable U.S. government securities (including U.S. government agency securities). Repurchase agreements are fully collateralized (including the interest accrued thereon) and such collateral is marked to market daily while the agreements remain in force. If the value of the collateral falls below the repurchase price plus accrued interest, the Fund will typically require the seller to deposit additional collateral by the next business day. If the request for additional collateral is not met, or the seller defaults, the Fund maintains the right to sell the collateral (although it may be prevented or delayed from doing so in certain circumstances) and may be required to claim any resulting loss against the seller. Park Avenue monitors the creditworthiness of the seller with which the Fund enters into repurchase agreements.
6. Temporary Borrowings
The Fund, with other funds managed by Park Avenue, is party to a $10 million committed revolving credit facility from State Street Bank and Trust Company for temporary borrowing purposes, including the meeting of redemption requests that otherwise might require
| 13 |
Table of Contents
NOTES TO FINANCIAL STATEMENTS — GUARDIAN INTEGRATED RESEARCH VIP FUND
the untimely disposition of securities. Interest is calculated based on the higher of the dailyone-month LIBOR rate and the Federal Funds rate plus 1.25% at the time of borrowing. In addition to the interest charged on any borrowings by the Fund, each fund pays a commitment fee of 0.30% per annum on its share of the unused portion of the credit facility. The agreement is in place until December 10, 2019. The Fund did not utilize the credit facility during the six months ended June 30, 2019.
7. Indemnifications
Under the Trust’s organizational documents and, in some cases, by contract, its officers and trustees are
indemnified against certain liabilities arising out of the performance of their duties to the Fund. In addition, in the normal course of business, the Fund enters into contracts with its vendors and others that provide general indemnifications. The Fund’s maximum exposure under these arrangements is unknown as this would involve future claims that may be made against the Fund that have not yet occurred. However, based on experience, the Fund expects the risk of loss to be remote.
| 14 |
Table of Contents
SUPPLEMENTAL INFORMATION(UNAUDITED)
Approval of Investment Advisory andSub-advisory Agreements
Section 15(c) of the Investment Company Act of 1940, as amended (the “1940 Act”), requires that a fund’s investment advisory andsub-advisory agreements be approved initially by the fund’s board of trustees. Section 15(c) also requires that the continuation of these agreements, after an initial term of up to two years, be annually reviewed and approved by the board. Any such agreement must be approved by a vote of a majority of the trustees who are not parties to the agreement or “interested persons” (as defined in the 1940 Act) of a party to the agreement at anin-person meeting of the board called for the purpose of voting on such approval.
At a meeting of the Board of Trustees (the “Board”) of Guardian Variable Products Trust (the “Trust”) held on March27-28, 2019 (the “Meeting”), the Board, including the trustees who are not parties to the agreement or “interested persons” as defined in the 1940 Act (the “Independent Trustees”), considered and voted unanimously to renew the existing investment management agreement (the “Management Agreement”) between the Trust, on behalf of Guardian Diversified Research VIP Fund, Guardian Growth & Income VIP Fund, Guardian Integrated Research VIP Fund, Guardian International Growth VIP Fund, Guardian International Value VIP Fund, Guardian Large Cap Disciplined Growth VIP Fund, Guardian Large Cap Disciplined Value VIP Fund, Guardian Large Cap Fundamental Growth VIP Fund, Guardian Mid Cap Traditional Growth VIP Fund, Guardian Mid Cap Relative Value VIP Fund and Guardian Core Plus Fixed Income VIP Fund (the “Funds”), and Park Avenue Institutional Advisers LLC (the “Manager”) for aone-term.
The Board, including the Independent Trustees, also considered and voted unanimously to renew the existingsub-advisory agreements (the“Sub-advisory Agreements,” collectively with the Management Agreement, the “Agreements”) between the Manager and investment advisory firms engaged to serve assub-advisers to certain of the Funds, namely Putnam Investment Management, LLC, AllianceBernstein L.P., Massachusetts Financial Services Company, J.P. Morgan Investment Management Inc., Lazard Asset Management LLC, Wellington Management Company LLP, Boston Partners Global Investors, Inc., ClearBridge Investments, LLC, Janus Capital Management LLC, Wells Capital Management Incorporated and Lord, Abbett & Co. LLC (the“Sub-advisers”) for aone-year term.
The Board is responsible for overseeing the management of each Fund. In determining whether to renew its approval of the Agreements, the Trustees evaluated information and factors that they considered to be relevant and appropriate through the exercise of their own business judgment. The Trustees considered certain information and factors in light of advice furnished to them by legal counsel to the Trust and, in the case of the Independent Trustees, their independent legal counsel. In advance of the Meeting, the Trustees received materials and information designed to assist their consideration of the Agreements. The Trustees received written responses from the Manager and eachSub-adviser to a series of questions and requests for information encompassing a wide variety of topics provided by independent counsel on behalf of the Independent Trustees. The Independent Trustees discussed the Funds with independent counsel during a telephonic meeting and executive session in advance of the Meeting. The Trustees also received materials and information regarding the legal standards applicable to their consideration of the Agreements and the process and criteria used by the Manager to identify and select theSub-advisers.
During the course of their deliberations, the Independent Trustees met to discuss and evaluate the Agreements in executive session with their independent legal counsel, outside of the presence of the Trustees who are not Independent Trustees and representatives from Fund management, the Manager or anySub-adviser.
In reaching its decisions to renew its approval of the Agreements, the Board took into account the materials and information described above as well as other materials and information provided to the Board and discussed with and among the Trustees. Individual Trustees may have given different weight to different factors and information with respect to each Agreement, and the Trustees did not identify any single factor or information that, in isolation, would be controlling in deciding to approve the Agreements. The discussion below is intended to summarize the broad factors that figured prominently in the Board’s decisions to approve the Agreements rather than to beall-inclusive. These broad factors included: (i) the nature, extent and quality of the services provided to the Funds by the Manager and theSub-advisers; (ii) the investment performance of each Fund; (iii) the fees charged and estimated profitability; (iv) the extent to which economies of scale exist for a Fund, and the extent to which a Fund benefits from economies of scale; and
| 15 |
Table of Contents
SUPPLEMENTAL INFORMATION(UNAUDITED)
(v) any other benefits derived by the Manager or theSub-advisers (or their respective affiliates) from their relationships with the Funds.
Nature, Extent and Quality of Services
The Trustees considered information regarding the nature, extent and quality of services provided to the Funds by the Manager. The Trustees also considered, among other things, the terms of the Management Agreement and the range of investment advisory services provided by the Manager. In addition, the Trustees reviewed the range ofnon-investment advisory services provided by the Manager consistent with the terms of the Management Agreement, notably coordinating the preparation and filing of various regulatory documents, coordinating the preparation and assembly of Board meeting materials and assisting the Board with certain valuation matters.
The Trustees considered that the Funds operate in a“manager-of-managers” structure and reviewed the responsibilities that the Manager has under this structure, including monitoring and evaluating the performance of theSub-advisers, monitoring theSub-advisers for adherence to the stated investment objectives, strategies, policies and restrictions of the Funds and supervising theSub-advisers with respect to the services that theSub-advisers would provide under theSub-advisory Agreements. The Trustees also considered the process used by the Manager, consistent with this structure, to identify and recommendsub-advisers, and the Manager’s ability to monitor and overseesub-advisers and recommend replacementsub-advisers, when necessary, and provide other services under the Management Agreement. The Board noted that investment management staff of the Manager and the Trust’s Chief Compliance Officer conductin-person oversight visits of theSub-advisers on a periodic basis, follow through with additional inquiry on any questions or concerns that arise during the visit and then report the results of the visit to the Board. The Trustees reviewed information regarding the experience and background of the Manager’s key personnel and the Manager’s organizational structure and resources, including investment, legal and administrative capabilities of the Manager. In this regard, the Trustees recognized that the Funds may benefit from the Manager’s ability to use similar resources and capabilities of its affiliates in providing services to the Funds.
The Trustees considered information regarding the nature, extent and quality of services provided to the Funds by theSub-advisers. The Trustees also
considered, among other things, the terms of theSub-advisory Agreements and the range of investment advisory services provided by theSub-advisers under the oversight of the Manager. In evaluating these investment advisory services, the Trustees considered, among other things, theSub-advisers’ investment philosophies, styles and/or processes and approach to managing the Funds. The Trustees received and evaluated information regarding the background, education, expertise and/or experience of the investment professionals that serve as portfolio managers for the Funds and the capabilities and resources of theSub-advisers.
Based upon these considerations, the Trustees concluded, within the context of their full deliberations, that the nature, extent and quality of services provided to the Funds by the Manager and eachSub-adviser were appropriate.
Investment Performance
In connection with each of its regular quarterly meetings, the Board receives information on the performance of each Fund, including net performance, relative performance rankings within each Fund’s Lipper peer group, Morningstar ratings, and performance as compared to benchmark index returns. At each quarterly Board meeting, members of the Manager’s senior investment team reviewed with the Board the economic and market environment, risk management, and style consistency in connection with management of the Funds. The Board considered investment performance for each Fund over theone-year and since inception periods.
The Board also received and reviewed a report prepared by Broadridge Financial Solutions (“Broadridge”), an independent provider of mutual fund industry data. The Board reviewed the investment performance of each Fund on an absolute basis and in comparison to an appropriate benchmark index and each Fund’s respective peer group as independently selected by Broadridge. The Board noted that, except for Guardian Growth & Income VIP Fund, Guardian Large Cap Disciplined Value VIP Fund and Guardian Mid Cap Traditional Growth VIP Fund, each of the Fund’s performance for theone-year and since inception periods was below the median of its respective peer group median and benchmark index. With respect to Guardian Large Cap Disciplined Value VIP Fund, the Board noted that the performance for theone-year period was lower than the peer group median and benchmark index and performance since inception was higher than the peer group median and benchmark
| 16 |
Table of Contents
SUPPLEMENTAL INFORMATION(UNAUDITED)
index. With respect to Guardian Growth & Income VIP Fund and Guardian Mid Cap Traditional Growth VIP Fund, the Board noted that the performance for both theone-year and since inception periods was higher than each Fund’s peer group median and benchmark index.
The Manager discussed with the Board factors contributing to the Funds’ performance results. In addition, for certain Funds, the Manager discussed with the Board longer term performance records of theSub-advisers for strategies used in managing the Funds. The Board concluded that the investment performance generated by eachSub-adviser was generally satisfactory, or, that any steps being taken by the Manager andSub-advisers to address any performance issues were satisfactory. The Board also noted the short operational history of each Fund.
Costs and Profitability
The Trustees considered the management fees paid by the Funds to the Manager under the Management Agreement and evaluated the reasonableness of these fees. The Trustees received and reviewed comparative information with respect to the management fees and the management fees paid by other funds offered as investment options underlying variable contracts within the applicable peer group based on data obtained from Broadridge. The Board noted that the contractual and actual (effective) management fees reported for each of the Funds were below or equal to its peer group in all cases except for the Guardian Mid Cap Traditional Growth VIP Fund. The Board noted that the actual (effective) management fee for this Fund exceeded the peer group median by a modest amount.
The Trustees considered thesub-advisory fees paid under theSub-advisory Agreements and evaluated the reasonableness of those fees. The Trustees also considered that the fees paid to theSub-advisers would be paid by the Manager and not the Funds and that the Manager had negotiated the fees with theSub-advisers atarm’s-length.
The Trustees received comparative information relating to each Fund’s operating expense ratios and the operating expense ratios of a peer group of funds. In this regard, the Board noted that each Fund’s operating expense ratio was equal to or lower than the operating expense ratio of its respective peer group median, except for Guardian Diversified Research VIP Fund, Guardian Growth & Income VIP Fund and Guardian Integrated Research VIP Fund. The Board noted that the operating expense ratio for these Funds exceeded the peer group median by a modest amount. The Trustees
considered the Manager’s commitment to limit each Fund’s operating expenses through an expense limitation agreement with the Trust. Although the Board recognized that the comparisons between the management fees and operating expenses of the Funds and those of identified peer funds are imprecise, given different terms of agreements and variations in fund strategies, the Trustees found that the comparative information supported their consideration and approval of the management fees and evaluation of the operating expenses.
The Board considered the Manager’s estimates of its profitability, which included allocations by the Manager of its costs in providing management services to the Funds. The Board considered the estimated profitability of the Manager both overall and on aFund-by-Fund basis. The Board did not consider any profitability information from theSub-advisers because the Manager would be responsible for payment of thesub-advisory fees and had negotiated the fees with theSub-advisers atarm’s-length.
Based on the consideration of the information and factors summarized above, as well as other relevant information and factors, the Board concluded that the proposed management andsub-advisory fees were reasonable in light of the nature, extent and quality of services rendered to the Funds by the Manager and theSub-advisers. The Board also concluded that the profitability of the Funds to the Manager was acceptable and the Board determined it was appropriate to revisit estimated Manager profitability in connection with future reviews of the Agreements.
Economies of Scale
The Board considered whether the Funds’ fee structure is designed to share economies of scale with shareholders as the Funds’ assets grow. In this regard, the Board noted that for ten of eleven Funds, the management andsub-advisory fee included breakpoints that are tiered based on growth in asset levels of each such Fund. The Board also noted that the Funds’ expenses were subject to an expense limitation provided by the Manager. The Board noted that expected economies of scale, where they exist, may be shared through the use of fee breakpoints, expense limitations by the Manager, and/or a lower overall fee.
Ancillary Benefits
The Board considered the potential benefits, other than management fees, that the Manager and/or its affiliates may receive because of the Manager’s relationship with
| 17 |
Table of Contents
SUPPLEMENTAL INFORMATION(UNAUDITED)
the Funds. The Trustees acknowledged that the Funds were designed to serve as investment options under variable contracts issued by affiliates of the Manager that would receive fees under those contracts and that Park Avenue Securities LLC, an affiliate of the Manager and principal underwriter of the Funds, and participating insurance companies, including insurance companies affiliated with the Manager, would be entitled to receive fees from the Funds under a plan of distribution adopted pursuant to Rule12b-1 under the 1940 Act. The Trustees considered the benefits to the Manager from increased assets under management. The Trustees considered that the Manager and its affiliates may benefit from (i) greater efficiencies in annuity administration and operations and potential cost savings due to a reduction in the number of unaffiliated funds available as annuity contract investment options, and (ii) increased dividends-received deductions due to the Funds’ status under the tax laws as disregarded
entities. In addition, the Trustees considered the potential benefits, other thansub-advisory fees, that theSub-advisers and their affiliates may receive because of their relationships with the Funds, including the potential increased ability to use soft dollars consistent with Trust policies and other benefits from increases in assets under management. The Trustees concluded that benefits that may accrue to the Manager and its affiliates are reasonable and the benefits that may accrue to theSub-advisers and their affiliates are consistent with those expected for asub-adviser to a mutual fund such as the applicable Fund.
Conclusion
Based on a comprehensive consideration and evaluation of all of the information and factors summarized above, among others, the Board as a whole, including the Independent Trustees, approved the Agreements.
| 18 |
Table of Contents
SUPPLEMENTAL INFORMATION(UNAUDITED)
The Statement of Additional Information (“SAI”) includes additional information about the Trust’s Trustees and Officers and is available, without charge, upon request by calling toll-free1-888-GUARDIAN(1-888-482-7342) or by visiting our website at http://guardianvpt.onlineprospectus.net/GuardianVPT/Prospectuses.
Portfolio Holdings and Proxy Voting Procedures
The Fund files its complete schedule of portfolio holdings with the Securities and Exchange Commission for the first and third quarters of each fiscal year as an exhibit to its reports on FormN-PORT. The Fund’s FormN-PORT reports are available on the Securities and Exchange Commission’s website at https://www.sec.gov. The Fund’s FormN-PORT information is also available, without charge, upon request, by calling toll-free1-888-GUARDIAN(1-888-482-7342) or by visiting our website at http://guardianvpt.onlineprospectus.net/GuardianVPT/
Prospectuses.
A description of the policies and procedures that the Fund uses to determine how to vote proxies relating to portfolio securities is included in the SAI. The SAI and information regarding how the Fund voted proxies relating to portfolio securities during the most recent12-month period ended June 30 may be obtained (i) without charge, upon request, by calling toll-free1-888-GUARDIAN(1-888-482-7342) or by visiting our website at http://guardianvpt.onlineprospectus.net/GuardianVPT/
Prospectuses; and (ii) on the Securities and Exchange Commission’s website at https://www.sec.gov.
| 19 |
Table of Contents
This report is transmitted to shareholders only. It is not authorized for use as an offer of sale or a solicitation of an offer to buy shares of the Fund unless accompanied or preceded by the Fund’s current prospectus. Past performance results shown in this report should not be considered a representation of future performance. Investment returns and principal value of shares will fluctuate so that shares, when redeemed, may be worth more or less than their original cost. Statements and other information herein are as dated and are subject to change.

The Guardian Life Insurance Company of America New York, NY 10001-2159
PUB8170
Table of Contents
Guardian Variable
Products Trust
2019
Semiannual Report
All Data as of June 30, 2019
Guardian Diversified Research VIP Fund
Important Notice
Beginning on January 1, 2021, as permitted by regulations adopted by the Securities and Exchange Commission, paper copies of the Fund’s shareholder reports will no longer be sent by mail from The Guardian Insurance & Annuity Company, Inc. (“GIAC”). Instead, GIAC will mail you a notice when copies of the shareholder reports are made available on a website. You will be notified by mail each time a report is posted and provided with a website link to access the report.
If you have already elected to receive shareholder reports electronically, you will not be affected by this change and you need not take any action. If you have not yet elected electronic delivery, at any time, you may elect to receive the Fund’s shareholder reports and certain other communications from GIAC electronically, by going to www.guardianlife.com and registering fore-delivery.
You may instead elect to receive all future shareholder reports in paper free of charge. If you wish to receive paper copies of your shareholder reports, please call GIAC’s Customer Service Office Contact Center at1-888-GUARDIAN(1-888-482-7342). Your election to receive reports in paper will apply to all the underlying funds available.

| Not FDIC insured. May lose value. No bank guarantee. | www.guardianlife.com |
Table of Contents
TABLE OF CONTENTS
Guardian Diversified Research VIP Fund
| 1 | ||||
| 2 | ||||
Financial Information | ||||
| Schedule of Investments | 3 | |||
| Statement of Assets and Liabilities | 6 | |||
| Statement of Operations | 6 | |||
| Statements of Changes in Net Assets | 7 | |||
| Financial Highlights | 8 | |||
| Notes to Financial Statements | 10 | |||
Supplemental Information | ||||
| 15 | ||||
| Portfolio Holdings and Proxy Voting Procedures | 19 | |||
Except as otherwise specifically stated, all information, including portfolio security positions, is as of June 30, 2019. Fund holdings will vary. Information contained herein has been obtained from sources believed reliable, but is not guaranteed.
Table of Contents
GUARDIAN DIVERSIFIED RESEARCH VIP FUND
Fund Characteristics (unaudited)
| Total Net Assets: $164,578,889 |
Sector Allocation1 As of June 30, 2019 |
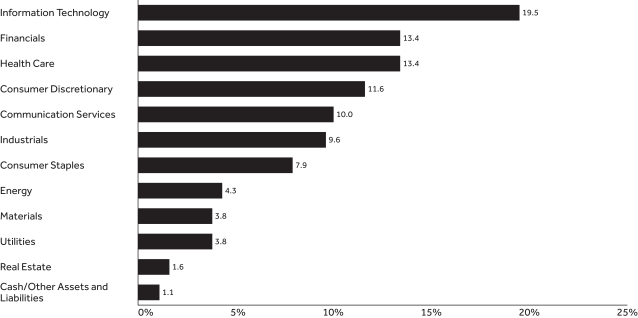 |
Top Ten Holdings2 As of June 30, 2019 | ||||
| Holding | % of Total Net Assets | |||
| Microsoft Corp. | 4.60% | |||
| Amazon.com, Inc. | 3.33% | |||
| Alphabet, Inc., Class A | 3.07% | |||
| Apple, Inc. | 2.79% | |||
| Facebook, Inc., Class A | 2.03% | |||
| Bank of America Corp. | 2.01% | |||
| The Procter & Gamble Co. | 2.00% | |||
| The Home Depot, Inc. | 1.80% | |||
| The Coca-Cola Co. | 1.78% | |||
| Citigroup, Inc. | 1.63% | |||
| Total | 25.04% | |||
| 1 | The Fund’s holdings are allocated to each sector based on the MSCI Global Industry Classification Standard (GICS®). Cash includes short-term investments and net other assets and liabilities. |
| 2 | Portfolio holdings are subject to change and should not be considered a recommendation to buy or sell individual securities. |
| 1 |
Table of Contents
UNDERSTANDING YOUR FUND’S EXPENSES(UNAUDITED)
By investing in the Fund, you incur two types of costs: (1) transaction costs and (2) ongoing costs, including, as applicable, investment advisory fees, distribution and/or service(12b-1) fees and other Fund expenses. The example below is intended to help you understand your ongoing costs (in dollars) of investing in the Fund and to compare these costs with the ongoing costs of investing in other mutual funds.
The example is based on an investment of $1,000 invested at the beginning of the period and held for the entire period from January 1, 2019 to June 30, 2019. The table below shows the Fund’s expenses in two ways:
Expenses based on actual return
This section of the table provides information about actual account values and actual expenses. You may use the information in this section, together with the amount you invested, to estimate the expenses that you paid over the period. Simply divide your account value by $1,000 (for example, an $8,600 account value divided by $1,000 = 8.6), then multiply the result by the number in the section under the heading entitled “Expenses Paid During Period” to estimate the expenses you paid on your account during this period.
Expenses based on hypothetical 5% return for comparison purposes
This section of the table provides information about hypothetical account values and hypothetical expenses based on the Fund’s actual expense ratio and an assumed rate of return of 5% per year before expenses, which is not the Fund’s actual return. The hypothetical account values and expenses may not be used to estimate the actual ending account balance or expenses you paid for the period. You may use this information to compare the ongoing costs of investing in the Fund with the cost of investing in other mutual funds. To do so, compare this 5% hypothetical example with the 5% hypothetical examples that appear in the shareholder reports of the other funds.
Note that the expenses shown in the table are meant to highlight your ongoing costs only and do not reflect any transactional costs, such as sales charges (loads), redemption fees, or exchange fees. Therefore the second section is useful in comparing ongoing costs only, and will not help you determine the relative total costs of owning different funds. If these transactional costs were included, your costs would have been higher. Charges and expenses at the insurance company separate account level are not reflected in the table.
Beginning 1/1/19 | Ending Account Value | Expenses Paid During Period* 1/1/19-6/30/19 | Expense Ratio During Period 1/1/19-6/30/19 | |||||||||||
| Based on Actual Return | $ 1,000.00 | $1,201.90 | $5.57 | 1.02% | ||||||||||
| Based on Hypothetical Return (5% Return Before Expenses) | $ 1,000.00 | $1,019.74 | $5.11 | 1.02% | ||||||||||
| * | Expenses are equal to the Fund’s annualized expense ratio as indicated, multiplied by the average account value over the period, multiplied by 181/365 (to reflect theone-half year period). |
| 2 |
Table of Contents
SCHEDULE OF INVESTMENTS — GUARDIAN DIVERSIFIED RESEARCH VIP FUND
| June 30, 2019(unaudited) | Shares | Value | ||||||
| Common Stocks – 98.9% |
| |||||||
| Aerospace & Defense – 2.3% |
| |||||||
General Dynamics Corp. | 4,334 | $ | 788,008 | |||||
Northrop Grumman Corp. | 2,679 | 865,612 | ||||||
The Boeing Co. | 2,485 | 904,565 | ||||||
TransDigm Group, Inc.(1) | 1,135 | 549,113 | ||||||
United Technologies Corp. | 5,797 | 754,769 | ||||||
|
| |||||||
| 3,862,067 | ||||||||
| Air Freight & Logistics – 0.1% |
| |||||||
FedEx Corp. | 1,505 | 247,106 | ||||||
|
| |||||||
| 247,106 | ||||||||
| Airlines – 0.2% |
| |||||||
Air Canada (Canada)(1) | 13,686 | 414,797 | ||||||
|
| |||||||
| 414,797 | ||||||||
| Automobiles – 1.3% |
| |||||||
General Motors Co. | 56,356 | 2,171,397 | ||||||
|
| |||||||
| 2,171,397 | ||||||||
| Banks – 6.0% |
| |||||||
Bank of America Corp. | 114,121 | 3,309,509 | ||||||
Citigroup, Inc. | 38,266 | 2,679,768 | ||||||
JPMorgan Chase & Co. | 13,650 | 1,526,070 | ||||||
The PNC Financial Services Group, Inc. | 10,716 | 1,471,093 | ||||||
Wells Fargo & Co. | 18,188 | 860,656 | ||||||
|
| |||||||
| 9,847,096 | ||||||||
| Beverages – 2.3% |
| |||||||
PepsiCo, Inc. | 6,137 | 804,745 | ||||||
The Coca-Cola Co. | 57,612 | 2,933,603 | ||||||
|
| |||||||
| 3,738,348 | ||||||||
| Biotechnology – 1.8% |
| |||||||
AbbVie, Inc. | 12,229 | 889,293 | ||||||
Amgen, Inc. | 4,964 | 914,766 | ||||||
Gilead Sciences, Inc. | 6,708 | 453,192 | ||||||
Vertex Pharmaceuticals, Inc.(1) | 3,477 | 637,612 | ||||||
|
| |||||||
| 2,894,863 | ||||||||
| Building Products – 1.1% |
| |||||||
Fortune Brands Home & Security, Inc. | 19,609 | 1,120,262 | ||||||
Johnson Controls International PLC | 15,637 | 645,965 | ||||||
|
| |||||||
| 1,766,227 | ||||||||
| Capital Markets – 4.0% |
| |||||||
Apollo Global Management LLC, Class A | 2,918 | 100,087 | ||||||
BlackRock, Inc. | 2,015 | 945,639 | ||||||
E*TRADE Financial Corp. | 24,263 | 1,082,130 | ||||||
Intercontinental Exchange, Inc. | 8,640 | 742,522 | ||||||
KKR & Co., Inc., Class A | 43,417 | 1,097,148 | ||||||
Raymond James Financial, Inc. | 10,425 | 881,434 | ||||||
The Goldman Sachs Group, Inc. | 8,875 | 1,815,825 | ||||||
|
| |||||||
| 6,664,785 | ||||||||
| Chemicals – 2.1% |
| |||||||
Dow, Inc. | 8,153 | 402,024 | ||||||
DuPont de Nemours, Inc. | 4,130 | 310,039 | ||||||
Linde PLC | 6,721 | 1,349,577 | ||||||
| June 30, 2019(unaudited) | Shares | Value | ||||||
| Chemicals(continued) |
| |||||||
The Sherwin-Williams Co. | 2,633 | $ | 1,206,678 | |||||
WR Grace & Co. | 2,028 | 154,351 | ||||||
|
| |||||||
| 3,422,669 | ||||||||
| Commercial Services & Supplies – 0.2% |
| |||||||
Waste Connections, Inc. | 3,313 | 316,656 | ||||||
|
| |||||||
| 316,656 | ||||||||
| Communications Equipment – 0.5% |
| |||||||
Cisco Systems, Inc. | 13,755 | 752,811 | ||||||
|
| |||||||
| 752,811 | ||||||||
| Construction Materials – 0.2% |
| |||||||
Summit Materials, Inc., Class A(1) | 19,019 | 366,116 | ||||||
|
| |||||||
| 366,116 | ||||||||
| Containers & Packaging – 0.5% |
| |||||||
AptarGroup, Inc. | 1,024 | 127,324 | ||||||
Avery Dennison Corp. | 1,889 | 218,519 | ||||||
Ball Corp. | 6,224 | 435,618 | ||||||
|
| |||||||
| 781,461 | ||||||||
| Diversified Telecommunication Services – 0.9% |
| |||||||
AT&T, Inc. | 45,112 | 1,511,703 | ||||||
|
| |||||||
| 1,511,703 | ||||||||
| Electric Utilities – 3.0% |
| |||||||
American Electric Power Co., Inc. | 17,253 | 1,518,437 | ||||||
Edison International | 4,862 | 327,747 | ||||||
Exelon Corp. | 29,700 | 1,423,818 | ||||||
NextEra Energy, Inc. | 4,710 | 964,891 | ||||||
The Southern Co. | 11,472 | 634,172 | ||||||
|
| |||||||
| 4,869,065 | ||||||||
| Electrical Equipment – 0.8% |
| |||||||
Eaton Corp. PLC | 16,418 | 1,367,291 | ||||||
|
| |||||||
| 1,367,291 | ||||||||
| Entertainment – 3.0% |
| |||||||
Activision Blizzard, Inc. | 20,252 | 955,894 | ||||||
Electronic Arts, Inc.(1) | 8,853 | 896,455 | ||||||
Netflix, Inc.(1) | 4,333 | 1,591,598 | ||||||
The Walt Disney Co. | 10,669 | 1,489,819 | ||||||
|
| |||||||
| 4,933,766 | ||||||||
| Equity Real Estate Investment – 1.6% |
| |||||||
Gaming and Leisure Properties, Inc. REIT | 33,396 | 1,301,776 | ||||||
SBA Communications Corp. REIT(1) | 5,758 | 1,294,629 | ||||||
|
| |||||||
| 2,596,405 | ||||||||
| Food & Staples Retailing – 2.0% |
| |||||||
BJ’s Wholesale Club Holdings, Inc.(1) | 14,032 | 370,445 | ||||||
Costco Wholesale Corp. | 2,821 | 745,477 | ||||||
Walmart, Inc. | 19,125 | 2,113,121 | ||||||
|
| |||||||
| 3,229,043 | ||||||||
| Food Products – 1.6% |
| |||||||
Archer-Daniels-Midland Co. | 5,654 | 230,683 | ||||||
McCormick & Co., Inc. | 5,009 | 776,445 | ||||||
| The accompanying notes are an integral part of these financial statements. | 3 |
Table of Contents
SCHEDULE OF INVESTMENTS — GUARDIAN DIVERSIFIED RESEARCH VIP FUND
| June 30, 2019(unaudited) | Shares | Value | ||||||
| Food Products(continued) |
| |||||||
The Hershey Co. | 7,259 | $ | 972,924 | |||||
Tyson Foods, Inc., Class A | 8,126 | 656,093 | ||||||
|
| |||||||
| 2,636,145 | ||||||||
| Health Care Equipment & Supplies – 3.9% |
| |||||||
Abbott Laboratories | 14,387 | 1,209,947 | ||||||
Baxter International, Inc. | 7,547 | 618,099 | ||||||
Becton Dickinson and Co. | 1,261 | 317,785 | ||||||
Boston Scientific Corp.(1) | 19,117 | 821,649 | ||||||
Danaher Corp. | 9,834 | 1,405,475 | ||||||
ICU Medical, Inc.(1) | 584 | 147,115 | ||||||
IDEXX Laboratories, Inc.(1) | 1,162 | 319,933 | ||||||
Medtronic PLC | 4,934 | 480,522 | ||||||
Stryker Corp. | 2,775 | 570,485 | ||||||
The Cooper Cos., Inc. | 1,436 | 483,774 | ||||||
|
| |||||||
| 6,374,784 | ||||||||
| Health Care Providers & Services – 2.4% |
| |||||||
Cigna Corp. | 12,599 | 1,984,972 | ||||||
CVS Health Corp. | 10,935 | 595,848 | ||||||
UnitedHealth Group, Inc. | 5,756 | 1,404,522 | ||||||
|
| |||||||
| 3,985,342 | ||||||||
| Hotels, Restaurants & Leisure – 2.6% |
| |||||||
Aramark | 9,340 | 336,800 | ||||||
Chipotle Mexican Grill, Inc.(1) | 1,170 | 857,470 | ||||||
Hilton Worldwide Holdings, Inc. | 10,820 | 1,057,547 | ||||||
MGM Resorts International | 10,395 | 296,985 | ||||||
Wynn Resorts Ltd. | 6,486 | 804,199 | ||||||
Yum China Holdings, Inc. | 18,966 | 876,229 | ||||||
|
| |||||||
| 4,229,230 | ||||||||
| Household Products – 2.0% |
| |||||||
The Procter & Gamble Co. | 29,989 | 3,288,294 | ||||||
|
| |||||||
| 3,288,294 | ||||||||
| Independent Power and Renewable Electricity Producers – 0.5% |
| |||||||
NRG Energy, Inc. | 24,039 | 844,250 | ||||||
|
| |||||||
| 844,250 | ||||||||
| Industrial Conglomerates – 2.1% |
| |||||||
3M Co. | 2,505 | 434,217 | ||||||
General Electric Co. | 53,511 | 561,865 | ||||||
Honeywell International, Inc. | 10,890 | 1,901,285 | ||||||
Roper Technologies, Inc. | 1,495 | 547,559 | ||||||
|
| |||||||
| 3,444,926 | ||||||||
| Insurance – 3.4% |
| |||||||
American International Group, Inc. | 33,563 | 1,788,237 | ||||||
Assured Guaranty Ltd. | 47,121 | 1,982,852 | ||||||
AXA S.A. (France) | 8,183 | 214,943 | ||||||
Prudential PLC (United Kingdom) | 76,828 | 1,673,365 | ||||||
|
| |||||||
| 5,659,397 | ||||||||
| Interactive Media & Services – 5.1% |
| |||||||
Alphabet, Inc., Class A(1) | 4,667 | 5,053,428 | ||||||
Facebook, Inc., Class A(1) | 17,328 | 3,344,304 | ||||||
|
| |||||||
| 8,397,732 | ||||||||
| June 30, 2019(unaudited) | Shares | Value | ||||||
| Internet & Direct Marketing Retail – 4.1% |
| |||||||
Amazon.com, Inc.(1) | 2,891 | $ | 5,474,484 | |||||
Booking Holdings, Inc.(1) | 719 | 1,347,917 | ||||||
|
| |||||||
| 6,822,401 | ||||||||
| IT Services – 6.0% |
| |||||||
DXC Technology Co. | 38,409 | 2,118,256 | ||||||
Fidelity National Information Services, Inc. | 17,311 | 2,123,714 | ||||||
First Data Corp., Class A(1) | 45,647 | 1,235,664 | ||||||
MasterCard, Inc., Class A | 7,770 | 2,055,398 | ||||||
Visa, Inc., Class A | 13,297 | 2,307,694 | ||||||
|
| |||||||
| 9,840,726 | ||||||||
| Life Sciences Tools & Services – 1.0% |
| |||||||
Mettler-Toledo International, Inc.(1) | 551 | 462,840 | ||||||
Thermo Fisher Scientific, Inc. | 4,157 | 1,220,828 | ||||||
|
| |||||||
| 1,683,668 | ||||||||
| Machinery – 0.7% |
| |||||||
Deere & Co. | 2,948 | 488,513 | ||||||
Stanley Black & Decker, Inc. | 4,145 | 599,408 | ||||||
|
| |||||||
| 1,087,921 | ||||||||
| Media – 1.0% |
| |||||||
Charter Communications, Inc., Class A(1) | 4,035 | 1,594,551 | ||||||
FOX Corp., Class A | 1 | 37 | ||||||
|
| |||||||
| 1,594,588 | ||||||||
| Metals & Mining – 1.0% |
| |||||||
Anglo American PLC (United Kingdom) | 22,273 | 637,099 | ||||||
Freeport-McMoRan, Inc. | 94,707 | 1,099,548 | ||||||
|
| |||||||
| 1,736,647 | ||||||||
| Multi-Utilities – 0.3% |
| |||||||
Ameren Corp. | 6,170 | 463,429 | ||||||
|
| |||||||
| 463,429 | ||||||||
| Oil, Gas & Consumable Fuels – 4.3% |
| |||||||
BP PLC (United Kingdom) | 302,259 | 2,112,313 | ||||||
Brigham Minerals, Inc., Class A(1) | 3,195 | 68,565 | ||||||
Cairn Energy PLC (United Kingdom)(1) | 191,839 | 423,173 | ||||||
Cenovus Energy, Inc. (Canada) | 234,824 | 2,071,106 | ||||||
Encana Corp. (Canada) | 99,031 | 508,181 | ||||||
Enterprise Products Partners LP | 52,914 | 1,527,627 | ||||||
Kosmos Energy Ltd. | 60,931 | 382,037 | ||||||
|
| |||||||
| 7,093,002 | ||||||||
| Pharmaceuticals – 4.3% |
| |||||||
Allergan PLC | 3,015 | 504,801 | ||||||
Bristol-Myers Squibb Co. | 13,112 | 594,629 | ||||||
Eli Lilly & Co. | 6,861 | 760,130 | ||||||
Johnson & Johnson | 14,038 | 1,955,213 | ||||||
Merck & Co., Inc. | 23,297 | 1,953,454 | ||||||
Pfizer, Inc. | 30,646 | 1,327,585 | ||||||
|
| |||||||
| 7,095,812 | ||||||||
| 4 | The accompanying notes are an integral part of these financial statements. |
Table of Contents
SCHEDULE OF INVESTMENTS — GUARDIAN DIVERSIFIED RESEARCH VIP FUND
| June 30, 2019(unaudited) | Shares | Value | ||||||
| Professional Services – 0.2% |
| |||||||
CoStar Group, Inc.(1) | 593 | $ | 328,557 | |||||
|
| |||||||
| 328,557 | ||||||||
| Road & Rail – 1.3% |
| |||||||
Norfolk Southern Corp. | 4,021 | 801,506 | ||||||
Union Pacific Corp. | 7,952 | 1,344,763 | ||||||
|
| |||||||
| 2,146,269 | ||||||||
| Semiconductors & Semiconductor Equipment – 3.0% |
| |||||||
NXP Semiconductors N.V. | 20,157 | 1,967,525 | ||||||
ON Semiconductor Corp.(1) | 63,178 | 1,276,827 | ||||||
Texas Instruments, Inc. | 14,761 | 1,693,972 | ||||||
|
| |||||||
| 4,938,324 | ||||||||
| Software – 7.2% |
| |||||||
Adobe, Inc.(1) | 6,220 | 1,832,723 | ||||||
Dassault Systemes SE (France) | 5,869 | 937,666 | ||||||
Microsoft Corp. | 56,468 | 7,564,453 | ||||||
salesforce.com, Inc.(1) | 9,945 | 1,508,955 | ||||||
|
| |||||||
| 11,843,797 | ||||||||
| Specialty Retail – 2.8% |
| |||||||
Advance Auto Parts, Inc. | 1,942 | 299,340 | ||||||
Burlington Stores, Inc.(1) | 2,472 | 420,611 | ||||||
CarMax, Inc.(1) | 4,669 | 405,409 | ||||||
The Home Depot, Inc. | 14,287 | 2,971,267 | ||||||
The TJX Cos., Inc. | 10,691 | 565,340 | ||||||
|
| |||||||
| 4,661,967 | ||||||||
| Technology Hardware, Storage & Peripherals – 2.8% |
| |||||||
Apple, Inc. | 23,239 | 4,599,463 | ||||||
|
| |||||||
| 4,599,463 | ||||||||
| Textiles, Apparel & Luxury Goods – 0.8% |
| |||||||
Levi Strauss & Co., Class A(1) | 12,896 | 269,268 | ||||||
NIKE, Inc., Class B | 12,063 | 1,012,689 | ||||||
|
| |||||||
| 1,281,957 | ||||||||
| June 30, 2019(unaudited) | Shares | Value | ||||||
| Trading Companies & Distributors – 0.6% |
| |||||||
United Rentals, Inc.(1) | 4,290 | $ | 568,983 | |||||
Yellow Cake PLC (United Kingdom)(1)(2) | 165,468 | 430,002 | ||||||
|
| |||||||
| 998,985 | ||||||||
| Total Common Stocks (Cost $148,352,604) |
| 162,831,285 | ||||||
| Principal Amount | Value | |||||||
| Short-Term Investment – 1.1% |
| |||||||
| Repurchase Agreements – 1.1% |
| |||||||
Fixed Income Clearing Corp., 0.50%, dated 6/28/2019, proceeds at maturity value of $1,780,074, due 7/1/2019(3) | $ | 1,780,000 | 1,780,000 | |||||
| Total Repurchase Agreements (Cost $1,780,000) |
| 1,780,000 | ||||||
| Total Investments – 100.0% (Cost $150,132,604) |
| 164,611,285 | ||||||
| Liabilities in excess of other assets – (0.0)% |
| (32,396 | ) | |||||
| Total Net Assets – 100.0% |
| $ | 164,578,889 | |||||
| (1) | Non–income–producing security. |
| (2) | Securities that may be resold in transactions, exempt from registration under Rule 144A of the Securities Act of 1933, as amended, normally to certain qualified buyers. At June 30, 2019, the aggregate market value of these securities amounted to $430,002, representing 0.3% of net assets. These securities have been deemed liquid by the investment adviser pursuant to the Fund’s liquidity procedures approved by the Board of Trustees. |
| (3) | The table below presents collateral for repurchase agreements. |
| Security | Coupon | Maturity Date | Principal Amount | Value | ||||||||||||
| U.S. Treasury Note | 2.75% | 8/15/2021 | $ | 1,765,000 | $ | 1,819,161 | ||||||||||
Legend:
REIT — Real Estate Investment Trust
The following is a summary of the inputs used as of June 30, 2019 in valuing the Fund’s investments. For more information on valuation inputs, please refer to Note 2a of the accompanying Notes to Financial Statements.
| Valuation Inputs | ||||||||||||||||
| Investments in Securities(unaudited) | Level 1 | Level 2 | Level 3 | Total | ||||||||||||
| Common Stocks | $ | 156,617,667 | $ | 6,213,618 | * | $ | — | $ | 162,831,285 | |||||||
| Repurchase Agreements | — | 1,780,000 | — | 1,780,000 | ||||||||||||
| Total | $ | 156,617,667 | $ | 7,993,618 | $ | — | $ | 164,611,285 | ||||||||
| * | Consists of certain foreign securities whose values were determined by a pricing service using pricing models (See Note 2a in Notes to Financial Statements). These investments in securities were classified as Level 2 rather than Level 1. |
| The accompanying notes are an integral part of these financial statements. | 5 |
Table of Contents
FINANCIAL INFORMATION — GUARDIAN DIVERSIFIED RESEARCH VIP FUND
For the Six Months Ended June 30, 2019 (unaudited) | ||||
Investment Income | ||||
Dividends | $ | 1,454,339 | ||
Interest | 4,519 | |||
Withholding taxes on foreign dividends | (6,098 | ) | ||
|
| |||
Total Investment Income | 1,452,760 | |||
|
| |||
Expenses | ||||
Investment advisory fees | 483,771 | |||
Distribution fees | 201,571 | |||
Trustees’ and officers’ fees | 38,451 | |||
Custodian and accounting fees | 28,418 | |||
Professional fees | 27,049 | |||
Administrative fees | 23,535 | |||
Shareholder reports | 15,178 | |||
Transfer agent fees | 9,432 | |||
Other expenses | 10,712 | |||
|
| |||
Total Expenses | 838,117 | |||
Less: Fees waived | (15,707 | ) | ||
|
| |||
Total Expenses, Net | 822,410 | |||
|
| |||
Net Investment Income/(Loss) | 630,350 | |||
|
| |||
Realized Gain/(Loss) and Change in Unrealized Appreciation/(Depreciation) on Investments and Foreign Currency Transactions | ||||
Net realized gain/(loss) from investments | 5,848,962 | |||
Net realized gain/(loss) from foreign currency transactions | (903 | ) | ||
Net change in unrealized appreciation/(depreciation) on investments | 23,031,306 | |||
Net change in unrealized appreciation/(depreciation) on translation of assets and liabilities in foreign currencies | 344 | |||
|
| |||
Net Gain on Investments and Foreign Currency Transactions | 28,879,709 | |||
|
| |||
Net Increase in Net Assets Resulting From Operations | $ | 29,510,059 | ||
|
| |||
| 6 | The accompanying notes are an integral part of these financial statements. |
Table of Contents
FINANCIAL INFORMATION — GUARDIAN DIVERSIFIED RESEARCH VIP FUND
| The accompanying notes are an integral part of these financial statements. | 7 |
Table of Contents
FINANCIAL INFORMATION — GUARDIAN DIVERSIFIED RESEARCH VIP FUND
The Financial Highlights table is intended to help you understand the Fund’s financial performance for the past six reporting periods (or, if shorter, the period since inception). Certain information reflects financial results for a single Fund share. The total returns in the table represent the rate that an investor would have earned (or lost) on an investment in the Fund.
Financial Highlights Six Months Ended Numbers are unaudited | ||||||||||||||||||||||||
| Per Share Operating Performance | ||||||||||||||||||||||||
| Net Asset Value, Beginning of Period | Net Investment Income(1) | Net Realized and Unrealized Gain/(Loss) | Total Operations | Net Asset Value, End of Period | Total Return(2) | |||||||||||||||||||
Six Months Ended 6/30/19 | $ | 11.84 | $ | 0.05 | $ | 2.34 | $ | 2.39 | $ | 14.23 | 20.19% | (4) | ||||||||||||
Year Ended 12/31/18 | 12.65 | 0.09 | (0.90 | ) | (0.81 | ) | 11.84 | (6.40)% | ||||||||||||||||
Year Ended 12/31/17 | 10.37 | 0.08 | 2.20 | 2.28 | 12.65 | 21.99% | ||||||||||||||||||
Period Ended 12/31/16(5) | 10.00 | 0.04 | 0.33 | 0.37 | 10.37 | 3.70% | (4) | |||||||||||||||||
| 8 | The accompanying notes are an integral part of these financial statements. |
Table of Contents
FINANCIAL INFORMATION — GUARDIAN DIVERSIFIED RESEARCH VIP FUND
| Ratios/Supplemental Data | ||||||||||||||||||||||
| Net Assets, End of Period (000s) | Net Ratio of Expenses to Average Net Assets(3) | Gross Ratio of Expenses to Average Net Assets | Net Ratio of Net Investment Income to Average Net Assets(3) | Gross Ratio of Net (Loss) to Average | Portfolio Turnover Rate | |||||||||||||||||
| $ | 164,579 | 1.02% | (4) | 1.04% | (4) | 0.78% | (4) | 0.76% | (4) | 48% | (4) | |||||||||||
| 148,193 | 1.02% | 1.09% | 0.68% | 0.61% | 88% | |||||||||||||||||
| 12,129 | 0.96% | 2.43% | 0.67% | (0.80)% | 154% | |||||||||||||||||
| 10,139 | 0.96% | (4) | 3.07% | (4) | 1.12% | (4) | (0.99)% | (4) | 61% | (4) | ||||||||||||
| (1) | Calculated based on the average shares outstanding during the period. |
| (2) | Total returns do not reflect the effects of charges deducted pursuant to the terms of The Guardian Insurance & Annuity Company, Inc.’s variable contracts. Inclusion of such charges would reduce the total returns for all periods shown. |
| (3) | Net Ratio of Expenses to Average Net Assets and Net Ratio of Net Investment Income to Average Net Assets include the effect of fee waivers and expense limitations. |
| (4) | Ratios for periods less than one year have been annualized, except for total return and portfolio turnover rate. For the period ended December 31, 2016, certainnon-recurring fees (i.e., audit fees) are not annualized. |
| (5) | Commenced operations on September 1, 2016. |
| The accompanying notes are an integral part of these financial statements. | 9 |
Table of Contents
NOTES TO FINANCIAL STATEMENTS — GUARDIAN DIVERSIFIED RESEARCH VIP FUND
June 30, 2019(unaudited)
1. Organization
Guardian Variable Products Trust (the “Trust”), a Delaware statutory trust organized on January 12, 2016, is registered under the Investment Company Act of 1940, as amended (the “1940 Act”), as anopen-end management investment company. The Trust currently has sixteen series. Guardian Diversified Research VIP Fund (the “Fund”) is a series of the Trust. The Fund is a diversified fund and commenced operations on September 1, 2016. The financial statements for other series of the Trust are presented in separate reports.
The Trust has authorized an unlimited number of shares of beneficial interest with no par value. Shares are bought and sold at closing net asset value (“NAV”). Shares of the Fund are only sold to certain separate accounts of The Guardian Insurance & Annuity Company, Inc. (“GIAC”) that fund certain variable annuity contracts and variable life insurance policies issued by GIAC. GIAC is a wholly-owned subsidiary of The Guardian Life Insurance Company of America (“Guardian Life”).
The Fund seeks capital appreciation.
2. Significant Accounting Policies
The following is a summary of significant accounting policies followed by the Fund in the preparation of its financial statements. The Fund follows the investment company accounting and reporting guidance of the Financial Accounting Standards Board (“FASB”) Accounting Standards Codification Topic 946 Financial Services — Investment Companies. The following policies are in conformity with accounting principles generally accepted in the United States of America (“GAAP”). The preparation of financial statements in accordance with GAAP requires management to make estimates and assumptions that affect the reported amounts and disclosures in the financial statements. Actual results could differ from those estimates.
a. Investment Valuations Equity securities traded on an exchange other than NASDAQ Stock Market, LLC (“NASDAQ”) are valued at the last reported sale price on the principal exchange or market on which they are traded; or, if there were no sales that day, at the mean between the closing bid and ask prices. Securities traded on the NASDAQ are generally valued at the NASDAQ official closing price, which may not be the last sale price. If the NASDAQ official closing price is not available for a security, that security is generally valued at the
mean between the closing bid and ask prices. Repurchase agreements are carried at cost, which approximates fair value (see Note 5d). Foreign securities are valued in the currencies of the markets in which they trade and then converted to U.S. dollars by the application of foreign exchange rates at the close of the New York Stock Exchange (“NYSE”). Forward foreign currency contracts, if any, are valued at the mean between the bid and ask rates for the specified time interpolated from rates for proximate time periods. Securities for which market quotations are not readily available or for which market quotations may be considered unreliable are valued at their fair values as determined in accordance with policies and procedures adopted by the Board of Trustees.
Under the policies and procedures approved by the Board of Trustees, Park Avenue Institutional Advisers LLC (“Park Avenue”), the Fund’s investment adviser, has established a Fair Valuation Committee to assist the Board of Trustees with the oversight and monitoring of the valuation of the Fund’s investments. This includes monitoring the appropriateness of fair values based on results of ongoing valuation oversight, including but not limited to consideration of security specific events, market events, and pricing vendor and broker-dealer due diligence. The Fair Valuation Committee oversees and carries out the policies for the valuation of investments held in the Fund. The Fair Valuation Committee is responsible for discussing and assessing the potential impacts to the fair values on an ongoing basis, and at least on a quarterly basis with the Board of Trustees.
Securities whose values have been materially affected by events occurring before the Fund’s valuation time but after the close of the securities’ principal exchange or market may be fair valued in accordance with policies and procedures adopted by the Board of Trustees. In addition, the values of the Fund’s investments in foreign securities are generally determined by a pricing service using pricing models designed to estimate likely changes in the values of those securities. Certain foreign equity instruments are valued by applying international fair value factors provided by approved pricing services. The factors seek to adjust the local closing price for movements of local markets post closing, but prior to the time the NAVs are calculated. Valuations reflected in this report are as of the report date. As a result, changes in valuation due to market events and/or issuer related events after the report date and prior to issuance of the report are not reflected herein.
| 10 |
Table of Contents
NOTES TO FINANCIAL STATEMENTS — GUARDIAN DIVERSIFIED RESEARCH VIP FUND
Various inputs are used in determining the valuation of the Fund’s investments. These inputs are summarized in three broad levels listed below.
| • | Level 1 – unadjusted inputs using quoted prices in active markets for identical investments. |
| • | Level 2– other significant observable inputs, including, but not limited to, quoted prices for similar investments, inputs other than quoted prices that are observable for investments (such as interest rates, prepayment speeds, credit risks, etc.) or other market corroborated inputs. |
| • | Level 3 – significant unobservable inputs (including the Fund’s own assumptions in determining the fair value of investments) |
Inputs may include price information, volatility statistics, specific and broad credit data, liquidity statistics, and other factors. A financial instrument’s level within the fair value hierarchy is based on the lowest level of any input; both individually and in aggregate, that is significant to the fair value measurement. However, the determination of what constitutes “observable” requires significant judgment by the Trust. The Trust considers observable data to be that market data which is readily available, regularly distributed or updated, reliable and verifiable, and provided by independent sources that are actively involved in the relevant market. The inputs or methodology used for valuing securities are not necessarily an indication of the risk associated with investing in those securities. Changes in valuation techniques may result in transfers into or out of a financial instrument’s assigned level within the hierarchy.
The FASB requires reporting entities to make disclosures about purchases, sales, issuances and settlements of Level 3 securities on a gross basis. For the six months ended June 30, 2019, there were no transfers into or out of Level 3 of the fair value hierarchy.
In determining a financial instrument’s placement within the hierarchy, the Trust separates the Fund’s investment portfolio into two categories: investments and derivatives (e.g., futures). A summary of inputs used to value the Fund’s assets and liabilities carried at fair value as of June 30, 2019 is included in the Schedule of Investments.
Investments Investments whose values are based on quoted market prices in active markets, and are therefore classified within Level 1, include active listed equities. Investments that trade in markets that are not considered to be active, but are valued based on quoted
market prices, dealer quotations or alternative pricing sources supported by observable inputs are classified within Level 2. These include certain U.S. government and sovereign obligations, most government agency securities, investment-grade corporate bonds, certain mortgage products, state, municipal and provincial obligations, and certain foreign equity securities, including securities whose prices may have been affected by events occurring after the close of trading on their principal exchange or market and, as a result, whose values are determined by a pricing service as described above, or securities whose values are otherwise determined using fair valuation methods approved by the Fund’s Board of Trustees.
Investments classified within Level 3 have significant unobservable inputs, as they trade infrequently or not at all. Level 3 investments include, among others, private placement securities. When observable prices are not available for these securities, the Trust uses one or more valuation techniques for which sufficient and reliable data is available. The inputs used by the Trust in estimating the value of Level 3 investments include, for example, the original transaction price, recent transactions in the same or similar instruments, completed or pending third-party transactions in the underlying investment or comparable issuers, subsequent rounds of financing, recapitalizations, and other transactions across the capital structure. Level 3 investments may also be adjusted to reflect illiquidity and/ornon-transferability, with the amount of such discount estimated by the Trust in the absence of market information. Assumptions used by the Trust due to the lack of observable inputs may significantly impact the resulting fair value and therefore the Fund’s results of operations. As of June 30, 2019, the Fund had no securities classified as Level 3.
Derivatives Exchange-traded derivatives, such as futures contracts, exchange-traded option contracts and certain swaps, are typically classified within Level 1 or Level 2 of the fair value hierarchy depending on whether or not they are deemed to be actively traded. Certainnon-exchange-traded derivatives, such as generic forwards, certain swaps and options, have inputs which can generally be corroborated by market data and are therefore classified within Level 2. During the six months ended June 30, 2019, the Fund did not hold any derivatives.
b. Securities TransactionsSecurities transactions are accounted for on the date securities are purchased or sold (trade date). Realized gains or losses on securities transactions are determined on the basis of specific identification.
| 11 |
Table of Contents
NOTES TO FINANCIAL STATEMENTS — GUARDIAN DIVERSIFIED RESEARCH VIP FUND
c. Foreign Currency Translation The accounting records of the Fund are maintained in U.S. dollars. Investment securities and all other assets and liabilities of the Fund denominated in a foreign currency are generally translated into U.S. dollars at the exchange rates quoted at the close of the NYSE on each business day. The market value of investment securities and other assets and liabilities are translated at the exchange rate as of the valuation date. Purchases and sales of securities, income receipts, and expense payments are translated into U.S. dollars at the exchange rates in effect on the dates of the respective transactions. The Fund does not isolate the portion of the fluctuations on investments resulting from changes in foreign currency exchange rates from the fluctuations in market prices of investments held. Such fluctuations are included in the Net change in net realized and unrealized gain/(loss) from investments on the Statement of Operations.
Reported realized foreign currency gains and losses arise from the disposition of foreign currency, currency gains or losses realized between the trade and settlement dates on securities transactions, and the difference between the amounts of dividends, interest and foreign withholding taxes recorded on the Fund’s books on the transaction date and the U.S. dollar equivalent of the amounts actually received or paid. These reported realized foreign currency gains and losses, if any, are included in Net realized gain/(loss) from foreign currency transactions on the Statement of Operations. Unrealized foreign currency gains and losses arise from changes (due to changes in exchange rates) in the value of foreign currency and other assets and liabilities denominated in foreign currencies, which are held at period end, if any, and are included in Net change in unrealized appreciation/(depreciation) on translation of assets and liabilities in foreign currencies on the Statement of Operations.
d. Foreign Capital Gains Tax The Fund may be subject to foreign taxes on income, gains on investments or currency purchases/repatriation, a portion of which may be recoverable. The Fund will accrue such taxes and recoveries as applicable, based upon their current interpretation of tax rules and regulations that exist in the markets in which they invest.
e. Investment Income Dividend income net of foreign taxes withheld, if any, is generally recorded on theex-dividend date. Interest income, which includes amortization/accretion of premium/discount, is determined using the interest income accrual method, and is accrued and recorded daily.
f. Allocation of Income and Expenses Many of the expenses of the Trust can be directly attributed to a specific series of the Trust. Expenses that cannot be directly attributed to a specific series of the Trust are generally apportioned among all the series in the Trust, based on relative net assets. In calculating net asset value per share for each series of the Trust, investment income, realized and unrealized gains and losses, and expenses other than series-specific expenses are allocated daily to each series based upon the proportion of net assets attributable to each series.
3. Transactions with Affiliates
a. Investment Advisory Feeand Expense Limitation Under the terms of the advisory agreement, which, after its two year initial term, is reviewed and approved annually by the Board of Trustees, the Fund pays an investment advisory fee to Park Avenue. Park Avenue is a wholly-owned subsidiary of Guardian Life and receives an investment advisory fee at an annual rate of 0.60% of the Fund’s average daily net assets. The fee is accrued daily and paid monthly.
Park Avenue has contractually agreed through April 30, 2020 to waive certain fees and/or reimburse certain expenses incurred by the Fund to the extent necessary to limit the Fund’s total annual operating expenses after fee waiver and/or expense reimbursement to 1.02% of the Fund’s average daily net assets (excluding, if applicable, any acquired fund fees and expenses, taxes, interest, transaction costs and brokerage commissions, litigation and extraordinary expenses). Prior to April 9, 2018, the expense limitation was 0.96%. The limitation may not be increased or terminated prior to this time without action by the Board of Trustees, may be terminated only upon approval of the Board of Trustees, and is subject to Park Avenue’s recoupment rights. For the six months ended June 30, 2019, Park Avenue waived fees and/or paid Fund expenses in the amount of $15,707.
Park Avenue may be entitled to recoupment of previously waived fees and reimbursed expenses from the Fund for three years from the date of the waiver or reimbursement, subject to the expense limitation in effect at the time of the waiver or reimbursement and at the time of the recoupment, if any. Amounts waived or reimbursed by Park Avenue pursuant to any expense limitation after April 9, 2018 will not be subject to Park Avenue’s recoupment rights. The amount available for potential future recoupment by Park Avenue from the
| 12 |
Table of Contents
NOTES TO FINANCIAL STATEMENTS — GUARDIAN DIVERSIFIED RESEARCH VIP FUND
Fund under the Expense Limitation Agreement and the expiration schedule at June 30, 2019 are as follows:
| Potential Recoupment Amounts Expiring | ||||||||||||
Total Potential Recoupment Amounts | 2021 | 2020 | 2019 | |||||||||
| $354,298 | $ | 60,975 | $ | 232,223 | $ | 61,100 | ||||||
Park Avenue has entered into aSub-Advisory Agreement with Putnam Investment Management LLC (“Putnam”). Putnam is responsible for providingday-to-day investment advisory services to the Fund, subject to the supervision of Park Avenue and the oversight of the Board of Trustees.Sub-advisory fees are paid by Park Avenue and do not represent a separate or additional expense to the Fund.
b. Compensation of Trustees and Officers Trustees and officers who are interested persons of the Trust, as defined in the 1940 Act, receive no compensation from the Fund, except for the Chief Compliance Officer of the Trust. Trustees of the Trust who are not interested persons of the Trust, and the Chief Compliance Officer, receive compensation and reimbursement of expenses from the Trust.
c. Distribution Fees Park Avenue Securities LLC (“PAS”), a wholly-owned subsidiary of Guardian Life, is the principal underwriter of Fund shares. The Trust has entered into a distribution and service agreement with PAS, which governs the sale and distribution of shares of the Fund. Under a distribution and service plan adopted by the Trust(“12b-1 plan”), PAS is compensated for services in such capacity, including its expenses in connection with the promotion and distribution of shares of the Fund, at an annual rate of 0.25% of the Fund’s average daily net assets. For the six months ended June 30, 2019, the Fund paid distribution fees in the amount of $201,571 to PAS.
PAS has directed that certain payments under the12b-1 plan be used to compensate GIAC for shareholder services provided to contract owners.
4. Federal Income Taxes
a. Distributions to Shareholders For federal income tax purposes, the Fund is treated as a disregarded entity (“DRE”). As a DRE, the Fund is not subject to an entity-level income tax; and any income, gains, losses, deductions, taxes, and credits of the Fund would instead be “passed through” directly to the separate accounts of GIAC that invest in the Fund and retain the same character for U.S. federal income tax purposes. In
addition, the Fund is not required to distribute taxable income and capital gains for U.S. federal income tax purposes. Therefore, no dividends and capital gains distributions were paid by the Fund.
5. Investments
a. Investment Purchases and Sales The cost of investments purchased and the proceeds from investments sold (excluding short-term investments) amounted to $76,218,219 and $89,149,479, respectively, for the six months ended June 30, 2019. During the six months ended June 30, 2019, there were no purchases or sales of U.S. government securities.
b. Foreign Securities Foreign securities investments involve special risks and considerations not typically associated with U.S. investments. These risks include, but are not limited to, currency risk; adverse political, regulatory, social, and economic developments; and less reliable information about issuers. Moreover, securities of some foreign issuers may be less liquid and their prices more volatile than those of comparable U.S. issuers.
c. Industry or Sector Concentration In its normal course of business, the Fund may invest a significant portion of its assets in companies within a limited number of industries or sectors. As a result, the Fund may be subject to a greater risk of loss than that of a fund invested in a wider spectrum of industries or sectors because the stocks of many or all of the companies in the industry, group of industries, sector, or sectors may decline in value due to developments adversely affecting the industry, group of industries, sector, or sectors.
d. Repurchase Agreements The Fund may invest in repurchase agreements to maintain liquidity and earn income over periods of time as short as overnight. The collateral for repurchase agreements is either cash or fully negotiable U.S. government securities (including U.S. government agency securities). Repurchase agreements are fully collateralized (including the interest accrued thereon) and such collateral is marked to market daily while the agreements remain in force. If the value of the collateral falls below the repurchase price plus accrued interest, the Fund will typically require the seller to deposit additional collateral by the next business day. If the request for additional collateral is not met, or the seller defaults, the Fund maintains the right to sell the collateral (although it may be prevented or delayed from doing so in certain circumstances) and may be required to claim any resulting loss against the
| 13 |
Table of Contents
NOTES TO FINANCIAL STATEMENTS — GUARDIAN DIVERSIFIED RESEARCH VIP FUND
seller. Park Avenue monitors the creditworthiness of the seller with which the Fund enters into repurchase agreements.
6. Temporary Borrowings
The Fund, with other funds managed by Park Avenue, is party to a $10 million committed revolving credit facility from State Street Bank and Trust Company for temporary borrowing purposes, including the meeting of redemption requests that otherwise might require the untimely disposition of securities. Interest is calculated based on the higher of the dailyone-month LIBOR rate and the Federal Funds rate plus 1.25% at the time of borrowing. In addition to the interest charged on any borrowings by the Fund, each fund pays a commitment fee of 0.30% per annum on its share of the unused portion of the credit facility. The agreement is in
place until December 10, 2019. The Fund did not utilize the credit facility during the six months ended June 30, 2019.
7. Indemnifications
Under the Trust’s organizational documents and, in some cases, by contract, its officers and trustees are indemnified against certain liabilities arising out of the performance of their duties to the Fund. In addition, in the normal course of business, the Fund enters into contracts with its vendors and others that provide general indemnifications. The Fund’s maximum exposure under these arrangements is unknown as this would involve future claims that may be made against the Fund that have not yet occurred. However, based on experience, the Fund expects the risk of loss to be remote.
| 14 |
Table of Contents
SUPPLEMENTAL INFORMATION(UNAUDITED)
Approval of Investment Advisory andSub-advisory Agreements
Section 15(c) of the Investment Company Act of 1940, as amended (the “1940 Act”), requires that a fund’s investment advisory andsub-advisory agreements be approved initially by the fund’s board of trustees. Section 15(c) also requires that the continuation of these agreements, after an initial term of up to two years, be annually reviewed and approved by the board. Any such agreement must be approved by a vote of a majority of the trustees who are not parties to the agreement or “interested persons” (as defined in the 1940 Act) of a party to the agreement at anin-person meeting of the board called for the purpose of voting on such approval.
At a meeting of the Board of Trustees (the “Board”) of Guardian Variable Products Trust (the “Trust”) held on March27-28, 2019 (the “Meeting”), the Board, including the trustees who are not parties to the agreement or “interested persons” as defined in the 1940 Act (the “Independent Trustees”), considered and voted unanimously to renew the existing investment management agreement (the “Management Agreement”) between the Trust, on behalf of Guardian Diversified Research VIP Fund, Guardian Growth & Income VIP Fund, Guardian Integrated Research VIP Fund, Guardian International Growth VIP Fund, Guardian International Value VIP Fund, Guardian Large Cap Disciplined Growth VIP Fund, Guardian Large Cap Disciplined Value VIP Fund, Guardian Large Cap Fundamental Growth VIP Fund, Guardian Mid Cap Traditional Growth VIP Fund, Guardian Mid Cap Relative Value VIP Fund and Guardian Core Plus Fixed Income VIP Fund (the “Funds”), and Park Avenue Institutional Advisers LLC (the “Manager”) for aone-term.
The Board, including the Independent Trustees, also considered and voted unanimously to renew the existingsub-advisory agreements (the“Sub-advisory Agreements,” collectively with the Management Agreement, the “Agreements”) between the Manager and investment advisory firms engaged to serve assub-advisers to certain of the Funds, namely Putnam Investment Management, LLC, AllianceBernstein L.P., Massachusetts Financial Services Company, J.P. Morgan Investment Management Inc., Lazard Asset Management LLC, Wellington Management Company LLP, Boston Partners Global Investors, Inc., ClearBridge Investments, LLC, Janus Capital Management LLC, Wells Capital Management Incorporated and Lord, Abbett & Co. LLC (the“Sub-advisers”) for aone-year term.
The Board is responsible for overseeing the management of each Fund. In determining whether to renew its approval of the Agreements, the Trustees evaluated information and factors that they considered to be relevant and appropriate through the exercise of their own business judgment. The Trustees considered certain information and factors in light of advice furnished to them by legal counsel to the Trust and, in the case of the Independent Trustees, their independent legal counsel. In advance of the Meeting, the Trustees received materials and information designed to assist their consideration of the Agreements. The Trustees received written responses from the Manager and eachSub-adviser to a series of questions and requests for information encompassing a wide variety of topics provided by independent counsel on behalf of the Independent Trustees. The Independent Trustees discussed the Funds with independent counsel during a telephonic meeting and executive session in advance of the Meeting. The Trustees also received materials and information regarding the legal standards applicable to their consideration of the Agreements and the process and criteria used by the Manager to identify and select theSub-advisers.
During the course of their deliberations, the Independent Trustees met to discuss and evaluate the Agreements in executive session with their independent legal counsel, outside of the presence of the Trustees who are not Independent Trustees and representatives from Fund management, the Manager or anySub-adviser.
In reaching its decisions to renew its approval of the Agreements, the Board took into account the materials and information described above as well as other materials and information provided to the Board and discussed with and among the Trustees. Individual Trustees may have given different weight to different factors and information with respect to each Agreement, and the Trustees did not identify any single factor or information that, in isolation, would be controlling in deciding to approve the Agreements. The discussion below is intended to summarize the broad factors that figured prominently in the Board’s decisions to approve the Agreements rather than to beall-inclusive. These broad factors included: (i) the nature, extent and quality of the services provided to the Funds by the Manager and theSub-advisers; (ii) the investment performance of each Fund; (iii) the fees charged and estimated profitability; (iv) the extent to which economies of scale exist for a Fund, and the extent to which a Fund benefits from economies of scale; and
| 15 |
Table of Contents
SUPPLEMENTAL INFORMATION(UNAUDITED)
(v) any other benefits derived by the Manager or theSub-advisers (or their respective affiliates) from their relationships with the Funds.
Nature, Extent and Quality of Services
The Trustees considered information regarding the nature, extent and quality of services provided to the Funds by the Manager. The Trustees also considered, among other things, the terms of the Management Agreement and the range of investment advisory services provided by the Manager. In addition, the Trustees reviewed the range ofnon-investment advisory services provided by the Manager consistent with the terms of the Management Agreement, notably coordinating the preparation and filing of various regulatory documents, coordinating the preparation and assembly of Board meeting materials and assisting the Board with certain valuation matters.
The Trustees considered that the Funds operate in a“manager-of-managers” structure and reviewed the responsibilities that the Manager has under this structure, including monitoring and evaluating the performance of theSub-advisers, monitoring theSub-advisers for adherence to the stated investment objectives, strategies, policies and restrictions of the Funds and supervising theSub-advisers with respect to the services that theSub-advisers would provide under theSub-advisory Agreements. The Trustees also considered the process used by the Manager, consistent with this structure, to identify and recommendsub-advisers, and the Manager’s ability to monitor and overseesub-advisers and recommend replacementsub-advisers, when necessary, and provide other services under the Management Agreement. The Board noted that investment management staff of the Manager and the Trust’s Chief Compliance Officer conductin-person oversight visits of theSub-advisers on a periodic basis, follow through with additional inquiry on any questions or concerns that arise during the visit and then report the results of the visit to the Board. The Trustees reviewed information regarding the experience and background of the Manager’s key personnel and the Manager’s organizational structure and resources, including investment, legal and administrative capabilities of the Manager. In this regard, the Trustees recognized that the Funds may benefit from the Manager’s ability to use similar resources and capabilities of its affiliates in providing services to the Funds.
The Trustees considered information regarding the nature, extent and quality of services provided to the
Funds by theSub-advisers. The Trustees also considered, among other things, the terms of theSub-advisory Agreements and the range of investment advisory services provided by theSub-advisers under the oversight of the Manager. In evaluating these investment advisory services, the Trustees considered, among other things, theSub-advisers’ investment philosophies, styles and/or processes and approach to managing the Funds. The Trustees received and evaluated information regarding the background, education, expertise and/or experience of the investment professionals that serve as portfolio managers for the Funds and the capabilities and resources of theSub-advisers.
Based upon these considerations, the Trustees concluded, within the context of their full deliberations, that the nature, extent and quality of services provided to the Funds by the Manager and eachSub-adviser were appropriate.
Investment Performance
In connection with each of its regular quarterly meetings, the Board receives information on the performance of each Fund, including net performance, relative performance rankings within each Fund’s Lipper peer group, Morningstar ratings, and performance as compared to benchmark index returns. At each quarterly Board meeting, members of the Manager’s senior investment team reviewed with the Board the economic and market environment, risk management, and style consistency in connection with management of the Funds. The Board considered investment performance for each Fund over theone-year and since inception periods.
The Board also received and reviewed a report prepared by Broadridge Financial Solutions (“Broadridge”), an independent provider of mutual fund industry data. The Board reviewed the investment performance of each Fund on an absolute basis and in comparison to an appropriate benchmark index and each Fund’s respective peer group as independently selected by Broadridge. The Board noted that, except for Guardian Growth & Income VIP Fund, Guardian Large Cap Disciplined Value VIP Fund and Guardian Mid Cap Traditional Growth VIP Fund, each of the Fund’s performance for theone-year and since inception periods was below the median of its respective peer group median and benchmark index. With respect to Guardian Large Cap Disciplined Value VIP Fund, the Board noted that the performance for theone-year period was lower than the peer group median and
| 16 |
Table of Contents
SUPPLEMENTAL INFORMATION(UNAUDITED)
benchmark index and performance since inception was higher than the peer group median and benchmark index. With respect to Guardian Growth & Income VIP Fund and Guardian Mid Cap Traditional Growth VIP Fund, the Board noted that the performance for both theone-year and since inception periods was higher than each Fund’s peer group median and benchmark index.
The Manager discussed with the Board factors contributing to the Funds’ performance results. In addition, for certain Funds, the Manager discussed with the Board longer term performance records of theSub-advisers for strategies used in managing the Funds. The Board concluded that the investment performance generated by eachSub-adviser was generally satisfactory, or, that any steps being taken by the Manager andSub-advisers to address any performance issues were satisfactory. The Board also noted the short operational history of each Fund.
Costs and Profitability
The Trustees considered the management fees paid by the Funds to the Manager under the Management Agreement and evaluated the reasonableness of these fees. The Trustees received and reviewed comparative information with respect to the management fees and the management fees paid by other funds offered as investment options underlying variable contracts within the applicable peer group based on data obtained from Broadridge. The Board noted that the contractual and actual (effective) management fees reported for each of the Funds were below or equal to its peer group in all cases except for the Guardian Mid Cap Traditional Growth VIP Fund. The Board noted that the actual (effective) management fee for this Fund exceeded the peer group median by a modest amount.
The Trustees considered thesub-advisory fees paid under theSub-advisory Agreements and evaluated the reasonableness of those fees. The Trustees also considered that the fees paid to theSub-advisers would be paid by the Manager and not the Funds and that the Manager had negotiated the fees with theSub-advisers atarm’s-length.
The Trustees received comparative information relating to each Fund’s operating expense ratios and the operating expense ratios of a peer group of funds. In this regard, the Board noted that each Fund’s operating expense ratio was equal to or lower than the operating expense ratio of its respective peer group median, except for Guardian Diversified Research VIP Fund, Guardian Growth & Income VIP Fund and Guardian Integrated Research VIP Fund. The Board noted that the
operating expense ratio for these Funds exceeded the peer group median by a modest amount. The Trustees considered the Manager’s commitment to limit each Fund’s operating expenses through an expense limitation agreement with the Trust. Although the Board recognized that the comparisons between the management fees and operating expenses of the Funds and those of identified peer funds are imprecise, given different terms of agreements and variations in fund strategies, the Trustees found that the comparative information supported their consideration and approval of the management fees and evaluation of the operating expenses.
The Board considered the Manager’s estimates of its profitability, which included allocations by the Manager of its costs in providing management services to the Funds. The Board considered the estimated profitability of the Manager both overall and on aFund-by-Fund basis. The Board did not consider any profitability information from theSub-advisers because the Manager would be responsible for payment of thesub-advisory fees and had negotiated the fees with theSub-advisers atarm’s-length.
Based on the consideration of the information and factors summarized above, as well as other relevant information and factors, the Board concluded that the proposed management andsub-advisory fees were reasonable in light of the nature, extent and quality of services rendered to the Funds by the Manager and theSub-advisers. The Board also concluded that the profitability of the Funds to the Manager was acceptable and the Board determined it was appropriate to revisit estimated Manager profitability in connection with future reviews of the Agreements.
Economies of Scale
The Board considered whether the Funds’ fee structure is designed to share economies of scale with shareholders as the Funds’ assets grow. In this regard, the Board noted that for ten of eleven Funds, the management andsub-advisory fee included breakpoints that are tiered based on growth in asset levels of each such Fund. The Board also noted that the Funds’ expenses were subject to an expense limitation provided by the Manager. The Board noted that expected economies of scale, where they exist, may be shared through the use of fee breakpoints, expense limitations by the Manager, and/or a lower overall fee.
| 17 |
Table of Contents
SUPPLEMENTAL INFORMATION(UNAUDITED)
Ancillary Benefits
The Board considered the potential benefits, other than management fees, that the Manager and/or its affiliates may receive because of the Manager’s relationship with the Funds. The Trustees acknowledged that the Funds were designed to serve as investment options under variable contracts issued by affiliates of the Manager that would receive fees under those contracts and that Park Avenue Securities LLC, an affiliate of the Manager and principal underwriter of the Funds, and participating insurance companies, including insurance companies affiliated with the Manager, would be entitled to receive fees from the Funds under a plan of distribution adopted pursuant to Rule12b-1 under the 1940 Act. The Trustees considered the benefits to the Manager from increased assets under management. The Trustees considered that the Manager and its affiliates may benefit from (i) greater efficiencies in annuity administration and operations and potential cost savings due to a reduction in the number of unaffiliated funds available as annuity contract investment options,
and (ii) increased dividends-received deductions due to the Funds’ status under the tax laws as disregarded entities. In addition, the Trustees considered the potential benefits, other thansub-advisory fees, that theSub-advisers and their affiliates may receive because of their relationships with the Funds, including the potential increased ability to use soft dollars consistent with Trust policies and other benefits from increases in assets under management. The Trustees concluded that benefits that may accrue to the Manager and its affiliates are reasonable and the benefits that may accrue to theSub-advisers and their affiliates are consistent with those expected for asub-adviser to a mutual fund such as the applicable Fund.
Conclusion
Based on a comprehensive consideration and evaluation of all of the information and factors summarized above, among others, the Board as a whole, including the Independent Trustees, approved the Agreements.
| 18 |
Table of Contents
SUPPLEMENTAL INFORMATION(UNAUDITED)
The Statement of Additional Information (“SAI”) includes additional information about the Trust’s Trustees and Officers and is available, without charge, upon request by calling toll-free1-888-GUARDIAN(1-888-482-7342) or by visiting our website at http://guardianvpt.onlineprospectus.net/GuardianVPT/Prospectuses.
Portfolio Holdings and Proxy Voting Procedures
The Fund files its complete schedule of portfolio holdings with the Securities and Exchange Commission for the first and third quarters of each fiscal year as an exhibit to its reports on FormN-PORT. The Fund’sForm N-PORT reports are available on the Securities and Exchange Commission’s website at https://www.sec.gov. The Fund’s FormN-PORT information is also available, without charge, upon request, by calling toll-free1-888-GUARDIAN(1-888-482-7342) or by visiting our website at http://guardianvpt.onlineprospectus.net/GuardianVPT/
Prospectuses.
A description of the policies and procedures that the Fund uses to determine how to vote proxies relating to portfolio securities is included in the SAI. The SAI and information regarding how the Fund voted proxies relating to portfolio securities during the most recent12-month period ended June 30 may be obtained (i) without charge, upon request, by calling toll-free1-888-GUARDIAN(1-888-482-7342) or by visiting our website at http://guardianvpt.onlineprospectus.net/GuardianVPT/
Prospectuses; and (ii) on the Securities and Exchange Commission’s website at https://www.sec.gov.
| 19 |
Table of Contents
This report is transmitted to shareholders only. It is not authorized for use as an offer of sale or a solicitation of an offer to buy shares of the Fund unless accompanied or preceded by the Fund’s current prospectus. Past performance results shown in this report should not be considered a representation of future performance. Investment returns and principal value of shares will fluctuate so that shares, when redeemed, may be worth more or less than their original cost. Statements and other information herein are as dated and are subject to change.

The Guardian Life Insurance Company of America New York, NY 10001-2159
PUB8168
Table of Contents
Guardian Variable
Products Trust
2019
Semiannual Report
All Data as of June 30, 2019
Guardian Large Cap Disciplined Value VIP Fund
Important Notice
Beginning on January 1, 2021, as permitted by regulations adopted by the Securities and Exchange Commission, paper copies of the Fund’s shareholder reports will no longer be sent by mail from The Guardian Insurance & Annuity Company, Inc. (“GIAC”). Instead, GIAC will mail you a notice when copies of the shareholder reports are made available on a website. You will be notified by mail each time a report is posted and provided with a website link to access the report.
If you have already elected to receive shareholder reports electronically, you will not be affected by this change and you need not take any action. If you have not yet elected electronic delivery, at any time, you may elect to receive the Fund’s shareholder reports and certain other communications from GIAC electronically, by going to www.guardianlife.com and registering fore-delivery.
You may instead elect to receive all future shareholder reports in paper free of charge. If you wish to receive paper copies of your shareholder reports, please call GIAC’s Customer Service Office Contact Center at1-888-GUARDIAN(1-888-482-7342). Your election to receive reports in paper will apply to all the underlying funds available.

| Not FDIC insured. May lose value. No bank guarantee. | www.guardianlife.com |
Table of Contents
Guardian Large Cap Disciplined Value VIP Fund
| 1 | ||||
| 2 | ||||
Financial Information | ||||
| Schedule of Investments | 3 | |||
| Statement of Assets and Liabilities | 6 | |||
| Statement of Operations | 6 | |||
| Statements of Changes in Net Assets | 7 | |||
| Financial Highlights | 8 | |||
| Notes to Financial Statements | 10 | |||
Supplemental Information | ||||
| Approval of Investment Advisory andSub-advisory Agreements | 15 | |||
| Portfolio Holdings and Proxy Voting Procedures | 19 | |||
Except as otherwise specifically stated, all information, including portfolio security positions, is as of June 30, 2019. Fund holdings will vary. Information contained herein has been obtained from sources believed reliable, but is not guaranteed.
Table of Contents
GUARDIAN LARGE CAP DISCIPLINED VALUE VIP FUND
Fund Characteristics (unaudited)
| Total Net Assets: $208,704,601 |
Sector Allocation1 As of June 30, 2019 |
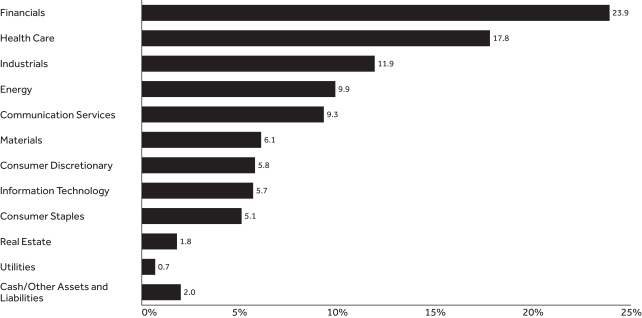 |
Top Ten Holdings2 As of June 30, 2019 |
| Holding | % of Total Net Assets | |||
| Berkshire Hathaway, Inc., Class B | 4.70% | |||
| Bank of America Corp. | 3.44% | |||
| Johnson & Johnson | 3.42% | |||
| Comcast Corp., Class A | 2.94% | |||
| The Procter & Gamble Co. | 2.44% | |||
| Verizon Communications, Inc. | 2.40% | |||
| Citigroup, Inc. | 2.31% | |||
| Chevron Corp. | 2.23% | |||
| Pfizer, Inc. | 2.21% | |||
| Cisco Systems, Inc. | 2.19% | |||
| Total | 28.28% | |||
| 1 | The Fund’s holdings are allocated to each sector based on the MSCI Global Industry Classification Standard (GICS®). Cash includes short-term investments and net other assets and liabilities. |
| 2 | Portfolio holdings are subject to change and should not be considered a recommendation to buy or sell individual securities. |
| 1 |
Table of Contents
UNDERSTANDING YOUR FUND’S EXPENSES(UNAUDITED)
By investing in the Fund, you incur two types of costs: (1) transaction costs and (2) ongoing costs, including, as applicable, investment advisory fees, distribution and/or service(12b-1) fees and other Fund expenses. The example below is intended to help you understand your ongoing costs (in dollars) of investing in the Fund and to compare these costs with the ongoing costs of investing in other mutual funds.
The example is based on an investment of $1,000 invested at the beginning of the period and held for the entire period from January 1, 2019 to June 30, 2019. The table below shows the Fund’s expenses in two ways:
Expenses based on actual return
This section of the table provides information about actual account values and actual expenses. You may use the information in this section, together with the amount you invested, to estimate the expenses that you paid over the period. Simply divide your account value by $1,000 (for example, an $8,600 account value divided by $1,000 = 8.6), then multiply the result by the number in the section under the heading entitled “Expenses Paid During Period” to estimate the expenses you paid on your account during this period.
Expenses based on hypothetical 5% return for comparison purposes
This section of the table provides information about hypothetical account values and hypothetical expenses based on the Fund’s actual expense ratio and an assumed rate of return of 5% per year before expenses, which is not the Fund’s actual return. The hypothetical account values and expenses may not be used to estimate the actual ending account balance or expenses you paid for the period. You may use this information to compare the ongoing costs of investing in the Fund with the cost of investing in other mutual funds. To do so, compare this 5% hypothetical example with the 5% hypothetical examples that appear in the shareholder reports of the other funds.
Note that the expenses shown in the table are meant to highlight your ongoing costs only and do not reflect any transactional costs, such as sales charges (loads), redemption fees, or exchange fees. Therefore the second section is useful in comparing ongoing costs only, and will not help you determine the relative total costs of owning different funds. If these transactional costs were included, your costs would have been higher. Charges and expenses at the insurance company separate account level are not reflected in the table.
| Beginning Account Value 1/1/19 | Ending Account Value | Expenses Paid During Period* 1/1/19-6/30/19 | Expense Ratio During Period 1/1/19-6/30/19 | |||||||||||
| Based on Actual Return | $1,000.00 | $1,124.90 | $5.11 | 0.97% | ||||||||||
| Based on Hypothetical Return (5% Return Before Expenses) | $1,000.00 | $1,019.98 | $4.86 | 0.97% | ||||||||||
| * | Expenses are equal to the Fund’s annualized expense ratio as indicated, multiplied by the average account value over the period, multiplied by 181/365 (to reflect theone-half year period). |
| 2 |
Table of Contents
SCHEDULE OF INVESTMENTS — GUARDIAN LARGE CAP DISCIPLINED VALUE VIP FUND
| June 30, 2019 (unaudited) | Shares | Value | ||||||
| Common Stocks – 98.0% |
| |||||||
| Aerospace & Defense – 3.1% |
| |||||||
The Boeing Co. | 5,768 | $ | 2,099,610 | |||||
United Technologies Corp. | 34,259 | 4,460,522 | ||||||
|
| |||||||
| 6,560,132 | ||||||||
| Air Freight & Logistics – 1.1% |
| |||||||
CH Robinson Worldwide, Inc. | 7,562 | 637,855 | ||||||
United Parcel Service, Inc., Class B | 15,223 | 1,572,079 | ||||||
|
| |||||||
| 2,209,934 | ||||||||
| Airlines – 1.9% |
| |||||||
Delta Air Lines, Inc. | 42,546 | 2,414,485 | ||||||
Southwest Airlines Co. | 31,683 | 1,608,863 | ||||||
|
| |||||||
| 4,023,348 | ||||||||
| Banks – 9.1% |
| |||||||
Bank of America Corp. | 247,644 | 7,181,676 | ||||||
BB&T Corp. | 26,769 | 1,315,161 | ||||||
Citigroup, Inc. | 68,753 | 4,814,773 | ||||||
SunTrust Banks, Inc. | 20,978 | 1,318,467 | ||||||
Wells Fargo & Co. | 93,616 | 4,429,909 | ||||||
|
| |||||||
| 19,059,986 | ||||||||
| Beverages – 0.5% |
| |||||||
Coca-Cola European Partners PLC | 20,007 | 1,130,396 | ||||||
|
| |||||||
| 1,130,396 | ||||||||
| Biotechnology – 0.7% |
| |||||||
Biogen, Inc.(1) | 6,619 | 1,547,986 | ||||||
|
| |||||||
| 1,547,986 | ||||||||
| Building Products – 0.7% |
| |||||||
Owens Corning | 26,368 | 1,534,618 | ||||||
|
| |||||||
| 1,534,618 | ||||||||
| Capital Markets – 0.3% |
| |||||||
The Charles Schwab Corp. | 15,657 | 629,255 | ||||||
|
| |||||||
| 629,255 | ||||||||
| Chemicals – 3.8% |
| |||||||
Dow, Inc. | 26,772 | 1,320,127 | ||||||
DuPont de Nemours, Inc. | 33,825 | 2,539,243 | ||||||
FMC Corp. | 12,087 | 1,002,617 | ||||||
Nutrien Ltd. | 38,929 | 2,081,144 | ||||||
The Mosaic Co. | 38,920 | 974,168 | ||||||
|
| |||||||
| 7,917,299 | ||||||||
| Communications Equipment – 2.2% |
| |||||||
Cisco Systems, Inc. | 83,380 | 4,563,387 | ||||||
|
| |||||||
| 4,563,387 | ||||||||
| Construction Materials – 0.9% |
| |||||||
Cemex S.A.B. de C.V., ADR | 144,715 | 613,591 | ||||||
CRH PLC, ADR | 36,809 | 1,205,495 | ||||||
|
| |||||||
| 1,819,086 | ||||||||
| Consumer Finance – 1.3% |
| |||||||
American Express Co. | 11,438 | 1,411,906 | ||||||
Discover Financial Services | 15,686 | 1,217,077 | ||||||
|
| |||||||
| 2,628,983 | ||||||||
| June 30, 2019 (unaudited) | Shares | Value | ||||||
| Diversified Financial Services – 4.7% |
| |||||||
Berkshire Hathaway, Inc., Class B(1) | 46,004 | $ | 9,806,673 | |||||
|
| |||||||
| 9,806,673 | ||||||||
| Diversified Telecommunication Services – 2.4% |
| |||||||
Verizon Communications, Inc. | 87,572 | 5,002,988 | ||||||
|
| |||||||
| 5,002,988 | ||||||||
| Electric Utilities – 0.7% |
| |||||||
Edison International | 22,564 | 1,521,039 | ||||||
|
| |||||||
| 1,521,039 | ||||||||
| Electrical Equipment – 1.3% |
| |||||||
Eaton Corp. PLC | 32,579 | 2,713,179 | ||||||
|
| |||||||
| 2,713,179 | ||||||||
| Energy Equipment & Services – 0.3% |
| |||||||
Apergy Corp.(1) | 17,114 | 574,004 | ||||||
|
| |||||||
| 574,004 | ||||||||
| Equity Real Estate Investment – 1.8% |
| |||||||
Equity Residential REIT | 16,653 | 1,264,296 | ||||||
Essex Property Trust, Inc. REIT | 3,902 | 1,139,111 | ||||||
SL Green Realty Corp. REIT | 16,312 | 1,310,995 | ||||||
|
| |||||||
| 3,714,402 | ||||||||
| Food Products – 2.2% |
| |||||||
Mondelez International, Inc., Class A | 55,472 | 2,989,941 | ||||||
Tyson Foods, Inc., Class A | 18,848 | 1,521,787 | ||||||
|
| |||||||
| 4,511,728 | ||||||||
| Health Care Equipment & Supplies – 2.6% |
| |||||||
Medtronic PLC | 41,317 | 4,023,862 | ||||||
Zimmer Biomet Holdings, Inc. | 11,978 | 1,410,290 | ||||||
|
| |||||||
| 5,434,152 | ||||||||
| Health Care Providers & Services – 7.9% |
| |||||||
Anthem, Inc. | 11,118 | 3,137,611 | ||||||
Cigna Corp. | 27,115 | 4,271,968 | ||||||
CVS Health Corp. | 40,573 | 2,210,823 | ||||||
McKesson Corp. | 9,961 | 1,338,659 | ||||||
Quest Diagnostics, Inc. | 24,456 | 2,489,865 | ||||||
UnitedHealth Group, Inc. | 12,488 | 3,047,197 | ||||||
|
| |||||||
| 16,496,123 | ||||||||
| Hotels, Restaurants & Leisure – 2.0% |
| |||||||
Las Vegas Sands Corp. | 32,429 | 1,916,230 | ||||||
Wyndham Destinations, Inc. | 22,226 | 975,721 | ||||||
Wyndham Hotels & Resorts, Inc. | 23,606 | 1,315,798 | ||||||
|
| |||||||
| 4,207,749 | ||||||||
| Household Durables – 0.5% |
| |||||||
Toll Brothers, Inc. | 25,595 | 937,289 | ||||||
|
| |||||||
| 937,289 | ||||||||
| Household Products – 2.4% |
| |||||||
The Procter & Gamble Co. | 46,535 | 5,102,563 | ||||||
|
| |||||||
| 5,102,563 | ||||||||
| Insurance – 8.5% |
| |||||||
American International Group, Inc. | 84,651 | 4,510,205 | ||||||
Aon PLC | 12,338 | 2,380,987 | ||||||
| The accompanying notes are an integral part of these financial statements. | 3 |
Table of Contents
SCHEDULE OF INVESTMENTS — GUARDIAN LARGE CAP DISCIPLINED VALUE VIP FUND
| June 30, 2019 (unaudited) | Shares | Value | ||||||
| Insurance (continued) |
| |||||||
Chubb Ltd. | 24,751 | $ | 3,645,575 | |||||
Everest Re Group Ltd. | 6,981 | 1,725,564 | ||||||
The Allstate Corp. | 30,831 | 3,135,204 | ||||||
The Travelers Cos., Inc. | 15,877 | 2,373,929 | ||||||
|
| |||||||
| 17,771,464 | ||||||||
| Interactive Media & Services – 2.0% |
| |||||||
Alphabet, Inc., Class A(1) | 3,751 | 4,061,583 | ||||||
|
| |||||||
| 4,061,583 | ||||||||
| Internet & Direct Marketing Retail – 1.1% |
| |||||||
Booking Holdings, Inc.(1) | 1,221 | 2,289,021 | ||||||
|
| |||||||
| 2,289,021 | ||||||||
| IT Services – 0.4% |
| |||||||
DXC Technology Co. | 14,921 | 822,893 | ||||||
|
| |||||||
| 822,893 | ||||||||
| Machinery – 1.0% |
| |||||||
Dover Corp. | 21,521 | 2,156,404 | ||||||
|
| |||||||
| 2,156,404 | ||||||||
| Media – 4.9% |
| |||||||
Altice USA, Inc., Class A(1) | 36,936 | 899,392 | ||||||
Comcast Corp., Class A | 144,925 | 6,127,429 | ||||||
FOX Corp., Class A | 48,858 | 1,790,157 | ||||||
Liberty Global PLC, Class C(1) | 56,562 | 1,500,590 | ||||||
|
| |||||||
| 10,317,568 | ||||||||
| Metals & Mining – 1.4% |
| |||||||
Barrick Gold Corp. | 185,005 | 2,917,529 | ||||||
|
| |||||||
| 2,917,529 | ||||||||
| Oil, Gas & Consumable Fuels – 9.6% |
| |||||||
Canadian Natural Resources Ltd. | 42,226 | 1,138,835 | ||||||
Chevron Corp. | 37,484 | 4,664,509 | ||||||
Cimarex Energy Co. | 19,900 | 1,180,667 | ||||||
ConocoPhillips | 42,851 | 2,613,911 | ||||||
Marathon Petroleum Corp. | 19,812 | 1,107,095 | ||||||
Noble Energy, Inc. | 100,586 | 2,253,126 | ||||||
Pioneer Natural Resources Co. | 8,477 | 1,304,271 | ||||||
Royal Dutch Shell PLC, Class A, ADR | 54,946 | 3,575,336 | ||||||
Valero Energy Corp. | 24,639 | 2,109,345 | ||||||
|
| |||||||
| 19,947,095 | ||||||||
| Pharmaceuticals – 6.6% |
| |||||||
Johnson & Johnson | 51,243 | 7,137,125 | ||||||
Novartis AG, ADR | 13,381 | 1,221,819 | ||||||
Novo Nordisk A/S, ADR | 14,914 | 761,210 | ||||||
Pfizer, Inc. | 106,552 | 4,615,833 | ||||||
|
| |||||||
| 13,735,987 | ||||||||
| Road & Rail – 2.8% |
| |||||||
Kansas City Southern | 18,852 | 2,296,551 | ||||||
Union Pacific Corp. | 20,610 | 3,485,357 | ||||||
|
| |||||||
| 5,781,908 | ||||||||
| June 30, 2019 (unaudited) | Shares | Value | ||||||
| Semiconductors & Semiconductor Equipment – 1.1% |
| |||||||
NXP Semiconductors N.V. | 22,586 | $ | 2,204,619 | |||||
|
| |||||||
| 2,204,619 | ||||||||
| Software – 2.0% |
| |||||||
Microsoft Corp. | 8,651 | 1,158,888 | ||||||
Oracle Corp. | 54,612 | 3,111,246 | ||||||
|
| |||||||
| 4,270,134 | ||||||||
| Specialty Retail – 2.2% |
| |||||||
AutoZone, Inc.(1) | 2,337 | 2,569,462 | ||||||
Lowe’s Cos., Inc. | 19,997 | 2,017,897 | ||||||
|
| |||||||
| 4,587,359 | ||||||||
| Total Common Stocks (Cost $197,130,620) |
| 204,509,863 | ||||||
| Principal Amount | Value | |||||||
| Short–Term Investment – 1.2% |
| |||||||
| Repurchase Agreements – 1.2% |
| |||||||
Fixed Income Clearing Corp., 0.50%, dated 6/28/2019, proceeds at maturity value of $2,610,109, due 7/1/2019(2) | $ | 2,610,000 | 2,610,000 | |||||
| Total Repurchase Agreements (Cost $2,610,000) |
| 2,610,000 | ||||||
| Total Investments – 99.2% (Cost $199,740,620) |
| 207,119,863 | ||||||
| Assets in excess of other liabilities – 0.8% |
| 1,584,738 | ||||||
| Total Net Assets – 100.0% |
| $ | 208,704,601 | |||||
| (1) | Non–income–producing security. |
| (2) | The table below presents collateral for repurchase agreements. |
| Security | Coupon | Maturity Date | Principal Amount | Value | ||||||||||||
| U.S. Treasury Note | 2.75% | 8/15/2021 | $ | 2,585,000 | $ | 2,664,323 | ||||||||||
Legend:
ADR — American Depositary Receipt
REIT — Real Estate Investment Trust
| 4 | The accompanying notes are an integral part of these financial statements. |
Table of Contents
SCHEDULE OF INVESTMENTS — GUARDIAN LARGE CAP DISCIPLINED VALUE VIP FUND
The following is a summary of the inputs used as of June 30, 2019 in valuing the Fund’s investments. For more information on valuation inputs, please refer to Note 2a of the accompanying Notes to Financial Statements.
| Valuation Inputs | ||||||||||||||||
| Investments in Securities (unaudited) | Level 1 | Level 2 | Level 3 | Total | ||||||||||||
| Common Stocks | $ | 204,509,863 | $ | — | $ | — | $ | 204,509,863 | ||||||||
| Repurchase Agreements | — | 2,610,000 | — | 2,610,000 | ||||||||||||
| Total | $ | 204,509,863 | $ | 2,610,000 | $ | — | $ | 207,119,863 | ||||||||
| The accompanying notes are an integral part of these financial statements. | 5 |
Table of Contents
FINANCIAL INFORMATION — GUARDIAN LARGE CAP DISCIPLINED VALUE VIP FUND
Statement of Assets and Liabilities As of June 30, 2019 (unaudited) | ||||
Assets | ||||
Investments, at value | $ | 207,119,863 | ||
Cash | 484 | |||
Receivable for investments sold | 4,849,709 | |||
Dividends/interest receivable | 138,274 | |||
Reimbursement receivable from adviser | 11,840 | |||
Foreign tax reclaims receivable | 2,761 | |||
Prepaid expenses | 4,929 | |||
|
| |||
Total Assets | 212,127,860 | |||
|
| |||
Liabilities | ||||
Payable for investments purchased | 3,131,991 | |||
Investment advisory fees payable | 105,514 | |||
Payable for fund shares redeemed | 90,086 | |||
Distribution fees payable | 42,252 | |||
Accrued audit fees | 14,680 | |||
Accrued custodian and accounting fees | 7,319 | |||
Accrued trustees’ and officers’ fees | 4,851 | |||
Accrued expenses and other liabilities | 26,566 | |||
|
| |||
Total Liabilities | 3,423,259 | |||
|
| |||
Total Net Assets | $ | 208,704,601 | ||
|
| |||
Net Assets Consist of: | ||||
Paid-in capital | $ | 197,550,942 | ||
Distributable earnings | 11,153,659 | |||
|
| |||
Total Net Assets | $ | 208,704,601 | ||
|
| |||
Investments, at Cost | $ | 199,740,620 | ||
|
| |||
Pricing of Shares | ||||
Shares of Beneficial Interest Outstanding with | 16,197,903 | |||
Net Asset Value Per Share | $12.88 | |||
Statement of Operations For the Six Months Ended June 30, 2019 (unaudited) | ||||
Investment Income | ||||
Dividends | $ | 2,407,101 | ||
Interest | 10,467 | |||
Withholding taxes on foreign dividends | (39,846 | ) | ||
|
| |||
Total Investment Income | 2,377,722 | |||
|
| |||
Expenses | ||||
Investment advisory fees | 630,414 | |||
Distribution fees | 252,342 | |||
Trustees’ and officers’ fees | 48,758 | |||
Professional fees | 30,583 | |||
Custodian and accounting fees | 24,689 | |||
Administrative fees | 23,535 | |||
Shareholder reports | 17,419 | |||
Transfer agent fees | 7,382 | |||
Other expenses | 13,455 | |||
|
| |||
Total Expenses | 1,048,577 | |||
Less: Fees waived | (69,492 | ) | ||
|
| |||
Total Expenses, Net | 979,085 | |||
|
| |||
Net Investment Income/(Loss) | 1,398,637 | |||
|
| |||
Realized Gain/(Loss) and Change in Unrealized Appreciation/(Depreciation) on Investments and Foreign Currency Transactions | ||||
Net realized gain/(loss) from investments | (2,651,181 | ) | ||
Net realized gain/(loss) from foreign currency transactions | 36 | |||
Net change in unrealized appreciation/(depreciation) on investments | 24,351,780 | |||
Net change in unrealized appreciation/(depreciation) on translation of assets and liabilities in foreign currencies | 214 | |||
|
| |||
Net Gain on Investments and Foreign Currency Transactions | 21,700,849 | |||
|
| |||
Net Increase in Net Assets Resulting From Operations | $ | 23,099,486 | ||
|
| |||
| 6 | The accompanying notes are an integral part of these financial statements. |
Table of Contents
FINANCIAL INFORMATION — GUARDIAN LARGE CAP DISCIPLINED VALUE VIP FUND
Statements of Changes in Net Assets Six Months Ended Numbers are unaudited |
| For the Six Months Ended 6/30/19 | For the Year Ended 12/31/18 | |||||||
| ||||||||
Operations | ||||||||
Net investment income/(loss) | $ | 1,398,637 | $ | 1,842,916 | ||||
Net realized gain/(loss) from investments and foreign currency transactions | (2,651,145 | ) | 530,348 | |||||
Net change in unrealized appreciation/(depreciation) on investments and | 24,351,994 | (19,482,381 | ) | |||||
|
|
|
| |||||
Net Increase/(Decrease) in Net Assets Resulting from Operations | 23,099,486 | (17,109,117 | ) | |||||
|
|
|
| |||||
Capital Share Transactions | ||||||||
Proceeds from sales of shares | 7,942,611 | 204,091,727 | ||||||
Cost of shares redeemed | (7,700,916 | ) | (17,523,968 | ) | ||||
|
|
|
| |||||
Net Increase in Net Assets Resulting from Capital Share Transactions | 241,695 | 186,567,759 | ||||||
|
|
|
| |||||
Net Increase in Net Assets | 23,341,181 | 169,458,642 | ||||||
|
|
|
| |||||
Net Assets | ||||||||
Beginning of period | 185,363,420 | 15,904,778 | ||||||
|
|
|
| |||||
End of period | $ | 208,704,601 | $ | 185,363,420 | ||||
|
|
|
| |||||
Other Information: | ||||||||
Shares | ||||||||
Sold | 627,817 | 16,317,390 | ||||||
Redeemed | (613,595 | ) | (1,371,590 | ) | ||||
|
|
|
| |||||
Net Increase | 14,222 | 14,945,800 | ||||||
|
|
|
| |||||
| The accompanying notes are an integral part of these financial statements. | 7 |
Table of Contents
FINANCIAL INFORMATION — GUARDIAN LARGE CAP DISCIPLINED VALUE VIP FUND
The Financial Highlights table is intended to help you understand the Fund’s financial performance for the past six reporting periods (or, if shorter, the period since inception). Certain information reflects financial results for a single Fund share. The total returns in the table represent the rate that an investor would have earned (or lost) on an investment in the Fund.
Financial Highlights Six Months Ended Numbers are unaudited | ||||||||||||||||||||||||
| Per Share Operating Performance | ||||||||||||||||||||||||
Net Asset Value, | Net Investment Income(1) | Net Realized and Unrealized Gain/(Loss) | Total Operations | Net Asset Value, End of Period | Total Return(2) | |||||||||||||||||||
Six Months Ended 6/30/19 | $ | 11.45 | $ | 0.09 | $ | 1.34 | $ | 1.43 | $ | 12.88 | 12.49% | (4) | ||||||||||||
Year Ended 12/31/18 | 12.85 | 0.15 | (1.55 | ) | (1.40 | ) | 11.45 | (10.89)% | ||||||||||||||||
Year Ended 12/31/17 | 10.78 | 0.10 | 1.97 | 2.07 | 12.85 | 19.20% | ||||||||||||||||||
Period Ended 12/31/16(5) | 10.00 | 0.03 | 0.75 | 0.78 | 10.78 | 7.80% | (4) | |||||||||||||||||
| 8 | The accompanying notes are an integral part of these financial statements. |
Table of Contents
FINANCIAL INFORMATION — GUARDIAN LARGE CAP DISCIPLINED VALUE VIP FUND
| Ratios/Supplemental Data | ||||||||||||||||||||||
| Net Assets, End of Period (000s) | Net Ratio of Expenses to Average Net Assets(3) | Gross Ratio of Expenses to Average Net Assets | Net Ratio of Net Investment Income to Average Net Assets(3) | Gross Ratio of Net (Loss) to Average | Portfolio Turnover Rate | |||||||||||||||||
| $ | 208,705 | 0.97% | (4) | 1.04% | (4) | 1.39% | (4) | 1.32% | (4) | 39% | (4) | |||||||||||
| 185,363 | 0.97% | 1.08% | 1.16% | 1.05% | 56% | |||||||||||||||||
| 15,905 | 0.98% | 1.91% | 0.89% | (0.04)% | 71% | |||||||||||||||||
| 17,081 | 0.98% | (4) | 2.70% | (4) | 0.88% | (4) | (0.84)% | (4) | 19% | (4) | ||||||||||||
| (1) | Calculated based on the average shares outstanding during the period. |
| (2) | Total returns do not reflect the effects of charges deducted pursuant to the terms of The Guardian Insurance & Annuity Company, Inc.’s variable contracts. Inclusion of such charges would reduce the total returns for all periods shown. |
| (3) | Net Ratio of Expenses to Average Net Assets and Net Ratio of Net Investment Income to Average Net Assets include the effect of fee waivers and expense limitations. |
| (4) | Ratios for periods less than one year have been annualized, except for total return and portfolio turnover rate. For the period ended December 31, 2016, certainnon-recurring fees (i.e., audit fees) are not annualized. |
| (5) | Commenced operations on September 1, 2016. |
| The accompanying notes are an integral part of these financial statements. | 9 |
Table of Contents
NOTES TO FINANCIAL STATEMENTS — GUARDIAN LARGE CAP DISCIPLINED VALUE VIP FUND
June 30, 2019(unaudited)
1. Organization
Guardian Variable Products Trust (the “Trust”), a Delaware statutory trust organized on January 12, 2016, is registered under the Investment Company Act of 1940, as amended (the “1940 Act”), as anopen-end management investment company. The Trust currently has sixteen series. Guardian Large Cap Disciplined Value VIP Fund (the “Fund”) is a series of the Trust. The Fund is a diversified fund and commenced operations on September 1, 2016. The financial statements for other series of the Trust are presented in separate reports.
The Trust has authorized an unlimited number of shares of beneficial interest with no par value. Shares are bought and sold at closing net asset value (“NAV”). Shares of the Fund are only sold to certain separate accounts of The Guardian Insurance & Annuity Company, Inc. (“GIAC”) that fund certain variable annuity contracts and variable life insurance policies issued by GIAC. GIAC is a wholly-owned subsidiary of The Guardian Life Insurance Company of America (“Guardian Life”).
The Fund seeks to provide long-term growth of capital primarily through investment in equity securities. Current income is a secondary objective.
2. Significant Accounting Policies
The following is a summary of significant accounting policies followed by the Fund in the preparation of its financial statements. The Fund follows the investment company accounting and reporting guidance of the Financial Accounting Standards Board (“FASB”) Accounting Standards Codification Topic 946 Financial Services – Investment Companies. The following policies are in conformity with accounting principles generally accepted in the United States of America (“GAAP”). The preparation of financial statements in accordance with GAAP requires management to make estimates and assumptions that affect the reported amounts and disclosures in the financial statements. Actual results could differ from those estimates.
a. Investment Valuations Equity securities traded on an exchange other than NASDAQ Stock Market, LLC (“NASDAQ”) are valued at the last reported sale price on the principal exchange or market on which they are traded; or, if there were no sales that day, at the mean between the closing bid and ask prices. Securities traded on the NASDAQ are generally valued at the NASDAQ official closing price, which may not be the last sale
price. If the NASDAQ official closing price is not available for a security, that security is generally valued at the mean between the closing bid and ask prices. Repurchase agreements are carried at cost, which approximates fair value (see Note 5d). Foreign securities are valued in the currencies of the markets in which they trade and then converted to U.S. dollars by the application of foreign exchange rates at the close of the New York Stock Exchange (“NYSE”). Forward foreign currency contracts, if any, are valued at the mean between the bid and ask rates for the specified time interpolated from rates for proximate time periods. Securities for which market quotations are not readily available or for which market quotations may be considered unreliable are valued at their fair values as determined in accordance with policies and procedures adopted by the Board of Trustees.
Under the policies and procedures approved by the Board of Trustees, Park Avenue Institutional Advisers LLC (“Park Avenue”), the Fund’s investment adviser, has established a Fair Valuation Committee to assist the Board of Trustees with the oversight and monitoring of the valuation of the Fund’s investments. This includes monitoring the appropriateness of fair values based on results of ongoing valuation oversight, including but not limited to consideration of security specific events, market events, and pricing vendor and broker-dealer due diligence. The Fair Valuation Committee oversees and carries out the policies for the valuation of investments held in the Fund. The Fair Valuation Committee is responsible for discussing and assessing the potential impacts to the fair values on an ongoing basis, and at least on a quarterly basis with the Board of Trustees.
Securities whose values have been materially affected by events occurring before the Fund’s valuation time but after the close of the securities’ principal exchange or market may be fair valued in accordance with policies and procedures adopted by the Board of Trustees. In addition, the values of the Fund’s investments in foreign securities are generally determined by a pricing service using pricing models designed to estimate likely changes in the values of those securities. Certain foreign equity instruments are valued by applying international fair value factors provided by approved pricing services. The factors seek to adjust the local closing price for movements of local markets post closing, but prior to the time the NAVs are calculated. Valuations reflected in this report are as of the report date. As a result, changes in valuation due to market events and/or issuer related events after the report date and prior to issuance of the report are not reflected herein.
| 10 |
Table of Contents
NOTES TO FINANCIAL STATEMENTS — GUARDIAN LARGE CAP DISCIPLINED VALUE VIP FUND
Various inputs are used in determining the valuation of the Fund’s investments. These inputs are summarized in three broad levels listed below.
| • | Level 1 — unadjusted inputs using quoted prices in active markets for identical investments. |
| • | Level 2 — other significant observable inputs, including, but not limited to, quoted prices for similar investments, inputs other than quoted prices that are observable for investments (such as interest rates, prepayment speeds, credit risks, etc.) or other market corroborated inputs. |
| • | Level 3 — significant unobservable inputs (including the Fund’s own assumptions in determining the fair value of investments) |
Inputs may include price information, volatility statistics, specific and broad credit data, liquidity statistics, and other factors. A financial instrument’s level within the fair value hierarchy is based on the lowest level of any input; both individually and in aggregate, that is significant to the fair value measurement. However, the determination of what constitutes “observable” requires significant judgment by the Trust. The Trust considers observable data to be that market data which is readily available, regularly distributed or updated, reliable and verifiable, and provided by independent sources that are actively involved in the relevant market. The inputs or methodology used for valuing securities are not necessarily an indication of the risk associated with investing in those securities. Changes in valuation techniques may result in transfers into or out of a financial instrument’s assigned level within the hierarchy.
The FASB requires reporting entities to make disclosures about purchases, sales, issuances and settlements of Level 3 securities on a gross basis. For the six months ended June 30, 2019, there were no transfers into or out of Level 3 of the fair value hierarchy.
In determining a financial instrument’s placement within the hierarchy, the Trust separates the Fund’s investment portfolio into two categories: investments and derivatives (e.g., futures). A summary of inputs used to value the Fund’s assets and liabilities carried at fair value as of June 30, 2019 is included in the Schedule of Investments.
InvestmentsInvestments whose values are based on quoted market prices in active markets, and are therefore classified within Level 1, include active listed equities. Investments that trade in markets that are not considered to be active, but are valued based on quoted
market prices, dealer quotations or alternative pricing sources supported by observable inputs are classified within Level 2. These include certain U.S. government and sovereign obligations, most government agency securities, investment-grade corporate bonds, certain mortgage products, state, municipal and provincial obligations, and certain foreign equity securities, including securities whose prices may have been affected by events occurring after the close of trading on their principal exchange or market and, as a result, whose values are determined by a pricing service as described above, or securities whose values are otherwise determined using fair valuation methods approved by the Fund’s Board of Trustees.
Investments classified within Level 3 have significant unobservable inputs, as they trade infrequently or not at all. Level 3 investments include, among others, private placement securities. When observable prices are not available for these securities, the Trust uses one or more valuation techniques for which sufficient and reliable data is available. The inputs used by the Trust in estimating the value of Level 3 investments include, for example, the original transaction price, recent transactions in the same or similar instruments, completed or pending third-party transactions in the underlying investment or comparable issuers, subsequent rounds of financing, recapitalizations, and other transactions across the capital structure. Level 3 investments may also be adjusted to reflect illiquidity and/ornon-transferability, with the amount of such discount estimated by the Trust in the absence of market information. Assumptions used by the Trust due to the lack of observable inputs may significantly impact the resulting fair value and therefore the Fund’s results of operations. As of June 30, 2019, the Fund had no securities classified as Level 3.
Derivatives Exchange-traded derivatives, such as futures contracts, exchange-traded option contracts and certain swaps, are typically classified within Level 1 or Level 2 of the fair value hierarchy depending on whether or not they are deemed to be actively traded. Certainnon-exchange-traded derivatives, such as generic forwards, certain swaps and options, have inputs which can generally be corroborated by market data and are therefore classified within Level 2. During the six months ended June 30, 2019, the Fund did not hold any derivatives.
b. Securities Transactions Securities transactions are accounted for on the date securities are purchased or sold (trade date). Realized gains or losses on securities transactions are determined on the basis of specific identification.
| 11 |
Table of Contents
NOTES TO FINANCIAL STATEMENTS — GUARDIAN LARGE CAP DISCIPLINED VALUE VIP FUND
c. Foreign Currency Translation The accounting records of the Fund are maintained in U.S. dollars. Investment securities and all other assets and liabilities of the Fund denominated in a foreign currency are generally translated into U.S. dollars at the exchange rates quoted at the close of the NYSE on each business day. The market value of investment securities and other assets and liabilities are translated at the exchange rate as of the valuation date. Purchases and sales of securities, income receipts, and expense payments are translated into U.S. dollars at the exchange rates in effect on the dates of the respective transactions. The Fund does not isolate the portion of the fluctuations on investments resulting from changes in foreign currency exchange rates from the fluctuations in market prices of investments held. Such fluctuations are included in the Net change in net realized and unrealized gain/(loss) from investments on the Statement of Operations.
Reported realized foreign currency gains and losses arise from the disposition of foreign currency, currency gains or losses realized between the trade and settlement dates on securities transactions, and the difference between the amounts of dividends, interest and foreign withholding taxes recorded on the Fund’s books on the transaction date and the U.S. dollar equivalent of the amounts actually received or paid. These reported realized foreign currency gains and losses, if any, are included in Net realized gain/(loss) from foreign currency transactions on the Statement of Operations. Unrealized foreign currency gains and losses arise from changes (due to changes in exchange rates) in the value of foreign currency and other assets and liabilities denominated in foreign currencies, which are held at period end, if any, and are included in Net change in unrealized appreciation/(depreciation) on translation of assets and liabilities in foreign currencies on the Statement of Operations.
d. Foreign Capital Gains Tax The Fund may be subject to foreign taxes on income, gains on investments or currency purchases/repatriation, a portion of which may be recoverable. The Fund will accrue such taxes and recoveries as applicable, based upon their current interpretation of tax rules and regulations that exist in the markets in which they invest.
e. Investment Income Dividend income net of foreign taxes withheld, if any, is generally recorded on theex-dividend date. Interest income, which includes amortization/accretion of premium/discount, is determined using the interest income accrual method, and is accrued and recorded daily.
f. Allocation of Income and Expenses Many of the expenses of the Trust can be directly attributed to a specific series of the Trust. Expenses that cannot be directly attributed to a specific series of the Trust are generally apportioned among all the series in the Trust, based on relative net assets. In calculating net asset value per share for each series of the Trust, investment income, realized and unrealized gains and losses, and expenses other than series-specific expenses are allocated daily to each series based upon the proportion of net assets attributable to each series.
3. Transactions with Affiliates
a. Investment Advisory Fee and Expense Limitation Under the terms of the advisory agreement, which, after its two year initial term, is reviewed and approved annually by the Board of Trustees, the Fund pays an investment advisory fee to Park Avenue. Park Avenue is a wholly-owned subsidiary of Guardian Life and receives an investment advisory fee at an annual rate of 0.65% up to $100 million, 0.60% up to $300 million, 0.55% up to $500 million, and 0.53% in excess of $500 million of the Fund’s average daily net assets. The fee is accrued daily and paid monthly.
Park Avenue has contractually agreed through April 30, 2020 to waive certain fees and/or reimburse certain expenses incurred by the Fund to the extent necessary to limit the Fund’s total annual operating expenses after fee waiver and/or expense reimbursement to 0.97% of the Fund’s average daily net assets (excluding, if applicable, any acquired fund fees and expenses, taxes, interest, transaction costs and brokerage commissions, litigation and extraordinary expenses). Prior to April 9, 2018, the expense limitation was 0.98%. The limitation may not be increased or terminated prior to this time without action by the Board of Trustees, may be terminated only upon approval of the Board of Trustees, and is subject to Park Avenue’s recoupment rights. For the six months ended June 30, 2019, Park Avenue waived fees and/or paid Fund expenses in the amount of $69,492.
Park Avenue may be entitled to recoupment of previously waived fees and reimbursed expenses from the Fund for three years from the date of the waiver or reimbursement, subject to the expense limitation in effect at the time of the waiver or reimbursement and at the time of the recoupment, if any. Amounts waived or reimbursed by Park Avenue pursuant to any expense limitation after April 9, 2018 will not be subject to Park Avenue’s recoupment rights. The amount available for potential future recoupment by Park Avenue from the
| 12 |
Table of Contents
NOTES TO FINANCIAL STATEMENTS — GUARDIAN LARGE CAP DISCIPLINED VALUE VIP FUND
Fund under the Expense Limitation Agreement and the expiration schedule at June 30, 2019 are as follows:
| Potential Recoupment Amounts Expiring | ||||||||||||
Total Potential Recoupment Amounts | 2021 | 2020 | 2019 | |||||||||
| $369,985 | $ | 62,448 | $ | 222,461 | $ | 85,076 | ||||||
Park Avenue has entered into aSub-Advisory Agreement with Boston Partners Global Investors, Inc. (“Boston Partners”). Boston Partners is responsible for providingday-to-day investment advisory services to the Fund, subject to the supervision of Park Avenue and the oversight of the Board of Trustees.Sub-advisory fees are paid by Park Avenue and do not represent a separate or additional expense to the Fund.
b. Compensation of Trustees and Officers Trustees and officers who are interested persons of the Trust, as defined in the 1940 Act, receive no compensation from the Fund, except for the Chief Compliance Officer of the Trust. Trustees of the Trust who are not interested persons of the Trust, and the Chief Compliance Officer, receive compensation and reimbursement of expenses from the Trust.
c. Distribution Fees Park Avenue Securities LLC (“PAS”), a wholly-owned subsidiary of Guardian Life, is the principal underwriter of Fund shares. The Trust has entered into a distribution and service agreement with PAS, which governs the sale and distribution of shares of the Fund. Under a distribution and service plan adopted by the Trust(“12b-1 plan”), PAS is compensated for services in such capacity, including its expenses in connection with the promotion and distribution of shares of the Fund, at an annual rate of 0.25% of the Fund’s average daily net assets. For the six months ended June 30, 2019, the Fund paid distribution fees in the amount of $252,342 to PAS.
PAS has directed that certain payments under the12b-1 plan be used to compensate GIAC for shareholder services provided to contract owners.
4. Federal Income Taxes
a. Distributions to Shareholders For federal income tax purposes, the Fund is treated as a disregarded entity (“DRE”). As a DRE, the Fund is not subject to an entity-level income tax; and any income, gains, losses, deductions, taxes, and credits of the Fund would instead be “passed through” directly to the separate accounts of GIAC that invest in the Fund and retain the same
character for U.S. federal income tax purposes. In addition, the Fund is not required to distribute taxable income and capital gains for U.S. federal income tax purposes. Therefore, no dividends and capital gains distributions were paid by the Fund.
5. Investments
a. Investment Purchases and Sales The cost of investments purchased and the proceeds from investments sold (excluding short-term investments) amounted to $77,507,435 and $79,252,371, respectively, for the six months ended June 30, 2019. During the six months ended June 30, 2019, there were no purchases or sales of U.S. government securities.
b. Foreign Securities Foreign securities investments involve special risks and considerations not typically associated with U.S. investments. These risks include, but are not limited to, currency risk; adverse political, regulatory, social, and economic developments; and less reliable information about issuers. Moreover, securities of some foreign issuers may be less liquid and their prices more volatile than those of comparable U.S. issuers.
c. Industry or Sector Concentration In its normal course of business, the Fund may invest a significant portion of its assets in companies within a limited number of industries or sectors. As a result, the Fund may be subject to a greater risk of loss than that of a fund invested in a wider spectrum of industries or sectors because the stocks of many or all of the companies in the industry, group of industries, sector, or sectors may decline in value due to developments adversely affecting the industry, group of industries, sector, or sectors.
d. Repurchase Agreements The Fund may invest in repurchase agreements to maintain liquidity and earn income over periods of time as short as overnight. The collateral for repurchase agreements is either cash or fully negotiable U.S. government securities (including U.S. government agency securities). Repurchase agreements are fully collateralized (including the interest accrued thereon) and such collateral is marked to market daily while the agreements remain in force. If the value of the collateral falls below the repurchase price plus accrued interest, the Fund will typically require the seller to deposit additional collateral by the next business day. If the request for additional collateral is not met, or the seller defaults, the Fund maintains the right to sell the collateral (although it may be prevented or delayed from doing so in certain circumstances) and may be required to claim any resulting loss against the
| 13 |
Table of Contents
NOTES TO FINANCIAL STATEMENTS — GUARDIAN LARGE CAP DISCIPLINED VALUE VIP FUND
seller. Park Avenue monitors the creditworthiness of the seller with which the Fund enters into repurchase agreements.
6. Temporary Borrowings
The Fund, with other funds managed by Park Avenue, is party to a $10 million committed revolving credit facility from State Street Bank and Trust Company for temporary borrowing purposes, including the meeting of redemption requests that otherwise might require the untimely disposition of securities. Interest is calculated based on the higher of the dailyone-month LIBOR rate and the Federal Funds rate plus 1.25% at the time of borrowing. In addition to the interest charged on any borrowings by the Fund, each fund pays a commitment fee of 0.30% per annum on its share of the unused portion of the credit facility. The agreement is in
place until December 10, 2019. The Fund did not utilize the credit facility during the six months ended June 30, 2019.
7. Indemnifications
Under the Trust��s organizational documents and, in some cases, by contract, its officers and trustees are indemnified against certain liabilities arising out of the performance of their duties to the Fund. In addition, in the normal course of business, the Fund enters into contracts with its vendors and others that provide general indemnifications. The Fund’s maximum exposure under these arrangements is unknown as this would involve future claims that may be made against the Fund that have not yet occurred. However, based on experience, the Fund expects the risk of loss to be remote.
| 14 |
Table of Contents
SUPPLEMENTAL INFORMATION(UNAUDITED)
Approval of Investment Advisory andSub-advisory Agreements
Section 15(c) of the Investment Company Act of 1940, as amended (the “1940 Act”), requires that a fund’s investment advisory andsub-advisory agreements be approved initially by the fund’s board of trustees. Section 15(c) also requires that the continuation of these agreements, after an initial term of up to two years, be annually reviewed and approved by the board. Any such agreement must be approved by a vote of a majority of the trustees who are not parties to the agreement or “interested persons” (as defined in the 1940 Act) of a party to the agreement at anin-person meeting of the board called for the purpose of voting on such approval.
At a meeting of the Board of Trustees (the “Board”) of Guardian Variable Products Trust (the “Trust”) held on March27-28, 2019 (the “Meeting”), the Board, including the trustees who are not parties to the agreement or “interested persons” as defined in the 1940 Act (the “Independent Trustees”), considered and voted unanimously to renew the existing investment management agreement (the “Management Agreement”) between the Trust, on behalf of Guardian Diversified Research VIP Fund, Guardian Growth & Income VIP Fund, Guardian Integrated Research VIP Fund, Guardian International Growth VIP Fund, Guardian International Value VIP Fund, Guardian Large Cap Disciplined Growth VIP Fund, Guardian Large Cap Disciplined Value VIP Fund, Guardian Large Cap Fundamental Growth VIP Fund, Guardian Mid Cap Traditional Growth VIP Fund, Guardian Mid Cap Relative Value VIP Fund and Guardian Core Plus Fixed Income VIP Fund (the “Funds”), and Park Avenue Institutional Advisers LLC (the “Manager”) for aone-term.
The Board, including the Independent Trustees, also considered and voted unanimously to renew the existingsub-advisory agreements (the“Sub-advisory Agreements,” collectively with the Management Agreement, the “Agreements”) between the Manager and investment advisory firms engaged to serve assub-advisers to certain of the Funds, namely Putnam Investment Management, LLC, AllianceBernstein L.P., Massachusetts Financial Services Company, J.P. Morgan Investment Management Inc., Lazard Asset Management LLC, Wellington Management Company LLP, Boston Partners Global Investors, Inc., ClearBridge Investments, LLC, Janus Capital Management LLC, Wells Capital Management Incorporated and Lord, Abbett & Co. LLC (the“Sub-advisers”) for aone-year term.
The Board is responsible for overseeing the management of each Fund. In determining whether to renew its approval of the Agreements, the Trustees evaluated information and factors that they considered to be relevant and appropriate through the exercise of their own business judgment. The Trustees considered certain information and factors in light of advice furnished to them by legal counsel to the Trust and, in the case of the Independent Trustees, their independent legal counsel. In advance of the Meeting, the Trustees received materials and information designed to assist their consideration of the Agreements. The Trustees received written responses from the Manager and eachSub-adviser to a series of questions and requests for information encompassing a wide variety of topics provided by independent counsel on behalf of the Independent Trustees. The Independent Trustees discussed the Funds with independent counsel during a telephonic meeting and executive session in advance of the Meeting. The Trustees also received materials and information regarding the legal standards applicable to their consideration of the Agreements and the process and criteria used by the Manager to identify and select theSub-advisers.
During the course of their deliberations, the Independent Trustees met to discuss and evaluate the Agreements in executive session with their independent legal counsel, outside of the presence of the Trustees who are not Independent Trustees and representatives from Fund management, the Manager or anySub-adviser.
In reaching its decisions to renew its approval of the Agreements, the Board took into account the materials and information described above as well as other materials and information provided to the Board and discussed with and among the Trustees. Individual Trustees may have given different weight to different factors and information with respect to each Agreement, and the Trustees did not identify any single factor or information that, in isolation, would be controlling in deciding to approve the Agreements. The discussion below is intended to summarize the broad factors that figured prominently in the Board’s decisions to approve the Agreements rather than to beall-inclusive. These broad factors included: (i) the nature, extent and quality of the services provided to the Funds by the Manager and theSub-advisers; (ii) the investment performance of each Fund; (iii) the fees charged and estimated profitability; (iv) the extent to which economies of scale exist for a Fund, and the extent to which a Fund benefits from economies of scale; and
| 15 |
Table of Contents
SUPPLEMENTAL INFORMATION(UNAUDITED)
(v) any other benefits derived by the Manager or theSub-advisers (or their respective affiliates) from their relationships with the Funds.
Nature, Extent and Quality of Services
The Trustees considered information regarding the nature, extent and quality of services provided to the Funds by the Manager. The Trustees also considered, among other things, the terms of the Management Agreement and the range of investment advisory services provided by the Manager. In addition, the Trustees reviewed the range ofnon-investment advisory services provided by the Manager consistent with the terms of the Management Agreement, notably coordinating the preparation and filing of various regulatory documents, coordinating the preparation and assembly of Board meeting materials and assisting the Board with certain valuation matters.
The Trustees considered that the Funds operate in a“manager-of-managers” structure and reviewed the responsibilities that the Manager has under this structure, including monitoring and evaluating the performance of theSub-advisers, monitoring theSub-advisers for adherence to the stated investment objectives, strategies, policies and restrictions of the Funds and supervising theSub-advisers with respect to the services that theSub-advisers would provide under theSub-advisory Agreements. The Trustees also considered the process used by the Manager, consistent with this structure, to identify and recommendsub-advisers, and the Manager’s ability to monitor and overseesub-advisers and recommend replacementsub-advisers, when necessary, and provide other services under the Management Agreement. The Board noted that investment management staff of the Manager and the Trust’s Chief Compliance Officer conductin-person oversight visits of theSub-advisers on a periodic basis, follow through with additional inquiry on any questions or concerns that arise during the visit and then report the results of the visit to the Board. The Trustees reviewed information regarding the experience and background of the Manager’s key personnel and the Manager’s organizational structure and resources, including investment, legal and administrative capabilities of the Manager. In this regard, the Trustees recognized that the Funds may benefit from the Manager’s ability to use similar resources and capabilities of its affiliates in providing services to the Funds.
The Trustees considered information regarding the nature, extent and quality of services provided to the
Funds by theSub-advisers. The Trustees also considered, among other things, the terms of theSub-advisory Agreements and the range of investment advisory services provided by theSub-advisers under the oversight of the Manager. In evaluating these investment advisory services, the Trustees considered, among other things, theSub-advisers’ investment philosophies, styles and/or processes and approach to managing the Funds. The Trustees received and evaluated information regarding the background, education, expertise and/or experience of the investment professionals that serve as portfolio managers for the Funds and the capabilities and resources of theSub-advisers.
Based upon these considerations, the Trustees concluded, within the context of their full deliberations, that the nature, extent and quality of services provided to the Funds by the Manager and eachSub-adviser were appropriate.
Investment Performance
In connection with each of its regular quarterly meetings, the Board receives information on the performance of each Fund, including net performance, relative performance rankings within each Fund’s Lipper peer group, Morningstar ratings, and performance as compared to benchmark index returns. At each quarterly Board meeting, members of the Manager’s senior investment team reviewed with the Board the economic and market environment, risk management, and style consistency in connection with management of the Funds. The Board considered investment performance for each Fund over theone-year and since inception periods.
The Board also received and reviewed a report prepared by Broadridge Financial Solutions (“Broadridge”), an independent provider of mutual fund industry data. The Board reviewed the investment performance of each Fund on an absolute basis and in comparison to an appropriate benchmark index and each Fund’s respective peer group as independently selected by Broadridge. The Board noted that, except for Guardian Growth & Income VIP Fund, Guardian Large Cap Disciplined Value VIP Fund and Guardian Mid Cap Traditional Growth VIP Fund, each of the Fund’s performance for theone-year and since inception periods was below the median of its respective peer group median and benchmark index. With respect to Guardian Large Cap Disciplined Value VIP Fund, the Board noted that the performance for theone-year period was lower than the peer group median and
| 16 |
Table of Contents
SUPPLEMENTAL INFORMATION(UNAUDITED)
benchmark index and performance since inception was higher than the peer group median and benchmark index. With respect to Guardian Growth & Income VIP Fund and Guardian Mid Cap Traditional Growth VIP Fund, the Board noted that the performance for both theone-year and since inception periods was higher than each Fund’s peer group median and benchmark index.
The Manager discussed with the Board factors contributing to the Funds’ performance results. In addition, for certain Funds, the Manager discussed with the Board longer term performance records of theSub-advisers for strategies used in managing the Funds. The Board concluded that the investment performance generated by eachSub-adviser was generally satisfactory, or, that any steps being taken by the Manager andSub-advisers to address any performance issues were satisfactory. The Board also noted the short operational history of each Fund.
Costs and Profitability
The Trustees considered the management fees paid by the Funds to the Manager under the Management Agreement and evaluated the reasonableness of these fees. The Trustees received and reviewed comparative information with respect to the management fees and the management fees paid by other funds offered as investment options underlying variable contracts within the applicable peer group based on data obtained from Broadridge. The Board noted that the contractual and actual (effective) management fees reported for each of the Funds were below or equal to its peer group in all cases except for the Guardian Mid Cap Traditional Growth VIP Fund. The Board noted that the actual (effective) management fee for this Fund exceeded the peer group median by a modest amount.
The Trustees considered thesub-advisory fees paid under theSub-advisory Agreements and evaluated the reasonableness of those fees. The Trustees also considered that the fees paid to theSub-advisers would be paid by the Manager and not the Funds and that the Manager had negotiated the fees with theSub-advisers atarm’s-length.
The Trustees received comparative information relating to each Fund’s operating expense ratios and the operating expense ratios of a peer group of funds. In this regard, the Board noted that each Fund’s operating expense ratio was equal to or lower than the operating expense ratio of its respective peer group median, except for Guardian Diversified Research VIP Fund, Guardian Growth & Income VIP Fund and Guardian Integrated Research VIP Fund. The Board noted that the
operating expense ratio for these Funds exceeded the peer group median by a modest amount. The Trustees considered the Manager’s commitment to limit each Fund’s operating expenses through an expense limitation agreement with the Trust. Although the Board recognized that the comparisons between the management fees and operating expenses of the Funds and those of identified peer funds are imprecise, given different terms of agreements and variations in fund strategies, the Trustees found that the comparative information supported their consideration and approval of the management fees and evaluation of the operating expenses.
The Board considered the Manager’s estimates of its profitability, which included allocations by the Manager of its costs in providing management services to the Funds. The Board considered the estimated profitability of the Manager both overall and on aFund-by-Fund basis. The Board did not consider any profitability information from theSub-advisers because the Manager would be responsible for payment of thesub-advisory fees and had negotiated the fees with theSub-advisers atarm’s-length.
Based on the consideration of the information and factors summarized above, as well as other relevant information and factors, the Board concluded that the proposed management andsub-advisory fees were reasonable in light of the nature, extent and quality of services rendered to the Funds by the Manager and theSub-advisers. The Board also concluded that the profitability of the Funds to the Manager was acceptable and the Board determined it was appropriate to revisit estimated Manager profitability in connection with future reviews of the Agreements.
Economies of Scale
The Board considered whether the Funds’ fee structure is designed to share economies of scale with shareholders as the Funds’ assets grow. In this regard, the Board noted that for ten of eleven Funds, the management andsub-advisory fee included breakpoints that are tiered based on growth in asset levels of each such Fund. The Board also noted that the Funds’ expenses were subject to an expense limitation provided by the Manager. The Board noted that expected economies of scale, where they exist, may be shared through the use of fee breakpoints, expense limitations by the Manager, and/or a lower overall fee.
| 17 |
Table of Contents
SUPPLEMENTAL INFORMATION(UNAUDITED)
Ancillary Benefits
The Board considered the potential benefits, other than management fees, that the Manager and/or its affiliates may receive because of the Manager’s relationship with the Funds. The Trustees acknowledged that the Funds were designed to serve as investment options under variable contracts issued by affiliates of the Manager that would receive fees under those contracts and that Park Avenue Securities LLC, an affiliate of the Manager and principal underwriter of the Funds, and participating insurance companies, including insurance companies affiliated with the Manager, would be entitled to receive fees from the Funds under a plan of distribution adopted pursuant to Rule12b-1 under the 1940 Act. The Trustees considered the benefits to the Manager from increased assets under management. The Trustees considered that the Manager and its affiliates may benefit from (i) greater efficiencies in annuity administration and operations and potential cost savings due to a reduction in the number of unaffiliated funds available as annuity contract investment options,
and (ii) increased dividends-received deductions due to the Funds’ status under the tax laws as disregarded entities. In addition, the Trustees considered the potential benefits, other thansub-advisory fees, that theSub-advisers and their affiliates may receive because of their relationships with the Funds, including the potential increased ability to use soft dollars consistent with Trust policies and other benefits from increases in assets under management. The Trustees concluded that benefits that may accrue to the Manager and its affiliates are reasonable and the benefits that may accrue to theSub-advisers and their affiliates are consistent with those expected for asub-adviser to a mutual fund such as the applicable Fund.
Conclusion
Based on a comprehensive consideration and evaluation of all of the information and factors summarized above, among others, the Board as a whole, including the Independent Trustees, approved the Agreements.
| 18 |
Table of Contents
SUPPLEMENTAL INFORMATION(UNAUDITED)
The Statement of Additional Information (“SAI”) includes additional information about the Trust’s Trustees and Officers and is available, without charge, upon request by calling toll-free1-888-GUARDIAN(1-888-482-7342) or by visiting our website at http://guardianvpt.onlineprospectus.net/GuardianVPT/Prospectuses.
Portfolio Holdings and Proxy Voting Procedures
The Fund files its complete schedule of portfolio holdings with the Securities and Exchange Commission for the first and third quarters of each fiscal year as an exhibit to its reports on FormN-PORT. The Fund’s FormN-PORT reports are available on the Securities and Exchange Commission’s website at https://www.sec.gov. The Fund’s FormN-PORT information is also available, without charge, upon request, by calling toll-free1-888-GUARDIAN(1-888-482-7342) or by visiting our website at http://guardianvpt.onlineprospectus.net/GuardianVPT/
Prospectuses.
A description of the policies and procedures that the Fund uses to determine how to vote proxies relating to portfolio securities is included in the SAI. The SAI and information regarding how the Fund voted proxies relating to portfolio securities during the most recent12-month period ended June 30 may be obtained (i) without charge, upon request, by calling toll-free1-888-GUARDIAN(1-888-482-7342) or by visiting our website at http://guardianvpt.onlineprospectus.net/GuardianVPT/
Prospectuses; and (ii) on the Securities and Exchange Commission’s website at https://www.sec.gov.
| 19 |
Table of Contents
This report is transmitted to shareholders only. It is not authorized for use as an offer of sale or a solicitation of an offer to buy shares of the Fund unless accompanied or preceded by the Fund’s current prospectus. Past performance results shown in this report should not be considered a representation of future performance. Investment returns and principal value of shares will fluctuate so that shares, when redeemed, may be worth more or less than their original cost. Statements and other information herein are as dated and are subject to change.

The Guardian Life Insurance Company of America New York, NY 10001-2159
PUB8174
Table of Contents
Guardian Variable
Products Trust
2019
Semiannual Report
All Data as of June 30, 2019
Guardian Growth & Income VIP Fund
Important Notice
Beginning on January 1, 2021, as permitted by regulations adopted by the Securities and Exchange Commission, paper copies of the Fund’s shareholder reports will no longer be sent by mail from The Guardian Insurance & Annuity Company, Inc. (“GIAC”). Instead, GIAC will mail you a notice when copies of the shareholder reports are made available on a website. You will be notified by mail each time a report is posted and provided with a website link to access the report.
If you have already elected to receive shareholder reports electronically, you will not be affected by this change and you need not take any action. If you have not yet elected electronic delivery, at any time, you may elect to receive the Fund’s shareholder reports and certain other communications from GIAC electronically, by going to www.guardianlife.com and registering fore-delivery.
You may instead elect to receive all future shareholder reports in paper free of charge. If you wish to receive paper copies of your shareholder reports, please call GIAC’s Customer Service Office Contact Center at1-888-GUARDIAN(1-888-482-7342). Your election to receive reports in paper will apply to all the underlying funds available.

| Not FDIC insured. May lose value. No bank guarantee. | www.guardianlife.com |
Table of Contents
Guardian Growth & Income VIP Fund
| 1 | ||||
| 2 | ||||
Financial Information | ||||
| Schedule of Investments | 3 | |||
| Statement of Assets and Liabilities | 5 | |||
| Statement of Operations | 5 | |||
| Statements of Changes in Net Assets | 6 | |||
| Financial Highlights | 8 | |||
| Notes to Financial Statements | 10 | |||
| Shareholder Meeting Results | 15 | |||
Supplemental Information | ||||
| Approval of Investment Advisory andSub-advisory Agreements | 16 | |||
| Portfolio Holdings and Proxy Voting Procedures | 20 | |||
Except as otherwise specifically stated, all information, including portfolio security positions, is as of June 30, 2019. Fund holdings will vary. Information contained herein has been obtained from sources believed reliable, but is not guaranteed.
Table of Contents
GUARDIAN GROWTH & INCOME VIP FUND
Fund Characteristics (unaudited)
| Total Net Assets: $185,101,920 |
Sector Allocation1 As of June 30, 2019 |
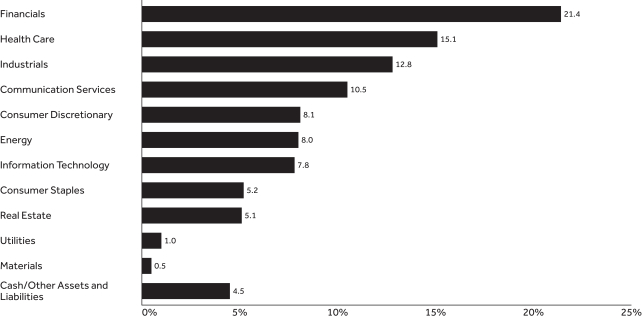 |
Top Ten Holdings2 As of June 30, 2019 | ||||
| Holding | % of Total Net Assets | |||
| Walmart, Inc. | 3.80% | |||
| Verizon Communications, Inc. | 3.73% | |||
| JPMorgan Chase & Co. | 3.72% | |||
| Berkshire Hathaway, Inc., Class B | 3.70% | |||
| Pfizer, Inc. | 3.44% | |||
| Comcast Corp., Class A | 2.96% | |||
| Roche Holding AG, ADR | 2.77% | |||
| The Allstate Corp. | 2.73% | |||
| Raytheon Co. | 2.41% | |||
| Cisco Systems, Inc. | 2.36% | |||
| Total | 31.62% | |||
| 1 | The Fund’s holdings are allocated to each sector based on the MSCI Global Industry Classification Standard (GICS®). Cash includes short-term investments and net other assets and liabilities. |
| 2 | Portfolio holdings are subject to change and should not be considered a recommendation to buy or sell individual securities. |
| 1 |
Table of Contents
UNDERSTANDING YOUR FUND’S EXPENSES(UNAUDITED)
By investing in the Fund, you incur two types of costs: (1) transaction costs and (2) ongoing costs, including, as applicable, investment advisory fees, distribution and/or service(12b-1) fees and other Fund expenses. The example below is intended to help you understand your ongoing costs (in dollars) of investing in the Fund and to compare these costs with the ongoing costs of investing in other mutual funds.
The example is based on an investment of $1,000 invested at the beginning of the period and held for the entire period from January 1, 2019 to June 30, 2019. The table below shows the Fund’s expenses in two ways:
Expenses based on actual return
This section of the table provides information about actual account values and actual expenses. You may use the information in this section, together with the amount you invested, to estimate the expenses that you paid over the period. Simply divide your account value by $1,000 (for example, an $8,600 account value divided by $1,000 = 8.6), then multiply the result by the number in the section under the heading entitled “Expenses Paid During Period” to estimate the expenses you paid on your account during this period.
Expenses based on hypothetical 5% return for comparison purposes
This section of the table provides information about hypothetical account values and hypothetical expenses based on the Fund’s actual expense ratio and an assumed rate of return of 5% per year before expenses, which is not the Fund’s actual return. The hypothetical account values and expenses may not be used to estimate the actual ending account balance or expenses you paid for the period. You may use this information to compare the ongoing costs of investing in the Fund with the cost of investing in other mutual funds. To do so, compare this 5% hypothetical example with the 5% hypothetical examples that appear in the shareholder reports of the other funds.
Note that the expenses shown in the table are meant to highlight your ongoing costs only and do not reflect any transactional costs, such as sales charges (loads), redemption fees, or exchange fees. Therefore the second section is useful in comparing ongoing costs only, and will not help you determine the relative total costs of owning different funds. If these transactional costs were included, your costs would have been higher. Charges and expenses at the insurance company separate account level are not reflected in the table.
Beginning Account Value 1/1/19 | Ending Account Value 6/30/19 | Expenses Paid During Period* 1/1/19-6/30/19 | Expense Ratio During Period 1/1/19-6/30/19 | |||||||||||
| Based on Actual Return | $1,000.00 | $1,139.70 | $5.36 | 1.01% | ||||||||||
| Based on Hypothetical Return (5% Return Before Expenses) | $1,000.00 | $1,019.79 | $5.06 | 1.01% | ||||||||||
| * | Expenses are equal to the Fund’s annualized expense ratio as indicated, multiplied by the average account value over the period, multiplied by 181/365 (to reflect theone-half year period). |
| 2 |
Table of Contents
SCHEDULE OF INVESTMENTS — GUARDIAN GROWTH & INCOME VIP FUND
| June 30, 2019(unaudited) | Shares | Value | ||||||
| Common Stocks – 95.5% | ||||||||
| Aerospace & Defense – 3.1% | ||||||||
Curtiss-Wright Corp. | 10,001 | $ | 1,271,427 | |||||
Raytheon Co. | 25,613 | 4,453,589 | ||||||
|
| |||||||
| 5,725,016 | ||||||||
| Airlines – 2.3% | ||||||||
Delta Air Lines, Inc. | 43,273 | 2,455,743 | ||||||
Southwest Airlines Co. | 35,039 | 1,779,280 | ||||||
|
| |||||||
| 4,235,023 | ||||||||
| Auto Components – 1.0% | ||||||||
BorgWarner, Inc. | 44,063 | 1,849,765 | ||||||
|
| |||||||
| 1,849,765 | ||||||||
| Banks – 6.0% | ||||||||
Citigroup, Inc. | 60,900 | 4,264,827 | ||||||
JPMorgan Chase & Co. | 61,610 | 6,887,998 | ||||||
|
| |||||||
| 11,152,825 | ||||||||
| Biotechnology – 4.0% | ||||||||
Amgen, Inc. | 5,055 | 931,535 | ||||||
Biogen, Inc.(1) | 6,320 | 1,478,059 | ||||||
Celgene Corp.(1) | 23,214 | 2,145,902 | ||||||
Gilead Sciences, Inc. | 41,469 | 2,801,646 | ||||||
|
| |||||||
| 7,357,142 | ||||||||
| Capital Markets – 3.5% | ||||||||
Northern Trust Corp. | 23,551 | 2,119,590 | ||||||
TD Ameritrade Holding Corp. | 34,922 | 1,743,306 | ||||||
The Goldman Sachs Group, Inc. | 12,552 | 2,568,139 | ||||||
|
| |||||||
| 6,431,035 | ||||||||
| Chemicals – 0.5% | ||||||||
LyondellBasell Industries N.V., Class A | 10,802 | 930,376 | ||||||
|
| |||||||
| 930,376 | ||||||||
| Communications Equipment – 3.2% |
| |||||||
Cisco Systems, Inc. | 79,713 | 4,362,692 | ||||||
F5 Networks, Inc.(1) | 10,585 | 1,541,494 | ||||||
|
| |||||||
| 5,904,186 | ||||||||
| Construction & Engineering – 0.8% |
| |||||||
EMCOR Group, Inc. | 16,688 | 1,470,213 | ||||||
|
| |||||||
| 1,470,213 | ||||||||
| Consumer Finance – 2.3% | ||||||||
Capital One Financial Corp. | 47,262 | 4,288,554 | ||||||
|
| |||||||
| 4,288,554 | ||||||||
| Diversified Financial Services – 3.7% |
| |||||||
Berkshire Hathaway, Inc., Class B(1) | 32,137 | 6,850,644 | ||||||
|
| |||||||
| 6,850,644 | ||||||||
| Diversified Telecommunication Services – 4.7% |
| |||||||
AT&T, Inc. | 52,396 | 1,755,790 | ||||||
Verizon Communications, Inc. | 120,721 | 6,896,791 | ||||||
|
| |||||||
| 8,652,581 | ||||||||
| Electric Utilities – 1.0% | ||||||||
Exelon Corp. | 37,327 | 1,789,456 | ||||||
|
| |||||||
| 1,789,456 | ||||||||
| June 30, 2019(unaudited) | Shares | Value | ||||||
| Electrical Equipment – 1.0% | ||||||||
Acuity Brands, Inc. | 7,592 | $ | 1,047,013 | |||||
Hubbell, Inc. | 6,503 | 847,991 | ||||||
|
| |||||||
| 1,895,004 | ||||||||
| Electronic Equipment, Instruments & Components – 1.9% |
| |||||||
Dolby Laboratories, Inc., Class A | 26,047 | 1,682,636 | ||||||
FLIR Systems, Inc. | 17,515 | 947,562 | ||||||
Keysight Technologies, Inc.(1) | 10,547 | 947,226 | ||||||
|
| |||||||
| 3,577,424 | ||||||||
| Energy Equipment & Services – 0.5% |
| |||||||
Dril-Quip, Inc.(1) | 18,179 | 872,592 | ||||||
|
| |||||||
| 872,592 | ||||||||
| Entertainment – 1.7% | ||||||||
The Walt Disney Co. | 22,757 | 3,177,787 | ||||||
|
| |||||||
| 3,177,787 | ||||||||
| Equity Real Estate Investment – 2.9% |
| |||||||
Mid-America Apartment Communities, Inc. REIT | 9,930 | 1,169,357 | ||||||
Regency Centers Corp. REIT | 62,610 | 4,178,591 | ||||||
|
| |||||||
| 5,347,948 | ||||||||
| Food & Staples Retailing – 4.5% | ||||||||
Walgreens Boots Alliance, Inc. | 22,625 | 1,236,909 | ||||||
Walmart, Inc. | 63,718 | 7,040,202 | ||||||
|
| |||||||
| 8,277,111 | ||||||||
| Health Care Providers & Services – 4.6% |
| |||||||
Anthem, Inc. | 10,071 | 2,842,137 | ||||||
Cigna Corp. | 21,709 | 3,420,253 | ||||||
Quest Diagnostics, Inc. | 22,913 | 2,332,772 | ||||||
|
| |||||||
| 8,595,162 | ||||||||
| Household Durables – 2.5% | ||||||||
DR Horton, Inc. | 68,095 | 2,936,937 | ||||||
Garmin Ltd. | 20,560 | 1,640,688 | ||||||
|
| |||||||
| 4,577,625 | ||||||||
| Insurance – 5.9% | ||||||||
Aflac, Inc. | 13,497 | 739,771 | ||||||
Fidelity National Financial, Inc. | 57,564 | 2,319,829 | ||||||
Reinsurance Group of America, Inc. | 18,315 | 2,857,689 | ||||||
The Allstate Corp. | 49,636 | 5,047,485 | ||||||
|
| |||||||
| 10,964,774 | ||||||||
| Internet & Direct Marketing Retail – 1.7% |
| |||||||
Expedia Group, Inc. | 24,300 | 3,232,629 | ||||||
|
| |||||||
| 3,232,629 | ||||||||
| IT Services – 2.2% | ||||||||
Akamai Technologies, Inc.(1) | 17,571 | 1,408,140 | ||||||
Cognizant Technology Solutions Corp., Class A | 14,755 | 935,319 | ||||||
Euronet Worldwide, Inc.(1) | 6,841 | 1,150,930 | ||||||
Leidos Holdings, Inc. | 7,933 | 633,450 | ||||||
|
| |||||||
| 4,127,839 | ||||||||
| The accompanying notes are an integral part of these financial statements. | 3 |
Table of Contents
SCHEDULE OF INVESTMENTS — GUARDIAN GROWTH & INCOME VIP FUND
| June 30, 2019(unaudited) | Shares | Value | ||||||
| Machinery – 3.3% | ||||||||
Altra Industrial Motion Corp. | 15,716 | $ | 563,890 | |||||
Crane Co. | 28,446 | 2,373,534 | ||||||
PACCAR, Inc. | 20,566 | 1,473,760 | ||||||
Parker-Hannifin Corp. | 10,375 | 1,763,854 | ||||||
|
| |||||||
| 6,175,038 | ||||||||
| Media – 4.1% | ||||||||
Comcast Corp., Class A | 129,602 | 5,479,573 | ||||||
Discovery, Inc., Class A(1) | 70,615 | 2,167,880 | ||||||
|
| |||||||
| 7,647,453 | ||||||||
| Oil, Gas & Consumable Fuels – 7.5% |
| |||||||
Apache Corp. | 34,522 | 1,000,103 | ||||||
ConocoPhillips | 70,183 | 4,281,163 | ||||||
Exxon Mobil Corp. | 36,337 | 2,784,504 | ||||||
Noble Energy, Inc. | 47,538 | 1,064,851 | ||||||
Occidental Petroleum Corp. | 11,699 | 588,226 | ||||||
Phillips 66 | 44,089 | 4,124,085 | ||||||
|
| |||||||
| 13,842,932 | ||||||||
| Pharmaceuticals – 6.5% | ||||||||
Bristol-Myers Squibb Co. | 10,496 | 475,994 | ||||||
Pfizer, Inc. | 146,923 | 6,364,704 | ||||||
Roche Holding AG, ADR | 146,360 | 5,137,236 | ||||||
|
| |||||||
| 11,977,934 | ||||||||
| Professional Services – 0.2% |
| |||||||
Robert Half International, Inc. | 5,508 | 314,011 | ||||||
|
| |||||||
| 314,011 | ||||||||
| Real Estate Management & Development – 2.2% |
| |||||||
CBRE Group, Inc., Class A(1) | 79,563 | 4,081,582 | ||||||
|
| |||||||
| 4,081,582 | ||||||||
| Road & Rail – 2.1% | ||||||||
Kansas City Southern | 6,987 | 851,156 | ||||||
Knight-Swift Transportation Holdings, Inc. | 30,385 | 997,844 | ||||||
Norfolk Southern Corp. | 7,337 | 1,462,484 | ||||||
Saia, Inc.(1) | 8,909 | 576,145 | ||||||
|
| |||||||
| 3,887,629 | ||||||||
| Specialty Retail – 2.1% | ||||||||
Advance Auto Parts, Inc. | 7,224 | 1,113,507 | ||||||
Murphy USA, Inc.(1) | 33,149 | 2,785,511 | ||||||
|
| |||||||
| 3,899,018 | ||||||||
| June 30, 2019(unaudited) | Shares | Value | ||||||
| Technology Hardware, Storage & Peripherals – 0.5% |
| |||||||
Apple, Inc. | 5,232 | $ | 1,035,517 | |||||
|
| |||||||
| 1,035,517 | ||||||||
| Textiles, Apparel & Luxury Goods – 0.8% |
| |||||||
Tapestry, Inc. | 46,753 | 1,483,473 | ||||||
|
| |||||||
| 1,483,473 | ||||||||
| Tobacco – 0.7% | ||||||||
Philip Morris International, Inc. | 15,669 | 1,230,487 | ||||||
|
| |||||||
| 1,230,487 | ||||||||
| Total Common Stocks (Cost $166,649,678) | 176,857,785 | |||||||
| Principal Amount | Value | |||||||
| Short-Term Investment – 4.6% |
| |||||||
| Repurchase Agreements – 4.6% |
| |||||||
Fixed Income Clearing Corp., 0.50%, dated 6/28/2019, proceeds at maturity value of $8,454,352, due 7/1/2019(2) | $ | 8,454,000 | 8,454,000 | |||||
| Total Repurchase Agreements (Cost $8,454,000) | 8,454,000 | |||||||
| Total Investments – 100.1%(Cost $175,103,678) | 185,311,785 | |||||||
| Liabilities in excess of other assets – (0.1)% |
| (209,865 | ) | |||||
| Total Net Assets – 100.0% | $ | 185,101,920 | ||||||
| (1) | Non–income–producing security. |
| (2) | The table below presents collateral for repurchase agreements. |
| Security | Coupon | Maturity Date | Principal Amount | Value | ||||||||||||
| U.S. Treasury Note | 2.75% | 8/15/2021 | $ | 8,370,000 | $ | 8,626,842 | ||||||||||
Legend:
ADR — American Depositary Receipt
REIT — Real Estate Investment Trust
The following is a summary of the inputs used as of June 30, 2019 in valuing the Fund’s investments. For more information on valuation inputs, please refer to Note 2a of the accompanying Notes to Financial Statements.
| Valuation Inputs | ||||||||||||||||
| Investments in Securities(unaudited) | Level 1 | Level 2 | Level 3 | Total | ||||||||||||
| Common Stocks | $ | 176,857,785 | $ | — | $ | — | $ | 176,857,785 | ||||||||
| Repurchase Agreements | — | 8,454,000 | — | 8,454,000 | ||||||||||||
| Total | $ | 176,857,785 | $ | 8,454,000 | $ | — | $ | 185,311,785 | ||||||||
| 4 | The accompanying notes are an integral part of these financial statements. |
Table of Contents
FINANCIAL INFORMATION — GUARDIAN GROWTH & INCOME VIP FUND
For the Six Months Ended June 30, 2019 (unaudited) | ||||
Investment Income | ||||
Dividends | $ | 1,835,997 | ||
Interest | 20,878 | |||
Withholding taxes on foreign dividends | (24,144 | ) | ||
|
| |||
Total Investment Income | 1,832,731 | |||
|
| |||
Expenses | ||||
Investment advisory fees | 562,897 | |||
Distribution fees | 224,209 | |||
Trustees’ and officers’ fees | 43,114 | |||
Professional fees | 28,798 | |||
Administrative fees | 23,535 | |||
Custodian and accounting fees | 21,330 | |||
Shareholder reports | 16,183 | |||
Transfer agent fees | 9,855 | |||
Other expenses | 11,764 | |||
|
| |||
Total Expenses | 941,685 | |||
Less: Fees waived | (35,880 | ) | ||
|
| |||
Total Expenses, Net | 905,805 | |||
|
| |||
Net Investment Income/(Loss) | 926,926 | |||
|
| |||
Realized Gain/(Loss) and Change in Unrealized Appreciation/(Depreciation) on Investments | ||||
Net realized gain/(loss) from investments | (225,320 | ) | ||
Net change in unrealized appreciation/(depreciation) on investments | 22,308,614 | |||
|
| |||
Net Gain on Investments | 22,083,294 | |||
|
| |||
Net Increase in Net Assets Resulting from Operations | $ | 23,010,220 | ||
|
| |||
| The accompanying notes are an integral part of these financial statements. | 5 |
Table of Contents
FINANCIAL INFORMATION — GUARDIAN GROWTH & INCOME VIP FUND
| 6 | The accompanying notes are an integral part of these financial statements. |
Table of Contents
This Page Intentionally Left Blank
| 7 |
Table of Contents
FINANCIAL INFORMATION — GUARDIAN GROWTH & INCOME VIP FUND
The Financial Highlights table is intended to help you understand the Fund’s financial performance for the past six reporting periods (or, if shorter, the period since inception). Certain information reflects financial results for a single Fund share. The total returns in the table represent the rate that an investor would have earned (or lost) on an investment in the Fund.
Financial Highlights Six Months Ended Numbers are unaudited | ||||||||||||||||||||||||
| Per Share Operating Performance | ||||||||||||||||||||||||
Net Asset Value, Beginning of Period | Net Investment Income(1) | Net Realized and Unrealized Gain/(Loss) | Total Operations | Net Asset Value, End of Period | Total Return(2) | |||||||||||||||||||
Six Months Ended 6/30/19 | $ | 11.81 | $ | 0.07 | $ | 1.58 | $ | 1.65 | $ | 13.46 | 13.97 | %(4) | ||||||||||||
Year Ended 12/31/18 | 12.85 | 0.12 | (1.16) | (1.04) | 11.81 | (8.09) | % | |||||||||||||||||
Year Ended 12/31/17 | 10.70 | 0.09 | 2.06 | 2.15 | 12.85 | 20.09 | % | |||||||||||||||||
Period Ended 12/31/16(5) | 10.00 | 0.04 | 0.66 | 0.70 | 10.70 | 7.00 | %(4) | |||||||||||||||||
| 8 | The accompanying notes are an integral part of these financial statements. |
Table of Contents
FINANCIAL INFORMATION — GUARDIAN GROWTH & INCOME VIP FUND
| Ratios/Supplemental Data | ||||||||||||||||||||||
Net Assets, End of Period (000s) | Net Ratio of Expenses to Average Net Assets(3) | Gross Ratio of Expenses to Average Net Assets | Net Ratio of Net Investment Income to Average Net Assets(3) | Gross Ratio of Net Investment Income/(Loss) to Average Net Assets | Portfolio Turnover Rate | |||||||||||||||||
| $ | 185,102 | 1.01% | (4) | 1.05% | (4) | 1.03% | (4) | 0.99% | (4) | 19% | (4) | |||||||||||
| 164,861 | 1.01% | 1.08% | 0.94% | 0.87% | 58% | |||||||||||||||||
| 10,542 | 0.98% | 2.04% | 0.81% | (0.25)% | 85% | |||||||||||||||||
| 9,457 | 0.98% | (4) | 3.11% | (4) | 1.20% | (4) | (0.93)% | (4) | 11% | (4) | ||||||||||||
| (1) | Calculated based on the average shares outstanding during the period. |
| (2) | Total returns do not reflect the effects of charges deducted pursuant to the terms of The Guardian Insurance & Annuity Company, Inc.’s variable contracts. Inclusion of such charges would reduce the total returns for all periods shown. |
| (3) | Net Ratio of Expenses to Average Net Assets and Net Ratio of Net Investment Income to Average Net Assets include the effect of fee waivers and expense limitations. |
| (4) | Ratios for periods less than one year have been annualized, except for total return and portfolio turnover rate. For the period ended December 31, 2016, certainnon-recurring fees (i.e., audit fees) are not annualized. |
| (5) | Commenced operations on September 1, 2016. |
| The accompanying notes are an integral part of these financial statements. | 9 |
Table of Contents
NOTES TO FINANCIAL STATEMENTS — GUARDIAN GROWTH & INCOME VIP FUND
June 30, 2019(unaudited)
1. Organization
Guardian Variable Products Trust (the “Trust”), a Delaware statutory trust organized on January 12, 2016, is registered under the Investment Company Act of 1940, as amended (the “1940 Act”), as anopen-end management investment company. The Trust currently has sixteen series. Guardian Growth & Income VIP Fund (the “Fund”) is a series of the Trust. The Fund is a diversified fund and commenced operations on September 1, 2016. The financial statements for other series of the Trust are presented in separate reports.
The Trust has authorized an unlimited number of shares of beneficial interest with no par value. Shares are bought and sold at closing net asset value (“NAV”). Shares of the Fund are only sold to certain separate accounts of The Guardian Insurance & Annuity Company, Inc. (“GIAC”) that fund certain variable annuity contracts and variable life insurance policies issued by GIAC. GIAC is a wholly-owned subsidiary of The Guardian Life Insurance Company of America (“Guardian Life”).
The Fund seeks long-term growth of capital.
2. Significant Accounting Policies
The following is a summary of significant accounting policies followed by the Fund in the preparation of its financial statements. The Fund follows the investment company accounting and reporting guidance of the Financial Accounting Standards Board (“FASB”) Accounting Standards Codification Topic 946 Financial Services – Investment Companies. The following policies are in conformity with accounting principles generally accepted in the United States of America (“GAAP”). The preparation of financial statements in accordance with GAAP requires management to make estimates and assumptions that affect the reported amounts and disclosures in the financial statements. Actual results could differ from those estimates.
a. Investment Valuations Equity securities traded on an exchange other than NASDAQ Stock Market, LLC (“NASDAQ”) are valued at the last reported sale price on the principal exchange or market on which they are traded; or, if there were no sales that day, at the mean between the closing bid and ask prices. Securities traded on the NASDAQ are generally valued at the NASDAQ official closing price, which may not be the last sale price. If the NASDAQ official closing price is not available for a security, that security is generally valued at the
mean between the closing bid and ask prices. Repurchase agreements are carried at cost, which approximates fair value (see Note 5d). Foreign securities are valued in the currencies of the markets in which they trade and then converted to U.S. dollars by the application of foreign exchange rates at the close of the New York Stock Exchange (“NYSE”). Forward foreign currency contracts, if any, are valued at the mean between the bid and ask rates for the specified time interpolated from rates for proximate time periods. Securities for which market quotations are not readily available or for which market quotations may be considered unreliable are valued at their fair values as determined in accordance with policies and procedures adopted by the Board of Trustees.
Under the policies and procedures approved by the Board of Trustees, Park Avenue Institutional Advisers LLC (“Park Avenue”), the Fund’s investment adviser, has established a Fair Valuation Committee to assist the Board of Trustees with the oversight and monitoring of the valuation of the Fund’s investments. This includes monitoring the appropriateness of fair values based on results of ongoing valuation oversight, including but not limited to consideration of security specific events, market events, and pricing vendor and broker-dealer due diligence. The Fair Valuation Committee oversees and carries out the policies for the valuation of investments held in the Fund. The Fair Valuation Committee is responsible for discussing and assessing the potential impacts to the fair values on an ongoing basis, and at least on a quarterly basis with the Board of Trustees.
Securities whose values have been materially affected by events occurring before the Fund’s valuation time but after the close of the securities’ principal exchange or market may be fair valued in accordance with policies and procedures adopted by the Board of Trustees. In addition, the values of the Fund’s investments in foreign securities are generally determined by a pricing service using pricing models designed to estimate likely changes in the values of those securities. Certain foreign equity instruments are valued by applying international fair value factors provided by approved pricing services. The factors seek to adjust the local closing price for movements of local markets post closing, but prior to the time the NAVs are calculated. Valuations reflected in this report are as of the report date. As a result, changes in valuation due to market events and/or issuer related events after the report date and prior to issuance of the report are not reflected herein.
| 10 |
Table of Contents
NOTES TO FINANCIAL STATEMENTS — GUARDIAN GROWTH & INCOME VIP FUND
Various inputs are used in determining the valuation of the Fund’s investments. These inputs are summarized in three broad levels listed below.
| • | Level 1 — unadjusted inputs using quoted prices in active markets for identical investments. |
| • | Level 2 — other significant observable inputs, including, but not limited to, quoted prices for similar investments, inputs other than quoted prices that are observable for investments (such as interest rates, prepayment speeds, credit risks, etc.) or other market corroborated inputs. |
| • | Level 3 — significant unobservable inputs (including the Fund’s own assumptions in determining the fair value of investments) |
Inputs may include price information, volatility statistics, specific and broad credit data, liquidity statistics, and other factors. A financial instrument’s level within the fair value hierarchy is based on the lowest level of any input; both individually and in aggregate, that is significant to the fair value measurement. However, the determination of what constitutes “observable” requires significant judgment by the Trust. The Trust considers observable data to be that market data which is readily available, regularly distributed or updated, reliable and verifiable, and provided by independent sources that are actively involved in the relevant market. The inputs or methodology used for valuing securities are not necessarily an indication of the risk associated with investing in those securities. Changes in valuation techniques may result in transfers into or out of a financial instrument’s assigned level within the hierarchy.
The FASB requires reporting entities to make disclosures about purchases, sales, issuances and settlements of Level 3 securities on a gross basis. For the six months ended June 30, 2019, there were no transfers into or out of Level 3 of the fair value hierarchy.
In determining a financial instrument’s placement within the hierarchy, the Trust separates the Fund’s investment portfolio into two categories: investments and derivatives (e.g., futures). A summary of inputs used to value the Fund’s assets and liabilities carried at fair value as of June 30, 2019 is included in the Schedule of Investments.
Investments Investments whose values are based on quoted market prices in active markets, and are therefore classified within Level 1, include active listed equities. Investments that trade in markets that are not considered to be active, but are valued based on quoted market prices, dealer quotations or alternative pricing
sources supported by observable inputs are classified within Level 2. These include certain U.S. government and sovereign obligations, most government agency securities, investment-grade corporate bonds, certain mortgage products, state, municipal and provincial obligations, and certain foreign equity securities, including securities whose prices may have been affected by events occurring after the close of trading on their principal exchange or market and, as a result, whose values are determined by a pricing service as described above, or securities whose values are otherwise determined using fair valuation methods approved by the Fund’s Board of Trustees.
Investments classified within Level 3 have significant unobservable inputs, as they trade infrequently or not at all. Level 3 investments include, among others, private placement securities. When observable prices are not available for these securities, the Trust uses one or more valuation techniques for which sufficient and reliable data is available. The inputs used by the Trust in estimating the value of Level 3 investments include, for example, the original transaction price, recent transactions in the same or similar instruments, completed or pending third-party transactions in the underlying investment or comparable issuers, subsequent rounds of financing, recapitalizations, and other transactions across the capital structure. Level 3 investments may also be adjusted to reflect illiquidity and/ornon-transferability, with the amount of such discount estimated by the Trust in the absence of market information. Assumptions used by the Trust due to the lack of observable inputs may significantly impact the resulting fair value and therefore the Fund’s results of operations. As of June 30, 2019, the Fund had no securities classified as Level 3.
Derivatives Exchange-traded derivatives, such as futures contracts, exchange-traded option contracts and certain swaps, are typically classified within Level 1 or Level 2 of the fair value hierarchy depending on whether or not they are deemed to be actively traded. Certainnon-exchange-traded derivatives, such as generic forwards, certain swaps and options, have inputs which can generally be corroborated by market data and are therefore classified within Level 2. During the six months ended June 30, 2019, the Fund did not hold any derivatives.
b. Securities Transactions Securities transactions are accounted for on the date securities are purchased or sold (trade date). Realized gains or losses on securities transactions are determined on the basis of specific identification.
| 11 |
Table of Contents
NOTES TO FINANCIAL STATEMENTS — GUARDIAN GROWTH & INCOME VIP FUND
c. Foreign Currency TranslationThe accounting records of the Fund are maintained in U.S. dollars. Investment securities and all other assets and liabilities of the Fund denominated in a foreign currency are generally translated into U.S. dollars at the exchange rates quoted at the close of the NYSE on each business day. The market value of investment securities and other assets and liabilities are translated at the exchange rate as of the valuation date. Purchases and sales of securities, income receipts, and expense payments are translated into U.S. dollars at the exchange rates in effect on the dates of the respective transactions. The Fund does not isolate the portion of the fluctuations on investments resulting from changes in foreign currency exchange rates from the fluctuations in market prices of investments held. Such fluctuations are included in the Net change in net realized and unrealized gain/(loss) from investments on the Statement of Operations.
Reported realized foreign currency gains and losses arise from the disposition of foreign currency, currency gains or losses realized between the trade and settlement dates on securities transactions, and the difference between the amounts of dividends, interest and foreign withholding taxes recorded on the Fund’s books on the transaction date and the U.S. dollar equivalent of the amounts actually received or paid. These reported realized foreign currency gains and losses, if any, are included in Net realized gain/(loss) from foreign currency transactions on the Statement of Operations. Unrealized foreign currency gains and losses arise from changes (due to changes in exchange rates) in the value of foreign currency and other assets and liabilities denominated in foreign currencies, which are held at period end, if any, and are included in Net change in unrealized appreciation/(depreciation) on translation of assets and liabilities in foreign currencies on the Statement of Operations.
d. Foreign Capital Gains Tax The Fund may be subject to foreign taxes on income, gains on investments or currency purchases/repatriation, a portion of which may be recoverable. The Fund will accrue such taxes and recoveries as applicable, based upon their current interpretation of tax rules and regulations that exist in the markets in which they invest.
e. Investment Income Dividend income net of foreign taxes withheld, if any, is generally recorded on theex-dividend date. Interest income, which includes amortization/accretion of premium/discount, is determined using the interest income accrual method, and is accrued and recorded daily.
f. Allocation of Income and Expenses Many of the expenses of the Trust can be directly attributed to a specific series of the Trust. Expenses that cannot be directly attributed to a specific series of the Trust are generally apportioned among all the series in the Trust, based on relative net assets. In calculating net asset value per share for each series of the Trust, investment income, realized and unrealized gains and losses, and expenses other than series-specific expenses are allocated daily to each series based upon the proportion of net assets attributable to each series.
3. Transactions with Affiliates
a. Investment Advisory Fee and Expense Limitation Under the terms of the advisory agreement, which, after its two year initial term, is reviewed and approved annually by the Board of Trustees, the Fund pays an investment advisory fee to Park Avenue. Park Avenue is a wholly-owned subsidiary of Guardian Life and receives an investment advisory fee at an annual rate of 0.65% up to $100 million, 0.60% up to $300 million, 0.55% up to $500 million, and 0.53% in excess of $500 million of the Fund’s average daily net assets. The fee is accrued daily and paid monthly.
Park Avenue has contractually agreed through April 30, 2020 to waive certain fees and/or reimburse certain expenses incurred by the Fund to the extent necessary to limit the Fund’s total annual operating expenses after fee waiver and/or expense reimbursement to 1.01% of the Fund’s average daily net assets (excluding, if applicable, any acquired fund fees and expenses, taxes, interest, transaction costs and brokerage commissions, litigation and extraordinary expenses). Prior to April 9, 2018, the expense limitation was 0.98%. The limitation may not be increased or terminated prior to this time without action by the Board of Trustees, may be terminated only upon approval of the Board of Trustees, and is subject to Park Avenue’s recoupment rights. For the six months ended June 30, 2019, Park Avenue waived fees and/or paid Fund expenses in the amount of $35,880.
Park Avenue may be entitled to recoupment of previously waived fees and reimbursed expenses from the Fund for three years from the date of the waiver or reimbursement, subject to the expense limitation in effect at the time of the waiver or reimbursement and at the time of the recoupment, if any. Amounts waived or reimbursed by Park Avenue pursuant to any expense limitation after April 9, 2018 will not be subject to Park Avenue’s recoupment rights. The amount available for potential future recoupment by Park Avenue from the
| 12 |
Table of Contents
NOTES TO FINANCIAL STATEMENTS — GUARDIAN GROWTH & INCOME VIP FUND
Fund under the Expense Limitation Agreement and the expiration schedule at June 30, 2019 are as follows:
| Potential Recoupment Amounts Expiring | ||||||||||||
Total Potential Recoupment Amounts | 2021 | 2020 | 2019 | |||||||||
| $252,225 | $ | 45,009 | $ | 147,462 | $ | 59,754 | ||||||
Park Avenue has entered into aSub-Advisory Agreement with AllianceBernstein L.P. (“AllianceBernstein”). AllianceBernstein is responsible for providingday-to-day investment advisory services to the Fund, subject to the supervision of Park Avenue and the oversight of the Board of Trustees.Sub-advisory fees are paid by Park Avenue and do not represent a separate or additional expense to the Fund.
b. Compensation of Trustees and Officers Trustees and officers who are interested persons of the Trust, as defined in the 1940 Act, receive no compensation from the Fund, except for the Chief Compliance Officer of the Trust. Trustees of the Trust who are not interested persons of the Trust, and the Chief Compliance Officer, receive compensation and reimbursement of expenses from the Trust.
c. Distribution Fees Park Avenue Securities LLC (“PAS”), a wholly-owned subsidiary of Guardian Life, is the principal underwriter of Fund shares. The Trust has entered into a distribution and service agreement with PAS, which governs the sale and distribution of shares of the Fund. Under a distribution and service plan adopted by the Trust(“12b-1 plan”), PAS is compensated for services in such capacity, including its expenses in connection with the promotion and distribution of shares of the Fund, at an annual rate of 0.25% of the Fund’s average daily net assets. For the six months ended June 30, 2019, the Fund paid distribution fees in the amount of $224,209 to PAS.
PAS has directed that certain payments under the12b-1 plan be used to compensate GIAC for shareholder services provided to contract owners.
4. Federal Income Taxes
a. Distributions to Shareholders For federal income tax purposes, the Fund is treated as a disregarded entity (“DRE”). As a DRE, the Fund is not subject to an entity-level income tax; and any income, gains, losses, deductions, taxes, and credits of the Fund would instead be “passed through” directly to the separate accounts of GIAC that invest in the Fund and retain the same character for U.S. federal income tax purposes. In
addition, the Fund is not required to distribute taxable income and capital gains for U.S. federal income tax purposes. Therefore, no dividends and capital gains distributions were paid by the Fund.
5. Investments
a. Investment Purchases and Sales The cost of investments purchased and the proceeds from investments sold (excluding short-term investments) amounted to $32,543,233 and $35,963,337, respectively, for the six months ended June 30, 2019. During the six months ended June 30, 2019, there were no purchases or sales of U.S. government securities.
b. Foreign Securities Foreign securities investments involve special risks and considerations not typically associated with U.S. investments. These risks include, but are not limited to, currency risk; adverse political, regulatory, social, and economic developments; and less reliable information about issuers. Moreover, securities of some foreign issuers may be less liquid and their prices more volatile than those of comparable U.S. issuers.
c. Industry or Sector Concentration In its normal course of business, the Fund may invest a significant portion of its assets in companies within a limited number of industries or sectors. As a result, the Fund may be subject to a greater risk of loss than that of a fund invested in a wider spectrum of industries or sectors because the stocks of many or all of the companies in the industry, group of industries, sector, or sectors may decline in value due to developments adversely affecting the industry, group of industries, sector, or sectors.
d. Repurchase Agreements The Fund may invest in repurchase agreements to maintain liquidity and earn income over periods of time as short as overnight. The collateral for repurchase agreements is either cash or fully negotiable U.S. government securities (including U.S. government agency securities). Repurchase agreements are fully collateralized (including the interest accrued thereon) and such collateral is marked to market daily while the agreements remain in force. If the value of the collateral falls below the repurchase price plus accrued interest, the Fund will typically require the seller to deposit additional collateral by the next business day. If the request for additional collateral is not met, or the seller defaults, the Fund maintains the right to sell the collateral (although it may be prevented or delayed from doing so in certain circumstances) and may be required to claim any resulting loss against the seller. Park Avenue monitors the creditworthiness of the seller with which the Fund enters into repurchase agreements.
| 13 |
Table of Contents
NOTES TO FINANCIAL STATEMENTS — GUARDIAN GROWTH & INCOME VIP FUND
6. Temporary Borrowings
The Fund, with other funds managed by Park Avenue, is party to a $10 million committed revolving credit facility from State Street Bank and Trust Company for temporary borrowing purposes, including the meeting of redemption requests that otherwise might require the untimely disposition of securities. Interest is calculated based on the higher of the dailyone-month LIBOR rate and the Federal Funds rate plus 1.25% at the time of borrowing. In addition to the interest charged on any borrowings by the Fund, each fund pays a commitment fee of 0.30% per annum on its share of the unused portion of the credit facility. The agreement is in place until December 10, 2019. The Fund did not utilize the credit facility during the six months ended June 30, 2019.
7. Indemnifications
Under the Trust’s organizational documents and, in some cases, by contract, its officers and trustees are indemnified against certain liabilities arising out of the performance of their duties to the Fund. In addition, in the normal course of business, the Fund enters into contracts with its vendors and others that provide general indemnifications. The Fund’s maximum exposure under these arrangements is unknown as this would involve future claims that may be made against the Fund that have not yet occurred. However, based on experience, the Fund expects the risk of loss to be remote.
| 14 |
Table of Contents
SHAREHOLDER MEETING RESULTS(UNAUDITED)
At a meeting held on March27-28, 2019, the Board of Trustees of Guardian Variable Products Trust approved submitting the following proposals (“Proposals”) to shareholders of the Fund at a special meeting to be held on May 24, 2019 (with any postponements or adjournments, “Special Meeting”):
1. To permit Park Avenue Institutional Advisers LLC, under certain circumstances, to enter into and/or materially amend investmentsub-advisory agreements with affiliated and unaffiliated sub-advisers on behalf of the Fund without obtaining shareholder approval; and
2. To approve a new investmentsub-advisory agreement between Park Avenue Institutional Advisers LLC and AllianceBernstein L.P. with respect to the Fund prompted by the Divestiture (as defined in the proxy statement), and to approve, under certain circumstances, any future investmentsub-advisory agreements prompted by Change of Control Events (as defined in the proxy statement) that occur as part of the Divestiture.
On or about May 1, 2019, shareholders of record of the Fund as of the close of business on March 29, 2019 were sent a proxy statement containing information regarding the Proposals. The proxy statement also included information about the Special Meeting, at which shareholders of the Fund were asked to consider and approve the Proposals. In addition, the proxy statement included information about voting (or providing voting instructions) on the Proposals and options shareholders had to do so.
The Special Meeting was held on June 26, 2019, and each Proposal passed.
The results of the Special Meeting were as follows:
Proposal 1. To permit Park Avenue Institutional Advisers LLC, under certain circumstances, to enter into and/or materially amend investmentsub-advisory agreements with affiliated and unaffiliated sub-advisers on behalf of the Fund without obtaining shareholder approval:
| Votes For | Votes Against | Abstentions | ||||||
| 11,438,257.596 | 1,905,404.720 | 604,057.963 | ||||||
Proposal 2. To approve a new investmentsub-advisory agreement between Park Avenue Institutional Advisers LLC and AllianceBernstein L.P. with respect to the Fund prompted by the Divestiture, and to approve, under certain circumstances, any future investmentsub-advisory agreements prompted by Change of Control Events that occur as part of the Divestiture:
| Votes For | Votes Against | Abstentions | ||||||
| 11,751,000.972 | 1,537,404.524 | 659,314.783 | ||||||
| 15 |
Table of Contents
SUPPLEMENTAL INFORMATION(UNAUDITED)
Approval of Investment Advisory andSub-advisory Agreements
Section 15(c) of the Investment Company Act of 1940, as amended (the “1940 Act”), requires that a fund’s investment advisory andsub-advisory agreements be approved initially by the fund’s board of trustees. Section 15(c) also requires that the continuation of these agreements, after an initial term of up to two years, be annually reviewed and approved by the board. Any such agreement must be approved by a vote of a majority of the trustees who are not parties to the agreement or “interested persons” (as defined in the 1940 Act) of a party to the agreement at anin-person meeting of the board called for the purpose of voting on such approval.
At a meeting of the Board of Trustees (the “Board”) of Guardian Variable Products Trust (the “Trust”) held on March27-28, 2019 (the “Meeting”), the Board, including the trustees who are not parties to the agreement or “interested persons” as defined in the 1940 Act (the “Independent Trustees”), considered and voted unanimously to renew the existing investment management agreement (the “Management Agreement”) between the Trust, on behalf of Guardian Diversified Research VIP Fund, Guardian Growth & Income VIP Fund, Guardian Integrated Research VIP Fund, Guardian International Growth VIP Fund, Guardian International Value VIP Fund, Guardian Large Cap Disciplined Growth VIP Fund, Guardian Large Cap Disciplined Value VIP Fund, Guardian Large Cap Fundamental Growth VIP Fund, Guardian Mid Cap Traditional Growth VIP Fund, Guardian Mid Cap Relative Value VIP Fund and Guardian Core Plus Fixed Income VIP Fund (the “Funds”), and Park Avenue Institutional Advisers LLC (the “Manager”) for aone-term.
The Board, including the Independent Trustees, also considered and voted unanimously to renew theexisting sub-advisory agreements (the“Sub-advisory Agreements,” collectively with the Management Agreement, the “Agreements”) between the Manager and investment advisory firms engaged to serve assub-advisers to certain of the Funds, namely Putnam Investment Management, LLC, AllianceBernstein L.P., Massachusetts Financial Services Company, J.P. Morgan Investment Management Inc., Lazard Asset Management LLC, Wellington Management Company LLP, Boston Partners Global Investors, Inc., ClearBridge Investments, LLC, Janus Capital Management LLC, Wells Capital Management Incorporated and Lord, Abbett & Co. LLC (the“Sub-advisers”) for aone-year term.
The Board is responsible for overseeing the management of each Fund. In determining whether to renew its approval of the Agreements, the Trustees evaluated information and factors that they considered to be relevant and appropriate through the exercise of their own business judgment. The Trustees considered certain information and factors in light of advice furnished to them by legal counsel to the Trust and, in the case of the Independent Trustees, their independent legal counsel. In advance of the Meeting, the Trustees received materials and information designed to assist their consideration of the Agreements. The Trustees received written responses from the Manager and eachSub-adviser to a series of questions and requests for information encompassing a wide variety of topics provided by independent counsel on behalf of the Independent Trustees. The Independent Trustees discussed the Funds with independent counsel during a telephonic meeting and executive session in advance of the Meeting. The Trustees also received materials and information regarding the legal standards applicable to their consideration of the Agreements and the process and criteria used by the Manager to identify and select theSub-advisers.
During the course of their deliberations, the Independent Trustees met to discuss and evaluate the Agreements in executive session with their independent legal counsel, outside of the presence of the Trustees who are not Independent Trustees and representatives from Fund management, the Manager or anySub-adviser.
In reaching its decisions to renew its approval of the Agreements, the Board took into account the materials and information described above as well as other materials and information provided to the Board and discussed with and among the Trustees. Individual Trustees may have given different weight to different factors and information with respect to each Agreement, and the Trustees did not identify any single factor or information that, in isolation, would be controlling in deciding to approve the Agreements. The discussion below is intended to summarize the broad factors that figured prominently in the Board’s decisions to approve the Agreements rather than to beall-inclusive. These broad factors included: (i) the nature, extent and quality of the services provided to the Funds by the Manager and theSub-advisers; (ii) the investment performance of each Fund; (iii) the fees charged and estimated profitability; (iv) the extent to which economies of scale exist for a Fund, and the extent to which a Fund benefits from economies of scale; and (v) any other benefits derived by
| 16 |
Table of Contents
SUPPLEMENTAL INFORMATION(UNAUDITED)
the Manager or theSub-advisers (or their respective affiliates) from their relationships with the Funds.
Nature, Extent and Quality of Services
The Trustees considered information regarding the nature, extent and quality of services provided to the Funds by the Manager. The Trustees also considered, among other things, the terms of the Management Agreement and the range of investment advisory services provided by the Manager. In addition, the Trustees reviewed the range ofnon-investment advisory services provided by the Manager consistent with the terms of the Management Agreement, notably coordinating the preparation and filing of various regulatory documents, coordinating the preparation and assembly of Board meeting materials and assisting the Board with certain valuation matters.
The Trustees considered that the Funds operate in a“manager-of-managers” structure and reviewed the responsibilities that the Manager has under this structure, including monitoring and evaluating the performance of theSub-advisers, monitoring theSub-advisers for adherence to the stated investment objectives, strategies, policies and restrictions of the Funds and supervising theSub-advisers with respect to the services that theSub-advisers would provide under theSub-advisory Agreements. The Trustees also considered the process used by the Manager, consistent with this structure, to identify and recommendsub-advisers, and the Manager’s ability to monitor and overseesub-advisers and recommend replacementsub-advisers, when necessary, and provide other services under the Management Agreement. The Board noted that investment management staff of the Manager and the Trust’s Chief Compliance Officer conductin-person oversight visits of theSub-advisers on a periodic basis, follow through with additional inquiry on any questions or concerns that arise during the visit and then report the results of the visit to the Board. The Trustees reviewed information regarding the experience and background of the Manager’s key personnel and the Manager’s organizational structure and resources, including investment, legal and administrative capabilities of the Manager. In this regard, the Trustees recognized that the Funds may benefit from the Manager’s ability to use similar resources and capabilities of its affiliates in providing services to the Funds.
The Trustees considered information regarding the nature, extent and quality of services provided to the Funds by theSub-advisers. The Trustees also considered, among other things, the terms of the
Sub-advisory Agreements and the range of investment advisory services provided by theSub-advisers under the oversight of the Manager. In evaluating these investment advisory services, the Trustees considered, among other things, theSub-advisers’ investment philosophies, styles and/or processes and approach to managing the Funds. The Trustees received and evaluated information regarding the background, education, expertise and/or experience of the investment professionals that serve as portfolio managers for the Funds and the capabilities and resources of theSub-advisers.
Based upon these considerations, the Trustees concluded, within the context of their full deliberations, that the nature, extent and quality of services provided to the Funds by the Manager and eachSub-adviser were appropriate.
Investment Performance
In connection with each of its regular quarterly meetings, the Board receives information on the performance of each Fund, including net performance, relative performance rankings within each Fund’s Lipper peer group, Morningstar ratings, and performance as compared to benchmark index returns. At each quarterly Board meeting, members of the Manager’s senior investment team reviewed with the Board the economic and market environment, risk management, and style consistency in connection with management of the Funds. The Board considered investment performance for each Fund over theone-year and since inception periods.
The Board also received and reviewed a report prepared by Broadridge Financial Solutions (“Broadridge”), an independent provider of mutual fund industry data. The Board reviewed the investment performance of each Fund on an absolute basis and in comparison to an appropriate benchmark index and each Fund’s respective peer group as independently selected by Broadridge. The Board noted that, except for Guardian Growth & Income VIP Fund, Guardian Large Cap Disciplined Value VIP Fund and Guardian Mid Cap Traditional Growth VIP Fund, each of the Fund’s performance for theone-year and since inception periods was below the median of its respective peer group median and benchmark index. With respect to Guardian Large Cap Disciplined Value VIP Fund, the Board noted that the performance for theone-year period was lower than the peer group median and benchmark index and performance since inception was higher than the peer group median and benchmark
| 17 |
Table of Contents
SUPPLEMENTAL INFORMATION(UNAUDITED)
index. With respect to Guardian Growth & Income VIP Fund and Guardian Mid Cap Traditional Growth VIP Fund, the Board noted that the performance for both theone-year and since inception periods was higher than each Fund’s peer group median and benchmark index.
The Manager discussed with the Board factors contributing to the Funds’ performance results. In addition, for certain Funds, the Manager discussed with the Board longer term performance records of theSub-advisers for strategies used in managing the Funds. The Board concluded that the investment performance generated by eachSub-adviser was generally satisfactory, or, that any steps being taken by the Manager andSub-advisers to address any performance issues were satisfactory. The Board also noted the short operational history of each Fund.
Costs and Profitability
The Trustees considered the management fees paid by the Funds to the Manager under the Management Agreement and evaluated the reasonableness of these fees. The Trustees received and reviewed comparative information with respect to the management fees and the management fees paid by other funds offered as investment options underlying variable contracts within the applicable peer group based on data obtained from Broadridge. The Board noted that the contractual and actual (effective) management fees reported for each of the Funds were below or equal to its peer group in all cases except for the Guardian Mid Cap Traditional Growth VIP Fund. The Board noted that the actual (effective) management fee for this Fund exceeded the peer group median by a modest amount.
The Trustees considered thesub-advisory fees paid under theSub-advisory Agreements and evaluated the reasonableness of those fees. The Trustees also considered that the fees paid to theSub-advisers would be paid by the Manager and not the Funds and that the Manager had negotiated the fees with theSub-advisers atarm’s-length.
The Trustees received comparative information relating to each Fund’s operating expense ratios and the operating expense ratios of a peer group of funds. In this regard, the Board noted that each Fund’s operating expense ratio was equal to or lower than the operating expense ratio of its respective peer group median, except for Guardian Diversified Research VIP Fund, Guardian Growth & Income VIP Fund and Guardian Integrated Research VIP Fund. The Board noted that the operating expense ratio for these Funds exceeded the peer group median by a modest amount. The Trustees
considered the Manager’s commitment to limit each Fund’s operating expenses through an expense limitation agreement with the Trust. Although the Board recognized that the comparisons between the management fees and operating expenses of the Funds and those of identified peer funds are imprecise, given different terms of agreements and variations in fund strategies, the Trustees found that the comparative information supported their consideration and approval of the management fees and evaluation of the operating expenses.
The Board considered the Manager’s estimates of its profitability, which included allocations by the Manager of its costs in providing management services to the Funds. The Board considered the estimated profitability of the Manager both overall and on aFund-by-Fund basis. The Board did not consider any profitability information from theSub-advisers because the Manager would be responsible for payment of thesub-advisory fees and had negotiated the fees with theSub-advisers atarm’s-length.
Based on the consideration of the information and factors summarized above, as well as other relevant information and factors, the Board concluded that the proposed management andsub-advisory fees were reasonable in light of the nature, extent and quality of services rendered to the Funds by the Manager and theSub-advisers. The Board also concluded that the profitability of the Funds to the Manager was acceptable and the Board determined it was appropriate to revisit estimated Manager profitability in connection with future reviews of the Agreements.
Economies of Scale
The Board considered whether the Funds’ fee structure is designed to share economies of scale with shareholders as the Funds’ assets grow. In this regard, the Board noted that for ten of eleven Funds, the management andsub-advisory fee included breakpoints that are tiered based on growth in asset levels of each such Fund. The Board also noted that the Funds’ expenses were subject to an expense limitation provided by the Manager. The Board noted that expected economies of scale, where they exist, may be shared through the use of fee breakpoints, expense limitations by the Manager, and/or a lower overall fee.
Ancillary Benefits
The Board considered the potential benefits, other than management fees, that the Manager and/or its affiliates may receive because of the Manager’s relationship with
| 18 |
Table of Contents
SUPPLEMENTAL INFORMATION(UNAUDITED)
the Funds. The Trustees acknowledged that the Funds were designed to serve as investment options under variable contracts issued by affiliates of the Manager that would receive fees under those contracts and that Park Avenue Securities LLC, an affiliate of the Manager and principal underwriter of the Funds, and participating insurance companies, including insurance companies affiliated with the Manager, would be entitled to receive fees from the Funds under a plan of distribution adopted pursuant to Rule12b-1 under the 1940 Act. The Trustees considered the benefits to the Manager from increased assets under management. The Trustees considered that the Manager and its affiliates may benefit from (i) greater efficiencies in annuity administration and operations and potential cost savings due to a reduction in the number of unaffiliated funds available as annuity contract investment options, and (ii) increased dividends-received deductions due to the Funds’ status under the tax laws as disregarded
entities. In addition, the Trustees considered the potential benefits, other thansub-advisory fees, that theSub-advisers and their affiliates may receive because of their relationships with the Funds, including the potential increased ability to use soft dollars consistent with Trust policies and other benefits from increases in assets under management. The Trustees concluded that benefits that may accrue to the Manager and its affiliates are reasonable and the benefits that may accrue to theSub-advisers and their affiliates are consistent with those expected for asub-adviser to a mutual fund such as the applicable Fund.
Conclusion
Based on a comprehensive consideration and evaluation of all of the information and factors summarized above, among others, the Board as a whole, including the Independent Trustees, approved the Agreements.
| 19 |
Table of Contents
SUPPLEMENTAL INFORMATION(UNAUDITED)
The Statement of Additional Information (“SAI”) includes additional information about the Trust’s Trustees and Officers and is available, without charge, upon request by calling toll-free1-888-GUARDIAN(1-888-482-7342) or by visiting our website at http://guardianvpt.onlineprospectus.net/GuardianVPT/Prospectuses.
Portfolio Holdings and Proxy Voting Procedures
The Fund files its complete schedule of portfolio holdings with the Securities and Exchange Commission for the first and third quarters of each fiscal year as an exhibit to its reports on FormN-PORT. The Fund’sForm N-PORT reports are available on the Securities and Exchange Commission’s website at https://www.sec.gov. The Fund’s FormN-PORT information is also available, without charge, upon request, by calling toll-free1-888-GUARDIAN(1-888-482-7342) or by visiting our website at http://guardianvpt.onlineprospectus.net/GuardianVPT/
Prospectuses.
A description of the policies and procedures that the Fund uses to determine how to vote proxies relating to portfolio securities is included in the SAI. The SAI and information regarding how the Fund voted proxies relating to portfolio securities during the most recent12-month period ended June 30 may be obtained (i) without charge, upon request, by calling toll-free1-888-GUARDIAN(1-888-482-7342) or by visiting our website at http://guardianvpt.onlineprospectus.net/GuardianVPT/
Prospectuses; and (ii) on the Securities and Exchange Commission’s website at https://www.sec.gov.
| 20 |
Table of Contents
This report is transmitted to shareholders only. It is not authorized for use as an offer of sale or a solicitation of an offer to buy shares of the Fund unless accompanied or preceded by the Fund’s current prospectus. Past performance results shown in this report should not be considered a representation of future performance. Investment returns and principal value of shares will fluctuate so that shares, when redeemed, may be worth more or less than their original cost. Statements and other information herein are as dated and are subject to change.

The Guardian Life Insurance Company of America New York, NY 10001-2159
PUB8169
Table of Contents
Guardian Variable
Products Trust
2019
Semiannual Report
All Data as of June 30, 2019
Guardian Mid Cap Traditional Growth VIP Fund
Important Notice
Beginning on January 1, 2021, as permitted by regulations adopted by the Securities and Exchange Commission, paper copies of the Fund’s shareholder reports will no longer be sent by mail from The Guardian Insurance & Annuity Company, Inc. (“GIAC”). Instead, GIAC will mail you a notice when copies of the shareholder reports are made available on a website. You will be notified by mail each time a report is posted and provided with a website link to access the report.
If you have already elected to receive shareholder reports electronically, you will not be affected by this change and you need not take any action. If you have not yet elected electronic delivery, at any time, you may elect to receive the Fund’s shareholder reports and certain other communications from GIAC electronically, by going to www.guardianlife.com and registering fore-delivery.
You may instead elect to receive all future shareholder reports in paper free of charge. If you wish to receive paper copies of your shareholder reports, please call GIAC’s Customer Service Office Contact Center at1-888-GUARDIAN(1-888-482-7342). Your election to receive reports in paper will apply to all the underlying funds available.

| Not FDIC insured. May lose value. No bank guarantee. | www.guardianlife.com |
Table of Contents
TABLE OF CONTENTS
Guardian Mid Cap Traditional Growth VIP Fund
| 1 | ||||
| 2 | ||||
Financial Information | ||||
| Schedule of Investments | 3 | |||
| Statement of Assets and Liabilities | 5 | |||
| Statement of Operations | 5 | |||
| Statements of Changes in Net Assets | 6 | |||
| Financial Highlights | 8 | |||
| Notes to Financial Statements | 10 | |||
Supplemental Information | ||||
| 15 | ||||
| Portfolio Holdings and Proxy Voting Procedures | 19 | |||
Except as otherwise specifically stated, all information, including portfolio security positions, is as of June 30, 2019. Fund holdings will vary. Information contained herein has been obtained from sources believed reliable, but is not guaranteed.
Table of Contents
GUARDIAN MID CAP TRADITIONAL GROWTH VIP FUND
Fund Characteristics (unaudited)
| Total Net Assets: $125,382,671 |
Sector Allocation1 As of June 30, 2019 |
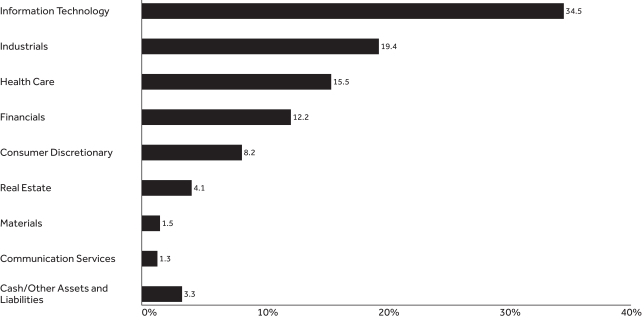 |
Top Ten Holdings2 As of June 30, 2019 | ||||
| Holding | % of Total Net Assets | |||
| WEX, Inc. | 2.64% | |||
| Constellation Software, Inc. | 2.57% | |||
| Sensata Technologies Holding PLC | 2.46% | |||
| Global Payments, Inc. | 2.43% | |||
| TE Connectivity Ltd. | 2.28% | |||
| TD Ameritrade Holding Corp. | 2.27% | |||
| The Cooper Cos., Inc. | 2.21% | |||
| SS&C Technologies Holdings, Inc. | 2.17% | |||
| LPL Financial Holdings, Inc. | 2.15% | |||
| Aon PLC | 2.15% | |||
| Total | 23.33% | |||
| 1 | The Fund’s holdings are allocated to each sector based on the MSCI Global Industry Classification Standard (GICS®). Cash includes short-term investments and net other assets and liabilities. |
| 2 | Portfolio holdings are subject to change and should not be considered a recommendation to buy or sell individual securities. |
| 1 |
Table of Contents
UNDERSTANDING YOUR FUND’S EXPENSES(UNAUDITED)
By investing in the Fund, you incur two types of costs: (1) transaction costs and (2) ongoing costs, including, as applicable, investment advisory fees, distribution and/or service(12b-1) fees and other Fund expenses. The example below is intended to help you understand your ongoing costs (in dollars) of investing in the Fund and to compare these costs with the ongoing costs of investing in other mutual funds.
The example is based on an investment of $1,000 invested at the beginning of the period and held for the entire period from January 1, 2019 to June 30, 2019. The table below shows the Fund’s expenses in two ways:
Expenses based on actual return
This section of the table provides information about actual account values and actual expenses. You may use the information in this section, together with the amount you invested, to estimate the expenses that you paid over the period. Simply divide your account value by $1,000 (for example, an $8,600 account value divided by $1,000 = 8.6), then multiply the result by the number in the section under the heading entitled “Expenses Paid During Period” to estimate the expenses you paid on your account during this period.
Expenses based on hypothetical 5% return for comparison purposes
This section of the table provides information about hypothetical account values and hypothetical expenses based on the Fund’s actual expense ratio and an assumed rate of return of 5% per year before expenses, which is not the Fund’s actual return. The hypothetical account values and expenses may not be used to estimate the actual ending account balance or expenses you paid for the period. You may use this information to compare the ongoing costs of investing in the Fund with the cost of investing in other mutual funds. To do so, compare this 5% hypothetical example with the 5% hypothetical examples that appear in the shareholder reports of the other funds.
Note that the expenses shown in the table are meant to highlight your ongoing costs only and do not reflect any transactional costs, such as sales charges (loads), redemption fees, or exchange fees. Therefore the second section is useful in comparing ongoing costs only, and will not help you determine the relative total costs of owning different funds. If these transactional costs were included, your costs would have been higher. Charges and expenses at the insurance company separate account level are not reflected in the table.
| �� | Beginning 1/1/19 | Ending Account Value | Expenses Paid During Period* 1/1/19-6/30/19 | Expense Ratio During Period 1/1/19-6/30/19 | ||||||||||
| Based on Actual Return | $ 1,000.00 | $1,267.30 | $6.18 | 1.10% | ||||||||||
| Based on Hypothetical Return (5% Return Before Expenses) | $ 1,000.00 | $1,019.34 | $5.51 | 1.10% | ||||||||||
| * | Expenses are equal to the Fund’s annualized expense ratio as indicated, multiplied by the average account value over the period, multiplied by 181/365 (to reflect the one-half year period). |
| 2 |
Table of Contents
SCHEDULE OF INVESTMENTS — GUARDIAN MID CAP TRADITIONAL GROWTH VIP FUND
| June 30, 2019(unaudited) | Shares | Value | ||||||
| Common Stocks – 96.7% |
| |||||||
| Aerospace & Defense - 3.1% |
| |||||||
Harris Corp. | 8,735 | $ | 1,652,051 | |||||
Teledyne Technologies, Inc.(1) | 8,053 | 2,205,475 | ||||||
|
| |||||||
| 3,857,526 | ||||||||
| Airlines – 0.7% |
| |||||||
Ryanair Holdings PLC, ADR(1) | 12,936 | 829,715 | ||||||
|
| |||||||
| 829,715 | ||||||||
| Auto Components – 0.3% |
| |||||||
Visteon Corp.(1) | 7,333 | 429,567 | ||||||
|
| |||||||
| 429,567 | ||||||||
| Banks – 0.5% |
| |||||||
SVB Financial Group(1) | 2,922 | 656,252 | ||||||
|
| |||||||
| 656,252 | ||||||||
| Biotechnology – 2.3% |
| |||||||
Alkermes PLC(1) | 378 | 8,520 | ||||||
Celgene Corp.(1) | 10,645 | 984,024 | ||||||
Neurocrine Biosciences, Inc.(1) | 11,943 | 1,008,347 | ||||||
Sage Therapeutics, Inc.(1) | 1,984 | 363,251 | ||||||
Sarepta Therapeutics, Inc.(1) | 3,798 | 577,106 | ||||||
|
| |||||||
| 2,941,248 | ||||||||
| Capital Markets – 5.9% |
| |||||||
Cboe Global Markets, Inc. | 7,553 | 782,718 | ||||||
LPL Financial Holdings, Inc. | 33,072 | 2,697,683 | ||||||
MSCI, Inc. | 4,224 | 1,008,649 | ||||||
TD Ameritrade Holding Corp. | 57,083 | 2,849,583 | ||||||
|
| |||||||
| 7,338,633 | ||||||||
| Commercial Services & Supplies – 2.8% |
| |||||||
Cimpress N.V.(1) | 13,480 | 1,225,197 | ||||||
Edenred (France) | 19,612 | 1,000,556 | ||||||
Ritchie Bros Auctioneers, Inc. | 37,047 | 1,230,702 | ||||||
|
| |||||||
| 3,456,455 | ||||||||
| Consumer Finance – 0.6% |
| |||||||
Synchrony Financial | 22,638 | 784,859 | ||||||
|
| |||||||
| 784,859 | ||||||||
| Containers & Packaging – 1.5% |
| |||||||
Sealed Air Corp. | 44,071 | 1,885,357 | ||||||
|
| |||||||
| 1,885,357 | ||||||||
| Diversified Consumer Services – 1.7% |
| |||||||
frontdoor, Inc.(1) | 14,560 | 634,088 | ||||||
ServiceMaster Global Holdings, Inc.(1) | 29,121 | 1,516,913 | ||||||
|
| |||||||
| 2,151,001 | ||||||||
| Electrical Equipment – 2.5% |
| |||||||
Sensata Technologies Holding PLC(1) | 62,964 | 3,085,236 | ||||||
|
| |||||||
| 3,085,236 | ||||||||
| Electronic Equipment, Instruments & Components – 6.0% |
| |||||||
Belden, Inc. | 13,990 | 833,384 | ||||||
Dolby Laboratories, Inc., Class A | 19,548 | 1,262,801 | ||||||
Flex Ltd.(1) | 107,025 | 1,024,229 | ||||||
National Instruments Corp. | 36,567 | 1,535,449 | ||||||
| June 30, 2019(unaudited) | Shares | Value | ||||||
| Electronic Equipment, Instruments & Components(continued) |
| |||||||
TE Connectivity Ltd. | 29,777 | $ | 2,852,041 | |||||
|
| |||||||
| 7,507,904 | ||||||||
| Entertainment – 0.5% |
| |||||||
Liberty Media Corp-Liberty Formula One, Class C(1) | 16,605 | 621,193 | ||||||
|
| |||||||
| 621,193 | ||||||||
| Equity Real Estate Investment – 4.1% |
| |||||||
Crown Castle International Corp. REIT | 19,535 | 2,546,387 | ||||||
Lamar Advertising Co., Class A REIT | 32,818 | 2,648,741 | ||||||
|
| |||||||
| 5,195,128 | ||||||||
| Health Care Equipment & Supplies – 6.9% |
| |||||||
Boston Scientific Corp.(1) | 61,082 | 2,625,304 | ||||||
ICU Medical, Inc.(1) | 4,173 | 1,051,220 | ||||||
STERIS PLC | 1,899 | 282,723 | ||||||
Teleflex, Inc. | 3,184 | 1,054,382 | ||||||
The Cooper Cos., Inc. | 8,215 | 2,767,551 | ||||||
Varian Medical Systems, Inc.(1) | 6,120 | 833,116 | ||||||
|
| |||||||
| 8,614,296 | ||||||||
| Hotels, Restaurants & Leisure – 3.3% |
| |||||||
Aramark | 28,887 | 1,041,665 | ||||||
Dunkin’ Brands Group, Inc. | 23,293 | 1,855,520 | ||||||
Norwegian Cruise Line Holdings Ltd.(1) | 22,571 | 1,210,483 | ||||||
|
| |||||||
| 4,107,668 | ||||||||
| Industrial Conglomerates – 1.2% |
| |||||||
Carlisle Cos., Inc. | 10,943 | 1,536,507 | ||||||
|
| |||||||
| 1,536,507 | ||||||||
| Insurance – 5.2% |
| |||||||
Aon PLC | 13,964 | 2,694,773 | ||||||
Intact Financial Corp. (Canada) | 18,599 | 1,718,797 | ||||||
WR Berkley Corp. | 32,545 | 2,145,692 | ||||||
|
| |||||||
| 6,559,262 | ||||||||
| Internet & Direct Marketing Retail – 0.5% |
| |||||||
Wayfair, Inc., Class A(1) | 4,448 | 649,408 | ||||||
|
| |||||||
| 649,408 | ||||||||
| IT Services – 12.7% |
| |||||||
Amdocs Ltd. | 29,227 | 1,814,705 | ||||||
Broadridge Financial Solutions, Inc. | 17,618 | 2,249,466 | ||||||
Euronet Worldwide, Inc.(1) | 4,535 | 762,969 | ||||||
Fidelity National Information Services, Inc. | 14,978 | 1,837,501 | ||||||
Gartner, Inc.(1) | 7,194 | 1,157,802 | ||||||
Global Payments, Inc. | 19,061 | 3,052,238 | ||||||
GoDaddy, Inc., Class A(1) | 24,182 | 1,696,367 | ||||||
WEX, Inc.(1) | 15,920 | 3,312,952 | ||||||
|
| |||||||
| 15,884,000 | ||||||||
| Life Sciences Tools & Services – 4.9% |
| |||||||
IQVIA Holdings, Inc.(1) | 11,776 | 1,894,758 | ||||||
PerkinElmer, Inc. | 27,810 | 2,679,216 | ||||||
| The accompanying notes are an integral part of these financial statements. | 3 |
Table of Contents
SCHEDULE OF INVESTMENTS — GUARDIAN MID CAP TRADITIONAL GROWTH VIP FUND
| June 30, 2019(unaudited) | Shares | Value | ||||||
| Life Sciences Tools & Services(continued) |
| |||||||
Waters Corp.(1) | 7,405 | $ | 1,593,852 | |||||
|
| |||||||
| 6,167,826 | ||||||||
| Machinery – 3.0% |
| |||||||
Rexnord Corp.(1) | 45,578 | 1,377,367 | ||||||
The Middleby Corp.(1) | 7,043 | 955,735 | ||||||
Wabtec Corp. | 19,477 | 1,397,670 | ||||||
|
| |||||||
| 3,730,772 | ||||||||
| Media – 0.8% |
| |||||||
Omnicom Group, Inc. | 11,570 | 948,161 | ||||||
|
| |||||||
| 948,161 | ||||||||
| Pharmaceuticals – 1.4% |
| |||||||
Catalent, Inc.(1) | 26,972 | 1,462,152 | ||||||
Elanco Animal Health, Inc.(1) | 9,143 | 309,034 | ||||||
|
| |||||||
| 1,771,186 | ||||||||
| Professional Services – 4.7% |
| |||||||
CoStar Group, Inc.(1) | 4,598 | 2,547,568 | ||||||
IHS Markit Ltd.(1) | 19,199 | 1,223,360 | ||||||
Verisk Analytics, Inc. | 14,809 | 2,168,926 | ||||||
|
| |||||||
| 5,939,854 | ||||||||
| Road & Rail – 0.8% |
| |||||||
Old Dominion Freight Line, Inc. | 6,816 | 1,017,356 | ||||||
|
| |||||||
| 1,017,356 | ||||||||
| Semiconductors & Semiconductor Equipment – 7.1% |
| |||||||
KLA-Tencor Corp. | 18,068 | 2,135,637 | ||||||
Lam Research Corp. | 8,657 | 1,626,131 | ||||||
Microchip Technology, Inc. | 30,041 | 2,604,555 | ||||||
ON Semiconductor Corp.(1) | 83,665 | 1,690,870 | ||||||
Xilinx, Inc. | 7,048 | 831,100 | ||||||
|
| |||||||
| 8,888,293 | ||||||||
| Software – 8.7% |
| |||||||
Atlassian Corp. PLC, Class A(1) | 13,205 | 1,727,742 | ||||||
Constellation Software, Inc. (Canada) | 3,423 | 3,226,175 | ||||||
Intuit, Inc. | 3,280 | 857,163 | ||||||
Nice Ltd., ADR(1) | 17,764 | 2,433,668 | ||||||
| June 30, 2019(unaudited) | Shares | Value | ||||||
| Software(continued) |
| |||||||
SS&C Technologies Holdings, Inc. | 47,170 | $ | 2,717,464 | |||||
|
| |||||||
| 10,962,212 | ||||||||
| Specialty Retail – 0.6% |
| |||||||
Williams-Sonoma, Inc. | 12,554 | 816,010 | ||||||
|
| |||||||
| 816,010 | ||||||||
| Textiles, Apparel & Luxury Goods – 1.8% |
| |||||||
Gildan Activewear, Inc. | 58,349 | 2,256,939 | ||||||
|
| |||||||
| 2,256,939 | ||||||||
| Trading Companies & Distributors – 0.6% |
| |||||||
Ferguson PLC (United Kingdom) | 10,072 | 717,922 | ||||||
|
| |||||||
| 717,922 | ||||||||
| Total Common Stocks (Cost $104,273,951) |
| 121,307,746 | ||||||
| Principal Amount | Value | |||||||
| Short-Term Investment – 3.4% |
| |||||||
| Repurchase Agreements – 3.4% |
| |||||||
Fixed Income Clearing Corp., 0.50%, dated 6/28/2019, proceeds at maturity value of $4,203,175, due 7/1/2019(2) | $ | 4,203,000 | 4,203,000 | |||||
| Total Repurchase Agreements (Cost $4,203,000) |
| 4,203,000 | ||||||
| Total Investments – 100.1% (Cost $108,476,951) |
| 125,510,746 | ||||||
| Liabilities in excess of other assets – (0.1)% |
| (128,075 | ) | |||||
| Total Net Assets – 100.0% |
| $ | 125,382,671 | |||||
| (1) | Non–income–producing security. |
| (2) | The table below presents collateral for repurchase agreements. |
| Security | Coupon | Maturity Date | Principal Amount | Value | ||||||||||||
| U.S. Treasury Note | 2.75% | 8/15/2021 | $ | 4,160,000 | $ | 4,287,654 | ||||||||||
Legend:
ADR — American Depositary Receipt
REIT — Real Estate Investment Trust
The following is a summary of the inputs used as of June 30, 2019 in valuing the Fund’s investments. For more information on valuation inputs, please refer to Note 2a of the accompanying Notes to Financial Statements.
| Valuation Inputs | ||||||||||||||||
| Investments in Securities(unaudited) | Level 1 | Level 2 | Level 3 | Total | ||||||||||||
| Common Stocks | $ | 119,589,268 | $ | 1,718,478 | * | $ | — | $ | 121,307,746 | |||||||
| Repurchase Agreements | — | 4,203,000 | — | 4,203,000 | ||||||||||||
| Total | $ | 119,589,268 | $ | 5,921,478 | $ | — | $ | 125,510,746 | ||||||||
| * | Consists of certain foreign securities whose values were determined by a pricing service using pricing models (See Note 2a in Notes to Financial Statements). These investments in securities were classified as Level 2 rather than Level 1. |
| 4 | The accompanying notes are an integral part of these financial statements. |
Table of Contents
FINANCIAL INFORMATION — GUARDIAN MID CAP TRADITIONAL GROWTH VIP FUND
For the Six Months Ended June 30, 2019 (unaudited) | ||||
Investment Income | ||||
Dividends | $ | 682,955 | ||
Interest | 8,203 | |||
Withholding taxes on foreign dividends | (22,338 | ) | ||
|
| |||
Total Investment Income | 668,820 | |||
|
| |||
Expenses | ||||
Investment advisory fees | 482,160 | |||
Distribution fees | 152,455 | |||
Trustees’ and officers’ fees | 28,939 | |||
Custodian and accounting fees | 26,305 | |||
Professional fees | 24,056 | |||
Administrative fees | 23,535 | |||
Shareholder reports | 14,733 | |||
Transfer agent fees | 6,870 | |||
Other expenses | 8,402 | |||
|
| |||
Total Expenses | 767,455 | |||
Less: Fees waived | (96,652 | ) | ||
|
| |||
Total Expenses, Net | 670,803 | |||
|
| |||
Net Investment Income/(Loss) | (1,983 | ) | ||
|
| |||
Realized Gain/(Loss) and Change in Unrealized Appreciation/(Depreciation) on Investments and Foreign Currency Transactions | ||||
Net realized gain/(loss) from investments | 3,086,945 | |||
Net realized gain/(loss) from foreign currency transactions | (245 | ) | ||
Net change in unrealized appreciation/(depreciation) on investments | 25,464,882 | |||
Net change in unrealized appreciation/(depreciation) on translation of assets and liabilities in foreign currencies | 4 | |||
|
| |||
Net Gain on Investments and Foreign Currency Transactions | 28,551,586 | |||
|
| |||
Net Increase in Net Assets Resulting From Operations | $ | 28,549,603 | ||
|
| |||
| The accompanying notes are an integral part of these financial statements. | 5 |
Table of Contents
FINANCIAL INFORMATION — GUARDIAN MID CAP TRADITIONAL GROWTH VIP FUND
| 6 | The accompanying notes are an integral part of these financial statements. |
Table of Contents
This Page Intentionally Left Blank
| 7 |
Table of Contents
FINANCIAL INFORMATION — GUARDIAN MID CAP TRADITIONAL GROWTH VIP FUND
The Financial Highlights table is intended to help you understand the Fund’s financial performance for the past six reporting periods (or, if shorter, the period since inception). Certain information reflects financial results for a single Fund share. The total returns in the table represent the rate that an investor would have earned (or lost) on an investment in the Fund.
Financial Highlights Six Months Ended Numbers are unaudited | ||||||||||||||||||||||||
| Per Share Operating Performance | ||||||||||||||||||||||||
| Net Asset Value, Beginning of Period | Net Investment Income/(Loss)(1) | Net Realized and Unrealized Gain/(Loss) | Total Operations | Net Asset Value, End of Period | Total Return(2) | |||||||||||||||||||
Six Months Ended 6/30/19 | $ | 12.27 | $ | (0.00 | )(4) | $ | 3.28 | $ | 3.28 | $ | 15.55 | 26.73% | (5) | |||||||||||
Year Ended 12/31/18 | 12.72 | (0.01 | ) | (0.44 | ) | (0.45 | ) | 12.27 | (3.54)% | |||||||||||||||
Year Ended 12/31/17 | 9.99 | (0.02 | ) | 2.75 | �� | 2.73 | 12.72 | 27.33% | ||||||||||||||||
Period Ended 12/31/16(7) | 10.00 | 0.00 | (8) | (0.01 | ) | (0.01 | ) | 9.99 | (0.10)% | (5) | ||||||||||||||
| 8 | The accompanying notes are an integral part of these financial statements. |
Table of Contents
FINANCIAL INFORMATION — GUARDIAN MID CAP TRADITIONAL GROWTH VIP FUND
| Ratios/Supplemental Data | ||||||||||||||||||||||
| Net Assets, End of Period (000s) | Net Ratio of Expenses to Average Net Assets(3) | Gross Ratio of Expenses to Average Net Assets | Net Ratio of Net Investment Income/ (Loss) to Average Net Assets(3) | Gross Ratio of Net Investment Loss to Average Net Assets | Portfolio Turnover Rate | |||||||||||||||||
| $ | 125,383 | 1.10% | (5) | 1.26% | (5) | (0.00)% | (5),(6) | (0.16)% | (5) | 5% | (5) | |||||||||||
| 110,065 | 1.10% | 1.31% | (0.07)% | (0.28)% | 30% | |||||||||||||||||
| 12,681 | 1.09% | 2.15% | (0.20)% | (1.26)% | 35% | |||||||||||||||||
| 13,272 | 1.09% | (5) | 2.93% | (5) | 0.14% | (5) | (1.70)% | (5) | 5% | (5) | ||||||||||||
| (1) | Calculated based on the average shares outstanding during the period. |
| (2) | Total returns do not reflect the effects of charges deducted pursuant to the terms of The Guardian Insurance & Annuity Company, Inc.’s variable contracts. Inclusion of such charges would reduce the total returns for all periods shown. |
| (3) | Net Ratio of Expenses to Average Net Assets and Net Ratio of Net Investment Income/(Loss) to Average Net Assets include the effect of fee waivers and expense limitations. |
| (4) | Rounds to $(0.00) per share. |
| (5) | Ratios for periods less than one year have been annualized, except for total return and portfolio turnover rate. For the period ended December 31, 2016, certainnon-recurring fees (i.e., audit fees) are not annualized. |
| (6) | Rounds to (0.00)%. |
| (7) | Commenced operations on September 1, 2016. |
| (8) | Rounds to $0.00 per share. |
| The accompanying notes are an integral part of these financial statements. | 9 |
Table of Contents
NOTES TO FINANCIAL STATEMENTS — GUARDIAN MID CAP TRADITIONAL GROWTH VIP FUND
June 30, 2019(unaudited)
1. Organization
Guardian Variable Products Trust (the “Trust”), a Delaware statutory trust organized on January 12, 2016, is registered under the Investment Company Act of 1940, as amended (the “1940 Act”), as anopen-end management investment company. The Trust currently has sixteen series. Guardian Mid Cap Traditional Growth VIP Fund (the “Fund”) is a series of the Trust. The Fund is a diversified fund and commenced operations on September 1, 2016. The financial statements for other series of the Trust are presented in separate reports.
The Trust has authorized an unlimited number of shares of beneficial interest with no par value. Shares are bought and sold at closing net asset value (“NAV”). Shares of the Fund are only sold to certain separate accounts of The Guardian Insurance & Annuity Company, Inc. (“GIAC”) that fund certain variable annuity contracts and variable life insurance policies issued by GIAC. GIAC is a wholly-owned subsidiary of The Guardian Life Insurance Company of America (“Guardian Life”).
The Fund seeks long-term growth of capital.
2. Significant Accounting Policies
The following is a summary of significant accounting policies followed by the Fund in the preparation of its financial statements. The Fund follows the investment company accounting and reporting guidance of the Financial Accounting Standards Board (“FASB”) Accounting Standards Codification Topic 946 Financial Services – Investment Companies. The following policies are in conformity with accounting principles generally accepted in the United States of America (“GAAP”). The preparation of financial statements in accordance with GAAP requires management to make estimates and assumptions that affect the reported amounts and disclosures in the financial statements. Actual results could differ from those estimates.
a. Investment Valuations Equity securities traded on an exchange other than NASDAQ Stock Market, LLC (“NASDAQ”) are valued at the last reported sale price on the principal exchange or market on which they are traded; or, if there were no sales that day, at the mean between the closing bid and ask prices. Securities traded on the NASDAQ are generally valued at the NASDAQ official closing price, which may not be the last sale price. If the NASDAQ official closing price is not available for a security, that security is generally valued at the
mean between the closing bid and ask prices. Repurchase agreements are carried at cost, which approximates fair value (see Note 5d). Foreign securities are valued in the currencies of the markets in which they trade and then converted to U.S. dollars by the application of foreign exchange rates at the close of the New York Stock Exchange (“NYSE”). Forward foreign currency contracts, if any, are valued at the mean between the bid and ask rates for the specified time interpolated from rates for proximate time periods. Securities for which market quotations are not readily available or for which market quotations may be considered unreliable are valued at their fair values as determined in accordance with policies and procedures adopted by the Board of Trustees.
Under the policies and procedures approved by the Board of Trustees, Park Avenue Institutional Advisers LLC (“Park Avenue”), the Fund’s investment adviser, has established a Fair Valuation Committee to assist the Board of Trustees with the oversight and monitoring of the valuation of the Fund’s investments. This includes monitoring the appropriateness of fair values based on results of ongoing valuation oversight, including but not limited to consideration of security specific events, market events, and pricing vendor and broker-dealer due diligence. The Fair Valuation Committee oversees and carries out the policies for the valuation of investments held in the Fund. The Fair Valuation Committee is responsible for discussing and assessing the potential impacts to the fair values on an ongoing basis, and at least on a quarterly basis with the Board of Trustees.
Securities whose values have been materially affected by events occurring before the Fund’s valuation time but after the close of the securities’ principal exchange or market may be fair valued in accordance with policies and procedures adopted by the Board of Trustees. In addition, the values of the Fund’s investments in foreign securities are generally determined by a pricing service using pricing models designed to estimate likely changes in the values of those securities. Certain foreign equity instruments are valued by applying international fair value factors provided by approved pricing services. The factors seek to adjust the local closing price for movements of local markets post closing, but prior to the time the NAVs are calculated. Valuations reflected in this report are as of the report date. As a result, changes in valuation due to market events and/or issuer related events after the report date and prior to issuance of the report are not reflected herein.
| 10 |
Table of Contents
NOTES TO FINANCIAL STATEMENTS — GUARDIAN MID CAP TRADITIONAL GROWTH VIP FUND
Various inputs are used in determining the valuation of the Fund’s investments. These inputs are summarized in three broad levels listed below.
| • | Level 1 — unadjusted inputs using quoted prices in active markets for identical investments. |
| • | Level 2 — other significant observable inputs, including, but not limited to, quoted prices for similar investments, inputs other than quoted prices that are observable for investments (such as interest rates, prepayment speeds, credit risks, etc.) or other market corroborated inputs. |
| • | Level 3 — significant unobservable inputs (including the Fund’s own assumptions in determining the fair value of investments) |
Inputs may include price information, volatility statistics, specific and broad credit data, liquidity statistics, and other factors. A financial instrument’s level within the fair value hierarchy is based on the lowest level of any input; both individually and in aggregate, that is significant to the fair value measurement. However, the determination of what constitutes “observable” requires significant judgment by the Trust. The Trust considers observable data to be that market data which is readily available, regularly distributed or updated, reliable and verifiable, and provided by independent sources that are actively involved in the relevant market. The inputs or methodology used for valuing securities are not necessarily an indication of the risk associated with investing in those securities. Changes in valuation techniques may result in transfers into or out of a financial instrument’s assigned level within the hierarchy.
The FASB requires reporting entities to make disclosures about purchases, sales, issuances and settlements of Level 3 securities on a gross basis. For the six months ended June 30, 2019, there were no transfers into or out of Level 3 of the fair value hierarchy.
In determining a financial instrument’s placement within the hierarchy, the Trust separates the Fund’s investment portfolio into two categories: investments and derivatives (e.g., futures). A summary of inputs used to value the Fund’s assets and liabilities carried at fair value as of June 30, 2019 is included in the Schedule of Investments.
InvestmentsInvestments whose values are based on quoted market prices in active markets, and are therefore classified within Level 1, include active listed equities. Investments that trade in markets that are not considered to be active, but are valued based on quoted market prices, dealer quotations or alternative pricing
sources supported by observable inputs are classified within Level 2. These include certain U.S. government and sovereign obligations, most government agency securities, investment-grade corporate bonds, certain mortgage products, state, municipal and provincial obligations, and certain foreign equity securities, including securities whose prices may have been affected by events occurring after the close of trading on their principal exchange or market and, as a result, whose values are determined by a pricing service as described above, or securities whose values are otherwise determined using fair valuation methods approved by the Fund’s Board of Trustees.
Investments classified within Level 3 have significant unobservable inputs, as they trade infrequently or not at all. Level 3 investments include, among others, private placement securities. When observable prices are not available for these securities, the Trust uses one or more valuation techniques for which sufficient and reliable data is available. The inputs used by the Trust in estimating the value of Level 3 investments include, for example, the original transaction price, recent transactions in the same or similar instruments, completed or pending third-party transactions in the underlying investment or comparable issuers, subsequent rounds of financing, recapitalizations, and other transactions across the capital structure. Level 3 investments may also be adjusted to reflect illiquidity and/ornon-transferability, with the amount of such discount estimated by the Trust in the absence of market information. Assumptions used by the Trust due to the lack of observable inputs may significantly impact the resulting fair value and therefore the Fund’s results of operations. As of June 30, 2019, the Fund had no securities classified as Level 3.
DerivativesExchange-traded derivatives, such as futures contracts, exchange-traded option contracts and certain swaps, are typically classified within Level 1 or Level 2 of the fair value hierarchy depending on whether or not they are deemed to be actively traded. Certainnon-exchange-traded derivatives, such as generic forwards, certain swaps and options, have inputs which can generally be corroborated by market data and are therefore classified within Level 2. During the six months ended June 30, 2019, the Fund did not hold any derivatives.
b. Securities TransactionsSecurities transactions are accounted for on the date securities are purchased or sold (trade date). Realized gains or losses on securities transactions are determined on the basis of specific identification.
| 11 |
Table of Contents
NOTES TO FINANCIAL STATEMENTS — GUARDIAN MID CAP TRADITIONAL GROWTH VIP FUND
c. Foreign Currency Translation The accounting records of the Fund are maintained in U.S. dollars. Investment securities and all other assets and liabilities of the Fund denominated in a foreign currency are generally translated into U.S. dollars at the exchange rates quoted at the close of the NYSE on each business day. The market value of investment securities and other assets and liabilities are translated at the exchange rate as of the valuation date. Purchases and sales of securities, income receipts, and expense payments are translated into U.S. dollars at the exchange rates in effect on the dates of the respective transactions. The Fund does not isolate the portion of the fluctuations on investments resulting from changes in foreign currency exchange rates from the fluctuations in market prices of investments held. Such fluctuations are included in the Net change in net realized and unrealized gain/(loss) from investments on the Statement of Operations.
Reported realized foreign currency gains and losses arise from the disposition of foreign currency, currency gains or losses realized between the trade and settlement dates on securities transactions, and the difference between the amounts of dividends, interest and foreign withholding taxes recorded on the Fund’s books on the transaction date and the U.S. dollar equivalent of the amounts actually received or paid. These reported realized foreign currency gains and losses, if any, are included in Net realized gain/(loss) from foreign currency transactions on the Statement of Operations. Unrealized foreign currency gains and losses arise from changes (due to changes in exchange rates) in the value of foreign currency and other assets and liabilities denominated in foreign currencies, which are held at period end, if any, and are included in Net change in unrealized appreciation/(depreciation) on translation of assets and liabilities in foreign currencies on the Statement of Operations.
d. Foreign Capital Gains Tax The Fund may be subject to foreign taxes on income, gains on investments or currency purchases/repatriation, a portion of which may be recoverable. The Fund will accrue such taxes and recoveries as applicable, based upon their current interpretation of tax rules and regulations that exist in the markets in which they invest.
e. Investment Income Dividend income net of foreign taxes withheld, if any, is generally recorded on theex-dividend date. Interest income, which includes amortization/accretion of premium/discount, is determined using the interest income accrual method, and is accrued and recorded daily.
f. Allocation of Income and Expenses Many of the expenses of the Trust can be directly attributed to a specific series of the Trust. Expenses that cannot be directly attributed to a specific series of the Trust are generally apportioned among all the series in the Trust, based on relative net assets. In calculating net asset value per share for each series of the Trust, investment income, realized and unrealized gains and losses, and expenses other than series-specific expenses are allocated daily to each series based upon the proportion of net assets attributable to each series.
3. Transactions with Affiliates
a. Investment Advisory Fee and Expense Limitation Under the terms of the advisory agreement, which, after its two year initial term, is reviewed and approved annually by the Board of Trustees, the Fund pays an investment advisory fee to Park Avenue. Park Avenue is a wholly-owned subsidiary of Guardian Life and receives an investment advisory fee at an annual rate of 0.80% up to $100 million, 0.75% up to $300 million, and 0.73% in excess of $300 million of the Fund’s average daily net assets. The fee is accrued daily and paid monthly.
Park Avenue has contractually agreed through April 30, 2020 to waive certain fees and/or reimburse certain expenses incurred by the Fund to the extent necessary to limit the Fund’s total annual operating expenses after fee waiver and/or expense reimbursement to 1.10% of the Fund’s average daily net assets (excluding, if applicable, any acquired fund fees and expenses, taxes, interest, transaction costs and brokerage commissions, litigation and extraordinary expenses). Prior to April 9, 2018, the expense limitation was 1.09%. The limitation may not be increased or terminated prior to this time without action by the Board of Trustees, may be terminated only upon approval of the Board of Trustees, and is subject to Park Avenue’s recoupment rights. For the six months ended June 30, 2019, Park Avenue waived fees and/or paid Fund expenses in the amount of $96,652.
Park Avenue may be entitled to recoupment of previously waived fees and reimbursed expenses from the Fund for three years from the date of the waiver or reimbursement, subject to the expense limitation in effect at the time of the waiver or reimbursement and at the time of the recoupment, if any. Amounts waived or reimbursed by Park Avenue pursuant to any expense limitation after April 9, 2018 will not be subject to Park Avenue’s recoupment rights. The amount available for potential future recoupment by Park Avenue from the
| 12 |
Table of Contents
NOTES TO FINANCIAL STATEMENTS — GUARDIAN MID CAP TRADITIONAL GROWTH VIP FUND
Fund under the Expense Limitation Agreement and the expiration schedule at June 30, 2019 are as follows:
| Potential Recoupment Amounts Expiring | ||||||||||||
Total Potential | 2021 | 2020 | 2019 | |||||||||
| $328,231 | $ | 54,113 | $ | 192,946 | $ | 81,172 | ||||||
Park Avenue has entered into aSub-Advisory Agreement with Janus Capital Management LLC (“Janus Capital”). Janus Capital is responsible for providingday-to-day investment advisory services to the Fund, subject to the supervision of Park Avenue and the oversight of the Board of Trustees.Sub-advisory fees are paid by Park Avenue and do not represent a separate or additional expense to the Fund.
b. Compensation of Trustees and Officers Trustees and officers who are interested persons of the Trust, as defined in the 1940 Act, receive no compensation from the Fund, except for the Chief Compliance Officer of the Trust. Trustees of the Trust who are not interested persons of the Trust, and the Chief Compliance Officer, receive compensation and reimbursement of expenses from the Trust.
c. Distribution Fees Park Avenue Securities LLC (“PAS”), a wholly-owned subsidiary of Guardian Life, is the principal underwriter of Fund shares. The Trust has entered into a distribution and service agreement with PAS, which governs the sale and distribution of shares of the Fund. Under a distribution and service plan adopted by the Trust(“12b-1 plan”), PAS is compensated for services in such capacity, including its expenses in connection with the promotion and distribution of shares of the Fund, at an annual rate of 0.25% of the Fund’s average daily net assets. For the six months ended June 30, 2019, the Fund paid distribution fees in the amount of $152,455 to PAS.
PAS has directed that certain payments under the12b-1 plan be used to compensate GIAC for shareholder services provided to contract owners.
4. Federal Income Taxes
a. Distributions to Shareholders For federal income tax purposes, the Fund is treated as a disregarded entity (“DRE”). As a DRE, the Fund is not subject to an entity-level income tax; and any income, gains, losses, deductions, taxes, and credits of the Fund would instead be “passed through” directly to the separate accounts of GIAC that invest in the Fund and retain the same character for U.S. federal income tax purposes. In
addition, the Fund is not required to distribute taxable income and capital gains for U.S. federal income tax purposes. Therefore, no dividends and capital gains distributions were paid by the Fund.
5. Investments
a. Investment Purchases and Sales The cost of investments purchased and the proceeds from investments sold (excluding short-term investments) amounted to $6,125,430 and $21,356,875, respectively, for the six months ended June 30, 2019. During the six months ended June 30, 2019, there were no purchases or sales of U.S. government securities.
b. Foreign Securities Foreign securities investments involve special risks and considerations not typically associated with U.S. investments. These risks include, but are not limited to, currency risk; adverse political, regulatory, social, and economic developments; and less reliable information about issuers. Moreover, securities of some foreign issuers may be less liquid and their prices more volatile than those of comparable U.S. issuers.
c. Industry or Sector Concentration In its normal course of business, the Fund may invest a significant portion of its assets in companies within a limited number of industries or sectors. As a result, the Fund may be subject to a greater risk of loss than that of a fund invested in a wider spectrum of industries or sectors because the stocks of many or all of the companies in the industry, group of industries, sector, or sectors may decline in value due to developments adversely affecting the industry, group of industries, sector, or sectors.
d. Repurchase Agreements The Fund may invest in repurchase agreements to maintain liquidity and earn income over periods of time as short as overnight. The collateral for repurchase agreements is either cash or fully negotiable U.S. government securities (including U.S. government agency securities). Repurchase agreements are fully collateralized (including the interest accrued thereon) and such collateral is marked to market daily while the agreements remain in force. If the value of the collateral falls below the repurchase price plus accrued interest, the Fund will typically require the seller to deposit additional collateral by the next business day. If the request for additional collateral is not met, or the seller defaults, the Fund maintains the right to sell the collateral (although it may be prevented or delayed from doing so in certain circumstances) and may be required to claim any resulting loss against the
| 13 |
Table of Contents
NOTES TO FINANCIAL STATEMENTS — GUARDIAN MID CAP TRADITIONAL GROWTH VIP FUND
seller. Park Avenue monitors the creditworthiness of the seller with which the Fund enters into repurchase agreements.
6. Temporary Borrowings
The Fund, with other funds managed by Park Avenue, is party to a $10 million committed revolving credit facility from State Street Bank and Trust Company for temporary borrowing purposes, including the meeting of redemption requests that otherwise might require the untimely disposition of securities. Interest is calculated based on the higher of the dailyone-month LIBOR rate and the Federal Funds rate plus 1.25% at the time of borrowing. In addition to the interest charged on any borrowings by the Fund, each fund pays a commitment fee of 0.30% per annum on its share of the unused portion of the credit facility. The agreement is in
place until December 10, 2019. The Fund did not utilize the credit facility during the six months ended June 30, 2019.
7. Indemnifications
Under the Trust’s organizational documents and, in some cases, by contract, its officers and trustees are indemnified against certain liabilities arising out of the performance of their duties to the Fund. In addition, in the normal course of business, the Fund enters into contracts with its vendors and others that provide general indemnifications. The Fund’s maximum exposure under these arrangements is unknown as this would involve future claims that may be made against the Fund that have not yet occurred. However, based on experience, the Fund expects the risk of loss to be remote.
| 14 |
Table of Contents
SUPPLEMENTAL INFORMATION(UNAUDITED)
Approval of Investment Advisory andSub-advisory Agreements
Section 15(c) of the Investment Company Act of 1940, as amended (the “1940 Act”), requires that a fund’s investment advisory andsub-advisory agreements be approved initially by the fund’s board of trustees. Section 15(c) also requires that the continuation of these agreements, after an initial term of up to two years, be annually reviewed and approved by the board. Any such agreement must be approved by a vote of a majority of the trustees who are not parties to the agreement or “interested persons” (as defined in the 1940 Act) of a party to the agreement at anin-person meeting of the board called for the purpose of voting on such approval.
At a meeting of the Board of Trustees (the “Board”) of Guardian Variable Products Trust (the “Trust”) held on March27-28, 2019 (the “Meeting”), the Board, including the trustees who are not parties to the agreement or “interested persons” as defined in the 1940 Act (the “Independent Trustees”), considered and voted unanimously to renew the existing investment management agreement (the “Management Agreement”) between the Trust, on behalf of Guardian Diversified Research VIP Fund, Guardian Growth & Income VIP Fund, Guardian Integrated Research VIP Fund, Guardian International Growth VIP Fund, Guardian International Value VIP Fund, Guardian Large Cap Disciplined Growth VIP Fund, Guardian Large Cap Disciplined Value VIP Fund, Guardian Large Cap Fundamental Growth VIP Fund, Guardian Mid Cap Traditional Growth VIP Fund, Guardian Mid Cap Relative Value VIP Fund and Guardian Core Plus Fixed Income VIP Fund (the “Funds”), and Park Avenue Institutional Advisers LLC (the “Manager”) for aone-term.
The Board, including the Independent Trustees, also considered and voted unanimously to renew the existingsub-advisory agreements (the“Sub-advisory Agreements,” collectively with the Management Agreement, the “Agreements”) between the Manager and investment advisory firms engaged to serve assub-advisers to certain of the Funds, namely Putnam Investment Management, LLC, AllianceBernstein L.P., Massachusetts Financial Services Company, J.P. Morgan Investment Management Inc., Lazard Asset Management LLC, Wellington Management Company LLP, Boston Partners Global Investors, Inc., ClearBridge Investments, LLC, Janus Capital Management LLC, Wells Capital Management Incorporated and Lord, Abbett & Co. LLC (the“Sub-advisers”) for aone-year term.
The Board is responsible for overseeing the management of each Fund. In determining whether to renew its approval of the Agreements, the Trustees evaluated information and factors that they considered to be relevant and appropriate through the exercise of their own business judgment. The Trustees considered certain information and factors in light of advice furnished to them by legal counsel to the Trust and, in the case of the Independent Trustees, their independent legal counsel. In advance of the Meeting, the Trustees received materials and information designed to assist their consideration of the Agreements. The Trustees received written responses from the Manager and eachSub-adviser to a series of questions and requests for information encompassing a wide variety of topics provided by independent counsel on behalf of the Independent Trustees. The Independent Trustees discussed the Funds with independent counsel during a telephonic meeting and executive session in advance of the Meeting. The Trustees also received materials and information regarding the legal standards applicable to their consideration of the Agreements and the process and criteria used by the Manager to identify and select theSub-advisers.
During the course of their deliberations, the Independent Trustees met to discuss and evaluate the Agreements in executive session with their independent legal counsel, outside of the presence of the Trustees who are not Independent Trustees and representatives from Fund management, the Manager or anySub-adviser.
In reaching its decisions to renew its approval of the Agreements, the Board took into account the materials and information described above as well as other materials and information provided to the Board and discussed with and among the Trustees. Individual Trustees may have given different weight to different factors and information with respect to each Agreement, and the Trustees did not identify any single factor or information that, in isolation, would be controlling in deciding to approve the Agreements. The discussion below is intended to summarize the broad factors that figured prominently in the Board’s decisions to approve the Agreements rather than to beall-inclusive. These broad factors included: (i) the nature, extent and quality of the services provided to the Funds by the Manager and theSub-advisers; (ii) the investment performance of each Fund; (iii) the fees charged and estimated profitability; (iv) the extent to which economies of scale exist for a Fund, and the extent to which a Fund benefits from economies of scale; and
| 15 |
Table of Contents
SUPPLEMENTAL INFORMATION(UNAUDITED)
(v) any other benefits derived by the Manager or theSub-advisers (or their respective affiliates) from their relationships with the Funds.
Nature, Extent and Quality of Services
The Trustees considered information regarding the nature, extent and quality of services provided to the Funds by the Manager. The Trustees also considered, among other things, the terms of the Management Agreement and the range of investment advisory services provided by the Manager. In addition, the Trustees reviewed the range ofnon-investment advisory services provided by the Manager consistent with the terms of the Management Agreement, notably coordinating the preparation and filing of various regulatory documents, coordinating the preparation and assembly of Board meeting materials and assisting the Board with certain valuation matters.
The Trustees considered that the Funds operate in a“manager-of-managers” structure and reviewed the responsibilities that the Manager has under this structure, including monitoring and evaluating the performance of theSub-advisers, monitoring theSub-advisers for adherence to the stated investment objectives, strategies, policies and restrictions of the Funds and supervising theSub-advisers with respect to the services that theSub-advisers would provide under theSub-advisory Agreements. The Trustees also considered the process used by the Manager, consistent with this structure, to identify and recommendsub-advisers, and the Manager’s ability to monitor and overseesub-advisers and recommend replacementsub-advisers, when necessary, and provide other services under the Management Agreement. The Board noted that investment management staff of the Manager and the Trust’s Chief Compliance Officer conductin-person oversight visits of theSub-advisers on a periodic basis, follow through with additional inquiry on any questions or concerns that arise during the visit and then report the results of the visit to the Board. The Trustees reviewed information regarding the experience and background of the Manager’s key personnel and the Manager’s organizational structure and resources, including investment, legal and administrative capabilities of the Manager. In this regard, the Trustees recognized that the Funds may benefit from the Manager’s ability to use similar resources and capabilities of its affiliates in providing services to the Funds.
The Trustees considered information regarding the nature, extent and quality of services provided to the
Funds by theSub-advisers. The Trustees also considered, among other things, the terms of theSub-advisory Agreements and the range of investment advisory services provided by theSub-advisers under the oversight of the Manager. In evaluating these investment advisory services, the Trustees considered, among other things, theSub-advisers’ investment philosophies, styles and/or processes and approach to managing the Funds. The Trustees received and evaluated information regarding the background, education, expertise and/or experience of the investment professionals that serve as portfolio managers for the Funds and the capabilities and resources of theSub-advisers.
Based upon these considerations, the Trustees concluded, within the context of their full deliberations, that the nature, extent and quality of services provided to the Funds by the Manager and eachSub-adviser were appropriate.
Investment Performance
In connection with each of its regular quarterly meetings, the Board receives information on the performance of each Fund, including net performance, relative performance rankings within each Fund’s Lipper peer group, Morningstar ratings, and performance as compared to benchmark index returns. At each quarterly Board meeting, members of the Manager’s senior investment team reviewed with the Board the economic and market environment, risk management, and style consistency in connection with management of the Funds. The Board considered investment performance for each Fund over theone-year and since inception periods.
The Board also received and reviewed a report prepared by Broadridge Financial Solutions (“Broadridge”), an independent provider of mutual fund industry data. The Board reviewed the investment performance of each Fund on an absolute basis and in comparison to an appropriate benchmark index and each Fund’s respective peer group as independently selected by Broadridge. The Board noted that, except for Guardian Growth & Income VIP Fund, Guardian Large Cap Disciplined Value VIP Fund and Guardian Mid Cap Traditional Growth VIP Fund, each of the Fund’s performance for theone-year and since inception periods was below the median of its respective peer group median and benchmark index. With respect to Guardian Large Cap Disciplined Value VIP Fund, the Board noted that the performance for theone-year period was lower than the peer group median and benchmark index and performance since inception was
| 16 |
Table of Contents
SUPPLEMENTAL INFORMATION(UNAUDITED)
higher than the peer group median and benchmark index. With respect to Guardian Growth & Income VIP Fund and Guardian Mid Cap Traditional Growth VIP Fund, the Board noted that the performance for both theone-year and since inception periods was higher than each Fund’s peer group median and benchmark index.
The Manager discussed with the Board factors contributing to the Funds’ performance results. In addition, for certain Funds, the Manager discussed with the Board longer term performance records of theSub-advisers for strategies used in managing the Funds. The Board concluded that the investment performance generated by eachSub-adviser was generally satisfactory, or, that any steps being taken by the Manager andSub-advisers to address any performance issues were satisfactory. The Board also noted the short operational history of each Fund.
Costs and Profitability
The Trustees considered the management fees paid by the Funds to the Manager under the Management Agreement and evaluated the reasonableness of these fees. The Trustees received and reviewed comparative information with respect to the management fees and the management fees paid by other funds offered as investment options underlying variable contracts within the applicable peer group based on data obtained from Broadridge. The Board noted that the contractual and actual (effective) management fees reported for each of the Funds were below or equal to its peer group in all cases except for the Guardian Mid Cap Traditional Growth VIP Fund. The Board noted that the actual (effective) management fee for this Fund exceeded the peer group median by a modest amount.
The Trustees considered thesub-advisory fees paid under theSub-advisory Agreements and evaluated the reasonableness of those fees. The Trustees also considered that the fees paid to theSub-advisers would be paid by the Manager and not the Funds and that the Manager had negotiated the fees with theSub-advisers atarm’s-length.
The Trustees received comparative information relating to each Fund’s operating expense ratios and the operating expense ratios of a peer group of funds. In this regard, the Board noted that each Fund’s operating expense ratio was equal to or lower than the operating expense ratio of its respective peer group median, except for Guardian Diversified Research VIP Fund, Guardian Growth & Income VIP Fund and Guardian Integrated Research VIP Fund. The Board noted that the operating expense ratio for these Funds exceeded the
peer group median by a modest amount. The Trustees considered the Manager’s commitment to limit each Fund’s operating expenses through an expense limitation agreement with the Trust. Although the Board recognized that the comparisons between the management fees and operating expenses of the Funds and those of identified peer funds are imprecise, given different terms of agreements and variations in fund strategies, the Trustees found that the comparative information supported their consideration and approval of the management fees and evaluation of the operating expenses.
The Board considered the Manager’s estimates of its profitability, which included allocations by the Manager of its costs in providing management services to the Funds. The Board considered the estimated profitability of the Manager both overall and on aFund-by-Fund basis. The Board did not consider any profitability information from theSub-advisers because the Manager would be responsible for payment of thesub-advisory fees and had negotiated the fees with theSub-advisers atarm’s-length.
Based on the consideration of the information and factors summarized above, as well as other relevant information and factors, the Board concluded that the proposed management andsub-advisory fees were reasonable in light of the nature, extent and quality of services rendered to the Funds by the Manager and theSub-advisers. The Board also concluded that the profitability of the Funds to the Manager was acceptable and the Board determined it was appropriate to revisit estimated Manager profitability in connection with future reviews of the Agreements.
Economies of Scale
The Board considered whether the Funds’ fee structure is designed to share economies of scale with shareholders as the Funds’ assets grow. In this regard, the Board noted that for ten of eleven Funds, the management andsub-advisory fee included breakpoints that are tiered based on growth in asset levels of each such Fund. The Board also noted that the Funds’ expenses were subject to an expense limitation provided by the Manager. The Board noted that expected economies of scale, where they exist, may be shared through the use of fee breakpoints, expense limitations by the Manager, and/or a lower overall fee.
Ancillary Benefits
The Board considered the potential benefits, other than management fees, that the Manager and/or its affiliates
| 17 |
Table of Contents
SUPPLEMENTAL INFORMATION(UNAUDITED)
may receive because of the Manager’s relationship with the Funds. The Trustees acknowledged that the Funds were designed to serve as investment options under variable contracts issued by affiliates of the Manager that would receive fees under those contracts and that Park Avenue Securities LLC, an affiliate of the Manager and principal underwriter of the Funds, and participating insurance companies, including insurance companies affiliated with the Manager, would be entitled to receive fees from the Funds under a plan of distribution adopted pursuant to Rule12b-1 under the 1940 Act. The Trustees considered the benefits to the Manager from increased assets under management. The Trustees considered that the Manager and its affiliates may benefit from (i) greater efficiencies in annuity administration and operations and potential cost savings due to a reduction in the number of unaffiliated funds available as annuity contract investment options, and (ii) increased dividends-received deductions due to
the Funds’ status under the tax laws as disregarded entities. In addition, the Trustees considered the potential benefits, other thansub-advisory fees, that theSub-advisers and their affiliates may receive because of their relationships with the Funds, including the potential increased ability to use soft dollars consistent with Trust policies and other benefits from increases in assets under management. The Trustees concluded that benefits that may accrue to the Manager and its affiliates are reasonable and the benefits that may accrue to theSub-advisers and their affiliates are consistent with those expected for asub-adviser to a mutual fund such as the applicable Fund.
Conclusion
Based on a comprehensive consideration and evaluation of all of the information and factors summarized above, among others, the Board as a whole, including the Independent Trustees, approved the Agreements.
| 18 |
Table of Contents
SUPPLEMENTAL INFORMATION(UNAUDITED)
The Statement of Additional Information (“SAI”) includes additional information about the Trust’s Trustees and Officers and is available, without charge, upon request by calling toll-free1-888-GUARDIAN(1-888-482-7342) or by visiting our website at http://guardianvpt.onlineprospectus.net/GuardianVPT/Prospectuses.
Portfolio Holdings and Proxy Voting Procedures
The Fund files its complete schedule of portfolio holdings with the Securities and Exchange Commission for the first and third quarters of each fiscal year as an exhibit to its reports on FormN-PORT. The Fund’sForm N-PORT reports are available on the Securities and Exchange Commission’s website at https://www.sec.gov. The Fund’s FormN-PORT information is also available, without charge, upon request, by calling toll-free1-888-GUARDIAN(1-888-482-7342) or by visiting our website at http://guardianvpt.onlineprospectus.net/GuardianVPT/
Prospectuses.
A description of the policies and procedures that the Fund uses to determine how to vote proxies relating to portfolio securities is included in the SAI. The SAI and information regarding how the Fund voted proxies relating to portfolio securities during the most recent12-month period ended June 30 may be obtained (i) without charge, upon request, by calling toll-free1-888-GUARDIAN(1-888-482-7342) or by visiting our website at http://guardianvpt.onlineprospectus.net/GuardianVPT/
Prospectuses; and (ii) on the Securities and Exchange Commission’s website at https://www.sec.gov.
| 19 |
Table of Contents
This report is transmitted to shareholders only. It is not authorized for use as an offer of sale or a solicitation of an offer to buy shares of the Fund unless accompanied or preceded by the Fund’s current prospectus. Past performance results shown in this report should not be considered a representation of future performance. Investment returns and principal value of shares will fluctuate so that shares, when redeemed, may be worth more or less than their original cost. Statements and other information herein are as dated and are subject to change.

The Guardian Life Insurance Company of America New York, NY 10001-2159
PUB8177
Table of Contents
Guardian Variable
Products Trust
2019
Semiannual Report
All Data as of June 30, 2019
Guardian Mid Cap Relative Value VIP Fund
Important Notice
Beginning on January 1, 2021, as permitted by regulations adopted by the Securities and Exchange Commission, paper copies of the Fund’s shareholder reports will no longer be sent by mail from The Guardian Insurance & Annuity Company, Inc. (“GIAC”). Instead, GIAC will mail you a notice when copies of the shareholder reports are made available on a website. You will be notified by mail each time a report is posted and provided with a website link to access the report.
If you have already elected to receive shareholder reports electronically, you will not be affected by this change and you need not take any action. If you have not yet elected electronic delivery, at any time, you may elect to receive the Fund’s shareholder reports and certain other communications from GIAC electronically, by going to www.guardianlife.com and registering for e-delivery.
You may instead elect to receive all future shareholder reports in paper free of charge. If you wish to receive paper copies of your shareholder reports, please call GIAC’s Customer Service Office Contact Center at 1-888-GUARDIAN (1-888-482-7342). Your election to receive reports in paper will apply to all the underlying funds available.

| Not FDIC insured. May lose value. No bank guarantee. | www.guardianlife.com |
Table of Contents
TABLE OF CONTENTS
Guardian Mid Cap Relative Value VIP Fund
| 1 | ||||
| 2 | ||||
Financial Information | ||||
| Schedule of Investments | 3 | |||
| Statement of Assets and Liabilities | 5 | |||
| Statement of Operations | 5 | |||
| Statements of Changes in Net Assets | 6 | |||
| Financial Highlights | 8 | |||
| Notes to Financial Statements | 10 | |||
| Shareholder Meeting Results | 15 | |||
Supplemental Information | ||||
| Approval of Investment Advisory and Sub-advisory Agreements | 16 | |||
| Portfolio Holdings and Proxy Voting Procedures | 20 | |||
Except as otherwise specifically stated, all information, including portfolio security positions, is as of June 30, 2019. Fund holdings will vary. Information contained herein has been obtained from sources believed reliable, but is not guaranteed.
Table of Contents
GUARDIAN MID CAP RELATIVE VALUE VIP FUND
Fund Characteristics (unaudited)
| Total Net Assets: $231,171,313 |
Sector Allocation1 As of June 30, 2019 | ||||
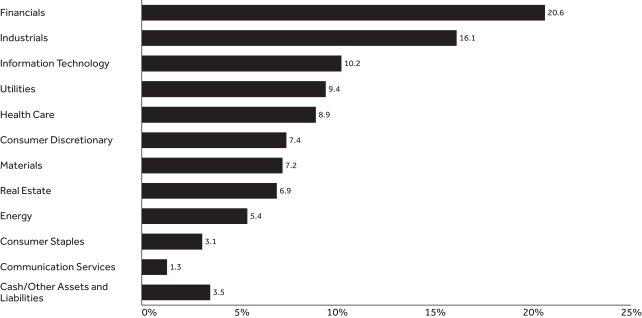 | ||||
Top Ten Holdings2 As of June 30, 2019 |
| Holding | % of Total Net Assets | |||||
| Jacobs Engineering Group, Inc. | 2.95% | |||||
| Brown & Brown, Inc. | 2.90% | |||||
| Ameren Corp. | 2.79% | |||||
| American Water Works Co., Inc. | 2.75% | |||||
| Amdocs Ltd. | 2.69% | |||||
| Kansas City Southern | 2.67% | |||||
| American Electric Power Co., Inc. | 2.63% | |||||
| Fidelity National Information Services, Inc. | 2.51% | |||||
| Republic Services, Inc. | 2.45% | |||||
| Arch Capital Group Ltd. | 2.28% | |||||
| Total | 26.62% | |||||
| 1 | The Fund’s holdings are allocated to each sector based on the MSCI Global Industry Classification Standard (GICS®). Cash includes short-term investments and net other assets and liabilities. |
| 2 | Portfolio holdings are subject to change and should not be considered a recommendation to buy or sell individual securities. |
| 1 |
Table of Contents
UNDERSTANDING YOUR FUND’S EXPENSES(UNAUDITED)
By investing in the Fund, you incur two types of costs: (1) transaction costs and (2) ongoing costs, including, as applicable, investment advisory fees, distribution and/or service(12b-1) fees and other Fund expenses. The example below is intended to help you understand your ongoing costs (in dollars) of investing in the Fund and to compare these costs with the ongoing costs of investing in other mutual funds.
The example is based on an investment of $1,000 invested at the beginning of the period and held for the entire period from January 1, 2019 to June 30, 2019. The table below shows the Fund’s expenses in two ways:
Expenses based on actual return
This section of the table provides information about actual account values and actual expenses. You may use the information in this section, together with the amount you invested, to estimate the expenses that you paid over the period. Simply divide your account value by $1,000 (for example, an $8,600 account value divided by $1,000 = 8.6), then multiply the result by the number in the section under the heading entitled “Expenses Paid During Period” to estimate the expenses you paid on your account during this period.
Expenses based on hypothetical 5% return for comparison purposes
This section of the table provides information about hypothetical account values and hypothetical expenses based on the Fund’s actual expense ratio and an assumed rate of return of 5% per year before expenses, which is not the Fund’s actual return. The hypothetical account values and expenses may not be used to estimate the actual ending account balance or expenses you paid for the period. You may use this information to compare the ongoing costs of investing in the Fund with the cost of investing in other mutual funds. To do so, compare this 5% hypothetical example with the 5% hypothetical examples that appear in the shareholder reports of the other funds.
Note that the expenses shown in the table are meant to highlight your ongoing costs only and do not reflect any transactional costs, such as sales charges (loads), redemption fees, or exchange fees. Therefore the second section is useful in comparing ongoing costs only, and will not help you determine the relative total costs of owning different funds. If these transactional costs were included, your costs would have been higher. Charges and expenses at the insurance company separate account level are not reflected in the table.
Beginning 1/1/19 | Ending Account Value | Expenses Paid During Period* 1/1/19-6/30/19 | Expense Ratio During Period 1/1/19-6/30/19 | |||||||||||
| Based on Actual Return | $1,000.00 | $1,221.80 | $5.51 | 1.00% | ||||||||||
| Based on Hypothetical Return (5% Return Before Expenses) | $1,000.00 | $1,019.84 | $5.01 | 1.00% | ||||||||||
| * | Expenses are equal to the Fund’s annualized expense ratio as indicated, multiplied by the average account value over the period, multiplied by 181/365 (to reflect theone-half year period). |
| 2 |
Table of Contents
SCHEDULE OF INVESTMENTS — GUARDIAN MID CAP RELATIVE VALUE VIP FUND
| June 30, 2019 (unaudited) | Shares | Value | ||||||
| Common Stocks – 96.5% |
| |||||||
| Aerospace & Defense – 1.4% |
| |||||||
Harris Corp. | 17,309 | $ | 3,273,651 | |||||
|
| |||||||
| 3,273,651 | ||||||||
| Auto Components – 1.0% |
| |||||||
Aptiv PLC | 29,945 | 2,420,454 | ||||||
|
| |||||||
| 2,420,454 | ||||||||
| Banks – 5.8% |
| |||||||
Fifth Third Bancorp | 134,297 | 3,746,886 | ||||||
PacWest Bancorp | 82,902 | 3,219,085 | ||||||
Regions Financial Corp. | 246,826 | 3,687,581 | ||||||
Zions Bancorporation N.A. | 57,833 | 2,659,161 | ||||||
|
| |||||||
| 13,312,713 | ||||||||
| Beverages – 2.1% |
| |||||||
Molson Coors Brewing Co., Class B | 85,656 | 4,796,736 | ||||||
|
| |||||||
| 4,796,736 | ||||||||
| Building Products – 1.2% |
| |||||||
Owens Corning | 47,569 | 2,768,516 | ||||||
|
| |||||||
| 2,768,516 | ||||||||
| Capital Markets – 1.0% |
| |||||||
Northern Trust Corp. | 25,677 | 2,310,930 | ||||||
|
| |||||||
| 2,310,930 | ||||||||
| Chemicals – 2.0% |
| |||||||
PPG Industries, Inc. | 39,154 | 4,569,663 | ||||||
|
| |||||||
| 4,569,663 | ||||||||
| Commercial Services & Supplies – 2.4% |
| |||||||
Republic Services, Inc. | 65,334 | 5,660,538 | ||||||
|
| |||||||
| 5,660,538 | ||||||||
| Construction & Engineering – 3.0% |
| |||||||
Jacobs Engineering Group, Inc. | 80,879 | 6,825,379 | ||||||
|
| |||||||
| 6,825,379 | ||||||||
| Construction Materials – 1.1% |
| |||||||
Eagle Materials, Inc. | 27,922 | 2,588,369 | ||||||
|
| |||||||
| 2,588,369 | ||||||||
| Containers & Packaging – 4.1% |
| |||||||
International Paper Co. | 50,327 | 2,180,166 | ||||||
Packaging Corp. of America | 33,232 | 3,167,674 | ||||||
Sealed Air Corp. | 95,610 | 4,090,196 | ||||||
|
| |||||||
| 9,438,036 | ||||||||
| Electric Utilities – 3.9% |
| |||||||
American Electric Power Co., Inc. | 69,220 | 6,092,052 | ||||||
FirstEnergy Corp. | 66,067 | 2,828,329 | ||||||
|
| |||||||
| 8,920,381 | ||||||||
| Electrical Equipment – 0.6% |
| |||||||
Acuity Brands, Inc. | 9,338 | 1,287,804 | ||||||
|
| |||||||
| 1,287,804 | ||||||||
| Energy Equipment & Services – 1.7% |
| |||||||
Baker Hughes a GE Co. | 48,631 | 1,197,782 | ||||||
National Oilwell Varco, Inc. | 89,427 | 1,987,962 | ||||||
| June 30, 2019 (unaudited) | Shares | Value | ||||||
| Energy Equipment & Services(continued) |
| |||||||
Patterson-UTI Energy, Inc. | 65,236 | $ | 750,866 | |||||
|
| |||||||
| 3,936,610 | ||||||||
| Equity Real Estate Investment – 4.7% |
| |||||||
American Campus Communities, Inc. REIT | 77,767 | 3,589,725 | ||||||
Invitation Homes, Inc. REIT | 152,007 | 4,063,147 | ||||||
Mid-America Apartment Communities, Inc. REIT | 26,501 | 3,120,758 | ||||||
|
| |||||||
| 10,773,630 | ||||||||
| Food Products – 0.6% |
| |||||||
Lamb Weston Holdings, Inc. | 22,711 | 1,438,969 | ||||||
|
| |||||||
| 1,438,969 | ||||||||
| Health Care Equipment & Supplies – 4.8% |
| |||||||
Alcon, Inc.(1) | 18,745 | 1,163,127 | ||||||
STERIS PLC | 17,434 | 2,595,574 | ||||||
Varian Medical Systems, Inc.(1) | 29,246 | 3,981,258 | ||||||
Zimmer Biomet Holdings, Inc. | 27,955 | 3,291,422 | ||||||
|
| |||||||
| 11,031,381 | ||||||||
| Health Care Providers & Services – 3.0% |
| |||||||
Humana, Inc. | 17,398 | 4,615,689 | ||||||
Universal Health Services, Inc., Class B | 17,153 | 2,236,580 | ||||||
|
| |||||||
| 6,852,269 | ||||||||
| Hotels, Restaurants & Leisure – 2.7% |
| |||||||
The Wendy’s Co. | 164,250 | 3,216,015 | ||||||
Vail Resorts, Inc. | 10,196 | 2,274,932 | ||||||
Yum China Holdings, Inc. | 18,376 | 848,971 | ||||||
|
| |||||||
| 6,339,918 | ||||||||
| Household Durables – 2.6% |
| |||||||
DR Horton, Inc. | 46,158 | 1,990,794 | ||||||
Mohawk Industries, Inc.(1) | 26,846 | 3,958,980 | ||||||
|
| |||||||
| 5,949,774 | ||||||||
| Household Products – 0.4% |
| |||||||
Spectrum Brands Holdings, Inc. | 18,390 | 988,830 | ||||||
|
| |||||||
| 988,830 | ||||||||
| Industrial Conglomerates – 1.8% |
| |||||||
Carlisle Cos., Inc. | 29,287 | 4,112,188 | ||||||
|
| |||||||
| 4,112,188 | ||||||||
| Insurance – 12.4% |
| |||||||
Arch Capital Group Ltd.(1) | 142,104 | 5,269,216 | ||||||
Brown & Brown, Inc. | 199,898 | 6,696,583 | ||||||
Fidelity National Financial, Inc. | 112,586 | 4,537,216 | ||||||
Loews Corp. | 91,211 | 4,986,505 | ||||||
The Allstate Corp. | 47,432 | 4,823,360 | ||||||
Willis Towers Watson PLC | 11,933 | 2,285,647 | ||||||
|
| |||||||
| 28,598,527 | ||||||||
| IT Services – 7.3% |
| |||||||
Amdocs Ltd. | 100,302 | 6,227,751 | ||||||
Euronet Worldwide, Inc.(1) | 19,712 | 3,316,347 | ||||||
| The accompanying notes are an integral part of these financial statements. | 3 |
Table of Contents
SCHEDULE OF INVESTMENTS — GUARDIAN MID CAP RELATIVE VALUE VIP FUND
| June 30, 2019 (unaudited) | Shares | Value | ||||||
| IT Services(continued) |
| |||||||
Fidelity National Information Services, Inc. | 47,294 | $ | 5,802,028 | |||||
Leidos Holdings, Inc. | 19,793 | 1,580,471 | ||||||
|
| |||||||
| 16,926,597 | ||||||||
| Life Sciences Tools & Services – 1.1% |
| |||||||
Charles River Laboratories International, Inc.(1) | 18,758 | 2,661,760 | ||||||
|
| |||||||
| 2,661,760 | ||||||||
| Machinery – 2.3% |
| |||||||
Cummins, Inc. | 14,088 | 2,413,838 | ||||||
Stanley Black & Decker, Inc. | 20,389 | 2,948,453 | ||||||
|
| |||||||
| 5,362,291 | ||||||||
| Media – 1.3% |
| |||||||
Discovery, Inc., Class C(1) | 103,901 | 2,955,983 | ||||||
|
| |||||||
| 2,955,983 | ||||||||
| Mortgage Real Estate Investment – 1.4% |
| |||||||
Annaly Capital Management, Inc. REIT | 357,016 | 3,259,556 | ||||||
|
| |||||||
| 3,259,556 | ||||||||
| Multiline Retail – 1.1% |
| |||||||
Kohl’s Corp. | 53,066 | 2,523,288 | ||||||
|
| |||||||
| 2,523,288 | ||||||||
| Multi-Utilities – 2.8% |
| |||||||
Ameren Corp. | 85,828 | 6,446,541 | ||||||
|
| |||||||
| 6,446,541 | ||||||||
| Oil, Gas & Consumable Fuels – 3.7% |
| |||||||
Cimarex Energy Co. | 41,202 | 2,444,515 | ||||||
Devon Energy Corp. | 49,965 | 1,425,002 | ||||||
Hess Corp. | 33,744 | 2,145,106 | ||||||
Valero Energy Corp. | 14,188 | 1,214,635 | ||||||
WPX Energy, Inc.(1) | 114,352 | 1,316,191 | ||||||
|
| |||||||
| 8,545,449 | ||||||||
| Real Estate Management & Development – 2.2% |
| |||||||
CBRE Group, Inc., Class A(1) | 101,388 | 5,201,204 | ||||||
|
| |||||||
| 5,201,204 | ||||||||
| Road & Rail – 2.7% |
| |||||||
Kansas City Southern | 50,591 | 6,162,996 | ||||||
|
| |||||||
| 6,162,996 | ||||||||
| Semiconductors & Semiconductor Equipment – 0.8% |
| |||||||
Analog Devices, Inc. | 15,695 | 1,771,495 | ||||||
|
| |||||||
| 1,771,495 | ||||||||
| June 30, 2019 (unaudited) | Shares | Value | ||||||
| Software – 0.6% |
| |||||||
Check Point Software Technologies Ltd.(1) | 12,531 | $ | 1,448,709 | |||||
|
| |||||||
| 1,448,709 | ||||||||
| Technology Hardware, Storage & Peripherals – 1.5% |
| |||||||
NCR Corp.(1) | 114,541 | 3,562,225 | ||||||
|
| |||||||
| 3,562,225 | ||||||||
| Trading Companies & Distributors – 0.7% |
| |||||||
AerCap Holdings NV(1) | 32,803 | 1,706,084 | ||||||
|
| |||||||
| 1,706,084 | ||||||||
| Water Utilities – 2.7% |
| |||||||
American Water Works Co., Inc. | 54,818 | 6,358,888 | ||||||
|
| |||||||
| 6,358,888 | ||||||||
| Total Common Stocks (Cost $207,046,072) |
| 223,088,332 | ||||||
| Principal Amount | Value | |||||||
| Short-Term Investment – 3.4% |
| |||||||
| Repurchase Agreements – 3.4% |
| |||||||
Fixed Income Clearing Corp., 0.50%, dated 6/28/2019, proceeds at maturity value of $7,749,323, due 7/1/2019(2) | $ | 7,749,000 | 7,749,000 | |||||
| Total Repurchase Agreements (Cost $7,749,000) |
| 7,749,000 | ||||||
| Total Investments – 99.9% (Cost $214,795,072) |
| 230,837,332 | ||||||
| Assets in excess of other liabilities – 0.1% |
| 333,981 | ||||||
| Total Net Assets – 100.0% |
| $ | 231,171,313 | |||||
| (1) | Non–income–producing security. |
| (2) | The table below presents collateral for repurchase agreements. |
| Security | Coupon | Maturity Date | Principal Amount | Value | ||||||||||||
| U.S. Treasury Note | 2.75% | 8/15/2021 | $ | 7,670,000 | $ | 7,905,362 | ||||||||||
Legend:
REIT — Real Estate Investment Trust
The following is a summary of the inputs used as of June 30, 2019 in valuing the Fund’s investments. For more information on valuation inputs, please refer to Note 2a of the accompanying Notes to Financial Statements.
| Valuation Inputs | ||||||||||||||||
| Investments in Securities(unaudited) | Level 1 | Level 2 | Level 3 | Total | ||||||||||||
| Common Stocks | $ | 223,088,332 | $ | — | $ | — | $ | 223,088,332 | ||||||||
| Repurchase Agreements | — | 7,749,000 | — | 7,749,000 | ||||||||||||
| Total | $ | 223,088,332 | $ | 7,749,000 | $ | — | $ | 230,837,332 | ||||||||
| 4 | The accompanying notes are an integral part of these financial statements. |
Table of Contents
FINANCIAL INFORMATION — GUARDIAN MID CAP RELATIVE VALUE VIP FUND
For the Six Months Ended June 30, 2019 (unaudited) | ||||
Investment Income | ||||
Dividends | $ | 2,073,881 | ||
Interest | 21,064 | |||
|
| |||
Total Investment Income | 2,094,945 | |||
|
| |||
Expenses | ||||
Investment advisory fees | 776,783 | |||
Distribution fees | 280,593 | |||
Trustees’ and officers’ fees | 52,457 | |||
Professional fees | 32,190 | |||
Custodian and accounting fees | 26,000 | |||
Administrative fees | 23,535 | |||
Shareholder reports | 18,620 | |||
Transfer agent fees | 9,632 | |||
Other expenses | 14,260 | |||
|
| |||
Total Expenses | 1,234,070 | |||
Less: Fees waived | (111,699 | ) | ||
|
| |||
Total Expenses, Net | 1,122,371 | |||
|
| |||
Net Investment Income/(Loss) | 972,574 | |||
|
| |||
Realized Gain/(Loss) and Change in Unrealized Appreciation/(Depreciation) on Investments | ||||
Net realized gain/(loss) from investments | 1,983,934 | |||
Net change in unrealized appreciation/(depreciation) on investments | 41,367,969 | |||
|
| |||
Net Gain on Investments | 43,351,903 | |||
|
| |||
Net Increase in Net Assets Resulting From Operations | $ | 44,324,477 | ||
|
| |||
| The accompanying notes are an integral part of these financial statements. | 5 |
Table of Contents
FINANCIAL INFORMATION — GUARDIAN MID CAP RELATIVE VALUE VIP FUND
| 6 | The accompanying notes are an integral part of these financial statements. |
Table of Contents
This Page Intentionally Left Blank
| 7 |
Table of Contents
FINANCIAL INFORMATION — GUARDIAN MID CAP RELATIVE VALUE VIP FUND
The Financial Highlights table is intended to help you understand the Fund’s financial performance for the past six reporting periods (or, if shorter, the period since inception). Certain information reflects financial results for a single Fund share. The total returns in the table represent the rate that an investor would have earned (or lost) on an investment in the Fund.
Financial Highlights Six Months Ended Numbers are unaudited | ||||||||||||||||||||||||
| Per Share Operating Performance | ||||||||||||||||||||||||
| Net Asset Value, Beginning of Period | Net Investment Income(1) | Net Realized and Unrealized Gain/(Loss) | Total Operations | Net Asset Value, End of Period | Total Return(2) | |||||||||||||||||||
Six Months Ended 6/30/19 | $ | 10.28 | $ | 0.05 | $ | 2.23 | $ | 2.28 | $ | 12.56 | 22.18% | (4) | ||||||||||||
Year Ended 12/31/18 | 12.02 | 0.08 | (1.82 | ) | (1.74 | ) | 10.28 | (14.48)% | ||||||||||||||||
Year Ended 12/31/17 | 10.81 | 0.10 | 1.11 | 1.21 | 12.02 | 11.19% | ||||||||||||||||||
Period Ended 12/31/16(5) | 10.00 | 0.03 | 0.78 | 0.81 | 10.81 | 8.10% | (4) | |||||||||||||||||
| 8 | The accompanying notes are an integral part of these financial statements. |
Table of Contents
FINANCIAL INFORMATION — GUARDIAN MID CAP RELATIVE VALUE VIP FUND
| Ratios/Supplemental Data | ||||||||||||||||||||||
| Net Assets, End of Period (000s) | Net Ratio of Expenses to Average Net Assets(3) | Gross Ratio of Expenses to Average Net Assets | Net Ratio of Net Investment Income to Average Net Assets(3) | Gross Ratio of Net (Loss) to Average | Portfolio Turnover Rate | |||||||||||||||||
| $ | 231,171 | 1.00% | (4) | 1.10% | (4) | 0.87% | (4) | 0.77% | (4) | 17% | (4) | |||||||||||
| 204,185 | 1.00% | 1.14% | 0.66% | 0.52% | 31% | |||||||||||||||||
| 12,797 | 1.09% | 2.09% | 0.87% | (0.13)% | 76% | |||||||||||||||||
| 14,921 | 1.09% | (4) | 2.80% | (4) | 0.93% | (4) | (0.76)% | (4) | 14% | (4) | ||||||||||||
| (1) | Calculated based on the average shares outstanding during the period. |
| (2) | Total returns do not reflect the effects of charges deducted pursuant to the terms of The Guardian Insurance & Annuity Company, Inc.’s variable contracts. Inclusion of such charges would reduce the total returns for all periods shown. |
| (3) | Net Ratio of Expenses to Average Net Assets and Net Ratio of Net Investment Income to Average Net Assets include the effect of fee waivers and expense limitations. |
| (4) | Ratios for periods less than one year have been annualized, except for total return and portfolio turnover rate. For the period ended December 31, 2016, certainnon-recurring fees (i.e., audit fees) are not annualized. |
| (5) | Commenced operations on September 1, 2016. |
| The accompanying notes are an integral part of these financial statements. | 9 |
Table of Contents
NOTES TO FINANCIAL STATEMENTS — GUARDIAN MID CAP RELATIVE VALUE VIP FUND
June 30, 2019(unaudited)
1. Organization
Guardian Variable Products Trust (the “Trust”), a Delaware statutory trust organized on January 12, 2016, is registered under the Investment Company Act of 1940, as amended (the “1940 Act”), as anopen-end management investment company. The Trust currently has sixteen series. Guardian Mid Cap Relative Value VIP Fund (the “Fund”) is a series of the Trust. The Fund is a diversified fund and commenced operations on September 1, 2016. The financial statements for other series of the Trust are presented in separate reports.
The Trust has authorized an unlimited number of shares of beneficial interest with no par value. Shares are bought and sold at closing net asset value (“NAV”). Shares of the Fund are only sold to certain separate accounts of The Guardian Insurance & Annuity Company, Inc. (“GIAC”) that fund certain variable annuity contracts and variable life insurance policies issued by GIAC. GIAC is a wholly-owned subsidiary of The Guardian Life Insurance Company of America (“Guardian Life”).
The Fund seeks long-term capital appreciation.
2. Significant Accounting Policies
The following is a summary of significant accounting policies followed by the Fund in the preparation of its financial statements. The Fund follows the investment company accounting and reporting guidance of the Financial Accounting Standards Board (“FASB”) Accounting Standards Codification Topic 946 Financial Services — Investment Companies. The following policies are in conformity with accounting principles generally accepted in the United States of America (“GAAP”). The preparation of financial statements in accordance with GAAP requires management to make estimates and assumptions that affect the reported amounts and disclosures in the financial statements. Actual results could differ from those estimates.
a. Investment Valuations Equity securities traded on an exchange other than NASDAQ Stock Market, LLC (“NASDAQ”) are valued at the last reported sale price on the principal exchange or market on which they are traded; or, if there were no sales that day, at the mean between the closing bid and ask prices. Securities traded on the NASDAQ are generally valued at the NASDAQ official closing price, which may not be the last sale price. If the NASDAQ official closing price is not available for a security, that security is generally valued at the mean between the closing bid and ask prices.
Repurchase agreements are carried at cost, which approximates fair value (see Note 5d). Foreign securities are valued in the currencies of the markets in which they trade and then converted to U.S. dollars by the application of foreign exchange rates at the close of the New York Stock Exchange (“NYSE”). Forward foreign currency contracts, if any, are valued at the mean between the bid and ask rates for the specified time interpolated from rates for proximate time periods. Securities for which market quotations are not readily available or for which market quotations may be considered unreliable are valued at their fair values as determined in accordance with policies and procedures adopted by the Board of Trustees.
Under the policies and procedures approved by the Board of Trustees, Park Avenue Institutional Advisers LLC (“Park Avenue”), the Fund’s investment adviser, has established a Fair Valuation Committee to assist the Board of Trustees with the oversight and monitoring of the valuation of the Fund’s investments. This includes monitoring the appropriateness of fair values based on results of ongoing valuation oversight, including but not limited to consideration of security specific events, market events, and pricing vendor and broker-dealer due diligence. The Fair Valuation Committee oversees and carries out the policies for the valuation of investments held in the Fund. The Fair Valuation Committee is responsible for discussing and assessing the potential impacts to the fair values on an ongoing basis, and at least on a quarterly basis with the Board of Trustees.
Securities whose values have been materially affected by events occurring before the Fund’s valuation time but after the close of the securities’ principal exchange or market may be fair valued in accordance with policies and procedures adopted by the Board of Trustees. In addition, the values of the Fund’s investments in foreign securities are generally determined by a pricing service using pricing models designed to estimate likely changes in the values of those securities. Certain foreign equity instruments are valued by applying international fair value factors provided by approved pricing services. The factors seek to adjust the local closing price for movements of local markets post closing, but prior to the time the NAVs are calculated. Valuations reflected in this report are as of the report date. As a result, changes in valuation due to market events and/or issuer related events after the report date and prior to issuance of the report are not reflected herein.
| 10 |
Table of Contents
NOTES TO FINANCIAL STATEMENTS — GUARDIAN MID CAP RELATIVE VALUE VIP FUND
Various inputs are used in determining the valuation of the Fund’s investments. These inputs are summarized in three broad levels listed below.
| • | Level 1 — unadjusted inputs using quoted prices in active markets for identical investments. |
| • | Level 2— other significant observable inputs, including, but not limited to, quoted prices for similar investments, inputs other than quoted prices that are observable for investments (such as interest rates, prepayment speeds, credit risks, etc.) or other market corroborated inputs. |
| • | Level 3 — significant unobservable inputs (including the Fund’s own assumptions in determining the fair value of investments) |
Inputs may include price information, volatility statistics, specific and broad credit data, liquidity statistics, and other factors. A financial instrument’s level within the fair value hierarchy is based on the lowest level of any input; both individually and in aggregate, that is significant to the fair value measurement. However, the determination of what constitutes “observable” requires significant judgment by the Trust. The Trust considers observable data to be that market data which is readily available, regularly distributed or updated, reliable and verifiable, and provided by independent sources that are actively involved in the relevant market. The inputs or methodology used for valuing securities are not necessarily an indication of the risk associated with investing in those securities. Changes in valuation techniques may result in transfers into or out of a financial instrument’s assigned level within the hierarchy.
The FASB requires reporting entities to make disclosures about purchases, sales, issuances and settlements of Level 3 securities on a gross basis. For the six months ended June 30, 2019, there were no transfers into or out of Level 3 of the fair value hierarchy.
In determining a financial instrument’s placement within the hierarchy, the Trust separates the Fund’s investment portfolio into two categories: investments and derivatives (e.g., futures). A summary of inputs used to value the Fund’s assets and liabilities carried at fair value as of June 30, 2019 is included in the Schedule of Investments.
Investments Investments whose values are based on quoted market prices in active markets, and are therefore classified within Level 1, include active listed equities. Investments that trade in markets that are not considered to be active, but are valued based on quoted market prices, dealer quotations or alternative pricing
sources supported by observable inputs are classified within Level 2. These include certain U.S. government and sovereign obligations, most government agency securities, investment-grade corporate bonds, certain mortgage products, state, municipal and provincial obligations, and certain foreign equity securities, including securities whose prices may have been affected by events occurring after the close of trading on their principal exchange or market and, as a result, whose values are determined by a pricing service as described above, or securities whose values are otherwise determined using fair valuation methods approved by the Fund’s Board of Trustees.
Investments classified within Level 3 have significant unobservable inputs, as they trade infrequently or not at all. Level 3 investments include, among others, private placement securities. When observable prices are not available for these securities, the Trust uses one or more valuation techniques for which sufficient and reliable data is available. The inputs used by the Trust in estimating the value of Level 3 investments include, for example, the original transaction price, recent transactions in the same or similar instruments, completed or pending third-party transactions in the underlying investment or comparable issuers, subsequent rounds of financing, recapitalizations, and other transactions across the capital structure. Level 3 investments may also be adjusted to reflect illiquidity and/ornon-transferability, with the amount of such discount estimated by the Trust in the absence of market information. Assumptions used by the Trust due to the lack of observable inputs may significantly impact the resulting fair value and therefore the Fund’s results of operations. As of June 30, 2019, the Fund had no securities classified as Level 3.
Derivatives Exchange-traded derivatives, such as futures contracts, exchange-traded option contracts and certain swaps, are typically classified within Level 1 or Level 2 of the fair value hierarchy depending on whether or not they are deemed to be actively traded. Certainnon-exchange-traded derivatives, such as generic forwards, certain swaps and options, have inputs which can generally be corroborated by market data and are therefore classified within Level 2. During the six months ended June 30, 2019, the Fund did not hold any derivatives.
b. Securities Transactions Securities transactions are accounted for on the date securities are purchased or sold (trade date). Realized gains or losses on securities transactions are determined on the basis of specific identification.
| 11 |
Table of Contents
NOTES TO FINANCIAL STATEMENTS — GUARDIAN MID CAP RELATIVE VALUE VIP FUND
c. Foreign Currency Translation The accounting records of the Fund are maintained in U.S. dollars. Investment securities and all other assets and liabilities of the Fund denominated in a foreign currency are generally translated into U.S. dollars at the exchange rates quoted at the close of the NYSE on each business day. The market value of investment securities and other assets and liabilities are translated at the exchange rate as of the valuation date. Purchases and sales of securities, income receipts, and expense payments are translated into U.S. dollars at the exchange rates in effect on the dates of the respective transactions. The Fund does not isolate the portion of the fluctuations on investments resulting from changes in foreign currency exchange rates from the fluctuations in market prices of investments held. Such fluctuations are included in the Net change in net realized and unrealized gain/(loss) from investments on the Statement of Operations.
Reported realized foreign currency gains and losses arise from the disposition of foreign currency, currency gains or losses realized between the trade and settlement dates on securities transactions, and the difference between the amounts of dividends, interest and foreign withholding taxes recorded on the Fund’s books on the transaction date and the U.S. dollar equivalent of the amounts actually received or paid. These reported realized foreign currency gains and losses, if any, are included in Net realized gain/(loss) from foreign currency transactions on the Statement of Operations. Unrealized foreign currency gains and losses arise from changes (due to changes in exchange rates) in the value of foreign currency and other assets and liabilities denominated in foreign currencies, which are held at period end, if any, and are included in Net change in unrealized appreciation/(depreciation) on translation of assets and liabilities in foreign currencies on the Statement of Operations.
d. Foreign Capital Gains Tax The Fund may be subject to foreign taxes on income, gains on investments or currency purchases/repatriation, a portion of which may be recoverable. The Fund will accrue such taxes and recoveries as applicable, based upon their current interpretation of tax rules and regulations that exist in the markets in which they invest.
e. Investment IncomeDividend income net of foreign taxes withheld, if any, is generally recorded on theex-dividend date. Interest income, which includes amortization/accretion of premium/discount, is determined using the interest income accrual method, and is accrued and recorded daily.
f. Allocation of Income and ExpensesMany of the expenses of the Trust can be directly attributed to a specific series of the Trust. Expenses that cannot be directly attributed to a specific series of the Trust are generally apportioned among all the series in the Trust, based on relative net assets. In calculating net asset value per share for each series of the Trust, investment income, realized and unrealized gains and losses, and expenses other than series-specific expenses are allocated daily to each series based upon the proportion of net assets attributable to each series.
3. Transactions with Affiliates
a. Investment Advisory Fee and Expense LimitationUnder the terms of the advisory agreement, which, after its two year initial term, is reviewed and approved annually by the Board of Trustees, the Fund pays an investment advisory fee to Park Avenue. Park Avenue is a wholly-owned subsidiary of Guardian Life and receives an investment advisory fee at an annual rate of 0.72% up to $100 million, 0.67% up to $300 million, 0.62% up to $500 million, and 0.60% in excess of $500 million of the Fund’s average daily net assets. The fee is accrued daily and paid monthly.
Park Avenue has contractually agreed through April 30, 2020 to waive certain fees and/or reimburse certain expenses incurred by the Fund to the extent necessary to limit the Fund’s total annual operating expenses after fee waiver and/or expense reimbursement to 1.00% of the Fund’s average daily net assets (excluding, if applicable, any acquired fund fees and expenses, taxes, interest, transaction costs and brokerage commissions, litigation and extraordinary expenses). Prior to April 9, 2018, the expense limitation was 1.09%. The limitation may not be increased or terminated prior to this time without action by the Board of Trustees, may be terminated only upon approval of the Board of Trustees, and is subject to Park Avenue’s recoupment rights. For the six months ended June 30, 2019, Park Avenue waived fees and/or paid Fund expenses in the amount of $111,699.
Park Avenue may be entitled to recoupment of previously waived fees and reimbursed expenses from the Fund for three years from the date of the waiver or reimbursement, subject to the expense limitation in effect at the time of the waiver or reimbursement and at the time of the recoupment, if any. Amounts waived or reimbursed by Park Avenue pursuant to any expense limitation after April 9, 2018 will not be subject to Park Avenue’s recoupment rights. The amount available for potential future recoupment by Park Avenue from the
| 12 |
Table of Contents
NOTES TO FINANCIAL STATEMENTS — GUARDIAN MID CAP RELATIVE VALUE VIP FUND
Fund under the Expense Limitation Agreement and the expiration schedule at June 30, 2019 are as follows:
| Potential Recoupment Amounts Expiring | ||||||||||||
Total Potential Recoupment Amounts | 2021 | 2020 | 2019 | |||||||||
| $324,090 | $ | 52,843 | $ | 191,233 | $ | 80,014 | ||||||
Park Avenue has entered into aSub-Advisory Agreement with Wells Capital Management Incorporated (“Wells Capital”). Wells Capital is responsible for providingday-to-day investment advisory services to the Fund, subject to the supervision of Park Avenue and the oversight of the Board of Trustees.Sub-advisory fees are paid by Park Avenue and do not represent a separate or additional expense to the Fund.
b. Compensation of Trustees and OfficersTrustees and officers who are interested persons of the Trust, as defined in the 1940 Act, receive no compensation from the Fund, except for the Chief Compliance Officer of the Trust. Trustees of the Trust who are not interested persons of the Trust, and the Chief Compliance Officer, receive compensation and reimbursement of expenses from the Trust.
c. Distribution FeesPark Avenue Securities LLC (“PAS”), a wholly-owned subsidiary of Guardian Life, is the principal underwriter of Fund shares. The Trust has entered into a distribution and service agreement with PAS, which governs the sale and distribution of shares of the Fund. Under a distribution and service plan adopted by the Trust(“12b-1 plan”), PAS is compensated for services in such capacity, including its expenses in connection with the promotion and distribution of shares of the Fund, at an annual rate of 0.25% of the Fund’s average daily net assets. For the six months ended June 30, 2019, the Fund paid distribution fees in the amount of $280,593 to PAS.
PAS has directed that certain payments under the12b-1 plan be used to compensate GIAC for shareholder services provided to contract owners.
4. Federal Income Taxes
a. Distributions to ShareholdersFor federal income tax purposes, the Fund is treated as a disregarded entity (“DRE”). As a DRE, the Fund is not subject to an entity-level income tax; and any income, gains, losses, deductions, taxes, and credits of the Fund would instead be “passed through” directly to the separate accounts of GIAC that invest in the Fund and retain the same
character for U.S. federal income tax purposes. In addition, the Fund is not required to distribute taxable income and capital gains for U.S. federal income tax purposes. Therefore, no dividends and capital gains distributions were paid by the Fund.
5. Investments
a. Investment Purchases and SalesThe cost of investments purchased and the proceeds from investments sold (excluding short-term investments) amounted to $37,784,875 and $57,400,770, respectively, for the six months ended June 30, 2019. During the six months ended June 30, 2019, there were no purchases or sales of U.S. government securities.
b. Foreign SecuritiesForeign securities investments involve special risks and considerations not typically associated with U.S. investments. These risks include, but are not limited to, currency risk; adverse political, regulatory, social, and economic developments; and less reliable information about issuers. Moreover, securities of some foreign issuers may be less liquid and their prices more volatile than those of comparable U.S. issuers.
c. Industry or Sector ConcentrationIn its normal course of business, the Fund may invest a significant portion of its assets in companies within a limited number of industries or sectors. As a result, the Fund may be subject to a greater risk of loss than that of a fund invested in a wider spectrum of industries or sectors because the stocks of many or all of the companies in the industry, group of industries, sector, or sectors may decline in value due to developments adversely affecting the industry, group of industries, sector, or sectors.
d. Repurchase AgreementsThe Fund may invest in repurchase agreements to maintain liquidity and earn income over periods of time as short as overnight. The collateral for repurchase agreements is either cash or fully negotiable U.S. government securities (including U.S. government agency securities). Repurchase agreements are fully collateralized (including the interest accrued thereon) and such collateral is marked to market daily while the agreements remain in force. If the value of the collateral falls below the repurchase price plus accrued interest, the Fund will typically require the seller to deposit additional collateral by the next business day. If the request for additional collateral is not met, or the seller defaults, the Fund maintains the right to sell the collateral (although it may be prevented or delayed from doing so in certain circumstances) and may be required to claim any resulting loss against the
| 13 |
Table of Contents
NOTES TO FINANCIAL STATEMENTS — GUARDIAN MID CAP RELATIVE VALUE VIP FUND
seller. Park Avenue monitors the creditworthiness of the seller with which the Fund enters into repurchase agreements.
6. Temporary Borrowings
The Fund, with other funds managed by Park Avenue, is party to a $10 million committed revolving credit facility from State Street Bank and Trust Company for temporary borrowing purposes, including the meeting of redemption requests that otherwise might require the untimely disposition of securities. Interest is calculated based on the higher of the dailyone-month LIBOR rate and the Federal Funds rate plus 1.25% at the time of borrowing. In addition to the interest charged on any borrowings by the Fund, each fund pays a commitment fee of 0.30% per annum on its share of the unused portion of the credit facility. The agreement is in
place until December 10, 2019. The Fund did not utilize the credit facility during the six months ended June 30, 2019.
7. Indemnifications
Under the Trust’s organizational documents and, in some cases, by contract, its officers and trustees are indemnified against certain liabilities arising out of the performance of their duties to the Fund. In addition, in the normal course of business, the Fund enters into contracts with its vendors and others that provide general indemnifications. The Fund’s maximum exposure under these arrangements is unknown as this would involve future claims that may be made against the Fund that have not yet occurred. However, based on experience, the Fund expects the risk of loss to be remote.
| 14 |
Table of Contents
SHAREHOLDER MEETING RESULTS(UNAUDITED)
At a meeting held on March27-28, 2019, the Board of Trustees of Guardian Variable Products Trust approved submitting the following proposal (“Proposal”) to shareholders of the Fund at a special meeting to be held on May 24, 2019 (with any postponements or adjournments, “Special Meeting”):
1. To permit Park Avenue Institutional Advisers LLC, under certain circumstances, to enter into and/or materially amend investmentsub-advisory agreements with affiliated and unaffiliated sub-advisers on behalf of the Fund without obtaining shareholder approval.
On or about May 1, 2019, shareholders of record of the Fund as of the close of business on March 29, 2019 were sent a proxy statement containing information regarding the Proposal. The proxy statement also included information about the Special Meeting, at which shareholders of the Fund were asked to consider and approve the Proposal. In addition, the proxy statement included information about voting (or providing voting instructions) on the Proposal and options shareholders had to do so.
The Special Meeting was held on June 26, 2019, and the Proposal passed.
The results of the Special Meeting were as follows:
Proposal 1. To permit Park Avenue Institutional Advisers LLC, under certain circumstances, to enter into and/or materially amend investmentsub-advisory agreements with affiliated and unaffiliated sub-advisers on behalf of the Fund without obtaining shareholder approval:
Votes For | Votes Against | Abstentions | ||||||
| 15,306,620.548 | 2,956,833.407 | 1,034,411.883 | ||||||
| 15 |
Table of Contents
SUPPLEMENTAL INFORMATION(UNAUDITED)
Approval of Investment Advisory andSub-advisory Agreements
Section 15(c) of the Investment Company Act of 1940, as amended (the “1940 Act”), requires that a fund’s investment advisory andsub-advisory agreements be approved initially by the fund’s board of trustees. Section 15(c) also requires that the continuation of these agreements, after an initial term of up to two years, be annually reviewed and approved by the board. Any such agreement must be approved by a vote of a majority of the trustees who are not parties to the agreement or “interested persons” (as defined in the 1940 Act) of a party to the agreement at anin-person meeting of the board called for the purpose of voting on such approval.
At a meeting of the Board of Trustees (the “Board”) of Guardian Variable Products Trust (the “Trust”) held on March27-28, 2019 (the “Meeting”), the Board, including the trustees who are not parties to the agreement or “interested persons” as defined in the 1940 Act (the “Independent Trustees”), considered and voted unanimously to renew the existing investment management agreement (the “Management Agreement”) between the Trust, on behalf of Guardian Diversified Research VIP Fund, Guardian Growth & Income VIP Fund, Guardian Integrated Research VIP Fund, Guardian International Growth VIP Fund, Guardian International Value VIP Fund, Guardian Large Cap Disciplined Growth VIP Fund, Guardian Large Cap Disciplined Value VIP Fund, Guardian Large Cap Fundamental Growth VIP Fund, Guardian Mid Cap Traditional Growth VIP Fund, Guardian Mid Cap Relative Value VIP Fund and Guardian Core Plus Fixed Income VIP Fund (the “Funds”), and Park Avenue Institutional Advisers LLC (the “Manager”) for aone-term.
The Board, including the Independent Trustees, also considered and voted unanimously to renew the existingsub-advisory agreements (the“Sub-advisory Agreements,” collectively with the Management Agreement, the “Agreements”) between the Manager and investment advisory firms engaged to serve assub-advisers to certain of the Funds, namely Putnam Investment Management, LLC, AllianceBernstein L.P., Massachusetts Financial Services Company, J.P. Morgan Investment Management Inc., Lazard Asset Management LLC, Wellington Management Company LLP, Boston Partners Global Investors, Inc., ClearBridge Investments, LLC, Janus Capital Management LLC, Wells Capital Management Incorporated and Lord, Abbett & Co. LLC (the“Sub-advisers”) for aone-year term.
The Board is responsible for overseeing the management of each Fund. In determining whether to renew its approval of the Agreements, the Trustees evaluated information and factors that they considered to be relevant and appropriate through the exercise of their own business judgment. The Trustees considered certain information and factors in light of advice furnished to them by legal counsel to the Trust and, in the case of the Independent Trustees, their independent legal counsel. In advance of the Meeting, the Trustees received materials and information designed to assist their consideration of the Agreements. The Trustees received written responses from the Manager and eachSub-adviser to a series of questions and requests for information encompassing a wide variety of topics provided by independent counsel on behalf of the Independent Trustees. The Independent Trustees discussed the Funds with independent counsel during a telephonic meeting and executive session in advance of the Meeting. The Trustees also received materials and information regarding the legal standards applicable to their consideration of the Agreements and the process and criteria used by the Manager to identify and select theSub-advisers.
During the course of their deliberations, the Independent Trustees met to discuss and evaluate the Agreements in executive session with their independent legal counsel, outside of the presence of the Trustees who are not Independent Trustees and representatives from Fund management, the Manager or anySub-adviser.
In reaching its decisions to renew its approval of the Agreements, the Board took into account the materials and information described above as well as other materials and information provided to the Board and discussed with and among the Trustees. Individual Trustees may have given different weight to different factors and information with respect to each Agreement, and the Trustees did not identify any single factor or information that, in isolation, would be controlling in deciding to approve the Agreements. The discussion below is intended to summarize the broad factors that figured prominently in the Board’s decisions to approve the Agreements rather than to beall-inclusive. These broad factors included: (i) the nature, extent and quality of the services provided to the Funds by the Manager and theSub-advisers; (ii) the investment performance of each Fund; (iii) the fees charged and estimated profitability; (iv) the extent to which economies of scale exist for a Fund, and the extent to which a Fund benefits from economies of scale; and
| 16 |
Table of Contents
SUPPLEMENTAL INFORMATION(UNAUDITED)
(v) any other benefits derived by the Manager or theSub-advisers (or their respective affiliates) from their relationships with the Funds.
Nature, Extent and Quality of Services
The Trustees considered information regarding the nature, extent and quality of services provided to the Funds by the Manager. The Trustees also considered, among other things, the terms of the Management Agreement and the range of investment advisory services provided by the Manager. In addition, the Trustees reviewed the range ofnon-investment advisory services provided by the Manager consistent with the terms of the Management Agreement, notably coordinating the preparation and filing of various regulatory documents, coordinating the preparation and assembly of Board meeting materials and assisting the Board with certain valuation matters.
The Trustees considered that the Funds operate in a“manager-of-managers” structure and reviewed the responsibilities that the Manager has under this structure, including monitoring and evaluating the performance of theSub-advisers, monitoring theSub-advisers for adherence to the stated investment objectives, strategies, policies and restrictions of the Funds and supervising theSub-advisers with respect to the services that theSub-advisers would provide under theSub-advisory Agreements. The Trustees also considered the process used by the Manager, consistent with this structure, to identify and recommendsub-advisers, and the Manager’s ability to monitor and overseesub-advisers and recommend replacementsub-advisers, when necessary, and provide other services under the Management Agreement. The Board noted that investment management staff of the Manager and the Trust’s Chief Compliance Officer conductin-person oversight visits of theSub-advisers on a periodic basis, follow through with additional inquiry on any questions or concerns that arise during the visit and then report the results of the visit to the Board. The Trustees reviewed information regarding the experience and background of the Manager’s key personnel and the Manager’s organizational structure and resources, including investment, legal and administrative capabilities of the Manager. In this regard, the Trustees recognized that the Funds may benefit from the Manager’s ability to use similar resources and capabilities of its affiliates in providing services to the Funds.
The Trustees considered information regarding the nature, extent and quality of services provided to the Funds by theSub-advisers. The Trustees also
considered, among other things, the terms of theSub-advisory Agreements and the range of investment advisory services provided by theSub-advisers under the oversight of the Manager. In evaluating these investment advisory services, the Trustees considered, among other things, theSub-advisers’ investment philosophies, styles and/or processes and approach to managing the Funds. The Trustees received and evaluated information regarding the background, education, expertise and/or experience of the investment professionals that serve as portfolio managers for the Funds and the capabilities and resources of theSub-advisers.
Based upon these considerations, the Trustees concluded, within the context of their full deliberations, that the nature, extent and quality of services provided to the Funds by the Manager and eachSub-adviser were appropriate.
Investment Performance
In connection with each of its regular quarterly meetings, the Board receives information on the performance of each Fund, including net performance, relative performance rankings within each Fund’s Lipper peer group, Morningstar ratings, and performance as compared to benchmark index returns. At each quarterly Board meeting, members of the Manager’s senior investment team reviewed with the Board the economic and market environment, risk management, and style consistency in connection with management of the Funds. The Board considered investment performance for each Fund over theone-year and since inception periods.
The Board also received and reviewed a report prepared by Broadridge Financial Solutions (“Broadridge”), an independent provider of mutual fund industry data. The Board reviewed the investment performance of each Fund on an absolute basis and in comparison to an appropriate benchmark index and each Fund’s respective peer group as independently selected by Broadridge. The Board noted that, except for Guardian Growth & Income VIP Fund, Guardian Large Cap Disciplined Value VIP Fund and Guardian Mid Cap Traditional Growth VIP Fund, each of the Fund’s performance for theone-year and since inception periods was below the median of its respective peer group median and benchmark index. With respect to Guardian Large Cap Disciplined Value VIP Fund, the Board noted that the performance for theone-year period was lower than the peer group median and benchmark index and performance since inception was
| 17 |
Table of Contents
SUPPLEMENTAL INFORMATION(UNAUDITED)
higher than the peer group median and benchmark index. With respect to Guardian Growth & Income VIP Fund and Guardian Mid Cap Traditional Growth VIP Fund, the Board noted that the performance for both theone-year and since inception periods was higher than each Fund’s peer group median and benchmark index.
The Manager discussed with the Board factors contributing to the Funds’ performance results. In addition, for certain Funds, the Manager discussed with the Board longer term performance records of theSub-advisers for strategies used in managing the Funds. The Board concluded that the investment performance generated by eachSub-adviser was generally satisfactory, or, that any steps being taken by the Manager andSub-advisers to address any performance issues were satisfactory. The Board also noted the short operational history of each Fund.
Costs and Profitability
The Trustees considered the management fees paid by the Funds to the Manager under the Management Agreement and evaluated the reasonableness of these fees. The Trustees received and reviewed comparative information with respect to the management fees and the management fees paid by other funds offered as investment options underlying variable contracts within the applicable peer group based on data obtained from Broadridge. The Board noted that the contractual and actual (effective) management fees reported for each of the Funds were below or equal to its peer group in all cases except for the Guardian Mid Cap Traditional Growth VIP Fund. The Board noted that the actual (effective) management fee for this Fund exceeded the peer group median by a modest amount.
The Trustees considered thesub-advisory fees paid under theSub-advisory Agreements and evaluated the reasonableness of those fees. The Trustees also considered that the fees paid to theSub-advisers would be paid by the Manager and not the Funds and that the Manager had negotiated the fees with theSub-advisers atarm’s-length.
The Trustees received comparative information relating to each Fund’s operating expense ratios and the operating expense ratios of a peer group of funds. In this regard, the Board noted that each Fund’s operating expense ratio was equal to or lower than the operating expense ratio of its respective peer group median, except for Guardian Diversified Research VIP Fund, Guardian Growth & Income VIP Fund and Guardian Integrated Research VIP Fund. The Board noted that the operating expense ratio for these Funds exceeded the
peer group median by a modest amount. The Trustees considered the Manager’s commitment to limit each Fund’s operating expenses through an expense limitation agreement with the Trust. Although the Board recognized that the comparisons between the management fees and operating expenses of the Funds and those of identified peer funds are imprecise, given different terms of agreements and variations in fund strategies, the Trustees found that the comparative information supported their consideration and approval of the management fees and evaluation of the operating expenses.
The Board considered the Manager’s estimates of its profitability, which included allocations by the Manager of its costs in providing management services to the Funds. The Board considered the estimated profitability of the Manager both overall and on aFund-by-Fund basis. The Board did not consider any profitability information from theSub-advisers because the Manager would be responsible for payment of thesub-advisory fees and had negotiated the fees with theSub-advisers atarm’s-length.
Based on the consideration of the information and factors summarized above, as well as other relevant information and factors, the Board concluded that the proposed management andsub-advisory fees were reasonable in light of the nature, extent and quality of services rendered to the Funds by the Manager and theSub-advisers. The Board also concluded that the profitability of the Funds to the Manager was acceptable and the Board determined it was appropriate to revisit estimated Manager profitability in connection with future reviews of the Agreements.
Economies of Scale
The Board considered whether the Funds’ fee structure is designed to share economies of scale with shareholders as the Funds’ assets grow. In this regard, the Board noted that for ten of eleven Funds, the management andsub-advisory fee included breakpoints that are tiered based on growth in asset levels of each such Fund. The Board also noted that the Funds’ expenses were subject to an expense limitation provided by the Manager. The Board noted that expected economies of scale, where they exist, may be shared through the use of fee breakpoints, expense limitations by the Manager, and/or a lower overall fee.
Ancillary Benefits
The Board considered the potential benefits, other than management fees, that the Manager and/or its affiliates
| 18 |
Table of Contents
SUPPLEMENTAL INFORMATION(UNAUDITED)
may receive because of the Manager’s relationship with the Funds. The Trustees acknowledged that the Funds were designed to serve as investment options under variable contracts issued by affiliates of the Manager that would receive fees under those contracts and that Park Avenue Securities LLC, an affiliate of the Manager and principal underwriter of the Funds, and participating insurance companies, including insurance companies affiliated with the Manager, would be entitled to receive fees from the Funds under a plan of distribution adopted pursuant to Rule12b-1 under the 1940 Act. The Trustees considered the benefits to the Manager from increased assets under management. The Trustees considered that the Manager and its affiliates may benefit from (i) greater efficiencies in annuity administration and operations and potential cost savings due to a reduction in the number of unaffiliated funds available as annuity contract investment options, and (ii) increased dividends-received deductions due to the Funds’ status under the tax laws as disregarded
entities. In addition, the Trustees considered the potential benefits, other thansub-advisory fees, that theSub-advisers and their affiliates may receive because of their relationships with the Funds, including the potential increased ability to use soft dollars consistent with Trust policies and other benefits from increases in assets under management. The Trustees concluded that benefits that may accrue to the Manager and its affiliates are reasonable and the benefits that may accrue to theSub-advisers and their affiliates are consistent with those expected for asub-adviser to a mutual fund such as the applicable Fund.
Conclusion
Based on a comprehensive consideration and evaluation of all of the information and factors summarized above, among others, the Board as a whole, including the Independent Trustees, approved the Agreements.
| 19 |
Table of Contents
SUPPLEMENTAL INFORMATION(UNAUDITED)
The Statement of Additional Information (“SAI”) includes additional information about the Trust’s Trustees and Officers and is available, without charge, upon request by calling toll-free1-888-GUARDIAN(1-888-482-7342) or by visiting our website at http://guardianvpt.onlineprospectus.net/GuardianVPT/Prospectuses.
Portfolio Holdings and Proxy Voting Procedures
The Fund files its complete schedule of portfolio holdings with the Securities and Exchange Commission for the first and third quarters of each fiscal year as an exhibit to its reports on FormN-PORT. The Fund’s FormN-PORT reports are available on the Securities and Exchange Commission’s website at https://www.sec.gov. The Fund’s FormN-PORT information is also available, without charge, upon request, by calling toll-free1-888-GUARDIAN(1-888-482-7342) or by visiting our website at http://guardianvpt.onlineprospectus.net/GuardianVPT/
Prospectuses.
A description of the policies and procedures that the Fund uses to determine how to vote proxies relating to portfolio securities is included in the SAI. The SAI and information regarding how the Fund voted proxies relating to portfolio securities during the most recent12-month period ended June 30 may be obtained (i) without charge, upon request, by calling toll-free1-888-GUARDIAN(1-888-482-7342) or by visiting our website at http://guardianvpt.onlineprospectus.net/GuardianVPT/
Prospectuses; and (ii) on the Securities and Exchange Commission’s website at https://www.sec.gov.
| 20 |
Table of Contents
This report is transmitted to shareholders only. It is not authorized for use as an offer of sale or a solicitation of an offer to buy shares of the Fund unless accompanied or preceded by the Fund’s current prospectus. Past performance results shown in this report should not be considered a representation of future performance. Investment returns and principal value of shares will fluctuate so that shares, when redeemed, may be worth more or less than their original cost. Statements and other information herein are as dated and are subject to change.

The Guardian Life Insurance Company of America New York, NY 10001-2159
PUB8176
Table of Contents
Guardian Variable
Products Trust
2019
Semiannual Report
All Data as of June 30, 2019
Guardian International Growth VIP Fund
Important Notice
Beginning on January 1, 2021, as permitted by regulations adopted by the Securities and Exchange Commission, paper copies of the Fund’s shareholder reports will no longer be sent by mail from The Guardian Insurance & Annuity Company, Inc. (“GIAC”). Instead, GIAC will mail you a notice when copies of the shareholder reports are made available on a website. You will be notified by mail each time a report is posted and provided with a website link to access the report.
If you have already elected to receive shareholder reports electronically, you will not be affected by this change and you need not take any action. If you have not yet elected electronic delivery, at any time, you may elect to receive the Fund’s shareholder reports and certain other communications from GIAC electronically, by going to www.guardianlife.com and registering fore-delivery.
You may instead elect to receive all future shareholder reports in paper free of charge. If you wish to receive paper copies of your shareholder reports, please call GIAC’s Customer Service Office Contact Center at1-888-GUARDIAN(1-888-482-7342). Your election to receive reports in paper will apply to all the underlying funds available.

| Not FDIC insured. May lose value. No bank guarantee. | www.guardianlife.com |
Table of Contents
Guardian International Growth VIP Fund
Except as otherwise specifically stated, all information, including portfolio security positions, is as of June 30, 2019. Fund holdings will vary. Information contained herein has been obtained from sources believed reliable, but is not guaranteed.
Table of Contents
GUARDIAN INTERNATIONAL GROWTH VIP FUND
Fund Characteristics (unaudited)
| Total Net Assets: $145,743,867 |
Geographic Region Allocation1 As of June 30, 2019 |
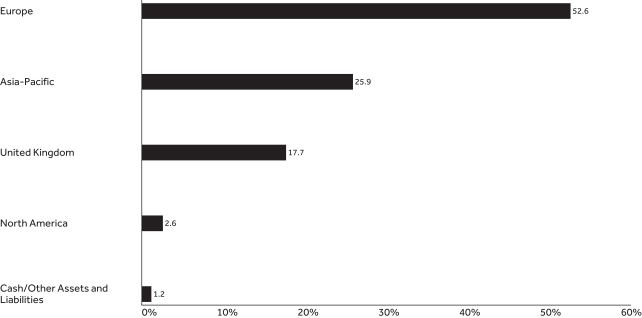 |
Sector Allocation2 As of June 30, 2019 |
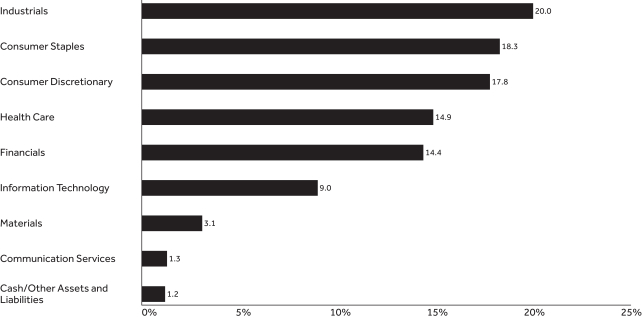 |
| 1 |
Table of Contents
GUARDIAN INTERNATIONAL GROWTH VIP FUND
Top Ten Holdings1 As of June 30, 2019 | ||||||
| Holding | Country | % of Total Net Assets | ||||
| Nestle S.A. (Reg S) | Switzerland | 5.97% | ||||
| Roche Holding AG | Switzerland | 3.86% | ||||
| AIA Group Ltd. | Hong Kong | 3.51% | ||||
| Unilever PLC | United Kingdom | 3.29% | ||||
| SAP SE | Germany | 3.18% | ||||
| LVMH Moet Hennessy Louis Vuitton SE | France | 2.95% | ||||
| Novartis AG (Reg S) | Switzerland | 2.90% | ||||
| Diageo PLC | United Kingdom | 2.78% | ||||
| ASML Holding N.V. | Netherlands | 2.63% | ||||
| Airbus SE | Netherlands | 2.49% | ||||
| Total | 33.56% | |||||
| 1 | Portfolio holdings are subject to change and should not be considered a recommendation to buy or sell individual securities. Cash includes short-term investments and net other assets and liabilities. |
| 2 | The Fund’s holdings are allocated to each sector based on the MSCI Global Industry Classification Standard (GICS®). Cash includes short-term investments and net other assets and liabilities. |
| 2 |
Table of Contents
UNDERSTANDING YOUR FUND’S EXPENSES(UNAUDITED)
By investing in the Fund, you incur two types of costs: (1) transaction costs and (2) ongoing costs, including, as applicable, investment advisory fees, distribution and/or service(12b-1) fees and other Fund expenses. The example below is intended to help you understand your ongoing costs (in dollars) of investing in the Fund and to compare these costs with the ongoing costs of investing in other mutual funds.
The example is based on an investment of $1,000 invested at the beginning of the period and held for the entire period from January 1, 2019 to June 30, 2019. The table below shows the Fund’s expenses in two ways:
Expenses based on actual return
This section of the table provides information about actual account values and actual expenses. You may use the information in this section, together with the amount you invested, to estimate the expenses that you paid over the period. Simply divide your account value by $1,000 (for example, an $8,600 account value divided by $1,000 = 8.6), then multiply the result by the number in the section under the heading entitled “Expenses Paid During Period” to estimate the expenses you paid on your account during this period.
Expenses based on hypothetical 5% return for comparison purposes
This section of the table provides information about hypothetical account values and hypothetical expenses based on the Fund’s actual expense ratio and an assumed rate of return of 5% per year before expenses, which is not the Fund’s actual return. The hypothetical account values and expenses may not be used to estimate the actual ending account balance or expenses you paid for the period. You may use this information to compare the ongoing costs of investing in the Fund with the cost of investing in other mutual funds. To do so, compare this 5% hypothetical example with the 5% hypothetical examples that appear in the shareholder reports of the other funds.
Note that the expenses shown in the table are meant to highlight your ongoing costs only and do not reflect any transactional costs, such as sales charges (loads), redemption fees, or exchange fees. Therefore the second section is useful in comparing ongoing costs only, and will not help you determine the relative total costs of owning different funds. If these transactional costs were included, your costs would have been higher. Charges and expenses at the insurance company separate account level are not reflected in the table.
Beginning 1/1/19 | Ending Account Value 6/30/19 | Expenses Paid During Period* 1/1/19-6/30/19 | Expense Ratio During Period 1/1/19-6/30/19 | |||||||||||
| Based on Actual Return | $1,000.00 | $1,210.90 | $6.47 | 1.18% | ||||||||||
| Based on Hypothetical Return (5% Return Before Expenses) | $1,000.00 | $1,018.94 | $5.91 | 1.18% | ||||||||||
| * | Expenses are equal to the Fund’s annualized expense ratio as indicated, multiplied by the average account value over the period, multiplied by 181/365 (to reflect theone-half year period). |
| 3 |
Table of Contents
SCHEDULE OF INVESTMENTS — GUARDIAN INTERNATIONAL GROWTH VIP FUND
| June 30, 2019(unaudited) | Shares | Value | ||||||
| Common Stocks – 98.8% | ||||||||
| Cayman Islands – 2.6% | ||||||||
Alibaba Group Holding Ltd., ADR(1) | 11,021 | $ | 1,867,508 | |||||
Tencent Holdings Ltd. | 40,400 | 1,827,717 | ||||||
|
| |||||||
| 3,695,225 | ||||||||
| China – 1.3% | ||||||||
Ping An Insurance Group Co. of China Ltd., Class H | 161,000 | 1,937,754 | ||||||
|
| |||||||
| 1,937,754 | ||||||||
| Denmark – 3.6% | ||||||||
Genmab A/S(1) | 8,907 | 1,639,908 | ||||||
Novo Nordisk A/S, Class B | 69,921 | 3,566,655 | ||||||
|
| |||||||
| 5,206,563 | ||||||||
| France – 8.3% | ||||||||
EssilorLuxottica S.A. | 18,637 | 2,436,197 | ||||||
L’Oreal S.A. | 10,016 | 2,853,008 | ||||||
LVMH Moet Hennessy Louis Vuitton SE | 10,109 | 4,303,315 | ||||||
Safran S.A. | 17,203 | 2,520,781 | ||||||
|
| |||||||
| 12,113,301 | ||||||||
| Germany – 12.7% | ||||||||
adidas AG | 9,911 | 3,059,769 | ||||||
Beiersdorf AG | 16,653 | 1,998,918 | ||||||
Continental AG | 11,104 | 1,618,892 | ||||||
Delivery Hero SE(1)(2) | 37,399 | 1,696,379 | ||||||
Deutsche Boerse AG | 14,603 | 2,065,671 | ||||||
MuenchenerRueckversicherungs-Gesellschaft AG in Muenchen (Reg S) | 7,656 | 1,921,459 | ||||||
SAP SE | 33,721 | 4,635,325 | ||||||
Zalando SE(1)(2) | 33,534 | 1,487,892 | ||||||
|
| |||||||
| 18,484,305 | ||||||||
| Hong Kong – 5.2% | ||||||||
AIA Group Ltd. | 472,800 | 5,111,273 | ||||||
Hong Kong Exchanges & Clearing Ltd. | 69,900 | 2,470,679 | ||||||
|
| |||||||
| 7,581,952 | ||||||||
| India – 1.6% | ||||||||
HDFC Bank Ltd., ADR | 18,088 | 2,352,164 | ||||||
|
| |||||||
| 2,352,164 | ||||||||
| Ireland – 1.5% | ||||||||
Linde PLC | 10,657 | 2,143,051 | ||||||
|
| |||||||
| 2,143,051 | ||||||||
| Italy – 1.0% | ||||||||
FinecoBank Banca Fineco S.p.A. | 132,142 | 1,474,038 | ||||||
|
| |||||||
| 1,474,038 | ||||||||
| Japan – 16.7% | ||||||||
Asahi Group Holdings Ltd. | 49,900 | 2,248,656 | ||||||
Daikin Industries Ltd. | 18,800 | 2,460,727 | ||||||
Keyence Corp. | 4,900 | 3,011,244 | ||||||
Makita Corp. | 58,700 | 2,000,030 | ||||||
Nidec Corp. | 17,100 | 2,346,503 | ||||||
| June 30, 2019(unaudited) | Shares | Value | ||||||
| Japan(continued) | ||||||||
Recruit Holdings Co. Ltd. | 74,900 | $ | 2,503,983 | |||||
Shimano, Inc. | 12,400 | 1,842,474 | ||||||
Shin-Etsu Chemical Co. Ltd. | 24,400 | 2,278,193 | ||||||
Shiseido Co. Ltd. | 25,900 | 1,956,163 | ||||||
SMC Corp. | 6,000 | 2,246,381 | ||||||
Yamaha Motor Co. Ltd. | 81,000 | 1,444,045 | ||||||
|
| |||||||
| 24,338,399 | ||||||||
| Netherlands – 5.1% | ||||||||
Airbus SE | 25,582 | 3,627,398 | ||||||
ASML Holding N.V. | 18,351 | 3,836,592 | ||||||
|
| |||||||
| 7,463,990 | ||||||||
| Spain – 1.7% | ||||||||
Industria de Diseno Textil S.A. | 80,347 | 2,414,039 | ||||||
|
| |||||||
| 2,414,039 | ||||||||
| Sweden – 2.9% | ||||||||
Assa Abloy AB, Class B | 91,250 | 2,065,767 | ||||||
Atlas Copco AB, Class A | 66,799 | 2,135,339 | ||||||
|
| |||||||
| 4,201,106 | ||||||||
| Switzerland – 15.8% | ||||||||
Alcon, Inc.(1) | 33,032 | 2,042,972 | ||||||
Lonza Group AG (Reg S)(1) | 7,282 | 2,457,491 | ||||||
Nestle S.A. (Reg S) | 84,098 | 8,706,559 | ||||||
Novartis AG (Reg S) | 46,188 | 4,224,678 | ||||||
Roche Holding AG | 19,997 | 5,626,482 | ||||||
|
| |||||||
| 23,058,182 | ||||||||
| Taiwan – 1.1% | ||||||||
Taiwan Semiconductor Manufacturing Co. Ltd., ADR | 42,214 | 1,653,522 | ||||||
|
| |||||||
| 1,653,522 | ||||||||
| United Kingdom – 17.7% | ||||||||
Burberry Group PLC | 81,577 | 1,935,357 | ||||||
Diageo PLC | 94,046 | 4,050,021 | ||||||
Ferguson PLC | 26,371 | 1,879,697 | ||||||
InterContinental Hotels Group PLC | 26,302 | 1,731,043 | ||||||
Intertek Group PLC | 34,443 | 2,412,988 | ||||||
London Stock Exchange Group PLC | 32,262 | 2,247,810 | ||||||
RELX PLC | 118,087 | 2,857,663 | ||||||
Smith & Nephew PLC | 104,203 | 2,261,206 | ||||||
St James’s Place PLC | 119,891 | 1,674,972 | ||||||
Unilever PLC | 77,126 | 4,789,361 | ||||||
|
| |||||||
| 25,840,118 | ||||||||
| Total Common Stocks (Cost $131,570,885) | 143,957,709 | |||||||
| 4 | The accompanying notes are an integral part of these financial statements. |
Table of Contents
SCHEDULE OF INVESTMENTS — GUARDIAN INTERNATIONAL GROWTH VIP FUND
| June 30, 2019(unaudited) | Principal Amount | Value | ||||||
| Short-Term Investment – 1.0% |
| |||||||
| Repurchase Agreements – 1.0% |
| |||||||
Fixed Income Clearing Corp., 0.50%, dated 6/28/2019, proceeds at maturity value of $1,451,060, due 7/1/2019(3) | $ | 1,451,000 | $ | 1,451,000 | ||||
| Total Repurchase Agreements (Cost $1,451,000) |
| 1,451,000 | ||||||
| Total Investments – 99.8% (Cost $133,021,885) |
| 145,408,709 | ||||||
| Assets in excess of other liabilities – 0.2% |
| 335,158 | ||||||
| Total Net Assets – 100.0% |
| $ | 145,743,867 | |||||
| (1) | Non–income–producing security. |
| (2) | Securities that may be resold in transactions, exempt from registration under Rule 144A of the Securities Act of 1933, as amended, normally to certain qualified buyers. At June 30, 2019, the aggregate market value of these securities amounted to $3,184,271, representing 2.2% of net assets. These securities have been deemed liquid by the investment adviser pursuant to the Fund’s liquidity procedures approved by the Board of Trustees. |
| (3) | The table below presents collateral for repurchase agreements. |
| Security | Coupon | Maturity Date | Principal Amount | Value | ||||||||||||
| U.S. Treasury Note | 2.75% | 8/15/2021 | $ | 1,440,000 | $ | 1,484,188 | ||||||||||
Legend:
ADR — American Depositary Receipt
The following is a summary of the inputs used as of June 30, 2019 in valuing the Fund’s investments. For more information on valuation inputs, please refer to Note 2a of the accompanying Notes to Financial Statements.
| Valuation Inputs | ||||||||||||||||
| Investments in Securities(unaudited) | Level 1 | Level 2 | Level 3 | Total | ||||||||||||
| Common Stocks |
| |||||||||||||||
Cayman Islands | $ | 1,867,508 | $ | 1,827,717 | * | $ | — | $ | 3,695,225 | |||||||
China | — | 1,937,754 | * | — | 1,937,754 | |||||||||||
Denmark | — | 5,206,563 | * | — | 5,206,563 | |||||||||||
France | — | 12,113,301 | * | — | 12,113,301 | |||||||||||
Germany | — | 18,484,305 | * | — | 18,484,305 | |||||||||||
Hong Kong | — | 7,581,952 | * | — | 7,581,952 | |||||||||||
India | 2,352,164 | — | — | 2,352,164 | ||||||||||||
Ireland | — | 2,143,051 | * | — | 2,143,051 | |||||||||||
Italy | — | 1,474,038 | * | — | 1,474,038 | |||||||||||
Japan | — | 24,338,399 | * | — | 24,338,399 | |||||||||||
Netherlands | — | 7,463,990 | * | — | 7,463,990 | |||||||||||
Spain | — | 2,414,039 | * | — | 2,414,039 | |||||||||||
Sweden | — | 4,201,106 | * | — | 4,201,106 | |||||||||||
Switzerland | — | 23,058,182 | * | — | 23,058,182 | |||||||||||
Taiwan | 1,653,522 | — | — | 1,653,522 | ||||||||||||
United Kingdom | — | 25,840,118 | * | — | 25,840,118 | |||||||||||
| Repurchase Agreements | — | 1,451,000 | — | 1,451,000 | ||||||||||||
| Total | $ | 5,873,194 | $ | 139,535,515 | $ | — | $ | 145,408,709 | ||||||||
| * | Consists of certain foreign securities whose values were determined by a pricing service using pricing models (See Note 2a in Notes to Financial Statements). These investments in securities were classified as Level 2 rather than Level 1. |
| The accompanying notes are an integral part of these financial statements. | 5 |
Table of Contents
FINANCIAL INFORMATION — GUARDIAN INTERNATIONAL GROWTH VIP FUND
For the Six Months Ended June 30, 2019 (unaudited) | ||||
Investment Income | ||||
Dividends | $ | 2,132,264 | ||
Interest | 6,638 | |||
Withholding taxes on foreign dividends | (218,853 | ) | ||
|
| |||
Total Investment Income | 1,920,049 | |||
|
| |||
Expenses | ||||
Investment advisory fees | 555,995 | |||
Distribution fees | 177,067 | |||
Custodian and accounting fees | 47,869 | |||
Trustees’ and officers’ fees | 32,434 | |||
Professional fees | 26,633 | |||
Administrative fees | 23,535 | |||
Shareholder reports | 17,495 | |||
Transfer agent fees | 7,700 | |||
Other expenses | 9,191 | |||
|
| |||
Total Expenses | 897,919 | |||
Less: Fees waived | (62,164 | ) | ||
|
| |||
Total Expenses, Net | 835,755 | |||
|
| |||
Net Investment Income/(Loss) | 1,084,294 | |||
|
| |||
Realized Gain/(Loss) and Change in Unrealized Appreciation/(Depreciation) on Investments and Foreign Currency Transactions | ||||
Net realized gain/(loss) from investments | (3,963,045 | ) | ||
Net realized gain/(loss) from foreign currency transactions | 4,189 | |||
Net change in unrealized appreciation/(depreciation) on investments | 30,146,987 | |||
Net change in unrealized appreciation/(depreciation) on translation of assets and liabilities in foreign currencies | 2,968 | |||
|
| |||
Net Gain on Investments and Foreign Currency Transactions | 26,191,099 | |||
|
| |||
Net Increase in Net Assets Resulting From Operations | $ | 27,275,393 | ||
|
| |||
| 6 | The accompanying notes are an integral part of these financial statements. |
Table of Contents
FINANCIAL INFORMATION — GUARDIAN INTERNATIONAL GROWTH VIP FUND
| The accompanying notes are an integral part of these financial statements. | 7 |
Table of Contents
FINANCIAL INFORMATION — GUARDIAN INTERNATIONAL GROWTH VIP FUND
The Financial Highlights table is intended to help you understand the Fund’s financial performance for the past six reporting periods (or, if shorter, the period since inception). Certain information reflects financial results for a single Fund share. The total returns in the table represent the rate that an investor would have earned (or lost) on an investment in the Fund.
Financial Highlights Six Months Ended Numbers are unaudited | ||||||||||||||||||||||||
| Per Share Operating Performance | ||||||||||||||||||||||||
| Net Asset Value, Beginning of Period | Net Investment Income/(Loss)(1) | Net Realized and Unrealized Gain/(Loss) | Total Operations | Net Asset Value, End of Period | Total Return(2) | |||||||||||||||||||
Six Months Ended 6/30/19 | $ | 10.24 | $ | 0.09 | $ | 2.07 | $ | 2.16 | $ | 12.40 | 21.09% | (4) | ||||||||||||
Year Ended 12/31/18 | 12.61 | 0.12 | (2.49 | ) | (2.37 | ) | 10.24 | (18.79)% | ||||||||||||||||
Year Ended 12/31/17 | 9.62 | 0.09 | 2.90 | 2.99 | 12.61 | 31.08% | ||||||||||||||||||
Period Ended 12/31/16(5) | 10.00 | (0.00 | )(6) | (0.38 | ) | (0.38 | ) | 9.62 | (3.80)% | (4) | ||||||||||||||
| 8 | The accompanying notes are an integral part of these financial statements. |
Table of Contents
FINANCIAL INFORMATION — GUARDIAN INTERNATIONAL GROWTH VIP FUND
| Ratios/Supplemental Data | ||||||||||||||||||||||
| Net Assets, End of Period (000s) | Net Ratio of Expenses to Average Net Assets(3) | Gross Ratio of Expenses to Average Net Assets | Net Ratio of Net Investment Income/(Loss) to Average Net Assets(3) | Gross Ratio of Net Investment Income/(Loss) to Average Net Assets | Portfolio Turnover Rate | |||||||||||||||||
| $ | 145,744 | 1.18% | (4) | 1.27% | (4) | 1.53% | (4) | 1.44% | (4) | 15% | (4) | |||||||||||
| 131,137 | 1.18% | 1.32% | 1.07% | 0.93% | 61% | |||||||||||||||||
| 10,636 | 1.22% | 2.49% | 0.79% | (0.48)% | 32% | |||||||||||||||||
| 10,980 | 1.22% | (4) | 3.20% | (4) | (0.06)% | (4) | (2.04)% | (4) | 8% | (4) | ||||||||||||
| (1) | Calculated based on the average shares outstanding during the period. |
| (2) | Total returns do not reflect the effects of charges deducted pursuant to the terms of The Guardian Insurance & Annuity Company, Inc.’s variable contracts. Inclusion of such charges would reduce the total returns for all periods shown. |
| (3) | Net Ratio of Expenses to Average Net Assets and Net Ratio of Net Investment Income/(Loss) to Average Net Assets include the effect of fee waivers and expense limitations. |
| (4) | Ratios for periods less than one year have been annualized, except for total return and portfolio turnover rate. For the period ended December 31, 2016, certainnon-recurring fees (i.e., audit fees) are not annualized. |
| (5) | Commenced operations on September 1, 2016. |
| (6) | Rounds to $(0.00) per share. |
| The accompanying notes are an integral part of these financial statements. | 9 |
Table of Contents
NOTES TO FINANCIAL STATEMENTS — GUARDIAN INTERNATIONAL GROWTH VIP FUND
June 30, 2019(unaudited)
1. Organization
Guardian Variable Products Trust (the “Trust”), a Delaware statutory trust organized on January 12, 2016, is registered under the Investment Company Act of 1940, as amended (the “1940 Act”), as anopen-end management investment company. The Trust currently has sixteen series. Guardian International Growth VIP Fund (the “Fund”) is a series of the Trust. The Fund is a diversified fund and commenced operations on September 1, 2016. The financial statements for other series of the Trust are presented in separate reports.
The Trust has authorized an unlimited number of shares of beneficial interest with no par value. Shares are bought and sold at closing net asset value (“NAV”). Shares of the Fund are only sold to certain separate accounts of The Guardian Insurance & Annuity Company, Inc. (“GIAC”) that fund certain variable annuity contracts and variable life insurance policies issued by GIAC. GIAC is a wholly-owned subsidiary of The Guardian Life Insurance Company of America (“Guardian Life”).
The Fund seeks total return consisting of long-term capital growth and current income.
2. Significant Accounting Policies
The following is a summary of significant accounting policies followed by the Fund in the preparation of its financial statements. The Fund follows the investment company accounting and reporting guidance of the Financial Accounting Standards Board (“FASB”) Accounting Standards Codification Topic 946 Financial Services — Investment Companies. The following policies are in conformity with accounting principles generally accepted in the United States of America (“GAAP”). The preparation of financial statements in accordance with GAAP requires management to make estimates and assumptions that affect the reported amounts and disclosures in the financial statements. Actual results could differ from those estimates.
a. Investment Valuations Equity securities traded on an exchange other than NASDAQ Stock Market, LLC (“NASDAQ”) are valued at the last reported sale price on the principal exchange or market on which they are traded; or, if there were no sales that day, at the mean between the closing bid and ask prices. Securities traded on the NASDAQ are generally valued at the NASDAQ official closing price, which may not be the last sale price. If the NASDAQ official closing price is not available for a security, that security is generally valued at the
mean between the closing bid and ask prices. Repurchase agreements are carried at cost, which approximates fair value (see Note 5d). Foreign securities are valued in the currencies of the markets in which they trade and then converted to U.S. dollars by the application of foreign exchange rates at the close of the New York Stock Exchange (“NYSE”). Forward foreign currency contracts, if any, are valued at the mean between the bid and ask rates for the specified time interpolated from rates for proximate time periods. Securities for which market quotations are not readily available or for which market quotations may be considered unreliable are valued at their fair values as determined in accordance with policies and procedures adopted by the Board of Trustees.
Under the policies and procedures approved by the Board of Trustees, Park Avenue Institutional Advisers LLC (“Park Avenue”), the Fund’s investment adviser, has established a Fair Valuation Committee to assist the Board of Trustees with the oversight and monitoring of the valuation of the Fund’s investments. This includes monitoring the appropriateness of fair values based on results of ongoing valuation oversight, including but not limited to consideration of security specific events, market events, and pricing vendor and broker-dealer due diligence. The Fair Valuation Committee oversees and carries out the policies for the valuation of investments held in the Fund. The Fair Valuation Committee is responsible for discussing and assessing the potential impacts to the fair values on an ongoing basis, and at least on a quarterly basis with the Board of Trustees.
Securities whose values have been materially affected by events occurring before the Fund’s valuation time but after the close of the securities’ principal exchange or market may be fair valued in accordance with policies and procedures adopted by the Board of Trustees. In addition, the values of the Fund’s investments in foreign securities are generally determined by a pricing service using pricing models designed to estimate likely changes in the values of those securities. Certain foreign equity instruments are valued by applying international fair value factors provided by approved pricing services. The factors seek to adjust the local closing price for movements of local markets post closing, but prior to the time the NAVs are calculated. Valuations reflected in this report are as of the report date. As a result, changes in valuation due to market events and/or issuer related events after the report date and prior to issuance of the report are not reflected herein.
| 10 |
Table of Contents
NOTES TO FINANCIAL STATEMENTS — GUARDIAN INTERNATIONAL GROWTH VIP FUND
Various inputs are used in determining the valuation of the Fund’s investments. These inputs are summarized in three broad levels listed below.
| • | Level 1 — unadjusted inputs using quoted prices in active markets for identical investments. |
| • | Level 2 — other significant observable inputs, including, but not limited to, quoted prices for similar investments, inputs other than quoted prices that are observable for investments (such as interest rates, prepayment speeds, credit risks, etc.) or other market corroborated inputs. |
| • | Level 3 — significant unobservable inputs (including the Fund’s own assumptions in determining the fair value of investments) |
Inputs may include price information, volatility statistics, specific and broad credit data, liquidity statistics, and other factors. A financial instrument’s level within the fair value hierarchy is based on the lowest level of any input; both individually and in aggregate, that is significant to the fair value measurement. However, the determination of what constitutes “observable” requires significant judgment by the Trust. The Trust considers observable data to be that market data which is readily available, regularly distributed or updated, reliable and verifiable, and provided by independent sources that are actively involved in the relevant market. The inputs or methodology used for valuing securities are not necessarily an indication of the risk associated with investing in those securities. Changes in valuation techniques may result in transfers into or out of a financial instrument’s assigned level within the hierarchy.
The FASB requires reporting entities to make disclosures about purchases, sales, issuances and settlements of Level 3 securities on a gross basis. For the six months ended June 30, 2019, there were no transfers into or out of Level 3 of the fair value hierarchy.
In determining a financial instrument’s placement within the hierarchy, the Trust separates the Fund’s investment portfolio into two categories: investments and derivatives (e.g., futures). A summary of inputs used to value the Fund’s assets and liabilities carried at fair value as of June 30, 2019 is included in the Schedule of Investments.
Investments Investments whose values are based on quoted market prices in active markets, and are therefore classified within Level 1, include active listed equities. Investments that trade in markets that are not considered to be active, but are valued based on quoted
market prices, dealer quotations or alternative pricing sources supported by observable inputs are classified within Level 2. These include certain U.S. government and sovereign obligations, most government agency securities, investment-grade corporate bonds, certain mortgage products, state, municipal and provincial obligations, and certain foreign equity securities, including securities whose prices may have been affected by events occurring after the close of trading on their principal exchange or market and, as a result, whose values are determined by a pricing service as described above, or securities whose values are otherwise determined using fair valuation methods approved by the Fund’s Board of Trustees.
Investments classified within Level 3 have significant unobservable inputs, as they trade infrequently or not at all. Level 3 investments include, among others, private placement securities. When observable prices are not available for these securities, the Trust uses one or more valuation techniques for which sufficient and reliable data is available. The inputs used by the Trust in estimating the value of Level 3 investments include, for example, the original transaction price, recent transactions in the same or similar instruments, completed or pending third-party transactions in the underlying investment or comparable issuers, subsequent rounds of financing, recapitalizations, and other transactions across the capital structure. Level 3 investments may also be adjusted to reflect illiquidity and/ornon-transferability, with the amount of such discount estimated by the Trust in the absence of market information. Assumptions used by the Trust due to the lack of observable inputs may significantly impact the resulting fair value and therefore the Fund’s results of operations. As of June 30, 2019, the Fund had no securities classified as Level 3.
Derivatives Exchange-traded derivatives, such as futures contracts, exchange-traded option contracts and certain swaps, are typically classified within Level 1 or Level 2 of the fair value hierarchy depending on whether or not they are deemed to be actively traded. Certainnon-exchange-traded derivatives, such as generic forwards, certain swaps and options, have inputs which can generally be corroborated by market data and are therefore classified within Level 2.
b. Securities Transactions Securities transactions are accounted for on the date securities are purchased or sold (trade date). Realized gains or losses on securities transactions are determined on the basis of specific identification.
| 11 |
Table of Contents
NOTES TO FINANCIAL STATEMENTS — GUARDIAN INTERNATIONAL GROWTH VIP FUND
c. Futures Contracts The Fund may enter into financial futures contracts. In entering into such contracts, the Fund is required to deposit with the counterparty, either in cash or securities, an amount equal to a certain percentage of the face value of the contract. Subsequent payments are received or made by the Fund each day, depending on the daily fluctuations in the values of the contracts, and are recorded for financial statement purposes as variation margin received or paid by the Fund. Daily changes in variation margin are recognized as unrealized gains or losses by the Fund. The Fund may not achieve the anticipated benefits of the financial futures contracts and may realize a loss.
d. Foreign Currency Translation The accounting records of the Fund are maintained in U.S. dollars. Investment securities and all other assets and liabilities of the Fund denominated in a foreign currency are generally translated into U.S. dollars at the exchange rates quoted at the close of the NYSE on each business day. The market value of investment securities and other assets and liabilities are translated at the exchange rate as of the valuation date. Purchases and sales of securities, income receipts, and expense payments are translated into U.S. dollars at the exchange rates in effect on the dates of the respective transactions. The Fund does not isolate the portion of the fluctuations on investments resulting from changes in foreign currency exchange rates from the fluctuations in market prices of investments held. Such fluctuations are included in the Net change in net realized and unrealized gain/(loss) from investments on the Statement of Operations.
Reported realized foreign currency gains and losses arise from the disposition of foreign currency, currency gains or losses realized between the trade and settlement dates on securities transactions, and the difference between the amounts of dividends, interest and foreign withholding taxes recorded on the Fund’s books on the transaction date and the U.S. dollar equivalent of the amounts actually received or paid. These reported realized foreign currency gains and losses, if any, are included in Net realized gain/(loss) from foreign currency transactions on the Statement of Operations. Unrealized foreign currency gains and losses arise from changes (due to changes in exchange rates) in the value of foreign currency and other assets and liabilities denominated in foreign currencies, which are held at period end, if any, and are included in Net change in unrealized appreciation/(depreciation) on translation of assets and liabilities in foreign currencies on the Statement of Operations.
e. Foreign Capital Gains Tax The Fund may be subject to foreign taxes on income, gains on investments or currency purchases/repatriation, a portion of which may be recoverable. The Fund will accrue such taxes and recoveries as applicable, based upon their current interpretation of tax rules and regulations that exist in the markets in which they invest.
f. Investment Income Dividend income net of foreign taxes withheld, if any, is generally recorded on theex-dividend date. Interest income, which includes amortization/accretion of premium/discount, is determined using the interest income accrual method, and is accrued and recorded daily.
g. Allocation of Income and Expenses Many of the expenses of the Trust can be directly attributed to a specific series of the Trust. Expenses that cannot be directly attributed to a specific series of the Trust are generally apportioned among all the series in the Trust, based on relative net assets. In calculating net asset value per share for each series of the Trust, investment income, realized and unrealized gains and losses, and expenses other than series-specific expenses are allocated daily to each series based upon the proportion of net assets attributable to each series.
3. Transactions with Affiliates
a. Investment Advisory Fee and Expense Limitation Under the terms of the advisory agreement, which, after its two year initial term, is reviewed and approved annually by the Board of Trustees, the Fund pays an investment advisory fee to Park Avenue. Park Avenue is a wholly-owned subsidiary of Guardian Life and receives an investment advisory fee at an annual rate of 0.80% of the first $100 million, and 0.75% in excess of $100 million of the Fund’s average daily net assets. The fee is accrued daily and paid monthly.
Park Avenue has contractually agreed through April 30, 2020 to waive certain fees and/or reimburse certain expenses incurred by the Fund to the extent necessary to limit the Fund’s total annual operating expenses after fee waiver and/or expense reimbursement to 1.18% of the Fund’s average daily net assets (excluding, if applicable, any acquired fund fees and expenses, taxes, interest, transaction costs and brokerage commissions, litigation and extraordinary expenses). Prior to April 9, 2018, the expense limitation was 1.22%. The limitation may not be increased or terminated prior to this time without action by the Board of Trustees, may be terminated only upon approval of the Board of Trustees, and is subject to Park Avenue’s recoupment rights. For the six months ended June 30, 2019, Park Avenue waived fees and/or paid Fund expenses in the amount of $62,164.
| 12 |
Table of Contents
NOTES TO FINANCIAL STATEMENTS — GUARDIAN INTERNATIONAL GROWTH VIP FUND
Park Avenue may be entitled to recoupment of previously waived fees and reimbursed expenses from the Fund for three years from the date of the waiver or reimbursement, subject to the expense limitation in effect at the time of the waiver or reimbursement and at the time of the recoupment, if any. Amounts waived or reimbursed by Park Avenue pursuant to any expense limitation after April 9, 2018 will not be subject to Park Avenue’s recoupment rights. The amount available for potential future recoupment by Park Avenue from the Fund under the Expense Limitation Agreement and the expiration schedule at June 30, 2019 are as follows:
| Potential Recoupment Amounts Expiring | ||||||||||||
Total Potential | 2021 | 2020 | 2019 | |||||||||
| $307,518 | $ | 48,645 | $ | 174,590 | $ | 84,283 | ||||||
Park Avenue has entered into aSub-Advisory Agreement with J.P. Morgan Investment Management Inc. (“J.P. Morgan”). J.P. Morgan is responsible for providingday-to-day investment advisory services to the Fund, subject to the supervision of Park Avenue and the oversight of the Board of Trustees.Sub-advisory fees are paid by Park Avenue and do not represent a separate or additional expense to the Fund.
b. Compensation of Trustees and Officers Trustees and officers who are interested persons of the Trust, as defined in the 1940 Act, receive no compensation from the Fund, except for the Chief Compliance Officer of the Trust. Trustees of the Trust who are not interested persons of the Trust, and the Chief Compliance Officer, receive compensation and reimbursement of expenses from the Trust.
c. Distribution Fees Park Avenue Securities LLC (“PAS”), a wholly-owned subsidiary of Guardian Life, is the principal underwriter of Fund shares. The Trust has entered into a distribution and service agreement with PAS, which governs the sale and distribution of shares of the Fund. Under a distribution and service plan adopted by the Trust(“12b-1 plan”), PAS is compensated for services in such capacity, including its expenses in connection with the promotion and distribution of shares of the Fund, at an annual rate of 0.25% of the Fund’s average daily net assets. For the six months ended June 30, 2019, the Fund paid distribution fees in the amount of $177,067 to PAS.
PAS has directed that certain payments under the12b-1 plan be used to compensate GIAC for shareholder services provided to contract owners.
4. Federal Income Taxes
a. Distributions to Shareholders For federal income tax purposes, the Fund is treated as a disregarded entity (“DRE”). As a DRE, the Fund is not subject to an entity-level income tax; and any income, gains, losses, deductions, taxes, and credits of the Fund would instead be “passed through” directly to the separate accounts of GIAC that invest in the Fund and retain the same character for U.S. federal income tax purposes. In addition, the Fund is not required to distribute taxable income and capital gains for U.S. federal income tax purposes. Therefore, no dividends and capital gains distributions were paid by the Fund.
5. Investments
a. Investment Purchases and Sales The cost of investments purchased and the proceeds from investments sold (excluding short-term investments) amounted to $20,256,099 and $31,649,844, respectively, for the six months ended June 30, 2019. During the six months ended June 30, 2019, there were no purchases or sales of U.S. government securities.
b. Foreign Securities Foreign securities investments involve special risks and considerations not typically associated with U.S. investments. These risks include, but are not limited to, currency risk; adverse political, regulatory, social, and economic developments; and less reliable information about issuers. Moreover, securities of some foreign issuers may be less liquid and their prices more volatile than those of comparable U.S. issuers.
c. Industry or Sector Concentration In its normal course of business, the Fund may invest a significant portion of its assets in companies within a limited number of industries or sectors. As a result, the Fund may be subject to a greater risk of loss than that of a fund invested in a wider spectrum of industries or sectors because the stocks of many or all of the companies in the industry, group of industries, sector, or sectors may decline in value due to developments adversely affecting the industry, group of industries, sector, or sectors.
d. Repurchase Agreements The Fund may invest in repurchase agreements to maintain liquidity and earn income over periods of time as short as overnight. The collateral for repurchase agreements is either cash or fully negotiable U.S. government securities (including U.S. government agency securities). Repurchase agreements are fully collateralized (including the interest accrued thereon) and such collateral is marked
| 13 |
Table of Contents
NOTES TO FINANCIAL STATEMENTS — GUARDIAN INTERNATIONAL GROWTH VIP FUND
to market daily while the agreements remain in force. If the value of the collateral falls below the repurchase price plus accrued interest, the Fund will typically require the seller to deposit additional collateral by the next business day. If the request for additional collateral is not met, or the seller defaults, the Fund maintains the right to sell the collateral (although it may be prevented or delayed from doing so in certain circumstances) and may be required to claim any resulting loss against the seller. Park Avenue monitors the creditworthiness of the seller with which the Fund enters into repurchase agreements.
6. Temporary Borrowings
The Fund, with other funds managed by Park Avenue, is party to a $10 million committed revolving credit facility from State Street Bank and Trust Company for temporary borrowing purposes, including the meeting of redemption requests that otherwise might require the untimely disposition of securities. Interest is calculated based on the higher of the dailyone-month LIBOR rate and the Federal Funds rate plus 1.25% at the
time of borrowing. In addition to the interest charged on any borrowings by the Fund, each fund pays a commitment fee of 0.30% per annum on its share of the unused portion of the credit facility. The agreement is in place until December 10, 2019. The Fund did not utilize the credit facility during the six months ended June 30, 2019.
7. Indemnifications
Under the Trust’s organizational documents and, in some cases, by contract, its officers and trustees are indemnified against certain liabilities arising out of the performance of their duties to the Fund. In addition, in the normal course of business, the Fund enters into contracts with its vendors and others that provide general indemnifications. The Fund’s maximum exposure under these arrangements is unknown as this would involve future claims that may be made against the Fund that have not yet occurred. However, based on experience, the Fund expects the risk of loss to be remote.
| 14 |
Table of Contents
SHAREHOLDER MEETING RESULTS(UNAUDITED)
At a meeting held on March27-28, 2019, the Board of Trustees of Guardian Variable Products Trust approved submitting the following proposal (“Proposal”) to shareholders of the Fund at a special meeting to be held on May 24, 2019 (with any postponements or adjournments, “Special Meeting”):
1. To permit Park Avenue Institutional Advisers LLC, under certain circumstances, to enter into and/or materially amend investmentsub-advisory agreements with affiliated and unaffiliated sub-advisers on behalf of the Fund without obtaining shareholder approval.
On or about May 1, 2019, shareholders of record of the Fund as of the close of business on March 29, 2019 were sent a proxy statement containing information regarding the Proposal. The proxy statement also included information about the Special Meeting, at which shareholders of the Fund were asked to consider and approve the Proposal. In addition, the proxy statement included information about voting (or providing voting instructions) on the Proposal and options shareholders had to do so.
The Special Meeting was held on June 26, 2019, and the Proposal passed.
The results of the Special Meeting were as follows:
Proposal 1. To permit Park Avenue Institutional Advisers LLC, under certain circumstances, to enter into and/or materially amend investmentsub-advisory agreements with affiliated and unaffiliated sub-advisers on behalf of the Fund without obtaining shareholder approval:
| Votes For | Votes Against | Abstentions | ||||||
| 10,433,703.198 | 1,738,896.395 | 546,744.881 | ||||||
| 15 |
Table of Contents
SUPPLEMENTAL INFORMATION(UNAUDITED)
Approval of Investment Advisory andSub-advisory Agreements
Section 15(c) of the Investment Company Act of 1940, as amended (the “1940 Act”), requires that a fund’s investment advisory andsub-advisory agreements be approved initially by the fund’s board of trustees. Section 15(c) also requires that the continuation of these agreements, after an initial term of up to two years, be annually reviewed and approved by the board. Any such agreement must be approved by a vote of a majority of the trustees who are not parties to the agreement or “interested persons” (as defined in the 1940 Act) of a party to the agreement at anin-person meeting of the board called for the purpose of voting on such approval.
At a meeting of the Board of Trustees (the “Board”) of Guardian Variable Products Trust (the “Trust”) held on March27-28, 2019 (the “Meeting”), the Board, including the trustees who are not parties to the agreement or “interested persons” as defined in the 1940 Act (the “Independent Trustees”), considered and voted unanimously to renew the existing investment management agreement (the “Management Agreement”) between the Trust, on behalf of Guardian Diversified Research VIP Fund, Guardian Growth & Income VIP Fund, Guardian Integrated Research VIP Fund, Guardian International Growth VIP Fund, Guardian International Value VIP Fund, Guardian Large Cap Disciplined Growth VIP Fund, Guardian Large Cap Disciplined Value VIP Fund, Guardian Large Cap Fundamental Growth VIP Fund, Guardian Mid Cap Traditional Growth VIP Fund, Guardian Mid Cap Relative Value VIP Fund and Guardian Core Plus Fixed Income VIP Fund (the “Funds”), and Park Avenue Institutional Advisers LLC (the “Manager”) for aone-term.
The Board, including the Independent Trustees, also considered and voted unanimously to renew the existingsub-advisory agreements (the“Sub-advisory Agreements,” collectively with the Management Agreement, the “Agreements”) between the Manager and investment advisory firms engaged to serve assub-advisers to certain of the Funds, namely Putnam Investment Management, LLC, AllianceBernstein L.P., Massachusetts Financial Services Company, J.P. Morgan Investment Management Inc., Lazard Asset Management LLC, Wellington Management Company LLP, Boston Partners Global Investors, Inc., ClearBridge Investments, LLC, Janus Capital Management LLC, Wells Capital Management Incorporated and Lord, Abbett & Co. LLC (the“Sub-advisers”) for aone-year term.
The Board is responsible for overseeing the management of each Fund. In determining whether to renew its approval of the Agreements, the Trustees evaluated information and factors that they considered to be relevant and appropriate through the exercise of their own business judgment. The Trustees considered certain information and factors in light of advice furnished to them by legal counsel to the Trust and, in the case of the Independent Trustees, their independent legal counsel. In advance of the Meeting, the Trustees received materials and information designed to assist their consideration of the Agreements. The Trustees received written responses from the Manager and eachSub-adviser to a series of questions and requests for information encompassing a wide variety of topics provided by independent counsel on behalf of the Independent Trustees. The Independent Trustees discussed the Funds with independent counsel during a telephonic meeting and executive session in advance of the Meeting. The Trustees also received materials and information regarding the legal standards applicable to their consideration of the Agreements and the process and criteria used by the Manager to identify and select theSub-advisers.
During the course of their deliberations, the Independent Trustees met to discuss and evaluate the Agreements in executive session with their independent legal counsel, outside of the presence of the Trustees who are not Independent Trustees and representatives from Fund management, the Manager or anySub-adviser.
In reaching its decisions to renew its approval of the Agreements, the Board took into account the materials and information described above as well as other materials and information provided to the Board and discussed with and among the Trustees. Individual Trustees may have given different weight to different factors and information with respect to each Agreement, and the Trustees did not identify any single factor or information that, in isolation, would be controlling in deciding to approve the Agreements. The discussion below is intended to summarize the broad factors that figured prominently in the Board’s decisions to approve the Agreements rather than to beall-inclusive. These broad factors included: (i) the nature, extent and quality of the services provided to the Funds by the Manager and theSub-advisers; (ii) the investment performance of each Fund; (iii) the fees charged and estimated profitability; (iv) the extent to which economies of scale exist for a Fund, and the extent to which a Fund benefits from economies of scale; and
| 16 |
Table of Contents
SUPPLEMENTAL INFORMATION(UNAUDITED)
(v) any other benefits derived by the Manager or theSub-advisers (or their respective affiliates) from their relationships with the Funds.
Nature, Extent and Quality of Services
The Trustees considered information regarding the nature, extent and quality of services provided to the Funds by the Manager. The Trustees also considered, among other things, the terms of the Management Agreement and the range of investment advisory services provided by the Manager. In addition, the Trustees reviewed the range ofnon-investment advisory services provided by the Manager consistent with the terms of the Management Agreement, notably coordinating the preparation and filing of various regulatory documents, coordinating the preparation and assembly of Board meeting materials and assisting the Board with certain valuation matters.
The Trustees considered that the Funds operate in a“manager-of-managers” structure and reviewed the responsibilities that the Manager has under this structure, including monitoring and evaluating the performance of theSub-advisers, monitoring theSub-advisers for adherence to the stated investment objectives, strategies, policies and restrictions of the Funds and supervising theSub-advisers with respect to the services that theSub-advisers would provide under theSub-advisory Agreements. The Trustees also considered the process used by the Manager, consistent with this structure, to identify and recommendsub-advisers, and the Manager’s ability to monitor and overseesub-advisers and recommend replacementsub-advisers, when necessary, and provide other services under the Management Agreement. The Board noted that investment management staff of the Manager and the Trust’s Chief Compliance Officer conductin-person oversight visits of theSub-advisers on a periodic basis, follow through with additional inquiry on any questions or concerns that arise during the visit and then report the results of the visit to the Board. The Trustees reviewed information regarding the experience and background of the Manager’s key personnel and the Manager’s organizational structure and resources, including investment, legal and administrative capabilities of the Manager. In this regard, the Trustees recognized that the Funds may benefit from the Manager’s ability to use similar resources and capabilities of its affiliates in providing services to the Funds.
The Trustees considered information regarding the nature, extent and quality of services provided to the Funds by theSub-advisers. The Trustees also
considered, among other things, the terms of theSub-advisory Agreements and the range of investment advisory services provided by theSub-advisers under the oversight of the Manager. In evaluating these investment advisory services, the Trustees considered, among other things, theSub-advisers’ investment philosophies, styles and/or processes and approach to managing the Funds. The Trustees received and evaluated information regarding the background, education, expertise and/or experience of the investment professionals that serve as portfolio managers for the Funds and the capabilities and resources of theSub-advisers.
Based upon these considerations, the Trustees concluded, within the context of their full deliberations, that the nature, extent and quality of services provided to the Funds by the Manager and eachSub-adviser were appropriate.
Investment Performance
In connection with each of its regular quarterly meetings, the Board receives information on the performance of each Fund, including net performance, relative performance rankings within each Fund’s Lipper peer group, Morningstar ratings, and performance as compared to benchmark index returns. At each quarterly Board meeting, members of the Manager’s senior investment team reviewed with the Board the economic and market environment, risk management, and style consistency in connection with management of the Funds. The Board considered investment performance for each Fund over theone-year and since inception periods.
The Board also received and reviewed a report prepared by Broadridge Financial Solutions (“Broadridge”), an independent provider of mutual fund industry data. The Board reviewed the investment performance of each Fund on an absolute basis and in comparison to an appropriate benchmark index and each Fund’s respective peer group as independently selected by Broadridge. The Board noted that, except for Guardian Growth & Income VIP Fund, Guardian Large Cap Disciplined Value VIP Fund and Guardian Mid Cap Traditional Growth VIP Fund, each of the Fund’s performance for theone-year and since inception periods was below the median of its respective peer group median and benchmark index. With respect to Guardian Large Cap Disciplined Value VIP Fund, the Board noted that the performance for theone-year period was lower than the peer group median and benchmark index and performance since inception was higher than the peer group median and benchmark
| 17 |
Table of Contents
SUPPLEMENTAL INFORMATION(UNAUDITED)
index. With respect to Guardian Growth & Income VIP Fund and Guardian Mid Cap Traditional Growth VIP Fund, the Board noted that the performance for both theone-year and since inception periods was higher than each Fund’s peer group median and benchmark index.
The Manager discussed with the Board factors contributing to the Funds’ performance results. In addition, for certain Funds, the Manager discussed with the Board longer term performance records of theSub-advisers for strategies used in managing the Funds. The Board concluded that the investment performance generated by eachSub-adviser was generally satisfactory, or, that any steps being taken by the Manager andSub-advisers to address any performance issues were satisfactory. The Board also noted the short operational history of each Fund.
Costs and Profitability
The Trustees considered the management fees paid by the Funds to the Manager under the Management Agreement and evaluated the reasonableness of these fees. The Trustees received and reviewed comparative information with respect to the management fees and the management fees paid by other funds offered as investment options underlying variable contracts within the applicable peer group based on data obtained from Broadridge. The Board noted that the contractual and actual (effective) management fees reported for each of the Funds were below or equal to its peer group in all cases except for the Guardian Mid Cap Traditional Growth VIP Fund. The Board noted that the actual (effective) management fee for this Fund exceeded the peer group median by a modest amount.
The Trustees considered thesub-advisory fees paid under theSub-advisory Agreements and evaluated the reasonableness of those fees. The Trustees also considered that the fees paid to theSub-advisers would be paid by the Manager and not the Funds and that the Manager had negotiated the fees with theSub-advisers atarm’s-length.
The Trustees received comparative information relating to each Fund’s operating expense ratios and the operating expense ratios of a peer group of funds. In this regard, the Board noted that each Fund’s operating expense ratio was equal to or lower than the operating expense ratio of its respective peer group median, except for Guardian Diversified Research VIP Fund, Guardian Growth & Income VIP Fund and Guardian Integrated Research VIP Fund. The Board noted that the operating expense ratio for these Funds exceeded the peer group median by a modest amount. The Trustees
considered the Manager’s commitment to limit each Fund’s operating expenses through an expense limitation agreement with the Trust. Although the Board recognized that the comparisons between the management fees and operating expenses of the Funds and those of identified peer funds are imprecise, given different terms of agreements and variations in fund strategies, the Trustees found that the comparative information supported their consideration and approval of the management fees and evaluation of the operating expenses.
The Board considered the Manager’s estimates of its profitability, which included allocations by the Manager of its costs in providing management services to the Funds. The Board considered the estimated profitability of the Manager both overall and on aFund-by-Fund basis. The Board did not consider any profitability information from theSub-advisers because the Manager would be responsible for payment of thesub-advisory fees and had negotiated the fees with theSub-advisers atarm’s-length.
Based on the consideration of the information and factors summarized above, as well as other relevant information and factors, the Board concluded that the proposed management andsub-advisory fees were reasonable in light of the nature, extent and quality of services rendered to the Funds by the Manager and theSub-advisers. The Board also concluded that the profitability of the Funds to the Manager was acceptable and the Board determined it was appropriate to revisit estimated Manager profitability in connection with future reviews of the Agreements.
Economies of Scale
The Board considered whether the Funds’ fee structure is designed to share economies of scale with shareholders as the Funds’ assets grow. In this regard, the Board noted that for ten of eleven Funds, the management andsub-advisory fee included breakpoints that are tiered based on growth in asset levels of each such Fund. The Board also noted that the Funds’ expenses were subject to an expense limitation provided by the Manager. The Board noted that expected economies of scale, where they exist, may be shared through the use of fee breakpoints, expense limitations by the Manager, and/or a lower overall fee.
Ancillary Benefits
The Board considered the potential benefits, other than management fees, that the Manager and/or its affiliates may receive because of the Manager’s relationship with the Funds. The Trustees acknowledged that the Funds
| 18 |
Table of Contents
SUPPLEMENTAL INFORMATION(UNAUDITED)
were designed to serve as investment options under variable contracts issued by affiliates of the Manager that would receive fees under those contracts and that Park Avenue Securities LLC, an affiliate of the Manager and principal underwriter of the Funds, and participating insurance companies, including insurance companies affiliated with the Manager, would be entitled to receive fees from the Funds under a plan of distribution adopted pursuant to Rule12b-1 under the 1940 Act. The Trustees considered the benefits to the Manager from increased assets under management. The Trustees considered that the Manager and its affiliates may benefit from (i) greater efficiencies in annuity administration and operations and potential cost savings due to a reduction in the number of unaffiliated funds available as annuity contract investment options, and (ii) increased dividends-received deductions due to the Funds’ status under the tax laws as disregarded
entities. In addition, the Trustees considered the
potential benefits, other thansub-advisory fees, that theSub-advisers and their affiliates may receive because of their relationships with the Funds, including the potential increased ability to use soft dollars consistent with Trust policies and other benefits from increases in assets under management. The Trustees concluded that benefits that may accrue to the Manager and its affiliates are reasonable and the benefits that may accrue to theSub-advisers and their affiliates are consistent with those expected for asub-adviser to a mutual fund such as the applicable Fund.
Conclusion
Based on a comprehensive consideration and evaluation of all of the information and factors summarized above, among others, the Board as a whole, including the Independent Trustees, approved the Agreements.
| 19 |
Table of Contents
SUPPLEMENTAL INFORMATION(UNAUDITED)
The Statement of Additional Information (“SAI”) includes additional information about the Trust’s Trustees and Officers and is available, without charge, upon request by calling toll-free1-888-GUARDIAN(1-888-482-7342) or by visiting our website at http://guardianvpt.onlineprospectus.net/GuardianVPT/Prospectuses.
Portfolio Holdings and Proxy Voting Procedures
The Fund files its complete schedule of portfolio holdings with the Securities and Exchange Commission for the first and third quarters of each fiscal year as an exhibit to its reports on FormN-PORT. The Fund’sForm N-PORT reports are available on the Securities and Exchange Commission’s website at https://www.sec.gov. The Fund’s FormN-PORT information is also available, without charge, upon request, by calling toll-free1-888-GUARDIAN(1-888-482-7342) or by visiting our website at http://guardianvpt.onlineprospectus.net/GuardianVPT/
Prospectuses.
A description of the policies and procedures that the Fund uses to determine how to vote proxies relating to portfolio securities is included in the SAI. The SAI and information regarding how the Fund voted proxies relating to portfolio securities during the most recent12-month period ended June 30 may be obtained (i) without charge, upon request, by calling toll-free1-888-GUARDIAN(1-888-482-7342) or by visiting our website at http://guardianvpt.onlineprospectus.net/GuardianVPT/
Prospectuses; and (ii) on the Securities and Exchange Commission’s website at https://www.sec.gov.
| 20 |
Table of Contents
This report is transmitted to shareholders only. It is not authorized for use as an offer of sale or a solicitation of an offer to buy shares of the Fund unless accompanied or preceded by the Fund’s current prospectus. Past performance results shown in this report should not be considered a representation of future performance. Investment returns and principal value of shares will fluctuate so that shares, when redeemed, may be worth more or less than their original cost. Statements and other information herein are as dated and are subject to change.

The Guardian Life Insurance Company of America New York, NY 10001-2159
PUB8171
Table of Contents
Guardian Variable
Products Trust
2019
Semiannual Report
All Data as of June 30, 2019
Guardian International Value VIP Fund
Important Notice
Beginning on January 1, 2021, as permitted by regulations adopted by the Securities and Exchange Commission, paper copies of the Fund’s shareholder reports will no longer be sent by mail from The Guardian Insurance & Annuity Company, Inc. (“GIAC”). Instead, GIAC will mail you a notice when copies of the shareholder reports are made available on a website. You will be notified by mail each time a report is posted and provided with a website link to access the report.
If you have already elected to receive shareholder reports electronically, you will not be affected by this change and you need not take any action. If you have not yet elected electronic delivery, at any time, you may elect to receive the Fund’s shareholder reports and certain other communications from GIAC electronically, by going to www.guardianlife.com and registering fore-delivery.
You may instead elect to receive all future shareholder reports in paper free of charge. If you wish to receive paper copies of your shareholder reports, please call GIAC’s Customer Service Office Contact Center at1-888-GUARDIAN(1-888-482-7342). Your election to receive reports in paper will apply to all the underlying funds available.

| Not FDIC insured. May lose value. No bank guarantee. | www.guardianlife.com |
Table of Contents
Guardian International Value VIP Fund
Except as otherwise specifically stated, all information, including portfolio security positions, is as of June 30, 2019. Fund holdings will vary. Information contained herein has been obtained from sources believed reliable, but is not guaranteed.
Table of Contents
GUARDIAN INTERNATIONAL VALUE VIP FUND
Fund Characteristics (unaudited)
Total Net Assets: $227,146,936
Geographic Region Allocation1 As of June 30, 2019 |
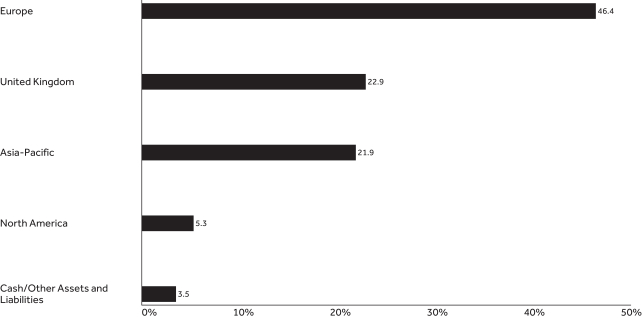 |
Sector Allocation2 As of June 30, 2019 |
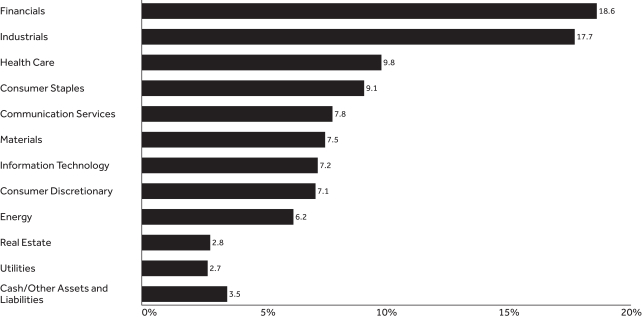 |
| 1 |
Table of Contents
GUARDIAN INTERNATIONAL VALUE VIP FUND
Top Ten Holdings1 As of June 30, 2019 | ||||||
| Holding | Country | % of Total Net Assets | ||||
| Novartis AG (Reg S) | Switzerland | 3.96% | ||||
| SAP SE | Germany | 3.64% | ||||
| Royal Dutch Shell PLC, Class A | United Kingdom | 3.36% | ||||
| Aon PLC | United Kingdom | 3.09% | ||||
| Medtronic PLC | Ireland | 2.71% | ||||
| Anheuser-Busch InBev S.A. | Belgium | 2.65% | ||||
| RELX PLC | United Kingdom | 2.59% | ||||
| Sanofi | France | 2.41% | ||||
| Prudential PLC | United Kingdom | 2.35% | ||||
| Unilever PLC | United Kingdom | 2.35% | ||||
| Total | 29.11% | |||||
| 1 | Portfolio holdings are subject to change and should not be considered a recommendation to buy or sell individual securities. Cash includesshort-term investments and net other assets and liabilities. |
| 2 | The Fund’s holdings are allocated to each sector based on the MSCI Global Industry Classification Standard (GICS®). Cash includes short-term investments and net other assets and liabilities. |
| 2 |
Table of Contents
UNDERSTANDING YOUR FUND’S EXPENSES(UNAUDITED)
By investing in the Fund, you incur two types of costs: (1) transaction costs and (2) ongoing costs, including, as applicable, investment advisory fees, distribution and/or service(12b-1) fees and other Fund expenses. The example below is intended to help you understand your ongoing costs (in dollars) of investing in the Fund and to compare these costs with the ongoing costs of investing in other mutual funds.
The example is based on an investment of $1,000 invested at the beginning of the period and held for the entire period from January 1, 2019 to June 30, 2019. The table below shows the Fund’s expenses in two ways:
Expenses based on actual return
This section of the table provides information about actual account values and actual expenses. You may use the information in this section, together with the amount you invested, to estimate the expenses that you paid over the period. Simply divide your account value by $1,000 (for example, an $8,600 account value divided by $1,000 = 8.6), then multiply the result by the number in the section under the heading entitled “Expenses Paid During Period” to estimate the expenses you paid on your account during this period.
Expenses based on hypothetical 5% return for comparison purposes
This section of the table provides information about hypothetical account values and hypothetical expenses based on the Fund’s actual expense ratio and an assumed rate of return of 5% per year before expenses, which is not the Fund’s actual return. The hypothetical account values and expenses may not be used to estimate the actual ending account balance or expenses you paid for the period. You may use this information to compare the ongoing costs of investing in the Fund with the cost of investing in other mutual funds. To do so, compare this 5% hypothetical example with the 5% hypothetical examples that appear in the shareholder reports of the other funds.
Note that the expenses shown in the table are meant to highlight your ongoing costs only and do not reflect any transactional costs, such as sales charges (loads), redemption fees, or exchange fees. Therefore the second section is useful in comparing ongoing costs only, and will not help you determine the relative total costs of owning different funds. If these transactional costs were included, your costs would have been higher. Charges and expenses at the insurance company separate account level are not reflected in the table.
Beginning Account Value 1/1/19 | Ending Account Value | Expenses Paid During Period* 1/1/19-6/30/19 | Expense Ratio During Period 1/1/19-6/30/19 | |||||||||||
| Based on Actual Return | $ 1,000.00 | $1,156.80 | $5.03 | 0.94% | ||||||||||
Based on Hypothetical Return (5% Return Before Expenses) | $ 1,000.00 | $1,020.13 | $4.71 | 0.94% | ||||||||||
| * | Expenses are equal to the Fund’s annualized expense ratio as indicated, multiplied by the average account value over the period, multiplied by181/365 (to reflect theone-half year period). |
| 3 |
Table of Contents
SCHEDULE OF INVESTMENTS — GUARDIAN INTERNATIONAL VALUE VIP FUND
| June 30, 2019(unaudited) | Shares | Value | ||||||
| Common Stocks – 94.7% |
| |||||||
| Australia – 1.2% |
| |||||||
Amcor PLC | 238,213 | $ | 2,707,574 | |||||
|
| |||||||
| 2,707,574 | ||||||||
| Belgium – 2.6% |
| |||||||
Anheuser-Busch InBev S.A. | 67,971 | 6,019,851 | ||||||
|
| |||||||
| 6,019,851 | ||||||||
| Canada – 5.3% |
| |||||||
Canadian National Railway Co. | 27,747 | 2,568,009 | ||||||
National Bank of Canada | 56,949 | 2,705,355 | ||||||
Rogers Communications, Inc., Class B | 45,400 | 2,430,255 | ||||||
Suncor Energy, Inc. | 142,310 | 4,439,207 | ||||||
|
| |||||||
| 12,142,826 | ||||||||
| China – 1.7% |
| |||||||
Ping An Insurance Group Co. of China Ltd., Class H | 317,500 | 3,821,347 | ||||||
|
| |||||||
| 3,821,347 | ||||||||
| Denmark – 1.6% |
| |||||||
Carlsberg A/S, Class B | 26,676 | 3,537,252 | ||||||
|
| |||||||
| 3,537,252 | ||||||||
| Finland – 2.5% |
| |||||||
Nordea Bank Abp | 335,897 | 2,440,514 | ||||||
Sampo OYJ, Class A | 67,785 | 3,198,962 | ||||||
|
| |||||||
| 5,639,476 | ||||||||
| France – 13.0% |
| |||||||
Air Liquide S.A. | 25,168 | 3,521,814 | ||||||
Atos SE | 30,352 | 2,537,778 | ||||||
Cie Generale des Etablissements Michelin SCA | 18,362 | 2,329,548 | ||||||
Engie S.A. | 193,795 | 2,942,940 | ||||||
Safran S.A. | 35,965 | 5,270,004 | ||||||
Sanofi | 63,138 | 5,461,999 | ||||||
Vinci S.A. | 31,910 | 3,271,658 | ||||||
Vivendi S.A. | 149,296 | 4,114,861 | ||||||
|
| |||||||
| 29,450,602 | ||||||||
| Germany – 5.0% |
| |||||||
Fresenius SE & Co. KGaA | 29,889 | 1,619,282 | ||||||
SAP SE | 60,180 | 8,272,408 | ||||||
Vonovia SE | 30,002 | 1,432,842 | ||||||
|
| |||||||
| 11,324,532 | ||||||||
| India – 1.1% |
| |||||||
ICICI Bank Ltd., ADR | 203,250 | 2,558,917 | ||||||
|
| |||||||
| 2,558,917 | ||||||||
| Ireland – 3.8% |
| |||||||
Medtronic PLC | 63,179 | 6,153,003 | ||||||
Ryanair Holdings PLC, ADR(1) | 38,294 | 2,456,177 | ||||||
|
| |||||||
| 8,609,180 | ||||||||
| Israel – 1.2% |
| |||||||
Bank LeumiLe-Israel BM | 368,047 | 2,659,455 | ||||||
|
| |||||||
| 2,659,455 | ||||||||
| June 30, 2019(unaudited) | Shares | Value | ||||||
| Japan – 12.8% |
| |||||||
Daiwa House Industry Co. Ltd. | 168,212 | $ | 4,912,498 | |||||
Hitachi Ltd. | 46,500 | 1,708,967 | ||||||
Kao Corp. | 37,930 | 2,893,685 | ||||||
Makita Corp. | 76,600 | 2,609,920 | ||||||
Nexon Co. Ltd.(1) | 213,500 | 3,099,528 | ||||||
Pan Pacific International Holdings Corp. | 33,057 | 2,101,135 | ||||||
Shin-Etsu Chemical Co. Ltd. | 42,900 | 4,005,511 | ||||||
Sumitomo Mitsui Financial Group, Inc. | 98,200 | 3,477,260 | ||||||
Suzuki Motor Corp. | 48,900 | 2,301,677 | ||||||
Yamaha Corp. | 43,100 | 2,052,142 | ||||||
|
| |||||||
| 29,162,323 | ||||||||
| Netherlands – 4.1% |
| |||||||
ABN AMRO Bank N.V.(2) | 99,416 | 2,127,268 | ||||||
Koninklijke DSM N.V. | 25,783 | 3,187,889 | ||||||
Wolters Kluwer N.V. | 53,485 | 3,893,844 | ||||||
|
| |||||||
| 9,209,001 | ||||||||
| Norway – 2.3% |
| |||||||
Equinor ASA | 109,200 | 2,163,467 | ||||||
Telenor ASA | 149,681 | 3,180,826 | ||||||
|
| |||||||
| 5,344,293 | ||||||||
| Republic of Korea – 1.2% |
| |||||||
Samsung Electronics Co. Ltd. | 66,916 | 2,728,298 | ||||||
|
| |||||||
| 2,728,298 | ||||||||
| Singapore – 2.7% |
| |||||||
DBS Group Holdings Ltd. | 218,280 | 4,190,234 | ||||||
NetLink NBN Trust | 2,834,600 | 1,864,572 | ||||||
|
| |||||||
| 6,054,806 | ||||||||
| Spain – 1.4% |
| |||||||
Red Electrica Corp. S.A. | 156,631 | 3,260,958 | ||||||
|
| |||||||
| 3,260,958 | ||||||||
| Sweden – 3.5% |
| |||||||
Assa Abloy AB, Class B | 220,959 | 5,002,190 | ||||||
Epiroc AB, Class A | 291,887 | 3,039,233 | ||||||
|
| |||||||
| 8,041,423 | ||||||||
| Switzerland – 4.8% |
| |||||||
ABB Ltd. | 94,091 | 1,889,426 | ||||||
Novartis AG (Reg S) | 98,423 | 9,002,457 | ||||||
|
| |||||||
| 10,891,883 | ||||||||
| United Kingdom – 22.9% |
| |||||||
Aon PLC | 36,324 | 7,009,806 | ||||||
BHP Group PLC | 130,045 | 3,319,058 | ||||||
Compass Group PLC | 138,175 | 3,311,393 | ||||||
Diageo PLC | 68,601 | 2,954,251 | ||||||
Ferguson PLC | 31,260 | 2,228,180 | ||||||
Howden Joinery Group PLC | 159,872 | 1,029,434 | ||||||
Informa PLC | 286,123 | 3,037,575 | ||||||
Network International Holdings PLC(1)(2) | 154,455 | 1,163,863 | ||||||
| 4 | The accompanying notes are an integral part of these financial statements. |
Table of Contents
SCHEDULE OF INVESTMENTS — GUARDIAN INTERNATIONAL VALUE VIP FUND
| June 30, 2019(unaudited) | Shares | Value | ||||||
| United Kingdom(continued) |
| |||||||
Prudential PLC | 245,467 | $ | 5,346,436 | |||||
RELX PLC | 242,457 | 5,892,728 | ||||||
Royal Dutch Shell PLC, Class A | 232,700 | 7,619,703 | ||||||
RSA Insurance Group PLC | 305,125 | 2,240,427 | ||||||
The Weir Group PLC | 74,279 | 1,459,108 | ||||||
Unilever PLC | 86,072 | 5,344,888 | ||||||
|
| |||||||
| 51,956,850 | ||||||||
| Total Common Stocks (Cost $209,048,425) |
| 215,120,847 | ||||||
| Shares | Value | |||||||
| Preferred Stocks – 1.8% |
| |||||||
| Germany – 1.8% |
| |||||||
Volkswagen AG, 3.00% | 23,630 | 3,982,245 | ||||||
|
| |||||||
| 3,982,245 | ||||||||
| Total Preferred Stocks (Cost $4,457,834) |
| 3,982,245 | ||||||
| June 30, 2019(unaudited) | Principal Amount | Value | ||||||
| Short-Term Investment – 3.5% |
| |||||||
| Repurchase Agreements – 3.5% |
| |||||||
Fixed Income Clearing Corp., 0.50%, dated 6/28/2019, proceeds at maturity value of $7,992,333, due 7/1/2019(3) | $ | 7,992,000 | $ | 7,992,000 | ||||
| Total Repurchase Agreements (Cost $7,992,000) |
| 7,992,000 | ||||||
| Total Investments – 100.0% (Cost $221,498,259) |
| 227,095,092 | ||||||
| Assets in excess of other liabilities – 0.0% |
| 51,844 | ||||||
| Total Net Assets – 100.0% |
| $ | 227,146,936 | |||||
| (1) | Non–income–producing security. |
| (2) | Securities that may be resold in transactions, exempt from registration under Rule 144A of the Securities Act of 1933, as amended, normally to certain qualified buyers. At June 30, 2019, the aggregate market value of these securities amounted to $3,291,131, representing 1.4% of net assets. These securities have been deemed liquid by the investment adviser pursuant to the Fund’s liquidity procedures approved by the Board of Trustees. |
| (3) | The table below presents collateral for repurchase agreements. |
| Security | Coupon | Maturity Date | Principal Amount | Value | ||||||||||||
| U.S. Treasury Note | 2.75% | 8/15/2021 | $ | 7,910,000 | $ | 8,152,726 | ||||||||||
Legend:
ADR — American Depositary Receipt
| The accompanying notes are an integral part of these financial statements. | 5 |
Table of Contents
SCHEDULE OF INVESTMENTS — GUARDIAN INTERNATIONAL VALUE VIP FUND
The following is a summary of the inputs used as of June 30, 2019 in valuing the Fund’s investments. For more information on valuation inputs, please refer to Note 2a of the accompanying Notes to Financial Statements.
| Valuation Inputs | ||||||||||||||||
| Investments in Securities(unaudited) | Level 1 | Level 2 | Level 3 | Total | ||||||||||||
| Common Stocks | ||||||||||||||||
Australia | $ | 2,707,574 | $ | — | $ | — | $ | 2,707,574 | ||||||||
Belgium | — | 6,019,851 | * | — | 6,019,851 | |||||||||||
Canada | 12,142,826 | — | — | 12,142,826 | ||||||||||||
China | — | 3,821,347 | * | — | 3,821,347 | |||||||||||
Denmark | — | 3,537,252 | * | — | 3,537,252 | |||||||||||
Finland | — | 5,639,476 | * | — | 5,639,476 | |||||||||||
France | — | 29,450,602 | * | — | 29,450,602 | |||||||||||
Germany | — | 11,324,532 | * | — | 11,324,532 | |||||||||||
India | 2,558,917 | — | — | 2,558,917 | ||||||||||||
Ireland | 8,609,180 | — | — | 8,609,180 | ||||||||||||
Israel | — | 2,659,455 | * | — | 2,659,455 | |||||||||||
Japan | — | 29,162,323 | * | — | 29,162,323 | |||||||||||
Netherlands | — | 9,209,001 | * | — | 9,209,001 | |||||||||||
Norway | — | 5,344,293 | * | — | 5,344,293 | |||||||||||
Republic of Korea | — | 2,728,298 | * | — | 2,728,298 | |||||||||||
Singapore | — | 6,054,806 | * | — | 6,054,806 | |||||||||||
Spain | — | 3,260,958 | * | — | 3,260,958 | |||||||||||
Sweden | — | 8,041,423 | * | — | 8,041,423 | |||||||||||
Switzerland | — | 10,891,883 | * | — | 10,891,883 | |||||||||||
United Kingdom | 7,009,806 | 44,947,044 | * | — | 51,956,850 | |||||||||||
| Preferred Stocks | ||||||||||||||||
Germany | — | 3,982,245 | * | — | 3,982,245 | |||||||||||
| Repurchase Agreements | — | 7,992,000 | — | 7,992,000 | ||||||||||||
| Total | $ | 33,028,303 | $ | 194,066,789 | $ | — | $ | 227,095,092 | ||||||||
| * | Consists of certain foreign securities whose values were determined by a pricing service using pricing models (See Note 2a in Notes to Financial Statements). These investments in securities were classified as Level 2 rather than Level 1. |
| 6 | The accompanying notes are an integral part of these financial statements. |
Table of Contents
FINANCIAL INFORMATION — GUARDIAN INTERNATIONAL VALUE VIP FUND
For the Six Months Ended June 30, 2019 (unaudited) | ||||
Investment Income | ||||
Dividends | $ | 5,225,281 | ||
Interest | 17,171 | |||
Withholding taxes on foreign dividends | (545,754 | ) | ||
|
| |||
Total Investment Income | 4,696,698 | |||
|
| |||
Expenses | ||||
Investment advisory fees | 854,256 | |||
Distribution fees | 276,487 | |||
Trustees’ and officers’ fees | 51,928 | |||
Custodian and accounting fees | 43,397 | |||
Professional fees | 32,861 | |||
Administrative fees | 23,535 | |||
Shareholder reports | 19,387 | |||
Transfer agent fees | 8,928 | |||
Other expenses | 14,301 | |||
|
| |||
Total Expenses | 1,325,080 | |||
Less: Fees waived | (285,489 | ) | ||
|
| |||
Total Expenses, Net | 1,039,591 | |||
|
| |||
Net Investment Income/(Loss) | 3,657,107 | |||
|
| |||
Realized Gain/(Loss) and Change in Unrealized Appreciation/(Depreciation) on Investments and Foreign Currency Transactions | ||||
Net realized gain/(loss) from investments | (5,078,744 | ) | ||
Net realized gain/(loss) from foreign currency transactions | (20,237 | ) | ||
Net change in unrealized appreciation/(depreciation) on investments | 33,469,957 | |||
Net change in unrealized appreciation/(depreciation) on translation of assets and liabilities in foreign currencies | 1,787 | |||
|
| |||
Net Gain on Investments and Foreign Currency Transactions | 28,372,763 | |||
|
| |||
Net Increase in Net Assets Resulting From Operations | $ | 32,029,870 | ||
|
| |||
| The accompanying notes are an integral part of these financial statements. | 7 |
Table of Contents
FINANCIAL INFORMATION — GUARDIAN INTERNATIONAL VALUE VIP FUND
| 8 | The accompanying notes are an integral part of these financial statements. |
Table of Contents
This Page Intentionally Left Blank
| 9 |
Table of Contents
FINANCIAL INFORMATION — GUARDIAN INTERNATIONAL VALUE VIP FUND
The Financial Highlights table is intended to help you understand the Fund’s financial performance for the past six reporting periods (or, if shorter, the period since inception). Certain information reflects financial results for a single Fund share. The total returns in the table represent the rate that an investor would have earned (or lost) on an investment in the Fund.
Financial Highlights Six Months Ended Numbers are unaudited | ||||||||||||||||||||||||
| Per Share Operating Performance | ||||||||||||||||||||||||
| Net Asset Value, Beginning of Period | Net Investment Income(1) | Net Realized and Unrealized Gain/(Loss) | Total Operations | Net Asset Value, End of Period | Total Return(2) | |||||||||||||||||||
Six Months Ended 6/30/19 | $ | 10.01 | $ | 0.18 | $ | 1.39 | $ | 1.57 | $ | 11.58 | 15.68% | (4) | ||||||||||||
Year Ended 12/31/18 | 11.80 | 0.20 | (1.99 | ) | (1.79 | ) | 10.01 | (15.17)% | ||||||||||||||||
Year Ended 12/31/17 | 9.63 | 0.15 | 2.02 | 2.17 | 11.80 | 22.53% | ||||||||||||||||||
Period Ended 12/31/16(5) | 10.00 | 0.01 | (0.38 | ) | (0.37 | ) | 9.63 | (3.70)% | (4) | |||||||||||||||
| 10 | The accompanying notes are an integral part of these financial statements. |
Table of Contents
FINANCIAL INFORMATION — GUARDIAN INTERNATIONAL VALUE VIP FUND
| Ratios/Supplemental Data | ||||||||||||||||||||||
| Net Assets, End of Period (000s) | Net Ratio of Expenses to Average Net Assets(3) | Gross Ratio of Expenses to Average Net Assets | Net Ratio of Net Investment Income to Average Net Assets(3) | Gross Ratio of Net Investment Income/(Loss) to Average Net Assets | Portfolio Turnover Rate | |||||||||||||||||
| $ | 227,147 | 0.94% | (4) | 1.20% | (4) | 3.31% | (4) | 3.05% | (4) | 15% | (4) | |||||||||||
| 208,182 | 0.94% | 1.23% | 1.79% | 1.50% | 74% | |||||||||||||||||
| 11,133 | 1.11% | 2.39% | 1.40% | 0.12% | 61% | |||||||||||||||||
| 14,100 | 1.11% | (4) | 3.11% | (4) | 0.42% | (4) | (1.58)% | (4) | 8% | (4) | ||||||||||||
| (1) | Calculated based on the average shares outstanding during the period. |
| (2) | Total returns do not reflect the effects of charges deducted pursuant to the terms of The Guardian Insurance & Annuity Company, Inc.’s variable contracts. Inclusion of such charges would reduce the total returns for all periods shown. |
| (3) | Net Ratio of Expenses to Average Net Assets and Net Ratio of Net Investment Income to Average Net Assets include the effect of fee waivers and expense limitations. |
| (4) | Ratios for periods less than one year have been annualized, except for total return and portfolio turnover rate. For the period ended December 31, 2016, certainnon-recurring fees (i.e., audit fees) are not annualized. |
| (5) | Commenced operations on September 1, 2016. |
| The accompanying notes are an integral part of these financial statements. | 11 |
Table of Contents
NOTES TO FINANCIAL STATEMENTS — GUARDIAN INTERNATIONAL VALUE VIP FUND
June 30, 2019(unaudited)
1. Organization
Guardian Variable Products Trust (the “Trust”), a Delaware statutory trust organized on January 12, 2016, is registered under the Investment Company Act of 1940, as amended (the “1940 Act”), as anopen-end management investment company. The Trust currently has sixteen series. Guardian International Value VIP Fund (the “Fund”) is a series of the Trust. The Fund is a diversified fund and commenced operations on September 1, 2016. The financial statements for other series of the Trust are presented in separate reports.
The Trust has authorized an unlimited number of shares of beneficial interest with no par value. Shares are bought and sold at closing net asset value (“NAV”). Shares of the Fund are only sold to certain separate accounts of The Guardian Insurance & Annuity Company, Inc. (“GIAC”) that fund certain variable annuity contracts and variable life insurance policies issued by GIAC. GIAC is a wholly-owned subsidiary of The Guardian Life Insurance Company of America (“Guardian Life”).
The Fund seeks long-term capital appreciation.
2. Significant Accounting Policies
The following is a summary of significant accounting policies followed by the Fund in the preparation of its financial statements. The Fund follows the investment company accounting and reporting guidance of the Financial Accounting Standards Board (“FASB”) Accounting Standards Codification Topic 946 Financial Services — Investment Companies. The following policies are in conformity with accounting principles generally accepted in the United States of America (“GAAP”). The preparation of financial statements in accordance with GAAP requires management to make estimates and assumptions that affect the reported amounts and disclosures in the financial statements. Actual results could differ from those estimates.
a. Investment Valuations Equity securities traded on an exchange other than NASDAQ Stock Market, LLC (“NASDAQ”) are valued at the last reported sale price on the principal exchange or market on which they are traded; or, if there were no sales that day, at the mean between the closing bid and ask prices. Securities traded on the NASDAQ are generally valued at the NASDAQ official closing price, which may not be the last sale price. If the NASDAQ official closing price is not available for a security, that security is generally valued at the
mean between the closing bid and ask prices. Repurchase agreements are carried at cost, which approximates fair value (see Note 5d). Foreign securities are valued in the currencies of the markets in which they trade and then converted to U.S. dollars by the application of foreign exchange rates at the close of the New York Stock Exchange (“NYSE”). Forward foreign currency contracts, if any, are valued at the mean between the bid and ask rates for the specified time interpolated from rates for proximate time periods. Securities for which market quotations are not readily available or for which market quotations may be considered unreliable are valued at their fair values as determined in accordance with policies and procedures adopted by the Board of Trustees.
Under the policies and procedures approved by the Board of Trustees, Park Avenue Institutional Advisers LLC (“Park Avenue”), the Fund’s investment adviser, has established a Fair Valuation Committee to assist the Board of Trustees with the oversight and monitoring of the valuation of the Fund’s investments. This includes monitoring the appropriateness of fair values based on results of ongoing valuation oversight, including but not limited to consideration of security specific events, market events, and pricing vendor and broker-dealer due diligence. The Fair Valuation Committee oversees and carries out the policies for the valuation of investments held in the Fund. The Fair Valuation Committee is responsible for discussing and assessing the potential impacts to the fair values on an ongoing basis, and at least on a quarterly basis with the Board of Trustees.
Securities whose values have been materially affected by events occurring before the Fund’s valuation time but after the close of the securities’ principal exchange or market may be fair valued in accordance with policies and procedures adopted by the Board of Trustees. In addition, the values of the Fund’s investments in foreign securities are generally determined by a pricing service using pricing models designed to estimate likely changes in the values of those securities. Certain foreign equity instruments are valued by applying international fair value factors provided by approved pricing services. The factors seek to adjust the local closing price for movements of local markets post closing, but prior to the time the NAVs are calculated. Valuations reflected in this report are as of the report date. As a result, changes in valuation due to market events and/or issuer related events after the report date and prior to issuance of the report are not reflected herein.
| 12 |
Table of Contents
NOTES TO FINANCIAL STATEMENTS — GUARDIAN INTERNATIONAL VALUE VIP FUND
Various inputs are used in determining the valuation of the Fund’s investments. These inputs are summarized in three broad levels listed below.
| • | Level 1 — unadjusted inputs using quoted prices in active markets for identical investments. |
| • | Level 2 — other significant observable inputs, including, but not limited to, quoted prices for similar investments, inputs other than quoted prices that are observable for investments (such as interest rates, prepayment speeds, credit risks, etc.) or other market corroborated inputs. |
| • | Level 3 — significant unobservable inputs (including the Fund’s own assumptions in determining the fair value of investments) |
Inputs may include price information, volatility statistics, specific and broad credit data, liquidity statistics, and other factors. A financial instrument’s level within the fair value hierarchy is based on the lowest level of any input; both individually and in aggregate, that is significant to the fair value measurement. However, the determination of what constitutes “observable” requires significant judgment by the Trust. The Trust considers observable data to be that market data which is readily available, regularly distributed or updated, reliable and verifiable, and provided by independent sources that are actively involved in the relevant market. The inputs or methodology used for valuing securities are not necessarily an indication of the risk associated with investing in those securities. Changes in valuation techniques may result in transfers into or out of a financial instrument’s assigned level within the hierarchy.
The FASB requires reporting entities to make disclosures about purchases, sales, issuances and settlements of Level 3 securities on a gross basis. For the six months ended June 30, 2019, there were no transfers into or out of Level 3 of the fair value hierarchy.
In determining a financial instrument’s placement within the hierarchy, the Trust separates the Fund’s investment portfolio into two categories: investments and derivatives (e.g., futures). A summary of inputs used to value the Fund’s assets and liabilities carried at fair value as of June 30, 2019 is included in the Schedule of Investments.
InvestmentsInvestments whose values are based on quoted market prices in active markets, and are therefore classified within Level 1, include active listed equities. Investments that trade in markets that are not considered to be active, but are valued based on quoted
market prices, dealer quotations or alternative pricing sources supported by observable inputs are classified within Level 2. These include certain U.S. government and sovereign obligations, most government agency securities, investment-grade corporate bonds, certain mortgage products, state, municipal and provincial obligations, and certain foreign equity securities, including securities whose prices may have been affected by events occurring after the close of trading on their principal exchange or market and, as a result, whose values are determined by a pricing service as described above, or securities whose values are otherwise determined using fair valuation methods approved by the Fund’s Board of Trustees.
Investments classified within Level 3 have significant unobservable inputs, as they trade infrequently or not at all. Level 3 investments include, among others, private placement securities. When observable prices are not available for these securities, the Trust uses one or more valuation techniques for which sufficient and reliable data is available. The inputs used by the Trust in estimating the value of Level 3 investments include, for example, the original transaction price, recent transactions in the same or similar instruments, completed or pending third-party transactions in the underlying investment or comparable issuers, subsequent rounds of financing, recapitalizations, and other transactions across the capital structure. Level 3 investments may also be adjusted to reflect illiquidity and/ornon-transferability, with the amount of such discount estimated by the Trust in the absence of market information. Assumptions used by the Trust due to the lack of observable inputs may significantly impact the resulting fair value and therefore the Fund’s results of operations. As of June 30, 2019, the Fund had no securities classified as Level 3.
DerivativesExchange-traded derivatives, such as futures contracts, exchange-traded option contracts and certain swaps, are typically classified within Level 1 or Level 2 of the fair value hierarchy depending on whether or not they are deemed to be actively traded. Certainnon-exchange-traded derivatives, such as generic forwards, certain swaps and options, have inputs which can generally be corroborated by market data and are therefore classified within Level 2. During the six months ended June 30, 2019, the Fund did not hold any derivatives.
b. Securities TransactionsSecurities transactions are accounted for on the date securities are purchased or sold (trade date). Realized gains or losses on securities transactions are determined on the basis of specific identification.
| 13 |
Table of Contents
NOTES TO FINANCIAL STATEMENTS — GUARDIAN INTERNATIONAL VALUE VIP FUND
c. Foreign Currency Translation The accounting records of the Fund are maintained in U.S. dollars. Investment securities and all other assets and liabilities of the Fund denominated in a foreign currency are generally translated into U.S. dollars at the exchange rates quoted at the close of the NYSE on each business day. The market value of investment securities and other assets and liabilities are translated at the exchange rate as of the valuation date. Purchases and sales of securities, income receipts, and expense payments are translated into U.S. dollars at the exchange rates in effect on the dates of the respective transactions. The Fund does not isolate the portion of the fluctuations on investments resulting from changes in foreign currency exchange rates from the fluctuations in market prices of investments held. Such fluctuations are included in the Net change in net realized and unrealized gain/(loss) from investments on the Statement of Operations.
Reported realized foreign currency gains and losses arise from the disposition of foreign currency, currency gains or losses realized between the trade and settlement dates on securities transactions, and the difference between the amounts of dividends, interest and foreign withholding taxes recorded on the Fund’s books on the transaction date and the U.S. dollar equivalent of the amounts actually received or paid. These reported realized foreign currency gains and losses, if any, are included in Net realized gain/(loss) from foreign currency transactions on the Statement of Operations. Unrealized foreign currency gains and losses arise from changes (due to changes in exchange rates) in the value of foreign currency and other assets and liabilities denominated in foreign currencies, which are held at period end, if any, and are included in Net change in unrealized appreciation/(depreciation) on translation of assets and liabilities in foreign currencies on the Statement of Operations.
d. Foreign Capital Gains Tax The Fund may be subject to foreign taxes on income, gains on investments or currency purchases/repatriation, a portion of which may be recoverable. The Fund will accrue such taxes and recoveries as applicable, based upon their current interpretation of tax rules and regulations that exist in the markets in which they invest.
e. Investment Income Dividend income net of foreign taxes withheld, if any, is generally recorded on theex-dividend date. Interest income, which includes amortization/accretion of premium/discount, is determined using the interest income accrual method, and is accrued and recorded daily.
f. Allocation of Income and Expenses Many of the expenses of the Trust can be directly attributed to a specific series of the Trust. Expenses that cannot be directly attributed to a specific series of the Trust are generally apportioned among all the series in the Trust, based on relative net assets. In calculating net asset value per share for each series of the Trust, investment income, realized and unrealized gains and losses, and expenses other than series-specific expenses are allocated daily to each series based upon the proportion of net assets attributable to each series.
3. Transactions with Affiliates
a. Investment Advisory Feeand Expense Limitation Under the terms of the advisory agreement, which, after its two year initial term, is reviewed and approved annually by the Board of Trustees, the Fund pays an investment advisory fee to Park Avenue. Park Avenue is a wholly-owned subsidiary of Guardian Life and receives an investment advisory fee at an annual rate of 0.80% of the first $100 million, and 0.75% in excess of $100 million of the Fund’s average daily net assets. The fee is accrued daily and paid monthly.
Park Avenue has contractually agreed through April 30, 2020 to waive certain fees and/or reimburse certain expenses incurred by the Fund to the extent necessary to limit the Fund’s total annual operating expenses after fee waiver and/or expense reimbursement to 0.94% of the Fund’s average daily net assets (excluding, if applicable, any acquired fund fees and expenses, taxes, interest, transaction costs and brokerage commissions, litigation and extraordinary expenses). Prior to April 9, 2018, the expense limitation was 1.11%. The limitation may not be increased or terminated prior to this time without action by the Board of Trustees, may be terminated only upon approval of the Board of Trustees, and is subject to Park Avenue’s recoupment rights. For the six months ended June 30, 2019, Park Avenue waived fees and/or paid Fund expenses in the amount of $285,489.
Park Avenue may be entitled to recoupment of previously waived fees and reimbursed expenses from the Fund for three years from the date of the waiver or reimbursement, subject to the expense limitation in effect at the time of the waiver or reimbursement and at the time of the recoupment, if any. Amounts waived or reimbursed by Park Avenue pursuant to any expense limitation after April 9, 2018 will not be subject to Park Avenue’s recoupment rights. The amount available for potential future recoupment by Park Avenue from the
| 14 |
Table of Contents
NOTES TO FINANCIAL STATEMENTS — GUARDIAN INTERNATIONAL VALUE VIP FUND
Fund under the Expense Limitation Agreement and the expiration schedule at June 30, 2019 are as follows:
| Potential Recoupment Amounts Expiring | ||||||||||||
Total Potential Recoupment Amounts | 2021 | 2020 | 2019 | |||||||||
| $388,825 | $ | 58,226 | $ | 240,766 | $ | 89,833 | ||||||
Park Avenue has entered into aSub-Advisory Agreement with Lazard Asset Management LLC (“Lazard”). Lazard is responsible for providingday-to-day investment advisory services to the Fund, subject to the supervision of Park Avenue and the oversight of the Board of Trustees.Sub-advisory fees are paid by Park Avenue and do not represent a separate or additional expense to the Fund.
b. Compensation of Trustees and Officers Trustees and officers who are interested persons of the Trust, as defined in the 1940 Act, receive no compensation from the Fund, except for the Chief Compliance Officer of the Trust. Trustees of the Trust who are not interested persons of the Trust, and the Chief Compliance Officer, receive compensation and reimbursement of expenses from the Trust.
c. Distribution Fees Park Avenue Securities LLC (“PAS”), a wholly-owned subsidiary of Guardian Life, is the principal underwriter of Fund shares. The Trust has entered into a distribution and service agreement with PAS, which governs the sale and distribution of shares of the Fund. Under a distribution and service plan adopted by the Trust(“12b-1 plan”), PAS is compensated for services in such capacity, including its expenses in connection with the promotion and distribution of shares of the Fund, at an annual rate of 0.25% of the Fund’s average daily net assets. For the six months ended June 30, 2019, the Fund paid distribution fees in the amount of $276,487 to PAS.
PAS has directed that certain payments under the12b-1 plan be used to compensate GIAC for shareholder services provided to contract owners.
4. Federal Income Taxes
a. Distributions to Shareholders For federal income tax purposes, the Fund is treated as a disregarded entity (“DRE”). As a DRE, the Fund is not subject to an entity-level income tax; and any income, gains, losses, deductions, taxes, and credits of the Fund would instead be “passed through” directly to the separate accounts of GIAC that invest in the Fund and retain the same
character for U.S. federal income tax purposes. In addition, the Fund is not required to distribute taxable income and capital gains for U.S. federal income tax purposes. Therefore, no dividends and capital gains distributions were paid by the Fund.
5. Investments
a. Investment Purchases and Sales The cost of investments purchased and the proceeds from investments sold (excluding short-term investments) amounted to $31,516,323 and $40,814,517, respectively, for the six months ended June 30, 2019. During the six months ended June 30, 2019, there were no purchases or sales of U.S. government securities.
b. Foreign Securities Foreign securities investments involve special risks and considerations not typically associated with U.S. investments. These risks include, but are not limited to, currency risk; adverse political, regulatory, social, and economic developments; and less reliable information about issuers. Moreover, securities of some foreign issuers may be less liquid and their prices more volatile than those of comparable U.S. issuers.
c. Industry or Sector Concentration In its normal course of business, the Fund may invest a significant portion of its assets in companies within a limited number of industries or sectors. As a result, the Fund may be subject to a greater risk of loss than that of a fund invested in a wider spectrum of industries or sectors because the stocks of many or all of the companies in the industry, group of industries, sector, or sectors may decline in value due to developments adversely affecting the industry, group of industries, sector, or sectors.
d. Repurchase Agreements The Fund may invest in repurchase agreements to maintain liquidity and earn income over periods of time as short as overnight. The collateral for repurchase agreements is either cash or fully negotiable U.S. government securities (including U.S. government agency securities). Repurchase agreements are fully collateralized (including the interest accrued thereon) and such collateral is marked to market daily while the agreements remain in force. If the value of the collateral falls below the repurchase price plus accrued interest, the Fund will typically require the seller to deposit additional collateral by the next business day. If the request for additional collateral is not met, or the seller defaults, the Fund maintains the right to sell the collateral (although it may be prevented or delayed from doing so in certain circumstances) and may be required to claim any resulting loss against the
| 15 |
Table of Contents
NOTES TO FINANCIAL STATEMENTS — GUARDIAN INTERNATIONAL VALUE VIP FUND
seller. Park Avenue monitors the creditworthiness of the seller with which the Fund enters into repurchase agreements.
6. Temporary Borrowings
The Fund, with other funds managed by Park Avenue, is party to a $10 million committed revolving credit facility from State Street Bank and Trust Company for temporary borrowing purposes, including the meeting of redemption requests that otherwise might require the untimely disposition of securities. Interest is calculated based on the higher of the dailyone-month LIBOR rate and the Federal Funds rate plus 1.25% at the time of borrowing. In addition to the interest charged on any borrowings by the Fund, each fund pays a commitment fee of 0.30% per annum on its share of the unused portion of the credit facility. The agreement is in
place until December 10, 2019. The Fund did not utilize the credit facility during the six months ended June 30, 2019.
7. Indemnifications
Under the Trust’s organizational documents and, in some cases, by contract, its officers and trustees are indemnified against certain liabilities arising out of the performance of their duties to the Fund. In addition, in the normal course of business, the Fund enters into contracts with its vendors and others that provide general indemnifications. The Fund’s maximum exposure under these arrangements is unknown as this would involve future claims that may be made against the Fund that have not yet occurred. However, based on experience, the Fund expects the risk of loss to be remote.
| 16 |
Table of Contents
SUPPLEMENTAL INFORMATION(UNAUDITED)
Approval of Investment Advisory andSub-advisory Agreements
Section 15(c) of the Investment Company Act of 1940, as amended (the “1940 Act”), requires that a fund’s investment advisory andsub-advisory agreements be approved initially by the fund’s board of trustees. Section 15(c) also requires that the continuation of these agreements, after an initial term of up to two years, be annually reviewed and approved by the board. Any such agreement must be approved by a vote of a majority of the trustees who are not parties to the agreement or “interested persons” (as defined in the 1940 Act) of a party to the agreement at anin-person meeting of the board called for the purpose of voting on such approval.
At a meeting of the Board of Trustees (the “Board”) of Guardian Variable Products Trust (the “Trust”) held on March27-28, 2019 (the “Meeting”), the Board, including the trustees who are not parties to the agreement or “interested persons” as defined in the 1940 Act (the “Independent Trustees”), considered and voted unanimously to renew the existing investment management agreement (the “Management Agreement”) between the Trust, on behalf of Guardian Diversified Research VIP Fund, Guardian Growth & Income VIP Fund, Guardian Integrated Research VIP Fund, Guardian International Growth VIP Fund, Guardian International Value VIP Fund, Guardian Large Cap Disciplined Growth VIP Fund, Guardian Large Cap Disciplined Value VIP Fund, Guardian Large Cap Fundamental Growth VIP Fund, Guardian Mid Cap Traditional Growth VIP Fund, Guardian Mid Cap Relative Value VIP Fund and Guardian Core Plus Fixed Income VIP Fund (the “Funds”), and Park Avenue Institutional Advisers LLC (the “Manager”) for aone-term.
The Board, including the Independent Trustees, also considered and voted unanimously to renew the existingsub-advisory agreements (the“Sub-advisory Agreements,” collectively with the Management Agreement, the “Agreements”) between the Manager and investment advisory firms engaged to serve assub-advisers to certain of the Funds, namely Putnam Investment Management, LLC, AllianceBernstein L.P., Massachusetts Financial Services Company, J.P. Morgan Investment Management Inc., Lazard Asset Management LLC, Wellington Management Company LLP, Boston Partners Global Investors, Inc., ClearBridge Investments, LLC, Janus Capital Management LLC, Wells Capital Management Incorporated and Lord, Abbett & Co. LLC (the“Sub-advisers”) for aone-year term.
The Board is responsible for overseeing the management of each Fund. In determining whether to renew its approval of the Agreements, the Trustees evaluated information and factors that they considered to be relevant and appropriate through the exercise of their own business judgment. The Trustees considered certain information and factors in light of advice furnished to them by legal counsel to the Trust and, in the case of the Independent Trustees, their independent legal counsel. In advance of the Meeting, the Trustees received materials and information designed to assist their consideration of the Agreements. The Trustees received written responses from the Manager and eachSub-adviser to a series of questions and requests for information encompassing a wide variety of topics provided by independent counsel on behalf of the Independent Trustees. The Independent Trustees discussed the Funds with independent counsel during a telephonic meeting and executive session in advance of the Meeting. The Trustees also received materials and information regarding the legal standards applicable to their consideration of the Agreements and the process and criteria used by the Manager to identify and select theSub-advisers.
During the course of their deliberations, the Independent Trustees met to discuss and evaluate the Agreements in executive session with their independent legal counsel, outside of the presence of the Trustees who are not Independent Trustees and representatives from Fund management, the Manager or anySub-adviser.
In reaching its decisions to renew its approval of the Agreements, the Board took into account the materials and information described above as well as other materials and information provided to the Board and discussed with and among the Trustees. Individual Trustees may have given different weight to different factors and information with respect to each Agreement, and the Trustees did not identify any single factor or information that, in isolation, would be controlling in deciding to approve the Agreements. The discussion below is intended to summarize the broad factors that figured prominently in the Board’s decisions to approve the Agreements rather than to beall-inclusive. These broad factors included: (i) the nature, extent and quality of the services provided to the Funds by the Manager and theSub-advisers; (ii) the investment performance of each Fund; (iii) the fees charged and estimated profitability; (iv) the extent to which economies of scale exist for a Fund, and the extent to which a Fund benefits from economies of scale; and
| 17 |
Table of Contents
SUPPLEMENTAL INFORMATION(UNAUDITED)
(v) any other benefits derived by the Manager or theSub-advisers (or their respective affiliates) from their relationships with the Funds.
Nature, Extent and Quality of Services
The Trustees considered information regarding the nature, extent and quality of services provided to the Funds by the Manager. The Trustees also considered, among other things, the terms of the Management Agreement and the range of investment advisory services provided by the Manager. In addition, the Trustees reviewed the range ofnon-investment advisory services provided by the Manager consistent with the terms of the Management Agreement, notably coordinating the preparation and filing of various regulatory documents, coordinating the preparation and assembly of Board meeting materials and assisting the Board with certain valuation matters.
The Trustees considered that the Funds operate in a“manager-of-managers” structure and reviewed the responsibilities that the Manager has under this structure, including monitoring and evaluating the performance of theSub-advisers, monitoring theSub-advisers for adherence to the stated investment objectives, strategies, policies and restrictions of the Funds and supervising theSub-advisers with respect to the services that theSub-advisers would provide under theSub-advisory Agreements. The Trustees also considered the process used by the Manager, consistent with this structure, to identify and recommendsub-advisers, and the Manager’s ability to monitor and overseesub-advisers and recommend replacementsub-advisers, when necessary, and provide other services under the Management Agreement. The Board noted that investment management staff of the Manager and the Trust’s Chief Compliance Officer conductin-person oversight visits of theSub-advisers on a periodic basis, follow through with additional inquiry on any questions or concerns that arise during the visit and then report the results of the visit to the Board. The Trustees reviewed information regarding the experience and background of the Manager’s key personnel and the Manager’s organizational structure and resources, including investment, legal and administrative capabilities of the Manager. In this regard, the Trustees recognized that the Funds may benefit from the Manager’s ability to use similar resources and capabilities of its affiliates in providing services to the Funds.
The Trustees considered information regarding the nature, extent and quality of services provided to the Funds by theSub-advisers. The Trustees also
considered, among other things, the terms of theSub-advisory Agreements and the range of investment advisory services provided by theSub-advisers under the oversight of the Manager. In evaluating these investment advisory services, the Trustees considered, among other things, theSub-advisers’ investment philosophies, styles and/or processes and approach to managing the Funds. The Trustees received and evaluated information regarding the background, education, expertise and/or experience of the investment professionals that serve as portfolio managers for the Funds and the capabilities and resources of theSub-advisers.
Based upon these considerations, the Trustees concluded, within the context of their full deliberations, that the nature, extent and quality of services provided to the Funds by the Manager and eachSub-adviser were appropriate.
Investment Performance
In connection with each of its regular quarterly meetings, the Board receives information on the performance of each Fund, including net performance, relative performance rankings within each Fund’s Lipper peer group, Morningstar ratings, and performance as compared to benchmark index returns. At each quarterly Board meeting, members of the Manager’s senior investment team reviewed with the Board the economic and market environment, risk management, and style consistency in connection with management of the Funds. The Board considered investment performance for each Fund over theone-year and since inception periods.
The Board also received and reviewed a report prepared by Broadridge Financial Solutions (“Broadridge”), an independent provider of mutual fund industry data. The Board reviewed the investment performance of each Fund on an absolute basis and in comparison to an appropriate benchmark index and each Fund’s respective peer group as independently selected by Broadridge. The Board noted that, except for Guardian Growth & Income VIP Fund, Guardian Large Cap Disciplined Value VIP Fund and Guardian Mid Cap Traditional Growth VIP Fund, each of the Fund’s performance for theone-year and since inception periods was below the median of its respective peer group median and benchmark index. With respect to Guardian Large Cap Disciplined Value VIP Fund, the Board noted that the performance for theone-year period was lower than the peer group median and benchmark index and performance since inception was higher than the peer group median and benchmark
| 18 |
Table of Contents
SUPPLEMENTAL INFORMATION(UNAUDITED)
index. With respect to Guardian Growth & Income VIP Fund and Guardian Mid Cap Traditional Growth VIP Fund, the Board noted that the performance for both theone-year and since inception periods was higher than each Fund’s peer group median and benchmark index.
The Manager discussed with the Board factors contributing to the Funds’ performance results. In addition, for certain Funds, the Manager discussed with the Board longer term performance records of theSub-advisers for strategies used in managing the Funds. The Board concluded that the investment performance generated by eachSub-adviser was generally satisfactory, or, that any steps being taken by the Manager andSub-advisers to address any performance issues were satisfactory. The Board also noted the short operational history of each Fund.
Costs and Profitability
The Trustees considered the management fees paid by the Funds to the Manager under the Management Agreement and evaluated the reasonableness of these fees. The Trustees received and reviewed comparative information with respect to the management fees and the management fees paid by other funds offered as investment options underlying variable contracts within the applicable peer group based on data obtained from Broadridge. The Board noted that the contractual and actual (effective) management fees reported for each of the Funds were below or equal to its peer group in all cases except for the Guardian Mid Cap Traditional Growth VIP Fund. The Board noted that the actual (effective) management fee for this Fund exceeded the peer group median by a modest amount.
The Trustees considered thesub-advisory fees paid under theSub-advisory Agreements and evaluated the reasonableness of those fees. The Trustees also considered that the fees paid to theSub-advisers would be paid by the Manager and not the Funds and that the Manager had negotiated the fees with theSub-advisers atarm’s-length.
The Trustees received comparative information relating to each Fund’s operating expense ratios and the operating expense ratios of a peer group of funds. In this regard, the Board noted that each Fund’s operating expense ratio was equal to or lower than the operating expense ratio of its respective peer group median, except for Guardian Diversified Research VIP Fund, Guardian Growth & Income VIP Fund and Guardian Integrated Research VIP Fund. The Board noted that the operating expense ratio for these Funds exceeded the peer group median by a modest amount. The Trustees
considered the Manager’s commitment to limit each Fund’s operating expenses through an expense limitation agreement with the Trust. Although the Board recognized that the comparisons between the management fees and operating expenses of the Funds and those of identified peer funds are imprecise, given different terms of agreements and variations in fund strategies, the Trustees found that the comparative information supported their consideration and approval of the management fees and evaluation of the operating expenses.
The Board considered the Manager’s estimates of its profitability, which included allocations by the Manager of its costs in providing management services to the Funds. The Board considered the estimated profitability of the Manager both overall and on aFund-by-Fund basis. The Board did not consider any profitability information from theSub-advisers because the Manager would be responsible for payment of thesub-advisory fees and had negotiated the fees with theSub-advisers atarm’s-length.
Based on the consideration of the information and factors summarized above, as well as other relevant information and factors, the Board concluded that the proposed management andsub-advisory fees were reasonable in light of the nature, extent and quality of services rendered to the Funds by the Manager and theSub-advisers. The Board also concluded that the profitability of the Funds to the Manager was acceptable and the Board determined it was appropriate to revisit estimated Manager profitability in connection with future reviews of the Agreements.
Economies of Scale
The Board considered whether the Funds’ fee structure is designed to share economies of scale with shareholders as the Funds’ assets grow. In this regard, the Board noted that for ten of eleven Funds, the management andsub-advisory fee included breakpoints that are tiered based on growth in asset levels of each such Fund. The Board also noted that the Funds’ expenses were subject to an expense limitation provided by the Manager. The Board noted that expected economies of scale, where they exist, may be shared through the use of fee breakpoints, expense limitations by the Manager, and/or a lower overall fee.
Ancillary Benefits
The Board considered the potential benefits, other than management fees, that the Manager and/or its affiliates may receive because of the Manager’s relationship with
| 19 |
Table of Contents
SUPPLEMENTAL INFORMATION(UNAUDITED)
the Funds. The Trustees acknowledged that the Funds were designed to serve as investment options under variable contracts issued by affiliates of the Manager that would receive fees under those contracts and that Park Avenue Securities LLC, an affiliate of the Manager and principal underwriter of the Funds, and participating insurance companies, including insurance companies affiliated with the Manager, would be entitled to receive fees from the Funds under a plan of distribution adopted pursuant to Rule12b-1 under the 1940 Act. The Trustees considered the benefits to the Manager from increased assets under management. The Trustees considered that the Manager and its affiliates may benefit from (i) greater efficiencies in annuity administration and operations and potential cost savings due to a reduction in the number of unaffiliated funds available as annuity contract investment options, and (ii) increased dividends-received deductions due to the Funds’ status under the tax laws as disregarded
entities. In addition, the Trustees considered the potential benefits, other thansub-advisory fees, that theSub-advisers and their affiliates may receive because of their relationships with the Funds, including the potential increased ability to use soft dollars consistent with Trust policies and other benefits from increases in assets under management. The Trustees concluded that benefits that may accrue to the Manager and its affiliates are reasonable and the benefits that may accrue to theSub-advisers and their affiliates are consistent with those expected for asub-adviser to a mutual fund such as the applicable Fund.
Conclusion
Based on a comprehensive consideration and evaluation of all of the information and factors summarized above, among others, the Board as a whole, including the Independent Trustees, approved the Agreements.
| 20 |
Table of Contents
SUPPLEMENTAL INFORMATION(UNAUDITED)
The Statement of Additional Information (“SAI”) includes additional information about the Trust’s Trustees and Officers and is available, without charge, upon request by calling toll-free1-888-GUARDIAN(1-888-482-7342) or by visiting our website at http://guardianvpt.onlineprospectus.net/GuardianVPT/Prospectuses.
Portfolio Holdings and Proxy Voting Procedures
The Fund files its complete schedule of portfolio holdings with the Securities and Exchange Commission for the first and third quarters of each fiscal year as an exhibit to its reports on FormN-PORT. The Fund’s FormN-PORT reports are available on the Securities and Exchange Commission’s website at https://www.sec.gov. The Fund’s FormN-PORT information is also available, without charge, upon request, by calling toll-free1-888-GUARDIAN(1-888-482-7342) or by visiting our website at http://guardianvpt.onlineprospectus.net/ GuardianVPT/
Prospectuses.
A description of the policies and procedures that the Fund uses to determine how to vote proxies relating to portfolio securities is included in the SAI. The SAI and information regarding how the Fund voted proxies relating to portfolio securities during the most recent12-month period ended June 30 may be obtained (i) without charge, upon request, by calling toll-free1-888-GUARDIAN(1-888-482-7342) or by visiting our website at http://guardianvpt.onlineprospectus.net/GuardianVPT/
Prospectuses; and (ii) on the Securities and Exchange Commission’s website at https://www.sec.gov.
| 21 |
Table of Contents
This report is transmitted to shareholders only. It is not authorized for use as an offer of sale or a solicitation of an offer to buy shares of the Fund unless accompanied or preceded by the Fund’s current prospectus. Past performance results shown in this report should not be considered a representation of future performance. Investment returns and principal value of shares will fluctuate so that shares, when redeemed, may be worth more or less than their original cost. Statements and other information herein are as dated and are subject to change.

The Guardian Life Insurance Company of America New York, NY 10001-2159
PUB8172
Table of Contents
Guardian Variable
Products Trust
2019
Semiannual Report
All Data as of June 30, 2019
Guardian Core Plus Fixed Income VIP Fund
Important Notice
Beginning on January 1, 2021, as permitted by regulations adopted by the Securities and Exchange Commission, paper copies of the Fund’s shareholder reports will no longer be sent by mail from The Guardian Insurance & Annuity Company, Inc. (“GIAC”). Instead, GIAC will mail you a notice when copies of the shareholder reports are made available on a website. You will be notified by mail each time a report is posted and provided with a website link to access the report.
If you have already elected to receive shareholder reports electronically, you will not be affected by this change and you need not take any action. If you have not yet elected electronic delivery, at any time, you may elect to receive the Fund’s shareholder reports and certain other communications from GIAC electronically, by going to www.guardianlife.com and registering fore-delivery.
You may instead elect to receive all future shareholder reports in paper free of charge. If you wish to receive paper copies of your shareholder reports, please call GIAC’s Customer Service Office Contact Center at1-888-GUARDIAN(1-888-482-7342). Your election to receive reports in paper will apply to all the underlying funds available.

| Not FDIC insured. May lose value. No bank guarantee. | www.guardianlife.com |
Table of Contents
TABLE OF CONTENTS
Guardian Core Plus Fixed Income VIP Fund
Except as otherwise specifically stated, all information, including portfolio security positions, is as of June 30, 2019. Fund holdings will vary. Information contained herein has been obtained from sources believed reliable, but is not guaranteed.
Table of Contents
GUARDIAN CORE PLUS FIXED INCOME VIP FUND
Fund Characteristics (unaudited)
| Total Net Assets: $368,995,118 |
Bond Sector Allocation1 As of June 30, 2019 |
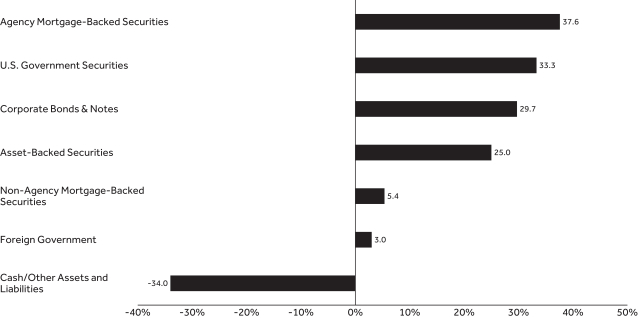 |
Bond Quality Allocation2 As of June 30, 2019 |
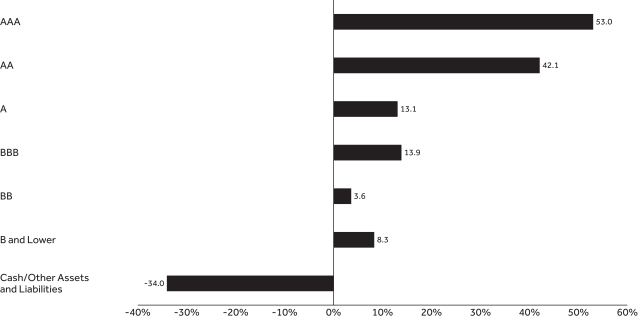 |
| 1 |
Table of Contents
GUARDIAN CORE PLUS FIXED INCOME VIP FUND
Top Ten Holdings1 As of June 30, 2019 | ||||||||||||
| Holding | Coupon Rate | Maturity Date | % of Total Net Assets | |||||||||
| U.S. Treasury Bill | 0.988% | 7/2/2019 | 21.51% | |||||||||
| Federal National Mortgage Association | 3.500% | 7/1/2049 | 16.10% | |||||||||
| Federal National Mortgage Association | 4.500% | 7/1/2049 | 14.37% | |||||||||
| Federal National Mortgage Association | 4.000% | 7/1/2049 | 7.09% | |||||||||
| U.S. Treasury Note Inflation Protected Security | 0.625% | 4/15/2023 | 4.72% | |||||||||
| U.S. Treasury Bond | 2.750% | 11/15/2047 | 2.79% | |||||||||
| U.S. Treasury Bond | 3.000% | 2/15/2049 | 1.54% | |||||||||
| U.S. Treasury Note | 2.500% | 1/31/2021 | 1.23% | |||||||||
| BAMLL Commercial Mortgage Securities Trust | 3.652% | 3/10/2037 | 1.10% | |||||||||
| JPMorgan Chase & Co. | 3.782% | 2/1/2028 | 0.97% | |||||||||
| Total |
| 71.42% | ||||||||||
| 1 | Portfolio holdings are subject to change and should not be considered a recommendation to buy or sell individual securities. Cash includes short-term investments and net other assets and liabilities. |
| 2 | The Bond Quality Allocation chart displays the percentage of fund assets allocated to each rating. Rating agencies’ independent ratings of individual securities are aggregated by Barclays, and market weights are reported using Standard & Poor’s letter rating conventions. Rating methodology uses the middle rating of Moody’s Investors Service, Inc., Standard & Poor’s Ratings Services, and Fitch Ratings. When a rating from only two of the rating agencies is available, the lower rating is used. Credit quality ratings assigned by a rating agency are subject to change periodically and are not absolute standards of credit quality. Rating agencies may fail to make timely changes in credit ratings, and an issuer’s current financial condition may be better or worse than a rating indicates. In formulating investment decisions for the Fund, Lord, Abbett & Co. LLC develops its own analysis of the credit quality and risks associated with individual debt instruments, rather than relying exclusively on rating agency ratings. |
| 2 |
Table of Contents
UNDERSTANDING YOUR FUND’S EXPENSES(UNAUDITED)
By investing in the Fund, you incur two types of costs: (1) transaction costs and (2) ongoing costs, including, as applicable, investment advisory fees, distribution and/or service(12b-1) fees and other Fund expenses. The example below is intended to help you understand your ongoing costs (in dollars) of investing in the Fund and to compare these costs with the ongoing costs of investing in other mutual funds.
The example is based on an investment of $1,000 invested at the beginning of the period and held for the entire period from January 1, 2019 to June 30, 2019. The table below shows the Fund’s expenses in two ways:
Expenses based on actual return
This section of the table provides information about actual account values and actual expenses. You may use the information in this section, together with the amount you invested, to estimate the expenses that you paid over the period. Simply divide your account value by $1,000 (for example, an $8,600 account value divided by $1,000 = 8.6), then multiply the result by the number in the section under the heading entitled “Expenses Paid During Period” to estimate the expenses you paid on your account during this period.
Expenses based on hypothetical 5% return for comparison purposes
This section of the table provides information about hypothetical account values and hypothetical expenses based on the Fund’s actual expense ratio and an assumed rate of return of 5% per year before expenses, which is not the Fund’s actual return. The hypothetical account values and expenses may not be used to estimate the actual ending account balance or expenses you paid for the period. You may use this information to compare the ongoing costs of investing in the Fund with the cost of investing in other mutual funds. To do so, compare this 5% hypothetical example with the 5% hypothetical examples that appear in the shareholder reports of the other funds.
Note that the expenses shown in the table are meant to highlight your ongoing costs only and do not reflect any transactional costs, such as sales charges (loads), redemption fees, or exchange fees. Therefore the second section is useful in comparing ongoing costs only, and will not help you determine the relative total costs of owning different funds. If these transactional costs were included, your costs would have been higher. Charges and expenses at the insurance company separate account level are not reflected in the table.
Beginning 1/1/19 | Ending Account Value | Expenses Paid During Period* 1/1/19-6/30/19 | Expense Ratio During Period 1/1/19-6/30/19 | |||||||||||||
| Based on Actual Return | $ | 1,000.00 | $ | 1,063.30 | $ | 4.04 | 0.79% | |||||||||
| Based on Hypothetical Return (5% Return Before Expenses) | $ | 1,000.00 | $ | 1,020.88 | $ | 3.96 | 0.79% | |||||||||
| * | Expenses are equal to the Fund’s annualized expense ratio as indicated, multiplied by the average account value over the period, multiplied by 181/365 (to reflect theone-half year period). |
| 3 |
Table of Contents
SCHEDULE OF INVESTMENTS — GUARDIAN CORE PLUS FIXED INCOME VIP FUND
| June 30, 2019(unaudited) | Principal Amount | Value | ||||||
| Agency Mortgage–Backed Securities – 37.6% |
| |||||||
Federal Home Loan Mortgage Corp. Multifamily Structured Pass-Through Certificate | $ | 42,000 | $ | 45,124 | ||||
Federal National Mortgage Association |
| 58,100,000 |
|
| 59,400,441 |
| ||
4.00% due 7/1/2049(1) | 25,300,000 | 26,148,439 | ||||||
4.50% due 7/1/2049(1) | 50,750,000 | 53,031,273 | ||||||
Government National Mortgage Association |
| 95,663 |
|
| 95,658 |
| ||
2017-41 AS | 81,883 | 81,310 | ||||||
2017-69 AS | 44,229 | 44,362 | ||||||
2017-71 AS | 28,453 | 28,438 | ||||||
2017-89 AB | 28,156 | 28,079 | ||||||
2017-90 AS | 38,916 | 38,946 | ||||||
| Total Agency Mortgage–Backed Securities (Cost $138,726,816) |
| 138,942,070 | ||||||
| Asset–Backed Securities – 25.0% |
| |||||||
ACC Trust | 230,000 | 231,012 | ||||||
2019-1 B | 294,000 | 299,393 | ||||||
2019-1 C | 500,000 | 509,278 | ||||||
Ally Auto Receivables Trust | 1,271,000 | 1,270,240 | ||||||
ALM VII Ltd. 4.077% (LIBOR 3 Month + 1.48%) due 10/15/2028(2)(3) | 1,806,000 | 1,808,492 | ||||||
2012-7A A2R2 4.153% (LIBOR 3 Month + 1.85%) due | 908,000 | 908,000 | ||||||
American Credit Acceptance Receivables Trust | 8,052 | 8,128 | ||||||
2018-4 A | 638,100 | 640,234 | ||||||
2019-2 B | 674,000 | 677,292 | ||||||
American Express Credit Account Master Trust | 1,000,000 | 997,955 | ||||||
AmeriCredit Automobile Receivables Trust | 884,000 | 885,128 | ||||||
| June 30, 2019(unaudited) | Principal Amount | Value | ||||||
| Asset–Backed Securities(continued) |
| |||||||
2016-3 C | $ | 2,097,000 | $ | 2,094,654 | ||||
2017-2 C | 44,000 | 44,417 | ||||||
2017-3 B | 18,000 | 17,991 | ||||||
2018-3 A2A | 437,297 | 438,464 | ||||||
2018-3 A2B 2.632% (LIBOR 1 Month + 0.25%) due 1/18/2022(3) | 437,297 | 436,859 | ||||||
2019-1 A2A | 574,000 | 576,368 | ||||||
2019-1 A2B 2.642% (LIBOR 1 Month + 0.26%) due 6/20/2022(3) | 635,000 | 634,951 | ||||||
Ares XLI CLO Ltd. 4.397% (LIBOR 3 Month + 1.80%) due 1/15/2029(2)(3) | 500,000 | 502,212 | ||||||
Ascentium Equipment Receivables Trust | 2,181 | 2,179 | ||||||
2016-2A B | 9,000 | 8,993 | ||||||
2017-1A A3 | 8,745 | 8,743 | ||||||
Avery Point VII CLO Ltd. 4.053% (LIBOR 3 Month + 1.75%) due 1/15/2028(2)(3) | 400,000 | 400,000 | ||||||
2015-7A CR 4.753% (LIBOR 3 Month + 2.45%) due 1/15/2028(2)(3) | 250,000 | 250,000 | ||||||
Avis Budget Rental Car Funding AESOP LLC | 826,000 | 828,096 | ||||||
Barclays Dryrock Issuance Trust | 2,624,000 | 2,623,518 | ||||||
Benefit Street Partners CLO IV Ltd. 3.842% (LIBOR 3 Month + 1.25%) due 1/20/2029(2)(3) | 1,000,000 | 999,484 | ||||||
BlueMountain CLO Ltd. 3.942% (LIBOR 3 Month + 1.35%) due 4/20/2027(2)(3) | 822,000 | 807,608 | ||||||
BMW Vehicle Lease Trust | 643,000 | 644,899 | ||||||
BMW Vehicle Owner Trust | 19,812 | 19,799 | ||||||
| 4 | The accompanying notes are an integral part of these financial statements. |
Table of Contents
SCHEDULE OF INVESTMENTS — GUARDIAN CORE PLUS FIXED INCOME VIP FUND
| June 30, 2019(unaudited) | Principal Amount | Value | ||||||
| Asset–Backed Securities(continued) |
| |||||||
California Republic Auto Receivables Trust | $ | 87,000 | $ | 86,917 | ||||
2015-3 A4 | 8,844 | 8,833 | ||||||
2015-4 A4 | 30,443 | 30,451 | ||||||
2016-2 B | 21,000 | 20,996 | ||||||
2017-1 A3 | 4,889 | 4,886 | ||||||
2018-1 A2 | 450,733 | 450,728 | ||||||
2018-1 B | 669,000 | 680,483 | ||||||
Capital Auto Receivables Asset Trust2017-1 B | 28,000 | 28,094 | ||||||
2017-1 C | 40,000 | 40,109 | ||||||
2017-1 D | 1,086,000 | 1,091,250 | ||||||
2018-1 A3 | 1,239,000 | 1,241,918 | ||||||
Capital One Multi-Asset Execution Trust | 808,000 | 806,915 | ||||||
2017-A1 A1 | 1,000,000 | 998,338 | ||||||
CarMax Auto Owner Trust | 12,422 | 12,417 | ||||||
2018-3 A2A | 408,876 | 409,922 | ||||||
Cedar Funding VI CLO Ltd. 4.192% (LIBOR 3 Month + 1.60%) due 10/20/2028(2)(3) | 400,000 | 396,713 | ||||||
Chase Issuance Trust | 534,000 | 533,451 | ||||||
2016-A5 A5 | 1,058,000 | 1,057,560 | ||||||
Chesapeake Funding II LLC | 23,415 | 23,403 | ||||||
2016-2A A1 | 136,381 | 136,150 | ||||||
2017-2A A1 | 265,668 | 265,027 | ||||||
2017-3A A1 | 1,209,145 | 1,203,124 | ||||||
Chrysler Capital Auto Receivables Trust | 6,000 | 6,018 | ||||||
| June 30, 2019(unaudited) | Principal Amount | Value | ||||||
| Asset–Backed Securities(continued) |
| |||||||
Citibank Credit Card Issuance Trust | $ | 608,000 | $ | 607,935 | ||||
CPS Auto Receivables Trust | 2,183 | 2,182 | ||||||
2017-D B | 955,000 | 954,066 | ||||||
2018-B A | 430,573 | 430,612 | ||||||
2018-B B | 1,509,000 | 1,515,127 | ||||||
2018-B D | 750,000 | 772,848 | ||||||
CPS Auto Trust | 292,568 | 292,799 | ||||||
2018-C B | 212,000 | 213,304 | ||||||
Daimler Trucks Retail Trust | 10,950 | 10,950 | ||||||
Discover Card Execution Note Trust | 1,942,000 | 1,941,417 | ||||||
2017-A2 A2 | 1,277,000 | 1,288,991 | ||||||
DLL Securitization Trust | 749,000 | 747,498 | ||||||
DRB Prime Student Loan Trust | 214,732 | 217,783 | ||||||
Drive Auto Receivables Trust | 1,320,473 | 1,336,976 | ||||||
2016-CA C | 11,515 | 11,524 | ||||||
2016-CA D | 14,000 | 14,220 | ||||||
2017-1 D | 3,156,000 | 3,194,114 | ||||||
2017-3 C | 45,975 | 46,032 | ||||||
2017-AA D | 26,000 | 26,447 | ||||||
2017-BA D | 1,499,000 | 1,507,949 | ||||||
2017-BA E | 2,100,000 | 2,166,835 | ||||||
2018-3 A3 | 315,861 | 315,959 | ||||||
2018-3 B | 265,000 | 265,900 | ||||||
2018-3 C | 633,000 | 640,123 | ||||||
2018-4 A3 | 814,706 | 815,200 | ||||||
| The accompanying notes are an integral part of these financial statements. | 5 |
Table of Contents
SCHEDULE OF INVESTMENTS — GUARDIAN CORE PLUS FIXED INCOME VIP FUND
| June 30, 2019(unaudited) | Principal Amount | Value | ||||||
| Asset–Backed Securities(continued) |
| |||||||
2018-5 A2A | $ | 336,146 | $ | 336,369 | ||||
2018-5 A2B 2.714% (LIBOR 1 Month + 0.32%) due 7/15/2021(3) | 275,639 | 275,572 | ||||||
2019-2 A2A | 1,005,000 | 1,007,205 | ||||||
Elm CLO Ltd. 3.473% (LIBOR 3 Month + 1.17%) due 1/17/2029(2)(3) | 1,283,000 | 1,283,000 | ||||||
Engs Commercial Finance Trust | 33,664 | 33,707 | ||||||
Enterprise Fleet Financing LLC | 241,992 | 243,136 | ||||||
First Investors Auto Owner Trust | 6,594 | 6,590 | ||||||
2017-3A A2 | 24,000 | 24,008 | ||||||
Flagship Credit Auto Trust | 434,344 | 434,475 | ||||||
2017-2 A | 4,612 | 4,608 | ||||||
2017-3 A | 8,615 | 8,594 | ||||||
2017-3 B | 20,000 | 19,987 | ||||||
2017-4 A | 10,089 | 10,063 | ||||||
2018-1 A | 18,699 | 18,700 | ||||||
2018-3 A | 1,088,575 | 1,094,300 | ||||||
2018-3 B | 479,000 | 487,384 | ||||||
Ford Credit Auto Owner Trust | 2,000,000 | 1,994,170 | ||||||
Ford Credit Floorplan Master Owner Trust A | 450,000 | 479,179 | ||||||
Foursight Capital Automobile Receivables Trust | 14,084 | 14,095 | ||||||
2018-1 A2 | 51,783 | 51,793 | ||||||
2018-1 B | 100,000 | 101,710 | ||||||
GM Financial Consumer Automobile Receivables Trust | 1,404 | 1,403 | ||||||
| June 30, 2019(unaudited) | Principal Amount | Value | ||||||
| Asset–Backed Securities(continued) |
| |||||||
Golden Credit Card Trust | $ | 2,015,000 | $ | 2,028,001 | ||||
Halcyon Loan Advisors Funding Ltd. 4.73% (LIBOR 3 Month + 2.15%) due 7/25/2027(2)(3) | 250,000 | 248,613 | ||||||
Hardee’s Funding LLC | 762,240 | 784,844 | ||||||
Honda Auto Receivables Owner Trust | 49 | 49 | ||||||
2019-1 A2 | 1,382,000 | 1,385,375 | ||||||
Hyundai Auto Lease Securitization Trust | 7,093 | 7,091 | ||||||
2017-C A3 | 637,000 | 636,253 | ||||||
KVK CLO Ltd. 5.747% (LIBOR 3 Month + 3.15%) due 1/15/2029(2)(3) | 483,000 | 483,259 | ||||||
LCM XXII Ltd. 4.072% (LIBOR 3 Month + 1.48%) due 10/20/2028(2)(3) | 250,000 | 250,562 | ||||||
LCM XXIV Ltd. 3.902% (LIBOR 3 Month + 1.31%) due 3/20/2030(2)(3) | 439,000 | 439,891 | ||||||
Longtrain Leasing III LLC | 464,000 | 478,300 | ||||||
Master Credit Card Trust II Series 2.873% (LIBOR 1 Month + 0.49%) due 7/21/2024(2)(3) | 100,000 | 99,830 | ||||||
ME Funding LLC | 472,000 | 478,406 | ||||||
Mercedes-Benz Auto Lease Trust | 7,687 | 7,686 | ||||||
2018-B A2 | 1,408,231 | 1,411,377 | ||||||
Mercedes-Benz Auto Receivables Trust | 5,420 | 5,401 | ||||||
MMAF Equipment Finance LLC | 1,373,842 | 1,372,661 | ||||||
| 6 | The accompanying notes are an integral part of these financial statements. |
Table of Contents
SCHEDULE OF INVESTMENTS — GUARDIAN CORE PLUS FIXED INCOME VIP FUND
| June 30, 2019(unaudited) | Principal Amount | Value | ||||||
| Asset–Backed Securities(continued) |
| |||||||
Navient Private Education Refi Loan Trust | $ | 368,000 | $ | 390,841 | ||||
NextGear Floorplan Master Owner Trust | 656,000 | 655,182 | ||||||
OHA Loan Funding Ltd. 4.392% (LIBOR 3 Month + 1.80%) due 1/20/2028(2)(3) | 542,000 | 539,956 | ||||||
Orange Lake Timeshare Trust | 137,081 | 138,007 | ||||||
Orec Ltd. 3.574% (LIBOR 1 Month + 1.18%) due 6/15/2036(2)(3) | 645,000 | 645,806 | ||||||
Palmer Square Loan Funding Ltd.2018-5A A1 3.442% (LIBOR 3 Month + 0.85%) due 1/20/2027(2)(3) | 636,791 | 632,507 | ||||||
2018-5A A2 3.992% (LIBOR 3 Month + 1.40%) due 1/20/2027(2)(3) | 250,000 | 244,931 | ||||||
Pennsylvania Higher Education Assistance Agency 2.85% (LIBOR 3 Month + 0.27%) due 4/25/2038(3) | 41,049 | 38,626 | ||||||
PFS Financing Corp. | 937,000 | 934,999 | ||||||
Regatta VI Funding Ltd. 4.642% (LIBOR 3 Month + 2.05%) due 7/20/2028(2)(3) | 314,000 | 310,204 | ||||||
Santander Drive Auto Receivables Trust | 446,364 | 446,722 | ||||||
2015-2 E | 1,293,000 | 1,297,082 | ||||||
2015-4 C | 1,800 | 1,801 | ||||||
2017-3 C | 12,000 | 12,027 | ||||||
2018-1 B | 46,000 | 46,069 | ||||||
2018-1 D | 35,000 | 35,507 | ||||||
2018-3 A2A | 83,834 | 83,844 | ||||||
SCF Equipment Leasing LLC2018-1A A2 | 593,108 | 592,980 | ||||||
2019-1A C | 1,298,000 | 1,328,973 | ||||||
| June 30, 2019(unaudited) | Principal Amount | Value | ||||||
| Asset–Backed Securities(continued) |
| |||||||
Shackleton CLO Ltd. 4.203% (LIBOR 3 Month + 1.90%) due 7/20/2030(2)(3) | $ | 1,042,000 | $ | 1,042,000 | ||||
SLC Student Loan Trust 4.01% (LIBOR 3 Month + 1.60%) due 12/15/2032(3) | 172,452 | 176,598 | ||||||
SoFi Professional Loan Program Trust | 1,006,417 | 1,004,273 | ||||||
2018-A A2A | 375,303 | 375,602 | ||||||
2018-B A1FX | 424,294 | 425,269 | ||||||
Sound Point CLO XI Ltd. 3.692% (LIBOR 3 Month + 1.10%) due 7/20/2028(2)(3) | 370,000 | 369,809 | ||||||
Sound Point CLO XII Ltd. 5.192% (LIBOR 3 Month + 2.60%) due 10/20/2028(2)(3) | 504,000 | 502,977 | ||||||
Sound Point CLO XV Ltd. 5.092% (LIBOR 3 Month + 2.50%) due 1/23/2029(2)(3) | 343,000 | 343,212 | ||||||
SunTrust Auto Receivables Trust | 3,576 | 3,574 | ||||||
Synchrony Credit Card Master Note Trust | 561,000 | 559,866 | ||||||
2017-1 A | 1,873,000 | 1,865,988 | ||||||
TCF Auto Receivables Owner Trust | 1,049,000 | 1,051,639 | ||||||
2016-1A B | 69,000 | 68,747 | ||||||
2016-PT1A B | 30,000 | 30,162 | ||||||
TCI-Symphony CLO Ltd. 4.077% (LIBOR 3 Month + 1.48%) due 10/13/2029(2)(3) | 250,000 | 250,751 | ||||||
Textainer Marine Containers VII Ltd. | 388,747 | 395,041 | ||||||
THL Credit Wind River CLO Ltd. 4.447% (LIBOR 3 Month + 1.85%) due 1/15/2026(2)(3) | 2,000,000 | 2,000,000 | ||||||
| The accompanying notes are an integral part of these financial statements. | 7 |
Table of Contents
SCHEDULE OF INVESTMENTS — GUARDIAN CORE PLUS FIXED INCOME VIP FUND
| June 30, 2019(unaudited) | Principal Amount | Value | ||||||
| Asset–Backed Securities(continued) |
| |||||||
Towd Point Asset Trust 3.004% (LIBOR 1 Month + 0.60%) due 1/25/2046(2)(3) | $ | 581,587 | $ | 576,060 | ||||
Towd Point Mortgage Trust 3.404% (LIBOR 1 Month + 1.00%) due 5/25/2058(2)(3) | 444,933 | 446,827 | ||||||
TPG Real Estate Finance Issuer Ltd. 3.524% (LIBOR 1 Month + 1.13%) due 11/15/2037(2)(3) | 658,000 | 659,234 | ||||||
Westgate Resorts LLC | 251,438 | 253,540 | ||||||
Westlake Automobile Receivables Trust | 827,000 | 822,496 | ||||||
2019-2A D | 356,000 | 350,792 | ||||||
Wheels SPV 2 LLC | 315,866 | 317,710 | ||||||
Wingstop Funding LLC | 530,670 | 553,329 | ||||||
World Financial Network Credit Card Master Trust | 2,894,000 | 2,891,710 | ||||||
2017-C M | 40,000 | 40,016 | ||||||
| Total Asset–Backed Securities (Cost $91,795,865) |
| 92,245,814 | ||||||
| Corporate Bonds & Notes – 29.7% |
| |||||||
| Aerospace & Defense – 0.4% |
| |||||||
Embraer Netherlands Finance B.V. | 15,000 | 16,181 | ||||||
Kratos Defense & Security Solutions, Inc. | 553,000 | 594,475 | ||||||
TransDigm, Inc. | 526,000 | 529,945 | ||||||
United Technologies Corp. | 303,000 | 353,344 | ||||||
|
| |||||||
| 1,493,945 | ||||||||
| Agriculture – 0.3% |
| |||||||
BAT Capital Corp. | 648,000 | 614,050 | ||||||
Reynolds American, Inc. | 548,000 | 601,283 | ||||||
|
| |||||||
| 1,215,333 | ||||||||
| Auto Manufacturers – 1.0% |
| |||||||
Daimler Finance North America LLC | 760,000 | 794,268 | ||||||
| June 30, 2019(unaudited) | Principal Amount | Value | ||||||
| Auto Manufacturers(continued) |
| |||||||
Ford Motor Co. | $ | 1,065,000 | $ | 1,259,576 | ||||
General Motors Co. | 50,000 | 55,350 | ||||||
6.75% due 4/1/2046 | 1,100,000 | 1,241,480 | ||||||
Tesla, Inc. | 382,000 | 335,205 | ||||||
|
| |||||||
| 3,685,879 | ||||||||
| Auto Parts & Equipment – 0.1% |
| |||||||
Aptiv PLC | 141,000 | 148,602 | ||||||
ZF North America Capital, Inc. | 319,000 | 329,666 | ||||||
|
| |||||||
| 478,268 | ||||||||
| Beverages – 0.5% |
| |||||||
Anheuser-Busch Cos. LLC / Anheuser-Busch InBev Worldwide, Inc. | 303,000 | 332,382 | ||||||
4.75% due 1/23/2029 | 1,168,000 | 1,325,921 | ||||||
Becle S.A.B. de C.V. | 150,000 | 150,299 | ||||||
|
| |||||||
| 1,808,602 | ||||||||
| Biotechnology – 0.1% |
| |||||||
Gilead Sciences, Inc. | 299,000 | 336,548 | ||||||
|
| |||||||
| 336,548 | ||||||||
| Chemicals – 0.5% |
| |||||||
Braskem Netherlands Finance B.V. | 400,000 | 404,600 | ||||||
CNAC HK Finbridge Co. Ltd. | 380,000 | 382,446 | ||||||
Mexichem S.A.B. de C.V. | 250,000 | 262,253 | ||||||
Phosagro OAO Via Phosagro Bond Funding DAC | 300,000 | 301,788 | ||||||
Rain CII Carbon LLC / CII Carbon Corp. | 376,000 | 347,800 | ||||||
|
| |||||||
| 1,698,887 | ||||||||
| Coal – 0.1% |
| |||||||
Indika Energy Capital III Pte Ltd. | 410,000 | 400,353 | ||||||
|
| |||||||
| 400,353 | ||||||||
| Commercial Banks – 7.7% |
| |||||||
Akbank T.A.S. | 200,000 | 198,760 | ||||||
Banco de Credito e Inversiones S.A. | 420,000 | 423,679 | ||||||
| 8 | The accompanying notes are an integral part of these financial statements. |
Table of Contents
SCHEDULE OF INVESTMENTS — GUARDIAN CORE PLUS FIXED INCOME VIP FUND
| June 30, 2019(unaudited) | Principal Amount | Value | ||||||
| Commercial Banks(continued) |
| |||||||
Bank of America Corp. 3.593% (3.593% fixed rate until 7/21/2027; LIBOR 3 Month + 1.37% thereafter) due 7/21/2028(3) | $ | 3,084,000 | $ | 3,215,534 | ||||
3.95% due 4/21/2025 | 25,000 | 26,214 | ||||||
4.00% due 1/22/2025 | 577,000 | 606,892 | ||||||
4.45% due 3/3/2026 | 250,000 | 269,661 | ||||||
CIT Group, Inc. | 820,000 | 932,750 | ||||||
Citigroup, Inc. 3.887% (3.887% fixed rate until 1/10/2027; LIBOR 3 Month + 1.563% thereafter) due 1/10/2028(3) | 1,966,000 | 2,079,963 | ||||||
3.98% (3.98% fixed rate until 3/20/2030; LIBOR 3 Month + 1.338% thereafter) due 3/20/2030(3) | 803,000 | 857,666 | ||||||
4.45% due 9/29/2027 | 361,000 | 388,943 | ||||||
Danske Bank A/S | 343,000 | 351,278 | ||||||
HBOS PLC | 35,000 | 40,699 | ||||||
JPMorgan Chase & Co. 3.782% (3.782% fixed rate until 2/1/2027; LIBOR 3 Month + 1.337% thereafter) due 2/1/2028(3) | 3,394,000 | 3,598,014 | ||||||
Macquarie Group Ltd. 4.654% (4.654% fixed rate until 3/27/2028; LIBOR 3 Month + 1.727% thereafter) due | 963,000 | 1,040,682 | ||||||
Morgan Stanley | 1,395,000 | 1,464,103 | ||||||
3.875% due 1/27/2026 | 578,000 | 614,421 | ||||||
4.00% due 7/23/2025 | 1,404,000 | 1,503,831 | ||||||
Popular, Inc. | 361,000 | 383,111 | ||||||
Santander U.K. PLC | 87,000 | 107,658 | ||||||
The Goldman Sachs Group, Inc. 4.223% (4.223% fixed rate until 5/1/2028; LIBOR 3 Month + 1.301% thereafter) due 5/1/2029(3) | 490,000 | 525,529 | ||||||
6.25% due 2/1/2041 | 405,000 | 543,037 | ||||||
The Toronto-Dominion Bank 3.625% (3.625% fixed rate until 9/15/2026; 5 Year USD Swap + 2.205% thereafter) due | 1,937,000 | 1,973,914 | ||||||
Turkiye Garanti Bankasi A/S | 400,000 | 404,450 | ||||||
UBS AG | 872,000 | 923,785 | ||||||
7.625% due 8/17/2022 | 900,000 | 1,009,539 | ||||||
| June 30, 2019(unaudited) | Principal Amount | Value | ||||||
| Commercial Banks(continued) |
| |||||||
Wachovia Corp. | $ | 151,000 | $ | 189,565 | ||||
Wells Fargo Bank N.A. | 1,250,000 | 1,738,375 | ||||||
Westpac Banking Corp. | 2,826,000 | 2,948,560 | ||||||
|
| |||||||
| 28,360,613 | ||||||||
| Commercial Services – 0.5% |
| |||||||
Adani Ports & Special Economic Zone Ltd. | 200,000 | 199,426 | ||||||
Ahern Rentals, Inc. | 389,000 | 345,238 | ||||||
United Rentals North America, Inc. | 817,000 | 833,340 | ||||||
Weight Watchers International, Inc. | 346,000 | 316,590 | ||||||
|
| |||||||
| 1,694,594 | ||||||||
| Computers – 0.3% |
| |||||||
Dell International LLC / EMC Corp. | 141,000 | 151,969 | ||||||
6.02% due 6/15/2026(2) | 134,000 | 147,826 | ||||||
8.35% due 7/15/2046(2) | 723,000 | 912,785 | ||||||
|
| |||||||
| 1,212,580 | ||||||||
| Diversified Financial Services – 1.8% |
| |||||||
AerCap Ireland Capital DAC / AerCap Global Aviation Trust | 872,000 | 877,097 | ||||||
3.875% due 1/23/2028 | 567,000 | 569,202 | ||||||
4.875% due 1/16/2024 | 328,000 | 352,208 | ||||||
Affiliated Managers Group, Inc. | 500,000 | 513,848 | ||||||
4.25% due 2/15/2024 | 25,000 | 26,559 | ||||||
Air Lease Corp. | 876,000 | 880,945 | ||||||
Ally Financial, Inc. | 573,000 | 757,340 | ||||||
GE Capital International Funding Co. Unlimited Co. | 987,000 | 976,890 | ||||||
International Lease Finance Corp. | 112,000 | 122,006 | ||||||
Navient Corp. | 178,000 | 180,003 | ||||||
6.75% due 6/25/2025 | 352,000 | 364,320 | ||||||
Neuberger Berman Group LLC / Neuberger Berman Finance Corp. | 380,000 | 400,897 | ||||||
4.875% due 4/15/2045(2) | 198,000 | 189,536 | ||||||
SURA Asset Management S.A. | 400,000 | 414,104 | ||||||
|
| |||||||
| 6,624,955 | ||||||||
| Electric – 2.0% |
| |||||||
Ausgrid Finance Pty. Ltd. | 686,000 | 729,388 | ||||||
| The accompanying notes are an integral part of these financial statements. | 9 |
Table of Contents
SCHEDULE OF INVESTMENTS — GUARDIAN CORE PLUS FIXED INCOME VIP FUND
| June 30, 2019(unaudited) | Principal Amount | Value | ||||||
| Electric(continued) |
| |||||||
Berkshire Hathaway Energy Co. | $ | 1,018,000 | $ | 1,041,064 | ||||
Calpine Corp. | 554,000 | 549,845 | ||||||
Cleco Corporate Holdings LLC | 258,000 | 275,832 | ||||||
Dayton Power & Light Co. | 130,000 | 133,577 | ||||||
Dominion Energy South Carolina, Inc. | 543,000 | 701,374 | ||||||
6.625% due 2/1/2032 | 15,000 | 19,718 | ||||||
Electricite de France S.A. | 621,000 | 707,164 | ||||||
Entergy Arkansas LLC | 452,000 | 498,454 | ||||||
Entergy Louisiana LLC | 292,000 | 322,164 | ||||||
Exelon Generation Co. LLC | 49,000 | 54,587 | ||||||
6.25% due 10/1/2039 | 450,000 | 532,136 | ||||||
Interstate Power & Light Co. | 354,000 | 368,451 | ||||||
Massachusetts Electric Co. | 370,000 | 380,883 | ||||||
Minejesa Capital B.V. | 200,000 | 202,212 | ||||||
Pennsylvania Electric Co. | 370,000 | 382,206 | ||||||
PSEG Power LLC | 228,000 | 312,506 | ||||||
Vistra Operations Co. LLC | 274,000 | 277,770 | ||||||
|
| |||||||
| 7,489,331 | ||||||||
| Electronics – 0.0% |
| |||||||
Trimble, Inc. | 22,000 | 23,571 | ||||||
|
| |||||||
| 23,571 | ||||||||
| Engineering & Construction – 0.2% |
| |||||||
China Railway Resources Huitung Ltd. | 581,000 | 600,933 | ||||||
|
| |||||||
| 600,933 | ||||||||
| Entertainment – 0.2% |
| |||||||
Penn National Gaming, Inc. | 193,000 | 190,588 | ||||||
Stars Group Holdings B.V. / Stars Group U.S.Co-Borrower LLC | 522,000 | 552,015 | ||||||
|
| |||||||
| 742,603 | ||||||||
| June 30, 2019(unaudited) | Principal Amount | Value | ||||||
| Food – 0.3% |
| |||||||
Albertsons Cos. LLC / Safeway, Inc. / New Albertsons LP / Albertson’s LLC | $ | 357,000 | $ | 369,941 | ||||
Arcor SAIC | 13,000 | 12,871 | ||||||
JBS USA LUX S.A. / JBS USA Food Co. / JBS USA Finance, Inc. | 514,000 | 558,333 | ||||||
|
| |||||||
| 941,145 | ||||||||
| Forest Products & Paper – 0.1% |
| |||||||
Fibria Overseas Finance Ltd. | 390,000 | 392,925 | ||||||
|
| |||||||
| 392,925 | ||||||||
| Gas – 0.3% |
| |||||||
Dominion Energy Gas Holdings LLC | 708,000 | 791,884 | ||||||
Piedmont Natural Gas Co., Inc. | 375,000 | 392,397 | ||||||
|
| |||||||
| 1,184,281 | ||||||||
| Hand & Machine Tools – 0.1% |
| |||||||
Kennametal, Inc. | 360,000 | 375,312 | ||||||
|
| |||||||
| 375,312 | ||||||||
| Healthcare-Services – 0.4% |
| |||||||
Acadia Healthcare Co., Inc. | 341,000 | 355,492 | ||||||
HCA, Inc. | 224,000 | 239,322 | ||||||
7.50% due 11/6/2033 | 10,000 | 11,500 | ||||||
Polaris Intermediate Corp. 8.50% due 12/1/2022, Toggle PIK (8.50% Cash or 9.25% | 351,000 | 309,758 | ||||||
Tenet Healthcare Corp. | 524,000 | 542,340 | ||||||
|
| |||||||
| 1,458,412 | ||||||||
| Home Builders – 0.3% |
| |||||||
Century Communities, Inc. | 283,000 | 286,891 | ||||||
TRI Pointe Group, Inc. | 377,000 | 362,863 | ||||||
William Lyon Homes, Inc. | 378,000 | 383,670 | ||||||
Williams Scotsman International, Inc. | 182,000 | 189,735 | ||||||
|
| |||||||
| 1,223,159 | ||||||||
| Household Products & Wares – 0.0% |
| |||||||
Kimberly-Clark de Mexico S.A.B. de C.V. | 100,000 | 100,167 | ||||||
|
| |||||||
| 100,167 | ||||||||
| 10 | The accompanying notes are an integral part of these financial statements. |
Table of Contents
SCHEDULE OF INVESTMENTS — GUARDIAN CORE PLUS FIXED INCOME VIP FUND
| June 30, 2019(unaudited) | Principal Amount | Value | ||||||
| Insurance – 0.3% |
| |||||||
Teachers Insurance & Annuity Association of America | $ | 797,000 | $ | 932,633 | ||||
Willis North America, Inc. | 50,000 | 50,493 | ||||||
|
| |||||||
| 983,126 | ||||||||
| Internet – 0.6% |
| |||||||
Match Group, Inc. | 350,000 | 369,250 | ||||||
Netflix, Inc. | 541,000 | 553,335 | ||||||
6.375% due 5/15/2029(2) | 483,000 | 548,954 | ||||||
Tencent Holdings Ltd. | 630,000 | 643,232 | ||||||
|
| |||||||
| 2,114,771 | ||||||||
| Investment Companies – 0.1% |
| |||||||
BrightSphere Investment Group PLC | 315,000 | 320,651 | ||||||
|
| |||||||
| 320,651 | ||||||||
| Iron & Steel – 0.1% |
| |||||||
Cleveland-Cliffs, Inc. | 362,000 | 360,190 | ||||||
|
| |||||||
| 360,190 | ||||||||
| Leisure Time – 0.4% |
| |||||||
Carnival PLC | 525,000 | 684,652 | ||||||
Royal Caribbean Cruises Ltd. | 949,000 | 955,996 | ||||||
|
| |||||||
| 1,640,648 | ||||||||
| Lodging – 0.2% |
| |||||||
Wyndham Destinations, Inc. | 527,000 | 550,056 | ||||||
|
| |||||||
| 550,056 | ||||||||
| Machinery-Diversified – 0.4% |
| |||||||
Nvent Finance Sarl | 1,587,000 | 1,612,420 | ||||||
|
| |||||||
| 1,612,420 | ||||||||
| Media – 2.0% |
| |||||||
AMC Networks, Inc. | 367,000 | 370,670 | ||||||
CCO Holdings LLC / CCO Holdings Capital Corp. | 718,000 | 733,222 | ||||||
5.75% due 2/15/2026(2) | 346,000 | 362,868 | ||||||
Cox Communications, Inc. | 110,000 | 111,077 | ||||||
4.50% due 6/30/2043(2) | 539,000 | 517,248 | ||||||
4.70% due 12/15/2042(2) | 496,000 | 493,621 | ||||||
8.375% due 3/1/2039(2) | 63,000 | 86,222 | ||||||
DISH DBS Corp. | 771,000 | 747,870 | ||||||
| June 30, 2019(unaudited) | Principal Amount | Value | ||||||
| Media(continued) |
| |||||||
Gray Television, Inc. | $ | 690,000 | $ | 748,650 | ||||
Myriad International Holdings B.V. | 540,000 | 588,492 | ||||||
The Walt Disney Co. | 359,000 | 600,449 | ||||||
Time Warner Cable LLC | 71,000 | 82,033 | ||||||
7.30% due 7/1/2038 | 634,000 | 769,450 | ||||||
Time Warner Entertainment Co. LP | 432,000 | 582,176 | ||||||
Ziggo B.V. | 385,000 | 391,626 | ||||||
|
| |||||||
| 7,185,674 | ||||||||
| Mining – 1.0% |
| |||||||
Anglo American Capital PLC | 1,000,000 | 1,003,860 | ||||||
4.75% due 4/10/2027(2) | 978,000 | 1,035,894 | ||||||
Barrick North America Finance LLC | 88,000 | 116,915 | ||||||
Corp. Nacional del Cobre de Chile | 450,000 | 488,264 | ||||||
Freeport-McMoRan, Inc. | 175,000 | 175,000 | ||||||
Glencore Finance Canada Ltd. | 705,000 | 728,702 | ||||||
|
| |||||||
| 3,548,635 | ||||||||
| Miscellaneous Manufacturing – 0.4% |
| |||||||
General Electric Co. 2.945% (LIBOR 3 Month + 0.38%) due 5/5/2026(3) | 448,000 | 407,435 | ||||||
6.15% due 8/7/2037 | 448,000 | 520,562 | ||||||
Siemens Financieringsmaatschappij N.V. | 500,000 | 488,289 | ||||||
|
| |||||||
| 1,416,286 | ||||||||
| Oil & Gas – 2.2% |
| |||||||
Apache Corp. | 572,000 | 557,839 | ||||||
5.10% due 9/1/2040 | 217,000 | 219,319 | ||||||
Ecopetrol S.A. | 190,000 | 210,121 | ||||||
Eni S.p.A. | 850,000 | 989,232 | ||||||
Equinor ASA | 700,000 | 880,185 | ||||||
Gazprom OAO Via Gaz Capital S.A. | 200,000 | 211,619 | ||||||
Hilcorp Energy I LP / Hilcorp Finance Co. | 563,000 | 565,815 | ||||||
Kerr-McGee Corp. | 20,000 | 27,376 | ||||||
MEG Energy Corp. | 556,000 | 528,200 | ||||||
| The accompanying notes are an integral part of these financial statements. | 11 |
Table of Contents
SCHEDULE OF INVESTMENTS — GUARDIAN CORE PLUS FIXED INCOME VIP FUND
| June 30, 2019(unaudited) | Principal Amount | Value | ||||||
| Oil & Gas(continued) |
| |||||||
Pertamina Persero PT | $ | 200,000 | $ | 219,833 | ||||
Petrobras Global Finance B.V. | 560,000 | 626,366 | ||||||
Petroleos Mexicanos | 803,000 | 737,299 | ||||||
Saudi Arabian Oil Co. | 570,000 | 573,692 | ||||||
Sinopec Group Overseas Development Ltd. | 200,000 | 212,450 | ||||||
SM Energy Co. | 226,000 | 209,050 | ||||||
6.75% due 9/15/2026 | 308,000 | 288,750 | ||||||
Valero Energy Corp. | 486,000 | 795,444 | ||||||
YPF S.A. | 415,000 | 415,705 | ||||||
|
| |||||||
| 8,268,295 | ||||||||
| Oil & Gas Services – 1.0% |
| |||||||
Baker Hughes a GE Co. LLC / Baker HughesCo-Obligor, Inc. | 1,753,000 | 1,697,006 | ||||||
Halliburton Co. | 299,000 | 380,954 | ||||||
7.45% due 9/15/2039 | 159,000 | 218,535 | ||||||
Nine Energy Service, Inc. | 499,000 | 486,525 | ||||||
Schlumberger Holdings Corp. | 380,000 | 407,114 | ||||||
Transocean Proteus Ltd. | 531,000 | 547,594 | ||||||
|
| |||||||
| 3,737,728 | ||||||||
| Pharmaceuticals – 0.3% |
| |||||||
AbbVie, Inc. | 307,000 | 323,118 | ||||||
Bausch Health Americas, Inc. | 825,000 | 923,010 | ||||||
Bayer Corp. | 11,000 | 13,029 | ||||||
|
| |||||||
| 1,259,157 | ||||||||
| Pipelines – 0.5% |
| |||||||
Abu Dhabi Crude Oil Pipeline LLC | 200,000 | 219,465 | ||||||
Colonial Pipeline Co. | 478,000 | 509,630 | ||||||
Northern Natural Gas Co. | 238,000 | 258,539 | ||||||
Peru LNG S.R.L. | 200,000 | 214,700 | ||||||
Sabine Pass Liquefaction LLC | 678,000 | 759,409 | ||||||
|
| |||||||
| 1,961,743 | ||||||||
| June 30, 2019(unaudited) | Principal Amount | Value | ||||||
| Real Estate – 0.4% |
| |||||||
China Evergrande Group | ||||||||
10.00% due 4/11/2023 | $ | 700,000 | $ | 678,336 | ||||
Country Garden Holdings Co. Ltd. | 200,000 | 195,624 | ||||||
4.75% due 9/28/2023 | 200,000 | 195,026 | ||||||
Shimao Property Holdings Ltd. | 320,000 | 322,276 | ||||||
|
| |||||||
| 1,391,262 | ||||||||
| Real Estate Investment Trusts – 0.8% |
| |||||||
EPR Properties | 608,000 | 634,271 | ||||||
4.75% due 12/15/2026 | 37,000 | 39,149 | ||||||
4.95% due 4/15/2028 | 197,000 | 211,900 | ||||||
MPT Operating Partnership LP / MPT Finance Corp. | 549,000 | 565,470 | ||||||
VEREIT Operating Partnership LP | 1,550,000 | 1,676,144 | ||||||
|
| |||||||
| 3,126,934 | ||||||||
| Semiconductors – 0.5% |
| |||||||
Broadcom Corp. / Broadcom Cayman Finance Ltd. | 151,000 | 152,430 | ||||||
Broadcom, Inc. | 1,505,000 | 1,512,481 | ||||||
|
| |||||||
| 1,664,911 | ||||||||
| Software – 0.3% |
| |||||||
Oracle Corp. | 775,000 | 1,062,411 | ||||||
|
| |||||||
| 1,062,411 | ||||||||
| Telecommunications – 0.7% |
| |||||||
AT&T, Inc. | 146,000 | 175,169 | ||||||
6.25% due 3/29/2041 | 689,000 | 842,278 | ||||||
Ooredoo International Finance Ltd. | 200,000 | 205,662 | ||||||
Sprint Capital Corp. | 897,000 | 921,936 | ||||||
Sprint Corp. | 160,000 | 173,800 | ||||||
Verizon Communications, Inc. 3.618% (LIBOR 3 Month + 1.10%) due 5/15/2025(3) | 297,000 | 300,816 | ||||||
|
| |||||||
| 2,619,661 | ||||||||
| Transportation – 0.2% |
| |||||||
Burlington Northern Santa Fe LLC | 229,000 | 301,843 | ||||||
Rumo Luxembourg Sarl | 400,000 | 431,704 | ||||||
|
| |||||||
| 733,547 | ||||||||
| 12 | The accompanying notes are an integral part of these financial statements. |
Table of Contents
SCHEDULE OF INVESTMENTS — GUARDIAN CORE PLUS FIXED INCOME VIP FUND
| June 30, 2019(unaudited) | Principal Amount | Value | ||||||
| Water – 0.1% |
| |||||||
Aqua America, Inc. | $ | 400,000 | $ | 415,677 | ||||
|
| |||||||
| 415,677 | ||||||||
| Total Corporate Bonds & Notes (Cost $104,725,336) |
| 109,516,179 | ||||||
| Non–Agency Mortgage–Backed Securities – 5.4% |
| |||||||
Atrium Hotel Portfolio Trust | 349,000 | 348,675 | ||||||
BAMLL Commercial Mortgage Securities Trust | 3,900,000 | 4,054,236 | ||||||
BB-UBS Trust | 860,000 | 901,041 | ||||||
BX Trust | 987,000 | 985,155 | ||||||
Caesars Palace Las Vegas Trust 2017-VICI A | 92,000 | 95,386 | ||||||
2017-VICI B | 57,000 | 59,256 | ||||||
Citigroup Commercial Mortgage Trust | 1,685,000 | 1,420,735 | ||||||
Commercial Mortgage Trust2015-PC1 AM | 310,000 | 333,978 | ||||||
2015-PC1 B | 100,000 | 106,103 | ||||||
2015-PC1 D | 33,000 | 30,545 | ||||||
DBWF Mortgage Trust | 630,000 | 630,341 | ||||||
GS Mortgage Securities Corp. Trust 2012-BWTR A | 1,273,000 | 1,298,732 | ||||||
2018-FBLU A | 631,000 | 630,803 | ||||||
2018-RIVR A | 438,000 | 438,547 | ||||||
JP Morgan Chase Commercial Mortgage Securities Corp. | 604,000 | 645,777 | ||||||
2018-LAQ A | 1,015,906 | 1,016,859 | ||||||
2018-LAQ D | 507,462 | 510,943 | ||||||
2018-MINN A | 339,000 | 334,986 | ||||||
2018-WPT | 242,000 | 241,697 | ||||||
| June 30, 2019(unaudited) | Principal Amount | Value | ||||||
| Non–Agency Mortgage–Backed Securities(continued) |
| |||||||
2018-WPT AFX | $ | 676,000 | $ | 724,501 | ||||
2018-WPT BFL | 724,000 | 723,093 | ||||||
2018-WPT BFX | 218,000 | 233,576 | ||||||
2018-WPT CFX | 290,000 | 310,606 | ||||||
JPMBB Commercial Mortgage Securities Trust | 13,000 | 13,472 | ||||||
Morgan Stanley Capital Barclays Bank Trust | ||||||||
2016-MART C | 100,000 | 99,888 | ||||||
2016-MART XCP | 5,633,000 | 56 | ||||||
The Bancorp Commercial Mortgage Trust | 16,240 | 16,174 | ||||||
Wells Fargo Commercial Mortgage Trust2015-C28 D | 1,500,000 | 1,387,658 | ||||||
2016-C35 C | 131,000 | 134,469 | ||||||
WFLD Mortgage Trust | 2,000,000 | 2,096,573 | ||||||
| Total Non–Agency Mortgage–Backed Securities (Cost $19,164,321) |
| 19,823,861 | ||||||
| Foreign Government – 3.0% |
| |||||||
Angolan Government International Bond | USD | 200,000 | 229,142 | |||||
Argentine Republic Government International Bond | USD | 2,292,000 | 1,932,179 | |||||
6.875% due 4/22/2021 | USD | 926,000 | 812,565 | |||||
Bahamas Government International Bond | USD | 400,000 | 431,929 | |||||
Bermuda Government International Bond | USD | 400,000 | 407,504 | |||||
Egypt Government International Bond | USD | 200,000 | 206,186 | |||||
7.903% due | USD | 200,000 | 202,486 | |||||
Export Credit Bank of Turkey | USD | 250,000 | 260,997 | |||||
Japan Bank for International Cooperation | USD | 1,936,000 | 1,929,695 | |||||
2.50% due 5/23/2024 | USD | 1,590,000 | 1,618,609 | |||||
| The accompanying notes are an integral part of these financial statements. | 13 |
Table of Contents
SCHEDULE OF INVESTMENTS — GUARDIAN CORE PLUS FIXED INCOME VIP FUND
| June 30, 2019(unaudited) | Principal Amount | Value | ||||||
| Foreign Government(continued) |
| |||||||
Mexico Government International Bond | USD | 395,000 | $ | 402,406 | ||||
4.00% due 10/2/2023 | USD | 560,000 | 584,080 | |||||
Nigeria Government International Bond | USD | 200,000 | 202,218 | |||||
Provincia de Buenos Aires Argentina | USD | 15,000 | 12,540 | |||||
Provincia de Mendoza Argentina | USD | 300,000 | 256,503 | |||||
Qatar Government International Bond | USD | 555,000 | 570,655 | |||||
5.103% due 4/23/2048(2) | USD | 210,000 | 250,163 | |||||
Romanian Government International Bond | USD | 8,000 | 10,143 | |||||
Turkey Government International Bond | USD | 745,000 | 755,411 | |||||
5.75% due 3/22/2024 | USD | 200,000 | 195,056 | |||||
| Total Foreign Government (Cost $11,329,822) |
| 11,270,467 | ||||||
| U.S. Government Securities – 33.3% |
| |||||||
U.S. Treasury Bill | $ | 79,371,000 | 79,366,723 | |||||
U.S. Treasury Bond | 9,882,000 | 10,314,723 | ||||||
3.00% due 2/15/2049 | 5,182,000 | 5,691,293 | ||||||
U.S. Treasury Note | ||||||||
1.75% due 6/30/2024 | 3,366,000 | 3,364,554 | ||||||
2.50% due 1/31/2021 | 4,493,000 | 4,540,036 | ||||||
2.625% due 2/15/2029 | 1,650,000 | 1,739,977 | ||||||
2.875% due 10/31/2020 | 406,000 | 411,281 | ||||||
U.S. Treasury Note Inflation Protected Security | 17,198,694 | 17,401,242 | ||||||
| Total U.S. Government Securities (Cost $121,423,092) |
| 122,829,829 | ||||||
| June 30, 2019(unaudited) | Principal Amount | Value | ||||||
| Short–Term Investment – 2.9% |
| |||||||
| Repurchase Agreements – 2.9% |
| |||||||
Fixed Income Clearing Corp., 0.50%, dated 6/28/2019, proceeds at maturity value of $10,534,439, due 7/1/2019(8) | $ | 10,534,000 | $ | 10,534,000 | ||||
| Total Repurchase Agreements (Cost $10,534,000) |
| 10,534,000 | ||||||
| Total Investments(9) – 136.9% (Cost $497,699,252) |
| 505,162,220 | ||||||
| Liabilities in excess of other assets(10) – (36.9)% |
| (136,167,102 | ) | |||||
| Total Net Assets – 100.0% |
| $ | 368,995,118 | |||||
| (1) | TBA — To be announced. |
| (2) | Securities that may be resold in transactions, exempt from registration under Rule 144A of the Securities Act of 1933, as amended, normally to certain qualified buyers. At June 30, 2019, the aggregate market value of these securities amounted to $115,406,205, representing 31.3% of net assets. These securities have been deemed liquid by the investment adviser pursuant to the Fund’s liquidity procedures approved by the Board of Trustees. |
| (3) | Variable rate securities, which may includestep-up bonds or adjustable rate mortgages. The rate shown is the rate in effect at June 30, 2019. |
| (4) | Payment–in–kind security, for which interest payments may be made in additional principal ranging from 0% to 100% of the full stated interest rate. As of June 30, 2019, interest payments had been made in cash. |
| (5) | Variable coupon rate based on weighted average interest rate of underlying mortgages. |
| (6) | Interest only security. |
| (7) | Interest rate shown reflects the discount rate at time of purchase. |
| (8) | The table below presents collateral for repurchase agreements. |
| Security | Coupon | Maturity Date | Principal Amount | Value | ||||||||||||
| U.S. Treasury Note | 2.75% | 8/15/2021 | $ | 10,425,000 | $ | 10,744,902 | ||||||||||
| (9) | Securities are segregated to cover anticipated or existing derivative positions or to be announced securities (TBA). |
| (10) | Liabilities in excess of other assets include net unrealized appreciation on futures contracts as follows: |
Open futures contracts at June 30, 2019:
| Type | Expiration | Contracts | Position | Notional Amount | Notional Value | Unrealized Appreciation | ||||||||||||||||||
| U.S.2-Year Treasury Note | September 2019 | 364 | Long | $ | 77,999,658 | $ | 78,325,407 | $ | 325,749 | |||||||||||||||
| U.S.5-Year Treasury Note | September 2019 | 336 | Long | 39,330,542 | 39,700,500 | 369,958 | ||||||||||||||||||
| U.S. Long Bond | September 2019 | 240 | Long | 36,585,425 | 37,342,500 | 757,075 | ||||||||||||||||||
| Total |
| $ | 153,915,625 | $ | 155,368,407 | $ | 1,452,782 | |||||||||||||||||
| Type | Expiration | Contracts | Position | Notional Amount | Notional Value | Unrealized Depreciation | ||||||||||||||||||
| U.S. Ultra10-Year Treasury Note | September 2019 | 188 | Short | $ | (25,472,442 | ) | $ | (25,967,500 | ) | $ | (495,058 | ) | ||||||||||||
| U.S. Ultra Long Bond | September 2019 | 61 | Short | (10,551,940 | ) | (10,831,313 | ) | (279,373 | ) | |||||||||||||||
| Total |
| $ | (36,024,382 | ) | $ | (36,798,813 | ) | $ | (774,431 | ) | ||||||||||||||
| 14 | The accompanying notes are an integral part of these financial statements. |
Table of Contents
SCHEDULE OF INVESTMENTS — GUARDIAN CORE PLUS FIXED INCOME VIP FUND
Legend:
CLO — Collateralized Loan Obligation
LIBOR — London Interbank Offered Rate
PIK — Payment–In–Kind
USD — United States Dollar
The following is a summary of the inputs used as of June 30, 2019 in valuing the Fund’s investments. For more information on valuation inputs, please refer to Note 2a of the accompanying Notes to Financial Statements.
| Valuation Inputs | ||||||||||||||||
| Investments in Securities(unaudited) | Level 1 | Level 2 | Level 3 | Total | ||||||||||||
| Agency Mortgage–Backed Securities | $ | — | $ | 138,942,070 | $ | — | $ | 138,942,070 | ||||||||
| Asset–Backed Securities | — | 92,245,814 | — | 92,245,814 | ||||||||||||
| Corporate Bonds & Notes | — | 109,516,179 | — | 109,516,179 | ||||||||||||
| Non–Agency Mortgage–Backed Securities | — | 19,823,861 | — | 19,823,861 | ||||||||||||
| Foreign Government | — | 11,270,467 | — | 11,270,467 | ||||||||||||
| U.S. Government Securities | — | 122,829,829 | — | 122,829,829 | ||||||||||||
| Repurchase Agreements | — | 10,534,000 | — | 10,534,000 | ||||||||||||
| Total | $ | — | $ | 505,162,220 | $ | — | $ | 505,162,220 | ||||||||
| Other Financial Instruments | ||||||||||||||||
| Futures Contracts | ||||||||||||||||
Assets | $ | 1,452,782 | $ | — | $ | — | $ | 1,452,782 | ||||||||
Liabilities | (774,431) | — | — | (774,431) | ||||||||||||
| Total | $ | 678,351 | $ | — | $ | — | $ | 678,351 | ||||||||
| The accompanying notes are an integral part of these financial statements. | 15 |
Table of Contents
FINANCIAL INFORMATION — GUARDIAN CORE PLUS FIXED INCOME VIP FUND
For the Six Months Ended June 30, 2019 (unaudited) | ||||
Investment Income | ||||
Interest | $ | 6,124,680 | ||
|
| |||
Total Investment Income | 6,124,680 | |||
|
| |||
Expenses | ||||
Investment advisory fees | 781,046 | |||
Distribution fees | 441,664 | |||
Trustees’ and officers’ fees | 83,022 | |||
Custodian and accounting fees | 49,819 | |||
Professional fees | 44,411 | |||
Shareholder reports | 27,385 | |||
Administrative fees | 23,535 | |||
Transfer agent fees | 10,062 | |||
Other expenses | 21,430 | |||
|
| |||
Total Expenses | 1,482,374 | |||
Less: Fees waived | (86,717 | ) | ||
|
| |||
Total Expenses, Net | 1,395,657 | |||
|
| |||
Net Investment Income/(Loss) | 4,729,023 | |||
|
| |||
Realized Gain/(Loss) and Change in Unrealized Appreciation/(Depreciation) on Investments and Futures Contracts | ||||
Net realized gain/(loss) from investments | 5,181,186 | |||
Net realized gain/(loss) from futures contracts | 1,638,902 | |||
Net change in unrealized appreciation/(depreciation) on investments | 10,500,934 | |||
Net change in unrealized appreciation/(depreciation) on futures contracts | 288,370 | |||
|
| |||
Net Gain on Investments and Futures Contracts | 17,609,392 | |||
|
| |||
Net Increase in Net Assets Resulting From Operations | $ | 22,338,415 | ||
|
| |||
| 16 | The accompanying notes are an integral part of these financial statements. |
Table of Contents
FINANCIAL INFORMATION — GUARDIAN CORE PLUS FIXED INCOME VIP FUND
| The accompanying notes are an integral part of these financial statements. | 17 |
Table of Contents
FINANCIAL INFORMATION — GUARDIAN CORE PLUS FIXED INCOME VIP FUND
The Financial Highlights table is intended to help you understand the Fund’s financial performance for the past six reporting periods (or, if shorter, the period since inception). Certain information reflects financial results for a single Fund share. The total returns in the table represent the rate that an investor would have earned (or lost) on an investment in the Fund.
Six Months Ended Numbers are unaudited | ||||||||||||||||||||||||
| Per Share Operating Performance | ||||||||||||||||||||||||
| Net Asset Value, Beginning of Period | Net Investment Income(1) | Net Realized and Unrealized Gain/(Loss) | Total Operations | Net Asset Value, End of Period | Total Return(2) | |||||||||||||||||||
Six Months Ended 6/30/19 | $ | 9.95 | $ | 0.14 | $ | 0.49 | $ | 0.63 | $ | 10.58 | 6.33 | %(4) | ||||||||||||
Year Ended 12/31/18 | 10.08 | 0.26 | (0.39 | ) | (0.13 | ) | 9.95 | (1.29) | % | |||||||||||||||
Year Ended 12/31/17 | 9.73 | 0.17 | 0.18 | 0.35 | 10.08 | 3.60 | % | |||||||||||||||||
Period Ended 12/31/16(5) | 10.00 | 0.04 | (0.31 | ) | (0.27 | ) | 9.73 | (2.70) | %(4) | |||||||||||||||
| 18 | The accompanying notes are an integral part of these financial statements. |
Table of Contents
FINANCIAL INFORMATION — GUARDIAN CORE PLUS FIXED INCOME VIP FUND
| Ratios/Supplemental Data | ||||||||||||||||||||||
| Net Assets, End of Period (000s) | Net Ratio of Expenses to Average Net Assets(3) | Gross Ratio of Expenses to Average Net Assets | Net Ratio of Net Investment Income to Average Net Assets(3) | Gross Ratio of Net Investment Income/(Loss) to Average Net Assets | Portfolio Turnover Rate | |||||||||||||||||
| $ | 368,995 | 0.79% | (4) | 0.84% | (4) | 2.68% | (4) | 2.63% | (4) | 128% | (4) | |||||||||||
| 355,070 | 0.79% | 0.87% | 2.60% | 2.52% | 543% | |||||||||||||||||
| 23,096 | 0.81% | 1.77% | 1.69% | 0.73% | 409% | |||||||||||||||||
| 24,888 | 0.81% | (4) | 2.54% | (4) | 1.18% | (4) | (0.55)% | (4) | 107% | (4) | ||||||||||||
| (1) | Calculated based on the average shares outstanding during the period. |
| (2) | Total returns do not reflect the effects of charges deducted pursuant to the terms of The Guardian Insurance & Annuity Company, Inc.’s variable contracts. Inclusion of such charges would reduce the total returns for all periods shown. |
| (3) | Net Ratio of Expenses to Average Net Assets and Net Ratio of Net Investment Income to Average Net Assets include the effect of fee waivers and expense limitations. |
| (4) | Ratios for periods less than one year have been annualized, except for total return and portfolio turnover rate. For the period ended December 31, 2016, certainnon-recurring fees (i.e., audit fees) are not annualized. |
| (5) | Commenced operations on September 1, 2016. |
| The accompanying notes are an integral part of these financial statements. | 19 |
Table of Contents
NOTES TO FINANCIAL STATEMENTS — GUARDIAN CORE PLUS FIXED INCOME VIP FUND
June 30, 2019(unaudited)
1. Organization
Guardian Variable Products Trust (the “Trust”), a Delaware statutory trust organized on January 12, 2016, is registered under the Investment Company Act of 1940, as amended (the “1940 Act”), as anopen-end management investment company. The Trust currently has sixteen series. Guardian Core Plus Fixed Income VIP Fund (the “Fund”) is a series of the Trust. The Fund is a diversified fund and commenced operations on September 1, 2016. The financial statements for other series of the Trust are presented in separate reports.
The Trust has authorized an unlimited number of shares of beneficial interest with no par value. Shares are bought and sold at closing net asset value (“NAV”). Shares of the Fund are only sold to certain separate accounts of The Guardian Insurance & Annuity Company, Inc. (“GIAC”) that fund certain variable annuity contracts and variable life insurance policies issued by GIAC. GIAC is a wholly-owned subsidiary of The Guardian Life Insurance Company of America (“Guardian Life”).
The Fund seeks income and capital appreciation to produce a high total return.
2. Significant Accounting Policies
The following is a summary of significant accounting policies followed by the Fund in the preparation of its financial statements. The Fund follows the investment company accounting and reporting guidance of the Financial Accounting Standards Board (“FASB”) Accounting Standards Codification Topic 946 Financial Services — Investment Companies. The following policies are in conformity with accounting principles generally accepted in the United States of America (“GAAP”). The preparation of financial statements in accordance with GAAP requires management to make estimates and assumptions that affect the reported amounts and disclosures in the financial statements. Actual results could differ from those estimates.
a. Investment ValuationsThe valuations of debt securities for which quoted bid prices are readily available are valued at the bid price by independent pricing services (each, a “Service”). Debt securities for which quoted bid prices are not readily available are valued by a Service at the evaluated bid price provided by the Service or the bid price provided by an independent broker-dealer or at a calculated price based on the spread to an appropriate benchmark provided by such broker-dealer. Securities for which
market quotations are not readily available or for which market quotations may be considered unreliable or for which a Service or independent broker-dealer does not provide a valuation are valued at their fair values as determined in accordance with policies and procedures adopted by the Board of Trustees.
Under the policies and procedures approved by the Board of Trustees, Park Avenue Institutional Advisers LLC (“Park Avenue”), the Fund’s investment adviser, has established a Fair Valuation Committee to assist the Board of Trustees with the oversight and monitoring of the valuation of the Fund’s investments. This includes monitoring the appropriateness of fair values based on results of ongoing valuation oversight, including but not limited to consideration of security specific events, market events, and pricing vendor and broker-dealer due diligence. The Fair Valuation Committee oversees and carries out the policies for the valuation of investments held in the Fund. The Fair Valuation Committee is responsible for discussing and assessing the potential impacts to the fair values on an ongoing basis, and at least on a quarterly basis with the Board of Trustees.
Equity securities traded on an exchange other than NASDAQ Stock Market, LLC (“NASDAQ”) are valued at the last reported sale price on the principal exchange or market on which they are traded; or, if there were no sales that day, at the mean between the closing bid and ask prices. Securities traded on the NASDAQ are generally valued at the NASDAQ official closing price, which may not be the last sale price. If the NASDAQ official closing price is not available for a security, that security is generally valued at the mean between the closing bid and ask prices. Repurchase agreements are carried at cost, which approximates fair value (see Note 5d). Foreign securities are valued in the currencies of the markets in which they trade and then converted to U.S. dollars by the application of foreign exchange rates at the close of the New York Stock Exchange (“NYSE”).
Securities whose values have been materially affected by events occurring before the Fund’s valuation time but after the close of the securities’ principal exchange or market may be fair valued in accordance with policies and procedures adopted by the Board of Trustees. Valuations reflected in this report are as of the report date. As a result, changes in valuation due to market events and/or issuer related events after the report date and prior to issuance of the report are not reflected herein.
| 20 |
Table of Contents
NOTES TO FINANCIAL STATEMENTS — GUARDIAN CORE PLUS FIXED INCOME VIP FUND
Various inputs are used in determining the valuation of the Fund’s investments. These inputs are summarized in three broad levels listed below.
| • | Level 1— unadjusted inputs using quoted prices in active markets for identical investments. |
| • | Level 2 — other significant observable inputs, including, but not limited to, quoted prices for similar investments, inputs other than quoted prices that are observable for investments (such as interest rates, prepayment speeds, credit risks, etc.) or other market corroborated inputs. |
| • | Level 3 — significant unobservable inputs (including the Fund’s own assumptions in determining the fair value of investments) |
Inputs may include price information, volatility statistics, specific and broad credit data, liquidity statistics, and other factors. A financial instrument’s level within the fair value hierarchy is based on the lowest level of any input; both individually and in aggregate, that is significant to the fair value measurement. However, the determination of what constitutes “observable” requires significant judgment by the Trust. The Trust considers observable data to be that market data which is readily available, regularly distributed or updated, reliable and verifiable, and provided by independent sources that are actively involved in the relevant market. The inputs or methodology used for valuing securities are not necessarily an indication of the risk associated with investing in those securities. Changes in valuation techniques may result in transfers into or out of a financial instrument’s assigned level within the hierarchy.
The FASB requires reporting entities to make disclosures about purchases, sales, issuances and settlements of Level 3 securities on a gross basis. For the six months ended June 30, 2019, there were no transfers into or out of Level 3 of the fair value hierarchy.
In determining a financial instrument’s placement within the hierarchy, the Trust separates the Fund’s investment portfolio into two categories: investments and derivatives (e.g., futures). A summary of inputs used to value the Fund’s assets and liabilities carried at fair value as of June 30, 2019 is included in the Schedule of Investments.
Investments Investments whose values are based on quoted market prices in active markets, and are therefore classified within Level 1, include active listed equities. Investments that trade in markets that are not considered to be active, but are valued based on quoted market prices, dealer quotations or alternative pricing
sources supported by observable inputs are classified within Level 2. These include certain U.S. government and sovereign obligations, most government agency securities, investment-grade corporate bonds, certain mortgage products, state, municipal and provincial obligations, and certain foreign equity securities, including securities whose prices may have been affected by events occurring after the close of trading on their principal exchange or market and, as a result, whose values are determined by a pricing service as described above, or securities whose values are otherwise determined using fair valuation methods approved by the Fund’s Board of Trustees.
Investments classified within Level 3 have significant unobservable inputs, as they trade infrequently or not at all. Level 3 investments include, among others, private placement securities. When observable prices are not available for these securities, the Trust uses one or more valuation techniques for which sufficient and reliable data is available. The inputs used by the Trust in estimating the value of Level 3 investments include, for example, the original transaction price, recent transactions in the same or similar instruments, completed or pending third-party transactions in the underlying investment or comparable issuers, subsequent rounds of financing, recapitalizations, and other transactions across the capital structure. Level 3 investments may also be adjusted to reflect illiquidity and/ornon-transferability, with the amount of such discount estimated by the Trust in the absence of market information. Assumptions used by the Trust due to the lack of observable inputs may significantly impact the resulting fair value and therefore the Fund’s results of operations. As of June 30, 2019, the Fund had no securities classified as Level 3.
DerivativesExchange-traded derivatives, such as futures contracts, exchange-traded option contracts and certain swaps, are typically classified within Level 1 or Level 2 of the fair value hierarchy depending on whether or not they are deemed to be actively traded. Certainnon-exchange-traded derivatives, such as generic forwards, certain swaps and options, have inputs which can generally be corroborated by market data and are therefore classified within Level 2.
b. Securities TransactionsSecurities transactions are accounted for on the date securities are purchased or sold (trade date). Realized gains or losses on securities transactions are determined on the basis of specific identification.
c. Futures ContractsThe Fund may enter into financial futures contracts. In entering into such contracts, the Fund is required to deposit with the counterparty, either
| 21 |
Table of Contents
NOTES TO FINANCIAL STATEMENTS — GUARDIAN CORE PLUS FIXED INCOME VIP FUND
in cash or securities, an amount equal to a certain percentage of the face value of the contract. Subsequent payments are received or made by the Fund each day, depending on the daily fluctuations in the values of the contracts, and are recorded for financial statement purposes as variation margin received or paid by the Fund. Daily changes in variation margin are recognized as unrealized gains or losses by the Fund. The Fund may not achieve the anticipated benefits of the financial futures contracts and may realize a loss.
d. Credit DerivativesThe Fund may enter into credit derivatives, including credit default swaps on individual obligations or credit indices. The Fund may use these investments (i) as alternatives to direct long or short investment in a particular security or securities, (ii) to adjust the Fund’s asset allocation or risk exposure, or (iii) for hedging purposes. The use by the Fund of credit default swaps may have the effect of creating a short position in a security. Credit derivatives can create investment leverage and may create additional investment risks that may subject the Fund to greater volatility than investments in more traditional securities, as described in the Statement of Additional Information.
The Fund may enter into credit default swap agreements either as a buyer or seller. The Fund may buy protection under a credit default swap to attempt to mitigate the risk of default or credit quality deterioration in one or more individual holdings or in a segment of the fixed income securities market. The Fund may sell protection under a credit default swap in an attempt to gain exposure to an underlying issuer’s credit quality characteristics without investing directly in that issuer.
For swaps entered with an individual counterparty, the Fund bears the risk of loss of the uncollateralized amount expected to be received under a credit default swap agreement in the event of the default or bankruptcy of the counterparty. Credit default swap agreements are generally valued at a price at which the counterparty to such agreement would terminate the agreement. The Fund may also enter into cleared swaps.
In entering into swap contracts, the Fund is required to deposit with the broker (or for the benefit of the broker), either in cash or securities, an amount equal to a percentage of the notional value of the contract. Subsequent payments are received or made by the Fund each day, depending on the daily fluctuations in the values of the contracts, and are recorded for financial statement purposes as variation margin received or paid by the Fund. Daily changes in variation margin are recognized as unrealized gains or losses by the Fund.
The Fund may not achieve the anticipated benefits of the swap contracts and may realize a loss.
The Fund enters into credit default swaps primarily for asset allocation and risk exposure management. There were no credit default swaps held as of June 30, 2019.
e. Options Transactions The Fund can write (sell) put and call options on securities and indexes to earn premiums, for hedging purposes, for risk management purposes or otherwise as part of its investment strategies. In writing options, the Fund is required to deposit with the broker or counterparty, either in cash or securities, an amount equal to a percentage of the face value of the options. When an option is written, the premium received is recorded as an asset with an equal liability that is subsequently marked to market to reflect the market value of the written option. These liabilities, if any, are reflected as written options, at value, in the Fund’s Statement of Assets and Liabilities. Premiums received from writing options which expire unexercised are recorded on the expiration date as a realized gain. The difference between the premium received and the amount paid on effecting a closing purchase transaction, including brokerage commissions, is also treated as a realized gain, or if the premium is less than the amount paid for the closing purchased transactions, as a realized loss. If a written call option is exercised, the premium is added to the proceeds from the sale of the underlying security in determining whether there has been a realized gain or loss. If a written put option is exercised, the premium reduces the cost basis of the security. In writing an option, the Fund bears the market risk of an unfavorable change in the price of the security underlying the written option. Exercise of a written option could result in the Fund purchasing or selling a security at a price different from its current market value. There were no options transactions as of June 30, 2019.
f. Investment IncomeDividend income net of foreign taxes withheld, if any, is generally recorded on theex-dividend date. Interest income, which includes amortization/accretion of premium/discount, is determined using the interest income accrual method, and is accrued and recorded daily.
g. Allocation of Income and Expenses Many of the expenses of the Trust can be directly attributed to a specific series of the Trust. Expenses that cannot be directly attributed to a specific series of the Trust are generally apportioned among all the series in the Trust, based on relative net assets. In calculating net asset value per share for each series of the Trust, investment income, realized and unrealized gains and losses, and
| 22 |
Table of Contents
NOTES TO FINANCIAL STATEMENTS — GUARDIAN CORE PLUS FIXED INCOME VIP FUND
expenses other than series-specific expenses are allocated daily to each series based upon the proportion of net assets attributable to each series.
3. Transactions with Affiliates
a. Investment Advisory Fee and Expense LimitationUnder the terms of the advisory agreement, which, after its two year initial term, is reviewed and approved annually by the Board of Trustees, the Fund pays an investment advisory fee to Park Avenue. Park Avenue is a wholly-owned subsidiary of Guardian Life and receives an investment advisory fee at an annual rate of 0.45% of the first $300 million, and 0.40% in excess of $300 million of the Fund’s average daily net assets. The fee is accrued daily and paid monthly.
Park Avenue has contractually agreed through April 30, 2020 to waive certain fees and/or reimburse certain expenses incurred by the Fund to the extent necessary to limit the Fund’s total annual operating expenses after fee waiver and/or expense reimbursement to 0.79% of the Fund’s average daily net assets (excluding, if applicable, any acquired fund fees and expenses, taxes, interest, transaction costs and brokerage commissions, litigation and extraordinary expenses). Prior to April 9, 2018, the expense limitation was 0.81%. The limitation may not be increased or terminated prior to this time without action by the Board of Trustees, may be terminated only upon approval of the Board of Trustees, and is subject to Park Avenue’s recoupment rights. For the six months ended June 30, 2019, Park Avenue waived fees and/or paid Fund expenses in the amount of $86,717.
Park Avenue may be entitled to recoupment of previously waived fees and reimbursed expenses from the Fund for three years from the date of the waiver or reimbursement, subject to the expense limitation in effect at the time of the waiver or reimbursement and at the time of the recoupment, if any. Amounts waived or reimbursed by Park Avenue pursuant to any expense limitation after April 9, 2018 will not be subject to Park Avenue’s recoupment rights. The amount available for potential future recoupment by Park Avenue from the Fund under the Expense Limitation Agreement and the expiration schedule at June 30, 2019 are as follows:
Potential Recoupment Amounts Expiring | ||||||||||
Total Potential Recoupment Amounts | 2021 | 2020 | 2019 | |||||||
| $515,884 | $86,166 | $284,497 | $145,221 | |||||||
Park Avenue has entered into aSub-Advisory Agreement with Lord, Abbett & Co. LLC (“Lord Abbett”).
Lord Abbett is responsible for providingday-to-day investment advisory services to the Fund, subject to the supervision of Park Avenue and the oversight of the Board of Trustees.Sub-advisory fees are paid by Park Avenue and do not represent a separate or additional expense to the Fund.
b. Compensation of Trustees and OfficersTrustees and officers who are interested persons of the Trust, as defined in the 1940 Act, receive no compensation from the Fund, except for the Chief Compliance Officer of the Trust. Trustees of the Trust who are not interested persons of the Trust, and the Chief Compliance Officer, receive compensation and reimbursement of expenses from the Trust.
c. Distribution FeesPark Avenue Securities LLC (“PAS”), a wholly-owned subsidiary of Guardian Life, is the principal underwriter of Fund shares. The Trust has entered into a distribution and service agreement with PAS, which governs the sale and distribution of shares of the Fund. Under a distribution and service plan adopted by the Trust(“12b-1 plan”), PAS is compensated for services in such capacity, including its expenses in connection with the promotion and distribution of shares of the Fund, at an annual rate of 0.25% of the Fund’s average daily net assets. For the six months ended June 30, 2019, the Fund paid distribution fees in the amount of $441,664 to PAS.
PAS has directed that certain payments under the12b-1 plan be used to compensate GIAC for shareholder services provided to contract owners.
4. Federal Income Taxes
a. Distributions to ShareholdersFor federal income tax purposes, the Fund is treated as a disregarded entity (“DRE”). As a DRE, the Fund is not subject to an entity-level income tax; and any income, gains, losses, deductions, taxes, and credits of the Fund would instead be “passed through” directly to the separate accounts of GIAC that invest in the Fund and retain the same character for U.S. federal income tax purposes. In addition, the Fund is not required to distribute taxable income and capital gains for U.S. federal income tax purposes. Therefore, no dividends and capital gains distributions were paid by the Fund.
5. Investments
a. Investment Purchases and SalesThe cost of investments and U.S. government agency obligations purchased and the proceeds from U.S. government agency obligations and other investments sold (excluding short-term investments and to be
| 23 |
Table of Contents
NOTES TO FINANCIAL STATEMENTS — GUARDIAN CORE PLUS FIXED INCOME VIP FUND
announced (TBA) securities) for the six months ended June 30, 2019, were as follows:
Other Investments | U.S. Agency | |||||||
| Purchases | $ | 82,087,143 | | $ | 264,278,988 | |||
| Sales | | 66,520,671 | | 283,401,570 | ||||
b. Foreign SecuritiesForeign securities investments involve special risks and considerations not typically associated with U.S. investments. These risks include, but are not limited to, currency risk; adverse political, regulatory, social, and economic developments; and less reliable information about issuers. Moreover, securities of some foreign issuers may be less liquid and their prices more volatile than those of comparable U.S. issuers.
c. Industry or Sector ConcentrationIn its normal course of business, the Fund may invest a significant portion of its assets in companies within a limited number of industries or sectors. As a result, the Fund may be subject to a greater risk of loss than that of a fund invested in a wider spectrum of industries or sectors because the stocks of many or all of the companies in the industry, group of industries, sector, or sectors may decline in value due to developments adversely affecting the industry, group of industries, sector, or sectors.
d. Repurchase AgreementsThe Fund may invest in repurchase agreements to maintain liquidity and earn income over periods of time as short as overnight. The collateral for repurchase agreements is either cash or fully negotiable U.S. government securities (including U.S. government agency securities). Repurchase agreements are fully collateralized (including the interest accrued thereon) and such collateral is marked to market daily while the agreements remain in force. If the value of the collateral falls below the repurchase price plus accrued interest, the Fund will typically require the seller to deposit additional collateral by the next business day. If the request for additional collateral is not met, or the seller defaults, the Fund maintains the right to sell the collateral (although it may be prevented or delayed from doing so in certain circumstances) and may be required to claim any resulting loss against the seller. Park Avenue monitors the creditworthiness of the seller with which the Fund enters into repurchase agreements.
e. Securities Purchased on a When-Issued or Delayed-Delivery BasisThe Fund may purchase securities on a when-issued or delayed-delivery basis, with payment
and delivery scheduled for a future date. These transactions are subject to market fluctuations and are subject to the risk that the value at delivery may be more or less than at the trade date purchase price. Although the Fund will generally enter into these transactions with the intention of taking delivery of the securities, it may sell the securities before the settlement date. Assets will be segregated when a fund agrees to purchase on a when-issued or delayed-delivery basis. These transactions may create investment leverage.
f. Restricted and Illiquid SecuritiesA restricted security cannot be resold to the general public without prior registration under the Securities Act of 1933, as amended (except pursuant to an applicable exemption). The values of these securities may be highly volatile. If the security is subsequently registered and resold, the issuer would typically bear the expense of all registrations at no cost to the Fund. Restricted and illiquid securities are valued according to the policies and procedures adopted by the Trust’s Board of Trustees and are noted, if any, in the Fund’s Schedule of Investments. As of June 30, 2019, the Fund did not hold any restricted or illiquid securities.
g. Below Investment Grade SecuritiesThe Fund may invest in below investment grade securities (i.e. lower-quality, “junk” debt), which are subject to various risks. Lower-quality debt is considered to be speculative because it is less certain that the issuer will be able to pay interest or repay the principal than in the case of investment grade debt. These securities can involve a substantially greater risk of default than higher-rated securities, and their values can decline significantly over short periods of time. Lower-quality debt securities tend to be more sensitive to adverse news about their issuers, the market and the economy in general, than higher-quality debt securities. The market for these securities can be less liquid, especially during periods of recession or general market decline.
h. Mortgage- and Asset-Backed SecuritiesThe values of some mortgage-related or asset-backed securities may be particularly sensitive to changes in prevailing interest rates. Early repayment of principal on some mortgage-related securities may expose the Fund to a lower rate of return upon reinvestment of principal. The values of mortgage- and asset-backed securities depend in part on the credit quality and adequacy of the underlying assets or collateral and may fluctuate in response to the market’s perception of these factors as well as current and future repayment rates. Some mortgage-backed securities are backed by the full faith and credit of the U.S. government (e.g., mortgage-backed securities issued by the Government National
| 24 |
Table of Contents
NOTES TO FINANCIAL STATEMENTS — GUARDIAN CORE PLUS FIXED INCOME VIP FUND
Mortgage Association, commonly known as “Ginnie Mae”), while other mortgage-backed securities (e.g., mortgage-backed securities issued by the Federal National Mortgage Association and the Federal Home Loan Mortgage Corporation, commonly known as “Fannie Mae” and “Freddie Mac”), are backed only by the credit of the government entity issuing them. In addition, some mortgage-backed securities are issued by private entities and, as such, are not guaranteed by the U.S. government or any agency or instrumentality of the U.S. government.
i. Treasury Inflation Protected SecuritiesTreasury inflation protected securities (“TIPS”) are debt securities issued by the U.S. Treasury whose principal and/or interest payments are adjusted for inflation, unlike debt securities that make fixed principal and interest payments. The interest rate paid by the TIPS is fixed, while the principal value rises or falls based on changes in a published Consumer Price Index (“CPI”). Thus, if inflation occurs, the principal and interest payments on TIPS are adjusted accordingly to protect investors from inflationary loss. During a deflationary period, the principal and interest payments decrease, although the TIPS principal amounts will not drop below their face amounts at maturity. In exchange for the inflation protection, the TIPS generally pay lower interest rates than typical U.S. Treasury securities. Only if inflation occurs will TIPS offer a higher real yield than a conventional Treasury bond of the same maturity.
j. Disclosures About Derivative Instruments and Hedging ActivitiesThe Fund entered into U.S. Treasury futures contracts for the six months ended June 30, 2019 to manage portfolio duration. The Fund bears the risk of interest rates moving unexpectedly, in which case the Fund may not achieve the anticipated benefits of the futures contracts and realize a loss. There is minimal counterparty credit risk to the Funds since futures are exchange traded and the exchange’s clearinghouse, as counterparty to all exchange traded futures, guarantees futures against default.
As of June 30, 2019, the Fund had the following derivatives at fair value, grouped into appropriate risk categories that illustrate the Fund’s use of derivative instruments:
Interest Rate Contracts | ||||
Asset Derivatives | ||||
| Futures Contracts1 | $ | 1,452,782 | ||
Liability Derivatives | ||||
| Futures Contracts1 | $ | (774,431 | ) | |
| 1 | Statement of Assets and Liabilities location: Includes cumulative unrealized appreciation/depreciation of futures contracts as reported in the Schedule of Investments. Only current day’s variation margin is reported within the Statements of Assets and Liabilities. |
Transactions in derivative investments for the six months ended June 30, 2019 were as follows:
Interest Rate Contracts | ||||
Net Realized Gain (Loss) | ||||
| Futures Contracts1 | $ | 1,638,902 | ||
Net Change in Unrealized Appreciation/Depreciation |
| |||
| Futures Contracts2 | $ | 288,370 | ||
Average Number of Notional Amounts | ||||
| Futures Contracts3 | 878 | |||
| 1 | Statement of Operations location: Net realized gain/(loss) from futures contracts. |
| 2 | Statement of Operations location: Net change in unrealized appreciation/(depreciation) on futures contracts. |
| 3 | Amount represents number of contracts. |
6. Temporary Borrowings
The Fund, with other funds managed by Park Avenue, is party to a $10 million committed revolving credit facility from State Street Bank and Trust Company for temporary borrowing purposes, including the meeting of redemption requests that otherwise might require the untimely disposition of securities. Interest is calculated based on the higher of the dailyone-month LIBOR rate and the Federal Funds rate plus 1.25% at the time of borrowing. In addition to the interest charged on any borrowings by the Fund, each fund pays a commitment fee of 0.30% per annum on its share of the unused portion of the credit facility. The agreement is in place until December 10, 2019. The Fund did not utilize the credit facility during the six months ended June 30, 2019.
7. Indemnifications
Under the Trust’s organizational documents and, in some cases, by contract, its officers and trustees are indemnified against certain liabilities arising out of the performance of their duties to the Fund. In addition, in the normal course of business, the Fund enters into contracts with its vendors and others that provide general indemnifications. The Fund’s maximum exposure under these arrangements is unknown as this would involve future claims that may be made against the Fund that have not yet occurred. However, based on experience, the Fund expects the risk of loss to be remote.
| 25 |
Table of Contents
SHAREHOLDER MEETING RESULTS(UNAUDITED)
At a meeting held on March27-28, 2019, the Board of Trustees of Guardian Variable Products Trust approved submitting the following proposal (“Proposal”) to shareholders of the Fund at a special meeting to be held on May 24, 2019 (with any postponements or adjournments, “Special Meeting”):
1. To permit Park Avenue Institutional Advisers LLC, under certain circumstances, to enter into and/or materially amend investmentsub-advisory agreements with affiliated and unaffiliated sub-advisers on behalf of the Fund without obtaining shareholder approval.
On or about May 1, 2019, shareholders of record of the Fund as of the close of business on March 29, 2019 were sent a proxy statement containing information regarding the Proposal. The proxy statement also included information about the Special Meeting, at which shareholders of the Fund were asked to consider and approve the Proposal. In addition, the proxy statement included information about voting (or providing voting instructions) on the Proposal and options shareholders had to do so.
The Special Meeting was held on June 26, 2019, and the Proposal passed.
The results of the Special Meeting were as follows:
Proposal 1. To permit Park Avenue Institutional Advisers LLC, under certain circumstances, to enter into and/or materially amend investmentsub-advisory agreements with affiliated and unaffiliated sub-advisers on behalf of the Fund without obtaining shareholder approval:
| Votes For | Votes Against | Abstentions | ||||||
| 28,097,299.928 | 4,455,344.770 | 1,710,865.443 | ||||||
| 26 |
Table of Contents
SUPPLEMENTAL INFORMATION(UNAUDITED)
Approval of Investment Advisory andSub-advisory Agreements
Section 15(c) of the Investment Company Act of 1940, as amended (the “1940 Act”), requires that a fund’s investment advisory andsub-advisory agreements be approved initially by the fund’s board of trustees. Section 15(c) also requires that the continuation of these agreements, after an initial term of up to two years, be annually reviewed and approved by the board. Any such agreement must be approved by a vote of a majority of the trustees who are not parties to the agreement or “interested persons” (as defined in the 1940 Act) of a party to the agreement at anin-person meeting of the board called for the purpose of voting on such approval.
At a meeting of the Board of Trustees (the “Board”) of Guardian Variable Products Trust (the “Trust”) held on March27-28, 2019 (the “Meeting”), the Board, including the trustees who are not parties to the agreement or “interested persons” as defined in the 1940 Act (the “Independent Trustees”), considered and voted unanimously to renew the existing investment management agreement (the “Management Agreement”) between the Trust, on behalf of Guardian Diversified Research VIP Fund, Guardian Growth & Income VIP Fund, Guardian Integrated Research VIP Fund, Guardian International Growth VIP Fund, Guardian International Value VIP Fund, Guardian Large Cap Disciplined Growth VIP Fund, Guardian Large Cap Disciplined Value VIP Fund, Guardian Large Cap Fundamental Growth VIP Fund, Guardian Mid Cap Traditional Growth VIP Fund, Guardian Mid Cap Relative Value VIP Fund and Guardian Core Plus Fixed Income VIP Fund (the “Funds”), and Park Avenue Institutional Advisers LLC (the “Manager”) for aone-term.
The Board, including the Independent Trustees, also considered and voted unanimously to renew the existingsub-advisory agreements (the“Sub-advisory Agreements,” collectively with the Management Agreement, the “Agreements”) between the Manager and investment advisory firms engaged to serve assub-advisers to certain of the Funds, namely Putnam Investment Management, LLC, AllianceBernstein L.P., Massachusetts Financial Services Company, J.P. Morgan Investment Management Inc., Lazard Asset Management LLC, Wellington Management Company LLP, Boston Partners Global Investors, Inc., ClearBridge Investments, LLC, Janus Capital Management LLC, Wells Capital Management Incorporated and Lord, Abbett & Co. LLC (the“Sub-advisers”) for aone-year term.
The Board is responsible for overseeing the management of each Fund. In determining whether to renew its approval of the Agreements, the Trustees evaluated information and factors that they considered to be relevant and appropriate through the exercise of their own business judgment. The Trustees considered certain information and factors in light of advice furnished to them by legal counsel to the Trust and, in the case of the Independent Trustees, their independent legal counsel. In advance of the Meeting, the Trustees received materials and information designed to assist their consideration of the Agreements. The Trustees received written responses from the Manager and eachSub-adviser to a series of questions and requests for information encompassing a wide variety of topics provided by independent counsel on behalf of the Independent Trustees. The Independent Trustees discussed the Funds with independent counsel during a telephonic meeting and executive session in advance of the Meeting. The Trustees also received materials and information regarding the legal standards applicable to their consideration of the Agreements and the process and criteria used by the Manager to identify and select theSub-advisers.
During the course of their deliberations, the Independent Trustees met to discuss and evaluate the Agreements in executive session with their independent legal counsel, outside of the presence of the Trustees who are not Independent Trustees and representatives from Fund management, the Manager or anySub-adviser.
In reaching its decisions to renew its approval of the Agreements, the Board took into account the materials and information described above as well as other materials and information provided to the Board and discussed with and among the Trustees. Individual Trustees may have given different weight to different factors and information with respect to each Agreement, and the Trustees did not identify any single factor or information that, in isolation, would be controlling in deciding to approve the Agreements. The discussion below is intended to summarize the broad factors that figured prominently in the Board’s decisions to approve the Agreements rather than to beall-inclusive. These broad factors included: (i) the nature, extent and quality of the services provided to the Funds by the Manager and theSub-advisers; (ii) the investment performance of each Fund; (iii) the fees charged and estimated profitability; (iv) the extent to which economies of scale exist for a Fund, and the extent to which a Fund benefits from economies of scale; and
| 27 |
Table of Contents
SUPPLEMENTAL INFORMATION(UNAUDITED)
(v) any other benefits derived by the Manager or theSub-advisers (or their respective affiliates) from their relationships with the Funds.
Nature, Extent and Quality of Services
The Trustees considered information regarding the nature, extent and quality of services provided to the Funds by the Manager. The Trustees also considered, among other things, the terms of the Management Agreement and the range of investment advisory services provided by the Manager. In addition, the Trustees reviewed the range ofnon-investment advisory services provided by the Manager consistent with the terms of the Management Agreement, notably coordinating the preparation and filing of various regulatory documents, coordinating the preparation and assembly of Board meeting materials and assisting the Board with certain valuation matters.
The Trustees considered that the Funds operate in a“manager-of-managers” structure and reviewed the responsibilities that the Manager has under this structure, including monitoring and evaluating the performance of theSub-advisers, monitoring theSub-advisers for adherence to the stated investment objectives, strategies, policies and restrictions of the Funds and supervising theSub-advisers with respect to the services that theSub-advisers would provide under theSub-advisory Agreements. The Trustees also considered the process used by the Manager, consistent with this structure, to identify and recommendsub-advisers, and the Manager’s ability to monitor and overseesub-advisers and recommend replacementsub-advisers, when necessary, and provide other services under the Management Agreement. The Board noted that investment management staff of the Manager and the Trust’s Chief Compliance Officer conductin-person oversight visits of theSub-advisers on a periodic basis, follow through with additional inquiry on any questions or concerns that arise during the visit and then report the results of the visit to the Board. The Trustees reviewed information regarding the experience and background of the Manager’s key personnel and the Manager’s organizational structure and resources, including investment, legal and administrative capabilities of the Manager. In this regard, the Trustees recognized that the Funds may benefit from the Manager’s ability to use similar resources and capabilities of its affiliates in providing services to the Funds.
The Trustees considered information regarding the nature, extent and quality of services provided to the Funds by theSub-advisers. The Trustees also
considered, among other things, the terms of theSub-advisory Agreements and the range of investment advisory services provided by theSub-advisers under the oversight of the Manager. In evaluating these investment advisory services, the Trustees considered, among other things, theSub-advisers’ investment philosophies, styles and/or processes and approach to managing the Funds. The Trustees received and evaluated information regarding the background, education, expertise and/or experience of the investment professionals that serve as portfolio managers for the Funds and the capabilities and resources of theSub-advisers.
Based upon these considerations, the Trustees concluded, within the context of their full deliberations, that the nature, extent and quality of services provided to the Funds by the Manager and eachSub-adviser were appropriate.
Investment Performance
In connection with each of its regular quarterly meetings, the Board receives information on the performance of each Fund, including net performance, relative performance rankings within each Fund’s Lipper peer group, Morningstar ratings, and performance as compared to benchmark index returns. At each quarterly Board meeting, members of the Manager’s senior investment team reviewed with the Board the economic and market environment, risk management, and style consistency in connection with management of the Funds. The Board considered investment performance for each Fund over theone-year and since inception periods.
The Board also received and reviewed a report prepared by Broadridge Financial Solutions (“Broadridge”), an independent provider of mutual fund industry data. The Board reviewed the investment performance of each Fund on an absolute basis and in comparison to an appropriate benchmark index and each Fund’s respective peer group as independently selected by Broadridge. The Board noted that, except for Guardian Growth & Income VIP Fund, Guardian Large Cap Disciplined Value VIP Fund and Guardian Mid Cap Traditional Growth VIP Fund, each of the Fund’s performance for theone-year and since inception periods was below the median of its respective peer group median and benchmark index. With respect to Guardian Large Cap Disciplined Value VIP Fund, the Board noted that the performance for theone-year period was lower than the peer group median and benchmark index and performance since inception was higher than the peer group median and benchmark
| 28 |
Table of Contents
SUPPLEMENTAL INFORMATION(UNAUDITED)
index. With respect to Guardian Growth & Income VIP Fund and Guardian Mid Cap Traditional Growth VIP Fund, the Board noted that the performance for both theone-year and since inception periods was higher than each Fund’s peer group median and benchmark index.
The Manager discussed with the Board factors contributing to the Funds’ performance results. In addition, for certain Funds, the Manager discussed with the Board longer term performance records of theSub-advisers for strategies used in managing the Funds. The Board concluded that the investment performance generated by eachSub-adviser was generally satisfactory, or, that any steps being taken by the Manager andSub-advisers to address any performance issues were satisfactory. The Board also noted the short operational history of each Fund.
Costs and Profitability
The Trustees considered the management fees paid by the Funds to the Manager under the Management Agreement and evaluated the reasonableness of these fees. The Trustees received and reviewed comparative information with respect to the management fees and the management fees paid by other funds offered as investment options underlying variable contracts within the applicable peer group based on data obtained from Broadridge. The Board noted that the contractual and actual (effective) management fees reported for each of the Funds were below or equal to its peer group in all cases except for the Guardian Mid Cap Traditional Growth VIP Fund. The Board noted that the actual (effective) management fee for this Fund exceeded the peer group median by a modest amount.
The Trustees considered thesub-advisory fees paid under theSub-advisory Agreements and evaluated the reasonableness of those fees. The Trustees also considered that the fees paid to theSub-advisers would be paid by the Manager and not the Funds and that the Manager had negotiated the fees with theSub-advisers atarm’s-length.
The Trustees received comparative information relating to each Fund’s operating expense ratios and the operating expense ratios of a peer group of funds. In this regard, the Board noted that each Fund’s operating expense ratio was equal to or lower than the operating expense ratio of its respective peer group median, except for Guardian Diversified Research VIP Fund, Guardian Growth & Income VIP Fund and Guardian Integrated Research VIP Fund. The Board noted that the operating expense ratio for these Funds exceeded the peer group median by a modest amount. The Trustees
considered the Manager’s commitment to limit each Fund’s operating expenses through an expense limitation agreement with the Trust. Although the Board recognized that the comparisons between the management fees and operating expenses of the Funds and those of identified peer funds are imprecise, given different terms of agreements and variations in fund strategies, the Trustees found that the comparative information supported their consideration and approval of the management fees and evaluation of the operating expenses.
The Board considered the Manager’s estimates of its profitability, which included allocations by the Manager of its costs in providing management services to the Funds. The Board considered the estimated profitability of the Manager both overall and on aFund-by-Fund basis. The Board did not consider any profitability information from theSub-advisers because the Manager would be responsible for payment of thesub-advisory fees and had negotiated the fees with theSub-advisers atarm’s-length.
Based on the consideration of the information and factors summarized above, as well as other relevant information and factors, the Board concluded that the proposed management andsub-advisory fees were reasonable in light of the nature, extent and quality of services rendered to the Funds by the Manager and theSub-advisers. The Board also concluded that the profitability of the Funds to the Manager was acceptable and the Board determined it was appropriate to revisit estimated Manager profitability in connection with future reviews of the Agreements.
Economies of Scale
The Board considered whether the Funds’ fee structure is designed to share economies of scale with shareholders as the Funds’ assets grow. In this regard, the Board noted that for ten of eleven Funds, the management andsub-advisory fee included breakpoints that are tiered based on growth in asset levels of each such Fund. The Board also noted that the Funds’ expenses were subject to an expense limitation provided by the Manager. The Board noted that expected economies of scale, where they exist, may be shared through the use of fee breakpoints, expense limitations by the Manager, and/or a lower overall fee.
Ancillary Benefits
The Board considered the potential benefits, other than management fees, that the Manager and/or its affiliates may receive because of the Manager’s relationship with
| 29 |
Table of Contents
SUPPLEMENTAL INFORMATION(UNAUDITED)
the Funds. The Trustees acknowledged that the Funds were designed to serve as investment options under variable contracts issued by affiliates of the Manager that would receive fees under those contracts and that Park Avenue Securities LLC, an affiliate of the Manager and principal underwriter of the Funds, and participating insurance companies, including insurance companies affiliated with the Manager, would be entitled to receive fees from the Funds under a plan of distribution adopted pursuant to Rule12b-1 under the 1940 Act. The Trustees considered the benefits to the Manager from increased assets under management. The Trustees considered that the Manager and its affiliates may benefit from (i) greater efficiencies in annuity administration and operations and potential cost savings due to a reduction in the number of unaffiliated funds available as annuity contract investment options, and (ii) increased dividends-received deductions due to the Funds’ status under the tax laws as disregarded
entities. In addition, the Trustees considered the potential benefits, other thansub-advisory fees, that theSub-advisers and their affiliates may receive because of their relationships with the Funds, including the potential increased ability to use soft dollars consistent with Trust policies and other benefits from increases in assets under management. The Trustees concluded that benefits that may accrue to the Manager and its affiliates are reasonable and the benefits that may accrue to theSub-advisers and their affiliates are consistent with those expected for asub-adviser to a mutual fund such as the applicable Fund.
Conclusion
Based on a comprehensive consideration and evaluation of all of the information and factors summarized above, among others, the Board as a whole, including the Independent Trustees, approved the Agreements.
| 30 |
Table of Contents
SUPPLEMENTAL INFORMATION(UNAUDITED)
The Statement of Additional Information (“SAI”) includes additional information about the Trust’s Trustees and Officers and is available, without charge, upon request by calling toll-free1-888-GUARDIAN(1-888-482-7342) or by visiting our website at http://guardianvpt.onlineprospectus.net/GuardianVPT/Prospectuses.
Portfolio Holdings and Proxy Voting Procedures
The Fund files its complete schedule of portfolio holdings with the Securities and Exchange Commission for the first and third quarters of each fiscal year as an exhibit to its reports on FormN-PORT. The Fund’s FormN-PORT reports are available on the Securities and Exchange Commission’s website at https://www.sec.gov. The Fund’s FormN-PORT information is also available, without charge, upon request, by calling toll-free1-888-GUARDIAN(1-888-482-7342) or by visiting our website at http://guardianvpt.onlineprospectus.net/GuardianVPT/
Prospectuses.
A description of the policies and procedures that the Fund uses to determine how to vote proxies relating to portfolio securities is included in the SAI. The SAI and information regarding how the Fund voted proxies relating to portfolio securities during the most recent12-month period ended June 30 may be obtained (i) without charge, upon request, by calling toll-free1-888-GUARDIAN(1-888-482-7342) or by visiting our website at http://guardianvpt.onlineprospectus.net/GuardianVPT/
Prospectuses; and (ii) on the Securities and Exchange Commission’s website at https://www.sec.gov.
| 31 |
Table of Contents
This report is transmitted to shareholders only. It is not authorized for use as an offer of sale or a solicitation of an offer to buy shares of the Fund unless accompanied or preceded by the Fund’s current prospectus. Past performance results shown in this report should not be considered a representation of future performance. Investment returns and principal value of shares will fluctuate so that shares, when redeemed, may be worth more or less than their original cost. Statements and other information herein are as dated and are subject to change.

The Guardian Life Insurance Company of America New York, NY 10001-2159
PUB8167
Table of Contents
| Item 2. | Code of Ethics. |
Not applicable to this semi-annual report.
| Item 3. | Audit Committee Financial Expert. |
Not applicable to this semi-annual report.
| Item 4. | Principal Accountant Fees and Services. |
Not applicable to this semi-annual report.
| Item 5. | Audit Committee of Listed registrants. |
Not applicable to the registrant.
| Item 6. | Investments. |
| (a) | The Schedule of Investments in securities of unaffiliated issuers as of the close of the reporting period is included as part of the report to shareholders filed under Item 1 of this Form. |
| (b) | None. |
| Item 7. | Disclosure of Proxy Voting Policies and Procedures forClosed-End Management Investment Companies. |
Not applicable to the registrant.
| Item 8. | Portfolio Managers ofClosed-End Management Investment Companies. |
Not applicable to the registrant.
| Item 9. | Purchases of Equity Securities byClosed-End Management Investment Company and Affiliated Purchasers. |
Not applicable to the registrant.
| Item 10. | Submission of Matters to a Vote of Security Holders. |
There have been no material changes to the procedures by which shareholders may recommend nominees to the registrant’s board of trustees, where those changes were implemented after the registrant last provided disclosure in response to the requirements of Item 407(c)(2)(iv) of RegulationS-K (as required by Item 22(b)(15) of Schedule 14A) or this Item.
| Item��11. | Controls and Procedures. |
| (a) | The registrant’s principal executive and principal financial officers have concluded that the registrant’s disclosure controls and procedures (as defined in Rule30a-3(c) under the Investment Company Act of 1940, as amended (the “1940 Act”) (17 CFR270.30a-3(c)) are effective, as of a date within 90 days of the filing date of this FormN-CSR, to provide reasonable assurance that the information required to be disclosed by the registrant on FormN-CSR is recorded, processed, summarized, and reported within the time periods specified in the Commission’s rules and forms, based on their evaluation of these disclosure controls and procedures required by Rule30a-3(b) under the 1940 Act (17 CFR270.30a-3(b)) and Rule13a-15(b) or15d-15(b) under the Securities Exchange Act of 1934 (17 CFR240.13a-15(b) or240.15d-15(b)). |
| (b) | There were no changes in the registrant’s internal control over financial reporting (as defined in Rule30a-3(d) under the 1940 Act (17 CFR270.30a-3(d)) that occurred during the period covered by this report that has materially affected, or is reasonably likely to materially affect, the registrant’s internal control over financial reporting. |
| Item 12. | Disclosure of Securities Lending Activities forClosed-End Management Investment Companies. |
Not applicable to the registrant.
Table of Contents
| Item 13. | Exhibits. |
| (a)(1) | Code of ethics – not applicable to this semi-annual report. | |
| (a)(2) | Certifications pursuant to Rule 30a-2(a) under the 1940 Act and Section 302 of theSarbanes-Oxley Act of 2002 are attached hereto. | |
| (a)(3) | Not applicable. | |
| (a)(4) | There was no change in the registrant’s independent public accountant during the reporting period. | |
| (b) | Certification pursuant to Rule 30a-2(b) under the 1940 Act and Section 906 of the Sarbanes-Oxley Act of 2002 is attached hereto. | |
Table of Contents
SIGNATURES
Pursuant to the requirements of the Securities Exchange Act of 1934 and the Investment Company Act of 1940, the registrant has duly caused this report to be signed on its behalf by the undersigned, thereunto duly authorized.
| (Registrant) | Guardian Variable Products Trust | |||
| By (Signature and Title) | /s/ Gordon Dinsmore | |||
| Gordon Dinsmore, President | ||||
| (Principal Executive Officer) | ||||
Date: September 5, 2019
Pursuant to the requirements of the Securities Exchange Act of 1934 and the Investment Company Act of 1940, this report has been signed below by the following persons on behalf of the registrant and in the capacities and on the dates indicated.
| By (Signature and Title) | /s/ Gordon Dinsmore | |||
| Gordon Dinsmore, President | ||||
| (Principal Executive Officer) |
Date: September 5, 2019
| By (Signature and Title) | /s/ John H Walter | |||
| John H Walter, Treasurer | ||||
| (Principal Financial and Accounting Officer) |
Date: September 5, 2019