UNITED STATES
SECURITIES AND EXCHANGE COMMISSION
Washington, D.C. 20549
FORM N-CSR
CERTIFIED SHAREHOLDER REPORT OF REGISTERED
MANAGEMENT INVESTMENT COMPANIES
Investment Company Act file number 811-23148
Guardian Variable Products Trust
(Exact name of registrant as specified in charter)
10 Hudson Yards New York, N.Y. 10001
(Address of principal executive offices) (Zip code)
Dominique Baede
President
Guardian Variable Products Trust
10 Hudson Yards
New York, N.Y. 10001
(Name and address of agent for service)
Registrant’s telephone number, including area code: 212-598-8000
Date of fiscal year end: December 31
Date of reporting period: June 30, 2023
| Item 1. | Reports to Stockholders. |
| | | A copy of the report transmitted to stockholders pursuant to Rule 30e-1 under the Investment Company Act of 1940 is filed herewith. |
Guardian Variable
Products Trust
2023
Semiannual Report
All Data as of June 30, 2023
Guardian Core Fixed Income VIP Fund

| | |
| Not FDIC insured. May lose value. No bank guarantee. | | www.guardianlife.com |
TABLE OF CONTENTS
Guardian Core Fixed Income VIP Fund
Except as otherwise specifically stated, all information, including portfolio security positions, is as of June 30, 2023. Fund holdings will vary. Information contained herein has been obtained from sources believed reliable, but is not guaranteed.
GUARDIAN CORE FIXED INCOME VIP FUND
Fund Characteristics (unaudited)
| | |
| Total Net Assets: $433,018,606 | | |
|
| |
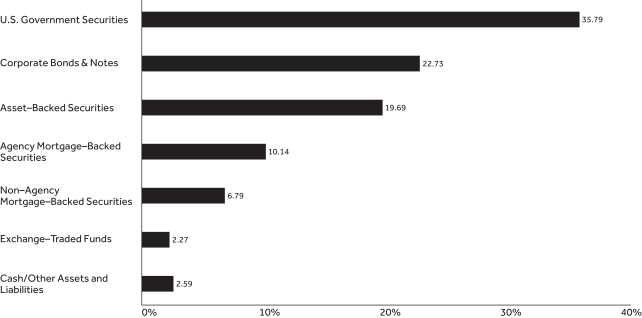
Bond Sector Allocation1 As of June 30, 2023 |
 |
|
| |
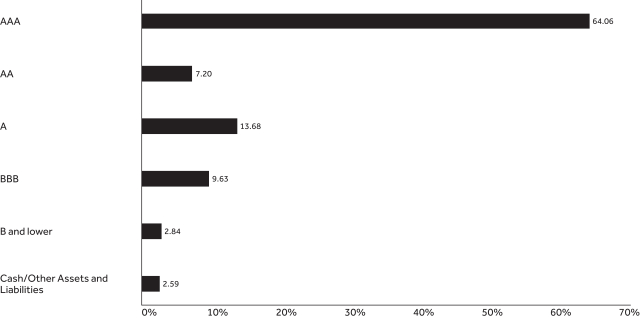
Bond Quality Allocation2 As of June 30, 2023 |
 |
GUARDIAN CORE FIXED INCOME VIP FUND
| | | | | | | | | | | | |
| | | | |
Top Ten Holdings1 As of June 30, 2023 | | | | | | | | | |
| | | | |
| Holding | | Coupon Rate | | | Maturity
Date | | | % of Total
Net Assets | |
| U.S. Treasury Note | | | 4.000% | | | | 6/30/2028 | | | | 11.48% | |
| U.S. Treasury Bond | | | 3.875% | | | | 5/15/2043 | | | | 10.03% | |
| U.S. Treasury Note | | | 4.625% | | | | 6/30/2025 | | | | 7.22% | |
| U.S. Treasury Bond | | | 3.625% | | | | 5/15/2053 | | | | 4.55% | |
| U.S. Treasury Note | | | 3.750% | | | | 5/31/2030 | | | | 2.51% | |
| Federal National Mortgage Association | | | 3.000% | | | | 5/1/2052 | | | | 1.96% | |
| Federal Home Loan Mortgage Corp. | | | 3.500% | | | | 6/1/2052 | | | | 1.39% | |
| iShares MBS ETF | | | — | | | | — | | | | 1.15% | |
| Vanguard Mortgage-Backed Securities ETF | | | — | | | | — | | | | 1.11% | |
| Federal National Mortgage Association | | | 4.000% | | | | 6/1/2052 | | | | 1.06% | |
| Total | | | | | | | | | | | 42.46% | |
| 1 | Portfolio holdings are subject to change and should not be considered a recommendation to buy or sell individual securities. Cash includes short-term investments and net other assets and liabilities. |
| 2 | The Bond Quality Allocation chart displays the percentage of fund assets allocated to each rating. Rating agencies’ independent ratings of individual securities are aggregated by Bloomberg, and market weights are reported using Standard & Poor’s letter rating conventions. Rating methodology uses the middle rating of Moody’s Investors Service, Inc., Standard & Poor’s Ratings Services, and Fitch Ratings. When a rating from only two of the rating agencies is available, the lower rating is used. Credit quality ratings assigned by a rating agency are subject to change periodically and are not absolute standards of credit quality. Rating agencies may fail to make timely changes in credit ratings, and an issuer’s current financial condition may be better or worse than a rating indicates. In formulating investment decisions for the Fund, Park Avenue Institutional Advisers LLC develops its own analysis of the credit quality and risks associated with individual debt instruments, rather than relying exclusively on rating agency ratings. |
UNDERSTANDING YOUR FUND’S EXPENSES (UNAUDITED)
By investing in the Fund, you incur two types of costs: (1) transaction costs and (2) ongoing costs, including, as applicable, investment advisory fees, distribution and/or service (12b-1) fees, if any, and other Fund expenses. The example below is intended to help you understand your ongoing costs (in dollars) of investing in the Fund and to compare these costs with the ongoing costs of investing in other mutual funds.
The example is based on an investment of $1,000 invested at the beginning of the period and held for the entire period from January 1, 2023 to June 30, 2023. The table below shows the Fund’s expenses in two ways:
Expenses based on actual return
This section of the table provides information about actual account values and actual expenses. You may use the information in this section, together with the amount you invested, to estimate the expenses that you paid over the period. Simply divide your account value by $1,000 (for example, an $8,600 account value divided by $1,000 = 8.6), then multiply the result by the number in the section under the heading entitled “Expenses Paid During Period” to estimate the expenses you paid on your account during this period.
Expenses based on hypothetical 5% return for comparison purposes
This section of the table provides information about hypothetical account values and hypothetical expenses based on the Fund’s actual expense ratio and an assumed rate of return of 5% per year before expenses, which is not the Fund’s actual return. The hypothetical account values and expenses may not be used to estimate the actual ending account balance or expenses you paid for the period. You may use this information to compare the ongoing costs of investing in the Fund with the cost of investing in other mutual funds. To do so, compare this 5% hypothetical example with the 5% hypothetical examples that appear in the shareholder reports of the other funds.
Note that the expenses shown in the table are meant to highlight your ongoing costs only and do not reflect any transactional costs, such as sales charges (loads), redemption fees, or exchange fees. Therefore the second section is useful in comparing ongoing costs only, and will not help you determine the relative total costs of owning different funds. If these transactional costs were included, your costs would have been higher. Charges and expenses at the insurance company separate account level are not reflected in the table.
| | | | | | | | | | | | | | |
| | | | | |
| | | Beginning
Account Value
1/1/23 | | Ending
Account Value
6/30/23 | | | Expenses Paid
During Period*
1/1/23-6/30/23 | | | Expense Ratio
During Period
1/1/23-6/30/23 | |
| Based on Actual Return | | $1,000.00 | | $ | 1,019.80 | | | $ | 2.50 | | | | 0.50% | |
Based on Hypothetical Return (5% Return Before Expenses) | | $1,000.00 | | $ | 1,022.32 | | | $ | 2.51 | | | | 0.50% | |
| * | Expenses are equal to the Fund’s annualized expense ratio as indicated, multiplied by the average account value over the period, multiplied by 181/365 (to reflect the one-half year period). |
SCHEDULE OF INVESTMENTS — GUARDIAN CORE FIXED INCOME VIP FUND
| | | | | | | | |
| June 30, 2023 (unaudited) | | Principal
Amount | | | Value | |
| Agency Mortgage–Backed Securities – 10.1% | |
| | | |
Federal Home Loan Mortgage Corp.
3.00% due 3/1/2052 | | $ | 2,741,813 | | | $ | 2,415,586 | |
3.50% due 6/1/2052 | | | 6,606,445 | | | | 6,020,513 | |
4.00% due 10/1/2037 | | | 435,714 | | | | 420,640 | |
4.00% due 6/1/2052 | | | 3,145,665 | | | | 2,950,789 | |
4.50% due 8/1/2052 | | | 3,835,899 | | | | 3,687,382 | |
4.50% due 9/1/2052 | | | 480,763 | | | | 462,066 | |
| | | |
Federal National Mortgage Association
3.00% due 7/1/2051 | | | 3,586,981 | | | | 3,162,804 | |
3.00% due 5/1/2052 | | | 9,652,860 | | | | 8,496,083 | |
3.50% due 6/1/2052 | | | 4,919,277 | | | | 4,483,033 | |
3.50% due 9/1/2052 | | | 3,964,063 | | | | 3,619,845 | |
3.50% due 10/1/2052 | | | 3,981,541 | | | | 3,626,603 | |
4.00% due 6/1/2052 | | | 4,881,624 | | | | 4,579,306 | |
| | | | | | | | | |
| | |
Total Agency Mortgage–Backed Securities
(Cost $46,278,380) | | | | 43,924,650 | |
| Asset–Backed Securities – 19.7% | |
| | | |
Aligned Data Centers Issuer LLC
2021-1A A2
1.937% due 8/15/2046(1) | | | 2,016,000 | | | | 1,762,086 | |
| | | |
Allegro CLO VI Ltd.
2017-2A B
6.76% (3 mo. USD LIBOR + 1.50%)
due 1/17/2031(1)(2)(3) | | | 2,000,000 | | | | 1,950,400 | |
| | | |
Ally Auto Receivables Trust
2022-1 A3
3.31% due 11/15/2026 | | | 3,850,000 | | | | 3,749,856 | |
| | | |
AmeriCredit Automobile Receivables Trust
2020-3 C
1.06% due 8/18/2026 | | | 2,625,000 | | | | 2,465,518 | |
| | | |
Anchorage Capital CLO 21 Ltd.
2021-21A B
7.00% (3 mo. USD LIBOR + 1.75%)
due 10/20/2034(1)(2)(3) | | | 1,750,000 | | | | 1,712,025 | |
| | | |
Ares XXVII CLO Ltd.
2013-2A BR2
6.923% (3 mo. USD LIBOR + 1.65%)
due 10/28/2034(1)(2)(3) | | | 2,000,000 | | | | 1,959,642 | |
| | | |
Ares XXVIIIR CLO Ltd.
2018-28RA A2
6.66% (3 mo. USD LIBOR + 1.40%)
due 10/17/2030(1)(2)(3) | | | 2,400,000 | | | | 2,358,847 | |
| | | |
Avis Budget Rental Car Funding AESOP LLC
2019-3A A
2.36% due 3/20/2026(1) | | | 2,440,000 | | | | 2,303,040 | |
| | | |
Barings CLO Ltd.
2020-1A AR
6.41% (3 mo. USD LIBOR + 1.15%)
due 10/15/2036(1)(2)(3) | | | 2,800,000 | | | | 2,733,405 | |
| | | | | | | | | |
| | | | | | | | |
| June 30, 2023 (unaudited) | | Principal
Amount | | | Value | |
| Asset–Backed Securities (continued) | |
| | | |
Battery Park CLO II Ltd.
2022-1A A1
7.259% (3 mo. USD Term SOFR + 2.21%)
due 10/20/2035(1)(2) | | $ | 3,550,000 | | | $ | 3,550,000 | |
| | | |
Benefit Street Partners CLO XVI Ltd.
2018-16A BR
6.81% (3 mo. USD LIBOR + 1.55%)
due 1/17/2032(1)(2)(3) | | | 2,800,000 | | | | 2,730,840 | |
| | | |
Canyon Capital CLO Ltd.
2022-1A B
6.832% (3 mo. USD Term SOFR + 1.85%)
due 4/15/2035(1)(2) | | | 2,000,000 | | | | 1,945,916 | |
| | | |
CarMax Auto Owner Trust
2020-4 B
0.85% due 6/15/2026 | | | 2,200,000 | | | | 2,052,612 | |
| | | |
Cathedral Lake VI Ltd.
2021-6A AN
6.505% (3 mo. USD LIBOR + 1.25%)
due 4/25/2034(1)(2)(3) | | | 2,500,000 | | | | 2,457,492 | |
| | | |
CIFC Funding Ltd.
2013-4A BRR
6.892% (3 mo. USD LIBOR + 1.60%)
due 4/27/2031(1)(2)(3) | | | 2,000,000 | | | | 1,955,600 | |
| | | |
Dryden 80 CLO Ltd.
2019-80A AR
6.236% (3 mo. USD Term SOFR + 1.25%)
due 1/17/2033(1)(2) | | | 3,350,000 | | | | 3,280,990 | |
| | | |
Dryden Senior Loan Fund
2017-47A CR
7.31% (3 mo. USD LIBOR + 2.05%)
due 4/15/2028(1)(2)(3) | | | 2,100,000 | | | | 2,075,850 | |
| | | |
Exeter Automobile Receivables Trust 2022-2A A3
2.80% due 11/17/2025 | | | 1,192,688 | | | | 1,188,162 | |
| | | |
Ford Credit Auto Owner Trust
2020-1 A
2.04% due 8/15/2031(1) | | | 2,400,000 | | | | 2,258,153 | |
| | | |
GM Financial Consumer Automobile Receivables Trust
2020-4 A4
0.50% due 2/17/2026 | | | 3,579,000 | | | | 3,388,859 | |
| | | |
Gulf Stream Meridian 6 Ltd.
2021-6A A1
6.45% (3 mo. USD LIBOR + 1.19%)
due 1/15/2037(1)(2)(3) | | | 1,800,000 | | | | 1,767,780 | |
| | | |
Hertz Vehicle Financing III LLC
2022-3A A
3.37% due 3/25/2025(1) | | | 2,140,000 | | | | 2,110,203 | |
| | | |
Hyundai Auto Lease Securitization Trust
2022-B A3
3.35% due 6/16/2025(1) | | | 2,800,000 | | | | 2,752,761 | |
| | | | | | | | | |
| | | | |
| 4 | | | | The accompanying notes are an integral part of these financial statements. |
SCHEDULE OF INVESTMENTS — GUARDIAN CORE FIXED INCOME VIP FUND
| | | | | | | | |
| June 30, 2023 (unaudited) | | Principal
Amount | | | Value | |
| Asset–Backed Securities (continued) | |
| | | |
Jamestown CLO XI Ltd.
2018-11A A2
6.951% (3 mo. USD LIBOR + 1.70%)
due 7/14/2031(1)(2)(3) | | $ | 2,800,000 | | | $ | 2,736,720 | |
| | | |
KKR CLO 38 Ltd.
38A A1
6.306% (3 mo. USD Term SOFR + 1.32%)
due 4/15/2033(1)(2) | | | 2,800,000 | | | | 2,753,217 | |
| | | |
Master Credit Card Trust
2021-1A A
0.53% due 11/21/2025(1) | | | 3,120,000 | | | | 2,973,048 | |
| | | |
Neuberger Berman Loan Advisers CLO 26 Ltd.
2017-26A BR
6.662% (3 mo. USD LIBOR + 1.40%)
due 10/18/2030(1)(2)(3) | | | 1,050,000 | | | | 1,026,980 | |
| | | |
Neuberger Berman Loan Advisers CLO 40 Ltd.
2021-40A A
6.32% (3 mo. USD LIBOR + 1.06%)
due 4/16/2033(1)(2)(3) | | | 2,900,000 | | | | 2,862,880 | |
| | | |
Nissan Auto Lease Trust
2023-A A4
4.80% due 7/15/2027 | | | 1,600,000 | | | | 1,576,879 | |
| | | |
OHA Credit Partners XIV Ltd.
2017-14A B
6.761% (3 mo. USD LIBOR + 1.50%)
due 1/21/2030(1)(2)(3) | | | 2,000,000 | | | | 1,953,800 | |
| | | |
PPM CLO 2 Ltd.
2019-2A BR
7.015% (3 mo. USD LIBOR + 1.75%)
due 4/16/2032(1)(2)(3) | | | 2,500,000 | | | | 2,418,500 | |
| | | |
Santander Drive Auto Receivables Trust
2022-3 A3
3.40% due 12/15/2026 | | | 2,657,738 | | | | 2,621,904 | |
| | | |
TIAA CLO IV Ltd.
2018-1A A2
6.95% (3 mo. USD LIBOR + 1.70%)
due 1/20/2032(1)(2)(3) | | | 1,240,000 | | | | 1,207,512 | |
| | | |
Toyota Auto Loan Extended Note Trust
2021-1A A
1.07% due 2/27/2034(1) | | | 2,175,000 | | | | 1,941,474 | |
| | | |
Verizon Owner Trust
2020-C A
0.41% due 4/21/2025 | | | 678,295 | | | | 671,223 | |
| | | |
Voya CLO Ltd.
2015-3A A3R
7.01% (3 mo. USD Term SOFR + 1.96%)
due 10/20/2031(1)(2) | | | 2,000,000 | | | | 1,967,064 | |
| | | | | | | | | |
| | | | | | | | |
| June 30, 2023 (unaudited) | | Principal
Amount | | | Value | |
| Asset–Backed Securities (continued) | |
| | | |
Westlake Automobile Receivables Trust
2022-3A A2
5.24% due 7/15/2025(1) | | $ | 1,493,846 | | | $ | 1,490,546 | |
| | | |
World Omni Auto Receivables Trust 2021-B A4
0.69% due 6/15/2027 | | | 2,800,000 | | | | 2,562,547 | |
| | | | | | | | | |
| | |
Total Asset–Backed Securities
(Cost $86,563,442) | | | | 85,274,331 | |
| Corporate Bonds & Notes – 22.7% | |
| Aerospace & Defense – 0.5% | |
| | | |
Lockheed Martin Corp.
4.75% due 2/15/2034 | | | 1,200,000 | | | | 1,196,724 | |
| | | |
5.20% due 2/15/2055 | | | 400,000 | | | | 412,924 | |
| | | |
Northrop Grumman Corp.
4.95% due 3/15/2053 | | | 400,000 | | | | 390,136 | |
| | | | | | | | | |
| | | |
| | | | | | | | 1,999,784 | |
| Agriculture – 0.5% | |
| | | |
Philip Morris International, Inc.
5.75% due 11/17/2032 | | | 2,300,000 | | | | 2,357,086 | |
| | | | | | | | | |
| | | |
| | | | | | | | 2,357,086 | |
| Beverages – 0.3% | |
| | | |
Anheuser-Busch InBev Worldwide, Inc.
3.50% due 6/1/2030 | | | 1,200,000 | | | | 1,116,960 | |
| | | | | | | | | |
| | | |
| | | | | | | | 1,116,960 | |
| Biotechnology – 0.2% | |
| | | |
Amgen, Inc.
5.25% due 3/2/2033 | | | 900,000 | | | | 900,909 | |
| | | | | | | | | |
| | | |
| | | | | | | | 900,909 | |
| Commercial Banks – 7.0% | |
| |
Bank of America Corp. | |
4.271% (4.271% fixed rate until 7/23/2028; 3 mo. USD Term SOFR + 1.57% thereafter)
due 7/23/2029(2) | | | 2,400,000 | | | | 2,276,208 | |
5.288% (5.288% fixed rate until 4/25/2033; SOFR + 1.91% thereafter)
due 4/25/2034(2) | | | 1,400,000 | | | | 1,387,162 | |
| | | |
Barclays PLC | | | | | | | | |
2.645% (2.645% fixed rate until 6/24/2030; 1 yr. CMT + 1.90% thereafter)
due 6/24/2031(2) | | | 1,600,000 | | | | 1,283,312 | |
7.119% (7.119% fixed rate until 6/27/2033; SOFR + 3.57% thereafter)
due 6/27/2034(2) | | | 500,000 | | | | 500,285 | |
| | | |
BNP Paribas SA | | | | | | | | |
5.125% (5.125% fixed rate until 1/13/2028; 1 yr. CMT + 1.45% thereafter)
due 1/13/2029(1)(2) | | | 2,200,000 | | | | 2,154,240 | |
| | | | | | | | | |
| | | | |
| The accompanying notes are an integral part of these financial statements. | | | | 5 |
SCHEDULE OF INVESTMENTS — GUARDIAN CORE FIXED INCOME VIP FUND
| | | | | | | | |
| June 30, 2023 (unaudited) | | Principal
Amount | | | Value | |
| Commercial Banks (continued) | |
5.335% (5.335% fixed rate until 6/12/2028; 1 yr. CMT + 1.50% thereafter)
due 6/12/2029(1)(2) | | $ | 2,200,000 | | | $ | 2,172,632 | |
| | | |
Credit Agricole SA
5.514% due 7/5/2033(1) | | | 800,000 | | | | 805,896 | |
| | | |
Deutsche Bank AG
2.311% (2.311% fixed rate until 11/16/2026; SOFR + 1.22% thereafter)
due 11/16/2027(2) | | | 2,900,000 | | | | 2,494,580 | |
| | | |
Discover Bank
4.682% (4.682% fixed rate until 8/9/2023; 5 yr. USD Swap + 1.73% thereafter)
due 8/9/2028(2) | | | 2,000,000 | | | | 1,816,760 | |
| | | |
Fifth Third Bank NA
2.25% due 2/1/2027 | | | 2,400,000 | | | | 2,107,008 | |
| | | |
Huntington National Bank
4.552% (4.552% fixed rate until 5/17/2027; SOFR + 1.65% thereafter)
due 5/17/2028(2) | | | 1,400,000 | | | | 1,309,210 | |
5.65% due 1/10/2030 | | | 500,000 | | | | 480,220 | |
| | | |
JPMorgan Chase & Co.
4.203% (4.203% fixed rate until 7/23/2028; 3 mo. USD Term SOFR + 1.52% thereafter)
due 7/23/2029(2) | | | 3,700,000 | | | | 3,517,109 | |
| | | |
Mitsubishi UFJ Financial Group, Inc.
5.406% (5.406% fixed rate until 4/19/2033; 1 yr. CMT + 1.97% thereafter)
due 4/19/2034(2) | | | 1,000,000 | | | | 991,720 | |
| | | |
Morgan Stanley 5.123% (5.123% fixed rate until 2/1/2028; SOFR + 1.73% thereafter)
due 2/1/2029(2) | | | 2,000,000 | | | | 1,973,680 | |
5.25% (5.250% fixed rate until 4/21/2033; SOFR + 1.87% thereafter)
due 4/21/2034(2) | | | 1,400,000 | | | | 1,381,744 | |
| | | |
NatWest Group PLC
5.808% (5.808% fixed rate until 9/13/2028; 1 yr. CMT + 1.95% thereafter)
due 9/13/2029(2) | | | 2,500,000 | | | | 2,467,050 | |
| | | |
Truist Financial Corp.
5.867% (5.867% fixed rate until 6/8/2033; SOFR + 2.36% thereafter)
due 6/8/2034(2) | | | 1,200,000 | | | | 1,202,280 | |
| | | | | | | | | |
| | | |
| | | | | | | | 30,321,096 | |
| Commercial Services – 0.1% | |
| | | |
S&P Global, Inc.
2.90% due 3/1/2032 | | | 700,000 | | | | 607,271 | |
| | | | | | | | | |
| | | |
| | | | | | | | 607,271 | |
| | | | | | | | |
| June 30, 2023 (unaudited) | | Principal
Amount | | | Value | |
| Computers – 0.3% | |
| | | |
Apple, Inc.
2.65% due 2/8/2051 | | $ | 500,000 | | | $ | 345,260 | |
3.25% due 8/8/2029 | | | 100,000 | | | | 93,604 | |
3.35% due 8/8/2032 | | | 1,000,000 | | | | 931,850 | |
| | | | | | | | | |
| | | |
| | | | | | | | 1,370,714 | |
| Cosmetics & Personal Care – 0.9% | |
| | | |
Haleon U.S. Capital LLC
3.625% due 3/24/2032 | | | 2,300,000 | | | | 2,062,663 | |
| | | |
Kenvue, Inc.
4.90% due 3/22/2033(1) | | | 1,700,000 | | | | 1,718,972 | |
5.05% due 3/22/2053(1) | | | 100,000 | | | | 101,941 | |
| | | | | | | | | |
| | | |
| | | | | | | | 3,883,576 | |
| Diversified Financial Services – 1.3% | |
| | | |
AerCap Ireland Capital DAC /
AerCap Global Aviation Trust
3.00% due 10/29/2028 | | | 2,450,000 | | | | 2,124,934 | |
| | | |
Air Lease Corp.
5.30% due 2/1/2028 | | | 1,000,000 | | | | 982,710 | |
| | | |
Charles Schwab Corp.
4.625% due 3/22/2030 | | | 1,800,000 | | | | 1,764,594 | |
| | | |
Mastercard, Inc.
4.85% due 3/9/2033 | | | 700,000 | | | | 712,817 | |
| | | | | | | | | |
| | | |
| | | | | | | | 5,585,055 | |
| Electric – 1.8% | |
| | | |
Alabama Power Co.
3.94% due 9/1/2032 | | | 1,000,000 | | | | 923,910 | |
| | | |
Consumers Energy Co.
4.20% due 9/1/2052 | | | 600,000 | | | | 514,638 | |
| | | |
Duke Energy Carolinas LLC
4.95% due 1/15/2033 | | | 1,000,000 | | | | 993,600 | |
| | | |
Duke Energy Corp.
3.50% due 6/15/2051 | | | 950,000 | | | | 688,902 | |
5.00% due 8/15/2052 | | | 400,000 | | | | 366,084 | |
| | | |
Exelon Corp.
5.60% due 3/15/2053 | | | 500,000 | | | | 504,385 | |
| | | |
PPL Electric Utilities Corp.
5.00% due 5/15/2033 | | | 500,000 | | | | 501,320 | |
5.25% due 5/15/2053 | | | 1,300,000 | | | | 1,324,856 | |
| | | |
Wisconsin Public Service Corp.
2.85% due 12/1/2051 | | | 400,000 | | | | 264,720 | |
| | | |
Xcel Energy, Inc.
4.60% due 6/1/2032 | | | 2,000,000 | | | | 1,892,760 | |
| | | | | | | | | |
| | | |
| | | | | | | | 7,975,175 | |
| Food – 0.3% | |
| | | |
Kroger Co.
1.70% due 1/15/2031 | | | 1,800,000 | | | | 1,412,388 | |
| | | | | | | | | |
| | | |
| | | | | | | | 1,412,388 | |
| Gas – 0.1% | |
| | | |
CenterPoint Energy Resources Corp.
5.40% due 3/1/2033 | | | 600,000 | | | | 610,788 | |
| | | | | | | | | |
| | | |
| | | | | | | | 610,788 | |
| | | | |
| 6 | | | | The accompanying notes are an integral part of these financial statements. |
SCHEDULE OF INVESTMENTS — GUARDIAN CORE FIXED INCOME VIP FUND
| | | | | | | | |
| June 30, 2023 (unaudited) | | Principal
Amount | | | Value | |
| Healthcare-Services – 0.7% | |
| | | |
Elevance Health, Inc.
4.75% due 2/15/2033 | | $ | 800,000 | | | $ | 777,824 | |
5.125% due 2/15/2053 | | | 200,000 | | | | 193,552 | |
| | | |
UnitedHealth Group, Inc.
2.30% due 5/15/2031 | | | 1,700,000 | | | | 1,437,282 | |
5.875% due 2/15/2053 | | | 400,000 | | | | 443,728 | |
| | | | | | | | | |
| | | |
| | | | | | | | 2,852,386 | |
| Insurance – 1.2% | |
| | | |
Aon Corp. / Aon Global Holdings PLC
5.35% due 2/28/2033 | | | 1,200,000 | | | | 1,209,876 | |
| | | |
Athene Holding Ltd.
3.50% due 1/15/2031 | | | 900,000 | | | | 741,312 | |
| | | |
Corebridge Financial, Inc.
3.90% due 4/5/2032 | | | 1,100,000 | | | | 957,957 | |
| | | |
Hartford Financial Services Group, Inc.
2.80% due 8/19/2029 | | | 700,000 | | | | 604,534 | |
3.60% due 8/19/2049 | | | 400,000 | | | | 301,968 | |
| | | |
MetLife, Inc.
4.55% due 3/23/2030 | | | 400,000 | | | | 391,532 | |
5.25% due 1/15/2054 | | | 600,000 | | | | 584,124 | |
| | | |
Prudential Financial, Inc. | | | | | | | | |
3.70% due 3/13/2051 | | | 200,000 | | | | 153,506 | |
5.75% due 7/15/2033 | | | 200,000 | | | | 209,580 | |
| | | | | | | | | |
| | | |
| | | | | | | | 5,154,389 | |
| Media – 0.9% | |
| | | |
Charter Communications Operating LLC / Charter Communications Operating Capital
2.25% due 1/15/2029 | | | 500,000 | | | | 416,415 | |
4.40% due 4/1/2033 | | | 300,000 | | | | 263,394 | |
5.25% due 4/1/2053 | | | 700,000 | | | | 564,984 | |
| | | |
Comcast Corp.
1.95% due 1/15/2031 | | | 1,600,000 | | | | 1,308,144 | |
2.887% due 11/1/2051 | | | 600,000 | | | | 402,432 | |
5.35% due 5/15/2053 | | | 700,000 | | | | 711,732 | |
| | | | | | | | | |
| | | |
| | | | | | | | 3,667,101 | |
| Oil & Gas – 1.2% | |
| | | |
BP Capital Markets America, Inc.
4.812% due 2/13/2033 | | | 2,600,000 | | | | 2,564,432 | |
| | | |
Cenovus Energy, Inc.
2.65% due 1/15/2032 | | | 500,000 | | | | 403,695 | |
3.75% due 2/15/2052 | | | 300,000 | | | | 212,979 | |
| | | |
Occidental Petroleum Corp.
7.50% due 5/1/2031 | | | 700,000 | | | | 764,246 | |
| | | |
Valero Energy Corp.
2.80% due 12/1/2031 | | | 1,300,000 | | | | 1,070,316 | |
| | | | | | | | | |
| | | |
| | | | | | | | 5,015,668 | |
| Oil & Gas Services – 0.3% | |
| | | |
Schlumberger Investment SA
4.85% due 5/15/2033 | | | 1,400,000 | | | | 1,380,050 | |
| | | | | | | | | |
| | | |
| | | | | | | | 1,380,050 | |
| | | | | | | | |
| June 30, 2023 (unaudited) | | Principal
Amount | | | Value | |
| Pharmaceuticals – 1.3% | |
| | | |
CVS Health Corp.
5.30% due 6/1/2033 | | $ | 2,000,000 | | | $ | 1,996,520 | |
5.875% due 6/1/2053 | | | 900,000 | | | | 924,579 | |
| | | |
Pfizer Investment Enterprises Pte Ltd.
4.75% due 5/19/2033 | | | 2,600,000 | | | | 2,591,290 | |
| | | | | | | | | |
| | | |
| | | | | | | | 5,512,389 | |
| Pipelines – 0.8% | |
| | | |
Cheniere Energy Partners LP
5.95% due 6/30/2033(1) | | | 700,000 | | | | 703,850 | |
| | | |
Energy Transfer LP
3.75% due 5/15/2030 | | | 700,000 | | | | 632,814 | |
5.00% due 5/15/2050 | | | 500,000 | | | | 422,490 | |
| | | |
ONEOK, Inc.
6.10% due 11/15/2032 | | | 700,000 | | | | 712,068 | |
| | | |
Western Midstream Operating LP
6.15% due 4/1/2033 | | | 1,100,000 | | | | 1,107,359 | |
| | | | | | | | | |
| | | |
| | | | | | | | 3,578,581 | |
| Real Estate Investment Trusts (REITs) – 0.9% | |
| | | |
American Tower Corp.
5.65% due 3/15/2033 | | | 1,000,000 | | | | 1,017,300 | |
| | | |
Extra Space Storage LP
5.50% due 7/1/2030 | | | 1,300,000 | | | | 1,292,356 | |
| | | |
Realty Income Corp.
4.85% due 3/15/2030 | | | 1,800,000 | | | | 1,744,182 | |
| | | | | | | | | |
| | | |
| | | | | | | | 4,053,838 | |
| Semiconductors – 0.8% | |
| | | |
Broadcom, Inc.
4.15% due 4/15/2032(1) | | | 2,000,000 | | | | 1,811,020 | |
| | | |
Intel Corp.
5.20% due 2/10/2033 | | | 1,200,000 | | | | 1,211,184 | |
| | | |
NXP BV / NXP Funding LLC / NXP USA, Inc.
2.65% due 2/15/2032 | | | 400,000 | | | | 323,408 | |
| | | | | | | | | |
| | | |
| | | | | | | | 3,345,612 | |
| Software – 0.5% | |
| | | |
Microsoft Corp.
2.921% due 3/17/2052 | | | 600,000 | | | | 445,908 | |
| | | |
Oracle Corp.
5.55% due 2/6/2053 | | | 300,000 | | | | 290,664 | |
6.25% due 11/9/2032 | | | 1,000,000 | | | | 1,060,950 | |
6.90% due 11/9/2052 | | | 300,000 | | | | 336,171 | |
| | | | | | | | | |
| | | |
| | | | | | | | 2,133,693 | |
| Telecommunications – 0.4% | |
| | | |
T-Mobile USA, Inc.
2.70% due 3/15/2032 | | | 1,700,000 | | | | 1,408,552 | |
3.40% due 10/15/2052 | | | 500,000 | | | | 356,845 | |
| | | |
Verizon Communications, Inc.
2.355% due 3/15/2032 | | | 200,000 | | | | 160,874 | |
| | | | | | | | | |
| | | |
| | | | | | | | 1,926,271 | |
| | | | |
| The accompanying notes are an integral part of these financial statements. | | | | 7 |
SCHEDULE OF INVESTMENTS — GUARDIAN CORE FIXED INCOME VIP FUND
| | | | | | | | |
| June 30, 2023 (unaudited) | | Principal
Amount | | | Value | |
| Transportation – 0.4% | |
| | | |
Union Pacific Corp.
3.95% due 9/10/2028 | | $ | 300,000 | | | $ | 290,685 | |
4.50% due 1/20/2033 | | | 500,000 | | | | 492,130 | |
4.95% due 5/15/2053 | | | 900,000 | | | | 896,364 | |
| | | | | | | | | |
| | | |
| | | | | | | | 1,679,179 | |
| | |
Total Corporate Bonds & Notes
(Cost $99,423,978) | | | | 98,439,959 | |
| Non–Agency Mortgage–Backed Securities – 6.8% | |
| | | |
Benchmark Mortgage Trust
2018-B3 AS
4.195% due 4/10/2051(2)(4) | | | 2,550,000 | | | | 2,305,788 | |
| | | |
Citigroup Commercial Mortgage Trust
2014-GC23 AS
3.863% due 7/10/2047 | | | 2,750,000 | | | | 2,640,096 | |
| | | |
Commercial Mortgage Trust
2017-COR2 A3
3.51% due 9/10/2050 | | | 2,920,000 | | | | 2,679,173 | |
2019-GC44 AM
3.263% due 8/15/2057 | | | 2,415,000 | | | | 2,021,526 | |
| | | |
DBGS Mortgage Trust
2018-C1 AM
4.756% due 10/15/2051(2)(4) | | | 2,400,000 | | | | 2,161,789 | |
| | | |
DBUBS Mortgage Trust
2017-BRBK A
3.452% due 10/10/2034(1) | | | 1,760,000 | | | | 1,597,662 | |
| | | |
Freddie Mac STACR REMIC Trust
2021-DNA7 M2
6.867% due 11/25/2041(1)(2)(4) | | | 2,200,000 | | | | 2,118,892 | |
2021-HQA4 M1
6.017% due 12/25/2041(1)(2)(4) | | | 1,393,116 | | | | 1,351,080 | |
2022-DNA1 M1A
6.067% due 1/25/2042(1)(2)(4) | | | 1,199,563 | | | | 1,179,955 | |
2022-HQA3 M1A
7.367% due 8/25/2042(1)(2)(4) | | | 2,509,143 | | | | 2,524,232 | |
| | | |
Hilton USA Trust
2016-HHV A
3.719% due 11/5/2038(1) | | | 1,875,000 | | | | 1,734,445 | |
| | | |
Morgan Stanley Bank of America Merrill Lynch Trust
2013-C9 AS
3.456% due 5/15/2046 | | | 429,370 | | | | 397,122 | |
| | | |
Wells Fargo Commercial Mortgage Trust
2015-NXS4 A4
3.718% due 12/15/2048 | | | 3,120,000 | | | | 2,948,996 | |
2018-C43 A4
4.012% due 3/15/2051(2)(4) | | | 3,000,000 | | | | 2,786,001 | |
| | | |
WFRBS Commercial Mortgage Trust
2014-C19 AS
4.271% due 3/15/2047 | | | 975,000 | | | | 953,982 | |
| | | | | | | | | |
| | |
Total Non–Agency Mortgage–Backed Securities
(Cost $30,910,917) | | | | 29,400,739 | |
| | | | | | | | |
| June 30, 2023 (unaudited) | | Principal
Amount | | | Value | |
| U.S. Government Securities – 35.8% | |
| | | |
U.S. Treasury Bond
3.625% due 5/15/2053 | | $ | 20,500,000 | | | $ | 19,712,031 | |
3.875% due 5/15/2043 | | | 44,500,000 | | | | 43,429,219 | |
| | | |
U.S. Treasury Note
3.75% due 5/31/2030 | | | 11,000,000 | | | | 10,848,750 | |
4.00% due 6/30/2028 | | | 50,000,000 | | | | 49,726,565 | |
4.625% due 6/30/2025 | | | 31,400,000 | | | | 31,256,493 | |
| | | | | | | | | |
| | |
Total U.S. Government Securities
(Cost $155,161,801) | | | | 154,973,058 | |
| | | | | | | | |
| | |
Shares | | | Value | |
| Exchange–Traded Funds – 2.3% | |
| | | |
iShares MBS ETF | | | 53,500 | | | | 4,989,677 | |
| | | |
Vanguard Mortgage-Backed Securities ETF | | | 104,800 | | | | 4,819,752 | |
| | | | | | | | | |
| | |
Total Exchange–Traded Funds
(Cost $9,918,211) | | | | 9,809,429 | |
| | | | | | | | |
| | | Principal
Amount | | |
Value | |
| Repurchase Agreements – 1.6% | |
| | | |
Fixed Income Clearing Corp., 1.52%, dated 6/30/2023, proceeds at maturity value of $6,698,289, due 7/3/2023(5) | | $ | 6,697,441 | | | | 6,697,441 | |
| | |
Total Repurchase Agreements
(Cost $6,697,441) | | | | 6,697,441 | |
| | |
Total Investments – 99.0%
(Cost $434,954,170) | | | | 428,519,607 | |
| | |
| Assets in excess of other liabilities – 1.0% | | | | 4,498,999 | |
| | |
| Total Net Assets – 100.0% | | | $ | 433,018,606 | |
| (1) | Securities that may be resold in transactions exempt from registration under Rule 144A of the Securities Act of 1933, as amended, normally to certain qualified buyers. At June 30, 2023, the aggregate market value of these securities amounted to $84,971,588, representing 19.6% of net assets. These securities have been deemed liquid by the investment adviser pursuant to the Fund’s liquidity procedures approved by the Board of Trustees. |
| (2) | Variable rate securities, which may include step-up bonds or adjustable rate mortgages. The rate shown is the rate in effect at June 30, 2023. |
| (3) | The London Interbank Offered Rate (“LIBOR”) is being phased out completely by June 30, 2023. There remains uncertainty regarding the nature of any replacement rate and the impact of a transition away from LIBOR on the Fund’s investments. |
| (4) | Variable coupon rate based on weighted average interest rate of underlying mortgages. |
| (5) | The table below presents collateral for repurchase agreements. |
| | | | | | | | | | | | | | | | |
| Security | | Coupon | | | Maturity
Date | | | Principal
Amount | | | Value | |
| U.S. Treasury Note | | | 4.625% | | | | 3/15/2026 | | | $ | 6,732,000 | | | $ | 6,831,471 | |
| | | | |
| 8 | | | | The accompanying notes are an integral part of these financial statements. |
SCHEDULE OF INVESTMENTS — GUARDIAN CORE FIXED INCOME VIP FUND
Open futures contracts at June 30, 2023:
| | | | | | | | | | | | | | | | | | | | | | | | |
| Type | | Expiration | | | Contracts | | | Position | | | Notional
Amount | | | Notional
Value | | | Unrealized
Depreciation | |
| U.S. 2-Year Treasury Note | | | September 2023 | | | | 531 | | | | Long | | | $ | 109,145,994 | | | $ | 107,975,531 | | | $ | (1,170,463 | ) |
| U.S. 5-Year Treasury Note | | | September 2023 | | | | 96 | | | | Long | | | | 10,433,579 | | | | 10,281,000 | | | | (152,579 | ) |
| U.S. Ultra 10-Year Treasury Note | | | September 2023 | | | | 10 | | | | Long | | | | 1,185,189 | | | | 1,184,375 | | | | (814 | ) |
| Total | | | $ | 120,764,762 | | | $ | 119,440,906 | | | $ | (1,323,856 | ) |
Centrally cleared credit default swap agreements — buy protection(6):
| | | | | | | | | | | | | | | | | | | | | | | | | | | | | | | | | | | | |
| Reference Entity | | Implied Credit
Spread at
6/30/23(7) | | | Notional Amount(8) | | | Maturity | | | (Pay)/Receive
Fixed Rate | | | Periodic
Payment
Frequency | | | Upfront
Payments | | | Value | | | Unrealized
Depreciation | |
| CDX.NA.IG.S40 | | | 0.66% | | | | USD | | | | 45,000,000 | | | | 6/20/2028 | | | | (1.00 | )% | | | Quarterly | | | $ | (526,294 | ) | | $ | (673,232 | ) | | $ | (146,938 | ) |
| (6) | When a credit event occurs as defined under the terms of the swap agreement, the Fund as a buyer of credit protection will either (i) receive from the seller of protection an amount equal to the notional amount of the swap and deliver the referenced obligation or underlying securities comprising the referenced obligation or (ii) receive a net settlement amount in the form of cash or securities equal to the notional amount of the swap less the recovery value of the referenced obligation or underlying securities comprising the referenced obligation. |
| (7) | Implied credit spread, represented in absolute terms, utilized in determining the value of the credit default swap agreements as of period end will serve as an indicator of the current status of the payment/performance risk and represent the likelihood or risk of default for the credit derivative. The implied credit spread of a referenced entity reflects the cost of buying/selling protection and may include payments required to be made to enter into the agreement. Generally, wider credit spreads represent a perceived deterioration of the referenced entity’s credit soundness and a greater likelihood or risk of default or other credit event occurring as defined under the terms of the swap agreement. |
| (8) | The notional amount represents the maximum potential amount the Fund could be required to pay as a buyer of credit protection if a credit event occurs, as defined under the terms of the swap agreement, for each security included in the CDX North America Investment Grade Index. |
Legend:
CLO — Collateralized Loan Obligation
CMT — Constant Maturity Treasury
LIBOR — London Interbank Offered Rate
SOFR — Secured Overnight Financing Rate
USD — United States Dollar
| | | | |
| The accompanying notes are an integral part of these financial statements. | | | | 9 |
SCHEDULE OF INVESTMENTS — GUARDIAN CORE FIXED INCOME VIP FUND
The following is a summary of the inputs used as of June 30, 2023 in valuing the Fund’s investments. For more information on valuation inputs, please refer to Note 2a of the accompanying Notes to Financial Statements.
| | | | | | | | | | | | | | | | |
| | | Valuation Inputs | | | | |
| Investments in Securities (unaudited) | | Level 1 | | | Level 2 | | | Level 3 | | | Total | |
| Agency Mortgage–Backed Securities | | $ | — | | | $ | 43,924,650 | | | $ | — | | | $ | 43,924,650 | |
| Asset–Backed Securities | | | — | | | | 85,274,331 | | | | — | | | | 85,274,331 | |
| Corporate Bonds & Notes | | | — | | | | 98,439,959 | | | | — | | | | 98,439,959 | |
| Non–Agency Mortgage–Backed Securities | | | — | | | | 29,400,739 | | | | — | | | | 29,400,739 | |
| U.S. Government Securities | | | — | | | | 154,973,058 | | | | — | | | | 154,973,058 | |
| Exchange–Traded Funds | | | 9,809,429 | | | | — | | | | — | | | | 9,809,429 | |
| Repurchase Agreements | | | — | | | | 6,697,441 | | | | — | | | | 6,697,441 | |
| Total | | $ | 9,809,429 | | | $ | 418,710,178 | | | $ | — | | | $ | 428,519,607 | |
| Other Financial Instruments | |
| Futures Contracts | | | | | | | | | | | | | | | | |
Liabilities | | $ | (1,323,856 | ) | | $ | — | | | $ | — | | | $ | (1,323,856 | ) |
| Swap Contracts | | | | | | | | | | | | | | | | |
Liabilities | | | — | | | | (146,938 | ) | | | — | | | | (146,938 | ) |
| Total | | $ | (1,323,856 | ) | | $ | (146,938 | ) | | $ | — | | | $ | (1,470,794 | ) |
| | | | |
| 10 | | | | The accompanying notes are an integral part of these financial statements. |
FINANCIAL INFORMATION — GUARDIAN CORE FIXED INCOME VIP FUND
| | | | |
Statement of Assets and Liabilities As of June 30, 2023 (unaudited) | | | |
Assets | | | | |
| | |
Investments, at value | | $ | 428,519,607 | |
| | |
Receivable for investments sold | | | 83,239,871 | |
| | |
Interest receivable | | | 2,445,887 | |
| | |
Receivable for variation margin on futures contracts | | | 1,556,198 | |
| | |
Receivable for variation margin on swap contracts | | | 1,116,819 | |
| | |
Cash deposits with brokers for futures contracts | | | 776,050 | |
| | |
Receivable for fund shares subscribed | | | 69,268 | |
| | |
Reimbursement receivable from adviser | | | 10,117 | |
| | |
Prepaid expenses | | | 5,061 | |
| | | | | |
| | |
Total Assets | | | 517,738,878 | |
| | | | | |
| | |
Liabilities | | | | |
| | |
Payable for investments purchased | | | 83,796,970 | |
| | |
Due to broker for swap contracts | | | 583,276 | |
| | |
Investment advisory fees payable | | | 156,051 | |
| | |
Payable for fund shares redeemed | | | 91,971 | |
| | |
Accrued custodian and accounting fees | | | 19,020 | |
| | |
Accrued audit fees | | | 15,632 | |
| | |
Accrued trustees’ and officers’ fees | | | 8,880 | |
| | |
Accrued expenses and other liabilities | | | 48,472 | |
| | | | | |
| | |
Total Liabilities | | | 84,720,272 | |
| | | | | |
| | |
Total Net Assets | | $ | 433,018,606 | |
| | | | | |
| | |
Net Assets Consist of: | | | | |
| | |
Paid-in capital | | $ | 443,446,651 | |
| | |
Distributable loss | | | (10,428,045 | ) |
| | | | | |
| | |
Total Net Assets | | $ | 433,018,606 | |
| | | | | |
Investments, at Cost | | $ | 434,954,170 | |
| | | | | |
| | |
Pricing of Shares | | | | |
| | |
Shares of Beneficial Interest Outstanding with
No Par Value | | | 44,187,913 | |
| | |
Net Asset Value Per Share | | | $9.80 | |
| | | | | |
| | | | |
Statement of Operations For the Six Months Ended June 30, 2023 (unaudited) | | | |
Investment Income | | | | |
| | |
Interest | | $ | 9,387,861 | |
| | |
Dividends | | | 126,507 | |
| | | | | |
| | |
Total Investment Income | | | 9,514,368 | |
| | | | | |
| | |
Expenses | | | | |
| | |
Investment advisory fees | | | 970,057 | |
| | |
Professional fees | | | 58,880 | |
| | |
Trustees’ and officers’ fees | | | 56,726 | |
| | |
Administrative fees | | | 30,035 | |
| | |
Custodian and accounting fees | | | 27,290 | |
| | |
Transfer agent fees | | | 10,569 | |
| | |
Shareholder reports | | | 6,768 | |
| | |
Other expenses | | | 12,395 | |
| | | | | |
| | |
Total Expenses | | | 1,172,720 | |
| | |
Less: Fees waived | | | (53,125 | ) |
| | | | | |
| | |
Total Expenses, Net | | | 1,119,595 | |
| | | | | |
| | |
Net Investment Income/(Loss) | | | 8,394,773 | |
| | | | | |
| | |
Realized Gain/(Loss) and Change in Unrealized Appreciation/(Depreciation) on Investments and Derivative Contracts | | | | |
| | |
Net realized gain/(loss) from investments | | | (19,062,817 | ) |
| | |
Net realized gain/(loss) from futures contracts | | | (226,726 | ) |
| | |
Net realized gain/(loss) from swap contracts | | | 172,280 | |
| | |
Net change in unrealized appreciation/(depreciation) on investments | | | 21,082,098 | |
| | |
Net change in unrealized appreciation/(depreciation) on futures contracts | | | (1,379,405 | ) |
| | |
Net change in unrealized appreciation/(depreciation) on swap contracts | | | (146,938 | ) |
| | | | | |
| | |
Net Gain on Investments and Derivative Contracts | | | 438,492 | |
| | | | | |
| | |
Net Increase in Net Assets Resulting From Operations | | $ | 8,833,265 | |
| | | | | |
| | | | | |
| | | | |
| The accompanying notes are an integral part of these financial statements. | | | | 11 |
FINANCIAL INFORMATION — GUARDIAN CORE FIXED INCOME VIP FUND
| | | | | | | | |
Statements of Changes in Net Assets Six Months Ended Numbers are unaudited | | | | | | |
| | | |
| | | For the
Six Months Ended
6/30/23 | | | For the
Period Ended
12/31/221 | |
| | | | |
Operations | | | | | | | | |
| | | |
Net investment income/(loss) | | $ | 8,394,773 | | | $ | 10,906,076 | |
| | | |
Net realized gain/(loss) from investments and derivative contracts | | | (19,117,263 | ) | | | (2,706,274 | ) |
| | | |
Net change in unrealized appreciation/(depreciation) on investments and derivative contracts | | | 19,555,755 | | | | (27,461,112 | ) |
| | | | | | | | | |
| | | |
Net Increase/(Decrease) in Net Assets Resulting from Operations | | | 8,833,265 | | | | (19,261,310 | ) |
| | | | | | | | | |
| | | |
Capital Share Transactions | | | | | | | | |
| | | |
Proceeds from sales of shares | | | 15,347,230 | | | | 524,761,918 | |
| | | |
Cost of shares redeemed | | | (40,966,774 | ) | | | (55,695,723 | ) |
| | | | | | | | | |
| | | |
Net Increase/(Decrease) in Net Assets Resulting from Capital Share Transactions | | | (25,619,544 | ) | | | 469,066,195 | |
| | | | | | | | | |
| | | |
Net Increase/(Decrease) in Net Assets | | | (16,786,279 | ) | | | 449,804,885 | |
| | | | | | | | | |
| | | |
Net Assets | | | | | | | | |
| | | |
Beginning of period | | | 449,804,885 | | | | — | |
| | | | | | | | | |
| | | |
End of period | | $ | 433,018,606 | | | $ | 449,804,885 | |
| | | | | | | | | |
| | | |
Other Information: | | | | | | | | |
| | | |
Shares | | | | | | | | |
| | | |
Sold | | | 1,558,280 | | | | 52,488,133 | |
| | | |
Redeemed | | | (4,160,524 | ) | | | (5,697,976 | ) |
| | | | | | | | | |
| | | |
Net Increase/(Decrease) | | | (2,602,244 | ) | | | 46,790,157 | |
| | | | | | | | | |
| | | | | | | | | |
| 1 | Commenced operations on May 2, 2022. |
| | | | |
| 12 | | | | The accompanying notes are an integral part of these financial statements. |
This Page Intentionally Left Blank
FINANCIAL INFORMATION — GUARDIAN CORE FIXED INCOME VIP FUND
The Financial Highlights table is intended to help you understand the Fund’s financial performance for the past six reporting periods (or, if shorter, the period since inception). Certain information reflects financial results for a single Fund share. The total returns in the table represent the rate that an investor would have earned (or lost) on an investment in the Fund.
| | | | | | | | | | | | | | | | | | | | | | | | |
Financial Highlights Six Months Ended Numbers are unaudited | | | | | | | | | | | | | | | | |
| | | Per Share Operating Performance | | | | |
| | | Net Asset Value,
Beginning of
Period | | | Net Investment
Income(1) | | | Net Realized
and Unrealized
Gain/(Loss) | | | Total
Operations | | | Net Asset
Value, End of
Period | | | Total
Return(2),(3) | |
| | | | | | | |
Six Months Ended 6/30/23 | | $ | 9.61 | | | $ | 0.18 | | | $ | 0.01 | | | $ | 0.19 | | | $ | 9.80 | | | | 1.98% | |
| | | | | | | |
Period Ended 12/31/22(5) | | | 10.00 | | | | 0.22 | | | | (0.61) | | | | (0.39) | | | | 9.61 | | | | (3.90)% | |
| | | | |
| 14 | | | | The accompanying notes are an integral part of these financial statements. |
FINANCIAL INFORMATION — GUARDIAN CORE FIXED INCOME VIP FUND
| | | | | | | | | | | | | | | | | | | | | | |
| |
| Ratios/Supplemental Data | |
Net Assets, End
of Period (000s) | | | Net Ratio of
Expenses to
Average Net
Assets(3),(4) | | | Gross Ratio of
Expenses to
Average Net
Assets(3) | | | Net Ratio of Net
Investment Income
to Average
Net Assets(3),(4) | | | Gross Ratio of Net
Investment Income
to Average
Net Assets(3) | | | Portfolio
Turnover Rate(3) | |
| | | | | |
| $ | 433,019 | | | | 0.50% | | | | 0.52% | | | | 3.75% | | | | 3.73% | | | | 166% | |
| | | | | |
| | 449,805 | | | | 0.50% | | | | 0.52% | | | | 3.41% | | | | 3.39% | | | | 90% | |
| (1) | Calculated based on the average shares outstanding during the period. |
| (2) | Total returns do not reflect the effects of charges deducted pursuant to the terms of The Guardian Insurance & Annuity Company, Inc.’s variable contracts. Inclusion of such charges would reduce the total returns for all periods shown. |
| (3) | Ratios for periods less than one year have been annualized, except for total return and portfolio turnover rate. For the period ended December 31, 2022, certain non-recurring fees (i.e., audit fees) are not annualized. |
| (4) | Net Ratio of Expenses to Average Net Assets and Net Ratio of Net Investment Income to Average Net Assets include the effect of fee waivers and expense limitations. |
| (5) | Commenced operations on May 2, 2022. |
| | | | |
| The accompanying notes are an integral part of these financial statements. | | | | 15 |
NOTES TO FINANCIAL STATEMENTS — GUARDIAN CORE FIXED INCOME VIP FUND
June 30, 2023 (unaudited)
1. Organization
Guardian Variable Products Trust (the “Trust”), a Delaware statutory trust organized on January 12, 2016, is registered under the Investment Company Act of 1940, as amended (the “1940 Act”), as an open-end management investment company. The Trust currently has twenty-four series. Guardian Core Fixed Income VIP Fund (the “Fund”) is a series of the Trust. The Fund is a diversified fund and commenced operations on May 2, 2022. The financial statements for other series of the Trust are presented in separate reports.
The Trust has authorized an unlimited number of shares of beneficial interest with no par value. Shares are bought and sold at closing net asset value (“NAV”). Shares of the Fund are only sold to certain separate accounts of The Guardian Insurance & Annuity Company, Inc. (“GIAC”) that fund certain variable annuity contracts and variable life insurance policies issued by GIAC. GIAC is a wholly-owned subsidiary of The Guardian Life Insurance Company of America (“Guardian Life”).
The Fund seeks to provide a high level of current income and capital appreciation without undue risk to principal.
2. Significant Accounting Policies
The following is a summary of significant accounting policies followed by the Fund in the preparation of its financial statements. The Fund follows the investment company accounting and reporting guidance of the Financial Accounting Standards Board (“FASB”) Accounting Standards Codification Topic 946 Financial Services – Investment Companies. The following policies are in conformity with accounting principles generally accepted in the United States of America (“GAAP”). The preparation of financial statements in accordance with GAAP requires management to make estimates and assumptions that affect the reported amounts and disclosures in the financial statements. Actual results could differ from those estimates.
a. Investment Valuations The Board of Trustees has designated Park Avenue Institutional Advisers LLC (“Park Avenue”) as the valuation designee for the Fund pursuant to Rule 2a-5 under the 1940 Act. Park Avenue has established a Fair Valuation Committee and has adopted fair valuation procedures that provide methodologies for fair valuing securities. These procedures include monitoring the appropriateness of fair values based on results of ongoing valuation oversight, including but not limited to consideration of
security specific events, market events, and pricing vendor and broker-dealer due diligence. The Fair Valuation Committee oversees and carries out the policies for the valuation of investments held in the Fund. The Fair Valuation Committee is responsible for discussing and assessing the potential impacts to the fair values on an ongoing basis, and reports to the Board of Trustees on at least a quarterly basis.
The valuations of debt securities for which quoted bid prices are readily available are valued at the bid price by independent pricing services (each, a “Service”). Debt securities for which quoted bid prices are not readily available are valued by a Service at the evaluated bid price provided by the Service or the bid price provided by an independent broker-dealer or at a calculated price based on the spread to an appropriate benchmark provided by such broker-dealer.
Equity securities traded on an exchange other than NASDAQ Stock Market, LLC (“NASDAQ”) are valued at the last reported sale price on the principal exchange or market on which they are traded; or, if there were no sales that day, at the mean between the closing bid and ask prices. Securities traded on the NASDAQ are generally valued at the NASDAQ official closing price, which may not be the last sale price. If the NASDAQ official closing price is not available for a security, that security is generally valued at the mean between the closing bid and ask prices. Repurchase agreements are carried at cost, which approximates fair value (see Note 5c). Foreign securities are valued in the currencies of the markets in which they trade and then converted to U.S. dollars by the application of foreign exchange rates at the close of the New York Stock Exchange (“NYSE”).
Exchange-traded financial futures contracts are valued at the last settlement price on the market where they are primarily traded.
Securities for which market quotations are not readily available or securities whose values have been materially affected by events occurring before the Fund’s valuation time but after the close of the securities’ principal exchange or market are valued at their fair values as determined in good faith by Park Avenue, as the Board of Trustee’s valuation designee (as defined in Rule 2a-5 under the 1940 Act), in accordance with Park Avenue’s procedures and under the general oversight of the Board of Trustees. Valuations reflected in this report are as of the report date. As a result, changes in valuation due to market events and/or issuer related events after the report date and prior to issuance of the report are not reflected herein.
NOTES TO FINANCIAL STATEMENTS — GUARDIAN CORE FIXED INCOME VIP FUND
Various inputs are used in determining the valuation of the Fund’s investments. These inputs are summarized in three broad levels listed below.
| • | | Level 1 – unadjusted inputs using quoted prices in active markets for identical investments. |
| • | | Level 2 – other significant observable inputs, including, but not limited to, quoted prices for similar investments, inputs other than quoted prices that are observable for investments (such as interest rates, prepayment speeds, credit risks, etc.) or other market corroborated inputs. |
| • | | Level 3 – significant unobservable inputs (including the Fund’s own assumptions in determining the fair value of investments). |
Inputs may include price information, volatility statistics, specific and broad credit data, liquidity statistics, and other factors. A financial instrument’s level within the fair value hierarchy is based on the lowest level of any input; both individually and in aggregate, that is significant to the fair value measurement. However, the determination of what constitutes “observable” requires significant judgment by the Trust. The Trust considers observable data to be that market data which is readily available, regularly distributed or updated, reliable and verifiable, and provided by independent sources that are actively involved in the relevant market. The inputs or methodology used for valuing securities are not necessarily an indication of the risk associated with investing in those securities. Changes in valuation techniques may result in transfers into or out of a financial instrument’s assigned level within the hierarchy.
The FASB requires reporting entities to make disclosures about purchases, sales, issuances and settlements of Level 3 securities on a gross basis. For the six months ended June 30, 2023, there were no transfers into or out of Level 3 of the fair value hierarchy.
In determining a financial instrument’s placement within the hierarchy, the Trust separates the Fund’s investment portfolio into two categories: investments and derivatives (e.g., futures). A summary of inputs used to value the Fund’s assets and liabilities carried at fair value as of June 30, 2023 is included in the Schedule of Investments.
Investments Investments whose values are based on quoted market prices in active markets, and are therefore classified within Level 1, include active listed equities. Investments that trade in markets that are not considered to be active, but are valued based on quoted
market prices, dealer quotations or alternative pricing sources supported by observable inputs are classified within Level 2. These include certain U.S. government and sovereign obligations, most government agency securities, investment-grade corporate bonds, certain mortgage products, state, municipal and provincial obligations, and certain foreign equity securities, including securities whose prices may have been affected by events occurring after the close of trading on their principal exchange or market and, as a result, whose values are determined by a pricing service as described above, or securities whose values are otherwise determined using fair valuation methods approved by the Fund’s Board of Trustees.
Investments classified within Level 3 have significant unobservable inputs, as they trade infrequently or not at all. Level 3 investments include, among others, private placement securities. When observable prices are not available for these securities, the Trust uses one or more valuation techniques for which sufficient and reliable data is available. The inputs used by the Trust in estimating the value of Level 3 investments include, for example, the original transaction price, recent transactions in the same or similar instruments, completed or pending third-party transactions in the underlying investment or comparable issuers, subsequent rounds of financing, recapitalizations, and other transactions across the capital structure. Level 3 investments may also be adjusted to reflect illiquidity and/or non-transferability, with the amount of such discount estimated by the Trust in the absence of market information. Assumptions used by the Trust due to the lack of observable inputs may significantly impact the resulting fair value and therefore the Fund’s results of operations. As of June 30, 2023, the Fund had no securities classified as Level 3.
Derivatives Exchange-traded derivatives, such as futures contracts, exchange-traded option contracts and certain swaps, are typically classified within Level 1 or Level 2 of the fair value hierarchy depending on whether or not they are deemed to be actively traded. Certain non-exchange-traded derivatives, such as generic forwards, certain swaps and options, have inputs which can generally be corroborated by market data and are therefore classified within Level 2.
b. Securities Transactions Securities transactions are accounted for on the date securities are purchased or sold (trade date). Realized gains or losses on securities transactions are determined on the basis of specific identification.
NOTES TO FINANCIAL STATEMENTS — GUARDIAN CORE FIXED INCOME VIP FUND
c. Futures Contracts The Fund may enter into financial futures contracts. In entering into such contracts, the Fund is required to deposit with the counterparty, either in cash or securities, an amount equal to a certain percentage of the face value of the contract. Subsequent payments are received or made by the Fund each day, depending on the daily fluctuations in the values of the contracts, and are recorded for financial statement purposes as variation margin received or paid by the Fund. Daily changes in variation margin are recognized as unrealized gains or losses by the Fund. The Fund may not achieve the anticipated benefits of the financial futures contracts and may realize a loss.
d. Credit Derivatives The Fund may enter into credit derivatives, including credit default swaps on individual obligations or credit indices. The Fund may use these investments (i) as alternatives to direct long or short investment in a particular security or securities, (ii) to adjust the Fund’s asset allocation or risk exposure, (iii) to enhance potential return, or (iv) for hedging purposes. The use by the Fund of credit default swaps may have the effect of creating a short position in a security. Credit derivatives can create investment leverage and may create additional investment risks that may subject the Fund to greater volatility than investments in more traditional securities, as described in the Statement of Additional Information.
The Fund may enter into credit default swap agreements either as a buyer or seller. The Fund may buy protection under a credit default swap to attempt to mitigate the risk of default or credit quality deterioration in one or more individual holdings or in a segment of the fixed income securities market. The Fund may sell protection under a credit default swap in an attempt to gain exposure to an underlying issuer’s credit quality characteristics without investing directly in that issuer.
For swaps entered with an individual counterparty, the Fund bears the risk of loss of the uncollateralized amount expected to be received under a credit default swap agreement in the event of the default or bankruptcy of the counterparty. Credit default swap agreements are generally valued at a price at which the counterparty to such agreement would terminate the agreement. The Fund may also enter into cleared swaps.
In entering into swap contracts, the Fund is required to deposit with the broker (or for the benefit of the broker), either in cash or securities, an amount equal to a percentage of the notional value of the contract. Subsequent payments are received or made by the Fund each day, depending on the daily fluctuations in the values of the contracts, and are recorded for financial
statement purposes as variation margin received or paid by the Fund. Daily changes in variation margin are recognized as unrealized gains or losses by the Fund. The Fund may not achieve the anticipated benefits of the swap contracts and may realize a loss. During the six months ended June 30, 2023, the Fund entered into credit default swaps for risk exposure management and to enhance potential return.
e. Options Transactions The Fund can write (sell) put and call options on securities and indexes to earn premiums, for hedging purposes, for risk management purposes or otherwise as part of its investment strategies. In writing options, the Fund is required to deposit with the broker or counterparty, either in cash or securities, an amount equal to a percentage of the face value of the options. When an option is written, the premium received is recorded as an asset with an equal liability that is subsequently marked to market to reflect the market value of the written option. These liabilities, if any, are reflected as written options, at value, in the Fund’s Statement of Assets and Liabilities. Premiums received from writing options which expire unexercised are recorded on the expiration date as a realized gain. The difference between the premium received and the amount paid on effecting a closing purchase transaction, including brokerage commissions, is also treated as a realized gain, or if the premium is less than the amount paid for the closing purchased transactions, as a realized loss. If a written call option is exercised, the premium is added to the proceeds from the sale of the underlying security in determining whether there has been a realized gain or loss. If a written put option is exercised, the premium reduces the cost basis of the security. In writing an option, the Fund bears the market risk of an unfavorable change in the price of the security underlying the written option. Exercise of a written option could result in the Fund purchasing or selling a security at a price different from its current market value. There were no options transactions as of June 30, 2023.
f. Investment Income Dividend income net of foreign taxes withheld, if any, is generally recorded on the ex-dividend date. Distributions received from real estate investment trusts, if any, may be classified as dividends, capital gains and/or return of capital. Interest income, which includes amortization/accretion of premium/discount, is determined using the interest income accrual method, and is accrued and recorded daily.
g. Allocation of Income and Expenses Many of the expenses of the Trust can be directly attributed to a specific series of the Trust. Expenses that cannot be
NOTES TO FINANCIAL STATEMENTS — GUARDIAN CORE FIXED INCOME VIP FUND
directly attributed to a specific series of the Trust are generally apportioned among all the series in the Trust, based on relative net assets. In calculating net asset value per share for each series of the Trust, investment income, realized and unrealized gains and losses, and expenses other than series-specific expenses are allocated daily to each series based upon the proportion of net assets attributable to each series.
3. Transactions with Affiliates
a. Investment Advisory Fee and Expense Limitation Under the terms of the advisory agreement, which, after its two year initial term, is reviewed and approved annually by the Board of Trustees, the Fund pays an investment advisory fee to Park Avenue. Park Avenue is a wholly-owned subsidiary of Guardian Life and receives an investment advisory fee at an annual rate of 0.45% of the first $300 million, and 0.40% in excess of $300 million of the Fund’s average daily net assets. The fee is accrued daily and paid monthly. The Fund has no sub-adviser.
Park Avenue has contractually agreed through April 30, 2024 to waive certain fees and/or reimburse certain expenses incurred by the Fund to the extent necessary to limit the Fund’s total annual operating expenses after fee waiver and/or expense reimbursement to 0.50% of the Fund’s average daily net assets (excluding, if applicable, any acquired fund fees and expenses, taxes, interest, transaction costs and brokerage commissions, litigation and extraordinary expenses). The limitation may not be increased or terminated prior to this time without action by the Board of Trustees and may be terminated only upon approval of the Board of Trustees. Amounts waived or reimbursed by Park Avenue pursuant to any expense limitation will not be subject to Park Avenue’s recoupment rights. For the six months ended June 30, 2023, Park Avenue waived fees and/or paid Fund expenses in the amount of $53,125.
b. Compensation of Trustees and Officers Trustees and officers who are interested persons of the Trust, as defined in the 1940 Act, receive no compensation from the Fund, except for the Chief Compliance Officer of the Trust. Trustees of the Trust who are not interested persons of the Trust, and the Chief Compliance Officer, receive compensation and reimbursement of expenses from the Trust.
4. Federal Income Taxes
a. Distributions to Shareholders For federal income tax purposes, the Fund is treated as a disregarded entity (“DRE”). As a DRE, the Fund is not subject to an entity-level income tax; and any income, gains, losses,
deductions, taxes, and credits of the Fund would instead be “passed through” directly to the separate accounts of GIAC that invest in the Fund and retain the same character for U.S. federal income tax purposes. In addition, the Fund is not required to distribute taxable income and capital gains for U.S. federal income tax purposes. Therefore, no dividends and capital gains distributions were paid by the Fund.
5. Investments
a. Investment Purchases and Sales The cost of investments and U.S. government agency obligations purchased and the proceeds from U.S. government agency obligations and other investments sold (excluding short-term investments and to be announced (TBA) securities) for the six months ended June 30, 2023, were as follows:
| | | | | | | | |
| | | |
| | | Other Investments | | | U.S.
Government and
Agency
Obligations | |
| Purchases | | $ | 187,611,313 | | | $ | 542,977,991 | |
| Sales | | | 196,259,930 | | | | 555,386,221 | |
b. Foreign Securities Foreign securities investments involve special risks and considerations not typically associated with U.S. investments. These risks include, but are not limited to, currency risk; adverse political, regulatory, social, and economic developments; and less reliable information about issuers. Moreover, securities of some foreign issuers may be less liquid and their prices more volatile than those of comparable U.S. issuers.
c. Repurchase Agreements The Fund may invest in repurchase agreements to maintain liquidity and earn income over periods of time as short as overnight. The collateral for repurchase agreements is either cash or fully negotiable U.S. government securities (including U.S. government agency securities). Repurchase agreements are fully collateralized (including the interest accrued thereon) and such collateral is marked to market daily while the agreements remain in force. If the value of the collateral falls below the repurchase price plus accrued interest, the Fund will typically require the seller to deposit additional collateral by the next business day. If the request for additional collateral is not met, or the seller defaults, the Fund maintains the right to sell the collateral (although it may be prevented or delayed from doing so in certain circumstances) and may be required to claim any resulting loss against the seller. Park Avenue monitors the creditworthiness of the seller with which the Fund enters into repurchase agreements.
NOTES TO FINANCIAL STATEMENTS — GUARDIAN CORE FIXED INCOME VIP FUND
d. Securities Purchased on a When-Issued or Delayed-Delivery Basis The Fund may purchase securities on a when-issued or delayed-delivery basis, with payment and delivery scheduled for a future date. These transactions are subject to market fluctuations and are subject to the risk that the value at delivery may be more or less than at the trade date purchase price. Although the Fund will generally enter into these transactions with the intention of taking delivery of the securities, it may sell the securities before the settlement date. Assets will be segregated when a fund agrees to purchase on a when-issued or delayed-delivery basis. These transactions may create investment leverage.
e. Restricted and Illiquid Securities A restricted security cannot be resold to the general public without prior registration under the Securities Act of 1933, as amended (except pursuant to an applicable exemption). The values of these securities may be highly volatile. If the security is subsequently registered and resold, the issuer would typically bear the expense of all registrations at no cost to the Fund. Restricted and illiquid securities are valued according to the policies and procedures adopted by the Trust’s Board of Trustees and are noted, if any, in the Fund’s Schedule of Investments. As of June 30, 2023, the Fund did not hold any restricted, other than 144A restricted securities or illiquid securities.
f. Below Investment Grade Securities The Fund may invest in below investment grade securities (i.e. lower-quality, “junk” debt), which are subject to various risks. Lower-quality debt is considered to be speculative because it is less certain that the issuer will be able to pay interest or repay the principal than in the case of investment grade debt. These securities can involve a substantially greater risk of default than higher-rated securities, and their values can decline significantly over short periods of time. Lower-quality debt securities tend to be more sensitive to adverse news about their issuers, the market and the economy in general, than higher-quality debt securities. The market for these securities can be less liquid, especially during periods of recession or general market decline.
g. Mortgage- and Asset-Backed Securities The values of some mortgage-related or asset-backed securities may be particularly sensitive to changes in prevailing interest rates. Early repayment of principal on some mortgage-related securities may expose the Fund to a lower rate of return upon reinvestment of principal. The values of mortgage- and asset-backed securities depend in part on the credit quality and adequacy of the underlying assets or collateral and may fluctuate in
response to the market’s perception of these factors as well as current and future repayment rates. Some mortgage-backed securities are backed by the full faith and credit of the U.S. government (e.g., mortgage-backed securities issued by the Government National Mortgage Association, commonly known as “Ginnie Mae”), while other mortgage-backed securities (e.g., mortgage-backed securities issued by the Federal National Mortgage Association and the Federal Home Loan Mortgage Corporation, commonly known as “Fannie Mae” and “Freddie Mac”), are backed only by the credit of the government entity issuing them. In addition, some mortgage-backed securities are issued by private entities and, as such, are not guaranteed by the U.S. government or any agency or instrumentality of the U.S. government.
h. Treasury Inflation Protected Securities Treasury inflation protected securities (“TIPS”) are debt securities issued by the U.S. Treasury whose principal and/or interest payments are adjusted for inflation, unlike debt securities that make fixed principal and interest payments. The interest rate paid by the TIPS is fixed, while the principal value rises or falls based on changes in a published Consumer Price Index (“CPI”). Thus, if inflation occurs, the principal and interest payments on TIPS are adjusted accordingly to protect investors from inflationary loss. During a deflationary period, the principal and interest payments decrease, although the TIPS principal amounts will not drop below their face amounts at maturity. In exchange for the inflation protection, the TIPS generally pay lower interest rates than typical U.S. Treasury securities. Only if inflation occurs will TIPS offer a higher real yield than a conventional Treasury bond of the same maturity.
i. Disclosures About Derivative Instruments and Hedging Activities The Fund entered into U.S. Treasury futures contracts for the six months ended June 30, 2023 to manage portfolio duration. The Fund bears the risk of interest rates moving unexpectedly, in which case the Fund may not achieve the anticipated benefits of the futures contracts and realize a loss. There is minimal counterparty credit risk to the Funds since futures are exchange traded and the exchange’s clearinghouse, as counterparty to all exchange traded futures, guarantees futures against default.
Under certain market conditions, the Fund may use credit default swaps to seek to (i) hedge various investments, (ii) manage or adjust duration and yield curve exposure, (iii) manage risk, (iv) enhance returns, or (v) as substitutes for permitted Fund investments. Credit default swaps involve the exchange of a floating
NOTES TO FINANCIAL STATEMENTS — GUARDIAN CORE FIXED INCOME VIP FUND
or fixed rate payment in return for assuming potential credit losses of an underlying security or pool of securities.
The gross returns to be exchanged or “swapped” between the parties are generally calculated with respect to a “notional amount,” i.e., the return on or increase in value of a particular dollar amount invested at a particular interest rate, in a particular foreign currency or security, or in a “basket” of securities representing a particular index. Cleared swaps are transacted through futures commission merchants (“FCM”s) that are members of central clearinghouses with the clearinghouse serving as a central counterparty similar to transactions in futures contracts. Funds post initial and variation margin by making payments to their clearing member FCMs.
Generally, the Fund will enter into credit default swaps on a net basis, which means that the two payment streams are netted out, with a Fund receiving or paying, as the case may be, only the net amount of the two payments. Credit default swaps do not normally involve the delivery of securities, other underlying assets or principal. Accordingly, the risk of loss with respect to credit default swaps is normally limited to the net amount of payments that a Fund is contractually obligated to make. If the other party to a credit default swap defaults, a Fund’s risk of loss consists of the net amount of payments that the Fund is contractually entitled to receive, if any.
In addition to the risks generally applicable to derivatives, risks associated with credit default swap agreements include adverse changes in the returns of the underlying instruments, failure of the counterparties to perform under the agreement’s terms and the possible lack of liquidity with respect to the agreements.
As of June 30, 2023, the Fund had the following derivatives at fair value, grouped into appropriate risk categories that illustrate the Fund’s use of derivative instruments:
| | | | | | | | |
| | | |
| | | Interest Rate Contracts | | | Credit Default Contracts | |
| | | |
Liability Derivatives | | | | | | | | |
| Futures Contracts1 | | $ | (1,323,856 | ) | | $ | — | |
| Swap Contracts2 | | | — | | | | (146,938 | ) |
| 1 | Statement of Assets and Liabilities location: Includes cumulative unrealized appreciation/(depreciation) of futures contracts as reported in the Schedule of Investments. Only current day’s variation margin is reported within the Statement of Assets and Liabilities. |
| 2 | Statement of Assets and Liabilities location: Includes the fair value of centrally cleared swap contracts as reported in the Schedule of Investments. Only current day’s variation margin is reported within the Statement of Assets and Liabilities. |
Transactions in derivative investments for the six months ended June 30, 2023 were as follows:
| | | | | | | | |
| | | |
| | | Interest Rate Contracts | | | Credit Default Contracts | |
| | | |
Net Realized Gain/(Loss) | | | | | | | | |
Futures Contracts1 | | $ | (226,726 | ) | | $ | — | |
| | | | | | | | | |
Swap Contracts2 | | | — | | | | 172,280 | |
| | | | | | | | | |
| | | |
| Net Change in Unrealized Appreciation/(Depreciation) | | | | | | | | |
Futures Contracts3 | | $ | (1,379,405 | ) | | $ | — | |
| | | | | | | | | |
Swap Contracts4 | | | — | | | | (146,938 | ) |
| | | | | | | | | |
| | | |
| Average Number of Notional Amounts | | | | | | | | |
Futures Contracts5 | | | 908 | | | | — | |
| | | | | | | | | |
| Swap Contracts – Buy/Sell Protection | | $ | — | | | $ | 25,714,286 | |
| | | | | | | | | |
| 1 | Statement of Operations location: Net realized gain/(loss) from futures contracts. |
| 2 | Statement of Operations location: Net realized gain/(loss) from swap contracts. |
| 3 | Statement of Operations location: Net change in unrealized appreciation/(depreciation) on futures contracts. |
| 4 | Statement of Operations location: Net change in unrealized appreciation/(depreciation) on swap contracts. |
| 5 | Amount represents number of contracts. |
6. Temporary Borrowings
The Fund, with other funds managed by Park Avenue, is party to a credit agreement with respect to a $10 million committed revolving credit facility from State Street Bank and Trust Company (the “Credit Agreement”) for temporary borrowing purposes, including the meeting of redemption requests that otherwise might require the untimely disposition of securities. Interest is based on a daily fluctuating rate per annum equal to the Applicable Rate (as defined in the Credit Agreement) plus the Applicable Margin (as defined in the Credit Agreement) that is subject to change from time to time as and when the Applicable Rate changes. Under the current Credit Agreement, the Applicable Rate for any day is defined as the rate per annum equal to the sum of (a) 0.10% plus (b) the higher of (i) the Federal Funds Effective Rate for such day and (ii) the Overnight Bank Funding Rate for such day; the Applicable Margin is 1.25%. In addition to the interest charged on any borrowings by the Fund, each fund pays a commitment fee of 0.30% per annum on its share of the unused portion of the credit facility. The agreement is in place until January 5, 2024. The Fund did not utilize the credit facility during the six months ended June 30, 2023.
NOTES TO FINANCIAL STATEMENTS — GUARDIAN CORE FIXED INCOME VIP FUND
7. Indemnifications
Under the Trust’s organizational documents and, in some cases, by contract, officers and Trustees of the Trust are indemnified against certain liabilities arising out of the performance of their duties to the Fund. In addition, in the normal course of business, the Fund enters into contracts with its vendors and others that provide general indemnifications. The Fund’s maximum exposure under these arrangements is unknown as this would involve future claims that may be made against the Fund that have not yet occurred. However, based on experience, the Fund expects the risk of loss to be remote.
8. Additional Information
The outbreak of COVID-19 has adversely impacted both local and global economies, including those in which the Fund may invest. These impacts include materially reduced consumer demand and economic output, disrupted supply chains, market closures, travel restrictions and quarantines, and strained healthcare systems. The Fund’s operations may be interrupted as a result, which may have a negative impact on the Fund’s investment performance.
SUPPLEMENTAL INFORMATION (UNAUDITED)
Liquidity Risk Management Program
In compliance with Rule 22e-4 under the Investment Company Act of 1940, as amended (the “Liquidity Rule”), Guardian Variable Products Trust (the “Trust”) has adopted and implemented a written liquidity risk management program (the “Program”) for each series of the Trust (each, a “Fund”), which is reasonably designed to assess and manage each Fund’s liquidity risk. The Fund’s “liquidity risk” is the risk that the Fund could not meet requests to redeem shares issued by the Fund without significant dilution of the remaining investors’ interests in the Fund.
The Board of Trustees of the Trust (the “Board”) Previously approved the designation of Park Avenue Institutional Advisers LLC (the “Administrator” or “PAIA”) as Program administrator. The Administrator established a Liquidity Risk Management Committee, which is comprised of certain officers of the Trust and PAIA, that assists the Administrator in the implementation and day-to-day administration of the Program and otherwise support carrying out the Administrator’s liquidity risk management responsibilities under the Program.
In accordance with the Program, each Fund’s liquidity risk is assessed no less frequently than annually, taking into consideration a variety of factors, including, as applicable, the Fund’s investment strategy and liquidity of portfolio investments, cash flow projections, and holdings of cash and cash equivalents, as well as borrowing arrangements and other funding sources. Certain factors are considered under both normal and reasonably foreseeable stressed conditions.
Each Fund portfolio investment is classified, no less than monthly, into one of four liquidity categories (including “highly liquid investments” and “illiquid investments,” discussed below) based on a determination of the number of days it is reasonably expected to take to convert the investment to cash, or sell or dispose of the investment, in current market conditions without significantly changing the investment’s market value.
The Liquidity Rule limits the Fund’s investments in illiquid investments by prohibiting the Fund from acquiring any illiquid investment if, immediately after the acquisition, the Fund would have invested more than 15% of its net assets in illiquid investments that are assets. The Program includes provisions reasonably designed to comply with this investment limitation. In addition, the Program includes provisions reasonably designed to comply with this investment limitation. In addition, the Program includes provisions reasonably designed to comply with the Liquidity Rule’s requirements relating to highly liquid investment minimums, which is a minimum amount of Fund net assets that must be invested in highly liquid investments that are assets, as applicable. The Fund was not required to adopt a highly liquid investment minimum during the period.
At a meeting of the Board held on March 29-30, 2023, the Board received a report (the “Report”) prepared by the Administrator addressing the Program’s operation and assessing the adequacy and effectiveness of its implementation for the period from January 1, 2022 through December 31, 2022 (the “Reporting Period”). The Report noted that the Administrator believes the Program operated effectively during the Reporting Period and continues to be reasonably designed to effectively assess and manage each Fund’s liquidity risk. The Report also noted that the Administrator believes the Program has been adequately and effectively implemented and the investment strategies for each Fund continue to be appropriate since its inception. In addition, the Report summarized the operation of the Program and the information and factors considered by the Administrator in its assessment of the Program’s implementation, such as the liquidity risk assessment framework and liquidity classification methodologies.
There can be no assurance that the Program will achieve its objectives under all circumstances. Please refer to the Fund’s prospectus for more information regarding the Fund’s exposure to liquidity risk and other risks to which an investment in the Fund may be subject.
SUPPLEMENTAL INFORMATION (UNAUDITED)
Approval of Investment Management Agreement
Section 15(c) of the Investment Company Act of 1940, as amended (the “1940 Act”), requires that a fund’s investment advisory and sub-advisory agreements be approved initially by the fund’s board of trustees. Section 15(c) also requires that the continuation of these agreements, after an initial term of up to two years, be annually reviewed and approved by the board. Any such agreement must be approved by a vote of a majority of the trustees who are not parties to the agreement or “interested persons” (as defined in the 1940 Act) of a party to the agreement at a meeting of the board called for the purpose of voting on such approval.
At a meeting of the Board of Trustees (the “Board”) of Guardian Variable Products Trust (the “Trust”) held on March 29-30, 2023 (the “Meeting”), the Board, including the trustees who are not parties to the agreement or “interested persons” as defined in the 1940 Act (the “Independent Trustees”), considered and voted unanimously to renew the existing investment management agreement between the Trust, on behalf of Guardian All Cap Core VIP Fund; Guardian Balanced Allocation VIP Fund; Guardian Core Fixed Income VIP Fund; Guardian Core Plus Fixed Income VIP Fund; Guardian Diversified Research VIP Fund; Guardian Equity Income VIP Fund; Guardian Global Utilities VIP Fund; Guardian Growth & Income VIP Fund; Guardian Integrated Research VIP Fund; Guardian International Growth VIP Fund; Guardian International Equity VIP Fund; Guardian Large Cap Disciplined Growth VIP Fund; Guardian Large Cap Disciplined Value VIP Fund; Guardian Large Cap Fundamental Growth VIP Fund; Guardian Mid Cap Relative Value VIP Fund; Guardian Mid Cap Traditional Growth VIP Fund; Guardian Multi-Sector Bond VIP Fund; Guardian Select Mid-Cap Core VIP Fund; Guardian Short Duration Bond VIP Fund; Guardian Small Cap Core VIP Fund; Guardian Small-Mid Cap Core VIP Fund; Guardian Strategic Large Cap Core VIP Fund; Guardian Total Return Bond VIP Fund and Guardian U.S. Government Securities VIP Fund (each, a “Fund,” and together, the “Funds”), in substantially the form presented at this meeting (the “Management Agreement”); and Park Avenue Institutional Advisers LLC (the “Manager”) for a one-year term.
The Board, including the Independent Trustees, also considered and voted unanimously to renew the existing sub-advisory agreements (the “Sub-Advisory Agreements,” collectively with the Management Agreement and Sub-Subadvisory Agreement, the “Agreements”) between the Manager and investment
advisory firms engaged to serve as sub-advisers to certain of the Funds (the “Sub-Advised Funds”), namely (i) ClearBridge Investments, LLC with respect to Guardian Small Cap Core VIP Fund; (ii) Putnam Investment Management, LLC with respect to Guardian Diversified Research VIP Fund; (iii) AllianceBernstein L.P. with respect to Guardian Growth & Income VIP Fund and Guardian Strategic Large Cap Core VIP Fund; (iv) J.P. Morgan Investment Management Inc. with respect to Guardian International Growth VIP Fund; (v) Schroder Investment Management North America Inc. with respect to Guardian International Equity VIP Fund; (vi) Wellington Management Company LLP with respect to Guardian Balanced Allocation VIP Fund, Guardian Equity Income VIP Fund, Guardian Integrated Research VIP Fund, Guardian Large Cap Disciplined Growth VIP Fund and Guardian Global Utilities VIP Fund; (vii) Boston Partners Global Investors, Inc. with respect to Guardian Large Cap Disciplined Value VIP Fund; (viii) Janus Henderson Investors US LLC with respect to Guardian Mid Cap Traditional Growth VIP Fund; (ix) Allspring Global Investments, LLC with respect to Guardian Mid Cap Relative Value VIP Fund and Guardian Small-Mid Cap Core VIP Fund; (x) Lord, Abbett & Co. LLC with respect to Guardian Core Plus Fixed Income VIP Fund; (xi) FIAM LLC with respect to Guardian Select Mid Cap Core VIP Fund; and (xii) Massachusetts Financial Services Company with respect to Guardian All Cap Core VIP Fund, each in substantially the form presented at this meeting, (each, a “Sub-Adviser” and collectively, the “Sub-Advisers”) for a one-year term.
The Board, including the Independent Trustees, also considered and voted unanimously to renew the existing sub-subadvisory agreement (the “Sub-Subadvisory Agreement”) between Schroder Investment Management North America Inc. and Schroder Investment Management North America Limited (also a Sub-Adviser) with respect to Guardian International Equity VIP Fund for a one-year term.
The Board is responsible for overseeing the management of each Fund. In determining whether to renew its approval of the Agreements, the Trustees evaluated information and factors that they considered to be relevant and appropriate through the exercise of their own business judgment. The Trustees considered certain information and factors in light of advice furnished to them by legal counsel to the Trust and, in the case of the Independent Trustees, their independent legal counsel. In advance of the Meeting, the Trustees received materials and information designed to assist their consideration of the Agreements. The Trustees received written responses from the Manager and each Sub-Adviser to a
SUPPLEMENTAL INFORMATION (UNAUDITED)
series of questions and requests for information encompassing a wide variety of topics provided by independent counsel on behalf of the Independent Trustees. The Independent Trustees also received materials and information regarding the legal standards applicable to their consideration of the Agreements and the process and criteria used by the Manager to identify and select the Sub-Advisers.
During the course of their deliberations, the Independent Trustees met twice to discuss and evaluate the materials, information and Agreements in executive session with their independent legal counsel, outside of the presence of the Trustees who are not Independent Trustees and representatives from Fund management, the Manager or any Sub-Adviser.
In reaching its decisions to renew its approval of the Agreements, the Board took into account the materials and information described above, as well as other materials and information provided to the Board throughout the year. Individual Trustees may have given different weight to different factors and information with respect to each Agreement, and the Trustees did not identify any single factor or information that, in isolation, would be controlling in deciding to approve the Agreements. The discussion below is intended to summarize the broad factors that figured prominently in the Board’s decisions to renew its approval of the Agreements rather than to be all-inclusive. These broad factors included: (i) the nature, extent and quality of the services provided to the Funds by the Manager and to the Sub-advised Funds by the Sub-Advisers; (ii) the investment performance of each Fund; (iii) estimated profitability of the Manager; (iv) fees and expenses; (v) the extent to which economies of scale may exist, and the extent to the benefits of economies of scale are shared with the Funds; and (vi) any other benefits derived by the Manager or the Sub-Advisers (or their respective affiliates) from their relationships with the Funds.
Nature, Extent and Quality of Services
The Trustees considered information regarding the nature, extent and quality of services provided to the Funds by the Manager. The Trustees also considered, among other things, the terms of the Management Agreement and the range of investment advisory services provided by the Manager. In addition, the Trustees reviewed the range of non-investment advisory services provided by the Manager consistent with the terms of the Management Agreement, notably coordinating the preparation and filing of various regulatory documents, coordinating the preparation and
assembly of Board meeting materials, and assisting the Board with certain valuation matters. The Board also received a description of the Manager’s and each Sub-Adviser’s business continuity plans and of their respective approaches to data privacy and cybersecurity, and related testing. The Board received information regarding the response of the Manager and the Sub-Advisers to the COVID-19 pandemic, including the continuation of remote work arrangements and return-to-office plans. The Board also received information about the Manager’s role as administrator of the Funds’ liquidity risk management program, the Manager’s approach to risk management, and the Manager’s vendor oversight programs.
The Trustees considered that the Sub-advised Funds operate in a “manager-of-managers” structure and reviewed the responsibilities that the Manager has under this structure, including monitoring and evaluating the performance of the Sub-Advisers, monitoring the Sub-Advisers for adherence to the stated investment objectives, strategies, policies and restrictions of the Funds and supervising the Sub-Advisers with respect to the services that the Sub-Advisers would provide under the Sub-Advisory Agreements. The Trustees also considered the process used by the Manager, consistent with this structure, to identify and recommend sub-advisers, and the Manager’s ability to monitor and oversee sub-advisers and recommend replacement sub-advisers, when necessary, and provide other services under the Management Agreement. The Board noted that investment management staff of the Manager and the Trust’s Chief Compliance Officer conduct oversight meetings with the Sub-Advisers on a periodic basis, follow through with additional inquiries on any questions or concerns that arise during the meetings and, as necessary, then report the results of the meetings to the Board. The Trustees reviewed information regarding the experience and background of the Manager’s key personnel and the Manager’s organizational structure and resources, including investment, legal and administrative capabilities of the Manager. In this regard, the Trustees recognized that the Funds may benefit from the Manager’s ability to use resources and capabilities of its affiliates in providing services to the Funds.
The Trustees considered information regarding the nature, extent and quality of services provided to the Sub-advised Funds by the Sub-Advisers. The Trustees also considered, among other things, the terms of the Sub-advisory Agreements and the range of investment advisory services provided by the Sub-Advisers under
SUPPLEMENTAL INFORMATION (UNAUDITED)
the oversight of the Manager. In evaluating these investment advisory services, the Trustees considered, among other things, the Sub-Advisers’ investment philosophies, styles and/or processes and approaches to managing the respective Sub-advised Funds. The Trustees received and evaluated information regarding the background, education, expertise and/or experience of the investment professionals who serve as portfolio managers for the Sub-advised Funds and the capabilities and resources of the Sub-Advisers.
Based upon these considerations, the Trustees concluded, within the context of their full deliberations, that the nature, extent and quality of services provided to the Funds by the Manager and the Sub-advised Funds by each respective Sub-Adviser were appropriate.
Investment Performance
In connection with each of its regular quarterly meetings, the Board receives information on the performance of each Fund, including net performance, relative performance rankings within the relevant Morningstar peer group, and performance as compared to benchmark index returns. At each quarterly Board meeting, members of the Manager’s funds management team review with the Board the economic and market environment, absolute and relative performance of each Fund, and any relevant information about risk management and style consistency in connection with management of the Funds. The Board considered investment performance for each Fund over the one-year, three-year (where available), five-year (where available) and since-inception periods.
The Board also received and reviewed a report prepared by Broadridge Financial Solutions (“Broadridge”), an independent provider of mutual fund industry data, which included comparisons of the performance of each Fund to performance of an appropriate peer universe. For details regarding each Fund’s performance, see the “Fund-by-Fund Factors” section below.
The Manager discussed with the Board factors contributing to the Funds’ performance results. In addition, for certain Funds, the Manager provided to the Board longer term performance records of the Sub-Advisers for strategies used in managing the Funds. The Board concluded that the investment performance generated by the Manager and each Sub-Adviser was generally satisfactory, or, that any steps being taken by the Manager and Sub-Advisers to address any performance issues were satisfactory.
Profitability
The Board received and considered the Manager’s estimate of its profitability, which included allocations by the Manager of its costs in providing management services to the Funds. The Board considered the estimated profitability of the Manager both overall and on a Fund-by-Fund basis.
The Board received and considered profitability information from most of the Sub-Advisers, but noted that the Manager had negotiated the fees with the Sub-Advisers at arm’s-length. Accordingly, the Board concluded that the profitability of the Sub-Advisers is a less relevant factor than Manager profitability.
Based on the consideration of this information, the Board concluded that the profitability of the Funds to the Manager was acceptable.
Fees and Expenses
The Trustees considered the management fees paid by the Funds to the Manager under the Management Agreement and evaluated the reasonableness of these fees. The Trustees received and reviewed comparative information with respect to the management fee and total expenses for each Fund and the management fees and total expenses for a peer group of other funds selected by Broadridge. The Trustees considered the Manager’s commitment to limit the total expenses of each Fund through an expense limitation agreement with the Trust. Although the Board recognized that the comparisons between the management fees and actual expenses of the Funds and those of the identified peer group are imprecise, given different terms of agreements and variations in fund strategies, the Trustees found that the comparative information supported their consideration and approval of the management fees and evaluation of the total expenses. For details regarding each Fund’s fee and expense comparisons, see the “Fund-by-Fund Factors” section below.
The Trustees considered the sub-advisory fees paid under the Sub-advisory Agreements and evaluated the reasonableness of those fees. The Trustees also considered that the fees paid to the Sub-Advisers would be paid by the Manager and not the Funds and that the Manager had negotiated the fees with the Sub-Advisers at arm’s-length.
Based on the consideration of the information and factors summarized above, as well as other relevant information and factors, the Board concluded that the management and sub-advisory fees were reasonable in
SUPPLEMENTAL INFORMATION (UNAUDITED)
light of the nature, extent and quality of services rendered to the Funds by the Manager and the Sub-Advisers.
Economies of Scale
The Board considered the extent to which economies of scale may exist, and the extent to the benefits of economies of scale are shared with the Funds. In this regard, the Board noted that for sixteen of twenty-four Funds, the management and sub-advisory fee included breakpoints that are tiered based on growth in asset levels of each such Fund and that for the other Funds, the fees reflected appropriate levels based on current and expected asset levels. The Board also noted that the expenses of the Funds are subject to expense limitations provided by the Manager. The Board noted that expected economies of scale, where they exist, may be shared through the use of fee breakpoints, expense limitations by the Manager, and/or a lower overall fee.
Ancillary Benefits
The Board considered the potential benefits, other than management fees, that the Manager and/or its affiliates may receive because of the Manager’s relationship with the Funds. The Trustees considered that the Funds were designed to serve as investment options under variable contracts issued by affiliates of the Manager that would receive fees under those contracts and that Park Avenue Securities LLC, an affiliate of the Manager and principal underwriter of the Funds, and participating insurance companies, including insurance companies affiliated with the Manager, would be entitled to receive fees from the Funds under a plan of distribution adopted pursuant to Rule 12b-1 under the 1940 Act. The Trustees considered that the Manager and its affiliates may benefit from (i) greater efficiencies in annuity administration and operations and potential cost savings due to a reduction in the number of unaffiliated funds available as annuity contract investment options, and (ii) increased dividends-received deductions due to the Funds’ status under the tax laws as disregarded entities. In addition, the Trustees considered the potential benefits, other than sub-advisory fees, that the Sub-Advisers and their affiliates may receive because of their relationships with the Funds, including the ability to receive research from soft dollar commissions consistent with Trust policies. The Trustees concluded that benefits that may accrue to the Manager and its affiliates are reasonable and the benefits that may accrue to the Sub-Advisers and their affiliates are consistent with those expected for a sub-adviser to a mutual fund such as the applicable Fund.
Fund-by-Fund Factors
The Broadridge report groups fees, expenses and performance into five quintiles, with the top quintile having the highest performance or lowest fees/expenses, and the bottom quintile having the lowest performance or highest fees/expenses. For purposes of the descriptions below, a Fund’s performance is considered “in line with” the benchmark index if it is within 0.20%.
Guardian Large Cap Fundamental Growth VIP Fund
| • | | The Board noted that the Fund’s performance was in the 3rd quintile of its performance universe for the 1-year period and in the 4th quintile for its performance universe for the 3-year and 5-year periods. The Board also noted that the Fund’s performance was below the benchmark index for the 1-year, 3-year and 5-year periods. |
| • | | The Board noted that the contractual management fee, the actual management fee and actual total expenses were in the 1st quintile of the expense group. |
Guardian Large Cap Disciplined Growth VIP Fund
| • | | The Board noted that the Fund’s performance was in the 3rd quintile of its performance universe for the 1-year and 3-year periods and in the 2nd quintile for the 5-year period. The Board also noted that the Fund’s performance was below the benchmark index for the 1-year, 3-year and 5-year periods. |
| • | | The Board noted that the contractual management fee, the actual management fee and actual total expenses were in the 1st quintile of the expense group. |
Guardian Integrated Research VIP Fund
| • | | The Board noted that the Fund’s performance was in the 5th quintile of its performance universe for the 1-year and 5-year periods and in the 4th quintile for 3-year period. The Board also noted that the Fund’s performance was below the benchmark index for the 1-year, 3-year and 5-year periods. |
| • | | The Board noted that the contractual management fee, the actual management fee and actual total expenses were in the 1st quintile of the expense group. |
Guardian Diversified Research VIP Fund
| • | | The Board noted that the Fund’s performance was in the 3rd quintile of its performance universe for the 1-year and 3-year periods and in the 2nd quintile for the 5-year period. The Board also noted that the Fund’s performance was higher than the benchmark |
SUPPLEMENTAL INFORMATION (UNAUDITED)
| | | index for the 1-year period. The Board note that the Fund’s performance was lower than the benchmark index for the 3-year and 5-year periods. |
| • | | The Board noted that the contractual management fee and actual management fee were in the 1st quintile of the expense group and that actual total expenses were in the 3rd quintile. |
Guardian Strategic Large Cap Core VIP Fund
| • | | The Board noted that the Fund’s performance was in the 1st quintile of its performance universe for the 1-year period. The Board acknowledged the Fund’s short operational history. The Board noted that the Fund’s performance was higher than the benchmark index for the 1-year period. |
| • | | The Board noted that the contractual management fee, the actual management fee and actual total expenses were in the 1st quintile of the expense group. |
Guardian Large Cap Disciplined Value VIP Fund
| • | | The Board noted that the Fund’s performance was in the 3rd quintile of its performance universe for the 1-year and 3-year periods and in the 4th quintile for the 5-year period. The Board also noted that the Fund’s performance was higher than the benchmark index for the 1-year and 3-year periods. The Board noted that the Fund’s performance was in line with the benchmark index for the 5-year period. |
| • | | The Board noted that the contractual management fee was in the 2nd quintile of the expense group, the actual management fee was in the 1st quintile of the expense group and that actual total expenses were in the 3rd quintile. |
Guardian Growth & Income VIP Fund
| • | | The Board noted that the Fund’s performance was in the 3rd quintile of its performance universe for the 1-year, 3-year and 5-year periods. The Board also noted that the Fund’s performance was higher than the benchmark index for the 1-year, 3-year and 5-year periods. |
| • | | The Board noted that the contractual management fee and the actual management fee were in the 1st quintile of the expense group and that actual total expenses were in the 3rd quintile. |
Guardian Equity Income VIP Fund
| • | | The Board noted that the Fund had less than one-year of operational history and was not able to evaluate an investment performance record for the Fund. The |
| | | Board noted that it would have an opportunity to review such information in connection with future annual reviews. The Board noted that, in the meantime, it received monthly performance reports from the Manager. |
| • | | The Board noted that the contractual management fee, the actual management fee and actual total expenses were in the 1st quintile of the expense group. |
Guardian All Cap Core VIP Fund
| • | | The Board noted that the Fund’s performance was in the 3rd quintile of its performance universe for the 1-year period. The Board acknowledged the Fund’s short operational history. The Board noted that the Fund’s performance was higher than the benchmark index for the 1-year period. |
| • | | The Board noted that the contractual management fee, the actual management fee and actual total expenses were in the 1st quintile of the expense group. |
Guardian Mid Cap Traditional Growth VIP Fund
| • | | The Board noted that the Fund’s performance was in the 1st quintile of its performance universe for the 1-year period and in the 2nd quintile for the 3-year and 5-year periods. The Board also noted that the Fund’s performance was higher than the benchmark index for the 1-year, 3-year and 5-year periods. |
| • | | The Board noted that the contractual management fee and actual management fee were in the 1st quintile of the expense group and that the actual total expenses were in the 4th quintile. |
Guardian Select Mid Cap Core VIP Fund
| • | | The Board noted that the Fund’s performance was in the 3rd quintile of its performance universe for the 1-year period. The Board acknowledged the Fund’s short operational history. The Board noted that the Fund’s performance was lower than the benchmark index for the 1-year period. |
| • | | The Board noted that the contractual management fee, the actual management fee and actual total expenses were in the 1st quintile of the expense group. |
Guardian Mid Cap Relative Value VIP Fund
| • | | The Board noted that the Fund’s performance was in the 2nd quintile of its performance universe for the 1-year, 3-year and 5-year periods. The Board also noted that the Fund’s performance was higher than the benchmark index for the 1-year, 3-year and 5-year periods. |
SUPPLEMENTAL INFORMATION (UNAUDITED)
| • | | The Board noted that the contractual management fee and the actual management fee were in the 2nd quintile of the expense group and the actual total expenses were in the 3rd quintile of the expense group. |
Guardian Small-Mid Cap Core VIP Fund
| • | | The Board noted that the Fund’s performance was in the 5th quintile of its performance universe for the 1-year period. The Board acknowledged the Fund’s short operational history. The Board noted that the Fund’s performance was higher than the benchmark index for the 1-year period. |
| • | | The Board noted that the contractual management fee, the actual management fee and actual total expenses were in the 1st quintile of the expense group. |
Guardian Small Cap Core VIP Fund
| • | | The Board noted that the Fund’s performance was in the 5th quintile of its performance universe for the 1-year and 3-year periods. The Board noted that the Fund’s performance was lower than the benchmark index for the 1-year and 3-year periods. |
| • | | The Board noted that the contractual management fee and the actual management fee were in the 1st quintile of the expense group and the actual total expenses were in the 2nd quintile of the expense group. |
Guardian International Growth VIP Fund
| • | | The Board noted that the Fund’s performance was in the 4th quintile of its performance universe for the 1-year period, in the 2nd quintile of its performance universe for the 3-year period and in the 3rd quintile of its performance universe for the 5-year period. The Board also noted that the Fund’s performance was lower than the benchmark index for the 1-year and 5-year periods. The Board noted that the Fund’s performance was higher than the benchmark index for the 3-year period. |
| • | | The Board noted that the contractual management fee and actual management fee were in the 2nd quintile of the expense group and that the actual total expenses were in the 3rd quintile. |
Guardian International Equity VIP Fund
| • | | The Board noted that the Fund’s performance was in the 5th quintile of its performance universe for the 1-year, 3-year and 5-year periods. The Board also noted that the Fund’s performance was lower than the benchmark index for the 1-year, 3-year and 5-year periods. |
| • | | The Board noted that the contractual management fee, the actual management fee and the actual total expenses were in the 2nd quintile of the expense group. |
Guardian Global Utilities VIP Fund
| • | | The Board noted that the Fund’s performance was in the 5th quintile of its performance universe for the 1-year period and in the 4th quintile of its performance universe for the 3-year period. The Board noted that the Fund’s performance was higher than the benchmark index for the 1-year and 3-year periods. |
| • | | The Board noted that the contractual management fee and the actual management fee were in the 1st quintile of the expense group and the actual total expenses were in the 2nd quintile of the expense group. |
Guardian Balanced Allocation VIP Fund
| • | | The Board noted that the Fund had less than one-year of operational history and was not able to evaluate an investment performance record for the Fund. The Board noted that it would have an opportunity to review such information in connection with future annual reviews. The Board noted that, in the meantime, it received monthly performance reports from the Manager. |
| • | | The Board noted that the contractual management fee, the actual management fee and actual total expenses were in the 1st quintile of the expense group. |
Guardian Core Plus Fixed Income VIP Fund
| • | | The Board noted that the Fund’s performance was in the 3rd quintile of its performance universe for the 1-year and 3-year periods and in the 4th quintile of its performance universe for the 5-year period. The Board also noted that the Fund’s performance was lower than the benchmark index for the 1-year and 5-year periods. The Board noted that the Fund’s performance was in line with the benchmark index for the 3-year period. |
| • | | The Board noted that the contractual management fee and actual management fee were in the 2nd quintile of the expense group and that actual total expenses were in the 3rd quintile. |
Guardian Total Return Bond VIP Fund
| • | | The Board noted that the Fund’s performance was in the 5th quintile of its performance universe for the 1-year and 3-year periods. The Board also noted that the Fund’s performance was lower than the benchmark index for the 1-year and 3-year periods. |
SUPPLEMENTAL INFORMATION (UNAUDITED)
| • | | The Board noted that the contractual management fee and actual management fee were in the 2nd quintile and the actual total expenses were in the 3rd quintile. |
Guardian Core Fixed Income VIP Fund
| • | | The Board noted that the Fund had less than one-year of operational history and was not able to evaluate an investment performance record for the Fund. The Board noted that it would have an opportunity to review such information in connection with future annual reviews. The Board noted that, in the meantime, it received monthly performance reports from the Manager. |
| • | | The Board noted that the contractual management fee was in the 2nd quintile of the expense group and the actual management fee and the actual total expenses were in the 1st quintile. |
Guardian Multi-Sector Bond VIP Fund
| • | | The Board noted that the Fund’s performance was in the 5th quintile of its performance universe for the 1-year and 3-year periods The Board also noted that the Fund’s performance was lower than the benchmark index for the 1-year and 3-year periods. |
| • | | The Board noted that the contractual management fee and actual total expenses were in the 1st quintile and the actual management fee was in the 2nd quintile. |
Guardian Short Duration Bond VIP Fund
| • | | The Board noted that the Fund had less than one-year of operational history and was not able to evaluate an investment performance record for the Fund. The |
| | Board noted that it would have an opportunity to review such information in connection with future annual reviews. The Board noted that, in the meantime, it received monthly performance reports from the Manager. |
| • | | The Board noted that the contractual management fee and actual total expenses were in the 3rd quintile of the expense group and the actual management fee was in the 1st quintile of the expense group. |
Guardian U.S. Government Securities VIP Fund
| • | | The Board noted that the Fund’s performance was in the 1st quintile of its performance universe for the 1-year period and in the 2nd quintile of its performance universe for the 3-year period. The Board also noted that the Fund’s performance was higher than the benchmark index for the 1-year and 3-year periods. |
| • | | The Board noted that the contractual management fee and the actual management fee were in the 1st quintile of the expense group and the actual total expenses were in the 2nd quintile of the expense group. |
Conclusion
Based on a comprehensive consideration and evaluation of all of the information and factors summarized above, among others, the Board as a whole, including the Independent Trustees, approved the Agreements.
SUPPLEMENTAL INFORMATION (UNAUDITED)
The Statement of Additional Information (“SAI”) includes additional information about the Trust’s Trustees and Officers and is available, without charge, upon request by calling toll-free 1-888-GUARDIAN (1-888-482-7342) or by visiting our website at http://guardianvpt.onlineprospectus.net/GuardianVPT/Prospectuses.
Portfolio Holdings and Proxy Voting Procedures
The Fund files its complete schedule of portfolio holdings with the Securities and Exchange Commission for the first and third quarters of each fiscal year as an exhibit to its reports on Form N-PORT. The Fund’s Form N-PORT reports are available on the Securities and Exchange Commission’s website at https://www.sec.gov. The Fund’s Form N-PORT information is also available, without charge, upon request, by calling toll-free 1-888-GUARDIAN (1-888-482-7342) or by visiting our website at http://guardianvpt.onlineprospectus.net/GuardianVPT/Prospectuses.
A description of the policies and procedures that the Fund uses to determine how to vote proxies relating to portfolio securities is included in the SAI. The SAI and information regarding how the Fund voted proxies relating to portfolio securities during the most recent 12-month period ended June 30 may be obtained (i) without charge, upon request, by calling toll-free 1-888-GUARDIAN (1-888-482-7342) or by visiting our website at http://guardianvpt.onlineprospectus.net/GuardianVPT/Prospectuses; and (ii) on the Securities and Exchange Commission’s website at https://www.sec.gov.
This report is transmitted to shareholders only. It is not authorized for use as an offer of sale or a solicitation of an offer to buy shares of the Fund unless accompanied or preceded by the Fund’s current prospectus. Past performance results shown in this report should not be considered a representation of future performance. Investment returns and principal value of shares will fluctuate so that shares, when redeemed, may be worth more or less than their original cost. Statements and other information herein are as dated and are subject to change.

The Guardian Life Insurance Company of America New York, NY 10001-2159
PUB11740
Guardian Variable
Products Trust
2023
Semiannual Report
All Data as of June 30, 2023
Guardian Core Plus Fixed Income VIP Fund

| | |
| Not FDIC insured. May lose value. No bank guarantee. | | www.guardianlife.com |
TABLE OF CONTENTS
Guardian Core Plus Fixed Income VIP Fund
Except as otherwise specifically stated, all information, including portfolio security positions, is as of June 30, 2023. Fund holdings will vary. Information contained herein has been obtained from sources believed reliable, but is not guaranteed.
GUARDIAN CORE PLUS FIXED INCOME VIP FUND
Fund Characteristics (unaudited)
| | |
| Total Net Assets: $238,979,307 | | |
|
| |
Bond Sector Allocation1 As of June 30, 2023 |
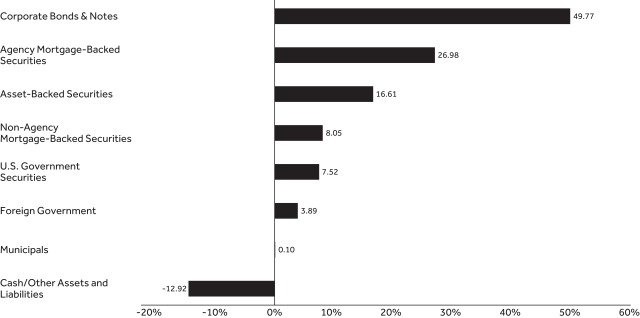 |
|
| |
Bond Quality Allocation2 As of June 30, 2023 |
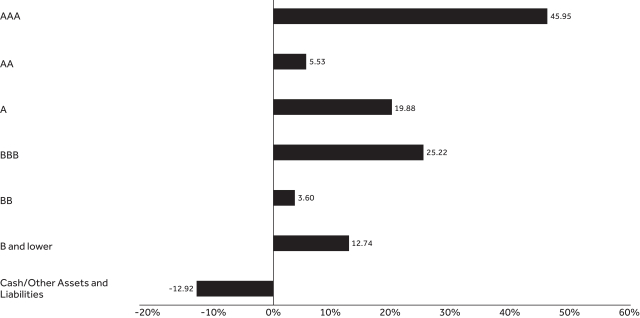 |
GUARDIAN CORE PLUS FIXED INCOME VIP FUND
| | | | | | | | | | | | |
| |
Top Ten Holdings1 As of June 30, 2023 | |
| | | | |
| Holding | | Coupon Rate | | | Maturity Date | | | % of Total
Net Assets | |
| U.S. Treasury Bond | | | 3.875% | | | | 5/15/2043 | | | | 2.58% | |
| Government National Mortgage Association | | | 5.000% | | | | 8/21/2053 | | | | 2.37% | |
| Government National Mortgage Association | | | 5.500% | | | | 8/21/2053 | | | | 2.33% | |
| Federal National Mortgage Association | | | 2.500% | | | | 8/1/2050 | | | | 1.92% | |
| Government National Mortgage Association | | | 6.000% | | | | 8/21/2053 | | | | 1.89% | |
| Government National Mortgage Association | | | 6.500% | | | | 8/21/2053 | | | | 1.42% | |
| Government National Mortgage Association | | | 4.500% | | | | 8/21/2053 | | | | 1.34% | |
| U.S. Treasury Bond | | | 3.625% | | | | 5/15/2053 | | | | 1.22% | |
| Province of Quebec | | | 3.625% | | | | 4/13/2028 | | | | 1.21% | |
| Uniform Mortgage-Backed Security | | | 5.500% | | | | 8/14/2053 | | | | 1.13% | |
| Total | | | | 17.41% | |
| 1 | Portfolio holdings are subject to change and should not be considered a recommendation to buy or sell individual securities. Cash includes short-term investments and net other assets and liabilities. |
| 2 | The Bond Quality Allocation chart displays the percentage of fund assets allocated to each rating. Rating agencies’ independent ratings of individual securities are aggregated by Bloomberg, and market weights are reported using Standard & Poor’s letter rating conventions. Rating methodology uses the middle rating of Moody’s Investors Service, Inc., Standard & Poor’s Ratings Services, and Fitch Ratings. When a rating from only two of the rating agencies is available, the lower rating is used. Credit quality ratings assigned by a rating agency are subject to change periodically and are not absolute standards of credit quality. Rating agencies may fail to make timely changes in credit ratings, and an issuer’s current financial condition may be better or worse than a rating indicates. In formulating investment decisions for the Fund, Lord, Abbett & Co. LLC develops its own analysis of the credit quality and risks associated with individual debt instruments, rather than relying exclusively on rating agency ratings. |
UNDERSTANDING YOUR FUND’S EXPENSES (UNAUDITED)
By investing in the Fund, you incur two types of costs: (1) transaction costs and (2) ongoing costs, including, as applicable, investment advisory fees, distribution and/or service (12b-1) fees and other Fund expenses. The example below is intended to help you understand your ongoing costs (in dollars) of investing in the Fund and to compare these costs with the ongoing costs of investing in other mutual funds.
The example is based on an investment of $1,000 invested at the beginning of the period and held for the entire period from January 1, 2023 to June 30, 2023. The table below shows the Fund’s expenses in two ways:
Expenses based on actual return
This section of the table provides information about actual account values and actual expenses. You may use the information in this section, together with the amount you invested, to estimate the expenses that you paid over the period. Simply divide your account value by $1,000 (for example, an $8,600 account value divided by $1,000 = 8.6), then multiply the result by the number in the section under the heading entitled “Expenses Paid During Period” to estimate the expenses you paid on your account during this period.
Expenses based on hypothetical 5% return for comparison purposes
This section of the table provides information about hypothetical account values and hypothetical expenses based on the Fund’s actual expense ratio and an assumed rate of return of 5% per year before expenses, which is not the Fund’s actual return. The hypothetical account values and expenses may not be used to estimate the actual ending account balance or expenses you paid for the period. You may use this information to compare the ongoing costs of investing in the Fund with the cost of investing in other mutual funds. To do so, compare this 5% hypothetical example with the 5% hypothetical examples that appear in the shareholder reports of the other funds.
Note that the expenses shown in the table are meant to highlight your ongoing costs only and do not reflect any transactional costs, such as sales charges (loads), redemption fees, or exchange fees. Therefore the second section is useful in comparing ongoing costs only, and will not help you determine the relative total costs of owning different funds. If these transactional costs were included, your costs would have been higher. Charges and expenses at the insurance company separate account level are not reflected in the table.
| | | | | | | | | | | | | | |
| | | | | |
| | | Beginning
Account Value 1/1/23 | | Ending Account Value
6/30/23 | | | Expenses Paid During Period* 1/1/23-6/30/23 | | | Expense Ratio During Period 1/1/23-6/30/23 | |
| Based on Actual Return | | $1,000.00 | | $ | 1,021.10 | | | $ | 4.06 | | | | 0.81% | |
Based on Hypothetical Return (5% Return Before Expenses) | | $1,000.00 | | $ | 1,020.78 | | | $ | 4.06 | | | | 0.81% | |
| * | Expenses are equal to the Fund’s annualized expense ratio as indicated, multiplied by the average account value over the period, multiplied by 181/365 (to reflect the one-half year period). |
SCHEDULE OF INVESTMENTS — GUARDIAN CORE PLUS FIXED INCOME VIP FUND
| | | | | | | | |
| June 30, 2023 (unaudited) | | Principal
Amount | | |
Value | |
| Agency Mortgage–Backed Securities – 27.0% | |
| | | |
Federal Home Loan Mortgage Corp.
2.50% due 11/1/2050 | | $ | 697,498 | | | $ | 597,588 | |
2.50% due 7/1/2051 | | | 870,239 | | | | 744,623 | |
3.50% due 2/1/2046 | | | 495,325 | | | | 461,176 | |
4.50% due 8/1/2052 | | | 1,264,696 | | | | 1,228,457 | |
5.00% due 7/1/2052 | | | 556,435 | | | | 551,339 | |
5.00% due 8/1/2052 | | | 2,112,710 | | | | 2,085,982 | |
| | | |
Federal National Mortgage Association | | | | | | | | |
2.00% due 6/1/2051 | | | 521,450 | | | | 426,169 | |
2.00% due 11/1/2051 | | | 634,824 | | | | 520,144 | |
2.50% due 8/1/2050 | | | 5,327,899 | | | | 4,586,655 | |
2.50% due 9/1/2050 | | | 2,716,672 | | | | 2,336,274 | |
2.50% due 1/1/2051 | | | 1,191,657 | | | | 1,023,971 | |
2.50% due 6/1/2051 | | | 819,400 | | | | 701,520 | |
2.50% due 8/1/2051 | | | 292,770 | | | | 251,331 | |
2.50% due 9/1/2051 | | | 419,092 | | | | 359,126 | |
2.50% due 12/1/2051 | | | 2,560,913 | | | | 2,190,163 | |
2.50% due 5/1/2052 | | | 549,974 | | | | 467,346 | |
3.00% due 12/1/2048 | | | 1,971,911 | | | | 1,764,824 | |
3.00% due 1/1/2051 | | | 547,213 | | | | 488,165 | |
3.50% due 7/1/2045 | | | 568,957 | | | | 527,731 | |
3.50% due 9/1/2051 | | | 243,013 | | | | 224,924 | |
3.50% due 4/1/2052 | | | 1,021,685 | | | | 940,687 | |
4.00% due 5/1/2052 | | | 1,041,528 | | | | 993,570 | |
4.00% due 6/1/2052 | | | 1,092,190 | | | | 1,032,388 | |
5.00% due 7/1/2052 | | | 757,819 | | | | 751,702 | |
5.00% due 8/1/2052 | | | 1,149,315 | | | | 1,133,249 | |
| | | |
Freddie Mac Multifamily Structured Pass-Through Certificates | | | | | | | | |
K145 A2
2.58% due 5/25/2032 | | | 1,000,000 | | | | 859,456 | |
KG07 A2
3.123% due 8/25/2032(1)(2) | | | 1,146,000 | | | | 1,028,212 | |
| | | |
Government National Mortgage Association
3.00% due 7/1/2053(3) | | | 1,089,000 | | | | 972,574 | |
3.00% due 8/1/2053(3) | | | 1,912,000 | | | | 1,709,397 | |
3.50% due 8/21/2053(3) | | | 775,000 | | | | 715,453 | |
4.00% due 8/1/2053(3) | | | 2,594,000 | | | | 2,453,927 | |
4.50% due 8/21/2053(3) | | | 3,306,000 | | | | 3,191,979 | |
5.00% due 8/21/2053(3) | | | 5,752,000 | | | | 5,650,690 | |
5.50% due 8/21/2053(3) | | | 5,605,000 | | | | 5,577,429 | |
6.00% due 8/21/2053(3) | | | 4,504,000 | | | | 4,527,556 | |
6.50% due 8/21/2053(3) | | | 3,333,000 | | | | 3,385,795 | |
| | | |
Uniform Mortgage-Backed Security
5.00% due 8/17/2038(3) | | | 815,000 | | | | 809,433 | |
5.50% due 8/17/2038(3) | | | 1,837,000 | | | | 1,844,072 | |
5.50% due 8/14/2053(3) | | | 2,719,000 | | | | 2,705,832 | |
6.00% due 8/14/2053(3) | | | 1,468,000 | | | | 1,480,258 | |
6.50% due 7/13/2053(3) | | | 272,000 | | | | 277,687 | |
6.50% due 8/14/2053(3) | | | 882,000 | | | | 900,072 | |
| | | | | | | | | |
| | |
Total Agency Mortgage–Backed Securities
(Cost $66,086,739) | | | | 64,478,926 | |
| Asset–Backed Securities – 16.6% | |
| | | |
Affirm Asset Securitization Trust
2023-A 1A
6.61% due 1/18/2028(4) | | | 725,000 | | | | 716,789 | |
| | | | | | | | | |
| | | | | | | | |
| June 30, 2023 (unaudited) | | Principal
Amount | | |
Value | |
| Asset–Backed Securities (continued) | |
| | | |
Ares XL CLO Ltd.
2016-40A A1RR
6.13% (3 mo. USD LIBOR + 0.87%)
due 1/15/2029(1)(4)(5) | | $ | 286,287 | | | $ | 283,739 | |
| | | |
Avant Loans Funding Trust
2022-REV1 A
6.54% due 9/15/2031(4) | | | 1,310,000 | | | | 1,307,483 | |
| | | |
Avid Automobile Receivables Trust 2019-1 D
4.03% due 7/15/2026(4) | | | 2,290,000 | | | | 2,287,949 | |
2021-1 E
3.39% due 4/17/2028(4) | | | 830,000 | | | | 766,577 | |
| | | |
Avis Budget Rental Car Funding AESOP LLC
2019-3A A
2.36% due 3/20/2026(4) | | | 1,545,000 | | | | 1,458,277 | |
2020-2A A
2.02% due 2/20/2027(4) | | | 1,750,000 | | | | 1,589,304 | |
| | | |
Bain Capital Credit CLO
2019-2A AR
6.36% (3 mo. USD LIBOR + 1.10%)
due 10/17/2032(1)(4)(5) | | | 880,000 | | | | 866,800 | |
| | | |
Ballyrock CLO 23 Ltd.
2023-23A A1
6.971% (3 mo. USD Term SOFR + 1.98%)
due 4/25/2036(1)(4) | | | 250,000 | | | | 250,284 | |
| | | |
Ballyrock CLO Ltd.
2018-1A A2
6.85% (3 mo. USD LIBOR + 1.60%)
due 4/20/2031(1)(4)(5) | | | 256,000 | | | | 250,650 | |
| | | |
Barings CLO Ltd.
2019-3A A1R
6.32% (3 mo. USD LIBOR + 1.07%)
due 4/20/2031(1)(4)(5) | | | 500,000 | | | | 492,750 | |
| | | |
Carlyle Global Market Strategies
CLO Ltd.
2012-3A A1A2
6.431% (3 mo. USD LIBOR + 1.18%)
due 1/14/2032(1)(4)(5) | | | 308,210 | | | | 304,789 | |
| | | |
Carlyle U.S. CLO Ltd.
2021-1A A1
6.40% (3 mo. USD LIBOR + 1.14%)
due 4/15/2034(1)(4)(5) | | | 1,400,000 | | | | 1,377,600 | |
| | | |
CarMax Auto Owner Trust
2023-1 B
4.98% due 1/16/2029 | | | 850,000 | | | | 830,798 | |
| | | |
CIFC Funding Ltd.
2021-4A A
6.31% (3 mo. USD LIBOR + 1.05%)
due 7/15/2033(1)(4)(5) | | | 1,000,000 | | | | 986,500 | |
| | | |
Drive Auto Receivables Trust
2020-2 C
2.28% due 8/17/2026 | | | 326,137 | | | | 325,053 | |
| | | | | | | | | |
| | | | |
| 4 | | | | The accompanying notes are an integral part of these financial statements. |
SCHEDULE OF INVESTMENTS — GUARDIAN CORE PLUS FIXED INCOME VIP FUND
| | | | | | | | |
| June 30, 2023 (unaudited) | | Principal
Amount | | |
Value | |
| Asset–Backed Securities (continued) | |
| | | |
Exeter Automobile Receivables Trust 2020-2A E
7.19% due 9/15/2027(4) | | $ | 1,100,000 | | | $ | 1,104,558 | |
2022-2A B
3.65% due 10/15/2026 | | | 1,020,000 | | | | 1,004,032 | |
| | | |
First Investors Auto Owner Trust
2021-1A E
3.35% due 4/15/2027(4) | | | 600,000 | | | | 559,104 | |
| | | |
Flagship Credit Auto Trust 2018-3 E
5.28% due 12/15/2025(4) | | | 725,000 | | | | 708,626 | |
2022-3 A3
4.55% due 4/15/2027(4) | | | 950,000 | | | | 931,615 | |
| | | |
Ford Credit Auto Lease Trust
2023-A A3
4.94% due 3/15/2026 | | | 1,150,000 | | | | 1,137,600 | |
| | | |
GM Financial Automobile Leasing Trust
2022-2 A2
2.93% due 10/21/2024 | | | 634,339 | | | | 630,129 | |
| | | |
Lending Funding Trust
2020-2A A
2.32% due 4/21/2031(4) | | | 936,000 | | | | 828,692 | |
| | | |
Lendmark Funding Trust
2021-1A A
1.90% due 11/20/2031(4) | | | 750,000 | | | | 639,740 | |
| | | |
LoanCore Issuer Ltd.
2022-CRE7 A
6.616% (30 day SOFR + 1.55%)
due 1/17/2037(1)(4) | | | 680,000 | | | | 666,545 | |
| | | |
Logan CLO I Ltd.
2021-1A A
6.41% (3 mo. USD LIBOR + 1.16%)
due 7/20/2034(1)(4)(5) | | | 530,000 | | | | 520,725 | |
| | | |
Marble Point CLO XVII Ltd.
2020-1A A
6.55% (3 mo. USD LIBOR + 1.30%)
due 4/20/2033(1)(4)(5) | | | 613,030 | | | | 601,444 | |
| | | |
Marlette Funding Trust
2020-2A D
4.65% due 9/16/2030(4) | | | 668,934 | | | | 660,016 | |
| | | |
ME Funding LLC
2019-1 A2
6.448% due 7/30/2049(4) | | | 962,105 | | | | 935,025 | |
| | | |
Mountain View CLO LLC
2017-1A AR
6.35% (3 mo. USD LIBOR + 1.09%)
due 10/16/2029(1)(4)(5) | | | 379,793 | | | | 376,792 | |
| | | |
Neuberger Berman Loan Advisers CLO 35 Ltd.
2019-35A A1
6.605% (3 mo. USD LIBOR + 1.34%)
due 1/19/2033(1)(4)(5) | | | 270,000 | | | | 267,354 | |
| | | | | | | | | |
| | | | | | | | |
| June 30, 2023 (unaudited) | | Principal
Amount | | |
Value | |
| Asset–Backed Securities (continued) | |
| | | |
OCP CLO Ltd.
2014-5A A1R
6.348% (3 mo. USD LIBOR + 1.08%)
due 4/26/2031(1)(4)(5) | | $ | 630,000 | | | $ | 624,456 | |
2014-7A A1RR
6.37% (3 mo. USD LIBOR + 1.12%)
due 7/20/2029(1)(4)(5) | | | 458,543 | | | | 454,462 | |
| | | |
Santander Consumer Auto Receivables Trust
2020-BA D
2.14% due 12/15/2026(4) | | | 1,475,000 | | | | 1,407,689 | |
| | | |
Santander Drive Auto Receivables Trust
2021-1 C
0.75% due 2/17/2026 | | | 538,590 | | | | 534,304 | |
2022-5 C
4.74% due 10/16/2028 | | | 498,000 | | | | 482,225 | |
2022-6 C
4.96% due 11/15/2028 | | | 1,080,000 | | | | 1,049,403 | |
2022-7 C
6.69% due 3/17/2031 | | | 1,060,000 | | | | 1,076,270 | |
| | | |
SCF Equipment Leasing LLC 2019-2A B
2.76% due 8/20/2026(4) | | | 797,000 | | | | 773,835 | |
2021-1A C
1.54% due 10/21/2030(4) | | | 1,000,000 | | | | 884,940 | |
2021-1A D
1.93% due 9/20/2030(4) | | | 750,000 | | | | 657,966 | |
| | | |
SEB Funding LLC
2021-1A A2
4.969% due 1/30/2052(4) | | | 812,963 | | | | 713,258 | |
| | | |
Signal Peak CLO 8 Ltd.
2020-8A A
6.52% (3 mo. USD LIBOR + 1.27%)
due 4/20/2033(1)(4)(5) | | | 1,003,948 | | | | 991,399 | |
| | | |
Sunrun Demeter Issuer LLC
2021-2A A
2.27% due 1/30/2057(4) | | | 463,174 | | | | 374,621 | |
| | | |
TCW CLO Ltd.
2022-1A A1
6.411% (3 mo. USD Term SOFR + 1.34%)
due 4/22/2033(1)(4) | | | 750,000 | | �� | | 738,675 | |
| | | |
Towd Point Asset Trust
2018-SL1 A
5.75% (1 mo. USD LIBOR + 0.60%)
due 1/25/2046(1)(4)(5) | | | 74,863 | | | | 74,658 | |
| | | |
Voya CLO Ltd.
2018-2A A1
6.26% (3 mo. USD LIBOR + 1.00%)
due 7/15/2031(1)(4)(5) | | | 490,000 | | | | 485,002 | |
| | | |
Westlake Automobile Receivables Trust
2020-3A E
3.34% due 6/15/2026(4) | | | 750,000 | | | | 714,675 | |
2023-1A C
5.74% due 8/15/2028(4) | | | 1,015,000 | | | | 997,155 | |
| | | | | | | | | |
| | | | |
| The accompanying notes are an integral part of these financial statements. | | | | 5 |
SCHEDULE OF INVESTMENTS — GUARDIAN CORE PLUS FIXED INCOME VIP FUND
| | | | | | | | |
| June 30, 2023 (unaudited) | | Principal
Amount | | |
Value | |
| Asset–Backed Securities (continued) | |
| | | |
World Omni Select Auto Trust
2023-A C
6.00% due 1/16/2029 | | $ | 985,000 | | | $ | 981,398 | |
| | | | | | | | | |
| | |
Total Asset–Backed Securities
(Cost $41,202,368) | | | | 39,683,730 | |
| Corporate Bonds & Notes – 49.8% | |
| |
| Aerospace & Defense – 0.3% | |
| | | |
Bombardier, Inc.
6.00% due 2/15/2028(4) | | | 514,000 | | | | 485,833 | |
| | | |
TransDigm, Inc.
4.625% due 1/15/2029 | | | 288,000 | | | | 256,121 | |
| | | | | | | | | |
| | | |
| | | | | | | | 741,954 | |
| Agriculture – 1.1% | |
| | | |
BAT Capital Corp.
3.222% due 8/15/2024 | | | 1,436,000 | | | | 1,393,279 | |
| | | |
Cargill, Inc.
4.00% due 6/22/2032(4) | | | 185,000 | | | | 171,199 | |
| | | |
Philip Morris International, Inc.
5.625% due 11/17/2029 | | | 592,000 | | | | 603,201 | |
| | | |
Viterra Finance BV
4.90% due 4/21/2027(4) | | | 398,000 | | | | 383,365 | |
| | | | | | | | | |
| | | |
| | | | | | | | 2,551,044 | |
| Airlines – 0.8% | |
| | | |
American Airlines, Inc.
7.25% due 2/15/2028(4) | | | 263,000 | | | | 261,582 | |
11.75% due 7/15/2025(4) | | | 236,000 | | | | 258,925 | |
| | | |
British Airways Pass-Through Trust
2020-1 A
4.25% due 11/15/2032(4)(6) | | | 544,644 | | | | 498,180 | |
| | | |
Delta Air Lines, Inc.
7.00% due 5/1/2025(4) | | | 717,000 | | | | 732,602 | |
| | | |
VistaJet Malta Finance PLC / Vista Management Holding, Inc.
7.875% due 5/1/2027(4) | | | 267,000 | | | | 239,940 | |
| | | | | | | | | |
| | | |
| | | | | | | | 1,991,229 | |
| Auto Manufacturers – 0.3% | |
| | | |
Ford Motor Co.
3.25% due 2/12/2032 | | | 848,000 | | | | 665,951 | |
| | | | | | | | | |
| | | |
| | | | | | | | 665,951 | |
| Beverages – 0.4% | |
| | | |
Bacardi Ltd. / Bacardi-Martini BV
5.40% due 6/15/2033(4) | | | 860,000 | | | | 855,425 | |
| | | | | | | | | |
| | | |
| | | | | | | | 855,425 | |
| Biotechnology – 0.1% | |
| | | |
Baxalta, Inc.
4.00% due 6/23/2025 | | | 175,000 | | | | 169,801 | |
| | | | | | | | | |
| | | |
| | | | | | | | 169,801 | |
| Building Materials – 0.4% | |
| | | |
Griffon Corp.
5.75% due 3/1/2028 | | | 264,000 | | | | 246,893 | |
| | | |
Smyrna Ready Mix Concrete LLC
6.00% due 11/1/2028(4) | | | 397,000 | | | | 375,542 | |
| | | |
Standard Industries, Inc.
4.375% due 7/15/2030(4) | | | 308,000 | | | | 266,916 | |
| | | | | | | | | |
| | | |
| | | | | | | | 889,351 | |
| | | | | | | | |
| June 30, 2023 (unaudited) | | Principal
Amount | | |
Value | |
| Chemicals – 0.6% | |
| | | |
CVR Partners LP / CVR Nitrogen Finance Corp.
6.125% due 6/15/2028(4) | | $ | 265,000 | | | $ | 230,855 | |
| | | |
International Flavors & Fragrances, Inc.
1.23% due 10/1/2025(4) | | | 1,008,000 | | | | 899,035 | |
| | | |
Rain CII Carbon LLC / CII Carbon Corp.
7.25% due 4/1/2025(4) | | | 253,000 | | | | 245,106 | |
| | | | | | | | | |
| | | |
| | | | | | | | 1,374,996 | |
| Commercial Banks – 16.1% | |
| | | |
ABN AMRO Bank NV
3.324% (3.324% fixed rate until 12/13/2031; 5 yr. CMT + 1.90% thereafter)
due 3/13/2037(1)(4) | | | 400,000 | | | | 303,620 | |
| | | |
Bank of America Corp.
1.658% (1.658% fixed rate until 3/11/2026; SOFR + 0.91% thereafter)
due 3/11/2027(1) | | | 1,693,000 | | | | 1,523,954 | |
2.087% (2.087% fixed rate until 6/14/2028; SOFR + 1.06% thereafter)
due 6/14/2029(1) | | | 1,256,000 | | | | 1,073,139 | |
2.687% (2.687% fixed rate until 4/22/2031; SOFR + 1.32% thereafter)
due 4/22/2032(1) | | | 509,000 | | | | 421,701 | |
3.458% (3.458% fixed rate until 3/15/2024; 3 mo. USD Term SOFR + 1.23% thereafter)
due 3/15/2025(1) | | | 618,000 | | | | 605,751 | |
3.593% (3.593% fixed rate until 7/21/2027; 3 mo. USD Term SOFR + 1.63% thereafter)
due 7/21/2028(1) | | | 1,500,000 | | | | 1,397,385 | |
| | | |
Bank of New York Mellon Corp.
4.289% (4.289% fixed rate until 6/13/2032; SOFR + 1.42% thereafter)
due 6/13/2033(1) | | | 554,000 | | | | 524,134 | |
Series J
4.967% (4.967% fixed rate until 4/26/2033; SOFR + 1.61% thereafter)
due 4/26/2034(1) | | | 443,000 | | | | 432,501 | |
| | | |
BankUnited, Inc.
5.125% due 6/11/2030 | | | 613,000 | | | | 467,866 | |
| | | |
BNP Paribas SA
2.219% (2.219% fixed rate until 6/9/2025; SOFR + 2.07% thereafter)
due 6/9/2026(1)(4) | | | 769,000 | | | | 712,309 | |
4.375% (4.375% fixed rate until 3/1/2028; 5 yr. USD Swap + 1.48% thereafter)
due 3/1/2033(1)(4) | | | 599,000 | | | | 540,717 | |
| | | | | | | | | |
| | | | |
| 6 | | | | The accompanying notes are an integral part of these financial statements. |
SCHEDULE OF INVESTMENTS — GUARDIAN CORE PLUS FIXED INCOME VIP FUND
| | | | | | | | |
| June 30, 2023 (unaudited) | | Principal
Amount | | |
Value | |
| Commercial Banks (continued) | |
| | | |
Citigroup, Inc.
2.666% (2.666% fixed rate until 1/29/2030; SOFR + 1.15% thereafter)
due 1/29/2031(1) | | $ | 400,000 | | | $ | 338,364 | |
3.887% (3.887% fixed rate until 1/10/2027; 3 mo. USD Term SOFR + 1.82% thereafter)
due 1/10/2028(1) | | | 712,000 | | | | 674,378 | |
3.98% (3.98% fixed rate until 3/20/2029; 3 mo. USD Term SOFR + 1.60% thereafter)
due 3/20/2030(1) | | | 2,518,000 | | | | 2,332,146 | |
4.14% (4.14% fixed rate until 5/24/2024; SOFR + 1.37% thereafter)
due 5/24/2025(1) | | | 287,000 | | | | 281,955 | |
| | | |
Citizens Bank NA
4.119% (4.119% fixed rate until 5/23/2024; SOFR + 1.40% thereafter)
due 5/23/2025(1) | | | 626,000 | | | | 592,891 | |
| | | |
Danske Bank A/S
3.773% (3.773% fixed rate until 3/28/2024; 1 yr. CMT + 1.45% thereafter)
due 3/28/2025(1)(4) | | | 1,345,000 | | | | 1,314,401 | |
4.375% due 6/12/2028(4) | | | 200,000 | | | | 184,492 | |
| | | |
First-Citizens Bank & Trust Co.
2.969% (2.969% fixed rate until 9/27/2024; 3 mo. USD Term SOFR + 1.72% thereafter)
due 9/27/2025(1) | | | 518,000 | | | | 487,614 | |
| | | |
Goldman Sachs Group, Inc.
2.383% (2.383% fixed rate until 7/21/2031; SOFR + 1.25% thereafter)
due 7/21/2032(1) | | | 500,000 | | | | 399,925 | |
| | | |
HSBC Holdings PLC
3.803% (3.803% fixed rate until 3/11/2024; 3 mo. USD Term SOFR + 1.47% thereafter)
due 3/11/2025(1) | | | 517,000 | | | | 506,975 | |
| | | |
Intesa Sanpaolo SpA
6.625% due 6/20/2033(4) | | | 840,000 | | | | 837,673 | |
| | | |
JPMorgan Chase & Co.
2.739% (2.739% fixed rate until 10/15/2029; 3 mo. USD Term SOFR + 1.51% thereafter)
due 10/15/2030(1) | | | 880,000 | | | | 758,419 | |
3.54% (3.54% fixed rate until 5/1/2027; 3 mo. USD Term SOFR + 1.64% thereafter)
due 5/1/2028(1) | | | 1,002,000 | | | | 937,131 | |
3.782% (3.782% fixed rate until 2/1/2027; 3 mo. USD Term SOFR + 1.60% thereafter)
due 2/1/2028(1) | | | 1,065,000 | | | | 1,015,009 | |
| | | | | | | | | |
| | | | | | | | |
| June 30, 2023 (unaudited) | | Principal
Amount | | |
Value | |
| Commercial Banks (continued) | |
| | | |
Lloyds Banking Group PLC
3.90% due 3/12/2024 | | $ | 648,000 | | | $ | 637,652 | |
| | | |
M&T Bank Corp.
5.053% (5.053% fixed rate until 1/27/2033; SOFR + 1.85% thereafter)
due 1/27/2034(1) | | | 752,000 | | | | 686,117 | |
| | | |
Macquarie Bank Ltd.
3.624% due 6/3/2030(4) | | | 203,000 | | | | 170,731 | |
| | | |
Macquarie Group Ltd.
2.691% (2.691% fixed rate until 6/23/2031; SOFR + 1.44% thereafter)
due 6/23/2032(1)(4) | | | 968,000 | | | | 765,620 | |
4.654% (4.654% fixed rate until 3/27/2028; 3 mo. USD LIBOR + 1.73% thereafter)
due 3/27/2029(1)(4)(5) | | | 963,000 | | | | 915,582 | |
| | | |
Mitsubishi UFJ Financial Group, Inc.
5.541% (5.541% fixed rate until 4/17/2025; 1 yr. CMT + 1.50% thereafter)
due 4/17/2026(1) | | | 320,000 | | | | 318,275 | |
| | | |
Morgan Stanley
2.239% (2.239% fixed rate until 7/21/2031; SOFR + 1.18% thereafter)
due 7/21/2032(1) | | | 799,000 | | | | 635,093 | |
2.484% (2.484% fixed rate until 9/16/2031; SOFR + 1.36% thereafter)
due 9/16/2036(1) | | | 542,000 | | | | 410,240 | |
4.21% (4.21% fixed rate until 4/20/2027; SOFR + 1.61% thereafter)
due 4/20/2028(1) | | | 391,000 | | | | 375,689 | |
4.431% (4.431% fixed rate until 1/23/2029; 3 mo. USD Term SOFR + 1.89% thereafter)
due 1/23/2030(1) | | | 2,494,000 | | | | 2,375,161 | |
| | | |
NatWest Group PLC
5.808% (5.808% fixed rate until 9/13/2028; 1 yr. CMT + 1.95% thereafter)
due 9/13/2029(1) | | | 327,000 | | | | 322,690 | |
7.472% (7.472% fixed rate until 11/10/2025; 1 yr. CMT + 2.85% thereafter)
due 11/10/2026(1) | | | 486,000 | | | | 497,387 | |
| | | |
Royal Bank of Canada
5.00% due 2/1/2033 | | | 995,000 | | | | 975,259 | |
6.00% due 11/1/2027 | | | 667,000 | | | | 684,289 | |
| | | |
State Street Corp.
4.164% (4.164% fixed rate until 8/4/2032; SOFR + 1.73% thereafter)
due 8/4/2033(1) | | | 469,000 | | | | 435,152 | |
| | | | | | | | | |
| | | | |
| The accompanying notes are an integral part of these financial statements. | | | | 7 |
SCHEDULE OF INVESTMENTS — GUARDIAN CORE PLUS FIXED INCOME VIP FUND
| | | | | | | | |
| June 30, 2023 (unaudited) | | Principal
Amount | | |
Value | |
| Commercial Banks (continued) | |
| | | |
Toronto-Dominion Bank
4.456% due 6/8/2032 | | $ | 300,000 | | | $ | 285,000 | |
| | | |
U.S. Bancorp
4.839% (4.839% fixed rate until 2/1/2033; SOFR + 1.60% thereafter)
due 2/1/2034(1) | | | 693,000 | | | | 648,932 | |
4.967% (4.967% fixed rate until 7/22/2032; SOFR + 2.11% thereafter)
due 7/22/2033(1) | | | 1,057,000 | | | | 958,403 | |
| | | |
UBS AG
5.125% due 5/15/2024 | | | 872,000 | | | | 857,054 | |
| | | |
UBS Group AG
1.364% (1.364% fixed rate until 1/30/2026; 1 yr. CMT + 1.08% thereafter)
due 1/30/2027(1)(4) | | | 473,000 | | | | 414,164 | |
1.494% (1.494% fixed rate until 8/10/2026; 1 yr. CMT + 0.85% thereafter)
due 8/10/2027(1)(4) | | | 553,000 | | | | 475,221 | |
4.703% (4.703% fixed rate until 8/5/2026; 1 yr. CMT + 2.05% thereafter)
due 8/5/2027(1)(4) | | | 365,000 | | | | 348,980 | |
5.711% (5.711% fixed rate until 1/12/2026; 1 yr. CMT + 1.55% thereafter)
due 1/12/2027(1)(4) | | | 603,000 | | | | 596,952 | |
6.442% (6.442% fixed rate until 8/11/2027; SOFR + 3.70% thereafter)
due 8/11/2028(1)(4) | | | 509,000 | | | | 510,873 | |
| | | |
Wells Fargo & Co.
2.188% (2.188% fixed rate until 4/30/2025; SOFR + 2.00% thereafter)
due 4/30/2026(1) | | | 652,000 | | | | 611,094 | |
2.393% (2.393% fixed rate until 6/2/2027; SOFR + 2.10% thereafter)
due 6/2/2028(1) | | | 2,093,000 | | | | 1,866,537 | |
3.35% (3.35% fixed rate until 3/2/2032; SOFR + 1.50% thereafter)
due 3/2/2033(1) | | | 900,000 | | | | 770,283 | |
3.584% (3.584% fixed rate until 5/22/2027; 3 mo. USD Term SOFR + 1.57% thereafter)
due 5/22/2028(1) | | | 976,000 | | | | 909,447 | |
5.389% (5.389% fixed rate until 4/24/2033; SOFR + 2.02% thereafter)
due 4/24/2034(1) | | | 447,000 | | | | 444,264 | |
| | | | | | | | | |
| | | |
| | | | | | | | 38,566,591 | |
| Commercial Services – 0.5% | |
| | | |
Adani Ports & Special Economic Zone Ltd.
4.00% due 7/30/2027 | | | 680,000 | | | | 578,387 | |
| | | | | | | | | |
| | | | | | | | |
| June 30, 2023 (unaudited) | | Principal
Amount | | |
Value | |
| Commercial Services (continued) | |
| | | |
Allied Universal Holdco LLC / Allied Universal Finance Corp. / Atlas Luxco 4 Sarl
4.625% due 6/1/2028(4) | | $ | 300,000 | | | $ | 252,489 | |
| | | |
Avis Budget Car Rental LLC / Avis Budget Finance, Inc.
4.75% due 4/1/2028(4) | | | 276,000 | | | | 253,851 | |
| | | |
Garda World Security Corp.
7.75% due 2/15/2028(4) | | | 243,000 | | | | 242,563 | |
| | | | | | | | | |
| | | |
| | | | | | | | 1,327,290 | |
| Computers – 0.1% | |
| | | |
Leidos, Inc.
5.75% due 3/15/2033 | | | 355,000 | | | | 353,260 | |
| | | | | | | | | |
| | | |
| | | | | | | | 353,260 | |
| Cosmetics & Personal Care – 0.1% | |
| | | |
Haleon U.S. Capital LLC
3.625% due 3/24/2032 | | | 295,000 | | | | 264,559 | |
| | | | | | | | | |
| | | |
| | | | | | | | 264,559 | |
| Diversified Financial Services – 2.4% | |
| | | |
Aircastle Ltd.
2.85% due 1/26/2028(4) | | | 600,000 | | | | 510,252 | |
| | | |
American Express Co.
4.42% (4.420% fixed rate until 8/3/2032; SOFR + 1.76% thereafter)
due 8/3/2033(1) | | | 400,000 | | | | 377,144 | |
| | | |
Aviation Capital Group LLC
1.95% due 1/30/2026(4) | | | 408,000 | | | | 363,189 | |
5.50% due 12/15/2024(4) | | | 982,000 | | | | 960,730 | |
6.375% due 7/15/2030(4) | | | 594,000 | | | | 590,145 | |
| | | |
Avolon Holdings Funding Ltd. 2.125% due 2/21/2026(4) | | | 1,255,000 | | | | 1,115,268 | |
4.25% due 4/15/2026(4) | | | 643,000 | | | | 598,839 | |
| | | |
LPL Holdings, Inc.
4.00% due 3/15/2029(4) | | | 522,000 | | | | 458,901 | |
| | | |
Neuberger Berman Group LLC / Neuberger Berman Finance Corp. 4.50% due 3/15/2027(4) | | | 329,000 | | | | 310,132 | |
4.875% due 4/15/2045(4) | | | 198,000 | | | | 161,790 | |
| | | |
OneMain Finance Corp.
5.375% due 11/15/2029 | | | 304,000 | | | | 259,576 | |
| | | | | | | | | |
| | | |
| | | | | | | | 5,705,966 | |
| Electric – 5.0% | |
| | | |
AEP Texas, Inc.
5.40% due 6/1/2033 | | | 298,000 | | | | 296,602 | |
| | | |
AES Corp.
3.95% due 7/15/2030(4) | | | 578,000 | | | | 519,021 | |
| | | |
Alfa Desarrollo SpA
4.55% due 9/27/2051(4) | | | 293,546 | | | | 215,512 | |
| | | |
American Transmission Systems, Inc.
2.65% due 1/15/2032(4) | | | 238,000 | | | | 196,990 | |
| | | |
Ausgrid Finance Pty. Ltd.
4.35% due 8/1/2028(4) | | | 580,000 | | | | 547,584 | |
| | | | | | | | | |
| | | | |
| 8 | | | | The accompanying notes are an integral part of these financial statements. |
SCHEDULE OF INVESTMENTS — GUARDIAN CORE PLUS FIXED INCOME VIP FUND
| | | | | | | | |
| June 30, 2023 (unaudited) | | Principal
Amount | | |
Value | |
| Electric (continued) | |
| | | |
Calpine Corp.
5.125% due 3/15/2028(4) | | $ | 536,000 | | | $ | 480,277 | |
| | | |
Constellation Energy Generation LLC
6.25% due 10/1/2039 | | | 600,000 | | | | 622,140 | |
| | | |
Duke Energy Corp.
4.50% due 8/15/2032 | | | 1,499,000 | | | | 1,415,401 | |
| | | |
Duke Energy Indiana LLC
5.40% due 4/1/2053 | | | 304,000 | | | | 307,086 | |
| | | |
Electricite de France SA
6.25% due 5/23/2033(4) | | | 762,000 | | | | 773,316 | |
| | | |
Eskom Holdings SOC Ltd.
6.35% due 8/10/2028 | | | 268,000 | | | | 250,261 | |
| | | |
Indiana Michigan Power Co.
5.625% due 4/1/2053 | | | 306,000 | | | | 315,137 | |
| | | |
Indianapolis Power & Light Co.
5.65% due 12/1/2032(4) | | | 1,000,000 | | | | 1,022,000 | |
| | | |
Minejesa Capital BV
4.625% due 8/10/2030(4) | | | 730,000 | | | | 655,102 | |
| | | |
National Grid PLC
5.809% due 6/12/2033 | | | 752,000 | | | | 766,168 | |
| | | |
NRG Energy, Inc.
4.45% due 6/15/2029(4) | | | 280,000 | | | | 247,775 | |
| | | |
Oklahoma Gas and Electric Co.
5.40% due 1/15/2033 | | | 340,000 | | | | 345,080 | |
| | | |
Perusahaan Perseroan Persero PT Perusahaan Listrik Negara
3.00% due 6/30/2030(4) | | | 504,000 | | | | 432,618 | |
| | | |
PG&E Corp.
5.00% due 7/1/2028 | | | 258,000 | | | | 236,834 | |
| | | |
Southern Co.
4.475% due 8/1/2024(1) | | | 1,156,000 | | | | 1,135,099 | |
| | | |
Vistra Operations Co. LLC
3.55% due 7/15/2024(4) | | | 841,000 | | | | 812,255 | |
4.375% due 5/1/2029(4) | | | 293,000 | | | | 256,460 | |
| | | | | | | | | |
| | | |
| | | | | | | | 11,848,718 | |
| Engineering & Construction – 0.2% | |
| | | |
Weekley Homes LLC / Weekley Finance Corp.
4.875% due 9/15/2028(4) | | | 558,000 | | | | 504,633 | |
| | | | | | | | | |
| | | |
| | | | | | | | 504,633 | |
| Entertainment – 0.6% | |
| | | |
Cinemark USA, Inc.
5.875% due 3/15/2026(4) | | | 256,000 | | | | 242,926 | |
| | | |
Jacobs Entertainment, Inc.
6.75% due 2/15/2029(4) | | | 438,000 | | | | 390,140 | |
| | | |
Warnermedia Holdings, Inc.
3.428% due 3/15/2024 | | | 914,000 | | | | 895,692 | |
| | | | | | | | | |
| | | |
| | | | | | | | 1,528,758 | |
| Food – 0.1% | |
| | | |
Albertsons Cos., Inc. / Safeway, Inc. /
New Albertsons LP / Albertsons LLC
3.50% due 3/15/2029(4) | | | 336,000 | | | | 292,223 | |
| | | | | | | | | |
| | | |
| | | | | | | | 292,223 | |
| | | | | | | | |
| June 30, 2023 (unaudited) | | Principal
Amount | | |
Value | |
| Gas – 1.0% | |
| | | |
CenterPoint Energy Resources Corp. 1.75% due 10/1/2030 | | $ | 301,000 | | | $ | 241,435 | |
4.40% due 7/1/2032 | | | 1,319,000 | | | | 1,262,402 | |
| | | |
National Fuel Gas Co.
5.50% due 1/15/2026 | | | 554,000 | | | | 545,480 | |
| | | |
Southwest Gas Corp.
4.05% due 3/15/2032 | | | 413,000 | | | | 371,712 | |
| | | | | | | | | |
| | | |
| | | | | | | | 2,421,029 | |
| Hand & Machine Tools – 0.2% | |
| | | |
Regal Rexnord Corp.
6.05% due 2/15/2026(4) | | | 541,000 | | | | 542,028 | |
| | | | | | | | | |
| | | |
| | | | | | | | 542,028 | |
| Healthcare-Products – 0.8% | |
| | | |
GE HealthCare Technologies, Inc.
5.65% due 11/15/2027 | | | 985,000 | | | | 996,426 | |
| | | |
Medline Borrower LP
3.875% due 4/1/2029(4) | | | 330,000 | | | | 287,024 | |
| | | |
Revvity, Inc.
0.85% due 9/15/2024 | | | 750,000 | | | | 705,780 | |
| | | | | | | | | |
| | | |
| | | | | | | | 1,989,230 | |
| Healthcare-Services – 2.2% | |
| | | |
Catalent Pharma Solutions, Inc.
5.00% due 7/15/2027(4) | | | 267,000 | | | | 245,784 | |
| | | |
Centene Corp.
2.45% due 7/15/2028 | | | 1,000,000 | | | | 857,170 | |
3.375% due 2/15/2030 | | | 966,000 | | | | 830,625 | |
4.25% due 12/15/2027 | | | 419,000 | | | | 392,067 | |
| | | |
Elevance Health, Inc.
2.25% due 5/15/2030 | | | 212,000 | | | | 177,643 | |
5.50% due 10/15/2032 | | | 606,000 | | | | 622,465 | |
| | | |
Humana, Inc.
1.35% due 2/3/2027 | | | 737,000 | | | | 641,448 | |
5.875% due 3/1/2033 | | | 770,000 | | | | 798,960 | |
| | | |
Tenet Healthcare Corp.
6.125% due 10/1/2028 | | | 400,000 | | | | 385,000 | |
6.75% due 5/15/2031(4) | | | 245,000 | | | | 246,389 | |
| | | | | | | | | |
| | | |
| | | | | | | | 5,197,551 | |
| Insurance – 1.0% | |
| | | |
Assurant, Inc.
2.65% due 1/15/2032 | | | 313,000 | | | | 233,933 | |
| | | |
GA Global Funding Trust
3.85% due 4/11/2025(4) | | | 898,000 | | | | 856,387 | |
| | | |
Metropolitan Life Global Funding I 4.05% due 8/25/2025(4) | | | 452,000 | | | | 435,457 | |
5.15% due 3/28/2033(4) | | | 389,000 | | | | 383,748 | |
| | | |
New York Life Global Funding
4.55% due 1/28/2033(4) | | | 518,000 | | | | 498,751 | |
| | | | | | | | | |
| | | |
| | | | | | | | 2,408,276 | |
| Internet – 0.8% | |
| | | |
Amazon.com, Inc.
4.70% due 12/1/2032 | | | 500,000 | | | | 503,730 | |
| | | |
Netflix, Inc.
6.375% due 5/15/2029 | | | 652,000 | | | | 689,581 | |
| | | | | | | | | |
| | | | |
| The accompanying notes are an integral part of these financial statements. | | | | 9 |
SCHEDULE OF INVESTMENTS — GUARDIAN CORE PLUS FIXED INCOME VIP FUND
| | | | | | | | |
| June 30, 2023 (unaudited) | | Principal
Amount | | |
Value | |
| Internet (continued) | |
| | | |
Prosus NV
3.257% due 1/19/2027(4) | | $ | 700,000 | | | $ | 633,381 | |
| | | | | | | | | |
| | | |
| | | | | | | | 1,826,692 | |
| Iron & Steel – 0.1% | |
| | | |
United States Steel Corp.
6.875% due 3/1/2029 | | | 240,000 | | | | 237,403 | |
| | | | | | | | | |
| | | |
| | | | | | | | 237,403 | |
| Leisure Time – 0.5% | |
| | | |
Life Time, Inc.
5.75% due 1/15/2026(4) | | | 260,000 | | | | 253,685 | |
| | | |
NCL Corp. Ltd.
5.875% due 2/15/2027(4) | | | 543,000 | | | | 527,975 | |
| | | |
Royal Caribbean Cruises Ltd.
5.375% due 7/15/2027(4) | | | 297,000 | | | | 278,461 | |
8.25% due 1/15/2029(4) | | | 134,000 | | | | 140,687 | |
| | | | | | | | | |
| | | |
| | | | | | | | 1,200,808 | |
| Lodging – 0.1% | |
| | | |
Genting New York LLC / GENNY Capital, Inc.
3.30% due 2/15/2026(4) | | | 273,000 | | | | 245,651 | |
| | | | | | | | | |
| | | |
| | | | | | | | 245,651 | |
| Machinery – Diversified – 0.4% | |
| | | |
nVent Finance Sarl
4.55% due 4/15/2028 | | | 1,112,000 | | | | 1,042,578 | |
| | | | | | | | | |
| | |
| | | | | 1,042,578 | |
| Media – 0.5% | |
| | | |
CCO Holdings LLC / CCO Holdings Capital Corp.
4.50% due 5/1/2032 | | | 477,000 | | | | 379,401 | |
| | | |
DISH Network Corp.
11.75% due 11/15/2027(4) | | | 267,000 | | | | 261,102 | |
| | | |
FactSet Research Systems, Inc.
3.45% due 3/1/2032 | | | 600,000 | | | | 512,580 | |
| | | | | | | | | |
| | |
| | | | | 1,153,083 | |
| Mining – 0.7% | |
| | | |
Corp. Nacional del Cobre de Chile
5.125% due 2/2/2033(4) | | | 515,000 | | | | 507,821 | |
| | | |
FMG Resources August 2006 Pty. Ltd.
4.375% due 4/1/2031(4) | | | 437,000 | | | | 372,971 | |
| | | |
Freeport Indonesia PT
5.315% due 4/14/2032 | | | 316,000 | | | | 299,391 | |
| | | |
Glencore Funding LLC
4.875% due 3/12/2029(4) | | | 511,000 | | | | 492,972 | |
| | | | | | | | | |
| | |
| | | | | 1,673,155 | |
| Oil & Gas – 3.7% | |
| | | |
Callon Petroleum Co.
8.00% due 8/1/2028(4) | | | 533,000 | | | | 527,259 | |
| | | |
Civitas Resources, Inc.
8.375% due 7/1/2028(4) | | | 300,000 | | | | 303,873 | |
| | | |
Comstock Resources, Inc.
6.75% due 3/1/2029(4) | | | 331,000 | | | | 303,070 | |
| | | | | | | | | |
| | | | | | | | |
| June 30, 2023 (unaudited) | | Principal
Amount | | |
Value | |
| Oil & Gas (continued) | |
| | | |
Continental Resources, Inc.
5.75% due 1/15/2031(4) | | $ | 1,500,000 | | | $ | 1,429,410 | |
| | | |
Diamondback Energy, Inc.
3.125% due 3/24/2031 | | | 1,304,000 | | | | 1,116,485 | |
| | | |
Earthstone Energy Holdings LLC
8.00% due 4/15/2027(4) | | | 534,000 | | | | 514,514 | |
| | | |
Ecopetrol SA
8.625% due 1/19/2029 | | | 245,000 | | | | 245,823 | |
| | | |
EQT Corp.
7.00% due 2/1/2030 | | | 1,311,000 | | | | 1,372,722 | |
| | | |
Occidental Petroleum Corp.
6.625% due 9/1/2030 | | | 778,000 | | | | 808,319 | |
| | | |
OQ SAOC
5.125% due 5/6/2028(4) | | | 250,000 | | | | 237,200 | |
| | | |
Ovintiv, Inc.
6.50% due 2/1/2038 | | | 498,000 | | | | 489,614 | |
| | | |
PBF Holding Co. LLC / PBF Finance Corp.
6.00% due 2/15/2028 | | | 535,000 | | | | 501,509 | |
| | | |
Petroleos Mexicanos
6.70% due 2/16/2032 | | | 860,000 | | | | 655,157 | |
| | | |
Vital Energy, Inc.
9.50% due 1/15/2025 | | | 288,000 | | | | 287,044 | |
| | | | | | | | | |
| | |
| | | | | 8,791,999 | |
| Packaging & Containers – 0.2% | |
| | | |
Mauser Packaging Solutions Holding Co.
7.875% due 8/15/2026(4) | | | 244,000 | | | | 242,024 | |
| | | |
Pactiv Evergreen Group Issuer LLC / Pactiv Evergreen Group Issuer, Inc.
4.375% due 10/15/2028(4) | | | 299,000 | | | | 260,937 | |
| | | | | | | | | |
| | | |
| | | | | | | | 502,961 | |
| Pharmaceuticals – 1.7% | |
| | | |
Cigna Group
2.40% due 3/15/2030 | | | 1,298,000 | | | | 1,102,768 | |
| | | |
CVS Health Corp.
3.25% due 8/15/2029 | | | 1,000,000 | | | | 897,490 | |
5.05% due 3/25/2048 | | | 400,000 | | | | 368,888 | |
| | | |
Option Care Health, Inc.
4.375% due 10/31/2029(4) | | | 325,000 | | | | 286,761 | |
| | | |
Organon & Co. / Organon Foreign Debt Co-Issuer BV
4.125% due 4/30/2028(4) | | | 321,000 | | | | 285,032 | |
| | | |
Pfizer Investment Enterprises Pte Ltd.
4.75% due 5/19/2033 | | | 1,059,000 | | | | 1,055,452 | |
| | | | | | | | | |
| | | |
| | | | | | | | 3,996,391 | |
| Pipelines – 1.7% | |
| | | |
Cheniere Energy Partners LP
3.25% due 1/31/2032 | | | 344,000 | | | | 283,817 | |
| | | |
CNX Midstream Partners LP
4.75% due 4/15/2030(4) | | | 457,000 | | | | 386,595 | |
| | | | | | | | | |
| | | | |
| 10 | | | | The accompanying notes are an integral part of these financial statements. |
SCHEDULE OF INVESTMENTS — GUARDIAN CORE PLUS FIXED INCOME VIP FUND
| | | | | | | | |
| June 30, 2023 (unaudited) | | Principal
Amount | | |
Value | |
| Pipelines (continued) | |
| | | |
Eastern Gas Transmission & Storage, Inc.
3.00% due 11/15/2029 | | $ | 428,000 | | | $ | 373,173 | |
| | | |
EIG Pearl Holdings Sarl
3.545% due 8/31/2036(4) | | | 706,000 | | | | 601,540 | |
| | | |
Galaxy Pipeline Assets Bidco Ltd.
3.25% due 9/30/2040(4) | | | 766,000 | | | | 594,156 | |
| | | |
Kinder Morgan Energy Partners LP
4.25% due 9/1/2024 | | | 643,000 | | | | 630,275 | |
| | | |
NGPL PipeCo LLC
3.25% due 7/15/2031(4) | | | 314,000 | | | | 259,075 | |
| | | |
Sabine Pass Liquefaction LLC
5.625% due 3/1/2025 | | | 696,000 | | | | 693,675 | |
| | | |
Venture Global LNG, Inc.
8.375% due 6/1/2031(4) | | | 242,000 | | | | 244,350 | |
| | | | | | | | | |
| | | |
| | | | | | | | 4,066,656 | |
| Real Estate Investment Trusts (REITs) – 1.7% | |
| | | |
American Tower Corp.
2.40% due 3/15/2025 | | | 448,000 | | | | 422,352 | |
2.95% due 1/15/2025 | | | 235,000 | | | | 224,770 | |
3.80% due 8/15/2029 | | | 800,000 | | | | 731,328 | |
5.55% due 7/15/2033 | | | 299,000 | | | | 301,153 | |
| | | |
Crown Castle, Inc.
2.10% due 4/1/2031 | | | 600,000 | | | | 480,084 | |
3.30% due 7/1/2030 | | | 800,000 | | | | 708,368 | |
| | | |
EPR Properties
4.95% due 4/15/2028 | | | 414,000 | | | | 370,249 | |
| | | |
Trust Fibra Uno
4.869% due 1/15/2030(4) | | | 290,000 | | | | 255,110 | |
| | | |
VICI Properties LP / VICI Note Co., Inc.
5.625% due 5/1/2024(4) | | | 474,000 | | | | 471,279 | |
| | | | | | | | | |
| | | |
| | | | | | | | 3,964,693 | |
| Retail – 0.5% | |
| | | |
Bayer Corp.
6.65% due 2/15/2028(4) | | | 343,000 | | | | 359,495 | |
| | | |
Evergreen Acqco 1 LP / TVI, Inc.
9.75% due 4/26/2028(4) | | | 244,000 | | | | 254,129 | |
| | | |
Macy’s Retail Holdings LLC
5.875% due 4/1/2029(4) | | | 278,000 | | | | 253,786 | |
| | | |
SRS Distribution, Inc.
4.625% due 7/1/2028(4) | | | 278,000 | | | | 249,149 | |
| | | | | | | | | |
| | | |
| | | | | | | | 1,116,559 | |
| Semiconductors – 0.3% | |
| | | |
Broadcom, Inc.
4.15% due 4/15/2032(4) | | | 427,000 | | | | 386,653 | |
| | | |
Entegris, Inc.
3.625% due 5/1/2029(4) | | | 307,000 | | | | 264,566 | |
| | | | | | | | | |
| | | |
| | | | | | | | 651,219 | |
| Software – 0.9% | |
| | | |
Cloud Software Group, Inc.
6.50% due 3/31/2029(4) | | | 302,000 | | | | 268,448 | |
| | | | | | | | | |
| | | | | | | | |
| June 30, 2023 (unaudited) | | Principal
Amount | | |
Value | |
| Software (continued) | |
| | | |
Oracle Corp.
2.875% due 3/25/2031 | | $ | 915,000 | | | $ | 779,818 | |
6.25% due 11/9/2032 | | | 500,000 | | | | 530,475 | |
| | | |
Workday, Inc.
3.80% due 4/1/2032 | | | 593,000 | | | | 533,623 | |
| | | | | | | | | |
| | | |
| | | | | | | | 2,112,364 | |
| Telecommunications – 1.5% | |
| | | |
AT&T, Inc.
4.30% due 2/15/2030 | | | 461,000 | | | | 437,724 | |
| | | |
Frontier Communications Holdings LLC
5.00% due 5/1/2028(4) | | | 575,000 | | | | 496,087 | |
| | | |
Sprint Capital Corp.
6.875% due 11/15/2028 | | | 689,000 | | | | 730,581 | |
8.75% due 3/15/2032 | | | 212,000 | | | | 256,236 | |
| | | |
T-Mobile USA, Inc.
3.50% due 4/15/2025 | | | 391,000 | | | | 376,216 | |
3.875% due 4/15/2030 | | | 1,500,000 | | | | 1,382,715 | |
| | | | | | | | | |
| | | |
| | | | | | | | 3,679,559 | |
| Trucking & Leasing – 0.2% | |
| | | |
Fortress Transportation and Infrastructure Investors LLC
5.50% due 5/1/2028(4) | | | 541,000 | | | | 496,275 | |
| | | | | | | | | |
| | | |
| | | | | | | | 496,275 | |
| | |
Total Corporate Bonds & Notes
(Cost $125,365,671) | | | | 118,947,909 | |
| Municipals – 0.1% | |
| | | |
New York City Transitional Finance Authority Future Tax Secured Revenue B-3
1.95% due 8/1/2034 | | | 330,000 | | | | 246,174 | |
| | | | | | | | | |
| | |
Total Municipals
(Cost $331,435) | | | | 246,174 | |
| Non–Agency Mortgage–Backed Securities–8.1% | |
| | | |
Angel Oak Mortgage Trust
2020-1 A1
2.466% due 12/25/2059(1)(2)(4) | | | 33,204 | | | | 30,721 | |
| | | |
BAMLL Commercial Mortgage Securities Trust
2013-WBRK A
3.652% due 3/10/2037(1)(2)(4) | | | 1,400,000 | | | | 1,256,853 | |
| | | |
BANK
2021-BNK35 A5
2.285% due 6/15/2064 | | | 259,000 | | | | 207,879 | |
2022-BNK44 A5
5.937% due 11/15/2055(1)(2) | | | 220,000 | | | | 227,763 | |
| | | |
BBCMS Mortgage Trust
2019-BWAY A
6.218% due 11/15/2034(1)(2)(4) | | | 365,000 | | | | 303,633 | |
2019-BWAY B
6.572% due 11/15/2034(1)(2)(4) | | | 160,000 | | | | 128,696 | |
| | | |
BMO Mortgage Trust
2023-C5 A4
5.494% due 6/15/2056 | | | 460,000 | | | | 464,600 | |
| | | | | | | | | |
| | | | |
| The accompanying notes are an integral part of these financial statements. | | | | 11 |
SCHEDULE OF INVESTMENTS — GUARDIAN CORE PLUS FIXED INCOME VIP FUND
| | | | | | | | |
| June 30, 2023 (unaudited) | | Principal
Amount | | |
Value | |
| Non–Agency Mortgage–Backed Securities (continued) | |
| | | |
BRAVO Residential Funding Trust
2021-NQM2 A1
0.97% due 3/25/2060(1)(2)(4) | | $ | 709,689 | | | $ | 654,609 | |
| | | |
BX Commercial Mortgage Trust
2021-XL2 A
5.882% due 10/15/2038(1)(2)(4) | | | 212,218 | | | | 205,772 | |
| | | |
CIM Trust
2021-J3 A1
2.50% due 6/25/2051(1)(2)(4) | | | 901,887 | | | | 725,167 | |
| | | |
Commercial Mortgage Trust
2014-CR17 AM
4.174% due 5/10/2047 | | | 620,000 | | | | 599,541 | |
2015-LC21 AM
4.043% due 7/10/2048(1)(2) | | | 522,000 | | | | 491,219 | |
2015-PC1 C
4.433% due 7/10/2050(1)(2) | | | 375,000 | | | | 326,881 | |
| | | |
Connecticut Avenue Securities Trust
2021-R01 1M2
6.617% due 10/25/2041(1)(2)(4) | | | 430,000 | | | | 421,061 | |
2023-R02 1M1
7.367% due 1/25/2043(1)(2)(4) | | | 502,158 | | | | 503,577 | |
2023-R05 1M2
8.167% due 6/25/2043(1)(2)(4) | | | 300,000 | | | | 300,898 | |
| | | |
Credit Suisse Mortgage Capital Certificates
2020-SPT1 A1
1.616% due 4/25/2065(1)(2)(4) | | | 34,758 | | | | 33,868 | |
| | | |
Deephaven Residential Mortgage Trust
2021-3 A1
1.194% due 8/25/2066(1)(2)(4) | | | 167,339 | | | | 138,073 | |
| | | |
EQUS Mortgage Trust
2021-EQAZ A
5.948% due 10/15/2038(1)(2)(4) | | | 237,995 | | | | 231,166 | |
| | | |
Fannie Mae Connecticut Avenue Securities
2021-R02 2M2
7.067% due 11/25/2041(1)(2)(4) | | | 420,000 | | | | 408,912 | |
| | | |
Flagstar Mortgage Trust
2021-3INV A2
2.50% due 6/25/2051(1)(2)(4) | | | 616,450 | | | | 495,709 | |
2021-7 A1
2.50% due 8/25/2051(1)(2)(4) | | | 579,117 | | | | 465,459 | |
| | | |
Freddie Mac STACR REMIC Trust 2021-DNA3 M2
7.167% due 10/25/2033(1)(2)(4) | | | 655,000 | | | | 641,105 | |
2021-DNA6 M2
6.567% due 10/25/2041(1)(2)(4) | | | 739,000 | | | | 719,874 | |
2021-DNA7 M2
6.867% due 11/25/2041(1)(2)(4) | | | 540,000 | | | | 520,092 | |
2021-HQA4 M1
6.017% due 12/25/2041(1)(2)(4) | | | 573,117 | | | | 555,824 | |
2022-HQA3 M1A
7.367% due 8/25/2042(1)(2)(4) | | | 224,031 | | | | 225,378 | |
| | | |
Freddie Mac Structured Agency Credit Risk Debt Notes
2023-DNA2 M1A
7.167% due 4/25/2043(1)(2)(4) | | | 574,127 | | | | 575,801 | |
| | | | | | | | | |
| | | | | | | | |
| June 30, 2023 (unaudited) | | Principal
Amount | | |
Value | |
| Non–Agency Mortgage–Backed Securities (continued) | |
| | | |
GCAT Trust
20203-NQM1 A1
4.25% due 10/25/2057(1)(2)(4) | | $ | 1,005,103 | | | $ | 924,144 | |
| | | |
GS Mortgage Securities Corp. Trust
2018-RIVR A
6.143% due 7/15/2035(1)(2)(4) | | | 437,247 | | | | 341,919 | |
2021-ROSS G
9.844% due 5/15/2026(1)(2)(4) | | | 660,000 | | | | 451,913 | |
2022-ECI A
7.342% due 8/15/2039(1)(2)(4) | | | 370,000 | | | | 370,294 | |
| | | |
GS Mortgage-Backed Securities Trust
2021-PJ2 A2
2.50% due 7/25/2051(1)(2)(4) | | | 480,178 | | | | 387,609 | |
2021-PJ8 A2
2.50% due 1/25/2052(1)(2)(4) | | | 650,263 | | | | 522,440 | |
2023-PJ1 A4
3.50% due 2/25/2053(1)(2)(4) | | | 519,637 | | | | 455,738 | |
| | | |
JP Morgan Chase Commercial Mortgage Securities Trust 2018-MINN A
6.463% due 11/15/2035(1)(2)(4) | | | 339,000 | | | | 333,844 | |
2020-MKST E
7.693% due 12/15/2036(1)(2)(4) | | | 570,000 | | | | 330,907 | |
| | | |
JP Morgan Mortgage Trust 2013-13 A3
2.50% due 4/25/2052(1)(2)(4) | | | 505,799 | | | | 406,411 | |
2021-INV8 A2
3.00% due 5/25/2052(1)(2)(4) | | | 475,362 | | | | 398,729 | |
| | | |
JPMBB Commercial Mortgage Securities Trust
2015-C30 C
4.368% due 7/15/2048(1)(2) | | | 340,000 | | | | 289,650 | |
| | | |
Ready Capital Mortgage Financing LLC
2022-FL8 A
6.717% due 1/25/2037(1)(2)(4) | | | 1,011,901 | | | | 996,777 | |
| | | |
Starwood Mortgage Residential Trust
2020-3 A1
1.486% due 4/25/2065(1)(2)(4) | | | 184,615 | | | | 169,195 | |
| | | |
Verus Securitization Trust 2020-1 A1
2.417% due 1/25/2060(1)(2)(4) | | | 61,729 | | | | 57,768 | |
2020-5 A1
1.218% due 5/25/2065(1)(2)(4) | | | 244,888 | | | | 222,966 | |
| | | |
Vista Point Securitization Trust
2020-2 A1
1.475% due 4/25/2065(1)(2)(4) | | | 128,609 | | | | 116,005 | |
| | | |
Wells Fargo Mortgage Backed Securities Trust
2021-INV2 A2
2.50% due 9/25/2051(1)(2)(4) | | | 425,917 | | | | 342,617 | |
| | | |
WFLD Mortgage Trust
2014-MONT A
3.88% due 8/10/2031(1)(2)(4) | | | 300,000 | | | | 251,579 | |
| | | | | | | | | |
| | |
Total Non–Agency Mortgage–Backed Securities
(Cost $20,609,782) | | | | 19,230,636 | |
| | | | |
| 12 | | | | The accompanying notes are an integral part of these financial statements. |
SCHEDULE OF INVESTMENTS — GUARDIAN CORE PLUS FIXED INCOME VIP FUND
| | | | | | | | |
| June 30, 2023 (unaudited) | | Principal
Amount | | |
Value | |
| Foreign Government – 3.9% | | | | | | | | |
| | | |
Bahrain Government International Bond
6.75% due 9/20/2029(4) | | USD | 240,000 | | | $ | 237,926 | |
| | | |
Costa Rica Government International Bond
6.55% due 4/3/2034(4) | | USD | 510,000 | | | | 511,969 | |
| | | |
Kommunalbanken A/S
1.125% due 10/26/2026 | | USD | 1,374,000 | | | | 1,225,168 | |
| | | |
Mexico Government International Bond
4.875% due 5/19/2033 | | USD | 670,000 | | | | 640,312 | |
| | | |
Panama Government International Bond
2.252% due 9/29/2032 | | USD | 833,000 | | | | 636,395 | |
| | | |
Province of Quebec Canada
3.625% due 4/13/2028 | | | USD 3,002,000 | | | | 2,895,009 | |
| | | |
Republic of South Africa Government International Bond
5.875% due 4/20/2032 | | USD | 275,000 | | | | 243,796 | |
| | | |
Senegal Government International Bond
6.25% due 5/23/2033(4) | | USD | 290,000 | | | | 242,901 | |
| | | |
Svensk Exportkredit AB
4.125% due 6/14/2028 | | USD | 2,447,000 | | | | 2,416,315 | |
| | | |
Turkey Government International Bond
4.25% due 4/14/2026 | | USD | 270,000 | | | | 241,086 | |
| | | | | | | | | |
| | |
Total Foreign Government
(Cost $9,461,125) | | | | 9,290,877 | |
| U.S. Government Securities – 7.5% | | | | | |
| | | |
U.S. Treasury Bond | | | | | | | | |
1.625% due 11/15/2050 | | $ | 1,740,000 | | | | 1,081,247 | |
2.25% due 5/15/2041 | | | 962,000 | | | | 741,041 | |
3.625% due 5/15/2053 | | | 3,036,000 | | | | 2,919,304 | |
3.875% due 5/15/2043 | | | 6,312,000 | | | | 6,160,117 | |
| | | | | | | | | |
| | | | | | | | |
| June 30, 2023 (unaudited) | | Principal
Amount | | |
Value | |
| | | |
U.S. Treasury Inflation-Indexed Bond
1.50% due 2/15/2053 | | | 2,670,334 | | | | 2,602,051 | |
| | | |
U.S. Treasury Note | | | | | | | | |
3.375% due 5/15/2033 | | | 894,000 | | | | 862,291 | |
3.875% due 4/30/2025 | | | 1,355,000 | | | | 1,328,694 | |
4.00% due 6/30/2028 | | | 2,290,000 | | | | 2,277,476 | |
| | | | | | | | | |
| | |
Total U.S. Government Securities
(Cost $18,062,060) | | | | 17,972,221 | |
| Repurchase Agreements – 1.1% | | | | | |
| | | |
Fixed Income Clearing Corp., 1.52%, dated 6/30/2023, proceeds at maturity value of $2,734,152, due 7/3/2023(7) | | $ | 2,733,806 | | | $ | 2,733,806 | |
| | | | | | | | | |
| | |
Total Repurchase Agreements
(Cost $2,733,806) | | | | 2,733,806 | |
| | |
Total Investments – 114.1%
(Cost $283,852,986) | | | | 272,584,279 | |
| | |
| Liabilities in excess of other assets – (14.1)% | | | | (33,604,972 | ) |
| | |
| Total Net Assets – 100.0% | | | $ | 238,979,307 | |
| (1) | Variable rate securities, which may include step-up bonds or adjustable rate mortgages. The rate shown is the rate in effect at June 30, 2023. |
| (2) | Variable coupon rate based on weighted average interest rate of underlying mortgages. |
| (3) | TBA — To be announced. |
| (4) | Securities that may be resold in transactions exempt from registration under Rule 144A of the Securities Act of 1933, as amended, normally to certain qualified buyers. At June 30, 2023, the aggregate market value of these securities amounted to $94,092,285, representing 39.4% of net assets. These securities have been deemed liquid by the investment adviser pursuant to the Fund’s liquidity procedures approved by the Board of Trustees. |
| (5) | The London Interbank Offered Rate (“LIBOR”) is being phased out completely by June 30, 2023. There remains uncertainty regarding the nature of any replacement rate and the impact of a transition away from LIBOR on the Fund’s investments. |
| (6) | The table below presents securities deemed illiquid by the investment adviser. |
| | | | | | | | | | | | | | | | | | | | |
Security | | Shares | | |
Cost | | |
Value | | | Acquisition
Date | | | % of Fund’s
Net Assets | |
| British Airways Pass-Through Trust 2020-1 A | | | 544,644 | | | $ | 573,680 | | | $ | 498,180 | | |
| 11/17/20 –
1/26/22 |
| | | 0.21% | |
| (7) | The table below presents collateral for repurchase agreements. |
| | | | | | | | | | | | | | | | |
Security | |
Coupon | | | Maturity
Date | | | Principal
Amount | | |
Value | |
| U.S. Treasury Note | | | 4.625% | | | | 3/15/2026 | | | $ | 2,747,900 | | | $ | 2,788,502 | |
| | | | |
| The accompanying notes are an integral part of these financial statements. | | | | 13 |
SCHEDULE OF INVESTMENTS — GUARDIAN CORE PLUS FIXED INCOME VIP FUND
Open futures contracts at June 30, 2023:
| | | | | | | | | | | | | | | | | | | | | | | | |
Type | |
Expiration | | |
Contracts | | |
Position | | |
Notional
Amount | | |
Notional
Value | | | Unrealized
Appreciation/
(Depreciation) | |
| U.S. 2-Year Treasury Note | | | September 2023 | | | | 147 | | | | Long | | | $ | 30,129,529 | | | $ | 29,891,531 | | | $ | (237,998 | ) |
| U.S. 10-Year Treasury Note | | | September 2023 | | | | 70 | | | | Long | | | | 7,989,616 | | | | 7,858,594 | | | | (131,022 | ) |
| U.S. Long Bond | | | September 2023 | | | | 137 | | | | Long | | | | 17,422,418 | | | | 17,386,156 | | | | (36,262 | ) |
| U.S. Ultra Bond | | | September 2023 | | | | 89 | | | | Long | | | | 12,003,785 | | | | 12,123,469 | | | | 119,684 | |
| Total | | | $ | 67,545,348 | | | $ | 67,259,750 | | | $ | (285,598 | ) |
| | | | | | | | | | | | | | | | | | | | | | | | | |
Type | |
Expiration | | |
Contracts | | |
Position | | | Notional
Amount | | | Notional
Value | | | Unrealized
Appreciation | |
| U.S. 5-Year Treasury Note | | | September 2023 | | | | 196 | | | | Short | | | $ | (21,190,578 | ) | | $ | (20,990,375 | ) | | $ | 200,203 | |
| U.S. Ultra 10-Year Treasury Note | | | September 2023 | | | | 199 | | | | Short | | | | (23,803,441 | ) | | | (23,569,062 | ) | | | 234,379 | |
| Total | | | $ | (44,994,019 | ) | | $ | (44,559,437 | ) | | $ | 434,582 | |
Legend:
CLO — Collateralized Loan Obligation
CMT — Constant Maturity Treasury
LIBOR — London Interbank Offered Rate
SOFR — Secured Overnight Financing Rate
USD — United States Dollar
The following is a summary of the inputs used as of June 30, 2023 in valuing the Fund’s investments. For more information on valuation inputs, please refer to Note 2a of the accompanying Notes to Financial Statements.
| | | | | | | | | | | | | | | | |
| | | Valuation Inputs | | | | |
| Investments in Securities (unaudited) | | Level 1 | | | Level 2 | | | Level 3 | | | Total | |
| Agency Mortgage–Backed Securities | | $ | — | | | $ | 64,478,926 | | | $ | — | | | $ | 64,478,926 | |
| Asset–Backed Securities | | | — | | | | 39,683,730 | | | | — | | | | 39,683,730 | |
| Corporate Bonds & Notes | | | — | | | | 118,947,909 | | | | — | | | | 118,947,909 | |
| Municipals | | | — | | | | 246,174 | | | | — | | | | 246,174 | |
| Non–Agency Mortgage–Backed Securities | | | — | | | | 19,230,636 | | | | — | | | | 19,230,636 | |
| Foreign Government | | | — | | | | 9,290,877 | | | | — | | | | 9,290,877 | |
| U.S. Government Securities | | | — | | | | 17,972,221 | | | | — | | | | 17,972,221 | |
| Repurchase Agreements | | | — | | | | 2,733,806 | | | | — | | | | 2,733,806 | |
| Total | | $ | — | | | $ | 272,584,279 | | | $ | — | | | $ | 272,584,279 | |
| Other Financial Instruments | | | | | | | | | | | | |
| Futures Contracts | | | | | | | | | | | | | | | | |
Assets | | $ | 554,266 | | | $ | — | | | $ | — | | | $ | 554,266 | |
Liabilities | | | (405,282 | ) | | | — | | | | — | | | | (405,282 | ) |
| Total | | $ | 148,984 | | | $ | — | | | $ | — | | | $ | 148,984 | |
| | | | |
| 14 | | | | The accompanying notes are an integral part of these financial statements. |
FINANCIAL INFORMATION — GUARDIAN CORE PLUS FIXED INCOME VIP FUND
| | | | |
Statement of Assets and Liabilities As of June 30, 2023 (unaudited) | | | |
Assets | | | | |
| | |
Investments, at value | | $ | 272,584,279 | |
| | |
Cash | | | 89,920 | |
| | |
Receivable for investments sold | | | 53,448,156 | |
| | |
Interest receivable | | | 2,042,813 | |
| | |
Cash deposits with brokers for futures contracts | | | 890,562 | |
| | |
Receivable for variation margin on futures contracts | | | 167,492 | |
| | |
Reimbursement receivable from adviser | | | 5,496 | |
| | |
Prepaid expenses | | | 2,845 | |
| | | | | |
| | |
Total Assets | | | 329,231,563 | |
| | | | | |
| | |
Liabilities | | | | |
| | |
Payable for investments purchased | | | 89,980,507 | |
| | |
Investment advisory fees payable | | | 89,314 | |
| | |
Distribution fees payable | | | 49,619 | |
| | |
Payable for fund shares redeemed | | | 46,188 | |
| | |
Accrued custodian and accounting fees | | | 29,026 | |
| | |
Accrued audit fees | | | 17,132 | |
| | |
Accrued trustees’ and officers’ fees | | | 5,105 | |
| | |
Accrued expenses and other liabilities | | | 35,365 | |
| | | | | |
| | |
Total Liabilities | | | 90,252,256 | |
| | | | | |
| | |
Total Net Assets | | $ | 238,979,307 | |
| | | | | |
| | |
Net Assets Consist of: | | | | |
| | |
Paid-in capital | | $ | 227,644,496 | |
| | |
Distributable earnings | | | 11,334,811 | |
| | | | | |
| | |
Total Net Assets | | $ | 238,979,307 | |
| | | | | |
Investments, at Cost | | $ | 283,852,986 | |
| | | | | |
| | |
Pricing of Shares | | | | |
| | |
Shares of Beneficial Interest Outstanding with
No Par Value | | | 23,579,117 | |
| | |
Net Asset Value Per Share | | | $10.14 | |
| | | | | |
| | | | |
Statement of Operations For the Six Months Ended June 30, 2023 (unaudited) | | | |
Investment Income | | | | |
| | |
Interest | | $ | 5,741,728 | |
| | | | | |
| | |
Total Investment Income | | | 5,741,728 | |
| | | | | |
| | |
Expenses | | | | |
| | |
Investment advisory fees | | | 562,186 | |
| | |
Distribution fees | | | 312,326 | |
| | |
Custodian and accounting fees | | | 49,445 | |
| | |
Professional fees | | | 40,675 | |
| | |
Trustees’ and officers’ fees | | | 32,010 | |
| | |
Administrative fees | | | 21,619 | |
| | |
Transfer agent fees | | | 7,173 | |
| | |
Shareholder reports | | | 6,521 | |
| | |
Other expenses | | | 6,999 | |
| | | | | |
| | |
Total Expenses | | | 1,038,954 | |
| | |
Less: Fees waived | | | (27,019 | ) |
| | | | | |
| | |
Total Expenses, Net | | | 1,011,935 | |
| | | | | |
| | |
Net Investment Income/(Loss) | | | 4,729,793 | |
| | | | | |
| | |
Realized Gain/(Loss) and Change in Unrealized Appreciation/(Depreciation) on Investments and Derivative Contracts | | | | |
| | |
Net realized gain/(loss) from investments | | | (4,036,973 | ) |
| | |
Net realized gain/(loss) from futures contracts | | | (724,829 | ) |
| | |
Net change in unrealized appreciation/(depreciation) on investments | | | 4,478,778 | |
| | |
Net change in unrealized appreciation/(depreciation) on futures contracts | | | 729,022 | |
| | | | | |
| | |
Net Gain on Investments and Derivative Contracts | | | 445,998 | |
| | | | | |
| | |
Net Increase in Net Assets Resulting From Operations | | $ | 5,175,791 | |
| | | | | |
| | | | | |
| | | | |
| The accompanying notes are an integral part of these financial statements. | | | | 15 |
FINANCIAL INFORMATION — GUARDIAN CORE PLUS FIXED INCOME VIP FUND
| | | | | | | | |
Statements of Changes in Net Assets Six Months Ended Numbers are unaudited | | | | | | |
| | | |
| | | For the
Six Months Ended 6/30/23 | | | For the
Year Ended 12/31/22 | |
| | | | | | | |
Operations | | | | | | | | |
| | | |
Net investment income/(loss) | | $ | 4,729,793 | | | $ | 7,032,281 | |
| | | |
Net realized gain/(loss) from investments and derivative contracts | | | (4,761,802 | ) | | | (35,072,103 | ) |
| | | |
Net change in unrealized appreciation/(depreciation) on investments and derivative contracts | | | 5,207,800 | | | | (18,037,992 | ) |
| | | | | | | | | |
| | | |
Net Increase/(Decrease) in Net Assets Resulting from Operations | | | 5,175,791 | | | | (46,077,814 | ) |
| | | | | | | | | |
| | | |
Capital Share Transactions | | | | | | | | |
| | | |
Proceeds from sales of shares | | | 7,575,403 | | | | 4,039,995 | |
| | | |
Cost of shares redeemed | | | (26,904,881 | ) | | | (50,161,423 | ) |
| | | | | | | | | |
| | | |
Net Decrease in Net Assets Resulting from Capital Share Transactions | | | (19,329,478 | ) | | | (46,121,428 | ) |
| | | | | | | | | |
| | | |
Net Decrease in Net Assets | | | (14,153,687 | ) | | | (92,199,242 | ) |
| | | | | | | | | |
| | | |
Net Assets | | | | | | | | |
| | | |
Beginning of period | | | 253,132,994 | | | | 345,332,236 | |
| | | | | | | | | |
| | | |
End of period | | $ | 238,979,307 | | | $ | 253,132,994 | |
| | | | | | | | | |
| | | |
Other Information: | | | | | | | | |
| | | |
Shares | | | | | | | | |
| | | |
Sold | | | 739,217 | | | | 407,441 | |
| | | |
Redeemed | | | (2,645,977 | ) | | | (4,754,295 | ) |
| | | | | | | | | |
| | | |
Net Decrease | | | (1,906,760 | ) | | | (4,346,854 | ) |
| | | | | | | | | |
| | | | | | | | | |
| | | | |
| 16 | | | | The accompanying notes are an integral part of these financial statements. |
This Page Intentionally Left Blank
FINANCIAL INFORMATION — GUARDIAN CORE PLUS FIXED INCOME VIP FUND
The Financial Highlights table is intended to help you understand the Fund’s financial performance for the past six reporting periods (or, if shorter, the period since inception). Certain information reflects financial results for a single Fund share. The total returns in the table represent the rate that an investor would have earned (or lost) on an investment in the Fund.
| | | | | | | | | | | | | | | | | | | | | | | | |
Financial Highlights Six Months Ended Numbers are unaudited | | | | | | | | | | | | | | | | |
| | | Per Share Operating Performance | | | | |
| | | Net Asset Value, Beginning of Period | | | Net Investment Income(1) | | | Net Realized and Unrealized Gain/(Loss) | | | Total Operations | | | Net Asset Value, End of Period | | | Total Return(2) | |
| | | | | | | |
Six Months Ended 6/30/23 | | $ | 9.93 | | | $ | 0.19 | | | $ | 0.02 | | | $ | 0.21 | | | $ | 10.14 | | | | 2.11% | (4) |
| | | | | | | |
Year Ended 12/31/22 | | | 11.58 | | | | 0.26 | | | | (1.91 | ) | | | (1.65 | ) | | | 9.93 | | | | (14.25)% | |
| | | | | | | |
Year Ended 12/31/21 | | | 11.58 | | | | 0.16 | | | | (0.16 | ) | | | 0.00 | | | | 11.58 | | | | 0.00% | |
| | | | | | | |
Year Ended 12/31/20 | | | 10.78 | | | | 0.24 | | | | 0.56 | | | | 0.80 | | | | 11.58 | | | | 7.42% | |
| | | | | | | |
Year Ended 12/31/19 | | | 9.95 | | | | 0.26 | | | | 0.57 | | | | 0.83 | | | | 10.78 | | | | 8.34% | |
| | | | | | | |
Year Ended 12/31/18 | | | 10.08 | | | | 0.26 | | | | (0.39 | ) | | | (0.13 | ) | | | 9.95 | | | | (1.29)% | |
| | | | |
| 18 | | | | The accompanying notes are an integral part of these financial statements. |
FINANCIAL INFORMATION — GUARDIAN CORE PLUS FIXED INCOME VIP FUND
| | | | | | | | | | | | | | | | | | | | | | |
| |
| Ratios/Supplemental Data | |
Net Assets, End of Period (000s) | | | Net Ratio of Expenses to Average Net Assets(3) | | | Gross Ratio of Expenses to Average Net Assets | | | Net Ratio of Net Investment Income to Average Net Assets(3) | | | Gross Ratio of Net Investment Income to Average Net Assets | | | Portfolio Turnover Rate | |
| | | | | |
| $ | 238,979 | | | | 0.81% | (4) | | | 0.83% | (4) | | | 3.79% | (4) | | | 3.77% | (4) | | | 75% | (4) |
| | | | | |
| | 253,133 | | | | 0.81% | | | | 0.81% | | | | 2.46% | | | | 2.46% | | | | 198% | |
| | | | | |
| | 345,332 | | | | 0.80% | | | | 0.80% | | | | 1.42% | | | | 1.42% | | | | 181% | |
| | | | | |
| | 341,827 | | | | 0.80% | | | | 0.83% | | | | 2.12% | | | | 2.09% | | | | 183% | |
| | | | | |
| | 350,049 | | | | 0.79% | | | | 0.84% | | | | 2.53% | | | | 2.48% | | | | 211% | |
| | | | | |
| | 355,070 | | | | 0.79% | | | | 0.87% | | | | 2.60% | | | | 2.52% | | | | 543% | |
| (1) | Calculated based on the average shares outstanding during the period. |
| (2) | Total returns do not reflect the effects of charges deducted pursuant to the terms of The Guardian Insurance & Annuity Company, Inc.’s variable contracts. Inclusion of such charges would reduce the total returns for all periods shown. |
| (3) | Net Ratio of Expenses to Average Net Assets and Net Ratio of Net Investment Income to Average Net Assets include the effect of fee waivers and expense limitations. |
| (4) | Ratios for periods less than one year have been annualized, except for total return and portfolio turnover rate. |
| | | | |
| The accompanying notes are an integral part of these financial statements. | | | | 19 |
NOTES TO FINANCIAL STATEMENTS — GUARDIAN CORE PLUS FIXED INCOME VIP FUND
June 30, 2023 (unaudited)
1. Organization
Guardian Variable Products Trust (the “Trust”), a Delaware statutory trust organized on January 12, 2016, is registered under the Investment Company Act of 1940, as amended (the “1940 Act”), as an open-end management investment company. The Trust currently has twenty-four series. Guardian Core Plus Fixed Income VIP Fund (the “Fund”) is a series of the Trust. The Fund is a diversified fund and commenced operations on September 1, 2016. The financial statements for other series of the Trust are presented in separate reports.
The Trust has authorized an unlimited number of shares of beneficial interest with no par value. Shares are bought and sold at closing net asset value (“NAV”). Shares of the Fund are only sold to certain separate accounts of The Guardian Insurance & Annuity Company, Inc. (“GIAC”) that fund certain variable annuity contracts and variable life insurance policies issued by GIAC. GIAC is a wholly-owned subsidiary of The Guardian Life Insurance Company of America (“Guardian Life”).
The Fund seeks income and capital appreciation to produce a high total return.
2. Significant Accounting Policies
The following is a summary of significant accounting policies followed by the Fund in the preparation of its financial statements. The Fund follows the investment company accounting and reporting guidance of the Financial Accounting Standards Board (“FASB”) Accounting Standards Codification Topic 946 Financial Services – Investment Companies. The following policies are in conformity with accounting principles generally accepted in the United States of America (“GAAP”). The preparation of financial statements in accordance with GAAP requires management to make estimates and assumptions that affect the reported amounts and disclosures in the financial statements. Actual results could differ from those estimates.
a. Investment Valuations The Board of Trustees has designated Park Avenue Institutional Advisers LLC (“Park Avenue”) as the valuation designee for the Fund pursuant to Rule 2a-5 under the 1940 Act. Park Avenue has established a Fair Valuation Committee and has adopted fair valuation procedures that provide methodologies for fair valuing securities. These procedures include monitoring the appropriateness of fair values based on results of ongoing valuation
oversight, including but not limited to consideration of security specific events, market events, and pricing vendor and broker-dealer due diligence. The Fair Valuation Committee oversees and carries out the policies for the valuation of investments held in the Fund. The Fair Valuation Committee is responsible for discussing and assessing the potential impacts to the fair values on an ongoing basis, and reports to the Board of Trustees on at least a quarterly basis.
The valuations of debt securities for which quoted bid prices are readily available are valued at the bid price by independent pricing services (each, a “Service”). Debt securities for which quoted bid prices are not readily available are valued by a Service at the evaluated bid price provided by the Service or the bid price provided by an independent broker-dealer or at a calculated price based on the spread to an appropriate benchmark provided by such broker-dealer.
Equity securities traded on an exchange other than NASDAQ Stock Market, LLC (“NASDAQ”) are valued at the last reported sale price on the principal exchange or market on which they are traded; or, if there were no sales that day, at the mean between the closing bid and ask prices. Securities traded on the NASDAQ are generally valued at the NASDAQ official closing price, which may not be the last sale price. If the NASDAQ official closing price is not available for a security, that security is generally valued at the mean between the closing bid and ask prices. Repurchase agreements are carried at cost, which approximates fair value (see Note 5c). Foreign securities are valued in the currencies of the markets in which they trade and then converted to U.S. dollars by the application of foreign exchange rates at the close of the New York Stock Exchange (“NYSE”).
Exchange-traded financial futures contracts are valued at the last settlement price on the market where they are primarily traded.
Securities for which market quotations are not readily available or securities whose values have been materially affected by events occurring before the Fund’s valuation time but after the close of the securities’ principal exchange or market are valued at their fair values as determined in good faith by Park Avenue, as the Board of Trustee’s valuation designee (as defined in Rule 2a-5 under the 1940 Act), in accordance with Park Avenue’s procedures and under the general oversight of the Board of Trustees. Valuations reflected in this report are as of the report date. As a result, changes in valuation due to market events and/or issuer related events after the report date and prior to issuance of the report are not reflected herein.
NOTES TO FINANCIAL STATEMENTS — GUARDIAN CORE PLUS FIXED INCOME VIP FUND
Various inputs are used in determining the valuation of the Fund’s investments. These inputs are summarized in three broad levels listed below.
| • | | Level 1 – unadjusted inputs using quoted prices in active markets for identical investments. |
| • | | Level 2 – other significant observable inputs, including, but not limited to, quoted prices for similar investments, inputs other than quoted prices that are observable for investments (such as interest rates, prepayment speeds, credit risks, etc.) or other market corroborated inputs. |
| • | | Level 3 – significant unobservable inputs (including the Fund’s own assumptions in determining the fair value of investments). |
Inputs may include price information, volatility statistics, specific and broad credit data, liquidity statistics, and other factors. A financial instrument’s level within the fair value hierarchy is based on the lowest level of any input; both individually and in aggregate, that is significant to the fair value measurement. However, the determination of what constitutes “observable” requires significant judgment by the Trust. The Trust considers observable data to be that market data which is readily available, regularly distributed or updated, reliable and verifiable, and provided by independent sources that are actively involved in the relevant market. The inputs or methodology used for valuing securities are not necessarily an indication of the risk associated with investing in those securities. Changes in valuation techniques may result in transfers into or out of a financial instrument’s assigned level within the hierarchy.
The FASB requires reporting entities to make disclosures about purchases, sales, issuances and settlements of Level 3 securities on a gross basis. For the six months ended June 30, 2023, there were no transfers into or out of Level 3 of the fair value hierarchy.
In determining a financial instrument’s placement within the hierarchy, the Trust separates the Fund’s investment portfolio into two categories: investments and derivatives (e.g., futures). A summary of inputs used to value the Fund’s assets and liabilities carried at fair value as of June 30, 2023 is included in the Schedule of Investments.
Investments Investments whose values are based on quoted market prices in active markets, and are therefore classified within Level 1, include active listed equities. Investments that trade in markets that are not considered to be active, but are valued based on quoted market prices, dealer quotations or alternative pricing
sources supported by observable inputs are classified within Level 2. These include certain U.S. government and sovereign obligations, most government agency securities, investment-grade corporate bonds, certain mortgage products, state, municipal and provincial obligations, and certain foreign equity securities, including securities whose prices may have been affected by events occurring after the close of trading on their principal exchange or market and, as a result, whose values are determined by a pricing service as described above, or securities whose values are otherwise determined using fair valuation methods approved by the Fund’s Board of Trustees.
Investments classified within Level 3 have significant unobservable inputs, as they trade infrequently or not at all. Level 3 investments include, among others, private placement securities. When observable prices are not available for these securities, the Trust uses one or more valuation techniques for which sufficient and reliable data is available. The inputs used by the Trust in estimating the value of Level 3 investments include, for example, the original transaction price, recent transactions in the same or similar instruments, completed or pending third-party transactions in the underlying investment or comparable issuers, subsequent rounds of financing, recapitalizations, and other transactions across the capital structure. Level 3 investments may also be adjusted to reflect illiquidity and/or non-transferability, with the amount of such discount estimated by the Trust in the absence of market information. Assumptions used by the Trust due to the lack of observable inputs may significantly impact the resulting fair value and therefore the Fund’s results of operations. As of June 30, 2023, the Fund had no securities classified as Level 3.
Derivatives Exchange-traded derivatives, such as futures contracts, exchange-traded option contracts and certain swaps, are typically classified within Level 1 or Level 2 of the fair value hierarchy depending on whether or not they are deemed to be actively traded. Certain non-exchange-traded derivatives, such as generic forwards, certain swaps and options, have inputs which can generally be corroborated by market data and are therefore classified within Level 2.
b. Securities Transactions Securities transactions are accounted for on the date securities are purchased or sold (trade date). Realized gains or losses on securities transactions are determined on the basis of specific identification.
c. Futures Contracts The Fund may enter into financial futures contracts. In entering into such contracts, the
NOTES TO FINANCIAL STATEMENTS — GUARDIAN CORE PLUS FIXED INCOME VIP FUND
Fund is required to deposit with the counterparty, either in cash or securities, an amount equal to a certain percentage of the face value of the contract. Subsequent payments are received or made by the Fund each day, depending on the daily fluctuations in the values of the contracts, and are recorded for financial statement purposes as variation margin received or paid by the Fund. Daily changes in variation margin are recognized as unrealized gains or losses by the Fund. The Fund may not achieve the anticipated benefits of the financial futures contracts and may realize a loss.
d. Credit Derivatives The Fund may enter into credit derivatives, including credit default swaps on individual obligations or credit indices. The Fund may use these investments for hedging and non-hedging purposes. The Fund may also invest in derivatives to seek to manage portfolio duration, as a substitute for holding, or to adjust exposure to, the underlying asset on which the derivative is based, or for cash management or portfolio management purposes. The use by the Fund of credit default swaps may have the effect of creating a short position in a security. Credit derivatives can create investment leverage and may create additional investment risks that may subject the Fund to greater volatility than investments in more traditional securities, as described in the Statement of Additional Information.
The Fund may enter into credit default swap agreements either as a buyer or seller. The Fund may buy protection under a credit default swap to attempt to mitigate the risk of default or credit quality deterioration in one or more individual holdings or in a segment of the fixed income securities market. The Fund may sell protection under a credit default swap in an attempt to gain exposure to an underlying issuer’s credit quality characteristics without investing directly in that issuer.
For swaps entered with an individual counterparty, the Fund bears the risk of loss of the uncollateralized amount expected to be received under a credit default swap agreement in the event of the default or bankruptcy of the counterparty. Credit default swap agreements are generally valued at a price at which the counterparty to such agreement would terminate the agreement. The Fund may also enter into cleared swaps.
In entering into swap contracts, the Fund is required to deposit with the broker (or for the benefit of the broker), either in cash or securities, an amount equal to a percentage of the notional value of the contract. Subsequent payments are received or made by the Fund each day, depending on the daily fluctuations in the values of the contracts, and are recorded for financial statement purposes as variation margin received or paid
by the Fund. Daily changes in variation margin are recognized as unrealized gains or losses by the Fund. The Fund may not achieve the anticipated benefits of the swap contracts and may realize a loss. There were no credit default swaps held as of June 30, 2023.
e. Options Transactions The Fund can write (sell) put and call options on securities and indexes to earn premiums, for hedging purposes, for risk management purposes or otherwise as part of its investment strategies. In writing options, the Fund is required to deposit with the broker or counterparty, either in cash or securities, an amount equal to a percentage of the face value of the options. When an option is written, the premium received is recorded as an asset with an equal liability that is subsequently marked to market to reflect the market value of the written option. These liabilities, if any, are reflected as written options, at value, in the Fund’s Statement of Assets and Liabilities. Premiums received from writing options which expire unexercised are recorded on the expiration date as a realized gain. The difference between the premium received and the amount paid on effecting a closing purchase transaction, including brokerage commissions, is also treated as a realized gain, or if the premium is less than the amount paid for the closing purchased transactions, as a realized loss. If a written call option is exercised, the premium is added to the proceeds from the sale of the underlying security in determining whether there has been a realized gain or loss. If a written put option is exercised, the premium reduces the cost basis of the security. In writing an option, the Fund bears the market risk of an unfavorable change in the price of the security underlying the written option. Exercise of a written option could result in the Fund purchasing or selling a security at a price different from its current market value. There were no options transactions as of June 30, 2023.
f. Investment Income Dividend income net of foreign taxes withheld, if any, is generally recorded on the ex-dividend date. Distributions received from real estate investment trusts, if any, may be classified as dividends, capital gains and/or return of capital. Interest income, which includes amortization/accretion of premium/discount, is determined using the interest income accrual method, and is accrued and recorded daily.
g. Allocation of Income and Expenses Many of the expenses of the Trust can be directly attributed to a specific series of the Trust. Expenses that cannot be directly attributed to a specific series of the Trust are generally apportioned among all the series in the Trust, based on relative net assets. In calculating net asset
NOTES TO FINANCIAL STATEMENTS — GUARDIAN CORE PLUS FIXED INCOME VIP FUND
value per share for each series of the Trust, investment income, realized and unrealized gains and losses, and expenses other than series-specific expenses are allocated daily to each series based upon the proportion of net assets attributable to each series.
3. Transactions with Affiliates
a. Investment Advisory Fee and Expense Limitation Under the terms of the advisory agreement, which, after its two year initial term, is reviewed and approved annually by the Board of Trustees, the Fund pays an investment advisory fee to Park Avenue. Park Avenue is a wholly-owned subsidiary of Guardian Life and receives an investment advisory fee at an annual rate of 0.45% of the first $300 million, and 0.40% in excess of $300 million of the Fund’s average daily net assets. The fee is accrued daily and paid monthly.
Park Avenue has contractually agreed through April 30, 2024 to waive certain fees and/or reimburse certain expenses incurred by the Fund to the extent necessary to limit the Fund’s total annual operating expenses after fee waiver and/or expense reimbursement to 0.81% of the Fund’s average daily net assets (excluding, if applicable, any acquired fund fees and expenses, taxes, interest, transaction costs and brokerage commissions, litigation and extraordinary expenses). The limitation may not be increased or terminated prior to this time without action by the Board of Trustees and may be terminated only upon approval of the Board of Trustees. Amounts waived or reimbursed by Park Avenue pursuant to any expense limitation will not be subject to Park Avenue’s recoupment rights. For the six months ended June 30, 2023, Park Avenue waived fees and/or paid Fund expenses in the amount of $27,019.
Park Avenue has entered into a Sub-Advisory Agreement with Lord, Abbett & Co. LLC (“Lord Abbett”). Lord Abbett is responsible for providing day-to-day investment advisory services to the Fund, subject to the supervision of Park Avenue and the oversight of the Board of Trustees. Sub-advisory fees are paid by Park Avenue and do not represent a separate or additional expense to the Fund.
b. Compensation of Trustees and Officers Trustees and officers who are interested persons of the Trust, as defined in the 1940 Act, receive no compensation from the Fund, except for the Chief Compliance Officer of the Trust. Trustees of the Trust who are not interested persons of the Trust, and the Chief Compliance Officer, receive compensation and reimbursement of expenses from the Trust.
c. Distribution Fees Park Avenue Securities LLC (“PAS”), a wholly-owned subsidiary of Guardian Life, is the principal underwriter of Fund shares. The Trust has entered into a distribution and service agreement with PAS, which governs the sale and distribution of shares of the Fund. Under a distribution and service plan adopted by the Trust (“12b-1 plan”), PAS is compensated for services in such capacity, including its expenses in connection with the promotion and distribution of shares of the Fund, at an annual rate of 0.25% of the Fund’s average daily net assets. For the six months ended June 30, 2023, the Fund paid distribution fees in the amount of $312,326 to PAS.
PAS has directed that certain payments under the 12b-1 plan be used to compensate GIAC for shareholder services provided to contract owners.
4. Federal Income Taxes
a. Distributions to Shareholders For federal income tax purposes, the Fund is treated as a disregarded entity (“DRE”). As a DRE, the Fund is not subject to an entity-level income tax; and any income, gains, losses, deductions, taxes, and credits of the Fund would instead be “passed through” directly to the separate accounts of GIAC that invest in the Fund and retain the same character for U.S. federal income tax purposes. In addition, the Fund is not required to distribute taxable income and capital gains for U.S. federal income tax purposes. Therefore, no dividends and capital gains distributions were paid by the Fund.
5. Investments
a. Investment Purchases and Sales The cost of investments and U.S. government agency obligations purchased and the proceeds from U.S. government agency obligations and other investments sold (excluding short-term investments and to be announced (TBA) securities) for the six months ended June 30, 2023, were as follows:
| | | | | | | | |
| | | |
| | | Other Investments | | | U.S.
Government
and Agency
Obligations | |
| Purchases | | $ | 95,975,243 | | | $ | 85,036,583 | |
| Sales | | | 92,097,533 | | | | 89,723,568 | |
b. Foreign Securities Foreign securities investments involve special risks and considerations not typically associated with U.S. investments. These risks include, but are not limited to, currency risk; adverse political, regulatory, social, and economic developments; and less reliable information about issuers. Moreover, securities
NOTES TO FINANCIAL STATEMENTS — GUARDIAN CORE PLUS FIXED INCOME VIP FUND
of some foreign issuers may be less liquid and their prices more volatile than those of comparable U.S. issuers.
c. Repurchase Agreements The Fund may invest in repurchase agreements to maintain liquidity and earn income over periods of time as short as overnight. The collateral for repurchase agreements is either cash or fully negotiable U.S. government securities (including U.S. government agency securities). Repurchase agreements are fully collateralized (including the interest accrued thereon) and such collateral is marked to market daily while the agreements remain in force. If the value of the collateral falls below the repurchase price plus accrued interest, the Fund will typically require the seller to deposit additional collateral by the next business day. If the request for additional collateral is not met, or the seller defaults, the Fund maintains the right to sell the collateral (although it may be prevented or delayed from doing so in certain circumstances) and may be required to claim any resulting loss against the seller. Park Avenue monitors the creditworthiness of the seller with which the Fund enters into repurchase agreements.
d. Securities Purchased on a When-Issued or Delayed-Delivery Basis The Fund may purchase securities on a when-issued or delayed-delivery basis, with payment and delivery scheduled for a future date. These transactions are subject to market fluctuations and are subject to the risk that the value at delivery may be more or less than at the trade date purchase price. Although the Fund will generally enter into these transactions with the intention of taking delivery of the securities, it may sell the securities before the settlement date. Assets will be segregated when a fund agrees to purchase on a when-issued or delayed-delivery basis. These transactions may create investment leverage.
e. Restricted and Illiquid Securities A restricted security cannot be resold to the general public without prior registration under the Securities Act of 1933, as amended (except pursuant to an applicable exemption). The values of these securities may be highly volatile. If the security is subsequently registered and resold, the issuer would typically bear the expense of all registrations at no cost to the Fund. Restricted and illiquid securities are valued according to the policies and procedures adopted by the Trust’s Board of Trustees and are noted, if any, in the Fund’s Schedule of Investments. As of June 30, 2023, the Fund held one illiquid security.
f. Below Investment Grade Securities The Fund may invest in below investment grade securities (i.e. lower-
quality, “junk” debt), which are subject to various risks. Lower-quality debt is considered to be speculative because it is less certain that the issuer will be able to pay interest or repay the principal than in the case of investment grade debt. These securities can involve a substantially greater risk of default than higher-rated securities, and their values can decline significantly over short periods of time. Lower-quality debt securities tend to be more sensitive to adverse news about their issuers, the market and the economy in general, than higher-quality debt securities. The market for these securities can be less liquid, especially during periods of recession or general market decline.
g. Mortgage- and Asset-Backed Securities The values of some mortgage-related or asset-backed securities may be particularly sensitive to changes in prevailing interest rates. Early repayment of principal on some mortgage-related securities may expose the Fund to a lower rate of return upon reinvestment of principal. The values of mortgage- and asset-backed securities depend in part on the credit quality and adequacy of the underlying assets or collateral and may fluctuate in response to the market’s perception of these factors as well as current and future repayment rates. Some mortgage-backed securities are backed by the full faith and credit of the U.S. government (e.g., mortgage-backed securities issued by the Government National Mortgage Association, commonly known as “Ginnie Mae”), while other mortgage-backed securities (e.g., mortgage-backed securities issued by the Federal National Mortgage Association and the Federal Home Loan Mortgage Corporation, commonly known as “Fannie Mae” and “Freddie Mac”), are backed only by the credit of the government entity issuing them. In addition, some mortgage-backed securities are issued by private entities and, as such, are not guaranteed by the U.S. government or any agency or instrumentality of the U.S. government.
h. Treasury Inflation Protected Securities Treasury inflation protected securities (“TIPS”) are debt securities issued by the U.S. Treasury whose principal and/or interest payments are adjusted for inflation, unlike debt securities that make fixed principal and interest payments. The interest rate paid by the TIPS is fixed, while the principal value rises or falls based on changes in a published Consumer Price Index (“CPI”). Thus, if inflation occurs, the principal and interest payments on TIPS are adjusted accordingly to protect investors from inflationary loss. During a deflationary period, the principal and interest payments decrease, although the TIPS principal amounts will not drop below their face amounts at maturity. In exchange for the inflation
NOTES TO FINANCIAL STATEMENTS — GUARDIAN CORE PLUS FIXED INCOME VIP FUND
protection, the TIPS generally pay lower interest rates than typical U.S. Treasury securities. Only if inflation occurs will TIPS offer a higher real yield than a conventional Treasury bond of the same maturity.
i. Disclosures About Derivative Instruments and Hedging Activities The Fund entered into U.S. Treasury futures contracts for the six months ended June 30, 2023 to manage portfolio duration. The Fund bears the risk of interest rates moving unexpectedly, in which case the Fund may not achieve the anticipated benefits of the futures contracts and realize a loss. There is minimal counterparty credit risk to the Funds since futures are exchange traded and the exchange’s clearinghouse, as counterparty to all exchange traded futures, guarantees futures against default.
Under certain market conditions, the Fund may use credit default swaps for hedging and non-hedging purposes. The Fund may also invest in derivatives to seek to manage portfolio duration, as a substitute for holding, or to adjust exposure to, the underlying asset on which the derivative is based, or for cash management or portfolio management purposes. Credit default swaps involve the exchange of a floating or fixed rate payment in return for assuming potential credit losses of an underlying security or pool of securities.
The gross returns to be exchanged or “swapped” between the parties are generally calculated with respect to a “notional amount,” i.e., the return on or increase in value of a particular dollar amount invested at a particular interest rate, in a particular foreign currency or security, or in a “basket” of securities representing a particular index. Cleared swaps are transacted through futures commission merchants (“FCM”s) that are members of central clearinghouses with the clearinghouse serving as a central counterparty similar to transactions in futures contracts. Funds post initial and variation margin by making payments to their clearing member FCMs.
Generally, the Fund will enter into credit default swaps on a net basis, which means that the two payment streams are netted out, with a Fund receiving or paying, as the case may be, only the net amount of the two payments. Credit default swaps do not normally involve the delivery of securities, other underlying assets or principal. Accordingly, the risk of loss with respect to credit default swaps is normally limited to the net amount of payments that a Fund is contractually obligated to make. If the other party to a credit default swap defaults, a Fund’s risk of loss consists of the net amount of payments that the Fund is contractually entitled to receive, if any.
In addition to the risks generally applicable to derivatives, risks associated with credit default swap agreements include adverse changes in the returns of the underlying instruments, failure of the counterparties to perform under the agreement’s terms and the possible lack of liquidity with respect to the agreements.
As of June 30, 2023, the Fund had the following derivatives at fair value, grouped into appropriate risk categories that illustrate the Fund’s use of derivative instruments:
| | | | |
| | |
| | | Interest
Rate Contracts | |
| | |
Asset Derivatives | | | | |
| Futures Contracts1 | | $ | 554,266 | |
| | |
Liability Derivatives | | | | |
| Futures Contracts1 | | $ | (405,282 | ) |
| 1 | Statement of Assets and Liabilities location: Includes cumulative unrealized appreciation/(depreciation) of futures contracts as reported in the Schedule of Investments. Only current day’s variation margin is reported within the Statement of Assets and Liabilities. |
Transactions in derivative investments for the six months ended June 30, 2023 were as follows:
| | | | |
| | |
| | | Interest
Rate Contracts | |
| | |
Net Realized Gain/(Loss) | | | | |
| Futures Contracts1 | | $ | (724,829 | ) |
| | |
Net Change in Unrealized Appreciation/(Depreciation) | | | | |
| Futures Contracts2 | | $ | 729,022 | |
| | |
Average Number of Notional Amounts | | | | |
| Futures Contracts3 | | | 576 | |
| 1 | Statement of Operations location: Net realized gain/(loss) from futures contracts. |
| 2 | Statement of Operations location: Net change in unrealized appreciation/(depreciation) on futures contracts. |
| 3 | Amount represents number of contracts. |
6. Temporary Borrowings
The Fund, with other funds managed by Park Avenue, is party to a credit agreement with respect to a $10 million committed revolving credit facility from State Street Bank and Trust Company (the “Credit Agreement”) for temporary borrowing purposes, including the meeting of redemption requests that otherwise might require the untimely disposition of securities. Interest is based on a daily fluctuating rate per annum equal to the Applicable Rate (as defined in the Credit Agreement) plus the Applicable Margin (as defined in the Credit Agreement) that is subject to change from time to time as and when the Applicable Rate changes. Under the
NOTES TO FINANCIAL STATEMENTS — GUARDIAN CORE PLUS FIXED INCOME VIP FUND
current Credit Agreement, the Applicable Rate for any day is defined as the rate per annum equal to the sum of (a) 0.10% plus (b) the higher of (i) the Federal Funds Effective Rate for such day and (ii) the Overnight Bank Funding Rate for such day; the Applicable Margin is 1.25%. In addition to the interest charged on any borrowings by the Fund, each fund pays a commitment fee of 0.30% per annum on its share of the unused portion of the credit facility. The agreement is in place until January 5, 2024. The Fund did not utilize the credit facility during the six months ended June 30, 2023.
7. Indemnifications
Under the Trust’s organizational documents and, in some cases, by contract, officers and Trustees of the Trust are indemnified against certain liabilities arising out of the performance of their duties to the Fund. In addition, in the normal course of business, the Fund
enters into contracts with its vendors and others that provide general indemnifications. The Fund’s maximum exposure under these arrangements is unknown as this would involve future claims that may be made against the Fund that have not yet occurred. However, based on experience, the Fund expects the risk of loss to be remote.
8. Additional Information
The outbreak of COVID-19 has adversely impacted both local and global economies, including those in which the Fund may invest. These impacts include materially reduced consumer demand and economic output, disrupted supply chains, market closures, travel restrictions and quarantines, and strained healthcare systems. The Fund’s operations may be interrupted as a result, which may have a negative impact on the Fund’s investment performance.
SUPPLEMENTAL INFORMATION (UNAUDITED)
Liquidity Risk Management Program
In compliance with Rule 22e-4 under the Investment Company Act of 1940, as amended (the “Liquidity Rule”), Guardian Variable Products Trust (the “Trust”) has adopted and implemented a written liquidity risk management program (the “Program”) for each series of the Trust (each, a “Fund”), which is reasonably designed to assess and manage each Fund’s liquidity risk. The Fund’s “liquidity risk” is the risk that the Fund could not meet requests to redeem shares issued by the Fund without significant dilution of the remaining investors’ interests in the Fund.
The Board of Trustees of the Trust (the “Board”) Previously approved the designation of Park Avenue Institutional Advisers LLC (the “Administrator” or “PAIA”) as Program administrator. The Administrator established a Liquidity Risk Management Committee, which is comprised of certain officers of the Trust and PAIA, that assists the Administrator in the implementation and day-to-day administration of the Program and otherwise support carrying out the Administrator’s liquidity risk management responsibilities under the Program.
In accordance with the Program, each Fund’s liquidity risk is assessed no less frequently than annually, taking into consideration a variety of factors, including, as applicable, the Fund’s investment strategy and liquidity of portfolio investments, cash flow projections, and holdings of cash and cash equivalents, as well as borrowing arrangements and other funding sources. Certain factors are considered under both normal and reasonably foreseeable stressed conditions.
Each Fund portfolio investment is classified, no less than monthly, into one of four liquidity categories (including “highly liquid investments” and “illiquid investments,” discussed below) based on a determination of the number of days it is reasonably expected to take to convert the investment to cash, or sell or dispose of the investment, in current market conditions without significantly changing the investment’s market value.
The Liquidity Rule limits the Fund’s investments in illiquid investments by prohibiting the Fund from acquiring any illiquid investment if, immediately after the acquisition, the Fund would have invested more than 15% of its net assets in illiquid investments that are assets. The Program includes provisions reasonably designed to comply with this investment limitation. In addition, the Program includes provisions reasonably designed to comply with this investment limitation. In addition, the Program includes provisions reasonably designed to comply with the Liquidity Rule’s requirements relating to highly liquid investment minimums, which is a minimum amount of Fund net assets that must be invested in highly liquid investments that are assets, as applicable. The Fund was not required to adopt a highly liquid investment minimum during the period.
At a meeting of the Board held on March 29-30, 2023, the Board received a report (the “Report”) prepared by the Administrator addressing the Program’s operation and assessing the adequacy and effectiveness of its implementation for the period from January 1, 2022 through December 31, 2022 (the “Reporting Period”). The Report noted that the Administrator believes the Program operated effectively during the Reporting Period and continues to be reasonably designed to effectively assess and manage each Fund’s liquidity risk. The Report also noted that the Administrator believes the Program has been adequately and effectively implemented and the investment strategies for each Fund continue to be appropriate since its inception. In addition, the Report summarized the operation of the Program and the information and factors considered by the Administrator in its assessment of the Program’s implementation, such as the liquidity risk assessment framework and liquidity classification methodologies.
There can be no assurance that the Program will achieve its objectives under all circumstances. Please refer to the Fund’s prospectus for more information regarding the Fund’s exposure to liquidity risk and other risks to which an investment in the Fund may be subject.
SUPPLEMENTAL INFORMATION (UNAUDITED)
Approval of Investment Management and Sub-advisory Agreements
Section 15(c) of the Investment Company Act of 1940, as amended (the “1940 Act”), requires that a fund’s investment advisory and sub-advisory agreements be approved initially by the fund’s board of trustees. Section 15(c) also requires that the continuation of these agreements, after an initial term of up to two years, be annually reviewed and approved by the board. Any such agreement must be approved by a vote of a majority of the trustees who are not parties to the agreement or “interested persons” (as defined in the 1940 Act) of a party to the agreement at a meeting of the board called for the purpose of voting on such approval.
At a meeting of the Board of Trustees (the “Board”) of Guardian Variable Products Trust (the “Trust”) held on March 29-30, 2023 (the “Meeting”), the Board, including the trustees who are not parties to the agreement or “interested persons” as defined in the 1940 Act (the “Independent Trustees”), considered and voted unanimously to renew the existing investment management agreement between the Trust, on behalf of Guardian All Cap Core VIP Fund; Guardian Balanced Allocation VIP Fund; Guardian Core Fixed Income VIP Fund; Guardian Core Plus Fixed Income VIP Fund; Guardian Diversified Research VIP Fund; Guardian Equity Income VIP Fund; Guardian Global Utilities VIP Fund; Guardian Growth & Income VIP Fund; Guardian Integrated Research VIP Fund; Guardian International Growth VIP Fund; Guardian International Equity VIP Fund; Guardian Large Cap Disciplined Growth VIP Fund; Guardian Large Cap Disciplined Value VIP Fund; Guardian Large Cap Fundamental Growth VIP Fund; Guardian Mid Cap Relative Value VIP Fund; Guardian Mid Cap Traditional Growth VIP Fund; Guardian Multi-Sector Bond VIP Fund; Guardian Select Mid-Cap Core VIP Fund; Guardian Short Duration Bond VIP Fund; Guardian Small Cap Core VIP Fund; Guardian Small-Mid Cap Core VIP Fund; Guardian Strategic Large Cap Core VIP Fund; Guardian Total Return Bond VIP Fund and Guardian U.S. Government Securities VIP Fund (each, a “Fund,” and together, the “Funds”), in substantially the form presented at this meeting (the “Management Agreement”); and Park Avenue Institutional Advisers LLC (the “Manager”) for a one-year term.
The Board, including the Independent Trustees, also considered and voted unanimously to renew the existing sub-advisory agreements (the “Sub-Advisory Agreements,” collectively with the Management Agreement and Sub-Subadvisory Agreement, the “Agreements”) between the Manager and investment
advisory firms engaged to serve as sub-advisers to certain of the Funds (the “Sub-Advised Funds”), namely (i) ClearBridge Investments, LLC with respect to Guardian Small Cap Core VIP Fund; (ii) Putnam Investment Management, LLC with respect to Guardian Diversified Research VIP Fund; (iii) AllianceBernstein L.P. with respect to Guardian Growth & Income VIP Fund and Guardian Strategic Large Cap Core VIP Fund; (iv) J.P. Morgan Investment Management Inc. with respect to Guardian International Growth VIP Fund; (v) Schroder Investment Management North America Inc. with respect to Guardian International Equity VIP Fund; (vi) Wellington Management Company LLP with respect to Guardian Balanced Allocation VIP Fund, Guardian Equity Income VIP Fund, Guardian Integrated Research VIP Fund, Guardian Large Cap Disciplined Growth VIP Fund and Guardian Global Utilities VIP Fund; (vii) Boston Partners Global Investors, Inc. with respect to Guardian Large Cap Disciplined Value VIP Fund; (viii) Janus Henderson Investors US LLC with respect to Guardian Mid Cap Traditional Growth VIP Fund; (ix) Allspring Global Investments, LLC with respect to Guardian Mid Cap Relative Value VIP Fund and Guardian Small-Mid Cap Core VIP Fund; (x) Lord, Abbett & Co. LLC with respect to Guardian Core Plus Fixed Income VIP Fund; (xi) FIAM LLC with respect to Guardian Select Mid Cap Core VIP Fund; and (xii) Massachusetts Financial Services Company with respect to Guardian All Cap Core VIP Fund, each in substantially the form presented at this meeting, (each, a “Sub-Adviser” and collectively, the “Sub-Advisers”) for a one-year term.
The Board, including the Independent Trustees, also considered and voted unanimously to renew the existing sub-subadvisory agreement (the “Sub-Subadvisory Agreement”) between Schroder Investment Management North America Inc. and Schroder Investment Management North America Limited (also a Sub-Adviser) with respect to Guardian International Equity VIP Fund for a one-year term.
The Board is responsible for overseeing the management of each Fund. In determining whether to renew its approval of the Agreements, the Trustees evaluated information and factors that they considered to be relevant and appropriate through the exercise of their own business judgment. The Trustees considered certain information and factors in light of advice furnished to them by legal counsel to the Trust and, in the case of the Independent Trustees, their independent legal counsel. In advance of the Meeting, the Trustees received materials and information designed to assist their consideration of the Agreements. The Trustees received written responses
SUPPLEMENTAL INFORMATION (UNAUDITED)
from the Manager and each Sub-Adviser to a series of questions and requests for information encompassing a wide variety of topics provided by independent counsel on behalf of the Independent Trustees. The Independent Trustees also received materials and information regarding the legal standards applicable to their consideration of the Agreements and the process and criteria used by the Manager to identify and select the Sub-Advisers.
During the course of their deliberations, the Independent Trustees met twice to discuss and evaluate the materials, information and Agreements in executive session with their independent legal counsel, outside of the presence of the Trustees who are not Independent Trustees and representatives from Fund management, the Manager or any Sub-Adviser.
In reaching its decisions to renew its approval of the Agreements, the Board took into account the materials and information described above, as well as other materials and information provided to the Board throughout the year. Individual Trustees may have given different weight to different factors and information with respect to each Agreement, and the Trustees did not identify any single factor or information that, in isolation, would be controlling in deciding to approve the Agreements. The discussion below is intended to summarize the broad factors that figured prominently in the Board’s decisions to renew its approval of the Agreements rather than to be all-inclusive. These broad factors included: (i) the nature, extent and quality of the services provided to the Funds by the Manager and to the Sub-advised Funds by the Sub-Advisers; (ii) the investment performance of each Fund; (iii) estimated profitability of the Manager; (iv) fees and expenses; (v) the extent to which economies of scale may exist, and the extent to the benefits of economies of scale are shared with the Funds; and (vi) any other benefits derived by the Manager or the Sub-Advisers (or their respective affiliates) from their relationships with the Funds.
Nature, Extent and Quality of Services
The Trustees considered information regarding the nature, extent and quality of services provided to the Funds by the Manager. The Trustees also considered, among other things, the terms of the Management Agreement and the range of investment advisory services provided by the Manager. In addition, the Trustees reviewed the range of non-investment advisory services provided by the Manager consistent with the terms of the Management Agreement, notably coordinating the preparation and filing of various
regulatory documents, coordinating the preparation and assembly of Board meeting materials, and assisting the Board with certain valuation matters. The Board also received a description of the Manager’s and each Sub-Adviser’s business continuity plans and of their respective approaches to data privacy and cybersecurity, and related testing. The Board received information regarding the response of the Manager and the Sub-Advisers to the COVID-19 pandemic, including the continuation of remote work arrangements and return-to-office plans. The Board also received information about the Manager’s role as administrator of the Funds’ liquidity risk management program, the Manager’s approach to risk management, and the Manager’s vendor oversight programs.
The Trustees considered that the Sub-advised Funds operate in a “manager-of-managers” structure and reviewed the responsibilities that the Manager has under this structure, including monitoring and evaluating the performance of the Sub-Advisers, monitoring the Sub-Advisers for adherence to the stated investment objectives, strategies, policies and restrictions of the Funds and supervising the Sub-Advisers with respect to the services that the Sub-Advisers would provide under the Sub-Advisory Agreements. The Trustees also considered the process used by the Manager, consistent with this structure, to identify and recommend sub-advisers, and the Manager’s ability to monitor and oversee sub-advisers and recommend replacement sub-advisers, when necessary, and provide other services under the Management Agreement. The Board noted that investment management staff of the Manager and the Trust’s Chief Compliance Officer conduct oversight meetings with the Sub-Advisers on a periodic basis, follow through with additional inquiries on any questions or concerns that arise during the meetings and, as necessary, then report the results of the meetings to the Board. The Trustees reviewed information regarding the experience and background of the Manager’s key personnel and the Manager’s organizational structure and resources, including investment, legal and administrative capabilities of the Manager. In this regard, the Trustees recognized that the Funds may benefit from the Manager’s ability to use resources and capabilities of its affiliates in providing services to the Funds.
The Trustees considered information regarding the nature, extent and quality of services provided to the Sub-advised Funds by the Sub-Advisers. The Trustees also considered, among other things, the terms of the Sub-advisory Agreements and the range of investment
SUPPLEMENTAL INFORMATION (UNAUDITED)
advisory services provided by the Sub-Advisers under the oversight of the Manager. In evaluating these investment advisory services, the Trustees considered, among other things, the Sub-Advisers’ investment philosophies, styles and/or processes and approaches to managing the respective Sub-advised Funds. The Trustees received and evaluated information regarding the background, education, expertise and/or experience of the investment professionals who serve as portfolio managers for the Sub-advised Funds and the capabilities and resources of the Sub-Advisers.
Based upon these considerations, the Trustees concluded, within the context of their full deliberations, that the nature, extent and quality of services provided to the Funds by the Manager and the Sub-advised Funds by each respective Sub-Adviser were appropriate.
Investment Performance
In connection with each of its regular quarterly meetings, the Board receives information on the performance of each Fund, including net performance, relative performance rankings within the relevant Morningstar peer group, and performance as compared to benchmark index returns. At each quarterly Board meeting, members of the Manager’s funds management team review with the Board the economic and market environment, absolute and relative performance of each Fund, and any relevant information about risk management and style consistency in connection with management of the Funds. The Board considered investment performance for each Fund over the one-year, three-year (where available), five-year (where available) and since-inception periods.
The Board also received and reviewed a report prepared by Broadridge Financial Solutions (“Broadridge”), an independent provider of mutual fund industry data, which included comparisons of the performance of each Fund to performance of an appropriate peer universe. For details regarding each Fund’s performance, see the “Fund-by-Fund Factors” section below.
The Manager discussed with the Board factors contributing to the Funds’ performance results. In addition, for certain Funds, the Manager provided to the Board longer term performance records of the Sub-Advisers for strategies used in managing the Funds. The Board concluded that the investment performance generated by the Manager and each Sub-Adviser was generally satisfactory, or, that any steps being taken by the Manager and Sub-Advisers to address any performance issues were satisfactory.
Profitability
The Board received and considered the Manager’s estimate of its profitability, which included allocations by the Manager of its costs in providing management services to the Funds. The Board considered the estimated profitability of the Manager both overall and on a Fund-by-Fund basis.
The Board received and considered profitability information from most of the Sub-Advisers, but noted that the Manager had negotiated the fees with the Sub-Advisers at arm’s-length. Accordingly, the Board concluded that the profitability of the Sub-Advisers is a less relevant factor than Manager profitability.
Based on the consideration of this information, the Board concluded that the profitability of the Funds to the Manager was acceptable.
Fees and Expenses
The Trustees considered the management fees paid by the Funds to the Manager under the Management Agreement and evaluated the reasonableness of these fees. The Trustees received and reviewed comparative information with respect to the management fee and total expenses for each Fund and the management fees and total expenses for a peer group of other funds selected by Broadridge. The Trustees considered the Manager’s commitment to limit the total expenses of each Fund through an expense limitation agreement with the Trust. Although the Board recognized that the comparisons between the management fees and actual expenses of the Funds and those of the identified peer group are imprecise, given different terms of agreements and variations in fund strategies, the Trustees found that the comparative information supported their consideration and approval of the management fees and evaluation of the total expenses. For details regarding each Fund’s fee and expense comparisons, see the “Fund-by-Fund Factors” section below.
The Trustees considered the sub-advisory fees paid under the Sub-advisory Agreements and evaluated the reasonableness of those fees. The Trustees also considered that the fees paid to the Sub-Advisers would be paid by the Manager and not the Funds and that the Manager had negotiated the fees with the Sub-Advisers at arm’s-length.
Based on the consideration of the information and factors summarized above, as well as other relevant information and factors, the Board concluded that the management and sub-advisory fees were reasonable in
SUPPLEMENTAL INFORMATION (UNAUDITED)
light of the nature, extent and quality of services rendered to the Funds by the Manager and the Sub-Advisers.
Economies of Scale
The Board considered the extent to which economies of scale may exist, and the extent to the benefits of economies of scale are shared with the Funds. In this regard, the Board noted that for sixteen of twenty-four Funds, the management and sub-advisory fee included breakpoints that are tiered based on growth in asset levels of each such Fund and that for the other Funds, the fees reflected appropriate levels based on current and expected asset levels. The Board also noted that the expenses of the Funds are subject to expense limitations provided by the Manager. The Board noted that expected economies of scale, where they exist, may be shared through the use of fee breakpoints, expense limitations by the Manager, and/or a lower overall fee.
Ancillary Benefits
The Board considered the potential benefits, other than management fees, that the Manager and/or its affiliates may receive because of the Manager’s relationship with the Funds. The Trustees considered that the Funds were designed to serve as investment options under variable contracts issued by affiliates of the Manager that would receive fees under those contracts and that Park Avenue Securities LLC, an affiliate of the Manager and principal underwriter of the Funds, and participating insurance companies, including insurance companies affiliated with the Manager, would be entitled to receive fees from the Funds under a plan of distribution adopted pursuant to Rule 12b-1 under the 1940 Act. The Trustees considered that the Manager and its affiliates may benefit from (i) greater efficiencies in annuity administration and operations and potential cost savings due to a reduction in the number of unaffiliated funds available as annuity contract investment options, and (ii) increased dividends-received deductions due to the Funds’ status under the tax laws as disregarded entities. In addition, the Trustees considered the potential benefits, other than sub-advisory fees, that the Sub-Advisers and their affiliates may receive because of their relationships with the Funds, including the ability to receive research from soft dollar commissions consistent with Trust policies. The Trustees concluded that benefits that may accrue to the Manager and its affiliates are reasonable and the benefits that may accrue to the Sub-Advisers and their affiliates are consistent with those expected for a sub-adviser to a mutual fund such as the applicable Fund.
Fund-by-Fund Factors
The Broadridge report groups fees, expenses and performance into five quintiles, with the top quintile having the highest performance or lowest fees/expenses, and the bottom quintile having the lowest performance or highest fees/expenses. For purposes of the descriptions below, a Fund’s performance is considered “in line with” the benchmark index if it is within 0.20%.
Guardian Large Cap Fundamental Growth VIP Fund
| • | | The Board noted that the Fund’s performance was in the 3rd quintile of its performance universe for the 1-year period and in the 4th quintile for its performance universe for the 3-year and 5-year periods. The Board also noted that the Fund’s performance was below the benchmark index for the 1-year, 3-year and 5-year periods. |
| • | | The Board noted that the contractual management fee, the actual management fee and actual total expenses were in the 1st quintile of the expense group. |
Guardian Large Cap Disciplined Growth VIP Fund
| • | | The Board noted that the Fund’s performance was in the 3rd quintile of its performance universe for the 1-year and 3-year periods and in the 2nd quintile for the 5-year period. The Board also noted that the Fund’s performance was below the benchmark index for the 1-year, 3-year and 5-year periods. |
| • | | The Board noted that the contractual management fee, the actual management fee and actual total expenses were in the 1st quintile of the expense group. |
Guardian Integrated Research VIP Fund
| • | | The Board noted that the Fund’s performance was in the 5th quintile of its performance universe for the 1-year and 5-year periods and in the 4th quintile for 3-year period. The Board also noted that the Fund’s performance was below the benchmark index for the 1-year, 3-year and 5-year periods. |
| • | | The Board noted that the contractual management fee, the actual management fee and actual total expenses were in the 1st quintile of the expense group. |
Guardian Diversified Research VIP Fund
| • | | The Board noted that the Fund’s performance was in the 3rd quintile of its performance universe for the 1-year and 3-year periods and in the 2nd quintile for the 5-year period. The Board also noted that the Fund’s performance was higher than the benchmark |
SUPPLEMENTAL INFORMATION (UNAUDITED)
| | | index for the 1-year period. The Board note that the Fund’s performance was lower than the benchmark index for the 3-year and 5-year periods. |
| • | | The Board noted that the contractual management fee and actual management fee were in the 1st quintile of the expense group and that actual total expenses were in the 3rd quintile. |
Guardian Strategic Large Cap Core VIP Fund
| • | | The Board noted that the Fund’s performance was in the 1st quintile of its performance universe for the 1-year period. The Board acknowledged the Fund’s short operational history. The Board noted that the Fund’s performance was higher than the benchmark index for the 1-year period. |
| • | | The Board noted that the contractual management fee, the actual management fee and actual total expenses were in the 1st quintile of the expense group. |
Guardian Large Cap Disciplined Value VIP Fund
| • | | The Board noted that the Fund’s performance was in the 3rd quintile of its performance universe for the 1-year and 3-year periods and in the 4th quintile for the 5-year period. The Board also noted that the Fund’s performance was higher than the benchmark index for the 1-year and 3-year periods. The Board noted that the Fund’s performance was in line with the benchmark index for the 5-year period. |
| • | | The Board noted that the contractual management fee was in the 2nd quintile of the expense group, the actual management fee was in the 1st quintile of the expense group and that actual total expenses were in the 3rd quintile. |
Guardian Growth & Income VIP Fund
| • | | The Board noted that the Fund’s performance was in the 3rd quintile of its performance universe for the 1-year, 3-year and 5-year periods. The Board also noted that the Fund’s performance was higher than the benchmark index for the 1-year, 3-year and 5-year periods. |
| • | | The Board noted that the contractual management fee and the actual management fee were in the 1st quintile of the expense group and that actual total expenses were in the 3rd quintile. |
Guardian Equity Income VIP Fund
| • | | The Board noted that the Fund had less than one-year of operational history and was not able to evaluate an investment performance record for the Fund. The |
| | | Board noted that it would have an opportunity to review such information in connection with future annual reviews. The Board noted that, in the meantime, it received monthly performance reports from the Manager. |
| • | | The Board noted that the contractual management fee, the actual management fee and actual total expenses were in the 1st quintile of the expense group. |
Guardian All Cap Core VIP Fund
| • | | The Board noted that the Fund’s performance was in the 3rd quintile of its performance universe for the 1-year period. The Board acknowledged the Fund’s short operational history. The Board noted that the Fund’s performance was higher than the benchmark index for the 1-year period. |
| • | | The Board noted that the contractual management fee, the actual management fee and actual total expenses were in the 1st quintile of the expense group. |
Guardian Mid Cap Traditional Growth VIP Fund
| • | | The Board noted that the Fund’s performance was in the 1st quintile of its performance universe for the 1-year period and in the 2nd quintile for the 3-year and 5-year periods. The Board also noted that the Fund’s performance was higher than the benchmark index for the 1-year, 3-year and 5-year periods. |
| • | | The Board noted that the contractual management fee and actual management fee were in the 1st quintile of the expense group and that the actual total expenses were in the 4th quintile. |
Guardian Select Mid Cap Core VIP Fund
| • | | The Board noted that the Fund’s performance was in the 3rd quintile of its performance universe for the 1-year period. The Board acknowledged the Fund’s short operational history. The Board noted that the Fund’s performance was lower than the benchmark index for the 1-year period. |
| • | | The Board noted that the contractual management fee, the actual management fee and actual total expenses were in the 1st quintile of the expense group. |
Guardian Mid Cap Relative Value VIP Fund
| • | | The Board noted that the Fund’s performance was in the 2nd quintile of its performance universe for the 1-year, 3-year and 5-year periods. The Board also noted that the Fund’s performance was higher than the benchmark index for the 1-year, 3-year and 5-year periods. |
SUPPLEMENTAL INFORMATION (UNAUDITED)
| • | | The Board noted that the contractual management fee and the actual management fee were in the 2nd quintile of the expense group and the actual total expenses were in the 3rd quintile of the expense group. |
Guardian Small-Mid Cap Core VIP Fund
| • | | The Board noted that the Fund’s performance was in the 5th quintile of its performance universe for the 1-year period. The Board acknowledged the Fund’s short operational history. The Board noted that the Fund’s performance was higher than the benchmark index for the 1-year period. |
| • | | The Board noted that the contractual management fee, the actual management fee and actual total expenses were in the 1st quintile of the expense group. |
Guardian Small Cap Core VIP Fund
| • | | The Board noted that the Fund’s performance was in the 5th quintile of its performance universe for the 1-year and 3-year periods. The Board noted that the Fund’s performance was lower than the benchmark index for the 1-year and 3-year periods. |
| • | | The Board noted that the contractual management fee and the actual management fee were in the 1st quintile of the expense group and the actual total expenses were in the 2nd quintile of the expense group. |
Guardian International Growth VIP Fund
| • | | The Board noted that the Fund’s performance was in the 4th quintile of its performance universe for the 1-year period, in the 2nd quintile of its performance universe for the 3-year period and in the 3rd quintile of its performance universe for the 5-year period. The Board also noted that the Fund’s performance was lower than the benchmark index for the 1-year and 5-year periods. The Board noted that the Fund’s performance was higher than the benchmark index for the 3-year period. |
| • | | The Board noted that the contractual management fee and actual management fee were in the 2nd quintile of the expense group and that the actual total expenses were in the 3rd quintile. |
Guardian International Equity VIP Fund
| • | | The Board noted that the Fund’s performance was in the 5th quintile of its performance universe for the 1-year, 3-year and 5-year periods. The Board also |
| | | noted that the Fund’s performance was lower than the benchmark index for the 1-year, 3-year and 5-year periods. |
| • | | The Board noted that the contractual management fee, the actual management fee and the actual total expenses were in the 2nd quintile of the expense group. |
Guardian Global Utilities VIP Fund
| • | | The Board noted that the Fund’s performance was in the 5th quintile of its performance universe for the 1-year period and in the 4th quintile of its performance universe for the 3-year period. The Board noted that the Fund’s performance was higher than the benchmark index for the 1-year and 3-year periods. |
| • | | The Board noted that the contractual management fee and the actual management fee were in the 1st quintile of the expense group and the actual total expenses were in the 2nd quintile of the expense group. |
Guardian Balanced Allocation VIP Fund
| • | | The Board noted that the Fund had less than one-year of operational history and was not able to evaluate an investment performance record for the Fund. The Board noted that it would have an opportunity to review such information in connection with future annual reviews. The Board noted that, in the meantime, it received monthly performance reports from the Manager. |
| • | | The Board noted that the contractual management fee, the actual management fee and actual total expenses were in the 1st quintile of the expense group. |
Guardian Core Plus Fixed Income VIP Fund
| • | | The Board noted that the Fund’s performance was in the 3rd quintile of its performance universe for the 1-year and 3-year periods and in the 4th quintile of its performance universe for the 5-year period. The Board also noted that the Fund’s performance was lower than the benchmark index for the 1-year and 5-year periods. The Board noted that the Fund’s performance was in line with the benchmark index for the 3-year period. |
| • | | The Board noted that the contractual management fee and actual management fee were in the 2nd quintile of the expense group and that actual total expenses were in the 3rd quintile. |
SUPPLEMENTAL INFORMATION (UNAUDITED)
Guardian Total Return Bond VIP Fund
| • | | The Board noted that the Fund’s performance was in the 5th quintile of its performance universe for the 1-year and 3-year periods. The Board also noted that the Fund’s performance was lower than the benchmark index for the 1-year and 3-year periods. |
| • | | The Board noted that the contractual management fee and actual management fee were in the 2nd quintile and the actual total expenses were in the 3rd quintile. |
Guardian Core Fixed Income VIP Fund
| • | | The Board noted that the Fund had less than one-year of operational history and was not able to evaluate an investment performance record for the Fund. The Board noted that it would have an opportunity to review such information in connection with future annual reviews. The Board noted that, in the meantime, it received monthly performance reports from the Manager. |
| • | | The Board noted that the contractual management fee was in the 2nd quintile of the expense group and the actual management fee and the actual total expenses were in the 1st quintile. |
Guardian Multi-Sector Bond VIP Fund
| • | | The Board noted that the Fund’s performance was in the 5th quintile of its performance universe for the 1-year and 3-year periods The Board also noted that the Fund’s performance was lower than the benchmark index for the 1-year and 3-year periods. |
| • | | The Board noted that the contractual management fee and actual total expenses were in the 1st quintile and the actual management fee was in the 2nd quintile. |
Guardian Short Duration Bond VIP Fund
| • | | The Board noted that the Fund had less than one-year of operational history and was not able to evaluate an investment performance record for the Fund. The Board noted that it would have an opportunity to review such information in connection with future annual reviews. The Board noted that, in the meantime, it received monthly performance reports from the Manager. |
| • | | The Board noted that the contractual management fee and actual total expenses were in the 3rd quintile of the expense group and the actual management fee was in the 1st quintile of the expense group. |
Guardian U.S. Government Securities VIP Fund
| • | | The Board noted that the Fund’s performance was in the 1st quintile of its performance universe for the 1-year period and in the 2nd quintile of its performance universe for the 3-year period. The Board also noted that the Fund’s performance was higher than the benchmark index for the 1-year and 3-year periods. |
| • | | The Board noted that the contractual management fee and the actual management fee were in the 1st quintile of the expense group and the actual total expenses were in the 2nd quintile of the expense group. |
Conclusion
Based on a comprehensive consideration and evaluation of all of the information and factors summarized above, among others, the Board as a whole, including the Independent Trustees, approved the Agreements.
SUPPLEMENTAL INFORMATION (UNAUDITED)
The Statement of Additional Information (“SAI”) includes additional information about the Trust’s Trustees and Officers and is available, without charge, upon request by calling toll-free 1-888-GUARDIAN (1-888-482-7342) or by visiting our website at http://guardianvpt.onlineprospectus.net/GuardianVPT/Prospectuses.
Portfolio Holdings and Proxy Voting Procedures
The Fund files its complete schedule of portfolio holdings with the Securities and Exchange Commission for the first and third quarters of each fiscal year as an exhibit to its reports on Form N-PORT. The Fund’s Form N-PORT reports are available on the Securities and Exchange Commission’s website at https://www.sec.gov. The Fund’s Form N-PORT information is also available, without charge, upon request, by calling toll-free 1-888-GUARDIAN (1-888-482-7342) or by visiting our website at http://guardianvpt.onlineprospectus.net/GuardianVPT/Prospectuses.
A description of the policies and procedures that the Fund uses to determine how to vote proxies relating to portfolio securities is included in the SAI. The SAI and information regarding how the Fund voted proxies relating to portfolio securities during the most recent 12-month period ended June 30 may be obtained (i) without charge, upon request, by calling toll-free 1-888-GUARDIAN (1-888-482-7342) or by visiting our website at http://guardianvpt.onlineprospectus.net/GuardianVPT/Prospectuses; and (ii) on the Securities and Exchange Commission’s website at https://www.sec.gov.
This report is transmitted to shareholders only. It is not authorized for use as an offer of sale or a solicitation of an offer to buy shares of the Fund unless accompanied or preceded by the Fund’s current prospectus. Past performance results shown in this report should not be considered a representation of future performance. Investment returns and principal value of shares will fluctuate so that shares, when redeemed, may be worth more or less than their original cost. Statements and other information herein are as dated and are subject to change.

The Guardian Life Insurance Company of America New York, NY 10001-2159
PUB8167
Guardian Variable
Products Trust
2023
Semiannual Report
All Data as of June 30, 2023
Guardian Diversified Research VIP Fund

| | |
| Not FDIC insured. May lose value. No bank guarantee. | | www.guardianlife.com |
TABLE OF CONTENTS
Guardian Diversified Research VIP Fund
Except as otherwise specifically stated, all information, including portfolio security positions, is as of June 30, 2023. Fund holdings will vary. Information contained herein has been obtained from sources believed reliable, but is not guaranteed.
GUARDIAN DIVERSIFIED RESEARCH VIP FUND
Fund Characteristics (unaudited)
|
| Total Net Assets: $149,708,649 |
| | |
| | |
Sector Allocation1 As of June 30, 2023 | | |
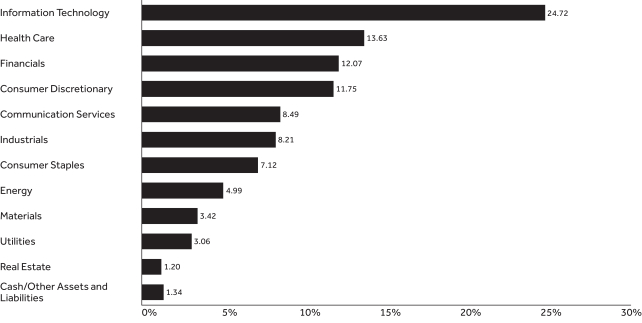 | | |
| | | | |
| | |
Top Ten Holdings2 As of June 30, 2023 | | | |
| | |
| Holding | | % of Total
Net Assets | |
| Microsoft Corp. | | | 7.29% | |
| Apple, Inc. | | | 5.09% | |
| Alphabet, Inc., Class A | | | 3.81% | |
| Amazon.com, Inc. | | | 3.43% | |
| Oracle Corp. | | | 2.75% | |
| NVIDIA Corp. | | | 2.66% | |
| Meta Platforms, Inc., Class A | | | 2.44% | |
| Exxon Mobil Corp. | | | 2.04% | |
| Mastercard, Inc., Class A | | | 2.00% | |
| Home Depot, Inc. | | | 1.77% | |
| Total | | | 33.28% | |
| 1 | The Fund’s holdings are allocated to each sector based on the MSCI Global Industry Classification Standard (GICS®). Cash includes short-term investments and net other assets and liabilities. |
| 2 | Portfolio holdings are subject to change and should not be considered a recommendation to buy or sell individual securities. |
UNDERSTANDING YOUR FUND’S EXPENSES (UNAUDITED)
By investing in the Fund, you incur two types of costs: (1) transaction costs and (2) ongoing costs, including, as applicable, investment advisory fees, distribution and/or service (12b-1) fees and other Fund expenses. The example below is intended to help you understand your ongoing costs (in dollars) of investing in the Fund and to compare these costs with the ongoing costs of investing in other mutual funds.
The example is based on an investment of $1,000 invested at the beginning of the period and held for the entire period from January 1, 2023 to June 30, 2023. The table below shows the Fund’s expenses in two ways:
Expenses based on actual return
This section of the table provides information about actual account values and actual expenses. You may use the information in this section, together with the amount you invested, to estimate the expenses that you paid over the period. Simply divide your account value by $1,000 (for example, an $8,600 account value divided by $1,000 = 8.6), then multiply the result by the number in the section under the heading entitled “Expenses Paid During Period” to estimate the expenses you paid on your account during this period.
Expenses based on hypothetical 5% return for comparison purposes
This section of the table provides information about hypothetical account values and hypothetical expenses based on the Fund’s actual expense ratio and an assumed rate of return of 5% per year before expenses, which is not the Fund’s actual return. The hypothetical account values and expenses may not be used to estimate the actual ending account balance or expenses you paid for the period. You may use this information to compare the ongoing costs of investing in the Fund with the cost of investing in other mutual funds. To do so, compare this 5% hypothetical example with the 5% hypothetical examples that appear in the shareholder reports of the other funds.
Note that the expenses shown in the table are meant to highlight your ongoing costs only and do not reflect any transactional costs, such as sales charges (loads), redemption fees, or exchange fees. Therefore the second section is useful in comparing ongoing costs only, and will not help you determine the relative total costs of owning different funds. If these transactional costs were included, your costs would have been higher. Charges and expenses at the insurance company separate account level are not reflected in the table.
| | | | | | | | | | | | | | |
| | | | | |
| | | Beginning
Account Value 1/1/23 | | Ending Account Value
6/30/23 | | | Expenses Paid During Period* 1/1/23-6/30/23 | | | Expense Ratio During Period 1/1/23-6/30/23 | |
| Based on Actual Return | | $1,000.00 | | $ | 1,179.00 | | | $ | 5.19 | | | | 0.96% | |
| Based on Hypothetical Return (5% Return Before Expenses) | | $1,000.00 | | $ | 1,020.03 | | | $ | 4.81 | | | | 0.96% | |
| * | Expenses are equal to the Fund’s annualized expense ratio as indicated, multiplied by the average account value over the period, multiplied by 181/365 (to reflect the one-half year period). |
SCHEDULE OF INVESTMENTS — GUARDIAN DIVERSIFIED RESEARCH VIP FUND
| | | | | | | | |
| June 30, 2023 (unaudited) | | Shares | | | Value | |
| Common Stocks – 98.7% | |
| |
| Aerospace & Defense – 1.7% | |
| | | |
Howmet Aerospace, Inc. | | | 7,677 | | | $ | 380,472 | |
| | | |
Northrop Grumman Corp. | | | 2,208 | | | | 1,006,407 | |
| | | |
Raytheon Technologies Corp. | | | 11,396 | | | | 1,116,352 | |
| | | | | | | | | |
| | |
| | | | | 2,503,231 | |
| Air Freight & Logistics – 0.5% | |
| | | |
FedEx Corp. | | | 2,987 | | | | 740,477 | |
| | | | | | | | | |
| | |
| | | | | 740,477 | |
| Automobiles – 1.8% | |
| | | |
General Motors Co. | | | 6,118 | | | | 235,910 | |
| | | |
Tesla, Inc.(1) | | | 9,348 | | | | 2,447,026 | |
| | | | | | | | | |
| | |
| | | | | 2,682,936 | |
| Banks – 1.9% | |
| | | |
Bank of America Corp. | | | 36,583 | | | | 1,049,566 | |
| | | |
Citigroup, Inc. | | | 39,678 | | | | 1,826,775 | |
| | | | | | | | | |
| | |
| | | | | 2,876,341 | |
| Beverages – 2.6% | |
| | | |
Coca-Cola Co. | | | 25,078 | | | | 1,510,197 | |
| | | |
Constellation Brands, Inc., Class A | | | 666 | | | | 163,923 | |
| | | |
PepsiCo, Inc. | | | 11,917 | | | | 2,207,267 | |
| | | | | | | | | |
| | |
| | | | | 3,881,387 | |
| Biotechnology – 1.7% | |
| | | |
AbbVie, Inc. | | | 5,234 | | | | 705,177 | |
| | | |
Alkermes PLC(1) | | | 12,927 | | | | 404,615 | |
| | | |
Ascendis Pharma A/S, ADR(1) | | | 7,462 | | | | 665,983 | |
| | | |
Biogen, Inc.(1) | | | 1,528 | | | | 435,251 | |
| | | |
Regeneron Pharmaceuticals, Inc.(1) | | | 526 | | | | 377,952 | |
| | | | | | | | | |
| | |
| | | | | 2,588,978 | |
| Broadline Retail – 3.4% | |
| | | |
Amazon.com, Inc.(1) | | | 39,445 | | | | 5,142,050 | |
| | | | | | | | | |
| | |
| | | | | 5,142,050 | |
| Building Products – 0.8% | |
| | | |
Johnson Controls International PLC | | | 17,053 | | | | 1,161,991 | |
| | | | | | | | | |
| | |
| | | | | 1,161,991 | |
| Capital Markets – 3.4% | |
| | | |
Charles Schwab Corp. | | | 19,748 | | | | 1,119,317 | |
| | | |
Goldman Sachs Group, Inc. | | | 5,145 | | | | 1,659,468 | |
| | | |
KKR & Co., Inc. | | | 19,641 | | | | 1,099,896 | |
| | | |
Quilter PLC (United Kingdom)(2) | | | 254,478 | | | | 256,232 | |
| | | |
S&P Global, Inc. | | | 2,414 | | | | 967,748 | |
| | | | | | | | | |
| | |
| | | | | 5,102,661 | |
| Chemicals – 2.2% | |
| | | |
Corteva, Inc. | | | 10,939 | | | | 626,805 | |
| | | |
DuPont de Nemours, Inc. | | | 13,085 | | | | 934,792 | |
| | | |
Eastman Chemical Co. | | | 4,549 | | | | 380,842 | |
| | | |
Linde PLC | | | 421 | | | | 160,435 | |
| | | |
PPG Industries, Inc. | | | 3,351 | | | | 496,953 | |
| | | |
Sherwin-Williams Co. | | | 2,752 | | | | 730,711 | |
| | | | | | | | | |
| | |
| | | | | 3,330,538 | |
| | | | | | | | |
| June 30, 2023 (unaudited) | | Shares | | | Value | |
| Construction Materials – 0.4% | |
| | | |
CRH PLC, ADR | | | 9,553 | | | $ | 532,389 | |
| | | | | | | | | |
| | |
| | | | | 532,389 | |
| Consumer Finance – 0.2% | |
| | | |
Capital One Financial Corp. | | | 2,940 | | | | 321,548 | |
| | | | | | | | | |
| | |
| | | | | 321,548 | |
| Consumer Staples Distribution & Retail – 2.2% | |
| | | |
BJ’s Wholesale Club Holdings, Inc.(1) | | | 2,431 | | | | 153,177 | |
| | | |
Costco Wholesale Corp. | | | 1,646 | | | | 886,174 | |
| | | |
Target Corp. | | | 5,279 | | | | 696,300 | |
| | | |
Walmart, Inc. | | | 10,191 | | | | 1,601,821 | |
| | | | | | | | | |
| | |
| | | | | 3,337,472 | |
| Containers & Packaging – 0.4% | |
| | | |
Avery Dennison Corp. | | | 1,907 | | | | 327,623 | |
| | | |
Berry Global Group, Inc. | | | 4,433 | | | | 285,219 | |
| | | | | | | | | |
| | |
| | | | | 612,842 | |
| Electric Utilities – 2.7% | |
| | | |
Exelon Corp. | | | 20,456 | | | | 833,377 | |
| | | |
NextEra Energy, Inc. | | | 10,364 | | | | 769,009 | |
| | | |
NRG Energy, Inc. | | | 52,405 | | | | 1,959,423 | |
| | | |
PG&E Corp.(1) | | | 26,552 | | | | 458,819 | |
| | | | | | | | | |
| | |
| | | | | 4,020,628 | |
| Electrical Equipment – 0.1% | |
| | | |
Emerson Electric Co. | | | 2,134 | | | | 192,892 | |
| | | | | | | | | |
| | |
| | | | | 192,892 | |
| Electronic Equipment, Instruments & Components – 1.0% | |
| | | |
CDW Corp. | | | 4,167 | | | | 764,645 | |
| | | |
Vontier Corp. | | | 22,126 | | | | 712,678 | |
| | | | | | | | | |
| | |
| | | | | 1,477,323 | |
| Energy Equipment & Services – 0.4% | |
| | | |
Diamond Offshore Drilling, Inc.(1) | | | 46,001 | | | | 655,054 | |
| | | | | | | | | |
| | |
| | | | | 655,054 | |
| Entertainment – 0.9% | |
| | | |
Netflix, Inc.(1) | | | 2,738 | | | | 1,206,062 | |
| | | |
Sea Ltd., ADR(1) | | | 3,462 | | | | 200,934 | |
| | | | | | | | | |
| | |
| | | | | 1,406,996 | |
| Financial Services – 4.0% | |
| | | |
Apollo Global Management, Inc. | | | 19,458 | | | | 1,494,569 | |
| | | |
Mastercard, Inc., Class A | | | 7,608 | | | | 2,992,227 | |
| | | |
Visa, Inc., Class A | | | 6,017 | | | | 1,428,917 | |
| | | | | | | | | |
| | |
| | | | | 5,915,713 | |
| Food Products – 0.3% | |
| | | |
General Mills, Inc. | | | 6,531 | | | | 500,928 | |
| | | | | | | | | |
| | |
| | | | | 500,928 | |
| Ground Transportation – 1.7% | |
| | | |
CSX Corp. | | | 12,603 | | | | 429,763 | |
| | | |
Hertz Global Holdings, Inc.(1) | | | 22,562 | | | | 414,915 | |
| | | |
Union Pacific Corp. | | | 8,323 | | | | 1,703,052 | |
| | | | | | | | | |
| | |
| | | | | 2,547,730 | |
| Health Care Equipment & Supplies – 2.7% | |
| | | |
Abbott Laboratories | | | 3,812 | | | | 415,584 | |
| | | | | | | | | |
| | | | |
| The accompanying notes are an integral part of these financial statements. | | | | 3 |
SCHEDULE OF INVESTMENTS — GUARDIAN DIVERSIFIED RESEARCH VIP FUND
| | | | | | | | |
| June 30, 2023 (unaudited) | | Shares | | | Value | |
| Health Care Equipment & Supplies (continued) | |
| | | |
Becton Dickinson and Co. | | | 2,422 | | | $ | 639,432 | |
| | | |
Boston Scientific Corp.(1) | | | 15,082 | | | | 815,785 | |
| | | |
Dexcom, Inc.(1) | | | 3,721 | | | | 478,186 | |
| | | |
IDEXX Laboratories, Inc.(1) | | | 507 | | | | 254,631 | |
| | | |
Intuitive Surgical, Inc.(1) | | | 2,488 | | | | 850,747 | |
| | | |
Medtronic PLC | | | 1,908 | | | | 168,095 | |
| | | |
Stryker Corp. | | | 1,254 | | | | 382,583 | |
| | | | | | | | | |
| | |
| | | | | 4,005,043 | |
| Health Care Providers & Services – 4.0% | |
| | | |
Cigna Group | | | 5,278 | | | | 1,481,007 | |
| | | |
Elevance Health, Inc. | | | 472 | | | | 209,705 | |
| | | |
Humana, Inc. | | | 1,016 | | | | 454,284 | |
| | | |
McKesson Corp. | | | 2,942 | | | | 1,257,146 | |
| | | |
UnitedHealth Group, Inc. | | | 5,382 | | | | 2,586,804 | |
| | | | | | | | | |
| | |
| | | | | 5,988,946 | |
| Hotels, Restaurants & Leisure – 2.2% | |
| | | |
Aramark | | | 8,018 | | | | 345,175 | |
| | | |
Booking Holdings, Inc.(1) | | | 487 | | | | 1,315,061 | |
| | | |
Chipotle Mexican Grill, Inc.(1) | | | 374 | | | | 799,986 | |
| | | |
Hilton Worldwide Holdings, Inc. | | | 4,801 | | | | 698,785 | |
| | | |
Penn Entertainment, Inc.(1) | | | 7,601 | | | | 182,652 | |
| | | | | | | | | |
| | |
| | | | | 3,341,659 | |
| Household Durables – 0.9% | |
| | | |
PulteGroup, Inc. | | | 17,184 | | | | 1,334,853 | |
| | | | | | | | | |
| | |
| | | | | 1,334,853 | |
| Household Products – 1.7% | |
| | | |
Procter & Gamble Co. | | | 17,141 | | | | 2,600,975 | |
| | | | | | | | | |
| | |
| | | | | 2,600,975 | |
| Independent Power and Renewable Electricity Producers – 0.1% | |
| | | |
Vistra Corp. | | | 5,581 | | | | 146,501 | |
| | | | | | | | | |
| | |
| | | | | 146,501 | |
| Industrial Conglomerates – 0.9% | |
| | | |
General Electric Co. | | | 2,689 | | | | 295,387 | |
| | | |
Honeywell International, Inc. | | | 5,365 | | | | 1,113,237 | |
| | | | | | | | | |
| | |
| | | | | 1,408,624 | |
| Insurance – 2.6% | |
| | | |
AIA Group Ltd. (Hong Kong) | | | 61,200 | | | | 624,435 | |
| | | |
Assured Guaranty Ltd. | | | 27,897 | | | | 1,556,652 | |
| | | |
AXA SA (France) | | | 23,282 | | | | 687,833 | |
| | | |
Prudential PLC (United Kingdom) | | | 69,940 | | | | 986,318 | |
| | | | | | | | | |
| | |
| | | | | 3,855,238 | |
| Interactive Media & Services – 6.3% | |
| | | |
Alphabet, Inc., Class A(1) | | | 47,663 | | | | 5,705,261 | |
| | | |
Meta Platforms, Inc., Class A(1) | | | 12,756 | | | | 3,660,717 | |
| | | | | | | | | |
| | |
| | | | | 9,365,978 | |
| Life Sciences Tools & Services – 1.5% | |
| | | |
Bio-Rad Laboratories, Inc., Class A(1) | | | 933 | | | | 353,719 | |
| | | |
Danaher Corp. | | | 2,819 | | | | 676,560 | |
| | | |
ICON PLC(1) | | | 205 | | | | 51,291 | |
| | | |
Thermo Fisher Scientific, Inc. | | | 2,171 | | | | 1,132,719 | |
| | | | | | | | | |
| | |
| | | | | 2,214,289 | |
| | | | | | | | |
| June 30, 2023 (unaudited) | | Shares | | | Value | |
| Machinery – 1.6% | |
| | | |
Deere & Co. | | | 918 | | | $ | 371,964 | |
| | | |
Ingersoll Rand, Inc. | | | 10,180 | | | | 665,365 | |
| | | |
Otis Worldwide Corp. | | | 14,773 | | | | 1,314,945 | |
| | | | | | | | | |
| | |
| | | | | 2,352,274 | |
| Media – 0.2% | |
| | | |
Charter Communications, Inc., Class A(1) | | | 811 | | | | 297,937 | |
| | | | | | | | | |
| | |
| | | | | 297,937 | |
| Metals & Mining – 0.4% | |
| | | |
Agnico Eagle Mines Ltd. (Canada) | | | 6,173 | | | | 308,242 | |
| | | |
Glencore PLC (Australia) | | | 59,358 | | | | 336,711 | |
| | | | | | | | | |
| | |
| | | | | 644,953 | |
| Multi-Utilities – 0.3% | |
| | | |
Ameren Corp. | | | 5,078 | | | | 414,720 | |
| | | | | | | | | |
| | |
| | | | | 414,720 | |
| Office REITs – 0.2% | |
| | | |
Vornado Realty Trust | | | 15,496 | | | | 281,098 | |
| | | | | | | | | |
| | |
| | | | | 281,098 | |
| Oil, Gas & Consumable Fuels – 4.6% | |
| | | |
BP PLC (United Kingdom) | | | 107,123 | | | | 627,617 | |
| | | |
Cenovus Energy, Inc. (Canada) | | | 83,364 | | | | 1,415,882 | |
| | | |
ConocoPhillips | | | 8,500 | | | | 880,685 | |
| | | |
Exxon Mobil Corp. | | | 28,439 | | | | 3,050,083 | |
| | | |
Shell PLC (Netherlands) | | | 28,296 | | | | 842,473 | |
| | | | | | | | | |
| | |
| | | | | 6,816,740 | |
| Passenger Airlines – 0.4% | |
| | | |
Southwest Airlines Co. | | | 14,516 | | | | 525,624 | |
| | | | | | | | | |
| | |
| | | | | 525,624 | |
| Personal Care Products – 0.1% | |
| | | |
Kenvue, Inc.(1) | | | 7,768 | | | | 205,231 | |
| | | | | | | | | |
| | |
| | | | | 205,231 | |
| Pharmaceuticals – 3.7% | |
| | | |
4Front Ventures Corp.(1) | | | 567,677 | | | | 88,501 | |
| | | |
Eli Lilly and Co. | | | 3,659 | | | | 1,715,998 | |
| | | |
Innoviva, Inc.(1) | | | 47,114 | | | | 599,761 | |
| | | |
Johnson & Johnson | | | 8,364 | | | | 1,384,409 | |
| | | |
Merck & Co., Inc. | | | 12,769 | | | | 1,473,415 | |
| | | |
TerrAscend Corp.(1) | | | 36,139 | | | | 65,411 | |
| | | |
Zoetis, Inc. | | | 1,646 | | | | 283,458 | |
| | | | | | | | | |
| | |
| | | | | 5,610,953 | |
| Semiconductors & Semiconductor Equipment – 6.3% | |
| | | |
Advanced Micro Devices, Inc.(1) | | | 14,600 | | | | 1,663,086 | |
| | | |
Broadcom, Inc. | | | 2,597 | | | | 2,252,716 | |
| | | |
NVIDIA Corp. | | | 9,406 | | | | 3,978,926 | |
| | | |
QUALCOMM, Inc. | | | 12,659 | | | | 1,506,927 | |
| | | | | | | | | |
| | |
| | | | | 9,401,655 | |
| Software – 12.4% | |
| | | |
Intuit, Inc. | | | 3,135 | | | | 1,436,426 | |
| | | |
Microsoft Corp. | | | 32,036 | | | | 10,909,539 | |
| | | | | | | | | |
| | | | |
| 4 | | | | The accompanying notes are an integral part of these financial statements. |
SCHEDULE OF INVESTMENTS — GUARDIAN DIVERSIFIED RESEARCH VIP FUND
| | | | | | | | |
| June 30, 2023 (unaudited) | | Shares | | | Value | |
| Software (continued) | |
| | | |
Oracle Corp. | | | 34,574 | | | $ | 4,117,418 | |
| | | |
Salesforce, Inc.(1) | | | 9,722 | | | | 2,053,870 | |
| | | | | | | | | |
| | |
| | | | | 18,517,253 | |
| Specialized REITs – 1.0% | |
| | | |
American Tower Corp. | | | 3,514 | | | | 681,505 | |
| | | |
Gaming and Leisure Properties, Inc. | | | 17,166 | | | | 831,865 | |
| | | | | | | | | |
| | |
| | | | | 1,513,370 | |
| Specialty Retail – 2.7% | |
| | | |
CarMax, Inc.(1) | | | 4,929 | | | | 412,557 | |
| | | |
Home Depot, Inc. | | | 8,556 | | | | 2,657,836 | |
| | | |
O’Reilly Automotive, Inc.(1) | | | 658 | | | | 628,588 | |
| | | |
TJX Cos., Inc. | | | 3,651 | | | | 309,568 | |
| | | |
Warby Parker, Inc., Class A(1) | | | 3,235 | | | | 37,817 | |
| | | | | | | | | |
| | |
| | | | | 4,046,366 | |
| Technology Hardware, Storage & Peripherals – 5.1% | |
| | | |
Apple, Inc. | | | 39,259 | | | | 7,615,068 | |
| | | | | | | | | |
| | |
| | | | | 7,615,068 | |
| Textiles, Apparel & Luxury Goods – 0.7% | |
| | | |
Levi Strauss & Co., Class A | | | 9,347 | | | | 134,877 | |
| | | |
Lululemon Athletica, Inc.(1) | | | 655 | | | | 247,918 | |
| | | |
NIKE, Inc., Class B | | | 5,903 | | | | 651,514 | |
| | | | | | | | | |
| | |
| | | | | 1,034,309 | |
| Tobacco – 0.1% | |
| | | |
Altria Group, Inc. | | | 3,061 | | | | 138,663 | |
| | | | | | | | | |
| | |
| | | | | 138,663 | |
| Trading Companies & Distributors – 0.6% | |
| | | |
United Rentals, Inc. | | | 1,938 | | | | 863,127 | |
| | | | | | | | | |
| | |
| | | | | 863,127 | |
| Wireless Telecommunication Services – 1.1% | |
| | | |
T-Mobile US, Inc.(1) | | | 11,762 | | | | 1,633,742 | |
| | | | | | | | | |
| | |
| | | | | 1,633,742 | |
| | |
Total Common Stocks
(Cost $104,095,985) | | | | 147,707,294 | |
| | | | | | | | |
| June 30, 2023 (unaudited) | | Principal
Amount | | |
Value | |
| Repurchase Agreements – 1.4% | |
| | | |
Fixed Income Clearing Corp., 1.52%, dated 6/30/2023, proceeds at maturity value of $2,150,950, due 7/3/2023(3) | | $ | 2,150,678 | | | $ | 2,150,678 | |
| | |
Total Repurchase Agreements
(Cost $2,150,678) | | | | 2,150,678 | |
| | |
Total Investments – 100.1%
(Cost $106,246,663) | | | | 149,857,972 | |
| | |
| Liabilities in excess of other assets – (0.1)% | | | | (149,323 | ) |
| | |
| Total Net Assets – 100.0% | | | $ | 149,708,649 | |
| (1) | Non–income–producing security. |
| (2) | Securities that may be resold in transactions exempt from registration under Rule 144A of the Securities Act of 1933, as amended, normally to certain qualified buyers. At June 30, 2023, the aggregate market value of these securities amounted to $256,232, representing 0.2% of net assets. These securities have been deemed liquid by the investment adviser pursuant to the Fund’s liquidity procedures approved by the Board of Trustees. |
| (3) | The table below presents collateral for repurchase agreements. |
| | | | | | | | | | | | | | | | |
| Security | | Coupon | | | Maturity
Date | | | Principal
Amount | | | Value | |
| U.S. Treasury Note | | | 4.625% | | | | 3/15/2026 | | | $ | 2,161,800 | | | $ | 2,193,742 | |
Legend:
ADR — American Depositary Receipt
REITs — Real Estate Investment Trusts
The following is a summary of the inputs used as of June 30, 2023 in valuing the Fund’s investments. For more information on valuation inputs, please refer to Note 2a of the accompanying Notes to Financial Statements.
| | | | | | | | | | | | | | | | |
| | | Valuation Inputs | | | | |
| Investments in Securities (unaudited) | | Level 1 | | | Level 2 | | | Level 3 | | | Total | |
| Common Stocks | | $ | 143,345,675 | | | $ | 4,361,619 | * | | $ | — | | | $ | 147,707,294 | |
| Repurchase Agreements | | | — | | | | 2,150,678 | | | | — | | | | 2,150,678 | |
| Total | | $ | 143,345,675 | | | $ | 6,512,297 | | | $ | — | | | $ | 149,857,972 | |
| * | Consists of certain foreign securities whose values were determined by a pricing service using pricing models (See Note 2a in Notes to Financial Statements). These investments in securities were classified as Level 2 rather than Level 1. |
| | | | |
| The accompanying notes are an integral part of these financial statements. | | | | 5 |
FINANCIAL INFORMATION — GUARDIAN DIVERSIFIED RESEARCH VIP FUND
| | | | |
Statement of Assets and Liabilities As of June 30, 2023 (unaudited) | | | |
Assets | | | | |
| | |
Investments, at value | | $ | 149,857,972 | |
| | |
Foreign currency, at value | | | 7,467 | |
| | |
Dividends/interest receivable | | | 65,292 | |
| | |
Receivable for investments sold | | | 44,183 | |
| | |
Foreign tax reclaims receivable | | | 15,896 | |
| | |
Reimbursement receivable from adviser | | | 3,632 | |
| | |
Prepaid expenses | | | 1,648 | |
| | | | | |
| | |
Total Assets | | | 149,996,090 | |
| | | | | |
| | |
Liabilities | | | | |
| | |
Payable for investments purchased | | | 92,688 | |
| | |
Investment advisory fees payable | | | 72,614 | |
| | |
Payable for fund shares redeemed | | | 30,989 | |
| | |
Distribution fees payable | | | 30,256 | |
| | |
Accrued custodian and accounting fees | | | 21,503 | |
| | |
Accrued audit fees | | | 13,978 | |
| | |
Accrued trustees’ and officers’ fees | | | 2,536 | |
| | |
Accrued expenses and other liabilities | | | 22,877 | |
| | | | | |
| | |
Total Liabilities | | | 287,441 | |
| | | | | |
| | |
Total Net Assets | | $ | 149,708,649 | |
| | | | | |
| | |
Net Assets Consist of: | | | | |
| | |
Paid-in capital | | $ | 35,678,982 | |
| | |
Distributable earnings | | | 114,029,667 | |
| | | | | |
| | |
Total Net Assets | | $ | 149,708,649 | |
| | | | | |
Investments, at Cost | | $ | 106,246,663 | |
| | | | | |
Foreign Currency, at Cost | | $ | 7,471 | |
| | | | | |
| | |
Pricing of Shares | | | | |
| | |
Shares of Beneficial Interest Outstanding with No Par Value | | | 6,533,074 | |
| | |
Net Asset Value Per Share | | | $22.92 | |
| | | | | |
| | | | |
Statement of Operations For the Six Months Ended June 30, 2023 (unaudited) | |
Investment Income | | | | |
| | |
Dividends | | $ | 1,104,499 | |
| | |
Interest | | | 8,596 | |
| | |
Withholding taxes on foreign dividends | | | (10,050 | ) |
| | | | | |
| | |
Total Investment Income | | | 1,103,045 | |
| | | | | |
| | |
Expenses | | | | |
| | |
Investment advisory fees | | | 431,130 | |
| | |
Distribution fees | | | 179,638 | |
| | |
Custodian and accounting fees | | | 27,061 | |
| | |
Professional fees | | | 27,045 | |
| | |
Trustees’ and officers’ fees | | | 17,754 | |
| | |
Administrative fees | | | 14,162 | |
| | |
Transfer agent fees | | | 7,254 | |
| | |
Shareholder reports | | | 4,527 | |
| | |
Other expenses | | | 4,052 | |
| | | | | |
| | |
Total Expenses | | | 712,623 | |
| | |
Less: Fees waived | | | (22,815 | ) |
| | | | | |
| | |
Total Expenses, Net | | | 689,808 | |
| | | | | |
| | |
Net Investment Income/(Loss) | | | 413,237 | |
| | | | | |
| | |
Realized Gain/(Loss) and Change in Unrealized Appreciation/(Depreciation) on Investments and Foreign Currency Transactions | | | | |
| | |
Net realized gain/(loss) from investments | | | 1,846,981 | |
| | |
Net realized gain/(loss) from foreign currency transactions | | | 741 | |
| | |
Net change in unrealized appreciation/(depreciation) on investments | | | 21,571,633 | |
| | |
Net change in unrealized appreciation/(depreciation) on translation of assets and liabilities in foreign currencies | | | 351 | |
| | | | | |
| | |
Net Gain on Investments and Foreign Currency Transactions | | | 23,419,706 | |
| | | | | |
| | |
Net Increase in Net Assets Resulting From Operations | | $ | 23,832,943 | |
| | | | | |
| | | | | |
| | | | |
| 6 | | | | The accompanying notes are an integral part of these financial statements. |
FINANCIAL INFORMATION — GUARDIAN DIVERSIFIED RESEARCH VIP FUND
| | | | | | | | |
Statements of Changes in Net Assets Six Months Ended Numbers are unaudited | | | | | | |
| | | |
| | | For the
Six Months Ended
6/30/23 | | | For the
Year Ended
12/31/22 | |
| | | | | | | |
Operations | | | | | |
| | | |
Net investment income/(loss) | | $ | 413,237 | | | $ | 835,776 | |
| | | |
Net realized gain/(loss) from investments and foreign currency transactions | | | 1,847,722 | | | | 7,406,487 | |
| | | |
Net change in unrealized appreciation/(depreciation) on investments and
translation of assets and liabilities in foreign currencies | | | 21,571,984 | | | | (41,223,699 | ) |
| | | | | | | | | |
| | | |
Net Increase/(Decrease) in Net Assets Resulting from Operations | | | 23,832,943 | | | | (32,981,436 | ) |
| | | | | | | | | |
| | |
Capital Share Transactions | | | | | |
| | | |
Proceeds from sales of shares | | | 663,342 | | | | 7,356,435 | |
| | | |
Cost of shares redeemed | | | (15,830,022 | ) | | | (25,374,417 | ) |
| | | | | | | | | |
| | | |
Net Decrease in Net Assets Resulting from Capital Share Transactions | | | (15,166,680 | ) | | | (18,017,982 | ) |
| | | | | | | | | |
| | | |
Net Increase/(Decrease) in Net Assets | | | 8,666,263 | | | | (50,999,418 | ) |
| | | | | | | | | |
| | |
Net Assets | | | | | |
| | | |
Beginning of period | | | 141,042,386 | | | | 192,041,804 | |
| | | | | | | | | |
| | | |
End of period | | $ | 149,708,649 | | | $ | 141,042,386 | |
| | | | | | | | | |
| | |
Other Information: | | | | | |
| | | |
Shares | | | | | | | | |
| | | |
Sold | | | 32,465 | | | | 359,038 | |
| | | |
Redeemed | | | (753,422 | ) | | | (1,232,800 | ) |
| | | | | | | | | |
| | | |
Net Decrease | | | (720,957 | ) | | | (873,762 | ) |
| | | | | | | | | |
| | | | | | | | | |
| | | | |
| The accompanying notes are an integral part of these financial statements. | | | | 7 |
FINANCIAL INFORMATION — GUARDIAN DIVERSIFIED RESEARCH VIP FUND
The Financial Highlights table is intended to help you understand the Fund’s financial performance for the past six reporting periods (or, if shorter, the period since inception). Certain information reflects financial results for a single Fund share. The total returns in the table represent the rate that an investor would have earned (or lost) on an investment in the Fund.
| | | | | | | | | | | | | | | | | | | | | | | | |
Financial Highlights Six Months Ended Numbers are unaudited | | | | | | | | | | | | | | | | |
| | | Per Share Operating Performance | | | | |
| | | Net Asset Value,
Beginning of
Period | | | Net Investment
Income(1) | | |
Net Realized
and Unrealized
Gain/(Loss) | | | Total
Operations | | | Net Asset
Value, End of
Period | | | Total
Return(2) | |
| | | | | | | |
Six Months Ended 6/30/23 | | $ | 19.44 | | | $ | 0.06 | | | $ | 3.42 | | | $ | 3.48 | | | $ | 22.92 | | | | 17.90% | (4) |
| | | | | | | |
Year Ended 12/31/22 | | | 23.63 | | | | 0.11 | | | | (4.30) | | | | (4.19) | | | | 19.44 | | | | (17.73)% | |
| | | | | | | |
Year Ended 12/31/21 | | | 19.05 | | | | 0.08 | | | | 4.50 | | | | 4.58 | | | | 23.63 | | | | 24.04% | |
| | | | | | | |
Year Ended 12/31/20 | | | 15.85 | | | | 0.08 | | | | 3.12 | | | | 3.20 | | | | 19.05 | | | | 20.19% | |
| | | | | | | |
Year Ended 12/31/19 | | | 11.84 | | | | 0.11 | | | | 3.90 | | | | 4.01 | | | | 15.85 | | | | 33.87% | |
| | | | | | | |
Year Ended 12/31/18 | | | 12.65 | | | | 0.09 | | | | (0.90) | | | | (0.81) | | | | 11.84 | | | | (6.40)% | |
| | | | |
| 8 | | | | The accompanying notes are an integral part of these financial statements. |
FINANCIAL INFORMATION — GUARDIAN DIVERSIFIED RESEARCH VIP FUND
| | | | | | | | | | | | | | | | | | | | | | |
| | | | | | | | | | | | | | | | | |
| Ratios/Supplemental Data | |
Net Assets, End
of Period (000s) | | | Net Ratio of
Expenses to
Average
Net Assets(3) | | | Gross Ratio of
Expenses to
Average Net
Assets | | | Net Ratio of Net
Investment Income
to Average
Net Assets(3) | | | Gross Ratio of Net
Investment Income
to Average
Net Assets | | | Portfolio
Turnover Rate | |
| | | | | |
| $ | 149,709 | | | | 0.96% | (4) | | | 0.99% | (4) | | | 0.58% | (4) | | | 0.55% | (4) | | | 17% | (4) |
| | | | | |
| | 141,042 | | | | 0.96% | | | | 0.99% | | | | 0.53% | | | | 0.50% | | | | 45% | |
| | | | | |
| | 192,042 | | | | 0.95% | | | | 0.95% | | | | 0.36% | | | | 0.36% | | | | 44% | |
| | | | | |
| | 193,384 | | | | 1.01% | | | | 1.02% | | | | 0.52% | | | | 0.51% | | | | 76% | |
| | | | | |
| | 196,050 | | | | 1.01% | | | | 1.03% | | | | 0.77% | | | | 0.75% | | | | 88% | |
| | | | | |
| | 148,193 | | | | 1.02% | | | | 1.09% | | | | 0.68% | | | | 0.61% | | | | 88% | |
| (1) | Calculated based on the average shares outstanding during the period. |
| (2) | Total returns do not reflect the effects of charges deducted pursuant to the terms of The Guardian Insurance & Annuity Company, Inc.’s variable contracts. Inclusion of such charges would reduce the total returns for all periods shown. |
| (3) | Net Ratio of Expenses to Average Net Assets and Net Ratio of Net Investment Income to Average Net Assets include the effect of fee waivers and expense limitations. |
| (4) | Ratios for periods less than one year have been annualized, except for total return and portfolio turnover rate. |
| | | | |
| The accompanying notes are an integral part of these financial statements. | | | | 9 |
NOTES TO FINANCIAL STATEMENTS — GUARDIAN DIVERSIFIED RESEARCH VIP FUND
June 30, 2023 (unaudited)
1. Organization
Guardian Variable Products Trust (the “Trust”), a Delaware statutory trust organized on January 12, 2016, is registered under the Investment Company Act of 1940, as amended (the “1940 Act”), as an open-end management investment company. The Trust currently has twenty-four series. Guardian Diversified Research VIP Fund (the “Fund”) is a series of the Trust. The Fund is a diversified fund and commenced operations on September 1, 2016. The financial statements for other series of the Trust are presented in separate reports.
The Trust has authorized an unlimited number of shares of beneficial interest with no par value. Shares are bought and sold at closing net asset value (“NAV”). Shares of the Fund are only sold to certain separate accounts of The Guardian Insurance & Annuity Company, Inc. (“GIAC”) that fund certain variable annuity contracts and variable life insurance policies issued by GIAC. GIAC is a wholly-owned subsidiary of The Guardian Life Insurance Company of America (“Guardian Life”).
The Fund seeks capital appreciation.
2. Significant Accounting Policies
The following is a summary of significant accounting policies followed by the Fund in the preparation of its financial statements. The Fund follows the investment company accounting and reporting guidance of the Financial Accounting Standards Board (“FASB”) Accounting Standards Codification Topic 946 Financial Services – Investment Companies. The following policies are in conformity with accounting principles generally accepted in the United States of America (“GAAP”). The preparation of financial statements in accordance with GAAP requires management to make estimates and assumptions that affect the reported amounts and disclosures in the financial statements. Actual results could differ from those estimates.
a. Investment Valuations The Board of Trustees has designated Park Avenue Institutional Advisers LLC (“Park Avenue”) as the valuation designee for the Fund pursuant to Rule 2a-5 under the 1940 Act. Park Avenue has established a Fair Valuation Committee and has adopted fair valuation procedures that provide methodologies for fair valuing securities. These procedures include monitoring the appropriateness of fair values based on results of ongoing valuation oversight, including but not limited to consideration of
security specific events, market events, and pricing vendor and broker-dealer due diligence. The Fair Valuation Committee oversees and carries out the policies for the valuation of investments held in the Fund. The Fair Valuation Committee is responsible for discussing and assessing the potential impacts to the fair values on an ongoing basis, and reports to the Board of Trustees on at least a quarterly basis.
Equity securities traded on an exchange other than NASDAQ Stock Market, LLC (“NASDAQ”) are valued at the last reported sale price on the principal exchange or market on which they are traded; or, if there were no sales that day, at the mean between the closing bid and ask prices. Securities traded on the NASDAQ are generally valued at the NASDAQ official closing price, which may not be the last sale price. If the NASDAQ official closing price is not available for a security, that security is generally valued at the mean between the closing bid and ask prices. Repurchase agreements are carried at cost, which approximates fair value (see Note 5d). Foreign securities are valued in the currencies of the markets in which they trade and then converted to U.S. dollars by the application of foreign exchange rates at the close of the New York Stock Exchange (“NYSE”). Forward foreign currency contracts, if any, are valued at the mean between the bid and ask rates for the specified time interpolated from rates for proximate time periods.
Securities for which market quotations are not readily available or securities whose values have been materially affected by events occurring before the Fund’s valuation time but after the close of the securities’ principal exchange or market are valued at their fair values as determined in good faith by Park Avenue, as the Board of Trustee’s valuation designee (as defined in Rule 2a-5 under the 1940 Act), in accordance with Park Avenue’s procedures and under the general oversight of the Board of Trustees. In addition, the values of the Fund’s investments in foreign securities are generally determined by a pricing service using pricing models designed to estimate likely changes in the values of those securities. Certain foreign equity instruments are valued by applying international fair value factors provided by approved pricing services. The factors seek to adjust the local closing price for movements of local markets post closing, but prior to the time the NAVs are calculated. Valuations reflected in this report are as of the report date. As a result, changes in valuation due to market events and/or issuer related events after the report date and prior to issuance of the report are not reflected herein.
NOTES TO FINANCIAL STATEMENTS — GUARDIAN DIVERSIFIED RESEARCH VIP FUND
Various inputs are used in determining the valuation of the Fund’s investments. These inputs are summarized in three broad levels listed below.
| • | | Level 1 – unadjusted inputs using quoted prices in active markets for identical investments. |
| • | | Level 2 – other significant observable inputs, including, but not limited to, quoted prices for similar investments, inputs other than quoted prices that are observable for investments (such as interest rates, prepayment speeds, credit risks, etc.) or other market corroborated inputs. |
| • | | Level 3 – significant unobservable inputs (including the Fund’s own assumptions in determining the fair value of investments). |
Inputs may include price information, volatility statistics, specific and broad credit data, liquidity statistics, and other factors. A financial instrument’s level within the fair value hierarchy is based on the lowest level of any input; both individually and in aggregate, that is significant to the fair value measurement. However, the determination of what constitutes “observable” requires significant judgment by the Trust. The Trust considers observable data to be that market data which is readily available, regularly distributed or updated, reliable and verifiable, and provided by independent sources that are actively involved in the relevant market. The inputs or methodology used for valuing securities are not necessarily an indication of the risk associated with investing in those securities. Changes in valuation techniques may result in transfers into or out of a financial instrument’s assigned level within the hierarchy.
The FASB requires reporting entities to make disclosures about purchases, sales, issuances and settlements of Level 3 securities on a gross basis. For the six months ended June 30, 2023, there were no transfers into or out of Level 3 of the fair value hierarchy.
In determining a financial instrument’s placement within the hierarchy, the Trust separates the Fund’s investment portfolio into two categories: investments and derivatives (e.g., futures). A summary of inputs used to value the Fund’s assets and liabilities carried at fair value as of June 30, 2023 is included in the Schedule of Investments.
Investments Investments whose values are based on quoted market prices in active markets, and are therefore classified within Level 1, include active listed equities. Investments that trade in markets that are not considered to be active, but are valued based on quoted
market prices, dealer quotations or alternative pricing sources supported by observable inputs are classified within Level 2. These include certain U.S. government and sovereign obligations, most government agency securities, investment-grade corporate bonds, certain mortgage products, state, municipal and provincial obligations, and certain foreign equity securities, including securities whose prices may have been affected by events occurring after the close of trading on their principal exchange or market and, as a result, whose values are determined by a pricing service as described above, or securities whose values are otherwise determined using fair valuation methods approved by the Fund’s Board of Trustees.
Investments classified within Level 3 have significant unobservable inputs, as they trade infrequently or not at all. Level 3 investments include, among others, private placement securities. When observable prices are not available for these securities, the Trust uses one or more valuation techniques for which sufficient and reliable data is available. The inputs used by the Trust in estimating the value of Level 3 investments include, for example, the original transaction price, recent transactions in the same or similar instruments, completed or pending third-party transactions in the underlying investment or comparable issuers, subsequent rounds of financing, recapitalizations, and other transactions across the capital structure. Level 3 investments may also be adjusted to reflect illiquidity and/or non-transferability, with the amount of such discount estimated by the Trust in the absence of market information. Assumptions used by the Trust due to the lack of observable inputs may significantly impact the resulting fair value and therefore the Fund’s results of operations. As of June 30, 2023, the Fund had no securities classified as Level 3.
Derivatives Exchange-traded derivatives, such as futures contracts, exchange-traded option contracts and certain swaps, are typically classified within Level 1 or Level 2 of the fair value hierarchy depending on whether or not they are deemed to be actively traded. Certain non-exchange-traded derivatives, such as generic forwards, certain swaps and options, have inputs which can generally be corroborated by market data and are therefore classified within Level 2. During the six months ended June 30, 2023, the Fund did not hold any derivatives.
b. Securities Transactions Securities transactions are accounted for on the date securities are purchased or sold (trade date). Realized gains or losses on securities transactions are determined on the basis of specific identification.
NOTES TO FINANCIAL STATEMENTS — GUARDIAN DIVERSIFIED RESEARCH VIP FUND
c. Foreign Currency Translation The accounting records of the Fund are maintained in U.S. dollars. Investment securities and all other assets and liabilities of the Fund denominated in a foreign currency are generally translated into U.S. dollars at the exchange rates quoted at the close of the NYSE on each business day. The market value of investment securities and other assets and liabilities are translated at the exchange rate as of the valuation date. Purchases and sales of securities, income receipts, and expense payments are translated into U.S. dollars at the exchange rates in effect on the dates of the respective transactions. The Fund does not isolate the portion of the fluctuations on investments resulting from changes in foreign currency exchange rates from the fluctuations in market prices of investments held. Such fluctuations are included in the Net change in net realized and unrealized gain/(loss) from investments on the Statement of Operations.
Reported realized foreign currency gains and losses arise from the disposition of foreign currency, currency gains or losses realized between the trade and settlement dates on securities transactions, and the difference between the amounts of dividends, interest and foreign withholding taxes recorded on the Fund’s books on the transaction date and the U.S. dollar equivalent of the amounts actually received or paid. These reported realized foreign currency gains and losses, if any, are included in Net realized gain/(loss) from foreign currency transactions on the Statement of Operations. Unrealized foreign currency gains and losses arise from changes (due to changes in exchange rates) in the value of foreign currency and other assets and liabilities denominated in foreign currencies, which are held at period end, if any, and are included in Net change in unrealized appreciation/(depreciation) on translation of assets and liabilities in foreign currencies on the Statement of Operations.
d. Foreign Capital Gains Tax The Fund may be subject to foreign taxes on income, gains on investments or currency purchases/repatriation, a portion of which may be recoverable. The Fund will accrue such taxes and recoveries as applicable, based upon their current interpretation of tax rules and regulations that exist in the markets in which they invest.
e. Investment Income Dividend income net of foreign taxes withheld, if any, is generally recorded on the ex-dividend date. Distributions received from real estate investment trusts, if any, may be classified as dividends, capital gains and/or return of capital. Interest income, which includes amortization/accretion of
premium/discount, is determined using the interest income accrual method, and is accrued and recorded daily.
f. Allocation of Income and Expenses Many of the expenses of the Trust can be directly attributed to a specific series of the Trust. Expenses that cannot be directly attributed to a specific series of the Trust are generally apportioned among all the series in the Trust, based on relative net assets. In calculating net asset value per share for each series of the Trust, investment income, realized and unrealized gains and losses, and expenses other than series-specific expenses are allocated daily to each series based upon the proportion of net assets attributable to each series.
3. Transactions with Affiliates
a. Investment Advisory Fee and Expense Limitation Under the terms of the advisory agreement, which, after its two year initial term, is reviewed and approved annually by the Board of Trustees, the Fund pays an investment advisory fee to Park Avenue. Park Avenue is a wholly-owned subsidiary of Guardian Life and receives an investment advisory fee at an annual rate of 0.60% of the Fund’s average daily net assets. The fee is accrued daily and paid monthly.
Park Avenue has contractually agreed through April 30, 2024 to waive certain fees and/or reimburse certain expenses incurred by the Fund to the extent necessary to limit the Fund’s total annual operating expenses after fee waiver and/or expense reimbursement to 0.96% of the Fund’s average daily net assets (excluding, if applicable, any acquired fund fees and expenses, taxes, interest, transaction costs and brokerage commissions, litigation and extraordinary expenses). The limitation may not be increased or terminated prior to this time without action by the Board of Trustees and may be terminated only upon approval of the Board of Trustees. Amounts waived or reimbursed by Park Avenue pursuant to any expense limitation will not be subject to Park Avenue’s recoupment rights. For the six months ended June 30, 2023, Park Avenue waived fees and/or paid Fund expenses in the amount of $22,815.
Park Avenue has entered into a Sub-Advisory Agreement with Putnam Investment Management LLC (“Putnam”). Putnam is responsible for providing day-to-day investment advisory services to the Fund, subject to the supervision of Park Avenue and the oversight of the Board of Trustees. Sub-advisory fees are paid by Park Avenue and do not represent a separate or additional expense to the Fund.
NOTES TO FINANCIAL STATEMENTS — GUARDIAN DIVERSIFIED RESEARCH VIP FUND
b. Compensation of Trustees and Officers Trustees and officers who are interested persons of the Trust, as defined in the 1940 Act, receive no compensation from the Fund, except for the Chief Compliance Officer of the Trust. Trustees of the Trust who are not interested persons of the Trust, and the Chief Compliance Officer, receive compensation and reimbursement of expenses from the Trust.
c. Distribution Fees Park Avenue Securities LLC (“PAS”), a wholly-owned subsidiary of Guardian Life, is the principal underwriter of Fund shares. The Trust has entered into a distribution and service agreement with PAS, which governs the sale and distribution of shares of the Fund. Under a distribution and service plan adopted by the Trust (“12b-1 plan”), PAS is compensated for services in such capacity, including its expenses in connection with the promotion and distribution of shares of the Fund, at an annual rate of 0.25% of the Fund’s average daily net assets. For the six months ended June 30, 2023, the Fund paid distribution fees in the amount of $179,638 to PAS.
PAS has directed that certain payments under the 12b-1 plan be used to compensate GIAC for shareholder services provided to contract owners.
4. Federal Income Taxes
a. Distributions to Shareholders For federal income tax purposes, the Fund is treated as a disregarded entity (“DRE”). As a DRE, the Fund is not subject to an entity-level income tax; and any income, gains, losses, deductions, taxes, and credits of the Fund would instead be “passed through” directly to the separate accounts of GIAC that invest in the Fund and retain the same character for U.S. federal income tax purposes. In addition, the Fund is not required to distribute taxable income and capital gains for U.S. federal income tax purposes. Therefore, no dividends and capital gains distributions were paid by the Fund.
5. Investments
a. Investment Purchases and Sales The cost of investments purchased and the proceeds from investments sold (excluding short-term investments) amounted to $24,099,199 and $39,623,040, respectively, for the six months ended June 30, 2023. During the six months ended June 30, 2023, there were no purchases or sales of U.S. government securities.
b. Foreign Securities Foreign securities investments involve special risks and considerations not typically associated with U.S. investments. These risks include, but are not limited to, currency risk; adverse political,
regulatory, social, and economic developments; and less reliable information about issuers. Moreover, securities of some foreign issuers may be less liquid and their prices more volatile than those of comparable U.S. issuers.
c. Industry or Sector Concentration In its normal course of business, the Fund may invest a significant portion of its assets in companies within a limited number of industries or sectors. As a result, the Fund may be subject to a greater risk of loss than that of a fund invested in a wider spectrum of industries or sectors because the stocks of many or all of the companies in the industry, group of industries, sector, or sectors may decline in value due to developments adversely affecting the industry, group of industries, sector, or sectors.
d. Repurchase Agreements The Fund may invest in repurchase agreements to maintain liquidity and earn income over periods of time as short as overnight. The collateral for repurchase agreements is either cash or fully negotiable U.S. government securities (including U.S. government agency securities). Repurchase agreements are fully collateralized (including the interest accrued thereon) and such collateral is marked to market daily while the agreements remain in force. If the value of the collateral falls below the repurchase price plus accrued interest, the Fund will typically require the seller to deposit additional collateral by the next business day. If the request for additional collateral is not met, or the seller defaults, the Fund maintains the right to sell the collateral (although it may be prevented or delayed from doing so in certain circumstances) and may be required to claim any resulting loss against the seller. Park Avenue monitors the creditworthiness of the seller with which the Fund enters into repurchase agreements.
e. Restricted and Illiquid Securities A restricted security cannot be resold to the general public without prior registration under the Securities Act of 1933, as amended (except pursuant to an applicable exemption). The values of these securities may be highly volatile. If the security is subsequently registered and resold, the issuer would typically bear the expense of all registrations at no cost to the Fund. Restricted and illiquid securities are valued according to the policies and procedures adopted by the Trust’s Board of Trustees and are noted, if any, in the Fund’s Schedule of Investments. As of June 30, 2023, the Fund did not hold any restricted, other than 144A restricted securities or illiquid securities.
NOTES TO FINANCIAL STATEMENTS — GUARDIAN DIVERSIFIED RESEARCH VIP FUND
6. Temporary Borrowings
The Fund, with other funds managed by Park Avenue, is party to a credit agreement with respect to a $10 million committed revolving credit facility from State Street Bank and Trust Company (the “Credit Agreement”) for temporary borrowing purposes, including the meeting of redemption requests that otherwise might require the untimely disposition of securities. Interest is based on a daily fluctuating rate per annum equal to the Applicable Rate (as defined in the Credit Agreement) plus the Applicable Margin (as defined in the Credit Agreement) that is subject to change from time to time as and when the Applicable Rate changes. Under the current Credit Agreement, the Applicable Rate for any day is defined as the rate per annum equal to the sum of (a) 0.10% plus (b) the higher of (i) the Federal Funds Effective Rate for such day and (ii) the Overnight Bank Funding Rate for such day; the Applicable Margin is 1.25%. In addition to the interest charged on any borrowings by the Fund, each fund pays a commitment fee of 0.30% per annum on its share of the unused portion of the credit facility. The agreement is in place until January 5, 2024. The Fund did not utilize the credit facility during the six months ended June 30, 2023.
7. Indemnifications
Under the Trust’s organizational documents and, in some cases, by contract, officers and Trustees of the Trust are indemnified against certain liabilities arising out of the performance of their duties to the Fund. In addition, in the normal course of business, the Fund enters into contracts with its vendors and others that provide general indemnifications. The Fund’s maximum exposure under these arrangements is unknown as this would involve future claims that may be made against the Fund that have not yet occurred. However, based on experience, the Fund expects the risk of loss to be remote.
8. Additional Information
The outbreak of COVID-19 has adversely impacted both local and global economies, including those in which the Fund may invest. These impacts include materially reduced consumer demand and economic output, disrupted supply chains, market closures, travel restrictions and quarantines, and strained healthcare systems. The Fund’s operations may be interrupted as a result, which may have a negative impact on the Fund’s investment performance.
SUPPLEMENTAL INFORMATION (UNAUDITED)
Liquidity Risk Management Program
In compliance with Rule 22e-4 under the Investment Company Act of 1940, as amended (the “Liquidity Rule”), Guardian Variable Products Trust (the “Trust”) has adopted and implemented a written liquidity risk management program (the “Program”) for each series of the Trust (each, a “Fund”), which is reasonably designed to assess and manage each Fund’s liquidity risk. The Fund’s “liquidity risk” is the risk that the Fund could not
meet requests to redeem shares issued by the Fund without significant dilution of the remaining investors’ interests in the Fund.
The Board of Trustees of the Trust (the “Board”)
Previously approved the designation of Park Avenue Institutional Advisers LLC (the “Administrator” or “PAIA”) as Program administrator. The Administrator established a Liquidity Risk Management Committee, which is comprised of certain officers of the Trust and PAIA, that assists the Administrator in the implementation and day-to-day administration of the Program and otherwise support carrying out the Administrator’s liquidity risk management responsibilities under the Program.
In accordance with the Program, each Fund’s liquidity risk is assessed no less frequently than annually, taking into consideration a variety of factors, including, as applicable, the Fund’s investment strategy and liquidity of portfolio investments, cash flow projections, and holdings of cash and cash equivalents, as well as borrowing arrangements and other funding sources. Certain factors are considered under both normal and reasonably foreseeable stressed conditions.
Each Fund portfolio investment is classified, no less than monthly, into one of four liquidity categories (including “highly liquid investments” and “illiquid investments,” discussed below) based on a determination of the number of days it is reasonably expected to take to convert the investment to cash, or sell or dispose of the investment, in current market conditions without
significantly changing the investment’s market value.
The Liquidity Rule limits the Fund’s investments in illiquid investments by prohibiting the Fund from acquiring any illiquid investment if, immediately after the acquisition, the Fund would have invested more than 15% of its net assets in illiquid investments that are assets. The Program includes provisions reasonably designed to comply with this investment limitation. In addition, the Program includes provisions reasonably designed to comply with this investment limitation. In addition, the Program includes provisions reasonably designed to comply with the Liquidity Rule’s requirements relating to highly liquid investment minimums, which is a minimum amount of Fund net assets that must be invested in highly liquid investments that are assets, as applicable. The Fund was not required to adopt a highly liquid investment minimum during the period.
At a meeting of the Board held on March 29-30, 2023, the Board received a report (the “Report”) prepared by the Administrator addressing the Program’s operation and assessing the adequacy and effectiveness of its implementation for the period from January 1, 2022 through December 31, 2022 (the “Reporting Period”). The Report noted that the Administrator believes the Program operated effectively during the Reporting Period and continues to be reasonably designed to effectively assess and manage each Fund’s liquidity risk. The Report also noted that the Administrator believes the Program has been adequately and effectively implemented and the investment strategies for each Fund continue to be appropriate since its inception. In addition, the Report summarized the operation of the Program and the information and factors considered by the Administrator in its assessment of the Program’s implementation, such as the liquidity risk assessment framework and liquidity classification methodologies.
There can be no assurance that the Program will achieve its objectives under all circumstances. Please refer to the Fund’s prospectus for more information regarding the Fund’s exposure to liquidity risk and other risks to which an investment in the Fund may be subject.
SUPPLEMENTAL INFORMATION (UNAUDITED)
Approval of Investment Management and Sub-advisory Agreements
Section 15(c) of the Investment Company Act of 1940, as amended (the “1940 Act”), requires that a fund’s investment advisory and sub-advisory agreements be approved initially by the fund’s board of trustees. Section 15(c) also requires that the continuation of these agreements, after an initial term of up to two years, be annually reviewed and approved by the board. Any such agreement must be approved by a vote of a majority of the trustees who are not parties to the agreement or “interested persons” (as defined in the 1940 Act) of a party to the agreement at a meeting of the board called for the purpose of voting on such approval.
At a meeting of the Board of Trustees (the “Board”) of Guardian Variable Products Trust (the “Trust”) held on March 29-30, 2023 (the “Meeting”), the Board, including the trustees who are not parties to the agreement or “interested persons” as defined in the 1940 Act (the “Independent Trustees”), considered and voted unanimously to renew the existing investment management agreement between the Trust, on behalf of Guardian All Cap Core VIP Fund; Guardian Balanced Allocation VIP Fund; Guardian Core Fixed Income VIP Fund; Guardian Core Plus Fixed Income VIP Fund; Guardian Diversified Research VIP Fund; Guardian Equity Income VIP Fund; Guardian Global Utilities VIP Fund; Guardian Growth & Income VIP Fund; Guardian Integrated Research VIP Fund; Guardian International Growth VIP Fund; Guardian International Equity VIP Fund; Guardian Large Cap Disciplined Growth VIP Fund; Guardian Large Cap Disciplined Value VIP Fund; Guardian Large Cap Fundamental Growth VIP Fund; Guardian Mid Cap Relative Value VIP Fund; Guardian Mid Cap Traditional Growth VIP Fund; Guardian Multi-Sector Bond VIP Fund; Guardian Select Mid-Cap Core VIP Fund; Guardian Short Duration Bond VIP Fund; Guardian Small Cap Core VIP Fund; Guardian Small-Mid Cap Core VIP Fund; Guardian Strategic Large Cap Core VIP Fund; Guardian Total Return Bond VIP Fund and Guardian U.S. Government Securities VIP Fund (each, a “Fund,” and together, the “Funds”), in substantially the form presented at this meeting (the “Management Agreement”); and Park Avenue Institutional Advisers LLC (the “Manager”) for a one-year term.
The Board, including the Independent Trustees, also considered and voted unanimously to renew the existing sub-advisory agreements (the “Sub-Advisory Agreements,” collectively with the Management Agreement and Sub-Subadvisory Agreement, the “Agreements”) between the Manager and investment
advisory firms engaged to serve as sub-advisers to certain of the Funds (the “Sub-Advised Funds”), namely (i) ClearBridge Investments, LLC with respect to Guardian Small Cap Core VIP Fund; (ii) Putnam Investment Management, LLC with respect to Guardian Diversified Research VIP Fund; (iii) AllianceBernstein L.P. with respect to Guardian Growth & Income VIP Fund and Guardian Strategic Large Cap Core VIP Fund; (iv) J.P. Morgan Investment Management Inc. with respect to Guardian International Growth VIP Fund; (v) Schroder Investment Management North America Inc. with respect to Guardian International Equity VIP Fund; (vi) Wellington Management Company LLP with respect to Guardian Balanced Allocation VIP Fund, Guardian Equity Income VIP Fund, Guardian Integrated Research VIP Fund, Guardian Large Cap Disciplined Growth VIP Fund and Guardian Global Utilities VIP Fund; (vii) Boston Partners Global Investors, Inc. with respect to Guardian Large Cap Disciplined Value VIP Fund; (viii) Janus Henderson Investors US LLC with respect to Guardian Mid Cap Traditional Growth VIP Fund; (ix) Allspring Global Investments, LLC with respect to Guardian Mid Cap Relative Value VIP Fund and Guardian Small-Mid Cap Core VIP Fund; (x) Lord, Abbett & Co. LLC with respect to Guardian Core Plus Fixed Income VIP Fund; (xi) FIAM LLC with respect to Guardian Select Mid Cap Core VIP Fund; and (xii) Massachusetts Financial Services Company with respect to Guardian All Cap Core VIP Fund, each in substantially the form presented at this meeting, (each, a “Sub-Adviser” and collectively, the “Sub-Advisers”) for a one-year term.
The Board, including the Independent Trustees, also considered and voted unanimously to renew the existing sub-subadvisory agreement (the “Sub-Subadvisory Agreement”) between Schroder Investment Management North America Inc. and Schroder Investment Management North America Limited (also a Sub-Adviser) with respect to Guardian International Equity VIP Fund for a one-year term.
The Board is responsible for overseeing the management of each Fund. In determining whether to renew its approval of the Agreements, the Trustees evaluated information and factors that they considered to be relevant and appropriate through the exercise of their own business judgment. The Trustees considered certain information and factors in light of advice furnished to them by legal counsel to the Trust and, in the case of the Independent Trustees, their independent legal counsel. In advance of the Meeting, the Trustees received materials and information designed to assist their consideration of the Agreements. The Trustees received written responses
SUPPLEMENTAL INFORMATION (UNAUDITED)
from the Manager and each Sub-Adviser to a series of questions and requests for information encompassing a wide variety of topics provided by independent counsel on behalf of the Independent Trustees. The Independent Trustees also received materials and information regarding the legal standards applicable to their consideration of the Agreements and the process and criteria used by the Manager to identify and select the Sub-Advisers.
During the course of their deliberations, the Independent Trustees met twice to discuss and evaluate the materials, information and Agreements in executive session with their independent legal counsel, outside of the presence of the Trustees who are not Independent Trustees and representatives from Fund management, the Manager or any Sub-Adviser.
In reaching its decisions to renew its approval of the Agreements, the Board took into account the materials and information described above, as well as other materials and information provided to the Board throughout the year. Individual Trustees may have given different weight to different factors and information with respect to each Agreement, and the Trustees did not identify any single factor or information that, in isolation, would be controlling in deciding to approve the Agreements. The discussion below is intended to summarize the broad factors that figured prominently in the Board’s decisions to renew its approval of the Agreements rather than to be all-inclusive. These broad factors included: (i) the nature, extent and quality of the services provided to the Funds by the Manager and to the Sub-advised Funds by the Sub-Advisers; (ii) the investment performance of each Fund; (iii) estimated profitability of the Manager; (iv) fees and expenses; (v) the extent to which economies of scale may exist, and the extent to the benefits of economies of scale are shared with the Funds; and (vi) any other benefits derived by the Manager or the Sub-Advisers (or their respective affiliates) from their relationships with the Funds.
Nature, Extent and Quality of Services
The Trustees considered information regarding the nature, extent and quality of services provided to the Funds by the Manager. The Trustees also considered, among other things, the terms of the Management Agreement and the range of investment advisory services provided by the Manager. In addition, the Trustees reviewed the range of non-investment advisory services provided by the Manager consistent with the terms of the Management Agreement, notably coordinating the preparation and filing of various
regulatory documents, coordinating the preparation and assembly of Board meeting materials, and assisting the Board with certain valuation matters. The Board also received a description of the Manager’s and each Sub-Adviser’s business continuity plans and of their respective approaches to data privacy and cybersecurity, and related testing. The Board received information regarding the response of the Manager and the Sub-Advisers to the COVID-19 pandemic, including the continuation of remote work arrangements and return-to-office plans. The Board also received information about the Manager’s role as administrator of the Funds’ liquidity risk management program, the Manager’s approach to risk management, and the Manager’s vendor oversight programs.
The Trustees considered that the Sub-advised Funds operate in a “manager-of-managers” structure and reviewed the responsibilities that the Manager has under this structure, including monitoring and evaluating the performance of the Sub-Advisers, monitoring the Sub-Advisers for adherence to the stated investment objectives, strategies, policies and restrictions of the Funds and supervising the Sub-Advisers with respect to the services that the Sub-Advisers would provide under the Sub-Advisory Agreements. The Trustees also considered the process used by the Manager, consistent with this structure, to identify and recommend sub-advisers, and the Manager’s ability to monitor and oversee sub-advisers and recommend replacement sub-advisers, when necessary, and provide other services under the Management Agreement. The Board noted that investment management staff of the Manager and the Trust’s Chief Compliance Officer conduct oversight meetings with the Sub-Advisers on a periodic basis, follow through with additional inquiries on any questions or concerns that arise during the meetings and, as necessary, then report the results of the meetings to the Board. The Trustees reviewed information regarding the experience and background of the Manager’s key personnel and the Manager’s organizational structure and resources, including investment, legal and administrative capabilities of the Manager. In this regard, the Trustees recognized that the Funds may benefit from the Manager’s ability to use resources and capabilities of its affiliates in providing services to the Funds.
The Trustees considered information regarding the nature, extent and quality of services provided to the Sub-advised Funds by the Sub-Advisers. The Trustees also considered, among other things, the terms of the Sub-advisory Agreements and the range of investment
SUPPLEMENTAL INFORMATION (UNAUDITED)
advisory services provided by the Sub-Advisers under the oversight of the Manager. In evaluating these investment advisory services, the Trustees considered, among other things, the Sub-Advisers’ investment philosophies, styles and/or processes and approaches to managing the respective Sub-advised Funds. The Trustees received and evaluated information regarding the background, education, expertise and/or experience of the investment professionals who serve as portfolio managers for the Sub-advised Funds and the capabilities and resources of the Sub-Advisers.
Based upon these considerations, the Trustees concluded, within the context of their full deliberations, that the nature, extent and quality of services provided to the Funds by the Manager and the Sub-advised Funds by each respective Sub-Adviser were appropriate.
Investment Performance
In connection with each of its regular quarterly meetings, the Board receives information on the performance of each Fund, including net performance, relative performance rankings within the relevant Morningstar peer group, and performance as compared to benchmark index returns. At each quarterly Board meeting, members of the Manager’s funds management team review with the Board the economic and market environment, absolute and relative performance of each Fund, and any relevant information about risk management and style consistency in connection with management of the Funds. The Board considered investment performance for each Fund over the one-year, three-year (where available), five-year (where available) and since-inception periods.
The Board also received and reviewed a report prepared by Broadridge Financial Solutions (“Broadridge”), an independent provider of mutual fund industry data, which included comparisons of the performance of each Fund to performance of an appropriate peer universe. For details regarding each Fund’s performance, see the “Fund-by-Fund Factors” section below.
The Manager discussed with the Board factors contributing to the Funds’ performance results. In addition, for certain Funds, the Manager provided to the Board longer term performance records of the Sub-Advisers for strategies used in managing the Funds. The Board concluded that the investment performance generated by the Manager and each Sub-Adviser was generally satisfactory, or, that any steps being taken by the Manager and Sub-Advisers to address any performance issues were satisfactory.
Profitability
The Board received and considered the Manager’s estimate of its profitability, which included allocations by the Manager of its costs in providing management services to the Funds. The Board considered the estimated profitability of the Manager both overall and on a Fund-by-Fund basis.
The Board received and considered profitability information from most of the Sub-Advisers, but noted that the Manager had negotiated the fees with the Sub-Advisers at arm’s-length. Accordingly, the Board concluded that the profitability of the Sub-Advisers is a less relevant factor than Manager profitability.
Based on the consideration of this information, the Board concluded that the profitability of the Funds to the Manager was acceptable.
Fees and Expenses
The Trustees considered the management fees paid by the Funds to the Manager under the Management Agreement and evaluated the reasonableness of these fees. The Trustees received and reviewed comparative information with respect to the management fee and total expenses for each Fund and the management fees and total expenses for a peer group of other funds selected by Broadridge. The Trustees considered the Manager’s commitment to limit the total expenses of each Fund through an expense limitation agreement with the Trust. Although the Board recognized that the comparisons between the management fees and actual expenses of the Funds and those of the identified peer group are imprecise, given different terms of agreements and variations in fund strategies, the Trustees found that the comparative information supported their consideration and approval of the management fees and evaluation of the total expenses. For details regarding each Fund’s fee and expense comparisons, see the “Fund-by-Fund Factors” section below.
The Trustees considered the sub-advisory fees paid under the Sub-advisory Agreements and evaluated the reasonableness of those fees. The Trustees also considered that the fees paid to the Sub-Advisers would be paid by the Manager and not the Funds and that the Manager had negotiated the fees with the Sub-Advisers at arm’s-length.
Based on the consideration of the information and factors summarized above, as well as other relevant information and factors, the Board concluded that the management and sub-advisory fees were reasonable in
SUPPLEMENTAL INFORMATION (UNAUDITED)
light of the nature, extent and quality of services rendered to the Funds by the Manager and the Sub-Advisers.
Economies of Scale
The Board considered the extent to which economies of scale may exist, and the extent to the benefits of economies of scale are shared with the Funds. In this regard, the Board noted that for sixteen of twenty-four Funds, the management and sub-advisory fee included breakpoints that are tiered based on growth in asset levels of each such Fund and that for the other Funds, the fees reflected appropriate levels based on current and expected asset levels. The Board also noted that the expenses of the Funds are subject to expense limitations provided by the Manager. The Board noted that expected economies of scale, where they exist, may be shared through the use of fee breakpoints, expense limitations by the Manager, and/or a lower overall fee.
Ancillary Benefits
The Board considered the potential benefits, other than management fees, that the Manager and/or its affiliates may receive because of the Manager’s relationship with the Funds. The Trustees considered that the Funds were designed to serve as investment options under variable contracts issued by affiliates of the Manager that would receive fees under those contracts and that Park Avenue Securities LLC, an affiliate of the Manager and principal underwriter of the Funds, and participating insurance companies, including insurance companies affiliated with the Manager, would be entitled to receive fees from the Funds under a plan of distribution adopted pursuant to Rule 12b-1 under the 1940 Act. The Trustees considered that the Manager and its affiliates may benefit from (i) greater efficiencies in annuity administration and operations and potential cost savings due to a reduction in the number of unaffiliated funds available as annuity contract investment options, and (ii) increased dividends-received deductions due to the Funds’ status under the tax laws as disregarded entities. In addition, the Trustees considered the potential benefits, other than sub-advisory fees, that the Sub-Advisers and their affiliates may receive because of their relationships with the Funds, including the ability to receive research from soft dollar commissions consistent with Trust policies. The Trustees concluded that benefits that may accrue to the Manager and its affiliates are reasonable and the benefits that may accrue to the Sub-Advisers and their affiliates are consistent with those expected for a sub-adviser to a mutual fund such as the applicable Fund.
Fund-by-Fund Factors
The Broadridge report groups fees, expenses and performance into five quintiles, with the top quintile having the highest performance or lowest fees/expenses, and the bottom quintile having the lowest performance or highest fees/expenses. For purposes of the descriptions below, a Fund’s performance is considered “in line with” the benchmark index if it is within 0.20%.
Guardian Large Cap Fundamental Growth VIP Fund
| • | | The Board noted that the Fund’s performance was in the 3rd quintile of its performance universe for the 1-year period and in the 4th quintile for its performance universe for the 3-year and 5-year periods. The Board also noted that the Fund’s performance was below the benchmark index for the 1-year, 3-year and 5-year periods. |
| • | | The Board noted that the contractual management fee, the actual management fee and actual total expenses were in the 1st quintile of the expense group. |
Guardian Large Cap Disciplined Growth VIP Fund
| • | | The Board noted that the Fund’s performance was in the 3rd quintile of its performance universe for the 1-year and 3-year periods and in the 2nd quintile for the 5-year period. The Board also noted that the Fund’s performance was below the benchmark index for the 1-year, 3-year and 5-year periods. |
| • | | The Board noted that the contractual management fee, the actual management fee and actual total expenses were in the 1st quintile of the expense group. |
Guardian Integrated Research VIP Fund
| • | | The Board noted that the Fund’s performance was in the 5th quintile of its performance universe for the 1-year and 5-year periods and in the 4th quintile for 3-year period. The Board also noted that the Fund’s performance was below the benchmark index for the 1-year, 3-year and 5-year periods. |
| • | | The Board noted that the contractual management fee, the actual management fee and actual total expenses were in the 1st quintile of the expense group. |
Guardian Diversified Research VIP Fund
| • | | The Board noted that the Fund’s performance was in the 3rd quintile of its performance universe for the 1-year and 3-year periods and in the 2nd quintile for the 5-year period. The Board also noted that the Fund’s performance was higher than the benchmark index for the 1-year period. The Board note that the Fund’s performance was lower than the benchmark index for the 3-year and 5-year periods. |
SUPPLEMENTAL INFORMATION (UNAUDITED)
| • | | The Board noted that the contractual management fee and actual management fee were in the 1st quintile of the expense group and that actual total expenses were in the 3rd quintile. |
Guardian Strategic Large Cap Core VIP Fund
| • | | The Board noted that the Fund’s performance was in the 1st quintile of its performance universe for the 1-year period. The Board acknowledged the Fund’s short operational history. The Board noted that the Fund’s performance was higher than the benchmark index for the 1-year period. |
| • | | The Board noted that the contractual management fee, the actual management fee and actual total expenses were in the 1st quintile of the expense group. |
Guardian Large Cap Disciplined Value VIP Fund
| • | | The Board noted that the Fund’s performance was in the 3rd quintile of its performance universe for the 1-year and 3-year periods and in the 4th quintile for the 5-year period. The Board also noted that the Fund’s performance was higher than the benchmark index for the 1-year and 3-year periods. The Board noted that the Fund’s performance was in line with the benchmark index for the 5-year period. |
| • | | The Board noted that the contractual management fee was in the 2nd quintile of the expense group, the actual management fee was in the 1st quintile of the expense group and that actual total expenses were in the 3rd quintile. |
Guardian Growth & Income VIP Fund
| • | | The Board noted that the Fund’s performance was in the 3rd quintile of its performance universe for the 1-year, 3-year and 5-year periods. The Board also noted that the Fund’s performance was higher than the benchmark index for the 1-year, 3-year and 5-year periods. |
| • | | The Board noted that the contractual management fee and the actual management fee were in the 1st quintile of the expense group and that actual total expenses were in the 3rd quintile. |
Guardian Equity Income VIP Fund
| • | | The Board noted that the Fund had less than one-year of operational history and was not able to evaluate an investment performance record for the Fund. The Board noted that it would have an opportunity to review such information in connection with future annual reviews. The Board noted that, in the meantime, it received monthly performance reports from the Manager. |
| • | | The Board noted that the contractual management fee, the actual management fee and actual total expenses were in the 1st quintile of the expense group. |
Guardian All Cap Core VIP Fund
| • | | The Board noted that the Fund’s performance was in the 3rd quintile of its performance universe for the 1-year period. The Board acknowledged the Fund’s short operational history. The Board noted that the Fund’s performance was higher than the benchmark index for the 1-year period. |
| • | | The Board noted that the contractual management fee, the actual management fee and actual total expenses were in the 1st quintile of the expense group. |
Guardian Mid Cap Traditional Growth VIP Fund
| • | | The Board noted that the Fund’s performance was in the 1st quintile of its performance universe for the 1-year period and in the 2nd quintile for the 3-year and 5-year periods. The Board also noted that the Fund’s performance was higher than the benchmark index for the 1-year, 3-year and 5-year periods. |
| • | | The Board noted that the contractual management fee and actual management fee were in the 1st quintile of the expense group and that the actual total expenses were in the 4th quintile. |
Guardian Select Mid Cap Core VIP Fund
| • | | The Board noted that the Fund’s performance was in the 3rd quintile of its performance universe for the 1-year period. The Board acknowledged the Fund’s short operational history. The Board noted that the Fund’s performance was lower than the benchmark index for the 1-year period. |
| • | | The Board noted that the contractual management fee, the actual management fee and actual total expenses were in the 1st quintile of the expense group. |
Guardian Mid Cap Relative Value VIP Fund
| • | | The Board noted that the Fund’s performance was in the 2nd quintile of its performance universe for the 1-year, 3-year and 5-year periods. The Board also noted that the Fund’s performance was higher than the benchmark index for the 1-year, 3-year and 5-year periods. |
| • | | The Board noted that the contractual management fee and the actual management fee were in the 2nd quintile of the expense group and the actual total expenses were in the 3rd quintile of the expense group. |
SUPPLEMENTAL INFORMATION (UNAUDITED)
Guardian Small-Mid Cap Core VIP Fund
| • | | The Board noted that the Fund’s performance was in the 5th quintile of its performance universe for the 1-year period. The Board acknowledged the Fund’s short operational history. The Board noted that the Fund’s performance was higher than the benchmark index for the 1-year period. |
| • | | The Board noted that the contractual management fee, the actual management fee and actual total expenses were in the 1st quintile of the expense group. |
Guardian Small Cap Core VIP Fund
| • | | The Board noted that the Fund’s performance was in the 5th quintile of its performance universe for the 1-year and 3-year periods. The Board noted that the Fund’s performance was lower than the benchmark index for the 1-year and 3-year periods. |
| • | | The Board noted that the contractual management fee and the actual management fee were in the 1st quintile of the expense group and the actual total expenses were in the 2nd quintile of the expense group. |
Guardian International Growth VIP Fund
| • | | The Board noted that the Fund’s performance was in the 4th quintile of its performance universe for the 1-year period, in the 2nd quintile of its performance universe for the 3-year period and in the 3rd quintile of its performance universe for the 5-year period. The Board also noted that the Fund’s performance was lower than the benchmark index for the 1-year and 5-year periods. The Board noted that the Fund’s performance was higher than the benchmark index for the 3-year period. |
| • | | The Board noted that the contractual management fee and actual management fee were in the 2nd quintile of the expense group and that the actual total expenses were in the 3rd quintile. |
Guardian International Equity VIP Fund
| • | | The Board noted that the Fund’s performance was in the 5th quintile of its performance universe for the 1-year, 3-year and 5-year periods. The Board also noted that the Fund’s performance was lower than the benchmark index for the 1-year, 3-year and 5-year periods. |
| • | | The Board noted that the contractual management fee, the actual management fee and the actual total expenses were in the 2nd quintile of the expense group. |
Guardian Global Utilities VIP Fund
| • | | The Board noted that the Fund’s performance was in the 5th quintile of its performance universe for the 1-year period and in the 4th quintile of its performance universe for the 3-year period. The Board noted that the Fund’s performance was higher than the benchmark index for the 1-year and 3-year periods. |
| • | | The Board noted that the contractual management fee and the actual management fee were in the 1st quintile of the expense group and the actual total expenses were in the 2nd quintile of the expense group. |
Guardian Balanced Allocation VIP Fund
| • | | The Board noted that the Fund had less than one-year of operational history and was not able to evaluate an investment performance record for the Fund. The Board noted that it would have an opportunity to review such information in connection with future annual reviews. The Board noted that, in the meantime, it received monthly performance reports from the Manager. |
| • | | The Board noted that the contractual management fee, the actual management fee and actual total expenses were in the 1st quintile of the expense group. |
Guardian Core Plus Fixed Income VIP Fund
| • | | The Board noted that the Fund’s performance was in the 3rd quintile of its performance universe for the 1-year and 3-year periods and in the 4th quintile of its performance universe for the 5-year period. The Board also noted that the Fund’s performance was lower than the benchmark index for the 1-year and 5-year periods. The Board noted that the Fund’s performance was in line with the benchmark index for the 3-year period. |
| • | | The Board noted that the contractual management fee and actual management fee were in the 2nd quintile of the expense group and that actual total expenses were in the 3rd quintile. |
Guardian Total Return Bond VIP Fund
| • | | The Board noted that the Fund’s performance was in the 5th quintile of its performance universe for the 1-year and 3-year periods. The Board also noted that the Fund’s performance was lower than the benchmark index for the 1-year and 3-year periods. |
| • | | The Board noted that the contractual management fee and actual management fee were in the 2nd quintile and the actual total expenses were in the 3rd quintile. |
SUPPLEMENTAL INFORMATION (UNAUDITED)
Guardian Core Fixed Income VIP Fund
| • | | The Board noted that the Fund had less than one-year of operational history and was not able to evaluate an investment performance record for the Fund. The Board noted that it would have an opportunity to review such information in connection with future annual reviews. The Board noted that, in the meantime, it received monthly performance reports from the Manager. |
| • | | The Board noted that the contractual management fee was in the 2nd quintile of the expense group and the actual management fee and the actual total expenses were in the 1st quintile. |
Guardian Multi-Sector Bond VIP Fund
| • | | The Board noted that the Fund’s performance was in the 5th quintile of its performance universe for the 1-year and 3-year periods The Board also noted that the Fund’s performance was lower than the benchmark index for the 1-year and 3-year periods. |
| • | | The Board noted that the contractual management fee and actual total expenses were in the 1st quintile and the actual management fee was in the 2nd quintile. |
Guardian Short Duration Bond VIP Fund
| • | | The Board noted that the Fund had less than one-year of operational history and was not able to evaluate an investment performance record for the Fund. The Board noted that it would have an opportunity to |
| | | review such information in connection with future annual reviews. The Board noted that, in the meantime, it received monthly performance reports from the Manager. |
| • | | The Board noted that the contractual management fee and actual total expenses were in the 3rd quintile of the expense group and the actual management fee was in the 1st quintile of the expense group. |
Guardian U.S. Government Securities VIP Fund
| • | | The Board noted that the Fund’s performance was in the 1st quintile of its performance universe for the 1-year period and in the 2nd quintile of its performance universe for the 3-year period. The Board also noted that the Fund’s performance was higher than the benchmark index for the 1-year and 3-year periods. |
| • | | The Board noted that the contractual management fee and the actual management fee were in the 1st quintile of the expense group and the actual total expenses were in the 2nd quintile of the expense group. |
Conclusion
Based on a comprehensive consideration and evaluation of all of the information and factors summarized above, among others, the Board as a whole, including the Independent Trustees, approved the Agreements.
SUPPLEMENTAL INFORMATION (UNAUDITED)
The Statement of Additional Information (“SAI”) includes additional information about the Trust’s Trustees and Officers and is available, without charge, upon request by calling toll-free 1-888-GUARDIAN (1-888-482-7342) or by visiting our website at http://guardianvpt.onlineprospectus.net/GuardianVPT/Prospectuses.
Portfolio Holdings and Proxy Voting Procedures
The Fund files its complete schedule of portfolio holdings with the Securities and Exchange Commission for the first and third quarters of each fiscal year as an exhibit to its reports on Form N-PORT. The Fund’s Form N-PORT reports are available on the Securities and Exchange Commission’s website at https://www.sec.gov. The Fund’s Form N-PORT information is also available, without charge, upon request, by calling toll-free 1-888-GUARDIAN (1-888-482-7342) or by visiting our website at http://guardianvpt.onlineprospectus.net/GuardianVPT/Prospectuses.
A description of the policies and procedures that the Fund uses to determine how to vote proxies relating to portfolio securities is included in the SAI. The SAI and information regarding how the Fund voted proxies relating to portfolio securities during the most recent 12-month period ended June 30 may be obtained (i) without charge, upon request, by calling toll-free 1-888-GUARDIAN (1-888-482-7342) or by visiting our website at http://guardianvpt.onlineprospectus.net/GuardianVPT/Prospectuses; and (ii) on the Securities and Exchange Commission’s website at https://www.sec.gov.
This report is transmitted to shareholders only. It is not authorized for use as an offer of sale or a solicitation of an offer to buy shares of the Fund unless accompanied or preceded by the Fund’s current prospectus. Past performance results shown in this report should not be considered a representation of future performance. Investment returns and principal value of shares will fluctuate so that shares, when redeemed, may be worth more or less than their original cost. Statements and other information herein are as dated and are subject to change.

The Guardian Life Insurance Company of America New York, NY 10001-2159
PUB8168
Guardian Variable
Products Trust
2023
Semiannual Report
All Data as of June 30, 2023
Guardian Global Utilities VIP Fund

| | |
| Not FDIC insured. May lose value. No bank guarantee. | | www.guardianlife.com |
TABLE OF CONTENTS
Guardian Global Utilities VIP Fund
Except as otherwise specifically stated, all information, including portfolio security positions, is as of June 30, 2023. Fund holdings will vary. Information contained herein has been obtained from sources believed reliable, but is not guaranteed.
GUARDIAN GLOBAL UTILITIES VIP FUND
Fund Characteristics (unaudited)
| | |
| Total Net Assets: $58,688,694 | | |
|
| |
Geographic Region Allocation1 As of June 30, 2023 |
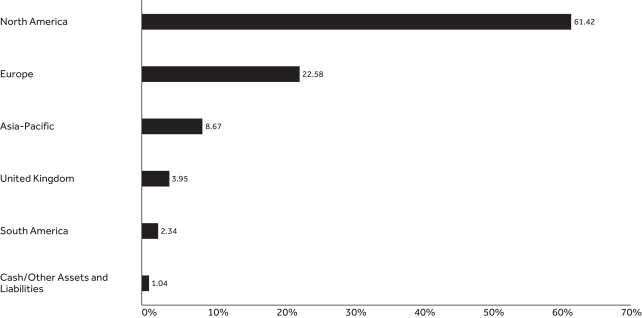 |
| | | | | | |
| | | |
Top Ten Holdings1 As of June 30, 2023 | | | | | |
| | | |
| Holding | | Country | | % of Total
Net Assets | |
| Engie SA | | France | | | 5.56% | |
| Duke Energy Corp. | | United States | | | 5.39% | |
| NextEra Energy, Inc. | | United States | | | 5.19% | |
| Iberdrola SA | | Spain | | | 5.14% | |
| Atmos Energy Corp. | | United States | | | 4.89% | |
| Edison International | | United States | | | 4.65% | |
| AES Corp. | | United States | | | 4.62% | |
| Southern Co. | | United States | | | 4.52% | |
| EDP – Energias de Portugal SA | | Portugal | | | 4.34% | |
| Sempra Energy | | United States | | | 4.32% | |
| Total | | | | | 48.62% | |
| 1 | Portfolio holdings are subject to change and should not be considered a recommendation to buy or sell individual securities. Cash includes short-term investments and net other assets and liabilities. |
UNDERSTANDING YOUR FUND’S EXPENSES (UNAUDITED)
By investing in the Fund, you incur two types of costs: (1) transaction costs and (2) ongoing costs, including, as applicable, investment advisory fees, distribution and/or service (12b-1) fees and other Fund expenses. The example below is intended to help you understand your ongoing costs (in dollars) of investing in the Fund and to compare these costs with the ongoing costs of investing in other mutual funds.
The example is based on an investment of $1,000 invested at the beginning of the period and held for the entire period from January 1, 2023 to June 30, 2023. The table below shows the Fund’s expenses in two ways:
Expenses based on actual return
This section of the table provides information about actual account values and actual expenses. You may use the information in this section, together with the amount you invested, to estimate the expenses that you paid over the period. Simply divide your account value by $1,000 (for example, an $8,600 account value divided by $1,000 = 8.6), then multiply the result by the number in the section under the heading entitled “Expenses Paid During Period” to estimate the expenses you paid on your account during this period.
Expenses based on hypothetical 5% return for comparison purposes
This section of the table provides information about hypothetical account values and hypothetical expenses based on the Fund’s actual expense ratio and an assumed rate of return of 5% per year before expenses, which is not the Fund’s actual return. The hypothetical account values and expenses may not be used to estimate the actual ending account balance or expenses you paid for the period. You may use this information to compare the ongoing costs of investing in the Fund with the cost of investing in other mutual funds. To do so, compare this 5% hypothetical example with the 5% hypothetical examples that appear in the shareholder reports of the other funds.
Note that the expenses shown in the table are meant to highlight your ongoing costs only and do not reflect any transactional costs, such as sales charges (loads), redemption fees, or exchange fees. Therefore the second section is useful in comparing ongoing costs only, and will not help you determine the relative total costs of owning different funds. If these transactional costs were included, your costs would have been higher. Charges and expenses at the insurance company separate account level are not reflected in the table.
| | | | | | | | | | | | | | | | |
| | | | | |
| | | Beginning
Account Value 1/1/23 | | | Ending Account Value
6/30/23 | | | Expenses Paid During Period* 1/1/23-6/30/23 | | | Expense Ratio During Period 1/1/23-6/30/23 | |
| Based on Actual Return | | | $1,000.00 | | | | $ 998.40 | | | | $5.10 | | | | 1.03% | |
Based on Hypothetical Return (5% Return Before Expenses) | | | $1,000.00 | | | | $1,019.69 | | | | $5.16 | | | | 1.03% | |
| * | Expenses are equal to the Fund’s annualized expense ratio as indicated, multiplied by the average account value over the period, multiplied by 181/365 (to reflect the one-half year period). |
SCHEDULE OF INVESTMENTS — GUARDIAN GLOBAL UTILITIES VIP FUND
| | | | | | | | |
| June 30, 2023 (unaudited) | | Shares | | | Value | |
| Common Stocks – 99.0% | | | | | | | | |
| | | |
| Bermuda – 3.0% | | | | | | | | |
| | | |
CK Infrastructure Holdings Ltd. | | | 332,000 | | | $ | 1,757,395 | |
| | | | | | | | | |
| | | |
| | | | | | | | 1,757,395 | |
| | | |
| Brazil – 2.3% | | | | | | | | |
| | | |
Cia de Saneamento Basico do Estado de Sao Paulo | | | 116,300 | | | | 1,374,022 | |
| | | | | | | | | |
| | | |
| | | | | | | | 1,374,022 | |
| | | |
| China – 5.1% | | | | | | | | |
| | | |
China Longyuan Power Group Corp. Ltd., Class H | | | 2,075,800 | | | | 2,145,099 | |
| | | |
ENN Energy Holdings Ltd. | | | 65,400 | | | | 817,286 | |
| | | | | | | | | |
| | | |
| | | | | | | | 2,962,385 | |
| | | |
| France – 5.6% | | | | | | | | |
| | | |
Engie SA | | | 196,197 | | | | 3,263,371 | |
| | | | | | | | | |
| | | |
| | | | | | | | 3,263,371 | |
| | | |
| Germany – 3.4% | | | | | | | | |
| | | |
RWE AG | | | 45,609 | | | | 1,985,233 | |
| | | | | | | | | |
| | | |
| | | | | | | | 1,985,233 | |
| | | |
| Italy – 4.2% | | | | | | | | |
| | | |
Enel SpA | | | 361,198 | | | | 2,433,135 | |
| | | | | | | | | |
| | | |
| | | | | | | | 2,433,135 | |
| | | |
| Japan – 3.6% | | | | | | | | |
| | | |
Kansai Electric Power Co., Inc. | | | 107,900 | | | | 1,355,637 | |
| | | |
Tokyo Gas Co. Ltd. | | | 35,300 | | | | 771,221 | |
| | | | | | | | | |
| | | |
| | | | | | | | 2,126,858 | |
| | | |
| Portugal – 4.3% | | | | | | | | |
| | | |
EDP–Energias de Portugal SA | | | 520,400 | | | | 2,547,275 | |
| | | | | | | | | |
| | | |
| | | | | | | | 2,547,275 | |
| | | |
| Spain – 5.1% | | | | | | | | |
| | | |
Iberdrola SA | | | 231,133 | | | | 3,019,032 | |
| | | | | | | | | |
| | | |
| | | | | | | | 3,019,032 | |
| | | |
| United Kingdom – 4.0% | | | | | | | | |
| | | |
National Grid PLC | | | 175,577 | | | | 2,320,095 | |
| | | | | | | | | |
| | | |
| | | | | | | | 2,320,095 | |
| | | |
| United States – 58.4% | | | | | | | | |
| | | |
AES Corp. | | | 130,762 | | | | 2,710,696 | |
| | | |
American Electric Power Co., Inc. | | | 28,872 | | | | 2,431,022 | |
| | | |
Atmos Energy Corp. | | | 24,664 | | | | 2,869,410 | |
| | | |
CenterPoint Energy, Inc. | | | 80,182 | | | | 2,337,305 | |
| | | |
Dominion Energy, Inc. | | | 26,072 | | | | 1,350,269 | |
| | | |
Duke Energy Corp. | | | 35,292 | | | | 3,167,104 | |
| | | |
Edison International | | | 39,267 | | | | 2,727,093 | |
| | | |
Exelon Corp. | | | 57,610 | | | | 2,347,031 | |
| | | |
NextEra Energy, Inc. | | | 41,045 | | | | 3,045,539 | |
| | | |
PG&E Corp.(1) | | | 111,826 | | | | 1,932,353 | |
| | | |
Public Service Enterprise Group, Inc. | | | 29,121 | | | | 1,823,266 | |
| | | |
Sempra Energy | | | 17,415 | | | | 2,535,450 | |
| | | | | | | | | |
| | | | | | | | |
| June 30, 2023 (unaudited) | | Shares | | | Value | |
| | | |
| United States (continued) | | | | | | | | |
| | | |
Southern Co. | | | 37,744 | | | $ | 2,651,516 | |
| | | |
Vistra Corp. | | | 90,002 | | | | 2,362,553 | |
| | | | | | | | | |
| | | |
| | | | | | | | 34,290,607 | |
| | |
Total Common Stocks
(Cost $51,355,275) | | | | 58,079,408 | |
| | | | | | | | |
| | | Principal
Amount | | | Value | |
| Repurchase Agreements – 0.6% | | | | | |
| | | |
Fixed Income Clearing Corp., 1.52%, dated 6/30/2023, proceeds at maturity value of $369,484, due 7/3/2023(2) | | $ | 369,437 | | | | 369,437 | |
| | | |
Total Repurchase Agreements
(Cost $369,437) | | | | | | | 369,437 | |
| | | |
Total Investments – 99.6%
(Cost $51,724,712) | | | | | | | 58,448,845 | |
| | |
| Assets in excess of other liabilities – 0.4% | | | | 239,849 | |
| | | |
| Total Net Assets – 100.0% | | | | | | $ | 58,688,694 | |
| (1) | Non–income–producing security. |
| (2) | The table below presents collateral for repurchase agreements. |
| | | | | | | | | | | | | | | | |
| Security | | Coupon | | | Maturity
Date | | | Principal
Amount | | | Value | |
| U.S. Treasury Note | | | 4.625% | | | | 3/15/2026 | | | | $371,400 | | | | $376,888 | |
| | | | |
| The accompanying notes are an integral part of these financial statements. | | | | 3 |
SCHEDULE OF INVESTMENTS — GUARDIAN GLOBAL UTILITIES VIP FUND
The following is a summary of the inputs used as of June 30, 2023 in valuing the Fund’s investments. For more information on valuation inputs, please refer to Note 2a of the accompanying Notes to Financial Statements.
| | | | | | | | | | | | | | | | |
| | | Valuation Inputs | | | | |
| Investments in Securities (unaudited) | | Level 1 | | | Level 2 | | | Level 3 | | | Total | |
| Common Stocks | | | | | | | | | | | | | | | | |
Bermuda | | $ | — | | | $ | 1,757,395 | * | | $ | — | | | $ | 1,757,395 | |
Brazil | | | 1,374,022 | | | | — | | | | — | | | | 1,374,022 | |
China | | | — | | | | 2,962,385 | * | | | — | | | | 2,962,385 | |
France | | | — | | | | 3,263,371 | * | | | — | | | | 3,263,371 | |
Germany | | | — | | | | 1,985,233 | * | | | — | | | | 1,985,233 | |
Italy | | | — | | | | 2,433,135 | * | | | — | | | | 2,433,135 | |
Japan | | | — | | | | 2,126,858 | * | | | — | | | | 2,126,858 | |
Portugal | | | — | | | | 2,547,275 | * | | | — | | | | 2,547,275 | |
Spain | | | — | | | | 3,019,032 | * | | | — | | | | 3,019,032 | |
United Kingdom | | | — | | | | 2,320,095 | * | | | — | | | | 2,320,095 | |
United States | | | 34,290,607 | | | | — | | | | — | | | | 34,290,607 | |
| Repurchase Agreements | | | — | | | | 369,437 | | | | — | | | | 369,437 | |
| Total | | $ | 35,664,629 | | | $ | 22,784,216 | | | $ | — | | | $ | 58,448,845 | |
| * | Consists of certain foreign securities whose values were determined by a pricing service using pricing models (See Note 2a in Notes to Financial Statements). These investments in securities were classified as Level 2 rather than Level 1. |
| | | | |
| 4 | | | | The accompanying notes are an integral part of these financial statements. |
FINANCIAL INFORMATION — GUARDIAN GLOBAL UTILITIES VIP FUND
| | | | |
Statement of Assets and Liabilities As of June 30, 2023 (unaudited) | | | |
Assets | | | | |
| | |
Investments, at value | | $ | 58,448,845 | |
| | |
Foreign currency, at value | | | 71 | |
| | |
Receivable for investments sold | | | 624,166 | |
| | |
Dividends/interest receivable | | | 231,828 | |
| | |
Foreign tax reclaims receivable | | | 85,025 | |
| | |
Reimbursement receivable from adviser | | | 10,748 | |
| | |
Prepaid expenses | | | 734 | |
| | | | | |
| | |
Total Assets | | | 59,401,417 | |
| | | | | |
| | |
Liabilities | | | | |
| | |
Payable for investments purchased | | | 578,546 | |
| | |
Investment advisory fees payable | | | 35,220 | |
| | |
Payable for fund shares redeemed | | | 31,385 | |
| | |
Accrued custodian and accounting fees | | | 21,347 | |
| | |
Accrued audit fees | | | 15,050 | |
| | |
Distribution fees payable | | | 12,062 | |
| | |
Accrued trustees’ and officers’ fees | | | 1,431 | |
| | |
Accrued expenses and other liabilities | | | 17,682 | |
| | | | | |
| | |
Total Liabilities | | | 712,723 | |
| | | | | |
| | |
Total Net Assets | | $ | 58,688,694 | |
| | | | | |
| | |
Net Assets Consist of: | | | | |
| | |
Paid-in capital | | $ | 40,654,707 | |
| | |
Distributable earnings | | | 18,033,987 | |
| | | | | |
| | |
Total Net Assets | | $ | 58,688,694 | |
| | | | | |
| | |
Investments, at Cost | | $ | 51,724,712 | |
| | | | | |
| | |
Foreign Currency, at Cost | | $ | 71 | |
| | | | | |
| | |
Pricing of Shares | | | | |
| | |
Shares of Beneficial Interest Outstanding with No Par Value | | | 4,768,930 | |
| | |
Net Asset Value Per Share | | | $12.31 | |
| | | | | |
| | | | |
Statement of Operations For the Six Months Ended June 30, 2023 (unaudited) | |
Investment Income | | | | |
| | |
Dividends | | $ | 1,486,350 | |
| | |
Interest | | | 3,305 | |
| | |
Withholding taxes on foreign dividends | | | (98,428 | ) |
| | | | | |
| | |
Total Investment Income | | | 1,391,227 | |
| | | | | |
| | |
Expenses | | | | |
| | |
Investment advisory fees | | | 227,299 | |
| | |
Distribution fees | | | 77,842 | |
| | |
Custodian and accounting fees | | | 25,975 | |
| | |
Professional fees | | | 21,038 | |
| | |
Administrative fees | | | 10,998 | |
| | |
Trustees’ and officers’ fees | | | 8,134 | |
| | |
Transfer agent fees | | | 6,639 | |
| | |
Shareholder reports | | | 4,074 | |
| | |
Other expenses | | | 2,377 | |
| | | | | |
| | |
Total Expenses | | | 384,376 | |
| | |
Less: Fees waived | | | (63,667 | ) |
| | | | | |
| | |
Total Expenses, Net | | | 320,709 | |
| | | | | |
| | |
Net Investment Income/(Loss) | | | 1,070,518 | |
| | | | | |
| | |
Realized Gain/(Loss) and Change in Unrealized Appreciation/(Depreciation) on Investments and Foreign Currency Transactions | | | | |
| | |
Net realized gain/(loss) from investments | | | 1,994,744 | |
| | |
Net realized gain/(loss) from foreign currency transactions | | | (16,963 | ) |
| | |
Net change in unrealized appreciation/(depreciation) on investments | | | (3,090,463 | ) |
| | |
Net change in unrealized appreciation/(depreciation) on translation of assets and liabilities in foreign currencies | | | 1,534 | |
| | | | | |
| | |
Net Loss on Investments and Foreign Currency Transactions | | | (1,111,148 | ) |
| | | | | |
| | |
Net Decrease in Net Assets Resulting From Operations | | $ | (40,630 | ) |
| | | | | |
| | | | | |
| | | | |
| The accompanying notes are an integral part of these financial statements. | | | | 5 |
FINANCIAL INFORMATION — GUARDIAN GLOBAL UTILITIES VIP FUND
| | | | | | | | |
Statements of Changes in Net Assets Six Months Ended Numbers are unaudited | | | | | | |
| | | |
| | | For the
Six Months Ended
6/30/23 | | | For the
Year Ended
12/31/22 | |
| | | | |
Operations | | | | | | | | |
| | | |
Net investment income/(loss) | | $ | 1,070,518 | | | $ | 1,638,493 | |
| | | |
Net realized gain/(loss) from investments and foreign currency transactions | | | 1,977,781 | | | | 1,126,724 | |
| | | |
Net change in unrealized appreciation/(depreciation) on investments and
translation of assets and liabilities in foreign currencies | | | (3,088,929 | ) | | | (4,027,837 | ) |
| | | | | | | | | |
| | | |
Net Decrease in Net Assets Resulting from Operations | | | (40,630 | ) | | | (1,262,620 | ) |
| | | | | | | | | |
| | | |
Capital Share Transactions | | | | | | | | |
| | | |
Proceeds from sales of shares | | | 2,269,940 | | | | 112,102 | |
| | | |
Cost of shares redeemed | | | (7,871,587 | ) | | | (22,639,081 | ) |
| | | | | | | | | |
| | | |
Net Decrease in Net Assets Resulting from Capital Share Transactions | | | (5,601,647 | ) | | | (22,526,979 | ) |
| | | | | | | | | |
| | | |
Net Decrease in Net Assets | | | (5,642,277 | ) | | | (23,789,599 | ) |
| | | | | | | | | |
| | | |
Net Assets | | | | | | | | |
| | | |
Beginning of period | | | 64,330,971 | | | | 88,120,570 | |
| | | | | | | | | |
| | | |
End of period | | $ | 58,688,694 | | | $ | 64,330,971 | |
| | | | | | | | | |
| | | |
Other Information: | | | | | | | | |
| | | |
Shares | | | | | | | | |
| | | |
Sold | | | 185,618 | | | | 9,266 | |
| | | |
Redeemed | | | (635,042 | ) | | | (1,871,485 | ) |
| | | | | | | | | |
| | | |
Net Decrease | | | (449,424 | ) | | | (1,862,219 | ) |
| | | | | | | | | |
| | | | | | | | | |
| | | | |
| 6 | | | | The accompanying notes are an integral part of these financial statements. |
This Page Intentionally Left Blank
FINANCIAL INFORMATION — GUARDIAN GLOBAL UTILITIES VIP FUND
The Financial Highlights table is intended to help you understand the Fund’s financial performance for the past six reporting periods (or, if shorter, the period since inception). Certain information reflects financial results for a single Fund share. The total returns in the table represent the rate that an investor would have earned (or lost) on an investment in the Fund.
| | | | | | | | | | | | | | | | | | | | | | | | |
Financial Highlights Six Months Ended Numbers are unaudited | | | | | | | | | | | | | | | | |
| | | Per Share Operating Performance | | | | |
| | | Net Asset Value,
Beginning of
Period | | | Net Investment
Income(1) | | | Net Realized
and Unrealized
Gain/(Loss) | | | Total
Operations | | | Net Asset
Value, End of
Period | | | Total
Return(2) | |
| | | | | | | |
Six Months Ended 6/30/23 | | $ | 12.33 | | | $ | 0.21 | | | $ | (0.23) | | | $ | (0.02) | | | $ | 12.31 | | | | (0.16)% | (4) |
| | | | | | | |
Year Ended 12/31/22 | | | 12.45 | | | | 0.28 | | | | (0.40) | | | | (0.12) | | | | 12.33 | | | | (0.96)% | |
| | | | | | | |
Year Ended 12/31/21 | | | 10.70 | | | | 0.28 | | | | 1.47 | | | | 1.75 | | | | 12.45 | | | | 16.36% | |
| | | | | | | |
Year Ended 12/31/20 | | | 10.27 | | | | 0.23 | | | | 0.20 | | | | 0.43 | | | | 10.70 | | | | 4.19% | |
| | | | | | | |
Period Ended 12/31/19(5) | | | 10.00 | | | | 0.03 | | | | 0.24 | | | | 0.27 | | | | 10.27 | | | | 2.70% | (4) |
| | | | |
| 8 | | | | The accompanying notes are an integral part of these financial statements. |
FINANCIAL INFORMATION — GUARDIAN GLOBAL UTILITIES VIP FUND
| | | | | | | | | | | | | | | | | | | | | | |
| | | | | | | | | | | | | | | | |
| Ratios/Supplemental Data | |
Net Assets, End
of Period (000s) | | | Net Ratio of
Expenses to
Average
Net Assets(3) | | | Gross Ratio of
Expenses to
Average Net
Assets | | | Net Ratio of Net
Investment Income
to Average
Net Assets(3) | | | Gross Ratio of Net
Investment Income
to Average
Net Assets | | | Portfolio
Turnover Rate | |
| | | | | | |
| $ | 58,689 | | | | 1.03% | (4) | | | 1.23% | (4) | | | 3.44% | (4) | | | 3.24% | (4) | | | 17% | (4) |
| | | | | | |
| | 64,331 | | | | 1.03% | | | | 1.21% | | | | 2.29% | | | | 2.11% | | | | 14% | |
| | | | | | |
| | 88,121 | | | | 1.03% | | | | 1.16% | | | | 2.38% | | | | 2.25% | | | | 22% | |
| | | | | | |
| | 84,619 | | | | 1.03% | | | | 1.22% | | | | 2.35% | | | | 2.16% | | | | 43% | |
| | | | | | |
| | 85,307 | | | | 0.89% | (4) | | | 1.37% | (4) | | | 1.56% | (4) | | | 1.08% | (4) | | | 50% | (4) |
| (1) | Calculated based on the average shares outstanding during the period. |
| (2) | Total returns do not reflect the effects of charges deducted pursuant to the terms of The Guardian Insurance & Annuity Company, Inc.’s variable contracts. Inclusion of such charges would reduce the total returns for all periods shown. |
| (3) | Net Ratio of Expenses to Average Net Assets and Net Ratio of Net Investment Income to Average Net Assets include the effect of fee waivers and expense limitations. |
| (4) | Ratios for periods less than one year have been annualized, except for total return and portfolio turnover rate. For the period ended December 31, 2019, certain non-recurring fees (i.e., audit fees) are not annualized. |
| (5) | Commenced operations on October 21, 2019. |
| | | | |
| The accompanying notes are an integral part of these financial statements. | | | | 9 |
NOTES TO FINANCIAL STATEMENTS — GUARDIAN GLOBAL UTILITIES VIP FUND
June 30, 2023 (unaudited)
1. Organization
Guardian Variable Products Trust (the “Trust”), a Delaware statutory trust organized on January 12, 2016, is registered under the Investment Company Act of 1940, as amended (the “1940 Act”), as an open-end management investment company. The Trust currently has twenty-four series. Guardian Global Utilities VIP Fund (the “Fund”) is a series of the Trust. The Fund is a diversified fund and commenced operations on October 21, 2019. The financial statements for other series of the Trust are presented in separate reports.
The Trust has authorized an unlimited number of shares of beneficial interest with no par value. Shares are bought and sold at closing net asset value (“NAV”). Shares of the Fund are only sold to certain separate accounts of The Guardian Insurance & Annuity Company, Inc. (“GIAC”) that fund certain variable annuity contracts and variable life insurance policies issued by GIAC. GIAC is a wholly-owned subsidiary of The Guardian Life Insurance Company of America (“Guardian Life”).
The Fund seeks total return.
2. Significant Accounting Policies
The following is a summary of significant accounting policies followed by the Fund in the preparation of its financial statements. The Fund follows the investment company accounting and reporting guidance of the Financial Accounting Standards Board (“FASB”) Accounting Standards Codification Topic 946 Financial Services – Investment Companies. The following policies are in conformity with accounting principles generally accepted in the United States of America (“GAAP”). The preparation of financial statements in accordance with GAAP requires management to make estimates and assumptions that affect the reported amounts and disclosures in the financial statements. Actual results could differ from those estimates.
a. Investment Valuations The Board of Trustees has designated Park Avenue Institutional Advisers LLC (“Park Avenue”) as the valuation designee for the Fund pursuant to Rule 2a-5 under the 1940 Act. Park Avenue has established a Fair Valuation Committee and has adopted fair valuation procedures that provide methodologies for fair valuing securities. These procedures include monitoring the appropriateness of fair values based on results of ongoing valuation oversight, including but not limited to consideration of
security specific events, market events, and pricing vendor and broker-dealer due diligence. The Fair Valuation Committee oversees and carries out the policies for the valuation of investments held in the Fund. The Fair Valuation Committee is responsible for discussing and assessing the potential impacts to the fair values on an ongoing basis, and reports to the Board of Trustees on at least a quarterly basis.
Equity securities traded on an exchange other than NASDAQ Stock Market, LLC (“NASDAQ”) are valued at the last reported sale price on the principal exchange or market on which they are traded; or, if there were no sales that day, at the mean between the closing bid and ask prices. Securities traded on the NASDAQ are generally valued at the NASDAQ official closing price, which may not be the last sale price. If the NASDAQ official closing price is not available for a security, that security is generally valued at the mean between the closing bid and ask prices. Repurchase agreements are carried at cost, which approximates fair value (see Note 5d). Foreign securities are valued in the currencies of the markets in which they trade and then converted to U.S. dollars by the application of foreign exchange rates at the close of the New York Stock Exchange (“NYSE”). Forward foreign currency contracts, if any, are valued at the mean between the bid and ask rates for the specified time interpolated from rates for proximate time periods.
Securities for which market quotations are not readily available or securities whose values have been materially affected by events occurring before the Fund’s valuation time but after the close of the securities’ principal exchange or market are valued at their fair values as determined in good faith by Park Avenue, as the Board of Trustee’s valuation designee (as defined in Rule 2a-5 under the 1940 Act), in accordance with Park Avenue’s procedures and under the general oversight of the Board of Trustees. In addition, the values of the Fund’s investments in foreign securities are generally determined by a pricing service using pricing models designed to estimate likely changes in the values of those securities. Certain foreign equity instruments are valued by applying international fair value factors provided by approved pricing services. The factors seek to adjust the local closing price for movements of local markets post closing, but prior to the time the NAVs are calculated. Valuations reflected in this report are as of the report date. As a result, changes in valuation due to market events and/or issuer related events after the report date and prior to issuance of the report are not reflected herein.
NOTES TO FINANCIAL STATEMENTS — GUARDIAN GLOBAL UTILITIES VIP FUND
Various inputs are used in determining the valuation of the Fund’s investments. These inputs are summarized in three broad levels listed below.
| • | | Level 1 – unadjusted inputs using quoted prices in active markets for identical investments. |
| • | | Level 2 – other significant observable inputs, including, but not limited to, quoted prices for similar investments, inputs other than quoted prices that are observable for investments (such as interest rates, prepayment speeds, credit risks, etc.) or other market corroborated inputs. |
| • | | Level 3 – significant unobservable inputs (including the Fund’s own assumptions in determining the fair value of investments). |
Inputs may include price information, volatility statistics, specific and broad credit data, liquidity statistics, and other factors. A financial instrument’s level within the fair value hierarchy is based on the lowest level of any input; both individually and in aggregate, that is significant to the fair value measurement. However, the determination of what constitutes “observable” requires significant judgment by the Trust. The Trust considers observable data to be that market data which is readily available, regularly distributed or updated, reliable and verifiable, and provided by independent sources that are actively involved in the relevant market. The inputs or methodology used for valuing securities are not necessarily an indication of the risk associated with investing in those securities. Changes in valuation techniques may result in transfers into or out of a financial instrument’s assigned level within the hierarchy.
The FASB requires reporting entities to make disclosures about purchases, sales, issuances and settlements of Level 3 securities on a gross basis. For the six months ended June 30, 2023, there were no transfers into or out of Level 3 of the fair value hierarchy.
In determining a financial instrument’s placement within the hierarchy, the Trust separates the Fund’s investment portfolio into two categories: investments and derivatives (e.g., futures). A summary of inputs used to value the Fund’s assets and liabilities carried at fair value as of June 30, 2023 is included in the Schedule of Investments.
Investments Investments whose values are based on quoted market prices in active markets, and are therefore classified within Level 1, include active listed equities. Investments that trade in markets that are not considered to be active, but are valued based on quoted
market prices, dealer quotations or alternative pricing sources supported by observable inputs are classified within Level 2. These include certain U.S. government and sovereign obligations, most government agency securities, investment-grade corporate bonds, certain mortgage products, state, municipal and provincial obligations, and certain foreign equity securities, including securities whose prices may have been affected by events occurring after the close of trading on their principal exchange or market and, as a result, whose values are determined by a pricing service as described above, or securities whose values are otherwise determined using fair valuation methods approved by the Fund’s Board of Trustees.
Investments classified within Level 3 have significant unobservable inputs, as they trade infrequently or not at all. Level 3 investments include, among others, private placement securities. When observable prices are not available for these securities, the Trust uses one or more valuation techniques for which sufficient and reliable data is available. The inputs used by the Trust in estimating the value of Level 3 investments include, for example, the original transaction price, recent transactions in the same or similar instruments, completed or pending third-party transactions in the underlying investment or comparable issuers, subsequent rounds of financing, recapitalizations, and other transactions across the capital structure. Level 3 investments may also be adjusted to reflect illiquidity and/or non-transferability, with the amount of such discount estimated by the Trust in the absence of market information. Assumptions used by the Trust due to the lack of observable inputs may significantly impact the resulting fair value and therefore the Fund’s results of operations. As of June 30, 2023, the Fund had no securities classified as Level 3.
Derivatives Exchange-traded derivatives, such as futures contracts, exchange-traded option contracts and certain swaps, are typically classified within Level 1 or Level 2 of the fair value hierarchy depending on whether or not they are deemed to be actively traded. Certain non-exchange-traded derivatives, such as generic forwards, certain swaps and options, have inputs which can generally be corroborated by market data and are therefore classified within Level 2. During the six months ended June 30, 2023, the Fund did not hold any derivatives.
b. Securities Transactions Securities transactions are accounted for on the date securities are purchased or sold (trade date). Realized gains or losses on securities transactions are determined on the basis of specific identification.
NOTES TO FINANCIAL STATEMENTS — GUARDIAN GLOBAL UTILITIES VIP FUND
c. Futures Contracts The Fund may enter into financial futures contracts. In entering into such contracts, the Fund is required to deposit with the counterparty, either in cash or securities, an amount equal to a certain percentage of the face value of the contract. Subsequent payments are received or made by the Fund each day, depending on the daily fluctuations in the values of the contracts, and are recorded for financial statement purposes as variation margin received or paid by the Fund. Daily changes in variation margin are recognized as unrealized gains or losses by the Fund. The Fund may not achieve the anticipated benefits of the financial futures contracts and may realize a loss.
d. Foreign Currency Translation The accounting records of the Fund are maintained in U.S. dollars. Investment securities and all other assets and liabilities of the Fund denominated in a foreign currency are generally translated into U.S. dollars at the exchange rates quoted at the close of the NYSE on each business day. The market value of investment securities and other assets and liabilities are translated at the exchange rate as of the valuation date. Purchases and sales of securities, income receipts, and expense payments are translated into U.S. dollars at the exchange rates in effect on the dates of the respective transactions. The Fund does not isolate the portion of the fluctuations on investments resulting from changes in foreign currency exchange rates from the fluctuations in market prices of investments held. Such fluctuations are included in the Net change in net realized and unrealized gain/(loss) from investments on the Statement of Operations.
Reported realized foreign currency gains and losses arise from the disposition of foreign currency, currency gains or losses realized between the trade and settlement dates on securities transactions, and the difference between the amounts of dividends, interest and foreign withholding taxes recorded on the Fund’s books on the transaction date and the U.S. dollar equivalent of the amounts actually received or paid. These reported realized foreign currency gains and losses, if any, are included in Net realized gain/(loss) from foreign currency transactions on the Statement of Operations. Unrealized foreign currency gains and losses arise from changes (due to changes in exchange rates) in the value of foreign currency and other assets and liabilities denominated in foreign currencies, which are held at period end, if any, and are included in Net change in unrealized appreciation/(depreciation) on translation of assets and liabilities in foreign currencies on the Statement of Operations.
e. Foreign Capital Gains Tax The Fund may be subject to foreign taxes on income, gains on investments or currency purchases/repatriation, a portion of which may be recoverable. The Fund will accrue such taxes and recoveries as applicable, based upon their current interpretation of tax rules and regulations that exist in the markets in which they invest.
f. Investment Income Dividend income net of foreign taxes withheld, if any, is generally recorded on the ex-dividend date. Distributions received from real estate investment trusts, if any, may be classified as dividends, capital gains and/or return of capital. Interest income, which includes amortization/accretion of premium/discount, is determined using the interest income accrual method, and is accrued and recorded daily.
g. Allocation of Income and Expenses Many of the expenses of the Trust can be directly attributed to a specific series of the Trust. Expenses that cannot be directly attributed to a specific series of the Trust are generally apportioned among all the series in the Trust, based on relative net assets. In calculating net asset value per share for each series of the Trust, investment income, realized and unrealized gains and losses, and expenses other than series-specific expenses are allocated daily to each series based upon the proportion of net assets attributable to each series.
3. Transactions with Affiliates
a. Investment Advisory Fee and Expense Limitation Under the terms of the advisory agreement, which, after its two year initial term, is reviewed and approved annually by the Board of Trustees, the Fund pays an investment advisory fee to Park Avenue. Park Avenue is a wholly-owned subsidiary of Guardian Life and receives an investment advisory fee at an annual rate of 0.73% of the Fund’s average daily net assets. The fee is accrued daily and paid monthly.
Park Avenue has contractually agreed through April 30, 2024 to waive certain fees and/or reimburse certain expenses incurred by the Fund to the extent necessary to limit the Fund’s total annual operating expenses after fee waiver and/or expense reimbursement to 1.03% of the Fund’s average daily net assets (excluding, if applicable, any acquired fund fees and expenses, taxes, interest, transaction costs and brokerage commissions, litigation and extraordinary expenses). The limitation may not be increased or terminated prior to this time without action by the Board of Trustees and may be terminated only upon approval of the Board of Trustees. Amounts waived or reimbursed by Park Avenue
NOTES TO FINANCIAL STATEMENTS — GUARDIAN GLOBAL UTILITIES VIP FUND
pursuant to any expense limitation will not be subject to Park Avenue’s recoupment rights. For the six months ended June 30, 2023, Park Avenue waived fees and/or paid Fund expenses in the amount of $63,667.
Park Avenue has entered into a Sub-Advisory Agreement with Wellington Management Company LLP (“Wellington”). Wellington is responsible for providing day-to-day investment advisory services to the Fund, subject to the supervision of Park Avenue and the oversight of the Board of Trustees. Sub-advisory fees are paid by Park Avenue and do not represent a separate or additional expense to the Fund.
b. Compensation of Trustees and Officers Trustees and officers who are interested persons of the Trust, as defined in the 1940 Act, receive no compensation from the Fund, except for the Chief Compliance Officer of the Trust. Trustees of the Trust who are not interested persons of the Trust, and the Chief Compliance Officer, receive compensation and reimbursement of expenses from the Trust.
c. Distribution Fees Park Avenue Securities LLC (“PAS”), a wholly-owned subsidiary of Guardian Life, is the principal underwriter of Fund shares. The Trust has entered into a distribution and service agreement with PAS, which governs the sale and distribution of shares of the Fund. Under a distribution and service plan adopted by the Trust (“12b-1 plan”), PAS is compensated for services in such capacity, including its expenses in connection with the promotion and distribution of shares of the Fund, at an annual rate of 0.25% of the Fund’s average daily net assets. For the six months ended June 30, 2023, the Fund paid distribution fees in the amount of $77,842 to PAS.
PAS has directed that certain payments under the 12b-1 plan be used to compensate GIAC for shareholder services provided to contract owners.
4. Federal Income Taxes
a. Distributions to Shareholders For federal income tax purposes, the Fund is treated as a disregarded entity (“DRE”). As a DRE, the Fund is not subject to an entity-level income tax; and any income, gains, losses, deductions, taxes, and credits of the Fund would instead be “passed through” directly to the separate accounts of GIAC that invest in the Fund and retain the same character for U.S. federal income tax purposes. In addition, the Fund is not required to distribute taxable income and capital gains for U.S. federal income tax purposes. Therefore, no dividends and capital gains distributions were paid by the Fund.
5. Investments
a. Investment Purchases and Sales The cost of investments purchased and the proceeds from investments sold (excluding short-term investments) amounted to $10,244,892 and $14,980,735, respectively, for the six months ended June 30, 2023. During the six months ended June 30, 2023, there were no purchases or sales of U.S. government securities.
b. Foreign Securities Foreign securities investments involve special risks and considerations not typically associated with U.S. investments. These risks include, but are not limited to, currency risk; adverse political, regulatory, social, and economic developments; and less reliable information about issuers. Moreover, securities of some foreign issuers may be less liquid and their prices more volatile than those of comparable U.S. issuers.
c. Industry or Sector Concentration In its normal course of business, the Fund may invest a significant portion of its assets in companies within a limited number of industries or sectors. As a result, the Fund may be subject to a greater risk of loss than that of a fund invested in a wider spectrum of industries or sectors because the stocks of many or all of the companies in the industry, group of industries, sector, or sectors may decline in value due to developments adversely affecting the industry, group of industries, sector, or sectors.
d. Repurchase Agreements The Fund may invest in repurchase agreements to maintain liquidity and earn income over periods of time as short as overnight. The collateral for repurchase agreements is either cash or fully negotiable U.S. government securities (including U.S. government agency securities). Repurchase agreements are fully collateralized (including the interest accrued thereon) and such collateral is marked to market daily while the agreements remain in force. If the value of the collateral falls below the repurchase price plus accrued interest, the Fund will typically require the seller to deposit additional collateral by the next business day. If the request for additional collateral is not met, or the seller defaults, the Fund maintains the right to sell the collateral (although it may be prevented or delayed from doing so in certain circumstances) and may be required to claim any resulting loss against the seller. Park Avenue monitors the creditworthiness of the seller with which the Fund enters into repurchase agreements.
e. Restricted and Illiquid Securities A restricted security cannot be resold to the general public without
NOTES TO FINANCIAL STATEMENTS — GUARDIAN GLOBAL UTILITIES VIP FUND
prior registration under the Securities Act of 1933, as amended (except pursuant to an applicable exemption). The values of these securities may be highly volatile. If the security is subsequently registered and resold, the issuer would typically bear the expense of all registrations at no cost to the Fund. Restricted and illiquid securities are valued according to the policies and procedures adopted by the Trust’s Board of Trustees and are noted, if any, in the Fund’s Schedule of Investments. As of June 30, 2023, the Fund did not hold any restricted, other than 144A restricted securities or illiquid securities.
6. Temporary Borrowings
The Fund, with other funds managed by Park Avenue, is party to a credit agreement with respect to a $10 million committed revolving credit facility from State Street Bank and Trust Company (the “Credit Agreement”) for temporary borrowing purposes, including the meeting of redemption requests that otherwise might require the untimely disposition of securities. Interest is based on a daily fluctuating rate per annum equal to the Applicable Rate (as defined in the Credit Agreement) plus the Applicable Margin (as defined in the Credit Agreement) that is subject to change from time to time as and when the Applicable Rate changes. Under the current Credit Agreement, the Applicable Rate for any day is defined as the rate per annum equal to the sum of (a) 0.10% plus (b) the higher of (i) the Federal Funds Effective Rate for such day and (ii) the Overnight Bank Funding Rate for such day; the Applicable Margin is
1.25%. In addition to the interest charged on any borrowings by the Fund, each fund pays a commitment fee of 0.30% per annum on its share of the unused portion of the credit facility. The agreement is in place until January 5, 2024. The Fund did not utilize the credit facility during the six months ended June 30, 2023.
7. Indemnifications
Under the Trust’s organizational documents and, in some cases, by contract, officers and Trustees of the Trust are indemnified against certain liabilities arising out of the performance of their duties to the Fund. In addition, in the normal course of business, the Fund enters into contracts with its vendors and others that provide general indemnifications. The Fund’s maximum exposure under these arrangements is unknown as this would involve future claims that may be made against the Fund that have not yet occurred. However, based on experience, the Fund expects the risk of loss to be remote.
8. Additional Information
The outbreak of COVID-19 has adversely impacted both local and global economies, including those in which the Fund may invest. These impacts include materially reduced consumer demand and economic output, disrupted supply chains, market closures, travel restrictions and quarantines, and strained healthcare systems. The Fund’s operations may be interrupted as a result, which may have a negative impact on the Fund’s investment performance.
SUPPLEMENTAL INFORMATION (UNAUDITED)
Liquidity Risk Management Program
In compliance with Rule 22e-4 under the Investment Company Act of 1940, as amended (the “Liquidity Rule”), Guardian Variable Products Trust (the “Trust”) has adopted and implemented a written liquidity risk management program (the “Program”) for each series of the Trust (each, a “Fund”), which is reasonably designed to assess and manage each Fund’s liquidity risk. The Fund’s “liquidity risk” is the risk that the Fund could not meet requests to redeem shares issued by the Fund without significant dilution of the remaining investors’ interests in the Fund.
The Board of Trustees of the Trust (the “Board”) Previously approved the designation of Park Avenue Institutional Advisers LLC (the “Administrator” or “PAIA”) as Program administrator. The Administrator established a Liquidity Risk Management Committee, which is comprised of certain officers of the Trust and PAIA, that assists the Administrator in the implementation and day-to-day administration of the Program and otherwise support carrying out the Administrator’s liquidity risk management responsibilities under the Program.
In accordance with the Program, each Fund’s liquidity risk is assessed no less frequently than annually, taking into consideration a variety of factors, including, as applicable, the Fund’s investment strategy and liquidity of portfolio investments, cash flow projections, and holdings of cash and cash equivalents, as well as borrowing arrangements and other funding sources. Certain factors are considered under both normal and reasonably foreseeable stressed conditions.
Each Fund portfolio investment is classified, no less than monthly, into one of four liquidity categories (including “highly liquid investments” and “illiquid investments,” discussed below) based on a determination of the number of days it is reasonably expected to take to convert the investment to cash, or sell or dispose of the investment, in current market conditions without significantly changing the investment’s market value.
The Liquidity Rule limits the Fund’s investments in illiquid investments by prohibiting the Fund from acquiring any illiquid investment if, immediately after the acquisition, the Fund would have invested more than 15% of its net assets in illiquid investments that are assets. The Program includes provisions reasonably designed to comply with this investment limitation. In addition, the Program includes provisions reasonably designed to comply with this investment limitation. In addition, the Program includes provisions reasonably designed to comply with the Liquidity Rule’s requirements relating to highly liquid investment minimums, which is a minimum amount of Fund net assets that must be invested in highly liquid investments that are assets, as applicable. The Fund was not required to adopt a highly liquid investment minimum during the period.
At a meeting of the Board held on March 29-30, 2023, the Board received a report (the “Report”) prepared by the Administrator addressing the Program’s operation and assessing the adequacy and effectiveness of its implementation for the period from January 1, 2022 through December 31, 2022 (the “Reporting Period”). The Report noted that the Administrator believes the Program operated effectively during the Reporting Period and continues to be reasonably designed to effectively assess and manage each Fund’s liquidity risk. The Report also noted that the Administrator believes the Program has been adequately and effectively implemented and the investment strategies for each Fund continue to be appropriate since its inception. In addition, the Report summarized the operation of the Program and the information and factors considered by the Administrator in its assessment of the Program’s implementation, such as the liquidity risk assessment framework and liquidity classification methodologies.
There can be no assurance that the Program will achieve its objectives under all circumstances. Please refer to the Fund’s prospectus for more information regarding the Fund’s exposure to liquidity risk and other risks to which an investment in the Fund may be subject.
SUPPLEMENTAL INFORMATION (UNAUDITED)
Approval of Investment Management and Sub-advisory Agreements
Section 15(c) of the Investment Company Act of 1940, as amended (the “1940 Act”), requires that a fund’s investment advisory and sub-advisory agreements be approved initially by the fund’s board of trustees. Section 15(c) also requires that the continuation of these agreements, after an initial term of up to two years, be annually reviewed and approved by the board. Any such agreement must be approved by a vote of a majority of the trustees who are not parties to the agreement or “interested persons” (as defined in the 1940 Act) of a party to the agreement at a meeting of the board called for the purpose of voting on such approval.
At a meeting of the Board of Trustees (the “Board”) of Guardian Variable Products Trust (the “Trust”) held on March 29-30, 2023 (the “Meeting”), the Board, including the trustees who are not parties to the agreement or “interested persons” as defined in the 1940 Act (the “Independent Trustees”), considered and voted unanimously to renew the existing investment management agreement between the Trust, on behalf of Guardian All Cap Core VIP Fund; Guardian Balanced Allocation VIP Fund; Guardian Core Fixed Income VIP Fund; Guardian Core Plus Fixed Income VIP Fund; Guardian Diversified Research VIP Fund; Guardian Equity Income VIP Fund; Guardian Global Utilities VIP Fund; Guardian Growth & Income VIP Fund; Guardian Integrated Research VIP Fund; Guardian International Growth VIP Fund; Guardian International Equity VIP Fund; Guardian Large Cap Disciplined Growth VIP Fund; Guardian Large Cap Disciplined Value VIP Fund; Guardian Large Cap Fundamental Growth VIP Fund; Guardian Mid Cap Relative Value VIP Fund; Guardian Mid Cap Traditional Growth VIP Fund; Guardian Multi-Sector Bond VIP Fund; Guardian Select Mid-Cap Core VIP Fund; Guardian Short Duration Bond VIP Fund; Guardian Small Cap Core VIP Fund; Guardian Small-Mid Cap Core VIP Fund; Guardian Strategic Large Cap Core VIP Fund; Guardian Total Return Bond VIP Fund and Guardian U.S. Government Securities VIP Fund (each, a “Fund,” and together, the “Funds”), in substantially the form presented at this meeting (the “Management Agreement”); and Park Avenue Institutional Advisers LLC (the “Manager”) for a one-year term.
The Board, including the Independent Trustees, also considered and voted unanimously to renew the existing sub-advisory agreements (the “Sub-Advisory Agreements,” collectively with the Management Agreement and Sub-Subadvisory Agreement, the
“Agreements”) between the Manager and investment advisory firms engaged to serve as sub-advisers to certain of the Funds (the “Sub-Advised Funds”), namely (i) ClearBridge Investments, LLC with respect to Guardian Small Cap Core VIP Fund; (ii) Putnam Investment Management, LLC with respect to Guardian Diversified Research VIP Fund; (iii) AllianceBernstein L.P. with respect to Guardian Growth & Income VIP Fund and Guardian Strategic Large Cap Core VIP Fund; (iv) J.P. Morgan Investment Management Inc. with respect to Guardian International Growth VIP Fund; (v) Schroder Investment Management North America Inc. with respect to Guardian International Equity VIP Fund; (vi) Wellington Management Company LLP with respect to Guardian Balanced Allocation VIP Fund, Guardian Equity Income VIP Fund, Guardian Integrated Research VIP Fund, Guardian Large Cap Disciplined Growth VIP Fund and Guardian Global Utilities VIP Fund; (vii) Boston Partners Global Investors, Inc. with respect to Guardian Large Cap Disciplined Value VIP Fund; (viii) Janus Henderson Investors US LLC with respect to Guardian Mid Cap Traditional Growth VIP Fund; (ix) Allspring Global Investments, LLC with respect to Guardian Mid Cap Relative Value VIP Fund and Guardian Small-Mid Cap Core VIP Fund; (x) Lord, Abbett & Co. LLC with respect to Guardian Core Plus Fixed Income VIP Fund; (xi) FIAM LLC with respect to Guardian Select Mid Cap Core VIP Fund; and (xii) Massachusetts Financial Services Company with respect to Guardian All Cap Core VIP Fund, each in substantially the form presented at this meeting, (each, a “Sub-Adviser” and collectively, the “Sub-Advisers”) for a one-year term.
The Board, including the Independent Trustees, also considered and voted unanimously to renew the existing sub-subadvisory agreement (the “Sub-Subadvisory Agreement”) between Schroder Investment Management North America Inc. and Schroder Investment Management North America Limited (also a Sub-Adviser) with respect to Guardian International Equity VIP Fund for a one-year term.
The Board is responsible for overseeing the management of each Fund. In determining whether to renew its approval of the Agreements, the Trustees evaluated information and factors that they considered to be relevant and appropriate through the exercise of their own business judgment. The Trustees considered certain information and factors in light of advice furnished to them by legal counsel to the Trust and, in the case of the Independent Trustees, their independent legal counsel. In advance of the Meeting, the Trustees received materials and information designed to assist their consideration of the
SUPPLEMENTAL INFORMATION (UNAUDITED)
Agreements. The Trustees received written responses from the Manager and each Sub-Adviser to a series of questions and requests for information encompassing a wide variety of topics provided by independent counsel on behalf of the Independent Trustees. The Independent Trustees also received materials and information regarding the legal standards applicable to their consideration of the Agreements and the process and criteria used by the Manager to identify and select the Sub-Advisers.
During the course of their deliberations, the Independent Trustees met twice to discuss and evaluate the materials, information and Agreements in executive session with their independent legal counsel, outside of the presence of the Trustees who are not Independent Trustees and representatives from Fund management, the Manager or any Sub-Adviser.
In reaching its decisions to renew its approval of the Agreements, the Board took into account the materials and information described above, as well as other materials and information provided to the Board throughout the year. Individual Trustees may have given different weight to different factors and information with respect to each Agreement, and the Trustees did not identify any single factor or information that, in isolation, would be controlling in deciding to approve the Agreements. The discussion below is intended to summarize the broad factors that figured prominently in the Board’s decisions to renew its approval of the Agreements rather than to be all-inclusive. These broad factors included: (i) the nature, extent and quality of the services provided to the Funds by the Manager and to the Sub-advised Funds by the Sub-Advisers; (ii) the investment performance of each Fund; (iii) estimated profitability of the Manager; (iv) fees and expenses; (v) the extent to which economies of scale may exist, and the extent to the benefits of economies of scale are shared with the Funds; and (vi) any other benefits derived by the Manager or the Sub-Advisers (or their respective affiliates) from their relationships with the Funds.
Nature, Extent and Quality of Services
The Trustees considered information regarding the nature, extent and quality of services provided to the Funds by the Manager. The Trustees also considered, among other things, the terms of the Management Agreement and the range of investment advisory services provided by the Manager. In addition, the Trustees reviewed the range of non-investment advisory services provided by the Manager consistent
with the terms of the Management Agreement, notably coordinating the preparation and filing of various regulatory documents, coordinating the preparation and assembly of Board meeting materials, and assisting the Board with certain valuation matters. The Board also received a description of the Manager’s and each Sub-Adviser’s business continuity plans and of their respective approaches to data privacy and cybersecurity, and related testing. The Board received information regarding the response of the Manager and the Sub-Advisers to the COVID-19 pandemic, including the continuation of remote work arrangements and return-to-office plans. The Board also received information about the Manager’s role as administrator of the Funds’ liquidity risk management program, the Manager’s approach to risk management, and the Manager’s vendor oversight programs.
The Trustees considered that the Sub-advised Funds operate in a “manager-of-managers” structure and reviewed the responsibilities that the Manager has under this structure, including monitoring and evaluating the performance of the Sub-Advisers, monitoring the Sub-Advisers for adherence to the stated investment objectives, strategies, policies and restrictions of the Funds and supervising the Sub-Advisers with respect to the services that the Sub-Advisers would provide under the Sub-Advisory Agreements. The Trustees also considered the process used by the Manager, consistent with this structure, to identify and recommend sub-advisers, and the Manager’s ability to monitor and oversee sub-advisers and recommend replacement sub-advisers, when necessary, and provide other services under the Management Agreement. The Board noted that investment management staff of the Manager and the Trust’s Chief Compliance Officer conduct oversight meetings with the Sub-Advisers on a periodic basis, follow through with additional inquiries on any questions or concerns that arise during the meetings and, as necessary, then report the results of the meetings to the Board. The Trustees reviewed information regarding the experience and background of the Manager’s key personnel and the Manager’s organizational structure and resources, including investment, legal and administrative capabilities of the Manager. In this regard, the Trustees recognized that the Funds may benefit from the Manager’s ability to use resources and capabilities of its affiliates in providing services to the Funds.
The Trustees considered information regarding the nature, extent and quality of services provided to the Sub-advised Funds by the Sub-Advisers. The Trustees
SUPPLEMENTAL INFORMATION (UNAUDITED)
also considered, among other things, the terms of the Sub-advisory Agreements and the range of investment advisory services provided by the Sub-Advisers under the oversight of the Manager. In evaluating these investment advisory services, the Trustees considered, among other things, the Sub-Advisers’ investment philosophies, styles and/or processes and approaches to managing the respective Sub-advised Funds. The Trustees received and evaluated information regarding the background, education, expertise and/or experience of the investment professionals who serve as portfolio managers for the Sub-advised Funds and the capabilities and resources of the Sub-Advisers.
Based upon these considerations, the Trustees concluded, within the context of their full deliberations, that the nature, extent and quality of services provided to the Funds by the Manager and the Sub-advised Funds by each respective Sub-Adviser were appropriate.
Investment Performance
In connection with each of its regular quarterly meetings, the Board receives information on the performance of each Fund, including net performance, relative performance rankings within the relevant Morningstar peer group, and performance as compared to benchmark index returns. At each quarterly Board meeting, members of the Manager’s funds management team review with the Board the economic and market environment, absolute and relative performance of each Fund, and any relevant information about risk management and style consistency in connection with management of the Funds. The Board considered investment performance for each Fund over the one-year, three-year (where available), five-year (where available) and since-inception periods.
The Board also received and reviewed a report prepared by Broadridge Financial Solutions (“Broadridge”), an independent provider of mutual fund industry data, which included comparisons of the performance of each Fund to performance of an appropriate peer universe. For details regarding each Fund’s performance, see the “Fund-by-Fund Factors” section below.
The Manager discussed with the Board factors contributing to the Funds’ performance results. In addition, for certain Funds, the Manager provided to the Board longer term performance records of the Sub-Advisers for strategies used in managing the Funds. The Board concluded that the investment performance generated by the Manager and each Sub-Adviser was generally satisfactory, or, that any steps being taken by
the Manager and Sub-Advisers to address any performance issues were satisfactory.
Profitability
The Board received and considered the Manager’s estimate of its profitability, which included allocations by the Manager of its costs in providing management services to the Funds. The Board considered the estimated profitability of the Manager both overall and on a Fund-by-Fund basis.
The Board received and considered profitability information from most of the Sub-Advisers, but noted that the Manager had negotiated the fees with the Sub-Advisers at arm’s-length. Accordingly, the Board concluded that the profitability of the Sub-Advisers is a less relevant factor than Manager profitability.
Based on the consideration of this information, the Board concluded that the profitability of the Funds to the Manager was acceptable.
Fees and Expenses
The Trustees considered the management fees paid by the Funds to the Manager under the Management Agreement and evaluated the reasonableness of these fees. The Trustees received and reviewed comparative information with respect to the management fee and total expenses for each Fund and the management fees and total expenses for a peer group of other funds selected by Broadridge. The Trustees considered the Manager’s commitment to limit the total expenses of each Fund through an expense limitation agreement with the Trust. Although the Board recognized that the comparisons between the management fees and actual expenses of the Funds and those of the identified peer group are imprecise, given different terms of agreements and variations in fund strategies, the Trustees found that the comparative information supported their consideration and approval of the management fees and evaluation of the total expenses. For details regarding each Fund’s fee and expense comparisons, see the “Fund-by-Fund Factors” section below.
The Trustees considered the sub-advisory fees paid under the Sub-advisory Agreements and evaluated the reasonableness of those fees. The Trustees also considered that the fees paid to the Sub-Advisers would be paid by the Manager and not the Funds and that the Manager had negotiated the fees with the Sub-Advisers at arm’s-length.
SUPPLEMENTAL INFORMATION (UNAUDITED)
Based on the consideration of the information and factors summarized above, as well as other relevant information and factors, the Board concluded that the management and sub-advisory fees were reasonable in light of the nature, extent and quality of services rendered to the Funds by the Manager and the Sub-Advisers.
Economies of Scale
The Board considered the extent to which economies of scale may exist, and the extent to the benefits of economies of scale are shared with the Funds. In this regard, the Board noted that for sixteen of twenty-four Funds, the management and sub-advisory fee included breakpoints that are tiered based on growth in asset levels of each such Fund and that for the other Funds, the fees reflected appropriate levels based on current and expected asset levels. The Board also noted that the expenses of the Funds are subject to expense limitations provided by the Manager. The Board noted that expected economies of scale, where they exist, may be shared through the use of fee breakpoints, expense limitations by the Manager, and/or a lower overall fee.
Ancillary Benefits
The Board considered the potential benefits, other than management fees, that the Manager and/or its affiliates may receive because of the Manager’s relationship with the Funds. The Trustees considered that the Funds were designed to serve as investment options under variable contracts issued by affiliates of the Manager that would receive fees under those contracts and that Park Avenue Securities LLC, an affiliate of the Manager and principal underwriter of the Funds, and participating insurance companies, including insurance companies affiliated with the Manager, would be entitled to receive fees from the Funds under a plan of distribution adopted pursuant to Rule 12b-1 under the 1940 Act. The Trustees considered that the Manager and its affiliates may benefit from (i) greater efficiencies in annuity administration and operations and potential cost savings due to a reduction in the number of unaffiliated funds available as annuity contract investment options, and (ii) increased dividends-received deductions due to the Funds’ status under the tax laws as disregarded entities. In addition, the Trustees considered the potential benefits, other than sub-advisory fees, that the Sub-Advisers and their affiliates may receive because of their relationships with the Funds, including the ability to receive research from soft dollar commissions consistent with Trust policies. The
Trustees concluded that benefits that may accrue to the Manager and its affiliates are reasonable and the benefits that may accrue to the Sub-Advisers and their affiliates are consistent with those expected for a sub-adviser to a mutual fund such as the applicable Fund.
Fund-by-Fund Factors
The Broadridge report groups fees, expenses and performance into five quintiles, with the top quintile having the highest performance or lowest fees/expenses, and the bottom quintile having the lowest performance or highest fees/expenses. For purposes of the descriptions below, a Fund’s performance is considered “in line with” the benchmark index if it is within 0.20%.
Guardian Large Cap Fundamental Growth VIP Fund
| • | | The Board noted that the Fund’s performance was in the 3rd quintile of its performance universe for the 1-year period and in the 4th quintile for its performance universe for the 3-year and 5-year periods. The Board also noted that the Fund’s performance was below the benchmark index for the 1-year, 3-year and 5-year periods. |
| • | | The Board noted that the contractual management fee, the actual management fee and actual total expenses were in the 1st quintile of the expense group. |
Guardian Large Cap Disciplined Growth VIP Fund
| • | | The Board noted that the Fund’s performance was in the 3rd quintile of its performance universe for the 1-year and 3-year periods and in the 2nd quintile for the 5-year period. The Board also noted that the Fund’s performance was below the benchmark index for the 1-year, 3-year and 5-year periods. |
| • | | The Board noted that the contractual management fee, the actual management fee and actual total expenses were in the 1st quintile of the expense group. |
Guardian Integrated Research VIP Fund
| • | | The Board noted that the Fund’s performance was in the 5th quintile of its performance universe for the 1-year and 5-year periods and in the 4th quintile for 3-year period. The Board also noted that the Fund’s performance was below the benchmark index for the 1-year, 3-year and 5-year periods. |
| • | | The Board noted that the contractual management fee, the actual management fee and actual total expenses were in the 1st quintile of the expense group. |
SUPPLEMENTAL INFORMATION (UNAUDITED)
Guardian Diversified Research VIP Fund
| • | | The Board noted that the Fund’s performance was in the 3rd quintile of its performance universe for the 1-year and 3-year periods and in the 2nd quintile for the 5-year period. The Board also noted that the Fund’s performance was higher than the benchmark index for the 1-year period. The Board note that the Fund’s performance was lower than the benchmark index for the 3-year and 5-year periods. |
| • | | The Board noted that the contractual management fee and actual management fee were in the 1st quintile of the expense group and that actual total expenses were in the 3rd quintile. |
Guardian Strategic Large Cap Core VIP Fund
| • | | The Board noted that the Fund’s performance was in the 1st quintile of its performance universe for the 1-year period. The Board acknowledged the Fund’s short operational history. The Board noted that the Fund’s performance was higher than the benchmark index for the 1-year period. |
| • | | The Board noted that the contractual management fee, the actual management fee and actual total expenses were in the 1st quintile of the expense group. |
Guardian Large Cap Disciplined Value VIP Fund
| • | | The Board noted that the Fund’s performance was in the 3rd quintile of its performance universe for the 1-year and 3-year periods and in the 4th quintile for the 5-year period. The Board also noted that the Fund’s performance was higher than the benchmark index for the 1-year and 3-year periods. The Board noted that the Fund’s performance was in line with the benchmark index for the 5-year period. |
| • | | The Board noted that the contractual management fee was in the 2nd quintile of the expense group, the actual management fee was in the 1st quintile of the expense group and that actual total expenses were in the 3rd quintile. |
Guardian Growth & Income VIP Fund
| • | | The Board noted that the Fund’s performance was in the 3rd quintile of its performance universe for the 1-year, 3-year and 5-year periods. The Board also noted that the Fund’s performance was higher than the benchmark index for the 1-year, 3-year and 5-year periods. |
| • | | The Board noted that the contractual management fee and the actual management fee were in the 1st quintile of the expense group and that actual total expenses were in the 3rd quintile. |
Guardian Equity Income VIP Fund
| • | | The Board noted that the Fund had less than one-year of operational history and was not able to evaluate an investment performance record for the Fund. The Board noted that it would have an opportunity to review such information in connection with future annual reviews. The Board noted that, in the meantime, it received monthly performance reports from the Manager. |
| • | | The Board noted that the contractual management fee, the actual management fee and actual total expenses were in the 1st quintile of the expense group. |
Guardian All Cap Core VIP Fund
| • | | The Board noted that the Fund’s performance was in the 3rd quintile of its performance universe for the 1-year period. The Board acknowledged the Fund’s short operational history. The Board noted that the Fund’s performance was higher than the benchmark index for the 1-year period. |
| • | | The Board noted that the contractual management fee, the actual management fee and actual total expenses were in the 1st quintile of the expense group. |
Guardian Mid Cap Traditional Growth VIP Fund
| • | | The Board noted that the Fund’s performance was in the 1st quintile of its performance universe for the 1-year period and in the 2nd quintile for the 3-year and 5-year periods. The Board also noted that the Fund’s performance was higher than the benchmark index for the 1-year, 3-year and 5-year periods. |
| • | | The Board noted that the contractual management fee and actual management fee were in the 1st quintile of the expense group and that the actual total expenses were in the 4th quintile. |
Guardian Select Mid Cap Core VIP Fund
| • | | The Board noted that the Fund’s performance was in the 3rd quintile of its performance universe for the 1-year period. The Board acknowledged the Fund’s short operational history. The Board noted that the Fund’s performance was lower than the benchmark index for the 1-year period. |
| • | | The Board noted that the contractual management fee, the actual management fee and actual total expenses were in the 1st quintile of the expense group. |
Guardian Mid Cap Relative Value VIP Fund
| • | | The Board noted that the Fund’s performance was in the 2nd quintile of its performance universe for the 1-year, 3-year and 5-year periods. The Board also |
SUPPLEMENTAL INFORMATION (UNAUDITED)
| | | noted that the Fund’s performance was higher than the benchmark index for the 1-year, 3-year and 5-year periods. |
| • | | The Board noted that the contractual management fee and the actual management fee were in the 2nd quintile of the expense group and the actual total expenses were in the 3rd quintile of the expense group. |
Guardian Small-Mid Cap Core VIP Fund
| • | | The Board noted that the Fund’s performance was in the 5th quintile of its performance universe for the 1-year period. The Board acknowledged the Fund’s short operational history. The Board noted that the Fund’s performance was higher than the benchmark index for the 1-year period. |
| • | | The Board noted that the contractual management fee, the actual management fee and actual total expenses were in the 1st quintile of the expense group. |
Guardian Small Cap Core VIP Fund
| • | | The Board noted that the Fund’s performance was in the 5th quintile of its performance universe for the 1-year and 3-year periods. The Board noted that the Fund’s performance was lower than the benchmark index for the 1-year and 3-year periods. |
| • | | The Board noted that the contractual management fee and the actual management fee were in the 1st quintile of the expense group and the actual total expenses were in the 2nd quintile of the expense group. |
Guardian International Growth VIP Fund
| • | | The Board noted that the Fund’s performance was in the 4th quintile of its performance universe for the 1-year period, in the 2nd quintile of its performance universe for the 3-year period and in the 3rd quintile of its performance universe for the 5-year period. The Board also noted that the Fund’s performance was lower than the benchmark index for the 1-year and 5-year periods. The Board noted that the Fund’s performance was higher than the benchmark index for the 3-year period. |
| • | | The Board noted that the contractual management fee and actual management fee were in the 2nd quintile of the expense group and that the actual total expenses were in the 3rd quintile. |
Guardian International Equity VIP Fund
| • | | The Board noted that the Fund’s performance was in the 5th quintile of its performance universe for the |
| | | 1-year, 3-year and 5-year periods. The Board also noted that the Fund’s performance was lower than the benchmark index for the 1-year, 3-year and 5-year periods. |
| • | | The Board noted that the contractual management fee, the actual management fee and the actual total expenses were in the 2nd quintile of the expense group. |
Guardian Global Utilities VIP Fund
| • | | The Board noted that the Fund’s performance was in the 5th quintile of its performance universe for the 1-year period and in the 4th quintile of its performance universe for the 3-year period. The Board noted that the Fund’s performance was higher than the benchmark index for the 1-year and 3-year periods. |
| • | | The Board noted that the contractual management fee and the actual management fee were in the 1st quintile of the expense group and the actual total expenses were in the 2nd quintile of the expense group. |
Guardian Balanced Allocation VIP Fund
| • | | The Board noted that the Fund had less than one-year of operational history and was not able to evaluate an investment performance record for the Fund. The Board noted that it would have an opportunity to review such information in connection with future annual reviews. The Board noted that, in the meantime, it received monthly performance reports from the Manager. |
| • | | The Board noted that the contractual management fee, the actual management fee and actual total expenses were in the 1st quintile of the expense group. |
Guardian Core Plus Fixed Income VIP Fund
| • | | The Board noted that the Fund’s performance was in the 3rd quintile of its performance universe for the 1-year and 3-year periods and in the 4th quintile of its performance universe for the 5-year period. The Board also noted that the Fund’s performance was lower than the benchmark index for the 1-year and 5-year periods. The Board noted that the Fund’s performance was in line with the benchmark index for the 3-year period. |
| • | | The Board noted that the contractual management fee and actual management fee were in the 2nd quintile of the expense group and that actual total expenses were in the 3rd quintile. |
SUPPLEMENTAL INFORMATION (UNAUDITED)
Guardian Total Return Bond VIP Fund
| • | | The Board noted that the Fund’s performance was in the 5th quintile of its performance universe for the 1-year and 3-year periods. The Board also noted that the Fund’s performance was lower than the benchmark index for the 1-year and 3-year periods. |
| • | | The Board noted that the contractual management fee and actual management fee were in the 2nd quintile and the actual total expenses were in the 3rd quintile. |
Guardian Core Fixed Income VIP Fund
| • | | The Board noted that the Fund had less than one-year of operational history and was not able to evaluate an investment performance record for the Fund. The Board noted that it would have an opportunity to review such information in connection with future annual reviews. The Board noted that, in the meantime, it received monthly performance reports from the Manager. |
| • | | The Board noted that the contractual management fee was in the 2nd quintile of the expense group and the actual management fee and the actual total expenses were in the 1st quintile. |
Guardian Multi-Sector Bond VIP Fund
| • | | The Board noted that the Fund’s performance was in the 5th quintile of its performance universe for the 1-year and 3-year periods The Board also noted that the Fund’s performance was lower than the benchmark index for the 1-year and 3-year periods. |
| • | | The Board noted that the contractual management fee and actual total expenses were in the 1st quintile and the actual management fee was in the 2nd quintile. |
Guardian Short Duration Bond VIP Fund
| • | | The Board noted that the Fund had less than one-year of operational history and was not able to evaluate an investment performance record for the Fund. The Board noted that it would have an opportunity to review such information in connection with future annual reviews. The Board noted that, in the meantime, it received monthly performance reports from the Manager. |
| • | | The Board noted that the contractual management fee and actual total expenses were in the 3rd quintile of the expense group and the actual management fee was in the 1st quintile of the expense group. |
Guardian U.S. Government Securities VIP Fund
| • | | The Board noted that the Fund’s performance was in the 1st quintile of its performance universe for the 1-year period and in the 2nd quintile of its performance universe for the 3-year period. The Board also noted that the Fund’s performance was higher than the benchmark index for the 1-year and 3-year periods. |
| • | | The Board noted that the contractual management fee and the actual management fee were in the 1st quintile of the expense group and the actual total expenses were in the 2nd quintile of the expense group. |
Conclusion
Based on a comprehensive consideration and evaluation of all of the information and factors summarized above, among others, the Board as a whole, including the Independent Trustees, approved the Agreements.
SUPPLEMENTAL INFORMATION (UNAUDITED)
The Statement of Additional Information (“SAI”) includes additional information about the Trust’s Trustees and Officers and is available, without charge, upon request by calling toll-free 1-888-GUARDIAN (1-888-482-7342) or by visiting our website at http://guardianvpt.onlineprospectus.net/GuardianVPT/Prospectuses.
Portfolio Holdings and Proxy Voting Procedures
The Fund files its complete schedule of portfolio holdings with the Securities and Exchange Commission for the first and third quarters of each fiscal year as an exhibit to its reports on Form N-PORT. The Fund’s Form N-PORT reports are available on the Securities and Exchange Commission’s website at https://www.sec.gov. The Fund’s Form N-PORT information is also available, without charge, upon request, by calling toll-free 1-888-GUARDIAN (1-888-482-7342) or by visiting our website at http://guardianvpt.onlineprospectus.net/GuardianVPT/Prospectuses.
A description of the policies and procedures that the Fund uses to determine how to vote proxies relating to portfolio securities is included in the SAI. The SAI and information regarding how the Fund voted proxies relating to portfolio securities during the most recent 12-month period ended June 30 may be obtained (i) without charge, upon request, by calling toll-free 1-888-GUARDIAN (1-888-482-7342) or by visiting our website at http://guardianvpt.onlineprospectus.net/GuardianVPT/Prospectuses; and (ii) on the Securities and Exchange Commission’s website at https://www.sec.gov.
This report is transmitted to shareholders only. It is not authorized for use as an offer of sale or a solicitation of an offer to buy shares of the Fund unless accompanied or preceded by the Fund’s current prospectus. Past performance results shown in this report should not be considered a representation of future performance. Investment returns and principal value of shares will fluctuate so that shares, when redeemed, may be worth more or less than their original cost. Statements and other information herein are as dated and are subject to change.

The Guardian Life Insurance Company of America New York, NY 10001-2159
PUB10537
Guardian Variable
Products Trust
2023
Semiannual Report
All Data as of June 30, 2023
Guardian Growth & Income VIP Fund

| | |
| Not FDIC insured. May lose value. No bank guarantee. | | www.guardianlife.com |
TABLE OF CONTENTS
Guardian Growth & Income VIP Fund
Except as otherwise specifically stated, all information, including portfolio security positions, is as of June 30, 2023. Fund holdings will vary. Information contained herein has been obtained from sources believed reliable, but is not guaranteed.
GUARDIAN GROWTH & INCOME VIP FUND
Fund Characteristics (unaudited)
Total Net Assets: $143,447,934
| | |
| | |
Sector Allocation1 As of June 30, 2023 | | |
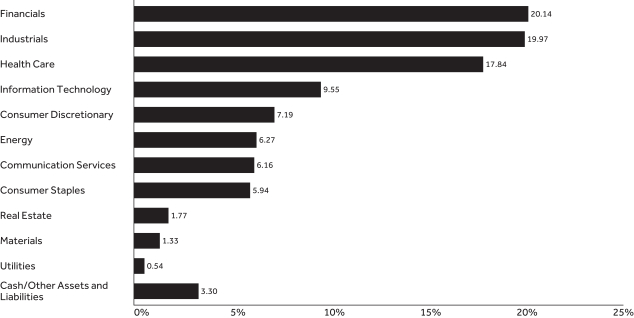
|
| | | | |
| | |
Top Ten Holdings2 As of June 30, 2023 | | | |
| | |
| Holding | | % of Total
Net Assets | |
| Philip Morris International, Inc. | | | 3.82% | |
| Berkshire Hathaway, Inc., Class B | | | 3.70% | |
| Alphabet, Inc., Class C | | | 3.69% | |
| JPMorgan Chase & Co. | | | 3.54% | |
| Elevance Health, Inc. | | | 3.35% | |
| Mastercard, Inc., Class A | | | 3.30% | |
| Roche Holding AG, ADR | | | 3.17% | |
| Amgen, Inc. | | | 2.77% | |
| Comcast Corp., Class A | | | 2.47% | |
| Gilead Sciences, Inc. | | | 2.44% | |
| Total | | | 32.25% | |
| 1 | The Fund’s holdings are allocated to each sector based on the MSCI Global Industry Classification Standard (GICS®). Cash includes short-term investments and net other assets and liabilities. |
| 2 | Portfolio holdings are subject to change and should not be considered a recommendation to buy or sell individual securities. |
UNDERSTANDING YOUR FUND’S EXPENSES (UNAUDITED)
By investing in the Fund, you incur two types of costs: (1) transaction costs and (2) ongoing costs, including, as applicable, investment advisory fees, distribution and/or service (12b-1) fees and other Fund expenses. The example below is intended to help you understand your ongoing costs (in dollars) of investing in the Fund and to compare these costs with the ongoing costs of investing in other mutual funds.
The example is based on an investment of $1,000 invested at the beginning of the period and held for the entire period from January 1, 2023 to June 30, 2023. The table below shows the Fund’s expenses in two ways:
Expenses based on actual return
This section of the table provides information about actual account values and actual expenses. You may use the information in this section, together with the amount you invested, to estimate the expenses that you paid over the period. Simply divide your account value by $1,000 (for example, an $8,600 account value divided by $1,000 = 8.6), then multiply the result by the number in the section under the heading entitled “Expenses Paid During Period” to estimate the expenses you paid on your account during this period.
Expenses based on hypothetical 5% return for comparison purposes
This section of the table provides information about hypothetical account values and hypothetical expenses based on the Fund’s actual expense ratio and an assumed rate of return of 5% per year before expenses, which is not the Fund’s actual return. The hypothetical account values and expenses may not be used to estimate the actual ending account balance or expenses you paid for the period. You may use this information to compare the ongoing costs of investing in the Fund with the cost of investing in other mutual funds. To do so, compare this 5% hypothetical example with the 5% hypothetical examples that appear in the shareholder reports of the other funds.
Note that the expenses shown in the table are meant to highlight your ongoing costs only and do not reflect any transactional costs, such as sales charges (loads), redemption fees, or exchange fees. Therefore the second section is useful in comparing ongoing costs only, and will not help you determine the relative total costs of owning different funds. If these transactional costs were included, your costs would have been higher. Charges and expenses at the insurance company separate account level are not reflected in the table.
| | | | | | | | | | | | | | |
| | | | | |
| | | Beginning
Account Value 1/1/23 | | Ending Account Value
6/30/23 | | | Expenses Paid During Period* 1/1/23-6/30/23 | | | Expense Ratio During Period 1/1/23-6/30/23 | |
| Based on Actual Return | | $1,000.00 | | $ | 1,031.40 | | | $ | 4.84 | | | | 0.96% | |
| Based on Hypothetical Return (5% Return Before Expenses) | | $1,000.00 | | $ | 1,020.03 | | | $ | 4.81 | | | | 0.96% | |
| * | Expenses are equal to the Fund’s annualized expense ratio as indicated, multiplied by the average account value over the period, multiplied by 181/365 (to reflect the one-half year period). |
SCHEDULE OF INVESTMENTS — GUARDIAN GROWTH & INCOME VIP FUND
| | | | | | | | |
| June 30, 2023 (unaudited) | | Shares | | | Value | |
| Common Stocks – 96.7% | |
| |
| Aerospace & Defense – 4.1% | |
| | | |
Curtiss-Wright Corp. | | | 6,379 | | | $ | 1,171,567 | |
| | | |
Raytheon Technologies Corp. | | | 25,506 | | | | 2,498,568 | |
| | | |
Textron, Inc. | | | 33,623 | | | | 2,273,923 | |
| | | | | | | | | |
| | |
| | | | | 5,944,058 | |
| Air Freight & Logistics – 0.8% | |
| | | |
Expeditors International of Washington, Inc. | | | 8,955 | | | | 1,084,719 | |
| | | | | | | | | |
| | |
| | | | | 1,084,719 | |
| Automobile Components – 1.5% | |
| | | |
BorgWarner, Inc. | | | 44,597 | | | | 2,181,239 | |
| | | | | | | | | |
| | |
| | | | | 2,181,239 | |
| Banks – 6.6% | |
| | | |
Bank OZK | | | 26,635 | | | | 1,069,662 | |
| | | |
JPMorgan Chase & Co. | | | 34,898 | | | | 5,075,565 | |
| | | |
Wells Fargo & Co. | | | 76,480 | | | | 3,264,166 | |
| | | | | | | | | |
| | |
| | | | | 9,409,393 | |
| Biotechnology – 7.6% | |
| | | |
Amgen, Inc. | | | 17,908 | | | | 3,975,934 | |
| | | |
Gilead Sciences, Inc. | | | 45,330 | | | | 3,493,583 | |
| | | |
Regeneron Pharmaceuticals, Inc.(1) | | | 4,818 | | | | 3,461,926 | |
| | | | | | | | | |
| | |
| | | | | 10,931,443 | |
| Building Products – 1.2% | |
| | | |
Builders FirstSource, Inc.(1) | | | 12,201 | | | | 1,659,336 | |
| | | | | | | | | |
| | |
| | | | | 1,659,336 | |
| Capital Markets – 1.9% | |
| | | |
Goldman Sachs Group, Inc. | | | 3,087 | | | | 995,681 | |
| | | |
Houlihan Lokey, Inc. | | | 12,091 | | | | 1,188,666 | |
| | | |
Raymond James Financial, Inc. | | | 4,684 | | | | 486,059 | |
| | | | | | | | | |
| | |
| | | | | 2,670,406 | |
| Chemicals – 0.5% | |
| | | |
LyondellBasell Industries NV, Class A | | | 7,819 | | | | 718,019 | |
| | | | | | | | | |
| | |
| | | | | 718,019 | |
| Communications Equipment – 2.4% | |
| | | |
Cisco Systems, Inc. | | | 66,008 | | | | 3,415,254 | |
| | | | | | | | | |
| | |
| | | | | 3,415,254 | |
| Construction & Engineering – 1.4% | |
| | | |
EMCOR Group, Inc. | | | 10,746 | | | | 1,985,646 | |
| | | | | | | | | |
| | |
| | | | | 1,985,646 | |
| Consumer Staples Distribution & Retail – 1.3% | |
| | | |
BJ’s Wholesale Club Holdings, Inc.(1) | | | 14,603 | | | | 920,135 | |
| | | |
Kroger Co. | | | 20,099 | | | | 944,653 | |
| | | | | | | | | |
| | |
| | | | | 1,864,788 | |
| Distributors – 1.3% | |
| | | |
LKQ Corp. | | | 32,312 | | | | 1,882,820 | |
| | | | | | | | | |
| | |
| | | | | 1,882,820 | |
| Electric Utilities – 0.5% | |
| | | |
IDACORP, Inc. | | | 7,592 | | | | 778,939 | |
| | | | | | | | | |
| | |
| | | | | 778,939 | |
| | | | | | | | |
| June 30, 2023 (unaudited) | | Shares | | | Value | |
| Electrical Equipment – 3.1% | |
| | | |
Acuity Brands, Inc. | | | 3,684 | | | $ | 600,787 | |
| | | |
Emerson Electric Co. | | | 14,877 | | | | 1,344,732 | |
| | | |
nVent Electric PLC | | | 31,685 | | | | 1,637,164 | |
| | | |
Sensata Technologies Holding PLC | | | 19,737 | | | | 887,967 | |
| | | | | | | | | |
| | |
| | | | | 4,470,650 | |
| Electronic Equipment, Instruments & Components – 1.7% | |
| | | |
IPG Photonics Corp.(1) | | | 6,351 | | | | 862,593 | |
| | | |
Keysight Technologies, Inc.(1) | | | 9,716 | | | | 1,626,944 | |
| | | | | | | | | |
| | |
| | | | | 2,489,537 | |
| Energy Equipment & Services – 0.9% | |
| | | |
Helmerich & Payne, Inc. | | | 35,103 | | | | 1,244,401 | |
| | | | | | | | | |
| | |
| | | | | 1,244,401 | |
| Financial Services – 9.1% | |
| | | |
Berkshire Hathaway, Inc., Class B(1) | | | 15,564 | | | | 5,307,324 | |
| | | |
Fiserv, Inc.(1) | | | 4,688 | | | | 591,391 | |
| | | |
FleetCor Technologies, Inc.(1) | | | 3,038 | | | | 762,781 | |
| | | |
Mastercard, Inc., Class A | | | 12,045 | | | | 4,737,299 | |
| | | |
PayPal Holdings, Inc.(1) | | | 24,330 | | | | 1,623,541 | |
| | | | | | | | | |
| | |
| | | | | 13,022,336 | |
| Food Products – 0.8% | |
| | | |
Kraft Heinz Co. | | | 33,126 | | | | 1,175,973 | |
| | | | | | | | | |
| | |
| | | | | 1,175,973 | |
| Ground Transportation – 0.7% | |
| | | |
Knight-Swift Transportation Holdings, Inc. | | | 18,764 | | | | 1,042,528 | |
| | | | | | | | | |
| | |
| | | | | 1,042,528 | |
| Health Care Providers & Services – 7.0% | |
| | | |
AmerisourceBergen Corp. | | | 3,037 | | | | 584,410 | |
| | | |
Cigna Group | | | 9,467 | | | | 2,656,440 | |
| | | |
Elevance Health, Inc. | | | 10,830 | | | | 4,811,661 | |
| | | |
Quest Diagnostics, Inc. | | | 14,646 | | | | 2,058,642 | |
| | | | | | | | | |
| | |
| | | | | 10,111,153 | |
| Hotels, Restaurants & Leisure – 1.4% | |
| | | |
Booking Holdings, Inc.(1) | | | 192 | | | | 518,463 | |
| | | |
Choice Hotels International, Inc. | | | 12,424 | | | | 1,460,069 | |
| | | | | | | | | |
| | |
| | | | | 1,978,532 | |
| Household Durables – 0.8% | |
| | | |
D.R. Horton, Inc. | | | 9,804 | | | | 1,193,049 | |
| | | | | | | | | |
| | |
| | | | | 1,193,049 | |
| Insurance – 2.6% | |
| | | |
American International Group, Inc. | | | 27,388 | | | | 1,575,906 | |
| | | |
Axis Capital Holdings Ltd. | | | 24,756 | | | | 1,332,615 | |
| | | |
MetLife, Inc. | | | 15,594 | | | | 881,529 | |
| | | | | | | | | |
| | |
| | | | | 3,790,050 | |
| Interactive Media & Services – 3.7% | |
| | | |
Alphabet, Inc., Class C(1) | | | 43,816 | | | | 5,300,422 | |
| | | | | | | | | |
| | |
| | | | | 5,300,422 | |
| IT Services – 2.0% | |
| | | |
Accenture PLC, Class A | | | 6,587 | | | | 2,032,617 | |
| | | |
Cognizant Technology Solutions Corp., Class A | | | 11,955 | | | | 780,422 | |
| | | | | | | | | |
| | |
| | | | | 2,813,039 | |
| | | | |
| The accompanying notes are an integral part of these financial statements. | | | | 3 |
SCHEDULE OF INVESTMENTS — GUARDIAN GROWTH & INCOME VIP FUND
| | | | | | | | |
| June 30, 2023 (unaudited) | | Shares | | | Value | |
| Machinery – 3.5% | |
| | | |
Dover Corp. | | | 2,956 | | | $ | 436,453 | |
| | | |
Middleby Corp.(1) | | | 6,255 | | | | 924,677 | |
| | | |
PACCAR, Inc. | | | 26,595 | | | | 2,224,672 | |
| | | |
Westinghouse Air Brake Technologies Corp. | | | 13,372 | | | | 1,466,507 | |
| | | | | | | | | |
| | |
| | | | | 5,052,309 | |
| Media – 2.5% | |
| | | |
Comcast Corp., Class A | | | 85,140 | | | | 3,537,567 | |
| | | | | | | | | |
| | |
| | | | | 3,537,567 | |
| Metals & Mining – 0.8% | |
| | | |
BHP Group Ltd., ADR | | | 19,916 | | | | 1,188,388 | |
| | | | | | | | | |
| | |
| | | | | 1,188,388 | |
| Oil, Gas & Consumable Fuels – 5.4% | |
| | | |
Chevron Corp. | | | 14,253 | | | | 2,242,709 | |
| | | |
ConocoPhillips | | | 18,798 | | | | 1,947,661 | |
| | | |
EOG Resources, Inc. | | | 14,127 | | | | 1,616,694 | |
| | | |
Phillips 66 | | | 20,307 | | | | 1,936,882 | |
| | | | | | | | | |
| | |
| | | | | 7,743,946 | |
| Passenger Airlines – 0.9% | |
| | | |
Alaska Air Group, Inc.(1) | | | 24,075 | | | | 1,280,308 | |
| | | | | | | | | |
| | |
| | | | | 1,280,308 | |
| Pharmaceuticals – 3.2% | |
| | | |
Roche Holding AG, ADR | | | 118,925 | | | | 4,542,935 | |
| | | | | | | | | |
| | |
| | | | | 4,542,935 | |
| Professional Services – 3.4% | |
| | | |
Leidos Holdings, Inc. | | | 13,283 | | | | 1,175,280 | |
| | | |
Maximus, Inc. | | | 20,231 | | | | 1,709,722 | |
| | | |
Robert Half International, Inc. | | | 26,389 | | | | 1,984,980 | |
| | | | | | | | | |
| | |
| | | | | 4,869,982 | |
| Semiconductors & Semiconductor Equipment – 3.5% | |
| | | |
NXP Semiconductors NV | | | 6,947 | | | | 1,421,912 | |
| | | |
QUALCOMM, Inc. | | | 19,074 | | | | 2,270,569 | |
| | | |
Taiwan Semiconductor Manufacturing Co. Ltd., ADR | | | 12,768 | | | | 1,288,546 | |
| | | | | | | | | |
| | |
| | | | | 4,981,027 | |
| Specialized REITs – 1.8% | |
| | | |
Weyerhaeuser Co. | | | 75,684 | | | | 2,536,171 | |
| | | | | | | | | |
| | |
| | | | | 2,536,171 | |
| | | | | | | | |
| June 30, 2023 (unaudited) | | Shares | | | Value | |
| Specialty Retail – 2.1% | |
| | | |
Lowe’s Cos., Inc. | | | 9,949 | | | $ | 2,245,489 | |
| | | |
Ulta Beauty, Inc.(1) | | | 1,758 | | | | 827,306 | |
| | | | | | | | | |
| | |
| | | | | 3,072,795 | |
| Tobacco – 3.8% | |
| | | |
Philip Morris International, Inc. | | | 56,148 | | | | 5,481,168 | |
| | | | | | | | | |
| | |
| | | | | 5,481,168 | |
| Trading Companies & Distributors – 0.9% | |
| | | |
Ferguson PLC | | | 2,907 | | | | 457,300 | |
| | | |
MSC Industrial Direct Co., Inc., Class A | | | 8,457 | | | | 805,783 | |
| | | | | | | | | |
| | |
| | | | | 1,263,083 | |
| | |
Total Common Stocks
(Cost $112,502,196) | | | | 138,707,409 | |
| | | | | | | | |
| | | Principal
Amount | | | Value | |
| Repurchase Agreements – 3.5% | |
| | | |
Fixed Income Clearing Corp., 1.52%, dated 6/30/2023, proceeds at maturity value of $4,981,090, due 7/3/2023(2) | | $ | 4,980,459 | | | | 4,980,459 | |
| | |
Total Repurchase Agreements
(Cost $4,980,459) | | | | 4,980,459 | |
| | | |
Total Investments – 100.2%
(Cost $117,482,655) | | | | | | | 143,687,868 | |
| | |
| Liabilities in excess of other assets – (0.2)% | | | | (239,934 | ) |
| | | |
| Total Net Assets – 100.0% | | | | | | $ | 143,447,934 | |
| (1) | Non–income–producing security. |
| (2) | The table below presents collateral for repurchase agreements. |
| | | | | | | | | | | | | | | | |
| Security | | Coupon | | | Maturity Date | | | Principal Amount | | | Value | |
| U.S. Treasury Note | | | 4.625% | | | | 3/15/2026 | | | $ | 5,006,100 | | | $ | 5,080,069 | |
Legend:
ADR — American Depositary Receipt
REITs — Real Estate Investment Trusts
The following is a summary of the inputs used as of June 30, 2023 in valuing the Fund’s investments. For more information on valuation inputs, please refer to Note 2a of the accompanying Notes to Financial Statements.
| | | | | | | | | | | | | | | | |
| | | Valuation Inputs | | | | |
| Investments in Securities (unaudited) | | Level 1 | | | Level 2 | | | Level 3 | | | Total | |
| Common Stocks | | $ | 138,707,409 | | | $ | — | | | $ | — | | | $ | 138,707,409 | |
| Repurchase Agreements | | | — | | | | 4,980,459 | | | | — | | | | 4,980,459 | |
| Total | | $ | 138,707,409 | | | $ | 4,980,459 | | | $ | — | | | $ | 143,687,868 | |
| | | | |
| 4 | | | | The accompanying notes are an integral part of these financial statements. |
FINANCIAL INFORMATION — GUARDIAN GROWTH & INCOME VIP FUND
| | | | |
Statement of Assets and Liabilities As of June 30, 2023 (unaudited) | | | |
Assets | | | | |
| | |
Investments, at value | | $ | 143,687,868 | |
| | |
Receivable for investments sold | | | 146,161 | |
| | |
Dividends/interest receivable | | | 110,913 | |
| | |
Foreign tax reclaims receivable | | | 110,902 | |
| | |
Reimbursement receivable from adviser | | | 6,406 | |
| | |
Prepaid expenses | | | 1,739 | |
| | | | | |
| | |
Total Assets | | | 144,063,989 | |
| | | | | |
| | |
Liabilities | | | | |
| | |
Payable for investments purchased | | | 437,464 | |
| | |
Investment advisory fees payable | | | 73,935 | |
| | |
Distribution fees payable | | | 29,094 | |
| | |
Payable for fund shares redeemed | | | 28,870 | |
| | |
Accrued audit fees | | | 13,978 | |
| | |
Accrued custodian and accounting fees | | | 6,682 | |
| | |
Accrued trustees’ and officers’ fees | | | 2,850 | |
| | |
Accrued expenses and other liabilities | | | 23,182 | |
| | | | | |
| | |
Total Liabilities | | | 616,055 | |
| | | | | |
| | |
Total Net Assets | | $ | 143,447,934 | |
| | | | | |
| | |
Net Assets Consist of: | | | | |
| | |
Paid-in capital | | $ | 60,385,605 | |
| | |
Distributable earnings | | | 83,062,329 | |
| | | | | |
| | |
Total Net Assets | | $ | 143,447,934 | |
| | | | | |
| | |
Investments, at Cost | | $ | 117,482,655 | |
| | | | | |
| | |
Pricing of Shares | | | | |
| | |
Shares of Beneficial Interest Outstanding with No Par Value | | | 7,654,146 | |
| | |
Net Asset Value Per Share | | | $18.74 | |
| | | | | |
| | | | |
Statement of Operations For the Six Months Ended June 30, 2023 (unaudited) | |
Investment Income | | | | |
| | |
Dividends | | $ | 1,570,656 | |
| | |
Interest | | | 42,172 | |
| | |
Withholding taxes on foreign dividends | | | (23,948 | ) |
| | | | | |
| | |
Total Investment Income | | | 1,588,880 | |
| | | | | |
| | |
Expenses | | | | |
| | |
Investment advisory fees | | | 447,841 | |
| | |
Distribution fees | | | 176,269 | |
| | |
Professional fees | | | 27,255 | |
| | |
Trustees’ and officers’ fees | | | 18,039 | |
| | |
Custodian and accounting fees | | | 15,048 | |
| | |
Administrative fees | | | 14,279 | |
| | |
Transfer agent fees | | | 7,274 | |
| | |
Shareholder reports | | | 4,778 | |
| | |
Other expenses | | | 4,053 | |
| | | | | |
| | |
Total Expenses | | | 714,836 | |
| | |
Less: Fees waived | | | (37,962 | ) |
| | | | | |
| | |
Total Expenses, Net | | | 676,874 | |
| | | | | |
| | |
Net Investment Income/(Loss) | | | 912,006 | |
| | | | | |
| | |
Realized Gain/(Loss) and Change in Unrealized Appreciation/(Depreciation) on Investments | | | | |
| | |
Net realized gain/(loss) from investments | | | 2,625,285 | |
| | |
Net change in unrealized appreciation/(depreciation) on investments | | | 864,312 | |
| | | | | |
| | |
Net Gain on Investments | | | 3,489,597 | |
| | | | | |
| | |
Net Increase in Net Assets Resulting From Operations | | $ | 4,401,603 | |
| | | | | |
| | | | | |
| | | | |
| The accompanying notes are an integral part of these financial statements. | | | | 5 |
FINANCIAL INFORMATION — GUARDIAN GROWTH & INCOME VIP FUND
| | | | | | | | |
Statements of Changes in Net Assets Six Months Ended Numbers are unaudited | | | | | | |
| | | |
| | | For the
Six Months Ended
6/30/23 | | | For the
Year Ended
12/31/22 | |
| | | | |
Operations | | | | | | | | |
| | | |
Net investment income/(loss) | | $ | 912,006 | | | $ | 2,000,754 | |
| | | |
Net realized gain/(loss) from investments | | | 2,625,285 | | | | 14,486,941 | |
| | | |
Net change in unrealized appreciation/(depreciation) on investments | | | 864,312 | | | | (26,639,030 | ) |
| | | | | | | | | |
| | | |
Net Increase/(Decrease) in Net Assets Resulting from Operations | | | 4,401,603 | | | | (10,151,335 | ) |
| | | | | | | | | |
| | | |
Capital Share Transactions | | | | | | | | |
| | | |
Proceeds from sales of shares | | | 7,430,666 | | | | 4,514,934 | |
| | | |
Cost of shares redeemed | | | (11,423,815 | ) | | | (44,921,721 | ) |
| | | | | | | | | |
| | | |
Net Decrease in Net Assets Resulting from Capital Share Transactions | | | (3,993,149 | ) | | | (40,406,787 | ) |
| | | | | | | | | |
| | | |
Net Increase/(Decrease) in Net Assets | | | 408,454 | | | | (50,558,122 | ) |
| | | | | | | | | |
| | | |
Net Assets | | | | | | | | |
| | | |
Beginning of period | | | 143,039,480 | | | | 193,597,602 | |
| | | | | | | | | |
| | | |
End of period | | $ | 143,447,934 | | | $ | 143,039,480 | |
| | | | | | | | | |
| | | |
Other Information: | | | | | | | | |
| | | |
Shares | | | | | | | | |
| | | |
Sold | | | 404,704 | | | | 252,969 | |
| | | |
Redeemed | | | (621,629 | ) | | | (2,479,604 | ) |
| | | | | | | | | |
| | | |
Net Decrease | | | (216,925 | ) | | | (2,226,635 | ) |
| | | | | | | | | |
| | | | | | | | | |
| | | | |
| 6 | | | | The accompanying notes are an integral part of these financial statements. |
This Page Intentionally Left Blank
FINANCIAL INFORMATION — GUARDIAN GROWTH & INCOME VIP FUND
The Financial Highlights table is intended to help you understand the Fund’s financial performance for the past six reporting periods (or, if shorter, the period since inception). Certain information reflects financial results for a single Fund share. The total returns in the table represent the rate that an investor would have earned (or lost) on an investment in the Fund.
| | | | | | | | | | | | | | | | | | | | | | | | |
Financial Highlights Six Months Ended Numbers are unaudited | | | | | | | | | | | | | | | | |
| | | Per Share Operating Performance | | | | |
| | |
Net Asset Value,
Beginning of
Period | | | Net Investment
Income(1) | | | Net Realized
and Unrealized
Gain/(Loss) | | | Total
Operations | | | Net Asset
Value, End of
Period | | | Total
Return(2) | |
| | | | | | | |
Six Months Ended 6/30/23 | | $ | 18.17 | | | $ | 0.12 | | | $ | 0.45 | | | $ | 0.57 | | | $ | 18.74 | | | | 3.14% | (4) |
| | | | | | | |
Year Ended 12/31/22 | | | 19.17 | | | | 0.23 | | | | (1.23) | | | | (1.00) | | | | 18.17 | | | | (5.22)% | |
| | | | | | | |
Year Ended 12/31/21 | | | 14.95 | | | | 0.14 | | | | 4.08 | | | | 4.22 | | | | 19.17 | | | | 28.23% | |
| | | | | | | |
Year Ended 12/31/20 | | | 14.64 | | | | 0.15 | | | | 0.16 | | | | 0.31 | | | | 14.95 | | | | 2.12% | |
| | | | | | | |
Year Ended 12/31/19 | | | 11.81 | | | | 0.14 | | | | 2.69 | | | | 2.83 | | | | 14.64 | | | | 23.96% | |
| | | | | | | |
Year Ended 12/31/18 | | | 12.85 | | | | 0.12 | | | | (1.16) | | | | (1.04) | | | | 11.81 | | | | (8.09)% | |
| | | | |
| 8 | | | | The accompanying notes are an integral part of these financial statements. |
FINANCIAL INFORMATION — GUARDIAN GROWTH & INCOME VIP FUND
| | | | | | | | | | | | | | | | | | | | | | |
| |
| Ratios/Supplemental Data | |
Net Assets, End
of Period (000s) | | | Net Ratio of
Expenses to
Average
Net Assets(3) | | | Gross Ratio of
Expenses to
Average Net
Assets | | | Net Ratio of Net Investment Income to Average Net Assets(3) | | | Gross Ratio of Net Investment Income to Average Net Assets | | | Portfolio
Turnover Rate | |
| | | | | |
| $ | 143,448 | | | | 0.96% | (4) | | | 1.01% | (4) | | | 1.29% | (4) | | | 1.24% | (4) | | | 23% | (4) |
| | | | | |
| | 143,039 | | | | 0.96% | | | | 0.99% | | | | 1.25% | | | | 1.22% | | | | 39% | |
| | | | | |
| | 193,598 | | | | 0.97% | | | | 0.98% | | | | 0.82% | | | | 0.81% | | | | 26% | |
| | | | | |
| | 198,155 | | | | 1.01% | | | | 1.03% | | | | 1.17% | | | | 1.15% | | | | 36% | |
| | | | | |
| | 187,172 | | | | 1.01% | | | | 1.04% | | | | 1.01% | | | | 0.98% | | | | 36% | |
| | | | | |
| | 164,861 | | | | 1.01% | | | | 1.08% | | | | 0.94% | | | | 0.87% | | | | 58% | |
| (1) | Calculated based on the average shares outstanding during the period. |
| (2) | Total returns do not reflect the effects of charges deducted pursuant to the terms of The Guardian Insurance & Annuity Company, Inc.’s variable contracts. Inclusion of such charges would reduce the total returns for all periods shown. |
| (3) | Net Ratio of Expenses to Average Net Assets and Net Ratio of Net Investment Income to Average Net Assets include the effect of fee waivers, expense limitations, and recoupments, if any. |
| (4) | Ratios for periods less than one year have been annualized, except for total return and portfolio turnover rate. |
| | | | |
| The accompanying notes are an integral part of these financial statements. | | | | 9 |
NOTES TO FINANCIAL STATEMENTS — GUARDIAN GROWTH & INCOME VIP FUND
June 30, 2023 (unaudited)
1. Organization
Guardian Variable Products Trust (the “Trust”), a Delaware statutory trust organized on January 12, 2016, is registered under the Investment Company Act of 1940, as amended (the “1940 Act”), as an open-end management investment company. The Trust currently has twenty-four series. Guardian Growth & Income VIP Fund (the “Fund”) is a series of the Trust. The Fund is a diversified fund and commenced operations on September 1, 2016. The financial statements for other series of the Trust are presented in separate reports.
The Trust has authorized an unlimited number of shares of beneficial interest with no par value. Shares are bought and sold at closing net asset value (“NAV”). Shares of the Fund are only sold to certain separate accounts of The Guardian Insurance & Annuity Company, Inc. (“GIAC”) that fund certain variable annuity contracts and variable life insurance policies issued by GIAC. GIAC is a wholly-owned subsidiary of The Guardian Life Insurance Company of America (“Guardian Life”).
The Fund seeks long-term growth of capital.
2. Significant Accounting Policies
The following is a summary of significant accounting policies followed by the Fund in the preparation of its financial statements. The Fund follows the investment company accounting and reporting guidance of the Financial Accounting Standards Board (“FASB”) Accounting Standards Codification Topic 946 Financial Services – Investment Companies. The following policies are in conformity with accounting principles generally accepted in the United States of America (“GAAP”). The preparation of financial statements in accordance with GAAP requires management to make estimates and assumptions that affect the reported amounts and disclosures in the financial statements. Actual results could differ from those estimates.
a. Investment Valuations The Board of Trustees has designated Park Avenue Institutional Advisers LLC (“Park Avenue”) as the valuation designee for the Fund pursuant to Rule 2a-5 under the 1940 Act. Park Avenue has established a Fair Valuation Committee and has adopted fair valuation procedures that provide methodologies for fair valuing securities. These procedures include monitoring the appropriateness of fair values based on results of ongoing valuation oversight, including but not limited to consideration of
security specific events, market events, and pricing vendor and broker-dealer due diligence. The Fair Valuation Committee oversees and carries out the policies for the valuation of investments held in the Fund. The Fair Valuation Committee is responsible for discussing and assessing the potential impacts to the fair values on an ongoing basis, and reports to the Board of Trustees on at least a quarterly basis.
Equity securities traded on an exchange other than NASDAQ Stock Market, LLC (“NASDAQ”) are valued at the last reported sale price on the principal exchange or market on which they are traded; or, if there were no sales that day, at the mean between the closing bid and ask prices. Securities traded on the NASDAQ are generally valued at the NASDAQ official closing price, which may not be the last sale price. If the NASDAQ official closing price is not available for a security, that security is generally valued at the mean between the closing bid and ask prices. Repurchase agreements are carried at cost, which approximates fair value (see Note 5d). Foreign securities are valued in the currencies of the markets in which they trade and then converted to U.S. dollars by the application of foreign exchange rates at the close of the New York Stock Exchange (“NYSE”). Forward foreign currency contracts, if any, are valued at the mean between the bid and ask rates for the specified time interpolated from rates for proximate time periods.
Securities for which market quotations are not readily available or securities whose values have been materially affected by events occurring before the Fund’s valuation time but after the close of the securities’ principal exchange or market are valued at their fair values as determined in good faith by Park Avenue, as the Board of Trustee’s valuation designee (as defined in Rule 2a-5 under the 1940 Act), in accordance with Park Avenue’s procedures and under the general oversight of the Board of Trustees. In addition, the values of the Fund’s investments in foreign securities are generally determined by a pricing service using pricing models designed to estimate likely changes in the values of those securities. Certain foreign equity instruments are valued by applying international fair value factors provided by approved pricing services. The factors seek to adjust the local closing price for movements of local markets post closing, but prior to the time the NAVs are calculated. Valuations reflected in this report are as of the report date. As a result, changes in valuation due to market events and/or issuer related events after the report date and prior to issuance of the report are not reflected herein.
NOTES TO FINANCIAL STATEMENTS — GUARDIAN GROWTH & INCOME VIP FUND
Various inputs are used in determining the valuation of the Fund’s investments. These inputs are summarized in three broad levels listed below.
| • | | Level 1 – unadjusted inputs using quoted prices in active markets for identical investments. |
| • | | Level 2 – other significant observable inputs, including, but not limited to, quoted prices for similar investments, inputs other than quoted prices that are observable for investments (such as interest rates, prepayment speeds, credit risks, etc.) or other market corroborated inputs. |
| • | | Level 3 – significant unobservable inputs (including the Fund’s own assumptions in determining the fair value of investments). |
Inputs may include price information, volatility statistics, specific and broad credit data, liquidity statistics, and other factors. A financial instrument’s level within the fair value hierarchy is based on the lowest level of any input; both individually and in aggregate, that is significant to the fair value measurement. However, the determination of what constitutes “observable” requires significant judgment by the Trust. The Trust considers observable data to be that market data which is readily available, regularly distributed or updated, reliable and verifiable, and provided by independent sources that are actively involved in the relevant market. The inputs or methodology used for valuing securities are not necessarily an indication of the risk associated with investing in those securities. Changes in valuation techniques may result in transfers into or out of a financial instrument’s assigned level within the hierarchy.
The FASB requires reporting entities to make disclosures about purchases, sales, issuances and settlements of Level 3 securities on a gross basis. For the six months ended June 30, 2023, there were no transfers into or out of Level 3 of the fair value hierarchy.
In determining a financial instrument’s placement within the hierarchy, the Trust separates the Fund’s investment portfolio into two categories: investments and derivatives (e.g., futures). A summary of inputs used to value the Fund’s assets and liabilities carried at fair value as of June 30, 2023 is included in the Schedule of Investments.
Investments Investments whose values are based on quoted market prices in active markets, and are therefore classified within Level 1, include active listed equities. Investments that trade in markets that are not considered to be active, but are valued based on quoted market prices, dealer quotations or alternative pricing
sources supported by observable inputs are classified within Level 2. These include certain U.S. government and sovereign obligations, most government agency securities, investment-grade corporate bonds, certain mortgage products, state, municipal and provincial obligations, and certain foreign equity securities, including securities whose prices may have been affected by events occurring after the close of trading on their principal exchange or market and, as a result, whose values are determined by a pricing service as described above, or securities whose values are otherwise determined using fair valuation methods approved by the Fund’s Board of Trustees.
Investments classified within Level 3 have significant unobservable inputs, as they trade infrequently or not at all. Level 3 investments include, among others, private placement securities. When observable prices are not available for these securities, the Trust uses one or more valuation techniques for which sufficient and reliable data is available. The inputs used by the Trust in estimating the value of Level 3 investments include, for example, the original transaction price, recent transactions in the same or similar instruments, completed or pending third-party transactions in the underlying investment or comparable issuers, subsequent rounds of financing, recapitalizations, and other transactions across the capital structure. Level 3 investments may also be adjusted to reflect illiquidity and/or non-transferability, with the amount of such discount estimated by the Trust in the absence of market information. Assumptions used by the Trust due to the lack of observable inputs may significantly impact the resulting fair value and therefore the Fund’s results of operations. As of June 30, 2023, the Fund had no securities classified as Level 3.
Derivatives Exchange-traded derivatives, such as futures contracts, exchange-traded option contracts and certain swaps, are typically classified within Level 1 or Level 2 of the fair value hierarchy depending on whether or not they are deemed to be actively traded. Certain non-exchange-traded derivatives, such as generic forwards, certain swaps and options, have inputs which can generally be corroborated by market data and are therefore classified within Level 2. During the six months ended June 30, 2023, the Fund did not hold any derivatives.
b. Securities Transactions Securities transactions are accounted for on the date securities are purchased or sold (trade date). Realized gains or losses on securities transactions are determined on the basis of specific identification.
NOTES TO FINANCIAL STATEMENTS — GUARDIAN GROWTH & INCOME VIP FUND
c. Foreign Currency Translation The accounting records of the Fund are maintained in U.S. dollars. Investment securities and all other assets and liabilities of the Fund denominated in a foreign currency are generally translated into U.S. dollars at the exchange rates quoted at the close of the NYSE on each business day. The market value of investment securities and other assets and liabilities are translated at the exchange rate as of the valuation date. Purchases and sales of securities, income receipts, and expense payments are translated into U.S. dollars at the exchange rates in effect on the dates of the respective transactions. The Fund does not isolate the portion of the fluctuations on investments resulting from changes in foreign currency exchange rates from the fluctuations in market prices of investments held. Such fluctuations are included in the Net change in net realized and unrealized gain/(loss) from investments on the Statement of Operations.
Reported realized foreign currency gains and losses arise from the disposition of foreign currency, currency gains or losses realized between the trade and settlement dates on securities transactions, and the difference between the amounts of dividends, interest and foreign withholding taxes recorded on the Fund’s books on the transaction date and the U.S. dollar equivalent of the amounts actually received or paid. These reported realized foreign currency gains and losses, if any, are included in Net realized gain/(loss) from foreign currency transactions on the Statement of Operations. Unrealized foreign currency gains and losses arise from changes (due to changes in exchange rates) in the value of foreign currency and other assets and liabilities denominated in foreign currencies, which are held at period end, if any, and are included in Net change in unrealized appreciation/(depreciation) on translation of assets and liabilities in foreign currencies on the Statement of Operations.
d. Foreign Capital Gains Tax The Fund may be subject to foreign taxes on income, gains on investments or currency purchases/repatriation, a portion of which may be recoverable. The Fund will accrue such taxes and recoveries as applicable, based upon their current interpretation of tax rules and regulations that exist in the markets in which they invest.
e. Investment Income Dividend income net of foreign taxes withheld, if any, is generally recorded on the ex-dividend date. Distributions received from real estate investment trusts, if any, may be classified as dividends, capital gains and/or return of capital. Interest income, which includes amortization/accretion of premium/
discount, is determined using the interest income accrual method, and is accrued and recorded daily.
f. Allocation of Income and Expenses Many of the expenses of the Trust can be directly attributed to a specific series of the Trust. Expenses that cannot be directly attributed to a specific series of the Trust are generally apportioned among all the series in the Trust, based on relative net assets. In calculating net asset value per share for each series of the Trust, investment income, realized and unrealized gains and losses, and expenses other than series-specific expenses are allocated daily to each series based upon the proportion of net assets attributable to each series.
3. Transactions with Affiliates
a. Investment Advisory Fee and Expense Limitation Under the terms of the advisory agreement, which, after its two year initial term, is reviewed and approved annually by the Board of Trustees, the Fund pays an investment advisory fee to Park Avenue. Park Avenue is a wholly-owned subsidiary of Guardian Life and receives an investment advisory fee at an annual rate of 0.65% up to $100 million, 0.60% from $100 to $300 million, 0.55% from $300 to $500 million, and 0.53% in excess of $500 million of the Fund’s average daily net assets. The fee is accrued daily and paid monthly.
Park Avenue has contractually agreed through April 30, 2024 to waive certain fees and/or reimburse certain expenses incurred by the Fund to the extent necessary to limit the Fund’s total annual operating expenses after fee waiver and/or expense reimbursement to 0.96% of the Fund’s average daily net assets (excluding, if applicable, any acquired fund fees and expenses, taxes, interest, transaction costs and brokerage commissions, litigation and extraordinary expenses). The limitation may not be increased or terminated prior to this time without action by the Board of Trustees and may be terminated only upon approval of the Board of Trustees. Amounts waived or reimbursed by Park Avenue pursuant to any expense limitation will not be subject to Park Avenue’s recoupment rights. For the six months ended June 30, 2023, Park Avenue waived fees and/or paid Fund expenses in the amount of $37,962.
Park Avenue has entered into a Sub-Advisory Agreement with AllianceBernstein L.P. (“AllianceBernstein”). AllianceBernstein is responsible for providing day-to-day investment advisory services to the Fund, subject to the supervision of Park Avenue and the oversight of the Board of Trustees. Sub-advisory fees are paid by Park Avenue and do not represent a separate or additional expense to the Fund.
NOTES TO FINANCIAL STATEMENTS — GUARDIAN GROWTH & INCOME VIP FUND
b. Compensation of Trustees and Officers Trustees and officers who are interested persons of the Trust, as defined in the 1940 Act, receive no compensation from the Fund, except for the Chief Compliance Officer of the Trust. Trustees of the Trust who are not interested persons of the Trust, and the Chief Compliance Officer, receive compensation and reimbursement of expenses from the Trust.
c. Distribution Fees Park Avenue Securities LLC (“PAS”), a wholly-owned subsidiary of Guardian Life, is the principal underwriter of Fund shares. The Trust has entered into a distribution and service agreement with PAS, which governs the sale and distribution of shares of the Fund. Under a distribution and service plan adopted by the Trust (“12b-1 plan”), PAS is compensated for services in such capacity, including its expenses in connection with the promotion and distribution of shares of the Fund, at an annual rate of 0.25% of the Fund’s average daily net assets. For the six months ended June 30, 2023, the Fund paid distribution fees in the amount of $176,269 to PAS.
PAS has directed that certain payments under the 12b-1 plan be used to compensate GIAC for shareholder services provided to contract owners.
4. Federal Income Taxes
a. Distributions to Shareholders For federal income tax purposes, the Fund is treated as a disregarded entity (“DRE”). As a DRE, the Fund is not subject to an entity-level income tax; and any income, gains, losses, deductions, taxes, and credits of the Fund would instead be “passed through” directly to the separate accounts of GIAC that invest in the Fund and retain the same character for U.S. federal income tax purposes. In addition, the Fund is not required to distribute taxable income and capital gains for U.S. federal income tax purposes. Therefore, no dividends and capital gains distributions were paid by the Fund.
5. Investments
a. Investment Purchases and Sales The cost of investments purchased and the proceeds from investments sold (excluding short-term investments) amounted to $31,431,026 and $33,065,857, respectively, for the six months ended June 30, 2023. During the six months ended June 30, 2023, there were no purchases or sales of U.S. government securities.
b. Foreign Securities Foreign securities investments involve special risks and considerations not typically associated with U.S. investments. These risks include,
but are not limited to, currency risk; adverse political, regulatory, social, and economic developments; and less reliable information about issuers. Moreover, securities of some foreign issuers may be less liquid and their prices more volatile than those of comparable U.S. issuers.
c. Industry or Sector Concentration In its normal course of business, the Fund may invest a significant portion of its assets in companies within a limited number of industries or sectors. As a result, the Fund may be subject to a greater risk of loss than that of a fund invested in a wider spectrum of industries or sectors because the stocks of many or all of the companies in the industry, group of industries, sector, or sectors may decline in value due to developments adversely affecting the industry, group of industries, sector, or sectors.
d. Repurchase Agreements The Fund may invest in repurchase agreements to maintain liquidity and earn income over periods of time as short as overnight. The collateral for repurchase agreements is either cash or fully negotiable U.S. government securities (including U.S. government agency securities). Repurchase agreements are fully collateralized (including the interest accrued thereon) and such collateral is marked to market daily while the agreements remain in force. If the value of the collateral falls below the repurchase price plus accrued interest, the Fund will typically require the seller to deposit additional collateral by the next business day. If the request for additional collateral is not met, or the seller defaults, the Fund maintains the right to sell the collateral (although it may be prevented or delayed from doing so in certain circumstances) and may be required to claim any resulting loss against the seller. Park Avenue monitors the creditworthiness of the seller with which the Fund enters into repurchase agreements.
6. Temporary Borrowings
The Fund, with other funds managed by Park Avenue, is party to a credit agreement with respect to a $10 million committed revolving credit facility from State Street Bank and Trust Company (the “Credit Agreement”) for temporary borrowing purposes, including the meeting of redemption requests that otherwise might require the untimely disposition of securities. Interest is based on a daily fluctuating rate per annum equal to the Applicable Rate (as defined in the Credit Agreement) plus the Applicable Margin (as defined in the Credit Agreement) that is subject to change from time to time as and when the Applicable Rate changes. Under the
NOTES TO FINANCIAL STATEMENTS — GUARDIAN GROWTH & INCOME VIP FUND
current Credit Agreement, the Applicable Rate for any day is defined as the rate per annum equal to the sum of (a) 0.10% plus (b) the higher of (i) the Federal Funds Effective Rate for such day and (ii) the Overnight Bank Funding Rate for such day; the Applicable Margin is 1.25%. In addition to the interest charged on any borrowings by the Fund, each fund pays a commitment fee of 0.30% per annum on its share of the unused portion of the credit facility. The agreement is in place until January 5, 2024. The Fund did not utilize the credit facility during the six months ended June 30, 2023.
7. Indemnifications
Under the Trust’s organizational documents and, in some cases, by contract, officers and Trustees of the Trust are indemnified against certain liabilities arising out of the performance of their duties to the Fund. In addition, in the normal course of business, the Fund
enters into contracts with its vendors and others that provide general indemnifications. The Fund’s maximum exposure under these arrangements is unknown as this would involve future claims that may be made against the Fund that have not yet occurred. However, based on experience, the Fund expects the risk of loss to be remote.
8. Additional Information
The outbreak of COVID-19 has adversely impacted both local and global economies, including those in which the Fund may invest. These impacts include materially reduced consumer demand and economic output, disrupted supply chains, market closures, travel restrictions and quarantines, and strained healthcare systems. The Fund’s operations may be interrupted as a result, which may have a negative impact on the Fund’s investment performance.
SUPPLEMENTAL INFORMATION (UNAUDITED)
Liquidity Risk Management Program
In compliance with Rule 22e-4 under the Investment Company Act of 1940, as amended (the “Liquidity Rule”), Guardian Variable Products Trust (the “Trust”) has adopted and implemented a written liquidity risk management program (the “Program”) for each series of the Trust (each, a “Fund”), which is reasonably designed to assess and manage each Fund’s liquidity risk. The Fund’s “liquidity risk” is the risk that the Fund could not meet requests to redeem shares issued by the Fund without significant dilution of the remaining investors’ interests in the Fund.
The Board of Trustees of the Trust (the “Board”) Previously approved the designation of Park Avenue Institutional Advisers LLC (the “Administrator” or “PAIA”) as Program administrator. The Administrator established a Liquidity Risk Management Committee, which is comprised of certain officers of the Trust and PAIA, that assists the Administrator in the implementation and day-to-day administration of the Program and otherwise support carrying out the Administrator’s liquidity risk management responsibilities under the Program.
In accordance with the Program, each Fund’s liquidity risk is assessed no less frequently than annually, taking into consideration a variety of factors, including, as applicable, the Fund’s investment strategy and liquidity of portfolio investments, cash flow projections, and holdings of cash and cash equivalents, as well as borrowing arrangements and other funding sources. Certain factors are considered under both normal and reasonably foreseeable stressed conditions.
Each Fund portfolio investment is classified, no less than monthly, into one of four liquidity categories (including “highly liquid investments” and “illiquid investments,” discussed below) based on a determination of the number of days it is reasonably expected to take to convert the investment to cash, or sell or dispose of the investment, in current market conditions without significantly changing the investment’s market value.
The Liquidity Rule limits the Fund’s investments in illiquid investments by prohibiting the Fund from acquiring any illiquid investment if, immediately after the acquisition, the Fund would have invested more than 15% of its net assets in illiquid investments that are assets. The Program includes provisions reasonably designed to comply with this investment limitation. In addition, the Program includes provisions reasonably designed to comply with this investment limitation. In addition, the Program includes provisions reasonably designed to comply with the Liquidity Rule’s requirements relating to highly liquid investment minimums, which is a minimum amount of Fund net assets that must be invested in highly liquid investments that are assets, as applicable. The Fund was not required to adopt a highly liquid investment minimum during the period.
At a meeting of the Board held on March 29-30, 2023, the Board received a report (the “Report”) prepared by the Administrator addressing the Program’s operation and assessing the adequacy and effectiveness of its implementation for the period from January 1, 2022 through December 31, 2022 (the “Reporting Period”). The Report noted that the Administrator believes the Program operated effectively during the Reporting Period and continues to be reasonably designed to effectively assess and manage each Fund’s liquidity risk. The Report also noted that the Administrator believes the Program has been adequately and effectively implemented and the investment strategies for each Fund continue to be appropriate since its inception. In addition, the Report summarized the operation of the Program and the information and factors considered by the Administrator in its assessment of the Program’s implementation, such as the liquidity risk assessment framework and liquidity classification methodologies.
There can be no assurance that the Program will achieve its objectives under all circumstances. Please refer to the Fund’s prospectus for more information regarding the Fund’s exposure to liquidity risk and other risks to which an investment in the Fund may be subject.
SUPPLEMENTAL INFORMATION (UNAUDITED)
Approval of Investment Management and Sub-advisory Agreements
Section 15(c) of the Investment Company Act of 1940, as amended (the “1940 Act”), requires that a fund’s investment advisory and sub-advisory agreements be approved initially by the fund’s board of trustees. Section 15(c) also requires that the continuation of these agreements, after an initial term of up to two years, be annually reviewed and approved by the board. Any such agreement must be approved by a vote of a majority of the trustees who are not parties to the agreement or “interested persons” (as defined in the 1940 Act) of a party to the agreement at a meeting of the board called for the purpose of voting on such approval.
At a meeting of the Board of Trustees (the “Board”) of Guardian Variable Products Trust (the “Trust”) held on March 29-30, 2023 (the “Meeting”), the Board, including the trustees who are not parties to the agreement or “interested persons” as defined in the 1940 Act (the “Independent Trustees”), considered and voted unanimously to renew the existing investment management agreement between the Trust, on behalf of Guardian All Cap Core VIP Fund; Guardian Balanced Allocation VIP Fund; Guardian Core Fixed Income VIP Fund; Guardian Core Plus Fixed Income VIP Fund; Guardian Diversified Research VIP Fund; Guardian Equity Income VIP Fund; Guardian Global Utilities VIP Fund; Guardian Growth & Income VIP Fund; Guardian Integrated Research VIP Fund; Guardian International Growth VIP Fund; Guardian International Equity VIP Fund; Guardian Large Cap Disciplined Growth VIP Fund; Guardian Large Cap Disciplined Value VIP Fund; Guardian Large Cap Fundamental Growth VIP Fund; Guardian Mid Cap Relative Value VIP Fund; Guardian Mid Cap Traditional Growth VIP Fund; Guardian Multi-Sector Bond VIP Fund; Guardian Select Mid-Cap Core VIP Fund; Guardian Short Duration Bond VIP Fund; Guardian Small Cap Core VIP Fund; Guardian Small-Mid Cap Core VIP Fund; Guardian Strategic Large Cap Core VIP Fund; Guardian Total Return Bond VIP Fund and Guardian U.S. Government Securities VIP Fund (each, a “Fund,” and together, the “Funds”), in substantially the form presented at this meeting (the “Management Agreement”); and Park Avenue Institutional Advisers LLC (the “Manager”) for a one-year term.
The Board, including the Independent Trustees, also considered and voted unanimously to renew the existing sub-advisory agreements (the “Sub-Advisory Agreements,” collectively with the Management Agreement and Sub-Subadvisory Agreement, the
“Agreements”) between the Manager and investment advisory firms engaged to serve as sub-advisers to certain of the Funds (the “Sub-Advised Funds”), namely (i) ClearBridge Investments, LLC with respect to Guardian Small Cap Core VIP Fund; (ii) Putnam Investment Management, LLC with respect to Guardian Diversified Research VIP Fund; (iii) AllianceBernstein L.P. with respect to Guardian Growth & Income VIP Fund and Guardian Strategic Large Cap Core VIP Fund; (iv) J.P. Morgan Investment Management Inc. with respect to Guardian International Growth VIP Fund; (v) Schroder Investment Management North America Inc. with respect to Guardian International Equity VIP Fund; (vi) Wellington Management Company LLP with respect to Guardian Balanced Allocation VIP Fund, Guardian Equity Income VIP Fund, Guardian Integrated Research VIP Fund, Guardian Large Cap Disciplined Growth VIP Fund and Guardian Global Utilities VIP Fund; (vii) Boston Partners Global Investors, Inc. with respect to Guardian Large Cap Disciplined Value VIP Fund; (viii) Janus Henderson Investors US LLC with respect to Guardian Mid Cap Traditional Growth VIP Fund; (ix) Allspring Global Investments, LLC with respect to Guardian Mid Cap Relative Value VIP Fund and Guardian Small-Mid Cap Core VIP Fund; (x) Lord, Abbett & Co. LLC with respect to Guardian Core Plus Fixed Income VIP Fund; (xi) FIAM LLC with respect to Guardian Select Mid Cap Core VIP Fund; and (xii) Massachusetts Financial Services Company with respect to Guardian All Cap Core VIP Fund, each in substantially the form presented at this meeting, (each, a “Sub-Adviser” and collectively, the “Sub-Advisers”) for a one-year term.
The Board, including the Independent Trustees, also considered and voted unanimously to renew the existing sub-subadvisory agreement (the “Sub-Subadvisory Agreement”) between Schroder Investment Management North America Inc. and Schroder Investment Management North America Limited (also a Sub-Adviser) with respect to Guardian International Equity VIP Fund for a one-year term.
The Board is responsible for overseeing the management of each Fund. In determining whether to renew its approval of the Agreements, the Trustees evaluated information and factors that they considered to be relevant and appropriate through the exercise of their own business judgment. The Trustees considered certain information and factors in light of advice furnished to them by legal counsel to the Trust and, in the case of the Independent Trustees, their independent legal counsel. In advance of the Meeting, the Trustees received materials and information designed to assist their consideration of the
SUPPLEMENTAL INFORMATION (UNAUDITED)
Agreements. The Trustees received written responses from the Manager and each Sub-Adviser to a series of questions and requests for information encompassing a wide variety of topics provided by independent counsel on behalf of the Independent Trustees. The Independent Trustees also received materials and information regarding the legal standards applicable to their consideration of the Agreements and the process and criteria used by the Manager to identify and select the Sub-Advisers.
During the course of their deliberations, the Independent Trustees met twice to discuss and evaluate the materials, information and Agreements in executive session with their independent legal counsel, outside of the presence of the Trustees who are not Independent Trustees and representatives from Fund management, the Manager or any Sub-Adviser.
In reaching its decisions to renew its approval of the Agreements, the Board took into account the materials and information described above, as well as other materials and information provided to the Board throughout the year. Individual Trustees may have given different weight to different factors and information with respect to each Agreement, and the Trustees did not identify any single factor or information that, in isolation, would be controlling in deciding to approve the Agreements. The discussion below is intended to summarize the broad factors that figured prominently in the Board’s decisions to renew its approval of the Agreements rather than to be all-inclusive. These broad factors included: (i) the nature, extent and quality of the services provided to the Funds by the Manager and to the Sub-advised Funds by the Sub-Advisers; (ii) the investment performance of each Fund; (iii) estimated profitability of the Manager; (iv) fees and expenses; (v) the extent to which economies of scale may exist, and the extent to the benefits of economies of scale are shared with the Funds; and (vi) any other benefits derived by the Manager or the Sub-Advisers (or their respective affiliates) from their relationships with the Funds.
Nature, Extent and Quality of Services
The Trustees considered information regarding the nature, extent and quality of services provided to the Funds by the Manager. The Trustees also considered, among other things, the terms of the Management Agreement and the range of investment advisory services provided by the Manager. In addition, the Trustees reviewed the range of non-investment advisory services provided by the Manager consistent
with the terms of the Management Agreement, notably coordinating the preparation and filing of various regulatory documents, coordinating the preparation and assembly of Board meeting materials, and assisting the Board with certain valuation matters. The Board also received a description of the Manager’s and each Sub-Adviser’s business continuity plans and of their respective approaches to data privacy and cybersecurity, and related testing. The Board received information regarding the response of the Manager and the Sub-Advisers to the COVID-19 pandemic, including the continuation of remote work arrangements and return-to-office plans. The Board also received information about the Manager’s role as administrator of the Funds’ liquidity risk management program, the Manager’s approach to risk management, and the Manager’s vendor oversight programs.
The Trustees considered that the Sub-advised Funds operate in a “manager-of-managers” structure and reviewed the responsibilities that the Manager has under this structure, including monitoring and evaluating the performance of the Sub-Advisers, monitoring the Sub-Advisers for adherence to the stated investment objectives, strategies, policies and restrictions of the Funds and supervising the Sub-Advisers with respect to the services that the Sub-Advisers would provide under the Sub-Advisory Agreements. The Trustees also considered the process used by the Manager, consistent with this structure, to identify and recommend sub-advisers, and the Manager’s ability to monitor and oversee sub-advisers and recommend replacement sub-advisers, when necessary, and provide other services under the Management Agreement. The Board noted that investment management staff of the Manager and the Trust’s Chief Compliance Officer conduct oversight meetings with the Sub-Advisers on a periodic basis, follow through with additional inquiries on any questions or concerns that arise during the meetings and, as necessary, then report the results of the meetings to the Board. The Trustees reviewed information regarding the experience and background of the Manager’s key personnel and the Manager’s organizational structure and resources, including investment, legal and administrative capabilities of the Manager. In this regard, the Trustees recognized that the Funds may benefit from the Manager’s ability to use resources and capabilities of its affiliates in providing services to the Funds.
The Trustees considered information regarding the nature, extent and quality of services provided to the Sub-advised Funds by the Sub-Advisers. The Trustees
SUPPLEMENTAL INFORMATION (UNAUDITED)
also considered, among other things, the terms of the Sub-advisory Agreements and the range of investment advisory services provided by the Sub-Advisers under the oversight of the Manager. In evaluating these investment advisory services, the Trustees considered, among other things, the Sub-Advisers’ investment philosophies, styles and/or processes and approaches to managing the respective Sub-advised Funds. The Trustees received and evaluated information regarding the background, education, expertise and/or experience of the investment professionals who serve as portfolio managers for the Sub-advised Funds and the capabilities and resources of the Sub-Advisers.
Based upon these considerations, the Trustees concluded, within the context of their full deliberations, that the nature, extent and quality of services provided to the Funds by the Manager and the Sub-advised Funds by each respective Sub-Adviser were appropriate.
Investment Performance
In connection with each of its regular quarterly meetings, the Board receives information on the performance of each Fund, including net performance, relative performance rankings within the relevant Morningstar peer group, and performance as compared to benchmark index returns. At each quarterly Board meeting, members of the Manager’s funds management team review with the Board the economic and market environment, absolute and relative performance of each Fund, and any relevant information about risk management and style consistency in connection with management of the Funds. The Board considered investment performance for each Fund over the one-year, three-year (where available), five-year (where available) and since-inception periods.
The Board also received and reviewed a report prepared by Broadridge Financial Solutions (“Broadridge”), an independent provider of mutual fund industry data, which included comparisons of the performance of each Fund to performance of an appropriate peer universe. For details regarding each Fund’s performance, see the “Fund-by-Fund Factors” section below.
The Manager discussed with the Board factors contributing to the Funds’ performance results. In addition, for certain Funds, the Manager provided to the Board longer term performance records of the Sub-Advisers for strategies used in managing the Funds. The Board concluded that the investment performance generated by the Manager and each Sub-Adviser was generally satisfactory, or, that any steps being taken by
the Manager and Sub-Advisers to address any performance issues were satisfactory.
Profitability
The Board received and considered the Manager’s estimate of its profitability, which included allocations by the Manager of its costs in providing management services to the Funds. The Board considered the estimated profitability of the Manager both overall and on a Fund-by-Fund basis.
The Board received and considered profitability information from most of the Sub-Advisers, but noted that the Manager had negotiated the fees with the Sub-Advisers at arm’s-length. Accordingly, the Board concluded that the profitability of the Sub-Advisers is a less relevant factor than Manager profitability.
Based on the consideration of this information, the Board concluded that the profitability of the Funds to the Manager was acceptable.
Fees and Expenses
The Trustees considered the management fees paid by the Funds to the Manager under the Management Agreement and evaluated the reasonableness of these fees. The Trustees received and reviewed comparative information with respect to the management fee and total expenses for each Fund and the management fees and total expenses for a peer group of other funds selected by Broadridge. The Trustees considered the Manager’s commitment to limit the total expenses of each Fund through an expense limitation agreement with the Trust. Although the Board recognized that the comparisons between the management fees and actual expenses of the Funds and those of the identified peer group are imprecise, given different terms of agreements and variations in fund strategies, the Trustees found that the comparative information supported their consideration and approval of the management fees and evaluation of the total expenses. For details regarding each Fund’s fee and expense comparisons, see the “Fund-by-Fund Factors” section below.
The Trustees considered the sub-advisory fees paid under the Sub-advisory Agreements and evaluated the reasonableness of those fees. The Trustees also considered that the fees paid to the Sub-Advisers would be paid by the Manager and not the Funds and that the Manager had negotiated the fees with the Sub-Advisers at arm’s-length.
SUPPLEMENTAL INFORMATION (UNAUDITED)
Based on the consideration of the information and factors summarized above, as well as other relevant information and factors, the Board concluded that the management and sub-advisory fees were reasonable in light of the nature, extent and quality of services rendered to the Funds by the Manager and the Sub-Advisers.
Economies of Scale
The Board considered the extent to which economies of scale may exist, and the extent to the benefits of economies of scale are shared with the Funds. In this regard, the Board noted that for sixteen of twenty-four Funds, the management and sub-advisory fee included breakpoints that are tiered based on growth in asset levels of each such Fund and that for the other Funds, the fees reflected appropriate levels based on current and expected asset levels. The Board also noted that the expenses of the Funds are subject to expense limitations provided by the Manager. The Board noted that expected economies of scale, where they exist, may be shared through the use of fee breakpoints, expense limitations by the Manager, and/or a lower overall fee.
Ancillary Benefits
The Board considered the potential benefits, other than management fees, that the Manager and/or its affiliates may receive because of the Manager’s relationship with the Funds. The Trustees considered that the Funds were designed to serve as investment options under variable contracts issued by affiliates of the Manager that would receive fees under those contracts and that Park Avenue Securities LLC, an affiliate of the Manager and principal underwriter of the Funds, and participating insurance companies, including insurance companies affiliated with the Manager, would be entitled to receive fees from the Funds under a plan of distribution adopted pursuant to Rule 12b-1 under the 1940 Act. The Trustees considered that the Manager and its affiliates may benefit from (i) greater efficiencies in annuity administration and operations and potential cost savings due to a reduction in the number of unaffiliated funds available as annuity contract investment options, and (ii) increased dividends-received deductions due to the Funds’ status under the tax laws as disregarded entities. In addition, the Trustees considered the potential benefits, other than sub-advisory fees, that the Sub-Advisers and their affiliates may receive because of their relationships with the Funds, including the ability to receive research from soft dollar commissions consistent with Trust policies. The Trustees concluded that benefits that may accrue to the
Manager and its affiliates are reasonable and the benefits that may accrue to the Sub-Advisers and their affiliates are consistent with those expected for a sub-adviser to a mutual fund such as the applicable Fund.
Fund-by-Fund Factors
The Broadridge report groups fees, expenses and performance into five quintiles, with the top quintile having the highest performance or lowest fees/expenses, and the bottom quintile having the lowest performance or highest fees/expenses. For purposes of the descriptions below, a Fund’s performance is considered “in line with” the benchmark index if it is within 0.20%.
Guardian Large Cap Fundamental Growth VIP Fund
| • | | The Board noted that the Fund’s performance was in the 3rd quintile of its performance universe for the 1-year period and in the 4th quintile for its performance universe for the 3-year and 5-year periods. The Board also noted that the Fund’s performance was below the benchmark index for the 1-year, 3-year and 5-year periods. |
| • | | The Board noted that the contractual management fee, the actual management fee and actual total expenses were in the 1st quintile of the expense group. |
Guardian Large Cap Disciplined Growth VIP Fund
| • | | The Board noted that the Fund’s performance was in the 3rd quintile of its performance universe for the 1-year and 3-year periods and in the 2nd quintile for the 5-year period. The Board also noted that the Fund’s performance was below the benchmark index for the 1-year, 3-year and 5-year periods. |
| • | | The Board noted that the contractual management fee, the actual management fee and actual total expenses were in the 1st quintile of the expense group. |
Guardian Integrated Research VIP Fund
| • | | The Board noted that the Fund’s performance was in the 5th quintile of its performance universe for the 1-year and 5-year periods and in the 4th quintile for 3-year period. The Board also noted that the Fund’s performance was below the benchmark index for the 1-year, 3-year and 5-year periods. |
| • | | The Board noted that the contractual management fee, the actual management fee and actual total expenses were in the 1st quintile of the expense group. |
SUPPLEMENTAL INFORMATION (UNAUDITED)
Guardian Diversified Research VIP Fund
| • | | The Board noted that the Fund’s performance was in the 3rd quintile of its performance universe for the 1-year and 3-year periods and in the 2nd quintile for the 5-year period. The Board also noted that the Fund’s performance was higher than the benchmark index for the 1-year period. The Board note that the Fund’s performance was lower than the benchmark index for the 3-year and 5-year periods. |
| • | | The Board noted that the contractual management fee and actual management fee were in the 1st quintile of the expense group and that actual total expenses were in the 3rd quintile. |
Guardian Strategic Large Cap Core VIP Fund
| • | | The Board noted that the Fund’s performance was in the 1st quintile of its performance universe for the 1-year period. The Board acknowledged the Fund’s short operational history. The Board noted that the Fund’s performance was higher than the benchmark index for the 1-year period. |
| • | | The Board noted that the contractual management fee, the actual management fee and actual total expenses were in the 1st quintile of the expense group. |
Guardian Large Cap Disciplined Value VIP Fund
| • | | The Board noted that the Fund’s performance was in the 3rd quintile of its performance universe for the 1-year and 3-year periods and in the 4th quintile for the 5-year period. The Board also noted that the Fund’s performance was higher than the benchmark index for the 1-year and 3-year periods. The Board noted that the Fund’s performance was in line with the benchmark index for the 5-year period. |
| • | | The Board noted that the contractual management fee was in the 2nd quintile of the expense group, the actual management fee was in the 1st quintile of the expense group and that actual total expenses were in the 3rd quintile. |
Guardian Growth & Income VIP Fund
| • | | The Board noted that the Fund’s performance was in the 3rd quintile of its performance universe for the 1-year, 3-year and 5-year periods. The Board also noted that the Fund’s performance was higher than the benchmark index for the 1-year, 3-year and 5-year periods. |
| • | | The Board noted that the contractual management fee and the actual management fee were in the 1st quintile of the expense group and that actual total expenses were in the 3rd quintile. |
Guardian Equity Income VIP Fund
| • | | The Board noted that the Fund had less than one-year of operational history and was not able to evaluate an investment performance record for the Fund. The Board noted that it would have an opportunity to review such information in connection with future annual reviews. The Board noted that, in the meantime, it received monthly performance reports from the Manager. |
| • | | The Board noted that the contractual management fee, the actual management fee and actual total expenses were in the 1st quintile of the expense group. |
Guardian All Cap Core VIP Fund
| • | | The Board noted that the Fund’s performance was in the 3rd quintile of its performance universe for the 1-year period. The Board acknowledged the Fund’s short operational history. The Board noted that the Fund’s performance was higher than the benchmark index for the 1-year period. |
| • | | The Board noted that the contractual management fee, the actual management fee and actual total expenses were in the 1st quintile of the expense group. |
Guardian Mid Cap Traditional Growth VIP Fund
| • | | The Board noted that the Fund’s performance was in the 1st quintile of its performance universe for the 1-year period and in the 2nd quintile for the 3-year and 5-year periods. The Board also noted that the Fund’s performance was higher than the benchmark index for the 1-year, 3-year and 5-year periods. |
| • | | The Board noted that the contractual management fee and actual management fee were in the 1st quintile of the expense group and that the actual total expenses were in the 4th quintile. |
Guardian Select Mid Cap Core VIP Fund
| • | | The Board noted that the Fund’s performance was in the 3rd quintile of its performance universe for the 1-year period. The Board acknowledged the Fund’s short operational history. The Board noted that the Fund’s performance was lower than the benchmark index for the 1-year period. |
| • | | The Board noted that the contractual management fee, the actual management fee and actual total expenses were in the 1st quintile of the expense group. |
Guardian Mid Cap Relative Value VIP Fund
| • | | The Board noted that the Fund’s performance was in the 2nd quintile of its performance universe for the |
SUPPLEMENTAL INFORMATION (UNAUDITED)
| | | 1-year, 3-year and 5-year periods. The Board also noted that the Fund’s performance was higher than the benchmark index for the 1-year, 3-year and 5-year periods. |
| • | | The Board noted that the contractual management fee and the actual management fee were in the 2nd quintile of the expense group and the actual total expenses were in the 3rd quintile of the expense group. |
Guardian Small-Mid Cap Core VIP Fund
| • | | The Board noted that the Fund’s performance was in the 5th quintile of its performance universe for the 1-year period. The Board acknowledged the Fund’s short operational history. The Board noted that the Fund’s performance was higher than the benchmark index for the 1-year period. |
| • | | The Board noted that the contractual management fee, the actual management fee and actual total expenses were in the 1st quintile of the expense group. |
Guardian Small Cap Core VIP Fund
| • | | The Board noted that the Fund’s performance was in the 5th quintile of its performance universe for the 1-year and 3-year periods. The Board noted that the Fund’s performance was lower than the benchmark index for the 1-year and 3-year periods. |
| • | | The Board noted that the contractual management fee and the actual management fee were in the 1st quintile of the expense group and the actual total expenses were in the 2nd quintile of the expense group. |
Guardian International Growth VIP Fund
| • | | The Board noted that the Fund’s performance was in the 4th quintile of its performance universe for the 1-year period, in the 2nd quintile of its performance universe for the 3-year period and in the 3rd quintile of its performance universe for the 5-year period. The Board also noted that the Fund’s performance was lower than the benchmark index for the 1-year and 5-year periods. The Board noted that the Fund’s performance was higher than the benchmark index for the 3-year period. |
| • | | The Board noted that the contractual management fee and actual management fee were in the 2nd quintile of the expense group and that the actual total expenses were in the 3rd quintile. |
Guardian International Equity VIP Fund
| • | | The Board noted that the Fund’s performance was in |
| | | the 5th quintile of its performance universe for the 1-year, 3-year and 5-year periods. The Board also noted that the Fund’s performance was lower than the benchmark index for the 1-year, 3-year and 5-year periods. |
| • | | The Board noted that the contractual management fee, the actual management fee and the actual total expenses were in the 2nd quintile of the expense group. |
Guardian Global Utilities VIP Fund
| • | | The Board noted that the Fund’s performance was in the 5th quintile of its performance universe for the 1-year period and in the 4th quintile of its performance universe for the 3-year period. The Board noted that the Fund’s performance was higher than the benchmark index for the 1-year and 3-year periods. |
| • | | The Board noted that the contractual management fee and the actual management fee were in the 1st quintile of the expense group and the actual total expenses were in the 2nd quintile of the expense group. |
Guardian Balanced Allocation VIP Fund
| • | | The Board noted that the Fund had less than one-year of operational history and was not able to evaluate an investment performance record for the Fund. The Board noted that it would have an opportunity to review such information in connection with future annual reviews. The Board noted that, in the meantime, it received monthly performance reports from the Manager. |
| • | | The Board noted that the contractual management fee, the actual management fee and actual total expenses were in the 1st quintile of the expense group. |
Guardian Core Plus Fixed Income VIP Fund
| • | | The Board noted that the Fund’s performance was in the 3rd quintile of its performance universe for the 1-year and 3-year periods and in the 4th quintile of its performance universe for the 5-year period. The Board also noted that the Fund’s performance was lower than the benchmark index for the 1-year and 5-year periods. The Board noted that the Fund’s performance was in line with the benchmark index for the 3-year period. |
| • | | The Board noted that the contractual management fee and actual management fee were in the 2nd quintile of the expense group and that actual total expenses were in the 3rd quintile. |
Guardian Total Return Bond VIP Fund
| • | | The Board noted that the Fund’s performance was in |
SUPPLEMENTAL INFORMATION (UNAUDITED)
| | | the 5th quintile of its performance universe for the 1-year and 3-year periods. The Board also noted that the Fund’s performance was lower than the benchmark index for the 1-year and 3-year periods. |
| • | | The Board noted that the contractual management fee and actual management fee were in the 2nd quintile and the actual total expenses were in the 3rd quintile. |
Guardian Core Fixed Income VIP Fund
| • | | The Board noted that the Fund had less than one-year of operational history and was not able to evaluate an investment performance record for the Fund. The Board noted that it would have an opportunity to review such information in connection with future annual reviews. The Board noted that, in the meantime, it received monthly performance reports from the Manager. |
| • | | The Board noted that the contractual management fee was in the 2nd quintile of the expense group and the actual management fee and the actual total expenses were in the 1st quintile. |
Guardian Multi-Sector Bond VIP Fund
| • | | The Board noted that the Fund’s performance was in the 5th quintile of its performance universe for the 1-year and 3-year periods The Board also noted that the Fund’s performance was lower than the benchmark index for the 1-year and 3-year periods. |
| • | | The Board noted that the contractual management fee and actual total expenses were in the 1st quintile and the actual management fee was in the 2nd quintile. |
Guardian Short Duration Bond VIP Fund
| • | | The Board noted that the Fund had less than one-year of operational history and was not able to evaluate an investment performance record for the Fund. The Board noted that it would have an opportunity to review such information in connection with future annual reviews. The Board noted that, in the meantime, it received monthly performance reports from the Manager. |
| • | | The Board noted that the contractual management fee and actual total expenses were in the 3rd quintile of the expense group and the actual management fee was in the 1st quintile of the expense group. |
Guardian U.S. Government Securities VIP Fund
| • | | The Board noted that the Fund’s performance was in the 1st quintile of its performance universe for the 1-year period and in the 2nd quintile of its performance universe for the 3-year period. The Board also noted that the Fund’s performance was higher than the benchmark index for the 1-year and 3-year periods. |
| • | | The Board noted that the contractual management fee and the actual management fee were in the 1st quintile of the expense group and the actual total expenses were in the 2nd quintile of the expense group. |
Conclusion
Based on a comprehensive consideration and evaluation of all of the information and factors summarized above, among others, the Board as a whole, including the Independent Trustees, approved the Agreements.
SUPPLEMENTAL INFORMATION (UNAUDITED)
The Statement of Additional Information (“SAI”) includes additional information about the Trust’s Trustees and Officers and is available, without charge, upon request by calling toll-free 1-888-GUARDIAN (1-888-482-7342) or by visiting our website at http://guardianvpt.onlineprospectus.net/GuardianVPT/Prospectuses.
Portfolio Holdings and Proxy Voting Procedures
The Fund files its complete schedule of portfolio holdings with the Securities and Exchange Commission for the first and third quarters of each fiscal year as an exhibit to its reports on Form N-PORT. The Fund’s Form N-PORT reports are available on the Securities and Exchange Commission’s website at https://www.sec.gov. The Fund’s Form N-PORT information is also available, without charge, upon request, by calling toll-free 1-888-GUARDIAN (1-888-482-7342) or by visiting our website at http://guardianvpt.onlineprospectus.net/GuardianVPT/Prospectuses.
A description of the policies and procedures that the Fund uses to determine how to vote proxies relating to portfolio securities is included in the SAI. The SAI and information regarding how the Fund voted proxies relating to portfolio securities during the most recent 12-month period ended June 30 may be obtained (i) without charge, upon request, by calling toll-free 1-888-GUARDIAN (1-888-482-7342) or by visiting our website at http://guardianvpt.onlineprospectus.net/GuardianVPT/Prospectuses; and (ii) on the Securities and Exchange Commission’s website at https://www.sec.gov.
This report is transmitted to shareholders only. It is not authorized for use as an offer of sale or a solicitation of an offer to buy shares of the Fund unless accompanied or preceded by the Fund’s current prospectus. Past performance results shown in this report should not be considered a representation of future performance. Investment returns and principal value of shares will fluctuate so that shares, when redeemed, may be worth more or less than their original cost. Statements and other information herein are as dated and are subject to change.

The Guardian Life Insurance Company of America New York, NY 10001-2159
PUB8169
Guardian Variable
Products Trust
2023
Semiannual Report
All Data as of June 30, 2023
Guardian All Cap Core VIP Fund

| | |
| Not FDIC insured. May lose value. No bank guarantee. | | www.guardianlife.com |
TABLE OF CONTENTS
Guardian All Cap Core VIP Fund
Except as otherwise specifically stated, all information, including portfolio security positions, is as of June 30, 2023. Fund holdings will vary. Information contained herein has been obtained from sources believed reliable, but is not guaranteed.
GUARDIAN ALL CAP CORE VIP FUND
Fund Characteristics (unaudited)
| | |
| Total Net Assets: $171,356,567 | | |
|
| |
Sector Allocation1 As of June 30, 2023 |
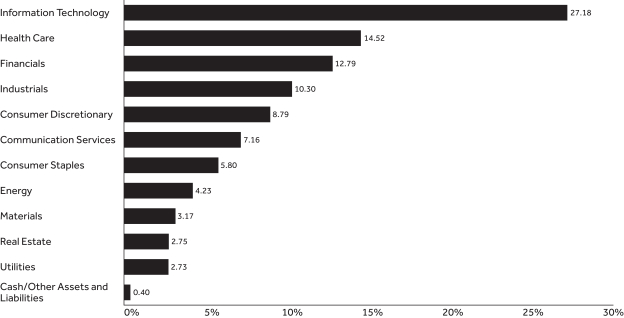 |
| | | | |
| | |
Top Ten Holdings2 As of June 30, 2023 | | | |
| | |
| Holding | | % of Total
Net Assets | |
| Apple, Inc. | | | 7.29 % | |
| Microsoft Corp. | | | 7.09 % | |
| Alphabet, Inc., Class A | | | 4.06 % | |
| Amazon.com, Inc. | | | 3.31 % | |
| Exxon Mobil Corp. | | | 1.96 % | |
| Visa, Inc., Class A | | | 1.74 % | |
| JPMorgan Chase & Co. | | | 1.55 % | |
| Broadcom, Inc. | | | 1.42 % | |
| Johnson & Johnson | | | 1.30 % | |
| Eli Lilly and Co. | | | 1.24% | |
| Total | | | 30.96% | |
| 1 | The Fund’s holdings are allocated to each sector based on the MSCI Global Industry Classification Standard (GICS®). Cash includes short-term investments and net other assets and liabilities. |
| 2 | Portfolio holdings are subject to change and should not be considered a recommendation to buy or sell individual securities. |
UNDERSTANDING YOUR FUND’S EXPENSES (UNAUDITED)
By investing in the Fund, you incur two types of costs: (1) transaction costs and (2) ongoing costs, including, as applicable, investment advisory fees, distribution and/or service (12b-1) fees and other Fund expenses. The example below is intended to help you understand your ongoing costs (in dollars) of investing in the Fund and to compare these costs with the ongoing costs of investing in other mutual funds.
The example is based on an investment of $1,000 invested at the beginning of the period and held for the entire period from January 1, 2023 to June 30, 2023. The table below shows the Fund’s expenses in two ways:
Expenses based on actual return
This section of the table provides information about actual account values and actual expenses. You may use the information in this section, together with the amount you invested, to estimate the expenses that you paid over the period. Simply divide your account value by $1,000 (for example, an $8,600 account value divided by $1,000 = 8.6), then multiply the result by the number in the section under the heading entitled “Expenses Paid During Period” to estimate the expenses you paid on your account during this period.
Expenses based on hypothetical 5% return for comparison purposes
This section of the table provides information about hypothetical account values and hypothetical expenses based on the Fund’s actual expense ratio and an assumed rate of return of 5% per year before expenses, which is not the Fund’s actual return. The hypothetical account values and expenses may not be used to estimate the actual ending account balance or expenses you paid for the period. You may use this information to compare the ongoing costs of investing in the Fund with the cost of investing in other mutual funds. To do so, compare this 5% hypothetical example with the 5% hypothetical examples that appear in the shareholder reports of the other funds.
Note that the expenses shown in the table are meant to highlight your ongoing costs only and do not reflect any transactional costs, such as sales charges (loads), redemption fees, or exchange fees. Therefore the second section is useful in comparing ongoing costs only, and will not help you determine the relative total costs of owning different funds. If these transactional costs were included, your costs would have been higher. Charges and expenses at the insurance company separate account level are not reflected in the table.
| | | | | | | | | | | | | | |
| | | | | |
| | | Beginning
Account Value 1/1/23 | | Ending Account Value
6/30/23 | | | Expenses Paid During Period* 1/1/23 - 6/30/23 | | | Expense Ratio During Period 1/1/23 - 6/30/23 | |
| Based on Actual Return | | $1,000.00 | | | $1,140.70 | | | | $4.14 | | | | 0.78% | |
| Based on Hypothetical Return (5% Return Before Expenses) | | $1,000.00 | | | $1,020.93 | | | | $3.91 | | | | 0.78% | |
| * | Expenses are equal to the Fund’s annualized expense ratio as indicated, multiplied by the average account value over the period, multiplied by 181/365 (to reflect the one-half year period). |
SCHEDULE OF INVESTMENTS — GUARDIAN ALL CAP CORE VIP FUND
| | | | | | | | |
| June 30, 2023 (unaudited) | | Shares | | | Value | |
| Common Stocks – 99.6% | | | | | | | | |
| | | |
| Aerospace & Defense – 1.3% | | | | | | | | |
| | | |
Boeing Co.(1) | | | 3,652 | | | $ | 771,156 | |
| | | |
General Dynamics Corp. | | | 2,346 | | | | 504,742 | |
| | | |
Howmet Aerospace, Inc. | | | 8,089 | | | | 400,891 | |
| | | |
Raytheon Technologies Corp. | | | 6,103 | | | | 597,850 | |
| | | | | | | | | |
| | |
| | | | | 2,274,639 | |
| Automobile Components – 0.3% | | | | | | | | |
| | | |
Aptiv PLC(1) | | | 4,646 | | | | 474,310 | |
| | | | | | | | | |
| | |
| | | | | 474,310 | |
| Banks – 3.1% | |
| | | |
First Interstate BancSystem, Inc., Class A | | | 7,231 | | | | 172,387 | |
| | | |
JPMorgan Chase & Co. | | | 18,310 | | | | 2,663,007 | |
| | | |
M&T Bank Corp. | | | 4,512 | | | | 558,405 | |
| | | |
PNC Financial Services Group, Inc. | | | 4,958 | | | | 624,460 | |
| | | |
Regions Financial Corp. | | | 26,465 | | | | 471,606 | |
| | | |
United Community Banks, Inc. | | | 6,788 | | | | 169,632 | |
| | | |
Wells Fargo & Co. | | | 15,789 | | | | 673,875 | |
| | | | | | | | | |
| | |
| | | | | 5,333,372 | |
| Beverages – 1.6% | |
| | | |
Coca-Cola Co. | | | 4,565 | | | | 274,904 | |
| | | |
Coca-Cola Europacific Partners PLC | | | 6,150 | | | | 396,245 | |
| | | |
Constellation Brands, Inc., Class A | | | 1,539 | | | | 378,794 | |
| | | |
PepsiCo, Inc. | | | 8,983 | | | | 1,663,831 | |
| | | | | | | | | |
| | |
| | | | | 2,713,774 | |
| Biotechnology – 1.0% | |
| | | |
Vertex Pharmaceuticals, Inc.(1) | | | 5,006 | | | | 1,761,661 | |
| | | | | | | | | |
| | |
| | | | | 1,761,661 | |
| Broadline Retail – 3.3% | |
| | | |
Amazon.com, Inc.(1) | | | 43,437 | | | | 5,662,447 | |
| | | | | | | | | |
| | |
| | | | | 5,662,447 | |
| Building Products – 1.0% | |
| | | |
AZEK Co., Inc.(1) | | | 11,203 | | | | 339,339 | |
| | | |
Johnson Controls International PLC | | | 12,467 | | | | 849,501 | |
| | | |
Masco Corp. | | | 8,036 | | | | 461,106 | |
| | | | | | | | | |
| | |
| | | | | 1,649,946 | |
| Capital Markets – 3.1% | |
| | | |
Cboe Global Markets, Inc. | | | 1,167 | | | | 161,058 | |
| | | |
Charles Schwab Corp. | | | 10,843 | | | | 614,581 | |
| | | |
CME Group, Inc. | | | 3,273 | | | | 606,454 | |
| | | |
Invesco Ltd. | | | 36,607 | | | | 615,364 | |
| | | |
KKR & Co., Inc. | | | 12,016 | | | | 672,896 | |
| | | |
Moody’s Corp. | | | 2,141 | | | | 744,468 | |
| | | |
Morgan Stanley | | | 11,712 | | | | 1,000,205 | |
| | | |
Morningstar, Inc. | | | 1,295 | | | | 253,911 | |
| | | |
Northern Trust Corp. | | | 3,530 | | | | 261,714 | |
| | | |
Raymond James Financial, Inc. | | | 3,279 | | | | 340,262 | |
| | | | | | | | | |
| | |
| | | | | 5,270,913 | |
| Chemicals – 2.6% | |
| | | |
Air Products and Chemicals, Inc. | | | 2,162 | | | | 647,584 | |
| | | |
Chemours Co. | | | 11,369 | | | | 419,402 | |
| | | | | | | | | |
| | | | | | | | |
| June 30, 2023 (unaudited) | | Shares | | | Value | |
| Chemicals (continued) | | | | | | | | |
| | | |
Corteva, Inc. | | | 4,809 | | | $ | 275,556 | |
| | | |
DuPont de Nemours, Inc. | | | 7,893 | | | | 563,876 | |
| | | |
Eastman Chemical Co. | | | 5,023 | | | | 420,525 | |
| | | |
Element Solutions, Inc. | | | 9,363 | | | | 179,770 | |
| | | |
International Flavors & Fragrances, Inc. | | | 3,083 | | | | 245,376 | |
| | | |
Linde PLC | | | 2,026 | | | | 772,068 | |
| | | |
Sherwin-Williams Co. | | | 2,196 | | | | 583,082 | |
| | | |
Tronox Holdings PLC | | | 21,702 | | | | 275,832 | |
| | | | | | | | | |
| | |
| | | | | 4,383,071 | |
| Commercial Services & Supplies – 0.6% | |
| | | |
GFL Environmental, Inc. | | | 26,155 | | | | 1,014,814 | |
| | | | | | | | | |
| | |
| | | | | 1,014,814 | |
| Communications Equipment – 0.3% | |
| | | |
Motorola Solutions, Inc. | | | 1,797 | | | | 527,024 | |
| | | | | | | | | |
| | |
| | | | | 527,024 | |
| Construction & Engineering – 0.2% | |
| | | |
API Group Corp.(1) | | | 15,031 | | | | 409,745 | |
| | | | | | | | | |
| | |
| | | | | 409,745 | |
| Construction Materials – 0.4% | |
| | | |
Summit Materials, Inc., Class A(1) | | | 10,062 | | | | 380,847 | |
| | | |
Vulcan Materials Co. | | | 1,636 | | | | 368,820 | |
| | | | | | | | | |
| | |
| | | | | 749,667 | |
| Consumer Finance – 0.6% | |
| | | |
American Express Co. | | | 3,793 | | | | 660,741 | |
| | | |
SLM Corp. | | | 21,435 | | | | 349,819 | |
| | | | | | | | | |
| | |
| | | | | 1,010,560 | |
| Consumer Staples Distribution & Retail – 1.2% | |
| | | |
Dollar General Corp. | | | 4,062 | | | | 689,646 | |
| | | |
Dollar Tree, Inc.(1) | | | 4,104 | | | | 588,924 | |
| | | |
Target Corp. | | | 6,503 | | | | 857,746 | |
| | | | | | | | | |
| | |
| | | | | 2,136,316 | |
| Containers & Packaging – 0.2% | |
| | | |
Crown Holdings, Inc. | | | 3,401 | | | | 295,445 | |
| | | | | | | | | |
| | |
| | | | | 295,445 | |
| Distributors – 0.3% | |
| | | |
LKQ Corp. | | | 7,647 | | | | 445,591 | |
| | | | | | | | | |
| | |
| | | | | 445,591 | |
| Diversified Consumer Services – 0.4% | |
| | | |
Bright Horizons Family Solutions, Inc.(1) | | | 4,521 | | | | 417,967 | |
| | | |
Grand Canyon Education, Inc.(1) | | | 2,010 | | | | 207,452 | |
| | | | | | | | | |
| | |
| | | | | 625,419 | |
| Diversified REITs – 0.4% | |
| | | |
Broadstone Net Lease, Inc. | | | 21,339 | | | | 329,474 | |
| | | |
Empire State Realty Trust, Inc., Class A | | | 39,277 | | | | 294,185 | |
| | | | | | | | | |
| | |
| | | | | 623,659 | |
| Electric Utilities – 2.1% | |
| | | |
Constellation Energy Corp. | | | 2,787 | | | | 255,150 | |
| | | |
Duke Energy Corp. | | | 4,727 | | | | 424,201 | |
| | | |
Evergy, Inc. | | | 2,506 | | | | 146,400 | |
| | | |
Exelon Corp. | | | 8,364 | | | | 340,749 | |
| | | | | | | | | |
| | | | |
| The accompanying notes are an integral part of these financial statements. | | | | 3 |
SCHEDULE OF INVESTMENTS — GUARDIAN ALL CAP CORE VIP FUND
| | | | | | | | |
| June 30, 2023 (unaudited) | | Shares | | | Value | |
| Electric Utilities (continued) | | | | | |
| | | |
FirstEnergy Corp. | | | 4,091 | | | $ | 159,058 | |
| | | |
NextEra Energy, Inc. | | | 12,005 | | | | 890,771 | |
| | | |
PG&E Corp.(1) | | | 45,510 | | | | 786,413 | |
| | | |
PPL Corp. | | | 6,169 | | | | 163,232 | |
| | | |
Xcel Energy, Inc. | | | 8,116 | | | | 504,572 | |
| | | | | | | | | |
| | |
| | | | | 3,670,546 | |
| Electrical Equipment – 1.9% | |
| | | |
AMETEK, Inc. | | | 5,575 | | | | 902,481 | |
| | | |
Eaton Corp. PLC | | | 6,393 | | | | 1,285,632 | |
| | | |
nVent Electric PLC | | | 5,695 | | | | 294,261 | |
| | | |
Regal Rexnord Corp. | | | 2,413 | | | | 371,361 | |
| | | |
Sensata Technologies Holding PLC | | | 8,801 | | | | 395,957 | |
| | | | | | | | | |
| | |
| | | | | 3,249,692 | |
| Electronic Equipment, Instruments & Components – 0.6% | |
| | | |
Amphenol Corp., Class A | | | 5,272 | | | | 447,856 | |
| | | |
TE Connectivity Ltd. | | | 1,047 | | | | 146,748 | |
| | | |
Zebra Technologies Corp., Class A(1) | | | 1,274 | | | | 376,887 | |
| | | | | | | | | |
| | |
| | | | | 971,491 | |
| Energy Equipment & Services – 0.4% | |
| | | |
Schlumberger NV | | | 9,292 | | | | 456,423 | |
| | | |
TechnipFMC PLC(1) | | | 17,298 | | | | 287,493 | |
| | | | | | | | | |
| | |
| | | | | 743,916 | |
| Entertainment – 1.5% | |
| | | |
Electronic Arts, Inc. | | | 5,753 | | | | 746,164 | |
| | | |
Spotify Technology SA(1) | | | 727 | | | | 116,720 | |
| | | |
Take-Two Interactive Software, Inc.(1) | | | 2,392 | | | | 352,006 | |
| | | |
Vivid Seats, Inc., Class A(1) | | | 19,375 | | | | 153,450 | |
| | | |
Walt Disney Co.(1) | | | 9,710 | | | | 866,909 | |
| | | |
Warner Bros Discovery, Inc.(1) | | | 23,672 | | | | 296,847 | |
| | | | | | | | | |
| | |
| | | | | 2,532,096 | |
| Financial Services – 2.7% | |
| | | |
Block, Inc.(1) | | | 5,237 | | | | 348,627 | |
| | | |
Fidelity National Information Services, Inc. | | | 3,277 | | | | 179,252 | |
| | | |
Fiserv, Inc.(1) | | | 3,388 | | | | 427,396 | |
| | | |
Flywire Corp.(1) | | | 6,177 | | | | 191,734 | |
| | | |
Visa, Inc., Class A | | | 12,561 | | | | 2,982,986 | |
| | | |
Voya Financial, Inc. | | | 6,252 | | | | 448,331 | |
| | | | | | | | | |
| | |
| | | | | 4,578,326 | |
| Food Products – 1.2% | |
| | | |
Archer-Daniels-Midland Co. | | | 5,728 | | | | 432,808 | |
| | | |
J.M. Smucker Co. | | | 1,876 | | | | 277,029 | |
| | | |
Mondelez International, Inc., Class A | | | 16,099 | | | | 1,174,261 | |
| | | |
Oatly Group AB, ADR(1) | | | 65,530 | | | | 134,336 | |
| | | | | | | | | |
| | |
| | | | | 2,018,434 | |
| Gas Utilities – 0.5% | |
| | | |
Southwest Gas Holdings, Inc. | | | 13,340 | | | | 849,091 | |
| | | | | | | | | |
| | |
| | | | | 849,091 | |
| Ground Transportation – 1.4% | |
| | | |
Canadian Pacific Kansas City Ltd. | | | 12,115 | | | | 978,529 | |
| | | | | | | | | |
| | | | | | | | |
| June 30, 2023 (unaudited) | | Shares | | | Value | |
| Ground Transportation (continued) | | | | | |
| | | |
Saia, Inc.(1) | | | 1,486 | | | $ | 508,821 | |
| | | |
Union Pacific Corp. | | | 4,575 | | | | 936,136 | |
| | | | | | | | | |
| | |
| | | | | 2,423,486 | |
| Health Care Equipment & Supplies – 4.3% | |
| | | |
Becton Dickinson and Co. | | | 6,181 | | | | 1,631,846 | |
| | | |
Boston Scientific Corp.(1) | | | 32,911 | | | | 1,780,156 | |
| | | |
Envista Holdings Corp.(1) | | | 8,438 | | | | 285,542 | |
| | | |
Medtronic PLC | | | 20,953 | | | | 1,845,959 | |
| | | |
QuidelOrtho Corp.(1) | | | 5,703 | | | | 472,550 | |
| | | |
Shockwave Medical, Inc.(1) | | | 475 | | | | 135,570 | |
| | | |
STERIS PLC | | | 5,342 | | | | 1,201,843 | |
| | | | | | | | | |
| | |
| | | | | 7,353,466 | |
| Health Care Providers & Services – 2.2% | |
| | | |
Cigna Group | | | 7,236 | | | | 2,030,422 | |
| | | |
Encompass Health Corp. | | | 8,021 | | | | 543,102 | |
| | | |
McKesson Corp. | | | 2,949 | | | | 1,260,137 | |
| | | | | | | | | |
| | |
| | | | | 3,833,661 | |
| Health Care Technology – 0.1% | |
| | | |
Veeva Systems, Inc., Class A(1) | | | 1,289 | | | | 254,874 | |
| | | | | | | | | |
| | |
| | | | | 254,874 | |
| Hotels, Restaurants & Leisure – 2.2% | |
| | | |
Booking Holdings, Inc.(1) | | | 239 | | | | 645,379 | |
| | | |
International Game Technology PLC | | | 11,742 | | | | 374,452 | |
| | | |
Las Vegas Sands Corp.(1) | | | 2,308 | | | | 133,864 | |
| | | |
Marriott International, Inc., Class A | | | 2,902 | | | | 533,068 | |
| | | |
Starbucks Corp. | | | 15,493 | | | | 1,534,737 | |
| | | |
Wendy’s Co. | | | 29,038 | | | | 631,577 | |
| | | | | | | | | |
| | |
| | | | | 3,853,077 | |
| Household Products – 1.1% | |
| | | |
Colgate-Palmolive Co. | | | 8,641 | | | | 665,703 | |
| | | |
Kimberly-Clark Corp. | | | 2,977 | | | | 411,004 | |
| | | |
Procter & Gamble Co. | | | 5,203 | | | | 789,503 | |
| | | | | | | | | |
| | |
| | | | | 1,866,210 | |
| Industrial Conglomerates – 0.6% | |
| | | |
Honeywell International, Inc. | | | 5,311 | | | | 1,102,032 | |
| | | | | | | | | |
| | |
| | | | | 1,102,032 | |
| Industrial REITs – 0.1% | |
| | | |
Prologis, Inc. | | | 1,468 | | | | 180,021 | |
| | | | | | | | | |
| | |
| | | | | 180,021 | |
| Insurance – 3.3% | |
| | | |
Aon PLC, Class A | | | 4,990 | | | | 1,722,548 | |
| | | |
Arthur J Gallagher & Co. | | | 4,679 | | | | 1,027,368 | |
| | | |
Assurant, Inc. | | | 1,904 | | | | 239,371 | |
| | | |
Chubb Ltd. | | | 4,986 | | | | 960,104 | |
| | | |
Hartford Financial Services Group, Inc. | | | 6,760 | | | | 486,855 | |
| | | |
MetLife, Inc. | | | 6,952 | | | | 392,997 | |
| | | |
Reinsurance Group of America, Inc. | | | 2,119 | | | | 293,884 | |
| | | |
Willis Towers Watson PLC | | | 2,535 | | | | 596,992 | |
| | | | | | | | | |
| | |
| | | | | 5,720,119 | |
| | | | |
| 4 | | | | The accompanying notes are an integral part of these financial statements. |
SCHEDULE OF INVESTMENTS — GUARDIAN ALL CAP CORE VIP FUND
| | | | | | | | |
| June 30, 2023 (unaudited) | | Shares | | | Value | |
| Interactive Media & Services – 4.1% | |
| | | |
Alphabet, Inc., Class A(1) | | | 58,132 | | | $ | 6,958,400 | |
| | | | | | | | | |
| | |
| | | | | 6,958,400 | |
| IT Services – 1.1% | |
| | | |
Accenture PLC, Class A | | | 4,803 | | | | 1,482,110 | |
| | | |
Gartner, Inc.(1) | | | 952 | | | | 333,495 | |
| | | |
Thoughtworks Holding, Inc.(1) | | | 18,111 | | | | 136,738 | |
| | | | | | | | | |
| | |
| | | | | 1,952,343 | |
| Leisure Products – 0.1% | |
| | | |
Funko, Inc., Class A(1) | | | 18,728 | | | | 202,637 | |
| | | | | | | | | |
| | |
| | | | | 202,637 | |
| Life Sciences Tools & Services – 1.3% | |
| | | |
Adaptive Biotechnologies Corp.(1) | | | 9,910 | | | | 66,496 | |
| | | |
Agilent Technologies, Inc. | | | 3,932 | | | | 472,823 | |
| | | |
ICON PLC(1) | | | 4,209 | | | | 1,053,092 | |
| | | |
Maravai LifeSciences Holdings, Inc., Class A(1) | | | 45,184 | | | | 561,637 | |
| | | | | | | | | |
| | |
| | | | | 2,154,048 | |
| Machinery – 1.3% | |
| | | |
Dover Corp. | | | 3,106 | | | | 458,601 | |
| | | |
Flowserve Corp. | | | 4,615 | | | | 171,447 | |
| | | |
Ingersoll Rand, Inc. | | | 6,582 | | | | 430,200 | |
| | | |
PACCAR, Inc. | | | 5,542 | | | | 463,588 | |
| | | |
Westinghouse Air Brake Technologies Corp. | | | 6,035 | | | | 661,858 | |
| | | | | | | | | |
| | |
| | | | | 2,185,694 | |
| Media – 1.2% | |
| | | |
Altice USA, Inc., Class A(1) | | | 46,714 | | | | 141,076 | |
| | | |
Cable One, Inc. | | | 1,255 | | | | 824,636 | |
| | | |
Liberty Broadband Corp., Class C(1) | | | 9,549 | | | | 764,970 | |
| | | |
Omnicom Group, Inc. | | | 3,587 | | | | 341,303 | |
| | | | | | | | | |
| | |
| | | | | 2,071,985 | |
| Multi-Utilities – 0.1% | |
| | | |
Dominion Energy, Inc. | | | 3,069 | | | | 158,944 | |
| | | | | | | | | |
| | |
| | | | | 158,944 | |
| Oil, Gas & Consumable Fuels – 3.8% | |
| | | |
Cheniere Energy, Inc. | | | 2,411 | | | | 367,340 | |
| | | |
ConocoPhillips | | | 9,551 | | | | 989,579 | |
| | | |
Diamondback Energy, Inc. | | | 5,033 | | | | 661,135 | |
| | | |
Exxon Mobil Corp. | | | 31,341 | | | | 3,361,322 | |
| | | |
Hess Corp. | | | 3,491 | | | | 474,602 | |
| | | |
Phillips 66 | | | 3,472 | | | | 331,159 | |
| | | |
Valero Energy Corp. | | | 2,729 | | | | 320,112 | |
| | | | | | | | | |
| | |
| | | | | 6,505,249 | |
| Personal Care Products – 0.2% | |
| | | |
Kenvue, Inc.(1) | | | 14,737 | | | | 389,352 | |
| | | | | | | | | |
| | |
| | | | | 389,352 | |
| Pharmaceuticals – 5.6% | |
| | | |
Eli Lilly and Co. | | | 4,544 | | | | 2,131,045 | |
| | | |
Johnson & Johnson | | | 13,400 | | | | 2,217,968 | |
| | | |
Merck & Co., Inc. | | | 16,742 | | | | 1,931,860 | |
| | | | | | | | | |
| | | | | | | | |
| June 30, 2023 (unaudited) | | Shares | | | Value | |
| Pharmaceuticals (continued) | | | | | |
| | | |
Organon & Co. | | | 18,735 | | | $ | 389,875 | |
| | | |
Pfizer, Inc. | | | 39,076 | | | | 1,433,308 | |
| | | |
Zoetis, Inc. | | | 8,239 | | | | 1,418,838 | |
| | | | | | | | | |
| | |
| | | | | 9,522,894 | |
| Professional Services – 2.0% | |
| | | |
Dun & Bradstreet Holdings, Inc. | | | 104,334 | | | | 1,207,144 | |
| | | |
Jacobs Solutions, Inc. | | | 4,502 | | | | 535,243 | |
| | | |
Leidos Holdings, Inc. | | | 7,874 | | | | 696,692 | |
| | | |
TriNet Group, Inc.(1) | | | 3,191 | | | | 303,049 | |
| | | |
WNS Holdings Ltd., ADR ()(1) | | | 8,169 | | | | 602,219 | |
| | | | | | | | | |
| | |
| | | | | 3,344,347 | |
| Real Estate Management & Development – 0.1% | |
| | | |
Jones Lang LaSalle, Inc.(1) | | | 1,336 | | | | 208,149 | |
| | | | | | | | | |
| | |
| | | | | 208,149 | |
| Residential REITs – 0.4% | |
| | | |
AvalonBay Communities, Inc. | | | 2,124 | | | | 402,009 | |
| | | |
Sun Communities, Inc. | | | 2,745 | | | | 358,113 | |
| | | | | | | | | |
| | |
| | | | | 760,122 | |
| Retail REITs – 0.2% | |
| | | |
Spirit Realty Capital, Inc. | | | 10,442 | | | | 411,206 | |
| | | | | | | | | |
| | |
| | | | | 411,206 | |
| Semiconductors & Semiconductor Equipment – 6.2% | |
| | | |
Advanced Micro Devices, Inc.(1) | | | 7,107 | | | | 809,558 | |
| | | |
Analog Devices, Inc. | | | 5,806 | | | | 1,131,067 | |
| | | |
Applied Materials, Inc. | | | 9,572 | | | | 1,383,537 | |
| | | |
Broadcom, Inc. | | | 2,811 | | | | 2,438,346 | |
| | | |
Enphase Energy, Inc.(1) | | | 1,446 | | | | 242,176 | |
| | | |
Lam Research Corp. | | | 1,878 | | | | 1,207,291 | |
| | | |
Marvell Technology, Inc. | | | 18,564 | | | | 1,109,756 | |
| | | |
Monolithic Power Systems, Inc. | | | 952 | | | | 514,299 | |
| | | |
NVIDIA Corp. | | | 1,850 | | | | 782,587 | |
| | | |
NXP Semiconductors NV | | | 4,526 | | | | 926,382 | |
| | | | | | | | | |
| | |
| | | | | 10,544,999 | |
| Software – 11.7% | |
| | | |
Adobe, Inc.(1) | | | 2,705 | | | | 1,322,718 | |
| | | |
Autodesk, Inc.(1) | | | 2,887 | | | | 590,709 | |
| | | |
Black Knight, Inc.(1) | | | 6,029 | | | | 360,112 | |
| | | |
Cadence Design Systems, Inc.(1) | | | 5,360 | | | | 1,257,027 | |
| | | |
Check Point Software Technologies Ltd.(1) | | | 1,831 | | | | 230,010 | |
| | | |
Five9, Inc.(1) | | | 2,244 | | | | 185,018 | |
| | | |
Microsoft Corp. | | | 35,660 | | | | 12,143,656 | |
| | | |
Nice Ltd., ADR(1) | | | 2,549 | | | | 526,368 | |
| | | |
Rapid7, Inc.(1) | | | 4,699 | | | | 212,771 | |
| | | |
Salesforce, Inc.(1) | | | 6,356 | | | | 1,342,769 | |
| | | |
ServiceNow, Inc.(1) | | | 2,643 | | | | 1,485,287 | |
| | | |
Tyler Technologies, Inc.(1) | | | 1,051 | | | | 437,710 | |
| | | | | | | | | |
| | |
| | | | | 20,094,155 | |
| Specialized REITs – 1.5% | |
| | | |
Equinix, Inc. | | | 775 | | | | 607,554 | |
| | | | | | | | | |
| | | | |
| The accompanying notes are an integral part of these financial statements. | | | | 5 |
SCHEDULE OF INVESTMENTS — GUARDIAN ALL CAP CORE VIP FUND
| | | | | | | | |
| June 30, 2023 (unaudited) | | Shares | | | Value | |
| Specialized REITs (continued) | | | | | |
| | | |
Extra Space Storage, Inc. | | | 2,625 | | | $ | 390,731 | |
| | | |
Rayonier, Inc. | | | 28,790 | | | | 904,006 | |
| | | |
SBA Communications Corp. | | | 2,695 | | | | 624,593 | |
| | | | | | | | | |
| | |
| | | | | 2,526,884 | |
| Specialty Retail – 1.8% | |
| | | |
Home Depot, Inc. | | | 6,494 | | | | 2,017,296 | |
| | | |
Ross Stores, Inc. | | | 9,773 | | | | 1,095,847 | |
| | | | | | | | | |
| | |
| | | | | 3,113,143 | |
| Technology Hardware, Storage & Peripherals – 7.3% | |
| | | |
Apple, Inc. | | | 64,367 | | | | 12,485,267 | |
| | | | | | | | | |
| | |
| | | | | 12,485,267 | |
| Textiles, Apparel & Luxury Goods – 0.6% | |
| | | |
Deckers Outdoor Corp.(1) | | | 1,174 | | | | 619,473 | |
| | | |
VF Corp. | | | 19,423 | | | | 370,785 | |
| | | | | | | | | |
| | |
| | | | | 990,258 | |
| Tobacco – 0.5% | |
| | | |
Philip Morris International, Inc. | | | 8,429 | | | | 822,839 | |
| | | | | | | | | |
| | |
| | | | | 822,839 | |
| Wireless Telecommunication Services – 0.4% | |
| | | |
T-Mobile US, Inc.(1) | | | 5,029 | | | | 698,528 | |
| | | | | | | | | |
| | |
| | | | | 698,528 | |
| | |
Total Common Stocks
(Cost $156,325,269) | | | | 170,664,354 | |
| | | | | | | | |
| June 30, 2023 (unaudited) | | Principal
Amount | | | Value | |
| Repurchase Agreements – 0.4% | |
| | | |
Fixed Income Clearing Corp., 1.52%, dated 6/30/2023, proceeds at maturity value of $754,966, due 7/3/2023(2) | | $ | 754,871 | | | | 754,871 | |
| | |
Total Repurchase Agreements
(Cost $754,871) | | | | 754,871 | |
| | |
Total Investments – 100.0%
(Cost $157,080,140) | | | | 171,419,225 | |
| | |
| Liabilities in excess of other assets – (0.0)% | | | | (62,658 | ) |
| | |
| Total Net Assets – 100.0% | | | $ | 171,356,567 | |
| (1) | Non–income–producing security. |
| (2) | The table below presents collateral for repurchase agreements. |
| | | | | | | | | | | | | | | | |
| Security | | Coupon | | | Maturity
Date | | | Principal
Amount | | | Value | |
| U.S. Treasury Note | | | 4.625% | | | | 3/15/2026 | | | $ | 758,800 | | | $ | 770,012 | |
Legend:
ADR — American Depositary Receipt
REITs — Real Estate Investment Trusts
| | | | |
| 6 | | | | The accompanying notes are an integral part of these financial statements. |
SCHEDULE OF INVESTMENTS — GUARDIAN ALL CAP CORE VIP FUND
The following is a summary of the inputs used as of June 30, 2023 in valuing the Fund’s investments. For more information on valuation inputs, please refer to Note 2a of the accompanying Notes to Financial Statements.
| | | | | | | | | | | | | | | | |
| | | Valuation Inputs | | | | |
| Investments in Securities (unaudited) | | Level 1 | | | Level 2 | | | Level 3 | | | Total | |
| Common Stocks | | $ | 170,664,354 | | | $ | — | | | $ | — | | | $ | 170,664,354 | |
| Repurchase Agreements | | | — | | | | 754,871 | | | | — | | | | 754,871 | |
| Total | | $ | 170,664,354 | | | $ | 754,871 | | | $ | — | | | $ | 171,419,225 | |
| | | | |
| The accompanying notes are an integral part of these financial statements. | | | | 7 |
FINANCIAL INFORMATION — GUARDIAN ALL CAP CORE VIP FUND
| | | | |
Statement of Assets and Liabilities As of June 30, 2023 (unaudited) | | | |
Assets | | | | |
| | |
Investments, at value | | $ | 171,419,225 | |
| | |
Dividends/interest receivable | | | 137,621 | |
| | |
Reimbursement receivable from adviser | | | 5,911 | |
| | |
Receivable for fund shares subscribed | | | 435 | |
| | |
Prepaid expenses | | | 1,881 | |
| | | | | |
| | |
Total Assets | | | 171,565,073 | |
| | | | | |
| | |
Liabilities | | | | |
| | |
Investment advisory fees payable | | | 60,623 | |
| | |
Payable for fund shares redeemed | | | 49,193 | |
| | |
Distribution fees payable | | | 34,445 | |
| | |
Accrued custodian and accounting fees | | | 22,300 | |
| | |
Accrued audit fees | | | 13,978 | |
| | |
Accrued administrative fees | | | 12,873 | |
| | |
Accrued trustees’ and officers’ fees | | | 2,845 | |
| | |
Accrued expenses and other liabilities | | | 12,249 | |
| | | | | |
| | |
Total Liabilities | | | 208,506 | |
| | | | | |
| | |
Total Net Assets | | $ | 171,356,567 | |
| | | | | |
| | |
Net Assets Consist of: | | | | |
| | |
Paid-in capital | | $ | 161,558,703 | |
| | |
Distributable earnings | | | 9,797,864 | |
| | | | | |
| | |
Total Net Assets | | $ | 171,356,567 | |
| | | | | |
| | |
Investments, at Cost | | $ | 157,080,140 | |
| | | | | |
| | |
Pricing of Shares | | | | |
| | |
Shares of Beneficial Interest Outstanding with No Par Value | | | 17,765,524 | |
| | |
Net Asset Value Per Share | | | $9.65 | |
| | | | | |
| | | | |
Statement of Operations For the Six Months Ended June 30, 2023 (unaudited) | |
Investment Income | | | | |
| | |
Dividends | | $ | 1,214,931 | |
| | |
Interest | | | 8,718 | |
| | |
Withholding taxes on foreign dividends | | | (2,020 | ) |
| | | | | |
| | |
Total Investment Income | | | 1,221,629 | |
| | | | | |
| | |
Expenses | | | | |
| | |
Investment advisory fees | | | 358,285 | |
| | |
Distribution fees | | | 203,571 | |
| | |
Professional fees | | | 28,687 | |
| | |
Custodian and accounting fees | | | 28,209 | |
| | |
Trustees’ and officers’ fees | | | 19,984 | |
| | |
Administrative fees | | | 15,007 | |
| | |
Transfer agent fees | | | 8,943 | |
| | |
Shareholder reports | | | 4,791 | |
| | |
Other expenses | | | 4,456 | |
| | | | | |
| | |
Total Expenses | | | 671,933 | |
| | |
Less: Fees waived | | | (36,791 | ) |
| | | | | |
| | |
Total Expenses, Net | | | 635,142 | |
| | | | | |
| | |
Net Investment Income/(Loss) | | | 586,487 | |
| | | | | |
| | |
Realized Gain/(Loss) and Change in Unrealized Appreciation/(Depreciation) on Investments and Foreign Currency Transactions | | | | |
| | |
Net realized gain/(loss) from investments | | | (1,662,221 | ) |
| | |
Net realized gain/(loss) from foreign currency transactions | | | 50 | |
| | |
Net change in unrealized appreciation/(depreciation) on investments | | | 22,638,450 | |
| | |
Net change in unrealized appreciation/(depreciation) on translation of assets and liabilities in foreign currencies | | | (1 | ) |
| | | | | |
| | |
Net Gain on Investments and Foreign Currency Transactions | | | 20,976,278 | |
| | | | | |
| | |
Net Increase in Net Assets Resulting From Operations | | $ | 21,562,765 | |
| | | | | |
| | | | | |
| | | | |
| 8 | | | | The accompanying notes are an integral part of these financial statements. |
FINANCIAL INFORMATION — GUARDIAN ALL CAP CORE VIP FUND
| | | | | | | | |
Statements of Changes in Net Assets Six Months Ended Numbers are unaudited | | | | | | |
| | | |
| | | For the Six Months Ended
6/30/23 | | | For the Year Ended
12/31/22 | |
| | | | |
Operations | | | | | | | | |
| | | |
Net investment income/(loss) | | $ | 586,487 | | | $ | 936,998 | |
| | | |
Net realized gain/(loss) from investments and foreign currency transactions | | | (1,662,171 | ) | | | (4,450,088 | ) |
| | | |
Net change in unrealized appreciation/(depreciation) on investments and
translation of assets and liabilities in foreign currencies | | | 22,638,449 | | | | (9,057,093 | ) |
| | | | | | | | | |
| | | |
Net Increase/(Decrease) in Net Assets Resulting from Operations | | | 21,562,765 | | | | (12,570,183 | ) |
| | | | | | | | | |
| | | |
Capital Share Transactions | | | | | | | | |
| | | |
Proceeds from sales of shares | | | 765,638 | | | | 152,852,067 | |
| | | |
Cost of shares redeemed | | | (10,156,989 | ) | | | (12,466,797 | ) |
| | | | | | | | | |
| | | |
Net Increase/(Decrease) in Net Assets Resulting from Capital Share Transactions | | | (9,391,351 | ) | | | 140,385,270 | |
| | | | | | | | | |
| | | |
Net Increase in Net Assets | | | 12,171,414 | | | | 127,815,087 | |
| | | | | | | | | |
| | | |
Net Assets | | | | | | | | |
| | | |
Beginning of period | | | 159,185,153 | | | | 31,370,066 | |
| | | | | | | | | |
| | | |
End of period | | $ | 171,356,567 | | | $ | 159,185,153 | |
| | | | | | | | | |
| | | |
Other Information: | | | | | | | | |
| | | |
Shares | | | | | | | | |
| | | |
Sold | | | 83,558 | | | | 17,198,613 | |
| | | |
Redeemed | | | (1,129,673 | ) | | | (1,444,390 | ) |
| | | | | | | | | |
| | | |
Net Increase/(Decrease) | | | (1,046,115 | ) | | | 15,754,223 | |
| | | | | | | | | |
| | | | | | | | | |
| | | | |
| The accompanying notes are an integral part of these financial statements. | | | | 9 |
FINANCIAL INFORMATION — GUARDIAN ALL CAP CORE VIP FUND
The Financial Highlights table is intended to help you understand the Fund’s financial performance for the past six reporting periods (or, if shorter, the period since inception). Certain information reflects financial results for a single Fund share. The total returns in the table represent the rate that an investor would have earned (or lost) on an investment in the Fund.
| | | | | | | | | | | | | | | | | | | | | | | | |
Financial Highlights Six Months Ended Numbers are unaudited | | | | | | | | | | | | | | | | |
| | | Per Share Operating Performance | | | | |
| | | Net Asset Value,
Beginning of
Period | | | Net Investment
Income(1) | | | Net Realized
and Unrealized
Gain/(Loss) | | | Total
Operations | | | Net Asset
Value, End of
Period | | | Total
Return(2) | |
| | | | | | | |
Six Months Ended 6/30/23 | | $ | 8.46 | | | $ | 0.03 | | | $ | 1.16 | | | $ | 1.19 | | | $ | 9.65 | | | | 14.07% | (4) |
| | | | | | | |
Year Ended 12/31/22 | | | 10.26 | | | | 0.07 | | | | (1.87 | ) | | | (1.80 | ) | | | 8.46 | | | | (17.54)% | |
| | | | | | | |
Period Ended 12/31/21(5) | | | 10.00 | | | | 0.01 | | | | 0.25 | | | | 0.26 | | | | 10.26 | | | | 2.60% | (4) |
| | | | |
| 10 | | | | The accompanying notes are an integral part of these financial statements. |
FINANCIAL INFORMATION — GUARDIAN ALL CAP CORE VIP FUND
| | | | | | | | | | | | | | | | | | | | | | |
| |
| Ratios/Supplemental Data | |
Net Assets, End
of Period (000s) | | | Net Ratio of
Expenses to
Average
Net Assets(3) | | | Gross Ratio of
Expenses to
Average Net
Assets | | | Net Ratio of Net Investment Income
to Average
Net Assets(3) | | | Gross Ratio of Net Investment Income
to Average
Net Assets | | | Portfolio
Turnover Rate | |
| | | | | |
| $ | 171,357 | | | | 0.78% | (4) | | | 0.83% | (4) | | | 0.72% | (4) | | | 0.67% | (4) | | | 16% | (4) |
| | | | | |
| | 159,185 | | | | 0.78% | | | | 0.85% | | | | 0.78% | | | | 0.71% | | | | 37% | |
| | | | | |
| | 31,370 | | | | 0.38% | (4) | | | 1.14% | (4) | | | 1.06% | (4) | | | 0.30% | (4) | | | 7% | (4) |
| (1) | Calculated based on the average shares outstanding during the period. |
| (2) | Total returns do not reflect the effects of charges deducted pursuant to the terms of The Guardian Insurance & Annuity Company, Inc.’s variable contracts. Inclusion of such charges would reduce the total returns for all periods shown. |
| (3) | Net Ratio of Expenses to Average Net Assets and Net Ratio of Net Investment Income to Average Net Assets include the effect of fee waivers and expense limitations. |
| (4) | Ratios for periods less than one year have been annualized, except for total return and portfolio turnover rate. For the period ended December 31, 2021, certain non-recurring fees (i.e., audit fees) are not annualized. |
| (5) | Commenced operations on October 25, 2021. |
| | | | |
| The accompanying notes are an integral part of these financial statements. | | | | 11 |
NOTES TO FINANCIAL STATEMENTS — GUARDIAN ALL CAP CORE VIP FUND
June 30, 2023 (unaudited)
1. Organization
Guardian Variable Products Trust (the “Trust”), a Delaware statutory trust organized on January 12, 2016, is registered under the Investment Company Act of 1940, as amended (the “1940 Act”), as an open-end management investment company. The Trust currently has twenty-four series. Guardian All Cap Core VIP Fund (the “Fund”) is a series of the Trust. The Fund is a diversified fund and commenced operations on October 25, 2021. The financial statements for other series of the Trust are presented in separate reports.
The Trust has authorized an unlimited number of shares of beneficial interest with no par value. Shares are bought and sold at closing net asset value (“NAV”). Shares of the Fund are only sold to certain separate accounts of The Guardian Insurance & Annuity Company, Inc. (“GIAC”) that fund certain variable annuity contracts and variable life insurance policies issued by GIAC. GIAC is a wholly-owned subsidiary of The Guardian Life Insurance Company of America (“Guardian Life”).
The Fund seeks capital appreciation.
2. Significant Accounting Policies
The following is a summary of significant accounting policies followed by the Fund in the preparation of its financial statements. The Fund follows the investment company accounting and reporting guidance of the Financial Accounting Standards Board (“FASB”) Accounting Standards Codification Topic 946 Financial Services – Investment Companies. The following policies are in conformity with accounting principles generally accepted in the United States of America (“GAAP”). The preparation of financial statements in accordance with GAAP requires management to make estimates and assumptions that affect the reported amounts and disclosures in the financial statements. Actual results could differ from those estimates.
a. Investment Valuations The Board of Trustees has designated Park Avenue Institutional Advisers LLC (“Park Avenue”) as the valuation designee for the Fund pursuant to Rule 2a-5 under the 1940 Act. Park Avenue has established a Fair Valuation Committee and has adopted fair valuation procedures that provide methodologies for fair valuing securities. These procedures include monitoring the appropriateness of fair values based on results of ongoing valuation oversight, including but not limited to consideration of security specific events, market events, and pricing
vendor and broker-dealer due diligence. The Fair Valuation Committee oversees and carries out the policies for the valuation of investments held in the Fund. The Fair Valuation Committee is responsible for discussing and assessing the potential impacts to the fair values on an ongoing basis, and reports to the Board of Trustees on at least a quarterly basis.
Equity securities traded on an exchange other than NASDAQ Stock Market, LLC (“NASDAQ”) are valued at the last reported sale price on the principal exchange or market on which they are traded; or, if there were no sales that day, at the mean between the closing bid and ask prices. Securities traded on the NASDAQ are generally valued at the NASDAQ official closing price, which may not be the last sale price. If the NASDAQ official closing price is not available for a security, that security is generally valued at the mean between the closing bid and ask prices. Repurchase agreements are carried at cost, which approximates fair value (see Note 5d). Foreign securities are valued in the currencies of the markets in which they trade and then converted to U.S. dollars by the application of foreign exchange rates at the close of the New York Stock Exchange (“NYSE”). Forward foreign currency contracts, if any, are valued at the mean between the bid and ask rates for the specified time interpolated from rates for proximate time periods.
Securities for which market quotations are not readily available or securities whose values have been materially affected by events occurring before the Fund’s valuation time but after the close of the securities’ principal exchange or market are valued at their fair values as determined in good faith by Park Avenue, as the Board of Trustee’s valuation designee (as defined in Rule 2a-5 under the 1940 Act), in accordance with Park Avenue’s procedures and under the general oversight of the Board of Trustees. In addition, the values of the Fund’s investments in foreign securities are generally determined by a pricing service using pricing models designed to estimate likely changes in the values of those securities. Certain foreign equity instruments are valued by applying international fair value factors provided by approved pricing services. The factors seek to adjust the local closing price for movements of local markets post closing, but prior to the time the NAVs are calculated. Valuations reflected in this report are as of the report date. As a result, changes in valuation due to market events and/or issuer related events after the report date and prior to issuance of the report are not reflected herein.
NOTES TO FINANCIAL STATEMENTS — GUARDIAN ALL CAP CORE VIP FUND
Various inputs are used in determining the valuation of the Fund’s investments. These inputs are summarized in three broad levels listed below.
| • | | Level 1 – unadjusted inputs using quoted prices in active markets for identical investments. |
| • | | Level 2 – other significant observable inputs, including, but not limited to, quoted prices for similar investments, inputs other than quoted prices that are observable for investments (such as interest rates, prepayment speeds, credit risks, etc.) or other market corroborated inputs. |
| • | | Level 3 – significant unobservable inputs (including the Fund’s own assumptions in determining the fair value of investments). |
Inputs may include price information, volatility statistics, specific and broad credit data, liquidity statistics, and other factors. A financial instrument’s level within the fair value hierarchy is based on the lowest level of any input; both individually and in aggregate, that is significant to the fair value measurement. However, the determination of what constitutes “observable” requires significant judgment by the Trust. The Trust considers observable data to be that market data which is readily available, regularly distributed or updated, reliable and verifiable, and provided by independent sources that are actively involved in the relevant market. The inputs or methodology used for valuing securities are not necessarily an indication of the risk associated with investing in those securities. Changes in valuation techniques may result in transfers into or out of a financial instrument’s assigned level within the hierarchy.
The FASB requires reporting entities to make disclosures about purchases, sales, issuances and settlements of Level 3 securities on a gross basis. For the six months ended June 30, 2023, there were no transfers into or out of Level 3 of the fair value hierarchy.
In determining a financial instrument’s placement within the hierarchy, the Trust separates the Fund’s investment portfolio into two categories: investments and derivatives (e.g., futures). A summary of inputs used to value the Fund’s assets and liabilities carried at fair value as of June 30, 2023 is included in the Schedule of Investments.
Investments Investments whose values are based on quoted market prices in active markets, and are therefore classified within Level 1, include active listed equities. Investments that trade in markets that are not considered to be active, but are valued based on quoted
market prices, dealer quotations or alternative pricing sources supported by observable inputs are classified within Level 2. These include certain U.S. government and sovereign obligations, most government agency securities, investment-grade corporate bonds, certain mortgage products, state, municipal and provincial obligations, and certain foreign equity securities, including securities whose prices may have been affected by events occurring after the close of trading on their principal exchange or market and, as a result, whose values are determined by a pricing service as described above, or securities whose values are otherwise determined using fair valuation methods approved by the Fund’s Board of Trustees.
Investments classified within Level 3 have significant unobservable inputs, as they trade infrequently or not at all. Level 3 investments include, among others, private placement securities. When observable prices are not available for these securities, the Trust uses one or more valuation techniques for which sufficient and reliable data is available. The inputs used by the Trust in estimating the value of Level 3 investments include, for example, the original transaction price, recent transactions in the same or similar instruments, completed or pending third-party transactions in the underlying investment or comparable issuers, subsequent rounds of financing, recapitalizations, and other transactions across the capital structure. Level 3 investments may also be adjusted to reflect illiquidity and/or non-transferability, with the amount of such discount estimated by the Trust in the absence of market information. Assumptions used by the Trust due to the lack of observable inputs may significantly impact the resulting fair value and therefore the Fund’s results of operations. As of June 30, 2023, the Fund had no securities classified as Level 3.
Derivatives Exchange-traded derivatives, such as futures contracts, exchange-traded option contracts and certain swaps, are typically classified within Level 1 or Level 2 of the fair value hierarchy depending on whether or not they are deemed to be actively traded. Certain non-exchange-traded derivatives, such as generic forwards, certain swaps and options, have inputs which can generally be corroborated by market data and are therefore classified within Level 2. During the six months ended June 30, 2023, the Fund did not hold any derivatives.
b. Securities Transactions Securities transactions are accounted for on the date securities are purchased or sold (trade date). Realized gains or losses on securities transactions are determined on the basis of specific identification.
NOTES TO FINANCIAL STATEMENTS — GUARDIAN ALL CAP CORE VIP FUND
c. Foreign Currency Translation The accounting records of the Fund are maintained in U.S. dollars. Investment securities and all other assets and liabilities of the Fund denominated in a foreign currency are generally translated into U.S. dollars at the exchange rates quoted at the close of the NYSE on each business day. The market value of investment securities and other assets and liabilities are translated at the exchange rate as of the valuation date. Purchases and sales of securities, income receipts, and expense payments are translated into U.S. dollars at the exchange rates in effect on the dates of the respective transactions. The Fund does not isolate the portion of the fluctuations on investments resulting from changes in foreign currency exchange rates from the fluctuations in market prices of investments held. Such fluctuations are included in the Net change in net realized and unrealized gain/(loss) from investments on the Statement of Operations.
Reported realized foreign currency gains and losses arise from the disposition of foreign currency, currency gains or losses realized between the trade and settlement dates on securities transactions, and the difference between the amounts of dividends, interest and foreign withholding taxes recorded on the Fund’s books on the transaction date and the U.S. dollar equivalent of the amounts actually received or paid. These reported realized foreign currency gains and losses, if any, are included in Net realized gain/(loss) from foreign currency transactions on the Statement of Operations. Unrealized foreign currency gains and losses arise from changes (due to changes in exchange rates) in the value of foreign currency and other assets and liabilities denominated in foreign currencies, which are held at period end, if any, and are included in Net change in unrealized appreciation/(depreciation) on translation of assets and liabilities in foreign currencies on the Statement of Operations.
d. Foreign Capital Gains Tax The Fund may be subject to foreign taxes on income, gains on investments or currency purchases/repatriation, a portion of which may be recoverable. The Fund will accrue such taxes and recoveries as applicable, based upon their current interpretation of tax rules and regulations that exist in the markets in which they invest.
e. Investment Income Dividend income net of foreign taxes withheld, if any, is generally recorded on the ex-dividend date. Distributions received from real estate investment trusts, if any, may be classified as dividends, capital gains and/or return of capital. Interest income, which includes amortization/accretion of premium/discount, is determined using the interest income accrual method, and is accrued and recorded daily.
f. Allocation of Income and Expenses Many of the expenses of the Trust can be directly attributed to a specific series of the Trust. Expenses that cannot be directly attributed to a specific series of the Trust are generally apportioned among all the series in the Trust, based on relative net assets. In calculating net asset value per share for each series of the Trust, investment income, realized and unrealized gains and losses, and expenses other than series-specific expenses are allocated daily to each series based upon the proportion of net assets attributable to each series.
3. Transactions with Affiliates
a. Investment Advisory Fee and Expense Limitation Under the terms of the advisory agreement, which, after its two year initial term, is reviewed and approved annually by the Board of Trustees, the Fund pays an investment advisory fee to Park Avenue. Park Avenue is a wholly-owned subsidiary of Guardian Life and receives an investment advisory fee at an annual rate of 0.44% of the first $500 million, and 0.40% in excess of $500 million of the Fund’s average daily net assets. The fee is accrued daily and paid monthly.
Park Avenue has contractually agreed through April 30, 2024 to waive certain fees and/or reimburse certain expenses incurred by the Fund to the extent necessary to limit the Fund’s total annual operating expenses after fee waiver and/or expense reimbursement to 0.78% of the Fund’s average daily net assets (excluding, if applicable, any acquired fund fees and expenses, taxes, interest, transaction costs and brokerage commissions, litigation and extraordinary expenses). The limitation may not be increased or terminated prior to this time without action by the Board of Trustees and may be terminated only upon approval of the Board of Trustees. Amounts waived or reimbursed by Park Avenue pursuant to any expense limitation will not be subject to Park Avenue’s recoupment rights. For the six months ended June 30, 2023, Park Avenue waived fees and/or paid Fund expenses in the amount of $36,791.
Park Avenue has entered into a Sub-Advisory Agreement with Massachusetts Financial Services Company (“MFS”). MFS is responsible for providing day-to-day investment advisory services to the Fund, subject to the supervision of Park Avenue and the oversight of the Board of Trustees. Sub-advisory fees are paid by Park Avenue and do not represent a separate or additional expense to the Fund.
b. Compensation of Trustees and Officers Trustees and officers who are interested persons of the Trust, as defined in the 1940 Act, receive no compensation from
NOTES TO FINANCIAL STATEMENTS — GUARDIAN ALL CAP CORE VIP FUND
the Fund, except for the Chief Compliance Officer of the Trust. Trustees of the Trust who are not interested persons of the Trust, and the Chief Compliance Officer, receive compensation and reimbursement of expenses from the Trust.
c. Distribution Fees Park Avenue Securities LLC (“PAS”), a wholly-owned subsidiary of Guardian Life, is the principal underwriter of Fund shares. The Trust has entered into a distribution and service agreement with PAS, which governs the sale and distribution of shares of the Fund. Under a distribution and service plan adopted by the Trust (“12b-1 plan”), PAS is compensated for services in such capacity, including its expenses in connection with the promotion and distribution of shares of the Fund, at an annual rate of 0.25% of the Fund’s average daily net assets. For the six months ended June 30, 2023, the Fund paid distribution fees in the amount of $203,571 to PAS.
PAS has directed that certain payments under the 12b-1 plan be used to compensate GIAC for shareholder services provided to contract owners.
4. Federal Income Taxes
a. Distributions to Shareholders For federal income tax purposes, the Fund is treated as a disregarded entity (“DRE”). As a DRE, the Fund is not subject to an entity-level income tax; and any income, gains, losses, deductions, taxes, and credits of the Fund would instead be “passed through” directly to the separate accounts of GIAC that invest in the Fund and retain the same character for U.S. federal income tax purposes. In addition, the Fund is not required to distribute taxable income and capital gains for U.S. federal income tax purposes. Therefore, no dividends and capital gains distributions were paid by the Fund.
5. Investments
a. Investment Purchases and Sales The cost of investments purchased and the proceeds from investments sold (excluding short-term investments) amounted to $25,413,521 and $33,494,348, respectively, for the six months ended June 30, 2023. During the six months ended June 30, 2023, there were no purchases or sales of U.S. government securities.
b. Foreign Securities Foreign securities investments involve special risks and considerations not typically associated with U.S. investments. These risks include, but are not limited to, currency risk; adverse political, regulatory, social, and economic developments; and less reliable information about issuers. Moreover, securities of some foreign issuers may be less liquid and their prices more volatile than those of comparable U.S. issuers.
c. Industry or Sector Concentration In its normal course of business, the Fund may invest a significant portion of its assets in companies within a limited number of industries or sectors. As a result, the Fund may be subject to a greater risk of loss than that of a fund invested in a wider spectrum of industries or sectors because the stocks of many or all of the companies in the industry, group of industries, sector, or sectors may decline in value due to developments adversely affecting the industry, group of industries, sector, or sectors.
d. Repurchase Agreements The Fund may invest in repurchase agreements to maintain liquidity and earn income over periods of time as short as overnight. The collateral for repurchase agreements is either cash or fully negotiable U.S. government securities (including U.S. government agency securities). Repurchase agreements are fully collateralized (including the interest accrued thereon) and such collateral is marked to market daily while the agreements remain in force. If the value of the collateral falls below the repurchase price plus accrued interest, the Fund will typically require the seller to deposit additional collateral by the next business day. If the request for additional collateral is not met, or the seller defaults, the Fund maintains the right to sell the collateral (although it may be prevented or delayed from doing so in certain circumstances) and may be required to claim any resulting loss against the seller. Park Avenue monitors the creditworthiness of the seller with which the Fund enters into repurchase agreements.
6. Temporary Borrowings
The Fund, with other funds managed by Park Avenue, is party to a credit agreement with respect to a $10 million committed revolving credit facility from State Street Bank and Trust Company (the “Credit Agreement”) for temporary borrowing purposes, including the meeting of redemption requests that otherwise might require the untimely disposition of securities. Interest is based on a daily fluctuating rate per annum equal to the Applicable Rate (as defined in the Credit Agreement) plus the Applicable Margin (as defined in the Credit Agreement) that is subject to change from time to time as and when the Applicable Rate changes. Under the current Credit Agreement, the Applicable Rate for any day is defined as the rate per annum equal to the sum of (a) 0.10% plus (b) the higher of (i) the Federal Funds Effective Rate for such day and (ii) the Overnight Bank Funding Rate for such day; the Applicable Margin is 1.25%. In addition to the interest charged on any borrowings by the Fund, each fund pays a commitment
NOTES TO FINANCIAL STATEMENTS — GUARDIAN ALL CAP CORE VIP FUND
fee of 0.30% per annum on its share of the unused portion of the credit facility. The agreement is in place until January 5, 2024. The Fund did not utilize the credit facility during the six months ended June 30, 2023.
7. Indemnifications
Under the Trust’s organizational documents and, in some cases, by contract, officers and Trustees of the Trust are indemnified against certain liabilities arising out of the performance of their duties to the Fund. In addition, in the normal course of business, the Fund enters into contracts with its vendors and others that provide general indemnifications. The Fund’s maximum exposure under these arrangements is unknown as this would involve future claims that may be made against
the Fund that have not yet occurred. However, based on experience, the Fund expects the risk of loss to be remote.
8. Additional Information
The outbreak of COVID-19 has adversely impacted both local and global economies, including those in which the Fund may invest. These impacts include materially reduced consumer demand and economic output, disrupted supply chains, market closures, travel restrictions and quarantines, and strained healthcare systems. The Fund’s operations may be interrupted as a result, which may have a negative impact on the Fund’s investment performance.
SUPPLEMENTAL INFORMATION (UNAUDITED)
Liquidity Risk Management Program
In compliance with Rule 22e-4 under the Investment Company Act of 1940, as amended (the “Liquidity Rule”), Guardian Variable Products Trust (the “Trust”) has adopted and implemented a written liquidity risk management program (the “Program”) for each series of the Trust (each, a “Fund”), which is reasonably designed to assess and manage each Fund’s liquidity risk. The Fund’s “liquidity risk” is the risk that the Fund could not meet requests to redeem shares issued by the Fund without significant dilution of the remaining investors’ interests in the Fund.
The Board of Trustees of the Trust (the “Board”) Previously approved the designation of Park Avenue Institutional Advisers LLC (the “Administrator” or “PAIA”) as Program administrator. The Administrator established a Liquidity Risk Management Committee, which is comprised of certain officers of the Trust and PAIA, that assists the Administrator in the implementation and day-to-day administration of the Program and otherwise support carrying out the Administrator’s liquidity risk management responsibilities under the Program.
In accordance with the Program, each Fund’s liquidity risk is assessed no less frequently than annually, taking into consideration a variety of factors, including, as applicable, the Fund’s investment strategy and liquidity of portfolio investments, cash flow projections, and holdings of cash and cash equivalents, as well as borrowing arrangements and other funding sources. Certain factors are considered under both normal and reasonably foreseeable stressed conditions.
Each Fund portfolio investment is classified, no less than monthly, into one of four liquidity categories (including “highly liquid investments” and “illiquid investments,” discussed below) based on a determination of the number of days it is reasonably expected to take to convert the investment to cash, or sell or dispose of the investment, in current market conditions without significantly changing the investment’s market value.
The Liquidity Rule limits the Fund’s investments in illiquid investments by prohibiting the Fund from acquiring any illiquid investment if, immediately after the acquisition, the Fund would have invested more than 15% of its net assets in illiquid investments that are assets. The Program includes provisions reasonably designed to comply with this investment limitation. In addition, the Program includes provisions reasonably designed to comply with this investment limitation. In addition, the Program includes provisions reasonably designed to comply with the Liquidity Rule’s requirements relating to highly liquid investment minimums, which is a minimum amount of Fund net assets that must be invested in highly liquid investments that are assets, as applicable. The Fund was not required to adopt a highly liquid investment minimum during the period.
At a meeting of the Board held on March 29-30, 2023, the Board received a report (the “Report”) prepared by the Administrator addressing the Program’s operation and assessing the adequacy and effectiveness of its implementation for the period from January 1, 2022 through December 31, 2022 (the “Reporting Period”). The Report noted that the Administrator believes the Program operated effectively during the Reporting Period and continues to be reasonably designed to effectively assess and manage each Fund’s liquidity risk. The Report also noted that the Administrator believes the Program has been adequately and effectively implemented and the investment strategies for each Fund continue to be appropriate since its inception. In addition, the Report summarized the operation of the Program and the information and factors considered by the Administrator in its assessment of the Program’s implementation, such as the liquidity risk assessment framework and liquidity classification methodologies.
There can be no assurance that the Program will achieve its objectives under all circumstances. Please refer to the Fund’s prospectus for more information regarding the Fund’s exposure to liquidity risk and other risks to which an investment in the Fund may be subject.
SUPPLEMENTAL INFORMATION (UNAUDITED)
Approval of Investment Management and Sub-advisory Agreements
Section 15(c) of the Investment Company Act of 1940, as amended (the “1940 Act”), requires that a fund’s investment advisory and sub-advisory agreements be approved initially by the fund’s board of trustees. Section 15(c) also requires that the continuation of these agreements, after an initial term of up to two years, be annually reviewed and approved by the board. Any such agreement must be approved by a vote of a majority of the trustees who are not parties to the agreement or “interested persons” (as defined in the 1940 Act) of a party to the agreement at a meeting of the board called for the purpose of voting on such approval.
At a meeting of the Board of Trustees (the “Board”) of Guardian Variable Products Trust (the “Trust”) held on March 29-30, 2023 (the “Meeting”), the Board, including the trustees who are not parties to the agreement or “interested persons” as defined in the 1940 Act (the “Independent Trustees”), considered and voted unanimously to renew the existing investment management agreement between the Trust, on behalf of Guardian All Cap Core VIP Fund; Guardian Balanced Allocation VIP Fund; Guardian Core Fixed Income VIP Fund; Guardian Core Plus Fixed Income VIP Fund; Guardian Diversified Research VIP Fund; Guardian Equity Income VIP Fund; Guardian Global Utilities VIP Fund; Guardian Growth & Income VIP Fund; Guardian Integrated Research VIP Fund; Guardian International Growth VIP Fund; Guardian International Equity VIP Fund; Guardian Large Cap Disciplined Growth VIP Fund; Guardian Large Cap Disciplined Value VIP Fund; Guardian Large Cap Fundamental Growth VIP Fund; Guardian Mid Cap Relative Value VIP Fund; Guardian Mid Cap Traditional Growth VIP Fund; Guardian Multi-Sector Bond VIP Fund; Guardian Select Mid-Cap Core VIP Fund; Guardian Short Duration Bond VIP Fund; Guardian Small Cap Core VIP Fund; Guardian Small-Mid Cap Core VIP Fund; Guardian Strategic Large Cap Core VIP Fund; Guardian Total Return Bond VIP Fund and Guardian U.S. Government Securities VIP Fund (each, a “Fund,” and together, the “Funds”), in substantially the form presented at this meeting (the “Management Agreement”); and Park Avenue Institutional Advisers LLC (the “Manager”) for a one-year term.
The Board, including the Independent Trustees, also considered and voted unanimously to renew the existing sub-advisory agreements (the “Sub-Advisory Agreements,” collectively with the Management Agreement and Sub-Subadvisory Agreement, the “Agreements”) between the Manager and investment
advisory firms engaged to serve as sub-advisers to certain of the Funds (the “Sub-Advised Funds”), namely (i) ClearBridge Investments, LLC with respect to Guardian Small Cap Core VIP Fund; (ii) Putnam Investment Management, LLC with respect to Guardian Diversified Research VIP Fund; (iii) AllianceBernstein L.P. with respect to Guardian Growth & Income VIP Fund and Guardian Strategic Large Cap Core VIP Fund; (iv) J.P. Morgan Investment Management Inc. with respect to Guardian International Growth VIP Fund; (v) Schroder Investment Management North America Inc. with respect to Guardian International Equity VIP Fund; (vi) Wellington Management Company LLP with respect to Guardian Balanced Allocation VIP Fund, Guardian Equity Income VIP Fund, Guardian Integrated Research VIP Fund, Guardian Large Cap Disciplined Growth VIP Fund and Guardian Global Utilities VIP Fund; (vii) Boston Partners Global Investors, Inc. with respect to Guardian Large Cap Disciplined Value VIP Fund; (viii) Janus Henderson Investors US LLC with respect to Guardian Mid Cap Traditional Growth VIP Fund; (ix) Allspring Global Investments, LLC with respect to Guardian Mid Cap Relative Value VIP Fund and Guardian Small-Mid Cap Core VIP Fund; (x) Lord, Abbett & Co. LLC with respect to Guardian Core Plus Fixed Income VIP Fund; (xi) FIAM LLC with respect to Guardian Select Mid Cap Core VIP Fund; and (xii) Massachusetts Financial Services Company with respect to Guardian All Cap Core VIP Fund, each in substantially the form presented at this meeting, (each, a “Sub-Adviser” and collectively, the “Sub-Advisers”) for a one-year term.
The Board, including the Independent Trustees, also considered and voted unanimously to renew the existing sub-subadvisory agreement (the “Sub-Subadvisory Agreement”) between Schroder Investment Management North America Inc. and Schroder Investment Management North America Limited (also a Sub-Adviser) with respect to Guardian International Equity VIP Fund for a one-year term.
The Board is responsible for overseeing the management of each Fund. In determining whether to renew its approval of the Agreements, the Trustees evaluated information and factors that they considered to be relevant and appropriate through the exercise of their own business judgment. The Trustees considered certain information and factors in light of advice furnished to them by legal counsel to the Trust and, in the case of the Independent Trustees, their independent legal counsel. In advance of the Meeting, the Trustees received materials and information designed to assist their consideration of the Agreements. The Trustees received written responses
SUPPLEMENTAL INFORMATION (UNAUDITED)
from the Manager and each Sub-Adviser to a series of questions and requests for information encompassing a wide variety of topics provided by independent counsel on behalf of the Independent Trustees. The Independent Trustees also received materials and information regarding the legal standards applicable to their consideration of the Agreements and the process and criteria used by the Manager to identify and select the Sub-Advisers.
During the course of their deliberations, the Independent Trustees met twice to discuss and evaluate the materials, information and Agreements in executive session with their independent legal counsel, outside of the presence of the Trustees who are not Independent Trustees and representatives from Fund management, the Manager or any Sub-Adviser.
In reaching its decisions to renew its approval of the Agreements, the Board took into account the materials and information described above, as well as other materials and information provided to the Board throughout the year. Individual Trustees may have given different weight to different factors and information with respect to each Agreement, and the Trustees did not identify any single factor or information that, in isolation, would be controlling in deciding to approve the Agreements. The discussion below is intended to summarize the broad factors that figured prominently in the Board’s decisions to renew its approval of the Agreements rather than to be all-inclusive. These broad factors included: (i) the nature, extent and quality of the services provided to the Funds by the Manager and to the Sub-advised Funds by the Sub-Advisers; (ii) the investment performance of each Fund; (iii) estimated profitability of the Manager; (iv) fees and expenses; (v) the extent to which economies of scale may exist, and the extent to the benefits of economies of scale are shared with the Funds; and (vi) any other benefits derived by the Manager or the Sub-Advisers (or their respective affiliates) from their relationships with the Funds.
Nature, Extent and Quality of Services
The Trustees considered information regarding the nature, extent and quality of services provided to the Funds by the Manager. The Trustees also considered, among other things, the terms of the Management Agreement and the range of investment advisory services provided by the Manager. In addition, the Trustees reviewed the range of non-investment advisory services provided by the Manager consistent with the terms of the Management Agreement, notably
coordinating the preparation and filing of various regulatory documents, coordinating the preparation and assembly of Board meeting materials, and assisting the Board with certain valuation matters. The Board also received a description of the Manager’s and each Sub-Adviser’s business continuity plans and of their respective approaches to data privacy and cybersecurity, and related testing. The Board received information regarding the response of the Manager and the Sub-Advisers to the COVID-19 pandemic, including the continuation of remote work arrangements and return-to-office plans. The Board also received information about the Manager’s role as administrator of the Funds’ liquidity risk management program, the Manager’s approach to risk management, and the Manager’s vendor oversight programs.
The Trustees considered that the Sub-advised Funds operate in a “manager-of-managers” structure and reviewed the responsibilities that the Manager has under this structure, including monitoring and evaluating the performance of the Sub-Advisers, monitoring the Sub-Advisers for adherence to the stated investment objectives, strategies, policies and restrictions of the Funds and supervising the Sub-Advisers with respect to the services that the Sub-Advisers would provide under the Sub-Advisory Agreements. The Trustees also considered the process used by the Manager, consistent with this structure, to identify and recommend sub-advisers, and the Manager’s ability to monitor and oversee sub-advisers and recommend replacement sub-advisers, when necessary, and provide other services under the Management Agreement. The Board noted that investment management staff of the Manager and the Trust’s Chief Compliance Officer conduct oversight meetings with the Sub-Advisers on a periodic basis, follow through with additional inquiries on any questions or concerns that arise during the meetings and, as necessary, then report the results of the meetings to the Board. The Trustees reviewed information regarding the experience and background of the Manager’s key personnel and the Manager’s organizational structure and resources, including investment, legal and administrative capabilities of the Manager. In this regard, the Trustees recognized that the Funds may benefit from the Manager’s ability to use resources and capabilities of its affiliates in providing services to the Funds.
The Trustees considered information regarding the nature, extent and quality of services provided to the Sub-advised Funds by the Sub-Advisers. The Trustees also considered, among other things, the terms of the
SUPPLEMENTAL INFORMATION (UNAUDITED)
Sub-advisory Agreements and the range of investment advisory services provided by the Sub-Advisers under the oversight of the Manager. In evaluating these investment advisory services, the Trustees considered, among other things, the Sub-Advisers’ investment philosophies, styles and/or processes and approaches to managing the respective Sub-advised Funds. The Trustees received and evaluated information regarding the background, education, expertise and/or experience of the investment professionals who serve as portfolio managers for the Sub-advised Funds and the capabilities and resources of the Sub-Advisers.
Based upon these considerations, the Trustees concluded, within the context of their full deliberations, that the nature, extent and quality of services provided to the Funds by the Manager and the Sub-advised Funds by each respective Sub-Adviser were appropriate.
Investment Performance
In connection with each of its regular quarterly meetings, the Board receives information on the performance of each Fund, including net performance, relative performance rankings within the relevant Morningstar peer group, and performance as compared to benchmark index returns. At each quarterly Board meeting, members of the Manager’s funds management team review with the Board the economic and market environment, absolute and relative performance of each Fund, and any relevant information about risk management and style consistency in connection with management of the Funds. The Board considered investment performance for each Fund over the one-year, three-year (where available), five-year (where available) and since-inception periods.
The Board also received and reviewed a report prepared by Broadridge Financial Solutions (“Broadridge”), an independent provider of mutual fund industry data, which included comparisons of the performance of each Fund to performance of an appropriate peer universe. For details regarding each Fund’s performance, see the “Fund-by-Fund Factors” section below.
The Manager discussed with the Board factors contributing to the Funds’ performance results. In addition, for certain Funds, the Manager provided to the Board longer term performance records of the Sub-Advisers for strategies used in managing the Funds. The Board concluded that the investment performance generated by the Manager and each Sub-Adviser was generally satisfactory, or, that any steps being taken by
the Manager and Sub-Advisers to address any performance issues were satisfactory.
Profitability
The Board received and considered the Manager’s estimate of its profitability, which included allocations by the Manager of its costs in providing management services to the Funds. The Board considered the estimated profitability of the Manager both overall and on a Fund-by-Fund basis.
The Board received and considered profitability information from most of the Sub-Advisers, but noted that the Manager had negotiated the fees with the Sub-Advisers at arm’s-length. Accordingly, the Board concluded that the profitability of the Sub-Advisers is a less relevant factor than Manager profitability.
Based on the consideration of this information, the Board concluded that the profitability of the Funds to the Manager was acceptable.
Fees and Expenses
The Trustees considered the management fees paid by the Funds to the Manager under the Management Agreement and evaluated the reasonableness of these fees. The Trustees received and reviewed comparative information with respect to the management fee and total expenses for each Fund and the management fees and total expenses for a peer group of other funds selected by Broadridge. The Trustees considered the Manager’s commitment to limit the total expenses of each Fund through an expense limitation agreement with the Trust. Although the Board recognized that the comparisons between the management fees and actual expenses of the Funds and those of the identified peer group are imprecise, given different terms of agreements and variations in fund strategies, the Trustees found that the comparative information supported their consideration and approval of the management fees and evaluation of the total expenses. For details regarding each Fund’s fee and expense comparisons, see the “Fund-by-Fund Factors” section below.
The Trustees considered the sub-advisory fees paid under the Sub-advisory Agreements and evaluated the reasonableness of those fees. The Trustees also considered that the fees paid to the Sub-Advisers would be paid by the Manager and not the Funds and that the Manager had negotiated the fees with the Sub-Advisers at arm’s-length.
SUPPLEMENTAL INFORMATION (UNAUDITED)
Based on the consideration of the information and factors summarized above, as well as other relevant information and factors, the Board concluded that the management and sub-advisory fees were reasonable in light of the nature, extent and quality of services rendered to the Funds by the Manager and the Sub-Advisers.
Economies of Scale
The Board considered the extent to which economies of scale may exist, and the extent to the benefits of economies of scale are shared with the Funds. In this regard, the Board noted that for sixteen of twenty-four Funds, the management and sub-advisory fee included breakpoints that are tiered based on growth in asset levels of each such Fund and that for the other Funds, the fees reflected appropriate levels based on current and expected asset levels. The Board also noted that the expenses of the Funds are subject to expense limitations provided by the Manager. The Board noted that expected economies of scale, where they exist, may be shared through the use of fee breakpoints, expense limitations by the Manager, and/or a lower overall fee.
Ancillary Benefits
The Board considered the potential benefits, other than management fees, that the Manager and/or its affiliates may receive because of the Manager’s relationship with the Funds. The Trustees considered that the Funds were designed to serve as investment options under variable contracts issued by affiliates of the Manager that would receive fees under those contracts and that Park Avenue Securities LLC, an affiliate of the Manager and principal underwriter of the Funds, and participating insurance companies, including insurance companies affiliated with the Manager, would be entitled to receive fees from the Funds under a plan of distribution adopted pursuant to Rule 12b-1 under the 1940 Act. The Trustees considered that the Manager and its affiliates may benefit from (i) greater efficiencies in annuity administration and operations and potential cost savings due to a reduction in the number of unaffiliated funds available as annuity contract investment options, and (ii) increased dividends-received deductions due to the Funds’ status under the tax laws as disregarded entities. In addition, the Trustees considered the potential benefits, other than sub-advisory fees, that the Sub-Advisers and their affiliates may receive because of their relationships with the Funds, including the ability to receive research from soft dollar commissions consistent with Trust policies. The
Trustees concluded that benefits that may accrue to the Manager and its affiliates are reasonable and the benefits that may accrue to the Sub-Advisers and their affiliates are consistent with those expected for a sub-adviser to a mutual fund such as the applicable Fund.
Fund-by-Fund Factors
The Broadridge report groups fees, expenses and performance into five quintiles, with the top quintile having the highest performance or lowest fees/expenses, and the bottom quintile having the lowest performance or highest fees/expenses. For purposes of the descriptions below, a Fund’s performance is considered “in line with” the benchmark index if it is within 0.20%.
Guardian Large Cap Fundamental Growth VIP Fund
| • | | The Board noted that the Fund’s performance was in the 3rd quintile of its performance universe for the 1-year period and in the 4th quintile for its performance universe for the 3-year and 5-year periods. The Board also noted that the Fund’s performance was below the benchmark index for the 1-year, 3-year and 5-year periods. |
| • | | The Board noted that the contractual management fee, the actual management fee and actual total expenses were in the 1st quintile of the expense group. |
Guardian Large Cap Disciplined Growth VIP Fund
| • | | The Board noted that the Fund’s performance was in the 3rd quintile of its performance universe for the 1-year and 3-year periods and in the 2nd quintile for the 5-year period. The Board also noted that the Fund’s performance was below the benchmark index for the 1-year, 3-year and 5-year periods. |
| • | | The Board noted that the contractual management fee, the actual management fee and actual total expenses were in the 1st quintile of the expense group. |
Guardian Integrated Research VIP Fund
| • | | The Board noted that the Fund’s performance was in the 5th quintile of its performance universe for the 1-year and 5-year periods and in the 4th quintile for 3-year period. The Board also noted that the Fund’s performance was below the benchmark index for the 1-year, 3-year and 5-year periods. |
| • | | The Board noted that the contractual management fee, the actual management fee and actual total expenses were in the 1st quintile of the expense group. |
SUPPLEMENTAL INFORMATION (UNAUDITED)
Guardian Diversified Research VIP Fund
| • | | The Board noted that the Fund’s performance was in the 3rd quintile of its performance universe for the 1-year and 3-year periods and in the 2nd quintile for the 5-year period. The Board also noted that the Fund’s performance was higher than the benchmark index for the 1-year period. The Board note that the Fund’s performance was lower than the benchmark index for the 3-year and 5-year periods. |
| • | | The Board noted that the contractual management fee and actual management fee were in the 1st quintile of the expense group and that actual total expenses were in the 3rd quintile. |
Guardian Strategic Large Cap Core VIP Fund
| • | | The Board noted that the Fund’s performance was in the 1st quintile of its performance universe for the 1-year period. The Board acknowledged the Fund’s short operational history. The Board noted that the Fund’s performance was higher than the benchmark index for the 1-year period. |
| • | | The Board noted that the contractual management fee, the actual management fee and actual total expenses were in the 1st quintile of the expense group. |
Guardian Large Cap Disciplined Value VIP Fund
| • | | The Board noted that the Fund’s performance was in the 3rd quintile of its performance universe for the 1-year and 3-year periods and in the 4th quintile for the 5-year period. The Board also noted that the Fund’s performance was higher than the benchmark index for the 1-year and 3-year periods. The Board noted that the Fund’s performance was in line with the benchmark index for the 5-year period. |
| • | | The Board noted that the contractual management fee was in the 2nd quintile of the expense group, the actual management fee was in the 1st quintile of the expense group and that actual total expenses were in the 3rd quintile. |
Guardian Growth & Income VIP Fund
| • | | The Board noted that the Fund’s performance was in the 3rd quintile of its performance universe for the 1-year, 3-year and 5-year periods. The Board also noted that the Fund’s performance was higher than the benchmark index for the 1-year, 3-year and 5-year periods. |
| • | | The Board noted that the contractual management fee and the actual management fee were in the 1st quintile of the expense group and that actual total expenses were in the 3rd quintile. |
Guardian Equity Income VIP Fund
| • | | The Board noted that the Fund had less than one-year of operational history and was not able to evaluate an investment performance record for the Fund. The Board noted that it would have an opportunity to review such information in connection with future annual reviews. The Board noted that, in the meantime, it received monthly performance reports from the Manager. |
| • | | The Board noted that the contractual management fee, the actual management fee and actual total expenses were in the 1st quintile of the expense group. |
Guardian All Cap Core VIP Fund
| • | | The Board noted that the Fund’s performance was in the 3rd quintile of its performance universe for the 1-year period. The Board acknowledged the Fund’s short operational history. The Board noted that the Fund’s performance was higher than the benchmark index for the 1-year period. |
| • | | The Board noted that the contractual management fee, the actual management fee and actual total expenses were in the 1st quintile of the expense group. |
Guardian Mid Cap Traditional Growth VIP Fund
| • | | The Board noted that the Fund’s performance was in the 1st quintile of its performance universe for the 1-year period and in the 2nd quintile for the 3-year and 5-year periods. The Board also noted that the Fund’s performance was higher than the benchmark index for the 1-year, 3-year and 5-year periods. |
| • | | The Board noted that the contractual management fee and actual management fee were in the 1st quintile of the expense group and that the actual total expenses were in the 4th quintile. |
Guardian Select Mid Cap Core VIP Fund
| • | | The Board noted that the Fund’s performance was in the 3rd quintile of its performance universe for the 1-year period. The Board acknowledged the Fund’s short operational history. The Board noted that the Fund’s performance was lower than the benchmark index for the 1-year period. |
| • | | The Board noted that the contractual management fee, the actual management fee and actual total expenses were in the 1st quintile of the expense group. |
Guardian Mid Cap Relative Value VIP Fund
| • | | The Board noted that the Fund’s performance was in the 2nd quintile of its performance universe for the 1-year, 3-year and 5-year periods. The Board also |
SUPPLEMENTAL INFORMATION (UNAUDITED)
| | | noted that the Fund’s performance was higher than the benchmark index for the 1-year, 3-year and 5-year periods. |
| • | | The Board noted that the contractual management fee and the actual management fee were in the 2nd quintile of the expense group and the actual total expenses were in the 3rd quintile of the expense group. |
Guardian Small-Mid Cap Core VIP Fund
| • | | The Board noted that the Fund’s performance was in the 5th quintile of its performance universe for the 1-year period. The Board acknowledged the Fund’s short operational history. The Board noted that the Fund’s performance was higher than the benchmark index for the 1-year period. |
| • | | The Board noted that the contractual management fee, the actual management fee and actual total expenses were in the 1st quintile of the expense group. |
Guardian Small Cap Core VIP Fund
| • | | The Board noted that the Fund’s performance was in the 5th quintile of its performance universe for the 1-year and 3-year periods. The Board noted that the Fund’s performance was lower than the benchmark index for the 1-year and 3-year periods. |
| • | | The Board noted that the contractual management fee and the actual management fee were in the 1st quintile of the expense group and the actual total expenses were in the 2nd quintile of the expense group. |
Guardian International Growth VIP Fund
| • | | The Board noted that the Fund’s performance was in the 4th quintile of its performance universe for the 1-year period, in the 2nd quintile of its performance universe for the 3-year period and in the 3rd quintile of its performance universe for the 5-year period. The Board also noted that the Fund’s performance was lower than the benchmark index for the 1-year and 5-year periods. The Board noted that the Fund’s performance was higher than the benchmark index for the 3-year period. |
| • | | The Board noted that the contractual management fee and actual management fee were in the 2nd quintile of the expense group and that the actual total expenses were in the 3rd quintile. |
Guardian International Equity VIP Fund
| • | | The Board noted that the Fund’s performance was in the 5th quintile of its performance universe for the 1-year, 3-year and 5-year periods. The Board also |
| | | noted that the Fund’s performance was lower than the benchmark index for the 1-year, 3-year and 5-year periods. |
| • | | The Board noted that the contractual management fee, the actual management fee and the actual total expenses were in the 2nd quintile of the expense group. |
Guardian Global Utilities VIP Fund
| • | | The Board noted that the Fund’s performance was in the 5th quintile of its performance universe for the 1-year period and in the 4th quintile of its performance universe for the 3-year period. The Board noted that the Fund’s performance was higher than the benchmark index for the 1-year and 3-year periods. |
| • | | The Board noted that the contractual management fee and the actual management fee were in the 1st quintile of the expense group and the actual total expenses were in the 2nd quintile of the expense group. |
Guardian Balanced Allocation VIP Fund
| • | | The Board noted that the Fund had less than one-year of operational history and was not able to evaluate an investment performance record for the Fund. The Board noted that it would have an opportunity to review such information in connection with future annual reviews. The Board noted that, in the meantime, it received monthly performance reports from the Manager. |
| • | | The Board noted that the contractual management fee, the actual management fee and actual total expenses were in the 1st quintile of the expense group. |
Guardian Core Plus Fixed Income VIP Fund
| • | | The Board noted that the Fund’s performance was in the 3rd quintile of its performance universe for the 1-year and 3-year periods and in the 4th quintile of its performance universe for the 5-year period. The Board also noted that the Fund’s performance was lower than the benchmark index for the 1-year and 5-year periods. The Board noted that the Fund’s performance was in line with the benchmark index for the 3-year period. |
| • | | The Board noted that the contractual management fee and actual management fee were in the 2nd quintile of the expense group and that actual total expenses were in the 3rd quintile. |
Guardian Total Return Bond VIP Fund
| • | | The Board noted that the Fund’s performance was in the 5th quintile of its performance universe for the |
SUPPLEMENTAL INFORMATION (UNAUDITED)
| | | 1-year and 3-year periods. The Board also noted that the Fund’s performance was lower than the benchmark index for the 1-year and 3-year periods. |
| • | | The Board noted that the contractual management fee and actual management fee were in the 2nd quintile and the actual total expenses were in the 3rd quintile. |
Guardian Core Fixed Income VIP Fund
| • | | The Board noted that the Fund had less than one-year of operational history and was not able to evaluate an investment performance record for the Fund. The Board noted that it would have an opportunity to review such information in connection with future annual reviews. The Board noted that, in the meantime, it received monthly performance reports from the Manager. |
| • | | The Board noted that the contractual management fee was in the 2nd quintile of the expense group and the actual management fee and the actual total expenses were in the 1st quintile. |
Guardian Multi-Sector Bond VIP Fund
| • | | The Board noted that the Fund’s performance was in the 5th quintile of its performance universe for the 1-year and 3-year periods The Board also noted that the Fund’s performance was lower than the benchmark index for the 1-year and 3-year periods. |
| • | | The Board noted that the contractual management fee and actual total expenses were in the 1st quintile and the actual management fee was in the 2nd quintile. |
Guardian Short Duration Bond VIP Fund
| • | | The Board noted that the Fund had less than one-year of operational history and was not able to evaluate an investment performance record for the Fund. The Board noted that it would have an opportunity to review such information in connection with future annual reviews. The Board noted that, in the meantime, it received monthly performance reports from the Manager. |
| • | | The Board noted that the contractual management fee and actual total expenses were in the 3rd quintile of the expense group and the actual management fee was in the 1st quintile of the expense group. |
Guardian U.S. Government Securities VIP Fund
| • | | The Board noted that the Fund’s performance was in the 1st quintile of its performance universe for the 1-year period and in the 2nd quintile of its performance universe for the 3-year period. The Board also noted that the Fund’s performance was higher than the benchmark index for the 1-year and 3-year periods. |
| • | | The Board noted that the contractual management fee and the actual management fee were in the 1st quintile of the expense group and the actual total expenses were in the 2nd quintile of the expense group. |
Conclusion
Based on a comprehensive consideration and evaluation of all of the information and factors summarized above, among others, the Board as a whole, including the Independent Trustees, approved the Agreements.
SUPPLEMENTAL INFORMATION (UNAUDITED)
The Statement of Additional Information (“SAI”) includes additional information about the Trust’s Trustees and Officers and is available, without charge, upon request by calling toll-free 1-888-GUARDIAN (1-888-482-7342) or by visiting our website at http://guardianvpt.onlineprospectus.net/GuardianVPT/Prospectuses.
Portfolio Holdings and Proxy Voting Procedures
The Fund files its complete schedule of portfolio holdings with the Securities and Exchange Commission for the first and third quarters of each fiscal year as an exhibit to its reports on Form N-PORT. The Fund’s Form N-PORT reports are available on the Securities and Exchange Commission’s website at https://www.sec.gov. The Fund’s Form N-PORT information is also available, without charge, upon request, by calling toll-free 1-888-GUARDIAN (1-888-482-7342) or by visiting our website at http://guardianvpt.onlineprospectus.net/GuardianVPT/Prospectuses.
A description of the policies and procedures that the Fund uses to determine how to vote proxies relating to portfolio securities is included in the SAI. The SAI and information regarding how the Fund voted proxies relating to portfolio securities during the most recent 12-month period ended June 30 may be obtained (i) without charge, upon request, by calling toll-free 1-888-GUARDIAN (1-888-482-7342) or by visiting our website at http://guardianvpt.onlineprospectus.net/GuardianVPT/Prospectuses; and (ii) on the Securities and Exchange Commission’s website at https://www.sec.gov.
This report is transmitted to shareholders only. It is not authorized for use as an offer of sale or a solicitation of an offer to buy shares of the Fund unless accompanied or preceded by the Fund’s current prospectus. Past performance results shown in this report should not be considered a representation of future performance. Investment returns and principal value of shares will fluctuate so that shares, when redeemed, may be worth more or less than their original cost. Statements and other information herein are as dated and are subject to change.

The Guardian Life Insurance Company of America New York, NY 10001-2159
PUB11407
Guardian Variable
Products Trust
2023
Semiannual Report
All Data as of June 30, 2023
Guardian Balanced Allocation VIP Fund

| | |
| Not FDIC insured. May lose value. No bank guarantee. | | www.guardianlife.com |
TABLE OF CONTENTS
Guardian Balanced Allocation VIP Fund
Except as otherwise specifically stated, all information, including portfolio security positions, is as of June 30, 2023. Fund holdings will vary. Information contained herein has been obtained from sources believed reliable, but is not guaranteed.
GUARDIAN BALANCED ALLOCATION VIP FUND
Fund Characteristics (unaudited)
| | |
| Total Net Assets: $222,394,252 | | |
|
| |
Portfolio Composition1 As of June 30, 2023 |
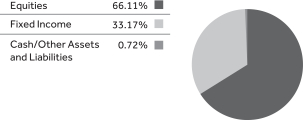
|
GUARDIAN BALANCED ALLOCATION VIP FUND
|
| |
Sector Allocation1 As of June 30, 2023 |
| |
| Equity Sector2,3 |
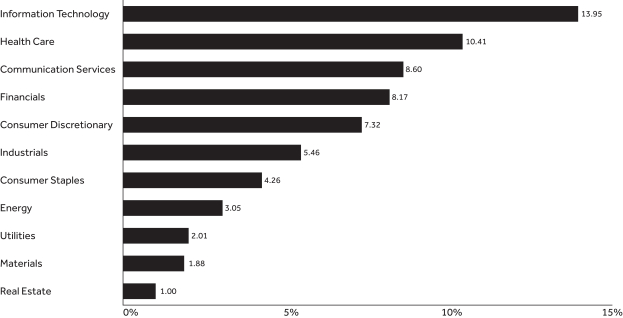 |
| |
| Bond Sector3 |
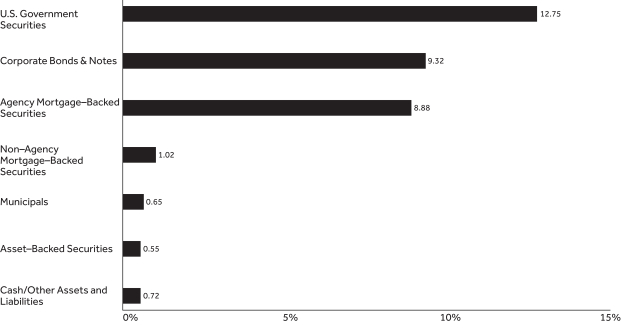 |
GUARDIAN BALANCED ALLOCATION VIP FUND
| | | | |
| | |
Top Ten Holdings1 As of June 30, 2023 | | | |
| | |
| Holding | | % of Total
Net Assets | |
| Microsoft Corp. | | | 5.01% | |
| Alphabet, Inc., Class A | | | 3.49% | |
| Amazon.com, Inc. | | | 3.43% | |
| Meta Platforms, Inc., Class A | | | 2.42% | |
| Apple, Inc. | | | 2.10% | |
| JPMorgan Chase & Co. | | | 1.11% | |
| Eli Lilly & Co. | | | 1.09% | |
| TJX Cos., Inc. | | | 1.00% | |
| U.S. Treasury Note, 3.625% due 5/15/2026 | | | 1.00% | |
| Performance Food Group Co. | | | 1.00% | |
| Total | | | 21.65% | |
| 1 | Portfolio holdings are subject to change and should not be considered a recommendation to buy or sell individual securities. Cash includes short-term investments and net other assets and liabilities. |
| 2 | The Fund’s holdings are allocated to each sector based on the MSCI Global Industry Classification Standard (GICS®). Cash includes short-term investments and net other assets and liabilities. |
| 3 | A sector may comprise several industries. |
UNDERSTANDING YOUR FUND’S EXPENSES (UNAUDITED)
By investing in the Fund, you incur two types of costs: (1) transaction costs and (2) ongoing costs, including, as applicable, investment advisory fees, distribution and/or service (12b-1) fees and other Fund expenses. The example below is intended to help you understand your ongoing costs (in dollars) of investing in the Fund and to compare these costs with the ongoing costs of investing in other mutual funds.
The example is based on an investment of $1,000 invested at the beginning of the period and held for the entire period from January 1, 2023 to June 30, 2023. The table below shows the Fund’s expenses in two ways:
Expenses based on actual return
This section of the table provides information about actual account values and actual expenses. You may use the information in this section, together with the amount you invested, to estimate the expenses that you paid over the period. Simply divide your account value by $1,000 (for example, an $8,600 account value divided by $1,000 = 8.6), then multiply the result by the number in the section under the heading entitled “Expenses Paid During Period” to estimate the expenses you paid on your account during this period.
Expenses based on hypothetical 5% return for comparison purposes
This section of the table provides information about hypothetical account values and hypothetical expenses based on the Fund’s actual expense ratio and an assumed rate of return of 5% per year before expenses, which is not the Fund’s actual return. The hypothetical account values and expenses may not be used to estimate the actual ending account balance or expenses you paid for the period. You may use this information to compare the ongoing costs of investing in the Fund with the cost of investing in other mutual funds. To do so, compare this 5% hypothetical example with the 5% hypothetical examples that appear in the shareholder reports of the other funds.
Note that the expenses shown in the table are meant to highlight your ongoing costs only and do not reflect any transactional costs, such as sales charges (loads), redemption fees, or exchange fees. Therefore the second section is useful in comparing ongoing costs only, and will not help you determine the relative total costs of owning different funds. If these transactional costs were included, your costs would have been higher. Charges and expenses at the insurance company separate account level are not reflected in the table.
| | | | | | | | | | | | | | |
| | | | | |
| | | Beginning
Account Value 1/1/23 | | Ending Account Value
6/30/23 | | | Expenses Paid During Period* 1/1/23-6/30/23 | | | Expense Ratio During Period 1/1/23-6/30/23 | |
| Based on Actual Return | | $1,000.00 | | $ | 1,102.50 | | | $ | 4.54 | | | | 0.87% | |
| Based on Hypothetical Return (5% Return Before Expenses) | | $1,000.00 | | $ | 1,020.48 | | | $ | 4.36 | | | | 0.87% | |
| * | Expenses are equal to the Fund’s annualized expense ratio as indicated, multiplied by the average account value over the period, multiplied by 181/365 (to reflect the one-half year period). |
SCHEDULE OF INVESTMENTS — GUARDIAN BALANCED ALLOCATION VIP FUND
| | | | | | | | |
| June 30, 2023 (unaudited) | | Shares | | | Value | |
| Common Stocks – 65.7% | |
| |
| Aerospace & Defense – 1.4% | |
| | | |
Boeing Co.(1) | | | 2,865 | | | $ | 604,973 | |
| | | |
General Dynamics Corp. | | | 3,776 | | | | 812,406 | |
| | | |
Lockheed Martin Corp. | | | 1,641 | | | | 755,484 | |
| | | |
Raytheon Technologies Corp. | | | 10,163 | | | | 995,568 | |
| | | | | | | | | |
| | |
| | | | | 3,168,431 | |
| Air Freight & Logistics – 0.2% | |
| | | |
CH Robinson Worldwide, Inc. | | | 5,330 | | | | 502,885 | |
| | | | | | | | | |
| | |
| | | | | 502,885 | |
| Automobiles – 0.3% | |
| | | |
Ford Motor Co. | | | 11,887 | | | | 179,850 | |
| | | |
Tesla, Inc.(1) | | | 2,022 | | | | 529,299 | |
| | | | | | | | | |
| | |
| | | | | 709,149 | |
| Banks – 1.1% | |
| | | |
JPMorgan Chase & Co. | | | 16,957 | | | | 2,466,226 | |
| | | | | | | | | |
| | |
| | | | | 2,466,226 | |
| Beverages – 1.2% | |
| | | |
Constellation Brands, Inc., Class A | | | 4,016 | | | | 988,458 | |
| | | |
Monster Beverage Corp.(1) | | | 29,415 | | | | 1,689,598 | |
| | | | | | | | | |
| | |
| | | | | 2,678,056 | |
| Biotechnology – 1.1% | |
| | | |
Alnylam Pharmaceuticals, Inc.(1) | | | 502 | | | | 95,350 | |
| | | |
Apellis Pharmaceuticals, Inc.(1) | | | 452 | | | | 41,177 | |
| | | |
Ascendis Pharma A/S, ADR(1) | | | 867 | | | | 77,380 | |
| | | |
Biogen, Inc.(1) | | | 934 | | | | 266,050 | |
| | | |
Celldex Therapeutics, Inc.(1) | | | 1,476 | | | | 50,081 | |
| | | |
Cytokinetics, Inc.(1) | | | 3,895 | | | | 127,055 | |
| | | |
Genmab A/S, ADR(1) | | | 2,377 | | | | 90,350 | |
| | | |
Gilead Sciences, Inc. | | | 2,008 | | | | 154,756 | |
| | | |
Immunocore Holdings PLC, ADR(1) | | | 900 | | | | 53,964 | |
| | | |
ImmunoGen, Inc.(1) | | | 2,853 | | | | 53,836 | |
| | | |
Karuna Therapeutics, Inc.(1) | | | 657 | | | | 142,470 | |
| | | |
Moderna, Inc.(1) | | | 718 | | | | 87,237 | |
| | | |
Prothena Corp. PLC(1) | | | 596 | | | | 40,695 | |
| | | |
PTC Therapeutics, Inc.(1) | | | 1,011 | | | | 41,117 | |
| | | |
Regeneron Pharmaceuticals, Inc.(1) | | | 368 | | | | 264,423 | |
| | | |
REVOLUTION Medicines, Inc.(1) | | | 1,830 | | | | 48,952 | |
| | | |
Roivant Sciences Ltd.(1) | | | 4,400 | | | | 44,352 | |
| | | |
Sage Therapeutics, Inc.(1) | | | 2,831 | | | | 133,114 | |
| | | |
Sarepta Therapeutics, Inc.(1) | | | 502 | | | | 57,489 | |
| | | |
Syndax Pharmaceuticals, Inc.(1) | | | 1,562 | | | | 32,693 | |
| | | |
United Therapeutics Corp.(1) | | | 315 | | | | 69,536 | |
| | | |
Vaxcyte, Inc.(1) | | | 917 | | | | 45,795 | |
| | | |
Vertex Pharmaceuticals, Inc.(1) | | | 1,424 | | | | 501,120 | |
| | | | | | | | | |
| | |
| | | | | 2,518,992 | |
| Broadline Retail – 3.7% | |
| | | |
Amazon.com, Inc.(1) | | | 58,545 | | | | 7,631,926 | |
| | | |
Etsy, Inc.(1) | | | 7,492 | | | | 633,898 | |
| | | | | | | | | |
| | |
| | | | | 8,265,824 | |
| | | | | | | | |
| June 30, 2023 (unaudited) | | Shares | | | Value | |
| Building Products – 0.6% | |
| | | |
AZEK Co., Inc.(1) | | | 7,843 | | | $ | 237,565 | |
| | | |
Builders FirstSource, Inc.(1) | | | 2,925 | | | | 397,800 | |
| | | |
Fortune Brands Innovations, Inc. | | | 3,212 | | | | 231,103 | |
| | | |
Johnson Controls International PLC | | | 3,609 | | | | 245,917 | |
| | | |
Masterbrand, Inc.(1) | | | 2,288 | | | | 26,610 | |
| | | |
Trane Technologies PLC | | | 400 | | | | 76,504 | |
| | | |
Zurn Elkay Water Solutions Corp. | | | 4,846 | | | | 130,309 | |
| | | | | | | | | |
| | |
| | | | | 1,345,808 | |
| Capital Markets – 2.1% | |
| | | |
Ares Management Corp., Class A | | | 19,195 | | | | 1,849,438 | |
| | | |
Morgan Stanley | | | 7,672 | | | | 655,189 | |
| | | |
S&P Global, Inc. | | | 3,807 | | | | 1,526,188 | |
| | | |
Tradeweb Markets, Inc., Class A | | | 9,755 | | | | 668,023 | |
| | | | | | | | | |
| | |
| | | | | 4,698,838 | |
| Chemicals – 1.8% | |
| | | |
Cabot Corp. | | | 8,517 | | | | 569,702 | |
| | | |
Celanese Corp. | | | 3,481 | | | | 403,100 | |
| | | |
FMC Corp. | | | 5,854 | | | | 610,806 | |
| | | |
Ingevity Corp.(1) | | | 3,794 | | | | 220,659 | |
| | | |
Linde PLC | | | 3,309 | | | | 1,260,994 | |
| | | |
Livent Corp.(1) | | | 7,140 | | | | 195,850 | |
| | | |
PPG Industries, Inc. | | | 4,816 | | | | 714,213 | |
| | | | | | | | | |
| | |
| | | | | 3,975,324 | |
| Commercial Services & Supplies – 0.4% | |
| | | |
Aurora Innovation, Inc.(1) | | | 31,031 | | | | 91,231 | |
| | | |
Clean Harbors, Inc.(1) | | | 2,386 | | | | 392,330 | |
| | | |
Waste Connections, Inc. | | | 3,349 | | | | 478,673 | |
| | | | | | | | | |
| | |
| | | | | 962,234 | |
| Construction & Engineering – 0.3% | |
| | | |
Fluor Corp.(1) | | | 13,557 | | | | 401,287 | |
| | | |
MasTec, Inc.(1) | | | 1,375 | | | | 162,209 | |
| | | | | | | | | |
| | |
| | | | | 563,496 | |
| Consumer Finance – 0.6% | |
| | | |
American Express Co. | | | 7,936 | | | | 1,382,451 | |
| | | | | | | | | |
| | |
| | | | | 1,382,451 | |
| Consumer Staples Distribution & Retail – 1.0% | |
| | | |
Performance Food Group Co.(1) | | | 36,809 | | | | 2,217,374 | |
| | | | | | | | | |
| | |
| | | | | 2,217,374 | |
| Containers & Packaging – 0.1% | |
| | | |
Ball Corp. | | | 3,347 | | | | 194,829 | |
| | | | | | | | | |
| | |
| | | | | 194,829 | |
| Electric Utilities – 1.8% | |
| | | |
Edison International | | | 9,595 | | | | 666,373 | |
| | | |
Exelon Corp. | | | 17,437 | | | | 710,383 | |
| | | |
NextEra Energy, Inc. | | | 9,890 | | | | 733,838 | |
| | | |
PG&E Corp.(1) | | | 59,075 | | | | 1,020,816 | |
| | | |
Southern Co. | | | 10,535 | | | | 740,084 | |
| | | | | | | | | |
| | |
| | | | | 3,871,494 | |
| | | | |
| The accompanying notes are an integral part of these financial statements. | | | | 5 |
SCHEDULE OF INVESTMENTS — GUARDIAN BALANCED ALLOCATION VIP FUND
| | | | | | | | |
| June 30, 2023 (unaudited) | | Shares | | | Value | |
| Electrical Equipment – 0.2% | |
| | | |
AMETEK, Inc. | | | 1,963 | | | $ | 317,770 | |
| | | |
Emerson Electric Co. | | | 2,005 | | | | 181,232 | |
| | | | | | | | | |
| | |
| | | | | 499,002 | |
| Energy Equipment & Services – 0.3% | |
| | | |
Schlumberger NV | | | 13,738 | | | | 674,811 | |
| | | | | | | | | |
| | |
| | | | | 674,811 | |
| Entertainment – 1.2% | |
| | | |
Activision Blizzard, Inc.(1) | | | 7,233 | | | | 609,742 | |
| | | |
Spotify Technology SA(1) | | | 4,507 | | | | 723,599 | |
| | | |
Walt Disney Co.(1) | | | 13,914 | | | | 1,242,242 | |
| | | | | | | | | |
| | |
| | | | | 2,575,583 | |
| Financial Services – 1.9% | |
| | | |
Block, Inc.(1) | | | 13,790 | | | | 918,000 | |
| | | |
Equitable Holdings, Inc. | | | 10,378 | | | | 281,867 | |
| | | |
FleetCor Technologies, Inc.(1) | | | 1,839 | | | | 461,736 | |
| | | |
Global Payments, Inc. | | | 6,159 | | | | 606,785 | |
| | | |
PayPal Holdings, Inc.(1) | | | 6,115 | | | | 408,054 | |
| | | |
Visa, Inc., Class A | | | 3,919 | | | | 930,684 | |
| | | |
WEX, Inc.(1) | | | 3,819 | | | | 695,325 | |
| | | | | | | | | |
| | |
| | | | | 4,302,451 | |
| Food Products – 0.9% | |
| | | |
Hershey Co. | | | 4,148 | | | | 1,035,755 | |
| | | |
Lamb Weston Holdings, Inc. | | | 7,806 | | | | 897,300 | |
| | | | | | | | | |
| | |
| | | | | 1,933,055 | |
| Gas Utilities – 0.3% | |
| | | |
Atmos Energy Corp. | | | 5,128 | | | | 596,592 | |
| | | | | | | | | |
| | |
| | | | | 596,592 | |
| Ground Transportation – 0.1% | |
| | | |
Knight-Swift Transportation Holdings, Inc. | | | 5,546 | | | | 308,136 | |
| | | | | | | | | |
| | |
| | | | | 308,136 | |
| Health Care Equipment & Supplies – 1.8% | |
| | | |
Abbott Laboratories | | | 7,988 | | | | 870,852 | |
| | | |
Boston Scientific Corp.(1) | | | 15,786 | | | | 853,865 | |
| | | |
Dexcom, Inc.(1) | | | 4,392 | | | | 564,416 | |
| | | |
Edwards Lifesciences Corp.(1) | | | 7,044 | | | | 664,460 | |
| | | |
Insulet Corp.(1) | | | 1,794 | | | | 517,282 | |
| | | |
Stryker Corp. | | | 1,859 | | | | 567,162 | |
| | | | | | | | | |
| | |
| | | | | 4,038,037 | |
| Health Care Providers & Services – 2.6% | |
| | | |
agilon health, Inc.(1) | | | 20,380 | | | | 353,389 | |
| | | |
AmerisourceBergen Corp. | | | 4,205 | | | | 809,168 | |
| | | |
Centene Corp.(1) | | | 12,571 | | | | 847,914 | |
| | | |
Elevance Health, Inc. | | | 1,640 | | | | 728,635 | |
| | | |
HCA Healthcare, Inc. | | | 2,625 | | | | 796,635 | |
| | | |
Humana, Inc. | | | 1,620 | | | | 724,351 | |
| | | |
Molina Healthcare, Inc.(1) | | | 2,391 | | | | 720,265 | |
| | | |
UnitedHealth Group, Inc. | | | 1,847 | | | | 887,742 | |
| | | | | | | | | |
| | |
| | | | | 5,868,099 | |
| | | | | | | | |
| June 30, 2023 (unaudited) | | Shares | | | Value | |
| Health Care REITs – 0.3% | |
| | | |
Welltower, Inc. | | | 8,055 | | | $ | 651,569 | |
| | | | | | | | | |
| | |
| | | | | 651,569 | |
| Hotel & Resort REITs – 0.3% | |
| | | |
Ryman Hospitality Properties, Inc. | | | 6,761 | | | | 628,232 | |
| | | | | | | | | |
| | |
| | | | | 628,232 | |
| Hotels, Restaurants & Leisure – 1.3% | |
| | | |
Airbnb, Inc., Class A(1) | | | 10,424 | | | | 1,335,940 | |
| | | |
Chipotle Mexican Grill, Inc.(1) | | | 212 | | | | 453,468 | |
| | | |
DraftKings, Inc., Class A(1) | | | 8,536 | | | | 226,801 | |
| | | |
Hyatt Hotels Corp., Class A | | | 7,367 | | | | 844,111 | |
| | | | | | | | | |
| | |
| | | | | 2,860,320 | |
| Household Durables – 0.4% | |
| | | |
D.R. Horton, Inc. | | | 1,682 | | | | 204,682 | |
| | | |
Lennar Corp., Class A | | | 2,603 | | | | 326,182 | |
| | | |
Skyline Champion Corp.(1) | | | 4,548 | | | | 297,667 | |
| | | | | | | | | |
| | |
| | | | | 828,531 | |
| Industrial Conglomerates – 0.2% | |
| | | |
Honeywell International, Inc. | | | 2,343 | | | | 486,172 | |
| | | | | | | | | |
| | |
| | | | | 486,172 | |
| Industrial REITs – 0.2% | |
| | | |
Rexford Industrial Realty, Inc. | | | 9,778 | | | | 510,607 | |
| | | | | | | | | |
| | |
| | | | | 510,607 | |
| Insurance – 2.0% | |
| | | |
Arch Capital Group Ltd.(1) | | | 8,172 | | | | 611,674 | |
| | | |
Assured Guaranty Ltd. | | | 6,294 | | | | 351,205 | |
| | | |
Chubb Ltd. | | | 3,774 | | | | 726,721 | |
| | | |
Everest Re Group Ltd. | | | 761 | | | | 260,156 | |
| | | |
Marsh & McLennan Cos., Inc. | | | 6,353 | | | | 1,194,872 | |
| | | |
MetLife, Inc. | | | 7,810 | | | | 441,499 | |
| | | |
Progressive Corp. | | | 4,289 | | | | 567,735 | |
| | | |
Trupanion, Inc.(1) | | | 12,648 | | | | 248,913 | |
| | | | | | | | | |
| | |
| | | | | 4,402,775 | |
| Interactive Media & Services – 6.3% | |
| | | |
Alphabet, Inc., Class A(1) | | | 64,811 | | | | 7,757,877 | |
| | | |
Bumble, Inc., Class A(1) | | | 27,775 | | | | 466,064 | |
| | | |
Cargurus, Inc.(1) | | | 21,676 | | | | 490,528 | |
| | | |
Meta Platforms, Inc., Class A(1) | | | 18,765 | | | | 5,385,180 | |
| | | | | | | | | |
| | |
| | | | | 14,099,649 | |
| IT Services – 1.1% | |
| | | |
GoDaddy, Inc., Class A(1) | | | 12,059 | | | | 905,993 | |
| | | |
Okta, Inc.(1) | | | 1,179 | | | | 81,764 | |
| | | |
Snowflake, Inc., Class A(1) | | | 986 | | | | 173,516 | |
| | | |
VeriSign, Inc.(1) | | | 5,847 | | | | 1,321,246 | |
| | | | | | | | | |
| | |
| | | | | 2,482,519 | |
| Life Sciences Tools & Services – 1.4% | |
| | | |
Agilent Technologies, Inc. | | | 5,477 | | | | 658,609 | |
| | | |
Danaher Corp. | | | 5,271 | | | | 1,265,040 | |
| | | |
ICON PLC(1) | | | 2,834 | | | | 709,067 | |
| | | |
Illumina, Inc.(1) | | | 2,502 | | | | 469,100 | |
| | | | | | | | | |
| | |
| | | | | 3,101,816 | |
| | | | |
| 6 | | | | The accompanying notes are an integral part of these financial statements. |
SCHEDULE OF INVESTMENTS — GUARDIAN BALANCED ALLOCATION VIP FUND
| | | | | | | | |
| June 30, 2023 (unaudited) | | Shares | | | Value | |
| Machinery – 0.9% | |
| | | |
Caterpillar, Inc. | | | 1,229 | | | $ | 302,395 | |
| | | |
Flowserve Corp. | | | 9,019 | | | | 335,056 | |
| | | |
Fortive Corp. | | | 5,279 | | | | 394,711 | |
| | | |
Ingersoll Rand, Inc. | | | 2,964 | | | | 193,727 | |
| | | |
Middleby Corp.(1) | | | 2,360 | | | | 348,879 | |
| | | |
Westinghouse Air Brake Technologies Corp. | | | 3,928 | | | | 430,784 | |
| | | | | | | | | |
| | |
| | | | | 2,005,552 | |
| Media – 0.6% | |
| | | |
New York Times Co., Class A | | | 12,762 | | | | 502,567 | |
| | | |
Omnicom Group, Inc. | | | 7,984 | | | | 759,678 | |
| | | | | | | | | |
| | |
| | | | | 1,262,245 | |
| Oil, Gas & Consumable Fuels – 2.8% | |
| | | |
BP PLC, ADR | | | 51,665 | | | | 1,823,258 | |
| | | |
ConocoPhillips | | | 12,195 | | | | 1,263,524 | |
| | | |
Diamondback Energy, Inc. | | | 1,530 | | | | 200,981 | |
| | | |
EOG Resources, Inc. | | | 3,413 | | | | 390,584 | |
| | | |
Marathon Petroleum Corp. | | | 5,766 | | | | 672,315 | |
| | | |
Shell PLC, ADR | | | 28,935 | | | | 1,747,095 | |
| | | | | | | | | |
| | |
| | | | | 6,097,757 | |
| Passenger Airlines – 0.2% | |
| | | |
Delta Air Lines, Inc.(1) | | | 10,018 | | | | 476,256 | |
| | | | | | | | | |
| | |
| | | | | 476,256 | |
| Personal Care Products – 0.2% | |
| | | |
Estee Lauder Cos., Inc., Class A | | | 2,607 | | | | 511,963 | |
| | | | | | | | | |
| | |
| | | | | 511,963 | |
| Pharmaceuticals – 3.4% | |
| | | |
Aclaris Therapeutics, Inc.(1) | | | 3,138 | | | | 32,541 | |
| | | |
AstraZeneca PLC, ADR | | | 12,516 | | | | 895,770 | |
| | | |
Elanco Animal Health, Inc.(1) | | | 11,656 | | | | 117,259 | |
| | | |
Eli Lilly and Co. | | | 5,178 | | | | 2,428,379 | |
| | | |
GSK PLC, ADR | | | 8,231 | | | | 293,353 | |
| | | |
Merck & Co., Inc. | | | 15,137 | | | | 1,746,658 | |
| | | |
Novartis AG, ADR | | | 4,123 | | | | 416,052 | |
| | | |
Pfizer, Inc. | | | 33,713 | | | | 1,236,593 | |
| | | |
Zoetis, Inc. | | | 2,608 | | | | 449,124 | |
| | | | | | | | | |
| | |
| | | | | 7,615,729 | |
| Professional Services – 0.7% | |
| | | |
Ceridian HCM Holding, Inc.(1) | | | 9,407 | | | | 629,987 | |
| | | |
CoStar Group, Inc.(1) | | | 1,956 | | | | 174,084 | |
| | | |
Genpact Ltd. | | | 7,809 | | | | 293,384 | |
| | | |
Science Applications International Corp. | | | 3,490 | | | | 392,555 | |
| | | |
TriNet Group, Inc.(1) | | | 1,342 | | | | 127,450 | |
| | | | | | | | | |
| | |
| | | | | 1,617,460 | |
| Semiconductors & Semiconductor Equipment – 4.2% | |
| | | |
Advanced Micro Devices, Inc.(1) | | | 18,213 | | | | 2,074,643 | |
| | | |
KLA Corp. | | | 2,097 | | | | 1,017,087 | |
| | | |
Marvell Technology, Inc. | | | 5,288 | | | | 316,117 | |
| | | |
Micron Technology, Inc. | | | 12,074 | | | | 761,990 | |
| | | |
NVIDIA Corp. | | | 3,775 | | | | 1,596,900 | |
| | | | | | | | | |
| | | | | | | | |
| June 30, 2023 (unaudited) | | Shares | | | Value | |
| Semiconductors & Semiconductor Equipment (continued) | |
| | | |
ON Semiconductor Corp.(1) | | | 8,732 | | | $ | 825,873 | |
| | | |
Teradyne, Inc. | | | 7,418 | | | | 825,846 | |
| | | |
Texas Instruments, Inc. | | | 10,364 | | | | 1,865,727 | |
| | | | | | | | | |
| | |
| | | | | 9,284,183 | |
| Software – 6.6% | |
| | | |
Bentley Systems, Inc., Class B | | | 1,506 | | | | 81,670 | |
| | | |
Guidewire Software, Inc.(1) | | | 2,011 | | | | 152,997 | |
| | | |
HashiCorp, Inc., Class A(1) | | | 5,804 | | | | 151,949 | |
| | | |
HubSpot, Inc.(1) | | | 477 | | | | 253,807 | |
| | | |
Microsoft Corp. | | | 32,740 | | | | 11,149,279 | |
| | | |
Palo Alto Networks, Inc.(1) | | | 1,418 | | | | 362,313 | |
| | | |
Salesforce, Inc.(1) | | | 5,110 | | | | 1,079,539 | |
| | | |
SentinelOne, Inc., Class A(1) | | | 4,686 | | | | 70,759 | |
| | | |
ServiceNow, Inc.(1) | | | 1,500 | | | | 842,955 | |
| | | |
Workday, Inc., Class A(1) | | | 1,884 | | | | 425,577 | |
| | | | | | | | | |
| | |
| | | | | 14,570,845 | |
| Specialized REITs – 0.2% | |
| | | |
Public Storage | | | 1,466 | | | | 427,896 | |
| | | | | | | | | |
| | |
| | | | | 427,896 | |
| Specialty Retail – 1.3% | |
| | | |
AutoZone, Inc.(1) | | | 247 | | | | 615,860 | |
| | | |
TJX Cos., Inc. | | | 26,182 | | | | 2,219,972 | |
| | | | | | | | | |
| | | |
| | | | | | | | 2,835,832 | |
| Technology Hardware, Storage & Peripherals – 2.1% | |
| | | |
Apple, Inc. | | | 24,129 | | | | 4,680,302 | |
| | | | | | | | | |
| | | |
| | | | | | | | 4,680,302 | |
| Textiles, Apparel & Luxury Goods – 0.4% | |
| | | |
Deckers Outdoor Corp.(1) | | | 441 | | | | 232,698 | |
| | | |
NIKE, Inc., Class B | | | 4,984 | | | | 550,084 | |
| | | | | | | | | |
| | | |
| | | | | | | | 782,782 | |
| Tobacco – 1.0% | |
| | | |
Philip Morris International, Inc. | | | 21,935 | | | | 2,141,295 | |
| | | | | | | | | |
| | | |
| | | | | | | | 2,141,295 | |
| Trading Companies & Distributors – 0.1% | |
| | | |
Herc Holdings, Inc. | | | 310 | | | | 42,423 | |
| | | |
WESCO International, Inc. | | | 914 | | | | 163,661 | |
| | | | | | | | | |
| | | |
| | | | | | | | 206,084 | |
| Wireless Telecommunication Services – 0.5% | |
| | | |
T-Mobile US, Inc.(1) | | | 8,609 | | | | 1,195,790 | |
| | | | | | | | | |
| | | |
| | | | | | | | 1,195,790 | |
| | |
Total Common Stocks
(Cost $130,081,336) | | | | 146,081,338 | |
| | | | | | | | |
| | | Principal
Amount | | |
Value | |
| Agency Mortgage–Backed Securities – 8.9% | |
| | | |
Federal Home Loan Mortgage Corp. | | | | | | | | |
2.00% due 5/1/2051 | | $ | 1,392,063 | | | | 1,142,431 | |
2.00% due 4/1/2052 | | | 1,315,657 | | | | 1,080,881 | |
| | | | | | | | | |
| | | | |
| The accompanying notes are an integral part of these financial statements. | | | | 7 |
SCHEDULE OF INVESTMENTS — GUARDIAN BALANCED ALLOCATION VIP FUND
| | | | | | | | |
| June 30, 2023 (unaudited) | | Principal
Amount | | | Value | |
| Agency Mortgage–Backed Securities (continued) | |
2.50% due 7/1/2041 | | $ | 389,633 | | | $ | 340,666 | |
2.50% due 2/1/2042 | | | 572,501 | | | | 502,794 | |
2.50% due 7/1/2051 | | | 1,276,010 | | | | 1,091,823 | |
2.50% due 10/1/2051 | | | 444,354 | | | | 377,092 | |
2.50% due 11/1/2051 | | | 417,231 | | | | 355,559 | |
3.00% due 10/1/2049 | | | 326,826 | | | | 290,242 | |
3.00% due 10/1/2051 | | | 307,660 | | | | 272,992 | |
4.00% due 4/1/2052 | | | 360,425 | | | | 339,123 | |
4.50% due 9/1/2037 | | | 196,863 | | | | 192,914 | |
4.50% due 1/1/2038 | | | 127,892 | | | | 125,326 | |
4.50% due 5/1/2038 | | | 26,707 | | | | 26,173 | |
4.50% due 7/1/2052 | | | 718,521 | | | | 690,577 | |
5.00% due 10/1/2052 | | | 252,220 | | | | 247,077 | |
5.00% due 1/1/2053 | | | 131,162 | | | | 128,488 | |
5.00% due 2/1/2053 | | | 181,750 | | | | 178,044 | |
5.00% due 4/1/2053 | | | 122,964 | | | | 120,441 | |
5.50% due 9/1/2052 | | | 270,027 | | | | 269,213 | |
5.50% due 2/1/2053 | | | 26,495 | | | | 26,367 | |
| | | |
Federal National Mortgage Association | | | | | | | | |
2.00% due 12/1/2050 | | | 1,247,929 | | | | 1,021,861 | |
2.00% due 2/1/2051 | | | 124,068 | | | | 102,605 | |
2.50% due 2/1/2041 | | | 68,187 | | | | 59,936 | |
2.50% due 5/1/2051 | | | 1,238,593 | | | | 1,057,019 | |
3.00% due 6/1/2051 | | | 258,117 | | | | 230,571 | |
3.00% due 10/1/2051 | | | 788,450 | | | | 694,945 | |
3.50% due 6/1/2037 | | | 74,409 | | | | 70,742 | |
3.50% due 4/1/2050 | | | 97,759 | | | | 89,883 | |
3.50% due 7/1/2051 | | | 546,225 | | | | 502,048 | |
3.50% due 4/1/2052 | | | 390,449 | | | | 356,956 | |
4.00% due 1/1/2038 | | | 594,008 | | | | 573,443 | |
4.00% due 8/1/2052 | | | 137,215 | | | | 128,718 | |
4.00% due 9/1/2052 | | | 219,395 | | | | 206,123 | |
4.00% due 10/1/2052 | | | 137,708 | | | | 129,248 | |
4.50% due 1/1/2038 | | | 134,048 | | | | 131,363 | |
4.50% due 4/1/2038 | | | 493,370 | | | | 483,541 | |
4.50% due 8/1/2052 | | | 1,872 | | | | 1,809 | |
4.50% due 1/1/2053 | | | 147,670 | | | | 142,328 | |
5.00% due 8/1/2052 | | | 697,724 | | | | 683,501 | |
5.00% due 5/1/2053 | | | 291,860 | | | | 285,874 | |
5.50% due 1/1/2053 | | | 162,271 | | | | 161,490 | |
| | | |
Freddie Mac Multifamily
Structured Pass-Through
Certificates | | | | | | | | |
K150 A2
3.71% due 9/25/2032(2)(3) | | | 78,000 | | | | 73,285 | |
K1522 A2
2.361% due 10/25/2036 | | | 500,000 | | | | 383,354 | |
K156 A2
2.43% due 4/25/2060(2)(3) | | | 165,000 | | | | 164,136 | |
| | | |
Government National Mortgage Association | | | | | | | | |
2.00% due 1/20/2051 | | | 120,840 | | | | 101,831 | |
2.00% due 2/20/2051 | | | 106,417 | | | | 89,700 | |
2.00% due 7/20/2051 | | | 139,974 | | | | 117,812 | |
2.00% due 11/20/2051 | | | 317,090 | | | | 266,572 | |
2.50% due 5/20/2051 | | | 554,127 | | | | 480,812 | |
2.50% due 8/20/2051 | | | 555,421 | | | | 481,472 | |
3.00% due 1/20/2051 | | | 525,965 | | | | 472,980 | |
| | | | | | | | | |
| | | | | | | | |
| June 30, 2023 (unaudited) | | Principal
Amount | | | Value | |
| Agency Mortgage–Backed Securities (continued) | |
3.00% due 5/20/2051 | | $ | 528,605 | | | $ | 474,591 | |
3.50% due 1/20/2052 | | | 473,622 | | | | 438,057 | |
3.50% due 2/20/2052 | | | 468,266 | | | | 433,102 | |
4.00% due 4/20/2052 | | | 89,405 | | | | 84,473 | |
4.00% due 5/20/2052 | | | 254,207 | | | | 240,184 | |
4.00% due 8/20/2052 | | | 372,736 | | | | 352,173 | |
4.50% due 8/20/2048 | | | 189,296 | | | | 185,115 | |
| | | | | | | | | |
| | |
Total Agency Mortgage–Backed Securities
(Cost $20,329,339) | | | | 19,751,876 | |
| Asset–Backed Securities – 0.6% | |
| | | |
GM Financial Consumer Automobile Receivables Trust 2023-1 A2A
5.19% due 3/16/2026 | | | 85,000 | | | | 84,670 | |
2023-2 A3
4.47% due 2/16/2028 | | | 105,000 | | | | 103,101 | |
| | | |
Navient Private Education Refi Loan Trust
2023-A A
5.51% due 10/15/2071(4) | | | 208,235 | | | | 204,574 | |
| | | |
New Economy Assets Phase 1 Sponsor LLC
2021-1 A1
1.91% due 10/20/2061(4) | | | 235,000 | | | | 201,161 | |
| | | |
SFS Auto Receivables Securitization Trust
2023-1A A2A
5.89% due 3/22/2027(4) | | | 80,000 | | | | 79,903 | |
| | | |
Vantage Data Centers Issuer LLC
2021-1A A2
2.165% due 10/15/2046(4) | | | 200,000 | | | | 174,375 | |
| | | |
Wheels Fleet Lease Funding 1 LLC
2023-1A A
5.80% due 4/18/2038(4) | | | 375,000 | | | | 372,718 | |
| | | | | | | | | |
| | |
Total Asset–Backed Securities
(Cost $1,257,369) | | | | 1,220,502 | |
| Corporate Bonds & Notes – 9.3% | |
| |
| Agriculture – 0.2% | |
| | | |
Philip Morris International, Inc.
5.125% due 11/17/2027 | | | 105,000 | | | | 105,340 | |
5.125% due 2/15/2030 | | | 175,000 | | | | 173,084 | |
5.625% due 11/17/2029 | | | 65,000 | | | | 66,230 | |
5.75% due 11/17/2032 | | | 130,000 | | | | 133,226 | |
| | | | | | | | | |
| | | |
| | | | | | | | 477,880 | |
| Airlines – 0.0% | |
| | | |
United Airlines Pass-Through Trust
2016-1 AA
3.10% due 1/7/2030 | | | 42,587 | | | | 38,396 | |
| | | | | | | | | |
| | | |
| | | | | | | | 38,396 | |
| Auto Manufacturers – 0.1% | |
| | | |
Daimler Truck Finance North America LLC
5.15% due 1/16/2026(4) | | | 150,000 | | | | 149,290 | |
| | | | | | | | | |
| | | |
| | | | | | | | 149,290 | |
| | | | |
| 8 | | | | The accompanying notes are an integral part of these financial statements. |
SCHEDULE OF INVESTMENTS — GUARDIAN BALANCED ALLOCATION VIP FUND
| | | | | | | | |
| June 30, 2023 (unaudited) | | Principal
Amount | | | Value | |
| Beverages – 0.2% | |
| | | |
Anheuser-Busch InBev Worldwide, Inc.
4.60% due 4/15/2048 | | $ | 171,000 | | | $ | 158,773 | |
| | | |
Bacardi Ltd. / Bacardi-Martini BV
5.25% due 1/15/2029(4) | | | 100,000 | | | | 99,344 | |
5.90% due 6/15/2043(4) | | | 100,000 | | | | 101,056 | |
| | | |
Diageo Capital PLC
2.375% due 10/24/2029 | | | 200,000 | | | | 173,604 | |
| | | | | | | | | |
| | | |
| | | | | | | | 532,777 | |
| Building Materials – 0.0% | |
| | | |
Trane Technologies Financing Ltd.
5.25% due 3/3/2033 | | | 85,000 | | | | 86,008 | |
| | | | | | | | | |
| | | |
| | | | | | | | 86,008 | |
| Commercial Banks – 1.8% | |
| | | |
Bank of America Corp.
1.734% (1.734% fixed rate until 7/22/2026; SOFR + 0.96% thereafter)
due 7/22/2027(2) | | | 256,000 | | | | 228,431 | |
2.299% (2.299% fixed rate until 7/21/2031; SOFR + 1.22% thereafter)
due 7/21/2032(2) | | | 185,000 | | | | 147,893 | |
| | | |
Bank of New York Mellon Corp.
Series J
4.967% (4.967% fixed rate until 4/26/2033; SOFR + 1.61% thereafter)
due 4/26/2034(2) | | | 214,000 | | | | 208,928 | |
| | | |
Credit Agricole SA
5.514% due 7/5/2033(4) | | | 250,000 | | | | 251,842 | |
| | | |
Credit Suisse AG
7.50% due 2/15/2028 | | | 500,000 | | | | 531,260 | |
| | | |
Danske Bank A/S
1.621% (1.621% fixed rate until 9/11/2025; 1 yr. CMT + 1.35% thereafter)
due 9/11/2026(2)(4) | | | 256,000 | | | | 229,530 | |
| | | |
Deutsche Bank AG
6.72% (6.720% fixed rate until 1/18/2028; SOFR + 3.18% thereafter)
due 1/18/2029(2) | | | 150,000 | | | | 150,535 | |
| | | |
Goldman Sachs Group, Inc.
1.431% (1.431% fixed rate until 3/9/2026; SOFR + 0.80% thereafter)
due 3/9/2027(2) | | | 291,000 | | | | 260,195 | |
3.50% due 1/23/2025 | | | 500,000 | | | | 482,790 | |
| | | |
HSBC Holdings PLC
2.099% (2.099% fixed rate until 6/4/2025; SOFR + 1.93% thereafter)
due 6/4/2026(2) | | | 445,000 | | | | 412,097 | |
| | | | | | | | | |
| | | | | | | | |
| June 30, 2023 (unaudited) | | Principal
Amount | | | Value | |
| Commercial Banks (continued) | |
| | | |
JPMorgan Chase & Co.
4.912% (4.912% fixed rate until 7/25/2032; SOFR + 2.08% thereafter)
due 7/25/2033(2) | | $ | 107,000 | | | $ | 104,613 | |
5.35% (5.350% fixed rate until 6/1/2033; SOFR + 1.85% thereafter)
due 6/1/2034(2) | | | 227,000 | | | | 229,191 | |
| | | |
Morgan Stanley
1.928% (1.928% fixed rate until 4/28/2031; SOFR + 1.02% thereafter)
due 4/28/2032(2) | | | 123,000 | | | | 95,974 | |
4.35% due 9/8/2026 | | | 268,000 | | | | 258,848 | |
| | | |
UBS Group AG
1.494% (1.494% fixed rate until 8/10/2026; 1 yr. CMT + 0.85% thereafter)
due 8/10/2027(2)(4) | | | 226,000 | | | | 194,213 | |
| | | |
Wells Fargo & Co.
3.00% due 2/19/2025 | | | 88,000 | | | | 84,520 | |
4.897% (4.897% fixed rate until 7/25/2032; SOFR + 2.10% thereafter)
due 7/25/2033(2) | | | 229,000 | | | | 219,515 | |
| | | | | | | | | |
| | | |
| | | | | | | | 4,090,375 | |
| Commercial Services – 0.3% | |
| | | |
Ashtead Capital, Inc.
2.45% due 8/12/2031(4) | | | 400,000 | | | | 314,440 | |
| | | |
ERAC USA Finance LLC
4.90% due 5/1/2033(4) | | | 236,000 | | | | 230,655 | |
5.40% due 5/1/2053(4) | | | 87,000 | | | | 86,879 | |
| | | | | | | | | |
| | | |
| | | | | | | | 631,974 | |
| Cosmetics & Personal Care – 0.1% | |
| | | |
Estee Lauder Cos., Inc.
5.15% due 5/15/2053 | | | 157,000 | | | | 159,655 | |
| | | | | | | | | |
| | | |
| | | | | | | | 159,655 | |
| Distribution/Wholesale – 0.0% | |
| | | |
LKQ Corp.
5.75% due 6/15/2028(4) | | | 65,000 | | | | 64,754 | |
| | | | | | | | | |
| | | |
| | | | | | | | 64,754 | |
| Diversified Financial Services – 0.9% | |
| | | |
American Express Co.
5.043% (5.043% fixed rate until 5/1/2033; SOFR + 1.84% thereafter)
due 5/1/2034(2) | | | 488,000 | | | | 477,327 | |
| | | |
Aviation Capital Group LLC
1.95% due 9/20/2026(4) | | | 241,000 | | | | 209,043 | |
| | | |
Capital One Financial Corp.
6.312% (6.312% fixed rate until 6/8/2028; SOFR + 2.64% thereafter)
due 6/8/2029(2) | | | 125,000 | | | | 124,283 | |
| | | | | | | | | |
| | | | |
| The accompanying notes are an integral part of these financial statements. | | | | 9 |
SCHEDULE OF INVESTMENTS — GUARDIAN BALANCED ALLOCATION VIP FUND
| | | | | | | | |
| June 30, 2023 (unaudited) | | Principal
Amount | | | Value | |
| Diversified Financial Services (continued) | |
6.377% (6.377% fixed rate until 6/8/2033; SOFR + 2.86% thereafter)
due 6/8/2034(2) | | $ | 241,000 | | | $ | 239,622 | |
| | | |
Intercontinental Exchange, Inc.
4.00% due 9/15/2027 | | | 109,000 | | | | 106,205 | |
4.35% due 6/15/2029 | | | 685,000 | | | | 671,129 | |
| | | |
Nasdaq, Inc.
5.55% due 2/15/2034 | | | 80,000 | | | | 80,413 | |
5.95% due 8/15/2053 | | | 25,000 | | | | 25,644 | |
6.10% due 6/28/2063 | | | 20,000 | | | | 20,515 | |
| | | | | | | | | |
| | | |
| | | | | | | | 1,954,181 | |
| Electric – 1.1% | |
| | | |
Alabama Power Co.
1.45% due 9/15/2030 | | | 18,000 | | | | 14,245 | |
| | | |
Appalachian Power Co.
3.40% due 6/1/2025 | | | 118,000 | | | | 112,977 | |
| | | |
Dominion Energy, Inc.
3.375% due 4/1/2030 | | | 39,000 | | | | 34,909 | |
4.85% due 8/15/2052 | | | 75,000 | | | | 66,901 | |
5.375% due 11/15/2032 | | | 443,000 | | | | 445,135 | |
| | | |
Duke Energy Corp.
2.65% due 9/1/2026 | | | 41,000 | | | | 37,920 | |
3.75% due 4/15/2024 | | | 132,000 | | | | 129,994 | |
| | | |
Edison International
5.25% due 11/15/2028 | | | 154,000 | | | | 150,048 | |
| | | |
Florida Power & Light Co.
5.05% due 4/1/2028 | | | 30,000 | | | | 30,242 | |
| | | |
Georgia Power Co.
4.70% due 5/15/2032 | | | 299,000 | | | | 289,223 | |
4.75% due 9/1/2040 | | | 38,000 | | | | 34,732 | |
5.125% due 5/15/2052 | | | 204,000 | | | | 198,710 | |
| | | |
Metropolitan Edison Co.
5.20% due 4/1/2028(4) | | | 10,000 | | | | 9,910 | |
| | | |
NextEra Energy Capital Holdings, Inc.
6.051% due 3/1/2025 | | | 25,000 | | | | 25,146 | |
| | | |
Pacific Gas and Electric Co.
4.50% due 7/1/2040 | | | 434,100 | | | | 337,556 | |
| | | |
Pennsylvania Electric Co.
3.60% due 6/1/2029(4) | | | 34,000 | | | | 30,832 | |
5.15% due 3/30/2026(4) | | | 5,000 | | | | 4,925 | |
| | | |
Southern California Edison Co.
3.70% due 8/1/2025 | | | 26,000 | | | | 25,035 | |
4.00% due 4/1/2047 | | | 29,000 | | | | 23,112 | |
4.65% due 10/1/2043 | | | 12,000 | | | | 10,503 | |
5.875% due 12/1/2053 | | | 115,000 | | | | 117,449 | |
| | | |
Southern Co.
2.95% due 7/1/2023 | | | 171,000 | | | | 171,000 | |
| | | |
Texas Electric Market Stabilization Funding LLC
4.265% due 8/1/2036(4) | | | 209,694 | | | | 199,627 | |
| | | | | | | | | |
| | | |
| | | | | | | | 2,500,131 | |
| Electronics – 0.1% | |
| | | |
Honeywell International, Inc.
4.25% due 1/15/2029 | | | 70,000 | | | | 68,145 | |
| | | | | | | | | |
| | | | | | | | |
| June 30, 2023 (unaudited) | | Principal
Amount | | | Value | |
| Electronics (continued) | |
4.50% due 1/15/2034 | | $ | 253,000 | | | $ | 247,439 | |
| | | | | | | | | |
| | | |
| | | | | | | | 315,584 | |
| Entertainment – 0.3% | |
| | | |
Warnermedia Holdings, Inc.
4.054% due 3/15/2029 | | | 625,000 | | | | 571,175 | |
| | | | | | | | | |
| | | |
| | | | | | | | 571,175 | |
| Gas – 0.2% | |
| | | |
Boston Gas Co.
3.15% due 8/1/2027(4) | | | 35,000 | | | | 31,855 | |
| | | |
CenterPoint Energy Resources Corp.
5.25% due 3/1/2028 | | | 257,000 | | | | 257,154 | |
| | | |
KeySpan Gas East Corp.
2.742% due 8/15/2026(4) | | | 162,000 | | | | 147,284 | |
| | | | | | | | | |
| | | |
| | | | | | | | 436,293 | |
| Healthcare-Products – 0.1% | |
| | | |
Alcon Finance Corp.
5.375% due 12/6/2032(4) | | | 200,000 | | | | 202,678 | |
| | | | | | | | | |
| | | |
| | | | | | | | 202,678 | |
| Healthcare-Services – 0.1% | |
| | | |
Bon Secours Mercy Health, Inc.
2.095% due 6/1/2031 | | | 200,000 | | | | 159,314 | |
| | | |
Sutter Health
2.294% due 8/15/2030 | | | 50,000 | | | | 41,344 | |
| | | | | | | | | |
| | | |
| | | | | | | | 200,658 | |
| Insurance – 0.3% | |
| | | |
Allstate Corp.
5.25% due 3/30/2033 | | | 65,000 | | | | 64,791 | |
| | | |
American International Group, Inc.
3.40% due 6/30/2030 | | | 72,000 | | | | 63,813 | |
| | | |
Athene Global Funding
2.50% due 3/24/2028(4) | | | 382,000 | | | | 321,801 | |
| | | |
Equitable Financial Life Global Funding
1.40% due 8/27/2027(4) | | | 162,000 | | | | 136,370 | |
| | | | | | | | | |
| | | |
| | | | | | | | 586,775 | |
| Internet – 0.1% | |
| | | |
Meta Platforms, Inc.
5.60% due 5/15/2053 | | | 139,000 | | | | 142,732 | |
| | | | | | | | | |
| | | |
| | | | | | | | 142,732 | |
| Media – 0.3% | |
| | | |
Charter Communications Operating LLC / Charter Communications Operating Capital
2.25% due 1/15/2029 | | | 125,000 | | | | 104,104 | |
| | | |
Comcast Corp.
3.95% due 10/15/2025 | | | 620,000 | | | | 604,159 | |
| | | |
Discovery Communications LLC
4.00% due 9/15/2055 | | | 16,000 | | | | 10,604 | |
| | | | | | | | | |
| | | |
| | | | | | | | 718,867 | |
| Oil & Gas – 0.7% | |
| | | |
BP Capital Markets America, Inc.
4.812% due 2/13/2033 | | | 450,000 | | | | 443,844 | |
| | | | | | | | | |
| | | | |
| 10 | | | | The accompanying notes are an integral part of these financial statements. |
SCHEDULE OF INVESTMENTS — GUARDIAN BALANCED ALLOCATION VIP FUND
| | | | | | | | |
| June 30, 2023 (unaudited) | | Principal
Amount | | | Value | |
| Oil & Gas (continued) | |
| | | |
Equinor ASA
3.00% due 4/6/2027 | | $ | 359,000 | | | $ | 336,028 | |
3.125% due 4/6/2030 | | | 24,000 | | | | 22,001 | |
| | | |
Hess Corp.
7.30% due 8/15/2031 | | | 271,000 | | | | 297,366 | |
| | | |
Occidental Petroleum Corp.
6.20% due 3/15/2040 | | | 245,000 | | | | 242,587 | |
| | | |
Var Energi ASA
8.00% due 11/15/2032(4) | | | 225,000 | | | | 238,918 | |
| | | | | | | | | |
| | | |
| | | | | | | | 1,580,744 | |
| Pharmaceuticals – 0.1% | |
| | | |
Pfizer Investment Enterprises Pte Ltd.
5.11% due 5/19/2043 | | | 245,000 | | | | 245,081 | |
| | | | | | | | | |
| | | |
| | | | | | | | 245,081 | |
| Pipelines – 0.8% | |
| | | |
Cheniere Energy Partners LP
4.00% due 3/1/2031 | | | 428,000 | | | | 376,957 | |
5.95% due 6/30/2033(4) | | | 80,000 | | | | 80,440 | |
| | | |
Eastern Gas Transmission & Storage, Inc.
3.60% due 12/15/2024 | | | 24,000 | | | | 23,088 | |
| | | |
EIG Pearl Holdings Sarl
3.545% due 8/31/2036(4) | | | 200,000 | | | | 170,408 | |
| | | |
Energy Transfer LP
4.95% due 6/15/2028 | | | 12,000 | | | | 11,668 | |
| | | |
Enterprise Products Operating LLC
5.35% due 1/31/2033 | | | 301,000 | | | | 306,159 | |
| | | |
Galaxy Pipeline Assets Bidco Ltd.
2.625% due 3/31/2036(4) | | | 245,000 | | | | 198,901 | |
| | | |
Gray Oak Pipeline LLC
2.60% due 10/15/2025(4) | | | 85,000 | | | | 78,039 | |
3.45% due 10/15/2027(4) | | | 15,000 | | | | 13,428 | |
| | | |
Greensaif Pipelines Bidco Sarl
6.129% due 2/23/2038(4) | | | 200,000 | | | | 204,318 | |
6.51% due 2/23/2042(4) | | | 200,000 | | | | 207,264 | |
| | | | | | | | | |
| | | |
| | | | | | | | 1,670,670 | |
| Real Estate – 0.1% | |
| | | |
CBRE Services, Inc.
5.95% due 8/15/2034 | | | 285,000 | | | | 282,549 | |
| | | | | | | | | |
| | | |
| | | | | | | | 282,549 | |
| Real Estate Investment Trusts (REITs) – 0.5% | |
| | | |
American Tower Trust I
5.49% due 3/15/2028(4) | | | 315,000 | | | | 314,310 | |
| | | |
Extra Space Storage LP
5.50% due 7/1/2030 | | | 60,000 | | | | 59,647 | |
5.70% due 4/1/2028 | | | 228,000 | | | | 227,852 | |
| | | |
Realty Income Corp.
4.90% due 7/15/2033 | | | 613,000 | | | | 587,033 | |
| | | | | | | | | |
| | | |
| | | | | | | | 1,188,842 | |
| Software – 0.2% | |
| | | |
Activision Blizzard, Inc.
2.50% due 9/15/2050 | | | 101,000 | | | | 64,867 | |
4.50% due 6/15/2047 | | | 141,000 | | | | 129,857 | |
| | | | | | | | | |
| | | | | | | | |
| June 30, 2023 (unaudited) | | Principal
Amount | | | Value | |
| Software (continued) | |
| | | |
Oracle Corp.
3.65% due 3/25/2041 | | $ | 352,000 | | | $ | 271,128 | |
| | | | | | | | | |
| | | |
| | | | | | | | 465,852 | |
| Telecommunications – 0.3% | |
| | | |
AT&T, Inc.
3.65% due 6/1/2051 | | | 95,000 | | | | 69,703 | |
3.85% due 6/1/2060 | | | 19,000 | | | | 13,782 | |
4.30% due 12/15/2042 | | | 26,000 | | | | 22,077 | |
5.40% due 2/15/2034 | | | 490,000 | | | | 491,220 | |
| | | | | | | | | |
| | | |
| | | | | | | | 596,782 | |
| Trucking & Leasing – 0.4% | |
| | | |
DAE Funding LLC
1.55% due 8/1/2024(4) | | | 294,000 | | | | 278,918 | |
| | | |
Penske Truck Leasing Co. LP / PTL Finance Corp.
3.95% due 3/10/2025(4) | | | 203,000 | | | | 195,213 | |
5.55% due 5/1/2028(4) | | | 130,000 | | | | 128,219 | |
5.70% due 2/1/2028(4) | | | 240,000 | | | | 237,173 | |
| | | | | | | | | |
| | | |
| | | | | | | | 839,523 | |
| | |
Total Corporate Bonds & Notes
(Cost $20,983,807) | | | | 20,730,226 | |
| Municipals – 0.6% | |
| | | |
Chicago Transit Authority Sales & Transfer Tax Receipts Revenue
Series A
6.899% due 12/1/2040 | | | 50,000 | | | | 56,467 | |
| | | |
Dallas Fort Worth International Airport
Series A
4.087% due 11/1/2051 | | | 100,000 | | | | 88,406 | |
| | | |
Metropolitan Transportation Authority
Series C2
5.175% due 11/15/2049 | | | 105,000 | | | | 96,044 | �� |
| | | |
Municipal Electric Authority of Georgia
6.637% due 4/1/2057 | | | 148,000 | | | | 169,038 | |
| | | |
Regents of the University of California Medical Center Pooled Revenue
3.006% due 5/15/2050 | | | 125,000 | | | | 87,765 | |
| | | |
State of Illinois
5.10% due 6/1/2033 | | | 740,000 | | | | 725,497 | |
| | | |
Texas Natural Gas Securitization Finance Corp.
5.102% due 4/1/2035 | | | 120,000 | | | | 120,447 | |
5.169% due 4/1/2041 | | | 90,000 | | | | 91,897 | |
| | | | | | | | | |
| | |
Total Municipals
(Cost $1,505,019) | | | | 1,435,561 | |
| Non–Agency Mortgage–Backed Securities – 1.0% | |
| | | |
BX Commercial Mortgage Trust
2021-VOLT A
5.893% due 9/15/2036(2)(3)(4) | | | 425,000 | | | | 411,338 | |
| | | | | | | | | |
| | | | |
| The accompanying notes are an integral part of these financial statements. | | | | 11 |
SCHEDULE OF INVESTMENTS — GUARDIAN BALANCED ALLOCATION VIP FUND
| | | | | | | | |
| June 30, 2023 (unaudited) | | Principal
Amount | | | Value | |
| Non–Agency Mortgage–Backed Securities (continued) | |
| | | |
BX Trust
2021-LGCY A
5.699% due 10/15/2036(2)(3)(4) | | $ | 400,000 | | | $ | 385,399 | |
| | | |
BXHPP Trust
2021-FILM A
5.843% due 8/15/2036(2)(3)(4) | | | 225,000 | | | | 212,045 | |
| | | |
Fannie Mae REMICS
2013-36 Z
3.00% due 4/25/2043 | | | 247,124 | | | | 221,571 | |
2013-83 NZ
3.50% due 8/25/2043 | | | 251,104 | | | | 232,133 | |
2020-27 HC
1.50% due 10/25/2049 | | | 410,233 | | | | 322,382 | |
| | | |
Freddie Mac REMICS
3967 ZP
4.00% due 9/15/2041 | | | 269,184 | | | | 257,011 | |
5170 DP
2.00% due 7/25/2050 | | | 256,020 | | | | 215,751 | |
| | | | | | | | | |
| | |
Total Non–Agency Mortgage–Backed Securities
(Cost $2,384,704) | | | | 2,257,630 | |
| U.S. Government Securities – 12.8% | |
| | | |
U.S. Treasury Bond
2.25% due 2/15/2052 | | | 1,491,000 | | | | 1,077,946 | |
2.375% due 2/15/2042 | | | 1,960,000 | | | | 1,526,350 | |
2.875% due 5/15/2052 | | | 35,100 | | | | 29,100 | |
3.25% due 5/15/2042 | | | 25,000 | | | | 22,313 | |
3.375% due 8/15/2042 | | | 129,600 | | | | 117,653 | |
3.625% due 2/15/2053 | | | 1,007,800 | | | | 967,960 | |
3.625% due 5/15/2053 | | | 389,000 | | | | 374,048 | |
3.875% due 2/15/2043 | | | 1,659,000 | | | | 1,618,043 | |
3.875% due 5/15/2043 | | | 534,000 | | | | 521,151 | |
4.00% due 11/15/2042 | | | 976,900 | | | | 971,252 | |
4.00% due 11/15/2052 | | | 1,333,300 | | | | 1,370,382 | |
| | | |
U.S. Treasury Note
2.50% due 4/30/2024 | | | 1,266,300 | | | | 1,235,978 | |
2.625% due 4/15/2025 | | | 1,935,000 | | | | 1,855,862 | |
2.625% due 5/31/2027 | | | 210,000 | | | | 197,334 | |
2.75% due 4/30/2027 | | | 2,092,500 | | | | 1,976,759 | |
2.75% due 7/31/2027 | | | 195,000 | | | | 183,848 | |
2.875% due 4/30/2029 | | | 20,000 | | | | 18,758 | |
3.125% due 8/15/2025 | | | 260,000 | | | | 251,083 | |
3.125% due 8/31/2027 | | | 269,000 | | | | 257,294 | |
3.25% due 6/30/2029 | | | 100,000 | | | | 95,680 | |
3.375% due 5/15/2033 | | | 93,800 | | | | 90,473 | |
3.50% due 9/15/2025 | | | 300,000 | | | | 291,867 | |
3.50% due 1/31/2028 | | | 80,300 | | | | 77,985 | |
3.50% due 4/30/2028 | | | 1,470,000 | | | | 1,428,312 | |
3.50% due 4/30/2030 | | | 70,000 | | | | 67,988 | |
3.625% due 5/15/2026 | | | 2,275,000 | | | | 2,219,725 | |
3.625% due 3/31/2028 | | | 113,000 | | | | 110,387 | |
3.625% due 5/31/2028 | | | 1,550,000 | | | | 1,516,215 | |
3.75% due 4/15/2026 | | | 575,000 | | | | 562,826 | |
3.75% due 5/31/2030 | | | 78,000 | | | | 76,928 | |
3.875% due 3/31/2025 | | | 831,000 | | | | 814,705 | |
3.875% due 4/30/2025 | | | 1,520,000 | | | | 1,490,491 | |
3.875% due 11/30/2027 | | | 889,000 | | | | 876,498 | |
3.875% due 12/31/2027 | | | 219,600 | | | | 216,563 | |
| | | | | | | | | |
| | | | | | | | |
| June 30, 2023 (unaudited) | | Principal
Amount | | | Value | |
| U.S. Government Securities (continued) | |
3.875% due 11/30/2029 | | $ | 169,000 | | | $ | 167,508 | |
3.875% due 12/31/2029 | | | 237,100 | | | | 235,099 | |
4.00% due 12/15/2025 | | | 482,000 | | | | 474,469 | |
4.00% due 2/29/2028 | | | 557,400 | | | | 553,394 | |
4.00% due 6/30/2028 | | | 200,000 | | | | 198,906 | |
4.00% due 10/31/2029 | | | 257,000 | | | | 256,398 | |
4.125% due 9/30/2027 | | | 423,400 | | | | 421,051 | |
4.125% due 10/31/2027 | | | 519,000 | | | | 516,283 | |
4.25% due 5/31/2025 | | | 600,000 | | | | 592,453 | |
4.625% due 2/28/2025 | | | 389,400 | | | | 386,388 | |
4.625% due 3/15/2026 | | | 40,000 | | | | 40,047 | |
| | | | | | | | | |
| | |
Total U.S. Government Securities
(Cost $29,179,713) | | | | 28,351,753 | |
| | | | | | | | |
| | | Shares | | | Value | |
| Exchange–Traded Funds – 0.4% | |
| | | |
SPDR S&P 500 ETF Trust | | | 2,078 | | | | 921,136 | |
| | | | | | | | | |
| | |
Total Exchange–Traded Funds
(Cost $904,901) | | | | 921,136 | |
| | | | | | | | |
| | | Principal
Amount | | | Value | |
| Repurchase Agreements – 0.7% | |
| | | |
Fixed Income Clearing Corp., 1.52%, dated 6/30/2023, proceeds at maturity value of $1,547,956, due 7/3/2023(5) | | $ | 1,547,760 | | | | 1,547,760 | |
| | | | | | | | | |
| | |
Total Repurchase Agreements
(Cost $1,547,760) | | | | 1,547,760 | |
| | |
Total Investments – 100.0%
(Cost $208,173,948) | | | | 222,297,782 | |
| | |
| Assets in excess of other liabilities – 0.0% | | | | 96,470 | |
| | |
| Total Net Assets – 100.0% | | | $ | 222,394,252 | |
| (1) | Non–income–producing security. |
| (2) | Variable rate securities, which may include step-up bonds or adjustable rate mortgages. The rate shown is the rate in effect at June 30, 2023. |
| (3) | Variable coupon rate based on weighted average interest rate of underlying mortgages. |
| (4) | Securities that may be resold in transactions exempt from registration under Rule 144A of the Securities Act of 1933, as amended, normally to certain qualified buyers. At June 30, 2023, the aggregate market value of these securities amounted to $7,403,390, representing 3.3% of net assets. These securities have been deemed liquid by the investment adviser pursuant to the Fund’s liquidity procedures approved by the Board of Trustees. |
| (5) | The table below presents collateral for repurchase agreements. |
| | | | | | | | | | | | | | | | |
| Security | | Coupon | | | Maturity
Date | | | Principal
Amount | | | Value | |
| U.S. Treasury Note | | | 4.625% | | | | 3/15/2026 | | | $ | 1,555,800 | | | $ | 1,578,788 | |
| | | | |
| 12 | | | | The accompanying notes are an integral part of these financial statements. |
SCHEDULE OF INVESTMENTS — GUARDIAN BALANCED ALLOCATION VIP FUND
Open futures contracts at June 30, 2023:
| | | | | | | | | | | | | | | | | | | | | | | | |
| Type | | Expiration | | | Contracts | | | Position | | | Notional
Amount | | | Notional
Value | | | Unrealized
Depreciation | |
| U.S. 2-Year Treasury Note | | | September 2023 | | | | 2 | | | | Long | | | $ | 406,754 | | | $ | 406,688 | | | $ | (66) | |
| U.S. 5-Year Treasury Note | | | September 2023 | | | | 34 | | | | Long | | | | 3,684,289 | | | | 3,641,187 | | | | (43,102 | ) |
| Total | | | $ | 4,091,043 | | | $ | 4,047,875 | | | $ | (43,168 | ) |
| | | | | | | | | | | | | | | | | | | | | | | | |
| Type | | Expiration | | | Contracts | | | Position | | | Notional
Amount | | | Notional
Value | | | Unrealized
Appreciation | |
| U.S. Ultra 10-Year Treasury Note | | | September 2023 | | | | 8 | | | | Short | | | $ | (958,852 | ) | | $ | (947,500 | ) | | $ | 11,352 | |
Legend:
ADR — American Depositary Receipt
CMT — Constant Maturity Treasury
SOFR — Secured Overnight Financing Rate
The following is a summary of the inputs used as of June 30, 2023 in valuing the Fund’s investments. For more information on valuation inputs, please refer to Note 2a of the accompanying Notes to Financial Statements.
| | | | | | | | | | | | | | | | |
| | | Valuation Inputs | | | | |
| Investments in Securities (unaudited) | | Level 1 | | | Level 2 | | | Level 3 | | | Total | |
| Common Stocks | | $ | 146,081,338 | | | $ | — | | | $ | — | | | $ | 146,081,338 | |
| Agency Mortgage–Backed Securities | | | — | | | | 19,751,876 | | | | — | | | | 19,751,876 | |
| Asset–Backed Securities | | | — | | | | 1,220,502 | | | | — | | | | 1,220,502 | |
| Corporate Bonds & Notes | | | — | | | | 20,730,226 | | | | — | | | | 20,730,226 | |
| Municipals | | | — | | | | 1,435,561 | | | | — | | | | 1,435,561 | |
| Non–Agency Mortgage–Backed Securities | | | — | | | | 2,257,630 | | | | — | | | | 2,257,630 | |
| U.S. Government Securities | | | — | | | | 28,351,753 | | | | — | | | | 28,351,753 | |
| Exchange–Traded Funds | | | 921,136 | | | | — | | | | — | | | | 921,136 | |
| Repurchase Agreements | | | — | | | | 1,547,760 | | | | — | | | | 1,547,760 | |
| Total | | $ | 147,002,474 | | | $ | 75,295,308 | | | $ | — | | | $ | 222,297,782 | |
| Other Financial Instruments | | | | | | | | | | | | |
| Futures Contracts | | | | | | | | | | | | | | | | |
Assets | | $ | 11,352 | | | $ | — | | | $ | — | | | $ | 11,352 | |
Liabilities | | | (43,168) | | | | — | | | | — | | | | (43,168 | ) |
| Total | | $ | (31,816 | ) | | $ | — | | | $ | — | | | $ | (31,816 | ) |
| | | | |
| The accompanying notes are an integral part of these financial statements. | | | | 13 |
FINANCIAL INFORMATION — GUARDIAN BALANCED ALLOCATION VIP FUND
| | | | |
Statement of Assets and Liabilities As of June 30, 2023 (unaudited) | | | |
Assets | | | | |
| | |
Investments, at value | | $ | 222,297,782 | |
| | |
Receivable for investments sold | | | 4,856,827 | |
| | |
Dividends/interest receivable | | | 601,189 | |
| | |
Cash deposits with brokers for futures contracts | | | 37,158 | |
| | |
Receivable for fund shares subscribed | | | 315 | |
| | |
Prepaid expenses | | | 2,480 | |
| | | | | |
| | |
Total Assets | | | 227,795,751 | |
| | | | | |
| | |
Liabilities | | | | |
| | |
Payable for investments purchased | | | 5,011,911 | |
| | |
Payable for fund shares redeemed | | | 137,179 | |
| | |
Investment advisory fees payable | | | 86,864 | |
| | |
Distribution fees payable | | | 45,241 | |
| | |
Payable for variation margin on futures contracts | | | 40,977 | |
| | |
Accrued custodian and accounting fees | | | 30,311 | |
| | |
Accrued audit fees | | | 13,282 | |
| | |
Accrued trustees’ and officers’ fees | | | 3,981 | |
| | |
Accrued expenses and other liabilities | | | 31,753 | |
| | | | | |
| | |
Total Liabilities | | | 5,401,499 | |
| | | | | |
| | |
Total Net Assets | | $ | 222,394,252 | |
| | | | | |
| | |
Net Assets Consist of: | | | | |
| | |
Paid-in capital | | $ | 213,813,406 | |
| | |
Distributable earnings | | | 8,580,846 | |
| | | | | |
| | |
Total Net Assets | | $ | 222,394,252 | |
| | | | | |
Investments, at Cost | | $ | 208,173,948 | |
| | | | | |
| | |
Pricing of Shares | | | | |
| | |
Shares of Beneficial Interest Outstanding with
No Par Value | | | 21,323,196 | |
| | |
Net Asset Value Per Share | | | $10.43 | |
| | | | | |
| | | | |
Statement of Operations For the Six Months Ended June 30, 2023 (unaudited) | |
Investment Income | | | | |
| | |
Interest | | $ | 1,553,337 | |
| | |
Dividends | | | 947,255 | |
| | |
Withholding taxes on foreign dividends | | | (3,171 | ) |
| | | | | |
| | |
Total Investment Income | | | 2,497,421 | |
| | | | | |
| | |
Expenses | | | | |
| | |
Investment advisory fees | | | 521,309 | |
| | |
Distribution fees | | | 271,515 | |
| | |
Custodian and accounting fees | | | 47,370 | |
| | |
Professional fees | | | 34,609 | |
| | |
Trustees’ and officers’ fees | | | 26,938 | |
| | |
Administrative fees | | | 19,774 | |
| | |
Transfer agent fees | | | 9,253 | |
| | |
Shareholder reports | | | 5,292 | |
| | |
Other expenses | | | 5,942 | |
| | | | | |
| | |
Total Expenses | | | 942,002 | |
| | | | | |
| | |
Net Investment Income/(Loss) | | | 1,555,419 | |
| | | | | |
| | |
Realized Gain/(Loss) and Change in Unrealized Appreciation/(Depreciation) on Investments, Derivative Contracts and Foreign Currency Transactions | | | | |
| | |
Net realized gain/(loss) from investments | | | (2,432,743 | ) |
| | |
Net realized gain/(loss) from futures contracts | | | 40,118 | |
| | |
Net realized gain/(loss) from foreign currency transactions | | | 1 | |
| | |
Net change in unrealized appreciation/(depreciation) on investments | | | 22,191,241 | |
| | |
Net change in unrealized appreciation/(depreciation) on futures contracts | | | (25,877 | ) |
| | | | | |
| | |
Net Gain on Investments, Derivative Contracts and Foreign Currency Transactions | | | 19,772,740 | |
| | | | | |
| | |
Net Increase in Net Assets Resulting From Operations | | | $ 21,328,159 | |
| | | | | |
| | | | | |
| | | | |
| 14 | | | | The accompanying notes are an integral part of these financial statements. |
FINANCIAL INFORMATION — GUARDIAN BALANCED ALLOCATION VIP FUND
| | | | | | | | |
Statements of Changes in Net Assets Six Months Ended Numbers are unaudited | |
| | | |
| | | For the
Six Months Ended
6/30/23 | | | For the
Period Ended
12/31/221 | |
| | | | |
| |
Operations | |
| | | |
Net investment income/(loss) | | $ | 1,555,419 | | | $ | 1,749,057 | |
| | | |
Net realized gain/(loss) from investments, derivative contracts and foreign currency transactions | | | (2,392,624 | ) | | | (6,423,024 | ) |
| | | |
Net change in unrealized appreciation/(depreciation) on investments and derivative contracts | | | 22,165,364 | | | | (8,073,346 | ) |
| | | | | | | | | |
| | | |
Net Increase/(Decrease) in Net Assets Resulting from Operations | | | 21,328,159 | | | | (12,747,313 | ) |
| | | | | | | | | |
| |
Capital Share Transactions | |
| | | |
Proceeds from sales of shares | | | 952,630 | | | | 243,244,258 | |
| | | |
Cost of shares redeemed | | | (14,083,783 | ) | | | (16,299,699 | ) |
| | | | | | | | | |
| | | |
Net Increase/(Decrease) in Net Assets Resulting from Capital Share Transactions | | | (13,131,153 | ) | | | 226,944,559 | |
| | | | | | | | | |
| | | |
Net Increase in Net Assets | | | 8,197,006 | | | | 214,197,246 | |
| | | | | | | | | |
| |
Net Assets | |
| | | |
Beginning of period | | | 214,197,246 | | | | — | |
| | | | | | | | | |
| | | |
End of period | | $ | 222,394,252 | | | $ | 214,197,246 | |
| | | | | | | | | |
| |
Other Information: | |
| | | |
Shares | | | | | | | | |
| | | |
Sold | | | 94,388 | | | | 24,337,152 | |
| | | |
Redeemed | | | (1,412,459 | ) | | | (1,695,885 | ) |
| | | | | | | | | |
| | | |
Net Increase/(Decrease) | | | (1,318,071 | ) | | | 22,641,267 | |
| | | | | | | | | |
| | | | | | | | | |
| 1 | Commenced operations on May 2, 2022. |
| | | | |
| The accompanying notes are an integral part of these financial statements. | | | | 15 |
FINANCIAL INFORMATION — GUARDIAN BALANCED ALLOCATION VIP FUND
The Financial Highlights table is intended to help you understand the Fund’s financial performance for the past six reporting periods (or, if shorter, the period since inception). Certain information reflects financial results for a single Fund share. The total returns in the table represent the rate that an investor would have earned (or lost) on an investment in the Fund.
| | | | | | | | | | | | | | | | | | | | | | | | |
Financial Highlights Six Months Ended Numbers are unaudited | | | | | | | | | | | | | | | | | | |
| | | Per Share Operating Performance | | | | |
| | |
Net Asset Value,
Beginning of
Period | | | Net Investment
Income(1) | | | Net Realized
and Unrealized
Gain/(Loss) | | | Total
Operations | | | Net Asset
Value, End of
Period | | | Total
Return(2),(3) | |
| | | | | | | |
Six Months Ended 6/30/23 | | $ | 9.46 | | | $ | 0.07 | | | $ | 0.90 | | | $ | 0.97 | | | $ | 10.43 | | | | 10.25% | |
| | | | | | | |
Period Ended 12/31/22(5) | | | 10.00 | | | | 0.07 | | | | (0.61 | ) | | | (0.54 | ) | | | 9.46 | | | | (5.40)% | |
| | | | |
| 16 | | | | The accompanying notes are an integral part of these financial statements. |
FINANCIAL INFORMATION — GUARDIAN BALANCED ALLOCATION VIP FUND
| | | | | | | | | | | | | | | | | | | | | | |
| |
| Ratios/Supplemental Data | |
Net Assets, End
of Period (000s) | | | Net Ratio of
Expenses to
Average
Net Assets(3),(4) | | | Gross Ratio of
Expenses to
Average Net
Assets(3) | | | Net Ratio of Net
Investment Income
to Average
Net Assets(3),(4) | | | Gross Ratio of Net
Investment Income
to Average
Net Assets(3) | | | Portfolio
Turnover Rate(3) | |
| | | | | |
| $ | 222,394 | | | | 0.87% | | | | 0.87% | | | | 1.43% | | | | 1.43% | | | | 53% | |
| | | | | |
| | 214,197 | | | | 0.86% | | | | 0.86% | | | | 1.17% | | | | 1.17% | | | | 59% | |
| (1) | Calculated based on the average shares outstanding during the period. |
| (2) | Total returns do not reflect the effects of charges deducted pursuant to the terms of The Guardian Insurance & Annuity Company, Inc.’s variable contracts. Inclusion of such charges would reduce the total returns for all periods shown. |
| (3) | Ratios for periods less than one year have been annualized, except for total return and portfolio turnover rate. For the period ended December 31, 2022, certain non-recurring fees (i.e., audit fees) are not annualized. |
| (4) | Net Ratio of Expenses to Average Net Assets and Net Ratio of Net Investment Income to Average Net Assets include the effect of fee waivers and expense limitations. |
| (5) | Commenced operations on May 2, 2022. |
| | | | |
| The accompanying notes are an integral part of these financial statements. | | | | 17 |
NOTES TO FINANCIAL STATEMENTS — GUARDIAN BALANCED ALLOCATION VIP FUND
June 30, 2023 (unaudited)
1. Organization
Guardian Variable Products Trust (the “Trust”), a Delaware statutory trust organized on January 12, 2016, is registered under the Investment Company Act of 1940, as amended (the “1940 Act”), as an open-end management investment company. The Trust currently has twenty-four series. Guardian Balanced Allocation VIP Fund (the “Fund”) is a series of the Trust. The Fund is a diversified fund and commenced operations on May 2, 2022. The financial statements for other series of the Trust are presented in separate reports.
The Trust has authorized an unlimited number of shares of beneficial interest with no par value. Shares are bought and sold at closing net asset value (“NAV”). Shares of the Fund are only sold to certain separate accounts of The Guardian Insurance & Annuity Company, Inc. (“GIAC”) that fund certain variable annuity contracts and variable life insurance policies issued by GIAC. GIAC is a wholly-owned subsidiary of The Guardian Life Insurance Company of America (“Guardian Life”).
The Fund seeks to provide capital appreciation and moderate current income while seeking to manage volatility.
2. Significant Accounting Policies
The following is a summary of significant accounting policies followed by the Fund in the preparation of its financial statements. The Fund follows the investment company accounting and reporting guidance of the Financial Accounting Standards Board (“FASB”) Accounting Standards Codification Topic 946 Financial Services – Investment Companies. The following policies are in conformity with accounting principles generally accepted in the United States of America (“GAAP”). The preparation of financial statements in accordance with GAAP requires management to make estimates and assumptions that affect the reported amounts and disclosures in the financial statements. Actual results could differ from those estimates.
a. Investment Valuations The Board of Trustees has designated Park Avenue Institutional Advisers LLC (“Park Avenue”) as the valuation designee for the Fund pursuant to Rule 2a-5 under the 1940 Act. Park Avenue has established a Fair Valuation Committee and has adopted fair valuation procedures that provide methodologies for fair valuing securities. These procedures include monitoring the appropriateness of fair values based on results of ongoing valuation
oversight, including but not limited to consideration of security specific events, market events, and pricing vendor and broker-dealer due diligence. The Fair Valuation Committee oversees and carries out the policies for the valuation of investments held in the Fund. The Fair Valuation Committee is responsible for discussing and assessing the potential impacts to the fair values on an ongoing basis, and reports to the Board of Trustees on at least a quarterly basis.
Equity securities traded on an exchange other than NASDAQ Stock Market, LLC (“NASDAQ”) are valued at the last reported sale price on the principal exchange or market on which they are traded; or, if there were no sales that day, at the mean between the closing bid and ask prices. Securities traded on the NASDAQ are generally valued at the NASDAQ official closing price, which may not be the last sale price. If the NASDAQ official closing price is not available for a security, that security is generally valued at the mean between the closing bid and ask prices. Repurchase agreements are carried at cost, which approximates fair value (see Note 5d). Foreign securities are valued in the currencies of the markets in which they trade and then converted to U.S. dollars by the application of foreign exchange rates at the close of the New York Stock Exchange (“NYSE”). Forward foreign currency contracts, if any, are valued at the mean between the bid and ask rates for the specified time interpolated from rates for proximate time periods.
The valuations of debt securities for which quoted bid prices are readily available are valued at the bid price by independent pricing services (each, a “Service”). Debt securities for which quoted bid prices are not readily available are valued by a Service at the evaluated bid price provided by the Service or the bid price provided by an independent broker-dealer or at a calculated price based on the spread to an appropriate benchmark provided by such broker-dealer.
Exchange-traded financial futures contracts are valued at the last settlement price on the market where they are primarily traded.
Securities for which market quotations are not readily available or securities whose values have been materially affected by events occurring before the Fund’s valuation time but after the close of the securities’ principal exchange or market are valued at their fair values as determined in good faith by Park Avenue, as the Board of Trustee’s valuation designee (as defined in Rule 2a-5 under the 1940 Act), in accordance with Park Avenue’s procedures and under the general oversight of the Board of Trustees. In addition, the values of the Fund’s
NOTES TO FINANCIAL STATEMENTS — GUARDIAN BALANCED ALLOCATION VIP FUND
investments in foreign securities are generally determined by a pricing service using pricing models designed to estimate likely changes in the values of those securities. Certain foreign equity instruments are valued by applying international fair value factors provided by approved pricing services. The factors seek to adjust the local closing price for movements of local markets post closing, but prior to the time the NAVs are calculated. Valuations reflected in this report are as of the report date. As a result, changes in valuation due to market events and/or issuer related events after the report date and prior to issuance of the report are not reflected herein.
Various inputs are used in determining the valuation of the Fund’s investments. These inputs are summarized in three broad levels listed below.
| • | | Level 1 – unadjusted inputs using quoted prices in active markets for identical investments. |
| • | | Level 2 – other significant observable inputs, including, but not limited to, quoted prices for similar investments, inputs other than quoted prices that are observable for investments (such as interest rates, prepayment speeds, credit risks, etc.) or other market corroborated inputs. |
| • | | Level 3 – significant unobservable inputs (including the Fund’s own assumptions in determining the fair value of investments). |
Inputs may include price information, volatility statistics, specific and broad credit data, liquidity statistics, and other factors. A financial instrument’s level within the fair value hierarchy is based on the lowest level of any input; both individually and in aggregate, that is significant to the fair value measurement. However, the determination of what constitutes “observable” requires significant judgment by the Trust. The Trust considers observable data to be that market data which is readily available, regularly distributed or updated, reliable and verifiable, and provided by independent sources that are actively involved in the relevant market. The inputs or methodology used for valuing securities are not necessarily an indication of the risk associated with investing in those securities. Changes in valuation techniques may result in transfers into or out of a financial instrument’s assigned level within the hierarchy.
The FASB requires reporting entities to make disclosures about purchases, sales, issuances and settlements of Level 3 securities on a gross basis. For the six months ended June 30, 2023, there were no transfers into or out of Level 3 of the fair value hierarchy.
In determining a financial instrument’s placement within the hierarchy, the Trust separates the Fund’s investment portfolio into two categories: investments and derivatives (e.g., futures). A summary of inputs used to value the Fund’s assets and liabilities carried at fair value as of June 30, 2023 is included in the Schedule of Investments.
Investments Investments whose values are based on quoted market prices in active markets, and are therefore classified within Level 1, include active listed equities. Investments that trade in markets that are not considered to be active, but are valued based on quoted market prices, dealer quotations or alternative pricing sources supported by observable inputs are classified within Level 2. These include certain U.S. government and sovereign obligations, most government agency securities, investment-grade corporate bonds, certain mortgage products, state, municipal and provincial obligations, and certain foreign equity securities, including securities whose prices may have been affected by events occurring after the close of trading on their principal exchange or market and, as a result, whose values are determined by a pricing service as described above, or securities whose values are otherwise determined using fair valuation methods approved by the Fund’s Board of Trustees.
Investments classified within Level 3 have significant unobservable inputs, as they trade infrequently or not at all. Level 3 investments include, among others, private placement securities. When observable prices are not available for these securities, the Trust uses one or more valuation techniques for which sufficient and reliable data is available. The inputs used by the Trust in estimating the value of Level 3 investments include, for example, the original transaction price, recent transactions in the same or similar instruments, completed or pending third-party transactions in the underlying investment or comparable issuers, subsequent rounds of financing, recapitalizations, and other transactions across the capital structure. Level 3 investments may also be adjusted to reflect illiquidity and/or non-transferability, with the amount of such discount estimated by the Trust in the absence of market information. Assumptions used by the Trust due to the lack of observable inputs may significantly impact the resulting fair value and therefore the Fund’s results of operations. As of June 30, 2023, the Fund had no securities classified as Level 3.
Derivatives Exchange-traded derivatives, such as futures contracts, exchange-traded option contracts and certain swaps, are typically classified within Level 1
NOTES TO FINANCIAL STATEMENTS — GUARDIAN BALANCED ALLOCATION VIP FUND
or Level 2 of the fair value hierarchy depending on whether or not they are deemed to be actively traded. Certain non-exchange-traded derivatives, such as generic forwards, certain swaps and options, have inputs which can generally be corroborated by market data and are therefore classified within Level 2.
b. Securities Transactions Securities transactions are accounted for on the date securities are purchased or sold (trade date). Realized gains or losses on securities transactions are determined on the basis of specific identification.
c. Futures Contracts The Fund may enter into financial futures contracts. In entering into such contracts, the Fund is required to deposit with the counterparty, either in cash or securities, an amount equal to a certain percentage of the face value of the contract. Subsequent payments are received or made by the Fund each day, depending on the daily fluctuations in the values of the contracts, and are recorded for financial statement purposes as variation margin received or paid by the Fund. Daily changes in variation margin are recognized as unrealized gains or losses by the Fund. The Fund may not achieve the anticipated benefits of the financial futures contracts and may realize a loss.
d. Credit Derivatives The Fund may enter into credit derivatives, including credit default swaps on individual obligations or credit indices. The use by the Fund of credit default swaps may have the effect of creating a short position in a security. Credit derivatives can create investment leverage and may create additional investment risks that may subject the Fund to greater volatility than investments in more traditional securities, as described in the Statement of Additional Information.
The Fund may enter into credit default swap agreements either as a buyer or seller. The Fund may buy protection under a credit default swap to attempt to mitigate the risk of default or credit quality deterioration in one or more individual holdings or in a segment of the fixed income securities market. The Fund may sell protection under a credit default swap in an attempt to gain exposure to an underlying issuer’s credit quality characteristics without investing directly in that issuer.
For swaps entered with an individual counterparty, the Fund bears the risk of loss of the uncollateralized amount expected to be received under a credit default swap agreement in the event of the default or bankruptcy of the counterparty. Credit default swap agreements are generally valued at a price at which the counterparty to such agreement would terminate the agreement. The Fund may also enter into cleared swaps.
In entering into swap contracts, the Fund is required to deposit with the broker (or for the benefit of the broker), either in cash or securities, an amount equal to a percentage of the notional value of the contract. Subsequent payments are received or made by the Fund each day, depending on the daily fluctuations in the values of the contracts, and are recorded for financial statement purposes as variation margin received or paid by the Fund. Daily changes in variation margin are recognized as unrealized gains or losses by the Fund. The Fund may not achieve the anticipated benefits of the swap contracts and may realize a loss. There were no credit default swaps held as of June 30, 2023.
e. Foreign Currency Translation The accounting records of the Fund are maintained in U.S. dollars. Investment securities and all other assets and liabilities of the Fund denominated in a foreign currency are generally translated into U.S. dollars at the exchange rates quoted at the close of the NYSE on each business day. The market value of investment securities and other assets and liabilities are translated at the exchange rate as of the valuation date. Purchases and sales of securities, income receipts, and expense payments are translated into U.S. dollars at the exchange rates in effect on the dates of the respective transactions. The Fund does not isolate the portion of the fluctuations on investments resulting from changes in foreign currency exchange rates from the fluctuations in market prices of investments held. Such fluctuations are included in the Net change in net realized and unrealized gain/(loss) from investments on the Statement of Operations.
Reported realized foreign currency gains and losses arise from the disposition of foreign currency, currency gains or losses realized between the trade and settlement dates on securities transactions, and the difference between the amounts of dividends, interest and foreign withholding taxes recorded on the Fund’s books on the transaction date and the U.S. dollar equivalent of the amounts actually received or paid. These reported realized foreign currency gains and losses, if any, are included in Net realized gain/(loss) from foreign currency transactions on the Statement of Operations. Unrealized foreign currency gains and losses arise from changes (due to changes in exchange rates) in the value of foreign currency and other assets and liabilities denominated in foreign currencies, which are held at period end, if any, and are included in Net change in unrealized appreciation/(depreciation) on translation of assets and liabilities in foreign currencies on the Statement of Operations.
NOTES TO FINANCIAL STATEMENTS — GUARDIAN BALANCED ALLOCATION VIP FUND
f. Foreign Capital Gains Tax The Fund may be subject to foreign taxes on income, gains on investments or currency purchases/repatriation, a portion of which may be recoverable. The Fund will accrue such taxes and recoveries as applicable, based upon their current interpretation of tax rules and regulations that exist in the markets in which they invest.
g. Investment Income Dividend income net of foreign taxes withheld, if any, is generally recorded on the ex-dividend date. Distributions received from real estate investment trusts, if any, may be classified as dividends, capital gains and/or return of capital. Interest income, which includes amortization/accretion of premium/discount, is determined using the interest income accrual method, and is accrued and recorded daily.
h. Allocation of Income and Expenses Many of the expenses of the Trust can be directly attributed to a specific series of the Trust. Expenses that cannot be directly attributed to a specific series of the Trust are generally apportioned among all the series in the Trust, based on relative net assets. In calculating net asset value per share for each series of the Trust, investment income, realized and unrealized gains and losses, and expenses other than series-specific expenses are allocated daily to each series based upon the proportion of net assets attributable to each series.
3. Transactions with Affiliates
a. Investment Advisory Fee and Expense Limitation Under the terms of the advisory agreement, which, after its two year initial term, is reviewed and approved annually by the Board of Trustees, the Fund pays an investment advisory fee to Park Avenue. Park Avenue is a wholly-owned subsidiary of Guardian Life and receives an investment advisory fee at an annual rate of 0.48% of the Fund’s average daily net assets. The fee is accrued daily and paid monthly.
Park Avenue has contractually agreed through April 30, 2024 to waive certain fees and/or reimburse certain expenses incurred by the Fund to the extent necessary to limit the Fund’s total annual operating expenses after fee waiver and/or expense reimbursement to 0.89% of the Fund’s average daily net assets (excluding, if applicable, any acquired fund fees and expenses, taxes, interest, transaction costs and brokerage commissions, litigation and extraordinary expenses). The limitation may not be increased or terminated prior to this time without action by the Board of Trustees, and may be terminated only upon approval of the Board of Trustees. Amounts waived or reimbursed by Park Avenue
pursuant to any expense limitation will not be subject to Park Avenue’s recoupment rights. For the six months ended June 30, 2023, Park Avenue did not waive any fees or pay any Fund expenses.
Park Avenue has entered into a Sub-Advisory Agreement with Wellington Management Company LLP (“Wellington”). Wellington is responsible for providing day-to-day investment advisory services to the Fund, subject to the supervision of Park Avenue and the oversight of the Board of Trustees. Sub-advisory fees are paid by Park Avenue and do not represent a separate or additional expense to the Fund.
b. Compensation of Trustees and Officers Trustees and officers who are interested persons of the Trust, as defined in the 1940 Act, receive no compensation from the Fund, except for the Chief Compliance Officer of the Trust. Trustees of the Trust who are not interested persons of the Trust, and the Chief Compliance Officer, receive compensation and reimbursement of expenses from the Trust.
c. Distribution Fees Park Avenue Securities LLC (“PAS”), a wholly-owned subsidiary of Guardian Life, is the principal underwriter of Fund shares. The Trust has entered into a distribution and service agreement with PAS, which governs the sale and distribution of shares of the Fund. Under a distribution and service plan adopted by the Trust (“12b-1 plan”), PAS is compensated for services in such capacity, including its expenses in connection with the promotion and distribution of shares of the Fund, at an annual rate of 0.25% of the Fund’s average daily net assets. For the six months ended June 30, 2023, the Fund paid distribution fees in the amount of $271,515 to PAS.
PAS has directed that certain payments under the 12b-1 plan be used to compensate GIAC for shareholder services provided to contract owners.
4. Federal Income Taxes
a. Distributions to Shareholders For federal income tax purposes, the Fund is treated as a disregarded entity (“DRE”). As a DRE, the Fund is not subject to an entity-level income tax; and any income, gains, losses, deductions, taxes, and credits of the Fund would instead be “passed through” directly to the separate accounts of GIAC that invest in the Fund and retain the same character for U.S. federal income tax purposes. In addition, the Fund is not required to distribute taxable income and capital gains for U.S. federal income tax purposes. Therefore, no dividends and capital gains distributions were paid by the Fund.
NOTES TO FINANCIAL STATEMENTS — GUARDIAN BALANCED ALLOCATION VIP FUND
5. Investments
a. Investment Purchases and Sales The cost of investments and U.S. government agency obligations purchased and the proceeds from U.S. government agency obligations and other investments sold (excluding short-term investments and to be announced (TBA) securities) for the six months ended June 30, 2023, were as follows:
| | | | | | | | |
| | | |
| | | Other Investments | | | U.S. Government and Agency Obligations | |
| Purchases | | $ | 68,293,559 | | | $ | 45,514,897 | |
| Sales | | | 75,166,894 | | | | 37,171,323 | |
b. Foreign Securities Foreign securities investments involve special risks and considerations not typically associated with U.S. investments. These risks include, but are not limited to, currency risk; adverse political, regulatory, social, and economic developments; and less reliable information about issuers. Moreover, securities of some foreign issuers may be less liquid and their prices more volatile than those of comparable U.S. issuers.
c. Industry or Sector Concentration In its normal course of business, the Fund may invest a significant portion of its assets in companies within a limited number of industries or sectors. As a result, the Fund may be subject to a greater risk of loss than that of a fund invested in a wider spectrum of industries or sectors because the stocks of many or all of the companies in the industry, group of industries, sector, or sectors may decline in value due to developments adversely affecting the industry, group of industries, sector, or sectors.
d. Repurchase Agreements The Fund may invest in repurchase agreements to maintain liquidity and earn income over periods of time as short as overnight. The collateral for repurchase agreements is either cash or fully negotiable U.S. government securities (including U.S. government agency securities). Repurchase agreements are fully collateralized (including the interest accrued thereon) and such collateral is marked to market daily while the agreements remain in force. If the value of the collateral falls below the repurchase price plus accrued interest, the Fund will typically require the seller to deposit additional collateral by the next business day. If the request for additional collateral is not met, or the seller defaults, the Fund maintains the right to sell the collateral (although it may be prevented or delayed from doing so in certain circumstances) and may be required to claim any resulting loss against the seller. Park Avenue monitors the creditworthiness of the seller with which the Fund enters into repurchase agreements.
e. Securities Purchased on a When-Issued or Delayed-Delivery Basis The Fund may purchase securities on a when-issued or delayed-delivery basis, with payment and delivery scheduled for a future date. These transactions are subject to market fluctuations and are subject to the risk that the value at delivery may be more or less than at the trade date purchase price. Although the Fund will generally enter into these transactions with the intention of taking delivery of the securities, it may sell the securities before the settlement date. Assets will be segregated when a fund agrees to purchase on a when-issued or delayed-delivery basis. These transactions may create investment leverage.
f. Restricted and Illiquid Securities A restricted security cannot be resold to the general public without prior registration under the Securities Act of 1933, as amended (except pursuant to an applicable exemption). The values of these securities may be highly volatile. If the security is subsequently registered and resold, the issuer would typically bear the expense of all registrations at no cost to the Fund. Restricted and illiquid securities are valued according to the policies and procedures adopted by the Trust’s Board of Trustees and are noted, if any, in the Fund’s Schedule of Investments. As of June 30, 2023, the Fund did not hold any restricted, other than 144A restricted securities or illiquid securities.
g. Below Investment Grade Securities The Fund may invest in below investment grade securities (i.e. lower-quality, “junk” debt), which are subject to various risks. Lower-quality debt is considered to be speculative because it is less certain that the issuer will be able to pay interest or repay the principal than in the case of investment grade debt. These securities can involve a substantially greater risk of default than higher-rated securities, and their values can decline significantly over short periods of time. Lower-quality debt securities tend to be more sensitive to adverse news about their issuers, the market and the economy in general, than higher-quality debt securities. The market for these securities can be less liquid, especially during periods of recession or general market decline.
h. Mortgage- and Asset-Backed Securities The values of some mortgage-related or asset-backed securities may be particularly sensitive to changes in prevailing interest rates. Early repayment of principal on some mortgage-related securities may expose the Fund to a lower rate of return upon reinvestment of principal. The values of mortgage- and asset-backed securities depend in part on the credit quality and adequacy of the underlying assets or collateral and may fluctuate in
NOTES TO FINANCIAL STATEMENTS — GUARDIAN BALANCED ALLOCATION VIP FUND
response to the market’s perception of these factors as well as current and future repayment rates. Some mortgage-backed securities are backed by the full faith and credit of the U.S. government (e.g., mortgage-backed securities issued by the Government National Mortgage Association, commonly known as “Ginnie Mae”), while other mortgage-backed securities (e.g., mortgage-backed securities issued by the Federal National Mortgage Association and the Federal Home Loan Mortgage Corporation, commonly known as “Fannie Mae” and “Freddie Mac”), are backed only by the credit of the government entity issuing them. In addition, some mortgage-backed securities are issued by private entities and, as such, are not guaranteed by the U.S. government or any agency or instrumentality of the U.S. government.
i. Treasury Inflation Protected Securities Treasury inflation protected securities (“TIPS”) are debt securities issued by the U.S. Treasury whose principal and/or interest payments are adjusted for inflation, unlike debt securities that make fixed principal and interest payments. The interest rate paid by the TIPS is fixed, while the principal value rises or falls based on changes in a published Consumer Price Index (“CPI”). Thus, if inflation occurs, the principal and interest payments on TIPS are adjusted accordingly to protect investors from inflationary loss. During a deflationary period, the principal and interest payments decrease, although the TIPS principal amounts will not drop below their face amounts at maturity. In exchange for the inflation protection, the TIPS generally pay lower interest rates than typical U.S. Treasury securities. Only if inflation occurs will TIPS offer a higher real yield than a conventional Treasury bond of the same maturity.
j. Disclosures About Derivative Instruments and Hedging Activities The Fund entered into U.S. Treasury futures contracts for the six months ended June 30, 2023 to manage portfolio duration. The Fund bears the risk of interest rates moving unexpectedly, in which case the Fund may not achieve the anticipated benefits of the futures contracts and realize a loss. There is minimal counterparty credit risk to the Funds since futures are exchange traded and the exchange’s clearinghouse, as counterparty to all exchange traded futures, guarantees futures against default.
Under certain market conditions, the Fund may use credit default swaps. Credit default swaps involve the exchange of a floating or fixed rate payment in return for assuming potential credit losses of an underlying security or pool of securities.
The gross returns to be exchanged or “swapped” between the parties are generally calculated with respect to a “notional amount,” i.e., the return on or increase in value of a particular dollar amount invested at a particular interest rate, in a particular foreign currency or security, or in a “basket” of securities representing a particular index. Cleared swaps are transacted through futures commission merchants (“FCM”s) that are members of central clearinghouses with the clearinghouse serving as a central counterparty similar to transactions in futures contracts. Funds post initial and variation margin by making payments to their clearing member FCMs.
Generally, the Fund will enter into credit default swaps on a net basis, which means that the two payment streams are netted out, with a Fund receiving or paying, as the case may be, only the net amount of the two payments. Credit default swaps do not normally involve the delivery of securities, other underlying assets or principal. Accordingly, the risk of loss with respect to credit default swaps is normally limited to the net amount of payments that a Fund is contractually obligated to make. If the other party to a credit default swap defaults, a Fund’s risk of loss consists of the net amount of payments that the Fund is contractually entitled to receive, if any.
In addition to the risks generally applicable to derivatives, risks associated with credit default swap agreements include adverse changes in the returns of the underlying instruments, failure of the counterparties to perform under the agreement’s terms and the possible lack of liquidity with respect to the agreements.
As of June 30, 2023, the Fund had the following derivatives at fair value, grouped into appropriate risk categories that illustrate the Fund’s use of derivative instruments:
| | | | |
| | |
| | | Interest Rate Contracts | |
| | |
Asset Derivatives | | | | |
| Futures Contracts1 | | $ | 11,352 | |
| | |
Liability Derivatives | | | | |
| Futures Contracts1 | | $ | (43,168 | ) |
| 1 | Statement of Assets and Liabilities location: Includes cumulative unrealized appreciation/(depreciation) of futures contracts as reported in the Schedule of Investments. Only current day’s variation margin is reported within the Statement of Assets and Liabilities. |
NOTES TO FINANCIAL STATEMENTS — GUARDIAN BALANCED ALLOCATION VIP FUND
Transactions in derivative investments for the six months ended June 30, 2023 were as follows:
| | | | |
| | |
| | | Interest Rate Contracts | |
| | |
Net Realized Gain/(Loss) | | | | |
| Futures Contracts1 | | $ | 40,118 | |
| | |
Net Change in Unrealized Appreciation/(Depreciation) | | | | |
| Futures Contracts2 | | $ | (25,877 | ) |
| | |
Average Number of Notional Amounts | | | | |
| Futures Contracts3 | | | 40 | |
| 1 | Statement of Operations location: Net realized gain/(loss) from futures contracts. |
| 2 | Statement of Operations location: Net change in unrealized appreciation/(depreciation) on futures contracts. |
| 3 | Amount represents number of contracts. |
6. Temporary Borrowings
The Fund, with other funds managed by Park Avenue, is party to a credit agreement with respect to a $10 million committed revolving credit facility from State Street Bank and Trust Company (the “Credit Agreement”) for temporary borrowing purposes, including the meeting of redemption requests that otherwise might require the untimely disposition of securities. Interest is based on a daily fluctuating rate per annum equal to the Applicable Rate (as defined in the Credit Agreement) plus the Applicable Margin (as defined in the Credit Agreement) that is subject to change from time to time as and when the Applicable Rate changes. Under the current Credit Agreement, the Applicable Rate for any day is defined as the rate per annum equal to the sum of (a) 0.10% plus (b) the higher of (i) the Federal Funds
Effective Rate for such day and (ii) the Overnight Bank Funding Rate for such day; the Applicable Margin is 1.25%. In addition to the interest charged on any borrowings by the Fund, each fund pays a commitment fee of 0.30% per annum on its share of the unused portion of the credit facility. The agreement is in place until January 5, 2024. The Fund did not utilize the credit facility during the six months ended June 30, 2023.
7. Indemnifications
Under the Trust’s organizational documents and, in some cases, by contract, officers and Trustees of the Trust are indemnified against certain liabilities arising out of the performance of their duties to the Fund. In addition, in the normal course of business, the Fund enters into contracts with its vendors and others that provide general indemnifications. The Fund’s maximum exposure under these arrangements is unknown as this would involve future claims that may be made against the Fund that have not yet occurred. However, based on experience, the Fund expects the risk of loss to be remote.
8. Additional Information
The outbreak of COVID-19 has adversely impacted both local and global economies, including those in which the Fund may invest. These impacts include materially reduced consumer demand and economic output, disrupted supply chains, market closures, travel restrictions and quarantines, and strained healthcare systems. The Fund’s operations may be interrupted as a result, which may have a negative impact on the Fund’s investment performance.
SUPPLEMENTAL INFORMATION (UNAUDITED)
Liquidity Risk Management Program
In compliance with Rule 22e-4 under the Investment Company Act of 1940, as amended (the “Liquidity Rule”), Guardian Variable Products Trust (the “Trust”) has adopted and implemented a written liquidity risk management program (the “Program”) for each series of the Trust (each, a “Fund”), which is reasonably designed to assess and manage each Fund’s liquidity risk. The Fund’s “liquidity risk” is the risk that the Fund could not
meet requests to redeem shares issued by the Fund without significant dilution of the remaining investors’ interests in the Fund.
The Board of Trustees of the Trust (the “Board”)
Previously approved the designation of Park Avenue Institutional Advisers LLC (the “Administrator” or “PAIA”) as Program administrator. The Administrator established a Liquidity Risk Management Committee, which is comprised of certain officers of the Trust and PAIA, that assists the Administrator in the implementation and day-to-day administration of the Program and otherwise support carrying out the Administrator’s liquidity risk management responsibilities under the Program.
In accordance with the Program, each Fund’s liquidity risk is assessed no less frequently than annually, taking into consideration a variety of factors, including, as applicable, the Fund’s investment strategy and liquidity of portfolio investments, cash flow projections, and holdings of cash and cash equivalents, as well as borrowing arrangements and other funding sources. Certain factors are considered under both normal and reasonably foreseeable stressed conditions.
Each Fund portfolio investment is classified, no less than monthly, into one of four liquidity categories (including “highly liquid investments” and “illiquid investments,” discussed below) based on a determination of the number of days it is reasonably expected to take to convert the investment to cash, or sell or dispose of the investment, in current market conditions without
significantly changing the investment’s market value.
The Liquidity Rule limits the Fund’s investments in illiquid investments by prohibiting the Fund from acquiring any illiquid investment if, immediately after the acquisition, the Fund would have invested more than 15% of its net assets in illiquid investments that are assets. The Program includes provisions reasonably designed to comply with this investment limitation. In addition, the Program includes provisions reasonably designed to comply with this investment limitation. In addition, the Program includes provisions reasonably designed to comply with the Liquidity Rule’s requirements relating to highly liquid investment minimums, which is a minimum amount of Fund net assets that must be invested in highly liquid investments that are assets, as applicable. The Fund was not required to adopt a highly liquid investment minimum during the
period.
At a meeting of the Board held on March 29-30, 2023, the Board received a report (the “Report”) prepared by the Administrator addressing the Program’s operation and assessing the adequacy and effectiveness of its implementation for the period from January 1, 2022 through December 31, 2022 (the “Reporting Period”). The Report noted that the Administrator believes the Program operated effectively during the Reporting Period and continues to be reasonably designed to effectively assess and manage each Fund’s liquidity risk. The Report also noted that the Administrator believes the Program has been adequately and effectively implemented and the investment strategies for each Fund continue to be appropriate since its inception. In addition, the Report summarized the operation of the Program and the information and factors considered by the Administrator in its assessment of the Program’s implementation, such as the liquidity risk assessment framework and liquidity classification methodologies.
There can be no assurance that the Program will achieve its objectives under all circumstances. Please refer to the Fund’s prospectus for more information regarding the Fund’s exposure to liquidity risk and other risks to which an investment in the Fund may be subject.
SUPPLEMENTAL INFORMATION (UNAUDITED)
Approval of Investment Management and Sub-advisory Agreements
Section 15(c) of the Investment Company Act of 1940, as amended (the “1940 Act”), requires that a fund’s investment advisory and sub-advisory agreements be approved initially by the fund’s board of trustees. Section 15(c) also requires that the continuation of these agreements, after an initial term of up to two years, be annually reviewed and approved by the board. Any such agreement must be approved by a vote of a majority of the trustees who are not parties to the agreement or “interested persons” (as defined in the 1940 Act) of a party to the agreement at a meeting of the board called for the purpose of voting on such approval.
At a meeting of the Board of Trustees (the “Board”) of Guardian Variable Products Trust (the “Trust”) held on March 29-30, 2023 (the “Meeting”), the Board, including the trustees who are not parties to the agreement or “interested persons” as defined in the 1940 Act (the “Independent Trustees”), considered and voted unanimously to renew the existing investment management agreement between the Trust, on behalf of Guardian All Cap Core VIP Fund; Guardian Balanced Allocation VIP Fund; Guardian Core Fixed Income VIP Fund; Guardian Core Plus Fixed Income VIP Fund; Guardian Diversified Research VIP Fund; Guardian Equity Income VIP Fund; Guardian Global Utilities VIP Fund; Guardian Growth & Income VIP Fund; Guardian Integrated Research VIP Fund; Guardian International Growth VIP Fund; Guardian International Equity VIP Fund; Guardian Large Cap Disciplined Growth VIP Fund; Guardian Large Cap Disciplined Value VIP Fund; Guardian Large Cap Fundamental Growth VIP Fund; Guardian Mid Cap Relative Value VIP Fund; Guardian Mid Cap Traditional Growth VIP Fund; Guardian Multi-Sector Bond VIP Fund; Guardian Select Mid-Cap Core VIP Fund; Guardian Short Duration Bond VIP Fund; Guardian Small Cap Core VIP Fund; Guardian Small-Mid Cap Core VIP Fund; Guardian Strategic Large Cap Core VIP Fund; Guardian Total Return Bond VIP Fund and Guardian U.S. Government Securities VIP Fund (each, a “Fund,” and together, the “Funds”), in substantially the form presented at this meeting (the “Management Agreement”); and Park Avenue Institutional Advisers LLC (the “Manager”) for a one-year term.
The Board, including the Independent Trustees, also considered and voted unanimously to renew the existing sub-advisory agreements (the “Sub-Advisory Agreements,” collectively with the Management Agreement and Sub-Subadvisory Agreement, the “Agreements”) between the Manager and investment
advisory firms engaged to serve as sub-advisers to certain of the Funds (the “Sub-Advised Funds”), namely (i) ClearBridge Investments, LLC with respect to Guardian Small Cap Core VIP Fund; (ii) Putnam Investment Management, LLC with respect to Guardian Diversified Research VIP Fund; (iii) AllianceBernstein L.P. with respect to Guardian Growth & Income VIP Fund and Guardian Strategic Large Cap Core VIP Fund; (iv) J.P. Morgan Investment Management Inc. with respect to Guardian International Growth VIP Fund; (v) Schroder Investment Management North America Inc. with respect to Guardian International Equity VIP Fund; (vi) Wellington Management Company LLP with respect to Guardian Balanced Allocation VIP Fund, Guardian Equity Income VIP Fund, Guardian Integrated Research VIP Fund, Guardian Large Cap Disciplined Growth VIP Fund and Guardian Global Utilities VIP Fund; (vii) Boston Partners Global Investors, Inc. with respect to Guardian Large Cap Disciplined Value VIP Fund; (viii) Janus Henderson Investors US LLC with respect to Guardian Mid Cap Traditional Growth VIP Fund; (ix) Allspring Global Investments, LLC with respect to Guardian Mid Cap Relative Value VIP Fund and Guardian Small-Mid Cap Core VIP Fund; (x) Lord, Abbett & Co. LLC with respect to Guardian Core Plus Fixed Income VIP Fund; (xi) FIAM LLC with respect to Guardian Select Mid Cap Core VIP Fund; and (xii) Massachusetts Financial Services Company with respect to Guardian All Cap Core VIP Fund, each in substantially the form presented at this meeting, (each, a “Sub-Adviser” and collectively, the “Sub-Advisers”) for a one-year term.
The Board, including the Independent Trustees, also considered and voted unanimously to renew the existing sub-subadvisory agreement (the “Sub-Subadvisory Agreement”) between Schroder Investment Management North America Inc. and Schroder Investment Management North America Limited (also a Sub-Adviser) with respect to Guardian International Equity VIP Fund for a one-year term.
The Board is responsible for overseeing the management of each Fund. In determining whether to renew its approval of the Agreements, the Trustees evaluated information and factors that they considered to be relevant and appropriate through the exercise of their own business judgment. The Trustees considered certain information and factors in light of advice furnished to them by legal counsel to the Trust and, in the case of the Independent Trustees, their independent legal counsel. In advance of the Meeting, the Trustees received materials and information designed to assist their consideration of the Agreements. The Trustees received written responses
SUPPLEMENTAL INFORMATION (UNAUDITED)
from the Manager and each Sub-Adviser to a series of questions and requests for information encompassing a wide variety of topics provided by independent counsel on behalf of the Independent Trustees. The Independent Trustees also received materials and information regarding the legal standards applicable to their consideration of the Agreements and the process and criteria used by the Manager to identify and select the Sub-Advisers.
During the course of their deliberations, the Independent Trustees met twice to discuss and evaluate the materials, information and Agreements in executive session with their independent legal counsel, outside of the presence of the Trustees who are not Independent Trustees and representatives from Fund management, the Manager or any Sub-Adviser.
In reaching its decisions to renew its approval of the Agreements, the Board took into account the materials and information described above, as well as other materials and information provided to the Board throughout the year. Individual Trustees may have given different weight to different factors and information with respect to each Agreement, and the Trustees did not identify any single factor or information that, in isolation, would be controlling in deciding to approve the Agreements. The discussion below is intended to summarize the broad factors that figured prominently in the Board’s decisions to renew its approval of the Agreements rather than to be all-inclusive. These broad factors included: (i) the nature, extent and quality of the services provided to the Funds by the Manager and to the Sub-advised Funds by the Sub-Advisers; (ii) the investment performance of each Fund; (iii) estimated profitability of the Manager; (iv) fees and expenses; (v) the extent to which economies of scale may exist, and the extent to the benefits of economies of scale are shared with the Funds; and (vi) any other benefits derived by the Manager or the Sub-Advisers (or their respective affiliates) from their relationships with the Funds.
Nature, Extent and Quality of Services
The Trustees considered information regarding the nature, extent and quality of services provided to the Funds by the Manager. The Trustees also considered, among other things, the terms of the Management Agreement and the range of investment advisory services provided by the Manager. In addition, the Trustees reviewed the range of non-investment advisory services provided by the Manager consistent with the terms of the Management Agreement, notably coordinating the preparation and filing of various
regulatory documents, coordinating the preparation and assembly of Board meeting materials, and assisting the Board with certain valuation matters. The Board also received a description of the Manager’s and each Sub-Adviser’s business continuity plans and of their respective approaches to data privacy and cybersecurity, and related testing. The Board received information regarding the response of the Manager and the Sub-Advisers to the COVID-19 pandemic, including the continuation of remote work arrangements and return-to-office plans. The Board also received information about the Manager’s role as administrator of the Funds’ liquidity risk management program, the Manager’s approach to risk management, and the Manager’s vendor oversight programs.
The Trustees considered that the Sub-advised Funds operate in a “manager-of-managers” structure and reviewed the responsibilities that the Manager has under this structure, including monitoring and evaluating the performance of the Sub-Advisers, monitoring the Sub-Advisers for adherence to the stated investment objectives, strategies, policies and restrictions of the Funds and supervising the Sub-Advisers with respect to the services that the Sub-Advisers would provide under the Sub-Advisory Agreements. The Trustees also considered the process used by the Manager, consistent with this structure, to identify and recommend sub-advisers, and the Manager’s ability to monitor and oversee sub-advisers and recommend replacement sub-advisers, when necessary, and provide other services under the Management Agreement. The Board noted that investment management staff of the Manager and the Trust’s Chief Compliance Officer conduct oversight meetings with the Sub-Advisers on a periodic basis, follow through with additional inquiries on any questions or concerns that arise during the meetings and, as necessary, then report the results of the meetings to the Board. The Trustees reviewed information regarding the experience and background of the Manager’s key personnel and the Manager’s organizational structure and resources, including investment, legal and administrative capabilities of the Manager. In this regard, the Trustees recognized that the Funds may benefit from the Manager’s ability to use resources and capabilities of its affiliates in providing services to the Funds.
The Trustees considered information regarding the nature, extent and quality of services provided to the Sub-advised Funds by the Sub-Advisers. The Trustees also considered, among other things, the terms of the Sub-advisory Agreements and the range of investment
SUPPLEMENTAL INFORMATION (UNAUDITED)
advisory services provided by the Sub-Advisers under the oversight of the Manager. In evaluating these investment advisory services, the Trustees considered, among other things, the Sub-Advisers’ investment philosophies, styles and/or processes and approaches to managing the respective Sub-advised Funds. The Trustees received and evaluated information regarding the background, education, expertise and/or experience of the investment professionals who serve as portfolio managers for the Sub-advised Funds and the capabilities and resources of the Sub-Advisers.
Based upon these considerations, the Trustees concluded, within the context of their full deliberations, that the nature, extent and quality of services provided to the Funds by the Manager and the Sub-advised Funds by each respective Sub-Adviser were appropriate.
Investment Performance
In connection with each of its regular quarterly meetings, the Board receives information on the performance of each Fund, including net performance, relative performance rankings within the relevant Morningstar peer group, and performance as compared to benchmark index returns. At each quarterly Board meeting, members of the Manager’s funds management team review with the Board the economic and market environment, absolute and relative performance of each Fund, and any relevant information about risk management and style consistency in connection with management of the Funds. The Board considered investment performance for each Fund over the one-year, three-year (where available), five-year (where available) and since-inception periods.
The Board also received and reviewed a report prepared by Broadridge Financial Solutions (“Broadridge”), an independent provider of mutual fund industry data, which included comparisons of the performance of each Fund to performance of an appropriate peer universe. For details regarding each Fund’s performance, see the “Fund-by-Fund Factors” section below.
The Manager discussed with the Board factors contributing to the Funds’ performance results. In addition, for certain Funds, the Manager provided to the Board longer term performance records of the Sub-Advisers for strategies used in managing the Funds. The Board concluded that the investment performance generated by the Manager and each Sub-Adviser was generally satisfactory, or, that any steps being taken by the Manager and Sub-Advisers to address any performance issues were satisfactory.
Profitability
The Board received and considered the Manager’s estimate of its profitability, which included allocations by the Manager of its costs in providing management services to the Funds. The Board considered the estimated profitability of the Manager both overall and on a Fund-by-Fund basis.
The Board received and considered profitability information from most of the Sub-Advisers, but noted that the Manager had negotiated the fees with the Sub-Advisers at arm’s-length. Accordingly, the Board concluded that the profitability of the Sub-Advisers is a less relevant factor than Manager profitability.
Based on the consideration of this information, the Board concluded that the profitability of the Funds to the Manager was acceptable.
Fees and Expenses
The Trustees considered the management fees paid by the Funds to the Manager under the Management Agreement and evaluated the reasonableness of these fees. The Trustees received and reviewed comparative information with respect to the management fee and total expenses for each Fund and the management fees and total expenses for a peer group of other funds selected by Broadridge. The Trustees considered the Manager’s commitment to limit the total expenses of each Fund through an expense limitation agreement with the Trust. Although the Board recognized that the comparisons between the management fees and actual expenses of the Funds and those of the identified peer group are imprecise, given different terms of agreements and variations in fund strategies, the Trustees found that the comparative information supported their consideration and approval of the management fees and evaluation of the total expenses. For details regarding each Fund’s fee and expense comparisons, see the “Fund-by-Fund Factors” section below.
The Trustees considered the sub-advisory fees paid under the Sub-advisory Agreements and evaluated the reasonableness of those fees. The Trustees also considered that the fees paid to the Sub-Advisers would be paid by the Manager and not the Funds and that the Manager had negotiated the fees with the Sub-Advisers at arm’s-length.
Based on the consideration of the information and factors summarized above, as well as other relevant information and factors, the Board concluded that the management and sub-advisory fees were reasonable in
SUPPLEMENTAL INFORMATION (UNAUDITED)
light of the nature, extent and quality of services rendered to the Funds by the Manager and the Sub-Advisers.
Economies of Scale
The Board considered the extent to which economies of scale may exist, and the extent to the benefits of economies of scale are shared with the Funds. In this regard, the Board noted that for sixteen of twenty-four Funds, the management and sub-advisory fee included breakpoints that are tiered based on growth in asset levels of each such Fund and that for the other Funds, the fees reflected appropriate levels based on current and expected asset levels. The Board also noted that the expenses of the Funds are subject to expense limitations provided by the Manager. The Board noted that expected economies of scale, where they exist, may be shared through the use of fee breakpoints, expense limitations by the Manager, and/or a lower overall fee.
Ancillary Benefits
The Board considered the potential benefits, other than management fees, that the Manager and/or its affiliates may receive because of the Manager’s relationship with the Funds. The Trustees considered that the Funds were designed to serve as investment options under variable contracts issued by affiliates of the Manager that would receive fees under those contracts and that Park Avenue Securities LLC, an affiliate of the Manager and principal underwriter of the Funds, and participating insurance companies, including insurance companies affiliated with the Manager, would be entitled to receive fees from the Funds under a plan of distribution adopted pursuant to Rule 12b-1 under the 1940 Act. The Trustees considered that the Manager and its affiliates may benefit from (i) greater efficiencies in annuity administration and operations and potential cost savings due to a reduction in the number of unaffiliated funds available as annuity contract investment options, and (ii) increased dividends-received deductions due to the Funds’ status under the tax laws as disregarded entities. In addition, the Trustees considered the potential benefits, other than sub-advisory fees, that the Sub-Advisers and their affiliates may receive because of their relationships with the Funds, including the ability to receive research from soft dollar commissions consistent with Trust policies. The Trustees concluded that benefits that may accrue to the Manager and its affiliates are reasonable and the benefits that may accrue to the Sub-Advisers and their affiliates are consistent with those expected for a sub-adviser to a mutual fund such as the applicable Fund.
Fund-by-Fund Factors
The Broadridge report groups fees, expenses and performance into five quintiles, with the top quintile having the highest performance or lowest fees/expenses, and the bottom quintile having the lowest performance or highest fees/expenses. For purposes of the descriptions below, a Fund’s performance is considered “in line with” the benchmark index if it is within 0.20%.
Guardian Large Cap Fundamental Growth VIP Fund
| • | | The Board noted that the Fund’s performance was in the 3rd quintile of its performance universe for the 1-year period and in the 4th quintile for its performance universe for the 3-year and 5-year periods. The Board also noted that the Fund’s performance was below the benchmark index for the 1-year, 3-year and 5-year periods. |
| • | | The Board noted that the contractual management fee, the actual management fee and actual total expenses were in the 1st quintile of the expense group. |
Guardian Large Cap Disciplined Growth VIP Fund
| • | | The Board noted that the Fund’s performance was in the 3rd quintile of its performance universe for the 1-year and 3-year periods and in the 2nd quintile for the 5-year period. The Board also noted that the Fund’s performance was below the benchmark index for the 1-year, 3-year and 5-year periods. |
| • | | The Board noted that the contractual management fee, the actual management fee and actual total expenses were in the 1st quintile of the expense group. |
Guardian Integrated Research VIP Fund
| • | | The Board noted that the Fund’s performance was in the 5th quintile of its performance universe for the 1-year and 5-year periods and in the 4th quintile for 3-year period. The Board also noted that the Fund’s performance was below the benchmark index for the 1-year, 3-year and 5-year periods. |
| • | | The Board noted that the contractual management fee, the actual management fee and actual total expenses were in the 1st quintile of the expense group. |
Guardian Diversified Research VIP Fund
| • | | The Board noted that the Fund’s performance was in the 3rd quintile of its performance universe for the 1-year and 3-year periods and in the 2nd quintile for the 5-year period. The Board also noted that the Fund’s performance was higher than the benchmark index for the 1-year period. The Board note that the Fund’s performance was lower than the benchmark index for the 3-year and 5-year periods. |
SUPPLEMENTAL INFORMATION (UNAUDITED)
| • | | The Board noted that the contractual management fee and actual management fee were in the 1st quintile of the expense group and that actual total expenses were in the 3rd quintile. |
Guardian Strategic Large Cap Core VIP Fund
| • | | The Board noted that the Fund’s performance was in the 1st quintile of its performance universe for the 1-year period. The Board acknowledged the Fund’s short operational history. The Board noted that the Fund’s performance was higher than the benchmark index for the 1-year period. |
| • | | The Board noted that the contractual management fee, the actual management fee and actual total expenses were in the 1st quintile of the expense group. |
Guardian Large Cap Disciplined Value VIP Fund
| • | | The Board noted that the Fund’s performance was in the 3rd quintile of its performance universe for the 1-year and 3-year periods and in the 4th quintile for the 5-year period. The Board also noted that the Fund’s performance was higher than the benchmark index for the 1-year and 3-year periods. The Board noted that the Fund’s performance was in line with the benchmark index for the 5-year period. |
| • | | The Board noted that the contractual management fee was in the 2nd quintile of the expense group, the actual management fee was in the 1st quintile of the expense group and that actual total expenses were in the 3rd quintile. |
Guardian Growth & Income VIP Fund
| • | | The Board noted that the Fund’s performance was in the 3rd quintile of its performance universe for the 1-year, 3-year and 5-year periods. The Board also noted that the Fund’s performance was higher than the benchmark index for the 1-year, 3-year and 5-year periods. |
| • | | The Board noted that the contractual management fee and the actual management fee were in the 1st quintile of the expense group and that actual total expenses were in the 3rd quintile. |
Guardian Equity Income VIP Fund
| • | | The Board noted that the Fund had less than one-year of operational history and was not able to evaluate an investment performance record for the Fund. The Board noted that it would have an opportunity to review such information in connection with future annual reviews. The Board noted that, in the meantime, it received monthly performance reports from the Manager. |
| • | | The Board noted that the contractual management fee, the actual management fee and actual total expenses were in the 1st quintile of the expense group. |
Guardian All Cap Core VIP Fund
| • | | The Board noted that the Fund’s performance was in the 3rd quintile of its performance universe for the 1-year period. The Board acknowledged the Fund’s short operational history. The Board noted that the Fund’s performance was higher than the benchmark index for the 1-year period. |
| • | | The Board noted that the contractual management fee, the actual management fee and actual total expenses were in the 1st quintile of the expense group. |
Guardian Mid Cap Traditional Growth VIP Fund
| • | | The Board noted that the Fund’s performance was in the 1st quintile of its performance universe for the 1-year period and in the 2nd quintile for the 3-year and 5-year periods. The Board also noted that the Fund’s performance was higher than the benchmark index for the 1-year, 3-year and 5-year periods. |
| • | | The Board noted that the contractual management fee and actual management fee were in the 1st quintile of the expense group and that the actual total expenses were in the 4th quintile. |
Guardian Select Mid Cap Core VIP Fund
| • | | The Board noted that the Fund’s performance was in the 3rd quintile of its performance universe for the 1-year period. The Board acknowledged the Fund’s short operational history. The Board noted that the Fund’s performance was lower than the benchmark index for the 1-year period. |
| • | | The Board noted that the contractual management fee, the actual management fee and actual total expenses were in the 1st quintile of the expense group. |
Guardian Mid Cap Relative Value VIP Fund
| • | | The Board noted that the Fund’s performance was in the 2nd quintile of its performance universe for the 1-year, 3-year and 5-year periods. The Board also noted that the Fund’s performance was higher than the benchmark index for the 1-year, 3-year and 5-year periods. |
| • | | The Board noted that the contractual management fee and the actual management fee were in the 2nd quintile of the expense group and the actual total expenses were in the 3rd quintile of the expense group. |
SUPPLEMENTAL INFORMATION (UNAUDITED)
Guardian Small-Mid Cap Core VIP Fund
| • | | The Board noted that the Fund’s performance was in the 5th quintile of its performance universe for the 1-year period. The Board acknowledged the Fund’s short operational history. The Board noted that the Fund’s performance was higher than the benchmark index for the 1-year period. |
| • | | The Board noted that the contractual management fee, the actual management fee and actual total expenses were in the 1st quintile of the expense group. |
Guardian Small Cap Core VIP Fund
| • | | The Board noted that the Fund’s performance was in the 5th quintile of its performance universe for the 1-year and 3-year periods. The Board noted that the Fund’s performance was lower than the benchmark index for the 1-year and 3-year periods. |
| • | | The Board noted that the contractual management fee and the actual management fee were in the 1st quintile of the expense group and the actual total expenses were in the 2nd quintile of the expense group. |
Guardian International Growth VIP Fund
| • | | The Board noted that the Fund’s performance was in the 4th quintile of its performance universe for the 1-year period, in the 2nd quintile of its performance universe for the 3-year period and in the 3rd quintile of its performance universe for the 5-year period. The Board also noted that the Fund’s performance was lower than the benchmark index for the 1-year and 5-year periods. The Board noted that the Fund’s performance was higher than the benchmark index for the 3-year period. |
| • | | The Board noted that the contractual management fee and actual management fee were in the 2nd quintile of the expense group and that the actual total expenses were in the 3rd quintile. |
Guardian International Equity VIP Fund
| • | | The Board noted that the Fund’s performance was in the 5th quintile of its performance universe for the 1-year, 3-year and 5-year periods. The Board also noted that the Fund’s performance was lower than the benchmark index for the 1-year, 3-year and 5-year periods. |
| • | | The Board noted that the contractual management fee, the actual management fee and the actual total expenses were in the 2nd quintile of the expense group. |
Guardian Global Utilities VIP Fund
| • | | The Board noted that the Fund’s performance was in the 5th quintile of its performance universe for the 1-year period and in the 4th quintile of its performance universe for the 3-year period. The Board noted that the Fund’s performance was higher than the benchmark index for the 1-year and 3-year periods. |
| • | | The Board noted that the contractual management fee and the actual management fee were in the 1st quintile of the expense group and the actual total expenses were in the 2nd quintile of the expense group. |
Guardian Balanced Allocation VIP Fund
| • | | The Board noted that the Fund had less than one-year of operational history and was not able to evaluate an investment performance record for the Fund. The Board noted that it would have an opportunity to review such information in connection with future annual reviews. The Board noted that, in the meantime, it received monthly performance reports from the Manager. |
| • | | The Board noted that the contractual management fee, the actual management fee and actual total expenses were in the 1st quintile of the expense group. |
Guardian Core Plus Fixed Income VIP Fund
| • | | The Board noted that the Fund’s performance was in the 3rd quintile of its performance universe for the 1-year and 3-year periods and in the 4th quintile of its performance universe for the 5-year period. The Board also noted that the Fund’s performance was lower than the benchmark index for the 1-year and 5-year periods. The Board noted that the Fund’s performance was in line with the benchmark index for the 3-year period. |
| • | | The Board noted that the contractual management fee and actual management fee were in the 2nd quintile of the expense group and that actual total expenses were in the 3rd quintile. |
Guardian Total Return Bond VIP Fund
| • | | The Board noted that the Fund’s performance was in the 5th quintile of its performance universe for the 1-year and 3-year periods. The Board also noted that the Fund’s performance was lower than the benchmark index for the 1-year and 3-year periods. |
| • | | The Board noted that the contractual management fee and actual management fee were in the 2nd quintile and the actual total expenses were in the 3rd quintile. |
SUPPLEMENTAL INFORMATION (UNAUDITED)
Guardian Core Fixed Income VIP Fund
| • | | The Board noted that the Fund had less than one-year of operational history and was not able to evaluate an investment performance record for the Fund. The Board noted that it would have an opportunity to review such information in connection with future annual reviews. The Board noted that, in the meantime, it received monthly performance reports from the Manager. |
| • | | The Board noted that the contractual management fee was in the 2nd quintile of the expense group and the actual management fee and the actual total expenses were in the 1st quintile. |
Guardian Multi-Sector Bond VIP Fund
| • | | The Board noted that the Fund’s performance was in the 5th quintile of its performance universe for the 1-year and 3-year periods The Board also noted that the Fund’s performance was lower than the benchmark index for the 1-year and 3-year periods. |
| • | | The Board noted that the contractual management fee and actual total expenses were in the 1st quintile and the actual management fee was in the 2nd quintile. |
Guardian Short Duration Bond VIP Fund
| • | | The Board noted that the Fund had less than one-year of operational history and was not able to evaluate an investment performance record for the Fund. The |
| | | Board noted that it would have an opportunity to review such information in connection with future annual reviews. The Board noted that, in the meantime, it received monthly performance reports from the Manager. |
| • | | The Board noted that the contractual management fee and actual total expenses were in the 3rd quintile of the expense group and the actual management fee was in the 1st quintile of the expense group. |
Guardian U.S. Government Securities VIP Fund
| • | | The Board noted that the Fund’s performance was in the 1st quintile of its performance universe for the 1-year period and in the 2nd quintile of its performance universe for the 3-year period. The Board also noted that the Fund’s performance was higher than the benchmark index for the 1-year and 3-year periods. |
| • | | The Board noted that the contractual management fee and the actual management fee were in the 1st quintile of the expense group and the actual total expenses were in the 2nd quintile of the expense group. |
Conclusion
Based on a comprehensive consideration and evaluation of all of the information and factors summarized above, among others, the Board as a whole, including the Independent Trustees, approved the Agreements.
SUPPLEMENTAL INFORMATION (UNAUDITED)
The Statement of Additional Information (“SAI”) includes additional information about the Trust’s Trustees and Officers and is available, without charge, upon request by calling toll-free 1-888-GUARDIAN (1-888-482-7342) or by visiting our website at http://guardianvpt.onlineprospectus.net/GuardianVPT/Prospectuses.
Portfolio Holdings and Proxy Voting Procedures
The Fund files its complete schedule of portfolio holdings with the Securities and Exchange Commission for the first and third quarters of each fiscal year as an exhibit to its reports on Form N-PORT. The Fund’s Form N-PORT reports are available on the Securities and Exchange Commission’s website at https://www.sec.gov. The Fund’s Form N-PORT information is also available, without charge, upon request, by calling toll-free 1-888-GUARDIAN (1-888-482-7342) or by visiting our website at http://guardianvpt.onlineprospectus.net/GuardianVPT/Prospectuses.
A description of the policies and procedures that the Fund uses to determine how to vote proxies relating to portfolio securities is included in the SAI. The SAI and information regarding how the Fund voted proxies relating to portfolio securities during the most recent 12-month period ended June 30 may be obtained (i) without charge, upon request, by calling toll-free 1-888-GUARDIAN (1-888-482-7342) or by visiting our website at http://guardianvpt.onlineprospectus.net/GuardianVPT/Prospectuses; and (ii) on the Securities and Exchange Commission’s website at https://www.sec.gov.
This report is transmitted to shareholders only. It is not authorized for use as an offer of sale or a solicitation of an offer to buy shares of the Fund unless accompanied or preceded by the Fund’s current prospectus. Past performance results shown in this report should not be considered a representation of future performance. Investment returns and principal value of shares will fluctuate so that shares, when redeemed, may be worth more or less than their original cost. Statements and other information herein are as dated and are subject to change.

The Guardian Life Insurance Company of America New York, NY 10001-2159
PUB11738
Guardian Variable
Products Trust
2023
Semiannual Report
All Data as of June 30, 2023
Guardian Equity Income VIP Fund

| | |
| Not FDIC insured. May lose value. No bank guarantee. | | www.guardianlife.com |
TABLE OF CONTENTS
Guardian Equity Income VIP Fund
Except as otherwise specifically stated, all information, including portfolio security positions, is as of June 30, 2023. Fund holdings will vary. Information contained herein has been obtained from sources believed reliable, but is not guaranteed.
GUARDIAN EQUITY INCOME VIP FUND
Fund Characteristics (unaudited)
| | |
| Total Net Assets: $141,368,502 | | |
|
| |
Sector Allocation1 As of June 30, 2023 |
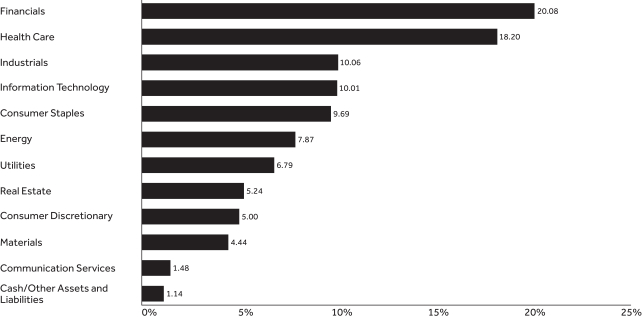 |
| | | | |
| |
Top Ten Holdings2 As of June 30, 2023 | |
| | |
| Holding | | % of Total
Net Assets | |
| Pfizer, Inc. | | | 3.46% | |
| Merck & Co., Inc. | | | 2.74% | |
| ConocoPhillips | | | 2.51% | |
| Johnson & Johnson | | | 2.50% | |
| JPMorgan Chase & Co. | | | 2.38% | |
| Cisco Systems, Inc. | | | 2.10% | |
| EOG Resources, Inc. | | | 2.09% | |
| Ares Management Corp., Class A | | | 1.98% | |
| Philip Morris International, Inc. | | | 1.96% | |
| Unilever PLC, ADR | | | 1.73% | |
| Total | | | 23.45% | |
| 1 | The Fund’s holdings are allocated to each sector based on the MSCI Global Industry Classification Standard (GICS®). Cash includes short-term investments and net other assets and liabilities. |
| 2 | Portfolio holdings are subject to change and should not be considered a recommendation to buy or sell individual securities. |
UNDERSTANDING YOUR FUND’S EXPENSES (UNAUDITED)
By investing in the Fund, you incur two types of costs: (1) transaction costs and (2) ongoing costs, including, as applicable, investment advisory fees, distribution and/or service (12b-1) fees, if any, and other Fund expenses. The example below is intended to help you understand your ongoing costs (in dollars) of investing in the Fund and to compare these costs with the ongoing costs of investing in other mutual funds.
The example is based on an investment of $1,000 invested at the beginning of the period and held for the entire period from January 1, 2023 to June 30, 2023. The table below shows the Fund’s expenses in two ways:
Expenses based on actual return
This section of the table provides information about actual account values and actual expenses. You may use the information in this section, together with the amount you invested, to estimate the expenses that you paid over the period. Simply divide your account value by $1,000 (for example, an $8,600 account value divided by $1,000 = 8.6), then multiply the result by the number in the section under the heading entitled “Expenses Paid During Period” to estimate the expenses you paid on your account during this period.
Expenses based on hypothetical 5% return for comparison purposes
This section of the table provides information about hypothetical account values and hypothetical expenses based on the Fund’s actual expense ratio and an assumed rate of return of 5% per year before expenses, which is not the Fund’s actual return. The hypothetical account values and expenses may not be used to estimate the actual ending account balance or expenses you paid for the period. You may use this information to compare the ongoing costs of investing in the Fund with the cost of investing in other mutual funds. To do so, compare this 5% hypothetical example with the 5% hypothetical examples that appear in the shareholder reports of the other funds.
Note that the expenses shown in the table are meant to highlight your ongoing costs only and do not reflect any transactional costs, such as sales charges (loads), redemption fees, or exchange fees. Therefore the second section is useful in comparing ongoing costs only, and will not help you determine the relative total costs of owning different funds. If these transactional costs were included, your costs would have been higher. Charges and expenses at the insurance company separate account level are not reflected in the table.
| | | | | | | | | | | | | | |
| | | | | |
| | | Beginning Account Value 1/1/23 | | Ending Account Value 6/30/23 | | | Expenses Paid During Period* 1/1/23-6/30/23 | | | Expense Ratio During Period 1/1/23-6/30/23 | |
| Based on Actual Return | | $1,000.00 | | $ | 1,020.50 | | | $ | 2.76 | | | | 0.55% | |
Based on Hypothetical Return (5% Return Before Expenses) | | $1,000.00 | | $ | 1,022.07 | | | $ | 2.76 | | | | 0.55% | |
| * | Expenses are equal to the Fund’s annualized expense ratio as indicated, multiplied by the average account value over the period, multiplied by 181/365 (to reflect the one-half year period). |
SCHEDULE OF INVESTMENTS — GUARDIAN EQUITY INCOME VIP FUND
| | | | | | | | |
| June 30, 2023 (unaudited) | | Shares | | | Value | |
| Common Stocks – 98.8% | |
| |
| Aerospace & Defense – 3.3% | |
| | | |
General Dynamics Corp. | | | 9,752 | | | $ | 2,098,143 | |
| | | |
L3Harris Technologies, Inc. | | | 6,123 | | | | 1,198,700 | |
| | | |
Raytheon Technologies Corp. | | | 13,494 | | | | 1,321,872 | |
| | | | | | | | | |
| | |
| | | | | 4,618,715 | |
| Banks – 7.2% | |
| | | |
JPMorgan Chase & Co. | | | 23,176 | | | | 3,370,717 | |
| | | |
M&T Bank Corp. | | | 16,335 | | | | 2,021,620 | |
| | | |
New York Community Bancorp, Inc. | | | 137,833 | | | | 1,549,243 | |
| | | |
Regions Financial Corp. | | | 88,746 | | | | 1,581,454 | |
| | | |
Royal Bank of Canada (Canada) | | | 17,635 | | | | 1,684,227 | |
| | | | | | | | | |
| | |
| | | | | 10,207,261 | |
| Beverages – 2.3% | |
| | | |
Keurig Dr Pepper, Inc. | | | 45,685 | | | | 1,428,570 | |
| | | |
Pernod Ricard SA (France) | | | 8,094 | | | | 1,788,283 | |
| | | | | | | | | |
| | |
| | | | | 3,216,853 | |
| Biotechnology – 1.5% | |
| | | |
Gilead Sciences, Inc. | | | 27,252 | | | | 2,100,312 | |
| | | | | | | | | |
| | |
| | | | | 2,100,312 | |
| Building Products – 1.3% | |
| | | |
Johnson Controls International PLC | | | 26,576 | | | | 1,810,889 | |
| | | | | | | | | |
| | |
| | | | | 1,810,889 | |
| Capital Markets – 7.0% | |
| | | |
Ares Management Corp., Class A | | | 29,018 | | | | 2,795,885 | |
| | | |
Blackstone, Inc. | | | 15,199 | | | | 1,413,051 | |
| | | |
Goldman Sachs Group, Inc. | | | 4,145 | | | | 1,336,928 | |
| | | |
Morgan Stanley | | | 24,660 | | | | 2,105,964 | |
| | | |
Raymond James Financial, Inc. | | | 21,195 | | | | 2,199,405 | |
| | | | | | | | | |
| | |
| | | | | 9,851,233 | |
| Chemicals – 2.8% | |
| | | |
Celanese Corp. | | | 8,220 | | | | 951,876 | |
| | | |
LyondellBasell Industries NV, Class A | | | 16,836 | | | | 1,546,050 | |
| | | |
PPG Industries, Inc. | | | 9,604 | | | | 1,424,273 | |
| | | | | | | | | |
| | |
| | | | | 3,922,199 | |
| Communications Equipment – 2.1% | |
| | | |
Cisco Systems, Inc. | | | 57,283 | | | | 2,963,822 | |
| | | | | | | | | |
| | |
| | | | | 2,963,822 | |
| Distributors – 1.1% | |
| | | |
LKQ Corp. | | | 26,210 | | | | 1,527,257 | |
| | | | | | | | | |
| | |
| | | | | 1,527,257 | |
| Electric Utilities – 4.1% | |
| | | |
American Electric Power Co., Inc. | | | 21,816 | | | | 1,836,907 | |
| | | |
Exelon Corp. | | | 56,962 | | | | 2,320,632 | |
| | | |
NextEra Energy, Inc. | | | 21,951 | | | | 1,628,764 | |
| | | | | | | | | |
| | |
| | | | | 5,786,303 | |
| Electrical Equipment – 2.5% | |
| | | |
Eaton Corp. PLC | | | 7,760 | | | | 1,560,536 | |
| | | |
Emerson Electric Co. | | | 21,547 | | | | 1,947,633 | |
| | | | | | | | | |
| | |
| | | | | 3,508,169 | |
| | | | | | | | |
| June 30, 2023 (unaudited) | | Shares | | | Value | |
| Electronic Equipment, Instruments & Components – 2.5% | |
| | | |
Corning, Inc. | | | 50,020 | | | $ | 1,752,701 | |
| | | |
TE Connectivity Ltd. | | | 12,646 | | | | 1,772,463 | |
| | | | | | | | | |
| | |
| | | | | 3,525,164 | |
| Financial Services – 1.9% | |
| | | |
Equitable Holdings, Inc. | | | 60,290 | | | | 1,637,476 | |
| | | |
Fidelity National Information Services, Inc. | | | 20,583 | | | | 1,125,890 | |
| | | | | | | | | |
| | |
| | | | | 2,763,366 | |
| Food Products – 3.1% | |
| | | |
Archer-Daniels-Midland Co. | | | 19,793 | | | | 1,495,559 | |
| | | |
Kellogg Co. | | | 23,830 | | | | 1,606,142 | |
| | | |
Mondelez International, Inc., Class A | | | 16,745 | | | | 1,221,380 | |
| | | | | | | | | |
| | |
| | | | | 4,323,081 | |
| Gas Utilities – 1.3% | |
| | | |
Atmos Energy Corp. | | | 16,208 | | | | 1,885,639 | |
| | | | | | | | | |
| | |
| | | | | 1,885,639 | |
| Ground Transportation – 1.0% | |
| | | |
Canadian National Railway Co. (Canada) | | | 11,375 | | | | 1,377,450 | |
| | | | | | | | | |
| | |
| | | | | 1,377,450 | |
| Health Care Equipment & Supplies – 1.5% | |
| | | |
Becton Dickinson and Co. | | | 8,302 | | | | 2,191,811 | |
| | | | | | | | | |
| | |
| | | | | 2,191,811 | |
| Health Care Providers & Services – 2.9% | |
| | | |
Elevance Health, Inc. | | | 3,938 | | | | 1,749,614 | |
| | | |
UnitedHealth Group, Inc. | | | 4,920 | | | | 2,364,749 | |
| | | | | | | | | |
| | |
| | | | | 4,114,363 | |
| Health Care REITs – 1.2% | |
| | | |
Welltower, Inc. | | | 21,325 | | | | 1,724,979 | |
| | | | | | | | | |
| | |
| | | | | 1,724,979 | |
| Hotel & Resort REITs – 1.0% | |
| | | |
Host Hotels & Resorts, Inc. | | | 84,378 | | | | 1,420,082 | |
| | | | | | | | | |
| | |
| | | | | 1,420,082 | |
| Household Durables – 1.0% | |
| | | |
Lennar Corp., Class A | | | 11,779 | | | | 1,476,026 | |
| | | | | | | | | |
| | |
| | | | | 1,476,026 | |
| Household Products – 0.7% | |
| | | |
Kimberly-Clark Corp. | | | 6,845 | | | | 945,021 | |
| | | | | | | | | |
| | |
| | | | | 945,021 | |
| Industrial Conglomerates – 2.0% | |
| | | |
Honeywell International, Inc. | | | 6,163 | | | | 1,278,822 | |
| | | |
Siemens AG, ADR | | | 8,911 | | | | 743,267 | |
| | | |
Siemens AG (Reg S) (Germany) | | | 5,327 | | | | 886,671 | |
| | | | | | | | | |
| | |
| | | | | 2,908,760 | |
| Insurance – 3.9% | |
| | | |
American International Group, Inc. | | | 26,643 | | | | 1,533,038 | |
| | | |
Chubb Ltd. | | | 8,870 | | | | 1,708,007 | |
| | | |
MetLife, Inc. | | | 41,068 | | | | 2,321,574 | |
| | | | | | | | | |
| | |
| | | | | 5,562,619 | |
| | | | |
| The accompanying notes are an integral part of these financial statements. | | | | 3 |
SCHEDULE OF INVESTMENTS — GUARDIAN EQUITY INCOME VIP FUND
| | | | | | | | |
| June 30, 2023 (unaudited) | | Shares | | | Value | |
| IT Services – 1.0% | |
| | | |
Amdocs Ltd. | | | 14,094 | | | $ | 1,393,192 | |
| | | | | | | | | |
| | |
| | | | | 1,393,192 | |
| Media – 1.5% | |
| | | |
Comcast Corp., Class A | | | 50,252 | | | | 2,087,971 | |
| | | | | | | | | |
| | |
| | | | | 2,087,971 | |
| Metals & Mining – 1.7% | |
| | | |
Barrick Gold Corp. | | | 48,889 | | | | 827,691 | |
| | | |
Rio Tinto PLC, ADR | | | 23,913 | | | | 1,526,606 | |
| | | | | | | | | |
| | |
| | | | | 2,354,297 | |
| Multi-Utilities – 1.4% | |
| | | |
Sempra Energy | | | 13,252 | | | | 1,929,359 | |
| | | | | | | | | |
| | |
| | | | | 1,929,359 | |
| Oil, Gas & Consumable Fuels – 7.9% | |
| | | |
ConocoPhillips | | | 34,325 | | | | 3,556,413 | |
| | | |
Coterra Energy, Inc. | | | 75,271 | | | | 1,904,356 | |
| | | |
EOG Resources, Inc. | | | 25,790 | | | | 2,951,408 | |
| | | |
Phillips 66 | | | 14,174 | | | | 1,351,916 | |
| | | |
TC Energy Corp. (Canada) | | | 33,655 | | | | 1,360,173 | |
| | | | | | | | | |
| | |
| | | | | 11,124,266 | |
| Personal Care Products – 1.7% | |
| | | |
Unilever PLC, ADR | | | 47,025 | | | | 2,451,413 | |
| | | | | | | | | |
| | |
| | | | | 2,451,413 | |
| Pharmaceuticals – 12.2% | |
| | | |
AstraZeneca PLC, ADR | | | 27,627 | | | | 1,977,264 | |
| | | |
Eli Lilly and Co. | | | 2,997 | | | | 1,405,533 | |
| | | |
Johnson & Johnson | | | 21,347 | | | | 3,533,355 | |
| | | |
Merck & Co., Inc. | | | 33,545 | | | | 3,870,758 | |
| | | |
Pfizer, Inc. | | | 133,270 | | | | 4,888,344 | |
| | | |
Roche Holding AG (Switzerland) | | | 5,384 | | | | 1,645,326 | |
| | | | | | | | | |
| | |
| | | | | 17,320,580 | |
| Semiconductors & Semiconductor Equipment – 4.4% | |
| | | |
Analog Devices, Inc. | | | 7,006 | | | | 1,364,839 | |
| | | |
Broadcom, Inc. | | | 1,789 | | | | 1,551,832 | |
| | | |
NXP Semiconductors NV | | | 9,094 | | | | 1,861,360 | |
| | | |
QUALCOMM, Inc. | | | 12,562 | | | | 1,495,381 | |
| | | | | | | | | |
| | |
| | | | | 6,273,412 | |
| | | | | | | | |
| June 30, 2023 (unaudited) | | Shares | | | Value | |
| Specialized REITs – 3.0% | |
| | | |
Crown Castle, Inc. | | | 19,045 | | | $ | 2,169,988 | |
| | | |
Gaming and Leisure Properties, Inc. | | | 43,057 | | | | 2,086,542 | |
| | | | | | | | | |
| | |
| | | | | 4,256,530 | |
| Specialty Retail – 2.9% | |
| | | |
Home Depot, Inc. | | | 7,142 | | | | 2,218,591 | |
| | | |
TJX Cos., Inc. | | | 21,756 | | | | 1,844,691 | |
| | | | | | | | | |
| | |
| | | | | 4,063,282 | |
| Tobacco – 1.9% | |
| | | |
Philip Morris International, Inc. | | | 28,328 | | | | 2,765,379 | |
| | | | | | | | | |
| | |
| | | | | 2,765,379 | |
| | |
Total Common Stocks
(Cost $136,911,663) | | | | 139,751,055 | |
| | | | | | | | |
| | | Principal
Amount | | |
Value | |
| Repurchase Agreements – 1.0% | |
| | | |
Fixed Income Clearing Corp., 1.52%, dated 6/30/2023, proceeds at maturity value of $1,367,136, due 7/3/2023(1) | | $ | 1,366,963 | | | | 1,366,963 | |
| | | |
Total Repurchase Agreements
(Cost $1,366,963) | | | | | | | 1,366,963 | |
| | | |
Total Investments – 99.8%
(Cost $138,278,626) | | | | | | | 141,118,018 | |
| | |
| Assets in excess of other liabilities – 0.2% | | | | 250,484 | |
| | | |
| Total Net Assets – 100.0% | | | | | | $ | 141,368,502 | |
| (1) | The table below presents collateral for repurchase agreements. |
| | | | | | | | | | | | | | | | |
| Security | | Coupon | | | Maturity
Date | | | Principal
Amount | | | Value | |
| U.S. Treasury Note | | | 4.625% | | | | 3/15/2026 | | | $ | 1,374,000 | | | $ | 1,394,302 | |
Legend:
ADR — American Depositary Receipt
REITs — Real Estate Investment Trusts
The following is a summary of the inputs used as of June 30, 2023 in valuing the Fund’s investments. For more information on valuation inputs, please refer to Note 2a of the accompanying Notes to Financial Statements.
| | | | | | | | | | | | | | | | |
| | | Valuation Inputs | | | | |
| Investments in Securities (unaudited) | | Level 1 | | | Level 2 | | | Level 3 | | | Total | |
| Common Stocks | | $ | 135,430,775 | | | $ | 4,320,280 | * | | $ | — | | | $ | 139,751,055 | |
| Repurchase Agreements | | | — | | | | 1,366,963 | | | | — | | | | 1,366,963 | |
| Total | | $ | 135,430,775 | | | $ | 5,687,243 | | | $ | — | | | $ | 141,118,018 | |
| * | Consists of certain foreign securities whose values were determined by a pricing service using pricing models (See Note 2a in Notes to Financial Statements). These investments in securities were classified as Level 2 rather than Level 1. |
| | | | |
| 4 | | | | The accompanying notes are an integral part of these financial statements. |
FINANCIAL INFORMATION — GUARDIAN EQUITY INCOME VIP FUND
| | | | |
Statement of Assets and Liabilities As of June 30, 2023 (unaudited) | | �� | |
Assets | | | | |
| | |
Investments, at value | | $ | 141,118,018 | |
| | |
Foreign currency, at value | | | 5,852 | |
| | |
Receivable for investments sold | | | 805,631 | |
| | |
Dividends/interest receivable | | | 195,867 | |
| | |
Foreign tax reclaims receivable | | | 14,466 | |
| | |
Reimbursement receivable from adviser | | | 10,565 | |
| | |
Prepaid expenses | | | 1,674 | |
| | | | | |
| | |
Total Assets | | | 142,152,073 | |
| | | | | |
| | |
Liabilities | | | | |
| | |
Payable for investments purchased | | | 541,530 | |
| | |
Payable for fund shares redeemed | | | 126,294 | |
| | |
Investment advisory fees payable | | | 57,163 | |
| | |
Accrued custodian and accounting fees | | | 16,945 | |
| | |
Accrued audit fees | | | 14,782 | |
| | |
Accrued trustees��� and officers’ fees | | | 3,012 | |
| | |
Accrued expenses and other liabilities | | | 23,845 | |
| | | | | |
| | |
Total Liabilities | | | 783,571 | |
| | | | | |
| | |
Total Net Assets | | $ | 141,368,502 | |
| | | | | |
| | |
Net Assets Consist of: | | | | |
| | |
Paid-in capital | | $ | 134,865,246 | |
| | |
Distributable earnings | | | 6,503,256 | |
| | | | | |
| | |
Total Net Assets | | $ | 141,368,502 | |
| | | | | |
| | |
Investments, at Cost | | $ | 138,278,626 | |
| | | | | |
| | |
Foreign Currency, at Cost | | $ | 5,852 | |
| | | | | |
| | |
Pricing of Shares | | | | |
| | |
Shares of Beneficial Interest Outstanding with No Par Value | | | 13,497,553 | |
| | |
Net Asset Value Per Share | | | $10.47 | |
| | | | | |
| | | | |
Statement of Operations For the Six Months Ended June 30, 2023 (unaudited) | | | |
Investment Income | | | | |
| | |
Dividends | | $ | 2,237,734 | |
| | |
Interest | | | 13,028 | |
| | |
Withholding taxes on foreign dividends | | | (38,184 | ) |
| | | | | |
| | |
Total Investment Income | | | 2,212,578 | |
| | | | | |
| | |
Expenses | | | | |
| | |
Investment advisory fees | | | 348,184 | |
| | |
Professional fees | | | 28,133 | |
| | |
Custodian and accounting fees | | | 21,380 | |
| | |
Trustees’ and officers’ fees | | | 18,140 | |
| | |
Administrative fees | | | 14,170 | |
| | |
Transfer agent fees | | | 7,595 | |
| | |
Shareholder reports | | | 4,492 | |
| | |
Other expenses | | | 3,958 | |
| | | | | |
| | |
Total Expenses | | | 446,052 | |
| | |
Less: Fees waived | | | (63,050 | ) |
| | | | | |
| | |
Total Expenses, Net | | | 383,002 | |
| | | | | |
| | |
Net Investment Income/(Loss) | | | 1,829,576 | |
| | | | | |
| | |
Realized Gain/(Loss) and Change in Unrealized Appreciation/(Depreciation) on Investments and Foreign Currency Transactions | | | | |
| | |
Net realized gain/(loss) from investments | | | 363,507 | |
| | |
Net realized gain/(loss) from foreign currency transactions | | | 224 | |
| | |
Net change in unrealized appreciation/(depreciation) on investments | | | 584,895 | |
| | |
Net change in unrealized appreciation/(depreciation) on translation of assets and liabilities in foreign currencies | | | 490 | |
| | | | | |
| | |
Net Gain on Investments and Foreign Currency Transactions | | | 949,116 | |
| | | | | |
| | |
Net Increase in Net Assets Resulting From Operations | | $ | 2,778,692 | |
| | | | | |
| | | | | |
| | | | |
| The accompanying notes are an integral part of these financial statements. | | | | 5 |
FINANCIAL INFORMATION — GUARDIAN EQUITY INCOME VIP FUND
| | | | | | | | |
Statements of Changes in Net Assets Six Months Ended Numbers are unaudited | | | | | | |
| | | |
| | | For the
Six Months Ended
6/30/23 | | | For the
Period Ended
12/31/221 | |
| | | | | | | |
Operations | | | | | | | | |
| | | |
Net investment income/(loss) | | $ | 1,829,576 | | | $ | 2,629,736 | |
| | | |
Net realized gain/(loss) from investments and foreign currency transactions | | | 363,731 | | | | (1,159,677 | ) |
| | | |
Net change in unrealized appreciation/(depreciation) on investments and
translation of assets and liabilities in foreign currencies | | | 585,385 | | | | 2,254,505 | |
| | | | | | | | | |
| | | |
Net Increase in Net Assets Resulting from Operations | | | 2,778,692 | | | | 3,724,564 | |
| | | | | | | | | |
| | | |
Capital Share Transactions | | | | | | | | |
| | | |
Proceeds from sales of shares | | | 4,436,725 | | | | 155,355,075 | |
| | | |
Cost of shares redeemed | | | (8,955,435 | ) | | | (15,971,119 | ) |
| | | | | | | | | |
| | | |
Net Increase/(Decrease) in Net Assets Resulting from Capital Share Transactions | | | (4,518,710 | ) | | | 139,383,956 | |
| | | | | | | | | |
| | | |
Net Increase/(Decrease) in Net Assets | | | (1,740,018 | ) | | | 143,108,520 | |
| | | | | | | | | |
| | | |
Net Assets | | | | | | | | |
| | | |
Beginning of period | | | 143,108,520 | | | | — | |
| | | | | | | | | |
| | | |
End of period | | $ | 141,368,502 | | | $ | 143,108,520 | |
| | | | | | | | | |
| | | |
Other Information: | | | | | | | | |
| | | |
Shares | | | | | | | | |
| | | |
Sold | | | 430,809 | | | | 15,535,623 | |
| | | |
Redeemed | | | (877,731 | ) | | | (1,591,148 | ) |
| | | | | | | | | |
| | | |
Net Increase/(Decrease) | | | (446,922 | ) | | | 13,944,475 | |
| | | | | | | | | |
| | | | | | | | | |
| 1 | Commenced operations on May 2, 2022. |
| | | | |
| 6 | | | | The accompanying notes are an integral part of these financial statements. |
This Page Intentionally Left Blank
FINANCIAL INFORMATION — GUARDIAN EQUITY INCOME VIP FUND
The Financial Highlights table is intended to help you understand the Fund’s financial performance for the past six reporting periods (or, if shorter, the period since inception). Certain information reflects financial results for a single Fund share. The total returns in the table represent the rate that an investor would have earned (or lost) on an investment in the Fund.
| | | | | | | | | | | | | | | | | | | | | | | | |
Financial Highlights Six Months Ended Numbers are unaudited | | | | | | | | | | | | | | | | |
| | | Per Share Operating Performance | | | | |
| | |
Net Asset Value,
Beginning of
Period | | | Net Investment
Income(1) | | | Net Realized
and Unrealized
Gain | | | Total
Operations | | | Net Asset
Value, End of
Period | | | Total Return(2),(3) | |
| | | | | | | |
Six Months Ended 6/30/23 | | $ | 10.26 | | | $ | 0.13 | | | $ | 0.08 | | | $ | 0.21 | | | $ | 10.47 | | | | 2.05% | |
| | | | | | | |
Period Ended 12/31/22(5) | | | 10.00 | | | | 0.18 | | | | 0.08 | | | | 0.26 | | | | 10.26 | | | | 2.60% | |
| | | | |
| 8 | | | | The accompanying notes are an integral part of these financial statements. |
FINANCIAL INFORMATION — GUARDIAN EQUITY INCOME VIP FUND
| | | | | | | | | | | | | | | | | | | | | | |
| |
| Ratios/Supplemental Data | |
Net Assets, End
of Period (000s) | | | Net Ratio of
Expenses to
Average
Net Assets(3),(4) | | | Gross Ratio of
Expenses to
Average Net
Assets(3) | | | Net Ratio of Net Investment Income
to Average
Net Assets(3),(4) | | | Gross Ratio of Net
Investment Income
to Average
Net Assets(3) | | | Portfolio
Turnover Rate(3) | |
| | | | | |
| $ | 141,369 | | | | 0.55% | | | | 0.64% | | | | 2.63% | | | | 2.54% | | | | 17% | |
| | | | | |
| | 143,109 | | | | 0.54% | | | | 0.64% | | | | 2.68% | | | | 2.58% | | | | 36% | |
| (1) | Calculated based on the average shares outstanding during the period. |
| (2) | Total returns do not reflect the effects of charges deducted pursuant to the terms of The Guardian Insurance & Annuity Company, Inc.’s variable contracts. Inclusion of such charges would reduce the total returns for all periods shown. |
| (3) | Ratios for periods less than one year have been annualized, except for total return and portfolio turnover rate. For the period ended December 31, 2022, certain non-recurring fees (i.e., audit fees) are not annualized. |
| (4) | Net Ratio of Expenses to Average Net Assets and Net Ratio of Net Investment Income to Average Net Assets include the effect of fee waivers and expense limitations. |
| (5) | Commenced operations on May 2, 2022. |
| | | | |
| The accompanying notes are an integral part of these financial statements. | | | | 9 |
NOTES TO FINANCIAL STATEMENTS — GUARDIAN EQUITY INCOME VIP FUND
June 30, 2023 (unaudited)
1. Organization
Guardian Variable Products Trust (the “Trust”), a Delaware statutory trust organized on January 12, 2016, is registered under the Investment Company Act of 1940, as amended (the “1940 Act”), as an open-end management investment company. The Trust currently has twenty-four series. Guardian Equity Income VIP Fund (the “Fund”) is a series of the Trust. The Fund is a diversified fund and commenced operations on May 2, 2022. The financial statements for other series of the Trust are presented in separate reports.
The Trust has authorized an unlimited number of shares of beneficial interest with no par value. Shares are bought and sold at closing net asset value (“NAV”). Shares of the Fund are only sold to certain separate accounts of The Guardian Insurance & Annuity Company, Inc. (“GIAC”) that fund certain variable annuity contracts and variable life insurance policies issued by GIAC. GIAC is a wholly-owned subsidiary of The Guardian Life Insurance Company of America (“Guardian Life”).
The Fund seeks a high level of current income consistent with growth of capital.
2. Significant Accounting Policies
The following is a summary of significant accounting policies followed by the Fund in the preparation of its financial statements. The Fund follows the investment company accounting and reporting guidance of the Financial Accounting Standards Board (“FASB”) Accounting Standards Codification Topic 946 Financial Services – Investment Companies. The following policies are in conformity with accounting principles generally accepted in the United States of America (“GAAP”). The preparation of financial statements in accordance with GAAP requires management to make estimates and assumptions that affect the reported amounts and disclosures in the financial statements. Actual results could differ from those estimates.
a. Investment Valuations The Board of Trustees has designated Park Avenue Institutional Advisers LLC (“Park Avenue”) as the valuation designee for the Fund pursuant to Rule 2a-5 under the 1940 Act. Park Avenue has established a Fair Valuation Committee and has adopted fair valuation procedures that provide methodologies for fair valuing securities. These procedures include monitoring the appropriateness of fair values based on results of ongoing valuation oversight, including but not limited to consideration of
security specific events, market events, and pricing vendor and broker-dealer due diligence. The Fair Valuation Committee oversees and carries out the policies for the valuation of investments held in the Fund. The Fair Valuation Committee is responsible for discussing and assessing the potential impacts to the fair values on an ongoing basis, and reports to the Board of Trustees on at least a quarterly basis.
Equity securities traded on an exchange other than NASDAQ Stock Market, LLC (“NASDAQ”) are valued at the last reported sale price on the principal exchange or market on which they are traded; or, if there were no sales that day, at the mean between the closing bid and ask prices. Securities traded on the NASDAQ are generally valued at the NASDAQ official closing price, which may not be the last sale price. If the NASDAQ official closing price is not available for a security, that security is generally valued at the mean between the closing bid and ask prices. Repurchase agreements are carried at cost, which approximates fair value (see Note 5d). Foreign securities are valued in the currencies of the markets in which they trade and then converted to U.S. dollars by the application of foreign exchange rates at the close of the New York Stock Exchange (“NYSE”). Forward foreign currency contracts, if any, are valued at the mean between the bid and ask rates for the specified time interpolated from rates for proximate time periods.
Securities for which market quotations are not readily available or securities whose values have been materially affected by events occurring before the Fund’s valuation time but after the close of the securities’ principal exchange or market are valued at their fair values as determined in good faith by Park Avenue, as the Board of Trustee’s valuation designee (as defined in Rule 2a-5 under the 1940 Act), in accordance with Park Avenue’s procedures and under the general oversight of the Board of Trustees. In addition, the values of the Fund’s investments in foreign securities are generally determined by a pricing service using pricing models designed to estimate likely changes in the values of those securities. Certain foreign equity instruments are valued by applying international fair value factors provided by approved pricing services. The factors seek to adjust the local closing price for movements of local markets post closing, but prior to the time the NAVs are calculated. Valuations reflected in this report are as of the report date. As a result, changes in valuation due to market events and/or issuer related events after the report date and prior to issuance of the report are not reflected herein.
NOTES TO FINANCIAL STATEMENTS — GUARDIAN EQUITY INCOME VIP FUND
Various inputs are used in determining the valuation of the Fund’s investments. These inputs are summarized in three broad levels listed below.
| • | | Level 1 – unadjusted inputs using quoted prices in active markets for identical investments. |
| • | | Level 2 – other significant observable inputs, including, but not limited to, quoted prices for similar investments, inputs other than quoted prices that are observable for investments (such as interest rates, prepayment speeds, credit risks, etc.) or other market corroborated inputs. |
| • | | Level 3 – significant unobservable inputs (including the Fund’s own assumptions in determining the fair value of investments). |
Inputs may include price information, volatility statistics, specific and broad credit data, liquidity statistics, and other factors. A financial instrument’s level within the fair value hierarchy is based on the lowest level of any input; both individually and in aggregate, that is significant to the fair value measurement. However, the determination of what constitutes “observable” requires significant judgment by the Trust. The Trust considers observable data to be that market data which is readily available, regularly distributed or updated, reliable and verifiable, and provided by independent sources that are actively involved in the relevant market. The inputs or methodology used for valuing securities are not necessarily an indication of the risk associated with investing in those securities. Changes in valuation techniques may result in transfers into or out of a financial instrument’s assigned level within the hierarchy.
The FASB requires reporting entities to make disclosures about purchases, sales, issuances and settlements of Level 3 securities on a gross basis. For the six months ended June 30, 2023, there were no transfers into or out of Level 3 of the fair value hierarchy.
In determining a financial instrument’s placement within the hierarchy, the Trust separates the Fund’s investment portfolio into two categories: investments and derivatives (e.g., futures). A summary of inputs used to value the Fund’s assets and liabilities carried at fair value as of June 30, 2023 is included in the Schedule of Investments.
Investments Investments whose values are based on quoted market prices in active markets, and are therefore classified within Level 1, include active listed equities. Investments that trade in markets that are not considered to be active, but are valued based on quoted
market prices, dealer quotations or alternative pricing sources supported by observable inputs are classified within Level 2. These include certain U.S. government and sovereign obligations, most government agency securities, investment-grade corporate bonds, certain mortgage products, state, municipal and provincial obligations, and certain foreign equity securities, including securities whose prices may have been affected by events occurring after the close of trading on their principal exchange or market and, as a result, whose values are determined by a pricing service as described above, or securities whose values are otherwise determined using fair valuation methods approved by the Fund’s Board of Trustees.
Investments classified within Level 3 have significant unobservable inputs, as they trade infrequently or not at all. Level 3 investments include, among others, private placement securities. When observable prices are not available for these securities, the Trust uses one or more valuation techniques for which sufficient and reliable data is available. The inputs used by the Trust in estimating the value of Level 3 investments include, for example, the original transaction price, recent transactions in the same or similar instruments, completed or pending third-party transactions in the underlying investment or comparable issuers, subsequent rounds of financing, recapitalizations, and other transactions across the capital structure. Level 3 investments may also be adjusted to reflect illiquidity and/or non-transferability, with the amount of such discount estimated by the Trust in the absence of market information. Assumptions used by the Trust due to the lack of observable inputs may significantly impact the resulting fair value and therefore the Fund’s results of operations. As of June 30, 2023, the Fund had no securities classified as Level 3.
Derivatives Exchange-traded derivatives, such as futures contracts, exchange-traded option contracts and certain swaps, are typically classified within Level 1 or Level 2 of the fair value hierarchy depending on whether or not they are deemed to be actively traded. Certain non-exchange-traded derivatives, such as generic forwards, certain swaps and options, have inputs which can generally be corroborated by market data and are therefore classified within Level 2. During the six months ended June 30, 2023, the Fund did not hold any derivatives.
b. Securities Transactions Securities transactions are accounted for on the date securities are purchased or sold (trade date). Realized gains or losses on securities transactions are determined on the basis of specific identification.
NOTES TO FINANCIAL STATEMENTS — GUARDIAN EQUITY INCOME VIP FUND
c. Foreign Currency Translation The accounting records of the Fund are maintained in U.S. dollars. Investment securities and all other assets and liabilities of the Fund denominated in a foreign currency are generally translated into U.S. dollars at the exchange rates quoted at the close of the NYSE on each business day. The market value of investment securities and other assets and liabilities are translated at the exchange rate as of the valuation date. Purchases and sales of securities, income receipts, and expense payments are translated into U.S. dollars at the exchange rates in effect on the dates of the respective transactions. The Fund does not isolate the portion of the fluctuations on investments resulting from changes in foreign currency exchange rates from the fluctuations in market prices of investments held. Such fluctuations are included in the Net change in net realized and unrealized gain/(loss) from investments on the Statement of Operations.
Reported realized foreign currency gains and losses arise from the disposition of foreign currency, currency gains or losses realized between the trade and settlement dates on securities transactions, and the difference between the amounts of dividends, interest and foreign withholding taxes recorded on the Fund’s books on the transaction date and the U.S. dollar equivalent of the amounts actually received or paid. These reported realized foreign currency gains and losses, if any, are included in Net realized gain/(loss) from foreign currency transactions on the Statement of Operations. Unrealized foreign currency gains and losses arise from changes (due to changes in exchange rates) in the value of foreign currency and other assets and liabilities denominated in foreign currencies, which are held at period end, if any, and are included in Net change in unrealized appreciation/(depreciation) on translation of assets and liabilities in foreign currencies on the Statement of Operations.
d. Foreign Capital Gains Tax The Fund may be subject to foreign taxes on income, gains on investments or currency purchases/repatriation, a portion of which may be recoverable. The Fund will accrue such taxes and recoveries as applicable, based upon their current interpretation of tax rules and regulations that exist in the markets in which they invest.
e. Investment Income Dividend income net of foreign taxes withheld, if any, is generally recorded on the ex-dividend date. Distributions received from real estate investment trusts, if any, may be classified as dividends, capital gains and/or return of capital. Interest income, which includes amortization/accretion of
premium/discount, is determined using the interest income accrual method, and is accrued and recorded daily.
f. Allocation of Income and Expenses Many of the expenses of the Trust can be directly attributed to a specific series of the Trust. Expenses that cannot be directly attributed to a specific series of the Trust are generally apportioned among all the series in the Trust, based on relative net assets. In calculating net asset value per share for each series of the Trust, investment income, realized and unrealized gains and losses, and expenses other than series-specific expenses are allocated daily to each series based upon the proportion of net assets attributable to each series.
3. Transactions with Affiliates
a. Investment Advisory Fee and Expense Limitation Under the terms of the advisory agreement, which, after its two year initial term, is reviewed and approved annually by the Board of Trustees, the Fund pays an investment advisory fee to Park Avenue. Park Avenue is a wholly-owned subsidiary of Guardian Life and receives an investment advisory fee at an annual rate of 0.50% of the Fund’s average daily net assets. The fee is accrued daily and paid monthly.
Park Avenue has contractually agreed through April 30, 2024 to waive certain fees and/or reimburse certain expenses incurred by the Fund to the extent necessary to limit the Fund’s total annual operating expenses after fee waiver and/or expense reimbursement to 0.55% of the Fund’s average daily net assets (excluding, if applicable, any acquired fund fees and expenses, taxes, interest, transaction costs and brokerage commissions, litigation and extraordinary expenses). The limitation may not be increased or terminated prior to this time without action by the Board of Trustees and may be terminated only upon approval of the Board of Trustees. Amounts waived or reimbursed by Park Avenue pursuant to any expense limitation will not be subject to Park Avenue’s recoupment rights. For the six months ended June 30, 2023, Park Avenue waived fees and/or paid Fund expenses in the amount of $63,050.
Park Avenue has entered into a Sub-Advisory Agreement with Wellington Management Company LLP (“Wellington”). Wellington is responsible for providing day-to-day investment advisory services to the Fund, subject to the supervision of Park Avenue and the oversight of the Board of Trustees. Sub-advisory fees are paid by Park Avenue and do not represent a separate or additional expense to the Fund.
NOTES TO FINANCIAL STATEMENTS — GUARDIAN EQUITY INCOME VIP FUND
b. Compensation of Trustees and Officers Trustees and officers who are interested persons of the Trust, as defined in the 1940 Act, receive no compensation from the Fund, except for the Chief Compliance Officer of the Trust. Trustees of the Trust who are not interested persons of the Trust, and the Chief Compliance Officer, receive compensation and reimbursement of expenses from the Trust.
4. Federal Income Taxes
a. Distributions to Shareholders For federal income tax purposes, the Fund is treated as a disregarded entity (“DRE”). As a DRE, the Fund is not subject to an entity-level income tax; and any income, gains, losses, deductions, taxes, and credits of the Fund would instead be “passed through” directly to the separate accounts of GIAC that invest in the Fund and retain the same character for U.S. federal income tax purposes. In addition, the Fund is not required to distribute taxable income and capital gains for U.S. federal income tax purposes. Therefore, no dividends and capital gains distributions were paid by the Fund.
5. Investments
a. Investment Purchases and Sales The cost of investments purchased and the proceeds from investments sold (excluding short-term investments) amounted to $23,182,631 and $25,728,794, respectively, for the six months ended June 30, 2023. During the six months ended June 30, 2023, there were no purchases or sales of U.S. government securities.
b. Foreign Securities Foreign securities investments involve special risks and considerations not typically associated with U.S. investments. These risks include, but are not limited to, currency risk; adverse political, regulatory, social, and economic developments; and less reliable information about issuers. Moreover, securities of some foreign issuers may be less liquid and their prices more volatile than those of comparable U.S. issuers.
c. Industry or Sector Concentration In its normal course of business, the Fund may invest a significant portion of its assets in companies within a limited number of industries or sectors. As a result, the Fund may be subject to a greater risk of loss than that of a fund invested in a wider spectrum of industries or sectors because the stocks of many or all of the companies in the industry, group of industries, sector, or sectors may decline in value due to developments adversely affecting the industry, group of industries, sector, or sectors.
d. Repurchase Agreements The Fund may invest in repurchase agreements to maintain liquidity and earn income over periods of time as short as overnight. The collateral for repurchase agreements is either cash or fully negotiable U.S. government securities (including U.S. government agency securities). Repurchase agreements are fully collateralized (including the interest accrued thereon) and such collateral is marked to market daily while the agreements remain in force. If the value of the collateral falls below the repurchase price plus accrued interest, the Fund will typically require the seller to deposit additional collateral by the next business day. If the request for additional collateral is not met, or the seller defaults, the Fund maintains the right to sell the collateral (although it may be prevented or delayed from doing so in certain circumstances) and may be required to claim any resulting loss against the seller. Park Avenue monitors the creditworthiness of the seller with which the Fund enters into repurchase agreements.
6. Temporary Borrowings
The Fund, with other funds managed by Park Avenue, is party to a credit agreement with respect to a $10 million committed revolving credit facility from State Street Bank and Trust Company (the “Credit Agreement”) for temporary borrowing purposes, including the meeting of redemption requests that otherwise might require the untimely disposition of securities. Interest is based on a daily fluctuating rate per annum equal to the Applicable Rate (as defined in the Credit Agreement) plus the Applicable Margin (as defined in the Credit Agreement) that is subject to change from time to time as and when the Applicable Rate changes. Under the current Credit Agreement, the Applicable Rate for any day is defined as the rate per annum equal to the sum of (a) 0.10% plus (b) the higher of (i) the Federal Funds Effective Rate for such day and (ii) the Overnight Bank Funding Rate for such day; the Applicable Margin is 1.25%. In addition to the interest charged on any borrowings by the Fund, each fund pays a commitment fee of 0.30% per annum on its share of the unused portion of the credit facility. The agreement is in place until January 5, 2024. The Fund did not utilize the credit facility during the six months ended June 30, 2023.
7. Indemnifications
Under the Trust’s organizational documents and, in some cases, by contract, officers and Trustees of the Trust are indemnified against certain liabilities arising out of the performance of their duties to the Fund. In addition, in the normal course of business, the Fund enters into contracts with its vendors and others that
NOTES TO FINANCIAL STATEMENTS — GUARDIAN EQUITY INCOME VIP FUND
provide general indemnifications. The Fund’s maximum exposure under these arrangements is unknown as this would involve future claims that may be made against the Fund that have not yet occurred. However, based on experience, the Fund expects the risk of loss to be remote.
8. Additional Information
The outbreak of COVID-19 has adversely impacted both local and global economies, including those in which the
Fund may invest. These impacts include materially reduced consumer demand and economic output, disrupted supply chains, market closures, travel restrictions and quarantines, and strained healthcare systems. The Fund’s operations may be interrupted as a result, which may have a negative impact on the Fund’s investment performance.
SUPPLEMENTAL INFORMATION (UNAUDITED)
Liquidity Risk Management Program
In compliance with Rule 22e-4 under the Investment Company Act of 1940, as amended (the “Liquidity Rule”), Guardian Variable Products Trust (the “Trust”) has adopted and implemented a written liquidity risk management program (the “Program”) for each series of the Trust (each, a “Fund”), which is reasonably designed to assess and manage each Fund’s liquidity risk. The Fund’s “liquidity risk” is the risk that the Fund could not
meet requests to redeem shares issued by the Fund without significant dilution of the remaining investors’ interests in the Fund.
The Board of Trustees of the Trust (the “Board”)
Previously approved the designation of Park Avenue Institutional Advisers LLC (the “Administrator” or “PAIA”) as Program administrator. The Administrator established a Liquidity Risk Management Committee, which is comprised of certain officers of the Trust and PAIA, that assists the Administrator in the implementation and day-to-day administration of the Program and otherwise support carrying out the Administrator’s liquidity risk management responsibilities under the Program.
In accordance with the Program, each Fund’s liquidity risk is assessed no less frequently than annually, taking into consideration a variety of factors, including, as applicable, the Fund’s investment strategy and liquidity of portfolio investments, cash flow projections, and holdings of cash and cash equivalents, as well as borrowing arrangements and other funding sources. Certain factors are considered under both normal and reasonably foreseeable stressed conditions.
Each Fund portfolio investment is classified, no less than monthly, into one of four liquidity categories (including “highly liquid investments” and “illiquid investments,” discussed below) based on a determination of the number of days it is reasonably expected to take to convert the investment to cash, or sell or dispose of the investment, in current market conditions without
significantly changing the investment’s market value.
The Liquidity Rule limits the Fund’s investments in illiquid investments by prohibiting the Fund from acquiring any illiquid investment if, immediately after the acquisition, the Fund would have invested more than 15% of its net assets in illiquid investments that are assets. The Program includes provisions reasonably designed to comply with this investment limitation. In addition, the Program includes provisions reasonably designed to comply with this investment limitation. In addition, the Program includes provisions reasonably designed to comply with the Liquidity Rule’s requirements relating to highly liquid investment minimums, which is a minimum amount of Fund net assets that must be invested in highly liquid investments that are assets, as applicable. The Fund was not required to adopt a highly liquid investment minimum during the period.
At a meeting of the Board held on March 29-30, 2023, the Board received a report (the “Report”) prepared by the Administrator addressing the Program’s operation and assessing the adequacy and effectiveness of its implementation for the period from January 1, 2022 through December 31, 2022 (the “Reporting Period”). The Report noted that the Administrator believes the Program operated effectively during the Reporting Period and continues to be reasonably designed to effectively assess and manage each Fund’s liquidity risk. The Report also noted that the Administrator believes the Program has been adequately and effectively implemented and the investment strategies for each Fund continue to be appropriate since its inception. In addition, the Report summarized the operation of the Program and the information and factors considered by the Administrator in its assessment of the Program’s implementation, such as the liquidity risk assessment framework and liquidity classification methodologies.
There can be no assurance that the Program will achieve its objectives under all circumstances. Please refer to the Fund’s prospectus for more information regarding the Fund’s exposure to liquidity risk and other risks to which an investment in the Fund may be subject.
SUPPLEMENTAL INFORMATION (UNAUDITED)
Approval of Investment Management and Sub-advisory Agreements
Section 15(c) of the Investment Company Act of 1940, as amended (the “1940 Act”), requires that a fund’s investment advisory and sub-advisory agreements be approved initially by the fund’s board of trustees. Section 15(c) also requires that the continuation of these agreements, after an initial term of up to two years, be annually reviewed and approved by the board. Any such agreement must be approved by a vote of a majority of the trustees who are not parties to the agreement or “interested persons” (as defined in the 1940 Act) of a party to the agreement at a meeting of the board called for the purpose of voting on such approval.
At a meeting of the Board of Trustees (the “Board”) of Guardian Variable Products Trust (the “Trust”) held on March 29-30, 2023 (the “Meeting”), the Board, including the trustees who are not parties to the agreement or “interested persons” as defined in the 1940 Act (the “Independent Trustees”), considered and voted unanimously to renew the existing investment management agreement between the Trust, on behalf of Guardian All Cap Core VIP Fund; Guardian Balanced Allocation VIP Fund; Guardian Core Fixed Income VIP Fund; Guardian Core Plus Fixed Income VIP Fund; Guardian Diversified Research VIP Fund; Guardian Equity Income VIP Fund; Guardian Global Utilities VIP Fund; Guardian Growth & Income VIP Fund; Guardian Integrated Research VIP Fund; Guardian International Growth VIP Fund; Guardian International Equity VIP Fund; Guardian Large Cap Disciplined Growth VIP Fund; Guardian Large Cap Disciplined Value VIP Fund; Guardian Large Cap Fundamental Growth VIP Fund; Guardian Mid Cap Relative Value VIP Fund; Guardian Mid Cap Traditional Growth VIP Fund; Guardian Multi-Sector Bond VIP Fund; Guardian Select Mid-Cap Core VIP Fund; Guardian Short Duration Bond VIP Fund; Guardian Small Cap Core VIP Fund; Guardian Small-Mid Cap Core VIP Fund; Guardian Strategic Large Cap Core VIP Fund; Guardian Total Return Bond VIP Fund and Guardian U.S. Government Securities VIP Fund (each, a “Fund,” and together, the “Funds”), in substantially the form presented at this meeting (the “Management Agreement”); and Park Avenue Institutional Advisers LLC (the “Manager”) for a one-year term.
The Board, including the Independent Trustees, also considered and voted unanimously to renew the existing sub-advisory agreements (the “Sub-Advisory Agreements,” collectively with the Management Agreement and Sub-Subadvisory Agreement, the “Agreements”) between the Manager and investment
advisory firms engaged to serve as sub-advisers to certain of the Funds (the “Sub-Advised Funds”), namely (i) ClearBridge Investments, LLC with respect to Guardian Small Cap Core VIP Fund; (ii) Putnam Investment Management, LLC with respect to Guardian Diversified Research VIP Fund; (iii) AllianceBernstein L.P. with respect to Guardian Growth & Income VIP Fund and Guardian Strategic Large Cap Core VIP Fund; (iv) J.P. Morgan Investment Management Inc. with respect to Guardian International Growth VIP Fund; (v) Schroder Investment Management North America Inc. with respect to Guardian International Equity VIP Fund; (vi) Wellington Management Company LLP with respect to Guardian Balanced Allocation VIP Fund, Guardian Equity Income VIP Fund, Guardian Integrated Research VIP Fund, Guardian Large Cap Disciplined Growth VIP Fund and Guardian Global Utilities VIP Fund; (vii) Boston Partners Global Investors, Inc. with respect to Guardian Large Cap Disciplined Value VIP Fund; (viii) Janus Henderson Investors US LLC with respect to Guardian Mid Cap Traditional Growth VIP Fund; (ix) Allspring Global Investments, LLC with respect to Guardian Mid Cap Relative Value VIP Fund and Guardian Small-Mid Cap Core VIP Fund; (x) Lord, Abbett & Co. LLC with respect to Guardian Core Plus Fixed Income VIP Fund; (xi) FIAM LLC with respect to Guardian Select Mid Cap Core VIP Fund; and (xii) Massachusetts Financial Services Company with respect to Guardian All Cap Core VIP Fund, each in substantially the form presented at this meeting, (each, a “Sub-Adviser” and collectively, the “Sub-Advisers”) for a one-year term.
The Board, including the Independent Trustees, also considered and voted unanimously to renew the existing sub-subadvisory agreement (the “Sub-Subadvisory Agreement”) between Schroder Investment Management North America Inc. and Schroder Investment Management North America Limited (also a Sub-Adviser) with respect to Guardian International Equity VIP Fund for a one-year term.
The Board is responsible for overseeing the management of each Fund. In determining whether to renew its approval of the Agreements, the Trustees evaluated information and factors that they considered to be relevant and appropriate through the exercise of their own business judgment. The Trustees considered certain information and factors in light of advice furnished to them by legal counsel to the Trust and, in the case of the Independent Trustees, their independent legal counsel. In advance of the Meeting, the Trustees received materials and information designed to assist their consideration of the Agreements. The Trustees received written responses
SUPPLEMENTAL INFORMATION (UNAUDITED)
from the Manager and each Sub-Adviser to a series of questions and requests for information encompassing a wide variety of topics provided by independent counsel on behalf of the Independent Trustees. The Independent Trustees also received materials and information regarding the legal standards applicable to their consideration of the Agreements and the process and criteria used by the Manager to identify and select the Sub-Advisers.
During the course of their deliberations, the Independent Trustees met twice to discuss and evaluate the materials, information and Agreements in executive session with their independent legal counsel, outside of the presence of the Trustees who are not Independent Trustees and representatives from Fund management, the Manager or any Sub-Adviser.
In reaching its decisions to renew its approval of the Agreements, the Board took into account the materials and information described above, as well as other materials and information provided to the Board throughout the year. Individual Trustees may have given different weight to different factors and information with respect to each Agreement, and the Trustees did not identify any single factor or information that, in isolation, would be controlling in deciding to approve the Agreements. The discussion below is intended to summarize the broad factors that figured prominently in the Board’s decisions to renew its approval of the Agreements rather than to be all-inclusive. These broad factors included: (i) the nature, extent and quality of the services provided to the Funds by the Manager and to the Sub-advised Funds by the Sub-Advisers; (ii) the investment performance of each Fund; (iii) estimated profitability of the Manager; (iv) fees and expenses; (v) the extent to which economies of scale may exist, and the extent to the benefits of economies of scale are shared with the Funds; and (vi) any other benefits derived by the Manager or the Sub-Advisers (or their respective affiliates) from their relationships with the Funds.
Nature, Extent and Quality of Services
The Trustees considered information regarding the nature, extent and quality of services provided to the Funds by the Manager. The Trustees also considered, among other things, the terms of the Management Agreement and the range of investment advisory services provided by the Manager. In addition, the Trustees reviewed the range of non-investment advisory services provided by the Manager consistent with the terms of the Management Agreement, notably coordinating the preparation and filing of various
regulatory documents, coordinating the preparation and assembly of Board meeting materials, and assisting the Board with certain valuation matters. The Board also received a description of the Manager’s and each Sub-Adviser’s business continuity plans and of their respective approaches to data privacy and cybersecurity, and related testing. The Board received information regarding the response of the Manager and the Sub-Advisers to the COVID-19 pandemic, including the continuation of remote work arrangements and return-to-office plans. The Board also received information about the Manager’s role as administrator of the Funds’ liquidity risk management program, the Manager’s approach to risk management, and the Manager’s vendor oversight programs.
The Trustees considered that the Sub-advised Funds operate in a “manager-of-managers” structure and reviewed the responsibilities that the Manager has under this structure, including monitoring and evaluating the performance of the Sub-Advisers, monitoring the Sub-Advisers for adherence to the stated investment objectives, strategies, policies and restrictions of the Funds and supervising the Sub-Advisers with respect to the services that the Sub-Advisers would provide under the Sub-Advisory Agreements. The Trustees also considered the process used by the Manager, consistent with this structure, to identify and recommend sub-advisers, and the Manager’s ability to monitor and oversee sub-advisers and recommend replacement sub-advisers, when necessary, and provide other services under the Management Agreement. The Board noted that investment management staff of the Manager and the Trust’s Chief Compliance Officer conduct oversight meetings with the Sub-Advisers on a periodic basis, follow through with additional inquiries on any questions or concerns that arise during the meetings and, as necessary, then report the results of the meetings to the Board. The Trustees reviewed information regarding the experience and background of the Manager’s key personnel and the Manager’s organizational structure and resources, including investment, legal and administrative capabilities of the Manager. In this regard, the Trustees recognized that the Funds may benefit from the Manager’s ability to use resources and capabilities of its affiliates in providing services to the Funds.
The Trustees considered information regarding the nature, extent and quality of services provided to the Sub-advised Funds by the Sub-Advisers. The Trustees also considered, among other things, the terms of the Sub-advisory Agreements and the range of investment
SUPPLEMENTAL INFORMATION (UNAUDITED)
advisory services provided by the Sub-Advisers under the oversight of the Manager. In evaluating these investment advisory services, the Trustees considered, among other things, the Sub-Advisers’ investment philosophies, styles and/or processes and approaches to managing the respective Sub-advised Funds. The Trustees received and evaluated information regarding the background, education, expertise and/or experience of the investment professionals who serve as portfolio managers for the Sub-advised Funds and the capabilities and resources of the Sub-Advisers.
Based upon these considerations, the Trustees concluded, within the context of their full deliberations, that the nature, extent and quality of services provided to the Funds by the Manager and the Sub-advised Funds by each respective Sub-Adviser were appropriate.
Investment Performance
In connection with each of its regular quarterly meetings, the Board receives information on the performance of each Fund, including net performance, relative performance rankings within the relevant Morningstar peer group, and performance as compared to benchmark index returns. At each quarterly Board meeting, members of the Manager’s funds management team review with the Board the economic and market environment, absolute and relative performance of each Fund, and any relevant information about risk management and style consistency in connection with management of the Funds. The Board considered investment performance for each Fund over the one-year, three-year (where available), five-year (where available) and since-inception periods.
The Board also received and reviewed a report prepared by Broadridge Financial Solutions (“Broadridge”), an independent provider of mutual fund industry data, which included comparisons of the performance of each Fund to performance of an appropriate peer universe. For details regarding each Fund’s performance, see the “Fund-by-Fund Factors” section below.
The Manager discussed with the Board factors contributing to the Funds’ performance results. In addition, for certain Funds, the Manager provided to the Board longer term performance records of the Sub-Advisers for strategies used in managing the Funds. The Board concluded that the investment performance generated by the Manager and each Sub-Adviser was generally satisfactory, or, that any steps being taken by the Manager and Sub-Advisers to address any performance issues were satisfactory.
Profitability
The Board received and considered the Manager’s estimate of its profitability, which included allocations by the Manager of its costs in providing management services to the Funds. The Board considered the estimated profitability of the Manager both overall and on a Fund-by-Fund basis.
The Board received and considered profitability information from most of the Sub-Advisers, but noted that the Manager had negotiated the fees with the Sub-Advisers at arm’s-length. Accordingly, the Board concluded that the profitability of the Sub-Advisers is a less relevant factor than Manager profitability.
Based on the consideration of this information, the Board concluded that the profitability of the Funds to the Manager was acceptable.
Fees and Expenses
The Trustees considered the management fees paid by the Funds to the Manager under the Management Agreement and evaluated the reasonableness of these fees. The Trustees received and reviewed comparative information with respect to the management fee and total expenses for each Fund and the management fees and total expenses for a peer group of other funds selected by Broadridge. The Trustees considered the Manager’s commitment to limit the total expenses of each Fund through an expense limitation agreement with the Trust. Although the Board recognized that the comparisons between the management fees and actual expenses of the Funds and those of the identified peer group are imprecise, given different terms of agreements and variations in fund strategies, the Trustees found that the comparative information supported their consideration and approval of the management fees and evaluation of the total expenses. For details regarding each Fund’s fee and expense comparisons, see the “Fund-by-Fund Factors” section below.
The Trustees considered the sub-advisory fees paid under the Sub-advisory Agreements and evaluated the reasonableness of those fees. The Trustees also considered that the fees paid to the Sub-Advisers would be paid by the Manager and not the Funds and that the Manager had negotiated the fees with the Sub-Advisers at arm’s-length.
Based on the consideration of the information and factors summarized above, as well as other relevant information and factors, the Board concluded that the management and sub-advisory fees were reasonable in
SUPPLEMENTAL INFORMATION (UNAUDITED)
light of the nature, extent and quality of services rendered to the Funds by the Manager and the Sub-Advisers.
Economies of Scale
The Board considered the extent to which economies of scale may exist, and the extent to the benefits of economies of scale are shared with the Funds. In this regard, the Board noted that for sixteen of twenty-four Funds, the management and sub-advisory fee included breakpoints that are tiered based on growth in asset levels of each such Fund and that for the other Funds, the fees reflected appropriate levels based on current and expected asset levels. The Board also noted that the expenses of the Funds are subject to expense limitations provided by the Manager. The Board noted that expected economies of scale, where they exist, may be shared through the use of fee breakpoints, expense limitations by the Manager, and/or a lower overall fee.
Ancillary Benefits
The Board considered the potential benefits, other than management fees, that the Manager and/or its affiliates may receive because of the Manager’s relationship with the Funds. The Trustees considered that the Funds were designed to serve as investment options under variable contracts issued by affiliates of the Manager that would receive fees under those contracts and that Park Avenue Securities LLC, an affiliate of the Manager and principal underwriter of the Funds, and participating insurance companies, including insurance companies affiliated with the Manager, would be entitled to receive fees from the Funds under a plan of distribution adopted pursuant to Rule 12b-1 under the 1940 Act. The Trustees considered that the Manager and its affiliates may benefit from (i) greater efficiencies in annuity administration and operations and potential cost savings due to a reduction in the number of unaffiliated funds available as annuity contract investment options, and (ii) increased dividends-received deductions due to the Funds’ status under the tax laws as disregarded entities. In addition, the Trustees considered the potential benefits, other than sub-advisory fees, that the Sub-Advisers and their affiliates may receive because of their relationships with the Funds, including the ability to receive research from soft dollar commissions consistent with Trust policies. The Trustees concluded that benefits that may accrue to the Manager and its affiliates are reasonable and the benefits that may accrue to the Sub-Advisers and their affiliates are consistent with those expected for a sub-adviser to a mutual fund such as the applicable Fund.
Fund-by-Fund Factors
The Broadridge report groups fees, expenses and performance into five quintiles, with the top quintile having the highest performance or lowest fees/expenses, and the bottom quintile having the lowest performance or highest fees/expenses. For purposes of the descriptions below, a Fund’s performance is considered “in line with” the benchmark index if it is within 0.20%.
Guardian Large Cap Fundamental Growth VIP Fund
| • | | The Board noted that the Fund’s performance was in the 3rd quintile of its performance universe for the 1-year period and in the 4th quintile for its performance universe for the 3-year and 5-year periods. The Board also noted that the Fund’s performance was below the benchmark index for the 1-year, 3-year and 5-year periods. |
| • | | The Board noted that the contractual management fee, the actual management fee and actual total expenses were in the 1st quintile of the expense group. |
Guardian Large Cap Disciplined Growth VIP Fund
| • | | The Board noted that the Fund’s performance was in the 3rd quintile of its performance universe for the 1-year and 3-year periods and in the 2nd quintile for the 5-year period. The Board also noted that the Fund’s performance was below the benchmark index for the 1-year, 3-year and 5-year periods. |
| • | | The Board noted that the contractual management fee, the actual management fee and actual total expenses were in the 1st quintile of the expense group. |
Guardian Integrated Research VIP Fund
| • | | The Board noted that the Fund’s performance was in the 5th quintile of its performance universe for the 1-year and 5-year periods and in the 4th quintile for 3-year period. The Board also noted that the Fund’s performance was below the benchmark index for the 1-year, 3-year and 5-year periods. |
| • | | The Board noted that the contractual management fee, the actual management fee and actual total expenses were in the 1st quintile of the expense group. |
Guardian Diversified Research VIP Fund
| • | | The Board noted that the Fund’s performance was in the 3rd quintile of its performance universe for the 1-year and 3-year periods and in the 2nd quintile for the 5-year period. The Board also noted that the Fund’s performance was higher than the benchmark |
SUPPLEMENTAL INFORMATION (UNAUDITED)
| | | index for the 1-year period. The Board note that the Fund’s performance was lower than the benchmark index for the 3-year and 5-year periods. |
| • | | The Board noted that the contractual management fee and actual management fee were in the 1st quintile of the expense group and that actual total expenses were in the 3rd quintile. |
Guardian Strategic Large Cap Core VIP Fund
| • | | The Board noted that the Fund’s performance was in the 1st quintile of its performance universe for the 1-year period. The Board acknowledged the Fund’s short operational history. The Board noted that the Fund’s performance was higher than the benchmark index for the 1-year period. |
| • | | The Board noted that the contractual management fee, the actual management fee and actual total expenses were in the 1st quintile of the expense group. |
Guardian Large Cap Disciplined Value VIP Fund
| • | | The Board noted that the Fund’s performance was in the 3rd quintile of its performance universe for the 1-year and 3-year periods and in the 4th quintile for the 5-year period. The Board also noted that the Fund’s performance was higher than the benchmark index for the 1-year and 3-year periods. The Board noted that the Fund’s performance was in line with the benchmark index for the 5-year period. |
| • | | The Board noted that the contractual management fee was in the 2nd quintile of the expense group, the actual management fee was in the 1st quintile of the expense group and that actual total expenses were in the 3rd quintile. |
Guardian Growth & Income VIP Fund
| • | | The Board noted that the Fund’s performance was in the 3rd quintile of its performance universe for the 1-year, 3-year and 5-year periods. The Board also noted that the Fund’s performance was higher than the benchmark index for the 1-year, 3-year and 5-year periods. |
| • | | The Board noted that the contractual management fee and the actual management fee were in the 1st quintile of the expense group and that actual total expenses were in the 3rd quintile. |
Guardian Equity Income VIP Fund
| • | | The Board noted that the Fund had less than one-year of operational history and was not able to evaluate an investment performance record for the Fund. The |
| | | Board noted that it would have an opportunity to review such information in connection with future annual reviews. The Board noted that, in the meantime, it received monthly performance reports from the Manager. |
| • | | The Board noted that the contractual management fee, the actual management fee and actual total expenses were in the 1st quintile of the expense group. |
Guardian All Cap Core VIP Fund
| • | | The Board noted that the Fund’s performance was in the 3rd quintile of its performance universe for the 1-year period. The Board acknowledged the Fund’s short operational history. The Board noted that the Fund’s performance was higher than the benchmark index for the 1-year period. |
| • | | The Board noted that the contractual management fee, the actual management fee and actual total expenses were in the 1st quintile of the expense group. |
Guardian Mid Cap Traditional Growth VIP Fund
| • | | The Board noted that the Fund’s performance was in the 1st quintile of its performance universe for the 1-year period and in the 2nd quintile for the 3-year and 5-year periods. The Board also noted that the Fund’s performance was higher than the benchmark index for the 1-year, 3-year and 5-year periods. |
| • | | The Board noted that the contractual management fee and actual management fee were in the 1st quintile of the expense group and that the actual total expenses were in the 4th quintile. |
Guardian Select Mid Cap Core VIP Fund
| • | | The Board noted that the Fund’s performance was in the 3rd quintile of its performance universe for the 1-year period. The Board acknowledged the Fund’s short operational history. The Board noted that the Fund’s performance was lower than the benchmark index for the 1-year period. |
| • | | The Board noted that the contractual management fee, the actual management fee and actual total expenses were in the 1st quintile of the expense group. |
Guardian Mid Cap Relative Value VIP Fund
| • | | The Board noted that the Fund’s performance was in the 2nd quintile of its performance universe for the 1-year, 3-year and 5-year periods. The Board also noted that the Fund’s performance was higher than the benchmark index for the 1-year, 3-year and 5-year periods. |
SUPPLEMENTAL INFORMATION (UNAUDITED)
| • | | The Board noted that the contractual management fee and the actual management fee were in the 2nd quintile of the expense group and the actual total expenses were in the 3rd quintile of the expense group. |
Guardian Small-Mid Cap Core VIP Fund
| • | | The Board noted that the Fund’s performance was in the 5th quintile of its performance universe for the 1-year period. The Board acknowledged the Fund’s short operational history. The Board noted that the Fund’s performance was higher than the benchmark index for the 1-year period. |
| • | | The Board noted that the contractual management fee, the actual management fee and actual total expenses were in the 1st quintile of the expense group. |
Guardian Small Cap Core VIP Fund
| • | | The Board noted that the Fund’s performance was in the 5th quintile of its performance universe for the 1-year and 3-year periods. The Board noted that the Fund’s performance was lower than the benchmark index for the 1-year and 3-year periods. |
| • | | The Board noted that the contractual management fee and the actual management fee were in the 1st quintile of the expense group and the actual total expenses were in the 2nd quintile of the expense group. |
Guardian International Growth VIP Fund
| • | | The Board noted that the Fund’s performance was in the 4th quintile of its performance universe for the 1-year period, in the 2nd quintile of its performance universe for the 3-year period and in the 3rd quintile of its performance universe for the 5-year period. The Board also noted that the Fund’s performance was lower than the benchmark index for the 1-year and 5-year periods. The Board noted that the Fund’s performance was higher than the benchmark index for the 3-year period. |
| • | | The Board noted that the contractual management fee and actual management fee were in the 2nd quintile of the expense group and that the actual total expenses were in the 3rd quintile. |
Guardian International Equity VIP Fund
| • | | The Board noted that the Fund’s performance was in the 5th quintile of its performance universe for the 1-year, 3-year and 5-year periods. The Board also noted that the Fund’s performance was lower than the benchmark index for the 1-year, 3-year and 5-year periods. |
| • | | The Board noted that the contractual management fee, the actual management fee and the actual total expenses were in the 2nd quintile of the expense group. |
Guardian Global Utilities VIP Fund
| • | | The Board noted that the Fund’s performance was in the 5th quintile of its performance universe for the 1-year period and in the 4th quintile of its performance universe for the 3-year period. The Board noted that the Fund’s performance was higher than the benchmark index for the 1-year and 3-year periods. |
| • | | The Board noted that the contractual management fee and the actual management fee were in the 1st quintile of the expense group and the actual total expenses were in the 2nd quintile of the expense group. |
Guardian Balanced Allocation VIP Fund
| • | | The Board noted that the Fund had less than one-year of operational history and was not able to evaluate an investment performance record for the Fund. The Board noted that it would have an opportunity to review such information in connection with future annual reviews. The Board noted that, in the meantime, it received monthly performance reports from the Manager. |
| • | | The Board noted that the contractual management fee, the actual management fee and actual total expenses were in the 1st quintile of the expense group. |
Guardian Core Plus Fixed Income VIP Fund
| • | | The Board noted that the Fund’s performance was in the 3rd quintile of its performance universe for the 1-year and 3-year periods and in the 4th quintile of its performance universe for the 5-year period. The Board also noted that the Fund’s performance was lower than the benchmark index for the 1-year and 5-year periods. The Board noted that the Fund’s performance was in line with the benchmark index for the 3-year period. |
| • | | The Board noted that the contractual management fee and actual management fee were in the 2nd quintile of the expense group and that actual total expenses were in the 3rd quintile. |
Guardian Total Return Bond VIP Fund
| • | | The Board noted that the Fund’s performance was in the 5th quintile of its performance universe for |
SUPPLEMENTAL INFORMATION (UNAUDITED)
| | | the 1-year and 3-year periods. The Board also noted that the Fund’s performance was lower than the benchmark index for the 1-year and 3-year periods. |
| • | | The Board noted that the contractual management fee and actual management fee were in the 2nd quintile and the actual total expenses were in the 3rd quintile. |
Guardian Core Fixed Income VIP Fund
| • | | The Board noted that the Fund had less than one-year of operational history and was not able to evaluate an investment performance record for the Fund. The Board noted that it would have an opportunity to review such information in connection with future annual reviews. The Board noted that, in the meantime, it received monthly performance reports from the Manager. |
| • | | The Board noted that the contractual management fee was in the 2nd quintile of the expense group and the actual management fee and the actual total expenses were in the 1st quintile. |
Guardian Multi-Sector Bond VIP Fund
| • | | The Board noted that the Fund’s performance was in the 5th quintile of its performance universe for the 1-year and 3-year periods The Board also noted that the Fund’s performance was lower than the benchmark index for the 1-year and 3-year periods. |
| • | | The Board noted that the contractual management fee and actual total expenses were in the 1st quintile and the actual management fee was in the 2nd quintile. |
Guardian Short Duration Bond VIP Fund
| • | | The Board noted that the Fund had less than one-year of operational history and was not able to evaluate an investment performance record for the Fund. The Board noted that it would have an opportunity to review such information in connection with future annual reviews. The Board noted that, in the meantime, it received monthly performance reports from the Manager. |
| • | | The Board noted that the contractual management fee and actual total expenses were in the 3rd quintile of the expense group and the actual management fee was in the 1st quintile of the expense group. |
Guardian U.S. Government Securities VIP Fund
| • | | The Board noted that the Fund’s performance was in the 1st quintile of its performance universe for the 1-year period and in the 2nd quintile of its performance universe for the 3-year period. The Board also noted that the Fund’s performance was higher than the benchmark index for the 1-year and 3-year periods. |
| • | | The Board noted that the contractual management fee and the actual management fee were in the 1st quintile of the expense group and the actual total expenses were in the 2nd quintile of the expense group. |
Conclusion
Based on a comprehensive consideration and evaluation of all of the information and factors summarized above, among others, the Board as a whole, including the Independent Trustees, approved the Agreements.
SUPPLEMENTAL INFORMATION (UNAUDITED)
The Statement of Additional Information (“SAI”) includes additional information about the Trust’s Trustees and Officers and is available, without charge, upon request by calling toll-free 1-888-GUARDIAN (1-888-482-7342) or by visiting our website at http://guardianvpt.onlineprospectus.net/GuardianVPT/Prospectuses.
Portfolio Holdings and Proxy Voting Procedures
The Fund files its complete schedule of portfolio holdings with the Securities and Exchange Commission for the first and third quarters of each fiscal year as an exhibit to its reports on Form N-PORT. The Fund’s Form N-PORT reports are available on the Securities and Exchange Commission’s website at https://www.sec.gov. The Fund’s Form N-PORT information is also available, without charge, upon request, by calling toll-free 1-888-GUARDIAN (1-888-482-7342) or by visiting our website at http://guardianvpt.onlineprospectus.net/GuardianVPT/Prospectuses.
A description of the policies and procedures that the Fund uses to determine how to vote proxies relating to portfolio securities is included in the SAI. The SAI and information regarding how the Fund voted proxies relating to portfolio securities during the most recent 12-month period ended June 30 may be obtained (i) without charge, upon request, by calling toll-free 1-888-GUARDIAN (1-888-482-7342) or by visiting our website at http://guardianvpt.onlineprospectus.net/GuardianVPT/Prospectuses; and (ii) on the Securities and Exchange Commission’s website at https://www.sec.gov.
This report is transmitted to shareholders only. It is not authorized for use as an offer of sale or a solicitation of an offer to buy shares of the Fund unless accompanied or preceded by the Fund’s current prospectus. Past performance results shown in this report should not be considered a representation of future performance. Investment returns and principal value of shares will fluctuate so that shares, when redeemed, may be worth more or less than their original cost. Statements and other information herein are as dated and are subject to change.

The Guardian Life Insurance Company of America New York, NY 10001-2159
PUB11739
Guardian Variable
Products Trust
2023
Semiannual Report
All Data as of June 30, 2023
Guardian Select Mid Cap Core VIP Fund

| | |
| Not FDIC insured. May lose value. No bank guarantee. | | www.guardianlife.com |
TABLE OF CONTENTS
Guardian Select Mid Cap Core VIP Fund
Except as otherwise specifically stated, all information, including portfolio security positions, is as of June 30, 2023. Fund holdings will vary. Information contained herein has been obtained from sources believed reliable, but is not guaranteed.
GUARDIAN SELECT MID CAP CORE VIP FUND
Fund Characteristics (unaudited)
|
| Total Net Assets: $227,051,043 |
|
| |
Sector Allocation1 As of June 30, 2023 |
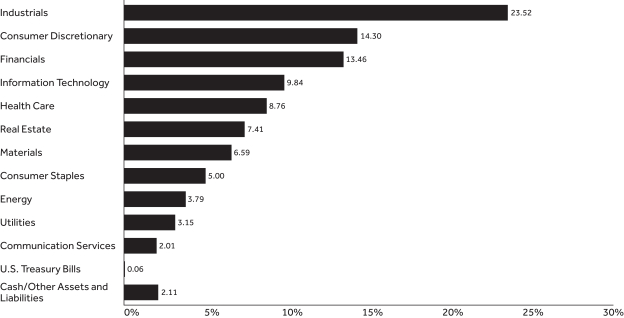 |
| | | | |
| | |
Top Ten Holdings2 As of June 30, 2023 | | | |
| | |
| Holding | | % of Total
Net Assets | |
| Bancorp, Inc. | | | 1.57% | |
| WESCO International, Inc. | | | 1.40% | |
| Regal Rexnord Corp. | | | 1.35% | |
| Landstar System, Inc. | | | 1.32% | |
| Five Below, Inc. | | | 1.30% | |
| CACI International, Inc., Class A | | | 1.29% | |
| WillScot Mobile Mini Holdings Corp. | | | 1.29% | |
| KBR, Inc. | | | 1.27% | |
| Aramark | | | 1.23% | |
| Flowserve Corp. | | | 1.20% | |
| Total | | | 13.22% | |
| 1 | The Fund’s holdings are allocated to each sector based on the MSCI Global Industry Classification Standard (GICS®). Cash includes short-term investments and net other assets and liabilities. |
| 2 | Portfolio holdings are subject to change and should not be considered a recommendation to buy or sell individual securities. |
UNDERSTANDING YOUR FUND’S EXPENSES (UNAUDITED)
By investing in the Fund, you incur two types of costs: (1) transaction costs and (2) ongoing costs, including, as applicable, investment advisory fees, distribution and/or service (12b-1) fees and other Fund expenses. The example below is intended to help you understand your ongoing costs (in dollars) of investing in the Fund and to compare these costs with the ongoing costs of investing in other mutual funds.
The example is based on an investment of $1,000 invested at the beginning of the period and held for the entire period from January 1, 2023 to June 30, 2023. The table below shows the Fund’s expenses in two ways:
Expenses based on actual return
This section of the table provides information about actual account values and actual expenses. You may use the information in this section, together with the amount you invested, to estimate the expenses that you paid over the period. Simply divide your account value by $1,000 (for example, an $8,600 account value divided by $1,000 = 8.6), then multiply the result by the number in the section under the heading entitled “Expenses Paid During Period” to estimate the expenses you paid on your account during this period.
Expenses based on hypothetical 5% return for comparison purposes
This section of the table provides information about hypothetical account values and hypothetical expenses based on the Fund’s actual expense ratio and an assumed rate of return of 5% per year before expenses, which is not the Fund’s actual return. The hypothetical account values and expenses may not be used to estimate the actual ending account balance or expenses you paid for the period. You may use this information to compare the ongoing costs of investing in the Fund with the cost of investing in other mutual funds. To do so, compare this 5% hypothetical example with the 5% hypothetical examples that appear in the shareholder reports of the other funds.
Note that the expenses shown in the table are meant to highlight your ongoing costs only and do not reflect any transactional costs, such as sales charges (loads), redemption fees, or exchange fees. Therefore the second section is useful in comparing ongoing costs only, and will not help you determine the relative total costs of owning different funds. If these transactional costs were included, your costs would have been higher. Charges and expenses at the insurance company separate account level are not reflected in the table.
| | | | | | | | | | | | | | |
| | | | | |
| | | Beginning
Account Value 1/1/23 | | Ending Account Value
6/30/23 | | | Expenses Paid During Period* 1/1/23-6/30/23 | | | Expense Ratio During Period 1/1/23-6/30/23 | |
| Based on Actual Return | | $1,000.00 | | $ | 1,090.20 | | | $ | 4.51 | | | | 0.87% | |
| Based on Hypothetical Return (5% Return Before Expenses) | | $1,000.00 | | $ | 1,020.48 | | | $ | 4.36 | | | | 0.87% | |
| * | Expenses are equal to the Fund’s annualized expense ratio as indicated, multiplied by the average account value over the period, multiplied by 181/365 (to reflect the one-half year period). |
SCHEDULE OF INVESTMENTS — GUARDIAN SELECT MID CAP CORE VIP FUND
| | | | | | | | |
| June 30, 2023 (unaudited) | | Shares | | | Value | |
| Common Stocks – 97.7% | |
| |
| Aerospace & Defense – 2.4% | |
| | | |
HEICO Corp., Class A | | | 18,736 | | | $ | 2,634,281 | |
| | | |
Howmet Aerospace, Inc. | | | 27,450 | | | | 1,360,422 | |
| | | |
Spirit AeroSystems Holdings, Inc., Class A | | | 48,940 | | | | 1,428,559 | |
| | | | | | | | | |
| | |
| | | | | 5,423,262 | |
| Automobile Components – 1.4% | |
| | | |
Adient PLC(1) | | | 27,275 | | | | 1,045,178 | |
| | | |
Lear Corp. | | | 13,130 | | | | 1,884,811 | |
| | | |
Novem Group SA (Luxembourg) | | | 20,072 | | | | 225,052 | |
| | | | | | | | | |
| | |
| | | | | 3,155,041 | |
| Automobiles – 0.5% | |
| | | |
Harley-Davidson, Inc. | | | 29,825 | | | | 1,050,138 | |
| | | | | | | | | |
| | |
| | | | | 1,050,138 | |
| Banks – 5.1% | |
| | | |
Associated Banc-Corp | | | 55,701 | | | | 904,027 | |
| | | |
Axos Financial, Inc.(1) | | | 7,135 | | | | 281,404 | |
| | | |
Bancorp, Inc.(1) | | | 109,219 | | | | 3,566,000 | |
| | | |
Cadence Bank | | | 34,432 | | | | 676,245 | |
| | | |
East West Bancorp, Inc. | | | 14,780 | | | | 780,236 | |
| | | |
First Interstate BancSystem, Inc., Class A | | | 10,587 | | | | 252,394 | |
| | | |
Pathward Financial, Inc. | | | 18,624 | | | | 863,409 | |
| | | |
Piraeus Financial Holdings SA (Greece)(1) | | | 114,146 | | | | 374,864 | |
| | | |
Popular, Inc. | | | 25,621 | | | | 1,550,583 | |
| | | |
Synovus Financial Corp. | | | 10,321 | | | | 312,210 | |
| | | |
Wintrust Financial Corp. | | | 8,609 | | | | 625,186 | |
| | | |
Zions Bancorporation NA | | | 49,317 | | | | 1,324,655 | |
| | | | | | | | | |
| | |
| | | | | 11,511,213 | |
| Beverages – 0.5% | |
| | | |
Boston Beer Co., Inc., Class A(1) | | | 1,585 | | | | 488,877 | |
| | | |
Celsius Holdings, Inc.(1) | | | 4,778 | | | | 712,830 | |
| | | | | | | | | |
| | |
| | | | | 1,201,707 | |
| Biotechnology – 0.6% | |
| | | |
United Therapeutics Corp.(1) | | | 6,100 | | | | 1,346,575 | |
| | | | | | | | | |
| | |
| | | | | 1,346,575 | |
| Building Products – 1.2% | |
| | | |
Carlisle Cos., Inc. | | | 10,376 | | | | 2,661,755 | |
| | | | | | | | | |
| | |
| | | | | 2,661,755 | |
| Capital Markets – 0.8% | |
| | | |
Interactive Brokers Group, Inc., Class A | | | 18,553 | | | | 1,541,198 | |
| | | |
Patria Investments Ltd., Class A | | | 20,443 | | | | 292,335 | |
| | | | | | | | | |
| | |
| | | | | 1,833,533 | |
| Chemicals – 2.1% | |
| | | |
Ashland, Inc. | | | 14,986 | | | | 1,302,433 | |
| | | |
RPM International, Inc. | | | 22,472 | | | | 2,016,413 | |
| | | |
Westlake Corp. | | | 11,227 | | | | 1,341,290 | |
| | | | | | | | | |
| | |
| | | | | 4,660,136 | |
| | | | | | | | |
| June 30, 2023 (unaudited) | | Shares | | | Value | |
| Commercial Services & Supplies – 0.8% | |
| | | |
Brink’s Co. | | | 27,676 | | | $ | 1,877,263 | |
| | | | | | | | | |
| | |
| | | | | 1,877,263 | |
| Construction & Engineering – 1.4% | |
| | | |
MDU Resources Group, Inc. | | | 15,324 | | | | 320,884 | |
| | | |
WillScot Mobile Mini Holdings Corp.(1) | | | 61,115 | | | | 2,920,686 | |
| | | | | | | | | |
| | |
| | | | | 3,241,570 | |
| Construction Materials – 1.0% | |
| | | |
Eagle Materials, Inc. | | | 11,070 | | | | 2,063,669 | |
| | | |
Knife River Corp.(1) | | | 3,831 | | | | 166,649 | |
| | | | | | | | | |
| | |
| | | | | 2,230,318 | |
| Consumer Finance – 1.1% | |
| | | |
FirstCash Holdings, Inc. | | | 4,916 | | | | 458,810 | |
| | | |
NerdWallet, Inc., Class A(1) | | | 20,772 | | | | 195,465 | |
| | | |
OneMain Holdings, Inc. | | | 40,939 | | | | 1,788,625 | |
| | | | | | | | | |
| | |
| | | | | 2,442,900 | |
| Consumer Staples Distribution & Retail – 2.5% | |
| | | |
Albertsons Cos., Inc., Class A | | | 4,424 | | | | 96,532 | |
| | | |
BJ’s Wholesale Club Holdings, Inc.(1) | | | 21,167 | | | | 1,333,733 | |
| | | |
Casey’s General Stores, Inc. | | | 2,846 | | | | 694,082 | |
| | | |
Performance Food Group Co.(1) | | | 30,121 | | | | 1,814,489 | |
| | | |
Sprouts Farmers Market, Inc.(1) | | | 16,081 | | | | 590,655 | |
| | | |
US Foods Holding Corp.(1) | | | 26,109 | | | | 1,148,796 | |
| | | | | | | | | |
| | |
| | | | | 5,678,287 | |
| Diversified Consumer Services – 0.8% | |
| | | |
H&R Block, Inc. | | | 28,393 | | | | 904,885 | |
| | | |
Service Corp. International | | | 13,634 | | | | 880,620 | |
| | | | | | | | | |
| | |
| | | | | 1,785,505 | |
| Diversified Telecommunication Services – 0.4% | |
| | | |
Frontier Communications Parent, Inc.(1) | | | 7,628 | | | | 142,186 | |
| | | |
Iridium Communications, Inc. | | | 12,630 | | | | 784,576 | |
| | | | | | | | | |
| | |
| | | | | 926,762 | |
| Electric Utilities – 0.6% | |
| | | |
ALLETE, Inc. | | | 8,933 | | | | 517,846 | |
| | | |
OGE Energy Corp. | | | 8,791 | | | | 315,685 | |
| | | |
PNM Resources, Inc. | | | 14,148 | | | | 638,075 | |
| | | | | | | | | |
| | |
| | | | | 1,471,606 | |
| Electrical Equipment – 1.3% | |
| | | |
Regal Rexnord Corp. | | | 19,822 | | | | 3,050,606 | |
| | | | | | | | | |
| | |
| | | | | 3,050,606 | |
| Electronic Equipment, Instruments & Components – 1.9% | |
| | | |
Avnet, Inc. | | | 22,811 | | | | 1,150,815 | |
| | | |
Cognex Corp. | | | 25,449 | | | | 1,425,653 | |
| | | |
Jabil, Inc. | | | 6,600 | | | | 712,338 | |
| | | |
Trimble, Inc.(1) | | | 10,783 | | | | 570,852 | |
| | | |
TTM Technologies, Inc.(1) | | | 33,845 | | | | 470,445 | |
| | | | | | | | | |
| | |
| | | | | 4,330,103 | |
| Energy Equipment & Services – 1.1% | |
| | | |
ChampionX Corp. | | | 51,465 | | | | 1,597,474 | |
| | | |
Liberty Energy, Inc. | | | 66,203 | | | | 885,134 | |
| | | | | | | | | |
| | |
| | | | | 2,482,608 | |
| | | | |
| The accompanying notes are an integral part of these financial statements. | | | | 3 |
SCHEDULE OF INVESTMENTS — GUARDIAN SELECT MID CAP CORE VIP FUND
| | | | | | | | |
| June 30, 2023 (unaudited) | | Shares | | | Value | |
| Entertainment – 0.3% | |
| | | |
Endeavor Group Holdings, Inc., Class A(1) | | | 10,319 | | | $ | 246,831 | |
| | | |
Liberty Media Corp-Liberty Formula One, Class C(1) | | | 3,846 | | | | 289,527 | |
| | | |
Warner Music Group Corp., Class A | | | 7,946 | | | | 207,311 | |
| | | | | | | | | |
| | |
| | | | | 743,669 | |
| Financial Services – 3.2% | |
| | | |
AvidXchange Holdings, Inc.(1) | | | 55,719 | | | | 578,363 | |
| | | |
Cairo Mezz PLC (Cyprus)(1) | | | 729,530 | | | | 95,498 | |
| | | |
Cannae Holdings, Inc.(1) | | | 21,118 | | | | 426,795 | |
| | | |
Essent Group Ltd. | | | 35,409 | | | | 1,657,141 | |
| | | |
MGIC Investment Corp. | | | 45,062 | | | | 711,529 | |
| | | |
Nuvei Corp. (Canada)(1)(2) | | | 12,503 | | | | 369,215 | |
| | | |
Repay Holdings Corp.(1) | | | 44,719 | | | | 350,150 | |
| | | |
Shift4 Payments, Inc., Class A(1) | | | 5,124 | | | | 347,971 | |
| | | |
UWM Holdings Corp. | | | 116,580 | | | | 652,848 | |
| | | |
Voya Financial, Inc. | | | 15,360 | | | | 1,101,466 | |
| | | |
WEX, Inc.(1) | | | 5,949 | | | | 1,083,134 | |
| | | | | | | | | |
| | |
| | | | | 7,374,110 | |
| Food Products – 1.2% | |
| | | |
Bunge Ltd. | | | 983 | | | | 92,746 | |
| | | |
Darling Ingredients, Inc.(1) | | | 17,821 | | | | 1,136,802 | |
| | | |
Freshpet, Inc.(1) | | | 2,789 | | | | 183,544 | |
| | | |
Ingredion, Inc. | | | 8,082 | | | | 856,288 | |
| | | |
Nomad Foods Ltd.(1) | | | 8,356 | | | | 146,397 | |
| | | |
Post Holdings, Inc.(1) | | | 2,541 | | | | 220,178 | |
| | | |
Sovos Brands, Inc.(1) | | | 8,551 | | | | 167,257 | |
| | | | | | | | | |
| | |
| | | | | 2,803,212 | |
| Gas Utilities – 0.9% | |
| | | |
Atmos Energy Corp. | | | 1,397 | | | | 162,527 | |
| | | |
National Fuel Gas Co. | | | 8,737 | | | | 448,732 | |
| | | |
ONE Gas, Inc. | | | 4,682 | | | | 359,625 | |
| | | |
Southwest Gas Holdings, Inc. | | | 11,982 | | | | 762,654 | |
| | | |
UGI Corp. | | | 11,304 | | | | 304,869 | |
| | | | | | | | | |
| | |
| | | | | 2,038,407 | |
| Ground Transportation – 2.5% | |
| | | |
Landstar System, Inc. | | | 15,598 | | | | 3,003,239 | |
| | | |
RXO, Inc.(1) | | | 32,931 | | | | 746,546 | |
| | | |
XPO, Inc.(1) | | | 32,801 | | | | 1,935,259 | |
| | | | | | | | | |
| | |
| | | | | 5,685,044 | |
| Health Care Equipment & Supplies – 2.9% | |
| | | |
ICU Medical, Inc.(1) | | | 6,300 | | | | 1,122,597 | |
| | | |
Masimo Corp.(1) | | | 13,300 | | | | 2,188,515 | |
| | | |
Nevro Corp.(1) | | | 17,500 | | | | 444,850 | |
| | | |
Penumbra, Inc.(1) | | | 6,850 | | | | 2,356,811 | |
| | | |
Tandem Diabetes Care, Inc.(1) | | | 22,000 | | | | 539,880 | |
| | | | | | | | | |
| | |
| | | | | 6,652,653 | |
| Health Care Providers & Services – 3.2% | |
| | | |
Acadia Healthcare Co., Inc.(1) | | | 22,000 | | | | 1,752,080 | |
| | | |
agilon health, Inc.(1) | | | 54,000 | | | | 936,360 | |
| | | |
Alignment Healthcare, Inc.(1) | | | 80,000 | | | | 460,000 | |
| | | | | | | | | |
| | | | | | | | |
| June 30, 2023 (unaudited) | | Shares | | | Value | |
| Health Care Providers & Services (continued) | |
| | | |
Chemed Corp. | | | 1,550 | | | $ | 839,588 | |
| | | |
Molina Healthcare, Inc.(1) | | | 3,100 | | | | 933,844 | |
| | | |
Privia Health Group, Inc.(1) | | | 40,000 | | | | 1,044,400 | |
| | | |
Surgery Partners, Inc.(1) | | | 30,000 | | | | 1,349,700 | |
| | | | | | | | | |
| | |
| | | | | 7,315,972 | |
| Health Care REITs – 1.2% | |
| | | |
Omega Healthcare Investors, Inc. | | | 36,050 | | | | 1,106,375 | |
| | | |
Ventas, Inc. | | | 34,763 | | | | 1,643,247 | |
| | | | | | | | | |
| | |
| | | | | 2,749,622 | |
| Health Care Technology – 0.4% | |
| | | |
Evolent Health, Inc., Class A(1) | | | 30,000 | | | | 909,000 | |
| | | | | | | | | |
| | |
| | | | | 909,000 | |
| Hotel & Resort REITs – 0.3% | |
| | | |
Ryman Hospitality Properties, Inc. | | | 6,720 | | | | 624,422 | |
| | | | | | | | | |
| | |
| | | | | 624,422 | |
| Hotels, Restaurants & Leisure – 5.3% | |
| | | |
Aramark | | | 64,886 | | | | 2,793,342 | |
| | | |
Brinker International, Inc.(1) | | | 13,746 | | | | 503,104 | |
| | | |
Caesars Entertainment, Inc.(1) | | | 25,525 | | | | 1,301,009 | |
| | | |
Churchill Downs, Inc. | | | 19,416 | | | | 2,702,125 | |
| | | |
Domino’s Pizza, Inc. | | | 3,900 | | | | 1,314,261 | |
| | | |
Planet Fitness, Inc., Class A(1) | | | 9,958 | | | | 671,568 | |
| | | |
Red Rock Resorts, Inc., Class A | | | 4,690 | | | | 219,398 | |
| | | |
Vail Resorts, Inc. | | | 3,011 | | | | 758,049 | |
| | | |
Wyndham Hotels & Resorts, Inc. | | | 27,283 | | | | 1,870,795 | |
| | | | | | | | | |
| | |
| | | | | 12,133,651 | |
| Household Durables – 2.0% | |
| | | |
Leggett & Platt, Inc. | | | 23,787 | | | | 704,571 | |
| | | |
Mohawk Industries, Inc.(1) | | | 8,837 | | | | 911,625 | |
| | | |
NVR, Inc.(1) | | | 175 | | | | 1,111,359 | |
| | | |
Taylor Morrison Home Corp.(1) | | | 36,203 | | | | 1,765,620 | |
| | | | | | | | | |
| | |
| | | | | 4,493,175 | |
| Household Products – 0.3% | |
| | | |
Energizer Holdings, Inc. | | | 13,032 | | | | 437,615 | |
| | | |
Reynolds Consumer Products, Inc. | | | 6,116 | | | | 172,777 | |
| | | | | | | | | |
| | |
| | | | | 610,392 | |
| Independent Power and Renewable Electricity Producers – 0.3% | |
| | | |
NextEra Energy Partners LP | | | 3,388 | | | | 198,672 | |
| | | |
Ormat Technologies, Inc. | | | 5,292 | | | | 425,795 | |
| | | | | | | | | |
| | |
| | | | | 624,467 | |
| Industrial REITs – 1.3% | |
| | | |
EastGroup Properties, Inc. | | | 11,990 | | | | 2,081,464 | |
| | | |
Terreno Realty Corp. | | | 15,010 | | | | 902,101 | |
| | | | | | | | | |
| | |
| | | | | 2,983,565 | |
| Insurance – 3.3% | |
| | | |
American Financial Group, Inc. | | | 10,495 | | | | 1,246,281 | |
| | | |
BRP Group, Inc., Class A(1) | | | 39,633 | | | | 982,106 | |
| | | |
Fairfax Financial Holdings Ltd. (Canada) | | | 1,040 | | | | 779,001 | |
| | | |
Globe Life, Inc. | | | 4,156 | | | | 455,581 | |
| | | |
Primerica, Inc. | | | 8,213 | | | | 1,624,203 | |
| | | | | | | | | |
| | | | |
| 4 | | | | The accompanying notes are an integral part of these financial statements. |
SCHEDULE OF INVESTMENTS — GUARDIAN SELECT MID CAP CORE VIP FUND
| | | | | | | | |
| June 30, 2023 (unaudited) | | Shares | | | Value | |
| Insurance (continued) | |
| | | |
Reinsurance Group of America, Inc. | | | 918 | | | $ | 127,317 | |
| | | |
Talanx AG (Germany) | | | 7,800 | | | | 447,167 | |
| | | |
Unum Group | | | 36,354 | | | | 1,734,086 | |
| | | | | | | | | |
| | |
| | | | | 7,395,742 | |
| Interactive Media & Services – 0.2% | |
| | | |
IAC, Inc.(1) | | | 1,143 | | | | 71,780 | |
| | | |
TripAdvisor, Inc.(1) | | | 6,080 | | | | 100,259 | |
| | | |
Ziff Davis, Inc.(1) | | | 5,344 | | | | 374,401 | |
| | | | | | | | | |
| | |
| | | | | 546,440 | |
| IT Services – 2.6% | |
| | | |
Akamai Technologies, Inc.(1) | | | 10,289 | | | | 924,673 | |
| | | |
EPAM Systems, Inc.(1) | | | 5,200 | | | | 1,168,700 | |
| | | |
GoDaddy, Inc., Class A(1) | | | 12,732 | | | | 956,555 | |
| | | |
MongoDB, Inc.(1) | | | 2,700 | | | | 1,109,673 | |
| | | |
Twilio, Inc., Class A(1) | | | 19,400 | | | | 1,234,228 | |
| | | |
Wix.com Ltd.(1) | | | 6,475 | | | | 506,604 | |
| | | | | | | | | |
| | |
| | | | | 5,900,433 | |
| Life Sciences Tools & Services – 1.6% | |
| | | |
10X Genomics, Inc., Class A(1) | | | 15,000 | | | | 837,600 | |
| | | |
Bruker Corp. | | | 21,800 | | | | 1,611,456 | |
| | | |
Repligen Corp.(1) | | | 8,600 | | | | 1,216,556 | |
| | | | | | | | | |
| | |
| | | | | 3,665,612 | |
| Machinery – 7.6% | |
| | | |
AGCO Corp. | | | 17,040 | | | | 2,239,397 | |
| | | |
Allison Transmission Holdings, Inc. | | | 13,856 | | | | 782,310 | |
| | | |
Chart Industries, Inc.(1) | | | 7,660 | | | | 1,223,991 | |
| | | |
Crane Co. | | | 15,500 | | | | 1,381,360 | |
| | | |
Crane NXT Co. | | | 15,190 | | | | 857,324 | |
| | | |
Dover Corp. | | | 7,690 | | | | 1,135,428 | |
| | | |
Esab Corp. | | | 35,730 | | | | 2,377,474 | |
| | | |
Flowserve Corp. | | | 73,505 | | | | 2,730,711 | |
| | | |
IDEX Corp. | | | 11,029 | | | | 2,374,102 | |
| | | |
ITT, Inc. | | | 22,441 | | | | 2,091,726 | |
| | | | | | | | | |
| | |
| | | | | 17,193,823 | |
| Marine Transportation – 0.8% | |
| | | |
Kirby Corp.(1) | | | 23,692 | | | | 1,823,099 | |
| | | | | | | | | |
| | |
| | | | | 1,823,099 | |
| Media – 0.9% | |
| | | |
Cable One, Inc. | | | 774 | | | | 508,580 | |
| | | |
Interpublic Group of Cos., Inc. | | | 8,054 | | | | 310,723 | |
| | | |
New York Times Co., Class A | | | 15,879 | | | | 625,315 | |
| | | |
Nexstar Media Group, Inc. | | | 3,694 | | | | 615,236 | |
| | | |
TEGNA, Inc. | | | 5,725 | | | | 92,974 | |
| | | | | | | | | |
| | |
| | | | | 2,152,828 | |
| Metals & Mining – 2.7% | |
| | | |
Alcoa Corp. | | | 31,253 | | | | 1,060,414 | |
| | | |
Cleveland-Cliffs, Inc.(1) | | | 65,331 | | | | 1,094,948 | |
| | | |
Lundin Mining Corp. (Chile) | | | 104,965 | | | | 822,447 | |
| | | |
Reliance Steel & Aluminum Co. | | | 9,456 | | | | 2,568,155 | |
| | | |
Royal Gold, Inc. | | | 5,174 | | | | 593,872 | |
| | | | | | | | | |
| | |
| | | | | 6,139,836 | |
| | | | | | | | |
| June 30, 2023 (unaudited) | | Shares | | | Value | |
| Multi-Utilities – 0.8% | |
| | | |
Black Hills Corp. | | | 13,978 | | | $ | 842,314 | |
| | | |
NorthWestern Corp. | | | 15,948 | | | | 905,209 | |
| | | | | | | | | |
| | |
| | | | | 1,747,523 | |
| Office REITs – 0.5% | |
| | | |
Postal Realty Trust, Inc., Class A | | | 84,328 | | | | 1,240,465 | |
| | | | | | | | | |
| | |
| | | | | 1,240,465 | |
| Oil, Gas & Consumable Fuels – 2.7% | |
| | | |
Chord Energy Corp. | | | 7,190 | | | | 1,105,822 | |
| | | |
Denbury, Inc.(1) | | | 10,251 | | | | 884,251 | |
| | | |
EQT Corp. | | | 25,045 | | | | 1,030,101 | |
| | | |
HF Sinclair Corp. | | | 30,582 | | | | 1,364,263 | |
| | | |
Northern Oil and Gas, Inc. | | | 29,551 | | | | 1,014,190 | |
| | | |
Targa Resources Corp. | | | 9,576 | | | | 728,734 | |
| | | | | | | | | |
| | |
| | | | | 6,127,361 | |
| Paper & Forest Products – 0.9% | |
| | | |
Louisiana-Pacific Corp. | | | 25,727 | | | | 1,929,010 | |
| | | | | | | | | |
| | |
| | | | | 1,929,010 | |
| Passenger Airlines – 0.2% | |
| | | |
JetBlue Airways Corp.(1) | | | 62,230 | | | | 551,358 | |
| | | | | | | | | |
| | |
| | | | | 551,358 | |
| Personal Care Products – 0.5% | |
| | | |
Beauty Health Co.(1) | | | 56,000 | | | | 468,720 | |
| | | |
BellRing Brands, Inc.(1) | | | 16,146 | | | | 590,944 | |
| | | | | | | | | |
| | |
| | | | | 1,059,664 | |
| Professional Services – 3.1% | |
| | | |
CACI International, Inc., Class A(1) | | | 8,590 | | | | 2,927,815 | |
| | | |
Ceridian HCM Holding, Inc.(1) | | | 11,846 | | | | 793,327 | |
| | | |
FTI Consulting, Inc.(1) | | | 2,350 | | | | 446,970 | |
| | | |
KBR, Inc. | | | 44,200 | | | | 2,875,652 | |
| | | | | | | | | |
| | |
| | | | | 7,043,764 | |
| Real Estate Management & Development – 0.5% | |
| | | |
Doma Holdings, Inc.(1) | | | 5,518 | | | | 27,258 | |
| | | |
Jones Lang LaSalle, Inc.(1) | | | 7,670 | | | | 1,194,986 | |
| | | |
WeWork, Inc., Class A(1) | | | 51,400 | | | | 13,128 | |
| | | | | | | | | |
| | |
| | | | | 1,235,372 | |
| Residential REITs – 0.7% | |
| | | |
Equity LifeStyle Properties, Inc. | | | 6,997 | | | | 468,029 | |
| | | |
Essex Property Trust, Inc. | | | 4,540 | | | | 1,063,722 | |
| | | | | | | | | |
| | |
| | | | | 1,531,751 | |
| Retail REITs – 1.1% | |
| | | |
SITE Centers Corp. | | | 82,174 | | | | 1,086,340 | |
| | | |
Spirit Realty Capital, Inc. | | | 29,490 | | | | 1,161,316 | |
| | | |
Tanger Factory Outlet Centers, Inc. | | | 9,810 | | | | 216,507 | |
| | | | | | | | | |
| | |
| | | | | 2,464,163 | |
| Semiconductors & Semiconductor Equipment – 0.3% | |
| | | |
SolarEdge Technologies, Inc.(1) | | | 2,620 | | | | 704,911 | |
| | | | | | | | | |
| | |
| | | | | 704,911 | |
| Software – 4.8% | |
| | | |
Aspen Technology, Inc.(1) | | | 2,843 | | | | 476,515 | |
| | | |
BILL Holdings, Inc.(1) | | | 8,000 | | | | 934,800 | |
| | | | | | | | | |
| | | | |
| The accompanying notes are an integral part of these financial statements. | | | | 5 |
SCHEDULE OF INVESTMENTS — GUARDIAN SELECT MID CAP CORE VIP FUND
| | | | | | | | |
| June 30, 2023 (unaudited) | | Shares | | | Value | |
| Software (continued) | |
| | | |
Blackbaud, Inc.(1) | | | 17,837 | | | $ | 1,269,638 | |
| | | |
Blend Labs, Inc., Class A(1) | | | 166,601 | | | | 157,804 | |
| | | |
Elastic NV(1) | | | 16,628 | | | | 1,066,187 | |
| | | |
Five9, Inc.(1) | | | 19,400 | | | | 1,599,530 | |
| | | |
Gen Digital, Inc. | | | 52,503 | | | | 973,931 | |
| | | |
Guidewire Software, Inc.(1) | | | 8,028 | | | | 610,770 | |
| | | |
HubSpot, Inc.(1) | | | 1,800 | | | | 957,762 | |
| | | |
PTC, Inc.(1) | | | 5,326 | | | | 757,890 | |
| | | |
Tenable Holdings, Inc.(1) | | | 26,573 | | | | 1,157,254 | |
| | | |
Workiva, Inc.(1) | | | 9,021 | | | | 917,075 | |
| | | | | | | | | |
| | |
| | | | | 10,879,156 | |
| Specialized REITs – 1.8% | |
| | | |
CubeSmart | | | 55,569 | | | | 2,481,712 | |
| | | |
Lamar Advertising Co., Class A | | | 15,310 | | | | 1,519,517 | |
| | | | | | | | | |
| | |
| | | | | 4,001,229 | |
| Specialty Retail – 2.3% | |
| | | |
Burlington Stores, Inc.(1) | | | 3,035 | | | | 477,679 | |
| | | |
Five Below, Inc.(1) | | | 15,033 | | | | 2,954,586 | |
| | | |
Foot Locker, Inc. | | | 22,466 | | | | 609,053 | |
| | | |
Valvoline, Inc. | | | 28,928 | | | | 1,085,089 | |
| | | | | | | | | |
| | |
| | | | | 5,126,407 | |
| Technology Hardware, Storage & Peripherals – 0.2% | |
| | | |
Western Digital Corp.(1) | | | 13,738 | | | | 521,082 | |
| | | | | | | | | |
| | |
| | | | | 521,082 | |
| Textiles, Apparel & Luxury Goods – 2.1% | |
| | | |
Capri Holdings Ltd.(1) | | | 22,533 | | | | 808,709 | |
| | | |
Levi Strauss & Co., Class A | | | 11,726 | | | | 169,206 | |
| | | |
PRADA SpA (Italy) | | | 106,884 | | | | 716,233 | |
| | | |
PVH Corp. | | | 17,221 | | | | 1,463,268 | |
| | | |
Tapestry, Inc. | | | 36,701 | | | | 1,570,803 | |
| | | | | | | | | |
| | |
| | | | | 4,728,219 | |
| Trading Companies & Distributors – 2.1% | |
| | | |
Air Lease Corp. | | | 39,840 | | | | 1,667,304 | |
| | | |
WESCO International, Inc. | | | 17,789 | | | | 3,185,298 | |
| | | | | | | | | |
| | |
| | | | | 4,852,602 | |
| Water Utilities – 0.6% | |
| | | |
Essential Utilities, Inc. | | | 31,609 | | | | 1,261,515 | |
| | | | | | | | | |
| | |
| | | | | 1,261,515 | |
| | |
Total Common Stocks
(Cost $219,152,044) | | | | 221,925,614 | |
| | | | | | | | |
| | | | | | | | |
| | | Principal
Amount | | | Value | |
| Corporate Bonds & Notes – 0.1% | |
| |
| Commercial Services – 0.1% | |
| | | |
Affirm Holdings, Inc., Convertible
0.000% due 11/15/2026(3) | | $ | 265,000 | | | $ | 195,835 | |
| | |
Total Corporate Bonds & Notes
(Cost $177,922) | | | | 195,835 | |
| U.S. Treasury Bills – 0.1% | |
| | | |
U.S. Treasury Bill
5.177% due 9/7/2023(4) | | | 70,000 | | | | 69,335 | |
5.218% due 9/21/2023(4) | | | 70,000 | | | | 69,195 | |
| | | | | | | | | |
| | |
Total U.S. Treasury Bills
(Cost $138,506) | | | | 138,530 | |
| Repurchase Agreements – 1.1% | |
| | | |
Fixed Income Clearing Corp., 1.52%, dated 6/30/2023, proceeds at maturity value of $2,599,735, due 7/3/2023(5) | | | 2,599,406 | | | | 2,599,406 | |
| | | | | | | | | |
| | |
Total Repurchase Agreements
(Cost $2,599,406) | | | | 2,599,406 | |
| | |
Total Investments – 99.0%
(Cost $222,067,878) | | | | 224,859,385 | |
| | |
| Assets in excess of other liabilities – 1.0% | | | | 2,191,658 | |
| | |
| Total Net Assets – 100.0% | | | $ | 227,051,043 | |
| (1) | Non–income–producing security. |
| (2) | Securities that may be resold in transactions exempt from registration under Rule 144A of the Securities Act of 1933, as amended, normally to certain qualified buyers. At June 30, 2023, the aggregate market value of these securities amounted to $369,215, representing 0.2% of net assets. These securities have been deemed liquid by the investment adviser pursuant to the Fund’s liquidity procedures approved by the Board of Trustees. |
| (4) | Interest rate shown reflects the discount rate at time of purchase. |
| (5) | The table below presents collateral for repurchase agreements. |
| | | | | | | | | | | | | | | | |
| Security | | Coupon | | | Maturity
Date | | | Principal
Amount | | | Value | |
| U.S. Treasury Note | | | 4.625% | | | | 3/15/2026 | | | $ | 2,612,800 | | | $ | 2,651,406 | |
Legend:
REITs — Real Estate Investment Trusts
| | | | |
| 6 | | | | The accompanying notes are an integral part of these financial statements. |
SCHEDULE OF INVESTMENTS — GUARDIAN SELECT MID CAP CORE VIP FUND
The following is a summary of the inputs used as of June 30, 2023 in valuing the Fund’s investments. For more information on valuation inputs, please refer to Note 2a of the accompanying Notes to Financial Statements.
| | | | | | | | | | | | | | | | |
| | | Valuation Inputs | | | | |
| Investments in Securities (unaudited) | | Level 1 | | | Level 2 | | | Level 3 | | | Total | |
| Common Stocks | | $ | 220,066,800 | | | $ | 1,858,814 | * | | $ | — | | | $ | 221,925,614 | |
| Corporate Bonds & Notes | | | — | | | | 195,835 | | | | — | | | | 195,835 | |
| U.S. Treasury Bills | | | — | | | | 138,530 | | | | — | | | | 138,530 | |
| Repurchase Agreements | | | — | | | | 2,599,406 | | | | — | | | | 2,599,406 | |
| Total | | $ | 220,066,800 | | | $ | 4,792,585 | | | $ | — | | | $ | 224,859,385 | |
| * | Consists of certain foreign securities whose values were determined by a pricing service using pricing models (See Note 2a in Notes to Financial Statements). These investments in securities were classified as Level 2 rather than Level 1. |
| | | | |
| The accompanying notes are an integral part of these financial statements. | | | | 7 |
FINANCIAL INFORMATION — GUARDIAN SELECT MID CAP CORE VIP FUND
| | | | |
Statement of Assets and Liabilities As of June 30, 2023 (unaudited) | | | |
Assets | | | | |
| | |
Investments, at value | | $ | 224,859,385 | |
| | |
Receivable for investments sold | | | 2,634,783 | |
| | |
Dividends/interest receivable | | | 261,889 | |
| | |
Reimbursement receivable from adviser | | | 7,269 | |
| | |
Foreign tax reclaims receivable | | | 5,634 | |
| | |
Cash deposits with brokers for futures contracts | | | 4,866 | |
| | |
Prepaid expenses | | | 2,572 | |
| | | | | |
| | |
Total Assets | | | 227,776,398 | |
| | | | | |
| | |
Liabilities | | | | |
| | |
Payable for investments purchased | | | 441,631 | |
| | |
Investment advisory fees payable | | | 97,173 | |
| | |
Payable for fund shares redeemed | | | 67,543 | |
| | |
Distribution fees payable | | | 45,836 | |
| | |
Accrued custodian and accounting fees | | | 28,774 | |
| | |
Accrued audit fees | | | 13,978 | |
| | |
Accrued trustees’ and officers’ fees | | | 4,047 | |
| | |
Accrued expenses and other liabilities | | | 26,373 | |
| | | | | |
| | |
Total Liabilities | | | 725,355 | |
| | | | | |
| | |
Total Net Assets | | $ | 227,051,043 | |
| | | | | |
| | |
Net Assets Consist of: | | | | |
| | |
Paid-in capital | | $ | 242,665,183 | |
| | |
Distributable loss | | | (15,614,140 | ) |
| | | | | |
| | |
Total Net Assets | | $ | 227,051,043 | |
| | | | | |
Investments, at Cost | | $ | 222,067,878 | |
| | | | | |
| | |
Pricing of Shares | | | | |
| | |
Shares of Beneficial Interest Outstanding with
No Par Value | | | 24,075,114 | |
| | |
Net Asset Value Per Share | | | $9.43 | |
| | | | | |
| | | | |
Statement of Operations For the Six Months Ended June 30, 2023 (unaudited) | |
Investment Income | | | | |
| | |
Dividends | | $ | 1,718,700 | |
| | |
Interest | | | 38,441 | |
| | |
Withholding taxes on foreign dividends | | | (10,590 | ) |
| | | | | |
| | |
Total Investment Income | | | 1,746,551 | |
| | | | | |
| | |
Expenses | | | | |
| | |
Investment advisory fees | | | 577,618 | |
| | |
Distribution fees | | | 272,461 | |
| | |
Custodian and accounting fees | | | 44,641 | |
| | |
Professional fees | | | 34,170 | |
| | |
Trustees’ and officers’ fees | | | 27,435 | |
| | |
Administrative fees | | | 17,418 | |
| | |
Transfer agent fees | | | 7,743 | |
| | |
Shareholder reports | | | 5,379 | |
| | |
Other expenses | | | 6,049 | |
| | | | | |
| | |
Total Expenses | | | 992,914 | |
| | |
Less: Fees waived | | | (44,749 | ) |
| | | | | |
| | |
Total Expenses, Net | | | 948,165 | |
| | | | | |
| | |
Net Investment Income/(Loss) | | | 798,386 | |
| | | | | |
| | |
Realized Gain/(Loss) and Change in Unrealized Appreciation/(Depreciation) on Investments, Derivative Contracts and Foreign Currency Transactions | | | | |
| | |
Net realized gain/(loss) from investments | | | (12,215,388 | ) |
| | |
Net realized gain/(loss) from futures contracts | | | (75,441 | ) |
| | |
Net realized gain/(loss) from foreign currency transactions | | | 296 | |
| | |
Net change in unrealized appreciation/(depreciation) on investments | | | 31,433,023 | |
| | |
Net change in unrealized appreciation/(depreciation) on futures contracts | | | 714 | |
| | |
Net change in unrealized appreciation/(depreciation) on translation of assets and liabilities in foreign currencies | | | 1 | |
| | | | | |
| | |
Net Gain on Investments, Derivative Contracts and Foreign Currency Transactions | | | 19,143,205 | |
| | | | | |
| | |
Net Increase in Net Assets Resulting From Operations | | $ | 19,941,591 | |
| | | | | |
| | | | | |
| | | | |
| 8 | | | | The accompanying notes are an integral part of these financial statements. |
FINANCIAL INFORMATION — GUARDIAN SELECT MID CAP CORE VIP FUND
| | | | | | | | |
Statements of Changes in Net Assets Six Months Ended Numbers are unaudited | |
| | | |
| | | For the
Six Months Ended
6/30/23 | | | For the
Year Ended
12/31/22 | |
| | | | |
Operations | |
| | | |
Net investment income/(loss) | | $ | 798,386 | | | $ | 1,615,935 | |
| | | |
Net realized gain/(loss) from investments, derivative contracts and foreign currency transactions | | | (12,290,533 | ) | | | (9,157,592 | ) |
| | | |
Net change in unrealized appreciation/(depreciation) on investments, derivative contracts and translation of assets and liabilities in foreign currencies | | | 31,433,738 | | | | (30,049,076 | ) |
| | | | | | | | | |
| | | |
Net Increase/(Decrease) in Net Assets Resulting from Operations | | | 19,941,591 | | | | (37,590,733 | ) |
| | | | | | | | | |
| |
Capital Share Transactions | |
| | | |
Proceeds from sales of shares | | | 13,427,413 | | | | 41,570,400 | |
| | | |
Cost of shares redeemed | | | (24,416,568 | ) | | | (47,730,311 | ) |
| | | | | | | | | |
| | | |
Net Decrease in Net Assets Resulting from Capital Share Transactions | | | (10,989,155 | ) | | | (6,159,911 | ) |
| | | | | | | | | |
| | | |
Net Increase/(Decrease) in Net Assets | | | 8,952,436 | | | | (43,750,644 | ) |
| | | | | | | | | |
| |
Net Assets | |
| | | |
Beginning of period | | | 218,098,607 | | | | 261,849,251 | |
| | | | | | | | | |
| | | |
End of period | | $ | 227,051,043 | | | $ | 218,098,607 | |
| | | | | | | | | |
| |
Other Information: | |
| | | |
Shares | | | | | | | | |
| | | |
Sold | | | 1,511,150 | | | | 4,545,332 | |
| | | |
Redeemed | | | (2,643,965 | ) | | | (5,326,228 | ) |
| | | | | | | | | |
| | | |
Net Decrease | | | (1,132,815 | ) | | | (780,896 | ) |
| | | | | | | | | |
| | | | | | | | | |
| | | | |
| The accompanying notes are an integral part of these financial statements. | | | | 9 |
FINANCIAL INFORMATION — GUARDIAN SELECT MID CAP CORE VIP FUND
The Financial Highlights table is intended to help you understand the Fund’s financial performance for the past six reporting periods (or, if shorter, the period since inception). Certain information reflects financial results for a single Fund share. The total returns in the table represent the rate that an investor would have earned (or lost) on an investment in the Fund.
| | | | | | | | | | | | | | | | | | | | | | | | |
Financial Highlights Six Months Ended Numbers are unaudited | | | | | | | | | | | | | | | | |
| | | Per Share Operating Performance | | | | |
| | | Net Asset Value,
Beginning of
Period | | | Net Investment
Income(1) | | | Net Realized
and Unrealized
Gain/(Loss) | | | Total
Operations | | | Net Asset
Value, End of
Period | | | Total
Return(2) | |
| | | | | | | |
Six Months Ended 6/30/23 | | $ | 8.65 | | | $ | 0.03 | | | $ | 0.75 | | | $ | 0.78 | | | $ | 9.43 | | | | 9.02 | %(4) |
| | | | | | | |
Year Ended 12/31/22 | | | 10.08 | | | | 0.06 | | | | (1.49) | | | | (1.43) | | | | 8.65 | | | | (14.19) | % |
| | | | | | | |
Period Ended 12/31/21(5) | | | 10.00 | | | | 0.02 | | | | 0.06 | | | | 0.08 | | | | 10.08 | | | | 0.80 | %(4) |
| | | | |
| 10 | | | | The accompanying notes are an integral part of these financial statements. |
FINANCIAL INFORMATION — GUARDIAN SELECT MID CAP CORE VIP FUND
| | | | | | | | | | | | | | | | | | | | | | |
| | | | | | | | | | | | | | | | |
| Ratios/Supplemental Data | |
Net Assets, End
of Period (000s) | | | Net Ratio of
Expenses to
Average
Net Assets(3) | | | Gross Ratio of
Expenses to
Average Net
Assets | | | Net Ratio of Net
Investment Income
to Average
Net Assets(3) | | | Gross Ratio of Net
Investment Income
to Average
Net Assets | | | Portfolio
Turnover Rate | |
| | | | | |
| $ | 227,051 | | | | 0.87%(4) | | | | 0.91%(4) | | | | 0.73%(4) | | | | 0.69%(4) | | | | 29% | (4) |
| | | | | |
| | 218,099 | | | | 0.87% | | | | 0.90% | | | | 0.69% | | | | 0.66% | | | | 74% | |
| | | | | |
| | 261,849 | | | | 0.82%(4) | | | | 0.90%(4) | | | | 0.96%(4) | | | | 0.88%(4) | | | | 93% | (4) |
| (1) | Calculated based on the average shares outstanding during the period. |
| (2) | Total returns do not reflect the effects of charges deducted pursuant to the terms of The Guardian Insurance & Annuity Company, Inc.’s variable contracts. Inclusion of such charges would reduce the total returns for all periods shown. |
| (3) | Net Ratio of Expenses to Average Net Assets and Net Ratio of Net Investment Income to Average Net Assets include the effect of fee waivers and expense limitations. |
| (4) | Ratios for periods less than one year have been annualized, except for total return and portfolio turnover rate. For the period ended December 31, 2021, certain non-recurring fees (i.e., audit fees) are not annualized. |
| (5) | Commenced operations on October 25, 2021. |
| | | | |
| The accompanying notes are an integral part of these financial statements. | | | | 11 |
NOTES TO FINANCIAL STATEMENTS — GUARDIAN SELECT MID CAP CORE VIP FUND
June 30, 2023 (unaudited)
1. Organization
Guardian Variable Products Trust (the “Trust”), a Delaware statutory trust organized on January 12, 2016, is registered under the Investment Company Act of 1940, as amended (the “1940 Act”), as an open-end management investment company. The Trust currently has twenty-four series. Guardian Select Mid Cap Core VIP Fund (the “Fund”) is a series of the Trust. The Fund is a diversified fund and commenced operations on October 25, 2021. The financial statements for other series of the Trust are presented in separate reports.
The Trust has authorized an unlimited number of shares of beneficial interest with no par value. Shares are bought and sold at closing net asset value (“NAV”). Shares of the Fund are only sold to certain separate accounts of The Guardian Insurance & Annuity Company, Inc. (“GIAC”) that fund certain variable annuity contracts and variable life insurance policies issued by GIAC. GIAC is a wholly-owned subsidiary of The Guardian Life Insurance Company of America (“Guardian Life”).
The Fund seeks long term growth of capital.
2. Significant Accounting Policies
The following is a summary of significant accounting policies followed by the Fund in the preparation of its financial statements. The Fund follows the investment company accounting and reporting guidance of the Financial Accounting Standards Board (“FASB”) Accounting Standards Codification Topic 946 Financial Services – Investment Companies. The following policies are in conformity with accounting principles generally accepted in the United States of America (“GAAP”). The preparation of financial statements in accordance with GAAP requires management to make estimates and assumptions that affect the reported amounts and disclosures in the financial statements. Actual results could differ from those estimates.
a. Investment Valuations The Board of Trustees has designated Park Avenue Institutional Advisers LLC (“Park Avenue”) as the valuation designee for the Fund pursuant to Rule 2a-5 under the 1940 Act. Park Avenue has established a Fair Valuation Committee and has adopted fair valuation procedures that provide methodologies for fair valuing securities. These procedures include monitoring the appropriateness of fair values based on results of ongoing valuation oversight, including but not limited to consideration of
security specific events, market events, and pricing vendor and broker-dealer due diligence. The Fair Valuation Committee oversees and carries out the policies for the valuation of investments held in the Fund. The Fair Valuation Committee is responsible for discussing and assessing the potential impacts to the fair values on an ongoing basis, and reports to the Board of Trustees on at least a quarterly basis.
Equity securities traded on an exchange other than NASDAQ Stock Market, LLC (“NASDAQ”) are valued at the last reported sale price on the principal exchange or market on which they are traded; or, if there were no sales that day, at the mean between the closing bid and ask prices. Securities traded on the NASDAQ are generally valued at the NASDAQ official closing price, which may not be the last sale price. If the NASDAQ official closing price is not available for a security, that security is generally valued at the mean between the closing bid and ask prices. Repurchase agreements are carried at cost, which approximates fair value (see Note 5d). Foreign securities are valued in the currencies of the markets in which they trade and then converted to U.S. dollars by the application of foreign exchange rates at the close of the New York Stock Exchange (“NYSE”). Forward foreign currency contracts, if any, are valued at the mean between the bid and ask rates for the specified time interpolated from rates for proximate time periods.
Exchange-traded financial futures contracts are valued at the last settlement price on the market where they are primarily traded.
Securities for which market quotations are not readily available or securities whose values have been materially affected by events occurring before the Fund’s valuation time but after the close of the securities’ principal exchange or market are valued at their fair values as determined in good faith by Park Avenue, as the Board of Trustee’s valuation designee (as defined in Rule 2a-5 under the 1940 Act), in accordance with Park Avenue’s procedures and under the general oversight of the Board of Trustees. In addition, the values of the Fund’s investments in foreign securities are generally determined by a pricing service using pricing models designed to estimate likely changes in the values of those securities. Certain foreign equity instruments are valued by applying international fair value factors provided by approved pricing services. The factors seek to adjust the local closing price for movements of local markets post closing, but prior to the time the NAVs are calculated. Valuations reflected in this report are as of the report date. As a result, changes in valuation due to market
NOTES TO FINANCIAL STATEMENTS — GUARDIAN SELECT MID CAP CORE VIP FUND
events and/or issuer related events after the report date and prior to issuance of the report are not reflected herein.
Various inputs are used in determining the valuation of the Fund’s investments. These inputs are summarized in three broad levels listed below.
| • | | Level 1 – unadjusted inputs using quoted prices in active markets for identical investments. |
| • | | Level 2 – other significant observable inputs, including, but not limited to, quoted prices for similar investments, inputs other than quoted prices that are observable for investments (such as interest rates, prepayment speeds, credit risks, etc.) or other market corroborated inputs. |
| • | | Level 3 – significant unobservable inputs (including the Fund’s own assumptions in determining the fair value of investments). |
Inputs may include price information, volatility statistics, specific and broad credit data, liquidity statistics, and other factors. A financial instrument’s level within the fair value hierarchy is based on the lowest level of any input; both individually and in aggregate, that is significant to the fair value measurement. However, the determination of what constitutes “observable” requires significant judgment by the Trust. The Trust considers observable data to be that market data which is readily available, regularly distributed or updated, reliable and verifiable, and provided by independent sources that are actively involved in the relevant market. The inputs or methodology used for valuing securities are not necessarily an indication of the risk associated with investing in those securities. Changes in valuation techniques may result in transfers into or out of a financial instrument’s assigned level within the hierarchy.
The FASB requires reporting entities to make disclosures about purchases, sales, issuances and settlements of Level 3 securities on a gross basis. For the six months ended June 30, 2023, there were no transfers into or out of Level 3 of the fair value hierarchy.
In determining a financial instrument’s placement within the hierarchy, the Trust separates the Fund’s investment portfolio into two categories: investments and derivatives (e.g., futures). A summary of inputs used to value the Fund’s assets and liabilities carried at fair value as of June 30, 2023 is included in the Schedule of Investments.
Investments Investments whose values are based on quoted market prices in active markets, and are
therefore classified within Level 1, include active listed equities. Investments that trade in markets that are not considered to be active, but are valued based on quoted market prices, dealer quotations or alternative pricing sources supported by observable inputs are classified within Level 2. These include certain U.S. government and sovereign obligations, most government agency securities, investment-grade corporate bonds, certain mortgage products, state, municipal and provincial obligations, and certain foreign equity securities, including securities whose prices may have been affected by events occurring after the close of trading on their principal exchange or market and, as a result, whose values are determined by a pricing service as described above, or securities whose values are otherwise determined using fair valuation methods approved by the Fund’s Board of Trustees.
Investments classified within Level 3 have significant unobservable inputs, as they trade infrequently or not at all. Level 3 investments include, among others, private placement securities. When observable prices are not available for these securities, the Trust uses one or more valuation techniques for which sufficient and reliable data is available. The inputs used by the Trust in estimating the value of Level 3 investments include, for example, the original transaction price, recent transactions in the same or similar instruments, completed or pending third-party transactions in the underlying investment or comparable issuers, subsequent rounds of financing, recapitalizations, and other transactions across the capital structure. Level 3 investments may also be adjusted to reflect illiquidity and/or non-transferability, with the amount of such discount estimated by the Trust in the absence of market information. Assumptions used by the Trust due to the lack of observable inputs may significantly impact the resulting fair value and therefore the Fund’s results of operations. As of June 30, 2023, the Fund had no securities classified as Level 3.
Derivatives Exchange-traded derivatives, such as futures contracts, exchange-traded option contracts and certain swaps, are typically classified within Level 1 or Level 2 of the fair value hierarchy depending on whether or not they are deemed to be actively traded. Certain non-exchange-traded derivatives, such as generic forwards, certain swaps and options, have inputs which can generally be corroborated by market data and are therefore classified within Level 2.
b. Securities Transactions Securities transactions are accounted for on the date securities are purchased or
NOTES TO FINANCIAL STATEMENTS — GUARDIAN SELECT MID CAP CORE VIP FUND
sold (trade date). Realized gains or losses on securities transactions are determined on the basis of specific identification.
c. Foreign Currency Translation The accounting records of the Fund are maintained in U.S. dollars. Investment securities and all other assets and liabilities of the Fund denominated in a foreign currency are generally translated into U.S. dollars at the exchange rates quoted at the close of the NYSE on each business day. The market value of investment securities and other assets and liabilities are translated at the exchange rate as of the valuation date. Purchases and sales of securities, income receipts, and expense payments are translated into U.S. dollars at the exchange rates in effect on the dates of the respective transactions. The Fund does not isolate the portion of the fluctuations on investments resulting from changes in foreign currency exchange rates from the fluctuations in market prices of investments held. Such fluctuations are included in the Net change in net realized and unrealized gain/(loss) from investments on the Statement of Operations.
Reported realized foreign currency gains and losses arise from the disposition of foreign currency, currency gains or losses realized between the trade and settlement dates on securities transactions, and the difference between the amounts of dividends, interest and foreign withholding taxes recorded on the Fund’s books on the transaction date and the U.S. dollar equivalent of the amounts actually received or paid. These reported realized foreign currency gains and losses, if any, are included in Net realized gain/(loss) from foreign currency transactions on the Statement of Operations. Unrealized foreign currency gains and losses arise from changes (due to changes in exchange rates) in the value of foreign currency and other assets and liabilities denominated in foreign currencies, which are held at period end, if any, and are included in Net change in unrealized appreciation/(depreciation) on translation of assets and liabilities in foreign currencies on the Statement of Operations.
d. Foreign Capital Gains Tax The Fund may be subject to foreign taxes on income, gains on investments or currency purchases/repatriation, a portion of which may be recoverable. The Fund will accrue such taxes and recoveries as applicable, based upon their current interpretation of tax rules and regulations that exist in the markets in which they invest.
e. Investment Income Dividend income net of foreign taxes withheld, if any, is generally recorded on the
ex-dividend date. Distributions received from real estate investment trusts, if any, may be classified as dividends, capital gains and/or return of capital. Interest income, which includes amortization/accretion of premium/discount, is determined using the interest income accrual method, and is accrued and recorded daily.
f. Allocation of Income and Expenses Many of the expenses of the Trust can be directly attributed to a specific series of the Trust. Expenses that cannot be directly attributed to a specific series of the Trust are generally apportioned among all the series in the Trust, based on relative net assets. In calculating net asset value per share for each series of the Trust, investment income, realized and unrealized gains and losses, and expenses other than series-specific expenses are allocated daily to each series based upon the proportion of net assets attributable to each series.
3. Transactions with Affiliates
a. Investment Advisory Fee and Expense Limitation Under the terms of the advisory agreement, which, after its two year initial term, is reviewed and approved annually by the Board of Trustees, the Fund pays an investment advisory fee to Park Avenue. Park Avenue is a wholly-owned subsidiary of Guardian Life and receives an investment advisory fee at an annual rate of 0.53% of the Fund’s average daily net assets. The fee is accrued daily and paid monthly.
Park Avenue has contractually agreed through April 30, 2024 to waive certain fees and/or reimburse certain expenses incurred by the Fund to the extent necessary to limit the Fund’s total annual operating expenses after fee waiver and/or expense reimbursement to 0.87% of the Fund’s average daily net assets (excluding, if applicable, any acquired fund fees and expenses, taxes, interest, transaction costs and brokerage commissions, litigation and extraordinary expenses). The limitation may not be increased or terminated prior to this time without action by the Board of Trustees and may be terminated only upon approval of the Board of Trustees. Amounts waived or reimbursed by Park Avenue pursuant to any expense limitation will not be subject to Park Avenue’s recoupment rights. For the six months ended June 30, 2023, Park Avenue waived fees and/or paid Fund expenses in the amount of $44,749.
Park Avenue has entered into a Sub-Advisory Agreement with FIAM LLC (“FIAM”). FIAM is responsible for providing day-to-day investment advisory services to the Fund, subject to the supervision of Park Avenue and the
NOTES TO FINANCIAL STATEMENTS — GUARDIAN SELECT MID CAP CORE VIP FUND
oversight of the Board of Trustees. Sub-advisory fees are paid by Park Avenue and do not represent a separate or additional expense to the Fund.
b. Compensation of Trustees and Officers Trustees and officers who are interested persons of the Trust, as defined in the 1940 Act, receive no compensation from the Fund, except for the Chief Compliance Officer of the Trust. Trustees of the Trust who are not interested persons of the Trust, and the Chief Compliance Officer, receive compensation and reimbursement of expenses from the Trust.
c. Distribution Fees Park Avenue Securities LLC (“PAS”), a wholly-owned subsidiary of Guardian Life, is the principal underwriter of Fund shares. The Trust has entered into a distribution and service agreement with PAS, which governs the sale and distribution of shares of the Fund. Under a distribution and service plan adopted by the Trust (“12b-1 plan”), PAS is compensated for services in such capacity, including its expenses in connection with the promotion and distribution of shares of the Fund, at an annual rate of 0.25% of the Fund’s average daily net assets. For the six months ended June 30, 2023, the Fund paid distribution fees in the amount of $272,461 to PAS.
PAS has directed that certain payments under the 12b-1 plan be used to compensate GIAC for shareholder services provided to contract owners.
4. Federal Income Taxes
a. Distributions to Shareholders For federal income tax purposes, the Fund is treated as a disregarded entity (“DRE”). As a DRE, the Fund is not subject to an entity-level income tax; and any income, gains, losses, deductions, taxes, and credits of the Fund would instead be “passed through” directly to the separate accounts of GIAC that invest in the Fund and retain the same character for U.S. federal income tax purposes. In addition, the Fund is not required to distribute taxable income and capital gains for U.S. federal income tax purposes. Therefore, no dividends and capital gains distributions were paid by the Fund.
5. Investments
a. Investment Purchases and Sales The cost of investments purchased and the proceeds from investments sold (excluding short-term investments) amounted to $62,670,923 and $75,456,062, respectively, for the six months ended June 30, 2023. During the six months ended June 30, 2023, there were no purchases or sales of U.S. government securities.
b. Foreign Securities Foreign securities investments involve special risks and considerations not typically associated with U.S. investments. These risks include, but are not limited to, currency risk; adverse political, regulatory, social, and economic developments; and less reliable information about issuers. Moreover, securities of some foreign issuers may be less liquid and their prices more volatile than those of comparable U.S. issuers.
c. Industry or Sector Concentration In its normal course of business, the Fund may invest a significant portion of its assets in companies within a limited number of industries or sectors. As a result, the Fund may be subject to a greater risk of loss than that of a fund invested in a wider spectrum of industries or sectors because the stocks of many or all of the companies in the industry, group of industries, sector, or sectors may decline in value due to developments adversely affecting the industry, group of industries, sector, or sectors.
d. Repurchase Agreements The Fund may invest in repurchase agreements to maintain liquidity and earn income over periods of time as short as overnight. The collateral for repurchase agreements is either cash or fully negotiable U.S. government securities (including U.S. government agency securities). Repurchase agreements are fully collateralized (including the interest accrued thereon) and such collateral is marked to market daily while the agreements remain in force. If the value of the collateral falls below the repurchase price plus accrued interest, the Fund will typically require the seller to deposit additional collateral by the next business day. If the request for additional collateral is not met, or the seller defaults, the Fund maintains the right to sell the collateral (although it may be prevented or delayed from doing so in certain circumstances) and may be required to claim any resulting loss against the seller. Park Avenue monitors the creditworthiness of the seller with which the Fund enters into repurchase agreements.
e. Disclosures About Derivative Instruments and Hedging Activities The Fund entered into equity futures contracts for the six months ended June 30, 2023 to equitize cash and keep the Fund fully invested. Using futures contracts involves various risks, including market, interest rate and equity risks. Risks of entering into futures contracts include the possibility that there may be an illiquid market or that a change in the value of the contract may not correlate with the changes in the value of the underlying securities. To the extent that market prices move in an unexpected direction, there is
NOTES TO FINANCIAL STATEMENTS — GUARDIAN SELECT MID CAP CORE VIP FUND
a risk that a Fund will not achieve the anticipated benefits of the futures contract or may realize a loss.
Transactions in derivative investments for the six months ended June 30, 2023 were as follows:
| | | | |
| | |
| | | Equity Contracts | |
| | |
Net Realized Gain/(Loss) | | | | |
| Futures Contracts1 | | $ | (75,441 | ) |
| |
Net Change in Unrealized Appreciation/(Depreciation) | |
| Futures Contracts2 | | $ | 714 | |
| | |
Average Number of Notional Amounts | | | | |
| Futures Contracts3 | | | 2 | |
| 1 | Statement of Operations location: Net realized gain/(loss) from futures contracts. |
| 2 | Statement of Operations location: Net change in unrealized appreciation/(depreciation) on futures contracts. |
| 3 | Amount represents number of contracts. |
6. Temporary Borrowings
The Fund, with other funds managed by Park Avenue, is party to a credit agreement with respect to a $10 million committed revolving credit facility from State Street Bank and Trust Company (the “Credit Agreement”) for temporary borrowing purposes, including the meeting of redemption requests that otherwise might require the untimely disposition of securities. Interest is based on a daily fluctuating rate per annum equal to the Applicable Rate (as defined in the Credit Agreement) plus the Applicable Margin (as defined in the Credit Agreement) that is subject to change from time to time as and when the Applicable Rate changes. Under the current Credit Agreement, the Applicable Rate for any day is defined as the rate per annum equal to the sum of (a) 0.10% plus (b) the higher of (i) the Federal Funds
Effective Rate for such day and (ii) the Overnight Bank Funding Rate for such day; the Applicable Margin is 1.25%. In addition to the interest charged on any borrowings by the Fund, each fund pays a commitment fee of 0.30% per annum on its share of the unused portion of the credit facility. The agreement is in place until January 5, 2024. The Fund did not utilize the credit facility during the six months ended June 30, 2023.
7. Indemnifications
Under the Trust’s organizational documents and, in some cases, by contract, officers and Trustees of the Trust are indemnified against certain liabilities arising out of the performance of their duties to the Fund. In addition, in the normal course of business, the Fund enters into contracts with its vendors and others that provide general indemnifications. The Fund’s maximum exposure under these arrangements is unknown as this would involve future claims that may be made against the Fund that have not yet occurred. However, based on experience, the Fund expects the risk of loss to be remote.
8. Additional Information
The outbreak of COVID-19 has adversely impacted both local and global economies, including those in which the Fund may invest. These impacts include materially reduced consumer demand and economic output, disrupted supply chains, market closures, travel restrictions and quarantines, and strained healthcare systems. The Fund’s operations may be interrupted as a result, which may have a negative impact on the Fund’s investment performance.
SUPPLEMENTAL INFORMATION (UNAUDITED)
Liquidity Risk Management Program
In compliance with Rule 22e-4 under the Investment Company Act of 1940, as amended (the “Liquidity Rule”), Guardian Variable Products Trust (the “Trust”) has adopted and implemented a written liquidity risk management program (the “Program”) for each series of the Trust (each, a “Fund”), which is reasonably designed to assess and manage each Fund’s liquidity risk. The Fund’s “liquidity risk” is the risk that the Fund could not meet requests to redeem shares issued by the Fund without significant dilution of the remaining investors’ interests in the Fund.
The Board of Trustees of the Trust (the “Board”) Previously approved the designation of Park Avenue Institutional Advisers LLC (the “Administrator” or “PAIA”) as Program administrator. The Administrator established a Liquidity Risk Management Committee, which is comprised of certain officers of the Trust and PAIA, that assists the Administrator in the implementation and day-to-day administration of the Program and otherwise support carrying out the Administrator’s liquidity risk management responsibilities under the Program.
In accordance with the Program, each Fund’s liquidity risk is assessed no less frequently than annually, taking into consideration a variety of factors, including, as applicable, the Fund’s investment strategy and liquidity of portfolio investments, cash flow projections, and holdings of cash and cash equivalents, as well as borrowing arrangements and other funding sources. Certain factors are considered under both normal and reasonably foreseeable stressed conditions.
Each Fund portfolio investment is classified, no less than monthly, into one of four liquidity categories (including “highly liquid investments” and “illiquid investments,” discussed below) based on a determination of the number of days it is reasonably expected to take to convert the investment to cash, or sell or dispose of the investment, in current market conditions without significantly changing the investment’s market value. The Liquidity Rule limits the Fund’s investments in
illiquid investments by prohibiting the Fund from acquiring any illiquid investment if, immediately after the acquisition, the Fund would have invested more than 15% of its net assets in illiquid investments that are assets. The Program includes provisions reasonably designed to comply with this investment limitation. In addition, the Program includes provisions reasonably designed to comply with this investment limitation. In addition, the Program includes provisions reasonably designed to comply with the Liquidity Rule’s requirements relating to highly liquid investment minimums, which is a minimum amount of Fund net assets that must be invested in highly liquid investments that are assets, as applicable. The Fund was not required to adopt a highly liquid investment minimum during the period.
At a meeting of the Board held on March 29-30, 2023, the Board received a report (the “Report”) prepared by the Administrator addressing the Program’s operation and assessing the adequacy and effectiveness of its implementation for the period from January 1, 2022 through December 31, 2022 (the “Reporting Period”). The Report noted that the Administrator believes the Program operated effectively during the Reporting Period and continues to be reasonably designed to effectively assess and manage each Fund’s liquidity risk. The Report also noted that the Administrator believes the Program has been adequately and effectively implemented and the investment strategies for each Fund continue to be appropriate since its inception. In addition, the Report summarized the operation of the Program and the information and factors considered by the Administrator in its assessment of the Program’s implementation, such as the liquidity risk assessment framework and liquidity classification methodologies.
There can be no assurance that the Program will achieve its objectives under all circumstances. Please refer to the Fund’s prospectus for more information regarding the Fund’s exposure to liquidity risk and other risks to which an investment in the Fund may be subject.
SUPPLEMENTAL INFORMATION (UNAUDITED)
Approval of Investment Management and Sub-advisory Agreements
Section 15(c) of the Investment Company Act of 1940, as amended (the “1940 Act”), requires that a fund’s investment advisory and sub-advisory agreements be approved initially by the fund’s board of trustees. Section 15(c) also requires that the continuation of these agreements, after an initial term of up to two years, be annually reviewed and approved by the board. Any such agreement must be approved by a vote of a majority of the trustees who are not parties to the agreement or “interested persons” (as defined in the 1940 Act) of a party to the agreement at a meeting of the board called for the purpose of voting on such approval.
At a meeting of the Board of Trustees (the “Board”) of Guardian Variable Products Trust (the “Trust”) held on March 29-30, 2023 (the “Meeting”), the Board, including the trustees who are not parties to the agreement or “interested persons” as defined in the 1940 Act (the “Independent Trustees”), considered and voted unanimously to renew the existing investment management agreement between the Trust, on behalf of Guardian All Cap Core VIP Fund; Guardian Balanced Allocation VIP Fund; Guardian Core Fixed Income VIP Fund; Guardian Core Plus Fixed Income VIP Fund; Guardian Diversified Research VIP Fund; Guardian Equity Income VIP Fund; Guardian Global Utilities VIP Fund; Guardian Growth & Income VIP Fund; Guardian Integrated Research VIP Fund; Guardian International Growth VIP Fund; Guardian International Equity VIP Fund; Guardian Large Cap Disciplined Growth VIP Fund; Guardian Large Cap Disciplined Value VIP Fund; Guardian Large Cap Fundamental Growth VIP Fund; Guardian Mid Cap Relative Value VIP Fund; Guardian Mid Cap Traditional Growth VIP Fund; Guardian Multi-Sector Bond VIP Fund; Guardian Select Mid-Cap Core VIP Fund; Guardian Short Duration Bond VIP Fund; Guardian Small Cap Core VIP Fund; Guardian Small-Mid Cap Core VIP Fund; Guardian Strategic Large Cap Core VIP Fund; Guardian Total Return Bond VIP Fund and Guardian U.S. Government Securities VIP Fund (each, a “Fund,” and together, the “Funds”), in substantially the form presented at this meeting (the “Management Agreement”); and Park Avenue Institutional Advisers LLC (the “Manager”) for a one-year term.
The Board, including the Independent Trustees, also considered and voted unanimously to renew the existing sub-advisory agreements (the “Sub-Advisory Agreements,” collectively with the Management Agreement and Sub-Subadvisory Agreement, the “Agreements”) between the Manager and investment
advisory firms engaged to serve as sub-advisers to certain of the Funds (the “Sub-Advised Funds”), namely (i) ClearBridge Investments, LLC with respect to Guardian Small Cap Core VIP Fund; (ii) Putnam Investment Management, LLC with respect to Guardian Diversified Research VIP Fund; (iii) AllianceBernstein L.P. with respect to Guardian Growth & Income VIP Fund and Guardian Strategic Large Cap Core VIP Fund; (iv) J.P. Morgan Investment Management Inc. with respect to Guardian International Growth VIP Fund; (v) Schroder Investment Management North America Inc. with respect to Guardian International Equity VIP Fund; (vi) Wellington Management Company LLP with respect to Guardian Balanced Allocation VIP Fund, Guardian Equity Income VIP Fund, Guardian Integrated Research VIP Fund, Guardian Large Cap Disciplined Growth VIP Fund and Guardian Global Utilities VIP Fund; (vii) Boston Partners Global Investors, Inc. with respect to Guardian Large Cap Disciplined Value VIP Fund; (viii) Janus Henderson Investors US LLC with respect to Guardian Mid Cap Traditional Growth VIP Fund; (ix) Allspring Global Investments, LLC with respect to Guardian Mid Cap Relative Value VIP Fund and Guardian Small-Mid Cap Core VIP Fund; (x) Lord, Abbett & Co. LLC with respect to Guardian Core Plus Fixed Income VIP Fund; (xi) FIAM LLC with respect to Guardian Select Mid Cap Core VIP Fund; and (xii) Massachusetts Financial Services Company with respect to Guardian All Cap Core VIP Fund, each in substantially the form presented at this meeting, (each, a “Sub-Adviser” and collectively, the “Sub-Advisers”) for a one-year term.
The Board, including the Independent Trustees, also considered and voted unanimously to renew the existing sub-subadvisory agreement (the “Sub-Subadvisory Agreement”) between Schroder Investment Management North America Inc. and Schroder Investment Management North America Limited (also a Sub-Adviser) with respect to Guardian International Equity VIP Fund for a one-year term.
The Board is responsible for overseeing the management of each Fund. In determining whether to renew its approval of the Agreements, the Trustees evaluated information and factors that they considered to be relevant and appropriate through the exercise of their own business judgment. The Trustees considered certain information and factors in light of advice furnished to them by legal counsel to the Trust and, in the case of the Independent Trustees, their independent legal counsel. In advance of the Meeting, the Trustees received materials and information designed to assist their consideration of the Agreements. The Trustees received written responses
SUPPLEMENTAL INFORMATION (UNAUDITED)
from the Manager and each Sub-Adviser to a series of questions and requests for information encompassing a wide variety of topics provided by independent counsel on behalf of the Independent Trustees. The Independent Trustees also received materials and information regarding the legal standards applicable to their consideration of the Agreements and the process and criteria used by the Manager to identify and select the Sub-Advisers.
During the course of their deliberations, the Independent Trustees met twice to discuss and evaluate the materials, information and Agreements in executive session with their independent legal counsel, outside of the presence of the Trustees who are not Independent Trustees and representatives from Fund management, the Manager or any Sub-Adviser.
In reaching its decisions to renew its approval of the Agreements, the Board took into account the materials and information described above, as well as other materials and information provided to the Board throughout the year. Individual Trustees may have given different weight to different factors and information with respect to each Agreement, and the Trustees did not identify any single factor or information that, in isolation, would be controlling in deciding to approve the Agreements. The discussion below is intended to summarize the broad factors that figured prominently in the Board’s decisions to renew its approval of the Agreements rather than to be all-inclusive. These broad factors included: (i) the nature, extent and quality of the services provided to the Funds by the Manager and to the Sub-advised Funds by the Sub-Advisers; (ii) the investment performance of each Fund; (iii) estimated profitability of the Manager; (iv) fees and expenses; (v) the extent to which economies of scale may exist, and the extent to the benefits of economies of scale are shared with the Funds; and (vi) any other benefits derived by the Manager or the Sub-Advisers (or their respective affiliates) from their relationships with the Funds.
Nature, Extent and Quality of Services
The Trustees considered information regarding the nature, extent and quality of services provided to the Funds by the Manager. The Trustees also considered, among other things, the terms of the Management Agreement and the range of investment advisory services provided by the Manager. In addition, the Trustees reviewed the range of non-investment advisory services provided by the Manager consistent with the terms of the Management Agreement, notably
coordinating the preparation and filing of various regulatory documents, coordinating the preparation and assembly of Board meeting materials, and assisting the Board with certain valuation matters. The Board also received a description of the Manager’s and each Sub-Adviser’s business continuity plans and of their respective approaches to data privacy and cybersecurity, and related testing. The Board received information regarding the response of the Manager and the Sub-Advisers to the COVID-19 pandemic, including the continuation of remote work arrangements and return-to-office plans. The Board also received information about the Manager’s role as administrator of the Funds’ liquidity risk management program, the Manager’s approach to risk management, and the Manager’s vendor oversight programs.
The Trustees considered that the Sub-advised Funds operate in a “manager-of-managers” structure and reviewed the responsibilities that the Manager has under this structure, including monitoring and evaluating the performance of the Sub-Advisers, monitoring the Sub-Advisers for adherence to the stated investment objectives, strategies, policies and restrictions of the Funds and supervising the Sub-Advisers with respect to the services that the Sub-Advisers would provide under the Sub-Advisory Agreements. The Trustees also considered the process used by the Manager, consistent with this structure, to identify and recommend sub-advisers, and the Manager’s ability to monitor and oversee sub-advisers and recommend replacement sub-advisers, when necessary, and provide other services under the Management Agreement. The Board noted that investment management staff of the Manager and the Trust’s Chief Compliance Officer conduct oversight meetings with the Sub-Advisers on a periodic basis, follow through with additional inquiries on any questions or concerns that arise during the meetings and, as necessary, then report the results of the meetings to the Board. The Trustees reviewed information regarding the experience and background of the Manager’s key personnel and the Manager’s organizational structure and resources, including investment, legal and administrative capabilities of the Manager. In this regard, the Trustees recognized that the Funds may benefit from the Manager’s ability to use resources and capabilities of its affiliates in providing services to the Funds.
The Trustees considered information regarding the nature, extent and quality of services provided to the Sub-advised Funds by the Sub-Advisers. The Trustees also considered, among other things, the terms of the
SUPPLEMENTAL INFORMATION (UNAUDITED)
Sub-advisory Agreements and the range of investment advisory services provided by the Sub-Advisers under the oversight of the Manager. In evaluating these investment advisory services, the Trustees considered, among other things, the Sub-Advisers’ investment philosophies, styles and/or processes and approaches to managing the respective Sub-advised Funds. The Trustees received and evaluated information regarding the background, education, expertise and/or experience of the investment professionals who serve as portfolio managers for the Sub-advised Funds and the capabilities and resources of the Sub-Advisers.
Based upon these considerations, the Trustees concluded, within the context of their full deliberations, that the nature, extent and quality of services provided to the Funds by the Manager and the Sub-advised Funds by each respective Sub-Adviser were appropriate.
Investment Performance
In connection with each of its regular quarterly meetings, the Board receives information on the performance of each Fund, including net performance, relative performance rankings within the relevant Morningstar peer group, and performance as compared to benchmark index returns. At each quarterly Board meeting, members of the Manager’s funds management team review with the Board the economic and market environment, absolute and relative performance of each Fund, and any relevant information about risk management and style consistency in connection with management of the Funds. The Board considered investment performance for each Fund over the one-year, three-year (where available), five-year (where available) and since-inception periods.
The Board also received and reviewed a report prepared by Broadridge Financial Solutions (“Broadridge”), an independent provider of mutual fund industry data, which included comparisons of the performance of each Fund to performance of an appropriate peer universe. For details regarding each Fund’s performance, see the “Fund-by-Fund Factors” section below.
The Manager discussed with the Board factors contributing to the Funds’ performance results. In addition, for certain Funds, the Manager provided to the Board longer term performance records of the Sub-Advisers for strategies used in managing the Funds. The Board concluded that the investment performance generated by the Manager and each Sub-Adviser was generally satisfactory, or, that any steps being taken by the Manager and Sub-Advisers to address any performance issues were satisfactory.
Profitability
The Board received and considered the Manager’s estimate of its profitability, which included allocations by the Manager of its costs in providing management services to the Funds. The Board considered the estimated profitability of the Manager both overall and on a Fund-by-Fund basis.
The Board received and considered profitability information from most of the Sub-Advisers, but noted that the Manager had negotiated the fees with the Sub-Advisers at arm’s-length. Accordingly, the Board concluded that the profitability of the Sub-Advisers is a less relevant factor than Manager profitability.
Based on the consideration of this information, the Board concluded that the profitability of the Funds to the Manager was acceptable.
Fees and Expenses
The Trustees considered the management fees paid by the Funds to the Manager under the Management Agreement and evaluated the reasonableness of these fees. The Trustees received and reviewed comparative information with respect to the management fee and total expenses for each Fund and the management fees and total expenses for a peer group of other funds selected by Broadridge. The Trustees considered the Manager’s commitment to limit the total expenses of each Fund through an expense limitation agreement with the Trust. Although the Board recognized that the comparisons between the management fees and actual expenses of the Funds and those of the identified peer group are imprecise, given different terms of agreements and variations in fund strategies, the Trustees found that the comparative information supported their consideration and approval of the management fees and evaluation of the total expenses. For details regarding each Fund’s fee and expense comparisons, see the “Fund-by-Fund Factors” section below.
The Trustees considered the sub-advisory fees paid under the Sub-advisory Agreements and evaluated the reasonableness of those fees. The Trustees also considered that the fees paid to the Sub-Advisers would be paid by the Manager and not the Funds and that the Manager had negotiated the fees with the Sub-Advisers at arm’s-length.
Based on the consideration of the information and factors summarized above, as well as other relevant information and factors, the Board concluded that the management and sub-advisory fees were reasonable in
SUPPLEMENTAL INFORMATION (UNAUDITED)
light of the nature, extent and quality of services rendered to the Funds by the Manager and the Sub-Advisers.
Economies of Scale
The Board considered the extent to which economies of scale may exist, and the extent to the benefits of economies of scale are shared with the Funds. In this regard, the Board noted that for sixteen of twenty-four Funds, the management and sub-advisory fee included breakpoints that are tiered based on growth in asset levels of each such Fund and that for the other Funds, the fees reflected appropriate levels based on current and expected asset levels. The Board also noted that the expenses of the Funds are subject to expense limitations provided by the Manager. The Board noted that expected economies of scale, where they exist, may be shared through the use of fee breakpoints, expense limitations by the Manager, and/or a lower overall fee.
Ancillary Benefits
The Board considered the potential benefits, other than management fees, that the Manager and/or its affiliates may receive because of the Manager’s relationship with the Funds. The Trustees considered that the Funds were designed to serve as investment options under variable contracts issued by affiliates of the Manager that would receive fees under those contracts and that Park Avenue Securities LLC, an affiliate of the Manager and principal underwriter of the Funds, and participating insurance companies, including insurance companies affiliated with the Manager, would be entitled to receive fees from the Funds under a plan of distribution adopted pursuant to Rule 12b-1 under the 1940 Act. The Trustees considered that the Manager and its affiliates may benefit from (i) greater efficiencies in annuity administration and operations and potential cost savings due to a reduction in the number of unaffiliated funds available as annuity contract investment options, and (ii) increased dividends-received deductions due to the Funds’ status under the tax laws as disregarded entities. In addition, the Trustees considered the potential benefits, other than sub-advisory fees, that the Sub-Advisers and their affiliates may receive because of their relationships with the Funds, including the ability to receive research from soft dollar commissions consistent with Trust policies. The Trustees concluded that benefits that may accrue to the Manager and its affiliates are reasonable and the benefits that may accrue to the Sub-Advisers and their affiliates are consistent with those expected for a sub-adviser to a mutual fund such as the applicable Fund.
Fund-by-Fund Factors
The Broadridge report groups fees, expenses and performance into five quintiles, with the top quintile having the highest performance or lowest fees/expenses, and the bottom quintile having the lowest performance or highest fees/expenses. For purposes of the descriptions below, a Fund’s performance is considered “in line with” the benchmark index if it is within 0.20%.
Guardian Large Cap Fundamental Growth VIP Fund
| • | | The Board noted that the Fund’s performance was in the 3rd quintile of its performance universe for the 1-year period and in the 4th quintile for its performance universe for the 3-year and 5-year periods. The Board also noted that the Fund’s performance was below the benchmark index for the 1-year, 3-year and 5-year periods. |
| • | | The Board noted that the contractual management fee, the actual management fee and actual total expenses were in the 1st quintile of the expense group. |
Guardian Large Cap Disciplined Growth VIP Fund
| • | | The Board noted that the Fund’s performance was in the 3rd quintile of its performance universe for the 1-year and 3-year periods and in the 2nd quintile for the 5-year period. The Board also noted that the Fund’s performance was below the benchmark index for the 1-year, 3-year and 5-year periods. |
| • | | The Board noted that the contractual management fee, the actual management fee and actual total expenses were in the 1st quintile of the expense group. |
Guardian Integrated Research VIP Fund
| • | | The Board noted that the Fund’s performance was in the 5th quintile of its performance universe for the 1-year and 5-year periods and in the 4th quintile for 3-year period. The Board also noted that the Fund’s performance was below the benchmark index for the 1-year, 3-year and 5-year periods. |
| • | | The Board noted that the contractual management fee, the actual management fee and actual total expenses were in the 1st quintile of the expense group. |
Guardian Diversified Research VIP Fund
| • | | The Board noted that the Fund’s performance was in the 3rd quintile of its performance universe for the 1-year and 3-year periods and in the 2nd quintile for the 5-year period. The Board also noted that the Fund’s performance was higher than the benchmark |
SUPPLEMENTAL INFORMATION (UNAUDITED)
| | index for the 1-year period. The Board note that the Fund’s performance was lower than the benchmark index for the 3-year and 5-year periods. |
| • | | The Board noted that the contractual management fee and actual management fee were in the 1st quintile of the expense group and that actual total expenses were in the 3rd quintile. |
Guardian Strategic Large Cap Core VIP Fund
| • | | The Board noted that the Fund’s performance was in the 1st quintile of its performance universe for the 1-year period. The Board acknowledged the Fund’s short operational history. The Board noted that the Fund’s performance was higher than the benchmark index for the 1-year period. |
| • | | The Board noted that the contractual management fee, the actual management fee and actual total expenses were in the 1st quintile of the expense group. |
Guardian Large Cap Disciplined Value VIP Fund
| • | | The Board noted that the Fund’s performance was in the 3rd quintile of its performance universe for the 1-year and 3-year periods and in the 4th quintile for the 5-year period. The Board also noted that the Fund’s performance was higher than the benchmark index for the 1-year and 3-year periods. The Board noted that the Fund’s performance was in line with the benchmark index for the 5-year period. |
| • | | The Board noted that the contractual management fee was in the 2nd quintile of the expense group, the actual management fee was in the 1st quintile of the expense group and that actual total expenses were in the 3rd quintile. |
Guardian Growth & Income VIP Fund
| • | | The Board noted that the Fund’s performance was in the 3rd quintile of its performance universe for the 1-year, 3-year and 5-year periods. The Board also noted that the Fund’s performance was higher than the benchmark index for the 1-year, 3-year and 5-year periods. |
| • | | The Board noted that the contractual management fee and the actual management fee were in the 1st quintile of the expense group and that actual total expenses were in the 3rd quintile. |
Guardian Equity Income VIP Fund
| • | | The Board noted that the Fund had less than one-year of operational history and was not able to evaluate an investment performance record for the Fund. The |
| | | Board noted that it would have an opportunity to review such information in connection with future annual reviews. The Board noted that, in the meantime, it received monthly performance reports from the Manager. |
| • | | The Board noted that the contractual management fee, the actual management fee and actual total expenses were in the 1st quintile of the expense group. |
Guardian All Cap Core VIP Fund
| • | | The Board noted that the Fund’s performance was in the 3rd quintile of its performance universe for the 1-year period. The Board acknowledged the Fund’s short operational history. The Board noted that the Fund’s performance was higher than the benchmark index for the 1-year period. |
| • | | The Board noted that the contractual management fee, the actual management fee and actual total expenses were in the 1st quintile of the expense group. |
Guardian Mid Cap Traditional Growth VIP Fund
| • | | The Board noted that the Fund’s performance was in the 1st quintile of its performance universe for the 1-year period and in the 2nd quintile for the 3-year and 5-year periods. The Board also noted that the Fund’s performance was higher than the benchmark index for the 1-year, 3-year and 5-year periods. |
| • | | The Board noted that the contractual management fee and actual management fee were in the 1st quintile of the expense group and that the actual total expenses were in the 4th quintile. |
Guardian Select Mid Cap Core VIP Fund
| • | | The Board noted that the Fund’s performance was in the 3rd quintile of its performance universe for the 1-year period. The Board acknowledged the Fund’s short operational history. The Board noted that the Fund’s performance was lower than the benchmark index for the 1-year period. |
| • | | The Board noted that the contractual management fee, the actual management fee and actual total expenses were in the 1st quintile of the expense group. |
Guardian Mid Cap Relative Value VIP Fund
| • | | The Board noted that the Fund’s performance was in the 2nd quintile of its performance universe for the 1-year, 3-year and 5-year periods. The Board also noted that the Fund’s performance was higher than the benchmark index for the 1-year, 3-year and 5-year periods. |
SUPPLEMENTAL INFORMATION (UNAUDITED)
| • | | The Board noted that the contractual management fee and the actual management fee were in the 2nd quintile of the expense group and the actual total expenses were in the 3rd quintile of the expense group. |
Guardian Small-Mid Cap Core VIP Fund
| • | | The Board noted that the Fund’s performance was in the 5th quintile of its performance universe for the 1-year period. The Board acknowledged the Fund’s short operational history. The Board noted that the Fund’s performance was higher than the benchmark index for the 1-year period. |
| • | | The Board noted that the contractual management fee, the actual management fee and actual total expenses were in the 1st quintile of the expense group. |
Guardian Small Cap Core VIP Fund
| • | | The Board noted that the Fund’s performance was in the 5th quintile of its performance universe for the 1-year and 3-year periods. The Board noted that the Fund’s performance was lower than the benchmark index for the 1-year and 3-year periods. |
| • | | The Board noted that the contractual management fee and the actual management fee were in the 1st quintile of the expense group and the actual total expenses were in the 2nd quintile of the expense group. |
Guardian International Growth VIP Fund
| • | | The Board noted that the Fund’s performance was in the 4th quintile of its performance universe for the 1-year period, in the 2nd quintile of its performance universe for the 3-year period and in the 3rd quintile of its performance universe for the 5-year period. The Board also noted that the Fund’s performance was lower than the benchmark index for the 1-year and 5-year periods. The Board noted that the Fund’s performance was higher than the benchmark index for the 3-year period. |
| • | | The Board noted that the contractual management fee and actual management fee were in the 2nd quintile of the expense group and that the actual total expenses were in the 3rd quintile. |
Guardian International Equity VIP Fund
| • | | The Board noted that the Fund’s performance was in the 5th quintile of its performance universe for the 1-year, 3-year and 5-year periods. The Board also noted that the Fund’s performance was lower than the benchmark index for the 1-year, 3-year and 5-year periods. |
| • | | The Board noted that the contractual management fee, the actual management fee and the actual total expenses were in the 2nd quintile of the expense group. |
Guardian Global Utilities VIP Fund
| • | | The Board noted that the Fund’s performance was in the 5th quintile of its performance universe for the 1-year period and in the 4th quintile of its performance universe for the 3-year period. The Board noted that the Fund’s performance was higher than the benchmark index for the 1-year and 3-year periods. |
| • | | The Board noted that the contractual management fee and the actual management fee were in the 1st quintile of the expense group and the actual total expenses were in the 2nd quintile of the expense group. |
Guardian Balanced Allocation VIP Fund
| • | | The Board noted that the Fund had less than one-year of operational history and was not able to evaluate an investment performance record for the Fund. The Board noted that it would have an opportunity to review such information in connection with future annual reviews. The Board noted that, in the meantime, it received monthly performance reports from the Manager. |
| • | | The Board noted that the contractual management fee, the actual management fee and actual total expenses were in the 1st quintile of the expense group. |
Guardian Core Plus Fixed Income VIP Fund
| • | | The Board noted that the Fund’s performance was in the 3rd quintile of its performance universe for the 1-year and 3-year periods and in the 4th quintile of its performance universe for the 5-year period. The Board also noted that the Fund’s performance was lower than the benchmark index for the 1-year and 5-year periods. The Board noted that the Fund’s performance was in line with the benchmark index for the 3-year period. |
| • | | The Board noted that the contractual management fee and actual management fee were in the 2nd quintile of the expense group and that actual total expenses were in the 3rd quintile. |
Guardian Total Return Bond VIP Fund
| • | | The Board noted that the Fund’s performance was in the 5th quintile of its performance universe for the 1-year and 3-year periods. The Board also noted that |
SUPPLEMENTAL INFORMATION (UNAUDITED)
| | | the Fund’s performance was lower than the benchmark index for the 1-year and 3-year periods. |
| • | | The Board noted that the contractual management fee and actual management fee were in the 2nd quintile and the actual total expenses were in the 3rd quintile. |
Guardian Core Fixed Income VIP Fund
| • | | The Board noted that the Fund had less than one-year of operational history and was not able to evaluate an investment performance record for the Fund. The Board noted that it would have an opportunity to review such information in connection with future annual reviews. The Board noted that, in the meantime, it received monthly performance reports from the Manager. |
| • | | The Board noted that the contractual management fee was in the 2nd quintile of the expense group and the actual management fee and the actual total expenses were in the 1st quintile. |
Guardian Multi-Sector Bond VIP Fund
| • | | The Board noted that the Fund’s performance was in the 5th quintile of its performance universe for the 1-year and 3-year periods The Board also noted that the Fund’s performance was lower than the benchmark index for the 1-year and 3-year periods. |
| • | | The Board noted that the contractual management fee and actual total expenses were in the 1st quintile and the actual management fee was in the 2nd quintile. |
Guardian Short Duration Bond VIP Fund
| • | | The Board noted that the Fund had less than one-year of operational history and was not able to evaluate an |
| | | investment performance record for the Fund. The Board noted that it would have an opportunity to review such information in connection with future annual reviews. The Board noted that, in the meantime, it received monthly performance reports from the Manager. |
| • | | The Board noted that the contractual management fee and actual total expenses were in the 3rd quintile of the expense group and the actual management fee was in the 1st quintile of the expense group. |
Guardian U.S. Government Securities VIP Fund
| • | | The Board noted that the Fund’s performance was in the 1st quintile of its performance universe for the 1-year period and in the 2nd quintile of its performance universe for the 3-year period. The Board also noted that the Fund’s performance was higher than the benchmark index for the 1-year and 3-year periods. |
| • | | The Board noted that the contractual management fee and the actual management fee were in the 1st quintile of the expense group and the actual total expenses were in the 2nd quintile of the expense group. |
Conclusion
Based on a comprehensive consideration and evaluation of all of the information and factors summarized above, among others, the Board as a whole, including the Independent Trustees, approved the Agreements.
SUPPLEMENTAL INFORMATION (UNAUDITED)
The Statement of Additional Information (“SAI”) includes additional information about the Trust’s Trustees and Officers and is available, without charge, upon request by calling toll-free 1-888-GUARDIAN (1-888-482-7342) or by visiting our website at http://guardianvpt.onlineprospectus.net/GuardianVPT/Prospectuses.
Portfolio Holdings and Proxy Voting Procedures
The Fund files its complete schedule of portfolio holdings with the Securities and Exchange Commission for the first and third quarters of each fiscal year as an exhibit to its reports on Form N-PORT. The Fund’s Form N-PORT reports are available on the Securities and Exchange Commission’s website at https://www.sec.gov. The Fund’s Form N-PORT information is also available, without charge, upon request, by calling toll-free 1-888-GUARDIAN (1-888-482-7342) or by visiting our website at http://guardianvpt.onlineprospectus.net/GuardianVPT/Prospectuses.
A description of the policies and procedures that the Fund uses to determine how to vote proxies relating to portfolio securities is included in the SAI. The SAI and information regarding how the Fund voted proxies relating to portfolio securities during the most recent 12-month period ended June 30 may be obtained (i) without charge, upon request, by calling toll-free 1-888-GUARDIAN (1-888-482-7342) or by visiting our website at http://guardianvpt.onlineprospectus.net/GuardianVPT/Prospectuses; and (ii) on the Securities and Exchange Commission’s website at https://www.sec.gov.
This report is transmitted to shareholders only. It is not authorized for use as an offer of sale or a solicitation of an offer to buy shares of the Fund unless accompanied or preceded by the Fund’s current prospectus. Past performance results shown in this report should not be considered a representation of future performance. Investment returns and principal value of shares will fluctuate so that shares, when redeemed, may be worth more or less than their original cost. Statements and other information herein are as dated and are subject to change.

The Guardian Life Insurance Company of America New York, NY 10001-2159
PUB11408
Guardian Variable
Products Trust
2023
Semiannual Report
All Data as of June 30, 2023
Guardian Small-Mid Cap Core VIP Fund

| | |
| Not FDIC insured. May lose value. No bank guarantee. | | www.guardianlife.com |
TABLE OF CONTENTS
Guardian Small-Mid Cap Core VIP Fund
Except as otherwise specifically stated, all information, including portfolio security positions, is as of June 30, 2023. Fund holdings will vary. Information contained herein has been obtained from sources believed reliable, but is not guaranteed.
GUARDIAN SMALL-MID CAP CORE VIP FUND
Fund Characteristics (unaudited)
|
| Total Net Assets: $293,173,624 |
|
| |
Sector Allocation1 As of June 30, 2023 |
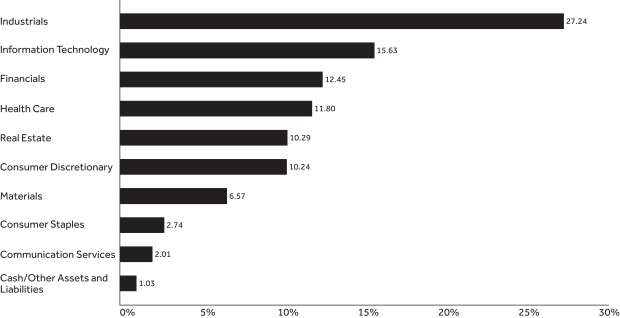
|
| | |
| |
Top Ten Holdings2 As of June 30, 2023 |
| | |
| Holding | | % of Total Net Assets |
| Atkore, Inc. | | 3.20% |
| Carlisle Cos., Inc. | | 2.64% |
| Masonite International Corp. | | 2.45% |
| AZEK Co., Inc. | | 2.03% |
| Marvell Technology, Inc. | | 2.00% |
| MTU Aero Engines AG | | 1.94% |
| United Rentals, Inc. | | 1.91% |
| Sun Communities, Inc. REIT | | 1.89% |
| ON Semiconductor Corp. | | 1.80% |
| HealthEquity, Inc. | | 1.77% |
| Total | | 21.63% |
| 1 | The Fund’s holdings are allocated to each sector based on the MSCI Global Industry Classification Standard (GICS®). Cash includes short-term investments and net other assets and liabilities. |
| 2 | Portfolio holdings are subject to change and should not be considered a recommendation to buy or sell individual securities. |
UNDERSTANDING YOUR FUND’S EXPENSES (UNAUDITED)
By investing in the Fund, you incur two types of costs: (1) transaction costs and (2) ongoing costs, including, as applicable, investment advisory fees, distribution and/or service (12b-1) fees and other Fund expenses. The example below is intended to help you understand your ongoing costs (in dollars) of investing in the Fund and to compare these costs with the ongoing costs of investing in other mutual funds.
The example is based on an investment of $1,000 invested at the beginning of the period and held for the entire period from January 1, 2023 to June 30, 2023. The table below shows the Fund’s expenses in two ways:
Expenses based on actual return
This section of the table provides information about actual account values and actual expenses. You may use the information in this section, together with the amount you invested, to estimate the expenses that you paid over the period. Simply divide your account value by $1,000 (for example, an $8,600 account value divided by $1,000 = 8.6), then multiply the result by the number in the section under the heading entitled “Expenses Paid During Period” to estimate the expenses you paid on your account during this period.
Expenses based on hypothetical 5% return for comparison purposes
This section of the table provides information about hypothetical account values and hypothetical expenses based on the Fund’s actual expense ratio and an assumed rate of return of 5% per year before expenses, which is not the Fund’s actual return. The hypothetical account values and expenses may not be used to estimate the actual ending account balance or expenses you paid for the period. You may use this information to compare the ongoing costs of investing in the Fund with the cost of investing in other mutual funds. To do so, compare this 5% hypothetical example with the 5% hypothetical examples that appear in the shareholder reports of the other funds.
Note that the expenses shown in the table are meant to highlight your ongoing costs only and do not reflect any transactional costs, such as sales charges (loads), redemption fees, or exchange fees. Therefore the second section is useful in comparing ongoing costs only, and will not help you determine the relative total costs of owning different funds. If these transactional costs were included, your costs would have been higher. Charges and expenses at the insurance company separate account level are not reflected in the table.
| | | | | | | | | | | | | | | | |
| | | | | |
| | | Beginning
Account Value 1/1/23 | | | Ending Account Value
6/30/23 | | | Expenses Paid During Period* 1/1/23 - 6/30/23 | | | Expense Ratio During Period 1/1/23 - 6/30/23 | |
| Based on Actual Return | | $ | 1,000.00 | | | $ | 1,085.20 | | | $ | 4.81 | | | | 0.93% | |
| Based on Hypothetical Return (5% Return Before Expenses) | | $ | 1,000.00 | | | $ | 1,020.18 | | | $ | 4.66 | | | | 0.93% | |
| * | Expenses are equal to the Fund’s annualized expense ratio as indicated, multiplied by the average account value over the period, multiplied by 181/365 (to reflect the one-half year period). |
SCHEDULE OF INVESTMENTS — GUARDIAN SMALL-MID CAP CORE VIP FUND
| | | | | | | | |
| June 30, 2023 (unaudited) | | Shares | | | Value | |
| Common Stocks – 97.7% | |
| |
| Aerospace & Defense – 3.2% | |
| | | |
Melrose Industries PLC (United Kingdom) | | | 550,046 | | | $ | 3,540,775 | |
| | | |
MTU Aero Engines AG (Germany) | | | 21,992 | | | | 5,698,228 | |
| | | | | | | | | |
| | |
| | | | | 9,239,003 | |
| Banks – 1.7% | |
| | | |
Pinnacle Financial Partners, Inc. | | | 37,117 | | | | 2,102,678 | |
| | | |
Webster Financial Corp. | | | 79,755 | | | | 3,010,751 | |
| | | | | | | | | |
| | |
| | | | | 5,113,429 | |
| Biotechnology – 0.2% | |
| | | |
Sage Therapeutics, Inc.(1) | | | 13,918 | | | | 654,424 | |
| | | | | | | | | |
| | |
| | | | | 654,424 | |
| Building Products – 7.1% | |
| | | |
AZEK Co., Inc.(1) | | | 196,737 | | | | 5,959,164 | |
| | | |
Carlisle Cos., Inc. | | | 30,189 | | | | 7,744,384 | |
| | | |
Masonite International Corp.(1) | | | 70,094 | | | | 7,180,429 | |
| | | | | | | | | |
| | |
| | | | | 20,883,977 | |
| Capital Markets – 2.2% | |
| | | |
Cboe Global Markets, Inc. | | | 27,105 | | | | 3,740,761 | |
| | | |
Raymond James Financial, Inc. | | | 24,774 | | | | 2,570,798 | |
| | | | | | | | | |
| | |
| | | | | 6,311,559 | |
| Chemicals – 3.3% | |
| | | |
Ashland, Inc. | | | 57,175 | | | | 4,969,079 | |
| | | |
Westlake Corp. | | | 39,253 | | | | 4,689,556 | |
| | | | | | | | | |
| | |
| | | | | 9,658,635 | |
| Commercial Services & Supplies – 2.1% | |
| | | |
Republic Services, Inc. | | | 18,070 | | | | 2,767,782 | |
| | | |
Stericycle, Inc.(1) | | | 75,986 | | | | 3,528,790 | |
| | | | | | | | | |
| | |
| | | | | 6,296,572 | |
| Construction & Engineering – 1.2% | |
| | | |
API Group Corp.(1) | | | 123,901 | | | | 3,377,541 | |
| | | | | | | | | |
| | |
| | | | | 3,377,541 | |
| Containers & Packaging – 1.5% | |
| | | |
Crown Holdings, Inc. | | | 51,474 | | | | 4,471,546 | |
| | | | | | | | | |
| | |
| | | | | 4,471,546 | |
| Diversified Consumer Services – 1.3% | |
| | | |
Service Corp. International | | | 59,570 | | | | 3,847,626 | |
| | | | | | | | | |
| | |
| | | | | 3,847,626 | |
| Electrical Equipment – 4.0% | |
| | | |
Atkore, Inc.(1) | | | 60,096 | | | | 9,371,370 | |
| | | |
Regal Rexnord Corp. | | | 15,626 | | | | 2,404,842 | |
| | | | | | | | | |
| | |
| | | | | 11,776,212 | |
| Electronic Equipment, Instruments & Components – 1.7% | |
| | | |
Teledyne Technologies, Inc.(1) | | | 12,231 | | | | 5,028,286 | |
| | | | | | | | | |
| | |
| | | | | 5,028,286 | |
| Entertainment – 1.2% | |
| | | |
Warner Music Group Corp., Class A | | | 130,110 | | | | 3,394,570 | |
| | | | | | | | | |
| | |
| | | | | 3,394,570 | |
| Financial Services – 1.3% | |
| | | |
Essent Group Ltd. | | | 81,522 | | | | 3,815,230 | |
| | | | | | | | | |
| | |
| | | | | 3,815,230 | |
| | | | | | | | |
| June 30, 2023 (unaudited) | | Shares | | | Value | |
| Food Products – 1.3% | |
| | | |
Nomad Foods Ltd.(1) | | | 222,037 | | | $ | 3,890,088 | |
| | | | | | | | | |
| | |
| | | | | 3,890,088 | |
| Health Care Equipment & Supplies – 4.4% | |
| | | |
Haemonetics Corp.(1) | | | 40,988 | | | | 3,489,718 | |
| | | |
Integer Holdings Corp.(1) | | | 56,828 | | | | 5,035,529 | |
| | | |
LivaNova PLC(1) | | | 86,948 | | | | 4,471,736 | |
| | | | | | | | | |
| | |
| | | | | 12,996,983 | |
| Health Care Providers & Services – 2.6% | |
| | | |
HealthEquity, Inc.(1) | | | 82,045 | | | | 5,180,321 | |
| | | |
Humana, Inc. | | | 5,629 | | | | 2,516,895 | |
| | | | | | | | | |
| | |
| | | | | 7,697,216 | |
| Health Care Technology – 0.8% | |
| | | |
Schrodinger, Inc.(1) | | | 45,206 | | | | 2,256,684 | |
| | | | | | | | | |
| | |
| | | | | 2,256,684 | |
| Hotels, Restaurants & Leisure – 1.4% | |
| | | |
Planet Fitness, Inc., Class A(1) | | | 59,580 | | | | 4,018,075 | |
| | | | | | | | | |
| | |
| | | | | 4,018,075 | |
| Household Durables – 1.1% | |
| | | |
Mohawk Industries, Inc.(1) | | | 32,593 | | | | 3,362,294 | |
| | | | | | | | | |
| | |
| | | | | 3,362,294 | |
| Household Products – 1.3% | |
| | | |
Church & Dwight Co., Inc. | | | 37,376 | | | | 3,746,196 | |
| | | | | | | | | |
| | |
| | | | | 3,746,196 | |
| Industrial REITs – 1.6% | |
| | | |
Terreno Realty Corp. | | | 78,800 | | | | 4,735,880 | |
| | | | | | | | | |
| | |
| | | | | 4,735,880 | |
| Insurance – 5.9% | |
| | | |
Arch Capital Group Ltd.(1) | | | 66,852 | | | | 5,003,872 | |
| | | |
Axis Capital Holdings Ltd. | | | 81,157 | | | | 4,368,682 | |
| | | |
First American Financial Corp. | | | 62,295 | | | | 3,552,061 | |
| | | |
Reinsurance Group of America, Inc. | | | 32,483 | | | | 4,505,067 | |
| | | | | | | | | |
| | |
| | | | | 17,429,682 | |
| Interactive Media & Services – 0.9% | |
| | | |
Bumble, Inc., Class A(1) | | | 149,452 | | | | 2,507,805 | |
| | | | | | | | | |
| | |
| | | | | 2,507,805 | |
| IT Services – 1.3% | |
| | | |
Okta, Inc.(1) | | | 56,874 | | | | 3,944,212 | |
| | | | | | | | | |
| | |
| | | | | 3,944,212 | |
| Life Sciences Tools & Services – 3.8% | |
| | | |
Azenta, Inc.(1) | | | 80,653 | | | | 3,764,882 | |
| | | |
Bio-Rad Laboratories, Inc., Class A(1) | | | 11,954 | | | | 4,532,001 | |
| | | |
Codexis, Inc.(1) | | | 115,353 | | | | 322,988 | |
| | | |
Sotera Health Co.(1) | | | 126,321 | | | | 2,379,888 | |
| | | | | | | | | |
| | |
| | | | | 10,999,759 | |
| Machinery – 1.3% | |
| | | |
Ingersoll Rand, Inc. | | | 57,779 | | | | 3,776,435 | |
| | | | | | | | | |
| | |
| | | | | 3,776,435 | |
| Metals & Mining – 1.8% | |
| | | |
Reliance Steel & Aluminum Co. | | | 8,127 | | | | 2,207,212 | |
| | | |
Steel Dynamics, Inc. | | | 26,863 | | | | 2,926,186 | |
| | | | | | | | | |
| | |
| | | | | 5,133,398 | |
| | | | |
| The accompanying notes are an integral part of these financial statements. | | | | 3 |
SCHEDULE OF INVESTMENTS — GUARDIAN SMALL-MID CAP CORE VIP FUND
| | | | | | | | |
| June 30, 2023 (unaudited) | | Shares | | | Value | |
| Personal Care Products – 0.1% | |
| | | |
Honest Co., Inc.(1) | | | 239,944 | | | $ | 403,106 | |
| | | | | | | | | |
| | |
| | | | | 403,106 | |
| Professional Services – 5.2% | |
| | | |
CACI International, Inc., Class A(1) | | | 11,476 | | | | 3,911,480 | |
| | | |
Dun & Bradstreet Holdings, Inc. | | | 262,255 | | | | 3,034,290 | |
| | | |
Genpact Ltd. | | | 95,798 | | | | 3,599,131 | |
| | | |
TransUnion | | | 59,096 | | | | 4,628,990 | |
| | | | | | | | | |
| | |
| | | | | 15,173,891 | |
| Residential REITs – 5.0% | |
| | | |
American Homes 4 Rent, Class A | | | 137,889 | | | | 4,888,165 | |
| | | |
Apartment Income REIT Corp. | | | 113,747 | | | | 4,105,129 | |
| | | |
Sun Communities, Inc. | | | 42,574 | | | | 5,554,204 | |
| | | | | | | | | |
| | |
| | | | | 14,547,498 | |
| Semiconductors & Semiconductor Equipment – 3.8% | |
| | | |
Marvell Technology, Inc. | | | 97,995 | | | | 5,858,141 | |
| | | |
ON Semiconductor Corp.(1) | | | 55,903 | | | | 5,287,306 | |
| | | | | | | | | |
| | |
| | | | | 11,145,447 | |
| Software – 8.8% | |
| | | |
8x8, Inc.(1) | | | 175,865 | | | | 743,909 | |
| | | |
Black Knight, Inc.(1) | | | 66,631 | | | | 3,979,870 | |
| | | |
Instructure Holdings, Inc.(1) | | | 138,311 | | | | 3,479,905 | |
| | | |
New Relic, Inc.(1) | | | 48,941 | | | | 3,202,699 | |
| | | |
PagerDuty, Inc.(1) | | | 188,582 | | | | 4,239,323 | |
| | | |
Q2 Holdings, Inc.(1) | | | 107,647 | | | | 3,326,292 | |
| | | |
Riskified Ltd., Class A(1) | | | 184,512 | | | | 896,728 | |
| | | |
SPS Commerce, Inc.(1) | | | 17,664 | | | | 3,392,548 | |
| | | |
WalkMe Ltd.(1) | | | 254,580 | | | | 2,443,968 | |
| | | | | | | | | |
| | |
| | | | | 25,705,242 | |
| Specialized REITs – 3.7% | |
| | | |
Life Storage, Inc. | | | 13,185 | | | | 1,753,078 | |
| | | |
SBA Communications Corp. | | | 18,577 | | | | 4,305,405 | |
| | | |
VICI Properties, Inc. | | | 153,325 | | | | 4,819,005 | |
| | | | | | | | | |
| | |
| | | | | 10,877,488 | |
| Specialty Retail – 5.3% | |
| | | |
Burlington Stores, Inc.(1) | | | 30,085 | | | | 4,735,078 | |
| | | |
Leslie’s, Inc.(1) | | | 382,184 | | | | 3,588,708 | |
| | | |
National Vision Holdings, Inc.(1) | | | 113,991 | | | | 2,768,842 | |
| | | |
Revolve Group, Inc.(1) | | | 165,725 | | | | 2,717,890 | |
| | | |
Tractor Supply Co. | | | 8,353 | | | | 1,846,848 | |
| | | | | | | | | |
| | |
| | | | | 15,657,366 | |
| | | | | | | | |
| June 30, 2023 (unaudited) | | Shares | | | Value | |
| Textiles, Apparel & Luxury Goods – 1.1% | |
| | | |
Deckers Outdoor Corp.(1) | | | 5,956 | | | $ | 3,142,743 | |
| | | | | | | | | |
| | |
| | | | | 3,142,743 | |
| Trading Companies & Distributors – 3.2% | |
| | | |
Air Lease Corp. | | | 89,212 | | | | 3,733,522 | |
| | | |
United Rentals, Inc. | | | 12,550 | | | | 5,589,394 | |
| | | | | | | | | |
| | |
| | | | | 9,322,916 | |
| | |
Total Common Stocks (Cost $303,262,894) | | | | 286,339,014 | |
| Exchange–Traded Funds – 1.3% | |
| | | |
SPDR S&P Biotech ETF | | | 45,865 | | | | 3,815,968 | |
| | |
Total Exchange–Traded Funds (Cost $4,748,414) | | | | 3,815,968 | |
| | | | | | | | |
| | | Principal
Amount | | | Value | |
| Repurchase Agreements – 1.5% | |
| | | |
Fixed Income Clearing Corp., 1.52%, dated 6/30/2023, proceeds at maturity value of $4,541,076, due 7/3/2023(2) | | $ | 4,540,501 | | | | 4,540,501 | |
| | |
Total Repurchase Agreements (Cost $4,540,501) | | | | 4,540,501 | |
| | |
Total Investments – 100.5% (Cost $312,551,809) | | | | 294,695,483 | |
| | |
| Liabilities in excess of other assets – (0.5)% | | | | (1,521,859 | ) |
| | |
| Total Net Assets – 100.0% | | | $ | 293,173,624 | |
| (1) | Non–income–producing security. |
| (2) | The table below presents collateral for repurchase agreements. |
| | | | | | | | | | | | | | | | |
| Security | | Coupon | | | Maturity Date | | | Principal Amount | | | Value | |
| U.S. Treasury Note | | | 4.625% | | | | 3/15/2026 | | | $ | 4,563,900 | | | $ | 4,631,335 | |
Legend:
REITs — Real Estate Investment Trusts
| | | | |
| 4 | | | | The accompanying notes are an integral part of these financial statements. |
SCHEDULE OF INVESTMENTS — GUARDIAN SMALL-MID CAP CORE VIP FUND
The following is a summary of the inputs used as of June 30, 2023 in valuing the Fund’s investments. For more information on valuation inputs, please refer to Note 2a of the accompanying Notes to Financial Statements.
| | | | | | | | | | | | | | | | |
| | | Valuation Inputs | | | | |
| Investments in Securities (unaudited) | | Level 1 | | | Level 2 | | | Level 3 | | | Total | |
| Common Stocks | | $ | 277,100,011 | | | $ | 9,239,003 | * | | $ | — | | | $ | 286,339,014 | |
| Exchange–Traded Funds | | | 3,815,968 | | | | — | | | | — | | | | 3,815,968 | |
| Repurchase Agreements | | | — | | | | 4,540,501 | | | | — | | | | 4,540,501 | |
| Total | | $ | 280,915,979 | | | $ | 13,779,504 | | | $ | — | | | $ | 294,695,483 | |
| * | Consists of certain foreign securities whose values were determined by a pricing service using pricing models (See Note 2a in Notes to Financial Statements). These investments in securities were classified as Level 2 rather than Level 1. |
| | | | |
| The accompanying notes are an integral part of these financial statements. | | | | 5 |
FINANCIAL INFORMATION — GUARDIAN SMALL-MID CAP CORE VIP FUND
| | | | |
Statement of Assets and Liabilities As of June 30, 2023 (unaudited) | | | |
Assets | | | | |
| | |
Investments, at value | | $ | 294,695,483 | |
| | |
Receivable for investments sold | | | 526,524 | |
| | |
Dividends/interest receivable | | | 222,509 | |
| | |
Foreign tax reclaims receivable | | | 16,811 | |
| | |
Reimbursement receivable from adviser | | | 12,239 | |
| | |
Prepaid expenses | | | 3,275 | |
| | | | | |
| | |
Total Assets | | | 295,476,841 | |
| | | | | |
| | |
Liabilities | | | | |
| | |
Payable for investments purchased | | | 1,896,033 | |
| | |
Investment advisory fees payable | | | 149,617 | |
| | |
Payable for fund shares redeemed | | | 135,911 | |
| | |
Distribution fees payable | | | 58,916 | |
| | |
Accrued audit fees | | | 13,978 | |
| | |
Accrued custodian and accounting fees | | | 10,693 | |
| | |
Accrued trustees’ and officers’ fees | | | 5,759 | |
| | |
Accrued expenses and other liabilities | | | 32,310 | |
| | | | | |
| | |
Total Liabilities | | | 2,303,217 | |
| | | | | |
| | |
Total Net Assets | | $ | 293,173,624 | |
| | | | | |
| | |
Net Assets Consist of: | | | | |
| | |
Paid-in capital | | $ | 330,420,933 | |
| | |
Distributable loss | | | (37,247,309 | ) |
| | | | | |
| | |
Total Net Assets | | $ | 293,173,624 | |
| | | | | |
Investments, at Cost | | $ | 312,551,809 | |
| | | | | |
| | |
Pricing of Shares | | | | |
| | |
Shares of Beneficial Interest Outstanding with No Par Value | | | 32,441,161 | |
| | |
Net Asset Value Per Share | | | $9.04 | |
| | | | | |
| | | | |
Statement of Operations For the Six Months Ended June 30, 2023 (unaudited) | |
Investment Income | | | | |
| | |
Dividends | | $ | 1,396,795 | |
| | |
Interest | | | 23,900 | |
| | |
Withholding taxes on foreign dividends | | | (14,432 | ) |
| | | | | |
| | |
Total Investment Income | | | 1,406,263 | |
| | | | | |
| | |
Expenses | | | | |
| | |
Investment advisory fees | | | 897,906 | |
| | |
Distribution fees | | | 353,466 | |
| | |
Professional fees | | | 40,829 | |
| | |
Trustees’ and officers’ fees | | | 36,484 | |
| | |
Administrative fees | | | 20,120 | |
| | |
Custodian and accounting fees | | | 18,272 | |
| | |
Transfer agent fees | | | 7,930 | |
| | |
Shareholder reports | | | 5,834 | |
| | |
Other expenses | | | 7,791 | |
| | | | | |
| | |
Total Expenses | | | 1,388,632 | |
| | |
Less: Fees waived | | | (73,740 | ) |
| | | | | |
| | |
Total Expenses, Net | | | 1,314,892 | |
| | | | | |
| | |
Net Investment Income/(Loss) | | | 91,371 | |
| | | | | |
| | |
Realized Gain/(Loss) and Change in Unrealized Appreciation/(Depreciation) on Investments and Foreign Currency Transactions | | | | |
| | |
Net realized gain/(loss) from investments | | | (6,506,627 | ) |
| | |
Net realized gain/(loss) from foreign currency transactions | | | (3,019 | ) |
| | |
Net change in unrealized appreciation/(depreciation) on investments | | | 32,653,460 | |
| | |
Net change in unrealized appreciation/(depreciation) on translation of assets and liabilities in foreign currencies | | | 82 | |
| | | | | |
| | |
Net Gain on Investments and Foreign Currency Transactions | | | 26,143,896 | |
| | | | | |
| | |
Net Increase in Net Assets Resulting From Operations | | $ | 26,235,267 | |
| | | | | |
| | | | | |
| | | | |
| 6 | | | | The accompanying notes are an integral part of these financial statements. |
FINANCIAL INFORMATION — GUARDIAN SMALL-MID CAP CORE VIP FUND
| | | | | | | | |
Statements of Changes in Net Assets Six Months Ended Numbers are unaudited | | | | | | |
| | | |
| | | For the Six Months
Ended 6/30/23 | | | For the Year Ended
12/31/22 | |
| | | | |
Operations | |
| | | |
Net investment income/(loss) | | $ | 91,371 | | | $ | (488,065 | ) |
| | | |
Net realized gain/(loss) from investments and foreign currency transactions | | | (6,509,646 | ) | | | (15,599,409 | ) |
| | | |
Net change in unrealized appreciation/(depreciation) on investments and
translation of assets and liabilities in foreign currencies | | | 32,653,542 | | | | (51,004,995 | ) |
| | | | | | | | | |
| | | |
Net Increase/(Decrease) in Net Assets Resulting from Operations | | | 26,235,267 | | | | (67,092,469 | ) |
| | | | | | | | | |
| |
Capital Share Transactions | |
| | | |
Proceeds from sales of shares | | | 22,967,127 | | | | 18,722,176 | |
| | | |
Cost of shares redeemed | | | (46,606,948 | ) | | | (46,179,165 | ) |
| | | | | | | | | |
| | | |
Net Decrease in Net Assets Resulting from Capital Share Transactions | | | (23,639,821 | ) | | | (27,456,989 | ) |
| | | | | | | | | |
| | | |
Net Increase/(Decrease) in Net Assets | | | 2,595,446 | | | | (94,549,458 | ) |
| | | | | | | | | |
| |
Net Assets | |
| | | |
Beginning of period | | | 290,578,178 | | | | 385,127,636 | |
| | | | | | | | | |
| | | |
End of period | | $ | 293,173,624 | | | $ | 290,578,178 | |
| | | | | | | | | |
| |
Other Information: | |
| | | |
Shares | | | | | | | | |
| | | |
Sold | | | 2,669,939 | | | | 2,101,513 | |
| | | |
Redeemed | | | (5,118,958 | ) | | | (5,375,253 | ) |
| | | | | | | | | |
| | | |
Net Decrease | | | (2,449,019 | ) | | | (3,273,740 | ) |
| | | | | | | | | |
| | | | | | | | | |
| | | | |
| The accompanying notes are an integral part of these financial statements. | | | | 7 |
FINANCIAL INFORMATION — GUARDIAN SMALL-MID CAP CORE VIP FUND
The Financial Highlights table is intended to help you understand the Fund’s financial performance for the past six reporting periods (or, if shorter, the period since inception). Certain information reflects financial results for a single Fund share. The total returns in the table represent the rate that an investor would have earned (or lost) on an investment in the Fund.
| | | | | | | | | | | | | | | | | | | | | | | | |
Financial Highlights Six Months Ended Numbers are unaudited | |
| | | Per Share Operating Performance | | | | |
| | | Net Asset Value,
Beginning of
Period | | | Net Investment
Income/(Loss)(1) | | | Net Realized
and Unrealized
Gain/(Loss) | | | Total
Operations | | | Net Asset Value,
End of Period | | | Total
Return(2) | |
| | | | | | | |
Six Months Ended 6/30/23 | | $ | 8.33 | | | $ | 0.00(4) | | | $ | 0.71 | | | $ | 0.71 | | | $ | 9.04 | | | | 8.52 | %(5) |
| | | | | | | |
Year Ended 12/31/22 | | | 10.09 | | | | (0.01) | | | | (1.75) | | | | (1.76) | | | | 8.33 | | | | (17.44) | % |
| | | | | | | |
Period Ended 12/31/21(6) | | | 10.00 | | | | (0.00)(7) | | | | 0.09 | | | | 0.09 | | | | 10.09 | | | | 0.90 | %(5) |
| | | | |
| 8 | | | | The accompanying notes are an integral part of these financial statements. |
FINANCIAL INFORMATION — GUARDIAN SMALL-MID CAP CORE VIP FUND
| | | | | | | | | | | | | | | | | | | | | | |
| | | | | | | | | | | | | | | | |
| Ratios/Supplemental Data | |
Net Assets, End
of Period (000s) | | | Net Ratio of
Expenses to
Average
Net Assets(3) | | | Gross Ratio of
Expenses to
Average
Net Assets | | | Net Ratio of Net Investment Income/ (Loss) to Average Net Assets(3) | | | Gross Ratio of Net Investment Income/ (Loss) to Average Net Assets | | | Portfolio
Turnover Rate | |
| | | | | |
| $ | 293,174 | | | | 0.93% | (5) | | | 0.98% | (5) | | | 0.06% | (5) | | | 0.01% | (5) | | | 24% | (5) |
| | | | | |
| | 290,578 | | | | 0.93% | | | | 0.97% | | | | (0.15)% | | | | (0.19)% | | | | 39% | |
| | | | | |
| | 385,128 | | | | 0.90% | (5) | | | 0.98% | (5) | | | (0.12)% | (5) | | | (0.20)% | (5) | | | 59% | (5) |
| (1) | Calculated based on the average shares outstanding during the period. |
| (2) | Total returns do not reflect the effects of charges deducted pursuant to the terms of The Guardian Insurance & Annuity Company, Inc.’s variable contracts. Inclusion of such charges would reduce the total returns for all periods shown. |
| (3) | Net Ratio of Expenses to Average Net Assets and Net Ratio of Net Investment Income (Loss) to Average Net Assets include the effect of fee waivers and expense limitations. |
| (4) | Rounds to $0.00 per share. |
| (5) | Ratios for periods less than one year have been annualized, except for total return and portfolio turnover rate. For the period ended December 31, 2021, certain non-recurring fees (i.e., audit fees) are not annualized. |
| (6) | Commenced operations on October 25, 2021. |
| (7) | Rounds to $(0.00) per share. |
| | | | |
| The accompanying notes are an integral part of these financial statements. | | | | 9 |
NOTES TO FINANCIAL STATEMENTS — GUARDIAN SMALL-MID CAP CORE VIP FUND
June 30, 2023 (unaudited)
1. Organization
Guardian Variable Products Trust (the “Trust”), a Delaware statutory trust organized on January 12, 2016, is registered under the Investment Company Act of 1940, as amended (the “1940 Act”), as an open-end management investment company. The Trust currently has twenty-four series. Guardian Small-Mid Cap Core VIP Fund (the “Fund”) is a series of the Trust. The Fund is a diversified fund and commenced operations on October 25, 2021. The financial statements for other series of the Trust are presented in separate reports.
The Trust has authorized an unlimited number of shares of beneficial interest with no par value. Shares are bought and sold at closing net asset value (“NAV”). Shares of the Fund are only sold to certain separate accounts of The Guardian Insurance & Annuity Company, Inc. (“GIAC”) that fund certain variable annuity contracts and variable life insurance policies issued by GIAC. GIAC is a wholly-owned subsidiary of The Guardian Life Insurance Company of America (“Guardian Life”).
The Fund seeks capital appreciation.
2. Significant Accounting Policies
The following is a summary of significant accounting policies followed by the Fund in the preparation of its financial statements. The Fund follows the investment company accounting and reporting guidance of the Financial Accounting Standards Board (“FASB”) Accounting Standards Codification Topic 946 Financial Services – Investment Companies. The following policies are in conformity with accounting principles generally accepted in the United States of America (“GAAP”). The preparation of financial statements in accordance with GAAP requires management to make estimates and assumptions that affect the reported amounts and disclosures in the financial statements. Actual results could differ from those estimates.
a. Investment Valuations The Board of Trustees has designated Park Avenue Institutional Advisers LLC (“Park Avenue”) as the valuation designee for the Fund pursuant to Rule 2a-5 under the 1940 Act. Park Avenue has established a Fair Valuation Committee and has adopted fair valuation procedures that provide methodologies for fair valuing securities. These procedures include monitoring the appropriateness of fair values based on results of ongoing valuation oversight, including but not limited to consideration of
security specific events, market events, and pricing vendor and broker-dealer due diligence. The Fair Valuation Committee oversees and carries out the policies for the valuation of investments held in the Fund. The Fair Valuation Committee is responsible for discussing and assessing the potential impacts to the fair values on an ongoing basis, and reports to the Board of Trustees on at least a quarterly basis.
Equity securities traded on an exchange other than NASDAQ Stock Market, LLC (“NASDAQ”) are valued at the last reported sale price on the principal exchange or market on which they are traded; or, if there were no sales that day, at the mean between the closing bid and ask prices. Securities traded on the NASDAQ are generally valued at the NASDAQ official closing price, which may not be the last sale price. If the NASDAQ official closing price is not available for a security, that security is generally valued at the mean between the closing bid and ask prices. Repurchase agreements are carried at cost, which approximates fair value (see Note 5d). Foreign securities are valued in the currencies of the markets in which they trade and then converted to U.S. dollars by the application of foreign exchange rates at the close of the New York Stock Exchange (“NYSE”). Forward foreign currency contracts, if any, are valued at the mean between the bid and ask rates for the specified time interpolated from rates for proximate time periods.
Securities for which market quotations are not readily available or securities whose values have been materially affected by events occurring before the Fund’s valuation time but after the close of the securities’ principal exchange or market are valued at their fair values as determined in good faith by Park Avenue, as the Board of Trustee’s valuation designee (as defined in Rule 2a-5 under the 1940 Act), in accordance with Park Avenue’s procedures and under the general oversight of the Board of Trustees. In addition, the values of the Fund’s investments in foreign securities are generally determined by a pricing service using pricing models designed to estimate likely changes in the values of those securities. Certain foreign equity instruments are valued by applying international fair value factors provided by approved pricing services. The factors seek to adjust the local closing price for movements of local markets post closing, but prior to the time the NAVs are calculated. Valuations reflected in this report are as of the report date. As a result, changes in valuation due to market events and/or issuer related events after the report date and prior to issuance of the report are not reflected herein.
NOTES TO FINANCIAL STATEMENTS — GUARDIAN SMALL-MID CAP CORE VIP FUND
Various inputs are used in determining the valuation of the Fund’s investments. These inputs are summarized in three broad levels listed below.
| • | | Level 1 – unadjusted inputs using quoted prices in active markets for identical investments. |
| • | | Level 2 – other significant observable inputs, including, but not limited to, quoted prices for similar investments, inputs other than quoted prices that are observable for investments (such as interest rates, prepayment speeds, credit risks, etc.) or other market corroborated inputs. |
| • | | Level 3 – significant unobservable inputs (including the Fund’s own assumptions in determining the fair value of investments). |
Inputs may include price information, volatility statistics, specific and broad credit data, liquidity statistics, and other factors. A financial instrument’s level within the fair value hierarchy is based on the lowest level of any input; both individually and in aggregate, that is significant to the fair value measurement. However, the determination of what constitutes “observable” requires significant judgment by the Trust. The Trust considers observable data to be that market data which is readily available, regularly distributed or updated, reliable and verifiable, and provided by independent sources that are actively involved in the relevant market. The inputs or methodology used for valuing securities are not necessarily an indication of the risk associated with investing in those securities. Changes in valuation techniques may result in transfers into or out of a financial instrument’s assigned level within the hierarchy.
The FASB requires reporting entities to make disclosures about purchases, sales, issuances and settlements of Level 3 securities on a gross basis. For the six months ended June 30, 2023, there were no transfers into or out of Level 3 of the fair value hierarchy.
In determining a financial instrument’s placement within the hierarchy, the Trust separates the Fund’s investment portfolio into two categories: investments and derivatives (e.g., futures). A summary of inputs used to value the Fund’s assets and liabilities carried at fair value as of June 30, 2023 is included in the Schedule of Investments.
Investments Investments whose values are based on quoted market prices in active markets, and are therefore classified within Level 1, include active listed equities. Investments that trade in markets that are not considered to be active, but are valued based on quoted market prices, dealer quotations or alternative pricing
sources supported by observable inputs are classified within Level 2. These include certain U.S. government and sovereign obligations, most government agency securities, investment-grade corporate bonds, certain mortgage products, state, municipal and provincial obligations, and certain foreign equity securities, including securities whose prices may have been affected by events occurring after the close of trading on their principal exchange or market and, as a result, whose values are determined by a pricing service as described above, or securities whose values are otherwise determined using fair valuation methods approved by the Fund’s Board of Trustees.
Investments classified within Level 3 have significant unobservable inputs, as they trade infrequently or not at all. Level 3 investments include, among others, private placement securities. When observable prices are not available for these securities, the Trust uses one or more valuation techniques for which sufficient and reliable data is available. The inputs used by the Trust in estimating the value of Level 3 investments include, for example, the original transaction price, recent transactions in the same or similar instruments, completed or pending third-party transactions in the underlying investment or comparable issuers, subsequent rounds of financing, recapitalizations, and other transactions across the capital structure. Level 3 investments may also be adjusted to reflect illiquidity and/or non-transferability, with the amount of such discount estimated by the Trust in the absence of market information. Assumptions used by the Trust due to the lack of observable inputs may significantly impact the resulting fair value and therefore the Fund’s results of operations. As of June 30, 2023, the Fund had no securities classified as Level 3.
Derivatives Exchange-traded derivatives, such as futures contracts, exchange-traded option contracts and certain swaps, are typically classified within Level 1 or Level 2 of the fair value hierarchy depending on whether or not they are deemed to be actively traded. Certain non-exchange-traded derivatives, such as generic forwards, certain swaps and options, have inputs which can generally be corroborated by market data and are therefore classified within Level 2. During the six months ended June 30, 2023, the Fund did not hold any derivatives.
b. Securities Transactions Securities transactions are accounted for on the date securities are purchased or sold (trade date). Realized gains or losses on securities transactions are determined on the basis of specific identification.
NOTES TO FINANCIAL STATEMENTS — GUARDIAN SMALL-MID CAP CORE VIP FUND
c. Foreign Currency Translation The accounting records of the Fund are maintained in U.S. dollars. Investment securities and all other assets and liabilities of the Fund denominated in a foreign currency are generally translated into U.S. dollars at the exchange rates quoted at the close of the NYSE on each business day. The market value of investment securities and other assets and liabilities are translated at the exchange rate as of the valuation date. Purchases and sales of securities, income receipts, and expense payments are translated into U.S. dollars at the exchange rates in effect on the dates of the respective transactions. The Fund does not isolate the portion of the fluctuations on investments resulting from changes in foreign currency exchange rates from the fluctuations in market prices of investments held. Such fluctuations are included in the Net change in net realized and unrealized gain/(loss) from investments on the Statement of Operations.
Reported realized foreign currency gains and losses arise from the disposition of foreign currency, currency gains or losses realized between the trade and settlement dates on securities transactions, and the difference between the amounts of dividends, interest and foreign withholding taxes recorded on the Fund’s books on the transaction date and the U.S. dollar equivalent of the amounts actually received or paid. These reported realized foreign currency gains and losses, if any, are included in Net realized gain/(loss) from foreign currency transactions on the Statement of Operations. Unrealized foreign currency gains and losses arise from changes (due to changes in exchange rates) in the value of foreign currency and other assets and liabilities denominated in foreign currencies, which are held at period end, if any, and are included in Net change in unrealized appreciation/(depreciation) on translation of assets and liabilities in foreign currencies on the Statement of Operations.
d. Foreign Capital Gains Tax The Fund may be subject to foreign taxes on income, gains on investments or currency purchases/repatriation, a portion of which may be recoverable. The Fund will accrue such taxes and recoveries as applicable, based upon their current interpretation of tax rules and regulations that exist in the markets in which they invest.
e. Investment Income Dividend income net of foreign taxes withheld, if any, is generally recorded on the ex-dividend date. Distributions received from real estate investment trusts, if any, may be classified as dividends, capital gains and/or return of capital. Interest income, which includes amortization/accretion of
premium/discount, is determined using the interest income accrual method, and is accrued and recorded daily.
f. Allocation of Income and Expenses Many of the expenses of the Trust can be directly attributed to a specific series of the Trust. Expenses that cannot be directly attributed to a specific series of the Trust are generally apportioned among all the series in the Trust, based on relative net assets. In calculating net asset value per share for each series of the Trust, investment income, realized and unrealized gains and losses, and expenses other than series-specific expenses are allocated daily to each series based upon the proportion of net assets attributable to each series.
3. Transactions with Affiliates
a. Investment Advisory Fee and Expense Limitation Under the terms of the advisory agreement, which, after its two year initial term, is reviewed and approved annually by the Board of Trustees, the Fund pays an investment advisory fee to Park Avenue. Park Avenue is a wholly-owned subsidiary of Guardian Life and receives an investment advisory fee at an annual rate of 0.65% of the first $200 million, and 0.60% in excess of $200 million of the Fund’s average daily net assets. The fee is accrued daily and paid monthly.
Park Avenue has contractually agreed through April 30, 2024 to waive certain fees and/or reimburse certain expenses incurred by the Fund to the extent necessary to limit the Fund’s total annual operating expenses after fee waiver and/or expense reimbursement to 0.93% of the Fund’s average daily net assets (excluding, if applicable, any acquired fund fees and expenses, taxes, interest, transaction costs and brokerage commissions, litigation and extraordinary expenses). The limitation may not be increased or terminated prior to this time without action by the Board of Trustees and may be terminated only upon approval of the Board of Trustees. Amounts waived or reimbursed by Park Avenue pursuant to any expense limitation will not be subject to Park Avenue’s recoupment rights. For the six months ended June 30, 2023, Park Avenue waived fees and/or paid Fund expenses in the amount of $73,740.
Park Avenue has entered into a Sub-Advisory Agreement with Allspring Global Investments, LLC (“Allspring”). Allspring is responsible for providing day-to-day investment advisory services to the Fund, subject to the supervision of Park Avenue and the oversight of the Board of Trustees. Sub-advisory fees are paid by Park Avenue and do not represent a separate or additional expense to the Fund.
NOTES TO FINANCIAL STATEMENTS — GUARDIAN SMALL-MID CAP CORE VIP FUND
b. Compensation of Trustees and Officers Trustees and officers who are interested persons of the Trust, as defined in the 1940 Act, receive no compensation from the Fund, except for the Chief Compliance Officer of the Trust. Trustees of the Trust who are not interested persons of the Trust, and the Chief Compliance Officer, receive compensation and reimbursement of expenses from the Trust.
c. Distribution Fees Park Avenue Securities LLC (“PAS”), a wholly-owned subsidiary of Guardian Life, is the principal underwriter of Fund shares. The Trust has entered into a distribution and service agreement with PAS, which governs the sale and distribution of shares of the Fund. Under a distribution and service plan adopted by the Trust (“12b-1 plan”), PAS is compensated for services in such capacity, including its expenses in connection with the promotion and distribution of shares of the Fund, at an annual rate of 0.25% of the Fund’s average daily net assets. For the six months ended June 30, 2023, the Fund paid distribution fees in the amount of $353,466 to PAS.
PAS has directed that certain payments under the 12b-1 plan be used to compensate GIAC for shareholder services provided to contract owners.
4. Federal Income Taxes
a. Distributions to Shareholders For federal income tax purposes, the Fund is treated as a disregarded entity (“DRE”). As a DRE, the Fund is not subject to an entity-level income tax; and any income, gains, losses, deductions, taxes, and credits of the Fund would instead be “passed through” directly to the separate accounts of GIAC that invest in the Fund and retain the same character for U.S. federal income tax purposes. In addition, the Fund is not required to distribute taxable income and capital gains for U.S. federal income tax purposes. Therefore, no dividends and capital gains distributions were paid by the Fund.
5. Investments
a. Investment Purchases and Sales The cost of investments purchased and the proceeds from investments sold (excluding short-term investments) amounted to $68,956,925 and $93,053,264, respectively, for the six months ended June 30, 2023. During the six months ended June 30, 2023, there were no purchases or sales of U.S. government securities.
b. Foreign Securities Foreign securities investments involve special risks and considerations not typically associated with U.S. investments. These risks include,
but are not limited to, currency risk; adverse political, regulatory, social, and economic developments; and less reliable information about issuers. Moreover, securities of some foreign issuers may be less liquid and their prices more volatile than those of comparable U.S. issuers.
c. Industry or Sector Concentration In its normal course of business, the Fund may invest a significant portion of its assets in companies within a limited number of industries or sectors. As a result, the Fund may be subject to a greater risk of loss than that of a fund invested in a wider spectrum of industries or sectors because the stocks of many or all of the companies in the industry, group of industries, sector, or sectors may decline in value due to developments adversely affecting the industry, group of industries, sector, or sectors.
d. Repurchase Agreements The Fund may invest in repurchase agreements to maintain liquidity and earn income over periods of time as short as overnight. The collateral for repurchase agreements is either cash or fully negotiable U.S. government securities (including U.S. government agency securities). Repurchase agreements are fully collateralized (including the interest accrued thereon) and such collateral is marked to market daily while the agreements remain in force. If the value of the collateral falls below the repurchase price plus accrued interest, the Fund will typically require the seller to deposit additional collateral by the next business day. If the request for additional collateral is not met, or the seller defaults, the Fund maintains the right to sell the collateral (although it may be prevented or delayed from doing so in certain circumstances) and may be required to claim any resulting loss against the seller. Park Avenue monitors the creditworthiness of the seller with which the Fund enters into repurchase agreements.
6. Temporary Borrowings
The Fund, with other funds managed by Park Avenue, is party to a credit agreement with respect to a $10 million committed revolving credit facility from State Street Bank and Trust Company (the “Credit Agreement”) for temporary borrowing purposes, including the meeting of redemption requests that otherwise might require the untimely disposition of securities. Interest is based on a daily fluctuating rate per annum equal to the Applicable Rate (as defined in the Credit Agreement) plus the Applicable Margin (as defined in the Credit Agreement) that is subject to change from time to time as and when the Applicable Rate changes. Under the
NOTES TO FINANCIAL STATEMENTS — GUARDIAN SMALL-MID CAP CORE VIP FUND
current Credit Agreement, the Applicable Rate for any day is defined as the rate per annum equal to the sum of (a) 0.10% plus (b) the higher of (i) the Federal Funds Effective Rate for such day and (ii) the Overnight Bank Funding Rate for such day; the Applicable Margin is 1.25%. In addition to the interest charged on any borrowings by the Fund, each fund pays a commitment fee of 0.30% per annum on its share of the unused portion of the credit facility. The agreement is in place until January 5, 2024. The Fund did not utilize the credit facility during the six months ended June 30, 2023.
7. Indemnifications
Under the Trust’s organizational documents and, in some cases, by contract, officers and Trustees of the Trust are indemnified against certain liabilities arising out of the performance of their duties to the Fund. In addition, in the normal course of business, the Fund
enters into contracts with its vendors and others that provide general indemnifications. The Fund’s maximum exposure under these arrangements is unknown as this would involve future claims that may be made against the Fund that have not yet occurred. However, based on experience, the Fund expects the risk of loss to be remote.
8. Additional Information
The outbreak of COVID-19 has adversely impacted both local and global economies, including those in which the Fund may invest. These impacts include materially reduced consumer demand and economic output, disrupted supply chains, market closures, travel restrictions and quarantines, and strained healthcare systems. The Fund’s operations may be interrupted as a result, which may have a negative impact on the Fund’s investment performance.
SUPPLEMENTAL INFORMATION (UNAUDITED)
Liquidity Risk Management Program
In compliance with Rule 22e-4 under the Investment Company Act of 1940, as amended (the “Liquidity Rule”), Guardian Variable Products Trust (the “Trust”) has adopted and implemented a written liquidity risk management program (the “Program”) for each series of the Trust (each, a “Fund”), which is reasonably designed to assess and manage each Fund’s liquidity risk. The Fund’s “liquidity risk” is the risk that the Fund could not meet requests to redeem shares issued by the Fund without significant dilution of the remaining investors’ interests in the Fund.
The Board of Trustees of the Trust (the “Board”) Previously approved the designation of Park Avenue Institutional Advisers LLC (the “Administrator” or “PAIA”) as Program administrator. The Administrator established a Liquidity Risk Management Committee, which is comprised of certain officers of the Trust and PAIA, that assists the Administrator in the implementation and day-to-day administration of the Program and otherwise support carrying out the Administrator’s liquidity risk management responsibilities under the Program.
In accordance with the Program, each Fund’s liquidity risk is assessed no less frequently than annually, taking into consideration a variety of factors, including, as applicable, the Fund’s investment strategy and liquidity of portfolio investments, cash flow projections, and holdings of cash and cash equivalents, as well as borrowing arrangements and other funding sources. Certain factors are considered under both normal and reasonably foreseeable stressed conditions.
Each Fund portfolio investment is classified, no less than monthly, into one of four liquidity categories (including “highly liquid investments” and “illiquid investments,” discussed below) based on a determination of the number of days it is reasonably expected to take to convert the investment to cash, or sell or dispose of the investment, in current market conditions without significantly changing the investment’s market value.
The Liquidity Rule limits the Fund’s investments in illiquid investments by prohibiting the Fund from acquiring any illiquid investment if, immediately after the acquisition, the Fund would have invested more than 15% of its net assets in illiquid investments that are assets. The Program includes provisions reasonably designed to comply with this investment limitation. In addition, the Program includes provisions reasonably designed to comply with this investment limitation. In addition, the Program includes provisions reasonably designed to comply with the Liquidity Rule’s requirements relating to highly liquid investment minimums, which is a minimum amount of Fund net assets that must be invested in highly liquid investments that are assets, as applicable. The Fund was not required to adopt a highly liquid investment minimum during the
period.
At a meeting of the Board held on March 29-30, 2023, the Board received a report (the “Report”) prepared by the Administrator addressing the Program’s operation and assessing the adequacy and effectiveness of its implementation for the period from January 1, 2022 through December 31, 2022 (the “Reporting Period”). The Report noted that the Administrator believes the Program operated effectively during the Reporting Period and continues to be reasonably designed to effectively assess and manage each Fund’s liquidity risk. The Report also noted that the Administrator believes the Program has been adequately and effectively implemented and the investment strategies for each Fund continue to be appropriate since its inception. In addition, the Report summarized the operation of the Program and the information and factors considered by the Administrator in its assessment of the Program’s implementation, such as the liquidity risk assessment framework and liquidity classification methodologies.
There can be no assurance that the Program will achieve its objectives under all circumstances. Please refer to the Fund’s prospectus for more information regarding the Fund’s exposure to liquidity risk and other risks to which an investment in the Fund may be subject.
SUPPLEMENTAL INFORMATION (UNAUDITED)
Approval of Investment Management and Sub-advisory Agreements
Section 15(c) of the Investment Company Act of 1940, as amended (the “1940 Act”), requires that a fund’s investment advisory and sub-advisory agreements be approved initially by the fund’s board of trustees. Section 15(c) also requires that the continuation of these agreements, after an initial term of up to two years, be annually reviewed and approved by the board. Any such agreement must be approved by a vote of a majority of the trustees who are not parties to the agreement or “interested persons” (as defined in the 1940 Act) of a party to the agreement at a meeting of the board called for the purpose of voting on such approval.
At a meeting of the Board of Trustees (the “Board”) of Guardian Variable Products Trust (the “Trust”) held on March 29-30, 2023 (the “Meeting”), the Board, including the trustees who are not parties to the agreement or “interested persons” as defined in the 1940 Act (the “Independent Trustees”), considered and voted unanimously to renew the existing investment management agreement between the Trust, on behalf of Guardian All Cap Core VIP Fund; Guardian Balanced Allocation VIP Fund; Guardian Core Fixed Income VIP Fund; Guardian Core Plus Fixed Income VIP Fund; Guardian Diversified Research VIP Fund; Guardian Equity Income VIP Fund; Guardian Global Utilities VIP Fund; Guardian Growth & Income VIP Fund; Guardian Integrated Research VIP Fund; Guardian International Growth VIP Fund; Guardian International Equity VIP Fund; Guardian Large Cap Disciplined Growth VIP Fund; Guardian Large Cap Disciplined Value VIP Fund; Guardian Large Cap Fundamental Growth VIP Fund; Guardian Mid Cap Relative Value VIP Fund; Guardian Mid Cap Traditional Growth VIP Fund; Guardian Multi-Sector Bond VIP Fund; Guardian Select Mid-Cap Core VIP Fund; Guardian Short Duration Bond VIP Fund; Guardian Small Cap Core VIP Fund; Guardian Small-Mid Cap Core VIP Fund; Guardian Strategic Large Cap Core VIP Fund; Guardian Total Return Bond VIP Fund and Guardian U.S. Government Securities VIP Fund (each, a “Fund,” and together, the “Funds”), in substantially the form presented at this meeting (the “Management Agreement”); and Park Avenue Institutional Advisers LLC (the “Manager”) for a one-year term.
The Board, including the Independent Trustees, also considered and voted unanimously to renew the existing sub-advisory agreements (the “Sub-Advisory Agreements,” collectively with the Management Agreement and Sub-Subadvisory Agreement, the “Agreements”) between the Manager and investment
advisory firms engaged to serve as sub-advisers to certain of the Funds (the “Sub-Advised Funds”), namely (i) ClearBridge Investments, LLC with respect to Guardian Small Cap Core VIP Fund; (ii) Putnam Investment Management, LLC with respect to Guardian Diversified Research VIP Fund; (iii) AllianceBernstein L.P. with respect to Guardian Growth & Income VIP Fund and Guardian Strategic Large Cap Core VIP Fund; (iv) J.P. Morgan Investment Management Inc. with respect to Guardian International Growth VIP Fund; (v) Schroder Investment Management North America Inc. with respect to Guardian International Equity VIP Fund; (vi) Wellington Management Company LLP with respect to Guardian Balanced Allocation VIP Fund, Guardian Equity Income VIP Fund, Guardian Integrated Research VIP Fund, Guardian Large Cap Disciplined Growth VIP Fund and Guardian Global Utilities VIP Fund; (vii) Boston Partners Global Investors, Inc. with respect to Guardian Large Cap Disciplined Value VIP Fund; (viii) Janus Henderson Investors US LLC with respect to Guardian Mid Cap Traditional Growth VIP Fund; (ix) Allspring Global Investments, LLC with respect to Guardian Mid Cap Relative Value VIP Fund and Guardian Small-Mid Cap Core VIP Fund; (x) Lord, Abbett & Co. LLC with respect to Guardian Core Plus Fixed Income VIP Fund; (xi) FIAM LLC with respect to Guardian Select Mid Cap Core VIP Fund; and (xii) Massachusetts Financial Services Company with respect to Guardian All Cap Core VIP Fund, each in substantially the form presented at this meeting, (each, a “Sub-Adviser” and collectively, the “Sub-Advisers”) for a one-year term.
The Board, including the Independent Trustees, also considered and voted unanimously to renew the existing sub-subadvisory agreement (the “Sub-Subadvisory Agreement”) between Schroder Investment Management North America Inc. and Schroder Investment Management North America Limited (also a Sub-Adviser) with respect to Guardian International Equity VIP Fund for a one-year term.
The Board is responsible for overseeing the management of each Fund. In determining whether to renew its approval of the Agreements, the Trustees evaluated information and factors that they considered to be relevant and appropriate through the exercise of their own business judgment. The Trustees considered certain information and factors in light of advice furnished to them by legal counsel to the Trust and, in the case of the Independent Trustees, their independent legal counsel. In advance of the Meeting, the Trustees received materials and information designed to assist their consideration of the Agreements. The Trustees received written responses
SUPPLEMENTAL INFORMATION (UNAUDITED)
from the Manager and each Sub-Adviser to a series of questions and requests for information encompassing a wide variety of topics provided by independent counsel on behalf of the Independent Trustees. The Independent Trustees also received materials and information regarding the legal standards applicable to their consideration of the Agreements and the process and criteria used by the Manager to identify and select the Sub-Advisers.
During the course of their deliberations, the Independent Trustees met twice to discuss and evaluate the materials, information and Agreements in executive session with their independent legal counsel, outside of the presence of the Trustees who are not Independent Trustees and representatives from Fund management, the Manager or any Sub-Adviser.
In reaching its decisions to renew its approval of the Agreements, the Board took into account the materials and information described above, as well as other materials and information provided to the Board throughout the year. Individual Trustees may have given different weight to different factors and information with respect to each Agreement, and the Trustees did not identify any single factor or information that, in isolation, would be controlling in deciding to approve the Agreements. The discussion below is intended to summarize the broad factors that figured prominently in the Board’s decisions to renew its approval of the Agreements rather than to be all-inclusive. These broad factors included: (i) the nature, extent and quality of the services provided to the Funds by the Manager and to the Sub-advised Funds by the Sub-Advisers; (ii) the investment performance of each Fund; (iii) estimated profitability of the Manager; (iv) fees and expenses; (v) the extent to which economies of scale may exist, and the extent to the benefits of economies of scale are shared with the Funds; and (vi) any other benefits derived by the Manager or the Sub-Advisers (or their respective affiliates) from their relationships with the Funds.
Nature, Extent and Quality of Services
The Trustees considered information regarding the nature, extent and quality of services provided to the Funds by the Manager. The Trustees also considered, among other things, the terms of the Management Agreement and the range of investment advisory services provided by the Manager. In addition, the Trustees reviewed the range of non-investment advisory services provided by the Manager consistent with the terms of the Management Agreement, notably coordinating the preparation and filing of various
regulatory documents, coordinating the preparation and assembly of Board meeting materials, and assisting the Board with certain valuation matters. The Board also received a description of the Manager’s and each Sub-Adviser’s business continuity plans and of their respective approaches to data privacy and cybersecurity, and related testing. The Board received information regarding the response of the Manager and the Sub-Advisers to the COVID-19 pandemic, including the continuation of remote work arrangements and return-to-office plans. The Board also received information about the Manager’s role as administrator of the Funds’ liquidity risk management program, the Manager’s approach to risk management, and the Manager’s vendor oversight programs.
The Trustees considered that the Sub-advised Funds operate in a “manager-of-managers” structure and reviewed the responsibilities that the Manager has under this structure, including monitoring and evaluating the performance of the Sub-Advisers, monitoring the Sub-Advisers for adherence to the stated investment objectives, strategies, policies and restrictions of the Funds and supervising the Sub-Advisers with respect to the services that the Sub-Advisers would provide under the Sub-Advisory Agreements. The Trustees also considered the process used by the Manager, consistent with this structure, to identify and recommend sub-advisers, and the Manager’s ability to monitor and oversee sub-advisers and recommend replacement sub-advisers, when necessary, and provide other services under the Management Agreement. The Board noted that investment management staff of the Manager and the Trust’s Chief Compliance Officer conduct oversight meetings with the Sub-Advisers on a periodic basis, follow through with additional inquiries on any questions or concerns that arise during the meetings and, as necessary, then report the results of the meetings to the Board. The Trustees reviewed information regarding the experience and background of the Manager’s key personnel and the Manager’s organizational structure and resources, including investment, legal and administrative capabilities of the Manager. In this regard, the Trustees recognized that the Funds may benefit from the Manager’s ability to use resources and capabilities of its affiliates in providing services to the Funds.
The Trustees considered information regarding the nature, extent and quality of services provided to the Sub-advised Funds by the Sub-Advisers. The Trustees also considered, among other things, the terms of the Sub-advisory Agreements and the range of investment
SUPPLEMENTAL INFORMATION (UNAUDITED)
advisory services provided by the Sub-Advisers under the oversight of the Manager. In evaluating these investment advisory services, the Trustees considered, among other things, the Sub-Advisers’ investment philosophies, styles and/or processes and approaches to managing the respective Sub-advised Funds. The Trustees received and evaluated information regarding the background, education, expertise and/or experience of the investment professionals who serve as portfolio managers for the Sub-advised Funds and the capabilities and resources of the Sub-Advisers.
Based upon these considerations, the Trustees concluded, within the context of their full deliberations, that the nature, extent and quality of services provided to the Funds by the Manager and the Sub-advised Funds by each respective Sub-Adviser were appropriate.
Investment Performance
In connection with each of its regular quarterly meetings, the Board receives information on the performance of each Fund, including net performance, relative performance rankings within the relevant Morningstar peer group, and performance as compared to benchmark index returns. At each quarterly Board meeting, members of the Manager’s funds management team review with the Board the economic and market environment, absolute and relative performance of each Fund, and any relevant information about risk management and style consistency in connection with management of the Funds. The Board considered investment performance for each Fund over the one-year, three-year (where available), five-year (where available) and since-inception periods.
The Board also received and reviewed a report prepared by Broadridge Financial Solutions (“Broadridge”), an independent provider of mutual fund industry data, which included comparisons of the performance of each Fund to performance of an appropriate peer universe. For details regarding each Fund’s performance, see the “Fund-by-Fund Factors” section below.
The Manager discussed with the Board factors contributing to the Funds’ performance results. In addition, for certain Funds, the Manager provided to the Board longer term performance records of the Sub-Advisers for strategies used in managing the Funds. The Board concluded that the investment performance generated by the Manager and each Sub-Adviser was generally satisfactory, or, that any steps being taken by the Manager and Sub-Advisers to address any performance issues were satisfactory.
Profitability
The Board received and considered the Manager’s estimate of its profitability, which included allocations by the Manager of its costs in providing management services to the Funds. The Board considered the estimated profitability of the Manager both overall and on a Fund-by-Fund basis.
The Board received and considered profitability information from most of the Sub-Advisers, but noted that the Manager had negotiated the fees with the Sub-Advisers at arm’s-length. Accordingly, the Board concluded that the profitability of the Sub-Advisers is a less relevant factor than Manager profitability.
Based on the consideration of this information, the Board concluded that the profitability of the Funds to the Manager was acceptable.
Fees and Expenses
The Trustees considered the management fees paid by the Funds to the Manager under the Management Agreement and evaluated the reasonableness of these fees. The Trustees received and reviewed comparative information with respect to the management fee and total expenses for each Fund and the management fees and total expenses for a peer group of other funds selected by Broadridge. The Trustees considered the Manager’s commitment to limit the total expenses of each Fund through an expense limitation agreement with the Trust. Although the Board recognized that the comparisons between the management fees and actual expenses of the Funds and those of the identified peer group are imprecise, given different terms of agreements and variations in fund strategies, the Trustees found that the comparative information supported their consideration and approval of the management fees and evaluation of the total expenses. For details regarding each Fund’s fee and expense comparisons, see the “Fund-by-Fund Factors” section below.
The Trustees considered the sub-advisory fees paid under the Sub-advisory Agreements and evaluated the reasonableness of those fees. The Trustees also considered that the fees paid to the Sub-Advisers would be paid by the Manager and not the Funds and that the Manager had negotiated the fees with the Sub-Advisers at arm’s-length.
Based on the consideration of the information and factors summarized above, as well as other relevant information and factors, the Board concluded that the management and sub-advisory fees were reasonable in
SUPPLEMENTAL INFORMATION (UNAUDITED)
light of the nature, extent and quality of services rendered to the Funds by the Manager and the Sub-Advisers.
Economies of Scale
The Board considered the extent to which economies of scale may exist, and the extent to the benefits of economies of scale are shared with the Funds. In this regard, the Board noted that for sixteen of twenty-four Funds, the management and sub-advisory fee included breakpoints that are tiered based on growth in asset levels of each such Fund and that for the other Funds, the fees reflected appropriate levels based on current and expected asset levels. The Board also noted that the expenses of the Funds are subject to expense limitations provided by the Manager. The Board noted that expected economies of scale, where they exist, may be shared through the use of fee breakpoints, expense limitations by the Manager, and/or a lower overall fee.
Ancillary Benefits
The Board considered the potential benefits, other than management fees, that the Manager and/or its affiliates may receive because of the Manager’s relationship with the Funds. The Trustees considered that the Funds were designed to serve as investment options under variable contracts issued by affiliates of the Manager that would receive fees under those contracts and that Park Avenue Securities LLC, an affiliate of the Manager and principal underwriter of the Funds, and participating insurance companies, including insurance companies affiliated with the Manager, would be entitled to receive fees from the Funds under a plan of distribution adopted pursuant to Rule 12b-1 under the 1940 Act. The Trustees considered that the Manager and its affiliates may benefit from (i) greater efficiencies in annuity administration and operations and potential cost savings due to a reduction in the number of unaffiliated funds available as annuity contract investment options, and (ii) increased dividends-received deductions due to the Funds’ status under the tax laws as disregarded entities. In addition, the Trustees considered the potential benefits, other than sub-advisory fees, that the Sub-Advisers and their affiliates may receive because of their relationships with the Funds, including the ability to receive research from soft dollar commissions consistent with Trust policies. The Trustees concluded that benefits that may accrue to the Manager and its affiliates are reasonable and the benefits that may accrue to the Sub-Advisers and their affiliates are consistent with those expected for a
sub-adviser to a mutual fund such as the applicable Fund.
Fund-by-Fund Factors
The Broadridge report groups fees, expenses and performance into five quintiles, with the top quintile having the highest performance or lowest fees/expenses, and the bottom quintile having the lowest performance or highest fees/expenses. For purposes of the descriptions below, a Fund’s performance is considered “in line with” the benchmark index if it is within 0.20%.
Guardian Large Cap Fundamental Growth VIP Fund
| • | | The Board noted that the Fund’s performance was in the 3rd quintile of its performance universe for the 1-year period and in the 4th quintile for its performance universe for the 3-year and 5-year periods. The Board also noted that the Fund’s performance was below the benchmark index for the 1-year, 3-year and 5-year periods. |
| • | | The Board noted that the contractual management fee, the actual management fee and actual total expenses were in the 1st quintile of the expense group. |
Guardian Large Cap Disciplined Growth VIP Fund
| • | | The Board noted that the Fund’s performance was in the 3rd quintile of its performance universe for the 1-year and 3-year periods and in the 2nd quintile for the 5-year period. The Board also noted that the Fund’s performance was below the benchmark index for the 1-year, 3-year and 5-year periods. |
| • | | The Board noted that the contractual management fee, the actual management fee and actual total expenses were in the 1st quintile of the expense group. |
Guardian Integrated Research VIP Fund
| • | | The Board noted that the Fund’s performance was in the 5th quintile of its performance universe for the 1-year and 5-year periods and in the 4th quintile for 3-year period. The Board also noted that the Fund’s performance was below the benchmark index for the 1-year, 3-year and 5-year periods. |
| • | | The Board noted that the contractual management fee, the actual management fee and actual total expenses were in the 1st quintile of the expense group. |
SUPPLEMENTAL INFORMATION (UNAUDITED)
Guardian Diversified Research VIP Fund
| • | | The Board noted that the Fund’s performance was in the 3rd quintile of its performance universe for the 1-year and 3-year periods and in the 2nd quintile for the 5-year period. The Board also noted that the Fund’s performance was higher than the benchmark index for the 1-year period. The Board note that the Fund’s performance was lower than the benchmark index for the 3-year and 5-year periods. |
| • | | The Board noted that the contractual management fee and actual management fee were in the 1st quintile of the expense group and that actual total expenses were in the 3rd quintile. |
Guardian Strategic Large Cap Core VIP Fund
| • | | The Board noted that the Fund’s performance was in the 1st quintile of its performance universe for the 1-year period. The Board acknowledged the Fund’s short operational history. The Board noted that the Fund’s performance was higher than the benchmark index for the 1-year period. |
| • | | The Board noted that the contractual management fee, the actual management fee and actual total expenses were in the 1st quintile of the expense group. |
Guardian Large Cap Disciplined Value VIP Fund
| • | | The Board noted that the Fund’s performance was in the 3rd quintile of its performance universe for the 1-year and 3-year periods and in the 4th quintile for the 5-year period. The Board also noted that the Fund’s performance was higher than the benchmark index for the 1-year and 3-year periods. The Board noted that the Fund’s performance was in line with the benchmark index for the 5-year period. |
| • | | The Board noted that the contractual management fee was in the 2nd quintile of the expense group, the actual management fee was in the 1st quintile of the expense group and that actual total expenses were in the 3rd quintile. |
Guardian Growth & Income VIP Fund
| • | | The Board noted that the Fund’s performance was in the 3rd quintile of its performance universe for the 1-year, 3-year and 5-year periods. The Board also noted that the Fund’s performance was higher than the benchmark index for the 1-year, 3-year and 5-year periods. |
| • | | The Board noted that the contractual management fee and the actual management fee were in the 1st quintile of the expense group and that actual total expenses were in the 3rd quintile. |
Guardian Equity Income VIP Fund
| • | | The Board noted that the Fund had less than one-year of operational history and was not able to evaluate an investment performance record for the Fund. The Board noted that it would have an opportunity to review such information in connection with future annual reviews. The Board noted that, in the meantime, it received monthly performance reports from the Manager. |
| • | | The Board noted that the contractual management fee, the actual management fee and actual total expenses were in the 1st quintile of the expense group. |
Guardian All Cap Core VIP Fund
| • | | The Board noted that the Fund’s performance was in the 3rd quintile of its performance universe for the 1-year period. The Board acknowledged the Fund’s short operational history. The Board noted that the Fund’s performance was higher than the benchmark index for the 1-year period. |
| • | | The Board noted that the contractual management fee, the actual management fee and actual total expenses were in the 1st quintile of the expense group. |
Guardian Mid Cap Traditional Growth VIP Fund
| • | | The Board noted that the Fund’s performance was in the 1st quintile of its performance universe for the 1-year period and in the 2nd quintile for the 3-year and 5-year periods. The Board also noted that the Fund’s performance was higher than the benchmark index for the 1-year, 3-year and 5-year periods. |
| • | | The Board noted that the contractual management fee and actual management fee were in the 1st quintile of the expense group and that the actual total expenses were in the 4th quintile. |
Guardian Select Mid Cap Core VIP Fund
| • | | The Board noted that the Fund’s performance was in the 3rd quintile of its performance universe for the 1-year period. The Board acknowledged the Fund’s short operational history. The Board noted that the Fund’s performance was lower than the benchmark index for the 1-year period. |
| • | | The Board noted that the contractual management fee, the actual management fee and actual total expenses were in the 1st quintile of the expense group. |
SUPPLEMENTAL INFORMATION (UNAUDITED)
Guardian Mid Cap Relative Value VIP Fund
| • | | The Board noted that the Fund’s performance was in the 2nd quintile of its performance universe for the 1-year, 3-year and 5-year periods. The Board also noted that the Fund’s performance was higher than the benchmark index for the 1-year, 3-year and 5-year periods. |
| • | | The Board noted that the contractual management fee and the actual management fee were in the 2nd quintile of the expense group and the actual total expenses were in the 3rd quintile of the expense group. |
Guardian Small-Mid Cap Core VIP Fund
| • | | The Board noted that the Fund’s performance was in the 5th quintile of its performance universe for the 1-year period. The Board acknowledged the Fund’s short operational history. The Board noted that the Fund’s performance was higher than the benchmark index for the 1-year period. |
| • | | The Board noted that the contractual management fee, the actual management fee and actual total expenses were in the 1st quintile of the expense group. |
Guardian Small Cap Core VIP Fund
| • | | The Board noted that the Fund’s performance was in the 5th quintile of its performance universe for the 1-year and 3-year periods. The Board noted that the Fund’s performance was lower than the benchmark index for the 1-year and 3-year periods. |
| • | | The Board noted that the contractual management fee and the actual management fee were in the 1st quintile of the expense group and the actual total expenses were in the 2nd quintile of the expense group. |
Guardian International Growth VIP Fund
| • | | The Board noted that the Fund’s performance was in the 4th quintile of its performance universe for the 1-year period, in the 2nd quintile of its performance universe for the 3-year period and in the 3rd quintile of its performance universe for the 5-year period. The Board also noted that the Fund’s performance was lower than the benchmark index for the 1-year and 5-year periods. The Board noted that the Fund’s performance was higher than the benchmark index for the 3-year period. |
| • | | The Board noted that the contractual management fee and actual management fee were in the 2nd quintile of the expense group and that the actual total expenses were in the 3rd quintile. |
Guardian International Equity VIP Fund
| • | | The Board noted that the Fund’s performance was in the 5th quintile of its performance universe for the 1-year, 3-year and 5-year periods. The Board also noted that the Fund’s performance was lower than the benchmark index for the 1-year, 3-year and 5-year periods. |
| • | | The Board noted that the contractual management fee, the actual management fee and the actual total expenses were in the 2nd quintile of the expense group. |
Guardian Global Utilities VIP Fund
| • | | The Board noted that the Fund’s performance was in the 5th quintile of its performance universe for the 1-year period and in the 4th quintile of its performance universe for the 3-year period. The Board noted that the Fund’s performance was higher than the benchmark index for the 1-year and 3-year periods. |
| • | | The Board noted that the contractual management fee and the actual management fee were in the 1st quintile of the expense group and the actual total expenses were in the 2nd quintile of the expense group. |
Guardian Balanced Allocation VIP Fund
| • | | The Board noted that the Fund had less than one-year of operational history and was not able to evaluate an investment performance record for the Fund. The Board noted that it would have an opportunity to review such information in connection with future annual reviews. The Board noted that, in the meantime, it received monthly performance reports from the Manager. |
| • | | The Board noted that the contractual management fee, the actual management fee and actual total expenses were in the 1st quintile of the expense group. |
Guardian Core Plus Fixed Income VIP Fund
| • | | The Board noted that the Fund’s performance was in the 3rd quintile of its performance universe for the 1-year and 3-year periods and in the 4th quintile of its performance universe for the 5-year period. The Board also noted that the Fund’s performance was lower than the benchmark index for the 1-year and 5-year periods. The Board noted that the Fund’s performance was in line with the benchmark index for the 3-year period. |
SUPPLEMENTAL INFORMATION (UNAUDITED)
| • | | The Board noted that the contractual management fee and actual management fee were in the 2nd quintile of the expense group and that actual total expenses were in the 3rd quintile. |
Guardian Total Return Bond VIP Fund
| • | | The Board noted that the Fund’s performance was in the 5th quintile of its performance universe for the 1-year and 3-year periods. The Board also noted that the Fund’s performance was lower than the benchmark index for the 1-year and 3-year periods. |
| • | | The Board noted that the contractual management fee and actual management fee were in the 2nd quintile and the actual total expenses were in the 3rd quintile. |
Guardian Core Fixed Income VIP Fund
| • | | The Board noted that the Fund had less than one-year of operational history and was not able to evaluate an investment performance record for the Fund. The Board noted that it would have an opportunity to review such information in connection with future annual reviews. The Board noted that, in the meantime, it received monthly performance reports from the Manager. |
| • | | The Board noted that the contractual management fee was in the 2nd quintile of the expense group and the actual management fee and the actual total expenses were in the 1st quintile. |
Guardian Multi-Sector Bond VIP Fund
| • | | The Board noted that the Fund’s performance was in the 5th quintile of its performance universe for the 1-year and 3-year periods The Board also noted that the Fund’s performance was lower than the benchmark index for the 1-year and 3-year periods. |
| • | | The Board noted that the contractual management fee and actual total expenses were in the 1st quintile and the actual management fee was in the 2nd quintile. |
Guardian Short Duration Bond VIP Fund
| • | | The Board noted that the Fund had less than one-year of operational history and was not able to evaluate an investment performance record for the Fund. The Board noted that it would have an opportunity to review such information in connection with future annual reviews. The Board noted that, in the meantime, it received monthly performance reports from the Manager. |
| • | | The Board noted that the contractual management fee and actual total expenses were in the 3rd quintile of the expense group and the actual management fee was in the 1st quintile of the expense group. |
Guardian U.S. Government Securities VIP Fund
| • | | The Board noted that the Fund’s performance was in the 1st quintile of its performance universe for the 1-year period and in the 2nd quintile of its performance universe for the 3-year period. The Board also noted that the Fund’s performance was higher than the benchmark index for the 1-year and 3-year periods. |
| • | | The Board noted that the contractual management fee and the actual management fee were in the 1st quintile of the expense group and the actual total expenses were in the 2nd quintile of the expense group. |
Conclusion
Based on a comprehensive consideration and evaluation of all of the information and factors summarized above, among others, the Board as a whole, including the Independent Trustees, approved the Agreements.
SUPPLEMENTAL INFORMATION (UNAUDITED)
The Statement of Additional Information (“SAI”) includes additional information about the Trust’s Trustees and Officers and is available, without charge, upon request by calling toll-free 1-888-GUARDIAN (1-888-482-7342) or by visiting our website at http://guardianvpt.onlineprospectus.net/GuardianVPT/Prospectuses.
Portfolio Holdings and Proxy Voting Procedures
The Fund files its complete schedule of portfolio holdings with the Securities and Exchange Commission for the first and third quarters of each fiscal year as an exhibit to its reports on Form N-PORT. The Fund’s Form N-PORT reports are available on the Securities and Exchange Commission’s website at https://www.sec.gov. The Fund’s Form N-PORT information is also available, without charge, upon request, by calling toll-free 1-888-GUARDIAN (1-888-482-7342) or by visiting our website at http://guardianvpt.onlineprospectus.net/GuardianVPT/Prospectuses.
A description of the policies and procedures that the Fund uses to determine how to vote proxies relating to portfolio securities is included in the SAI. The SAI and information regarding how the Fund voted proxies relating to portfolio securities during the most recent 12-month period ended June 30 may be obtained (i) without charge, upon request, by calling toll-free 1-888-GUARDIAN (1-888-482-7342) or by visiting our website at http://guardianvpt.onlineprospectus.net/GuardianVPT/Prospectuses; and (ii) on the Securities and Exchange Commission’s website at https://www.sec.gov.
This report is transmitted to shareholders only. It is not authorized for use as an offer of sale or a solicitation of an offer to buy shares of the Fund unless accompanied or preceded by the Fund’s current prospectus. Past performance results shown in this report should not be considered a representation of future performance. Investment returns and principal value of shares will fluctuate so that shares, when redeemed, may be worth more or less than their original cost. Statements and other information herein are as dated and are subject to change.

The Guardian Life Insurance Company of America New York, NY 10001-2159
PUB11409
Guardian Variable
Products Trust
2023
Semiannual Report
All Data as of June 30, 2023
Guardian Strategic Large Cap Core VIP Fund

| | |
| Not FDIC insured. May lose value. No bank guarantee. | | www.guardianlife.com |
TABLE OF CONTENTS
Guardian Strategic Large Cap Core VIP Fund
Except as otherwise specifically stated, all information, including portfolio security positions, is as of June 30, 2023. Fund holdings will vary. Information contained herein has been obtained from sources believed reliable, but is not guaranteed.
GUARDIAN STRATEGIC LARGE CAP CORE VIP FUND
Fund Characteristics (unaudited)
| | |
| Total Net Assets: $275,186,113 | | |
|
| |
Sector Allocation1 As of June 30, 2023 |
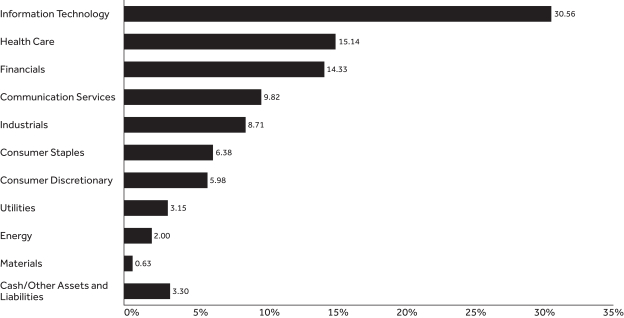 |
| | | | |
| | |
Top Ten Holdings2 As of June 30, 2023 | | | |
| | |
| Holding | | % of Total
Net Assets | |
| Microsoft Corp. | | | 8.57% | |
| Alphabet, Inc., Class C | | | 4.82% | |
| Apple, Inc. | | | 4.34% | |
| Broadcom, Inc. | | | 2.93% | |
| Merck & Co., Inc. | | | 2.82% | |
| AbbVie, Inc. | | | 2.49% | |
| UnitedHealth Group, Inc. | | | 2.45% | |
| AutoZone, Inc. | | | 2.31% | |
| Oracle Corp. | | | 2.22% | |
| Visa, Inc., Class A | | | 2.16% | |
| Total | | | 35.11% | |
| 1 | The Fund’s holdings are allocated to each sector based on the MSCI Global Industry Classification Standard (GICS®). Cash includes short-term investments and net other assets and liabilities. |
| 2 | Portfolio holdings are subject to change and should not be considered a recommendation to buy or sell individual securities. |
UNDERSTANDING YOUR FUND’S EXPENSES (UNAUDITED)
By investing in the Fund, you incur two types of costs: (1) transaction costs and (2) ongoing costs, including, as applicable, investment advisory fees, distribution and/or service (12b-1) fees and other Fund expenses. The example below is intended to help you understand your ongoing costs (in dollars) of investing in the Fund and to compare these costs with the ongoing costs of investing in other mutual funds.
The example is based on an investment of $1,000 invested at the beginning of the period and held for the entire period from January 1, 2023 to June 30, 2023. The table below shows the Fund’s expenses in two ways:
Expenses based on actual return
This section of the table provides information about actual account values and actual expenses. You may use the information in this section, together with the amount you invested, to estimate the expenses that you paid over the period. Simply divide your account value by $1,000 (for example, an $8,600 account value divided by $1,000 = 8.6), then multiply the result by the number in the section under the heading entitled “Expenses Paid During Period” to estimate the expenses you paid on your account during this period.
Expenses based on hypothetical 5% return for comparison purposes
This section of the table provides information about hypothetical account values and hypothetical expenses based on the Fund’s actual expense ratio and an assumed rate of return of 5% per year before expenses, which is not the Fund’s actual return. The hypothetical account values and expenses may not be used to estimate the actual ending account balance or expenses you paid for the period. You may use this information to compare the ongoing costs of investing in the Fund with the cost of investing in other mutual funds. To do so, compare this 5% hypothetical example with the 5% hypothetical examples that appear in the shareholder reports of the other funds.
Note that the expenses shown in the table are meant to highlight your ongoing costs only and do not reflect any transactional costs, such as sales charges (loads), redemption fees, or exchange fees. Therefore the second section is useful in comparing ongoing costs only, and will not help you determine the relative total costs of owning different funds. If these transactional costs were included, your costs would have been higher. Charges and expenses at the insurance company separate account level are not reflected in the table.
| | | | | | | | | | | | | | |
| | | | | |
| | | Beginning
Account Value 1/1/23 | | Ending Account Value
6/30/23 | | | Expenses Paid During Period* 1/1/23-6/30/23 | | | Expense Ratio During Period 1/1/23-6/30/23 | |
| Based on Actual Return | | $1,000.00 | | $ | 1,118.50 | | | $ | 4.41 | | | | 0.84% | |
Based on Hypothetical Return (5% Return Before Expenses) | | $1,000.00 | | $ | 1,020.63 | | | $ | 4.21 | | | | 0.84% | |
| * | Expenses are equal to the Fund’s annualized expense ratio as indicated, multiplied by the average account value over the period, multiplied by 181/365 (to reflect the one-half year period). |
SCHEDULE OF INVESTMENTS — GUARDIAN STRATEGIC LARGE CAP CORE VIP FUND
| | | | | | | | |
| June 30, 2023 (unaudited) | | Shares | | | Value | |
| Common Stocks – 96.7% | | | | | | | | |
| | | |
| Aerospace & Defense – 1.6% | | | | | | | | |
| | | |
Lockheed Martin Corp. | | | 9,767 | | | $ | 4,496,531 | |
| | | | | | | | | |
| | | |
| | | | | | | | 4,496,531 | |
| Banks – 2.0% | | | | | |
| | | |
JPMorgan Chase & Co. | | | 36,833 | | | | 5,356,992 | |
| | | | | | | | | |
| | | |
| | | | | | | | 5,356,992 | |
| Beverages – 1.4% | | | | | |
| | | |
Coca-Cola Co. | | | 65,124 | | | | 3,921,767 | |
| | | | | | | | | |
| | |
| | | | | 3,921,767 | |
| Biotechnology – 4.4% | | | | | |
| | | |
AbbVie, Inc. | | | 50,907 | | | | 6,858,700 | |
| | | |
Gilead Sciences, Inc. | | | 38,102 | | | | 2,936,521 | |
| | | |
Vertex Pharmaceuticals, Inc.(1) | | | 6,543 | | | | 2,302,547 | |
| | | | | | | | | |
| | |
| | | | | 12,097,768 | |
| Broadline Retail – 0.7% | | | | | |
| | | |
Amazon.com, Inc.(1) | | | 14,609 | | | | 1,904,429 | |
| | | | | | | | | |
| | |
| | | | | 1,904,429 | |
| Capital Markets – 3.4% | | | | | |
| | | |
Cboe Global Markets, Inc. | | | 11,775 | | | | 1,625,068 | |
| | | |
Houlihan Lokey, Inc. | | | 24,492 | | | | 2,407,809 | |
| | | |
Nasdaq, Inc. | | | 38,344 | | | | 1,911,448 | |
| | | |
S&P Global, Inc. | | | 8,825 | | | | 3,537,854 | |
| | | | | | | | | |
| | |
| | | | | 9,482,179 | |
| Chemicals – 0.6% | | | | | |
| | | |
LyondellBasell Industries NV, Class A | | | 19,007 | | | | 1,745,413 | |
| | | | | | | | | |
| | |
| | | | | 1,745,413 | |
| Construction & Engineering – 0.7% | | | | | |
| | | |
AECOM | | | 23,289 | | | | 1,972,345 | |
| | | | | | | | | |
| | |
| | | | | 1,972,345 | |
| Consumer Staples Distribution & Retail – 2.3% | |
| | | |
Koninklijke Ahold Delhaize NV, ADR | | | 96,554 | | | | 3,286,698 | |
| | | |
Walmart, Inc. | | | 19,473 | | | | 3,060,766 | |
| | | | | | | | | |
| | |
| | | | | 6,347,464 | |
| Diversified Telecommunication Services – 0.9% | |
| | | |
Verizon Communications, Inc. | | | 63,236 | | | | 2,351,747 | |
| | | | | | | | | |
| | |
| | | | | 2,351,747 | |
| Electric Utilities – 2.2% | | | | | |
| | | |
American Electric Power Co., Inc. | | | 27,115 | | | | 2,283,083 | |
| | | |
NextEra Energy, Inc. | | | 19,700 | | | | 1,461,740 | |
| | | |
Xcel Energy, Inc. | | | 37,203 | | | | 2,312,911 | |
| | | | | | | | | |
| | |
| | | | | 6,057,734 | |
| Electronic Equipment, Instruments & Components – 0.5% | |
| | | |
CDW Corp. | | | 8,099 | | | | 1,486,167 | |
| | | | | | | | | |
| | |
| | | | | 1,486,167 | |
| Entertainment – 1.6% | | | | | |
| | | |
Electronic Arts, Inc. | | | 33,428 | | | | 4,335,612 | |
| | | | | | | | | |
| | |
| | | | | 4,335,612 | |
| | | | | | | | |
| June 30, 2023 (unaudited) | | Shares | | | Value | |
| Financial Services – 3.6% | |
| | | |
Fidelity National Information Services, Inc. | | | 20,642 | | | $ | 1,129,118 | |
| | | |
Mastercard, Inc., Class A | | | 7,001 | | | | 2,753,493 | |
| | | |
Visa, Inc., Class A | | | 25,052 | | | | 5,949,349 | |
| | | | | | | | | |
| | | |
| | | | | | | | 9,831,960 | |
| Food Products – 0.8% | | | | | | | | |
| | | |
General Mills, Inc. | | | 27,779 | | | | 2,130,649 | |
| | | | | | | | | |
| | |
| | | | | 2,130,649 | |
| Ground Transportation – 0.5% | |
| | | |
Knight-Swift Transportation Holdings, Inc. | | | 23,355 | | | | 1,297,604 | |
| | | | | | | | | |
| | |
| | | | | 1,297,604 | |
| Health Care Providers & Services – 5.5% | |
| | | |
AmerisourceBergen Corp. | | | 7,712 | | | | 1,484,020 | |
| | | |
Centene Corp.(1) | | | 44,420 | | | | 2,996,129 | |
| | | |
McKesson Corp. | | | 8,839 | | | | 3,776,993 | |
| | | |
UnitedHealth Group, Inc. | | | 14,021 | | | | 6,739,054 | |
| | | | | | | | | |
| | |
| | | | | 14,996,196 | |
| Hotels, Restaurants & Leisure – 1.5% | |
| | | |
Booking Holdings, Inc.(1) | | | 745 | | | | 2,011,746 | |
| | | |
Compass Group PLC, ADR | | | 76,776 | | | | 2,189,651 | |
| | | | | | | | | |
| | |
| | | | | 4,201,397 | |
| Household Products – 0.5% | | | | | | | | |
| | | |
Procter & Gamble Co. | | | 9,135 | | | | 1,386,145 | |
| | | | | | | | | |
| | |
| | | | | 1,386,145 | |
| Insurance – 5.4% | | | | | | | | |
| | | |
Everest Re Group Ltd. | | | 8,577 | | | | 2,932,133 | |
| | | |
Marsh & McLennan Cos., Inc. | | | 24,785 | | | | 4,661,563 | |
| | | |
Progressive Corp. | | | 14,787 | | | | 1,957,355 | |
| | | |
Selective Insurance Group, Inc. | | | 15,751 | | | | 1,511,309 | |
| | | |
Willis Towers Watson PLC | | | 15,652 | | | | 3,686,046 | |
| | | | | | | | | |
| | |
| | | | | 14,748,406 | |
| Interactive Media & Services – 6.0% | |
| | | |
Alphabet, Inc., Class C(1) | | | 109,590 | | | | 13,257,102 | |
| | | |
Meta Platforms, Inc., Class A(1) | | | 11,272 | | | | 3,234,839 | |
| | | | | | | | | |
| | |
| | | | | 16,491,941 | |
| IT Services – 2.8% | |
| | | |
Amdocs Ltd. | | | 31,775 | | | | 3,140,959 | |
| | | |
VeriSign, Inc.(1) | | | 20,508 | | | | 4,634,193 | |
| | | | | | | | | |
| | |
| | | | | 7,775,152 | |
| Life Sciences Tools & Services – 0.4% | |
| | | |
Thermo Fisher Scientific, Inc. | | | 2,039 | | | | 1,063,848 | |
| | | | | | | | | |
| | |
| | | | | 1,063,848 | |
| Media – 1.4% | | | | | | | | |
| | | |
Comcast Corp., Class A | | | 92,358 | | | | 3,837,475 | |
| | | | | | | | | |
| | |
| | | | | 3,837,475 | |
| Multi-Utilities – 0.9% | | | | | | | | |
| | | |
CenterPoint Energy, Inc. | | | 89,298 | | | | 2,603,037 | |
| | | | | | | | | |
| | |
| | | | | 2,603,037 | |
| | | | |
| The accompanying notes are an integral part of these financial statements. | | | | 3 |
SCHEDULE OF INVESTMENTS — GUARDIAN STRATEGIC LARGE CAP CORE VIP FUND
| | | | | | | | |
| June 30, 2023 (unaudited) | | Shares | | | Value | |
| Oil, Gas & Consumable Fuels – 2.0% | |
| | | |
Shell PLC, ADR | | | 91,246 | | | $ | 5,509,433 | |
| | | | | | | | | |
| | |
| | | | | 5,509,433 | |
| Pharmaceuticals – 4.9% | �� | | | | | | | |
| | | |
Bristol-Myers Squibb Co. | | | 27,448 | | | | 1,755,300 | |
| | | |
Eli Lilly and Co. | | | 8,536 | | | | 4,003,213 | |
| | | |
Merck & Co., Inc. | | | 67,247 | | | | 7,759,631 | |
| | | | | | | | | |
| | | |
| | | | | | | | 13,518,144 | |
| Professional Services – 5.9% | |
| | | |
Automatic Data Processing, Inc. | | | 12,394 | | | | 2,724,077 | |
| | | |
Booz Allen Hamilton Holding Corp. | | | 11,554 | | | | 1,289,426 | |
| | | |
Experian PLC, ADR | | | 68,714 | | | | 2,627,623 | |
| | | |
Genpact Ltd. | | | 117,776 | | | | 4,424,844 | |
| | | |
Paychex, Inc. | | | 32,435 | | | | 3,628,504 | |
| | | |
RELX PLC, ADR | | | 45,334 | | | | 1,515,516 | |
| | | | | | | | | |
| | | |
| | | | | | | | 16,209,990 | |
| Semiconductors & Semiconductor Equipment – 3.8% | |
| | | |
Broadcom, Inc. | | | 9,282 | | | | 8,051,485 | |
| | | |
KLA Corp. | | | 2,944 | | | | 1,427,899 | |
| | | |
Texas Instruments, Inc. | | | 5,743 | | | | 1,033,855 | |
| | | | | | | | | |
| | | |
| | | | | | | | 10,513,239 | |
| Software – 19.0% | |
| | | |
Adobe, Inc.(1) | | | 11,770 | | | | 5,755,412 | |
| | | |
Fortinet, Inc.(1) | | | 33,009 | | | | 2,495,150 | |
| | | |
Gen Digital, Inc. | | | 186,016 | | | | 3,450,597 | |
| | | |
Intuit, Inc. | | | 6,294 | | | | 2,883,848 | |
| | | |
Microsoft Corp. | | | 69,274 | | | | 23,590,568 | |
| | | |
Nice Ltd., ADR(1) | | | 5,731 | | | | 1,183,451 | |
| | | |
Oracle Corp. | | | 51,186 | | | | 6,095,741 | |
| | | |
ServiceNow, Inc.(1) | | | 8,228 | | | | 4,623,889 | |
| | | |
VMware, Inc., Class A(1) | | | 16,004 | | | | 2,299,615 | |
| | | | | | | | | |
| | | |
| | | | | | | | 52,378,271 | |
| Specialty Retail – 3.8% | |
| | | |
AutoZone, Inc.(1) | | | 2,555 | | | | 6,370,535 | |
| | | |
O’Reilly Automotive, Inc.(1) | | | 4,171 | | | | 3,984,556 | |
| | | | | | | | | |
| | | |
| | | | | | | | 10,355,091 | |
| Technology Hardware, Storage & Peripherals – 4.3% | |
| | | |
Apple, Inc. | | | 61,524 | | | | 11,933,810 | |
| | | | | | | | | |
| | | |
| | | | | | | | 11,933,810 | |
| | | | | | | | |
| June 30, 2023 (unaudited) | | Shares | | | Value | |
| Tobacco – 1.4% | |
| | | |
Philip Morris International, Inc. | | | 38,636 | | | $ | 3,771,646 | |
| | | | | | | | | |
| | | |
| | | | | | | | 3,771,646 | |
| | |
Total Common Stocks (Cost $239,883,773) | | | | 266,109,582 | |
| | | | | | | | |
| | | Principal
Amount | | | Value | |
| Repurchase Agreements – 3.8% | |
| | | |
Fixed Income Clearing Corp., 1.52%, dated 6/30/2023, proceeds at maturity value of $10,385,447, due 7/3/2023(2) | | $ | 10,384,132 | | | | 10,384,132 | |
| | |
Total Repurchase Agreements
(Cost $10,384,132) | | | | 10,384,132 | |
| | | |
Total Investments – 100.5%
(Cost $250,267,905) | | | | | | | 276,493,714 | |
| | |
| Liabilities in excess of other assets – (0.5)% | | | | (1,307,601 | ) |
| | | |
| Total Net Assets – 100.0% | | | | | | $ | 275,186,113 | |
| (1) | Non–income–producing security. |
| (2) | The table below presents collateral for repurchase agreements. |
| | | | | | | | | | | | | | | | |
| Security | | Coupon | | | Maturity
Date | | | Principal
Amount | | | Value | |
| U.S. Treasury Note | | | 4.625% | | | | 3/15/2026 | | | $ | 10,437,600 | | | $ | 10,591,824 | |
Legend:
ADR — American Depositary Receipt
The following is a summary of the inputs used as of June 30, 2023 in valuing the Fund’s investments. For more information on valuation inputs, please refer to Note 2a of the accompanying Notes to Financial Statements.
| | | | | | | | | | | | | | | | |
| | | Valuation Inputs | | | | |
| Investments in Securities (unaudited) | | Level 1 | | | Level 2 | | | Level 3 | | | Total | |
| Common Stocks | | $ | 266,109,582 | | | $ | — | | | $ | — | | | $ | 266,109,582 | |
| Repurchase Agreements | | | — | | | | 10,384,132 | | | | — | | | | 10,384,132 | |
| Total | | $ | 266,109,582 | | | $ | 10,384,132 | | | $ | — | | | $ | 276,493,714 | |
| | | | |
| 4 | | | | The accompanying notes are an integral part of these financial statements. |
FINANCIAL INFORMATION — GUARDIAN STRATEGIC LARGE CAP CORE VIP FUND
| | | | |
Statement of Assets and Liabilities As of June 30, 2023 (unaudited) | | | |
Assets | | | | |
| | |
Investments, at value | | $ | 276,493,714 | |
| | |
Receivable for investments sold | | | 2,057,363 | |
| | |
Dividends/interest receivable | | | 238,379 | |
| | |
Reimbursement receivable from adviser | | | 9,867 | |
| | |
Prepaid expenses | | | 3,215 | |
| | | | | |
| | |
Total Assets | | | 278,802,538 | |
| | | | | |
| | |
Liabilities | | | | |
| | |
Payable for investments purchased | | | 3,175,390 | |
| | |
Payable for fund shares redeemed | | | 204,997 | |
| | |
Investment advisory fees payable | | | 120,373 | |
| | |
Distribution fees payable | | | 56,077 | |
| | |
Accrued audit fees | | | 13,978 | |
| | |
Accrued custodian and accounting fees | | | 8,002 | |
| | |
Accrued trustees’ and officers’ fees | | | 5,326 | |
| | |
Accrued expenses and other liabilities | | | 32,282 | |
| | | | | |
| | |
Total Liabilities | | | 3,616,425 | |
| | | | | |
| | |
Total Net Assets | | $ | 275,186,113 | |
| | | | | |
| | |
Net Assets Consist of: | | | | |
| | |
Paid-in capital | | $ | 270,018,833 | |
| | |
Distributable earnings | | | 5,167,280 | |
| | | | | |
| | |
Total Net Assets | | $ | 275,186,113 | |
| | | | | |
| | |
Investments, at Cost | | $ | 250,267,905 | |
| | | | | |
| | |
Pricing of Shares | | | | |
| | |
Shares of Beneficial Interest Outstanding with No Par Value | | | 26,514,235 | |
| | |
Net Asset Value Per Share | | | $10.38 | |
| | | | | |
| | | | |
Statement of Operations For the Six Months Ended June 30, 2023 (unaudited) | |
Investment Income | | | | |
| | |
Dividends | | $ | 2,238,799 | |
| | |
Interest | | | 79,749 | |
| | |
Withholding taxes on foreign dividends | | | (35,465 | ) |
| | | | | |
| | |
Total Investment Income | | | 2,283,083 | |
| | | | | |
| | |
Expenses | | | | |
| | |
Investment advisory fees | | | 727,755 | |
| | |
Distribution fees | | | 339,083 | |
| | |
Professional fees | | | 39,109 | |
| | |
Trustees’ and officers’ fees | | | 34,146 | |
| | |
Administrative fees | | | 19,686 | |
| | |
Custodian and accounting fees | | | 16,451 | |
| | |
Transfer agent fees | | | 8,451 | |
| | |
Shareholder reports | | | 5,759 | |
| | |
Other expenses | | | 7,550 | |
| | | | | |
| | |
Total Expenses | | | 1,197,990 | |
| | |
Less: Fees waived | | | (58,671 | ) |
| | | | | |
| | |
Total Expenses, Net | | | 1,139,319 | |
| | | | | |
| | |
Net Investment Income/(Loss) | | | 1,143,764 | |
| | | | | |
| | |
Realized Gain/(Loss) and Change in Unrealized Appreciation/(Depreciation) on Investments | | | | |
| | |
Net realized gain/(loss) from investments | | | (4,931,721 | ) |
| | |
Net change in unrealized appreciation/(depreciation) on investments | | | 34,316,512 | |
| | | | | |
| | |
Net Gain on Investments | | | 29,384,791 | |
| | | | | |
| | |
Net Increase in Net Assets Resulting From Operations | | $ | 30,528,555 | |
| | | | | |
| | | | | |
| | | | |
| The accompanying notes are an integral part of these financial statements. | | | | 5 |
FINANCIAL INFORMATION — GUARDIAN STRATEGIC LARGE CAP CORE VIP FUND
| | | | | | | | |
Statements of Changes in Net Assets Six Months Ended Numbers are unaudited | | | | | | |
| | | |
| | | For the Six Months Ended
6/30/23 | | | For the Year Ended
12/31/22 | |
| | | | |
Operations | | | | | | | | |
| | | |
Net investment income/(loss) | | $ | 1,143,764 | | | $ | 2,436,441 | |
| | | |
Net realized gain/(loss) from investments | | | (4,931,721 | ) | | | (18,899,562 | ) |
| | | |
Net change in unrealized appreciation/(depreciation) on investments | | | 34,316,512 | | | | (20,561,767 | ) |
| | | | | | | | | |
| | | |
Net Increase/(Decrease) in Net Assets Resulting from Operations | | | 30,528,555 | | | | (37,024,888 | ) |
| | | | | | | | | |
| | | |
Capital Share Transactions | | | | | | | | |
| | | |
Proceeds from sales of shares | | | 8,247,147 | | | | 3,263,707 | |
| | | |
Cost of shares redeemed | | | (34,050,121 | ) | | | (67,779,297 | ) |
| | | | | | | | | |
| | | |
Net Decrease in Net Assets Resulting from Capital Share Transactions | | | (25,802,974 | ) | | | (64,515,590 | ) |
| | | | | | | | | |
| | | |
Net Increase/(Decrease) in Net Assets | | | 4,725,581 | | | | (101,540,478 | ) |
| | | | | | | | | |
| | | |
Net Assets | | | | | | | | |
| | | |
Beginning of period | | | 270,460,532 | | | | 372,001,010 | |
| | | | | | | | | |
| | | |
End of period | | $ | 275,186,113 | | | $ | 270,460,532 | |
| | | | | | | | | |
| | | |
Other Information: | | | | | | | | |
| | | |
Shares | | | | | | | | |
| | | |
Sold | | | 862,578 | | | | 352,090 | |
| | | |
Redeemed | | | (3,508,095 | ) | | | (7,236,045 | ) |
| | | | | | | | | |
| | | |
Net Decrease | | | (2,645,517 | ) | | | (6,883,955 | ) |
| | | | | | | | | |
| | | | | | | | | |
| | | | |
| 6 | | | | The accompanying notes are an integral part of these financial statements. |
This Page Intentionally Left Blank
FINANCIAL INFORMATION — GUARDIAN STRATEGIC LARGE CAP CORE VIP FUND
The Financial Highlights table is intended to help you understand the Fund’s financial performance for the past six reporting periods (or, if shorter, the period since inception). Certain information reflects financial results for a single Fund share. The total returns in the table represent the rate that an investor would have earned (or lost) on an investment in the Fund.
| | | | | | | | | | | | | | | | | | | | | | | | |
Financial Highlights Six Months Ended Numbers are unaudited | | | | | | | | | | | | | | | | |
| | | Per Share Operating Performance | | | | |
| | | Net Asset Value,
Beginning of
Period | | | Net Investment
Income(1) | | | Net Realized
and Unrealized
Gain/(Loss) | | | Total
Operations | | | Net Asset
Value, End of
Period | | | Total
Return(2) | |
| | | | | | | |
Six Months Ended 6/30/23 | | $ | 9.28 | | | $ | 0.04 | | | $ | 1.06 | | | $ | 1.10 | | | $ | 10.38 | | | | 11.85% | (4) |
| | | | | | | |
Year Ended 12/31/22 | | | 10.32 | | | | 0.08 | | | | (1.12) | | | | (1.04) | | | | 9.28 | | | | (10.08)% | |
| | | | | | | |
Period Ended 12/31/21(5) | | | 10.00 | | | | 0.01 | | | | 0.31 | | | | 0.32 | | | | 10.32 | | | | 3.20% | (4) |
| | | | |
| 8 | | | | The accompanying notes are an integral part of these financial statements. |
FINANCIAL INFORMATION — GUARDIAN STRATEGIC LARGE CAP CORE VIP FUND
| | | | | | | | | | | | | | | | | | | | | | |
| | | | | | | | | | | | | | | | |
| Ratios/Supplemental Data | |
Net Assets, End
of Period (000s) | | | Net Ratio of
Expenses to
Average
Net Assets(3) | | | Gross Ratio of
Expenses to
Average Net
Assets | | | Net Ratio of Net
Investment Income
to Average
Net Assets(3) | | | Gross Ratio of Net Investment Income to Average Net Assets | | | Portfolio
Turnover Rate | |
| | | | | |
| $ | 275,186 | | | | 0.84% | (4) | | | 0.88% | (4) | | | 0.84% | (4) | | | 0.80% | (4) | | | 21% | (4) |
| | | | | |
| | 270,461 | | | | 0.84% | | | | 0.87% | | | | 0.80% | | | | 0.77% | | | | 45% | |
| | | | | |
| | 372,001 | | | | 0.81% | (4) | | | 0.89% | (4) | | | 0.82% | (4) | | | 0.74% | (4) | | | 80% | (4) |
| (1) | Calculated based on the average shares outstanding during the period. |
| (2) | Total returns do not reflect the effects of charges deducted pursuant to the terms of The Guardian Insurance & Annuity Company, Inc.’s variable contracts. Inclusion of such charges would reduce the total returns for all periods shown. |
| (3) | Net Ratio of Expenses to Average Net Assets and Net Ratio of Net Investment Income to Average Net Assets include the effect of fee waivers and expense limitations. |
| (4) | Ratios for periods less than one year have been annualized, except for total return and portfolio turnover rate. For the period ended December 31, 2021, certain non-recurring fees (i.e., audit fees) are not annualized. |
| (5) | Commenced operations on October 25, 2021. |
| | | | |
| The accompanying notes are an integral part of these financial statements. | | | | 9 |
NOTES TO FINANCIAL STATEMENTS — GUARDIAN STRATEGIC LARGE CAP CORE VIP FUND
June 30, 2023 (unaudited)
1. Organization
Guardian Variable Products Trust (the “Trust”), a Delaware statutory trust organized on January 12, 2016, is registered under the Investment Company Act of 1940, as amended (the “1940 Act”), as an open-end management investment company. The Trust currently has twenty-four series. Guardian Strategic Large Cap Core VIP Fund (the “Fund”) is a series of the Trust. The Fund is a diversified fund and commenced operations on October 25, 2021. The financial statements for other series of the Trust are presented in separate reports.
The Trust has authorized an unlimited number of shares of beneficial interest with no par value. Shares are bought and sold at closing net asset value (“NAV”). Shares of the Fund are only sold to certain separate accounts of The Guardian Insurance & Annuity Company, Inc. (“GIAC”) that fund certain variable annuity contracts and variable life insurance policies issued by GIAC. GIAC is a wholly-owned subsidiary of The Guardian Life Insurance Company of America (“Guardian Life”).
The Fund seeks capital appreciation.
2. Significant Accounting Policies
The following is a summary of significant accounting policies followed by the Fund in the preparation of its financial statements. The Fund follows the investment company accounting and reporting guidance of the Financial Accounting Standards Board (“FASB”) Accounting Standards Codification Topic 946 Financial Services – Investment Companies. The following policies are in conformity with accounting principles generally accepted in the United States of America (“GAAP”). The preparation of financial statements in accordance with GAAP requires management to make estimates and assumptions that affect the reported amounts and disclosures in the financial statements. Actual results could differ from those estimates.
a. Investment Valuations The Board of Trustees has designated Park Avenue Institutional Advisers LLC (“Park Avenue”) as the valuation designee for the Fund pursuant to Rule 2a-5 under the 1940 Act. Park Avenue has established a Fair Valuation Committee and has adopted fair valuation procedures that provide methodologies for fair valuing securities. These procedures include monitoring the appropriateness of fair values based on results of ongoing valuation oversight, including but not limited to consideration of security specific events, market events, and pricing
vendor and broker-dealer due diligence. The Fair Valuation Committee oversees and carries out the policies for the valuation of investments held in the Fund. The Fair Valuation Committee is responsible for discussing and assessing the potential impacts to the fair values on an ongoing basis, and reports to the Board of Trustees on at least a quarterly basis.
Equity securities traded on an exchange other than NASDAQ Stock Market, LLC (“NASDAQ”) are valued at the last reported sale price on the principal exchange or market on which they are traded; or, if there were no sales that day, at the mean between the closing bid and ask prices. Securities traded on the NASDAQ are generally valued at the NASDAQ official closing price, which may not be the last sale price. If the NASDAQ official closing price is not available for a security, that security is generally valued at the mean between the closing bid and ask prices. Repurchase agreements are carried at cost, which approximates fair value (see Note 5d). Foreign securities are valued in the currencies of the markets in which they trade and then converted to U.S. dollars by the application of foreign exchange rates at the close of the New York Stock Exchange (“NYSE”). Forward foreign currency contracts, if any, are valued at the mean between the bid and ask rates for the specified time interpolated from rates for proximate time periods.
Securities for which market quotations are not readily available or securities whose values have been materially affected by events occurring before the Fund’s valuation time but after the close of the securities’ principal exchange or market are valued at their fair values as determined in good faith by Park Avenue, as the Board of Trustee’s valuation designee (as defined in Rule 2a-5 under the 1940 Act), in accordance with Park Avenue’s procedures and under the general oversight of the Board of Trustees. In addition, the values of the Fund’s investments in foreign securities are generally determined by a pricing service using pricing models designed to estimate likely changes in the values of those securities. Certain foreign equity instruments are valued by applying international fair value factors provided by approved pricing services. The factors seek to adjust the local closing price for movements of local markets post closing, but prior to the time the NAVs are calculated. Valuations reflected in this report are as of the report date. As a result, changes in valuation due to market events and/or issuer related events after the report date and prior to issuance of the report are not reflected herein.
NOTES TO FINANCIAL STATEMENTS — GUARDIAN STRATEGIC LARGE CAP CORE VIP FUND
Various inputs are used in determining the valuation of the Fund’s investments. These inputs are summarized in three broad levels listed below.
| • | | Level 1 – unadjusted inputs using quoted prices in active markets for identical investments. |
| • | | Level 2 – other significant observable inputs, including, but not limited to, quoted prices for similar investments, inputs other than quoted prices that are observable for investments (such as interest rates, prepayment speeds, credit risks, etc.) or other market corroborated inputs. |
| • | | Level 3 – significant unobservable inputs (including the Fund’s own assumptions in determining the fair value of investments). |
Inputs may include price information, volatility statistics, specific and broad credit data, liquidity statistics, and other factors. A financial instrument’s level within the fair value hierarchy is based on the lowest level of any input; both individually and in aggregate, that is significant to the fair value measurement. However, the determination of what constitutes “observable” requires significant judgment by the Trust. The Trust considers observable data to be that market data which is readily available, regularly distributed or updated, reliable and verifiable, and provided by independent sources that are actively involved in the relevant market. The inputs or methodology used for valuing securities are not necessarily an indication of the risk associated with investing in those securities. Changes in valuation techniques may result in transfers into or out of a financial instrument’s assigned level within the hierarchy.
The FASB requires reporting entities to make disclosures about purchases, sales, issuances and settlements of Level 3 securities on a gross basis. For the six months ended June 30, 2023, there were no transfers into or out of Level 3 of the fair value hierarchy.
In determining a financial instrument’s placement within the hierarchy, the Trust separates the Fund’s investment portfolio into two categories: investments and derivatives (e.g., futures). A summary of inputs used to value the Fund’s assets and liabilities carried at fair value as of June 30, 2023 is included in the Schedule of Investments.
Investments Investments whose values are based on quoted market prices in active markets, and are therefore classified within Level 1, include active listed equities. Investments that trade in markets that are not considered to be active, but are valued based on quoted
market prices, dealer quotations or alternative pricing
sources supported by observable inputs are classified within Level 2. These include certain U.S. government and sovereign obligations, most government agency securities, investment-grade corporate bonds, certain mortgage products, state, municipal and provincial obligations, and certain foreign equity securities, including securities whose prices may have been affected by events occurring after the close of trading on their principal exchange or market and, as a result, whose values are determined by a pricing service as described above, or securities whose values are otherwise determined using fair valuation methods approved by the Fund’s Board of Trustees.
Investments classified within Level 3 have significant unobservable inputs, as they trade infrequently or not at all. Level 3 investments include, among others, private placement securities. When observable prices are not available for these securities, the Trust uses one or more valuation techniques for which sufficient and reliable data is available. The inputs used by the Trust in estimating the value of Level 3 investments include, for example, the original transaction price, recent transactions in the same or similar instruments, completed or pending third-party transactions in the underlying investment or comparable issuers, subsequent rounds of financing, recapitalizations, and other transactions across the capital structure. Level 3 investments may also be adjusted to reflect illiquidity and/or non-transferability, with the amount of such discount estimated by the Trust in the absence of market information. Assumptions used by the Trust due to the lack of observable inputs may significantly impact the resulting fair value and therefore the Fund’s results of operations. As of June 30, 2023, the Fund had no securities classified as Level 3.
Derivatives Exchange-traded derivatives, such as futures contracts, exchange-traded option contracts and certain swaps, are typically classified within Level 1 or Level 2 of the fair value hierarchy depending on whether or not they are deemed to be actively traded. Certain non-exchange-traded derivatives, such as generic forwards, certain swaps and options, have inputs which can generally be corroborated by market data and are therefore classified within Level 2. During the six months ended June 30, 2023, the Fund did not hold any derivatives.
b. Securities Transactions Securities transactions are accounted for on the date securities are purchased or sold (trade date). Realized gains or losses on securities transactions are determined on the basis of specific identification.
NOTES TO FINANCIAL STATEMENTS — GUARDIAN STRATEGIC LARGE CAP CORE VIP FUND
c. Foreign Currency Translation The accounting records of the Fund are maintained in U.S. dollars. Investment securities and all other assets and liabilities of the Fund denominated in a foreign currency are generally translated into U.S. dollars at the exchange rates quoted at the close of the NYSE on each business day. The market value of investment securities and other assets and liabilities are translated at the exchange rate as of the valuation date. Purchases and sales of securities, income receipts, and expense payments are translated into U.S. dollars at the exchange rates in effect on the dates of the respective transactions. The Fund does not isolate the portion of the fluctuations on investments resulting from changes in foreign currency exchange rates from the fluctuations in market prices of investments held. Such fluctuations are included in the Net change in net realized and unrealized gain/(loss) from investments on the Statement of Operations.
Reported realized foreign currency gains and losses arise from the disposition of foreign currency, currency gains or losses realized between the trade and settlement dates on securities transactions, and the difference between the amounts of dividends, interest and foreign withholding taxes recorded on the Fund’s books on the transaction date and the U.S. dollar equivalent of the amounts actually received or paid. These reported realized foreign currency gains and losses, if any, are included in Net realized gain/(loss) from foreign currency transactions on the Statement of Operations. Unrealized foreign currency gains and losses arise from changes (due to changes in exchange rates) in the value of foreign currency and other assets and liabilities denominated in foreign currencies, which are held at period end, if any, and are included in Net change in unrealized appreciation/(depreciation) on translation of assets and liabilities in foreign currencies on the Statement of Operations.
d. Foreign Capital Gains Tax The Fund may be subject to foreign taxes on income, gains on investments or currency purchases/repatriation, a portion of which may be recoverable. The Fund will accrue such taxes and recoveries as applicable, based upon their current interpretation of tax rules and regulations that exist in the markets in which they invest.
e. Investment Income Dividend income net of foreign taxes withheld, if any, is generally recorded on the ex-dividend date. Distributions received from real estate investment trusts, if any, may be classified as dividends, capital gains and/or return of capital.
Interest income, which includes amortization/accretion
of premium/discount, is determined using the interest income accrual method, and is accrued and recorded daily.
f. Allocation of Income and Expenses Many of the expenses of the Trust can be directly attributed to a specific series of the Trust. Expenses that cannot be directly attributed to a specific series of the Trust are generally apportioned among all the series in the Trust, based on relative net assets. In calculating net asset value per share for each series of the Trust, investment income, realized and unrealized gains and losses, and expenses other than series-specific expenses are allocated daily to each series based upon the proportion of net assets attributable to each series.
3. Transactions with Affiliates
a. Investment Advisory Fee and Expense Limitation Under the terms of the advisory agreement, which, after its two year initial term, is reviewed and approved annually by the Board of Trustees, the Fund pays an investment advisory fee to Park Avenue. Park Avenue is a wholly-owned subsidiary of Guardian Life and receives an investment advisory fee at an annual rate of 0.55% of the first $200 million, and 0.50% in excess of $200 million of the Fund’s average daily net assets. The fee is accrued daily and paid monthly.
Park Avenue has contractually agreed through April 30, 2024 to waive certain fees and/or reimburse certain expenses incurred by the Fund to the extent necessary to limit the Fund’s total annual operating expenses after fee waiver and/or expense reimbursement to 0.84% of the Fund’s average daily net assets (excluding, if applicable, any acquired fund fees and expenses, taxes, interest, transaction costs and brokerage commissions, litigation and extraordinary expenses). The limitation may not be increased or terminated prior to this time without action by the Board of Trustees and may be terminated only upon approval of the Board of Trustees. Amounts waived or reimbursed by Park Avenue pursuant to any expense limitation will not be subject to Park Avenue’s recoupment rights. For the six months ended June 30, 2023, Park Avenue waived fees and/or paid Fund expenses in the amount of $58,671.
Park Avenue has entered into a Sub-Advisory Agreement with AllianceBernstein L.P. (“AllianceBernstein”). AllianceBernstein is responsible for providing day-to-day investment advisory services to the Fund, subject to the supervision of Park Avenue and the oversight of the Board of Trustees. Sub-advisory fees are paid by Park Avenue and do not represent a separate or additional expense to the Fund.
NOTES TO FINANCIAL STATEMENTS — GUARDIAN STRATEGIC LARGE CAP CORE VIP FUND
b. Compensation of Trustees and Officers Trustees and officers who are interested persons of the Trust, as defined in the 1940 Act, receive no compensation from the Fund, except for the Chief Compliance Officer of the Trust. Trustees of the Trust who are not interested persons of the Trust, and the Chief Compliance Officer, receive compensation and reimbursement of expenses from the Trust.
c. Distribution Fees Park Avenue Securities LLC (“PAS”), a wholly-owned subsidiary of Guardian Life, is the principal underwriter of Fund shares. The Trust has entered into a distribution and service agreement with PAS, which governs the sale and distribution of shares of the Fund. Under a distribution and service plan adopted by the Trust (“12b-1 plan”), PAS is compensated for services in such capacity, including its expenses in connection with the promotion and distribution of shares of the Fund, at an annual rate of 0.25% of the Fund’s average daily net assets. For the six months ended June 30, 2023, the Fund paid distribution fees in the amount of $339,083 to PAS.
PAS has directed that certain payments under the 12b-1 plan be used to compensate GIAC for shareholder services provided to contract owners.
4. Federal Income Taxes
a. Distributions to Shareholders For federal income tax purposes, the Fund is treated as a disregarded entity (“DRE”). As a DRE, the Fund is not subject to an entity-level income tax; and any income, gains, losses, deductions, taxes, and credits of the Fund would instead be “passed through” directly to the separate accounts of GIAC that invest in the Fund and retain the same character for U.S. federal income tax purposes. In addition, the Fund is not required to distribute taxable income and capital gains for U.S. federal income tax purposes. Therefore, no dividends and capital gains distributions were paid by the Fund.
5. Investments
a. Investment Purchases and Sales The cost of investments purchased and the proceeds from investments sold (excluding short-term investments) amounted to $54,202,247 and $77,212,518, respectively, for the six months ended June 30, 2023. During the six months ended June 30, 2023, there were no purchases or sales of U.S. government securities.
b. Foreign Securities Foreign securities investments involve special risks and considerations not typically associated with U.S. investments. These risks include, but are not limited to, currency risk; adverse political,
regulatory, social, and economic developments; and less reliable information about issuers. Moreover, securities of some foreign issuers may be less liquid and their prices more volatile than those of comparable U.S. issuers.
c. Industry or Sector Concentration In its normal course of business, the Fund may invest a significant portion of its assets in companies within a limited number of industries or sectors. As a result, the Fund may be subject to a greater risk of loss than that of a fund invested in a wider spectrum of industries or sectors because the stocks of many or all of the companies in the industry, group of industries, sector, or sectors may decline in value due to developments adversely affecting the industry, group of industries, sector, or sectors.
d. Repurchase Agreements The Fund may invest in repurchase agreements to maintain liquidity and earn income over periods of time as short as overnight. The collateral for repurchase agreements is either cash or fully negotiable U.S. government securities (including U.S. government agency securities). Repurchase agreements are fully collateralized (including the interest accrued thereon) and such collateral is marked to market daily while the agreements remain in force. If the value of the collateral falls below the repurchase price plus accrued interest, the Fund will typically require the seller to deposit additional collateral by the next business day. If the request for additional collateral is not met, or the seller defaults, the Fund maintains the right to sell the collateral (although it may be prevented or delayed from doing so in certain circumstances) and may be required to claim any resulting loss against the seller. Park Avenue monitors the creditworthiness of the seller with which the Fund enters into repurchase agreements.
6. Temporary Borrowings
The Fund, with other funds managed by Park Avenue, is party to a credit agreement with respect to a $10 million committed revolving credit facility from State Street Bank and Trust Company (the “Credit Agreement”) for temporary borrowing purposes, including the meeting of redemption requests that otherwise might require the untimely disposition of securities. Interest is based on a daily fluctuating rate per annum equal to the Applicable Rate (as defined in the Credit Agreement) plus the Applicable Margin (as defined in the Credit Agreement) that is subject to change from time to time as and when the Applicable Rate changes. Under the current Credit Agreement, the Applicable Rate for any day is defined as the rate per annum equal to the
NOTES TO FINANCIAL STATEMENTS — GUARDIAN STRATEGIC LARGE CAP CORE VIP FUND
sum of (a) 0.10% plus (b) the higher of (i) the Federal Funds Effective Rate for such day and (ii) the Overnight Bank Funding Rate for such day; the Applicable Margin is 1.25%. In addition to the interest charged on any borrowings by the Fund, each fund pays a commitment fee of 0.30% per annum on its share of the unused portion of the credit facility. The agreement is in place until January 5, 2024. The Fund did not utilize the credit facility during the six months ended June 30, 2023.
7. Indemnifications
Under the Trust’s organizational documents and, in some cases, by contract, officers and Trustees of the Trust are indemnified against certain liabilities arising out of the performance of their duties to the Fund. In addition, in the normal course of business, the Fund enters into contracts with its vendors and others that
provide general indemnifications. The Fund’s maximum exposure under these arrangements is unknown as this would involve future claims that may be made against the Fund that have not yet occurred. However, based on experience, the Fund expects the risk of loss to be remote.
8. Additional Information
The outbreak of COVID-19 has adversely impacted both local and global economies, including those in which the Fund may invest. These impacts include materially reduced consumer demand and economic output, disrupted supply chains, market closures, travel restrictions and quarantines, and strained healthcare systems. The Fund’s operations may be interrupted as a result, which may have a negative impact on the Fund’s investment performance.
SUPPLEMENTAL INFORMATION (UNAUDITED)
Liquidity Risk Management Program
In compliance with Rule 22e-4 under the Investment Company Act of 1940, as amended (the “Liquidity Rule”), Guardian Variable Products Trust (the “Trust”) has adopted and implemented a written liquidity risk management program (the “Program”) for each series of the Trust (each, a “Fund”), which is reasonably designed to assess and manage each Fund’s liquidity risk. The Fund’s “liquidity risk” is the risk that the Fund could not meet requests to redeem shares issued by the Fund without significant dilution of the remaining investors’ interests in the Fund.
The Board of Trustees of the Trust (the “Board”) Previously approved the designation of Park Avenue Institutional Advisers LLC (the “Administrator” or “PAIA”) as Program administrator. The Administrator established a Liquidity Risk Management Committee, which is comprised of certain officers of the Trust and PAIA, that assists the Administrator in the implementation and day-to-day administration of the Program and otherwise support carrying out the Administrator’s liquidity risk management responsibilities under the Program.
In accordance with the Program, each Fund’s liquidity risk is assessed no less frequently than annually, taking into consideration a variety of factors, including, as applicable, the Fund’s investment strategy and liquidity of portfolio investments, cash flow projections, and holdings of cash and cash equivalents, as well as borrowing arrangements and other funding sources. Certain factors are considered under both normal and reasonably foreseeable stressed conditions.
Each Fund portfolio investment is classified, no less than monthly, into one of four liquidity categories (including “highly liquid investments” and “illiquid investments,” discussed below) based on a determination of the number of days it is reasonably expected to take to convert the investment to cash, or sell or dispose of the investment, in current market conditions without significantly changing the investment’s market value.
The Liquidity Rule limits the Fund’s investments in illiquid investments by prohibiting the Fund from acquiring any illiquid investment if, immediately after the acquisition, the Fund would have invested more than 15% of its net assets in illiquid investments that are assets. The Program includes provisions reasonably designed to comply with this investment limitation. In addition, the Program includes provisions reasonably designed to comply with this investment limitation. In addition, the Program includes provisions reasonably designed to comply with the Liquidity Rule’s requirements relating to highly liquid investment minimums, which is a minimum amount of Fund net assets that must be invested in highly liquid investments that are assets, as applicable. The Fund was not required to adopt a highly liquid investment minimum during the period.
At a meeting of the Board held on March 29-30, 2023, the Board received a report (the “Report”) prepared by the Administrator addressing the Program’s operation and assessing the adequacy and effectiveness of its implementation for the period from January 1, 2022 through December 31, 2022 (the “Reporting Period”). The Report noted that the Administrator believes the Program operated effectively during the Reporting Period and continues to be reasonably designed to effectively assess and manage each Fund’s liquidity risk. The Report also noted that the Administrator believes the Program has been adequately and effectively implemented and the investment strategies for each Fund continue to be appropriate since its inception. In addition, the Report summarized the operation of the Program and the information and factors considered by the Administrator in its assessment of the Program’s implementation, such as the liquidity risk assessment framework and liquidity classification methodologies.
There can be no assurance that the Program will achieve its objectives under all circumstances. Please refer to the Fund’s prospectus for more information regarding the Fund’s exposure to liquidity risk and other risks to which an investment in the Fund may be subject.
SUPPLEMENTAL INFORMATION (UNAUDITED)
Approval of Investment Management and Sub-advisory Agreements
Section 15(c) of the Investment Company Act of 1940, as amended (the “1940 Act”), requires that a fund’s investment advisory and sub-advisory agreements be approved initially by the fund’s board of trustees. Section 15(c) also requires that the continuation of these agreements, after an initial term of up to two years, be annually reviewed and approved by the board. Any such agreement must be approved by a vote of a majority of the trustees who are not parties to the agreement or “interested persons” (as defined in the 1940 Act) of a party to the agreement at a meeting of the board called for the purpose of voting on such approval.
At a meeting of the Board of Trustees (the “Board”) of Guardian Variable Products Trust (the “Trust”) held on March 29-30, 2023 (the “Meeting”), the Board, including the trustees who are not parties to the agreement or “interested persons” as defined in the 1940 Act (the “Independent Trustees”), considered and voted unanimously to renew the existing investment management agreement between the Trust, on behalf of Guardian All Cap Core VIP Fund; Guardian Balanced Allocation VIP Fund; Guardian Core Fixed Income VIP Fund; Guardian Core Plus Fixed Income VIP Fund; Guardian Diversified Research VIP Fund; Guardian Equity Income VIP Fund; Guardian Global Utilities VIP Fund; Guardian Growth & Income VIP Fund; Guardian Integrated Research VIP Fund; Guardian International Growth VIP Fund; Guardian International Equity VIP Fund; Guardian Large Cap Disciplined Growth VIP Fund; Guardian Large Cap Disciplined Value VIP Fund; Guardian Large Cap Fundamental Growth VIP Fund; Guardian Mid Cap Relative Value VIP Fund; Guardian Mid Cap Traditional Growth VIP Fund; Guardian Multi-Sector Bond VIP Fund; Guardian Select Mid-Cap Core VIP Fund; Guardian Short Duration Bond VIP Fund; Guardian Small Cap Core VIP Fund; Guardian Small-Mid Cap Core VIP Fund; Guardian Strategic Large Cap Core VIP Fund; Guardian Total Return Bond VIP Fund and Guardian U.S. Government Securities VIP Fund (each, a “Fund,” and together, the “Funds”), in substantially the form presented at this meeting (the “Management Agreement”); and Park Avenue Institutional Advisers LLC (the “Manager”) for a one-year term.
The Board, including the Independent Trustees, also considered and voted unanimously to renew the existing sub-advisory agreements (the “Sub-Advisory Agreements,” collectively with the Management Agreement and Sub-Subadvisory Agreement, the
“Agreements”) between the Manager and investment advisory firms engaged to serve as sub-advisers to certain of the Funds (the “Sub-Advised Funds”), namely (i) ClearBridge Investments, LLC with respect to Guardian Small Cap Core VIP Fund; (ii) Putnam Investment Management, LLC with respect to Guardian Diversified Research VIP Fund; (iii) AllianceBernstein L.P. with respect to Guardian Growth & Income VIP Fund and Guardian Strategic Large Cap Core VIP Fund; (iv) J.P. Morgan Investment Management Inc. with respect to Guardian International Growth VIP Fund; (v) Schroder Investment Management North America Inc. with respect to Guardian International Equity VIP Fund; (vi) Wellington Management Company LLP with respect to Guardian Balanced Allocation VIP Fund, Guardian Equity Income VIP Fund, Guardian Integrated Research VIP Fund, Guardian Large Cap Disciplined Growth VIP Fund and Guardian Global Utilities VIP Fund; (vii) Boston Partners Global Investors, Inc. with respect to Guardian Large Cap Disciplined Value VIP Fund; (viii) Janus Henderson Investors US LLC with respect to Guardian Mid Cap Traditional Growth VIP Fund; (ix) Allspring Global Investments, LLC with respect to Guardian Mid Cap Relative Value VIP Fund and Guardian Small-Mid Cap Core VIP Fund; (x) Lord, Abbett & Co. LLC with respect to Guardian Core Plus Fixed Income VIP Fund; (xi) FIAM LLC with respect to Guardian Select Mid Cap Core VIP Fund; and (xii) Massachusetts Financial Services Company with respect to Guardian All Cap Core VIP Fund, each in substantially the form presented at this meeting, (each, a “Sub-Adviser” and collectively, the “Sub-Advisers”) for a one-year term.
The Board, including the Independent Trustees, also considered and voted unanimously to renew the existing sub-subadvisory agreement (the “Sub-Subadvisory Agreement”) between Schroder Investment Management North America Inc. and Schroder Investment Management North America Limited (also a Sub-Adviser) with respect to Guardian International Equity VIP Fund for a one-year term.
The Board is responsible for overseeing the management of each Fund. In determining whether to renew its approval of the Agreements, the Trustees evaluated information and factors that they considered to be relevant and appropriate through the exercise of their own business judgment. The Trustees considered certain information and factors in light of advice furnished to them by legal counsel to the Trust and, in the case of the Independent Trustees, their independent legal counsel. In advance of the Meeting, the Trustees received materials and information
SUPPLEMENTAL INFORMATION (UNAUDITED)
designed to assist their consideration of the Agreements. The Trustees received written responses from the Manager and each Sub-Adviser to a series of questions and requests for information encompassing a wide variety of topics provided by independent counsel on behalf of the Independent Trustees. The Independent Trustees also received materials and information regarding the legal standards applicable to their consideration of the Agreements and the process and criteria used by the Manager to identify and select the Sub-Advisers.
During the course of their deliberations, the Independent Trustees met twice to discuss and evaluate the materials, information and Agreements in executive session with their independent legal counsel, outside of the presence of the Trustees who are not Independent Trustees and representatives from Fund management, the Manager or any Sub-Adviser.
In reaching its decisions to renew its approval of the Agreements, the Board took into account the materials and information described above, as well as other materials and information provided to the Board throughout the year. Individual Trustees may have given different weight to different factors and information with respect to each Agreement, and the Trustees did not identify any single factor or information that, in isolation, would be controlling in deciding to approve the Agreements. The discussion below is intended to summarize the broad factors that figured prominently in the Board’s decisions to renew its approval of the Agreements rather than to be all-inclusive. These broad factors included: (i) the nature, extent and quality of the services provided to the Funds by the Manager and to the Sub-advised Funds by the Sub-Advisers; (ii) the investment performance of each Fund; (iii) estimated profitability of the Manager; (iv) fees and expenses; (v) the extent to which economies of scale may exist, and the extent to the benefits of economies of scale are shared with the Funds; and (vi) any other benefits derived by the Manager or the Sub-Advisers (or their respective affiliates) from their relationships with the Funds.
Nature, Extent and Quality of Services
The Trustees considered information regarding the nature, extent and quality of services provided to the Funds by the Manager. The Trustees also considered, among other things, the terms of the Management Agreement and the range of investment advisory services provided by the Manager. In addition, the Trustees reviewed the range of non-investment advisory services provided by the Manager consistent
with the terms of the Management Agreement, notably coordinating the preparation and filing of various regulatory documents, coordinating the preparation and assembly of Board meeting materials, and assisting the Board with certain valuation matters. The Board also received a description of the Manager’s and each Sub-Adviser’s business continuity plans and of their respective approaches to data privacy and cybersecurity, and related testing. The Board received information regarding the response of the Manager and the Sub-Advisers to the COVID-19 pandemic, including the continuation of remote work arrangements and return-to-office plans. The Board also received information about the Manager’s role as administrator of the Funds’ liquidity risk management program, the Manager’s approach to risk management, and the Manager’s vendor oversight programs.
The Trustees considered that the Sub-advised Funds operate in a “manager-of-managers” structure and reviewed the responsibilities that the Manager has under this structure, including monitoring and evaluating the performance of the Sub-Advisers, monitoring the Sub-Advisers for adherence to the stated investment objectives, strategies, policies and restrictions of the Funds and supervising the Sub-Advisers with respect to the services that the Sub-Advisers would provide under the Sub-Advisory Agreements. The Trustees also considered the process used by the Manager, consistent with this structure, to identify and recommend sub-advisers, and the Manager’s ability to monitor and oversee sub-advisers and recommend replacement sub-advisers, when necessary, and provide other services under the Management Agreement. The Board noted that investment management staff of the Manager and the Trust’s Chief Compliance Officer conduct oversight meetings with the Sub-Advisers on a periodic basis, follow through with additional inquiries on any questions or concerns that arise during the meetings and, as necessary, then report the results of the meetings to the Board. The Trustees reviewed information regarding the experience and background of the Manager’s key personnel and the Manager’s organizational structure and resources, including investment, legal and administrative capabilities of the Manager. In this regard, the Trustees recognized that the Funds may benefit from the Manager’s ability to use resources and capabilities of its affiliates in providing services to the Funds.
The Trustees considered information regarding the nature, extent and quality of services provided to the Sub-advised Funds by the Sub-Advisers. The Trustees
SUPPLEMENTAL INFORMATION (UNAUDITED)
also considered, among other things, the terms of the Sub-advisory Agreements and the range of investment advisory services provided by the Sub-Advisers under the oversight of the Manager. In evaluating these investment advisory services, the Trustees considered, among other things, the Sub-Advisers’ investment philosophies, styles and/or processes and approaches to managing the respective Sub-advised Funds. The Trustees received and evaluated information regarding the background, education, expertise and/or experience of the investment professionals who serve as portfolio managers for the Sub-advised Funds and the capabilities and resources of the Sub-Advisers.
Based upon these considerations, the Trustees concluded, within the context of their full deliberations, that the nature, extent and quality of services provided to the Funds by the Manager and the Sub-advised Funds by each respective Sub-Adviser were appropriate.
Investment Performance
In connection with each of its regular quarterly meetings, the Board receives information on the performance of each Fund, including net performance, relative performance rankings within the relevant Morningstar peer group, and performance as compared to benchmark index returns. At each quarterly Board meeting, members of the Manager’s funds management team review with the Board the economic and market environment, absolute and relative performance of each Fund, and any relevant information about risk management and style consistency in connection with management of the Funds. The Board considered investment performance for each Fund over the one-year, three-year (where available), five-year (where available) and since-inception periods.
The Board also received and reviewed a report prepared by Broadridge Financial Solutions (“Broadridge”), an independent provider of mutual fund industry data, which included comparisons of the performance of each Fund to performance of an appropriate peer universe. For details regarding each Fund’s performance, see the “Fund-by-Fund Factors” section below.
The Manager discussed with the Board factors contributing to the Funds’ performance results. In addition, for certain Funds, the Manager provided to the Board longer term performance records of the Sub-Advisers for strategies used in managing the Funds. The Board concluded that the investment performance generated by the Manager and each Sub-Adviser was generally satisfactory, or, that any steps being taken by
the Manager and Sub-Advisers to address any performance issues were satisfactory.
Profitability
The Board received and considered the Manager’s estimate of its profitability, which included allocations by the Manager of its costs in providing management services to the Funds. The Board considered the estimated profitability of the Manager both overall and on a Fund-by-Fund basis.
The Board received and considered profitability information from most of the Sub-Advisers, but noted that the Manager had negotiated the fees with the Sub-Advisers at arm’s-length. Accordingly, the Board concluded that the profitability of the Sub-Advisers is a less relevant factor than Manager profitability.
Based on the consideration of this information, the Board concluded that the profitability of the Funds to the Manager was acceptable.
Fees and Expenses
The Trustees considered the management fees paid by the Funds to the Manager under the Management Agreement and evaluated the reasonableness of these fees. The Trustees received and reviewed comparative information with respect to the management fee and total expenses for each Fund and the management fees and total expenses for a peer group of other funds selected by Broadridge. The Trustees considered the Manager’s commitment to limit the total expenses of each Fund through an expense limitation agreement with the Trust. Although the Board recognized that the comparisons between the management fees and actual expenses of the Funds and those of the identified peer group are imprecise, given different terms of agreements and variations in fund strategies, the Trustees found that the comparative information supported their consideration and approval of the management fees and evaluation of the total expenses. For details regarding each Fund’s fee and expense comparisons, see the “Fund-by-Fund Factors” section below.
The Trustees considered the sub-advisory fees paid under the Sub-advisory Agreements and evaluated the reasonableness of those fees. The Trustees also considered that the fees paid to the Sub-Advisers would be paid by the Manager and not the Funds and that the Manager had negotiated the fees with the Sub-Advisers at arm’s-length.
SUPPLEMENTAL INFORMATION (UNAUDITED)
Based on the consideration of the information and factors summarized above, as well as other relevant information and factors, the Board concluded that the management and sub-advisory fees were reasonable in light of the nature, extent and quality of services rendered to the Funds by the Manager and the Sub-Advisers.
Economies of Scale
The Board considered the extent to which economies of scale may exist, and the extent to the benefits of economies of scale are shared with the Funds. In this regard, the Board noted that for sixteen of twenty-four Funds, the management and sub-advisory fee included breakpoints that are tiered based on growth in asset levels of each such Fund and that for the other Funds, the fees reflected appropriate levels based on current and expected asset levels. The Board also noted that the expenses of the Funds are subject to expense limitations provided by the Manager. The Board noted that expected economies of scale, where they exist, may be shared through the use of fee breakpoints, expense limitations by the Manager, and/or a lower overall fee.
Ancillary Benefits
The Board considered the potential benefits, other than management fees, that the Manager and/or its affiliates may receive because of the Manager’s relationship with the Funds. The Trustees considered that the Funds were designed to serve as investment options under variable contracts issued by affiliates of the Manager that would receive fees under those contracts and that Park Avenue Securities LLC, an affiliate of the Manager and principal underwriter of the Funds, and participating insurance companies, including insurance companies affiliated with the Manager, would be entitled to receive fees from the Funds under a plan of distribution adopted pursuant to Rule 12b-1 under the 1940 Act. The Trustees considered that the Manager and its affiliates may benefit from (i) greater efficiencies in annuity administration and operations and potential cost savings due to a reduction in the number of unaffiliated funds available as annuity contract investment options, and (ii) increased dividends-received deductions due to the Funds’ status under the tax laws as disregarded entities. In addition, the Trustees considered the potential benefits, other than sub-advisory fees, that the Sub-Advisers and their affiliates may receive because of their relationships with the Funds, including the ability to receive research from soft dollar commissions consistent with Trust policies. The Trustees concluded that benefits that may accrue to the
Manager and its affiliates are reasonable and the benefits that may accrue to the Sub-Advisers and their affiliates are consistent with those expected for a sub-adviser to a mutual fund such as the applicable Fund.
Fund-by-Fund Factors
The Broadridge report groups fees, expenses and performance into five quintiles, with the top quintile having the highest performance or lowest fees/expenses, and the bottom quintile having the lowest performance or highest fees/expenses. For purposes of the descriptions below, a Fund’s performance is considered “in line with” the benchmark index if it is within 0.20%.
Guardian Large Cap Fundamental Growth VIP Fund
| • | | The Board noted that the Fund’s performance was in the 3rd quintile of its performance universe for the 1-year period and in the 4th quintile for its performance universe for the 3-year and 5-year periods. The Board also noted that the Fund’s performance was below the benchmark index for the 1-year, 3-year and 5-year periods. |
| • | | The Board noted that the contractual management fee, the actual management fee and actual total expenses were in the 1st quintile of the expense group. |
Guardian Large Cap Disciplined Growth VIP Fund
| • | | The Board noted that the Fund’s performance was in the 3rd quintile of its performance universe for the 1-year and 3-year periods and in the 2nd quintile for the 5-year period. The Board also noted that the Fund’s performance was below the benchmark index for the 1-year, 3-year and 5-year periods. |
| • | | The Board noted that the contractual management fee, the actual management fee and actual total expenses were in the 1st quintile of the expense group. |
Guardian Integrated Research VIP Fund
| • | | The Board noted that the Fund’s performance was in the 5th quintile of its performance universe for the 1-year and 5-year periods and in the 4th quintile for 3-year period. The Board also noted that the Fund’s performance was below the benchmark index for the 1-year, 3-year and 5-year periods. |
| • | | The Board noted that the contractual management fee, the actual management fee and actual total expenses were in the 1st quintile of the expense group. |
SUPPLEMENTAL INFORMATION (UNAUDITED)
Guardian Diversified Research VIP Fund
| • | | The Board noted that the Fund’s performance was in the 3rd quintile of its performance universe for the 1-year and 3-year periods and in the 2nd quintile for the 5-year period. The Board also noted that the Fund’s performance was higher than the benchmark index for the 1-year period. The Board note that the Fund’s performance was lower than the benchmark index for the 3-year and 5-year periods. |
| • | | The Board noted that the contractual management fee and actual management fee were in the 1st quintile of the expense group and that actual total expenses were in the 3rd quintile. |
Guardian Strategic Large Cap Core VIP Fund
| • | | The Board noted that the Fund’s performance was in the 1st quintile of its performance universe for the 1-year period. The Board acknowledged the Fund’s short operational history. The Board noted that the Fund’s performance was higher than the benchmark index for the 1-year period. |
| • | | The Board noted that the contractual management fee, the actual management fee and actual total expenses were in the 1st quintile of the expense group. |
Guardian Large Cap Disciplined Value VIP Fund
| • | | The Board noted that the Fund’s performance was in the 3rd quintile of its performance universe for the 1-year and 3-year periods and in the 4th quintile for the 5-year period. The Board also noted that the Fund’s performance was higher than the benchmark index for the 1-year and 3-year periods. The Board noted that the Fund’s performance was in line with the benchmark index for the 5-year period. |
| • | | The Board noted that the contractual management fee was in the 2nd quintile of the expense group, the actual management fee was in the 1st quintile of the expense group and that actual total expenses were in the 3rd quintile. |
Guardian Growth & Income VIP Fund
| • | | The Board noted that the Fund’s performance was in the 3rd quintile of its performance universe for the 1-year, 3-year and 5-year periods. The Board also noted that the Fund’s performance was higher than the benchmark index for the 1-year, 3-year and 5-year periods. |
| • | | The Board noted that the contractual management fee and the actual management fee were in the 1st quintile of the expense group and that actual total expenses were in the 3rd quintile. |
Guardian Equity Income VIP Fund
| • | | The Board noted that the Fund had less than one-year of operational history and was not able to evaluate an investment performance record for the Fund. The Board noted that it would have an opportunity to review such information in connection with future annual reviews. The Board noted that, in the meantime, it received monthly performance reports from the Manager. |
| • | | The Board noted that the contractual management fee, the actual management fee and actual total expenses were in the 1st quintile of the expense group. |
Guardian All Cap Core VIP Fund
| • | | The Board noted that the Fund’s performance was in the 3rd quintile of its performance universe for the 1-year period. The Board acknowledged the Fund’s short operational history. The Board noted that the Fund’s performance was higher than the benchmark index for the 1-year period. |
| • | | The Board noted that the contractual management fee, the actual management fee and actual total expenses were in the 1st quintile of the expense group. |
Guardian Mid Cap Traditional Growth VIP Fund
| • | | The Board noted that the Fund’s performance was in the 1st quintile of its performance universe for the 1-year period and in the 2nd quintile for the 3-year and 5-year periods. The Board also noted that the Fund’s performance was higher than the benchmark index for the 1-year, 3-year and 5-year periods. |
| • | | The Board noted that the contractual management fee and actual management fee were in the 1st quintile of the expense group and that the actual total expenses were in the 4th quintile. |
Guardian Select Mid Cap Core VIP Fund
| • | | The Board noted that the Fund’s performance was in the 3rd quintile of its performance universe for the 1-year period. The Board acknowledged the Fund’s short operational history. The Board noted that the Fund’s performance was lower than the benchmark index for the 1-year period. |
| • | | The Board noted that the contractual management fee, the actual management fee and actual total expenses were in the 1st quintile of the expense group. |
Guardian Mid Cap Relative Value VIP Fund
| • | | The Board noted that the Fund’s performance was in the 2nd quintile of its performance universe for the 1-year, 3-year and 5-year periods. The Board also |
SUPPLEMENTAL INFORMATION (UNAUDITED)
| | | noted that the Fund’s performance was higher than the benchmark index for the 1-year, 3-year and 5-year periods. |
| • | | The Board noted that the contractual management fee and the actual management fee were in the 2nd quintile of the expense group and the actual total expenses were in the 3rd quintile of the expense group. |
Guardian Small-Mid Cap Core VIP Fund
| • | | The Board noted that the Fund’s performance was in the 5th quintile of its performance universe for the 1-year period. The Board acknowledged the Fund’s short operational history. The Board noted that the Fund’s performance was higher than the benchmark index for the 1-year period. |
| • | | The Board noted that the contractual management fee, the actual management fee and actual total expenses were in the 1st quintile of the expense group. |
Guardian Small Cap Core VIP Fund
| • | | The Board noted that the Fund’s performance was in the 5th quintile of its performance universe for the 1-year and 3-year periods. The Board noted that the Fund’s performance was lower than the benchmark index for the 1-year and 3-year periods. |
| • | | The Board noted that the contractual management fee and the actual management fee were in the 1st quintile of the expense group and the actual total expenses were in the 2nd quintile of the expense group. |
Guardian International Growth VIP Fund
| • | | The Board noted that the Fund’s performance was in the 4th quintile of its performance universe for the 1-year period, in the 2nd quintile of its performance universe for the 3-year period and in the 3rd quintile of its performance universe for the 5-year period. The Board also noted that the Fund’s performance was lower than the benchmark index for the 1-year and 5-year periods. The Board noted that the Fund’s performance was higher than the benchmark index for the 3-year period. |
| • | | The Board noted that the contractual management fee and actual management fee were in the 2nd quintile of the expense group and that the actual total expenses were in the 3rd quintile. |
Guardian International Equity VIP Fund
| • | | The Board noted that the Fund’s performance was in the 5th quintile of its performance universe for the |
| | | 1-year, 3-year and 5-year periods. The Board also noted that the Fund’s performance was lower than the benchmark index for the 1-year, 3-year and 5-year periods. |
| • | | The Board noted that the contractual management fee, the actual management fee and the actual total expenses were in the 2nd quintile of the expense group. |
Guardian Global Utilities VIP Fund
| • | | The Board noted that the Fund’s performance was in the 5th quintile of its performance universe for the 1-year period and in the 4th quintile of its performance universe for the 3-year period. The Board noted that the Fund’s performance was higher than the benchmark index for the 1-year and 3-year periods. |
| • | | The Board noted that the contractual management fee and the actual management fee were in the 1st quintile of the expense group and the actual total expenses were in the 2nd quintile of the expense group. |
Guardian Balanced Allocation VIP Fund
| • | | The Board noted that the Fund had less than one-year of operational history and was not able to evaluate an investment performance record for the Fund. The Board noted that it would have an opportunity to review such information in connection with future annual reviews. The Board noted that, in the meantime, it received monthly performance reports from the Manager. |
| • | | The Board noted that the contractual management fee, the actual management fee and actual total expenses were in the 1st quintile of the expense group. |
Guardian Core Plus Fixed Income VIP Fund
| • | | The Board noted that the Fund’s performance was in the 3rd quintile of its performance universe for the 1-year and 3-year periods and in the 4th quintile of its performance universe for the 5-year period. The Board also noted that the Fund’s performance was lower than the benchmark index for the 1-year and 5-year periods. The Board noted that the Fund’s performance was in line with the benchmark index for the 3-year period. |
| • | | The Board noted that the contractual management fee and actual management fee were in the 2nd quintile of the expense group and that actual total expenses were in the 3rd quintile. |
Guardian Total Return Bond VIP Fund
| • | | The Board noted that the Fund’s performance was in the 5th quintile of its performance universe for the |
SUPPLEMENTAL INFORMATION (UNAUDITED)
| | | 1-year and 3-year periods. The Board also noted that the Fund’s performance was lower than the benchmark index for the 1-year and 3-year periods. |
| • | | The Board noted that the contractual management fee and actual management fee were in the 2nd quintile and the actual total expenses were in the 3rd quintile. |
Guardian Core Fixed Income VIP Fund
| • | | The Board noted that the Fund had less than one-year of operational history and was not able to evaluate an investment performance record for the Fund. The Board noted that it would have an opportunity to review such information in connection with future annual reviews. The Board noted that, in the meantime, it received monthly performance reports from the Manager. |
| • | | The Board noted that the contractual management fee was in the 2nd quintile of the expense group and the actual management fee and the actual total expenses were in the 1st quintile. |
Guardian Multi-Sector Bond VIP Fund
| • | | The Board noted that the Fund’s performance was in the 5th quintile of its performance universe for the 1-year and 3-year periods The Board also noted that the Fund’s performance was lower than the benchmark index for the 1-year and 3-year periods. |
| • | | The Board noted that the contractual management fee and actual total expenses were in the 1st quintile and the actual management fee was in the 2nd quintile. |
Guardian Short Duration Bond VIP Fund
| • | | The Board noted that the Fund had less than one-year of operational history and was not able to evaluate an investment performance record for the Fund. The Board noted that it would have an opportunity to review such information in connection with future annual reviews. The Board noted that, in the meantime, it received monthly performance reports from the Manager. |
| • | | The Board noted that the contractual management fee and actual total expenses were in the 3rd quintile of the expense group and the actual management fee was in the 1st quintile of the expense group. |
Guardian U.S. Government Securities VIP Fund
| • | | The Board noted that the Fund’s performance was in the 1st quintile of its performance universe for the 1-year period and in the 2nd quintile of its performance universe for the 3-year period. The Board also noted that the Fund’s performance was higher than the benchmark index for the 1-year and 3-year periods. |
| • | | The Board noted that the contractual management fee and the actual management fee were in the 1st quintile of the expense group and the actual total expenses were in the 2nd quintile of the expense group. |
Conclusion
Based on a comprehensive consideration and evaluation of all of the information and factors summarized above, among others, the Board as a whole, including the Independent Trustees, approved the Agreements.
SUPPLEMENTAL INFORMATION (UNAUDITED)
The Statement of Additional Information (“SAI”) includes additional information about the Trust’s Trustees and Officers and is available, without charge, upon request by calling toll-free 1-888-GUARDIAN (1-888-482-7342) or by visiting our website at http://guardianvpt.onlineprospectus.net/GuardianVPT/Prospectuses.
Portfolio Holdings and Proxy Voting Procedures
The Fund files its complete schedule of portfolio holdings with the Securities and Exchange Commission for the first and third quarters of each fiscal year as an exhibit to its reports on Form N-PORT. The Fund’s Form N-PORT reports are available on the Securities and Exchange Commission’s website at https://www.sec.gov. The Fund’s Form N-PORT information is also available, without charge, upon request, by calling toll-free 1-888-GUARDIAN (1-888-482-7342) or by visiting our website at http://guardianvpt.onlineprospectus.net/GuardianVPT/Prospectuses.
A description of the policies and procedures that the Fund uses to determine how to vote proxies relating to portfolio securities is included in the SAI. The SAI and information regarding how the Fund voted proxies relating to portfolio securities during the most recent 12-month period ended June 30 may be obtained (i) without charge, upon request, by calling toll-free 1-888-GUARDIAN (1-888-482-7342) or by visiting our website at http://guardianvpt.onlineprospectus.net/GuardianVPT/Prospectuses; and (ii) on the Securities and Exchange Commission’s website at https://www.sec.gov.
This report is transmitted to shareholders only. It is not authorized for use as an offer of sale or a solicitation of an offer to buy shares of the Fund unless accompanied or preceded by the Fund’s current prospectus. Past performance results shown in this report should not be considered a representation of future performance. Investment returns and principal value of shares will fluctuate so that shares, when redeemed, may be worth more or less than their original cost. Statements and other information herein are as dated and are subject to change.

The Guardian Life Insurance Company of America New York, NY 10001-2159
PUB11410
Guardian Variable
Products Trust
2023
Semiannual Report
All Data as of June 30, 2023
Guardian Integrated Research VIP Fund

| | |
| Not FDIC insured. May lose value. No bank guarantee. | | www.guardianlife.com |
TABLE OF CONTENTS
Guardian Integrated Research VIP Fund
Except as otherwise specifically stated, all information, including portfolio security positions, is as of June 30, 2023. Fund holdings will vary. Information contained herein has been obtained from sources believed reliable, but is not guaranteed.
GUARDIAN INTEGRATED RESEARCH VIP FUND
Fund Characteristics (unaudited)
| | |
| Total Net Assets: $371,804,351 | | |
|
| |
Sector Allocation1 As of June 30, 2023 |
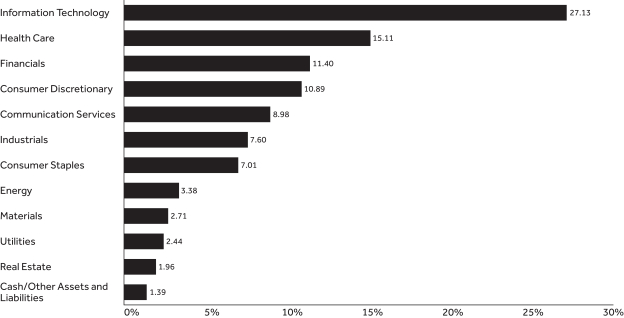 |
| | | | |
| | |
Top Ten Holdings2 As of June 30, 2023 | | | |
| | |
| Holding | | % of Total Net Assets | |
| Microsoft Corp. | | | 7.50% | |
| Apple, Inc. | | | 6.34% | |
| Amazon.com, Inc. | | | 4.46% | |
| Alphabet, Inc., Class A | | | 3.82% | |
| UnitedHealth Group, Inc. | | | 2.49% | |
| NVIDIA Corp. | | | 2.48% | |
| JPMorgan Chase & Co. | | | 2.26% | |
| Meta Platforms, Inc., Class A | | | 2.16% | |
| Procter & Gamble Co. | | | 2.15% | |
| Mastercard, Inc., Class A | | | 1.95% | |
| Total | | | 35.61% | |
| 1 | The Fund’s holdings are allocated to each sector based on the MSCI Global Industry Classification Standard (GICS®). Cash includes short-term investments and net other assets and liabilities. |
| 2 | Portfolio holdings are subject to change and should not be considered a recommendation to buy or sell individual securities. |
UNDERSTANDING YOUR FUND’S EXPENSES (UNAUDITED)
By investing in the Fund, you incur two types of costs: (1) transaction costs and (2) ongoing costs, including, as applicable, investment advisory fees, distribution and/or service (12b-1) fees and other Fund expenses. The example below is intended to help you understand your ongoing costs (in dollars) of investing in the Fund and to compare these costs with the ongoing costs of investing in other mutual funds.
The example is based on an investment of $1,000 invested at the beginning of the period and held for the entire period from January 1, 2023 to June 30, 2023. The table below shows the Fund’s expenses in two ways:
Expenses based on actual return
This section of the table provides information about actual account values and actual expenses. You may use the information in this section, together with the amount you invested, to estimate the expenses that you paid over the period. Simply divide your account value by $1,000 (for example, an $8,600 account value divided by $1,000 = 8.6), then multiply the result by the number in the section under the heading entitled “Expenses Paid During Period” to estimate the expenses you paid on your account during this period.
Expenses based on hypothetical 5% return for comparison purposes
This section of the table provides information about hypothetical account values and hypothetical expenses based on the Fund’s actual expense ratio and an assumed rate of return of 5% per year before expenses, which is not the Fund’s actual return. The hypothetical account values and expenses may not be used to estimate the actual ending account balance or expenses you paid for the period. You may use this information to compare the ongoing costs of investing in the Fund with the cost of investing in other mutual funds. To do so, compare this 5% hypothetical example with the 5% hypothetical examples that appear in the shareholder reports of the other funds.
Note that the expenses shown in the table are meant to highlight your ongoing costs only and do not reflect any transactional costs, such as sales charges (loads), redemption fees, or exchange fees. Therefore the second section is useful in comparing ongoing costs only, and will not help you determine the relative total costs of owning different funds. If these transactional costs were included, your costs would have been higher. Charges and expenses at the insurance company separate account level are not reflected in the table.
| | | | | | | | | | | | | | |
| | | | | |
| | | Beginning
Account Value 1/1/23 | | Ending Account Value
6/30/23 | | | Expenses Paid During Period* 1/1/23-6/30/23 | | | Expense Ratio During Period 1/1/23-6/30/23 | |
| Based on Actual Return | | $1,000.00 | | $ | 1,149.10 | | | $ | 4.48 | | | | 0.84% | |
Based on Hypothetical Return (5% Return Before Expenses) | | $1,000.00 | | $ | 1,020.63 | | | $ | 4.21 | | | | 0.84% | |
| * | Expenses are equal to the Fund’s annualized expense ratio as indicated, multiplied by the average account value over the period, multiplied by 181/365 (to reflect the one-half year period). |
SCHEDULE OF INVESTMENTS — GUARDIAN INTEGRATED RESEARCH VIP FUND
| | | | | | | | |
| June 30, 2023 (unaudited) | | Shares | | | Value | |
| Common Stocks – 98.6% | | | | | | | | |
| | | |
| Aerospace & Defense – 1.5% | | | | | | | | |
| | | |
Raytheon Technologies Corp. | | | 56,427 | | | $ | 5,527,589 | |
| | | | | | | | | |
| | | |
| | | | | | | | 5,527,589 | |
| Automobiles – 0.6% | | | | | |
| | | |
Tesla, Inc.(1) | | | 9,026 | | | | 2,362,736 | |
| | | | | | | | | |
| | | |
| | | | | | | | 2,362,736 | |
| Banks – 3.6% | | | | | |
| | | |
Bank of America Corp. | | | 170,855 | | | | 4,901,830 | |
| | | |
JPMorgan Chase & Co. | | | 57,650 | | | | 8,384,616 | |
| | | | | | | | | |
| | | |
| | | | | | | | 13,286,446 | |
| Beverages – 2.6% | | | | | |
| | | |
Constellation Brands, Inc., Class A | | | 19,996 | | | | 4,921,615 | |
| | | |
Monster Beverage Corp.(1) | | | 82,693 | | | | 4,749,886 | |
| | | | | | | | | |
| | | |
| | | | | | | | 9,671,501 | |
| Biotechnology – 2.3% | | | | | |
| | | |
Regeneron Pharmaceuticals, Inc.(1) | | | 4,209 | | | | 3,024,335 | |
| | | |
Vertex Pharmaceuticals, Inc.(1) | | | 15,534 | | | | 5,466,570 | |
| | | | | | | | | |
| | | |
| | | | | | | | 8,490,905 | |
| Broadline Retail – 4.5% | | | | | |
| | | |
Amazon.com, Inc.(1) | | | 127,214 | | | | 16,583,617 | |
| | | | | | | | | |
| | | |
| | | | | | | | 16,583,617 | |
| Building Products – 1.0% | | | | | |
| | | |
Johnson Controls International PLC | | | 54,494 | | | | 3,713,221 | |
| | | | | | | | | |
| | | |
| | | | | | | | 3,713,221 | |
| Capital Markets – 1.5% | | | | | |
| | | |
Morgan Stanley | | | 65,851 | | | | 5,623,675 | |
| | | | | | | | | |
| | | |
| | | | | | | | 5,623,675 | |
| Chemicals – 2.7% | | | | | |
| | | |
PPG Industries, Inc. | | | 31,632 | | | | 4,691,026 | |
| | | |
Sherwin-Williams Co. | | | 20,212 | | | | 5,366,690 | |
| | | | | | | | | |
| | | |
| | | | | | | | 10,057,716 | |
| Consumer Finance – 1.1% | | | | | |
| | | |
American Express Co. | | | 23,956 | | | | 4,173,135 | |
| | | | | | | | | |
| | | |
| | | | | | | | 4,173,135 | |
| Electric Utilities – 2.4% | | | | | |
| | | |
American Electric Power Co., Inc. | | | 32,793 | | | | 2,761,171 | |
| | | |
Duke Energy Corp. | | | 43,318 | | | | 3,887,357 | |
| | | |
Eversource Energy | | | 34,372 | | | | 2,437,662 | |
| | | | | | | | | |
| | | |
| | | | | | | | 9,086,190 | |
| Electrical Equipment – 1.4% | | | | | |
| | | |
AMETEK, Inc. | | | 31,902 | | | | 5,164,296 | |
| | | | | | | | | |
| | | |
| | | | | | | | 5,164,296 | |
| Electronic Equipment, Instruments & Components – 0.9% | |
| | | |
CDW Corp. | | | 17,947 | | | | 3,293,275 | |
| | | | | | | | | |
| | | |
| | | | | | | | 3,293,275 | |
| Energy Equipment & Services – 0.6% | | | | | |
| | | |
Schlumberger NV | | | 45,812 | | | | 2,250,285 | |
| | | | | | | | | |
| | | |
| | | | | | | | 2,250,285 | |
| | | | | | | | |
| June 30, 2023 (unaudited) | | Shares | | | Value | |
| Entertainment – 1.2% | |
| | | |
Walt Disney Co.(1) | | | 48,502 | | | $ | 4,330,259 | |
| | | | | | | | | |
| | | |
| | | | | | | | 4,330,259 | |
| Financial Services – 1.9% | | | | | |
| | | |
Mastercard, Inc., Class A | | | 18,413 | | | | 7,241,833 | |
| | | | | | | | | |
| | | |
| | | | | | | | 7,241,833 | |
| Health Care Equipment & Supplies – 3.5% | | | | | |
| | | |
Abbott Laboratories | | | 47,471 | | | | 5,175,288 | |
| | | |
Becton Dickinson and Co. | | | 16,298 | | | | 4,302,835 | |
| | | |
Hologic, Inc.(1) | | | 44,903 | | | | 3,635,796 | |
| | | | | | | | | |
| | | |
| | | | | | | | 13,113,919 | |
| Health Care Providers & Services – 2.5% | | | | | |
| | | |
UnitedHealth Group, Inc. | | | 19,246 | | | | 9,250,397 | |
| | | | | | | | | |
| | | |
| | | | | | | | 9,250,397 | |
| Hotels, Restaurants & Leisure – 3.0% | | | | | |
| | | |
Airbnb, Inc., Class A(1) | | | 14,824 | | | | 1,899,844 | |
| | | |
Marriott International, Inc., Class A | | | 20,687 | | | | 3,799,995 | |
| | | |
McDonald’s Corp. | | | 18,121 | | | | 5,407,487 | |
| | | | | | | | | |
| | | |
| | | | | | | | 11,107,326 | |
| Household Products – 3.4% | | | | | |
| | | |
Colgate-Palmolive Co. | | | 60,545 | | | | 4,664,387 | |
| | | |
Procter & Gamble Co. | | | 52,584 | | | | 7,979,096 | |
| | | | | | | | | |
| | | |
| | | | | | | | 12,643,483 | |
| Industrial REITs – 1.2% | | | | | |
| | | |
Prologis, Inc. | | | 36,050 | | | | 4,420,812 | |
| | | | | | | | | |
| | | |
| | | | | | | | 4,420,812 | |
| Insurance – 3.2% | | | | | |
| | | |
Arch Capital Group Ltd.(1) | | | 44,010 | | | | 3,294,149 | |
| | | |
Chubb Ltd. | | | 21,618 | | | | 4,162,762 | |
| | | |
Progressive Corp. | | | 34,804 | | | | 4,607,005 | |
| | | | | | | | | |
| | | |
| | | | | | | | 12,063,916 | |
| Interactive Media & Services – 7.8% | | | | | |
| | | |
Alphabet, Inc., Class A(1) | | | 118,636 | | | | 14,200,729 | |
| | | |
Alphabet, Inc., Class C(1) | | | 40,097 | | | | 4,850,534 | |
| | | |
Meta Platforms, Inc., Class A(1) | | | 28,037 | | | | 8,046,059 | |
| | | |
ZoomInfo Technologies, Inc.(1) | | | 77,713 | | | | 1,973,133 | |
| | | | | | | | | |
| | | |
| | | | | | | | 29,070,455 | |
| IT Services – 0.8% | | | | | |
| | | |
GoDaddy, Inc., Class A(1) | | | 41,995 | | | | 3,155,084 | |
| | | | | | | | | |
| | | |
| | | | | | | | 3,155,084 | |
| Life Sciences Tools & Services – 2.3% | | | | | |
| | | |
Danaher Corp. | | | 16,978 | | | | 4,074,720 | |
| | | |
Thermo Fisher Scientific, Inc. | | | 8,546 | | | | 4,458,876 | |
| | | | | | | | | |
| | | |
| | | | | | | | 8,533,596 | |
| Machinery – 3.7% | | | | | |
| | | |
Deere & Co. | | | 13,616 | | | | 5,517,067 | |
| | | |
Illinois Tool Works, Inc. | | | 17,082 | | | | 4,273,233 | |
| | | |
Nordson Corp. | | | 16,396 | | | | 4,069,159 | |
| | | | | | | | | |
| | | |
| | | | | | | | 13,859,459 | |
| | | | |
| The accompanying notes are an integral part of these financial statements. | | | | 3 |
SCHEDULE OF INVESTMENTS — GUARDIAN INTEGRATED RESEARCH VIP FUND
| | | | | | | | |
| June 30, 2023 (unaudited) | | Shares | | | Value | |
| Oil, Gas & Consumable Fuels – 2.8% | | | | | |
| | | |
ConocoPhillips | | | 25,078 | | | $ | 2,598,332 | |
| | | |
EOG Resources, Inc. | | | 34,375 | | | | 3,933,875 | |
| | | |
Pioneer Natural Resources Co. | | | 18,251 | | | | 3,781,242 | |
| | | | | | | | | |
| | | |
| | | | | | | | 10,313,449 | |
| Personal Care Products – 1.0% | | | | | |
| | | |
Estee Lauder Cos., Inc., Class A | | | 18,976 | | | | 3,726,507 | |
| | | | | | | | | |
| | | |
| | | | | | | | 3,726,507 | |
| Pharmaceuticals – 4.5% | | | | | |
| | | |
Eli Lilly and Co. | | | 14,423 | | | | 6,764,099 | |
| | | |
Merck & Co., Inc. | | | 45,163 | | | | 5,211,359 | |
| | | |
Pfizer, Inc. | | | 131,480 | | | | 4,822,686 | |
| | | | | | | | | |
| | | |
| | | | | | | | 16,798,144 | |
| Residential REITs – 0.8% | | | | | |
| | | |
AvalonBay Communities, Inc. | | | 15,120 | | | | 2,861,762 | |
| | | | | | | | | |
| | | |
| | | | | | | | 2,861,762 | |
| Semiconductors & Semiconductor Equipment – 8.7% | |
| | | |
Advanced Micro Devices, Inc.(1) | | | 41,367 | | | | 4,712,115 | |
| | | |
Broadcom, Inc. | | | 5,936 | | | | 5,149,064 | |
| | | |
KLA Corp. | | | 9,697 | | | | 4,703,239 | |
| | | |
NVIDIA Corp. | | | 21,837 | | | | 9,237,488 | |
| | | |
QUALCOMM, Inc. | | | 31,183 | | | | 3,712,024 | |
| | | |
Texas Instruments, Inc. | | | 26,231 | | | | 4,722,105 | |
| | | | | | | | | |
| | | |
| | | | | | | | 32,236,035 | |
| Software – 10.4% | | | | | |
| | | |
Microsoft Corp. | | | 81,881 | | | | 27,883,756 | |
| | | |
Palo Alto Networks, Inc.(1) | | | 12,960 | | | | 3,311,410 | |
| | | |
Salesforce, Inc.(1) | | | 19,190 | | | | 4,054,079 | |
| | | |
Workday, Inc., Class A(1) | | | 14,837 | | | | 3,351,530 | |
| | | | | | | | | |
| | | |
| | | | | | | | 38,600,775 | |
| Specialty Retail – 1.5% | | | | | |
| | | |
TJX Cos., Inc. | | | 63,690 | | | | 5,400,275 | |
| | | | | | | | | |
| | | |
| | | | | | | | 5,400,275 | |
| | | | | | | | |
| June 30, 2023 (unaudited) | | Shares | | | Value | |
| Technology Hardware, Storage & Peripherals – 6.3% | |
| | | |
Apple, Inc. | | | 121,611 | | | $ | 23,588,886 | |
| | | | | | | | | |
| | | |
| | | | | | | | 23,588,886 | |
| Textiles, Apparel & Luxury Goods – 1.4% | | | | | |
| | | |
NIKE, Inc., Class B | | | 45,505 | | | | 5,022,387 | |
| | | | | | | | | |
| | | |
| | | | | | | | 5,022,387 | |
| | |
Total Common Stocks
(Cost $350,879,718) | | | | 366,623,346 | |
| | | | | | | | |
| | | Principal
Amount | | | Value | |
| Repurchase Agreements – 1.1% | | | | | |
| | | |
Fixed Income Clearing Corp., 1.52%, dated 6/30/2023, proceeds at maturity value of $4,183,255, due 7/3/2023(2) | | $ | 4,182,725 | | | | 4,182,725 | |
| | | |
Total Repurchase Agreements
(Cost $4,182,725) | | | | | | | 4,182,725 | |
| | | |
Total Investments – 99.7%
(Cost $355,062,443) | | | | | | | 370,806,071 | |
| | |
| Assets in excess of other liabilities – 0.3% | | | | 998,280 | |
| | | |
| Total Net Assets – 100.0% | | | | | | $ | 371,804,351 | |
| (1) | Non–income–producing security. |
| (2) | The table below presents collateral for repurchase agreements. |
| | | | | | | | | | | | | | | | |
| Security | | Coupon | | | Maturity Date | | | Principal Amount | | | Value | |
| U.S. Treasury Note | | | 4.625% | | | | 3/15/2026 | | | $ | 4,204,300 | | | $ | 4,266,422 | |
Legend:
REITs — Real Estate Investment Trusts
The following is a summary of the inputs used as of June 30, 2023 in valuing the Fund’s investments. For more information on valuation inputs, please refer to Note 2a of the accompanying Notes to Financial Statements.
| | | | | | | | | | | | | | | | |
| | | Valuation Inputs | | | | |
| Investments in Securities (unaudited) | | Level 1 | | | Level 2 | | | Level 3 | | | Total | |
| Common Stocks | | $ | 366,623,346 | | | $ | — | | | $ | — | | | $ | 366,623,346 | |
| Repurchase Agreements | | | — | | | | 4,182,725 | | | | — | | | | 4,182,725 | |
| Total | | $ | 366,623,346 | | | $ | 4,182,725 | | | $ | — | | | $ | 370,806,071 | |
| | | | |
| 4 | | | | The accompanying notes are an integral part of these financial statements. |
FINANCIAL INFORMATION — GUARDIAN INTEGRATED RESEARCH VIP FUND
| | | | |
Statement of Assets and Liabilities As of June 30, 2023 (unaudited) | | | |
Assets | | | | |
| | |
Investments, at value | | $ | 370,806,071 | |
| | |
Receivable for investments sold | | | 1,373,800 | |
| | |
Dividends/interest receivable | | | 187,723 | |
| | |
Prepaid expenses | | | 4,202 | |
| | | | | |
| | |
Total Assets | | | 372,371,796 | |
| | | | | |
| | |
Liabilities | | | | |
| | |
Payable for fund shares redeemed | | | 269,862 | |
| | |
Investment advisory fees payable | | | 152,235 | |
| | |
Distribution fees payable | | | 75,543 | |
| | |
Accrued audit fees | | | 13,978 | |
| | |
Accrued custodian and accounting fees | | | 11,044 | |
| | |
Accrued trustees’ and officers’ fees | | | 6,437 | |
| | |
Accrued expenses and other liabilities | | | 38,346 | |
| | | | | |
| | |
Total Liabilities | | | 567,445 | |
| | | | | |
| | |
Total Net Assets | | $ | 371,804,351 | |
| | | | | |
| | |
Net Assets Consist of: | | | | |
| | |
Paid-in capital | | $ | 370,693,364 | |
| | |
Distributable earnings | | | 1,110,987 | |
| | | | | |
| | |
Total Net Assets | | $ | 371,804,351 | |
| | | | | |
Investments, at Cost | | $ | 355,062,443 | |
| | | | | |
| | |
Pricing of Shares | | | | |
| | |
Shares of Beneficial Interest Outstanding with No Par Value | | | 18,769,819 | |
| | |
Net Asset Value Per Share | | | $19.81 | |
| | | | | |
| | | | |
Statement of Operations For the Six Months Ended June 30, 2023 (unaudited) | | | |
Investment Income | | | | |
| | |
Dividends | | $ | 2,859,183 | |
| | |
Interest | | | 30,661 | |
| | | | | |
| | |
Total Investment Income | | | 2,889,844 | |
| | | | | |
| | |
Expenses | | | | |
| | |
Investment advisory fees | | | 835,072 | |
| | |
Distribution fees | | | 450,636 | |
| | |
Professional fees | | | 46,745 | |
| | |
Trustees’ and officers’ fees | | | 44,524 | |
| | |
Administrative fees | | | 23,536 | |
| | |
Custodian and accounting fees | | | 16,645 | |
| | |
Transfer agent fees | | | 8,252 | |
| | |
Shareholder reports | | | 6,780 | |
| | |
Other expenses | | | 9,933 | |
| | | | | |
| | |
Total Expenses | | | 1,442,123 | |
| | |
Expenses recouped by adviser | | | 72,015 | |
| | | | | |
| | |
Total Expenses | | | 1,514,138 | |
| | | | | |
| | |
Net Investment Income/(Loss) | | | 1,375,706 | |
| | | | | |
| | |
Realized Gain/(Loss) and Change in Unrealized Appreciation/(Depreciation) on Investments | | | | |
| | |
Net realized gain/(loss) from investments | | | (8,305,533 | ) |
| | |
Net change in unrealized appreciation/(depreciation) on investments | | | 57,079,208 | |
| | | | | |
| | |
Net Gain on Investments | | | 48,773,675 | |
| | | | | |
| | |
Net Increase in Net Assets Resulting From Operations | | $ | 50,149,381 | |
| | | | | |
| | | | | |
| | | | |
| The accompanying notes are an integral part of these financial statements. | | | | 5 |
FINANCIAL INFORMATION — GUARDIAN INTEGRATED RESEARCH VIP FUND
| | | | | | | | |
Statements of Changes in Net Assets Six Months Ended Numbers are unaudited | | | | | | |
| | | |
| | | For the Six Months Ended
6/30/23 | | | For the Year Ended
12/31/22 | |
| | | | |
Operations | | | | | | | | |
| | | |
Net investment income/(loss) | | $ | 1,375,706 | | | $ | 2,372,171 | |
| | | |
Net realized gain/(loss) from investments | | | (8,305,533 | ) | | | (22,022,024 | ) |
| | | |
Net change in unrealized appreciation/(depreciation) on investments | | | 57,079,208 | | | | (55,661,313 | ) |
| | | | | | | | | |
| | | |
Net Increase/(Decrease) in Net Assets Resulting from Operations | | | 50,149,381 | | | | (75,311,166 | ) |
| | | | | | | | | |
| | | |
Capital Share Transactions | | | | | | | | |
| | | |
Proceeds from sales of shares | | | 5,828,830 | | | | 166,384,832 | |
| | | |
Cost of shares redeemed | | | (38,075,109 | ) | | | (58,390,301 | ) |
| | | | | | | | | |
| | | |
Net Increase/(Decrease) in Net Assets Resulting from Capital Share Transactions | | | (32,246,279 | ) | | | 107,994,531 | |
| | | | | | | | | |
| | | |
Net Increase in Net Assets | | | 17,903,102 | | | | 32,683,365 | |
| | | | | | | | | |
| | | |
Net Assets | | | | | | | | |
| | | |
Beginning of period | | | 353,901,249 | | | | 321,217,884 | |
| | | | | | | | | |
| | | |
End of period | | $ | 371,804,351 | | | $ | 353,901,249 | |
| | | | | | | | | |
| | | |
Other Information: | | | | | | | | |
| | | |
Shares | | | | | | | | |
| | | |
Sold | | | 316,231 | | | | 8,974,058 | |
| | | |
Redeemed | | | (2,069,618 | ) | | | (3,147,509 | ) |
| | | | | | | | | |
| | | |
Net Increase/(Decrease) | | | (1,753,387 | ) | | | 5,826,549 | |
| | | | | | | | | |
| | | | | | | | | |
| | | | |
| 6 | | | | The accompanying notes are an integral part of these financial statements. |
This Page Intentionally Left Blank
FINANCIAL INFORMATION — GUARDIAN INTEGRATED RESEARCH VIP FUND
The Financial Highlights table is intended to help you understand the Fund’s financial performance for the past six reporting periods (or, if shorter, the period since inception). Certain information reflects financial results for a single Fund share. The total returns in the table represent the rate that an investor would have earned (or lost) on an investment in the Fund.
| | | | | | | | | | | | | | | | | | | | | | | | |
Financial Highlights Six Months Ended Numbers are unaudited | | | | | | | | | | | | | | | | |
| | | Per Share Operating Performance | | | | |
| | |
Net Asset Value,
Beginning of
Period | | | Net Investment
Income(1) | | | Net Realized
and Unrealized
Gain/(Loss) | | | Total
Operations | | | Net Asset
Value, End of
Period | | | Total
Return(2) | |
| | | | | | | |
Six Months Ended 6/30/23 | | $ | 17.24 | | | $ | 0.07 | | | $ | 2.50 | | | $ | 2.57 | | | $ | 19.81 | | | | 14.91 | %(4) |
| | | | | | | |
Year Ended 12/31/22 | | | 21.86 | | | | 0.12 | | | | (4.74) | | | | (4.62) | | | | 17.24 | | | | (21.13) | % |
| | | | | | | |
Year Ended 12/31/21 | | | 17.06 | | | | 0.11 | | | | 4.69 | | | | 4.80 | | | | 21.86 | | | | 28.14 | % |
| | | | | | | |
Year Ended 12/31/20 | | | 14.31 | | | | 0.20 | (6) | | | 2.55 | | | | 2.75 | | | | 17.06 | | | | 19.22 | % |
| | | | | | | |
Year Ended 12/31/19 | | | 11.26 | | | | 0.14 | | | | 2.91 | | | | 3.05 | | | | 14.31 | | | | 27.09 | % |
| | | | | | | |
Year Ended 12/31/18 | | | 12.28 | | | | 0.12 | | | | (1.14) | | | | (1.02) | | | | 11.26 | | | | (8.31) | % |
| | | | |
| 8 | | | | The accompanying notes are an integral part of these financial statements. |
FINANCIAL INFORMATION — GUARDIAN INTEGRATED RESEARCH VIP FUND
| | | | | | | | | | | | | | | | | | | | | | |
| |
| Ratios/Supplemental Data | |
Net Assets, End
of Period (000s) | | | Net Ratio of
Expenses to
Average
Net Assets(3) | | | Gross Ratio of
Expenses to
Average Net
Assets | | | Net Ratio of Net Investment Income to Average Net Assets(3) | | | Gross Ratio of Net Investment Income/ (Loss) to Average Net Assets | | | Portfolio
Turnover Rate | |
| | | | | |
| $ | 371,804 | | | | 0.84% | (4) | | | 0.84% | (4) | | | 0.76% | (4) | | | 0.76% | (4) | | | 15% | (4) |
| | | | | |
| | 353,901 | | | | 0.84% | | | | 0.84% | | | | 0.68% | | | | 0.68% | | | | 24% | |
| | | | | |
| | 321,218 | | | | 0.86% | | | | 0.91% | | | | 0.53% | | | | 0.48% | | | | 274% | (5) |
| | | | | |
| | 12,432 | | | | 0.96% | | | | 2.08% | | | | 1.36% | (6) | | | 0.24% | (6) | | | 61% | |
| | | | | |
| | 11,852 | | | | 0.96% | | | | 2.30% | | | | 1.08% | | | | (0.26)% | | | | 117% | |
| | | | | |
| | 9,814 | | | | 0.96% | | | | 2.39% | | | | 0.93% | | | | (0.50)% | | | | 58% | |
| (1) | Calculated based on the average shares outstanding during the period. |
| (2) | Total returns do not reflect the effects of charges deducted pursuant to the terms of The Guardian Insurance & Annuity Company, Inc.’s variable contracts. Inclusion of such charges would reduce the total returns for all periods shown. |
| (3) | Net Ratio of Expenses to Average Net Assets and Net Ratio of Net Investment Income to Average Net Assets include the effect of fee waivers, expense limitations, and recoupments, if any. |
| (4) | Ratios for periods less than one year have been annualized, except for total return and portfolio turnover rate. |
| (5) | The Fund’s portfolio turnover rate during the year reflects higher purchase and sale activities due to a significant inflow of assets into the fund. |
| (6) | Reflects a special dividend paid out during the year by one of the Fund’s holdings. Had the Fund not received the special dividend, the Net Investment Income per share would have been $0.11, the Net Ratio of Net Investment Income to Average Net Assets would have been 0.76%, and the Gross Ratio of Net Investment Income/(Loss) to Average Net Assets would have been (0.36)%. |
| | | | |
| The accompanying notes are an integral part of these financial statements. | | | | 9 |
NOTES TO FINANCIAL STATEMENTS — GUARDIAN INTEGRATED RESEARCH VIP FUND
June 30, 2023 (unaudited)
1. Organization
Guardian Variable Products Trust (the “Trust”), a Delaware statutory trust organized on January 12, 2016, is registered under the Investment Company Act of 1940, as amended (the “1940 Act”), as an open-end management investment company. The Trust currently has twenty-four series. Guardian Integrated Research VIP Fund (the “Fund”) is a series of the Trust. The Fund is a diversified fund and commenced operations on September 1, 2016. The financial statements for other series of the Trust are presented in separate reports.
The Trust has authorized an unlimited number of shares of beneficial interest with no par value. Shares are bought and sold at closing net asset value (“NAV”). Shares of the Fund are only sold to certain separate accounts of The Guardian Insurance & Annuity Company, Inc. (“GIAC”) that fund certain variable annuity contracts and variable life insurance policies issued by GIAC. GIAC is a wholly-owned subsidiary of The Guardian Life Insurance Company of America (“Guardian Life”).
The Fund seeks capital appreciation.
2. Significant Accounting Policies
The following is a summary of significant accounting policies followed by the Fund in the preparation of its financial statements. The Fund follows the investment company accounting and reporting guidance of the Financial Accounting Standards Board (“FASB”) Accounting Standards Codification Topic 946 Financial Services – Investment Companies. The following policies are in conformity with accounting principles generally accepted in the United States of America (“GAAP”). The preparation of financial statements in accordance with GAAP requires management to make estimates and assumptions that affect the reported amounts and disclosures in the financial statements. Actual results could differ from those estimates.
a. Investment Valuations The Board of Trustees has designated Park Avenue Institutional Advisers LLC (“Park Avenue”) as the valuation designee for the Fund pursuant to Rule 2a-5 under the 1940 Act. Park Avenue has established a Fair Valuation Committee and has adopted fair valuation procedures that provide methodologies for fair valuing securities. These procedures include monitoring the appropriateness of fair values based on results of ongoing valuation oversight, including but not limited to consideration of
security specific events, market events, and pricing vendor and broker-dealer due diligence. The Fair Valuation Committee oversees and carries out the policies for the valuation of investments held in the Fund. The Fair Valuation Committee is responsible for discussing and assessing the potential impacts to the fair values on an ongoing basis, and reports to the Board of Trustees on at least a quarterly basis.
Equity securities traded on an exchange other than NASDAQ Stock Market, LLC (“NASDAQ”) are valued at the last reported sale price on the principal exchange or market on which they are traded; or, if there were no sales that day, at the mean between the closing bid and ask prices. Securities traded on the NASDAQ are generally valued at the NASDAQ official closing price, which may not be the last sale price. If the NASDAQ official closing price is not available for a security, that security is generally valued at the mean between the closing bid and ask prices. Repurchase agreements are carried at cost, which approximates fair value (see Note 5d). Foreign securities are valued in the currencies of the markets in which they trade and then converted to U.S. dollars by the application of foreign exchange rates at the close of the New York Stock Exchange (“NYSE”). Forward foreign currency contracts, if any, are valued at the mean between the bid and ask rates for the specified time interpolated from rates for proximate time periods.
Securities for which market quotations are not readily available or securities whose values have been materially affected by events occurring before the Fund’s valuation time but after the close of the securities’ principal exchange or market are valued at their fair values as determined in good faith by Park Avenue, as the Board of Trustee’s valuation designee (as defined in Rule 2a-5 under the 1940 Act), in accordance with Park Avenue’s procedures and under the general oversight of the Board of Trustees. In addition, the values of the Fund’s investments in foreign securities are generally determined by a pricing service using pricing models designed to estimate likely changes in the values of those securities. Certain foreign equity instruments are valued by applying international fair value factors provided by approved pricing services. The factors seek to adjust the local closing price for movements of local markets post closing, but prior to the time the NAVs are calculated. Valuations reflected in this report are as of the report date. As a result, changes in valuation due to market events and/or issuer related events after the report date and prior to issuance of the report are not reflected herein.
NOTES TO FINANCIAL STATEMENTS — GUARDIAN INTEGRATED RESEARCH VIP FUND
Various inputs are used in determining the valuation of the Fund’s investments. These inputs are summarized in three broad levels listed below.
| • | | Level 1 – unadjusted inputs using quoted prices in active markets for identical investments. |
| • | | Level 2 – other significant observable inputs, including, but not limited to, quoted prices for similar investments, inputs other than quoted prices that are observable for investments (such as interest rates, prepayment speeds, credit risks, etc.) or other market corroborated inputs. |
| • | | Level 3 – significant unobservable inputs (including the Fund’s own assumptions in determining the fair value of investments). |
Inputs may include price information, volatility statistics, specific and broad credit data, liquidity statistics, and other factors. A financial instrument’s level within the fair value hierarchy is based on the lowest level of any input; both individually and in aggregate, that is significant to the fair value measurement. However, the determination of what constitutes “observable” requires significant judgment by the Trust. The Trust considers observable data to be that market data which is readily available, regularly distributed or updated, reliable and verifiable, and provided by independent sources that are actively involved in the relevant market. The inputs or methodology used for valuing securities are not necessarily an indication of the risk associated with investing in those securities. Changes in valuation techniques may result in transfers into or out of a financial instrument’s assigned level within the hierarchy.
The FASB requires reporting entities to make disclosures about purchases, sales, issuances and settlements of Level 3 securities on a gross basis. For the six months ended June 30, 2023, there were no transfers into or out of Level 3 of the fair value hierarchy.
In determining a financial instrument’s placement within the hierarchy, the Trust separates the Fund’s investment portfolio into two categories: investments and derivatives (e.g., futures). A summary of inputs used to value the Fund’s assets and liabilities carried at fair value as of June 30, 2023 is included in the Schedule of Investments.
Investments Investments whose values are based on quoted market prices in active markets, and are therefore classified within Level 1, include active listed equities. Investments that trade in markets that are not considered to be active, but are valued based on quoted
market prices, dealer quotations or alternative pricing sources supported by observable inputs are classified within Level 2. These include certain U.S. government and sovereign obligations, most government agency securities, investment-grade corporate bonds, certain mortgage products, state, municipal and provincial obligations, and certain foreign equity securities, including securities whose prices may have been affected by events occurring after the close of trading on their principal exchange or market and, as a result, whose values are determined by a pricing service as described above, or securities whose values are otherwise determined using fair valuation methods approved by the Fund’s Board of Trustees.
Investments classified within Level 3 have significant unobservable inputs, as they trade infrequently or not at all. Level 3 investments include, among others, private placement securities. When observable prices are not available for these securities, the Trust uses one or more valuation techniques for which sufficient and reliable data is available. The inputs used by the Trust in estimating the value of Level 3 investments include, for example, the original transaction price, recent transactions in the same or similar instruments, completed or pending third-party transactions in the underlying investment or comparable issuers, subsequent rounds of financing, recapitalizations, and other transactions across the capital structure. Level 3 investments may also be adjusted to reflect illiquidity and/or non-transferability, with the amount of such discount estimated by the Trust in the absence of market information. Assumptions used by the Trust due to the lack of observable inputs may significantly impact the resulting fair value and therefore the Fund’s results of operations. As of June 30, 2023, the Fund had no securities classified as Level 3.
Derivatives Exchange-traded derivatives, such as futures contracts, exchange-traded option contracts and certain swaps, are typically classified within Level 1 or Level 2 of the fair value hierarchy depending on whether or not they are deemed to be actively traded. Certain non-exchange-traded derivatives, such as generic forwards, certain swaps and options, have inputs which can generally be corroborated by market data and are therefore classified within Level 2. During the six months ended June 30, 2023, the Fund did not hold any derivatives.
b. Securities Transactions Securities transactions are accounted for on the date securities are purchased or sold (trade date). Realized gains or losses on securities transactions are determined on the basis of specific identification.
NOTES TO FINANCIAL STATEMENTS — GUARDIAN INTEGRATED RESEARCH VIP FUND
c. Foreign Currency Translation The accounting records of the Fund are maintained in U.S. dollars. Investment securities and all other assets and liabilities of the Fund denominated in a foreign currency are generally translated into U.S. dollars at the exchange rates quoted at the close of the NYSE on each business day. The market value of investment securities and other assets and liabilities are translated at the exchange rate as of the valuation date. Purchases and sales of securities, income receipts, and expense payments are translated into U.S. dollars at the exchange rates in effect on the dates of the respective transactions. The Fund does not isolate the portion of the fluctuations on investments resulting from changes in foreign currency exchange rates from the fluctuations in market prices of investments held. Such fluctuations are included in the Net change in net realized and unrealized gain/(loss) from investments on the Statement of Operations.
Reported realized foreign currency gains and losses arise from the disposition of foreign currency, currency gains or losses realized between the trade and settlement dates on securities transactions, and the difference between the amounts of dividends, interest and foreign withholding taxes recorded on the Fund’s books on the transaction date and the U.S. dollar equivalent of the amounts actually received or paid. These reported realized foreign currency gains and losses, if any, are included in Net realized gain/(loss) from foreign currency transactions on the Statement of Operations. Unrealized foreign currency gains and losses arise from changes (due to changes in exchange rates) in the value of foreign currency and other assets and liabilities denominated in foreign currencies, which are held at period end, if any, and are included in Net change in unrealized appreciation/(depreciation) on translation of assets and liabilities in foreign currencies on the Statement of Operations.
d. Foreign Capital Gains Tax The Fund may be subject to foreign taxes on income, gains on investments or currency purchases/repatriation, a portion of which may be recoverable. The Fund will accrue such taxes and recoveries as applicable, based upon their current interpretation of tax rules and regulations that exist in the markets in which they invest.
e. Investment Income Dividend income net of foreign taxes withheld, if any, is generally recorded on the ex-dividend date. Distributions received from real estate investment trusts, if any, may be classified as dividends, capital gains and/or return of capital. Interest income, which includes amortization/accretion of
premium/discount, is determined using the interest income accrual method, and is accrued and recorded daily.
f. Allocation of Income and Expenses Many of the expenses of the Trust can be directly attributed to a specific series of the Trust. Expenses that cannot be directly attributed to a specific series of the Trust are generally apportioned among all the series in the Trust, based on relative net assets. In calculating net asset value per share for each series of the Trust, investment income, realized and unrealized gains and losses, and expenses other than series-specific expenses are allocated daily to each series based upon the proportion of net assets attributable to each series.
3. Transactions with Affiliates
a. Investment Advisory Fee and Expense Limitation Under the terms of the advisory agreement, which, after its two year initial term, is reviewed and approved annually by the Board of Trustees, the Fund pays an investment advisory fee to Park Avenue. Park Avenue is a wholly-owned subsidiary of Guardian Life and receives an investment advisory fee at an annual rate of 0.50% up to $200 million, 0.43% from $200 to $300 million, and 0.40% in excess of $300 million of the Fund’s average daily net assets. The fee is accrued daily and paid monthly.
Park Avenue has contractually agreed through April 30, 2024 to waive certain fees and/or reimburse certain expenses incurred by the Fund to the extent necessary to limit the Fund’s total annual operating expenses after fee waiver and/or expense reimbursement to 0.84% of the Fund’s average daily net assets (excluding, if applicable, any acquired fund fees and expenses, taxes, interest, transaction costs and brokerage commissions, litigation and extraordinary expenses). The limitation may not be increased or terminated prior to this time without action by the Board of Trustees and may be terminated only upon approval of the Board of Trustees. For the six months ended June 30, 2023, Park Avenue did not waive any fees or pay any Fund expenses.
Park Avenue may be entitled to recoupment of previously waived fees and reimbursed expenses from the Fund for three years from the date of the waiver or reimbursement, subject to the expense limitation in effect at the time of the waiver or reimbursement and at the time of the recoupment, if any. Amounts waived or reimbursed by Park Avenue pursuant to any expense limitation after October 25, 2021 will not be subject to Park Avenue’s recoupment rights. For the six months ended June 30, 2023, Park Avenue recouped previously
NOTES TO FINANCIAL STATEMENTS — GUARDIAN INTEGRATED RESEARCH VIP FUND
waived or reimbursed expenses in the amount of $72,015. The amount available for potential future recoupment by Park Avenue from the Fund under the Expense Limitation Agreement and the expiration schedule at June 30, 2023 are as follows:
| | | | | | | | |
| | | |
| | | Potential Recoupment Amounts | | | Expiration Date | |
| | | $ | 54,626 | | | | 2023 | |
| | | $ | 35,993 | | | | 2024 | |
| | | | | | | | | |
| Total Potential Recoupment Amounts | | $ | 90,619 | | | | | |
Park Avenue has entered into a Sub-Advisory Agreement with Wellington Management Company LLP (“Wellington”). Wellington is responsible for providing day-to-day investment advisory services to the Fund, subject to the supervision of Park Avenue and the oversight of the Board of Trustees. Sub-advisory fees are paid by Park Avenue and do not represent a separate or additional expense to the Fund.
b. Compensation of Trustees and Officers Trustees and officers who are interested persons of the Trust, as defined in the 1940 Act, receive no compensation from the Fund, except for the Chief Compliance Officer of the Trust. Trustees of the Trust who are not interested persons of the Trust, and the Chief Compliance Officer, receive compensation and reimbursement of expenses from the Trust.
c. Distribution Fees Park Avenue Securities LLC (“PAS”), a wholly-owned subsidiary of Guardian Life, is the principal underwriter of Fund shares. The Trust has entered into a distribution and service agreement with PAS, which governs the sale and distribution of shares of the Fund. Under a distribution and service plan adopted by the Trust (“12b-1 plan”), PAS is compensated for services in such capacity, including its expenses in connection with the promotion and distribution of shares of the Fund, at an annual rate of 0.25% of the Fund’s average daily net assets. For the six months ended June 30, 2023, the Fund paid distribution fees in the amount of $450,636 to PAS.
PAS has directed that certain payments under the 12b-1 plan be used to compensate GIAC for shareholder services provided to contract owners.
4. Federal Income Taxes
a. Distributions to Shareholders For federal income tax purposes, the Fund is treated as a disregarded entity (“DRE”). As a DRE, the Fund is not subject to an entity-level income tax; and any income, gains, losses, deductions, taxes, and credits of the Fund would instead
be “passed through” directly to the separate accounts of GIAC that invest in the Fund and retain the same character for U.S. federal income tax purposes. In addition, the Fund is not required to distribute taxable income and capital gains for U.S. federal income tax purposes. Therefore, no dividends and capital gains distributions were paid by the Fund.
5. Investments
a. Investment Purchases and Sales The cost of investments purchased and the proceeds from investments sold (excluding short-term investments) amounted to $53,156,123 and $84,736,020, respectively, for the six months ended June 30, 2023. During the six months ended June 30, 2023, there were no purchases or sales of U.S. government securities.
b. Foreign Securities Foreign securities investments involve special risks and considerations not typically associated with U.S. investments. These risks include, but are not limited to, currency risk; adverse political, regulatory, social, and economic developments; and less reliable information about issuers. Moreover, securities of some foreign issuers may be less liquid and their prices more volatile than those of comparable U.S. issuers.
c. Industry or Sector Concentration In its normal course of business, the Fund may invest a significant portion of its assets in companies within a limited number of industries or sectors. As a result, the Fund may be subject to a greater risk of loss than that of a fund invested in a wider spectrum of industries or sectors because the stocks of many or all of the companies in the industry, group of industries, sector, or sectors may decline in value due to developments adversely affecting the industry, group of industries, sector, or sectors.
d. Repurchase Agreements The Fund may invest in repurchase agreements to maintain liquidity and earn income over periods of time as short as overnight. The collateral for repurchase agreements is either cash or fully negotiable U.S. government securities (including U.S. government agency securities). Repurchase agreements are fully collateralized (including the interest accrued thereon) and such collateral is marked to market daily while the agreements remain in force. If the value of the collateral falls below the repurchase price plus accrued interest, the Fund will typically require the seller to deposit additional collateral by the next business day. If the request for additional collateral is not met, or the seller defaults, the Fund maintains the right to sell the collateral (although it may be prevented
NOTES TO FINANCIAL STATEMENTS — GUARDIAN INTEGRATED RESEARCH VIP FUND
or delayed from doing so in certain circumstances) and may be required to claim any resulting loss against the seller. Park Avenue monitors the creditworthiness of the seller with which the Fund enters into repurchase agreements.
6. Temporary Borrowings
The Fund, with other funds managed by Park Avenue, is party to a credit agreement with respect to a $10 million committed revolving credit facility from State Street Bank and Trust Company (the “Credit Agreement”) for temporary borrowing purposes, including the meeting of redemption requests that otherwise might require the untimely disposition of securities. Interest is based on a daily fluctuating rate per annum equal to the Applicable Rate (as defined in the Credit Agreement) plus the Applicable Margin (as defined in the Credit Agreement) that is subject to change from time to time as and when the Applicable Rate changes. Under the current Credit Agreement, the Applicable Rate for any day is defined as the rate per annum equal to the sum of (a) 0.10% plus (b) the higher of (i) the Federal Funds Effective Rate for such day and (ii) the Overnight Bank Funding Rate for such day; the Applicable Margin is 1.25%. In addition to the interest charged on any borrowings by the Fund, each fund pays a commitment fee of 0.30% per annum on its share of the unused
portion of the credit facility. The agreement is in place
until January 5, 2024. The Fund did not utilize the credit facility during the six months ended June 30, 2023.
7. Indemnifications
Under the Trust’s organizational documents and, in some cases, by contract, officers and Trustees of the Trust are indemnified against certain liabilities arising out of the performance of their duties to the Fund. In addition, in the normal course of business, the Fund enters into contracts with its vendors and others that provide general indemnifications. The Fund’s maximum exposure under these arrangements is unknown as this would involve future claims that may be made against the Fund that have not yet occurred. However, based on experience, the Fund expects the risk of loss to be remote.
8. Additional Information
The outbreak of COVID-19 has adversely impacted both local and global economies, including those in which the Fund may invest. These impacts include materially reduced consumer demand and economic output, disrupted supply chains, market closures, travel restrictions and quarantines, and strained healthcare systems. The Fund’s operations may be interrupted as a result, which may have a negative impact on the Fund’s investment performance.
SUPPLEMENTAL INFORMATION (UNAUDITED)
Liquidity Risk Management Program
In compliance with Rule 22e-4 under the Investment Company Act of 1940, as amended (the “Liquidity Rule”), Guardian Variable Products Trust (the “Trust”) has adopted and implemented a written liquidity risk management program (the “Program”) for each series of the Trust (each, a “Fund”), which is reasonably designed to assess and manage each Fund’s liquidity risk. The Fund’s “liquidity risk” is the risk that the Fund could not meet requests to redeem shares issued by the Fund without significant dilution of the remaining investors’ interests in the Fund.
The Board of Trustees of the Trust (the “Board”) Previously approved the designation of Park Avenue Institutional Advisers LLC (the “Administrator” or “PAIA”) as Program administrator. The Administrator established a Liquidity Risk Management Committee, which is comprised of certain officers of the Trust and PAIA, that assists the Administrator in the implementation and day-to-day administration of the Program and otherwise support carrying out the Administrator’s liquidity risk management responsibilities under the Program.
In accordance with the Program, each Fund’s liquidity risk is assessed no less frequently than annually, taking into consideration a variety of factors, including, as applicable, the Fund’s investment strategy and liquidity of portfolio investments, cash flow projections, and holdings of cash and cash equivalents, as well as borrowing arrangements and other funding sources. Certain factors are considered under both normal and reasonably foreseeable stressed conditions.
Each Fund portfolio investment is classified, no less than monthly, into one of four liquidity categories (including “highly liquid investments” and “illiquid investments,” discussed below) based on a determination of the number of days it is reasonably expected to take to convert the investment to cash, or sell or dispose of the investment, in current market conditions without significantly changing the investment’s market value.
The Liquidity Rule limits the Fund’s investments in illiquid investments by prohibiting the Fund from acquiring any illiquid investment if, immediately after the acquisition, the Fund would have invested more than 15% of its net assets in illiquid investments that are assets. The Program includes provisions reasonably designed to comply with this investment limitation. In addition, the Program includes provisions reasonably designed to comply with this investment limitation. In addition, the Program includes provisions reasonably designed to comply with the Liquidity Rule’s requirements relating to highly liquid investment minimums, which is a minimum amount of Fund net assets that must be invested in highly liquid investments that are assets, as applicable. The Fund was not required to adopt a highly liquid investment minimum during the period.
At a meeting of the Board held on March 29-30, 2023, the Board received a report (the “Report”) prepared by the Administrator addressing the Program’s operation and assessing the adequacy and effectiveness of its implementation for the period from January 1, 2022 through December 31, 2022 (the “Reporting Period”). The Report noted that the Administrator believes the Program operated effectively during the Reporting Period and continues to be reasonably designed to effectively assess and manage each Fund’s liquidity risk. The Report also noted that the Administrator believes the Program has been adequately and effectively implemented and the investment strategies for each Fund continue to be appropriate since its inception. In addition, the Report summarized the operation of the Program and the information and factors considered by the Administrator in its assessment of the Program’s implementation, such as the liquidity risk assessment framework and liquidity classification methodologies.
There can be no assurance that the Program will achieve its objectives under all circumstances. Please refer to the Fund’s prospectus for more information regarding the Fund’s exposure to liquidity risk and other risks to which an investment in the Fund may be subject.
SUPPLEMENTAL INFORMATION (UNAUDITED)
Approval of Investment Management and Sub-advisory Agreements
Section 15(c) of the Investment Company Act of 1940, as amended (the “1940 Act”), requires that a fund’s investment advisory and sub-advisory agreements be approved initially by the fund’s board of trustees. Section 15(c) also requires that the continuation of these agreements, after an initial term of up to two years, be annually reviewed and approved by the board. Any such agreement must be approved by a vote of a majority of the trustees who are not parties to the agreement or “interested persons” (as defined in the 1940 Act) of a party to the agreement at a meeting of the board called for the purpose of voting on such approval.
At a meeting of the Board of Trustees (the “Board”) of Guardian Variable Products Trust (the “Trust”) held on March 29-30, 2023 (the “Meeting”), the Board, including the trustees who are not parties to the agreement or “interested persons” as defined in the 1940 Act (the “Independent Trustees”), considered and voted unanimously to renew the existing investment management agreement between the Trust, on behalf of Guardian All Cap Core VIP Fund; Guardian Balanced Allocation VIP Fund; Guardian Core Fixed Income VIP Fund; Guardian Core Plus Fixed Income VIP Fund; Guardian Diversified Research VIP Fund; Guardian Equity Income VIP Fund; Guardian Global Utilities VIP Fund; Guardian Growth & Income VIP Fund; Guardian Integrated Research VIP Fund; Guardian International Growth VIP Fund; Guardian International Equity VIP Fund; Guardian Large Cap Disciplined Growth VIP Fund; Guardian Large Cap Disciplined Value VIP Fund; Guardian Large Cap Fundamental Growth VIP Fund; Guardian Mid Cap Relative Value VIP Fund; Guardian Mid Cap Traditional Growth VIP Fund; Guardian Multi-Sector Bond VIP Fund; Guardian Select Mid-Cap Core VIP Fund; Guardian Short Duration Bond VIP Fund; Guardian Small Cap Core VIP Fund; Guardian Small-Mid Cap Core VIP Fund; Guardian Strategic Large Cap Core VIP Fund; Guardian Total Return Bond VIP Fund and Guardian U.S. Government Securities VIP Fund (each, a “Fund,” and together, the “Funds”), in substantially the form presented at this meeting (the “Management Agreement”); and Park Avenue Institutional Advisers LLC (the “Manager”) for a one-year term.
The Board, including the Independent Trustees, also considered and voted unanimously to renew the existing sub-advisory agreements (the “Sub-Advisory Agreements,” collectively with the Management Agreement and Sub-Subadvisory Agreement, the “Agreements”) between the Manager and investment
advisory firms engaged to serve as sub-advisers to certain of the Funds (the “Sub-Advised Funds”), namely (i) ClearBridge Investments, LLC with respect to Guardian Small Cap Core VIP Fund; (ii) Putnam Investment Management, LLC with respect to Guardian Diversified Research VIP Fund; (iii) AllianceBernstein L.P. with respect to Guardian Growth & Income VIP Fund and Guardian Strategic Large Cap Core VIP Fund; (iv) J.P. Morgan Investment Management Inc. with respect to Guardian International Growth VIP Fund; (v) Schroder Investment Management North America Inc. with respect to Guardian International Equity VIP Fund; (vi) Wellington Management Company LLP with respect to Guardian Balanced Allocation VIP Fund, Guardian Equity Income VIP Fund, Guardian Integrated Research VIP Fund, Guardian Large Cap Disciplined Growth VIP Fund and Guardian Global Utilities VIP Fund; (vii) Boston Partners Global Investors, Inc. with respect to Guardian Large Cap Disciplined Value VIP Fund; (viii) Janus Henderson Investors US LLC with respect to Guardian Mid Cap Traditional Growth VIP Fund; (ix) Allspring Global Investments, LLC with respect to Guardian Mid Cap Relative Value VIP Fund and Guardian Small-Mid Cap Core VIP Fund; (x) Lord, Abbett & Co. LLC with respect to Guardian Core Plus Fixed Income VIP Fund; (xi) FIAM LLC with respect to Guardian Select Mid Cap Core VIP Fund; and (xii) Massachusetts Financial Services Company with respect to Guardian All Cap Core VIP Fund, each in substantially the form presented at this meeting, (each, a “Sub-Adviser” and collectively, the “Sub-Advisers”) for a one-year term.
The Board, including the Independent Trustees, also considered and voted unanimously to renew the existing sub-subadvisory agreement (the “Sub-Subadvisory Agreement”) between Schroder Investment Management North America Inc. and Schroder Investment Management North America Limited (also a Sub-Adviser) with respect to Guardian International Equity VIP Fund for a one-year term.
The Board is responsible for overseeing the management of each Fund. In determining whether to renew its approval of the Agreements, the Trustees evaluated information and factors that they considered to be relevant and appropriate through the exercise of their own business judgment. The Trustees considered certain information and factors in light of advice furnished to them by legal counsel to the Trust and, in the case of the Independent Trustees, their independent legal counsel. In advance of the Meeting, the Trustees received materials and information designed to assist their consideration of the Agreements. The Trustees received written responses
SUPPLEMENTAL INFORMATION (UNAUDITED)
from the Manager and each Sub-Adviser to a series of questions and requests for information encompassing a wide variety of topics provided by independent counsel on behalf of the Independent Trustees. The Independent Trustees also received materials and information regarding the legal standards applicable to their consideration of the Agreements and the process and criteria used by the Manager to identify and select the Sub-Advisers.
During the course of their deliberations, the Independent Trustees met twice to discuss and evaluate the materials, information and Agreements in executive session with their independent legal counsel, outside of the presence of the Trustees who are not Independent Trustees and representatives from Fund management, the Manager or any Sub-Adviser.
In reaching its decisions to renew its approval of the Agreements, the Board took into account the materials and information described above, as well as other materials and information provided to the Board throughout the year. Individual Trustees may have given different weight to different factors and information with respect to each Agreement, and the Trustees did not identify any single factor or information that, in isolation, would be controlling in deciding to approve the Agreements. The discussion below is intended to summarize the broad factors that figured prominently in the Board’s decisions to renew its approval of the Agreements rather than to be all-inclusive. These broad factors included: (i) the nature, extent and quality of the services provided to the Funds by the Manager and to the Sub-advised Funds by the Sub-Advisers; (ii) the investment performance of each Fund; (iii) estimated profitability of the Manager; (iv) fees and expenses; (v) the extent to which economies of scale may exist, and the extent to the benefits of economies of scale are shared with the Funds; and (vi) any other benefits derived by the Manager or the Sub-Advisers (or their respective affiliates) from their relationships with the Funds.
Nature, Extent and Quality of Services
The Trustees considered information regarding the nature, extent and quality of services provided to the Funds by the Manager. The Trustees also considered, among other things, the terms of the Management Agreement and the range of investment advisory services provided by the Manager. In addition, the Trustees reviewed the range of non-investment advisory services provided by the Manager consistent with the terms of the Management Agreement, notably coordinating the preparation and filing of various
regulatory documents, coordinating the preparation and assembly of Board meeting materials, and assisting the Board with certain valuation matters. The Board also received a description of the Manager’s and each Sub-Adviser’s business continuity plans and of their respective approaches to data privacy and cybersecurity, and related testing. The Board received information regarding the response of the Manager and the Sub-Advisers to the COVID-19 pandemic, including the continuation of remote work arrangements and return-to-office plans. The Board also received information about the Manager’s role as administrator of the Funds’ liquidity risk management program, the Manager’s approach to risk management, and the Manager’s vendor oversight programs.
The Trustees considered that the Sub-advised Funds operate in a “manager-of-managers” structure and reviewed the responsibilities that the Manager has under this structure, including monitoring and evaluating the performance of the Sub-Advisers, monitoring the Sub-Advisers for adherence to the stated investment objectives, strategies, policies and restrictions of the Funds and supervising the Sub-Advisers with respect to the services that the Sub-Advisers would provide under the Sub-Advisory Agreements. The Trustees also considered the process used by the Manager, consistent with this structure, to identify and recommend sub-advisers, and the Manager’s ability to monitor and oversee sub-advisers and recommend replacement sub-advisers, when necessary, and provide other services under the Management Agreement. The Board noted that investment management staff of the Manager and the Trust’s Chief Compliance Officer conduct oversight meetings with the Sub-Advisers on a periodic basis, follow through with additional inquiries on any questions or concerns that arise during the meetings and, as necessary, then report the results of the meetings to the Board. The Trustees reviewed information regarding the experience and background of the Manager’s key personnel and the Manager’s organizational structure and resources, including investment, legal and administrative capabilities of the Manager. In this regard, the Trustees recognized that the Funds may benefit from the Manager’s ability to use resources and capabilities of its affiliates in providing services to the Funds.
The Trustees considered information regarding the nature, extent and quality of services provided to the Sub-advised Funds by the Sub-Advisers. The Trustees also considered, among other things, the terms of the Sub-advisory Agreements and the range of investment
SUPPLEMENTAL INFORMATION (UNAUDITED)
advisory services provided by the Sub-Advisers under the oversight of the Manager. In evaluating these investment advisory services, the Trustees considered, among other things, the Sub-Advisers’ investment philosophies, styles and/or processes and approaches to managing the respective Sub-advised Funds. The Trustees received and evaluated information regarding the background, education, expertise and/or experience of the investment professionals who serve as portfolio managers for the Sub-advised Funds and the capabilities and resources of the Sub-Advisers.
Based upon these considerations, the Trustees concluded, within the context of their full deliberations, that the nature, extent and quality of services provided to the Funds by the Manager and the Sub-advised Funds by each respective Sub-Adviser were appropriate.
Investment Performance
In connection with each of its regular quarterly meetings, the Board receives information on the performance of each Fund, including net performance, relative performance rankings within the relevant Morningstar peer group, and performance as compared to benchmark index returns. At each quarterly Board meeting, members of the Manager’s funds management team review with the Board the economic and market environment, absolute and relative performance of each Fund, and any relevant information about risk management and style consistency in connection with management of the Funds. The Board considered investment performance for each Fund over the one-year, three-year (where available), five-year (where available) and since-inception periods.
The Board also received and reviewed a report prepared by Broadridge Financial Solutions (“Broadridge”), an independent provider of mutual fund industry data, which included comparisons of the performance of each Fund to performance of an appropriate peer universe. For details regarding each Fund’s performance, see the “Fund-by-Fund Factors” section below.
The Manager discussed with the Board factors contributing to the Funds’ performance results. In addition, for certain Funds, the Manager provided to the Board longer term performance records of the Sub-Advisers for strategies used in managing the Funds. The Board concluded that the investment performance generated by the Manager and each Sub-Adviser was generally satisfactory, or, that any steps being taken by the Manager and Sub-Advisers to address any performance issues were satisfactory.
Profitability
The Board received and considered the Manager’s estimate of its profitability, which included allocations by the Manager of its costs in providing management services to the Funds. The Board considered the estimated profitability of the Manager both overall and on a Fund-by-Fund basis.
The Board received and considered profitability information from most of the Sub-Advisers, but noted that the Manager had negotiated the fees with the Sub-Advisers at arm’s-length. Accordingly, the Board concluded that the profitability of the Sub-Advisers is a less relevant factor than Manager profitability.
Based on the consideration of this information, the Board concluded that the profitability of the Funds to the Manager was acceptable.
Fees and Expenses
The Trustees considered the management fees paid by the Funds to the Manager under the Management Agreement and evaluated the reasonableness of these fees. The Trustees received and reviewed comparative information with respect to the management fee and total expenses for each Fund and the management fees and total expenses for a peer group of other funds selected by Broadridge. The Trustees considered the Manager’s commitment to limit the total expenses of each Fund through an expense limitation agreement with the Trust. Although the Board recognized that the comparisons between the management fees and actual expenses of the Funds and those of the identified peer group are imprecise, given different terms of agreements and variations in fund strategies, the Trustees found that the comparative information supported their consideration and approval of the management fees and evaluation of the total expenses. For details regarding each Fund’s fee and expense comparisons, see the “Fund-by-Fund Factors” section below.
The Trustees considered the sub-advisory fees paid under the Sub-advisory Agreements and evaluated the reasonableness of those fees. The Trustees also considered that the fees paid to the Sub-Advisers would be paid by the Manager and not the Funds and that the Manager had negotiated the fees with the Sub-Advisers at arm’s-length.
Based on the consideration of the information and factors summarized above, as well as other relevant information and factors, the Board concluded that the management and sub-advisory fees were reasonable in
SUPPLEMENTAL INFORMATION (UNAUDITED)
light of the nature, extent and quality of services rendered to the Funds by the Manager and the Sub-Advisers.
Economies of Scale
The Board considered the extent to which economies of scale may exist, and the extent to the benefits of economies of scale are shared with the Funds. In this regard, the Board noted that for sixteen of twenty-four Funds, the management and sub-advisory fee included breakpoints that are tiered based on growth in asset levels of each such Fund and that for the other Funds, the fees reflected appropriate levels based on current and expected asset levels. The Board also noted that the expenses of the Funds are subject to expense limitations provided by the Manager. The Board noted that expected economies of scale, where they exist, may be shared through the use of fee breakpoints, expense limitations by the Manager, and/or a lower overall fee.
Ancillary Benefits
The Board considered the potential benefits, other than management fees, that the Manager and/or its affiliates may receive because of the Manager’s relationship with the Funds. The Trustees considered that the Funds were designed to serve as investment options under variable contracts issued by affiliates of the Manager that would receive fees under those contracts and that Park Avenue Securities LLC, an affiliate of the Manager and principal underwriter of the Funds, and participating insurance companies, including insurance companies affiliated with the Manager, would be entitled to receive fees from the Funds under a plan of distribution adopted pursuant to Rule 12b-1 under the 1940 Act. The Trustees considered that the Manager and its affiliates may benefit from (i) greater efficiencies in annuity administration and operations and potential cost savings due to a reduction in the number of unaffiliated funds available as annuity contract investment options, and (ii) increased dividends-received deductions due to the Funds’ status under the tax laws as disregarded entities. In addition, the Trustees considered the potential benefits, other than sub-advisory fees, that the Sub-Advisers and their affiliates may receive because of their relationships with the Funds, including the ability to receive research from soft dollar commissions consistent with Trust policies. The Trustees concluded that benefits that may accrue to the Manager and its affiliates are reasonable and the benefits that may accrue to the Sub-Advisers and their affiliates are consistent with those expected for a sub-adviser to a mutual fund such as the applicable Fund.
Fund-by-Fund Factors
The Broadridge report groups fees, expenses and performance into five quintiles, with the top quintile having the highest performance or lowest fees/expenses, and the bottom quintile having the lowest performance or highest fees/expenses. For purposes of the descriptions below, a Fund’s performance is considered “in line with” the benchmark index if it is within 0.20%.
Guardian Large Cap Fundamental Growth VIP Fund
| • | | The Board noted that the Fund’s performance was in the 3rd quintile of its performance universe for the 1-year period and in the 4th quintile for its performance universe for the 3-year and 5-year periods. The Board also noted that the Fund’s performance was below the benchmark index for the 1-year, 3-year and 5-year periods. |
| • | | The Board noted that the contractual management fee, the actual management fee and actual total expenses were in the 1st quintile of the expense group. |
Guardian Large Cap Disciplined Growth VIP Fund
| • | | The Board noted that the Fund’s performance was in the 3rd quintile of its performance universe for the 1-year and 3-year periods and in the 2nd quintile for the 5-year period. The Board also noted that the Fund’s performance was below the benchmark index for the 1-year, 3-year and 5-year periods. |
| • | | The Board noted that the contractual management fee, the actual management fee and actual total expenses were in the 1st quintile of the expense group. |
Guardian Integrated Research VIP Fund
| • | | The Board noted that the Fund’s performance was in the 5th quintile of its performance universe for the 1-year and 5-year periods and in the 4th quintile for 3-year period. The Board also noted that the Fund’s performance was below the benchmark index for the 1-year, 3-year and 5-year periods. |
| • | | The Board noted that the contractual management fee, the actual management fee and actual total expenses were in the 1st quintile of the expense group. |
Guardian Diversified Research VIP Fund
| • | | The Board noted that the Fund’s performance was in the 3rd quintile of its performance universe for the 1-year and 3-year periods and in the 2nd quintile for the 5-year period. The Board also noted that the Fund’s performance was higher than the benchmark index for the 1-year period. The Board note that the |
SUPPLEMENTAL INFORMATION (UNAUDITED)
| | | Fund’s performance was lower than the benchmark index for the 3-year and 5-year periods. |
| • | | The Board noted that the contractual management fee and actual management fee were in the 1st quintile of the expense group and that actual total expenses were in the 3rd quintile. |
Guardian Strategic Large Cap Core VIP Fund
| • | | The Board noted that the Fund’s performance was in the 1st quintile of its performance universe for the 1-year period. The Board acknowledged the Fund’s short operational history. The Board noted that the Fund’s performance was higher than the benchmark index for the 1-year period. |
| • | | The Board noted that the contractual management fee, the actual management fee and actual total expenses were in the 1st quintile of the expense group. |
Guardian Large Cap Disciplined Value VIP Fund
| • | | The Board noted that the Fund’s performance was in the 3rd quintile of its performance universe for the 1-year and 3-year periods and in the 4th quintile for the 5-year period. The Board also noted that the Fund’s performance was higher than the benchmark index for the 1-year and 3-year periods. The Board noted that the Fund’s performance was in line with the benchmark index for the 5-year period. |
| • | | The Board noted that the contractual management fee was in the 2nd quintile of the expense group, the actual management fee was in the 1st quintile of the expense group and that actual total expenses were in the 3rd quintile. |
Guardian Growth & Income VIP Fund
| • | | The Board noted that the Fund’s performance was in the 3rd quintile of its performance universe for the 1-year, 3-year and 5-year periods. The Board also noted that the Fund’s performance was higher than the benchmark index for the 1-year, 3-year and 5-year periods. |
| • | | The Board noted that the contractual management fee and the actual management fee were in the 1st quintile of the expense group and that actual total expenses were in the 3rd quintile. |
Guardian Equity Income VIP Fund
| • | | The Board noted that the Fund had less than one-year of operational history and was not able to evaluate an investment performance record for the Fund. The Board noted that it would have an opportunity to review such information in connection with future |
| | | annual reviews. The Board noted that, in the meantime, it received monthly performance reports from the Manager. |
| • | | The Board noted that the contractual management fee, the actual management fee and actual total expenses were in the 1st quintile of the expense group. |
Guardian All Cap Core VIP Fund
| • | | The Board noted that the Fund’s performance was in the 3rd quintile of its performance universe for the 1-year period. The Board acknowledged the Fund’s short operational history. The Board noted that the Fund’s performance was higher than the benchmark index for the 1-year period. |
| • | | The Board noted that the contractual management fee, the actual management fee and actual total expenses were in the 1st quintile of the expense group. |
Guardian Mid Cap Traditional Growth VIP Fund
| • | | The Board noted that the Fund’s performance was in the 1st quintile of its performance universe for the 1-year period and in the 2nd quintile for the 3-year and 5-year periods. The Board also noted that the Fund’s performance was higher than the benchmark index for the 1-year, 3-year and 5-year periods. |
| • | | The Board noted that the contractual management fee and actual management fee were in the 1st quintile of the expense group and that the actual total expenses were in the 4th quintile. |
Guardian Select Mid Cap Core VIP Fund
| • | | The Board noted that the Fund’s performance was in the 3rd quintile of its performance universe for the 1-year period. The Board acknowledged the Fund’s short operational history. The Board noted that the Fund’s performance was lower than the benchmark index for the 1-year period. |
| • | | The Board noted that the contractual management fee, the actual management fee and actual total expenses were in the 1st quintile of the expense group. |
Guardian Mid Cap Relative Value VIP Fund
| • | | The Board noted that the Fund’s performance was in the 2nd quintile of its performance universe for the 1-year, 3-year and 5-year periods. The Board also noted that the Fund’s performance was higher than the benchmark index for the 1-year, 3-year and 5-year periods. |
| • | | The Board noted that the contractual management fee and the actual management fee were in the 2nd |
SUPPLEMENTAL INFORMATION (UNAUDITED)
| | | quintile of the expense group and the actual total expenses were in the 3rd quintile of the expense group. |
Guardian Small-Mid Cap Core VIP Fund
| • | | The Board noted that the Fund’s performance was in the 5th quintile of its performance universe for the 1-year period. The Board acknowledged the Fund’s short operational history. The Board noted that the Fund’s performance was higher than the benchmark index for the 1-year period. |
| • | | The Board noted that the contractual management fee, the actual management fee and actual total expenses were in the 1st quintile of the expense group. |
Guardian Small Cap Core VIP Fund
| • | | The Board noted that the Fund’s performance was in the 5th quintile of its performance universe for the 1-year and 3-year periods. The Board noted that the Fund’s performance was lower than the benchmark index for the 1-year and 3-year periods. |
| • | | The Board noted that the contractual management fee and the actual management fee were in the 1st quintile of the expense group and the actual total expenses were in the 2nd quintile of the expense group. |
Guardian International Growth VIP Fund
| • | | The Board noted that the Fund’s performance was in the 4th quintile of its performance universe for the 1-year period, in the 2nd quintile of its performance universe for the 3-year period and in the 3rd quintile of its performance universe for the 5-year period. The Board also noted that the Fund’s performance was lower than the benchmark index for the 1-year and 5-year periods. The Board noted that the Fund’s performance was higher than the benchmark index for the 3-year period. |
| • | | The Board noted that the contractual management fee and actual management fee were in the 2nd quintile of the expense group and that the actual total expenses were in the 3rd quintile. |
Guardian International Equity VIP Fund
| • | | The Board noted that the Fund’s performance was in the 5th quintile of its performance universe for the 1-year, 3-year and 5-year periods. The Board also noted that the Fund’s performance was lower than the benchmark index for the 1-year, 3-year and 5-year periods. |
| • | | The Board noted that the contractual management fee, the actual management fee and the actual total expenses were in the 2nd quintile of the expense group. |
Guardian Global Utilities VIP Fund
| • | | The Board noted that the Fund’s performance was in the 5th quintile of its performance universe for the 1-year period and in the 4th quintile of its performance universe for the 3-year period. The Board noted that the Fund’s performance was higher than the benchmark index for the 1-year and 3-year periods. |
| • | | The Board noted that the contractual management fee and the actual management fee were in the 1st quintile of the expense group and the actual total expenses were in the 2nd quintile of the expense group. |
Guardian Balanced Allocation VIP Fund
| • | | The Board noted that the Fund had less than one-year of operational history and was not able to evaluate an investment performance record for the Fund. The Board noted that it would have an opportunity to review such information in connection with future annual reviews. The Board noted that, in the meantime, it received monthly performance reports from the Manager. |
| • | | The Board noted that the contractual management fee, the actual management fee and actual total expenses were in the 1st quintile of the expense group. |
Guardian Core Plus Fixed Income VIP Fund
| • | | The Board noted that the Fund’s performance was in the 3rd quintile of its performance universe for the 1-year and 3-year periods and in the 4th quintile of its performance universe for the 5-year period. The Board also noted that the Fund’s performance was lower than the benchmark index for the 1-year and 5-year periods. The Board noted that the Fund’s performance was in line with the benchmark index for the 3-year period. |
| • | | The Board noted that the contractual management fee and actual management fee were in the 2nd quintile of the expense group and that actual total expenses were in the 3rd quintile. |
Guardian Total Return Bond VIP Fund
| • | | The Board noted that the Fund’s performance was in the 5th quintile of its performance universe for the |
SUPPLEMENTAL INFORMATION (UNAUDITED)
| | | 1-year and 3-year periods. The Board also noted that the Fund’s performance was lower than the benchmark index for the 1-year and 3-year periods. |
| • | | The Board noted that the contractual management fee and actual management fee were in the 2nd quintile and the actual total expenses were in the 3rd quintile. |
Guardian Core Fixed Income VIP Fund
| • | | The Board noted that the Fund had less than one-year of operational history and was not able to evaluate an investment performance record for the Fund. The Board noted that it would have an opportunity to review such information in connection with future annual reviews. The Board noted that, in the meantime, it received monthly performance reports from the Manager. |
| • | | The Board noted that the contractual management fee was in the 2nd quintile of the expense group and the actual management fee and the actual total expenses were in the 1st quintile. |
Guardian Multi-Sector Bond VIP Fund
| • | | The Board noted that the Fund’s performance was in the 5th quintile of its performance universe for the 1-year and 3-year periods The Board also noted that the Fund’s performance was lower than the benchmark index for the 1-year and 3-year periods. |
| • | | The Board noted that the contractual management fee and actual total expenses were in the 1st quintile and the actual management fee was in the 2nd quintile. |
Guardian Short Duration Bond VIP Fund
| • | | The Board noted that the Fund had less than one-year of operational history and was not able to evaluate an investment performance record for the Fund. The Board noted that it would have an opportunity to review such information in connection with future annual reviews. The Board noted that, in the meantime, it received monthly performance reports from the Manager. |
| • | | The Board noted that the contractual management fee and actual total expenses were in the 3rd quintile of the expense group and the actual management fee was in the 1st quintile of the expense group. |
Guardian U.S. Government Securities VIP Fund
| • | | The Board noted that the Fund’s performance was in the 1st quintile of its performance universe for the 1-year period and in the 2nd quintile of its performance universe for the 3-year period. The Board also noted that the Fund’s performance was higher than the benchmark index for the 1-year and 3-year periods. |
| • | | The Board noted that the contractual management fee and the actual management fee were in the 1st quintile of the expense group and the actual total expenses were in the 2nd quintile of the expense group. |
Conclusion
Based on a comprehensive consideration and evaluation of all of the information and factors summarized above, among others, the Board as a whole, including the Independent Trustees, approved the Agreements.
SUPPLEMENTAL INFORMATION (UNAUDITED)
The Statement of Additional Information (“SAI”) includes additional information about the Trust’s Trustees and Officers and is available, without charge, upon request by calling toll-free 1-888-GUARDIAN (1-888-482-7342) or by visiting our website at http://guardianvpt.onlineprospectus.net/GuardianVPT/Prospectuses.
Portfolio Holdings and Proxy Voting Procedures
The Fund files its complete schedule of portfolio holdings with the Securities and Exchange Commission for the first and third quarters of each fiscal year as an exhibit to its reports on Form N-PORT. The Fund’s Form N-PORT reports are available on the Securities and Exchange Commission’s website at https://www.sec.gov. The Fund’s Form N-PORT information is also available, without charge, upon request, by calling toll-free 1-888-GUARDIAN (1-888-482-7342) or by visiting our website at http://guardianvpt.onlineprospectus.net/GuardianVPT/Prospectuses.
A description of the policies and procedures that the Fund uses to determine how to vote proxies relating to portfolio securities is included in the SAI. The SAI and information regarding how the Fund voted proxies relating to portfolio securities during the most recent 12-month period ended June 30 may be obtained (i) without charge, upon request, by calling toll-free 1-888-GUARDIAN (1-888-482-7342) or by visiting our website at http://guardianvpt.onlineprospectus.net/GuardianVPT/Prospectuses; and (ii) on the Securities and Exchange Commission’s website at https://www.sec.gov.
This report is transmitted to shareholders only. It is not authorized for use as an offer of sale or a solicitation of an offer to buy shares of the Fund unless accompanied or preceded by the Fund’s current prospectus. Past performance results shown in this report should not be considered a representation of future performance. Investment returns and principal value of shares will fluctuate so that shares, when redeemed, may be worth more or less than their original cost. Statements and other information herein are as dated and are subject to change.

The Guardian Life Insurance Company of America New York, NY 10001-2159
PUB8170
Guardian Variable
Products Trust
2023
Semiannual Report
All Data as of June 30, 2023
Guardian International Equity VIP Fund

| | |
| Not FDIC insured. May lose value. No bank guarantee. | | www.guardianlife.com |
TABLE OF CONTENTS
Guardian International Equity VIP Fund
Except as otherwise specifically stated, all information, including portfolio security positions, is as of June 30, 2023. Fund holdings will vary. Information contained herein has been obtained from sources believed reliable, but is not guaranteed.
GUARDIAN INTERNATIONAL EQUITY VIP FUND
Fund Characteristics (unaudited)
| | |
| Total Net Assets: $302,155,567 | | |
|
| |
Geographic Region Allocation1 As of June 30, 2023 |
| |
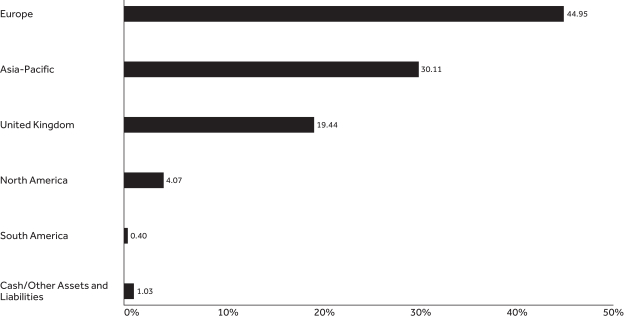 |
|
| |
Sector Allocation2 As of June 30, 2023 |
| |
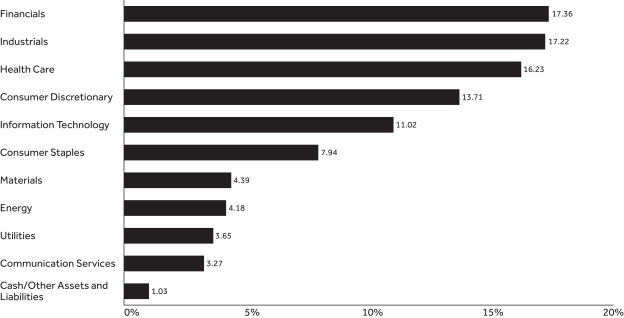 |
GUARDIAN INTERNATIONAL EQUITY VIP FUND
| | | | | | |
| | | |
Top Ten Holdings1 As of June 30, 2023 | | | | | |
| | | |
| Holding | | Country | | % of Total
Net Assets | |
| Shell PLC | | United Kingdom | | | 2.70% | |
| Roche Holding AG | | Switzerland | | | 2.47% | |
| Novo Nordisk A/S, Class B | | Denmark | | | 2.34% | |
| Mitsubishi UFJ Financial Group, Inc. | | Japan | | | 2.27% | |
| Nestle SA (Reg S) | | Switzerland | | | 2.14% | |
| SAP SE | | Germany | | | 2.12% | |
| AstraZeneca PLC | | United Kingdom | | | 2.10% | |
| Sanofi | | France | | | 2.01% | |
| Unilever PLC | | United Kingdom | | | 1.97% | |
| ASML Holding NV | | Netherlands | | | 1.87% | |
| Total | | | | | 21.99% | |
| 1 | Portfolio holdings are subject to change and should not be considered a recommendation to buy or sell individual securities. Cash includes short-term investments and net other assets and liabilities. |
| 2 | The Fund’s holdings are allocated to each sector based on the MSCI Global Industry Classification Standard (GICS®). Cash includes short-term investments and net other assets and liabilities. |
UNDERSTANDING YOUR FUND’S EXPENSES (UNAUDITED)
By investing in the Fund, you incur two types of costs: (1) transaction costs and (2) ongoing costs, including, as applicable, investment advisory fees, distribution and/or service (12b-1) fees and other Fund expenses. The example below is intended to help you understand your ongoing costs (in dollars) of investing in the Fund and to compare these costs with the ongoing costs of investing in other mutual funds.
The example is based on an investment of $1,000 invested at the beginning of the period and held for the entire period from January 1, 2023 to June 30, 2023. The table below shows the Fund’s expenses in two ways:
Expenses based on actual return
This section of the table provides information about actual account values and actual expenses. You may use the information in this section, together with the amount you invested, to estimate the expenses that you paid over the period. Simply divide your account value by $1,000 (for example, an $8,600 account value divided by $1,000 = 8.6), then multiply the result by the number in the section under the heading entitled “Expenses Paid During Period” to estimate the expenses you paid on your account during this period.
Expenses based on hypothetical 5% return for comparison purposes
This section of the table provides information about hypothetical account values and hypothetical expenses based on the Fund’s actual expense ratio and an assumed rate of return of 5% per year before expenses, which is not the Fund’s actual return. The hypothetical account values and expenses may not be used to estimate the actual ending account balance or expenses you paid for the period. You may use this information to compare the ongoing costs of investing in the Fund with the cost of investing in other mutual funds. To do so, compare this 5% hypothetical example with the 5% hypothetical examples that appear in the shareholder reports of the other funds.
Note that the expenses shown in the table are meant to highlight your ongoing costs only and do not reflect any transactional costs, such as sales charges (loads), redemption fees, or exchange fees. Therefore the second section is useful in comparing ongoing costs only, and will not help you determine the relative total costs of owning different funds. If these transactional costs were included, your costs would have been higher. Charges and expenses at the insurance company separate account level are not reflected in the table.
| | | | | | | | | | | | | | |
| | | | | |
| | | Beginning
Account Value 1/1/23 | | Ending Account Value
6/30/23 | | | Expenses Paid During Period* 1/1/23-6/30/23 | | | Expense Ratio During Period 1/1/23-6/30/23 | |
| Based on Actual Return | | $1,000.00 | | | $1,122.00 | | | | $5.68 | | | | 1.08% | |
Based on Hypothetical Return (5% Return Before Expenses) | | $1,000.00 | | | $1,019.44 | | | | $5.41 | | | | 1.08% | |
| * | Expenses are equal to the Fund’s annualized expense ratio as indicated, multiplied by the average account value over the period, multiplied by 181/365 (to reflect the one-half year period). |
SCHEDULE OF INVESTMENTS — GUARDIAN INTERNATIONAL EQUITY VIP FUND
| | | | | | | | |
| June 30, 2023 (unaudited) | | Shares | | | Value | |
| Common Stocks – 98.3% | | | | | | | | |
| | | |
| Australia – 1.2% | | | | | | | | |
| | | |
Rio Tinto Ltd. | | | 46,899 | | | $ | 3,609,276 | |
| | | | | | | | | |
| | | |
| | | | | | | | 3,609,276 | |
| | | |
| Austria – 1.1% | | | | | | | | |
| | | |
Erste Group Bank AG | | | 89,785 | | | | 3,152,688 | |
| | | | | | | | | |
| | | |
| | | | | | | | 3,152,688 | |
| | | |
| Belgium – 0.8% | | | | | | | | |
| | | |
UCB SA | | | 27,695 | | | | 2,454,535 | |
| | | | | | | | | |
| | | |
| | | | | | | | 2,454,535 | |
| | | |
| Brazil – 0.4% | | | | | | | | |
| | | |
B3 SA - Brasil Bolsa Balcao | | | 398,565 | | | | 1,216,122 | |
| | | | | | | | | |
| | | |
| | | | | | | | 1,216,122 | |
| | | |
| Canada – 0.6% | | | | | | | | |
| | | |
Toronto-Dominion Bank | | | 30,988 | | | | 1,920,683 | |
| | | | | | | | | |
| | | |
| | | | | | | | 1,920,683 | |
| | | |
| Cayman Islands – 0.9% | | | | | | | | |
| | | |
Alibaba Group Holding Ltd.(1) | | | 129,300 | | | | 1,344,728 | |
| | | |
Tencent Holdings Ltd. | | | 30,400 | | | | 1,293,901 | |
| | | | | | | | | |
| | | |
| | | | | | | | 2,638,629 | |
| | | |
| China – 0.3% | | | | | | | | |
| | | |
Contemporary Amperex Technology Co. Ltd., Class A | | | 30,600 | | | | 966,301 | |
| | | | | | | | | |
| | | |
| | | | | | | | 966,301 | |
| | | |
| Denmark – 3.6% | | | | | | | | |
| | | |
Novo Nordisk A/S, Class B | | | 43,859 | | | | 7,083,832 | |
| | | |
Vestas Wind Systems A/S(1) | | | 141,778 | | | | 3,766,904 | |
| | | | | | | | | |
| | | |
| | | | | | | | 10,850,736 | |
| | | |
| France – 8.2% | | | | | | | | |
| | | |
Carrefour SA | | | 120,243 | | | | 2,278,745 | |
| | | |
EssilorLuxottica SA | | | 23,059 | | | | 4,363,866 | |
| | | |
Legrand SA | | | 22,684 | | | | 2,250,291 | |
| | | |
Sanofi | | | 56,791 | | | | 6,088,167 | |
| | | |
Schneider Electric SE | | | 29,964 | | | | 5,461,453 | |
| | | |
TotalEnergies SE | | | 77,894 | | | | 4,464,298 | |
| | | | | | | | | |
| | | |
| | | | | | | | 24,906,820 | |
| | | |
| Germany – 6.6% | | | | | | | | |
| | | |
Bayer AG (Reg S) | | | 25,228 | | | | 1,394,755 | |
| | | |
Bayerische Motoren Werke AG | | | 31,449 | | | | 3,862,452 | |
| | | |
Infineon Technologies AG | | | 70,233 | | | | 2,896,446 | |
| | | |
SAP SE | | | 46,801 | | | | 6,390,393 | |
| | | |
Siemens AG (Reg S) | | | 32,527 | | | | 5,414,071 | |
| | | | | | | | | |
| | | |
| | | | | | | | 19,958,117 | |
| | | |
| Hong Kong – 2.9% | | | | | | | | |
| | | |
AIA Group Ltd. | | | 459,800 | | | | 4,691,424 | |
| | | |
BOC Hong Kong Holdings Ltd. | | | 884,500 | | | | 2,707,230 | |
| | | |
Techtronic Industries Co. Ltd. | | | 123,000 | | | | 1,345,884 | |
| | | | | | | | | |
| | | |
| | | | | | | | 8,744,538 | |
| | | | | | | | |
| June 30, 2023 (unaudited) | | Shares | | | Value | |
| India – 1.0% | | | | | | | | |
| | | |
HDFC Bank Ltd., ADR | | | 43,116 | | | $ | 3,005,185 | |
| | | | | | | | | |
| | | |
| | | | | | | | 3,005,185 | |
| | | |
| Indonesia – 0.7% | | | | | | | | |
| | | |
Bank Central Asia Tbk PT | | | 3,404,400 | | | | 2,098,725 | |
| | | | | | | | | |
| | | |
| | | | | | | | 2,098,725 | |
| | | |
| Ireland – 0.7% | | | | | | | | |
| | | |
Linde PLC | | | 5,779 | | | | 2,202,261 | |
| | | | | | | | | |
| | | |
| | | | | | | | 2,202,261 | |
| | | |
| Israel – 0.5% | | | | | | | | |
| | | |
Nice Ltd., ADR(1) | | | 7,355 | | | | 1,518,808 | |
| | | | | | | | | |
| | | |
| | | | | | | | 1,518,808 | |
| | | |
| Italy – 0.9% | | | | | | | | |
| | | |
FinecoBank Banca Fineco SpA | | | 198,922 | | | | 2,683,242 | |
| | | | | | | | | |
| | | |
| | | | | | | | 2,683,242 | |
| | | |
| Japan – 20.6% | | | | | | | | |
| | | |
Bridgestone Corp. | | | 105,700 | | | | 4,343,250 | |
| | | |
Daikin Industries Ltd. | | | 21,100 | | | | 4,307,030 | |
| | | |
FANUC Corp. | | | 67,100 | | | | 2,359,262 | |
| | | |
FUJIFILM Holdings Corp. | | | 46,400 | | | | 2,755,737 | |
| | | |
Hitachi Ltd. | | | 56,000 | | | | 3,465,930 | |
| | | |
KDDI Corp. | | | 127,200 | | | | 3,931,223 | |
| | | |
Keyence Corp. | | | 6,300 | | | | 2,979,385 | |
| | | |
Kubota Corp. | | | 172,900 | | | | 2,518,694 | |
| | | |
Makita Corp. | | | 49,700 | | | | 1,395,070 | |
| | | |
MISUMI Group, Inc. | | | 74,800 | | | | 1,497,082 | |
| | | |
Mitsubishi UFJ Financial Group, Inc. | | | 927,800 | | | | 6,848,428 | |
| | | |
Murata Manufacturing Co. Ltd. | | | 37,600 | | | | 2,157,483 | |
| | | |
Nitori Holdings Co. Ltd. | | | 16,800 | | | | 1,879,735 | |
| | | |
Recruit Holdings Co. Ltd. | | | 70,600 | | | | 2,253,095 | |
| | | |
Sekisui Chemical Co. Ltd. | | | 151,200 | | | | 2,187,143 | |
| | | |
SMC Corp. | | | 6,000 | | | | 3,334,802 | |
| | | |
Sony Group Corp. | | | 53,200 | | | | 4,771,914 | |
| | | |
Terumo Corp. | | | 109,800 | | | | 3,492,093 | |
| | | |
Tokio Marine Holdings, Inc. | | | 116,500 | | | | 2,689,891 | |
| | | |
Toyota Motor Corp. | | | 182,600 | | | | 2,918,137 | |
| | | | | | | | | |
| | | |
| | | | | | | | 62,085,384 | |
| | | |
| Luxembourg – 0.5% | | | | | | | | |
| | | |
Spotify Technology SA(1) | | | 10,088 | | | | 1,619,628 | |
| | | | | | | | | |
| | | |
| | | | | | | | 1,619,628 | |
| | | |
| Netherlands – 4.4% | | | | | | | | |
| | | |
Aalberts NV | | | 33,588 | | | | 1,413,943 | |
| | | |
Adyen NV(1)(2) | | | 1,050 | | | | 1,819,245 | |
| | | |
Akzo Nobel NV | | | 36,194 | | | | 2,957,431 | |
| | | |
ASML Holding NV | | | 7,819 | | | | 5,659,947 | |
| | | |
Universal Music Group NV | | | 64,822 | | | | 1,440,188 | |
| | | | | | | | | |
| | | |
| | | | | | | | 13,290,754 | |
| | | | |
| 4 | | | | The accompanying notes are an integral part of these financial statements. |
SCHEDULE OF INVESTMENTS — GUARDIAN INTERNATIONAL EQUITY VIP FUND
| | | | | | | | |
| June 30, 2023 (unaudited) | | Shares | | | Value | |
| Norway – 1.4% | | | | | | | | |
| | | |
DNB Bank ASA | | | 155,716 | | | $ | 2,911,228 | |
| | | |
Norsk Hydro ASA | | | 232,505 | | | | 1,381,958 | |
| | | | | | | | | |
| | | |
| | | | | | | | 4,293,186 | |
| | | |
| Republic of Korea – 2.1% | | | | | | | | |
| | | |
Samsung Electronics Co. Ltd. | | | 79,568 | | | | 4,385,505 | |
| | | |
Samsung SDI Co. Ltd. | | | 3,709 | | | | 1,897,609 | |
| | | | | | | | | |
| | | |
| | | | | | | | 6,283,114 | |
| | | |
| Spain – 3.8% | | | | | | | | |
| | | |
Banco Bilbao Vizcaya Argentaria SA | | | 582,230 | | | | 4,489,412 | |
| | | |
CaixaBank SA | | | 607,915 | | | | 2,521,541 | |
| | | |
Iberdrola SA | | | 347,694 | | | | 4,541,538 | |
| | | | | | | | | |
| | | |
| | | | | | | | 11,552,491 | |
| | | |
| Sweden – 2.1% | | | | | | | | |
| | | |
Nibe Industrier AB, Class B | | | 72,624 | | | | 690,275 | |
| | | |
Sandvik AB | | | 163,565 | | | | 3,193,869 | |
| | | |
Svenska Handelsbanken AB, Class A | | | 308,397 | | | | 2,586,747 | |
| | | | | | | | | |
| | | |
| | | | | | | | 6,470,891 | |
| | | |
| Switzerland – 10.1% | | | | | | | | |
| | | |
Alcon, Inc. | | | 41,976 | | | | 3,487,602 | |
| | | |
Chocoladefabriken Lindt & Spruengli AG | | | 172 | | | | 2,160,602 | |
| | | |
Cie Financiere Richemont SA (Reg S), Class A | | | 18,576 | | | | 3,151,858 | |
| | | |
Lonza Group AG (Reg S) | | | 6,131 | | | | 3,661,375 | |
| | | |
Nestle SA (Reg S) | | | 53,767 | | | | 6,469,498 | |
| | | |
On Holding AG, Class A(1) | | | 75,245 | | | | 2,483,085 | |
| | | |
Roche Holding AG | | | 24,375 | | | | 7,448,890 | |
| | | |
Sika AG (Reg S) | | | 5,292 | | | | 1,513,632 | |
| | | | | | | | | |
| | | |
| | | | | | | | 30,376,542 | |
| | | |
| Taiwan – 0.9% | | | | | | | | |
| | | |
Taiwan Semiconductor Manufacturing Co. Ltd. | | | 143,000 | | | | 2,664,852 | |
| | | | | | | | | |
| | | |
| | | | | | | | 2,664,852 | |
| | | |
| United Kingdom – 19.4% | | | | | | | | |
| | | |
Antofagasta PLC | | | 85,989 | | | | 1,602,484 | |
| | | |
AstraZeneca PLC | | | 44,283 | | | | 6,343,017 | |
| | | |
Bunzl PLC | | | 67,642 | | | | 2,575,349 | |
| | | |
Burberry Group PLC | | | 111,426 | | | | 2,998,865 | |
| | | |
Diageo PLC | | | 75,541 | | | | 3,240,402 | |
| | | |
GSK PLC | | | 182,895 | | | | 3,230,782 | |
| | | |
HSBC Holdings PLC | | | 491,617 | | | | 3,888,397 | |
| | | |
Kingfisher PLC | | | 407,369 | | | | 1,198,467 | |
| | | |
National Grid PLC | | | 172,670 | | | | 2,281,682 | |
| | | |
Prudential PLC | | | 228,795 | | | | 3,226,545 | |
| | | |
Reckitt Benckiser Group PLC | | | 52,035 | | | | 3,907,844 | |
| | | |
RELX PLC | | | 114,282 | | | | 3,809,980 | |
| | | |
Shell PLC | | | 270,874 | | | | 8,153,297 | |
| | | |
SSE PLC | | | 179,126 | | | | 4,196,419 | |
| | | | | | | | |
| June 30, 2023 (unaudited) | | Shares | | | Value | |
| United Kingdom (continued) | | | | | | | | |
| | | |
Unilever PLC | | | 114,117 | | | $ | 5,950,346 | |
| | | |
Whitbread PLC | | | 49,812 | | | | 2,143,573 | |
| | | | | | | | | |
| | | |
| | | | | | | | 58,747,449 | |
| | | |
| United States – 2.6% | | | | | | | | |
| | | |
Booking Holdings, Inc.(1) | | | 1,045 | | | | 2,821,845 | |
| | | |
Liberty Media Corp-Liberty Formula One, Class C(1) | | | 21,383 | | | | 1,609,712 | |
| | | |
Lululemon Athletica, Inc.(1) | | | 5,957 | | | | 2,254,725 | |
| | | |
MercadoLibre, Inc.(1) | | | 882 | | | | 1,044,817 | |
| | | | | | | | | |
| | | |
| | | | | | | | 7,731,099 | |
| | | |
Total Common Stocks
(Cost $293,372,020) | | | | | | | 297,042,056 | |
| Preferred Stocks – 0.7% | | | | | | | | |
| | | |
| Germany – 0.7% | | | | | | | | |
| | | |
Dr. Ing. h.c. F. Porsche AG(2) | | | 16,233 | | | | 2,014,762 | |
| | | |
Total Preferred Stocks
(Cost $1,311,148) | | | | | | | 2,014,762 | |
| | | | | | | | |
| | | Principal
Amount | | | Value | |
| Repurchase Agreements – 0.6% | |
| | | |
Fixed Income Clearing Corp., 1.52%, dated 6/30/2023, proceeds at maturity value of $1,760,416, due 7/3/2023(3) | | $ | 1,760,193 | | | | 1,760,193 | |
| | | |
Total Repurchase Agreements
(Cost $1,760,193) | | | | | | | 1,760,193 | |
| | | |
Total Investments – 99.6%
(Cost $296,443,361) | | | | | | | 300,817,011 | |
| | |
| Assets in excess of other liabilities – 0.4% | | | | 1,338,556 | |
| | | |
| Total Net Assets – 100.0% | | | | | | $ | 302,155,567 | |
| (1) | Non–income–producing security. |
| (2) | Securities that may be resold in transactions exempt from registration under Rule 144A of the Securities Act of 1933, as amended, normally to certain qualified buyers. At June 30, 2023, the aggregate market value of these securities amounted to $3,834,007, representing 1.3% of net assets. These securities have been deemed liquid by the investment adviser pursuant to the Fund’s liquidity procedures approved by the Board of Trustees. |
| (3) | The table below presents collateral for repurchase agreements. |
| | | | | | | | | | | | | | | | |
| Security | | Coupon | | | Maturity
Date | �� | | Principal
Amount | | | Value | |
| U.S. Treasury Note | | | 4.625% | | | | 3/15/2026 | | | $ | 1,769,300 | | | $ | 1,795,443 | |
Legend:
ADR — American Depositary Receipt
| | | | |
| The accompanying notes are an integral part of these financial statements. | | | | 5 |
SCHEDULE OF INVESTMENTS — GUARDIAN INTERNATIONAL EQUITY VIP FUND
The following is a summary of the inputs used as of June 30, 2023 in valuing the Fund’s investments. For more information on valuation inputs, please refer to Note 2a of the accompanying Notes to Financial Statements.
| | | | | | | | | | | | | | | | |
| | | Valuation Inputs | | | | |
| Investments in Securities (unaudited) | | Level 1 | | | Level 2 | | | Level 3 | | | Total | |
| Common Stocks | | | | | | | | | | | | | | | | |
Australia | | $ | — | | | $ | 3,609,276 | * | | $ | — | | | $ | 3,609,276 | |
Austria | | | — | | | | 3,152,688 | * | | | — | | | | 3,152,688 | |
Belgium | | | — | | | | 2,454,535 | * | | | — | | | | 2,454,535 | |
Brazil | | | 1,216,122 | | | | — | | | | — | | | | 1,216,122 | |
Canada | | | 1,920,683 | | | | — | | | | — | | | | 1,920,683 | |
Cayman Islands | | | — | | | | 2,638,629 | * | | | — | | | | 2,638,629 | |
China | | | — | | | | 966,301 | * | | | — | | | | 966,301 | |
Denmark | | | — | | | | 10,850,736 | * | | | — | | | | 10,850,736 | |
France | | | — | | | | 24,906,820 | * | | | — | | | | 24,906,820 | |
Germany | | | — | | | | 19,958,117 | * | | | — | | | | 19,958,117 | |
Hong Kong | | | — | | | | 8,744,538 | * | | | — | | | | 8,744,538 | |
India | | | 3,005,185 | | | | — | | | | — | | | | 3,005,185 | |
Indonesia | | | — | | | | 2,098,725 | * | | | — | | | | 2,098,725 | |
Ireland | | | 2,202,261 | | | | — | | | | — | | | | 2,202,261 | |
Israel | | | 1,518,808 | | | | — | | | | — | | | | 1,518,808 | |
Italy | | | — | | | | 2,683,242 | * | | | — | | | | 2,683,242 | |
Japan | | | — | | | | 62,085,384 | * | | | — | | | | 62,085,384 | |
Luxembourg | | | 1,619,628 | | | | — | | | | — | | | | 1,619,628 | |
Netherlands | | | — | | | | 13,290,754 | * | | | — | | | | 13,290,754 | |
Norway | | | — | | | | 4,293,186 | * | | | — | | | | 4,293,186 | |
Republic of Korea | | | — | | | | 6,283,114 | * | | | — | | | | 6,283,114 | |
Spain | | | — | | | | 11,552,491 | * | | | — | | | | 11,552,491 | |
Sweden | | | — | | | | 6,470,891 | * | | | — | | | | 6,470,891 | |
Switzerland | | | 2,483,085 | | | | 27,893,457 | * | | | — | | | | 30,376,542 | |
Taiwan | | | — | | | | 2,664,852 | * | | | — | | | | 2,664,852 | |
United Kingdom | | | — | | | | 58,747,449 | * | | | — | | | | 58,747,449 | |
United States | | | 7,731,099 | | | | — | | | | — | | | | 7,731,099 | |
| Preferred Stocks | | | | | | | | | | | | | | | | |
Germany | | | — | | | | 2,014,762 | * | | | — | | | | 2,014,762 | |
| Repurchase Agreements | | | — | | | | 1,760,193 | | | | — | | | | 1,760,193 | |
| Total | | $ | 21,696,871 | | | $ | 279,120,140 | | | $ | — | | | $ | 300,817,011 | |
| * | Consists of certain foreign securities whose values were determined by a pricing service using pricing models (See Note 2a in Notes to Financial Statements). These investments in securities were classified as Level 2 rather than Level 1. |
| | | | |
| 6 | | | | The accompanying notes are an integral part of these financial statements. |
FINANCIAL INFORMATION — GUARDIAN INTERNATIONAL EQUITY VIP FUND
| | | | |
Statement of Assets and Liabilities As of June 30, 2023 (unaudited) | | | |
Assets | | | | |
| | |
Investments, at value | | $ | 300,817,011 | |
| | |
Foreign currency, at value | | | 410,653 | |
| | |
Foreign tax reclaims receivable | | | 890,552 | |
| | |
Dividends/interest receivable | | | 511,633 | |
| | |
Receivable for investments sold | | | 22,053 | |
| | |
Reimbursement receivable from adviser | | | 15,707 | |
| | |
Receivable for fund shares subscribed | | | 570 | |
| | |
Prepaid expenses | | | 3,470 | |
| | | | | |
| | |
Total Assets | | | 302,671,649 | |
| | | | | |
| | |
Liabilities | | | | |
| | |
Investment advisory fees payable | | | 191,266 | |
| | |
Payable for fund shares redeemed | | | 160,890 | |
| | |
Distribution fees payable | | | 62,385 | |
| | |
Accrued custodian and accounting fees | | | 43,161 | |
| | |
Accrued audit fees | | | 15,050 | |
| | |
Accrued trustees’ and officers’ fees | | | 6,549 | |
| | |
Accrued expenses and other liabilities | | | 36,781 | |
| | | | | |
| | |
Total Liabilities | | | 516,082 | |
| | | | | |
| | |
Total Net Assets | | $ | 302,155,567 | |
| | | | | |
| | |
Net Assets Consist of: | | | | |
| | |
Paid-in capital | | $ | 300,164,526 | |
| | |
Distributable earnings | | | 1,991,041 | |
| | | | | |
| | |
Total Net Assets | | $ | 302,155,567 | |
| | | | | |
Investments, at Cost | | $ | 296,443,361 | |
| | | | | |
Foreign Currency, at Cost | | $ | 415,456 | |
| | | | | |
| | |
Pricing of Shares | | | | |
| | |
Shares of Beneficial Interest Outstanding with No Par Value | | | 23,639,024 | |
| | |
Net Asset Value Per Share | | | $12.78 | |
| | | | | |
| | | | |
Statement of Operations For the Six Months Ended June 30, 2023 (unaudited) | |
Investment Income | | | | |
| | |
Dividends | | $ | 6,097,960 | |
| | |
Interest | | | 9,956 | |
| | |
Withholding taxes on foreign dividends | | | (691,788 | ) |
| | | | | |
| | |
Total Investment Income | | | 5,416,128 | |
| | | | | |
| | |
Expenses | | | | |
| | |
Investment advisory fees | | | 1,209,848 | |
| | |
Distribution fees | | | 395,018 | |
| | |
Custodian and accounting fees | | | 57,663 | |
| | |
Professional fees | | | 45,208 | |
| | |
Trustees’ and officers’ fees | | | 40,976 | |
| | |
Administrative fees | | | 20,877 | |
| | |
Transfer agent fees | | | 7,153 | |
| | |
Shareholder reports | | | 6,749 | |
| | |
Other expenses | | | 10,922 | |
| | | | | |
| | |
Total Expenses | | | 1,794,414 | |
| | |
Less: Fees waived | | | (87,938 | ) |
| | | | | |
| | |
Total Expenses, Net | | | 1,706,476 | |
| | | | | |
| | |
Net Investment Income/(Loss) | | | 3,709,652 | |
| | | | | |
| | |
Realized Gain/(Loss) and Change in Unrealized Appreciation/(Depreciation) on Investments and Foreign Currency Transactions | | | | |
| | |
Net realized gain/(loss) from investments | | | (10,211,944 | ) |
| | |
Net realized gain/(loss) from foreign currency transactions | | | 37,934 | |
| | |
Net change in unrealized appreciation/(depreciation) on investments | | | 44,570,544 | |
| | |
Net change in unrealized appreciation/(depreciation) on translation of assets and liabilities in foreign currencies | | | 17,063 | |
| | | | | |
| | |
Net Gain on Investments and Foreign Currency Transactions | | | 34,413,597 | |
| | | | | |
| | |
Net Increase in Net Assets Resulting From Operations | | $ | 38,123,249 | |
| | | | | |
| | | | | |
| | | | |
| The accompanying notes are an integral part of these financial statements. | | | | 7 |
FINANCIAL INFORMATION — GUARDIAN INTERNATIONAL EQUITY VIP FUND
| | | | | | | | |
Statements of Changes in Net Assets Six Months Ended Numbers are unaudited | | | | | | |
| | | |
| | | For the Six Months Ended
6/30/23 | | | For the Year Ended
12/31/22 | |
| | | | |
Operations | | | | | | | | |
| | | |
Net investment income/(loss) | | $ | 3,709,652 | | | $ | 4,451,101 | |
| | | |
Net realized gain/(loss) from investments and foreign currency transactions | | | (10,174,010 | ) | | | (12,361,227 | ) |
| | | |
Net change in unrealized appreciation/(depreciation) on investments and
translation of assets and liabilities in foreign currencies | | | 44,587,607 | | | | (66,148,218 | ) |
| | | | | | | | | |
| | | |
Net Increase/(Decrease) in Net Assets Resulting from Operations | | | 38,123,249 | | | | (74,058,344 | ) |
| | | | | | | | | |
| | | |
Capital Share Transactions | | | | | | | | |
| | | |
Proceeds from sales of shares | | | 73,893 | | | | 34,530,478 | |
| | | |
Cost of shares redeemed | | | (61,053,697 | ) | | | (47,367,070 | ) |
| | | | | | | | | |
| | | |
Net Decrease in Net Assets Resulting from Capital Share Transactions | | | (60,979,804 | ) | | | (12,836,592 | ) |
| | | | | | | | | |
| | | |
Net Decrease in Net Assets | | | (22,856,555 | ) | | | (86,894,936 | ) |
| | | | | | | | | |
| | | |
Net Assets | | | | | | | | |
| | | |
Beginning of period | | | 325,012,122 | | | | 411,907,058 | |
| | | | | | | | | |
| | | |
End of period | | $ | 302,155,567 | | | $ | 325,012,122 | |
| | | | | | | | | |
| | | |
Other Information: | | | | | | | | |
| | | |
Shares | | | | | | | | |
| | | |
Sold | | | 5,856 | | | | 2,969,799 | |
| | | |
Redeemed | | | (4,904,220 | ) | | | (4,125,624 | ) |
| | | | | | | | | |
| | | |
Net Decrease | | | (4,898,364 | ) | | | (1,155,825 | ) |
| | | | | | | | | |
| | | | | | | | | |
| | | | |
| 8 | | | | The accompanying notes are an integral part of these financial statements. |
This Page Intentionally Left Blank
FINANCIAL INFORMATION — GUARDIAN INTERNATIONAL EQUITY VIP FUND
The Financial Highlights table is intended to help you understand the Fund’s financial performance for the past six reporting periods (or, if shorter, the period since inception). Certain information reflects financial results for a single Fund share. The total returns in the table represent the rate that an investor would have earned (or lost) on an investment in the Fund.
| | | | | | | | | | | | | | | | | | | | | | | | |
Financial Highlights Six Months Ended Numbers are unaudited | | | | | | | | | | | | | | | | |
| | | Per Share Operating Performance | | | | |
| | |
Net Asset Value,
Beginning of
Period | | | Net Investment
Income(1) | | | Net Realized
and Unrealized
Gain/(Loss) | | | Total
Operations | | | Net Asset
Value, End of
Period | | | Total
Return(2) | |
| | | | | | | |
Six Months Ended 6/30/23 | | $ | 11.39 | | | $ | 0.14 | | | $ | 1.25 | | | $ | 1.39 | | | $ | 12.78 | | | | 12.20% | (4) |
| | | | | | | |
Year Ended 12/31/22 | | | 13.87 | | | | 0.15 | | | | (2.63) | | | | (2.48) | | | | 11.39 | | | | (17.88)% | |
| | | | | | | |
Year Ended 12/31/21 | | | 13.16 | | | | 0.30(5) | | | | 0.41 | | | | 0.71 | | | | 13.87 | | | | 5.40% | |
| | | | | | | |
Year Ended 12/31/20 | | | 12.15 | | | | 0.12 | | | | 0.89 | | | | 1.01 | | | | 13.16 | | | | 8.31% | |
| | | | | | | |
Year Ended 12/31/19 | | | 10.01 | | | | 0.22 | | | | 1.92 | | | | 2.14 | | | | 12.15 | | | | 21.38% | |
| | | | | | | |
Year Ended 12/31/18 | | | 11.80 | | | | 0.20 | | | | (1.99) | | | | (1.79) | | | | 10.01 | | | | (15.17)% | |
| | | | |
| 10 | | | | The accompanying notes are an integral part of these financial statements. |
FINANCIAL INFORMATION — GUARDIAN INTERNATIONAL EQUITY VIP FUND
| | | | | | | | | | | | | | | | | | | | | | |
| | | | | | | | | | | | | | | | |
| Ratios/Supplemental Data | |
Net Assets, End
of Period (000s) | | | Net Ratio of
Expenses to
Average
Net Assets(3) | | | Gross Ratio of
Expenses to
Average Net
Assets | | | Net Ratio of Net
Investment Income
to Average Net Assets(3) | | | Gross Ratio of Net
Investment Income
to Average
Net Assets | | | Portfolio
Turnover Rate | |
| | | | | | |
| $ | 302,156 | | | | 1.08% | (4) | | | 1.14% | (4) | | | 2.35% | (4) | | | 2.29% | (4) | | | 15% | (4) |
| | | | | | |
| | 325,012 | | | | 1.08% | | | | 1.12% | | | | 1.30% | | | | 1.26% | | | | 136% | |
| | | | | | |
| | 411,907 | | | | 1.06% | | | | 1.13% | | | | 2.20% | (5) | | | 2.13% | (5) | | | 40% | |
| | | | | | |
| | 234,233 | | | | 1.00% | | | | 1.18% | | | | 1.03% | | | | 0.85% | | | | 38% | |
| | | | | | |
| | 220,989 | | | | 0.94% | | | | 1.20% | | | | 1.99% | | | | 1.73% | | | | 32% | |
| | | | | | |
| | 208,182 | | | | 0.94% | | | | 1.23% | | | | 1.79% | | | | 1.50% | | | | 74% | |
| (1) | Calculated based on the average shares outstanding during the period. |
| (2) | Total returns do not reflect the effects of charges deducted pursuant to the terms of The Guardian Insurance & Annuity Company, Inc.’s variable contracts. Inclusion of such charges would reduce the total returns for all periods shown. |
| (3) | Net Ratio of Expenses to Average Net Assets and Net Ratio of Net Investment Income to Average Net Assets include the effect of fee waivers and expense limitations. |
| (4) | Ratios for periods less than one year have been annualized, except for total return and portfolio turnover rate. |
| (5) | Reflects a special dividend paid out during the year by one of the Fund’s holdings. Had the Fund not received the special dividend, the Net Investment Income per share would have been $0.19, the Net Ratio of Net Investment Income to Average Net Assets would have been 1.37%, and the Gross Ratio of Net Investment Income to Average Net Assets would have been 1.30%. |
| | | | |
| The accompanying notes are an integral part of these financial statements. | | | | 11 |
NOTES TO FINANCIAL STATEMENTS — GUARDIAN INTERNATIONAL EQUITY VIP FUND
June 30, 2023 (unaudited)
1. Organization
Guardian Variable Products Trust (the “Trust”), a Delaware statutory trust organized on January 12, 2016, is registered under the Investment Company Act of 1940, as amended (the “1940 Act”), as an open-end management investment company. The Trust currently has twenty-four series. Guardian International Equity VIP Fund (the “Fund”) is a series of the Trust. The Fund is a diversified fund and commenced operations on September 1, 2016. The financial statements for other series of the Trust are presented in separate reports.
The Trust has authorized an unlimited number of shares of beneficial interest with no par value. Shares are bought and sold at closing net asset value (“NAV”). Shares of the Fund are only sold to certain separate accounts of The Guardian Insurance & Annuity Company, Inc. (“GIAC”) that fund certain variable annuity contracts and variable life insurance policies issued by GIAC. GIAC is a wholly-owned subsidiary of The Guardian Life Insurance Company of America (“Guardian Life”).
The Fund seeks long-term capital appreciation.
2. Significant Accounting Policies
The following is a summary of significant accounting policies followed by the Fund in the preparation of its financial statements. The Fund follows the investment company accounting and reporting guidance of the Financial Accounting Standards Board (“FASB”) Accounting Standards Codification Topic 946 Financial Services – Investment Companies. The following policies are in conformity with accounting principles generally accepted in the United States of America (“GAAP”). The preparation of financial statements in accordance with GAAP requires management to make estimates and assumptions that affect the reported amounts and disclosures in the financial statements. Actual results could differ from those estimates.
a. Investment Valuations The Board of Trustees has designated Park Avenue Institutional Advisers LLC (“Park Avenue”) as the valuation designee for the Fund pursuant to Rule 2a-5 under the 1940 Act. Park Avenue has established a Fair Valuation Committee and has adopted fair valuation procedures that provide methodologies for fair valuing securities. These procedures include monitoring the appropriateness of fair values based on results of ongoing valuation oversight, including but not limited to consideration of security specific events, market events, and pricing
vendor and broker-dealer due diligence. The Fair Valuation Committee oversees and carries out the policies for the valuation of investments held in the Fund. The Fair Valuation Committee is responsible for discussing and assessing the potential impacts to the fair values on an ongoing basis, and reports to the Board of Trustees on at least a quarterly basis.
Equity securities traded on an exchange other than NASDAQ Stock Market, LLC (“NASDAQ”) are valued at the last reported sale price on the principal exchange or market on which they are traded; or, if there were no sales that day, at the mean between the closing bid and ask prices. Securities traded on the NASDAQ are generally valued at the NASDAQ official closing price, which may not be the last sale price. If the NASDAQ official closing price is not available for a security, that security is generally valued at the mean between the closing bid and ask prices. Repurchase agreements are carried at cost, which approximates fair value (see Note 5d). Foreign securities are valued in the currencies of the markets in which they trade and then converted to U.S. dollars by the application of foreign exchange rates at the close of the New York Stock Exchange (“NYSE”). Forward foreign currency contracts, if any, are valued at the mean between the bid and ask rates for the specified time interpolated from rates for proximate time periods.
Securities for which market quotations are not readily available or securities whose values have been materially affected by events occurring before the Fund’s valuation time but after the close of the securities’ principal exchange or market are valued at their fair values as determined in good faith by Park Avenue, as the Board of Trustee’s valuation designee (as defined in Rule 2a-5 under the 1940 Act), in accordance with Park Avenue’s procedures and under the general oversight of the Board of Trustees. In addition, the values of the Fund’s investments in foreign securities are generally determined by a pricing service using pricing models designed to estimate likely changes in the values of those securities. Certain foreign equity instruments are valued by applying international fair value factors provided by approved pricing services. The factors seek to adjust the local closing price for movements of local markets post closing, but prior to the time the NAVs are calculated. Valuations reflected in this report are as of the report date. As a result, changes in valuation due to market events and/or issuer related events after the report date and prior to issuance of the report are not reflected herein.
NOTES TO FINANCIAL STATEMENTS — GUARDIAN INTERNATIONAL EQUITY VIP FUND
Various inputs are used in determining the valuation of the Fund’s investments. These inputs are summarized in three broad levels listed below.
| • | | Level 1 - unadjusted inputs using quoted prices in active markets for identical investments. |
| • | | Level 2 - other significant observable inputs, including, but not limited to, quoted prices for similar investments, inputs other than quoted prices that are observable for investments (such as interest rates, prepayment speeds, credit risks, etc.) or other market corroborated inputs. |
| • | | Level 3 - significant unobservable inputs (including the Fund’s own assumptions in determining the fair value of investments). |
Inputs may include price information, volatility statistics, specific and broad credit data, liquidity statistics, and other factors. A financial instrument’s level within the fair value hierarchy is based on the lowest level of any input; both individually and in aggregate, that is significant to the fair value measurement. However, the determination of what constitutes “observable” requires significant judgment by the Trust. The Trust considers observable data to be that market data which is readily available, regularly distributed or updated, reliable and verifiable, and provided by independent sources that are actively involved in the relevant market. The inputs or methodology used for valuing securities are not necessarily an indication of the risk associated with investing in those securities. Changes in valuation techniques may result in transfers into or out of a financial instrument’s assigned level within the hierarchy.
The FASB requires reporting entities to make disclosures about purchases, sales, issuances and settlements of Level 3 securities on a gross basis. For the six months ended June 30, 2023, there were no transfers into or out of Level 3 of the fair value hierarchy.
In determining a financial instrument’s placement within the hierarchy, the Trust separates the Fund’s investment portfolio into two categories: investments and derivatives (e.g., futures). A summary of inputs used to value the Fund’s assets and liabilities carried at fair value as of June 30, 2023 is included in the Schedule of Investments.
Investments Investments whose values are based on quoted market prices in active markets, and are therefore classified within Level 1, include active listed equities. Investments that trade in markets that are not considered to be active, but are valued based on quoted market prices, dealer quotations or alternative pricing
sources supported by observable inputs are classified within Level 2. These include certain U.S. government and sovereign obligations, most government agency securities, investment-grade corporate bonds, certain mortgage products, state, municipal and provincial obligations, and certain foreign equity securities, including securities whose prices may have been affected by events occurring after the close of trading on their principal exchange or market and, as a result, whose values are determined by a pricing service as described above, or securities whose values are otherwise determined using fair valuation methods approved by the Fund’s Board of Trustees.
Investments classified within Level 3 have significant unobservable inputs, as they trade infrequently or not at all. Level 3 investments include, among others, private placement securities. When observable prices are not available for these securities, the Trust uses one or more valuation techniques for which sufficient and reliable data is available. The inputs used by the Trust in estimating the value of Level 3 investments include, for example, the original transaction price, recent transactions in the same or similar instruments, completed or pending third-party transactions in the underlying investment or comparable issuers, subsequent rounds of financing, recapitalizations, and other transactions across the capital structure. Level 3 investments may also be adjusted to reflect illiquidity and/or non-transferability, with the amount of such discount estimated by the Trust in the absence of market information. Assumptions used by the Trust due to the lack of observable inputs may significantly impact the resulting fair value and therefore the Fund’s results of operations. As of June 30, 2023, the Fund had no securities classified as Level 3.
Derivatives Exchange-traded derivatives, such as futures contracts, exchange-traded option contracts and certain swaps, are typically classified within Level 1 or Level 2 of the fair value hierarchy depending on whether or not they are deemed to be actively traded. Certain non-exchange-traded derivatives, such as generic forwards, certain swaps and options, have inputs which can generally be corroborated by market data and are therefore classified within Level 2. During the six months ended June 30, 2023, the Fund did not hold any derivatives.
b. Securities Transactions Securities transactions are accounted for on the date securities are purchased or sold (trade date). Realized gains or losses on securities transactions are determined on the basis of specific identification.
NOTES TO FINANCIAL STATEMENTS — GUARDIAN INTERNATIONAL EQUITY VIP FUND
c. Futures Contracts The Fund may enter into financial futures contracts. In entering into such contracts, the Fund is required to deposit with the counterparty, either in cash or securities, an amount equal to a certain percentage of the face value of the contract. Subsequent payments are received or made by the Fund each day, depending on the daily fluctuations in the values of the contracts, and are recorded for financial statement purposes as variation margin received or paid by the Fund. Daily changes in variation margin are recognized as unrealized gains or losses by the Fund. The Fund may not achieve the anticipated benefits of the financial futures contracts and may realize a loss.
d. Foreign Currency Translation The accounting records of the Fund are maintained in U.S. dollars. Investment securities and all other assets and liabilities of the Fund denominated in a foreign currency are generally translated into U.S. dollars at the exchange rates quoted at the close of the NYSE on each business day. The market value of investment securities and other assets and liabilities are translated at the exchange rate as of the valuation date. Purchases and sales of securities, income receipts, and expense payments are translated into U.S. dollars at the exchange rates in effect on the dates of the respective transactions. The Fund does not isolate the portion of the fluctuations on investments resulting from changes in foreign currency exchange rates from the fluctuations in market prices of investments held. Such fluctuations are included in the Net change in net realized and unrealized gain/(loss) from investments on the Statement of Operations.
Reported realized foreign currency gains and losses arise from the disposition of foreign currency, currency gains or losses realized between the trade and settlement dates on securities transactions, and the difference between the amounts of dividends, interest and foreign withholding taxes recorded on the Fund’s books on the transaction date and the U.S. dollar equivalent of the amounts actually received or paid. These reported realized foreign currency gains and losses, if any, are included in Net realized gain/(loss) from foreign currency transactions on the Statement of Operations. Unrealized foreign currency gains and losses arise from changes (due to changes in exchange rates) in the value of foreign currency and other assets and liabilities denominated in foreign currencies, which are held at period end, if any, and are included in Net change in unrealized appreciation/(depreciation) on translation of assets and liabilities in foreign currencies on the Statement of Operations.
e. Foreign Capital Gains Tax The Fund may be subject to foreign taxes on income, gains on investments or currency purchases/repatriation, a portion of which may be recoverable. The Fund will accrue such taxes and recoveries as applicable, based upon their current interpretation of tax rules and regulations that exist in the markets in which they invest.
f. Investment Income Dividend income net of foreign taxes withheld, if any, is generally recorded on the ex-dividend date. Distributions received from real estate investment trusts, if any, may be classified as dividends, capital gains and/or return of capital. Interest income, which includes amortization/accretion of premium/discount, is determined using the interest income accrual method, and is accrued and recorded daily.
g. Allocation of Income and Expenses Many of the expenses of the Trust can be directly attributed to a specific series of the Trust. Expenses that cannot be directly attributed to a specific series of the Trust are generally apportioned among all the series in the Trust, based on relative net assets. In calculating net asset value per share for each series of the Trust, investment income, realized and unrealized gains and losses, and expenses other than series-specific expenses are allocated daily to each series based upon the proportion of net assets attributable to each series.
3. Transactions with Affiliates
a. Investment Advisory Fee and Expense Limitation Under the terms of the advisory agreement, which, after its two year initial term, is reviewed and approved annually by the Board of Trustees, the Fund pays an investment advisory fee to Park Avenue. Park Avenue is a wholly-owned subsidiary of Guardian Life and receives an investment advisory fee at an annual rate of 0.80% of the first $100 million, and 0.75% in excess of $100 million of the Fund’s average daily net assets. The fee is accrued daily and paid monthly.
Park Avenue has contractually agreed through April 30, 2024 to waive certain fees and/or reimburse certain expenses incurred by the Fund to the extent necessary to limit the Fund’s total annual operating expenses after fee waiver and/or expense reimbursement to 1.08% of the Fund’s average daily net assets (excluding, if applicable, any acquired fund fees and expenses, taxes, interest, transaction costs and brokerage commissions, litigation and extraordinary expenses). The limitation may not be increased or terminated prior to this time without action by the Board of Trustees and may be
NOTES TO FINANCIAL STATEMENTS — GUARDIAN INTERNATIONAL EQUITY VIP FUND
terminated only upon approval of the Board of Trustees. Amounts waived or reimbursed by Park Avenue pursuant to any expense limitation will not be subject to Park Avenue’s recoupment rights. For the six months ended June 30, 2023, Park Avenue waived fees and/or paid Fund expenses in the amount of $87,938.
Park Avenue has entered into a Sub-Advisory Agreement with Schroder Investment Management North America, Inc. (“Schroder Inc.”). Schroder Inc. is responsible for providing day-to-day investment advisory services to the Fund, subject to the supervision of Park Avenue and the oversight of the Board of Trustees. Sub-advisory fees are paid by Park Avenue and do not represent a separate or additional expense to the Fund. Schroder Inc. also entered into a Sub-subadvisory Agreement with its affiliate, Schroder Investment Management North America Limited (“Schroder Limited”). The sub-subadvisory fees under the Sub-subadvisory Agreement are paid by Schroder Inc. to Schroder Limited and do not represent a separate or additional expense to the Fund.
b. Compensation of Trustees and Officers Trustees and officers who are interested persons of the Trust, as defined in the 1940 Act, receive no compensation from the Fund, except for the Chief Compliance Officer of the Trust. Trustees of the Trust who are not interested persons of the Trust, and the Chief Compliance Officer, receive compensation and reimbursement of expenses from the Trust.
c. Distribution Fees Park Avenue Securities LLC (“PAS”), a wholly-owned subsidiary of Guardian Life, is the principal underwriter of Fund shares. The Trust has entered into a distribution and service agreement with PAS, which governs the sale and distribution of shares of the Fund. Under a distribution and service plan adopted by the Trust (“12b-1 plan”), PAS is compensated for services in such capacity, including its expenses in connection with the promotion and distribution of shares of the Fund, at an annual rate of 0.25% of the Fund’s average daily net assets. For the six months ended June 30, 2023, the Fund paid distribution fees in the amount of $395,018 to PAS.
PAS has directed that certain payments under the 12b-1 plan be used to compensate GIAC for shareholder services provided to contract owners.
4. Federal Income Taxes
a. Distributions to Shareholders For federal income tax purposes, the Fund is treated as a disregarded entity (“DRE”). As a DRE, the Fund is not subject to an entity-level income tax; and any income, gains, losses,
deductions, taxes, and credits of the Fund would instead be “passed through” directly to the separate accounts of GIAC that invest in the Fund and retain the same character for U.S. federal income tax purposes. In addition, the Fund is not required to distribute taxable income and capital gains for U.S. federal income tax purposes. Therefore, no dividends and capital gains distributions were paid by the Fund.
5. Investments
a. Investment Purchases and Sales The cost of investments purchased and the proceeds from investments sold (excluding short-term investments) amounted to $45,866,911 and $103,931,749, respectively, for the six months ended June 30, 2023. During the six months ended June 30, 2023, there were no purchases or sales of U.S. government securities.
b. Foreign Securities Foreign securities investments involve special risks and considerations not typically associated with U.S. investments. These risks include, but are not limited to, currency risk; adverse political, regulatory, social, and economic developments; and less reliable information about issuers. Moreover, securities of some foreign issuers may be less liquid and their prices more volatile than those of comparable U.S. issuers.
c. Industry or Sector Concentration In its normal course of business, the Fund may invest a significant portion of its assets in companies within a limited number of industries or sectors. As a result, the Fund may be subject to a greater risk of loss than that of a fund invested in a wider spectrum of industries or sectors because the stocks of many or all of the companies in the industry, group of industries, sector, or sectors may decline in value due to developments adversely affecting the industry, group of industries, sector, or sectors.
d. Repurchase Agreements The Fund may invest in repurchase agreements to maintain liquidity and earn income over periods of time as short as overnight. The collateral for repurchase agreements is either cash or fully negotiable U.S. government securities (including U.S. government agency securities). Repurchase agreements are fully collateralized (including the interest accrued thereon) and such collateral is marked to market daily while the agreements remain in force. If the value of the collateral falls below the repurchase price plus accrued interest, the Fund will typically require the seller to deposit additional collateral by the next business day. If the request for additional collateral is not met, or the seller defaults, the Fund maintains the
NOTES TO FINANCIAL STATEMENTS — GUARDIAN INTERNATIONAL EQUITY VIP FUND
right to sell the collateral (although it may be prevented or delayed from doing so in certain circumstances) and may be required to claim any resulting loss against the seller. Park Avenue monitors the creditworthiness of the seller with which the Fund enters into repurchase agreements.
e. Restricted and Illiquid Securities A restricted security cannot be resold to the general public without prior registration under the Securities Act of 1933, as amended (except pursuant to an applicable exemption). The values of these securities may be highly volatile. If the security is subsequently registered and resold, the issuer would typically bear the expense of all registrations at no cost to the Fund. Restricted and illiquid securities are valued according to the policies and procedures adopted by the Trust’s Board of Trustees and are noted, if any, in the Fund’s Schedule of Investments. As of June 30, 2023, the Fund did not hold any restricted, other than 144A restricted securities or illiquid securities.
6. Temporary Borrowings
The Fund, with other funds managed by Park Avenue, is party to a credit agreement with respect to a $10 million committed revolving credit facility from State Street Bank and Trust Company (the “Credit Agreement”) for temporary borrowing purposes, including the meeting of redemption requests that otherwise might require the untimely disposition of securities. Interest is based on a daily fluctuating rate per annum equal to the Applicable Rate (as defined in the Credit Agreement) plus the Applicable Margin (as defined in the Credit Agreement) that is subject to change from time to time as and when the Applicable Rate changes. Under the current Credit Agreement, the Applicable Rate for any
day is defined as the rate per annum equal to the sum of (a) 0.10% plus (b) the higher of (i) the Federal Funds Effective Rate for such day and (ii) the Overnight Bank Funding Rate for such day; the Applicable Margin is 1.25%. In addition to the interest charged on any borrowings by the Fund, each fund pays a commitment fee of 0.30% per annum on its share of the unused portion of the credit facility. The agreement is in place until January 5, 2024. The Fund did not utilize the credit facility during the six months ended June 30, 2023.
7. Indemnifications
Under the Trust’s organizational documents and, in some cases, by contract, officers and Trustees of the Trust are indemnified against certain liabilities arising out of the performance of their duties to the Fund. In addition, in the normal course of business, the Fund enters into contracts with its vendors and others that provide general indemnifications. The Fund’s maximum exposure under these arrangements is unknown as this would involve future claims that may be made against the Fund that have not yet occurred. However, based on experience, the Fund expects the risk of loss to be remote.
8. Additional Information
The outbreak of COVID-19 has adversely impacted both local and global economies, including those in which the Fund may invest. These impacts include materially reduced consumer demand and economic output, disrupted supply chains, market closures, travel restrictions and quarantines, and strained healthcare systems. The Fund’s operations may be interrupted as a result, which may have a negative impact on the Fund’s investment performance.
SUPPLEMENTAL INFORMATION (UNAUDITED)
Liquidity Risk Management Program
In compliance with Rule 22e-4 under the Investment Company Act of 1940, as amended (the “Liquidity Rule”), Guardian Variable Products Trust (the “Trust”) has adopted and implemented a written liquidity risk management program (the “Program”) for each series of the Trust (each, a “Fund”), which is reasonably designed to assess and manage each Fund’s liquidity risk. The Fund’s “liquidity risk” is the risk that the Fund could not meet requests to redeem shares issued by the Fund without significant dilution of the remaining investors’ interests in the Fund.
The Board of Trustees of the Trust (the “Board”) Previously approved the designation of Park Avenue Institutional Advisers LLC (the “Administrator” or “PAIA”) as Program administrator. The Administrator established a Liquidity Risk Management Committee, which is comprised of certain officers of the Trust and PAIA, that assists the Administrator in the implementation and day-to-day administration of the Program and otherwise support carrying out the Administrator’s liquidity risk management responsibilities under the Program.
In accordance with the Program, each Fund’s liquidity risk is assessed no less frequently than annually, taking into consideration a variety of factors, including, as applicable, the Fund’s investment strategy and liquidity of portfolio investments, cash flow projections, and holdings of cash and cash equivalents, as well as borrowing arrangements and other funding sources. Certain factors are considered under both normal and reasonably foreseeable stressed conditions.
Each Fund portfolio investment is classified, no less than monthly, into one of four liquidity categories (including “highly liquid investments” and “illiquid investments,” discussed below) based on a determination of the number of days it is reasonably expected to take to convert the investment to cash, or sell or dispose of the investment, in current market conditions without significantly changing the investment’s market value.
The Liquidity Rule limits the Fund’s investments in illiquid investments by prohibiting the Fund from acquiring any illiquid investment if, immediately after the acquisition, the Fund would have invested more than 15% of its net assets in illiquid investments that are assets. The Program includes provisions reasonably designed to comply with this investment limitation. In addition, the Program includes provisions reasonably designed to comply with this investment limitation. In addition, the Program includes provisions reasonably designed to comply with the Liquidity Rule’s requirements relating to highly liquid investment minimums, which is a minimum amount of Fund net assets that must be invested in highly liquid investments that are assets, as applicable. The Fund was not required to adopt a highly liquid investment minimum during the period.
At a meeting of the Board held on March 29-30, 2023, the Board received a report (the “Report”) prepared by the Administrator addressing the Program’s operation and assessing the adequacy and effectiveness of its implementation for the period from January 1, 2022 through December 31, 2022 (the “Reporting Period”). The Report noted that the Administrator believes the Program operated effectively during the Reporting Period and continues to be reasonably designed to effectively assess and manage each Fund’s liquidity risk. The Report also noted that the Administrator believes the Program has been adequately and effectively implemented and the investment strategies for each Fund continue to be appropriate since its inception. In addition, the Report summarized the operation of the Program and the information and factors considered by the Administrator in its assessment of the Program’s implementation, such as the liquidity risk assessment framework and liquidity classification methodologies.
There can be no assurance that the Program will achieve its objectives under all circumstances. Please refer to the Fund’s prospectus for more information regarding the Fund’s exposure to liquidity risk and other risks to which an investment in the Fund may be subject.
SUPPLEMENTAL INFORMATION (UNAUDITED)
Approval of Investment Management and Sub-advisory Agreements
Section 15(c) of the Investment Company Act of 1940, as amended (the “1940 Act”), requires that a fund’s investment advisory and sub-advisory agreements be approved initially by the fund’s board of trustees. Section 15(c) also requires that the continuation of these agreements, after an initial term of up to two years, be annually reviewed and approved by the board. Any such agreement must be approved by a vote of a majority of the trustees who are not parties to the agreement or “interested persons” (as defined in the 1940 Act) of a party to the agreement at a meeting of the board called for the purpose of voting on such approval.
At a meeting of the Board of Trustees (the “Board”) of Guardian Variable Products Trust (the “Trust”) held on March 29-30, 2023 (the “Meeting”), the Board, including the trustees who are not parties to the agreement or “interested persons” as defined in the 1940 Act (the “Independent Trustees”), considered and voted unanimously to renew the existing investment management agreement between the Trust, on behalf of Guardian All Cap Core VIP Fund; Guardian Balanced Allocation VIP Fund; Guardian Core Fixed Income VIP Fund; Guardian Core Plus Fixed Income VIP Fund; Guardian Diversified Research VIP Fund; Guardian Equity Income VIP Fund; Guardian Global Utilities VIP Fund; Guardian Growth & Income VIP Fund; Guardian Integrated Research VIP Fund; Guardian International Growth VIP Fund; Guardian International Equity VIP Fund; Guardian Large Cap Disciplined Growth VIP Fund; Guardian Large Cap Disciplined Value VIP Fund; Guardian Large Cap Fundamental Growth VIP Fund; Guardian Mid Cap Relative Value VIP Fund; Guardian Mid Cap Traditional Growth VIP Fund; Guardian Multi-Sector Bond VIP Fund; Guardian Select Mid-Cap Core VIP Fund; Guardian Short Duration Bond VIP Fund; Guardian Small Cap Core VIP Fund; Guardian Small-Mid Cap Core VIP Fund; Guardian Strategic Large Cap Core VIP Fund; Guardian Total Return Bond VIP Fund and Guardian U.S. Government Securities VIP Fund (each, a “Fund,” and together, the “Funds”), in substantially the form presented at this meeting (the “Management Agreement”); and Park Avenue Institutional Advisers LLC (the “Manager”) for a one-year term.
The Board, including the Independent Trustees, also considered and voted unanimously to renew the existing sub-advisory agreements (the “Sub-Advisory Agreements,” collectively with the Management Agreement and Sub-Subadvisory Agreement, the “Agreements”) between the Manager and investment
advisory firms engaged to serve as sub-advisers to certain of the Funds (the “Sub-Advised Funds”), namely (i) ClearBridge Investments, LLC with respect to Guardian Small Cap Core VIP Fund; (ii) Putnam Investment Management, LLC with respect to Guardian Diversified Research VIP Fund; (iii) AllianceBernstein L.P. with respect to Guardian Growth & Income VIP Fund and Guardian Strategic Large Cap Core VIP Fund; (iv) J.P. Morgan Investment Management Inc. with respect to Guardian International Growth VIP Fund; (v) Schroder Investment Management North America Inc. with respect to Guardian International Equity VIP Fund; (vi) Wellington Management Company LLP with respect to Guardian Balanced Allocation VIP Fund, Guardian Equity Income VIP Fund, Guardian Integrated Research VIP Fund, Guardian Large Cap Disciplined Growth VIP Fund and Guardian Global Utilities VIP Fund; (vii) Boston Partners Global Investors, Inc. with respect to Guardian Large Cap Disciplined Value VIP Fund; (viii) Janus Henderson Investors US LLC with respect to Guardian Mid Cap Traditional Growth VIP Fund; (ix) Allspring Global Investments, LLC with respect to Guardian Mid Cap Relative Value VIP Fund and Guardian Small-Mid Cap Core VIP Fund; (x) Lord, Abbett & Co. LLC with respect to Guardian Core Plus Fixed Income VIP Fund; (xi) FIAM LLC with respect to Guardian Select Mid Cap Core VIP Fund; and (xii) Massachusetts Financial Services Company with respect to Guardian All Cap Core VIP Fund, each in substantially the form presented at this meeting, (each, a “Sub-Adviser” and collectively, the “Sub-Advisers”) for a one-year term.
The Board, including the Independent Trustees, also considered and voted unanimously to renew the existing sub-subadvisory agreement (the “Sub-Subadvisory Agreement”) between Schroder Investment Management North America Inc. and Schroder Investment Management North America Limited (also a Sub-Adviser) with respect to Guardian International Equity VIP Fund for a one-year term.
The Board is responsible for overseeing the management of each Fund. In determining whether to renew its approval of the Agreements, the Trustees evaluated information and factors that they considered to be relevant and appropriate through the exercise of their own business judgment. The Trustees considered certain information and factors in light of advice furnished to them by legal counsel to the Trust and, in the case of the Independent Trustees, their independent legal counsel. In advance of the Meeting, the Trustees received materials and information designed to assist their consideration of the Agreements. The Trustees received written responses
SUPPLEMENTAL INFORMATION (UNAUDITED)
from the Manager and each Sub-Adviser to a series of questions and requests for information encompassing a wide variety of topics provided by independent counsel on behalf of the Independent Trustees. The Independent Trustees also received materials and information regarding the legal standards applicable to their consideration of the Agreements and the process and criteria used by the Manager to identify and select the Sub-Advisers.
During the course of their deliberations, the Independent Trustees met twice to discuss and evaluate the materials, information and Agreements in executive session with their independent legal counsel, outside of the presence of the Trustees who are not Independent Trustees and representatives from Fund management, the Manager or any Sub-Adviser.
In reaching its decisions to renew its approval of the Agreements, the Board took into account the materials and information described above, as well as other materials and information provided to the Board throughout the year. Individual Trustees may have given different weight to different factors and information with respect to each Agreement, and the Trustees did not identify any single factor or information that, in isolation, would be controlling in deciding to approve the Agreements. The discussion below is intended to summarize the broad factors that figured prominently in the Board’s decisions to renew its approval of the Agreements rather than to be all-inclusive. These broad factors included: (i) the nature, extent and quality of the services provided to the Funds by the Manager and to the Sub-advised Funds by the Sub-Advisers; (ii) the investment performance of each Fund; (iii) estimated profitability of the Manager; (iv) fees and expenses; (v) the extent to which economies of scale may exist, and the extent to the benefits of economies of scale are shared with the Funds; and (vi) any other benefits derived by the Manager or the Sub-Advisers (or their respective affiliates) from their relationships with the Funds.
Nature, Extent and Quality of Services
The Trustees considered information regarding the nature, extent and quality of services provided to the Funds by the Manager. The Trustees also considered, among other things, the terms of the Management Agreement and the range of investment advisory services provided by the Manager. In addition, the Trustees reviewed the range of non-investment advisory services provided by the Manager consistent with the terms of the Management Agreement, notably coordinating the preparation and filing of various
regulatory documents, coordinating the preparation and assembly of Board meeting materials, and assisting the Board with certain valuation matters. The Board also received a description of the Manager’s and each Sub-Adviser’s business continuity plans and of their respective approaches to data privacy and cybersecurity, and related testing. The Board received information regarding the response of the Manager and the Sub-Advisers to the COVID-19 pandemic, including the continuation of remote work arrangements and return-to-office plans. The Board also received information about the Manager’s role as administrator of the Funds’ liquidity risk management program, the Manager’s approach to risk management, and the Manager’s vendor oversight programs.
The Trustees considered that the Sub-advised Funds operate in a “manager-of-managers” structure and reviewed the responsibilities that the Manager has under this structure, including monitoring and evaluating the performance of the Sub-Advisers, monitoring the Sub-Advisers for adherence to the stated investment objectives, strategies, policies and restrictions of the Funds and supervising the Sub-Advisers with respect to the services that the Sub-Advisers would provide under the Sub-Advisory Agreements. The Trustees also considered the process used by the Manager, consistent with this structure, to identify and recommend sub-advisers, and the Manager’s ability to monitor and oversee sub-advisers and recommend replacement sub-advisers, when necessary, and provide other services under the Management Agreement. The Board noted that investment management staff of the Manager and the Trust’s Chief Compliance Officer conduct oversight meetings with the Sub-Advisers on a periodic basis, follow through with additional inquiries on any questions or concerns that arise during the meetings and, as necessary, then report the results of the meetings to the Board. The Trustees reviewed information regarding the experience and background of the Manager’s key personnel and the Manager’s organizational structure and resources, including investment, legal and administrative capabilities of the Manager. In this regard, the Trustees recognized that the Funds may benefit from the Manager’s ability to use resources and capabilities of its affiliates in providing services to the Funds.
The Trustees considered information regarding the nature, extent and quality of services provided to the Sub-advised Funds by the Sub-Advisers. The Trustees also considered, among other things, the terms of the Sub-advisory Agreements and the range of investment
SUPPLEMENTAL INFORMATION (UNAUDITED)
advisory services provided by the Sub-Advisers under the oversight of the Manager. In evaluating these investment advisory services, the Trustees considered, among other things, the Sub-Advisers’ investment philosophies, styles and/or processes and approaches to managing the respective Sub-advised Funds. The Trustees received and evaluated information regarding the background, education, expertise and/or experience of the investment professionals who serve as portfolio managers for the Sub-advised Funds and the capabilities and resources of the Sub-Advisers.
Based upon these considerations, the Trustees concluded, within the context of their full deliberations, that the nature, extent and quality of services provided to the Funds by the Manager and the Sub-advised Funds by each respective Sub-Adviser were appropriate.
Investment Performance
In connection with each of its regular quarterly meetings, the Board receives information on the performance of each Fund, including net performance, relative performance rankings within the relevant Morningstar peer group, and performance as compared to benchmark index returns. At each quarterly Board meeting, members of the Manager’s funds management team review with the Board the economic and market environment, absolute and relative performance of each Fund, and any relevant information about risk management and style consistency in connection with management of the Funds. The Board considered investment performance for each Fund over the one-year, three-year (where available), five-year (where available) and since-inception periods.
The Board also received and reviewed a report prepared by Broadridge Financial Solutions (“Broadridge”), an independent provider of mutual fund industry data, which included comparisons of the performance of each Fund to performance of an appropriate peer universe. For details regarding each Fund’s performance, see the “Fund-by-Fund Factors” section below.
The Manager discussed with the Board factors contributing to the Funds’ performance results. In addition, for certain Funds, the Manager provided to the Board longer term performance records of the Sub-Advisers for strategies used in managing the Funds. The Board concluded that the investment performance generated by the Manager and each Sub-Adviser was generally satisfactory, or, that any steps being taken by the Manager and Sub-Advisers to address any performance issues were satisfactory.
Profitability
The Board received and considered the Manager’s estimate of its profitability, which included allocations by the Manager of its costs in providing management services to the Funds. The Board considered the estimated profitability of the Manager both overall and on a Fund-by-Fund basis.
The Board received and considered profitability information from most of the Sub-Advisers, but noted that the Manager had negotiated the fees with the Sub-Advisers at arm’s-length. Accordingly, the Board concluded that the profitability of the Sub-Advisers is a less relevant factor than Manager profitability.
Based on the consideration of this information, the Board concluded that the profitability of the Funds to the Manager was acceptable.
Fees and Expenses
The Trustees considered the management fees paid by the Funds to the Manager under the Management Agreement and evaluated the reasonableness of these fees. The Trustees received and reviewed comparative information with respect to the management fee and total expenses for each Fund and the management fees and total expenses for a peer group of other funds selected by Broadridge. The Trustees considered the Manager’s commitment to limit the total expenses of each Fund through an expense limitation agreement with the Trust. Although the Board recognized that the comparisons between the management fees and actual expenses of the Funds and those of the identified peer group are imprecise, given different terms of agreements and variations in fund strategies, the Trustees found that the comparative information supported their consideration and approval of the management fees and evaluation of the total expenses. For details regarding each Fund’s fee and expense comparisons, see the “Fund-by-Fund Factors” section below.
The Trustees considered the sub-advisory fees paid under the Sub-advisory Agreements and evaluated the reasonableness of those fees. The Trustees also considered that the fees paid to the Sub-Advisers would be paid by the Manager and not the Funds and that the Manager had negotiated the fees with the Sub-Advisers at arm’s-length.
Based on the consideration of the information and factors summarized above, as well as other relevant information and factors, the Board concluded that the management and sub-advisory fees were reasonable in
SUPPLEMENTAL INFORMATION (UNAUDITED)
light of the nature, extent and quality of services rendered to the Funds by the Manager and the Sub-Advisers.
Economies of Scale
The Board considered the extent to which economies of scale may exist, and the extent to the benefits of economies of scale are shared with the Funds. In this regard, the Board noted that for sixteen of twenty-four Funds, the management and sub-advisory fee included breakpoints that are tiered based on growth in asset levels of each such Fund and that for the other Funds, the fees reflected appropriate levels based on current and expected asset levels. The Board also noted that the expenses of the Funds are subject to expense limitations provided by the Manager. The Board noted that expected economies of scale, where they exist, may be shared through the use of fee breakpoints, expense limitations by the Manager, and/or a lower overall fee.
Ancillary Benefits
The Board considered the potential benefits, other than management fees, that the Manager and/or its affiliates may receive because of the Manager’s relationship with the Funds. The Trustees considered that the Funds were designed to serve as investment options under variable contracts issued by affiliates of the Manager that would receive fees under those contracts and that Park Avenue Securities LLC, an affiliate of the Manager and principal underwriter of the Funds, and participating insurance companies, including insurance companies affiliated with the Manager, would be entitled to receive fees from the Funds under a plan of distribution adopted pursuant to Rule 12b-1 under the 1940 Act. The Trustees considered that the Manager and its affiliates may benefit from (i) greater efficiencies in annuity administration and operations and potential cost savings due to a reduction in the number of unaffiliated funds available as annuity contract investment options, and (ii) increased dividends-received deductions due to the Funds’ status under the tax laws as disregarded entities. In addition, the Trustees considered the potential benefits, other than sub-advisory fees, that the Sub-Advisers and their affiliates may receive because of their relationships with the Funds, including the ability to receive research from soft dollar commissions consistent with Trust policies. The Trustees concluded that benefits that may accrue to the Manager and its affiliates are reasonable and the benefits that may accrue to the Sub-Advisers and their affiliates are consistent with those expected for a sub-adviser to a mutual fund such as the applicable Fund.
Fund-by-Fund Factors
The Broadridge report groups fees, expenses and performance into five quintiles, with the top quintile having the highest performance or lowest fees/expenses, and the bottom quintile having the lowest performance or highest fees/expenses. For purposes of the descriptions below, a Fund’s performance is considered “in line with” the benchmark index if it is within 0.20%.
Guardian Large Cap Fundamental Growth VIP Fund
| • | | The Board noted that the Fund’s performance was in the 3rd quintile of its performance universe for the 1-year period and in the 4th quintile for its performance universe for the 3-year and 5-year periods. The Board also noted that the Fund’s performance was below the benchmark index for the 1-year, 3-year and 5-year periods. |
| • | | The Board noted that the contractual management fee, the actual management fee and actual total expenses were in the 1st quintile of the expense group. |
Guardian Large Cap Disciplined Growth VIP Fund
| • | | The Board noted that the Fund’s performance was in the 3rd quintile of its performance universe for the 1-year and 3-year periods and in the 2nd quintile for the 5-year period. The Board also noted that the Fund’s performance was below the benchmark index for the 1-year, 3-year and 5-year periods. |
| • | | The Board noted that the contractual management fee, the actual management fee and actual total expenses were in the 1st quintile of the expense group. |
Guardian Integrated Research VIP Fund
| • | | The Board noted that the Fund’s performance was in the 5th quintile of its performance universe for the 1-year and 5-year periods and in the 4th quintile for 3-year period. The Board also noted that the Fund’s performance was below the benchmark index for the 1-year, 3-year and 5-year periods. |
| • | | The Board noted that the contractual management fee, the actual management fee and actual total expenses were in the 1st quintile of the expense group. |
Guardian Diversified Research VIP Fund
| • | | The Board noted that the Fund’s performance was in the 3rd quintile of its performance universe for the 1-year and 3-year periods and in the 2nd quintile for the 5-year period. The Board also noted that the Fund’s performance was higher than the benchmark index for the 1-year period. The Board note that the |
SUPPLEMENTAL INFORMATION (UNAUDITED)
| | | Fund’s performance was lower than the benchmark index for the 3-year and 5-year periods. |
| • | | The Board noted that the contractual management fee and actual management fee were in the 1st quintile of the expense group and that actual total expenses were in the 3rd quintile. |
Guardian Strategic Large Cap Core VIP Fund
| • | | The Board noted that the Fund’s performance was in the 1st quintile of its performance universe for the 1-year period. The Board acknowledged the Fund’s short operational history. The Board noted that the Fund’s performance was higher than the benchmark index for the 1-year period. |
| • | | The Board noted that the contractual management fee, the actual management fee and actual total expenses were in the 1st quintile of the expense group. |
Guardian Large Cap Disciplined Value VIP Fund
| • | | The Board noted that the Fund’s performance was in the 3rd quintile of its performance universe for the 1-year and 3-year periods and in the 4th quintile for the 5-year period. The Board also noted that the Fund’s performance was higher than the benchmark index for the 1-year and 3-year periods. The Board noted that the Fund’s performance was in line with the benchmark index for the 5-year period. |
| • | | The Board noted that the contractual management fee was in the 2nd quintile of the expense group, the actual management fee was in the 1st quintile of the expense group and that actual total expenses were in the 3rd quintile. |
Guardian Growth & Income VIP Fund
| • | | The Board noted that the Fund’s performance was in the 3rd quintile of its performance universe for the 1-year, 3-year and 5-year periods. The Board also noted that the Fund’s performance was higher than the benchmark index for the 1-year, 3-year and 5-year periods. |
| • | | The Board noted that the contractual management fee and the actual management fee were in the 1st quintile of the expense group and that actual total expenses were in the 3rd quintile. |
Guardian Equity Income VIP Fund
| • | | The Board noted that the Fund had less than one-year of operational history and was not able to evaluate an investment performance record for the Fund. The Board noted that it would have an opportunity to review such information in connection with future annual reviews. The Board noted that, in the |
| | | meantime, it received monthly performance reports from the Manager. |
| • | | The Board noted that the contractual management fee, the actual management fee and actual total expenses were in the 1st quintile of the expense group. |
Guardian All Cap Core VIP Fund
| • | | The Board noted that the Fund’s performance was in the 3rd quintile of its performance universe for the 1-year period. The Board acknowledged the Fund’s short operational history. The Board noted that the Fund’s performance was higher than the benchmark index for the 1-year period. |
| • | | The Board noted that the contractual management fee, the actual management fee and actual total expenses were in the 1st quintile of the expense group. |
Guardian Mid Cap Traditional Growth VIP Fund
| • | | The Board noted that the Fund’s performance was in the 1st quintile of its performance universe for the 1-year period and in the 2nd quintile for the 3-year and 5-year periods. The Board also noted that the Fund’s performance was higher than the benchmark index for the 1-year, 3-year and 5-year periods. |
| • | | The Board noted that the contractual management fee and actual management fee were in the 1st quintile of the expense group and that the actual total expenses were in the 4th quintile. |
Guardian Select Mid Cap Core VIP Fund
| • | | The Board noted that the Fund’s performance was in the 3rd quintile of its performance universe for the 1-year period. The Board acknowledged the Fund’s short operational history. The Board noted that the Fund’s performance was lower than the benchmark index for the 1-year period. |
| • | | The Board noted that the contractual management fee, the actual management fee and actual total expenses were in the 1st quintile of the expense group. |
Guardian Mid Cap Relative Value VIP Fund
| • | | The Board noted that the Fund’s performance was in the 2nd quintile of its performance universe for the 1-year, 3-year and 5-year periods. The Board also noted that the Fund’s performance was higher than the benchmark index for the 1-year, 3-year and 5-year periods. |
| • | | The Board noted that the contractual management fee and the actual management fee were in the 2nd quintile of the expense group and the actual total expenses were in the 3rd quintile of the expense group. |
SUPPLEMENTAL INFORMATION (UNAUDITED)
Guardian Small-Mid Cap Core VIP Fund
| • | | The Board noted that the Fund’s performance was in the 5th quintile of its performance universe for the 1-year period. The Board acknowledged the Fund’s short operational history. The Board noted that the Fund’s performance was higher than the benchmark index for the 1-year period. |
| • | | The Board noted that the contractual management fee, the actual management fee and actual total expenses were in the 1st quintile of the expense group. |
Guardian Small Cap Core VIP Fund
| • | | The Board noted that the Fund’s performance was in the 5th quintile of its performance universe for the 1-year and 3-year periods. The Board noted that the Fund’s performance was lower than the benchmark index for the 1-year and 3-year periods. |
| • | | The Board noted that the contractual management fee and the actual management fee were in the 1st quintile of the expense group and the actual total expenses were in the 2nd quintile of the expense group. |
Guardian International Growth VIP Fund
| • | | The Board noted that the Fund’s performance was in the 4th quintile of its performance universe for the 1-year period, in the 2nd quintile of its performance universe for the 3-year period and in the 3rd quintile of its performance universe for the 5-year period. The Board also noted that the Fund’s performance was lower than the benchmark index for the 1-year and 5-year periods. The Board noted that the Fund’s performance was higher than the benchmark index for the 3-year period. |
| • | | The Board noted that the contractual management fee and actual management fee were in the 2nd quintile of the expense group and that the actual total expenses were in the 3rd quintile. |
Guardian International Equity VIP Fund
| • | | The Board noted that the Fund’s performance was in the 5th quintile of its performance universe for the 1-year, 3-year and 5-year periods. The Board also noted that the Fund’s performance was lower than the benchmark index for the 1-year, 3-year and 5-year periods. |
| • | | The Board noted that the contractual management fee, the actual management fee and the actual total expenses were in the 2nd quintile of the expense group. |
Guardian Global Utilities VIP Fund
| • | | The Board noted that the Fund’s performance was in the 5th quintile of its performance universe for the 1-year period and in the 4th quintile of its performance universe for the 3-year period. The Board noted that the Fund’s performance was higher than the benchmark index for the 1-year and 3-year periods. |
| • | | The Board noted that the contractual management fee and the actual management fee were in the 1st quintile of the expense group and the actual total expenses were in the 2nd quintile of the expense group. |
Guardian Balanced Allocation VIP Fund
| • | | The Board noted that the Fund had less than one-year of operational history and was not able to evaluate an investment performance record for the Fund. The Board noted that it would have an opportunity to review such information in connection with future annual reviews. The Board noted that, in the meantime, it received monthly performance reports from the Manager. |
| • | | The Board noted that the contractual management fee, the actual management fee and actual total expenses were in the 1st quintile of the expense group. |
Guardian Core Plus Fixed Income VIP Fund
| • | | The Board noted that the Fund’s performance was in the 3rd quintile of its performance universe for the 1-year and 3-year periods and in the 4th quintile of its performance universe for the 5-year period. The Board also noted that the Fund’s performance was lower than the benchmark index for the 1-year and 5-year periods. The Board noted that the Fund’s performance was in line with the benchmark index for the 3-year period. |
| • | | The Board noted that the contractual management fee and actual management fee were in the 2nd quintile of the expense group and that actual total expenses were in the 3rd quintile. |
Guardian Total Return Bond VIP Fund
| • | | The Board noted that the Fund’s performance was in the 5th quintile of its performance universe for the 1-year and 3-year periods. The Board also noted that the Fund’s performance was lower than the benchmark index for the 1-year and 3-year periods. |
| • | | The Board noted that the contractual management fee and actual management fee were in the 2nd quintile and the actual total expenses were in the 3rd quintile. |
SUPPLEMENTAL INFORMATION (UNAUDITED)
Guardian Core Fixed Income VIP Fund
| • | | The Board noted that the Fund had less than one-year of operational history and was not able to evaluate an investment performance record for the Fund. The Board noted that it would have an opportunity to review such information in connection with future annual reviews. The Board noted that, in the meantime, it received monthly performance reports from the Manager. |
| • | | The Board noted that the contractual management fee was in the 2nd quintile of the expense group and the actual management fee and the actual total expenses were in the 1st quintile. |
Guardian Multi-Sector Bond VIP Fund
| • | | The Board noted that the Fund’s performance was in the 5th quintile of its performance universe for the 1-year and 3-year periods The Board also noted that the Fund’s performance was lower than the benchmark index for the 1-year and 3-year periods. |
| • | | The Board noted that the contractual management fee and actual total expenses were in the 1st quintile and the actual management fee was in the 2nd quintile. |
Guardian Short Duration Bond VIP Fund
| • | | The Board noted that the Fund had less than one-year of operational history and was not able to evaluate an investment performance record for the Fund. The |
| | | Board noted that it would have an opportunity to review such information in connection with future annual reviews. The Board noted that, in the meantime, it received monthly performance reports from the Manager. |
| • | | The Board noted that the contractual management fee and actual total expenses were in the 3rd quintile of the expense group and the actual management fee was in the 1st quintile of the expense group. |
Guardian U.S. Government Securities VIP Fund
| • | | The Board noted that the Fund’s performance was in the 1st quintile of its performance universe for the 1-year period and in the 2nd quintile of its performance universe for the 3-year period. The Board also noted that the Fund’s performance was higher than the benchmark index for the 1-year and 3-year periods. |
| • | | The Board noted that the contractual management fee and the actual management fee were in the 1st quintile of the expense group and the actual total expenses were in the 2nd quintile of the expense group. |
Conclusion
Based on a comprehensive consideration and evaluation of all of the information and factors summarized above, among others, the Board as a whole, including the Independent Trustees, approved the Agreements.
SUPPLEMENTAL INFORMATION (UNAUDITED)
The Statement of Additional Information (“SAI”) includes additional information about the Trust’s Trustees and Officers and is available, without charge, upon request by calling toll-free 1-888-GUARDIAN (1-888-482-7342) or by visiting our website at http://guardianvpt.onlineprospectus.net/GuardianVPT/Prospectuses.
Portfolio Holdings and Proxy Voting Procedures
The Fund files its complete schedule of portfolio holdings with the Securities and Exchange Commission for the first and third quarters of each fiscal year as an exhibit to its reports on Form N-PORT. The Fund’s Form N-PORT reports are available on the Securities and Exchange Commission’s website at https://www.sec.gov. The Fund’s Form N-PORT information is also available, without charge, upon request, by calling toll-free 1-888-GUARDIAN (1-888-482-7342) or by visiting our website at http://guardianvpt.onlineprospectus.net/GuardianVPT/Prospectuses.
A description of the policies and procedures that the Fund uses to determine how to vote proxies relating to portfolio securities is included in the SAI. The SAI and information regarding how the Fund voted proxies relating to portfolio securities during the most recent 12-month period ended June 30 may be obtained (i) without charge, upon request, by calling toll-free 1-888-GUARDIAN (1-888-482-7342) or by visiting our website at http://guardianvpt.onlineprospectus.net/GuardianVPT/Prospectuses; and (ii) on the Securities and Exchange Commission’s website at https://www.sec.gov.
This report is transmitted to shareholders only. It is not authorized for use as an offer of sale or a solicitation of an offer to buy shares of the Fund unless accompanied or preceded by the Fund’s current prospectus. Past performance results shown in this report should not be considered a representation of future performance. Investment returns and principal value of shares will fluctuate so that shares, when redeemed, may be worth more or less than their original cost. Statements and other information herein are as dated and are subject to change.

The Guardian Life Insurance Company of America New York, NY 10001-2159
PUB8172
Guardian Variable
Products Trust
2023
Semiannual Report
All Data as of June 30, 2023
Guardian International Growth VIP Fund

| | |
| Not FDIC insured. May lose value. No bank guarantee. | | www.guardianlife.com |
TABLE OF CONTENTS
Guardian International Growth VIP Fund
Except as otherwise specifically stated, all information, including portfolio security positions, is as of June 30, 2023. Fund holdings will vary. Information contained herein has been obtained from sources believed reliable, but is not guaranteed.
GUARDIAN INTERNATIONAL GROWTH VIP FUND
Fund Characteristics (unaudited)
| | |
| Total Net Assets: $106,341,604 | | |
|
| |
Geographic Region Allocation1 As of June 30, 2023 |
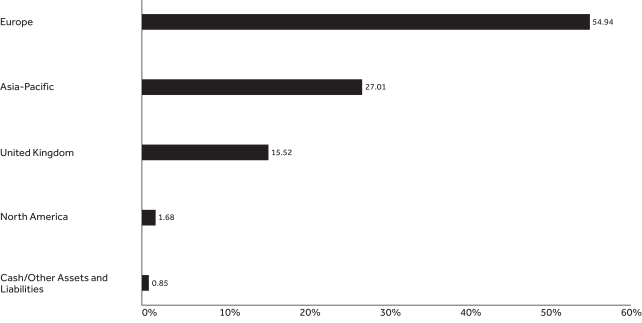
|
|
| |
Sector Allocation2 As of June 30, 2023 |
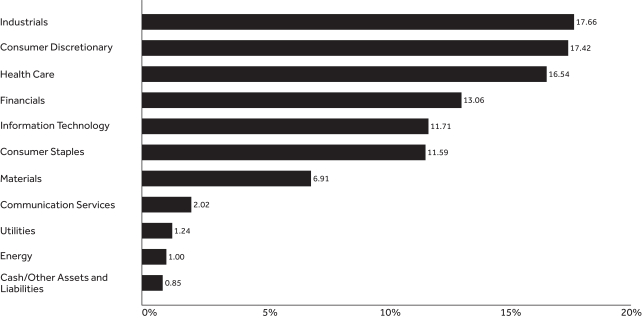 |
GUARDIAN INTERNATIONAL GROWTH VIP FUND
| | | | | | |
| | | |
Top Ten Holdings2 As of June 30, 2023 | | | | | |
| | | |
| Holding | | Country | | % of Total
Net Assets | |
| ASML Holding NV | | Netherlands | | | 5.61% | |
| Nestle SA (Reg S) | | Switzerland | | | 4.99% | |
| LVMH Moet Hennessy Louis Vuitton SE | | France | | | 4.88% | |
| Novo Nordisk A/S, Class B | | Denmark | | | 3.92% | |
| AstraZeneca PLC | | United Kingdom | | | 3.55% | |
| Sony Group Corp. | | Japan | | | 2.94% | |
| Keyence Corp. | | Japan | | | 2.71% | |
| AIA Group Ltd. | | Hong Kong | | | 2.49% | |
| Safran SA | | France | | | 2.30% | |
| Diageo PLC | | United Kingdom | | | 2.26% | |
| Total | | | | | 35.65% | |
| 1 | Portfolio holdings are subject to change and should not be considered a recommendation to buy or sell individual securities. Cash includes short-term investments and net other assets and liabilities. |
| 2 | The Fund’s holdings are allocated to each sector based on the MSCI Global Industry Classification Standard (GICS®). Cash includes short-term investments and net other assets and liabilities. |
UNDERSTANDING YOUR FUND’S EXPENSES (UNAUDITED)
By investing in the Fund, you incur two types of costs: (1) transaction costs and (2) ongoing costs, including, as applicable, investment advisory fees, distribution and/or service (12b-1) fees and other Fund expenses. The example below is intended to help you understand your ongoing costs (in dollars) of investing in the Fund and to compare these costs with the ongoing costs of investing in other mutual funds.
The example is based on an investment of $1,000 invested at the beginning of the period and held for the entire period from January 1, 2023 to June 30, 2023. The table below shows the Fund’s expenses in two ways:
Expenses based on actual return
This section of the table provides information about actual account values and actual expenses. You may use the information in this section, together with the amount you invested, to estimate the expenses that you paid over the period. Simply divide your account value by $1,000 (for example, an $8,600 account value divided by $1,000 = 8.6), then multiply the result by the number in the section under the heading entitled “Expenses Paid During Period” to estimate the expenses you paid on your account during this period.
Expenses based on hypothetical 5% return for comparison purposes
This section of the table provides information about hypothetical account values and hypothetical expenses based on the Fund’s actual expense ratio and an assumed rate of return of 5% per year before expenses, which is not the Fund’s actual return. The hypothetical account values and expenses may not be used to estimate the actual ending account balance or expenses you paid for the period. You may use this information to compare the ongoing costs of investing in the Fund with the cost of investing in other mutual funds. To do so, compare this 5% hypothetical example with the 5% hypothetical examples that appear in the shareholder reports of the other funds.
Note that the expenses shown in the table are meant to highlight your ongoing costs only and do not reflect any transactional costs, such as sales charges (loads), redemption fees, or exchange fees. Therefore the second section is useful in comparing ongoing costs only, and will not help you determine the relative total costs of owning different funds. If these transactional costs were included, your costs would have been higher. Charges and expenses at the insurance company separate account level are not reflected in the table.
| | | | | | | | | | | | | | |
| | | | | |
| | | Beginning
Account Value 1/1/23 | | Ending Account Value
6/30/23 | | | Expenses Paid During Period* 1/1/23-6/30/23 | | | Expense Ratio During Period 1/1/23-6/30/23 | |
| Based on Actual Return | | $1,000.00 | | | $1,142.20 | | | | $6.27 | | | | 1.18% | |
| Based on Hypothetical Return (5% Return Before Expenses) | | $1,000.00 | | | $1,018.94 | | | | $5.91 | | | | 1.18% | |
| * | Expenses are equal to the Fund’s annualized expense ratio as indicated, multiplied by the average account value over the period, multiplied by 181/365 (to reflect the one-half year period). |
SCHEDULE OF INVESTMENTS — GUARDIAN INTERNATIONAL GROWTH VIP FUND
| | | | | | | | |
| June 30, 2023 (unaudited) | | Shares | | | Value | |
| Common Stocks – 99.1% | |
| |
| Australia – 1.3% | |
| | | |
IDP Education Ltd. | | | 23,926 | | | $ | 353,792 | |
| | | |
Woodside Energy Group Ltd. | | | 46,125 | | | | 1,068,190 | |
| | | | | | | | | |
| | | |
| | | | | | | | 1,421,982 | |
| Cayman Islands – 1.0% | | | | | | | | |
| | | |
Tencent Holdings Ltd. | | | 24,000 | | | | 1,021,501 | |
| | | | | | | | | |
| | | |
| | | | | | | | 1,021,501 | |
| Denmark – 4.9% | | | | | | | | |
| | | |
Genmab A/S(1) | | | 2,841 | | | | 1,078,290 | |
| | | |
Novo Nordisk A/S, Class B | | | 25,817 | | | | 4,169,801 | |
| | | | | | | | | |
| | | |
| | | | | | | | 5,248,091 | |
| France – 15.4% | |
| | | |
Air Liquide SA | | | 11,257 | | | | 2,018,178 | |
| | | |
Capgemini SE | | | 2,288 | | | | 433,442 | |
| | | |
L’Oreal SA | | | 4,388 | | | | 2,047,781 | |
| | | |
LVMH Moet Hennessy Louis Vuitton SE | | | 5,497 | | | | 5,187,661 | |
| | | |
Safran SA | | | 15,595 | | | | 2,450,157 | |
| | | |
Schneider Electric SE | | | 12,111 | | | | 2,207,437 | |
| | | |
Vinci SA | | | 17,478 | | | | 2,031,422 | |
| | | | | | | | | |
| | | |
| | | | | | | | 16,376,078 | |
| Germany – 6.1% | |
| | | |
adidas AG | | | 1,035 | | | | 200,743 | |
| | | |
Beiersdorf AG | | | 3,190 | | | | 422,060 | |
| | | |
Delivery Hero SE(1)(2) | | | 12,106 | | | | 533,675 | |
| | | |
Deutsche Boerse AG | | | 10,800 | | | | 1,994,591 | |
| | | |
Deutsche Telekom AG (Reg S) | | | 51,438 | | | | 1,121,191 | |
| | | |
Infineon Technologies AG | | | 41,461 | | | | 1,709,874 | |
| | | |
Zalando SE(1)(2) | | | 18,413 | | | | 529,766 | |
| | | | | | | | | |
| | | |
| | | | | | | | 6,511,900 | |
| Hong Kong – 2.5% | |
| | | |
AIA Group Ltd. | | | 259,400 | | | | 2,646,706 | |
| | | | | | | | | |
| | | |
| | | | | | | | 2,646,706 | |
| India – 1.4% | |
| | | |
HDFC Bank Ltd., ADR | | | 20,954 | | | | 1,460,494 | |
| | | | | | | | | |
| | | |
| | | | | | | | 1,460,494 | |
| Ireland – 1.8% | |
| | | |
Linde PLC | | | 4,853 | | | | 1,849,637 | |
| | | | | | | | | |
| | | |
| | | | | | | | 1,849,637 | |
| Japan – 19.3% | |
| | | |
Ajinomoto Co., Inc. | | | 29,700 | | | | 1,182,524 | |
| | | |
Daikin Industries Ltd. | | | 11,700 | | | | 2,388,259 | |
| | | |
Hoya Corp. | | | 18,500 | | | | 2,206,854 | |
| | | |
Keyence Corp. | | | 6,100 | | | | 2,884,801 | |
| | | |
Otsuka Corp. | | | 8,300 | | | | 322,990 | |
| | | |
Recruit Holdings Co. Ltd. | | | 63,500 | | | | 2,026,508 | |
| | | |
Seven & i Holdings Co. Ltd. | | | 22,100 | | | | 955,558 | |
| | | |
Shimano, Inc. | | | 7,500 | | | | 1,255,401 | |
| | | |
Shin-Etsu Chemical Co. Ltd. | | | 70,300 | | | | 2,336,546 | |
| | | |
Sony Group Corp. | | | 34,900 | | | | 3,130,448 | |
| | | |
Terumo Corp. | | | 16,600 | | | | 527,948 | |
| | | |
Tokio Marine Holdings, Inc. | | | 57,300 | | | | 1,323,011 | |
| | | | | | | | | |
| | | |
| | | | | | | | 20,540,848 | |
| | | | | | | | |
| June 30, 2023 (unaudited) | | Shares | | | Value | |
| Netherlands – 9.4% | |
| | | |
Adyen NV(1)(2) | | | 586 | | | $ | 1,015,312 | |
| | | |
Argenx SE(1) | | | 2,614 | | | | 1,017,017 | |
| | | |
ASML Holding NV | | | 8,235 | | | | 5,961,077 | |
| | | |
Ferrari NV | | | 3,033 | | | | 992,959 | |
| | | |
Wolters Kluwer NV | | | 7,963 | | | | 1,011,101 | |
| | | | | | | | | |
| | | |
| | | | | | | | 9,997,466 | |
| Singapore – 1.4% | |
| | | |
DBS Group Holdings Ltd. | | | 64,600 | | | | 1,510,499 | |
| | | | | | | | | |
| | | |
| | | | | | | | 1,510,499 | |
| Spain – 2.7% | |
| | | |
Iberdrola SA | | | 101,232 | | | | 1,322,280 | |
| | | |
Industria de Diseno Textil SA | | | 39,538 | | | | 1,536,141 | |
| | | | | | | | | |
| | | |
| | | | | | | | 2,858,421 | |
| Sweden – 3.9% | |
| | | |
Atlas Copco AB, Class A | | | 144,394 | | | | 2,082,491 | |
| | | |
Epiroc AB, Class A | | | 54,231 | | | | 1,027,226 | |
| | | |
Evolution AB(2) | | | 8,360 | | | | 1,059,377 | |
| | | | | | | | | |
| | | |
| | | | | | | | 4,169,094 | |
| Switzerland – 10.7% | |
| | | |
Cie Financiere Richemont SA (Reg S), Class A | | | 8,800 | | | | 1,493,128 | |
| | | |
Lonza Group AG (Reg S) | | | 2,376 | | | | 1,418,925 | |
| | | |
Nestle SA (Reg S) | | | 44,133 | | | | 5,310,290 | |
| | | |
Roche Holding AG | | | 7,431 | | | | 2,270,880 | |
| | | |
Straumann Holding AG (Reg S) | | | 5,691 | | | | 924,163 | |
| | | | | | | | | |
| | | |
| | | | | | | | 11,417,386 | |
| Taiwan – 1.1% | |
| | | |
Taiwan Semiconductor Manufacturing Co. Ltd., ADR | | | 11,280 | | | | 1,138,377 | |
| | | | | | | | | |
| | | |
| | | | | | | | 1,138,377 | |
| United Kingdom – 15.5% | |
| | | |
3i Group PLC | | | 58,919 | | | | 1,463,208 | |
| | | |
Allfunds Group PLC | | | 68,431 | | | | 418,389 | |
| | | |
Anglo American PLC | | | 40,515 | | | | 1,148,373 | |
| | | |
AstraZeneca PLC | | | 26,323 | | | | 3,770,459 | |
| | | |
Diageo PLC | | | 56,014 | | | | 2,402,773 | |
| | | |
Ferguson PLC | | | 5,689 | | | | 898,139 | |
| | | |
InterContinental Hotels Group PLC | | | 21,431 | | | | 1,479,945 | |
| | | |
London Stock Exchange Group PLC | | | 19,414 | | | | 2,057,237 | |
| | | |
Oxford Nanopore Technologies PLC(1) | | | 76,179 | | | | 206,351 | |
| | | |
RELX PLC | | | 61,117 | | | | 2,037,862 | |
| | | |
Spirax-Sarco Engineering PLC | | | 4,733 | | | | 623,429 | |
| | | | | | | | | |
| | | |
| | | | | | | | 16,506,165 | |
| United States – 0.7% | |
| | | |
MercadoLibre, Inc.(1) | | | 647 | | | | 766,436 | |
| | | | | | | | | |
| | | |
| | | | | | | | 766,436 | |
| | |
Total Common Stocks
(Cost $78,961,704) | | | | 105,441,081 | |
| | | | |
| 4 | | | | The accompanying notes are an integral part of these financial statements. |
SCHEDULE OF INVESTMENTS — GUARDIAN INTERNATIONAL GROWTH VIP FUND
| | | | | | | | |
| June 30, 2023 (unaudited) | | Principal
Amount | | |
Value | |
| |
| Repurchase Agreements – 0.7% | |
| | | |
Fixed Income Clearing Corp., 1.52%, dated 6/30/2023, proceeds at maturity value of $705,753, due 7/3/2023(3) | | $ | 705,664 | | | $ | 705,664 | |
| | |
Total Repurchase Agreements
(Cost $705,664) | | | | 705,664 | |
| | |
Total Investments – 99.8%
(Cost $79,667,368) | | | | 106,146,745 | |
| | |
| Assets in excess of other liabilities – 0.2% | | | | 194,859 | |
| | |
| Total Net Assets – 100.0% | | | $ | 106,341,604 | |
| (1) | Non–income–producing security. |
| (2) | Securities that may be resold in transactions exempt from registration under Rule 144A of the Securities Act of 1933, as amended, normally to certain qualified buyers. At June 30, 2023, the aggregate market value of these securities amounted to $3,138,130, representing 3.0% of net assets. These securities have been deemed liquid by the investment adviser pursuant to the Fund’s liquidity procedures approved by the Board of Trustees. |
| (3) | The table below presents collateral for repurchase agreements. |
| | | | | | | | | | | | | | | | |
| Security | | Coupon | | | Maturity
Date | | | Principal
Amount | | |
Value | |
| U.S. Treasury Note | | | 4.625% | | | | 3/15/2026 | | | $ | 709,300 | | | $ | 719,780 | |
Legend:
ADR — American Depositary Receipt
| | | | |
| The accompanying notes are an integral part of these financial statements. | | | | 5 |
SCHEDULE OF INVESTMENTS — GUARDIAN INTERNATIONAL GROWTH VIP FUND
The following is a summary of the inputs used as of June 30, 2023 in valuing the Fund’s investments. For more information on valuation inputs, please refer to Note 2a of the accompanying Notes to Financial Statements.
| | | | | | | | | | | | | | | | |
| | | Valuation Inputs | | | | |
| Investments in Securities (unaudited) | | Level 1 | | | Level 2 | | | Level 3 | | | Total | |
| Common Stocks | | | | | | | | | | | | | | | | |
Australia | | $ | — | | | $ | 1,421,982 | * | | $ | — | | | $ | 1,421,982 | |
Cayman Islands | | | — | | | | 1,021,501 | * | | | — | | | | 1,021,501 | |
Denmark | | | — | | | | 5,248,091 | * | | | — | | | | 5,248,091 | |
France | | | — | | | | 16,376,078 | * | | | — | | | | 16,376,078 | |
Germany | | | — | | | | 6,511,900 | * | | | — | | | | 6,511,900 | |
Hong Kong | | | — | | | | 2,646,706 | * | | | — | | | | 2,646,706 | |
India | | | 1,460,494 | | | | — | | | | — | | | | 1,460,494 | |
Ireland | | | — | | | | 1,849,637 | * | | | — | | | | 1,849,637 | |
Japan | | | — | | | | 20,540,848 | * | | | — | | | | 20,540,848 | |
Netherlands | | | — | | | | 9,997,466 | * | | | — | | | | 9,997,466 | |
Singapore | | | — | | | | 1,510,499 | * | | | — | | | | 1,510,499 | |
Spain | | | — | | | | 2,858,421 | * | | | — | | | | 2,858,421 | |
Sweden | | | — | | | | 4,169,094 | * | | | — | | | | 4,169,094 | |
Switzerland | | | — | | | | 11,417,386 | * | | | — | | | | 11,417,386 | |
Taiwan | | | 1,138,377 | | | | — | | | | — | | | | 1,138,377 | |
United Kingdom | | | — | | | | 16,506,165 | * | | | — | | | | 16,506,165 | |
United States | | | 766,436 | | | | — | | | | — | | | | 766,436 | |
| Repurchase Agreements | | | — | | | | 705,664 | | | | — | | | | 705,664 | |
| Total | | $ | 3,365,307 | | | $ | 102,781,438 | | | $ | — | | | $ | 106,146,745 | |
| * | Consists of certain foreign securities whose values were determined by a pricing service using pricing models (See Note 2a in Notes to Financial Statements). These investments in securities were classified as Level 2 rather than Level 1. |
| | | | |
| 6 | | | | The accompanying notes are an integral part of these financial statements. |
FINANCIAL INFORMATION — GUARDIAN INTERNATIONAL GROWTH VIP FUND
| | | | |
Statement of Assets and Liabilities As of June 30, 2023 (unaudited) | | | |
Assets | | | | |
| | |
Investments, at value | | $ | 106,146,745 | |
| | |
Foreign currency, at value | | | 22,426 | |
| | |
Foreign tax reclaims receivable | | | 502,428 | |
| | |
Receivable for investments sold | | | 165,423 | |
| | |
Dividends/interest receivable | | | 37,212 | |
| | |
Reimbursement receivable from adviser | | | 5,246 | |
| | |
Receivable for fund shares subscribed | | | 265 | |
| | |
Prepaid expenses | | | 1,192 | |
| | | | | |
| | |
Total Assets | | | 106,880,937 | |
| | | | | |
| | |
Liabilities | | | | |
| | |
Payable for investments purchased | | | 321,599 | |
| | |
Investment advisory fees payable | | | 70,048 | |
| | |
Payable for fund shares redeemed | | | 64,497 | |
| | |
Accrued custodian and accounting fees | | | 23,998 | |
| | |
Distribution fees payable | | | 21,979 | |
| | |
Accrued audit fees | | | 15,050 | |
| | |
Accrued trustees’ and officers’ fees | | | 2,230 | |
| | |
Accrued expenses and other liabilities | | | 19,932 | |
| | | | | |
| | |
Total Liabilities | | | 539,333 | |
| | | | | |
| | |
Total Net Assets | | $ | 106,341,604 | |
| | | | | |
| | |
Net Assets Consist of: | | | | |
| | |
Paid-in capital | | $ | 67,772,423 | |
| | |
Distributable earnings | | | 38,569,181 | |
| | | | | |
| | |
Total Net Assets | | $ | 106,341,604 | |
| | | | | |
Investments, at Cost | | $ | 79,667,368 | |
| | | | | |
Foreign Currency, at Cost | | $ | 22,188 | |
| | | | | |
| | |
Pricing of Shares | | | | |
| | |
Shares of Beneficial Interest Outstanding with No Par Value | | | 6,756,614 | |
| | |
Net Asset Value Per Share | | | $15.74 | |
| | | | | |
| | | | |
Statement of Operations For the Six Months Ended June 30, 2023 (unaudited) | |
Investment Income | | | | |
| | |
Dividends | | $ | 1,489,831 | |
| | |
Interest | | | 7,368 | |
| | |
Withholding taxes on foreign dividends | | | (133,512 | ) |
| | | | | |
| | |
Total Investment Income | | | 1,363,687 | |
| | | | | |
| | |
Expenses | | | | |
| | |
Investment advisory fees | | | 443,675 | |
| | |
Distribution fees | | | 139,627 | |
| | |
Custodian and accounting fees | | | 34,944 | |
| | |
Professional fees | | | 25,691 | |
| | |
Trustees’ and officers’ fees | | | 14,460 | |
| | |
Administrative fees | | | 12,677 | |
| | |
Transfer agent fees | | | 6,896 | |
| | |
Shareholder reports | | | 4,263 | |
| | |
Other expenses | | | 3,061 | |
| | | | | |
| | |
Total Expenses | | | 685,294 | |
| | |
Less: Fees waived | | | (26,255 | ) |
| | | | | |
| | |
Total Expenses, Net | | | 659,039 | |
| | | | | |
| | |
Net Investment Income/(Loss) | | | 704,648 | |
| | | | | |
| | |
Realized Gain/(Loss) and Change in Unrealized Appreciation/(Depreciation) on Investments and Foreign Currency Transactions | | | | |
| | |
Net realized gain/(loss) from investments | | | 1,098,269 | |
| | |
Net realized gain/(loss) from foreign currency transactions | | | (34,803 | ) |
| | |
Net change in unrealized appreciation/(depreciation) on investments | | | 13,762,444 | |
| | |
Net change in unrealized appreciation/(depreciation) on translation of assets and liabilities in foreign currencies | | | 12,716 | |
| | | | | |
| | |
Net Gain on Investments and Foreign Currency Transactions | | | 14,838,626 | |
| | | | | |
| | |
Net Increase in Net Assets Resulting From Operations | | $ | 15,543,274 | |
| | | | | |
| | | | | |
| | | | |
| The accompanying notes are an integral part of these financial statements. | | | | 7 |
FINANCIAL INFORMATION — GUARDIAN INTERNATIONAL GROWTH VIP FUND
| | | | | | | | |
Statements of Changes in Net Assets Six Months Ended Numbers are unaudited | | | | | | |
| | | |
| | | For the
Six Months Ended
6/30/23 | | | For the
Year Ended
12/31/22 | |
| | | | |
Operations | |
| | | |
Net investment income/(loss) | | $ | 704,648 | | | $ | 420,805 | |
| | | |
Net realized gain/(loss) from investments and foreign currency transactions | | | 1,063,466 | | | | (4,597,473 | ) |
| | | |
Net change in unrealized appreciation/(depreciation) on investments and
translation of assets and liabilities in foreign currencies | | | 13,775,160 | | | | (38,921,225 | ) |
| | | | | | | | | |
| | | |
Net Increase/(Decrease) in Net Assets Resulting from Operations | | | 15,543,274 | | | | (43,097,893 | ) |
| | | | | | | | | |
| |
Capital Share Transactions | |
| | | |
Proceeds from sales of shares | | | 188,911 | | | | 30,232,445 | |
| | | |
Cost of shares redeemed | | | (24,052,896 | ) | | | (21,298,973 | ) |
| | | | | | | | | |
| | | |
Net Increase/(Decrease) in Net Assets Resulting from Capital Share Transactions | | | (23,863,985 | ) | | | 8,933,472 | |
| | | | | | | | | |
| | | |
Net Decrease in Net Assets | | | (8,320,711 | ) | | | (34,164,421 | ) |
| | | | | | | | | |
| |
Net Assets | |
| | | |
Beginning of period | | | 114,662,315 | | | | 148,826,736 | |
| | | | | | | | | |
| | | |
End of period | | $ | 106,341,604 | | | $ | 114,662,315 | |
| | | | | | | | | |
| |
Other Information: | |
| | | |
Shares | | | | | | | | |
| | | |
Sold | | | 12,543 | | | | 2,045,765 | |
| | | |
Redeemed | | | (1,574,263 | ) | | | (1,474,540 | ) |
| | | | | | | | | |
| | | |
Net Increase/(Decrease) | | | (1,561,720 | ) | | | 571,225 | |
| | | | | | | | | |
| | | | | | | | | |
| | | | |
| 8 | | | | The accompanying notes are an integral part of these financial statements. |
This Page Intentionally Left Blank
FINANCIAL INFORMATION — GUARDIAN INTERNATIONAL GROWTH VIP FUND
The Financial Highlights table is intended to help you understand the Fund’s financial performance for the past six reporting periods (or, if shorter, the period since inception). Certain information reflects financial results for a single Fund share. The total returns in the table represent the rate that an investor would have earned (or lost) on an investment in the Fund.
| | | | | | | | | | | | | | | | | | | | | | | | |
Financial Highlights Six Months Ended Numbers are unaudited | | | | | | | | | | | | | | | | |
| | | Per Share Operating Performance | | | | |
| | | Net Asset Value,
Beginning of
Period | | | Net Investment
Income/(Loss)(1) | | | Net Realized
and Unrealized
Gain/(Loss) | | | Total
Operations | | | Net Asset
Value, End of
Period | | | Total
Return(2) | |
| | | | | | | |
Six Months Ended 6/30/23 | | $ | 13.78 | | | $ | 0.09 | | | $ | 1.87 | | | $ | 1.96 | | | $ | 15.74 | | | | 14.22% | (4) |
| | | | | | | |
Year Ended 12/31/22 | | | 19.21 | | | | 0.05 | | | | (5.48) | | | | (5.43) | | | | 13.78 | | | | (28.27)% | |
| | | | | | | |
Year Ended 12/31/21 | | | 17.34 | | | | (0.01 | ) | | | 1.88 | | | | 1.87 | | | | 19.21 | | | | 10.78% | |
| | | | | | | |
Year Ended 12/31/20 | | | 13.53 | | | | (0.00 | )(5) | | | 3.81 | | | | 3.81 | | | | 17.34 | | | | 28.16% | |
| | | | | | | |
Year Ended 12/31/19 | | | 10.24 | | | | 0.07 | | | | 3.22 | | | | 3.29 | | | | 13.53 | | | | 32.13% | |
| | | | | | | |
Year Ended 12/31/18 | | | 12.61 | | | | 0.12 | | | | (2.49) | | | | (2.37) | | | | 10.24 | | | | (18.79)% | |
| | | | |
| 10 | | | | The accompanying notes are an integral part of these financial statements. |
FINANCIAL INFORMATION — GUARDIAN INTERNATIONAL GROWTH VIP FUND
| | | | | | | | | | | | | | | | | | | | | | |
| | | | | | | | | | | | | | | | | |
| Ratios/Supplemental Data | |
Net Assets, End
of Period (000s) | | | Net Ratio of
Expenses to
Average
Net Assets(3) | | | Gross Ratio of
Expenses to
Average Net
Assets | | | Net Ratio of Net
Investment Income/ (Loss) to Average
Net Assets(3) | | | Gross Ratio of Net
Investment Income/
(Loss) to Average
Net Assets | | | Portfolio
Turnover Rate | |
| | | | | |
| $ | 106,342 | | | | 1.18% | (4) | | | 1.23% | (4) | | | 1.26% | (4) | | | 1.21% | (4) | | | 21% | (4) |
| | | | | |
| | 114,662 | | | | 1.18% | | | | 1.21% | | | | 0.35% | | | | 0.32% | | | | 40% | |
| | | | | |
| | 148,827 | | | | 1.17% | | | | 1.17% | | | | (0.05)% | | | | (0.05)% | | | | 31% | |
| | | | | |
| | 146,998 | | | | 1.18% | | | | 1.24% | | | | (0.00)% | (6) | | | (0.06)% | | | | 25% | |
| | | | | |
| | 146,555 | | | | 1.18% | | | | 1.26% | | | | 0.56% | | | | 0.48% | | | | 25% | |
| | | | | |
| | 131,137 | | | | 1.18% | | | | 1.32% | | | | 1.07% | | | | 0.93% | | | | 61% | |
| (1) | Calculated based on the average shares outstanding during the period. |
| (2) | Total returns do not reflect the effects of charges deducted pursuant to the terms of The Guardian Insurance & Annuity Company, Inc.’s variable contracts. Inclusion of such charges would reduce the total returns for all periods shown. |
| (3) | Net Ratio of Expenses to Average Net Assets and Net Ratio of Net Investment Income/(Loss) to Average Net Assets include the effect of fee waivers and expense limitations. |
| (4) | Ratios for periods less than one year have been annualized, except for total return and portfolio turnover rate. |
| (5) | Rounds to $(0.00) per share. |
| | | | |
| The accompanying notes are an integral part of these financial statements. | | | | 11 |
NOTES TO FINANCIAL STATEMENTS — GUARDIAN INTERNATIONAL GROWTH VIP FUND
June 30, 2023 (unaudited)
1. Organization
Guardian Variable Products Trust (the “Trust”), a Delaware statutory trust organized on January 12, 2016, is registered under the Investment Company Act of 1940, as amended (the “1940 Act”), as an open-end management investment company. The Trust currently has twenty-four series. Guardian International Growth VIP Fund (the “Fund”) is a series of the Trust. The Fund is a diversified fund and commenced operations on September 1, 2016. The financial statements for other series of the Trust are presented in separate reports.
The Trust has authorized an unlimited number of shares of beneficial interest with no par value. Shares are bought and sold at closing net asset value (“NAV”). Shares of the Fund are only sold to certain separate accounts of The Guardian Insurance & Annuity Company, Inc. (“GIAC”) that fund certain variable annuity contracts and variable life insurance policies issued by GIAC. GIAC is a wholly-owned subsidiary of The Guardian Life Insurance Company of America (“Guardian Life”).
The Fund seeks total return consisting of long-term capital growth and current income.
2. Significant Accounting Policies
The following is a summary of significant accounting policies followed by the Fund in the preparation of its financial statements. The Fund follows the investment company accounting and reporting guidance of the Financial Accounting Standards Board (“FASB”) Accounting Standards Codification Topic 946 Financial Services – Investment Companies. The following policies are in conformity with accounting principles generally accepted in the United States of America (“GAAP”). The preparation of financial statements in accordance with GAAP requires management to make estimates and assumptions that affect the reported amounts and disclosures in the financial statements. Actual results could differ from those estimates.
a. Investment Valuations The Board of Trustees has designated Park Avenue Institutional Advisers LLC (“Park Avenue”) as the valuation designee for the Fund pursuant to Rule 2a-5 under the 1940 Act. Park Avenue has established a Fair Valuation Committee and has adopted fair valuation procedures that provide methodologies for fair valuing securities. These procedures include monitoring the appropriateness of fair values based on results of ongoing valuation
oversight, including but not limited to consideration of security specific events, market events, and pricing vendor and broker-dealer due diligence. The Fair Valuation Committee oversees and carries out the policies for the valuation of investments held in the Fund. The Fair Valuation Committee is responsible for discussing and assessing the potential impacts to the fair values on an ongoing basis, and reports to the Board of Trustees on at least a quarterly basis.
Equity securities traded on an exchange other than NASDAQ Stock Market, LLC (“NASDAQ”) are valued at the last reported sale price on the principal exchange or market on which they are traded; or, if there were no sales that day, at the mean between the closing bid and ask prices. Securities traded on the NASDAQ are generally valued at the NASDAQ official closing price, which may not be the last sale price. If the NASDAQ official closing price is not available for a security, that security is generally valued at the mean between the closing bid and ask prices. Repurchase agreements are carried at cost, which approximates fair value (see Note 5d). Foreign securities are valued in the currencies of the markets in which they trade and then converted to U.S. dollars by the application of foreign exchange rates at the close of the New York Stock Exchange (“NYSE”). Forward foreign currency contracts, if any, are valued at the mean between the bid and ask rates for the specified time interpolated from rates for proximate time periods.
Securities for which market quotations are not readily available or securities whose values have been materially affected by events occurring before the Fund’s valuation time but after the close of the securities’ principal exchange or market are valued at their fair values as determined in good faith by Park Avenue, as the Board of Trustee’s valuation designee (as defined in Rule 2a-5 under the 1940 Act), in accordance with Park Avenue’s procedures and under the general oversight of the Board of Trustees. In addition, the values of the Fund’s investments in foreign securities are generally determined by a pricing service using pricing models designed to estimate likely changes in the values of those securities. Certain foreign equity instruments are valued by applying international fair value factors provided by approved pricing services. The factors seek to adjust the local closing price for movements of local markets post closing, but prior to the time the NAVs are calculated. Valuations reflected in this report are as of the report date. As a result, changes in valuation due to market events and/or issuer related events after the report date and prior to issuance of the report are not reflected herein.
NOTES TO FINANCIAL STATEMENTS — GUARDIAN INTERNATIONAL GROWTH VIP FUND
Various inputs are used in determining the valuation of the Fund’s investments. These inputs are summarized in three broad levels listed below.
| • | | Level 1 – unadjusted inputs using quoted prices in active markets for identical investments. |
| • | | Level 2 – other significant observable inputs, including, but not limited to, quoted prices for similar investments, inputs other than quoted prices that are observable for investments (such as interest rates, prepayment speeds, credit risks, etc.) or other market corroborated inputs. |
| • | | Level 3 – significant unobservable inputs (including the Fund’s own assumptions in determining the fair value of investments). |
Inputs may include price information, volatility statistics, specific and broad credit data, liquidity statistics, and other factors. A financial instrument’s level within the fair value hierarchy is based on the lowest level of any input; both individually and in aggregate, that is significant to the fair value measurement. However, the determination of what constitutes “observable” requires significant judgment by the Trust. The Trust considers observable data to be that market data which is readily available, regularly distributed or updated, reliable and verifiable, and provided by independent sources that are actively involved in the relevant market. The inputs or methodology used for valuing securities are not necessarily an indication of the risk associated with investing in those securities. Changes in valuation techniques may result in transfers into or out of a financial instrument’s assigned level within the hierarchy.
The FASB requires reporting entities to make disclosures about purchases, sales, issuances and settlements of Level 3 securities on a gross basis. For the six months ended June 30, 2023, there were no transfers into or out of Level 3 of the fair value hierarchy.
In determining a financial instrument’s placement within the hierarchy, the Trust separates the Fund’s investment portfolio into two categories: investments and derivatives (e.g., futures). A summary of inputs used to value the Fund’s assets and liabilities carried at fair value as of June 30, 2023 is included in the Schedule of Investments.
Investments Investments whose values are based on quoted market prices in active markets, and are therefore classified within Level 1, include active listed equities. Investments that trade in markets that are not considered to be active, but are valued based on quoted
market prices, dealer quotations or alternative pricing sources supported by observable inputs are classified within Level 2. These include certain U.S. government and sovereign obligations, most government agency securities, investment-grade corporate bonds, certain mortgage products, state, municipal and provincial obligations, and certain foreign equity securities, including securities whose prices may have been affected by events occurring after the close of trading on their principal exchange or market and, as a result, whose values are determined by a pricing service as described above, or securities whose values are otherwise determined using fair valuation methods approved by the Fund’s Board of Trustees.
Investments classified within Level 3 have significant unobservable inputs, as they trade infrequently or not at all. Level 3 investments include, among others, private placement securities. When observable prices are not available for these securities, the Trust uses one or more valuation techniques for which sufficient and reliable data is available. The inputs used by the Trust in estimating the value of Level 3 investments include, for example, the original transaction price, recent transactions in the same or similar instruments, completed or pending third-party transactions in the underlying investment or comparable issuers, subsequent rounds of financing, recapitalizations, and other transactions across the capital structure. Level 3 investments may also be adjusted to reflect illiquidity and/or non-transferability, with the amount of such discount estimated by the Trust in the absence of market information. Assumptions used by the Trust due to the lack of observable inputs may significantly impact the resulting fair value and therefore the Fund’s results of operations. As of June 30, 2023, the Fund had no securities classified as Level 3.
Derivatives Exchange-traded derivatives, such as futures contracts, exchange-traded option contracts and certain swaps, are typically classified within Level 1 or Level 2 of the fair value hierarchy depending on whether or not they are deemed to be actively traded. Certain non-exchange-traded derivatives, such as generic forwards, certain swaps and options, have inputs which can generally be corroborated by market data and are therefore classified within Level 2. During the six months ended June 30, 2023, the Fund did not hold any derivatives.
b. Securities Transactions Securities transactions are accounted for on the date securities are purchased or sold (trade date). Realized gains or losses on securities transactions are determined on the basis of specific identification.
NOTES TO FINANCIAL STATEMENTS — GUARDIAN INTERNATIONAL GROWTH VIP FUND
c. Futures Contracts The Fund may enter into financial futures contracts. In entering into such contracts, the Fund is required to deposit with the counterparty, either in cash or securities, an amount equal to a certain percentage of the face value of the contract. Subsequent payments are received or made by the Fund each day, depending on the daily fluctuations in the values of the contracts, and are recorded for financial statement purposes as variation margin received or paid by the Fund. Daily changes in variation margin are recognized as unrealized gains or losses by the Fund. The Fund may not achieve the anticipated benefits of the financial futures contracts and may realize a loss.
d. Foreign Currency Translation The accounting records of the Fund are maintained in U.S. dollars. Investment securities and all other assets and liabilities of the Fund denominated in a foreign currency are generally translated into U.S. dollars at the exchange rates quoted at the close of the NYSE on each business day. The market value of investment securities and other assets and liabilities are translated at the exchange rate as of the valuation date. Purchases and sales of securities, income receipts, and expense payments are translated into U.S. dollars at the exchange rates in effect on the dates of the respective transactions. The Fund does not isolate the portion of the fluctuations on investments resulting from changes in foreign currency exchange rates from the fluctuations in market prices of investments held. Such fluctuations are included in the Net change in net realized and unrealized gain/(loss) from investments on the Statement of Operations.
Reported realized foreign currency gains and losses arise from the disposition of foreign currency, currency gains or losses realized between the trade and settlement dates on securities transactions, and the difference between the amounts of dividends, interest and foreign withholding taxes recorded on the Fund’s books on the transaction date and the U.S. dollar equivalent of the amounts actually received or paid. These reported realized foreign currency gains and losses, if any, are included in Net realized gain/(loss) from foreign currency transactions on the Statement of Operations. Unrealized foreign currency gains and losses arise from changes (due to changes in exchange rates) in the value of foreign currency and other assets and liabilities denominated in foreign currencies, which are held at period end, if any, and are included in Net change in unrealized appreciation/(depreciation) on translation of assets and liabilities in foreign currencies on the Statement of Operations.
e. Foreign Capital Gains Tax The Fund may be subject to foreign taxes on income, gains on investments or currency purchases/repatriation, a portion of which may be recoverable. The Fund will accrue such taxes and recoveries as applicable, based upon their current interpretation of tax rules and regulations that exist in the markets in which they invest.
f. Investment Income Dividend income net of foreign taxes withheld, if any, is generally recorded on the ex-dividend date. Distributions received from real estate investment trusts, if any, may be classified as dividends, capital gains and/or return of capital. Interest income, which includes amortization/accretion of premium/discount, is determined using the interest income accrual method, and is accrued and recorded daily.
g. Allocation of Income and Expenses Many of the expenses of the Trust can be directly attributed to a specific series of the Trust. Expenses that cannot be directly attributed to a specific series of the Trust are generally apportioned among all the series in the Trust, based on relative net assets. In calculating net asset value per share for each series of the Trust, investment income, realized and unrealized gains and losses, and expenses other than series-specific expenses are allocated daily to each series based upon the proportion of net assets attributable to each series.
3. Transactions with Affiliates
a. Investment Advisory Fee and Expense Limitation Under the terms of the advisory agreement, which, after its two year initial term, is reviewed and approved annually by the Board of Trustees, the Fund pays an investment advisory fee to Park Avenue. Park Avenue is a wholly-owned subsidiary of Guardian Life and receives an investment advisory fee at an annual rate of 0.80% of the first $100 million, and 0.75% in excess of $100 million of the Fund’s average daily net assets. The fee is accrued daily and paid monthly.
Park Avenue has contractually agreed through April 30, 2024 to waive certain fees and/or reimburse certain expenses incurred by the Fund to the extent necessary to limit the Fund’s total annual operating expenses after fee waiver and/or expense reimbursement to 1.18% of the Fund’s average daily net assets (excluding, if applicable, any acquired fund fees and expenses, taxes, interest, transaction costs and brokerage commissions, litigation and extraordinary expenses). The limitation may not be increased or terminated prior to this time without action by the Board of Trustees and may be terminated only upon approval of the Board of Trustees.
NOTES TO FINANCIAL STATEMENTS — GUARDIAN INTERNATIONAL GROWTH VIP FUND
Amounts waived or reimbursed by Park Avenue pursuant to any expense limitation will not be subject to Park Avenue’s recoupment rights. For the six months ended June 30, 2023, Park Avenue waived fees and/or paid Fund expenses in the amount of $26,255.
Park Avenue has entered into a Sub-Advisory Agreement with J.P. Morgan Investment Management Inc. (“J.P. Morgan”). J.P. Morgan is responsible for providing day-to-day investment advisory services to the Fund, subject to the supervision of Park Avenue and the oversight of the Board of Trustees. Sub-advisory fees are paid by Park Avenue and do not represent a separate or additional expense to the Fund.
b. Compensation of Trustees and Officers Trustees and officers who are interested persons of the Trust, as defined in the 1940 Act, receive no compensation from the Fund, except for the Chief Compliance Officer of the Trust. Trustees of the Trust who are not interested persons of the Trust, and the Chief Compliance Officer, receive compensation and reimbursement of expenses from the Trust.
c. Distribution Fees Park Avenue Securities LLC (“PAS”), a wholly-owned subsidiary of Guardian Life, is the principal underwriter of Fund shares. The Trust has entered into a distribution and service agreement with PAS, which governs the sale and distribution of shares of the Fund. Under a distribution and service plan adopted by the Trust (“12b-1 plan”), PAS is compensated for services in such capacity, including its expenses in connection with the promotion and distribution of shares of the Fund, at an annual rate of 0.25% of the Fund’s average daily net assets. For the six months ended June 30, 2023, the Fund paid distribution fees in the amount of $139,627 to PAS.
PAS has directed that certain payments under the 12b-1 plan be used to compensate GIAC for shareholder services provided to contract owners.
4. Federal Income Taxes
a. Distributions to Shareholders For federal income tax purposes, the Fund is treated as a disregarded entity (“DRE”). As a DRE, the Fund is not subject to an entity-level income tax; and any income, gains, losses, deductions, taxes, and credits of the Fund would instead be “passed through” directly to the separate accounts of GIAC that invest in the Fund and retain the same character for U.S. federal income tax purposes. In addition, the Fund is not required to distribute taxable income and capital gains for U.S. federal income tax purposes. Therefore, no dividends and capital gains distributions were paid by the Fund.
5. Investments
a. Investment Purchases and Sales The cost of investments purchased and the proceeds from investments sold (excluding short-term investments) amounted to $22,887,828 and $45,151,837, respectively, for the six months ended June 30, 2023. During the six months ended June 30, 2023, there were no purchases or sales of U.S. government securities.
b. Foreign Securities Foreign securities investments involve special risks and considerations not typically associated with U.S. investments. These risks include, but are not limited to, currency risk; adverse political, regulatory, social, and economic developments; and less reliable information about issuers. Moreover, securities of some foreign issuers may be less liquid and their prices more volatile than those of comparable U.S. issuers.
c. Industry or Sector Concentration In its normal course of business, the Fund may invest a significant portion of its assets in companies within a limited number of industries or sectors. As a result, the Fund may be subject to a greater risk of loss than that of a fund invested in a wider spectrum of industries or sectors because the stocks of many or all of the companies in the industry, group of industries, sector, or sectors may decline in value due to developments adversely affecting the industry, group of industries, sector, or sectors.
d. Repurchase Agreements The Fund may invest in repurchase agreements to maintain liquidity and earn income over periods of time as short as overnight. The collateral for repurchase agreements is either cash or fully negotiable U.S. government securities (including U.S. government agency securities). Repurchase agreements are fully collateralized (including the interest accrued thereon) and such collateral is marked to market daily while the agreements remain in force. If the value of the collateral falls below the repurchase price plus accrued interest, the Fund will typically require the seller to deposit additional collateral by the next business day. If the request for additional collateral is not met, or the seller defaults, the Fund maintains the right to sell the collateral (although it may be prevented or delayed from doing so in certain circumstances) and may be required to claim any resulting loss against the seller. Park Avenue monitors the creditworthiness of the seller with which the Fund enters into repurchase agreements.
NOTES TO FINANCIAL STATEMENTS — GUARDIAN INTERNATIONAL GROWTH VIP FUND
6. Temporary Borrowings
The Fund, with other funds managed by Park Avenue, is party to a credit agreement with respect to a $10 million committed revolving credit facility from State Street Bank and Trust Company (the “Credit Agreement”) for temporary borrowing purposes, including the meeting of redemption requests that otherwise might require the untimely disposition of securities. Interest is based on a daily fluctuating rate per annum equal to the Applicable Rate (as defined in the Credit Agreement) plus the Applicable Margin (as defined in the Credit Agreement) that is subject to change from time to time as and when the Applicable Rate changes. Under the current Credit Agreement, the Applicable Rate for any day is defined as the rate per annum equal to the sum of (a) 0.10% plus (b) the higher of (i) the Federal Funds Effective Rate for such day and (ii) the Overnight Bank Funding Rate for such day; the Applicable Margin is 1.25%. In addition to the interest charged on any borrowings by the Fund, each fund pays a commitment fee of 0.30% per annum on its share of the unused portion of the credit facility. The agreement is in place until January 5, 2024. The Fund did not utilize the credit facility during the six months ended June 30, 2023.
7. Indemnifications
Under the Trust’s organizational documents and, in some cases, by contract, officers and Trustees of the Trust are indemnified against certain liabilities arising out of the performance of their duties to the Fund. In addition, in the normal course of business, the Fund enters into contracts with its vendors and others that provide general indemnifications. The Fund’s maximum exposure under these arrangements is unknown as this would involve future claims that may be made against the Fund that have not yet occurred. However, based on experience, the Fund expects the risk of loss to be remote.
8. Additional Information
The outbreak of COVID-19 has adversely impacted both local and global economies, including those in which the Fund may invest. These impacts include materially reduced consumer demand and economic output, disrupted supply chains, market closures, travel restrictions and quarantines, and strained healthcare systems. The Fund’s operations may be interrupted as a result, which may have a negative impact on the Fund’s investment performance.
SUPPLEMENTAL INFORMATION (UNAUDITED)
Liquidity Risk Management Program
In compliance with Rule 22e-4 under the Investment Company Act of 1940, as amended (the “Liquidity Rule”), Guardian Variable Products Trust (the “Trust”) has adopted and implemented a written liquidity risk management program (the “Program”) for each series of the Trust (each, a “Fund”), which is reasonably designed to assess and manage each Fund’s liquidity risk. The Fund’s “liquidity risk” is the risk that the Fund could not
meet requests to redeem shares issued by the Fund without significant dilution of the remaining investors’ interests in the Fund.
The Board of Trustees of the Trust (the “Board”)
Previously approved the designation of Park Avenue Institutional Advisers LLC (the “Administrator” or “PAIA”) as Program administrator. The Administrator established a Liquidity Risk Management Committee, which is comprised of certain officers of the Trust and PAIA, that assists the Administrator in the implementation and day-to-day administration of the Program and otherwise support carrying out the Administrator’s liquidity risk management responsibilities under the Program.
In accordance with the Program, each Fund’s liquidity risk is assessed no less frequently than annually, taking into consideration a variety of factors, including, as applicable, the Fund’s investment strategy and liquidity of portfolio investments, cash flow projections, and holdings of cash and cash equivalents, as well as borrowing arrangements and other funding sources. Certain factors are considered under both normal and reasonably foreseeable stressed conditions.
Each Fund portfolio investment is classified, no less than monthly, into one of four liquidity categories (including “highly liquid investments” and “illiquid investments,” discussed below) based on a determination of the number of days it is reasonably expected to take to convert the investment to cash, or sell or dispose of the investment, in current market conditions without significantly changing the investment’s market value.
The Liquidity Rule limits the Fund’s investments in illiquid investments by prohibiting the Fund from acquiring any illiquid investment if, immediately after the acquisition, the Fund would have invested more than 15% of its net assets in illiquid investments that are assets. The Program includes provisions reasonably designed to comply with this investment limitation. In addition, the Program includes provisions reasonably designed to comply with this investment limitation. In addition, the Program includes provisions reasonably designed to comply with the Liquidity Rule’s requirements relating to highly liquid investment minimums, which is a minimum amount of Fund net assets that must be invested in highly liquid investments that are assets, as applicable. The Fund was not required to adopt a highly liquid investment minimum during the
period.
At a meeting of the Board held on March 29-30, 2023, the Board received a report (the “Report”) prepared by the Administrator addressing the Program’s operation and assessing the adequacy and effectiveness of its implementation for the period from January 1, 2022 through December 31, 2022 (the “Reporting Period”). The Report noted that the Administrator believes the Program operated effectively during the Reporting Period and continues to be reasonably designed to effectively assess and manage each Fund’s liquidity risk. The Report also noted that the Administrator believes the Program has been adequately and effectively implemented and the investment strategies for each Fund continue to be appropriate since its inception. In addition, the Report summarized the operation of the Program and the information and factors considered by the Administrator in its assessment of the Program’s implementation, such as the liquidity risk assessment framework and liquidity classification methodologies.
There can be no assurance that the Program will achieve its objectives under all circumstances. Please refer to the Fund’s prospectus for more information regarding the Fund’s exposure to liquidity risk and other risks to which an investment in the Fund may be subject.
SUPPLEMENTAL INFORMATION (UNAUDITED)
Approval of Investment Management and Sub-advisory Agreements
Section 15(c) of the Investment Company Act of 1940, as amended (the “1940 Act”), requires that a fund’s investment advisory and sub-advisory agreements be approved initially by the fund’s board of trustees. Section 15(c) also requires that the continuation of these agreements, after an initial term of up to two years, be annually reviewed and approved by the board. Any such agreement must be approved by a vote of a majority of the trustees who are not parties to the agreement or “interested persons” (as defined in the 1940 Act) of a party to the agreement at a meeting of the board called for the purpose of voting on such approval.
At a meeting of the Board of Trustees (the “Board”) of Guardian Variable Products Trust (the “Trust”) held on March 29-30, 2023 (the “Meeting”), the Board, including the trustees who are not parties to the agreement or “interested persons” as defined in the 1940 Act (the “Independent Trustees”), considered and voted unanimously to renew the existing investment management agreement between the Trust, on behalf of Guardian All Cap Core VIP Fund; Guardian Balanced Allocation VIP Fund; Guardian Core Fixed Income VIP Fund; Guardian Core Plus Fixed Income VIP Fund; Guardian Diversified Research VIP Fund; Guardian Equity Income VIP Fund; Guardian Global Utilities VIP Fund; Guardian Growth & Income VIP Fund; Guardian Integrated Research VIP Fund; Guardian International Growth VIP Fund; Guardian International Equity VIP Fund; Guardian Large Cap Disciplined Growth VIP Fund; Guardian Large Cap Disciplined Value VIP Fund; Guardian Large Cap Fundamental Growth VIP Fund; Guardian Mid Cap Relative Value VIP Fund; Guardian Mid Cap Traditional Growth VIP Fund; Guardian Multi-Sector Bond VIP Fund; Guardian Select Mid-Cap Core VIP Fund; Guardian Short Duration Bond VIP Fund; Guardian Small Cap Core VIP Fund; Guardian Small-Mid Cap Core VIP Fund; Guardian Strategic Large Cap Core VIP Fund; Guardian Total Return Bond VIP Fund and Guardian U.S. Government Securities VIP Fund (each, a “Fund,” and together, the “Funds”), in substantially the form presented at this meeting (the “Management Agreement”); and Park Avenue Institutional Advisers LLC (the “Manager”) for a one-year term.
The Board, including the Independent Trustees, also considered and voted unanimously to renew the existing sub-advisory agreements (the “Sub-Advisory Agreements,” collectively with the Management Agreement and Sub-Subadvisory Agreement, the
“Agreements”) between the Manager and investment advisory firms engaged to serve as sub-advisers to certain of the Funds (the “Sub-Advised Funds”), namely (i) ClearBridge Investments, LLC with respect to Guardian Small Cap Core VIP Fund; (ii) Putnam Investment Management, LLC with respect to Guardian Diversified Research VIP Fund; (iii) AllianceBernstein L.P. with respect to Guardian Growth & Income VIP Fund and Guardian Strategic Large Cap Core VIP Fund; (iv) J.P. Morgan Investment Management Inc. with respect to Guardian International Growth VIP Fund; (v) Schroder Investment Management North America Inc. with respect to Guardian International Equity VIP Fund; (vi) Wellington Management Company LLP with respect to Guardian Balanced Allocation VIP Fund, Guardian Equity Income VIP Fund, Guardian Integrated Research VIP Fund, Guardian Large Cap Disciplined Growth VIP Fund and Guardian Global Utilities VIP Fund; (vii) Boston Partners Global Investors, Inc. with respect to Guardian Large Cap Disciplined Value VIP Fund; (viii) Janus Henderson Investors US LLC with respect to Guardian Mid Cap Traditional Growth VIP Fund; (ix) Allspring Global Investments, LLC with respect to Guardian Mid Cap Relative Value VIP Fund and Guardian Small-Mid Cap Core VIP Fund; (x) Lord, Abbett & Co. LLC with respect to Guardian Core Plus Fixed Income VIP Fund; (xi) FIAM LLC with respect to Guardian Select Mid Cap Core VIP Fund; and (xii) Massachusetts Financial Services Company with respect to Guardian All Cap Core VIP Fund, each in substantially the form presented at this meeting, (each, a “Sub-Adviser” and collectively, the “Sub-Advisers”) for a one-year term.
The Board, including the Independent Trustees, also considered and voted unanimously to renew the existing sub-subadvisory agreement (the “Sub-Subadvisory Agreement”) between Schroder Investment Management North America Inc. and Schroder Investment Management North America Limited (also a Sub-Adviser) with respect to Guardian International Equity VIP Fund for a one-year term.
The Board is responsible for overseeing the management of each Fund. In determining whether to renew its approval of the Agreements, the Trustees evaluated information and factors that they considered to be relevant and appropriate through the exercise of their own business judgment. The Trustees considered certain information and factors in light of advice furnished to them by legal counsel to the Trust and, in the case of the Independent Trustees, their independent legal counsel. In advance of the Meeting, the Trustees received materials and information designed to assist their consideration of the
SUPPLEMENTAL INFORMATION (UNAUDITED)
Agreements. The Trustees received written responses from the Manager and each Sub-Adviser to a series of questions and requests for information encompassing a wide variety of topics provided by independent counsel on behalf of the Independent Trustees. The Independent Trustees also received materials and information regarding the legal standards applicable to their consideration of the Agreements and the process and criteria used by the Manager to identify and select the Sub-Advisers.
During the course of their deliberations, the Independent Trustees met twice to discuss and evaluate the materials, information and Agreements in executive session with their independent legal counsel, outside of the presence of the Trustees who are not Independent Trustees and representatives from Fund management, the Manager or any Sub-Adviser.
In reaching its decisions to renew its approval of the Agreements, the Board took into account the materials and information described above, as well as other materials and information provided to the Board throughout the year. Individual Trustees may have given different weight to different factors and information with respect to each Agreement, and the Trustees did not identify any single factor or information that, in isolation, would be controlling in deciding to approve the Agreements. The discussion below is intended to summarize the broad factors that figured prominently in the Board’s decisions to renew its approval of the Agreements rather than to be all-inclusive. These broad factors included: (i) the nature, extent and quality of the services provided to the Funds by the Manager and to the Sub-advised Funds by the Sub-Advisers; (ii) the investment performance of each Fund; (iii) estimated profitability of the Manager; (iv) fees and expenses; (v) the extent to which economies of scale may exist, and the extent to the benefits of economies of scale are shared with the Funds; and (vi) any other benefits derived by the Manager or the Sub-Advisers (or their respective affiliates) from their relationships with the Funds.
Nature, Extent and Quality of Services
The Trustees considered information regarding the nature, extent and quality of services provided to the Funds by the Manager. The Trustees also considered, among other things, the terms of the Management Agreement and the range of investment advisory services provided by the Manager. In addition, the Trustees reviewed the range of non-investment advisory services provided by the Manager consistent with the terms of the Management Agreement, notably
coordinating the preparation and filing of various regulatory documents, coordinating the preparation and assembly of Board meeting materials, and assisting the Board with certain valuation matters. The Board also received a description of the Manager’s and each Sub-Adviser’s business continuity plans and of their respective approaches to data privacy and cybersecurity, and related testing. The Board received information regarding the response of the Manager and the Sub-Advisers to the COVID-19 pandemic, including the continuation of remote work arrangements and return-to-office plans. The Board also received information about the Manager’s role as administrator of the Funds’ liquidity risk management program, the Manager’s approach to risk management, and the Manager’s vendor oversight programs.
The Trustees considered that the Sub-advised Funds operate in a “manager-of-managers” structure and reviewed the responsibilities that the Manager has under this structure, including monitoring and evaluating the performance of the Sub-Advisers, monitoring the Sub-Advisers for adherence to the stated investment objectives, strategies, policies and restrictions of the Funds and supervising the Sub-Advisers with respect to the services that the Sub-Advisers would provide under the Sub-Advisory Agreements. The Trustees also considered the process used by the Manager, consistent with this structure, to identify and recommend sub-advisers, and the Manager’s ability to monitor and oversee sub-advisers and recommend replacement sub-advisers, when necessary, and provide other services under the Management Agreement. The Board noted that investment management staff of the Manager and the Trust’s Chief Compliance Officer conduct oversight meetings with the Sub-Advisers on a periodic basis, follow through with additional inquiries on any questions or concerns that arise during the meetings and, as necessary, then report the results of the meetings to the Board. The Trustees reviewed information regarding the experience and background of the Manager’s key personnel and the Manager’s organizational structure and resources, including investment, legal and administrative capabilities of the Manager. In this regard, the Trustees recognized that the Funds may benefit from the Manager’s ability to use resources and capabilities of its affiliates in providing services to the Funds.
The Trustees considered information regarding the nature, extent and quality of services provided to the Sub-advised Funds by the Sub-Advisers. The Trustees also considered, among other things, the terms of the
SUPPLEMENTAL INFORMATION (UNAUDITED)
Sub-advisory Agreements and the range of investment advisory services provided by the Sub-Advisers under the oversight of the Manager. In evaluating these investment advisory services, the Trustees considered, among other things, the Sub-Advisers’ investment philosophies, styles and/or processes and approaches to managing the respective Sub-advised Funds. The Trustees received and evaluated information regarding the background, education, expertise and/or experience of the investment professionals who serve as portfolio managers for the Sub-advised Funds and the capabilities and resources of the Sub-Advisers.
Based upon these considerations, the Trustees concluded, within the context of their full deliberations, that the nature, extent and quality of services provided to the Funds by the Manager and the Sub-advised Funds by each respective Sub-Adviser were appropriate.
Investment Performance
In connection with each of its regular quarterly meetings, the Board receives information on the performance of each Fund, including net performance, relative performance rankings within the relevant Morningstar peer group, and performance as compared to benchmark index returns. At each quarterly Board meeting, members of the Manager’s funds management team review with the Board the economic and market environment, absolute and relative performance of each Fund, and any relevant information about risk management and style consistency in connection with management of the Funds. The Board considered investment performance for each Fund over the one-year, three-year (where available), five-year (where available) and since-inception periods.
The Board also received and reviewed a report prepared by Broadridge Financial Solutions (“Broadridge”), an independent provider of mutual fund industry data, which included comparisons of the performance of each Fund to performance of an appropriate peer universe. For details regarding each Fund’s performance, see the “Fund-by-Fund Factors” section below.
The Manager discussed with the Board factors contributing to the Funds’ performance results. In addition, for certain Funds, the Manager provided to the Board longer term performance records of the Sub-Advisers for strategies used in managing the Funds. The Board concluded that the investment performance generated by the Manager and each Sub-Adviser was generally satisfactory, or, that any steps being taken by the Manager and Sub-Advisers to address any performance issues were satisfactory.
Profitability
The Board received and considered the Manager’s estimate of its profitability, which included allocations by the Manager of its costs in providing management services to the Funds. The Board considered the estimated profitability of the Manager both overall and on a Fund-by-Fund basis.
The Board received and considered profitability information from most of the Sub-Advisers, but noted that the Manager had negotiated the fees with the Sub-Advisers at arm’s-length. Accordingly, the Board concluded that the profitability of the Sub-Advisers is a less relevant factor than Manager profitability.
Based on the consideration of this information, the Board concluded that the profitability of the Funds to the Manager was acceptable.
Fees and Expenses
The Trustees considered the management fees paid by the Funds to the Manager under the Management Agreement and evaluated the reasonableness of these fees. The Trustees received and reviewed comparative information with respect to the management fee and total expenses for each Fund and the management fees and total expenses for a peer group of other funds selected by Broadridge. The Trustees considered the Manager’s commitment to limit the total expenses of each Fund through an expense limitation agreement with the Trust. Although the Board recognized that the comparisons between the management fees and actual expenses of the Funds and those of the identified peer group are imprecise, given different terms of agreements and variations in fund strategies, the Trustees found that the comparative information supported their consideration and approval of the management fees and evaluation of the total expenses. For details regarding each Fund’s fee and expense comparisons, see the “Fund-by-Fund Factors” section below.
The Trustees considered the sub-advisory fees paid under the Sub-advisory Agreements and evaluated the reasonableness of those fees. The Trustees also considered that the fees paid to the Sub-Advisers would be paid by the Manager and not the Funds and that the Manager had negotiated the fees with the Sub-Advisers at arm’s-length.
Based on the consideration of the information and factors summarized above, as well as other relevant information and factors, the Board concluded that the management and sub-advisory fees were reasonable in
SUPPLEMENTAL INFORMATION (UNAUDITED)
light of the nature, extent and quality of services rendered to the Funds by the Manager and the Sub-Advisers.
Economies of Scale
The Board considered the extent to which economies of scale may exist, and the extent to the benefits of economies of scale are shared with the Funds. In this regard, the Board noted that for sixteen of twenty-four Funds, the management and sub-advisory fee included breakpoints that are tiered based on growth in asset levels of each such Fund and that for the other Funds, the fees reflected appropriate levels based on current and expected asset levels. The Board also noted that the expenses of the Funds are subject to expense limitations provided by the Manager. The Board noted that expected economies of scale, where they exist, may be shared through the use of fee breakpoints, expense limitations by the Manager, and/or a lower overall fee.
Ancillary Benefits
The Board considered the potential benefits, other than management fees, that the Manager and/or its affiliates may receive because of the Manager’s relationship with the Funds. The Trustees considered that the Funds were designed to serve as investment options under variable contracts issued by affiliates of the Manager that would receive fees under those contracts and that Park Avenue Securities LLC, an affiliate of the Manager and principal underwriter of the Funds, and participating insurance companies, including insurance companies affiliated with the Manager, would be entitled to receive fees from the Funds under a plan of distribution adopted pursuant to Rule 12b-1 under the 1940 Act. The Trustees considered that the Manager and its affiliates may benefit from (i) greater efficiencies in annuity administration and operations and potential cost savings due to a reduction in the number of unaffiliated funds available as annuity contract investment options, and (ii) increased dividends-received deductions due to the Funds’ status under the tax laws as disregarded entities. In addition, the Trustees considered the potential benefits, other than sub-advisory fees, that the Sub-Advisers and their affiliates may receive because of their relationships with the Funds, including the ability to receive research from soft dollar commissions consistent with Trust policies. The Trustees concluded that benefits that may accrue to the Manager and its affiliates are reasonable and the benefits that may accrue to the Sub-Advisers and their affiliates are consistent with those expected for a sub-adviser to a mutual fund such as the applicable Fund.
Fund-by-Fund Factors
The Broadridge report groups fees, expenses and performance into five quintiles, with the top quintile having the highest performance or lowest fees/expenses, and the bottom quintile having the lowest performance or highest fees/expenses. For purposes of the descriptions below, a Fund’s performance is considered “in line with” the benchmark index if it is within 0.20%.
Guardian Large Cap Fundamental Growth VIP Fund
| • | | The Board noted that the Fund’s performance was in the 3rd quintile of its performance universe for the 1-year period and in the 4th quintile for its performance universe for the 3-year and 5-year periods. The Board also noted that the Fund’s performance was below the benchmark index for the 1-year, 3-year and 5-year periods. |
| • | | The Board noted that the contractual management fee, the actual management fee and actual total expenses were in the 1st quintile of the expense group. |
Guardian Large Cap Disciplined Growth VIP Fund
| • | | The Board noted that the Fund’s performance was in the 3rd quintile of its performance universe for the 1-year and 3-year periods and in the 2nd quintile for the 5-year period. The Board also noted that the Fund’s performance was below the benchmark index for the 1-year, 3-year and 5-year periods. |
| • | | The Board noted that the contractual management fee, the actual management fee and actual total expenses were in the 1st quintile of the expense group. |
Guardian Integrated Research VIP Fund
| • | | The Board noted that the Fund’s performance was in the 5th quintile of its performance universe for the 1-year and 5-year periods and in the 4th quintile for 3-year period. The Board also noted that the Fund’s performance was below the benchmark index for the 1-year, 3-year and 5-year periods. |
| • | | The Board noted that the contractual management fee, the actual management fee and actual total expenses were in the 1st quintile of the expense group. |
Guardian Diversified Research VIP Fund
| • | | The Board noted that the Fund’s performance was in the 3rd quintile of its performance universe for the 1-year and 3-year periods and in the 2nd quintile for the 5-year period. The Board also noted that the Fund’s performance was higher than the benchmark |
SUPPLEMENTAL INFORMATION (UNAUDITED)
| | | index for the 1-year period. The Board note that the Fund’s performance was lower than the benchmark index for the 3-year and 5-year periods. |
| • | | The Board noted that the contractual management fee and actual management fee were in the 1st quintile of the expense group and that actual total expenses were in the 3rd quintile. |
Guardian Strategic Large Cap Core VIP Fund
| • | | The Board noted that the Fund’s performance was in the 1st quintile of its performance universe for the 1-year period. The Board acknowledged the Fund’s short operational history. The Board noted that the Fund’s performance was higher than the benchmark index for the 1-year period. |
| • | | The Board noted that the contractual management fee, the actual management fee and actual total expenses were in the 1st quintile of the expense group. |
Guardian Large Cap Disciplined Value VIP Fund
| • | | The Board noted that the Fund’s performance was in the 3rd quintile of its performance universe for the 1-year and 3-year periods and in the 4th quintile for the 5-year period. The Board also noted that the Fund’s performance was higher than the benchmark index for the 1-year and 3-year periods. The Board noted that the Fund’s performance was in line with the benchmark index for the 5-year period. |
| • | | The Board noted that the contractual management fee was in the 2nd quintile of the expense group, the actual management fee was in the 1st quintile of the expense group and that actual total expenses were in the 3rd quintile. |
Guardian Growth & Income VIP Fund
| • | | The Board noted that the Fund’s performance was in the 3rd quintile of its performance universe for the 1-year, 3-year and 5-year periods. The Board also noted that the Fund’s performance was higher than the benchmark index for the 1-year, 3-year and 5-year periods. |
| • | | The Board noted that the contractual management fee and the actual management fee were in the 1st quintile of the expense group and that actual total expenses were in the 3rd quintile. |
Guardian Equity Income VIP Fund
| • | | The Board noted that the Fund had less than one-year of operational history and was not able to evaluate an investment performance record for the Fund. The |
| | | Board noted that it would have an opportunity to review such information in connection with future annual reviews. The Board noted that, in the meantime, it received monthly performance reports from the Manager. |
| • | | The Board noted that the contractual management fee, the actual management fee and actual total expenses were in the 1st quintile of the expense group. |
Guardian All Cap Core VIP Fund
| • | | The Board noted that the Fund’s performance was in the 3rd quintile of its performance universe for the 1-year period. The Board acknowledged the Fund’s short operational history. The Board noted that the Fund’s performance was higher than the benchmark index for the 1-year period. |
| • | | The Board noted that the contractual management fee, the actual management fee and actual total expenses were in the 1st quintile of the expense group. |
Guardian Mid Cap Traditional Growth VIP Fund
| • | | The Board noted that the Fund’s performance was in the 1st quintile of its performance universe for the 1-year period and in the 2nd quintile for the 3-year and 5-year periods. The Board also noted that the Fund’s performance was higher than the benchmark index for the 1-year, 3-year and 5-year periods. |
| • | | The Board noted that the contractual management fee and actual management fee were in the 1st quintile of the expense group and that the actual total expenses were in the 4th quintile. |
Guardian Select Mid Cap Core VIP Fund
| • | | The Board noted that the Fund’s performance was in the 3rd quintile of its performance universe for the 1-year period. The Board acknowledged the Fund’s short operational history. The Board noted that the Fund’s performance was lower than the benchmark index for the 1-year period. |
| • | | The Board noted that the contractual management fee, the actual management fee and actual total expenses were in the 1st quintile of the expense group. |
Guardian Mid Cap Relative Value VIP Fund
| • | | The Board noted that the Fund’s performance was in the 2nd quintile of its performance universe for the 1-year, 3-year and 5-year periods. The Board also noted that the Fund’s performance was higher than the benchmark index for the 1-year, 3-year and 5-year periods. |
SUPPLEMENTAL INFORMATION (UNAUDITED)
| • | | The Board noted that the contractual management fee and the actual management fee were in the 2nd quintile of the expense group and the actual total expenses were in the 3rd quintile of the expense group. |
Guardian Small-Mid Cap Core VIP Fund
| • | | The Board noted that the Fund’s performance was in the 5th quintile of its performance universe for the 1-year period. The Board acknowledged the Fund’s short operational history. The Board noted that the Fund’s performance was higher than the benchmark index for the 1-year period. |
| • | | The Board noted that the contractual management fee, the actual management fee and actual total expenses were in the 1st quintile of the expense group. |
Guardian Small Cap Core VIP Fund
| • | | The Board noted that the Fund’s performance was in the 5th quintile of its performance universe for the 1-year and 3-year periods. The Board noted that the Fund’s performance was lower than the benchmark index for the 1-year and 3-year periods. |
| • | | The Board noted that the contractual management fee and the actual management fee were in the 1st quintile of the expense group and the actual total expenses were in the 2nd quintile of the expense group. |
Guardian International Growth VIP Fund
| • | | The Board noted that the Fund’s performance was in the 4th quintile of its performance universe for the 1-year period, in the 2nd quintile of its performance universe for the 3-year period and in the 3rd quintile of its performance universe for the 5-year period. The Board also noted that the Fund’s performance was lower than the benchmark index for the 1-year and 5-year periods. The Board noted that the Fund’s performance was higher than the benchmark index for the 3-year period. |
| • | | The Board noted that the contractual management fee and actual management fee were in the 2nd quintile of the expense group and that the actual total expenses were in the 3rd quintile. |
Guardian International Equity VIP Fund
| • | | The Board noted that the Fund’s performance was in the 5th quintile of its performance universe for the 1-year, 3-year and 5-year periods. The Board also noted that the Fund’s performance was lower than the benchmark index for the 1-year, 3-year and 5-year periods. |
| • | | The Board noted that the contractual management fee, the actual management fee and the actual total expenses were in the 2nd quintile of the expense group. |
Guardian Global Utilities VIP Fund
| • | | The Board noted that the Fund’s performance was in the 5th quintile of its performance universe for the 1-year period and in the 4th quintile of its performance universe for the 3-year period. The Board noted that the Fund’s performance was higher than the benchmark index for the 1-year and 3-year periods. |
| • | | The Board noted that the contractual management fee and the actual management fee were in the 1st quintile of the expense group and the actual total expenses were in the 2nd quintile of the expense group. |
Guardian Balanced Allocation VIP Fund
| • | | The Board noted that the Fund had less than one-year of operational history and was not able to evaluate an investment performance record for the Fund. The Board noted that it would have an opportunity to review such information in connection with future annual reviews. The Board noted that, in the meantime, it received monthly performance reports from the Manager. |
| • | | The Board noted that the contractual management fee, the actual management fee and actual total expenses were in the 1st quintile of the expense group. |
Guardian Core Plus Fixed Income VIP Fund
| • | | The Board noted that the Fund’s performance was in the 3rd quintile of its performance universe for the 1-year and 3-year periods and in the 4th quintile of its performance universe for the 5-year period. The Board also noted that the Fund’s performance was lower than the benchmark index for the 1-year and 5-year periods. The Board noted that the Fund’s performance was in line with the benchmark index for the 3-year period. |
| • | | The Board noted that the contractual management fee and actual management fee were in the 2nd quintile of the expense group and that actual total expenses were in the 3rd quintile. |
Guardian Total Return Bond VIP Fund
| • | | The Board noted that the Fund’s performance was in the 5th quintile of its performance universe for the 1-year and 3-year periods. The Board also noted that the Fund’s performance was lower than the benchmark index for the 1-year and 3-year periods. |
SUPPLEMENTAL INFORMATION (UNAUDITED)
| • | | The Board noted that the contractual management fee and actual management fee were in the 2nd quintile and the actual total expenses were in the 3rd quintile. |
Guardian Core Fixed Income VIP Fund
| • | | The Board noted that the Fund had less than one-year of operational history and was not able to evaluate an investment performance record for the Fund. The Board noted that it would have an opportunity to review such information in connection with future annual reviews. The Board noted that, in the meantime, it received monthly performance reports from the Manager. |
| • | | The Board noted that the contractual management fee was in the 2nd quintile of the expense group and the actual management fee and the actual total expenses were in the 1st quintile. |
Guardian Multi-Sector Bond VIP Fund
| • | | The Board noted that the Fund’s performance was in the 5th quintile of its performance universe for the 1-year and 3-year periods The Board also noted that the Fund’s performance was lower than the benchmark index for the 1-year and 3-year periods. |
| • | | The Board noted that the contractual management fee and actual total expenses were in the 1st quintile and the actual management fee was in the 2nd quintile. |
Guardian Short Duration Bond VIP Fund
| • | | The Board noted that the Fund had less than one-year of operational history and was not able to evaluate an investment performance record for the Fund. The Board noted that it would have an opportunity to review such information in connection with future annual reviews. The Board noted that, in the meantime, it received monthly performance reports from the Manager. |
| • | | The Board noted that the contractual management fee and actual total expenses were in the 3rd quintile of the expense group and the actual management fee was in the 1st quintile of the expense group. |
Guardian U.S. Government Securities VIP Fund
| • | | The Board noted that the Fund’s performance was in the 1st quintile of its performance universe for the 1-year period and in the 2nd quintile of its performance universe for the 3-year period. The Board also noted that the Fund’s performance was higher than the benchmark index for the 1-year and 3-year periods. |
| • | | The Board noted that the contractual management fee and the actual management fee were in the 1st quintile of the expense group and the actual total expenses were in the 2nd quintile of the expense group. |
Conclusion
Based on a comprehensive consideration and evaluation of all of the information and factors summarized above, among others, the Board as a whole, including the Independent Trustees, approved the Agreements.
SUPPLEMENTAL INFORMATION (UNAUDITED)
The Statement of Additional Information (“SAI”) includes additional information about the Trust’s Trustees and Officers and is available, without charge, upon request by calling toll-free 1-888-GUARDIAN (1-888-482-7342) or by visiting our website at http://guardianvpt.onlineprospectus.net/GuardianVPT/Prospectuses.
Portfolio Holdings and Proxy Voting Procedures
The Fund files its complete schedule of portfolio holdings with the Securities and Exchange Commission for the first and third quarters of each fiscal year as an exhibit to its reports on Form N-PORT. The Fund’s Form N-PORT reports are available on the Securities and Exchange Commission’s website at https://www.sec.gov. The Fund’s Form N-PORT information is also available, without charge, upon request, by calling toll-free 1-888-GUARDIAN (1-888-482-7342) or by visiting our website at http://guardianvpt.onlineprospectus.net/GuardianVPT/Prospectuses.
A description of the policies and procedures that the Fund uses to determine how to vote proxies relating to portfolio securities is included in the SAI. The SAI and information regarding how the Fund voted proxies relating to portfolio securities during the most recent 12-month period ended June 30 may be obtained (i) without charge, upon request, by calling toll-free 1-888-GUARDIAN (1-888-482-7342) or by visiting our website at http://guardianvpt.onlineprospectus.net/GuardianVPT/Prospectuses; and (ii) on the Securities and Exchange Commission’s website at https://www.sec.gov.
This report is transmitted to shareholders only. It is not authorized for use as an offer of sale or a solicitation of an offer to buy shares of the Fund unless accompanied or preceded by the Fund’s current prospectus. Past performance results shown in this report should not be considered a representation of future performance. Investment returns and principal value of shares will fluctuate so that shares, when redeemed, may be worth more or less than their original cost. Statements and other information herein are as dated and are subject to change.

The Guardian Life Insurance Company of America New York, NY 10001-2159
PUB8171
Guardian Variable
Products Trust
2023
Semiannual Report
All Data as of June 30, 2023
Guardian Large Cap Disciplined Growth VIP Fund

| | |
| Not FDIC insured. May lose value. No bank guarantee. | | www.guardianlife.com |
TABLE OF CONTENTS
Guardian Large Cap Disciplined Growth VIP Fund
Except as otherwise specifically stated, all information, including portfolio security positions, is as of June 30, 2023. Fund holdings will vary. Information contained herein has been obtained from sources believed reliable, but is not guaranteed.
GUARDIAN LARGE CAP DISCIPLINED GROWTH VIP FUND
Fund Characteristics (unaudited)
|
| Total Net Assets: $493,144,152 |
|
| |
Sector Allocation1 As of June 30, 2023 |
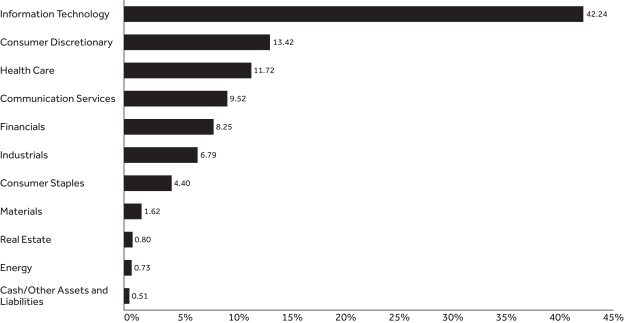 |
| | | | |
| |
Top Ten Holdings2 As of June 30, 2023 | |
| | |
| Holding | | % of Total
Net Assets | |
| Apple, Inc. | | | 10.80% | |
| Microsoft Corp. | | | 10.07% | |
| Amazon.com, Inc. | | | 4.99% | |
| NVIDIA Corp. | | | 4.58% | |
| Alphabet, Inc., Class A | | | 4.49% | |
| Meta Platforms, Inc., Class A | | | 3.48% | |
| Mastercard, Inc., Class A | | | 3.19% | |
| Eli Lilly and Co. | | | 2.65% | |
| UnitedHealth Group, Inc. | | | 2.63% | |
| Tesla, Inc. | | | 1.90% | |
| Total | | | 48.78% | |
| 1 | The Fund’s holdings are allocated to each sector based on the MSCI Global Industry Classification Standard (GICS®). Cash includes short-term investments and net other assets and liabilities. |
| 2 | Portfolio holdings are subject to change and should not be considered a recommendation to buy or sell individual securities. |
UNDERSTANDING YOUR FUND’S EXPENSES (UNAUDITED)
By investing in the Fund, you incur two types of costs: (1) transaction costs and (2) ongoing costs, including, as applicable, investment advisory fees, distribution and/or service (12b-1) fees and other Fund expenses. The example below is intended to help you understand your ongoing costs (in dollars) of investing in the Fund and to compare these costs with the ongoing costs of investing in other mutual funds.
The example is based on an investment of $1,000 invested at the beginning of the period and held for the entire period from January 1, 2023 to June 30, 2023. The table below shows the Fund’s expenses in two ways:
Expenses based on actual return
This section of the table provides information about actual account values and actual expenses. You may use the information in this section, together with the amount you invested, to estimate the expenses that you paid over the period. Simply divide your account value by $1,000 (for example, an $8,600 account value divided by $1,000 = 8.6), then multiply the result by the number in the section under the heading entitled “Expenses Paid During Period” to estimate the expenses you paid on your account during this period.
Expenses based on hypothetical 5% return for comparison purposes
This section of the table provides information about hypothetical account values and hypothetical expenses based on the Fund’s actual expense ratio and an assumed rate of return of 5% per year before expenses, which is not the Fund’s actual return. The hypothetical account values and expenses may not be used to estimate the actual ending account balance or expenses you paid for the period. You may use this information to compare the ongoing costs of investing in the Fund with the cost of investing in other mutual funds. To do so, compare this 5% hypothetical example with the 5% hypothetical examples that appear in the shareholder reports of the other funds.
Note that the expenses shown in the table are meant to highlight your ongoing costs only and do not reflect any transactional costs, such as sales charges (loads), redemption fees, or exchange fees. Therefore the second section is useful in comparing ongoing costs only, and will not help you determine the relative total costs of owning different funds. If these transactional costs were included, your costs would have been higher. Charges and expenses at the insurance company separate account level are not reflected in the table.
| | | | | | | | | | | | | | |
| | | | | |
| | | Beginning
Account Value 1/1/23 | | Ending Account Value
6/30/23 | | | Expenses Paid During Period* 1/1/23-6/30/23 | | | Expense Ratio During Period 1/1/23-6/30/23 | |
| Based on Actual Return | | $1,000.00 | | $ | 1,295.70 | | | $ | 4.95 | | | | 0.87% | |
Based on Hypothetical Return (5% Return Before Expenses) | | $1,000.00 | | $ | 1,020.48 | | | $ | 4.36 | | | | 0.87% | |
| * | Expenses are equal to the Fund’s annualized expense ratio as indicated, multiplied by the average account value over the period, multiplied by 181/365 (to reflect the one-half year period). |
SCHEDULE OF INVESTMENTS — GUARDIAN LARGE CAP DISCIPLINED GROWTH VIP FUND
| | | | | | | | |
| June 30, 2023 (unaudited) | | Shares | | | Value | |
| Common Stocks – 99.5% | |
| |
| Aerospace & Defense – 1.0% | |
| | | |
Raytheon Technologies Corp. | | | 49,410 | | | $ | 4,840,204 | |
| | | | | | | | | |
| | |
| | | | | 4,840,204 | |
| Automobiles – 1.9% | |
| | | |
Tesla, Inc.(1) | | | 35,839 | | | | 9,381,575 | |
| | | | | | | | | |
| | |
| | | | | 9,381,575 | |
| Beverages – 3.1% | |
| | | |
Brown-Forman Corp., Class B | | | 52,726 | | | | 3,521,042 | |
| | | |
Constellation Brands, Inc., Class A | | | 22,110 | | | | 5,441,934 | |
| | | |
Monster Beverage Corp.(1) | | | 108,529 | | | | 6,233,906 | |
| | | | | | | | | |
| | |
| | | | | 15,196,882 | |
| Biotechnology – 1.6% | |
| | | |
United Therapeutics Corp.(1) | | | 8,004 | | | | 1,766,883 | |
| | | |
Vertex Pharmaceuticals, Inc.(1) | | | 18,065 | | | | 6,357,254 | |
| | | | | | | | | |
| | |
| | | | | 8,124,137 | |
| Broadline Retail – 5.0% | |
| | | |
Amazon.com, Inc.(1) | | | 188,726 | | | | 24,602,321 | |
| | | | | | | | | |
| | |
| | | | | 24,602,321 | |
| Building Products – 0.7% | |
| | | |
Builders FirstSource, Inc.(1) | | | 23,937 | | | | 3,255,432 | |
| | | | | | | | | |
| | |
| | | | | 3,255,432 | |
| Capital Markets – 2.2% | |
| | | |
Ares Management Corp., Class A | | | 37,238 | | | | 3,587,881 | |
| | | |
Morgan Stanley | | | 33,000 | | | | 2,818,200 | |
| | | |
S&P Global, Inc. | | | 11,246 | | | | 4,508,409 | |
| | | | | | | | | |
| | |
| | | | | 10,914,490 | |
| Chemicals – 1.6% | |
| | | |
Albemarle Corp. | | | 11,106 | | | | 2,477,637 | |
| | | |
Sherwin-Williams Co. | | | 20,782 | | | | 5,518,037 | |
| | | | | | | | | |
| | |
| | | | | 7,995,674 | |
| Consumer Finance – 0.8% | |
| | | |
American Express Co. | | | 22,786 | | | | 3,969,321 | |
| | | | | | | | | |
| | |
| | | | | 3,969,321 | |
| Electronic Equipment, Instruments & Components – 3.5% | |
| | | |
Amphenol Corp., Class A | | | 67,374 | | | | 5,723,421 | |
| | | |
CDW Corp. | | | 28,976 | | | | 5,317,096 | |
| | | |
Jabil, Inc. | | | 56,528 | | | | 6,101,067 | |
| | | | | | | | | |
| | |
| | | | | 17,141,584 | |
| Entertainment – 0.8% | |
| | | |
Walt Disney Co.(1) | | | 42,102 | | | | 3,758,867 | |
| | | | | | | | | |
| | |
| | | | | 3,758,867 | |
| Financial Services – 4.4% | |
| | | |
Block, Inc.(1) | | | 36,816 | | | | 2,450,841 | |
| | | |
FleetCor Technologies, Inc.(1) | | | 14,239 | | | | 3,575,128 | |
| | | |
Mastercard, Inc., Class A | | | 40,026 | | | | 15,742,226 | |
| | | | | | | | | |
| | |
| | | | | 21,768,195 | |
| Ground Transportation – 0.8% | |
| | | |
Uber Technologies, Inc.(1) | | | 93,075 | | | | 4,018,048 | |
| | | | | | | | | |
| | |
| | | | | 4,018,048 | |
| | | | | | | | |
| June 30, 2023 (unaudited) | | Shares | | | Value | |
| Health Care Equipment & Supplies – 2.2% | |
| | | |
Boston Scientific Corp.(1) | | | 46,083 | | | $ | 2,492,630 | |
| | | |
Dexcom, Inc.(1) | | | 31,249 | | | | 4,015,809 | |
| | | |
Edwards Lifesciences Corp.(1) | | | 44,049 | | | | 4,155,142 | |
| | | | | | | | | |
| | |
| | | | | 10,663,581 | |
| Health Care Providers & Services – 2.6% | |
| | | |
UnitedHealth Group, Inc. | | | 27,018 | | | | 12,985,931 | |
| | | | | | | | | |
| | |
| | | | | 12,985,931 | |
| Health Care Technology – 0.8% | |
| | | |
Veeva Systems, Inc., Class A(1) | | | 20,296 | | | | 4,013,128 | |
| | | | | | | | | |
| | |
| | | | | 4,013,128 | |
| Hotels, Restaurants & Leisure – 2.2% | |
| | | |
Airbnb, Inc., Class A(1) | | | 31,870 | | | | 4,084,459 | |
| | | |
Chipotle Mexican Grill, Inc.(1) | | | 3,248 | | | | 6,947,472 | |
| | | | | | | | | |
| | |
| | | | | 11,031,931 | |
| Industrial REITs – 0.8% | |
| | | |
Prologis, Inc. | | | 32,347 | | | | 3,966,713 | |
| | | | | | | | | |
| | |
| | | | | 3,966,713 | |
| Insurance – 0.8% | |
| | | |
Arch Capital Group Ltd.(1) | | | 53,674 | | | | 4,017,499 | |
| | | | | | | | | |
| | |
| | | | | 4,017,499 | |
| Interactive Media & Services – 8.8% | |
| | | |
Alphabet, Inc., Class A(1) | | | 184,947 | | | | 22,138,156 | |
| | | |
Meta Platforms, Inc., Class A(1) | | | 59,825 | | | | 17,168,579 | |
| | | |
ZoomInfo Technologies, Inc.(1) | | | 152,742 | | | | 3,878,119 | |
| | | | | | | | | |
| | |
| | | | | 43,184,854 | |
| IT Services – 0.6% | |
| | | |
GoDaddy, Inc., Class A(1) | | | 39,585 | | | | 2,974,021 | |
| | | | | | | | | |
| | |
| | | | | 2,974,021 | |
| Life Sciences Tools & Services – 0.9% | |
| | | |
Thermo Fisher Scientific, Inc. | | | 8,749 | | | | 4,564,791 | |
| | | | | | | | | |
| | |
| | | | | 4,564,791 | |
| Machinery – 3.6% | |
| | | |
Deere & Co. | | | 17,705 | | | | 7,173,889 | |
| | | |
Ingersoll Rand, Inc. | | | 71,492 | | | | 4,672,717 | |
| | | |
Nordson Corp. | | | 23,349 | | | | 5,794,755 | |
| | | | | | | | | |
| | |
| | | | | 17,641,361 | |
| Oil, Gas & Consumable Fuels – 0.7% | |
| | | |
Pioneer Natural Resources Co. | | | 17,442 | | | | 3,613,634 | |
| | | | | | | | | |
| | |
| | | | | 3,613,634 | |
| Personal Care Products – 1.3% | |
| | | |
Estee Lauder Cos., Inc., Class A | | | 33,229 | | | | 6,525,511 | |
| | | | | | | | | |
| | |
| | | | | 6,525,511 | |
| Pharmaceuticals – 3.5% | |
| | | |
Eli Lilly and Co. | | | 27,837 | | | | 13,054,996 | |
| | | |
Merck & Co., Inc. | | | 38,109 | | | | 4,397,398 | |
| | | | | | | | | |
| | |
| | | | | 17,452,394 | |
| Professional Services – 0.8% | |
| | | |
Paycom Software, Inc. | | | 11,555 | | | | 3,711,928 | |
| | | | | | | | | |
| | |
| | | | | 3,711,928 | |
| | | | |
| The accompanying notes are an integral part of these financial statements. | | | | 3 |
SCHEDULE OF INVESTMENTS — GUARDIAN LARGE CAP DISCIPLINED GROWTH VIP FUND
| | | | | | | | |
| June 30, 2023 (unaudited) | | Shares | | | Value | |
| Semiconductors & Semiconductor Equipment – 10.3% | |
| | | |
Advanced Micro Devices, Inc.(1) | | | 61,630 | | | $ | 7,020,273 | |
| | | |
Broadcom, Inc. | | | 10,049 | | | | 8,716,804 | |
| | | |
KLA Corp. | | | 13,095 | | | | 6,351,337 | |
| | | |
NVIDIA Corp. | | | 53,421 | | | | 22,598,152 | |
| | | |
Texas Instruments, Inc. | | | 32,820 | | | | 5,908,256 | |
| | | | | | | | | |
| | |
| | | | | 50,594,822 | |
| Software – 17.1% | |
| | | |
Cadence Design Systems, Inc.(1) | | | 19,504 | | | | 4,574,078 | |
| | | |
HubSpot, Inc.(1) | | | 5,204 | | | | 2,768,996 | |
| | | |
Microsoft Corp. | | | 145,812 | | | | 49,654,819 | |
| | | |
Palo Alto Networks, Inc.(1) | | | 27,631 | | | | 7,059,997 | |
| | | |
Salesforce, Inc.(1) | | | 21,115 | | | | 4,460,755 | |
| | | |
ServiceNow, Inc.(1) | | | 15,964 | | | | 8,971,289 | |
| | | |
Workday, Inc., Class A(1) | | | 30,319 | | | | 6,848,759 | |
| | | | | | | | | |
| | |
| | | | | 84,338,693 | |
| Specialty Retail – 1.3% | |
| | | |
TJX Cos., Inc. | | | 78,062 | | | | 6,618,877 | |
| | | | | | | | | |
| | |
| | | | | 6,618,877 | |
| Technology Hardware, Storage & Peripherals – 10.8% | |
| | | |
Apple, Inc. | | | 274,428 | | | | 53,230,799 | |
| | | | | | | | | |
| | |
| | | | | 53,230,799 | |
| Textiles, Apparel & Luxury Goods – 3.0% | |
| | | |
Lululemon Athletica, Inc.(1) | | | 17,441 | | | | 6,601,418 | |
| | | |
NIKE, Inc., Class B | | | 71,967 | | | | 7,942,998 | |
| | | | | | | | | |
| | | |
| | | | | | | | 14,544,416 | |
| | |
Total Common Stocks
(Cost $339,306,064) | | | | 490,641,614 | |
| | | | | | | | |
| June 30, 2023 (unaudited) | | Principal
Amount | | | Value | |
| Repurchase Agreements – 0.1% | |
| | | |
Fixed Income Clearing Corp., 1.52%, dated 6/30/2023, proceeds at maturity value of $568,481, due 7/3/2023(2) | | $ | 568,409 | | | $ | 568,409 | |
| | | |
Total Repurchase Agreements
(Cost $568,409) | | | | | | | 568,409 | |
| | | |
Total Investments – 99.6%
(Cost $339,874,473) | | | | | | | 491,210,023 | |
| | |
| Assets in excess of other liabilities – 0.4% | | | | 1,934,129 | |
| | | |
| Total Net Assets – 100.0% | | | | | | $ | 493,144,152 | |
| (1) | Non–income–producing security. |
| (2) | The table below presents collateral for repurchase agreements. |
| | | | | | | | | | | | | | | | |
| Security | | Coupon | | | Maturity
Date | | | Principal
Amount | | | Value | |
| U.S. Treasury Note | | | 4.625% | | | | 3/15/2026 | | | $ | 571,400 | | | $ | 579,843 | |
Legend:
REITs — Real Estate Investment Trusts
The following is a summary of the inputs used as of June 30, 2023 in valuing the Fund’s investments. For more information on valuation inputs, please refer to Note 2a of the accompanying Notes to Financial Statements.
| | | | | | | | | | | | | | | | |
| | | Valuation Inputs | | | | |
| Investments in Securities (unaudited) | | Level 1 | | | Level 2 | | | Level 3 | | | Total | |
| Common Stocks | | $ | 490,641,614 | | | $ | — | | | $ | — | | | $ | 490,641,614 | |
| Repurchase Agreements | | | — | | | | 568,409 | | | | — | | | | 568,409 | |
| Total | | $ | 490,641,614 | | | $ | 568,409 | | | $ | — | | | $ | 491,210,023 | |
| | | | |
| 4 | | | | The accompanying notes are an integral part of these financial statements. |
FINANCIAL INFORMATION — GUARDIAN LARGE CAP DISCIPLINED GROWTH VIP FUND
| | | | |
Statement of Assets and Liabilities As of June 30, 2023 (unaudited) | | | |
Assets | | | | |
| | |
Investments, at value | | $ | 491,210,023 | |
| | |
Receivable for investments sold | | | 2,426,075 | |
| | |
Dividends/interest receivable | | | 120,062 | |
| | |
Reimbursement receivable from adviser | | | 7,014 | |
| | |
Prepaid expenses | | | 5,090 | |
| | | | | |
| | |
Total Assets | | | 493,768,264 | |
| | | | | |
| | |
Liabilities | | | | |
| | |
Payable for fund shares redeemed | | | 228,413 | |
| | |
Investment advisory fees payable | | | 223,612 | |
| | |
Distribution fees payable | | | 99,603 | |
| | |
Accrued audit fees | | | 13,978 | |
| | |
Accrued custodian and accounting fees | | | 10,429 | |
| | |
Accrued trustees’ and officers’ fees | | | 6,902 | |
| | |
Accrued expenses and other liabilities | | | 41,175 | |
| | | | | |
| | |
Total Liabilities | | | 624,112 | |
| | | | | |
| | |
Total Net Assets | | $ | 493,144,152 | |
| | | | | |
| | |
Net Assets Consist of: | | | | |
| | |
Paid-in capital | | $ | 154,743,032 | |
| | |
Distributable earnings | | | 338,401,120 | |
| | | | | |
| | |
Total Net Assets | | $ | 493,144,152 | |
| | | | | |
Investments, at Cost | | $ | 339,874,473 | |
| | | | | |
| | |
Pricing of Shares | | | | |
| | |
Shares of Beneficial Interest Outstanding with No Par Value | | | 19,365,737 | |
| | |
Net Asset Value Per Share | | | $25.46 | |
| | | | | |
| | | | |
Statement of Operations For the Six Months Ended June 30, 2023 (unaudited) | |
Investment Income | | | | |
| | |
Dividends | | $ | 1,855,779 | |
| | |
Interest | | | 12,527 | |
| | | | | |
| | |
Total Investment Income | | | 1,868,306 | |
| | | | | |
| | |
Expenses | | | | |
| | |
Investment advisory fees | | | 1,302,324 | |
| | |
Distribution fees | | | 578,436 | |
| | |
Trustees’ and officers’ fees | | | 55,002 | |
| | |
Professional fees | | | 54,459 | |
| | |
Administrative fees | | | 27,066 | |
| | |
Custodian and accounting fees | | | 18,225 | |
| | |
Transfer agent fees | | | 8,748 | |
| | |
Shareholder reports | | | 6,896 | |
| | |
Other expenses | | | 12,119 | |
| | | | | |
| | |
Total Expenses | | | 2,063,275 | |
| | |
Less: Fees waived | | | (50,320 | ) |
| | | | | |
| | |
Total Expenses, Net | | | 2,012,955 | |
| | | | | |
| | |
Net Investment Income/(Loss) | | | (144,649 | ) |
| | | | | |
| | |
Realized Gain/(Loss) and Change in Unrealized Appreciation/(Depreciation) on Investments | | | | |
| | |
Net realized gain/(loss) from investments | | | 16,751,387 | |
| | |
Net change in unrealized appreciation/(depreciation) on investments | | | 104,684,879 | |
| | | | | |
| | |
Net Gain on Investments | | | 121,436,266 | |
| | | | | |
| | |
Net Increase in Net Assets Resulting From Operations | | $ | 121,291,617 | |
| | | | | |
| | | | | |
| | | | |
| The accompanying notes are an integral part of these financial statements. | | | | 5 |
FINANCIAL INFORMATION — GUARDIAN LARGE CAP DISCIPLINED GROWTH VIP FUND
| | | | | | | | |
Statements of Changes in Net Assets Six Months Ended Numbers are unaudited | | | | | | |
| | | |
| | | For the
Six Months Ended
6/30/23 | | | For the
Year Ended
12/31/22 | |
| | | | |
Operations | | | | | | | | |
| | | |
Net investment income/(loss) | | $ | (144,649 | ) | | $ | (750,093 | ) |
| | | |
Net realized gain/(loss) from investments | | | 16,751,387 | | | | (10,126,990 | ) |
| | | |
Net change in unrealized appreciation/(depreciation) on investments | | | 104,684,879 | | | | (185,987,750 | ) |
| | | | | | | | | |
| | | |
Net Increase/(Decrease) in Net Assets Resulting from Operations | | | 121,291,617 | | | | (196,864,833 | ) |
| | | | | | | | | |
| | | |
Capital Share Transactions | | | | | | | | |
| | | |
Proceeds from sales of shares | | | 1,494,261 | | | | 91,090,129 | |
| | | |
Cost of shares redeemed | | | (69,182,934 | ) | | | (77,446,731 | ) |
| | | | | | | | | |
| | | |
Net Increase/(Decrease) in Net Assets Resulting from Capital Share Transactions | | | (67,688,673 | ) | | | 13,643,398 | |
| | | | | | | | | |
| | | |
Net Increase/(Decrease) in Net Assets | | | 53,602,944 | | | | (183,221,435 | ) |
| | | | | | | | | |
| | | |
Net Assets | | | | | | | | |
| | | |
Beginning of period | | | 439,541,208 | | | | 622,762,643 | |
| | | | | | | | | |
| | | |
End of period | | $ | 493,144,152 | | | $ | 439,541,208 | |
| | | | | | | | | |
| | | |
Other Information: | | | | | | | | |
| | | |
Shares | | | | | | | | |
| | | |
Sold | | | 65,095 | | | | 4,085,055 | |
| | | |
Redeemed | | | (3,063,653 | ) | | | (3,426,409 | ) |
| | | | | | | | | |
| | | |
Net Increase/(Decrease) | | | (2,998,558 | ) | | | 658,646 | |
| | | | | | | | | |
| | | | | | | | | |
| | | | |
| 6 | | | | The accompanying notes are an integral part of these financial statements. |
This Page Intentionally Left Blank
FINANCIAL INFORMATION — GUARDIAN LARGE CAP DISCIPLINED GROWTH VIP FUND
The Financial Highlights table is intended to help you understand the Fund’s financial performance for the past six reporting periods (or, if shorter, the period since inception). Certain information reflects financial results for a single Fund share. The total returns in the table represent the rate that an investor would have earned (or lost) on an investment in the Fund.
| | | | | | | | | | | | | | | | | | | | | | | | |
Financial Highlights Six Months Ended Numbers are unaudited | | | | | | | | | | | | | | | | |
| | | Per Share Operating Performance | | | | |
| | | Net Asset Value,
Beginning of
Period | | | Net Investment
Loss(1) | | | Net Realized
and Unrealized
Gain/(Loss) | | | Total
Operations | | | Net Asset
Value, End of
Period | | | Total
Return(2) | |
| | | | | | | |
Six Months Ended 6/30/23 | | $ | 19.65 | | | $ | (0.01) | | | $ | 5.82 | | | $ | 5.81 | | | $ | 25.46 | | | | 29.57% | (4) |
| | | | | | | |
Year Ended 12/31/22 | | | 28.69 | | | | (0.03) | | | | (9.01) | | | | (9.04) | | | | 19.65 | | | | (31.51)% | |
| | | | | | | |
Year Ended 12/31/21 | | | 23.83 | | | | (0.09) | | | | 4.95 | | | | 4.86 | | | | 28.69 | | | | 20.39% | |
| | | | | | | |
Year Ended 12/31/20 | | | 17.47 | | | | (0.02) | | | | 6.38 | | | | 6.36 | | | | 23.83 | | | | 36.41% | |
| | | | | | | |
Year Ended 12/31/19 | | | 12.52 | | | | (0.00) | (5) | | | 4.95 | | | | 4.95 | | | | 17.47 | | | | 39.54% | |
| | | | | | | |
Year Ended 12/31/18 | | | 12.67 | | | | (0.01) | | | | (0.14) | | | | (0.15) | | | | 12.52 | | | | (1.18)% | |
| | | | |
| 8 | | | | The accompanying notes are an integral part of these financial statements. |
FINANCIAL INFORMATION — GUARDIAN LARGE CAP DISCIPLINED GROWTH VIP FUND
| | | | | | | | | | | | | | | | | | | | | | |
| |
| Ratios/Supplemental Data | |
Net Assets, End
of Period (000s) | | | Net Ratio of
Expenses to
Average
Net Assets(3) | | | Gross Ratio of
Expenses to
Average Net
Assets | | | Net Ratio of Net
Investment Loss
to Average
Net Assets(3) | | | Gross Ratio of Net
Investment Loss
to Average
Net Assets | | | Portfolio
Turnover Rate | |
| | | | | |
| $ | 493,144 | | | | 0.87% | (4) | | | 0.89% | (4) | | | (0.06)% | (4) | | | (0.08)% | (4) | | | 21% | (4) |
| | | | | |
| | 439,541 | | | | 0.87% | | | | 0.89% | | | | (0.15)% | | | | (0.17)% | | | | 38% | |
| | | | | |
| | 622,763 | | | | 0.87% | | | | 0.87% | | | | (0.34)% | | | | (0.34)% | | | | 28% | |
| | | | | |
| | 621,402 | | | | 0.87% | | | | 0.89% | | | | (0.12)% | | | | (0.14)% | | | | 24% | |
| | | | | |
| | 625,755 | | | | 0.87% | | | | 0.96% | | | | (0.01)% | | | | (0.10)% | | | | 116% | |
| | | | | |
| | 181,144 | | | | 0.87% | | | | 1.04% | | | | (0.05)% | | | | (0.22)% | | | | 47% | |
| (1) | Calculated based on the average shares outstanding during the period. |
| (2) | Total returns do not reflect the effects of charges deducted pursuant to the terms of The Guardian Insurance & Annuity Company, Inc.’s variable contracts. Inclusion of such charges would reduce the total returns for all periods shown. |
| (3) | Net Ratio of Expenses to Average Net Assets and Net Ratio of Net Investment Loss to Average Net Assets include the effect of fee waivers, expense limitations, and recoupments, if any. |
| (4) | Ratios for periods less than one year have been annualized, except for total return and portfolio turnover rate. |
| (5) | Rounds to $(0.00) per share. |
| | | | |
| The accompanying notes are an integral part of these financial statements. | | | | 9 |
NOTES TO FINANCIAL STATEMENTS — GUARDIAN LARGE CAP DISCIPLINED GROWTH VIP FUND
June 30, 2023 (unaudited)
1. Organization
Guardian Variable Products Trust (the “Trust”), a Delaware statutory trust organized on January 12, 2016, is registered under the Investment Company Act of 1940, as amended (the “1940 Act”), as an open-end management investment company. The Trust currently has twenty-four series. Guardian Large Cap Disciplined Growth VIP Fund (the “Fund”) is a series of the Trust. The Fund is a diversified fund and commenced operations on September 1, 2016. The financial statements for other series of the Trust are presented in separate reports.
The Trust has authorized an unlimited number of shares of beneficial interest with no par value. Shares are bought and sold at closing net asset value (“NAV”). Shares of the Fund are only sold to certain separate accounts of The Guardian Insurance & Annuity Company, Inc. (“GIAC”) that fund certain variable annuity contracts and variable life insurance policies issued by GIAC. GIAC is a wholly-owned subsidiary of The Guardian Life Insurance Company of America (“Guardian Life”).
The Fund seeks to maximize long-term growth.
2. Significant Accounting Policies
The following is a summary of significant accounting policies followed by the Fund in the preparation of its financial statements. The Fund follows the investment company accounting and reporting guidance of the Financial Accounting Standards Board (“FASB”) Accounting Standards Codification Topic 946 Financial Services – Investment Companies. The following policies are in conformity with accounting principles generally accepted in the United States of America (“GAAP”). The preparation of financial statements in accordance with GAAP requires management to make estimates and assumptions that affect the reported amounts and disclosures in the financial statements. Actual results could differ from those estimates.
a. Investment Valuations The Board of Trustees has designated Park Avenue Institutional Advisers LLC (“Park Avenue”) as the valuation designee for the Fund pursuant to Rule 2a-5 under the 1940 Act. Park Avenue has established a Fair Valuation Committee and has adopted fair valuation procedures that provide methodologies for fair valuing securities. These procedures include monitoring the appropriateness of fair values based on results of ongoing valuation
oversight, including but not limited to consideration of security specific events, market events, and pricing vendor and broker-dealer due diligence. The Fair Valuation Committee oversees and carries out the policies for the valuation of investments held in the Fund. The Fair Valuation Committee is responsible for discussing and assessing the potential impacts to the fair values on an ongoing basis, and reports to the Board of Trustees on at least a quarterly basis.
Equity securities traded on an exchange other than NASDAQ Stock Market, LLC (“NASDAQ”) are valued at the last reported sale price on the principal exchange or market on which they are traded; or, if there were no sales that day, at the mean between the closing bid and ask prices. Securities traded on the NASDAQ are generally valued at the NASDAQ official closing price, which may not be the last sale price. If the NASDAQ official closing price is not available for a security, that security is generally valued at the mean between the closing bid and ask prices. Repurchase agreements are carried at cost, which approximates fair value (see Note 5d). Foreign securities are valued in the currencies of the markets in which they trade and then converted to U.S. dollars by the application of foreign exchange rates at the close of the New York Stock Exchange (“NYSE”). Forward foreign currency contracts, if any, are valued at the mean between the bid and ask rates for the specified time interpolated from rates for proximate time periods.
Securities for which market quotations are not readily available or securities whose values have been materially affected by events occurring before the Fund’s valuation time but after the close of the securities’ principal exchange or market are valued at their fair values as determined in good faith by Park Avenue, as the Board of Trustee’s valuation designee (as defined in Rule 2a-5 under the 1940 Act), in accordance with Park Avenue’s procedures and under the general oversight of the Board of Trustees. In addition, the values of the Fund’s investments in foreign securities are generally determined by a pricing service using pricing models designed to estimate likely changes in the values of those securities. Certain foreign equity instruments are valued by applying international fair value factors provided by approved pricing services. The factors seek to adjust the local closing price for movements of local markets post closing, but prior to the time the NAVs are calculated. Valuations reflected in this report are as of the report date. As a result, changes in valuation due to market events and/or issuer related events after the report date and prior to issuance of the report are not reflected herein.
NOTES TO FINANCIAL STATEMENTS — GUARDIAN LARGE CAP DISCIPLINED GROWTH VIP FUND
Various inputs are used in determining the valuation of the Fund’s investments. These inputs are summarized in three broad levels listed below.
| • | | Level 1 – unadjusted inputs using quoted prices in active markets for identical investments. |
| • | | Level 2 – other significant observable inputs, including, but not limited to, quoted prices for similar investments, inputs other than quoted prices that are observable for investments (such as interest rates, prepayment speeds, credit risks, etc.) or other market corroborated inputs. |
| • | | Level 3 – significant unobservable inputs (including the Fund’s own assumptions in determining the fair value of investments). |
Inputs may include price information, volatility statistics, specific and broad credit data, liquidity statistics, and other factors. A financial instrument’s level within the fair value hierarchy is based on the lowest level of any input; both individually and in aggregate, that is significant to the fair value measurement. However, the determination of what constitutes “observable” requires significant judgment by the Trust. The Trust considers observable data to be that market data which is readily available, regularly distributed or updated, reliable and verifiable, and provided by independent sources that are actively involved in the relevant market. The inputs or methodology used for valuing securities are not necessarily an indication of the risk associated with investing in those securities. Changes in valuation techniques may result in transfers into or out of a financial instrument’s assigned level within the hierarchy.
The FASB requires reporting entities to make disclosures about purchases, sales, issuances and settlements of Level 3 securities on a gross basis. For the six months ended June 30, 2023, there were no transfers into or out of Level 3 of the fair value hierarchy.
In determining a financial instrument’s placement within the hierarchy, the Trust separates the Fund’s investment portfolio into two categories: investments and derivatives (e.g., futures). A summary of inputs used to value the Fund’s assets and liabilities carried at fair value as of June 30, 2023 is included in the Schedule of Investments.
Investments Investments whose values are based on quoted market prices in active markets, and are therefore classified within Level 1, include active listed equities. Investments that trade in markets that are not considered to be active, but are valued based on quoted
market prices, dealer quotations or alternative pricing sources supported by observable inputs are classified within Level 2. These include certain U.S. government and sovereign obligations, most government agency securities, investment-grade corporate bonds, certain mortgage products, state, municipal and provincial obligations, and certain foreign equity securities, including securities whose prices may have been affected by events occurring after the close of trading on their principal exchange or market and, as a result, whose values are determined by a pricing service as described above, or securities whose values are otherwise determined using fair valuation methods approved by the Fund’s Board of Trustees.
Investments classified within Level 3 have significant unobservable inputs, as they trade infrequently or not at all. Level 3 investments include, among others, private placement securities. When observable prices are not available for these securities, the Trust uses one or more valuation techniques for which sufficient and reliable data is available. The inputs used by the Trust in estimating the value of Level 3 investments include, for example, the original transaction price, recent transactions in the same or similar instruments, completed or pending third-party transactions in the underlying investment or comparable issuers, subsequent rounds of financing, recapitalizations, and other transactions across the capital structure. Level 3 investments may also be adjusted to reflect illiquidity and/or non-transferability, with the amount of such discount estimated by the Trust in the absence of market information. Assumptions used by the Trust due to the lack of observable inputs may significantly impact the resulting fair value and therefore the Fund’s results of operations. As of June 30, 2023, the Fund had no securities classified as Level 3.
Derivatives Exchange-traded derivatives, such as futures contracts, exchange-traded option contracts and certain swaps, are typically classified within Level 1 or Level 2 of the fair value hierarchy depending on whether or not they are deemed to be actively traded. Certain non-exchange-traded derivatives, such as generic forwards, certain swaps and options, have inputs which can generally be corroborated by market data and are therefore classified within Level 2. During the six months ended June 30, 2023, the Fund did not hold any derivatives.
b. Securities Transactions Securities transactions are accounted for on the date securities are purchased or sold (trade date). Realized gains or losses on securities transactions are determined on the basis of specific identification.
NOTES TO FINANCIAL STATEMENTS — GUARDIAN LARGE CAP DISCIPLINED GROWTH VIP FUND
c. Foreign Currency Translation The accounting records of the Fund are maintained in U.S. dollars. Investment securities and all other assets and liabilities of the Fund denominated in a foreign currency are generally translated into U.S. dollars at the exchange rates quoted at the close of the NYSE on each business day. The market value of investment securities and other assets and liabilities are translated at the exchange rate as of the valuation date. Purchases and sales of securities, income receipts, and expense payments are translated into U.S. dollars at the exchange rates in effect on the dates of the respective transactions. The Fund does not isolate the portion of the fluctuations on investments resulting from changes in foreign currency exchange rates from the fluctuations in market prices of investments held. Such fluctuations are included in the Net change in net realized and unrealized gain/(loss) from investments on the Statement of Operations.
Reported realized foreign currency gains and losses arise from the disposition of foreign currency, currency gains or losses realized between the trade and settlement dates on securities transactions, and the difference between the amounts of dividends, interest and foreign withholding taxes recorded on the Fund’s books on the transaction date and the U.S. dollar equivalent of the amounts actually received or paid. These reported realized foreign currency gains and losses, if any, are included in Net realized gain/(loss) from foreign currency transactions on the Statement of Operations. Unrealized foreign currency gains and losses arise from changes (due to changes in exchange rates) in the value of foreign currency and other assets and liabilities denominated in foreign currencies, which are held at period end, if any, and are included in Net change in unrealized appreciation/(depreciation) on translation of assets and liabilities in foreign currencies on the Statement of Operations.
d. Foreign Capital Gains Tax The Fund may be subject to foreign taxes on income, gains on investments or currency purchases/repatriation, a portion of which may be recoverable. The Fund will accrue such taxes and recoveries as applicable, based upon their current interpretation of tax rules and regulations that exist in the markets in which they invest.
e. Investment Income Dividend income net of foreign taxes withheld, if any, is generally recorded on the ex-dividend date. Distributions received from real estate investment trusts, if any, may be classified as dividends, capital gains and/or return of capital. Interest income, which includes amortization/accretion of
premium/discount, is determined using the interest income accrual method, and is accrued and recorded daily.
f. Allocation of Income and Expenses Many of the expenses of the Trust can be directly attributed to a specific series of the Trust. Expenses that cannot be directly attributed to a specific series of the Trust are generally apportioned among all the series in the Trust, based on relative net assets. In calculating net asset value per share for each series of the Trust, investment income, realized and unrealized gains and losses, and expenses other than series-specific expenses are allocated daily to each series based upon the proportion of net assets attributable to each series.
3. Transactions with Affiliates
a. Investment Advisory Fee and Expense Limitation Under the terms of the advisory agreement, which, after its two year initial term, is reviewed and approved annually by the Board of Trustees, the Fund pays an investment advisory fee to Park Avenue. Park Avenue is a wholly-owned subsidiary of Guardian Life and receives an investment advisory fee at an annual rate of 0.62% up to $100 million, 0.57% from $100 to $300 million, 0.52% from $300 to $500 million, and 0.50% in excess of $500 million of the Fund’s average daily net assets. The fee is accrued daily and paid monthly.
Park Avenue has contractually agreed through April 30, 2024 to waive certain fees and/or reimburse certain expenses incurred by the Fund to the extent necessary to limit the Fund’s total annual operating expenses after fee waiver and/or expense reimbursement to 0.87% of the Fund’s average daily net assets (excluding, if applicable, any acquired fund fees and expenses, taxes, interest, transaction costs and brokerage commissions, litigation and extraordinary expenses). The limitation may not be increased or terminated prior to this time without action by the Board of Trustees and may be terminated only upon approval of the Board of Trustees. Amounts waived or reimbursed by Park Avenue pursuant to any expense limitation will not be subject to Park Avenue’s recoupment rights. For the six months ended June 30, 2023, Park Avenue waived fees and/or paid Fund expenses in the amount of $50,320.
Park Avenue has entered into a Sub-Advisory Agreement with Wellington Management Company LLP (“Wellington”). Wellington is responsible for providing day-to-day investment advisory services to the Fund, subject to the supervision of Park Avenue and the oversight of the Board of Trustees. Sub-advisory fees are paid by Park Avenue and do not represent a separate or additional expense to the Fund.
NOTES TO FINANCIAL STATEMENTS — GUARDIAN LARGE CAP DISCIPLINED GROWTH VIP FUND
b. Compensation of Trustees and Officers Trustees and officers who are interested persons of the Trust, as defined in the 1940 Act, receive no compensation from the Fund, except for the Chief Compliance Officer of the Trust. Trustees of the Trust who are not interested persons of the Trust, and the Chief Compliance Officer, receive compensation and reimbursement of expenses from the Trust.
c. Distribution Fees Park Avenue Securities LLC (“PAS”), a wholly-owned subsidiary of Guardian Life, is the principal underwriter of Fund shares. The Trust has entered into a distribution and service agreement with PAS, which governs the sale and distribution of shares of the Fund. Under a distribution and service plan adopted by the Trust (“12b-1 plan”), PAS is compensated for services in such capacity, including its expenses in connection with the promotion and distribution of shares of the Fund, at an annual rate of 0.25% of the Fund’s average daily net assets. For the six months ended June 30, 2023, the Fund paid distribution fees in the amount of $578,436 to PAS.
PAS has directed that certain payments under the 12b-1 plan be used to compensate GIAC for shareholder services provided to contract owners.
4. Federal Income Taxes
a. Distributions to Shareholders For federal income tax purposes, the Fund is treated as a disregarded entity (“DRE”). As a DRE, the Fund is not subject to an entity-level income tax; and any income, gains, losses, deductions, taxes, and credits of the Fund would instead be “passed through” directly to the separate accounts of GIAC that invest in the Fund and retain the same character for U.S. federal income tax purposes. In addition, the Fund is not required to distribute taxable income and capital gains for U.S. federal income tax purposes. Therefore, no dividends and capital gains distributions were paid by the Fund.
5. Investments
a. Investment Purchases and Sales The cost of investments purchased and the proceeds from investments sold (excluding short-term investments) amounted to $96,133,026 and $164,189,417, respectively, for the six months ended June 30, 2023. During the six months ended June 30, 2023, there were no purchases or sales of U.S. government securities.
b. Foreign Securities Foreign securities investments involve special risks and considerations not typically associated with U.S. investments. These risks include, but are not limited to, currency risk; adverse political,
regulatory, social, and economic developments; and less reliable information about issuers. Moreover, securities of some foreign issuers may be less liquid and their prices more volatile than those of comparable U.S. issuers.
c. Industry or Sector Concentration In its normal course of business, the Fund may invest a significant portion of its assets in companies within a limited number of industries or sectors. As a result, the Fund may be subject to a greater risk of loss than that of a fund invested in a wider spectrum of industries or sectors because the stocks of many or all of the companies in the industry, group of industries, sector, or sectors may decline in value due to developments adversely affecting the industry, group of industries, sector, or sectors.
d. Repurchase Agreements The Fund may invest in repurchase agreements to maintain liquidity and earn income over periods of time as short as overnight. The collateral for repurchase agreements is either cash or fully negotiable U.S. government securities (including U.S. government agency securities). Repurchase agreements are fully collateralized (including the interest accrued thereon) and such collateral is marked to market daily while the agreements remain in force. If the value of the collateral falls below the repurchase price plus accrued interest, the Fund will typically require the seller to deposit additional collateral by the next business day. If the request for additional collateral is not met, or the seller defaults, the Fund maintains the right to sell the collateral (although it may be prevented or delayed from doing so in certain circumstances) and may be required to claim any resulting loss against the seller. Park Avenue monitors the creditworthiness of the seller with which the Fund enters into repurchase agreements.
6. Temporary Borrowings
The Fund, with other funds managed by Park Avenue, is party to a credit agreement with respect to a $10 million committed revolving credit facility from State Street Bank and Trust Company (the “Credit Agreement”) for temporary borrowing purposes, including the meeting of redemption requests that otherwise might require the untimely disposition of securities. Interest is based on a daily fluctuating rate per annum equal to the Applicable Rate (as defined in the Credit Agreement) plus the Applicable Margin (as defined in the Credit Agreement) that is subject to change from time to time as and when the Applicable Rate changes. Under the current Credit Agreement, the Applicable Rate for any day is defined as the rate per annum equal to the sum of
NOTES TO FINANCIAL STATEMENTS — GUARDIAN LARGE CAP DISCIPLINED GROWTH VIP FUND
(a) 0.10% plus (b) the higher of (i) the Federal Funds Effective Rate for such day and (ii) the Overnight Bank Funding Rate for such day; the Applicable Margin is 1.25%. In addition to the interest charged on any borrowings by the Fund, each fund pays a commitment fee of 0.30% per annum on its share of the unused portion of the credit facility. The agreement is in place until January 5, 2024. The Fund did not utilize the credit facility during the six months ended June 30, 2023.
7. Indemnifications
Under the Trust’s organizational documents and, in some cases, by contract, officers and Trustees of the Trust are indemnified against certain liabilities arising out of the performance of their duties to the Fund. In addition, in the normal course of business, the Fund enters into contracts with its vendors and others that
provide general indemnifications. The Fund’s maximum exposure under these arrangements is unknown as this would involve future claims that may be made against the Fund that have not yet occurred. However, based on experience, the Fund expects the risk of loss to be remote.
8. Additional Information
The outbreak of COVID-19 has adversely impacted both local and global economies, including those in which the Fund may invest. These impacts include materially reduced consumer demand and economic output, disrupted supply chains, market closures, travel restrictions and quarantines, and strained healthcare systems. The Fund’s operations may be interrupted as a result, which may have a negative impact on the Fund’s investment performance.
SUPPLEMENTAL INFORMATION (UNAUDITED)
Liquidity Risk Management Program
In compliance with Rule 22e-4 under the Investment Company Act of 1940, as amended (the “Liquidity Rule”), Guardian Variable Products Trust (the “Trust”) has adopted and implemented a written liquidity risk management program (the “Program”) for each series of the Trust (each, a “Fund”), which is reasonably designed to assess and manage each Fund’s liquidity risk. The Fund’s “liquidity risk” is the risk that the Fund could not meet requests to redeem shares issued by the Fund without significant dilution of the remaining investors’ interests in the Fund.
The Board of Trustees of the Trust (the “Board”) Previously approved the designation of Park Avenue Institutional Advisers LLC (the “Administrator” or “PAIA”) as Program administrator. The Administrator established a Liquidity Risk Management Committee, which is comprised of certain officers of the Trust and PAIA, that assists the Administrator in the implementation and day-to-day administration of the Program and otherwise support carrying out the Administrator’s liquidity risk management responsibilities under the Program.
In accordance with the Program, each Fund’s liquidity risk is assessed no less frequently than annually, taking into consideration a variety of factors, including, as applicable, the Fund’s investment strategy and liquidity of portfolio investments, cash flow projections, and holdings of cash and cash equivalents, as well as borrowing arrangements and other funding sources. Certain factors are considered under both normal and reasonably foreseeable stressed conditions.
Each Fund portfolio investment is classified, no less than monthly, into one of four liquidity categories (including “highly liquid investments” and “illiquid investments,” discussed below) based on a determination of the number of days it is reasonably expected to take to convert the investment to cash, or sell or dispose of the investment, in current market conditions without significantly changing the investment’s market value.
The Liquidity Rule limits the Fund’s investments in illiquid investments by prohibiting the Fund from acquiring any illiquid investment if, immediately after the acquisition, the Fund would have invested more than 15% of its net assets in illiquid investments that are assets. The Program includes provisions reasonably designed to comply with this investment limitation. In addition, the Program includes provisions reasonably designed to comply with this investment limitation. In addition, the Program includes provisions reasonably designed to comply with the Liquidity Rule’s requirements relating to highly liquid investment minimums, which is a minimum amount of Fund net assets that must be invested in highly liquid investments that are assets, as applicable. The Fund was not required to adopt a highly liquid investment minimum during the period.
At a meeting of the Board held on March 29-30, 2023, the Board received a report (the “Report”) prepared by the Administrator addressing the Program’s operation and assessing the adequacy and effectiveness of its implementation for the period from January 1, 2022 through December 31, 2022 (the “Reporting Period”). The Report noted that the Administrator believes the Program operated effectively during the Reporting Period and continues to be reasonably designed to effectively assess and manage each Fund’s liquidity risk. The Report also noted that the Administrator believes the Program has been adequately and effectively implemented and the investment strategies for each Fund continue to be appropriate since its inception. In addition, the Report summarized the operation of the Program and the information and factors considered by the Administrator in its assessment of the Program’s implementation, such as the liquidity risk assessment framework and liquidity classification methodologies.
There can be no assurance that the Program will achieve its objectives under all circumstances. Please refer to the Fund’s prospectus for more information regarding the Fund’s exposure to liquidity risk and other risks to which an investment in the Fund may be subject.
SUPPLEMENTAL INFORMATION (UNAUDITED)
Approval of Investment Management and Sub-advisory Agreements
Section 15(c) of the Investment Company Act of 1940, as amended (the “1940 Act”), requires that a fund’s investment advisory and sub-advisory agreements be approved initially by the fund’s board of trustees. Section 15(c) also requires that the continuation of these agreements, after an initial term of up to two years, be annually reviewed and approved by the board. Any such agreement must be approved by a vote of a majority of the trustees who are not parties to the agreement or “interested persons” (as defined in the 1940 Act) of a party to the agreement at a meeting of the board called for the purpose of voting on such approval.
At a meeting of the Board of Trustees (the “Board”) of Guardian Variable Products Trust (the “Trust”) held on March 29-30, 2023 (the “Meeting”), the Board, including the trustees who are not parties to the agreement or “interested persons” as defined in the 1940 Act (the “Independent Trustees”), considered and voted unanimously to renew the existing investment management agreement between the Trust, on behalf of Guardian All Cap Core VIP Fund; Guardian Balanced Allocation VIP Fund; Guardian Core Fixed Income VIP Fund; Guardian Core Plus Fixed Income VIP Fund; Guardian Diversified Research VIP Fund; Guardian Equity Income VIP Fund; Guardian Global Utilities VIP Fund; Guardian Growth & Income VIP Fund; Guardian Integrated Research VIP Fund; Guardian International Growth VIP Fund; Guardian International Equity VIP Fund; Guardian Large Cap Disciplined Growth VIP Fund; Guardian Large Cap Disciplined Value VIP Fund; Guardian Large Cap Fundamental Growth VIP Fund; Guardian Mid Cap Relative Value VIP Fund; Guardian Mid Cap Traditional Growth VIP Fund; Guardian Multi-Sector Bond VIP Fund; Guardian Select Mid-Cap Core VIP Fund; Guardian Short Duration Bond VIP Fund; Guardian Small Cap Core VIP Fund; Guardian Small-Mid Cap Core VIP Fund; Guardian Strategic Large Cap Core VIP Fund; Guardian Total Return Bond VIP Fund and Guardian U.S. Government Securities VIP Fund (each, a “Fund,” and together, the “Funds”), in substantially the form presented at this meeting (the “Management Agreement”); and Park Avenue Institutional Advisers LLC (the “Manager”) for a one-year term.
The Board, including the Independent Trustees, also considered and voted unanimously to renew the existing sub-advisory agreements (the “Sub-Advisory Agreements,” collectively with the Management Agreement and Sub-Subadvisory Agreement, the “Agreements”) between the Manager and investment
advisory firms engaged to serve as sub-advisers to certain of the Funds (the “Sub-Advised Funds”), namely (i) ClearBridge Investments, LLC with respect to Guardian Small Cap Core VIP Fund; (ii) Putnam Investment Management, LLC with respect to Guardian Diversified Research VIP Fund; (iii) AllianceBernstein L.P. with respect to Guardian Growth & Income VIP Fund and Guardian Strategic Large Cap Core VIP Fund; (iv) J.P. Morgan Investment Management Inc. with respect to Guardian International Growth VIP Fund; (v) Schroder Investment Management North America Inc. with respect to Guardian International Equity VIP Fund; (vi) Wellington Management Company LLP with respect to Guardian Balanced Allocation VIP Fund, Guardian Equity Income VIP Fund, Guardian Integrated Research VIP Fund, Guardian Large Cap Disciplined Growth VIP Fund and Guardian Global Utilities VIP Fund; (vii) Boston Partners Global Investors, Inc. with respect to Guardian Large Cap Disciplined Value VIP Fund; (viii) Janus Henderson Investors US LLC with respect to Guardian Mid Cap Traditional Growth VIP Fund; (ix) Allspring Global Investments, LLC with respect to Guardian Mid Cap Relative Value VIP Fund and Guardian Small-Mid Cap Core VIP Fund; (x) Lord, Abbett & Co. LLC with respect to Guardian Core Plus Fixed Income VIP Fund; (xi) FIAM LLC with respect to Guardian Select Mid Cap Core VIP Fund; and (xii) Massachusetts Financial Services Company with respect to Guardian All Cap Core VIP Fund, each in substantially the form presented at this meeting, (each, a “Sub-Adviser” and collectively, the “Sub-Advisers”) for a one-year term.
The Board, including the Independent Trustees, also considered and voted unanimously to renew the existing sub-subadvisory agreement (the “Sub-Subadvisory Agreement”) between Schroder Investment Management North America Inc. and Schroder Investment Management North America Limited (also a Sub-Adviser) with respect to Guardian International Equity VIP Fund for a one-year term.
The Board is responsible for overseeing the management of each Fund. In determining whether to renew its approval of the Agreements, the Trustees evaluated information and factors that they considered to be relevant and appropriate through the exercise of their own business judgment. The Trustees considered certain information and factors in light of advice furnished to them by legal counsel to the Trust and, in the case of the Independent Trustees, their independent legal counsel. In advance of the Meeting, the Trustees received materials and information designed to assist their consideration of the Agreements. The Trustees received written responses
SUPPLEMENTAL INFORMATION (UNAUDITED)
from the Manager and each Sub-Adviser to a series of questions and requests for information encompassing a wide variety of topics provided by independent counsel on behalf of the Independent Trustees. The Independent Trustees also received materials and information regarding the legal standards applicable to their consideration of the Agreements and the process and criteria used by the Manager to identify and select the Sub-Advisers.
During the course of their deliberations, the Independent Trustees met twice to discuss and evaluate the materials, information and Agreements in executive session with their independent legal counsel, outside of the presence of the Trustees who are not Independent Trustees and representatives from Fund management, the Manager or any Sub-Adviser.
In reaching its decisions to renew its approval of the Agreements, the Board took into account the materials and information described above, as well as other materials and information provided to the Board throughout the year. Individual Trustees may have given different weight to different factors and information with respect to each Agreement, and the Trustees did not identify any single factor or information that, in isolation, would be controlling in deciding to approve the Agreements. The discussion below is intended to summarize the broad factors that figured prominently in the Board’s decisions to renew its approval of the Agreements rather than to be all-inclusive. These broad factors included: (i) the nature, extent and quality of the services provided to the Funds by the Manager and to the Sub-advised Funds by the Sub-Advisers; (ii) the investment performance of each Fund; (iii) estimated profitability of the Manager; (iv) fees and expenses; (v) the extent to which economies of scale may exist, and the extent to the benefits of economies of scale are shared with the Funds; and (vi) any other benefits derived by the Manager or the Sub-Advisers (or their respective affiliates) from their relationships with the Funds.
Nature, Extent and Quality of Services
The Trustees considered information regarding the nature, extent and quality of services provided to the Funds by the Manager. The Trustees also considered, among other things, the terms of the Management Agreement and the range of investment advisory services provided by the Manager. In addition, the Trustees reviewed the range of non-investment advisory services provided by the Manager consistent with the terms of the Management Agreement, notably coordinating the preparation and filing of various
regulatory documents, coordinating the preparation and assembly of Board meeting materials, and assisting the Board with certain valuation matters. The Board also received a description of the Manager’s and each Sub-Adviser’s business continuity plans and of their respective approaches to data privacy and cybersecurity, and related testing. The Board received information regarding the response of the Manager and the Sub-Advisers to the COVID-19 pandemic, including the continuation of remote work arrangements and return-to-office plans. The Board also received information about the Manager’s role as administrator of the Funds’ liquidity risk management program, the Manager’s approach to risk management, and the Manager’s vendor oversight programs.
The Trustees considered that the Sub-advised Funds operate in a “manager-of-managers” structure and reviewed the responsibilities that the Manager has under this structure, including monitoring and evaluating the performance of the Sub-Advisers, monitoring the Sub-Advisers for adherence to the stated investment objectives, strategies, policies and restrictions of the Funds and supervising the Sub-Advisers with respect to the services that the Sub-Advisers would provide under the Sub-Advisory Agreements. The Trustees also considered the process used by the Manager, consistent with this structure, to identify and recommend sub-advisers, and the Manager’s ability to monitor and oversee sub-advisers and recommend replacement sub-advisers, when necessary, and provide other services under the Management Agreement. The Board noted that investment management staff of the Manager and the Trust’s Chief Compliance Officer conduct oversight meetings with the Sub-Advisers on a periodic basis, follow through with additional inquiries on any questions or concerns that arise during the meetings and, as necessary, then report the results of the meetings to the Board. The Trustees reviewed information regarding the experience and background of the Manager’s key personnel and the Manager’s organizational structure and resources, including investment, legal and administrative capabilities of the Manager. In this regard, the Trustees recognized that the Funds may benefit from the Manager’s ability to use resources and capabilities of its affiliates in providing services to the Funds.
The Trustees considered information regarding the nature, extent and quality of services provided to the Sub-advised Funds by the Sub-Advisers. The Trustees also considered, among other things, the terms of the Sub-advisory Agreements and the range of investment
SUPPLEMENTAL INFORMATION (UNAUDITED)
advisory services provided by the Sub-Advisers under the oversight of the Manager. In evaluating these investment advisory services, the Trustees considered, among other things, the Sub-Advisers’ investment philosophies, styles and/or processes and approaches to managing the respective Sub-advised Funds. The Trustees received and evaluated information regarding the background, education, expertise and/or experience of the investment professionals who serve as portfolio managers for the Sub-advised Funds and the capabilities and resources of the Sub-Advisers.
Based upon these considerations, the Trustees concluded, within the context of their full deliberations, that the nature, extent and quality of services provided to the Funds by the Manager and the Sub-advised Funds by each respective Sub-Adviser were appropriate.
Investment Performance
In connection with each of its regular quarterly meetings, the Board receives information on the performance of each Fund, including net performance, relative performance rankings within the relevant Morningstar peer group, and performance as compared to benchmark index returns. At each quarterly Board meeting, members of the Manager’s funds management team review with the Board the economic and market environment, absolute and relative performance of each Fund, and any relevant information about risk management and style consistency in connection with management of the Funds. The Board considered investment performance for each Fund over the one-year, three-year (where available), five-year (where available) and since-inception periods.
The Board also received and reviewed a report prepared by Broadridge Financial Solutions (“Broadridge”), an independent provider of mutual fund industry data, which included comparisons of the performance of each Fund to performance of an appropriate peer universe. For details regarding each Fund’s performance, see the “Fund-by-Fund Factors” section below.
The Manager discussed with the Board factors contributing to the Funds’ performance results. In addition, for certain Funds, the Manager provided to the Board longer term performance records of the Sub-Advisers for strategies used in managing the Funds. The Board concluded that the investment performance generated by the Manager and each Sub-Adviser was generally satisfactory, or, that any steps being taken by the Manager and Sub-Advisers to address any performance issues were satisfactory.
Profitability
The Board received and considered the Manager’s estimate of its profitability, which included allocations by the Manager of its costs in providing management services to the Funds. The Board considered the estimated profitability of the Manager both overall and on a Fund-by-Fund basis.
The Board received and considered profitability information from most of the Sub-Advisers, but noted that the Manager had negotiated the fees with the Sub-Advisers at arm’s-length. Accordingly, the Board concluded that the profitability of the Sub-Advisers is a less relevant factor than Manager profitability.
Based on the consideration of this information, the Board concluded that the profitability of the Funds to the Manager was acceptable.
Fees and Expenses
The Trustees considered the management fees paid by the Funds to the Manager under the Management Agreement and evaluated the reasonableness of these fees. The Trustees received and reviewed comparative information with respect to the management fee and total expenses for each Fund and the management fees and total expenses for a peer group of other funds selected by Broadridge. The Trustees considered the Manager’s commitment to limit the total expenses of each Fund through an expense limitation agreement with the Trust. Although the Board recognized that the comparisons between the management fees and actual expenses of the Funds and those of the identified peer group are imprecise, given different terms of agreements and variations in fund strategies, the Trustees found that the comparative information supported their consideration and approval of the management fees and evaluation of the total expenses. For details regarding each Fund’s fee and expense comparisons, see the “Fund-by-Fund Factors” section below.
The Trustees considered the sub-advisory fees paid under the Sub-advisory Agreements and evaluated the reasonableness of those fees. The Trustees also considered that the fees paid to the Sub-Advisers would be paid by the Manager and not the Funds and that the Manager had negotiated the fees with the Sub-Advisers at arm’s-length.
Based on the consideration of the information and factors summarized above, as well as other relevant information and factors, the Board concluded that the
SUPPLEMENTAL INFORMATION (UNAUDITED)
management and sub-advisory fees were reasonable in light of the nature, extent and quality of services rendered to the Funds by the Manager and the Sub-Advisers.
Economies of Scale
The Board considered the extent to which economies of scale may exist, and the extent to the benefits of economies of scale are shared with the Funds. In this regard, the Board noted that for sixteen of twenty-four Funds, the management and sub-advisory fee included breakpoints that are tiered based on growth in asset levels of each such Fund and that for the other Funds, the fees reflected appropriate levels based on current and expected asset levels. The Board also noted that the expenses of the Funds are subject to expense limitations provided by the Manager. The Board noted that expected economies of scale, where they exist, may be shared through the use of fee breakpoints, expense limitations by the Manager, and/or a lower overall fee.
Ancillary Benefits
The Board considered the potential benefits, other than management fees, that the Manager and/or its affiliates may receive because of the Manager’s relationship with the Funds. The Trustees considered that the Funds were designed to serve as investment options under variable contracts issued by affiliates of the Manager that would receive fees under those contracts and that Park Avenue Securities LLC, an affiliate of the Manager and principal underwriter of the Funds, and participating insurance companies, including insurance companies affiliated with the Manager, would be entitled to receive fees from the Funds under a plan of distribution adopted pursuant to Rule 12b-1 under the 1940 Act. The Trustees considered that the Manager and its affiliates may benefit from (i) greater efficiencies in annuity administration and operations and potential cost savings due to a reduction in the number of unaffiliated funds available as annuity contract investment options, and (ii) increased dividends-received deductions due to the Funds’ status under the tax laws as disregarded entities. In addition, the Trustees considered the potential benefits, other than sub-advisory fees, that the Sub-Advisers and their affiliates may receive because of their relationships with the Funds, including the ability to receive research from soft dollar commissions consistent with Trust policies. The Trustees concluded that benefits that may accrue to the Manager and its affiliates are reasonable and the benefits that may accrue to the Sub-Advisers and their affiliates are consistent with those expected for a sub-adviser to a mutual fund such as the applicable Fund.
Fund-by-Fund Factors
The Broadridge report groups fees, expenses and performance into five quintiles, with the top quintile having the highest performance or lowest fees/expenses, and the bottom quintile having the lowest performance or highest fees/expenses. For purposes of the descriptions below, a Fund’s performance is considered “in line with” the benchmark index if it is within 0.20%.
Guardian Large Cap Fundamental Growth VIP Fund
| • | | The Board noted that the Fund’s performance was in the 3rd quintile of its performance universe for the 1-year period and in the 4th quintile for its performance universe for the 3-year and 5-year periods. The Board also noted that the Fund’s performance was below the benchmark index for the 1-year, 3-year and 5-year periods. |
| • | | The Board noted that the contractual management fee, the actual management fee and actual total expenses were in the 1st quintile of the expense group. |
Guardian Large Cap Disciplined Growth VIP Fund
| • | | The Board noted that the Fund’s performance was in the 3rd quintile of its performance universe for the 1-year and 3-year periods and in the 2nd quintile for the 5-year period. The Board also noted that the Fund’s performance was below the benchmark index for the 1-year, 3-year and 5-year periods. |
| • | | The Board noted that the contractual management fee, the actual management fee and actual total expenses were in the 1st quintile of the expense group. |
Guardian Integrated Research VIP Fund
| • | | The Board noted that the Fund’s performance was in the 5th quintile of its performance universe for the 1-year and 5-year periods and in the 4th quintile for 3-year period. The Board also noted that the Fund’s performance was below the benchmark index for the 1-year, 3-year and 5-year periods. |
| • | | The Board noted that the contractual management fee, the actual management fee and actual total expenses were in the 1st quintile of the expense group. |
Guardian Diversified Research VIP Fund
| • | | The Board noted that the Fund’s performance was in the 3rd quintile of its performance universe for the 1-year and 3-year periods and in the 2nd quintile for the 5-year period. The Board also noted that the Fund’s performance was higher than the benchmark index for the 1-year period. The Board note that the |
SUPPLEMENTAL INFORMATION (UNAUDITED)
| | | Fund’s performance was lower than the benchmark index for the 3-year and 5-year periods. |
| • | | The Board noted that the contractual management fee and actual management fee were in the 1st quintile of the expense group and that actual total expenses were in the 3rd quintile. |
Guardian Strategic Large Cap Core VIP Fund
| • | | The Board noted that the Fund’s performance was in the 1st quintile of its performance universe for the 1-year period. The Board acknowledged the Fund’s short operational history. The Board noted that the Fund’s performance was higher than the benchmark index for the 1-year period. |
| • | | The Board noted that the contractual management fee, the actual management fee and actual total expenses were in the 1st quintile of the expense group. |
Guardian Large Cap Disciplined Value VIP Fund
| • | | The Board noted that the Fund’s performance was in the 3rd quintile of its performance universe for the 1-year and 3-year periods and in the 4th quintile for the 5-year period. The Board also noted that the Fund’s performance was higher than the benchmark index for the 1-year and 3-year periods. The Board noted that the Fund’s performance was in line with the benchmark index for the 5-year period. |
| • | | The Board noted that the contractual management fee was in the 2nd quintile of the expense group, the actual management fee was in the 1st quintile of the expense group and that actual total expenses were in the 3rd quintile. |
Guardian Growth & Income VIP Fund
| • | | The Board noted that the Fund’s performance was in the 3rd quintile of its performance universe for the 1-year, 3-year and 5-year periods. The Board also noted that the Fund’s performance was higher than the benchmark index for the 1-year, 3-year and 5-year periods. |
| • | | The Board noted that the contractual management fee and the actual management fee were in the 1st quintile of the expense group and that actual total expenses were in the 3rd quintile. |
Guardian Equity Income VIP Fund
| • | | The Board noted that the Fund had less than one-year of operational history and was not able to evaluate an investment performance record for the Fund. The Board noted that it would have an opportunity to review such information in connection with future |
| | | annual reviews. The Board noted that, in the meantime, it received monthly performance reports from the Manager. |
| • | | The Board noted that the contractual management fee, the actual management fee and actual total expenses were in the 1st quintile of the expense group. |
Guardian All Cap Core VIP Fund
| • | | The Board noted that the Fund’s performance was in the 3rd quintile of its performance universe for the 1-year period. The Board acknowledged the Fund’s short operational history. The Board noted that the Fund’s performance was higher than the benchmark index for the 1-year period. |
| • | | The Board noted that the contractual management fee, the actual management fee and actual total expenses were in the 1st quintile of the expense group. |
Guardian Mid Cap Traditional Growth VIP Fund
| • | | The Board noted that the Fund’s performance was in the 1st quintile of its performance universe for the 1-year period and in the 2nd quintile for the 3-year and 5-year periods. The Board also noted that the Fund’s performance was higher than the benchmark index for the 1-year, 3-year and 5-year periods. |
| • | | The Board noted that the contractual management fee and actual management fee were in the 1st quintile of the expense group and that the actual total expenses were in the 4th quintile. |
Guardian Select Mid Cap Core VIP Fund
| • | | The Board noted that the Fund’s performance was in the 3rd quintile of its performance universe for the 1-year period. The Board acknowledged the Fund’s short operational history. The Board noted that the Fund’s performance was lower than the benchmark index for the 1-year period. |
| • | | The Board noted that the contractual management fee, the actual management fee and actual total expenses were in the 1st quintile of the expense group. |
Guardian Mid Cap Relative Value VIP Fund
| • | | The Board noted that the Fund’s performance was in the 2nd quintile of its performance universe for the 1-year, 3-year and 5-year periods. The Board also noted that the Fund’s performance was higher than the benchmark index for the 1-year, 3-year and 5-year periods. |
| • | | The Board noted that the contractual management fee and the actual management fee were in the 2nd |
SUPPLEMENTAL INFORMATION (UNAUDITED)
| | | quintile of the expense group and the actual total expenses were in the 3rd quintile of the expense group. |
Guardian Small-Mid Cap Core VIP Fund
| • | | The Board noted that the Fund’s performance was in the 5th quintile of its performance universe for the 1-year period. The Board acknowledged the Fund’s short operational history. The Board noted that the Fund’s performance was higher than the benchmark index for the 1-year period. |
| • | | The Board noted that the contractual management fee, the actual management fee and actual total expenses were in the 1st quintile of the expense group. |
Guardian Small Cap Core VIP Fund
| • | | The Board noted that the Fund’s performance was in the 5th quintile of its performance universe for the 1-year and 3-year periods. The Board noted that the Fund’s performance was lower than the benchmark index for the 1-year and 3-year periods. |
| • | | The Board noted that the contractual management fee and the actual management fee were in the 1st quintile of the expense group and the actual total expenses were in the 2nd quintile of the expense group. |
Guardian International Growth VIP Fund
| • | | The Board noted that the Fund’s performance was in the 4th quintile of its performance universe for the 1-year period, in the 2nd quintile of its performance universe for the 3-year period and in the 3rd quintile of its performance universe for the 5-year period. The Board also noted that the Fund’s performance was lower than the benchmark index for the 1-year and 5-year periods. The Board noted that the Fund’s performance was higher than the benchmark index for the 3-year period. |
| • | | The Board noted that the contractual management fee and actual management fee were in the 2nd quintile of the expense group and that the actual total expenses were in the 3rd quintile. |
Guardian International Equity VIP Fund
| • | | The Board noted that the Fund’s performance was in the 5th quintile of its performance universe for the 1-year, 3-year and 5-year periods. The Board also noted that the Fund’s performance was lower than the benchmark index for the 1-year, 3-year and 5-year periods. |
| • | | The Board noted that the contractual management fee, the actual management fee and the actual total expenses were in the 2nd quintile of the expense group. |
Guardian Global Utilities VIP Fund
| • | | The Board noted that the Fund’s performance was in the 5th quintile of its performance universe for the 1-year period and in the 4th quintile of its performance universe for the 3-year period. The Board noted that the Fund’s performance was higher than the benchmark index for the 1-year and 3-year periods. |
| • | | The Board noted that the contractual management fee and the actual management fee were in the 1st quintile of the expense group and the actual total expenses were in the 2nd quintile of the expense group. |
Guardian Balanced Allocation VIP Fund
| • | | The Board noted that the Fund had less than one-year of operational history and was not able to evaluate an investment performance record for the Fund. The Board noted that it would have an opportunity to review such information in connection with future annual reviews. The Board noted that, in the meantime, it received monthly performance reports from the Manager. |
| • | | The Board noted that the contractual management fee, the actual management fee and actual total expenses were in the 1st quintile of the expense group. |
Guardian Core Plus Fixed Income VIP Fund
| • | | The Board noted that the Fund’s performance was in the 3rd quintile of its performance universe for the 1-year and 3-year periods and in the 4th quintile of its performance universe for the 5-year period. The Board also noted that the Fund’s performance was lower than the benchmark index for the 1-year and 5-year periods. The Board noted that the Fund’s performance was in line with the benchmark index for the 3-year period. |
| • | | The Board noted that the contractual management fee and actual management fee were in the 2nd quintile of the expense group and that actual total expenses were in the 3rd quintile. |
Guardian Total Return Bond VIP Fund
| • | | The Board noted that the Fund’s performance was in the 5th quintile of its performance universe for the 1-year and 3-year periods. The Board also noted that the Fund’s performance was lower than the benchmark index for the 1-year and 3-year periods. |
SUPPLEMENTAL INFORMATION (UNAUDITED)
| • | | The Board noted that the contractual management fee and actual management fee were in the 2nd quintile and the actual total expenses were in the 3rd quintile. |
Guardian Core Fixed Income VIP Fund
| • | | The Board noted that the Fund had less than one-year of operational history and was not able to evaluate an investment performance record for the Fund. The Board noted that it would have an opportunity to review such information in connection with future annual reviews. The Board noted that, in the meantime, it received monthly performance reports from the Manager. |
| • | | The Board noted that the contractual management fee was in the 2nd quintile of the expense group and the actual management fee and the actual total expenses were in the 1st quintile. |
Guardian Multi-Sector Bond VIP Fund
| • | | The Board noted that the Fund’s performance was in the 5th quintile of its performance universe for the 1-year and 3-year periods The Board also noted that the Fund’s performance was lower than the benchmark index for the 1-year and 3-year periods. |
| • | | The Board noted that the contractual management fee and actual total expenses were in the 1st quintile and the actual management fee was in the 2nd quintile. |
Guardian Short Duration Bond VIP Fund
| • | | The Board noted that the Fund had less than one-year of operational history and was not able to evaluate an |
| | | investment performance record for the Fund. The Board noted that it would have an opportunity to review such information in connection with future annual reviews. The Board noted that, in the meantime, it received monthly performance reports from the Manager. |
| • | | The Board noted that the contractual management fee and actual total expenses were in the 3rd quintile of the expense group and the actual management fee was in the 1st quintile of the expense group. |
Guardian U.S. Government Securities VIP Fund
| • | | The Board noted that the Fund’s performance was in the 1st quintile of its performance universe for the 1-year period and in the 2nd quintile of its performance universe for the 3-year period. The Board also noted that the Fund’s performance was higher than the benchmark index for the 1-year and 3-year periods. |
| • | | The Board noted that the contractual management fee and the actual management fee were in the 1st quintile of the expense group and the actual total expenses were in the 2nd quintile of the expense group. |
Conclusion
Based on a comprehensive consideration and evaluation of all of the information and factors summarized above, among others, the Board as a whole, including the Independent Trustees, approved the Agreements.
SUPPLEMENTAL INFORMATION (UNAUDITED)
The Statement of Additional Information (“SAI”) includes additional information about the Trust’s Trustees and Officers and is available, without charge, upon request by calling toll-free 1-888-GUARDIAN (1-888-482-7342) or by visiting our website at http://guardianvpt.onlineprospectus.net/GuardianVPT/Prospectuses.
Portfolio Holdings and Proxy Voting Procedures
The Fund files its complete schedule of portfolio holdings with the Securities and Exchange Commission for the first and third quarters of each fiscal year as an exhibit to its reports on Form N-PORT. The Fund’s Form N-PORT reports are available on the Securities and Exchange Commission’s website at https://www.sec.gov. The Fund’s Form N-PORT information is also available, without charge, upon request, by calling toll-free 1-888-GUARDIAN (1-888-482-7342) or by visiting our website at http://guardianvpt.onlineprospectus.net/GuardianVPT/Prospectuses.
A description of the policies and procedures that the Fund uses to determine how to vote proxies relating to portfolio securities is included in the SAI. The SAI and information regarding how the Fund voted proxies relating to portfolio securities during the most recent 12-month period ended June 30 may be obtained (i) without charge, upon request, by calling toll-free 1-888-GUARDIAN (1-888-482-7342) or by visiting our website at http://guardianvpt.onlineprospectus.net/GuardianVPT/Prospectuses; and (ii) on the Securities and Exchange Commission’s website at https://www.sec.gov.
This report is transmitted to shareholders only. It is not authorized for use as an offer of sale or a solicitation of an offer to buy shares of the Fund unless accompanied or preceded by the Fund’s current prospectus. Past performance results shown in this report should not be considered a representation of future performance. Investment returns and principal value of shares will fluctuate so that shares, when redeemed, may be worth more or less than their original cost. Statements and other information herein are as dated and are subject to change.

The Guardian Life Insurance Company of America New York, NY 10001-2159
PUB8173
Guardian Variable
Products Trust
2023
Semiannual Report
All Data as of June 30, 2023
Guardian Large Cap Disciplined Value VIP Fund

| | |
| Not FDIC insured. May lose value. No bank guarantee. | | www.guardianlife.com |
TABLE OF CONTENTS
Guardian Large Cap Disciplined Value VIP Fund
Except as otherwise specifically stated, all information, including portfolio security positions, is as of June 30, 2023. Fund holdings will vary. Information contained herein has been obtained from sources believed reliable, but is not guaranteed.
GUARDIAN LARGE CAP DISCIPLINED VALUE VIP FUND
Fund Characteristics (unaudited)
| | |
| Total Net Assets: $157,130,060 | | |
|
| |
Sector Allocation1 As of June 30, 2023 |
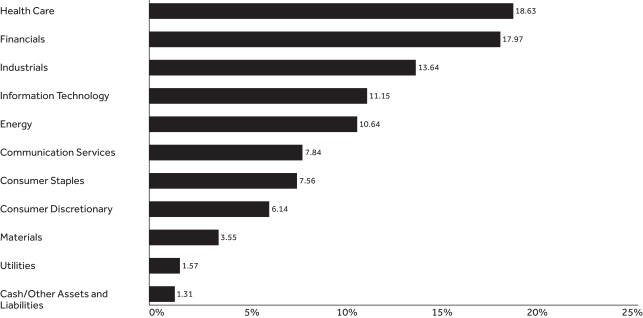 |
| | | | |
| |
Top Ten Holdings2 As of June 30, 2023 | |
| | |
| Holding | | % of Total
Net Assets | |
| JPMorgan Chase & Co. | | | 3.76% | |
| Berkshire Hathaway, Inc., Class B | | | 3.64% | |
| Alphabet, Inc., Class A | | | 3.18% | |
| Bristol-Myers Squibb Co. | | | 2.87% | |
| Johnson & Johnson | | | 2.81% | |
| Cisco Systems, Inc. | | | 2.56% | |
| Wells Fargo & Co. | | | 2.22% | |
| Activision Blizzard, Inc. | | | 2.00% | |
| AutoZone, Inc. | | | 1.98% | |
| Walmart, Inc. | | | 1.77% | |
| Total | | | 26.79% | |
| 1 | The Fund’s holdings are allocated to each sector based on the MSCI Global Industry Classification Standard (GICS®). Cash includes short-term investments and net other assets and liabilities. |
| 2 | Portfolio holdings are subject to change and should not be considered a recommendation to buy or sell individual securities. |
UNDERSTANDING YOUR FUND’S EXPENSES (UNAUDITED)
By investing in the Fund, you incur two types of costs: (1) transaction costs and (2) ongoing costs, including, as applicable, investment advisory fees, distribution and/or service (12b-1) fees and other Fund expenses. The example below is intended to help you understand your ongoing costs (in dollars) of investing in the Fund and to compare these costs with the ongoing costs of investing in other mutual funds.
The example is based on an investment of $1,000 invested at the beginning of the period and held for the entire period from January 1, 2023 to June 30, 2023. The table below shows the Fund’s expenses in two ways:
Expenses based on actual return
This section of the table provides information about actual account values and actual expenses. You may use the information in this section, together with the amount you invested, to estimate the expenses that you paid over the period. Simply divide your account value by $1,000 (for example, an $8,600 account value divided by $1,000 = 8.6), then multiply the result by the number in the section under the heading entitled “Expenses Paid During Period” to estimate the expenses you paid on your account during this period.
Expenses based on hypothetical 5% return for comparison purposes
This section of the table provides information about hypothetical account values and hypothetical expenses based on the Fund’s actual expense ratio and an assumed rate of return of 5% per year before expenses, which is not the Fund’s actual return. The hypothetical account values and expenses may not be used to estimate the actual ending account balance or expenses you paid for the period. You may use this information to compare the ongoing costs of investing in the Fund with the cost of investing in other mutual funds. To do so, compare this 5% hypothetical example with the 5% hypothetical examples that appear in the shareholder reports of the other funds.
Note that the expenses shown in the table are meant to highlight your ongoing costs only and do not reflect any transactional costs, such as sales charges (loads), redemption fees, or exchange fees. Therefore the second section is useful in comparing ongoing costs only, and will not help you determine the relative total costs of owning different funds. If these transactional costs were included, your costs would have been higher. Charges and expenses at the insurance company separate account level are not reflected in the table.
| | | | | | | | | | | | | | | | |
| | | | | |
| | | Beginning
Account Value 1/1/23 | | | Ending Account Value
6/30/23 | | | Expenses Paid During Period* 1/1/23-6/30/23 | | | Expense Ratio During Period 1/1/23-6/30/23 | |
| Based on Actual Return | | $ | 1,000.00 | | | $ | 1,037.90 | | | $ | 4.90 | | | | 0.97% | |
Based on Hypothetical Return (5% Return Before Expenses) | | $ | 1,000.00 | | | $ | 1,019.98 | | | $ | 4.86 | | | | 0.97% | |
| * | Expenses are equal to the Fund’s annualized expense ratio as indicated, multiplied by the average account value over the period, multiplied by 181/365 (to reflect the one-half year period). |
SCHEDULE OF INVESTMENTS — GUARDIAN LARGE CAP DISCIPLINED VALUE VIP FUND
| | | | | | | | |
| June 30, 2023 (unaudited) | | Shares | | | Value | |
| Common Stocks – 98.7% | |
| |
| Aerospace & Defense – 2.7% | |
| | | |
General Dynamics Corp. | | | 9,695 | | | $ | 2,085,879 | |
| | | |
Howmet Aerospace, Inc. | | | 43,933 | | | | 2,177,320 | |
| | | | | | | | | |
| | |
| | | | | 4,263,199 | |
| Automobile Components – 0.4% | |
| | | |
BorgWarner, Inc. | | | 14,083 | | | | 688,800 | |
| | | | | | | | | |
| | |
| | | | | 688,800 | |
| Banks – 6.0% | |
| | | |
JPMorgan Chase & Co. | | | 40,645 | | | | 5,911,409 | |
| | | |
Wells Fargo & Co. | | | 81,799 | | | | 3,491,181 | |
| | | | | | | | | |
| | |
| | | | | 9,402,590 | |
| Beverages – 2.4% | |
| | | |
Coca-Cola Europacific Partners PLC | | | 20,237 | | | | 1,303,870 | |
| | | |
Keurig Dr Pepper, Inc. | | | 80,603 | | | | 2,520,456 | |
| | | | | | | | | |
| | |
| | | | | 3,824,326 | |
| Biotechnology – 1.0% | |
| | | |
Amgen, Inc. | | | 7,210 | | | | 1,600,764 | |
| | | | | | | | | |
| | |
| | | | | 1,600,764 | |
| Building Products – 1.4% | |
| | | |
Allegion PLC | | | 9,502 | | | | 1,140,430 | |
| | | |
Masco Corp. | | | 17,487 | | | | 1,003,404 | |
| | | | | | | | | |
| | |
| | | | | 2,143,834 | |
| Capital Markets – 2.5% | |
| | | |
Ares Management Corp., Class A | | | 7,364 | | | | 709,521 | |
| | | |
Goldman Sachs Group, Inc. | | | 5,955 | | | | 1,920,726 | |
| | | |
Intercontinental Exchange, Inc. | | | 11,968 | | | | 1,353,342 | |
| | | | | | | | | |
| | |
| | | | | 3,983,589 | |
| Chemicals – 2.2% | |
| | | |
Corteva, Inc. | | | 15,806 | | | | 905,683 | |
| | | |
DuPont de Nemours, Inc. | | | 25,386 | | | | 1,813,576 | |
| | | |
Olin Corp. | | | 13,315 | | | | 684,258 | |
| | | | | | | | | |
| | |
| | | | | 3,403,517 | |
| Communications Equipment – 2.6% | |
| | | |
Cisco Systems, Inc. | | | 77,713 | | | | 4,020,871 | |
| | | | | | | | | |
| | |
| | | | | 4,020,871 | |
| Construction Materials – 1.0% | |
| | | |
CRH PLC, ADR | | | 26,725 | | | | 1,489,384 | |
| | | | | | | | | |
| | |
| | | | | 1,489,384 | |
| Consumer Finance – 0.6% | |
| | | |
Discover Financial Services | | | 7,911 | | | | 924,400 | |
| | | | | | | | | |
| | |
| | | | | 924,400 | |
| Consumer Staples Distribution & Retail – 3.8% | |
| | | |
Dollar General Corp. | | | 2,886 | | | | 489,985 | |
| | | |
Kroger Co. | | | 17,003 | | | | 799,141 | |
| | | |
US Foods Holding Corp.(1) | | | 43,761 | | | | 1,925,484 | |
| | | |
Walmart, Inc. | | | 17,682 | | | | 2,779,257 | |
| | | | | | | | | |
| | |
| | | | | 5,993,867 | |
| Distributors – 1.0% | |
| | | |
LKQ Corp. | | | 26,846 | | | | 1,564,316 | |
| | | | | | | | | |
| | |
| | | | | 1,564,316 | |
| | | | | | | | |
| June 30, 2023 (unaudited) | | Shares | | | Value | |
| Electric Utilities – 1.0% | |
| | | |
FirstEnergy Corp. | | | 39,319 | | | $ | 1,528,723 | |
| | | | | | | | | |
| | |
| | | | | 1,528,723 | |
| Electrical Equipment – 1.1% | |
| | | |
Eaton Corp. PLC | | | 8,797 | | | | 1,769,077 | |
| | | | | | | | | |
| | |
| | | | | 1,769,077 | |
| Energy Equipment & Services – 2.8% | |
| | | |
Halliburton Co. | | | 61,646 | | | | 2,033,702 | |
| | | |
Schlumberger NV | | | 48,642 | | | | 2,389,295 | |
| | | | | | | | | |
| | |
| | | | | 4,422,997 | |
| Entertainment – 2.7% | |
| | | |
Activision Blizzard, Inc.(1) | | | 37,362 | | | | 3,149,617 | |
| | | |
Take-Two Interactive Software, Inc.(1) | | | 3,272 | | | | 481,507 | |
| | | |
Warner Bros Discovery, Inc.(1) | | | 54,340 | | | | 681,424 | |
| | | | | | | | | |
| | |
| | | | | 4,312,548 | |
| Financial Services – 5.6% | |
| | | |
Berkshire Hathaway, Inc., Class B(1) | | | 16,771 | | | | 5,718,911 | |
| | | |
FleetCor Technologies, Inc.(1) | | | 7,298 | | | | 1,832,382 | |
| | | |
Global Payments, Inc. | | | 12,173 | | | | 1,199,284 | |
| | | | | | | | | |
| | |
| | | | | 8,750,577 | |
| Health Care Providers & Services – 8.3% | |
| | | |
AmerisourceBergen Corp. | | | 11,692 | | | | 2,249,892 | |
| | | |
Centene Corp.(1) | | | 27,367 | | | | 1,845,904 | |
| | | |
Cigna Group | | | 9,628 | | | | 2,701,617 | |
| | | |
CVS Health Corp. | | | 30,732 | | | | 2,124,503 | |
| | | |
McKesson Corp. | | | 3,366 | | | | 1,438,325 | |
| | | |
UnitedHealth Group, Inc. | | | 5,541 | | | | 2,663,226 | |
| | | | | | | | | |
| | |
| | | | | 13,023,467 | |
| Hotels, Restaurants & Leisure – 0.9% | |
| | | |
Booking Holdings, Inc.(1) | | | 534 | | | | 1,441,976 | |
| | | | | | | | | |
| | |
| | | | | 1,441,976 | |
| Household Durables – 1.5% | |
| | | |
Mohawk Industries, Inc.(1) | | | 9,580 | | | | 988,273 | |
| | | |
Sony Group Corp., ADR | | | 15,042 | | | | 1,354,381 | |
| | | | | | | | | |
| | |
| | | | | 2,342,654 | |
| Insurance – 3.3% | |
| | | |
Allstate Corp. | | | 5,115 | | | | 557,740 | |
| | | |
Aon PLC, Class A | | | 2,748 | | | | 948,609 | |
| | | |
Arthur J Gallagher & Co. | | | 6,396 | | | | 1,404,370 | |
| | | |
Chubb Ltd. | | | 7,772 | | | | 1,496,576 | |
| | | |
Progressive Corp. | | | 5,772 | | | | 764,040 | |
| | | | | | | | | |
| | |
| | | | | 5,171,335 | |
| Interactive Media & Services – 3.2% | |
| | | |
Alphabet, Inc., Class A(1) | | | 41,677 | | | | 4,988,737 | |
| | | | | | | | | |
| | |
| | | | | 4,988,737 | |
| IT Services – 0.8% | |
| | | |
Cognizant Technology Solutions Corp., Class A | | | 19,388 | | | | 1,265,649 | |
| | | | | | | | | |
| | |
| | | | | 1,265,649 | |
| Life Sciences Tools & Services – 2.2% | |
| | | |
Avantor, Inc.(1) | | | 68,910 | | | | 1,415,411 | |
| | | | | | | | | |
| | | | |
| The accompanying notes are an integral part of these financial statements. | | | | 3 |
SCHEDULE OF INVESTMENTS — GUARDIAN LARGE CAP DISCIPLINED VALUE VIP FUND
| | | | | | | | |
| June 30, 2023 (unaudited) | | Shares | | | Value | |
| Life Sciences Tools & Services (continued) | |
| | | |
ICON PLC(1) | | | 8,128 | | | $ | 2,033,626 | |
| | | | | | | | | |
| | |
| | | | | 3,449,037 | |
| Machinery – 4.8% | |
| | | |
Caterpillar, Inc. | | | 3,637 | | | | 894,884 | |
| | | |
Deere & Co. | | | 4,444 | | | | 1,800,664 | |
| | | |
Dover Corp. | | | 5,556 | | | | 820,343 | |
| | | |
Fortive Corp. | | | 22,496 | | | | 1,682,026 | |
| | | |
Otis Worldwide Corp. | | | 11,575 | | | | 1,030,291 | |
| | | |
Westinghouse Air Brake Technologies Corp. | | | 12,130 | | | | 1,330,297 | |
| | | | | | | | | |
| | |
| | | | | 7,558,505 | |
| Media – 0.9% | |
| | | |
Omnicom Group, Inc. | | | 14,256 | | | | 1,356,458 | |
| | | | | | | | | |
| | |
| | | | | 1,356,458 | |
| Metals & Mining – 0.4% | |
| | | |
Teck Resources Ltd., Class B | | | 16,322 | | | | 687,156 | |
| | | | | | | | | |
| | |
| | | | | 687,156 | |
| Multi-Utilities – 0.6% | |
| | | |
CenterPoint Energy, Inc. | | | 31,967 | | | | 931,838 | |
| | | | | | | | | |
| | |
| | | | | 931,838 | |
| Oil, Gas & Consumable Fuels – 7.8% | |
| | | |
Canadian Natural Resources Ltd. | | | 38,494 | | | | 2,165,672 | |
| | | |
Cenovus Energy, Inc. | | | 124,264 | | | | 2,110,003 | |
| | | |
ConocoPhillips | | | 19,436 | | | | 2,013,764 | |
| | | |
Exxon Mobil Corp. | | | 15,343 | | | | 1,645,537 | |
| | | |
Marathon Petroleum Corp. | | | 21,041 | | | | 2,453,381 | |
| | | |
Peabody Energy Corp. | | | 32,522 | | | | 704,426 | |
| | | |
Pioneer Natural Resources Co. | | | 5,789 | | | | 1,199,365 | |
| | | | | | | | | |
| | |
| | | | | 12,292,148 | |
| Personal Care Products – 0.1% | |
| | | |
Kenvue, Inc.(1) | | | 5,735 | | | | 151,519 | |
| | | | | | | | | |
| | |
| | | | | 151,519 | |
| Pharmaceuticals – 7.1% | |
| | | |
Bristol-Myers Squibb Co. | | | 70,606 | | | | 4,515,254 | |
| | | |
Johnson & Johnson | | | 26,666 | | | | 4,413,756 | |
| | | |
Sanofi, ADR | | | 42,145 | | | | 2,271,615 | |
| | | | | | | | | |
| | |
| | | | | 11,200,625 | |
| Professional Services – 1.6% | |
| | | |
Leidos Holdings, Inc. | | | 14,475 | | | | 1,280,748 | |
| | | |
SS&C Technologies Holdings, Inc. | | | 21,231 | | | | 1,286,599 | |
| | | | | | | | | |
| | |
| | | | | 2,567,347 | |
| Semiconductors & Semiconductor Equipment – 6.8% | |
| | | |
Advanced Micro Devices, Inc.(1) | | | 17,270 | | | | 1,967,226 | |
| | | |
Applied Materials, Inc. | | | 14,809 | | | | 2,140,493 | |
| | | |
Lam Research Corp. | | | 1,776 | | | | 1,141,719 | |
| | | |
Microchip Technology, Inc. | | | 22,474 | | | | 2,013,446 | |
| | | |
Micron Technology, Inc. | | | 27,526 | | | | 1,737,166 | |
| | | |
NXP Semiconductors NV | | | 1,724 | | | | 352,868 | |
| | | |
QUALCOMM, Inc. | | | 11,628 | | | | 1,384,197 | |
| | | | | | | | | |
| | |
| | | | | 10,737,115 | |
| | | | | | | | |
| June 30, 2023 (unaudited) | | Shares | | | Value | |
| Specialty Retail – 2.3% | |
| | | |
AutoZone, Inc.(1) | | | 1,248 | | | $ | 3,111,713 | |
| | | |
Ulta Beauty, Inc.(1) | | | 1,045 | | | | 491,772 | |
| | | | | | | | | |
| | |
| | | | | 3,603,485 | |
| Technology Hardware, Storage & Peripherals – 1.0% | |
| | | |
Dell Technologies, Inc., Class C | | | 27,723 | | | | 1,500,092 | |
| | | | | | | | | |
| | |
| | | | | 1,500,092 | |
| Tobacco – 1.2% | |
| | | |
Philip Morris International, Inc. | | | 19,642 | | | | 1,917,452 | |
| | | | | | | | | |
| | |
| | | | | 1,917,452 | |
| Trading Companies & Distributors – 2.0% | |
| | | |
United Rentals, Inc. | | | 4,953 | | | | 2,205,918 | |
| | | |
WESCO International, Inc. | | | 5,171 | | | | 925,919 | |
| | | | | | | | | |
| | |
| | | | | 3,131,837 | |
| Wireless Telecommunication Services – 1.1% | |
| | | |
T-Mobile US, Inc.(1) | | | 12,005 | | | | 1,667,494 | |
| | | | | | | | | |
| | |
| | | | | 1,667,494 | |
| | |
Total Common Stocks
(Cost $122,179,006) | | | | 155,073,305 | |
| | | | | | | | |
| | | Principal
Amount | | |
Value | |
| |
| Repurchase Agreements – 1.4% | |
| | | |
Fixed Income Clearing Corp., 1.52%, dated 6/30/2023, proceeds at maturity value of $2,169,005, due 7/3/2023(2) | | $ | 2,168,730 | | | | 2,168,730 | |
| | |
Total Repurchase Agreements
(Cost $2,168,730) | | | | 2,168,730 | |
| | |
Total Investments – 100.1%
(Cost $124,347,736) | | | | 157,242,035 | |
| | |
| Liabilities in excess of other assets – (0.1)% | | | | (111,975 | ) |
| | |
| Total Net Assets – 100.0% | | | $ | 157,130,060 | |
| (1) | Non–income–producing security. |
| (2) | The table below presents collateral for repurchase agreements. |
| | | | | | | | | | | | | | | | |
| Security | | Coupon | | | Maturity
Date | | | Principal
Amount | | |
Value | |
| U.S. Treasury Note | | | 4.625% | | | | 3/15/2026 | | | $ | 2,179,900 | | | $ | 2,212,110 | |
Legend:
ADR — American Depositary Receipt
| | | | |
| 4 | | | | The accompanying notes are an integral part of these financial statements. |
SCHEDULE OF INVESTMENTS — GUARDIAN LARGE CAP DISCIPLINED VALUE VIP FUND
The following is a summary of the inputs used as of June 30, 2023 in valuing the Fund’s investments. For more information on valuation inputs, please refer to Note 2a of the accompanying Notes to Financial Statements.
| | | | | | | | | | | | | | | | |
| | | Valuation Inputs | | | | |
| Investments in Securities (unaudited) | | Level 1 | | | Level 2 | | | Level 3 | | | Total | |
| Common Stocks | | $ | 155,073,305 | | | $ | — | | | $ | — | | | $ | 155,073,305 | |
| Repurchase Agreements | | | — | | | | 2,168,730 | | | | — | | | | 2,168,730 | |
| Total | | $ | 155,073,305 | | | $ | 2,168,730 | | | $ | — | | | $ | 157,242,035 | |
| | | | |
| The accompanying notes are an integral part of these financial statements. | | | | 5 |
FINANCIAL INFORMATION — GUARDIAN LARGE CAP DISCIPLINED VALUE VIP FUND
| | | | |
Statement of Assets and Liabilities As of June 30, 2023 (unaudited) | |
Assets | | | | |
| | |
Investments, at value | | $ | 157,242,035 | |
| | |
Cash | | | 16,308 | |
| | |
Dividends/interest receivable | | | 95,393 | |
| | |
Foreign tax reclaims receivable | | | 84,400 | |
| | |
Reimbursement receivable from adviser | | | 4,799 | |
| | |
Prepaid expenses | | | 1,929 | |
| | | | | |
| | |
Total Assets | | | 157,444,864 | |
| | | | | |
| | |
Liabilities | | | | |
| | |
Payable for fund shares redeemed | | | 152,386 | |
| | |
Investment advisory fees payable | | | 80,561 | |
| | |
Distribution fees payable | | | 31,855 | |
| | |
Accrued audit fees | | | 13,978 | |
| | |
Accrued custodian and accounting fees | | | 9,823 | |
| | |
Accrued trustees’ and officers’ fees | | | 3,000 | |
| | |
Accrued expenses and other liabilities | | | 23,201 | |
| | | | | |
| | |
Total Liabilities | | | 314,804 | |
| | | | | |
| | |
Total Net Assets | | $ | 157,130,060 | |
| | | | | |
| | |
Net Assets Consist of: | | | | |
| | |
Paid-in capital | | $ | 64,124,887 | |
| | |
Distributable earnings | | | 93,005,173 | |
| | | | | |
| | |
Total Net Assets | | $ | 157,130,060 | |
| | | | | |
Investments, at Cost | | $ | 124,347,736 | |
| | | | | |
| | |
Pricing of Shares | | | | |
| | |
Shares of Beneficial Interest Outstanding with
No Par Value | | | 8,572,273 | |
| | |
Net Asset Value Per Share | | | $18.33 | |
| | | | | |
| | | | |
Statement of Operations For the Six Months Ended June 30, 2023 (unaudited) | |
Investment Income | | | | |
| | |
Dividends | | $ | 1,471,826 | |
| | |
Interest | | | 23,047 | |
| | | | | |
| | |
Total Investment Income | | | 1,494,873 | |
| | | | | |
| | |
Expenses | | | | |
| | |
Investment advisory fees | | | 485,536 | |
| | |
Distribution fees | | | 191,976 | |
| | |
Professional fees | | | 28,232 | |
| | |
Trustees’ and officers’ fees | | | 19,367 | |
| | |
Custodian and accounting fees | | | 18,156 | |
| | |
Administrative fees | | | 15,005 | |
| | |
Transfer agent fees | | | 6,290 | |
| | |
Shareholder reports | | | 4,527 | |
| | |
Other expenses | | | 4,491 | |
| | | | | |
| | |
Total Expenses | | | 773,580 | |
| | |
Less: Fees waived | | | (28,713 | ) |
| | | | | |
| | |
Total Expenses, Net | | | 744,867 | |
| | | | | |
| | |
Net Investment Income/(Loss) | | | 750,006 | |
| | | | | |
| | |
Realized Gain/(Loss) and Change in Unrealized Appreciation/(Depreciation) on Investments and Foreign Currency Transactions | | | | |
| | |
Net realized gain/(loss) from investments | | | 4,790,454 | |
| | |
Net realized gain/(loss) from foreign currency transactions | | | 560 | |
| | |
Net change in unrealized appreciation/(depreciation) on investments | | | 130,522 | |
| | |
Net change in unrealized appreciation/(depreciation) on translation of assets and liabilities in foreign currencies | | | (177 | ) |
| | | | | |
| | |
Net Gain on Investments and Foreign Currency Transactions | | | 4,921,359 | |
| | | | | |
| | |
Net Increase in Net Assets Resulting From Operations | | $ | 5,671,365 | |
| | | | | |
| | | | | |
| | | | |
| 6 | | | | The accompanying notes are an integral part of these financial statements. |
FINANCIAL INFORMATION — GUARDIAN LARGE CAP DISCIPLINED VALUE VIP FUND
| | | | | | | | |
Statements of Changes in Net Assets Six Months Ended Numbers are unaudited | |
| | | |
| | | For the
Six Months Ended
6/30/23 | | | For the
Year Ended
12/31/22 | |
| | | | |
Operations | |
| | | |
Net investment income/(loss) | | $ | 750,006 | | | $ | 1,801,232 | |
| | | |
Net realized gain/(loss) from investments and foreign currency transactions | | | 4,791,014 | | | | 17,292,282 | |
| | | |
Net change in unrealized appreciation/(depreciation) on investments and
translation of assets and liabilities in foreign currencies | | | 130,345 | | | | (28,742,703 | ) |
| | | | | | | | | |
| | | |
Net Increase/(Decrease) in Net Assets Resulting from Operations | | | 5,671,365 | | | | (9,649,189 | ) |
| | | | | | | | | |
| |
Capital Share Transactions | |
| | | |
Proceeds from sales of shares | | | 14,985,964 | | | | 9,188,915 | |
| | | |
Cost of shares redeemed | | | (16,720,572 | ) | | | (65,454,790 | ) |
| | | | | | | | | |
| | | |
Net Decrease in Net Assets Resulting from Capital Share Transactions | | | (1,734,608 | ) | | | (56,265,875 | ) |
| | | | | | | | | |
| | | |
Net Increase/(Decrease) in Net Assets | | | 3,936,757 | | | | (65,915,064 | ) |
| | | | | | | | | |
| |
Net Assets | |
| | | |
Beginning of period | | | 153,193,303 | | | | 219,108,367 | |
| | | | | | | | | |
| | | |
End of period | | $ | 157,130,060 | | | $ | 153,193,303 | |
| | | | | | | | | |
| |
Other Information: | |
| | | |
Shares | | | | | | | | |
| | | |
Sold | | | 839,986 | | | | 527,283 | |
| | | |
Redeemed | | | (942,848 | ) | | | (3,648,672 | ) |
| | | | | | | | | |
| | | |
Net Decrease | | | (102,862 | ) | | | (3,121,389 | ) |
| | | | | | | | | |
| | | | | | | | | |
| | | | |
| The accompanying notes are an integral part of these financial statements. | | | | 7 |
FINANCIAL INFORMATION — GUARDIAN LARGE CAP DISCIPLINED VALUE VIP FUND
The Financial Highlights table is intended to help you understand the Fund’s financial performance for the past six reporting periods (or, if shorter, the period since inception). Certain information reflects financial results for a single Fund share. The total returns in the table represent the rate that an investor would have earned (or lost) on an investment in the Fund.
| | | | | | | | | | | | | | | | | | | | | | | | |
Financial Highlights Six Months Ended Numbers are unaudited | |
| | | Per Share Operating Performance | | | | |
| | | Net Asset Value,
Beginning of
Period | | | Net Investment
Income(1) | | |
Net Realized
and Unrealized
Gain/(Loss) | | | Total
Operations | | | Net Asset
Value, End of
Period | | | Total
Return(2) | |
| | | | | | | |
Six Months Ended 6/30/23 | | $ | 17.66 | | | $ | 0.09 | | | $ | 0.58 | | | $ | 0.67 | | | $ | 18.33 | | | | 3.79% | (4) |
| | | | | | | |
Year Ended 12/31/22 | | | 18.57 | | | | 0.18 | | | | (1.09 | ) | | | (0.91 | ) | | | 17.66 | | | | (4.90)% | |
| | | | | | | |
Year Ended 12/31/21 | | | 14.30 | | | | 0.12 | | | | 4.15 | | | | 4.27 | | | | 18.57 | | | | 29.86% | |
| | | | | | | |
Year Ended 12/31/20 | | | 14.13 | | | | 0.19 | (5) | | | (0.02 | ) | | | 0.17 | | | | 14.30 | | | | 1.20% | |
| | | | | | | |
Year Ended 12/31/19 | | | 11.45 | | | | 0.16 | | | | 2.52 | | | | 2.68 | | | | 14.13 | | | | 23.41% | |
| | | | | | | |
Year Ended 12/31/18 | | | 12.85 | | | | 0.15 | | | | (1.55 | ) | | | (1.40 | ) | | | 11.45 | | | | (10.89)% | |
| | | | |
| 8 | | | | The accompanying notes are an integral part of these financial statements. |
FINANCIAL INFORMATION — GUARDIAN LARGE CAP DISCIPLINED VALUE VIP FUND
| | | | | | | | | | | | | | | | | | | | | | |
| | | | | | | | | | | | | | | | |
| Ratios/Supplemental Data | |
Net Assets, End
of Period (000s) | | | Net Ratio of
Expenses to
Average
Net Assets(3) | | | Gross Ratio of
Expenses to
Average Net
Assets | | | Net Ratio of Net
Investment Income
to Average
Net Assets(3) | | | Gross Ratio of Net
Investment Income
to Average
Net Assets | | | Portfolio
Turnover Rate | |
| | | | | |
| $ | 157,130 | | | | 0.97% | (4) | | | 1.01% | (4) | | | 0.98% | (4) | | | 0.94% | (4) | | | 31% | (4) |
| | | | | |
| | 153,193 | | | | 0.97% | | | | 0.98% | | | | 1.01% | | | | 1.00% | | | | 33% | |
| | | | | |
| | 219,108 | | | | 0.97% | | | | 0.97% | | | | 0.71% | | | | 0.71% | | | | 45% | |
| | | | | |
| | 223,410 | | | | 0.97% | | | | 1.02% | | | | 1.53% | (5) | | | 1.48% | (5) | | | 73% | |
| | | | | |
| | 213,249 | | | | 0.97% | | | | 1.03% | | | | 1.22% | | | | 1.16% | | | | 66% | |
| | | | | |
| | 185,363 | | | | 0.97% | | | | 1.08% | | | | 1.16% | | | | 1.05% | | | | 56% | |
| (1) | Calculated based on the average shares outstanding during the period. |
| (2) | Total returns do not reflect the effects of charges deducted pursuant to the terms of The Guardian Insurance & Annuity Company, Inc.’s variable contracts. Inclusion of such charges would reduce the total returns for all periods shown. |
| (3) | Net Ratio of Expenses to Average Net Assets and Net Ratio of Net Investment Income to Average Net Assets include the effect of fee waivers and expense limitations. |
| (4) | Ratios for periods less than one year have been annualized, except for total return and portfolio turnover rate. |
| (5) | Reflects a special dividend paid out during the year by one of the Fund’s holdings. Had the Fund not received the special dividend, the Net Investment Income per share would have been $0.14, the Net Ratio of Net Investment Income to Average Net Assets would have been 1.15%, and the Gross Ratio of Net Investment Income to Average Net Assets would have been 1.10%. |
| | | | |
| The accompanying notes are an integral part of these financial statements. | | | | 9 |
NOTES TO FINANCIAL STATEMENTS — GUARDIAN LARGE CAP DISCIPLINED VALUE VIP FUND
June 30, 2023 (unaudited)
1. Organization
Guardian Variable Products Trust (the “Trust”), a Delaware statutory trust organized on January 12, 2016, is registered under the Investment Company Act of 1940, as amended (the “1940 Act”), as an open-end management investment company. The Trust currently has twenty-four series. Guardian Large Cap Disciplined Value VIP Fund (the “Fund”) is a series of the Trust. The Fund is a diversified fund and commenced operations on September 1, 2016. The financial statements for other series of the Trust are presented in separate reports.
The Trust has authorized an unlimited number of shares of beneficial interest with no par value. Shares are bought and sold at closing net asset value (“NAV”). Shares of the Fund are only sold to certain separate accounts of The Guardian Insurance & Annuity Company, Inc. (“GIAC”) that fund certain variable annuity contracts and variable life insurance policies issued by GIAC. GIAC is a wholly-owned subsidiary of The Guardian Life Insurance Company of America (“Guardian Life”).
The Fund seeks to provide long-term growth of capital primarily through investment in equity securities. Current income is a secondary objective.
2. Significant Accounting Policies
The following is a summary of significant accounting policies followed by the Fund in the preparation of its financial statements. The Fund follows the investment company accounting and reporting guidance of the Financial Accounting Standards Board (“FASB”) Accounting Standards Codification Topic 946 Financial Services – Investment Companies. The following policies are in conformity with accounting principles generally accepted in the United States of America (“GAAP”). The preparation of financial statements in accordance with GAAP requires management to make estimates and assumptions that affect the reported amounts and disclosures in the financial statements. Actual results could differ from those estimates.
a. Investment Valuations The Board of Trustees has designated Park Avenue Institutional Advisers LLC (“Park Avenue”) as the valuation designee for the Fund pursuant to Rule 2a-5 under the 1940 Act. Park Avenue has established a Fair Valuation Committee and has adopted fair valuation procedures that provide methodologies for fair valuing securities. These procedures include monitoring the appropriateness of fair values based on results of ongoing valuation
oversight, including but not limited to consideration of security specific events, market events, and pricing vendor and broker-dealer due diligence. The Fair Valuation Committee oversees and carries out the policies for the valuation of investments held in the Fund. The Fair Valuation Committee is responsible for discussing and assessing the potential impacts to the fair values on an ongoing basis, and reports to the Board of Trustees on at least a quarterly basis.
Equity securities traded on an exchange other than NASDAQ Stock Market, LLC (“NASDAQ”) are valued at the last reported sale price on the principal exchange or market on which they are traded; or, if there were no sales that day, at the mean between the closing bid and ask prices. Securities traded on the NASDAQ are generally valued at the NASDAQ official closing price, which may not be the last sale price. If the NASDAQ official closing price is not available for a security, that security is generally valued at the mean between the closing bid and ask prices. Repurchase agreements are carried at cost, which approximates fair value (see Note 5d). Foreign securities are valued in the currencies of the markets in which they trade and then converted to U.S. dollars by the application of foreign exchange rates at the close of the New York Stock Exchange (“NYSE”). Forward foreign currency contracts, if any, are valued at the mean between the bid and ask rates for the specified time interpolated from rates for proximate time periods.
Securities for which market quotations are not readily available or securities whose values have been materially affected by events occurring before the Fund’s valuation time but after the close of the securities’ principal exchange or market are valued at their fair values as determined in good faith by Park Avenue, as the Board of Trustee’s valuation designee (as defined in Rule 2a-5 under the 1940 Act), in accordance with Park Avenue’s procedures and under the general oversight of the Board of Trustees. In addition, the values of the Fund’s investments in foreign securities are generally determined by a pricing service using pricing models designed to estimate likely changes in the values of those securities. Certain foreign equity instruments are valued by applying international fair value factors provided by approved pricing services. The factors seek to adjust the local closing price for movements of local markets post closing, but prior to the time the NAVs are calculated. Valuations reflected in this report are as of the report date. As a result, changes in valuation due to market events and/or issuer related events after the report date and prior to issuance of the report are not reflected herein.
NOTES TO FINANCIAL STATEMENTS — GUARDIAN LARGE CAP DISCIPLINED VALUE VIP FUND
Various inputs are used in determining the valuation of the Fund’s investments. These inputs are summarized in three broad levels listed below.
| • | | Level 1 – unadjusted inputs using quoted prices in active markets for identical investments. |
| • | | Level 2 – other significant observable inputs, including, but not limited to, quoted prices for similar investments, inputs other than quoted prices that are observable for investments (such as interest rates, prepayment speeds, credit risks, etc.) or other market corroborated inputs. |
| • | | Level 3 – significant unobservable inputs (including the Fund’s own assumptions in determining the fair value of investments). |
Inputs may include price information, volatility statistics, specific and broad credit data, liquidity statistics, and other factors. A financial instrument’s level within the fair value hierarchy is based on the lowest level of any input; both individually and in aggregate, that is significant to the fair value measurement. However, the determination of what constitutes “observable” requires significant judgment by the Trust. The Trust considers observable data to be that market data which is readily available, regularly distributed or updated, reliable and verifiable, and provided by independent sources that are actively involved in the relevant market. The inputs or methodology used for valuing securities are not necessarily an indication of the risk associated with investing in those securities. Changes in valuation techniques may result in transfers into or out of a financial instrument’s assigned level within the hierarchy.
The FASB requires reporting entities to make disclosures about purchases, sales, issuances and settlements of Level 3 securities on a gross basis. For the six months ended June 30, 2023, there were no transfers into or out of Level 3 of the fair value hierarchy.
In determining a financial instrument’s placement within the hierarchy, the Trust separates the Fund’s investment portfolio into two categories: investments and derivatives (e.g., futures). A summary of inputs used to value the Fund’s assets and liabilities carried at fair value as of June 30, 2023 is included in the Schedule of Investments.
Investments Investments whose values are based on quoted market prices in active markets, and are therefore classified within Level 1, include active listed equities. Investments that trade in markets that are not considered to be active, but are valued based on quoted
market prices, dealer quotations or alternative pricing sources supported by observable inputs are classified within Level 2. These include certain U.S. government and sovereign obligations, most government agency securities, investment-grade corporate bonds, certain mortgage products, state, municipal and provincial obligations, and certain foreign equity securities, including securities whose prices may have been affected by events occurring after the close of trading on their principal exchange or market and, as a result, whose values are determined by a pricing service as described above, or securities whose values are otherwise determined using fair valuation methods approved by the Fund’s Board of Trustees.
Investments classified within Level 3 have significant unobservable inputs, as they trade infrequently or not at all. Level 3 investments include, among others, private placement securities. When observable prices are not available for these securities, the Trust uses one or more valuation techniques for which sufficient and reliable data is available. The inputs used by the Trust in estimating the value of Level 3 investments include, for example, the original transaction price, recent transactions in the same or similar instruments, completed or pending third-party transactions in the underlying investment or comparable issuers, subsequent rounds of financing, recapitalizations, and other transactions across the capital structure. Level 3 investments may also be adjusted to reflect illiquidity and/or non-transferability, with the amount of such discount estimated by the Trust in the absence of market information. Assumptions used by the Trust due to the lack of observable inputs may significantly impact the resulting fair value and therefore the Fund’s results of operations. As of June 30, 2023, the Fund had no securities classified as Level 3.
Derivatives Exchange-traded derivatives, such as futures contracts, exchange-traded option contracts and certain swaps, are typically classified within Level 1 or Level 2 of the fair value hierarchy depending on whether or not they are deemed to be actively traded. Certain non-exchange-traded derivatives, such as generic forwards, certain swaps and options, have inputs which can generally be corroborated by market data and are therefore classified within Level 2. During the six months ended June 30, 2023, the Fund did not hold any derivatives.
b. Securities Transactions Securities transactions are accounted for on the date securities are purchased or sold (trade date). Realized gains or losses on securities transactions are determined on the basis of specific identification.
NOTES TO FINANCIAL STATEMENTS — GUARDIAN LARGE CAP DISCIPLINED VALUE VIP FUND
c. Foreign Currency Translation The accounting records of the Fund are maintained in U.S. dollars. Investment securities and all other assets and liabilities of the Fund denominated in a foreign currency are generally translated into U.S. dollars at the exchange rates quoted at the close of the NYSE on each business day. The market value of investment securities and other assets and liabilities are translated at the exchange rate as of the valuation date. Purchases and sales of securities, income receipts, and expense payments are translated into U.S. dollars at the exchange rates in effect on the dates of the respective transactions. The Fund does not isolate the portion of the fluctuations on investments resulting from changes in foreign currency exchange rates from the fluctuations in market prices of investments held. Such fluctuations are included in the Net change in net realized and unrealized gain/(loss) from investments on the Statement of Operations.
Reported realized foreign currency gains and losses arise from the disposition of foreign currency, currency gains or losses realized between the trade and settlement dates on securities transactions, and the difference between the amounts of dividends, interest and foreign withholding taxes recorded on the Fund’s books on the transaction date and the U.S. dollar equivalent of the amounts actually received or paid. These reported realized foreign currency gains and losses, if any, are included in Net realized gain/(loss) from foreign currency transactions on the Statement of Operations. Unrealized foreign currency gains and losses arise from changes (due to changes in exchange rates) in the value of foreign currency and other assets and liabilities denominated in foreign currencies, which are held at period end, if any, and are included in Net change in unrealized appreciation/(depreciation) on translation of assets and liabilities in foreign currencies on the Statement of Operations.
d. Foreign Capital Gains Tax The Fund may be subject to foreign taxes on income, gains on investments or currency purchases/repatriation, a portion of which may be recoverable. The Fund will accrue such taxes and recoveries as applicable, based upon their current interpretation of tax rules and regulations that exist in the markets in which they invest.
e. Investment Income Dividend income net of foreign taxes withheld, if any, is generally recorded on the ex-dividend date. Distributions received from real estate investment trusts, if any, may be classified as dividends, capital gains and/or return of capital. Interest income, which includes amortization/accretion of
premium/discount, is determined using the interest income accrual method, and is accrued and recorded daily.
f. Allocation of Income and Expenses Many of the expenses of the Trust can be directly attributed to a specific series of the Trust. Expenses that cannot be directly attributed to a specific series of the Trust are generally apportioned among all the series in the Trust, based on relative net assets. In calculating net asset value per share for each series of the Trust, investment income, realized and unrealized gains and losses, and expenses other than series-specific expenses are allocated daily to each series based upon the proportion of net assets attributable to each series.
3. Transactions with Affiliates
a. Investment Advisory Fee and Expense Limitation Under the terms of the advisory agreement, which, after its two year initial term, is reviewed and approved annually by the Board of Trustees, the Fund pays an investment advisory fee to Park Avenue. Park Avenue is a wholly-owned subsidiary of Guardian Life and receives an investment advisory fee at an annual rate of 0.65% up to $100 million, 0.60% from $100 to $300 million, 0.55% from $300 to $500 million, and 0.53% in excess of $500 million of the Fund’s average daily net assets. The fee is accrued daily and paid monthly.
Park Avenue has contractually agreed through April 30, 2024 to waive certain fees and/or reimburse certain expenses incurred by the Fund to the extent necessary to limit the Fund’s total annual operating expenses after fee waiver and/or expense reimbursement to 0.97% of the Fund’s average daily net assets (excluding, if applicable, any acquired fund fees and expenses, taxes, interest, transaction costs and brokerage commissions, litigation and extraordinary expenses). The limitation may not be increased or terminated prior to this time without action by the Board of Trustees and may be terminated only upon approval of the Board of Trustees. Amounts waived or reimbursed by Park Avenue pursuant to any expense limitation will not be subject to Park Avenue’s recoupment rights. For the six months ended June 30, 2023, Park Avenue waived fees and/or paid Fund expenses in the amount of $28,713.
Park Avenue has entered into a Sub-Advisory Agreement with Boston Partners Global Investors, Inc. (“Boston Partners”). Boston Partners is responsible for providing day-to-day investment advisory services to the Fund, subject to the supervision of Park Avenue and the oversight of the Board of Trustees. Sub-advisory fees are paid by Park Avenue and do not represent a separate or additional expense to the Fund.
NOTES TO FINANCIAL STATEMENTS — GUARDIAN LARGE CAP DISCIPLINED VALUE VIP FUND
b. Compensation of Trustees and Officers Trustees and officers who are interested persons of the Trust, as defined in the 1940 Act, receive no compensation from the Fund, except for the Chief Compliance Officer of the Trust. Trustees of the Trust who are not interested persons of the Trust, and the Chief Compliance Officer, receive compensation and reimbursement of expenses from the Trust.
c. Distribution Fees Park Avenue Securities LLC (“PAS”), a wholly-owned subsidiary of Guardian Life, is the principal underwriter of Fund shares. The Trust has entered into a distribution and service agreement with PAS, which governs the sale and distribution of shares of the Fund. Under a distribution and service plan adopted by the Trust (“12b-1 plan”), PAS is compensated for services in such capacity, including its expenses in connection with the promotion and distribution of shares of the Fund, at an annual rate of 0.25% of the Fund’s average daily net assets. For the six months ended June 30, 2023, the Fund paid distribution fees in the amount of $191,976 to PAS.
PAS has directed that certain payments under the 12b-1 plan be used to compensate GIAC for shareholder services provided to contract owners.
4. Federal Income Taxes
a. Distributions to Shareholders For federal income tax purposes, the Fund is treated as a disregarded entity (“DRE”). As a DRE, the Fund is not subject to an entity-level income tax; and any income, gains, losses, deductions, taxes, and credits of the Fund would instead be “passed through” directly to the separate accounts of GIAC that invest in the Fund and retain the same character for U.S. federal income tax purposes. In addition, the Fund is not required to distribute taxable income and capital gains for U.S. federal income tax purposes. Therefore, no dividends and capital gains distributions were paid by the Fund.
5. Investments
a. Investment Purchases and Sales The cost of investments purchased and the proceeds from investments sold (excluding short-term investments) amounted to $47,386,505 and $46,988,193, respectively, for the six months ended June 30, 2023. During the six months ended June 30, 2023, there were no purchases or sales of U.S. government securities.
b. Foreign Securities Foreign securities investments involve special risks and considerations not typically associated with U.S. investments. These risks include, but are not limited to, currency risk; adverse political,
regulatory, social, and economic developments; and less reliable information about issuers. Moreover, securities of some foreign issuers may be less liquid and their prices more volatile than those of comparable U.S. issuers.
c. Industry or Sector Concentration In its normal course of business, the Fund may invest a significant portion of its assets in companies within a limited number of industries or sectors. As a result, the Fund may be subject to a greater risk of loss than that of a fund invested in a wider spectrum of industries or sectors because the stocks of many or all of the companies in the industry, group of industries, sector, or sectors may decline in value due to developments adversely affecting the industry, group of industries, sector, or sectors.
d. Repurchase Agreements The Fund may invest in repurchase agreements to maintain liquidity and earn income over periods of time as short as overnight. The collateral for repurchase agreements is either cash or fully negotiable U.S. government securities (including U.S. government agency securities). Repurchase agreements are fully collateralized (including the interest accrued thereon) and such collateral is marked to market daily while the agreements remain in force. If the value of the collateral falls below the repurchase price plus accrued interest, the Fund will typically require the seller to deposit additional collateral by the next business day. If the request for additional collateral is not met, or the seller defaults, the Fund maintains the right to sell the collateral (although it may be prevented or delayed from doing so in certain circumstances) and may be required to claim any resulting loss against the seller. Park Avenue monitors the creditworthiness of the seller with which the Fund enters into repurchase agreements.
6. Temporary Borrowings
The Fund, with other funds managed by Park Avenue, is party to a credit agreement with respect to a $10 million committed revolving credit facility from State Street Bank and Trust Company (the “Credit Agreement”) for temporary borrowing purposes, including the meeting of redemption requests that otherwise might require the untimely disposition of securities. Interest is based on a daily fluctuating rate per annum equal to the Applicable Rate (as defined in the Credit Agreement) plus the Applicable Margin (as defined in the Credit Agreement) that is subject to change from time to time as and when the Applicable Rate changes. Under the current Credit Agreement, the Applicable Rate for any day is defined as the rate per annum equal to the sum of
NOTES TO FINANCIAL STATEMENTS — GUARDIAN LARGE CAP DISCIPLINED VALUE VIP FUND
(a) 0.10% plus (b) the higher of (i) the Federal Funds Effective Rate for such day and (ii) the Overnight Bank Funding Rate for such day; the Applicable Margin is 1.25%. In addition to the interest charged on any borrowings by the Fund, each fund pays a commitment fee of 0.30% per annum on its share of the unused portion of the credit facility. The agreement is in place until January 5, 2024. The Fund did not utilize the credit facility during the six months ended June 30, 2023.
7. Indemnifications
Under the Trust’s organizational documents and, in some cases, by contract, officers and Trustees of the Trust are indemnified against certain liabilities arising out of the performance of their duties to the Fund. In addition, in the normal course of business, the Fund enters into contracts with its vendors and others that
provide general indemnifications. The Fund’s maximum exposure under these arrangements is unknown as this would involve future claims that may be made against the Fund that have not yet occurred. However, based on experience, the Fund expects the risk of loss to be remote.
8. Additional Information
The outbreak of COVID-19 has adversely impacted both local and global economies, including those in which the Fund may invest. These impacts include materially reduced consumer demand and economic output, disrupted supply chains, market closures, travel restrictions and quarantines, and strained healthcare systems. The Fund’s operations may be interrupted as a result, which may have a negative impact on the Fund’s investment performance.
SUPPLEMENTAL INFORMATION (UNAUDITED)
Liquidity Risk Management Program
In compliance with Rule 22e-4 under the Investment Company Act of 1940, as amended (the “Liquidity Rule”), Guardian Variable Products Trust (the “Trust”) has adopted and implemented a written liquidity risk management program (the “Program”) for each series of the Trust (each, a “Fund”), which is reasonably designed to assess and manage each Fund’s liquidity risk. The Fund’s “liquidity risk” is the risk that the Fund could not meet requests to redeem shares issued by the Fund without significant dilution of the remaining investors’ interests in the Fund.
The Board of Trustees of the Trust (the “Board”) Previously approved the designation of Park Avenue Institutional Advisers LLC (the “Administrator” or “PAIA”) as Program administrator. The Administrator established a Liquidity Risk Management Committee, which is comprised of certain officers of the Trust and PAIA, that assists the Administrator in the implementation and day-to-day administration of the Program and otherwise support carrying out the Administrator’s liquidity risk management responsibilities under the Program.
In accordance with the Program, each Fund’s liquidity risk is assessed no less frequently than annually, taking into consideration a variety of factors, including, as applicable, the Fund’s investment strategy and liquidity of portfolio investments, cash flow projections, and holdings of cash and cash equivalents, as well as borrowing arrangements and other funding sources. Certain factors are considered under both normal and reasonably foreseeable stressed conditions.
Each Fund portfolio investment is classified, no less than monthly, into one of four liquidity categories (including “highly liquid investments” and “illiquid investments,” discussed below) based on a determination of the number of days it is reasonably expected to take to convert the investment to cash, or sell or dispose of the investment, in current market conditions without significantly changing the investment’s market value.
The Liquidity Rule limits the Fund’s investments in illiquid investments by prohibiting the Fund from acquiring any illiquid investment if, immediately after the acquisition, the Fund would have invested more than 15% of its net assets in illiquid investments that are assets. The Program includes provisions reasonably designed to comply with this investment limitation. In addition, the Program includes provisions reasonably designed to comply with this investment limitation. In addition, the Program includes provisions reasonably designed to comply with the Liquidity Rule’s requirements relating to highly liquid investment minimums, which is a minimum amount of Fund net assets that must be invested in highly liquid investments that are assets, as applicable. The Fund was not required to adopt a highly liquid investment minimum during the period.
At a meeting of the Board held on March 29-30, 2023, the Board received a report (the “Report”) prepared by the Administrator addressing the Program’s operation and assessing the adequacy and effectiveness of its implementation for the period from January 1, 2022 through December 31, 2022 (the “Reporting Period”). The Report noted that the Administrator believes the Program operated effectively during the Reporting Period and continues to be reasonably designed to effectively assess and manage each Fund’s liquidity risk. The Report also noted that the Administrator believes the Program has been adequately and effectively implemented and the investment strategies for each Fund continue to be appropriate since its inception. In addition, the Report summarized the operation of the Program and the information and factors considered by the Administrator in its assessment of the Program’s implementation, such as the liquidity risk assessment framework and liquidity classification methodologies.
There can be no assurance that the Program will achieve its objectives under all circumstances. Please refer to the Fund’s prospectus for more information regarding the Fund’s exposure to liquidity risk and other risks to which an investment in the Fund may be subject.
SUPPLEMENTAL INFORMATION (UNAUDITED)
Approval of Investment Management and Sub-advisory Agreements
Section 15(c) of the Investment Company Act of 1940, as amended (the “1940 Act”), requires that a fund’s investment advisory and sub-advisory agreements be approved initially by the fund’s board of trustees. Section 15(c) also requires that the continuation of these agreements, after an initial term of up to two years, be annually reviewed and approved by the board. Any such agreement must be approved by a vote of a majority of the trustees who are not parties to the agreement or “interested persons” (as defined in the 1940 Act) of a party to the agreement at a meeting of the board called for the purpose of voting on such approval.
At a meeting of the Board of Trustees (the “Board”) of Guardian Variable Products Trust (the “Trust”) held on March 29-30, 2023 (the “Meeting”), the Board, including the trustees who are not parties to the agreement or “interested persons” as defined in the 1940 Act (the “Independent Trustees”), considered and voted unanimously to renew the existing investment management agreement between the Trust, on behalf of Guardian All Cap Core VIP Fund; Guardian Balanced Allocation VIP Fund; Guardian Core Fixed Income VIP Fund; Guardian Core Plus Fixed Income VIP Fund; Guardian Diversified Research VIP Fund; Guardian Equity Income VIP Fund; Guardian Global Utilities VIP Fund; Guardian Growth & Income VIP Fund; Guardian Integrated Research VIP Fund; Guardian International Growth VIP Fund; Guardian International Equity VIP Fund; Guardian Large Cap Disciplined Growth VIP Fund; Guardian Large Cap Disciplined Value VIP Fund; Guardian Large Cap Fundamental Growth VIP Fund; Guardian Mid Cap Relative Value VIP Fund; Guardian Mid Cap Traditional Growth VIP Fund; Guardian Multi-Sector Bond VIP Fund; Guardian Select Mid-Cap Core VIP Fund; Guardian Short Duration Bond VIP Fund; Guardian Small Cap Core VIP Fund; Guardian Small-Mid Cap Core VIP Fund; Guardian Strategic Large Cap Core VIP Fund; Guardian Total Return Bond VIP Fund and Guardian U.S. Government Securities VIP Fund (each, a “Fund,” and together, the “Funds”), in substantially the form presented at this meeting (the “Management Agreement”); and Park Avenue Institutional Advisers LLC (the “Manager”) for a one-year term.
The Board, including the Independent Trustees, also considered and voted unanimously to renew the existing sub-advisory agreements (the “Sub-Advisory Agreements,” collectively with the Management Agreement and Sub-Subadvisory Agreement, the “Agreements”) between the Manager and investment
advisory firms engaged to serve as sub-advisers to certain of the Funds (the “Sub-Advised Funds”), namely (i) ClearBridge Investments, LLC with respect to Guardian Small Cap Core VIP Fund; (ii) Putnam Investment Management, LLC with respect to Guardian Diversified Research VIP Fund; (iii) AllianceBernstein L.P. with respect to Guardian Growth & Income VIP Fund and Guardian Strategic Large Cap Core VIP Fund; (iv) J.P. Morgan Investment Management Inc. with respect to Guardian International Growth VIP Fund; (v) Schroder Investment Management North America Inc. with respect to Guardian International Equity VIP Fund; (vi) Wellington Management Company LLP with respect to Guardian Balanced Allocation VIP Fund, Guardian Equity Income VIP Fund, Guardian Integrated Research VIP Fund, Guardian Large Cap Disciplined Growth VIP Fund and Guardian Global Utilities VIP Fund; (vii) Boston Partners Global Investors, Inc. with respect to Guardian Large Cap Disciplined Value VIP Fund; (viii) Janus Henderson Investors US LLC with respect to Guardian Mid Cap Traditional Growth VIP Fund; (ix) Allspring Global Investments, LLC with respect to Guardian Mid Cap Relative Value VIP Fund and Guardian Small-Mid Cap Core VIP Fund; (x) Lord, Abbett & Co. LLC with respect to Guardian Core Plus Fixed Income VIP Fund; (xi) FIAM LLC with respect to Guardian Select Mid Cap Core VIP Fund; and (xii) Massachusetts Financial Services Company with respect to Guardian All Cap Core VIP Fund, each in substantially the form presented at this meeting, (each, a “Sub-Adviser” and collectively, the “Sub-Advisers”) for a one-year term.
The Board, including the Independent Trustees, also considered and voted unanimously to renew the existing sub-subadvisory agreement (the “Sub-Subadvisory Agreement”) between Schroder Investment Management North America Inc. and Schroder Investment Management North America Limited (also a Sub-Adviser) with respect to Guardian International Equity VIP Fund for a one-year term.
The Board is responsible for overseeing the management of each Fund. In determining whether to renew its approval of the Agreements, the Trustees evaluated information and factors that they considered to be relevant and appropriate through the exercise of their own business judgment. The Trustees considered certain information and factors in light of advice furnished to them by legal counsel to the Trust and, in the case of the Independent Trustees, their independent legal counsel. In advance of the Meeting, the Trustees received materials and information designed to assist their consideration of the Agreements. The Trustees received written responses
SUPPLEMENTAL INFORMATION (UNAUDITED)
from the Manager and each Sub-Adviser to a series of questions and requests for information encompassing a wide variety of topics provided by independent counsel on behalf of the Independent Trustees. The Independent Trustees also received materials and information regarding the legal standards applicable to their consideration of the Agreements and the process and criteria used by the Manager to identify and select the Sub-Advisers.
During the course of their deliberations, the Independent Trustees met twice to discuss and evaluate the materials, information and Agreements in executive session with their independent legal counsel, outside of the presence of the Trustees who are not Independent Trustees and representatives from Fund management, the Manager or any Sub-Adviser.
In reaching its decisions to renew its approval of the Agreements, the Board took into account the materials and information described above, as well as other materials and information provided to the Board throughout the year. Individual Trustees may have given different weight to different factors and information with respect to each Agreement, and the Trustees did not identify any single factor or information that, in isolation, would be controlling in deciding to approve the Agreements. The discussion below is intended to summarize the broad factors that figured prominently in the Board’s decisions to renew its approval of the Agreements rather than to be all-inclusive. These broad factors included: (i) the nature, extent and quality of the services provided to the Funds by the Manager and to the Sub-advised Funds by the Sub-Advisers; (ii) the investment performance of each Fund; (iii) estimated profitability of the Manager; (iv) fees and expenses; (v) the extent to which economies of scale may exist, and the extent to the benefits of economies of scale are shared with the Funds; and (vi) any other benefits derived by the Manager or the Sub-Advisers (or their respective affiliates) from their relationships with the Funds.
Nature, Extent and Quality of Services
The Trustees considered information regarding the nature, extent and quality of services provided to the Funds by the Manager. The Trustees also considered, among other things, the terms of the Management Agreement and the range of investment advisory services provided by the Manager. In addition, the Trustees reviewed the range of non-investment advisory services provided by the Manager consistent with the terms of the Management Agreement, notably coordinating the preparation and filing of various
regulatory documents, coordinating the preparation and assembly of Board meeting materials, and assisting the Board with certain valuation matters. The Board also received a description of the Manager’s and each Sub-Adviser’s business continuity plans and of their respective approaches to data privacy and cybersecurity, and related testing. The Board received information regarding the response of the Manager and the Sub-Advisers to the COVID-19 pandemic, including the continuation of remote work arrangements and return-to-office plans. The Board also received information about the Manager’s role as administrator of the Funds’ liquidity risk management program, the Manager’s approach to risk management, and the Manager’s vendor oversight programs.
The Trustees considered that the Sub-advised Funds operate in a “manager-of-managers” structure and reviewed the responsibilities that the Manager has under this structure, including monitoring and evaluating the performance of the Sub-Advisers, monitoring the Sub-Advisers for adherence to the stated investment objectives, strategies, policies and restrictions of the Funds and supervising the Sub-Advisers with respect to the services that the Sub-Advisers would provide under the Sub-Advisory Agreements. The Trustees also considered the process used by the Manager, consistent with this structure, to identify and recommend sub-advisers, and the Manager’s ability to monitor and oversee sub-advisers and recommend replacement sub-advisers, when necessary, and provide other services under the Management Agreement. The Board noted that investment management staff of the Manager and the Trust’s Chief Compliance Officer conduct oversight meetings with the Sub-Advisers on a periodic basis, follow through with additional inquiries on any questions or concerns that arise during the meetings and, as necessary, then report the results of the meetings to the Board. The Trustees reviewed information regarding the experience and background of the Manager’s key personnel and the Manager’s organizational structure and resources, including investment, legal and administrative capabilities of the Manager. In this regard, the Trustees recognized that the Funds may benefit from the Manager’s ability to use resources and capabilities of its affiliates in providing services to the Funds.
The Trustees considered information regarding the nature, extent and quality of services provided to the Sub-advised Funds by the Sub-Advisers. The Trustees also considered, among other things, the terms of the Sub-advisory Agreements and the range of investment
SUPPLEMENTAL INFORMATION (UNAUDITED)
advisory services provided by the Sub-Advisers under the oversight of the Manager. In evaluating these investment advisory services, the Trustees considered, among other things, the Sub-Advisers’ investment philosophies, styles and/or processes and approaches to managing the respective Sub-advised Funds. The Trustees received and evaluated information regarding the background, education, expertise and/or experience of the investment professionals who serve as portfolio managers for the Sub-advised Funds and the capabilities and resources of the Sub-Advisers.
Based upon these considerations, the Trustees concluded, within the context of their full deliberations, that the nature, extent and quality of services provided to the Funds by the Manager and the Sub-advised Funds by each respective Sub-Adviser were appropriate.
Investment Performance
In connection with each of its regular quarterly meetings, the Board receives information on the performance of each Fund, including net performance, relative performance rankings within the relevant Morningstar peer group, and performance as compared to benchmark index returns. At each quarterly Board meeting, members of the Manager’s funds management team review with the Board the economic and market environment, absolute and relative performance of each Fund, and any relevant information about risk management and style consistency in connection with management of the Funds. The Board considered investment performance for each Fund over the one-year, three-year (where available), five-year (where available) and since-inception periods.
The Board also received and reviewed a report prepared by Broadridge Financial Solutions (“Broadridge”), an independent provider of mutual fund industry data, which included comparisons of the performance of each Fund to performance of an appropriate peer universe. For details regarding each Fund’s performance, see the “Fund-by-Fund Factors” section below.
The Manager discussed with the Board factors contributing to the Funds’ performance results. In addition, for certain Funds, the Manager provided to the Board longer term performance records of the Sub-Advisers for strategies used in managing the Funds. The Board concluded that the investment performance generated by the Manager and each Sub-Adviser was generally satisfactory, or, that any steps being taken by the Manager and Sub-Advisers to address any performance issues were satisfactory.
Profitability
The Board received and considered the Manager’s estimate of its profitability, which included allocations by the Manager of its costs in providing management services to the Funds. The Board considered the estimated profitability of the Manager both overall and on a Fund-by-Fund basis.
The Board received and considered profitability information from most of the Sub-Advisers, but noted that the Manager had negotiated the fees with the Sub-Advisers at arm’s-length. Accordingly, the Board concluded that the profitability of the Sub-Advisers is a less relevant factor than Manager profitability.
Based on the consideration of this information, the Board concluded that the profitability of the Funds to the Manager was acceptable.
Fees and Expenses
The Trustees considered the management fees paid by the Funds to the Manager under the Management Agreement and evaluated the reasonableness of these fees. The Trustees received and reviewed comparative information with respect to the management fee and total expenses for each Fund and the management fees and total expenses for a peer group of other funds selected by Broadridge. The Trustees considered the Manager’s commitment to limit the total expenses of each Fund through an expense limitation agreement with the Trust. Although the Board recognized that the comparisons between the management fees and actual expenses of the Funds and those of the identified peer group are imprecise, given different terms of agreements and variations in fund strategies, the Trustees found that the comparative information supported their consideration and approval of the management fees and evaluation of the total expenses. For details regarding each Fund’s fee and expense comparisons, see the “Fund-by-Fund Factors” section below.
The Trustees considered the sub-advisory fees paid under the Sub-advisory Agreements and evaluated the reasonableness of those fees. The Trustees also considered that the fees paid to the Sub-Advisers would be paid by the Manager and not the Funds and that the Manager had negotiated the fees with the Sub-Advisers at arm’s-length.
Based on the consideration of the information and factors summarized above, as well as other relevant information and factors, the Board concluded that the management and sub-advisory fees were reasonable in
SUPPLEMENTAL INFORMATION (UNAUDITED)
light of the nature, extent and quality of services rendered to the Funds by the Manager and the Sub-Advisers.
Economies of Scale
The Board considered the extent to which economies of scale may exist, and the extent to the benefits of economies of scale are shared with the Funds. In this regard, the Board noted that for sixteen of twenty-four Funds, the management and sub-advisory fee included breakpoints that are tiered based on growth in asset levels of each such Fund and that for the other Funds, the fees reflected appropriate levels based on current and expected asset levels. The Board also noted that the expenses of the Funds are subject to expense limitations provided by the Manager. The Board noted that expected economies of scale, where they exist, may be shared through the use of fee breakpoints, expense limitations by the Manager, and/or a lower overall fee.
Ancillary Benefits
The Board considered the potential benefits, other than management fees, that the Manager and/or its affiliates may receive because of the Manager’s relationship with the Funds. The Trustees considered that the Funds were designed to serve as investment options under variable contracts issued by affiliates of the Manager that would receive fees under those contracts and that Park Avenue Securities LLC, an affiliate of the Manager and principal underwriter of the Funds, and participating insurance companies, including insurance companies affiliated with the Manager, would be entitled to receive fees from the Funds under a plan of distribution adopted pursuant to Rule 12b-1 under the 1940 Act. The Trustees considered that the Manager and its affiliates may benefit from (i) greater efficiencies in annuity administration and operations and potential cost savings due to a reduction in the number of unaffiliated funds available as annuity contract investment options, and (ii) increased dividends-received deductions due to the Funds’ status under the tax laws as disregarded entities. In addition, the Trustees considered the potential benefits, other than sub-advisory fees, that the Sub-Advisers and their affiliates may receive because of their relationships with the Funds, including the ability to receive research from soft dollar commissions consistent with Trust policies. The Trustees concluded that benefits that may accrue to the Manager and its affiliates are reasonable and the benefits that may accrue to the Sub-Advisers and their affiliates are consistent with those expected for a sub-adviser to a mutual fund such as the applicable Fund.
Fund-by-Fund Factors
The Broadridge report groups fees, expenses and performance into five quintiles, with the top quintile having the highest performance or lowest fees/expenses, and the bottom quintile having the lowest performance or highest fees/expenses. For purposes of the descriptions below, a Fund’s performance is considered “in line with” the benchmark index if it is within 0.20%.
Guardian Large Cap Fundamental Growth VIP Fund
| | • | | The Board noted that the Fund’s performance was in the 3rd quintile of its performance universe for the 1-year period and in the 4th quintile for its performance universe for the 3-year and 5-year periods. The Board also noted that the Fund’s performance was below the benchmark index for the 1-year, 3-year and 5-year periods. |
| | • | | The Board noted that the contractual management fee, the actual management fee and actual total expenses were in the 1st quintile of the expense group. |
Guardian Large Cap Disciplined Growth VIP Fund
| | • | | The Board noted that the Fund’s performance was in the 3rd quintile of its performance universe for the 1-year and 3-year periods and in the 2nd quintile for the 5-year period. The Board also noted that the Fund’s performance was below the benchmark index for the 1-year, 3-year and 5-year periods. |
| | • | | The Board noted that the contractual management fee, the actual management fee and actual total expenses were in the 1st quintile of the expense group. |
Guardian Integrated Research VIP Fund
| | • | | The Board noted that the Fund’s performance was in the 5th quintile of its performance universe for the 1-year and 5-year periods and in the 4th quintile for 3-year period. The Board also noted that the Fund’s performance was below the benchmark index for the 1-year, 3-year and 5-year periods. |
| | • | | The Board noted that the contractual management fee, the actual management fee and actual total expenses were in the 1st quintile of the expense group. |
Guardian Diversified Research VIP Fund
| | • | | The Board noted that the Fund’s performance was in the 3rd quintile of its performance universe for the 1-year and 3-year periods and in the 2nd quintile for the 5-year period. The Board also noted that the |
SUPPLEMENTAL INFORMATION (UNAUDITED)
| | | Fund’s performance was higher than the benchmark index for the 1-year period. The Board note that the Fund’s performance was lower than the benchmark index for the 3-year and 5-year periods. |
| | • | | The Board noted that the contractual management fee and actual management fee were in the 1st quintile of the expense group and that actual total expenses were in the 3rd quintile. |
Guardian Strategic Large Cap Core VIP Fund
| | • | | The Board noted that the Fund’s performance was in the 1st quintile of its performance universe for the 1-year period. The Board acknowledged the Fund’s short operational history. The Board noted that the Fund’s performance was higher than the benchmark index for the 1-year period. |
| | • | | The Board noted that the contractual management fee, the actual management fee and actual total expenses were in the 1st quintile of the expense group. |
Guardian Large Cap Disciplined Value VIP Fund
| | • | | The Board noted that the Fund’s performance was in the 3rd quintile of its performance universe for the 1-year and 3-year periods and in the 4th quintile for the 5-year period. The Board also noted that the Fund’s performance was higher than the benchmark index for the 1-year and 3-year periods. The Board noted that the Fund’s performance was in line with the benchmark index for the 5-year period. |
| | • | | The Board noted that the contractual management fee was in the 2nd quintile of the expense group, the actual management fee was in the 1st quintile of the expense group and that actual total expenses were in the 3rd quintile. |
Guardian Growth & Income VIP Fund
| | • | | The Board noted that the Fund’s performance was in the 3rd quintile of its performance universe for the 1-year, 3-year and 5-year periods. The Board also noted that the Fund’s performance was higher than the benchmark index for the 1-year, 3-year and 5-year periods. |
| | • | | The Board noted that the contractual management fee and the actual management fee were in the 1st quintile of the expense group and that actual total expenses were in the 3rd quintile. |
Guardian Equity Income VIP Fund
| | • | | The Board noted that the Fund had less than one-year of operational history and was not able to evaluate an investment performance record for the Fund. The Board noted that it would have an opportunity to review such information in connection with future annual reviews. The Board noted that, in the meantime, it received monthly performance reports from the Manager. |
| | • | | The Board noted that the contractual management fee, the actual management fee and actual total expenses were in the 1st quintile of the expense group. |
Guardian All Cap Core VIP Fund
| | • | | The Board noted that the Fund’s performance was in the 3rd quintile of its performance universe for the 1-year period. The Board acknowledged the Fund’s short operational history. The Board noted that the Fund’s performance was higher than the benchmark index for the 1-year period. |
| | • | | The Board noted that the contractual management fee, the actual management fee and actual total expenses were in the 1st quintile of the expense group. |
Guardian Mid Cap Traditional Growth VIP Fund
| | • | | The Board noted that the Fund’s performance was in the 1st quintile of its performance universe for the 1-year period and in the 2nd quintile for the 3-year and 5-year periods. The Board also noted that the Fund’s performance was higher than the benchmark index for the 1-year, 3-year and 5-year periods. |
| | • | | The Board noted that the contractual management fee and actual management fee were in the 1st quintile of the expense group and that the actual total expenses were in the 4th quintile. |
Guardian Select Mid Cap Core VIP Fund
| | • | | The Board noted that the Fund’s performance was in the 3rd quintile of its performance universe for the 1-year period. The Board acknowledged the Fund’s short operational history. The Board noted that the Fund’s performance was lower than the benchmark index for the 1-year period. |
| | • | | The Board noted that the contractual management fee, the actual management fee and actual total expenses were in the 1st quintile of the expense group. |
SUPPLEMENTAL INFORMATION (UNAUDITED)
Guardian Mid Cap Relative Value VIP Fund
| | • | | The Board noted that the Fund’s performance was in the 2nd quintile of its performance universe for the 1-year, 3-year and 5-year periods. The Board also noted that the Fund’s performance was higher than the benchmark index for the 1-year, 3-year and 5-year periods. |
| | • | | The Board noted that the contractual management fee and the actual management fee were in the 2nd quintile of the expense group and the actual total expenses were in the 3rd quintile of the expense group. |
Guardian Small-Mid Cap Core VIP Fund
| | • | | The Board noted that the Fund’s performance was in the 5th quintile of its performance universe for the 1-year period. The Board acknowledged the Fund’s short operational history. The Board noted that the Fund’s performance was higher than the benchmark index for the 1-year period. |
| | • | | The Board noted that the contractual management fee, the actual management fee and actual total expenses were in the 1st quintile of the expense group. |
Guardian Small Cap Core VIP Fund
| | • | | The Board noted that the Fund’s performance was in the 5th quintile of its performance universe for the 1-year and 3-year periods. The Board noted that the Fund’s performance was lower than the benchmark index for the 1-year and 3-year periods. |
| | • | | The Board noted that the contractual management fee and the actual management fee were in the 1st quintile of the expense group and the actual total expenses were in the 2nd quintile of the expense group. |
Guardian International Growth VIP Fund
| | • | | The Board noted that the Fund’s performance was in the 4th quintile of its performance universe for the 1-year period, in the 2nd quintile of its performance universe for the 3-year period and in the 3rd quintile of its performance universe for the 5-year period. The Board also noted that the Fund’s performance was lower than the benchmark index for the 1-year and 5-year periods. The Board noted that the Fund’s performance was higher than the benchmark index for the 3-year period. |
| | • | | The Board noted that the contractual management fee and actual management fee were in the 2nd quintile of the expense group and that the actual total expenses were in the 3rd quintile. |
Guardian International Equity VIP Fund
| | • | | The Board noted that the Fund’s performance was in the 5th quintile of its performance universe for the 1-year, 3-year and 5-year periods. The Board also noted that the Fund’s performance was lower than the benchmark index for the 1-year, 3-year and 5-year periods. |
| | • | | The Board noted that the contractual management fee, the actual management fee and the actual total expenses were in the 2nd quintile of the expense group. |
Guardian Global Utilities VIP Fund
| | • | | The Board noted that the Fund’s performance was in the 5th quintile of its performance universe for the 1-year period and in the 4th quintile of its performance universe for the 3-year period. The Board noted that the Fund’s performance was higher than the benchmark index for the 1-year and 3-year periods. |
| | • | | The Board noted that the contractual management fee and the actual management fee were in the 1st quintile of the expense group and the actual total expenses were in the 2nd quintile of the expense group. |
Guardian Balanced Allocation VIP Fund
| | • | | The Board noted that the Fund had less than one-year of operational history and was not able to evaluate an investment performance record for the Fund. The Board noted that it would have an opportunity to review such information in connection with future annual reviews. The Board noted that, in the meantime, it received monthly performance reports from the Manager. |
| | • | | The Board noted that the contractual management fee, the actual management fee and actual total expenses were in the 1st quintile of the expense group. |
Guardian Core Plus Fixed Income VIP Fund
| | • | | The Board noted that the Fund’s performance was in the 3rd quintile of its performance universe for the 1-year and 3-year periods and in the 4th quintile of its performance universe for the 5-year period. The Board also noted that the Fund’s performance was lower than the benchmark index for the 1-year and 5-year periods. The Board noted that the Fund’s performance was in line with the benchmark index for the 3-year period. |
| | • | | The Board noted that the contractual management fee and actual management fee were in the |
SUPPLEMENTAL INFORMATION (UNAUDITED)
| | | 2nd quintile of the expense group and that actual total expenses were in the 3rd quintile. |
Guardian Total Return Bond VIP Fund
| | • | | The Board noted that the Fund’s performance was in the 5th quintile of its performance universe for the 1-year and 3-year periods. The Board also noted that the Fund’s performance was lower than the benchmark index for the 1-year and 3-year periods. |
| | • | | The Board noted that the contractual management fee and actual management fee were in the 2nd quintile and the actual total expenses were in the 3rd quintile. |
Guardian Core Fixed Income VIP Fund
| | • | | The Board noted that the Fund had less than one-year of operational history and was not able to evaluate an investment performance record for the Fund. The Board noted that it would have an opportunity to review such information in connection with future annual reviews. The Board noted that, in the meantime, it received monthly performance reports from the Manager. |
| | • | | The Board noted that the contractual management fee was in the 2nd quintile of the expense group and the actual management fee and the actual total expenses were in the 1st quintile. |
Guardian Multi-Sector Bond VIP Fund
| | • | | The Board noted that the Fund’s performance was in the 5th quintile of its performance universe for the 1-year and 3-year periods The Board also noted that the Fund’s performance was lower than the benchmark index for the 1-year and 3-year periods. |
| | • | | The Board noted that the contractual management fee and actual total expenses were in the 1st quintile and the actual management fee was in the 2nd quintile. |
Guardian Short Duration Bond VIP Fund
| | • | | The Board noted that the Fund had less than one-year of operational history and was not able to evaluate an investment performance record for the Fund. The Board noted that it would have an opportunity to review such information in connection with future annual reviews. The Board noted that, in the meantime, it received monthly performance reports from the Manager. |
| | • | | The Board noted that the contractual management fee and actual total expenses were in the 3rd quintile of the expense group and the actual management fee was in the 1st quintile of the expense group. |
Guardian U.S. Government Securities VIP Fund
| | • | | The Board noted that the Fund’s performance was in the 1st quintile of its performance universe for the 1-year period and in the 2nd quintile of its performance universe for the 3-year period. The Board also noted that the Fund’s performance was higher than the benchmark index for the 1-year and 3-year periods. |
| | • | | The Board noted that the contractual management fee and the actual management fee were in the 1st quintile of the expense group and the actual total expenses were in the 2nd quintile of the expense group. |
Conclusion
Based on a comprehensive consideration and evaluation of all of the information and factors summarized above, among others, the Board as a whole, including the Independent Trustees, approved the Agreements.
SUPPLEMENTAL INFORMATION (UNAUDITED)
The Statement of Additional Information (“SAI”) includes additional information about the Trust’s Trustees and Officers and is available, without charge, upon request by calling toll-free 1-888-GUARDIAN (1-888-482-7342) or by visiting our website at http://guardianvpt.onlineprospectus.net/GuardianVPT/Prospectuses.
Portfolio Holdings and Proxy Voting Procedures
The Fund files its complete schedule of portfolio holdings with the Securities and Exchange Commission for the first and third quarters of each fiscal year as an exhibit to its reports on Form N-PORT. The Fund’s Form N-PORT reports are available on the Securities and Exchange Commission’s website at https://www.sec.gov. The Fund’s Form N-PORT information is also available, without charge, upon request, by calling toll-free 1-888-GUARDIAN (1-888-482-7342) or by visiting our website at http://guardianvpt.onlineprospectus.net/GuardianVPT/Prospectuses.
A description of the policies and procedures that the Fund uses to determine how to vote proxies relating to portfolio securities is included in the SAI. The SAI and information regarding how the Fund voted proxies relating to portfolio securities during the most recent 12-month period ended June 30 may be obtained (i) without charge, upon request, by calling toll-free 1-888-GUARDIAN (1-888-482-7342) or by visiting our website at http://guardianvpt.onlineprospectus.net/GuardianVPT/Prospectuses; and (ii) on the Securities and Exchange Commission’s website at https://www.sec.gov.
This report is transmitted to shareholders only. It is not authorized for use as an offer of sale or a solicitation of an offer to buy shares of the Fund unless accompanied or preceded by the Fund’s current prospectus. Past performance results shown in this report should not be considered a representation of future performance. Investment returns and principal value of shares will fluctuate so that shares, when redeemed, may be worth more or less than their original cost. Statements and other information herein are as dated and are subject to change.

The Guardian Life Insurance Company of America New York, NY 10001-2159
PUB8174
Guardian Variable
Products Trust
2023
Semiannual Report
All Data as of June 30, 2023
Guardian Large Cap Fundamental Growth VIP Fund

| | |
| Not FDIC insured. May lose value. No bank guarantee. | | www.guardianlife.com |
TABLE OF CONTENTS
Guardian Large Cap Fundamental Growth VIP Fund
Except as otherwise specifically stated, all information, including portfolio security positions, is as of June 30, 2023. Fund holdings will vary. Information contained herein has been obtained from sources believed reliable, but is not guaranteed.
GUARDIAN LARGE CAP FUNDAMENTAL GROWTH VIP FUND
Fund Characteristics (unaudited)
| | |
| Total Net Assets: $273,455,589 | | |
|
| |
Sector Allocation1 As of June 30, 2023 |
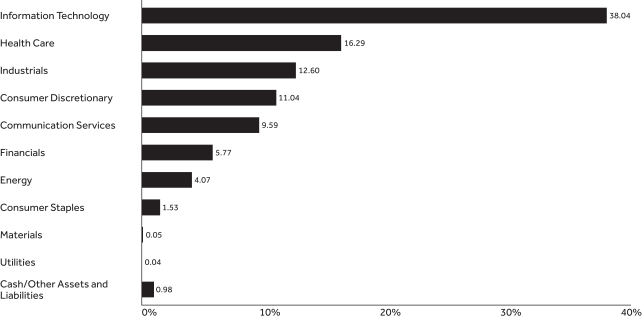 |
| | | | |
| |
Top Ten Holdings2 As of June 30, 2023 | |
| | |
| Holding | | % of Total
Net Assets | |
| Microsoft Corp. | | | 12.47% | |
| NVIDIA Corp. | | | 7.44% | |
| Alphabet, Inc., Class A | | | 5.01% | |
| Apple, Inc. | | | 4.33% | |
| Uber Technologies, Inc. | | | 3.55% | |
| Amazon.com, Inc. | | | 3.31% | |
| Vertex Pharmaceuticals, Inc. | | | 2.29% | |
| UnitedHealth Group, Inc. | | | 2.29% | |
| Eli Lilly and Co. | | | 2.06% | |
| Netflix, Inc. | | | 1.88% | |
| Total | | | 44.63% | |
| 1 | The Fund’s holdings are allocated to each sector based on the MSCI Global Industry Classification Standard (GICS®). Cash includes short-term investments and net other assets and liabilities. |
| 2 | Portfolio holdings are subject to change and should not be considered a recommendation to buy or sell individual securities. |
UNDERSTANDING YOUR FUND’S EXPENSES (UNAUDITED)
By investing in the Fund, you incur two types of costs: (1) transaction costs and (2) ongoing costs, including, as applicable, investment advisory fees, distribution and/or service (12b-1) fees and other Fund expenses. The example below is intended to help you understand your ongoing costs (in dollars) of investing in the Fund and to compare these costs with the ongoing costs of investing in other mutual funds.
The example is based on an investment of $1,000 invested at the beginning of the period and held for the entire period from January 1, 2023 to June 30, 2023. The table below shows the Fund’s expenses in two ways:
Expenses based on actual return
This section of the table provides information about actual account values and actual expenses. You may use the information in this section, together with the amount you invested, to estimate the expenses that you paid over the period. Simply divide your account value by $1,000 (for example, an $8,600 account value divided by $1,000 = 8.6), then multiply the result by the number in the section under the heading entitled “Expenses Paid During Period” to estimate the expenses you paid on your account during this period.
Expenses based on hypothetical 5% return for comparison purposes
This section of the table provides information about hypothetical account values and hypothetical expenses based on the Fund’s actual expense ratio and an assumed rate of return of 5% per year before expenses, which is not the Fund’s actual return. The hypothetical account values and expenses may not be used to estimate the actual ending account balance or expenses you paid for the period. You may use this information to compare the ongoing costs of investing in the Fund with the cost of investing in other mutual funds. To do so, compare this 5% hypothetical example with the 5% hypothetical examples that appear in the shareholder reports of the other funds.
Note that the expenses shown in the table are meant to highlight your ongoing costs only and do not reflect any transactional costs, such as sales charges (loads), redemption fees, or exchange fees. Therefore the second section is useful in comparing ongoing costs only, and will not help you determine the relative total costs of owning different funds. If these transactional costs were included, your costs would have been higher. Charges and expenses at the insurance company separate account level are not reflected in the table.
| | | | | | | | | | | | | | |
| | | | | |
| | | Beginning
Account Value 1/1/23 | | Ending Account Value
6/30/23 | | | Expenses Paid During Period* 1/1/23-6/30/23 | | | Expense Ratio During Period 1/1/23-6/30/23 | |
| Based on Actual Return | | $1,000.00 | | $ | 1,306.70 | | | $ | 5.32 | | | | 0.93% | |
| Based on Hypothetical Return (5% Return Before Expenses) | | $1,000.00 | | $ | 1,020.18 | | | $ | 4.66 | | | | 0.93% | |
| * | Expenses are equal to the Fund’s annualized expense ratio as indicated, multiplied by the average account value over the period, multiplied by 181/365 (to reflect the one-half year period). |
SCHEDULE OF INVESTMENTS — GUARDIAN LARGE CAP FUNDAMENTAL GROWTH VIP FUND
| | | | | | | | |
| June 30, 2023 (unaudited) | | Shares | | | Value | |
| Common Stocks – 99.0% | |
| |
| Aerospace & Defense – 0.5% | |
| | | |
Boeing Co.(1) | | | 275 | | | $ | 58,069 | |
| | | |
Spirit AeroSystems Holdings, Inc., Class A | | | 41,032 | | | | 1,197,724 | |
| | | | | | | | | |
| | |
| | | | | 1,255,793 | |
| Automobile Components – 0.0% | |
| | | |
Mobileye Global, Inc., Class A(1) | | | 1,800 | | | | 69,156 | |
| | | | | | | | | |
| | |
| | | | | 69,156 | |
| Automobiles – 1.2% | |
| | | |
BYD Co. Ltd., Class H (China) | | | 37,000 | | | | 1,183,366 | |
| | | |
Ferrari NV | | | 6,300 | | | | 2,048,823 | |
| | | | | | | | | |
| | |
| | | | | 3,232,189 | |
| Banks – 0.1% | |
| | | |
HDFC Bank Ltd., ADR (India) | | | 2,100 | | | | 146,370 | |
| | | | | | | | | |
| | |
| | | | | 146,370 | |
| Beverages – 1.2% | |
| | | |
Boston Beer Co., Inc., Class A(1) | | | 2,400 | | | | 740,256 | |
| | | |
Monster Beverage Corp.(1) | | | 46,100 | | | | 2,647,984 | |
| | | | | | | | | |
| | |
| | | | | 3,388,240 | |
| Biotechnology – 6.0% | |
| | | |
2seventy bio, Inc.(1) | | | 2,600 | | | | 26,312 | |
| | | |
Affimed NV(1) | | | 14,400 | | | | 8,614 | |
| | | |
Alnylam Pharmaceuticals, Inc.(1) | | | 8,000 | | | | 1,519,520 | |
| | | |
Arcellx, Inc.(1) | | | 1,700 | | | | 53,754 | |
| | | |
Beam Therapeutics, Inc.(1) | | | 2,100 | | | | 67,053 | |
| | | |
Biogen, Inc.(1) | | | 5,300 | | | | 1,509,705 | |
| | | |
Cytokinetics, Inc.(1) | | | 5,300 | | | | 172,886 | |
| | | |
Evelo Biosciences, Inc.(1) | | | 620 | | | | 2,015 | |
| | | |
Galapagos NV, ADR(1) | | | 15,600 | | | | 634,296 | |
| | | |
Genmab A/S (Denmark)(1) | | | 1,200 | | | | 455,455 | |
| | | |
Hookipa Pharma, Inc.(1) | | | 22,700 | | | | 19,976 | |
| | | |
Immunocore Holdings PLC, ADR(1) | | | 5,400 | | | | 323,784 | |
| | | |
Insmed, Inc.(1) | | | 25,600 | | | | 540,160 | |
| | | |
Regeneron Pharmaceuticals, Inc.(1) | | | 3,000 | | | | 2,155,620 | |
| | | |
Seagen, Inc.(1) | | | 12,200 | | | | 2,348,012 | |
| | | |
Vertex Pharmaceuticals, Inc.(1) | | | 17,800 | | | | 6,263,998 | |
| | | |
Vor BioPharma, Inc.(1) | | | 16,800 | | | | 51,912 | |
| | | |
XOMA Corp.(1) | | | 9,400 | | | | 177,566 | |
| | | | | | | | | |
| | |
| | | | | 16,330,638 | |
| Broadline Retail – 4.2% | |
| | | |
Amazon.com, Inc.(1) | | | 69,500 | | | | 9,060,020 | |
| | | |
Dollarama, Inc. (Canada) | | | 2,100 | | | | 142,224 | |
| | | |
MercadoLibre, Inc.(1) | | | 2,016 | | | | 2,388,154 | |
| | | | | | | | | |
| | |
| | | | | 11,590,398 | |
| Capital Markets – 1.9% | |
| | | |
CME Group, Inc. | | | 27,300 | | | | 5,058,417 | |
| | | | | | | | | |
| | |
| | | | | 5,058,417 | |
| Chemicals – 0.1% | |
| | | |
Aspen Aerogels, Inc.(1) | | | 19,100 | | | | 150,699 | |
| | | | | | | | | |
| | |
| | | | | 150,699 | |
| | | | | | | | |
| June 30, 2023 (unaudited) | | Shares | | | Value | |
| Diversified Consumer Services – 0.1% | |
| | | |
Laureate Education, Inc. | | | 20,900 | | | $ | 252,681 | |
| | | | | | | | | |
| | |
| | | | | 252,681 | |
| Electrical Equipment – 1.4% | |
| | | |
Bloom Energy Corp., Class A(1) | | | 4,200 | | | | 68,670 | |
| | | |
Eaton Corp. PLC | | | 15,500 | | | | 3,117,050 | |
| | | |
Hubbell, Inc. | | | 2,100 | | | | 696,276 | |
| | | | | | | | | |
| | |
| | | | | 3,881,996 | |
| Electronic Equipment, Instruments & Components – 1.4% | |
| | | |
Flex Ltd.(1) | | | 87,497 | | | | 2,418,417 | |
| | | |
Jabil, Inc. | | | 13,797 | | | | 1,489,110 | |
| | | | | | | | | |
| | |
| | | | | 3,907,527 | |
| Energy Equipment & Services – 0.5% | |
| | | |
Baker Hughes Co. | | | 42,290 | | | | 1,336,787 | |
| | | | | | | | | |
| | |
| | | | | 1,336,787 | |
| Entertainment – 4.6% | |
| | | |
Netflix, Inc.(1) | | | 11,700 | | | | 5,153,733 | |
| | | |
Universal Music Group NV (Netherlands) | | | 209,727 | | | | 4,659,627 | |
| | | |
Warner Music Group Corp., Class A | | | 102,800 | | | | 2,682,052 | |
| | | | | | | | | |
| | |
| | | | | 12,495,412 | |
| Financial Services – 2.4% | |
| | | |
Block, Inc.(1) | | | 24,065 | | | | 1,602,007 | |
| | | |
Mastercard, Inc., Class A | | | 12,922 | | | | 5,082,223 | |
| | | | | | | | | |
| | |
| | | | | 6,684,230 | |
| Ground Transportation – 3.6% | |
| | | |
Uber Technologies, Inc.(1) | | | 224,956 | | | | 9,711,351 | |
| | | | | | | | | |
| | |
| | | | | 9,711,351 | |
| Health Care Equipment & Supplies – 1.6% | |
| | | |
Boston Scientific Corp.(1) | | | 67,426 | | | | 3,647,072 | |
| | | |
Insulet Corp.(1) | | | 200 | | | | 57,668 | |
| | | |
Penumbra, Inc.(1) | | | 1,900 | | | | 653,714 | |
| | | | | | | | | |
| | |
| | | | | 4,358,454 | |
| Health Care Providers & Services – 3.2% | |
| | | |
HealthEquity, Inc.(1) | | | 40,042 | | | | 2,528,252 | |
| | | |
Option Care Health, Inc.(1) | | | 2,100 | | | | 68,229 | |
| | | |
UnitedHealth Group, Inc. | | | 13,000 | | | | 6,248,320 | |
| | | | | | | | | |
| | |
| | | | | 8,844,801 | |
| Health Care Technology – 0.1% | |
| | | |
Simulations Plus, Inc. | | | 3,700 | | | | 160,321 | |
| | | | | | | | | |
| | |
| | | | | 160,321 | |
| Hotels, Restaurants & Leisure – 2.4% | |
| | | |
Airbnb, Inc., Class A(1) | | | 16,000 | | | | 2,050,560 | |
| | | |
Booking Holdings, Inc.(1) | | | 576 | | | | 1,555,390 | |
| | | |
Flutter Entertainment PLC
(Australia)(1) | | | 13,200 | | | | 2,651,296 | |
| | | |
Kura Sushi USA, Inc., Class A(1) | | | 4,400 | | | | 408,980 | |
| | | | | | | | | |
| | |
| | | | | 6,666,226 | |
| Industrial Conglomerates – 1.5% | |
| | | |
General Electric Co. | | | 37,246 | | | | 4,091,473 | |
| | | | | | | | | |
| | |
| | | | | 4,091,473 | |
| | | | |
| The accompanying notes are an integral part of these financial statements. | | | | 3 |
SCHEDULE OF INVESTMENTS — GUARDIAN LARGE CAP FUNDAMENTAL GROWTH VIP FUND
| | | | | | | | |
| June 30, 2023 (unaudited) | | Shares | | | Value | |
| Insurance – 1.4% | |
| | | |
Arthur J Gallagher & Co. | | | 10,400 | | | $ | 2,283,528 | |
| | | |
BRP Group, Inc., Class A(1) | | | 15,800 | | | | 391,524 | |
| | | |
Marsh & McLennan Cos., Inc. | | | 6,500 | | | | 1,222,520 | |
| | | | | | | | | |
| | |
| | | | | 3,897,572 | |
| Interactive Media & Services – 5.0% | |
| | | |
Alphabet, Inc., Class A(1) | | | 114,500 | | | | 13,705,650 | |
| | | | | | | | | |
| | |
| | | | | 13,705,650 | |
| IT Services – 2.0% | |
| | | |
Gartner, Inc.(1) | | | 2,400 | | | | 840,744 | |
| | | |
MongoDB, Inc.(1) | | | 8,174 | | | | 3,359,432 | |
| | | |
Shopify, Inc., Class A(1) | | | 17,704 | | | | 1,143,679 | |
| | | | | | | | | |
| | |
| | | | | 5,343,855 | |
| Life Sciences Tools & Services – 2.5% | |
| | | |
Bio-Techne Corp. | | | 7,888 | | | | 643,898 | |
| | | |
Bruker Corp. | | | 18,491 | | | | 1,366,855 | |
| | | |
Charles River Laboratories International, Inc.(1) | | | 4,453 | | | | 936,243 | |
| | | |
Codexis, Inc.(1) | | | 16,600 | | | | 46,480 | |
| | | |
Danaher Corp. | | | 5,449 | | | | 1,307,760 | |
| | | |
Repligen Corp.(1) | | | 4,700 | | | | 664,862 | |
| | | |
Sartorius Stedim Biotech (France) | | | 2,900 | | | | 724,700 | |
| | | |
Thermo Fisher Scientific, Inc. | | | 2,429 | | | | 1,267,331 | |
| | | | | | | | | |
| | |
| | | | | 6,958,129 | |
| Machinery – 2.0% | |
| | | |
Energy Recovery, Inc.(1) | | | 7,700 | | | | 215,215 | |
| | | |
Ingersoll Rand, Inc. | | | 43,065 | | | | 2,814,728 | |
| | | |
Parker-Hannifin Corp. | | | 4,500 | | | | 1,755,180 | |
| | | |
Westinghouse Air Brake Technologies Corp. | | | 6,800 | | | | 745,756 | |
| | | | | | | | | |
| | |
| | | | | 5,530,879 | |
| Media – 0.0% | |
| | | |
Innovid Corp.(1) | | | 11,100 | | | | 12,099 | |
| | | | | | | | | |
| | |
| | | | | 12,099 | |
| Oil, Gas & Consumable Fuels – 3.6% | |
| | | |
Cheniere Energy, Inc. | | | 26,100 | | | | 3,976,596 | |
| | | |
Denbury, Inc.(1) | | | 4,400 | | | | 379,544 | |
| | | |
New Fortress Energy, Inc. | | | 18,400 | | | | 492,752 | |
| | | |
Range Resources Corp. | | | 48,100 | | | | 1,414,140 | |
| | | |
Reliance Industries Ltd., GDR(2) | | | 56,603 | | | | 3,526,367 | |
| | | | | | | | | |
| | |
| | | | | 9,789,399 | |
| Passenger Airlines – 0.6% | |
| | | |
Ryanair Holdings PLC, ADR(1) | | | 13,600 | | | | 1,504,160 | |
| | | | | | | | | |
| | |
| | | | | 1,504,160 | |
| Personal Care Products – 0.3% | |
| | | |
Estee Lauder Cos., Inc., Class A | | | 4,100 | | | | 805,158 | |
| | | | | | | | | |
| | |
| | | | | 805,158 | |
| Pharmaceuticals – 2.9% | |
| | | |
Aclaris Therapeutics, Inc.(1) | | | 7,200 | | | | 74,664 | |
| | | |
AstraZeneca PLC, ADR | | | 22,900 | | | | 1,638,953 | |
| | | |
Eli Lilly and Co. | | | 12,034 | | | | 5,643,705 | |
| | | | | | | | | |
| | | | | | | | |
| June 30, 2023 (unaudited) | | Shares | | | Value | |
| Pharmaceuticals (continued) | |
| | | |
Revance Therapeutics, Inc.(1) | | | 20,900 | | | $ | 528,979 | |
| | | | | | | | | |
| | |
| | | | | 7,886,301 | |
| Professional Services – 2.2% | |
| | | |
Equifax, Inc. | | | 6,700 | | | | 1,576,510 | |
| | | |
KBR, Inc. | | | 50,700 | | | | 3,298,542 | |
| | | |
TransUnion | | | 14,900 | | | | 1,167,117 | |
| | | | | | | | | |
| | |
| | | | | 6,042,169 | |
| Semiconductors & Semiconductor Equipment – 13.3% | |
| | | |
AIXTRON SE (Germany) | | | 27,400 | | | | 929,467 | |
| | | |
Allegro MicroSystems, Inc.(1) | | | 10,247 | | | | 462,550 | |
| | | |
ASML Holding NV | | | 2,136 | | | | 1,548,066 | |
| | | |
BE Semiconductor Industries NV (Netherlands) | | | 12,800 | | | | 1,387,608 | |
| | | |
KLA Corp. | | | 2,633 | | | | 1,277,058 | |
| | | |
Monolithic Power Systems, Inc. | | | 1,700 | | | | 918,391 | |
| | | |
NVIDIA Corp. | | | 48,092 | | | | 20,343,878 | |
| | | |
NXP Semiconductors NV | | | 11,400 | | | | 2,333,352 | |
| | | |
SiTime Corp.(1) | | | 11,144 | | | | 1,314,658 | |
| | | |
Taiwan Semiconductor Manufacturing Co. Ltd., ADR | | | 43,356 | | | | 4,375,487 | |
| | | |
Universal Display Corp. | | | 9,954 | | | | 1,434,670 | |
| | | | | | | | | |
| | |
| | | | | 36,325,185 | |
| Software – 17.0% | |
| | | |
Confluent, Inc., Class A(1) | | | 47,367 | | | | 1,672,529 | |
| | | |
HashiCorp, Inc., Class A(1) | | | 19,900 | | | | 520,982 | |
| | | |
HubSpot, Inc.(1) | | | 3,900 | | | | 2,075,151 | |
| | | |
Manhattan Associates, Inc.(1) | | | 9,648 | | | | 1,928,442 | |
| | | |
Microsoft Corp. | | | 100,104 | | | | 34,089,416 | |
| | | |
Nice Ltd., ADR(1) | | | 4,000 | | | | 826,000 | |
| | | |
Oracle Corp. | | | 38,400 | | | | 4,573,056 | |
| | | |
ServiceNow, Inc.(1) | | | 1,600 | | | | 899,152 | |
| | | |
Volue ASA (Norway)(1) | | | 19,170 | | | | 32,240 | |
| | | | | | | | | |
| | |
| | | | | 46,616,968 | |
| Specialty Retail – 1.8% | |
| | | |
Five Below, Inc.(1) | | | 10,759 | | | | 2,114,574 | |
| | | |
TJX Cos., Inc. | | | 34,469 | | | | 2,922,626 | |
| | | | | | | | | |
| | |
| | | | | 5,037,200 | |
| Technology Hardware, Storage & Peripherals – 4.3% | |
| | | |
Apple, Inc. | | | 61,002 | | | | 11,832,558 | |
| | | | | | | | | |
| | |
| | | | | 11,832,558 | |
| Textiles, Apparel & Luxury Goods – 1.2% | |
| | | |
Cie Financiere Richemont SA (Reg S), Class A (Switzerland) | | | 500 | | | | 84,837 | |
| | | |
LVMH Moet Hennessy Louis Vuitton SE (France) | | | 2,000 | | | | 1,887,451 | |
| | | |
Samsonite International SA(1)(2) | | | 478,200 | | | | 1,359,500 | |
| | | | | | | | | |
| | |
| | | | | 3,331,788 | |
| Trading Companies & Distributors – 0.9% | |
| | | |
Ferguson PLC (United Kingdom) | | | 15,500 | | | | 2,447,031 | |
| | | | | | | | | |
| | |
| | | | | 2,447,031 | |
| | |
Total Common Stocks
(Cost $203,023,396) | | | | 270,679,260 | |
| | | | |
| 4 | | | | The accompanying notes are an integral part of these financial statements. |
SCHEDULE OF INVESTMENTS — GUARDIAN LARGE CAP FUNDAMENTAL GROWTH VIP FUND
| | | | | | | | |
| June 30, 2023 (unaudited) | | Shares | | | Value | |
| Limited Partnerships – 0.0% | |
| | | |
Brookfield Renewable Partners LP | | | 3,600 | | | $ | 106,164 | |
| | | | | | | | | |
| | |
Total Limited Partnerships
(Cost $111,423) | | | | 106,164 | |
| | |
Total Investments – 99.0%
(Cost $203,134,819) | | | | 270,785,424 | |
| | |
| Assets in excess of other liabilities – 1.0% | | | | 2,670,165 | |
| | |
| Total Net Assets – 100.0% | | | $ | 273,455,589 | |
| (1) | Non–income–producing security. |
| (2) | Securities that may be resold in transactions exempt from registration under Rule 144A of the Securities Act of 1933, as amended, normally to certain qualified buyers. At June 30, 2023, the aggregate market value of these securities amounted to $4,885,867, representing 1.8% of net assets. These securities have been deemed liquid by the investment adviser pursuant to the Fund’s liquidity procedures approved by the Board of Trustees. |
Legend:
ADR — American Depositary Receipt
GDR — Global Depositary Receipt
The following is a summary of the inputs used as of June 30, 2023 in valuing the Fund’s investments. For more information on valuation inputs, please refer to Note 2a of the accompanying Notes to Financial Statements.
| | | | | | | | | | | | | | | | |
| | | Valuation Inputs | | | | |
| Investments in Securities (unaudited) | | Level 1 | | | Level 2 | | | Level 3 | | | Total | |
| Common Stocks | | $ | 252,876,682 | | | $ | 17,802,578 | * | | $ | — | | | $ | 270,679,260 | |
| Limited Partnerships | | | 106,164 | | | | — | | | | — | | | | 106,164 | |
| Total | | $ | 252,982,846 | | | $ | 17,802,578 | | | $ | — | | | $ | 270,785,424 | |
| * | Consists of certain foreign securities whose values were determined by a pricing service using pricing models (See Notes to Schedule of Investments). These investments in securities were classified as Level 2 rather than Level 1. |
| | | | |
| The accompanying notes are an integral part of these financial statements. | | | | 5 |
FINANCIAL INFORMATION — GUARDIAN LARGE CAP FUNDAMENTAL GROWTH VIP FUND
| | | | |
Statement of Assets and Liabilities As of June 30, 2023 (unaudited) | |
Assets | | | | |
| | |
Investments, at value | | $ | 270,785,424 | |
| | |
Foreign currency, at value | | | 16 | |
| | |
Receivable for investments sold | | | 3,401,190 | |
| | |
Dividends/interest receivable | | | 53,000 | |
| | |
Foreign tax reclaims receivable | | | 37,668 | |
| | |
Prepaid expenses | | | 2,821 | |
| | | | | |
| | |
Total Assets | | | 274,280,119 | |
| | | | | |
| | |
Liabilities | | | | |
| | |
Due to custodian | | | 280,555 | |
| | |
Payable for fund shares redeemed | | | 198,000 | |
| | |
Investment advisory fees payable | | | 130,599 | |
| | |
Payable for investments purchased | | | 101,168 | |
| | |
Distribution fees payable | | | 55,478 | |
| | |
Accrued audit fees | | | 13,978 | |
| | |
Accrued custodian and accounting fees | | | 11,419 | |
| | |
Accrued trustees’ and officers’ fees | | | 4,098 | |
| | |
Accrued expenses and other liabilities | | | 29,235 | |
| | | | | |
| | |
Total Liabilities | | | 824,530 | |
| | | | | |
| | |
Total Net Assets | | $ | 273,455,589 | |
| | | | | |
| | |
Net Assets Consist of: | | | | |
| | |
Paid-in capital | | $ | 80,460,253 | |
| | |
Distributable earnings | | | 192,995,336 | |
| | | | | |
| | |
Total Net Assets | | $ | 273,455,589 | |
| | | | | |
Investments, at Cost | | $ | 203,134,819 | |
| | | | | |
Foreign Currency, at Cost | | $ | 16 | |
| | | | | |
| | |
Pricing of Shares | | | | |
| | |
Shares of Beneficial Interest Outstanding with No Par Value | | | 11,862,259 | |
| | |
Net Asset Value Per Share | | | $23.05 | |
| | | | | |
| | | | |
Statement of Operations For the Six Months Ended June 30, 2023 (unaudited) | |
Investment Income | | | | |
| | |
Dividends | | $ | 870,313 | |
| | |
Non-cash dividends | | | 54,989 | |
| | |
Interest | | | 21,370 | |
| | |
Withholding taxes on foreign dividends | | | (28,669 | ) |
| | | | | |
| | |
Total Investment Income | | | 918,003 | |
| | | | | |
| | |
Expenses | | | | |
| | |
Investment advisory fees | | | 770,714 | |
| | |
Distribution fees | | | 327,158 | |
| | |
Professional fees | | | 37,317 | |
| | |
Trustees’ and officers’ fees | | | 31,711 | |
| | |
Administrative fees | | | 18,598 | |
| | |
Custodian and accounting fees | | | 16,665 | |
| | |
Transfer agent fees | | | 7,390 | |
| | |
Shareholder reports | | | 5,959 | |
| | |
Other expenses | | | 6,754 | |
| | | | | |
| | |
Total Expenses | | | 1,222,266 | |
| | | | | |
| | |
Net Investment Income/(Loss) | | | (304,263 | ) |
| | | | | |
| | |
Realized Gain/(Loss) and Change in Unrealized Appreciation/(Depreciation) on Investments and Foreign Currency Transactions | | | | |
| | |
Net realized gain/(loss) from investments | | | 32,686,358 | |
| | |
Net realized gain/(loss) from foreign currency transactions | | | (62,650 | ) |
| | |
Net change in unrealized appreciation/(depreciation) on investments | | | 38,745,997 | |
| | |
Net change in unrealized appreciation/(depreciation) on translation of assets and liabilities in foreign currencies | | | 12 | |
| | | | | |
| | |
Net Gain on Investments and Foreign Currency Transactions | | | 71,369,717 | |
| | | | | |
| | |
Net Increase in Net Assets Resulting From Operations | | $ | 71,065,454 | |
| | | | | |
| | | | | |
| | | | |
| 6 | | | | The accompanying notes are an integral part of these financial statements. |
FINANCIAL INFORMATION — GUARDIAN LARGE CAP FUNDAMENTAL GROWTH VIP FUND
| | | | | | | | |
Statements of Changes in Net Assets Six Months Ended Numbers are unaudited | | | | | | |
| | | |
| | | For the
Six Months Ended
6/30/23 | | | For the
Year Ended
12/31/22 | |
| | | | |
Operations | |
| | | |
Net investment income/(loss) | | $ | (304,263 | ) | | $ | (708,433 | ) |
| | | |
Net realized gain/(loss) from investments and foreign currency transactions | | | 32,623,708 | | | | 3,529,314 | |
| | | |
Net change in unrealized appreciation/(depreciation) on investments and
translation of assets and liabilities in foreign currencies | | | 38,746,009 | | | | (118,066,982 | ) |
| | | | | | | | | |
| | | |
Net Increase/(Decrease) in Net Assets Resulting from Operations | | | 71,065,454 | | | | (115,246,101 | ) |
| | | | | | | | | |
| |
Capital Share Transactions | |
| | | |
Proceeds from sales of shares | | | 659,587 | | | | 70,196,441 | |
| | | |
Cost of shares redeemed | | | (51,872,694 | ) | | | (49,649,218 | ) |
| | | | | | | | | |
| | | |
Net Increase/(Decrease) in Net Assets Resulting from Capital Share Transactions | | | (51,213,107 | ) | | | 20,547,223 | |
| | | | | | | | | |
| | | |
Net Increase/(Decrease) in Net Assets | | | 19,852,347 | | | | (94,698,878 | ) |
| | | | | | | | | |
| |
Net Assets | |
| | | |
Beginning of period | | | 253,603,242 | | | | 348,302,120 | |
| | | | | | | | | |
| | | |
End of period | | $ | 273,455,589 | | | $ | 253,603,242 | |
| | | | | | | | | |
| |
Other Information: | |
| | | |
Shares | | | | | | | | |
| | | |
Sold | | | 32,593 | | | | 3,583,941 | |
| | | |
Redeemed | | | (2,547,220 | ) | | | (2,487,413 | ) |
| | | | | | | | | |
| | | |
Net Increase/(Decrease) | | | (2,514,627 | ) | | | 1,096,528 | |
| | | | | | | | | |
| | | | | | | | | |
| | | | |
| The accompanying notes are an integral part of these financial statements. | | | | 7 |
FINANCIAL INFORMATION — GUARDIAN LARGE CAP FUNDAMENTAL GROWTH VIP FUND
The Financial Highlights table is intended to help you understand the Fund’s financial performance for the past six reporting periods (or, if shorter, the period since inception). Certain information reflects financial results for a single Fund share. The total returns in the table represent the rate that an investor would have earned (or lost) on an investment in the Fund.
| | | | | | | | | | | | | | | | | | | | | | | | |
Financial Highlights Six Months Ended Numbers are unaudited | | | | | | | | | | | | | | | | | | |
| | | Per Share Operating Performance | | | | |
| | | Net Asset Value,
Beginning of
Period | | | Net Investment
Income/(Loss)(1) | | | Net Realized
and Unrealized
Gain/(Loss) | | | Total
Operations | | | Net Asset
Value, End of
Period | | | Total
Return(2) | |
| | | | | | | |
Six Months Ended 6/30/23 | | $ | 17.64 | | | $ | (0.02) | | | $ | 5.43 | | | $ | 5.41 | | | $ | 23.05 | | | | 30.67% | (4) |
| | | | | | | |
Year Ended 12/31/22 | | | 26.23 | | | | (0.05) | | | | (8.54) | | | | (8.59) | | | | 17.64 | | | | (32.75)% | |
| | | | | | | |
Year Ended 12/31/21 | | | 21.57 | | | | (0.08) | | | | 4.74 | | | | 4.66 | | | | 26.23 | | | | 21.60% | |
| | | | | | | |
Year Ended 12/31/20 | | | 16.50 | | | | (0.03) | | | | 5.10 | | | | 5.07 | | | | 21.57 | | | | 30.73% | |
| | | | | | | |
Year Ended 12/31/19 | | | 12.51 | | | | 0.00(5) | | | | 3.99 | | | | 3.99 | | | | 16.50 | | | | 31.89% | |
| | | | | | | |
Year Ended 12/31/18 | | | 12.74 | | | | 0.03 | | | | (0.26) | | | | (0.23) | | | | 12.51 | | | | (1.81)% | |
| | | | |
| 8 | | | | The accompanying notes are an integral part of these financial statements. |
FINANCIAL INFORMATION — GUARDIAN LARGE CAP FUNDAMENTAL GROWTH VIP FUND
| | | | | | | | | | | | | | | | | | | | | | |
| | |
| Ratios/Supplemental Data | |
Net Assets, End
of Period (000s) | | | Net Ratio of
Expenses to
Average
Net Assets(3) | | | Gross Ratio of
Expenses to
Average Net
Assets | | | Net Ratio of Net
Investment
Income/(Loss)
to Average
Net Assets(3) | | | Gross Ratio of
Net Investment
Income/(Loss)
to Average
Net Assets | | | Portfolio
Turnover Rate | |
| | | | | |
| $ | 273,456 | | | | 0.93% | (4) | | | 0.93% | (4) | | | (0.23)% | (4) | | | (0.23)% | (4) | | | 80% | (4) |
| | | | | |
| | 253,603 | | | | 0.93% | | | | 0.93% | | | | (0.25)% | | | | (0.25)% | | | | 31% | |
| | | | | |
| | 348,302 | | | | 0.91% | | | | 0.91% | | | | (0.34)% | | | | (0.34)% | | | | 21% | |
| | | | | |
| | 339,890 | | | | 1.00% | | | | 1.00% | | | | (0.18)% | | | | (0.18)% | | | | 20% | |
| | | | | |
| | 349,921 | | | | 1.00% | | | | 1.00% | | | | 0.01% | | | | 0.01% | | | | 44% | |
| | | | | |
| | 223,264 | | | | 1.00% | | | | 1.02% | | | | 0.26% | | | | 0.24% | | | | 33% | |
| (1) | Calculated based on the average shares outstanding during the period. |
| (2) | Total returns do not reflect the effects of charges deducted pursuant to the terms of The Guardian Insurance & Annuity Company, Inc.’s variable contracts. Inclusion of such charges would reduce the total returns for all periods shown. |
| (3) | Net Ratio of Expenses to Average Net Assets and Net Ratio of Net Investment Income/(Loss) to Average Net Assets include the effect of fee waivers, expense limitations, and recoupments, if any. |
| (4) | Ratios for periods less than one year have been annualized, except for total return and portfolio turnover rate. |
| (5) | Rounds to $0.00 per share. |
| | | | |
| The accompanying notes are an integral part of these financial statements. | | | | 9 |
NOTES TO FINANCIAL STATEMENTS — GUARDIAN LARGE CAP FUNDAMENTAL GROWTH VIP FUND
June 30, 2023 (unaudited)
1. Organization
Guardian Variable Products Trust (the “Trust”), a Delaware statutory trust organized on January 12, 2016, is registered under the Investment Company Act of 1940, as amended (the “1940 Act”), as an open-end management investment company. The Trust currently has twenty-four series. Guardian Large Cap Fundamental Growth VIP Fund (the “Fund”) is a series of the Trust. The Fund is a diversified fund and commenced operations on September 1, 2016. The financial statements for other series of the Trust are presented in separate reports.
The Trust has authorized an unlimited number of shares of beneficial interest with no par value. Shares are bought and sold at closing net asset value (“NAV”). Shares of the Fund are only sold to certain separate accounts of The Guardian Insurance & Annuity Company, Inc. (“GIAC”) that fund certain variable annuity contracts and variable life insurance policies issued by GIAC. GIAC is a wholly-owned subsidiary of The Guardian Life Insurance Company of America (“Guardian Life”).
The Fund seeks long-term growth of capital.
2. Significant Accounting Policies
The following is a summary of significant accounting policies followed by the Fund in the preparation of its financial statements. The Fund follows the investment company accounting and reporting guidance of the Financial Accounting Standards Board (“FASB”) Accounting Standards Codification Topic 946 Financial Services – Investment Companies. The following policies are in conformity with accounting principles generally accepted in the United States of America (“GAAP”). The preparation of financial statements in accordance with GAAP requires management to make estimates and assumptions that affect the reported amounts and disclosures in the financial statements. Actual results could differ from those estimates.
a. Investment Valuations The Board of Trustees has designated Park Avenue Institutional Advisers LLC (“Park Avenue”) as the valuation designee for the Fund pursuant to Rule 2a-5 under the 1940 Act. Park Avenue has established a Fair Valuation Committee and has adopted fair valuation procedures that provide methodologies for fair valuing securities. These procedures include monitoring the appropriateness of fair values based on results of ongoing valuation
oversight, including but not limited to consideration of security specific events, market events, and pricing vendor and broker-dealer due diligence. The Fair Valuation Committee oversees and carries out the policies for the valuation of investments held in the Fund. The Fair Valuation Committee is responsible for discussing and assessing the potential impacts to the fair values on an ongoing basis, and reports to the Board of Trustees on at least a quarterly basis.
Equity securities traded on an exchange other than NASDAQ Stock Market, LLC (“NASDAQ”) are valued at the last reported sale price on the principal exchange or market on which they are traded; or, if there were no sales that day, at the mean between the closing bid and ask prices. Securities traded on the NASDAQ are generally valued at the NASDAQ official closing price, which may not be the last sale price. If the NASDAQ official closing price is not available for a security, that security is generally valued at the mean between the closing bid and ask prices. Repurchase agreements are carried at cost, which approximates fair value (see Note 5d). Foreign securities are valued in the currencies of the markets in which they trade and then converted to U.S. dollars by the application of foreign exchange rates at the close of the New York Stock Exchange (“NYSE”). Forward foreign currency contracts, if any, are valued at the mean between the bid and ask rates for the specified time interpolated from rates for proximate time periods.
Securities for which market quotations are not readily available or securities whose values have been materially affected by events occurring before the Fund’s valuation time but after the close of the securities’ principal exchange or market are valued at their fair values as determined in good faith by Park Avenue, as the Board of Trustee’s valuation designee (as defined in Rule 2a-5 under the 1940 Act), in accordance with Park Avenue’s procedures and under the general oversight of the Board of Trustees. In addition, the values of the Fund’s investments in foreign securities are generally determined by a pricing service using pricing models designed to estimate likely changes in the values of those securities. Certain foreign equity instruments are valued by applying international fair value factors provided by approved pricing services. The factors seek to adjust the local closing price for movements of local markets post closing, but prior to the time the NAVs are calculated. Valuations reflected in this report are as of the report date. As a result, changes in valuation due to market events and/or issuer related events after the report date and prior to issuance of the report are not reflected herein.
NOTES TO FINANCIAL STATEMENTS — GUARDIAN LARGE CAP FUNDAMENTAL GROWTH VIP FUND
Various inputs are used in determining the valuation of the Fund’s investments. These inputs are summarized in three broad levels listed below.
| • | | Level 1 – unadjusted inputs using quoted prices in active markets for identical investments. |
| • | | Level 2 – other significant observable inputs, including, but not limited to, quoted prices for similar investments, inputs other than quoted prices that are observable for investments (such as interest rates, prepayment speeds, credit risks, etc.) or other market corroborated inputs. |
| • | | Level 3 – significant unobservable inputs (including the Fund’s own assumptions in determining the fair value of investments). |
Inputs may include price information, volatility statistics, specific and broad credit data, liquidity statistics, and other factors. A financial instrument’s level within the fair value hierarchy is based on the lowest level of any input; both individually and in aggregate, that is significant to the fair value measurement. However, the determination of what constitutes “observable” requires significant judgment by the Trust. The Trust considers observable data to be that market data which is readily available, regularly distributed or updated, reliable and verifiable, and provided by independent sources that are actively involved in the relevant market. The inputs or methodology used for valuing securities are not necessarily an indication of the risk associated with investing in those securities. Changes in valuation techniques may result in transfers into or out of a financial instrument’s assigned level within the hierarchy.
The FASB requires reporting entities to make disclosures about purchases, sales, issuances and settlements of Level 3 securities on a gross basis. For the six months ended June 30, 2023, there were no transfers into or out of Level 3 of the fair value hierarchy.
In determining a financial instrument’s placement within the hierarchy, the Trust separates the Fund’s investment portfolio into two categories: investments and derivatives (e.g., futures). A summary of inputs used to value the Fund’s assets and liabilities carried at fair value as of June 30, 2023 is included in the Schedule of Investments.
Investments Investments whose values are based on quoted market prices in active markets, and are therefore classified within Level 1, include active listed equities. Investments that trade in markets that are not considered to be active, but are valued based on quoted market prices, dealer quotations or alternative pricing
sources supported by observable inputs are classified within Level 2. These include certain U.S. government and sovereign obligations, most government agency securities, investment-grade corporate bonds, certain mortgage products, state, municipal and provincial obligations, and certain foreign equity securities, including securities whose prices may have been affected by events occurring after the close of trading on their principal exchange or market and, as a result, whose values are determined by a pricing service as described above, or securities whose values are otherwise determined using fair valuation methods approved by the Fund’s Board of Trustees.
Investments classified within Level 3 have significant unobservable inputs, as they trade infrequently or not at all. Level 3 investments include, among others, private placement securities. When observable prices are not available for these securities, the Trust uses one or more valuation techniques for which sufficient and reliable data is available. The inputs used by the Trust in estimating the value of Level 3 investments include, for example, the original transaction price, recent transactions in the same or similar instruments, completed or pending third-party transactions in the underlying investment or comparable issuers, subsequent rounds of financing, recapitalizations, and other transactions across the capital structure. Level 3 investments may also be adjusted to reflect illiquidity and/or non-transferability, with the amount of such discount estimated by the Trust in the absence of market information. Assumptions used by the Trust due to the lack of observable inputs may significantly impact the resulting fair value and therefore the Fund’s results of operations. As of June 30, 2023, the Fund had no securities classified as Level 3.
Derivatives Exchange-traded derivatives, such as futures contracts, exchange-traded option contracts and certain swaps, are typically classified within Level 1 or Level 2 of the fair value hierarchy depending on whether or not they are deemed to be actively traded. Certain non-exchange-traded derivatives, such as generic forwards, certain swaps and options, have inputs which can generally be corroborated by market data and are therefore classified within Level 2. During the six months ended June 30, 2023, the Fund did not hold any derivatives.
b. Securities Transactions Securities transactions are accounted for on the date securities are purchased or sold (trade date). Realized gains or losses on securities transactions are determined on the basis of specific identification.
NOTES TO FINANCIAL STATEMENTS — GUARDIAN LARGE CAP FUNDAMENTAL GROWTH VIP FUND
c. Foreign Currency Translation The accounting records of the Fund are maintained in U.S. dollars. Investment securities and all other assets and liabilities of the Fund denominated in a foreign currency are generally translated into U.S. dollars at the exchange rates quoted at the close of the NYSE on each business day. The market value of investment securities and other assets and liabilities are translated at the exchange rate as of the valuation date. Purchases and sales of securities, income receipts, and expense payments are translated into U.S. dollars at the exchange rates in effect on the dates of the respective transactions. The Fund does not isolate the portion of the fluctuations on investments resulting from changes in foreign currency exchange rates from the fluctuations in market prices of investments held. Such fluctuations are included in the Net change in net realized and unrealized gain/(loss) from investments on the Statement of Operations.
Reported realized foreign currency gains and losses arise from the disposition of foreign currency, currency gains or losses realized between the trade and settlement dates on securities transactions, and the difference between the amounts of dividends, interest and foreign withholding taxes recorded on the Fund’s books on the transaction date and the U.S. dollar equivalent of the amounts actually received or paid. These reported realized foreign currency gains and losses, if any, are included in Net realized gain/(loss) from foreign currency transactions on the Statement of Operations. Unrealized foreign currency gains and losses arise from changes (due to changes in exchange rates) in the value of foreign currency and other assets and liabilities denominated in foreign currencies, which are held at period end, if any, and are included in Net change in unrealized appreciation/(depreciation) on translation of assets and liabilities in foreign currencies on the Statement of Operations.
d. Foreign Capital Gains Tax The Fund may be subject to foreign taxes on income, gains on investments or currency purchases/repatriation, a portion of which may be recoverable. The Fund will accrue such taxes and recoveries as applicable, based upon their current interpretation of tax rules and regulations that exist in the markets in which they invest.
e. Investment Income Dividend income net of foreign taxes withheld, if any, is generally recorded on the ex-dividend date. Distributions received from real estate investment trusts, if any, may be classified as dividends, capital gains and/or return of capital. Interest income, which includes amortization/accretion of premium/discount, is determined using the interest income accrual method, and is accrued and recorded daily.
f. Allocation of Income and Expenses Many of the expenses of the Trust can be directly attributed to a specific series of the Trust. Expenses that cannot be directly attributed to a specific series of the Trust are generally apportioned among all the series in the Trust, based on relative net assets. In calculating net asset value per share for each series of the Trust, investment income, realized and unrealized gains and losses, and expenses other than series-specific expenses are allocated daily to each series based upon the proportion of net assets attributable to each series.
3. Transactions with Affiliates
a. Investment Advisory Fee and Expense Limitation Under the terms of the advisory agreement, which, after its two year initial term, is reviewed and approved annually by the Board of Trustees, the Fund pays an investment advisory fee to Park Avenue. Park Avenue is a wholly-owned subsidiary of Guardian Life and receives an investment advisory fee at an annual rate of 0.62% up to $100 million, 0.57% from $100 to $300 million, 0.52% from $300 to $500 million, and 0.50% in excess of $500 million of the Fund’s average daily net assets. The fee is accrued daily and paid monthly.
Park Avenue has contractually agreed through April 30, 2024 to waive certain fees and/or reimburse certain expenses incurred by the Fund to the extent necessary to limit the Fund’s total annual operating expenses after fee waiver and/or expense reimbursement to 1.01% of the Fund’s average daily net assets (excluding, if applicable, any acquired fund fees and expenses, taxes, interest, transaction costs and brokerage commissions, litigation and extraordinary expenses). The limitation may not be increased or terminated prior to this time without action by the Board of Trustees, and may be terminated only upon approval of the Board of Trustees. Amounts waived or reimbursed by Park Avenue pursuant to any expense limitation will not be subject to Park Avenue’s recoupment rights. For the six months ended June 30, 2023, Park Avenue did not waive any fees or pay any Fund expenses.
Park Avenue has entered into a Sub-Advisory Agreement with FIAM LLC (“FIAM”), effective May 1, 2023. Prior to this date, ClearBridge Investments LLC was sub-advisor to the Fund. FIAM is responsible for providing day-to-day investment advisory services to the Fund, subject to the supervision of Park Avenue and the oversight of the Board of Trustees. Sub-advisory fees are paid by Park Avenue and do not represent a separate or additional expense to the Fund.
NOTES TO FINANCIAL STATEMENTS — GUARDIAN LARGE CAP FUNDAMENTAL GROWTH VIP FUND
b. Compensation of Trustees and Officers Trustees and officers who are interested persons of the Trust, as defined in the 1940 Act, receive no compensation from the Fund, except for the Chief Compliance Officer of the Trust. Trustees of the Trust who are not interested persons of the Trust, and the Chief Compliance Officer, receive compensation and reimbursement of expenses from the Trust.
c. Distribution Fees Park Avenue Securities LLC (“PAS”), a wholly-owned subsidiary of Guardian Life, is the principal underwriter of Fund shares. The Trust has entered into a distribution and service agreement with PAS, which governs the sale and distribution of shares of the Fund. Under a distribution and service plan adopted by the Trust (“12b-1 plan”), PAS is compensated for services in such capacity, including its expenses in connection with the promotion and distribution of shares of the Fund, at an annual rate of 0.25% of the Fund’s average daily net assets. For the six months ended June 30, 2023, the Fund paid distribution fees in the amount of $327,158 to PAS.
PAS has directed that certain payments under the 12b-1 plan be used to compensate GIAC for shareholder services provided to contract owners.
4. Federal Income Taxes
a. Distributions to Shareholders For federal income tax purposes, the Fund is treated as a disregarded entity (“DRE”). As a DRE, the Fund is not subject to an entity-level income tax; and any income, gains, losses, deductions, taxes, and credits of the Fund would instead be “passed through” directly to the separate accounts of GIAC that invest in the Fund and retain the same character for U.S. federal income tax purposes. In addition, the Fund is not required to distribute taxable income and capital gains for U.S. federal income tax purposes. Therefore, no dividends and capital gains distributions were paid by the Fund.
5. Investments
a. Investment Purchases and Sales The cost of investments purchased and the proceeds from investments sold (excluding short-term investments) amounted to $207,468,177 and $256,256,979, respectively, for the six months ended June 30, 2023. During the six months ended June 30, 2023, there were no purchases or sales of U.S. government securities.
b. Foreign Securities Foreign securities investments involve special risks and considerations not typically associated with U.S. investments. These risks include, but are not limited to, currency risk; adverse political,
regulatory, social, and economic developments; and less reliable information about issuers. Moreover, securities of some foreign issuers may be less liquid and their prices more volatile than those of comparable U.S. issuers.
c. Industry or Sector Concentration In its normal course of business, the Fund may invest a significant portion of its assets in companies within a limited number of industries or sectors. As a result, the Fund may be subject to a greater risk of loss than that of a fund invested in a wider spectrum of industries or sectors because the stocks of many or all of the companies in the industry, group of industries, sector, or sectors may decline in value due to developments adversely affecting the industry, group of industries, sector, or sectors.
d. Repurchase Agreements The Fund may invest in repurchase agreements to maintain liquidity and earn income over periods of time as short as overnight. The collateral for repurchase agreements is either cash or fully negotiable U.S. government securities (including U.S. government agency securities). Repurchase agreements are fully collateralized (including the interest accrued thereon) and such collateral is marked to market daily while the agreements remain in force. If the value of the collateral falls below the repurchase price plus accrued interest, the Fund will typically require the seller to deposit additional collateral by the next business day. If the request for additional collateral is not met, or the seller defaults, the Fund maintains the right to sell the collateral (although it may be prevented or delayed from doing so in certain circumstances) and may be required to claim any resulting loss against the seller. Park Avenue monitors the creditworthiness of the seller with which the Fund enters into repurchase agreements.
6. Temporary Borrowings
The Fund, with other funds managed by Park Avenue, is party to a credit agreement with respect to a $10 million committed revolving credit facility from State Street Bank and Trust Company (the “Credit Agreement”) for temporary borrowing purposes, including the meeting of redemption requests that otherwise might require the untimely disposition of securities. Interest is based on a daily fluctuating rate per annum equal to the Applicable Rate (as defined in the Credit Agreement) plus the Applicable Margin (as defined in the Credit Agreement) that is subject to change from time to time as and when the Applicable Rate changes. Under the current Credit Agreement, the Applicable Rate for any day is defined as the rate per annum equal to the
NOTES TO FINANCIAL STATEMENTS — GUARDIAN LARGE CAP FUNDAMENTAL GROWTH VIP FUND
sum of (a) 0.10% plus (b) the higher of (i) the Federal Funds Effective Rate for such day and (ii) the Overnight Bank Funding Rate for such day; the Applicable Margin is 1.25%. In addition to the interest charged on any borrowings by the Fund, each fund pays a commitment fee of 0.30% per annum on its share of the unused portion of the credit facility. The agreement is in place until January 5, 2024. The Fund did not utilize the credit facility during the six months ended June 30, 2023.
7. Indemnifications
Under the Trust’s organizational documents and, in some cases, by contract, officers and Trustees of the Trust are indemnified against certain liabilities arising out of the performance of their duties to the Fund. In addition, in the normal course of business, the Fund enters into contracts with its vendors and others that
provide general indemnifications. The Fund’s maximum exposure under these arrangements is unknown as this would involve future claims that may be made against the Fund that have not yet occurred. However, based on experience, the Fund expects the risk of loss to be remote.
8. Additional Information
The outbreak of COVID-19 has adversely impacted both local and global economies, including those in which the Fund may invest. These impacts include materially reduced consumer demand and economic output, disrupted supply chains, market closures, travel restrictions and quarantines, and strained healthcare systems. The Fund’s operations may be interrupted as a result, which may have a negative impact on the Fund’s investment performance.
SUPPLEMENTAL INFORMATION (UNAUDITED)
Liquidity Risk Management Program
In compliance with Rule 22e-4 under the Investment Company Act of 1940, as amended (the “Liquidity Rule”), Guardian Variable Products Trust (the “Trust”) has adopted and implemented a written liquidity risk management program (the “Program”) for each series of the Trust (each, a “Fund”), which is reasonably designed to assess and manage each Fund’s liquidity risk. The Fund’s “liquidity risk” is the risk that the Fund could not meet requests to redeem shares issued by the Fund without significant dilution of the remaining investors’ interests in the Fund.
The Board of Trustees of the Trust (the “Board”) Previously approved the designation of Park Avenue Institutional Advisers LLC (the “Administrator” or “PAIA”) as Program administrator. The Administrator established a Liquidity Risk Management Committee, which is comprised of certain officers of the Trust and PAIA, that assists the Administrator in the implementation and day-to-day administration of the Program and otherwise support carrying out the Administrator’s liquidity risk management responsibilities under the Program.
In accordance with the Program, each Fund’s liquidity risk is assessed no less frequently than annually, taking into consideration a variety of factors, including, as applicable, the Fund’s investment strategy and liquidity of portfolio investments, cash flow projections, and holdings of cash and cash equivalents, as well as borrowing arrangements and other funding sources. Certain factors are considered under both normal and reasonably foreseeable stressed conditions.
Each Fund portfolio investment is classified, no less than monthly, into one of four liquidity categories (including “highly liquid investments” and “illiquid investments,” discussed below) based on a determination of the number of days it is reasonably expected to take to convert the investment to cash, or sell or dispose of the investment, in current market conditions without significantly changing the investment’s market value.
The Liquidity Rule limits the Fund’s investments in illiquid investments by prohibiting the Fund from acquiring any illiquid investment if, immediately after the acquisition, the Fund would have invested more than 15% of its net assets in illiquid investments that are assets. The Program includes provisions reasonably designed to comply with this investment limitation. In addition, the Program includes provisions reasonably designed to comply with this investment limitation. In addition, the Program includes provisions reasonably designed to comply with the Liquidity Rule’s requirements relating to highly liquid investment minimums, which is a minimum amount of Fund net assets that must be invested in highly liquid investments that are assets, as applicable. The Fund was not required to adopt a highly liquid investment minimum during the period.
At a meeting of the Board held on March 29-30, 2023, the Board received a report (the “Report”) prepared by the Administrator addressing the Program’s operation and assessing the adequacy and effectiveness of its implementation for the period from January 1, 2022 through December 31, 2022 (the “Reporting Period”). The Report noted that the Administrator believes the Program operated effectively during the Reporting Period and continues to be reasonably designed to effectively assess and manage each Fund’s liquidity risk. The Report also noted that the Administrator believes the Program has been adequately and effectively implemented and the investment strategies for each Fund continue to be appropriate since its inception. In addition, the Report summarized the operation of the Program and the information and factors considered by the Administrator in its assessment of the Program’s implementation, such as the liquidity risk assessment framework and liquidity classification methodologies.
There can be no assurance that the Program will achieve its objectives under all circumstances. Please refer to the Fund’s prospectus for more information regarding the Fund’s exposure to liquidity risk and other risks to which an investment in the Fund may be subject.
SUPPLEMENTAL INFORMATION (UNAUDITED)
Approval of Investment Management and Sub-advisory Agreements
Section 15(c) of the Investment Company Act of 1940, as amended (the “1940 Act”), requires that a fund’s investment advisory and sub-advisory agreements be approved initially by the fund’s board of trustees. Section 15(c) also requires that the continuation of these agreements, after an initial term of up to two years, be annually reviewed and approved by the board. Any such agreement must be approved by a vote of a majority of the trustees who are not parties to the agreement or “interested persons” (as defined in the 1940 Act) of a party to the agreement at a meeting of the board called for the purpose of voting on such approval.
At a meeting of the Board of Trustees (the “Board”) of Guardian Variable Products Trust (the “Trust”) held on March 29-30, 2023 (the “Meeting”), the Board, including the trustees who are not parties to the agreement or “interested persons” as defined in the 1940 Act (the “Independent Trustees”), considered and voted unanimously to renew the existing investment management agreement between the Trust, on behalf of Guardian All Cap Core VIP Fund; Guardian Balanced Allocation VIP Fund; Guardian Core Fixed Income VIP Fund; Guardian Core Plus Fixed Income VIP Fund; Guardian Diversified Research VIP Fund; Guardian Equity Income VIP Fund; Guardian Global Utilities VIP Fund; Guardian Growth & Income VIP Fund; Guardian Integrated Research VIP Fund; Guardian International Growth VIP Fund; Guardian International Equity VIP Fund; Guardian Large Cap Disciplined Growth VIP Fund; Guardian Large Cap Disciplined Value VIP Fund; Guardian Large Cap Fundamental Growth VIP Fund; Guardian Mid Cap Relative Value VIP Fund; Guardian Mid Cap Traditional Growth VIP Fund; Guardian Multi-Sector Bond VIP Fund; Guardian Select Mid-Cap Core VIP Fund; Guardian Short Duration Bond VIP Fund; Guardian Small Cap Core VIP Fund; Guardian Small-Mid Cap Core VIP Fund; Guardian Strategic Large Cap Core VIP Fund; Guardian Total Return Bond VIP Fund and Guardian U.S. Government Securities VIP Fund (each, a “Fund,” and together, the “Funds”), in substantially the form presented at this meeting (the “Management Agreement”); and Park Avenue Institutional Advisers LLC (the “Manager”) for a one-year term.
The Board, including the Independent Trustees, also considered and voted unanimously to renew the existing sub-advisory agreements (the “Sub-Advisory Agreements,” collectively with the Management Agreement and Sub-Subadvisory Agreement, the “Agreements”) between the Manager and investment
advisory firms engaged to serve as sub-advisers to certain of the Funds (the “Sub-Advised Funds”), namely (i) ClearBridge Investments, LLC with respect to Guardian Small Cap Core VIP Fund; (ii) Putnam Investment Management, LLC with respect to Guardian Diversified Research VIP Fund; (iii) AllianceBernstein L.P. with respect to Guardian Growth & Income VIP Fund and Guardian Strategic Large Cap Core VIP Fund; (iv) J.P. Morgan Investment Management Inc. with respect to Guardian International Growth VIP Fund; (v) Schroder Investment Management North America Inc. with respect to Guardian International Equity VIP Fund; (vi) Wellington Management Company LLP with respect to Guardian Balanced Allocation VIP Fund, Guardian Equity Income VIP Fund, Guardian Integrated Research VIP Fund, Guardian Large Cap Disciplined Growth VIP Fund and Guardian Global Utilities VIP Fund; (vii) Boston Partners Global Investors, Inc. with respect to Guardian Large Cap Disciplined Value VIP Fund; (viii) Janus Henderson Investors US LLC with respect to Guardian Mid Cap Traditional Growth VIP Fund; (ix) Allspring Global Investments, LLC with respect to Guardian Mid Cap Relative Value VIP Fund and Guardian Small-Mid Cap Core VIP Fund; (x) Lord, Abbett & Co. LLC with respect to Guardian Core Plus Fixed Income VIP Fund; (xi) FIAM LLC with respect to Guardian Select Mid Cap Core VIP Fund; and (xii) Massachusetts Financial Services Company with respect to Guardian All Cap Core VIP Fund, each in substantially the form presented at this meeting, (each, a “Sub-Adviser” and collectively, the “Sub-Advisers”) for a one-year term.
The Board, including the Independent Trustees, also considered and voted unanimously to renew the existing sub-subadvisory agreement (the “Sub-Subadvisory Agreement”) between Schroder Investment Management North America Inc. and Schroder Investment Management North America Limited (also a Sub-Adviser) with respect to Guardian International Equity VIP Fund for a one-year term.
The Board is responsible for overseeing the management of each Fund. In determining whether to renew its approval of the Agreements, the Trustees evaluated information and factors that they considered to be relevant and appropriate through the exercise of their own business judgment. The Trustees considered certain information and factors in light of advice furnished to them by legal counsel to the Trust and, in the case of the Independent Trustees, their independent legal counsel. In advance of the Meeting, the Trustees received materials and information designed to assist their consideration of the Agreements. The Trustees received written responses
SUPPLEMENTAL INFORMATION (UNAUDITED)
from the Manager and each Sub-Adviser to a series of questions and requests for information encompassing a wide variety of topics provided by independent counsel on behalf of the Independent Trustees. The Independent Trustees also received materials and information regarding the legal standards applicable to their consideration of the Agreements and the process and criteria used by the Manager to identify and select the Sub-Advisers.
During the course of their deliberations, the Independent Trustees met twice to discuss and evaluate the materials, information and Agreements in executive session with their independent legal counsel, outside of the presence of the Trustees who are not Independent Trustees and representatives from Fund management, the Manager or any Sub-Adviser.
In reaching its decisions to renew its approval of the Agreements, the Board took into account the materials and information described above, as well as other materials and information provided to the Board throughout the year. Individual Trustees may have given different weight to different factors and information with respect to each Agreement, and the Trustees did not identify any single factor or information that, in isolation, would be controlling in deciding to approve the Agreements. The discussion below is intended to summarize the broad factors that figured prominently in the Board’s decisions to renew its approval of the Agreements rather than to be all-inclusive. These broad factors included: (i) the nature, extent and quality of the services provided to the Funds by the Manager and to the Sub-advised Funds by the Sub-Advisers; (ii) the investment performance of each Fund; (iii) estimated profitability of the Manager; (iv) fees and expenses; (v) the extent to which economies of scale may exist, and the extent to the benefits of economies of scale are shared with the Funds; and (vi) any other benefits derived by the Manager or the Sub-Advisers (or their respective affiliates) from their relationships with the Funds.
Nature, Extent and Quality of Services
The Trustees considered information regarding the nature, extent and quality of services provided to the Funds by the Manager. The Trustees also considered, among other things, the terms of the Management Agreement and the range of investment advisory services provided by the Manager. In addition, the Trustees reviewed the range of non-investment advisory services provided by the Manager consistent with the terms of the Management Agreement, notably coordinating the preparation and filing of various
regulatory documents, coordinating the preparation and assembly of Board meeting materials, and assisting the Board with certain valuation matters. The Board also received a description of the Manager’s and each Sub-Adviser’s business continuity plans and of their respective approaches to data privacy and cybersecurity, and related testing. The Board received information regarding the response of the Manager and the Sub-Advisers to the COVID-19 pandemic, including the continuation of remote work arrangements and return-to-office plans. The Board also received information about the Manager’s role as administrator of the Funds’ liquidity risk management program, the Manager’s approach to risk management, and the Manager’s vendor oversight programs.
The Trustees considered that the Sub-advised Funds operate in a “manager-of-managers” structure and reviewed the responsibilities that the Manager has under this structure, including monitoring and evaluating the performance of the Sub-Advisers, monitoring the Sub-Advisers for adherence to the stated investment objectives, strategies, policies and restrictions of the Funds and supervising the Sub-Advisers with respect to the services that the Sub-Advisers would provide under the Sub-Advisory Agreements. The Trustees also considered the process used by the Manager, consistent with this structure, to identify and recommend sub-advisers, and the Manager’s ability to monitor and oversee sub-advisers and recommend replacement sub-advisers, when necessary, and provide other services under the Management Agreement. The Board noted that investment management staff of the Manager and the Trust’s Chief Compliance Officer conduct oversight meetings with the Sub-Advisers on a periodic basis, follow through with additional inquiries on any questions or concerns that arise during the meetings and, as necessary, then report the results of the meetings to the Board. The Trustees reviewed information regarding the experience and background of the Manager’s key personnel and the Manager’s organizational structure and resources, including investment, legal and administrative capabilities of the Manager. In this regard, the Trustees recognized that the Funds may benefit from the Manager’s ability to use resources and capabilities of its affiliates in providing services to the Funds.
The Trustees considered information regarding the nature, extent and quality of services provided to the Sub-advised Funds by the Sub-Advisers. The Trustees also considered, among other things, the terms of the Sub-advisory Agreements and the range of investment
SUPPLEMENTAL INFORMATION (UNAUDITED)
advisory services provided by the Sub-Advisers under the oversight of the Manager. In evaluating these investment advisory services, the Trustees considered, among other things, the Sub-Advisers’ investment philosophies, styles and/or processes and approaches to managing the respective Sub-advised Funds. The Trustees received and evaluated information regarding the background, education, expertise and/or experience of the investment professionals who serve as portfolio managers for the Sub-advised Funds and the capabilities and resources of the Sub-Advisers.
Based upon these considerations, the Trustees concluded, within the context of their full deliberations, that the nature, extent and quality of services provided to the Funds by the Manager and the Sub-advised Funds by each respective Sub-Adviser were appropriate.
Investment Performance
In connection with each of its regular quarterly meetings, the Board receives information on the performance of each Fund, including net performance, relative performance rankings within the relevant Morningstar peer group, and performance as compared to benchmark index returns. At each quarterly Board meeting, members of the Manager’s funds management team review with the Board the economic and market environment, absolute and relative performance of each Fund, and any relevant information about risk management and style consistency in connection with management of the Funds. The Board considered investment performance for each Fund over the one-year, three-year (where available), five-year (where available) and since-inception periods.
The Board also received and reviewed a report prepared by Broadridge Financial Solutions (“Broadridge”), an independent provider of mutual fund industry data, which included comparisons of the performance of each Fund to performance of an appropriate peer universe. For details regarding each Fund’s performance, see the “Fund-by-Fund Factors” section below.
The Manager discussed with the Board factors contributing to the Funds’ performance results. In addition, for certain Funds, the Manager provided to the Board longer term performance records of the Sub-Advisers for strategies used in managing the Funds. The Board concluded that the investment performance generated by the Manager and each Sub-Adviser was generally satisfactory, or, that any steps being taken by the Manager and Sub-Advisers to address any performance issues were satisfactory.
Profitability
The Board received and considered the Manager’s estimate of its profitability, which included allocations by the Manager of its costs in providing management services to the Funds. The Board considered the estimated profitability of the Manager both overall and on a Fund-by-Fund basis.
The Board received and considered profitability information from most of the Sub-Advisers, but noted that the Manager had negotiated the fees with the Sub-Advisers at arm’s-length. Accordingly, the Board concluded that the profitability of the Sub-Advisers is a less relevant factor than Manager profitability.
Based on the consideration of this information, the Board concluded that the profitability of the Funds to the Manager was acceptable.
Fees and Expenses
The Trustees considered the management fees paid by the Funds to the Manager under the Management Agreement and evaluated the reasonableness of these fees. The Trustees received and reviewed comparative information with respect to the management fee and total expenses for each Fund and the management fees and total expenses for a peer group of other funds selected by Broadridge. The Trustees considered the Manager’s commitment to limit the total expenses of each Fund through an expense limitation agreement with the Trust. Although the Board recognized that the comparisons between the management fees and actual expenses of the Funds and those of the identified peer group are imprecise, given different terms of agreements and variations in fund strategies, the Trustees found that the comparative information supported their consideration and approval of the management fees and evaluation of the total expenses. For details regarding each Fund’s fee and expense comparisons, see the “Fund-by-Fund Factors” section below.
The Trustees considered the sub-advisory fees paid under the Sub-advisory Agreements and evaluated the reasonableness of those fees. The Trustees also considered that the fees paid to the Sub-Advisers would be paid by the Manager and not the Funds and that the Manager had negotiated the fees with the Sub-Advisers at arm’s-length.
Based on the consideration of the information and factors summarized above, as well as other relevant information and factors, the Board concluded that the management and sub-advisory fees were reasonable in
SUPPLEMENTAL INFORMATION (UNAUDITED)
light of the nature, extent and quality of services rendered to the Funds by the Manager and the Sub-Advisers.
Economies of Scale
The Board considered the extent to which economies of scale may exist, and the extent to the benefits of economies of scale are shared with the Funds. In this regard, the Board noted that for sixteen of twenty-four Funds, the management and sub-advisory fee included breakpoints that are tiered based on growth in asset levels of each such Fund and that for the other Funds, the fees reflected appropriate levels based on current and expected asset levels. The Board also noted that the expenses of the Funds are subject to expense limitations provided by the Manager. The Board noted that expected economies of scale, where they exist, may be shared through the use of fee breakpoints, expense limitations by the Manager, and/or a lower overall fee.
Ancillary Benefits
The Board considered the potential benefits, other than management fees, that the Manager and/or its affiliates may receive because of the Manager’s relationship with the Funds. The Trustees considered that the Funds were designed to serve as investment options under variable contracts issued by affiliates of the Manager that would receive fees under those contracts and that Park Avenue Securities LLC, an affiliate of the Manager and principal underwriter of the Funds, and participating insurance companies, including insurance companies affiliated with the Manager, would be entitled to receive fees from the Funds under a plan of distribution adopted pursuant to Rule 12b-1 under the 1940 Act. The Trustees considered that the Manager and its affiliates may benefit from (i) greater efficiencies in annuity administration and operations and potential cost savings due to a reduction in the number of unaffiliated funds available as annuity contract investment options, and (ii) increased dividends-received deductions due to the Funds’ status under the tax laws as disregarded entities. In addition, the Trustees considered the potential benefits, other than sub-advisory fees, that the Sub-Advisers and their affiliates may receive because of their relationships with the Funds, including the ability to receive research from soft dollar commissions consistent with Trust policies. The Trustees concluded that benefits that may accrue to the Manager and its affiliates are reasonable and the benefits that may accrue to the Sub-Advisers and their affiliates are consistent with those expected for a sub-adviser to a mutual fund such as the applicable Fund.
Fund-by-Fund Factors
The Broadridge report groups fees, expenses and performance into five quintiles, with the top quintile having the highest performance or lowest fees/expenses, and the bottom quintile having the lowest performance or highest fees/expenses. For purposes of the descriptions below, a Fund’s performance is considered “in line with” the benchmark index if it is within 0.20%.
Guardian Large Cap Fundamental Growth VIP Fund
| • | | The Board noted that the Fund’s performance was in the 3rd quintile of its performance universe for the 1-year period and in the 4th quintile for its performance universe for the 3-year and 5-year periods. The Board also noted that the Fund’s performance was below the benchmark index for the 1-year, 3-year and 5-year periods. |
| • | | The Board noted that the contractual management fee, the actual management fee and actual total expenses were in the 1st quintile of the expense group. |
Guardian Large Cap Disciplined Growth VIP Fund
| • | | The Board noted that the Fund’s performance was in the 3rd quintile of its performance universe for the 1-year and 3-year periods and in the 2nd quintile for the 5-year period. The Board also noted that the Fund’s performance was below the benchmark index for the 1-year, 3-year and 5-year periods. |
| • | | The Board noted that the contractual management fee, the actual management fee and actual total expenses were in the 1st quintile of the expense group. |
Guardian Integrated Research VIP Fund
| • | | The Board noted that the Fund’s performance was in the 5th quintile of its performance universe for the 1-year and 5-year periods and in the 4th quintile for 3-year period. The Board also noted that the Fund’s performance was below the benchmark index for the 1-year, 3-year and 5-year periods. |
| • | | The Board noted that the contractual management fee, the actual management fee and actual total expenses were in the 1st quintile of the expense group. |
Guardian Diversified Research VIP Fund
| • | | The Board noted that the Fund’s performance was in the 3rd quintile of its performance universe for the 1-year and 3-year periods and in the 2nd quintile for the 5-year period. The Board also noted that the Fund’s performance was higher than the benchmark |
SUPPLEMENTAL INFORMATION (UNAUDITED)
| | | index for the 1-year period. The Board note that the Fund’s performance was lower than the benchmark index for the 3-year and 5-year periods. |
| • | | The Board noted that the contractual management fee and actual management fee were in the 1st quintile of the expense group and that actual total expenses were in the 3rd quintile. |
Guardian Strategic Large Cap Core VIP Fund
| • | | The Board noted that the Fund’s performance was in the 1st quintile of its performance universe for the 1-year period. The Board acknowledged the Fund’s short operational history. The Board noted that the Fund’s performance was higher than the benchmark index for the 1-year period. |
| • | | The Board noted that the contractual management fee, the actual management fee and actual total expenses were in the 1st quintile of the expense group. |
Guardian Large Cap Disciplined Value VIP Fund
| • | | The Board noted that the Fund’s performance was in the 3rd quintile of its performance universe for the 1-year and 3-year periods and in the 4th quintile for the 5-year period. The Board also noted that the Fund’s performance was higher than the benchmark index for the 1-year and 3-year periods. The Board noted that the Fund’s performance was in line with the benchmark index for the 5-year period. |
| • | | The Board noted that the contractual management fee was in the 2nd quintile of the expense group, the actual management fee was in the 1st quintile of the expense group and that actual total expenses were in the 3rd quintile. |
Guardian Growth & Income VIP Fund
| • | | The Board noted that the Fund’s performance was in the 3rd quintile of its performance universe for the 1-year, 3-year and 5-year periods. The Board also noted that the Fund’s performance was higher than the benchmark index for the 1-year, 3-year and 5-year periods. |
| • | | The Board noted that the contractual management fee and the actual management fee were in the 1st quintile of the expense group and that actual total expenses were in the 3rd quintile. |
Guardian Equity Income VIP Fund
| • | | The Board noted that the Fund had less than one-year of operational history and was not able to evaluate an investment performance record for the Fund. The |
| | | Board noted that it would have an opportunity to review such information in connection with future annual reviews. The Board noted that, in the meantime, it received monthly performance reports from the Manager. |
| • | | The Board noted that the contractual management fee, the actual management fee and actual total expenses were in the 1st quintile of the expense group. |
Guardian All Cap Core VIP Fund
| • | | The Board noted that the Fund’s performance was in the 3rd quintile of its performance universe for the 1-year period. The Board acknowledged the Fund’s short operational history. The Board noted that the Fund’s performance was higher than the benchmark index for the 1-year period. |
| • | | The Board noted that the contractual management fee, the actual management fee and actual total expenses were in the 1st quintile of the expense group. |
Guardian Mid Cap Traditional Growth VIP Fund
| • | | The Board noted that the Fund’s performance was in the 1st quintile of its performance universe for the 1-year period and in the 2nd quintile for the 3-year and 5-year periods. The Board also noted that the Fund’s performance was higher than the benchmark index for the 1-year, 3-year and 5-year periods. |
| • | | The Board noted that the contractual management fee and actual management fee were in the 1st quintile of the expense group and that the actual total expenses were in the 4th quintile. |
Guardian Select Mid Cap Core VIP Fund
| • | | The Board noted that the Fund’s performance was in the 3rd quintile of its performance universe for the 1-year period. The Board acknowledged the Fund’s short operational history. The Board noted that the Fund’s performance was lower than the benchmark index for the 1-year period. |
| • | | The Board noted that the contractual management fee, the actual management fee and actual total expenses were in the 1st quintile of the expense group. |
Guardian Mid Cap Relative Value VIP Fund
| • | | The Board noted that the Fund’s performance was in the 2nd quintile of its performance universe for the 1-year, 3-year and 5-year periods. The Board also noted that the Fund’s performance was higher than the benchmark index for the 1-year, 3-year and 5-year periods. |
SUPPLEMENTAL INFORMATION (UNAUDITED)
| • | | The Board noted that the contractual management fee and the actual management fee were in the 2nd quintile of the expense group and the actual total expenses were in the 3rd quintile of the expense group. |
Guardian Small-Mid Cap Core VIP Fund
| • | | The Board noted that the Fund’s performance was in the 5th quintile of its performance universe for the 1-year period. The Board acknowledged the Fund’s short operational history. The Board noted that the Fund’s performance was higher than the benchmark index for the 1-year period. |
| • | | The Board noted that the contractual management fee, the actual management fee and actual total expenses were in the 1st quintile of the expense group. |
Guardian Small Cap Core VIP Fund
| • | | The Board noted that the Fund’s performance was in the 5th quintile of its performance universe for the 1-year and 3-year periods. The Board noted that the Fund’s performance was lower than the benchmark index for the 1-year and 3-year periods. |
| • | | The Board noted that the contractual management fee and the actual management fee were in the 1st quintile of the expense group and the actual total expenses were in the 2nd quintile of the expense group. |
Guardian International Growth VIP Fund
| • | | The Board noted that the Fund’s performance was in the 4th quintile of its performance universe for the 1-year period, in the 2nd quintile of its performance universe for the 3-year period and in the 3rd quintile of its performance universe for the 5-year period. The Board also noted that the Fund’s performance was lower than the benchmark index for the 1-year and 5-year periods. The Board noted that the Fund’s performance was higher than the benchmark index for the 3-year period. |
| • | | The Board noted that the contractual management fee and actual management fee were in the 2nd quintile of the expense group and that the actual total expenses were in the 3rd quintile. |
Guardian International Equity VIP Fund
| • | | The Board noted that the Fund’s performance was in the 5th quintile of its performance universe for the 1-year, 3-year and 5-year periods. The Board also noted that the Fund’s performance was lower than |
| | | the benchmark index for the 1-year, 3-year and 5-year periods. |
| • | | The Board noted that the contractual management fee, the actual management fee and the actual total expenses were in the 2nd quintile of the expense group. |
Guardian Global Utilities VIP Fund
| • | | The Board noted that the Fund’s performance was in the 5th quintile of its performance universe for the 1-year period and in the 4th quintile of its performance universe for the 3-year period. The Board noted that the Fund’s performance was higher than the benchmark index for the 1-year and 3-year periods. |
| • | | The Board noted that the contractual management fee and the actual management fee were in the 1st quintile of the expense group and the actual total expenses were in the 2nd quintile of the expense group. |
Guardian Balanced Allocation VIP Fund
| • | | The Board noted that the Fund had less than one-year of operational history and was not able to evaluate an investment performance record for the Fund. The Board noted that it would have an opportunity to review such information in connection with future annual reviews. The Board noted that, in the meantime, it received monthly performance reports from the Manager. |
| • | | The Board noted that the contractual management fee, the actual management fee and actual total expenses were in the 1st quintile of the expense group. |
Guardian Core Plus Fixed Income VIP Fund
| • | | The Board noted that the Fund’s performance was in the 3rd quintile of its performance universe for the 1-year and 3-year periods and in the 4th quintile of its performance universe for the 5-year period. The Board also noted that the Fund’s performance was lower than the benchmark index for the 1-year and 5-year periods. The Board noted that the Fund’s performance was in line with the benchmark index for the 3-year period. |
| • | | The Board noted that the contractual management fee and actual management fee were in the 2nd quintile of the expense group and that actual total expenses were in the 3rd quintile. |
SUPPLEMENTAL INFORMATION (UNAUDITED)
Guardian Total Return Bond VIP Fund
| • | | The Board noted that the Fund’s performance was in the 5th quintile of its performance universe for the 1-year and 3-year periods. The Board also noted that the Fund’s performance was lower than the benchmark index for the 1-year and 3-year periods. |
| • | | The Board noted that the contractual management fee and actual management fee were in the 2nd quintile and the actual total expenses were in the 3rd quintile. |
Guardian Core Fixed Income VIP Fund
| • | | The Board noted that the Fund had less than one-year of operational history and was not able to evaluate an investment performance record for the Fund. The Board noted that it would have an opportunity to review such information in connection with future annual reviews. The Board noted that, in the meantime, it received monthly performance reports from the Manager. |
| • | | The Board noted that the contractual management fee was in the 2nd quintile of the expense group and the actual management fee and the actual total expenses were in the 1st quintile. |
Guardian Multi-Sector Bond VIP Fund
| • | | The Board noted that the Fund’s performance was in the 5th quintile of its performance universe for the 1-year and 3-year periods The Board also noted that the Fund’s performance was lower than the benchmark index for the 1-year and 3-year periods. |
| • | | The Board noted that the contractual management fee and actual total expenses were in the 1st quintile and the actual management fee was in the 2nd quintile. |
Guardian Short Duration Bond VIP Fund
| • | | The Board noted that the Fund had less than one-year of operational history and was not able to evaluate an investment performance record for the Fund. The Board noted that it would have an opportunity to review such information in connection with future annual reviews. The Board noted that, in the meantime, it received monthly performance reports from the Manager. |
| • | | The Board noted that the contractual management fee and actual total expenses were in the 3rd quintile of the expense group and the actual management fee was in the 1st quintile of the expense group. |
Guardian U.S. Government Securities VIP Fund
| • | | The Board noted that the Fund’s performance was in the 1st quintile of its performance universe for the 1-year period and in the 2nd quintile of its performance universe for the 3-year period. The Board also noted that the Fund’s performance was higher than the benchmark index for the 1-year and 3-year periods. |
| • | | The Board noted that the contractual management fee and the actual management fee were in the 1st quintile of the expense group and the actual total expenses were in the 2nd quintile of the expense group. |
Conclusion
Based on a comprehensive consideration and evaluation of all of the information and factors summarized above, among others, the Board as a whole, including the Independent Trustees, approved the Agreements.
SUPPLEMENTAL INFORMATION (UNAUDITED)
Guardian Large Cap Fundamental Growth VIP Fund Approval of Sub-Advisory Agreement
Section 15(c) of the Investment Company Act of 1940, as amended (the “1940 Act”), requires that a fund’s investment advisory and sub-advisory agreements be approved initially by the fund’s board of trustees. Section 15(c) also requires that the continuation of these agreements, after an initial term of up to two years, be annually reviewed and approved by the board. Any such agreement must be approved by a vote of a majority of the trustees who are not parties to the agreement or “interested persons” (as defined in the 1940 Act) of a party to the agreement at a meeting of the board called for the purpose of voting on such approval.
At a meeting of the Board of Trustees (the “Board”) of Guardian Variable Products Trust (the “Trust”) held on March 29-30, 2023 (the “March Meeting”), the Board, including the trustees who are not parties to the agreement or “interested persons” as defined in the 1940 Act (the “Independent Trustees”), considered and voted unanimously to approve the proposed sub-advisory agreement (the “Sub-Advisory Agreement”) between Park Avenue Institutional Advisers LLC (the “Manager”) and FIAM LLC (the “Sub-Adviser”) to serve as sub-adviser to Guardian Large Cap Fundamental Growth VIP Fund (the “Fund”) for an initial term of two years.
The Board is responsible for overseeing the management of the Fund. In determining whether to approve the Sub-Advisory Agreement, the Trustees evaluated information and factors that they considered to be relevant and appropriate through the exercise of their own business judgment. The Trustees considered certain information and factors in light of advice furnished to them by legal counsel to the Trust and, in the case of the Independent Trustees, their independent legal counsel. In advance of the March Meeting, the Trustees received materials and information designed to assist their consideration of the Sub-Advisory Agreement. At an Investment Committee meeting held on February 13, 2023 (the “February Meeting”), the Board received a presentation from the Sub-Adviser regarding the services to be rendered to the Fund. The Manager also discussed proposed changes to the Fund’s principal investment strategies. The Trustees received written responses from the Sub-Adviser to a series of questions and requests for information covering a wide variety of topics provided by independent counsel on behalf of the Independent Trustees. The Trustees also received materials and information regarding the legal standards applicable to
their consideration of the Sub-Advisory Agreement and the process and criteria used by the Manager to identify and select the Sub-Adviser.
During the course of their deliberations at the February and March Meetings, the Independent Trustees met to discuss and evaluate the Sub-Advisory Agreement in executive session with their independent legal counsel, outside of the presence of the Trustees who are not Independent Trustees and representatives from Fund management, the Manager or the Sub-Adviser.
In reaching its decisions to approve the Sub-Advisory Agreement, the Board took into account the materials and information described above as well as other materials and information provided to the Board and discussed with and among the Trustees. Individual Trustees may have given different weight to different factors and information with respect to the Sub-Advisory Agreement, and the Trustees did not identify any single factor or information that, in isolation, would be controlling in deciding to approve the Sub-Advisory Agreement. The discussion below is intended to summarize the broad factors that figured prominently in the Board’s decisions to approve the Sub-Advisory Agreement rather than to be all-inclusive. These broad factors included: (i) the nature, extent and quality of the services to be provided to the Fund by the Sub-Adviser; (ii) the investment performance of a fund managed by the Sub-Adviser with strategies similar to the Fund; (iii) the fees to be charged; (iv) the extent to which economies of scale may in the future exist for the Fund, and the extent to which the Fund may benefit from future economies of scale; and (v) any other benefits anticipated to be derived by the Sub-Adviser (or its affiliates) from its relationships with the Fund.
Nature, Extent and Quality of Services
The Trustees considered information regarding the nature, extent and quality of services to be provided to the Fund by the Sub-Adviser. The Trustees also considered, among other things, the terms of the Sub-advisory Agreement and the range of investment advisory services to be provided by the Sub-Adviser under the oversight of the Manager. In evaluating the investment advisory services, the Trustees considered, among other things, the Sub-Adviser’s investment philosophy, style and process and approach to managing risk. The Trustees also considered information regarding a fund managed by the Sub-Adviser with similar strategies as the Fund, including performance and portfolio characteristics. The Trustees received and evaluated information regarding the background, education, expertise and/or experience
SUPPLEMENTAL INFORMATION (UNAUDITED)
of the investment professionals that would serve as portfolio managers for the Fund and the capabilities, resources and reputation of the Sub-Adviser.
Based upon these considerations, the Board concluded, within the context of their full deliberations, that the nature, extent and quality of services to be provided to the Fund by the Sub-Adviser were appropriate.
Investment Performance
Because the Sub-Adviser is new to the Fund, the Board was not able to evaluate an investment performance record for the Fund with respect to the Sub-Adviser. The Board did consider the Sub-Adviser’s performance history with respect to a similarly-managed fund. While there was no historical Sub-Adviser performance information with respect to the Fund for review, the Board noted that it would have an opportunity to review such information in connection with future annual reviews of the Sub-Advisory Agreement.
Costs and Profitability
The Trustees considered the proposed sub-advisory fees to be paid under the Sub-Advisory Agreement and evaluated the reasonableness of the fees, which were lower than the fees charged by the current Sub-Adviser for the Fund. The Trustees considered that the fees to be paid to the Sub-Adviser would be paid by the Manager and not the Fund and that the Manager had negotiated the fees with the Sub-Adviser at arm’s-length.
The Trustees did not request or consider any projected profitability information from the Sub-Adviser because the Manager would be responsible for payment of the
sub-advisory fees and had negotiated the fees with the Sub-Adviser at arm’s-length.
Based on the consideration of the information and factors summarized above, as well as other relevant information and factors, the Trustees concluded that the proposed sub-advisory fees were reasonable in light of the nature, extent and quality of services expected to be rendered to the Fund by the Sub-Adviser.
Economies of Scale
The Trustees concluded that it was appropriate to revisit potential economies of scale in connection with future reviews of the Sub-Advisory Agreement or earlier if warranted.
Ancillary Benefits
The Trustees considered the potential benefits, other than the sub-advisory fee, that the Sub-Adviser and its affiliates may receive because of their relationships with the Fund, including the ability to use soft dollars consistent with Trust policies and other benefits from increases in assets under management. The Trustees concluded that the benefits that may accrue to the Sub-Adviser and its affiliates are consistent with those expected for a Sub-Adviser to a mutual fund such as the Fund.
Conclusion
Based on a comprehensive consideration and evaluation of all of the information and factors summarized above, among others, the Board as a whole, including the Independent Trustees, approved the Sub-Advisory Agreement.
SUPPLEMENTAL INFORMATION (UNAUDITED)
The Statement of Additional Information (“SAI”) includes additional information about the Trust’s Trustees and Officers and is available, without charge, upon request by calling toll-free 1-888-GUARDIAN (1-888-482-7342) or by visiting our website at http://guardianvpt.onlineprospectus.net/GuardianVPT/Prospectuses.
Portfolio Holdings and Proxy Voting Procedures
The Fund files its complete schedule of portfolio holdings with the Securities and Exchange Commission for the first and third quarters of each fiscal year as an exhibit to its reports on Form N-PORT. The Fund’s Form N-PORT reports are available on the Securities and Exchange Commission’s website at https://www.sec.gov. The Fund’s Form N-PORT information is also available, without charge, upon request, by calling toll-free 1-888-GUARDIAN (1-888-482-7342) or by visiting our website at http://guardianvpt.onlineprospectus.net/GuardianVPT/Prospectuses.
A description of the policies and procedures that the Fund uses to determine how to vote proxies relating to portfolio securities is included in the SAI. The SAI and information regarding how the Fund voted proxies relating to portfolio securities during the most recent 12-month period ended June 30 may be obtained (i) without charge, upon request, by calling toll-free 1-888-GUARDIAN (1-888-482-7342) or by visiting our website at http://guardianvpt.onlineprospectus.net/GuardianVPT/Prospectuses; and (ii) on the Securities and Exchange Commission’s website at https://www.sec.gov.
This report is transmitted to shareholders only. It is not authorized for use as an offer of sale or a solicitation of an offer to buy shares of the Fund unless accompanied or preceded by the Fund’s current prospectus. Past performance results shown in this report should not be considered a representation of future performance. Investment returns and principal value of shares will fluctuate so that shares, when redeemed, may be worth more or less than their original cost. Statements and other information herein are as dated and are subject to change.

The Guardian Life Insurance Company of America New York, NY 10001-2159
PUB8175
Guardian Variable
Products Trust
2023
Semiannual Report
All Data as of June 30, 2023
Guardian Mid Cap Relative Value VIP Fund

| | |
| Not FDIC insured. May lose value. No bank guarantee. | | www.guardianlife.com |
TABLE OF CONTENTS
Guardian Mid Cap Relative Value VIP Fund
Except as otherwise specifically stated, all information, including portfolio security positions, is as of June 30, 2023. Fund holdings will vary. Information contained herein has been obtained from sources believed reliable, but is not guaranteed.
GUARDIAN MID CAP RELATIVE VALUE VIP FUND
Fund Characteristics (unaudited)
| | |
| Total Net Assets: $171,758,185 | | |
|
| |
Sector Allocation1 As of June 30, 2023 |
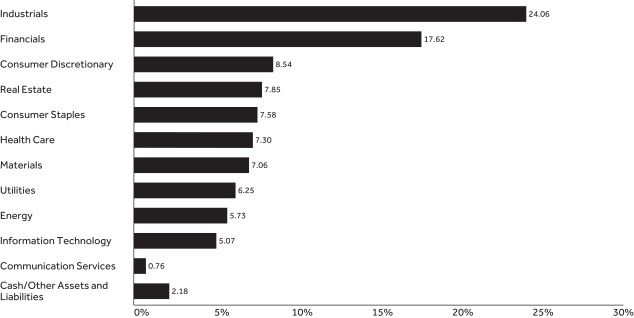 |
| | | | |
| |
Top Ten Holdings2 As of June 30, 2023 | |
| | |
| Holding | | % of Total
Net Assets | |
| Vulcan Materials Co. | | | 3.60% | |
| Republic Services, Inc. | | | 3.55% | |
| AerCap Holdings NV | | | 3.42% | |
| LKQ Corp. | | | 3.26% | |
| Amdocs Ltd. | | | 3.20% | |
| Carlisle Cos., Inc. | | | 3.18% | |
| Jacobs Solutions, Inc. | | | 3.05% | |
| MasTec, Inc. | | | 3.02% | |
| CBRE Group, Inc., Class A | | | 2.84% | |
| Arch Capital Group Ltd. | | | 2.84% | |
| Total | | | 31.96% | |
| 1 | The Fund’s holdings are allocated to each sector based on the MSCI Global Industry Classification Standard (GICS®). Cash includes short-term investments and net other assets and liabilities. |
| 2 | Portfolio holdings are subject to change and should not be considered a recommendation to buy or sell individual securities. |
UNDERSTANDING YOUR FUND’S EXPENSES (UNAUDITED)
By investing in the Fund, you incur two types of costs: (1) transaction costs and (2) ongoing costs, including, as applicable, investment advisory fees, distribution and/or service (12b-1) fees and other Fund expenses. The example below is intended to help you understand your ongoing costs (in dollars) of investing in the Fund and to compare these costs with the ongoing costs of investing in other mutual funds.
The example is based on an investment of $1,000 invested at the beginning of the period and held for the entire period from January 1, 2023 to June 30, 2023. The table below shows the Fund’s expenses in two ways:
Expenses based on actual return
This section of the table provides information about actual account values and actual expenses. You may use the information in this section, together with the amount you invested, to estimate the expenses that you paid over the period. Simply divide your account value by $1,000 (for example, an $8,600 account value divided by $1,000 = 8.6), then multiply the result by the number in the section under the heading entitled “Expenses Paid During Period” to estimate the expenses you paid on your account during this period.
Expenses based on hypothetical 5% return for comparison purposes
This section of the table provides information about hypothetical account values and hypothetical expenses based on the Fund’s actual expense ratio and an assumed rate of return of 5% per year before expenses, which is not the Fund’s actual return. The hypothetical account values and expenses may not be used to estimate the actual ending account balance or expenses you paid for the period. You may use this information to compare the ongoing costs of investing in the Fund with the cost of investing in other mutual funds. To do so, compare this 5% hypothetical example with the 5% hypothetical examples that appear in the shareholder reports of the other funds.
Note that the expenses shown in the table are meant to highlight your ongoing costs only and do not reflect any transactional costs, such as sales charges (loads), redemption fees, or exchange fees. Therefore the second section is useful in comparing ongoing costs only, and will not help you determine the relative total costs of owning different funds. If these transactional costs were included, your costs would have been higher. Charges and expenses at the insurance company separate account level are not reflected in the table.
| | | | | | | | | | | | | | |
| | | | | |
| | | Beginning
Account Value 1/1/23 | | Ending Account Value
6/30/23 | | | Expenses Paid During Period* 1/1/23-6/30/23 | | | Expense Ratio During Period 1/1/23-6/30/23 | |
| Based on Actual Return | | $1,000.00 | | $ | 1,060.40 | | | $ | 5.47 | | | | 1.07% | |
Based on Hypothetical Return (5% Return Before Expenses) | | $1,000.00 | | $ | 1,019.49 | | | $ | 5.36 | | | | 1.07% | |
| * | Expenses are equal to the Fund’s annualized expense ratio as indicated, multiplied by the average account value over the period, multiplied by 181/365 (to reflect the one-half year period). |
SCHEDULE OF INVESTMENTS — GUARDIAN MID CAP RELATIVE VALUE VIP FUND
| | | | | | | | |
| June 30, 2023 (unaudited) | | Shares | | | Value | |
| Common Stocks – 97.8% | | | | | | | | |
| | | |
| Aerospace & Defense – 2.0% | | | | | | | | |
| | | |
L3Harris Technologies, Inc. | | | 17,421 | | | $ | 3,410,509 | |
| | | | | | | | | |
| | | |
| | | | | | | | 3,410,509 | |
| Automobile Components – 0.9% | | | | | |
| | | |
Aptiv PLC(1) | | | 15,445 | | | | 1,576,780 | |
| | | | | | | | | |
| | | |
| | | | | | | | 1,576,780 | |
| Banks – 2.7% | | | | | |
| | | |
Citizens Financial Group, Inc. | | | 16,437 | | | | 428,677 | |
| | | |
Fifth Third Bancorp | | | 104,148 | | | | 2,729,719 | |
| | | |
Regions Financial Corp. | | | 87,650 | | | | 1,561,923 | |
| | | | | | | | | |
| | | |
| | | | | | | | 4,720,319 | |
| Beverages – 2.5% | | | | | |
| | | |
Keurig Dr Pepper, Inc. | | | 136,930 | | | | 4,281,801 | |
| | | | | | | | | |
| | | |
| | | | | | | | 4,281,801 | |
| Building Products – 3.2% | | | | | |
| | | |
Carlisle Cos., Inc. | | | 21,328 | | | | 5,471,272 | |
| | | | | | | | | |
| | | |
| | | | | | | | 5,471,272 | |
| Chemicals – 1.2% | | | | | |
| | | |
Ashland, Inc. | | | 109 | | | | 9,473 | |
| | | |
Huntsman Corp. | | | 76,769 | | | | 2,074,299 | |
| | | | | | | | | |
| | | |
| | | | | | | | 2,083,772 | |
| Commercial Services & Supplies – 3.5% | | | | | |
| | | |
Republic Services, Inc. | | | 39,854 | | | | 6,104,437 | |
| | | | | | | | | |
| | | |
| | | | | | | | 6,104,437 | |
| Construction & Engineering – 4.1% | | | | | |
| | | |
API Group Corp.(1) | | | 67,107 | | | | 1,829,337 | |
| | | |
MasTec, Inc.(1) | | | 43,922 | | | | 5,181,478 | |
| | | | | | | | | |
| | | |
| | | | | | | | 7,010,815 | |
| Construction Materials – 3.6% | | | | | |
| | | |
Vulcan Materials Co. | | | 27,446 | | | | 6,187,426 | |
| | | | | | | | | |
| | | |
| | | | | | | | 6,187,426 | |
| Consumer Finance – 0.7% | | | | | |
| | | |
Discover Financial Services | | | 10,291 | | | | 1,202,503 | |
| | | | | | | | | |
| | | |
| | | | | | | | 1,202,503 | |
| Containers & Packaging – 0.8% | | | | | |
| | | |
AptarGroup, Inc. | | | 11,497 | | | | 1,332,042 | |
| | | | | | | | | |
| | | |
| | | | | | | | 1,332,042 | |
| Distributors – 3.3% | | | | | |
| | | |
LKQ Corp. | | | 95,994 | | | | 5,593,570 | |
| | | | | | | | | |
| | | |
| | | | | | | | 5,593,570 | |
| Electric Utilities – 4.5% | | | | | |
| | | |
American Electric Power Co., Inc. | | | 46,320 | | | | 3,900,144 | |
| | | |
FirstEnergy Corp. | | | 97,279 | | | | 3,782,208 | |
| | | | | | | | | |
| | | |
| | | | | | | | 7,682,352 | |
| Energy Equipment & Services – 1.5% | | | | | |
| | | |
Baker Hughes Co. | | | 56,891 | | | | 1,798,325 | |
| | | |
NOV, Inc. | | | 46,125 | | | | 739,845 | |
| | | | | | | | | |
| | | |
| | | | | | | | 2,538,170 | |
| | | | | | | | |
| June 30, 2023 (unaudited) | | Shares | | | Value | |
| Financial Services – 2.4% | | | | | |
| | | |
Euronet Worldwide, Inc.(1) | | | 35,156 | | | $ | 4,126,260 | |
| | | |
Pershing Square Tontine Holdings Ltd.(1)(2)(3) | | | 125,172 | | | | 0 | |
| | | | | | | | | |
| | | |
| | | | | | | | 4,126,260 | |
| Ground Transportation – 1.0% | | | | | |
| | | |
Knight-Swift Transportation Holdings, Inc. | | | 29,709 | | | | 1,650,632 | |
| | | | | | | | | |
| | | |
| | | | | | | | 1,650,632 | |
| Health Care Equipment & Supplies – 5.6% | | | | | |
| | | |
Alcon, Inc. | | | 56,165 | | | | 4,611,708 | |
| | | |
Teleflex, Inc. | | | 6,873 | | | | 1,663,472 | |
| | | |
Zimmer Biomet Holdings, Inc. | | | 22,665 | | | | 3,300,024 | |
| | | | | | | | | |
| | | |
| | | | | | | | 9,575,204 | |
| Hotels, Restaurants & Leisure – 2.0% | | | | | |
| | | |
Wendy’s Co. | | | 55,382 | | | | 1,204,559 | |
| | | |
Yum China Holdings, Inc. | | | 40,190 | | | | 2,270,735 | |
| | | | | | | | | |
| | | |
| | | | | | | | 3,475,294 | |
| Household Durables – 1.0% | | | | | |
| | | |
D.R. Horton, Inc. | | | 13,619 | | | | 1,657,296 | |
| | | | | | | | | |
| | | |
| | | | | | | | 1,657,296 | |
| Household Products – 5.1% | | | | | |
| | | |
Church & Dwight Co., Inc. | | | 44,489 | | | | 4,459,132 | |
| | | |
Reynolds Consumer Products, Inc. | | | 151,262 | | | | 4,273,152 | |
| | | | | | | | | |
| | | |
| | | | | | | | 8,732,284 | |
| Insurance – 9.5% | | | | | |
| | | |
Allstate Corp. | | | 35,862 | | | | 3,910,392 | |
| | | |
Arch Capital Group Ltd.(1) | | | 65,085 | | | | 4,871,612 | |
| | | |
Axis Capital Holdings Ltd. | | | 12,415 | | | | 668,299 | |
| | | |
Brown & Brown, Inc. | | | 67,271 | | | | 4,630,936 | |
| | | |
Loews Corp. | | | 38,999 | | | | 2,315,761 | |
| | | | | | | | | |
| | | |
| | | | | | | | 16,397,000 | |
| Interactive Media & Services – 0.8% | | | | | |
| | | |
Match Group, Inc.(1) | | | 31,364 | | | | 1,312,583 | |
| | | | | | | | | |
| | | |
| | | | | | | | 1,312,583 | |
| IT Services – 3.2% | | | | | |
| | | |
Amdocs Ltd. | | | 55,671 | | | | 5,503,078 | |
| | | | | | | | | |
| | | |
| | | | | | | | 5,503,078 | |
| Life Sciences Tools & Services – 1.7% | | | | | |
| | | |
Charles River Laboratories International, Inc.(1) | | | 14,091 | | | | 2,962,633 | |
| | | | | | | | | |
| | | |
| | | | | | | | 2,962,633 | |
| Machinery – 2.2% | | | | | |
| | | |
Donaldson Co., Inc. | | | 35,950 | | | | 2,247,234 | |
| | | |
Gates Industrial Corp. PLC(1) | | | 116,300 | | | | 1,567,724 | |
| | | | | | | | | |
| | | |
| | | | | | | | 3,814,958 | |
| Metals & Mining – 1.5% | | | | | |
| | | |
Freeport-McMoRan, Inc. | | | 62,897 | | | | 2,515,880 | |
| | | | | | | | | |
| | | |
| | | | | | | | 2,515,880 | |
| | | | |
| The accompanying notes are an integral part of these financial statements. | | | | 3 |
SCHEDULE OF INVESTMENTS — GUARDIAN MID CAP RELATIVE VALUE VIP FUND
| | | | | | | | |
| June 30, 2023 (unaudited) | | Shares | | | Value | |
| Mortgage REITs – 2.2% | |
| | | |
Annaly Capital Management, Inc. | | | 190,886 | | | $ | 3,819,629 | |
| | | | | | | | | |
| | | |
| | | | | | | | 3,819,629 | |
| Office REITs – 1.6% | | | | | |
| | | |
Boston Properties, Inc. | | | 47,280 | | | | 2,722,855 | |
| | | | | | | | | |
| | | |
| | | | | | | | 2,722,855 | |
| Oil, Gas & Consumable Fuels – 4.2% | |
| | | |
Devon Energy Corp. | | | 36,048 | | | | 1,742,560 | |
| | | |
EOG Resources, Inc. | | | 22,833 | | | | 2,613,009 | |
| | | |
Targa Resources Corp. | | | 6,851 | | | | 521,361 | |
| | | |
Valero Energy Corp. | | | 20,654 | | | | 2,422,714 | |
| | | | | | | | | |
| | | |
| | | | | | | | 7,299,644 | |
| Professional Services – 3.9% | | | | | |
| | | |
Dun & Bradstreet Holdings, Inc. | | | 126,518 | | | | 1,463,813 | |
| | | |
Jacobs Solutions, Inc. | | | 44,041 | | | | 5,236,035 | |
| | | | | | | | | |
| | | |
| | | | | | | | 6,699,848 | |
| Real Estate Management & Development – 2.8% | |
| | | |
CBRE Group, Inc., Class A(1) | | | 60,446 | | | | 4,878,597 | |
| | | | | | | | | |
| | | |
| | | | | | | | 4,878,597 | |
| Semiconductors & Semiconductor Equipment – 0.9% | |
| | | |
ON Semiconductor Corp.(1) | | | 12,186 | | | | 1,152,552 | |
| | | |
Teradyne, Inc. | | | 3,928 | | | | 437,304 | |
| | | | | | | | | |
| | | |
| | | | | | | | 1,589,856 | |
| Software – 0.9% | | | | | |
| | | |
Synopsys, Inc.(1) | | | 3,720 | | | | 1,619,725 | |
| | | | | | | | | |
| | | |
| | | | | | | | 1,619,725 | |
| Specialized REITs – 3.4% | | | | | |
| | | |
CubeSmart | | | 29,594 | | | | 1,321,668 | |
| | | |
Gaming and Leisure Properties, Inc. | | | 58,683 | | | | 2,843,778 | |
| | | |
Weyerhaeuser Co. | | | 51,332 | | | | 1,720,136 | |
| | | | | | | | | |
| | | |
| | | | | | | | 5,885,582 | |
| Specialty Retail – 1.4% | | | | | |
| | | |
Foot Locker, Inc. | | | 30,929 | | | | 838,485 | |
| | | |
RH(1) | | | 4,609 | | | | 1,519,081 | |
| | | | | | | | | |
| | | |
| | | | | | | | 2,357,566 | |
| Trading Companies & Distributors – 4.2% | | | | | |
| | | |
AerCap Holdings NV(1) | | | 92,425 | | | | 5,870,836 | |
| | | |
Ferguson PLC | | | 8,184 | | | | 1,287,425 | |
| | | | | | | | | |
| | | |
| | | | | | | | 7,158,261 | |
| Water Utilities – 1.8% | | | | | |
| | | |
American Water Works Co., Inc. | | | 21,394 | | | | 3,053,994 | |
| | | | | | | | | |
| | | |
| | | | | | | | 3,053,994 | |
| | |
Total Common Stocks
(Cost $126,957,577) | | | | 168,004,427 | |
| Warrants – 0.0% | |
| | | |
Pershing Square Tontine Holdings Ltd.(1)(2) | | | 14,344 | | | | 0 | |
| | | | | | | | | |
| | |
Total Warrants
(Cost $0) | | | | 0 | |
| | | | | | | | |
| June 30, 2023 (unaudited) | | Principal
Amount | | | Value | |
| Repurchase Agreements – 2.1% | |
| | | |
Fixed Income Clearing Corp., 1.52%, dated 6/30/2023, proceeds at maturity value of $3,523,755, due 7/3/2023(4) | | $ | 3,523,309 | | | $ | 3,523,309 | |
| | | |
Total Repurchase Agreements
(Cost $3,523,309) | | | | | | | 3,523,309 | |
| | | |
Total Investments – 99.9%
(Cost $130,480,886) | | | | | | | 171,527,736 | |
| | |
| Assets in excess of other liabilities – 0.1% | | | | 230,449 | |
| | | |
| Total Net Assets – 100.0% | | | | | | $ | 171,758,185 | |
| (1) | Non–income–producing security. |
| (2) | The table below presents securities deemed illiquid by the investment adviser. |
| | | | | | | | | | | | | | | | | | | | |
| Security | | Shares | | | Cost | | | Value | | | Acquisition
Date | | | % of Fund’s
Net Assets | |
| Pershing Square Tontine Holdings Ltd. | | | 125,172 | | | $ | 0 | | | $ | 0 | | | | 7/26/2022 | | | | 0.00 | % |
| Pershing Square Tontine Holdings Ltd. | | | 14,344 | | | | 0 | | | | 0 | | | | 7/26/2022 | | | | 0.00 | |
| (3) | Escrow interests represent beneficial interests in bankruptcy reorganizations or liquidation proceedings and may be subject to resale, redemption or transferability restrictions. The amount and timing of future payments, if any, cannot be predicted with certainty. |
| (4) | The table below presents collateral for repurchase agreements. |
| | | | | | | | | | | | | | | | |
| Security | | Coupon | | | Maturity Date | | | Principal Amount | | | Value | |
| U.S. Treasury Note | | | 4.625% | | | | 3/15/2026 | | | $ | 3,541,500 | | | $ | 3,593,829 | |
Legend:
REITs — Real Estate Investment Trusts
| | | | |
| 4 | | | | The accompanying notes are an integral part of these financial statements. |
SCHEDULE OF INVESTMENTS — GUARDIAN MID CAP RELATIVE VALUE VIP FUND
The following is a summary of the inputs used as of June 30, 2023 in valuing the Fund’s investments. For more information on valuation inputs, please refer to Note 2a of the accompanying Notes to Financial Statements.
| | | | | | | | | | | | | | | | |
| | | Valuation Inputs | | | | |
| Investments in Securities (unaudited) | | Level 1 | | | Level 2 | | | Level 3 | | | Total | |
| Common Stocks | | $ | 168,004,427 | | | $ | — | | | $ | — | | | $ | 168,004,427 | |
| Warrants | | | — | | | | 0 | | | | — | | | | 0 | |
| Repurchase Agreements | | | — | | | | 3,523,309 | | | | — | | | | 3,523,309 | |
| Total | | $ | 168,004,427 | | | $ | 3,523,309 | | | $ | — | | | $ | 171,527,736 | |
| | | | |
| The accompanying notes are an integral part of these financial statements. | | | | 5 |
FINANCIAL INFORMATION — GUARDIAN MID CAP RELATIVE VALUE VIP FUND
| | | | |
Statement of Assets and Liabilities As of June 30, 2023 (unaudited) | | | |
Assets | | | | |
| | |
Investments, at value | | $ | 171,527,736 | |
| | |
Receivable for investments sold | | | 785,683 | |
| | |
Dividends/interest receivable | | | 355,850 | |
| | |
Foreign tax reclaims receivable | | | 4,341 | |
| | |
Prepaid expenses | | | 2,061 | |
| | | | | |
| | |
Total Assets | | | 172,675,671 | |
| | | | | |
| | |
Liabilities | | | | |
| | |
Payable for investments purchased | | | 608,326 | |
| | |
Payable for fund shares redeemed | | | 124,293 | |
| | |
Investment advisory fees payable | | | 96,445 | |
| | |
Distribution fees payable | | | 34,453 | |
| | |
Accrued audit fees | | | 13,978 | |
| | |
Accrued custodian and accounting fees | | | 11,005 | |
| | |
Accrued trustees’ and officers’ fees | | | 3,804 | |
| | |
Accrued expenses and other liabilities | | | 25,182 | |
| | | | | |
| | |
Total Liabilities | | | 917,486 | |
| | | | | |
| | |
Total Net Assets | | $ | 171,758,185 | |
| | | | | |
| | |
Net Assets Consist of: | | | | |
| | |
Paid-in capital | | $ | 51,459,505 | |
| | |
Distributable earnings | | | 120,298,680 | |
| | | | | |
| | |
Total Net Assets | | $ | 171,758,185 | |
| | | | | |
Investments, at Cost | | $ | 130,480,886 | |
| | | | | |
| | |
Pricing of Shares | | | | |
| | |
Shares of Beneficial Interest Outstanding with
No Par Value | | | 9,226,595 | |
| | |
Net Asset Value Per Share | | | $18.62 | |
| | | | | |
| | | | |
Statement of Operations For the Six Months Ended June 30, 2023 (unaudited) | |
Investment Income | | | | |
| | |
Dividends | | $ | 1,681,565 | |
| | |
Interest | | | 37,251 | |
| | |
Withholding taxes on foreign dividends | | | (4,485 | ) |
| | | | | |
| | |
Total Investment Income | | | 1,714,331 | |
| | | | | |
| | |
Expenses | | | | |
| | |
Investment advisory fees | | | 587,640 | |
| | |
Distribution fees | | | 210,017 | |
| | |
Professional fees | | | 30,224 | |
| | |
Trustees’ and officers’ fees | | | 22,073 | |
| | |
Custodian and accounting fees | | | 16,986 | |
| | |
Administrative fees | | | 15,607 | |
| | |
Transfer agent fees | | | 7,075 | |
| | |
Shareholder reports | | | 5,043 | |
| | |
Other expenses | | | 4,862 | |
| | | | | |
| | |
Total Expenses | | | 899,527 | |
| | | | | |
| | |
Net Investment Income/(Loss) | | | 814,804 | |
| | | | | |
| | |
Realized Gain/(Loss) and Change in Unrealized Appreciation/(Depreciation) on Investments | | | | |
| | |
Net realized gain/(loss) from investments | | | 5,256,447 | |
| | |
Net change in unrealized appreciation/(depreciation) on investments | | | 4,119,658 | |
| | | | | |
| | |
Net Gain on Investments | | | 9,376,105 | |
| | | | | |
| | |
Net Increase in Net Assets Resulting From Operations | | $ | 10,190,909 | |
| | | | | |
| | | | | |
| | | | |
| 6 | | | | The accompanying notes are an integral part of these financial statements. |
FINANCIAL INFORMATION — GUARDIAN MID CAP RELATIVE VALUE VIP FUND
| | | | | | | | |
Statements of Changes in Net Assets Six Months Ended Numbers are unaudited | | | | | | |
| | | |
| | | For the
Six Months Ended
6/30/23 | | | For the
Year Ended
12/31/22 | |
| | | | |
Operations | | | | | | | | |
| | | |
Net investment income/(loss) | | $ | 814,804 | | | $ | 1,619,436 | |
| | | |
Net realized gain/(loss) from investments | | | 5,256,447 | | | | 21,337,187 | |
| | | |
Net change in unrealized appreciation/(depreciation) on investments | | | 4,119,658 | | | | (35,212,513 | ) |
| | | | | | | | | |
| | | |
Net Increase/(Decrease) in Net Assets Resulting from Operations | | | 10,190,909 | | | | (12,255,890 | ) |
| | | | | | | | | |
| | | |
Capital Share Transactions | | | | | | | | |
| | | |
Proceeds from sales of shares | | | 7,162,202 | | | | 3,793,845 | |
| | | |
Cost of shares redeemed | | | (19,453,941 | ) | | | (54,742,262 | ) |
| | | | | | | | | |
| | | |
Net Decrease in Net Assets Resulting from Capital Share Transactions | | | (12,291,739 | ) | | | (50,948,417 | ) |
| | | | | | | | | |
| | | |
Net Decrease in Net Assets | | | (2,100,830 | ) | | | (63,204,307 | ) |
| | | | | | | | | |
| | | |
Net Assets | | | | | | | | |
| | | |
Beginning of period | | | 173,859,015 | | | | 237,063,322 | |
| | | | | | | | | |
| | | |
End of period | | $ | 171,758,185 | | | $ | 173,859,015 | |
| | | | | | | | | |
| | | |
Other Information: | | | | | | | | |
| | | |
Shares | | | | | | | | |
| | | |
Sold | | | 405,369 | | | | 220,840 | |
| | | |
Redeemed | | | (1,079,843 | ) | | | (3,167,374 | ) |
| | | | | | | | | |
| | | |
Net Decrease | | | (674,474 | ) | | | (2,946,534 | ) |
| | | | | | | | | |
| | | | | | | | | |
| | | | |
| The accompanying notes are an integral part of these financial statements. | | | | 7 |
FINANCIAL INFORMATION — GUARDIAN MID CAP RELATIVE VALUE VIP FUND
The Financial Highlights table is intended to help you understand the Fund’s financial performance for the past six reporting periods (or, if shorter, the period since inception). Certain information reflects financial results for a single Fund share. The total returns in the table represent the rate that an investor would have earned (or lost) on an investment in the Fund.
| | | | | | | | | | | | | | | | | | | | | | | | |
Financial Highlights Six Months Ended Numbers are unaudited | | | | | | | | | | | | | | | | |
| | | Per Share Operating Performance | | | | |
| | |
Net Asset Value,
Beginning of
Period | | | Net Investment
Income(1) | | | Net Realized
and Unrealized
Gain/(Loss) | | | Total
Operations | | | Net Asset
Value, End of
Period | | | Total
Return(2) | |
| | | | | | | |
Six Months Ended 6/30/23 | | $ | 17.56 | | | $ | 0.09 | | | $ | 0.97 | | | $ | 1.06 | | | $ | 18.62 | | | | 6.04% | (4) |
| | | | | | | |
Year Ended 12/31/22 | | | 18.45 | | | | 0.14 | | | | (1.03) | | | | (0.89) | | | | 17.56 | | | | (4.82)% | |
| | | | | | | |
Year Ended 12/31/21 | | | 14.32 | | | | 0.05 | | | | 4.08 | | | | 4.13 | | | | 18.45 | | | | 28.84% | |
| | | | | | | |
Year Ended 12/31/20 | | | 13.93 | | | | 0.09 | | | | 0.30 | | | | 0.39 | | | | 14.32 | | | | 2.80% | |
| | | | | | | |
Year Ended 12/31/19 | | | 10.28 | | | | 0.10 | | | | 3.55 | | | | 3.65 | | | | 13.93 | | | | 35.51% | |
| | | | | | | |
Year Ended 12/31/18 | | | 12.02 | | | | 0.08 | | | | (1.82) | | | | (1.74) | | | | 10.28 | | | | (14.48)% | |
| | | | |
| 8 | | | | The accompanying notes are an integral part of these financial statements. |
FINANCIAL INFORMATION — GUARDIAN MID CAP RELATIVE VALUE VIP FUND
| | | | | | | | | | | | | | | | | | | | | | |
| |
| Ratios/Supplemental Data | |
Net Assets, End
of Period (000s) | | | Net Ratio of
Expenses to
Average Net Assets(3) | | | Gross Ratio of
Expenses to
Average Net
Assets | | | Net Ratio of Net
Investment Income
to Average
Net Assets(3) | | | Gross Ratio of Net
Investment Income
to Average
Net Assets | | | Portfolio
Turnover Rate | |
| | | | | |
| $ | 171,758 | | | | 1.07%(4) | | | | 1.07%(4) | | | | 0.97%(4) | | | | 0.97%(4) | | | | 14% | (4) |
| | | | | |
| | 173,859 | | | | 1.05% | | | | 1.05% | | | | 0.83% | | | | 0.83% | | | | 24% | |
| | | | | |
| | 237,063 | | | | 1.05% | | | | 1.05% | | | | 0.32% | | | | 0.32% | | | | 31% | |
| | | | | |
| | 244,930 | | | | 1.06% | | | | 1.11% | | | | 0.70% | | | | 0.65% | | | | 56% | |
| | | | | |
| | 235,342 | | | | 1.00% | | | | 1.10% | | | | 0.83% | | | | 0.73% | | | | 37% | |
| | | | | |
| | 204,185 | | | | 1.00% | | | | 1.14% | | | | 0.66% | | | | 0.52% | | | | 31% | |
| (1) | Calculated based on the average shares outstanding during the period. |
| (2) | Total returns do not reflect the effects of charges deducted pursuant to the terms of The Guardian Insurance & Annuity Company, Inc.’s variable contracts. Inclusion of such charges would reduce the total returns for all periods shown. |
| (3) | Net Ratio of Expenses to Average Net Assets and Net Ratio of Net Investment Income to Average Net Assets include the effect of fee waivers, expense limitations, and recoupments, if any. |
| (4) | Ratios for periods less than one year have been annualized, except for total return and portfolio turnover rate. |
| | | | |
| The accompanying notes are an integral part of these financial statements. | | | | 9 |
NOTES TO FINANCIAL STATEMENTS — GUARDIAN MID CAP RELATIVE VALUE VIP FUND
June 30, 2023 (unaudited)
1. Organization
Guardian Variable Products Trust (the “Trust”), a Delaware statutory trust organized on January 12, 2016, is registered under the Investment Company Act of 1940, as amended (the “1940 Act”), as an open-end management investment company. The Trust currently has twenty-four series. Guardian Mid Cap Relative Value VIP Fund (the “Fund”) is a series of the Trust. The Fund is a diversified fund and commenced operations on September 1, 2016. The financial statements for other series of the Trust are presented in separate reports.
The Trust has authorized an unlimited number of shares of beneficial interest with no par value. Shares are bought and sold at closing net asset value (“NAV”). Shares of the Fund are only sold to certain separate accounts of The Guardian Insurance & Annuity Company, Inc. (“GIAC”) that fund certain variable annuity contracts and variable life insurance policies issued by GIAC. GIAC is a wholly-owned subsidiary of The Guardian Life Insurance Company of America (“Guardian Life”).
The Fund seeks long-term capital appreciation.
2. Significant Accounting Policies
The following is a summary of significant accounting policies followed by the Fund in the preparation of its financial statements. The Fund follows the investment company accounting and reporting guidance of the Financial Accounting Standards Board (“FASB”) Accounting Standards Codification Topic 946 Financial Services – Investment Companies. The following policies are in conformity with accounting principles generally accepted in the United States of America (“GAAP”). The preparation of financial statements in accordance with GAAP requires management to make estimates and assumptions that affect the reported amounts and disclosures in the financial statements. Actual results could differ from those estimates.
a. Investment Valuations The Board of Trustees has designated Park Avenue Institutional Advisers LLC (“Park Avenue”) as the valuation designee for the Fund pursuant to Rule 2a-5 under the 1940 Act. Park Avenue has established a Fair Valuation Committee and has adopted fair valuation procedures that provide methodologies for fair valuing securities. These procedures include monitoring the appropriateness of fair values based on results of ongoing valuation oversight, including but not limited to consideration of
security specific events, market events, and pricing vendor and broker-dealer due diligence. The Fair Valuation Committee oversees and carries out the policies for the valuation of investments held in the Fund. The Fair Valuation Committee is responsible for discussing and assessing the potential impacts to the fair values on an ongoing basis, and reports to the Board of Trustees on at least a quarterly basis.
Equity securities traded on an exchange other than NASDAQ Stock Market, LLC (“NASDAQ”) are valued at the last reported sale price on the principal exchange or market on which they are traded; or, if there were no sales that day, at the mean between the closing bid and ask prices. Securities traded on the NASDAQ are generally valued at the NASDAQ official closing price, which may not be the last sale price. If the NASDAQ official closing price is not available for a security, that security is generally valued at the mean between the closing bid and ask prices. Repurchase agreements are carried at cost, which approximates fair value (see Note 5d). Foreign securities are valued in the currencies of the markets in which they trade and then converted to U.S. dollars by the application of foreign exchange rates at the close of the New York Stock Exchange (“NYSE”). Forward foreign currency contracts, if any, are valued at the mean between the bid and ask rates for the specified time interpolated from rates for proximate time periods.
Securities for which market quotations are not readily available or securities whose values have been materially affected by events occurring before the Fund’s valuation time but after the close of the securities’ principal exchange or market are valued at their fair values as determined in good faith by Park Avenue, as the Board of Trustee’s valuation designee (as defined in Rule 2a-5 under the 1940 Act), in accordance with Park Avenue’s procedures and under the general oversight of the Board of Trustees. In addition, the values of the Fund’s investments in foreign securities are generally determined by a pricing service using pricing models designed to estimate likely changes in the values of those securities. Certain foreign equity instruments are valued by applying international fair value factors provided by approved pricing services. The factors seek to adjust the local closing price for movements of local markets post closing, but prior to the time the NAVs are calculated. Valuations reflected in this report are as of the report date. As a result, changes in valuation due to market events and/or issuer related events after the report date and prior to issuance of the report are not reflected herein.
NOTES TO FINANCIAL STATEMENTS — GUARDIAN MID CAP RELATIVE VALUE VIP FUND
Various inputs are used in determining the valuation of the Fund’s investments. These inputs are summarized in three broad levels listed below.
| • | | Level 1 – unadjusted inputs using quoted prices in active markets for identical investments. |
| • | | Level 2 – other significant observable inputs, including, but not limited to, quoted prices for similar investments, inputs other than quoted prices that are observable for investments (such as interest rates, prepayment speeds, credit risks, etc.) or other market corroborated inputs. |
| • | | Level 3 – significant unobservable inputs (including the Fund’s own assumptions in determining the fair value of investments). |
Inputs may include price information, volatility statistics, specific and broad credit data, liquidity statistics, and other factors. A financial instrument’s level within the fair value hierarchy is based on the lowest level of any input; both individually and in aggregate, that is significant to the fair value measurement. However, the determination of what constitutes “observable” requires significant judgment by the Trust. The Trust considers observable data to be that market data which is readily available, regularly distributed or updated, reliable and verifiable, and provided by independent sources that are actively involved in the relevant market. The inputs or methodology used for valuing securities are not necessarily an indication of the risk associated with investing in those securities. Changes in valuation techniques may result in transfers into or out of a financial instrument’s assigned level within the hierarchy.
The FASB requires reporting entities to make disclosures about purchases, sales, issuances and settlements of Level 3 securities on a gross basis. For the six months ended June 30, 2023, there were no transfers into or out of Level 3 of the fair value hierarchy.
In determining a financial instrument’s placement within the hierarchy, the Trust separates the Fund’s investment portfolio into two categories: investments and derivatives (e.g., futures). A summary of inputs used to value the Fund’s assets and liabilities carried at fair value as of June 30, 2023 is included in the Schedule of Investments.
Investments Investments whose values are based on quoted market prices in active markets, and are therefore classified within Level 1, include active listed equities. Investments that trade in markets that are not considered to be active, but are valued based on quoted
market prices, dealer quotations or alternative pricing sources supported by observable inputs are classified within Level 2. These include certain U.S. government and sovereign obligations, most government agency securities, investment-grade corporate bonds, certain mortgage products, state, municipal and provincial obligations, and certain foreign equity securities, including securities whose prices may have been affected by events occurring after the close of trading on their principal exchange or market and, as a result, whose values are determined by a pricing service as described above, or securities whose values are otherwise determined using fair valuation methods approved by the Fund’s Board of Trustees.
Investments classified within Level 3 have significant unobservable inputs, as they trade infrequently or not at all. Level 3 investments include, among others, private placement securities. When observable prices are not available for these securities, the Trust uses one or more valuation techniques for which sufficient and reliable data is available. The inputs used by the Trust in estimating the value of Level 3 investments include, for example, the original transaction price, recent transactions in the same or similar instruments, completed or pending third-party transactions in the underlying investment or comparable issuers, subsequent rounds of financing, recapitalizations, and other transactions across the capital structure. Level 3 investments may also be adjusted to reflect illiquidity and/or non-transferability, with the amount of such discount estimated by the Trust in the absence of market information. Assumptions used by the Trust due to the lack of observable inputs may significantly impact the resulting fair value and therefore the Fund’s results of operations. As of June 30, 2023, the Fund had no securities classified as Level 3.
Derivatives Exchange-traded derivatives, such as futures contracts, exchange-traded option contracts and certain swaps, are typically classified within Level 1 or Level 2 of the fair value hierarchy depending on whether or not they are deemed to be actively traded. Certain non-exchange-traded derivatives, such as generic forwards, certain swaps and options, have inputs which can generally be corroborated by market data and are therefore classified within Level 2. During the six months ended June 30, 2023, the Fund did not hold any derivatives.
b. Securities Transactions Securities transactions are accounted for on the date securities are purchased or sold (trade date). Realized gains or losses on securities transactions are determined on the basis of specific identification.
NOTES TO FINANCIAL STATEMENTS — GUARDIAN MID CAP RELATIVE VALUE VIP FUND
c. Foreign Currency Translation The accounting records of the Fund are maintained in U.S. dollars. Investment securities and all other assets and liabilities of the Fund denominated in a foreign currency are generally translated into U.S. dollars at the exchange rates quoted at the close of the NYSE on each business day. The market value of investment securities and other assets and liabilities are translated at the exchange rate as of the valuation date. Purchases and sales of securities, income receipts, and expense payments are translated into U.S. dollars at the exchange rates in effect on the dates of the respective transactions. The Fund does not isolate the portion of the fluctuations on investments resulting from changes in foreign currency exchange rates from the fluctuations in market prices of investments held. Such fluctuations are included in the Net change in net realized and unrealized gain/(loss) from investments on the Statement of Operations.
Reported realized foreign currency gains and losses arise from the disposition of foreign currency, currency gains or losses realized between the trade and settlement dates on securities transactions, and the difference between the amounts of dividends, interest and foreign withholding taxes recorded on the Fund’s books on the transaction date and the U.S. dollar equivalent of the amounts actually received or paid. These reported realized foreign currency gains and losses, if any, are included in Net realized gain/(loss) from foreign currency transactions on the Statement of Operations. Unrealized foreign currency gains and losses arise from changes (due to changes in exchange rates) in the value of foreign currency and other assets and liabilities denominated in foreign currencies, which are held at period end, if any, and are included in Net change in unrealized appreciation/(depreciation) on translation of assets and liabilities in foreign currencies on the Statement of Operations.
d. Foreign Capital Gains Tax The Fund may be subject to foreign taxes on income, gains on investments or currency purchases/repatriation, a portion of which may be recoverable. The Fund will accrue such taxes and recoveries as applicable, based upon their current interpretation of tax rules and regulations that exist in the markets in which they invest.
e. Investment Income Dividend income net of foreign taxes withheld, if any, is generally recorded on the ex-dividend date. Distributions received from real estate investment trusts, if any, may be classified as dividends, capital gains and/or return of capital. Interest income, which includes amortization/accretion of
premium/discount, is determined using the interest income accrual method, and is accrued and recorded daily.
f. Allocation of Income and Expenses Many of the expenses of the Trust can be directly attributed to a specific series of the Trust. Expenses that cannot be directly attributed to a specific series of the Trust are generally apportioned among all the series in the Trust, based on relative net assets. In calculating net asset value per share for each series of the Trust, investment income, realized and unrealized gains and losses, and expenses other than series-specific expenses are allocated daily to each series based upon the proportion of net assets attributable to each series.
3. Transactions with Affiliates
a. Investment Advisory Fee and Expense Limitation Under the terms of the advisory agreement, which, after its two year initial term, is reviewed and approved annually by the Board of Trustees, the Fund pays an investment advisory fee to Park Avenue. Park Avenue is a wholly-owned subsidiary of Guardian Life and receives an investment advisory fee at an annual rate of 0.72% up to $100 million, 0.67% from $100 to $300 million, 0.62% from $300 to $500 million, and 0.60% in excess of $500 million of the Fund’s average daily net assets. The fee is accrued daily and paid monthly.
Park Avenue has contractually agreed through April 30, 2024 to waive certain fees and/or reimburse certain expenses incurred by the Fund to the extent necessary to limit the Fund’s total annual operating expenses after fee waiver and/or expense reimbursement to 1.08% of the Fund’s average daily net assets (excluding, if applicable, any acquired fund fees and expenses, taxes, interest, transaction costs and brokerage commissions, litigation and extraordinary expenses). The limitation may not be increased or terminated prior to this time without action by the Board of Trustees, and may be terminated only upon approval of the Board of Trustees. Amounts waived or reimbursed by Park Avenue pursuant to any expense limitation will not be subject to Park Avenue’s recoupment rights. For the six months ended June 30, 2023, Park Avenue did not waive any fees or pay any Fund expenses.
Park Avenue has entered into a Sub-Advisory Agreement with Allspring Global Investments, LLC (“Allspring”). Allspring is responsible for providing day-to-day investment advisory services to the Fund, subject to the supervision of Park Avenue and the oversight of the Board of Trustees. Sub-advisory fees are paid by Park Avenue and do not represent a separate or additional expense to the Fund.
NOTES TO FINANCIAL STATEMENTS — GUARDIAN MID CAP RELATIVE VALUE VIP FUND
b. Compensation of Trustees and Officers Trustees and officers who are interested persons of the Trust, as defined in the 1940 Act, receive no compensation from the Fund, except for the Chief Compliance Officer of the Trust. Trustees of the Trust who are not interested persons of the Trust, and the Chief Compliance Officer, receive compensation and reimbursement of expenses from the Trust.
c. Distribution Fees Park Avenue Securities LLC (“PAS”), a wholly-owned subsidiary of Guardian Life, is the principal underwriter of Fund shares. The Trust has entered into a distribution and service agreement with PAS, which governs the sale and distribution of shares of the Fund. Under a distribution and service plan adopted by the Trust (“12b-1 plan”), PAS is compensated for services in such capacity, including its expenses in connection with the promotion and distribution of shares of the Fund, at an annual rate of 0.25% of the Fund’s average daily net assets. For the six months ended June 30, 2023, the Fund paid distribution fees in the amount of $210,017 to PAS.
PAS has directed that certain payments under the 12b-1 plan be used to compensate GIAC for shareholder services provided to contract owners.
4. Federal Income Taxes
a. Distributions to Shareholders For federal income tax purposes, the Fund is treated as a disregarded entity (“DRE”). As a DRE, the Fund is not subject to an entity-level income tax; and any income, gains, losses, deductions, taxes, and credits of the Fund would instead be “passed through” directly to the separate accounts of GIAC that invest in the Fund and retain the same character for U.S. federal income tax purposes. In addition, the Fund is not required to distribute taxable income and capital gains for U.S. federal income tax purposes. Therefore, no dividends and capital gains distributions were paid by the Fund.
5. Investments
a. Investment Purchases and Sales The cost of investments purchased and the proceeds from investments sold (excluding short-term investments) amounted to $23,190,401 and $33,874,027, respectively, for the six months ended June 30, 2023. During the six months ended June 30, 2023, there were no purchases or sales of U.S. government securities.
b. Foreign Securities Foreign securities investments involve special risks and considerations not typically associated with U.S. investments. These risks include,
but are not limited to, currency risk; adverse political, regulatory, social, and economic developments; and less reliable information about issuers. Moreover, securities of some foreign issuers may be less liquid and their prices more volatile than those of comparable U.S. issuers.
c. Industry or Sector Concentration In its normal course of business, the Fund may invest a significant portion of its assets in companies within a limited number of industries or sectors. As a result, the Fund may be subject to a greater risk of loss than that of a fund invested in a wider spectrum of industries or sectors because the stocks of many or all of the companies in the industry, group of industries, sector, or sectors may decline in value due to developments adversely affecting the industry, group of industries, sector, or sectors.
d. Repurchase Agreements The Fund may invest in repurchase agreements to maintain liquidity and earn income over periods of time as short as overnight. The collateral for repurchase agreements is either cash or fully negotiable U.S. government securities (including U.S. government agency securities). Repurchase agreements are fully collateralized (including the interest accrued thereon) and such collateral is marked to market daily while the agreements remain in force. If the value of the collateral falls below the repurchase price plus accrued interest, the Fund will typically require the seller to deposit additional collateral by the next business day. If the request for additional collateral is not met, or the seller defaults, the Fund maintains the right to sell the collateral (although it may be prevented or delayed from doing so in certain circumstances) and may be required to claim any resulting loss against the seller. Park Avenue monitors the creditworthiness of the seller with which the Fund enters into repurchase agreements.
e. Restricted and Illiquid Securities A restricted security cannot be resold to the general public without prior registration under the Securities Act of 1933, as amended (except pursuant to an applicable exemption). The values of these securities may be highly volatile. If the security is subsequently registered and resold, the issuer would typically bear the expense of all registrations at no cost to the Fund. Restricted and illiquid securities are valued according to the policies and procedures adopted by the Trust’s Board of Trustees and are noted, if any, in the Fund’s Schedule of Investments. As of June 30, 2023, the Fund held two illiquid securities.
NOTES TO FINANCIAL STATEMENTS — GUARDIAN MID CAP RELATIVE VALUE VIP FUND
6. Temporary Borrowings
The Fund, with other funds managed by Park Avenue, is party to a credit agreement with respect to a $10 million committed revolving credit facility from State Street Bank and Trust Company (the “Credit Agreement”) for temporary borrowing purposes, including the meeting of redemption requests that otherwise might require the untimely disposition of securities. Interest is based on a daily fluctuating rate per annum equal to the Applicable Rate (as defined in the Credit Agreement) plus the Applicable Margin (as defined in the Credit Agreement) that is subject to change from time to time as and when the Applicable Rate changes. Under the current Credit Agreement, the Applicable Rate for any day is defined as the rate per annum equal to the sum of (a) 0.10% plus (b) the higher of (i) the Federal Funds Effective Rate for such day and (ii) the Overnight Bank Funding Rate for such day; the Applicable Margin is 1.25%. In addition to the interest charged on any borrowings by the Fund, each fund pays a commitment fee of 0.30% per annum on its share of the unused portion of the credit facility. The agreement is in place until January 5, 2024. The Fund did not utilize the credit facility during the six months ended June 30, 2023.
7. Indemnifications
Under the Trust’s organizational documents and, in some cases, by contract, officers and Trustees of the Trust are indemnified against certain liabilities arising out of the performance of their duties to the Fund. In addition, in the normal course of business, the Fund enters into contracts with its vendors and others that provide general indemnifications. The Fund’s maximum exposure under these arrangements is unknown as this would involve future claims that may be made against the Fund that have not yet occurred. However, based on experience, the Fund expects the risk of loss to be remote.
8. Additional Information
The outbreak of COVID-19 has adversely impacted both local and global economies, including those in which the Fund may invest. These impacts include materially reduced consumer demand and economic output, disrupted supply chains, market closures, travel restrictions and quarantines, and strained healthcare systems. The Fund’s operations may be interrupted as a result, which may have a negative impact on the Fund’s investment performance.
SUPPLEMENTAL INFORMATION (UNAUDITED)
Liquidity Risk Management Program
In compliance with Rule 22e-4 under the Investment Company Act of 1940, as amended (the “Liquidity Rule”), Guardian Variable Products Trust (the “Trust”) has adopted and implemented a written liquidity risk management program (the “Program”) for each series of the Trust (each, a “Fund”), which is reasonably designed to assess and manage each Fund’s liquidity risk. The Fund’s “liquidity risk” is the risk that the Fund could not meet requests to redeem shares issued by the Fund without significant dilution of the remaining investors’ interests in the Fund.
The Board of Trustees of the Trust (the “Board”) Previously approved the designation of Park Avenue Institutional Advisers LLC (the “Administrator” or “PAIA”) as Program administrator. The Administrator established a Liquidity Risk Management Committee, which is comprised of certain officers of the Trust and PAIA, that assists the Administrator in the implementation and day-to-day administration of the Program and otherwise support carrying out the Administrator’s liquidity risk management responsibilities under the Program.
In accordance with the Program, each Fund’s liquidity risk is assessed no less frequently than annually, taking into consideration a variety of factors, including, as applicable, the Fund’s investment strategy and liquidity of portfolio investments, cash flow projections, and holdings of cash and cash equivalents, as well as borrowing arrangements and other funding sources. Certain factors are considered under both normal and reasonably foreseeable stressed conditions.
Each Fund portfolio investment is classified, no less than monthly, into one of four liquidity categories (including “highly liquid investments” and “illiquid investments,” discussed below) based on a determination of the number of days it is reasonably expected to take to convert the investment to cash, or sell or dispose of the investment, in current market conditions without significantly changing the investment’s market value.
The Liquidity Rule limits the Fund’s investments in illiquid investments by prohibiting the Fund from acquiring any illiquid investment if, immediately after the acquisition, the Fund would have invested more than 15% of its net assets in illiquid investments that are assets. The Program includes provisions reasonably designed to comply with this investment limitation. In addition, the Program includes provisions reasonably designed to comply with this investment limitation. In addition, the Program includes provisions reasonably designed to comply with the Liquidity Rule’s requirements relating to highly liquid investment minimums, which is a minimum amount of Fund net assets that must be invested in highly liquid investments that are assets, as applicable. The Fund was not required to adopt a highly liquid investment minimum during the period.
At a meeting of the Board held on March 29-30, 2023, the Board received a report (the “Report”) prepared by the Administrator addressing the Program’s operation and assessing the adequacy and effectiveness of its implementation for the period from January 1, 2022 through December 31, 2022 (the “Reporting Period”). The Report noted that the Administrator believes the Program operated effectively during the Reporting Period and continues to be reasonably designed to effectively assess and manage each Fund’s liquidity risk. The Report also noted that the Administrator believes the Program has been adequately and effectively implemented and the investment strategies for each Fund continue to be appropriate since its inception. In addition, the Report summarized the operation of the Program and the information and factors considered by the Administrator in its assessment of the Program’s implementation, such as the liquidity risk assessment framework and liquidity classification methodologies.
There can be no assurance that the Program will achieve its objectives under all circumstances. Please refer to the Fund’s prospectus for more information regarding the Fund’s exposure to liquidity risk and other risks to which an investment in the Fund may be subject.
SUPPLEMENTAL INFORMATION (UNAUDITED)
Approval of Investment Management and Sub-advisory Agreements
Section 15(c) of the Investment Company Act of 1940, as amended (the “1940 Act”), requires that a fund’s investment advisory and sub-advisory agreements be approved initially by the fund’s board of trustees. Section 15(c) also requires that the continuation of these agreements, after an initial term of up to two years, be annually reviewed and approved by the board. Any such agreement must be approved by a vote of a majority of the trustees who are not parties to the agreement or “interested persons” (as defined in the 1940 Act) of a party to the agreement at a meeting of the board called for the purpose of voting on such approval.
At a meeting of the Board of Trustees (the “Board”) of Guardian Variable Products Trust (the “Trust”) held on March 29-30, 2023 (the “Meeting”), the Board, including the trustees who are not parties to the agreement or “interested persons” as defined in the 1940 Act (the “Independent Trustees”), considered and voted unanimously to renew the existing investment management agreement between the Trust, on behalf of Guardian All Cap Core VIP Fund; Guardian Balanced Allocation VIP Fund; Guardian Core Fixed Income VIP Fund; Guardian Core Plus Fixed Income VIP Fund; Guardian Diversified Research VIP Fund; Guardian Equity Income VIP Fund; Guardian Global Utilities VIP Fund; Guardian Growth & Income VIP Fund; Guardian Integrated Research VIP Fund; Guardian International Growth VIP Fund; Guardian International Equity VIP Fund; Guardian Large Cap Disciplined Growth VIP Fund; Guardian Large Cap Disciplined Value VIP Fund; Guardian Large Cap Fundamental Growth VIP Fund; Guardian Mid Cap Relative Value VIP Fund; Guardian Mid Cap Traditional Growth VIP Fund; Guardian Multi-Sector Bond VIP Fund; Guardian Select Mid-Cap Core VIP Fund; Guardian Short Duration Bond VIP Fund; Guardian Small Cap Core VIP Fund; Guardian Small-Mid Cap Core VIP Fund; Guardian Strategic Large Cap Core VIP Fund; Guardian Total Return Bond VIP Fund and Guardian U.S. Government Securities VIP Fund (each, a “Fund,” and together, the “Funds”), in substantially the form presented at this meeting (the “Management Agreement”); and Park Avenue Institutional Advisers LLC (the “Manager”) for a one-year term.
The Board, including the Independent Trustees, also considered and voted unanimously to renew the existing sub-advisory agreements (the “Sub-Advisory Agreements,” collectively with the Management Agreement and Sub-Subadvisory Agreement, the “Agreements”) between the Manager and investment
advisory firms engaged to serve as sub-advisers to certain of the Funds (the “Sub-Advised Funds”), namely (i) ClearBridge Investments, LLC with respect to Guardian Small Cap Core VIP Fund; (ii) Putnam Investment Management, LLC with respect to Guardian Diversified Research VIP Fund; (iii) AllianceBernstein L.P. with respect to Guardian Growth & Income VIP Fund and Guardian Strategic Large Cap Core VIP Fund; (iv) J.P. Morgan Investment Management Inc. with respect to Guardian International Growth VIP Fund; (v) Schroder Investment Management North America Inc. with respect to Guardian International Equity VIP Fund; (vi) Wellington Management Company LLP with respect to Guardian Balanced Allocation VIP Fund, Guardian Equity Income VIP Fund, Guardian Integrated Research VIP Fund, Guardian Large Cap Disciplined Growth VIP Fund and Guardian Global Utilities VIP Fund; (vii) Boston Partners Global Investors, Inc. with respect to Guardian Large Cap Disciplined Value VIP Fund; (viii) Janus Henderson Investors US LLC with respect to Guardian Mid Cap Traditional Growth VIP Fund; (ix) Allspring Global Investments, LLC with respect to Guardian Mid Cap Relative Value VIP Fund and Guardian Small-Mid Cap Core VIP Fund; (x) Lord, Abbett & Co. LLC with respect to Guardian Core Plus Fixed Income VIP Fund; (xi) FIAM LLC with respect to Guardian Select Mid Cap Core VIP Fund; and (xii) Massachusetts Financial Services Company with respect to Guardian All Cap Core VIP Fund, each in substantially the form presented at this meeting, (each, a “Sub-Adviser” and collectively, the “Sub-Advisers”) for a one-year term.
The Board, including the Independent Trustees, also considered and voted unanimously to renew the existing sub-subadvisory agreement (the “Sub-Subadvisory Agreement”) between Schroder Investment Management North America Inc. and Schroder Investment Management North America Limited (also a Sub-Adviser) with respect to Guardian International Equity VIP Fund for a one-year term.
The Board is responsible for overseeing the management of each Fund. In determining whether to renew its approval of the Agreements, the Trustees evaluated information and factors that they considered to be relevant and appropriate through the exercise of their own business judgment. The Trustees considered certain information and factors in light of advice furnished to them by legal counsel to the Trust and, in the case of the Independent Trustees, their independent legal counsel. In advance of the Meeting, the Trustees received materials and information designed to assist their consideration of the Agreements. The Trustees received written responses
SUPPLEMENTAL INFORMATION (UNAUDITED)
from the Manager and each Sub-Adviser to a series of questions and requests for information encompassing a wide variety of topics provided by independent counsel on behalf of the Independent Trustees. The Independent Trustees also received materials and information regarding the legal standards applicable to their consideration of the Agreements and the process and criteria used by the Manager to identify and select the Sub-Advisers.
During the course of their deliberations, the Independent Trustees met twice to discuss and evaluate the materials, information and Agreements in executive session with their independent legal counsel, outside of the presence of the Trustees who are not Independent Trustees and representatives from Fund management, the Manager or any Sub-Adviser.
In reaching its decisions to renew its approval of the Agreements, the Board took into account the materials and information described above, as well as other materials and information provided to the Board throughout the year. Individual Trustees may have given different weight to different factors and information with respect to each Agreement, and the Trustees did not identify any single factor or information that, in isolation, would be controlling in deciding to approve the Agreements. The discussion below is intended to summarize the broad factors that figured prominently in the Board’s decisions to renew its approval of the Agreements rather than to be all-inclusive. These broad factors included: (i) the nature, extent and quality of the services provided to the Funds by the Manager and to the Sub-advised Funds by the Sub-Advisers; (ii) the investment performance of each Fund; (iii) estimated profitability of the Manager; (iv) fees and expenses; (v) the extent to which economies of scale may exist, and the extent to the benefits of economies of scale are shared with the Funds; and (vi) any other benefits derived by the Manager or the Sub-Advisers (or their respective affiliates) from their relationships with the Funds.
Nature, Extent and Quality of Services
The Trustees considered information regarding the nature, extent and quality of services provided to the Funds by the Manager. The Trustees also considered, among other things, the terms of the Management Agreement and the range of investment advisory services provided by the Manager. In addition, the Trustees reviewed the range of non-investment advisory services provided by the Manager consistent with the terms of the Management Agreement, notably coordinating the preparation and filing of various
regulatory documents, coordinating the preparation and assembly of Board meeting materials, and assisting the Board with certain valuation matters. The Board also received a description of the Manager’s and each Sub-Adviser’s business continuity plans and of their respective approaches to data privacy and cybersecurity, and related testing. The Board received information regarding the response of the Manager and the Sub-Advisers to the COVID-19 pandemic, including the continuation of remote work arrangements and return-to-office plans. The Board also received information about the Manager’s role as administrator of the Funds’ liquidity risk management program, the Manager’s approach to risk management, and the Manager’s vendor oversight programs.
The Trustees considered that the Sub-advised Funds operate in a “manager-of-managers” structure and reviewed the responsibilities that the Manager has under this structure, including monitoring and evaluating the performance of the Sub-Advisers, monitoring the Sub-Advisers for adherence to the stated investment objectives, strategies, policies and restrictions of the Funds and supervising the Sub-Advisers with respect to the services that the Sub-Advisers would provide under the Sub-Advisory Agreements. The Trustees also considered the process used by the Manager, consistent with this structure, to identify and recommend sub-advisers, and the Manager’s ability to monitor and oversee sub-advisers and recommend replacement sub-advisers, when necessary, and provide other services under the Management Agreement. The Board noted that investment management staff of the Manager and the Trust’s Chief Compliance Officer conduct oversight meetings with the Sub-Advisers on a periodic basis, follow through with additional inquiries on any questions or concerns that arise during the meetings and, as necessary, then report the results of the meetings to the Board. The Trustees reviewed information regarding the experience and background of the Manager’s key personnel and the Manager’s organizational structure and resources, including investment, legal and administrative capabilities of the Manager. In this regard, the Trustees recognized that the Funds may benefit from the Manager’s ability to use resources and capabilities of its affiliates in providing services to the Funds.
The Trustees considered information regarding the nature, extent and quality of services provided to the Sub-advised Funds by the Sub-Advisers. The Trustees also considered, among other things, the terms of the Sub-advisory Agreements and the range of investment
SUPPLEMENTAL INFORMATION (UNAUDITED)
advisory services provided by the Sub-Advisers under the oversight of the Manager. In evaluating these investment advisory services, the Trustees considered, among other things, the Sub-Advisers’ investment philosophies, styles and/or processes and approaches to managing the respective Sub-advised Funds. The Trustees received and evaluated information regarding the background, education, expertise and/or experience of the investment professionals who serve as portfolio managers for the Sub-advised Funds and the capabilities and resources of the Sub-Advisers.
Based upon these considerations, the Trustees concluded, within the context of their full deliberations, that the nature, extent and quality of services provided to the Funds by the Manager and the Sub-advised Funds by each respective Sub-Adviser were appropriate.
Investment Performance
In connection with each of its regular quarterly meetings, the Board receives information on the performance of each Fund, including net performance, relative performance rankings within the relevant Morningstar peer group, and performance as compared to benchmark index returns. At each quarterly Board meeting, members of the Manager’s funds management team review with the Board the economic and market environment, absolute and relative performance of each Fund, and any relevant information about risk management and style consistency in connection with management of the Funds. The Board considered investment performance for each Fund over the one-year, three-year (where available), five-year (where available) and since-inception periods.
The Board also received and reviewed a report prepared by Broadridge Financial Solutions (“Broadridge”), an independent provider of mutual fund industry data, which included comparisons of the performance of each Fund to performance of an appropriate peer universe. For details regarding each Fund’s performance, see the “Fund-by-Fund Factors” section below.
The Manager discussed with the Board factors contributing to the Funds’ performance results. In addition, for certain Funds, the Manager provided to the Board longer term performance records of the Sub-Advisers for strategies used in managing the Funds. The Board concluded that the investment performance generated by the Manager and each Sub-Adviser was generally satisfactory, or, that any steps being taken by the Manager and Sub-Advisers to address any performance issues were satisfactory.
Profitability
The Board received and considered the Manager’s estimate of its profitability, which included allocations by the Manager of its costs in providing management services to the Funds. The Board considered the estimated profitability of the Manager both overall and on a Fund-by-Fund basis.
The Board received and considered profitability information from most of the Sub-Advisers, but noted that the Manager had negotiated the fees with the Sub-Advisers at arm’s-length. Accordingly, the Board concluded that the profitability of the Sub-Advisers is a less relevant factor than Manager profitability.
Based on the consideration of this information, the Board concluded that the profitability of the Funds to the Manager was acceptable.
Fees and Expenses
The Trustees considered the management fees paid by the Funds to the Manager under the Management Agreement and evaluated the reasonableness of these fees. The Trustees received and reviewed comparative information with respect to the management fee and total expenses for each Fund and the management fees and total expenses for a peer group of other funds selected by Broadridge. The Trustees considered the Manager’s commitment to limit the total expenses of each Fund through an expense limitation agreement with the Trust. Although the Board recognized that the comparisons between the management fees and actual expenses of the Funds and those of the identified peer group are imprecise, given different terms of agreements and variations in fund strategies, the Trustees found that the comparative information supported their consideration and approval of the management fees and evaluation of the total expenses. For details regarding each Fund’s fee and expense comparisons, see the “Fund-by-Fund Factors” section below.
The Trustees considered the sub-advisory fees paid under the Sub-advisory Agreements and evaluated the reasonableness of those fees. The Trustees also considered that the fees paid to the Sub-Advisers would be paid by the Manager and not the Funds and that the Manager had negotiated the fees with the Sub-Advisers at arm’s-length.
Based on the consideration of the information and factors summarized above, as well as other relevant information and factors, the Board concluded that the management and sub-advisory fees were reasonable in
SUPPLEMENTAL INFORMATION (UNAUDITED)
light of the nature, extent and quality of services rendered to the Funds by the Manager and the Sub-Advisers.
Economies of Scale
The Board considered the extent to which economies of scale may exist, and the extent to the benefits of economies of scale are shared with the Funds. In this regard, the Board noted that for sixteen of twenty-four Funds, the management and sub-advisory fee included breakpoints that are tiered based on growth in asset levels of each such Fund and that for the other Funds, the fees reflected appropriate levels based on current and expected asset levels. The Board also noted that the expenses of the Funds are subject to expense limitations provided by the Manager. The Board noted that expected economies of scale, where they exist, may be shared through the use of fee breakpoints, expense limitations by the Manager, and/or a lower overall fee.
Ancillary Benefits
The Board considered the potential benefits, other than management fees, that the Manager and/or its affiliates may receive because of the Manager’s relationship with the Funds. The Trustees considered that the Funds were designed to serve as investment options under variable contracts issued by affiliates of the Manager that would receive fees under those contracts and that Park Avenue Securities LLC, an affiliate of the Manager and principal underwriter of the Funds, and participating insurance companies, including insurance companies affiliated with the Manager, would be entitled to receive fees from the Funds under a plan of distribution adopted pursuant to Rule 12b-1 under the 1940 Act. The Trustees considered that the Manager and its affiliates may benefit from (i) greater efficiencies in annuity administration and operations and potential cost savings due to a reduction in the number of unaffiliated funds available as annuity contract investment options, and (ii) increased dividends-received deductions due to the Funds’ status under the tax laws as disregarded entities. In addition, the Trustees considered the potential benefits, other than sub-advisory fees, that the Sub-Advisers and their affiliates may receive because of their relationships with the Funds, including the ability to receive research from soft dollar commissions consistent with Trust policies. The Trustees concluded that benefits that may accrue to the Manager and its affiliates are reasonable and the benefits that may accrue to the Sub-Advisers and their affiliates are consistent with those expected for a sub-adviser to a mutual fund such as the applicable Fund.
Fund-by-Fund Factors
The Broadridge report groups fees, expenses and performance into five quintiles, with the top quintile having the highest performance or lowest fees/expenses, and the bottom quintile having the lowest performance or highest fees/expenses. For purposes of the descriptions below, a Fund’s performance is considered “in line with” the benchmark index if it is within 0.20%.
Guardian Large Cap Fundamental Growth VIP Fund
| • | | The Board noted that the Fund’s performance was in the 3rd quintile of its performance universe for the 1-year period and in the 4th quintile for its performance universe for the 3-year and 5-year periods. The Board also noted that the Fund’s performance was below the benchmark index for the 1-year, 3-year and 5-year periods. |
| • | | The Board noted that the contractual management fee, the actual management fee and actual total expenses were in the 1st quintile of the expense group. |
Guardian Large Cap Disciplined Growth VIP Fund
| • | | The Board noted that the Fund’s performance was in the 3rd quintile of its performance universe for the 1-year and 3-year periods and in the 2nd quintile for the 5-year period. The Board also noted that the Fund’s performance was below the benchmark index for the 1-year, 3-year and 5-year periods. |
| • | | The Board noted that the contractual management fee, the actual management fee and actual total expenses were in the 1st quintile of the expense group. |
Guardian Integrated Research VIP Fund
| • | | The Board noted that the Fund’s performance was in the 5th quintile of its performance universe for the 1-year and 5-year periods and in the 4th quintile for 3-year period. The Board also noted that the Fund’s performance was below the benchmark index for the 1-year, 3-year and 5-year periods. |
| • | | The Board noted that the contractual management fee, the actual management fee and actual total expenses were in the 1st quintile of the expense group. |
Guardian Diversified Research VIP Fund
| • | | The Board noted that the Fund’s performance was in the 3rd quintile of its performance universe for the 1-year and 3-year periods and in the 2nd quintile for the 5-year period. The Board also noted that the Fund’s performance was higher than the benchmark index for the 1-year period. The Board note that the Fund’s performance was lower than the benchmark index for the 3-year and 5-year periods. |
SUPPLEMENTAL INFORMATION (UNAUDITED)
| • | | The Board noted that the contractual management fee and actual management fee were in the 1st quintile of the expense group and that actual total expenses were in the 3rd quintile. |
Guardian Strategic Large Cap Core VIP Fund
| • | | The Board noted that the Fund’s performance was in the 1st quintile of its performance universe for the 1-year period. The Board acknowledged the Fund’s short operational history. The Board noted that the Fund’s performance was higher than the benchmark index for the 1-year period. |
| • | | The Board noted that the contractual management fee, the actual management fee and actual total expenses were in the 1st quintile of the expense group. |
Guardian Large Cap Disciplined Value VIP Fund
| • | | The Board noted that the Fund’s performance was in the 3rd quintile of its performance universe for the 1-year and 3-year periods and in the 4th quintile for the 5-year period. The Board also noted that the Fund’s performance was higher than the benchmark index for the 1-year and 3-year periods. The Board noted that the Fund’s performance was in line with the benchmark index for the 5-year period. |
| • | | The Board noted that the contractual management fee was in the 2nd quintile of the expense group, the actual management fee was in the 1st quintile of the expense group and that actual total expenses were in the 3rd quintile. |
Guardian Growth & Income VIP Fund
| • | | The Board noted that the Fund’s performance was in the 3rd quintile of its performance universe for the 1-year, 3-year and 5-year periods. The Board also noted that the Fund’s performance was higher than the benchmark index for the 1-year, 3-year and 5-year periods. |
| • | | The Board noted that the contractual management fee and the actual management fee were in the 1st quintile of the expense group and that actual total expenses were in the 3rd quintile. |
Guardian Equity Income VIP Fund
| • | | The Board noted that the Fund had less than one-year of operational history and was not able to evaluate an investment performance record for the Fund. The Board noted that it would have an opportunity to review such information in connection with future annual reviews. The Board noted that, in the meantime, it received monthly performance reports from the Manager. |
| • | | The Board noted that the contractual management fee, the actual management fee and actual total expenses were in the 1st quintile of the expense group. |
Guardian All Cap Core VIP Fund
| • | | The Board noted that the Fund’s performance was in the 3rd quintile of its performance universe for the 1-year period. The Board acknowledged the Fund’s short operational history. The Board noted that the Fund’s performance was higher than the benchmark index for the 1-year period. |
| • | | The Board noted that the contractual management fee, the actual management fee and actual total expenses were in the 1st quintile of the expense group. |
Guardian Mid Cap Traditional Growth VIP Fund
| • | | The Board noted that the Fund’s performance was in the 1st quintile of its performance universe for the 1-year period and in the 2nd quintile for the 3-year and 5-year periods. The Board also noted that the Fund’s performance was higher than the benchmark index for the 1-year, 3-year and 5-year periods. |
| • | | The Board noted that the contractual management fee and actual management fee were in the 1st quintile of the expense group and that the actual total expenses were in the 4th quintile. |
Guardian Select Mid Cap Core VIP Fund
| • | | The Board noted that the Fund’s performance was in the 3rd quintile of its performance universe for the 1-year period. The Board acknowledged the Fund’s short operational history. The Board noted that the Fund’s performance was lower than the benchmark index for the 1-year period. |
| • | | The Board noted that the contractual management fee, the actual management fee and actual total expenses were in the 1st quintile of the expense group. |
Guardian Mid Cap Relative Value VIP Fund
| • | | The Board noted that the Fund’s performance was in the 2nd quintile of its performance universe for the 1-year, 3-year and 5-year periods. The Board also noted that the Fund’s performance was higher than the benchmark index for the 1-year, 3-year and 5-year periods. |
| • | | The Board noted that the contractual management fee and the actual management fee were in the 2nd quintile of the expense group and the actual total expenses were in the 3rd quintile of the expense group. |
SUPPLEMENTAL INFORMATION (UNAUDITED)
Guardian Small-Mid Cap Core VIP Fund
| • | | The Board noted that the Fund’s performance was in the 5th quintile of its performance universe for the 1-year period. The Board acknowledged the Fund’s short operational history. The Board noted that the Fund’s performance was higher than the benchmark index for the 1-year period. |
| • | | The Board noted that the contractual management fee, the actual management fee and actual total expenses were in the 1st quintile of the expense group. |
Guardian Small Cap Core VIP Fund
| • | | The Board noted that the Fund’s performance was in the 5th quintile of its performance universe for the 1-year and 3-year periods. The Board noted that the Fund’s performance was lower than the benchmark index for the 1-year and 3-year periods. |
| • | | The Board noted that the contractual management fee and the actual management fee were in the 1st quintile of the expense group and the actual total expenses were in the 2nd quintile of the expense group. |
Guardian International Growth VIP Fund
| • | | The Board noted that the Fund’s performance was in the 4th quintile of its performance universe for the 1-year period, in the 2nd quintile of its performance universe for the 3-year period and in the 3rd quintile of its performance universe for the 5-year period. The Board also noted that the Fund’s performance was lower than the benchmark index for the 1-year and 5-year periods. The Board noted that the Fund’s performance was higher than the benchmark index for the 3-year period. |
| • | | The Board noted that the contractual management fee and actual management fee were in the 2nd quintile of the expense group and that the actual total expenses were in the 3rd quintile. |
Guardian International Equity VIP Fund
| • | | The Board noted that the Fund’s performance was in the 5th quintile of its performance universe for the 1-year, 3-year and 5-year periods. The Board also noted that the Fund’s performance was lower than the benchmark index for the 1-year, 3-year and 5-year periods. |
| • | | The Board noted that the contractual management fee, the actual management fee and the actual total expenses were in the 2nd quintile of the expense group. |
Guardian Global Utilities VIP Fund
| • | | The Board noted that the Fund’s performance was in the 5th quintile of its performance universe for the 1-year period and in the 4th quintile of its performance universe for the 3-year period. The Board noted that the Fund’s performance was higher than the benchmark index for the 1-year and 3-year periods. |
| • | | The Board noted that the contractual management fee and the actual management fee were in the 1st quintile of the expense group and the actual total expenses were in the 2nd quintile of the expense group. |
Guardian Balanced Allocation VIP Fund
| • | | The Board noted that the Fund had less than one-year of operational history and was not able to evaluate an investment performance record for the Fund. The Board noted that it would have an opportunity to review such information in connection with future annual reviews. The Board noted that, in the meantime, it received monthly performance reports from the Manager. |
| • | | The Board noted that the contractual management fee, the actual management fee and actual total expenses were in the 1st quintile of the expense group. |
Guardian Core Plus Fixed Income VIP Fund
| • | | The Board noted that the Fund’s performance was in the 3rd quintile of its performance universe for the 1-year and 3-year periods and in the 4th quintile of its performance universe for the 5-year period. The Board also noted that the Fund’s performance was lower than the benchmark index for the 1-year and 5-year periods. The Board noted that the Fund’s performance was in line with the benchmark index for the 3-year period. |
| • | | The Board noted that the contractual management fee and actual management fee were in the 2nd quintile of the expense group and that actual total expenses were in the 3rd quintile. |
Guardian Total Return Bond VIP Fund
| • | | The Board noted that the Fund’s performance was in the 5th quintile of its performance universe for the 1-year and 3-year periods. The Board also noted that the Fund’s performance was lower than the benchmark index for the 1-year and 3-year periods. |
| • | | The Board noted that the contractual management fee and actual management fee were in the 2nd quintile and the actual total expenses were in the 3rd quintile. |
SUPPLEMENTAL INFORMATION (UNAUDITED)
Guardian Core Fixed Income VIP Fund
| • | | The Board noted that the Fund had less than one-year of operational history and was not able to evaluate an investment performance record for the Fund. The Board noted that it would have an opportunity to review such information in connection with future annual reviews. The Board noted that, in the meantime, it received monthly performance reports from the Manager. |
| • | | The Board noted that the contractual management fee was in the 2nd quintile of the expense group and the actual management fee and the actual total expenses were in the 1st quintile. |
Guardian Multi-Sector Bond VIP Fund
| • | | The Board noted that the Fund’s performance was in the 5th quintile of its performance universe for the 1-year and 3-year periods The Board also noted that the Fund’s performance was lower than the benchmark index for the 1-year and 3-year periods. |
| • | | The Board noted that the contractual management fee and actual total expenses were in the 1st quintile and the actual management fee was in the 2nd quintile. |
Guardian Short Duration Bond VIP Fund
| • | | The Board noted that the Fund had less than one-year of operational history and was not able to evaluate an investment performance record for the Fund. The |
| | | Board noted that it would have an opportunity to review such information in connection with future annual reviews. The Board noted that, in the meantime, it received monthly performance reports from the Manager. |
| • | | The Board noted that the contractual management fee and actual total expenses were in the 3rd quintile of the expense group and the actual management fee was in the 1st quintile of the expense group. |
Guardian U.S. Government Securities VIP Fund
| • | | The Board noted that the Fund’s performance was in the 1st quintile of its performance universe for the 1-year period and in the 2nd quintile of its performance universe for the 3-year period. The Board also noted that the Fund’s performance was higher than the benchmark index for the 1-year and 3-year periods. |
| • | | The Board noted that the contractual management fee and the actual management fee were in the 1st quintile of the expense group and the actual total expenses were in the 2nd quintile of the expense group. |
Conclusion
Based on a comprehensive consideration and evaluation of all of the information and factors summarized above, among others, the Board as a whole, including the Independent Trustees, approved the Agreements.
SUPPLEMENTAL INFORMATION (UNAUDITED)
The Statement of Additional Information (“SAI”) includes additional information about the Trust’s Trustees and Officers and is available, without charge, upon request by calling toll-free 1-888-GUARDIAN (1-888-482-7342) or by visiting our website at http://guardianvpt.onlineprospectus.net/GuardianVPT/Prospectuses.
Portfolio Holdings and Proxy Voting Procedures
The Fund files its complete schedule of portfolio holdings with the Securities and Exchange Commission for the first and third quarters of each fiscal year as an exhibit to its reports on Form N-PORT. The Fund’s Form N-PORT reports are available on the Securities and Exchange Commission’s website at https://www.sec.gov. The Fund’s Form N-PORT information is also available, without charge, upon request, by calling toll-free 1-888-GUARDIAN (1-888-482-7342) or by visiting our website at http://guardianvpt.onlineprospectus.net/GuardianVPT/Prospectuses.
A description of the policies and procedures that the Fund uses to determine how to vote proxies relating to portfolio securities is included in the SAI. The SAI and information regarding how the Fund voted proxies relating to portfolio securities during the most recent 12-month period ended June 30 may be obtained (i) without charge, upon request, by calling toll-free 1-888-GUARDIAN (1-888-482-7342) or by visiting our website at http://guardianvpt.onlineprospectus.net/GuardianVPT/Prospectuses; and (ii) on the Securities and Exchange Commission’s website at https://www.sec.gov.
This report is transmitted to shareholders only. It is not authorized for use as an offer of sale or a solicitation of an offer to buy shares of the Fund unless accompanied or preceded by the Fund’s current prospectus. Past performance results shown in this report should not be considered a representation of future performance. Investment returns and principal value of shares will fluctuate so that shares, when redeemed, may be worth more or less than their original cost. Statements and other information herein are as dated and are subject to change.

The Guardian Life Insurance Company of America New York, NY 10001-2159
PUB8176
Guardian Variable
Products Trust
2023
Semiannual Report
All Data as of June 30, 2023
Guardian Mid Cap Traditional Growth VIP Fund

| | |
| Not FDIC insured. May lose value. No bank guarantee. | | www.guardianlife.com |
TABLE OF CONTENTS
Guardian Mid Cap Traditional Growth VIP Fund
Except as otherwise specifically stated, all information, including portfolio security positions, is as of June 30, 2023. Fund holdings will vary. Information contained herein has been obtained from sources believed reliable, but is not guaranteed.
GUARDIAN MID CAP TRADITIONAL GROWTH VIP FUND
Fund Characteristics (unaudited)
| | |
| Total Net Assets: $88,595,489 | | |
|
| |
Sector Allocation1 As of June 30, 2023 |
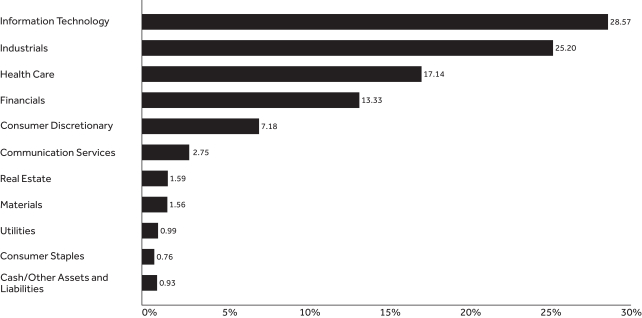 |
| | | | |
| |
Top Ten Holdings2 As of June 30, 2023 | |
| | |
| Holding | | % of Total
Net Assets | |
| ON Semiconductor Corp. | | | 4.02% | |
| Constellation Software, Inc. | | | 3.84% | |
| Boston Scientific Corp. | | | 3.15% | |
| WEX, Inc. | | | 3.05% | |
| SS&C Technologies Holdings, Inc. | | | 2.82% | |
| Intact Financial Corp. | | | 2.71% | |
| Amdocs Ltd. | | | 2.62% | |
| Flex Ltd. | | | 2.49% | |
| Sensata Technologies Holding PLC | | | 2.44% | |
| Teleflex, Inc. | | | 2.41% | |
| Total | | | 29.55% | |
| 1 | The Fund’s holdings are allocated to each sector based on the MSCI Global Industry Classification Standard (GICS®). Cash includes short-term investments and net other assets and liabilities. |
| 2 | Portfolio holdings are subject to change and should not be considered a recommendation to buy or sell individual securities. |
UNDERSTANDING YOUR FUND’S EXPENSES (UNAUDITED)
By investing in the Fund, you incur two types of costs: (1) transaction costs and (2) ongoing costs, including, as applicable, investment advisory fees, distribution and/or service (12b-1) fees and other Fund expenses. The example below is intended to help you understand your ongoing costs (in dollars) of investing in the Fund and to compare these costs with the ongoing costs of investing in other mutual funds.
The example is based on an investment of $1,000 invested at the beginning of the period and held for the entire period from January 1, 2023 to June 30, 2023. The table below shows the Fund’s expenses in two ways:
Expenses based on actual return
This section of the table provides information about actual account values and actual expenses. You may use the information in this section, together with the amount you invested, to estimate the expenses that you paid over the period. Simply divide your account value by $1,000 (for example, an $8,600 account value divided by $1,000 = 8.6), then multiply the result by the number in the section under the heading entitled “Expenses Paid During Period” to estimate the expenses you paid on your account during this period.
Expenses based on hypothetical 5% return for comparison purposes
This section of the table provides information about hypothetical account values and hypothetical expenses based on the Fund’s actual expense ratio and an assumed rate of return of 5% per year before expenses, which is not the Fund’s actual return. The hypothetical account values and expenses may not be used to estimate the actual ending account balance or expenses you paid for the period. You may use this information to compare the ongoing costs of investing in the Fund with the cost of investing in other mutual funds. To do so, compare this 5% hypothetical example with the 5% hypothetical examples that appear in the shareholder reports of the other funds.
Note that the expenses shown in the table are meant to highlight your ongoing costs only and do not reflect any transactional costs, such as sales charges (loads), redemption fees, or exchange fees. Therefore the second section is useful in comparing ongoing costs only, and will not help you determine the relative total costs of owning different funds. If these transactional costs were included, your costs would have been higher. Charges and expenses at the insurance company separate account level are not reflected in the table.
| | | | | | | | | | | | | | |
| | | | | |
| | | Beginning
Account Value 1/1/23 | | Ending Account Value
6/30/23 | | | Expenses Paid During Period* 1/1/23-6/30/23 | | | Expense Ratio During Period 1/1/23-6/30/23 | |
| Based on Actual Return | | $1,000.00 | | $ | 1,122.80 | | | $ | 5.74 | | | | 1.09% | |
| Based on Hypothetical Return (5% Return Before Expenses) | | $1,000.00 | | $ | 1,019.39 | | | $ | 5.46 | | | | 1.09% | |
| * | Expenses are equal to the Fund’s annualized expense ratio as indicated, multiplied by the average account value over the period, multiplied by 181/365 (to reflect the one-half year period). |
SCHEDULE OF INVESTMENTS — GUARDIAN MID CAP TRADITIONAL GROWTH VIP FUND
| | | | | | | | |
| June 30, 2023 (unaudited) | | Shares | | | Value | |
| Common Stocks – 99.1% | |
| |
| Aerospace & Defense – 1.4% | |
| | | |
L3Harris Technologies, Inc. | | | 6,391 | | | $ | 1,251,166 | |
| | | | | | | | | |
| | |
| | | | | 1,251,166 | |
| Automobile Components – 0.5% | |
| | | |
Visteon Corp.(1) | | | 2,819 | | | | 404,837 | |
| | | | | | | | | |
| | |
| | | | | 404,837 | |
| Biotechnology – 2.7% | |
| | | |
Abcam PLC, ADR(1) | | | 14,175 | | | | 346,862 | |
| | | |
Argenx SE, ADR(1) | | | 1,697 | | | | 661,372 | |
| | | |
Ascendis Pharma A/S, ADR(1) | | | 4,873 | | | | 434,915 | |
| | | |
BioMarin Pharmaceutical, Inc.(1) | | | 6,451 | | | | 559,173 | |
| | | |
Sarepta Therapeutics, Inc.(1) | | | 3,622 | | | | 414,791 | |
| | | | | | | | | |
| | |
| | | | | 2,417,113 | |
| Capital Markets – 3.8% | |
| | | |
Cboe Global Markets, Inc. | | | 4,050 | | | | 558,940 | |
| | | |
Charles Schwab Corp. | | | 11,875 | | | | 673,075 | |
| | | |
LPL Financial Holdings, Inc. | | | 8,157 | | | | 1,773,577 | |
| | | |
MSCI, Inc. | | | 761 | | | | 357,130 | |
| | | | | | | | | |
| | |
| | | | | 3,362,722 | |
| Chemicals – 0.9% | |
| | | |
Corteva, Inc. | | | 14,670 | | | | 840,591 | |
| | | | | | | | | |
| | |
| | | | | 840,591 | |
| Commercial Services & Supplies – 3.7% | |
| | | |
Cimpress PLC(1) | | | 10,905 | | | | 648,630 | |
| | | |
Clean Harbors, Inc.(1) | | | 2,903 | | | | 477,340 | |
| | | |
RB Global, Inc. | | | 13,526 | | | | 811,560 | |
| | | |
Rentokil Initial PLC (United Kingdom) | | | 22,462 | | | | 175,445 | |
| | | |
Rentokil Initial PLC, ADR | | | 29,531 | | | | 1,152,004 | |
| | | | | | | | | |
| | |
| | | | | 3,264,979 | |
| Consumer Staples Distribution & Retail – 0.7% | |
| | | |
Dollar Tree, Inc.(1) | | | 4,673 | | | | 670,575 | |
| | | | | | | | | |
| | |
| | | | | 670,575 | |
| Containers & Packaging – 0.6% | |
| | | |
Sealed Air Corp. | | | 13,614 | | | | 544,560 | |
| | | | | | | | | |
| | |
| | | | | 544,560 | |
| Diversified Consumer Services – 0.6% | |
| | | |
Frontdoor, Inc.(1) | | | 16,645 | | | | 530,975 | |
| | | | | | | | | |
| | |
| | | | | 530,975 | |
| Electric Utilities – 1.0% | |
| | | |
Alliant Energy Corp. | | | 16,646 | | | | 873,582 | |
| | | | | | | | | |
| | |
| | | | | 873,582 | |
| Electrical Equipment – 3.0% | |
| | | |
Regal Rexnord Corp. | | | 3,379 | | | | 520,028 | |
| | | |
Sensata Technologies Holding PLC | | | 48,036 | | | | 2,161,140 | |
| | | | | | | | | |
| | |
| | | | | 2,681,168 | |
| Electronic Equipment, Instruments & Components – 6.9% | |
| | | |
Flex Ltd.(1) | | | 79,852 | | | | 2,207,109 | |
| | | |
National Instruments Corp. | | | 17,343 | | | | 995,488 | |
| | | |
TE Connectivity Ltd. | | | 7,701 | | | | 1,079,372 | |
| | | |
Teledyne Technologies, Inc.(1) | | | 4,442 | | | | 1,826,151 | |
| | | | | | | | | |
| | |
| | | | | 6,108,120 | |
| | | | | | | | |
| June 30, 2023 (unaudited) | | Shares | | | Value | |
| Entertainment – 2.3% | |
| | | |
Liberty Media Corp-Liberty Formula One, Class A(1) | | | 708 | | | $ | 47,875 | |
| | | |
Liberty Media Corp-Liberty Formula One, Class C(1) | | | 26,095 | | | | 1,964,432 | |
| | | | | | | | | |
| | |
| | | | | 2,012,307 | |
| Financial Services – 4.4% | |
| | | |
Fidelity National Information Services, Inc. | | | 10,524 | | | | 575,663 | |
| | | |
Global Payments, Inc. | | | 6,003 | | | | 591,415 | |
| | | |
WEX, Inc.(1) | | | 14,840 | | | | 2,701,919 | |
| | | | | | | | | |
| | |
| | | | | 3,868,997 | |
| Ground Transportation – 3.2% | |
| | | |
JB Hunt Transport Services, Inc. | | | 10,514 | | | | 1,903,349 | |
| | | |
TFI International, Inc. | | | 8,114 | | | | 924,672 | |
| | | | | | | | | |
| | |
| | | | | 2,828,021 | |
| Health Care Equipment & Supplies – 8.7% | |
| | | |
Boston Scientific Corp.(1) | | | 51,661 | | | | 2,794,344 | |
| | | |
Cooper Cos., Inc. | | | 2,309 | | | | 885,340 | |
| | | |
Dentsply Sirona, Inc. | | | 20,210 | | | | 808,804 | |
| | | |
ICU Medical, Inc.(1) | | | 6,109 | | | | 1,088,563 | |
| | | |
Teleflex, Inc. | | | 8,814 | | | | 2,133,252 | |
| | | | | | | | | |
| | |
| | | | | 7,710,303 | |
| Hotels, Restaurants & Leisure – 2.6% | |
| | | |
Aramark | | | 32,913 | | | | 1,416,905 | |
| | | |
Entain PLC (United Kingdom) | | | 56,236 | | | | 913,285 | |
| | | | | | | | | |
| | |
| | | | | 2,330,190 | |
| Insurance – 5.2% | |
| | | |
Intact Financial Corp. (Canada) | | | 15,549 | | | | 2,400,749 | |
| | | |
Ryan Specialty Holdings, Inc.(1) | | | 12,806 | | | | 574,862 | |
| | | |
W R Berkley Corp. | | | 26,847 | | | | 1,599,007 | |
| | | | | | | | | |
| | |
| | | | | 4,574,618 | |
| Interactive Media & Services – 0.5% | |
| | | |
Ziff Davis, Inc.(1) | | | 6,049 | | | | 423,793 | |
| | | | | | | | | |
| | |
| | | | | 423,793 | |
| IT Services – 5.0% | |
| | | |
Amdocs Ltd. | | | 23,448 | | | | 2,317,835 | |
| | | |
GoDaddy, Inc., Class A(1) | | | 27,615 | | | | 2,074,715 | |
| | | | | | | | | |
| | |
| | | | | 4,392,550 | |
| Life Sciences Tools & Services – 4.8% | |
| | | |
Avantor, Inc.(1) | | | 50,136 | | | | 1,029,793 | |
| | | |
Illumina, Inc.(1) | | | 4,216 | | | | 790,458 | |
| | | |
Revvity, Inc. | | | 15,468 | | | | 1,837,444 | |
| | | |
Waters Corp.(1) | | | 2,310 | | | | 615,707 | |
| | | | | | | | | |
| | |
| | | | | 4,273,402 | |
| Machinery – 4.0% | |
| | | |
Fortive Corp. | | | 3,252 | | | | 243,152 | |
| | | |
Ingersoll Rand, Inc. | | | 28,944 | | | | 1,891,780 | |
| | | |
Westinghouse Air Brake Technologies Corp. | | | 13,289 | | | | 1,457,405 | |
| | | | | | | | | |
| | |
| | | | | 3,592,337 | |
| | | | |
| The accompanying notes are an integral part of these financial statements. | | | | 3 |
SCHEDULE OF INVESTMENTS — GUARDIAN MID CAP TRADITIONAL GROWTH VIP FUND
| | | | | | | | |
| June 30, 2023 (unaudited) | | Shares | | | Value | |
| Passenger Airlines – 1.4% | |
| | | |
Ryanair Holdings PLC, ADR(1) | | | 10,874 | | | $ | 1,202,664 | |
| | | | | | | | | |
| | |
| | | | | 1,202,664 | |
| Pharmaceuticals – 0.9% | |
| | | |
Catalent, Inc.(1) | | | 18,070 | | | | 783,515 | |
| | | | | | | | | |
| | |
| | | | | 783,515 | |
| Professional Services – 6.7% | |
| | | |
Broadridge Financial Solutions, Inc. | | | 8,300 | | | | 1,374,729 | |
| | | |
Ceridian HCM Holding, Inc.(1) | | | 16,539 | | | | 1,107,617 | |
| | | |
SS&C Technologies Holdings, Inc. | | | 41,191 | | | | 2,496,174 | |
| | | |
TransUnion | | | 11,900 | | | | 932,127 | |
| | | | | | | | | |
| | |
| | | | | 5,910,647 | |
| Semiconductors & Semiconductor Equipment – 10.0% | |
| | | |
KLA Corp. | | | 1,873 | | | | 908,442 | |
| | | |
Lam Research Corp. | | | 1,322 | | | | 849,861 | |
| | | |
Microchip Technology, Inc. | | | 18,942 | | | | 1,697,014 | |
| | | |
NXP Semiconductors NV | | | 8,893 | | | | 1,820,219 | |
| | | |
ON Semiconductor Corp.(1) | | | 37,705 | | | | 3,566,139 | |
| | | | | | | | | |
| | |
| | | | | 8,841,675 | |
| Software – 6.7% | |
| | | |
Atlassian Corp., Class A(1) | | | 1,971 | | | | 330,754 | |
| | | |
Constellation Software, Inc. (Canada) | | | 1,640 | | | | 3,397,929 | |
| | | |
Dynatrace, Inc.(1) | | | 13,009 | | | | 669,573 | |
| | | |
Nice Ltd., ADR(1) | | | 5,848 | | | | 1,207,612 | |
| | | |
Topicus.com, Inc. (Canada)(1) | | | 4,490 | | | | 368,249 | |
| | | | | | | | | |
| | |
| | | | | 5,974,117 | |
| Specialized REITs – 1.6% | |
| | | |
Lamar Advertising Co., Class A | | | 14,161 | | | | 1,405,479 | |
| | | | | | | | | |
| | |
| | | | | 1,405,479 | |
| Specialty Retail – 2.1% | |
| | | |
Burlington Stores, Inc.(1) | | | 2,206 | | | | 347,202 | |
| | | |
CarMax, Inc.(1) | | | 17,020 | | | | 1,424,574 | |
| | | |
Wayfair, Inc., Class A(1) | | | 1,253 | | | | 81,458 | |
| | | | | | | | | |
| | |
| | | | | 1,853,234 | |
| | | | | | | | |
| June 30, 2023 (unaudited) | | Shares | | | Value | |
| Textiles, Apparel & Luxury Goods – 1.4% | |
| | | |
Gildan Activewear, Inc. | | | 38,658 | | | $ | 1,246,334 | |
| | | | | | | | | |
| | |
| | | | | 1,246,334 | |
| Trading Companies & Distributors – 1.8% | |
| | | |
Ferguson PLC | | | 10,142 | | | | 1,595,438 | |
| | | | | | | | | |
| | |
| | | | | 1,595,438 | |
| | |
Total Common Stocks
(Cost $65,883,360) | | | | 87,770,009 | |
| | | | | | | | |
| | | Principal
Amount | | | Value | |
| Repurchase Agreements – 0.3% | |
| | | |
Fixed Income Clearing Corp., 1.52%, dated 6/30/2023, proceeds at maturity value of $277,186, due 7/3/2023(2) | | $ | 277,151 | | | | 277,151 | |
| | |
Total Repurchase Agreements
(Cost $277,151) | | | | 277,151 | |
| | |
Total Investments – 99.4%
(Cost $66,160,511) | | | | 88,047,160 | |
| | |
| Assets in excess of other liabilities – 0.6% | | | | 548,329 | |
| | |
| Total Net Assets – 100.0% | | | $ | 88,595,489 | |
| (1) | Non–income–producing security. |
| (2) | The table below presents collateral for repurchase agreements. |
| | | | | | | | | | | | | | | | |
| Security | | Coupon | | | Maturity
Date | | | Principal
Amount | | | Value | |
| U.S. Treasury Note | | | 4.625% | | | | 3/15/2026 | | | $ | 278,600 | | | $ | 282,717 | |
Legend:
ADR — American Depositary Receipt
REITs — Real Estate Investment Trusts
The following is a summary of the inputs used as of June 30, 2023 in valuing the Fund’s investments. For more information on valuation inputs, please refer to Note 2a of the accompanying Notes to Financial Statements.
| | | | | | | | | | | | | | | | |
| | | Valuation Inputs | | | | |
| Investments in Securities (unaudited) | | Level 1 | | | Level 2 | | | Level 3 | | | Total | |
| Common Stocks | | $ | 86,681,279 | | | $ | 1,088,730 | * | | $ | — | | | $ | 87,770,009 | |
| Repurchase Agreements | | | — | | | | 277,151 | | | | — | | | | 277,151 | |
| Total | | $ | 86,681,279 | | | $ | 1,365,881 | | | $ | — | | | $ | 88,047,160 | |
| * | Consists of certain foreign securities whose values were determined by a pricing service using pricing models (See Note 2a in Notes to Financial Statements). These investments in securities were classified as Level 2 rather than Level 1. |
| | | | |
| 4 | | | | The accompanying notes are an integral part of these financial statements. |
FINANCIAL INFORMATION — GUARDIAN MID CAP TRADITIONAL GROWTH VIP FUND
| | | | |
Statement of Assets and Liabilities As of June 30, 2023 (unaudited) | |
Assets | | | | |
| | |
Investments, at value | | $ | 88,047,160 | |
| | |
Foreign currency, at value | | | 11,066 | |
| | |
Receivable for investments sold | | | 851,739 | |
| | |
Dividends/interest receivable | | | 41,996 | |
| | |
Reimbursement receivable from adviser | | | 10,327 | |
| | |
Foreign tax reclaims receivable | | | 1,748 | |
| | |
Prepaid expenses | | | 1,030 | |
| | | | | |
| | |
Total Assets | | | 88,965,066 | |
| | | | | |
| | |
Liabilities | | | | |
| | |
Payable for investments purchased | | | 136,252 | |
| | |
Payable for fund shares redeemed | | | 106,464 | |
| | |
Investment advisory fees payable | | | 57,187 | |
| | |
Distribution fees payable | | | 17,871 | |
| | |
Accrued custodian and accounting fees | | | 17,440 | |
| | |
Accrued audit fees | | | 13,978 | |
| | |
Accrued trustees’ and officers’ fees | | | 1,721 | |
| | |
Accrued expenses and other liabilities | | | 18,664 | |
| | | | | |
| | |
Total Liabilities | | | 369,577 | |
| | | | | |
| | |
Total Net Assets | | $ | 88,595,489 | |
| | | | | |
| | |
Net Assets Consist of: | | | | |
| | |
Paid-in capital | | $ | 20,015,618 | |
| | |
Distributable earnings | | | 68,579,871 | |
| | | | | |
| | |
Total Net Assets | | $ | 88,595,489 | |
| | | | | |
Investments, at Cost | | $ | 66,160,511 | |
| | | | | |
Foreign Currency, at Cost | | $ | 11,065 | |
| | | | | |
| | |
Pricing of Shares | | | | |
| | |
Shares of Beneficial Interest Outstanding with
No Par Value | | | 4,088,203 | |
| | |
Net Asset Value Per Share | | | $21.67 | |
| | | | | |
| | | | |
Statement of Operations For the Six Months Ended June 30, 2023 (unaudited) | |
Investment Income | | | | |
| | |
Dividends | | $ | 404,098 | |
| | |
Non-cash dividends | | | 52,036 | |
| | |
Interest | | | 11,598 | |
| | |
Withholding taxes on foreign dividends | | | (22,440 | ) |
| | | | | |
| | |
Total Investment Income | | | 445,292 | |
| | | | | |
| | |
Expenses | | | | |
| | |
Investment advisory fees | | | 346,278 | |
| | |
Distribution fees | | | 108,212 | |
| | |
Professional fees | | | 22,160 | |
| | |
Custodian and accounting fees | | | 21,600 | |
| | |
Administrative fees | | | 11,950 | |
| | |
Trustees’ and officers’ fees | | | 11,117 | |
| | |
Transfer agent fees | | | 5,924 | |
| | |
Shareholder reports | | | 4,092 | |
| | |
Other expenses | | | 2,466 | |
| | | | | |
| | |
Total Expenses | | | 533,799 | |
| | |
Less: Fees waived | | | (61,995 | ) |
| | | | | |
| | |
Total Expenses, Net | | | 471,804 | |
| | | | | |
| | |
Net Investment Income/(Loss) | | | (26,512 | ) |
| | | | | |
| | |
Realized Gain/(Loss) and Change in Unrealized Appreciation/(Depreciation) on Investments and Foreign Currency Transactions | | | | |
| | |
Net realized gain/(loss) from investments | | | 1,280,789 | |
| | |
Net realized gain/(loss) from foreign currency transactions | | | 92 | |
| | |
Net change in unrealized appreciation/(depreciation) on investments | | | 9,428,119 | |
| | |
Net change in unrealized appreciation/(depreciation) on translation of assets and liabilities in foreign currencies | | | 26 | |
| | | | | |
| | |
Net Gain on Investments and Foreign Currency Transactions | | | 10,709,026 | |
| | | | | |
| | |
Net Increase in Net Assets Resulting From Operations | | $ | 10,682,514 | |
| | | | | |
| | | | | |
| | | | |
| The accompanying notes are an integral part of these financial statements. | | | | 5 |
FINANCIAL INFORMATION — GUARDIAN MID CAP TRADITIONAL GROWTH VIP FUND
| | | | | | | | |
Statements of Changes in Net Assets Six Months Ended Numbers are unaudited | | | | | | |
| | | |
| | | For the
Six Months Ended
6/30/23 | | | For the
Year Ended
12/31/22 | |
| | | | |
Operations | |
| | | |
Net investment income/(loss) | | $ | (26,512 | ) | | $ | (289,459 | ) |
| | | |
Net realized gain/(loss) from investments and foreign currency transactions | | | 1,280,881 | | | | 8,345,888 | |
| | | |
Net change in unrealized appreciation/(depreciation) on investments and
translation of assets and liabilities in foreign currencies | | | 9,428,145 | | | | (28,734,162 | ) |
| | | | | | | | | |
| | | |
Net Increase/(Decrease) in Net Assets Resulting from Operations | | | 10,682,514 | | | | (20,677,733 | ) |
| | | | | | | | | |
| |
Capital Share Transactions | |
| | | |
Proceeds from sales of shares | | | 4,689,502 | | | | 6,059,704 | |
| | | |
Cost of shares redeemed | | | (15,196,153 | ) | | | (20,064,443 | ) |
| | | | | | | | | |
| | | |
Net Decrease in Net Assets Resulting from Capital Share Transactions | | | (10,506,651 | ) | | | (14,004,739 | ) |
| | | | | | | | | |
| | | |
Net Increase/(Decrease) in Net Assets | | | 175,863 | | | | (34,682,472 | ) |
| | | | | | | | | |
| |
Net Assets | |
| | | |
Beginning of period | | | 88,419,626 | | | | 123,102,098 | |
| | | | | | | | | |
| | | |
End of period | | $ | 88,595,489 | | | $ | 88,419,626 | |
| | | | | | | | | |
| |
Other Information: | |
| | | |
Shares | | | | | | | | |
| | | |
Sold | | | 231,226 | | | | 302,605 | |
| | | |
Redeemed | | | (723,812 | ) | | | (999,928 | ) |
| | | | | | | | | |
| | | |
Net Decrease | | | (492,586 | ) | | | (697,323 | ) |
| | | | | | | | | |
| | | | | | | | | |
| | | | |
| 6 | | | | The accompanying notes are an integral part of these financial statements. |
This Page Intentionally Left Blank
FINANCIAL INFORMATION — GUARDIAN MID CAP TRADITIONAL GROWTH VIP FUND
The Financial Highlights table is intended to help you understand the Fund’s financial performance for the past six reporting periods (or, if shorter, the period since inception). Certain information reflects financial results for a single Fund share. The total returns in the table represent the rate that an investor would have earned (or lost) on an investment in the Fund.
| | | | | | | | | | | | | | | | | | | | | | | | |
Financial Highlights Six Months Ended Numbers are unaudited | | | | | | | | | | | | | | | | | | |
| | | Per Share Operating Performance | | | | |
| | | Net Asset Value,
Beginning of
Period | | | Net Investment
Loss(1) | | | Net Realized
and Unrealized
Gain/(Loss) | | | Total
Operations | | | Net Asset
Value, End of
Period | | | Total
Return(2) | |
| | | | | | | |
Six Months Ended 6/30/23 | | $ | 19.30 | | | $ | (0.01)(4) | | | $ | 2.38 | | | $ | 2.37 | | | $ | 21.67 | | | | 12.28% | (5) |
| | | | | | | |
Year Ended 12/31/22 | | | 23.32 | | | | (0.06) | | | | (3.96) | | | | (4.02) | | | | 19.30 | | | | (17.24)% | |
| | | | | | | |
Year Ended 12/31/21 | | | 19.91 | | | | (0.05) | | | | 3.46 | | | | 3.41 | | | | 23.32 | | | | 17.13% | |
| | | | | | | |
Year Ended 12/31/20 | | | 16.71 | | | | (0.04) | | | | 3.24 | | | | 3.20 | | | | 19.91 | | | | 19.15% | |
| | | | | | | |
Year Ended 12/31/19 | | | 12.27 | | | | (0.01) | | | | 4.45 | | | | 4.44 | | | | 16.71 | | | | 36.19% | |
| | | | | | | |
Year Ended 12/31/18 | | | 12.72 | | | | (0.01) | | | | (0.44) | | | | (0.45) | | | | 12.27 | | | | (3.54)% | |
| | | | |
| 8 | | | | The accompanying notes are an integral part of these financial statements. |
FINANCIAL INFORMATION — GUARDIAN MID CAP TRADITIONAL GROWTH VIP FUND
| | | | | | | | | | | | | | | | | | | | | | |
| | | | | | | | | | | | | | | | |
| Ratios/Supplemental Data | |
Net Assets, End
of Period (000s) | | | Net Ratio of
Expenses to
Average
Net Assets(3) | | | Gross Ratio of
Expenses to
Average Net
Assets | | | Net Ratio of Net
Investment Loss
to Average
Net Assets(3) | | | Gross Ratio of Net
Investment Loss
to Average Net Assets | | | Portfolio
Turnover Rate | |
| | | | | |
| $ | 88,595 | | | | 1.09%(5) | | | | 1.23%(5) | | | | (0.06)%(4),(5) | | | | (0.20)% (4),(5) | | | | 9% | (5) |
| | | | | |
| | 88,420 | | | | 1.10% | | | | 1.21% | | | | (0.29)% | | | | (0.40)% | | | | 16% | |
| | | | | |
| | 123,102 | | | | 1.10% | | | | 1.17% | | | | (0.24)% | | | | (0.31)% | | | | 10% | |
| | | | | |
| | 130,558 | | | | 1.10% | | | | 1.23% | | | | (0.25)% | | | | (0.38)% | | | | 19% | |
| | | | | |
| | 125,058 | | | | 1.10% | | | | 1.26% | | | | (0.07)% | | | | (0.23)% | | | | 10% | |
| | | | | |
| | 110,065 | | | | 1.10% | | | | 1.31% | | | | (0.07)% | | | | (0.28)% | | | | 30% | |
| (1) | Calculated based on the average shares outstanding during the period. |
| (2) | Total returns do not reflect the effects of charges deducted pursuant to the terms of The Guardian Insurance & Annuity Company, Inc.’s variable contracts. Inclusion of such charges would reduce the total returns for all periods shown. |
| (3) | Net Ratio of Expenses to Average Net Assets and Net Ratio of Net Investment Loss to Average Net Assets include the effect of fee waivers and expense limitations. |
| (4) | Reflects a special dividend paid out during the period by one of the Fund’s holdings. Had the Fund not received the special dividend, the Net Investment Loss per share would have been $(0.02), the Net Ratio of Net Investment Loss to Average Net Assets would have been (0.18)%, and the Gross Ratio of Net Investment Loss to Average Net Assets would have been (0.32)%. |
| (5) | Ratios for periods less than one year have been annualized, except for total return and portfolio turnover rate. |
| | | | |
| The accompanying notes are an integral part of these financial statements. | | | | 9 |
NOTES TO FINANCIAL STATEMENTS — GUARDIAN MID CAP TRADITIONAL GROWTH VIP FUND
June 30, 2023 (unaudited)
1. Organization
Guardian Variable Products Trust (the “Trust”), a Delaware statutory trust organized on January 12, 2016, is registered under the Investment Company Act of 1940, as amended (the “1940 Act”), as an open-end management investment company. The Trust currently has twenty-four series. Guardian Mid Cap Traditional Growth VIP Fund (the “Fund”) is a series of the Trust. The Fund is a diversified fund and commenced operations on September 1, 2016. The financial statements for other series of the Trust are presented in separate reports.
The Trust has authorized an unlimited number of shares of beneficial interest with no par value. Shares are bought and sold at closing net asset value (“NAV”). Shares of the Fund are only sold to certain separate accounts of The Guardian Insurance & Annuity Company, Inc. (“GIAC”) that fund certain variable annuity contracts and variable life insurance policies issued by GIAC. GIAC is a wholly-owned subsidiary of The Guardian Life Insurance Company of America (“Guardian Life”).
The Fund seeks long-term growth of capital.
2. Significant Accounting Policies
The following is a summary of significant accounting policies followed by the Fund in the preparation of its financial statements. The Fund follows the investment company accounting and reporting guidance of the Financial Accounting Standards Board (“FASB”) Accounting Standards Codification Topic 946 Financial Services – Investment Companies. The following policies are in conformity with accounting principles generally accepted in the United States of America (“GAAP”). The preparation of financial statements in accordance with GAAP requires management to make estimates and assumptions that affect the reported amounts and disclosures in the financial statements. Actual results could differ from those estimates.
a. Investment Valuations The Board of Trustees has designated Park Avenue Institutional Advisers LLC (“Park Avenue”) as the valuation designee for the Fund pursuant to Rule 2a-5 under the 1940 Act. Park Avenue has established a Fair Valuation Committee and has adopted fair valuation procedures that provide methodologies for fair valuing securities. These procedures include monitoring the appropriateness of fair values based on results of ongoing valuation oversight, including but not limited to consideration of
security specific events, market events, and pricing vendor and broker-dealer due diligence. The Fair Valuation Committee oversees and carries out the policies for the valuation of investments held in the Fund. The Fair Valuation Committee is responsible for discussing and assessing the potential impacts to the fair values on an ongoing basis, and reports to the Board of Trustees on at least a quarterly basis.
Equity securities traded on an exchange other than NASDAQ Stock Market, LLC (“NASDAQ”) are valued at the last reported sale price on the principal exchange or market on which they are traded; or, if there were no sales that day, at the mean between the closing bid and ask prices. Securities traded on the NASDAQ are generally valued at the NASDAQ official closing price, which may not be the last sale price. If the NASDAQ official closing price is not available for a security, that security is generally valued at the mean between the closing bid and ask prices. Repurchase agreements are carried at cost, which approximates fair value (see Note 5d). Foreign securities are valued in the currencies of the markets in which they trade and then converted to U.S. dollars by the application of foreign exchange rates at the close of the New York Stock Exchange (“NYSE”). Forward foreign currency contracts, if any, are valued at the mean between the bid and ask rates for the specified time interpolated from rates for proximate time periods.
Securities for which market quotations are not readily available or securities whose values have been materially affected by events occurring before the Fund’s valuation time but after the close of the securities’ principal exchange or market are valued at their fair values as determined in good faith by Park Avenue, as the Board of Trustee’s valuation designee (as defined in Rule 2a-5 under the 1940 Act), in accordance with Park Avenue’s procedures and under the general oversight of the Board of Trustees. In addition, the values of the Fund’s investments in foreign securities are generally determined by a pricing service using pricing models designed to estimate likely changes in the values of those securities. Certain foreign equity instruments are valued by applying international fair value factors provided by approved pricing services. The factors seek to adjust the local closing price for movements of local markets post closing, but prior to the time the NAVs are calculated. Valuations reflected in this report are as of the report date. As a result, changes in valuation due to market events and/or issuer related events after the report date and prior to issuance of the report are not reflected herein.
NOTES TO FINANCIAL STATEMENTS — GUARDIAN MID CAP TRADITIONAL GROWTH VIP FUND
Various inputs are used in determining the valuation of the Fund’s investments. These inputs are summarized in three broad levels listed below.
| • | | Level 1 - unadjusted inputs using quoted prices in active markets for identical investments. |
| • | | Level 2 - other significant observable inputs, including, but not limited to, quoted prices for similar investments, inputs other than quoted prices that are observable for investments (such as interest rates, prepayment speeds, credit risks, etc.) or other market corroborated inputs. |
| • | | Level 3 - significant unobservable inputs (including the Fund’s own assumptions in determining the fair value of investments). |
Inputs may include price information, volatility statistics, specific and broad credit data, liquidity statistics, and other factors. A financial instrument’s level within the fair value hierarchy is based on the lowest level of any input; both individually and in aggregate, that is significant to the fair value measurement. However, the determination of what constitutes “observable” requires significant judgment by the Trust. The Trust considers observable data to be that market data which is readily available, regularly distributed or updated, reliable and verifiable, and provided by independent sources that are actively involved in the relevant market. The inputs or methodology used for valuing securities are not necessarily an indication of the risk associated with investing in those securities. Changes in valuation techniques may result in transfers into or out of a financial instrument’s assigned level within the hierarchy.
The FASB requires reporting entities to make disclosures about purchases, sales, issuances and settlements of Level 3 securities on a gross basis. For the six months ended June 30, 2023, there were no transfers into or out of Level 3 of the fair value hierarchy.
In determining a financial instrument’s placement within the hierarchy, the Trust separates the Fund’s investment portfolio into two categories: investments and derivatives (e.g., futures). A summary of inputs used to value the Fund’s assets and liabilities carried at fair value as of June 30, 2023 is included in the Schedule of Investments.
Investments Investments whose values are based on quoted market prices in active markets, and are therefore classified within Level 1, include active listed equities. Investments that trade in markets that are not considered to be active, but are valued based on quoted market prices, dealer quotations or alternative pricing
sources supported by observable inputs are classified within Level 2. These include certain U.S. government and sovereign obligations, most government agency securities, investment-grade corporate bonds, certain mortgage products, state, municipal and provincial obligations, and certain foreign equity securities, including securities whose prices may have been affected by events occurring after the close of trading on their principal exchange or market and, as a result, whose values are determined by a pricing service as described above, or securities whose values are otherwise determined using fair valuation methods approved by the Fund’s Board of Trustees.
Investments classified within Level 3 have significant unobservable inputs, as they trade infrequently or not at all. Level 3 investments include, among others, private placement securities. When observable prices are not available for these securities, the Trust uses one or more valuation techniques for which sufficient and reliable data is available. The inputs used by the Trust in estimating the value of Level 3 investments include, for example, the original transaction price, recent transactions in the same or similar instruments, completed or pending third-party transactions in the underlying investment or comparable issuers, subsequent rounds of financing, recapitalizations, and other transactions across the capital structure. Level 3 investments may also be adjusted to reflect illiquidity and/or non-transferability, with the amount of such discount estimated by the Trust in the absence of market information. Assumptions used by the Trust due to the lack of observable inputs may significantly impact the resulting fair value and therefore the Fund’s results of operations. As of June 30, 2023, the Fund had no securities classified as Level 3.
Derivatives Exchange-traded derivatives, such as futures contracts, exchange-traded option contracts and certain swaps, are typically classified within Level 1 or Level 2 of the fair value hierarchy depending on whether or not they are deemed to be actively traded. Certain non-exchange-traded derivatives, such as generic forwards, certain swaps and options, have inputs which can generally be corroborated by market data and are therefore classified within Level 2. During the six months ended June 30, 2023, the Fund did not hold any derivatives.
b. Securities Transactions Securities transactions are accounted for on the date securities are purchased or sold (trade date). Realized gains or losses on securities transactions are determined on the basis of specific identification.
NOTES TO FINANCIAL STATEMENTS — GUARDIAN MID CAP TRADITIONAL GROWTH VIP FUND
c. Foreign Currency Translation The accounting records of the Fund are maintained in U.S. dollars. Investment securities and all other assets and liabilities of the Fund denominated in a foreign currency are generally translated into U.S. dollars at the exchange rates quoted at the close of the NYSE on each business day. The market value of investment securities and other assets and liabilities are translated at the exchange rate as of the valuation date. Purchases and sales of securities, income receipts, and expense payments are translated into U.S. dollars at the exchange rates in effect on the dates of the respective transactions. The Fund does not isolate the portion of the fluctuations on investments resulting from changes in foreign currency exchange rates from the fluctuations in market prices of investments held. Such fluctuations are included in the Net change in net realized and unrealized gain/(loss) from investments on the Statement of Operations.
Reported realized foreign currency gains and losses arise from the disposition of foreign currency, currency gains or losses realized between the trade and settlement dates on securities transactions, and the difference between the amounts of dividends, interest and foreign withholding taxes recorded on the Fund’s books on the transaction date and the U.S. dollar equivalent of the amounts actually received or paid. These reported realized foreign currency gains and losses, if any, are included in Net realized gain/(loss) from foreign currency transactions on the Statement of Operations. Unrealized foreign currency gains and losses arise from changes (due to changes in exchange rates) in the value of foreign currency and other assets and liabilities denominated in foreign currencies, which are held at period end, if any, and are included in Net change in unrealized appreciation/(depreciation) on translation of assets and liabilities in foreign currencies on the Statement of Operations.
d. Foreign Capital Gains Tax The Fund may be subject to foreign taxes on income, gains on investments or currency purchases/repatriation, a portion of which may be recoverable. The Fund will accrue such taxes and recoveries as applicable, based upon their current interpretation of tax rules and regulations that exist in the markets in which they invest.
e. Investment Income Dividend income net of foreign taxes withheld, if any, is generally recorded on the ex-dividend date. Distributions received from real estate investment trusts, if any, may be classified as dividends, capital gains and/or return of capital. Interest income, which includes amortization/accretion of
premium/discount, is determined using the interest income accrual method, and is accrued and recorded daily.
f. Allocation of Income and Expenses Many of the expenses of the Trust can be directly attributed to a specific series of the Trust. Expenses that cannot be directly attributed to a specific series of the Trust are generally apportioned among all the series in the Trust, based on relative net assets. In calculating net asset value per share for each series of the Trust, investment income, realized and unrealized gains and losses, and expenses other than series-specific expenses are allocated daily to each series based upon the proportion of net assets attributable to each series.
3. Transactions with Affiliates
a. Investment Advisory Fee and Expense Limitation Under the terms of the advisory agreement, which, after its two year initial term, is reviewed and approved annually by the Board of Trustees, the Fund pays an investment advisory fee to Park Avenue. Park Avenue is a wholly-owned subsidiary of Guardian Life and receives an investment advisory fee at an annual rate of 0.80% up to $100 million, 0.75% from $100 to $300 million, and 0.73% in excess of $300 million of the Fund’s average daily net assets. The fee is accrued daily and paid monthly.
Park Avenue has contractually agreed through April 30, 2024 to waive certain fees and/or reimburse certain expenses incurred by the Fund to the extent necessary to limit the Fund’s total annual operating expenses after fee waiver and/or expense reimbursement to 1.09% of the Fund’s average daily net assets (excluding, if applicable, any acquired fund fees and expenses, taxes, interest, transaction costs and brokerage commissions, litigation and extraordinary expenses). The limitation may not be increased or terminated prior to this time without action by the Board of Trustees and may be terminated only upon approval of the Board of Trustees. Amounts waived or reimbursed by Park Avenue pursuant to any expense limitation will not be subject to Park Avenue’s recoupment rights. For the six months ended June 30, 2023, Park Avenue waived fees and/or paid Fund expenses in the amount of $61,995.
Park Avenue has entered into a Sub-Advisory Agreement with Janus Henderson Investors US LLC (“Janus”). Janus is responsible for providing day-to-day investment advisory services to the Fund, subject to the supervision of Park Avenue and the oversight of the Board of Trustees. Sub-advisory fees are paid by Park Avenue and do not represent a separate or additional expense to the Fund.
NOTES TO FINANCIAL STATEMENTS — GUARDIAN MID CAP TRADITIONAL GROWTH VIP FUND
b. Compensation of Trustees and Officers Trustees and officers who are interested persons of the Trust, as defined in the 1940 Act, receive no compensation from the Fund, except for the Chief Compliance Officer of the Trust. Trustees of the Trust who are not interested persons of the Trust, and the Chief Compliance Officer, receive compensation and reimbursement of expenses from the Trust.
c. Distribution Fees Park Avenue Securities LLC (“PAS”), a wholly-owned subsidiary of Guardian Life, is the principal underwriter of Fund shares. The Trust has entered into a distribution and service agreement with PAS, which governs the sale and distribution of shares of the Fund. Under a distribution and service plan adopted by the Trust (“12b-1 plan”), PAS is compensated for services in such capacity, including its expenses in connection with the promotion and distribution of shares of the Fund, at an annual rate of 0.25% of the Fund’s average daily net assets. For the six months ended June 30, 2023, the Fund paid distribution fees in the amount of $108,212 to PAS.
PAS has directed that certain payments under the 12b-1 plan be used to compensate GIAC for shareholder services provided to contract owners.
4. Federal Income Taxes
a. Distributions to Shareholders For federal income tax purposes, the Fund is treated as a disregarded entity (“DRE”). As a DRE, the Fund is not subject to an entity-level income tax; and any income, gains, losses, deductions, taxes, and credits of the Fund would instead be “passed through” directly to the separate accounts of GIAC that invest in the Fund and retain the same character for U.S. federal income tax purposes. In addition, the Fund is not required to distribute taxable income and capital gains for U.S. federal income tax purposes. Therefore, no dividends and capital gains distributions were paid by the Fund.
5. Investments
a. Investment Purchases and Sales The cost of investments purchased and the proceeds from investments sold (excluding short-term investments) amounted to $7,519,594 and $15,768,824, respectively, for the six months ended June 30, 2023. During the six months ended June 30, 2023, there were no purchases or sales of U.S. government securities.
b. Foreign Securities Foreign securities investments involve special risks and considerations not typically associated with U.S. investments. These risks include, but are not limited to, currency risk; adverse political,
regulatory, social, and economic developments; and less reliable information about issuers. Moreover, securities of some foreign issuers may be less liquid and their prices more volatile than those of comparable U.S. issuers.
c. Industry or Sector Concentration In its normal course of business, the Fund may invest a significant portion of its assets in companies within a limited number of industries or sectors. As a result, the Fund may be subject to a greater risk of loss than that of a fund invested in a wider spectrum of industries or sectors because the stocks of many or all of the companies in the industry, group of industries, sector, or sectors may decline in value due to developments adversely affecting the industry, group of industries, sector, or sectors.
d. Repurchase Agreements The Fund may invest in repurchase agreements to maintain liquidity and earn income over periods of time as short as overnight. The collateral for repurchase agreements is either cash or fully negotiable U.S. government securities (including U.S. government agency securities). Repurchase agreements are fully collateralized (including the interest accrued thereon) and such collateral is marked to market daily while the agreements remain in force. If the value of the collateral falls below the repurchase price plus accrued interest, the Fund will typically require the seller to deposit additional collateral by the next business day. If the request for additional collateral is not met, or the seller defaults, the Fund maintains the right to sell the collateral (although it may be prevented or delayed from doing so in certain circumstances) and may be required to claim any resulting loss against the seller. Park Avenue monitors the creditworthiness of the seller with which the Fund enters into repurchase agreements.
6. Temporary Borrowings
The Fund, with other funds managed by Park Avenue, is party to a credit agreement with respect to a $10 million committed revolving credit facility from State Street Bank and Trust Company (the “Credit Agreement”) for temporary borrowing purposes, including the meeting of redemption requests that otherwise might require the untimely disposition of securities. Interest is based on a daily fluctuating rate per annum equal to the Applicable Rate (as defined in the Credit Agreement) plus the Applicable Margin (as defined in the Credit Agreement) that is subject to change from time to time as and when the Applicable Rate changes. Under the current Credit Agreement, the Applicable Rate for any day is defined as the rate per annum equal to the sum of
NOTES TO FINANCIAL STATEMENTS — GUARDIAN MID CAP TRADITIONAL GROWTH VIP FUND
(a) 0.10% plus (b) the higher of (i) the Federal Funds Effective Rate for such day and (ii) the Overnight Bank Funding Rate for such day; the Applicable Margin is 1.25%. In addition to the interest charged on any borrowings by the Fund, each fund pays a commitment fee of 0.30% per annum on its share of the unused portion of the credit facility. The agreement is in place until January 5, 2024. The Fund did not utilize the credit facility during the six months ended June 30, 2023.
7. Indemnifications
Under the Trust’s organizational documents and, in some cases, by contract, officers and Trustees of the Trust are indemnified against certain liabilities arising out of the performance of their duties to the Fund. In addition, in the normal course of business, the Fund enters into contracts with its vendors and others that
provide general indemnifications. The Fund’s maximum exposure under these arrangements is unknown as this would involve future claims that may be made against the Fund that have not yet occurred. However, based on experience, the Fund expects the risk of loss to be remote.
8. Additional Information
The outbreak of COVID-19 has adversely impacted both local and global economies, including those in which the Fund may invest. These impacts include materially reduced consumer demand and economic output, disrupted supply chains, market closures, travel restrictions and quarantines, and strained healthcare systems. The Fund’s operations may be interrupted as a result, which may have a negative impact on the Fund’s investment performance.
SUPPLEMENTAL INFORMATION (UNAUDITED)
Liquidity Risk Management Program
In compliance with Rule 22e-4 under the Investment Company Act of 1940, as amended (the “Liquidity Rule”), Guardian Variable Products Trust (the “Trust”) has adopted and implemented a written liquidity risk management program (the “Program”) for each series of the Trust (each, a “Fund”), which is reasonably designed to assess and manage each Fund’s liquidity risk. The Fund’s “liquidity risk” is the risk that the Fund could not meet requests to redeem shares issued by the Fund without significant dilution of the remaining investors’ interests in the Fund.
The Board of Trustees of the Trust (the “Board”)
Previously approved the designation of Park Avenue Institutional Advisers LLC (the “Administrator” or “PAIA”) as Program administrator. The Administrator established a Liquidity Risk Management Committee, which is comprised of certain officers of the Trust and PAIA, that assists the Administrator in the implementation and day-to-day administration of the Program and otherwise support carrying out the Administrator’s liquidity risk management responsibilities under the Program.
In accordance with the Program, each Fund’s liquidity risk is assessed no less frequently than annually, taking into consideration a variety of factors, including, as applicable, the Fund’s investment strategy and liquidity of portfolio investments, cash flow projections, and holdings of cash and cash equivalents, as well as borrowing arrangements and other funding sources. Certain factors are considered under both normal and reasonably foreseeable stressed conditions.
Each Fund portfolio investment is classified, no less than monthly, into one of four liquidity categories (including “highly liquid investments” and “illiquid investments,” discussed below) based on a determination of the number of days it is reasonably expected to take to convert the investment to cash, or sell or dispose of the investment, in current market conditions without significantly changing the investment’s market value.
The Liquidity Rule limits the Fund’s investments in illiquid investments by prohibiting the Fund from acquiring any illiquid investment if, immediately after the acquisition, the Fund would have invested more than 15% of its net assets in illiquid investments that are assets. The Program includes provisions reasonably designed to comply with this investment limitation. In addition, the Program includes provisions reasonably designed to comply with this investment limitation. In addition, the Program includes provisions reasonably designed to comply with the Liquidity Rule’s requirements relating to highly liquid investment minimums, which is a minimum amount of Fund net assets that must be invested in highly liquid investments that are assets, as applicable. The Fund was not required to adopt a highly liquid investment minimum during the period.
At a meeting of the Board held on March 29-30, 2023, the Board received a report (the “Report”) prepared by the Administrator addressing the Program’s operation and assessing the adequacy and effectiveness of its implementation for the period from January 1, 2022 through December 31, 2022 (the “Reporting Period”). The Report noted that the Administrator believes the Program operated effectively during the Reporting Period and continues to be reasonably designed to effectively assess and manage each Fund’s liquidity risk. The Report also noted that the Administrator believes the Program has been adequately and effectively implemented and the investment strategies for each Fund continue to be appropriate since its inception. In addition, the Report summarized the operation of the Program and the information and factors considered by the Administrator in its assessment of the Program’s implementation, such as the liquidity risk assessment framework and liquidity classification methodologies.
There can be no assurance that the Program will achieve its objectives under all circumstances. Please refer to the Fund’s prospectus for more information regarding the Fund’s exposure to liquidity risk and other risks to which an investment in the Fund may be subject.
SUPPLEMENTAL INFORMATION (UNAUDITED)
Approval of Investment Management and
Sub-advisory Agreements
Section 15(c) of the Investment Company Act of 1940, as amended (the “1940 Act”), requires that a fund’s investment advisory and sub-advisory agreements be approved initially by the fund’s board of trustees. Section 15(c) also requires that the continuation of these agreements, after an initial term of up to two years, be annually reviewed and approved by the board. Any such agreement must be approved by a vote of a majority of the trustees who are not parties to the agreement or “interested persons” (as defined in the 1940 Act) of a party to the agreement at a meeting of the board called for the purpose of voting on such approval.
At a meeting of the Board of Trustees (the “Board”) of Guardian Variable Products Trust (the “Trust”) held on March 29-30, 2023 (the “Meeting”), the Board, including the trustees who are not parties to the agreement or “interested persons” as defined in the 1940 Act (the “Independent Trustees”), considered and voted unanimously to renew the existing investment management agreement between the Trust, on behalf of Guardian All Cap Core VIP Fund; Guardian Balanced Allocation VIP Fund; Guardian Core Fixed Income VIP Fund; Guardian Core Plus Fixed Income VIP Fund; Guardian Diversified Research VIP Fund; Guardian Equity Income VIP Fund; Guardian Global Utilities VIP Fund; Guardian Growth & Income VIP Fund; Guardian Integrated Research VIP Fund; Guardian International Growth VIP Fund; Guardian International Equity VIP Fund; Guardian Large Cap Disciplined Growth VIP Fund; Guardian Large Cap Disciplined Value VIP Fund; Guardian Large Cap Fundamental Growth VIP Fund; Guardian Mid Cap Relative Value VIP Fund; Guardian Mid Cap Traditional Growth VIP Fund; Guardian Multi-Sector Bond VIP Fund; Guardian Select Mid-Cap Core VIP Fund; Guardian Short Duration Bond VIP Fund; Guardian Small Cap Core VIP Fund; Guardian Small-Mid Cap Core VIP Fund; Guardian Strategic Large Cap Core VIP Fund; Guardian Total Return Bond VIP Fund and Guardian U.S. Government Securities VIP Fund (each, a “Fund,” and together, the “Funds”), in substantially the form presented at this meeting (the “Management Agreement”); and Park Avenue Institutional Advisers LLC (the “Manager”) for a one-year term.
The Board, including the Independent Trustees, also considered and voted unanimously to renew the existing sub-advisory agreements (the “Sub-Advisory Agreements,” collectively with the Management Agreement and Sub-Subadvisory Agreement, the “Agreements”) between the Manager and investment
advisory firms engaged to serve as sub-advisers to certain of the Funds (the “Sub-Advised Funds”), namely (i) ClearBridge Investments, LLC with respect to Guardian Small Cap Core VIP Fund; (ii) Putnam Investment Management, LLC with respect to Guardian Diversified Research VIP Fund; (iii) AllianceBernstein L.P. with respect to Guardian Growth & Income VIP Fund and Guardian Strategic Large Cap Core VIP Fund; (iv) J.P. Morgan Investment Management Inc. with respect to Guardian International Growth VIP Fund; (v) Schroder Investment Management North America Inc. with respect to Guardian International Equity VIP Fund; (vi) Wellington Management Company LLP with respect to Guardian Balanced Allocation VIP Fund, Guardian Equity Income VIP Fund, Guardian Integrated Research VIP Fund, Guardian Large Cap Disciplined Growth VIP Fund and Guardian Global Utilities VIP Fund; (vii) Boston Partners Global Investors, Inc. with respect to Guardian Large Cap Disciplined Value VIP Fund; (viii) Janus Henderson Investors US LLC with respect to Guardian Mid Cap Traditional Growth VIP Fund; (ix) Allspring Global Investments, LLC with respect to Guardian Mid Cap Relative Value VIP Fund and Guardian Small-Mid Cap Core VIP Fund; (x) Lord, Abbett & Co. LLC with respect to Guardian Core Plus Fixed Income VIP Fund; (xi) FIAM LLC with respect to Guardian Select Mid Cap Core VIP Fund; and (xii) Massachusetts Financial Services Company with respect to Guardian All Cap Core VIP Fund, each in substantially the form presented at this meeting, (each, a “Sub-Adviser” and collectively, the “Sub-Advisers”) for a one-year term.
The Board, including the Independent Trustees, also considered and voted unanimously to renew the existing sub-subadvisory agreement (the “Sub-Subadvisory Agreement”) between Schroder Investment Management North America Inc. and Schroder Investment Management North America Limited (also a Sub-Adviser) with respect to Guardian International Equity VIP Fund for a one-year term.
The Board is responsible for overseeing the management of each Fund. In determining whether to renew its approval of the Agreements, the Trustees evaluated information and factors that they considered to be relevant and appropriate through the exercise of their own business judgment. The Trustees considered certain information and factors in light of advice furnished to them by legal counsel to the Trust and, in the case of the Independent Trustees, their independent legal counsel. In advance of the Meeting, the Trustees received materials and information designed to assist their consideration of the Agreements. The Trustees received written responses
SUPPLEMENTAL INFORMATION (UNAUDITED)
from the Manager and each Sub-Adviser to a series of questions and requests for information encompassing a wide variety of topics provided by independent counsel on behalf of the Independent Trustees. The Independent Trustees also received materials and information regarding the legal standards applicable to their consideration of the Agreements and the process and criteria used by the Manager to identify and select the Sub-Advisers.
During the course of their deliberations, the Independent Trustees met twice to discuss and evaluate the materials, information and Agreements in executive session with their independent legal counsel, outside of the presence of the Trustees who are not Independent Trustees and representatives from Fund management, the Manager or any Sub-Adviser.
In reaching its decisions to renew its approval of the Agreements, the Board took into account the materials and information described above, as well as other materials and information provided to the Board throughout the year. Individual Trustees may have given different weight to different factors and information with respect to each Agreement, and the Trustees did not identify any single factor or information that, in isolation, would be controlling in deciding to approve the Agreements. The discussion below is intended to summarize the broad factors that figured prominently in the Board’s decisions to renew its approval of the Agreements rather than to be all-inclusive. These broad factors included: (i) the nature, extent and quality of the services provided to the Funds by the Manager and to the Sub-advised Funds by the Sub-Advisers; (ii) the investment performance of each Fund; (iii) estimated profitability of the Manager; (iv) fees and expenses; (v) the extent to which economies of scale may exist, and the extent to the benefits of economies of scale are shared with the Funds; and (vi) any other benefits derived by the Manager or the Sub-Advisers (or their respective affiliates) from their relationships with the Funds.
Nature, Extent and Quality of Services
The Trustees considered information regarding the nature, extent and quality of services provided to the Funds by the Manager. The Trustees also considered, among other things, the terms of the Management Agreement and the range of investment advisory services provided by the Manager. In addition, the Trustees reviewed the range of non-investment advisory services provided by the Manager consistent with the terms of the Management Agreement, notably coordinating the preparation and filing of various
regulatory documents, coordinating the preparation and assembly of Board meeting materials, and assisting the Board with certain valuation matters. The Board also received a description of the Manager’s and each Sub-Adviser’s business continuity plans and of their respective approaches to data privacy and cybersecurity, and related testing. The Board received information regarding the response of the Manager and the Sub-Advisers to the COVID-19 pandemic, including the continuation of remote work arrangements and return-to-office plans. The Board also received information about the Manager’s role as administrator of the Funds’ liquidity risk management program, the Manager’s approach to risk management, and the Manager’s vendor oversight programs.
The Trustees considered that the Sub-advised Funds operate in a “manager-of-managers” structure and reviewed the responsibilities that the Manager has under this structure, including monitoring and evaluating the performance of the Sub-Advisers, monitoring the Sub-Advisers for adherence to the stated investment objectives, strategies, policies and restrictions of the Funds and supervising the Sub-Advisers with respect to the services that the Sub-Advisers would provide under the Sub-Advisory Agreements. The Trustees also considered the process used by the Manager, consistent with this structure, to identify and recommend sub-advisers, and the Manager’s ability to monitor and oversee sub-advisers and recommend replacement sub-advisers, when necessary, and provide other services under the Management Agreement. The Board noted that investment management staff of the Manager and the Trust’s Chief Compliance Officer conduct oversight meetings with the Sub-Advisers on a periodic basis, follow through with additional inquiries on any questions or concerns that arise during the meetings and, as necessary, then report the results of the meetings to the Board. The Trustees reviewed information regarding the experience and background of the Manager’s key personnel and the Manager’s organizational structure and resources, including investment, legal and administrative capabilities of the Manager. In this regard, the Trustees recognized that the Funds may benefit from the Manager’s ability to use resources and capabilities of its affiliates in providing services to the Funds.
The Trustees considered information regarding the nature, extent and quality of services provided to the Sub-advised Funds by the Sub-Advisers. The Trustees also considered, among other things, the terms of the Sub-advisory Agreements and the range of investment
SUPPLEMENTAL INFORMATION (UNAUDITED)
advisory services provided by the Sub-Advisers under the oversight of the Manager. In evaluating these investment advisory services, the Trustees considered, among other things, the Sub-Advisers’ investment philosophies, styles and/or processes and approaches to managing the respective Sub-advised Funds. The Trustees received and evaluated information regarding the background, education, expertise and/or experience of the investment professionals who serve as portfolio managers for the Sub-advised Funds and the capabilities and resources of the Sub-Advisers.
Based upon these considerations, the Trustees concluded, within the context of their full deliberations, that the nature, extent and quality of services provided to the Funds by the Manager and the Sub-advised Funds by each respective Sub-Adviser were appropriate.
Investment Performance
In connection with each of its regular quarterly meetings, the Board receives information on the performance of each Fund, including net performance, relative performance rankings within the relevant Morningstar peer group, and performance as compared to benchmark index returns. At each quarterly Board meeting, members of the Manager’s funds management team review with the Board the economic and market environment, absolute and relative performance of each Fund, and any relevant information about risk management and style consistency in connection with management of the Funds. The Board considered investment performance for each Fund over the one-year, three-year (where available), five-year (where available) and since-inception periods.
The Board also received and reviewed a report prepared by Broadridge Financial Solutions (“Broadridge”), an independent provider of mutual fund industry data, which included comparisons of the performance of each Fund to performance of an appropriate peer universe. For details regarding each Fund’s performance, see the “Fund-by-Fund Factors” section below.
The Manager discussed with the Board factors contributing to the Funds’ performance results. In addition, for certain Funds, the Manager provided to the Board longer term performance records of the Sub-Advisers for strategies used in managing the Funds. The Board concluded that the investment performance generated by the Manager and each Sub-Adviser was generally satisfactory, or, that any steps being taken by the Manager and Sub-Advisers to address any performance issues were satisfactory.
Profitability
The Board received and considered the Manager’s estimate of its profitability, which included allocations by the Manager of its costs in providing management services to the Funds. The Board considered the estimated profitability of the Manager both overall and on a Fund-by-Fund basis.
The Board received and considered profitability information from most of the Sub-Advisers, but noted that the Manager had negotiated the fees with the Sub-Advisers at arm’s-length. Accordingly, the Board concluded that the profitability of the Sub-Advisers is a less relevant factor than Manager profitability.
Based on the consideration of this information, the Board concluded that the profitability of the Funds to the Manager was acceptable.
Fees and Expenses
The Trustees considered the management fees paid by the Funds to the Manager under the Management Agreement and evaluated the reasonableness of these fees. The Trustees received and reviewed comparative information with respect to the management fee and total expenses for each Fund and the management fees and total expenses for a peer group of other funds selected by Broadridge. The Trustees considered the Manager’s commitment to limit the total expenses of each Fund through an expense limitation agreement with the Trust. Although the Board recognized that the comparisons between the management fees and actual expenses of the Funds and those of the identified peer group are imprecise, given different terms of agreements and variations in fund strategies, the Trustees found that the comparative information supported their consideration and approval of the management fees and evaluation of the total expenses. For details regarding each Fund’s fee and expense comparisons, see the “Fund-by-Fund Factors” section below.
The Trustees considered the sub-advisory fees paid under the Sub-advisory Agreements and evaluated the reasonableness of those fees. The Trustees also considered that the fees paid to the Sub-Advisers would be paid by the Manager and not the Funds and that the Manager had negotiated the fees with the Sub-Advisers at arm’s-length.
Based on the consideration of the information and factors summarized above, as well as other relevant information and factors, the Board concluded that the management and sub-advisory fees were reasonable in
SUPPLEMENTAL INFORMATION (UNAUDITED)
light of the nature, extent and quality of services rendered to the Funds by the Manager and the Sub-Advisers.
Economies of Scale
The Board considered the extent to which economies of scale may exist, and the extent to the benefits of economies of scale are shared with the Funds. In this regard, the Board noted that for sixteen of twenty-four Funds, the management and sub-advisory fee included breakpoints that are tiered based on growth in asset levels of each such Fund and that for the other Funds, the fees reflected appropriate levels based on current and expected asset levels. The Board also noted that the expenses of the Funds are subject to expense limitations provided by the Manager. The Board noted that expected economies of scale, where they exist, may be shared through the use of fee breakpoints, expense limitations by the Manager, and/or a lower overall fee.
Ancillary Benefits
The Board considered the potential benefits, other than management fees, that the Manager and/or its affiliates may receive because of the Manager’s relationship with the Funds. The Trustees considered that the Funds were designed to serve as investment options under variable contracts issued by affiliates of the Manager that would receive fees under those contracts and that Park Avenue Securities LLC, an affiliate of the Manager and principal underwriter of the Funds, and participating insurance companies, including insurance companies affiliated with the Manager, would be entitled to receive fees from the Funds under a plan of distribution adopted pursuant to Rule 12b-1 under the 1940 Act. The Trustees considered that the Manager and its affiliates may benefit from (i) greater efficiencies in annuity administration and operations and potential cost savings due to a reduction in the number of unaffiliated funds available as annuity contract investment options, and (ii) increased dividends-received deductions due to the Funds’ status under the tax laws as disregarded entities. In addition, the Trustees considered the potential benefits, other than sub-advisory fees, that the Sub-Advisers and their affiliates may receive because of their relationships with the Funds, including the ability to receive research from soft dollar commissions consistent with Trust policies. The Trustees concluded that benefits that may accrue to the Manager and its affiliates are reasonable and the benefits that may accrue to the Sub-Advisers and their affiliates are consistent with those expected for a sub-adviser to a mutual fund such as the applicable Fund.
Fund-by-Fund Factors
The Broadridge report groups fees, expenses and performance into five quintiles, with the top quintile having the highest performance or lowest fees/expenses, and the bottom quintile having the lowest performance or highest fees/expenses. For purposes of the descriptions below, a Fund’s performance is considered “in line with” the benchmark index if it is within 0.20%.
Guardian Large Cap Fundamental Growth VIP Fund
| • | | The Board noted that the Fund’s performance was in the 3rd quintile of its performance universe for the 1-year period and in the 4th quintile for its performance universe for the 3-year and 5-year periods. The Board also noted that the Fund’s performance was below the benchmark index for the 1-year, 3-year and 5-year periods. |
| • | | The Board noted that the contractual management fee, the actual management fee and actual total expenses were in the 1st quintile of the expense group. |
Guardian Large Cap Disciplined Growth VIP Fund
| • | | The Board noted that the Fund’s performance was in the 3rd quintile of its performance universe for the 1-year and 3-year periods and in the 2nd quintile for the 5-year period. The Board also noted that the Fund’s performance was below the benchmark index for the 1-year, 3-year and 5-year periods. |
| • | | The Board noted that the contractual management fee, the actual management fee and actual total expenses were in the 1st quintile of the expense group. |
Guardian Integrated Research VIP Fund
| • | | The Board noted that the Fund’s performance was in the 5th quintile of its performance universe for the 1-year and 5-year periods and in the 4th quintile for 3-year period. The Board also noted that the Fund’s performance was below the benchmark index for the 1-year, 3-year and 5-year periods. |
| • | | The Board noted that the contractual management fee, the actual management fee and actual total expenses were in the 1st quintile of the expense group. |
Guardian Diversified Research VIP Fund
| • | | The Board noted that the Fund’s performance was in the 3rd quintile of its performance universe for the 1-year and 3-year periods and in the 2nd quintile for the 5-year period. The Board also noted that the Fund’s performance was higher than the benchmark index for the 1-year period. The Board note that the |
SUPPLEMENTAL INFORMATION (UNAUDITED)
| | | Fund’s performance was lower than the benchmark index for the 3-year and 5-year periods. |
| • | | The Board noted that the contractual management fee and actual management fee were in the 1st quintile of the expense group and that actual total expenses were in the 3rd quintile. |
Guardian Strategic Large Cap Core VIP Fund
| • | | The Board noted that the Fund’s performance was in the 1st quintile of its performance universe for the 1-year period. The Board acknowledged the Fund’s short operational history. The Board noted that the Fund’s performance was higher than the benchmark index for the 1-year period. |
| • | | The Board noted that the contractual management fee, the actual management fee and actual total expenses were in the 1st quintile of the expense group. |
Guardian Large Cap Disciplined Value VIP Fund
| • | | The Board noted that the Fund’s performance was in the 3rd quintile of its performance universe for the 1-year and 3-year periods and in the 4th quintile for the 5-year period. The Board also noted that the Fund’s performance was higher than the benchmark index for the 1-year and 3-year periods. The Board noted that the Fund’s performance was in line with the benchmark index for the 5-year period. |
| • | | The Board noted that the contractual management fee was in the 2nd quintile of the expense group, the actual management fee was in the 1st quintile of the expense group and that actual total expenses were in the 3rd quintile. |
Guardian Growth & Income VIP Fund
| • | | The Board noted that the Fund’s performance was in the 3rd quintile of its performance universe for the 1-year, 3-year and 5-year periods. The Board also noted that the Fund’s performance was higher than the benchmark index for the 1-year, 3-year and 5-year periods. |
| • | | The Board noted that the contractual management fee and the actual management fee were in the 1st quintile of the expense group and that actual total expenses were in the 3rd quintile. |
Guardian Equity Income VIP Fund
| • | | The Board noted that the Fund had less than one-year of operational history and was not able to evaluate an investment performance record for the Fund. The Board noted that it would have an opportunity to review such information in connection with future annual reviews. The Board noted that, in the |
| | | meantime, it received monthly performance reports from the Manager. |
| • | | The Board noted that the contractual management fee, the actual management fee and actual total expenses were in the 1st quintile of the expense group. |
Guardian All Cap Core VIP Fund
| • | | The Board noted that the Fund’s performance was in the 3rd quintile of its performance universe for the 1-year period. The Board acknowledged the Fund’s short operational history. The Board noted that the Fund’s performance was higher than the benchmark index for the 1-year period. |
| • | | The Board noted that the contractual management fee, the actual management fee and actual total expenses were in the 1st quintile of the expense group. |
Guardian Mid Cap Traditional Growth VIP Fund
| • | | The Board noted that the Fund’s performance was in the 1st quintile of its performance universe for the 1-year period and in the 2nd quintile for the 3-year and 5-year periods. The Board also noted that the Fund’s performance was higher than the benchmark index for the 1-year, 3-year and 5-year periods. |
| • | | The Board noted that the contractual management fee and actual management fee were in the 1st quintile of the expense group and that the actual total expenses were in the 4th quintile. |
Guardian Select Mid Cap Core VIP Fund
| • | | The Board noted that the Fund’s performance was in the 3rd quintile of its performance universe for the 1-year period. The Board acknowledged the Fund’s short operational history. The Board noted that the Fund’s performance was lower than the benchmark index for the 1-year period. |
| • | | The Board noted that the contractual management fee, the actual management fee and actual total expenses were in the 1st quintile of the expense group. |
Guardian Mid Cap Relative Value VIP Fund
| • | | The Board noted that the Fund’s performance was in the 2nd quintile of its performance universe for the 1-year, 3-year and 5-year periods. The Board also noted that the Fund’s performance was higher than the benchmark index for the 1-year, 3-year and 5-year periods. |
| • | | The Board noted that the contractual management fee and the actual management fee were in the 2nd quintile of the expense group and the actual total expenses were in the 3rd quintile of the expense group. |
SUPPLEMENTAL INFORMATION (UNAUDITED)
Guardian Small-Mid Cap Core VIP Fund
| • | | The Board noted that the Fund’s performance was in the 5th quintile of its performance universe for the 1-year period. The Board acknowledged the Fund’s short operational history. The Board noted that the Fund’s performance was higher than the benchmark index for the 1-year period. |
| • | | The Board noted that the contractual management fee, the actual management fee and actual total expenses were in the 1st quintile of the expense group. |
Guardian Small Cap Core VIP Fund
| • | | The Board noted that the Fund’s performance was in the 5th quintile of its performance universe for the 1-year and 3-year periods. The Board noted that the Fund’s performance was lower than the benchmark index for the 1-year and 3-year periods. |
| • | | The Board noted that the contractual management fee and the actual management fee were in the 1st quintile of the expense group and the actual total expenses were in the 2nd quintile of the expense group. |
Guardian International Growth VIP Fund
| • | | The Board noted that the Fund’s performance was in the 4th quintile of its performance universe for the 1-year period, in the 2nd quintile of its performance universe for the 3-year period and in the 3rd quintile of its performance universe for the 5-year period. The Board also noted that the Fund’s performance was lower than the benchmark index for the 1-year and 5-year periods. The Board noted that the Fund’s performance was higher than the benchmark index for the 3-year period. |
| • | | The Board noted that the contractual management fee and actual management fee were in the 2nd quintile of the expense group and that the actual total expenses were in the 3rd quintile. |
Guardian International Equity VIP Fund
| • | | The Board noted that the Fund’s performance was in the 5th quintile of its performance universe for the 1-year, 3-year and 5-year periods. The Board also noted that the Fund’s performance was lower than the benchmark index for the 1-year, 3-year and 5-year periods. |
| • | | The Board noted that the contractual management fee, the actual management fee and the actual total expenses were in the 2nd quintile of the expense group. |
Guardian Global Utilities VIP Fund
| • | | The Board noted that the Fund’s performance was in the 5th quintile of its performance universe for the 1-year period and in the 4th quintile of its performance universe for the 3-year period. The Board noted that the Fund’s performance was higher than the benchmark index for the 1-year and 3-year periods. |
| • | | The Board noted that the contractual management fee and the actual management fee were in the 1st quintile of the expense group and the actual total expenses were in the 2nd quintile of the expense group. |
Guardian Balanced Allocation VIP Fund
| • | | The Board noted that the Fund had less than one-year of operational history and was not able to evaluate an investment performance record for the Fund. The Board noted that it would have an opportunity to review such information in connection with future annual reviews. The Board noted that, in the meantime, it received monthly performance reports from the Manager. |
| • | | The Board noted that the contractual management fee, the actual management fee and actual total expenses were in the 1st quintile of the expense group. |
Guardian Core Plus Fixed Income VIP Fund
| • | | The Board noted that the Fund’s performance was in the 3rd quintile of its performance universe for the 1-year and 3-year periods and in the 4th quintile of its performance universe for the 5-year period. The Board also noted that the Fund’s performance was lower than the benchmark index for the 1-year and 5-year periods. The Board noted that the Fund’s performance was in line with the benchmark index for the 3-year period. |
| • | | The Board noted that the contractual management fee and actual management fee were in the 2nd quintile of the expense group and that actual total expenses were in the 3rd quintile. |
Guardian Total Return Bond VIP Fund
| • | | The Board noted that the Fund’s performance was in the 5th quintile of its performance universe for the 1-year and 3-year periods. The Board also noted that the Fund’s performance was lower than the benchmark index for the 1-year and 3-year periods. |
| • | | The Board noted that the contractual management fee and actual management fee were in the 2nd quintile and the actual total expenses were in the 3rd quintile. |
SUPPLEMENTAL INFORMATION (UNAUDITED)
Guardian Core Fixed Income VIP Fund
| • | | The Board noted that the Fund had less than one-year of operational history and was not able to evaluate an investment performance record for the Fund. The Board noted that it would have an opportunity to review such information in connection with future annual reviews. The Board noted that, in the meantime, it received monthly performance reports from the Manager. |
| • | | The Board noted that the contractual management fee was in the 2nd quintile of the expense group and the actual management fee and the actual total expenses were in the 1st quintile. |
Guardian Multi-Sector Bond VIP Fund
| • | | The Board noted that the Fund’s performance was in the 5th quintile of its performance universe for the 1-year and 3-year periods The Board also noted that the Fund’s performance was lower than the benchmark index for the 1-year and 3-year periods. |
| • | | The Board noted that the contractual management fee and actual total expenses were in the 1st quintile and the actual management fee was in the 2nd quintile. |
Guardian Short Duration Bond VIP Fund
| • | | The Board noted that the Fund had less than one-year of operational history and was not able to evaluate an investment performance record for the Fund. The |
| | | Board noted that it would have an opportunity to review such information in connection with future annual reviews. The Board noted that, in the meantime, it received monthly performance reports from the Manager. |
| • | | The Board noted that the contractual management fee and actual total expenses were in the 3rd quintile of the expense group and the actual management fee was in the 1st quintile of the expense group. |
Guardian U.S. Government Securities VIP Fund
| • | | The Board noted that the Fund’s performance was in the 1st quintile of its performance universe for the 1-year period and in the 2nd quintile of its performance universe for the 3-year period. The Board also noted that the Fund’s performance was higher than the benchmark index for the 1-year and 3-year periods. |
| • | | The Board noted that the contractual management fee and the actual management fee were in the 1st quintile of the expense group and the actual total expenses were in the 2nd quintile of the expense group. |
Conclusion
Based on a comprehensive consideration and evaluation of all of the information and factors summarized above, among others, the Board as a whole, including the Independent Trustees, approved the Agreements.
SUPPLEMENTAL INFORMATION (UNAUDITED)
The Statement of Additional Information (“SAI”) includes additional information about the Trust’s Trustees and Officers and is available, without charge, upon request by calling toll-free 1-888-GUARDIAN (1-888-482-7342) or by visiting our website at http://guardianvpt.onlineprospectus.net/GuardianVPT/Prospectuses.
Portfolio Holdings and Proxy Voting Procedures
The Fund files its complete schedule of portfolio holdings with the Securities and Exchange Commission for the first and third quarters of each fiscal year as an exhibit to its reports on Form N-PORT. The Fund’s Form N-PORT reports are available on the Securities and Exchange Commission’s website at https://www.sec.gov. The Fund’s Form N-PORT information is also available, without charge, upon request, by calling toll-free 1-888-GUARDIAN (1-888-482-7342) or by visiting our website at http://guardianvpt.onlineprospectus.net/GuardianVPT/Prospectuses.
A description of the policies and procedures that the Fund uses to determine how to vote proxies relating to portfolio securities is included in the SAI. The SAI and information regarding how the Fund voted proxies relating to portfolio securities during the most recent 12-month period ended June 30 may be obtained (i) without charge, upon request, by calling toll-free 1-888-GUARDIAN (1-888-482-7342) or by visiting our website at http://guardianvpt.onlineprospectus.net/GuardianVPT/Prospectuses; and (ii) on the Securities and Exchange Commission’s website at https://www.sec.gov.
This report is transmitted to shareholders only. It is not authorized for use as an offer of sale or a solicitation of an offer to buy shares of the Fund unless accompanied or preceded by the Fund’s current prospectus. Past performance results shown in this report should not be considered a representation of future performance. Investment returns and principal value of shares will fluctuate so that shares, when redeemed, may be worth more or less than their original cost. Statements and other information herein are as dated and are subject to change.

The Guardian Life Insurance Company of America New York, NY 10001-2159
PUB8177
Guardian Variable
Products Trust
2023
Semiannual Report
All Data as of June 30, 2023
Guardian Multi-Sector Bond VIP Fund

| | |
| Not FDIC insured. May lose value. No bank guarantee. | | www.guardianlife.com |
TABLE OF CONTENTS
Guardian Multi-Sector Bond VIP Fund
Except as otherwise specifically stated, all information, including portfolio security positions, is as of June 30, 2023. Fund holdings will vary. Information contained herein has been obtained from sources believed reliable, but is not guaranteed.
GUARDIAN MULTI-SECTOR BOND VIP FUND
Fund Characteristics (unaudited)
| | |
| Total Net Assets: $223,516,366 | | |
|
| |
Bond Sector Allocation1 As of June 30, 2023 |
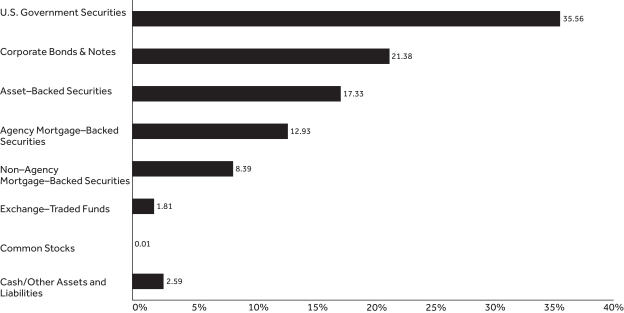
|
|
| |
Bond Quality Allocation2 As of June 30, 2023 |
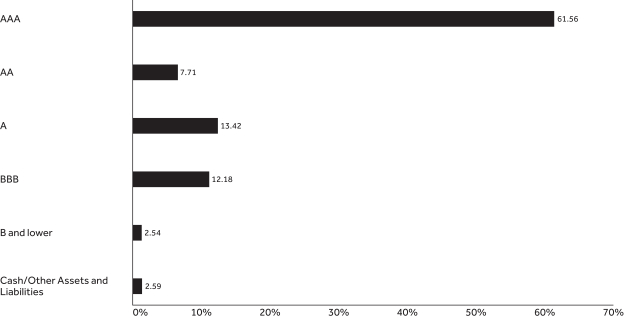
|
GUARDIAN MULTI-SECTOR BOND VIP FUND
| | | | | | | | | | | | |
| | | | |
Top Ten Holdings1 As of June 30, 2023 | | | | | | | | | |
| | | | |
| Holding | | Coupon Rate | | | Maturity Date | | | % of Total
Net Assets | |
| U.S. Treasury Note | | | 4.625% | | | | 6/30/2025 | | | | 11.58% | |
| U.S. Treasury Bond | | | 3.875% | | | | 5/15/2043 | | | | 9.39% | |
| U.S. Treasury Note | | | 4.000% | | | | 6/30/2028 | | | | 7.12% | |
| U.S. Treasury Bond | | | 3.625% | | | | 5/15/2053 | | | | 4.52% | |
| U.S. Treasury Note | | | 3.750% | | | | 5/31/2030 | | | | 2.96% | |
| Federal National Mortgage Association | | | 3.500% | | | | 6/1/2052 | | | | 2.01% | |
| Federal Home Loan Mortgage Corp. | | | 4.000% | | | | 6/1/2052 | | | | 1.77% | |
| Benchmark Mortgage Trust | | | 3.419% | | | | 8/15/2052 | | | | 1.72% | |
| Federal National Mortgage Association | | | 3.000% | | | | 3/1/2052 | | | | 1.57% | |
| Federal Home Loan Mortgage Corp. | | | 2.500% | | | | 9/1/2052 | | | | 1.38% | |
| Total | | | | | | | | | | | 44.02% | |
| 1 | Portfolio holdings are subject to change and should not be considered a recommendation to buy or sell individual securities. Cash includes short-term investments and net other assets and liabilities. |
| 2 | The Bond Quality Allocation chart displays the percentage of fund assets allocated to each rating. Rating agencies’ independent ratings of individual securities are aggregated by Bloomberg, and market weights are reported using Standard & Poor’s letter rating conventions. Rating methodology uses the middle rating of Moody’s Investors Service, Inc., Standard & Poor’s Ratings Services, and Fitch Ratings. When a rating from only two of the rating agencies is available, the lower rating is used. Credit quality ratings assigned by a rating agency are subject to change periodically and are not absolute standards of credit quality. Rating agencies may fail to make timely changes in credit ratings, and an issuer’s current financial condition may be better or worse than a rating indicates. In formulating investment decisions for the Fund, Park Avenue Institutional Advisers LLC develops its own analysis of the credit quality and risks associated with individual debt instruments, rather than relying exclusively on rating agency ratings. |
UNDERSTANDING YOUR FUND’S EXPENSES (UNAUDITED)
By investing in the Fund, you incur two types of costs: (1) transaction costs and (2) ongoing costs, including, as applicable, investment advisory fees, distribution and/or service (12b-1) fees and other Fund expenses. The example below is intended to help you understand your ongoing costs (in dollars) of investing in the Fund and to compare these costs with the ongoing costs of investing in other mutual funds.
The example is based on an investment of $1,000 invested at the beginning of the period and held for the entire period from January 1, 2023 to June 30, 2023. The table below shows the Fund’s expenses in two ways:
Expenses based on actual return
This section of the table provides information about actual account values and actual expenses. You may use the information in this section, together with the amount you invested, to estimate the expenses that you paid over the period. Simply divide your account value by $1,000 (for example, an $8,600 account value divided by $1,000 = 8.6), then multiply the result by the number in the section under the heading entitled “Expenses Paid During Period” to estimate the expenses you paid on your account during this period.
Expenses based on hypothetical 5% return for comparison purposes
This section of the table provides information about hypothetical account values and hypothetical expenses based on the Fund’s actual expense ratio and an assumed rate of return of 5% per year before expenses, which is not the Fund’s actual return. The hypothetical account values and expenses may not be used to estimate the actual ending account balance or expenses you paid for the period. You may use this information to compare the ongoing costs of investing in the Fund with the cost of investing in other mutual funds. To do so, compare this 5% hypothetical example with the 5% hypothetical examples that appear in the shareholder reports of the other funds.
Note that the expenses shown in the table are meant to highlight your ongoing costs only and do not reflect any transactional costs, such as sales charges (loads), redemption fees, or exchange fees. Therefore the second section is useful in comparing ongoing costs only, and will not help you determine the relative total costs of owning different funds. If these transactional costs were included, your costs would have been higher. Charges and expenses at the insurance company separate account level are not reflected in the table.
| | | | | | | | | | | | | | |
| | | | | |
| | | Beginning
Account Value 1/1/23 | | Ending Account Value
6/30/23 | | | Expenses Paid During Period* 1/1/23-6/30/23 | | | Expense Ratio During Period 1/1/23-6/30/23 | |
| Based on Actual Return | | $1,000.00 | | $ | 1,014.40 | | | $ | 4.45 | | | | 0.89% | |
Based on Hypothetical Return (5% Return Before Expenses) | | $1,000.00 | | $ | 1,020.38 | | | $ | 4.46 | | | | 0.89% | |
| * | Expenses are equal to the Fund’s annualized expense ratio as indicated, multiplied by the average account value over the period, multiplied by 181/365 (to reflect the one-half year period). |
SCHEDULE OF INVESTMENTS — GUARDIAN MULTI-SECTOR BOND VIP FUND
| | | | | | | | |
| June 30, 2023 (unaudited) | | Principal
Amount | | | Value | |
| Agency Mortgage–Backed Securities – 12.9% | |
| | | |
Federal Home Loan Mortgage Corp.
2.50% due 9/1/2052 | | $ | 3,652,104 | | | $ | 3,094,886 | |
3.50% due 6/1/2052 | | | 3,020,089 | | | | 2,752,235 | |
4.00% due 10/1/2037 | | | 435,714 | | | | 420,640 | |
4.00% due 6/1/2052 | | | 4,225,520 | | | | 3,963,746 | |
4.50% due 9/1/2052 | | | 480,763 | | | | 462,066 | |
5.00% due 12/1/2052 | | | 1,058,713 | | | | 1,037,126 | |
| | | |
Federal National Mortgage Association
2.50% due 5/1/2052 | | | 1,226,244 | | | | 1,039,271 | |
3.00% due 7/1/2051 | | | 1,793,491 | | | | 1,581,402 | |
3.00% due 3/1/2052 | | | 3,991,549 | | | | 3,516,964 | |
3.00% due 5/1/2052 | | | 2,176,035 | | | | 1,914,948 | |
3.50% due 6/1/2052 | | | 4,919,277 | | | | 4,483,033 | |
3.50% due 10/1/2052 | | | 1,942,215 | | | | 1,769,075 | |
3.50% due 11/1/2052 | | | 1,847,444 | | | | 1,682,672 | |
4.00% due 12/1/2052 | | | 1,271,283 | | | | 1,192,552 | |
| | | | | | | | | |
| | |
Total Agency Mortgage–Backed Securities
(Cost $29,465,331) | | | | 28,910,616 | |
| Asset–Backed Securities – 17.3% | |
| | | |
AIMCO CLO
2017-AA DR
8.40% (3 mo. USD LIBOR + 3.15%)
due 4/20/2034(1)(2)(3) | | | 1,800,000 | | | | 1,649,700 | |
| | | |
Allegro CLO VI Ltd.
2017-2A B
6.76% (3 mo. USD LIBOR + 1.50%)
due 1/17/2031(1)(2)(3) | | | 1,000,000 | | | | 975,200 | |
| | | |
Ares XXXIV CLO Ltd.
2015-2A BR2
6.86% (3 mo. USD LIBOR + 1.60%)
due 4/17/2033(1)(2)(3) | | | 300,000 | | | | 290,640 | |
| | | |
Avis Budget Rental Car Funding AESOP LLC
2019-3A A
2.36% due 3/20/2026(1) | | | 1,180,000 | | | | 1,113,765 | |
| | | |
Barings CLO Ltd.
2020-1A AR
6.41% (3 mo. USD LIBOR + 1.15%)
due 10/15/2036(1)(2)(3) | | | 1,350,000 | | | | 1,317,892 | |
| | | |
Battery Park CLO II Ltd.
2022-1A A1
7.259% (3 mo. USD Term SOFR + 2.21%)
due 10/20/2035(1)(2) | | | 1,800,000 | | | | 1,800,000 | |
| | | |
BlueMountain CLO Ltd.
2014-2A BR2
7.00% (3 mo. USD LIBOR + 1.75%)
due 10/20/2030(1)(2)(3) | | | 600,000 | | | | 587,280 | |
| | | |
CarMax Auto Owner Trust
2020-4 B
0.85% due 6/15/2026 | | | 1,250,000 | | | | 1,166,257 | |
| | | |
Cathedral Lake VI Ltd.
2021-6A AN
6.505% (3 mo. USD LIBOR + 1.25%)
due 4/25/2034(1)(2)(3) | | | 1,400,000 | | | | 1,376,196 | |
| | | | | | | | | |
| | | | | | | | |
| June 30, 2023 (unaudited) | | Principal
Amount | | | Value | |
| Asset–Backed Securities (continued) | |
| | | |
CIFC Funding Ltd.
2013-4A BRR
6.892% (3 mo. USD LIBOR + 1.60%)
due 4/27/2031(1)(2)(3) | | $ | 1,200,000 | | | $ | 1,173,360 | |
| | | |
DB Master Finance LLC
2021-1A A2II
2.493% due 11/20/2051(1) | | | 935,750 | | | | 777,859 | |
| | | |
Dryden 80 CLO Ltd.
2019-80A AR
6.236% (3 mo. USD Term SOFR + 1.25%)
due 1/17/2033(1)(2) | | | 1,700,000 | | | | 1,664,980 | |
| | | |
Elmwood CLO IX Ltd.
2021-2A C
7.15% (3 mo. USD LIBOR + 1.90%)
due 7/20/2034(1)(2)(3) | | | 1,000,000 | | | | 947,500 | |
| | | |
Ford Credit Auto Owner Trust
2020-1 A
2.04% due 8/15/2031(1) | | | 1,600,000 | | | | 1,505,436 | |
| | | |
GM Financial Automobile Leasing Trust
2023-1 A3
5.16% due 4/20/2026 | | | 1,050,000 | | | | 1,042,125 | |
| | | |
Golden Credit Card Trust
2018-4A A
3.44% due 8/15/2025(1) | | | 1,410,000 | | | | 1,406,309 | |
| | | |
Greywolf CLO II Ltd.
2013-1A C2RR
9.46% (3 mo. USD LIBOR + 4.20%)
due 4/15/2034(1)(2)(3) | | | 2,400,000 | | | | 2,268,938 | |
| | | |
Gulf Stream Meridian 6 Ltd.
2021-6A A1
6.45% (3 mo. USD LIBOR + 1.19%)
due 1/15/2037(1)(2)(3) | | | 1,300,000 | | | | 1,276,730 | |
| | | |
Hyundai Auto Receivables Trust
2021-A A3
0.38% due 9/15/2025 | | | 1,187,925 | | | | 1,156,934 | |
| | | |
ICG U.S. CLO Ltd.
2018-2A B
7.023% (3 mo. USD LIBOR + 1.75%)
due 7/22/2031(1)(2)(3) | | | 1,000,000 | | | | 970,425 | |
| | | |
KKR CLO 38 Ltd.
38A A1
6.306% (3 mo. USD Term SOFR + 1.32%)
due 4/15/2033(1)(2) | | | 1,500,000 | | | | 1,474,938 | |
| | | |
Madison Park Funding XXIII Ltd.
2017-23A BR
6.842% (3 mo. USD LIBOR + 1.55%)
due 7/27/2031(1)(2)(3) | | | 1,150,000 | | | | 1,127,460 | |
| | | |
Master Credit Card Trust
2021-1A A
0.53% due 11/21/2025(1) | | | 1,410,000 | | | | 1,343,589 | |
| | | |
Neuberger Berman CLO XVII Ltd. 2014-17A BR2
6.773% (3 mo. USD LIBOR + 1.50%)
due 4/22/2029(1)(2)(3) | | | 1,400,000 | | | | 1,371,720 | |
| | | | | | | | | |
| | | | |
| 4 | | | | The accompanying notes are an integral part of these financial statements. |
SCHEDULE OF INVESTMENTS — GUARDIAN MULTI-SECTOR BOND VIP FUND
| | | | | | | | |
| June 30, 2023 (unaudited) | | Principal
Amount | | | Value | |
| Asset–Backed Securities (continued) | |
| | | |
Neuberger Berman Loan Advisers CLO 40 Ltd.
2021-40A A
6.32% (3 mo. USD LIBOR + 1.06%)
due 4/16/2033(1)(2)(3) | | $ | 1,400,000 | | | $ | 1,382,080 | |
| | | |
Nissan Auto Lease Trust
2023-A A4
4.80% due 7/15/2027 | | | 900,000 | | | | 886,994 | |
| | | |
Octagon Investment Partners 50 Ltd.
2020-4A DR
8.41% (3 mo. USD LIBOR + 3.15%)
due 1/15/2035(1)(2)(3) | | | 400,000 | | | | 349,640 | |
| | | |
OHA Credit Funding 2 Ltd.
2019-2A CR
7.461% (3 mo. USD LIBOR + 2.20%)
due 4/21/2034(1)(2)(3) | | | 1,800,000 | | | | 1,740,420 | |
| | | |
Oscar U.S. Funding XIV LLC
2022-1A A2
1.60% due 3/10/2025(1) | | | 467,488 | | | | 462,399 | |
| | | |
TIAA CLO IV Ltd.
2018-1A A2
6.95% (3 mo. USD LIBOR + 1.70%)
due 1/20/2032(1)(2)(3) | | | 1,520,000 | | | | 1,480,176 | |
| | | |
Voya CLO Ltd.
2016-3A A3R
7.012% (3 mo. USD LIBOR + 1.75%)
due 10/18/2031(1)(2)(3) | | | 835,000 | | | | 811,620 | |
| | | |
Westlake Automobile Receivables Trust
2022-3A A2
5.24% due 7/15/2025(1) | | | 776,985 | | | | 775,268 | |
| | | |
World Omni Auto Receivables Trust
2022-C A2
3.73% due 3/16/2026 | | | 1,062,699 | | | | 1,052,574 | |
| | | | | | | | | |
| | |
Total Asset–Backed Securities
(Cost $39,655,942) | | | | 38,726,404 | |
| |
| Corporate Bonds & Notes – 21.4% | |
| |
| Aerospace & Defense – 0.5% | |
| | | |
Lockheed Martin Corp.
4.75% due 2/15/2034 | | | 600,000 | | | | 598,362 | |
5.20% due 2/15/2055 | | | 300,000 | | | | 309,693 | |
| | | |
Northrop Grumman Corp.
4.95% due 3/15/2053 | | | 300,000 | | | | 292,602 | |
| | | | | | | | | |
| | | |
| | | | | | | | 1,200,657 | |
| Agriculture – 0.5% | |
| | | |
Philip Morris International, Inc.
5.75% due 11/17/2032 | | | 1,000,000 | | | | 1,024,820 | |
| | | | | | | | | |
| | | |
| | | | | | | | 1,024,820 | |
| Biotechnology – 0.2% | |
| | | |
Amgen, Inc.
5.25% due 3/2/2033 | | | 400,000 | | | | 400,404 | |
| | | | | | | | | |
| | | |
| | | | | | | | 400,404 | |
| | | | | | | | |
| June 30, 2023 (unaudited) | | Principal
Amount | | | Value | |
| Commercial Banks – 6.6% | |
| | | |
Bank of America Corp.
4.271% (4.271% fixed rate until
7/23/2028; 3 mo. USD Term SOFR + 1.57% thereafter)
due 7/23/2029(2) | | $ | 1,100,000 | | | $ | 1,043,262 | |
| | | |
5.288% (5.288% fixed rate until 4/25/2033; SOFR + 1.91% thereafter)
due 4/25/2034(2) | | | 700,000 | | | | 693,581 | |
| | | |
Barclays PLC
2.645% (2.645% fixed rate until 6/24/2030; 1 yr. CMT + 1.90% thereafter)
due 6/24/2031(2) | | | 900,000 | | | | 721,863 | |
| | | |
7.119% (7.119% fixed rate until 6/27/2033; SOFR + 3.57% thereafter)
due 6/27/2034(2) | | | 200,000 | | | | 200,114 | |
| | | |
BNP Paribas SA
5.125% (5.125% fixed rate until 1/13/2028; 1 yr. CMT + 1.45% thereafter)
due 1/13/2029(1)(2) | | | 600,000 | | | | 587,520 | |
| | | |
5.335% (5.335% fixed rate until 6/12/2028; 1 yr. CMT + 1.50% thereafter)
due 6/12/2029(1)(2) | | | 600,000 | | | | 592,536 | |
| | | |
Credit Agricole SA
5.514% due 7/5/2033(1) | | | 400,000 | | | | 402,948 | |
| | | |
Deutsche Bank AG
2.311% (2.311% fixed rate until 11/16/2026; SOFR + 1.22% thereafter)
due 11/16/2027(2) | | | 1,600,000 | | | | 1,376,320 | |
| | | |
Discover Bank
4.682% (4.682% fixed rate until 8/9/2023; 5 yr. USD Swap + 1.73% thereafter)
due 8/9/2028(2) | | | 1,300,000 | | | | 1,180,894 | |
| | | |
Fifth Third Bank NA
2.25% due 2/1/2027 | | | 1,300,000 | | | | 1,141,296 | |
| | | |
Huntington National Bank
4.552% (4.552% fixed rate until 5/17/2027; SOFR + 1.65% thereafter)
due 5/17/2028(2) | | | 700,000 | | | | 654,605 | |
| | | |
5.65% due 1/10/2030 | | | 300,000 | | | | 288,132 | |
| | | |
JPMorgan Chase & Co.
4.203% (4.203% fixed rate until 7/23/2028; 3 mo. USD Term SOFR + 1.52% thereafter)
due 7/23/2029(2) | | | 2,000,000 | | | | 1,901,140 | |
| | | |
Mitsubishi UFJ Financial Group, Inc.
5.406% (5.406% fixed rate until 4/19/2033; 1 yr. CMT + 1.97% thereafter)
due 4/19/2034(2) | | | 500,000 | | | | 495,860 | |
| | | | | | | | | |
| | | | |
| The accompanying notes are an integral part of these financial statements. | | | | 5 |
SCHEDULE OF INVESTMENTS — GUARDIAN MULTI-SECTOR BOND VIP FUND
| | | | | | | | |
| June 30, 2023 (unaudited) | | Principal
Amount | | | Value | |
| Commercial Banks (continued) | |
| | | |
Morgan Stanley
5.123% (5.123% fixed rate until 2/1/2028; SOFR + 1.73% thereafter)
due 2/1/2029(2) | | $ | 1,100,000 | | | $ | 1,085,524 | |
| | | |
5.25% (5.25% fixed rate until 4/21/2033; SOFR + 1.87% thereafter)
due 4/21/2034(2) | | | 600,000 | | | | 592,176 | |
| | | |
NatWest Group PLC
5.808% (5.808% fixed rate until 9/13/2028; 1 yr. CMT + 1.95% thereafter)
due 9/13/2029(2) | | | 1,300,000 | | | | 1,282,866 | |
| | | |
Truist Financial Corp.
5.867% (5.867% fixed rate until 6/8/2033; SOFR + 2.36% thereafter)
due 6/8/2034(2) | | | 600,000 | | | | 601,140 | |
| | | | | | | | | |
| | |
| | | | | 14,841,777 | |
| Computers – 0.2% | | | | | |
| | | |
Apple, Inc.
2.65% due 2/8/2051 | | | 200,000 | | | | 138,104 | |
3.35% due 8/8/2032 | | | 400,000 | | | | 372,740 | |
| | | | | | | | | |
| | |
| | | | | 510,844 | |
| Cosmetics & Personal Care – 0.8% | | | | | |
| | | |
Haleon U.S. Capital LLC
3.625% due 3/24/2032 | | | 1,200,000 | | | | 1,076,172 | |
| | | |
Kenvue, Inc.
4.90% due 3/22/2033(1) | | | 700,000 | | | | 707,812 | |
5.05% due 3/22/2053(1) | | | 100,000 | | | | 101,941 | |
| | | | | | | | | |
| | |
| | | | | 1,885,925 | |
| Diversified Financial Services – 1.2% | | | | | |
| | | |
AerCap Ireland Capital DAC / AerCap Global Aviation Trust
3.00% due 10/29/2028 | | | 1,400,000 | | | | 1,214,248 | |
| | | |
Air Lease Corp.
5.30% due 2/1/2028 | | | 500,000 | | | | 491,355 | |
| | | |
Charles Schwab Corp.
4.625% due 3/22/2030 | | | 600,000 | | | | 588,198 | |
| | | |
Mastercard, Inc.
4.85% due 3/9/2033 | | | 300,000 | | | | 305,493 | |
| | | | | | | | | |
| | |
| | | | | 2,599,294 | |
| Electric – 1.6% | | | | | |
| | | |
Consumers Energy Co.
4.20% due 9/1/2052 | | | 200,000 | | | | 171,546 | |
| | | |
Duke Energy Carolinas LLC
4.95% due 1/15/2033 | | | 300,000 | | | | 298,080 | |
| | | |
Duke Energy Corp.
3.50% due 6/15/2051 | | | 450,000 | | | | 326,322 | |
| | | |
5.00% due 8/15/2052 | | | 200,000 | | | | 183,042 | |
| | | |
Exelon Corp.
5.60% due 3/15/2053 | | | 400,000 | | | | 403,508 | |
| | | |
PPL Electric Utilities Corp.
5.00% due 5/15/2033 | | | 300,000 | | | | 300,792 | |
5.25% due 5/15/2053 | | | 600,000 | | | | 611,472 | |
| | | | | | | | | |
| | | | | | | | |
| June 30, 2023 (unaudited) | | Principal
Amount | | | Value | |
| Electric (continued) | |
| | | |
Wisconsin Public Service Corp.
2.85% due 12/1/2051 | | $ | 100,000 | | | $ | 66,180 | |
| | | |
Xcel Energy, Inc.
4.60% due 6/1/2032 | | | 1,300,000 | | | | 1,230,294 | |
| | | | | | | | | |
| | |
| | | | | 3,591,236 | |
| Food – 0.1% | |
| | | |
Kroger Co.
1.70% due 1/15/2031 | | | 200,000 | | | | 156,932 | |
| | | | | | | | | |
| | |
| | | | | 156,932 | |
| Gas – 0.3% | | | | | |
| | | |
CenterPoint Energy Resources Corp.
5.40% due 3/1/2033 | | | 600,000 | | | | 610,788 | |
| | | | | | | | | |
| | |
| | | | | 610,788 | |
| Healthcare-Services – 0.6% | | | | | |
| | | |
Elevance Health, Inc.
4.75% due 2/15/2033 | | | 400,000 | | | | 388,912 | |
5.125% due 2/15/2053 | | | 100,000 | | | | 96,776 | |
| | | |
UnitedHealth Group, Inc.
4.20% due 5/15/2032 | | | 600,000 | | | | 572,556 | |
5.875% due 2/15/2053 | | | 200,000 | | | | 221,864 | |
| | | | | | | | | |
| | |
| | | | | 1,280,108 | |
| Insurance – 1.2% | |
| | | |
Aon Corp. / Aon Global Holdings PLC
5.35% due 2/28/2033 | | | 600,000 | | | | 604,938 | |
| | | |
Athene Holding Ltd.
3.50% due 1/15/2031 | | | 500,000 | | | | 411,840 | |
| | | |
Corebridge Financial, Inc.
3.90% due 4/5/2032 | | | 600,000 | | | | 522,522 | |
| | | |
Hartford Financial Services Group, Inc.
3.60% due 8/19/2049 | | | 400,000 | | | | 301,968 | |
| | | |
MetLife, Inc.
4.55% due 3/23/2030 | | | 500,000 | | | | 489,415 | |
5.25% due 1/15/2054 | | | 200,000 | | | | 194,708 | |
| | | |
Prudential Financial, Inc.
3.70% due 3/13/2051 | | | 100,000 | | | | 76,753 | |
5.75% due 7/15/2033 | | | 100,000 | | | | 104,790 | |
| | | | | | | | | |
| | |
| | | | | 2,706,934 | |
| Media – 0.8% | | | | | |
| | | |
Charter Communications Operating LLC / Charter Communications Operating Capital
4.40% due 4/1/2033 | | | 300,000 | | | | 263,394 | |
5.25% due 4/1/2053 | | | 400,000 | | | | 322,848 | |
| | | |
Comcast Corp.
1.95% due 1/15/2031 | | | 740,000 | | | | 605,017 | |
2.887% due 11/1/2051 | | | 300,000 | | | | 201,216 | |
5.35% due 5/15/2053 | | | 300,000 | | | | 305,028 | |
| | | | | | | | | |
| | |
| | | | | 1,697,503 | |
| Oil & Gas – 1.3% | | | | | |
| | | |
BP Capital Markets America, Inc.
4.812% due 2/13/2033 | | | 1,500,000 | | | | 1,479,480 | |
| | | | | | | | | |
| | | | |
| 6 | | | | The accompanying notes are an integral part of these financial statements. |
SCHEDULE OF INVESTMENTS — GUARDIAN MULTI-SECTOR BOND VIP FUND
| | | | | | | | |
| June 30, 2023 (unaudited) | | Principal
Amount | | | Value | |
| Oil & Gas (continued) | |
| | | |
Cenovus Energy, Inc.
2.65% due 1/15/2032 | | $ | 400,000 | | | $ | 322,956 | |
3.75% due 2/15/2052 | | | 200,000 | | | | 141,986 | |
| | | |
Occidental Petroleum Corp.
7.50% due 5/1/2031 | | | 400,000 | | | | 436,712 | |
| | | |
Valero Energy Corp.
2.80% due 12/1/2031 | | | 700,000 | | | | 576,324 | |
| | | | | | | | | |
| | |
| | | | | 2,957,458 | |
| Oil & Gas Services – 0.3% | | | | | |
| | | |
Schlumberger Investment SA
4.85% due 5/15/2033 | | | 600,000 | | | | 591,450 | |
| | | | | | | | | |
| | |
| | | | | 591,450 | |
| Pharmaceuticals – 1.1% | | | | | |
| | | |
CVS Health Corp.
5.30% due 6/1/2033 | | | 900,000 | | | | 898,434 | |
| | | |
5.875% due 6/1/2053 | | | 300,000 | | | | 308,193 | |
| | | |
Pfizer Investment Enterprises Pte Ltd.
4.75% due 5/19/2033 | | | 1,200,000 | | | | 1,195,980 | |
| | | | | | | | | |
| | |
| | | | | 2,402,607 | |
| Pipelines – 0.9% | | | | | |
| | | |
Cheniere Energy Partners LP
5.95% due 6/30/2033(1) | | | 400,000 | | | | 402,200 | |
| | | |
Energy Transfer LP
3.75% due 5/15/2030 | | | 500,000 | | | | 452,010 | |
5.00% due 5/15/2050 | | | 200,000 | | | | 168,996 | |
| | | |
ONEOK, Inc.
6.10% due 11/15/2032 | | | 400,000 | | | | 406,896 | |
| | | |
Western Midstream Operating LP
6.15% due 4/1/2033 | | | 600,000 | | | | 604,014 | |
| | | | | | | | | |
| | |
| | | | | 2,034,116 | |
| Real Estate Investment Trusts (REITs) – 1.1% | |
| | | |
American Tower Corp.
5.50% due 3/15/2028 | | | 400,000 | | | | 398,120 | |
| | | |
5.65% due 3/15/2033 | | | 500,000 | | | | 508,650 | |
| | | |
Extra Space Storage LP
5.50% due 7/1/2030 | | | 600,000 | | | | 596,472 | |
| | | |
Realty Income Corp.
4.85% due 3/15/2030 | | | 900,000 | | | | 872,091 | |
| | | | | | | | | |
| | |
| | | | | 2,375,333 | |
| Semiconductors – 0.9% | | | | | |
| | | |
Broadcom, Inc.
4.15% due 4/15/2032(1) | | | 1,100,000 | | | | 996,061 | |
| | | |
Intel Corp.
5.20% due 2/10/2033 | | | 600,000 | | | | 605,592 | |
| | | |
NXP BV / NXP Funding LLC / NXP USA, Inc.
2.65% due 2/15/2032 | | | 500,000 | | | | 404,260 | |
| | | | | | | | | |
| | |
| | | | | 2,005,913 | |
| Software – 0.4% | | | | | |
| | | |
Microsoft Corp.
2.921% due 3/17/2052 | | | 200,000 | | | | 148,636 | |
| | | |
Oracle Corp.
5.55% due 2/6/2053 | | | 200,000 | | | | 193,776 | |
6.25% due 11/9/2032 | | | 400,000 | | | | 424,380 | |
6.90% due 11/9/2052 | | | 200,000 | | | | 224,114 | |
| | | | | | | | | |
| | |
| | | | | 990,906 | |
| | | | | | | | |
| June 30, 2023 (unaudited) | | Principal
Amount | | | Value | |
| Telecommunications – 0.4% | | | | | |
| | | |
T-Mobile USA, Inc.
2.70% due 3/15/2032 | | $ | 950,000 | | | $ | 787,132 | |
3.40% due 10/15/2052 | | | 200,000 | | | | 142,738 | |
| | | | | | | | | |
| | |
| | | | | 929,870 | |
| Transportation – 0.4% | | | | | |
| | | |
Union Pacific Corp.
3.95% due 9/10/2028 | | | 300,000 | | | | 290,685 | |
4.50% due 1/20/2033 | | | 200,000 | | | | 196,852 | |
4.95% due 5/15/2053 | | | 500,000 | | | | 497,980 | |
| | | | | | | | | |
| | |
| | | | | 985,517 | |
| | |
Total Corporate Bonds & Notes
(Cost $48,581,096) | | | | 47,780,392 | |
| Non–Agency Mortgage–Backed Securities – 8.4% | |
| | | |
BANK
2019-BNK24 AS
3.283% due 11/15/2062(2)(4) | | | 1,412,000 | | | | 1,190,412 | |
| | | |
2022-BNK43 B
5.327% due 8/15/2055(2)(4) | | | 500,000 | | | | 431,242 | |
| | | |
BB-UBS Trust
2012-SHOW A
3.43% due 11/5/2036(1) | | | 1,200,000 | | | | 1,139,889 | |
| | | |
Benchmark Mortgage Trust
2019-B12 AS
3.419% due 8/15/2052 | | | 4,500,000 | | | | 3,843,501 | |
| | | |
Citigroup Commercial Mortgage Trust
2016-C3 AS
3.366% due 11/15/2049(2)(4) | | | 1,000,000 | | | | 896,696 | |
| | | |
Commercial Mortgage Trust
2014-CR18 AM
4.103% due 7/15/2047 | | | 1,455,000 | | | | 1,399,039 | |
| | | |
Freddie Mac STACR REMIC Trust 2021-DNA7 M2
6.867% due 11/25/2041(1)(2)(4) | | | 1,100,000 | | | | 1,059,446 | |
| | | |
2021-HQA4 M1
6.017% due 12/25/2041(1)(2)(4) | | | 696,558 | | | | 675,540 | |
| | | |
2022-DNA1 M1A
6.067% due 1/25/2042(1)(2)(4) | | | 627,959 | | | | 617,695 | |
| | | |
2022-HQA3 M1A
7.367% due 8/25/2042(1)(2)(4) | | | 1,299,378 | | | | 1,307,192 | |
| | | |
Jackson Park Trust
2019-LIC B
2.914% due 10/14/2039(1) | | | 640,000 | | | | 523,749 | |
| | | |
Morgan Stanley Capital I Trust 2018-H4 A4
4.31% due 12/15/2051 | | | 800,000 | | | | 744,440 | |
| | | |
2020-L4 AS
2.88% due 2/15/2053 | | | 1,000,000 | | | | 804,751 | |
| | | |
NYC Commercial Mortgage Trust
2021-909 C
3.312% due 4/10/2043(1)(2)(4) | | | 385,000 | | | | 257,299 | |
| | | |
ONE Park Mortgage Trust
2021-PARK B
6.212% due 3/15/2036(1)(2)(4) | | | 500,000 | | | | 460,653 | |
| | | |
SLG Office Trust
2021-OVA A
2.585% due 7/15/2041(1) | | | 1,600,000 | | | | 1,282,465 | |
| | | | | | | | | |
| | | | |
| The accompanying notes are an integral part of these financial statements. | | | | 7 |
SCHEDULE OF INVESTMENTS — GUARDIAN MULTI-SECTOR BOND VIP FUND
| | | | | | | | |
| June 30, 2023 (unaudited) | | Principal
Amount | | | Value | |
| Non–Agency Mortgage–Backed Securities (continued) | |
| | | |
Stack Infrastructure Issuer LLC
2021-1A A2
1.877% due 3/26/2046(1) | | $ | 750,000 | | | $ | 656,532 | |
| | | |
WFRBS Commercial Mortgage Trust
2014-C19 AS
4.271% due 3/15/2047 | | | 1,500,000 | | | | 1,467,664 | |
| | | | | | | | | |
| | |
Total Non–Agency Mortgage–Backed Securities
(Cost $21,252,591) | | | | 18,758,205 | |
| U.S. Government Securities – 35.6% | | | | | |
| | | |
U.S. Treasury Bond
3.625% due 5/15/2053 | | | 10,500,000 | | | | 10,096,406 | |
3.875% due 5/15/2043 | | | 21,500,000 | | | | 20,982,656 | |
| | | |
U.S. Treasury Note
3.75% due 5/31/2030 | | | 6,700,000 | | | | 6,607,875 | |
4.00% due 6/30/2028 | | | 16,000,000 | | | | 15,912,501 | |
4.625% due 6/30/2025 | | | 26,000,000 | | | | 25,881,172 | |
| | | | | | | | | |
| | |
Total U.S. Government Securities
(Cost $79,574,291) | | | | 79,480,610 | |
| | | | | | | | |
| | |
Shares | | | Value | |
| Common Stocks – 0.0% | |
| Media – 0.0% | |
| | | |
Altice USA, Inc., Class A(5) | | | 10,940 | | | | 33,039 | |
| | | | | | | | | |
| | |
Total Common Stocks
(Cost $125,181) | | | | 33,039 | |
| Exchange–Traded Funds – 1.8% | | | | | |
| | | |
iShares MBS ETF | | | 17,100 | | | | 1,594,832 | |
Vanguard Mortgage-Backed Securities ETF | | | 53,100 | | | | 2,442,069 | |
| | |
Total Exchange–Traded Funds
(Cost $4,082,793) | | | | 4,036,901 | |
| | | | | | | | |
| June 30, 2023 (unaudited) | | Principal
Amount | | | Value | |
| Repurchase Agreements – 1.0% | | | | | |
Fixed Income Clearing Corp.,
1.52%, dated 6/30/2023, proceeds at maturity value of $2,120,383, due 7/3/2023(6) | | $ | 2,120,115 | | | $ | 2,120,115 | |
| | |
Total Repurchase Agreements
(Cost $2,120,115) | | | | 2,120,115 | |
| | |
Total Investments – 98.4%
(Cost $224,857,340) | | | | 219,846,282 | |
| | |
| Assets in excess of other liabilities – 1.6% | | | | 3,670,084 | |
| | |
| Total Net Assets – 100.0% | | | $ | 223,516,366 | |
| (1) | Securities that may be resold in transactions exempt from registration under Rule 144A of the Securities Act of 1933, as amended, normally to certain qualified buyers. At June 30, 2023, the aggregate market value of these securities amounted to $45,192,998, representing 20.2% of net assets. These securities have been deemed liquid by the investment adviser pursuant to the Fund’s liquidity procedures approved by the Board of Trustees. |
| (2) | Variable rate securities, which may include step-up bonds or adjustable rate mortgages. The rate shown is the rate in effect at June 30, 2023. |
| (3) | The London Interbank Offered Rate (“LIBOR”) is being phased out completely by June 30, 2023. There remains uncertainty regarding the nature of any replacement rate and the impact of a transition away from LIBOR on the Fund’s investments. |
| (4) | Variable coupon rate based on weighted average interest rate of underlying mortgages. |
| (5) | Non–income–producing security. |
| (6) | The table below presents collateral for repurchase agreements. |
| | | | | | | | | | | | | | | | |
| Security | | Coupon | | | Maturity
Date | | | Principal
Amount | | | Value | |
| U.S. Treasury Note | | | 4.625% | | | | 3/15/2026 | | | $ | 2,131,100 | | | $ | 2,162,589 | |
Open futures contracts at June 30, 2023:
| | | | | | | | | | | | | | | | | | | | | | | | |
| Type | | Expiration | | | Contracts | | | Position | | | Notional
Amount | | | Notional
Value | | | Unrealized
Depreciation | |
| U.S. 2-Year Treasury Note | | | September 2023 | | | | 236 | | | | Long | | | $ | 48,624,168 | | | $ | 47,989,125 | | | $ | (635,043 | ) |
| U.S. 5-Year Treasury Note | | | September 2023 | | | | 136 | | | | Long | | | | 14,859,344 | | | | 14,564,750 | | | | (294,594 | ) |
| Total | | | $ | 63,483,512 | | | $ | 62,553,875 | | | $ | (929,637 | ) |
| | | | | | | | | | | | | | | | | | | | | | | | |
| Type | | Expiration | | | Contracts | | | Position | | | Notional
Amount | | | Notional
Value | | | Unrealized
Appreciation | |
| U.S. Ultra 10-Year Treasury Note | | | September 2023 | | | | 19 | | | | Short | | | $ | (2,257,375 | ) | | $ | (2,250,313 | ) | | $ | 7,062 | |
Centrally cleared credit default swap agreements — buy protection(7):
| | | | | | | | | | | | | | | | | | | | | | | | | | | | | | | | | | | | |
| Reference Entity | | Implied Credit
Spread at
6/30/23(8) | | | Notional Amount(9) | | | Maturity | | | (Pay)/Receive
Fixed Rate | | | Periodic
Payment
Frequency | | | Upfront
Payments | | | Value | | | Unrealized
Depreciation | |
| CDX.NA.HY.S40 | | | 4.29% | | | | USD | | | | 21,325,000 | | | | 6/20/2028 | | | | (5.00)% | | | | Quarterly | | | $ | (252,562 | ) | | $ | (595,614 | ) | | $ | (343,052 | ) |
| (7) | When a credit event occurs as defined under the terms of the swap agreement, the Fund as a buyer of credit protection will either (i) receive from the seller of protection an amount equal to the notional amount of the swap and deliver the referenced obligation or underlying securities |
| | | | |
| 8 | | | | The accompanying notes are an integral part of these financial statements. |
SCHEDULE OF INVESTMENTS — GUARDIAN MULTI-SECTOR BOND VIP FUND
| | comprising the referenced obligation or (ii) receive a net settlement amount in the form of cash or securities equal to the notional amount of the swap less the recovery value of the referenced obligation or underlying securities comprising the referenced obligation. |
| (8) | Implied credit spread, represented in absolute terms, utilized in determining the value of the credit default swap agreements as of period end will serve as an indicator of the current status of the payment/performance risk and represent the likelihood or risk of default for the credit derivative. The implied credit spread of a referenced entity reflects the cost of buying/selling protection and may include payments required to be made to enter into the agreement. Generally, wider credit spreads represent a perceived deterioration of the referenced entity’s credit soundness and a greater likelihood or risk of default or other credit event occurring as defined under the terms of the swap agreement. |
| (9) | The notional amount represents the maximum potential amount the Fund could be required to pay as a buyer of credit protection if a credit event occurs, as defined under the terms of the swap agreement, for each security included in the CDX North America High Yield Index. |
Legend:
CLO — Collateralized Loan Obligation
CMT — Constant Maturity Treasury
LIBOR — London Interbank Offered Rate
SOFR — Secured Overnight Financing Rate
USD — United States Dollar
The following is a summary of the inputs used as of June 30, 2023 in valuing the Fund’s investments. For more information on valuation inputs, please refer to Note 2a of the accompanying Notes to Financial Statements.
| | | | | | | | | | | | | | | | |
| | | Valuation Inputs | | | | |
| Investments in Securities (unaudited) | | Level 1 | | | Level 2 | | | Level 3 | | | Total | |
| Agency Mortgage–Backed Securities | | $ | — | | | $ | 28,910,616 | | | $ | — | | | $ | 28,910,616 | |
| Asset–Backed Securities | | | — | | | | 38,726,404 | | | | — | | | | 38,726,404 | |
| Corporate Bonds & Notes | | | — | | | | 47,780,392 | | | | — | | | | 47,780,392 | |
| Non–Agency Mortgage–Backed Securities | | | — | | | | 18,758,205 | | | | — | | | | 18,758,205 | |
| U.S. Government Securities | | | — | | | | 79,480,610 | | | | — | | | | 79,480,610 | |
| Common Stocks | | | 33,039 | | | | — | | | | — | | | | 33,039 | |
| Exchange–Traded Funds | | | 4,036,901 | | | | — | | | | — | | | | 4,036,901 | |
| Repurchase Agreements | | | — | | | | 2,120,115 | | | | — | | | | 2,120,115 | |
| Total | | $ | 4,069,940 | | | $ | 215,776,342 | | | $ | — | | | $ | 219,846,282 | |
| Other Financial Instruments | | | | | | | | | | | | |
| Futures Contracts | | | | | | | | | | | | | | | | |
Assets | | $ | 7,062 | | | $ | — | | | $ | — | | | $ | 7,062 | |
Liabilities | | | (929,637 | ) | | | — | | | | — | | | | (929,637 | ) |
| Swap Contracts | | | | | | | | | | | | | | | | |
Liabilities | | | — | | | | (343,052 | ) | | | — | | | | (343,052 | ) |
| Total | | $ | (922,575 | ) | | $ | (343,052 | ) | | $ | — | | | $ | (1,265,627 | ) |
| | | | |
| The accompanying notes are an integral part of these financial statements. | | | | 9 |
FINANCIAL INFORMATION — GUARDIAN MULTI-SECTOR BOND VIP FUND
| | | | |
Statement of Assets and Liabilities As of June 30, 2023 (unaudited) | | | |
Assets | | | | |
| | |
Investments, at value | | $ | 219,846,282 | |
| | |
Receivable for investments sold | | | 43,039,111 | |
| | |
Receivable for variation margin on swap contracts | | | 2,228,435 | |
| | |
Receivable for variation margin on futures contracts | | | 1,342,472 | |
| | |
Interest receivable | | | 1,303,256 | |
| | |
Cash deposits with brokers for futures contracts | | | 465,867 | |
| | |
Receivable for fund shares subscribed | | | 8,508 | |
| | |
Prepaid expenses | | | 2,621 | |
| | | | | |
| | |
Total Assets | | | 268,236,552 | |
| | | | | |
| | |
Liabilities | | | | |
| | |
Payable for investments purchased | | | 43,199,321 | |
| | |
Due to broker for swap contracts | | | 1,185,559 | |
| | |
Payable for fund shares redeemed | | | 119,186 | |
| | |
Investment advisory fees payable | | | 96,692 | |
| | |
Distribution fees payable | | | 46,487 | |
| | |
Accrued audit fees | | | 18,739 | |
| | |
Accrued custodian and accounting fees | | | 17,595 | |
| | |
Accrued trustees’ and officers’ fees | | | 4,490 | |
| | |
Accrued expenses and other liabilities | | | 32,117 | |
| | | | | |
| | |
Total Liabilities | | | 44,720,186 | |
| | | | | |
| | |
Total Net Assets | | $ | 223,516,366 | |
| | | | | |
| | |
Net Assets Consist of: | | | | |
| | |
Paid-in capital | | $ | 247,912,882 | |
| | |
Distributable loss | | | (24,396,516 | ) |
| | | | | |
| | |
Total Net Assets | | $ | 223,516,366 | |
| | | | | |
Investments, at Cost | | $ | 224,857,340 | |
| | | | | |
| | |
Pricing of Shares | | | | |
| | |
Shares of Beneficial Interest Outstanding with No Par Value | | | 24,480,667 | |
| | |
Net Asset Value Per Share | | | $9.13 | |
| | | | | |
| | | | |
Statement of Operations For the Six Months Ended June 30, 2023 (unaudited) | |
Investment Income | | | | |
| | |
Interest | | $ | 4,970,288 | |
| | |
Dividends | | | 65,817 | |
| | | | | |
| | |
Total Investment Income | | | 5,036,105 | |
| | | | | |
| | |
Expenses | | | | |
| | |
Investment advisory fees | | | 606,536 | |
| | |
Distribution fees | | | 291,604 | |
| | |
Professional fees | | | 40,341 | |
| | |
Trustees’ and officers’ fees | | | 29,353 | |
| | |
Custodian and accounting fees | | | 27,803 | |
| | |
Administrative fees | | | 20,807 | |
| | |
Transfer agent fees | | | 6,793 | |
| | |
Shareholder reports | | | 5,921 | |
| | |
Other expenses | | | 6,470 | |
| | | | | |
| | |
Total Expenses | | | 1,035,628 | |
| | | | | |
| | |
Net Investment Income/(Loss) | | | 4,000,477 | |
| | | | | |
| | |
Realized Gain/(Loss) and Change in Unrealized Appreciation/(Depreciation) on Investments and Derivative Contracts | | | | |
| | |
Net realized gain/(loss) from investments | | | (7,111,973 | ) |
| | |
Net realized gain/(loss) from futures contracts | | | 1,490,600 | |
| | |
Net realized gain/(loss) from swap contracts | | | (2,858,929 | ) |
| | |
Net change in unrealized appreciation/(depreciation) on investments | | | 7,023,413 | |
| | |
Net change in unrealized appreciation/(depreciation) on futures contracts | | | (787,029 | ) |
| | |
Net change in unrealized appreciation/(depreciation) on swap contracts | | | 1,595,744 | |
| | | | | |
| | |
Net Loss on Investments and Derivative Contracts | | | (648,174 | ) |
| | | | | |
| | |
Net Increase in Net Assets Resulting From Operations | | $ | 3,352,303 | |
| | | | | |
| | | | | |
| | | | |
| 10 | | | | The accompanying notes are an integral part of these financial statements. |
FINANCIAL INFORMATION — GUARDIAN MULTI-SECTOR BOND VIP FUND
| | | | | | | | |
Statements of Changes in Net Assets Six Months Ended Numbers are unaudited | | | | | | |
| | | |
| | | For the
Six Months Ended
6/30/23 | | | For the
Year Ended
12/31/22 | |
| | | | |
Operations | | | | | | | | |
| | | |
Net investment income/(loss) | | $ | 4,000,477 | | | $ | 7,020,206 | |
| | | |
Net realized gain/(loss) from investments and derivative contracts | | | (8,480,302 | ) | | | (41,871,851 | ) |
| | | |
Net change in unrealized appreciation/(depreciation) on investments and derivative contracts | | | 7,832,128 | | | | (13,649,317 | ) |
| | | | | | | | | |
| | | |
Net Increase/(Decrease) in Net Assets Resulting from Operations | | | 3,352,303 | | | | (48,500,962 | ) |
| | | | | | | | | |
| | | |
Capital Share Transactions | | | | | | | | |
| | | |
Proceeds from sales of shares | | | 10,425,604 | | | | 5,250,070 | |
| | | |
Cost of shares redeemed | | | (22,854,276 | ) | | | (39,661,497 | ) |
| | | | | | | | | |
| | | |
Net Decrease in Net Assets Resulting from Capital Share Transactions | | | (12,428,672 | ) | | | (34,411,427 | ) |
| | | | | | | | | |
| | | |
Net Decrease in Net Assets | | | (9,076,369 | ) | | | (82,912,389 | ) |
| | | | | | | | | |
| | | |
Net Assets | | | | | | | | |
| | | |
Beginning of period | | | 232,592,735 | | | | 315,505,124 | |
| | | | | | | | | |
| | | |
End of period | | $ | 223,516,366 | | | $ | 232,592,735 | |
| | | | | | | | | |
| | | |
Other Information: | | | | | | | | |
| | | |
Shares | | | | | | | | |
| | | |
Sold | | | 1,129,774 | | | | 555,585 | |
| | | |
Redeemed | | | (2,483,860 | ) | | | (4,085,788 | ) |
| | | | | | | | | |
| | | |
Net Decrease | | | (1,354,086 | ) | | | (3,530,203 | ) |
| | | | | | | | | |
| | | | | | | | | |
| | | | |
| The accompanying notes are an integral part of these financial statements. | | | | 11 |
FINANCIAL INFORMATION — GUARDIAN MULTI-SECTOR BOND VIP FUND
The Financial Highlights table is intended to help you understand the Fund’s financial performance for the past six reporting periods (or, if shorter, the period since inception). Certain information reflects financial results for a single Fund share. The total returns in the table represent the rate that an investor would have earned (or lost) on an investment in the Fund.
| | | | | | | | | | | | | | | | | | | | | | | | |
Financial Highlights Six Months Ended Numbers are unaudited | | | | | | | | | | | | | | | | |
| | | Per Share Operating Performance | | | | |
| | | Net Asset Value,
Beginning of
Period | | | Net Investment
Income(1) | | | Net Realized
and Unrealized
Gain/(Loss) | | | Total
Operations | | | Net Asset
Value, End of
Period | | | Total
Return(2) | |
| | | | | | | |
Six Months Ended 6/30/23 | | $ | 9.00 | | | $ | 0.16 | | | $ | (0.03 | ) | | $ | 0.13 | | | $ | 9.13 | | | | 1.44% | (4) |
| | | | | | | |
Year Ended 12/31/22 | | | 10.74 | | | | 0.26 | | | | (2.00 | ) | | | (1.74) | | | | 9.00 | | | | (16.20)% | |
| | | | | | | |
Year Ended 12/31/21 | | | 10.74 | | | | 0.21 | | | | (0.21 | ) | | | 0.00 | | | | 10.74 | | | | 0.00% | |
| | | | | | | |
Year Ended 12/31/20 | | | 10.03 | | | | 0.14 | | | | 0.57 | | | | 0.71 | | | | 10.74 | | | | 7.08% | |
| | | | | | | |
Period Ended 12/31/19(5) | | | 10.00 | | | | 0.03 | | | | 0.00 | (6) | | | 0.03 | | | | 10.03 | | | | 0.30% | (4) |
| | | | |
| 12 | | | | The accompanying notes are an integral part of these financial statements. |
FINANCIAL INFORMATION — GUARDIAN MULTI-SECTOR BOND VIP FUND
| | | | | | | | | | | | | | | | | | | | | | |
| | | | | | | | | | | | | | | | |
| Ratios/Supplemental Data | |
Net Assets, End
of Period (000s) | | | Net Ratio of
Expenses to
Average
Net Assets(3) | | | Gross Ratio of
Expenses to
Average Net
Assets | | | Net Ratio of Net
Investment Income
to Average
Net Assets(3) | | | Gross Ratio of Net
Investment Income
to Average
Net Assets | | | Portfolio
Turnover Rate | |
| | | | | | |
| $ | 223,516 | | | | 0.89% | (4) | | | 0.89% | (4) | | | 3.43% | (4) | | | 3.43% | (4) | | | 186% | (4) |
| | | | | | |
| | 232,593 | | | | 0.88% | | | | 0.88% | | | | 2.68% | | | | 2.68% | | | | 182% | |
| | | | | | |
| | 315,505 | | | | 0.87% | | | | 0.87% | | | | 1.99% | | | | 1.99% | | | | 172% | |
| | | | | | |
| | 306,696 | | | | 0.89% | | | | 0.89% | | | | 1.38% | | | | 1.38% | | | | 163% | |
| | | | | | |
| | 309,877 | | | | 0.93% | (4) | | | 0.93% | (4) | | | 1.33% | (4) | | | 1.33% | (4) | | | 27% | (4) |
| (1) | Calculated based on the average shares outstanding during the period. |
| (2) | Total returns do not reflect the effects of charges deducted pursuant to the terms of The Guardian Insurance & Annuity Company, Inc.’s variable contracts. Inclusion of such charges would reduce the total returns for all periods shown. |
| (3) | Net Ratio of Expenses to Average Net Assets and Net Ratio of Net Investment Income to Average Net Assets include the effect of fee waivers and expense limitations. |
| (4) | Ratios for periods less than one year have been annualized, except for total return and portfolio turnover rate. For the period ended December 31, 2019, certain non-recurring fees (i.e., audit fees) are not annualized. |
| (5) | Commenced operations on October 21, 2019. |
| (6) | Rounds to $0.00 per share. |
| | | | |
| The accompanying notes are an integral part of these financial statements. | | | | 13 |
NOTES TO FINANCIAL STATEMENTS — GUARDIAN MULTI-SECTOR BOND VIP FUND
June 30, 2023 (unaudited)
1. Organization
Guardian Variable Products Trust (the “Trust”), a Delaware statutory trust organized on January 12, 2016, is registered under the Investment Company Act of 1940, as amended (the “1940 Act”), as an open-end management investment company. The Trust currently has twenty-four series. Guardian Multi-Sector Bond VIP Fund (the “Fund”) is a series of the Trust. The Fund is a diversified fund and commenced operations on October 21, 2019. The financial statements for other series of the Trust are presented in separate reports.
The Trust has authorized an unlimited number of shares of beneficial interest with no par value. Shares are bought and sold at closing net asset value (“NAV”). Shares of the Fund are only sold to certain separate accounts of The Guardian Insurance & Annuity Company, Inc. (“GIAC”) that fund certain variable annuity contracts and variable life insurance policies issued by GIAC. GIAC is a wholly-owned subsidiary of The Guardian Life Insurance Company of America (“Guardian Life”).
The Fund seeks to provide a high current income with a secondary objective of capital appreciation.
2. Significant Accounting Policies
The following is a summary of significant accounting policies followed by the Fund in the preparation of its financial statements. The Fund follows the investment company accounting and reporting guidance of the Financial Accounting Standards Board (“FASB”) Accounting Standards Codification Topic 946 Financial Services – Investment Companies. The following policies are in conformity with accounting principles generally accepted in the United States of America (“GAAP”). The preparation of financial statements in accordance with GAAP requires management to make estimates and assumptions that affect the reported amounts and disclosures in the financial statements. Actual results could differ from those estimates.
a. Investment Valuations The Board of Trustees has designated Park Avenue Institutional Advisers LLC (“Park Avenue”) as the valuation designee for the Fund pursuant to Rule 2a-5 under the 1940 Act. Park Avenue has established a Fair Valuation Committee and has adopted fair valuation procedures that provide methodologies for fair valuing securities. These procedures include monitoring the appropriateness of fair values based on results of ongoing valuation
oversight, including but not limited to consideration of security specific events, market events, and pricing vendor and broker-dealer due diligence. The Fair Valuation Committee oversees and carries out the policies for the valuation of investments held in the Fund. The Fair Valuation Committee is responsible for discussing and assessing the potential impacts to the fair values on an ongoing basis, and reports to the Board of Trustees on at least a quarterly basis.
The valuations of debt securities for which quoted bid prices are readily available are valued at the bid price by independent pricing services (each, a “Service”). Debt securities for which quoted bid prices are not readily available are valued by a Service at the evaluated bid price provided by the Service or the bid price provided by an independent broker-dealer or at a calculated price based on the spread to an appropriate benchmark provided by such broker-dealer.
Equity securities traded on an exchange other than NASDAQ Stock Market, LLC (“NASDAQ”) are valued at the last reported sale price on the principal exchange or market on which they are traded; or, if there were no sales that day, at the mean between the closing bid and ask prices. Securities traded on the NASDAQ are generally valued at the NASDAQ official closing price, which may not be the last sale price. If the NASDAQ official closing price is not available for a security, that security is generally valued at the mean between the closing bid and ask prices. Repurchase agreements are carried at cost, which approximates fair value (see Note 5c). Foreign securities are valued in the currencies of the markets in which they trade and then converted to U.S. dollars by the application of foreign exchange rates at the close of the New York Stock Exchange (“NYSE”).
Exchange-traded financial futures and swap contracts are valued at the last settlement price on the market where they are primarily traded.
Securities for which market quotations are not readily available or securities whose values have been materially affected by events occurring before the Fund’s valuation time but after the close of the securities’ principal exchange or market are valued at their fair values as determined in good faith by Park Avenue, as the Board of Trustee’s valuation designee (as defined in Rule 2a-5 under the 1940 Act), in accordance with Park Avenue’s procedures and under the general oversight of the Board of Trustees. Valuations reflected in this report are as of the report date. As a result, changes in valuation due to market events and/or issuer related events after the report date and prior to issuance of the report are not reflected herein.
NOTES TO FINANCIAL STATEMENTS — GUARDIAN MULTI-SECTOR BOND VIP FUND
Various inputs are used in determining the valuation of the Fund’s investments. These inputs are summarized in three broad levels listed below.
| • | | Level 1 – unadjusted inputs using quoted prices in active markets for identical investments. |
| • | | Level 2 – other significant observable inputs, including, but not limited to, quoted prices for similar investments, inputs other than quoted prices that are observable for investments (such as interest rates, prepayment speeds, credit risks, etc.) or other market corroborated inputs. |
| • | | Level 3 – significant unobservable inputs (including the Fund’s own assumptions in determining the fair value of investments). |
Inputs may include price information, volatility statistics, specific and broad credit data, liquidity statistics, and other factors. A financial instrument’s level within the fair value hierarchy is based on the lowest level of any input; both individually and in aggregate, that is significant to the fair value measurement. However, the determination of what constitutes “observable” requires significant judgment by the Trust. The Trust considers observable data to be that market data which is readily available, regularly distributed or updated, reliable and verifiable, and provided by independent sources that are actively involved in the relevant market. The inputs or methodology used for valuing securities are not necessarily an indication of the risk associated with investing in those securities. Changes in valuation techniques may result in transfers into or out of a financial instrument’s assigned level within the hierarchy.
The FASB requires reporting entities to make disclosures about purchases, sales, issuances and settlements of Level 3 securities on a gross basis. For the six months ended June 30, 2023, there were no transfers into or out of Level 3 of the fair value hierarchy.
In determining a financial instrument’s placement within the hierarchy, the Trust separates the Fund’s investment portfolio into two categories: investments and derivatives (e.g., futures). A summary of inputs used to value the Fund’s assets and liabilities carried at fair value as of June 30, 2023 is included in the Schedule of Investments.
Investments Investments whose values are based on quoted market prices in active markets, and are therefore classified within Level 1, include active listed equities. Investments that trade in markets that are not considered to be active, but are valued based on quoted market prices, dealer quotations or alternative pricing
sources supported by observable inputs are classified within Level 2. These include certain U.S. government and sovereign obligations, most government agency securities, investment-grade corporate bonds, certain mortgage products, state, municipal and provincial obligations, and certain foreign equity securities, including securities whose prices may have been affected by events occurring after the close of trading on their principal exchange or market and, as a result, whose values are determined by a pricing service as described above, or securities whose values are otherwise determined using fair valuation methods approved by the Fund’s Board of Trustees.
Investments classified within Level 3 have significant unobservable inputs, as they trade infrequently or not at all. Level 3 investments include, among others, private placement securities. When observable prices are not available for these securities, the Trust uses one or more valuation techniques for which sufficient and reliable data is available. The inputs used by the Trust in estimating the value of Level 3 investments include, for example, the original transaction price, recent transactions in the same or similar instruments, completed or pending third-party transactions in the underlying investment or comparable issuers, subsequent rounds of financing, recapitalizations, and other transactions across the capital structure. Level 3 investments may also be adjusted to reflect illiquidity and/or non-transferability, with the amount of such discount estimated by the Trust in the absence of market information. Assumptions used by the Trust due to the lack of observable inputs may significantly impact the resulting fair value and therefore the Fund’s results of operations. As of June 30, 2023, the Fund had no securities classified as Level 3.
Derivatives Exchange-traded derivatives, such as futures contracts, exchange-traded option contracts and certain swaps, are typically classified within Level 1 or Level 2 of the fair value hierarchy depending on whether or not they are deemed to be actively traded. Certain non-exchange-traded derivatives, such as generic forwards, certain swaps and options, have inputs which can generally be corroborated by market data and are therefore classified within Level 2.
b. Securities Transactions Securities transactions are accounted for on the date securities are purchased or sold (trade date). Realized gains or losses on securities transactions are determined on the basis of specific identification.
c. Futures Contracts The Fund may enter into financial futures contracts. In entering into such contracts, the
NOTES TO FINANCIAL STATEMENTS — GUARDIAN MULTI-SECTOR BOND VIP FUND
Fund is required to deposit with the counterparty, either in cash or securities, an amount equal to a certain percentage of the face value of the contract. Subsequent payments are received or made by the Fund each day, depending on the daily fluctuations in the values of the contracts, and are recorded for financial statement purposes as variation margin received or paid by the Fund. Daily changes in variation margin are recognized as unrealized gains or losses by the Fund. The Fund may not achieve the anticipated benefits of the financial futures contracts and may realize a loss.
d. Credit Derivatives The Fund may enter into credit derivatives, including credit default swaps on individual obligations or credit indices. The Fund may use these investments to seek to (i) hedge various investments, (ii) manage or adjust duration and yield curve positioning, (iii) manage risk, (iv) enhance potential returns, or (v) as substitutes for permitted Fund investments. The use by the Fund of credit default swaps may have the effect of creating a short position in a security. Credit derivatives can create investment leverage and may create additional investment risks that may subject the Fund to greater volatility than investments in more traditional securities, as described in the Statement of Additional Information.
The Fund may enter into credit default swap agreements either as a buyer or seller. The Fund may buy protection under a credit default swap to attempt to mitigate the risk of default or credit quality deterioration in one or more individual holdings or in a segment of the fixed income securities market. The Fund may sell protection under a credit default swap in an attempt to gain exposure to an underlying issuer’s credit quality characteristics without investing directly in that issuer.
For swaps entered with an individual counterparty, the Fund bears the risk of loss of the uncollateralized amount expected to be received under a credit default swap agreement in the event of the default or bankruptcy of the counterparty. Credit default swap agreements are generally valued at a price at which the counterparty to such agreement would terminate the agreement. The Fund may also enter into cleared swaps.
In entering into swap contracts, the Fund is required to deposit with the broker (or for the benefit of the broker), either in cash or securities, an amount equal to a percentage of the notional value of the contract. Subsequent payments are received or made by the Fund each day, depending on the daily fluctuations in the values of the contracts, and are recorded for financial statement purposes as variation margin received or paid
by the Fund. Daily changes in variation margin are recognized as unrealized gains or losses by the Fund. The Fund may not achieve the anticipated benefits of the swap contracts and may realize a loss. During the six months ended June 30, 2023, the Fund entered into credit default swaps for risk exposure management and to enhance potential return.
e. Options Transactions The Fund can write (sell) put and call options on securities and indexes to earn premiums, for hedging purposes, for risk management purposes or otherwise as part of its investment strategies. In writing options, the Fund is required to deposit with the broker or counterparty, either in cash or securities, an amount equal to a percentage of the face value of the options. When an option is written, the premium received is recorded as an asset with an equal liability that is subsequently marked to market to reflect the market value of the written option. These liabilities, if any, are reflected as written options, at value, in the Fund’s Statement of Assets and Liabilities. Premiums received from writing options which expire unexercised are recorded on the expiration date as a realized gain. The difference between the premium received and the amount paid on effecting a closing purchase transaction, including brokerage commissions, is also treated as a realized gain, or if the premium is less than the amount paid for the closing purchased transactions, as a realized loss. If a written call option is exercised, the premium is added to the proceeds from the sale of the underlying security in determining whether there has been a realized gain or loss. If a written put option is exercised, the premium reduces the cost basis of the security. In writing an option, the Fund bears the market risk of an unfavorable change in the price of the security underlying the written option. Exercise of a written option could result in the Fund purchasing or selling a security at a price different from its current market value. There were no options transactions as of June 30, 2023.
f. Investment Income Dividend income net of foreign taxes withheld, if any, is generally recorded on the ex-dividend date. Distributions received from real estate investment trusts, if any, may be classified as dividends, capital gains and/or return of capital. Interest income, which includes amortization/accretion of premium/discount, is determined using the interest income accrual method, and is accrued and recorded daily.
g. Allocation of Income and Expenses Many of the expenses of the Trust can be directly attributed to a specific series of the Trust. Expenses that cannot be directly attributed to a specific series of the Trust are generally apportioned among all the series in the Trust,
NOTES TO FINANCIAL STATEMENTS — GUARDIAN MULTI-SECTOR BOND VIP FUND
based on relative net assets. In calculating net asset value per share for each series of the Trust, investment income, realized and unrealized gains and losses, and expenses other than series-specific expenses are allocated daily to each series based upon the proportion of net assets attributable to each series.
3. Transactions with Affiliates
a. Investment Advisory Fee and Expense Limitation Under the terms of the advisory agreement, which, after its two year initial term, is reviewed and approved annually by the Board of Trustees, the Fund pays an investment advisory fee to Park Avenue. Park Avenue is a wholly-owned subsidiary of Guardian Life and receives an investment advisory fee at an annual rate of 0.52% of the Fund’s average daily net assets. The fee is accrued daily and paid monthly. The Fund has no sub-adviser.
Park Avenue has contractually agreed through April 30, 2024 to waive certain fees and/or reimburse certain expenses incurred by the Fund to the extent necessary to limit the Fund’s total annual operating expenses after fee waiver and/or expense reimbursement to 1.00% of the Fund’s average daily net assets (excluding, if applicable, any acquired fund fees and expenses, taxes, interest, transaction costs and brokerage commissions, litigation and extraordinary expenses). The limitation may not be increased or terminated prior to this time without action by the Board of Trustees and may be terminated only upon approval of the Board of Trustees. Amounts waived or reimbursed by Park Avenue pursuant to any expense limitation will not be subject to Park Avenue’s recoupment rights. For the six months ended June 30, 2023, Park Avenue did not waive any fees or pay any Fund expenses.
b. Compensation of Trustees and Officers Trustees and officers who are interested persons of the Trust, as defined in the 1940 Act, receive no compensation from the Fund, except for the Chief Compliance Officer of the Trust. Trustees of the Trust who are not interested persons of the Trust, and the Chief Compliance Officer, receive compensation and reimbursement of expenses from the Trust.
c. Distribution Fees Park Avenue Securities LLC (“PAS”), a wholly-owned subsidiary of Guardian Life, is the principal underwriter of Fund shares. The Trust has entered into a distribution and service agreement with PAS, which governs the sale and distribution of shares of the Fund. Under a distribution and service plan adopted by the Trust (“12b-1 plan”), PAS is compensated for services in such capacity, including its expenses in connection with the promotion and distribution of
shares of the Fund, at an annual rate of 0.25% of the Fund’s average daily net assets. For the six months ended June 30, 2023, the Fund paid distribution fees in the amount of $291,604 to PAS.
PAS has directed that certain payments under the 12b-1 plan be used to compensate GIAC for shareholder services provided to contract owners.
4. Federal Income Taxes
a. Distributions to Shareholders For federal income tax purposes, the Fund is treated as a disregarded entity (“DRE”). As a DRE, the Fund is not subject to an entity-level income tax; and any income, gains, losses, deductions, taxes, and credits of the Fund would instead be “passed through” directly to the separate accounts of GIAC that invest in the Fund and retain the same character for U.S. federal income tax purposes. In addition, the Fund is not required to distribute taxable income and capital gains for U.S. federal income tax purposes. Therefore, no dividends and capital gains distributions were paid by the Fund.
5. Investments
a. Investment Purchases and Sales The cost of investments and U.S. government agency obligations purchased and the proceeds from U.S. government agency obligations and other investments sold (excluding short-term investments and to be announced (TBA) securities) for the six months ended June 30, 2023, were as follows:
| | | | | | | | |
| | | |
| | | Other Investments | | | U.S. Government and
Agency Obligations | |
| Purchases | | $ | 100,131,852 | | | $ | 321,382,106 | |
| Sales | | | 102,686,209 | | | | 314,862,744 | |
b. Foreign Securities Foreign securities investments involve special risks and considerations not typically associated with U.S. investments. These risks include, but are not limited to, currency risk; adverse political, regulatory, social, and economic developments; and less reliable information about issuers. Moreover, securities of some foreign issuers may be less liquid and their prices more volatile than those of comparable U.S. issuers.
c. Repurchase Agreements The Fund may invest in repurchase agreements to maintain liquidity and earn income over periods of time as short as overnight. The collateral for repurchase agreements is either cash or fully negotiable U.S. government securities (including U.S. government agency securities). Repurchase
NOTES TO FINANCIAL STATEMENTS — GUARDIAN MULTI-SECTOR BOND VIP FUND
agreements are fully collateralized (including the interest accrued thereon) and such collateral is marked to market daily while the agreements remain in force. If the value of the collateral falls below the repurchase price plus accrued interest, the Fund will typically require the seller to deposit additional collateral by the next business day. If the request for additional collateral is not met, or the seller defaults, the Fund maintains the right to sell the collateral (although it may be prevented or delayed from doing so in certain circumstances) and may be required to claim any resulting loss against the seller. Park Avenue monitors the creditworthiness of the seller with which the Fund enters into repurchase agreements.
d. Securities Purchased on a When-Issued or Delayed-Delivery Basis The Fund may purchase securities on a when-issued or delayed-delivery basis, with payment and delivery scheduled for a future date. These transactions are subject to market fluctuations and are subject to the risk that the value at delivery may be more or less than at the trade date purchase price. Although the Fund will generally enter into these transactions with the intention of taking delivery of the securities, it may sell the securities before the settlement date. Assets will be segregated when a fund agrees to purchase on a when-issued or delayed-delivery basis. These transactions may create investment leverage.
e. Restricted and Illiquid Securities A restricted security cannot be resold to the general public without prior registration under the Securities Act of 1933, as amended (except pursuant to an applicable exemption). The values of these securities may be highly volatile. If the security is subsequently registered and resold, the issuer would typically bear the expense of all registrations at no cost to the Fund. Restricted and illiquid securities are valued according to the policies and procedures adopted by the Trust’s Board of Trustees and are noted, if any, in the Fund’s Schedule of Investments. As of June 30, 2023, the Fund did not hold any restricted, other than 144A restricted securities or illiquid securities.
f. Below Investment Grade Securities The Fund may invest in below investment grade securities (i.e. lower-quality, “junk” debt), which are subject to various risks. Lower-quality debt is considered to be speculative because it is less certain that the issuer will be able to pay interest or repay the principal than in the case of investment grade debt. These securities can involve a substantially greater risk of default than higher-rated securities, and their values can decline significantly over short periods of time. Lower-quality debt securities
tend to be more sensitive to adverse news about their issuers, the market and the economy in general, than higher-quality debt securities. The market for these securities can be less liquid, especially during periods of recession or general market decline.
g. Mortgage- and Asset-Backed Securities The values of some mortgage-related or asset-backed securities may be particularly sensitive to changes in prevailing interest rates. Early repayment of principal on some mortgage-related securities may expose the Fund to a lower rate of return upon reinvestment of principal. The values of mortgage- and asset-backed securities depend in part on the credit quality and adequacy of the underlying assets or collateral and may fluctuate in response to the market’s perception of these factors as well as current and future repayment rates. Some mortgage-backed securities are backed by the full faith and credit of the U.S. government (e.g., mortgage-backed securities issued by the Government National Mortgage Association, commonly known as “Ginnie Mae”), while other mortgage-backed securities (e.g., mortgage-backed securities issued by the Federal National Mortgage Association and the Federal Home Loan Mortgage Corporation, commonly known as “Fannie Mae” and “Freddie Mac”), are backed only by the credit of the government entity issuing them. In addition, some mortgage-backed securities are issued by private entities and, as such, are not guaranteed by the U.S. government or any agency or instrumentality of the U.S. government.
h. Treasury Inflation Protected Securities Treasury inflation protected securities (“TIPS”) are debt securities issued by the U.S. Treasury whose principal and/or interest payments are adjusted for inflation, unlike debt securities that make fixed principal and interest payments. The interest rate paid by the TIPS is fixed, while the principal value rises or falls based on changes in a published Consumer Price Index (“CPI”). Thus, if inflation occurs, the principal and interest payments on TIPS are adjusted accordingly to protect investors from inflationary loss. During a deflationary period, the principal and interest payments decrease, although the TIPS principal amounts will not drop below their face amounts at maturity. In exchange for the inflation protection, the TIPS generally pay lower interest rates than typical U.S. Treasury securities. Only if inflation occurs will TIPS offer a higher real yield than a conventional Treasury bond of the same maturity.
i. Disclosures About Derivative Instruments and Hedging Activities The Fund entered into U.S. Treasury futures contracts for the six months ended June 30,
NOTES TO FINANCIAL STATEMENTS — GUARDIAN MULTI-SECTOR BOND VIP FUND
2023 to manage portfolio duration. The Fund bears the risk of interest rates moving unexpectedly, in which case the Fund may not achieve the anticipated benefits of the futures contracts and realize a loss. There is minimal counterparty credit risk to the Funds since futures are exchange traded and the exchange’s clearinghouse, as counterparty to all exchange traded futures, guarantees futures against default.
Under certain market conditions, the Fund may use credit default swaps to seek to (i) hedge various investments, (ii) manage or adjust duration and yield curve exposure, (iii) manage risk, (iv) enhance returns, or (v) as substitutes for permitted Fund investments. Credit default swaps involve the exchange of a floating or fixed rate payment in return for assuming potential credit losses of an underlying security or pool of securities.
The gross returns to be exchanged or “swapped” between the parties are generally calculated with respect to a “notional amount,” i.e., the return on or increase in value of a particular dollar amount invested at a particular interest rate, in a particular foreign currency or security, or in a “basket” of securities representing a particular index. Cleared swaps are transacted through futures commission merchants (“FCM”s) that are members of central clearinghouses with the clearinghouse serving as a central counterparty similar to transactions in futures contracts. Funds post initial and variation margin by making payments to their clearing member FCMs.
Generally, the Fund will enter into credit default swaps on a net basis, which means that the two payment streams are netted out, with a Fund receiving or paying, as the case may be, only the net amount of the two payments. Credit default swaps do not normally involve the delivery of securities, other underlying assets or principal. Accordingly, the risk of loss with respect to credit default swaps is normally limited to the net amount of payments that a Fund is contractually obligated to make. If the other party to a credit default swap defaults, a Fund’s risk of loss consists of the net amount of payments that the Fund is contractually entitled to receive, if any.
In addition to the risks generally applicable to derivatives, risks associated with credit default swap agreements include adverse changes in the returns of the underlying instruments, failure of the counterparties to perform under the agreement’s terms and the possible lack of liquidity with respect to the agreements.
As of June 30, 2023, the Fund had the following derivatives at fair value, grouped into appropriate risk categories that illustrate the Fund’s use of derivative instruments:
| | | | | | | | |
| | | |
| | | Interest Rate Contracts | | | Credit Default Contracts | |
| | | |
Asset Derivatives | | | | | | | | |
| Futures Contracts1 | | $ | 7,062 | | | $ | — | |
| | | |
Liability Derivatives | | | | | | | | |
| Futures Contracts1 | | $ | (929,637 | ) | | $ | — | |
| Swap Contracts2 | | | — | | | | (343,052 | ) |
| 1 | Statement of Assets and Liabilities location: Includes cumulative unrealized appreciation/(depreciation) of futures contracts as reported in the Schedule of Investments. Only current day’s variation margin is reported within the Statement of Assets and Liabilities. |
| 2 | Statement of Assets and Liabilities location: Includes the fair value of centrally cleared swap contracts as reported in the Schedule of Investments. Only current day’s variation margin is reported within the Statement of Assets and Liabilities. |
Transactions in derivative investments for the six months ended June 30, 2023 were as follows:
| | | | | | | | |
| | | |
| | | Interest Rate Contracts | | | Credit Default Contracts | |
| | | |
Net Realized Gain/(Loss) | | | | | | | | |
| Futures Contracts1 | | $ | 1,490,600 | | | $ | — | |
| Swap Contracts2 | | | — | | | | (2,858,929 | ) |
| | | |
Net Change in Unrealized Appreciation/(Depreciation) | | | | | | | | |
| Futures Contracts3 | | $ | (787,029 | ) | | $ | — | |
| Swap Contracts4 | | | — | | | | 1,595,744 | |
| | | |
Average Number of Notional Amounts | | | | | | | | |
| Futures Contracts5 | | | 498 | | | | — | |
| Swap Contracts — Buy/Sell Protection | | $ | — | | | $ | 26,435,714 | |
| 1 | Statement of Operations location: Net realized gain/(loss) from futures contracts. |
| 2 | Statement of Operations location: Net realized gain/(loss) from swap contracts. |
| 3 | Statement of Operations location: Net change in unrealized appreciation/(depreciation) on futures contracts. |
| 4 | Statement of Operations location: Net change in unrealized appreciation/(depreciation) on swap contracts. |
| 5 | Amount represents number of contracts. |
6. Temporary Borrowings
The Fund, with other funds managed by Park Avenue, is party to a credit agreement with respect to a $10 million committed revolving credit facility from State Street Bank and Trust Company (the “Credit Agreement”) for temporary borrowing purposes, including the meeting of redemption requests that otherwise might require the untimely disposition of securities. Interest is based on a daily fluctuating rate per annum equal to the
NOTES TO FINANCIAL STATEMENTS — GUARDIAN MULTI-SECTOR BOND VIP FUND
Applicable Rate (as defined in the Credit Agreement) plus the Applicable Margin (as defined in the Credit Agreement) that is subject to change from time to time as and when the Applicable Rate changes. Under the current Credit Agreement, the Applicable Rate for any day is defined as the rate per annum equal to the sum of (a) 0.10% plus (b) the higher of (i) the Federal Funds Effective Rate for such day and (ii) the Overnight Bank Funding Rate for such day; the Applicable Margin is 1.25%. In addition to the interest charged on any borrowings by the Fund, each fund pays a commitment fee of 0.30% per annum on its share of the unused portion of the credit facility. The agreement is in place until January 5, 2024. The Fund did not utilize the credit facility during the six months ended June 30, 2023.
7. Indemnifications
Under the Trust’s organizational documents and, in some cases, by contract, officers and Trustees of the Trust are indemnified against certain liabilities arising
out of the performance of their duties to the Fund. In addition, in the normal course of business, the Fund enters into contracts with its vendors and others that provide general indemnifications. The Fund’s maximum exposure under these arrangements is unknown as this would involve future claims that may be made against the Fund that have not yet occurred. However, based on experience, the Fund expects the risk of loss to be remote.
8. Additional Information
The outbreak of COVID-19 has adversely impacted both local and global economies, including those in which the Fund may invest. These impacts include materially reduced consumer demand and economic output, disrupted supply chains, market closures, travel restrictions and quarantines, and strained healthcare systems. The Fund’s operations may be interrupted as a result, which may have a negative impact on the Fund’s investment performance.
SUPPLEMENTAL INFORMATION (UNAUDITED)
Liquidity Risk Management Program
In compliance with Rule 22e-4 under the Investment Company Act of 1940, as amended (the “Liquidity Rule”), Guardian Variable Products Trust (the “Trust”) has adopted and implemented a written liquidity risk management program (the “Program”) for each series of the Trust (each, a “Fund���), which is reasonably designed to assess and manage each Fund’s liquidity risk. The Fund’s “liquidity risk” is the risk that the Fund could not
meet requests to redeem shares issued by the Fund without significant dilution of the remaining investors’ interests in the Fund.
The Board of Trustees of the Trust (the “Board”)
Previously approved the designation of Park Avenue Institutional Advisers LLC (the “Administrator” or “PAIA”) as Program administrator. The Administrator established a Liquidity Risk Management Committee, which is comprised of certain officers of the Trust and PAIA, that assists the Administrator in the implementation and day-to-day administration of the Program and otherwise support carrying out the Administrator’s liquidity risk management responsibilities under the Program.
In accordance with the Program, each Fund’s liquidity risk is assessed no less frequently than annually, taking into consideration a variety of factors, including, as applicable, the Fund’s investment strategy and liquidity of portfolio investments, cash flow projections, and holdings of cash and cash equivalents, as well as borrowing arrangements and other funding sources. Certain factors are considered under both normal and reasonably foreseeable stressed conditions.
Each Fund portfolio investment is classified, no less than monthly, into one of four liquidity categories (including “highly liquid investments” and “illiquid investments,” discussed below) based on a determination of the number of days it is reasonably expected to take to convert the investment to cash, or sell or dispose of the investment, in current market conditions without significantly changing the investment’s market value.
The Liquidity Rule limits the Fund’s investments in illiquid investments by prohibiting the Fund from acquiring any illiquid investment if, immediately after the acquisition, the Fund would have invested more than 15% of its net assets in illiquid investments that are assets. The Program includes provisions reasonably designed to comply with this investment limitation. In addition, the Program includes provisions reasonably designed to comply with this investment limitation. In addition, the Program includes provisions reasonably designed to comply with the Liquidity Rule’s requirements relating to highly liquid investment minimums, which is a minimum amount of Fund net assets that must be invested in highly liquid investments that are assets, as applicable. The Fund was not required to adopt a highly liquid investment minimum during the period.
At a meeting of the Board held on March 29-30, 2023, the Board received a report (the “Report”) prepared by the Administrator addressing the Program’s operation and assessing the adequacy and effectiveness of its implementation for the period from January 1, 2022 through December 31, 2022 (the “Reporting Period”). The Report noted that the Administrator believes the Program operated effectively during the Reporting Period and continues to be reasonably designed to effectively assess and manage each Fund’s liquidity risk. The Report also noted that the Administrator believes the Program has been adequately and effectively implemented and the investment strategies for each Fund continue to be appropriate since its inception. In addition, the Report summarized the operation of the Program and the information and factors considered by the Administrator in its assessment of the Program’s implementation, such as the liquidity risk assessment framework and liquidity classification methodologies.
There can be no assurance that the Program will achieve its objectives under all circumstances. Please refer to the Fund’s prospectus for more information regarding the Fund’s exposure to liquidity risk and other risks to which an investment in the Fund may be subject.
SUPPLEMENTAL INFORMATION (UNAUDITED)
Approval of Investment Management Agreement
Section 15(c) of the Investment Company Act of 1940, as amended (the “1940 Act”), requires that a fund’s investment advisory and sub-advisory agreements be approved initially by the fund’s board of trustees. Section 15(c) also requires that the continuation of these agreements, after an initial term of up to two years, be annually reviewed and approved by the board. Any such agreement must be approved by a vote of a majority of the trustees who are not parties to the agreement or “interested persons” (as defined in the 1940 Act) of a party to the agreement at a meeting of the board called for the purpose of voting on such approval.
At a meeting of the Board of Trustees (the “Board”) of Guardian Variable Products Trust (the “Trust”) held on March 29-30, 2023 (the “Meeting”), the Board, including the trustees who are not parties to the agreement or “interested persons” as defined in the 1940 Act (the “Independent Trustees”), considered and voted unanimously to renew the existing investment management agreement between the Trust, on behalf of Guardian All Cap Core VIP Fund; Guardian Balanced Allocation VIP Fund; Guardian Core Fixed Income VIP Fund; Guardian Core Plus Fixed Income VIP Fund; Guardian Diversified Research VIP Fund; Guardian Equity Income VIP Fund; Guardian Global Utilities VIP Fund; Guardian Growth & Income VIP Fund; Guardian Integrated Research VIP Fund; Guardian International Growth VIP Fund; Guardian International Equity VIP Fund; Guardian Large Cap Disciplined Growth VIP Fund; Guardian Large Cap Disciplined Value VIP Fund; Guardian Large Cap Fundamental Growth VIP Fund; Guardian Mid Cap Relative Value VIP Fund; Guardian Mid Cap Traditional Growth VIP Fund; Guardian Multi-Sector Bond VIP Fund; Guardian Select Mid-Cap Core VIP Fund; Guardian Short Duration Bond VIP Fund; Guardian Small Cap Core VIP Fund; Guardian Small-Mid Cap Core VIP Fund; Guardian Strategic Large Cap Core VIP Fund; Guardian Total Return Bond VIP Fund and Guardian U.S. Government Securities VIP Fund (each, a “Fund,” and together, the “Funds”), in substantially the form presented at this meeting (the “Management Agreement”); and Park Avenue Institutional Advisers LLC (the “Manager”) for a one-year term.
The Board, including the Independent Trustees, also considered and voted unanimously to renew the existing sub-advisory agreements (the “Sub-Advisory Agreements,” collectively with the Management Agreement and Sub-Subadvisory Agreement, the “Agreements”) between the Manager and investment
advisory firms engaged to serve as sub-advisers to certain of the Funds (the “Sub-Advised Funds”), namely (i) ClearBridge Investments, LLC with respect to Guardian Small Cap Core VIP Fund; (ii) Putnam Investment Management, LLC with respect to Guardian Diversified Research VIP Fund; (iii) AllianceBernstein L.P. with respect to Guardian Growth & Income VIP Fund and Guardian Strategic Large Cap Core VIP Fund; (iv) J.P. Morgan Investment Management Inc. with respect to Guardian International Growth VIP Fund; (v) Schroder Investment Management North America Inc. with respect to Guardian International Equity VIP Fund; (vi) Wellington Management Company LLP with respect to Guardian Balanced Allocation VIP Fund, Guardian Equity Income VIP Fund, Guardian Integrated Research VIP Fund, Guardian Large Cap Disciplined Growth VIP Fund and Guardian Global Utilities VIP Fund; (vii) Boston Partners Global Investors, Inc. with respect to Guardian Large Cap Disciplined Value VIP Fund; (viii) Janus Henderson Investors US LLC with respect to Guardian Mid Cap Traditional Growth VIP Fund; (ix) Allspring Global Investments, LLC with respect to Guardian Mid Cap Relative Value VIP Fund and Guardian Small-Mid Cap Core VIP Fund; (x) Lord, Abbett & Co. LLC with respect to Guardian Core Plus Fixed Income VIP Fund; (xi) FIAM LLC with respect to Guardian Select Mid Cap Core VIP Fund; and (xii) Massachusetts Financial Services Company with respect to Guardian All Cap Core VIP Fund, each in substantially the form presented at this meeting, (each, a “Sub-Adviser” and collectively, the “Sub-Advisers”) for a one-year term.
The Board, including the Independent Trustees, also considered and voted unanimously to renew the existing sub-subadvisory agreement (the “Sub-Subadvisory Agreement”) between Schroder Investment Management North America Inc. and Schroder Investment Management North America Limited (also a Sub-Adviser) with respect to Guardian International Equity VIP Fund for a one-year term.
The Board is responsible for overseeing the management of each Fund. In determining whether to renew its approval of the Agreements, the Trustees evaluated information and factors that they considered to be relevant and appropriate through the exercise of their own business judgment. The Trustees considered certain information and factors in light of advice furnished to them by legal counsel to the Trust and, in the case of the Independent Trustees, their independent legal counsel. In advance of the Meeting, the Trustees received materials and information designed to assist their consideration of the Agreements. The Trustees received written responses
SUPPLEMENTAL INFORMATION (UNAUDITED)
from the Manager and each Sub-Adviser to a series of questions and requests for information encompassing a wide variety of topics provided by independent counsel on behalf of the Independent Trustees. The Independent Trustees also received materials and information regarding the legal standards applicable to their consideration of the Agreements and the process and criteria used by the Manager to identify and select the Sub-Advisers.
During the course of their deliberations, the Independent Trustees met twice to discuss and evaluate the materials, information and Agreements in executive session with their independent legal counsel, outside of the presence of the Trustees who are not Independent Trustees and representatives from Fund management, the Manager or any Sub-Adviser.
In reaching its decisions to renew its approval of the Agreements, the Board took into account the materials and information described above, as well as other materials and information provided to the Board throughout the year. Individual Trustees may have given different weight to different factors and information with respect to each Agreement, and the Trustees did not identify any single factor or information that, in isolation, would be controlling in deciding to approve the Agreements. The discussion below is intended to summarize the broad factors that figured prominently in the Board’s decisions to renew its approval of the Agreements rather than to be all-inclusive. These broad factors included: (i) the nature, extent and quality of the services provided to the Funds by the Manager and to the Sub-advised Funds by the Sub-Advisers; (ii) the investment performance of each Fund; (iii) estimated profitability of the Manager; (iv) fees and expenses; (v) the extent to which economies of scale may exist, and the extent to the benefits of economies of scale are shared with the Funds; and (vi) any other benefits derived by the Manager or the Sub-Advisers (or their respective affiliates) from their relationships with the Funds.
Nature, Extent and Quality of Services
The Trustees considered information regarding the nature, extent and quality of services provided to the Funds by the Manager. The Trustees also considered, among other things, the terms of the Management Agreement and the range of investment advisory services provided by the Manager. In addition, the Trustees reviewed the range of non-investment advisory services provided by the Manager consistent with the terms of the Management Agreement, notably coordinating the preparation and filing of various
regulatory documents, coordinating the preparation and assembly of Board meeting materials, and assisting the Board with certain valuation matters. The Board also received a description of the Manager’s and each Sub-Adviser’s business continuity plans and of their respective approaches to data privacy and cybersecurity, and related testing. The Board received information regarding the response of the Manager and the Sub-Advisers to the COVID-19 pandemic, including the continuation of remote work arrangements and return-to-office plans. The Board also received information about the Manager’s role as administrator of the Funds’ liquidity risk management program, the Manager’s approach to risk management, and the Manager’s vendor oversight programs.
The Trustees considered that the Sub-advised Funds operate in a “manager-of-managers” structure and reviewed the responsibilities that the Manager has under this structure, including monitoring and evaluating the performance of the Sub-Advisers, monitoring the Sub-Advisers for adherence to the stated investment objectives, strategies, policies and restrictions of the Funds and supervising the Sub-Advisers with respect to the services that the Sub-Advisers would provide under the Sub-Advisory Agreements. The Trustees also considered the process used by the Manager, consistent with this structure, to identify and recommend sub-advisers, and the Manager’s ability to monitor and oversee sub-advisers and recommend replacement sub-advisers, when necessary, and provide other services under the Management Agreement. The Board noted that investment management staff of the Manager and the Trust’s Chief Compliance Officer conduct oversight meetings with the Sub-Advisers on a periodic basis, follow through with additional inquiries on any questions or concerns that arise during the meetings and, as necessary, then report the results of the meetings to the Board. The Trustees reviewed information regarding the experience and background of the Manager’s key personnel and the Manager’s organizational structure and resources, including investment, legal and administrative capabilities of the Manager. In this regard, the Trustees recognized that the Funds may benefit from the Manager’s ability to use resources and capabilities of its affiliates in providing services to the Funds.
The Trustees considered information regarding the nature, extent and quality of services provided to the Sub-advised Funds by the Sub-Advisers. The Trustees also considered, among other things, the terms of the Sub-advisory Agreements and the range of investment
SUPPLEMENTAL INFORMATION (UNAUDITED)
advisory services provided by the Sub-Advisers under the oversight of the Manager. In evaluating these investment advisory services, the Trustees considered, among other things, the Sub-Advisers’ investment philosophies, styles and/or processes and approaches to managing the respective Sub-advised Funds. The Trustees received and evaluated information regarding the background, education, expertise and/or experience of the investment professionals who serve as portfolio managers for the Sub-advised Funds and the capabilities and resources of the Sub-Advisers.
Based upon these considerations, the Trustees concluded, within the context of their full deliberations, that the nature, extent and quality of services provided to the Funds by the Manager and the Sub-advised Funds by each respective Sub-Adviser were appropriate.
Investment Performance
In connection with each of its regular quarterly meetings, the Board receives information on the performance of each Fund, including net performance, relative performance rankings within the relevant Morningstar peer group, and performance as compared to benchmark index returns. At each quarterly Board meeting, members of the Manager’s funds management team review with the Board the economic and market environment, absolute and relative performance of each Fund, and any relevant information about risk management and style consistency in connection with management of the Funds. The Board considered investment performance for each Fund over the one-year, three-year (where available), five-year (where available) and since-inception periods.
The Board also received and reviewed a report prepared by Broadridge Financial Solutions (“Broadridge”), an independent provider of mutual fund industry data, which included comparisons of the performance of each Fund to performance of an appropriate peer universe. For details regarding each Fund’s performance, see the “Fund-by-Fund Factors” section below.
The Manager discussed with the Board factors contributing to the Funds’ performance results. In addition, for certain Funds, the Manager provided to the Board longer term performance records of the Sub-Advisers for strategies used in managing the Funds. The Board concluded that the investment performance generated by the Manager and each Sub-Adviser was generally satisfactory, or, that any steps being taken by the Manager and Sub-Advisers to address any performance issues were satisfactory.
Profitability
The Board received and considered the Manager’s estimate of its profitability, which included allocations by the Manager of its costs in providing management services to the Funds. The Board considered the estimated profitability of the Manager both overall and on a Fund-by-Fund basis.
The Board received and considered profitability information from most of the Sub-Advisers, but noted that the Manager had negotiated the fees with the Sub-Advisers at arm’s-length. Accordingly, the Board concluded that the profitability of the Sub-Advisers is a less relevant factor than Manager profitability.
Based on the consideration of this information, the Board concluded that the profitability of the Funds to the Manager was acceptable.
Fees and Expenses
The Trustees considered the management fees paid by the Funds to the Manager under the Management Agreement and evaluated the reasonableness of these fees. The Trustees received and reviewed comparative information with respect to the management fee and total expenses for each Fund and the management fees and total expenses for a peer group of other funds selected by Broadridge. The Trustees considered the Manager’s commitment to limit the total expenses of each Fund through an expense limitation agreement with the Trust. Although the Board recognized that the comparisons between the management fees and actual expenses of the Funds and those of the identified peer group are imprecise, given different terms of agreements and variations in fund strategies, the Trustees found that the comparative information supported their consideration and approval of the management fees and evaluation of the total expenses. For details regarding each Fund’s fee and expense comparisons, see the “Fund-by-Fund Factors” section below.
The Trustees considered the sub-advisory fees paid under the Sub-advisory Agreements and evaluated the reasonableness of those fees. The Trustees also considered that the fees paid to the Sub-Advisers would be paid by the Manager and not the Funds and that the Manager had negotiated the fees with the Sub-Advisers at arm’s-length.
Based on the consideration of the information and factors summarized above, as well as other relevant information and factors, the Board concluded that the
SUPPLEMENTAL INFORMATION (UNAUDITED)
management and sub-advisory fees were reasonable in light of the nature, extent and quality of services rendered to the Funds by the Manager and the Sub-Advisers.
Economies of Scale
The Board considered the extent to which economies of scale may exist, and the extent to the benefits of economies of scale are shared with the Funds. In this regard, the Board noted that for sixteen of twenty-four Funds, the management and sub-advisory fee included breakpoints that are tiered based on growth in asset levels of each such Fund and that for the other Funds, the fees reflected appropriate levels based on current and expected asset levels. The Board also noted that the expenses of the Funds are subject to expense limitations provided by the Manager. The Board noted that expected economies of scale, where they exist, may be shared through the use of fee breakpoints, expense limitations by the Manager, and/or a lower overall fee.
Ancillary Benefits
The Board considered the potential benefits, other than management fees, that the Manager and/or its affiliates may receive because of the Manager’s relationship with the Funds. The Trustees considered that the Funds were designed to serve as investment options under variable contracts issued by affiliates of the Manager that would receive fees under those contracts and that Park Avenue Securities LLC, an affiliate of the Manager and principal underwriter of the Funds, and participating insurance companies, including insurance companies affiliated with the Manager, would be entitled to receive fees from the Funds under a plan of distribution adopted pursuant to Rule 12b-1 under the 1940 Act. The Trustees considered that the Manager and its affiliates may benefit from (i) greater efficiencies in annuity administration and operations and potential cost savings due to a reduction in the number of unaffiliated funds available as annuity contract investment options, and (ii) increased dividends-received deductions due to the Funds’ status under the tax laws as disregarded entities. In addition, the Trustees considered the potential benefits, other than sub-advisory fees, that the Sub-Advisers and their affiliates may receive because of their relationships with the Funds, including the ability to receive research from soft dollar commissions consistent with Trust policies. The Trustees concluded that benefits that may accrue to the Manager and its affiliates are reasonable and the benefits that may accrue to the Sub-Advisers and their affiliates are consistent with those expected for a sub-adviser to a mutual fund such as the applicable Fund.
Fund-by-Fund Factors
The Broadridge report groups fees, expenses and performance into five quintiles, with the top quintile having the highest performance or lowest fees/expenses, and the bottom quintile having the lowest performance or highest fees/expenses. For purposes of the descriptions below, a Fund’s performance is considered “in line with” the benchmark index if it is within 0.20%.
Guardian Large Cap Fundamental Growth VIP Fund
| • | | The Board noted that the Fund’s performance was in the 3rd quintile of its performance universe for the 1-year period and in the 4th quintile for its performance universe for the 3-year and 5-year periods. The Board also noted that the Fund’s performance was below the benchmark index for the 1-year, 3-year and 5-year periods. |
| • | | The Board noted that the contractual management fee, the actual management fee and actual total expenses were in the 1st quintile of the expense group. |
Guardian Large Cap Disciplined Growth VIP Fund
| • | | The Board noted that the Fund’s performance was in the 3rd quintile of its performance universe for the 1-year and 3-year periods and in the 2nd quintile for the 5-year period. The Board also noted that the Fund’s performance was below the benchmark index for the 1-year, 3-year and 5-year periods. |
| • | | The Board noted that the contractual management fee, the actual management fee and actual total expenses were in the 1st quintile of the expense group. |
Guardian Integrated Research VIP Fund
| • | | The Board noted that the Fund’s performance was in the 5th quintile of its performance universe for the 1-year and 5-year periods and in the 4th quintile for 3-year period. The Board also noted that the Fund’s performance was below the benchmark index for the 1-year, 3-year and 5-year periods. |
| • | | The Board noted that the contractual management fee, the actual management fee and actual total expenses were in the 1st quintile of the expense group. |
Guardian Diversified Research VIP Fund
| • | | The Board noted that the Fund’s performance was in the 3rd quintile of its performance universe for the 1-year and 3-year periods and in the 2nd quintile for the 5-year period. The Board also noted that the Fund’s performance was higher than the benchmark index for the 1-year period. The Board note that the Fund’s performance was lower than the benchmark index for the 3-year and 5-year periods. |
SUPPLEMENTAL INFORMATION (UNAUDITED)
| • | | The Board noted that the contractual management fee and actual management fee were in the 1st quintile of the expense group and that actual total expenses were in the 3rd quintile. |
Guardian Strategic Large Cap Core VIP Fund
| • | | The Board noted that the Fund’s performance was in the 1st quintile of its performance universe for the 1-year period. The Board acknowledged the Fund’s short operational history. The Board noted that the Fund’s performance was higher than the benchmark index for the 1-year period. |
| • | | The Board noted that the contractual management fee, the actual management fee and actual total expenses were in the 1st quintile of the expense group. |
Guardian Large Cap Disciplined Value VIP Fund
| • | | The Board noted that the Fund’s performance was in the 3rd quintile of its performance universe for the 1-year and 3-year periods and in the 4th quintile for the 5-year period. The Board also noted that the Fund’s performance was higher than the benchmark index for the 1-year and 3-year periods. The Board noted that the Fund’s performance was in line with the benchmark index for the 5-year period. |
| • | | The Board noted that the contractual management fee was in the 2nd quintile of the expense group, the actual management fee was in the 1st quintile of the expense group and that actual total expenses were in the 3rd quintile. |
Guardian Growth & Income VIP Fund
| • | | The Board noted that the Fund’s performance was in the 3rd quintile of its performance universe for the 1-year, 3-year and 5-year periods. The Board also noted that the Fund’s performance was higher than the benchmark index for the 1-year, 3-year and 5-year periods. |
| • | | The Board noted that the contractual management fee and the actual management fee were in the 1st quintile of the expense group and that actual total expenses were in the 3rd quintile. |
Guardian Equity Income VIP Fund
| • | | The Board noted that the Fund had less than one-year of operational history and was not able to evaluate an investment performance record for the Fund. The Board noted that it would have an opportunity to review such information in connection with future annual reviews. The Board noted that, in the meantime, it received monthly performance reports from the Manager. |
| • | | The Board noted that the contractual management fee, the actual management fee and actual total expenses were in the 1st quintile of the expense group. |
Guardian All Cap Core VIP Fund
| • | | The Board noted that the Fund’s performance was in the 3rd quintile of its performance universe for the 1-year period. The Board acknowledged the Fund’s short operational history. The Board noted that the Fund’s performance was higher than the benchmark index for the 1-year period. |
| • | | The Board noted that the contractual management fee, the actual management fee and actual total expenses were in the 1st quintile of the expense group. |
Guardian Mid Cap Traditional Growth VIP Fund
| • | | The Board noted that the Fund’s performance was in the 1st quintile of its performance universe for the 1-year period and in the 2nd quintile for the 3-year and 5-year periods. The Board also noted that the Fund’s performance was higher than the benchmark index for the 1-year, 3-year and 5-year periods. |
| • | | The Board noted that the contractual management fee and actual management fee were in the 1st quintile of the expense group and that the actual total expenses were in the 4th quintile. |
Guardian Select Mid Cap Core VIP Fund
| • | | The Board noted that the Fund’s performance was in the 3rd quintile of its performance universe for the 1-year period. The Board acknowledged the Fund’s short operational history. The Board noted that the Fund’s performance was lower than the benchmark index for the 1-year period. |
| • | | The Board noted that the contractual management fee, the actual management fee and actual total expenses were in the 1st quintile of the expense group. |
Guardian Mid Cap Relative Value VIP Fund
| • | | The Board noted that the Fund’s performance was in the 2nd quintile of its performance universe for the 1-year, 3-year and 5-year periods. The Board also noted that the Fund’s performance was higher than the benchmark index for the 1-year, 3-year and 5-year periods. |
| • | | The Board noted that the contractual management fee and the actual management fee were in the 2nd quintile of the expense group and the actual total expenses were in the 3rd quintile of the expense group. |
SUPPLEMENTAL INFORMATION (UNAUDITED)
Guardian Small-Mid Cap Core VIP Fund
| • | | The Board noted that the Fund’s performance was in the 5th quintile of its performance universe for the 1-year period. The Board acknowledged the Fund’s short operational history. The Board noted that the Fund’s performance was higher than the benchmark index for the 1-year period. |
| • | | The Board noted that the contractual management fee, the actual management fee and actual total expenses were in the 1st quintile of the expense group. |
Guardian Small Cap Core VIP Fund
| • | | The Board noted that the Fund’s performance was in the 5th quintile of its performance universe for the 1-year and 3-year periods. The Board noted that the Fund’s performance was lower than the benchmark index for the 1-year and 3-year periods. |
| • | | The Board noted that the contractual management fee and the actual management fee were in the 1st quintile of the expense group and the actual total expenses were in the 2nd quintile of the expense group. |
Guardian International Growth VIP Fund
| • | | The Board noted that the Fund’s performance was in the 4th quintile of its performance universe for the 1-year period, in the 2nd quintile of its performance universe for the 3-year period and in the 3rd quintile of its performance universe for the 5-year period. The Board also noted that the Fund’s performance was lower than the benchmark index for the 1-year and 5-year periods. The Board noted that the Fund’s performance was higher than the benchmark index for the 3-year period. |
| • | | The Board noted that the contractual management fee and actual management fee were in the 2nd quintile of the expense group and that the actual total expenses were in the 3rd quintile. |
Guardian International Equity VIP Fund
| • | | The Board noted that the Fund’s performance was in the 5th quintile of its performance universe for the 1-year, 3-year and 5-year periods. The Board also noted that the Fund’s performance was lower than the benchmark index for the 1-year, 3-year and 5-year periods. |
| • | | The Board noted that the contractual management fee, the actual management fee and the actual total expenses were in the 2nd quintile of the expense group. |
Guardian Global Utilities VIP Fund
| • | | The Board noted that the Fund’s performance was in the 5th quintile of its performance universe for the 1-year period and in the 4th quintile of its performance universe for the 3-year period. The Board noted that the Fund’s performance was higher than the benchmark index for the 1-year and 3-year periods. |
| • | | The Board noted that the contractual management fee and the actual management fee were in the 1st quintile of the expense group and the actual total expenses were in the 2nd quintile of the expense group. |
Guardian Balanced Allocation VIP Fund
| • | | The Board noted that the Fund had less than one-year of operational history and was not able to evaluate an investment performance record for the Fund. The Board noted that it would have an opportunity to review such information in connection with future annual reviews. The Board noted that, in the meantime, it received monthly performance reports from the Manager. |
| • | | The Board noted that the contractual management fee, the actual management fee and actual total expenses were in the 1st quintile of the expense group. |
Guardian Core Plus Fixed Income VIP Fund
| • | | The Board noted that the Fund’s performance was in the 3rd quintile of its performance universe for the 1-year and 3-year periods and in the 4th quintile of its performance universe for the 5-year period. The Board also noted that the Fund’s performance was lower than the benchmark index for the 1-year and 5-year periods. The Board noted that the Fund’s performance was in line with the benchmark index for the 3-year period. |
| • | | The Board noted that the contractual management fee and actual management fee were in the 2nd quintile of the expense group and that actual total expenses were in the 3rd quintile. |
Guardian Total Return Bond VIP Fund
| • | | The Board noted that the Fund’s performance was in the 5th quintile of its performance universe for the 1-year and 3-year periods. The Board also noted that the Fund’s performance was lower than the benchmark index for the 1-year and 3-year periods. |
| • | | The Board noted that the contractual management fee and actual management fee were in the 2nd quintile and the actual total expenses were in the 3rd quintile. |
SUPPLEMENTAL INFORMATION (UNAUDITED)
Guardian Core Fixed Income VIP Fund
| • | | The Board noted that the Fund had less than one-year of operational history and was not able to evaluate an investment performance record for the Fund. The Board noted that it would have an opportunity to review such information in connection with future annual reviews. The Board noted that, in the meantime, it received monthly performance reports from the Manager. |
| • | | The Board noted that the contractual management fee was in the 2nd quintile of the expense group and the actual management fee and the actual total expenses were in the 1st quintile. |
Guardian Multi-Sector Bond VIP Fund
| • | | The Board noted that the Fund’s performance was in the 5th quintile of its performance universe for the 1-year and 3-year periods The Board also noted that the Fund’s performance was lower than the benchmark index for the 1-year and 3-year periods. |
| • | | The Board noted that the contractual management fee and actual total expenses were in the 1st quintile and the actual management fee was in the 2nd quintile. |
Guardian Short Duration Bond VIP Fund
| • | | The Board noted that the Fund had less than one-year of operational history and was not able to evaluate an investment performance record for the Fund. The |
| | | Board noted that it would have an opportunity to review such information in connection with future annual reviews. The Board noted that, in the meantime, it received monthly performance reports from the Manager. |
| • | | The Board noted that the contractual management fee and actual total expenses were in the 3rd quintile of the expense group and the actual management fee was in the 1st quintile of the expense group. |
Guardian U.S. Government Securities VIP Fund
| • | | The Board noted that the Fund’s performance was in the 1st quintile of its performance universe for the 1-year period and in the 2nd quintile of its performance universe for the 3-year period. The Board also noted that the Fund’s performance was higher than the benchmark index for the 1-year and 3-year periods. |
| • | | The Board noted that the contractual management fee and the actual management fee were in the 1st quintile of the expense group and the actual total expenses were in the 2nd quintile of the expense group. |
Conclusion
Based on a comprehensive consideration and evaluation of all of the information and factors summarized above, among others, the Board as a whole, including the Independent Trustees, approved the Agreements.
SUPPLEMENTAL INFORMATION (UNAUDITED)
The Statement of Additional Information (“SAI”) includes additional information about the Trust’s Trustees and Officers and is available, without charge, upon request by calling toll-free 1-888-GUARDIAN (1-888-482-7342) or by visiting our website at http://guardianvpt.onlineprospectus.net/GuardianVPT/Prospectuses.
Portfolio Holdings and Proxy Voting Procedures
The Fund files its complete schedule of portfolio holdings with the Securities and Exchange Commission for the first and third quarters of each fiscal year as an exhibit to its reports on Form N-PORT. The Fund’s Form N-PORT reports are available on the Securities and Exchange Commission’s website at https://www.sec.gov. The Fund’s Form N-PORT information is also available, without charge, upon request, by calling toll-free 1-888-GUARDIAN (1-888-482-7342) or by visiting our website at http://guardianvpt.onlineprospectus.net/GuardianVPT/Prospectuses.
A description of the policies and procedures that the Fund uses to determine how to vote proxies relating to portfolio securities is included in the SAI. The SAI and information regarding how the Fund voted proxies relating to portfolio securities during the most recent 12-month period ended June 30 may be obtained (i) without charge, upon request, by calling toll-free 1-888-GUARDIAN (1-888-482-7342) or by visiting our website at http://guardianvpt.onlineprospectus.net/GuardianVPT/Prospectuses; and (ii) on the Securities and Exchange Commission’s website at https://www.sec.gov.
This report is transmitted to shareholders only. It is not authorized for use as an offer of sale or a solicitation of an offer to buy shares of the Fund unless accompanied or preceded by the Fund’s current prospectus. Past performance results shown in this report should not be considered a representation of future performance. Investment returns and principal value of shares will fluctuate so that shares, when redeemed, may be worth more or less than their original cost. Statements and other information herein are as dated and are subject to change.

The Guardian Life Insurance Company of America New York, NY 10001-2159
PUB10525
Guardian Variable
Products Trust
2023
Semiannual Report
All Data as of June 30, 2023
Guardian Short Duration Bond VIP Fund

| | |
| Not FDIC insured. May lose value. No bank guarantee. | | www.guardianlife.com |
TABLE OF CONTENTS
Guardian Short Duration Bond VIP Fund
Except as otherwise specifically stated, all information, including portfolio security positions, is as of June 30, 2023. Fund holdings will vary. Information contained herein has been obtained from sources believed reliable, but is not guaranteed.
GUARDIAN SHORT DURATION BOND VIP FUND
Fund Characteristics (unaudited)
Total Net Assets: $182,338,798
| | |
| |
Bond Sector Allocation1 As of June 30, 2023 |
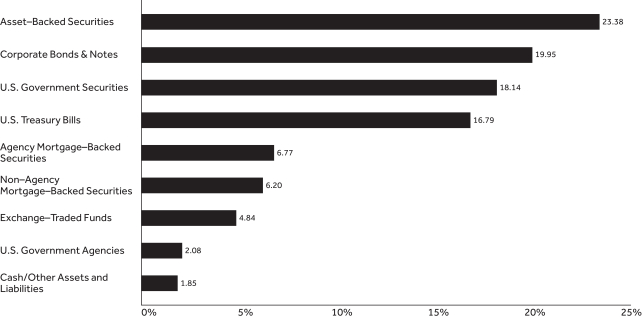 | | |
| | |
| |
Bond Quality Allocation2 As of June 30, 2023 |
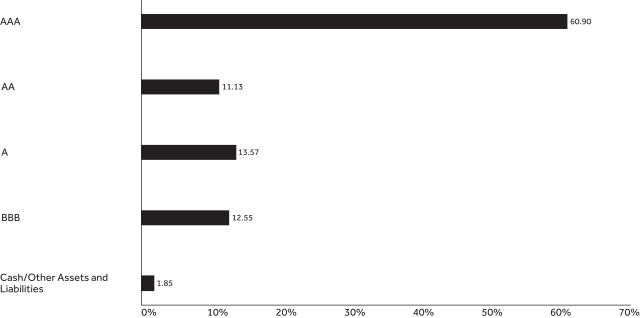 | | |
GUARDIAN SHORT DURATION BOND VIP FUND
| | | | | | | | | | | | |
| | | | |
Top Ten Holdings1 As of June 30, 2023 | | | | | | | | | |
| | | | |
| Holding | | Coupon Rate | | | Maturity Date | | | % of Total
Net Assets | |
| U.S. Treasury Bill | | | 5.391% | | | | 11/30/2023 | | | | 16.79% | |
| U.S. Treasury Note | | | 4.625% | | | | 6/30/2025 | | | | 14.47% | |
| Vanguard Short-Term Inflation-Protected Securities ETF | | | — | | | | — | | | | 4.85% | |
| U.S. Treasury Note | | | 3.500% | | | | 4/30/2030 | | | | 3.68% | |
| Federal Farm Credit Banks Funding Corp. | | | 2.640% | | | | 4/8/2026 | | | | 2.08% | |
| Federal National Mortgage Association | | | 3.500% | | | | 4/1/2052 | | | | 1.41% | |
| Federal National Mortgage Association | | | 3.000% | | | | 5/1/2037 | | | | 1.33% | |
| American Express Credit Account Master Trust | | | 3.750% | | | | 8/15/2027 | | | | 1.06% | |
| Federal National Mortgage Association | | | 4.000% | | | | 6/1/2052 | | | | 0.99% | |
| Toyota Auto Loan Extended Note Trust | | | 1.070% | | | | 2/27/2034 | | | | 0.85% | |
| Total | | | | | | | | | | | 47.51% | |
| 1 | Portfolio holdings are subject to change and should not be considered a recommendation to buy or sell individual securities. Cash includes short-term investments and net other assets and liabilities. |
| 2 | The Bond Quality Allocation chart displays the percentage of fund assets allocated to each rating. Rating agencies’ independent ratings of individual securities are aggregated by Bloomberg, and market weights are reported using Standard & Poor’s letter rating conventions. Rating methodology uses the middle rating of Moody’s Investors Service, Inc., Standard & Poor’s Ratings Services, and Fitch Ratings. When a rating from only two of the rating agencies is available, the lower rating is used. Credit quality ratings assigned by a rating agency are subject to change periodically and are not absolute standards of credit quality. Rating agencies may fail to make timely changes in credit ratings, and an issuer’s current financial condition may be better or worse than a rating indicates. In formulating investment decisions for the Fund, Park Avenue Institutional Advisers LLC develops its own analysis of the credit quality and risks associated with individual debt instruments, rather than relying exclusively on rating agency ratings. |
UNDERSTANDING YOUR FUND’S EXPENSES (UNAUDITED)
By investing in the Fund, you incur two types of costs: (1) transaction costs and (2) ongoing costs, including, as applicable, investment advisory fees, distribution and/or service (12b-1) fees, if any, and other Fund expenses. The example below is intended to help you understand your ongoing costs (in dollars) of investing in the Fund and to compare these costs with the ongoing costs of investing in other mutual funds.
The example is based on an investment of $1,000 invested at the beginning of the period and held for the entire period from January 1, 2023 to June 30, 2023. The table below shows the Fund’s expenses in two ways:
Expenses based on actual return
This section of the table provides information about actual account values and actual expenses. You may use the information in this section, together with the amount you invested, to estimate the expenses that you paid over the period. Simply divide your account value by $1,000 (for example, an $8,600 account value divided by $1,000 = 8.6), then multiply the result by the number in the section under the heading entitled “Expenses Paid During Period” to estimate the expenses you paid on your account during this period.
Expenses based on hypothetical 5% return for comparison purposes
This section of the table provides information about hypothetical account values and hypothetical expenses based on the Fund’s actual expense ratio and an assumed rate of return of 5% per year before expenses, which is not the Fund’s actual return. The hypothetical account values and expenses may not be used to estimate the actual ending account balance or expenses you paid for the period. You may use this information to compare the ongoing costs of investing in the Fund with the cost of investing in other mutual funds. To do so, compare this 5% hypothetical example with the 5% hypothetical examples that appear in the shareholder reports of the other funds.
Note that the expenses shown in the table are meant to highlight your ongoing costs only and do not reflect any transactional costs, such as sales charges (loads), redemption fees, or exchange fees. Therefore the second section is useful in comparing ongoing costs only, and will not help you determine the relative total costs of owning different funds. If these transactional costs were included, your costs would have been higher. Charges and expenses at the insurance company separate account level are not reflected in the table.
| | | | | | | | | | | | | | |
| | | | | |
| | | Beginning
Account Value 1/1/23 | | Ending Account Value
6/30/23 | | | Expenses Paid During Period* 1/1/23-6/30/23 | | | Expense Ratio During Period 1/1/23-6/30/23 | |
| Based on Actual Return | | $1,000.00 | | $ | 1,004.10 | | | $ | 2.48 | | | | 0.50% | |
Based on Hypothetical Return (5% Return Before Expenses) | | $1,000.00 | | $ | 1,022.32 | | | $ | 2.51 | | | | 0.50% | |
| * | Expenses are equal to the Fund’s annualized expense ratio as indicated, multiplied by the average account value over the period, multiplied by 181/365 (to reflect the one-half year period). |
SCHEDULE OF INVESTMENTS — GUARDIAN SHORT DURATION BOND VIP FUND
| | | | | | | | |
| June 30, 2023 (unaudited) | | Principal
Amount | | | Value | |
| Agency Mortgage–Backed Securities – 6.8% | |
| | | |
Federal Home Loan Mortgage Corp.
3.50% due 6/1/2052 | | $ | 1,132,533 | | | $ | 1,032,088 | |
4.00% due 6/1/2052 | | | 1,314,606 | | | | 1,233,166 | |
| | | |
Federal National Mortgage Association
3.00% due 5/1/2037 | | | 2,608,711 | | | | 2,433,975 | |
3.00% due 7/1/2051 | | | 1,524,467 | | | | 1,344,192 | |
3.00% due 5/1/2052 | | | 473,869 | | | | 417,450 | |
3.50% due 4/1/2052 | | | 2,820,907 | | | | 2,571,643 | |
3.50% due 10/1/2052 | | | 1,650,883 | | | | 1,503,714 | |
4.00% due 6/1/2052 | | | 1,924,486 | | | | 1,805,303 | |
| | | | | | | | | |
| | |
Total Agency Mortgage–Backed Securities
(Cost $12,998,095) | | | | 12,341,531 | |
| Asset–Backed Securities – 23.4% | |
| | | |
Aligned Data Centers Issuer LLC
2021-1A A2
1.937% due 8/15/2046(1) | | | 900,000 | | | | 786,646 | |
| | | |
Allegro CLO VI Ltd.
2017-2A B
6.76% (3 mo. USD LIBOR + 1.50%)
due 1/17/2031(1)(2)(3) | | | 1,000,000 | | | | 975,200 | |
| | | |
American Express Credit Account Master Trust
2022-3 A
3.75% due 8/15/2027 | | | 2,000,000 | | | | 1,937,868 | |
| | | |
AmeriCredit Automobile Receivables Trust
2020-3 C
1.06% due 8/18/2026 | | | 1,125,000 | | | | 1,056,651 | |
| | | |
Anchorage Capital CLO 21 Ltd.
2021-21A B
7.00% (3 mo. USD LIBOR + 1.75%)
due 10/20/2034(1)(2)(3) | | | 1,000,000 | | | | 978,300 | |
| | | |
Anchorage Capital CLO 7 Ltd.
2015-7A BR2
7.023% (3 mo. USD LIBOR + 1.75%)
due 1/28/2031(1)(2)(3) | | | 1,000,000 | | | | 984,200 | |
| | | |
Apidos CLO XXII
2015-22A A2R
6.75% (3 mo. USD LIBOR + 1.50%)
due 4/20/2031(1)(2)(3) | | | 1,000,000 | | | | 980,719 | |
| | | |
Ares XXVII CLO Ltd.
2013-2A BR2
6.923% (3 mo. USD LIBOR + 1.65%)
due 10/28/2034(1)(2)(3) | | | 1,000,000 | | | | 979,821 | |
| | | |
Ares XXVIIIR CLO Ltd.
2018-28RA A2
6.66% (3 mo. USD LIBOR + 1.40%)
due 10/17/2030(1)(2)(3) | | | 1,100,000 | | | | 1,081,138 | |
| | | | | | | | | |
| | | | | | | | |
| June 30, 2023 (unaudited) | | Principal
Amount | | | Value | |
| Asset–Backed Securities (continued) | |
| | | |
Avis Budget Rental Car Funding AESOP LLC
2021-2A A
1.66% due 2/20/2028(1) | | $ | 1,100,000 | | | $ | 952,633 | |
| | | |
Barings CLO Ltd.
2020-1A AR
6.41% (3 mo. USD LIBOR + 1.15%)
due 10/15/2036(1)(2)(3) | | | 1,200,000 | | | | 1,171,459 | |
| | | |
Benefit Street Partners CLO XVI Ltd.
2018-16A BR
6.81% (3 mo. USD LIBOR + 1.55%)
due 1/17/2032(1)(2)(3) | | | 1,200,000 | | | | 1,170,360 | |
| | | |
Canyon Capital CLO Ltd.
2022-1A B
6.832% (3 mo. USD Term SOFR + 1.85%)
due 4/15/2035(1)(2) | | | 1,200,000 | | | | 1,167,550 | |
| | | |
Carlyle U.S. CLO Ltd.
2018-2A A2
6.86% (3 mo. USD LIBOR + 1.60%)
due 10/15/2031(1)(2)(3) | | | 1,000,000 | | | | 981,654 | |
| | | |
CarMax Auto Owner Trust
2020-4 B
0.85% due 6/15/2026 | | | 850,000 | | | | 793,055 | |
| | | |
Cathedral Lake VI Ltd.
2021-6A AN
6.505% (3 mo. USD LIBOR + 1.25%)
due 4/25/2034(1)(2)(3) | | | 1,200,000 | | | | 1,179,596 | |
| | | |
CIFC Funding Ltd.
2013-4A BRR
6.892% (3 mo. USD LIBOR + 1.60%)
due 4/27/2031(1)(2)(3) | | | 1,000,000 | | | | 977,800 | |
| | | |
Domino’s Pizza Master Issuer LLC
2017-1A A23
4.118% due 7/25/2047(1) | | | 710,625 | | | | 653,195 | |
| | | |
Dryden 53 CLO Ltd.
2017-53A B
6.66% (3 mo. USD LIBOR + 1.40%)
due 1/15/2031(1)(2)(3) | | | 1,100,000 | | | | 1,073,930 | |
| | | |
Dryden Senior Loan Fund
2017-47A CR
7.31% (3 mo. USD LIBOR + 2.05%)
due 4/15/2028(1)(2)(3) | | | 1,000,000 | | | | 988,500 | |
| | | |
Exeter Automobile Receivables Trust
2022-2A A3
2.80% due 11/17/2025 | | | 511,152 | | | | 509,212 | |
| | | |
Ford Credit Floorplan Master Owner Trust A
2020-2 A
1.06% due 9/15/2027 | | | 1,100,000 | | | | 997,528 | |
| | | | | | | | | |
| | | | |
| 4 | | | | The accompanying notes are an integral part of these financial statements. |
SCHEDULE OF INVESTMENTS — GUARDIAN SHORT DURATION BOND VIP FUND
| | | | | | | | |
| June 30, 2023 (unaudited) | | Principal
Amount | | | Value | |
| Asset–Backed Securities (continued) | |
| | | |
Gulf Stream Meridian 6 Ltd.
2021-6A A1
6.45% (3 mo. USD LIBOR + 1.19%)
due 1/15/2037(1)(2)(3) | | $ | 1,000,000 | | | $ | 982,100 | |
| | | |
Hertz Vehicle Financing III LLC
2022-3A A
3.37% due 3/25/2025(1) | | | 960,000 | | | | 946,633 | |
| | | |
Jamestown CLO XI Ltd.
2018-11A A2
6.951% (3 mo. USD LIBOR + 1.70%)
due 7/14/2031(1)(2)(3) | | | 1,200,000 | | | | 1,172,880 | |
| | | |
KKR CLO 38 Ltd.
38A A1
6.306% (3 mo. USD Term SOFR + 1.32%)
due 4/15/2033(1)(2) | | | 1,225,000 | | | | 1,204,533 | |
| | | |
Madison Park Funding XXIII Ltd.
2017-23A BR
6.842% (3 mo. USD LIBOR + 1.55%)
due 7/27/2031(1)(2)(3) | | | 1,050,000 | | | | 1,029,420 | |
| | | |
Neuberger Berman Loan Advisers CLO 26 Ltd.
2017-26A BR
6.662% (3 mo. USD LIBOR + 1.40%)
due 10/18/2030(1)(2)(3) | | | 1,000,000 | | | | 978,076 | |
| | | |
Neuberger Berman Loan Advisers CLO 40 Ltd.
2021-40A A
6.32% (3 mo. USD LIBOR + 1.06%)
due 4/16/2033(1)(2)(3) | | | 1,200,000 | | | | 1,184,640 | |
| | | |
Nissan Auto Lease Trust
2023-A A4
4.80% due 7/15/2027 | | | 700,000 | | | | 689,885 | |
| | | |
Octagon Investment Partners 36 Ltd.
2018-1A B
6.65% (3 mo. USD LIBOR + 1.39%)
due 4/15/2031(1)(2)(3) | | | 1,209,375 | | | | 1,175,633 | |
| | | |
OHA Credit Partners XIV Ltd.
2017-14A B
6.761% (3 mo. USD LIBOR + 1.50%)
due 1/21/2030(1)(2)(3) | | | 1,000,000 | | | | 976,900 | |
| | | |
PPM CLO 2 Ltd.
2019-2A BR
7.015% (3 mo. USD LIBOR + 1.75%)
due 4/16/2032(1)(2)(3) | | | 1,000,000 | | | | 967,400 | |
| | | |
Santander Drive Auto Receivables Trust
2022-3 A3
3.40% due 12/15/2026 | | | 1,139,030 | | | | 1,123,673 | |
| | | | | | | | | |
| | | | | | | | |
| June 30, 2023 (unaudited) | | Principal
Amount | | | Value | |
| Asset–Backed Securities (continued) | |
| | | |
Santander Retail Auto Lease Trust
2021-C A3
0.50% due 3/20/2025(1) | | $ | 779,312 | | | $ | 772,312 | |
| | | |
TIAA CLO IV Ltd.
2018-1A A2
6.95% (3 mo. USD LIBOR + 1.70%)
due 1/20/2032(1)(2)(3) | | | 1,170,000 | | | | 1,139,346 | |
| | | |
Toyota Auto Loan Extended Note Trust
2021-1A A
1.07% due 2/27/2034(1) | | | 1,735,000 | | | | 1,548,716 | |
| | | |
Verizon Owner Trust
2020-C A
0.41% due 4/21/2025 | | | 290,698 | | | | 287,667 | |
| | | |
Voya CLO Ltd.
2015-3A A3R
7.01% (3 mo. USD Term SOFR + 1.96%)
due 10/20/2031(1)(2) | | | 1,000,000 | | | | 983,532 | |
| | | |
Westlake Automobile Receivables Trust
2022-3A A2
5.24% due 7/15/2025(1) | | | 633,613 | | | | 632,213 | |
| | | |
World Omni Auto Receivables Trust
2021-B A4
0.69% due 6/15/2027 | | | 1,200,000 | | | | 1,098,235 | |
| | | |
World Omni Automobile Lease Securitization Trust
2021-A A4
0.50% due 11/16/2026 | | | 1,390,000 | | | | 1,354,409 | |
| | | | | | | | | |
| | |
Total Asset–Backed Securities
(Cost $43,280,145) | | | | 42,625,218 | |
| Corporate Bonds & Notes – 19.9% | |
| |
| Aerospace & Defense – 0.6% | |
| | | |
Boeing Co.
2.196% due 2/4/2026 | | | 200,000 | | | | 183,658 | |
4.875% due 5/1/2025 | | | 1,000,000 | | | | 985,670 | |
| | | | | | | | | |
| | | |
| | | | | | | | 1,169,328 | |
| Agriculture – 0.2% | |
| | | |
Reynolds American, Inc.
4.45% due 6/12/2025 | | | 400,000 | | | | 388,860 | |
| | | | | | | | | |
| | | |
| | | | | | | | 388,860 | |
| Chemicals – 0.3% | |
| | | |
LYB International Finance III LLC
1.25% due 10/1/2025 | | | 600,000 | | | | 542,832 | |
| | | | | | | | | |
| | | |
| | | | | | | | 542,832 | |
| Commercial Banks – 8.1% | |
| | | |
Banco Santander SA
2.746% due 5/28/2025 | | | 1,000,000 | | | | 939,310 | |
| | | |
Bank of America Corp.
3.093% (3.093% fixed rate until 10/1/2024; 3 mo. USD Term SOFR + 1.35% thereafter)
due 10/1/2025(2) | | | 1,000,000 | | | | 962,440 | |
| | | | | | | | | |
| | | | |
| The accompanying notes are an integral part of these financial statements. | | | | 5 |
SCHEDULE OF INVESTMENTS — GUARDIAN SHORT DURATION BOND VIP FUND
| | | | | | | | |
| June 30, 2023 (unaudited) | | Principal
Amount | | | Value | |
| Commercial Banks (continued) | |
3.384% (3.384% fixed rate until 4/2/2025; SOFR + 1.33% thereafter)
due 4/2/2026(2) | | $ | 1,000,000 | | | $ | 959,290 | |
5.08% (5.08% fixed rate until 1/20/2026; SOFR + 1.29% thereafter)
due 1/20/2027(2) | | | 500,000 | | | | 494,170 | |
| | | |
Barclays PLC
2.852% (2.852% fixed rate until 5/7/2025; SOFR + 2.71% thereafter)
due 5/7/2026(2) | | | 1,000,000 | | | | 937,440 | |
7.325% (7.325% fixed rate until 11/2/2025; 1 yr. CMT + 3.05% thereafter)
due 11/2/2026(2) | | | 200,000 | | | | 204,698 | |
| | | |
Danske Bank A/S
1.621% (1.621% fixed rate until 9/11/2025; 1 yr. CMT + 1.35% thereafter)
due 9/11/2026(1)(2) | | | 200,000 | | | | 179,320 | |
| | | |
Deutsche Bank AG
2.129% (2.129% fixed rate until 11/24/2025; SOFR + 1.87% thereafter)
due 11/24/2026(2) | | | 150,000 | | | | 133,176 | |
| | | |
Fifth Third Bancorp
2.375% due 1/28/2025 | | | 1,000,000 | | | | 938,440 | |
| | | |
Fifth Third Bank NA
5.852% (5.852% fixed rate until 10/27/2024; SOFR + 1.23% thereafter)
due 10/27/2025(2) | | | 250,000 | | | | 244,017 | |
| | | |
Huntington Bancshares, Inc.
2.625% due 8/6/2024 | | | 1,000,000 | | | | 956,800 | |
| | | |
Huntington National Bank
5.699% (5.699% fixed rate until 11/18/2024; SOFR + 1.22% thereafter)
due 11/18/2025(2) | | | 250,000 | | | | 242,833 | |
| | | |
JPMorgan Chase & Co.
2.005% (2.005% fixed rate until 3/13/2025; 3 mo. USD Term SOFR + 1.59% thereafter)
due 3/13/2026(2) | | | 200,000 | | | | 187,864 | |
3.845% (3.845% fixed rate until 6/14/2024; SOFR + 0.98% thereafter)
due 6/14/2025(2) | | | 1,000,000 | | | | 978,320 | |
| | | |
Mitsubishi UFJ Financial Group, Inc.
1.412% due 7/17/2025 | | | 1,100,000 | | | | 1,008,150 | |
5.719% (5.719% fixed rate until 2/20/2025; 1 yr. CMT + 1.08% thereafter)
due 2/20/2026(2) | | | 500,000 | | | | 497,500 | |
| | | |
Morgan Stanley
2.72% (2.72% fixed rate until 7/22/2024; SOFR + 1.15% thereafter)
due 7/22/2025(2) | | | 1,000,000 | | | | 964,310 | |
| | | | | | | | | |
| | | | | | | | |
| June 30, 2023 (unaudited) | | Principal
Amount | | | Value | |
| Commercial Banks (continued) | |
5.05% (5.05% fixed rate until 1/28/2026; SOFR + 1.30% thereafter)
due 1/28/2027(2) | | $ | 300,000 | | | $ | 297,474 | |
| | | |
NatWest Group PLC
5.847% (5.847% fixed rate until 3/2/2026; 1 yr. CMT + 1.35% thereafter)
due 3/2/2027(2) | | | 250,000 | | | | 247,297 | |
7.472% (7.472% fixed rate until 11/10/2025; 1 yr. CMT + 2.85% thereafter)
due 11/10/2026(2) | | | 300,000 | | | | 307,029 | |
| | | |
Truist Bank
3.625% due 9/16/2025 | | | 250,000 | | | | 233,473 | |
| | | |
Truist Financial Corp.
2.50% due 8/1/2024 | | | 1,000,000 | | | | 964,430 | |
4.00% due 5/1/2025 | | | 1,000,000 | | | | 967,570 | |
| | | |
UBS Group AG
3.75% due 3/26/2025 | | | 900,000 | | | | 861,669 | |
| | | | | | | | | |
| | | |
| | | | | | | | 14,707,020 | |
| Commercial Services – 0.6% | |
| | | |
Global Payments, Inc.
2.65% due 2/15/2025 | | | 1,100,000 | | | | 1,043,768 | |
| | | | | | | | | |
| | | |
| | | | | | | | 1,043,768 | |
| Cosmetics & Personal Care – 0.5% | |
| | | |
Procter & Gamble Co.
1.00% due 4/23/2026 | | | 1,100,000 | | | | 995,797 | |
| | | | | | | | | |
| | | |
| | | | | | | | 995,797 | |
| Diversified Financial Services – 2.0% | |
| | | |
AerCap Ireland Capital DAC / AerCap Global Aviation Trust 1.65% due 10/29/2024 | | | 1,200,000 | | | | 1,127,268 | |
4.875% due 1/16/2024 | | | 550,000 | | | | 546,012 | |
6.50% due 7/15/2025 | | | 800,000 | | | | 804,648 | |
| | | |
Air Lease Corp.
2.875% due 1/15/2026 | | | 200,000 | | | | 185,186 | |
| | | |
Charles Schwab Corp.
1.15% due 5/13/2026 | | | 200,000 | | | | 177,012 | |
| | | |
Synchrony Financial
4.25% due 8/15/2024 | | | 800,000 | | | | 770,384 | |
| | | | | | | | | |
| | | |
| | | | | | | | 3,610,510 | |
| Electric – 1.0% | |
| | | |
DTE Energy Co.
Series F
1.05% due 6/1/2025 | | | 1,100,000 | | | | 1,007,776 | |
| | | |
Pacific Gas and Electric Co.
3.45% due 7/1/2025 | | | 300,000 | | | | 283,851 | |
| | | |
Public Service Enterprise Group, Inc.
2.875% due 6/15/2024 | | | 500,000 | | | | 485,490 | |
| | | | | | | | | |
| | | |
| | | | | | | | 1,777,117 | |
| | | | |
| 6 | | | | The accompanying notes are an integral part of these financial statements. |
SCHEDULE OF INVESTMENTS — GUARDIAN SHORT DURATION BOND VIP FUND
| | | | | | | | |
| June 30, 2023 (unaudited) | | Principal
Amount | | | Value | |
| |
| Healthcare – Services – 0.9% | |
| | | |
Elevance Health, Inc.
4.90% due 2/8/2026 | | $ | 200,000 | | | $ | 196,672 | |
| | | |
UnitedHealth Group, Inc.
1.15% due 5/15/2026 | | | 1,100,000 | | | | 995,126 | |
3.10% due 3/15/2026 | | | 400,000 | | | | 382,588 | |
| | | | | | | | | |
| | | |
| | | | | | | | 1,574,386 | |
| Insurance – 0.2% | |
| | | |
Prudential Financial, Inc.
5.375% (5.375% fixed rate until 5/15/2025; 3 mo. USD LIBOR + 3.03% thereafter)
due 5/15/2045(2)(3) | | | 400,000 | | | | 390,672 | |
| | | | | | | | | |
| | | |
| | | | | | | | 390,672 | |
| Lodging – 0.1% | |
| | | |
Marriott International, Inc.
3.125% due 6/15/2026 | | | 200,000 | | | | 187,870 | |
| | | | | | | | | |
| | | |
| | | | | | | | 187,870 | |
| Media – 0.6% | |
| | | |
Charter Communications Operating LLC / Charter Communications Operating Capital
4.908% due 7/23/2025 | | | 1,000,000 | | | | 980,660 | |
| | | |
Discovery Communications LLC
4.90% due 3/11/2026 | | | 200,000 | | | | 196,176 | |
| | | | | | | | | |
| | | |
| | | | | | | | 1,176,836 | |
| Oil & Gas – 1.0% | |
| | | |
Canadian Natural Resources Ltd.
3.90% due 2/1/2025 | | | 500,000 | | | | 483,735 | |
| | | |
Diamondback Energy, Inc.
3.25% due 12/1/2026 | | | 200,000 | | | | 188,074 | |
| | | |
Occidental Petroleum Corp.
5.875% due 9/1/2025 | | | 200,000 | | | | 199,262 | |
| | | |
Shell International Finance BV
2.875% due 5/10/2026 | | | 1,000,000 | | | | 952,900 | |
| | | | | | | | | |
| | | |
| | | | | | | | 1,823,971 | |
| Pharmaceuticals – 0.3% | |
| | | |
Astrazeneca Finance LLC
1.20% due 5/28/2026 | | | 500,000 | | | | 451,145 | |
| | | |
CVS Health Corp.
3.875% due 7/20/2025 | | | 200,000 | | | | 194,472 | |
| | | | | | | | | |
| | | |
| | | | | | | | 645,617 | |
| Pipelines – 1.2% | |
| | | |
Energy Transfer LP
2.90% due 5/15/2025 | | | 1,100,000 | | | | 1,044,208 | |
| | | |
TransCanada PipeLines Ltd.
6.203% due 3/9/2026 | | | 500,000 | | | | 500,385 | |
| | | |
Western Midstream Operating LP
3.35% due 2/1/2025 | | | 600,000 | | | | 573,984 | |
| | | | | | | | | |
| | | |
| | | | | | | | 2,118,577 | |
| Real Estate Investment Trusts (REITs) – 1.5% | |
| | | |
American Tower Corp.
2.40% due 3/15/2025 | | | 1,200,000 | | | | 1,131,300 | |
| | | | | | | | | |
| | | | | | | | |
| June 30, 2023 (unaudited) | | Principal
Amount | | | Value | |
| |
| Real Estate Investment Trusts (REITs) (continued) | |
| | | |
Essex Portfolio LP
3.50% due 4/1/2025 | | $ | 500,000 | | | $ | 480,900 | |
| | | |
NNN REIT, Inc.
3.90% due 6/15/2024 | | | 1,000,000 | | | | 979,260 | |
| | | |
Simon Property Group LP
3.375% due 10/1/2024 | | | 250,000 | | | | 242,653 | |
| | | | | | | | | |
| | | |
| | | | | | | | 2,834,113 | |
| Semiconductors – 0.1% | |
| | | |
Broadcom, Inc.
3.459% due 9/15/2026 | | | 200,000 | | | | 189,148 | |
| | | | | | | | | |
| | | |
| | | | | | | | 189,148 | |
| Software – 0.3% | |
| | | |
Fiserv, Inc.
3.85% due 6/1/2025 | | | 200,000 | | | | 194,020 | |
| | | |
Oracle Corp.
2.50% due 4/1/2025 | | | 300,000 | | | | 284,745 | |
| | | | | | | | | |
| | | |
| | | | | | | | 478,765 | |
| Telecommunications – 0.4% | |
| | | |
AT&T, Inc.
1.70% due 3/25/2026 | | | 200,000 | | | | 182,212 | |
| | | |
T-Mobile USA, Inc.
3.50% due 4/15/2025 | | | 200,000 | | | | 192,438 | |
| | | |
Verizon Communications, Inc.
3.376% due 2/15/2025 | | | 350,000 | | | | 338,219 | |
| | | | | | | | | |
| | | |
| | | | | | | | 712,869 | |
| | |
Total Corporate Bonds & Notes
(Cost $36,535,383) | | | | 36,368,056 | |
| Non–Agency Mortgage–Backed Securities – 6.2% | |
| | | |
Benchmark Mortgage Trust
2018-B3 AS
4.195% due 4/10/2051(2)(4) | | | 1,150,000 | | | | 1,039,865 | |
| | | |
Commercial Mortgage Trust
2017-COR2 A3
3.51% due 9/10/2050 | | | 1,200,000 | | | | 1,101,030 | |
2019-GC44 AM
3.263% due 8/15/2057 | | | 1,085,000 | | | | 908,222 | |
| | | |
DBGS Mortgage Trust
2018-C1 AM
4.756% due 10/15/2051(2)(4) | | | 1,100,000 | | | | 990,820 | |
| | | |
DBUBS Mortgage Trust
2017-BRBK A
3.452% due 10/10/2034(1) | | | 793,000 | | | | 719,856 | |
| | | |
Freddie Mac STACR REMIC Trust 2021-DNA7 M2
6.867% due 11/25/2041(1)(2)(4) | | | 900,000 | | | | 866,819 | |
2021-HQA4 M1
6.017% due 12/25/2041(1)(2)(4) | | | 568,709 | | | | 551,549 | |
2022-DNA1 M1A
6.067% due 1/25/2042(1)(2)(4) | | | 483,046 | | | | 475,150 | |
2022-HQA3 M1A
7.367% due 8/25/2042(1)(2)(4) | | | 1,030,541 | | | | 1,036,738 | |
| | | |
Hilton USA Trust
2016-HHV A
3.719% due 11/5/2038(1) | | | 845,000 | | | | 781,657 | |
| | | | | | | | | |
| | | | |
| The accompanying notes are an integral part of these financial statements. | | | | 7 |
SCHEDULE OF INVESTMENTS — GUARDIAN SHORT DURATION BOND VIP FUND
| | | | | | | | |
| June 30, 2023 (unaudited) | | Principal
Amount | | | Value | |
| Non–Agency Mortgage–Backed Securities (continued) | |
| | | |
Morgan Stanley Bank of America Merrill Lynch Trust
2013-C9 AS
3.456% due 5/15/2046 | | $ | 190,178 | | | $ | 175,894 | |
| | | |
Wells Fargo Commercial Mortgage Trust
2015-NXS4 A4
3.718% due 12/15/2048 | | | 1,380,000 | | | | 1,304,363 | |
2016-LC24 A4
2.942% due 10/15/2049 | | | 1,000,000 | | | | 914,071 | |
| | | |
WFRBS Commercial Mortgage Trust
2014-C19 AS
4.271% due 3/15/2047 | | | 440,000 | | | | 430,515 | |
| | | | | | | | | |
| | |
Total Non–Agency Mortgage–Backed Securities
(Cost $11,857,604) | | | | 11,296,549 | |
| U.S. Government Agencies – 2.1% | |
| | | |
Federal Farm Credit Banks Funding Corp.
2.64% due 4/8/2026 | | | 4,000,000 | | | | 3,793,480 | |
| | | | | | | | | |
| | |
Total U.S. Government Agencies
(Cost $3,959,990) | | | | 3,793,480 | |
| U.S. Government Securities – 18.1% | |
| | | |
U.S. Treasury Note
3.50% due 4/30/2030 | | | 6,900,000 | | | | 6,701,625 | |
4.625% due 6/30/2025 | | | 26,500,000 | | | | 26,378,887 | |
| | | | | | | | | |
| | |
Total U.S. Government Securities
(Cost $33,136,584) | | | | 33,080,512 | |
| U.S. Treasury Bills – 16.8% | |
| | | |
U.S. Treasury Bill
5.391% due 11/30/2023(5) | | | 31,300,000 | | | | 30,618,573 | |
| | | | | | | | | |
| | |
Total U.S. Treasury Bills
(Cost $30,621,345) | | | | 30,618,573 | |
| | | | | | | | |
| | |
Shares | | | Value | |
| Exchange–Traded Funds – 4.8% | |
| | | |
Vanguard Short-Term Inflation-Protected Securities ETF | | | 186,300 | | | | 8,834,346 | |
| | | | | | | | | |
| | |
Total Exchange–Traded Funds
(Cost $9,417,345) | | | | 8,834,346 | |
| | | | | | | | |
| June 30, 2023 (unaudited) | | Principal
Amount | | |
Value | |
| Repurchase Agreements – 1.5% | |
| | | |
Fixed Income Clearing Corp., 1.52%, dated 6/30/2023, proceeds at maturity value of $2,707,808, due 7/3/2023(6) | | $ | 2,707,465 | | | $ | 2,707,465 | |
| | |
Total Repurchase Agreements
(Cost $2,707,465) | | | | 2,707,465 | |
| | |
Total Investments – 99.6%
(Cost $184,513,956) | | | | 181,665,730 | |
| | |
| Assets in excess of other liabilities – 0.4% | | | | 673,068 | |
| | |
| Total Net Assets – 100.0% | | | $ | 182,338,798 | |
| (1) | Securities that may be resold in transactions exempt from registration under Rule 144A of the Securities Act of 1933, as amended, normally to certain qualified buyers. At June 30, 2023, the aggregate market value of these securities amounted to $37,388,124, representing 20.5% of net assets. These securities have been deemed liquid by the investment adviser pursuant to the Fund’s liquidity procedures approved by the Board of Trustees. |
| (2) | Variable rate securities, which may include step-up bonds or adjustable rate mortgages. The rate shown is the rate in effect at June 30, 2023. |
| (3) | The London Interbank Offered Rate (“LIBOR”) is being phased out completely by June 30, 2023. There remains uncertainty regarding the nature of any replacement rate and the impact of a transition away from LIBOR on the Fund’s investments. |
| (4) | Variable coupon rate based on weighted average interest rate of underlying mortgages. |
| (5) | Interest rate shown reflects the discount rate at time of purchase. |
| (6) | The table below presents collateral for repurchase agreements. |
| | | | | | | | | | | | | | | | |
| Security | | Coupon | | | Maturity
Date | | | Principal
Amount | | |
Value | |
| U.S. Treasury Note | | | 4.625% | | | | 3/15/2026 | | | $ | 2,721,500 | | | $ | 2,761,712 | |
Open futures contracts at June 30, 2023:
| | | | | | | | | | | | | | | | | | | | | | | | |
| Type | | Expiration | | | Contracts | | | Position | | | Notional
Amount | | | Notional
Value | | | Unrealized
Depreciation | |
| U.S. 2-Year Treasury Note | | | September 2023 | | | | 438 | | | | Long | | | $ | 90,124,253 | | | $ | 89,064,563 | | | $ | (1,059,690 | ) |
| Total | | | $ | 90,124,253 | | | $ | 89,064,563 | | | $ | (1,059,690 | ) |
| | | | |
| 8 | | | | The accompanying notes are an integral part of these financial statements. |
SCHEDULE OF INVESTMENTS — GUARDIAN SHORT DURATION BOND VIP FUND
| | | | | | | | | | | | | | | | | | | | | | | | |
| Type | | Expiration | | | Contracts | | | Position | | | Notional
Amount | | | Notional
Value | | | Unrealized
Appreciation/
(Depreciation) | |
| U.S. 10-Year Treasury Note | | | September 2023 | | | | 99 | | | | Short | | | $ | (11,318,376 | ) | | $ | (11,114,297 | ) | | $ | 204,079 | |
| U.S. Long Bond | | | September 2023 | | | | 22 | | | | Short | | | | (2,794,722 | ) | | | (2,791,938 | ) | | | 2,784 | |
| U.S. Ultra 10-Year Treasury Note | | | September 2023 | | | | 64 | | | | Short | | | | (7,599,413 | ) | | | (7,580,000 | ) | | | 19,413 | |
| U.S. Ultra Bond | | | September 2023 | | | | 3 | | | | Short | | | | (404,895 | ) | | | (408,656 | ) | | | (3,761 | ) |
| Total | | | $ | (22,117,406 | ) | | $ | (21,894,891 | ) | | $ | 222,515 | |
Centrally cleared credit default swap agreements — buy protection(7):
| | | | | | | | | | | | | | | | | | | | | | | | | | | | | | | | |
| Reference Entity | | Implied Credit
Spread at
6/30/23(8) | | | Notional Amount(9) | | | Maturity | | | (Pay)/Receive
Fixed Rate | | | Periodic
Payment
Frequency | | | Upfront
Payments | | | Value | | | Unrealized
Depreciation | |
| CDX.NA.HY.S40 | | | 4.29% | | | | USD 19,750,000 | | | | 6/20/2028 | | | | (5.00)% | | | | Quarterly | | | $ | (233,908 | ) | | $ | (551,624 | ) | | $ | (317,716 | ) |
| (7) | When a credit event occurs as defined under the terms of the swap agreement, the Fund as a buyer of credit protection will either (i) receive from the seller of protection an amount equal to the notional amount of the swap and deliver the referenced obligation or underlying securities comprising the referenced obligation or (ii) receive a net settlement amount in the form of cash or securities equal to the notional amount of the swap less the recovery value of the referenced obligation or underlying securities comprising the referenced obligation. |
| (8) | Implied credit spread, represented in absolute terms, utilized in determining the value of the credit default swap agreements as of period end will serve as an indicator of the current status of the payment/performance risk and represent the likelihood or risk of default for the credit derivative. The implied credit spread of a referenced entity reflects the cost of buying/selling protection and may include payments required to be made to enter into the agreement. Generally, wider credit spreads represent a perceived deterioration of the referenced entity’s credit soundness and a greater likelihood or risk of default or other credit event occurring as defined under the terms of the swap agreement. |
| (9) | The notional amount represents the maximum potential amount the Fund could be required to pay as a buyer of credit protection if a credit event occurs, as defined under the terms of the swap agreement, for each security included in the CDX North America High Yield Index. |
Legend:
CLO — Collateralized Loan Obligation
CMT — Constant Maturity Treasury
LIBOR — London Interbank Offered Rate
SOFR — Secured Overnight Financing Rate
USD — United States Dollar
The following is a summary of the inputs used as of June 30, 2023 in valuing the Fund’s investments. For more information on valuation inputs, please refer to Note 2a of the accompanying Notes to Financial Statements.
| | | | | | | | | | | | | | | | |
| | | Valuation Inputs | | | | |
| Investments in Securities (unaudited) | | Level 1 | | | Level 2 | | | Level 3 | | | Total | |
| Agency Mortgage–Backed Securities | | $ | — | | | $ | 12,341,531 | | | $ | — | | | $ | 12,341,531 | |
| Asset–Backed Securities | | | — | | | | 42,625,218 | | | | — | | | | 42,625,218 | |
| Corporate Bonds & Notes | | | — | | | | 36,368,056 | | | | — | | | | 36,368,056 | |
| Non–Agency Mortgage–Backed Securities | | | — | | | | 11,296,549 | | | | — | | | | 11,296,549 | |
| U.S. Government Agencies | | | — | | | | 3,793,480 | | | | — | | | | 3,793,480 | |
| U.S. Government Securities | | | — | | | | 33,080,512 | | | | — | | | | 33,080,512 | |
| U.S. Treasury Bills | | | — | | | | 30,618,573 | | | | — | | | | 30,618,573 | |
| Exchange–Traded Funds | | | 8,834,346 | | | | — | | | | — | | | | 8,834,346 | |
| Repurchase Agreements | | | — | | | | 2,707,465 | | | | — | | | | 2,707,465 | |
| Total | | $ | 8,834,346 | | | $ | 172,831,384 | | | $ | — | | | $ | 181,665,730 | |
| Other Financial Instruments | | | | | | | | | | | | |
| Futures Contracts | | | | | | | | | | | | | | | | |
Assets | | $ | 226,276 | | | $ | — | | | $ | — | | | $ | 226,276 | |
Liabilities | | | (1,063,451 | ) | | | — | | | | — | | | | (1,063,451 | ) |
| Swap Contracts | | | | | | | | | | | | | | | | |
Liabilities | | | — | | | | (317,716 | ) | | | — | | | | (317,716 | ) |
| Total | | $ | (837,175 | ) | | $ | (317,716 | ) | | $ | — | | | $ | (1,154,891 | ) |
| | | | |
| The accompanying notes are an integral part of these financial statements. | | | | 9 |
FINANCIAL INFORMATION — GUARDIAN SHORT DURATION BOND VIP FUND
| | | | |
Statement of Assets and Liabilities As of June 30, 2023 (unaudited) | | | |
Assets | | | | |
| | |
Investments, at value | | $ | 181,665,730 | |
| | |
Receivable for investments sold | | | 52,426,019 | |
| | |
Receivable for variation margin on swap contracts | | | 2,063,850 | |
| | |
Interest receivable | | | 859,888 | |
| | |
Cash deposits with brokers for futures contracts | | | 551,640 | |
| | |
Reimbursement receivable from adviser | | | 12,405 | |
| | |
Receivable for fund shares subscribed | | | 7,305 | |
| | |
Prepaid expenses | | | 2,240 | |
| | | | | |
| | |
Total Assets | | | 237,589,077 | |
| | | | | |
| | |
Liabilities | | | | |
| | |
Payable for investments purchased | | | 53,923,723 | |
| | |
Due to broker for swap contracts | | | 1,097,997 | |
| | |
Payable for fund shares redeemed | | | 79,654 | |
| | |
Investment advisory fees payable | | | 68,315 | |
| | |
Accrued custodian and accounting fees | | | 17,781 | |
| | |
Payable for variation margin on futures contracts | | | 15,768 | |
| | |
Accrued audit fees | | | 12,452 | |
| | |
Accrued trustees’ and officers’ fees | | | 3,635 | |
| | |
Accrued expenses and other liabilities | | | 30,954 | |
| | | | | |
| | |
Total Liabilities | | | 55,250,279 | |
| | | | | |
| | |
Total Net Assets | | $ | 182,338,798 | |
| | | | | |
| | |
Net Assets Consist of: | | | | |
| | |
Paid-in capital | | $ | 186,428,187 | |
| | |
Distributable loss | | | (4,089,389 | ) |
| | | | | |
| | |
Total Net Assets | | $ | 182,338,798 | |
| | | | | |
Investments, at Cost | | $ | 184,513,956 | |
| | | | | |
| | |
Pricing of Shares | | | | |
| | |
Shares of Beneficial Interest Outstanding with No Par Value | | | 18,580,824 | |
| | |
Net Asset Value Per Share | | | $9.81 | |
| | | | | |
| | | | |
Statement of Operations For the Six Months Ended June 30, 2023 (unaudited) | | | |
Investment Income | | | | |
| | |
Dividends | | $ | 5,347 | |
| | |
Interest | | | 3,763,619 | |
| | | | | |
| | |
Total Investment Income | | | 3,768,966 | |
| | | | | |
| | |
Expenses | | | | |
| | |
Investment advisory fees | | | 426,260 | |
| | |
Professional fees | | | 34,518 | |
| | |
Custodian and accounting fees | | | 23,722 | |
| | |
Trustees’ and officers’ fees | | | 23,542 | |
| | |
Administrative fees | | | 19,196 | |
| | |
Transfer agent fees | | | 8,750 | |
| | |
Shareholder reports | | | 5,164 | |
| | |
Other expenses | | | 5,461 | |
| | | | | |
| | |
Total Expenses | | | 546,613 | |
| | |
Less: Fees waived | | | (72,991 | ) |
| | | | | |
| | |
Total Expenses, Net | | | 473,622 | |
| | | | | |
| | |
Net Investment Income/(Loss) | | | 3,295,344 | |
| | | | | |
| | |
Realized Gain/(Loss) and Change in Unrealized Appreciation/(Depreciation) on Investments and Derivative Contracts | | | | |
| | |
Net realized gain/(loss) from investments | | | (2,961,399 | ) |
| | |
Net realized gain/(loss) from futures contracts | | | (703,258 | ) |
| | |
Net realized gain/(loss) from swap contracts | | | (2,045,822 | ) |
| | |
Net change in unrealized appreciation/(depreciation) on investments | | | 3,287,639 | |
| | |
Net change in unrealized appreciation/(depreciation) on futures contracts | | | (924,665 | ) |
| | |
Net change in unrealized appreciation/(depreciation) on swap contracts | | | 967,720 | |
| | | | | |
| | |
Net Loss on Investments and Derivative Contracts | | | (2,379,785 | ) |
| | | | | |
| | |
Net Increase in Net Assets Resulting From Operations | | $ | 915,559 | |
| | | | | |
| | | | | |
| | | | |
| 10 | | | | The accompanying notes are an integral part of these financial statements. |
FINANCIAL INFORMATION — GUARDIAN SHORT DURATION BOND VIP FUND
| | | | | | | | |
Statements of Changes in Net Assets Six Months Ended Numbers are unaudited | | | | | | |
| | | |
| | | For the
Six Months Ended
6/30/23 | | | For the
Period Ended
12/31/221 | |
| | | | |
Operations | | | | | | | | |
| | | |
Net investment income/(loss) | | $ | 3,295,344 | | | $ | 4,096,143 | |
| | | |
Net realized gain/(loss) from investments and derivative contracts | | | (5,710,479 | ) | | | (1,767,280 | ) |
| | | |
Net change in unrealized appreciation/(depreciation) on investments and derivative contracts | | | 3,330,694 | | | | (7,333,811 | ) |
| | | | | | | | | |
| | | |
Net Increase/(Decrease) in Net Assets Resulting from Operations | | | 915,559 | | | | (5,004,948 | ) |
| | | | | | | | | |
| | | |
Capital Share Transactions | | | | | | | | |
| | | |
Proceeds from sales of shares | | | 15,185,074 | | | | 234,189,617 | |
| | | |
Cost of shares redeemed | | | (20,359,516 | ) | | | (42,586,988 | ) |
| | | | | | | | | |
| | | |
Net Increase/(Decrease) in Net Assets Resulting from Capital Share Transactions | | | (5,174,442 | ) | | | 191,602,629 | |
| | | | | | | | | |
| | | |
Net Increase/(Decrease) in Net Assets | | | (4,258,883 | ) | | | 186,597,681 | |
| | | | | | | | | |
| | | |
Net Assets | | | | | | | | |
| | | |
Beginning of period | | | 186,597,681 | | | | — | |
| | | | | | | | | |
| | | |
End of period | | $ | 182,338,798 | | | $ | 186,597,681 | |
| | | | | | | | | |
| | | |
Other Information: | | | | | | | | |
| | | |
Shares | | | | | | | | |
| | | |
Sold | | | 1,547,673 | | | | 23,424,754 | |
| | | |
Redeemed | | | (2,063,663 | ) | | | (4,327,940 | ) |
| | | | | | | | | |
| | | |
Net Increase/(Decrease) | | | (515,990 | ) | | | 19,096,814 | |
| | | | | | | | | |
| | | | | | | | | |
| 1 | Commenced operations on May 2, 2022. |
| | | | |
| The accompanying notes are an integral part of these financial statements. | | | | 11 |
FINANCIAL INFORMATION — GUARDIAN SHORT DURATION BOND VIP FUND
The Financial Highlights table is intended to help you understand the Fund’s financial performance for the past six reporting periods (or, if shorter, the period since inception). Certain information reflects financial results for a single Fund share. The total returns in the table represent the rate that an investor would have earned (or lost) on an investment in the Fund.
| | | | | | | | | | | | | | | | | | | | | | | | |
Financial Highlights Six Months Ended Numbers are unaudited | | | | | | | | | | | | | | | | |
| | | Per Share Operating Performance | | | | |
| | | Net Asset Value,
Beginning of
Period | | | Net Investment
Income(1) | | | Net Realized
and Unrealized
Loss | | | Total
Operations | | |
Net Asset
Value, End of
Period | | | Total
Return(2),(3) | |
| | | | | | | |
Six Months Ended 6/30/23 | | $ | 9.77 | | | $ | 0.17 | | | $ | (0.13) | | | $ | 0.04 | | | $ | 9.81 | | | | 0.41 | % |
| | | | | | | |
Period Ended 12/31/22(5) | | | 10.00 | | | | 0.20 | | | | (0.43) | | | | (0.23) | | | | 9.77 | | | | (2.30) | % |
| | | | |
| 12 | | | | The accompanying notes are an integral part of these financial statements. |
FINANCIAL INFORMATION — GUARDIAN SHORT DURATION BOND VIP FUND
| | | | | | | | | | | | | | | | | | | | | | |
| |
| Ratios/Supplemental Data | |
Net Assets, End
of Period (000s) | | | Net Ratio of
Expenses to
Average
Net Assets(3),(4) | | | Gross Ratio of
Expenses to
Average Net
Assets(3) | | | Net Ratio of Net
Investment Income
to Average
Net Assets(3),(4) | | | Gross Ratio of Net
Investment Income
to Average
Net Assets(3) | | | Portfolio
Turnover Rate(3) | |
| | | | | |
| $ | 182,339 | | | | 0.50% | | | | 0.58% | | | | 3.48% | | | | 3.40% | | | | 155% | |
| | | | | |
| | 186,598 | | | | 0.49% | | | | 0.58% | | | | 3.00% | | | | 2.91% | | | | 61% | |
| (1) | Calculated based on the average shares outstanding during the period. |
| (2) | Total returns do not reflect the effects of charges deducted pursuant to the terms of The Guardian Insurance & Annuity Company, Inc.’s variable contracts. Inclusion of such charges would reduce the total returns for all periods shown. |
| (3) | Ratios for periods less than one year have been annualized, except for total return and portfolio turnover rate. For the period ended December 31, 2022, certain non-recurring fees (i.e., audit fees) are not annualized. |
| (4) | Net Ratio of Expenses to Average Net Assets and Net Ratio of Net Investment Income to Average Net Assets include the effect of fee waivers and expense limitations. |
| (5) | Commenced operations on May 2, 2022. |
| | | | |
| The accompanying notes are an integral part of these financial statements. | | | | 13 |
NOTES TO FINANCIAL STATEMENTS — GUARDIAN SHORT DURATION BOND VIP FUND
June 30, 2023 (unaudited)
1. Organization
Guardian Variable Products Trust (the “Trust”), a Delaware statutory trust organized on January 12, 2016, is registered under the Investment Company Act of 1940, as amended (the “1940 Act”), as an open-end management investment company. The Trust currently has twenty-four series. Guardian Short Duration Bond VIP Fund (the “Fund”) is a series of the Trust. The Fund is a diversified fund and commenced operations on May 2, 2022. The financial statements for other series of the Trust are presented in separate reports.
The Trust has authorized an unlimited number of shares of beneficial interest with no par value. Shares are bought and sold at closing net asset value (“NAV”). Shares of the Fund are only sold to certain separate accounts of The Guardian Insurance & Annuity Company, Inc. (“GIAC”) that fund certain variable annuity contracts and variable life insurance policies issued by GIAC. GIAC is a wholly-owned subsidiary of The Guardian Life Insurance Company of America (“Guardian Life”).
The Fund seeks to provide a high level of current income consistent with preservation of capital.
2. Significant Accounting Policies
The following is a summary of significant accounting policies followed by the Fund in the preparation of its financial statements. The Fund follows the investment company accounting and reporting guidance of the Financial Accounting Standards Board (“FASB”) Accounting Standards Codification Topic 946 Financial Services – Investment Companies. The following policies are in conformity with accounting principles generally accepted in the United States of America (“GAAP”). The preparation of financial statements in accordance with GAAP requires management to make estimates and assumptions that affect the reported amounts and disclosures in the financial statements. Actual results could differ from those estimates.
a. Investment Valuations The Board of Trustees has designated Park Avenue Institutional Advisers LLC (“Park Avenue”) as the valuation designee for the Fund pursuant to Rule 2a-5 under the 1940 Act. Park Avenue has established a Fair Valuation Committee and has adopted fair valuation procedures that provide methodologies for fair valuing securities. These procedures include monitoring the appropriateness of fair values based on results of ongoing valuation oversight, including but not limited to consideration of
security specific events, market events, and pricing vendor and broker-dealer due diligence. The Fair Valuation Committee oversees and carries out the policies for the valuation of investments held in the Fund. The Fair Valuation Committee is responsible for discussing and assessing the potential impacts to the fair values on an ongoing basis, and reports to the Board of Trustees on at least a quarterly basis.
The valuations of debt securities for which quoted bid prices are readily available are valued at the bid price by independent pricing services (each, a “Service”). Debt securities for which quoted bid prices are not readily available are valued by a Service at the evaluated bid price provided by the Service or the bid price provided by an independent broker-dealer or at a calculated price based on the spread to an appropriate benchmark provided by such broker-dealer.
Equity securities traded on an exchange other than NASDAQ Stock Market, LLC (“NASDAQ”) are valued at the last reported sale price on the principal exchange or market on which they are traded; or, if there were no sales that day, at the mean between the closing bid and ask prices. Securities traded on the NASDAQ are generally valued at the NASDAQ official closing price, which may not be the last sale price. If the NASDAQ official closing price is not available for a security, that security is generally valued at the mean between the closing bid and ask prices. Repurchase agreements are carried at cost, which approximates fair value (see Note 5c). Foreign securities are valued in the currencies of the markets in which they trade and then converted to U.S. dollars by the application of foreign exchange rates at the close of the New York Stock Exchange (“NYSE”).
Exchange-traded financial futures and swap contracts are valued at the last settlement price on the market where they are primarily traded.
Securities for which market quotations are not readily available or securities whose values have been materially affected by events occurring before the Fund’s valuation time but after the close of the securities’ principal exchange or market are valued at their fair values as determined in good faith by Park Avenue, as the Board of Trustee’s valuation designee (as defined in Rule 2a-5 under the 1940 Act), in accordance with Park Avenue’s procedures and under the general oversight of the Board of Trustees. Valuations reflected in this report are as of the report date. As a result, changes in valuation due to market events and/or issuer related events after the report date and prior to issuance of the report are not reflected herein.
NOTES TO FINANCIAL STATEMENTS — GUARDIAN SHORT DURATION BOND VIP FUND
Various inputs are used in determining the valuation of the Fund’s investments. These inputs are summarized in three broad levels listed below.
| • | | Level 1 – unadjusted inputs using quoted prices in active markets for identical investments. |
| • | | Level 2 – other significant observable inputs, including, but not limited to, quoted prices for similar investments, inputs other than quoted prices that are observable for investments (such as interest rates, prepayment speeds, credit risks, etc.) or other market corroborated inputs. |
| • | | Level 3 – significant unobservable inputs (including the Fund’s own assumptions in determining the fair value of investments). |
Inputs may include price information, volatility statistics, specific and broad credit data, liquidity statistics, and other factors. A financial instrument’s level within the fair value hierarchy is based on the lowest level of any input; both individually and in aggregate, that is significant to the fair value measurement. However, the determination of what constitutes “observable” requires significant judgment by the Trust. The Trust considers observable data to be that market data which is readily available, regularly distributed or updated, reliable and verifiable, and provided by independent sources that are actively involved in the relevant market. The inputs or methodology used for valuing securities are not necessarily an indication of the risk associated with investing in those securities. Changes in valuation techniques may result in transfers into or out of a financial instrument’s assigned level within the hierarchy.
The FASB requires reporting entities to make disclosures about purchases, sales, issuances and settlements of Level 3 securities on a gross basis. For the six months ended June 30, 2023, there were no transfers into or out of Level 3 of the fair value hierarchy.
In determining a financial instrument’s placement within the hierarchy, the Trust separates the Fund’s investment portfolio into two categories: investments and derivatives (e.g., futures). A summary of inputs used to value the Fund’s assets and liabilities carried at fair value as of June 30, 2023 is included in the Schedule of Investments.
Investments Investments whose values are based on quoted market prices in active markets, and are therefore classified within Level 1, include active listed equities. Investments that trade in markets that are not considered to be active, but are valued based on quoted
market prices, dealer quotations or alternative pricing sources supported by observable inputs are classified within Level 2. These include certain U.S. government and sovereign obligations, most government agency securities, investment-grade corporate bonds, certain mortgage products, state, municipal and provincial obligations, and certain foreign equity securities, including securities whose prices may have been affected by events occurring after the close of trading on their principal exchange or market and, as a result, whose values are determined by a pricing service as described above, or securities whose values are otherwise determined using fair valuation methods approved by the Fund’s Board of Trustees.
Investments classified within Level 3 have significant unobservable inputs, as they trade infrequently or not at all. Level 3 investments include, among others, private placement securities. When observable prices are not available for these securities, the Trust uses one or more valuation techniques for which sufficient and reliable data is available. The inputs used by the Trust in estimating the value of Level 3 investments include, for example, the original transaction price, recent transactions in the same or similar instruments, completed or pending third-party transactions in the underlying investment or comparable issuers, subsequent rounds of financing, recapitalizations, and other transactions across the capital structure. Level 3 investments may also be adjusted to reflect illiquidity and/or non-transferability, with the amount of such discount estimated by the Trust in the absence of market information. Assumptions used by the Trust due to the lack of observable inputs may significantly impact the resulting fair value and therefore the Fund’s results of operations. As of June 30, 2023, the Fund had no securities classified as Level 3.
Derivatives Exchange-traded derivatives, such as futures contracts, exchange-traded option contracts and certain swaps, are typically classified within Level 1 or Level 2 of the fair value hierarchy depending on whether or not they are deemed to be actively traded. Certain non-exchange-traded derivatives, such as generic forwards, certain swaps and options, have inputs which can generally be corroborated by market data and are therefore classified within Level 2.
b. Securities Transactions Securities transactions are accounted for on the date securities are purchased or sold (trade date). Realized gains or losses on securities transactions are determined on the basis of specific identification.
NOTES TO FINANCIAL STATEMENTS — GUARDIAN SHORT DURATION BOND VIP FUND
c. Futures Contracts The Fund may enter into financial futures contracts. In entering into such contracts, the Fund is required to deposit with the counterparty, either in cash or securities, an amount equal to a certain percentage of the face value of the contract. Subsequent payments are received or made by the Fund each day, depending on the daily fluctuations in the values of the contracts, and are recorded for financial statement purposes as variation margin received or paid by the Fund. Daily changes in variation margin are recognized as unrealized gains or losses by the Fund. The Fund may not achieve the anticipated benefits of the financial futures contracts and may realize a loss.
d. Credit Derivatives The Fund may enter into credit derivatives, including credit default swaps on individual obligations or credit indices. The Fund may use these investments to seek to (i) hedge various investments, (ii) manage or adjust duration and yield curve positioning, (iii) manage risk, (iv) enhance potential returns, or (v) as substitutes for permitted Fund investments. The use by the Fund of credit default swaps may have the effect of creating a short position in a security. Credit derivatives can create investment leverage and may create additional investment risks that may subject the Fund to greater volatility than investments in more traditional securities, as described in the Statement of Additional Information.
The Fund may enter into credit default swap agreements either as a buyer or seller. The Fund may buy protection under a credit default swap to attempt to mitigate the risk of default or credit quality deterioration in one or more individual holdings or in a segment of the fixed income securities market. The Fund may sell protection under a credit default swap in an attempt to gain exposure to an underlying issuer’s credit quality characteristics without investing directly in that issuer.
For swaps entered with an individual counterparty, the Fund bears the risk of loss of the uncollateralized amount expected to be received under a credit default swap agreement in the event of the default or bankruptcy of the counterparty. Credit default swap agreements are generally valued at a price at which the counterparty to such agreement would terminate the agreement. The Fund may also enter into cleared swaps.
In entering into swap contracts, the Fund is required to deposit with the broker (or for the benefit of the broker), either in cash or securities, an amount equal to a percentage of the notional value of the contract. Subsequent payments are received or made by the Fund each day, depending on the daily fluctuations in the
values of the contracts, and are recorded for financial statement purposes as variation margin received or paid by the Fund. Daily changes in variation margin are recognized as unrealized gains or losses by the Fund. The Fund may not achieve the anticipated benefits of the swap contracts and may realize a loss. During the six months ended June 30, 2023, the Fund entered into credit default swaps for risk exposure management and to enhance potential return.
e. Options Transactions The Fund can write (sell) put and call options on securities and indexes to earn premiums, for hedging purposes, for risk management purposes or otherwise as part of its investment strategies. In writing options, the Fund is required to deposit with the broker or counterparty, either in cash or securities, an amount equal to a percentage of the face value of the options. When an option is written, the premium received is recorded as an asset with an equal liability that is subsequently marked to market to reflect the market value of the written option. These liabilities, if any, are reflected as written options, at value, in the Fund’s Statement of Assets and Liabilities. Premiums received from writing options which expire unexercised are recorded on the expiration date as a realized gain. The difference between the premium received and the amount paid on effecting a closing purchase transaction, including brokerage commissions, is also treated as a realized gain, or if the premium is less than the amount paid for the closing purchased transactions, as a realized loss. If a written call option is exercised, the premium is added to the proceeds from the sale of the underlying security in determining whether there has been a realized gain or loss. If a written put option is exercised, the premium reduces the cost basis of the security. In writing an option, the Fund bears the market risk of an unfavorable change in the price of the security underlying the written option. Exercise of a written option could result in the Fund purchasing or selling a security at a price different from its current market value. There were no options transactions as of June 30, 2023.
f. Investment Income Dividend income net of foreign taxes withheld, if any, is generally recorded on the ex-dividend date. Distributions received from real estate investment trusts, if any, may be classified as dividends, capital gains and/or return of capital. Interest income, which includes amortization/accretion of premium/discount, is determined using the interest income accrual method, and is accrued and recorded daily.
g. Allocation of Income and Expenses Many of the expenses of the Trust can be directly attributed to a specific series of the Trust. Expenses that cannot be
NOTES TO FINANCIAL STATEMENTS — GUARDIAN SHORT DURATION BOND VIP FUND
directly attributed to a specific series of the Trust are generally apportioned among all the series in the Trust, based on relative net assets. In calculating net asset value per share for each series of the Trust, investment income, realized and unrealized gains and losses, and expenses other than series-specific expenses are allocated daily to each series based upon the proportion of net assets attributable to each series.
3. Transactions with Affiliates
a. Investment Advisory Fee and Expense Limitation Under the terms of the advisory agreement, which, after its two year initial term, is reviewed and approved annually by the Board of Trustees, the Fund pays an investment advisory fee to Park Avenue. Park Avenue is a wholly-owned subsidiary of Guardian Life and receives an investment advisory fee at an annual rate of 0.45% of the first $300 million, and 0.40% in excess of $300 million of the Fund’s average daily net assets. The fee is accrued daily and paid monthly. The Fund has no sub-adviser.
Park Avenue has contractually agreed through April 30, 2024 to waive certain fees and/or reimburse certain expenses incurred by the Fund to the extent necessary to limit the Fund’s total annual operating expenses after fee waiver and/or expense reimbursement to 0.50% of the Fund’s average daily net assets (excluding, if applicable, any acquired fund fees and expenses, taxes, interest, transaction costs and brokerage commissions, litigation and extraordinary expenses). The limitation may not be increased or terminated prior to this time without action by the Board of Trustees and may be terminated only upon approval of the Board of Trustees. Amounts waived or reimbursed by Park Avenue pursuant to any expense limitation will not be subject to Park Avenue’s recoupment rights. For the six months ended June 30, 2023, Park Avenue waived fees and/or paid Fund expenses in the amount of $72,991.
b. Compensation of Trustees and Officers Trustees and officers who are interested persons of the Trust, as defined in the 1940 Act, receive no compensation from the Fund, except for the Chief Compliance Officer of the Trust. Trustees of the Trust who are not interested persons of the Trust, and the Chief Compliance Officer, receive compensation and reimbursement of expenses from the Trust.
4. Federal Income Taxes
a. Distributions to Shareholders For federal income tax purposes, the Fund is treated as a disregarded entity (“DRE”). As a DRE, the Fund is not subject to an entity-level income tax; and any income, gains, losses,
deductions, taxes, and credits of the Fund would instead be “passed through” directly to the separate accounts of GIAC that invest in the Fund and retain the same character for U.S. federal income tax purposes. In addition, the Fund is not required to distribute taxable income and capital gains for U.S. federal income tax purposes. Therefore, no dividends and capital gains distributions were paid by the Fund.
5. Investments
a. Investment Purchases and Sales The cost of investments and U.S. government agency obligations purchased and the proceeds from U.S. government agency obligations and other investments sold (excluding short-term investments and to be announced (TBA) securities) for the six months ended June 30, 2023, were as follows:
| | | | | | | | |
| | | |
| | | Other Investments | | | U.S.
Government
and Agency
Obligations | |
| Purchases | | $ | 54,329,413 | | | $ | 196,836,116 | |
| Sales | | | 29,625,915 | | | | 253,946,505 | |
b. Foreign Securities Foreign securities investments involve special risks and considerations not typically associated with U.S. investments. These risks include, but are not limited to, currency risk; adverse political, regulatory, social, and economic developments; and less reliable information about issuers. Moreover, securities of some foreign issuers may be less liquid and their prices more volatile than those of comparable U.S. issuers.
c. Repurchase Agreements The Fund may invest in repurchase agreements to maintain liquidity and earn income over periods of time as short as overnight. The collateral for repurchase agreements is either cash or fully negotiable U.S. government securities (including U.S. government agency securities). Repurchase agreements are fully collateralized (including the interest accrued thereon) and such collateral is marked to market daily while the agreements remain in force. If the value of the collateral falls below the repurchase price plus accrued interest, the Fund will typically require the seller to deposit additional collateral by the next business day. If the request for additional collateral is not met, or the seller defaults, the Fund maintains the right to sell the collateral (although it may be prevented or delayed from doing so in certain circumstances) and may be required to claim any resulting loss against the seller. Park Avenue monitors the creditworthiness of the seller with which the Fund enters into repurchase agreements.
NOTES TO FINANCIAL STATEMENTS — GUARDIAN SHORT DURATION BOND VIP FUND
d. Securities Purchased on a When-Issued or Delayed-Delivery Basis The Fund may purchase securities on a when-issued or delayed-delivery basis, with payment and delivery scheduled for a future date. These transactions are subject to market fluctuations and are subject to the risk that the value at delivery may be more or less than at the trade date purchase price. Although the Fund will generally enter into these transactions with the intention of taking delivery of the securities, it may sell the securities before the settlement date. Assets will be segregated when a fund agrees to purchase on a when-issued or delayed-delivery basis. These transactions may create investment leverage.
e. Restricted and Illiquid Securities A restricted security cannot be resold to the general public without prior registration under the Securities Act of 1933, as amended (except pursuant to an applicable exemption). The values of these securities may be highly volatile. If the security is subsequently registered and resold, the issuer would typically bear the expense of all registrations at no cost to the Fund. Restricted and illiquid securities are valued according to the policies and procedures adopted by the Trust’s Board of Trustees and are noted, if any, in the Fund’s Schedule of Investments. As of June 30, 2023, the Fund did not hold any restricted, other than 144A restricted securities or illiquid securities.
f. Below Investment Grade Securities The Fund may invest in below investment grade securities (i.e. lower-quality, “junk” debt), which are subject to various risks. Lower-quality debt is considered to be speculative because it is less certain that the issuer will be able to pay interest or repay the principal than in the case of investment grade debt. These securities can involve a substantially greater risk of default than higher-rated securities, and their values can decline significantly over short periods of time. Lower-quality debt securities tend to be more sensitive to adverse news about their issuers, the market and the economy in general, than higher-quality debt securities. The market for these securities can be less liquid, especially during periods of recession or general market decline.
g. Mortgage- and Asset-Backed Securities The values of some mortgage-related or asset-backed securities may be particularly sensitive to changes in prevailing interest rates. Early repayment of principal on some mortgage-related securities may expose the Fund to a lower rate of return upon reinvestment of principal. The values of mortgage- and asset-backed securities depend in part on the credit quality and adequacy of the underlying assets or collateral and may fluctuate in
response to the market’s perception of these factors as well as current and future repayment rates. Some mortgage-backed securities are backed by the full faith and credit of the U.S. government (e.g., mortgage-backed securities issued by the Government National Mortgage Association, commonly known as “Ginnie Mae”), while other mortgage-backed securities (e.g., mortgage-backed securities issued by the Federal National Mortgage Association and the Federal Home Loan Mortgage Corporation, commonly known as “Fannie Mae” and “Freddie Mac”), are backed only by the credit of the government entity issuing them. In addition, some mortgage-backed securities are issued by private entities and, as such, are not guaranteed by the U.S. government or any agency or instrumentality of the U.S. government.
h. Treasury Inflation Protected Securities Treasury inflation protected securities (“TIPS”) are debt securities issued by the U.S. Treasury whose principal and/or interest payments are adjusted for inflation, unlike debt securities that make fixed principal and interest payments. The interest rate paid by the TIPS is fixed, while the principal value rises or falls based on changes in a published Consumer Price Index (“CPI”). Thus, if inflation occurs, the principal and interest payments on TIPS are adjusted accordingly to protect investors from inflationary loss. During a deflationary period, the principal and interest payments decrease, although the TIPS principal amounts will not drop below their face amounts at maturity. In exchange for the inflation protection, the TIPS generally pay lower interest rates than typical U.S. Treasury securities. Only if inflation occurs will TIPS offer a higher real yield than a conventional Treasury bond of the same maturity.
i. Loan Risk Investments in loans are particularly subject to, among other risks, credit risk, interest rate risk, and counterparty risk. The Fund’s investments in loans can be difficult to value accurately and may be more susceptible to liquidity risk than fixed income (or debt) investments of similar credit quality and/or maturity. Investments or transactions in loans are often subject to long settlement periods (potentially longer than seven days), which could limit the ability of the Fund to invest sale proceeds in other investments and to use proceeds to meet its current redemption obligations. As a result, the Fund may be forced to sell other, more desirable, liquid investments, sell illiquid investments at a loss or take other measures to raise cash. Loans often are rated below investment-grade and may be unrated and subject the Fund to the risk that the value of the collateral for the loan may be insufficient to cover the borrower’s obligations should the borrower fail to make
NOTES TO FINANCIAL STATEMENTS — GUARDIAN SHORT DURATION BOND VIP FUND
payments or become insolvent. Participations in loans may subject the Fund to the credit risk of both the borrower and the issuer of the participation and may make enforcement of loan covenants (if any) more difficult for the Fund as legal action may have to go through the issuer of the participations. Investments in loans that lack or possess fewer or contingent contractual restrictive covenants are particularly susceptible to the risks associated with these investments. In addition, loans and other similar investments may not be considered “securities” and, as a result, the Fund may not be entitled to rely on the anti-fraud protections under the federal securities laws and instead may have to resort to state law and direct claims.
j. Disclosures About Derivative Instruments and Hedging Activities The Fund entered into U.S. Treasury futures contracts for the six months ended June 30, 2023 to manage portfolio duration. The Fund bears the risk of interest rates moving unexpectedly, in which case the Fund may not achieve the anticipated benefits of the futures contracts and realize a loss. There is minimal counterparty credit risk to the Funds since futures are exchange traded and the exchange’s clearinghouse, as counterparty to all exchange traded futures, guarantees futures against default.
Under certain market conditions, the Fund may use credit default swaps to seek to (i) hedge various investments, (ii) manage or adjust duration and yield curve exposure, (iii) manage risk, (iv) enhance returns, or (v) as substitutes for permitted Fund investments. Credit default swaps involve the exchange of a floating or fixed rate payment in return for assuming potential credit losses of an underlying security or pool of securities.
The gross returns to be exchanged or “swapped” between the parties are generally calculated with respect to a “notional amount,” i.e., the return on or increase in value of a particular dollar amount invested at a particular interest rate, in a particular foreign currency or security, or in a “basket” of securities representing a particular index. Cleared swaps are transacted through futures commission merchants (“FCM”s) that are members of central clearinghouses with the clearinghouse serving as a central counterparty similar to transactions in futures contracts. Funds post initial and variation margin by making payments to their clearing member FCMs.
Generally, the Fund will enter into credit default swaps on a net basis, which means that the two payment
streams are netted out, with a Fund receiving or paying, as the case may be, only the net amount of the two payments. Credit default swaps do not normally involve the delivery of securities, other underlying assets or principal. Accordingly, the risk of loss with respect to credit default swaps is normally limited to the net amount of payments that a Fund is contractually obligated to make. If the other party to a credit default swap defaults, a Fund’s risk of loss consists of the net amount of payments that the Fund is contractually entitled to receive, if any.
In addition to the risks generally applicable to derivatives, risks associated with credit default swap agreements include adverse changes in the returns of the underlying instruments, failure of the counterparties to perform under the agreement’s terms and the possible lack of liquidity with respect to the agreements.
As of June 30, 2023, the Fund had the following derivatives at fair value, grouped into appropriate risk categories that illustrate the Fund’s use of derivative instruments:
| | | | | | | | |
| | | |
| | | Interest
Rate Contracts | | | Credit
Default Contracts | |
| | | |
Asset Derivatives | | | | | | | | |
| Futures Contracts1 | | $ | 226,276 | | | $ | — | |
| | | |
Liability Derivatives | | | | | | | | |
| Futures Contracts1 | | $ | (1,063,451 | ) | | $ | — | |
| Swap Contracts2 | | | — | | | | (317,716 | ) |
| 1 | Statement of Assets and Liabilities location: Includes cumulative unrealized appreciation/(depreciation) of futures contracts as reported in the Schedule of Investments. Only current day’s variation margin is reported within the Statement of Assets and Liabilities. |
| 2 | Statement of Assets and Liabilities location: Includes the fair value of centrally cleared swap contracts as reported in the Schedule of Investments. Only current day’s variation margin is reported within the Statement of Assets and Liabilities. |
NOTES TO FINANCIAL STATEMENTS — GUARDIAN SHORT DURATION BOND VIP FUND
Transactions in derivative investments for the six months ended June 30, 2023 were as follows:
| | | | | | | | |
| | | |
| | | Interest
Rate Contracts | | | Credit
Default Contracts | |
| | | |
Net Realized Gain/(Loss) | | | | | | | | |
| Futures Contracts1 | | $ | (703,258 | ) | | $ | — | |
| Swap Contracts2 | | | — | | | | (2,045,822 | ) |
| | | |
Net Change in Unrealized Appreciation/(Depreciation) | | | | | | | | |
| Futures Contracts3 | | $ | (924,665 | ) | | $ | — | |
| Swap Contracts4 | | | — | | | | 967,720 | |
| | | |
Average Number of Notional Amounts | | | | | | | | |
| Futures Contracts5 | | | 588 | | | | — | |
| Swap Contracts — Buy/Sell Protection | | $ | — | | | $ | 20,785,714 | |
| 1 | Statement of Operations location: Net realized gain/(loss) from futures contracts. |
| 2 | Statement of Operations location: Net realized gain/(loss) from swap contracts. |
| 3 | Statement of Operations location: Net change in unrealized appreciation/(depreciation) on futures contracts. |
| 4 | Statement of Operations location: Net change in unrealized appreciation/(depreciation) on swap contracts. |
| 5 | Amount represents number of contracts. |
6. Temporary Borrowings
The Fund, with other funds managed by Park Avenue, is party to a credit agreement with respect to a $10 million committed revolving credit facility from State Street Bank and Trust Company (the “Credit Agreement”) for temporary borrowing purposes, including the meeting of redemption requests that otherwise might require the untimely disposition of securities. Interest is based on a daily fluctuating rate per annum equal to the Applicable Rate (as defined in the Credit Agreement) plus the Applicable Margin (as defined in the Credit Agreement) that is subject to change from time to time as and when the Applicable Rate changes. Under the current Credit Agreement, the Applicable Rate for any day is defined as the rate per annum equal to the sum of (a) 0.10% plus (b) the higher of (i) the Federal Funds Effective Rate for such day and (ii) the Overnight Bank
Funding Rate for such day; the Applicable Margin is 1.25%. In addition to the interest charged on any borrowings by the Fund, each fund pays a commitment fee of 0.30% per annum on its share of the unused portion of the credit facility. The agreement is in place until January 5, 2024. The Fund did not utilize the credit facility during the six months ended June 30, 2023.
7. Indemnifications
Under the Trust’s organizational documents and, in some cases, by contract, officers and Trustees of the Trust are indemnified against certain liabilities arising out of the performance of their duties to the Fund. In addition, in the normal course of business, the Fund enters into contracts with its vendors and others that provide general indemnifications. The Fund’s maximum exposure under these arrangements is unknown as this would involve future claims that may be made against the Fund that have not yet occurred. However, based on experience, the Fund expects the risk of loss to be remote.
8. Additional Information
The outbreak of COVID-19 has adversely impacted both local and global economies, including those in which the Fund may invest. These impacts include materially reduced consumer demand and economic output, disrupted supply chains, market closures, travel restrictions and quarantines, and strained healthcare systems. The Fund’s operations may be interrupted as a result, which may have a negative impact on the Fund’s investment performance.
9. Subsequent Event
The Bloomberg US Government/Credit 1-3 Year Total Return Index (the “Index”) replaced the Bloomberg US Government Bond 1-3 Year Index as the Fund’s primary benchmark effective July 1, 2023. The Index was selected to align more closely with the Fund’s investment strategy and portfolio holdings.
SUPPLEMENTAL INFORMATION (UNAUDITED)
Liquidity Risk Management Program
In compliance with Rule 22e-4 under the Investment Company Act of 1940, as amended (the “Liquidity Rule”), Guardian Variable Products Trust (the “Trust”) has adopted and implemented a written liquidity risk management program (the “Program”) for each series of the Trust (each, a “Fund”), which is reasonably designed to assess and manage each Fund’s liquidity risk. The Fund’s “liquidity risk” is the risk that the Fund could not
meet requests to redeem shares issued by the Fund without significant dilution of the remaining investors’ interests in the Fund.
The Board of Trustees of the Trust (the “Board”)
Previously approved the designation of Park Avenue Institutional Advisers LLC (the “Administrator” or “PAIA”) as Program administrator. The Administrator established a Liquidity Risk Management Committee, which is comprised of certain officers of the Trust and PAIA, that assists the Administrator in the implementation and day-to-day administration of the Program and otherwise support carrying out the Administrator’s liquidity risk management responsibilities under the Program.
In accordance with the Program, each Fund’s liquidity risk is assessed no less frequently than annually, taking into consideration a variety of factors, including, as applicable, the Fund’s investment strategy and liquidity of portfolio investments, cash flow projections, and holdings of cash and cash equivalents, as well as borrowing arrangements and other funding sources. Certain factors are considered under both normal and reasonably foreseeable stressed conditions.
Each Fund portfolio investment is classified, no less than monthly, into one of four liquidity categories (including “highly liquid investments” and “illiquid investments,” discussed below) based on a determination of the number of days it is reasonably expected to take to convert the investment to cash, or sell or dispose of the investment, in current market conditions without
significantly changing the investment’s market value.
The Liquidity Rule limits the Fund’s investments in illiquid investments by prohibiting the Fund from acquiring any illiquid investment if, immediately after the acquisition, the Fund would have invested more than 15% of its net assets in illiquid investments that are assets. The Program includes provisions reasonably designed to comply with this investment limitation. In addition, the Program includes provisions reasonably designed to comply with this investment limitation. In addition, the Program includes provisions reasonably designed to comply with the Liquidity Rule’s requirements relating to highly liquid investment minimums, which is a minimum amount of Fund net assets that must be invested in highly liquid investments that are assets, as applicable. The Fund was not required to adopt a highly liquid investment minimum during the period.
At a meeting of the Board held on March 29-30, 2023, the Board received a report (the “Report”) prepared by the Administrator addressing the Program’s operation and assessing the adequacy and effectiveness of its implementation for the period from January 1, 2022 through December 31, 2022 (the “Reporting Period”). The Report noted that the Administrator believes the Program operated effectively during the Reporting Period and continues to be reasonably designed to effectively assess and manage each Fund’s liquidity risk. The Report also noted that the Administrator believes the Program has been adequately and effectively implemented and the investment strategies for each Fund continue to be appropriate since its inception. In addition, the Report summarized the operation of the Program and the information and factors considered by the Administrator in its assessment of the Program’s implementation, such as the liquidity risk assessment framework and liquidity classification methodologies.
There can be no assurance that the Program will achieve its objectives under all circumstances. Please refer to the Fund’s prospectus for more information regarding the Fund’s exposure to liquidity risk and other risks to which an investment in the Fund may be subject.
SUPPLEMENTAL INFORMATION (UNAUDITED)
Approval of Investment Management Agreement
Section 15(c) of the Investment Company Act of 1940, as amended (the “1940 Act”), requires that a fund’s investment advisory and sub-advisory agreements be approved initially by the fund’s board of trustees. Section 15(c) also requires that the continuation of these agreements, after an initial term of up to two years, be annually reviewed and approved by the board. Any such agreement must be approved by a vote of a majority of the trustees who are not parties to the agreement or “interested persons” (as defined in the 1940 Act) of a party to the agreement at a meeting of the board called for the purpose of voting on such approval.
At a meeting of the Board of Trustees (the “Board”) of Guardian Variable Products Trust (the “Trust”) held on March 29-30, 2023 (the “Meeting”), the Board, including the trustees who are not parties to the agreement or “interested persons” as defined in the 1940 Act (the “Independent Trustees”), considered and voted unanimously to renew the existing investment management agreement between the Trust, on behalf of Guardian All Cap Core VIP Fund; Guardian Balanced Allocation VIP Fund; Guardian Core Fixed Income VIP Fund; Guardian Core Plus Fixed Income VIP Fund; Guardian Diversified Research VIP Fund; Guardian Equity Income VIP Fund; Guardian Global Utilities VIP Fund; Guardian Growth & Income VIP Fund; Guardian Integrated Research VIP Fund; Guardian International Growth VIP Fund; Guardian International Equity VIP Fund; Guardian Large Cap Disciplined Growth VIP Fund; Guardian Large Cap Disciplined Value VIP Fund; Guardian Large Cap Fundamental Growth VIP Fund; Guardian Mid Cap Relative Value VIP Fund; Guardian Mid Cap Traditional Growth VIP Fund; Guardian Multi-Sector Bond VIP Fund; Guardian Select Mid-Cap Core VIP Fund; Guardian Short Duration Bond VIP Fund; Guardian Small Cap Core VIP Fund; Guardian Small-Mid Cap Core VIP Fund; Guardian Strategic Large Cap Core VIP Fund; Guardian Total Return Bond VIP Fund and Guardian U.S. Government Securities VIP Fund (each, a “Fund,” and together, the “Funds”), in substantially the form presented at this meeting (the “Management Agreement”); and Park Avenue Institutional Advisers LLC (the “Manager”) for a one-year term.
The Board, including the Independent Trustees, also considered and voted unanimously to renew the existing sub-advisory agreements (the “Sub-Advisory Agreements,” collectively with the Management Agreement and Sub-Subadvisory Agreement, the “Agreements”) between the Manager and investment
advisory firms engaged to serve as sub-advisers to certain of the Funds (the “Sub-Advised Funds”), namely (i) ClearBridge Investments, LLC with respect to Guardian Small Cap Core VIP Fund; (ii) Putnam Investment Management, LLC with respect to Guardian Diversified Research VIP Fund; (iii) AllianceBernstein L.P. with respect to Guardian Growth & Income VIP Fund and Guardian Strategic Large Cap Core VIP Fund; (iv) J.P. Morgan Investment Management Inc. with respect to Guardian International Growth VIP Fund; (v) Schroder Investment Management North America Inc. with respect to Guardian International Equity VIP Fund; (vi) Wellington Management Company LLP with respect to Guardian Balanced Allocation VIP Fund, Guardian Equity Income VIP Fund, Guardian Integrated Research VIP Fund, Guardian Large Cap Disciplined Growth VIP Fund and Guardian Global Utilities VIP Fund; (vii) Boston Partners Global Investors, Inc. with respect to Guardian Large Cap Disciplined Value VIP Fund; (viii) Janus Henderson Investors US LLC with respect to Guardian Mid Cap Traditional Growth VIP Fund; (ix) Allspring Global Investments, LLC with respect to Guardian Mid Cap Relative Value VIP Fund and Guardian Small-Mid Cap Core VIP Fund; (x) Lord, Abbett & Co. LLC with respect to Guardian Core Plus Fixed Income VIP Fund; (xi) FIAM LLC with respect to Guardian Select Mid Cap Core VIP Fund; and (xii) Massachusetts Financial Services Company with respect to Guardian All Cap Core VIP Fund, each in substantially the form presented at this meeting, (each, a “Sub-Adviser” and collectively, the “Sub-Advisers”) for a one-year term.
The Board, including the Independent Trustees, also considered and voted unanimously to renew the existing sub-subadvisory agreement (the “Sub-Subadvisory Agreement”) between Schroder Investment Management North America Inc. and Schroder Investment Management North America Limited (also a Sub-Adviser) with respect to Guardian International Equity VIP Fund for a one-year term.
The Board is responsible for overseeing the management of each Fund. In determining whether to renew its approval of the Agreements, the Trustees evaluated information and factors that they considered to be relevant and appropriate through the exercise of their own business judgment. The Trustees considered certain information and factors in light of advice furnished to them by legal counsel to the Trust and, in the case of the Independent Trustees, their independent legal counsel. In advance of the Meeting, the Trustees received materials and information designed to assist their consideration of the Agreements. The Trustees received written responses
SUPPLEMENTAL INFORMATION (UNAUDITED)
from the Manager and each Sub-Adviser to a series of questions and requests for information encompassing a wide variety of topics provided by independent counsel on behalf of the Independent Trustees. The Independent Trustees also received materials and information regarding the legal standards applicable to their consideration of the Agreements and the process and criteria used by the Manager to identify and select the Sub-Advisers.
During the course of their deliberations, the Independent Trustees met twice to discuss and evaluate the materials, information and Agreements in executive session with their independent legal counsel, outside of the presence of the Trustees who are not Independent Trustees and representatives from Fund management, the Manager or any Sub-Adviser.
In reaching its decisions to renew its approval of the Agreements, the Board took into account the materials and information described above, as well as other materials and information provided to the Board throughout the year. Individual Trustees may have given different weight to different factors and information with respect to each Agreement, and the Trustees did not identify any single factor or information that, in isolation, would be controlling in deciding to approve the Agreements. The discussion below is intended to summarize the broad factors that figured prominently in the Board’s decisions to renew its approval of the Agreements rather than to be all-inclusive. These broad factors included: (i) the nature, extent and quality of the services provided to the Funds by the Manager and to the Sub-advised Funds by the Sub-Advisers; (ii) the investment performance of each Fund; (iii) estimated profitability of the Manager; (iv) fees and expenses; (v) the extent to which economies of scale may exist, and the extent to the benefits of economies of scale are shared with the Funds; and (vi) any other benefits derived by the Manager or the Sub-Advisers (or their respective affiliates) from their relationships with the Funds.
Nature, Extent and Quality of Services
The Trustees considered information regarding the nature, extent and quality of services provided to the Funds by the Manager. The Trustees also considered, among other things, the terms of the Management Agreement and the range of investment advisory services provided by the Manager. In addition, the Trustees reviewed the range of non-investment advisory services provided by the Manager consistent with the terms of the Management Agreement, notably coordinating the preparation and filing of various
regulatory documents, coordinating the preparation and assembly of Board meeting materials, and assisting the Board with certain valuation matters. The Board also received a description of the Manager’s and each Sub-Adviser’s business continuity plans and of their respective approaches to data privacy and cybersecurity, and related testing. The Board received information regarding the response of the Manager and the Sub-Advisers to the COVID-19 pandemic, including the continuation of remote work arrangements and return-to-office plans. The Board also received information about the Manager’s role as administrator of the Funds’ liquidity risk management program, the Manager’s approach to risk management, and the Manager’s vendor oversight programs.
The Trustees considered that the Sub-advised Funds operate in a “manager-of-managers” structure and reviewed the responsibilities that the Manager has under this structure, including monitoring and evaluating the performance of the Sub-Advisers, monitoring the Sub-Advisers for adherence to the stated investment objectives, strategies, policies and restrictions of the Funds and supervising the Sub-Advisers with respect to the services that the Sub-Advisers would provide under the Sub-Advisory Agreements. The Trustees also considered the process used by the Manager, consistent with this structure, to identify and recommend sub-advisers, and the Manager’s ability to monitor and oversee sub-advisers and recommend replacement sub-advisers, when necessary, and provide other services under the Management Agreement. The Board noted that investment management staff of the Manager and the Trust’s Chief Compliance Officer conduct oversight meetings with the Sub-Advisers on a periodic basis, follow through with additional inquiries on any questions or concerns that arise during the meetings and, as necessary, then report the results of the meetings to the Board. The Trustees reviewed information regarding the experience and background of the Manager’s key personnel and the Manager’s organizational structure and resources, including investment, legal and administrative capabilities of the Manager. In this regard, the Trustees recognized that the Funds may benefit from the Manager’s ability to use resources and capabilities of its affiliates in providing services to the Funds.
The Trustees considered information regarding the nature, extent and quality of services provided to the Sub-advised Funds by the Sub-Advisers. The Trustees also considered, among other things, the terms of the Sub-advisory Agreements and the range of investment
SUPPLEMENTAL INFORMATION (UNAUDITED)
advisory services provided by the Sub-Advisers under the oversight of the Manager. In evaluating these investment advisory services, the Trustees considered, among other things, the Sub-Advisers’ investment philosophies, styles and/or processes and approaches to managing the respective Sub-advised Funds. The Trustees received and evaluated information regarding the background, education, expertise and/or experience of the investment professionals who serve as portfolio managers for the Sub-advised Funds and the capabilities and resources of the Sub-Advisers.
Based upon these considerations, the Trustees concluded, within the context of their full deliberations, that the nature, extent and quality of services provided to the Funds by the Manager and the Sub-advised Funds by each respective Sub-Adviser were appropriate.
Investment Performance
In connection with each of its regular quarterly meetings, the Board receives information on the performance of each Fund, including net performance, relative performance rankings within the relevant Morningstar peer group, and performance as compared to benchmark index returns. At each quarterly Board meeting, members of the Manager’s funds management team review with the Board the economic and market environment, absolute and relative performance of each Fund, and any relevant information about risk management and style consistency in connection with management of the Funds. The Board considered investment performance for each Fund over the one-year, three-year (where available), five-year (where available) and since-inception periods.
The Board also received and reviewed a report prepared by Broadridge Financial Solutions (“Broadridge”), an independent provider of mutual fund industry data, which included comparisons of the performance of each Fund to performance of an appropriate peer universe. For details regarding each Fund’s performance, see the “Fund-by-Fund Factors” section below.
The Manager discussed with the Board factors contributing to the Funds’ performance results. In addition, for certain Funds, the Manager provided to the Board longer term performance records of the Sub-Advisers for strategies used in managing the Funds. The Board concluded that the investment performance generated by the Manager and each Sub-Adviser was generally satisfactory, or, that any steps being taken by the Manager and Sub-Advisers to address any performance issues were satisfactory.
Profitability
The Board received and considered the Manager’s estimate of its profitability, which included allocations by the Manager of its costs in providing management services to the Funds. The Board considered the estimated profitability of the Manager both overall and on a Fund-by-Fund basis.
The Board received and considered profitability information from most of the Sub-Advisers, but noted that the Manager had negotiated the fees with the Sub-Advisers at arm’s-length. Accordingly, the Board concluded that the profitability of the Sub-Advisers is a less relevant factor than Manager profitability.
Based on the consideration of this information, the Board concluded that the profitability of the Funds to the Manager was acceptable.
Fees and Expenses
The Trustees considered the management fees paid by the Funds to the Manager under the Management Agreement and evaluated the reasonableness of these fees. The Trustees received and reviewed comparative information with respect to the management fee and total expenses for each Fund and the management fees and total expenses for a peer group of other funds selected by Broadridge. The Trustees considered the Manager’s commitment to limit the total expenses of each Fund through an expense limitation agreement with the Trust. Although the Board recognized that the comparisons between the management fees and actual expenses of the Funds and those of the identified peer group are imprecise, given different terms of agreements and variations in fund strategies, the Trustees found that the comparative information supported their consideration and approval of the management fees and evaluation of the total expenses. For details regarding each Fund’s fee and expense comparisons, see the “Fund-by-Fund Factors” section below.
The Trustees considered the sub-advisory fees paid under the Sub-advisory Agreements and evaluated the reasonableness of those fees. The Trustees also considered that the fees paid to the Sub-Advisers would be paid by the Manager and not the Funds and that the Manager had negotiated the fees with the Sub-Advisers at arm’s-length.
Based on the consideration of the information and factors summarized above, as well as other relevant information and factors, the Board concluded that the management and sub-advisory fees were reasonable in
SUPPLEMENTAL INFORMATION (UNAUDITED)
light of the nature, extent and quality of services rendered to the Funds by the Manager and the Sub-Advisers.
Economies of Scale
The Board considered the extent to which economies of scale may exist, and the extent to the benefits of economies of scale are shared with the Funds. In this regard, the Board noted that for sixteen of twenty-four Funds, the management and sub-advisory fee included breakpoints that are tiered based on growth in asset levels of each such Fund and that for the other Funds, the fees reflected appropriate levels based on current and expected asset levels. The Board also noted that the expenses of the Funds are subject to expense limitations provided by the Manager. The Board noted that expected economies of scale, where they exist, may be shared through the use of fee breakpoints, expense limitations by the Manager, and/or a lower overall fee.
Ancillary Benefits
The Board considered the potential benefits, other than management fees, that the Manager and/or its affiliates may receive because of the Manager’s relationship with the Funds. The Trustees considered that the Funds were designed to serve as investment options under variable contracts issued by affiliates of the Manager that would receive fees under those contracts and that Park Avenue Securities LLC, an affiliate of the Manager and principal underwriter of the Funds, and participating insurance companies, including insurance companies affiliated with the Manager, would be entitled to receive fees from the Funds under a plan of distribution adopted pursuant to Rule 12b-1 under the 1940 Act. The Trustees considered that the Manager and its affiliates may benefit from (i) greater efficiencies in annuity administration and operations and potential cost savings due to a reduction in the number of unaffiliated funds available as annuity contract investment options, and (ii) increased dividends-received deductions due to the Funds’ status under the tax laws as disregarded entities. In addition, the Trustees considered the potential benefits, other than sub-advisory fees, that the Sub-Advisers and their affiliates may receive because of their relationships with the Funds, including the ability to receive research from soft dollar commissions consistent with Trust policies. The Trustees concluded that benefits that may accrue to the Manager and its affiliates are reasonable and the benefits that may accrue to the Sub-Advisers and their affiliates are consistent with those expected for a sub-adviser to a mutual fund such as the applicable Fund.
Fund-by-Fund Factors
The Broadridge report groups fees, expenses and performance into five quintiles, with the top quintile having the highest performance or lowest fees/expenses, and the bottom quintile having the lowest performance or highest fees/expenses. For purposes of the descriptions below, a Fund’s performance is considered “in line with” the benchmark index if it is within 0.20%.
Guardian Large Cap Fundamental Growth VIP Fund
| • | | The Board noted that the Fund’s performance was in the 3rd quintile of its performance universe for the 1-year period and in the 4th quintile for its performance universe for the 3-year and 5-year periods. The Board also noted that the Fund’s performance was below the benchmark index for the 1-year, 3-year and 5-year periods. |
| • | | The Board noted that the contractual management fee, the actual management fee and actual total expenses were in the 1st quintile of the expense group. |
Guardian Large Cap Disciplined Growth VIP Fund
| • | | The Board noted that the Fund’s performance was in the 3rd quintile of its performance universe for the 1-year and 3-year periods and in the 2nd quintile for the 5-year period. The Board also noted that the Fund’s performance was below the benchmark index for the 1-year, 3-year and 5-year periods. |
| • | | The Board noted that the contractual management fee, the actual management fee and actual total expenses were in the 1st quintile of the expense group. |
Guardian Integrated Research VIP Fund
| • | | The Board noted that the Fund’s performance was in the 5th quintile of its performance universe for the 1-year and 5-year periods and in the 4th quintile for 3-year period. The Board also noted that the Fund’s performance was below the benchmark index for the 1-year, 3-year and 5-year periods. |
| • | | The Board noted that the contractual management fee, the actual management fee and actual total expenses were in the 1st quintile of the expense group. |
Guardian Diversified Research VIP Fund
| • | | The Board noted that the Fund’s performance was in the 3rd quintile of its performance universe for the 1-year and 3-year periods and in the 2nd quintile for the 5-year period. The Board also noted that the Fund’s performance was higher than the benchmark |
SUPPLEMENTAL INFORMATION (UNAUDITED)
| | | index for the 1-year period. The Board note that the Fund’s performance was lower than the benchmark index for the 3-year and 5-year periods. |
| • | | The Board noted that the contractual management fee and actual management fee were in the 1st quintile of the expense group and that actual total expenses were in the 3rd quintile. |
Guardian Strategic Large Cap Core VIP Fund
| • | | The Board noted that the Fund’s performance was in the 1st quintile of its performance universe for the 1-year period. The Board acknowledged the Fund’s short operational history. The Board noted that the Fund’s performance was higher than the benchmark index for the 1-year period. |
| • | | The Board noted that the contractual management fee, the actual management fee and actual total expenses were in the 1st quintile of the expense group. |
Guardian Large Cap Disciplined Value VIP Fund
| • | | The Board noted that the Fund’s performance was in the 3rd quintile of its performance universe for the 1-year and 3-year periods and in the 4th quintile for the 5-year period. The Board also noted that the Fund’s performance was higher than the benchmark index for the 1-year and 3-year periods. The Board noted that the Fund’s performance was in line with the benchmark index for the 5-year period. |
| • | | The Board noted that the contractual management fee was in the 2nd quintile of the expense group, the actual management fee was in the 1st quintile of the expense group and that actual total expenses were in the 3rd quintile. |
Guardian Growth & Income VIP Fund
| • | | The Board noted that the Fund’s performance was in the 3rd quintile of its performance universe for the 1-year, 3-year and 5-year periods. The Board also noted that the Fund’s performance was higher than the benchmark index for the 1-year, 3-year and 5-year periods. |
| • | | The Board noted that the contractual management fee and the actual management fee were in the 1st quintile of the expense group and that actual total expenses were in the 3rd quintile. |
Guardian Equity Income VIP Fund
| • | | The Board noted that the Fund had less than one-year of operational history and was not able to evaluate an investment performance record for the Fund. The |
| | | Board noted that it would have an opportunity to review such information in connection with future annual reviews. The Board noted that, in the meantime, it received monthly performance reports from the Manager. |
| • | | The Board noted that the contractual management fee, the actual management fee and actual total expenses were in the 1st quintile of the expense group. |
Guardian All Cap Core VIP Fund
| • | | The Board noted that the Fund’s performance was in the 3rd quintile of its performance universe for the 1-year period. The Board acknowledged the Fund’s short operational history. The Board noted that the Fund’s performance was higher than the benchmark index for the 1-year period. |
| • | | The Board noted that the contractual management fee, the actual management fee and actual total expenses were in the 1st quintile of the expense group. |
Guardian Mid Cap Traditional Growth VIP Fund
| • | | The Board noted that the Fund’s performance was in the 1st quintile of its performance universe for the 1-year period and in the 2nd quintile for the 3-year and 5-year periods. The Board also noted that the Fund’s performance was higher than the benchmark index for the 1-year, 3-year and 5-year periods. |
| • | | The Board noted that the contractual management fee and actual management fee were in the 1st quintile of the expense group and that the actual total expenses were in the 4th quintile. |
Guardian Select Mid Cap Core VIP Fund
| • | | The Board noted that the Fund’s performance was in the 3rd quintile of its performance universe for the 1-year period. The Board acknowledged the Fund’s short operational history. The Board noted that the Fund’s performance was lower than the benchmark index for the 1-year period. |
| • | | The Board noted that the contractual management fee, the actual management fee and actual total expenses were in the 1st quintile of the expense group. |
Guardian Mid Cap Relative Value VIP Fund
| • | | The Board noted that the Fund’s performance was in the 2nd quintile of its performance universe for the 1-year, 3-year and 5-year periods. The Board also noted that the Fund’s performance was higher than the benchmark index for the 1-year, 3-year and 5-year periods. |
SUPPLEMENTAL INFORMATION (UNAUDITED)
| • | | The Board noted that the contractual management fee and the actual management fee were in the 2nd quintile of the expense group and the actual total expenses were in the 3rd quintile of the expense group. |
Guardian Small-Mid Cap Core VIP Fund
| • | | The Board noted that the Fund’s performance was in the 5th quintile of its performance universe for the 1-year period. The Board acknowledged the Fund’s short operational history. The Board noted that the Fund’s performance was higher than the benchmark index for the 1-year period. |
| • | | The Board noted that the contractual management fee, the actual management fee and actual total expenses were in the 1st quintile of the expense group. |
Guardian Small Cap Core VIP Fund
| • | | The Board noted that the Fund’s performance was in the 5th quintile of its performance universe for the 1-year and 3-year periods. The Board noted that the Fund’s performance was lower than the benchmark index for the 1-year and 3-year periods. |
| • | | The Board noted that the contractual management fee and the actual management fee were in the 1st quintile of the expense group and the actual total expenses were in the 2nd quintile of the expense group. |
Guardian International Growth VIP Fund
| • | | The Board noted that the Fund’s performance was in the 4th quintile of its performance universe for the 1-year period, in the 2nd quintile of its performance universe for the 3-year period and in the 3rd quintile of its performance universe for the 5-year period. The Board also noted that the Fund’s performance was lower than the benchmark index for the 1-year and 5-year periods. The Board noted that the Fund’s performance was higher than the benchmark index for the 3-year period. |
| • | | The Board noted that the contractual management fee and actual management fee were in the 2nd quintile of the expense group and that the actual total expenses were in the 3rd quintile. |
Guardian International Equity VIP Fund
| • | | The Board noted that the Fund’s performance was in the 5th quintile of its performance universe for the 1-year, 3-year and 5-year periods. The Board also noted that the Fund’s performance was lower than the benchmark index for the 1-year, 3-year and 5-year periods. |
| • | | The Board noted that the contractual management fee, the actual management fee and the actual total expenses were in the 2nd quintile of the expense group. |
Guardian Global Utilities VIP Fund
| • | | The Board noted that the Fund’s performance was in the 5th quintile of its performance universe for the 1-year period and in the 4th quintile of its performance universe for the 3-year period. The Board noted that the Fund’s performance was higher than the benchmark index for the 1-year and 3-year periods. |
| • | | The Board noted that the contractual management fee and the actual management fee were in the 1st quintile of the expense group and the actual total expenses were in the 2nd quintile of the expense group. |
Guardian Balanced Allocation VIP Fund
| • | | The Board noted that the Fund had less than one-year of operational history and was not able to evaluate an investment performance record for the Fund. The Board noted that it would have an opportunity to review such information in connection with future annual reviews. The Board noted that, in the meantime, it received monthly performance reports from the Manager. |
| • | | The Board noted that the contractual management fee, the actual management fee and actual total expenses were in the 1st quintile of the expense group. |
Guardian Core Plus Fixed Income VIP Fund
| • | | The Board noted that the Fund’s performance was in the 3rd quintile of its performance universe for the 1-year and 3-year periods and in the 4th quintile of its performance universe for the 5-year period. The Board also noted that the Fund’s performance was lower than the benchmark index for the 1-year and 5-year periods. The Board noted that the Fund’s performance was in line with the benchmark index for the 3-year period. |
| • | | The Board noted that the contractual management fee and actual management fee were in the 2nd quintile of the expense group and that actual total expenses were in the 3rd quintile. |
Guardian Total Return Bond VIP Fund
| • | | The Board noted that the Fund’s performance was in the 5th quintile of its performance universe for the 1-year and 3-year periods. The Board also noted that |
SUPPLEMENTAL INFORMATION (UNAUDITED)
| | | the Fund’s performance was lower than the benchmark index for the 1-year and 3-year periods. |
| • | | The Board noted that the contractual management fee and actual management fee were in the 2nd quintile and the actual total expenses were in the 3rd quintile. |
Guardian Core Fixed Income VIP Fund
| • | | The Board noted that the Fund had less than one-year of operational history and was not able to evaluate an investment performance record for the Fund. The Board noted that it would have an opportunity to review such information in connection with future annual reviews. The Board noted that, in the meantime, it received monthly performance reports from the Manager. |
| • | | The Board noted that the contractual management fee was in the 2nd quintile of the expense group and the actual management fee and the actual total expenses were in the 1st quintile. |
Guardian Multi-Sector Bond VIP Fund
| • | | The Board noted that the Fund’s performance was in the 5th quintile of its performance universe for the 1-year and 3-year periods The Board also noted that the Fund’s performance was lower than the benchmark index for the 1-year and 3-year periods. |
| • | | The Board noted that the contractual management fee and actual total expenses were in the 1st quintile and the actual management fee was in the 2nd quintile. |
Guardian Short Duration Bond VIP Fund
| • | | The Board noted that the Fund had less than one-year of operational history and was not able to evaluate an |
| | | investment performance record for the Fund. The Board noted that it would have an opportunity to review such information in connection with future annual reviews. The Board noted that, in the meantime, it received monthly performance reports from the Manager. |
| • | | The Board noted that the contractual management fee and actual total expenses were in the 3rd quintile of the expense group and the actual management fee was in the 1st quintile of the expense group. |
Guardian U.S. Government Securities VIP Fund
| • | | The Board noted that the Fund’s performance was in the 1st quintile of its performance universe for the 1-year period and in the 2nd quintile of its performance universe for the 3-year period. The Board also noted that the Fund’s performance was higher than the benchmark index for the 1-year and 3-year periods. |
| • | | The Board noted that the contractual management fee and the actual management fee were in the 1st quintile of the expense group and the actual total expenses were in the 2nd quintile of the expense group. |
Conclusion
Based on a comprehensive consideration and evaluation of all of the information and factors summarized above, among others, the Board as a whole, including the Independent Trustees, approved the Agreements.
SUPPLEMENTAL INFORMATION (UNAUDITED)
The Statement of Additional Information (“SAI”) includes additional information about the Trust’s Trustees and Officers and is available, without charge, upon request by calling toll-free 1-888-GUARDIAN (1-888-482-7342) or by visiting our website at http://guardianvpt.onlineprospectus.net/GuardianVPT/Prospectuses.
Portfolio Holdings and Proxy Voting Procedures
The Fund files its complete schedule of portfolio holdings with the Securities and Exchange Commission for the first and third quarters of each fiscal year as an exhibit to its reports on Form N-PORT. The Fund’s Form N-PORT reports are available on the Securities and Exchange Commission’s website at https://www.sec.gov. The Fund’s Form N-PORT information is also available, without charge, upon request, by calling toll-free 1-888-GUARDIAN (1-888-482-7342) or by visiting our website at http://guardianvpt.onlineprospectus.net/GuardianVPT/Prospectuses.
A description of the policies and procedures that the Fund uses to determine how to vote proxies relating to portfolio securities is included in the SAI. The SAI and information regarding how the Fund voted proxies relating to portfolio securities during the most recent 12-month period ended June 30 may be obtained (i) without charge, upon request, by calling toll-free 1-888-GUARDIAN (1-888-482-7342) or by visiting our website at http://guardianvpt.onlineprospectus.net/GuardianVPT/Prospectuses; and (ii) on the Securities and Exchange Commission’s website at https://www.sec.gov.
This report is transmitted to shareholders only. It is not authorized for use as an offer of sale or a solicitation of an offer to buy shares of the Fund unless accompanied or preceded by the Fund’s current prospectus. Past performance results shown in this report should not be considered a representation of future performance. Investment returns and principal value of shares will fluctuate so that shares, when redeemed, may be worth more or less than their original cost. Statements and other information herein are as dated and are subject to change.

The Guardian Life Insurance Company of America New York, NY 10001-2159
PUB11741
Guardian Variable
Products Trust
2023
Semiannual Report
All Data as of June 30, 2023
Guardian Small Cap Core VIP Fund

| | |
| Not FDIC insured. May lose value. No bank guarantee. | | www.guardianlife.com |
TABLE OF CONTENTS
Guardian Small Cap Core VIP Fund
Except as otherwise specifically stated, all information, including portfolio security positions, is as of June 30, 2023. Fund holdings will vary. Information contained herein has been obtained from sources believed reliable, but is not guaranteed.
GUARDIAN SMALL CAP CORE VIP FUND
Fund Characteristics (unaudited)
| | |
| Total Net Assets: $274,392,964 | | |
|
| |
Sector Allocation1 As of June 30, 2023 |
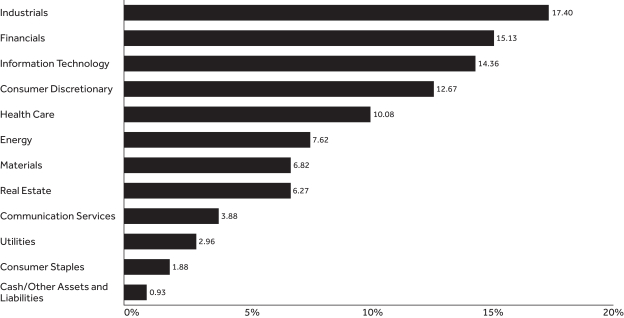 |
| | | | |
| |
Top Ten Holdings2 As of June 30, 2023 | |
| | |
| Holding | | % of Total
Net Assets | |
| Murphy USA, Inc. | | | 2.14% | |
| Textainer Group Holdings Ltd. | | | 1.98% | |
| Eagle Materials, Inc. | | | 1.89% | |
| Bloomin’ Brands, Inc. | | | 1.80% | |
| SMART Global Holdings, Inc. | | | 1.79% | |
| Century Communities, Inc. | | | 1.79% | |
| Kite Realty Group Trust REIT | | | 1.78% | |
| Euronet Worldwide, Inc. | | | 1.77% | |
| Terex Corp. | | | 1.76% | |
| Itron, Inc. | | | 1.54% | |
| Total | | | 18.24% | |
| 1 | The Fund’s holdings are allocated to each sector based on the MSCI Global Industry Classification Standard (GICS®). Cash includes short-term investments and net other assets and liabilities. |
| 2 | Portfolio holdings are subject to change and should not be considered a recommendation to buy or sell individual securities. |
UNDERSTANDING YOUR FUND’S EXPENSES (UNAUDITED)
By investing in the Fund, you incur two types of costs: (1) transaction costs and (2) ongoing costs, including, as applicable, investment advisory fees, distribution and/or service (12b-1) fees and other Fund expenses. The example below is intended to help you understand your ongoing costs (in dollars) of investing in the Fund and to compare these costs with the ongoing costs of investing in other mutual funds.
The example is based on an investment of $1,000 invested at the beginning of the period and held for the entire period from January 1, 2023 to June 30, 2023. The table below shows the Fund’s expenses in two ways:
Expenses based on actual return
This section of the table provides information about actual account values and actual expenses. You may use the information in this section, together with the amount you invested, to estimate the expenses that you paid over the period. Simply divide your account value by $1,000 (for example, an $8,600 account value divided by $1,000 = 8.6), then multiply the result by the number in the section under the heading entitled “Expenses Paid During Period” to estimate the expenses you paid on your account during this period.
Expenses based on hypothetical 5% return for comparison purposes
This section of the table provides information about hypothetical account values and hypothetical expenses based on the Fund’s actual expense ratio and an assumed rate of return of 5% per year before expenses, which is not the Fund’s actual return. The hypothetical account values and expenses may not be used to estimate the actual ending account balance or expenses you paid for the period. You may use this information to compare the ongoing costs of investing in the Fund with the cost of investing in other mutual funds. To do so, compare this 5% hypothetical example with the 5% hypothetical examples that appear in the shareholder reports of the other funds.
Note that the expenses shown in the table are meant to highlight your ongoing costs only and do not reflect any transactional costs, such as sales charges (loads), redemption fees, or exchange fees. Therefore the second section is useful in comparing ongoing costs only, and will not help you determine the relative total costs of owning different funds. If these transactional costs were included, your costs would have been higher. Charges and expenses at the insurance company separate account level are not reflected in the table.
| | | | | | | | | | | | | | |
| | | | | |
| | | Beginning
Account Value 1/1/23 | | Ending Account Value
6/30/23 | | | Expenses Paid During Period* 1/1/23-6/30/23 | | | Expense Ratio During Period 1/1/23-6/30/23 | |
| Based on Actual Return | | $1,000.00 | | $ | 1,127.10 | | | $ | 5.49 | | | | 1.04% | |
| Based on Hypothetical Return (5% Return Before Expenses) | | $1,000.00 | | $ | 1,019.64 | | | $ | 5.21 | | | | 1.04% | |
| * | Expenses are equal to the Fund’s annualized expense ratio as indicated, multiplied by the average account value over the period, multiplied by 181/365 (to reflect the one-half year period). |
SCHEDULE OF INVESTMENTS — GUARDIAN SMALL CAP CORE VIP FUND
| | | | | | | | |
| June 30, 2023 (unaudited) | | Shares | | | Value | |
| Common Stocks – 99.1% | |
| |
| Automobile Components – 0.9% | |
| | | |
Visteon Corp.(1) | | | 16,540 | | | $ | 2,375,309 | |
| | | | | | | | | |
| | |
| | | | | 2,375,309 | |
| Banks – 6.5% | |
| | | |
Bank OZK | | | 83,993 | | | | 3,373,159 | |
| | | |
Cadence Bank | | | 138,369 | | | | 2,717,567 | |
| | | |
Prosperity Bancshares, Inc. | | | 47,500 | | | | 2,682,800 | |
| | | |
Washington Federal, Inc. | | | 101,705 | | | | 2,697,216 | |
| | | |
WesBanco, Inc. | | | 95,626 | | | | 2,448,982 | |
| | | |
Wintrust Financial Corp. | | | 53,306 | | | | 3,871,082 | |
| | | | | | | | | |
| | |
| | | | | 17,790,806 | |
| Biotechnology – 0.6% | |
| | | |
Ultragenyx Pharmaceutical, Inc.(1) | | | 34,922 | | | | 1,610,952 | |
| | | | | | | | | |
| | |
| | | | | 1,610,952 | |
| Chemicals – 2.3% | |
| | | |
Avient Corp. | | | 60,728 | | | | 2,483,775 | |
| | | |
Olin Corp. | | | 72,123 | | | | 3,706,401 | |
| | | | | | | | | |
| | |
| | | | | 6,190,176 | |
| Communications Equipment – 0.8% | |
| | | |
Extreme Networks, Inc.(1) | | | 88,100 | | | | 2,295,005 | |
| | | | | | | | | |
| | |
| | | | | 2,295,005 | |
| Construction & Engineering – 1.4% | |
| | | |
Primoris Services Corp. | | | 129,672 | | | | 3,951,106 | |
| | | | | | | | | |
| | |
| | | | | 3,951,106 | |
| Construction Materials – 1.9% | |
| | | |
Eagle Materials, Inc. | | | 27,800 | | | | 5,182,476 | |
| | | | | | | | | |
| | |
| | | | | 5,182,476 | |
| Consumer Finance – 3.7% | |
| | | |
Encore Capital Group, Inc.(1) | | | 65,566 | | | | 3,187,819 | |
| | | |
OneMain Holdings, Inc. | | | 85,100 | | | | 3,718,019 | |
| | | |
PROG Holdings, Inc.(1) | | | 100,351 | | | | 3,223,274 | |
| | | | | | | | | |
| | |
| | | | | 10,129,112 | |
| Diversified Consumer Services – 0.7% | |
| | | |
Stride, Inc.(1) | | | 52,876 | | | | 1,968,573 | |
| | | | | | | | | |
| | |
| | | | | 1,968,573 | |
| Diversified Telecommunication Services – 0.7% | |
| | | |
Anterix, Inc.(1) | | | 60,439 | | | | 1,915,312 | |
| | | | | | | | | |
| | |
| | | | | 1,915,312 | |
| Electric Utilities – 1.4% | |
| | | |
Portland General Electric Co. | | | 81,604 | | | | 3,821,515 | |
| | | | | | | | | |
| | |
| | | | | 3,821,515 | |
| Electrical Equipment – 1.3% | |
| | | |
EnerSys | | | 32,835 | | | | 3,563,254 | |
| | | | | | | | | |
| | |
| | | | | 3,563,254 | |
| Electronic Equipment, Instruments & Components – 3.5% | |
| | | |
Advanced Energy Industries, Inc. | | | 24,692 | | | | 2,751,924 | |
| | | |
Itron, Inc.(1) | | | 58,442 | | | | 4,213,668 | |
| | | |
nLight, Inc.(1) | | | 165,122 | | | | 2,546,181 | |
| | | | | | | | | |
| | |
| | | | | 9,511,773 | |
| | | | | | | | |
| June 30, 2023 (unaudited) | | Shares | | | Value | |
| Energy Equipment & Services – 2.7% | |
| | | |
Atlas Energy Solutions, Inc., Class A | | | 135,900 | | | $ | 2,359,224 | |
| | | |
Helmerich & Payne, Inc. | | | 57,194 | | | | 2,027,527 | |
| | | |
Valaris Ltd.(1) | | | 50,200 | | | | 3,159,086 | |
| | | | | | | | | |
| | |
| | | | | 7,545,837 | |
| Entertainment – 0.7% | |
| | | |
PLAYSTUDIOS, Inc.(1)(2) | | | 325,000 | | | | 1,595,750 | |
| | | |
PLAYSTUDIOS, Inc.(1) | | | 44,181 | | | | 216,929 | |
| | | | | | | | | |
| | |
| | | | | 1,812,679 | |
| Financial Services – 3.1% | |
| | | |
Euronet Worldwide, Inc.(1) | | | 41,400 | | | | 4,859,118 | |
| | | |
NMI Holdings, Inc., Class A(1) | | | 144,294 | | | | 3,725,671 | |
| | | | | | | | | |
| | |
| | | | | 8,584,789 | |
| Food Products – 1.9% | |
| | | |
Sovos Brands, Inc.(1) | | | 120,793 | | | | 2,362,711 | |
| | | |
Utz Brands, Inc. | | | 170,104 | | | | 2,782,902 | |
| | | | | | | | | |
| | |
| | | | | 5,145,613 | |
| Ground Transportation – 1.2% | |
| | | |
Marten Transport Ltd. | | | 155,789 | | | | 3,349,464 | |
| | | | | | | | | |
| | |
| | | | | 3,349,464 | |
| Health Care Equipment & Supplies – 1.9% | |
| | | |
Lantheus Holdings, Inc.(1) | | | 27,044 | | | | 2,269,532 | |
| | | |
Novocure Ltd.(1) | | | 16,767 | | | | 695,831 | |
| | | |
Omnicell, Inc.(1) | | | 32,359 | | | | 2,383,888 | |
| | | | | | | | | |
| | |
| | | | | 5,349,251 | |
| Health Care Providers & Services – 4.5% | |
| | | |
Acadia Healthcare Co., Inc.(1) | | | 43,205 | | | | 3,440,846 | |
| | | |
CareMax, Inc.(1) | | | 90,158 | | | | 280,391 | |
| | | |
CareMax, Inc.(1)(2) | | | 213,620 | | | | 664,358 | |
| | | |
HealthEquity, Inc.(1) | | | 63,682 | | | | 4,020,882 | |
| | | |
R1 RCM, Inc.(1) | | | 214,447 | | | | 3,956,547 | |
| | | | | | | | | |
| | |
| | | | | 12,363,024 | |
| Hotel & Resort REITs – 0.9% | |
| | | |
RLJ Lodging Trust | | | 247,783 | | | | 2,544,731 | |
| | | | | | | | | |
| | |
| | | | | 2,544,731 | |
| Hotels, Restaurants & Leisure – 3.0% | |
| | | |
Bloomin’ Brands, Inc. | | | 183,700 | | | | 4,939,693 | |
| | | |
Everi Holdings, Inc.(1) | | | 224,855 | | | | 3,251,403 | |
| | | | | | | | | |
| | |
| | | | | 8,191,096 | |
| Household Durables – 1.8% | |
| | | |
Century Communities, Inc. | | | 64,038 | | | | 4,906,592 | |
| | | | | | | | | |
| | |
| | | | | 4,906,592 | |
| Independent Power and Renewable Electricity Producers – 0.9% | |
| | | |
Sunnova Energy International, Inc.(1) | | | 140,909 | | | | 2,580,044 | |
| | | | | | | | | |
| | |
| | | | | 2,580,044 | |
| Industrial REITs – 0.9% | |
| | | |
LXP Industrial Trust | | | 253,178 | | | | 2,468,486 | |
| | | | | | | | | |
| | |
| | | | | 2,468,486 | |
| | | | |
| The accompanying notes are an integral part of these financial statements. | | | | 3 |
SCHEDULE OF INVESTMENTS — GUARDIAN SMALL CAP CORE VIP FUND
| | | | | | | | |
| June 30, 2023 (unaudited) | | Shares | | | Value | |
| Insurance – 1.0% | |
| | | |
Assured Guaranty Ltd. | | | 50,505 | | | $ | 2,818,179 | |
| | | | | | | | | |
| | |
| | | | | 2,818,179 | |
| IT Services – 1.6% | |
| | | |
BigCommerce Holdings, Inc.(1) | | | 283,700 | | | | 2,822,815 | |
| | | |
Thoughtworks Holding, Inc.(1) | | | 220,621 | | | | 1,665,689 | |
| | | | | | | | | |
| | |
| | | | | 4,488,504 | |
| Leisure Products – 1.4% | |
| | | |
Vista Outdoor, Inc.(1) | | | 138,683 | | | | 3,837,359 | |
| | | | | | | | | |
| | |
| | | | | 3,837,359 | |
| Life Sciences Tools & Services – 0.8% | |
| | | |
Maravai LifeSciences Holdings, Inc., Class A(1) | | | 170,600 | | | | 2,120,558 | |
| | | | | | | | | |
| | |
| | | | | 2,120,558 | |
| Machinery – 4.8% | |
| | | |
Crane Co. | | | 25,400 | | | | 2,263,648 | |
| | | |
Crane NXT Co. | | | 42,200 | | | | 2,381,768 | |
| | | |
Hillman Solutions Corp.(1) | | | 419,175 | | | | 3,776,767 | |
| | | |
Terex Corp. | | | 80,800 | | | | 4,834,264 | |
| | | | | | | | | |
| | |
| | | | | 13,256,447 | |
| Media – 2.5% | |
| | | |
Gambling.com Group Ltd.(1) | | | 130,800 | | | | 1,339,392 | |
| | | |
Gray Television, Inc. | | | 252,716 | | | | 1,991,402 | |
| | | |
Integral Ad Science Holding Corp.(1) | | | 199,235 | | | | 3,582,245 | |
| | | | | | | | | |
| | |
| | | | | 6,913,039 | |
| Metals & Mining – 2.7% | |
| | | |
Commercial Metals Co. | | | 41,766 | | | | 2,199,397 | |
| | | |
Constellium SE(1) | | | 165,144 | | | | 2,840,477 | |
| | | |
MP Materials Corp.(1) | | | 100,076 | | | | 2,289,739 | |
| | | | | | | | | |
| | |
| | | | | 7,329,613 | |
| Mortgage REITs – 0.8% | |
| | | |
Redwood Trust, Inc. | | | 345,158 | | | | 2,198,656 | |
| | | | | | | | | |
| | |
| | | | | 2,198,656 | |
| Multi-Utilities – 0.6% | |
| | | |
Black Hills Corp. | | | 28,359 | | | | 1,708,913 | |
| | | | | | | | | |
| | |
| | | | | 1,708,913 | |
| Office REITs – 1.4% | |
| | | |
Corporate Office Properties Trust | | | 156,134 | | | | 3,708,182 | |
| | | | | | | | | |
| | |
| | | | | 3,708,182 | |
| Oil, Gas & Consumable Fuels – 4.9% | |
| | | |
CNX Resources Corp.(1) | | | 140,014 | | | | 2,481,048 | |
| | | |
HF Sinclair Corp. | | | 85,148 | | | | 3,798,452 | |
| | | |
Magnolia Oil & Gas Corp., Class A | | | 184,045 | | | | 3,846,541 | |
| | | |
Matador Resources Co. | | | 62,000 | | | | 3,243,840 | |
| | | | | | | | | |
| | |
| | | | | 13,369,881 | |
| Pharmaceuticals – 2.3% | |
| | | |
Cara Therapeutics, Inc.(1) | | | 187,700 | | | | 531,191 | |
| | | |
Intra-Cellular Therapies, Inc.(1) | | | 37,571 | | | | 2,378,996 | |
| | | |
Prestige Consumer Healthcare, Inc.(1) | | | 55,600 | | | | 3,304,308 | |
| | | | | | | | | |
| | |
| | | | | 6,214,495 | |
| | | | | | | | |
| June 30, 2023 (unaudited) | | Shares | | | Value | |
| Professional Services – 3.0% | |
| | | |
ICF International, Inc. | | | 29,994 | | | $ | 3,730,954 | |
| | | |
Korn Ferry | | | 51,561 | | | | 2,554,332 | |
| | | |
Sterling Check Corp.(1) | | | 159,023 | | | | 1,949,622 | |
| | | | | | | | | |
| | |
| | | | | 8,234,908 | |
| Retail REITs – 1.8% | |
| | | |
Kite Realty Group Trust | | | 219,248 | | | | 4,898,000 | |
| | | | | | | | | |
| | |
| | | | | 4,898,000 | |
| Semiconductors & Semiconductor Equipment – 4.1% | |
| | | |
indie Semiconductor, Inc., Class A(1) | | | 239,700 | | | | 2,253,180 | |
| | | |
Photronics, Inc.(1) | | | 153,800 | | | | 3,966,502 | |
| | | |
SMART Global Holdings, Inc.(1) | | | 169,175 | | | | 4,907,767 | |
| | | | | | | | | |
| | |
| | | | | 11,127,449 | |
| Software – 4.4% | |
| | | |
CommVault Systems, Inc.(1) | | | 46,225 | | | | 3,356,859 | |
| | | |
NCR Corp.(1) | | | 159,182 | | | | 4,011,386 | |
| | | |
Rapid7, Inc.(1) | | | 59,634 | | | | 2,700,228 | |
| | | |
WalkMe Ltd.(1) | | | 199,390 | | | | 1,914,144 | |
| | | | | | | | | |
| | |
| | | | | 11,982,617 | |
| Specialized REITs – 1.3% | |
| | | |
PotlatchDeltic Corp. | | | 67,800 | | | | 3,583,230 | |
| | | | | | | | | |
| | |
| | | | | 3,583,230 | |
| Specialty Retail – 4.9% | |
| | | |
Group 1 Automotive, Inc. | | | 14,129 | | | | 3,646,695 | |
| | | |
Murphy USA, Inc. | | | 18,879 | | | | 5,873,446 | |
| | | |
Petco Health & Wellness Co., Inc.(1) | | | 182,156 | | | | 1,621,188 | |
| | | |
Urban Outfitters, Inc.(1) | | | 70,882 | | | | 2,348,321 | |
| | | | | | | | | |
| | |
| | | | | 13,489,650 | |
| Trading Companies & Distributors – 5.6% | |
| | | |
Custom Truck One Source, Inc.(1) | | | 368,617 | | | | 2,484,478 | |
| | | |
GATX Corp. | | | 28,401 | | | | 3,656,345 | |
| | | |
Rush Enterprises, Inc., Class A | | | 63,060 | | | | 3,830,264 | |
| | | |
Textainer Group Holdings Ltd. | | | 137,940 | | | | 5,432,077 | |
| | | | | | | | | |
| | |
| | | | | 15,403,164 | |
| | |
Total Common Stocks
(Cost $240,496,524) | | | | 271,829,819 | |
| | | | | | | | |
| | | | | | | | |
| | | Principal
Amount | | | Value | |
| Repurchase Agreements – 0.3% | |
Fixed Income Clearing Corp., 1.52%, dated 6/30/2023, proceeds at maturity value of $952,223, due 7/3/2023(3) | | | $952,103 | | | | 952,103 | |
| | |
Total Repurchase Agreements
(Cost $952,103) | | | | 952,103 | |
| | |
Total Investments – 99.4%
(Cost $241,448,627) | | | | 272,781,922 | |
| | |
| Assets in excess of other liabilities – 0.6% | | | | 1,611,042 | |
| | |
| Total Net Assets – 100.0% | | | | $274,392,964 | |
| | | | |
| 4 | | | | The accompanying notes are an integral part of these financial statements. |
SCHEDULE OF INVESTMENTS — GUARDIAN SMALL CAP CORE VIP FUND
| (1) | Non–income–producing security. |
| (2) | Security is restricted. Acquired through a private placement transaction exempt from registration under the Securities Act of 1933. May be subject to legal or contractual restrictions on resale. At June 30, 2023, the aggregate market value of these securities amounted to $2,260,108, representing 0.8% of net assets. |
| (3) | The table below presents collateral for repurchase agreements. |
| | | | | | | | | | | | | | | | |
| Security | | Coupon | | | Maturity
Date | | | Principal
Amount | | | Value | |
| U.S. Treasury Note | | | 4.625% | | | | 3/15/2026 | | | $ | 957,100 | | | $ | 971,242 | |
Legend:
REITs — Real Estate Investment Trusts
The following is a summary of the inputs used as of June 30, 2023 in valuing the Fund’s investments. For more information on valuation inputs, please refer to Note 2a of the accompanying Notes to Financial Statements.
| | | | | | | | | | | | | | | | |
| | | Valuation Inputs | | | | |
| Investments in Securities (unaudited) | | Level 1 | | | Level 2 | | | Level 3 | | | Total | |
| Common Stocks | | $ | 271,829,819 | | | $ | — | | | $ | — | | | $ | 271,829,819 | |
| Repurchase Agreements | | | — | | | | 952,103 | | | | — | | | | 952,103 | |
| Total | | $ | 271,829,819 | | | $ | 952,103 | | | $ | — | | | $ | 272,781,922 | |
| | | | |
| The accompanying notes are an integral part of these financial statements. | | | | 5 |
FINANCIAL INFORMATION — GUARDIAN SMALL CAP CORE VIP FUND
| | | | |
Statement of Assets and Liabilities As of June 30, 2023 (unaudited) | |
Assets | | | | |
| | |
Investments, at value | | $ | 272,781,922 | |
| | |
Receivable for investments sold | | | 1,793,221 | |
| | |
Dividends/interest receivable | | | 277,219 | |
| | |
Prepaid expenses | | | 3,035 | |
| | | | | |
| | |
Total Assets | | | 274,855,397 | |
| | | | | |
| | |
Liabilities | | | | |
| | |
Payable for fund shares redeemed | | | 189,947 | |
| | |
Investment advisory fees payable | | | 153,273 | |
| | |
Distribution fees payable | | | 55,534 | |
| | |
Accrued custodian and accounting fees | | | 15,690 | |
| | |
Accrued audit fees | | | 13,978 | |
| | |
Accrued trustees’ and officers’ fees | | | 4,321 | |
| | |
Accrued expenses and other liabilities | | | 29,690 | |
| | | | | |
| | |
Total Liabilities | | | 462,433 | |
| | | | | |
| | |
Total Net Assets | | $ | 274,392,964 | |
| | | | | |
| | |
Net Assets Consist of: | | | | |
| | |
Paid-in capital | | $ | 199,603,148 | |
| | |
Distributable earnings | | | 74,789,816 | |
| | | | | |
| | |
Total Net Assets | | $ | 274,392,964 | |
| | | | | |
Investments, at Cost | | $ | 241,448,627 | |
| | | | | |
| | |
Pricing of Shares | | | | |
| | |
Shares of Beneficial Interest Outstanding with No Par Value | | | 22,922,805 | |
| | |
Net Asset Value Per Share | | | $11.97 | |
| | | | | |
| | | | |
Statement of Operations For the Six Months Ended June 30, 2023 (unaudited) | |
Investment Income | | | | |
| | |
Dividends | | $ | 1,840,202 | |
| | |
Interest | | | 21,431 | |
| | | | | |
| | |
Total Investment Income | | | 1,861,633 | |
| | | | | |
| | |
Expenses | | | | |
| | |
Investment advisory fees | | | 869,126 | |
| | |
Distribution fees | | | 314,901 | |
| | |
Professional fees | | | 36,743 | |
| | |
Trustees’ and officers’ fees | | | 30,933 | |
| | |
Administrative fees | | | 18,987 | |
| | |
Custodian and accounting fees | | | 18,902 | |
| | |
Transfer agent fees | | | 7,774 | |
| | |
Shareholder reports | | | 5,506 | |
| | |
Other expenses | | | 7,057 | |
| | | | | |
| | |
Total Expenses | | | 1,309,929 | |
| | | | | |
| | |
Net Investment Income/(Loss) | | | 551,704 | |
| | | | | |
| | |
Realized Gain/(Loss) and Change in Unrealized Appreciation/(Depreciation) on Investments | | | | |
| | |
Net realized gain/(loss) from investments | | | (3,523,636 | ) |
| | |
Net change in unrealized appreciation/(depreciation) on investments | | | 34,993,894 | |
| | | | | |
| | |
Net Gain on Investments | | | 31,470,258 | |
| | | | | |
| | |
Net Increase in Net Assets Resulting From Operations | | $ | 32,021,962 | |
| | | | | |
| | | | | |
| | | | |
| 6 | | | | The accompanying notes are an integral part of these financial statements. |
FINANCIAL INFORMATION — GUARDIAN SMALL CAP CORE VIP FUND
| | | | | | | | |
Statements of Changes in Net Assets Six Months Ended Numbers are unaudited | | | | | | |
| | | |
| | | For the
Six Months Ended
6/30/23 | | | For the
Year Ended
12/31/22 | |
| | | | |
Operations | |
| | | |
Net investment income/(loss) | | $ | 551,704 | | | $ | 636,886 | |
| | | |
Net realized gain/(loss) from investments | | | (3,523,636 | ) | | | (1,545,322 | ) |
| | | |
Net change in unrealized appreciation/(depreciation) on investments | | | 34,993,894 | | | | (62,682,085 | ) |
| | | | | | | | | |
| | | |
Net Increase/(Decrease) in Net Assets Resulting from Operations | | | 32,021,962 | | | | (63,590,521 | ) |
| | | | | | | | | |
| |
Capital Share Transactions | |
| | | |
Proceeds from sales of shares | | | 22,596,648 | | | | 69,252,183 | |
| | | |
Cost of shares redeemed | | | (26,751,064 | ) | | | (43,280,112 | ) |
| | | | | | | | | |
| | | |
Net Increase/(Decrease) in Net Assets Resulting from Capital Share Transactions | | | (4,154,416 | ) | | | 25,972,071 | |
| | | | | | | | | |
| | | |
Net Increase/(Decrease) in Net Assets | | | 27,867,546 | | | | (37,618,450 | ) |
| | | | | | | | | |
| |
Net Assets | |
| | | |
Beginning of period | | | 246,525,418 | | | | 284,143,868 | |
| | | | | | | | | |
| | | |
End of period | | $ | 274,392,964 | | | $ | 246,525,418 | |
| | | | | | | | | |
| |
Other Information: | |
| | | |
Shares | | | | | | | | |
| | | |
Sold | | | 2,079,793 | | | | 5,747,650 | |
| | | |
Redeemed | | | (2,360,556 | ) | | | (3,722,078 | ) |
| | | | | | | | | |
| | | |
Net Increase/(Decrease) | | | (280,763 | ) | | | 2,025,572 | |
| | | | | | | | | |
| | | | | | | | | |
| | | | |
| The accompanying notes are an integral part of these financial statements. | | | | 7 |
FINANCIAL INFORMATION — GUARDIAN SMALL CAP CORE VIP FUND
The Financial Highlights table is intended to help you understand the Fund’s financial performance for the past six reporting periods (or, if shorter, the period since inception). Certain information reflects financial results for a single Fund share. The total returns in the table represent the rate that an investor would have earned (or lost) on an investment in the Fund.
| | | | | | | | | | | | | | | | | | | | | | | | |
Financial Highlights Six Months Ended Numbers are unaudited | | | | | | | | | | | | | | | | | | |
| | | Per Share Operating Performance | | | | |
| | | Net Asset Value,
Beginning of
Period | | | Net Investment
Income(1) | | | Net Realized
and Unrealized
Gain/(Loss) | | | Total
Operations | | | Net Asset
Value, End of
Period | | | Total
Return(2) | |
| | | | | | | |
Six Months Ended 6/30/23 | | $ | 10.62 | | | $ | 0.02 | | | $ | 1.33 | | | $ | 1.35 | | | $ | 11.97 | | | | 12.71 | %(4) |
| | | | | | | |
Year Ended 12/31/22 | | | 13.42 | | | | 0.03 | | | | (2.83) | | | | (2.80) | | | | 10.62 | | | | (20.86) | % |
| | | | | | | |
Year Ended 12/31/21 | | | 11.40 | | | | 0.00 | (5) | | | 2.02 | | | | 2.02 | | | | 13.42 | | | | 17.72 | % |
| | | | | | | |
Year Ended 12/31/20 | | | 11.13 | | | | 0.05 | | | | 0.22 | | | | 0.27 | | | | 11.40 | | | | 2.43 | % |
| | | | | | | |
Period Ended 12/31/19(6) | | | 10.00 | | | | 0.01 | | | | 1.12 | | | | 1.13 | | | | 11.13 | | | | 11.30 | %(4) |
| | | | |
| 8 | | | | The accompanying notes are an integral part of these financial statements. |
FINANCIAL INFORMATION — GUARDIAN SMALL CAP CORE VIP FUND
| | | | | | | | | | | | | | | | | | | | | | |
| | | | | | | | | | | | | | | | | |
| Ratios/Supplemental Data | |
Net Assets, End
of Period (000s) | | | Net Ratio of
Expenses to
Average
Net Assets(3) | | | Gross Ratio of
Expenses to
Average Net
Assets | | | Net Ratio of Net
Investment Income
to Average
Net Assets(3) | | | Gross Ratio of Net
Investment Income
to Average
Net Assets | | | Portfolio
Turnover Rate | |
| | | | | |
| $ | 274,393 | | | | 1.04% | (4) | | | 1.04% | (4) | | | 0.44% | (4) | | | 0.44% | (4) | | | 20% | (4) |
| | | | | |
| | 246,525 | | | | 1.04% | | | | 1.04% | | | | 0.23% | | | | 0.23% | | | | 48% | |
| | | | | |
| | 284,144 | | | | 1.04% | | | | 1.04% | | | | 0.01% | | | | 0.01% | | | | 45% | |
| | | | | |
| | 337,527 | | | | 1.05% | | | | 1.05% | | | | 0.53% | | | | 0.53% | | | | 69% | |
| | | | | |
| | 310,451 | | | | 1.01% | (4) | | | 1.09% | (4) | | | 0.57% | (4) | | | 0.49% | (4) | | | 98% | (4) |
| (1) | Calculated based on the average shares outstanding during the period. |
| (2) | Total returns do not reflect the effects of charges deducted pursuant to the terms of The Guardian Insurance & Annuity Company, Inc.’s variable contracts. Inclusion of such charges would reduce the total returns for all periods shown. |
| (3) | Net Ratio of Expenses to Average Net Assets and Net Ratio of Net Investment Income to Average Net Assets include the effect of fee waivers and expense limitations. |
| (4) | Ratios for periods less than one year have been annualized, except for total return and portfolio turnover rate. For the period ended December 31, 2019, certain non-recurring fees (i.e., audit fees) are not annualized. |
| (5) | Rounds to $0.00 per share. |
| (6) | Commenced operations on October 21, 2019. |
| | | | |
| The accompanying notes are an integral part of these financial statements. | | | | 9 |
NOTES TO FINANCIAL STATEMENTS — GUARDIAN SMALL CAP CORE VIP FUND
June 30, 2023 (unaudited)
1. Organization
Guardian Variable Products Trust (the “Trust”), a Delaware statutory trust organized on January 12, 2016, is registered under the Investment Company Act of 1940, as amended (the “1940 Act”), as an open-end management investment company. The Trust currently has twenty-four series. Guardian Small Cap Core VIP Fund (the “Fund”) is a series of the Trust. The Fund is a diversified fund and commenced operations on October 21, 2019. The financial statements for other series of the Trust are presented in separate reports.
The Trust has authorized an unlimited number of shares of beneficial interest with no par value. Shares are bought and sold at closing net asset value (“NAV”). Shares of the Fund are only sold to certain separate accounts of The Guardian Insurance & Annuity Company, Inc. (“GIAC”) that fund certain variable annuity contracts and variable life insurance policies issued by GIAC. GIAC is a wholly-owned subsidiary of The Guardian Life Insurance Company of America (“Guardian Life”).
The Fund seeks capital appreciation.
2. Significant Accounting Policies
The following is a summary of significant accounting policies followed by the Fund in the preparation of its financial statements. The Fund follows the investment company accounting and reporting guidance of the Financial Accounting Standards Board (“FASB”) Accounting Standards Codification Topic 946 Financial Services – Investment Companies. The following policies are in conformity with accounting principles generally accepted in the United States of America (“GAAP”). The preparation of financial statements in accordance with GAAP requires management to make estimates and assumptions that affect the reported amounts and disclosures in the financial statements. Actual results could differ from those estimates.
a. Investment Valuations The Board of Trustees has designated Park Avenue Institutional Advisers LLC (“Park Avenue”) as the valuation designee for the Fund pursuant to Rule 2a-5 under the 1940 Act. Park Avenue has established a Fair Valuation Committee and has adopted fair valuation procedures that provide methodologies for fair valuing securities. These procedures include monitoring the appropriateness of fair values based on results of ongoing valuation oversight, including but not limited to consideration of
security specific events, market events, and pricing vendor and broker-dealer due diligence. The Fair Valuation Committee oversees and carries out the policies for the valuation of investments held in the Fund. The Fair Valuation Committee is responsible for discussing and assessing the potential impacts to the fair values on an ongoing basis, and reports to the Board of Trustees on at least a quarterly basis.
Equity securities traded on an exchange other than NASDAQ Stock Market, LLC (“NASDAQ”) are valued at the last reported sale price on the principal exchange or market on which they are traded; or, if there were no sales that day, at the mean between the closing bid and ask prices. Securities traded on the NASDAQ are generally valued at the NASDAQ official closing price, which may not be the last sale price. If the NASDAQ official closing price is not available for a security, that security is generally valued at the mean between the closing bid and ask prices. Repurchase agreements are carried at cost, which approximates fair value (see Note 5d). Foreign securities are valued in the currencies of the markets in which they trade and then converted to U.S. dollars by the application of foreign exchange rates at the close of the New York Stock Exchange (“NYSE”). Forward foreign currency contracts, if any, are valued at the mean between the bid and ask rates for the specified time interpolated from rates for proximate time periods.
Securities for which market quotations are not readily available or securities whose values have been materially affected by events occurring before the Fund’s valuation time but after the close of the securities’ principal exchange or market are valued at their fair values as determined in good faith by Park Avenue, as the Board of Trustee’s valuation designee (as defined in Rule 2a-5 under the 1940 Act), in accordance with Park Avenue’s procedures and under the general oversight of the Board of Trustees. In addition, the values of the Fund’s investments in foreign securities are generally determined by a pricing service using pricing models designed to estimate likely changes in the values of those securities. Certain foreign equity instruments are valued by applying international fair value factors provided by approved pricing services. The factors seek to adjust the local closing price for movements of local markets post closing, but prior to the time the NAVs are calculated. Valuations reflected in this report are as of the report date. As a result, changes in valuation due to market events and/or issuer related events after the report date and prior to issuance of the report are not reflected herein.
NOTES TO FINANCIAL STATEMENTS — GUARDIAN SMALL CAP CORE VIP FUND
Various inputs are used in determining the valuation of the Fund’s investments. These inputs are summarized in three broad levels listed below.
| • | | Level 1 – unadjusted inputs using quoted prices in active markets for identical investments. |
| • | | Level 2 – other significant observable inputs, including, but not limited to, quoted prices for similar investments, inputs other than quoted prices that are observable for investments (such as interest rates, prepayment speeds, credit risks, price below current market value, etc.) or other market corroborated inputs. |
| • | | Level 3 – significant unobservable inputs (including the Fund’s own assumptions in determining the fair value of investments). |
Inputs may include price information, volatility statistics, specific and broad credit data, liquidity statistics, and other factors. A financial instrument’s level within the fair value hierarchy is based on the lowest level of any input; both individually and in aggregate, that is significant to the fair value measurement. However, the determination of what constitutes “observable” requires significant judgment by the Trust. The Trust considers observable data to be that market data which is readily available, regularly distributed or updated, reliable and verifiable, and provided by independent sources that are actively involved in the relevant market. The inputs or methodology used for valuing securities are not necessarily an indication of the risk associated with investing in those securities. Changes in valuation techniques may result in transfers into or out of a financial instrument’s assigned level within the hierarchy.
The FASB requires reporting entities to make disclosures about purchases, sales, issuances and settlements of Level 3 securities on a gross basis. For the six months ended June 30, 2023, there were no transfers into or out of Level 3 of the fair value hierarchy.
In determining a financial instrument’s placement within the hierarchy, the Trust separates the Fund’s investment portfolio into two categories: investments and derivatives (e.g., futures). A summary of inputs used to value the Fund’s assets and liabilities carried at fair value as of June 30, 2023 is included in the Schedule of Investments.
Investments Investments whose values are based on quoted market prices in active markets, and are therefore classified within Level 1, include active listed equities. Investments that trade in markets that are not
considered to be active, but are valued based on quoted market prices, dealer quotations or alternative pricing sources supported by observable inputs are classified within Level 2. These include certain U.S. government and sovereign obligations, private investment in public equity, most government agency securities, investment-grade corporate bonds, certain mortgage products, state, municipal and provincial obligations, and certain foreign equity securities, including securities whose prices may have been affected by events occurring after the close of trading on their principal exchange or market and, as a result, whose values are determined by a pricing service as described above, or securities whose values are otherwise determined using fair valuation methods approved by the Fund’s Board of Trustees.
Investments classified within Level 3 have significant unobservable inputs, as they trade infrequently or not at all. Level 3 investments include, among others, private placement securities. When observable prices are not available for these securities, the Trust uses one or more valuation techniques for which sufficient and reliable data is available. The inputs used by the Trust in estimating the value of Level 3 investments include, for example, the original transaction price, recent transactions in the same or similar instruments, completed or pending third-party transactions in the underlying investment or comparable issuers, subsequent rounds of financing, recapitalizations, and other transactions across the capital structure. Level 3 investments may also be adjusted to reflect illiquidity and/or non-transferability, with the amount of such discount estimated by the Trust in the absence of market information. Assumptions used by the Trust due to the lack of observable inputs may significantly impact the resulting fair value and therefore the Fund’s results of operations. As of June 30, 2023, the Fund had no securities classified as Level 3.
Derivatives Exchange-traded derivatives, such as futures contracts, exchange-traded option contracts and certain swaps, are typically classified within Level 1 or Level 2 of the fair value hierarchy depending on whether or not they are deemed to be actively traded. Certain non-exchange-traded derivatives, such as generic forwards, certain swaps and options, have inputs which can generally be corroborated by market data and are therefore classified within Level 2. During the six months ended June 30, 2023, the Fund did not hold any derivatives.
b. Securities Transactions Securities transactions are accounted for on the date securities are purchased or
NOTES TO FINANCIAL STATEMENTS — GUARDIAN SMALL CAP CORE VIP FUND
sold (trade date). Realized gains or losses on securities transactions are determined on the basis of specific identification.
c. Foreign Currency Translation The accounting records of the Fund are maintained in U.S. dollars. Investment securities and all other assets and liabilities of the Fund denominated in a foreign currency are generally translated into U.S. dollars at the exchange rates quoted at the close of the NYSE on each business day. The market value of investment securities and other assets and liabilities are translated at the exchange rate as of the valuation date. Purchases and sales of securities, income receipts, and expense payments are translated into U.S. dollars at the exchange rates in effect on the dates of the respective transactions. The Fund does not isolate the portion of the fluctuations on investments resulting from changes in foreign currency exchange rates from the fluctuations in market prices of investments held. Such fluctuations are included in the Net change in net realized and unrealized gain/(loss) from investments on the Statement of Operations.
Reported realized foreign currency gains and losses arise from the disposition of foreign currency, currency gains or losses realized between the trade and settlement dates on securities transactions, and the difference between the amounts of dividends, interest and foreign withholding taxes recorded on the Fund’s books on the transaction date and the U.S. dollar equivalent of the amounts actually received or paid. These reported realized foreign currency gains and losses, if any, are included in Net realized gain/(loss) from foreign currency transactions on the Statement of Operations. Unrealized foreign currency gains and losses arise from changes (due to changes in exchange rates) in the value of foreign currency and other assets and liabilities denominated in foreign currencies, which are held at period end, if any, and are included in Net change in unrealized appreciation/(depreciation) on translation of assets and liabilities in foreign currencies on the Statement of Operations.
d. Foreign Capital Gains Tax The Fund may be subject to foreign taxes on income, gains on investments or currency purchases/repatriation, a portion of which may be recoverable. The Fund will accrue such taxes and recoveries as applicable, based upon their current interpretation of tax rules and regulations that exist in the markets in which they invest.
e. Investment Income Dividend income net of foreign taxes withheld, if any, is generally recorded on the ex-dividend date. Distributions received from real
estate investment trusts, if any, may be classified as dividends, capital gains and/or return of capital. Interest income, which includes amortization/accretion of premium/discount, is determined using the interest income accrual method, and is accrued and recorded daily.
f. Allocation of Income and Expenses Many of the expenses of the Trust can be directly attributed to a specific series of the Trust. Expenses that cannot be directly attributed to a specific series of the Trust are generally apportioned among all the series in the Trust, based on relative net assets. In calculating net asset value per share for each series of the Trust, investment income, realized and unrealized gains and losses, and expenses other than series-specific expenses are allocated daily to each series based upon the proportion of net assets attributable to each series.
3. Transactions with Affiliates
a. Investment Advisory Fee and Expense Limitation Under the terms of the advisory agreement, which, after its two year initial term, is reviewed and approved annually by the Board of Trustees, the Fund pays an investment advisory fee to Park Avenue. Park Avenue is a wholly-owned subsidiary of Guardian Life and receives an investment advisory fee at an annual rate of 0.69% of the Fund’s average daily net assets. The fee is accrued daily and paid monthly.
Park Avenue has contractually agreed through April 30, 2024 to waive certain fees and/or reimburse certain expenses incurred by the Fund to the extent necessary to limit the Fund’s total annual operating expenses after fee waiver and/or expense reimbursement to 1.05% of the Fund’s average daily net assets (excluding, if applicable, any acquired fund fees and expenses, taxes, interest, transaction costs and brokerage commissions, litigation and extraordinary expenses). The limitation may not be increased or terminated prior to this time without action by the Board of Trustees, and may be terminated only upon approval of the Board of Trustees. Amounts waived or reimbursed by Park Avenue pursuant to any expense limitation will not be subject to Park Avenue’s recoupment rights. For the six months ended June 30, 2023, Park Avenue did not waive any fees or pay any Fund expenses.
Park Avenue has entered into a Sub-Advisory Agreement with ClearBridge Investments LLC (“ClearBridge”). ClearBridge is responsible for providing day-to-day investment advisory services to the Fund, subject to the supervision of Park Avenue and the oversight of the Board of Trustees. Sub-advisory fees
NOTES TO FINANCIAL STATEMENTS — GUARDIAN SMALL CAP CORE VIP FUND
are paid by Park Avenue and do not represent a separate or additional expense to the Fund.
b. Compensation of Trustees and Officers Trustees and officers who are interested persons of the Trust, as defined in the 1940 Act, receive no compensation from the Fund, except for the Chief Compliance Officer of the Trust. Trustees of the Trust who are not interested persons of the Trust, and the Chief Compliance Officer, receive compensation and reimbursement of expenses from the Trust.
c. Distribution Fees Park Avenue Securities LLC (“PAS”), a wholly-owned subsidiary of Guardian Life, is the principal underwriter of Fund shares. The Trust has entered into a distribution and service agreement with PAS, which governs the sale and distribution of shares of the Fund. Under a distribution and service plan adopted by the Trust (“12b-1 plan”), PAS is compensated for services in such capacity, including its expenses in connection with the promotion and distribution of shares of the Fund, at an annual rate of 0.25% of the Fund’s average daily net assets. For the six months ended June 30, 2023, the Fund paid distribution fees in the amount of $314,901 to PAS.
PAS has directed that certain payments under the 12b-1 plan be used to compensate GIAC for shareholder services provided to contract owners.
4. Federal Income Taxes
a. Distributions to Shareholders For federal income tax purposes, the Fund is treated as a disregarded entity (“DRE”). As a DRE, the Fund is not subject to an entity-level income tax; and any income, gains, losses, deductions, taxes, and credits of the Fund would instead be “passed through” directly to the separate accounts of GIAC that invest in the Fund and retain the same character for U.S. federal income tax purposes. In addition, the Fund is not required to distribute taxable income and capital gains for U.S. federal income tax purposes. Therefore, no dividends and capital gains distributions were paid by the Fund.
5. Investments
a. Investment Purchases and Sales The cost of investments purchased and the proceeds from investments sold (excluding short-term investments) amounted to $51,519,922 and $54,176,904, respectively, for the six months ended June 30, 2023. During the six months ended June 30, 2023, there were no purchases or sales of U.S. government securities.
b. Foreign Securities Foreign securities investments involve special risks and considerations not typically
associated with U.S. investments. These risks include, but are not limited to, currency risk; adverse political, regulatory, social, and economic developments; and less reliable information about issuers. Moreover, securities of some foreign issuers may be less liquid and their prices more volatile than those of comparable U.S. issuers.
c. Industry or Sector Concentration In its normal course of business, the Fund may invest a significant portion of its assets in companies within a limited number of industries or sectors. As a result, the Fund may be subject to a greater risk of loss than that of a fund invested in a wider spectrum of industries or sectors because the stocks of many or all of the companies in the industry, group of industries, sector, or sectors may decline in value due to developments adversely affecting the industry, group of industries, sector, or sectors.
d. Repurchase Agreements The Fund may invest in repurchase agreements to maintain liquidity and earn income over periods of time as short as overnight. The collateral for repurchase agreements is either cash or fully negotiable U.S. government securities (including U.S. government agency securities). Repurchase agreements are fully collateralized (including the interest accrued thereon) and such collateral is marked to market daily while the agreements remain in force. If the value of the collateral falls below the repurchase price plus accrued interest, the Fund will typically require the seller to deposit additional collateral by the next business day. If the request for additional collateral is not met, or the seller defaults, the Fund maintains the right to sell the collateral (although it may be prevented or delayed from doing so in certain circumstances) and may be required to claim any resulting loss against the seller. Park Avenue monitors the creditworthiness of the seller with which the Fund enters into repurchase agreements.
e. Restricted and Illiquid Securities A restricted security cannot be resold to the general public without prior registration under the Securities Act of 1933, as amended (except pursuant to an applicable exemption). The values of these securities may be highly volatile. If the security is subsequently registered and resold, the issuer would typically bear the expense of all registrations at no cost to the Fund. Restricted and illiquid securities are valued according to the policies and procedures adopted by the Trust’s Board of Trustees and are noted, if any, in the Fund’s Schedule of Investments. As of June 30, 2023, the Fund held two restricted securities, and did not hold any illiquid securities.
NOTES TO FINANCIAL STATEMENTS — GUARDIAN SMALL CAP CORE VIP FUND
f. Private Investment in Public Equity A Fund may invest in securities that are purchased in private investment in public equity (“PIPE”) transactions. PIPEs are an accredited investor’s purchase of stock in a public company at a discount to the current market value per share for the purpose of raising capital and may also issue warrants enabling a Fund to purchase additional shares at a price equal to or at a premium to current market prices. Securities acquired by a Fund in such transactions are subject to resale restrictions under securities laws. Because the shares issued in a PIPE transaction are “restricted securities” under the federal securities laws, a Fund cannot freely trade the securities until the issuer files a registration statement to provide for the public resale of the shares, which typically occurs after the completion of the PIPE transaction and the public registration process with the SEC is completed, a period which can last many months. While issuers in PIPE transactions typically agree that they will register the securities for resale by a Fund after the transaction closes (thereby removing resale restrictions), there is no guarantee that the securities will in fact be registered, or that the registration will be maintained. In addition, a PIPE issuer may require a Fund to agree to other resale restrictions as a condition to the sale of such securities. Thus, a Fund’s ability to resell securities acquired in PIPE transactions may be limited, and even though a public market may exist for such securities, the securities held by a Fund may be deemed illiquid.
g. Special Purpose Acquisition Companies A Fund may invest in stock, warrants, rights and other securities of special purpose acquisition companies (“SPACs”) or similar special purpose entities in a private placement transaction or as part of a public offering. A SPAC, sometimes referred to as “blank check company,” is a private or publicly traded company that raises investment capital for the purpose of acquiring or merging with an existing company. The shares of a SPAC are typically issued in “units” that include one share of common stock and one right or warrant (or partial right or warrant) conveying the right to purchase additional shares of common stock. At a specified time, the rights and warrants may be separated from the common stock at the election of the holder, after which time each security typically is freely tradeable. Private companies can combine with a SPAC to go public by taking the SPAC’s place on an exchange as an alternative to making an initial public offering. Additionally, a Fund may purchase units or shares of SPACs that have completed an IPO on a secondary market, during a SPAC’s IPO or through a PIPE offering. PIPE transactions involve the purchase of securities typically at a discount to the market price of the company’s common stock and may
be subject to transfer restrictions, which typically would make them less liquid than equity issued through a public offering. Investments in SPACs also have risks peculiar to the SPAC structure and investment process. Until an acquisition or merger is completed, a SPAC generally invests its assets, less a portion retained to cover expenses, in U.S. government securities, money market securities and cash and does not typically pay dividends in respect of its common stock. To the extent a SPAC is invested in cash or similar securities, this may impact a Fund’s ability to meet its investment objective. SPAC shareholders may not approve any proposed acquisition or merger, or an acquisition or merger, once effected, may prove unsuccessful. If an acquisition or merger is not completed within a pre-established period (typically, two years), the remainder of funds invested in the SPAC are returned to its shareholders. While a SPAC investor may receive both stock in the SPAC, as well as warrants or other rights at no marginal cost, those warrants or other rights may expire worthless or may be repurchased or retired by the SPAC at an unfavorable price. A Fund may also be delayed in receiving any redemption or liquidation proceeds from a SPAC to which it is entitled. An investment in a SPAC is typically subject to a higher risk of dilution by additional later offerings of interests in the SPAC or by other investors exercising existing rights to purchase shares of the SPAC. Moreover, interests in SPACs may be illiquid and/or be subject to restrictions on resale, which may remain for an extended time, and may only be traded in the over-the-counter market.
6. Temporary Borrowings
The Fund, with other funds managed by Park Avenue, is party to a credit agreement with respect to a $10 million committed revolving credit facility from State Street Bank and Trust Company (the “Credit Agreement”) for temporary borrowing purposes, including the meeting of redemption requests that otherwise might require the untimely disposition of securities. Interest is based on a daily fluctuating rate per annum equal to the Applicable Rate (as defined in the Credit Agreement) plus the Applicable Margin (as defined in the Credit Agreement) that is subject to change from time to time as and when the Applicable Rate changes. Under the current Credit Agreement, the Applicable Rate for any day is defined as the rate per annum equal to the sum of (a) 0.10% plus (b) the higher of (i) the Federal Funds Effective Rate for such day and (ii) the Overnight Bank Funding Rate for such day; the Applicable Margin is 1.25%. In addition to the interest charged on any borrowings by the Fund, each fund pays a commitment fee of 0.30% per annum on its share of the unused
NOTES TO FINANCIAL STATEMENTS — GUARDIAN SMALL CAP CORE VIP FUND
portion of the credit facility. The agreement is in place until January 5, 2024. The Fund did not utilize the credit facility during the six months ended June 30, 2023.
7. Indemnifications
Under the Trust’s organizational documents and, in some cases, by contract, officers and Trustees of the Trust are indemnified against certain liabilities arising out of the performance of their duties to the Fund. In addition, in the normal course of business, the Fund enters into contracts with its vendors and others that provide general indemnifications. The Fund’s maximum exposure under these arrangements is unknown as this would involve future claims that may be made against
the Fund that have not yet occurred. However, based on experience, the Fund expects the risk of loss to be remote.
8. Additional Information
The outbreak of COVID-19 has adversely impacted both local and global economies, including those in which the Fund may invest. These impacts include materially reduced consumer demand and economic output, disrupted supply chains, market closures, travel restrictions and quarantines, and strained healthcare systems. The Fund’s operations may be interrupted as a result, which may have a negative impact on the Fund’s investment performance.
SUPPLEMENTAL INFORMATION (UNAUDITED)
Liquidity Risk Management Program
In compliance with Rule 22e-4 under the Investment Company Act of 1940, as amended (the “Liquidity Rule”), Guardian Variable Products Trust (the “Trust”) has adopted and implemented a written liquidity risk management program (the “Program”) for each series of the Trust (each, a “Fund”), which is reasonably designed to assess and manage each Fund’s liquidity risk. The Fund’s “liquidity risk” is the risk that the Fund could not meet requests to redeem shares issued by the Fund without significant dilution of the remaining investors’ interests in the Fund.
The Board of Trustees of the Trust (the “Board”) Previously approved the designation of Park Avenue Institutional Advisers LLC (the “Administrator” or “PAIA”) as Program administrator. The Administrator established a Liquidity Risk Management Committee, which is comprised of certain officers of the Trust and PAIA, that assists the Administrator in the implementation and day-to-day administration of the Program and otherwise support carrying out the Administrator’s liquidity risk management responsibilities under the Program.
In accordance with the Program, each Fund’s liquidity risk is assessed no less frequently than annually, taking into consideration a variety of factors, including, as applicable, the Fund’s investment strategy and liquidity of portfolio investments, cash flow projections, and holdings of cash and cash equivalents, as well as borrowing arrangements and other funding sources. Certain factors are considered under both normal and reasonably foreseeable stressed conditions.
Each Fund portfolio investment is classified, no less than monthly, into one of four liquidity categories (including “highly liquid investments” and “illiquid investments,” discussed below) based on a determination of the number of days it is reasonably expected to take to convert the investment to cash, or sell or dispose of the investment, in current market conditions without significantly changing the investment’s market value.
The Liquidity Rule limits the Fund’s investments in illiquid investments by prohibiting the Fund from acquiring any illiquid investment if, immediately after the acquisition, the Fund would have invested more than 15% of its net assets in illiquid investments that are assets. The Program includes provisions reasonably designed to comply with this investment limitation. In addition, the Program includes provisions reasonably designed to comply with this investment limitation. In addition, the Program includes provisions reasonably designed to comply with the Liquidity Rule’s requirements relating to highly liquid investment minimums, which is a minimum amount of Fund net assets that must be invested in highly liquid investments that are assets, as applicable. The Fund was not required to adopt a highly liquid investment minimum during the period.
At a meeting of the Board held on March 29-30, 2023, the Board received a report (the “Report”) prepared by the Administrator addressing the Program’s operation and assessing the adequacy and effectiveness of its implementation for the period from January 1, 2022 through December 31, 2022 (the “Reporting Period”). The Report noted that the Administrator believes the Program operated effectively during the Reporting Period and continues to be reasonably designed to effectively assess and manage each Fund’s liquidity risk. The Report also noted that the Administrator believes the Program has been adequately and effectively implemented and the investment strategies for each Fund continue to be appropriate since its inception. In addition, the Report summarized the operation of the Program and the information and factors considered by the Administrator in its assessment of the Program’s implementation, such as the liquidity risk assessment framework and liquidity classification methodologies.
There can be no assurance that the Program will achieve its objectives under all circumstances. Please refer to the Fund’s prospectus for more information regarding the Fund’s exposure to liquidity risk and other risks to which an investment in the Fund may be subject.
SUPPLEMENTAL INFORMATION (UNAUDITED)
Approval of Investment Management and Sub-advisory Agreements
Section 15(c) of the Investment Company Act of 1940, as amended (the “1940 Act”), requires that a fund’s investment advisory and sub-advisory agreements be approved initially by the fund’s board of trustees. Section 15(c) also requires that the continuation of these agreements, after an initial term of up to two years, be annually reviewed and approved by the board. Any such agreement must be approved by a vote of a majority of the trustees who are not parties to the agreement or “interested persons” (as defined in the 1940 Act) of a party to the agreement at a meeting of the board called for the purpose of voting on such approval.
At a meeting of the Board of Trustees (the “Board”) of Guardian Variable Products Trust (the “Trust”) held on March 29-30, 2023 (the “Meeting”), the Board, including the trustees who are not parties to the agreement or “interested persons” as defined in the 1940 Act (the “Independent Trustees”), considered and voted unanimously to renew the existing investment management agreement between the Trust, on behalf of Guardian All Cap Core VIP Fund; Guardian Balanced Allocation VIP Fund; Guardian Core Fixed Income VIP Fund; Guardian Core Plus Fixed Income VIP Fund; Guardian Diversified Research VIP Fund; Guardian Equity Income VIP Fund; Guardian Global Utilities VIP Fund; Guardian Growth & Income VIP Fund; Guardian Integrated Research VIP Fund; Guardian International Growth VIP Fund; Guardian International Equity VIP Fund; Guardian Large Cap Disciplined Growth VIP Fund; Guardian Large Cap Disciplined Value VIP Fund; Guardian Large Cap Fundamental Growth VIP Fund; Guardian Mid Cap Relative Value VIP Fund; Guardian Mid Cap Traditional Growth VIP Fund; Guardian Multi-Sector Bond VIP Fund; Guardian Select Mid-Cap Core VIP Fund; Guardian Short Duration Bond VIP Fund; Guardian Small Cap Core VIP Fund; Guardian Small-Mid Cap Core VIP Fund; Guardian Strategic Large Cap Core VIP Fund; Guardian Total Return Bond VIP Fund and Guardian U.S. Government Securities VIP Fund (each, a “Fund,” and together, the “Funds”), in substantially the form presented at this meeting (the “Management Agreement”); and Park Avenue Institutional Advisers LLC (the “Manager”) for a one-year term.
The Board, including the Independent Trustees, also considered and voted unanimously to renew the existing sub-advisory agreements (the “Sub-Advisory Agreements,” collectively with the Management Agreement and Sub-Subadvisory Agreement, the “Agreements”) between the Manager and investment
advisory firms engaged to serve as sub-advisers to certain of the Funds (the “Sub-Advised Funds”), namely (i) ClearBridge Investments, LLC with respect to Guardian Small Cap Core VIP Fund; (ii) Putnam Investment Management, LLC with respect to Guardian Diversified Research VIP Fund; (iii) AllianceBernstein L.P. with respect to Guardian Growth & Income VIP Fund and Guardian Strategic Large Cap Core VIP Fund; (iv) J.P. Morgan Investment Management Inc. with respect to Guardian International Growth VIP Fund; (v) Schroder Investment Management North America Inc. with respect to Guardian International Equity VIP Fund; (vi) Wellington Management Company LLP with respect to Guardian Balanced Allocation VIP Fund, Guardian Equity Income VIP Fund, Guardian Integrated Research VIP Fund, Guardian Large Cap Disciplined Growth VIP Fund and Guardian Global Utilities VIP Fund; (vii) Boston Partners Global Investors, Inc. with respect to Guardian Large Cap Disciplined Value VIP Fund; (viii) Janus Henderson Investors US LLC with respect to Guardian Mid Cap Traditional Growth VIP Fund; (ix) Allspring Global Investments, LLC with respect to Guardian Mid Cap Relative Value VIP Fund and Guardian Small-Mid Cap Core VIP Fund; (x) Lord, Abbett & Co. LLC with respect to Guardian Core Plus Fixed Income VIP Fund; (xi) FIAM LLC with respect to Guardian Select Mid Cap Core VIP Fund; and (xii) Massachusetts Financial Services Company with respect to Guardian All Cap Core VIP Fund, each in substantially the form presented at this meeting, (each, a “Sub-Adviser” and collectively, the “Sub-Advisers”) for a one-year term.
The Board, including the Independent Trustees, also considered and voted unanimously to renew the existing sub-subadvisory agreement (the “Sub-Subadvisory Agreement”) between Schroder Investment Management North America Inc. and Schroder Investment Management North America Limited (also a Sub-Adviser) with respect to Guardian International Equity VIP Fund for a one-year term.
The Board is responsible for overseeing the management of each Fund. In determining whether to renew its approval of the Agreements, the Trustees evaluated information and factors that they considered to be relevant and appropriate through the exercise of their own business judgment. The Trustees considered certain information and factors in light of advice furnished to them by legal counsel to the Trust and, in the case of the Independent Trustees, their independent legal counsel. In advance of the Meeting, the Trustees received materials and information designed to assist their consideration of the Agreements. The Trustees received written responses
SUPPLEMENTAL INFORMATION (UNAUDITED)
from the Manager and each Sub-Adviser to a series of questions and requests for information encompassing a wide variety of topics provided by independent counsel on behalf of the Independent Trustees. The Independent Trustees also received materials and information regarding the legal standards applicable to their consideration of the Agreements and the process and criteria used by the Manager to identify and select the Sub-Advisers.
During the course of their deliberations, the Independent Trustees met twice to discuss and evaluate the materials, information and Agreements in executive session with their independent legal counsel, outside of the presence of the Trustees who are not Independent Trustees and representatives from Fund management, the Manager or any Sub-Adviser.
In reaching its decisions to renew its approval of the Agreements, the Board took into account the materials and information described above, as well as other materials and information provided to the Board throughout the year. Individual Trustees may have given different weight to different factors and information with respect to each Agreement, and the Trustees did not identify any single factor or information that, in isolation, would be controlling in deciding to approve the Agreements. The discussion below is intended to summarize the broad factors that figured prominently in the Board’s decisions to renew its approval of the Agreements rather than to be all-inclusive. These broad factors included: (i) the nature, extent and quality of the services provided to the Funds by the Manager and to the Sub-advised Funds by the Sub-Advisers; (ii) the investment performance of each Fund; (iii) estimated profitability of the Manager; (iv) fees and expenses; (v) the extent to which economies of scale may exist, and the extent to the benefits of economies of scale are shared with the Funds; and (vi) any other benefits derived by the Manager or the Sub-Advisers (or their respective affiliates) from their relationships with the Funds.
Nature, Extent and Quality of Services
The Trustees considered information regarding the nature, extent and quality of services provided to the Funds by the Manager. The Trustees also considered, among other things, the terms of the Management Agreement and the range of investment advisory services provided by the Manager. In addition, the Trustees reviewed the range of non-investment advisory services provided by the Manager consistent with the terms of the Management Agreement, notably coordinating the preparation and filing of various
regulatory documents, coordinating the preparation and assembly of Board meeting materials, and assisting the Board with certain valuation matters. The Board also received a description of the Manager’s and each Sub-Adviser’s business continuity plans and of their respective approaches to data privacy and cybersecurity, and related testing. The Board received information regarding the response of the Manager and the Sub-Advisers to the COVID-19 pandemic, including the continuation of remote work arrangements and return-to-office plans. The Board also received information about the Manager’s role as administrator of the Funds’ liquidity risk management program, the Manager’s approach to risk management, and the Manager’s vendor oversight programs.
The Trustees considered that the Sub-advised Funds operate in a “manager-of-managers” structure and reviewed the responsibilities that the Manager has under this structure, including monitoring and evaluating the performance of the Sub-Advisers, monitoring the Sub-Advisers for adherence to the stated investment objectives, strategies, policies and restrictions of the Funds and supervising the Sub-Advisers with respect to the services that the Sub-Advisers would provide under the Sub-Advisory Agreements. The Trustees also considered the process used by the Manager, consistent with this structure, to identify and recommend sub-advisers, and the Manager’s ability to monitor and oversee sub-advisers and recommend replacement sub-advisers, when necessary, and provide other services under the Management Agreement. The Board noted that investment management staff of the Manager and the Trust’s Chief Compliance Officer conduct oversight meetings with the Sub-Advisers on a periodic basis, follow through with additional inquiries on any questions or concerns that arise during the meetings and, as necessary, then report the results of the meetings to the Board. The Trustees reviewed information regarding the experience and background of the Manager’s key personnel and the Manager’s organizational structure and resources, including investment, legal and administrative capabilities of the Manager. In this regard, the Trustees recognized that the Funds may benefit from the Manager’s ability to use resources and capabilities of its affiliates in providing services to the Funds.
The Trustees considered information regarding the nature, extent and quality of services provided to the Sub-advised Funds by the Sub-Advisers. The Trustees also considered, among other things, the terms of the Sub-advisory Agreements and the range of investment
SUPPLEMENTAL INFORMATION (UNAUDITED)
advisory services provided by the Sub-Advisers under the oversight of the Manager. In evaluating these investment advisory services, the Trustees considered, among other things, the Sub-Advisers’ investment philosophies, styles and/or processes and approaches to managing the respective Sub-advised Funds. The Trustees received and evaluated information regarding the background, education, expertise and/or experience of the investment professionals who serve as portfolio managers for the Sub-advised Funds and the capabilities and resources of the Sub-Advisers.
Based upon these considerations, the Trustees concluded, within the context of their full deliberations, that the nature, extent and quality of services provided to the Funds by the Manager and the Sub-advised Funds by each respective Sub-Adviser were appropriate.
Investment Performance
In connection with each of its regular quarterly meetings, the Board receives information on the performance of each Fund, including net performance, relative performance rankings within the relevant Morningstar peer group, and performance as compared to benchmark index returns. At each quarterly Board meeting, members of the Manager’s funds management team review with the Board the economic and market environment, absolute and relative performance of each Fund, and any relevant information about risk management and style consistency in connection with management of the Funds. The Board considered investment performance for each Fund over the one-year, three-year (where available), five-year (where available) and since-inception periods.
The Board also received and reviewed a report prepared by Broadridge Financial Solutions (“Broadridge”), an independent provider of mutual fund industry data, which included comparisons of the performance of each Fund to performance of an appropriate peer universe. For details regarding each Fund’s performance, see the “Fund-by-Fund Factors” section below.
The Manager discussed with the Board factors contributing to the Funds’ performance results. In addition, for certain Funds, the Manager provided to the Board longer term performance records of the Sub-Advisers for strategies used in managing the Funds. The Board concluded that the investment performance generated by the Manager and each Sub-Adviser was generally satisfactory, or, that any steps being taken by the Manager and Sub-Advisers to address any performance issues were satisfactory.
Profitability
The Board received and considered the Manager’s estimate of its profitability, which included allocations by the Manager of its costs in providing management services to the Funds. The Board considered the estimated profitability of the Manager both overall and on a Fund-by-Fund basis.
The Board received and considered profitability information from most of the Sub-Advisers, but noted that the Manager had negotiated the fees with the Sub-Advisers at arm’s-length. Accordingly, the Board concluded that the profitability of the Sub-Advisers is a less relevant factor than Manager profitability.
Based on the consideration of this information, the Board concluded that the profitability of the Funds to the Manager was acceptable.
Fees and Expenses
The Trustees considered the management fees paid by the Funds to the Manager under the Management Agreement and evaluated the reasonableness of these fees. The Trustees received and reviewed comparative information with respect to the management fee and total expenses for each Fund and the management fees and total expenses for a peer group of other funds selected by Broadridge. The Trustees considered the Manager’s commitment to limit the total expenses of each Fund through an expense limitation agreement with the Trust. Although the Board recognized that the comparisons between the management fees and actual expenses of the Funds and those of the identified peer group are imprecise, given different terms of agreements and variations in fund strategies, the Trustees found that the comparative information supported their consideration and approval of the management fees and evaluation of the total expenses. For details regarding each Fund’s fee and expense comparisons, see the “Fund-by-Fund Factors” section below.
The Trustees considered the sub-advisory fees paid under the Sub-advisory Agreements and evaluated the reasonableness of those fees. The Trustees also considered that the fees paid to the Sub-Advisers would be paid by the Manager and not the Funds and that the Manager had negotiated the fees with the Sub-Advisers at arm’s-length.
Based on the consideration of the information and factors summarized above, as well as other relevant information and factors, the Board concluded that the management and sub-advisory fees were reasonable in
SUPPLEMENTAL INFORMATION (UNAUDITED)
light of the nature, extent and quality of services rendered to the Funds by the Manager and the Sub-Advisers.
Economies of Scale
The Board considered the extent to which economies of scale may exist, and the extent to the benefits of economies of scale are shared with the Funds. In this regard, the Board noted that for sixteen of twenty-four Funds, the management and sub-advisory fee included breakpoints that are tiered based on growth in asset levels of each such Fund and that for the other Funds, the fees reflected appropriate levels based on current and expected asset levels. The Board also noted that the expenses of the Funds are subject to expense limitations provided by the Manager. The Board noted that expected economies of scale, where they exist, may be shared through the use of fee breakpoints, expense limitations by the Manager, and/or a lower overall fee.
Ancillary Benefits
The Board considered the potential benefits, other than management fees, that the Manager and/or its affiliates may receive because of the Manager’s relationship with the Funds. The Trustees considered that the Funds were designed to serve as investment options under variable contracts issued by affiliates of the Manager that would receive fees under those contracts and that Park Avenue Securities LLC, an affiliate of the Manager and principal underwriter of the Funds, and participating insurance companies, including insurance companies affiliated with the Manager, would be entitled to receive fees from the Funds under a plan of distribution adopted pursuant to Rule 12b-1 under the 1940 Act. The Trustees considered that the Manager and its affiliates may benefit from (i) greater efficiencies in annuity administration and operations and potential cost savings due to a reduction in the number of unaffiliated funds available as annuity contract investment options, and (ii) increased dividends-received deductions due to the Funds’ status under the tax laws as disregarded entities. In addition, the Trustees considered the potential benefits, other than sub-advisory fees, that the Sub-Advisers and their affiliates may receive because of their relationships with the Funds, including the ability to receive research from soft dollar commissions consistent with Trust policies. The Trustees concluded that benefits that may accrue to the Manager and its affiliates are reasonable and the benefits that may accrue to the Sub-Advisers and their affiliates are consistent with those expected for a sub-adviser to a mutual fund such as the applicable Fund.
Fund-by-Fund Factors
The Broadridge report groups fees, expenses and performance into five quintiles, with the top quintile having the highest performance or lowest fees/expenses, and the bottom quintile having the lowest performance or highest fees/expenses. For purposes of the descriptions below, a Fund’s performance is considered “in line with” the benchmark index if it is within 0.20%.
Guardian Large Cap Fundamental Growth VIP Fund
| • | | The Board noted that the Fund’s performance was in the 3rd quintile of its performance universe for the 1-year period and in the 4th quintile for its performance universe for the 3-year and 5-year periods. The Board also noted that the Fund’s performance was below the benchmark index for the 1-year, 3-year and 5-year periods. |
| • | | The Board noted that the contractual management fee, the actual management fee and actual total expenses were in the 1st quintile of the expense group. |
Guardian Large Cap Disciplined Growth VIP Fund
| • | | The Board noted that the Fund’s performance was in the 3rd quintile of its performance universe for the 1-year and 3-year periods and in the 2nd quintile for the 5-year period. The Board also noted that the Fund’s performance was below the benchmark index for the 1-year, 3-year and 5-year periods. |
| • | | The Board noted that the contractual management fee, the actual management fee and actual total expenses were in the 1st quintile of the expense group. |
Guardian Integrated Research VIP Fund
| • | | The Board noted that the Fund’s performance was in the 5th quintile of its performance universe for the 1-year and 5-year periods and in the 4th quintile for 3-year period. The Board also noted that the Fund’s performance was below the benchmark index for the 1-year, 3-year and 5-year periods. |
| • | | The Board noted that the contractual management fee, the actual management fee and actual total expenses were in the 1st quintile of the expense group. |
Guardian Diversified Research VIP Fund
| • | | The Board noted that the Fund’s performance was in the 3rd quintile of its performance universe for the 1-year and 3-year periods and in the 2nd quintile for the 5-year period. The Board also noted that the Fund’s performance was higher than the benchmark |
SUPPLEMENTAL INFORMATION (UNAUDITED)
| | | index for the 1-year period. The Board note that the Fund’s performance was lower than the benchmark index for the 3-year and 5-year periods. |
| • | | The Board noted that the contractual management fee and actual management fee were in the 1st quintile of the expense group and that actual total expenses were in the 3rd quintile. |
Guardian Strategic Large Cap Core VIP Fund
| • | | The Board noted that the Fund’s performance was in the 1st quintile of its performance universe for the 1-year period. The Board acknowledged the Fund’s short operational history. The Board noted that the Fund’s performance was higher than the benchmark index for the 1-year period. |
| • | | The Board noted that the contractual management fee, the actual management fee and actual total expenses were in the 1st quintile of the expense group. |
Guardian Large Cap Disciplined Value VIP Fund
| • | | The Board noted that the Fund’s performance was in the 3rd quintile of its performance universe for the 1-year and 3-year periods and in the 4th quintile for the 5-year period. The Board also noted that the Fund’s performance was higher than the benchmark index for the 1-year and 3-year periods. The Board noted that the Fund’s performance was in line with the benchmark index for the 5-year period. |
| • | | The Board noted that the contractual management fee was in the 2nd quintile of the expense group, the actual management fee was in the 1st quintile of the expense group and that actual total expenses were in the 3rd quintile. |
Guardian Growth & Income VIP Fund
| • | | The Board noted that the Fund’s performance was in the 3rd quintile of its performance universe for the 1-year, 3-year and 5-year periods. The Board also noted that the Fund’s performance was higher than the benchmark index for the 1-year, 3-year and 5-year periods. |
| • | | The Board noted that the contractual management fee and the actual management fee were in the 1st quintile of the expense group and that actual total expenses were in the 3rd quintile. |
Guardian Equity Income VIP Fund
| • | | The Board noted that the Fund had less than one-year of operational history and was not able to evaluate an |
| | | investment performance record for the Fund. The Board noted that it would have an opportunity to review such information in connection with future annual reviews. The Board noted that, in the meantime, it received monthly performance reports from the Manager. |
| • | | The Board noted that the contractual management fee, the actual management fee and actual total expenses were in the 1st quintile of the expense group. |
Guardian All Cap Core VIP Fund
| • | | The Board noted that the Fund’s performance was in the 3rd quintile of its performance universe for the 1-year period. The Board acknowledged the Fund’s short operational history. The Board noted that the Fund’s performance was higher than the benchmark index for the 1-year period. |
| • | | The Board noted that the contractual management fee, the actual management fee and actual total expenses were in the 1st quintile of the expense group. |
Guardian Mid Cap Traditional Growth VIP Fund
| • | | The Board noted that the Fund’s performance was in the 1st quintile of its performance universe for the 1-year period and in the 2nd quintile for the 3-year and 5-year periods. The Board also noted that the Fund’s performance was higher than the benchmark index for the 1-year, 3-year and 5-year periods. |
| • | | The Board noted that the contractual management fee and actual management fee were in the 1st quintile of the expense group and that the actual total expenses were in the 4th quintile. |
Guardian Select Mid Cap Core VIP Fund
| • | | The Board noted that the Fund’s performance was in the 3rd quintile of its performance universe for the 1-year period. The Board acknowledged the Fund’s short operational history. The Board noted that the Fund’s performance was lower than the benchmark index for the 1-year period. |
| • | | The Board noted that the contractual management fee, the actual management fee and actual total expenses were in the 1st quintile of the expense group. |
Guardian Mid Cap Relative Value VIP Fund
| • | | The Board noted that the Fund’s performance was in the 2nd quintile of its performance universe for the 1-year, 3-year and 5-year periods. The Board also noted that the Fund’s performance was higher than the benchmark index for the 1-year, 3-year and 5-year periods. |
SUPPLEMENTAL INFORMATION (UNAUDITED)
| • | | The Board noted that the contractual management fee and the actual management fee were in the 2nd quintile of the expense group and the actual total expenses were in the 3rd quintile of the expense group. |
Guardian Small-Mid Cap Core VIP Fund
| • | | The Board noted that the Fund’s performance was in the 5th quintile of its performance universe for the 1-year period. The Board acknowledged the Fund’s short operational history. The Board noted that the Fund’s performance was higher than the benchmark index for the 1-year period. |
| • | | The Board noted that the contractual management fee, the actual management fee and actual total expenses were in the 1st quintile of the expense group. |
Guardian Small Cap Core VIP Fund
| • | | The Board noted that the Fund’s performance was in the 5th quintile of its performance universe for the 1-year and 3-year periods. The Board noted that the Fund’s performance was lower than the benchmark index for the 1-year and 3-year periods. |
| • | | The Board noted that the contractual management fee and the actual management fee were in the 1st quintile of the expense group and the actual total expenses were in the 2nd quintile of the expense group. |
Guardian International Growth VIP Fund
| • | | The Board noted that the Fund’s performance was in the 4th quintile of its performance universe for the 1-year period, in the 2nd quintile of its performance universe for the 3-year period and in the 3rd quintile of its performance universe for the 5-year period. The Board also noted that the Fund’s performance was lower than the benchmark index for the 1-year and 5-year periods. The Board noted that the Fund’s performance was higher than the benchmark index for the 3-year period. |
| • | | The Board noted that the contractual management fee and actual management fee were in the 2nd quintile of the expense group and that the actual total expenses were in the 3rd quintile. |
Guardian International Equity VIP Fund
| • | | The Board noted that the Fund’s performance was in the 5th quintile of its performance universe for the 1-year, 3-year and 5-year periods. The Board also |
| | | noted that the Fund’s performance was lower than the benchmark index for the 1-year, 3-year and 5-year periods. |
| • | | The Board noted that the contractual management fee, the actual management fee and the actual total expenses were in the 2nd quintile of the expense group. |
Guardian Global Utilities VIP Fund
| • | | The Board noted that the Fund’s performance was in the 5th quintile of its performance universe for the 1-year period and in the 4th quintile of its performance universe for the 3-year period. The Board noted that the Fund’s performance was higher than the benchmark index for the 1-year and 3-year periods. |
| • | | The Board noted that the contractual management fee and the actual management fee were in the 1st quintile of the expense group and the actual total expenses were in the 2nd quintile of the expense group. |
Guardian Balanced Allocation VIP Fund
| • | | The Board noted that the Fund had less than one-year of operational history and was not able to evaluate an investment performance record for the Fund. The Board noted that it would have an opportunity to review such information in connection with future annual reviews. The Board noted that, in the meantime, it received monthly performance reports from the Manager. |
| • | | The Board noted that the contractual management fee, the actual management fee and actual total expenses were in the 1st quintile of the expense group. |
Guardian Core Plus Fixed Income VIP Fund
| • | | The Board noted that the Fund’s performance was in the 3rd quintile of its performance universe for the 1-year and 3-year periods and in the 4th quintile of its performance universe for the 5-year period. The Board also noted that the Fund’s performance was lower than the benchmark index for the 1-year and 5-year periods. The Board noted that the Fund’s performance was in line with the benchmark index for the 3-year period. |
| • | | The Board noted that the contractual management fee and actual management fee were in the 2nd quintile of the expense group and that actual total expenses were in the 3rd quintile. |
SUPPLEMENTAL INFORMATION (UNAUDITED)
Guardian Total Return Bond VIP Fund
| • | | The Board noted that the Fund’s performance was in the 5th quintile of its performance universe for the 1-year and 3-year periods. The Board also noted that the Fund’s performance was lower than the benchmark index for the 1-year and 3-year periods. |
| • | | The Board noted that the contractual management fee and actual management fee were in the 2nd quintile and the actual total expenses were in the 3rd quintile. |
Guardian Core Fixed Income VIP Fund
| • | | The Board noted that the Fund had less than one-year of operational history and was not able to evaluate an investment performance record for the Fund. The Board noted that it would have an opportunity to review such information in connection with future annual reviews. The Board noted that, in the meantime, it received monthly performance reports from the Manager. |
| • | | The Board noted that the contractual management fee was in the 2nd quintile of the expense group and the actual management fee and the actual total expenses were in the 1st quintile. |
Guardian Multi-Sector Bond VIP Fund
| • | | The Board noted that the Fund’s performance was in the 5th quintile of its performance universe for the 1-year and 3-year periods The Board also noted that the Fund’s performance was lower than the benchmark index for the 1-year and 3-year periods. |
| • | | The Board noted that the contractual management fee and actual total expenses were in the 1st quintile and the actual management fee was in the 2nd quintile. |
Guardian Short Duration Bond VIP Fund
| • | | The Board noted that the Fund had less than one-year of operational history and was not able to evaluate an investment performance record for the Fund. The Board noted that it would have an opportunity to review such information in connection with future annual reviews. The Board noted that, in the meantime, it received monthly performance reports from the Manager. |
| • | | The Board noted that the contractual management fee and actual total expenses were in the 3rd quintile of the expense group and the actual management fee was in the 1st quintile of the expense group. |
Guardian U.S. Government Securities VIP Fund
| • | | The Board noted that the Fund’s performance was in the 1st quintile of its performance universe for the 1-year period and in the 2nd quintile of its performance universe for the 3-year period. The Board also noted that the Fund’s performance was higher than the benchmark index for the 1-year and 3-year periods. |
| • | | The Board noted that the contractual management fee and the actual management fee were in the 1st quintile of the expense group and the actual total expenses were in the 2nd quintile of the expense group. |
Conclusion
Based on a comprehensive consideration and evaluation of all of the information and factors summarized above, among others, the Board as a whole, including the Independent Trustees, approved the Agreements.
SUPPLEMENTAL INFORMATION (UNAUDITED)
The Statement of Additional Information (“SAI”) includes additional information about the Trust’s Trustees and Officers and is available, without charge, upon request by calling toll-free 1-888-GUARDIAN (1-888-482-7342) or by visiting our website at http://guardianvpt.onlineprospectus.net/GuardianVPT/Prospectuses.
Portfolio Holdings and Proxy Voting Procedures
The Fund files its complete schedule of portfolio holdings with the Securities and Exchange Commission for the first and third quarters of each fiscal year as an exhibit to its reports on Form N-PORT. The Fund’s Form N-PORT reports are available on the Securities and Exchange Commission’s website at https://www.sec.gov. The Fund’s Form N-PORT information is also available, without charge, upon request, by calling toll-free 1-888-GUARDIAN (1-888-482-7342) or by visiting our website at http://guardianvpt.onlineprospectus.net/GuardianVPT/Prospectuses.
A description of the policies and procedures that the Fund uses to determine how to vote proxies relating to portfolio securities is included in the SAI. The SAI and information regarding how the Fund voted proxies relating to portfolio securities during the most recent 12-month period ended June 30 may be obtained (i) without charge, upon request, by calling toll-free 1-888-GUARDIAN (1-888-482-7342) or by visiting our website at http://guardianvpt.onlineprospectus.net/GuardianVPT/Prospectuses; and (ii) on the Securities and Exchange Commission’s website at https://www.sec.gov.
This report is transmitted to shareholders only. It is not authorized for use as an offer of sale or a solicitation of an offer to buy shares of the Fund unless accompanied or preceded by the Fund’s current prospectus. Past performance results shown in this report should not be considered a representation of future performance. Investment returns and principal value of shares will fluctuate so that shares, when redeemed, may be worth more or less than their original cost. Statements and other information herein are as dated and are subject to change.

The Guardian Life Insurance Company of America New York, NY 10001-2159
PUB10526
Guardian Variable
Products Trust
2023
Semiannual Report
All Data as of June 30, 2023
Guardian Total Return Bond VIP Fund

| | |
| Not FDIC insured. May lose value. No bank guarantee. | | www.guardianlife.com |
TABLE OF CONTENTS
Guardian Total Return Bond VIP Fund
Except as otherwise specifically stated, all information, including portfolio security positions, is as of June 30, 2023. Fund holdings will vary. Information contained herein has been obtained from sources believed reliable, but is not guaranteed.
GUARDIAN TOTAL RETURN BOND VIP FUND
Fund Characteristics (unaudited)
| | |
| Total Net Assets: $256,622,441 | | |
| | | | |
| | |
Bond Sector Allocation1 As of June 30, 2023 | | | |
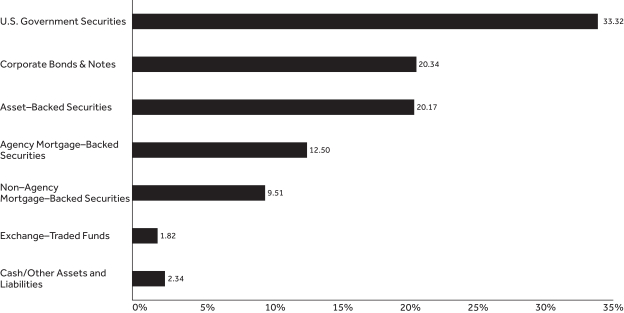 | | | | |
| |
Bond Quality Allocation2 As of June 30, 2023 | |
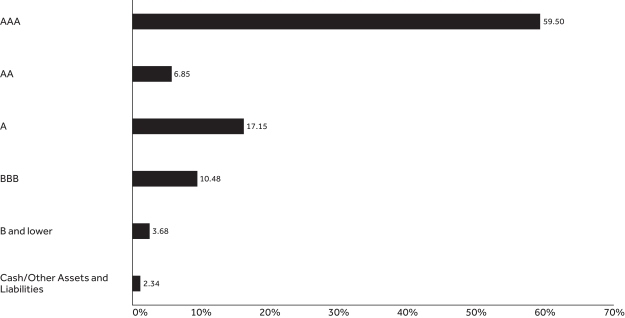 | | | | |
GUARDIAN TOTAL RETURN BOND VIP FUND
| | | | | | | | | | | | |
| | | | |
Top Ten Holdings1 As of June 30, 2023 | | | | | | | | | |
| | | | |
| Holding | | Coupon Rate | | | Maturity Date | | | % of Total Net Assets | |
| U.S. Treasury Bond | | | 3.875% | | | | 5/15/2043 | | | | 9.32% | |
| U.S. Treasury Note | | | 4.000% | | | | 6/30/2028 | | | | 9.11% | |
| U.S. Treasury Note | | | 4.625% | | | | 6/30/2025 | | | | 7.29% | |
| U.S. Treasury Bond | | | 3.625% | | | | 5/15/2053 | | | | 4.69% | |
| U.S. Treasury Note | | | 3.750% | | | | 5/31/2030 | | | | 2.92% | |
| Federal National Mortgage Association | | | 3.000% | | | | 5/1/2052 | | | | 1.62% | |
| Federal National Mortgage Association | | | 3.500% | | | | 6/1/2052 | | | | 1.55% | |
| Federal Home Loan Mortgage Corp. | | | 3.500% | | | | 6/1/2052 | | | | 1.34% | |
| Federal National Mortgage Association | | | 2.500% | | | | 1/1/2052 | | | | 1.28% | |
| Octagon Loan Funding Ltd. | | | 7.545% | | | | 11/18/2031 | | | | 1.19% | |
| Total | | | | 40.31% | |
| 1 | Portfolio holdings are subject to change and should not be considered a recommendation to buy or sell individual securities. Cash includes short-term investments and net other assets and liabilities. |
| 2 | The Bond Quality Allocation chart displays the percentage of fund assets allocated to each rating. Rating agencies’ independent ratings of individual securities are aggregated by Bloomberg, and market weights are reported using Standard & Poor’s letter rating conventions. Rating methodology uses the middle rating of Moody’s Investors Service, Inc., Standard & Poor’s Ratings Services, and Fitch Ratings. When a rating from only two of the rating agencies is available, the lower rating is used. Credit quality ratings assigned by a rating agency are subject to change periodically and are not absolute standards of credit quality. Rating agencies may fail to make timely changes in credit ratings, and an issuer’s current financial condition may be better or worse than a rating indicates. In formulating investment decisions for the Fund, Park Avenue Institutional Advisers LLC develops its own analysis of the credit quality and risks associated with individual debt instruments, rather than relying exclusively on rating agency ratings. |
UNDERSTANDING YOUR FUND’S EXPENSES (UNAUDITED)
By investing in the Fund, you incur two types of costs: (1) transaction costs and (2) ongoing costs, including, as applicable, investment advisory fees, distribution and/or service (12b-1) fees and other Fund expenses. The example below is intended to help you understand your ongoing costs (in dollars) of investing in the Fund and to compare these costs with the ongoing costs of investing in other mutual funds.
The example is based on an investment of $1,000 invested at the beginning of the period and held for the entire period from January 1, 2023 to June 30, 2023. The table below shows the Fund’s expenses in two ways:
Expenses based on actual return
This section of the table provides information about actual account values and actual expenses. You may use the information in this section, together with the amount you invested, to estimate the expenses that you paid over the period. Simply divide your account value by $1,000 (for example, an $8,600 account value divided by $1,000 = 8.6), then multiply the result by the number in the section under the heading entitled “Expenses Paid During Period” to estimate the expenses you paid on your account during this period.
Expenses based on hypothetical 5% return for comparison purposes
This section of the table provides information about hypothetical account values and hypothetical expenses based on the Fund’s actual expense ratio and an assumed rate of return of 5% per year before expenses, which is not the Fund’s actual return. The hypothetical account values and expenses may not be used to estimate the actual ending account balance or expenses you paid for the period. You may use this information to compare the ongoing costs of investing in the Fund with the cost of investing in other mutual funds. To do so, compare this 5% hypothetical example with the 5% hypothetical examples that appear in the shareholder reports of the other funds.
Note that the expenses shown in the table are meant to highlight your ongoing costs only and do not reflect any transactional costs, such as sales charges (loads), redemption fees, or exchange fees. Therefore the second section is useful in comparing ongoing costs only, and will not help you determine the relative total costs of owning different funds. If these transactional costs were included, your costs would have been higher. Charges and expenses at the insurance company separate account level are not reflected in the table.
| | | | | | | | | | | | | | | | |
| | | | | |
| | | Beginning
Account Value 1/1/23 | | | Ending Account Value
6/30/23 | | | Expenses Paid During Period* 1/1/23-6/30/23 | | | Expense Ratio During Period 1/1/23-6/30/23 | |
| Based on Actual Return | | $ | 1,000.00 | | | $ | 1,016.70 | | | $ | 3.95 | | | | 0.79% | |
| Based on Hypothetical Return (5% Return Before Expenses) | | $ | 1,000.00 | | | $ | 1,020.88 | | | $ | 3.96 | | | | 0.79% | |
| * | Expenses are equal to the Fund’s annualized expense ratio as indicated, multiplied by the average account value over the period, multiplied by 181/365 (to reflect the one-half year period). |
SCHEDULE OF INVESTMENTS — GUARDIAN TOTAL RETURN BOND VIP FUND
| | | | | | | | |
| June 30, 2023 (unaudited) | | Principal Amount | | | Value | |
| Agency Mortgage–Backed Securities – 12.5% | |
| | | |
Federal Home Loan Mortgage Corp.
3.00% due 3/1/2052 | | $ | 2,102,057 | | | $ | 1,851,950 | |
3.50% due 6/1/2052 | | | 3,775,111 | | | | 3,440,293 | |
4.00% due 10/1/2037 | | | 435,714 | | | | 420,640 | |
4.00% due 6/1/2052 | | | 704,253 | | | | 660,624 | |
4.50% due 9/1/2052 | | | 480,763 | | | | 462,066 | |
5.00% due 12/1/2052 | | | 1,251,206 | | | | 1,225,695 | |
| | | |
Federal National Mortgage Association
2.50% due 1/1/2052 | | | 3,882,719 | | | | 3,292,378 | |
2.50% due 5/1/2052 | | | 2,662,938 | | | | 2,256,904 | |
3.00% due 7/1/2051 | | | 2,241,863 | | | | 1,976,752 | |
3.00% due 3/1/2052 | | | 3,407,419 | | | | 3,002,286 | |
3.00% due 5/1/2052 | | | 4,730,511 | | | | 4,162,931 | |
3.50% due 6/1/2052 | | | 4,351,668 | | | | 3,965,760 | |
3.50% due 10/1/2052 | | | 2,330,658 | | | | 2,122,890 | |
3.50% due 11/1/2052 | | | 2,236,380 | | | | 2,036,918 | |
4.00% due 12/1/2052 | | | 1,271,283 | | | | 1,192,553 | |
| | | | | | | | | |
| | |
Total Agency Mortgage–Backed Securities
(Cost $32,734,576) | | | | 32,070,640 | |
| Asset–Backed Securities – 20.2% | |
| | | |
Allegro CLO VI Ltd.
2017-2A B
6.76% (3 mo. USD LIBOR + 1.50%)
due 1/17/2031(1)(2)(3) | | | 1,000,000 | | | | 975,200 | |
| | | |
Anchorage Capital CLO 7 Ltd.
2015-7A BR2
7.023% (3 mo. USD LIBOR + 1.75%)
due 1/28/2031(1)(2)(3) | | | 500,000 | | | | 492,100 | |
| | | |
Ares XXXIIR CLO Ltd.
2014-32RA B
7.121% (3 mo. USD LIBOR + 1.80%)
due 5/15/2030(1)(2)(3) | | | 1,200,000 | | | | 1,135,440 | |
| | | |
Ares XXXIV CLO Ltd.
2015-2A BR2
6.86% (3 mo. USD LIBOR + 1.60%)
due 4/17/2033(1)(2)(3) | | | 450,000 | | | | 435,960 | |
| | | |
Avis Budget Rental Car Funding AESOP LLC
2019-3A A
2.36% due 3/20/2026(1) | | | 1,380,000 | | | | 1,302,539 | |
| | | |
Barings CLO Ltd.
2020-1A AR
6.41% (3 mo. USD LIBOR + 1.15%)
due 10/15/2036(1)(2)(3) | | | 1,550,000 | | | | 1,513,135 | |
| | | |
Battalion CLO XX Ltd.
2021-20A D
8.36% (3 mo. USD LIBOR + 3.10%)
due 7/15/2034(1)(2)(3) | | | 2,000,000 | | | | 1,712,360 | |
| | | |
BlueMountain CLO Ltd.
2014-2A BR2
7.00% (3 mo. USD LIBOR + 1.75%)
due 10/20/2030(1)(2)(3) | | | 800,000 | | | | 783,040 | |
| | | |
BMW Vehicle Lease Trust
2023-1 A3
5.16% due 11/25/2025 | | | 1,000,000 | | | | 993,552 | |
| | | | | | | | | |
| | | | | | | | |
| June 30, 2023 (unaudited) | | Principal Amount | | | Value | |
| Asset–Backed Securities (continued) | |
| | | |
Carlyle U.S. CLO Ltd.
2017-3A BR
7.25% (3 mo. USD LIBOR + 2.00%)
due 7/20/2029(1)(2)(3) | | $ | 3,000,000 | | | $ | 2,846,700 | |
| | | |
CarMax Auto Owner Trust
2020-4 B
0.85% due 6/15/2026 | | | 1,400,000 | | | | 1,306,208 | |
| | | |
Cathedral Lake VI Ltd.
2021-6A AN
6.505% (3 mo. USD LIBOR + 1.25%)
due 4/25/2034(1)(2)(3) | | | 1,200,000 | | | | 1,179,596 | |
| | | |
CIFC Funding Ltd.
2013-4A BRR
6.892% (3 mo. USD LIBOR + 1.60%)
due 4/27/2031(1)(2)(3) | | | 800,000 | | | | 782,240 | |
| | | |
DB Master Finance LLC
2021-1A A2II
2.493% due 11/20/2051(1) | | | 1,034,250 | | | | 859,738 | |
| | | |
Elmwood CLO IX Ltd.
2021-2A C
7.15% (3 mo. USD LIBOR + 1.90%)
due 7/20/2034(1)(2)(3) | | | 3,000,000 | | | | 2,842,500 | |
| | | |
Ford Credit Auto Owner Trust
2020-1 A
2.04% due 8/15/2031(1) | | | 1,100,000 | | | | 1,034,987 | |
| | | |
Ford Credit Floorplan Master Owner Trust A
2020-2 A
1.06% due 9/15/2027 | | | 1,500,000 | | | | 1,360,266 | |
| | | |
GM Financial Automobile Leasing Trust
2023-1 A3
5.16% due 4/20/2026 | | | 1,140,000 | | | | 1,131,450 | |
| | | |
GM Financial Consumer Automobile Receivables Trust
2020-A A3
0.38% due 8/18/2025 | | | 546,833 | | | | 535,760 | |
| | | |
Golden Credit Card Trust
2018-4A A
3.44% due 8/15/2025(1) | | | 1,590,000 | | | | 1,585,837 | |
| | | |
Gulf Stream Meridian 6 Ltd.
2021-6A A1
6.45% (3 mo. USD LIBOR + 1.19%)
due 1/15/2037(1)(2)(3) | | | 1,150,000 | | | | 1,129,415 | |
| | | |
ICG U.S. CLO Ltd.
2018-2A B
7.023% (3 mo. USD LIBOR + 1.75%)
due 7/22/2031(1)(2)(3) | | | 1,300,000 | | | | 1,261,553 | |
| | | |
KKR CLO 38 Ltd.
38A A1
6.306% (3 mo. USD Term SOFR + 1.32%)
due 4/15/2033(1)(2) | | | 1,725,000 | | | | 1,696,179 | |
| | | |
Madison Park Funding XXIII Ltd.
2017-23A BR
6.842% (3 mo. USD LIBOR + 1.55%)
due 7/27/2031(1)(2)(3) | | | 1,300,000 | | | | 1,274,520 | |
| | | | | | | | | |
| | | | |
| 4 | | | | The accompanying notes are an integral part of these financial statements. |
SCHEDULE OF INVESTMENTS — GUARDIAN TOTAL RETURN BOND VIP FUND
| | | | | | | | |
| June 30, 2023 (unaudited) | | Principal Amount | | | Value | |
| Asset–Backed Securities (continued) | |
| | | |
Master Credit Card Trust
2021-1A A
0.53% due 11/21/2025(1) | | $ | 1,590,000 | | | $ | 1,515,111 | |
| | | |
Neuberger Berman CLO XVI-S Ltd.
2017-16SA BR
6.66% (3 mo. USD LIBOR + 1.40%)
due 4/15/2034(1)(2)(3) | | | 1,000,000 | | | | 955,300 | |
| | | |
Neuberger Berman CLO XVII Ltd.
2014-17A BR2
6.773% (3 mo. USD LIBOR + 1.50%)
due 4/22/2029(1)(2)(3) | | | 1,100,000 | �� | | | 1,077,780 | |
| | | |
Neuberger Berman Loan Advisers CLO 40 Ltd.
2021-40A A
6.32% (3 mo. USD LIBOR + 1.06%)
due 4/16/2033(1)(2)(3) | | | 1,500,000 | | | | 1,480,800 | |
| | | |
Nissan Auto Lease Trust
2023-A A4
4.80% due 7/15/2027 | | | 550,000 | | | | 542,052 | |
| | | |
Octagon Investment Partners 50 Ltd.
2020-4A DR
8.41% (3 mo. USD LIBOR + 3.15%)
due 1/15/2035(1)(2)(3) | | | 1,100,000 | | | | 961,510 | |
| | | |
Octagon Loan Funding Ltd.
2014-1A CRR
7.545% (3 mo. USD LIBOR + 2.20%)
due 11/18/2031(1)(2)(3) | | | 3,200,000 | | | | 3,060,160 | |
| | | |
OHA Credit Funding 3 Ltd.
2019-3A CR
7.20% (3 mo. USD LIBOR + 1.95%)
due 7/2/2035(1)(2)(3) | | | 3,000,000 | | | | 2,856,300 | |
| | | |
Oscar U.S. Funding XIV LLC
2022-1A A2
1.60% due 3/10/2025(1) | | | 504,887 | | | | 499,391 | |
| | | |
Riserva CLO Ltd.
2016-3A CRR
7.062% (3 mo. USD LIBOR + 1.80%)
due 1/18/2034(1)(2)(3) | | | 3,000,000 | | | | 2,818,200 | |
| | | |
Synchrony Card Funding LLC
2022-A1 A
3.37% due 4/15/2028 | | | 1,190,000 | | | | 1,145,033 | |
| | | |
TIAA CLO IV Ltd.
2018-1A A2
6.95% (3 mo. USD LIBOR + 1.70%)
due 1/20/2032(1)(2)(3) | | | 1,720,000 | | | | 1,674,936 | |
| | | |
Voya CLO Ltd.
2016-3A A3R
7.012% (3 mo. USD LIBOR + 1.75%)
due 10/18/2031(1)(2)(3) | | | 955,000 | | | | 928,260 | |
| | | |
Westlake Automobile Receivables Trust
2022-3A A2
5.24% due 7/15/2025(1) | | | 878,733 | | | | 876,792 | |
| | | | | | | | | |
| | | | | | | | |
| June 30, 2023 (unaudited) | | Principal Amount | | | Value | |
| Asset–Backed Securities (continued) | |
| | | |
World Omni Auto Receivables Trust
2022-C A2
3.73% due 3/16/2026 | | $ | 1,214,513 | | | $ | 1,202,942 | |
| | |
| | |
Total Asset–Backed Securities
(Cost $53,741,279) | | | | 51,764,842 | |
| Corporate Bonds & Notes – 20.3% | |
| |
| Aerospace & Defense – 0.4% | |
| | | |
Lockheed Martin Corp.
4.75% due 2/15/2034 | | | 600,000 | | | | 598,362 | |
5.20% due 2/15/2055 | | | 300,000 | | | | 309,693 | |
| | | |
Northrop Grumman Corp.
4.95% due 3/15/2053 | | | 200,000 | | | | 195,068 | |
| | | | | | | | | |
| | | |
| | | | | | | | 1,103,123 | |
| Agriculture – 0.5% | |
| | | |
Philip Morris International, Inc.
5.75% due 11/17/2032 | | | 1,200,000 | | | | 1,229,784 | |
| | | | | | | | | |
| | | |
| | | | | | | | 1,229,784 | |
| Commercial Banks – 6.2% | |
| | | |
Bank of America Corp.
4.271% (4.271% fixed rate until 7/23/2028; 3 mo. USD Term SOFR + 1.57% thereafter)
due 7/23/2029(2) | | | 1,200,000 | | | | 1,138,104 | |
5.288% (5.288% fixed rate until 4/25/2033; SOFR + 1.91% thereafter)
due 4/25/2034(2) | | | 900,000 | | | | 891,747 | |
| | | |
Barclays PLC
2.645% (2.645% fixed rate until 6/24/2030; 1 yr. CMT + 1.90% thereafter)
due 6/24/2031(2) | | | 900,000 | | | | 721,863 | |
7.119% (7.119% fixed rate until 6/27/2033; SOFR + 3.57% thereafter)
due 6/27/2034(2) | | | 300,000 | | | | 300,171 | |
| | | |
BNP Paribas SA
5.125% (5.125% fixed rate until 1/13/2028; 1 yr. CMT + 1.45% thereafter)
due 1/13/2029(1)(2) | | | 500,000 | | | | 489,600 | |
5.335% (5.335% fixed rate until 6/12/2028; 1 yr. CMT + 1.50% thereafter)
due 6/12/2029(1)(2) | | | 800,000 | | | | 790,048 | |
| | | |
Credit Agricole SA
5.514% due 7/5/2033(1) | | | 500,000 | | | | 503,685 | |
| | | |
Deutsche Bank AG
2.311% (2.311% fixed rate until 11/16/2026; SOFR + 1.22% thereafter)
due 11/16/2027(2) | | | 1,700,000 | | | | 1,462,340 | |
| | | |
Discover Bank
4.682% (4.682% fixed rate until 8/9/2023; 5 yr. USD Swap + 1.73% thereafter)
due 8/9/2028(2) | | | 1,300,000 | | | | 1,180,894 | |
| | | |
Fifth Third Bank NA
2.25% due 2/1/2027 | | | 1,300,000 | | | | 1,141,296 | |
| | | | | | | | | |
| | | | |
| The accompanying notes are an integral part of these financial statements. | | | | 5 |
SCHEDULE OF INVESTMENTS — GUARDIAN TOTAL RETURN BOND VIP FUND
| | | | | | | | |
| June 30, 2023 (unaudited) | | Principal Amount | | | Value | |
| |
| Commercial Banks (continued) | |
| |
Huntington National Bank | |
4.552% (4.552% fixed rate until 5/17/2027; SOFR + 1.65% thereafter)
due 5/17/2028(2) | | $ | 700,000 | | | $ | 654,605 | |
5.65% due 1/10/2030 | | | 300,000 | | | | 288,132 | |
| | | |
JPMorgan Chase & Co.
4.203% (4.203% fixed rate until 7/23/2028; 3 mo. USD Term SOFR + 1.52% thereafter)
due 7/23/2029(2) | | | 2,000,000 | | | | 1,901,140 | |
| | | |
Mitsubishi UFJ Financial Group, Inc.
5.406% (5.406% fixed rate until 4/19/2033; 1 yr. CMT + 1.97% thereafter)
due 4/19/2034(2) | | | 500,000 | | | | 495,860 | |
| | | |
Morgan Stanley
5.123% (5.123% fixed rate until 2/1/2028; SOFR + 1.73% thereafter)
due 2/1/2029(2) | | | 1,100,000 | | | | 1,085,524 | |
5.25% (5.25% fixed rate until 4/21/2033; SOFR + 1.87% thereafter)
due 4/21/2034(2) | | | 800,000 | | | | 789,568 | |
| | | |
NatWest Group PLC
5.808% (5.808% fixed rate until 9/13/2028; 1 yr. CMT + 1.95% thereafter)
due 9/13/2029(2) | | | 1,400,000 | | | | 1,381,548 | |
| | | |
Truist Financial Corp.
5.867% (5.867% fixed rate until 6/8/2033; SOFR + 2.36% thereafter)
due 6/8/2034(2) | | | 600,000 | | | | 601,140 | |
| | | | | | | | | |
| | | |
| | | | | | | | 15,817,265 | |
| Computers – 0.5% | |
| | | |
Apple, Inc.
2.65% due 2/8/2051 | | | 100,000 | | | | 69,052 | |
3.25% due 8/8/2029 | | | 1,000,000 | | | | 936,040 | |
3.35% due 8/8/2032 | | | 400,000 | | | | 372,740 | |
| | | | | | | | | |
| | | |
| | | | | | | | 1,377,832 | |
| Cosmetics & Personal Care – 0.6% | |
| | | |
Haleon U.S. Capital LLC
3.625% due 3/24/2032 | | | 900,000 | | | | 807,129 | |
| | | |
Kenvue, Inc.
4.90% due 3/22/2033(1) | | | 700,000 | | | | 707,812 | |
5.05% due 3/22/2053(1) | | | 100,000 | | | | 101,941 | |
| | | | | | | | | |
| | | |
| | | | | | | | 1,616,882 | |
| Diversified Financial Services – 1.2% | |
| | | |
AerCap Ireland Capital DAC / AerCap Global Aviation Trust
3.00% due 10/29/2028 | | | 1,500,000 | | | | 1,300,980 | |
| | | |
Air Lease Corp.
5.30% due 2/1/2028 | | | 600,000 | | | | 589,626 | |
| | | |
Charles Schwab Corp.
4.625% due 3/22/2030 | | | 800,000 | | | | 784,264 | |
| | | |
Mastercard, Inc.
4.85% due 3/9/2033 | | | 400,000 | | | | 407,324 | |
| | | | | | | | | |
| | | |
| | | | | | | | 3,082,194 | |
| | | | | | | | |
| June 30, 2023 (unaudited) | | Principal Amount | | | Value | |
| |
| Electric – 1.7% | |
| | | |
Alabama Power Co.
3.94% due 9/1/2032 | | $ | 550,000 | | | $ | 508,151 | |
| | | |
Consumers Energy Co.
4.20% due 9/1/2052 | | | 200,000 | | | | 171,546 | |
| | | |
Duke Energy Carolinas LLC
4.95% due 1/15/2033 | | | 500,000 | | | | 496,800 | |
| | | |
Duke Energy Corp.
3.50% due 6/15/2051 | | | 450,000 | | | | 326,322 | |
5.00% due 8/15/2052 | | | 200,000 | | | | 183,042 | |
| | | |
Exelon Corp.
5.60% due 3/15/2053 | | | 400,000 | | | | 403,508 | |
| | | |
PPL Electric Utilities Corp.
5.00% due 5/15/2033 | | | 300,000 | | | | 300,792 | |
5.25% due 5/15/2053 | | | 600,000 | | | | 611,472 | |
| | | |
Wisconsin Public Service Corp.
2.85% due 12/1/2051 | | | 150,000 | | | | 99,270 | |
| | | |
Xcel Energy, Inc.
4.60% due 6/1/2032 | | | 1,300,000 | | | | 1,230,294 | |
| | | | | | | | | |
| | | |
| | | | | | | | 4,331,197 | |
| Food – 0.2% | |
| | | |
Kroger Co.
1.70% due 1/15/2031 | | | 650,000 | | | | 510,029 | |
| | | | | | | | | |
| | | |
| | | | | | | | 510,029 | |
| Gas – 0.4% | |
| | | |
CenterPoint Energy Resources Corp.
5.40% due 3/1/2033 | | | 900,000 | | | | 916,182 | |
| | | | | | | | | |
| | | |
| | | | | | | | 916,182 | |
| Healthcare–Services – 0.5% | |
| | | |
Elevance Health, Inc.
4.75% due 2/15/2033 | | | 400,000 | | | | 388,912 | |
5.125% due 2/15/2053 | | | 100,000 | | | | 96,776 | |
| | | |
UnitedHealth Group, Inc.
4.20% due 5/15/2032 | | | 600,000 | | | | 572,556 | |
5.875% due 2/15/2053 | | | 200,000 | | | | 221,864 | |
| | | | | | | | | |
| | | |
| | | | | | | | 1,280,108 | |
| Insurance – 1.2% | |
| | | |
Aon Corp. / Aon Global Holdings PLC
5.35% due 2/28/2033 | | | 700,000 | | | | 705,761 | |
| | | |
Athene Holding Ltd.
3.50% due 1/15/2031 | | | 450,000 | | | | 370,656 | |
| | | |
Corebridge Financial, Inc.
3.90% due 4/5/2032 | | | 600,000 | | | | 522,522 | |
| | | |
Hartford Financial Services Group, Inc.
2.80% due 8/19/2029 | | | 510,000 | | | | 440,446 | |
3.60% due 8/19/2049 | | | 200,000 | | | | 150,984 | |
| | | |
MetLife, Inc.
4.55% due 3/23/2030 | | | 500,000 | | | | 489,415 | |
5.25% due 1/15/2054 | | | 300,000 | | | | 292,062 | |
| | | |
Prudential Financial, Inc.
3.70% due 3/13/2051 | | | 100,000 | | | | 76,753 | |
5.75% due 7/15/2033 | | | 100,000 | | | | 104,790 | |
| | | | | | | | | |
| | | |
| | | | | | | | 3,153,389 | |
| | | | |
| 6 | | | | The accompanying notes are an integral part of these financial statements. |
SCHEDULE OF INVESTMENTS — GUARDIAN TOTAL RETURN BOND VIP FUND
| | | | | | | | |
| June 30, 2023 (unaudited) | | Principal Amount | | | Value | |
| Media – 0.7% | |
| | | |
Charter Communications Operating LLC / Charter Communications Operating Capital
3.90% due 6/1/2052 | | $ | 20,000 | | | $ | 13,031 | |
4.40% due 4/1/2033 | | | 300,000 | | | | 263,394 | |
5.25% due 4/1/2053 | | | 400,000 | | | | 322,848 | |
| | | |
Comcast Corp.
1.95% due 1/15/2031 | | | 970,000 | | | | 793,062 | |
2.887% due 11/1/2051 | | | 300,000 | | | | 201,216 | |
5.35% due 5/15/2053 | | | 300,000 | | | | 305,028 | |
| | | | | | | | | |
| | | |
| | | | | | | | 1,898,579 | |
| Oil & Gas – 1.0% | |
| | | |
BP Capital Markets America, Inc.
3.06% due 6/17/2041 | | | 450,000 | | | | 341,721 | |
4.812% due 2/13/2033 | | | 700,000 | | | | 690,424 | |
| | | |
Cenovus Energy, Inc.
2.65% due 1/15/2032 | | | 300,000 | | | | 242,217 | |
3.75% due 2/15/2052 | | | 200,000 | | | | 141,986 | |
| | | |
Occidental Petroleum Corp.
7.50% due 5/1/2031 | | | 400,000 | | | | 436,712 | |
| | | |
Valero Energy Corp.
2.80% due 12/1/2031 | | | 800,000 | | | | 658,656 | |
| | | | | | | | | |
| | | |
| | | | | | | | 2,511,716 | |
| Oil & Gas Services – 0.2% | |
| | | |
Schlumberger Investment SA
4.85% due 5/15/2033 | | | 600,000 | | | | 591,450 | |
| | | | | | | | | |
| | | |
| | | | | | | | 591,450 | |
| Pharmaceuticals – 1.1% | |
| | | |
CVS Health Corp.
5.30% due 6/1/2033 | | | 1,000,000 | | | | 998,260 | |
5.875% due 6/1/2053 | | | 500,000 | | | | 513,655 | |
| | | |
Pfizer Investment Enterprises Pte Ltd.
4.75% due 5/19/2033 | | | 1,400,000 | | | | 1,395,310 | |
| | | | | | | | | |
| | | |
| | | | | | | | 2,907,225 | |
| Pipelines – 0.8% | |
| | | |
Cheniere Energy Partners LP
5.95% due 6/30/2033(1) | | | 500,000 | | | | 502,750 | |
| | | |
Energy Transfer LP
3.75% due 5/15/2030 | | | 500,000 | | | | 452,010 | |
5.00% due 5/15/2050 | | | 200,000 | | | | 168,996 | |
| | | |
ONEOK, Inc.
6.10% due 11/15/2032 | | | 400,000 | | | | 406,896 | |
| | | |
Western Midstream Operating LP
6.15% due 4/1/2033 | | | 600,000 | | | | 604,014 | |
| | | | | | | | | |
| | | |
| | | | | | | | 2,134,666 | |
| Real Estate Investment Trusts (REITs) – 1.1% | |
| | | |
American Tower Corp.
5.50% due 3/15/2028 | | | 700,000 | | | | 696,710 | |
5.65% due 3/15/2033 | | | 500,000 | | | | 508,650 | |
| | | |
Extra Space Storage LP
5.50% due 7/1/2030 | | | 800,000 | | | | 795,296 | |
| | | |
Realty Income Corp.
4.85% due 3/15/2030 | | | 900,000 | | | | 872,091 | |
| | | | | | | | | |
| | | |
| | | | | | | | 2,872,747 | |
| | | | | | | | |
| June 30, 2023 (unaudited) | | Principal Amount | | | Value | |
| Semiconductors – 0.7% | |
| | | |
Broadcom, Inc.
4.15% due 4/15/2032(1) | | $ | 1,100,000 | | | $ | 996,061 | |
| | | |
Intel Corp.
5.20% due 2/10/2033 | | | 600,000 | | | | 605,592 | |
| | | |
NXP BV / NXP Funding LLC / NXP USA, Inc.
2.65% due 2/15/2032 | | | 250,000 | | | | 202,130 | |
| | | | | | | | | |
| | | |
| | | | | | | | 1,803,783 | |
| Software – 0.5% | |
| | | |
Microsoft Corp.
2.921% due 3/17/2052 | | | 300,000 | | | | 222,954 | |
| | | |
Oracle Corp.
5.55% due 2/6/2053 | | | 200,000 | | | | 193,776 | |
6.25% due 11/9/2032 | | | 500,000 | | | | 530,475 | |
6.90% due 11/9/2052 | | | 200,000 | | | | 224,114 | |
| | | | | | | | | |
| | | |
| | | | | | | | 1,171,319 | |
| Telecommunications – 0.4% | |
| | | |
T-Mobile USA, Inc.
2.70% due 3/15/2032 | | | 750,000 | | | | 621,420 | |
3.40% due 10/15/2052 | | | 400,000 | | | | 285,476 | |
| | | | | | | | | |
| | | |
| | | | | | | | 906,896 | |
| Transportation – 0.4% | |
| | | |
Union Pacific Corp.
3.95% due 9/10/2028 | | | 300,000 | | | | 290,685 | |
4.50% due 1/20/2033 | | | 200,000 | | | | 196,852 | |
4.95% due 5/15/2053 | | | 500,000 | | | | 497,980 | |
| | | | | | | | | |
| | | |
| | | | | | | | 985,517 | |
| | |
Total Corporate Bonds & Notes (Cost $53,297,134) | | | | 52,201,883 | |
| Non–Agency Mortgage–Backed Securities – 9.5% | |
| | | |
BANK
2019-BNK24 AS
3.283% due 11/15/2062(2)(4) | | | 1,413,000 | | | | 1,191,255 | |
2022-BNK43 B
5.327% due 8/15/2055(2)(4) | | | 500,000 | | | | 431,242 | |
| | | |
BB-UBS Trust
2012-SHOW A
3.43% due 11/5/2036(1) | | | 2,500,000 | | | | 2,374,769 | |
| | | |
Citigroup Commercial Mortgage Trust
2014-GC21 A5
3.855% due 5/10/2047 | | | 1,330,000 | | | | 1,301,248 | |
2016-C3 AS
3.366% due 11/15/2049(2)(4) | | | 1,125,000 | | | | 1,008,783 | |
| | | |
Commercial Mortgage Trust
2014-CR18 AM
4.103% due 7/15/2047 | | | 1,550,000 | | | | 1,490,385 | |
| | | |
Freddie Mac STACR REMIC Trust 2021-DNA7 M2
6.867% due 11/25/2041(1)(2)(4) | | | 1,300,000 | | | | 1,252,072 | |
2021-HQA4 M1
6.017% due 12/25/2041(1)(2)(4) | | | 793,547 | | | | 769,603 | |
2022-DNA1 M1A
6.067% due 1/25/2042(1)(2)(4) | | | 708,467 | | | | 696,886 | |
2022-HQA3 M1A
7.367% due 8/25/2042(1)(2)(4) | | | 1,433,796 | | | | 1,442,418 | |
| | | | | | | | | |
| | | | |
| The accompanying notes are an integral part of these financial statements. | | | | 7 |
SCHEDULE OF INVESTMENTS — GUARDIAN TOTAL RETURN BOND VIP FUND
| | | | | | | | |
| June 30, 2023 (unaudited) | | Principal Amount | | | Value | |
| Non–Agency Mortgage–Backed Securities (continued) | |
| | | |
Grace Trust
2020-GRCE C
2.769% due 12/10/2040(1)(2)(4) | | $ | 1,100,000 | | | $ | 821,779 | |
| | | |
GS Mortgage Securities Trust
2013-GC16 A4
4.271% due 11/10/2046 | | | 423,827 | | | | 422,478 | |
| | | |
Jackson Park Trust
2019-LIC B
2.914% due 10/14/2039(1) | | | 680,000 | | | | 556,484 | |
| | | |
Life Mortgage Trust
2021-BMR C
6.362% due 3/15/2038(1)(2)(4) | | | 1,474,455 | | | | 1,419,546 | |
| | | |
Morgan Stanley Capital I Trust 2018-H4 A4
4.31% due 12/15/2051 | | | 900,000 | | | | 837,495 | |
2020-L4 AS
2.88% due 2/15/2053 | | | 750,000 | | | | 603,564 | |
| | | |
NYC Commercial Mortgage Trust
2021-909 C
3.312% due 4/10/2043(1)(2)(4) | | | 580,000 | | | | 387,620 | |
| | | |
ONE Park Mortgage Trust
2021-PARK B
6.212% due 3/15/2036(1)(2)(4) | | | 500,000 | | | | 460,653 | |
| | | |
SLG Office Trust
2021-OVA A
2.585% due 7/15/2041(1) | | | 1,800,000 | | | | 1,442,773 | |
| | | |
Stack Infrastructure Issuer LLC
2021-1A A2
1.877% due 3/26/2046(1) | | | 1,250,000 | | | | 1,094,220 | |
| | | |
Wells Fargo Commercial Mortgage Trust
2018-AUS A
4.194% due 8/17/2036(1)(2)(4) | | | 2,000,000 | | | | 1,805,599 | |
2021-SAVE A
6.343% due 2/15/2040(1)(2)(4) | | | 1,181,728 | | | | 1,111,419 | |
| | | |
WFRBS Commercial Mortgage Trust
2014-C19 AS
4.271% due 3/15/2047 | | | 1,500,000 | | | | 1,467,664 | |
| | | | | | | | | |
| | |
Total Non–Agency Mortgage–Backed Securities
(Cost $27,032,708) | | | | 24,389,955 | |
| U.S. Government Securities – 33.3% | |
| | | |
U.S. Treasury Bond
3.625% due 5/15/2053 | | | 12,500,000 | | | | 12,019,531 | |
3.875% due 5/15/2043 | | | 24,500,000 | | | | 23,910,469 | |
| | | |
U.S. Treasury Note
3.75% due 5/31/2030 | | | 7,600,000 | | | | 7,495,500 | |
4.00% due 6/30/2028 | | | 23,500,000 | | | | 23,371,486 | |
4.625% due 6/30/2025 | | | 18,800,000 | | | | 18,714,078 | |
| | | | | | | | | |
| | |
Total U.S. Government Securities
(Cost $85,617,096) | | | | 85,511,064 | |
| | | | | | | | |
| June 30, 2023 (unaudited) | | Shares | | | Value | |
| Exchange–Traded Funds – 1.8% | |
| | | |
iShares MBS ETF | | | 20,500 | | | $ | 1,911,932 | |
| | | |
Vanguard Mortgage-Backed Securities ETF | | | 60,000 | | | | 2,759,400 | |
| | | | | | | | | |
| | |
Total Exchange–Traded Funds (Cost $4,724,266) | | | | 4,671,332 | |
| | | | | | | | |
| | | Principal
Amount | | | Value | |
| Repurchase Agreements – 0.9% | |
| | | |
Fixed Income Clearing Corp.,
1.52%, dated 6/30/2023, proceeds at maturity value of $2,250,842, due 7/3/2023(5) | | $ | 2,250,557 | | | | 2,250,557 | |
| | |
Total Repurchase Agreements
(Cost $2,250,557) | | | | 2,250,557 | |
| | |
Total Investments – 98.5%
(Cost $259,397,616) | | | $ | 252,860,273 | |
| | |
| Assets in excess of other liabilities – 1.5% | | | | 3,762,168 | |
| | |
| Total Net Assets – 100.0% | | | $ | 256,622,441 | |
| (1) | Securities that may be resold in transactions exempt from registration under Rule 144A of the Securities Act of 1933, as amended, normally to certain qualified buyers. At June 30, 2023, the aggregate market value of these securities amounted to $63,275,317, representing 24.7% of net assets. These securities have been deemed liquid by the investment adviser pursuant to the Fund’s liquidity procedures approved by the Board of Trustees. |
| (2) | Variable rate securities, which may include step-up bonds or adjustable rate mortgages. The rate shown is the rate in effect at June 30, 2023. |
| (3) | The London Interbank Offered Rate (“LIBOR”) is being phased out completely by June 30, 2023. There remains uncertainty regarding the nature of any replacement rate and the impact of a transition away from LIBOR on the Fund’s investments. |
| (4) | Variable coupon rate based on weighted average interest rate of underlying mortgages. |
| (5) | The table below presents collateral for repurchase agreements. |
| | | | | | | | | | | | | | | | |
| Security | | Coupon | | | Maturity Date | | | Principal Amount | | | Value | |
| U.S. Treasury Note | | | 4.625% | | | | 3/15/2026 | | | $ | 2,262,200 | | | $ | 2,295,626 | |
| | | | |
| 8 | | | | The accompanying notes are an integral part of these financial statements. |
SCHEDULE OF INVESTMENTS — GUARDIAN TOTAL RETURN BOND VIP FUND
Open futures contracts at June 30, 2023:
| | | | | | | | | | | | | | | | | | | | | | | | |
| Type | | Expiration | | | Contracts | | | Position | | | Notional
Amount | | | Notional
Value | | | Unrealized
Depreciation | |
| U.S. 2-Year Treasury Note | | | September 2023 | | | | 328 | | | | Long | | | $ | 67,584,461 | | | $ | 66,696,750 | | | $ | (887,711 | ) |
| U.S. 5-Year Treasury Note | | | September 2023 | | | | 130 | | | | Long | | | | 14,183,983 | | | | 13,922,188 | | | | (261,795 | ) |
| Total | | | $ | 81,768,444 | | | $ | 80,618,938 | | | $ | (1,149,506 | ) |
| | | | | | | | | | | | | | | | | | | | | | | | |
| Type | | Expiration | | | Contracts | | | Position | | | Notional
Amount | | | Notional
Value | | | Unrealized
Appreciation | |
| U.S. Ultra 10-Year Treasury Note | | | September 2023 | | | | 4 | | | | Short | | | $ | (476,862 | ) | | $ | (473,750 | ) | | $ | 3,112 | |
Centrally cleared credit default swap agreements — buy protection(6):
| | | | | | | | | | | | | | | | | | | | | | | | | | | | | | | | |
Reference
Entity | | Implied Credit
Spread at
6/30/23(7) | | | Notional Amount(8) | | | Maturity | | | (Pay)/Receive
Fixed Rate | | | Periodic
Payment
Frequency | | | Upfront
Payments | | | Value | | | Unrealized
Depreciation | |
| CDX.NA.HY.S40 | | | 4.29% | | | | USD 20,200,000 | | | | 6/20/2028 | | | | (5.00 | )% | | | Quarterly | | | $ | (239,238 | ) | | $ | (564,193 | ) | | $ | (324,955 | ) |
| (6) | When a credit event occurs as defined under the terms of the swap agreement, the Fund as a buyer of credit protection will either (i) receive from the seller of protection an amount equal to the notional amount of the swap and deliver the referenced obligation or underlying securities comprising the referenced obligation or (ii) receive a net settlement amount in the form of cash or securities equal to the notional amount of the swap less the recovery value of the referenced obligation or underlying securities comprising the referenced obligation. |
| (7) | Implied credit spread, represented in absolute terms, utilized in determining the value of the credit default swap agreements as of period end will serve as an indicator of the current status of the payment/performance risk and represent the likelihood or risk of default for the credit derivative. The implied credit spread of a referenced entity reflects the cost of buying/selling protection and may include payments required to be made to enter into the agreement. Generally, wider credit spreads represent a perceived deterioration of the referenced entity’s credit soundness and a greater likelihood or risk of default or other credit event occurring as defined under the terms of the swap agreement. |
| (8) | The notional amount represents the maximum potential amount the Fund could be required to pay as a buyer of credit protection if a credit event occurs, as defined under the terms of the swap agreement, for each security included in the CDX North America High Yield Index. |
Legend:
CLO — Collateralized Loan Obligation
CMT — Constant Maturity Treasury
LIBOR — London Interbank Offered Rate
SOFR — Secured Overnight Financing Rate
USD — United States Dollar
The following is a summary of the inputs used as of June 30, 2023 in valuing the Fund’s investments. For more information on valuation inputs, please refer to Note 2a of the accompanying Notes to Financial Statements.
| | | | | | | | | | | | | | | | |
| | | Valuation Inputs | | | | |
| Investments in Securities (unaudited) | | Level 1 | | | Level 2 | | | Level 3 | | | Total | |
| Agency Mortgage–Backed Securities | | $ | — | | | $ | 32,070,640 | | | $ | — | | | $ | 32,070,640 | |
| Asset–Backed Securities | | | — | | | | 51,764,842 | | | | — | | | | 51,764,842 | |
| Corporate Bonds & Notes | | | — | | | | 52,201,883 | | | | — | | | | 52,201,883 | |
| Non–Agency Mortgage–Backed Securities | | | — | | | | 24,389,955 | | | | — | | | | 24,389,955 | |
| U.S. Government Securities | | | — | | | | 85,511,064 | | | | — | | | | 85,511,064 | |
| Exchange–Traded Funds | | | 4,671,332 | | | | — | | | | — | | | | 4,671,332 | |
| Repurchase Agreements | | | — | | | | 2,250,557 | | | | — | | | | 2,250,557 | |
| Total | | $ | 4,671,332 | | | $ | 248,188,941 | | | $ | — | | | $ | 252,860,273 | |
| Other Financial Instruments | | | | | | | | | | | | |
| Futures Contracts | | | | | | | | | | | | | | | | |
Assets | | $ | 3,112 | | | $ | — | | | $ | — | | | $ | 3,112 | |
Liabilities | | | (1,149,506 | ) | | | — | | | | — | | | | (1,149,506 | ) |
| Swap Contracts | | | | | | | | | | | | | | | | |
Liabilities | | | — | | | | (324,955 | ) | | | — | | | | (324,955 | ) |
| Total | | $ | (1,146,394 | ) | | $ | (324,955 | ) | | $ | — | | | $ | (1,471,349 | ) |
| | | | |
| The accompanying notes are an integral part of these financial statements. | | | | 9 |
FINANCIAL INFORMATION — GUARDIAN TOTAL RETURN BOND VIP FUND
| | | | |
Statement of Assets and Liabilities As of June 30, 2023 (unaudited) | | | |
Assets | | | | |
| | |
Investments, at value | | $ | 252,860,273 | |
| | |
Receivable for investments sold | | | 43,250,943 | |
| | |
Receivable for variation margin on swap contracts | | | 2,110,874 | |
| | |
Interest receivable | | | 1,514,938 | |
| | |
Receivable for variation margin on futures contracts | | | 1,329,052 | |
| | |
Cash deposits with brokers for futures contracts | | | 606,254 | |
| | |
Reimbursement receivable from adviser | | | 5,535 | |
| | |
Receivable for fund shares subscribed | | | 3,199 | |
| | |
Prepaid expenses | | | 2,977 | |
| | | | | |
| | |
Total Assets | | | 301,684,045 | |
| | | | | |
| | |
Liabilities | | | | |
| | |
Payable for investments purchased | | | 43,593,040 | |
| | |
Due to broker for swap contracts | | | 1,123,015 | |
| | |
Payable for fund shares redeemed | | | 119,152 | |
| | |
Investment advisory fees payable | | | 95,964 | |
| | |
Distribution fees payable | | | 53,313 | |
| | |
Accrued custodian and accounting fees | | | 18,888 | |
| | |
Accrued audit fees | | | 18,739 | |
| | |
Accrued trustees’ and officers’ fees | | | 5,135 | |
| | |
Accrued expenses and other liabilities | | | 34,358 | |
| | | | | |
| | |
Total Liabilities | | | 45,061,604 | |
| | | | | |
| | |
Total Net Assets | | $ | 256,622,441 | |
| | | | | |
| | |
Net Assets Consist of: | | | | |
| | |
Paid-in capital | | $ | 285,229,708 | |
| | |
Distributable loss | | | (28,607,267 | ) |
| | | | | |
| | |
Total Net Assets | | $ | 256,622,441 | |
| | | | | |
Investments, at Cost | | $ | 259,397,616 | |
| | | | | |
| | |
Pricing of Shares | | | | |
| | |
Shares of Beneficial Interest Outstanding with No Par Value | | | 28,118,005 | |
| | |
Net Asset Value Per Share | | | $9.13 | |
| | | | | |
| | | | |
Statement of Operations For the Six Months Ended June 30, 2023 (unaudited) | |
Investment Income | | | | |
| | |
Interest | | $ | 5,696,864 | |
| | |
Dividends | | | 75,006 | |
| | | | | |
| | |
Total Investment Income | | | 5,771,870 | |
| | | | | |
| | |
Expenses | | | | |
| | |
Investment advisory fees | | | 601,130 | |
| | |
Distribution fees | | | 333,961 | |
| | |
Professional fees | | | 43,480 | |
| | |
Trustees’ and officers’ fees | | | 33,618 | |
| | |
Custodian and accounting fees | | | 28,862 | |
| | |
Administrative fees | | | 22,160 | |
| | |
Transfer agent fees | | | 7,048 | |
| | |
Shareholder reports | | | 6,188 | |
| | |
Other expenses | | | 7,342 | |
| | | | | |
| | |
Total Expenses | | | 1,083,789 | |
| | |
Less: Fees waived | | | (28,471 | ) |
| | | | | |
| | |
Total Expenses, Net | | | 1,055,318 | |
| | | | | |
| | |
Net Investment Income/(Loss) | | | 4,716,552 | |
| | | | | |
| | |
Realized Gain/(Loss) and Change in Unrealized Appreciation/(Depreciation) on Investments and Derivative Contracts | | | | |
| | |
Net realized gain/(loss) from investments | | | (10,971,751 | ) |
| | |
Net realized gain/(loss) from futures contracts | | | 1,150,669 | |
| | |
Net realized gain/(loss) from swap contracts | | | (2,980,867 | ) |
| | |
Net change in unrealized appreciation/(depreciation) on investments | | | 11,691,158 | |
| | |
Net change in unrealized appreciation/(depreciation) on futures contracts | | | (969,246 | ) |
| | |
Net change in unrealized appreciation/(depreciation) on swap contracts | | | 1,711,905 | |
| | | | | |
| | |
Net Loss on Investments and Derivative Contracts | | | (368,132 | ) |
| | | | | |
| | |
Net Increase in Net Assets Resulting From Operations | | $ | 4,348,420 | |
| | | | | |
| | | | | |
| | | | |
| 10 | | | | The accompanying notes are an integral part of these financial statements. |
FINANCIAL INFORMATION — GUARDIAN TOTAL RETURN BOND VIP FUND
| | | | | | | | |
Statements of Changes in Net Assets Six Months Ended Numbers are unaudited | | | | | | |
| | | |
| | | For the Six Months Ended
6/30/23 | | | For the Year Ended
12/31/22 | |
| | | | |
Operations | | | | | | | | |
| | | |
Net investment income/(loss) | | $ | 4,716,552 | | | $ | 7,566,776 | |
| | | |
Net realized gain/(loss) from investments and derivative contracts | | | (12,801,949 | ) | | | (40,150,372 | ) |
| | | |
Net change in unrealized appreciation/(depreciation) on investments and derivative contracts | | | 12,433,817 | | | | (18,967,525 | ) |
| | | | | | | | | |
| | | |
Net Increase/(Decrease) in Net Assets Resulting from Operations | | | 4,348,420 | | | | (51,551,121 | ) |
| | | | | | | | | |
| | | |
Capital Share Transactions | | | | | | | | |
| | | |
Proceeds from sales of shares | | | 10,816,723 | | | | 6,810,826 | |
| | | |
Cost of shares redeemed | | | (24,912,277 | ) | | | (44,092,704 | ) |
| | | | | | | | | |
| | | |
Net Decrease in Net Assets Resulting from Capital Share Transactions | | | (14,095,554 | ) | | | (37,281,878 | ) |
| | | | | | | | | |
| | | |
Net Decrease in Net Assets | | | (9,747,134 | ) | | | (88,832,999 | ) |
| | | | | | | | | |
| | | |
Net Assets | | | | | | | | |
| | | |
Beginning of period | | | 266,369,575 | | | | 355,202,574 | |
| | | | | | | | | |
| | | |
End of period | | $ | 256,622,441 | | | $ | 266,369,575 | |
| | | | | | | | | |
| | | |
Other Information: | | | | | | | | |
| | | |
Shares | | | | | | | | |
| | | |
Sold | | | 1,173,456 | | | | 737,252 | |
| | | |
Redeemed | | | (2,709,255 | ) | | | (4,569,733 | ) |
| | | | | | | | | |
| | | |
Net Decrease | | | (1,535,799 | ) | | | (3,832,481 | ) |
| | | | | | | | | |
| | | | | | | | | |
| | | | |
| The accompanying notes are an integral part of these financial statements. | | | | 11 |
FINANCIAL INFORMATION — GUARDIAN TOTAL RETURN BOND VIP FUND
The Financial Highlights table is intended to help you understand the Fund’s financial performance for the past six reporting periods (or, if shorter, the period since inception). Certain information reflects financial results for a single Fund share. The total returns in the table represent the rate that an investor would have earned (or lost) on an investment in the Fund.
| | | | | | | | | | | | | | | | | | | | | | | | |
Financial Highlights Six Months Ended Numbers are unaudited | | | | | | | | | | | | | | | | |
| | | Per Share Operating Performance | | | | |
| | |
Net Asset Value,
Beginning of
Period | | | Net Investment
Income(1) | | | Net Realized
and Unrealized
Gain/(Loss) | | | Total
Operations | | | Net Asset
Value, End of
Period | | | Total
Return(2) | |
| | | | | | | |
Six Months Ended 6/30/23 | | $ | 8.98 | | | $ | 0.16 | | | $ | (0.01) | | | $ | 0.15 | | | $ | 9.13 | | | | 1.67%(4) | |
| | | | | | | |
Year Ended 12/31/22 | | | 10.61 | | | | 0.24 | | | | (1.87) | | | | (1.63) | | | | 8.98 | | | | (15.36)% | |
| | | | | | | |
Year Ended 12/31/21 | | | 10.70 | | | | 0.18 | | | | (0.27) | | | | (0.09) | | | | 10.61 | | | | (0.84)% | |
| | | | | | | |
Year Ended 12/31/20 | | | 10.03 | | | | 0.14 | | | | 0.53 | | | | 0.67 | | | | 10.70 | | | | 6.68% | |
| | | | | | | |
Period Ended 12/31/19(5) | | | 10.00 | | | | 0.03 | | | | 0.00(6) | | | | 0.03 | | | | 10.03 | | | | 0.30%(4) | |
| | | | |
| 12 | | | | The accompanying notes are an integral part of these financial statements. |
FINANCIAL INFORMATION — GUARDIAN TOTAL RETURN BOND VIP FUND
| | | | | | | | | | | | | | | | | | | | | | |
| |
| Ratios/Supplemental Data | |
Net Assets, End
of Period (000s) | | | Net Ratio of
Expenses to
Average
Net Assets(3) | | | Gross Ratio of
Expenses to
Average Net
Assets | | | Net Ratio of Net
Investment Income
to Average
Net Assets(3) | | | Gross Ratio of Net
Investment Income
to Average
Net Assets | | | Portfolio
Turnover Rate | |
| | | | | |
| $ | 256,622 | | | | 0.79%(4) | | | | 0.81%(4) | | | | 3.53%(4) | | | | 3.51%(4) | | | | 181%(4) | |
| | | | | |
| | 266,370 | | | | 0.79% | | | | 0.80% | | | | 2.54% | | | | 2.53% | | | | 154% | |
| | | | | |
| | 355,203 | | | | 0.79% | | | | 0.79% | | | | 1.68% | | | | 1.68% | | | | 155% | |
| | | | | |
| | 333,391 | | | | 0.79% | | | | 0.81% | | | | 1.40% | | | | 1.38% | | | | 112% | |
| | | | | |
| | 337,312 | | | | 0.75%(4) | | | | 0.85%(4) | | | | 1.56%(4) | | | | 1.46%(4) | | | | 18%(4) | |
| (1) | Calculated based on the average shares outstanding during the period. |
| (2) | Total returns do not reflect the effects of charges deducted pursuant to the terms of The Guardian Insurance & Annuity Company, Inc.’s variable contracts. Inclusion of such charges would reduce the total returns for all periods shown. |
| (3) | Net Ratio of Expenses to Average Net Assets and Net Ratio of Net Investment Income to Average Net Assets include the effect of fee waivers and expense limitations. |
| (4) | Ratios for periods less than one year have been annualized, except for total return and portfolio turnover rate. For the period ended December 31, 2019, certain non-recurring fees (i.e., audit fees) are not annualized. |
| (5) | Commenced operations on October 21, 2019. |
| (6) | Rounds to $0.00 per share. |
| | | | |
| The accompanying notes are an integral part of these financial statements. | | | | 13 |
NOTES TO FINANCIAL STATEMENTS — GUARDIAN TOTAL RETURN BOND VIP FUND
June 30, 2023 (unaudited)
1. Organization
Guardian Variable Products Trust (the “Trust”), a Delaware statutory trust organized on January 12, 2016, is registered under the Investment Company Act of 1940, as amended (the “1940 Act”), as an open-end management investment company. The Trust currently has twenty-four series. Guardian Total Return Bond VIP Fund (the “Fund”) is a series of the Trust. The Fund is a diversified fund and commenced operations on October 21, 2019. The financial statements for other series of the Trust are presented in separate reports.
The Trust has authorized an unlimited number of shares of beneficial interest with no par value. Shares are bought and sold at closing net asset value (“NAV”). Shares of the Fund are only sold to certain separate accounts of The Guardian Insurance & Annuity Company, Inc. (“GIAC”) that fund certain variable annuity contracts and variable life insurance policies issued by GIAC. GIAC is a wholly-owned subsidiary of The Guardian Life Insurance Company of America (“Guardian Life”).
The Fund seeks total return with an emphasis on current income as well as capital appreciation.
2. Significant Accounting Policies
The following is a summary of significant accounting policies followed by the Fund in the preparation of its financial statements. The Fund follows the investment company accounting and reporting guidance of the Financial Accounting Standards Board (“FASB”) Accounting Standards Codification Topic 946 Financial Services – Investment Companies. The following policies are in conformity with accounting principles generally accepted in the United States of America (“GAAP”). The preparation of financial statements in accordance with GAAP requires management to make estimates and assumptions that affect the reported amounts and disclosures in the financial statements. Actual results could differ from those estimates.
a. Investment Valuations The Board of Trustees has designated Park Avenue Institutional Advisers LLC (“Park Avenue”) as the valuation designee for the Fund pursuant to Rule 2a-5 under the 1940 Act. Park Avenue has established a Fair Valuation Committee and has adopted fair valuation procedures that provide methodologies for fair valuing securities. These procedures include monitoring the appropriateness of fair values based on results of ongoing valuation oversight, including but not limited to consideration of
security specific events, market events, and pricing vendor and broker-dealer due diligence. The Fair Valuation Committee oversees and carries out the policies for the valuation of investments held in the Fund. The Fair Valuation Committee is responsible for discussing and assessing the potential impacts to the fair values on an ongoing basis, and reports to the Board of Trustees on at least a quarterly basis.
The valuations of debt securities for which quoted bid prices are readily available are valued at the bid price by independent pricing services (each, a “Service”). Debt securities for which quoted bid prices are not readily available are valued by a Service at the evaluated bid price provided by the Service or the bid price provided by an independent broker-dealer or at a calculated price based on the spread to an appropriate benchmark provided by such broker-dealer.
Equity securities traded on an exchange other than NASDAQ Stock Market, LLC (“NASDAQ”) are valued at the last reported sale price on the principal exchange or market on which they are traded; or, if there were no sales that day, at the mean between the closing bid and ask prices. Securities traded on the NASDAQ are generally valued at the NASDAQ official closing price, which may not be the last sale price. If the NASDAQ official closing price is not available for a security, that security is generally valued at the mean between the closing bid and ask prices. Repurchase agreements are carried at cost, which approximates fair value (see Note 5c). Foreign securities are valued in the currencies of the markets in which they trade and then converted to U.S. dollars by the application of foreign exchange rates at the close of the New York Stock Exchange (“NYSE”).
Exchange-traded financial futures and swap contracts are valued at the last settlement price on the market where they are primarily traded.
Securities for which market quotations are not readily available or securities whose values have been materially affected by events occurring before the Fund’s valuation time but after the close of the securities’ principal exchange or market are valued at their fair values as determined in good faith by Park Avenue, as the Board of Trustee’s valuation designee (as defined in Rule 2a-5 under the 1940 Act), in accordance with Park Avenue’s procedures and under the general oversight of the Board of Trustees. Valuations reflected in this report are as of the report date. As a result, changes in valuation due to market events and/or issuer related events after the report date and prior to issuance of the report are not reflected herein.
NOTES TO FINANCIAL STATEMENTS — GUARDIAN TOTAL RETURN BOND VIP FUND
Various inputs are used in determining the valuation of the Fund’s investments. These inputs are summarized in three broad levels listed below.
| • | | Level 1 – unadjusted inputs using quoted prices in active markets for identical investments. |
| • | | Level 2 – other significant observable inputs, including, but not limited to, quoted prices for similar investments, inputs other than quoted prices that are observable for investments (such as interest rates, prepayment speeds, credit risks, etc.) or other market corroborated inputs. |
| • | | Level 3 – significant unobservable inputs (including the Fund’s own assumptions in determining the fair value of investments). |
Inputs may include price information, volatility statistics, specific and broad credit data, liquidity statistics, and other factors. A financial instrument’s level within the fair value hierarchy is based on the lowest level of any input; both individually and in aggregate, that is significant to the fair value measurement. However, the determination of what constitutes “observable” requires significant judgment by the Trust. The Trust considers observable data to be that market data which is readily available, regularly distributed or updated, reliable and verifiable, and provided by independent sources that are actively involved in the relevant market. The inputs or methodology used for valuing securities are not necessarily an indication of the risk associated with investing in those securities. Changes in valuation techniques may result in transfers into or out of a financial instrument’s assigned level within the hierarchy.
The FASB requires reporting entities to make disclosures about purchases, sales, issuances and settlements of Level 3 securities on a gross basis. For the six months ended June 30, 2023, there were no transfers into or out of Level 3 of the fair value hierarchy.
In determining a financial instrument’s placement within the hierarchy, the Trust separates the Fund’s investment portfolio into two categories: investments and derivatives (e.g., futures). A summary of inputs used to value the Fund’s assets and liabilities carried at fair value as of June 30, 2023 is included in the Schedule of Investments.
Investments Investments whose values are based on quoted market prices in active markets, and are therefore classified within Level 1, include active listed equities. Investments that trade in markets that are not considered to be active, but are valued based on quoted
market prices, dealer quotations or alternative pricing sources supported by observable inputs are classified within Level 2. These include certain U.S. government and sovereign obligations, most government agency securities, investment-grade corporate bonds, certain mortgage products, state, municipal and provincial obligations, and certain foreign equity securities, including securities whose prices may have been affected by events occurring after the close of trading on their principal exchange or market and, as a result, whose values are determined by a pricing service as described above, or securities whose values are otherwise determined using fair valuation methods approved by the Fund’s Board of Trustees.
Investments classified within Level 3 have significant unobservable inputs, as they trade infrequently or not at all. Level 3 investments include, among others, private placement securities. When observable prices are not available for these securities, the Trust uses one or more valuation techniques for which sufficient and reliable data is available. The inputs used by the Trust in estimating the value of Level 3 investments include, for example, the original transaction price, recent transactions in the same or similar instruments, completed or pending third-party transactions in the underlying investment or comparable issuers, subsequent rounds of financing, recapitalizations, and other transactions across the capital structure. Level 3 investments may also be adjusted to reflect illiquidity and/or non-transferability, with the amount of such discount estimated by the Trust in the absence of market information. Assumptions used by the Trust due to the lack of observable inputs may significantly impact the resulting fair value and therefore the Fund’s results of operations. As of June 30, 2023, the Fund had no securities classified as Level 3.
Derivatives Exchange-traded derivatives, such as futures contracts, exchange-traded option contracts and certain swaps, are typically classified within Level 1 or Level 2 of the fair value hierarchy depending on whether or not they are deemed to be actively traded. Certain non-exchange-traded derivatives, such as generic forwards, certain swaps and options, have inputs which can generally be corroborated by market data and are therefore classified within Level 2.
b. Securities Transactions Securities transactions are accounted for on the date securities are purchased or sold (trade date). Realized gains or losses on securities transactions are determined on the basis of specific identification.
NOTES TO FINANCIAL STATEMENTS — GUARDIAN TOTAL RETURN BOND VIP FUND
c. Futures Contracts The Fund may enter into financial futures contracts. In entering into such contracts, the Fund is required to deposit with the counterparty, either in cash or securities, an amount equal to a certain percentage of the face value of the contract. Subsequent payments are received or made by the Fund each day, depending on the daily fluctuations in the values of the contracts, and are recorded for financial statement purposes as variation margin received or paid by the Fund. Daily changes in variation margin are recognized as unrealized gains or losses by the Fund. The Fund may not achieve the anticipated benefits of the financial futures contracts and may realize a loss.
d. Credit Derivatives The Fund may enter into credit derivatives, including credit default swaps on individual obligations or credit indices. The Fund may use these investments (i) as alternatives to direct long or short investment in a particular security or securities, (ii) to adjust the Fund’s asset allocation or risk exposure, (iii) to enhance potential return, or (iv) for hedging purposes. The use by the Fund of credit default swaps may have the effect of creating a short position in a security. Credit derivatives can create investment leverage and may create additional investment risks that may subject the Fund to greater volatility than investments in more traditional securities, as described in the Statement of Additional Information.
The Fund may enter into credit default swap agreements either as a buyer or seller. The Fund may buy protection under a credit default swap to attempt to mitigate the risk of default or credit quality deterioration in one or more individual holdings or in a segment of the fixed income securities market. The Fund may sell protection under a credit default swap in an attempt to gain exposure to an underlying issuer’s credit quality characteristics without investing directly in that issuer.
For swaps entered with an individual counterparty, the Fund bears the risk of loss of the uncollateralized amount expected to be received under a credit default swap agreement in the event of the default or bankruptcy of the counterparty. Credit default swap agreements are generally valued at a price at which the counterparty to such agreement would terminate the agreement. The Fund may also enter into cleared swaps.
In entering into swap contracts, the Fund is required to deposit with the broker (or for the benefit of the broker), either in cash or securities, an amount equal to a percentage of the notional value of the contract. Subsequent payments are received or made by the Fund each day, depending on the daily fluctuations in the values of the contracts, and are recorded for financial
statement purposes as variation margin received or paid by the Fund. Daily changes in variation margin are recognized as unrealized gains or losses by the Fund. The Fund may not achieve the anticipated benefits of the swap contracts and may realize a loss. During the six months ended June 30, 2023, the Fund entered into credit default swaps for risk exposure management and to enhance potential return.
e. Options Transactions The Fund can write (sell) put and call options on securities and indexes to earn premiums, for hedging purposes, for risk management purposes or otherwise as part of its investment strategies. In writing options, the Fund is required to deposit with the broker or counterparty, either in cash or securities, an amount equal to a percentage of the face value of the options. When an option is written, the premium received is recorded as an asset with an equal liability that is subsequently marked to market to reflect the market value of the written option. These liabilities, if any, are reflected as written options, at value, in the Fund’s Statement of Assets and Liabilities. Premiums received from writing options which expire unexercised are recorded on the expiration date as a realized gain. The difference between the premium received and the amount paid on effecting a closing purchase transaction, including brokerage commissions, is also treated as a realized gain, or if the premium is less than the amount paid for the closing purchased transactions, as a realized loss. If a written call option is exercised, the premium is added to the proceeds from the sale of the underlying security in determining whether there has been a realized gain or loss. If a written put option is exercised, the premium reduces the cost basis of the security. In writing an option, the Fund bears the market risk of an unfavorable change in the price of the security underlying the written option. Exercise of a written option could result in the Fund purchasing or selling a security at a price different from its current market value. There were no options transactions as of June 30, 2023.
f. Investment Income Dividend income net of foreign taxes withheld, if any, is generally recorded on the ex-dividend date. Distributions received from real estate investment trusts, if any, may be classified as dividends, capital gains and/or return of capital. Interest income, which includes amortization/accretion of premium/discount, is determined using the interest income accrual method, and is accrued and recorded daily.
g. Allocation of Income and Expenses Many of the expenses of the Trust can be directly attributed to a specific series of the Trust. Expenses that cannot be
NOTES TO FINANCIAL STATEMENTS — GUARDIAN TOTAL RETURN BOND VIP FUND
directly attributed to a specific series of the Trust are generally apportioned among all the series in the Trust, based on relative net assets. In calculating net asset value per share for each series of the Trust, investment income, realized and unrealized gains and losses, and expenses other than series-specific expenses are allocated daily to each series based upon the proportion of net assets attributable to each series.
3. Transactions with Affiliates
a. Investment Advisory Fee and Expense Limitation Under the terms of the advisory agreement, which, after its two year initial term, is reviewed and approved annually by the Board of Trustees, the Fund pays an investment advisory fee to Park Avenue. Park Avenue is a wholly-owned subsidiary of Guardian Life and receives an investment advisory fee at an annual rate of 0.45% of the first $300 million, and 0.40% in excess of $300 million of the Fund’s average daily net assets. The fee is accrued daily and paid monthly. The Fund has no sub-adviser.
Park Avenue has contractually agreed through April 30, 2024 to waive certain fees and/or reimburse certain expenses incurred by the Fund to the extent necessary to limit the Fund’s total annual operating expenses after fee waiver and/or expense reimbursement to 0.79% of the Fund’s average daily net assets (excluding, if applicable, any acquired fund fees and expenses, taxes, interest, transaction costs and brokerage commissions, litigation and extraordinary expenses). The limitation may not be increased or terminated prior to this time without action by the Board of Trustees and may be terminated only upon approval of the Board of Trustees. Amounts waived or reimbursed by Park Avenue pursuant to any expense limitation will not be subject to Park Avenue’s recoupment rights. For the six months ended June 30, 2023, Park Avenue waived fees and/or paid Fund expenses in the amount of $28,471.
b. Compensation of Trustees and Officers Trustees and officers who are interested persons of the Trust, as defined in the 1940 Act, receive no compensation from the Fund, except for the Chief Compliance Officer of the Trust. Trustees of the Trust who are not interested persons of the Trust, and the Chief Compliance Officer, receive compensation and reimbursement of expenses from the Trust.
c. Distribution Fees Park Avenue Securities LLC (“PAS”), a wholly-owned subsidiary of Guardian Life, is the principal underwriter of Fund shares. The Trust has entered into a distribution and service agreement with PAS, which governs the sale and distribution of shares of
the Fund. Under a distribution and service plan adopted by the Trust (“12b-1 plan”), PAS is compensated for services in such capacity, including its expenses in connection with the promotion and distribution of shares of the Fund, at an annual rate of 0.25% of the Fund’s average daily net assets. For the six months ended June 30, 2023, the Fund paid distribution fees in the amount of $333,961 to PAS.
PAS has directed that certain payments under the 12b-1 plan be used to compensate GIAC for shareholder services provided to contract owners.
4. Federal Income Taxes
a. Distributions to Shareholders For federal income tax purposes, the Fund is treated as a disregarded entity (“DRE”). As a DRE, the Fund is not subject to an entity-level income tax; and any income, gains, losses, deductions, taxes, and credits of the Fund would instead be “passed through” directly to the separate accounts of GIAC that invest in the Fund and retain the same character for U.S. federal income tax purposes. In addition, the Fund is not required to distribute taxable income and capital gains for U.S. federal income tax purposes. Therefore, no dividends and capital gains distributions were paid by the Fund.
5. Investments
a. Investment Purchases and Sales The cost of investments and U.S. government agency obligations purchased and the proceeds from U.S. government agency obligations and other investments sold (excluding short-term investments and to be announced (TBA) securities) for the six months ended June 30, 2023, were as follows:
| | | | | | | | |
| | | |
| | | Other Investments | | | U.S.
Government
and Agency
Obligations | |
| Purchases | | $ | 105,239,413 | | | $ | 365,304,237 | |
| Sales | | | 108,153,179 | | | | 355,043,044 | |
b. Foreign Securities Foreign securities investments involve special risks and considerations not typically associated with U.S. investments. These risks include, but are not limited to, currency risk; adverse political, regulatory, social, and economic developments; and less reliable information about issuers. Moreover, securities of some foreign issuers may be less liquid and their prices more volatile than those of comparable U.S. issuers.
c. Repurchase Agreements The Fund may invest in repurchase agreements to maintain liquidity and earn
NOTES TO FINANCIAL STATEMENTS — GUARDIAN TOTAL RETURN BOND VIP FUND
income over periods of time as short as overnight. The collateral for repurchase agreements is either cash or fully negotiable U.S. government securities (including U.S. government agency securities). Repurchase agreements are fully collateralized (including the interest accrued thereon) and such collateral is marked to market daily while the agreements remain in force. If the value of the collateral falls below the repurchase price plus accrued interest, the Fund will typically require the seller to deposit additional collateral by the next business day. If the request for additional collateral is not met, or the seller defaults, the Fund maintains the right to sell the collateral (although it may be prevented or delayed from doing so in certain circumstances) and may be required to claim any resulting loss against the seller. Park Avenue monitors the creditworthiness of the seller with which the Fund enters into repurchase agreements.
d. Securities Purchased on a When-Issued or Delayed-Delivery Basis The Fund may purchase securities on a when-issued or delayed-delivery basis, with payment and delivery scheduled for a future date. These transactions are subject to market fluctuations and are subject to the risk that the value at delivery may be more or less than at the trade date purchase price. Although the Fund will generally enter into these transactions with the intention of taking delivery of the securities, it may sell the securities before the settlement date. Assets will be segregated when a fund agrees to purchase on a when-issued or delayed-delivery basis. These transactions may create investment leverage.
e. Restricted and Illiquid Securities A restricted security cannot be resold to the general public without prior registration under the Securities Act of 1933, as amended (except pursuant to an applicable exemption). The values of these securities may be highly volatile. If the security is subsequently registered and resold, the issuer would typically bear the expense of all registrations at no cost to the Fund. Restricted and illiquid securities are valued according to the policies and procedures adopted by the Trust’s Board of Trustees and are noted, if any, in the Fund’s Schedule of Investments. As of June 30, 2023, the Fund did not hold any restricted, other than 144A restricted securities or illiquid securities.
f. Below Investment Grade Securities The Fund may invest in below investment grade securities (i.e. lower-quality, “junk” debt), which are subject to various risks. Lower-quality debt is considered to be speculative because it is less certain that the issuer will be able to pay interest or repay the principal than in the case of
investment grade debt. These securities can involve a substantially greater risk of default than higher-rated securities, and their values can decline significantly over short periods of time. Lower-quality debt securities tend to be more sensitive to adverse news about their issuers, the market and the economy in general, than higher-quality debt securities. The market for these securities can be less liquid, especially during periods of recession or general market decline.
g. Mortgage- and Asset-Backed Securities The values of some mortgage-related or asset-backed securities may be particularly sensitive to changes in prevailing interest rates. Early repayment of principal on some mortgage-related securities may expose the Fund to a lower rate of return upon reinvestment of principal. The values of mortgage- and asset-backed securities depend in part on the credit quality and adequacy of the underlying assets or collateral and may fluctuate in response to the market’s perception of these factors as well as current and future repayment rates. Some mortgage-backed securities are backed by the full faith and credit of the U.S. government (e.g., mortgage-backed securities issued by the Government National Mortgage Association, commonly known as “Ginnie Mae”), while other mortgage-backed securities (e.g., mortgage-backed securities issued by the Federal National Mortgage Association and the Federal Home Loan Mortgage Corporation, commonly known as “Fannie Mae” and “Freddie Mac”), are backed only by the credit of the government entity issuing them. In addition, some mortgage-backed securities are issued by private entities and, as such, are not guaranteed by the U.S. government or any agency or instrumentality of the U.S. government.
h. Treasury Inflation Protected Securities Treasury inflation protected securities (“TIPS”) are debt securities issued by the U.S. Treasury whose principal and/or interest payments are adjusted for inflation, unlike debt securities that make fixed principal and interest payments. The interest rate paid by the TIPS is fixed, while the principal value rises or falls based on changes in a published Consumer Price Index (“CPI”). Thus, if inflation occurs, the principal and interest payments on TIPS are adjusted accordingly to protect investors from inflationary loss. During a deflationary period, the principal and interest payments decrease, although the TIPS principal amounts will not drop below their face amounts at maturity. In exchange for the inflation protection, the TIPS generally pay lower interest rates than typical U.S. Treasury securities. Only if inflation occurs will TIPS offer a higher real yield than a conventional Treasury bond of the same maturity.
NOTES TO FINANCIAL STATEMENTS — GUARDIAN TOTAL RETURN BOND VIP FUND
i. Disclosures About Derivative Instruments and Hedging Activities The Fund entered into U.S. Treasury futures contracts for the six months ended June 30, 2023 to manage portfolio duration. The Fund bears the risk of interest rates moving unexpectedly, in which case the Fund may not achieve the anticipated benefits of the futures contracts and realize a loss. There is minimal counterparty credit risk to the Funds since futures are exchange traded and the exchange’s clearinghouse, as counterparty to all exchange traded futures, guarantees futures against default.
Under certain market conditions, the Fund may use credit default swaps to seek to (i) hedge various investments, (ii) manage or adjust duration and yield curve exposure, (iii) manage risk, (iv) enhance returns, or (v) as substitutes for permitted Fund investments. Credit default swaps involve the exchange of a floating or fixed rate payment in return for assuming potential credit losses of an underlying security or pool of securities.
The gross returns to be exchanged or “swapped” between the parties are generally calculated with respect to a “notional amount,” i.e., the return on or increase in value of a particular dollar amount invested at a particular interest rate, in a particular foreign currency or security, or in a “basket” of securities representing a particular index. Cleared swaps are transacted through futures commission merchants (“FCM”s) that are members of central clearinghouses with the clearinghouse serving as a central counterparty similar to transactions in futures contracts. Funds post initial and variation margin by making payments to their clearing member FCMs.
Generally, the Fund will enter into credit default swaps on a net basis, which means that the two payment streams are netted out, with a Fund receiving or paying, as the case may be, only the net amount of the two payments. Credit default swaps do not normally involve the delivery of securities, other underlying assets or principal. Accordingly, the risk of loss with respect to credit default swaps is normally limited to the net amount of payments that a Fund is contractually obligated to make. If the other party to a credit default swap defaults, a Fund’s risk of loss consists of the net amount of payments that the Fund is contractually entitled to receive, if any.
In addition to the risks generally applicable to derivatives, risks associated with credit default swap agreements include adverse changes in the returns of the underlying instruments, failure of the counterparties
to perform under the agreement’s terms and the possible lack of liquidity with respect to the agreements.
As of June 30, 2023, the Fund had the following derivatives at fair value, grouped into appropriate risk categories that illustrate the Fund’s use of derivative instruments:
| | | | | | | | |
| | | |
| | | Interest Rate Contracts | | | Credit
Default Contracts | |
| | | |
Asset Derivatives | | | | | | | | |
| Futures Contracts1 | | $ | 3,112 | | | $ | — | |
| | | |
Liability Derivatives | | | | | | | | |
| Futures Contracts1 | | $ | (1,149,506 | ) | | $ | — | |
| Swap Contracts2 | | | — | | | | (324,955 | ) |
| 1 | Statement of Assets and Liabilities location: Includes cumulative unrealized appreciation/(depreciation) of futures contracts as reported in the Schedule of Investments. Only current day’s variation margin is reported within the Statement of Assets and Liabilities. |
| 2 | Statement of Assets and Liabilities location: Includes the fair value of centrally cleared swap contracts as reported in the Schedule of Investments. Only current day’s variation margin is reported within the Statement of Assets and Liabilities. |
Transactions in derivative investments for the six months ended June 30, 2023 were as follows:
| | | | | | | | |
| | | |
| | | Interest Rate Contracts | | | Credit
Default Contracts | |
| | | |
Net Realized Gain/(Loss) | | | | | | | | |
| Futures Contracts1 | | $ | 1,150,669 | | | $ | — | |
| Swap Contracts2 | | | — | | | | (2,980,867 | ) |
| | | |
Net Change in Unrealized Appreciation/(Depreciation) | | | | | | | | |
| Futures Contracts3 | | $ | (969,246 | ) | | $ | — | |
| Swap Contracts4 | | | — | | | | 1,711,905 | |
| | | |
Average Number of Notional Amounts | | | | | | | | |
| Futures Contracts5 | | | 585 | | | | — | |
| Swap Contracts — Buy/Sell Protection | | $ | — | | | $ | 26,342,857 | |
| 1 | Statement of Operations location: Net realized gain/(loss) from futures contracts. |
| 2 | Statement of Operations location: Net realized gain/(loss) from swap contracts. |
| 3 | Statement of Operations location: Net change in unrealized appreciation/(depreciation) on futures contracts. |
| 4 | Statement of Operations location: Net change in unrealized appreciation/(depreciation) on swap contracts. |
| 5 | Amount represents number of contracts. |
6. Temporary Borrowings
The Fund, with other funds managed by Park Avenue, is party to a credit agreement with respect to a $10 million committed revolving credit facility from State Street
NOTES TO FINANCIAL STATEMENTS — GUARDIAN TOTAL RETURN BOND VIP FUND
Bank and Trust Company (the “Credit Agreement”) for temporary borrowing purposes, including the meeting of redemption requests that otherwise might require the untimely disposition of securities. Interest is based on a daily fluctuating rate per annum equal to the Applicable Rate (as defined in the Credit Agreement) plus the Applicable Margin (as defined in the Credit Agreement) that is subject to change from time to time as and when the Applicable Rate changes. Under the current Credit Agreement, the Applicable Rate for any day is defined as the rate per annum equal to the sum of (a) 0.10% plus (b) the higher of (i) the Federal Funds Effective Rate for such day and (ii) the Overnight Bank Funding Rate for such day; the Applicable Margin is 1.25%. In addition to the interest charged on any borrowings by the Fund, each fund pays a commitment fee of 0.30% per annum on its share of the unused portion of the credit facility. The agreement is in place until January 5, 2024. The Fund did not utilize the credit facility during the six months ended June 30, 2023.
7. Indemnifications
Under the Trust’s organizational documents and, in some cases, by contract, officers and Trustees of the
Trust are indemnified against certain liabilities arising out of the performance of their duties to the Fund. In addition, in the normal course of business, the Fund enters into contracts with its vendors and others that provide general indemnifications. The Fund’s maximum exposure under these arrangements is unknown as this would involve future claims that may be made against the Fund that have not yet occurred. However, based on experience, the Fund expects the risk of loss to be remote.
8. Additional Information
The outbreak of COVID-19 has adversely impacted both local and global economies, including those in which the Fund may invest. These impacts include materially reduced consumer demand and economic output, disrupted supply chains, market closures, travel restrictions and quarantines, and strained healthcare systems. The Fund’s operations may be interrupted as a result, which may have a negative impact on the Fund’s investment performance.
SUPPLEMENTAL INFORMATION (UNAUDITED)
Liquidity Risk Management Program
In compliance with Rule 22e-4 under the Investment Company Act of 1940, as amended (the “Liquidity Rule”), Guardian Variable Products Trust (the “Trust”) has adopted and implemented a written liquidity risk management program (the “Program”) for each series of the Trust (each, a “Fund”), which is reasonably designed to assess and manage each Fund’s liquidity risk. The Fund’s “liquidity risk” is the risk that the Fund could not meet requests to redeem shares issued by the Fund without significant dilution of the remaining investors’ interests in the Fund.
The Board of Trustees of the Trust (the “Board”) Previously approved the designation of Park Avenue Institutional Advisers LLC (the “Administrator” or “PAIA”) as Program administrator. The Administrator established a Liquidity Risk Management Committee, which is comprised of certain officers of the Trust and PAIA, that assists the Administrator in the implementation and day-to-day administration of the Program and otherwise support carrying out the Administrator’s liquidity risk management responsibilities under the Program.
In accordance with the Program, each Fund’s liquidity risk is assessed no less frequently than annually, taking into consideration a variety of factors, including, as applicable, the Fund’s investment strategy and liquidity of portfolio investments, cash flow projections, and holdings of cash and cash equivalents, as well as borrowing arrangements and other funding sources. Certain factors are considered under both normal and reasonably foreseeable stressed conditions.
Each Fund portfolio investment is classified, no less than monthly, into one of four liquidity categories (including “highly liquid investments” and “illiquid investments,” discussed below) based on a determination of the number of days it is reasonably expected to take to convert the investment to cash, or sell or dispose of the investment, in current market conditions without significantly changing the investment’s market value.
The Liquidity Rule limits the Fund’s investments in illiquid investments by prohibiting the Fund from acquiring any illiquid investment if, immediately after the acquisition, the Fund would have invested more than 15% of its net assets in illiquid investments that are assets. The Program includes provisions reasonably designed to comply with this investment limitation. In addition, the Program includes provisions reasonably designed to comply with this investment limitation. In addition, the Program includes provisions reasonably designed to comply with the Liquidity Rule’s requirements relating to highly liquid investment minimums, which is a minimum amount of Fund net assets that must be invested in highly liquid investments that are assets, as applicable. The Fund was not required to adopt a highly liquid investment minimum during the period.
At a meeting of the Board held on March 29-30, 2023, the Board received a report (the “Report”) prepared by the Administrator addressing the Program’s operation and assessing the adequacy and effectiveness of its implementation for the period from January 1, 2022 through December 31, 2022 (the “Reporting Period”). The Report noted that the Administrator believes the Program operated effectively during the Reporting Period and continues to be reasonably designed to effectively assess and manage each Fund’s liquidity risk. The Report also noted that the Administrator believes the Program has been adequately and effectively implemented and the investment strategies for each Fund continue to be appropriate since its inception. In addition, the Report summarized the operation of the Program and the information and factors considered by the Administrator in its assessment of the Program’s implementation, such as the liquidity risk assessment framework and liquidity classification methodologies.
There can be no assurance that the Program will achieve its objectives under all circumstances. Please refer to the Fund’s prospectus for more information regarding the Fund’s exposure to liquidity risk and other risks to which an investment in the Fund may be subject.
SUPPLEMENTAL INFORMATION (UNAUDITED)
Approval of Investment Management Agreement
Section 15(c) of the Investment Company Act of 1940, as amended (the “1940 Act”), requires that a fund’s investment advisory and sub-advisory agreements be approved initially by the fund’s board of trustees. Section 15(c) also requires that the continuation of these agreements, after an initial term of up to two years, be annually reviewed and approved by the board. Any such agreement must be approved by a vote of a majority of the trustees who are not parties to the agreement or “interested persons” (as defined in the 1940 Act) of a party to the agreement at a meeting of the board called for the purpose of voting on such approval.
At a meeting of the Board of Trustees (the “Board”) of Guardian Variable Products Trust (the “Trust”) held on March 29-30, 2023 (the “Meeting”), the Board, including the trustees who are not parties to the agreement or “interested persons” as defined in the 1940 Act (the “Independent Trustees”), considered and voted unanimously to renew the existing investment management agreement between the Trust, on behalf of Guardian All Cap Core VIP Fund; Guardian Balanced Allocation VIP Fund; Guardian Core Fixed Income VIP Fund; Guardian Core Plus Fixed Income VIP Fund; Guardian Diversified Research VIP Fund; Guardian Equity Income VIP Fund; Guardian Global Utilities VIP Fund; Guardian Growth & Income VIP Fund; Guardian Integrated Research VIP Fund; Guardian International Growth VIP Fund; Guardian International Equity VIP Fund; Guardian Large Cap Disciplined Growth VIP Fund; Guardian Large Cap Disciplined Value VIP Fund; Guardian Large Cap Fundamental Growth VIP Fund; Guardian Mid Cap Relative Value VIP Fund; Guardian Mid Cap Traditional Growth VIP Fund; Guardian Multi-Sector Bond VIP Fund; Guardian Select Mid-Cap Core VIP Fund; Guardian Short Duration Bond VIP Fund; Guardian Small Cap Core VIP Fund; Guardian Small-Mid Cap Core VIP Fund; Guardian Strategic Large Cap Core VIP Fund; Guardian Total Return Bond VIP Fund and Guardian U.S. Government Securities VIP Fund (each, a “Fund,” and together, the “Funds”), in substantially the form presented at this meeting (the “Management Agreement”); and Park Avenue Institutional Advisers LLC (the “Manager”) for a one-year term.
The Board, including the Independent Trustees, also considered and voted unanimously to renew the existing sub-advisory agreements (the “Sub-Advisory Agreements,” collectively with the Management Agreement and Sub-Subadvisory Agreement, the “Agreements”) between the Manager and investment
advisory firms engaged to serve as sub-advisers to certain of the Funds (the “Sub-Advised Funds”), namely (i) ClearBridge Investments, LLC with respect to Guardian Small Cap Core VIP Fund; (ii) Putnam Investment Management, LLC with respect to Guardian Diversified Research VIP Fund; (iii) AllianceBernstein L.P. with respect to Guardian Growth & Income VIP Fund and Guardian Strategic Large Cap Core VIP Fund; (iv) J.P. Morgan Investment Management Inc. with respect to Guardian International Growth VIP Fund; (v) Schroder Investment Management North America Inc. with respect to Guardian International Equity VIP Fund; (vi) Wellington Management Company LLP with respect to Guardian Balanced Allocation VIP Fund, Guardian Equity Income VIP Fund, Guardian Integrated Research VIP Fund, Guardian Large Cap Disciplined Growth VIP Fund and Guardian Global Utilities VIP Fund; (vii) Boston Partners Global Investors, Inc. with respect to Guardian Large Cap Disciplined Value VIP Fund; (viii) Janus Henderson Investors US LLC with respect to Guardian Mid Cap Traditional Growth VIP Fund; (ix) Allspring Global Investments, LLC with respect to Guardian Mid Cap Relative Value VIP Fund and Guardian Small-Mid Cap Core VIP Fund; (x) Lord, Abbett & Co. LLC with respect to Guardian Core Plus Fixed Income VIP Fund; (xi) FIAM LLC with respect to Guardian Select Mid Cap Core VIP Fund; and (xii) Massachusetts Financial Services Company with respect to Guardian All Cap Core VIP Fund, each in substantially the form presented at this meeting, (each, a “Sub-Adviser” and collectively, the “Sub-Advisers”) for a one-year term.
The Board, including the Independent Trustees, also considered and voted unanimously to renew the existing sub-subadvisory agreement (the “Sub-Subadvisory Agreement”) between Schroder Investment Management North America Inc. and Schroder Investment Management North America Limited (also a Sub-Adviser) with respect to Guardian International Equity VIP Fund for a one-year term.
The Board is responsible for overseeing the management of each Fund. In determining whether to renew its approval of the Agreements, the Trustees evaluated information and factors that they considered to be relevant and appropriate through the exercise of their own business judgment. The Trustees considered certain information and factors in light of advice furnished to them by legal counsel to the Trust and, in the case of the Independent Trustees, their independent legal counsel. In advance of the Meeting, the Trustees received materials and information designed to assist their consideration of the Agreements. The Trustees received written responses
SUPPLEMENTAL INFORMATION (UNAUDITED)
from the Manager and each Sub-Adviser to a series of questions and requests for information encompassing a wide variety of topics provided by independent counsel on behalf of the Independent Trustees. The Independent Trustees also received materials and information regarding the legal standards applicable to their consideration of the Agreements and the process and criteria used by the Manager to identify and select the Sub-Advisers.
During the course of their deliberations, the Independent Trustees met twice to discuss and evaluate the materials, information and Agreements in executive session with their independent legal counsel, outside of the presence of the Trustees who are not Independent Trustees and representatives from Fund management, the Manager or any Sub-Adviser.
In reaching its decisions to renew its approval of the Agreements, the Board took into account the materials and information described above, as well as other materials and information provided to the Board throughout the year. Individual Trustees may have given different weight to different factors and information with respect to each Agreement, and the Trustees did not identify any single factor or information that, in isolation, would be controlling in deciding to approve the Agreements. The discussion below is intended to summarize the broad factors that figured prominently in the Board’s decisions to renew its approval of the Agreements rather than to be all-inclusive. These broad factors included: (i) the nature, extent and quality of the services provided to the Funds by the Manager and to the Sub-advised Funds by the Sub-Advisers; (ii) the investment performance of each Fund; (iii) estimated profitability of the Manager; (iv) fees and expenses; (v) the extent to which economies of scale may exist, and the extent to the benefits of economies of scale are shared with the Funds; and (vi) any other benefits derived by the Manager or the Sub-Advisers (or their respective affiliates) from their relationships with the Funds.
Nature, Extent and Quality of Services
The Trustees considered information regarding the nature, extent and quality of services provided to the Funds by the Manager. The Trustees also considered, among other things, the terms of the Management Agreement and the range of investment advisory services provided by the Manager. In addition, the Trustees reviewed the range of non-investment advisory services provided by the Manager consistent with the terms of the Management Agreement, notably coordinating the preparation and filing of various
regulatory documents, coordinating the preparation and assembly of Board meeting materials, and assisting the Board with certain valuation matters. The Board also received a description of the Manager’s and each Sub-Adviser’s business continuity plans and of their respective approaches to data privacy and cybersecurity, and related testing. The Board received information regarding the response of the Manager and the Sub-Advisers to the COVID-19 pandemic, including the continuation of remote work arrangements and return-to-office plans. The Board also received information about the Manager’s role as administrator of the Funds’ liquidity risk management program, the Manager’s approach to risk management, and the Manager’s vendor oversight programs.
The Trustees considered that the Sub-advised Funds operate in a “manager-of-managers” structure and reviewed the responsibilities that the Manager has under this structure, including monitoring and evaluating the performance of the Sub-Advisers, monitoring the Sub-Advisers for adherence to the stated investment objectives, strategies, policies and restrictions of the Funds and supervising the Sub-Advisers with respect to the services that the Sub-Advisers would provide under the Sub-Advisory Agreements. The Trustees also considered the process used by the Manager, consistent with this structure, to identify and recommend sub-advisers, and the Manager’s ability to monitor and oversee sub-advisers and recommend replacement sub-advisers, when necessary, and provide other services under the Management Agreement. The Board noted that investment management staff of the Manager and the Trust’s Chief Compliance Officer conduct oversight meetings with the Sub-Advisers on a periodic basis, follow through with additional inquiries on any questions or concerns that arise during the meetings and, as necessary, then report the results of the meetings to the Board. The Trustees reviewed information regarding the experience and background of the Manager’s key personnel and the Manager’s organizational structure and resources, including investment, legal and administrative capabilities of the Manager. In this regard, the Trustees recognized that the Funds may benefit from the Manager’s ability to use resources and capabilities of its affiliates in providing services to the Funds.
The Trustees considered information regarding the nature, extent and quality of services provided to the Sub-advised Funds by the Sub-Advisers. The Trustees also considered, among other things, the terms of the Sub-advisory Agreements and the range of investment
SUPPLEMENTAL INFORMATION (UNAUDITED)
advisory services provided by the Sub-Advisers under the oversight of the Manager. In evaluating these investment advisory services, the Trustees considered, among other things, the Sub-Advisers’ investment philosophies, styles and/or processes and approaches to managing the respective Sub-advised Funds. The Trustees received and evaluated information regarding the background, education, expertise and/or experience of the investment professionals who serve as portfolio managers for the Sub-advised Funds and the capabilities and resources of the Sub-Advisers.
Based upon these considerations, the Trustees concluded, within the context of their full deliberations, that the nature, extent and quality of services provided to the Funds by the Manager and the Sub-advised Funds by each respective Sub-Adviser were appropriate.
Investment Performance
In connection with each of its regular quarterly meetings, the Board receives information on the performance of each Fund, including net performance, relative performance rankings within the relevant Morningstar peer group, and performance as compared to benchmark index returns. At each quarterly Board meeting, members of the Manager’s funds management team review with the Board the economic and market environment, absolute and relative performance of each Fund, and any relevant information about risk management and style consistency in connection with management of the Funds. The Board considered investment performance for each Fund over the one-year, three-year (where available), five-year (where available) and since-inception periods.
The Board also received and reviewed a report prepared by Broadridge Financial Solutions (“Broadridge”), an independent provider of mutual fund industry data, which included comparisons of the performance of each Fund to performance of an appropriate peer universe. For details regarding each Fund’s performance, see the “Fund-by-Fund Factors” section below.
The Manager discussed with the Board factors contributing to the Funds’ performance results. In addition, for certain Funds, the Manager provided to the Board longer term performance records of the Sub-Advisers for strategies used in managing the Funds. The Board concluded that the investment performance generated by the Manager and each Sub-Adviser was generally satisfactory, or, that any steps being taken by the Manager and Sub-Advisers to address any performance issues were satisfactory.
Profitability
The Board received and considered the Manager’s estimate of its profitability, which included allocations by the Manager of its costs in providing management services to the Funds. The Board considered the estimated profitability of the Manager both overall and on a Fund-by-Fund basis.
The Board received and considered profitability information from most of the Sub-Advisers, but noted that the Manager had negotiated the fees with the Sub-Advisers at arm’s-length. Accordingly, the Board concluded that the profitability of the Sub-Advisers is a less relevant factor than Manager profitability.
Based on the consideration of this information, the Board concluded that the profitability of the Funds to the Manager was acceptable.
Fees and Expenses
The Trustees considered the management fees paid by the Funds to the Manager under the Management Agreement and evaluated the reasonableness of these fees. The Trustees received and reviewed comparative information with respect to the management fee and total expenses for each Fund and the management fees and total expenses for a peer group of other funds selected by Broadridge. The Trustees considered the Manager’s commitment to limit the total expenses of each Fund through an expense limitation agreement with the Trust. Although the Board recognized that the comparisons between the management fees and actual expenses of the Funds and those of the identified peer group are imprecise, given different terms of agreements and variations in fund strategies, the Trustees found that the comparative information supported their consideration and approval of the management fees and evaluation of the total expenses. For details regarding each Fund’s fee and expense comparisons, see the “Fund-by-Fund Factors” section below.
The Trustees considered the sub-advisory fees paid under the Sub-advisory Agreements and evaluated the reasonableness of those fees. The Trustees also considered that the fees paid to the Sub-Advisers would be paid by the Manager and not the Funds and that the Manager had negotiated the fees with the Sub-Advisers at arm’s-length.
Based on the consideration of the information and factors summarized above, as well as other relevant information and factors, the Board concluded that the management and sub-advisory fees were reasonable in
SUPPLEMENTAL INFORMATION (UNAUDITED)
light of the nature, extent and quality of services rendered to the Funds by the Manager and the Sub-Advisers.
Economies of Scale
The Board considered the extent to which economies of scale may exist, and the extent to the benefits of economies of scale are shared with the Funds. In this regard, the Board noted that for sixteen of twenty-four Funds, the management and sub-advisory fee included breakpoints that are tiered based on growth in asset levels of each such Fund and that for the other Funds, the fees reflected appropriate levels based on current and expected asset levels. The Board also noted that the expenses of the Funds are subject to expense limitations provided by the Manager. The Board noted that expected economies of scale, where they exist, may be shared through the use of fee breakpoints, expense limitations by the Manager, and/or a lower overall fee.
Ancillary Benefits
The Board considered the potential benefits, other than management fees, that the Manager and/or its affiliates may receive because of the Manager’s relationship with the Funds. The Trustees considered that the Funds were designed to serve as investment options under variable contracts issued by affiliates of the Manager that would receive fees under those contracts and that Park Avenue Securities LLC, an affiliate of the Manager and principal underwriter of the Funds, and participating insurance companies, including insurance companies affiliated with the Manager, would be entitled to receive fees from the Funds under a plan of distribution adopted pursuant to Rule 12b-1 under the 1940 Act. The Trustees considered that the Manager and its affiliates may benefit from (i) greater efficiencies in annuity administration and operations and potential cost savings due to a reduction in the number of unaffiliated funds available as annuity contract investment options, and (ii) increased dividends-received deductions due to the Funds’ status under the tax laws as disregarded entities. In addition, the Trustees considered the potential benefits, other than sub-advisory fees, that the Sub-Advisers and their affiliates may receive because of their relationships with the Funds, including the ability to receive research from soft dollar commissions consistent with Trust policies. The Trustees concluded that benefits that may accrue to the Manager and its affiliates are reasonable and the benefits that may accrue to the Sub-Advisers and their affiliates are consistent with those expected for a sub-adviser to a mutual fund such as the applicable Fund.
Fund-by-Fund Factors
The Broadridge report groups fees, expenses and performance into five quintiles, with the top quintile having the highest performance or lowest fees/expenses, and the bottom quintile having the lowest performance or highest fees/expenses. For purposes of the descriptions below, a Fund’s performance is considered “in line with” the benchmark index if it is within 0.20%.
Guardian Large Cap Fundamental Growth VIP Fund
| • | | The Board noted that the Fund’s performance was in the 3rd quintile of its performance universe for the 1-year period and in the 4th quintile for its performance universe for the 3-year and 5-year periods. The Board also noted that the Fund’s performance was below the benchmark index for the 1-year, 3-year and 5-year periods. |
| • | | The Board noted that the contractual management fee, the actual management fee and actual total expenses were in the 1st quintile of the expense group. |
Guardian Large Cap Disciplined Growth VIP Fund
| • | | The Board noted that the Fund’s performance was in the 3rd quintile of its performance universe for the 1-year and 3-year periods and in the 2nd quintile for the 5-year period. The Board also noted that the Fund’s performance was below the benchmark index for the 1-year, 3-year and 5-year periods. |
| • | | The Board noted that the contractual management fee, the actual management fee and actual total expenses were in the 1st quintile of the expense group. |
Guardian Integrated Research VIP Fund
| • | | The Board noted that the Fund’s performance was in the 5th quintile of its performance universe for the 1-year and 5-year periods and in the 4th quintile for 3-year period. The Board also noted that the Fund’s performance was below the benchmark index for the 1-year, 3-year and 5-year periods. |
| • | | The Board noted that the contractual management fee, the actual management fee and actual total expenses were in the 1st quintile of the expense group. |
Guardian Diversified Research VIP Fund
| • | | The Board noted that the Fund’s performance was in the 3rd quintile of its performance universe for the 1-year and 3-year periods and in the 2nd quintile for the 5-year period. The Board also noted that the Fund’s performance was higher than the benchmark |
SUPPLEMENTAL INFORMATION (UNAUDITED)
| | | index for the 1-year period. The Board note that the Fund’s performance was lower than the benchmark index for the 3-year and 5-year periods. |
| • | | The Board noted that the contractual management fee and actual management fee were in the 1st quintile of the expense group and that actual total expenses were in the 3rd quintile. |
Guardian Strategic Large Cap Core VIP Fund
| • | | The Board noted that the Fund’s performance was in the 1st quintile of its performance universe for the 1-year period. The Board acknowledged the Fund’s short operational history. The Board noted that the Fund’s performance was higher than the benchmark index for the 1-year period. |
| • | | The Board noted that the contractual management fee, the actual management fee and actual total expenses were in the 1st quintile of the expense group. |
Guardian Large Cap Disciplined Value VIP Fund
| • | | The Board noted that the Fund’s performance was in the 3rd quintile of its performance universe for the 1-year and 3-year periods and in the 4th quintile for the 5-year period. The Board also noted that the Fund’s performance was higher than the benchmark index for the 1-year and 3-year periods. The Board noted that the Fund’s performance was in line with the benchmark index for the 5-year period. |
| • | | The Board noted that the contractual management fee was in the 2nd quintile of the expense group, the actual management fee was in the 1st quintile of the expense group and that actual total expenses were in the 3rd quintile. |
Guardian Growth & Income VIP Fund
| • | | The Board noted that the Fund’s performance was in the 3rd quintile of its performance universe for the 1-year, 3-year and 5-year periods. The Board also noted that the Fund’s performance was higher than the benchmark index for the 1-year, 3-year and 5-year periods. |
| • | | The Board noted that the contractual management fee and the actual management fee were in the 1st quintile of the expense group and that actual total expenses were in the 3rd quintile. |
Guardian Equity Income VIP Fund
| • | | The Board noted that the Fund had less than one-year of operational history and was not able to evaluate an investment performance record for the Fund. The |
| | | Board noted that it would have an opportunity to review such information in connection with future annual reviews. The Board noted that, in the meantime, it received monthly performance reports from the Manager. |
| • | | The Board noted that the contractual management fee, the actual management fee and actual total expenses were in the 1st quintile of the expense group. |
Guardian All Cap Core VIP Fund
| • | | The Board noted that the Fund’s performance was in the 3rd quintile of its performance universe for the 1-year period. The Board acknowledged the Fund’s short operational history. The Board noted that the Fund’s performance was higher than the benchmark index for the 1-year period. |
| • | | The Board noted that the contractual management fee, the actual management fee and actual total expenses were in the 1st quintile of the expense group. |
Guardian Mid Cap Traditional Growth VIP Fund
| • | | The Board noted that the Fund’s performance was in the 1st quintile of its performance universe for the 1-year period and in the 2nd quintile for the 3-year and 5-year periods. The Board also noted that the Fund’s performance was higher than the benchmark index for the 1-year, 3-year and 5-year periods. |
| • | | The Board noted that the contractual management fee and actual management fee were in the 1st quintile of the expense group and that the actual total expenses were in the 4th quintile. |
Guardian Select Mid Cap Core VIP Fund
| • | | The Board noted that the Fund’s performance was in the 3rd quintile of its performance universe for the 1-year period. The Board acknowledged the Fund’s short operational history. The Board noted that the Fund’s performance was lower than the benchmark index for the 1-year period. |
| • | | The Board noted that the contractual management fee, the actual management fee and actual total expenses were in the 1st quintile of the expense group. |
Guardian Mid Cap Relative Value VIP Fund
| • | | The Board noted that the Fund’s performance was in the 2nd quintile of its performance universe for the 1-year, 3-year and 5-year periods. The Board also noted that the Fund’s performance was higher than the benchmark index for the 1-year, 3-year and 5-year periods. |
SUPPLEMENTAL INFORMATION (UNAUDITED)
| • | | The Board noted that the contractual management fee and the actual management fee were in the 2nd quintile of the expense group and the actual total expenses were in the 3rd quintile of the expense group. |
Guardian Small-Mid Cap Core VIP Fund
| • | | The Board noted that the Fund’s performance was in the 5th quintile of its performance universe for the 1-year period. The Board acknowledged the Fund’s short operational history. The Board noted that the Fund’s performance was higher than the benchmark index for the 1-year period. |
| • | | The Board noted that the contractual management fee, the actual management fee and actual total expenses were in the 1st quintile of the expense group. |
Guardian Small Cap Core VIP Fund
| • | | The Board noted that the Fund’s performance was in the 5th quintile of its performance universe for the 1-year and 3-year periods. The Board noted that the Fund’s performance was lower than the benchmark index for the 1-year and 3-year periods. |
| • | | The Board noted that the contractual management fee and the actual management fee were in the 1st quintile of the expense group and the actual total expenses were in the 2nd quintile of the expense group. |
Guardian International Growth VIP Fund
| • | | The Board noted that the Fund’s performance was in the 4th quintile of its performance universe for the 1-year period, in the 2nd quintile of its performance universe for the 3-year period and in the 3rd quintile of its performance universe for the 5-year period. The Board also noted that the Fund’s performance was lower than the benchmark index for the 1-year and 5-year periods. The Board noted that the Fund’s performance was higher than the benchmark index for the 3-year period. |
| • | | The Board noted that the contractual management fee and actual management fee were in the 2nd quintile of the expense group and that the actual total expenses were in the 3rd quintile. |
Guardian International Equity VIP Fund
| • | | The Board noted that the Fund’s performance was in the 5th quintile of its performance universe for the 1-year, 3-year and 5-year periods. The Board also noted that the Fund’s performance was lower than the benchmark index for the 1-year, 3-year and 5-year periods. |
| • | | The Board noted that the contractual management fee, the actual management fee and the actual total expenses were in the 2nd quintile of the expense group. |
Guardian Global Utilities VIP Fund
| • | | The Board noted that the Fund’s performance was in the 5th quintile of its performance universe for the 1-year period and in the 4th quintile of its performance universe for the 3-year period. The Board noted that the Fund’s performance was higher than the benchmark index for the 1-year and 3-year periods. |
| • | | The Board noted that the contractual management fee and the actual management fee were in the 1st quintile of the expense group and the actual total expenses were in the 2nd quintile of the expense group. |
Guardian Balanced Allocation VIP Fund
| • | | The Board noted that the Fund had less than one-year of operational history and was not able to evaluate an investment performance record for the Fund. The Board noted that it would have an opportunity to review such information in connection with future annual reviews. The Board noted that, in the meantime, it received monthly performance reports from the Manager. |
| • | | The Board noted that the contractual management fee, the actual management fee and actual total expenses were in the 1st quintile of the expense group. |
Guardian Core Plus Fixed Income VIP Fund
| • | | The Board noted that the Fund’s performance was in the 3rd quintile of its performance universe for the 1-year and 3-year periods and in the 4th quintile of its performance universe for the 5-year period. The Board also noted that the Fund’s performance was lower than the benchmark index for the 1-year and 5-year periods. The Board noted that the Fund’s performance was in line with the benchmark index for the 3-year period. |
| • | | The Board noted that the contractual management fee and actual management fee were in the 2nd quintile of the expense group and that actual total expenses were in the 3rd quintile. |
Guardian Total Return Bond VIP Fund
| • | | The Board noted that the Fund’s performance was in the 5th quintile of its performance universe for the 1-year and 3-year periods. The Board also noted that the Fund’s performance was lower than the benchmark index for the 1-year and 3-year periods. |
SUPPLEMENTAL INFORMATION (UNAUDITED)
| • | | The Board noted that the contractual management fee and actual management fee were in the 2nd quintile and the actual total expenses were in the 3rd quintile. |
Guardian Core Fixed Income VIP Fund
| • | | The Board noted that the Fund had less than one-year of operational history and was not able to evaluate an investment performance record for the Fund. The Board noted that it would have an opportunity to review such information in connection with future annual reviews. The Board noted that, in the meantime, it received monthly performance reports from the Manager. |
| • | | The Board noted that the contractual management fee was in the 2nd quintile of the expense group and the actual management fee and the actual total expenses were in the 1st quintile. |
Guardian Multi-Sector Bond VIP Fund
| • | | The Board noted that the Fund’s performance was in the 5th quintile of its performance universe for the 1-year and 3-year periods The Board also noted that the Fund’s performance was lower than the benchmark index for the 1-year and 3-year periods. |
| • | | The Board noted that the contractual management fee and actual total expenses were in the 1st quintile and the actual management fee was in the 2nd quintile. |
Guardian Short Duration Bond VIP Fund
| • | | The Board noted that the Fund had less than one-year of operational history and was not able to evaluate an |
| | | investment performance record for the Fund. The Board noted that it would have an opportunity to review such information in connection with future annual reviews. The Board noted that, in the meantime, it received monthly performance reports from the Manager. |
| • | | The Board noted that the contractual management fee and actual total expenses were in the 3rd quintile of the expense group and the actual management fee was in the 1st quintile of the expense group. |
Guardian U.S. Government Securities VIP Fund
| • | | The Board noted that the Fund’s performance was in the 1st quintile of its performance universe for the 1-year period and in the 2nd quintile of its performance universe for the 3-year period. The Board also noted that the Fund’s performance was higher than the benchmark index for the 1-year and 3-year periods. |
| • | | The Board noted that the contractual management fee and the actual management fee were in the 1st quintile of the expense group and the actual total expenses were in the 2nd quintile of the expense group. |
Conclusion
Based on a comprehensive consideration and evaluation of all of the information and factors summarized above, among others, the Board as a whole, including the Independent Trustees, approved the Agreements.
SUPPLEMENTAL INFORMATION (UNAUDITED)
The Statement of Additional Information (“SAI”) includes additional information about the Trust’s Trustees and Officers and is available, without charge, upon request by calling toll-free 1-888-GUARDIAN (1-888-482-7342) or by visiting our website at http://guardianvpt.onlineprospectus.net/GuardianVPT/Prospectuses.
Portfolio Holdings and Proxy Voting Procedures
The Fund files its complete schedule of portfolio holdings with the Securities and Exchange Commission for the first and third quarters of each fiscal year as an exhibit to its reports on Form N-PORT. The Fund’s Form N-PORT reports are available on the Securities and Exchange Commission’s website at https://www.sec.gov. The Fund’s Form N-PORT information is also available, without charge, upon request, by calling toll-free 1-888-GUARDIAN (1-888-482-7342) or by visiting our website at http://guardianvpt.onlineprospectus.net/GuardianVPT/Prospectuses.
A description of the policies and procedures that the Fund uses to determine how to vote proxies relating to portfolio securities is included in the SAI. The SAI and information regarding how the Fund voted proxies relating to portfolio securities during the most recent 12-month period ended June 30 may be obtained (i) without charge, upon request, by calling toll-free 1-888-GUARDIAN (1-888-482-7342) or by visiting our website at http://guardianvpt.onlineprospectus.net/GuardianVPT/Prospectuses; and (ii) on the Securities and Exchange Commission’s website at https://www.sec.gov.
This report is transmitted to shareholders only. It is not authorized for use as an offer of sale or a solicitation of an offer to buy shares of the Fund unless accompanied or preceded by the Fund’s current prospectus. Past performance results shown in this report should not be considered a representation of future performance. Investment returns and principal value of shares will fluctuate so that shares, when redeemed, may be worth more or less than their original cost. Statements and other information herein are as dated and are subject to change.

The Guardian Life Insurance Company of America New York, NY 10001-2159
PUB10524
Guardian Variable
Products Trust
2023
Semiannual Report
All Data as of June 30, 2023
Guardian U.S. Government Securities VIP Fund

| | |
| Not FDIC insured. May lose value. No bank guarantee. | | www.guardianlife.com |
TABLE OF CONTENTS
Guardian U.S. Government Securities VIP Fund
Except as otherwise specifically stated, all information, including portfolio security positions, is as of June 30, 2023. Fund holdings will vary. Information contained herein has been obtained from sources believed reliable, but is not guaranteed.
GUARDIAN U.S. GOVERNMENT SECURITIES VIP FUND
Fund Characteristics (unaudited)
Total Net Assets: $193,142,392
|
| |
Bond Sector Allocation1 As of June 30, 2023 |
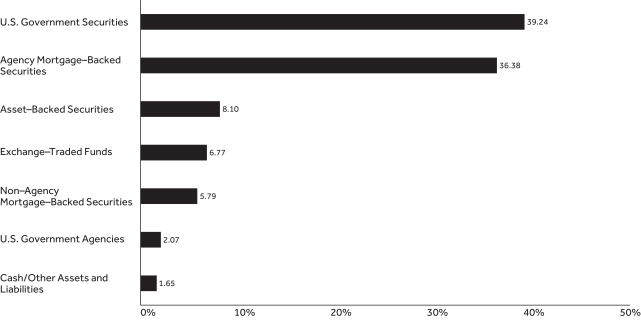
|
|
| |
Bond Quality Allocation2 As of June 30, 2023 |
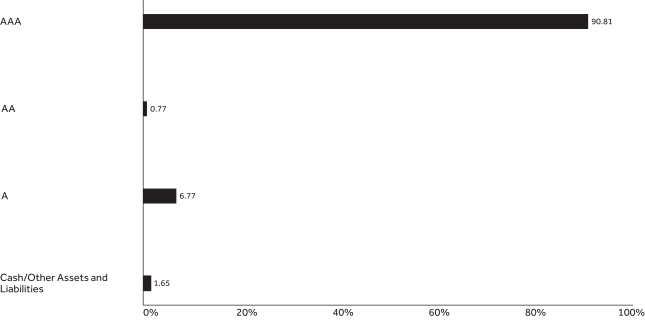
|
GUARDIAN U.S. GOVERNMENT SECURITIES VIP FUND
| | | | | | | | | | | | |
| |
Top Ten Holdings1 As of June 30, 2023 | |
| | | | |
| Holding | | Coupon Rate | | | Maturity Date | | | % of Total
Net Assets | |
| U.S. Treasury Note | | | 4.625% | | | | 6/30/2025 | | | | 17.52% | |
| U.S. Treasury Note | | | 4.000% | | | | 6/30/2028 | | | | 16.99% | |
| Vanguard Mortgage-Backed Securities ETF | | | — | | | | — | | | | 4.84% | |
| Fannie Mae ACES | | | 3.610% | | | | 2/25/2031 | | | | 3.64% | |
| Federal National Mortgage Association | | | 2.500% | | | | 7/1/2052 | | | | 3.36% | |
| U.S. Treasury Note | | | 3.750% | | | | 5/31/2030 | | | | 3.07% | |
| Federal Home Loan Bank Discount Notes | | | 2.539% | | | | 7/6/2023 | | | | 2.07% | |
| Federal National Mortgage Association | | | 3.000% | | | | 11/1/2052 | | | | 2.01% | |
| Federal Home Loan Mortgage Corp. | | | 5.000% | | | | 12/1/2052 | | | | 1.95% | |
| iShares MBS ETF | | | — | | | | — | | | | 1.93% | |
| Total | | | | 57.38% | |
| 1 | Portfolio holdings are subject to change and should not be considered a recommendation to buy or sell individual securities. Cash includes short-term investments and net other assets and liabilities. |
| 2 | The Bond Quality Allocation chart displays the percentage of fund assets allocated to each rating. Rating agencies’ independent ratings of individual securities are aggregated by Bloomberg, and market weights are reported using Standard & Poor’s letter rating conventions. Rating methodology uses the middle rating of Moody’s Investors Service, Inc., Standard & Poor’s Ratings Services, and Fitch Ratings. When a rating from only two of the rating agencies is available, the lower rating is used. Credit quality ratings assigned by a rating agency are subject to change periodically and are not absolute standards of credit quality. Rating agencies may fail to make timely changes in credit ratings, and an issuer’s current financial condition may be better or worse than a rating indicates. In formulating investment decisions for the Fund, Park Avenue Institutional Advisers LLC develops its own analysis of the credit quality and risks associated with individual debt instruments, rather than relying exclusively on rating agency ratings. |
UNDERSTANDING YOUR FUND’S EXPENSES (UNAUDITED)
By investing in the Fund, you incur two types of costs: (1) transaction costs and (2) ongoing costs, including, as applicable, investment advisory fees, distribution and/or service (12b-1) fees and other Fund expenses. The example below is intended to help you understand your ongoing costs (in dollars) of investing in the Fund and to compare these costs with the ongoing costs of investing in other mutual funds.
The example is based on an investment of $1,000 invested at the beginning of the period and held for the entire period from January 1, 2023 to June 30, 2023. The table below shows the Fund’s expenses in two ways:
Expenses based on actual return
This section of the table provides information about actual account values and actual expenses. You may use the information in this section, together with the amount you invested, to estimate the expenses that you paid over the period. Simply divide your account value by $1,000 (for example, an $8,600 account value divided by $1,000 = 8.6), then multiply the result by the number in the section under the heading entitled “Expenses Paid During Period” to estimate the expenses you paid on your account during this period.
Expenses based on hypothetical 5% return for comparison purposes
This section of the table provides information about hypothetical account values and hypothetical expenses based on the Fund’s actual expense ratio and an assumed rate of return of 5% per year before expenses, which is not the Fund’s actual return. The hypothetical account values and expenses may not be used to estimate the actual ending account balance or expenses you paid for the period. You may use this information to compare the ongoing costs of investing in the Fund with the cost of investing in other mutual funds. To do so, compare this 5% hypothetical example with the 5% hypothetical examples that appear in the shareholder reports of the other funds.
Note that the expenses shown in the table are meant to highlight your ongoing costs only and do not reflect any transactional costs, such as sales charges (loads), redemption fees, or exchange fees. Therefore the second section is useful in comparing ongoing costs only, and will not help you determine the relative total costs of owning different funds. If these transactional costs were included, your costs would have been higher. Charges and expenses at the insurance company separate account level are not reflected in the table.
| | | | | | | | | | | | | | |
| | | | | |
| | | Beginning
Account Value 1/1/23 | | Ending Account Value
6/30/23 | | | Expenses Paid During Period* 1/1/23-6/30/23 | | | Expense Ratio During Period 1/1/23-6/30/23 | |
| Based on Actual Return | | $1,000.00 | | $ | 1,011.70 | | | $ | 3.74 | | | | 0.75% | |
| Based on Hypothetical Return (5% Return Before Expenses) | | $1,000.00 | | $ | 1,021.08 | | | $ | 3.76 | | | | 0.75% | |
| * | Expenses are equal to the Fund’s annualized expense ratio as indicated, multiplied by the average account value over the period, multiplied by 181/365 (to reflect the one-half year period). |
SCHEDULE OF INVESTMENTS — GUARDIAN U.S. GOVERNMENT SECURITIES VIP FUND
| | | | | | | | |
| June 30, 2023 (unaudited) | | Principal
Amount | | | Value | |
| Agency Mortgage–Backed Securities – 36.4% | |
| | | |
Fannie Mae ACES
2019-M4 A2
3.61% due 2/25/2031 | | $ | 7,467,755 | | | $ | 7,019,687 | |
2021-M4 A2
1.513% due 2/25/2031(1)(2) | | | 1,000,000 | | | | 802,639 | |
| | | |
Federal Home Loan Mortgage Corp.
2.50% due 9/1/2037 | | | 1,791,420 | | | | 1,630,297 | |
3.00% due 4/1/2052 | | | 2,912,238 | | | | 2,565,734 | |
3.50% due 11/1/2052 | | | 3,204,053 | | | | 2,918,252 | |
4.00% due 10/1/2052 | | | 2,807,750 | | | | 2,633,808 | |
4.50% due 2/1/2053 | | | 1,605,488 | | | | 1,543,050 | |
5.00% due 12/1/2052 | | | 3,849,864 | | | | 3,771,369 | |
| | | |
Federal National Mortgage Association
2.00% due 6/1/2037 | | | 2,003,215 | | | | 1,774,628 | |
2.00% due 9/1/2037 | | | 1,916,903 | | | | 1,698,164 | |
2.50% due 10/1/2037 | | | 23,164 | | | | 21,082 | |
2.50% due 11/1/2037 | | | 935,272 | | | | 851,192 | |
2.50% due 1/1/2052 | | | 2,058,404 | | | | 1,745,437 | |
2.50% due 3/1/2052 | | | 1,971,192 | | | | 1,670,633 | |
2.50% due 4/1/2052 | | | 1,937,853 | | | | 1,644,256 | |
2.50% due 5/1/2052 | | | 1,939,448 | | | | 1,645,609 | |
2.50% due 7/1/2052 | | | 7,656,932 | | | | 6,489,435 | |
3.00% due 11/1/2037 | | | 1,146,129 | | | | 1,069,360 | |
3.00% due 7/1/2051 | | | 1,614,141 | | | | 1,423,262 | |
3.00% due 3/1/2052 | | | 769,960 | | | | 678,378 | |
3.00% due 4/1/2052 | | | 969,365 | | | | 853,952 | |
3.00% due 11/1/2052 | | | 4,412,252 | | | | 3,884,364 | |
3.50% due 10/1/2052 | | | 1,747,994 | | | | 1,592,167 | |
3.50% due 11/1/2052 | | | 3,403,186 | | | | 3,099,658 | |
4.50% due 9/1/2052 | | | 1,084,537 | | | | 1,042,398 | |
4.50% due 2/1/2053 | | | 1,605,588 | | | | 1,543,157 | |
| | | |
Freddie Mac Multifamily Structured Pass-Through Certificates
K048 A2
3.284% due 6/25/2025(1)(2) | | | 2,045,000 | | | | 1,972,819 | |
K078 A2
3.854% due 6/25/2028 | | | 600,000 | | | | 580,861 | |
K082 A2
3.92% due 9/25/2028(1)(2) | | | 3,385,000 | | | | 3,283,312 | |
K102 A2
2.537% due 10/25/2029 | | | 2,000,000 | | | | 1,779,891 | |
K124 A2
1.658% due 12/25/2030 | | | 4,200,000 | | | | 3,432,783 | |
K730 A2
3.59% due 1/25/2025(1)(2) | | | 3,714,695 | | | | 3,610,901 | |
| | | | | | | | | |
| | |
Total Agency Mortgage–Backed Securities
(Cost $73,312,439) | | | | 70,272,535 | |
| Asset–Backed Securities – 8.1% | |
| | | |
AmeriCredit Automobile Receivables Trust
2019-2 C
2.74% due 4/18/2025 | | | 457,673 | | | | 455,739 | |
| | | |
Barings CLO Ltd.
2020-1A AR
6.41% (3 mo. USD LIBOR + 1.15%)
due 10/15/2036(1)(3)(4) | | | 1,100,000 | | | | 1,073,838 | |
| | | | | | | | | |
| | | | | | | | |
| June 30, 2023 (unaudited) | | Principal
Amount | | | Value | |
| Asset–Backed Securities (continued) | |
| | | |
BlueMountain CLO Ltd.
2014-2A BR2
7.00% (3 mo. USD LIBOR + 1.75%)
due 10/20/2030(1)(3)(4) | | $ | 600,000 | | | $ | 587,280 | |
| | | |
BMW Vehicle Lease Trust
2023-1 A3
5.16% due 11/25/2025 | | | 1,000,000 | | | | 993,552 | |
| | | |
Cathedral Lake VI Ltd.
2021-6A AN
6.505% (3 mo. USD LIBOR + 1.25%)
due 4/25/2034(1)(3)(4) | | | 1,200,000 | | | | 1,179,596 | |
| | | |
Ford Credit Auto Lease Trust
2021-B A3
0.37% due 10/15/2024 | | | 758,041 | | | | 753,560 | |
| | | |
GM Financial Automobile Leasing Trust
2023-1 A3
5.16% due 4/20/2026 | | | 810,000 | | | | 803,925 | |
| | | |
Gulf Stream Meridian 6 Ltd.
2021-6A A1
6.45% (3 mo. USD LIBOR + 1.19%)
due 1/15/2037(1)(3)(4) | | | 1,000,000 | | | | 982,100 | |
| | | |
Honda Auto Receivables Owner Trust
2021-2 A3
0.33% due 8/15/2025 | | | 1,155,265 | | | | 1,123,250 | |
| | | |
KKR CLO 38 Ltd.
38A A1
6.306% (3 mo. USD Term SOFR + 1.32%)
due 4/15/2033(1)(3) | | | 1,250,000 | | | | 1,229,115 | |
| | | |
NextGear Floorplan Master Owner Trust
2022-1A A2
2.80% due 3/15/2027(3) | | | 1,750,000 | | | | 1,660,843 | |
| | | |
Santander Retail Auto Lease Trust
2021-C A3
0.50% due 3/20/2025(3) | | | 675,404 | | | | 669,337 | |
| | | |
Toyota Lease Owner Trust
2021-A A4
0.50% due 8/20/2025(3) | | | 1,000,000 | | | | 989,827 | |
| | | |
Verizon Owner Trust
2020-A B
1.98% due 7/22/2024 | | | 76,302 | | | | 76,179 | |
| | | |
Voya CLO Ltd.
2016-3A A3R
7.012% (3 mo. USD LIBOR + 1.75%)
due 10/18/2031(1)(3)(4) | | | 925,000 | | | | 899,100 | |
| | | |
Westlake Automobile Receivables Trust
2022-3A A2
5.24% due 7/15/2025(3) | | | 684,487 | | | | 682,975 | |
| | | |
World Omni Auto Receivables Trust
2023-A A2A
5.18% due 7/15/2026 | | | 1,500,000 | | | | 1,492,791 | |
| | | | | | | | | |
| | |
Total Asset–Backed Securities
(Cost $15,829,022) | | | | 15,653,007 | |
| | | | |
| 4 | | | | The accompanying notes are an integral part of these financial statements. |
SCHEDULE OF INVESTMENTS — GUARDIAN U.S. GOVERNMENT SECURITIES VIP FUND
| | | | | | | | |
| June 30, 2023 (unaudited) | | Principal
Amount | | | Value | |
| Non–Agency Mortgage–Backed Securities – 5.8% | |
| | | |
BB-UBS Trust
2012-SHOW A
3.43% due 11/5/2036(3) | | $ | 1,000,000 | | | $ | 949,908 | |
| | | |
Citigroup Commercial Mortgage Trust
2014-GC21 A5
3.855% due 5/10/2047 | | | 1,700,000 | | | | 1,663,248 | |
2019-PRM B
3.644% due 5/10/2036(3) | | | 1,309,824 | | | | 1,293,026 | |
| | | |
Commercial Mortgage Trust
2014-UBS3 A4
3.819% due 6/10/2047 | | | 1,550,000 | | | | 1,510,668 | |
2015-CR23 A4
3.497% due 5/10/2048 | | | 2,500,000 | | | | 2,379,711 | |
| | | |
GS Mortgage Securities Trust
2013-GC16 A4
4.271% due 11/10/2046 | | | 796,794 | | | | 794,259 | |
| | | |
Hudson Yards Mortgage Trust
2016-10HY A
2.835% due 8/10/2038(3) | | | 600,000 | | | | 538,943 | |
| | | |
ONE Park Mortgage Trust
2021-PARK A
5.962% due 3/15/2036(1)(2)(3) | | | 500,000 | | | | 472,646 | |
| | | |
Wells Fargo Commercial Mortgage Trust
2021-SAVE A
6.343% due 2/15/2040(1)(2)(3) | | | 636,315 | | | | 598,456 | |
| | | |
WFRBS Commercial Mortgage Trust
2014-C19 AS
4.271% due 3/15/2047 | | | 1,000,000 | | | | 978,443 | |
| | | | | | | | | |
| | |
Total Non–Agency Mortgage–Backed Securities
(Cost $11,933,146) | | | | 11,179,308 | |
| U.S. Government Agencies – 2.1% | |
| | | |
Federal Home Loan Bank Discount Notes
2.539% due 7/6/2023(5) | | | 4,000,000 | | | | 3,998,352 | |
| | | | | | | | | |
| | |
Total U.S. Government Agencies
(Cost $3,997,333) | | | | 3,998,352 | |
| U.S. Government Securities – 39.2% | |
| | | |
U.S. Treasury Inflation-Indexed Note
0.125% due 4/15/2027 | | | 547,873 | | | | 507,208 | |
| | | |
U.S. Treasury Note
3.375% due 5/15/2033 | | | 2,800,000 | | | | 2,700,687 | |
3.75% due 5/31/2030 | | | 6,000,000 | | | | 5,917,500 | |
4.00% due 6/30/2028 | | | 33,000,000 | | | | 32,819,533 | |
4.625% due 6/30/2025 | | | 34,000,000 | | | | 33,844,610 | |
| | | | | | | | | |
| | |
Total U.S. Government Securities
(Cost $75,888,310) | | | | 75,789,538 | |
| | | | | | | | |
| June 30, 2023 (unaudited) | |
Shares | | | Value | |
| Exchange–Traded Funds – 6.8% | |
| | | |
iShares MBS ETF | | | 40,000 | | | $ | 3,730,600 | |
| | | |
Vanguard Mortgage-Backed Securities ETF | | | 203,100 | | | | 9,340,569 | |
| | | | | | | | | |
| | |
Total Exchange–Traded Funds
(Cost $13,004,999) | | | | 13,071,169 | |
| | | | | | | | |
| | | Principal
Amount | | | Value | |
| Repurchase Agreements – 0.6% | |
| | | |
Fixed Income Clearing Corp., 1.52%, dated 6/30/2023, proceeds at maturity value of $1,232,600, due 7/3/2023(6) | | $ | 1,232,444 | | | | 1,232,444 | |
| | | | | | | | | |
| | |
Total Repurchase Agreements
(Cost $1,232,444) | | | | 1,232,444 | |
| | | |
Total Investments – 99.0%
(Cost $195,197,693) | | | | | | | 191,196,353 | |
| | |
| Assets in excess of other liabilities – 1.0% | | | | 1,946,039 | |
| | | |
| Total Net Assets – 100.0% | | | | | | $ | 193,142,392 | |
| (1) | Variable rate securities, which may include step-up bonds or adjustable rate mortgages. The rate shown is the rate in effect at June 30, 2023. |
| (2) | Variable coupon rate based on weighted average interest rate of underlying mortgages. |
| (3) | Securities that may be resold in transactions exempt from registration under Rule 144A of the Securities Act of 1933, as amended, normally to certain qualified buyers. At June 30, 2023, the aggregate market value of these securities amounted to $13,806,990, representing 7.1% of net assets. These securities have been deemed liquid by the investment adviser pursuant to the Fund’s liquidity procedures approved by the Board of Trustees. |
| (4) | The London Interbank Offered Rate (“LIBOR”) is being phased out completely by June 30, 2023. There remains uncertainty regarding the nature of any replacement rate and the impact of a transition away from LIBOR on the Fund’s investments. |
| (5) | Interest rate shown reflects the discount rate at time of purchase. |
| (6) | The table below presents collateral for repurchase agreements. |
| | | | | | | | | | | | | | | | |
| Security | | Coupon | | | Maturity
Date | | | Principal
Amount | | | Value | |
| U.S. Treasury Note | | | 4.625% | | | | 3/15/2026 | | | $ | 1,238,800 | | | $ | 1,257,104 | |
| | | | |
| The accompanying notes are an integral part of these financial statements. | | | | 5 |
SCHEDULE OF INVESTMENTS — GUARDIAN U.S. GOVERNMENT SECURITIES VIP FUND
Open futures contracts at June 30, 2023:
| | | | | | | | | | | | | | | | | | | | | | | | |
| Type | | Expiration | | | Contracts | | | Position | | | Notional Amount | | | Notional
Value | | | Unrealized
Depreciation | |
| U.S. 2-Year Treasury Note | | | September 2023 | | | | 173 | | | | Long | | | $ | 35,604,062 | | | $ | 35,178,469 | | | $ | (425,593 | ) |
| U.S. Long Bond | | | September 2023 | | | | 39 | | | | Long | | | | 4,958,488 | | | | 4,949,344 | | | | (9,144 | ) |
| Total | | | $ | 40,562,550 | | | $ | 40,127,813 | | | $ | (434,737 | ) |
Centrally cleared credit default swap agreements — buy protection(7):
| | | | | | | | | | | | | | | | | | | | | | | | | | | | | | | | | | | | |
| Reference Entity | | Implied Credit
Spread at
6/30/23(8) | | | Notional Amount(9) | | | Maturity | | | (Pay)/Receive
Fixed Rate | | | Periodic
Payment
Frequency | | | Upfront
Payments | | | Value | | | Unrealized
Depreciation | |
| CDX.NA.IG.S40 | | | 0.66% | | | | USD | | | | 20,400,000 | | | | 6/20/2028 | | | | (1.00 | )% | | | Quarterly | | | $ | (238,587) | | | $ | (305,199) | | | $ | (66,612) | |
| (7) | When a credit event occurs as defined under the terms of the swap agreement, the Fund as a buyer of credit protection will either (i) receive from the seller of protection an amount equal to the notional amount of the swap and deliver the referenced obligation or underlying securities comprising the referenced obligation or (ii) receive a net settlement amount in the form of cash or securities equal to the notional amount of the swap less the recovery value of the referenced obligation or underlying securities comprising the referenced obligation. |
| (8) | Implied credit spread, represented in absolute terms, utilized in determining the value of the credit default swap agreements as of period end will serve as an indicator of the current status of the payment/performance risk and represent the likelihood or risk of default for the credit derivative. The implied credit spread of a referenced entity reflects the cost of buying/selling protection and may include payments required to be made to enter into the agreement. Generally, wider credit spreads represent a perceived deterioration of the referenced entity’s credit soundness and a greater likelihood or risk of default or other credit event occurring as defined under the terms of the swap agreement. |
| (9) | The notional amount represents the maximum potential amount the Fund could be required to pay as a buyer of credit protection if a credit event occurs, as defined under the terms of the swap agreement, for each security included in the CDX North America Investment Grade Index. |
Legend:
CLO — Collateralized Loan Obligation
LIBOR — London Interbank Offered Rate
SOFR — Secured Overnight Financing Rate
USD — United States Dollar
The following is a summary of the inputs used as of June 30, 2023 in valuing the Fund’s investments. For more information on valuation inputs, please refer to Note 2a of the accompanying Notes to Financial Statements.
| | | | | | | | | | | | | | | | |
| | | Valuation Inputs | | | | |
| Investments in Securities (unaudited) | | Level 1 | | | Level 2 | | | Level 3 | | | Total | |
| Agency Mortgage–Backed Securities | | $ | — | | | $ | 70,272,535 | | | $ | — | | | $ | 70,272,535 | |
| Asset–Backed Securities | | | — | | | | 15,653,007 | | | | — | | | | 15,653,007 | |
| Non–Agency Mortgage–Backed Securities | | | — | | | | 11,179,308 | | | | — | | | | 11,179,308 | |
| U.S. Government Agencies | | | — | | | | 3,998,352 | | | | — | | | | 3,998,352 | |
| U.S. Government Securities | | | — | | | | 75,789,538 | | | | — | | | | 75,789,538 | |
| Exchange–Traded Funds | | | 13,071,169 | | | | — | | | | — | | | | 13,071,169 | |
| Repurchase Agreements | | | — | | | | 1,232,444 | | | | — | | | | 1,232,444 | |
| Total | | $ | 13,071,169 | | | $ | 178,125,184 | | | $ | — | | | $ | 191,196,353 | |
| Other Financial Instruments | |
| Futures Contracts | | | | | | | | | |
Liabilities | | $ | (434,737 | ) | | $ | — | | | $ | — | | | $ | (434,737 | ) |
| Swap Contracts | | | | | | | | | |
Liabilities | | | — | | | | (66,612 | ) | | | — | | | | (66,612 | ) |
| Total | | $ | (434,737 | ) | | $ | (66,612 | ) | | $ | — | | | $ | (501,349 | ) |
| | | | |
| 6 | | | | The accompanying notes are an integral part of these financial statements. |
FINANCIAL INFORMATION — GUARDIAN U.S. GOVERNMENT SECURITIES VIP FUND
| | | | |
Statement of Assets and Liabilities As of June 30, 2023 (unaudited) | |
Assets | | | | |
| | |
Investments, at value | | $ | 191,196,353 | |
| | |
Receivable for investments sold | | | 67,073,983 | |
| | |
Receivable for variation margin on futures contracts | | | 821,092 | |
| | |
Receivable for variation margin on swap contracts | | | 506,292 | |
| | |
Cash deposits with brokers for futures contracts | | | 399,025 | |
| | |
Interest receivable | | | 370,597 | |
| | |
Reimbursement receivable from adviser | | | 14,869 | |
| | |
Receivable for fund shares subscribed | | | 8,467 | |
| | |
Prepaid expenses | | | 2,342 | |
| | | | | |
| | |
Total Assets | | | 260,393,020 | |
| | | | | |
| | |
Liabilities | | | | |
| | |
Payable for investments purchased | | | 66,707,213 | |
| | |
Due to broker for swap contracts | | | 264,418 | |
| | |
Payable for fund shares redeemed | | | 102,157 | |
| | |
Investment advisory fees payable | | | 75,663 | |
| | |
Distribution fees payable | | | 40,246 | |
| | |
Accrued audit fees | | | 17,132 | |
| | |
Accrued custodian and accounting fees | | | 10,012 | |
| | |
Accrued trustees’ and officers’ fees | | | 3,938 | |
| | |
Accrued expenses and other liabilities | | | 29,849 | |
| | | | | |
| | |
Total Liabilities | | | 67,250,628 | |
| | | | | |
| | |
Total Net Assets | | $ | 193,142,392 | |
| | | | | |
| | |
Net Assets Consist of: | | | | |
| | |
Paid-in capital | | $ | 205,060,303 | |
| | |
Distributable loss | | | (11,917,911 | ) |
| | | | | |
| | |
Total Net Assets | | $ | 193,142,392 | |
| | | | | |
Investments, at Cost | | $ | 195,197,693 | |
| | | | | |
| | |
Pricing of Shares | | | | |
| | |
Shares of Beneficial Interest Outstanding with No Par Value | | | 20,259,997 | |
| | |
Net Asset Value Per Share | | | $9.53 | |
| | | | | |
| | | | |
Statement of Operations For the Six Months Ended June 30, 2023 (unaudited) | |
Investment Income | | | | |
| | |
Interest | | $ | 3,182,079 | |
| | |
Dividends | | | 187,496 | |
| | | | | |
| | |
Total Investment Income | | | 3,369,575 | |
| | | | | |
| | |
Expenses | | | | |
| | |
Investment advisory fees | | | 474,818 | |
| | |
Distribution fees | | | 252,563 | |
| | |
Professional fees | | | 35,840 | |
| | |
Trustees’ and officers’ fees | | | 25,419 | |
| | |
Administrative fees | | | 19,614 | |
| | |
Custodian and accounting fees | | | 18,761 | |
| | |
Transfer agent fees | | | 7,553 | |
| | |
Shareholder reports | | | 5,591 | |
| | |
Other expenses | | | 5,738 | |
| | | | | |
| | |
Total Expenses | | | 845,897 | |
| | |
Less: Fees waived | | | (88,208 | ) |
| | | | | |
| | |
Total Expenses, Net | | | 757,689 | |
| | | | | |
| | |
Net Investment Income/(Loss) | | | 2,611,886 | |
| | | | | |
| | |
Realized Gain/(Loss) and Change in Unrealized Appreciation/(Depreciation) on Investments and Derivative Contracts | | | | |
| | |
Net realized gain/(loss) from investments | | | (8,696,076) | |
| | |
Net realized gain/(loss) from futures contracts | | | 17,827 | |
| | |
Net realized gain/(loss) from swap contracts | | | 75,901 | |
| | |
Net change in unrealized appreciation/(depreciation) on investments | | | 8,832,349 | |
| | |
Net change in unrealized appreciation/(depreciation) on futures contracts | | | (300,796 | ) |
| | |
Net change in unrealized appreciation/(depreciation) on swap contracts | | | (66,612 | ) |
| | | | | |
| | |
Net Loss on Investments and Derivative Contracts | | | (137,407 | ) |
| | | | | |
| | |
Net Increase in Net Assets Resulting From Operations | | $ | 2,474,479 | |
| | | | | |
| | | | | |
| | | | |
| The accompanying notes are an integral part of these financial statements. | | | | 7 |
FINANCIAL INFORMATION — GUARDIAN U.S. GOVERNMENT SECURITIES VIP FUND
| | | | | | | | |
Statements of Changes in Net Assets Six Months Ended Numbers are unaudited | |
| | | |
| | | For the
Six Months Ended
6/30/23 | | | For the
Year Ended
12/31/22 | |
| | | | |
Operations | |
| | | |
Net investment income/(loss) | | $ | 2,611,886 | | | $ | 2,717,472 | |
| | | |
Net realized gain/(loss) from investments and derivative contracts | | | (8,602,348 | ) | | | (12,681,535 | ) |
| | | |
Net change in unrealized appreciation/(depreciation) on investments and derivative contracts | | | 8,464,941 | | | | (11,542,754 | ) |
| | | | | | | | | |
| | | |
Net Increase/(Decrease) in Net Assets Resulting from Operations | | | 2,474,479 | | | | (21,506,817 | ) |
| | | | | | | | | |
| |
Capital Share Transactions | |
| | | |
Proceeds from sales of shares | | | 10,917,606 | | | | 2,100,820 | |
| | | |
Cost of shares redeemed | | | (21,572,410 | ) | | | (53,178,924 | ) |
| | | | | | | | | |
| | | |
Net Decrease in Net Assets Resulting from Capital Share Transactions | | | (10,654,804 | ) | | | (51,078,104 | ) |
| | | | | | | | | |
| | | |
Net Decrease in Net Assets | | | (8,180,325 | ) | | | (72,584,921 | ) |
| | | | | | | | | |
| |
Net Assets | |
| | | |
Beginning of period | | | 201,322,717 | | | | 273,907,638 | |
| | | | | | | | | |
| | | |
End of period | | $ | 193,142,392 | | | $ | 201,322,717 | |
| | | | | | | | | |
| |
Other Information: | |
| | | |
Shares | | | | | | | | |
| | | |
Sold | | | 1,136,233 | | | | 218,217 | |
| | | |
Redeemed | | | (2,244,280 | ) | | | (5,509,979 | ) |
| | | | | | | | | |
| | | |
Net Decrease | | | (1,108,047 | ) | | | (5,291,762 | ) |
| | | | | | | | | |
| | | | | | | | | |
| | | | |
| 8 | | | | The accompanying notes are an integral part of these financial statements. |
This Page Intentionally Left Blank
FINANCIAL INFORMATION — GUARDIAN U.S. GOVERNMENT SECURITIES VIP FUND
The Financial Highlights table is intended to help you understand the Fund’s financial performance for the past six reporting periods (or, if shorter, the period since inception). Certain information reflects financial results for a single Fund share. The total returns in the table represent the rate that an investor would have earned (or lost) on an investment in the Fund.
| | | | | | | | | | | | | | | | | | | | | | | | |
Financial Highlights Six Months Ended Numbers are unaudited | | | | | | | | | | | | | | | | | | |
| | | Per Share Operating Performance | | | | |
| | | Net Asset Value,
Beginning of
Period | | | Net Investment
Income(1) | | |
Net Realized
and Unrealized
Gain/(Loss) | | | Total
Operations | | | Net Asset
Value, End of
Period | | | Total
Return(2) | |
| | | | | | | |
Six Months Ended 6/30/23 | | $ | 9.42 | | | $ | 0.12 | | | $ | (0.01) | | | $ | 0.11 | | | $ | 9.53 | | | | 1.17% | (4) |
| | | | | | | |
Year Ended 12/31/22 | | | 10.27 | | | | 0.11 | | | | (0.96) | | | | (0.85) | | | | 9.42 | | | | (8.28)% | |
| | | | | | | |
Year Ended 12/31/21 | | | 10.53 | | | | 0.06 | | | | (0.32) | | | | (0.26) | | | | 10.27 | | | | (2.47)% | |
| | | | | | | |
Year Ended 12/31/20 | | | 10.00 | | | | 0.09 | | | | 0.44 | | | | 0.53 | | | | 10.53 | | | | 5.30% | |
| | | | | | | |
Period Ended 12/31/19(5) | | | 10.00 | | | | 0.02 | | | | (0.02) | | | | 0.00 | | | | 10.00 | | | | 0.00% | (4) |
| | | | |
| 10 | | | | The accompanying notes are an integral part of these financial statements. |
FINANCIAL INFORMATION — GUARDIAN U.S. GOVERNMENT SECURITIES VIP FUND
| | | | | | | | | | | | | | | | | | | | | | |
| | | | | | | | | | | | | | | | | |
| Ratios/Supplemental Data | |
Net Assets, End
of Period (000s) | | | Net Ratio of
Expenses to
Average
Net Assets(3) | | | Gross Ratio of
Expenses to
Average Net
Assets | | | Net Ratio of Net
Investment Income
to Average
Net Assets(3) | | | Gross Ratio of Net
Investment Income
to Average
Net Assets | | | Portfolio
Turnover Rate | |
| | | | | |
| $ | 193,142 | | | | 0.75% | (4) | | | 0.84% | (4) | | | 2.59% | (4) | | | 2.50% | (4) | | | 193% | (4) |
| | | | | |
| | 201,323 | | | | 0.75% | | | | 0.83% | | | | 1.18% | | | | 1.10% | | | | 52% | |
| | | | | |
| | 273,908 | | | | 0.75% | | | | 0.82% | | | | 0.61% | | | | 0.54% | | | | 64% | |
| | | | | |
| | 263,190 | | | | 0.75% | | | | 0.84% | | | | 0.84% | | | | 0.75% | | | | 76% | |
| | | | | |
| | 270,003 | | | | 0.70% | (4) | | | 0.89% | (4) | | | 1.29% | (4) | | | 1.10% | (4) | | | 31% | (4) |
| (1) | Calculated based on the average shares outstanding during the period. |
| (2) | Total returns do not reflect the effects of charges deducted pursuant to the terms of The Guardian Insurance & Annuity Company, Inc.’s variable contracts. Inclusion of such charges would reduce the total returns for all periods shown. |
| (3) | Net Ratio of Expenses to Average Net Assets and Net Ratio of Net Investment Income to Average Net Assets include the effect of fee waivers and expense limitations. |
| (4) | Ratios for periods less than one year have been annualized, except for total return and portfolio turnover rate. For the period ended December 31, 2019, certain non-recurring fees (i.e., audit fees) are not annualized. |
| (5) | Commenced operations on October 21, 2019. |
| | | | |
| The accompanying notes are an integral part of these financial statements. | | | | 11 |
NOTES TO FINANCIAL STATEMENTS — GUARDIAN U.S. GOVERNMENT SECURITIES VIP FUND
June 30, 2023 (unaudited)
1. Organization
Guardian Variable Products Trust (the “Trust”), a Delaware statutory trust organized on January 12, 2016, is registered under the Investment Company Act of 1940, as amended (the “1940 Act”), as an open-end management investment company. The Trust currently has twenty-four series. Guardian U.S. Government Securities VIP Fund (the “Fund”) is a series of the Trust. The Fund is a diversified fund and commenced operations on October 21, 2019. The financial statements for other series of the Trust are presented in separate reports.
The Trust has authorized an unlimited number of shares of beneficial interest with no par value. Shares are bought and sold at closing net asset value (“NAV”). Shares of the Fund are only sold to certain separate accounts of The Guardian Insurance & Annuity Company, Inc. (“GIAC”) that fund certain variable annuity contracts and variable life insurance policies issued by GIAC. GIAC is a wholly-owned subsidiary of The Guardian Life Insurance Company of America (“Guardian Life”).
The Fund seeks total return with an emphasis on current income as well as capital appreciation.
2. Significant Accounting Policies
The following is a summary of significant accounting policies followed by the Fund in the preparation of its financial statements. The Fund follows the investment company accounting and reporting guidance of the Financial Accounting Standards Board (“FASB”) Accounting Standards Codification Topic 946 Financial Services – Investment Companies. The following policies are in conformity with accounting principles generally accepted in the United States of America (“GAAP”). The preparation of financial statements in accordance with GAAP requires management to make estimates and assumptions that affect the reported amounts and disclosures in the financial statements. Actual results could differ from those estimates.
a. Investment Valuations The Board of Trustees has designated Park Avenue Institutional Advisers LLC (“Park Avenue”) as the valuation designee for the Fund pursuant to Rule 2a-5 under the 1940 Act. Park Avenue has established a Fair Valuation Committee and has adopted fair valuation procedures that provide methodologies for fair valuing securities. These procedures include monitoring the appropriateness of
fair values based on results of ongoing valuation oversight, including but not limited to consideration of security specific events, market events, and pricing vendor and broker-dealer due diligence. The Fair Valuation Committee oversees and carries out the policies for the valuation of investments held in the Fund. The Fair Valuation Committee is responsible for discussing and assessing the potential impacts to the fair values on an ongoing basis, and reports to the Board of Trustees on at least a quarterly basis.
The valuations of debt securities for which quoted bid prices are readily available are valued at the bid price by independent pricing services (each, a “Service”). Debt securities for which quoted bid prices are not readily available are valued by a Service at the evaluated bid price provided by the Service or the bid price provided by an independent broker-dealer or at a calculated price based on the spread to an appropriate benchmark provided by such broker-dealer.
Equity securities traded on an exchange other than NASDAQ Stock Market, LLC (“NASDAQ”) are valued at the last reported sale price on the principal exchange or market on which they are traded; or, if there were no sales that day, at the mean between the closing bid and ask prices. Securities traded on the NASDAQ are generally valued at the NASDAQ official closing price, which may not be the last sale price. If the NASDAQ official closing price is not available for a security, that security is generally valued at the mean between the closing bid and ask prices. Repurchase agreements are carried at cost, which approximates fair value (see Note 5d). Foreign securities are valued in the currencies of the markets in which they trade and then converted to U.S. dollars by the application of foreign exchange rates at the close of the New York Stock Exchange (“NYSE”).
Exchange-traded financial futures contracts are valued at the last settlement price on the market where they are primarily traded.
Securities for which market quotations are not readily available or securities whose values have been materially affected by events occurring before the Fund’s valuation time but after the close of the securities’ principal exchange or market are valued at their fair values as determined in good faith by Park Avenue, as the Board of Trustee’s valuation designee (as defined in Rule 2a-5 under the 1940 Act), in accordance with Park Avenue’s procedures and under the general oversight of the Board of Trustees. Valuations reflected in this report are as of the report date. As a result, changes in valuation due to market events and/or issuer related events after the report date and prior to issuance of the report are not reflected herein.
NOTES TO FINANCIAL STATEMENTS — GUARDIAN U.S. GOVERNMENT SECURITIES VIP FUND
Various inputs are used in determining the valuation of the Fund’s investments. These inputs are summarized in three broad levels listed below.
| • | | Level 1 – unadjusted inputs using quoted prices in active markets for identical investments. |
| • | | Level 2 – other significant observable inputs, including, but not limited to, quoted prices for similar investments, inputs other than quoted prices that are observable for investments (such as interest rates, prepayment speeds, credit risks, etc.) or other market corroborated inputs. |
| • | | Level 3 – significant unobservable inputs (including the Fund’s own assumptions in determining the fair value of investments). |
Inputs may include price information, volatility statistics, specific and broad credit data, liquidity statistics, and other factors. A financial instrument’s level within the fair value hierarchy is based on the lowest level of any input; both individually and in aggregate, that is significant to the fair value measurement. However, the determination of what constitutes “observable” requires significant judgment by the Trust. The Trust considers observable data to be that market data which is readily available, regularly distributed or updated, reliable and verifiable, and provided by independent sources that are actively involved in the relevant market. The inputs or methodology used for valuing securities are not necessarily an indication of the risk associated with investing in those securities. Changes in valuation techniques may result in transfers into or out of a financial instrument’s assigned level within the hierarchy.
The FASB requires reporting entities to make disclosures about purchases, sales, issuances and settlements of Level 3 securities on a gross basis. For the six months ended June 30, 2023, there were no transfers into or out of Level 3 of the fair value hierarchy.
In determining a financial instrument’s placement within the hierarchy, the Trust separates the Fund’s investment portfolio into two categories: investments and derivatives (e.g., futures). A summary of inputs used to value the Fund’s assets and liabilities carried at fair value as of June 30, 2023 is included in the Schedule of Investments.
Investments Investments whose values are based on quoted market prices in active markets, and are therefore classified within Level 1, include active listed equities. Investments that trade in markets that are not considered to be active, but are valued based on quoted market prices, dealer quotations or alternative pricing
sources supported by observable inputs are classified within Level 2. These include certain U.S. government and sovereign obligations, most government agency securities, investment-grade corporate bonds, certain mortgage products, state, municipal and provincial obligations, and certain foreign equity securities, including securities whose prices may have been affected by events occurring after the close of trading on their principal exchange or market and, as a result, whose values are determined by a pricing service as described above, or securities whose values are otherwise determined using fair valuation methods approved by the Fund’s Board of Trustees.
Investments classified within Level 3 have significant unobservable inputs, as they trade infrequently or not at all. Level 3 investments include, among others, private placement securities. When observable prices are not available for these securities, the Trust uses one or more valuation techniques for which sufficient and reliable data is available. The inputs used by the Trust in estimating the value of Level 3 investments include, for example, the original transaction price, recent transactions in the same or similar instruments, completed or pending third-party transactions in the underlying investment or comparable issuers, subsequent rounds of financing, recapitalizations, and other transactions across the capital structure. Level 3 investments may also be adjusted to reflect illiquidity and/or non-transferability, with the amount of such discount estimated by the Trust in the absence of market information. Assumptions used by the Trust due to the lack of observable inputs may significantly impact the resulting fair value and therefore the Fund’s results of operations. As of June 30, 2023, the Fund had no securities classified as Level 3.
Derivatives Exchange-traded derivatives, such as futures contracts, exchange-traded option contracts and certain swaps, are typically classified within Level 1 or Level 2 of the fair value hierarchy depending on whether or not they are deemed to be actively traded. Certain non-exchange-traded derivatives, such as generic forwards, certain swaps and options, have inputs which can generally be corroborated by market data and are therefore classified within Level 2.
b. Securities Transactions Securities transactions are accounted for on the date securities are purchased or sold (trade date). Realized gains or losses on securities transactions are determined on the basis of specific identification.
c. Futures Contracts The Fund may enter into financial futures contracts. In entering into such contracts, the
NOTES TO FINANCIAL STATEMENTS — GUARDIAN U.S. GOVERNMENT SECURITIES VIP FUND
Fund is required to deposit with the counterparty, either in cash or securities, an amount equal to a certain percentage of the face value of the contract. Subsequent payments are received or made by the Fund each day, depending on the daily fluctuations in the values of the contracts, and are recorded for financial statement purposes as variation margin received or paid by the Fund. Daily changes in variation margin are recognized as unrealized gains or losses by the Fund. The Fund may not achieve the anticipated benefits of the financial futures contracts and may realize a loss.
d. Credit Derivatives The Fund may enter into credit derivatives, including credit default swaps on individual obligations or credit indices. The Fund may use these investments to seek to (i) hedge various investments, (ii) manage or adjust duration and yield curve positioning, (iii) manage risk, (iv) enhance potential returns, or (v) as substitutes for permitted Fund investments. The use by the Fund of credit default swaps may have the effect of creating a short position in a security. Credit derivatives can create investment leverage and may create additional investment risks that may subject the Fund to greater volatility than investments in more traditional securities, as described in the Statement of Additional Information.
The Fund may enter into credit default swap agreements either as a buyer or seller. The Fund may buy protection under a credit default swap to attempt to mitigate the risk of default or credit quality deterioration in one or more individual holdings or in a segment of the fixed income securities market. The Fund may sell protection under a credit default swap in an attempt to gain exposure to an underlying issuer’s credit quality characteristics without investing directly in that issuer.
For swaps entered with an individual counterparty, the Fund bears the risk of loss of the uncollateralized amount expected to be received under a credit default swap agreement in the event of the default or bankruptcy of the counterparty. Credit default swap agreements are generally valued at a price at which the counterparty to such agreement would terminate the agreement. The Fund may also enter into cleared swaps.
In entering into swap contracts, the Fund is required to deposit with the broker (or for the benefit of the broker), either in cash or securities, an amount equal to a percentage of the notional value of the contract. Subsequent payments are received or made by the Fund each day, depending on the daily fluctuations in the values of the contracts, and are recorded for financial statement purposes as variation margin received or paid
by the Fund. Daily changes in variation margin are recognized as unrealized gains or losses by the Fund. The Fund may not achieve the anticipated benefits of the swap contracts and may realize a loss. During the six months ended June 30, 2023, the Fund entered into credit default swaps for risk exposure management and to enhance potential return.
e. Options Transactions The Fund can write (sell) put and call options on securities and indexes to earn premiums, for hedging purposes, for risk management purposes or otherwise as part of its investment strategies. In writing options, the Fund is required to deposit with the broker or counterparty, either in cash or securities, an amount equal to a percentage of the face value of the options. When an option is written, the premium received is recorded as an asset with an equal liability that is subsequently marked to market to reflect the market value of the written option. These liabilities, if any, are reflected as written options, at value, in the Fund’s Statement of Assets and Liabilities. Premiums received from writing options which expire unexercised are recorded on the expiration date as a realized gain. The difference between the premium received and the amount paid on effecting a closing purchase transaction, including brokerage commissions, is also treated as a realized gain, or if the premium is less than the amount paid for the closing purchased transactions, as a realized loss. If a written call option is exercised, the premium is added to the proceeds from the sale of the underlying security in determining whether there has been a realized gain or loss. If a written put option is exercised, the premium reduces the cost basis of the security. In writing an option, the Fund bears the market risk of an unfavorable change in the price of the security underlying the written option. Exercise of a written option could result in the Fund purchasing or selling a security at a price different from its current market value. There were no options transactions as of June 30, 2023.
f. Investment Income Dividend income net of foreign taxes withheld, if any, is generally recorded on the ex-dividend date. Distributions received from real estate investment trusts, if any, may be classified as dividends, capital gains and/or return of capital. Interest income, which includes amortization/accretion of premium/discount, is determined using the interest income accrual method, and is accrued and recorded daily.
g. Allocation of Income and Expenses Many of the expenses of the Trust can be directly attributed to a specific series of the Trust. Expenses that cannot be directly attributed to a specific series of the Trust are
NOTES TO FINANCIAL STATEMENTS — GUARDIAN U.S. GOVERNMENT SECURITIES VIP FUND
generally apportioned among all the series in the Trust, based on relative net assets. In calculating net asset value per share for each series of the Trust, investment income, realized and unrealized gains and losses, and expenses other than series-specific expenses are allocated daily to each series based upon the proportion of net assets attributable to each series.
3. Transactions with Affiliates
a. Investment Advisory Fee and Expense Limitation Under the terms of the advisory agreement, which, after its two year initial term, is reviewed and approved annually by the Board of Trustees, the Fund pays an investment advisory fee to Park Avenue. Park Avenue is a wholly-owned subsidiary of Guardian Life and receives an investment advisory fee at an annual rate of 0.47% of the Fund’s average daily net assets. The fee is accrued daily and paid monthly. The Fund has no sub-adviser.
Park Avenue has contractually agreed through April 30, 2024 to waive certain fees and/or reimburse certain expenses incurred by the Fund to the extent necessary to limit the Fund’s total annual operating expenses after fee waiver and/or expense reimbursement to 0.75% of the Fund’s average daily net assets (excluding, if applicable, any acquired fund fees and expenses, taxes, interest, transaction costs and brokerage commissions, litigation and extraordinary expenses). The limitation may not be increased or terminated prior to this time without action by the Board of Trustees and may be terminated only upon approval of the Board of Trustees. Amounts waived or reimbursed by Park Avenue pursuant to any expense limitation will not be subject to Park Avenue’s recoupment rights. For the six months ended June 30, 2023, Park Avenue waived fees and/or paid Fund expenses in the amount of $88,208.
b. Compensation of Trustees and Officers Trustees and officers who are interested persons of the Trust, as defined in the 1940 Act, receive no compensation from the Fund, except for the Chief Compliance Officer of the Trust. Trustees of the Trust who are not interested persons of the Trust, and the Chief Compliance Officer, receive compensation and reimbursement of expenses from the Trust.
c. Distribution Fees Park Avenue Securities LLC (“PAS”), a wholly-owned subsidiary of Guardian Life, is the principal underwriter of Fund shares. The Trust has entered into a distribution and service agreement with PAS, which governs the sale and distribution of shares of the Fund. Under a distribution and service plan adopted by the Trust (“12b-1 plan”), PAS is compensated for services in such capacity, including its expenses in
connection with the promotion and distribution of shares of the Fund, at an annual rate of 0.25% of the Fund’s average daily net assets. For the six months ended June 30, 2023, the Fund paid distribution fees in the amount of $252,563 to PAS.
PAS has directed that certain payments under the 12b-1 plan be used to compensate GIAC for shareholder services provided to contract owners.
4. Federal Income Taxes
a. Distributions to Shareholders For federal income tax purposes, the Fund is treated as a disregarded entity (“DRE”). As a DRE, the Fund is not subject to an entity-level income tax; and any income, gains, losses, deductions, taxes, and credits of the Fund would instead be “passed through” directly to the separate accounts of GIAC that invest in the Fund and retain the same character for U.S. federal income tax purposes. In addition, the Fund is not required to distribute taxable income and capital gains for U.S. federal income tax purposes. Therefore, no dividends and capital gains distributions were paid by the Fund.
5. Investments
a. Investment Purchases and Sales The cost of investments and U.S. government agency obligations purchased and the proceeds from U.S. government agency obligations and other investments sold (excluding short-term investments and to be announced (TBA) securities) for the six months ended June 30, 2023, were as follows:
| | | | | | | | |
| | | |
| | | Other Investments | | | U.S.
Government
and Agency
Obligations | |
| Purchases | | $ | 19,586,004 | | | $ | 361,803,047 | |
| Sales | | | 23,126,568 | | | | 362,379,257 | |
b. Foreign Securities Foreign securities investments involve special risks and considerations not typically associated with U.S. investments. These risks include, but are not limited to, currency risk; adverse political, regulatory, social, and economic developments; and less reliable information about issuers. Moreover, securities of some foreign issuers may be less liquid and their prices more volatile than those of comparable U.S. issuers.
c. Industry or Sector Concentration In its normal course of business, the Fund may invest a significant portion of its assets in companies within a limited number of industries or sectors. As a result, the Fund
NOTES TO FINANCIAL STATEMENTS — GUARDIAN U.S. GOVERNMENT SECURITIES VIP FUND
may be subject to a greater risk of loss than that of a fund invested in a wider spectrum of industries or sectors because the stocks of many or all of the companies in the industry, group of industries, sector, or sectors may decline in value due to developments adversely affecting the industry, group of industries, sector, or sectors.
d. Repurchase Agreements The Fund may invest in repurchase agreements to maintain liquidity and earn income over periods of time as short as overnight. The collateral for repurchase agreements is either cash or fully negotiable U.S. government securities (including U.S. government agency securities). Repurchase agreements are fully collateralized (including the interest accrued thereon) and such collateral is marked to market daily while the agreements remain in force. If the value of the collateral falls below the repurchase price plus accrued interest, the Fund will typically require the seller to deposit additional collateral by the next business day. If the request for additional collateral is not met, or the seller defaults, the Fund maintains the right to sell the collateral (although it may be prevented or delayed from doing so in certain circumstances) and may be required to claim any resulting loss against the seller. Park Avenue monitors the creditworthiness of the seller with which the Fund enters into repurchase agreements.
e. Securities Purchased on a When-Issued or Delayed-Delivery Basis The Fund may purchase securities on a when-issued or delayed-delivery basis, with payment and delivery scheduled for a future date. These transactions are subject to market fluctuations and are subject to the risk that the value at delivery may be more or less than at the trade date purchase price. Although the Fund will generally enter into these transactions with the intention of taking delivery of the securities, it may sell the securities before the settlement date. Assets will be segregated when a fund agrees to purchase on a when-issued or delayed-delivery basis. These transactions may create investment leverage.
f. Restricted and Illiquid Securities A restricted security cannot be resold to the general public without prior registration under the Securities Act of 1933, as amended (except pursuant to an applicable exemption). The values of these securities may be highly volatile. If the security is subsequently registered and resold, the issuer would typically bear the expense of all registrations at no cost to the Fund. Restricted and illiquid securities are valued according to the policies and procedures adopted by the Trust’s Board of Trustees and are noted, if any, in the Fund’s Schedule of Investments. As of June 30, 2023, the
Fund did not hold any restricted, other than 144A restricted securities or illiquid securities.
g. Mortgage- and Asset-Backed Securities The values of some mortgage-related or asset-backed securities may be particularly sensitive to changes in prevailing interest rates. Early repayment of principal on some mortgage-related securities may expose the Fund to a lower rate of return upon reinvestment of principal. The values of mortgage- and asset-backed securities depend in part on the credit quality and adequacy of the underlying assets or collateral and may fluctuate in response to the market’s perception of these factors as well as current and future repayment rates. Some mortgage-backed securities are backed by the full faith and credit of the U.S. government (e.g., mortgage-backed securities issued by the Government National Mortgage Association, commonly known as “Ginnie Mae”), while other mortgage-backed securities (e.g., mortgage-backed securities issued by the Federal National Mortgage Association and the Federal Home Loan Mortgage Corporation, commonly known as “Fannie Mae” and “Freddie Mac”), are backed only by the credit of the government entity issuing them. In addition, some mortgage-backed securities are issued by private entities and, as such, are not guaranteed by the U.S. government or any agency or instrumentality of the U.S. government.
h. Treasury Inflation Protected Securities Treasury inflation protected securities (“TIPS”) are debt securities issued by the U.S. Treasury whose principal and/or interest payments are adjusted for inflation, unlike debt securities that make fixed principal and interest payments. The interest rate paid by the TIPS is fixed, while the principal value rises or falls based on changes in a published Consumer Price Index (“CPI”). Thus, if inflation occurs, the principal and interest payments on TIPS are adjusted accordingly to protect investors from inflationary loss. During a deflationary period, the principal and interest payments decrease, although the TIPS principal amounts will not drop below their face amounts at maturity. In exchange for the inflation protection, the TIPS generally pay lower interest rates than typical U.S. Treasury securities. Only if inflation occurs will TIPS offer a higher real yield than a conventional Treasury bond of the same maturity.
i. Disclosures About Derivative Instruments and Hedging Activities The Fund entered into futures contracts for the six months ended June 30, 2023 to manage portfolio duration. The Fund bears the risk of interest rates moving unexpectedly, in which case the Fund may not achieve the anticipated benefits of the
NOTES TO FINANCIAL STATEMENTS — GUARDIAN U.S. GOVERNMENT SECURITIES VIP FUND
futures contracts and realize a loss. There is minimal counterparty credit risk to the Funds since futures are exchange traded and the exchange’s clearinghouse, as counterparty to all exchange traded futures, guarantees futures against default.
Under certain market conditions, the Fund may use credit default swaps to seek to (i) hedge various investments, (ii) manage or adjust duration and yield curve exposure, (iii) manage risk, (iv) enhance returns, or (v) as substitutes for permitted Fund investments. Credit default swaps involve the exchange of a floating or fixed rate payment in return for assuming potential credit losses of an underlying security or pool of securities.
The gross returns to be exchanged or “swapped” between the parties are generally calculated with respect to a “notional amount,” i.e., the return on or increase in value of a particular dollar amount invested at a particular interest rate, in a particular foreign currency or security, or in a “basket” of securities representing a particular index. Cleared swaps are transacted through futures commission merchants (“FCM”s) that are members of central clearinghouses with the clearinghouse serving as a central counterparty similar to transactions in futures contracts. Funds post initial and variation margin by making payments to their clearing member FCMs.
Generally, the Fund will enter into credit default swaps on a net basis, which means that the two payment streams are netted out, with a Fund receiving or paying, as the case may be, only the net amount of the two payments. Credit default swaps do not normally involve the delivery of securities, other underlying assets or principal. Accordingly, the risk of loss with respect to credit default swaps is normally limited to the net amount of payments that a Fund is contractually obligated to make. If the other party to a credit default swap defaults, a Fund’s risk of loss consists of the net amount of payments that the Fund is contractually entitled to receive, if any.
In addition to the risks generally applicable to derivatives, risks associated with credit default swap agreements include adverse changes in the returns of the underlying instruments, failure of the counterparties to perform under the agreement’s terms and the possible lack of liquidity with respect to the agreements.
As of June 30, 2023, the Fund had the following derivatives at fair value, grouped into appropriate risk
categories that illustrate the Fund’s use of derivative instruments:
| | | | | | | | |
| | | |
| | | Interest
Rate Contracts | | | Credit
Default Contracts | |
| | | |
Liability Derivatives | | | | | | | | |
| Futures Contracts1 | | $ | (434,737 | ) | | $ | — | |
| Swap Contracts2 | | | — | | | | (66,612 | ) |
| 1 | Statement of Assets and Liabilities location: Includes cumulative unrealized appreciation/(depreciation) of futures contracts as reported in the Schedule of Investments. Only current day’s variation margin is reported within the Statement of Assets and Liabilities. |
| 2 | Statement of Assets and Liabilities location: Includes the fair value of centrally cleared swap contracts as reported in the Schedule of Investments. Only current day’s variation margin is reported within the Statement of Assets and Liabilities. |
Transactions in derivative investments for the six months ended June 30, 2023 were as follows:
| | | | | | | | |
| | | |
| | | Interest
Rate Contracts | | | Credit
Default Contracts | |
| | | |
Net Realized Gain/(Loss) | | | | | | | | |
| Futures Contracts1 | | $ | 17,827 | | | $ | — | |
| Swap Contracts2 | | | — | | | | 75,901 | |
| | | |
Net Change in Unrealized Appreciation/(Depreciation) | | | | | | | | |
| Futures Contracts3 | | $ | (300,796 | ) | | $ | — | |
| Swap Contracts4 | | | — | | | | (66,612 | ) |
| | | |
Average Number of Notional Amounts | | | | | | | | |
| Futures Contracts5 | | | 156 | | | | — | |
| Swap Contracts — Buy/Sell Protection | | $ | — | | | $ | 11,600,000 | |
| 1 | Statement of Operations location: Net realized gain/(loss) from futures contracts. |
| 2 | Statement of Operations location: Net realized gain/(loss) from swap contracts. |
| 3 | Statement of Operations location: Net change in unrealized appreciation/(depreciation) on futures contracts. |
| 4 | Statement of Operations location: Net change in unrealized appreciation/(depreciation) on swap contracts. |
| 5 | Amount represents number of contracts. |
6. Temporary Borrowings
The Fund, with other funds managed by Park Avenue, is party to a credit agreement with respect to a $10 million committed revolving credit facility from State Street Bank and Trust Company (the “Credit Agreement”) for temporary borrowing purposes, including the meeting of redemption requests that otherwise might require the untimely disposition of securities. Interest is based on a daily fluctuating rate per annum equal to the Applicable Rate (as defined in the Credit Agreement) plus the Applicable Margin (as defined in the Credit
NOTES TO FINANCIAL STATEMENTS — GUARDIAN U.S. GOVERNMENT SECURITIES VIP FUND
Agreement) that is subject to change from time to time as and when the Applicable Rate changes. Under the current Credit Agreement, the Applicable Rate for any day is defined as the rate per annum equal to the sum of (a) 0.10% plus (b) the higher of (i) the Federal Funds Effective Rate for such day and (ii) the Overnight Bank Funding Rate for such day; the Applicable Margin is 1.25%. In addition to the interest charged on any borrowings by the Fund, each fund pays a commitment fee of 0.30% per annum on its share of the unused portion of the credit facility. The agreement is in place until January 5, 2024. The Fund did not utilize the credit facility during the six months ended June 30, 2023.
7. Indemnifications
Under the Trust’s organizational documents and, in some cases, by contract, officers and Trustees of the Trust are indemnified against certain liabilities arising out of the performance of their duties to the Fund. In
addition, in the normal course of business, the Fund enters into contracts with its vendors and others that provide general indemnifications. The Fund’s maximum exposure under these arrangements is unknown as this would involve future claims that may be made against the Fund that have not yet occurred. However, based on experience, the Fund expects the risk of loss to be remote.
8. Additional Information
The outbreak of COVID-19 has adversely impacted both local and global economies, including those in which the Fund may invest. These impacts include materially reduced consumer demand and economic output, disrupted supply chains, market closures, travel restrictions and quarantines, and strained healthcare systems. The Fund’s operations may be interrupted as a result, which may have a negative impact on the Fund’s investment performance.
SUPPLEMENTAL INFORMATION (UNAUDITED)
Liquidity Risk Management Program
In compliance with Rule 22e-4 under the Investment Company Act of 1940, as amended (the “Liquidity Rule”), Guardian Variable Products Trust (the “Trust”) has adopted and implemented a written liquidity risk management program (the “Program”) for each series of the Trust (each, a “Fund”), which is reasonably designed to assess and manage each Fund’s liquidity risk. The Fund’s “liquidity risk” is the risk that the Fund could not
meet requests to redeem shares issued by the Fund without significant dilution of the remaining investors’ interests in the Fund.
The Board of Trustees of the Trust (the “Board”)
Previously approved the designation of Park Avenue Institutional Advisers LLC (the “Administrator” or “PAIA”) as Program administrator. The Administrator established a Liquidity Risk Management Committee, which is comprised of certain officers of the Trust and PAIA, that assists the Administrator in the implementation and day-to-day administration of the Program and otherwise support carrying out the Administrator’s liquidity risk management responsibilities under the Program.
In accordance with the Program, each Fund’s liquidity risk is assessed no less frequently than annually, taking into consideration a variety of factors, including, as applicable, the Fund’s investment strategy and liquidity of portfolio investments, cash flow projections, and holdings of cash and cash equivalents, as well as borrowing arrangements and other funding sources. Certain factors are considered under both normal and reasonably foreseeable stressed conditions.
Each Fund portfolio investment is classified, no less than monthly, into one of four liquidity categories (including “highly liquid investments” and “illiquid investments,” discussed below) based on a determination of the number of days it is reasonably expected to take to convert the investment to cash, or sell or dispose of the investment, in current market conditions without
significantly changing the investment’s market value.
The Liquidity Rule limits the Fund’s investments in illiquid investments by prohibiting the Fund from acquiring any illiquid investment if, immediately after the acquisition, the Fund would have invested more than 15% of its net assets in illiquid investments that are assets. The Program includes provisions reasonably designed to comply with this investment limitation. In addition, the Program includes provisions reasonably designed to comply with this investment limitation. In addition, the Program includes provisions reasonably designed to comply with the Liquidity Rule’s requirements relating to highly liquid investment minimums, which is a minimum amount of Fund net assets that must be invested in highly liquid investments that are assets, as applicable. The Fund was not required to adopt a highly liquid investment minimum during the
period.
At a meeting of the Board held on March 29-30, 2023, the Board received a report (the “Report”) prepared by the Administrator addressing the Program’s operation and assessing the adequacy and effectiveness of its implementation for the period from January 1, 2022 through December 31, 2022 (the “Reporting Period”). The Report noted that the Administrator believes the Program operated effectively during the Reporting Period and continues to be reasonably designed to effectively assess and manage each Fund’s liquidity risk. The Report also noted that the Administrator believes the Program has been adequately and effectively implemented and the investment strategies for each Fund continue to be appropriate since its inception. In addition, the Report summarized the operation of the Program and the information and factors considered by the Administrator in its assessment of the Program’s implementation, such as the liquidity risk assessment framework and liquidity classification methodologies.
There can be no assurance that the Program will achieve its objectives under all circumstances. Please refer to the Fund’s prospectus for more information regarding the Fund’s exposure to liquidity risk and other risks to which an investment in the Fund may be subject.
SUPPLEMENTAL INFORMATION (UNAUDITED)
Approval of Investment Management Agreement
Section 15(c) of the Investment Company Act of 1940, as amended (the “1940 Act”), requires that a fund’s investment advisory and sub-advisory agreements be approved initially by the fund’s board of trustees. Section 15(c) also requires that the continuation of these agreements, after an initial term of up to two years, be annually reviewed and approved by the board. Any such agreement must be approved by a vote of a majority of the trustees who are not parties to the agreement or “interested persons” (as defined in the 1940 Act) of a party to the agreement at a meeting of the board called for the purpose of voting on such approval.
At a meeting of the Board of Trustees (the “Board”) of Guardian Variable Products Trust (the “Trust”) held on March 29-30, 2023 (the “Meeting”), the Board, including the trustees who are not parties to the agreement or “interested persons” as defined in the 1940 Act (the “Independent Trustees”), considered and voted unanimously to renew the existing investment management agreement between the Trust, on behalf of Guardian All Cap Core VIP Fund; Guardian Balanced Allocation VIP Fund; Guardian Core Fixed Income VIP Fund; Guardian Core Plus Fixed Income VIP Fund; Guardian Diversified Research VIP Fund; Guardian Equity Income VIP Fund; Guardian Global Utilities VIP Fund; Guardian Growth & Income VIP Fund; Guardian Integrated Research VIP Fund; Guardian International Growth VIP Fund; Guardian International Equity VIP Fund; Guardian Large Cap Disciplined Growth VIP Fund; Guardian Large Cap Disciplined Value VIP Fund; Guardian Large Cap Fundamental Growth VIP Fund; Guardian Mid Cap Relative Value VIP Fund; Guardian Mid Cap Traditional Growth VIP Fund; Guardian Multi-Sector Bond VIP Fund; Guardian Select Mid-Cap Core VIP Fund; Guardian Short Duration Bond VIP Fund; Guardian Small Cap Core VIP Fund; Guardian Small-Mid Cap Core VIP Fund; Guardian Strategic Large Cap Core VIP Fund; Guardian Total Return Bond VIP Fund and Guardian U.S. Government Securities VIP Fund (each, a “Fund,” and together, the “Funds”), in substantially the form presented at this meeting (the “Management Agreement”); and Park Avenue Institutional Advisers LLC (the “Manager”) for a one-year term.
The Board, including the Independent Trustees, also considered and voted unanimously to renew the existing sub-advisory agreements (the “Sub-Advisory Agreements,” collectively with the Management Agreement and Sub-Subadvisory Agreement, the “Agreements”) between the Manager and investment
advisory firms engaged to serve as sub-advisers to certain of the Funds (the “Sub-Advised Funds”), namely (i) ClearBridge Investments, LLC with respect to Guardian Small Cap Core VIP Fund; (ii) Putnam Investment Management, LLC with respect to Guardian Diversified Research VIP Fund; (iii) AllianceBernstein L.P. with respect to Guardian Growth & Income VIP Fund and Guardian Strategic Large Cap Core VIP Fund; (iv) J.P. Morgan Investment Management Inc. with respect to Guardian International Growth VIP Fund; (v) Schroder Investment Management North America Inc. with respect to Guardian International Equity VIP Fund; (vi) Wellington Management Company LLP with respect to Guardian Balanced Allocation VIP Fund, Guardian Equity Income VIP Fund, Guardian Integrated Research VIP Fund, Guardian Large Cap Disciplined Growth VIP Fund and Guardian Global Utilities VIP Fund; (vii) Boston Partners Global Investors, Inc. with respect to Guardian Large Cap Disciplined Value VIP Fund; (viii) Janus Henderson Investors US LLC with respect to Guardian Mid Cap Traditional Growth VIP Fund; (ix) Allspring Global Investments, LLC with respect to Guardian Mid Cap Relative Value VIP Fund and Guardian Small-Mid Cap Core VIP Fund; (x) Lord, Abbett & Co. LLC with respect to Guardian Core Plus Fixed Income VIP Fund; (xi) FIAM LLC with respect to Guardian Select Mid Cap Core VIP Fund; and (xii) Massachusetts Financial Services Company with respect to Guardian All Cap Core VIP Fund, each in substantially the form presented at this meeting, (each, a “Sub-Adviser” and collectively, the “Sub-Advisers”) for a one-year term.
The Board, including the Independent Trustees, also considered and voted unanimously to renew the existing sub-subadvisory agreement (the “Sub-Subadvisory Agreement”) between Schroder Investment Management North America Inc. and Schroder Investment Management North America Limited (also a Sub-Adviser) with respect to Guardian International Equity VIP Fund for a one-year term.
The Board is responsible for overseeing the management of each Fund. In determining whether to renew its approval of the Agreements, the Trustees evaluated information and factors that they considered to be relevant and appropriate through the exercise of their own business judgment. The Trustees considered certain information and factors in light of advice furnished to them by legal counsel to the Trust and, in the case of the Independent Trustees, their independent legal counsel. In advance of the Meeting, the Trustees received materials and information designed to assist their consideration of the Agreements. The Trustees received written responses
SUPPLEMENTAL INFORMATION (UNAUDITED)
from the Manager and each Sub-Adviser to a series of questions and requests for information encompassing a wide variety of topics provided by independent counsel on behalf of the Independent Trustees. The Independent Trustees also received materials and information regarding the legal standards applicable to their consideration of the Agreements and the process and criteria used by the Manager to identify and select the Sub-Advisers.
During the course of their deliberations, the Independent Trustees met twice to discuss and evaluate the materials, information and Agreements in executive session with their independent legal counsel, outside of the presence of the Trustees who are not Independent Trustees and representatives from Fund management, the Manager or any Sub-Adviser.
In reaching its decisions to renew its approval of the Agreements, the Board took into account the materials and information described above, as well as other materials and information provided to the Board throughout the year. Individual Trustees may have given different weight to different factors and information with respect to each Agreement, and the Trustees did not identify any single factor or information that, in isolation, would be controlling in deciding to approve the Agreements. The discussion below is intended to summarize the broad factors that figured prominently in the Board’s decisions to renew its approval of the Agreements rather than to be all-inclusive. These broad factors included: (i) the nature, extent and quality of the services provided to the Funds by the Manager and to the Sub-advised Funds by the Sub-Advisers; (ii) the investment performance of each Fund; (iii) estimated profitability of the Manager; (iv) fees and expenses; (v) the extent to which economies of scale may exist, and the extent to the benefits of economies of scale are shared with the Funds; and (vi) any other benefits derived by the Manager or the Sub-Advisers (or their respective affiliates) from their relationships with the Funds.
Nature, Extent and Quality of Services
The Trustees considered information regarding the nature, extent and quality of services provided to the Funds by the Manager. The Trustees also considered, among other things, the terms of the Management Agreement and the range of investment advisory services provided by the Manager. In addition, the Trustees reviewed the range of non-investment advisory services provided by the Manager consistent with the terms of the Management Agreement, notably coordinating the preparation and filing of various
regulatory documents, coordinating the preparation and assembly of Board meeting materials, and assisting the Board with certain valuation matters. The Board also received a description of the Manager’s and each Sub-Adviser’s business continuity plans and of their respective approaches to data privacy and cybersecurity, and related testing. The Board received information regarding the response of the Manager and the Sub-Advisers to the COVID-19 pandemic, including the continuation of remote work arrangements and return-to-office plans. The Board also received information about the Manager’s role as administrator of the Funds’ liquidity risk management program, the Manager’s approach to risk management, and the Manager’s vendor oversight programs.
The Trustees considered that the Sub-advised Funds operate in a “manager-of-managers” structure and reviewed the responsibilities that the Manager has under this structure, including monitoring and evaluating the performance of the Sub-Advisers, monitoring the Sub-Advisers for adherence to the stated investment objectives, strategies, policies and restrictions of the Funds and supervising the Sub-Advisers with respect to the services that the Sub-Advisers would provide under the Sub-Advisory Agreements. The Trustees also considered the process used by the Manager, consistent with this structure, to identify and recommend sub-advisers, and the Manager’s ability to monitor and oversee sub-advisers and recommend replacement sub-advisers, when necessary, and provide other services under the Management Agreement. The Board noted that investment management staff of the Manager and the Trust’s Chief Compliance Officer conduct oversight meetings with the Sub-Advisers on a periodic basis, follow through with additional inquiries on any questions or concerns that arise during the meetings and, as necessary, then report the results of the meetings to the Board. The Trustees reviewed information regarding the experience and background of the Manager’s key personnel and the Manager’s organizational structure and resources, including investment, legal and administrative capabilities of the Manager. In this regard, the Trustees recognized that the Funds may benefit from the Manager’s ability to use resources and capabilities of its affiliates in providing services to the Funds.
The Trustees considered information regarding the nature, extent and quality of services provided to the Sub-advised Funds by the Sub-Advisers. The Trustees also considered, among other things, the terms of the Sub-advisory Agreements and the range of investment
SUPPLEMENTAL INFORMATION (UNAUDITED)
advisory services provided by the Sub-Advisers under the oversight of the Manager. In evaluating these investment advisory services, the Trustees considered, among other things, the Sub-Advisers’ investment philosophies, styles and/or processes and approaches to managing the respective Sub-advised Funds. The Trustees received and evaluated information regarding the background, education, expertise and/or experience of the investment professionals who serve as portfolio managers for the Sub-advised Funds and the capabilities and resources of the Sub-Advisers.
Based upon these considerations, the Trustees concluded, within the context of their full deliberations, that the nature, extent and quality of services provided to the Funds by the Manager and the Sub-advised Funds by each respective Sub-Adviser were appropriate.
Investment Performance
In connection with each of its regular quarterly meetings, the Board receives information on the performance of each Fund, including net performance, relative performance rankings within the relevant Morningstar peer group, and performance as compared to benchmark index returns. At each quarterly Board meeting, members of the Manager’s funds management team review with the Board the economic and market environment, absolute and relative performance of each Fund, and any relevant information about risk management and style consistency in connection with management of the Funds. The Board considered investment performance for each Fund over the one-year, three-year (where available), five-year (where available) and since-inception periods.
The Board also received and reviewed a report prepared by Broadridge Financial Solutions (“Broadridge”), an independent provider of mutual fund industry data, which included comparisons of the performance of each Fund to performance of an appropriate peer universe. For details regarding each Fund’s performance, see the “Fund-by-Fund Factors” section below.
The Manager discussed with the Board factors contributing to the Funds’ performance results. In addition, for certain Funds, the Manager provided to the Board longer term performance records of the Sub-Advisers for strategies used in managing the Funds. The Board concluded that the investment performance generated by the Manager and each Sub-Adviser was generally satisfactory, or, that any steps being taken by the Manager and Sub-Advisers to address any performance issues were satisfactory.
Profitability
The Board received and considered the Manager’s estimate of its profitability, which included allocations by the Manager of its costs in providing management services to the Funds. The Board considered the estimated profitability of the Manager both overall and on a Fund-by-Fund basis.
The Board received and considered profitability information from most of the Sub-Advisers, but noted that the Manager had negotiated the fees with the Sub-Advisers at arm’s-length. Accordingly, the Board concluded that the profitability of the Sub-Advisers is a less relevant factor than Manager profitability.
Based on the consideration of this information, the Board concluded that the profitability of the Funds to the Manager was acceptable.
Fees and Expenses
The Trustees considered the management fees paid by the Funds to the Manager under the Management Agreement and evaluated the reasonableness of these fees. The Trustees received and reviewed comparative information with respect to the management fee and total expenses for each Fund and the management fees and total expenses for a peer group of other funds selected by Broadridge. The Trustees considered the Manager’s commitment to limit the total expenses of each Fund through an expense limitation agreement with the Trust. Although the Board recognized that the comparisons between the management fees and actual expenses of the Funds and those of the identified peer group are imprecise, given different terms of agreements and variations in fund strategies, the Trustees found that the comparative information supported their consideration and approval of the management fees and evaluation of the total expenses. For details regarding each Fund’s fee and expense comparisons, see the “Fund-by-Fund Factors” section below.
The Trustees considered the sub-advisory fees paid under the Sub-advisory Agreements and evaluated the reasonableness of those fees. The Trustees also considered that the fees paid to the Sub-Advisers would be paid by the Manager and not the Funds and that the Manager had negotiated the fees with the Sub-Advisers at arm’s-length.
Based on the consideration of the information and factors summarized above, as well as other relevant information and factors, the Board concluded that the management and sub-advisory fees were reasonable in
SUPPLEMENTAL INFORMATION (UNAUDITED)
light of the nature, extent and quality of services rendered to the Funds by the Manager and the Sub-Advisers.
Economies of Scale
The Board considered the extent to which economies of scale may exist, and the extent to the benefits of economies of scale are shared with the Funds. In this regard, the Board noted that for sixteen of twenty-four Funds, the management and sub-advisory fee included breakpoints that are tiered based on growth in asset levels of each such Fund and that for the other Funds, the fees reflected appropriate levels based on current and expected asset levels. The Board also noted that the expenses of the Funds are subject to expense limitations provided by the Manager. The Board noted that expected economies of scale, where they exist, may be shared through the use of fee breakpoints, expense limitations by the Manager, and/or a lower overall fee.
Ancillary Benefits
The Board considered the potential benefits, other than management fees, that the Manager and/or its affiliates may receive because of the Manager’s relationship with the Funds. The Trustees considered that the Funds were designed to serve as investment options under variable contracts issued by affiliates of the Manager that would receive fees under those contracts and that Park Avenue Securities LLC, an affiliate of the Manager and principal underwriter of the Funds, and participating insurance companies, including insurance companies affiliated with the Manager, would be entitled to receive fees from the Funds under a plan of distribution adopted pursuant to Rule 12b-1 under the 1940 Act. The Trustees considered that the Manager and its affiliates may benefit from (i) greater efficiencies in annuity administration and operations and potential cost savings due to a reduction in the number of unaffiliated funds available as annuity contract investment options, and (ii) increased dividends-received deductions due to the Funds’ status under the tax laws as disregarded entities. In addition, the Trustees considered the potential benefits, other than sub-advisory fees, that the Sub-Advisers and their affiliates may receive because of their relationships with the Funds, including the ability to receive research from soft dollar commissions consistent with Trust policies. The Trustees concluded that benefits that may accrue to the Manager and its affiliates are reasonable and the benefits that may accrue to the Sub-Advisers and their affiliates are consistent with those expected for a sub-adviser to a mutual fund such as the applicable Fund.
Fund-by-Fund Factors
The Broadridge report groups fees, expenses and performance into five quintiles, with the top quintile having the highest performance or lowest fees/expenses, and the bottom quintile having the lowest performance or highest fees/expenses. For purposes of the descriptions below, a Fund’s performance is considered “in line with” the benchmark index if it is within 0.20%.
Guardian Large Cap Fundamental Growth VIP Fund
| • | | The Board noted that the Fund’s performance was in the 3rd quintile of its performance universe for the 1-year period and in the 4th quintile for its performance universe for the 3-year and 5-year periods. The Board also noted that the Fund’s performance was below the benchmark index for the 1-year, 3-year and 5-year periods. |
| • | | The Board noted that the contractual management fee, the actual management fee and actual total expenses were in the 1st quintile of the expense group. |
Guardian Large Cap Disciplined Growth VIP Fund
| • | | The Board noted that the Fund’s performance was in the 3rd quintile of its performance universe for the 1-year and 3-year periods and in the 2nd quintile for the 5-year period. The Board also noted that the Fund’s performance was below the benchmark index for the 1-year, 3-year and 5-year periods. |
| • | | The Board noted that the contractual management fee, the actual management fee and actual total expenses were in the 1st quintile of the expense group. |
Guardian Integrated Research VIP Fund
| • | | The Board noted that the Fund’s performance was in the 5th quintile of its performance universe for the 1-year and 5-year periods and in the 4th quintile for 3-year period. The Board also noted that the Fund’s performance was below the benchmark index for the 1-year, 3-year and 5-year periods. |
| • | | The Board noted that the contractual management fee, the actual management fee and actual total expenses were in the 1st quintile of the expense group. |
Guardian Diversified Research VIP Fund
| • | | The Board noted that the Fund’s performance was in the 3rd quintile of its performance universe for the 1-year and 3-year periods and in the 2nd quintile for the 5-year period. The Board also noted that the Fund’s performance was higher than the benchmark index for the 1-year period. The Board note that the Fund’s performance was lower than the benchmark index for the 3-year and 5-year periods. |
SUPPLEMENTAL INFORMATION (UNAUDITED)
| • | | The Board noted that the contractual management fee and actual management fee were in the 1st quintile of the expense group and that actual total expenses were in the 3rd quintile. |
Guardian Strategic Large Cap Core VIP Fund
| • | | The Board noted that the Fund’s performance was in the 1st quintile of its performance universe for the 1-year period. The Board acknowledged the Fund’s short operational history. The Board noted that the Fund’s performance was higher than the benchmark index for the 1-year period. |
| • | | The Board noted that the contractual management fee, the actual management fee and actual total expenses were in the 1st quintile of the expense group. |
Guardian Large Cap Disciplined Value VIP Fund
| • | | The Board noted that the Fund’s performance was in the 3rd quintile of its performance universe for the 1-year and 3-year periods and in the 4th quintile for the 5-year period. The Board also noted that the Fund’s performance was higher than the benchmark index for the 1-year and 3-year periods. The Board noted that the Fund’s performance was in line with the benchmark index for the 5-year period. |
| • | | The Board noted that the contractual management fee was in the 2nd quintile of the expense group, the actual management fee was in the 1st quintile of the expense group and that actual total expenses were in the 3rd quintile. |
Guardian Growth & Income VIP Fund
| • | | The Board noted that the Fund’s performance was in the 3rd quintile of its performance universe for the 1-year, 3-year and 5-year periods. The Board also noted that the Fund’s performance was higher than the benchmark index for the 1-year, 3-year and 5-year periods. |
| • | | The Board noted that the contractual management fee and the actual management fee were in the 1st quintile of the expense group and that actual total expenses were in the 3rd quintile. |
Guardian Equity Income VIP Fund
| • | | The Board noted that the Fund had less than one-year of operational history and was not able to evaluate an investment performance record for the Fund. The Board noted that it would have an opportunity to review such information in connection with future annual reviews. The Board noted that, in the meantime, it received monthly performance reports from the Manager. |
| • | | The Board noted that the contractual management fee, the actual management fee and actual total expenses were in the 1st quintile of the expense group. |
Guardian All Cap Core VIP Fund
| • | | The Board noted that the Fund’s performance was in the 3rd quintile of its performance universe for the 1-year period. The Board acknowledged the Fund’s short operational history. The Board noted that the Fund’s performance was higher than the benchmark index for the 1-year period. |
| • | | The Board noted that the contractual management fee, the actual management fee and actual total expenses were in the 1st quintile of the expense group. |
Guardian Mid Cap Traditional Growth VIP Fund
| • | | The Board noted that the Fund’s performance was in the 1st quintile of its performance universe for the 1-year period and in the 2nd quintile for the 3-year and 5-year periods. The Board also noted that the Fund’s performance was higher than the benchmark index for the 1-year, 3-year and 5-year periods. |
| • | | The Board noted that the contractual management fee and actual management fee were in the 1st quintile of the expense group and that the actual total expenses were in the 4th quintile. |
Guardian Select Mid Cap Core VIP Fund
| • | | The Board noted that the Fund’s performance was in the 3rd quintile of its performance universe for the 1-year period. The Board acknowledged the Fund’s short operational history. The Board noted that the Fund’s performance was lower than the benchmark index for the 1-year period. |
| • | | The Board noted that the contractual management fee, the actual management fee and actual total expenses were in the 1st quintile of the expense group. |
Guardian Mid Cap Relative Value VIP Fund
| • | | The Board noted that the Fund’s performance was in the 2nd quintile of its performance universe for the 1-year, 3-year and 5-year periods. The Board also noted that the Fund’s performance was higher than the benchmark index for the 1-year, 3-year and 5-year periods. |
| • | | The Board noted that the contractual management fee and the actual management fee were in the 2nd quintile of the expense group and the actual total expenses were in the 3rd quintile of the expense group. |
SUPPLEMENTAL INFORMATION (UNAUDITED)
Guardian Small-Mid Cap Core VIP Fund
| • | | The Board noted that the Fund’s performance was in the 5th quintile of its performance universe for the 1-year period. The Board acknowledged the Fund’s short operational history. The Board noted that the Fund’s performance was higher than the benchmark index for the 1-year period. |
| • | | The Board noted that the contractual management fee, the actual management fee and actual total expenses were in the 1st quintile of the expense group. |
Guardian Small Cap Core VIP Fund
| • | | The Board noted that the Fund’s performance was in the 5th quintile of its performance universe for the 1-year and 3-year periods. The Board noted that the Fund’s performance was lower than the benchmark index for the 1-year and 3-year periods. |
| • | | The Board noted that the contractual management fee and the actual management fee were in the 1st quintile of the expense group and the actual total expenses were in the 2nd quintile of the expense group. |
Guardian International Growth VIP Fund
| • | | The Board noted that the Fund’s performance was in the 4th quintile of its performance universe for the 1-year period, in the 2nd quintile of its performance universe for the 3-year period and in the 3rd quintile of its performance universe for the 5-year period. The Board also noted that the Fund’s performance was lower than the benchmark index for the 1-year and 5-year periods. The Board noted that the Fund’s performance was higher than the benchmark index for the 3-year period. |
| • | | The Board noted that the contractual management fee and actual management fee were in the 2nd quintile of the expense group and that the actual total expenses were in the 3rd quintile. |
Guardian International Equity VIP Fund
| • | | The Board noted that the Fund’s performance was in the 5th quintile of its performance universe for the 1-year, 3-year and 5-year periods. The Board also noted that the Fund’s performance was lower than the benchmark index for the 1-year, 3-year and 5-year periods. |
| • | | The Board noted that the contractual management fee, the actual management fee and the actual total expenses were in the 2nd quintile of the expense group. |
Guardian Global Utilities VIP Fund
| • | | The Board noted that the Fund’s performance was in the 5th quintile of its performance universe for the 1-year period and in the 4th quintile of its performance universe for the 3-year period. The Board noted that the Fund’s performance was higher than the benchmark index for the 1-year and 3-year periods. |
| • | | The Board noted that the contractual management fee and the actual management fee were in the 1st quintile of the expense group and the actual total expenses were in the 2nd quintile of the expense group. |
Guardian Balanced Allocation VIP Fund
| • | | The Board noted that the Fund had less than one-year of operational history and was not able to evaluate an investment performance record for the Fund. The Board noted that it would have an opportunity to review such information in connection with future annual reviews. The Board noted that, in the meantime, it received monthly performance reports from the Manager. |
| • | | The Board noted that the contractual management fee, the actual management fee and actual total expenses were in the 1st quintile of the expense group. |
Guardian Core Plus Fixed Income VIP Fund
| • | | The Board noted that the Fund’s performance was in the 3rd quintile of its performance universe for the 1-year and 3-year periods and in the 4th quintile of its performance universe for the 5-year period. The Board also noted that the Fund’s performance was lower than the benchmark index for the 1-year and 5-year periods. The Board noted that the Fund’s performance was in line with the benchmark index for the 3-year period. |
| • | | The Board noted that the contractual management fee and actual management fee were in the 2nd quintile of the expense group and that actual total expenses were in the 3rd quintile. |
Guardian Total Return Bond VIP Fund
| • | | The Board noted that the Fund’s performance was in the 5th quintile of its performance universe for the 1-year and 3-year periods. The Board also noted that the Fund’s performance was lower than the benchmark index for the 1-year and 3-year periods. |
| • | | The Board noted that the contractual management fee and actual management fee were in the 2nd quintile and the actual total expenses were in the 3rd quintile. |
SUPPLEMENTAL INFORMATION (UNAUDITED)
Guardian Core Fixed Income VIP Fund
| • | | The Board noted that the Fund had less than one-year of operational history and was not able to evaluate an investment performance record for the Fund. The Board noted that it would have an opportunity to review such information in connection with future annual reviews. The Board noted that, in the meantime, it received monthly performance reports from the Manager. |
| • | | The Board noted that the contractual management fee was in the 2nd quintile of the expense group and the actual management fee and the actual total expenses were in the 1st quintile. |
Guardian Multi-Sector Bond VIP Fund
| • | | The Board noted that the Fund’s performance was in the 5th quintile of its performance universe for the 1-year and 3-year periods The Board also noted that the Fund’s performance was lower than the benchmark index for the 1-year and 3-year periods. |
| • | | The Board noted that the contractual management fee and actual total expenses were in the 1st quintile and the actual management fee was in the 2nd quintile. |
Guardian Short Duration Bond VIP Fund
| • | | The Board noted that the Fund had less than one-year of operational history and was not able to evaluate an investment performance record for the Fund. The |
| | | Board noted that it would have an opportunity to review such information in connection with future annual reviews. The Board noted that, in the meantime, it received monthly performance reports from the Manager. |
| • | | The Board noted that the contractual management fee and actual total expenses were in the 3rd quintile of the expense group and the actual management fee was in the 1st quintile of the expense group. |
Guardian U.S. Government Securities VIP Fund
| • | | The Board noted that the Fund’s performance was in the 1st quintile of its performance universe for the 1-year period and in the 2nd quintile of its performance universe for the 3-year period. The Board also noted that the Fund’s performance was higher than the benchmark index for the 1-year and 3-year periods. |
| • | | The Board noted that the contractual management fee and the actual management fee were in the 1st quintile of the expense group and the actual total expenses were in the 2nd quintile of the expense group. |
Conclusion
Based on a comprehensive consideration and evaluation of all of the information and factors summarized above, among others, the Board as a whole, including the Independent Trustees, approved the Agreements.
SUPPLEMENTAL INFORMATION (UNAUDITED)
The Statement of Additional Information (“SAI”) includes additional information about the Trust’s Trustees and Officers and is available, without charge, upon request by calling toll-free 1-888-GUARDIAN (1-888-482-7342) or by visiting our website at http://guardianvpt.onlineprospectus.net/GuardianVPT/Prospectuses.
Portfolio Holdings and Proxy Voting Procedures
The Fund files its complete schedule of portfolio holdings with the Securities and Exchange Commission for the first and third quarters of each fiscal year as an exhibit to its reports on Form N-PORT. The Fund’s Form N-PORT reports are available on the Securities and Exchange Commission’s website at https://www.sec.gov. The Fund’s Form N-PORT information is also available, without charge, upon request, by calling toll-free 1-888-GUARDIAN (1-888-482-7342) or by visiting our website at http://guardianvpt.onlineprospectus.net/GuardianVPT/Prospectuses.
A description of the policies and procedures that the Fund uses to determine how to vote proxies relating to portfolio securities is included in the SAI. The SAI and information regarding how the Fund voted proxies relating to portfolio securities during the most recent 12-month period ended June 30 may be obtained (i) without charge, upon request, by calling toll-free 1-888-GUARDIAN (1-888-482-7342) or by visiting our website at http://guardianvpt.onlineprospectus.net/GuardianVPT/Prospectuses; and (ii) on the Securities and Exchange Commission’s website at https://www.sec.gov.
This report is transmitted to shareholders only. It is not authorized for use as an offer of sale or a solicitation of an offer to buy shares of the Fund unless accompanied or preceded by the Fund’s current prospectus. Past performance results shown in this report should not be considered a representation of future performance. Investment returns and principal value of shares will fluctuate so that shares, when redeemed, may be worth more or less than their original cost. Statements and other information herein are as dated and are subject to change.

The Guardian Life Insurance Company of America New York, NY 10001-2159
PUB10527
Not applicable to this semi-annual report.
| Item 3. | Audit Committee Financial Expert. |
Not applicable to this semi-annual report.
| Item 4. | Principal Accountant Fees and Services. |
Not applicable to this semi-annual report.
| Item 5. | Audit Committee of Listed Registrants. |
Not applicable to the registrant.
| | (a) | The Schedule of Investments is included as part of the report to shareholders filed under Item 1 of this Form N-CSR. |
| Item 7. | Disclosure of Proxy Voting Policies and Procedures for Closed-End Management Investment Companies. |
Not applicable to the registrant.
| Item 8. | Portfolio Managers of Closed-End Management Investment Companies. |
Not applicable to the registrant.
| Item 9. | Purchases of Equity Securities by Closed-End Management Investment Company and Affiliated Purchasers. |
Not applicable to the registrant.
| Item 10. | Submission of Matters to a Vote of Security Holders. |
There have been no material changes to the procedures by which shareholders may recommend nominees to the registrant’s Board of Trustees.
| Item 11. | Controls and Procedures. |
| | (a) | Based on their evaluation of the registrant’s disclosure controls and procedures, the registrant’s principal executive officer and principal financial officer have concluded that the registrant’s disclosure controls and procedures are effective, as of a date within 90 days of the filing date of this Form N-CSR, to provide reasonable assurance that the information required to be disclosed by the registrant on Form N-CSR is recorded, processed, summarized, and reported within the time periods specified in the Commission’s rules and forms. |
| | (b) | There were no changes in the registrant’s internal control over financial reporting that occurred during the period covered by this report that has materially affected, or is reasonably likely to materially affect, the registrant’s internal control over financial reporting. |
| Item 12. | Disclosure of Securities Lending Activities for Closed-End Management Investment Companies. |
Not applicable to the registrant.
(a)(1) Code of ethics – Not applicable to this semi-annual report.
(a)(2) Certifications pursuant to Rule 30a-2(a) under the Investment Company Act of 1940, as amended (17 CFR 270.30a-2(a)) are attached hereto.
(b) Certifications pursuant to Rule 30a-2(b) under the Investment Company Act of 1940, as amended (17 CFR 270.30a-2(b)) and 18 U.S.C. Section 1350 (as adopted pursuant to Section 906 of the Sarbanes-Oxley Act of 2002) are attached hereto.
SIGNATURES
Pursuant to the requirements of the Securities Exchange Act of 1934 and the Investment Company Act of 1940, the registrant has duly caused this report to be signed on its behalf by the undersigned, thereunto duly authorized.
| | | | |
| (Registrant) | | | | Guardian Variable Products Trust |
| | |
| By (Signature and Title)* | | | | /s/ Dominique Baede |
| | | | Dominique Baede, President |
| | | | (Principal Executive Officer) |
| Date: September 5, 2023 | | | | |
Pursuant to the requirements of the Securities Exchange Act of 1934 and the Investment Company Act of 1940, this report has been signed below by the following persons on behalf of the registrant and in the capacities and on the dates indicated.
| | | | |
| By (Signature and Title)* | | | | /s/ Dominique Baede |
| | | | Dominique Baede, President |
| | | | (Principal Executive Officer) |
| | |
| Date: September 5, 2023 | | | | |
| | |
| By (Signature and Title)* | | | | /s/ John H Walter |
| | | | John H Walter, Treasurer |
| | | | (Principal Financial and Accounting Officer) |
| Date: September 5, 2023 | | | | |