Table of Contents
UNITED STATES
SECURITIES AND EXCHANGE COMMISSION
Washington, D.C. 20549
FORM N-CSR
CERTIFIED SHAREHOLDER REPORT OF REGISTERED
MANAGEMENT INVESTMENT COMPANIES
Investment Company Act file number: 811-23149
Thrivent Core Funds
(Exact name of registrant as specified in charter)
625 Fourth Avenue South
Minneapolis, Minnesota 55415
(Address of principal executive offices) (Zip code)
John D. Jackson
Assistant Secretary
625 Fourth Avenue South
Minneapolis, Minnesota 55415
(Name and address of agent for service)
Registrant’s telephone number, including area code: (612) 844-7190
Date of fiscal year end: October 31
Date of reporting period: October 31, 2018
Table of Contents
| Item 1. | Report to Stockholders |
Table of Contents
ANNUAL REPORT
OCTOBER 31, 2018
THRIVENT CORE FUNDS
Table of Contents
| Portfolio Perspectives | ||||
| 2 | ||||
| 4 | ||||
| 6 | ||||
| 8 | ||||
| 10 | ||||
| 11 | ||||
| 13 | ||||
| 17 | ||||
| 21 | ||||
| 24 | ||||
| 31 | ||||
| 32 | ||||
| 33 | ||||
| 35 | ||||
| 48 | ||||
| 50 | ||||
| 51 | ||||
Table of Contents
THRIVENT CORE EMERGING MARKETS DEBT FUND
Kent L. White, CFA, and Cortney L. Swensen, CFA , Portfolio Co-Managers
The Fund seeks to maximize total return while providing high current income and capital appreciation. The Fund’s investment objective may be changed without shareholder approval.
Investment in Thrivent Core Emerging Market Debt involves risks including credit, derivative, emerging markets, ETF, foreign securities, high yield, interest rate, investment adviser, issuer, liquidity, market, non-diversified, and sovereign debt risks. A detailed description of each risk can be found in the significant risks section of the accompanying notes to financial statements.
How did the Fund perform during the 12-month period ended October 31, 2018?
Thrivent Core Emerging Markets Debt Fund earned a return of -4.35%. The Fund’s market benchmark, the Bloomberg Barclays EM USD Aggregate Index, earned a return of -3.39%.
What factors affected the Fund’s performance?
The global backdrop was challenging for emerging market (EM) debt during the reporting period with several factors weighing on this market segment. First, global growth began to de-synchronize as the U.S. economy gained traction while other world economies showed signs of slowing. Second, global liquidity conditions tightened on the heels of four more federal funds rate increases by the Federal Reserve (Fed) totaling 1.00%. The combination of these two factors caused the U.S. dollar to strengthen versus most currencies. Third, trade tensions continued to escalate with the U.S. enacting tariffs on Chinese goods and aluminum and steel from Canada, Europe and Mexico, and these countries in turn retaliating with their own tariffs. The trade rhetoric between the U.S. and China was particularly problematic because EM economic growth is so highly dependent on global trade. Finally, we saw an elevated level of political cycle turmoil in these regions this year, which tends to heavily influence the markets, including contentious elections in Mexico and Brazil. The combination of these issues led to increased market volatility and stress across EM stock and bond markets.
EM countries are more negatively impacted by higher U.S. interest rates and the stronger dollar because many rely on foreign capital to fund their fiscal and current account deficits. As U.S. rates rise, more investment capital shifts back to that country, making it harder for EM countries to sell their debt. Also, much of EM debt is U.S. dollar-denominated, which makes it more difficult to service when local currencies devalue. The countries that performed the worst during this period were those that rely the most on external capital to fund their deficits. Two of the biggest laggards were Turkey and Argentina, which saw their economies thrown into chaos after the lira and peso plunged in value. The EM countries that performed best were those more heavily exposed to oil because prices for the commodity rose for most of the reporting period to reach four-year highs in early October. Given the risk-off sentiment throughout the period, investment-grade EM bonds outperformed high-yield EM bonds.
Because the Fund was launched shortly before this performance period began, we were continuing to invest inflows as the period got underway. The Fund’s underperformance versus the Bloomberg Barclays EM USD Aggregate Index was primarily because the benchmark has much higher corporate and quasi-sovereign exposure, and therefore a shorter duration than the Fund. In the rising rate environment, the Fund’s longer duration was detrimental because it made the portfolio more sensitive to the rate changes. Within its investment-grade exposure, the Fund benefited from security selection due to our weightings along the various credit curves and an overweighting in Middle Eastern countries. The Fund’s high-yield exposure had a slightly positive contribution with overweighted positions in Bahrain, Croatia and Brazil offsetting the significant negative impact of an overweighting in Argentina.
What is your outlook?
While EM valuations are more attractive now, there are several macro factors holding us back from being more constructive at the end of the reporting period. We expect continued tightening of global financial conditions and ongoing trade policy uncertainties between the U.S. and China. Also, many central banks in EM countries are increasing interest rates almost in lock step with the Fed in order to defend their currencies, which is not an overall positive for economic growth in these countries. Regardless of the broader market backdrop, we will continue to focus our efforts on finding the most attractive credits and securities within EM countries.
The returns shown do not reflect taxes a shareholder would pay on distributions or redemptions.
2
Table of Contents
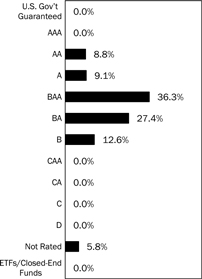
Bond Quality Ratings Distributions |
 |
Major Market Sectors (% of Net Assets) | ||||
Foreign Government | 94.6 | % | ||
Energy | 2.1 | % | ||
Utilities | 0.2 | % | ||
Top 10 Countries (% of Net Assets) |
| |||
Indonesia | 9.8 | % | ||
Turkey | 8.1 | % | ||
Mexico | 7.7 | % | ||
Argentina | 7.6 | % | ||
Saudi Arabia | 6.6 | % | ||
Russia | 6.5 | % | ||
Qatar | 4.7 | % | ||
Colombia | 4.6 | % | ||
Brazil | 4.2 | % | ||
South Africa | 3.9 | % | ||
| Investments in securities in these countries represent 63.7% of the total net assets of the Fund. | ||||
Bond quality ratings are obtained from Moody’s Investors Service, Inc. (“Moody’s”) and Standard & Poor’s Ratings Services (“S&P”). Ratings from S&P, when used, are converted into their equivalent Moody’s ratings. If Moody’s and S&P have assigned different ratings to a security, the lowest rating for the security is used. Not rated may include cash. Investments in derivatives and short-term investments are not reflected in the table.
Quoted Bond Quality Ratings Distributions, Major Market Sectors and Top 10 Countries are subject to change.
The lists of Major Market Sectors and Top 10 Countries exclude short-term investments and collateral held for securities loaned. Bond Quality Ratings Distributions exclude collateral held for securities loaned.
Average Annual Total Returns 1 As of October 31, 2018 | ||||||
1-Year | From Inception 9/5/2017 | |||||
| -4.35% | -4.57 | % | ||||
Value of a $10,000 lnvestment 1
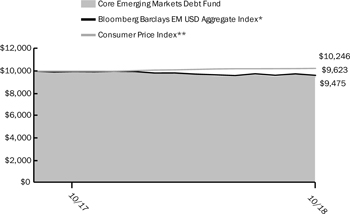
Past performance is not an indication of future results. The prospectus contains more complete information on the investment objectives, risks, charges and expenses of the investment company, which investors should read and consider carefully before investing. To obtain a prospectus, contact a registered representative or visit ThriventFunds.com. Total investment return and principal value of your investment will fluctuate, and your shares, when redeemed, may be worth more or less than their original cost. Current performance may be higher or lower than the performance data quoted. Call 800-847-4836 for performance results current to the most recent month-end.
| 1 | Average annual total returns represent past performance and reflect changes in share prices, the reinvestment of all dividends and capital gains, and the effects of compounding. Periods of less than one year are not annualized. At various times, the Fund’s adviser may have waived its management fee and/or reimbursed Fund expenses, without which the Fund’s total returns would have been lower. The returns shown do not reflect taxes a shareholder would pay on distributions or redemptions. Unless otherwise noted, the Index results shown do not reflect deductions for fees, expenses, or taxes. Index results shown reflect reinvestment of dividends. It is not possible to invest directly in an Index. |
| * | The Bloomberg Barclays EM USD Aggregate Index is a hard currency Emerging Markets debt benchmark that includes USD denominated debt from sovereign, quasi-sovereign, and corporate EM issuers. |
| ** | The Consumer Price Index is an inflationary indicator that measures the change in the cost of a fixed basket of products and services, including housing, electricity, food and transportation. |
3
Table of Contents
THRIVENT CORE INTERNATIONAL EQUITY FUND
Noah J. Monsen, CFA and Brian W. Bomgren, CQF, Portfolio Co-Managers
The Fund seeks long-term capital appreciation. The Fund’s investment objective may be changed without shareholder approval.
Investment in Thrivent Core International Equity involves risks including equity security, foreign currency, foreign securities, futures contracts, investment adviser, issuer, large cap, market, mid cap, quantitative investing, and small cap risks. A detailed description of each risk can be found in the significant risks section of the accompanying notes to financial statements.
How did the Fund perform during the since-inception period from November 14, 2017, through October 31, 2018?
Thrivent Core International Equity Fund earned a since-inception return of -7.08%. The Fund’s market benchmark, the MSCI World Ex-USA Index (net), earned a since-inception return of -6.12%
What factors affected the Fund’s performance?
At the beginning of the period, the world appeared to be enjoying a synchronized global economic recovery led by the U.S. with surprising strength also seen in Japan, Europe and China. International equity markets performed strongly through early 2018 as the combination of solid growth and accommodative monetary policies supported stocks. However, as the period progressed, world economies quickly began to diverge with the U.S. continuing to gain traction while other economies slowed. Global stock markets corrected in February as trade war talks heated up and China’s economy appeared to falter. Geopolitical events continued to influence markets as dissatisfaction with the European Union (EU) percolated and factored into various European elections. The United Kingdom struck a deal with the EU over the country’s Brexit transition, but the timing and exact implications of the transition remained somewhat unclear. The U.S. enacted tariffs on Chinese goods and aluminum and steel from Canada, Europe and Mexico, and these countries in turn retaliated with their own tariffs, which ramped up trade war concerns. Although monetary policy remained accommodative across much of the world, the Federal Reserve (Fed) continued to raise the target federal funds rate with four hikes totaling 1.00%, which caused significant strengthening of the U.S. dollar versus other currencies. Emerging market (EM) countries were most negatively impacted by the stronger dollar because most EM debt is U.S. dollar-denominated. The stronger dollar, along with growing concern about the economic impact of trade wars, led to increased market volatility and stress among EM stock and bond markets. Oil prices rose for most of the reporting period to reach four-year highs in early October before dropping sharply in the final weeks due to a supply glut and falling demand because of the global economic slowdown. For the second time in 2018, world equity markets broadly corrected during October’s risk-off mode due to a myriad of factors including the escalating trade tensions, potential monetary policy missteps by the Fed and policy uncertainty in other major economies, which could potentially dampen global economic growth. Over the period, U.S. equity markets produced solid positive returns on the back of strong corporate earnings and corporate tax reform, while international equities were negative, particularly EM stocks.
Our international equity team uses a quantitative approach to select securities that focuses on emphasizing certain factors in the markets that we believe will outperform. During the period since the Fund’s inception in November 2017, factor performance has been challenging. Our value factors, which are a key part of the Fund’s investment process, underperformed in most regions during this time frame. Also, our portfolio’s overall tilt toward smaller-capitalization stocks detracted because larger-cap stocks outperformed. The Fund experienced mixed results from our profitability and quality factors. The momentum factor, which emphasizes stocks that have recently performed well, worked well in most regions except for Japan. The Fund also benefited from our emphasis on low-volatility and high-quality stocks across all regions during the period.
Country allocations overall aided the Fund’s performance including an underweighting to Hong Kong and overweighting to Japan. The only detractor of note on a country basis was our portfolio’s overweighting in Denmark. On the other hand, sector allocations modestly detracted including our emphases on the consumer staples and consumer discretionary sectors, especially the automotive industry. The portfolio’s underweighted position in the financial sector proved helpful. Although currency exposure in the Fund’s portfolio was small, it benefited results. The primary contributor was an underweighting to the euro, which lost nearly 10% of its value in 2018 versus the U.S. dollar.
What is your outlook?
Going forward, factor exposures will continue to drive the investment process for this Fund. Among our international equity holdings, we are focused on finding profitable companies with attractive valuations, positive price momentum, low volatility and high earnings quality. The Fund’s industry and country weightings will continue to be driven by the companies we own based on the factors we are emphasizing.
The returns shown do not reflect taxes a shareholder would pay on distributions or redemptions.
4
Table of Contents
Portfolio Composition (% of Portfolio) | ||||
Common Stock | 100.0 | % | ||
Short-Term Investments | <0.1 | % | ||
|
| |||
Total | 100.0 | % | ||
Major Market Sectors (% of Net Assets) | ||||
Industrials | 15.6 | % | ||
Consumer Discretionary | 15.3 | % | ||
Materials | 13.5 | % | ||
Consumer Staples | 11.9 | % | ||
Financials | 11.5 | % | ||
Health Care | 10.1 | % | ||
Information Technology | 8.0 | % | ||
Communications Services | 4.6 | % | ||
Energy | 4.0 | % | ||
Real Estate | 2.6 | % | ||
Top 10 Countries (% of Net Assets) | ||||
Japan | 27.5 | % | ||
United Kingdom | 17.7 | % | ||
Canada | 8.0 | % | ||
Switzerland | 6.9 | % | ||
France | 6.2 | % | ||
Australia | 5.5 | % | ||
Germany | 5.0 | % | ||
Spain | 4.7 | % | ||
Sweden | 4.1 | % | ||
Netherlands | 3.8 | % | ||
| Investments in securities in these countries represent 89.4% of the total net assets of the Fund. |
| |||
Quoted Portfolio Composition, Major Market Sectors, and Top 10 Countries are subject to change.
The lists of Major Market Sectors and Top 10 Countries exclude short-term investments and collateral held for securities loaned. The Portfolio Composition chart excludes collateral held for securities loaned.
Average Annual Total Returns 1 As of October 31, 2018 |
From Inception 11/14/2017 |
| -7.08% |
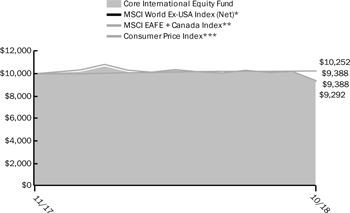
Value of a $10,000 lnvestment 1 ,^
Past performance is not an indication of future results. The prospectus contains more complete information on the investment objectives, risks, charges and expenses of the investment company, which investors should read and consider carefully before investing. To obtain a prospectus, contact a registered representative or visit ThriventFunds.com. Total investment return and principal value of your investment will fluctuate, and your shares, when redeemed, may be worth more or less than their original cost. Current performance may be higher or lower than the performance data quoted. Call 800-847-4836 for performance results current to the most recent month-end.
| 1 | Average annual total returns represent past performance and reflect changes in share prices, the reinvestment of all dividends and capital gains, and the effects of compounding. Periods of less than one year are not annualized. At various times, the Fund’s adviser may have waived its management fee and/or reimbursed Fund expenses, without which the Fund’s total returns would have been lower. The returns shown do not reflect taxes a shareholder would pay on distributions or redemptions. Unless otherwise noted, the Index results shown do not reflect deductions for fees, expenses, or taxes. Index results shown reflect reinvestment of dividends. It is not possible to invest directly in an Index. |
| ^ | Effective September 11, 2018, the Fund’s benchmark changed from the MSCI EAFE + Canada Index to the MSCI World Ex-USA Index (Net). The Adviser made this benchmark change because the new index is more readily available and has identical returns to the old index going back at least ten years. Thus, the MSCI World Ex-USA Index (Net) will be shown in shareholder reports for periods ended October 31, 2018 and beyond. |
| * | The MSCI World Ex-USA Index (Net) is an index which captures large and mid cap representation across 22 of 23 Developed Markets countries, excluding the United States |
| ** | The MSCI EAFE +Canada Index is an equity index which captures large and mid cap representation across Developed Markets countries around the world included Canada. |
| *** | The Consumer Price Index is an inflationary indicator that measures the change in the cost of a fixed basket of products and services, including housing, electricity, food and transportation. |
5
Table of Contents
THRIVENT CORE LOW VOLATILITY EQUITY FUND
Noah J. Monsen, CFA and Brian W. Bomgren, CQF, Portfolio Co-Managers
The Fund seeks to provide long-term capital appreciation with lower volatility relative to the domestic equity market. The Fund’s investment objective may be changed without shareholder approval.
Investment in Thrivent Core Low Volatility Equity involves risks including equity security, investment adviser, issuer, large cap, market, mid cap, quantitative investing, and small cap risks. A detailed description of each risk can be found in the significant risks section of the accompanying notes to financial statements.
How did the Fund perform during the since-inception period from February 28, 2018, through October 31, 2018?
Thrivent Core Low Volatility Equity Fund earned a since-inception return of 5.40%. The Fund’s market benchmark, the MSCI USA Minimum Volatility Index (USD), earned a since-inception return of 5.81%.
What factors affected the Fund’s performance?
During the time frame when this Fund was launched, world economies began to diverge from their previously synchronized growth. The U.S. economy continued to gain traction while other economies slowed, particularly in Europe and Asia. The Federal Reserve (Fed) continued to raise the target federal funds rate with three hikes since the Fund’s inception totaling 0.75% in March, June and September, which contributed to a flattening of the Treasury yield curve and significant strengthening of the U.S. dollar versus other currencies. The U.S. enacted tariffs on Chinese goods and aluminum and steel from Canada, Europe and Mexico, and these countries in turn retaliated with their own tariffs, which ramped up trade war fears. Oil prices rose for most of the reporting period to reach four-year highs in early October before dropping sharply in the final weeks due to a supply glut and falling demand because of the global economic slowdown. U.S. equity markets benefited during much of this period from strong corporate earnings and corporate tax reform. However, during the final month of the period, stocks sold off across U.S. and world markets due to a myriad of factors including the escalating trade tensions, potential monetary policy missteps by the Fed, geopolitical concerns and policy uncertainty in other major economies, which all have the potential to dampen global economic growth. On the heels of 2017’s record-low levels, volatility-as measured by Wall Street’s “Fear Index” (i.e., the Volatility Index, or VIX)-jumped sharply in February and March, before settling down again until October, when we saw another spike.
Since the Fund’s inception on February 28, 2018, low volatility as an investment strategy has worked well. The benchmark MSCI USA Minimum Volatility Index (USD) advanced 5.81%, but with 25% less volatility than the MSCI USA Index, which gained 1.07%. In managing the Fund, our investment team uses a quantitative approach to select securities that focuses on emphasizing certain factors in the market that we believe will outperform.
During the reporting period, the Fund’s relative return benefited overall from the various factors we emphasized, mainly because of our overweightings to momentum (stocks that have recently performed well) and liquidity (stocks that are more easily traded). However, the performance of our value factors, a key part of the Fund’s investment process, was challenging. The Fund experienced mixed results from our profitability and quality factors, with some positives offsetting others that were negative.
Also, although the Fund’s investment strategy generally worked well during the period, it was somewhat challenging for us to find stocks that were less volatile than our already low-volatility benchmark. That said, security selection was a positive contributor overall, primarily due to favorable results in the information technology sector, while stock selection in the consumer discretionary and real estate investment trust (REIT) sectors lagged. Industry allocations modestly detracted from the Fund’s results.
What is your outlook?
We believe the current fiscal and monetary policy uncertainties that are plaguing the market could further increase market volatility, which would be beneficial for a low-volatility strategy relative to the market. On the other hand, rising interest rates are a risk for this strategy because many low-volatility stocks are also high dividend payers, sometimes referred to a bond proxies, whose valuations are often hurt by rising interest rates. Current consensus estimates call for four more Fed rate hikes over the next 12 months, although policymakers may need to dial back the pace if U.S. economic growth falters or inflation does not increase from current levels. While value performed poorly during this period, we believe the market will shift back toward favoring these types of stocks in the coming months. We continue to focus on finding profitable companies with low volatility, attractive valuations, positive price momentum and high earnings quality. The Fund’s industry weightings will be driven by the companies we own based on the factors we are emphasizing.
The returns shown do not reflect taxes a shareholder would pay on distributions or redemptions.
6
Table of Contents
Portfolio Composition (% of Portfolio) | ||||
Common Stock | 99.9 | % | ||
Short-Term Investments | 0.1 | % | ||
|
| |||
Total | 100.0 | % | ||
Major Market Sectors (% of Net Assets) | ||||
Information Technology | 21.7 | % | ||
Health Care | 16.1 | % | ||
Financials | 14.8 | % | ||
lndustrials | 10.6 | % | ||
Consumer Staples | 9.2 | % | ||
Real Estate | 8.7 | % | ||
Utilities | 7.9 | % | ||
Consumer Discretionary | 5.3 | % | ||
Communications Services | 3.3 | % | ||
Materials | 1.3 | % | ||
Top 10 Holdings (% of Net Assets) | ||||
Eli Lilly and Company | 2.6 | % | ||
Automatic Data Processing, Inc. | 2.3 | % | ||
Pfizer, Inc. | 2.3 | % | ||
Verizon Communications, Inc. | 2.2 | % | ||
PepsiCo, Inc. | 2.2 | % | ||
UnitedHealth Group, Inc. | 2.2 | % | ||
NextEra Energy, Inc. | 2.1 | % | ||
McDonald’s Corporation | 2.1 | % | ||
Fiserv, Inc. | 2.1 | % | ||
Johnson & Johnson | 2.1 | % | ||
| These securities represent 22.2% of the total net assets of the Fund. |
| |||
Quoted Portfolio Composition, Major Market Sectors and Top 10 Holdings are subject to change.
The lists of Major Market Sectors and Top 10 holdings exclude short-term investments and collateral held for securities loaned. The Portfolio Composition chart excludes collateral held for securities loaned.
Average Annual Total Returns 1 As of October 31, 2018 |
From Inception 02/28/2018 |
| 5.40% |
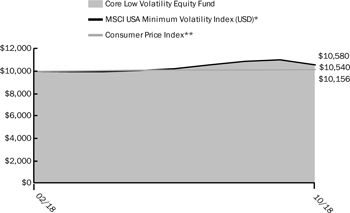
Value of a $10,000 lnvestment l
Past performance is not an indication of future results. The prospectus contains more complete information on the investment objectives, risks, charges and expenses of the investment company, which investors should read and consider carefully before investing. To obtain a prospectus, contact a registered representative or visit ThriventFunds.com. Total investment return and principal value of your investment will fluctuate, and your shares, when redeemed, may be worth more or less than their original cost. Current performance may be higher or lower than the performance data quoted. Call 800-847-4836 for performance results current to the most recent month-end.
| 1 | Average annual total returns represent past performance and reflect changes in share prices, the reinvestment of all dividends and capital gains, and the effects of compounding. Periods of less than one year are not annualized. At various times, the Fund’s adviser may have waived its management fee and/or reimbursed Fund expenses, without which the Fund’s total returns would have been lower. The returns shown do not reflect taxes a shareholder would pay on distributions or redemptions. Unless otherwise noted, the Index results shown do not reflect deductions for fees, expenses, or taxes. Index results shown reflect reinvestment of dividends. It is not possible to invest directly in an Index. |
| * | The MSCI USA Minimum Volatility Index (USD) is an index which aims to reflect the performance characteristics of a minimum variance strategy applied to the large and mid cap USA equity universe. |
| ** | The Consumer Price Index is an inflationary indicator that measures the change in the cost of a fixed basket of products and services, including housing, electricity, food and transportation. |
7
Table of Contents
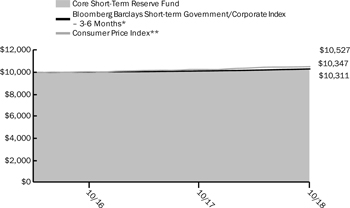
THRIVENT CORE SHORT-TERM RESERVE FUND
William D. Stouten, Portfolio Manager
The Fund seeks a high level of current income consistent with liquidity and the preservation of capital.
Investment in Thrivent Core Short-Term Reserve Fund involves credit, government securities, interest rate, investment adviser, mortgage-backed and other asset-backed securities, portfolio turnover rate, prepayment, redemption and lending, and redemption and share ownership risks. A detailed description of each risk can be found in the significant risks section of the accompanying notes to financial statements.
For the 12-month period ended October 31, 2018, the Fund earned a return of 2.01%. The Fund’s market benchmark, the Bloomberg Barclays Short-Term Government/Corporate Index (3-6 months), earned a return of 1.67%. The Fund outperformed its benchmark primarily due to its high exposure to Tier II commercial paper and lower exposure to government securities. While the Bloomberg Barclays benchmark does not include any commercial paper, our Fund’s portfolio has significant exposure to the segment. More than 70% of the Fund’s portfolio was invested in commercial paper and certificates of deposit (CDs), more than 10% in corporate bonds and the remainder split between asset-backed securities, U.S. government obligations and municipal securities. At the end of the reporting period, the Fund’s one-day yield was 2.40% and its net assets totaled around $4.9 billion. The Fund’s weighted average life (WAL) was 113 days and its WAM was 70 days at period end. Due to the volatility of the total net assets of the Fund, we typically target an average WAM of less than 65 days. A shorter WAM reduces the price sensitivity of the portfolio to changes in interest rates and aids with liquidity. Our primary focus in managing the Fund continues to center on maximizing current income while preserving liquidity and minimizing net asset value volatility.
The returns shown do not reflect taxes a shareholder would pay on distributions or redemptions.
8
Table of Contents
Portfolio Composition (% of Portfolio) | ||||
Short-Term Investments | 100.0 | % | ||
|
| |||
Total | 100.0 | % | ||
Major Market Sectors (% of Net Assets) | ||||
Financials | 38.8 | % | ||
Asset-Backed Securities | 9.6 | % | ||
Foreign | 8.9 | % | ||
Utilities | 7.8 | % | ||
Consumer Non-Cyclical | 7.0 | % | ||
Consumer Cyclical | 6.1 | % | ||
Capital Goods | 5.6 | % | ||
Energy | 5.5 | % | ||
Technology | 3.3 | % | ||
Basic Materials | 2.7 | % | ||
Top 10 Holdings (% of Net Assets) | ||||
American Honda Finance Corporation | 1.7 | % | ||
Federal Home Loan Bank | 0.8 | % | ||
USAA Capital Corporation | 0.8 | % | ||
Apple, Inc. | 0.8 | % | ||
CarMax Auto Owner Trust 2018-4 | 0.7 | % | ||
Nestle Finance International, Ltd. | 0.7 | % | ||
National Rural Utilities Cooperative Finance Corporation | 0.7 | % | ||
BMW Vehicle Lease Trust | 0.7 | % | ||
KeyCorp | 0.6 | % | ||
Omnicom Cap, Inc. | 0.6 | % | ||
| These securities represent 8.1% of the total net assets of the Fund. |
| |||
Quoted Major Market Sectors, Portfolio Composition and Top 10 Holdings are subject to change.
Average Annual Total Returns 1 As of October 31, 2018 | ||||||
1-Year | From Inception | |||||
| 2.01% | 1.38 | % | ||||
Value of a $10,000 lnvestment1
Past performance is not an indication of future results. The prospectus contains more complete information on the investment objectives, risks, charges and expenses of the investment company, which investors should read and consider carefully before investing. To obtain a prospectus, contact a registered representative or visit ThriventFunds.com. Total investment return and principal value of your investment will fluctuate, and your shares, when redeemed, may be worth more or less than their original cost. Current performance may be higher or lower than the performance data quoted. Call 800-847-4836 for performance results current to the most recent month-end.
| 1 | Avenage annual total returns represent past performance and reflect changes in share prices, the reinvestment of all dividends and capital gains, and the effects of compounding. Periods of less than one year are not annualized. At various times, the Fund’s adviser may have waived its management fee and/or reimbursed Fund expenses, without which the Fund’s total returns would have been lower. The returns shown do not reflect taxes a shareholder would pay on distributions or redemptions. Unless otherwise noted, the Index results shown do not reflect deductions for fees, expenses, or taxes. Index results shown reflect reinvestment of dividends. It is not possible to invest directly in an Index. |
| * | The Bloomberg Barclays Short-term Government/Corporate Index – 3-6 months is an index which measures the performance of USD denominated, fixed rate, investment grade bonds that are in the government or corporate sector and have a remaining maturity of 3-6 months. |
| ** | The Consumer Price Index is an inflationary indicator that measures the change in the cost of a fixed basket of products and services, including housing, electricity, food and transportation. |
9
Table of Contents
(unaudited)
As a shareholder of a Fund, you incur ongoing costs, including administrative fees and other Fund expenses. This Example is intended to help you understand your ongoing costs (in dollars) of investing in a Fund and to compare these costs with the ongoing costs of investing in other mutual funds. The Example is based on an investment of $1,000 invested at the beginning of the period and held for the entire period from May 1, 2018 through October 31, 2018.
Actual Expenses
In the table below, the first line provides information about actual account values and actual expenses. You may use the information in this line, together with the amount you invested, to estimate the expenses that you paid over the period. Simply divide your account value by $1,000 (for example, an $8,600 account value divided by $1,000 = 8.6), then multiply the result by the number in the first line under the heading entitled “Expenses Paid during Period” to estimate the expenses you paid on your account during the period.
Hypothetical Example for Comparison Purposes
In the table below, the second line provides information about hypothetical account values and hypothetical expenses based on the Fund’s actual expense ratio and an assumed rate of return of 5% per year before expenses, which is not the Fund’s actual return. The hypothetical account values and expenses may not be used to estimate the actual ending account balance or expenses you paid for the period. You may use this information to compare the ongoing costs of investing in the Fund and other funds. To do so, compare this 5% hypothetical example with the 5% hypothetical example that appears in the shareholder reports of the other funds.
| Beginning Account Value 5/1/2018 | Ending Account Value 10/31/2018 | Expenses Paid During Period 5/1/2018 -10/31/2018* | Annualized Expense Ratio | |||||||||||||
Thrivent Core Emerging Markets Debt Fund |
| |||||||||||||||
Actual | $ | 1,000 | $ | 984 | $ | 0.25 | 0.05 | % | ||||||||
Hypothetical** | $ | 1,000 | $ | 1,025 | $ | 0.25 | 0.05 | % | ||||||||
Thrivent Core International Equity Fund |
| |||||||||||||||
Actual | $ | 1,000 | $ | 905 | $ | 0.30 | 0.06 | % | ||||||||
Hypothetical** | $ | 1,000 | $ | 1,025 | $ | 0.31 | 0.06 | % | ||||||||
Thrivent Core Low Volatility Equity Fund |
| |||||||||||||||
Actual | $ | 1,000 | $ | 1,065 | $ | 0.21 | 0.04 | % | ||||||||
Hypothetical** | $ | 1,000 | $ | 1,025 | $ | 0.20 | 0.04 | % | ||||||||
Thrivent Core Short-Term Reserve Fund |
| |||||||||||||||
Actual | $ | 1,000 | $ | 1,012 | $ | 0.03 | 0.01 | % | ||||||||
Hypothetical** | $ | 1,000 | $ | 1,025 | $ | 0.03 | 0.01 | % | ||||||||
| * | Expenses are equal to the Fund’s annualized expense ratio, multiplied by the average account value over the period, multiplied by 184/365 to reflect the one-half year period. |
| ** | Assuming 5% annualized total return before expenses. |
10
Table of Contents

Report of Independent Registered Public Accounting Firm
To the Board of Trustees of Thrivent Core Funds and Shareholders of Thrivent Core Emerging Markets Debt Fund, Thrivent Core International Equity Fund, Thrivent Core Low Volatility Equity Fund and Thrivent Core Short-Term Reserve Fund
Opinions on the Financial Statements
We have audited the accompanying statements of assets and liabilities, including the schedules of investments of each of the funds listed in the table below (constituting Thrivent Core Funds, hereafter collectively referred to as the “Funds”) as of October 31, 2018, the related statements of operations for the periods listed in the table below, the statements of changes in net assets for the periods listed in the table below, including the related notes, and the financial highlights for each of the periods indicated therein (collectively referred to as the “financial statements”). In our opinion, the financial statements present fairly, in all material respects, the financial position of each of the Funds as of October 31, 2018, the results of each of their operations for the periods listed in the table below, the changes in each of their net assets for the periods listed in the table below, and each of the financial highlights for each of the periods indicated therein in conformity with accounting principles generally accepted in the United States of America.
| Thrivent Core Emerging Markets Debt Fund (4) | Thrivent Core Low Volatility Equity Fund (3) | |
| Thrivent Core International Equity Fund (2) | Thrivent Core Short-Term Reserve Fund (1) | |
(1) Statement of operations for the year ended October 31, 2018 and statement of changes in net assets for each of the two years in the period ended October 31, 2018 | ||
(2) Statements of operations and changes in net assets for the period November 14, 2017 (commencement of operations) through October 31, 2018 | ||
(3) Statements of operations and changes in net assets for the period February 28, 2018 (commencement of operations) through October 31, 2018 | ||
(4) Statement of operations for the year ended October 31, 2018 and statement of changes in net assets for the year ended October 31, 2018 and for the period September 5, 2017 (commencement of operations) through October 31, 2017 | ||
Basis for Opinions
These financial statements are the responsibility of the Funds’ management. Our responsibility is to express an opinion on the Funds’ financial statements based on our audits. We are a public accounting firm registered with the Public Company Accounting Oversight Board (United States) (“PCAOB”) and are required to be independent with respect to the Funds in accordance with the U.S. federal securities laws and the applicable rules and regulations of the Securities and Exchange Commission and the PCAOB.
We conducted our audits of these financial statements in accordance with the standards of the PCAOB. Those standards require that we plan and perform the audit to obtain reasonable assurance about whether the financial statements are free of material misstatement, whether due to error or fraud.

11
Table of Contents
Our audits included performing procedures to assess the risks of material misstatement of the financial statements, whether due to error or fraud, and performing procedures that respond to those risks. Such procedures included examining, on a test basis, evidence regarding the amounts and disclosures in the financial statements. Our audits also included evaluating the accounting principles used and significant estimates made by management, as well as evaluating the overall presentation of the financial statements. Our procedures included confirmation of securities owned as of October 31, 2018 by correspondence with the custodian, transfer agent, and brokers; when replies were not received from brokers, we performed other auditing procedures. We believe that our audits provide a reasonable basis for our opinions.
December 17, 2018
We have served as the auditor of one or more investment companies in Thrivent Financial for Lutherans investment company complex since 1987.
12
Table of Contents
Schedule of Investments as of October 31, 2018
Principal | Long-Term Fixed Income (96.9%) | Value | ||||||
| Argentina (7.6%) | ||||||||
Argentina Government International Bond | ||||||||
| $3,250,000 | 7.125%, 6/28/2117 | $ | 2,421,250 | |||||
| 6,375,000 | 6.875%, 4/22/2021 | 6,104,062 | ||||||
| 3,865,000 | 5.625%, 1/26/2022 | �� | 3,478,500 | |||||
| 3,000,000 | 4.625%, 1/11/2023 | 2,542,500 | ||||||
| 11,702,000 | 7.500%, 4/22/2026 | 10,274,356 | ||||||
| 5,000,000 | 6.875%, 1/26/2027 | 4,182,500 | ||||||
| 6,000,000 | 5.875%, 1/11/2028 | 4,650,000 | ||||||
| 7,973,407 | 8.280%, 12/31/2033 | 6,877,063 | ||||||
| 2,103,057 | 8.280%, 12/31/2033 | 1,790,774 | ||||||
| 7,963,066 | 2.500%, 12/31/2038a | 4,459,317 | ||||||
| 3,671,000 | 7.625%, 4/22/2046 | 2,889,077 | ||||||
| 2,500,000 | 6.875%, 1/11/2048 | 1,843,750 | ||||||
|
| |||||||
| Total | 51,513,149 | |||||||
|
| |||||||
| Bahrain (3.5%) | ||||||||
Bahrain Government International Bond | ||||||||
| 5,000,000 | 5.875%, 1/26/2021b | 4,987,300 | ||||||
| 2,500,000 | 6.125%, 7/5/2022b | 2,515,650 | ||||||
| 4,000,000 | 6.125%, 8/1/2023b | 4,035,640 | ||||||
| 2,000,000 | 6.875%, 10/5/2025b | 2,070,000 | ||||||
| 3,500,000 | 7.000%, 1/26/2026b | 3,501,764 | ||||||
| 2,000,000 | 7.000%, 10/12/2028b | 1,952,280 | ||||||
| 2,500,000 | 6.750%, 9/20/2029b | 2,383,375 | ||||||
| 3,000,000 | 7.500%, 9/20/2047b | 2,765,238 | ||||||
|
| |||||||
| Total | 24,211,247 | |||||||
|
| |||||||
| Brazil (4.2%) | ||||||||
Brazil Government International Bond | ||||||||
| 4,800,000 | 2.625%, 1/5/2023 | 4,444,848 | ||||||
| 6,911,000 | 6.000%, 4/7/2026 | 7,226,625 | ||||||
| 3,000,000 | 4.625%, 1/13/2028 | 2,818,500 | ||||||
| 2,000,000 | 8.250%, 1/20/2034 | 2,395,000 | ||||||
| 5,005,000 | 7.125%, 1/20/2037 | 5,505,500 | ||||||
| 5,500,000 | 5.000%, 1/27/2045 | 4,592,500 | ||||||
| 2,000,000 | 5.625%, 2/21/2047 | 1,795,000 | ||||||
|
| |||||||
| Total | 28,777,973 | |||||||
|
| |||||||
| Cayman Islands (2.5%) | ||||||||
Dubai DOF Sukuk, Ltd. | ||||||||
| 2,000,000 | 6.450%, 5/2/2022 | 2,150,460 | ||||||
| 2,000,000 | 3.875%, 1/30/2023 | 1,977,000 | ||||||
KSA Sukuk, Ltd. | ||||||||
| 7,000,000 | 2.894%, 4/20/2022b | 6,755,000 | ||||||
| 2,500,000 | 3.628%, 4/20/2027b | 2,387,500 | ||||||
RAK Capital | ||||||||
| 2,000,000 | 3.094%, 3/31/2025 | 1,872,124 | ||||||
Sharjah Sukuk, Ltd. | ||||||||
| 2,000,000 | 3.839%, 1/27/2021 | 1,997,860 | ||||||
|
| |||||||
| Total | 17,139,944 | |||||||
|
| |||||||
| Colombia (4.6%) | ||||||||
Colombia Government International Bond | ||||||||
| 3,870,000 | 4.375%, 7/12/2021 | 3,920,310 | ||||||
| 5,000,000 | 2.625%, 3/15/2023 | 4,687,500 | ||||||
| 1,910,000 | 4.000%, 2/26/2024 | 1,885,170 | ||||||
| 4,875,000 | 3.875%, 4/25/2027 | 4,645,875 | ||||||
| 4,000,000 | 7.375%, 9/18/2037 | 4,830,000 | ||||||
| 3,000,000 | 6.125%, 1/18/2041 | 3,235,530 | ||||||
Principal | Long-Term Fixed Income (96.9%) | Value | ||||||
| Colombia (4.6%) - continued | ||||||||
| $7,705,000 | 5.625%, 2/26/2044 | $ | 7,878,362 | |||||
|
| |||||||
| Total | 31,082,747 | |||||||
|
| |||||||
| Croatia (2.5%) | ||||||||
Croatia Government International Bond | ||||||||
| 2,650,000 | 6.750%, 11/5/2019b | 2,730,692 | ||||||
| 4,000,000 | 6.625%, 7/14/2020b | 4,174,744 | ||||||
| 4,500,000 | 6.375%, 3/24/2021b | 4,722,858 | ||||||
| 2,000,000 | 5.500%, 4/4/2023b | 2,097,872 | ||||||
| 3,021,000 | 6.000%, 1/26/2024b,c | 3,253,967 | ||||||
|
| |||||||
| Total | 16,980,133 | |||||||
|
| |||||||
| Dominican Republic (3.1%) | ||||||||
Dominican Republic Government International Bond | ||||||||
| 2,000,000 | 7.500%, 5/6/2021b | 2,070,000 | ||||||
| 1,500,000 | 6.600%, 1/28/2024b | 1,563,750 | ||||||
| 3,500,000 | 5.500%, 1/27/2025b | 3,452,750 | ||||||
| 3,000,000 | 6.875%, 1/29/2026b | 3,150,000 | ||||||
| 2,000,000 | 5.950%, 1/25/2027b | 1,990,000 | ||||||
| 1,000,000 | 6.000%, 7/19/2028b | 991,250 | ||||||
| 5,000,000 | 7.450%, 4/30/2044b | 5,225,000 | ||||||
| 2,000,000 | 6.850%, 1/27/2045b | 1,970,000 | ||||||
| 1,000,000 | 6.500%, 2/15/2048b | 946,500 | ||||||
|
| |||||||
| Total | 21,359,250 | |||||||
|
| |||||||
| Hungary (1.9%) | ||||||||
Hungary Government International Bond | ||||||||
| 2,500,000 | 6.375%, 3/29/2021 | 2,646,250 | ||||||
| 5,950,000 | 5.750%, 11/22/2023 | 6,373,949 | ||||||
| 2,000,000 | 5.375%, 3/25/2024 | 2,120,400 | ||||||
| 1,500,000 | 7.625%, 3/29/2041 | 2,036,250 | ||||||
|
| |||||||
| Total | 13,176,849 | |||||||
|
| |||||||
| Indonesia (9.8%) | ||||||||
Indonesia Government International Bond | ||||||||
| 5,750,000 | 4.875%, 5/5/2021b | 5,871,164 | ||||||
| 4,650,000 | 3.750%, 4/25/2022b | 4,561,803 | ||||||
| 4,000,000 | 3.375%, 4/15/2023b | 3,823,504 | ||||||
| 6,197,000 | 5.875%, 1/15/2024b | 6,518,649 | ||||||
| 575,000 | 4.125%, 1/15/2025b | 552,124 | ||||||
| 6,100,000 | 4.750%, 1/8/2026b | 6,028,612 | ||||||
| 5,000,000 | 8.500%, 10/12/2035b | 6,553,290 | ||||||
| 2,000,000 | 6.625%, 2/17/2037b | 2,241,660 | ||||||
| 2,000,000 | 7.750%, 1/17/2038b | 2,492,346 | ||||||
| 3,226,000 | 6.750%, 1/15/2044b | 3,710,823 | ||||||
| 3,700,000 | 5.125%, 1/15/2045b | 3,475,588 | ||||||
| 4,000,000 | 5.950%, 1/8/2046b | 4,196,760 | ||||||
| 1,200,000 | 5.250%, 1/8/2047b | 1,151,970 | ||||||
| 1,500,000 | 4.350%, 1/11/2048c | 1,284,754 | ||||||
Perusahaan Penerbit SBSN Indonesia III | ||||||||
| 3,000,000 | 3.400%, 3/29/2021b | 2,969,550 | ||||||
| 1,000,000 | 3.750%, 3/1/2023b | 972,500 | ||||||
| 2,500,000 | 4.350%, 9/10/2024b | 2,462,500 | ||||||
| 3,500,000 | 4.150%, 3/29/2027b | 3,285,625 | ||||||
| 4,000,000 | 4.400%, 3/1/2028b | 3,792,640 | ||||||
|
| |||||||
| Total | 65,945,862 | |||||||
|
| |||||||
| The accompanying Notes to Financial Statements are an integral part of this schedule. |
| 13 |
Table of Contents
EMERGING MARKETS DEBT FUND
Schedule of Investments as of October 31, 2018
Principal | Long-Term Fixed Income (96.9%) | Value | ||||||
| Kuwait (1.8%) | ||||||||
Kuwait Government International Bond | ||||||||
| $5,500,000 | 2.750%, 3/20/2022b | $ | 5,345,780 | |||||
| 7,000,000 | 3.500%, 3/20/2027b | 6,798,750 | ||||||
|
| |||||||
| Total | 12,144,530 | |||||||
|
| |||||||
| Mexico (7.7%) | ||||||||
Mexico Government International Bond | ||||||||
| 5,590,000 | 5.750%, 10/12/2110 | 5,162,365 | ||||||
| 5,220,000 | 4.000%, 10/2/2023 | 5,162,580 | ||||||
| 1,215,000 | 3.600%, 1/30/2025 | 1,151,212 | ||||||
| 3,000,000 | 4.125%, 1/21/2026 | 2,890,350 | ||||||
| 5,781,000 | 4.150%, 3/28/2027 | 5,500,622 | ||||||
| 5,085,000 | 3.750%, 1/11/2028 | 4,680,793 | ||||||
| 1,000,000 | 6.750%, 9/27/2034 | 1,147,500 | ||||||
| 5,878,000 | 6.050%, 1/11/2040 | 6,124,876 | ||||||
| 6,000,000 | 5.550%, 1/21/2045 | 5,928,060 | ||||||
| 5,250,000 | 4.600%, 1/23/2046 | 4,533,427 | ||||||
| 2,000,000 | 4.600%, 2/10/2048 | 1,737,000 | ||||||
Petroleos Mexicanos | ||||||||
| 2,850,000 | 6.375%, 2/4/2021 | 2,916,063 | ||||||
| 2,500,000 | 6.500%, 3/13/2027 | 2,422,500 | ||||||
| 2,000,000 | 6.500%, 1/23/2029b | 1,911,000 | ||||||
|
| |||||||
| Total | 51,268,348 | |||||||
|
| |||||||
| Netherlands (1.0%) | ||||||||
Petrobras Global Finance BV | ||||||||
| 674,000 | 8.375%, 5/23/2021 | 735,233 | ||||||
| 3,000,000 | 5.299%, 1/27/2025 | 2,861,250 | ||||||
| 3,500,000 | 7.375%, 1/17/2027 | 3,632,475 | ||||||
|
| |||||||
| Total | 7,228,958 | |||||||
|
| |||||||
| Oman (3.5%) | ||||||||
Oman Government International Bond | ||||||||
| 3,000,000 | 3.625%, 6/15/2021b | 2,919,240 | ||||||
| 3,000,000 | 4.125%, 1/17/2023b | 2,872,920 | ||||||
| 2,000,000 | 5.932%, 10/31/2025b | 1,998,000 | ||||||
| 5,000,000 | 4.750%, 6/15/2026b | 4,600,000 | ||||||
| 2,000,000 | 5.375%, 3/8/2027b | 1,883,000 | ||||||
| 4,000,000 | 5.625%, 1/17/2028b | 3,810,000 | ||||||
| 6,000,000 | 6.750%, 1/17/2048b | 5,475,000 | ||||||
|
| |||||||
| Total | 23,558,160 | |||||||
|
| |||||||
| Panama (2.9%) | ||||||||
Panama Government International Bond | ||||||||
| 2,000,000 | 4.500%, 4/16/2050 | 1,843,000 | ||||||
| 2,000,000 | 9.375%, 1/16/2023 | 2,465,000 | ||||||
| 3,000,000 | 3.750%, 3/16/2025 | 2,922,030 | ||||||
| 1,500,000 | 8.875%, 9/30/2027 | 1,976,250 | ||||||
| 2,000,000 | 3.875%, 3/17/2028 | 1,921,020 | ||||||
| 1,688,000 | 9.375%, 4/1/2029 | 2,337,880 | ||||||
| 5,079,000 | 6.700%, 1/26/2036 | 6,082,103 | ||||||
|
| |||||||
| Total | 19,547,283 | |||||||
|
| |||||||
| Peru (1.8%) | ||||||||
Peru Government International Bond | ||||||||
| 3,650,000 | 5.625%, 11/18/2050 | 4,078,875 | ||||||
| 1,000,000 | 7.350%, 7/21/2025 | 1,205,000 | ||||||
Principal | Long-Term Fixed Income (96.9%) | Value | ||||||
| Peru (1.8%) - continued | ||||||||
| $5,000,000 | 8.750%, 11/21/2033 | $ | 7,150,000 | |||||
|
| |||||||
| Total | 12,433,875 | |||||||
|
| |||||||
| Philippines (2.4%) | ||||||||
Philippines Government International Bond | ||||||||
| 1,250,000 | 4.000%, 1/15/2021 | 1,262,338 | ||||||
| 5,025,000 | 7.750%, 1/14/2031 | 6,586,298 | ||||||
| 2,625,000 | 6.375%, 10/23/2034 | 3,189,819 | ||||||
| 1,000,000 | 5.000%, 1/13/2037 | 1,059,444 | ||||||
| 3,720,000 | 3.950%, 1/20/2040 | 3,430,818 | ||||||
|
| |||||||
| Total | 15,528,717 | |||||||
|
| |||||||
| Poland (1.0%) | ||||||||
Poland Government International Bond | ||||||||
| 4,000,000 | 5.000%, 3/23/2022 | 4,183,960 | ||||||
| 3,000,000 | 4.000%, 1/22/2024 | 3,029,268 | ||||||
|
| |||||||
| Total | 7,213,228 | |||||||
|
| |||||||
| Qatar (4.7%) | ||||||||
Qatar Government International Bond | ||||||||
| 6,000,000 | 4.500%, 1/20/2022b | 6,141,144 | ||||||
| 5,000,000 | 3.250%, 6/2/2026b | 4,745,800 | ||||||
| 5,500,000 | 4.500%, 4/23/2028b | 5,610,000 | ||||||
| 2,000,000 | 9.750%, 6/15/2030b | 2,959,120 | ||||||
| 2,000,000 | 5.750%, 1/20/2042b | 2,293,896 | ||||||
| 1,250,000 | 4.625%, 6/2/2046b | 1,243,750 | ||||||
| 9,750,000 | 5.103%, 4/23/2048b | 9,896,250 | ||||||
|
| |||||||
| Total | 32,889,960 | |||||||
|
| |||||||
| Russia (6.5%) | ||||||||
Russia Government International Bond | ||||||||
| 9,100,000 | 5.000%, 4/29/2020b | 9,253,280 | ||||||
| 2,000,000 | 4.500%, 4/4/2022b | 2,017,620 | ||||||
| 600,000 | 4.875%, 9/16/2023b | 613,482 | ||||||
| 7,600,000 | 4.750%, 5/27/2026 | 7,497,400 | ||||||
| 4,000,000 | 4.250%, 6/23/2027b | 3,786,744 | ||||||
| 2,000,000 | 12.750%, 6/24/2028b | 3,165,248 | ||||||
| 3,000,000 | 4.375%, 3/21/2029b | 2,837,190 | ||||||
| 1,245,000 | 7.500%, 3/31/2030b | 1,360,212 | ||||||
| 6,600,000 | 5.625%, 4/4/2042b | 6,705,930 | ||||||
| 8,000,000 | 5.250%, 6/23/2047b | 7,404,800 | ||||||
|
| |||||||
| Total | 44,641,906 | |||||||
|
| |||||||
| Saudi Arabia (6.6%) | ||||||||
Saudi Arabia Government International Bond | ||||||||
| 2,500,000 | 2.375%, 10/26/2021b | 2,387,950 | ||||||
| 3,000,000 | 2.875%, 3/4/2023b | 2,850,600 | ||||||
| 6,000,000 | 4.000%, 4/17/2025b | 5,891,568 | ||||||
| 5,000,000 | 3.250%, 10/26/2026b | 4,619,000 | ||||||
| 6,000,000 | 3.625%, 3/4/2028b | 5,630,400 | ||||||
| 7,000,000 | 4.500%, 4/17/2030b | 6,895,000 | ||||||
| 5,250,000 | 4.500%, 10/26/2046b | 4,756,511 | ||||||
| 4,000,000 | 4.625%, 10/4/2047b | 3,668,400 | ||||||
| 9,000,000 | 5.000%, 4/17/2049b | 8,631,288 | ||||||
|
| |||||||
| Total | 45,330,717 | |||||||
|
| |||||||
| The accompanying Notes to Financial Statements are an integral part of this schedule. |
| 14 |
Table of Contents
EMERGING MARKETS DEBT FUND
Schedule of Investments as of October 31, 2018
Principal | Long-Term Fixed Income (96.9%) | Value | ||||||
| South Africa (3.9%) | ||||||||
Eskom Holdings SOC, Ltd. | ||||||||
| $1,500,000 | 6.350%, 8/10/2028b | $ | 1,445,325 | |||||
South Africa Government International Bond | ||||||||
| 3,500,000 | 5.500%, 3/9/2020 | 3,535,000 | ||||||
| 4,125,000 | 5.875%, 5/30/2022 | 4,208,738 | ||||||
| 2,000,000 | 4.665%, 1/17/2024 | 1,910,960 | ||||||
| 4,500,000 | 5.875%, 9/16/2025 | 4,437,720 | ||||||
| 1,600,000 | 4.875%, 4/14/2026 | 1,480,000 | ||||||
| 1,500,000 | 4.850%, 9/27/2027 | 1,355,625 | ||||||
| 4,000,000 | 4.300%, 10/12/2028 | 3,410,000 | ||||||
| 500,000 | 5.875%, 6/22/2030 | 470,625 | ||||||
| 500,000 | 6.250%, 3/8/2041 | 464,780 | ||||||
| 5,200,000 | 5.650%, 9/27/2047 | 4,381,000 | ||||||
|
| |||||||
| Total | 27,099,773 | |||||||
|
| |||||||
| Sri Lanka (1.3%) | ||||||||
Sri Lanka Government International Bond | ||||||||
| 1,500,000 | 6.250%, 10/4/2020b | 1,447,452 | ||||||
| 1,500,000 | 5.750%, 1/18/2022b | 1,393,457 | ||||||
| 1,500,000 | 5.875%, 7/25/2022b | 1,383,605 | ||||||
| 1,000,000 | 5.750%, 4/18/2023b | 898,828 | ||||||
| 2,000,000 | 6.850%, 11/3/2025b | 1,815,120 | ||||||
| 1,500,000 | 6.200%, 5/11/2027b | 1,282,137 | ||||||
| 1,000,000 | 6.750%, 4/18/2028b | 880,011 | ||||||
|
| |||||||
| Total | 9,100,610 | |||||||
|
| |||||||
| Turkey (8.1%) | ||||||||
Turkey Government International Bond | ||||||||
| 1,500,000 | 7.500%, 11/7/2019 | 1,518,009 | ||||||
| 4,750,000 | 7.000%, 6/5/2020 | 4,780,704 | ||||||
| 2,500,000 | 5.625%, 3/30/2021 | 2,437,360 | ||||||
| 4,000,000 | 5.125%, 3/25/2022 | 3,761,240 | ||||||
| 8,000,000 | 5.750%, 3/22/2024 | 7,451,936 | ||||||
| 2,250,000 | 7.375%, 2/5/2025 | 2,230,101 | ||||||
| 3,000,000 | 4.250%, 4/14/2026 | 2,470,092 | ||||||
| 2,042,000 | 4.875%, 10/9/2026 | 1,726,029 | ||||||
| 4,300,000 | 6.000%, 3/25/2027 | 3,873,388 | ||||||
| 1,000,000 | 5.125%, 2/17/2028 | 843,750 | ||||||
| 4,000,000 | 6.125%, 10/24/2028 | 3,563,864 | ||||||
| 2,500,000 | 8.000%, 2/14/2034 | 2,483,285 | ||||||
| 6,839,000 | 6.875%, 3/17/2036 | 6,080,213 | ||||||
| 5,935,000 | 6.750%, 5/30/2040 | 5,148,613 | ||||||
| 6,500,000 | 6.625%, 2/17/2045 | 5,487,820 | ||||||
| 3,000,000 | 5.750%, 5/11/2047 | 2,272,500 | ||||||
|
| |||||||
| Total | 56,128,904 | |||||||
|
| |||||||
| United Arab Emirates (2.2%) | ||||||||
Abu Dhabi Government International Bond | ||||||||
| 3,000,000 | 2.500%, 10/11/2022b | 2,874,960 | ||||||
| 3,000,000 | 3.125%, 5/3/2026b | 2,835,000 | ||||||
| 5,500,000 | 3.125%, 10/11/2027b | 5,106,519 | ||||||
| 4,000,000 | 4.125%, 10/11/2047b | 3,700,640 | ||||||
Dubai Government International Bond | ||||||||
| 1,000,000 | 7.750%, 10/5/2020 | 1,073,900 | ||||||
|
| |||||||
| Total | 15,591,019 | |||||||
|
| |||||||
Principal | Long-Term Fixed Income (96.9%) | Value | ||||||
| Uruguay (1.8%) | ||||||||
Uruguay Government International Bond | ||||||||
| $1,071,287 | 4.975%, 4/20/2055 | $ | 993,619 | |||||
| 9,000,000 | 5.100%, 6/18/2050 | 8,527,500 | ||||||
| 1,000,000 | 4.500%, 8/14/2024c | 1,008,970 | ||||||
| 2,500,000 | 4.375%, 10/27/2027 | 2,468,750 | ||||||
|
| |||||||
| Total | 12,998,839 | |||||||
|
| |||||||
| Total Long-Term Fixed Income (cost $718,818,438) | 662,891,981 | |||||||
|
| |||||||
Shares | Collateral Held for Securities | |||||||
| 4,446,979 | Thrivent Cash Management Trust | 4,446,979 | ||||||
|
| |||||||
| Total Collateral Held for Securities Loaned (cost $4,446,979) | 4,446,979 | |||||||
|
| |||||||
Shares or | Short-Term Investments (1.8%) | |||||||
Thrivent Core Short-Term Reserve Fund | ||||||||
| 1,226,951 | 2.430% | 12,269,508 | ||||||
|
| |||||||
| Total Short-Term Investments (cost $12,269,508) | 12,269,508 | |||||||
|
| |||||||
Total Investments (cost $735,534,925) 99.3% | $ | 679,608,468 | ||||||
|
| |||||||
| Other Assets and Liabilities, Net 0.7% | 4,622,160 | |||||||
|
| |||||||
| Total Net Assets 100.0% | $ | 684,230,628 | ||||||
|
| |||||||
| a | Denotes step coupon securities. Step coupon securities pay an initial coupon rate for the first period and then different coupon rates for following periods. The rate shown is as of October 31, 2018. |
| b | Denotes securities sold under Rule 144A of the Securities Act of 1933, which exempts them from registration. These securities may be resold to other dealers in the program or to other qualified institutional buyers. As of October 31, 2018, the value of these investments was $314,396,165 or 45.9% of total net assets. |
| c | All or a portion of the security is on loan. |
The following table presents the total amount of securities loaned with continuous maturity, by type, offset by the gross payable upon return of collateral for securities loaned by Thrivent Core Emerging Markets Debt Fund as of October 31, 2018:
Securities Lending Transactions
Taxable Debt Security | $ | 4,185,835 | ||
|
| |||
Total lending | $ | 4,185,835 | ||
Gross amount payable upon return of collateral for securities loaned | $ | 4,446,979 | ||
|
| |||
Net amounts due to counterparty | $ | 261,144 | ||
|
|
| The accompanying Notes to Financial Statements are an integral part of this schedule. |
| 15 |
Table of Contents
EMERGING MARKETS DEBT FUND
Schedule of Investments as of October 31, 2018
Unrealized Appreciation (Depreciation)
Gross unrealized appreciation and depreciation of investments of the portfolio as a whole (including derivatives), based on cost for federal income tax purposes, were as follows:
Gross unrealized appreciation | $ | 383,626 | ||
Gross unrealized depreciation | (56,625,336 | ) | ||
Net unrealized appreciation (depreciation) | ($ | 56,241,710 | ) | |
|
| |||
Cost for federal income tax purposes | $ | 735,850,178 |
Fair Valuation Measurements
The following table is a summary of the inputs used, as of October 31, 2018, in valuing Emerging Markets Debt Fund’s assets carried at fair value.
Investments in Securities | Total | Level 1 | Level 2 | Level 3 | ||||||||||||
Long-Term Fixed Income | ||||||||||||||||
Energy | 14,478,521 | – | 14,478,521 | – | ||||||||||||
Foreign Government | 646,968,135 | – | 646,968,135 | – | ||||||||||||
Utilities | 1,445,325 | – | 1,445,325 | – | ||||||||||||
|
|
|
|
|
|
|
| |||||||||
| Subtotal Investments in Securities | $ | 662,891,981 | $ | – | $ | 662,891,981 | $ | – | ||||||||
|
|
|
|
|
|
|
| |||||||||
Other Investments * | Total | |||
Short-Term Investments | 12,269,508 | |||
Collateral Held for Securities Loaned | 4,446,979 | |||
|
| |||
| Subtotal Other Investments | $ | 16,716,487 | ||
|
| |||
| Total Investments at Value | $ | 679,608,468 | ||
|
| |||
| * | Certain investments are measured at fair value using a net asset value per share that is not publicly available (practical expedient). According to disclosure requirements of Accounting Standards Codification (ASC) 820, Fair Value Measurement, securities valued using the practical expedient are not classified in the fair value hierarchy. The fair value amounts presented in this table are intended to permit reconciliation of the fair value hierarchy to the amounts presented in the Statement of Assets and Liabilities. |
There were no significant transfers between Levels during the period ended October 31, 2018. Transfers between Levels are identified as of the end of the period.
Investment in Affiliates
Affiliated issuers, as defined under the Investment Company Act of 1940, include those in which the Fund’s holdings of an issuer represent 5% or more of the outstanding voting securities of an issuer, any affiliated mutual fund, or a company which is under common ownership or control with the Fund. The Fund owns shares of Thrivent Cash Management Trust for the purpose of securities lending and Thrivent Core Short-Term Reserve Fund primarily to serve as a cash sweep vehicle for the Fund. Thrivent Cash Management Trust and Thrivent Core Funds are established solely for investment by Thrivent entities.
A summary of transactions (in thousands) for the fiscal year to date, in Emerging Markets Debt Fund, is as follows:
Fund | Value 10/31/2017 | Gross Purchases | Gross Sales | Shares Held at 10/31/2018 | Value 10/31/2018 | % of Net Assets | ||||||||||||||||||||||
| Affiliated Short-Term Investments | ||||||||||||||||||||||||||||
Core Short-Term Reserve, 2.430% | $ | 3,193 | $ | 204,749 | $ | 195,672 | 1,227 | $ | 12,270 | 1.8 | % | |||||||||||||||||
| Total Affiliated Short-Term Investments | 3,193 | 12,270 | 1.8 | |||||||||||||||||||||||||
| Collateral Held for Securities Loaned | ||||||||||||||||||||||||||||
Cash Management Trust- Collateral Investment | – | 13,015 | 8,568 | 4,447 | 4,447 | 0.6 | ||||||||||||||||||||||
| Total Collateral Held for Securities Loaned | – | 4,447 | 0.6 | |||||||||||||||||||||||||
| Total Value | $ | 3,193 | $ | 16,717 | ||||||||||||||||||||||||
Fund | Net Realized Gain/(Loss) | Change in Unrealized Appreciation/ (Depreciation) | Distributions of Realized Capital Gains | Income Earned 11/1/2017 -10/31/2018 | ||||||||||||
| Affiliated Short-Term Investments | ||||||||||||||||
Core Short-Term Reserve, 2.430% | $ | – | $ | – | $ | 0 | $ | 139 | ||||||||
| Total Income from Affiliated Investments | $ | 139 | ||||||||||||||
| Collateral Held for Securities Loaned | ||||||||||||||||
Cash Management Trust- Collateral Investment | – | – | – | 12 | ||||||||||||
| Total Affiliated Income from Securities Loaned, Net | $ | 12 | ||||||||||||||
| Total | $ | – | $ | – | $ | 0 | ||||||||||
The accompanying Notes to Financial Statements are an integral part of this schedule.
16
Table of Contents
Schedule of Investments as of October 31, 2018
Shares | Common Stock (99.5%) | Value | ||||||
| Australia (5.5%) | ||||||||
| 36,259 | ASX, Ltd. | $ | 1,522,903 | |||||
| 451,418 | Australia and New Zealand Banking Group, Ltd. | 8,309,100 | ||||||
| 360,173 | BHP Billiton, Ltd. | 8,310,509 | ||||||
| 49,752 | Carsales.com, Ltd. | 431,228 | ||||||
| 1,058,061 | FlexiGroup, Ltd. | 1,152,967 | ||||||
| 484,862 | GWA Group, Ltd. | 948,202 | ||||||
| 5,959,784 | Medibank Private, Ltd. | 11,816,864 | ||||||
| 39,868 | Monadelphous Group, Ltd. | 407,976 | ||||||
| 1,088 | Rio Tinto, Ltd. | 59,201 | ||||||
| 431,871 | Sandfire Resources NL | 2,042,042 | ||||||
| 286,064 | Seven West Media, Ltd.a | 158,544 | ||||||
| 110,389 | Super Retail Group, Ltd. | 566,100 | ||||||
| 234,664 | Wesfarmers, Ltd. | 7,771,536 | ||||||
|
| |||||||
| Total | 43,497,172 | |||||||
|
| |||||||
| Austria (0.7%) | ||||||||
| 104,745 | OMV AG | 5,816,728 | ||||||
|
| |||||||
| Total | 5,816,728 | |||||||
|
| |||||||
| Canada (8.0%) | ||||||||
| 41,645 | Artis Real Estate Investment Trust | 354,304 | ||||||
| 14,555 | Canfor Corporationa | 209,074 | ||||||
| 283,855 | CGI Group, Inc.a | 17,530,033 | ||||||
| 408,412 | CI Financial Corporation | 6,040,322 | ||||||
| 312,255 | Empire Company, Ltd. | 5,680,814 | ||||||
| 104,853 | Genworth MI Canada, Inc.b | 3,441,603 | ||||||
| 13,820 | Loblaw Companies, Ltd. | 691,184 | ||||||
| 200,129 | Magna International, Inc. | 9,854,352 | ||||||
| 129,508 | Methanex Corporationb | 8,383,053 | ||||||
| 122,366 | National Bank of Canada | 5,554,782 | ||||||
| 96,190 | Quebecor, Inc. | 1,886,609 | ||||||
| 27,233 | SmartCentres Real Estate Investment Trust | 622,256 | ||||||
| 37,593 | Sun Life Financial, Inc. | 1,376,701 | ||||||
| 96,806 | Transcontinental, Inc. | 1,593,517 | ||||||
|
| |||||||
| Total | 63,218,604 | |||||||
|
| |||||||
| Denmark (3.4%) | ||||||||
| 506,559 | Novo Nordisk AS | 21,876,539 | ||||||
| 13,958 | Rockwool International AS | 4,768,868 | ||||||
| 19,434 | Topdanmark AS | 923,768 | ||||||
|
| |||||||
| Total | 27,569,175 | |||||||
|
| |||||||
| Finland (1.8%) | ||||||||
| 437,810 | UPM-Kymmene Oyj | 14,074,970 | ||||||
|
| |||||||
| Total | 14,074,970 | |||||||
|
| |||||||
| France (6.2%) | ||||||||
| 113,404 | Capgemini SA | 13,847,096 | ||||||
| 14,625 | Cie Generale des Etablissements Michelin | 1,497,220 | ||||||
| 280,248 | CNP Assurances | 6,245,990 | ||||||
| 8,378 | Gaztransport Et Technigaz SA | 619,215 | ||||||
| 21,485 | Ipsos SA | 572,111 | ||||||
| 5,600 | LNA Sante | 296,150 | ||||||
| 218,277 | Peugeot SA | 5,188,586 | ||||||
| 64,715 | Schneider Electric SE | 4,679,588 | ||||||
| 89,049 | Total SAb | 5,224,960 | ||||||
| 122,051 | Vinci SAb | 10,862,404 | ||||||
|
| |||||||
| Total | 49,033,320 | |||||||
|
| |||||||
Shares | Common Stock (99.5%) | Value | ||||||
| Germany (5.0%) | ||||||||
| 52,026 | Aareal Bank AG | $ | 1,935,423 | |||||
| 3,812 | Allianz SE | 794,111 | ||||||
| 211,778 | BASF SE | 16,251,451 | ||||||
| 225,593 | Evonik Industries AG | 6,978,859 | ||||||
| 12,173 | Fuchs Petrolub SE | 563,481 | ||||||
| 70,580 | Hannover Rueckversicherung SE | 9,491,606 | ||||||
| 12,949 | Hochtief AG | 1,918,881 | ||||||
| 91,862 | ProSiebenSat.1 Media AG | 2,121,219 | ||||||
| 2,649 | Siltronic AG | 242,607 | ||||||
|
| |||||||
| Total | 40,297,638 | |||||||
|
| |||||||
| Hong Kong (0.7%) | ||||||||
| 76,000 | Hang Lung Properties, Ltd. | 137,763 | ||||||
| 906,000 | Hysan Development Company, Ltd. | 4,248,866 | ||||||
| 283,000 | Road King Infrastructure, Ltd. | 438,059 | ||||||
| 86,000 | Swire Pacific, Ltd. | 893,428 | ||||||
|
| |||||||
| Total | 5,718,116 | |||||||
|
| |||||||
| Ireland (<0.1%) | ||||||||
| 12,866 | Glanbia plc | 228,262 | ||||||
|
| |||||||
| Total | 228,262 | |||||||
|
| |||||||
| Italy (0.7%) | ||||||||
| 43,135 | Amplifon SPA | 764,102 | ||||||
| 7,513 | Anima Holding SPAc | 31,416 | ||||||
| 311,158 | Banca Monte dei Paschi di Siena SPAa,b | 510,841 | ||||||
| 27,915 | Eni SPA | 495,761 | ||||||
| 344,280 | Finecobank Banca Fineco SPA | 3,598,267 | ||||||
|
| |||||||
| Total | 5,400,387 | |||||||
|
| |||||||
| Japan (27.5%) | ||||||||
| 28,200 | AOKI Holdings, Inc. | 371,424 | ||||||
| 24,400 | Aoyama Trading Company, Ltd. | 738,185 | ||||||
| 40,000 | Arcs Company, Ltd. | 966,571 | ||||||
| 43,900 | Autobacs Seven Company, Ltd. | 706,534 | ||||||
| 35,000 | Benesse Holdings, Inc. | 976,102 | ||||||
| 400,300 | Bridgestone Corporation | 15,435,288 | ||||||
| 298,300 | Canon, Inc. | 8,496,601 | ||||||
| 35,800 | Chiyoda Company, Ltd. | 690,141 | ||||||
| 353,600 | Daicel Corporation | 3,740,740 | ||||||
| 81,700 | Daito Trust Construction Company, Ltd. | 10,771,196 | ||||||
| 56,900 | DCM Holdings Company, Ltd. | 553,296 | ||||||
| 61,500 | Denso Corporation | 2,743,255 | ||||||
| 8,400 | Glory, Ltd. | 195,606 | ||||||
| 167,300 | Hino Motors, Ltd. | 1,601,443 | ||||||
| 400 | Hirose Electric Company, Ltd. | 38,123 | ||||||
| 33,700 | Hitachi Chemical Company, Ltd. | 531,181 | ||||||
| 21,300 | Hitachi High-Technologies Corporation | 799,376 | ||||||
| 51,300 | Hitachi Zosen Corporation | 194,961 | ||||||
| 39,800 | Hokuetsu Corporation | 190,115 | ||||||
| 507,400 | Honda Motor Company, Ltd. | 14,484,002 | ||||||
| 61,400 | Inaba Denki Sangyo Company, Ltd. | 2,472,145 | ||||||
| 833,100 | Japan Tobacco, Inc. | 21,406,777 | ||||||
| 67,900 | JSR Corporation | 1,011,926 | ||||||
| 601,200 | Konica Minolta Holdings, Inc. | 5,950,913 | ||||||
| 368,400 | Kuraray Company, Ltd. | 5,060,165 | ||||||
| 155,200 | Kyoei Steel, Ltd. | 2,811,419 | ||||||
| 53,600 | KYORIN Holdings, Inc. | 1,170,597 | ||||||
| 76,100 | Matsui Securities Company, Ltd. | 775,604 | ||||||
| 12,900 | Ministop Company, Ltd. | 238,187 | ||||||
| 33,400 | Miraca Holdings, Inc. | 813,091 | ||||||
| 47,100 | Mitsuboshi Belting, Ltd. | 1,157,090 | ||||||
| The accompanying Notes to Financial Statements are an integral part of this schedule. |
| 17 |
Table of Contents
INTERNATIONAL EQUITY FUND
Schedule of Investments as of October 31, 2018
Shares | Common Stock (99.5%) | Value | ||||||
| Japan (27.5%) - continued | ||||||||
| 81,000 | NEC Networks & System Integration Corporation | $ | 1,765,480 | |||||
| 14,000 | NH Foods, Ltd. | 482,802 | ||||||
| 192,000 | NHK Spring Company, Ltd. | 1,644,034 | ||||||
| 165,500 | Nippon Kayaku Company, Ltd. | 1,969,645 | ||||||
| 115,700 | Nippon Light Metal Holdings Company, Ltd. | 243,965 | ||||||
| 558,900 | Nippon Steel & Sumitomo Metal Corporation | 10,309,565 | ||||||
| 1,868,500 | Nissan Motor Company, Ltd. | 16,999,170 | ||||||
| 155,800 | Nitto Kogyo Corporation | 2,713,460 | ||||||
| 160,100 | NTT DOCOMO, Inc. | 3,970,295 | ||||||
| 430,500 | Osaka Gas Company, Ltd. | 7,872,123 | ||||||
| 24,800 | Plenus Company, Ltd.b | 396,902 | ||||||
| 30,900 | Ryoyo Electro Corporation | 443,120 | ||||||
| 66,700 | Sangetsu Company, Ltd. | 1,282,862 | ||||||
| 78,600 | Sankyo Company, Ltd. | 3,001,006 | ||||||
| 8,600 | Sanyo Special Steel Company, Ltd. | 197,751 | ||||||
| 1,054,100 | Sekisui House, Ltd. | 15,471,052 | ||||||
| 36,800 | Senshu Ikeda Holdings, Inc. | 113,088 | ||||||
| 45,500 | SHIMAMURA Company, Ltd. | 3,827,213 | ||||||
| 453,100 | Shinko Electric Industries Company, Ltd. | 3,154,566 | ||||||
| 18,700 | ShinMaywa Industries, Ltd. | 230,222 | ||||||
| 21,600 | Sugi Holdings Company, Ltd. | 988,972 | ||||||
| 830,700 | Sumitomo Electric Industries, Ltd. | 11,328,747 | ||||||
| 140,000 | Sumitomo Rubber Industries, Ltd. | 2,008,257 | ||||||
| 45,200 | Taiheiyo Cement Corporation | 1,330,086 | ||||||
| 22,900 | Taikisha, Ltd. | 646,207 | ||||||
| 23,100 | Taiyo Holdings Company, Ltd. | 825,346 | ||||||
| 13,100 | Takara Standard Company, Ltd. | 202,272 | ||||||
| 107,500 | Toagosei Company, Ltd. | 1,103,838 | ||||||
| 15,900 | Tokyo Seimitsu Company, Ltd. | 382,349 | ||||||
| 62,200 | Toppan Forms Company, Ltd. | 565,419 | ||||||
| 296,200 | Toppan Printing Company, Ltd. | 4,187,506 | ||||||
| 9,200 | Toshiba Machine Company, Ltd. | 174,224 | ||||||
| 264,100 | Toyoda Gosei Company, Ltd. | 5,696,021 | ||||||
| 48,800 | Tsubakimoto Chain Company | 1,873,744 | ||||||
| 218,700 | TV Asahi Holdings Corporation | 4,082,884 | ||||||
| 16,900 | Ube Industries, Ltd. | 368,127 | ||||||
| 18,300 | Yamato Kogyo Company, Ltd. | 482,275 | ||||||
| 28,900 | Yuasa Trading Company, Ltd. | 948,051 | ||||||
|
| |||||||
| Total | 220,374,700 | |||||||
|
| |||||||
| Luxembourg (<0.1%) | ||||||||
| 3,142 | RTL Group SA | 201,666 | ||||||
|
| |||||||
| Total | 201,666 | |||||||
|
| |||||||
| Netherlands (3.8%) | ||||||||
| 109,041 | Euronext NVc | 6,709,525 | ||||||
| 52,289 | ForFarmers BV | 588,878 | ||||||
| 318,285 | Koninklijke Ahold Delhaize NV | 7,285,668 | ||||||
| 231,531 | Unilever NVb | 12,441,252 | ||||||
| 51,529 | Wolters Kluwer NV | 2,923,460 | ||||||
|
| |||||||
| Total | 29,948,783 | |||||||
|
| |||||||
| Norway (2.7%) | ||||||||
| 561,079 | DnB ASA | 10,136,679 | ||||||
| 619,623 | Telenor ASA | 11,361,014 | ||||||
|
| |||||||
| Total | 21,497,693 | |||||||
|
| |||||||
Shares | Common Stock (99.5%) | Value | ||||||
| Singapore (0.1%) | ||||||||
| 657,600 | Wing Tai Holdings, Ltd. | $ | 916,523 | |||||
|
| |||||||
| Total | 916,523 | |||||||
|
| |||||||
| Spain (4.7%) | ||||||||
| 222,246 | ACS Actividades de Construccion y Servicios, SAa | 8,321,170 | ||||||
| 132,034 | Amadeus IT Holding SA | 10,631,924 | ||||||
| 180,174 | Bankinter SA | 1,476,158 | ||||||
| 936,652 | CaixaBank SA | 3,790,340 | ||||||
| 30,683 | CIA De Distribucion Integral | 740,793 | ||||||
| 424,647 | Enagas SA | 11,258,805 | ||||||
| 173,619 | Mediaset Espana Comunicacion SA | 1,180,575 | ||||||
|
| |||||||
| Total | 37,399,765 | |||||||
|
| |||||||
| Sweden (4.1%) | ||||||||
| 366,753 | Atlas Copco AB, Class A | 9,066,782 | ||||||
| 327,794 | Atlas Copco AB, Class B | 7,507,574 | ||||||
| 158,522 | Granges AB | 1,675,912 | ||||||
| 21,513 | Hexpol AB | 199,082 | ||||||
| 80,216 | Nobina ABc | 535,250 | ||||||
| 94,256 | Sandvik AB | 1,490,074 | ||||||
| 413,494 | SKF AB | 6,629,188 | ||||||
| 64,934 | SSAB AB, Class A | 259,235 | ||||||
| 128,615 | Swedish Match AB | 6,551,480 | ||||||
|
| |||||||
| Total | 33,914,577 | |||||||
|
| |||||||
| Switzerland (6.9%) | ||||||||
| 18,610 | Ferguson plc | 1,254,678 | ||||||
| 227,641 | Novartis AG | 19,935,061 | ||||||
| 50,680 | Pargesa Holding SA | 3,720,421 | ||||||
| 79,988 | Roche Holding AG | 19,466,072 | ||||||
| 42,520 | Schindler Holding AG, Participation Certificate | 8,965,960 | ||||||
| 571 | SGS SA | 1,356,154 | ||||||
|
| |||||||
| Total | 54,698,346 | |||||||
|
| |||||||
| United Kingdom (17.7%) | ||||||||
| 34,551 | Berkeley Group Holdings plc | 1,544,198 | ||||||
| 626,588 | BHP Billiton plc | 12,499,613 | ||||||
| 416,338 | Bunzl plc | 12,281,941 | ||||||
| 591,996 | Direct Line Insurance Group plc | 2,487,733 | ||||||
| 842,588 | GlaxoSmithKline plc | 16,319,048 | ||||||
| 77,002 | Halma plc | 1,306,754 | ||||||
| 347,664 | Imperial Brands plc | 11,776,296 | ||||||
| 175,506 | Inchcape plc | 1,212,164 | ||||||
| 3,726,516 | ITV plc | 7,073,945 | ||||||
| 1,995,655 | KCOM Group plc | 2,349,330 | ||||||
| 243,398 | Mondi plc | 5,731,745 | ||||||
| 188,414 | National Express Group plc | 962,735 | ||||||
| 38,107 | Next plc | 2,531,555 | ||||||
| 57,434 | Northgate plc | 276,617 | ||||||
| 445,015 | PageGroup plc | 2,852,537 | ||||||
| 32,776 | Paragon Banking Group plc | 178,120 | ||||||
| 101,614 | Petrofac, Ltd. | 747,221 | ||||||
| 531,830 | RELX plc | 10,517,823 | ||||||
| 381,183 | RELX plc | 7,542,578 | ||||||
| 25,167 | Royal Dutch Shell plc, Class A | 801,773 | ||||||
| 570,540 | Royal Dutch Shell plc, Class B | 18,606,984 | ||||||
| 60,131 | Smiths Group plc | 1,071,867 | ||||||
| 24,895 | Spirax-Sarco Engineering plc | 2,056,326 | ||||||
| 339,943 | Unilever plc | 18,006,661 | ||||||
|
| |||||||
| Total | 140,735,564 | |||||||
|
| |||||||
| The accompanying Notes to Financial Statements are an integral part of this schedule. |
| 18 |
Table of Contents
INTERNATIONAL EQUITY FUND
Schedule of Investments as of October 31, 2018
Shares | Common Stock (99.5%) | Value | ||||||
| United States (<0.1%) | ||||||||
| 7,414 | Kulicke and Soffa Industries, Inc. | $ | 150,727 | |||||
|
| |||||||
| Total | 150,727 | |||||||
|
| |||||||
| Total Common Stock (cost $867,803,605) | 794,692,716 | |||||||
|
| |||||||
Shares | Collateral Held for Securities Loaned | |||||||
| 28,504,220 | Thrivent Cash Management Trust | 28,504,220 | ||||||
|
| |||||||
| Total Collateral Held for Securities Loaned (cost $28,504,220) | 28,504,220 | |||||||
|
| |||||||
Shares or | Short-Term Investments (<0.1%) | |||||||
Thrivent Core Short-Term Reserve Fund | ||||||||
| 17,046 | 2.430% | 170,457 | ||||||
|
| |||||||
| Total Short-Term Investments (cost $170,457) | 170,457 | |||||||
|
| |||||||
| Total Investments (cost $896,478,282) 103.1% | $ | 823,367,393 | ||||||
|
| |||||||
| Other Assets and Liabilities, Net (3.1%) | (25,139,885 | ) | ||||||
|
| |||||||
| Total Net Assets 100.0% | $ | 798,227,508 | ||||||
|
| |||||||
| a | Non-income producing security. |
| b | All or a portion of the security is on loan. |
| c | Denotes securities sold under Rule 144A of the Securities Act of 1933, which exempts them from registration. These securities may be resold to other dealers in the program or to other qualified institutional buyers. As of October 31, 2018, the value of these investments was $7,276,191 or 0.9% of total net assets. |
The following table presents the total amount of securities loaned with continuous maturity, by type, offset by the gross payable upon return of collateral for securities loaned by Thrivent Core International Equity Fund as of October 31, 2018:
Securities Lending Transactions
Common Stock | $ | 26,888,047 | ||
|
| |||
Total lending | $ | 26,888,047 | ||
Gross amount payable upon return of collateral for securities loaned | $ | 28,504,220 | ||
|
| |||
Net amounts due to counterparty | $ | 1,616,173 | ||
|
|
| Unrealized Appreciation (Depreciation) | ||||
Gross unrealized appreciation and depreciation of investments of the portfolio as a whole (including derivatives), based on cost for federal income tax purposes, were as follows: | ||||
Gross unrealized appreciation | $ | 8,742,537 | ||
Gross unrealized depreciation | (83,091,245 | ) | ||
|
| |||
Net unrealized appreciation (depreciation) | $ | (74,348,708 | ) | |
Cost for federal income tax purposes | $ | 897,716,101 | ||
| The accompanying Notes to Financial Statements are an integral part of this schedule. |
| 19 |
Table of Contents
INTERNATIONAL EQUITY FUND
Schedule of Investments as of October 31, 2018
Fair Valuation Measurements
The following table is a summary of the inputs used, as of October 31, 2018, in valuing International Equity Fund’s assets carried at fair value.
Investments in Securities | Total | Level 1 | Level 2 | Level 3 | ||||||||||||
Common Stock | ||||||||||||||||
Communications Services | 36,426,271 | – | 36,426,271 | – | ||||||||||||
Consumer Discretionary | 122,525,388 | 9,854,352 | 112,671,036 | – | ||||||||||||
Consumer Staples | 95,105,340 | – | 95,105,340 | – | ||||||||||||
Energy | 32,312,642 | – | 32,312,642 | – | ||||||||||||
Financials | 92,134,332 | – | 92,134,332 | – | ||||||||||||
Health Care | 80,640,660 | – | 80,640,660 | – | ||||||||||||
Industrials | 124,616,367 | – | 124,616,367 | – | ||||||||||||
Information Technology | 63,940,293 | 150,727 | 63,789,566 | – | ||||||||||||
Materials | 107,414,371 | 8,383,053 | 99,031,318 | – | ||||||||||||
Real Estate | 20,446,124 | – | 20,446,124 | – | ||||||||||||
Utilities | 19,130,928 | – | 19,130,928 | – | ||||||||||||
|
|
|
|
|
|
|
| |||||||||
| Subtotal Investments in Securities | $ | 794,692,716 | $ | 18,388,132 | $ | 776,304,584 | $ | – | ||||||||
|
|
|
|
|
|
|
| |||||||||
Other Investments * | Total | |||
Short-Term Investments | 170,457 | |||
Collateral Held for Securities Loaned | 28,504,220 | |||
|
| |||
| Subtotal Other Investments | $ | 28,674,677 | ||
|
| |||
| Total Investments at Value | $ | 823,367,393 | ||
|
| |||
| * | Certain investments are measured at fair value using a net asset value per share that is not publicly available (practical expedient). According to disclosure requirements of Accounting Standards Codification (ASC) 820, Fair Value Measurement, securities valued using the practical expedient are not classified in the fair value hierarchy. The fair value amounts presented in this table are intended to permit reconciliation of the fair value hierarchy to the amounts presented in the Statement of Assets and Liabilities. |
There were no significant transfers between Levels during the period ended October 31, 2018. Transfers between Levels are identified as of the end of the period.
Investment in Affiliates
Affiliated issuers, as defined under the Investment Company Act of 1940, include those in which the Fund’s holdings of an issuer represent 5% or more of the outstanding voting securities of an issuer, any affiliated mutual fund, or a company which is under common ownership or control with the Fund. The Fund owns shares of Thrivent Cash Management Trust for the purpose of securities lending and Thrivent Core Short-Term Reserve Fund primarily to serve as a cash sweep vehicle for the Fund. Thrivent Cash Management Trust and Thrivent Core Funds are established solely for investment by Thrivent entities.
A summary of transactions (in thousands) for the fiscal year to date, in International Equity Fund, is as follows:
Fund | Value 11/14/2017 (inception) | Gross Purchases | Gross Sales | Shares Held at 10/31/2018 | Value 10/31/2018 | % of Net Assets | ||||||||||||||||||
| Affiliated Short-Term Investments | ||||||||||||||||||||||||
Core Short-Term Reserve, 2.430% | $ | – | $ | 291,255 | $ | 291,085 | 17 | $ | 170 | <0.1 | % | |||||||||||||
|
|
|
|
|
|
|
|
|
|
|
| |||||||||||||
| Total Affiliated Short-Term Investments | – | 170 | <0.1 | |||||||||||||||||||||
|
|
|
|
|
| |||||||||||||||||||
| Collateral Held for Securities Loaned | ||||||||||||||||||||||||
Cash Management Trust-Collateral Investment | – | 240,461 | 211,957 | 28,504 | 28,504 | 3.6 | ||||||||||||||||||
|
|
|
|
|
|
|
|
|
|
|
| |||||||||||||
| Total Collateral Held for Securities Loaned | – | 28,504 | 3.6 | |||||||||||||||||||||
|
|
|
|
|
| |||||||||||||||||||
| Total Value | $ | – | $ | 28,674 | ||||||||||||||||||||
|
|
|
| |||||||||||||||||||||
Fund | Net Realized Gain/(Loss) | Change in Unrealized Appreciation/ (Depreciation) | Distributions of Realized Capital Gains | Income Earned 11/14/2017 -10/31/2018 | ||||||||||||
| Affiliated Short-Term Investments | ||||||||||||||||
Core Short-Term Reserve, 2.430% | $ | – | $ | – | $ | 0 | $ | 63 | ||||||||
|
|
|
|
|
|
|
| |||||||||
| Total Income from Affiliated Investments | $ | 63 | ||||||||||||||
|
| |||||||||||||||
| Collateral Held for Securities Loaned | ||||||||||||||||
Cash Management Trust-Collateral Investment | – | – | – | 336 | ||||||||||||
|
|
|
|
|
|
|
| |||||||||
| Total Affiliated Income from Securities Loaned, Net | $ | 336 | ||||||||||||||
|
| |||||||||||||||
| Total | $ | – | $ | – | $ | 0 | ||||||||||
|
|
|
|
|
| |||||||||||
The accompanying Notes to Financial Statements are an integral part of this schedule.
20
Table of Contents
Schedule of Investments as of October 31, 2018
Shares | Common Stock (99.9%) | Value | ||||||
| Communications Services (3.3%) | ||||||||
| 172,019 | AT&T, Inc. | $ | 5,277,543 | |||||
| 1,533 | Facebook, Inc.a | 232,694 | ||||||
| 97,812 | Liberty SiriusXM Groupa | 4,033,767 | ||||||
| 343,877 | Verizon Communications, Inc. | 19,631,938 | ||||||
|
| |||||||
| Total | 29,175,942 | |||||||
|
| |||||||
| Consumer Discretionary (5.3%) | ||||||||
| 816 | Booking Holdings, Inc.a | 1,529,657 | ||||||
| 97,733 | Home Depot, Inc. | 17,189,280 | ||||||
| 104,060 | McDonald’s Corporation | 18,408,214 | ||||||
| 78,185 | Ross Stores, Inc. | 7,740,315 | ||||||
| 14,099 | Walt Disney Company | 1,618,988 | ||||||
|
| |||||||
| Total | 46,486,454 | |||||||
|
| |||||||
| Consumer Staples (9.2%) | ||||||||
| 260,790 | Altria Group, Inc. | 16,961,782 | ||||||
| 176,354 | Archer-Daniels-Midland Company | 8,332,726 | ||||||
| 379,842 | Coca-Cola Company | 18,186,835 | ||||||
| 410,755 | Mondelez International, Inc. | 17,243,495 | ||||||
| 170,276 | PepsiCo, Inc. | 19,135,617 | ||||||
|
| |||||||
| Total | 79,860,455 | |||||||
|
| |||||||
| Energy (1.0%) | ||||||||
| 56,933 | Exxon Mobil Corporation | 4,536,421 | ||||||
| 56,981 | Occidental Petroleum Corporation | 3,821,716 | ||||||
|
| |||||||
| Total | 8,358,137 | |||||||
|
| |||||||
| Financials (14.8%) | ||||||||
| 369,286 | Aflac, Inc. | 15,905,148 | ||||||
| 184,208 | Allstate Corporation | 17,632,390 | ||||||
| 15,734 | American Express Company | 1,616,354 | ||||||
| 132,638 | American Financial Group, Inc. | 13,267,779 | ||||||
| 121,569 | Arthur J. Gallagher & Company | 8,997,322 | ||||||
| 74,432 | Berkshire Hathaway, Inc.a | 15,279,401 | ||||||
| 48,078 | Cincinnati Financial Corporation | 3,780,854 | ||||||
| 43,538 | First American Financial Corporation | 1,930,040 | ||||||
| 18,260 | Hartford Financial Services Group, Inc. | 829,369 | ||||||
| 209,809 | KeyCorp | 3,810,131 | ||||||
| 186,980 | Loews Corporation | 8,705,789 | ||||||
| 9,384 | Markel Corporationa | 10,258,964 | ||||||
| 139,499 | Marsh & McLennan Companies, Inc. | 11,822,540 | ||||||
| 301,945 | U.S. Bancorp | 15,782,665 | ||||||
|
| |||||||
| Total | 129,618,746 | |||||||
|
| |||||||
| Health Care (16.1%) | ||||||||
| 52,314 | Abbott Laboratories | 3,606,527 | ||||||
| 19,462 | Amgen, Inc. | 3,752,079 | ||||||
| 239,759 | Baxter International, Inc. | 14,987,335 | ||||||
| 26,572 | Boston Scientific Corporationa | 960,312 | ||||||
| 26,034 | Bristol-Myers Squibb Company | 1,315,758 | ||||||
| 174,515 | Danaher Corporation | 17,346,791 | ||||||
| 18,868 | Edwards Lifesciences Corporationa | 2,784,917 | ||||||
| 205,658 | Eli Lilly and Company | 22,301,554 | ||||||
| 8,771 | Hill-Rom Holdings, Inc. | 737,466 | ||||||
| 130,076 | Johnson & Johnson | 18,209,339 | ||||||
| 458,374 | Pfizer, Inc. | 19,737,584 | ||||||
| 9,542 | Stryker Corporation | 1,547,903 | ||||||
| 61,013 | Thermo Fisher Scientific, Inc. | 14,255,688 | ||||||
| 71,880 | UnitedHealth Group, Inc. | 18,785,838 | ||||||
|
| |||||||
| Total | 140,329,091 | |||||||
|
| |||||||
Shares | Common Stock (99.9%) | Value | ||||||
| Industrials (10.6%) | ||||||||
| 150,642 | AMETEK, Inc. | $ | 10,105,065 | |||||
| 75,366 | General Dynamics Corporation | 13,006,664 | ||||||
| 108,110 | Honeywell International, Inc. | 15,656,490 | ||||||
| 37,291 | Illinois Tool Works, Inc. | 4,757,213 | ||||||
| 106,527 | Ingersoll-Rand plc | 10,220,200 | ||||||
| 51,844 | Lockheed Martin Corporation | 15,234,360 | ||||||
| 46,905 | Northrop Grumman Corporation | 12,286,765 | ||||||
| 22,012 | Raytheon Company | 3,852,981 | ||||||
| 18,018 | Resideo Technologies, Inc.a | 379,279 | ||||||
| 94,421 | Waste Connections, Inc. | 7,217,541 | ||||||
|
| |||||||
| Total | 92,716,558 | |||||||
|
| |||||||
| Information Technology (21.7%) | ||||||||
| 7,112 | Agilent Technologies, Inc. | 460,786 | ||||||
| 199,263 | Amphenol Corporation | 17,834,039 | ||||||
| 137,126 | Automatic Data Processing, Inc. | 19,757,114 | ||||||
| 144,536 | Cisco Systems, Inc. | 6,612,522 | ||||||
| 221,739 | Cognizant Technology Solutions Corporation | 15,306,643 | ||||||
| 169,971 | Fidelity National Information Services, Inc. | 17,693,981 | ||||||
| 231,445 | Fiserv, Inc.a | 18,353,589 | ||||||
| 61,416 | Intuit, Inc. | 12,958,776 | ||||||
| 91,689 | MasterCard, Inc. | 18,124,165 | ||||||
| 79,743 | Microsoft Corporation | 8,517,350 | ||||||
| 356,379 | Oracle Corporation | 17,405,550 | ||||||
| 54,577 | Paychex, Inc. | 3,574,248 | ||||||
| 162,043 | Synopsys, Inc.a | 14,507,710 | ||||||
| 131,171 | Visa, Inc. | 18,081,922 | ||||||
|
| |||||||
| Total | 189,188,395 | |||||||
|
| |||||||
| Materials (1.3%) | ||||||||
| 376,074 | Newmont Mining Corporation | 11,628,208 | ||||||
|
| |||||||
| Total | 11,628,208 | |||||||
|
| |||||||
| Real Estate (8.7%) | ||||||||
| 96,870 | American Tower Corporation | 15,093,315 | ||||||
| 104,813 | Crown Castle International Corporation | 11,397,366 | ||||||
| 412,177 | Douglas Emmett, Inc. | 14,916,686 | ||||||
| 64,752 | Equity Residential | 4,206,290 | ||||||
| 205,983 | First Industrial Realty Trust, Inc. | 6,323,678 | ||||||
| 241,419 | Highwoods Properties, Inc. | 10,294,106 | ||||||
| 104,512 | Liberty Property Trust | 4,375,917 | ||||||
| 52,082 | Regency Centers Corporation | 3,299,915 | ||||||
| 43,140 | UDR, Inc. | 1,690,657 | ||||||
| 162,202 | Weyerhaeuser Company | 4,319,439 | ||||||
|
| |||||||
| Total | 75,917,369 | |||||||
|
| |||||||
| Utilities (7.9%) | ||||||||
| 21,828 | ALLETE, Inc. | 1,615,272 | ||||||
| 26,443 | Atmos Energy Corporation | 2,461,314 | ||||||
| 249,523 | CMS Energy Corporation | 12,356,379 | ||||||
| 71,449 | Duke Energy Corporation | 5,903,831 | ||||||
| 146,264 | Entergy Corporation | 12,278,863 | ||||||
| 42,434 | Exelon Corporation | 1,859,034 | ||||||
| 123,452 | MDU Resources Group, Inc. | 3,081,362 | ||||||
| 107,202 | NextEra Energy, Inc. | 18,492,345 | ||||||
| 14,999 | ONE Gas, Inc. | 1,183,571 | ||||||
| 49,782 | Public Service Enterprise Group, Inc. | 2,659,852 | ||||||
| 85,437 | Southern Company | 3,847,228 | ||||||
| The accompanying Notes to Financial Statements are an integral part of this schedule. |
| 21 |
Table of Contents
LOW VOLATILITY EQUITY FUND
Schedule of Investments as of October 31, 2018
Shares | Common Stock (99.9%) | Value | ||||||
| Utilities (7.9%) - continued | ||||||||
| 65,001 | UGI Corporation | $ | 3,448,953 | |||||
|
| |||||||
| Total | 69,188,004 | |||||||
|
| |||||||
Total Common Stock (cost $853,423,600) | 872,467,359 | |||||||
|
| |||||||
Shares or | Short-Term Investments (0.1%) | Value | ||||||
Thrivent Core Short-Term Reserve Fund | ||||||||
| 83,009 | 2.430% | 830,094 | ||||||
|
| |||||||
Total Short-Term Investments (cost $830,094) | 830,094 | |||||||
|
| |||||||
| Total Investments (cost $854,253,694) 100.0% | $ | 873,297,453 | ||||||
|
| |||||||
| Other Assets and Liabilities, Net <0.1% | 375,220 | |||||||
|
| |||||||
| Total Net Assets 100.0% | $ | 873,672,673 | ||||||
|
| |||||||
| a | Non-income producing security. |
Unrealized Appreciation (Depreciation)
Gross unrealized appreciation and depreciation of investments of the portfolio as a whole (including derivatives), based on cost for federal income tax purposes, were as follows: | ||||
Gross unrealized appreciation | $ | 50,296,222 | ||
Gross unrealized depreciation | (31,290,732 | ) | ||
|
| |||
Net unrealized appreciation (depreciation) | $ | 19,005,490 | ||
Cost for federal income tax purposes | $ | 854,291,963 | ||
| The accompanying Notes to Financial Statements are an integral part of this schedule. |
| 22 |
Table of Contents
LOW VOLATILITY EQUITY FUND
Schedule of Investments as of October 31, 2018
Fair Valuation Measurements
The following table is a summary of the inputs used, as of October 31, 2018, in valuing Low Volatility Equity Fund’s assets carried at fair value.
Investments in Securities | Total | Level 1 | Level 2 | Level 3 | ||||||||||||
Common Stock | ||||||||||||||||
Communications Services | 29,175,942 | 29,175,942 | – | – | ||||||||||||
Consumer Discretionary | 46,486,454 | 46,486,454 | – | – | ||||||||||||
Consumer Staples | 79,860,455 | 79,860,455 | – | – | ||||||||||||
Energy | 8,358,137 | 8,358,137 | – | – | ||||||||||||
Financials | 129,618,746 | 129,618,746 | – | – | ||||||||||||
Health Care | 140,329,091 | 140,329,091 | – | – | ||||||||||||
Industrials | 92,716,558 | 92,716,558 | – | – | ||||||||||||
Information Technology | 189,188,395 | 189,188,395 | – | – | ||||||||||||
Materials | 11,628,208 | 11,628,208 | – | – | ||||||||||||
Real Estate | 75,917,369 | 75,917,369 | – | – | ||||||||||||
Utilities | 69,188,004 | 69,188,004 | – | – | ||||||||||||
|
|
|
|
|
|
|
| |||||||||
| Subtotal Investments in Securities | $ | 872,467,359 | $ | 872,467,359 | $ | – | $ | – | ||||||||
|
|
|
|
|
|
|
| |||||||||
Other Investments * | Total | |||
Short-Term Investments | 830,094 | |||
|
| |||
| Subtotal Other Investments | $ | 830,094 | ||
|
| |||
| Total Investments at Value | $ | 873,297,453 | ||
|
| |||
| * | Certain investments are measured at fair value using a net asset value per share that is not publicly available (practical expedient). According to disclosure requirements of Accounting Standards Codification (ASC) 820, Fair Value Measurement, securities valued using the practical expedient are not classified in the fair value hierarchy. The fair value amounts presented in this table are intended to permit reconciliation of the fair value hierarchy to the amounts presented in the Statement of Assets and Liabilities. |
There were no significant transfers between Levels during the period ended October 31, 2018. Transfers between Levels are identified as of the end of the period.
Investment in Affiliates
Affiliated issuers, as defined under the Investment Company Act of 1940, include those in which the Fund’s holdings of an issuer represent 5% or more of the outstanding voting securities of an issuer, any affiliated mutual fund, or a company which is under common ownership or control with the Fund. The Fund owns shares of Thrivent Core Short-Term Reserve Fund primarily to serve as a cash sweep vehicle for the Fund. Thrivent Core Funds are established solely for investment by Thrivent entities.
A summary of transactions (in thousands) for the fiscal year to date, in Low Volatility Equity Fund, is as follows:
Fund | Value 2/28/2018 (inception) | Gross Purchases | Gross Sales | Shares Held at 10/31/2018 | Value 10/31/2018 | % of Net Assets | ||||||||||||||||||
| Affiliated Short-Term Investments | ||||||||||||||||||||||||
Core Short-Term Reserve, 2.430% | $ | — | $ | 54,611 | $ | 53,781 | 83 | $ | 830 | 0.1 | % | |||||||||||||
|
|
|
|
|
|
|
|
|
|
|
| |||||||||||||
| Total Affiliated Short-Term Investments | — | 830 | 0.1 | |||||||||||||||||||||
|
|
|
|
|
| |||||||||||||||||||
| Total Value | $ | — | $ | 830 | ||||||||||||||||||||
|
|
|
| |||||||||||||||||||||
Fund | Net Realized Gain/(Loss) | Change in Unrealized Appreciation/ (Depreciation) | Distributions of Realized Capital Gains | Income Earned 2/28/2018 - 10/31/2018 | ||||||||||||
| Affiliated Short-Term Investments | ||||||||||||||||
Core Short-Term Reserve, 2.430% | $ | – | $ | – | $ | – | $ | 23 | ||||||||
|
|
|
|
|
|
|
| |||||||||
| Total Income from Affiliated Investments | $ | 23 | ||||||||||||||
|
|
|
|
|
|
|
| |||||||||
| Total | $ | – | $ | – | $ | – | ||||||||||
|
|
|
|
|
|
|
| |||||||||
The accompanying Notes to Financial Statements are an integral part of this schedule.
23
Table of Contents
Schedule of Investments as of October 31, 2018
Principal | Asset-Backed Securities (9.6%)a | Value | ||||||
Ally Auto Receivables Trust | ||||||||
| $10,528,387 | 2.397% , 7/15/2019, Ser. 2018-3 | $ | 10,525,365 | |||||
AmeriCredit Automobile Receivables Trust | ||||||||
| 16,605,998 | 2.429% , 8/19/2019, Ser. 2018-2 | 16,600,844 | ||||||
ARI Fleet Lease Trust | ||||||||
| 8,804,244 | 1.950% , 3/15/2019, Ser. 2018-Ab | 8,799,168 | ||||||
Ascentium Equipment Receivables, LLC | ||||||||
| 12,258,708 | 2.500% , 5/10/2019, Ser. 2018-1Ab | 12,258,706 | ||||||
| 21,000,000 | 2.731% , 11/12/2019, Ser. 2018-2Ab | 20,992,154 | ||||||
BMW Vehicle Lease Trust | ||||||||
| 33,000,000 | 2.496% , 10/21/2019, Ser. 2018-1 | 32,989,546 | ||||||
California Republic Auto Receivables Trust | ||||||||
| 4,366,748 | 2.450% , 7/15/2019, Ser. 2018-1 | 4,366,835 | ||||||
Canadian Pacer Auto Receivables Trust | ||||||||
| 28,000,000 | 2.547% , 10/21/2019, Ser. 2018-2Ab | 27,990,491 | ||||||
CarMax Auto Owner Trust | ||||||||
| 3,888,044 | 2.300% , 5/15/2019, Ser. 2018-2 | 3,888,069 | ||||||
CarMax Auto Owner Trust 2018-4 | ||||||||
| 35,000,000 | 2.592% , 11/15/2019, Ser. 2018-4 | 34,988,996 | ||||||
CCG Receivables Trust | ||||||||
| 822,825 | 1.850% , 2/14/2019, Ser. 2018-1b | 822,689 | ||||||
CNH Equipment Trust | ||||||||
| 15,423,927 | 2.450% , 6/14/2019, Ser. 2018-A | 15,424,199 | ||||||
| 17,553,417 | 2.470% , 10/15/2019, Ser. 2018-B | 17,544,468 | ||||||
Dell Equipment Finance Trust | ||||||||
| 11,520,257 | 2.450% , 6/24/2019, Ser. 2018-1b | 11,520,350 | ||||||
| 23,000,000 | 2.657% , 10/22/2019, Ser. 2018-2b | 22,992,580 | ||||||
DLL Securitization Trust | ||||||||
| 7,359,807 | 2.450% , 5/17/2019, Ser. 2018-1b | 7,359,166 | ||||||
Drive Auto Receivables Trust | ||||||||
| 18,265,404 | 2.451% , 9/16/2019, Ser. 2018-4 | 18,262,332 | ||||||
Enterprise Fleet Financing, LLC | ||||||||
| 7,178,154 | 2.150% , 3/20/2019, Ser. 2018-1b | 7,174,745 | ||||||
| 20,000,000 | 2.815% , 11/20/2019, Ser. 2018-3b | 19,996,722 | ||||||
Ford Credit Auto Lease Trust | ||||||||
| 8,007,197 | 2.300% , 5/15/2019, Ser. 2018-A | 8,007,294 | ||||||
| 26,386,675 | 2.452% , 10/15/2019, Ser. 2018-B | 26,377,870 | ||||||
Principal | Asset-Backed Securities (9.6%)a | Value | ||||||
GM Financial Automobile Leasing Trust | ||||||||
| $19,727,876 | 2.420% , 9/20/2019, Ser. 2018-3 | $ | 19,717,248 | |||||
GM Financial Consumer Automobile Receivables Trust | ||||||||
| 1,795,091 | 2.300% , 4/16/2019, Ser. 2018-2 | 1,795,098 | ||||||
Great America Leasing Receivables | ||||||||
| 1,485,442 | 1.850% , 2/15/2019, Ser. 2018-1b | 1,485,370 | ||||||
Hyundai Auto Lease Securitization Trust | ||||||||
| 5,862,882 | 2.371% , 6/17/2019, Ser. 2018-Bb | 5,861,559 | ||||||
John Deere Owner Trust | ||||||||
| 3,258,917 | 1.950% , 3/15/2019, Ser. 2018-A | 3,258,540 | ||||||
| 17,813,886 | 2.535% , 8/15/2019, Ser. 2018-B | 17,808,640 | ||||||
Kubota Credit Owner Trust | ||||||||
| 7,585,285 | 2.370% , 5/15/2019, Ser. 2018-1Ab | 7,584,236 | ||||||
Prestige Auto Receivables Trust | ||||||||
| 5,970,300 | 2.528% , 10/15/2019, Ser. 2018-1Ab | 5,969,020 | ||||||
Santander Drive Auto Receivables Trust | ||||||||
| 5,374,797 | 2.450% , 6/17/2019, Ser. 2018-3 | 5,374,822 | ||||||
Securitized Term Auto Receivables Trust | ||||||||
| 6,409,935 | 2.400% , 4/25/2019, Ser. 2018-1Ab | 6,410,027 | ||||||
Volvo Financial Equipment, LLC | ||||||||
| 2,552,151 | 1.850% , 2/15/2019, Ser. 2018-1Ab | 2,552,157 | ||||||
Westlake Automobile Receivables Trust | ||||||||
| 10,531,896 | 2.530% , 9/16/2019, Ser. 2018-3Ab | 10,526,797 | ||||||
Wheels SPV 2, LLC | ||||||||
| 11,759,230 | 2.550% , 7/20/2019, Ser. 2018-1Ab | 11,759,696 | ||||||
World Omni Auto Receivables Trust | ||||||||
| 1,080,675 | 2.250% , 4/15/2019, Ser. 2018-B | 1,080,674 | ||||||
| 9,346,593 | 2.360% , 8/15/2019, Ser. 2018-C | 9,342,475 | ||||||
| 25,000,000 | 2.441% , 10/15/2019, Ser. 2018-D | 24,991,423 | ||||||
| Total | 464,400,371 | |||||||
|
| |||||||
Principal | Basic Materials (2.7%)a | Value | ||||||
Dow Chemical Company | ||||||||
| 250,000 | 2.470% , 11/29/2018 | 249,497 | ||||||
| 8,370,000 | 2.510% , 12/17/2018 | 8,342,047 | ||||||
| 15,000,000 | 2.610% , 12/27/2018 | 14,938,298 | ||||||
Eastman Chemical Company | ||||||||
| 12,850,000 | 2.480% , 11/21/2018b | 12,831,395 | ||||||
EI du Pont de Nemours & Company | ||||||||
| 5,000,000 | 2.400% , 11/8/2018b | 4,997,327 | ||||||
| 18,750,000 | 2.500% , 11/15/2018b | 18,730,859 | ||||||
| The accompanying Notes to Financial Statements are an integral part of this schedule. |
| 24 |
Table of Contents
SHORT-TERM RESERVE FUND
Schedule of Investments as of October 31, 2018
Principal | Basic Materials (2.7%)a | Value | ||||||
Honeywell International, Inc. | ||||||||
| $24,457,000 | 2.560% (LIBOR 3M + 0.040%), 10/30/2019c | $ | 24,452,735 | |||||
International Paper Company | ||||||||
| 10,000,000 | 2.400% , 11/5/2018b | 9,996,671 | ||||||
| 15,000,000 | 2.390% , 11/7/2018b | 14,992,971 | ||||||
| 20,000,000 | 2.420% , 11/13/2018b | 19,982,320 | ||||||
|
| |||||||
| Total | 129,514,120 | |||||||
|
| |||||||
Principal | Capital Goods (5.6%)a | Value | ||||||
Boeing Company | ||||||||
| 10,000,000 | 2.340% , 12/18/2018b | 9,969,040 | ||||||
Caterpillar Financial Services Corporation | ||||||||
| 20,314,000 | 2.803% (LIBOR 3M + 0.450%), 12/21/2018c | 20,324,064 | ||||||
John Deere Canada, ULC | ||||||||
| 15,481,000 | 2.300% , 11/19/2018b,d | 15,462,551 | ||||||
| 20,225,000 | 2.460% , 1/15/2019b,d | 20,120,435 | ||||||
John Deere Capital Corporation | ||||||||
| 28,185,000 | 2.978% (LIBOR 3M + 0.570%), 1/8/2019c | 28,209,833 | ||||||
Rockwell Collins, Inc. | ||||||||
| 15,000,000 | 2.510% , 11/28/2018b | 14,970,880 | ||||||
| 6,000,000 | 2.500% , 11/30/2018b | 5,987,500 | ||||||
Stanley Black & Decker, Inc. | ||||||||
| 10,000,000 | 2.380% , 11/1/2018b | 9,999,315 | ||||||
| 20,000,000 | 2.400% , 11/5/2018b | 19,993,125 | ||||||
| 15,000,000 | 2.380% , 11/6/2018b | 14,993,805 | ||||||
| 15,000,000 | 2.420% , 11/19/2018b | 14,980,145 | ||||||
| 4,000,000 | 2.430% , 11/20/2018b | 3,994,422 | ||||||
United Technologies Corporation | ||||||||
| 25,000,000 | 2.515% , 11/26/2018b | 24,955,006 | ||||||
| 14,850,000 | 2.520% , 11/28/2018b | 14,821,171 | ||||||
Waste Management, Inc. | ||||||||
| 10,000,000 | 2.400% , 11/2/2018b,d | 9,998,684 | ||||||
| 20,000,000 | 2.400% , 11/6/2018b,d | 19,992,020 | ||||||
| 10,000,000 | 2.420% , 11/8/2018b,d | 9,994,653 | ||||||
| 15,000,000 | 2.420% , 11/15/2018b,d | 14,984,688 | ||||||
|
| |||||||
| Total | 273,751,337 | |||||||
|
| |||||||
Principal | Communications Services (1.1%)a | Value | ||||||
Omnicom Cap, Inc. | ||||||||
| 30,000,000 | 2.370% , 11/1/2018b,d | 29,998,023 | ||||||
Rogers Communications, Inc. | ||||||||
| 25,000,000 | 2.500% , 11/29/2018b,d | 24,949,693 | ||||||
|
| |||||||
| Total | 54,947,716 | |||||||
|
| |||||||
Principal | Consumer Cyclical (6.1%)a | Value | ||||||
American Honda Finance Corporation | ||||||||
| 10,770,000 | 2.180% , 11/6/2018d | 10,766,001 | ||||||
| 80,424,000 | 2.602% (LIBOR 3M + 0.280%), 11/19/2018c | 80,426,886 | ||||||
| 7,400,000 | 2.220% , 12/7/2018b,d | 7,382,309 | ||||||
| 11,651,000 | 2.619% (LIBOR 3M + 0.150%), 1/22/2019c | 11,652,082 | ||||||
Golden Funding Corporation | ||||||||
| 18,720,000 | 2.370% , 11/13/2018b,d | 18,704,621 | ||||||
| 17,051,000 | 2.300% , 11/28/2018b,d | 17,020,418 | ||||||
Principal | Consumer Cyclical (6.1%)a | Value | ||||||
Nissan Motor Acceptance Corporation | ||||||||
| $10,000,000 | 2.300% , 11/5/2018b,d | $ | 9,996,896 | |||||
| 5,000,000 | 2.350% , 3/4/2019b | 4,990,359 | ||||||
Toyota Credit Canada, Inc. | ||||||||
| 15,000,000 | 2.380% , 11/14/2018 | 14,987,429 | ||||||
| 10,000,000 | 2.400% , 2/5/2019d | 9,932,531 | ||||||
| 25,000,000 | 2.510% (LIBOR 1M + 0.230%), 7/10/2019c,d | 25,000,875 | ||||||
Toyota Financial Services de Puerto Rico, Inc. | ||||||||
| 15,000,000 | 2.260% , 12/10/2018b | 14,962,217 | ||||||
Toyota Motor Financial Netherlands BV | ||||||||
| 25,000,000 | 2.332% (LIBOR 3M + 0.020%), 11/26/2018c,d | 25,000,119 | ||||||
| 10,000,000 | 2.448% (LIBOR 3M + 0.100%), 4/30/2019c,d | 10,000,980 | ||||||
| 25,000,000 | 2.456% (LIBOR 3M + 0.070%), 6/25/2019c,d | 24,996,646 | ||||||
VF Corporation | ||||||||
| 10,000,000 | 2.410% , 11/27/2018b | 9,980,995 | ||||||
|
| |||||||
| Total | 295,801,364 | |||||||
|
| |||||||
Principal | Consumer Non-Cyclical (7.0%)a | Value | ||||||
Anthem Inc | ||||||||
| 10,000,000 | 2.400% , 11/9/2018b | 9,993,992 | ||||||
| 5,000,000 | 2.450% , 11/26/2018b | 4,990,936 | ||||||
| 20,000,000 | 2.450% , 11/27/2018b | 19,962,245 | ||||||
Coca-Cola Company | ||||||||
| 10,000,000 | 2.320% , 12/4/2018b | 9,978,382 | ||||||
| 25,000,000 | 2.284% , 12/17/2018b | 24,924,278 | ||||||
| 5,000,000 | 2.400% , 1/16/2019b | 4,974,686 | ||||||
| 10,000,000 | 2.390% , 2/12/2019b | 9,929,887 | ||||||
| 20,000,000 | 2.430% , 2/13/2019b | 19,858,250 | ||||||
| 10,000,000 | 2.420% , 2/14/2019b | 9,928,362 | ||||||
| 10,000,000 | 2.410% , 2/15/2019b | 9,927,567 | ||||||
| 20,000,000 | 2.445% , 3/11/2019b | 19,816,018 | ||||||
Kroger Company | ||||||||
| 25,085,000 | 2.350% , 11/1/2018b | 25,083,420 | ||||||
Nestle Finance International, Ltd. | ||||||||
| 10,000,000 | 2.190% , 11/16/2018d | 9,990,169 | ||||||
| 25,000,000 | 2.200% , 11/20/2018d | 24,969,167 | ||||||
| 35,000,000 | 2.294% , 12/17/2018d | 34,893,623 | ||||||
Novartis Finance Corporation | ||||||||
| 5,800,000 | 2.320% , 12/17/2018b,d | 5,782,576 | ||||||
PepsiCo, Inc. | ||||||||
| 9,875,000 | 2.900% (LIBOR 3M + 0.590%), 2/22/2019c | 9,892,711 | ||||||
| 10,978,000 | 2.389% (LIBOR 3M + 0.040%), 5/2/2019c | 10,979,016 | ||||||
Reckitt Benckiser Treasury Services plc | ||||||||
| 5,000,000 | 2.430% , 11/5/2018b,d | 4,998,448 | ||||||
| 20,000,000 | 2.425% , 11/14/2018b,d | 19,982,438 | ||||||
| 5,000,000 | 2.450% , 11/26/2018b,d | 4,991,759 | ||||||
Roche Holdings, Inc. | ||||||||
| 5,500,000 | 2.726% (LIBOR 3M + 0.340%), 9/30/2019b,c | 5,511,508 | ||||||
UnitedHealth Group, Inc. | ||||||||
| 25,000,000 | 2.490% , 12/28/2018b | 24,896,688 | ||||||
| 17,500,000 | 2.490% , 12/31/2018b | 17,423,733 | ||||||
|
| |||||||
| Total | 343,679,859 | |||||||
|
| |||||||
| The accompanying Notes to Financial Statements are an integral part of this schedule. |
| 25 |
Table of Contents
SHORT-TERM RESERVE FUND
Schedule of Investments as of October 31, 2018
Principal | Energy (5.5%)a | Value | ||||||
BP Capital Markets plc | ||||||||
| $25,000,000 | 2.260% , 11/13/2018b,d | $ | 24,979,353 | |||||
| 25,000,000 | 2.300% , 12/14/2018b,d | 24,926,330 | ||||||
| 25,000,000 | 2.390% , 12/18/2018b,d | 24,919,100 | ||||||
Chevron Corporation | ||||||||
| 24,730,000 | 2.825% (LIBOR 3M + 0.510%), 11/16/2018c | 24,734,879 | ||||||
| 7,175,000 | 1.686% , 2/28/2019 | 7,151,224 | ||||||
Exxon Mobil Corporation | ||||||||
| 16,900,000 | 2.484% (LIBOR 3M + 0.150%), 3/15/2019c | 16,907,846 | ||||||
Schlumberger Holdings Corporation | ||||||||
| 7,000,000 | 2.350% , 12/21/2018b | 6,996,689 | ||||||
Shell International Finance BV | ||||||||
| 21,083,000 | 2.684% (LIBOR 3M + 0.350%), 9/12/2019c | 21,136,340 | ||||||
Suncor Energy, Inc. | ||||||||
| 4,500,000 | 2.480% , 11/5/2018b,d | 4,498,502 | ||||||
| 11,050,000 | 2.470% , 11/8/2018b,d | 11,044,067 | ||||||
| 10,000,000 | 2.490% , 11/14/2018b,d | 9,990,457 | ||||||
| 5,000,000 | 2.500% , 11/15/2018b,d | 4,994,875 | ||||||
Total Capital Canada, Ltd. | ||||||||
| 10,000,000 | 2.160% , 11/6/2018b,d | 9,996,312 | ||||||
| 15,000,000 | 2.220% , 12/4/2018b,d | 14,966,864 | ||||||
| 20,000,000 | 2.270% , 12/19/2018b,d | 19,935,429 | ||||||
| 25,050,000 | 2.440% , 1/24/2019b,d | 24,905,211 | ||||||
Total Capital International SA | ||||||||
| 6,300,000 | 2.125% , 1/10/2019 | 6,292,869 | ||||||
TransCanada American Investments, Ltd. | ||||||||
| 5,280,000 | 2.400% , 11/7/2018b,d | 5,277,649 | ||||||
TransCanada PipeLines, Ltd. | ||||||||
| 5,000,000 | 2.420% , 11/21/2018b | 4,992,761 | ||||||
|
| |||||||
| Total | 268,646,757 | |||||||
|
| |||||||
Principal | Financials (38.8%)a | Value | ||||||
ANZ New Zealand International, Ltd. of London | ||||||||
| 15,000,000 | 2.537% (LIBOR 1M + 0.260%), 11/9/2018b,c,d | 15,001,095 | ||||||
Bank of America NA | ||||||||
| 5,190,000 | 2.050% , 12/7/2018 | 5,187,613 | ||||||
Bank of Montreal Chicago | ||||||||
| 15,000,000 | 2.519% (LIBOR 1M + 0.240%), 11/5/2018c | 15,000,585 | ||||||
| 15,000,000 | 2.426% (LIBOR 1M + 0.170%), 3/4/2019c | 15,003,120 | ||||||
| 10,000,000 | 2.407% (LIBOR 3M + 0.080%), 6/7/2019c | 9,998,180 | ||||||
Bank of Nova Scotia | ||||||||
| 5,418,000 | 3.266% (LIBOR 3M + 0.830%), 1/15/2019c | 5,425,748 | ||||||
| 10,000,000 | 2.614% (LIBOR 3M + 0.200%), 4/10/2019c | 10,004,766 | ||||||
Bank of Nova Scotia Houston | ||||||||
| 10,000,000 | 2.445% (LIBOR 3M + 0.130%), 5/16/2019c | 10,000,502 | ||||||
| 15,000,000 | 2.480% (LIBOR 1M + 0.200%), 8/14/2019c | 14,989,170 | ||||||
Barton Capital SA | ||||||||
| 5,600,000 | 2.380% , 11/14/2018b,d | 5,594,928 | ||||||
| 15,000,000 | 2.280% , 11/19/2018b,d | 14,981,356 | ||||||
Principal | Financials (38.8%)a | Value | ||||||
Berkshire Hathaway Finance Corporation | ||||||||
| $5,000,000 | 2.574% (LIBOR 3M + 0.260%), 8/15/2019c | $ | 5,007,843 | |||||
Branch Banking and Trust Company | ||||||||
| 12,800,000 | 2.873% (LIBOR 3M + 0.530%), 5/1/2019c | 12,817,323 | ||||||
CAFCO, LLC | ||||||||
| 25,000,000 | 2.250% , 11/21/2018b,d | 24,966,283 | ||||||
| 10,000,000 | 2.250% , 11/29/2018b,d | 9,981,464 | ||||||
Canadian Imperial Bank of Commerce | ||||||||
| 15,000,000 | 2.486% (LIBOR 1M + 0.230%), 8/1/2019c | 15,001,680 | ||||||
Chariot Funding, LLC | ||||||||
| 10,000,000 | 2.420% , 11/13/2018b | 9,991,785 | ||||||
| 16,250,000 | 2.250% , 11/26/2018b | 16,222,784 | ||||||
| 10,000,000 | 2.400% , 11/29/2018b | 9,981,190 | ||||||
| 1,500,000 | 2.300% , 12/12/2018b | 1,495,870 | ||||||
| 2,850,000 | 2.490% , 2/11/2019b | 2,828,848 | ||||||
| 8,000,000 | 2.710% , 3/28/2019b | 7,912,351 | ||||||
| 10,000,000 | 2.660% , 4/17/2019b | 9,871,480 | ||||||
| 20,000,000 | 2.700% , 5/17/2019b | 19,690,240 | ||||||
| 10,000,000 | 2.780% , 7/12/2019b | 9,797,929 | ||||||
Charta, LLC | ||||||||
| 15,000,000 | 2.250% , 11/16/2018b,d | 14,984,673 | ||||||
| 11,300,000 | 2.500% , 2/14/2019b,d | 11,211,463 | ||||||
Ciesco, LLC | ||||||||
| 10,000,000 | 2.440% , 11/6/2018b,d | 9,996,237 | ||||||
| 7,550,000 | 2.270% , 12/14/2018b,d | 7,528,379 | ||||||
Citibank NA | ||||||||
| 17,060,000 | 2.571% (LIBOR 3M + 0.230%), 11/9/2018c | 17,060,953 | ||||||
| 25,095,000 | 2.678% (LIBOR 3M + 0.340%), 3/20/2019c | 25,110,094 | ||||||
Cooperatieve Rabobank UA | ||||||||
| 5,000,000 | 2.250% , 1/14/2019 | 4,996,305 | ||||||
| 15,000,000 | 2.450% , 2/1/2019 | 15,000,585 | ||||||
CRC Funding, LLC | ||||||||
| 10,000,000 | 2.250% , 11/20/2018b,d | 9,987,278 | ||||||
| 9,000,000 | 2.250% , 11/29/2018b,d | 8,983,267 | ||||||
| 20,000,000 | 2.260% , 12/5/2018b,d | 19,954,850 | ||||||
| 5,000,000 | 2.450% , 2/20/2019b,d | 4,959,213 | ||||||
Dealers Capital Access Trust, LLC | ||||||||
| 4,000,000 | 2.250% , 11/13/2018 | 3,996,727 | ||||||
| 3,740,000 | 2.250% , 11/26/2018 | 3,733,685 | ||||||
| 15,000,000 | 2.250% , 12/6/2018 | 14,964,420 | ||||||
Glaxosmithkline Finance plc | ||||||||
| 20,000,000 | 2.320% , 11/19/2018b,d | 19,975,110 | ||||||
Gotham Funding Corporation | ||||||||
| 13,399,000 | 2.260% , 11/26/2018b,d | 13,376,723 | ||||||
ING (US) Funding, LLC | ||||||||
| 25,000,000 | 2.530% (LIBOR 1M + 0.250%), 11/15/2018c,d | 25,002,850 | ||||||
| 15,000,000 | 2.290% , 12/27/2018d | 14,942,620 | ||||||
| 1,100,000 | 2.430% (LIBOR 1M + 0.150%), 2/21/2019c,d | 1,100,180 | ||||||
| 15,000,000 | 2.525% (LIBOR 3M + 0.100%), 4/12/2019c,d | 15,001,928 | ||||||
| 14,250,000 | 2.490% (LIBOR 1M + 0.200%), 5/17/2019c,d | 14,250,712 | ||||||
ING Bank NV | ||||||||
| 6,695,000 | 2.000% , 11/26/2018b | 6,692,121 | ||||||
| The accompanying Notes to Financial Statements are an integral part of this schedule. |
| 26 |
Table of Contents
SHORT-TERM RESERVE FUND
Schedule of Investments as of October 31, 2018
Principal | Financials (38.8%)a | Value | ||||||
JPMorgan Chase Bank NA | ||||||||
| $4,625,000 | 2.956% (LIBOR 3M + 0.590%), 9/23/2019c | $ | 4,640,348 | |||||
Jupiter Securitization Company, LLC | ||||||||
| 25,000,000 | 2.790% , 4/29/2019b,d | 24,651,250 | ||||||
KeyCorp | ||||||||
| 31,025,000 | 2.300% , 12/13/2018 | 31,011,970 | ||||||
Liberty Street Funding, LLC | ||||||||
| 5,000,000 | 2.260% , 11/7/2018b,d | 4,997,803 | ||||||
| 15,000,000 | 2.270% , 12/11/2018b,d | 14,960,093 | ||||||
Lloyds Bank plc | ||||||||
| 10,000,000 | 2.527% (LIBOR 1M + 0.250%), 12/7/2018c | 10,002,720 | ||||||
LMA Americas, LLC | ||||||||
| 10,000,000 | 2.350% , 11/13/2018b,d | 9,991,767 | ||||||
| 10,000,000 | 2.340% , 11/27/2018b,d | 9,982,570 | ||||||
MetLife Short Term Funding, LLC | ||||||||
| 7,500,000 | 2.230% , 11/14/2018b,d | 7,493,414 | ||||||
| 15,000,000 | 2.270% , 12/17/2018b,d | 14,954,351 | ||||||
| 6,000,000 | 2.300% , 12/26/2018b,d | 5,977,992 | ||||||
| 15,000,000 | 2.400% , 1/23/2019b,d | 14,911,450 | ||||||
| 11,000,000 | 2.500% , 1/28/2019b,d | 10,930,301 | ||||||
Mizuho Bank, Ltd. | ||||||||
| 10,000,000 | 2.700% , 2/26/2019b | 9,911,336 | ||||||
National Australia Bank, Ltd. | ||||||||
| 15,000,000 | 2.412% (LIBOR 3M + 0.100%), 5/21/2019b,c | 15,004,870 | ||||||
| 15,000,000 | 2.461% (LIBOR 1M + 0.200%), 8/2/2019b,c | 14,998,350 | ||||||
Natixis NY | ||||||||
| 10,000,000 | 2.400% , 12/14/2018 | 9,972,366 | ||||||
| 10,000,000 | 2.320% , 12/20/2018 | 9,968,292 | ||||||
Natixis SA | ||||||||
| 5,235,000 | 1.800% , 11/13/2018 | 5,234,167 | ||||||
Nederlandse Waterschapsbank NV | ||||||||
| 20,000,000 | 2.420% , 2/12/2019b | 19,859,427 | ||||||
| 25,000,000 | 2.465% , 2/21/2019b | 24,807,429 | ||||||
New York Life Global Funding | ||||||||
| 10,000,000 | 2.545% (LIBOR 3M + 0.120%), 4/12/2019b,c | 10,002,026 | ||||||
| 11,605,000 | 2.569% (LIBOR 3M + 0.100%), 1/21/2020b,c | 11,613,640 | ||||||
Nieuw Amsterdam Receivables Corporation | ||||||||
| 2,100,000 | 2.450% , 1/25/2019b,d | 2,087,057 | ||||||
Nordea Bank AB New York | ||||||||
| 20,000,000 | 2.419% (LIBOR 1M + 0.140%), 4/5/2019c | 19,998,960 | ||||||
| 25,000,000 | 2.450% (LIBOR 1M + 0.170%), 5/15/2019c | 24,997,250 | ||||||
| 15,000,000 | 2.454% (LIBOR 1M + 0.170%), 6/10/2019c | 14,997,405 | ||||||
Nordea Bank AB NY | ||||||||
| 20,000,000 | 2.460% (LIBOR 1M + 0.180%), 2/20/2019c | 20,005,180 | ||||||
| 20,000,000 | 2.382% (LIBOR 3M + 0.070%), 5/21/2019c | 19,996,642 | ||||||
Nordea Holding ABP | ||||||||
| 17,309,000 | 2.375% , 4/4/2019b | 17,275,578 | ||||||
Old Line Funding, LLC | ||||||||
| 6,000,000 | 2.520% , 1/15/2019d | 5,968,701 | ||||||
| 25,000,000 | 2.600% , 2/22/2019b,d | 24,794,325 | ||||||
| 25,000,000 | 2.620% , 3/22/2019b,d | 24,738,286 | ||||||
Principal | Financials (38.8%)a | Value | ||||||
PNC Bank NA | ||||||||
| $25,000,000 | 2.717% (LIBOR 3M + 0.400%), 12/7/2018c | $ | 25,008,427 | |||||
| 4,610,000 | 2.200% , 1/28/2019 | 4,602,164 | ||||||
Pricoa Short Term Funding, LLC | ||||||||
| 10,000,000 | 2.400% , 11/15/2018b | 9,990,583 | ||||||
| 10,200,000 | 2.300% , 12/24/2018b | 10,164,106 | ||||||
| 15,000,000 | 2.400% , 2/15/2019b | 14,886,134 | ||||||
Rabobank Nederland | ||||||||
| 15,000,000 | 2.290% , 12/17/2018 | 15,000,022 | ||||||
Royal Bank of Canada | ||||||||
| 15,195,000 | 2.557% (LIBOR 3M + 0.240%), 8/29/2019c | 15,205,263 | ||||||
Simon Property Group, LP | ||||||||
| 15,000,000 | 2.250% , 12/11/2018b | 14,960,384 | ||||||
| 9,385,000 | 2.200% , 2/1/2019 | 9,369,356 | ||||||
Skandinaviska Enskilda Banken AB | ||||||||
| 15,000,000 | 2.590% (LIBOR 1M + 0.310%), 11/20/2018c | 15,002,745 | ||||||
Sumitomo Mitsui Bank NY | ||||||||
| 10,000,000 | 2.457% (LIBOR 1M + 0.180%), 2/8/2019c | 10,000,850 | ||||||
Suncorp-Metway, Ltd. | ||||||||
| 17,400,000 | 2.430% , 11/15/2018b | 17,382,600 | ||||||
| 15,000,000 | 2.580% , 3/13/2019b | 14,848,214 | ||||||
Svenska Handelsbanken AB | ||||||||
| 3,953,000 | 2.500% , 1/25/2019 | 3,950,707 | ||||||
| 7,240,000 | 2.824% (LIBOR 3M + 0.490%), 6/17/2019c | 7,255,555 | ||||||
Svenska Handelsbanken NY | ||||||||
| 25,000,000 | 2.490% (LIBOR 1M + 0.210%), 11/20/2018c | 25,003,175 | ||||||
| 15,000,000 | 2.476% (LIBOR 1M + 0.220%), 2/1/2019c | 15,005,940 | ||||||
| 25,000,000 | 2.417% (LIBOR 1M + 0.140%), 2/7/2019c | 25,004,500 | ||||||
| 6,840,000 | 2.738% (LIBOR 3M + 0.400%), 2/12/2019c | 6,846,716 | ||||||
| 25,000,000 | 2.429% (LIBOR 1M + 0.150%), 4/5/2019c | 24,999,350 | ||||||
| 10,000,000 | 2.443% (LIBOR 3M + 0.100%), 5/7/2019c | 9,999,479 | ||||||
Thunder Bay Funding, LLC | ||||||||
| 25,000,000 | 2.500% (LIBOR 1M + 0.220%), 12/20/2018b,c,d | 25,007,275 | ||||||
| 25,000,000 | 2.424% (LIBOR 1M + 0.150%), 2/4/2019b,c,d | 24,999,994 | ||||||
| 25,000,000 | 2.541% (LIBOR 1M + 0.260%), 2/25/2019b,c,d | 25,004,359 | ||||||
Toronto Dominion Bank | ||||||||
| 15,000,000 | 2.419% (LIBOR 3M + 0.070%), 8/2/2019b,c | 14,991,048 | ||||||
Toronto-Dominion Bank | ||||||||
| 10,000,000 | 2.527% (LIBOR 1M + 0.230%), 11/30/2018b,c | 10,002,090 | ||||||
| 10,000,000 | 2.537% (LIBOR 1M + 0.250%), 1/11/2019b,c | 10,003,340 | ||||||
| 10,000,000 | 2.681% (LIBOR 1M + 0.400%), 6/7/2019b,c | 10,012,230 | ||||||
Toronto-Dominion Bank NY | ||||||||
| 10,000,000 | 2.619% (LIBOR 3M + 0.170%), 4/17/2019c | 10,003,616 | ||||||
| 15,000,000 | 2.683% (LIBOR 1M + 0.400%), 6/12/2019c | 14,999,077 | ||||||
| The accompanying Notes to Financial Statements are an integral part of this schedule. |
| 27 |
Table of Contents
SHORT-TERM RESERVE FUND
Schedule of Investments as of October 31, 2018
Principal | Financials (38.8%)a | Value | ||||||
| $10,000,000 | 2.580% (LIBOR 1M + 0.300%), 7/22/2019c | $ | 9,999,279 | |||||
| 10,000,000 | 2.402% (LIBOR 3M + 0.080%), 8/16/2019c | 9,995,305 | ||||||
| 15,000,000 | 2.433% (LIBOR 3M + 0.110%), 9/6/2019c | 14,996,173 | ||||||
U.S. Bancorp | ||||||||
| 20,500,000 | 2.890% (LIBOR 3M + 0.400%), 4/25/2019c | 20,513,944 | ||||||
U.S. Bank NA | ||||||||
| 3,495,000 | 2.439% (LIBOR 3M + 0.120%), 3/14/2019c | 3,495,695 | ||||||
| 15,000,000 | 1.400% , 4/26/2019 | 14,890,358 | ||||||
| 14,410,000 | 2.462% (LIBOR 3M + 0.150%), 5/24/2019c | 14,413,393 | ||||||
| 4,900,000 | 2.807% (LIBOR 3M + 0.320%), 1/24/2020c | 4,907,801 | ||||||
U.S. Bank NA Ohio | ||||||||
| 25,000,000 | 2.512% (LIBOR 1M + 0.230%), 5/23/2019c | 24,998,601 | ||||||
| 15,000,000 | 2.419% (LIBOR 1M + 0.140%), 7/3/2019c | 14,993,355 | ||||||
| 15,000,000 | 2.542% (LIBOR 1M + 0.260%), 7/23/2019c | 14,998,915 | ||||||
| 10,000,000 | 2.910% , 7/23/2019 | 9,995,684 | ||||||
UBS AG | ||||||||
| 11,000,000 | 2.637% (LIBOR 3M + 0.320%), 12/7/2018b,c | 11,001,716 | ||||||
USAA Capital Corporation | ||||||||
| 38,109,000 | 2.573% (LIBOR 3M + 0.230%), 2/1/2019b,c | 38,129,760 | ||||||
Wells Fargo Bank NA | ||||||||
| 17,381,000 | 1.800% , 11/28/2018 | 17,371,926 | ||||||
| 7,935,000 | 2.440% , 12/12/2018 | 7,935,912 | ||||||
| 8,000,000 | 2.567% (LIBOR 1M + 0.270%), 1/30/2019c | 8,004,152 | ||||||
| 8,370,000 | 2.529% (LIBOR 1M + 0.250%), 2/1/2019c | 8,373,984 | ||||||
| 8,000,000 | 2.658% (LIBOR 3M + 0.250%), 4/5/2019c | 8,005,394 | ||||||
| 10,000,000 | 1.750% , 5/24/2019 | 9,935,079 | ||||||
| 10,000,000 | 2.595% (LIBOR 1M + 0.300%), 6/3/2019c | 9,999,416 | ||||||
| 15,000,000 | 2.492% (LIBOR 3M + 0.180%), 6/24/2019c | 15,003,835 | ||||||
| 15,000,000 | 2.560% (LIBOR 3M + 0.140%), 7/11/2019c | 14,998,901 | ||||||
| 10,000,000 | 2.599% (LIBOR 3M + 0.150%), 10/17/2019c | 9,996,180 | ||||||
Westpac Bank NY | ||||||||
| 10,000,000 | 2.650% (FEDL 1M + 0.450%), 2/15/2019c | 9,999,972 | ||||||
Westpac Banking Corporation | ||||||||
| 9,000,000 | 2.250% , 1/17/2019 | 8,991,071 | ||||||
| 25,000,000 | 3.127% (LIBOR 3M + 0.650%), 1/23/2019b,c | 25,031,123 | ||||||
| 10,000,000 | 2.700% (FEDL 1M + 0.500%), 2/22/2019b,c | 10,001,498 | ||||||
| 15,000,000 | 2.491% (LIBOR 3M + 0.180%), 2/27/2019b,c | 15,013,245 | ||||||
| 15,000,000 | 2.412% (LIBOR 3M + 0.100%), 5/24/2019b,c | 14,999,109 | ||||||
Principal | Financials (38.8%)a | Value | ||||||
| $10,000,000 | 2.382% (LIBOR 3M + 0.070%), 8/16/2019b,c | $ | 9,994,528 | |||||
|
| |||||||
| Total | 1,880,796,425 | |||||||
|
| |||||||
Principal | Foreign (8.9%)a | Value | ||||||
Caisse des Depots et Consignations | ||||||||
| 15,000,000 | 2.250% , 11/14/2018b | 14,987,382 | ||||||
| 25,000,000 | 2.390% , 1/30/2019b | 24,841,951 | ||||||
| 25,000,000 | 2.420% , 1/31/2019b | 24,840,214 | ||||||
| 25,000,000 | 2.430% , 2/6/2019b | 24,829,521 | ||||||
| 25,000,000 | 2.440% , 2/12/2019b | 24,818,794 | ||||||
| 25,000,000 | 2.470% , 2/19/2019b | 24,806,212 | ||||||
Erste Abwicklungsanstalt | ||||||||
| 15,000,000 | 2.190% , 11/16/2018b | 14,985,020 | ||||||
| 15,000,000 | 2.280% , 12/13/2018b | 14,957,788 | ||||||
| 10,000,000 | 2.260% , 12/14/2018b | 9,971,180 | ||||||
| 15,000,000 | 2.480% , 2/12/2019b | 14,889,110 | ||||||
| 30,200,000 | 2.521% , 2/20/2019b | 29,958,628 | ||||||
Kells Funding, LLC | ||||||||
| 25,000,000 | 2.240% , 11/16/2018b,d | 24,974,645 | ||||||
| 10,000,000 | 2.240% , 11/19/2018b,d | 9,987,924 | ||||||
| 15,000,000 | 2.240% , 11/30/2018b,d | 14,971,125 | ||||||
| 25,000,000 | 2.380% , 1/22/2019b,d | 24,856,767 | ||||||
| 10,000,000 | 2.510% , 2/25/2019b,d | 9,915,468 | ||||||
| 10,000,000 | 2.520% , 3/1/2019b,d | 9,912,208 | ||||||
| 15,000,000 | 2.590% , 4/5/2019b,d | 14,824,890 | ||||||
| 10,000,000 | 2.650% , 4/11/2019b,d | 9,877,690 | ||||||
| 15,000,000 | 2.740% , 5/28/2019b,d | 14,754,512 | ||||||
KFW | ||||||||
| 11,100,000 | 2.190% , 11/28/2018b,d | 11,080,351 | ||||||
| 15,000,000 | 2.450% , 2/25/2019b,d | 14,886,998 | ||||||
| 20,750,000 | 2.490% , 3/15/2019b,d | 20,567,685 | ||||||
KFW CP Development | ||||||||
| 25,000,000 | 2.580% , 4/3/2019d | 24,744,617 | ||||||
|
| |||||||
| Total | 429,240,680 | |||||||
|
| |||||||
Principal | Technology (3.3%)a | Value | ||||||
Altera Corporation | ||||||||
| 5,000,000 | 2.500% , 11/15/2018 | 4,999,946 | ||||||
Apple, Inc. | ||||||||
| 10,000,000 | 2.220% , 11/19/2018b | 9,988,188 | ||||||
| 15,000,000 | 2.280% , 12/11/2018b | 14,960,947 | ||||||
| 36,800,000 | 2.230% , 12/12/2018b | 36,701,769 | ||||||
| 4,828,000 | 1.550% , 2/8/2019 | 4,812,475 | ||||||
| 4,075,000 | 2.641% (LIBOR 3M + 0.300%), 5/6/2019c | 4,080,697 | ||||||
Cisco Systems, Inc. | ||||||||
| 19,489,000 | 4.950% , 2/15/2019 | 19,618,520 | ||||||
International Business Machines Corporation | ||||||||
| 15,000,000 | 2.250% , 12/19/2018b | 14,952,960 | ||||||
| 25,000,000 | 2.310% , 12/20/2018b | 24,919,896 | ||||||
| 16,000,000 | 2.708% (LIBOR 3M + 0.370%), 2/12/2019c | 16,012,995 | ||||||
Oracle Corporation | ||||||||
| 7,810,000 | 3.016% (LIBOR 3M + 0.580%), 1/15/2019c | 7,818,239 | ||||||
|
| |||||||
| Total | 158,866,632 | |||||||
|
| |||||||
| The accompanying Notes to Financial Statements are an integral part of this schedule. |
| 28 |
Table of Contents
SHORT-TERM RESERVE FUND
Schedule of Investments as of October 31, 2018
Principal | Transportation (1.5%)a | Value | ||||||
Canadian National Railway Company | ||||||||
| $10,000,000 | 2.190% , 11/5/2018b,d | $ | 9,996,896 | |||||
| 15,000,000 | 2.240% , 11/7/2018b,d | 14,993,467 | ||||||
| 18,521,000 | 2.170% , 11/13/2018b,d | 18,505,918 | ||||||
| 20,000,000 | 2.210% , 11/26/2018b,d | 19,967,038 | ||||||
| 10,000,000 | 2.330% , 12/4/2018b,d | 9,978,268 | ||||||
|
| |||||||
| Total | 73,441,587 | |||||||
|
| |||||||
Principal | U.S. Government and Agencies (1.3%)a | Value | ||||||
Federal Home Loan Bank | ||||||||
| 5,000,000 | 2.196% (LIBOR 1M + (0.085)%), 9/9/2019c | 4,997,920 | ||||||
| 17,840,000 | 2.280% , 9/20/2019e | 17,830,010 | ||||||
| 38,800,000 | 2.294% (LIBOR 1M + FLAT), 10/26/2020c | 38,777,536 | ||||||
Overseas Private Investment Corporation | ||||||||
| 1,810,000 | 0.000% , 5/17/2019 | 1,827,054 | ||||||
|
| |||||||
| Total | 63,432,520 | |||||||
|
| |||||||
Principal | U.S. Municipals (1.1%)a | Value | ||||||
San Jose, CA Financing Auth. | ||||||||
| 5,000,000 | 2.380% , 12/20/2018d | 4,999,950 | ||||||
State of California | ||||||||
| 3,000,000 | 2.200% , 11/14/2018d | 3,000,450 | ||||||
| 15,000,000 | 2.450% , 1/23/2019d | 15,024,663 | ||||||
State of Tennessee | ||||||||
| 15,000,000 | 2.250% , 12/10/2018d | 15,000,150 | ||||||
| 6,663,000 | 2.250% , 12/11/2018d | 6,662,867 | ||||||
| 10,000,000 | 2.400% , 1/28/2019d | 10,014,871 | ||||||
|
| |||||||
| Total | 54,702,951 | |||||||
|
| |||||||
Principal | Utilities (7.8%)a | Value | ||||||
American Electric Power Company, Inc. | ||||||||
| 5,000,000 | 2.450% , 11/6/2018b | 4,997,997 | ||||||
| 15,000,000 | 2.470% , 11/8/2018b | 14,991,947 | ||||||
Duke Energy Corporation | ||||||||
| 15,000,000 | 2.360% , 11/1/2018b | 14,999,012 | ||||||
| 10,000,000 | 2.410% , 11/6/2018b | 9,995,993 | ||||||
| 10,000,000 | 2.400% , 11/8/2018b | 9,994,631 | ||||||
Georgia Transmission Corporation | ||||||||
| 25,000,000 | 2.180% , 11/8/2018b | 24,987,705 | ||||||
ITC Holdings Corporation | ||||||||
| 22,000,000 | 2.460% , 11/19/2018b | 21,971,263 | ||||||
Long Island Power Authority | ||||||||
| 25,000,000 | 2.400% , 1/9/2019d | 24,999,500 | ||||||
National Rural Utilities Cooperative Finance Corporation | ||||||||
| 22,050,000 | 2.300% , 11/27/2018 | 22,012,228 | ||||||
| 34,486,000 | 2.608% (LIBOR 3M + 0.200%), 4/5/2019c | 34,505,887 | ||||||
Nextera Energy Capital Holdings | ||||||||
| 11,000,000 | 2.430% , 11/15/2018b,d | 10,988,725 | ||||||
| 3,240,000 | 2.450% , 11/16/2018b,d | 3,236,452 | ||||||
| 2,000,000 | 2.500% , 11/29/2018b,d | 1,995,975 | ||||||
| 9,510,000 | 2.570% , 12/5/2018b,d | 9,486,728 | ||||||
Oncor Electric Delivery Company, LLC | ||||||||
| 10,000,000 | 2.300% , 11/13/2018b | 9,991,160 | ||||||
| 5,000,000 | 2.400% , 11/14/2018b | 4,995,228 | ||||||
Principal | Utilities (7.8%)a | Value | ||||||
| $17,500,000 | 2.410% , 11/16/2018b | $ | 17,480,836 | |||||
| 5,000,000 | 2.450% , 11/26/2018b | 4,991,001 | ||||||
| 15,000,000 | 2.600% , 1/22/2019b | 14,907,075 | ||||||
PPL Capital Funding, Inc. | ||||||||
| 6,625,000 | 2.410% , 11/1/2018b,d | 6,624,563 | ||||||
| 15,670,000 | 2.400% , 11/2/2018b,d | 15,667,929 | ||||||
| 5,000,000 | 2.450% , 11/7/2018b,d | 4,997,657 | ||||||
| 10,000,000 | 2.400% , 11/14/2018b,d | 9,990,457 | ||||||
| 10,000,000 | 2.430% , 11/15/2018b,d | 9,989,750 | ||||||
Sempra Global | ||||||||
| 10,000,000 | 2.410% , 11/8/2018b,d | 9,994,631 | ||||||
| 14,000,000 | 2.460% , 11/15/2018b,d | 13,985,650 | ||||||
| 14,250,000 | 2.430% , 11/16/2018b,d | 14,234,395 | ||||||
| 15,000,000 | 2.480% , 11/26/2018b,d | 14,973,003 | ||||||
| 17,000,000 | 2.480% , 11/29/2018b,d | 16,965,791 | ||||||
|
| |||||||
| Total | 378,953,169 | |||||||
|
| |||||||
| Total Investments (cost $4,870,850,828) 100.3% | $ | 4,870,175,488 | ||||||
|
| |||||||
| Other Assets and Liabilities, Net (0.3)% | (15,626,706 | ) | ||||||
|
| |||||||
| Total Net Assets 100.0% | $ | 4,854,548,782 | ||||||
|
| |||||||
| a | The interest rate shown reflects the yield, coupon rate or the discount rate at the date of purchase. |
| b | Denotes securities sold under Rule 144A of the Securities Act of 1933, which exempts them from registration. These securities may be resold to other dealers in the program or to other qualified institutional buyers. As of October 31, 2018, the value of these investments was $2,865,399,451 or 59.0% of total net assets. |
| c | Denotes variable rate securities. The rate shown is as of October 31, 2018. The rates of certain variable rate securities are based on a published reference rate and spread; these may vary by security and the reference rate and spread are indicated in their description. The rates of other variable rate securities are determined by the issuer or agent and are based on current market conditions. These securities do not indicate a reference rate and spread in their description. |
| d | Denotes investments that benefit from credit enhancement or liquidity support provided by a third party bank, institution or government. |
| e | Denotes step coupon securities. Step coupon securities pay an initial coupon rate for the first period and then different coupon rates for following periods. The rate shown is as of October 31, 2018. |
| Definitions: | ||
Auth. - | Authority | |
Ser. - | Series | |
| Reference Rate Index: | ||
| FEDL 1M - | Federal Funds 1 Month Rate | |
| LIBOR 1M - | ICE Libor USD Rate 1 Month | |
| LIBOR 3M - | ICE Libor USD Rate 3 Month |
| The accompanying Notes to Financial Statements are an integral part of this schedule. |
| 29 |
Table of Contents
SHORT-TERM RESERVE FUND
Schedule of Investments as of October 31, 2018
Unrealized Appreciation (Depreciation)
Gross unrealized appreciation and depreciation of investments of the portfolio as a whole (including derivatives), based on cost for federal income tax purposes, were as follows: | ||||
Gross unrealized appreciation | $ | 183,495 | ||
Gross unrealized depreciation | (858,835 | ) | ||
|
| |||
Net unrealized appreciation (depreciation) | $ | (675,340 | ) | |
Cost for federal income tax purposes | $ | 4,870,850,828 | ||
Fair Valuation Measurements
The following table is a summary of the inputs used, as of October 31, 2018, in valuing Short-Term Reserve Fund’s assets carried at fair value or amortized cost, which approximates fair value.
Investments in Securities | Total | Level 1 | Level 2 | Level 3 | ||||||||||||
Asset-Backed Securities | 464,400,371 | – | 464,400,371 | – | ||||||||||||
Basic Materials | 129,514,120 | – | 129,514,120 | – | ||||||||||||
Capital Goods | 273,751,337 | – | 273,751,337 | – | ||||||||||||
Communications Services | 54,947,716 | – | 54,947,716 | – | ||||||||||||
Consumer Cyclical | 295,801,364 | – | 295,801,364 | – | ||||||||||||
Consumer Non-Cyclical | 343,679,859 | – | 343,679,859 | – | ||||||||||||
Energy | 268,646,757 | – | 268,646,757 | – | ||||||||||||
Financials | 1,880,796,425 | – | 1,880,796,425 | – | ||||||||||||
Foreign | 429,240,680 | – | 429,240,680 | – | ||||||||||||
Technology | 158,866,632 | – | 158,866,632 | – | ||||||||||||
Transportation | 73,441,587 | – | 73,441,587 | – | ||||||||||||
U.S. Government and Agencies | 63,432,520 | – | 63,432,520 | – | ||||||||||||
U.S. Municipals | 54,702,951 | – | 54,702,951 | – | ||||||||||||
Utilities | 378,953,169 | – | 378,953,169 | – | ||||||||||||
|
|
|
|
|
|
|
| |||||||||
| Total Investments at Value | $ | 4,870,175,488 | $ | – | $ | 4,870,175,488 | $ | – | ||||||||
|
|
|
|
|
|
|
| |||||||||
There were no significant transfers between Levels during the period ended October 31, 2018. Transfers between Levels are identified as of the end of the period.
The accompanying Notes to Financial Statements are an integral part of this schedule.
30
Table of Contents
STATEMENTOF ASSETSAND LIABILITIES
As of October 31, 2018 | Emerging Markets Debt Fund | International Equity Fund | Low Volatility Equity Fund | Short-Term Reserve Fund | ||||||||||||
| Assets | ||||||||||||||||
| Investments at cost | $ | 735,534,925 | $ | 896,478,282 | $ | 854,253,694 | $ | 4,870,850,828 | ||||||||
Investments in unaffiliated securities at value (#) | 662,891,981 | 794,692,716 | 872,467,359 | 4,870,175,488 | ||||||||||||
Investments in affiliated securities at value | 16,716,487 | 28,674,677 | 830,094 | – | ||||||||||||
Cash | – | 521 | (a) | – | 166,063 | |||||||||||
Dividends and interest receivable | 7,635,517 | 3,625,833 | 495,841 | 6,373,277 | ||||||||||||
Prepaid expenses | 2,500 | 2,988 | 5,153 | 8,867 | ||||||||||||
Prepaid trustee fees | 1,091 | 1,091 | 1,090 | 1,091 | ||||||||||||
Receivable for: | ||||||||||||||||
Investments sold | 1,491,274 | 5,155,438 | – | – | ||||||||||||
Total Assets | 688,738,850 | 832,153,264 | 873,799,537 | 4,876,724,786 | ||||||||||||
Liabilities | ||||||||||||||||
Distributions payable | – | – | – | 10,057,338 | ||||||||||||
Accrued expenses | 48,556 | 137,594 | 110,738 | 29,843 | ||||||||||||
Payable for: | ||||||||||||||||
Investments purchased | – | 5,269,147 | – | 12,086,327 | ||||||||||||
Return of collateral for securities loaned | 4,446,979 | 28,504,220 | – | – | ||||||||||||
Administrative service fees | 11,807 | 13,915 | 15,261 | – | ||||||||||||
Director deferred compensation | 880 | 880 | 865 | 2,496 | ||||||||||||
Commitments and contingent liabilities^ | – | – | – | – | ||||||||||||
Total Liabilities | 4,508,222 | 33,925,756 | 126,864 | 22,176,004 | ||||||||||||
| Net Assets | ||||||||||||||||
Capital stock (beneficial interest) | 742,251,702 | 859,601,448 | 824,997,173 | 4,855,236,810 | ||||||||||||
Distributable earnings/(accumulated loss) | (58,021,074 | ) | (61,373,940 | ) | 48,675,500 | (688,028 | ) | |||||||||
Total Net Assets | $ | 684,230,628 | $ | 798,227,508 | $ | 873,672,673 | $ | 4,854,548,782 | ||||||||
Shares of beneficial interest outstanding | 75,717,041 | 86,000,215 | 82,864,125 | 485,524,147 | ||||||||||||
Net asset value per share | $ | 9.04 | $ | 9.28 | $ | 10.54 | $ | 10.00 | ||||||||
(#) Includes securities on loan of | $ | 4,185,835 | $ | 26,888,047 | $ | – | $ | – | ||||||||
| (a) | Includes foreign currency holdings of $521 (cost $523). |
| ^ | Commitments and contingent liabilities accrual. Additional information can be found in the accompanying Notes to Financial Statements. |
The accompanying Notes to Financial Statements are an integral part of this statement.
31
Table of Contents
STATEMENTOF OPERATIONS
For the year ended October 31, 2018 | Emerging Markets Debt Fund | International Equity Fund(a) | Low Volatility Equity Fund(b) | Short-Term Reserve Fund | ||||||||||||
Investment Income | ||||||||||||||||
Dividends | $ | – | $ | 26,680,569 | $ | 10,902,277 | $ | – | ||||||||
Interest | 26,640,292 | 33,932 | 29,208 | 99,494,049 | ||||||||||||
Affiliated income from securities loaned, net | 12,400 | 336,334 | – | – | ||||||||||||
Income from affiliated investments | 139,450 | 63,253 | 22,892 | – | ||||||||||||
Non cash income | – | 2,458,630 | – | – | ||||||||||||
Foreign tax withholding | – | (2,838,486 | ) | (7,640 | ) | – | ||||||||||
Total Investment Income | 26,792,142 | 26,734,232 | 10,946,737 | 99,494,049 | ||||||||||||
| Expenses | ||||||||||||||||
Administrative service fees | 184,827 | 212,192 | 153,688 | 90,000 | ||||||||||||
Amortization of offering costs | 9,319 | 4,896 | 4,839 | – | ||||||||||||
Audit and legal fees | 29,954 | 33,662 | 28,438 | 48,159 | ||||||||||||
Custody fees | 15,342 | 185,877 | 6,509 | 77,468 | ||||||||||||
Insurance expenses | 5,644 | 5,455 | 4,145 | 23,216 | ||||||||||||
Printing and postage expenses | 2,969 | 5,881 | 2,022 | 4,032 | ||||||||||||
SEC and state registration expenses | 37,703 | 101,760 | 99,990 | – | ||||||||||||
Transfer agent fees | 30,000 | 30,000 | 20,000 | 30,000 | ||||||||||||
Directors’ fees | 7,341 | 7,029 | 5,081 | 7,476 | ||||||||||||
Pricing service fees | 5,413 | 10,965 | 667 | 80,333 | ||||||||||||
Other expenses | 7,939 | 10,191 | 5,976 | 8,597 | ||||||||||||
Total Expenses Before Reimbursement | 336,451 | 607,908 | 331,355 | 369,281 | ||||||||||||
Total Net Expenses | 336,451 | 607,908 | 331,355 | 369,281 | ||||||||||||
Net Investment Income/(Loss) | 26,455,691 | 26,126,324 | 10,615,382 | 99,124,768 | ||||||||||||
| Realized and Unrealized Gains/(Losses) | ||||||||||||||||
Net realized gains/(losses) on: | ||||||||||||||||
Investments | (2,183,616 | ) | (12,713,281 | ) | 19,013,033 | (17,348 | ) | |||||||||
Distributions of realized capital gains from affiliated investments | 73 | 48 | – | – | ||||||||||||
Foreign currency transactions | – | (618,630 | ) | – | – | |||||||||||
Change in net unrealized appreciation/(depreciation) on: | ||||||||||||||||
Investments | (50,984,782 | ) | (73,110,889 | ) | 19,043,759 | (538,217 | ) | |||||||||
Foreign currency transactions | – | (57,264 | ) | – | – | |||||||||||
| Net Realized and Unrealized Gains/(Losses) | (53,168,325 | ) | (86,500,016 | ) | 38,056,792 | (555,565 | ) | |||||||||
| Net Increase/(Decrease) in Net Assets Resulting From Operations | $ | (26,712,634 | ) | $ | (60,373,692 | ) | $ | 48,672,174 | $ | 98,569,203 | ||||||
| (a) | For the period from November 14, 2017 (inception) through October 31, 2018. |
| (b) | For the period from February 28, 2018 (inception) through October 31, 2018. |
The accompanying Notes to Financial Statements are an integral part of this statement.
32
Table of Contents
STATEMENTOF CHANGESIN NET ASSETS
| Emerging Markets Debt Fund | International Equity Fund | |||||||||||
For the periods ended | 10/31/2018 | 10/31/2017(a) | 10/31/2018(b) | |||||||||
| Operations | ||||||||||||
Net investment income/(loss) | $ | 26,455,691 | $ | 1,945,176 | $ | 26,126,324 | ||||||
Net realized gains/(losses) | (2,183,543 | ) | (17,955 | ) | (13,331,863 | ) | ||||||
Change in net unrealized appreciation/(depreciation) | (50,984,782 | ) | (4,941,675 | ) | (73,168,153 | ) | ||||||
| Net Change in Net Assets Resulting From Operations | (26,712,634 | ) | (3,014,454 | ) | (60,373,692 | ) | ||||||
| Distributions to Shareholders (%) | ||||||||||||
From net investment income/net realized gains | (26,395,545 | ) | N/A | (1,001,317 | ) | |||||||
From net investment income | N/A | (1,904,256 | ) | N/A | ||||||||
| Total Distributions to Shareholders | (26,395,545 | ) | (1,904,256 | ) | (1,001,317 | ) | ||||||
| Capital Stock Transactions | ||||||||||||
Sold | 183,634,669 | 426,772,907 | 858,700,000 | |||||||||
Distributions reinvested | 7,978,341 | – | 1,001,317 | |||||||||
In-kind contributions | 124,931,300 | – | – | |||||||||
Redeemed | (960,000 | ) | (99,700 | ) | (98,800 | ) | ||||||
| Total Capital Stock Transactions | 315,584,310 | 426,673,207 | 859,602,517 | |||||||||
| Net Increase/(Decrease) in Net Assets | 262,476,131 | 421,754,497 | 798,227,508 | |||||||||
| Net Assets, Beginning of Period | 421,754,497 | – | – | |||||||||
| Net Assets, End of Period | $ | 684,230,628 | $ | 421,754,497 | $ | 798,227,508 | ||||||
| Capital Stock Share Transactions | ||||||||||||
Sold | 19,060,690 | 42,773,617 | 85,911,466 | |||||||||
Distributions reinvested | 874,746 | – | 98,749 | |||||||||
In-kind contributions | 13,123,036 | – | – | |||||||||
Redeemed | (105,048 | ) | (10,000 | ) | (10,000 | ) | ||||||
|
|
|
|
|
| |||||||
Total Capital Stock Share Transactions | 32,953,424 | 42,763,617 | 86,000,215 | |||||||||
|
|
|
|
|
| |||||||
| (a) | For the period from September 5, 2017 (inception) through October 31, 2017. |
| (b) | For the period from November 14, 2017 (inception) through October 31, 2018. |
| (%) | Distributions to Shareholders. Additional information can be found in the accompanying Notes to Financial Statements – Recent Accounting Pronouncements – Disclosure Update and Simplification. |
The accompanying Notes to Financial Statements are an integral part of this statement.
33
Table of Contents
THRIVENT CORE FUNDS
STATEMENTOF CHANGESIN NET ASSETS –CONTINUED
| Low Volatility Equity Fund | Short-Term Reserve Fund | |||||||||||
For the periods ended | 10/31/2018(a) | 10/31/2018 | 10/31/2017 | |||||||||
| Operations | ||||||||||||
Net investment income/(loss) | $ | 10,615,382 | $ | 99,124,768 | $ | 57,864,605 | ||||||
Net realized gains/(losses) | 19,013,033 | (17,348 | ) | 77,715 | ||||||||
Change in net unrealized appreciation/(depreciation) | 19,043,759 | (538,217 | ) | (1,903,290 | ) | |||||||
| Net Change in Net Assets Resulting From Operations | 48,672,174 | 98,569,203 | 56,039,030 | |||||||||
| Distributions to Shareholders (%) | ||||||||||||
From net investment income/net realized gains | – | (99,185,270 | ) | N/A | ||||||||
From net investment income | N/A | N/A | (57,864,605 | ) | ||||||||
| Total Distributions to Shareholders | – | (99,185,270 | ) | (57,864,605 | ) | |||||||
| Capital Stock Transactions | ||||||||||||
Sold | 825,099,999 | 12,052,138,996 | 10,504,705,250 | |||||||||
Redeemed | (99,500 | ) | (12,185,182,945 | ) | (10,277,162,836 | ) | ||||||
| Total Capital Stock Transactions | 825,000,499 | (133,043,949 | ) | 227,542,414 | ||||||||
| Net Increase/(Decrease) in Net Assets | 873,672,673 | (133,660,016 | ) | 225,716,839 | ||||||||
| Net Assets, Beginning of Period | – | 4,988,208,798 | 4,762,491,959 | |||||||||
| Net Assets, End of Period | $ | 873,672,673 | $ | 4,854,548,782 | $ | 4,988,208,798 | ||||||
Capital Stock Share Transactions | ||||||||||||
Sold | 82,874,125 | 1,205,213,900 | 1,050,470,525 | |||||||||
Redeemed | (10,000 | ) | (1,218,518,295 | ) | (1,027,716,284 | ) | ||||||
|
|
|
|
|
| |||||||
Total Capital Stock Share Transactions | 82,864,125 | (13,304,395 | ) | 22,754,241 | ||||||||
|
|
|
|
|
| |||||||
| (a) | For the period from February 28, 2018 (inception) through October 31, 2018. |
| (%) | Distributions to Shareholders. Additional information can be found in the accompanying Notes to Financial Statements – Recent Accounting Pronouncements – Disclosure Update and Simplification. |
The accompanying Notes to Financial Statements are an integral part of this statement.
34
Table of Contents
NOTESTO FINANCIAL STATEMENTS
October 31, 2018
1) ORGANIZATION
Thrivent Core Funds (the “Trust”) was organized as a Delaware statutory trust on March 18, 2016, and is registered as an open-end management investment company under the Investment Company Act of 1940. The Trust is divided into four separate series, each with its own investment objective and policies (each, a “Fund”). The four series of the Trust are Thrivent Core Emerging Markets Debt Fund, which is non-diversified, and Thrivent Core International Equity Fund, Thrivent Core Low Volatility Equity Fund, and Thrivent Core Short-Term Reserve Fund, which are diversified. Thrivent Core Short-Term Reserve Fund serves as a cash sweep vehicle for Thrivent Mutual Funds and Thrivent Series Fund, Inc. Thrivent Core International Equity Fund was incepted on November 14, 2017, while Thrivent Core Low Volatility Equity Fund was incepted on February 28, 2018.
The Funds are each an investment company which follows the accounting and reporting guidance of the Financial Accounting Standard Board (FASB) Accounting Standard Codification Topic 946 – Financial Services – Investment Companies.
Under the Trust’s organizational documents, its officers and trustees are indemnified against certain liabilities arising out of the performance of their duties to the Trust. In addition, in the normal course of business, the Trust enters into contracts with vendors and others that provide general damage clauses. The Trust’s maximum exposure under these contracts is unknown, as this would involve future claims that may be made against the Trust. However, based on experience, the Trust expects the risk of loss to be remote.
(2) SIGNIFICANT ACCOUNTING POLICIES
Valuation of Investments —Securities traded on U.S. or foreign securities exchanges or included in a national market system are valued at the last sale price on the principal exchange or the official closing price of the national market system. Over-the-counter securities and listed securities for which no price is readily available are valued at the current bid price considered best to represent the value at that time. Security prices are based on quotes that are obtained from an independent pricing service approved by the Trust’s Board of Trustees (“Board”). The pricing service, in determining values of fixed-income securities, takes into consideration such factors as current quotations by broker/dealers, coupon, maturity, quality, type of issue, trading characteristics, and other yield and risk factors it deems relevant in determining valuations. Securities which cannot be valued by the approved pricing service are valued using valuations obtained from
dealers that make markets in the securities. Investments in open-ended mutual funds are valued at the net asset value at the close of each business day.
The Board has delegated responsibility for daily valuation of the Funds’ securities to the investment adviser, Thrivent Asset Management, LLC (the “Adviser”). The Adviser has formed a Valuation Committee (“Committee”) that is responsible for overseeing the Funds’ valuation policies in accordance with Valuation Policies and Procedures. The Committee meets on a monthly and on an as-needed basis to review price challenges, price overrides, stale prices, shadow prices, manual prices, money market pricing, international fair valuation, and other securities requiring fair valuation.
The Committee monitors for significant events occurring prior to the close of trading on the New York Stock Exchange that could have a material impact on the value of any securities that are held by the Funds. Examples of such events include trading halts, national news/events, and issuer-specific developments. If the Committee decides that such events warrant using fair value estimates, the Committee will take such events into consideration in determining the fair value of such securities. If market quotations or prices are not readily available or determined to be unreliable, the securities will be valued at fair value as determined in good faith pursuant to procedures adopted by the Board.
In accordance with U.S. Generally Accepted Accounting Principles (“GAAP”), the various inputs used to determine the fair value of the Funds’ investments are summarized in three broad levels. Level 1 includes quoted prices in active markets for identical securities, typically included in this level are U.S. equity securities, futures, options and registered investment company funds. Level 2 includes other significant observable inputs such as quoted prices for similar securities, interest rates, prepayment speeds and credit risk, typically included in this level are fixed income securities, international securities, swaps and forward contracts. Level 3 includes significant unobservable inputs such as the Adviser’s own assumptions and broker evaluations in determining the fair value of investments. Of the Level 3 securities, those for which market values were not readily available or were deemed unreliable were fair valued as determined in good faith under procedures established by the Board. The valuation levels are not necessarily an indication of the risk associated with investing in these securities or other investments. Investments measured using net asset value per share as a practical expedient for fair value and that are not publicly available-for-sale are not categorized within the fair value hierarchy.
Valuation of International Securities — The Funds value certain foreign securities traded on foreign exchanges that close prior to the close of the New York Stock Exchange using a fair value pricing service. The fair value pricing service uses a multi-factor model that may take into account the
35
Table of Contents
THRIVENT CORE FUNDS
NOTESTO FINANCIAL STATEMENTS
October 31, 2018
local close, relevant general and sector indices, currency fluctuation, prices of other securities (including ADRs, New York registered shares, and ETFs), and futures, as applicable, to determine price adjustments for each security in order to reflect the effects of post-closing events. The Board has authorized the Adviser to make fair valuation determinations pursuant to policies approved by the Board.
Foreign Currency Translation — The accounting records of each Fund are maintained in U.S. dollars. Securities and other assets and liabilities that are denominated in foreign currencies are translated into U.S. dollars at the daily closing rates of exchange.
Foreign currency amounts related to the purchase or sale of securities and income and expenses are translated at the exchange rate on the transaction date. Net realized and unrealized currency gains and losses are recorded from closed currency contracts, disposition of foreign currencies, exchange gains or losses between the trade date and settlement date on securities transactions, and other translation gains or losses on dividends, interest income and foreign withholding taxes. The Funds do not separately report the effect of changes in foreign exchange rates from changes in market prices on securities held. Such changes are included in net realized and unrealized gain or loss from investments in the Statement of Operations.
For federal income tax purposes, the Funds treat the effect of changes in foreign exchange rates arising from actual foreign currency transactions and the changes in foreign exchange rates between the trade date and settlement date as ordinary income.
Federal Income Taxes — No provision has been made for income taxes because each Fund’s policy is to qualify as a regulated investment company under the Internal Revenue Code and distribute substantially all investment company taxable income and net capital gain on a timely basis. It is also the intention of each Fund to distribute an amount sufficient to avoid imposition of any federal excise tax. The Funds, accordingly, anticipate paying no federal taxes and no federal tax provision was recorded. Each Fund is treated as a separate taxable entity for federal income tax purposes. Funds may utilize earnings and profits distributed to shareholders on the redemption of shares as part of the dividends paid deduction.
GAAP requires management of the Funds (i.e., the Adviser) to make additional tax disclosures with respect to the tax effects of certain income tax positions, whether those positions were taken on previously filed tax returns or are expected to be taken on future returns. These positions must meet a “more likely than not” standard that, based on the technical merits of the position, would have a greater than 50 percent likelihood of being sustained upon examination. In evaluating whether
a tax position has met the more-likely-than-not recognition threshold, the Adviser must presume that the position will be examined by the appropriate taxing authority that has full knowledge of all relevant information.
The Adviser analyzed all open tax years, as defined by the statute of limitations, for all major jurisdictions. Open tax years are those that are open for examination by taxing authorities. Major jurisdictions for the Funds include U.S. Federal, Minnesota, Wisconsin, and Massachusetts as well as certain foreign countries. As of October 31, 2018, open U.S. Federal, Minnesota, Wisconsin and Massachusetts tax years include tax years ended October 31, 2016 through 2018. The Funds have no examinations in progress and none are expected at this time.
As of October 31, 2018, the Adviser has reviewed all open tax years and major jurisdictions and concluded that there is no effect to each fund’s tax liability, financial position or results of operations. There is no tax liability resulting from unrecognized tax benefits related to uncertain income tax positions taken or expected to be taken in future tax returns. The Funds also are not aware of any tax positions for which it is reasonably possible that the total amounts of unrecognized tax benefits will significantly change in the next 12 months.
Expenses and Income — Estimated expenses are accrued daily. The Funds are charged for those expenses that are directly attributable to them. Expenses that are not directly attributable to a Fund are allocated among all appropriate Funds in proportion to their respective net assets, number of shareholder accounts or other reasonable basis.
Interest income is accrued daily on all debt securities, as is accretion of market discount and original issue discount and amortization of premium. Paydown gains and losses on mortgage- and asset-backed securities are recorded as components of interest income. Dividend income and capital gain distributions are recorded on the ex-dividend date. However, certain dividends from foreign securities are recorded as soon as the information is available to the Funds. Non-cash income, if any, is recorded at the fair market value of the securities received.
Distributions to Shareholders — Net investment income is distributed to each shareholder as a dividend. Dividends from Emerging Markets Debt Fund are declared and distributed monthly. Dividends of International Equity Fund and Low Volatility Equity Fund are declared and distributed annually. Dividends from Short-Term Reserve Fund are declared daily and distributed monthly. Net realized gains from securities transactions, if any, are distributed at least annually after the close of the fiscal year.
Derivative Financial Instruments — Certain Funds may invest in derivatives. Derivatives, a category that includes options, futures, swaps, foreign currency forward contracts and
36
Table of Contents
THRIVENT CORE FUNDS
NOTESTO FINANCIAL STATEMENTS
October 31, 2018
hybrid instruments, are financial instruments whose value is derived from another security, an index or a currency. Each applicable Fund may use derivatives for hedging (attempting to offset a potential loss in one position by establishing an interest in an opposite position). This includes the use of currency-based derivatives to manage the risk of its positions in foreign securities. Each applicable Fund may also use derivatives for replication of a certain asset class or speculation (investing for potential income or capital gain). These contracts may be transacted on an exchange or over-the-counter (“OTC”).
A derivative may incur a mark to market loss if the value of the derivative decreases due to an unfavorable change in the market rates or values of the underlying derivative. Losses can also occur if the counterparty does not perform under the derivative. A Fund’s risk of loss from the counterparty credit risk on OTC derivatives is generally limited to the aggregate unrealized gain netted against any collateral held by such Fund. With exchange traded futures and centrally cleared swaps, there is minimal counterparty credit risk to the Funds because the exchange’s clearinghouse, as counterparty to such derivatives, guarantees against a possible default. The clearinghouse stands between the buyer and the seller of the derivative; thus, the credit risk is limited to the failure of the clearinghouse. However, credit risk still exists in exchange traded futures and centrally cleared swaps with respect to initial and variation margin that is held in a broker’s customer accounts. While brokers are required to segregate customer margin from their own assets, in the event that a broker becomes insolvent or goes into bankruptcy and at that time there is a shortfall in the aggregate amount of margin held by the broker for all its clients, U.S. bankruptcy laws will typically allocate that shortfall on a pro-rata basis across all the broker’s customers, potentially resulting in losses to the Funds. Using derivatives to hedge can guard against potential risks, but it also adds to the Funds’ expenses and can eliminate some opportunities for gains. In addition, a derivative used for mitigating exposure or replication may not accurately track the value of the underlying asset. Another risk with derivatives is that some types can amplify a gain or loss, potentially earning or losing substantially more money than the actual cost of the derivative.
In order to define their contractual rights and to secure rights that will help the Funds mitigate their counterparty risk, the Funds may enter into an International Swaps and Derivatives Association, Inc. Master Agreement (“ISDA Master Agreement”) or similar agreement with its derivative contract counterparties. An ISDA Master Agreement is a bilateral agreement between a Fund and a counterparty that governs OTC derivatives and foreign exchange contracts and typically includes, among other things, collateral posting terms and netting provisions in the event of a default and/or termination event. Under an ISDA Master Agreement, each Fund may, under certain circumstances, offset with the counterparty
certain derivatives’ payables and/or receivables with collateral held and/or posted and create one single net payment. The provisions of the ISDA Master Agreement typically permit a single net payment in the event of a default (close-out netting) including the bankruptcy or insolvency of the counterparty. Note, however, that bankruptcy and insolvency laws of a particular jurisdiction may impose restrictions on or prohibitions against the right of offset in bankruptcy, insolvency or other events.
Collateral and margin requirements vary by type of derivative. Margin requirements are established by the broker or clearinghouse for exchange traded and centrally cleared derivatives (futures, options, and centrally cleared swaps). Brokers can ask for margining in excess of the minimum in certain situations. Collateral terms are contract specific for OTC derivatives (foreign currency exchange contracts, options, swaps). For derivatives traded under an ISDA Master Agreement, the collateral requirements are typically calculated by netting the mark to market amount for each transaction under such agreement and comparing that amount to the value of any collateral currently pledged by the Fund and the counterparty. For financial reporting purposes, non-cash collateral that has been pledged to cover obligations of the Fund has been noted in the Schedule of Investments. To the extent amounts due to the Fund from its counterparties are not fully collateralized, contractually or otherwise, the Fund bears the risk of loss from counterparty nonperformance. The Funds attempt to mitigate counterparty risk by only entering into agreements with counterparties that they believe have the financial resources to honor their obligations and by monitoring the financial stability of those counterparties.
Options — Certain Funds may buy put and call options and write put and covered call options. The Funds intend to use such derivative instruments as hedges to facilitate buying or selling securities or to provide protection against adverse movements in security prices or interest rates. The Funds may also enter into options contracts to protect against adverse foreign exchange rate fluctuations. Option contracts are valued daily and unrealized appreciation or depreciation is recorded. A Fund will realize a gain or loss upon expiration or closing of the option transaction. When an option is exercised, the proceeds upon sale for a written call option or the cost of a security for purchased put and call options is adjusted by the amount of premium received or paid.
Buying put options tends to decrease a Fund’s exposure to the underlying security while buying call options tends to increase a Fund’s exposure to the underlying security. The risk associated with purchasing put and call options is limited to the premium paid. There is no significant counterparty risk on exchange-traded options as the exchange guarantees the contract against default. Writing put options tends to increase a Fund’s exposure to the underlying security while writing call options tends to decrease a Fund’s exposure to the underlying
37
Table of Contents
THRIVENT CORE FUNDS
NOTESTO FINANCIAL STATEMENTS
October 31, 2018
security. The writer of an option has no control over whether the underlying security may be bought or sold, and therefore bears the market risk of an unfavorable change in the price of the underlying security. The counterparty risk for purchased options arises when a Fund has purchased an option, exercises that option, and the counterparty doesn’t buy from the Fund or sell to the Fund the underlying asset as required. In the case where a Fund has written an option, the Fund doesn’t have counterparty risk. Counterparty risk on purchased over-the-counter options is partially mitigated by the Fund’s collateral posting requirements. As the option increases in value to the Fund, the Fund receives collateral from the counterparty. Risks of loss may exceed amounts recognized on the Statement of Assets and Liabilities.
Futures Contracts — Certain Funds may use futures contracts to manage the exposure to interest rate and market or currency fluctuations. Gains or losses on futures contracts can offset changes in the yield of securities. When a futures contract is opened, cash or other investments equal to the required “initial margin deposit” are held on deposit with and pledged to the broker. Additional securities held by the Funds may be earmarked to cover open futures contracts. The futures contract’s daily change in value (“variation margin”) is either paid to or received from the broker, and is recorded as an unrealized gain or loss. When the contract is closed, realized gain or loss is recorded equal to the difference between the value of the contract when opened and the value of the contract when closed. Futures contracts involve, to varying degrees, risk of loss in excess of the variation margin disclosed in the Statement of Assets and Liabilities. Exchange-traded futures have no significant counterparty risk as the exchange guarantees the contracts against default.
Foreign Currency Forward Contracts — In connection with purchases and sales of securities denominated in foreign currencies, certain Funds may enter into foreign currency forward contracts. Additionally, the Funds may enter into such contracts to mitigate currency and counterparty exposure to other foreign-currency-denominated investments. These contracts are recorded at value and the related realized and change in unrealized foreign exchange gains and losses are included in the Statement of Operations. In the event that counterparties fail to settle these forward contracts, the Funds could be exposed to foreign currency fluctuations. Foreign currency contracts are valued daily and unrealized appreciation or depreciation is recorded daily as the difference between the contract exchange rate and the closing forward rate applied to the face amount of the contract. A realized gain or loss is recorded at the time
a forward contract is closed. These contracts are over-the-counter and the Fund is exposed to counterparty risk equal to the discounted net amount of payments to the Fund.
Swap Agreements — Certain Funds may enter into swap transactions, which involve swapping one or more investment characteristics of a security or a basket of securities with another party. Such transactions include market risk, risk of default by the other party to the transaction, risk of imperfect correlation and manager risk and may involve commissions or other costs. Swap transactions generally do not involve delivery of securities, other underlying assets or principal. Accordingly, the risk of loss with respect to swap transactions is generally limited to the net amount of payments that the Fund is contractually obligated to make, or in the case of the counterparty defaulting, the net amount of payments that the Fund is contractually entitled to receive. Risks of loss may exceed amounts recognized on the Statement of Assets and Liabilities. If there is a default by the counterparty, the Fund may have contractual remedies pursuant to the agreements related to the transaction. The contracts are valued daily and unrealized appreciation or depreciation is recorded. Swap agreements are valued at the clearinghouse end of day prices as furnished by an independent pricing service. The pricing service takes into account such factors as swap curves, default probabilities, recent trades, recovery rates and other factors it deems relevant in determining valuations. Daily fluctuations in the value of the centrally cleared credit default contracts are recorded in variation margin in the Statement of Assets and Liabilities and recorded as unrealized gain or loss. The Fund accrues for the periodic payment and amortizes upfront payments, if any, on swap agreements on a daily basis with the net amount recorded as realized gains or losses in the Statement of Operations. Receipts and payments received or made as a result of a credit event or termination of the contract are also recognized as realized gains or losses in the Statement of Operations. Collateral, in the form of cash or securities, may be required to be held with the Fund’s custodian, or a third party, in connection with these agreements. Certain swap agreements are over-the-counter and the Fund is exposed to counterparty risk, which is the discounted net amount of payments owed to the Fund. This risk is partially mitigated by the Fund’s collateral posting requirements. As the swap increases in value to the Fund, the Fund receives collateral from the counterparty. Certain interest rate and credit default index swaps must be cleared through a clearinghouse or central counterparty.
Credit Default Swaps — A credit default swap is a swap agreement between two parties to exchange the credit risk of a particular issuer, basket of securities or reference entity. In a credit default swap transaction, a buyer pays periodic fees in return for payment by the seller which is contingent upon an adverse credit event occurring in the underlying issuer or reference entity. The seller collects periodic fees
38
Table of Contents
THRIVENT CORE FUNDS
NOTESTO FINANCIAL STATEMENTS
October 31, 2018
from the buyer and profits if the credit of the underlying issuer or reference entity remains stable or improves while the swap is outstanding, but the seller in a credit default swap contract would be required to pay the amount of credit loss, determined as specified in the agreement, to the buyer in the event of an adverse credit event in the reference entity. A buyer of a credit default swap is said to buy protection whereas a seller of a credit default swap is said to sell protection. The Funds may be either the protection seller or the protection buyer.
Certain Funds enter into credit default derivative contracts directly through credit default swaps (CDS) or through credit default swap indices (“CDX Indices”). CDX Indices are static pools of equally weighted credit default swaps referencing corporate bonds and/or loans designed to provide diversified credit exposure to these asset classes. Funds sell default protection and assume long-risk positions in individual credits or indices. Index positions are entered into to gain exposure to
the corporate bond and/or loan markets in a cost-efficient and diversified structure. In the event that a position defaults, by going into bankruptcy and failing to pay interest or principal on borrowed money, within any given CDX Index held, the maximum potential amount of future payments required would be equal to the pro-rata share of that position within the index based on the notional amount of the index. In the event of a default under a CDS contract the maximum potential amount of future payments would be the notional amount. For CDS, the default events could be bankruptcy and failing to pay interest or principal on borrowed money or a restructuring. A restructuring is a change in the underlying obligations which would include reduction in interest or principal, maturity extension and subordination to other obligations.
For financial reporting purposes, the Funds do not offset derivative assets and derivative liabilities that are subject to netting arrangements in the Statement of Assets and Liabilities.
The following table presents the gross and net information about liabilities subject to master netting arrangements, as presented in the Statement of Assets and Liabilities:
| Gross Amounts Not Offset in the | ||||||||||||||||||||||||||||
| Statement of Assets and Liabilities | ||||||||||||||||||||||||||||
Fund | Gross Amounts of Recognized Liabilities | Gross Amounts Offset | Net Amounts of Recognized Liabilities | Financial Instruments | Cash Collateral Pledged | Non-Cash Collateral Pledged(**) | Net Amount | |||||||||||||||||||||
Emerging Markets Debt Securities Lending | 4,446,979 | – | 4,446,979 | 4,185,835 | – | – | 261,144 | (^) | ||||||||||||||||||||
International Equity Securities Lending | 28,504,220 | – | 28,504,220 | 26,888,047 | – | – | 1,616,173 | (^) | ||||||||||||||||||||
| (**) | Excess of collateral pledged to the counterparty may not be shown for financial reporting purposes. |
| (^) | Net securities lending amounts represent the net amount payable to the counterparty in the event of a default. |
Securities Lending — The Trust has entered into a Securities Lending Agreement (the “Agreement”) with Goldman Sachs Bank USA doing business as Goldman Sachs Agency Lending (“GSAL”) pursuant to which GSAL provides securities lending services. The Agreement authorizes GSAL to lend securities to authorized borrowers on behalf of the Funds. Pursuant to the Agreement, loaned securities are typically initially collateralized equal to at least 102% for U.S. securities and 105% for non-U.S. securities of the market value of the loaned securities. Daily market fluctuations could cause the value of loaned securities to be more or less than the value of the collateral received. Any additional collateral is adjusted and settled on the next business day. The Trust has the ability to recall the loans at any time and could do so in order to vote proxies or sell the loaned securities. All cash collateral received is invested in Thrivent Cash Management Trust. The Funds receive dividends and interest that would have been earned on the securities loaned while
simultaneously seeking to earn income on the investment of cash collateral. Amounts earned on investments in Thrivent Cash Management Trust, net of rebates, fees paid to GSAL for services provided and any other securities lending expenses, are included in income from securities loaned on the Statement of Operations. By investing any cash collateral it receives in these transactions, a Fund could realize additional gains or losses. If the borrower fails to return the securities or the invested collateral has declined in value, the Fund could lose money. Generally, in the event of borrower default, the Fund has the right to use the collateral to offset any losses incurred. However, in the event the Fund is delayed or prevented from exercising its right to dispose of the collateral, there may be a potential loss. Some of these losses may be indemnified by the lending agent.
39
Table of Contents
THRIVENT CORE FUNDS
NOTESTO FINANCIAL STATEMENTS
October 31, 2018
As of October 31, 2018, the value of securities on loan is as follows:
Fund | Securities on Loan | |||
Emerging Markets Debt | $ | 4,185,835 | ||
International Equity | 26,888,047 | |||
When-Issued and Delayed Delivery Transactions — The Funds may purchase or sell securities on a when-issued or delayed delivery basis. These transactions involve a commitment by the Funds to purchase or sell securities for a predetermined price or yield, with payment and delivery taking place beyond the customary settlement period. When delayed delivery purchases are outstanding, the Funds will designate liquid assets in an amount sufficient to meet the purchase price. When purchasing a security on a delayed delivery basis, the Funds assume the rights and risks of ownership of the security, including the risk of price and yield fluctuations, and take such fluctuations into account when determining its net asset value. A Fund may dispose of a delayed delivery transaction after it is entered into, and may sell when-issued securities before they are delivered, which may result in a capital gain or loss. When a Fund has sold a security on a delayed delivery basis, a Fund does not participate in future gains and losses with respect to the security.
Repurchase Agreements — The Funds may engage in repurchase agreement transactions in pursuit of its investment objective. A repurchase agreement consists of a purchase and a simultaneous agreement to resell an investment for later delivery at an agreed upon price and rate of interest. The Funds use a third-party custodian to maintain the collateral. If the original seller of a security subject to a repurchase agreement fails to repurchase the security at the agreed upon time, the Funds could incur a loss due to a drop in the value of the security during the time it takes the Funds to either sell the security or take action to enforce the original seller’s agreement to repurchase the security. Also, if a defaulting original seller filed for bankruptcy or became insolvent, disposition of such security might be delayed by pending legal action. The Funds may only enter into repurchase agreements with banks and other recognized financial institutions such as broker/dealers that are found by the Adviser to be creditworthy. During the year ended October 31, 2018, the Funds did not engage in this type of investment.
Loan Commitments — Certain Funds may enter into loan commitments, which generally have interest rates which are reset daily, monthly, quarterly or semi-annually by reference to a base lending rate, plus a premium. These base rates are primarily the London-Interbank Offered Rate (“LIBOR”), and secondarily the prime rate offered by one or more major United States banks (the “Prime Rate”) and the certificate of deposit (“CD”) rate or other base lending rates used by commercial lenders. Loan commitments often require prepayments from excess cash flows or allow the borrower to repay at its election. The rate at which the borrower repays
cannot be predicted with accuracy. Therefore, the remaining maturity may be considerably less than the stated maturity shown in the Schedule of Investments.
All or a portion of these loan commitments may be unfunded. A Fund is obligated to fund these commitments at the borrower’s discretion. Therefore, the Fund must have funds sufficient to cover its contractual obligation. These unfunded loan commitments, which are marked to market daily, are presented in the Schedule of Investments.
Accounting Estimates — The preparation of financial statements in conformity with GAAP requires management to make estimates and assumptions that affect the reported amounts of assets and liabilities and disclosure of contingent assets and liabilities at the date of the financial statements and the reported amounts of income and expenses during the reporting period. Actual results could differ from these estimates.
Amortization of Offering Costs — The offering costs referenced in the Statement of Operations for Emerging Markets Debt Fund, International Equity Fund and Low Volatility Equity Fund are costs incurred by the Fund in order to establish it for sale. These costs generally include any legal costs associated with registering the Fund. These costs are amortized over a period of 12 months from inception.
Recent Accounting Pronouncements —
Premium Amortization on Purchased Callable Debt Securities
In March 2017, the Financial Accounting Standards Board (FASB) issued Accounting Standards Update (ASU) No. 2017-08 Premium Amortization on Purchased Callable Debt Securities. ASU No. 2017-08 updates the accounting standards to shorten the amortization period for certain purchased callable debt securities, held at a premium, to be amortized to the earliest call date. The update applies to securities with explicit, non-contingent call features that are callable at fixed prices and on preset dates. The amendments are effective for fiscal years, and interim periods within those fiscal years, beginning after December 15, 2018. At this time, management is evaluating the implications of this guidance and the impact it will have to financial statement amounts and footnote disclosures.
Fair Value Measurement (Topic 820)
In August 2018, the Financial Accounting Standards Board (FASB) issued Accounting Standards Update (ASU) No. 2018-13 Fair Value Measurement (Topic 820). ASU No. 2018-13 updates the disclosure requirements on fair value measurements by modifying or removing certain disclosures and adding certain new disclosures. The amendments are effective for fiscal years, and the interim periods within those fiscal years, beginning after December 15, 2019. At this time, management is evaluating the implications of this guidance and the impact it will have to financial statement amounts and footnote disclosures.
40
Table of Contents
THRIVENT CORE FUNDS
NOTESTO FINANCIAL STATEMENTS
October 31, 2018
Disclosure Update and Simplification
In September 2018, the Securities and Exchange Commission released Final Rule 33-10532, Disclosure Update and Simplification, which amends certain disclosure requirements that the Commission has determined to be redundant, duplicative, overlapping, outdated, or superseded, in light of other Commission disclosure requirements, GAAP,
or changes in the information environment. The amendments are effective for filings subsequent to November 5, 2018. Management has evaluated the impact of these amendments and has implemented disclosure changes to the Statement of Assets and Liabilities and the Statement of Changes in Net Assets. The components of distributable earnings are no longer required to be presented on the Statement of Assets and Liabilities. Additionally, the source of distributions to shareholders and the amount of undistributed net investment income is no longer required to be presented on the Statement of Changes in Net Assets.
In-kind Contributions — During March 2018, the Thrivent Core Emerging Markets Debt Fund received an in-kind contribution which consisted of $124,931,300 in securities. As a result of the in-kind contribution, Thrivent Core Emerging Markets Debt Fund issued 13,123,036 shares at a $9.52/share net asset value. The in-kind amounts and shares issued are included in the Capital Stock Transactions of the Statement of Changes in Net Assets for Thrivent Core Emerging Markets Debt Fund. These in-kind transactions were conducted at market value. The transactions were as follows:
Contributing Fund/Portfolio | Shares Issued | In-kind Amount | ||||||
Balanced Income Plus Fund | 1,120,664 | $ | 10,668,722 | |||||
Balanced Income Plus Portfolio | 1,298,780 | $ | 12,364,385 | |||||
Diversified Income Plus Fund | 1,577,662 | $ | 15,019,338 | |||||
Diversified Income Plus Portfolio | 1,289,457 | $ | 12,275,624 | |||||
Growth and Income Plus Fund | 123,308 | $ | 1,173,896 | |||||
Growth and Income Plus Portfolio | 140,246 | $ | 1,335,143 | |||||
Opportunity Income Plus Fund | 6,361,609 | $ | 60,562,521 | |||||
Opportunity Income Plus Portfolio | 1,211,310 | $ | 11,531,671 | |||||
|
|
|
| |||||
Totals | 13,123,036 | $ | 124,931,300 | |||||
Other — For financial statement purposes, investment security transactions are accounted for on the trade date. Realized gains or losses on sales are determined on a specific cost identification basis, which is the same basis for federal income tax purposes.
(3) FEES AND COMPENSATION PAID TO AFFILIATES
Fees — The Trust has entered into an administration and accounting services agreement with the Adviser pursuant to which the Adviser provides certain administrative and accounting personnel and services. The Fund pays an annual fixed fee plus percentage of net assets to the Adviser. These fees are accrued daily and paid monthly. For the year ended October 31, 2018, the Adviser received aggregate fees for administrative and accounting personnel and services of $640,707 from the Trust.
The Trust has entered into an agreement with Thrivent Financial Investor Services, Inc. (“Thrivent Investor Services”) to provide transfer agency services necessary to the Trust. These fees are accrued daily and paid monthly. For the year ended, October 31, 2018, Thrivent Investor Services received $110,000.00 for transfer agent services from the Trust.
Each Trustee who is not affiliated with the Adviser receives an annual fee from the Trust for services as a Trustee and is eligible to participate in a deferred compensation plan with respect to these fees. Participants in the plan may designate their deferred Trustee’s fees as if invested in a series of the Thrivent Mutual Funds, except for Money Market Fund as it is not eligible for the deferral plan. The value of each participant’s deferred compensation account will increase or decrease as if it were invested in shares of a particular series of Thrivent Mutual Funds. Their fees as well as the change in value are included in Trustee fees in the Statement of Operations. The deferred fees remain in the appropriate Fund until distribution in accordance with the plan. The Payable for trustee deferred compensation, located in the Statement of Assets and Liabilities, is unsecured.
Those trustees not participating in the above plan received $24,203 in fees from the Trust during the year ended October 31, 2018. In addition, the Trust reimbursed unaffiliated Trustees for reasonable expenses incurred in relation to attendance at the meetings and industry conferences.
41
Table of Contents
THRIVENT CORE FUNDS
NOTESTO FINANCIAL STATEMENTS
October 31, 2018
Certain officers and non-independent Trustees of the Trust are employed at Thrivent Financial for Lutherans and receive no compensation from the Trust. Affiliated employees and board consultants are reimbursed for reasonable expenses incurred in relation to board meeting attendance.
Indirect Expenses — The Funds may invest in other mutual funds. Fees and expenses of those underlying funds are not included in the Funds’ expense ratio. The Funds indirectly bear their proportionate share of the annualized weighted average expense ratio for the underlying funds in which it invests.
Interfund Lending — The Funds may participate in an interfund lending program (the “Program”) pursuant to an exemptive order issued by the SEC. The Program permits the Funds to borrow cash for temporary purposes from Thrivent Core Short-Term Reserve Fund. Interest is charged to each participating Fund based on its borrowings at the average of the repo rate and bank loan rate, each as defined in the Program. Each borrowing made under the Program matures no later than seven calendar days after the date of the borrowing, and each borrowing must be securitized by a pledge of segregated collateral with a market value at least equal to 102% of the outstanding principal value of the loan. For the year ended October 31, 2018, no Funds borrowed cash through the interfund lending program.
(4) FEDERAL INCOME TAX INFORMATION
Distributions are based on amounts calculated in accordance with the applicable federal income tax regulations, which may differ from GAAP. At the end of the fiscal year, reclassifications between net asset accounts are made for differences that are
permanent in nature. These permanent differences primarily relate to the tax treatment of organizational fees.
On the Statement of Assets and Liabilities, as a result of permanent book-to-tax differences, reclassification adjustments were made as increases or decreases as applicable in the table below:
Portfolio | Distributable earnings/ (accumulated loss) | Capital Stock | ||||||||||
Emerging Markets Debt | $ | 5,815 | $ | (5,815 | ) | |||||||
International Equity | 1,069 | (1,069 | ) | |||||||||
Low Volatility Equity | 3,326 | (3,326 | ) | |||||||||
At October 31, 2018, the components of distributable earnings on a tax basis were as follows:
Fund | Undistributed Ordinary Incomea | Undistributed Long- Term Capital Gain | ||||||||||
Emerging Markets Debt | $ | 55,400 | $ | – | ||||||||
International Equity | 25,020,657 | – | ||||||||||
Low Volatility Equity | 29,670,119 | – | ||||||||||
Short-Term Reserve | 25,492 | – | ||||||||||
(a) Undistributed Ordinary Income includes income derived from Short-Term Capital Gains.
At October 31, 2018, the following Funds had accumulated net realized capital loss carryovers as follows:
Fund | Capital Loss Carryover | Expiration | ||||||||||
Emerging Markets Debt | $ | 1,833,806 | Unlimited | |||||||||
International Equity | 11,982,934 | Unlimited | ||||||||||
Short-Term Reserve | 17,348 | Unlimited | ||||||||||
The tax character of distributions paid during the years ended October 31, 2018 and 2017 was as follows:
| Ordinary Income a | Long-Term Capital Gain | |||||||||||||||
Fund | 10/31/2018 | 10/31/2017 | 10/31/2018 | 10/31/2017 | ||||||||||||
Emerging Markets Debt | $ | 26,395,545 | $ | 1,904,256 | $ | – | $ | – | ||||||||
International Equity | 1,001,317 | – | – | – | ||||||||||||
Short-Term Reserve | 99,124,770 | 57,864,605 | 60,500 | – | ||||||||||||
| (a) | Ordinary income includes income derived from short-term capital gains. |
(5) SECURITY TRANSACTIONS
Purchases and Sales of Investment Securities — For the year ended October 31, 2018, the cost of purchases and the proceeds from sales of investment securities, other than U.S. Government and short-term securities, were as follows:
| In thousands | ||||||||
Fund | Purchases | Sales | ||||||
Emerging Markets Debt | $ | 254,115 | $ | 64,680 | ||||
International Equity | 1,417,309 | 536,581 | ||||||
Low Volatility Equity | 1,141,387 | 306,977 | ||||||
Short-Term Reserve | 1,440,044 | 1,310,223 | ||||||
Purchases and sales of U.S. Government securities were:
| In thousands | ||||||||
Fund | Purchases | Sales | ||||||
Emerging Markets Debt | $ | 9,004 | $ | 9,019 | ||||
Short-Term Reserve | 1,810 | 108,047 | ||||||
(6) SECURITY TRANSACTIONS WITH AFFILIATED FUNDS
The Funds are permitted to purchase or sell securities from or to certain other Funds under specified conditions outlined in procedures adopted by the Board. The procedures have been designed to ensure that any purchase or sale of securities by a Fund from or to another fund or portfolio that is or could
42
Table of Contents
THRIVENT CORE FUNDS
NOTESTO FINANCIAL STATEMENTS
October 31, 2018
be considered an affiliate by virtue of having a common investment adviser (or affiliated investment advisers), common Trustees and/or common officers complies with Rule 17a-7 of the 1940 Act. Further, as defined under the procedures, each transaction is executed at the current market price.
During the year ended October 31, 2018, no funds engaged in these type of transactions.
(7) RELATED PARTY TRANSACTIONS
As of October 31, 2018, related parties held 100% of the outstanding shares of all Thrivent Core Funds. Subscription and redemption activity by concentrated accounts may have a significant effect on the operation of the Funds. In the case of a large redemption, the Funds may be forced to sell investments at inopportune times, resulting in additional losses for the Funds.
(8) SUBSEQUENT EVENTS
The Adviser of the Funds has evaluated the impact of subsequent events through the date the financial statements were issued, and, except as already included in the Notes to Financial Statements, has determined that no additional items require disclosure.
(9) MARKET RISK
Over time, securities markets generally tend to move in cycles with periods when security prices rise and periods when security prices decline. The value of a Fund’s investments may move with these cycles and, in some instances, increase or decrease more than the applicable market(s) as measured by the Fund’s benchmark index(es). The securities markets may also decline because of factors that affect a particular industry. As of October 31, 2018, the following Funds had portfolio concentration greater than 25% in certain sectors.
Fund | Sector | % of Total Net Assets | ||||
Core Emerging Market Debt | Foreign Government | 94.6 | % | |||
Core Short-Term Reserve | Financials | 38.8 | % | |||
(10) SIGNIFICANT RISKS
Credit Risk — Credit risk is the risk that an issuer of a debt security to which the Fund is exposed may no longer be able or willing to pay its debt. As a result of such an event, the debt security may decline in price and affect the value of the Fund.
Derivatives Risk — The use of derivatives (such as credit default swaps) involves additional risks and transaction costs which could leave the Fund in a worse position than if it had not used these instruments. The use of derivatives can lead to losses because of adverse movements in the price or value of the underlying asset, index or rate, which may be
magnified by certain features of the contract. Changes in the value of the derivative may not correlate as intended with the underlying asset, rate or index, and the Fund could lose much more than the original amount invested. Derivatives can be highly volatile, illiquid and difficult to value. Certain derivatives may also be subject to counterparty risk, which is that the other party in the transaction will not fulfill its contractual obligations due to its financial condition, market events, or other reasons.
Emerging Markets Risk — The economic and political structures of developing countries, in most cases, do not compare favorably with the U.S. or other developed countries in terms of wealth and stability, and their financial markets often lack liquidity. Fund performance will likely be negatively affected by portfolio exposure to countries in the midst of, among other things, hyperinflation, currency devaluation, trade disagreements, sudden political upheaval, or interventionist government policies. Significant buying or selling actions by a few major investors may also heighten the volatility of emerging markets. These factors make investing in emerging market countries significantly riskier than in other countries, and events in any one country could cause the Fund’s share price to decline.
Equity Security Risk — Equity securities held by the Fund may decline significantly in price over short or extended periods of time, and such declines may occur because of declines in the equity market as a whole, or because of declines in only a particular country, company, industry, or sector of the market. From time to time, the Fund may invest a significant portion of its assets in companies in one or more related sectors or industries which would make the Fund more vulnerable to adverse developments affecting such sectors or industries. Equity securities are generally more volatile than most debt securities.
ETF Risk — An ETF is subject to the risks of the underlying investments that it holds. In addition, for index-based ETFs, the performance of an ETF may diverge from the performance of such index (commonly known as tracking error). ETFs are subject to fees and expenses (like management fees and operating expenses) that do not apply to an index, and the Fund will indirectly bear its proportionate share of any such fees and expenses paid by the ETFs in which it invests.
Foreign Currency Risk — The value of a foreign currency may decline against the U.S. dollar, which would reduce the dollar value of securities denominated in that currency. The overall impact of such a decline of foreign currency can be significant, unpredictable, and long lasting, depending on the currencies represented, how each one appreciates or depreciates in relation to the U.S. dollar, and whether currency positions are hedged. Under normal conditions, the Fund does not engage in extensive foreign currency hedging
43
Table of Contents
THRIVENT CORE FUNDS
NOTESTO FINANCIAL STATEMENTS
October 31, 2018
programs. Further, exchange rate movements are volatile, and it is not possible to effectively hedge the currency risks of many developing countries.
Foreign Securities Risk — Foreign securities generally carry more risk and are more volatile than their domestic counterparts, in part because of higher political and economic risks, lack of reliable information and fluctuations in currency exchange rates. The Fund’s investment in any country could be subject to governmental actions such as capital or currency controls, nationalizing a company or industry, expropriating assets, or imposing punitive taxes that would have an adverse effect on security prices, and impair the Fund’s ability to repatriate capital or income. Foreign securities may also be more difficult to resell than comparable U.S. securities because the markets for foreign securities are often less liquid. Even when a foreign security increases in price in its local currency, the appreciation may be diluted by adverse changes in exchange rates when the security’s value is converted to U.S. dollars. Foreign withholding taxes also may apply and errors and delays may occur in the settlement process for foreign securities.
Futures Contract Risk — The value of a futures contract tends to increase and decrease in tandem with the value of the underlying instrument. The price of futures can be highly volatile; using them could lower total return, and the potential loss from futures can exceed the Fund’s initial investment in such contracts. In addition, the value of the futures contract may not accurately track the value of the underlying instrument.
Government Securities Risk — The Fund invests in securities issued or guaranteed by the U.S. government or its agencies and instrumentalities (such as Federal Home Loan Bank, Ginnie Mae, Fannie Mae or Freddie Mac securities). Securities issued or guaranteed by Federal Home Loan Bank, Ginnie Mae, Fannie Mae or Freddie Mac are not issued directly by the U.S. government. Ginnie Mae is a wholly owned U.S. corporation that is authorized to guarantee, with the full faith and credit of the U.S. government, the timely payment of principal and interest of its securities. By contrast, securities issued or guaranteed by U.S. government-related organizations such as Federal Home Loan Bank, Fannie Mae and Freddie Mac are not backed by the full faith and credit of the U.S. government. No assurance can be given that the U.S. government would provide financial support to its agencies and instrumentalities if not required to do so by law. In addition, the value of U.S. government securities may be affected by changes in the credit rating of the U.S. government.
High Yield Risk — High yield securities – commonly known as “junk bonds” – to which the Fund is exposed are considered predominantly speculative with respect to the issuer’s continuing ability to make principal and interest payments.
If the issuer of the security is in default with respect to interest or principal payments, the value of the Fund may be negatively affected. High yield securities generally have a less liquid resale market.
Interest Rate Risk — Interest rate risk is the risk that prices of debt securities decline in value when interest rates rise for debt securities that pay a fixed rate of interest. Debt securities with longer durations (a measure of price sensitivity of a bond or bond fund to changes in interest rates) or maturities (i.e., the amount of time until a bond’s issuer must pay its principal or face value) tend to be more sensitive to changes in interest rates than debt securities with shorter durations or maturities. Changes by the Federal Reserve to monetary policies could affect interest rates and the value of some securities.
Investment Adviser Risk — The Fund is actively managed and the success of its investment strategy depends significantly on the skills of the adviser in assessing the potential of the investments in which the Fund invests. This assessment of investments may prove incorrect, resulting in losses or poor performance, even in rising markets.
Issuer Risk — Issuer risk is the possibility that factors specific to an issuer to which the Fund is exposed will affect the market prices of the issuer’s securities and therefore the value of the Fund.
Large Cap Risk — Large-sized companies may be unable to respond quickly to new competitive challenges such as changes in technology. They may also not be able to attain the high growth rate of successful smaller companies, especially during extended periods of economic expansion.
Liquidity Risk — Liquidity is the ability to sell a security relatively quickly for a price that most closely reflects the actual value of the security. Dealer inventories of bonds are at or near historic lows in relation to market size, which has the potential to decrease liquidity and increase price volatility in the fixed income markets, particularly during periods of economic or market stress. As a result of this decreased liquidity, the Fund may have to accept a lower price to sell a security, sell other securities to raise cash, or give up an investment opportunity, any of which could have a negative effect on performance.
Market Risk — Over time, securities markets generally tend to move in cycles with periods when security prices rise and periods when security prices decline. The value of the Fund’s investments may move with these cycles and, in some instances, increase or decrease more than the applicable
44
Table of Contents
THRIVENT CORE FUNDS
NOTESTO FINANCIAL STATEMENTS
October 31, 2018
market(s) as measured by the Fund’s benchmark index(es). The securities markets may also decline because of factors that affect a particular industry.
Mid Cap Risk — Medium-sized companies often have greater price volatility, lower trading volume, and less liquidity than larger, more-established companies. These companies tend to have smaller revenues, narrower product lines, less management depth and experience, smaller shares of their product or service markets, fewer financial resources, and less competitive strength than larger companies.
Mortgage-Backed and Other Asset-Backed Securities Risk
— The value of mortgage-backed and asset-backed securities will be influenced by the factors affecting the housing market and the assets underlying such securities. As a result, during periods of declining asset value, difficult or frozen credit markets, swings in interest rates, or deteriorating economic conditions, mortgage-related and asset-backed securities may decline in value, face valuation difficulties, become more volatile and/or become illiquid. In addition, both mortgage-backed and asset-backed securities are sensitive to changes in the repayment patterns of the underlying security. If the principal payment on the underlying asset is repaid faster or slower than the holder of the asset-backed or mortgage-backed security anticipates, the price of the security may fall, particularly if the holder must reinvest the repaid principal at lower rates or must continue to hold the security when interest rates rise. This effect may cause the value of the Fund to decline and reduce the overall return of the Fund.
Non-Diversified Risk — The Fund is not “diversified” within the meaning of the 1940 Act. That means the Fund may invest a greater percentage of its assets in the securities of any single issuer compared to other funds. A non-diversified portfolio is generally more susceptible than a diversified portfolio to the risk that events or developments affecting a particular issuer or industry will significantly affect the Fund’s performance.
Prepayment Risk — Mortgage-backed and asset-backed securities are sensitive to changes in the repayment patterns of the underlying securities, including the conversion, prepayment or redemption of the investments. If the principal payment on the underlying asset is repaid faster than the holder of the mortgage-backed or asset-backed security anticipates, the price of the security may fall, especially if the holder must reinvest the repaid principal at lower rates. When people start prepaying the principal on the collateral underlying a collateralized mortgage obligation (“CMOs”) (such as mortgages underlying a CMO), for example, some classes may retire substantially earlier than the stated maturity or final distribution dates.
Quantitative Investing Risk — The risk that securities selected according to a quantitative analysis methodology can
perform differently from the market as a whole based on the model and the factors used in the analysis, the weight placed on each factor and changes in the factor’s historical trends. Such models are based on assumptions of these and other market factors, and the models may not take into account certain factors, or perform as intended, and may result in a decline in the value of the Fund’s portfolio.
Redemption and Lending Risk — The Fund participates in an interfund lending program (the “Program”) which enables a participating fund to lend cash directly to and borrow money from other participating funds for temporary purposes. The other participants in the Program are other mutual funds advised by the Adviser and its affiliates. Under the Program, all loans will be made by the Fund. There is risk that a borrowing fund could be unable to repay a loan when due, and a delay in repayment to the Fund could result in a lost opportunity and increase risk of the Fund experiencing a loss when meeting redemption requests if it is forced to sell securities at unfavorable prices in an effort to generate sufficient cash to pay redeeming shareholders.
Redemption and Share Ownership Risk — The Fund may need to sell portfolio securities to meet redemption requests. The Fund could experience a loss when selling portfolio securities to meet redemption requests if there is (i) significant redemption activity by shareholders, including, for example, when a single investor or few large investors make a significant redemption of Fund shares, (ii) a disruption in the normal operation of the markets in which the Fund buys and sells portfolio securities or (iii) the inability of the Fund to sell portfolio securities because such securities are illiquid. In such events, the Fund could be forced to sell securities at unfavorable prices in an effort to generate sufficient cash to pay redeeming shareholders. A majority of the Fund’s shares may be held by other mutual funds advised by the Adviser and its affiliates. It also is possible that some or all of these other mutual funds will decide to purchase or redeem shares of the Fund simultaneously or within a short period of time of one another in order to execute their asset allocation strategies. Accordingly, there is a risk that the share trading activities of these shareholders could disrupt the Fund’s investment strategies which could have adverse consequences for the Fund and other shareholders (e.g., by requiring the Fund to sell investments at inopportune times or causing the Fund to maintain larger-than-expected cash positions pending acquisition of investments).
Small Cap Risk — Smaller, less seasoned companies often have greater price volatility, lower trading volume, and less liquidity than larger, more established companies. These companies tend to have small revenues, narrower product lines, less management depth and experience, small shares of their product or service markets, fewer financial resources,
45
Table of Contents
THRIVENT CORE FUNDS
NOTESTO FINANCIAL STATEMENTS
October 31, 2018
and less competitive strength than larger companies. Such companies seldom pay significant dividends that could cushion returns in a falling market
Sovereign Debt Risk — Sovereign debt securities are issued or guaranteed by foreign governmental entities. These investments are subject to the risk that a governmental entity may delay or refuse to pay interest or repay principal on its sovereign debt, due, for example, to cash flow problems, insufficient foreign currency reserves, political considerations, the relative size of the governmental entity’s debt position in relation to the economy or the failure to put in place economic reforms required by the International Monetary Fund or other multilateral agencies. If a governmental entity defaults, it may ask for more time in which to pay or for further loans. There is no legal process for collecting sovereign debts that a government does not pay nor are there bankruptcy proceedings through which all or part of the sovereign debt that a governmental entity has not repaid may be collected.
46
Table of Contents
(This page intentionally left blank)
47
Table of Contents
FINANCIAL HIGHLIGHTS
FOR A SHARE OUTSTANDING THROUGHOUT EACH PERIOD *
| Income From Investment Operations | Less Distributions From | |||||||||||||||||||||||
| Net Asset Value, Beginning of Period | Net Investment Income/(Loss) | Net Realized and Unrealized Gain/(Loss) on Investments(a) | Total from Investment Operations | Net Investment Income | Net Realized Gain on Investments | |||||||||||||||||||
| EMERGING MARKETS DEBT FUND | ||||||||||||||||||||||||
Year Ended 10/31/2018 | $ | 9.86 | $ | 0.40 | $ | (0.82 | ) | $ | (0.42 | ) | $ | (0.40 | ) | $ | – | |||||||||
Year Ended 10/31/2017 (c) | 10.00 | 0.05 | (0.14 | ) | (0.09 | ) | (0.05 | ) | – | |||||||||||||||
| INTERNATIONAL EQUITY FUND | ||||||||||||||||||||||||
Year Ended 10/31/2018 (d) | 10.00 | 0.31 | (1.02 | ) | (0.71 | ) | (0.01 | ) | – | |||||||||||||||
| LOW VOLATILITY EQUITY FUND | ||||||||||||||||||||||||
Year Ended 10/31/2018 (e) | 10.00 | 0.13 | 0.41 | 0.54 | – | – | ||||||||||||||||||
| SHORT-TERM RESERVE FUND | ||||||||||||||||||||||||
Year Ended 10/31/2018 | 10.00 | 0.20 | 0.00 | 0.20 | (0.20 | ) | 0.00 | |||||||||||||||||
Year Ended 10/31/2017 | 10.00 | 0.11 | 0.00 | 0.11 | (0.11 | ) | – | |||||||||||||||||
Year Ended 10/31/2016 (f) | 10.00 | 0.03 | 0.00 | 0.03 | (0.03 | ) | – | |||||||||||||||||
| (a) | The amount shown may not correlate with the change in aggregate gains and losses of portfolio securities due to the timing of sales and redemptions of portfolio shares. |
| (b) | Total investment return assumes dividend reinvestment and does not reflect any deduction for applicable sales charges. Not annualized for periods less than one year. |
| (c) | Since inception, September 5, 2017. |
| (d) | Since inception, November 14, 2017. |
| (e) | Since inception, February 28, 2018. |
| (f) | Since inception, May 2, 2016. |
| * | All per share amounts have been rounded to the nearest cent. |
| ** | Computed on an annualized basis for periods less than one year |
The accompanying Notes to Financial Statements are an integral part of this statement.
48
Table of Contents
THRIVENT CORE FUNDS
FINANCIAL HIGHLIGHTS –CONTINUED
RATIOS/SUPPLEMENTAL DATA
| Ratio to Average Net Assets** | Ratio to Average Net Assets Before Expenses Waived, Credited or Paid Indirectly** | |||||||||||||||||||||||||||||||||
Total | Net Asset Value, End of Period | Total Return(b) | Net Assets, End of Period (in millions) | Expenses | Net Investment Income/(Loss) | Expenses | Net Investment Income/(Loss) | Portfolio Turnover Rate | ||||||||||||||||||||||||||
| $ | (0.40 | ) | $ | 9.04 | (4.35)% | $ | 684.2 | 0.06 | % | 4.38 | % | 0.06 | % | 4.38 | % | 13 | % | |||||||||||||||||
| (0.05 | ) | 9.86 | (0.94)% | 421.8 | 0.21 | % | 3.48 | % | 0.21 | % | 3.48 | % | 0 | % | ||||||||||||||||||||
| (0.01 | ) | 9.28 | (7.08)% | 798.2 | 0.08 | % | 3.42 | % | 0.08 | % | 3.42 | % | 73 | % | ||||||||||||||||||||
| – | 10.54 | 5.40% | 873.7 | 0.06 | % | 1.88 | % | 0.06 | % | 1.88 | % | 40 | % | |||||||||||||||||||||
| (0.20 | ) | 10.00 | 2.01% | 4,854.5 | 0.01 | % | 1.99 | % | 0.01 | % | 1.99 | % | 213 | % | ||||||||||||||||||||
| (0.11 | ) | 10.00 | 1.12% | 4,988.2 | 0.01 | % | 1.11 | % | 0.01 | % | 1.11 | % | 143 | % | ||||||||||||||||||||
| (0.03 | ) | 10.00 | 0.32% | 4,762.5 | 0.01 | % | 0.67 | % | 0.01 | % | 0.67 | % | 31 | % | ||||||||||||||||||||
The accompanying Notes to Financial Statements are an integral part of this statement.
49
Table of Contents
(Unaudited)
PROXY VOTING
The policies and procedures that the Trust uses to determine how to vote proxies relating to portfolio securities are attached to the Trust’s Statement of Additional Information. The Trust files a report of how it voted proxies relating to portfolio securities on Form N-PX with the SEC. You may request a free copy of the Statement of Additional Information or the report of how the Trust voted proxies relating to portfolio securities during the most recent 12-month period ended June 29 by calling 800-847-4836. You also may review the Statement of Additional Information or the report of how the Trust voted proxies relating to portfolio securities during the most recent 12-month period ended June 29 at SEC.gov.
QUARTERLY SCHEDULE OF PORTFOLIO HOLDINGS
The Trust files its Schedule of Portfolio Holdings on Form N-Q with the SEC for the first and third quarters of each fiscal year. You may request a free copy of the Trust’s Forms N-Q by calling 800-847-4836. The Trust’s Forms N-Q also are available at SEC.gov where it is filed on Form N-Q. You also may review and copy the Forms N-Q for the Trust at the SEC’s Public Reference Room in Washington, DC. You may get information about the operation of the Public Reference Room by calling 800-SEC-0330.
SHAREHOLDER NOTIFICATION OF FEDERAL TAX INFORMATION
Pursuant to IRC 852(b)(3) of the Internal Revenue Code, Core Short-Term Reserve Fund hereby designates $60,500 as long-term capital gains distributed during the year ended October 31, 2018, or if subsequently determined to be different, the net capital gain of such year.
Core International Equity fund designates 95% of dividends declared from net investment income as qualified dividend income for individuals under the Jobs and Growth Tax Relief Reconciliation Act of 2003 for the tax period ending October 31, 2018.
50
Table of Contents
The following table provides information about the Trustees and Officers of the Trust. The Board is responsible for the management and supervision of the Funds’ business affairs and for exercising all powers except those reserved to the shareholders. Each Trustee oversees the Trust and also serves as:
| • | Trustee of Thrivent Mutual Funds, a registered investment company consisting of 24 funds that offer Class A and Class S shares. |
| • | Director of Thrivent Series Fund, Inc., a registered investment company consisting of 29 funds that serve as underlying funds for variable contracts issued by Thrivent Financial and Thrivent Life Insurance Company and separate accounts of insurance companies not affiliated with Thrivent Financial. |
| • | Trustee of Thrivent Cash Management Trust, a registered investment company consisting of one fund that serves as a cash collateral fund for a securities lending program sponsored by Thrivent Financial. |
David Royal also serves as Trustee of Thrivent Church Loan and Income Fund, a closed-end registered investment company.
Thrivent Series Fund, Inc., Thrivent Mutual Funds, Thrivent Cash Management Trust, Thrivent Core Funds, and Thrivent Church Loan and Income Fund are referred to herein as the “Fund Complex.” The Statement of Additional Information includes additional information about the Trustees and is available, without charge, by calling 800-847-4836.
Interested Trustees (1)(2)(3)(4)
Name | Principal Occupation(s) and Directorships of Public Companies and Other Investment Companies During the Past Five Years | |
David S. Royal (1971) 2015 | Chief Investment Officer, Thrivent Financial since 2017; VP, President, Mutual Funds, Thrivent Financial from 2015 to 2017; Vice President and Deputy General Counsel from 2006 to 2015. Currently, Director of Children’s Cancer Research Fund and Advisory Board member of Twin Bridge Capital Partners; Director of Fairview Hospital Foundation until 2017. | |
Russell W. Swansen (1957) 2009 | Retired; Chief Investment Officer, Thrivent Financial from 2003 to 2017. Currently, Advisory Board member of Twin Bridge Capital Partners, Advisory Board member of Invenshure LLC, and Director of Intellectual Takeout; Director of Children’s Cancer Research Fund until 2017. | |
| Independent Trustees (2)(3)(4)(5) | ||
Name (Year of Birth) Year Elected | Principal Occupation(s) and Directorships of Public Companies and Other Investment Companies During the Past Five Years | |
Janice B. Case (1952) 2011 | Retired. Independent Trustee of North American Electric Reliability Corporation (the electric reliability organization (“ERD”) for North America) since 2008. | |
Robert J. Chersi (1961) 2017 | Founder of Chersi Services LLC (consulting firm) since 2012; Executive Director of Center for Global Governance, Reporting & Regulation and Adjunct Professor of Finance and Economics at Pace University since 2013; Helpful Executive in Research (counseling) in the Department of Accounting & Information Systems at Rutgers University since 2013. Director and Chairman of the Audit Committee of Brightsphere Investment Group plc since 2016; Advisory Board member of the Pace University Lubin School of Business. | |
Richard A. Hauser (1943) 2004 | Retired; Member, PowerHaus Advisors LLC since 2016; Vice President and Assistant General Counsel, The Boeing Company from 2007 to 2016. | |
Marc S. Joseph (1960) 2011 | Managing Director of Granite Ridge LLP (consulting and advisory firm) since 2009; Managing Director of Triangle Crest (private investing and consulting firm) since 2004. | |
Paul R. Laubscher (1956) 2009 | Portfolio Manager for U.S. private real estate portfolios of IBM Retirement Funds. | |
James A. Nussle (1960) 2011 | President and Chief Executive Officer of Credit Union National Association since September 2014; President and Chief Operating Officer of Growth Energy (trade association) from 2010 through August 2014; Advisory Board member of AVISTA Capital Partners (private equity firm) from 2010 to 2015; CEO of The Nussle Group LLC (consulting firm) since 2009. Advisory Board member of AVISTA Capital Partners and Director of Portfolio Recovery Associates (PRAA) since 2010. | |
51
Table of Contents
BOARDOF TRUSTEESAND OFFICERS
Independent Trustees (2)(3)(4)(5)
Name (Year of Birth) Year Elected | Principal Occupation(s) and Directorships of Public Companies and Other Investment Companies During the Past Five Years | |
Verne O. Sedlacek (1954) 2017 | Chief Executive Officer of E&F Advisors LLC (consulting) since 2015; President & Chief Executive Officer of the Commonfund from 2003 to 2015. Director of Association of Governing Boards of Universities and Collleges since 2007; Trustee of Valparaiso University since 2015; Trustee of Museum of American Finance since 2015; Chairman of the Board of Directors of AGB Institutional Strategies since 2016. | |
Constance L. Souders (1950) 2007 | Retired. | |
52
Table of Contents
BOARDOF TRUSTEESAND OFFICERS
Executive Officers (2)(4)
Name (Year of Birth) Position Held With Trust | Principal Occupation(s) During the Past Five Years | |
David S. Royal (1971) Trustee, President and Chief Investment Officer | Chief Investment Officer, Thrivent Financial since 2017; VP, President, Mutual Funds, Thrivent Financial from 2015 to 2017; Vice President and Deputy General Counsel from 2006 to 2015. | |
Gerard V. Vaillancourt (1967) Treasurer and Principal Accounting Officer | Vice President, Mutual Fund Accounting since 2006. | |
Michael W. Kremenak (1978) Secretary and Chief Legal Officer | Vice President, Thrivent Financial since 2015; Senior Counsel, Thrivent Financial from 2013 to 2015; Vice President and Assistant General Counsel at Nuveen Investments from 2011 to 2013. | |
Ted S. Dryden (1965) Chief Compliance Officer | Vice President, Chief Compliance Officer - Thrivent Funds, Thrivent Financial since 2018; Director, Chief Compliance Officer - Thrivent Funds, Thrivent Financial from 2010 to 2018. | |
Janice M. Guimond (1964) Vice President | Vice President, Investment Operations, Thrivent Financial since 2004. | |
Kathleen M. Koelling (1977) Privacy and Identity Theft and Anti-Money Laundering Officer (6) | Vice President, Deputy General Counsel, Thrivent Financial since 2018; Vice President, Managing Counsel, Thrivent Financial from 2016 to 2018; Privacy and Identity Theft and Anti-Money Laundering Officer, Thrivent Financial since 2011; Senior Counsel, Thrivent Financial from 2002 to 2016. | |
Kathryn A. Stelter (1962) Vice President | Vice President, Mutual Funds Chief Operations Officer, Thrivent Financial since 2017; Director, Mutual Fund Operations, Thrivent Financial from 2014 to 2017; Director, Mutual Fund Operations at Hartford Funds from 2006 to 2014. | |
Troy A. Beaver (1967) Vice President | Vice President, Mutual Funds Marketing & Distribution, Thrivent Financial since 2015; Vice President, Marketing, American Century Investments from 2006 to 2015. | |
James M. Odland (1955) Assistant Secretary | Vice President, Managing Counsel, Thrivent Financial since 2005. | |
Jill M. Forte (1974) Assistant Secretary | Senior Counsel, Thrivent Financial since 2017; Counsel, Thrivent Financial from 2015 to 2017; Associate Counsel, Ameriprise Financial, Inc. from 2013 to 2015; Manager - Legal Affairs, Ameriprise Financial, Inc. from 2010 to 2013. | |
John D. Jackson (1977) Assistant Secretary | Senior Counsel, Thrivent Financial since 2017; Associate General Counsel, RBC Global Asset Management (US) Inc. from 2011 to 2017. | |
Sarah L. Bergstrom (1977) Assistant Treasurer | Head of Mutual Fund Accounting, Thrivent Financial since 2017; Director, Fund Accounting Administration, Thrivent Financial from 2007 to 2017. | |
| (1) | “Interested person” of the Trust as defined in the 1940 Act by virtue of a position with Thrivent Financial. Mr. Royal is considered an interested person because of his principal occupation with Thrivent Financial. Mr. Swansen is considered an interested person because of his past occupation with Thrivent Financial. |
| (2) | Each Trustee generally serves an indefinite term until her or his successor is duly elected and qualified. Officers serve at the discretion of the Board until their successors are duly appointed and qualified. |
| (3) | Each Trustee, other than Mr. Royal, oversees 58 portfolios. Mr. Royal oversees 59 portfolios. |
| (4) | The address for each Trustee and Officer unless otherwise noted is 625 Fourth Avenue South, Minneapolis, MN 55415. |
| (5) | The Trustees other than Mr. Royal and Mr. Swansen are not “interested persons” of the Trust and are referred to as “Independent Trustees.” |
| (6) | The address for this Officer is 4321 North Ballard Road, Appleton, WI 54913. |
53
Table of Contents
(This page intentionally left blank)
Table of Contents
(This page intentionally left blank)
Table of Contents
(This page intentionally left blank)
Table of Contents
This report is submitted for the information of shareholders
of Thrivent Core Funds. It is not authorized for distribution to
prospective investors unless preceded or accompanied by the
current prospectus for Thrivent Core Funds, which contains more
complete information about the Trust, including investment
objectives, risks, charges and expenses.
Table of Contents
| Item 2. | Code of Ethics |
As of the end of the period covered by this report, registrant has adopted a code of ethics (as defined in Item 2 of Form N-CSR) applicable to registrant’s Principal Executive Officer, Principal Financial Officer and Principal Accounting Officer. No waivers were granted to such code of ethics during the period covered by this report. A copy of this code of ethics is filed as an exhibit to this Form N-CSR.
| Item 3. | Audit Committee Financial Expert |
Registrant’s Board of Trustees has determined that Robert J. Chersi, an independent trustee, is the Audit Committee Financial Expert.
| Item 4. | Principal Accountant Fees and Services |
| (a) | Audit Fees |
The aggregate fees billed by registrant’s independent public accountants, PricewaterhouseCoopers LLP (“PwC”), for each of the last two fiscal years for professional services rendered in connection with the audit of registrant’s annual financial statements or services that are normally provided by the accountant in connection with statutory and regulatory filings or engagements were $16,520 for the year ended October 31, 2017 and $115,196 for the year ended October 31, 2018.
Table of Contents
| (b) | Audit-Related Fees |
The aggregate fees PwC billed to registrant for each of the last two fiscal years for assurance and other services that are reasonably related to the performance of registrant’s audit and are not reported under Item 4(a) were $0 for the year ended October 31, 2017 and $0 for the year ended October 31, 2018. The aggregate fees PwC billed to registrant’s investment adviser and any entity controlling, controlled by, or under common control with registrant’s investment adviser for assurance and other services directly related to the operations and financial reporting of registrant were $1,000 for the year ended October 31, 2017 and $3,515 for the year ended October 31, 2018. The 2017 payments were for corporate action consultation services. The 2018 payments were for review of SEC comment letter.
| (c) | Tax Fees |
The aggregate tax fees PwC billed to registrant for each of the last two fiscal years for tax compliance, tax advice and tax planning services were $12,738 for the year ended October 31, 2017 and $6,938 for the year ended October 31, 2018. These fees include payments for tax return compliance services, excise distribution review services and other tax related matters. The aggregate tax fees PwC billed to registrant’s investment adviser and any entity controlling, controlled by, or under common control with registrant’s investment adviser for services directly related to the operations and financial reporting of registrant were $0 for the year ended October 31, 2017 and $0 for the year ended October 31, 2018.
| (d) | All Other Fees |
The aggregate fees PwC billed to registrant for each of the last two fiscal years for products and services provided, other than the services reported in paragraphs (a) through (c) of this item, were $0 for the years ended October 31, 2017 and October 31, 2018. The aggregate fees PwC billed to registrant’s investment adviser and any entity controlling, controlled by, or under common control with registrant’s investment adviser for products and services provided, other than the services reported in paragraphs (a) through (c) of this item, were $3,600 for the year ended October 31, 2017 and $23,550 for the year ended October 31, 2018. The 2017 payments were for access to a PwC-sponsored online library that provides interpretive guidance regarding U.S. and foreign accounting standards. The 2018 payments were for access to a PwC-sponsored online library that provides interpretive guidance regarding U.S. and foreign accounting standards and for fees related to the merger of certain series of Thrivent Mutual Funds and certain series of Thrivent Series Fund, Inc. These figures are also reported in response to item 4(g) below.
| (e) | Registrant’s audit committee charter provides that the audit committee (comprised of the independent Trustees of registrant) is responsible for pre-approval of all auditing services performed for the registrant. The audit committee also is responsible for pre-approval (subject to the de minimis exceptions for non-audit services described in Section 10A(i)(1)(B) of the Securities Exchange Act of 1934) of all non-auditing services performed for the registrant or an affiliate of registrant. In addition, registrant’s audit committee charter permits a designated member of the audit committee to pre-approve, between meetings, one or more audit or non-audit service projects, subject to an expense limit and notification to the audit committee at the next committee meeting. Registrant’s audit committee pre-approved all fees described above that PwC billed to registrant. |
| (f) | Less than 50% of the hours billed by PwC for auditing services to registrant for the fiscal year ended October 31, 2018 were for work performed by persons other than full-time permanent employees of PwC. |
Table of Contents
| (g) | The aggregate non-audit fees billed by PwC to registrant and to registrant’s investment adviser and any entity controlling, controlled by, or under common control with registrant’s investment adviser for the fiscal years ending October 31, 2017 and October 31, 2018 were $3,600 and $23,550 respectively. These figures are also reported in response to item 4(d) above. |
| (h) | Registrant’s audit committee has considered the non-audit services provided to the registrant and registrant’s investment adviser and any entity controlling, controlled by, or under common control with registrant’s investment adviser as described above and determined that these services do not compromise PwC’s independence. |
| Item 5. | Audit Committee of Listed Registrants |
Not applicable.
| Item 6. | Investments |
| (a) | Registrant’s Schedule of Investments is included in the report to shareholders filed underItem 1. |
| (b) | Not applicable to this filing. |
| Item 7. | Disclosure of Proxy Voting Policies and Procedures for Closed-End Management Investment Companies |
Not applicable.
| Item 8. | Portfolio Managers of Closed-End Management Investment Companies |
Not applicable.
| Item 9. | Purchases of Equity Securities by Closed-End Management Investment Company and Affiliated Purchasers. |
Not applicable.
| Item 10. | Submission of Matters to a Vote of Security Holders |
There have been no material changes to the procedures by which shareholders may recommend nominees to registrant’s board of trustees.
| Item 11. | Controls and Procedures |
(a) Registrant’s principal executive and principal financial officers, or persons performing similar functions, have concluded that registrant’s disclosure controls and procedures (as defined in Rule 30a-3(c) under the Investment Company Act of 1940) are effective, based on their evaluation of these controls and procedures as of a date within 90 days of the filing date of this report.
(b) Registrant’s principal executive and principal financial officers, or persons performing similar functions, are aware of no change in registrant’s internal control over financial reporting (as defined in Rule 30a-3(d) under the Investment Company Act of 1940) that occurred during registrant’s most recent fiscal quarter that has materially affected, or is reasonably likely to materially affect, registrant’s internal control over financial reporting.
| Item 12. | Disclosure of Securities Lending Activities for Closed-End Management Investment Companies |
Not applicable
Table of Contents
| Item 13. | Exhibits |
(a)(1) Any code of ethics, or amendment thereto, that is the subject of the disclosure required by Item 2, to the extent that the registrant intends to satisfy the Item 2 requirements through filing of an exhibit: See EX-99.CODE attached hereto.
(a)(2) A separate certification for each principal executive officer and principal financial officer of the registrant as required by Rule 30a-2(a) under the 1940 Act (17 CFR 270.30a-2(a)) in the exact form set forth below: See EX-99.CERT attached hereto.
(a)(3) Any written solicitation to purchase securities under Rule 23c-1 under the 1940 Act (17 CFR 270.23c-1) sent or given during the period covered by the report by or on behalf of the registrant to 10 or more persons: Not applicable.
(a)(4) Change in the registrant’s independent public accountant: Not applicable
(b) If the report is filed under Section 13(a) or 15(d) of the Exchange Act, provide the certifications required by Rule 30a-2(b) under the 1940 Act (17 CFR 270.30a-2(b)), Rule 13a-14(b) or Rule 15d-14(b) under the Exchange Act (17 CFR 240.13a-14(b) or 240.15d-14(b)), and Section 1350 of Chapter 63 of Title 18 of the United States Code (18 U.S.C. 1350) as an exhibit. A certification furnished pursuant to this paragraph will not be deemed “filed” for purposes of Section 18 of the Exchange Act (15 U.S.C. 78r), or otherwise subject to the liability of that section. Such certification will not be deemed to be incorporated by reference into any filing under the Securities Act of 1933 or the Exchange Act, except to the extent that the registrant specifically incorporates it by reference: See EX-99.906CERT attached hereto.
Table of Contents
SIGNATURES
Pursuant to the requirements of the Securities Exchange Act of 1934 and the Investment Company Act of 1940, the registrant has duly caused this report to be signed on its behalf by the undersigned, thereunto duly authorized.
| Date: December 28, 2018 | THRIVENT CORE FUNDS | |||||
| By: | /s/ David S. Royal | |||||
| David S. Royal | ||||||
| President and Chief Investment Officer | ||||||
Pursuant to the requirements of the Securities Exchange Act of 1934 and the Investment Company Act of 1940, this report has been signed below by the following persons on behalf of the registrant and in the capacities and on the dates indicated.
| Date: December 28, 2018 | By: | /s/ David S. Royal | ||||
| David S. Royal | ||||||
| President and Chief Investment Officer | ||||||
| (principal executive officer) | ||||||
| Date: December 28, 2018 | By: | /s/ Gerard V. Vaillancourt | ||||
| Gerard V. Vaillancourt | ||||||
| Treasurer and Principal Accounting Officer | ||||||
| (principal financial officer) | ||||||