| DAVIS FUNDAMENTAL ETF TRUST | Table of Contents |
Management’s Discussion of Fund Performance: | |
| 2 |
| 4 |
| 6 |
| 8 |
| | |
Fund Overview: | |
| 10 |
| 12 |
| 14 |
| 16 |
| | |
| 18 |
| | |
Schedule of Investments: | |
| 19 |
| 21 |
| 23 |
| 26 |
| | |
| 28 |
| | |
| 29 |
| | |
| 30 |
| | |
| 32 |
| | |
| 38 |
| | |
| 39 |
| | |
| 41 |
| | |
| 42 |
| | |
| 45 |
This Annual Report is authorized for use by existing shareholders. Prospective shareholders must receive a current Davis Fundamental ETF Trust prospectus, which contains more information about investment strategies, risks, charges, and expenses. Please read the prospectus carefully before investing or sending money.
The views in this report were as of October 31, 2019 and may not necessarily reflect the same views on the date this report is first published or any time thereafter. These views are intended to help shareholders in understanding the Funds’ investment methodology and do not constitute investment advice.
Shares of the Davis Fundamental ETF Trust are not deposits or obligations of any bank, are not guaranteed by any bank, are not insured by the FDIC or any other agency, and involve investment risks, including possible loss of the principal amount invested.
Portfolio Proxy Voting Policies and Procedures
The Funds have adopted Portfolio Proxy Voting Policies and Procedures under which the Funds vote proxies relating to securities held by the Funds. A description of the Funds’ Portfolio Proxy Voting Policies and Procedures is available (i) without charge, upon request, by calling the Funds toll-free at 1-800-279-0279, (ii) on the Funds’ website at www.davisetfs.com, and (iii) on the SEC’s website at www.sec.gov.
In addition, the Funds are required to file Form N-PX, with their complete proxy voting record for the 12 months ended June 30th, no later than August 31st of each year. The Funds’ Form N-PX filing is available (i) without charge, upon request, by calling the Funds toll-free at 1-800-279-0279, (ii) on the Funds’ website at www.davisetfs.com, and (iii) on the SEC’s website at www.sec.gov.
Quarterly Schedule of Investments
The Funds file their complete schedule of investments with the SEC on Form N-CSR (as of the end of the second and fourth quarters) and on Form N-PORT-EX (available for filings after March 31, 2019, formerly Form N-Q) (as of the end of the first and third quarters). The Funds’ Forms N-CSR (Annual and Semi-Annual Reports) and N-PORT-EX are available on the Funds’ website at www.davisetfs.com, and on the SEC’s website at www.sec.gov. A list of the Funds’ daily holdings is also available at www.davisetfs.com.
| DAVIS FUNDAMENTAL ETF TRUST | Management’s Discussion of Fund Performance |
| DAVIS SELECT U.S. EQUITY ETF | |
Performance Overview
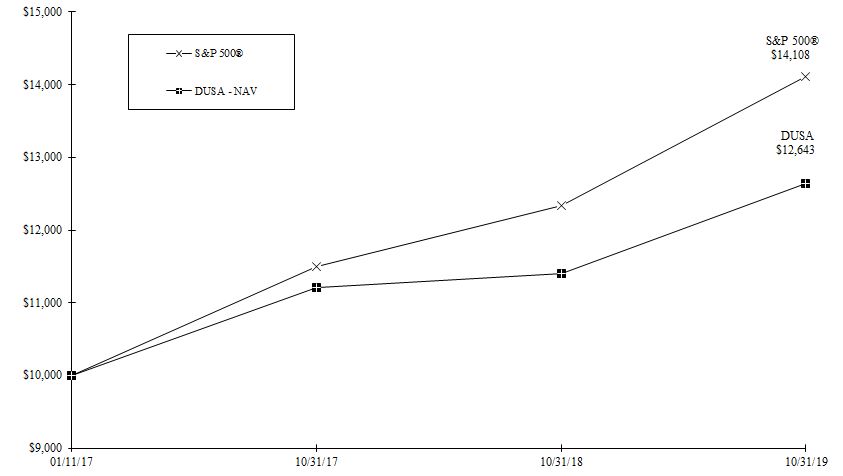
Davis Select U.S. Equity ETF’s net asset value and market price returns1 (10.94% and 10.82%, respectively) underperformed the 14.33% return for the Standard & Poor’s 500® Index (the “Index”) for the twelve-month period ended October 31, 2019 (the “period”). The sectors2 within the Index that reported the strongest performance were Real Estate (up 27%), Utilities (up 24%), and Information Technology (up 22%). The only sector within the Index that reported negative performance for the period was Energy (down 11%). The other weakest, but still positive, performing sectors for the period were Health Care (up 9%) and Financials (up 13%).
Detractors from Performance
The Fund’s holdings in the weakest performing sector within the Index, Energy, were the most substantial detractor3 from absolute performance and were also a significant detractor to performance relative to the Index, owing to weaker stock selection (down 46%, versus down 11%). The Fund’s two Energy holdings, Apache4 (down 41%) and Encana (down 61%), were the top two detractors.
Financials weighed most on performance relative to the Index. The Fund was overweight in this sector (43% average weighting, compared with 14% for the Index), and its Financial securities had weaker returns than those of the Index (up 7%, compared with up 13%). AIA Group (down 2%), a new purchase, was a weak performer. In the strong market environment, Bank of New York Mellon hindered the Fund’s relative performance, as it was up only 1% during the period.
The Fund’s performance was further hindered by its significant underweight position in Information Technology securities (1% average weighting, compared with 20% for the Index). Information Technology was a strong-performing sector during the period.
Additional detractors included Adient (down 30%) and CVS (down 14%).
Contributors to Performance
The Consumer Discretionary sector holdings were the most significant contributor to the Fund’s performance on both an absolute and relative basis due to strong stock selection (up 25%, compared with up 16%). New Oriental Education & Technology (up 109%), the top contributor for the period, and Amazon (up 11%) boosted Fund performance.
While Financials weighed on relative performance, they were a top contributor to the Fund’s absolute return. Top contributors included JPMorgan Chase (up 18%), American Express (up 16%), U.S. Bancorp (up 12%), and Capital One Financial (up 6%).
The Communication Services sector was beneficial to both absolute and relative performance. The Fund’s Communication Services holdings outperformed those of the Index (up 22%, versus up 16%). The Fund also benefited from having a higher average weighting (14%, versus 10% for the Index) in this sector. Strong performers were Alphabet (up 17%) and Facebook (up 26%). Alphabet was the largest holding at the end of the period, representing 10.21% of net assets.
Industrials helped Fund performance as well (up 22%, versus up 15% for the Index). The Fund maintained a slightly overweight position (12% average weighting, versus 9% for the Index), which included top performers United Technologies (up 18%) and Ferguson (up 30%).
When compared to the Index, the Fund benefited from having a significantly lower average weighting (2%, versus 14%) in Health Care, which was the second weakest-performing sector within the Index for the period.
The Fund’s foreign securities significantly outperformed its U.S. holdings (up 31%, versus up 8%).
Davis Select U.S. Equity ETF’s investment objective is long-term capital growth and capital preservation. There can be no assurance that the Fund will achieve its objective. Davis Select U.S. Equity ETF’s principal risks are: authorized participant concentration risk, common stock risk, cybersecurity risk, depositary receipts risk, exchange-traded fund risk, fees and expenses risk, financial services risk, focused portfolio risk, foreign country risk, foreign currency risk, headline risk, intraday indicative value risk, large-capitalization companies risk, manager risk, market trading risk, mid- and small-capitalization companies risk, and stock market risk. See the prospectus for a full description of each risk.
Davis Select U.S. Equity ETF focuses its investments in fewer companies, and it may be subject to greater risks than a more diversified fund that is not allowed to focus its investments in a few companies. The Fund’s investment performance, both good and bad, is expected to reflect the economic performance of its more focused portfolio.
Past performance does not guarantee future results, Fund prices fluctuate, and the value of an investment may be worth more or less than the purchase price. Data provided in this performance overview is for the twelve-month period ended October 31, 2019, unless otherwise noted. Return figures for underlying Fund positions reflect the return of the security from the beginning of the period or the date of first purchase if subsequent thereto through the end of the period or the date the position is completely liquidated. The actual contribution to the Fund will vary based on a number of factors (e.g., trading activity, weighting). Portfolio holding information is as of the end of the twelve-month period, October 31, 2019, unless otherwise noted.
1 | The net asset value return is based on the NAV of the Fund and the market price return represents changes to the midpoint price, which is the average of the bid-ask prices at 4:00 P.M. EST when the NAV is determined. |
2 | The companies included in the Standard & Poor’s 500® Index are divided into eleven sectors. One or more industry groups make up a sector. For purposes of measuring concentration, the Fund generally classifies companies at the industry group or industry level. See the SAI for additional information regarding the Fund’s concentration policy. |
3 | A company’s or sector’s contribution to or detraction from the Fund’s performance is a product both of its appreciation or depreciation and its weighting within the Fund. For example, a 5% holding that rises 20% has twice as much impact as a 1% holding that rises 50%. |
4 | This Management Discussion of Fund Performance discusses a number of individual companies. The information provided in this report does not provide information reasonably sufficient upon which to base an investment decision and should not be considered a recommendation to purchase, sell, or hold any particular security. The Schedule of Investments lists the Fund’s holdings of each company discussed. |
| DAVIS FUNDAMENTAL ETF TRUST | Management’s Discussion of Fund Performance |
| DAVIS SELECT U.S. EQUITY ETF - (CONTINUED) | |
Comparison of a $10,000 investment in Davis Select U.S. Equity ETF (DUSA) versus the
Standard & Poor’s 500® Index for an investment made at NAV on January 11, 2017
Average Annual Total Return for periods ended October 31, 2019
| Fund & Benchmark Index | 1-Year | Since Fund’s Inception (01/11/17) | Gross Expense Ratio | Net Expense Ratio |
DUSA - Net Asset Value (NAV) | 10.94% | 8.73% | 0.63% | 0.63% |
DUSA - Market Price | 10.82% | 8.73% | 0.63% | 0.63% |
S&P 500® Index | 14.33% | 13.06% | | |
The Standard & Poor’s 500® Index is an unmanaged index of 500 selected common stocks, most of which are listed on the New York Stock Exchange. The Index is adjusted for dividends, weighted towards stocks with large market capitalizations, and represents approximately two-thirds of the total market value of all domestic common stocks. Investments cannot be made directly in the Index.
The performance data quoted in this report represents past performance and is not a guarantee of future results. The investment return and principal value will fluctuate so that shares may be worth more or less than their original cost when redeemed. The NAV return is based on the NAV of the Fund and the market price return represents changes to the midpoint price, which is the average of the bid-ask prices at 4:00 P.M. EST when the NAV is determined. NAV and market price returns assume that all distributions were reinvested at NAV. Market price returns do not include brokerage commissions that may be payable on secondary market transactions or annual fees to financial intermediaries. If brokerage commissions or annual fees were included, market price returns would be lower. Current performance may be higher or lower than performance data quoted. The operating expense ratios may vary in future years. For most recent month-end performance information, please call Investor Services at 1-800-279-0279 or visit the Fund’s website at www.davisetfs.com.
Average Annual Total Return for periods ended September 30, 2019
| | 1-Year | Since Fund’s Inception (01/11/17) |
DUSA - Net Asset Value (NAV) | (2.95)% | 7.76% |
DUSA - Market Price | (2.98)% | 7.81% |
| DAVIS FUNDAMENTAL ETF TRUST | Management’s Discussion of Fund Performance |
| DAVIS SELECT FINANCIAL ETF | |
Performance Overview
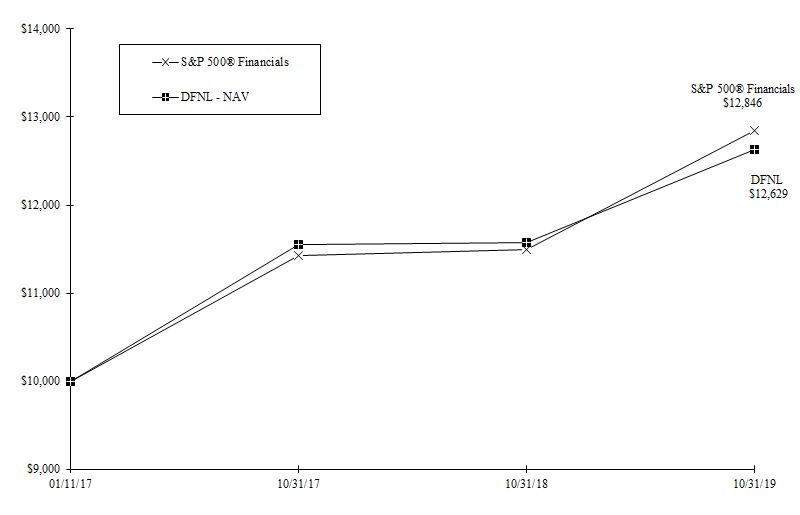
Davis Select Financial ETF’s net asset value and market price returns1 (9.15% and 9.13%, respectively) underperformed the 11.72% return for the S&P 500® Financials Index (the “Index”) for the twelve-month period ended October 31, 2019 (the “period”). The industries2 within the Financials sector that reported the strongest performance were Insurance (up 18%), Consumer Finance (up 15%), and Banks (up 12%). While all industries within the Index reported positive performance, the industries within the Index that reported the weakest performance were Diversified Financial Services (up 3%) and Capital Markets (up 11%).
Detractors from Performance
Bank securities were the most significant detractor3 from the Fund’s performance relative to the Index due to weaker stock selection (up 6%, compared with up 12%). The top three detractors for the period were all from this industry. They were Metro Bank4 (down 76%), Bank of N.T. Butterfield (down 14%), and Danske Bank (down 21%). Metro Bank was a new purchase.
The Fund’s Capital Markets securities negatively impacted relative performance. This was due to both weaker performing stocks (up 5%, versus up 11%) and weighting (18% average weighting, compared with 21%). Five of the Fund’s eight Capital Markets securities were among the weakest performing securities for the period, including Goldman Sachs (down 4%), Charles Schwab (down 11%), State Street (down 1%), Bank of New York Mellon (up 1%), and Julius Baer (down less than 1%).
Greenlight Capital (down 7%) also detracted from performance.
During the period, the Fund had an average weight of 16% of its net assets in foreign securities. These foreign securities underperformed the Fund’s U.S. holdings (down 1%, compared to up 12%).
Contributors to Performance
The Fund’s Insurance holdings were the most significant absolute contributor to performance (up 16%). The Fund maintained a fairly large weighting in this strong-performing industry (18% average weighting). The top contributor to performance was Chubb (up 25%). Alleghany (up 30%) also boosted Fund performance.
Diversified Financial Services securities were the most significant contributor to the Fund’s relative performance due to the Fund’s lower average weighting (8%, versus 13%) and stronger stock selection (up 5%, compared with up 3%) in this industry.
The Fund retains the flexibility to invest a limited portion of its assets in non-financial securities. During the period, the Fund held a Media & Entertainment holding, Alphabet, which was up 17%.
While the top relative detractor, the Bank industry was an important absolute contributor due to a number of strong-performing securities, which included U.S. Bancorp (up 12%), JPMorgan Chase (up 18%), PNC Financial (up 18%), and DBS Group Holdings (up 18%). U.S. Bancorp (8.29% of net assets) was the largest holding at the end of the period.
American Express (up 16%) and Capital One Financial (up 6%), the Fund’s only two Consumer Finance securities, positively impacted performance. Capital One Financial was the second largest holding at the end of the period representing 7.82% of net assets.
KKR (up 24%) also contributed positively to Fund performance.
Davis Select Financial ETF’s investment objective is long-term growth of capital. There can be no assurance that the Fund will achieve its objective. Davis Select Financial ETF’s principal risks are: authorized participant concentration risk, common stock risk, credit risk, cybersecurity risk, depositary receipts risk, emerging market risk, exchange-traded fund risk, fees and expenses risk, financial services risk, focused portfolio risk, foreign country risk, foreign currency risk, headline risk, interest rate sensitivity risk, intraday indicative value risk, large-capitalization companies risk, manager risk, market trading risk, mid- and small-capitalization companies risk, and stock market risk. See the prospectus for a full description of each risk.
Davis Select Financial ETF concentrates its investments in the financial sector, and it may be subject to greater risks than a fund that does not concentrate its investments in a particular sector. The Fund’s investment performance, both good and bad, is expected to reflect the economic performance of the financial sector more than a fund that does not concentrate its portfolio.
Davis Select Financial ETF focuses its investments in fewer companies, and it may be subject to greater risks than a more diversified fund that is not allowed to focus its investments in a few companies. The Fund’s investment performance, both good and bad, is expected to reflect the economic performance of its more focused portfolio.
Past performance does not guarantee future results, Fund prices fluctuate, and the value of an investment may be worth more or less than the purchase price. Data provided in this performance overview is for the twelve-month period ended October 31, 2019, unless otherwise noted. Return figures for underlying Fund positions reflect the return of the security from the beginning of the period or the date of first purchase if subsequent thereto through the end of the period or the date the position is completely liquidated. The actual contribution to the Fund will vary based on a number of factors (e.g., trading activity, weighting). Portfolio holding information is as of the end of the twelve-month period, October 31, 2019, unless otherwise noted.
1 | The net asset value return is based on the NAV of the Fund and the market price return represents changes to the midpoint price, which is the average of the bid-ask prices at 4:00 P.M. EST when the NAV is determined. |
2 | The companies included in the S&P 500® Financials Index are divided into five industries. One or more sub-industries make up an industry. |
3 | A company’s or industry’s contribution to or detraction from the Fund’s performance is a product both of its appreciation or depreciation and its weighting within the Fund. For example, a 5% holding that rises 20% has twice as much impact as a 1% holding that rises 50%. |
4 | This Management Discussion of Fund Performance discusses a number of individual companies. The information provided in this report does not provide information reasonably sufficient upon which to base an investment decision and should not be considered a recommendation to purchase, sell, or hold any particular security. The Schedule of Investments lists the Fund’s holdings of each company discussed. |
| DAVIS FUNDAMENTAL ETF TRUST | Management’s Discussion of Fund Performance |
| DAVIS SELECT FINANCIAL ETF - (CONTINUED) | |
Comparison of a $10,000 investment in Davis Select Financial ETF (DFNL) versus the
Standard & Poor’s 500® Financials Index for an investment made at NAV on January 11, 2017
Average Annual Total Return for periods ended October 31, 2019
| Fund & Benchmark Index | 1-Year | Since Fund’s Inception (01/11/17) | Gross Expense Ratio | Net Expense Ratio |
DFNL - Net Asset Value (NAV) | 9.15% | 8.69% | 0.64% | 0.64% |
DFNL - Market Price | 9.13% | 8.70% | 0.64% | 0.64% |
S&P 500® Financials Index | 11.72% | 9.35% | | |
The Standard & Poor’s 500® Index is an unmanaged index of 500 selected common stocks, most of which are listed on the New York Stock Exchange. The Index is adjusted for dividends, weighted towards stocks with large market capitalizations, and represents approximately two-thirds of the total market value of all domestic common stocks. The S&P 500® Financials Index comprises those companies included in the Standard & Poor’s 500® Index that are classified as members of the GICS® Financials sector. Investments cannot be made directly in the Index.
The performance data quoted in this report represents past performance and is not a guarantee of future results. The investment return and principal value will fluctuate so that shares may be worth more or less than their original cost when redeemed. The NAV return is based on the NAV of the Fund and the market price return represents changes to the midpoint price, which is the average of the bid-ask prices at 4:00 P.M. EST when the NAV is determined. NAV and market price returns assume that all distributions were reinvested at NAV. Market price returns do not include brokerage commissions that may be payable on secondary market transactions or annual fees to financial intermediaries. If brokerage commissions or annual fees were included, market price returns would be lower. Current performance may be higher or lower than performance data quoted. The operating expense ratios may vary in future years. For most recent month-end performance information, please call Investor Services at 1-800-279-0279 or visit the Fund’s website at www.davisetfs.com.
Average Annual Total Return for periods ended September 30, 2019
| | 1-Year | Since Fund’s Inception (01/11/17) |
DFNL - Net Asset Value (NAV) | (0.61)% | 8.00% |
DFNL - Market Price | (0.63)% | 8.02% |
| DAVIS FUNDAMENTAL ETF TRUST | Management’s Discussion of Fund Performance |
| DAVIS SELECT WORLDWIDE ETF | |
Performance Overview
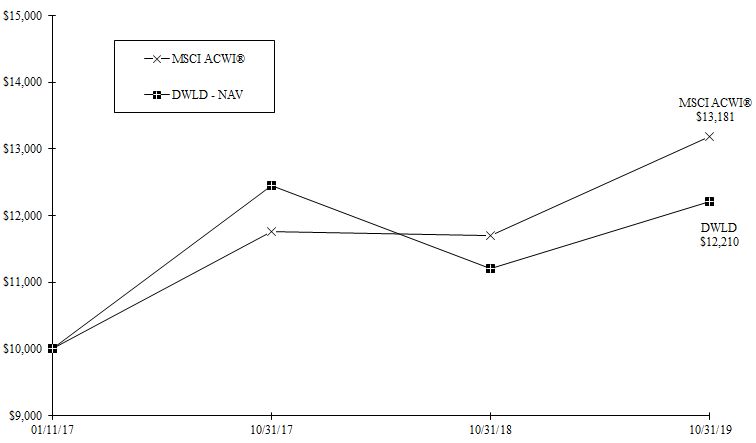
Davis Select Worldwide ETF’s net asset value and market price returns1 (8.99% and 8.97%, respectively) underperformed the 12.59% return for the Morgan Stanley Capital International All Country World Index (the “Index”) for the twelve-month period ended October 31, 2019 (the “period”). The sectors2 within the Index that reported the strongest performance were Real Estate (up 23%), Utilities (up 22%), and Information Technology (up 22%). The only sector within the Index that reported negative performance for the period was Energy (down 5%). The other weakest, but still positive, performing sectors were Materials (up 8%) and Health Care (up 11%).
Detractors from Performance
The Fund’s holdings in the weakest performing sector within the Index, Energy, were the most substantial detractor3 from performance on both an absolute basis and relative to the Index, owing primarily to weaker stock selection (down 50%, versus down 5%). All three of the Fund’s Energy holdings were among the top detractors for the period: Encana4 (down 61%), Apache (down 41%), the top two detractors for the period, respectively, and Seven Generations Energy (down 48%).
The Fund’s Financial holdings were a top relative detractor largely due to stock selection (up 2%, versus up 11%). Negative performers included a new purchase, Metro Bank (down 76%), Yiren Digital (down 58%), and Danske Bank (down 21%).
The Fund’s Information Technology securities had a return of 7%, compared with 22% for the Index. The Fund was also significantly underweight in the Information Technology sector compared to the Index (average weighting of 7%, compared with 15% for the Index). Hollysys Automation (down 26%) is a leading provider of automation and control technologies and application in China.
The Fund had a significant percentage of assets invested in the Consumer Discretionary sector. Two holdings from this sector that hindered performance included Tarena International (down 82%), which was sold during the period, and Quotient Technology (down 33%). Baidu (down 46%), from the Communications Services sector, is a Chinese internet services company that, among other things, provides a leading Chinese search engine, was also among the top detractors during the period.
Contributors to Performance
The Consumer Discretionary sector holdings were the most significant contributor to the Fund’s performance on both an absolute and relative basis due primarily to strong stock selection (up 24%, compared with up 15%) and significant overweight position (30% average weighting, versus 11%). A number of Consumer Discretionary holdings boosted Fund performance, including the top contributor for the period New Oriental Education & Technology (up 109%), JD.com (up 32%), and Alibaba (up 24%). New Oriental Education & Technology (8.64% of net assets) was the largest position at the end of the period.
Industrials helped Fund performance primarily as a result of strong stock selection (up 30%, versus up 15% for the Index). Ferguson (up 30%) and InterGlobe Aviation (up 71%) both helped to boost performance.
The Communication Services sector was also beneficial to both absolute and relative performance. The Fund’s Communication Services holdings outperformed those of the Index (up 19%, versus up 13%). Alphabet (up 17%) and Facebook (up 26%) generated strong returns. Alphabet was among the largest holdings at the end of the period, representing 7.02% of net assets. Naspers (up 25%) also was a top contributor in the Communication Services sector before being moved to the Consumer Discretionary sector during the period.
Sul America (up 85%) and Applied Materials (up 68%) also helped Fund performance.
The Fund’s foreign securities outperformed its U.S. holdings (up 10%, versus up 8%). A large part of this positive performance was due to the Fund’s Chinese holdings. The Chinese holdings represented the Fund’s largest foreign position (25%).
Davis Select Worldwide ETF’s investment objective is long-term growth of capital. There can be no assurance that the Fund will achieve its objective. Davis Select Worldwide ETF’s principal risks are: authorized participant concentration risk, common stock risk, cybersecurity risk, depositary receipts risk, emerging market risk, exchange-traded fund risk, fees and expenses risk, foreign country risk, foreign currency risk, foreign market risk, headline risk, intraday indicative value risk, large-capitalization companies risk, manager risk, market trading risk, mid- and small-capitalization companies risk, and stock market risk. See the prospectus for a full description of each risk.
Past performance does not guarantee future results, Fund prices fluctuate, and the value of an investment may be worth more or less than the purchase price. Data provided in this performance overview is for the twelve-month period ended October 31, 2019, unless otherwise noted. Return figures for underlying Fund positions reflect the return of the security from the beginning of the period or the date of first purchase if subsequent thereto through the end of the period or the date the position is completely liquidated. The actual contribution to the Fund will vary based on a number of factors (e.g., trading activity, weighting). Portfolio holding information is as of the end of the twelve-month period, October 31, 2019, unless otherwise noted.
1 | The net asset value return is based on the NAV of the Fund and the market price return represents changes to the midpoint price, which is the average of the bid-ask prices at 4:00 P.M. EST when the NAV is determined. |
2 | The companies included in the Morgan Stanley Capital International All Country World Index are divided into eleven sectors. One or more industry groups make up a sector. For purposes of measuring concentration, the Fund generally classifies companies at the industry group or industry level. See the SAI for additional information regarding the Fund’s concentration policy. |
3 | A company’s or sector’s contribution to or detraction from the Fund’s performance is a product both of its appreciation or depreciation and its weighting within the Fund. For example, a 5% holding that rises 20% has twice as much impact as a 1% holding that rises 50%. |
4 | This Management Discussion of Fund Performance discusses a number of individual companies. The information provided in this report does not provide information reasonably sufficient upon which to base an investment decision and should not be considered a recommendation to purchase, sell, or hold any particular security. The Schedule of Investments lists the Fund’s holdings of each company discussed. |
| DAVIS FUNDAMENTAL ETF TRUST | Management’s Discussion of Fund Performance |
| DAVIS SELECT WORLDWIDE ETF - (CONTINUED) | |
Comparison of a $10,000 investment in Davis Select Worldwide ETF (DWLD) versus the
Morgan Stanley Capital International All Country World Index (MSCI ACWI®)
for an investment at NAV on January 11, 2017
Average Annual Total Return for periods ended October 31, 2019
| Fund & Benchmark Index | 1-Year | Since Fund’s Inception (01/11/17) | Gross Expense Ratio | Net Expense Ratio |
DWLD - Net Asset Value (NAV) | 8.99% | 7.38% | 0.63% | 0.63% |
DWLD - Market Price | 8.97% | 7.41% | 0.63% | 0.63% |
MSCI ACWI® | 12.59% | 10.36% | | |
The MSCI ACWI® is a free float-adjusted market capitalization weighted index that is designed to measure the equity market performance of developed and emerging markets. The Index includes reinvestment of dividends, net of foreign withholding taxes. Investments cannot be made directly in the Index.
The performance data quoted in this report represents past performance and is not a guarantee of future results. The investment return and principal value will fluctuate so that shares may be worth more or less than their original cost when redeemed. The NAV return is based on the NAV of the Fund and the market price return represents changes to the midpoint price, which is the average of the bid-ask prices at 4:00 P.M. EST when the NAV is determined. NAV and market price returns assume that all distributions were reinvested at NAV. Market price returns do not include brokerage commissions that may be payable on secondary market transactions or annual fees to financial intermediaries. If brokerage commissions or annual fees were included, market price returns would be lower. Current performance may be higher or lower than performance data quoted. The operating expense ratios may vary in future years. For most recent month-end performance information, please call Investor Services at 1-800-279-0279 or visit the Fund’s website at www.davisetfs.com.
Average Annual Total Return for periods ended September 30, 2019
| | 1-Year | Since Fund’s Inception (01/11/17) |
DWLD - Net Asset Value (NAV) | (6.99)% | 6.45% |
DWLD - Market Price | (7.16)% | 6.41% |
| DAVIS FUNDAMENTAL ETF TRUST | Management’s Discussion of Fund Performance |
| DAVIS SELECT INTERNATIONAL ETF | |
Performance Overview
Davis Select International ETF’s net asset value and market price returns1 (10.37% and 10.50%, respectively) underperformed the 11.27% return for the Morgan Stanley Capital International All Country World Index ex USA (the “Index”) for the twelve-month period ended October 31, 2019 (the “period”). The sectors2 within the Index that reported the strongest performance were Information Technology (up 22%), Utilities (up 20%), and Real Estate (up 18%). The only sector within the Index that reported negative performance for the period was Energy (down less than 1%). The other weakest, but still positive, performing sectors were Materials (up 6%) and Financials (up 9%).
Detractors from Performance
The Fund’s holdings in the Energy sector were the most substantial detractor3 from performance on both an absolute basis and relative to the Index. The underperformance in this sector compared to the Index was largely related to weaker stock selection (down 55%, versus down less than 1%) Both of the Fund’s Energy holdings, Encana4 (down 61%), the top detractor, and Seven Generations Energy (down 48%), were weak performers.
The Fund’s sole Information Technology holding, Hollysys Automation, which is a leading provider of automation and control technologies and application in China, was down 26%, while the Index’s Information Technology holdings were up 22%. The Fund’s low weighting in this top performing sector within the Index (4% average weight, compared with 8%) negatively impacted the Fund’s relative performance.
The Fund’s Financial holdings were a top detractor primarily due to stock selection (up 2%, versus up 9%). The Fund’s performance also was hindered relative to the Index as a result of its large weighting in this sector (26% average weight, compared with 22%). Negative performers included a new purchase, Metro Bank (down 76%), Yiren Digital (down 58%), Danske Bank (down 21%), and Bank of N.T. Butterfield (down 14%).
Tarena International (down 82%), which was sold during the period, was a key detractor from the Fund’s performance. Baidu (down 46%) and Fang Holdings (down 79%), two Communication Services holdings, were also among the top detractors.
At the end of the period, the Fund held 8% of its net assets in repurchase agreements. Given the strong market, the Fund’s repurchase agreement position weighed on performance.
Contributors to Performance
The Consumer Discretionary sector holdings were the most significant contributor to the Fund’s performance on both an absolute and relative basis due primarily to strong stock selection (up 36%, compared with up 16%) and significant overweight position (29% average weighting, versus 11%). A number of Consumer Discretionary holdings boosted Fund performance, including the top contributor for the period, New Oriental Education & Technology (up 109%), Alibaba (up 24%), JD.com (up 32%), and Meituan Dianping (up 42%). New Oriental Education & Technology (12.00% of net assets) and Alibaba (7.37% of net assets) were the two largest positions, respectively, at the end of the period. Naspers (up 25%) moved from the Communication Services sector to the Consumer Discretionary sector during the period and contributed in each sector.
Likewise, Industrials helped Fund performance. The Fund’s Industrials holdings generated a return of 35%, while the Index’s returned 14%. InterGlobe Aviation (up 71%), Schneider Electric (up 32%), Ferguson (up 30%), and Safran (up 24%) were each helpful to performance. Ferguson was one of the largest positions at the end of the period representing 5.26% of net assets.
The Fund had a small position in Health Care securities (up 18%), which was also beneficial to absolute performance.
Another individual contributor was Sul America (up 85%).
The Fund’s largest geographic position was in Chinese securities (an average weighting of 35% during the period). The Fund’s Chinese securities were up 16% during the period.
Davis Select International ETF’s investment objective is long-term growth of capital. There can be no assurance that the Fund will achieve its objective. Davis Select International ETF’s principal risks are: authorized participant concentration risk, common stock risk, cybersecurity risk, depositary receipts risk, emerging market risk, exchange-traded fund risk, fees and expenses risk, foreign country risk, foreign currency risk, foreign market risk, headline risk, intraday indicative value risk, large-capitalization companies risk, manager risk, market trading risk, mid- and small-capitalization companies risk, and stock market risk. See the prospectus for a full description of each risk.
Past performance does not guarantee future results, Fund prices fluctuate, and the value of an investment may be worth more or less than the purchase price. Data provided in this performance overview is for the twelve-month period ended October 31, 2019, unless otherwise noted. Return figures for underlying Fund positions reflect the return of the security from the beginning of the period or the date of first purchase if subsequent thereto through the end of the period or the date the position is completely liquidated. The actual contribution to the Fund will vary based on a number of factors (e.g., trading activity, weighting). Portfolio holding information is as of the end of the twelve-month period, October 31, 2019, unless otherwise noted.
1 | The net asset value return is based on the NAV of the Fund and the market price return represents changes to the midpoint price, which is the average of the bid-ask prices at 4:00 P.M. EST when the NAV is determined. |
2 | The companies included in the Morgan Stanley Capital International All Country World Index ex USA are divided into eleven sectors. One or more industry groups make up a sector. For purposes of measuring concentration, the Fund generally classifies companies at the industry group or industry level. See the SAI for additional information regarding the Fund’s concentration policy. |
3 | A company’s or sector’s contribution to or detraction from the Fund’s performance is a product both of its appreciation or depreciation and its weighting within the Fund. For example, a 5% holding that rises 20% has twice as much impact as a 1% holding that rises 50%. |
4 | This Management Discussion of Fund Performance discusses a number of individual companies. The information provided in this report does not provide information reasonably sufficient upon which to base an investment decision and should not be considered a recommendation to purchase, sell, or hold any particular security. The Schedule of Investments lists the Fund’s holdings of each company discussed. |
| DAVIS FUNDAMENTAL ETF TRUST | Management’s Discussion of Fund Performance |
| DAVIS SELECT INTERNATIONAL ETF - (CONTINUED) | |
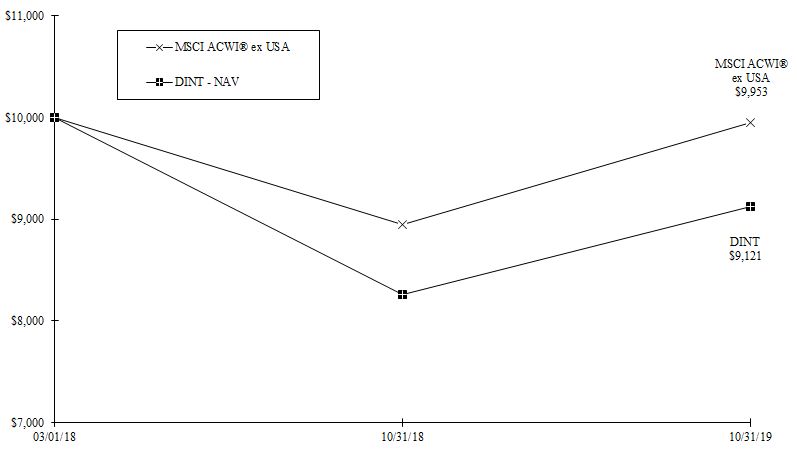
Comparison of a $10,000 investment in Davis Select International ETF (DINT) versus the
Morgan Stanley Capital International All Country World Index ex USA (MSCI ACWI® ex USA)
for an investment at NAV on March 1, 2018
Average Annual Total Return for periods ended October 31, 2019
| Fund & Benchmark Index | 1-Year | Since Fund’s Inception (03/01/18) | Gross Expense Ratio | Net Expense Ratio |
DINT - Net Asset Value (NAV) | 10.37% | (5.36)% | 0.68% | 0.68% |
DINT - Market Price | 10.50% | (5.24)% | 0.68% | 0.68% |
MSCI ACWI® ex USA | 11.27% | (0.28)% | | |
The MSCI ACWI® ex USA is a free float-adjusted market capitalization weighted index designed to measure the equity market performance of developed and emerging markets, excluding the United States. The Index includes reinvestment of dividends, net of foreign withholding taxes. Investments cannot be made directly in the Index.
The performance data quoted in this report represents past performance and is not a guarantee of future results. The investment return and principal value will fluctuate so that shares may be worth more or less than their original cost when redeemed. The NAV return is based on the NAV of the Fund and the market price return represents changes to the midpoint price, which is the average of the bid-ask prices at 4:00 P.M. EST when the NAV is determined. NAV and market price returns assume that all distributions were reinvested at NAV. Market price returns do not include brokerage commissions that may be payable on secondary market transactions or annual fees to financial intermediaries. If brokerage commissions or annual fees were included, market price returns would be lower. Current performance may be higher or lower than performance data quoted. The operating expense ratios may vary in future years. For most recent month-end performance information, please call Investor Services at 1-800-279-0279 or visit the Fund’s website at www.davisetfs.com.
Average Annual Total Return for periods ended September 30, 2019
| | 1-Year | Since Fund’s Inception (03/01/18) |
DINT - Net Asset Value (NAV) | (4.25)% | (7.51)% |
DINT - Market Price | (4.28)% | (7.39)% |
| DAVIS FUNDAMENTAL ETF TRUST | |
| DAVIS SELECT U.S. EQUITY ETF | October 31, 2019 |
| Portfolio Composition | | Industry Weightings |
| (% of Fund’s 10/31/19 Net Assets) | | (% of 10/31/19 Stock Holdings) |
| | | | | | | |
| | | | | Fund | | S&P 500® |
Common Stock (U.S.) | 81.20% | | Diversified Financials | 24.67% | | 5.04% |
Common Stock (Foreign) | 17.72% | | Banks | 16.26% | | 5.59% |
Short-Term Investments | 1.01% | | Media & Entertainment | 14.20% | | 8.16% |
| Other Assets & Liabilities | 0.07% | | Retailing | 12.37% | | 6.50% |
| | 100.00% | | Capital Goods | 10.84% | | 6.57% |
| | | | Consumer Services | 6.78% | | 1.89% |
| | | | Insurance | 6.29% | | 2.33% |
| | | | Health Care | 2.98% | | 14.03% |
| | | | Energy | 2.82% | | 4.32% |
| | | | Information Technology | 1.89% | | 22.30% |
| | | | Automobiles & Components | 0.90% | | 0.47% |
| | | | Other | – | | 22.80% |
| | | | | 100.00% | | 100.00% |
Top 10 Long-Term Holdings
(% of Fund’s 10/31/19 Net Assets)
| | | |
Alphabet Inc., Class C | Media & Entertainment | 10.21% |
Berkshire Hathaway Inc., Class B | Diversified Financial Services | 10.06% |
Amazon.com, Inc. | Retailing | 9.14% |
United Technologies Corp. | Capital Goods | 7.27% |
New Oriental Education & Technology Group, Inc., ADR | Consumer Services | 6.70% |
Capital One Financial Corp. | Consumer Finance | 6.63% |
Wells Fargo & Co. | Banks | 4.90% |
JPMorgan Chase & Co. | Banks | 4.42% |
U.S. Bancorp | Banks | 4.27% |
American Express Co. | Consumer Finance | 4.19% |
Frequency Distribution of Discounts and Premiums
Bid/Ask Midpoint versus NAV through October 31, 2019
The following Frequency Distribution of Discounts and Premiums tables are provided to show the frequency at which the bid/ask midpoint price for the Fund was at a discount or premium to the daily NAV. The following tables are for comparative purposes only and represent the period January 12, 2017 (commencement of trading) through October 31, 2019. Shareholders may pay more than NAV when they buy Fund shares and receive less than NAV when they sell those shares because shares are bought and sold at current market price. Data presented represents past performance and cannot be used to predict future results.
| Number of Days Bid/Ask Midpoint At/Above NAV |
| For the Period | 0.00%-0.49% | 0.50%-0.99% | 1.00%-1.99% | >=2.00% |
| 01/12/17 – 10/31/17 | 203 | 0 | 0 | 0 |
| 11/01/17 – 10/31/18 | 248 | 0 | 0 | 1 |
| 11/01/18 – 10/31/19 | 234 | 0 | 0 | 0 |
| Number of Days Bid/Ask Midpoint Below NAV |
| For the Period | 0.00%-0.49% | 0.50%-0.99% | 1.00%-1.99% | >=2.00% |
| 01/12/17 – 10/31/17 | 0 | 0 | 0 | 0 |
| 11/01/17 – 10/31/18 | 3 | 0 | 0 | 0 |
| 11/01/18 – 10/31/19 | 17 | 0 | 0 | 0 |
| DAVIS FUNDAMENTAL ETF TRUST | Fund Overview |
| DAVIS SELECT U.S. EQUITY ETF - (CONTINUED) | October 31, 2019 |
New Positions Added (11/01/18-10/31/19)
(Highlighted positions are those greater than 2.00% of the Fund’s 10/31/19 net assets)
| Security | Industry | Date of 1st Purchase | % of Fund’s 10/31/19 Net Assets |
AIA Group Ltd. | Life & Health Insurance | 06/19/19 | 2.38% |
Bank of America Corp. | Banks | 02/27/19 | 0.97% |
CVS Health Corp. | Health Care Equipment & Services | 11/29/18 | 0.56% |
DBS Group Holdings Ltd. | Banks | 09/16/19 | 1.53% |
Intel Corp. | Semiconductors & Semiconductor | | |
| | Equipment | 05/23/19 | 1.87% |
Quest Diagnostics Inc. | Health Care Equipment & Services | 01/29/19 | 2.38% |
Positions Closed (11/01/18-10/31/19)
(Gains and losses greater than $400,000 are highlighted)
| Security | Industry | Date of Final Sale | Realized Gain (Loss) |
Aetna Inc. | Health Care Equipment & Services | 11/29/18 | $ | 461,896 |
General Electric Co. | Capital Goods | 05/03/19 | | (792,295) |
LafargeHolcim Ltd. | Materials | 07/03/19 | | (139,186) |
MultiChoice Group Ltd. | Media & Entertainment | 03/08/19 | | 4,280 |
Prosus N.V., Class N | Retailing | 10/29/19 | | (78,383) |
Safran S.A. | Capital Goods | 02/06/19 | | 1,278,804 |
Wabtec Corp. | Capital Goods | 04/17/19 | | 767 |
| DAVIS FUNDAMENTAL ETF TRUST | |
| DAVIS SELECT FINANCIAL ETF | October 31, 2019 |
| Portfolio Composition | | Industry Weightings |
| (% of Fund’s 10/31/19 Net Assets) | | (% of 10/31/19 Stock Holdings) |
| | | | | | |
| | | | | Fund | | S&P 500® Financials |
Common Stock (U.S.) | 84.29% | | Banks | 39.06% | | 43.14% |
Common Stock (Foreign) | 15.39% | | Insurance | 18.38% | | 17.96% |
Short-Term Investments | 0.26% | | Capital Markets | 18.18% | | 20.92% |
Other Assets & Liabilities | 0.06% | | Consumer Finance | 13.37% | | 5.23% |
| | 100.00% | | Diversified Financial Services | 7.76% | | 12.75% |
| | | | Media & Entertainment | 3.25% | | – |
| | | | | 100.00% | | 100.00% |
Top 10 Long-Term Holdings
(% of Fund’s 10/31/19 Net Assets)
| | | |
U.S. Bancorp | Banks | 8.29% |
Capital One Financial Corp. | Consumer Finance | 7.82% |
Berkshire Hathaway Inc., Class B | Diversified Financial Services | 7.74% |
Markel Corp. | Property & Casualty Insurance | 5.67% |
JPMorgan Chase & Co. | Banks | 5.64% |
American Express Co. | Consumer Finance | 5.51% |
Wells Fargo & Co. | Banks | 5.41% |
Bank of America Corp. | Banks | 4.83% |
Bank of New York Mellon Corp. | Capital Markets | 4.74% |
PNC Financial Services Group, Inc. | Banks | 4.29% |
Frequency Distribution of Discounts and Premiums
Bid/Ask Midpoint versus NAV through October 31, 2019
The following Frequency Distribution of Discounts and Premiums tables are provided to show the frequency at which the bid/ask midpoint price for the Fund was at a discount or premium to the daily NAV. The following tables are for comparative purposes only and represent the period January 12, 2017 (commencement of trading) through October 31, 2019. Shareholders may pay more than NAV when they buy Fund shares and receive less than NAV when they sell those shares because shares are bought and sold at current market price. Data presented represents past performance and cannot be used to predict future results.
| Number of Days Bid/Ask Midpoint At/Above NAV |
| For the Period | 0.00%-0.49% | 0.50%-0.99% | 1.00%-1.99% | >=2.00% |
| 01/12/17 – 10/31/17 | 203 | 0 | 0 | 0 |
| 11/01/17 – 10/31/18 | 241 | 0 | 0 | 0 |
| 11/01/18 – 10/31/19 | 144 | 1 | 0 | 0 |
| Number of Days Bid/Ask Midpoint Below NAV |
| For the Period | 0.00%-0.49% | 0.50%-0.99% | 1.00%-1.99% | >=2.00% |
| 01/12/17 – 10/31/17 | 0 | 0 | 0 | 0 |
| 11/01/17 – 10/31/18 | 11 | 0 | 0 | 0 |
| 11/01/18 – 10/31/19 | 106 | 0 | 0 | 0 |
| DAVIS FUNDAMENTAL ETF TRUST | Fund Overview |
| DAVIS SELECT FINANCIAL ETF - (CONTINUED) | October 31, 2019 |
New Positions Added (11/01/18-10/31/19)
(Highlighted positions are those greater than 4.00% of the Fund’s 10/31/19 net assets)
| Security | Industry | Date of 1st Purchase | % of Fund’s 10/31/19 Net Assets |
Bank of America Corp. | Banks | 01/29/19 | 4.83% |
Metro Bank PLC | Banks | 04/23/19 | 0.52% |
Positions Closed (11/01/18-10/31/19)
(Gains greater than $900,000 are highlighted)
| Security | Industry | Date of Final Sale | Realized Gain |
Blackstone Group L.P. | Capital Markets | 04/17/19 | $ | 72,450 |
Oaktree Capital Group LLC, Class A | Capital Markets | 03/15/19 | | 529,215 |
Visa Inc., Class A | Diversified Financial Services | 04/30/19 | | 923,133 |
| DAVIS FUNDAMENTAL ETF TRUST | |
| DAVIS SELECT WORLDWIDE ETF | October 31, 2019 |
| Portfolio Composition | | Industry Weightings |
| (% of Fund’s 10/31/19 Net Assets) | | (% of 10/31/19 Stock Holdings) |
| | | | | | | |
| | | | | | | MSCI |
| | | | | Fund | | ACWI® |
Common Stock (Foreign) | 52.73% | | Retailing | 21.18% | | 5.08% |
Common Stock (U.S.) | 44.58% | | Banks | 13.92% | | 8.93% |
Short-Term Investments | 2.62% | | Diversified Financials | 12.29% | | 3.98% |
Other Assets & Liabilities | 0.07% | | Media & Entertainment | 11.76% | | 5.79% |
| | 100.00% | | Capital Goods | 9.20% | | 7.12% |
| | | | Consumer Services | 8.88% | | 1.72% |
| | | | Information Technology | 8.78% | | 16.54% |
| | | | Insurance | 5.94% | | 3.84% |
| | | | Energy | 4.59% | | 5.30% |
| | | | Transportation | 1.88% | | 2.13% |
| | | | Automobiles & Components | 1.58% | | 1.95% |
| | | | Health Care | – | | 11.57% |
| | | | Other | – | | 26.05% |
| | | | | 100.00% | | 100.00% |
| Country Diversification | | Top 10 Long-Term Holdings |
| (% of 10/31/19 Stock Holdings) | | (% of Fund’s 10/31/19 Net Assets) |
| | | | | |
United States | 45.81% | | New Oriental Education & Technology Group, Inc., ADR | 8.64% |
China | 25.28% | | Alphabet Inc., Class C | 7.02% |
United Kingdom | 5.59% | | Amazon.com, Inc. | 5.73% |
Singapore | 3.39% | | Alibaba Group Holding Ltd., ADR | 5.47% |
Brazil | 3.38% | | JD.com, Inc., Class A, ADR | 5.36% |
South Africa | 3.25% | | Wells Fargo & Co. | 5.20% |
Canada | 3.19% | | Ferguson PLC | 4.88% |
Hong Kong | 2.57% | | Capital One Financial Corp. | 4.77% |
Bermuda | 1.96% | | Berkshire Hathaway Inc., Class B | 4.70% |
India | 1.88% | | United Technologies Corp. | 4.08% |
Denmark | 1.56% | | | |
Norway | 1.09% | | | |
Switzerland | 1.05% | | | |
| | 100.00% | | | |
Frequency Distribution of Discounts and Premiums
Bid/Ask Midpoint versus NAV through October 31, 2019
The following Frequency Distribution of Discounts and Premiums tables are provided to show the frequency at which the bid/ask midpoint price for the Fund was at a discount or premium to the daily NAV. The following tables are for comparative purposes only and represent the period January 12, 2017 (commencement of trading) through October 31, 2019. Shareholders may pay more than NAV when they buy Fund shares and receive less than NAV when they sell those shares because shares are bought and sold at current market price. Data presented represents past performance and cannot be used to predict future results.
| Number of Days Bid/Ask Midpoint At/Above NAV |
| For the Period | 0.00%-0.49% | 0.50%-0.99% | 1.00%-1.99% | >=2.00% |
| 01/12/17 – 10/31/17 | 194 | 6 | 0 | 1 |
| 11/01/17 – 10/31/18 | 232 | 1 | 0 | 0 |
| 11/01/18 – 10/31/19 | 147 | 0 | 0 | 0 |
| Number of Days Bid/Ask Midpoint Below NAV |
| For the Period | 0.00%-0.49% | 0.50%-0.99% | 1.00%-1.99% | >=2.00% |
| 01/12/17 – 10/31/17 | 2 | 0 | 0 | 0 |
| 11/01/17 – 10/31/18 | 19 | 0 | 0 | 0 |
| 11/01/18 – 10/31/19 | 104 | 0 | 0 | 0 |
| DAVIS FUNDAMENTAL ETF TRUST | Fund Overview |
| DAVIS SELECT WORLDWIDE ETF - (CONTINUED) | October 31, 2019 |
New Positions Added (11/01/18-10/31/19)
(Highlighted positions are those greater than 1.50% of the Fund’s 10/31/19 net assets)
| Security | Industry | Date of 1st Purchase | % of Fund’s 10/31/19 Net Assets |
AIA Group Ltd. | Life & Health Insurance | 06/19/19 | 2.50% |
CVS Health Corp. | Health Care Equipment & Services | 11/29/18 | – |
Intel Corp. | Semiconductors & Semiconductor | | |
| | Equipment | 05/23/19 | 1.92% |
iQIYI, Inc., Class A, ADR | Media & Entertainment | 12/03/18 | – |
Julius Baer Group Ltd. | Capital Markets | 04/10/19 | 1.03% |
Metro Bank PLC | Banks | 04/23/19 | 0.56% |
Positions Closed (11/01/18-10/31/19)
(Gains and losses greater than $800,000 are highlighted)
| Security | Industry | Date of Final Sale | Realized Gain (Loss) |
Aetna Inc. | Health Care Equipment & Services | 11/29/18 | $ | 1,211,024 |
CAR Inc. | Transportation | 02/11/19 | | (68,760) |
China Index Holdings Ltd., ADR | Commercial & Professional Services | 06/13/19 | | (25,079) |
CVS Health Corp. | Health Care Equipment & Services | 11/30/18 | | (11,221) |
General Electric Co. | Capital Goods | 02/25/19 | | (959,302) |
iQIYI, Inc., Class A, ADR | Media & Entertainment | 06/18/19 | | (304,284) |
LafargeHolcim Ltd. | Materials | 07/03/19 | | (617,101) |
MultiChoice Group Ltd. | Media & Entertainment | 03/08/19 | | 42,802 |
Prosus N.V., Class N | Retailing | 10/29/19 | | 48,219 |
Shire PLC, ADR | Pharmaceuticals, Biotechnology & | | | |
| | Life Sciences | 01/04/19 | | 827,051 |
Tarena International, Inc., Class A, ADR | Consumer Services | 07/31/19 | | (3,603,135) |
| DAVIS FUNDAMENTAL ETF TRUST | |
| DAVIS SELECT INTERNATIONAL ETF | October 31, 2019 |
| Portfolio Composition | | Industry Weightings |
| (% of Fund’s 10/31/19 Net Assets) | | (% of 10/31/19 Stock Holdings) |
| | | | | | | |
| | | | | | | MSCI |
| | | | | | | ACWI® |
| | | | | Fund | | EX USA |
Common Stock (Foreign) | 92.09% | | Retailing | 22.66% | | 3.43% |
Short-Term Investments | 7.56% | | Capital Goods | 16.20% | | 7.85% |
Other Assets & Liabilities | 0.35% | | Banks | 15.44% | | 13.13% |
| | 100.00% | | Consumer Services | 13.04% | | 1.47% |
| | | | Insurance | 8.65% | | 5.32% |
| | | | Diversified Financials | 5.45% | | 3.10% |
| | | | Energy | 4.98% | | 6.61% |
| | | | Transportation | 4.33% | | 2.71% |
| | | | Health Care | 3.78% | | 8.69% |
| | | | Information Technology | 3.26% | | 9.01% |
| | | | Media & Entertainment | 2.21% | | 2.75% |
| | | | Materials | – | | 7.27% |
| | | | Other | – | | 28.66% |
| | | | | 100.00% | | 100.00% |
| Country Diversification | | Top 10 Long-Term Holdings |
| (% of 10/31/19 Stock Holdings) | | (% of Fund’s 10/31/19 Net Assets) |
| | | | | |
China | 39.30% | | New Oriental Education & Technology Group, Inc., ADR | 12.00% |
France | 9.43% | | Alibaba Group Holding Ltd., ADR | 7.37% |
Switzerland | 7.12% | | Ferguson PLC | 5.26% |
United Kingdom | 6.31% | | JD.com, Inc., Class A, ADR | 4.81% |
Brazil | 5.43% | | Schneider Electric SE | 4.75% |
Singapore | 5.05% | | DBS Group Holdings Ltd. | 4.65% |
Canada | 4.98% | | Sul America S.A. | 4.15% |
Hong Kong | 4.14% | | Safran S.A. | 3.94% |
South Africa | 3.97% | | AIA Group Ltd. | 3.81% |
Norway | 3.86% | | Meituan Dianping, Class B | 3.75% |
Bermuda | 3.60% | | | |
India | 3.42% | | | |
Denmark | 2.33% | | | |
Germany | 1.06% | | | |
| | 100.00% | | | |
Frequency Distribution of Discounts and Premiums
Bid/Ask Midpoint versus NAV through October 31, 2019
The following Frequency Distribution of Discounts and Premiums tables are provided to show the frequency at which the bid/ask midpoint price for the Fund was at a discount or premium to the daily NAV. The following tables are for comparative purposes only and represent the period March 2, 2018 (commencement of trading) through October 31, 2019. Shareholders may pay more than NAV when they buy Fund shares and receive less than NAV when they sell those shares because shares are bought and sold at current market price. Data presented represents past performance and cannot be used to predict future results.
| Number of Days Bid/Ask Midpoint At/Above NAV |
| For the Period | 0.00%-0.49% | 0.50%-0.99% | 1.00%-1.99% | >=2.00% |
| 03/02/18 – 10/31/18 | 140 | 21 | 0 | 0 |
| 11/01/18 – 10/31/19 | 219 | 10 | 0 | 0 |
| Number of Days Bid/Ask Midpoint Below NAV |
| For the Period | 0.00%-0.49% | 0.50%-0.99% | 1.00%-1.99% | >=2.00% |
| 03/02/18 – 10/31/18 | 9 | 0 | 0 | 0 |
| 11/01/18 – 10/31/19 | 22 | 0 | 0 | 0 |
| DAVIS FUNDAMENTAL ETF TRUST | Fund Overview |
| DAVIS SELECT INTERNATIONAL ETF - (CONTINUED) | October 31, 2019 |
New Positions Added (11/01/18-10/31/19)
(Highlighted positions are those greater than 3.00% of the Fund’s 10/31/19 net assets)
| Security | Industry | Date of 1st Purchase | % of Fund’s 10/31/19 Net Assets |
AIA Group Ltd. | Life & Health Insurance | 06/19/19 | 3.81% |
iQIYI, Inc., Class A, ADR | Media & Entertainment | 12/03/18 | 1.24% |
Meituan Dianping, Class B | Retailing | 07/18/19 | 3.75% |
Metro Bank PLC | Banks | 04/23/19 | 0.56% |
Takeda Pharmaceutical Co. Ltd., ADR | Pharmaceuticals, Biotechnology & | | |
| | Life Sciences | 01/09/19 | -– |
Positions Closed (11/01/18-10/31/19)
(Gains and losses greater than $190,000 are highlighted)
| Security | Industry | Date of Final Sale | Realized Gain (Loss) |
Alcon Inc. | Healthcare Equipment & Services | 04/11/19 | $ | 25,306 |
CAR Inc. | Transportation | 02/11/19 | | (18,988) |
China Index Holdings Ltd., ADR | Commercial & Professional Services | 06/13/19 | | (86,699) |
LafargeHolcim Ltd. | Materials | 07/03/19 | | 31,542 |
MultiChoice Group Ltd. | Media & Entertainment | 03/26/19 | | 45,550 |
Prosus N.V., Class N | Retailing | 10/29/19 | | (4,714) |
Shire PLC, ADR | Pharmaceuticals, Biotechnology & | | | |
| | Life Sciences | 01/09/19 | | 196,105 |
Takeda Pharmaceutical Co. Ltd., ADR | Pharmaceuticals, Biotechnology & | | | |
| | Life Sciences | 01/11/19 | | 22 |
Tarena International, Inc., Class A, ADR | Consumer Services | 07/31/19 | | (2,528,238) |
ZTO Express (Cayman) Inc., Class A, ADR | Transportation | 06/17/19 | | 112,557 |
| DAVIS FUNDAMENTAL ETF TRUST | |
As a shareholder of each Fund, you incur two types of costs: (1) transaction costs for purchasing and selling shares; and (2) ongoing costs, including advisory and administrative fees and other Fund expenses. The Expense Example is intended to help you understand your ongoing costs (in dollars) of investing in each Fund and to compare these costs with the ongoing costs of investing in other funds. The Expense Example is based on an investment of $1,000 invested at the beginning of the period and held for the entire period indicated, which for each Fund is for the six-month period ended October 31, 2019.
Actual Expenses
The information represented in the row entitled “Actual” provides information about actual account values and actual expenses. You may use the information in this row, together with the amount you invested, to estimate the expenses that you paid over the period. Simply divide your account value by $1,000 (for example, an $8,600 account value divided by $1,000 = 8.6), then multiply the result by the number under the heading “Expenses Paid During Period” to estimate the expenses you paid on your account during this period.
Hypothetical Example for Comparison Purposes
The information represented in the row entitled “Hypothetical” provides information about hypothetical account values and hypothetical expenses based on each Fund’s actual expense ratio and an assumed rate of return of 5% per year before expenses, which is not the Fund’s actual return. The hypothetical account values and expenses may not be used to estimate the actual ending account balance or expenses you paid for the period. You may use this information to compare the ongoing costs of investing in the Fund and other funds. To do so, compare this 5% hypothetical example with the 5% hypothetical examples that appear in the shareholder reports of the other funds.
Please note that the expenses shown in the table are meant to highlight your ongoing costs only and do not reflect any transactional costs, such as brokerage commissions paid on purchases and sales of Fund shares or annual fees to financial intermediaries. Therefore, the information in the row entitled “Hypothetical” is useful in comparing ongoing costs only, and will not help you determine the relative total costs of owning different funds. In addition, if these transactional costs or annual fees were included, your costs would be higher.
| | Beginning | | Ending | | Expenses Paid |
| | Account Value | | Account Value | | During Period* |
| | (05/01/19) | | (10/31/19) | | (05/01/19-10/31/19) |
Davis Select U.S. Equity ETF | | | | | |
| (annualized expense ratio 0.62%**) | | | | | |
| Actual | $1,000.00 | | $1,017.29 | | $3.15 |
| Hypothetical | $1,000.00 | | $1,022.08 | | $3.16 |
Davis Select Financial ETF | | | | | |
| (annualized expense ratio 0.64%**) | | | | | |
| Actual | $1,000.00 | | $1,022.58 | | $3.26 |
| Hypothetical | $1,000.00 | | $1,021.98 | | $3.26 |
Davis Select Worldwide ETF | | | | | |
| (annualized expense ratio 0.63%**) | | | | | |
| Actual | $1,000.00 | | $960.68 | | $3.11 |
| Hypothetical | $1,000.00 | | $1,022.03 | | $3.21 |
Davis Select International ETF | | | | | |
| (annualized expense ratio 0.68%**) | | | | | |
| Actual | $1,000.00 | | $953.79 | | $3.35 |
| Hypothetical | $1,000.00 | | $1,021.78 | | $3.47 |
| | | | | | |
| Hypothetical assumes 5% annual return before expenses. |
| |
| *Expenses are equal to each Fund’s annualized operating expense ratio, multiplied by the average account value over the period, multiplied by 184/365 (to reflect the one-half year period). |
| |
| **The expense ratios reflect the impact, if any, of certain reimbursements and/or waivers from the Adviser. |
| DAVIS FUNDAMENTAL ETF TRUST | |
| DAVIS SELECT U.S. EQUITY ETF | October 31, 2019 |
| | Shares | | Value
(Note 1) |
COMMON STOCK – (98.92%) |
| | COMMUNICATION SERVICES – (14.05%) |
| | | Media & Entertainment – (14.05%) |
| | | | | | | | | | |
| | Facebook, Inc., Class A * | | | | | | |
| | | | Total Communication Services | | | |
| | CONSUMER DISCRETIONARY – (19.83%) |
| | Automobiles & Components – (0.89%) |
| | | | | | | | |
| | Consumer Services – (6.70%) |
| | New Oriental Education & Technology Group, Inc., ADR (China)* | | | | | | |
| | Retailing – (12.24%) |
| | Alibaba Group Holding Ltd., ADR (China)* | | | | | | |
| | | | | | | | |
| | Naspers Ltd. - N (South Africa) | | | | | | |
| | | | 25,276,083 |
| | Total Consumer Discretionary | | | |
| | ENERGY – (2.80%) |
| | | | | | | | |
| | | | | | | | |
| | | | | |
| | FINANCIALS – (46.71%) |
| | Banks – (16.09%) |
| | | | | | | | |
| | DBS Group Holdings Ltd. (Singapore) | | | | | | |
| | | | | | | | |
| | | | | | | | |
| | | | | | | | |
| | | | 33,228,765 |
| | Diversified Financials – (24.40%) |
| | Capital Markets – (3.52%) |
| | Bank of New York Mellon Corp. | | | | | | |
| | Consumer Finance – (10.82%) |
| | | | | | | | |
| | Capital One Financial Corp. | | | | | | |
| | | 22,352,892 |
| | Diversified Financial Services – (10.06%) |
| | Berkshire Hathaway Inc., Class B * | | | | | | |
| | | | 50,394,855 |
| | Insurance – (6.22%) |
| | Life & Health Insurance – (2.38%) |
| | AIA Group Ltd. (Hong Kong) | | | | | | |
| | Property & Casualty Insurance – (3.84%) |
| | | | | | | | |
| | | | 12,844,068 |
| | | | | |
| | HEALTH CARE – (2.94%) |
| | Health Care Equipment & Services – (2.94%) |
| | | | | | | | |
| DAVIS FUNDAMENTAL ETF TRUST | Schedule of Investments |
| DAVIS SELECT U.S. EQUITY ETF - (CONTINUED) | October 31, 2019 |
| | Shares/Principal | | Value
(Note 1) |
| COMMON STOCK – (CONTINUED) |
| | HEALTH CARE – (CONTINUED) |
| | | Health Care Equipment & Services – (Continued) |
| | | | | | | | | | |
| | | | | | | | |
| | INDUSTRIALS – (10.72%) |
| | Capital Goods – (10.72%) |
| | Ferguson PLC (United Kingdom) | | | | | | |
| | United Technologies Corp. | | | | | | |
| | | | | |
| | INFORMATION TECHNOLOGY – (1.87%) |
| | Semiconductors & Semiconductor Equipment – (1.87%) |
| | | | | | | | |
| | Total Information Technology | | | |
| | TOTAL COMMON STOCK – (Identified cost $180,504,064)
| | | 204,306,89 |
SHORT-TERM INVESTMENTS – (1.01%) |
| | INTL FCStone Financial Inc. Joint Repurchase Agreement, 1.79%, 11/01/19, dated 10/31/19, repurchase value of $926,046 (collateralized by: U.S. Government agency mortgages and obligations in a pooled cash account, 1.50%-6.00%, 12/28/20-11/01/49, total market value $944,520) | | | | | | |
| | Nomura Securities International, Inc. Joint Repurchase Agreement, 1.74%, 11/01/19, dated 10/31/19, repurchase value of $244,012 (collateralized by: U.S. Government agency mortgages in a pooled cash account, 2.96%-4.00%, 09/01/33-08/01/49, total market value $248,880) | | | | | | |
| | SunTrust Robinson Humphrey, Inc. Joint Repurchase Agreement, 1.79%, 11/01/19, dated 10/31/19, repurchase value of $926,046 (collateralized by: U.S. Government agency mortgages in a pooled cash account, 2.50%-5.00%, 10/01/34-10/01/49, total market value $944,520) | | | | | | |
| | TOTAL SHORT-TERM INVESTMENTS – (Identified cost $2,096,000)
| | | |
| |
Total Investments – (99.93%) – (Identified cost $182,600,064) | | | 206,402,890 |
| | Other Assets Less Liabilities – (0.07%) | | | 137,971 |
| | Net Assets – (100.00%) | | $ | 206,540,861 |
| |
| | ADR: American Depositary Receipt |
| |
| | * | Non-income producing security. |
| |
| See Notes to Financial Statements |
| DAVIS FUNDAMENTAL ETF TRUST | |
| DAVIS SELECT FINANCIAL ETF | October 31, 2019 |
| | Shares | | Value
(Note 1) |
COMMON STOCK – (99.68%) |
| | COMMUNICATION SERVICES – (3.24%) |
| | | Media & Entertainment – (3.24%) |
| | | | | | | | | | |
| | | | Total Communication Services | | | |
| | FINANCIALS – (96.44%) |
| | Banks – (38.94%) |
| | | | | | | | |
| | Bank of N.T. Butterfield & Son Ltd. (Bermuda) | | | | | | |
| | Danske Bank A/S (Denmark) | | | | | | |
| | DBS Group Holdings Ltd. (Singapore) | | | | | | |
| | | | | | | | |
| | | | | | | | |
| | Metro Bank PLC (United Kingdom)* | | | | | | |
| | PNC Financial Services Group, Inc. | | | | | | |
| | | | | | | | |
| | | | | | | | |
| | | | 56,403,324 |
| | Diversified Financials – (39.19%) |
| | Capital Markets – (18.12%) |
| | Bank of New York Mellon Corp. | | | | | | |
| | | | | | | | |
| | Goldman Sachs Group, Inc. | | | | | | |
| | Julius Baer Group Ltd. (Switzerland) | | | | | | |
| | | | | | | | |
| | | | | | | | |
| | | 26,247,944 |
| | Consumer Finance – (13.33%) |
| | | | | | | | |
| | Capital One Financial Corp. | | | | | | |
| | | 19,303,300 |
| | Diversified Financial Services – (7.74%) |
| | Berkshire Hathaway Inc., Class B * | | | | | | |
| | | | 56,762,288 |
| | Insurance – (18.31%) |
| | Property & Casualty Insurance – (11.82%) |
| | | | | | | | |
| | | | | | | | |
| | | | | | | | |
| | | 17,126,189 |
| | Reinsurance – (6.49%) |
| | | | | | | | |
| | | | | | | | |
| | Greenlight Capital Re, Ltd., Class A * | | | | | | |
| DAVIS FUNDAMENTAL ETF TRUST | Schedule of Investments |
| DAVIS SELECT FINANCIAL ETF - (CONTINUED) | October 31, 2019 |
| | Shares/Principal | | Value
(Note 1) |
| COMMON STOCK – (CONTINUED) |
| | FINANCIALS – (CONTINUED) |
| | | Insurance – (Continued) |
| | | | Reinsurance – (Continued) |
| | | | Swiss Re AG (Switzerland) | | | | | | |
| | | 9,404,994 |
| | | | 26,531,183 |
| | | | | | | | | |
| | TOTAL COMMON STOCK – (Identified cost $137,452,860)
| | | |
SHORT-TERM INVESTMENTS – (0.26%) |
| | INTL FCStone Financial Inc. Joint Repurchase Agreement, 1.79%, 11/01/19, dated 10/31/19, repurchase value of $166,008 (collateralized by: U.S. Government agency mortgages and obligations in a pooled cash account, 1.50%-6.00%, 12/28/20-11/01/49, total market value $169,320) | | | | | | |
| | Nomura Securities International, Inc. Joint Repurchase Agreement, 1.74%, 11/01/19, dated 10/31/19, repurchase value of $44,002 (collateralized by: U.S. Government agency mortgages in a pooled cash account, 2.74%-4.00%, 09/01/29-08/01/49, total market value $44,880) | | | | | | |
| | SunTrust Robinson Humphrey, Inc. Joint Repurchase Agreement, 1.79%, 11/01/19, dated 10/31/19, repurchase value of $166,008 (collateralized by: U.S. Government agency mortgages in a pooled cash account, 2.50%-5.00%, 01/01/44-10/01/49, total market value $169,320) | | | | | | |
| | TOTAL SHORT-TERM INVESTMENTS – (Identified cost $376,000)
| | | |
| |
Total Investments – (99.94%) – (Identified cost $137,828,860) | | | 144,762,924 |
| | Other Assets Less Liabilities – (0.06%) | | | 89,462 |
| | Net Assets – (100.00%) | | $ | 144,852,386 |
| |
| | * | Non-income producing security. |
| |
| See Notes to Financial Statements |
| DAVIS FUNDAMENTAL ETF TRUST | |
| DAVIS SELECT WORLDWIDE ETF | October 31, 2019 |
| | Shares | | Value
(Note 1) |
COMMON STOCK – (97.31%) |
| | COMMUNICATION SERVICES – (11.44%) |
| | | Media & Entertainment – (11.44%) |
| | | | | | | | | | |
| | Baidu, Inc., Class A, ADR (China)* | | | | | | |
| | Facebook, Inc., Class A * | | | | | | |
| | Fang Holdings Ltd., Class A, ADR (China)* | | | | | | |
| | | | Total Communication Services | | | |
| | CONSUMER DISCRETIONARY – (30.78%) |
| | Automobiles & Components – (1.53%) |
| | | | | | | | |
| | Consumer Services – (8.64%) |
| | New Oriental Education & Technology Group, Inc., ADR (China)* | | | | | | |
| | Retailing – (20.61%) |
| | Alibaba Group Holding Ltd., ADR (China)* | | | | | | |
| | | | | | | | |
| | JD.com, Inc., Class A, ADR (China)* | | | | | | |
| | Naspers Ltd. - N (South Africa) | | | | | | |
| | Quotient Technology Inc. * | | | | | | |
| | | | 46,413,056 |
| | Total Consumer Discretionary | | | |
| | ENERGY – (4.47%) |
| | | | | | | | |
| | | | | | | | |
| | Seven Generations Energy Ltd., Class A (Canada)* | | | | | | |
| | | | | |
| | FINANCIALS – (31.29%) |
| | Banks – (13.55%) |
| | Bank of N.T. Butterfield & Son Ltd. (Bermuda) | | | | | | |
| | Danske Bank A/S (Denmark) | | | | | | |
| | DBS Group Holdings Ltd. (Singapore) | | | | | | |
| | | | | | | | |
| | Metro Bank PLC (United Kingdom)* | | | | | | |
| | | | | | | | |
| | | | 30,505,556 |
| | Diversified Financials – (11.96%) |
| | Capital Markets – (2.08%) |
| | Julius Baer Group Ltd. (Switzerland) | | | | | | |
| | Noah Holdings Ltd., ADS (China)* | | | | | | |
| | | 4,672,682 |
| | Consumer Finance – (5.18%) |
| | Capital One Financial Corp. | | | | | | |
| | Yiren Digital Ltd., ADR (China)* | | | | | | |
| | | 11,668,207 |
| | Diversified Financial Services – (4.70%) |
| | Berkshire Hathaway Inc., Class B * | | | | | | |
| | | | 26,935,876 |
| DAVIS FUNDAMENTAL ETF TRUST | Schedule of Investments |
| DAVIS SELECT WORLDWIDE ETF - (CONTINUED) | October 31, 2019 |
| | Shares/Units/ Principal | | Value
(Note 1) |
| COMMON STOCK – (CONTINUED) |
| | FINANCIALS – (CONTINUED) |
| | | Insurance – (5.78%) |
| | | Life & Health Insurance – (2.50%) |
| | | AIA Group Ltd. (Hong Kong) | | | | | | |
| | Multi-line Insurance – (3.28%) |
| | Sul America S.A. (Brazil) | | | | | | |
| | | | 13,019,431 |
| | | | | | | | |
| | INDUSTRIALS – (10.79%) |
| | Capital Goods – (8.96%) |
| | Ferguson PLC (United Kingdom) | | | | | | |
| | United Technologies Corp. | | | | | | |
| | | | 20,169,543 |
| | Transportation – (1.83%) |
| | InterGlobe Aviation Ltd. (India) | | | | | | |
| | | | | |
| | INFORMATION TECHNOLOGY – (8.54%) |
| | Semiconductors & Semiconductor Equipment – (5.37%) |
| | | | | | | | |
| | | | | | | | |
| | | | 12,090,660 |
| | Technology Hardware & Equipment – (3.17%) |
| | Hollysys Automation Technologies Ltd. (China) | | | | | | |
| | Total Information Technology | | | |
| | TOTAL COMMON STOCK – (Identified cost $224,342,877)
| | | |
SHORT-TERM INVESTMENTS – (2.62%) |
| | INTL FCStone Financial Inc. Joint Repurchase Agreement, 1.79%, 11/01/19, dated 10/31/19, repurchase value of $2,604,129 (collateralized by: U.S. Government agency mortgages and obligations in a pooled cash account, 1.50%-6.00%, 12/28/20-11/01/49, total market value $2,656,080) | | | | | | |
| | Nomura Securities International, Inc. Joint Repurchase Agreement, 1.74%, 11/01/19, dated 10/31/19, repurchase value of $687,033 (collateralized by: U.S. Government agency mortgages in a pooled cash account, 3.50%-4.50%, 03/01/49-10/01/49, total market value $700,740) | | | | | | |
| | SunTrust Robinson Humphrey, Inc. Joint Repurchase Agreement, 1.79%, 11/01/19, dated 10/31/19, repurchase value of $2,604,129 (collateralized by: U.S. Government agency mortgages in a pooled cash account, 2.50%-5.00%, 10/01/34-10/01/49, total market value $2,656,080) | | | | | | |
| | TOTAL SHORT-TERM INVESTMENTS – (Identified cost $5,895,000)
| | | 5,895,000 |
| DAVIS FUNDAMENTAL ETF TRUST | Schedule of Investments |
| DAVIS SELECT WORLDWIDE ETF - (CONTINUED) | October 31, 2019 |
| | Total Investments – (99.93%) – (Identified cost $230,237,877) | | $ | 225,047,616 |
| | Other Assets Less Liabilities – (0.07%) | | | 151,261 |
| | Net Assets – (100.00%) | | $ | 225,198,877 |
| |
| | ADR: American Depositary Receipt |
| |
| | ADS: American Depositary Share |
| |
| | * | Non-income producing security. |
| |
| See Notes to Financial Statements |
| DAVIS FUNDAMENTAL ETF TRUST | |
| DAVIS SELECT INTERNATIONAL ETF | October 31, 2019 |
| | Shares/Units | | Value
(Note 1) |
COMMON STOCK – (92.09%) |
| | COMMUNICATION SERVICES – (2.04%) |
| | | Media & Entertainment – (2.04%) |
| | | | Baidu, Inc., Class A, ADR (China)* | | | | | | |
| | Fang Holdings Ltd., Class A, ADR (China)* | | | | | | |
| | iQIYI, Inc., Class A, ADR (China)* | | | | | | |
| | | | Total Communication Services | | | |
| | CONSUMER DISCRETIONARY – (32.87%) |
| | Consumer Services – (12.00%) |
| | New Oriental Education & Technology Group, Inc., ADR (China)* | | | | | | |
| | Retailing – (20.87%) |
| | Alibaba Group Holding Ltd., ADR (China)* | | | | | | |
| | JD.com, Inc., Class A, ADR (China)* | | | | | | |
| | Meituan Dianping, Class B (China)* | | | | | | |
| | Naspers Ltd. - N (South Africa) | | | | | | |
| | Trip.com Group Ltd., ADR (China)* | | | | | | |
| | | | 27,878,259 |
| | Total Consumer Discretionary | | | |
| | ENERGY – (4.59%) |
| | | | | | | | |
| | Seven Generations Energy Ltd., Class A (Canada)* | | | | | | |
| | | | | |
| | FINANCIALS – (27.20%) |
| | Banks – (14.22%) |
| | Bank of N.T. Butterfield & Son Ltd. (Bermuda) | | | | | | |
| | Danske Bank A/S (Denmark) | | | | | | |
| | DBS Group Holdings Ltd. (Singapore) | | | | | | |
| | | | | | | | |
| | Metro Bank PLC (United Kingdom)* | | | | | | |
| | | | 18,998,399 |
| | Diversified Financials – (5.02%) |
| | Capital Markets – (4.49%) |
| | Julius Baer Group Ltd. (Switzerland) | | | | | | |
| | Noah Holdings Ltd., ADS (China)* | | | | | | |
| | | 5,995,228 |
| | Consumer Finance – (0.53%) |
| | Yiren Digital Ltd., ADR (China)* | | | | | | |
| | | | 6,707,116 |
| | Insurance – (7.96%) |
| | Life & Health Insurance – (3.81%) |
| | AIA Group Ltd. (Hong Kong) | | | | | | |
| | Multi-line Insurance – (4.15%) |
| | Sul America S.A. (Brazil) | | | | | | |
| | | | 10,640,826 |
| | | | | |
| | HEALTH CARE – (3.48%) |
| | Pharmaceuticals, Biotechnology & Life Sciences – (3.48%) |
| | Novartis AG, ADR (Switzerland) | | | | | | |
| DAVIS FUNDAMENTAL ETF TRUST | Schedule of Investments |
| DAVIS SELECT INTERNATIONAL ETF - (CONTINUED) | October 31, 2019 |
| | Shares/Principal | | Value
(Note 1) |
| COMMON STOCK – (CONTINUED) |
| | HEALTH CARE – (CONTINUED) |
| | | Pharmaceuticals, Biotechnology & Life Sciences – (Continued) |
| | | | Roche Holding AG - Genusschein (Switzerland) | | | | | | |
| | | | | | | | | |
| | INDUSTRIALS – (18.91%) |
| | Capital Goods – (14.92%) |
| | | | | | | | |
| | Ferguson PLC (United Kingdom) | | | | | | |
| | | | | | | | |
| | Schneider Electric SE (France) | | | | | | |
| | | | 19,938,407 |
| | Transportation – (3.99%) |
| | | | | | | | |
| | InterGlobe Aviation Ltd. (India) | | | | | | |
| | | | 5,327,764 |
| | | | | |
| | INFORMATION TECHNOLOGY – (3.00%) |
| | Technology Hardware & Equipment – (3.00%) |
| | Hollysys Automation Technologies Ltd. (China) | | | | | | |
| | Total Information Technology | | | |
| | TOTAL COMMON STOCK – (Identified cost $119,956,031)
| | | |
SHORT-TERM INVESTMENTS – (7.56%) |
| | INTL FCStone Financial Inc. Joint Repurchase Agreement, 1.79%, 11/01/19, dated 10/31/19, repurchase value of $4,462,222 (collateralized by: U.S. Government agency mortgages and obligations in a pooled cash account, 1.50%-6.00%, 12/28/20-11/01/49, total market value $4,551,240) | | | | | | |
| | Nomura Securities International, Inc. Joint Repurchase Agreement, 1.74%, 11/01/19, dated 10/31/19, repurchase value of $1,176,057 (collateralized by: U.S. Government agency mortgages in a pooled cash account, 3.00%-7.50%, 10/01/26-10/01/49, total market value $1,199,520) | | | | | | |
| | SunTrust Robinson Humphrey, Inc. Joint Repurchase Agreement, 1.79%, 11/01/19, dated 10/31/19, repurchase value of $4,462,222 (collateralized by: U.S. Government agency mortgages in a pooled cash account, 2.50%-5.00%, 10/01/34-10/01/49, total market value $4,551,240) | | | | | | |
| | TOTAL SHORT-TERM INVESTMENTS – (Identified cost $10,100,000)
| | | |
| |
Total Investments – (99.65%) – (Identified cost $130,056,031) | | | 133,143,895 |
| | Other Assets Less Liabilities – (0.35%) | | | 464,644 |
| | Net Assets – (100.00%) | | $ | 133,608,539 |
| |
| | ADR: American Depositary Receipt |
| |
| | ADS: American Depositary Share |
| |
| | * | Non-income producing security. |
| |
| See Notes to Financial Statements |
| DAVIS FUNDAMENTAL ETF TRUST | Statements of Assets and Liabilities |
| | At October 31, 2019 |
| | | | Davis Select U.S. Equity ETF | | | Davis Select Financial ETF | | | Davis Select Worldwide ETF | | | Davis Select International ETF |
ASSETS: | | | | | | | | | | |
Investments in securities at value* (see accompanying Schedules of Investments) | | $ | 206,402,890 | | $ | 144,762,924 | | $ | 225,047,616 | | $ | 133,143,895 |
Cash | | | 993 | | | 850 | | | 854 | | | 588 |
| Receivables: | | | | | | | | | | | | | | |
| | Capital stock sold | | | – | | | – | | | – | | | 1,798,919 |
| | Dividends and interest | | | 279,274 | | | 194,790 | | | 387,129 | | | 291,201 |
Prepaid expenses | | | 1,046 | | | 841 | | | 1,170 | | | 555 |
| | | Total assets | | | 206,684,203 | | | 144,959,405 | | | 225,436,769 | | | 135,235,158 |
LIABILITIES: | | | | | | | | | | |
| Payables: | | | | | | | | | | | | | | |
| | Deferred foreign taxes | | | – | | | – | | | 81,624 | | | 136,398 |
| | Investment securities purchased | | | – | | | – | | | – | | | 1,380,042 |
Accrued audit fees | | | 13,219 | | | 13,219 | | | 13,219 | | | 11,456 |
Accrued accounting, custodian, and transfer agent fees | | | 14,300 | | | 15,000 | | | 22,700 | | | 18,700 |
Accrued investment advisory fees | | | 96,779 | | | 67,803 | | | 106,374 | | | 61,004 |
Accrued registration and filing fees | | | 7,291 | | | 199 | | | 507 | | | 8,070 |
Other accrued expenses | | | 11,753 | | | 10,798 | | | 13,468 | | | 10,949 |
| | Total liabilities | | | 143,342 | | | 107,019 | | | 237,892 | | | 1,626,619 |
NET ASSETS | | $ | 206,540,861 | | $ | 144,852,386 | | $ | 225,198,877 | | $ | 133,608,539 |
SHARES OUTSTANDING | | | 8,400,000 | | | 5,950,000 | | | 9,550,000 | | | 7,450,000 |
NET ASSET VALUE, per share (Net assets ÷ Shares outstanding) | | $ | 24.59 | | $ | 24.34 | | $ | 23.58 | | $ | 17.93 |
NET ASSETS CONSIST OF: | | | | | | | | | | |
Paid-in capital | | $ | 182,470,583 | | $ | 134,544,924 | | $ | 240,190,658 | | $ | 132,973,405 |
| | | | | | | | | | | | |
Distributable earnings (losses)** | | | 24,070,278 | | | 10,307,462 | | | (14,991,781) | | | 635,134 |
| | Net Assets | | $ | 206,540,861 | | $ | 144,852,386 | | $ | 225,198,877 | | $ | 133,608,539 |
| | | | | | | | | | | | |
| *Including: | | | | | | | | | | |
| | Cost of investments | | $ | 182,600,064 | | $ | 137,828,860 | | $ | 230,237,877 | | $ | 130,056,031 |
| | | | | | | | | | | | |
**Net of deferred foreign taxes of | | | – | | | – | | | 81,624 | | | 136,398 |
| See Notes to Financial Statements |
| DAVIS FUNDAMENTAL ETF TRUST | |
| | For the year ended October 31, 2019 |
| | | | Davis Select U.S. Equity ETF | | | Davis Select Financial ETF | | | Davis Select Worldwide ETF | | | Davis Select International ETF |
INVESTMENT INCOME: | | | | | | | | | | | | | |
| Income: | | | | | | | | | | | | | |
Dividends* | | $ | 2,380,415 | | $ | 3,161,522 | | $ | 2,643,990 | | $ | 1,735,243 |
Interest | | | 143,017 | | | 38,672 | | | 82,272 | | | 107,757 |
| | | Total income | | | 2,523,432 | | | 3,200,194 | | | 2,726,262 | | | 1,843,000 |
Expenses: | | | | | | | | | | | | | |
Investment advisory fees (Note 3) | | | 986,763 | | | 789,501 | | | 1,182,897 | | | 570,687 |
Accounting, custodian, and transfer agent fees | | | 56,936 | | | 61,540 | | | 86,797 | | | 73,518 |
Audit fees | | | 17,625 | | | 17,625 | | | 17,625 | | | 15,275 |
Legal fees | | | 9,700 | | | 6,600 | | | 11,600 | | | 7,150 |
Reports to shareholders | | | 8,037 | | | 9,580 | | | 15,834 | | | 3,291 |
Trustees’ fees and expenses | | | 14,192 | | | 12,917 | | | 17,550 | | | 9,190 |
Registration and filing fees | | | 7,122 | | | 15 | | | 20 | | | 7,950 |
Miscellaneous | | | 23,115 | | | 21,627 | | | 29,498 | | | 20,548 |
| | Total expenses | | | 1,123,490 | | | 919,405 | | | 1,361,821 | | | 707,609 |
| Net investment income | | | 1,399,942 | | | 2,280,789 | | | 1,364,441 | | | 1,135,391 |
REALIZED & UNREALIZED GAIN (LOSS) ON INVESTMENTS AND FOREIGN CURRENCY TRANSACTIONS: | | | | | | | | | | | | | |
Net realized gain (loss) from: | | | | | | | | | | | | | |
| | Investment transactions** | | | (753,440) | | | 2,327,266 | | | (12,650,440) | | | (3,076,382) |
| | Foreign currency transactions | | | (1,819) | | | (3,452) | | | 17,583 | | | (10,728) |
| Net realized gain (loss) | | | (755,259) | | | 2,323,814 | | | (12,632,857) | | | (3,087,110) |
Net change in unrealized appreciation (depreciation)*** | | | 22,238,298 | | | 6,290,320 | | | 24,956,854 | | | 13,218,861 |
| | Net realized and unrealized gain on investments and foreign currency transactions | | | 21,483,039 | | | 8,614,134 | | | 12,323,997 | | | 10,131,751 |
Net increase in net assets resulting from operations | | $ | 22,882,981 | | $ | 10,894,923 | | $ | 13,688,438 | | $ | 11,267,142 |
| | | | | | | | | | | |
*Net of foreign taxes withheld of | | $ | 4,107 | | $ | 109,296 | | $ | 98,112 | | $ | 159,309 |
| | | | | | | | | | | |
**Net of foreign taxes of | | | – | | | – | | | – | | | 34,787 |
| | | | | | | | | | | |
***Net of deferred foreign taxes of | – | | | – | | | 81,624 | | | 136,398 |
| See Notes to Financial Statements |
| DAVIS FUNDAMENTAL ETF TRUST | Statements of Changes in Net Assets |
| | For the year ended October 31, 2019 |
| | | | Davis Select U.S. Equity ETF | | | Davis Select Financial ETF | | | Davis Select Worldwide ETF | | | Davis Select International ETF |
OPERATIONS: | | | | | | | | | | | | | |
Net investment income | | $ | 1,399,942 | | $ | 2,280,789 | | $ | 1,364,441 | | $ | 1,135,391 |
Net realized gain (loss) from investments and foreign currency transactions | | | (755,259) | | | 2,323,814 | | | (12,632,857) | | | (3,087,110) |
Net change in unrealized appreciation (depreciation) on investments and foreign currency transactions | | | 22,238,298 | | | 6,290,320 | | | 24,956,854 | | | 13,218,861 |
| | Net increase in net assets resulting from operations | | | 22,882,981 | | | 10,894,923 | | | 13,688,438 | | | 11,267,142 |
DIVIDENDS AND DISTRIBUTIONS TO SHAREHOLDERS: | | | (3,520,440) | | | (4,095,360) | | | (7,947,720) | | | (281,250) |
CAPITAL SHARE TRANSACTIONS: | | | | | | | | | | | | | |
Proceeds from shares sold | | | 56,164,573 | | | 8,758,754 | | | 36,390,142 | | | 62,251,958 |
Cost of shares redeemed | | | – | | | (21,398,214) | | | (37,710,616) | | | – |
| | Net increase (decrease) in net assets resulting from capital share transactions | | | 56,164,573 | | | (12,639,460) | | | (1,320,474) | | | 62,251,958 |
Total increase (decrease) in net assets | | | 75,527,114 | | | (5,839,897) | | | 4,420,244 | | | 73,237,850 |
NET ASSETS: | | | | | | | | | | | | | |
Beginning of year | | | 131,013,747 | | | 150,692,283 | | | 220,778,633 | | | 60,370,689 |
| End of year | | $ | 206,540,861 | | $ | 144,852,386 | | $ | 225,198,877 | | $ | 133,608,539 |
CHANGES IN SHARES OUTSTANDING: | | | | | | | | | | | | | |
Shares outstanding, beginning of year | | | 5,750,000 | | | 6,550,000 | | | 9,800,000 | | | 3,700,000 |
Shares sold | | | 2,650,000 | | | 400,000 | | | 1,600,000 | | | 3,750,000 |
Shares redeemed | | | – | | | (1,000,000) | | | (1,850,000) | | | – |
| | Shares outstanding, end of year | | | 8,400,000 | | | 5,950,000 | | | 9,550,000 | | | 7,450,000 |
| See Notes to Financial Statements |
| DAVIS FUNDAMENTAL ETF TRUST | Statements of Changes in Net Assets |
| | For the year ended October 31, 2018 |
| | | | Davis Select U.S. Equity ETF | | | Davis Select Financial ETF | | | Davis Select Worldwide ETF | | | Davis Select International ETF* |
OPERATIONS: | | | | | | | | | | | | | |
Net investment income | | $ | 941,814 | | $ | 1,596,554 | | $ | 1,380,789 | | $ | 271,897 |
Net realized gain (loss) from investments and foreign currency transactions | | | 2,249,292 | | | 2,631,538 | | | 6,882,742 | | | (355,034) |
Net change in unrealized appreciation (depreciation) on investments and foreign currency transactions | | | (4,157,296) | | | (6,615,642) | | | (40,936,679) | | | (10,267,621) |
| | Net decrease in net assets resulting from operations | | | (966,190) | | | (2,387,550) | | | (32,673,148) | | | (10,350,758) |
DIVIDENDS AND DISTRIBUTIONS TO SHAREHOLDERS: | | | (618,930) | | | (1,260,480) | | | (302,450) | | | – |
CAPITAL SHARE TRANSACTIONS: | | | | | | | | | | | | | |
Proceeds from shares sold | | | 57,006,865 | | | 62,692,158 | | | 159,042,953 | | | 70,721,447 |
Cost of shares redeemed | | | – | | | (2,389,397) | | | (4,444,891) | | | – |
| | Net increase in net assets resulting from capital share transactions | | | 57,006,865 | | | 60,302,761 | | | 154,598,062 | | | 70,721,447 |
| Total increase in net assets | | | 55,421,745 | | | 56,654,731 | | | 121,622,464 | | | 60,370,689 |
NET ASSETS: | | | | | | | | | | | | | |
Beginning of period | | | 75,592,002 | | | 94,037,552 | | | 99,156,169 | | | – |
| End of period | | $ | 131,013,747 | | $ | 150,692,283 | | $ | 220,778,633 | | $ | 60,370,689 |
CHANGES IN SHARES OUTSTANDING: | | | | | | | | | | | | | |
Shares outstanding, beginning of period | | | 3,350,000 | | | 4,050,000 | | | 3,950,000 | | | – |
Shares sold | | | 2,400,000 | | | 2,600,000 | | | 6,050,000 | | | 3,700,000 |
Shares redeemed | | | – | | | (100,000) | | | (200,000) | | | – |
| | Shares outstanding, end of period | | | 5,750,000 | | | 6,550,000 | | | 9,800,000 | | | 3,700,000 |
| *For the period March 1, 2018 (commencement of investment operations is the date the initial creation units were established) to October 31, 2018. |
| |
| See Notes to Financial Statements |
| DAVIS FUNDAMENTAL ETF TRUST | Notes to Financial Statements |
| | October 31, 2019 |
NOTE 1 - SUMMARY OF SIGNIFICANT ACCOUNTING POLICIES
Davis Fundamental ETF Trust (the “Trust”) was organized on March 18, 2016 as a Delaware business trust and is registered under the Investment Company Act of 1940 (“1940 Act”), as amended, as an open-end management investment company. The Trust follows the reporting guidance of the Financial Accounting Standards Board (“FASB”) Accounting Standards Codification Topic 946, Financial Services – Investment Companies. The Trust consists of four series of funds, Davis Select U.S. Equity ETF, Davis Select Financial ETF, Davis Select Worldwide ETF, and Davis Select International ETF (individually referred to as a “Fund” or collectively as the “Funds”). Each series of the Trust represents shares of beneficial interest in a separate portfolio of securities and other assets, with its own objective and policies. Davis Select U.S. Equity ETF and Davis Select Financial ETF are non-diversified and Davis Select Worldwide ETF and Davis Select International ETF are diversified, each an investment management company under the 1940 Act. Each Fund is an actively managed exchange-traded fund (“ETF”).
Davis Select U.S. Equity ETF seeks to achieve long-term capital growth and capital preservation. It invests primarily in common stocks of large companies (generally, companies with market capitalizations of $10 billion or more at the time of initial purchase).
Davis Select Financial ETF seeks to achieve long-term growth of capital. It invests at least 80% of the Fund’s net assets in securities issued by companies principally engaged in the financial services sector.
Davis Select Worldwide ETF seeks to achieve long-term growth of capital. It invests principally in common stocks issued by both United States and foreign companies, including countries with developed or emerging markets.
Davis Select International ETF seeks to achieve long-term growth of capital. It invests principally in common stocks issued by foreign companies, including countries with developed or emerging markets.
Because of the risk inherent in any investment program, the Funds cannot ensure that the investment objective of any of its series will be achieved. The Funds account separately for the assets, liabilities, and operations of each Fund. The assets of each Fund are segregated, and a shareholder’s interest is limited to the Fund in which shares are held. The following is a summary of significant accounting policies followed by the Funds in the preparation of their financial statements.
Security Valuation - The Funds calculate the net asset value of their shares as of the close of the New York Stock Exchange (“Exchange”), normally 4:00 P.M. Eastern time, on each day the Exchange is open for business. Securities listed on the Exchange (and other national exchanges including NASDAQ) are valued at the last reported sales price on the day of valuation. Listed securities for which no sale was reported on that date are valued at the last quoted bid price. Securities traded on foreign exchanges are valued based upon the last sales price on the principal exchange on which the security is traded prior to the time when the Funds’ assets are valued. Securities (including restricted securities) for which market quotations are not readily available or securities whose values have been materially affected by what Davis Selected Advisers, L.P. (“Davis Advisors” or “Adviser”), the Funds’ investment adviser, identifies as a significant event occurring before the Funds’ assets are valued, but after the close of their respective exchanges will be fair valued using a fair valuation methodology applicable to the security type or the significant event as previously approved by the Funds’ Pricing Committee and Board of Trustees. The Pricing Committee considers all facts it deems relevant that are reasonably available, through either public information or information available to the Adviser’s portfolio management team, when determining the fair value of a security. To assess the appropriateness of security valuations, the Adviser may consider (i) comparing prior day prices and/or prices of comparable securities; (ii) comparing sale prices to the prior or current day prices and challenge those prices exceeding certain tolerance levels with the third-party pricing service or broker source; (iii) new rounds of financing; (iv) the performance of the market or the issuer’s industry; (v) the liquidity of the security; (vi) the size of the holding in a fund; and/or (vii) any other appropriate information. The determination of a security’s fair value price often involves the consideration of a number of subjective factors and is therefore subject to the unavoidable risk that the value assigned to a security may be higher or lower than the security’s value would be if a reliable market quotation of the security was readily available. Fair value determinations are subject to review, approval, and ratification by the Funds’ Board of Trustees at its next regularly scheduled meeting covering the period in which the fair valuation was determined.
Short-term securities purchased within 60 days to maturity are valued at amortized cost, which approximates market value.
The Funds’ valuation procedures are reviewed and subject to approval by the Board of Trustees. There have been no significant changes to the fair valuation procedures during the period.
| DAVIS FUNDAMENTAL ETF TRUST | Notes to Financial Statements – (Continued) |
| | October 31, 2019 |
NOTE 1 - SUMMARY OF SIGNIFICANT ACCOUNTING POLICIES – (CONTINUED)
Fair Value Measurements - Fair value is defined as the price that the Funds would receive upon selling an investment in an orderly transaction to an independent buyer in the principal market for the investment. Various inputs are used to determine the fair value of the Funds’ investments. These inputs are summarized in the three broad levels listed below.
Level 1 – quoted prices in active markets for identical securities
Level 2 – other significant observable inputs (including quoted prices for similar investments, interest rates, prepayment speeds, credit risk, etc.)
Level 3 – significant unobservable inputs (including the Fund’s own assumptions in determining the fair value of investments)
The inputs or methodologies used for valuing securities are not necessarily an indication of the risks associated with investing in those securities nor can it be assured that the Funds can obtain the fair value assigned to a security if they were to sell the security.
The following is a summary of the inputs used as of October 31, 2019 in valuing each Fund’s investments carried at value:
| | Investments in Securities at Value |
| | | | | | | | Davis Select |
| | Davis Select | | Davis Select | | Davis Select | | International |
| | U.S. Equity ETF | | Financial ETF | | Worldwide ETF | | ETF |
Valuation Inputs | | | | | | | | | | | |
| Level 1 – Quoted Prices: | | �� | | | | | | | | | |
Common Stock: | | | | | | | | | | | |
| Communication Services | $ | 29,015,845 | | $ | 4,690,129 | | $ | 25,771,135 | | $ | 2,726,058 |
| Consumer Discretionary | | 40,959,027 | | | – | | | 69,326,024 | | | 43,918,530 |
| Energy | | 5,773,511 | | | – | | | 10,054,900 | | | 6,131,149 |
| Financials | | 96,467,688 | | | 139,696,795 | | | 70,460,863 | | | 36,346,341 |
| Health Care | | 6,082,405 | | | – | | | – | | | 4,648,716 |
| Industrials | | 22,151,372 | | | – | | | 24,296,971 | | | 25,266,171 |
| Information Technology | | 3,857,042 | | | – | | | 19,242,723 | | | 4,006,930 |
| Total Level 1 | | 204,306,890 | | | 144,386,924 | | | 219,152,616 | | | 123,043,895 |
Level 2 – Other Significant Observable Inputs: | | | | | | | | | | | |
| Short-term securities | | 2,096,000 | | | 376,000 | | | 5,895,000 | | | 10,100,000 |
| Total Level 2 | | 2,096,000 | | | 376,000 | | | 5,895,000 | | | 10,100,000 |
Level 3 – Significant Unobservable Inputs: | | | | | | | | | | | |
| Total Level 3 | | – | | | – | | | – | | | – |
| Total Investments | $ | 206,402,890 | | $ | 144,762,924 | | $ | 225,047,616 | | $ | 133,143,895 |
| DAVIS FUNDAMENTAL ETF TRUST | Notes to Financial Statements – (Continued) |
| | October 31, 2019 |
NOTE 1 - SUMMARY OF SIGNIFICANT ACCOUNTING POLICIES – (CONTINUED)
Master Repurchase Agreements - The Funds, along with other affiliated funds, may transfer uninvested cash balances into one or more master repurchase agreement accounts. These balances are invested in one or more repurchase agreements, secured by U.S. Government securities. A custodian bank holds securities pledged as collateral for repurchase agreements until the agreements mature. Each agreement requires that the market value of the collateral be sufficient to cover payments of interest and principal; however, in the event of default by the other party to the agreement, retention of the collateral may be subject to legal proceedings.
Currency Translation - The market values of all assets and liabilities denominated in foreign currencies are recorded in the financial statements after translation to the U.S. dollar based upon the mean between the bid and offered quotations of the currencies against U.S. dollars on the date of valuation. The cost basis of such assets and liabilities is determined based upon historical exchange rates. Income and expenses are translated at average exchange rates in effect as accrued or incurred.
Foreign Currency - The Funds may enter into forward purchases or sales of foreign currencies to hedge certain foreign currency denominated assets and liabilities against declines in market value relative to the U.S. dollar. Forward currency contracts are marked-to-market daily and the change in market value is recorded by the Funds as an unrealized gain or loss. When the forward currency contract is closed, the Funds record a realized gain or loss equal to the difference between the value of the forward currency contract at the time it was opened and value at the time it was closed. Investments in forward currency contracts may expose the Funds to risks resulting from unanticipated movements in foreign currency exchange rates or failure of the counter-party to the agreement to perform in accordance with the terms of the contract. There were no forward contracts entered into by the Funds.
Reported net realized foreign exchange gains or losses arise from the sales of foreign currencies, currency gains or losses realized between the trade and settlement dates on security transactions, the difference between the amounts of dividends, interest, and foreign withholding taxes recorded on the Funds’ books, and the U.S. dollar equivalent of the amounts actually received or paid. Net unrealized foreign exchange gains or losses arise from changes in the value of assets and liabilities other than investments in securities at fiscal year-end, resulting from changes in the exchange rate. The Funds include foreign currency gains and losses realized on the sales of investments together with market gains and losses on such investments in the Statements of Operations.
Federal Income Taxes - It is each Fund’s policy to comply with the requirements of the Internal Revenue Code applicable to regulated investment companies, and to distribute substantially all of its taxable income, including any net realized gains on investments not offset by loss carryovers, to shareholders. Therefore, no provision for federal income or excise tax is required. The Adviser analyzed the Funds’ tax positions taken on federal and state income tax returns for all open tax years and concluded that as of October 31, 2019, no provision for income tax is required in the Funds’ financial statements related to these tax positions. The Funds’ federal and state (Arizona) income and federal excise tax returns for tax years for which the applicable statutes of limitations have not expired are subject to examination by the Internal Revenue Service and state Department of Revenue. The earliest tax year that remains subject to examination by these jurisdictions is 2017 (Davis Select International ETF, 2018).
Capital losses will be carried forward to future years if not offset by gains. At October 31, 2019, the Funds had available for federal income tax purposes unused capital loss carryforwards as follows:
| | | Capital Loss Carryforwards (No Expiration) |
| | | Davis Select | | Davis Select | | Davis Select |
| | | U.S. Equity ETF | | Worldwide ETF | | International ETF |
Short-term | | $ | 277,798 | | $ | 4,756,126 | | $ | 1,363,872 |
Long-term | | | 546,796 | | | 6,669,675 | | | 2,327,698 |
| Total | | $ | 824,594 | | $ | 11,425,801 | | $ | 3,691,570 |
Additionally, based on the Funds’ understanding of the tax rules and rates related to income, gains, and transactions for the foreign jurisdictions in which they invest, the Funds will provide for foreign taxes, and where appropriate, deferred foreign taxes.
| DAVIS FUNDAMENTAL ETF TRUST | Notes to Financial Statements – (Continued) |
| | October 31, 2019 |
NOTE 1 - SUMMARY OF SIGNIFICANT ACCOUNTING POLICIES – (CONTINUED)
Federal Income Taxes - (Continued)
At October 31, 2019, the unrealized appreciation (depreciation) and aggregate cost of investments for federal income tax purposes were as follows:
| | Davis Select | | Davis Select | | Davis Select | | Davis Select |
| | U.S. Equity ETF | | Financial ETF | | Worldwide ETF | | International ETF |
Unrealized appreciation | $ | 32,182,142 | | $ | 13,208,490 | | $ | 28,650,689 | | $ | 16,675,417 |
Unrealized depreciation | | (9,576,830) | | | (6,523,796) | | | (37,404,065) | | | (15,849,780) |
Net unrealized appreciation (depreciation) | $ | 22,605,312 | | $ | 6,684,694 | | $ | (8,753,376) | | $ | 825,637 |
Aggregate cost | $ | 183,797,578 | | $ | 138,078,230 | | $ | 233,800,992 | | $ | 132,318,258 |
Securities Transactions and Related Investment Income - Securities transactions are accounted for on the trade date (date the order to buy or sell is executed) with realized gain or loss on the sale of securities being determined based upon identified cost. Dividend income is recorded on the ex-dividend date. Interest income, which includes accretion of discount and amortization of premium, is accrued as earned.
Dividends and Distributions to Shareholders - Dividends and distributions to shareholders are recorded on the ex-dividend date. Net investment income (loss), net realized gains (losses), and net unrealized appreciation (depreciation) on investments [collectively “Distributable earnings (losses)”] may differ for financial statement and tax purposes primarily due to differing treatments of wash sales, foreign currency transactions, corporate actions, in-kind transactions, and partnership income. The character of dividends and distributions made during the fiscal year from net investment income and net realized securities gains may differ from their ultimate characterization for federal income tax purposes. Also, due to the timing of dividends and distributions, the fiscal year in which amounts are distributed may differ from the fiscal year in which income or realized gain was recorded by the Funds. The Funds adjust certain components of capital to reflect permanent differences between financial statement amounts and net income and realized gains/losses determined in accordance with income tax rules. The Funds’ net assets have not been affected by these reclassifications. During the year ended October 31, 2019, amounts have been reclassified to reflect increases (decreases) as follows:
| | Davis Select Financial ETF | | Davis Select Worldwide ETF |
Distributable earnings (losses) | $ | (855,580) | | $ | 1,735,359 |
Paid-in capital | | 855,580 | | | (1,735,359) |
The tax character of distributions paid during the years ended October 31, 2019 and 2018 was as follows:
| | Ordinary Income | | Long-Term Capital Gain | | Total |
| Davis Select U.S. Equity ETF | | | | | | | | |
| 2019 | $ | 3,300,828 | | $ | 219,612 | | $ | 3,520,440 |
| 2018 | | 618,930 | | | – | | | 618,930 |
Davis Select Financial ETF | | | | | | | | |
| 2019 | | 3,036,800 | | | 1,058,560 | | | 4,095,360 |
| 2018 | | 1,260,480 | | | – | | | 1,260,480 |
Davis Select Worldwide ETF | | | | | | | | |
| 2019 | | 4,900,315 | | | 3,047,405 | | | 7,947,720 |
| 2018 | | 302,450 | | | – | | | 302,450 |
Davis Select International ETF | | | | | | | | |
| 2019 | | 281,250 | | | – | | | 281,250 |
| 2018 | | – | | | – | | | – |
| DAVIS FUNDAMENTAL ETF TRUST | Notes to Financial Statements – (Continued) |
| | October 31, 2019 |
NOTE 1 - SUMMARY OF SIGNIFICANT ACCOUNTING POLICIES – (CONTINUED)
Dividends and Distributions to Shareholders - (Continued)
As of October 31, 2019, the components of distributable earnings (losses) on a tax basis were as follows:
| | Davis Select U.S. Equity ETF | | Davis Select Financial ETF | | Davis Select Worldwide ETF | | Davis Select International ETF |
Undistributed ordinary income | $ | 2,290,042 | | $ | 1,893,333 | | $ | 5,268,661 | | $ | 3,637,691 |
Undistributed long-term capital gain | | – | | | 1,728,542 | | | – | | | – |
Accumulated net realized losses from investments | | (824,594) | | | – | | | (11,425,801) | | | (3,691,570) |
Net unrealized appreciation (depreciation) on investments and foreign currency transactions | | 22,604,830 | | | 6,685,587 | | | (8,834,641) | | | 689,013 |
| Total | $ | 24,070,278 | | $ | 10,307,462 | | $ | (14,991,781) | | $ | 635,134 |
Indemnification - Under the Funds’ organizational documents, their officers and trustees are indemnified against certain liabilities arising out of the performance of their duties to the Funds. In addition, some of the Funds’ contracts with their service providers contain general indemnification clauses. The Funds’ maximum exposure under these arrangements is unknown since the amount of any future claims that may be made against the Funds cannot be determined and the Funds have no historical basis for predicting the likelihood of any such claims.
Use of Estimates in Financial Statements - In preparing financial statements in conformity with accounting principles generally accepted in the United States of America, management makes estimates and assumptions that affect the reported amounts of assets and liabilities and disclosure of contingent assets and liabilities at the date of the financial statements, as well as the reported amounts of income and expenses during the reporting period. Actual results may differ from these estimates.
NOTE 2 - PURCHASES AND SALES OF SECURITIES
The cost of purchases and proceeds from sales of investment securities (excluding in-kind purchases and redemptions and short-term securities) during the year ended October 31, 2019 were as follows:
| | Davis Select | | Davis Select | | Davis Select | | Davis Select |
| | U.S. Equity ETF | | Financial ETF | | Worldwide ETF | | International ETF |
Cost of purchases | $ | 31,694,878 | | $ | 21,756,726 | | $ | 36,630,497 | | $ | 27,351,260 |
Proceeds from sales | | 20,422,026 | | | 21,632,823 | | | 49,959,076 | | | 19,215,669 |
The cost of in-kind purchases and proceeds from in-kind redemptions during the year ended October 31, 2019 were as follows:
| | Davis Select | | Davis Select | | Davis Select | | Davis Select |
| | U.S. Equity ETF | | Financial ETF | | Worldwide ETF | | International ETF |
Cost of in-kind purchases | $ | 47,800,375 | | $ | 7,440,939 | | $ | 20,265,552 | | $ | 46,904,794 |
Proceeds from in-kind redemptions | | – | | | 18,114,850 | | | 18,741,238 | | | – |
Gains and losses on in-kind redemptions are not recognized at the Fund level for tax purposes.
| DAVIS FUNDAMENTAL ETF TRUST | Notes to Financial Statements – (Continued) |
| | October 31, 2019 |
NOTE 3 - INVESTMENT ADVISORY AND OTHER AGREEMENTS WITH SERVICE PROVIDERS (INCLUDING AFFILIATES)
Davis Selected Advisers-NY, Inc. (“DSA-NY”), a wholly-owned subsidiary of the Adviser, acts as sub-adviser to the Funds. DSA-NY performs research and portfolio management services for the Funds under a Sub-Advisory Agreement with the Adviser. The Funds pay no fees directly to DSA-NY.
All officers of the Funds (including the Interested Trustee/Chairman) hold positions as executive officers with the Adviser or its affiliates.
As of October 31, 2019, related shareholders with greater than 20% of outstanding shares were as follows:
| Davis Select | | Davis Select | | Davis Select |
| U.S. Equity ETF | | Financial ETF | | International ETF |
| 38% | | 32% | | 49% |
Investment activities of this shareholder could have a material impact on the Funds.
Investment Advisory Fees and Reimbursement/Waiver of Expenses - Advisory fees are paid monthly to the Adviser. The annual rate for each Fund is 0.55% of the average net assets. The Adviser has contractually agreed to waive fees and/or reimburse the Funds’ expenses to the extent necessary to cap total annual Fund operating expenses (Davis Select U.S. Equity ETF, 0.65%; Davis Select Financial ETF, 0.65%; Davis Select Worldwide ETF, 0.65%; Davis Select International ETF, 0.75%), until March 1, 2020. After that date, there is no assurance that the Adviser will continue to waive fees and/or reimburse expenses. The agreement cannot be terminated prior to that date without the consent of the Board of Trustees.
Accounting, Custodian, and Transfer Agent Fees - State Street Bank and Trust Company serves as the Funds’ primary accounting provider, custodian, and transfer agent.
Distributor - Foreside Fund Services, LLC (“Distributor”) serves as the Funds’ distributor. The Funds pay no fees directly to the Distributor.
NOTE 4 - CAPITAL STOCK
As of October 31, 2019, there were an unlimited number of shares of beneficial interest without par value authorized by the Trust. Individual shares of a Fund are listed on a national securities exchange through a broker-dealer. Such transactions may be subject to customary commission rates imposed by the broker-dealer. The price of Fund shares is based on the market price, and because ETF shares trade at a market price rather than at NAV, shares may trade at a price greater than NAV (a premium) or less than NAV (a discount).
The Funds will only issue or redeem shares that have been aggregated into blocks of 50,000 shares or multiples thereof (“Creation Units”) to broker-dealers that have entered into a participation agreement with the Distributor (“Authorized Participants”). The Funds generally will issue or redeem Creations Units in return for a designated portfolio of securities (and an amount of cash) the Fund specifies each day (“Creation Basket”). Authorized participants purchasing and redeeming Creation Units may be charged a transaction fee to offset transfer and other transaction costs associated with the issuance and redemption of Creation Units.
NOTE 5 - NEW PRONOUNCEMENT
In September 2019, the SEC voted to approve Rule 6c-11 for exchange-traded funds (“ETF Rule”). The new ETF Rule codifies exemptive relief, creating the ability for investment managers to launch ETFs structured as standalone open-end investment companies without having to obtain an order from the SEC Division of Investment Management. The ETF Rule also makes certain amendments to Form N-CEN, Form N-CSR, Form N-1A, Form N-8B-2, Form N-PORT, and Regulation S-X. The compliance date for the amendments is December 22, 2020. The Adviser is currently evaluating the amendments and their impacts, if any, on the Funds’ financial statements.
| DAVIS FUNDAMENTAL ETF TRUST | Federal Income Tax Information ( Unaudited) |
In early 2020, shareholders will receive information regarding all dividends and distributions paid to them by the Funds during calendar year 2019. Regulations of the U.S. Treasury Department require the Funds to report this information to the Internal Revenue Service.
The information and distributions reported herein may differ from the information reported as distributions taxable to certain shareholders for the calendar year 2019 with their 2019 Form 1099-DIV. Certain dividends paid by the Funds may be designated as qualified dividend income for U.S. federal income tax purposes. Complete information will be reported in conjunction with your 2019 Form 1099-DIV.
The information is presented to assist shareholders in reporting distributions received from the Funds to the Internal Revenue Service. Because of the complexity of the federal regulations that may affect your individual tax return and the many variations in state and local regulations, we recommend that you consult your tax adviser for specific guidance.
Each Fund designates the following amounts distributed during the fiscal year ended October 31, 2019, as dividends eligible for the corporate dividends-received deduction, qualified dividend income, and long-term capital gain distributions.
| | | Davis Select U.S. Equity ETF | | Davis Select Financial ETF | | Davis Select Worldwide ETF | | Davis Select International ETF |
Income dividends | | $ | 3,300,828 | | $ | 3,036,800 | | $ | 4,900,315 | | $ | 281,250 |
Income qualifying for corporate dividends-received deduction | | $ | 1,300,078 | | $ | 1,669,273 | | $ | 868,000 | | $ | – |
| | | 39% | | | 55% | | | 18% | | | – |
| Qualified dividend income | | $ | 1,964,820 | | $ | 2,403,760 | | $ | 2,413,101 | | $ | 281,250 |
| | | 60% | | | 79% | | | 49% | | | 100% |
| Long-term capital gain distributions | | $ | 219,612 | | $ | 1,058,560 | | $ | 3,047,405 | | $ | – |
Pursuant to Section 853 of the Internal Revenue Code, Davis Select Worldwide ETF and Davis Select International ETF designate $67,631 and $129,222, respectively, as foreign taxes paid during the year ended October 31, 2019. During the year ended October 31, 2019, Davis Select Worldwide ETF and Davis Select International ETF received foreign sourced income in the amounts of $5,712,882 and $4,460,040, respectively. The Funds did not derive any income from ineligible foreign sources as defined under Section 901(j) of the Internal Revenue Code. Foreign taxes paid for purposes of Section 853 may be less than actual foreign taxes paid for financial statement purposes.
DAVIS FUNDAMENTAL ETF TRUST |
The following financial information represents selected data for each share of capital stock outstanding throughout each period: |
| | | Income (Loss) from Investment Operations |
| | Net Asset Value, Beginning of Period | Net Investment Incomea | Net Realized and Unrealized Gains (Losses) | Total from Investment Operations |
| Davis Select U.S. Equity ETF: | | | | |
| Year ended October 31, 2019 | $22.78 | $0.18 | $2.18 | $2.36 |
| Year ended October 31, 2018 | $22.56 | $0.20 | $0.18 | $0.38 |
Period from January 11, 2017e to October 31, 2017 | $20.13 | $0.13 | $2.30 | $2.43 |
| Davis Select Financial ETF: | | | | |
| Year ended October 31, 2019 | $23.01 | $0.36 | $1.61 | $1.97 |
| Year ended October 31, 2018 | $23.22 | $0.29 | $(0.23) | $0.06 |
Period from January 11, 2017e to October 31, 2017 | $20.10 | $0.14 | $2.98 | $3.12 |
| Davis Select Worldwide ETF: | | | | |
| Year ended October 31, 2019 | $22.53 | $0.14 | $1.71 | $1.85 |
| Year ended October 31, 2018 | $25.10 | $0.18 | $(2.70) | $(2.52) |
Period from January 11, 2017e to October 31, 2017 | $20.15 | $0.04 | $4.91 | $4.95 |
| Davis Select International ETF: | | | | |
| Year ended October 31, 2019 | $16.32 | $0.19 | $1.48 | $1.67 |
Period from March 1, 2018e to October 31, 2018 | $19.74 | $0.13 | $(3.55) | $(3.42) |
a | Per share calculations were based on average shares outstanding for the period. |
| |
b | Net asset value total return is calculated assuming an initial investment made at the net asset value at the beginning of the period, with all dividends and distributions reinvested in additional shares on the reinvestment date, and redemption at the net asset value calculated on the last business day of the fiscal period. Market price total return is calculated assuming an initial investment made at the market price at the beginning of the period, with all dividends and distributions reinvested in additional shares on the reinvestment date, and sale at the market price calculated on the last business day of the fiscal period. Market price is determined by trading that occurs on the NASDAQ, and may be greater or less than net asset value, depending on the 4:00 P.M. EST midpoint of the bid-ask prices for a share of the Fund. Total returns are not annualized for periods of less than one year. |
| |
c | The ratios in this column reflect the impact, if any, of certain reimbursements and/or waivers from the Adviser. |
| Dividends and Distributions | | | | | | Ratios to Average Net Assets | |
Dividends from Net Investment Income | Distributions from Realized Gains | Total Distributions | Net Asset Value, End of Period | Total Return Net Asset Valueb | Market Price, End of Period | Total Return Market Priceb | Net Assets, End of Period (in thousands) | Gross Expense Ratio | Net Expense Ratioc | Net Investment Income (Loss) Ratio | Portfolio Turnoverd |
| | | | | | | | | | | | |
| $(0.15) | $(0.40) | $(0.55) | $24.59 | 10.94% | $24.59 | 10.82% | $206,541 | 0.63% | 0.63% | 0.78% | 12% |
| $(0.08) | $(0.08) | $(0.16) | $22.78 | 1.66% | $22.81 | 1.48% | $131,014 | 0.65% | 0.63% | 0.83% | 28% |
| $– | $– | $– | $22.56 | 12.11% | $22.63 | 12.43% | $75,592 | 0.81%f | 0.60%f | 0.75%f | 6% |
| | | | | | | | | | | | |
| $(0.27) | $(0.37) | $(0.64) | $24.34 | 9.15% | $24.36 | 9.13% | $144,852 | 0.64% | 0.64% | 1.59% | 15% |
| $(0.10) | $(0.17) | $(0.27) | $23.01 | 0.18% | $23.02 | (0.00)%g | $150,692 | 0.64% | 0.64% | 1.22% | 20% |
| $– | $– | $– | $23.22 | 15.50% | $23.28 | 15.77% | $94,038 | 0.76%f | 0.65%f | 0.81%f | 13% |
| | | | | | | | | | | | |
| $(0.13) | $(0.67) | $(0.80) | $23.58 | 8.99% | $23.60 | 8.97% | $225,199 | 0.63% | 0.63% | 0.63% | 17% |
| $(0.02) | $(0.03) | $(0.05) | $22.53 | (10.08)% | $22.55 | (10.30)% | $220,779 | 0.64% | 0.64% | 0.68% | 36% |
| $– | $– | $– | $25.10 | 24.58% | $25.19 | 24.99% | $99,156 | 0.86%f | 0.65%f | 0.19%f | 14% |
| | | | | | | | | | | | |
| $(0.06) | $– | $(0.06) | $17.93 | 10.37% | $17.98 | 10.50% | $133,609 | 0.68% | 0.68% | 1.09% | 19% |
| $– | $– | $– | $16.32 | (17.36)% | $16.34 | (17.27)% | $60,371 | 0.85%f | 0.75%f | 1.05%f | 17% |
d | The lesser of purchases or sales of portfolio securities for a period, divided by the average of the market value of portfolio securities owned during the period. Securities received or delivered from in-kind purchases or redemptions are excluded from the calculation. | |
| |
e | Commencement of investment operations is the date the initial creation units were established. |
| |
f | Annualized. |
| |
g | Down less than 0.005%. |
| |
| See Notes to Financial Statements |
| DAVIS FUNDAMENTAL ETF TRUST | Report of Independent Registered Public Accounting Firm |
The Shareholders and Board of Trustees
Davis Fundamental ETF Trust:
Opinion on the Financial Statements
We have audited the accompanying statements of assets and liabilities of Davis Select U.S. Equity ETF, Davis Select Financial ETF, Davis Select Worldwide ETF, and Davis Select International ETF (each a series of Davis Fundamental ETF Trust) (the “Funds”), including the schedules of investments, as of October 31, 2019, the related statements of operations for the year then ended, the statements of changes in net assets for each of the years in the two-year period then ended (period from March 1, 2018 to October 31, 2018 for Davis Select International ETF), and the related notes (collectively, the “financial statements”) and the financial highlights for each of the years in the two-year period then ended (period from March 1, 2018 to October 31, 2018 for Davis Select International ETF) and the period from January 11, 2017 to October 31, 2017 for Davis Select U.S. Equity ETF, Davis Select Financial ETF, and Davis Select Worldwide ETF. In our opinion, the financial statements and financial highlights present fairly, in all material respects, the financial position of the Funds as of October 31, 2019, the results of their operations for the year then ended, the changes in their net assets for each of the years in the two-year period then ended (period from March 1, 2018 to October 31, 2018 for Davis Select International ETF) and the financial highlights for each of the years in the two-year period then ended (period from March 1, 2018 to October 31, 2018 for Davis Select International ETF) and the period from January 11, 2017 to October 31, 2017 for Davis Select U.S. Equity ETF, Davis Select Financial ETF, and Davis Select Worldwide ETF, in conformity with U.S. generally accepted accounting principles.
Basis for Opinion
These financial statements and financial highlights are the responsibility of the Funds’ management. Our responsibility is to express an opinion on these financial statements and financial highlights based on our audits. We are a public accounting firm registered with the Public Company Accounting Oversight Board (United States) (“PCAOB”) and are required to be independent with respect to the Funds in accordance with the U.S. federal securities laws and the applicable rules and regulations of the Securities and Exchange Commission and the PCAOB.
We conducted our audits in accordance with the standards of the PCAOB. Those standards require that we plan and perform the audit to obtain reasonable assurance about whether the financial statements and financial highlights are free of material misstatement, whether due to error or fraud. Our audits included performing procedures to assess the risks of material misstatement of the financial statements and financial highlights, whether due to error or fraud, and performing procedures that respond to those risks. Such procedures included examining, on a test basis, evidence regarding the amounts and disclosures in the financial statements and financial highlights. Such procedures also included confirmation of securities owned as of October 31, 2019, by correspondence with the custodian and brokers or by other appropriate auditing procedures. Our audits also included evaluating the accounting principles used and significant estimates made by management, as well as evaluating the overall presentation of the financial statements and financial highlights. We believe that our audits provide a reasonable basis for our opinion.
KPMG LLP
We have served as the auditor of one or more Davis Fundamental ETF Trust investment companies since 2016.
Denver, Colorado
December 19, 2019
| DAVIS FUNDAMENTAL ETF TRUST | Trustee Approval of Advisory Agreement ( Unaudited) |
Board Considerations Regarding Approval of Advisory Agreement
The Board of Trustees (the “Trustees”) of the Davis Fundamental ETF Trust (the “Trust”) oversees the management of each series of the Trust, which includes Davis Select U.S. Equity ETF, Davis Select Financial ETF, Davis Select Worldwide ETF, and Davis Select International ETF (each a “Fund” and collectively the “Funds”). The Trustees, as required by law, determine annually whether to approve the continuance of each Fund’s advisory agreement.
With the assistance of counsel, the Independent Trustees undertook a comprehensive review process in anticipation of their annual contract review meeting, held in May 2019 (the “Meeting”). During the in-person Meeting, the Trustees, including the Independent Trustees separately, considered whether to renew the investment advisory agreement with Davis Selected Advisers, L.P. (the “Adviser”) and Davis Selected Advisers–NY, Inc. (the “Sub-Adviser”) (jointly “Davis Advisors” and, such agreement, the “Advisory Agreement”). As part of this process, Davis Advisors provided the Independent Trustees with material (including investment performance data) that was responsive to questions and requests for information submitted to Davis Advisors on behalf of the Independent Trustees. At this meeting, the Independent Trustees reviewed and evaluated all information which they deemed reasonably necessary under the circumstances, and were provided guidance by their independent counsel. In reaching their decision, the Independent Trustees also took into account information furnished to them throughout the year and otherwise provided to them during their quarterly meetings or through prior communications. The Independent Trustees concluded that they had been supplied with sufficient information and data to analyze the Advisory Agreement and that their questions and information requests had been sufficiently answered by Davis Advisors. Upon completion of this review, the Independent Trustees found that the terms of the Advisory Agreement were fair and reasonable and that continuation of the Advisory Agreement was in the best interests of the Funds and their shareholders.
Reasons the Independent Trustees Approved Continuation of the Advisory Agreement
The Independent Trustees’ determinations were based upon a comprehensive consideration of all information provided to them, and they did not identify any single item or piece of information as the controlling factor. Each Independent Trustee did not necessarily attribute the same weight to each factor. The following facts and conclusions were important, but not exclusive, to the Independent Trustees’ recommendation to renew the Advisory Agreement.
The Independent Trustees considered the investment performance of each Fund on an absolute basis as well as relative to its benchmark and other comparable funds. The Independent Trustees not only considered the investment performance of each Fund, but also the full range and quality of services provided by Davis Advisors to each Fund and its shareholders, including whether:
1)
| A Fund achieves satisfactory investments results after all costs; |
2)
| Davis Advisors efficiently and effectively handles shareholder and authorized participant requests, provides quality accounting, legal and compliance services, and oversees third-party service providers; and |
3)
| Davis Advisors fosters healthy investor behavior. |
The Independent Trustees considered that a shareholder’s ultimate return is the product of a fund’s results as well as the shareholder’s behavior, specifically in selecting when to buy, sell, or hold. The Independent Trustees concluded that, through its actions and communications, Davis Advisors has attempted to have a meaningful impact on investor behavior. The Independent Trustees also considered the investment management team and Davis Advisors’ investment process. The Independent Trustees noted that Davis Advisors employs a disciplined, company-specific, research-driven, businesslike, long-term investment philosophy. The Independent Trustees considered the quality of Davis Advisors’ investment process as well as the experience, capability, and integrity of its senior management and other personnel.
The Independent Trustees noted that Davis Advisors invested a significant amount in each of the Funds, and the Independent Trustees considered that these investments tend to align Davis Advisors’ interests with the interests of other shareholders, as they face the same risks, pay the same fees, are motivated to achieve satisfactory long-term returns, and that significant investment by Davis Advisors contributes to the economies of scale of the Funds.
| DAVIS FUNDAMENTAL ETF TRUST | Trustee Approval of Advisory Agreement |
| | (Unaudited) – (Continued) |
Reasons the Independent Trustees Approved Continuation of the Advisory Agreement – (Continued)
The Independent Trustees noted the importance of reviewing quantitative measures, but recognized that qualitative factors are also important in assessing whether shareholders are likely to be well served by the continuation of the Advisory Agreement. They noted both the value and shortcomings of purely quantitative measures, including the data provided by independent service providers, and concluded that, while such measures and data may be informative, the judgment of the Independent Trustees must take many factors into consideration in representing the shareholders of the Funds, including those listed below. In connection with reviewing comparative performance information, the Independent Trustees generally give greater weight to longer-term measurements.
The Independent Trustees assessed (a) comparative fee and expense information for other funds as selected and analyzed by a nationally recognized independent service provider; (b) information regarding fees charged by Davis Advisors to other advisory clients, including funds that it advises and/or sub-advises, and private accounts, as well as the differences in the services provided to such other clients; and (c) the fee schedule of each of the Funds, including an assessment of the fee waiver and expense limitation agreement for each Fund.
The Independent Trustees reviewed the management fee schedule and expense ratio for each Fund, noting that each of the Funds currently has in place a fee waiver and expense reimbursement agreement, the profitability (if any) of each Fund to Davis Advisors, the extent to which economies of scale might be realized if the Funds’ net assets increase, and whether the fee schedules reflect those potential economies of scale at this time. The Independent Trustees considered the nature, quality, and extent of the services being provided to each Fund and the costs incurred by Davis Advisors in providing such services. The Independent Trustees considered various potential benefits that Davis Advisors may receive in connection with the services it provides under the Advisory Agreement with the Funds, including a review of portfolio brokerage practices. The Independent Trustees noted that Davis Advisors does not use client commissions to pay for publications, both paper based or electronic, that are available to the general public or for research reports that are created by parties other than the broker-dealers providing trade execution, clearing, and/or settlement services to the Funds. The Independent Trustees also considered the potential for any fall-out benefits that may be realized by Davis Advisors as a result of its relationship with the Funds.
The Independent Trustees compared the fees paid to Davis Advisors by the Funds with those paid by Davis Advisors’ advised and sub-advised clients, private account clients, and managed money/wrap clients. To the extent sub-advised, private account, or managed money/wrap fees were lower than fees paid by the Funds, the Independent Trustees noted that the range of services provided to the Funds is more extensive, with greater risks associated with operating SEC-registered, actively managed exchange-traded funds. Serving as the primary adviser for actively managed exchange-traded funds is more work because of the complex overlay of regulatory, tax, and accounting issues, which are unique to exchange-traded funds. The Independent Trustees considered the investments necessary to manage the Funds, including the areas of risk oversight, information technology, which includes maintenance of the Davis ETF website, and compliance. With respect to risk, the Independent Trustees noted that not only have regulations become more complex and burdensome, but the scrutiny of regulators and shareholders has also become more intense. The Independent Trustees concluded that reasonable justifications existed for any differences between the fee rates for the Funds and Davis Advisors’ other lines of business.
Davis Select U.S. Equity ETF (“DUSA”)
The Independent Trustees noted that DUSA’s net asset value (“NAV”) return underperformed both the Standard & Poor’s 500® Index (“S&P 500®”) and the Lipper Large-Cap Core average over the one-year and since inception periods ended April 30, 2019. Broadridge, an independent service provider, presented a report to the Independent Trustees that included comparative fee, expense, and investment performance data. The report compared the Fund’s performance, fees, and expenses to other similar funds as selected by Broadridge. As DUSA does not yet have a meaningful long term track record, the Independent Trustees also considered the historical performance of Davis Advisors’ concentrated equity composite strategy on an absolute basis as well as relative to the S&P 500®. The Independent Trustees considered DUSA’s management fee and total net expense ratio, including a review of a relevant peer group as selected by Broadridge. The Independent Trustees noted the limited number of ETFs that are comparable to the Fund in reviewing the Broadridge data.
| DAVIS FUNDAMENTAL ETF TRUST | Trustee Approval of Advisory Agreement |
| | (Unaudited) – (Continued) |
Davis Select Financial ETF (“DFNL”)
The Independent Trustees noted that DFNL’s NAV return exceeded the Lipper Financial Services Funds average over the one-year and since inception periods ended April 30, 2019, but underperformed compared to the S&P 500® Financials Index (“S&P 500® Financials”) for the same periods. Broadridge, an independent service provider, presented a report to the Independent Trustees that included comparative fee, expense, and investment performance data. The report compared the Fund’s performance, fees, and expenses to other similar funds as selected by Broadridge. As DFNL does not yet have a meaningful long term track record, the Independent Trustees also considered the historical performance of Davis Advisors’ financial composite strategy on an absolute basis as well as relative to the S&P 500®. The Independent Trustees considered DFNL’s management fee and total net expense ratio, including a review of a relevant peer group as selected by Broadridge. The Independent Trustees noted the limited number of ETFs that are comparable to the Fund in reviewing the Broadridge data.
Davis Select Worldwide ETF (“DWLD”)
The Independent Trustees noted that DWLD’s NAV return underperformed both the Morgan Stanley Capital International All Country World Index (“MSCI ACWI®”) and Lipper Global Multi-Cap Growth Fund average over the one-year and since inception periods ended April 30, 2019. Broadridge, an independent service provider, presented a report to the Independent Trustees that included comparative fee, expense, and investment performance data. The report compared the Fund’s performance, fees, and expenses to other similar funds as selected by Broadridge. As DWLD does not yet have a meaningful long term track record, the Independent Trustees also considered the historical performance of Davis Advisors’ global equity composite strategy on an absolute basis as well as relative to the MSCI ACWI®. The Independent Trustees considered DWLD’s management fee and total net expense ratio, including a review of a relevant peer group as selected by Broadridge. The Independent Trustees noted the limited number of ETFs that are comparable to the Fund in reviewing the Broadridge data.
Davis Select International ETF (“DINT”)
The Independent Trustees noted that DINT’s NAV return exceeded the Lipper International Large-Cap Core Fund, but underperformed the Morgan Stanley Capital International All Country World Index ex USA (“MSCI ACWI® ex USA”) average over the one-year period and underperformed both since inception, all periods ended April 30, 2019. Broadridge, an independent service provider, presented a report to the Independent Trustees that included comparative fee, expense, and investment performance data. The report compared the Fund’s performance, fees, and expenses to other similar funds as selected by Broadridge. As DINT does not yet have a meaningful long term track record, the Independent Trustees also considered the historical performance of Davis Advisors’ international equity composite strategy on an absolute basis as well as relative to the MSCI ACWI® ex USA. The Independent Trustees considered DINT’s management fee and total net expense ratio, including a review of a relevant peer group as selected by Broadridge. The Independent Trustees noted the limited number of ETFs that are comparable to the Fund in reviewing the Broadridge data.
Approval of the Advisory Agreement
The Independent Trustees concluded that Davis Advisors had provided each of the Funds and its shareholders a reasonable level of both investment and non-investment services. The Independent Trustees further concluded that shareholders have received a significant benefit from Davis Advisors’ shareholder-oriented approach, as well as the execution of its investment discipline.
The Independent Trustees determined that the advisory fees for each of the Funds were reasonable in light of the nature, quality, and extent of the services being provided to the Funds, the costs incurred by Davis Advisors in providing such services, and in comparison to the range of the average advisory fees of their peer groups as determined by an independent service provider. The Independent Trustees found that the terms of the Advisory Agreement are fair and reasonable and that continuation of the Advisory Agreement is in the best interest of each Fund and its shareholders. The Independent Trustees and the full Board of Trustees therefore voted to continue the Advisory Agreement for each Fund.
| DAVIS FUNDAMENTAL ETF TRUST | |
For the purpose of their service as Trustees to the Davis Fundamental ETF Trust, the business address for each of the Trustees is 2949 E. Elvira Road, Suite 101, Tucson, AZ 85756. Each Trustee serves until retirement, resignation, death, or removal.
Name, Date of Birth, Position(s) Held with Funds, Length of Service | Principal Occupation(s) During Past Five Years | Number of Portfolios Overseen | Other Directorships |
Independent Trustees
Ralph J. Egizi (03/31/48) Trustee since 2016 | President, EGZ International, LLC (investment and financial consulting company); Director, Benefits Finance and Investments, Eastman Chemical Company (manufacturer of chemicals, fibers, and plastics), from 1999 to 2013. | 4 | None |
| | | | |
Thomas D. Tays (03/07/57) Trustee since 2016 | Retired. Chief Legal Officer, Davis Selected Advisers, L.P. from 1997 to 2013. | 4 | None |
Interested Trustee*
Kenneth C. Eich (08/14/53) Trustee/Chairman since 2016 | Executive Vice President and Principal Executive Officer of the Davis Fundamental ETF Trust (consisting of four portfolios), Davis Funds (consisting of 13 portfolios), Selected Funds (consisting of two portfolios), and Clipper Funds Trust (consisting of one portfolio); Chief Operating Officer, Davis Selected Advisers, L.P.; and also serves as an executive officer of certain companies affiliated with the Adviser. | 4 | None |
* Kenneth C. Eich owns partnership units (directly, indirectly, or both) of the Adviser and is considered to be an “interested person” of the Funds as defined in the Investment Company Act of 1940.
Officers
Christopher C. Davis (born 07/13/65, Davis Fundamental ETF Trust officer since 2016). President of the Davis Fundamental ETF Trust (consisting of four portfolios), Davis Funds (consisting of 13 portfolios), Selected Funds (consisting of two portfolios), and Clipper Funds Trust (consisting of one portfolio); Director, Davis Funds, Selected Funds, and Clipper Fund; Chairman, Davis Selected Advisers, L.P.; and also serves as an executive officer of certain companies affiliated with the Adviser, including sole member of the Adviser’s general partner, Davis Investments, LLC.
Kenneth C. Eich (born 08/14/53, Davis Fundamental ETF Trust officer since 2016). See description in the section on Interested Trustee.
Douglas A. Haines (born 03/04/71, Davis Fundamental ETF Trust officer since 2016). Vice President, Treasurer, Chief Financial Officer, Principal Financial Officer, and Principal Accounting Officer of the Davis Fundamental ETF Trust (consisting of four portfolios), Davis Funds (consisting of 13 portfolios), Selected Funds (consisting of two portfolios), and Clipper Funds Trust (consisting of one portfolio); Vice President and Director of Fund Accounting, Davis Selected Advisers, L.P.
Randi J. Roessler (born 06/26/81, Davis Fundamental ETF Trust officer since 2018). Vice President and Chief Compliance Officer of the Davis Fundamental ETF Trust (consisting of four portfolios), Davis Funds (consisting of 13 portfolios), Selected Funds (consisting of two portfolios), and Clipper Funds Trust (consisting of one portfolio); Vice President and Chief Compliance Officer, Davis Selected Advisers, L.P.; and also serves as an executive officer of certain companies affiliated with the Adviser.
Ryan M. Charles (born 07/25/78, Davis Fundamental ETF Trust officer since 2016). Vice President and Secretary of the Davis Fundamental ETF Trust (consisting of four portfolios), Davis Funds (consisting of 13 portfolios), Selected Funds (consisting of two portfolios), and Clipper Funds Trust (consisting of one portfolio); Vice President, Chief Legal Officer and Secretary, Davis Selected Advisers, L.P.; and also serves as an executive officer of certain companies affiliated with the Adviser.
| DAVIS FUNDAMENTAL ETF TRUST |
| Investment Adviser |
Davis Selected Advisers, L.P. (Doing business as “Davis Advisors”) |
2949 East Elvira Road, Suite 101 |
Tucson, Arizona 85756 |
(800) 279-0279 |
| |
| Distributor |
Foreside Fund Services, LLC |
3 Canal Plaza, Suite 100 |
Portland, Maine 04101 |
| |
| Accounting Agent, Custodian, and Transfer Agent |
State Street Bank and Trust Co. |
One Lincoln Street |
Boston, Massachusetts 02111 |
| |
| Legal Counsel |
Greenberg Traurig, LLP |
1144 15th Street, Suite 3300 |
Denver, Colorado 80202 |
| |
| Independent Registered Public Accounting Firm |
KPMG LLP |
1225 17th Street, Suite 800 |
Denver, Colorado 80202 |
For more information about Davis Fundamental ETF Trust, including management fee, charges, and expenses, see the current prospectus, which must precede or accompany this report. The Funds’ Statement of Additional Information contains additional information about the Funds’ Trustees and is available without charge, upon request, by calling 1-800-279-0279 and on the Funds’ website at www.davisetfs.com. Fact Sheets are available on the Funds’ website at www.davisetfs.com.