Exhibit 99.2
U.S. Well Services, LLC Matlin & Partners Acquisition Corp. July 16 th , 2018 Investor Presentation
0/48/86 172/22/44 68 / 161 / 63 2 FORWARD - LOOKING STATEMENTS Certain statements contained in this presentation (“Presentation”), which reflect the current views of Matlin & Partners Acqu isi tion Corp. (“MPAC”), U.S. Well Services, LLC (“USWS”), and USWS Holdings LLC, a holding company for USWS (“USWS Holdings”), with respect to future even ts and financial performance, and any other statements of a future or forward - looking nature, constitute “forward - looking statements” for the pur poses of federal securities laws. These forward - looking statements include, but are not limited to, statements with respect to the completion of the transac tions contemplated by the definitive merger and contribution agreement among MPAC, USWS Holdings and the parties named therein and the future operating an d financial performance, business plans and prospects of the combined company. In addition, any statements that refer to projections, for eca sts or other characterizations of future events or circumstances, including any underlying assumptions, are forward - looking statements. The f orward - looking statements contained in this Presentation are based on MPAC’s and USWS’ current expectations and beliefs concerning future de vel opments and their potential effects on MPAC and USWS. There can be no assurance that future developments affecting us will be those that we hav e a nticipated. These forward - looking statements involve a number of risks, uncertainties (some of which are beyond MPAC’s and USWS’ control) or other assumptions that may cause actual results or performance to be materially different from those expressed or implied by these forward - looking stat ements. A description of certain risks and uncertainties and factors that could cause actual results to differ materially from past r esu lts and future plans and projected and estimated future results can be found in MPAC’s Annual Report on Form 10 - K for the fiscal year ended December 31, 2017 and in subsequent Quarterly Reports on Form 10 - Q, including in the sections thereof captioned “Risk Factors” and “Cautionary Note Regar ding Forward - Looking Statements,” as well as in its subsequent Current Reports on Form 8 - K, all of which are filed with the SEC and available free of charge at www.sec.gov. None of MPAC, USWS or their respective affiliates or representatives assumes any obligation to update or correct any forward - loo king statements or other information contained in this Presentation. USE OF PROJECTIONS Any estimates, forecasts or projections set forth in this Presentation have been prepared by USWS and/or MPAC in good faith o n a basis believed to be reasonable. Such estimates, forecasts and projections involve significant elements of subjective judgment and analysis and re fle ct numerous judgment, estimates and assumptions that are inherently uncertain in prospective financial information of any kind. As such, no represe nta tion can be or is made as to the attainability of such estimates, forecasts and projections. The recipient is cautioned that such estimates, forecasts or projections have not been audited and have not been prepared in conformity with generally accepted accounting principles (“GAAP”). The risks and other fac tors that could impact the USWS’ or the combined company’s ability to attain the projected results set forth in this Presentation. The recipient the ref ore should not rely on the estimates, forecasts or projections contained in this Presentation. USE OF NON - GAAP FINANCIAL MEASURES This Presentation includes certain non - GAAP financial measures. These non - GAAP financial measures are in addition to, and not a substitute for or superior to measures of financial performance prepared in accordance with GAAP. There are a number of limitations related to the use of these non - GAAP financial measures versus their nearest GAAP equivalents. For example, other companies may calculate non - GAAP financial measures differently or may use other measures to evaluate their performance, all of which could reduce the usefulness of the non - GAAP financial measures in cluded in this Presentation as tools for comparison. Disclaimer

0/48/86 172/22/44 68 / 161 / 63 3 INDUSTRY AND MARKET DATA Certain information contained in this Presentation has been derived from sources prepared by third parties believed by USWS a nd/ or MPAC to be reliable, including independent industry publications, government publications, public disclosures by other companies or othe r p ublished independent sources. Although USWS and/or MPAC believe these sources are reliable, neither of them has independently verified th e information, and they cannot guarantee, nor do they make any representation regarding, its accuracy and completeness. ADDITIONAL INFORMATION This Presentation is for informational purposes only and shall not constitute an offer to sell or the solicitation of an offe r t o buy any securities pursuant to the proposed business combination or otherwise, nor shall there be any sale of securities In any jurisdiction in whi ch the offer, solicitation or sale would be unlawful prior to the registration or qualification under the securities laws of any such juris dic tion. No offer of securities shall be made except by means of a prospectus meeting the requirements of Section 10 of the Securities Act of 1933, as amende d. In connection with the proposed business combination, MPAC intends to file a proxy statement with the Securities and Exchange Commission (t he “SEC”). The definitive proxy statement and other relevant documents will be sent or given to the stockholders of MPAC and will contain im por tant information about the proposed business combination and related matters. MPAC stockholders and other interested persons are advised to re ad, when available, the proxy statement in connection with MPAC’s solicitation of proxies for the meeting of stockholders to be held t o a pprove the business combination because the proxy statement will contain important information about the proposed business combination. When avai lab le, the definitive proxy statement will be mailed to the MPAC stockholders as of a record date to be established for voting on the bu sin ess combination. Stockholders will also be able to obtain copies of the proxy statement, without charge, once available, at the SEC’s website at www.sec.gov. PARTICIPANTS IN THE SOLICITATION MPAC and its directors and officers may be deemed participants in the solicitation of proxies of MPAC’s stockholders in conne cti on with the proposed business combination. MPAC stockholders and other interested persons may obtain, without charge, more detailed infor mat ion regarding the directors and officers of MPAC in MPAC’s Registration Statement on Form S - 1 initially filed with the SEC on February 15, 201 7. Other information regarding the participants in the proxy solicitation and a description of their direct and indirect interests, by se curity holdings or otherwise, will be contained in the definitive proxy statement and other relevant materials to be filed with tile SEC regardi ng the proposed business combination if and when they become available. Disclaimer (Continued)

0/48/86 172/22/44 68 / 161 / 63 4 · USWS Holdings LLC, the parent of U.S. Well Services (“USWS”), and Matlin & Partners Acquisition Corp. (“MPAC”) have signed a definitive merger and contribution agreement that will create a public next - generation pressure pumping company · Up to $460MM total cash proceeds, including $325MM cash from MPAC SPAC and $135MM of committed PIPE financing at $10.00 per share, are expected to be used to de - lever (net cash at closing) and build 5 additional Clean Fleets ® and 1 conventional fleet, expanding the total fleet size to 17 with ~800,000 HHP · All USWS shareholders are rolling 100% of their equity stake of $274MM into the transaction · In addition to PIPE financing, successfully secured up to $90MM commitment to backstop potential SPAC redemptions · Customer contracts mitigate risk to financial forecasts · Transaction expected to close in early Q4 2018 · USWS’ proprietary electric frac Clean Fleet ® is set to transform the hydraulic fracturing industry through substantial cost and environmental efficiencies · Reduces completion costs -- 90% to 95% fuel cost savings versus diesel powered fleets · Improves operational efficiencies -- eliminates maintenance - intensive diesel engines and transmissions · Reduces environmental impact -- ~99% reduction in CO and NOx emissions · Reduces safety hazards -- eliminates diesel delivery trucks from roads and well - sites; mitigates risk of fires · Clean Fleet ® has a longer useful life – 15 - 20 years vs. 6 years for diesel powered fleets Executive Summary
0/48/86 172/22/44 68 / 161 / 63 5 Short - Term Execution Will be Initial Focus: · Utilize new capital to execute multi - fleet orders and expand supply chain · Roll - out new Clean Fleet© design, which allows for faster mobilization times and greater redundancy Long - Term Goal: · Transition to 100% high - spec electric pressure pumping company · Transaction provides the capital to accelerate this transformation Safety Remains Our Priority: · USWS has established a culture of safety across the organization · Robust training programs for new and existing workforce · Fleet staffing begins 60 - 90 days before delivery USWS: Long - term Growth and Short - Term Execution
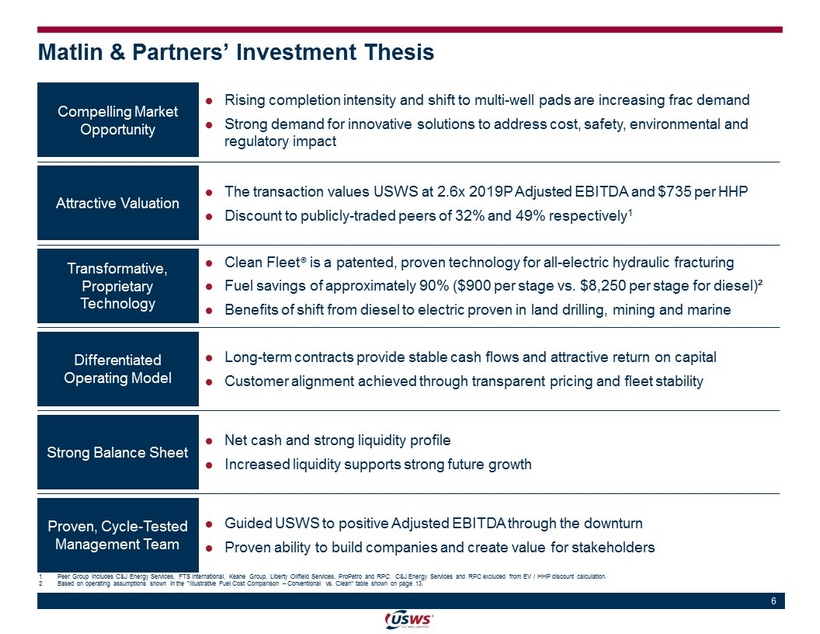
0/48/86 172/22/44 68 / 161 / 63 6 Matlin & Partners’ Investment Thesis · Clean Fleet ® is a patented, proven technology for all - electric hydraulic fracturing · Fuel savings of approximately 90% ($900 per stage vs. $8,250 per stage for diesel)² · Benefits of shift from diesel to electric proven in land drilling, mining and marine Transformative, Proprietary Technology · Long - term contracts provide stable cash flows and attractive return on capital · Customer alignment achieved through transparent pricing and fleet stability Differentiated Operating Model · Net cash and strong liquidity profile · Increased liquidity supports strong future growth Strong Balance Sheet · Guided USWS to positive Adjusted EBITDA through the downturn · Proven ability to build companies and create value for stakeholders Proven, Cycle - Tested Management Team · The transaction values USWS at 2.6x 2019P Adjusted EBITDA and $735 per HHP · Discount to publicly - traded peers of 32% and 49% respectively 1 Attractive Valuation · Rising completion intensity and shift to multi - well pads are increasing frac demand · Strong demand for innovative solutions to address cost, safety, environmental and regulatory impact Compelling Market Opportunity 1 Peer Group includes C&J Energy Services, FTS International, Keane Group, Liberty Oilfield Services, ProPetro and RPC. C&J En erg y Services and RPC excluded from EV / HHP discount calculation. 2 Based on operating assumptions shown in the ”Illustrative Fuel Cost Comparison – Conventional vs. Clean” table shown on page 13.

0/48/86 172/22/44 68 / 161 / 63 7 Transaction Overview: $135MM PIPE Addresses Rising Demand for Clean Fleet ® · Existing USWS equity owners will receive rollover equity consideration equivalent to ~34% of the pro forma combined company Consideration · $329MM 2 of cash in trust held by MPAC to be used to: · Repay USWS’ Term Loan and Revolving Credit Facility · Fund Clean Fleet® expansion MPAC Trust Cash · Business combination between MPAC and USWS at an enterprise valuation of $588MM · 2.6x 2019P Adjusted EBITDA of $225MM and ~$735 per HHP¹ · Strong internal cash flow plus net cash enables scalable Clean Fleet® expansion · Expected transaction closing early - Q4 2018 Transaction Highlights 1 Assumes HHP Pro Forma for future expansion. 2 Cash includes estimated $4 million accrued interest (net of taxes) in MPAC trust account at closing, assuming no redemptions. · $135MM PIPE Offering · Funds additional Clean Fleet® expansion due to expanded customer interest PIPE Offering

0/48/86 172/22/44 68 / 161 / 63 8 80.1% 74.7% 72.6% 69.6% 68.9% 68.3% 62.4% 50.0% 60.0% 70.0% 80.0% 90.0% LBRT USWS FTSI FRAC RES PUMP CJ 69.2% 5.9x 4.2x 3.9x 3.8x 3.8x 3.3x 2.6x 0.0x 1.0x 2.0x 3.0x 4.0x 5.0x 6.0x 7.0x RES LBRT PUMP CJ FRAC FTSI USWS 3.8x $1,861 $1,604 $1,266 $1,172 $735 $0 $400 $800 $1,200 $1,600 $2,000 LBRT PUMP FRAC FTSI USWS $ 1,435 29.1% 27.6% 23.6% 16.7% 15.1% 14.7% 8.9% 0.0% 5.0% 10.0% 15.0% 20.0% 25.0% 30.0% FTSI USWS CJ LBRT FRAC PUMP RES 15.9% ¹ Source: Peer - company public filings, Capital IQ. Pricing as of July 12, 2018. ² Defined as (EBITDA – Maintenance Capex) / EBITDA. ³ HHP pro forma for announced HHP additions. ⁴ Free Cash Flow Yield defined as (Cash Flow From Operations – Maintenance Capex) / Total Enterprise Value. Attractive Valuation Relative To Peers EV / 2019P EBITDA¹ 2019P Free Cash Flow Yield¹ ,4 EV / Pro Forma HHP¹ , ³ Median Median Median 2019P Free Cash Flow Conversion¹ , ² Median
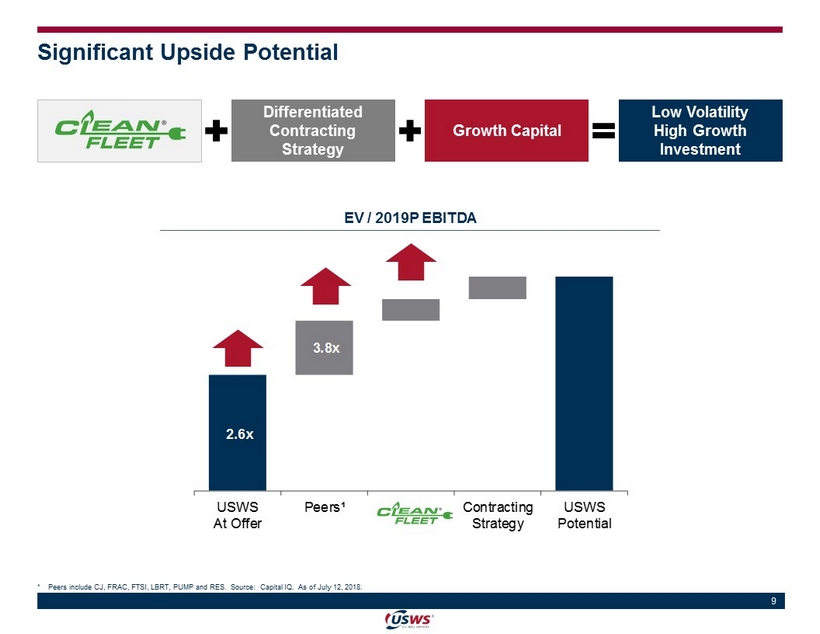
0/48/86 172/22/44 68 / 161 / 63 9 Significant Upside Potential EV / 2019P EBITDA Differentiated Contracting Strategy Growth Capital Low Volatility High Growth Investment ¹ Peers include CJ, FRAC, FTSI, LBRT, PUMP and RES. Source: Capital IQ. As of July 12, 2018. 2.6x 3.8x USWS At Offer Peers¹ Clean Fleet Contracting Strategy USWS Potential
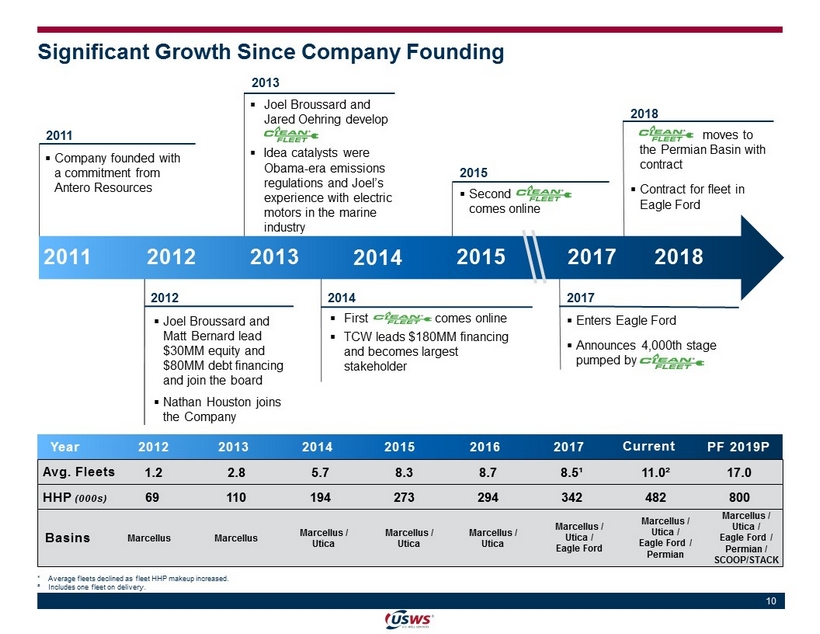
0/48/86 172/22/44 68 / 161 / 63 10 Significant Growth Since Company Founding ▪ Company founded with a commitment from Antero Resources 2011 2012 ▪ Joel Broussard and Matt Bernard lead $30MM equity and $80MM debt financing and join the board ▪ Nathan Houston joins the Company ▪ Joel Broussard and Jared Oehring develop Clean Fleet® ▪ Idea catalysts were Obama - era emissions regulations and Joel’s experience with electric motors in the marine industry 2013 ▪ Second Clean Fleet® comes online 2015 ▪ Clean Flee moves to the Permian Basin with contract ▪ Contract for fleet in Eagle Ford 2018 ▪ First Clean Flee comes online ▪ TCW leads $180MM financing and becomes largest stakeholder 2014 2017 ▪ Enters Eagle Ford ▪ Announces 4,000th stage pumped by Clean Flee ¹ Average fleets declined as fleet HHP makeup increased. ² Includes one fleet on delivery. 1.2 2.8 5.7 8.3 8.7 8.5¹ 11.0² 17.0 Avg. Fleets Year 2012 2013 2015 2017 2014 PF 2019P 2016 Current HHP (000s) 69 110 194 273 294 342 482 800 Basins Marcellus Marcellus Marcellus / Utica Marcellus / Utica Marcellus / Utica Marcellus / Utica / Eagle Ford Marcellus / Utica / Eagle Ford / Permian Marcellus / Utica / Eagle Ford / Permian / SCOOP/STACK 2011 2012 2013 2015 2017 2014 2018

0/48/86 172/22/44 68 / 161 / 63 11 · Pure - play provider of hydraulic fracturing services with approximately 481,000 HHP (10 active fleets, 1 fleet expected to be delivered Q3 2018) · Company plan contemplates adding 6 fleets (including 5 Clean Fleets ® ), growing asset base to approximately 800,000 HHP · Pioneered electric powered Clean Fleet ® technology in 2014 · Long - term contracts protected earnings during the downturn and offer ongoing cash flow visibility · Modern, premium equipment supported by robust maintenance program · Customer - centric culture with focus on driving safety and efficiency through technology · Diverse, high - quality E&P customer base · Cycle - tested management team with a demonstrated ability to build and sell oilfield services companies Pure - Play Frac Service Provider Facility & Fleet Locations Corporate Headquarters Sales Office/Warehouse Field Office Current Operations Target Expansion Areas Historical and Projected Adj. EBITDA And Adj. EBITDA Margin $44 $65 $86 $25 $72 $147 $225 0% 10% 20% 30% $0 $50 $100 $150 $200 $250 2013 2014 2015 2016 2017 2018P 2019P Adj. EBITDA Adj. EBITDA Margin (Dollar amounts in millions) (Adj. EBITDA Margin) (Adj. EBITDA) Generated more EBITDA in 2016 than all competitors combined¹ ¹ Includes CFW, FRAC, FTSI, LBRT, PTEN, PUMP and RES . Source: Capital IQ.

0/48/86 172/22/44 68 / 161 / 63 12 · First - mover in electric frac technology with approximately 6,000 stages completed · All - electric frac fleet, Clean Fleet ® , is significantly advantaged to conventional fleets · Strong intellectual property protection supported by 15 patents (with an additional 53 pending)¹ Clean Fleet ® Is A Game - Changing Technology With Strong Patent Protection Clean Fleet ® On Location In The Permian Key Clean Fleet ® Advantages Significant Operating Cost Savings Reduced Maintenance Longer Useful Life Noise Reduction Near Zero Emissions Enhanced HSSE Improved Stage Rate Efficiency ¹ Includes 12 issued patents and 3 notifications of allowance.
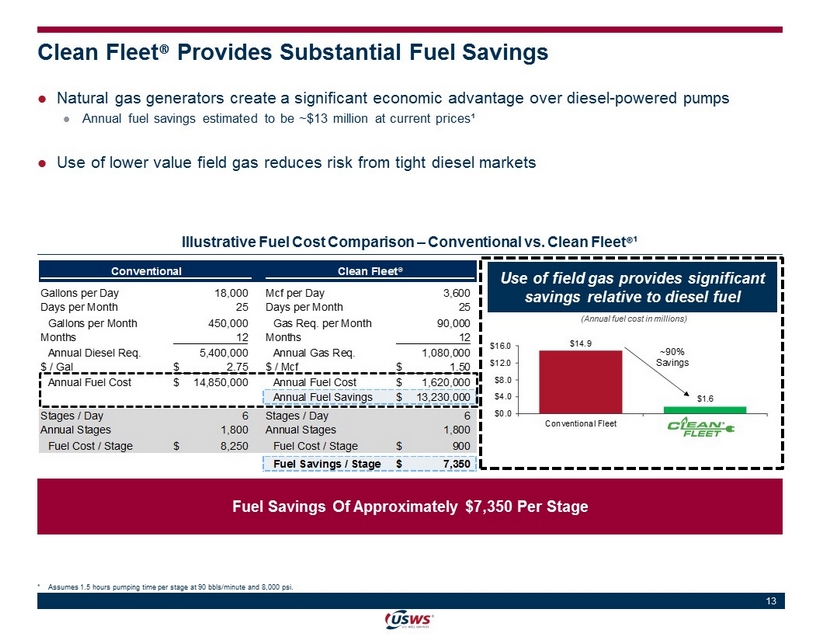
0/48/86 172/22/44 68 / 161 / 63 13 · Natural gas generators create a significant economic advantage over diesel - powered pumps · Annual fuel savings estimated to be ~$13 million at current prices¹ · Use of lower value field gas reduces risk from tight diesel markets Clean Fleet ® Provides Substantial Fuel Savings Illustrative Fuel Cost Comparison – Conventional vs. Clean Fleet ®¹ Fuel Savings Of Approximately $7,350 Per Stage ¹ Assumes 1.5 hours pumping time per stage at 90 bbls/minute and 8,000 psi. Conventional Clean Fleet® Gallons per Day 18,000 Mcf per Day 3,600 Days per Month 25 Days per Month 25 Gallons per Month 450,000 Gas Req. per Month 90,000 Months 12 Months 12 Annual Diesel Req. 5,400,000 Annual Gas Req. 1,080,000 $ / Gal 2.75$ $ / Mcf 1.50$ Annual Fuel Cost 14,850,000$ Annual Fuel Cost 1,620,000$ Annual Fuel Savings 13,230,000$ Stages / Day 6 Stages / Day 6 Annual Stages 1,800 Annual Stages 1,800 Fuel Cost / Stage 8,250$ Fuel Cost / Stage 900$ Fuel Savings / Stage 7,350$ Use of field gas provides significant savings relative to diesel fuel (Annual fuel cost in millions) $14.9 $1.6 $0.0 $4.0 $8.0 $12.0 $16.0 Conventional Fleet CF ~90% Savings

0/48/86 172/22/44 68 / 161 / 63 14 0 2 4 6 8 10 12 14 Clean Fleet ® Is Safer, Cheaper And Better Considerable HSE advantages Reduced vibration and elimination of oil and filter changes dramatically increases uptime Noise reduction averages up to 69% relative to conventional fleets Environmental impact is limited by near elimination of NOx emissions (g/kW - hr) NOx Emissions Reduction 0 2 4 6 8 10 Tier 1 Engine Tier 2 Engine Tier 4 Engine Clean Fleet® Actual Monitoring Points (kPa) Noise Reduction¹ Clean Fleet ® Conventional Fleet ¹ Monitoring points reflect noise readings at various locations around the frac site (not specifically correlated to distance). Conventional High Heat High Noise Fueling on location Climbing on equipment to make mechanical repairs Combustion sources near well head Frequent truck trips for fuel Low Heat Low Noise Zero Fueling Zero Oil/Filter changes Zero Combustion Sources near well head Zero truck trips for fuel CLEAN FLEET

0/48/86 172/22/44 68 / 161 / 63 15 · USWS is in discussions with a multitude of active well - capitalized Oil & Gas producers · USWS is working with various equipment manufacturers to streamline the delivery schedule of Clean Fleet ® · Fleet assembly vendor has indicated that it has the capacity to deliver 12 Clean Fleet ® per year to USWS · Additional suppliers of generators are being vetted · Customers want Clean Fleet ® · Substantial fuel savings (field gas vs. diesel) · Greater efficiencies (higher daily pumping hours) · Reduced NOx emissions · Reduced noise levels · Additional HSE advantages Scaling Clean Fleet ® Deliveries on Robust Demand
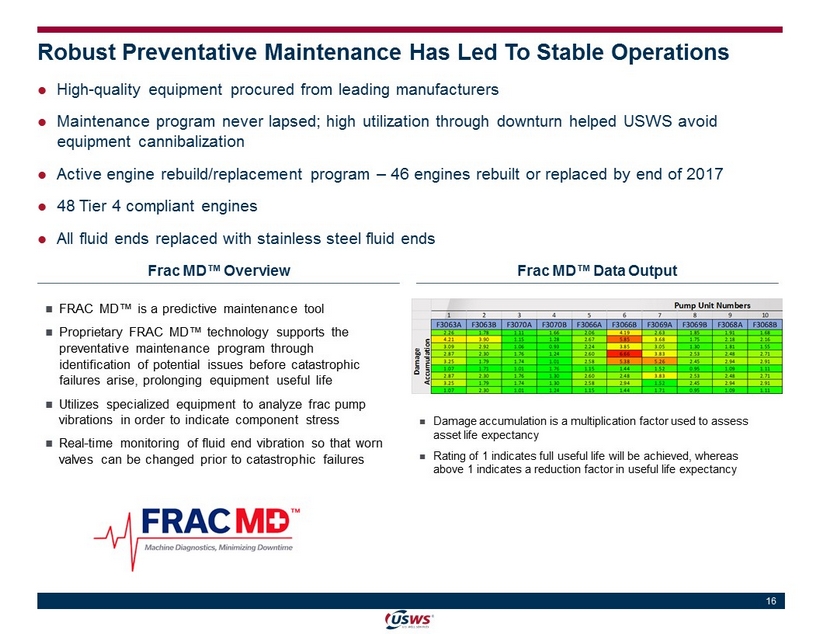
0/48/86 172/22/44 68 / 161 / 63 16 Robust Preventative Maintenance Has Led To Stable Operations · High - quality equipment procured from leading manufacturers · Maintenance program never lapsed; high utilization through downturn helped USWS avoid equipment cannibalization · Active engine rebuild/replacement program – 46 engines rebuilt or replaced by end of 2017 · 48 Tier 4 compliant engines · All fluid ends replaced with stainless steel fluid ends Frac MD™ Data Output Frac MD™ Overview · FRAC MD™ is a predictive maintenance tool · Proprietary FRAC MD™ technology supports the preventative maintenance program through identification of potential issues before catastrophic failures arise, prolonging equipment useful life · Utilizes specialized equipment to analyze frac pump vibrations in order to indicate component stress · Real - time monitoring of fluid end vibration so that worn valves can be changed prior to catastrophic failures · Damage accumulation is a multiplication factor used to assess asset life expectancy · Rating of 1 indicates full useful life will be achieved, whereas above 1 indicates a reduction factor in useful life expectancy

0/48/86 172/22/44 68 / 161 / 63 17 · True contracts – unlike MSAs or dedicated fleets typically seen in the industry · Fixed - price contracts are typically comprised of: · fixed monthly service and equipment (“S&E”) charges · repair and maintenance (“R&M”) surcharges · pass - through margin on consumables provided, where applicable · Long - term contracts are fundamental to business strategy Contracts Reduce Cash Flow Volatility Key Benefits Of USWS’ Contracts · Secures attractive pricing and returns on capital employed · Reduces volatility during periods of slowing activity levels Downside Protection · Allows USWS to underwrite new fleet economics to ensure attractive returns are achieved · Contract economics provide payback periods of as little as two years Attractive Newbuild Economics · Allows customers to capture upside from efficient operations · Protects USWS from short - term disruptions unrelated to USWS’ operations Maximizes Efficiency · Fixed service and equipment charge eliminates need to negotiate standby charges · Structure allows USWS to price contracts without “hiding” margin in consumables Transparent Structure

0/48/86 172/22/44 68 / 161 / 63 18 Sources & Uses And Pro Forma Ownership Pro Forma Ownership And Valuation ¹ Estimated Sources & Uses of Cash ¹ 1. Uses based on estimates of Baseline Adjusted Net Debt Amount as per the Merger & Contribution Agreement. 2. Cash includes estimated $4 million accrued interest (net of taxes) in MPAC trust account at closing, assuming no redemptions. 3. Includes a $7.5 million ”change in control bonus” expense that is payable to management at closing, $1 million to be paid in cas h and the remaining $6.5 million agreed to be paid in 650,000 shares. 4. Excludes warrants to purchase 16.25 million shares at an exercise price of $11.50 per share; MPAC Sponsor warrants to purchase 7.75 million shares at an exercise price of $11.50 per share; 1.0 million MPAC Sponsor shar es restructured to become transferable only after the trading price exceeds $12.00 for 20 out of 30 consecutive trading days or oth er certain conditions; and 530,000 newly issued LTIP shares that vest only after the trading price exceeds $12.00 for 20 out of 30 consecutive trading days and also over 3 years. 5. Backstop commitment fee payable in 900,000 newly issued shares (and transferred MPAC Sponsor warrants to purchase 3.625 milli on shares) in exchange for binding obligation to backstop/fund redemptions of up to $90 million to satisfy the $280 million Minimum Cash Condition. Excludes a 10 million share option at a purchase price of $10.00 per share, which may be exercised in whole or in part, prior to closing. 6. Represents 650,000 shares payable in respect of the “change in control bonus”, as noted above. 7. Excludes shares issuable in connection with expected adjustment from the assumed Baseline Adjusted Net Debt Amount resulting fro m excess cash flow generated from operations during the period from signing to closing. (Dollar amounts and share counts in millions) (Dollar amounts in millions) Sources: Rollover Equity 281$ PIPE Offering 135 Cash From Trust 2 329 Total Sources 745$ Uses: USWS Rollover Equity 274$ Repayment of Term Loan 168 Repayment of Credit Facility 30 Fees and Expenses 3 32 Growth Capital 242 Total Uses 745$ Pro Forma Net Cash: Cash 247$ Less: Capital Leases 14 Less: Equipment Financing 19 Less: Notes Payable 1 Pro Forma Net Cash 213$ Pro Forma Ownership 4 : MPAC Public Shareholders 32.50 40.6% MPAC Sponsor 5.13 6.4% PIPE Investors 13.50 16.9% Backstop Commitment Fee 5 0.90 1.1% Transaction Fees & Expenses 6 0.65 0.8% USWS Rollover Equity 7 27.40 34.2% Total Outstanding at Close 80.08 100.0% Pro Forma Market Capitalization 801$ Less: Net Cash 213 Implied Enterprise Value 588$ Adj. EBITDA 2018P 147$ 2019P 225$ Enterprise Value / Adj. EBITDA 2018P 4.0x 2019P 2.6x

0/48/86 172/22/44 68 / 161 / 63 19 Team Has Successfully Executed on Organic Growth (Dollar amounts in millions, except per fleet amounts) ¹ Adjustments include addbacks for one - time and non - recurring expenses including advisor fees, litigation expenses, fleet start - up costs and non - cash compensation. ² Based on implied fleet utilization of 100 stages per month per fleet. Historical & Projected Results 2015 2016 2017 2018P 2019P Revenue 415$ 295$ 499$ 705$ 900$ Cost of Sales 325 262 422 541 643 Gross Profit 90 32 77 164 257 Gross Profit Margin 22% 11% 15% 23% 29% SG&A Expense 7 10 21 20 32 Adjustments¹ (2) (2) (17) (3) - Adjusted EBITDA 86$ 25$ 72$ 147$ 225$ Adjusted EBITDA Margin 21% 8% 14% 21% 25% Adjustments¹ (2) (2) (17) (3) - Less: D&A Expense (68) (66) (97) (100) (118) EBIT 15 (43) (42) 44 107 Net Other Income (11) (7) (32) (5) - Net Interest Expense (37) (45) (27) (22) (1) Net Income (33) (95) (101) 17 106 Capital Expenditures 94$ 19$ 72$ 97$ 269$ Avg. No. Of Fleets 8.3 8.7 8.5 10.3 13.8 Avg. No. Of Active Fleets² 5.5 5.1 7.9 10.3 13.8 Adj. EBITDA Per Active Fleet 15.7$ 4.9$ 9.2$ 14.4$ 16.3$

0/48/86 172/22/44 68 / 161 / 63 20 · USWS’ contracts provide for full payback in less than four years · IRRs on newbuilds exceed USWS’ targeted return on capital Attractive Returns On Newbuild Fleets (Dollar amounts in millions) Payback Analysis Conventional Clean Fleet® Clean Fleet® – Leased Generators Up-Front Capital Cost 38.0$ 63.0$ 42.0$ Stages per Month 100 100 100 Fixed Monthly S&E 34.8$ 34.8$ 34.8$ Monthly R&M 5.4 5.4 5.4 Consumables 36.0 36.0 36.0 Total Annual Revenue 76.2 76.2 76.2 Fixed Expenses 12.2 12.2 18.2 Variable Expenses 41.2 41.2 41.2 Gross Profit 22.8 22.8 16.8 Maintenance Capex (6% Revenues) 4.6 4.6 4.6 Net Cash Flow 18.2$ 18.2$ 12.2$ Useful Life (Years) 5 20 20 Payback Period (Years) 2.1 3.5 3.4 MOIC 2.4x 5.8x 5.8x

0/48/86 172/22/44 68 / 161 / 63 21 Exciting Opportunity at Attractive Valuation · Clean Fleet ® is a patented, proven technology for all - electric hydraulic fracturing · Fuel savings of approximately 90% ($900 per stage vs. $8,250 per stage for diesel)² · Benefits of shift from diesel to electric proven in land drilling, mining and marine Transformative, Proprietary Technology · Long - term contracts provide stable cash flows and attractive return on capital · Customer alignment achieved through transparent pricing and fleet stability Differentiated Operating Model · Net cash and strong liquidity profile · Increased liquidity supports strong future growth Strong Balance Sheet · Guided USWS to positive Adjusted EBITDA through the downturn · Proven ability to build companies and create value for stakeholders Proven, Cycle - Tested Management Team · The transaction values USWS at 2.6x 2019P Adjusted EBITDA and $735 per HHP · Discount to publicly - traded peers of 32% and 49% respectively 1 Attractive Valuation · Rising completion intensity and shift to multi - well pads are increasing frac demand · Strong demand for innovative solutions to address cost, safety, environmental and regulatory impact Compelling Market Opportunity 1 Peer Group includes C&J Energy Services, FTS International, Keane Group, Liberty Oilfield Services, ProPetro and RPC. C&J En erg y Services and RPC excluded from EV / HHP discount calculation. 2 Based on operating assumptions shown in the ”Illustrative Fuel Cost Comparison – Conventional vs. Clean” table shown on page 13.
Appendix

0/48/86 172/22/44 68 / 161 / 63 23 U.S. Well Services Management Team Joel Broussard CEO ▪ Director of USWS since 2012 and as CEO since 2017 ▪ Seasoned oilfield services executive and serial entrepreneur ▪ Previously founded, and subsequently sold, Gulf Offshore Logistics, Go - Coil, LLC, and Louisiana Spring Water Matt Bernard CAO ▪ CFO of USWS since 2015 ▪ 26 years of energy finance and accounting related experience (10 years at Ernst & Young, 16 years in industry) ▪ Previously served as President and CFO of Gulf Offshore Logistics ▪ B.S. in Accounting from Nicholls State University Nathan Houston COO ▪ Joined USWS in 2012 and currently serves as COO ▪ 17 years of experience and an extensive technical background, with prior experience at Halliburton, Dominion Transmission and Superior Well Services. ▪ Member of the Society of Petroleum Engineers ▪ B.S. in Geo - Environmental Engineering from Pennsylvania State University Kyle O’Neill CFO ▪ Will join USWS as CFO following the close of the transaction ▪ Director of USWS since 2017 ▪ Joined TCW Direct Lending Group in 2013 with the acquisition of the Special Situations Funds Group from Regiment Capital Advisors, LP, where he worked since 2005 ▪ Began his career as an energy investment banker with JPMorgan ▪ BA from Michigan State University
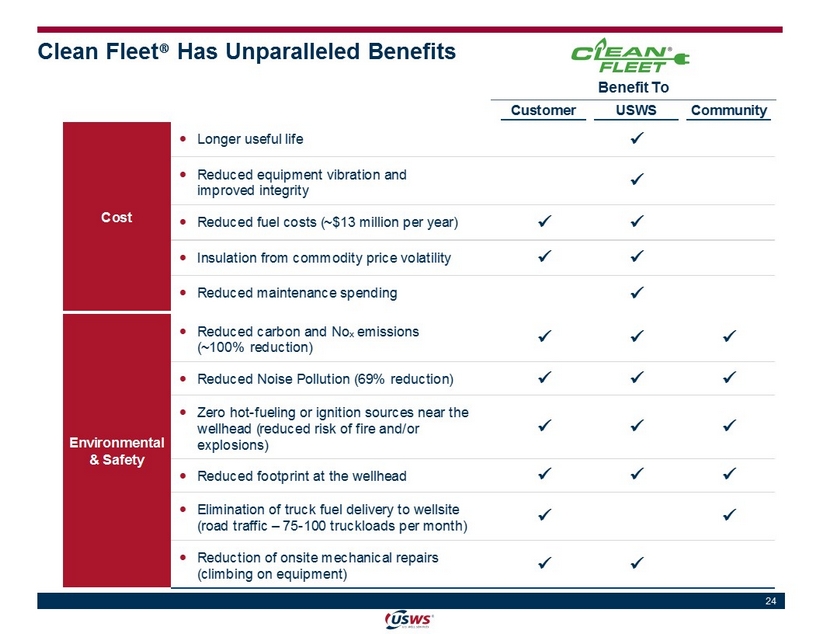
0/48/86 172/22/44 68 / 161 / 63 24 Clean Fleet ® Has Unparalleled Benefits Benefit To Customer USWS Community Cost ✓ Longer useful life x ✓ Reduced equipment vibration and improved integrity x ✓ Reduced fuel costs (~$13 million per year) x x ✓ Insulation from commodity price volatility x x ✓ Reduced maintenance spending x Environmental & Safety ✓ Reduced carbon and No x emissions (~100% reduction) x x x ✓ Reduced Noise Pollution (69% reduction) x x x ✓ Zero hot-fueling or ignition sources near the wellhead (reduced risk of fire and/or explosions) x x x ✓ Reduced footprint at the wellhead x x x ✓ Elimination of truck fuel delivery to wellsite (road traffic – 75-100 truckloads per month) x x ✓ Reduction of onsite mechanical repairs (climbing on equipment) x x

0/48/86 172/22/44 68 / 161 / 63 25 Grown Organically To Become A Leading Pure - Play Frac Company · Founded in 2012 · Pursued a prudent growth strategy, adding fleets with strong customer support in the form of long - term contracts with material cancellation provisions · All equipment purchased new resulting in a young fleet (average age of 3.1 years) · Broad customer base across three major basins with plans to grow to five basins with additional fleets (HHP in thousands) Average Historical and Projected HHP 1.2 2.8 5.7 8.3 8.7 8.5¹ 11.0 ¹ Average fleets declined as fleet HHP makeup increased. 481 69 110 194 273 294 342 481 800 0 100 200 300 400 500 600 700 800 2012 2013 2014 2015 2016 2017 Current Pro Forma Marcellus Marcellus Marcellus / Utica Marcellus / Utica Marcellus / Utica Marcellus / Utica / Eagle Ford Marcellus / Utica / Eagle Ford / Permian Marcellus / Utica / Eagle Ford/ Permian 17.0 Average Fleets Markets Served

0/48/86 172/22/44 68 / 161 / 63 26 · Nine fleets operating under long - term contracts, with one additional fleet under contract to begin work in early Q4 2018 · Currently, one Clean Fleet ® is working in the spot market as part of an industry education program. · 60% of current fleets currently operate on fixed - price contracts · Company is undertaking discussions to deploy six additional fleets in the near term Contracts Provide Visibility Into Cash Flows Contract Summary – As of May 1, 2018 Fleet Q1 2018 Q2 2018 Q3 2018 Q4 2018 Number Type Region Jan Feb Mar Apr May Jun Jul Aug Sep Oct Nov Dec Existing Fleets: Fleet 1 Conv. Appalachia Contracted (4/1/17 - 6/30/19) – Per Stage Pricing Fleet 2 Conv. Appalachia Contracted (7/1/17 - 7/31/18) - Fixed Monthly S&E Spot Work Fleet 3 Conv. Eagle Ford Contracted (5/1/17 - 12/31/18) – Fixed Monthly S&E Fleet 4 Clean Appalachia Industry Education Program Fleet 5 Conv. Appalachia Contracted (1/1/18 - 12/31/18) – Per Stage Pricing Fleet 6 Conv. Appalachia Contracted (4/1/17 - 9/30/19) – Per Stage Pricing Fleet 7 Conv. Appalachia Contracted (7/1/17 - 12/31/18) – Fixed Monthly S&E Fleet 8 Clean Permian Spot Work Contracted (2/1/18 - 12/31/18) – Fixed Monthly S&E Fleet 9 Conv. Eagle Ford Contracted (9/15/17 - 8/31/19) – Fixed Monthly S&E Fleet 10 Conv. Eagle Ford Contracted (10/15/17 - 10/31/19) – Fixed Monthly S&E Fleet 11 Conv. Eagle Ford Contrctd. (10/1/18 - 9/30/20) – Fixed Mo. S&E Growth Fleets: Fleet 12 Conv. Mid-Con Contract Negotiations in Progress – Fixed Monthly S&E Fleet 13 Clean Mid-Con Contract Negotiations in Progress – Fixed Monthly S&E Fleet 14 Clean Permian Contract Negotiations in Progress – Fixed Monthly S&E Fleet 15 Clean Appalachia Contract Negotiations in Progress – Fixed Monthly S&E

0/48/86 172/22/44 68 / 161 / 63 27 5.2 5.6 5.9 6.3 6.7 7.4 7.6 7.9 8.1 8.4 8.7 4.0 4.5 5.0 5.5 6.0 6.5 7.0 7.5 8.0 8.5 9.0 2011 2013 2015 2017 2019P 2021P · Completion intensity, including longer lateral lengths, increasing proppant loadings, and increasing numbers of frac stages per well, is the key driver of well productivity · Leading edge well completions require substantial amounts of water and proppant, sufficient hydraulic horsepower and 24/7 frac operations Completion Intensity Continues To Increase (Thousands of Stimulated Feet) Increasing Lateral Lengths¹ (Average Number of Stages per Well) Higher Proppant Loadings² Higher Number Of Frac Stages¹ Increasing Completion Intensity Is Driving Well Productivity (MM Pounds of Proppant per Well) 5.9 7.3 9.4 11.6 14.2 0.0 2.0 4.0 6.0 8.0 10.0 12.0 14.0 16.0 2014 2015 2016 2017 2018P ¹ Source: Rystad Energy as of March 1, 2018. ² Spears & Associates as of December 2017. 19 19 19 23 25 29 33 35 36 38 39 15 20 25 30 35 40 2011 2013 2015 2017 2019P 2021P

0/48/86 172/22/44 68 / 161 / 63 28 Illustrative Fully Diluted Share Count and Ownership 1. 1.0 million MPAC Sponsor shares were restructured to become transferable only after the trading price exceeds $12.00 for 20 o ut of 30 consecutive trading days or other certain conditions. 2. Backstop commitment fee payable in 900,000 newly issued shares (and transferred MPAC Sponsor warrants to purchase 3.625 milli on shares) in exchange for binding obligation to backstop/fund redemptions of up to $90 million to satisfy the $280 million Minimum Cash Condition. Excludes a 10 million share option at a purchase price of $10.00 per share, which may be exercised in whole or in part, prior to closing. 3. Represents the 650,000 shares payable in respect of the “change in control bonus” expense that is payable to management in th e c losing. 4. Excludes shares issuable in connection with potential adjustment for excess cash flow generated from operations post - signing to closing. 5. 530,000 newly issued LTIP shares were subjected to vesting only after the trading price exceeds $12.00 for 20 out of 30 conse cut ive trading days; still subject to ratable vesting over 3 years. 6. Public warrants to purchase 16.25 million shares at an exercise price of $11.50 per share; and MPAC Sponsor warrants to purchase 7.75 million shares at an exercise price of $11.50 per share. Assumes application of tr ea sury method for warrant dilution impact on share count. Share count in millions $10.00 $11.00 $12.00 $13.00 $14.00 $15.00 $16.00 $17.00 $18.00 MPAC Public Shares 32.50 32.50 32.50 32.50 32.50 32.50 32.50 32.50 32.50 MPAC Sponsor Shares 1 5.13 5.13 6.13 6.13 6.13 6.13 6.13 6.13 6.13 PIPE Shares 13.50 13.50 13.50 13.50 13.50 13.50 13.50 13.50 13.50 Backstop Commitment Fee Shares 2 0.90 0.90 0.90 0.90 0.90 0.90 0.90 0.90 0.90 Transaction Fees & Expenses 3 0.65 0.65 0.65 0.65 0.65 0.65 0.65 0.65 0.65 USWS Rollover Shares 4 27.40 27.40 27.40 27.40 27.40 27.40 27.40 27.40 27.40 LTIP Shares 5 -- -- 0.53 0.53 0.53 0.53 0.53 0.53 0.53 MPAC Sponsor Warrants 6 -- -- 0.32 0.89 1.38 1.81 2.18 2.51 2.80 MPAC Public Warrants 6 -- -- 0.68 1.88 2.90 3.79 4.57 5.26 5.87 Total Shares 80.08 80.08 82.61 84.37 85.89 87.21 88.36 89.37 90.27 Illustrative Share Price

U.S. Well Services, LLC Matlin & Partners Acquisition Corp . July 16 th , 2018 Investor Presentation


