Wells Fargo Commercial Mortgage Trust 2016-C34
Filed: 3 May 16, 12:00am
| FREE WRITING PROSPECTUS | ||
| FILED PURSUANT TO RULE 433 | ||
| REGISTRATION FILE NO.: 333-206677-05 | ||

Free Writing Prospectus
Structural and Collateral Term Sheet
$702,787,500
(Approximate Initial Pool Balance)
$575,004,000
(Approximate Aggregate Certificate Balance of Offered Certificates)
Wells Fargo Commercial Mortgage Trust 2016-C34
as Issuing Entity
Wells Fargo Commercial Mortgage Securities, Inc.
as Depositor
Wells Fargo Bank, National Association
Natixis Real Estate Capital LLC
Rialto Mortgage Finance, LLC
Silverpeak Real Estate Finance LLC
Basis Real Estate Capital II, LLC
as Sponsors and Mortgage Loan Sellers
Commercial Mortgage Pass-Through Certificates
Series 2016-C34
May 3, 2016
| WELLS FARGO SECURITIES | ||
| Lead Manager and Sole Bookrunner | ||
Academy Securities Co-Manager | Deutsche Bank Securities Co-Manager | Natixis Securities Americas LLC Co-Manager |
STATEMENT REGARDING THIS FREE WRITING PROSPECTUS
The depositor has filed a registration statement (including a prospectus) with the Securities and Exchange Commission (‘‘SEC’’) (SEC File No. 333-206677) for the offering to which this communication relates. Before you invest, you should read the prospectus in the registration statement and other documents the depositor has filed with the SEC for more complete information about the depositor, the issuing entity and this offering. You may get these documents for free by visiting EDGAR on the SEC Web site at www.sec.gov. Alternatively, the depositor, any underwriter, or any dealer participating in the offering will arrange to send you the prospectus after filing if you request it by calling toll free 1-800-745-2063 (8 a.m. – 5 p.m. EST) or by emailing wfs.cmbs@wellsfargo.com.
Nothing in this document constitutes an offer of securities for sale in any jurisdiction where the offer or sale is not permitted. The information contained herein is preliminary as of the date hereof, supersedes any such information previously delivered to you and will be superseded by any such information subsequently delivered and ultimately by the final prospectus relating to the securities. These materials are subject to change, completion, supplement or amendment from time to time.
This free writing prospectus has been prepared by the underwriters for information purposes only and does not constitute, in whole or in part, a prospectus for the purposes of Directive 2003/71/EC (as amended) and/or Part VI of the Financial Services and Markets Act 2000, as amended, or other offering document.
STATEMENT REGARDING ASSUMPTIONS AS TO SECURITIES, PRICING ESTIMATES AND OTHER INFORMATION
The attached information contains certain tables and other statistical analyses (the “Computational Materials”) which have been prepared in reliance upon information furnished by the Mortgage Loan Sellers. Numerous assumptions were used in preparing the Computational Materials, which may or may not be reflected herein. As such, no assurance can be given as to the Computational Materials’ accuracy, appropriateness or completeness in any particular context; or as to whether the Computational Materials and/or the assumptions upon which they are based reflect present market conditions or future market performance. The Computational Materials should not be construed as either projections or predictions or as legal, tax, financial or accounting advice. You should consult your own counsel, accountant and other advisors as to the legal, tax, business, financial and related aspects of a purchase of these securities. Any weighted average lives, yields and principal payment periods shown in the Computational Materials are based on prepayment and/or loss assumptions, and changes in such prepayment and/or loss assumptions may dramatically affect such weighted average lives, yields and principal payment periods. In addition, it is possible that prepayments or losses on the underlying assets will occur at rates higher or lower than the rates shown in the attached Computational Materials. The specific characteristics of the securities may differ from those shown in the Computational Materials due to differences between the final underlying assets and the preliminary underlying assets used in preparing the Computational Materials. The principal amount and designation of any security described in the Computational Materials are subject to change prior to issuance. None of Wells Fargo Securities, LLC, Academy Securities, Inc., Deutsche Bank Securities Inc., Natixis Securities Americas LLC or any of their respective affiliates, make any representation or warranty as to the actual rate or timing of payments or losses on any of the underlying assets or the payments or yield on the securities. The information in this presentation is based upon management forecasts and reflects prevailing conditions and management’s views as of this date, all of which are subject to change. In preparing this presentation, we have relied upon and assumed, without independent verification, the accuracy and completeness of all information available from public sources or which was provided to us by or on behalf of the Mortgage Loan Sellers or which was otherwise reviewed by us.
This free writing prospectus contains certain forward-looking statements. If and when included in this free writing prospectus, the words “expects”, “intends”, “anticipates”, “estimates” and analogous expressions and all statements that are not historical facts, including statements about our beliefs or expectations, are intended to identify forward-looking statements. Any forward-looking statements are made subject to risks and uncertainties which could cause actual results to differ materially from those stated. Those risks and uncertainties include, among other things, declines in general economic and business conditions, increased competition, changes in demographics, changes in political and social conditions, regulatory initiatives and changes in customer preferences, many of which are beyond our control and the control of any other person or entity related to this offering. The forward-looking statements made in this free writing prospectus are made as of the date stated on the cover. We have no obligation to update or revise any forward-looking statement.
Wells Fargo Securities is the trade name for the capital markets and investment banking services of Wells Fargo & Company and its subsidiaries, including but not limited to Wells Fargo Securities, LLC, a member of NYSE, FINRA, NFA and SIPC, Wells Fargo Prime Services, LLC, a member of FINRA, NFA and SIPC, and Wells Fargo Bank, N.A. Wells Fargo Securities, LLC and Wells Fargo Prime Services, LLC are distinct entities from affiliated banks and thrifts.
IMPORTANT NOTICE REGARDING THE OFFERED CERTIFICATES
The information herein is preliminary and may be supplemented or amended prior to the time of sale. Prospective investors should understand that, when considering the purchase of the Offered Certificates, a contract of sale will come into being no sooner than the date on which the relevant class of certificates has been priced and the investor has otherwise taken all actions the investor must take to become committed to purchase the Offered Certificates, and the investor has therefore entered into a contract of sale. Any “indications of interest” expressed by any prospective investor, and any “soft circles” generated by the underwriters, prior to the time of sale, will not create binding contractual obligations for such prospective investors, on the one hand, or the underwriters, the depositor or any of their respective agents or affiliates, on the other hand.
In addition, the Offered Certificates referred to in these materials and the asset pool backing them are subject to modification or revision (including the possibility that one or more classes of certificates may be split, combined or eliminated at any time prior to issuance or availability of a final prospectus) and are offered on a “when, as and if issued” basis. As a result of the foregoing, a prospective investor may commit to purchase certificates that have characteristics that may change, and each prospective investor is advised that all or a portion of the certificates referred to in these materials may be issued without all or certain of the characteristics described in these materials. The underwriters’ obligation to sell certificates to any prospective investor is conditioned on the certificates and the transaction having the characteristics described in these materials. If the underwriters determine that a condition is not satisfied in any material respect, such prospective investor will be notified, and neither the depositor nor the underwriters will have any obligation to such prospective investor to deliver any portion of the Offered Certificates which such prospective investor has committed to purchase, and there will be no liability between the underwriters, the depositor or any of their respective agents or affiliates, on the one hand, and such prospective investor, on the other hand, as a consequence of the non-delivery.
The underwriters described in these materials may from time to time perform investment banking services for, or solicit investment banking business from, any company named in these materials. The underwriters and/or their affiliates or respective employees may from time to time have a long or short position in any security or contract discussed in these materials.
The information contained herein supersedes any previous such information delivered to any prospective investor and will be superseded by information delivered to such prospective investor prior to the time of sale.
IMPORTANT NOTICE RELATING TO AUTOMATICALLY-GENERATED EMAIL DISCLAIMERS
Any legends, disclaimers or other notices that may appear at the bottom of any email communication to which this free writing prospectus is attached relating to (1) these materials not constituting an offer (or a solicitation of an offer), (2) no representation that these materials are accurate or complete and may not be updated or (3) these materials possibly being confidential, are not applicable to these materials and should be disregarded. Such legends, disclaimers or other notices have been automatically generated as a result of these materials having been sent via Bloomberg or another system.
THE INFORMATION IN THIS STRUCTURAL AND COLLATERAL TERM SHEET IS NOT COMPLETE AND MAY BE AMENDED PRIOR TO THE TIME OF SALE. THIS TERM SHEET IS NOT AN OFFER TO SELL THESE SECURITIES AND IT IS NOT A SOLICITATION OF AN OFFER TO BUY THESE SECURITIES IN ANY JURISDICTION WHERE THE OFFER OR SALE IS NOT PERMITTED.
| 2 |
| Wells Fargo Commercial Mortgage Trust 2016-C34 | Certificate Structure |
| I. | Certificate Structure |
| Class | Expected Ratings (DBRS/Fitch/Moody’s)(1) | Approximate Initial Certificate Balance or Notional Amount(2) |
Approx. Initial | Pass-Through Rate Description | Weighted Average Life (Years)(4) | Expected Principal Window(4) | Certificate Principal to Value Ratio(5) | Certificate Principal U/W NOI Debt Yield(6) | |||||||
| Offered Certificates | |||||||||||||||
| A-1 | AAA(sf)/AAAsf/Aaa(sf) | $33,179,000 | 30.000% | (7) | 2.81 | 06/16 – 03/21 | 46.1% | 14.5% | |||||||
| A-2 | AAA(sf)/AAAsf/Aaa(sf) | $100,629,000 | 30.000% | (7) | 4.93 | 03/21 – 05/21 | 46.1% | 14.5% | |||||||
| A-3 | AAA(sf)/AAAsf/Aaa(sf) | $115,000,000(8) | 30.000% | (7) | 9.64 | 11/25 – 02/26 | 46.1% | 14.5% | |||||||
| A-4 | AAA(sf)/AAAsf/Aaa(sf) | $172,158,000 | 30.000% | (7) | 9.78 | 02/26 – 04/26 | 46.1% | 14.5% | |||||||
| A-SB | AAA(sf)/AAAsf/Aaa(sf) | $45,985,000 | 30.000% | (7) | 7.32 | 05/21 – 11/25 | 46.1% | 14.5% | |||||||
| A-S | AAA(sf)/AAAsf/Aa2(sf) | $35,139,000 | 25.000% | (7) | 9.89 | 04/26 – 04/26 | 49.4% | 13.5% | |||||||
| X-A | AAA(sf)/AAAsf/NR | $527,090,000(9) | N/A | Variable(10) | N/A | N/A | N/A | N/A | |||||||
| X-B | AAA(sf)/AA-sf/NR | $36,018,000(11) | N/A | Variable(12) | N/A | N/A | N/A | N/A | |||||||
| B | AA(low)(sf)/AA-sf/NR | $36,018,000 | 19.875% | (7) | 9.89 | 04/26 – 04/26 | 52.8% | 12.6% | |||||||
| C | A(low)(sf)/A-sf/NR | $36,896,000 | 14.625% | (7) | 9.89 | 04/26 – 04/26 | 56.3% | 11.9% | |||||||
| Non-Offered Certificates | |||||||||||||||
| X-E | AAA(sf)/BB-sf/NR | $20,205,000(13) | N/A | Variable(14) | N/A | N/A | N/A | N/A | |||||||
| X-FG | AAA(sf)/NR/NR | $20,205,000(15) | N/A | Variable(16) | N/A | N/A | N/A | N/A | |||||||
| X-H | AAA(sf)/NR/NR | $21,084,500(17) | N/A | Variable(18) | N/A | N/A | N/A | N/A | |||||||
| A-3FL | AAA(sf)/AAAsf/Aaa(sf)(19) | $25,000,000(20)(21) | 30.000% | LIBOR plus [ ](22) | 9.64 | 11/25 – 02/26 | 46.1% | 14.5% | |||||||
| A-3FX | AAA(sf)/AAAsf/Aaa(sf) | $0(20)(21) | 30.000% | (7) | 9.64 | 11/25 – 02/26 | 46.1% | 14.5% | |||||||
| D | BBB(low)(sf)/BBB-sf/NR | $41,289,000 | 8.750% | (7) | 9.89 | 04/26 – 04/26 | 60.1% | 11.1% | |||||||
| E | BB(high)(sf)/BB-sf/NR | $20,205,000 | 5.875% | (7) | 9.96 | 04/26 – 05/26 | 62.0% | 10.8% | |||||||
| F | BB(low)(sf)/B-sf/NR | $7,907,000 | 4.750% | (7) | 9.98 | 05/26 – 05/26 | 62.8% | 10.6% | |||||||
| G | B(low)(sf)/NR/NR | $12,298,000 | 3.000% | (7) | 9.98 | 05/26 – 05/26 | 63.9% | 10.4% | |||||||
| H | NR/NR/NR | $21,084,500 | 0.000% | (7) | 9.98 | 05/26 – 05/26 | 65.9% | 10.1% | |||||||
Notes:
| (1) | The expected ratings presented are those of DBRS, Inc. (“DBRS”), Fitch Ratings, Inc. (“Fitch”) and Moody’s Investors Service, Inc. (“Moody’s”) which the depositor hired to rate the offered certificates. One or more other nationally recognized statistical rating organizations that were not hired by the depositor may use information they receive pursuant to Rule 17g-5 under the Securities Exchange Act of 1934, as amended (the “Exchange Act”) or otherwise, to rate or provide market reports and/or published commentary related to the offered certificates. We cannot assure you as to what ratings a non-hired nationally recognized statistical rating organization would assign or that its reports will not express differing, possibly negative, views of the mortgage loans and/or the offered certificates. The ratings of each class of offered certificates address the likelihood of the timely distribution of interest and, except in the case of the Class X-A and X-B certificates, the ultimate distribution of principal due on those classes on or before the Rated Final Distribution Date. See “Risk Factors—Other Risks Relating to the Certificates—Nationally Recognized Statistical Rating Organizations May Assign Different Ratings to the Certificates; Ratings of the Certificates Reflect Only the Views of the Applicable Rating Agencies as of the Dates Such Ratings Were Issued; Ratings May Affect ERISA Eligibility; Ratings May Be Downgraded” and “Ratings” in the Preliminary Prospectus, expected to be dated May 3, 2016 (the “Preliminary Prospectus”). DBRS, Fitch and Moody’s have informed us that the “sf” designation in their ratings represents an identifier for structured finance product ratings. |
| (2) | The certificate balances and notional amounts set forth in the table are approximate. The actual initial certificate balances and notional amounts may be larger or smaller depending on the initial pool balance of the mortgage loans definitively included in the pool of mortgage loans, which aggregate cut-off date balance may be as much as 5% larger or smaller than the amount presented in the Preliminary Prospectus. |
| (3) | The approximate initial credit support with respect to the Class A-1, A-2, A-3, A-3FL, A-3FX, A-4 and A-SB Certificates represents the approximate credit enhancement for the Class A-1, A-2, A-3, A-4, A-3FL, A-3FX and A-SB Certificates in the aggregate. |
| (4) | Weighted Average Lives and Expected Principal Windows are calculated based on an assumed prepayment rate of 0% CPR and the “Structuring Assumptions” described under “Yield and Maturity Considerations—Weighted Average Life” in the Preliminary Prospectus. |
| (5) | The Certificate Principal to Value Ratio for each Class of Certificates (other than the Class A-1, A-2, A-3, A-3FL, A-3FX, A-4 and A-SB Certificates) is calculated as the product of (a) the weighted average Cut-off Date LTV Ratio for the mortgage loans and (b) a fraction, the numerator of which is the total initial Certificate Balance of such Class of Certificates and all Classes of Principal Balance Certificates senior to such Class of Certificates and the denominator of which is the total initial Certificate Balance of all of the Principal Balance Certificates. The Certificate Principal to Value Ratio for each of the Class A-1, A-2, A-3, A-3FL, A-3FX, A-4 and A-SB Certificates is calculated in the aggregate for those Classes as if they were a single Class and is calculated as the product of (a) the weighted average Cut-off Date LTV Ratio for the mortgage loans and (b) a fraction, the numerator of which is the total initial aggregate Certificate Balances of such Classes of Certificates and the denominator of which is the total initial Certificate Balance of all of the Principal Balance Certificates. In any event, however, excess mortgaged property value associated with a mortgage loan will not be available to offset losses on any other mortgage loan. |
| (6) | The Certificate Principal U/W NOI Debt Yield for each Class of Certificates (other than the Class A-1, A-2, A-3, A-3FL, A-3FX, A-4 and A-SB Certificates) is calculated as the product of (a) the weighted average U/W NOI Debt Yield for the mortgage loans and (b) a fraction, the numerator of which is the total initial Certificate Balance of all of the Classes of Principal Balance Certificates and the denominator of which is the total initial Certificate Balance for such Class of Certificates and all Classes of Principal Balance Certificates senior to such Class of Certificates. The Certificate Principal U/W NOI Debt Yield for each of the Class A-1, A-2, A-3, A-3FL, A-3FX, A-4 and A-SB Certificates is calculated in the aggregate for those Classes as if they were a single Class and is calculated as the product of (a) the weighted average U/W NOI Debt Yield for the mortgage loans and (b) a fraction, the numerator of which is the total initial Certificate Balance of all of the Classes of Principal Balance Certificates and the denominator of which is the total aggregate initial Certificate Balances for the Class A-1, A-2, A-3, A-3FL, A-3FX, A-4 and A-SB Certificates. In any event, however, cash flow from each mortgaged property supports only the related mortgage loan and will not be available to support any other mortgage loan. |
| (7) | The pass-through rates for the Class A-1, A-2, A-3, A-3FX, A-4, A-SB, A-S, B, C, D, E, F, G and H Certificates in each case will be one of the following: (i) a fixed rateper annum, (ii) a variable rate per annum equal to the weighted average of the net mortgage interest rates on the mortgage loans for the related distribution date, (iii) a variable rateper annum equal to the lesser of (a) a fixed rate and (b) the weighted average of the net mortgage interest rates on the mortgage loans for the related distribution date or (iv) a variable rateper annum equal to the weighted average of the net mortgage interest rates on the mortgage loans for the related distribution date minus a specified percentage. For purposes of the calculation of the weighted average of the net mortgage interest rates on the mortgage loans for each distribution date, the mortgage interest rates will be adjusted as necessary to a 30/360 basis. |
THE INFORMATION IN THIS STRUCTURAL AND COLLATERAL TERM SHEET IS NOT COMPLETE AND MAY BE AMENDED PRIOR TO THE TIME OF SALE. THIS TERM SHEET IS NOT AN OFFER TO SELL THESE SECURITIES AND IT IS NOT A SOLICITATION OF AN OFFER TO BUY THESE SECURITIES IN ANY JURISDICTION WHERE THE OFFER OR SALE IS NOT PERMITTED.
| 3 |
| Wells Fargo Commercial Mortgage Trust 2016-C34 | Certificate Structure |
| (8) | Represents the initial certificate balance of the Class A-3 Certificates that will be issued on the closing date. |
| (9) | The Class X-A Certificates are notional amount certificates. The Notional Amount of the Class X-A Certificates will be equal to the aggregate Certificate Balance of the Class A-1, A-2, A-3, A-4, A-SB and A-S Certificates and the Class A-3FX regular interest outstanding from time to time. The Class X-A Certificates will not be entitled to distributions of principal. |
| (10) | The pass-through rate for the Class X-A Certificates for any distribution date will be aper annum rate equal to the excess, if any, of (a) the weighted average of the net mortgage interest rates on the mortgage loans for the related distribution date, over (b) the weighted average of the pass-through rates on the Class A-1, A-2, A-3, A-4, A-SB and A-S Certificates and the Class A-3FX regular interest for the related distribution date, weighted on the basis of their respective Certificate Balances outstanding immediately prior to that distribution date. For purposes of the calculation of the weighted average of the net mortgage interest rates on the mortgage loans for each distribution date, the mortgage interest rates will be adjusted as necessary to a 30/360 basis. |
| (11) | The Class X-B Certificates are notional amount certificates. The Notional Amount of the Class X-B Certificates will be equal to the Certificate Balance of the Class B Certificates outstanding from time to time. The Class X-B Certificates will not be entitled to distributions of principal. |
| (12) | The pass-through rate for the Class X-B Certificates for any distribution date will be aper annum rate equal to the excess, if any, of (a) the weighted average of the net mortgage interest rates on the mortgage loans for the related distribution date, over (b) the pass-through rate on the Class B Certificates for the related distribution date. For purposes of the calculation of the weighted average of the net mortgage interest rates on the mortgage loans for each distribution date, the mortgage interest rates will be adjusted as necessary to a 30/360 basis. |
| (13) | The Class X-E Certificates are notional amount certificates. The Notional Amount of the Class X-E Certificates will be equal to the Certificate Balance of the Class E Certificates outstanding from time to time. The Class X-E Certificates will not be entitled to distributions of principal. |
| (14) | The pass-through rate for the Class X-E Certificates for any distribution date will be aper annumrate equal to the excess, if any, of (a) the weighted average of the net mortgage interest rates on the mortgage loans for the related distribution date, over (b) the pass-through rate on the Class E Certificates for the related distribution date. For purposes of the calculation of the weighted average of the net mortgage interest rates on the mortgage loans for each distribution date, the mortgage interest rates will be adjusted as necessary to a 30/360 basis. |
| (15) | The Class X-FG Certificates are notional amount certificates. The Notional Amount of the Class X-FG Certificates will be equal to the aggregate Certificate Balance of the Class F and G Certificates outstanding from time to time. The Class X-FG Certificates will not be entitled to distributions of principal. |
| (16) | The pass-through rate for the Class X-FG Certificates for any distribution date will be aper annumrate equal to the excess, if any, of (a) the weighted average of the net mortgage interest rates on the mortgage loans for the related distribution date, over (b) the weighted average of the pass-through rates on the Class F and G Certificates for the related distribution date, weighted on the basis of their respective Certificate Balances outstanding immediately prior to that distribution date. For purposes of the calculation of the weighted average of the net mortgage interest rates on the mortgage loans for each distribution date, the mortgage interest rates will be adjusted as necessary to a 30/360 basis. |
| (17) | The Class X-H Certificates are notional amount certificates. The Notional Amount of the Class X-H Certificates will be equal to the Certificate Balance of the Class H Certificates outstanding from time to time. The Class X-H Certificates will not be entitled to distributions of principal. |
| (18) | The pass-through rate for the Class X-H Certificates for any distribution date will be aper annum rate equal to the excess, if any, of (a) the weighted average of the net mortgage interest rates on the mortgage loans for the related distribution date, over (b) the pass-through rate on the Class H Certificates for the related distribution date. For purposes of the calculation of the weighted average of the net mortgage interest rates on the mortgage loans for each distribution date, the mortgage interest rates will be adjusted as necessary to a 30/360 basis. |
| (19) | The ratings assigned to the Class A-3FL Certificates reflect only the receipt of up to the fixed rate of interest equal to the pass-through rate for the Class A-3FX regular interest. The ratings of DBRS, Fitch and Moody’s do not address any shortfalls or delays in payment that investors in the Class A-3FL Certificates may experience as a result of the conversion of the pass-through rate on Class A-3FL Certificates from a floating interest rate to a fixed rate following a default under the swap agreement. See “Ratings” in the Private Placement Memorandum. |
| (20) | The aggregate initial certificate balance of the Class A-3, A-3FL and A-3FX Certificates will be $140,000,000. The aggregate certificate balance of the Class A-3FL and A-3FX Certificates will at all times equal the certificate balance of the Class A-3FX regular interest. The initial certificate balance of the Class A-3FL certificates is $25,000,000. The certificate balance of the Class A-3FX certificates will initially be $0. The initial certificate balance of the Class A-3FX regular interest is $25,000,000. |
| (21) | The Class A-3FL Certificates will evidence a beneficial interest in a grantor trust that includes the Class A-3FX regular interest and an interest rate swap contract. Under some circumstances, holders of the Class A-3FL Certificates may exchange all or a portion of their certificates for a like principal amount of Class A-3FX Certificates having the same pass-through rate as the Class A-3FX regular interest. The aggregate certificate balance of the Class A-3FL Certificates may be adjusted from time to time as a result of such an exchange. |
| (22) | The pass-through rate applicable to the Class A-3FL Certificates on each distribution date will be aper annum rate equal to LIBOR plus a specified percentage; provided, however, that under certain circumstances (generally involving a default or termination under the related interest rate swap contract), the pass-through rate applicable to the Class A-3FL Certificates may convert to a rate equal to the pass-through rate on the Class A-3FX regular interest; provided, further, that if such per annum rate is determined to be below zero, the per annum rate will be deemed to be zero. The initial LIBOR rate will be determined two LIBOR business days prior to the Closing Date, and subsequent LIBOR rates for the Class A-3FL Certificates will be determined two LIBOR business days before the start of the related interest accrual period. |
THE INFORMATION IN THIS STRUCTURAL AND COLLATERAL TERM SHEET IS NOT COMPLETE AND MAY BE AMENDED PRIOR TO THE TIME OF SALE. THIS TERM SHEET IS NOT AN OFFER TO SELL THESE SECURITIES AND IT IS NOT A SOLICITATION OF AN OFFER TO BUY THESE SECURITIES IN ANY JURISDICTION WHERE THE OFFER OR SALE IS NOT PERMITTED.
| 4 |
| Wells Fargo Commercial Mortgage Trust 2016-C34 | Transaction Highlights |
| II. | Transaction Highlights |
Mortgage Loan Sellers:
| Mortgage Loan Seller | Number of Mortgage Loans | Number of Mortgaged Properties | Aggregate Cut-off Date Balance | % of Initial Pool Balance | |||||||
| Wells Fargo Bank, National Association | 32 | 32 | $236,472,369 | 33.6 | % | ||||||
| Natixis Real Estate Capital LLC(1) | 9 | 28 | 206,001,998 | 29.3 | |||||||
| Rialto Mortgage Finance, LLC | 15 | 19 | 127,599,500 | 18.2 | |||||||
| Silverpeak Real Estate Finance LLC | 8 | 9 | 103,037,089 | 14.7 | |||||||
| Basis Real Estate Capital II, LLC | 4 | 4 | 29,676,544 | 4.2 | |||||||
| Total | 68 | 92 | $702,787,500 | 100.0 | % | ||||||
| (1) | One of the Mortgage Loans for which Natixis Real Estate Capital LLC is the mortgage loan seller was originated by its affiliate, Natixis, New York Branch. |
Loan Pool:
| Initial Pool Balance: | $702,787,500 |
| Number of Mortgage Loans: | 68 |
| Average Cut-off Date Balance per Mortgage Loan: | $10,335,110 |
| Number of Mortgaged Properties: | 92 |
| Average Cut-off Date Balance per Mortgaged Property(1): | $7,638,995 |
| Weighted Average Mortgage Interest Rate: | 5.052% |
| Ten Largest Mortgage Loans as % of Initial Pool Balance: | 50.2% |
| Weighted Average Original Term to Maturity (months): | 111 |
| Weighted Average Remaining Term to Maturity (months): | 109 |
| Weighted Average Original Amortization Term (months)(2): | 353 |
| Weighted Average Remaining Amortization Term (months)(2): | 352 |
| Weighted Average Seasoning (months): | 2 |
| (1) | Information regarding mortgage loans secured by multiple properties is based on an allocation according to relative appraised values or the allocated loan amounts or property-specific release prices set forth in the related loan documents or such other allocation as the related mortgage loan seller deemed appropriate. |
| (2) | Excludes any mortgage loan that does not amortize. |
Credit Statistics:
| Weighted Average U/W Net Cash Flow DSCR(1): | 1.48x |
| Weighted Average U/W Net Operating Income Debt Yield(1): | 10.1% |
| Weighted Average Cut-off Date Loan-to-Value Ratio(1): | 65.9% |
| Weighted Average Balloon Loan-to-Value Ratio(1): | 57.7% |
| % of Mortgage Loans with Additional Subordinate Debt(2): | 18.3% |
| % of Mortgage Loans with Single Tenants(3): | 2.7% |
| (1) | With respect to any mortgage loan that is part of a whole loan, loan-to-value ratio, debt service coverage ratio and debt yield calculations include the relatedpari passu companion loan(s) but exclude any related subordinate companion loan(s) (unless otherwise stated). The debt service coverage ratio, debt yield and loan-to-value ratio information do not take into account any subordinate debt (whether or not secured by the related mortgaged property), that currently exists or is allowed under the terms of any mortgage loan. See “Description of the Mortgage Pool—Mortgage Pool Characteristics” in the Preliminary Prospectus and Annex A-1 to the Preliminary Prospectus. |
| (2) | The percentage figure expressed as “% of Mortgage Loans with Additional Subordinate Debt” is determined as a percentage of the initial pool balance and does not take into account any future subordinate debt (whether or not secured by the mortgaged property), that may be permitted under the terms of any mortgage loan or the pooling and servicing agreement. See “Description of the Mortgage Pool—Additional Indebtedness—Other Unsecured Indebtedness”. |
| (3) | Excludes mortgage loans that are secured by multiple single tenant properties. |
THE INFORMATION IN THIS STRUCTURAL AND COLLATERAL TERM SHEET IS NOT COMPLETE AND MAY BE AMENDED PRIOR TO THE TIME OF SALE. THIS TERM SHEET IS NOT AN OFFER TO SELL THESE SECURITIES AND IT IS NOT A SOLICITATION OF AN OFFER TO BUY THESE SECURITIES IN ANY JURISDICTION WHERE THE OFFER OR SALE IS NOT PERMITTED.
| 5 |
| Wells Fargo Commercial Mortgage Trust 2016-C34 | Transaction Highlights |
Loan Structural Features:
Amortization:Based on the Initial Pool Balance, 91.1% of the mortgage pool (66 mortgage loans) has scheduled amortization, as follows:
52.1% (32 mortgage loans) provides for an interest-only period followed by an amortization period; and
39.0% (34 mortgage loans) requires amortization during the entire loan term.
Interest-Only:Based on the Initial Pool Balance, 8.9% of the mortgage pool (2 mortgage loans) provides for interest-only payments during the entire loan term. The Weighted Average Cut-off Date Loan-to-Value Ratio and Weighted Average U/W Net Cash Flow DSCR for those mortgage loans are 63.9% and 1.95x, respectively.
Hard Lockboxes: Based on the Initial Pool Balance, 37.3% of the mortgage pool (12 mortgage loans) have hard lockboxes in place.
Reserves:The mortgage loans require amounts to be escrowed monthly as follows (excluding any mortgage loans with springing provisions):
| Real Estate Taxes: | 88.1% of the pool |
| Insurance: | 78.6% of the pool |
| Capital Replacements: | 93.1% of the pool |
| TI/LC: | 93.6% of the pool(1) |
| (1)The percentage of Initial Pool Balance for mortgage loans with TI/LC reserves is based on the aggregate principal balance allocable to loans that include retail, office and industrial properties. | |
Call Protection/Defeasance: Based on the Initial Pool Balance, the mortgage pool has the following call protection and defeasance features:
92.6% of the mortgage pool (62 mortgage loans) features a lockout period, then defeasance only until an open period;
5.8% of the mortgage pool (4 mortgage loans) features a lockout period, then the greater of a prepayment premium or yield maintenance until an open period;
1.6% of the mortgage pool (2 mortgage loans) features a lockout period, then the greater of a prepayment premium or yield maintenance or defeasance until an open period; and
Please refer to Annex A-1 to the Preliminary Prospectus for further information regarding individual loan call protection.
THE INFORMATION IN THIS STRUCTURAL AND COLLATERAL TERM SHEET IS NOT COMPLETE AND MAY BE AMENDED PRIOR TO THE TIME OF SALE. THIS TERM SHEET IS NOT AN OFFER TO SELL THESE SECURITIES AND IT IS NOT A SOLICITATION OF AN OFFER TO BUY THESE SECURITIES IN ANY JURISDICTION WHERE THE OFFER OR SALE IS NOT PERMITTED.
| 6 |
| Wells Fargo Commercial Mortgage Trust 2016-C34 | Issue Characteristics |
| III. | Issue Characteristics |
| Securities Offered: | $575,004,000 approximate monthly pay, multi-class, commercial mortgage REMIC pass-through certificates consisting of 10 classes (Classes A-1, A-2, A-3, A-4, A-SB, A-S, B, C, X-A and X-B), which are offered pursuant to a registration statement filed with the SEC (such classes of certificates, the “Offered Certificates”). |
| Mortgage Loan Sellers: | Wells Fargo Bank, National Association (“WFB”), Natixis Real Estate Capital LLC (“Natixis”), Rialto Mortgage Finance, LLC (“RMF”), Silverpeak Real Estate Finance LLC (“SPREF”) and Basis Real Estate Capital II, LLC (“Basis”). |
| Sole Lead Bookrunning Manager: | Wells Fargo Securities, LLC |
| Co-Managers: | Academy Securities, Inc., Deutsche Bank Securities Inc. and Natixis Securities Americas LLC |
| Rating Agencies: | DBRS, Inc., Fitch Ratings, Inc. and Moody’s Investors Service, Inc. |
| Master Servicer: | Wells Fargo Bank, National Association |
| Special Servicer: | LNR Partners, LLC |
| Certificate Administrator: | Wells Fargo Bank, National Association |
| Trustee: | Wilmington Trust, National Association |
| Operating Advisor: | Pentalpha Surveillance LLC |
| Asset Representations Reviewer: | Pentalpha Surveillance LLC |
| Initial Majority Controlling Class Certificateholder: | Prime Finance CMBS B-Piece Holdco I, L.P. |
| Cut-off Date: | The Cut-off Date with respect to each mortgage loan is the due date for the monthly debt service payment that is due in May 2016 (or, in the case of any mortgage loan that has its first due date in June 2016, the date that would have been its due date in May 2016 under the terms of that mortgage loan if a monthly debt service payment were scheduled to be due in that month). |
| Expected Closing Date: | On or about May 24, 2016. |
| Determination Dates: | The 11th day of each month (or if that day is not a business day, the next succeeding business day), commencing in June 2016. |
| Distribution Dates: | The fourth business day following the Determination Date in each month, commencing in June 2016. |
| Rated Final Distribution Date: | The Distribution Date in May 2049. |
| Interest Accrual Period: | With respect to any Distribution Date, the calendar month immediately preceding the month in which such Distribution Date occurs. |
| Day Count: | The Offered Certificates will accrue interest on a 30/360 basis. |
| Minimum Denominations: | $10,000 for each Class of Offered Certificates (other than the Class X-A and X-B Certificates) and $1,000,000 for the Class X-A and X-B Certificates. Investments may also be made in any whole dollar denomination in excess of the applicable minimum denomination. |
| Clean-up Call: | 1% |
| Delivery: | DTC, Euroclear and Clearstream Banking |
| ERISA/SMMEA Status: | Each Class of Offered Certificates is expected to be eligible for exemptive relief under ERISA. No Class of Offered Certificates will be SMMEA eligible. |
| Risk Factors: | THE CERTIFICATES INVOLVE CERTAIN RISKS AND MAY NOT BE SUITABLE FOR ALL INVESTORS. SEE THE “RISK FACTORS” SECTION OF THE PRELIMINARY PROSPECTUS. |
| Bond Analytics Information: | The Certificate Administrator will be authorized to make distribution date statements, CREFC® reports and certain supplemental reports (other than confidential information) available to certain financial modeling and data provision services, including Bloomberg, L.P., Trepp, LLC, Intex Solutions, Inc., Markit Group Limited, Interactive Data Corp., BlackRock Financial Management, Inc., CMBS.com, Inc. and Thomson Reuters Corporation. |
THE INFORMATION IN THIS STRUCTURAL AND COLLATERAL TERM SHEET IS NOT COMPLETE AND MAY BE AMENDED PRIOR TO THE TIME OF SALE. THIS TERM SHEET IS NOT AN OFFER TO SELL THESE SECURITIES AND IT IS NOT A SOLICITATION OF AN OFFER TO BUY THESE SECURITIES IN ANY JURISDICTION WHERE THE OFFER OR SALE IS NOT PERMITTED.
| 7 |
| Wells Fargo Commercial Mortgage Trust 2016-C34 | Characteristics of the Mortgage Pool |
| IV. | Characteristics of the Mortgage Pool(1) |
| A. | Ten Largest Mortgage Loans |
| Mortgage Loan Seller | Mortgage Loan Name | City | State | Number of Mortgage Loans / Mortgaged Properties | Mortgage Loan Cut-off Date Balance ($) | % of Initial Pool Balance (%) | Property Type | Number of SF/Rooms | Cut-off Date Balance Per SF/Room | Cut-off Date LTV Ratio (%) | Balloon LTV Ratio (%) | U/W NCF DSCR (x) | U/W NOI Debt Yield (%) |
| Natixis | Regent Portfolio | Various | Various | 1 / 13 | $70,000,000 | 9.96% | Various | 352,001 | $232 | 62.2% | 59.6% | 1.45x | 10.1% |
| Natixis | Congressional North Shopping Center & 121 Congressional Lane | Rockville | MD | 1 / 2 | 58,750,000 | 8.4 | Various | 232,201 | 253 | 64.5 | 64.5 | 1.95 | 8.9 |
| WFB | Hilton & Homewood Suites Philadelphia | Philadelphia | PA | 1 / 1 | 44,779,868 | 6.4 | Hospitality | 331 | 135,287 | 58.5 | 48.0 | 1.68 | 12.5 |
| RMF | Shelby Town Center | Shelby Township | MI | 1 / 1 | 30,000,000 | 4.3 | Retail | 238,229 | 126 | 70.7 | 62.5 | 1.40 | 9.5 |
| Natixis | Marriott Monterey | Monterey | CA | 1 / 1 | 29,967,471 | 4.3 | Hospitality | 341 | 190,409 | 54.1 | 45.3 | 1.60 | 13.2 |
| SPREF | 200 Precision & 425 Privet Portfolio | Horsham | PA | 1 / 2 | 28,000,000 | 4.0 | Various | 246,790 | 113 | 71.6 | 64.5 | 1.53 | 10.2 |
| WFB | Old Mill Village & Enterprise Center | Oakhurst | CA | 1 / 1 | 24,314,370 | 3.5 | Mixed Use | 332,759 | 73 | 70.5 | 44.2 | 1.25 | 10.5 |
| SPREF | Nolitan Hotel | New York | NY | 1 / 1 | 24,000,000 | 3.4 | Hospitality | 57 | 421,053 | 60.8 | 50.4 | 1.40 | 10.4 |
| RMF | Storage Solutions Self Storage Portfolio | Various | ME | 1 / 4 | 22,380,000 | 3.2 | Self Storage | 259,420 | 86 | 65.6 | 62.8 | 1.42 | 9.5 |
| Basis | Shoppes at Alafaya | Orlando | FL | 1 / 1 | 20,950,000 | 3.0 | Retail | 120,639 | 174 | 73.1 | 63.7 | 1.25 | 8.8 |
| Top Three Total/Weighted Average | 3 / 16 | $173,529,868 | 24.7% | 62.0% | 58.3% | 1.68x | 10.3% | ||||||
| Top Five Total/Weighted Average | 5 / 18 | $233,497,339 | 33.2% | 62.1% | 57.1% | 1.63x | 10.6% | ||||||
| Top Ten Total/Weighted Average | 10 / 27 | $353,141,708 | 50.2% | 64.2% | 57.1% | 1.55x | 10.4% | ||||||
| Non-Top Ten Total/Weighted Average | 58 / 65 | $349,645,792 | 49.8% | 67.6% | 58.3% | 1.41x | 9.9% | ||||||
| (1) | With respect to any mortgage loan that is part of a whole loan, Cut-off Date Balance Per SF/Room, loan-to-value ratio, debt service coverage ratio and debt yield calculations include the relatedpari passu companion loan(s) but exclude any related subordinate companion loan(s) (unless otherwise stated). With respect to each mortgage loan, debt service coverage ratio, debt yield and loan-to-value ratio information do not take into account of subordinate debt (whether or not secured by the related mortgaged property), if any, that currently exists or is allowed under the terms of such mortgage loan. |
THE INFORMATION IN THIS STRUCTURAL AND COLLATERAL TERM SHEET IS NOT COMPLETE AND MAY BE AMENDED PRIOR TO THE TIME OF SALE. THIS TERM SHEET IS NOT AN OFFER TO SELL THESE SECURITIES AND IT IS NOT A SOLICITATION OF AN OFFER TO BUY THESE SECURITIES IN ANY JURISDICTION WHERE THE OFFER OR SALE IS NOT PERMITTED.
| 8 |
| Wells Fargo Commercial Mortgage Trust 2016-C34 | Characteristics of the Mortgage Pool |
| B. | Summary of thePari PassuWhole Loans |
| Property Name | Mortgage Loan Seller | Note(s) | Related Notes in Loan Group (Original Balance) | Holder of Note | Lead Servicer for the Entire Whole loan | Current Master Servicer Under Related Securitization Servicing Agreement | Current Special Servicer Under Related Securitization Servicing Agreement |
| Regent Portfolio | Natixis | A-1 | $70,000,000 | WFCM 2016-C34 | Yes | Wells Fargo Bank, National Association | LNR Partners, LLC |
| Natixis | A-2 | $11,500,000 | (1) | No | TBD | TBD | |
| Marriott Monterey | Natixis | A-1 | $35,000,000 | CGCMT 2016-P3 | Yes | Wells Fargo Bank, National Association | C-III Asset Management LLC |
| Natixis | A-2 | $30,000,000 | WFCM 2016-C34 | No | Wells Fargo Bank, National Association | LNR Partners, LLC |
| (1) | The relatedpari passu companion loan Note A-2 is currently held by an affiliate of Natixis and is expected to be contributed to a future securitization. No assurance can be provided that the Note A-2 will not be split further. |
| C. | Mortgage Loans with Additional Secured and Mezzanine Financing |
| Loan No. | Mortgage Loan Seller | Mortgage Loan Name | Mortgage Loan Cut-off Date Balance ($) | % of Initial Pool Balance (%) | Subordinate Debt | Mezzanine Debt Cut-off Date Balance ($) | Total Debt Interest Rate (%)(1) | Mortgage Loan U/W NCF DSCR (x)(2) | Total Debt U/W NCF DSCR (x) | Mortgage Loan Cut-off Date U/W NOI Debt Yield (%)(2) | Total Debt Cut-off Date U/W NOI Debt Yield (%) | Mortgage Loan Cut-off Date LTV Ratio (%)(2) | Total Debt Cut-off Date LTV Ratio (%) |
| 1 | Natixis | Regent Portfolio | $70,000,000 | 9.96% | NAP | $10,000,000 | 6.064% | 1.45x | 1.17x | 10.1% | 9.0% | 62.2% | 69.8% |
| 2 | Natixis | Congressional North Shopping Center & 121 Congressional Lane | 58,750,000 | 8.4 | 4,500,000 | NAP | 4.823 | 1.95 | 1.64 | 8.9 | 8.3 | 64.5 | 69.4 |
| Total/Weighted Average | $128,750,000 | 18.3% | $4,500,000 | $10,000,000 | 5.498% | 1.68x | 1.38x | 9.6% | 8.7% | 63.2% | 69.6% | ||
| (1) | Total Debt Interest Rate for any specified mortgage loan reflects the weighted average of the interest rates on the respective components of the total debt. |
| (2) | With respect to the Regent Portfolio mortgage loan, which is part of a whole loan, the loan-to-value ratio, debt service coverage ratio and debt yield calculations include the relatedpari passucompanion loan(s). With respect to the Congressional North Shopping Center & 121 Congressional Lane mortgage loan, which is part of a whole loan, the loan-to-value ratio, debt service coverage ratio and debt yield calculations exclude the related subordinate companion loan. |
THE INFORMATION IN THIS STRUCTURAL AND COLLATERAL TERM SHEET IS NOT COMPLETE AND MAY BE AMENDED PRIOR TO THE TIME OF SALE. THIS TERM SHEET IS NOT AN OFFER TO SELL THESE SECURITIES AND IT IS NOT A SOLICITATION OF AN OFFER TO BUY THESE SECURITIES IN ANY JURISDICTION WHERE THE OFFER OR SALE IS NOT PERMITTED.
| 9 |
| Wells Fargo Commercial Mortgage Trust 2016-C34 | Characteristics of the Mortgage Pool |
| D. | Previous Securitization History(1) |
| Loan No. | Mortgage Loan Seller | Mortgage Loan or Mortgaged Property Name | City | State | Property Type | Mortgage Loan or Mortgaged Property Cut-off Date Balance ($) | % of Initial Pool Balance (%) | Previous Securitization |
| 2 | Natixis | Congressional North Shopping Center & 121 Congressional Lane | Rockville | MD | Various | $58,750,000 | 8.4% | BACM 2006-4 |
| 3 | WFB | Hilton & Homewood Suites Philadelphia | Philadelphia | PA | Hospitality | 44,779,868 | 6.4 | CD 2007-CD4 |
| 4 | RMF | Shelby Town Center | Shelby Township | MI | Retail | 30,000,000 | 4.3 | MSC 2005-HQ7 |
| 5 | Natixis | Marriott Monterey | Monterey | CA | Hospitality | 29,967,471 | 4.3 | JPMCC 2006-LDP8 |
| 7 | WFB | Old Mill Village & Enterprise Center | Oakhurst | CA | Mixed Use | 24,314,370 | 3.5 | BACM 2006-2 |
| 8 | SPREF | Nolitan Hotel | New York | NY | Hospitality | 24,000,000 | 3.4 | COMM 2012-CR5 |
| 11 | RMF | Embassy Plaza | Tucson | AZ | Retail | 17,500,000 | 2.5 | WBCMT 2006-C25; MLMT 2004-MKB1 |
| 12 | WFB | Manchester Parkade | Manchester | CT | Mixed Use | 16,439,932 | 2.3 | GSMS 2006-GG6 |
| 13 | Natixis | Matrix Portfolio | Various | Various | Various | 16,370,000 | 2.3 | JPMCC 2008-C2 |
| 14 | WFB | Tempe Square | Tempe | AZ | Retail | 15,625,000 | 2.2 | CSMC 2006-C3 |
| 16 | WFB | Pacific Palisades Bowl MHC | Pacific Palisades | CA | Manufactured Housing Community | 12,900,000 | 1.8 | BACM 2006-1 |
| 17 | WFB | Sonora Plaza I | Sonora | CA | Retail | 12,700,000 | 1.8 | JPMCC 2006-CB16 |
| 21 | Natixis | Securlock Colony | The Colony | TX | Self Storage | 9,908,634 | 1.4 | COMM 2006-C7 |
| 22 | WFB | Security Public Storage - Santa Rosa | Santa Rosa | CA | Self Storage | 9,801,255 | 1.4 | BSCMS 2006-T22 |
| 23 | SPREF | Overbrook Plaza | Philadelphia | PA | Retail | 9,400,000 | 1.3 | GECMC 2006-C1 |
| 39 | WFB | Northwood Hills Apartments | Dallas | TX | Multifamily | 4,784,743 | 0.7 | CSMC 2006-C2 |
| 40 | WFB | Victorville Self Storage | Victorville | CA | Self Storage | 4,500,000 | 0.6 | LBUBS 2006-C6 |
| 41 | RMF | Corners Shopping Center | Shelby Township | MI | Retail | 4,495,302 | 0.6 | CSMC 2006-C1 |
| 47 | SPREF | PetSmart - Killeen | Killeen | TX | Retail | 3,487,089 | 0.5 | LBUBS 2007-C2 |
| 48 | Natixis | Shoppes of Waterville Commons | Waterville | ME | Retail | 3,410,820 | 0.5 | MSC 2006-HQ9 |
| 51 | WFB | Stor It 4 Less - Sun Valley, CA | Sun Valley | CA | Self Storage | 2,993,404 | 0.4 | GECMC 2006-C1 |
| 53 | WFB | Maple Place Shopping Center | Novi | MI | Retail | 2,845,320 | 0.4 | MSC 2005-T19 |
| 54 | WFB | Parkway Pavillion | Clarksville | TN | Retail | 2,700,000 | 0.4 | MSC 2006-HQ9 |
| 56 | WFB | Shoppes at First Colony | Sugar Land | TX | Retail | 2,650,000 | 0.4 | CSMC 2006-C4 |
| 58 | WFB | Windswept Plaza | Rockport | TX | Retail | 2,288,466 | 0.3 | CSMC 2006-C3 |
| 60 | RMF | CVS Akron | Akron | OH | Retail | 1,692,820 | 0.2 | MSC 2006-T23 |
| 62 | WFB | Plaza Center I & II | Parker | CO | Office | 1,600,000 | 0.2 | BSCMS 2006-PW13 |
| 66 | WFB | Security Public Storage - Riverbank | Riverbank | CA | Self Storage | 1,348,483 | 0.2 | MSC 2006-T23 |
| 68 | WFB | Sandoval Self Storage | Laredo | TX | Self Storage | 1,261,123 | 0.2 | CGCMT 2006-C5 |
| Total | $372,514,100 | 53.0% |
| (1) | The table above represents the most recent securitization with respect to the mortgaged property securing the related mortgage loan, based on information provided by the related borrower or obtained through searches of a third-party database. While loans secured by the above mortgaged properties may have been securitized multiple times in prior transactions, mortgage loans in this securitization are only listed in the above chart if the mortgage loan paid off a loan in another securitization. The information has not otherwise been confirmed by the mortgage loan sellers. |
THE INFORMATION IN THIS STRUCTURAL AND COLLATERAL TERM SHEET IS NOT COMPLETE AND MAY BE AMENDED PRIOR TO THE TIME OF SALE. THIS TERM SHEET IS NOT AN OFFER TO SELL THESE SECURITIES AND IT IS NOT A SOLICITATION OF AN OFFER TO BUY THESE SECURITIES IN ANY JURISDICTION WHERE THE OFFER OR SALE IS NOT PERMITTED.
| 10 |
| Wells Fargo Commercial Mortgage Trust 2016-C34 | Characteristics of the Mortgage Pool |
| E. | Mortgage Loans with Scheduled Balloon Payments and Related Classes |
| Class A-2(1) | ||||||||||||||||
| Loan No. | Mortgage Loan Seller | Mortgage Loan Name | State | Property Type | Mortgage Loan Cut-off Date Balance ($) | % of Initial Pool Balance (%) | Balloon Balance ($) | % of Class A-2 Certificate Balance (%)(2) | SF/ Pads/ Units | Loan per SF/ Pad/Unit ($)(3) | U/W NCF DSCR (x)(3) | U/W NOI Debt Yield (%)(3) | Cut-off Date LTV Ratio (%)(3) | Balloon LTV Ratio (%)(3) | Rem. IO Period (mos.) | Rem. Term to Maturity (mos.) |
| 1 | Natixis | Regent Portfolio | Various | Various | $70,000,000 | 9.96% | $67,030,271 | 66.6% | 352,001 | $232 | 1.45x | 10.1% | 62.2% | 59.6% | 24 | 60 |
| 9 | RMF | Storage Solutions Self Storage Portfolio | ME | Self Storage | 22,380,000 | 3.2 | 21,437,400 | 21.3 | 259,420 | 86 | 1.42 | 9.5 | 65.6 | 62.8 | 22 | 58 |
| 34 | RMF | Bit O Heaven MHC | TX | Manufactured Housing Community | 5,437,500 | 0.8 | 5,187,335 | 5.2 | 759 | 7,164 | 1.29 | 10.1 | 70.5 | 67.3 | 11 | 59 |
| 39 | WFB | Northwood Hills Apartments | TX | Multifamily | 4,784,743 | 0.7 | 4,277,197 | 4.3 | 192 | 24,921 | 1.85 | 14.4 | 57.0 | 50.9 | 0 | 58 |
| Total/Weighted Average | $102,602,243 | 14.6% | $97,932,204 | 97.3% | 1.45x | 10.2% | 63.1% | 60.3% | 22 | 59 | ||||||
| (1) | The table above presents the mortgage loan(s) whose balloon payments would be applied to pay down the principal balance of the Class A-2 Certificates, assuming a 0% CPR and applying the “Structuring Assumptions” described in the Preliminary Prospectus, including the assumptions that (i) none of the mortgage loans in the pool experience prepayments prior to maturity, defaults or losses; (ii) there are no extensions of maturity dates of any mortgage loans in the pool; and (iii) each mortgage loan in the pool is paid in full on its stated maturity date. Each Class of Certificates evidences undivided ownership interests in the entire pool of mortgage loans. Debt service coverage ratio, debt yield and loan-to-value ratio information do not take into account subordinate debt (whether or not secured by the related mortgaged property), if any, that currently exists or is allowed under the terms of any mortgage loan. See Annex A-1 to the Preliminary Prospectus. |
| (2) | Reflects the percentage equal to the Balloon Balance divided by the initial Class A-2 Certificate Balance. |
| (3) | With respect to the Regent Portfolio mortgage loan, which is part of a whole loan, the Loan per SF/Pad/Unit, loan-to-value ratio, debt service coverage ratio and debt yield calculations include the relatedpari passu companion loan(s). |
THE INFORMATION IN THIS STRUCTURAL AND COLLATERAL TERM SHEET IS NOT COMPLETE AND MAY BE AMENDED PRIOR TO THE TIME OF SALE. THIS TERM SHEET IS NOT AN OFFER TO SELL THESE SECURITIES AND IT IS NOT A SOLICITATION OF AN OFFER TO BUY THESE SECURITIES IN ANY JURISDICTION WHERE THE OFFER OR SALE IS NOT PERMITTED.
| 11 |
Wells Fargo Commercial Mortgage Trust 2016-C34 | Characteristics of the Mortgage Pool |
| F. | Property Type Distribution(1) |
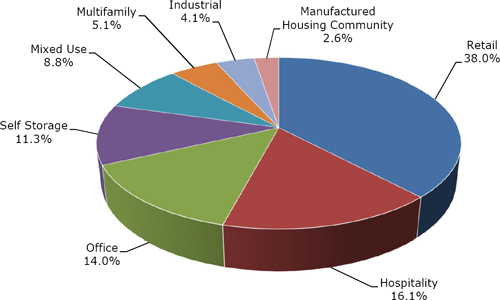
| Property Type | Number of Mortgaged Properties | Aggregate Cut-off Date Balance ($) | % of Initial Pool Balance (%) | Weighted Average Cut- off Date LTV Ratio (%) | Weighted Average Balloon LTV Ratio (%) | Weighted Average U/W NCF DSCR (x) | Weighted Average U/W NOI Debt Yield (%) | Weighted Average U/W NCF Debt Yield (%) | Weighted Average Mortgage Rate (%) | |||||||
| Retail | 33 | $267,010,815 | 38.0 | % | 68.7 | % | 61.7 | % | 1.48 | x | 9.4 | % | 8.8 | % | 4.960 | % |
| Anchored | 12 | 204,345,637 | 29.1 | 68.7 | 62.6 | 1.51 | 9.3 | 8.7 | 4.861 | |||||||
| Unanchored | 8 | 26,046,525 | 3.7 | 68.1 | 56.8 | 1.36 | 10.1 | 9.3 | 5.305 | |||||||
| Single Tenant | 6 | 18,885,510 | 2.7 | 65.4 | 58.7 | 1.39 | 9.0 | 8.8 | 5.329 | |||||||
| Shadow Anchored | 7 | 17,733,143 | 2.5 | 72.8 | 61.1 | 1.41 | 10.3 | 9.4 | 5.191 | |||||||
| Hospitality | 5 | 113,321,995 | 16.1 | 57.3 | 47.5 | 1.66 | 12.7 | 10.9 | 5.207 | |||||||
| Full Service | 3 | 98,747,339 | 14.1 | 57.7 | 47.8 | 1.59 | 12.2 | 10.4 | 5.145 | |||||||
| Extended Stay | 1 | 8,979,582 | 1.3 | 46.8 | 38.5 | 2.54 | 18.0 | 16.4 | 5.000 | |||||||
| Limited Service | 1 | 5,595,074 | 0.8 | 66.6 | 57.6 | 1.43 | 12.4 | 11.0 | 6.640 | |||||||
| Office | 15 | 98,213,128 | 14.0 | 64.5 | 60.2 | 1.46 | 10.2 | 9.6 | 5.144 | |||||||
| Medical | 13 | 78,030,008 | 11.1 | 63.0 | 59.4 | 1.44 | 10.1 | 9.5 | 5.239 | |||||||
| Suburban | 2 | 20,183,120 | 2.9 | 70.1 | 63.3 | 1.55 | 10.4 | 9.7 | 4.774 | |||||||
| Self Storage | 21 | 79,751,777 | 11.3 | 64.2 | 56.0 | 1.43 | 9.5 | 9.4 | 5.069 | |||||||
| Self Storage | 21 | 79,751,777 | 11.3 | 64.2 | 56.0 | 1.43 | 9.5 | 9.4 | 5.069 | |||||||
| Mixed Use | 5 | 61,633,065 | 8.8 | 70.1 | 54.9 | 1.38 | 10.0 | 9.2 | 4.891 | |||||||
| Industrial/Retail | 1 | 24,314,370 | 3.5 | 70.5 | 44.2 | 1.25 | 10.5 | 9.7 | 4.710 | |||||||
| Retail/Industrial/Office | 1 | 16,439,932 | 2.3 | 74.7 | 61.6 | 1.41 | 10.4 | 9.1 | 4.970 | |||||||
| Retail/Office | 1 | 10,149,400 | 1.4 | 65.7 | 60.9 | 1.24 | 8.6 | 8.2 | 5.260 | |||||||
| Office/Retail | 1 | 7,029,363 | 1.0 | 64.5 | 64.5 | 1.95 | 8.9 | 8.7 | 4.369 | |||||||
| Multifamily/Retail | 1 | 3,700,000 | 0.5 | 69.8 | 61.5 | 1.44 | 10.2 | 10.0 | 5.710 | |||||||
| Multifamily | 6 | 35,811,286 | 5.1 | 69.3 | 61.1 | 1.38 | 9.8 | 9.2 | 5.175 | |||||||
| Garden | 6 | 35,811,286 | 5.1 | 69.3 | 61.1 | 1.38 | 9.8 | 9.2 | 5.175 | |||||||
| Industrial | 5 | 28,707,935 | 4.1 | 67.4 | 56.7 | 1.39 | 9.7 | 9.2 | 4.972 | |||||||
| Flex | 2 | 14,737,943 | 2.1 | 68.4 | 58.1 | 1.47 | 10.2 | 9.6 | 4.844 | |||||||
| Warehouse | 3 | 13,969,992 | 2.0 | 66.5 | 55.2 | 1.30 | 9.2 | 8.8 | 5.107 | |||||||
| Manufactured Housing Community | 2 | 18,337,500 | 2.6 | 69.7 | 62.0 | 1.33 | 9.1 | 8.9 | 5.299 | |||||||
| Manufactured Housing Community | 2 | 18,337,500 | 2.6 | 69.7 | 62.0 | 1.33 | 9.1 | 8.9 | 5.299 | |||||||
| Total/Weighted Average: | 92 | $702,787,500 | 100.0 | % | 65.9 | % | 57.7 | % | 1.48 | x | 10.1 | % | 9.4 | % | 5.052 | % |
| (1) | Because this table presents information relating to the mortgaged properties and not the mortgage loans, the information for mortgage loans secured by more than one mortgaged property is based on allocated amounts (allocating the mortgage loan balance to each of those properties according to the relative appraised values of the mortgaged properties or the allocated loan amounts or property-specific release prices set forth in the related mortgage loan documents or such other allocation as the related mortgage loan seller deemed appropriate). With respect to any mortgage loan that is part of a whole loan, the loan-to-value ratio, debt service coverage ratio and debt yield calculations include the relatedpari passu companion loan(s) but exclude any related subordinate companion loan(s) (unless otherwise stated). With respect to each mortgage loan, debt service coverage ratio, debt yield and loan-to-value ratio information do not take into account of any subordinate debt (whether or not secured by the related mortgaged property) that currently exists or is allowed under the terms of such mortgage loan. See Annex A-1 to the Preliminary Prospectus. |
THE INFORMATION IN THIS STRUCTURAL AND COLLATERAL TERM SHEET IS NOT COMPLETE AND MAY BE AMENDED PRIOR TO THE TIME OF SALE. THIS TERM SHEET IS NOT AN OFFER TO SELL THESE SECURITIES AND IT IS NOT A SOLICITATION OF AN OFFER TO BUY THESE SECURITIES IN ANY JURISDICTION WHERE THE OFFER OR SALE IS NOT PERMITTED.
| 12 |
Wells Fargo Commercial Mortgage Trust 2016-C34 | Characteristics of the Mortgage Pool |
| G. | Geographic Distribution(1)(2) |
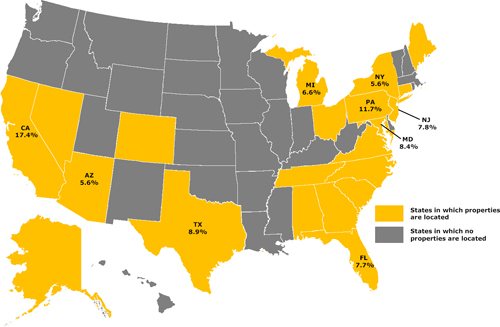
| Location | Number of Mortgaged Properties | Aggregate Cut-off Date Balance ($) | % of Initial Pool Balance (%) | Weighted Average Cut- off Date LTV Ratio (%) | Weighted Average Balloon LTV Ratio (%) | Weighted Average U/W NCF DSCR (x) | Weighted Average U/W NOI Debt Yield (%) | Weighted Average U/W NCF Debt Yield (%) | Weighted Average Mortgage Rate (%) | |||||||
| California | 12 | $122,346,046 | 17.4 | % | 64.8 | % | 51.8 | % | 1.41 | x | 10.5 | % | 9.6 | % | 5.027 | % |
| Northern | 8 | 95,052,642 | 13.5 | 64.3 | 50.1 | 1.42 | 10.9 | 9.8 | 5.067 | |||||||
| Southern | 4 | 27,293,404 | 3.9 | 66.7 | 57.5 | 1.40 | 9.2 | 8.9 | 4.889 | |||||||
| Pennsylvania | 4 | 82,179,868 | 11.7 | 64.8 | 55.7 | 1.59 | 11.4 | 10.1 | 4.830 | |||||||
| Texas | 14 | 62,271,681 | 8.9 | 67.7 | 58.0 | 1.34 | 9.7 | 9.2 | 5.325 | |||||||
| Maryland | 2 | 58,750,000 | 8.4 | 64.5 | 64.5 | 1.95 | 8.9 | 8.7 | 4.369 | |||||||
| New Jersey | 11 | 54,851,167 | 7.8 | 62.2 | 59.6 | 1.45 | 10.1 | 9.6 | 5.213 | |||||||
| Florida | 10 | 54,155,573 | 7.7 | 68.9 | 60.7 | 1.35 | 9.7 | 9.0 | 5.336 | |||||||
| Michigan | 5 | 46,035,986 | 6.6 | 68.5 | 59.1 | 1.43 | 10.2 | 9.5 | 5.143 | |||||||
| Arizona | 3 | 39,425,000 | 5.6 | 67.6 | 62.7 | 1.33 | 9.0 | 8.3 | 4.765 | |||||||
| New York | 3 | 39,188,334 | 5.6 | 62.1 | 54.1 | 1.42 | 10.3 | 9.5 | 5.313 | |||||||
| Other(3) | 28 | 143,583,846 | 20.4 | 67.2 | 58.4 | 1.46 | 10.2 | 9.6 | 5.171 | |||||||
| Total/Weighted Average | 92 | $702,787,500 | 100.0 | % | 65.9 | % | 57.7 | % | 1.48 | x | 10.1 | % | 9.4 | % | 5.052 | % |
| (1) | The mortgaged properties are located in 21 states and the District of Columbia. |
| (2) | Because this table presents information relating to the mortgaged properties and not the mortgage loans, the information for mortgage loans secured by more than one mortgaged property is based on allocated amounts (allocating the mortgage loan balance to each of those properties according to the relative appraised values of the mortgaged properties or the allocated loan amounts or property-specific release prices set forth in the related mortgage loan documents or such other allocation as the related mortgage loan seller deemed appropriate). With respect to any mortgage loan that is part of a whole loan, the loan-to-value ratio, debt service coverage ratio and debt yield calculations include the relatedpari passu companion loan(s) but exclude any related subordinate companion loan(s) (unless otherwise stated). With respect to each mortgage loan, debt service coverage ratio, debt yield and loan-to-value ratio information do not take into account of any subordinate debt (whether or not secured by the related mortgaged property) that currently exists or is allowed under the terms of such mortgage loan. See Annex A-1 to the Preliminary Prospectus. |
| (3) | Includes 12 other states and District of Columbia. |
THE INFORMATION IN THIS STRUCTURAL AND COLLATERAL TERM SHEET IS NOT COMPLETE AND MAY BE AMENDED PRIOR TO THE TIME OF SALE. THIS TERM SHEET IS NOT AN OFFER TO SELL THESE SECURITIES AND IT IS NOT A SOLICITATION OF AN OFFER TO BUY THESE SECURITIES IN ANY JURISDICTION WHERE THE OFFER OR SALE IS NOT PERMITTED.
| 13 |
Wells Fargo Commercial Mortgage Trust 2016-C34 | Characteristics of the Mortgage Pool |
| H. | Characteristics of the Mortgage Pool(1) |
| CUT-OFF DATE BALANCE | ||||
| Range of Cut-off Date Balances ($) | Number of Mortgage Loans | Aggregate Cut- off Date Balance | % of Initial Pool Balance | |
| 1,261,123 - 2,000,000 | 9 | $13,511,409 | 1.9 | % |
| 2,000,001 - 3,000,000 | 9 | 23,562,745 | 3.4 | |
| 3,000,001 - 4,000,000 | 8 | 28,223,964 | 4.0 | |
| 4,000,001 - 5,000,000 | 6 | 27,769,634 | 4.0 | |
| 5,000,001 - 6,000,000 | 6 | 33,503,637 | 4.8 | |
| 6,000,001 - 7,000,000 | 4 | 26,450,000 | 3.8 | |
| 8,000,001 - 9,000,000 | 2 | 17,679,582 | 2.5 | |
| 9,000,001 - 10,000,000 | 4 | 38,209,889 | 5.4 | |
| 10,000,001 - 15,000,000 | 6 | 74,800,000 | 10.6 | |
| 15,000,001 - 20,000,000 | 4 | 65,934,932 | 9.4 | |
| 20,000,001 - 30,000,000 | 7 | 179,611,841 | 25.6 | |
| 30,000,001 - 50,000,000 | 1 | 44,779,868 | 6.4 | |
| 50,000,001 - 70,000,000 | 2 | 128,750,000 | 18.3 | |
| Total: | 68 | $702,787,500 | 100.0 | % |
| Average: | $10,335,110 | |||
| UNDERWRITTEN NOI DEBT SERVICE COVERAGE RATIO | ||||
| Range of U/W NOI DSCRs (x) | Number of Mortgage Loans | Aggregate Cut- off Date Balance | % of Initial Pool Balance | |
| 1.20 | 1 | $3,835,000 | 0.5 | % |
| 1.21 - 1.30 | 8 | 63,410,464 | 9.0 | |
| 1.31 - 1.40 | 15 | 125,893,683 | 17.9 | |
| 1.41 - 1.50 | 14 | 132,664,711 | 18.9 | |
| 1.51 - 1.60 | 8 | 128,772,439 | 18.3 | |
| 1.61 - 1.70 | 8 | 76,173,128 | 10.8 | |
| 1.71 - 1.80 | 3 | 8,296,126 | 1.2 | |
| 1.81 - 1.90 | 1 | 1,686,439 | 0.2 | |
| 1.91 - 2.00 | 4 | 84,397,339 | 12.0 | |
| 2.01 - 2.50 | 5 | 68,678,589 | 9.8 | |
| 2.51 - 2.78 | 1 | 8,979,582 | 1.3 | |
| Total: | 68 | $702,787,500 | 100.0 | % |
| Weighted Average: | 1.59x | |||
| UNDERWRITTEN NCF DEBT SERVICE COVERAGE RATIO | ||||
| Range of U/W NCF DSCRs (x) | Number of Mortgage Loans | Aggregate Cut- off Date Balance | % of Initial Pool Balance | |
| 1.20 | 4 | $28,430,723 | 4.0 | % |
| 1.21 - 1.30 | 16 | 125,117,302 | 17.8 | |
| 1.31 - 1.40 | 20 | 194,421,458 | 27.7 | |
| 1.41 - 1.50 | 10 | 143,441,821 | 20.4 | |
| 1.51 - 1.60 | 5 | 69,305,593 | 9.9 | |
| 1.61 - 1.70 | 4 | 52,466,306 | 7.5 | |
| 1.71 - 1.80 | 2 | 3,896,126 | 0.6 | |
| 1.81 - 1.90 | 3 | 12,980,106 | 1.8 | |
| 1.91 - 2.00 | 2 | 62,400,000 | 8.9 | |
| 2.01 - 2.50 | 1 | 1,348,483 | 0.2 | |
| 2.51 - 2.54 | 1 | 8,979,582 | 1.3 | |
| Total: | 68 | $702,787,500 | 100.0 | % |
| Weighted Average: | 1.48x | |||
| LOAN PURPOSE | ||||
| Loan Purpose | Number of Mortgage Loans | Aggregate Cut- off Date Balance | % of Initial Pool Balance | |
| Refinance | 51 | $598,330,089 | 85.1 | % |
| Acquisition | 17 | 104,457,411 | 14.9 | |
| Total: | 68 | $702,787,500 | 100.0 | % |
| MORTGAGE RATE | ||||
| Range of Mortgage Rates (%) | Number of Mortgage Loans | Aggregate Cut- off Date Balance | % of Initial Pool Balance | |
| 4.369 - 4.500 | 1 | $58,750,000 | 8.4 | % |
| 4.501 - 4.750 | 7 | 89,933,445 | 12.8 | |
| 4.751 - 5.000 | 13 | 176,822,134 | 25.2 | |
| 5.001 - 5.250 | 23 | 184,795,061 | 26.3 | |
| 5.251 - 5.500 | 17 | 134,959,684 | 19.2 | |
| 5.501 - 5.750 | 4 | 43,007,514 | 6.1 | |
| 5.751 - 6.000 | 1 | 3,487,089 | 0.5 | |
| 6.251 - 6.500 | 1 | 5,437,500 | 0.8 | |
| 6.501 - 6.640 | 1 | 5,595,074 | 0.8 | |
| Total: | 68 | $702,787,500 | 100.0 | % |
| Weighted Average: | 5.052% | |||
| UNDERWRITTEN NOI DEBT YIELD | ||||
| Range of U/W NOI Debt Yields (%) | Number of Mortgage Loans | Aggregate Cut- off Date Balance | % of Initial Pool Balance | |
| 8.0 | 1 | $3,835,000 | 0.5 | % |
| 8.1 - 9.0 | 18 | 219,517,944 | 31.2 | |
| 9.1 - 10.0 | 14 | 123,434,108 | 17.6 | |
| 10.1 - 11.0 | 21 | 235,621,998 | 33.5 | |
| 11.1 - 12.0 | 4 | 17,145,302 | 2.4 | |
| 12.1 - 13.0 | 5 | 55,957,506 | 8.0 | |
| 13.1 - 14.0 | 2 | 32,162,835 | 4.6 | |
| 14.1 - 15.0 | 1 | 4,784,743 | 0.7 | |
| 15.1 - 16.0 | 1 | 1,348,483 | 0.2 | |
| 17.1 - 18.0 | 1 | 8,979,582 | 1.3 | |
| Total: | 68 | $702,787,500 | 100.0 | % |
| Weighted Average: | 10.1% | |||
| UNDERWRITTEN NCF DEBT YIELD | ||||
| Range of U/W NCF Debt Yields (%) | Number of Mortgage Loans | Aggregate Cut- off Date Balance | % of Initial Pool Balance | |
| 8.0 | 4 | $28,354,454 | 4.0 | % |
| 8.1 - 9.0 | 28 | 305,299,283 | 43.4 | |
| 9.1 - 10.0 | 19 | 239,272,562 | 34.0 | |
| 10.1 - 11.0 | 9 | 101,156,904 | 14.4 | |
| 11.1 - 12.0 | 3 | 9,100,000 | 1.3 | |
| 12.1 - 13.0 | 2 | 4,491,490 | 0.6 | |
| 13.1 - 14.0 | 1 | 4,784,743 | 0.7 | |
| 15.1 - 16.0 | 1 | 1,348,483 | 0.2 | |
| 16.1 - 16.4 | 1 | 8,979,582 | 1.3 | |
| Total: | 68 | $702,787,500 | 100.0 | % |
| Weighted Average: | 9.4% | |||
| (1) | With respect to any mortgage loan that is part of a whole loan, the loan-to-value ratio, debt service coverage ratio and debt yield calculations include the relatedpari passucompanion loan(s) but exclude any related subordinate companion loan(s) (unless otherwise stated). With respect to each mortgage loan, debt service coverage ratio, debt yield and loan-to-value ratio information do not take into account any subordinate debt (whether or not secured by the related mortgaged property), that currently exists or is allowed under the terms of such mortgage loan. See Annex A-1 to the Preliminary Prospectus. Prepayment provisions for each mortgage loan reflects the entire life of the loan (from origination to maturity). |
THE INFORMATION IN THIS STRUCTURAL AND COLLATERAL TERM SHEET IS NOT COMPLETE AND MAY BE AMENDED PRIOR TO THE TIME OF SALE. THIS TERM SHEET IS NOT AN OFFER TO SELL THESE SECURITIES AND IT IS NOT A SOLICITATION OF AN OFFER TO BUY THESE SECURITIES IN ANY JURISDICTION WHERE THE OFFER OR SALE IS NOT PERMITTED.
| 14 |
Wells Fargo Commercial Mortgage Trust 2016-C34 | Characteristics of the Mortgage Pool |
| ORIGINAL TERM TO MATURITY | ||||
| Original Terms to Maturity (months) | Number of Mortgage Loans | Aggregate Cut- off Date Balance | % of Initial Pool Balance | |
| 60 | 4 | $102,602,243 | 14.6 | % |
| 120 | 64 | 600,185,258 | 85.4 | |
| Total: | 68 | $702,787,500 | 100.0 | % |
| Weighted Average: | 111 months | |||
| REMAINING TERM TO MATURITY | ||||
| Range of Remaining Terms to Maturity (months) | Number of Mortgage Loans | Aggregate Cut- off Date Balance | % of Initial Pool Balance | |
| 58 - 60 | 4 | $102,602,243 | 14.6 | % |
| 85 - 120 | 64 | 600,185,258 | 85.4 | |
| Total: | 68 | $702,787,500 | 100.0 | % |
| Weighted Average: | 109 months | |||
| ORIGINAL AMORTIZATION TERM(2) | ||||
| Original Amortization Terms (months) | Number of Mortgage Loans | Aggregate Cut- off Date Balance | % of Initial Pool Balance | |
| Non-Amortizing | 2 | $62,400,000 | 8.9 | % |
| 240 | 1 | 24,314,370 | 3.5 | |
| 300 | 9 | 29,412,647 | 4.2 | |
| 330 | 1 | 3,487,089 | 0.5 | |
| 360 | 55 | 583,173,394 | 83.0 | |
| Total: | 68 | $702,787,500 | 100.0 | % |
| Weighted Average(3): | 353 months | |||
(2) The original amortization term shown for any mortgage loan that is interest-only for part of its term does not include the number of months in its interest-only period and reflects only the number of months as of the commencement of amortization remaining from the end of such interest-only period. (3) Excludes the non-amortizing mortgage loans. | ||||
| REMAINING AMORTIZATION TERM(4) | ||||
| Range of Remaining Amortization Terms (months) | Number of Mortgage Loans | Aggregate Cut- off Date Balance | % of Initial Pool Balance | |
| Non-Amortizing | 2 | $62,400,000 | 8.9 | % |
| 237 - 240 | 1 | 24,314,370 | 3.5 | |
| 241 - 300 | 9 | 29,412,647 | 4.2 | |
| 301 - 360 | 56 | 586,660,483 | 83.5 | |
| Total: | 68 | $702,787,500 | 100.0 | % |
| Weighted Average(5): | 352 months | |||
(4) The remaining amortization term shown for any mortgage loan that is interest-only for part of its term does not include the number of months in its interest-only period and reflects only the number of months as of the commencement of amortization remaining from the end of such interest-only period. (5) Excludes the non-amortizing mortgage loans. | ||||
| LOCKBOXES | ||||
| Type of Lockbox | Number of Mortgage Loans | Aggregate Cut- off Date Balance | % of Initial Pool Balance | |
| Springing | 46 | $393,107,640 | 55.9 | % |
| Hard/Springing Cash Management | 9 | 170,812,454 | 24.3 | |
| Hard/Upfront CashManagement | 3 | 91,300,000 | 13.0 | |
| None | 9 | 31,127,474 | 4.4 | |
| Soft/Springing Cash Management | 1 | 16,439,932 | 2.3 | |
| Total: | 68 | $702,787,500 | 100.0 | % |
| PREPAYMENT PROVISION SUMMARY | ||||
| Prepayment Provision | Number of Mortgage Loans | Aggregate Cut- off Date Balance | % of Initial Pool Balance | |
| Lockout / Def / Open | 62 | $650,670,291 | 92.6 | % |
| Lockout / GRTR 1% or YM / Open | 3 | 34,217,471 | 4.9 | |
| Lockout / GRTR 1% or YM or Def / Open | 2 | 11,149,738 | 1.6 | |
| Lockout / GRTR 2% or YM / Open | 1 | 6,750,000 | 1.0 | |
| Total: | 68 | $702,787,500 | 100.0 | % |
| CUT-OFF DATE LOAN-TO-VALUE RATIO | ||||
| Range of Cut-off Date LTV Ratios (%) | Number of Mortgage Loans | Aggregate Cut- off Date Balance | % of Initial Pool Balance | |
| 38.5 - 40.0 | 1 | $1,348,483 | 0.2 | % |
| 45.1 - 50.0 | 1 | 8,979,582 | 1.3 | |
| 50.1 - 55.0 | 5 | 42,717,471 | 6.1 | |
| 55.1 - 60.0 | 2 | 49,564,610 | 7.1 | |
| 60.1 - 65.0 | 16 | 225,458,197 | 32.1 | |
| 65.1 - 70.0 | 21 | 141,446,123 | 20.1 | |
| 70.1 - 74.7 | 22 | 233,273,034 | 33.2 | |
| Total: | 68 | $702,787,500 | 100.0 | % |
| Weighted Average: | 65.9% | |||
| BALLOON LOAN-TO-VALUE RATIO | ||||
| Range of Balloon LTV Ratios (%) | Number of Mortgage Loans | Aggregate Cut- off Date Balance | % of Initial Pool Balance | |
| 32.1 - 35.0 | 1 | $1,348,483 | 0.2 | % |
| 35.1 - 40.0 | 1 | 8,979,582 | 1.3 | |
| 40.1 - 45.0 | 3 | 31,814,370 | 4.5 | |
| 45.1 - 50.0 | 6 | 85,297,279 | 12.1 | |
| 50.1 - 55.0 | 15 | 84,397,218 | 12.0 | |
| 55.1 - 60.0 | 18 | 173,387,343 | 24.7 | |
| 60.1 - 65.0 | 19 | 268,875,725 | 38.3 | |
| 65.1 - 67.3 | 5 | 48,687,500 | 6.9 | |
| Total: | 68 | $702,787,500 | 100.0 | % |
| Weighted Average: | 57.7% | |||
| AMORTIZATION TYPE | ||||
| Type of Amortization | Number of Mortgage Loans | Aggregate Cut- off Date Balance | % of Initial Pool Balance | |
| Interest-only, Amortizing Balloon | 32 | $366,135,500 | 52.1 | % |
| Amortizing Balloon | 34 | 274,252,000 | 39.0 | |
| Interest-only, Balloon | 2 | 62,400,000 | 8.9 | |
| Total: | 68 | $702,787,500 | 100.0 | % |
| ORIGINAL TERM OF INTEREST-ONLY PERIOD FOR PARTIAL IO LOANS | ||||
| IO Terms (months) | Number of Mortgage Loans | Aggregate Cut- off Date Balance | % of Initial Pool Balance | |
| 12 | 2 | $8,137,500 | 1.2 | % |
| 24 | 13 | 168,688,000 | 24.0 | |
| 36 | 11 | 99,015,000 | 14.1 | |
| 48 | 2 | 39,200,000 | 5.6 | |
| 60 | 3 | 35,470,000 | 5.0 | |
| 84 | 1 | 15,625,000 | 2.2 | |
| Total: | 32 | $366,135,500 | 52.1 | % |
| Weighted Average: | 36 months | |||
| SEASONING | ||||
| Seasoning (months) | Number of Mortgage Loans | Aggregate Cut- off Date Balance | % of Initial Pool Balance | |
| 0 | 8 | $140,100,000 | 19.9 | % |
| 1 | 27 | 199,375,472 | 28.4 | |
| 2 | 16 | 107,267,994 | 15.3 | |
| 3 | 12 | 157,862,911 | 22.5 | |
| 4 | 3 | 59,081,123 | 8.4 | |
| 5 | 1 | 11,100,000 | 1.6 | |
| 6 | 1 | 28,000,000 | 4.0 | |
| Total: | 68 | $702,787,500 | 100.0 | % |
| Weighted Average: | 2 months | |||
THE INFORMATION IN THIS STRUCTURAL AND COLLATERAL TERM SHEET IS NOT COMPLETE AND MAY BE AMENDED PRIOR TO THE TIME OF SALE. THIS TERM SHEET IS NOT AN OFFER TO SELL THESE SECURITIES AND IT IS NOT A SOLICITATION OF AN OFFER TO BUY THESE SECURITIES IN ANY JURISDICTION WHERE THE OFFER OR SALE IS NOT PERMITTED.
| 15 |
| Wells Fargo Commercial Mortgage Trust 2016-C34 | Certain Terms and Conditions |
V. Certain Terms and Conditions
| Interest Entitlements: | The interest entitlement of each Class of Offered Certificates on each Distribution Date generally will be the interest accrued during the related Interest Accrual Period on the related Certificate Balance or Notional Amount at the related pass-through rate, net of any prepayment interest shortfalls allocated to that Class for such Distribution Date as described below. If prepayment interest shortfalls arise from voluntary prepayments (without Master Servicer consent) on particular non-specially serviced loans during any collection period, the Master Servicer is required to make a compensating interest payment to offset those shortfalls, generally up to an amount equal to the portion of its master servicing fees that accrue at 0.25 basis pointsper annum. The remaining amount of prepayment interest shortfalls will be allocated to reduce the interest entitlement on all Classes of Certificates,pro rata, based on their respective amounts of accrued interest for the related Distribution Date. If a Class receives less than the entirety of its interest entitlement on any Distribution Date, then the shortfall (excluding any shortfall due to prepayment interest shortfalls), together with interest thereon, will be added to its interest entitlement for the next succeeding Distribution Date. | ||
| Principal Distribution Amount: | The Principal Distribution Amount for each Distribution Date generally will be the aggregate amount of principal received or advanced in respect of the mortgage loans, net of any non-recoverable advances and interest thereon and workout-delayed reimbursement amounts that are reimbursed to the Master Servicer, the Special Servicer or the Trustee during the related collection period. Non-recoverable advances and interest thereon are reimbursable from principal collections and advances before reimbursement from other amounts. Workout-delayed reimbursement amounts are reimbursable from principal collections. | ||
| Distributions: | On each Distribution Date, funds available for distribution from the mortgage loans, net of specified trust fees, expenses and reimbursements will generally be distributed in the following amounts and order of priority (in each case to the extent of remaining available funds): | ||
| 1. | Class A-1, A-2, A-3, A-4, A-SB, X-A, X-B, X-E, X-FG and X-H Certificates and Class A-3FX regular interest: To interest on the Class A-1, A-2, A-3, A-4, A-SB, X-A, X-B, X-E, X-FG and X-H Certificates and the Class A-3FX regular interest,pro rata, according to their respective interest entitlements. | ||
| 2. | Class A-1, A-2, A-3, A-4 and A-SB Certificates and Class A-3FX regular interest: To principal on the Class A-1, A-2, A-3, A-4 and A-SB Certificates and the Class A-3FX regular interest in the following amounts and order of priority: (i) first, to principal on the Class A-SB Certificates, in an amount up to the Principal Distribution Amount for such Distribution Date until their Certificate Balance is reduced to the Class A-SB Planned Principal Balance for such Distribution Date; (ii) second, to principal on the Class A-1 Certificates until their Certificate Balance is reduced to zero, up to the remainder of the Principal Distribution Amount for such Distribution Date; (iii) third, to principal on the Class A-2 Certificates until their Certificate Balance is reduced to zero, up to the remainder of the Principal Distribution Amount for such Distribution Date; (iv) fourth, to principal on the Class A-3 Certificates and the Class A-3FX regular interest,pro rata, based on their respective outstanding Certificate Balances, until their Certificate Balances are reduced to zero, up to the remainder of the Principal Distribution Amount for such Distribution Date; (v) fifth, to principal on the Class A-4 Certificates until their Certificate Balance is reduced to zero, up to the remainder of the Principal Distribution Amount for such Distribution Date; and (vi) sixth, to principal on the Class A-SB Certificates until their Certificate Balance is reduced to zero, up to the remainder of the Principal Distribution Amount for such Distribution Date. However, if the Certificate Balance of each and every Class of Principal Balance Certificates, other than the Class A-1, A-2, A-3, A-4 and A-SB Certificates and the Class A-3FX regular interest, has been reduced to zero as a result of the allocation of Mortgage Loan losses and expenses and any of the Class A-1, A-2, A-3, A-4 and A-SB Certificates and the Class A-3FX regular interest remains outstanding, then the Principal Distribution Amount will be distributed to the Class A-1, A-2, A-3, A-4 and A-SB Certificates and the Class A-3FX regular interest,pro rata, based on their respective outstanding Certificate Balances, until their Certificate Balances have been reduced to zero. | ||
| 3. | Class A-1, A-2, A-3, A-4 and A-SB Certificates and the Class A-3FX regular interest: To reimburse the holders of the Class A-1, A-2, A-3, A-4 and A-SB Certificates and the Class A-3FX regular interest,pro rata, on the basis of previously allocated unreimbursed losses, for any previously unreimbursed losses (plus interest thereon) on the mortgage loans that were previously allocated in reduction of the Certificate Balances of such Classes. | ||
THE INFORMATION IN THIS STRUCTURAL AND COLLATERAL TERM SHEET IS NOT COMPLETE AND MAY BE AMENDED PRIOR TO THE TIME OF SALE. THIS TERM SHEET IS NOT AN OFFER TO SELL THESE SECURITIES AND IT IS NOT A SOLICITATION OF AN OFFER TO BUY THESE SECURITIES IN ANY JURISDICTION WHERE THE OFFER OR SALE IS NOT PERMITTED.
| 16 |
| Wells Fargo Commercial Mortgage Trust 2016-C34 | Certain Terms and Conditions |
| 4. | Class A-S Certificates: To make distributions on the Class A-S Certificates as follows: (a) first, to interest on the Class A-S Certificates in the amount of the interest entitlement for that Class; (b) next, to the extent of the portion of the Principal Distribution Amount remaining after distributions in respect of principal to each Class with a higher distribution priority (in this case, the Class A-1, A-2, A-3, A-4 and A-SB Certificates and the Class A-3FX regular interest), to principal on the Class A-S Certificates until their Certificate Balance is reduced to zero; and (c) next, to reimburse the holders of the Class A-S Certificates for any previously unreimbursed losses (plus interest thereon) on the mortgage loans that were previously allocated to that Class in reduction of their Certificate Balance. | ||
| 5. | Class B Certificates: To make distributions on the Class B Certificates as follows: (a) first, to interest on the Class B Certificates in the amount of the interest entitlement for that Class; (b) next, to the extent of the portion of the Principal Distribution Amount remaining after distributions in respect of principal to each Class with a higher distribution priority (in this case, the Class A-1, A-2, A-3, A-4, A-SB and A-S Certificates and the Class A-3FX regular interest), to principal on the Class B Certificates until their Certificate Balance is reduced to zero; and (c) next, to reimburse the holders of the Class B Certificates for any previously unreimbursed losses (plus interest thereon) on the mortgage loans that were previously allocated to that Class in reduction of their Certificate Balance. | ||
| 6. | Class C Certificates: To make distributions on the Class C Certificates as follows: (a) first, to interest on the Class C Certificates in the amount of the interest entitlement for that Class; (b) next, to the extent of the portion of the Principal Distribution Amount remaining after distributions in respect of principal to each Class with a higher distribution priority (in this case, the Class A-1, A-2, A-3, A-4, A-SB, A-S and B Certificates and the Class A-3FX regular interest), to principal on the Class C Certificates until their Certificate Balance is reduced to zero; and (c) next, to reimburse the holders of the Class C Certificates for any previously unreimbursed losses (plus interest thereon) on the mortgage loans that were previously allocated to that Class in reduction of their Certificate Balance. | ||
| 7. | After the Class A-1, A-2, A-3, A-4, A-SB, A-S, B and C Certificates and the Class A-3FX regular interest are paid all amounts to which they are entitled, the remaining funds available for distribution will be used to pay interest, principal and loss reimbursement amounts on the Class D, E, F, G and H Certificates sequentially in that order in a manner analogous to the Class C Certificates. | ||
| Allocation of Yield Maintenance and Prepayment Premiums: | If any yield maintenance charge or prepayment premium is collected during any particular collection period with respect to any mortgage loan, then on the Distribution Date corresponding to that collection period, the certificate administrator will pay that yield maintenance charge or prepayment premium (net of liquidation fees payable therefrom) in the following manner: (1) to each of the Class A-1, A-2, A-3, A-4, A-SB, A-S, B, C and D Certificates and the Class A-3FX regular interest, the product of (a) such yield maintenance charge or prepayment premium, (b) the related Base Interest Fraction (as defined in the Preliminary Prospectus) for such Class, and (c) a fraction, the numerator of which is equal to the amount of principal distributed to such Class for that Distribution Date, and the denominator of which is the total amount of principal distributed to all Principal Balance Certificates (other than the Class A-3FX and A-3FL Certificates) and the Class A-3FX regular interest for the Distribution Date, and (2) to the Class X-A Certificates, the excess, if any, of (a) the product of (i) such yield maintenance charge or prepayment premium and (ii) a fraction, the numerator of which is equal to the amount of principal distributed to the Class A-1, A-2, A-3, A-4, A-SB and A-S Certificates and Class A-3FX regular interest for that Distribution Date, and the denominator of which is the total amount of principal distributed to all Principal Balance Certificates for that Distribution Date (other than the Class A-3FX and A-3FL Certificates) and the Class A-3FX regular interest for that Distribution Date, over (b) the amount of such yield maintenance charge or prepayment premium distributed to the Class A-1, A-2, A-3, A-4, A-SB and A-S Certificates and Class A-3FX regular interest as described above, and (3) to the Class X-B Certificates, any remaining yield maintenance charge or prepayment premium not distributed as described above. No prepayment premiums or yield maintenance charges will be distributed to the holders of the Class X-E, X-FG, X-H, E, F, G, H, or R Certificates. For a description of when prepayment premiums and yield maintenance charges are generally required on the mortgage loans, see Annex A-1 to the Preliminary Prospectus. See also “Risk Factors—Risks Relating to the Mortgage Loans—Risks Relating to Enforceability of Yield Maintenance Charges, Prepayment Premiums or Defeasance Provisions” and “Risk Factors—Other Risks Relating to the Certificates—Your Yield May Be Affected by Defaults, Prepayments and Other Factors” in the Preliminary Prospectus. Prepayment premiums and yield maintenance charges will be distributed on each Distribution Date only to the extent they are actually received on the mortgage loans as of the related Determination Date. | ||
THE INFORMATION IN THIS STRUCTURAL AND COLLATERAL TERM SHEET IS NOT COMPLETE AND MAY BE AMENDED PRIOR TO THE TIME OF SALE. THIS TERM SHEET IS NOT AN OFFER TO SELL THESE SECURITIES AND IT IS NOT A SOLICITATION OF AN OFFER TO BUY THESE SECURITIES IN ANY JURISDICTION WHERE THE OFFER OR SALE IS NOT PERMITTED.
| 17 |
| Wells Fargo Commercial Mortgage Trust 2016-C34 | Certain Terms and Conditions |
| Realized Losses: | The Certificate Balances of the Class A-1, A-2, A-3, A-4, A-SB, A-S, B, C, D, E, F, G and H Certificates and the Class A-3FX regular interest, will be reduced without distribution on any Distribution Date as a write-off to the extent of any losses realized on the mortgage loans allocated to such Class on such Distribution Date. Such losses will be applied in the following order, in each case until the related Certificate Balance is reduced to zero: first, to the Class H Certificates; second, to the Class G Certificates; third, to the Class F Certificates; fourth, to the Class E Certificates; fifth, to the Class D Certificates; sixth, to the Class C Certificates; seventh, to the Class B Certificates; eighth, to the Class A-S Certificates; and, finally,pro rata, to the Class A-1, A-2, A-3, A-4 and A-SB Certificates and Class A-3FX regular interest based on their outstanding Certificate Balances.
The notional amount of the Class X-A Certificates will be reduced by the amount of all losses that are allocated to the Class A-1, A-2, A-3, A-4, A-SB or A-S Certificates or the Class A-3FX regular interest as write-offs in reduction of their Certificate Balances. The notional amount of the Class X-B Certificates will be reduced by the amount of all losses that are allocated to the Class B Certificates as write-offs in reduction of their Certificate Balance. The notional amount of the Class X-E Certificates will be reduced by the amount of all losses that are allocated to the Class E Certificates as write-offs in reduction of their Certificate Balance. The notional amount of the Class X-FG Certificates will be reduced by the amount of all losses that are allocated to the Class F or G Certificates as write-offs in reduction of their respective Certificate Balances. The notional amount of the Class X-H Certificates will be reduced by the amount of all losses that are allocated to the Class H Certificates as write-offs in reduction of their Certificate Balance.
| |
| P&I Advances: | The Master Servicer or, if the Master Servicer fails to do so, the Trustee, will be obligated to advance delinquent debt service payments (other than balloon payments, excess interest and default interest) and assumed debt service payments on mortgage loans with delinquent balloon payments (excluding any related companion loan), except to the extent any such advance is deemed non-recoverable from collections on the related mortgage loan. In addition, if an Appraisal Reduction Amount exists for a given mortgage loan, the interest portion of any P&I advance for such mortgage loan will be reduced, which will have the effect of reducing the amount of interest available for distribution to the Certificates in reverse alphabetical order of their Class designations (except (a) that interest payments on the Class A-1, A-2, A-3, A-4, A-SB, X-A, X-B, X-E, X-FG and X-H Certificates and the Class A-3FX regular interest would be affected on apari passu basis). | |
| Servicing Advances: | The Master Servicer or, if the Master Servicer fails to do so, the Trustee, will be obligated to make servicing advances, including the payment of delinquent property taxes, insurance premiums and ground rent, except to the extent that those advances are deemed non-recoverable from collections on the related mortgage loan. The Master Servicer or the trustee, as applicable, will have the primary obligation to make any required servicing advances with respect to the Regent Portfolio whole loan. The master servicer or trustee, as applicable, under the CGCMT 2015-P3 securitization will have the primary obligation to make any required servicing advances with respect to the Marriott Monterey whole loan. The Special Servicer will have no obligation to make servicing advances but may do so in an emergency situation. | |
Appraisal Reduction Amounts:
| An Appraisal Reduction Amount generally will be created in the amount, if any, by which the principal balance of a required appraisal loan (which is a mortgage loan with respect to which certain defaults, modifications or insolvency events have occurred as further described in the Preliminary Prospectus) plus other amounts overdue or advanced in connection with such mortgage loan exceeds 90% of the appraised value of the related mortgaged property plus certain escrows and reserves (including letters of credit) held with respect to the mortgage loan. With respect to the Congressional North Shopping Center & 121 Congressional Lane mortgage loan, any Appraisal Reduction Amount will be allocated first to the related subordinate companion loan and then to the Congressional North Shopping Center & 121 Congressional Lane mortgage loan.
A mortgage loan will cease to be a required appraisal loan when the same has ceased to be a specially serviced loan (if applicable), has been brought current for at least three consecutive months and no other circumstances exist that would cause such mortgage loan to be a required appraisal loan.
Appraisal Reduction Amounts will affect the amount of debt service advances in respect of the related mortgage loan. Appraisal Reduction Amounts will also be taken into account in the determination of the identity of the Class whose majority constitutes the “majority controlling class certificateholder” and is entitled to appoint the directing certificateholder. |
THE INFORMATION IN THIS STRUCTURAL AND COLLATERAL TERM SHEET IS NOT COMPLETE AND MAY BE AMENDED PRIOR TO THE TIME OF SALE. THIS TERM SHEET IS NOT AN OFFER TO SELL THESE SECURITIES AND IT IS NOT A SOLICITATION OF AN OFFER TO BUY THESE SECURITIES IN ANY JURISDICTION WHERE THE OFFER OR SALE IS NOT PERMITTED.
| 18 |
| Wells Fargo Commercial Mortgage Trust 2016-C34 | Certain Terms and Conditions |
Clean-Up Call and Exchange Termination:
| On each Distribution Date occurring after the aggregate unpaid principal balance of the mortgage loans is reduced below 1% of the initial aggregate principal balance of the mortgage loans as of the Cut-off Date, certain specified persons will have the option to purchase all of the remaining mortgage loans (and the trust’s interest in all property acquired through exercise of remedies in respect of any mortgage loan) at the price specified in the Preliminary Prospectus. Exercise of the option will terminate the trust and retire the then-outstanding certificates.
If the aggregate Certificate Balances of each of the Class A-1, A-2, A-3, A-4, A-SB, A-S, B, C and D Certificates and the Class A-3FX regular interest have been reduced to zero, the trust may also be terminated in connection with an exchange of all the then-outstanding certificates (other than the Class R Certificates) for the mortgage loans and REO properties then remaining in the issuing entity, but all of the holders of those Classes of outstanding certificates would have to voluntarily participate in the exchange.
| |
| Liquidation Loan Waterfall: | Following the liquidation of any loan or property, the net liquidation proceeds generally will be applied (after reimbursement of advances and certain trust fund expenses), first, as a recovery of accrued interest, other than delinquent interest that was not advanced as a result of Appraisal Reduction Amounts, second, as a recovery of principal until all principal has been recovered, and then as a recovery of delinquent interest that was not advanced as a result of Appraisal Reduction Amounts. Please see “Description of the Certificates—Distributions—Application Priority of Mortgage Loan Collections or Whole Loan Collections” in the Preliminary Prospectus. | |
| Majority Controlling Class Certificateholder and Directing Certificateholder: | A directing certificateholder may be appointed by the “majority controlling class certificate-holder”, which will be the holder(s) of a majority of the “controlling class”, which means the most subordinate class among the Class E, F, G and H Certificates that has a Certificate Balance, as notionally reduced by any Appraisal Reduction Amounts allocable to that class, that is at least equal to 25% of its total initial Certificate Balance; provided that if at any time the Certificate Balances of the Principal Balance Certificates (other than the Class E, F, G and H Certificates) have been reduced to zero as a result of principal payments on the mortgage loans, then the “controlling class” will be the most subordinate class of Class E, F, G and H Certificates that has a Certificate Balance greater than zero without regard to any Appraisal Reduction Amounts. The majority controlling class certificateholder will have a continuing right to appoint, remove or replace the directing certificateholder in its sole discretion. This right may be exercised at any time and from time to time. See “Pooling and Servicing Agreement—The Directing Certificateholder” in the Preliminary Prospectus. | |
| Control and Consultation: | The rights of various parties to replace the Special Servicer and approve or consult with respect to major actions of the Special Servicer will vary according to defined periods.
A “Control Termination Event” occurs if the Class E Certificates have a Certificate Balance, net of any Appraisal Reduction Amounts allocable to that Class, that is less than 25% of the initial Certificate Balance of that Class.
A “Consultation Termination Event” occurs if the Class E Certificates have a Certificate Balance, without regard to any Appraisal Reduction Amounts allocable to that Class, that is less than 25% of the initial Certificate Balance of that Class.
If no Control Termination Event has occurred and is continuing, except with respect to the Excluded Loans (as defined below), (i) the directing certificateholder will be entitled to grant or withhold approval of asset status reports prepared, and material servicing actions proposed, by the Special Servicer, and (ii) the directing certificateholder will be entitled to terminate and replace the Special Servicer with or without cause, and appoint itself or another person as the successor special servicer; provided, however, that LNR Partners, LLC or its affiliate may only be terminated as the Special Servicer without cause if LNR Securities Holdings, LLC or its affiliate owns less than 25% of the certificate balance of the controlling class. It will be a condition to such appointment that DBRS, Fitch and Moody’s confirm that the appointment would not result in a qualification, downgrade or withdrawal of any of their then-current ratings of certificates.
If a Control Termination Event has occurred and is continuing but no Consultation Termination Event has occurred and is continuing, the Special Servicer will be required to consult with the directing certificateholder (other than with respect to Excluded Loans) and the Operating Advisor in connection with asset status reports and material special servicing actions.
If a Consultation Termination Event has occurred and is continuing, the Special Servicer must seek to consult with the Operating Advisor in connection with asset status reports and material special servicing actions, and, in general, no directing certificateholder will be recognized or have any right to terminate the Special Servicer or approve, direct or consult with respect to servicing matters.
With respect to the Regent Portfolio mortgage loan, the rights of the directing certificateholder described above will be subject to the consultation rights of the holder of the relatedpari passu companion loan(s) as described below. |
THE INFORMATION IN THIS STRUCTURAL AND COLLATERAL TERM SHEET IS NOT COMPLETE AND MAY BE AMENDED PRIOR TO THE TIME OF SALE. THIS TERM SHEET IS NOT AN OFFER TO SELL THESE SECURITIES AND IT IS NOT A SOLICITATION OF AN OFFER TO BUY THESE SECURITIES IN ANY JURISDICTION WHERE THE OFFER OR SALE IS NOT PERMITTED.
| 19 |
| Wells Fargo Commercial Mortgage Trust 2016-C34 | Certain Terms and Conditions |
| Notwithstanding any contrary description set forth above, with respect to the Regent Portfolio mortgage loan, the holder of thepari passu companion loan(s) in the related whole loan (or its representative, including any directing certificateholder under any securitization of suchpari passu companion loan(s)) will have consultation rights with respect to asset status reports and material special servicing actions involving the related whole loan, as provided for in the related intercreditor agreement and as described in the Preliminary Prospectus, and those rights will be in addition to the rights of the directing certificateholder in this transaction described above. For purposes of the servicing of the Regent Portfolio whole loan, the occurrence and continuance of a Control Termination Event or Consultation Termination Event under this securitization will not limit the consultation and other rights of the holder of thepari passu companion loan(s). Notwithstanding any contrary description above, with respect to the Congressional North Shopping Center & 121 Congressional Lane mortgage loan, so long as a control appraisal period has not occurred with respect to the related subordinate companion loan, the holder of such subordinate companion loan will generally have the same rights with respect to the Congressional North Shopping Center & 121 Congressional Lane whole loan as the directing certificateholder has prior to the occurrence and continuance of Control Termination Event with respect to the mortgage loans; except that the holder of the related subordinate companion loan shall only have the right to remove and replace the special servicer for the Congressional North Shopping Center & 121 Congressional Lane whole loan upon the occurrence and continuance of a servicer termination event. During the continuance of a control appraisal period with respect to the related subordinate companion loan, the holder of such subordinate companion loan will no longer have any such rights with respect to the Congressional North Shopping Center & 121 Congressional Lane whole loan and all of those rights will be exercisable by the directing certificateholder subject to the limitations described above. Also, notwithstanding any contrary description set forth above, with respect to the Marriott Monterey mortgage loan, in general the related whole loan will be serviced under the CGCMT 2016-P3 pooling and servicing agreement, which grants the related directing certificateholder control rights that may include the right to approve or disapprove various material servicing actions involving the related whole loan but the directing certificateholder for this securitization (so long as no Consultation Termination Event has occurred and is occurring) will nonetheless have the right to be consulted on a non-binding basis with respect to such actions. For purposes of the servicing of the Marriott Monterey whole loan, the occurrence and continuance of a Control Termination Event or Consultation Termination Event under this securitization will not limit the control or other rights of the directing certificateholder under the CGCMT 2016-P3 securitization. Notwithstanding any contrary description set forth above, in the event that, with respect to any mortgage loan, the majority controlling class certificateholder or the directing certificateholder is (i) a borrower, a mortgagor or a manager of a mortgaged property, or the holder of a mezzanine loan that has accelerated the related mezzanine loan (unless (a) acceleration was automatic under such mezzanine loan, (b) the event directly giving rise to the automatic acceleration under such mezzanine loan was not initiated by such mezzanine lender or an affiliate of such mezzanine lender, and (c) such mezzanine lender is stayed from exercising and has not commenced the exercise of remedies associated with foreclosure of the equity collateral under such mezzanine loan) or commenced foreclosure or enforcement proceedings against the equity collateral pledged to secure the related mezzanine loan or any affiliate thereof, (ii) with respect to borrower, a mortgagor, a manager of a Mortgaged Property or a mezzanine lender that has accelerated the related mezzanine loan (unless (a) acceleration was automatic under such mezzanine loan, (b) the event directly giving rise to the automatic acceleration under such mezzanine loan was not initiated by such mezzanine lender or an affiliate of such mezzanine lender, and (c) such mezzanine lender is stayed from exercising and has not commenced the exercise of remedies associated with foreclosure of the equity collateral under such mezzanine loan) or commenced foreclosure or enforcement proceedings against the equity collateral pledged to secure the related mezzanine loan, (x) any other person controlling or controlled by or under common control with such borrower, mortgagor, manager or mezzanine lender, as applicable, or (y) any other person owning, directly or indirectly, 25% or more of the beneficial interests in such borrower, mortgagor, manager or mezzanine lender (each, a “borrower party”), the majority controlling class certificateholder and the directing certificateholder will have no right to receive asset status reports or such other information as may be specified in the pooling and servicing agreement, to grant or withhold approval of, or consult with respect to, asset status reports prepared, and material servicing actions proposed, by the Special Servicer, with respect to such mortgage loan, and such mortgage loan will be referred to as an “Excluded Loan”. In addition, notwithstanding any contrary description set forth above, in the event that, with respect to any mortgage loan, a controlling class certificateholder is a borrower party, such controlling class certificateholder will have no right to receive asset status reports or such other information as may be specified in the pooling and servicing agreement with respect to such mortgage loan, and such controlling class certificateholder will be referred to as an “excluded |
THE INFORMATION IN THIS STRUCTURAL AND COLLATERAL TERM SHEET IS NOT COMPLETE AND MAY BE AMENDED PRIOR TO THE TIME OF SALE. THIS TERM SHEET IS NOT AN OFFER TO SELL THESE SECURITIES AND IT IS NOT A SOLICITATION OF AN OFFER TO BUY THESE SECURITIES IN ANY JURISDICTION WHERE THE OFFER OR SALE IS NOT PERMITTED.
| 20 |
| Wells Fargo Commercial Mortgage Trust 2016-C34 | Certain Terms and Conditions |
| controlling class holder”. | ||
| Replacement of Special Servicer by General Vote of Certificateholders: | If a Control Termination Event has occurred and is continuing, the Special Servicer may be removed and replaced without cause upon the affirmative direction of certificate owners holding not less than 66-2/3% of a certificateholder quorum, following a proposal from certificate owners holding not less than 25% of the appraisal-reduced voting rights of all Certificates. The certificateholders who initiate a vote on a termination and replacement of the Special Servicer without cause must cause DBRS, Fitch and Moody’s to confirm the then-current ratings of the certificates (or decline to review the matter) and cause the payment of the fees and expenses incurred in the replacement. If no Control Termination Event has occurred and is continuing, the Special Servicer may be replaced by the directing certificateholder, subject to DBRS, Fitch and Moody’s confirming the then-current ratings of the Certificates (or declining to review the matter). | |
| Excluded Special Servicer: | In the event that, with respect to any mortgage loan, the Special Servicer is a borrower party, the Special Servicer will be required to resign as special servicer of such mortgage loan (referred to as an “excluded special servicer loan”). If no Control Termination Event has occurred and is continuing, the directing certificateholder will be entitled to appoint (and may replace with or without cause) a separate special servicer that is not a borrower party (referred to as an “excluded special servicer”) with respect to such excluded special servicer loan unless such excluded special servicer loan is also an excluded loan. Otherwise, upon resignation of the Special Servicer with respect to an excluded special servicer loan, such resigning Special Servicer will be required to appoint the excluded special servicer. | |
| Appraisal Remedy: | If the Class of certificates comprising the controlling class loses its status as controlling class because of the application of an Appraisal Reduction Amount, the holders of a majority of the Voting Rights of such Class may require the Special Servicer to order a second appraisal for any mortgage loan in respect of which an Appraisal Reduction Amount has been applied. The Special Servicer must thereafter determine whether, based on its assessment of such second appraisal, any recalculation of the Appraisal Reduction Amount is warranted. Such Class will not be able to exercise any direction, control, consent and/or similar rights of the controlling class unless and until reinstated as the controlling class through such determination; and pending such determination, the rights of the controlling class will be exercised by the most senior control eligible certificates (which may only be any one of Class E, F, G or H), if any.
With respect to the Congressional North Shopping Center & 121 Congressional Lane whole loan, the related intercreditor agreement may provide that the holder of the related subordinate companion loan will have the same rights to request a qualified appraisal be obtained by the Special Servicer at the expense of such holder as are described above with respect to the holders of an appraised-out controlling class.
| |
| Sale of Defaulted Assets: | There will be no “fair value” purchase option. Instead, the pooling and servicing agreement will authorize the Special Servicer to sell defaulted mortgage loans serviced by the Special Servicer to the highest bidder in a manner generally similar to sales of REO properties.
The sale of a defaulted loan (other than with respect to the Marriott Monterey whole loan) for less than par plus accrued interest and certain other fees and expenses owed on the loan will be subject to consent or consultation rights of the directing certificateholder and/or Operating Advisor and, in the case of the Regent Portfolio mortgage loan, consultation rights of the holders of the relatedpari passu companion loan, and, in the case of the Congressional North Shopping Center & 121 Congressional Lane mortgage loan, the consent rights of the holders of the related subordinate companion loan, as described in the Preliminary Prospectus.
In the case of the Regent Portfolio whole loan, pursuant to the related intercreditor agreement and the pooling and servicing agreement, if the Special Servicer offers to sell to any person (or offers to purchase) for cash such mortgage loan during such time as the related whole loan constitutes a defaulted mortgage loan, then in connection with any such sale, the Special Servicer is required to sell both the mortgage loan and the relatedpari passu companion loan as a single whole loan
In the case of the Marriott Monterey mortgage loan, pursuant to the CGCMT 2015-P3 pooling and servicing agreement and the related intercreditor agreement, as applicable, the CGCMT 2015-P3 special servicer may offer to sell to any person (or may offer to purchase) for cash the related whole loan during such time as the related companion loan constitutes a defaulted mortgage loan under the CGCMT 2015-P3 pooling and servicing agreement, and, in connection with any such sale, the CGCMT 2015-P3 special servicer is required to sell both the mortgage loan and the relatedpari passu companion loan(s) and any subordinate companion loans as a whole loan. The directing certificateholder for this securitization will have consultation rights as the holder of an interest in the related mortgage loan, as described in the Preliminary Prospectus.
In the case of the Congressional North Shopping Center & 121 Congressional Lane whole loan, the related subordinate companion loan holder, pursuant to the related intercreditor agreement, will have the right at any time such whole loan constitutes a defaulted mortgage |
THE INFORMATION IN THIS STRUCTURAL AND COLLATERAL TERM SHEET IS NOT COMPLETE AND MAY BE AMENDED PRIOR TO THE TIME OF SALE. THIS TERM SHEET IS NOT AN OFFER TO SELL THESE SECURITIES AND IT IS NOT A SOLICITATION OF AN OFFER TO BUY THESE SECURITIES IN ANY JURISDICTION WHERE THE OFFER OR SALE IS NOT PERMITTED.
| 21 |
| Wells Fargo Commercial Mortgage Trust 2016-C34 | Certain Terms and Conditions |
| loan to purchase such whole loan, in whole but not in part, at a purchase price determined pursuant to the related intercreditor agreement. | ||
| “As-Is” Appraisals: | Appraisals must be conducted on an “as-is” basis, and must be no more than 9 months old, for purposes of determining Appraisal Reduction Amounts and market value in connection with REO sales. Required appraisals may consist of updates of prior appraisals. Internal valuations by the Special Servicer are permitted if the principal balance of a mortgage loan is less than $2,000,000. | |
| Operating Advisor: | The Operating Advisor will perform certain review duties if a Control Termination Event has occurred and is continuing (or, with respect to the Congressional North Shopping Center & 121 Congressional Lane whole loan, after the occurrence and during the continuance of both a Control Termination Event and a Control Appraisal Period), which will generally include a limited annual review of, and the delivery of a report regarding, certain actions of the Special Servicer with respect to the resolution and/or liquidation of specially serviced loans to the Certificate Administrator. The review and report generally will be based on any asset status reports and additional information delivered to the Operating Advisor by the Special Servicer. In addition, if a Control Termination Event has occurred and is continuing, the Special Servicer must seek to consult with the Operating Advisor (in addition to the directing certificateholder if no Consultation Termination Event has occurred and is continuing) in connection with material special servicing actions with respect to specially serviced loans serviced by the Special Servicer. Furthermore, under certain circumstances, but only if a Consultation Termination Event has occurred and is continuing, the Operating Advisor may recommend the replacement of the Special Servicer, in which case the Certificate Administrator will deliver notice of such recommendation to the certificateholders, and certificateholders with specified percentages of the voting rights may direct the replacement of the Special Servicer at their expense.
If a Consultation Termination Event has occurred and is continuing, the Operating Advisor may be removed and replaced without cause upon the affirmative direction of certificate owners holding not less than 75% of the appraisal-reduced voting rights of all Principal Balance Certificates, following a proposal from certificate owners holding not less than 25% of the appraisal-reduced voting rights of all certificates. The certificateholders who initiate a vote on a termination and replacement of the Operating Advisor without cause must cause DBRS, Fitch and Moody’s to confirm the then-current ratings of the certificates (or decline to review the matter) and cause the payment of the fees and expenses incurred in the replacement. The Operating Advisor generally may be discharged from its duties if and when the Class A-1, A-2, A-3, A-4, A-SB, A-S, B, C and D Certificates and Class A-3FX regular interest are retired.
| |
| Asset Representations Reviewer: | The Asset Representations Reviewer will be required to review certain delinquent mortgage loans after a specified delinquency threshold has been exceeded (an “Asset Review Trigger”) and the required percentage of certificateholders vote to direct a review of such delinquent loans. An Asset Review Trigger will occur when either (1) mortgage loans with an aggregate outstanding principal balance of 25.0% or more of the aggregate outstanding principal balance of all of the mortgage loans (including any REO loans (or a portion of any REO loan in the case of a whole loan) held by the issuing entity as of the end of the applicable collection period are delinquent loans or (2) at least 15 mortgage loans are delinquent loans as of the end of the applicable collection period and the outstanding principal balance of such delinquent loans in the aggregate constitutes at least 20.0% of the aggregate outstanding principal balance of all of the mortgage loans (including any REO loans (or a portion of any REO loan in the case of a whole loan)) held by the issuing entity as of the end of the applicable collection period. See “Pooling and Servicing Agreement—The Asset Representations Reviewer—Asset Review” in the Preliminary Prospectus.
The Asset Representations Reviewer may be terminated and replaced without cause. Upon (i) the written direction of certificateholders evidencing not less than 25% of the voting rights (without regard to the application of any Appraisal Reduction Amounts) requesting a vote to terminate and replace the Asset Representations Reviewer with a proposed successor Asset Representations Reviewer that is an eligible asset reviewer, and (ii) payment by such holders to the certificate administrator of the reasonable fees and expenses to be incurred by the certificate administrator in connection with administering such vote, the certificate administrator will promptly provide notice to all certificateholders and the Asset Representations Reviewer of such request by posting such notice on its internet website, and by mailing such notice to all certificateholders and the Asset Representations Reviewer. Upon the written direction of certificateholders evidencing at least 75% of a certificateholder quorum (without regard to the application of any Appraisal Reduction Amounts), the trustee will terminate all of the rights and obligations of the Asset Representations Reviewer under the pooling and servicing agreement by written notice to the Asset Representations Reviewer, and the proposed successor Asset Representations Reviewer will be appointed. See “Pooling and Servicing Agreement—The Asset Representations Reviewer” in the Preliminary Prospectus.
|
THE INFORMATION IN THIS STRUCTURAL AND COLLATERAL TERM SHEET IS NOT COMPLETE AND MAY BE AMENDED PRIOR TO THE TIME OF SALE. THIS TERM SHEET IS NOT AN OFFER TO SELL THESE SECURITIES AND IT IS NOT A SOLICITATION OF AN OFFER TO BUY THESE SECURITIES IN ANY JURISDICTION WHERE THE OFFER OR SALE IS NOT PERMITTED.
| 22 |
| Wells Fargo Commercial Mortgage Trust 2016-C34 | Certain Terms and Conditions |
| Dispute Resolution Provisions: | The mortgage loan sellers will be subject to the dispute resolution provisions set forth in the pooling and servicing agreement to the extent those provisions are triggered with respect to any mortgage loan sold to the depositor by a mortgage loan seller and such mortgage loan seller will be obligated under the related mortgage loan purchase agreement to comply with all applicable provisions and to take part in any mediation or arbitration proceedings that may result.
Generally, in the event that a Repurchase Request (as defined in the Preliminary Prospectus) is not “Resolved” (as defined below) within 180 days after the related mortgage loan seller receives such Repurchase Request, then the enforcing servicer will be required to send a notice to the “Initial Requesting Certificateholder” (if any) and the Certificate Administrator indicating the enforcing servicer’s intended course of action with respect to the Repurchase Request. If (a) the enforcing servicer’s intended course of action with respect to the Repurchase Request does not involve pursuing further action to exercise rights against the related mortgage loan seller with respect to the Repurchase Request and the Initial Requesting Certificateholder, if any, or any other certificateholder or certificate owner wishes to exercise its right to refer the matter to mediation (including nonbinding arbitration) or arbitration, or (b) the enforcing servicer’s intended course of action is to pursue further action to exercise rights against the related mortgage loan seller with respect to the Repurchase Request but the Initial Requesting Certificateholder, if any, or any other certificateholder or certificate owner does not agree with the dispute resolution method selected by the enforcing servicer, then the Initial Requesting Certificateholder, if any, or such other certificateholder or certificate owner may deliver a written notice to the Special Servicer indicating its intent to exercise its right to refer the matter to either mediation or arbitration.
| |
| “Resolved” means, with respect to a Repurchase Request, (i) that the related Material Defect has been cured, (ii) the related mortgage loan has been repurchased in accordance with the related mortgage loan purchase agreement, (iii) a mortgage loan has been substituted for the related mortgage loan in accordance with the related mortgage loan purchase agreement, (iv) the applicable mortgage loan seller makes a Loss of Value Payment (as defined in the Preliminary Prospectus), (v) a contractually binding agreement is entered into between the enforcing servicer, on behalf of the issuing entity, and the related mortgage loan seller that settles the related mortgage loan seller’s obligations under the related mortgage loan purchase agreement, or (vi) the related mortgage loan is no longer property of the issuing entity as a result of a sale or other disposition in accordance with the pooling and servicing agreement. See “Pooling and Servicing Agreement—Dispute Resolution Provisions” in the Preliminary Prospectus. | ||
| Investor Communications: | The certificate administrator is required to include on any Form 10–D any request received from a certificateholder to communicate with other certificateholders related to certificateholders exercising their rights under the terms of the pooling and servicing agreement. Any certificateholder wishing to communicate with other certificateholders regarding the exercise of its rights under the terms of the Pooling and Servicing Agreement will be able to deliver a written request signed by an authorized representative of the requesting investor to the certificate administrator. | |
| Certain Fee Offsets: | If a workout fee is earned by the Special Servicer following a loan default with respect to any mortgage loan that it services, then certain limitations will apply based on modification fees paid by the borrower. The modification fee generally must not exceed 1% of the principal balance of the loan as modified in any 12-month period. In addition, if the loan re-defaults, any subsequent workout fee on that loan must be reduced by a portion of the modification fees paid by the borrower in the previous 12-months. Likewise, liquidation fees collected in connection with a liquidation or partial liquidation of a mortgage loan must be reduced by a portion of the modification fees paid by the borrower in the previous 12 months. | |
| Deal Website: | The Certificate Administrator will be required to maintain a deal website which will include, among other items: (a) summaries of asset status reports prepared by the Special Servicer, (b) inspection reports, (c) appraisals, (d) various “special notices” described in the Preliminary Prospectus, (e) the “Investor Q&A Forum” and (f) a voluntary “Investor Registry”. Investors may access the deal website following execution of a certification and confidentiality agreement. | |
| Initial Majority Controlling Class Certificateholder: | It is expected that Prime Finance CMBS B-Piece Holdco I, L.P. will be the initial majority controlling class certificateholder. | |
| Whole Loans: | The mortgaged properties identified on Annex A-1 to the Preliminary Prospectus as Regent Portfolio, Congressional North Shopping Center & 121 Congressional Lane and Marriott Monterey secure both a mortgage loan to be included in the trust fund and one or more other mortgage loans that will not be included in the trust fund, which will bepari passu or subordinate in right of payment with the mortgage loan included in the trust fund. We refer to such group of mortgage loans as a “whole loan”. The Regent Portfolio whole loan and the Congressional North Shopping Center & 121 Congressional Lane whole loan will be principally serviced under the pooling and servicing agreement for this WFCM 2016-C34 securitization. The |
THE INFORMATION IN THIS STRUCTURAL AND COLLATERAL TERM SHEET IS NOT COMPLETE AND MAY BE AMENDED PRIOR TO THE TIME OF SALE. THIS TERM SHEET IS NOT AN OFFER TO SELL THESE SECURITIES AND IT IS NOT A SOLICITATION OF AN OFFER TO BUY THESE SECURITIES IN ANY JURISDICTION WHERE THE OFFER OR SALE IS NOT PERMITTED.
| 23 |
| Wells Fargo Commercial Mortgage Trust 2016-C34 | Certain Terms and Conditions |
| Marriott Monterey whole loan will be principally serviced under the pooling and servicing agreement for the CGCMT 2015-P3 securitization. | ||
| As of the closing date, the companion loan in such whole loan will be held by the party identified above under “IV. Characteristics of the Mortgage Pool—B. Summary of the Whole Loans”. |
THE INFORMATION IN THIS STRUCTURAL AND COLLATERAL TERM SHEET IS NOT COMPLETE AND MAY BE AMENDED PRIOR TO THE TIME OF SALE. THIS TERM SHEET IS NOT AN OFFER TO SELL THESE SECURITIES AND IT IS NOT A SOLICITATION OF AN OFFER TO BUY THESE SECURITIES IN ANY JURISDICTION WHERE THE OFFER OR SALE IS NOT PERMITTED.
| 24 |
(THIS PAGE INTENTIONALLY LEFT BLANK)
THE INFORMATION IN THIS STRUCTURAL AND COLLATERAL TERM SHEET IS NOT COMPLETE AND MAY BE AMENDED PRIOR TO THE TIME OF SALE. THIS TERM SHEET IS NOT AN OFFER TO SELL THESE SECURITIES AND IT IS NOT A SOLICITATION OF AN OFFER TO BUY THESE SECURITIES IN ANY JURISDICTION WHERE THE OFFER OR SALE IS NOT PERMITTED.
| 25 |
| REGENT PORTFOLIO |

THE INFORMATION IN THIS STRUCTURAL AND COLLATERAL TERM SHEET IS NOT COMPLETE AND MAY BE AMENDED PRIOR TO THE TIME OF SALE. THIS TERM SHEET IS NOT AN OFFER TO SELL THESE SECURITIES AND IT IS NOT A SOLICITATION OF AN OFFER TO BUY THESE SECURITIES IN ANY JURISDICTION WHERE THE OFFER OR SALE IS NOT PERMITTED.
| 26 |
| REGENT PORTFOLIO |

THE INFORMATION IN THIS STRUCTURAL AND COLLATERAL TERM SHEET IS NOT COMPLETE AND MAY BE AMENDED PRIOR TO THE TIME OF SALE. THIS TERM SHEET IS NOT AN OFFER TO SELL THESE SECURITIES AND IT IS NOT A SOLICITATION OF AN OFFER TO BUY THESE SECURITIES IN ANY JURISDICTION WHERE THE OFFER OR SALE IS NOT PERMITTED.
| 27 |
| No. 1 – Regent Portfolio | |||||||
| Loan Information | Property Information | ||||||
| Mortgage Loan Seller: | Natixis Real Estate Capital LLC | Single Asset/Portfolio: | Portfolio | ||||
| Credit Assessment (DBRS/Fitch/Moody’s): | NR/NR/NR | Property Type: | Various – See Table | ||||
| Original Principal Balance(1): | $70,000,000 | Specific Property Type: | Various – See Table | ||||
| Cut-off Date Balance(1): | $70,000,000 | Location: | Various – See Table | ||||
| % of Initial Pool Balance: | 9.96% | Size: | 352,001 SF | ||||
| Loan Purpose: | Refinance | Cut-off Date Balance Per SF(1)(3): | $231.53 | ||||
| Borrower Names(2): | Various | Year Built/Renovated: | Various – See Table | ||||
| Sponsors: | John H. Hajjar | Title Vesting: | Fee | ||||
| Mortgage Rate: | 5.213% | Property Manager: | Self-managed | ||||
| Note Date: | April 29, 2016 | 4th Most Recent Occupancy (As of)(5): | 98.1% (12/31/2012) | ||||
| Anticipated Repayment Date: | NAP | 3rd Most Recent Occupancy (As of)(5): | 80.2% (12/31/2013) | ||||
| Maturity Date: | May 5, 2021 | 2nd Most Recent Occupancy (As of)(5): | 82.4% (12/31/2014) | ||||
| IO Period: | 24 months | Most Recent Occupancy (As of)(5): | 91.8% (12/31/2015) | ||||
| Loan Term (Original): | 60 months | Current Occupancy (As of)(5): | 90.0% (Various) | ||||
| Seasoning: | 0 month | ||||||
| Amortization Term (Original): | 360 months | Underwriting and Financial Information: | |||||
| Loan Amortization Type: | Interest-only, Amortizing Balloon | ||||||
| Interest Accrual Method: | Actual/360 | 4thMost Recent NOI(6): | $4,900,834 (12/31/2012) | ||||
| Call Protection: | L(24),D(33),O(3) | 3rdMost Recent NOI(As of)(6): | $5,245,022 (12/31/2013) | ||||
| Lockbox Type: | Hard/Upfront Cash Management | 2ndMost Recent NOI (As of)(6): | $5,866,631 (12/31/2014) | ||||
| Additional Debt(1)(3): | Yes | Most Recent NOI (As of)(6): | $5,664,235 (12/31/2015) | ||||
| Additional Debt Type(1)(3): | Pari Passu, Mezzanine | ||||||
| U/W Revenues(6): | $12,145,490 | ||||||
| U/W Expenses: | $3,910,696 | ||||||
| Escrows and Reserves(4): | U/W NOI(6): | $8,234,793 | |||||
| U/W NCF(6): | $7,812,392 | ||||||
| Type: | Initial | Monthly | Cap (If Any) | U/W NOI DSCR(1): | 1.53x | ||
| Taxes | $142,117 | $142,117 | NAP | U/W NCF DSCR(1)(3): | 1.45x | ||
| Insurance | $13,311 | $13,311 | NAP | U/W NOI Debt Yield(1): | 10.1% | ||
| Replacement Reserves | $0 | $5,887 | NAP | U/W NCF Debt Yield(1)(3): | 9.6% | ||
| TI/LC Reserve | $665,950(4) | $29,436 | $1,059,705 | As-Is Appraised Value: | $131,000,000 | ||
| Deferred Maintenance | $184,394 | $0 | NAP | As-Is Appraisal Valuation Date: | September 29, 2015 | ||
| Rent Abatement | $252,711 | $0 | NAP | Cut-off Date LTV Ratio(1)(3)(7): | 62.2% | ||
| Common Charge | $37,944 | (4) | NAP | LTV Ratio at Maturity or ARD(1)(3)(7): | 59.6% | ||
| (1) | The Regent Portfolio Whole Loan (as defined below), with an original principal balance of $81,500,000, is comprised of twopari passu notes (Notes A-1 and A-2). The controlling Note A-1 had an original principal balance of $70,000,000, has an outstanding principal balance of $70,000,000 as of the Cut-Off Date and will be contributed to the WFCM 2016-C34 Trust. The non-controlling Note A-2 had an original principal balance of $11,500,000 and is expected to be contributed to a future trust or trusts. All statistical financial information related to balances per square foot, loan-to-value ratios, debt service coverage ratios and debt yields are based on the Regent Portfolio Whole Loan. |
| (2) | See “The Borrowers” section. |
| (3) | See “Subordinate and Mezzanine Indebtedness” section. The equity interest in the borrower has been pledged to secure mezzanine indebtedness with an original principal balance of $10,000,000. All statistical information related to the balances per square foot, loan-to-value ratios, debt service coverage ratios and debt yields are based solely on the Regent Portfolio Whole Loan. As of the Cut-off Date, the Cut-off Date Balance per SF, U/W NCF DSCR, U/W NCF Debt Yield, Cut-off Date LTV Ratio and LTV Ratio at Maturity or ARD based on the Regent Portfolio Whole Loan and the mezzanine indebtedness were $259.94, 1.17x, 8.5%, 69.8% and 67.2%, respectively. |
| (4) | See “Escrows” section. |
| (5) | See “Historical Occupancy” section. |
| (6) | See “Cash Flow Analysis” section. |
| (7) | See “Appraisal” section. The Regent Portfolio Properties had an aggregate portfolio “as-is” appraised value of $131,000,000, and the cumulative “as-is” appraised values of individual Regent Portfolio Properties is $124,300,000. The Cut-off Date LTV Ratio and LTV Ratio at Maturity based on the cumulative “as-is” appraised values of the individual Regent Portfolio Properties are 65.6% and 62.8%, respectively. |
The Mortgage Loan. The mortgage loan (the “Regent Portfolio Mortgage Loan”) is part of a whole loan (the “Regent Portfolio Whole Loan”) that is evidenced by twopari passu promissory notes (Notes A-1 and A-2) secured by a first mortgage encumbering 12 medical office properties and one warehouse property located in New Jersey, New York and Florida (the “Regent Portfolio Properties”). The Regent Portfolio Mortgage Loan was originated on April 29, 2016 by Natixis Real Estate Capital LLC. The Regent Portfolio Whole Loan had an original principal balance of $81,500,000, has an outstanding principal balance as of the Cut-off Date of $81,500,000 and accrues interest at an interest rate of 5.213%per annum. The Regent Portfolio Whole Loan had an initial term of 60 months, has a remaining term of 60 months as of the Cut-off Date, requires interest-only payments for the first 24 payments following origination and, thereafter, requires payments of principal and interest based on a 30-year amortization schedule. The Regent Portfolio Whole Loan matures on May 5, 2021.
The Regent Portfolio Mortgage Loan, evidenced by the controlling Note A-1, will be contributed to the WFCM 2016-C34 Trust, had an original principal balance of $70,000,000 and has an outstanding principal balance as of the Cut-off Date of $70,000,000. The non-
THE INFORMATION IN THIS STRUCTURAL AND COLLATERAL TERM SHEET IS NOT COMPLETE AND MAY BE AMENDED PRIOR TO THE TIME OF SALE. THIS TERM SHEET IS NOT AN OFFER TO SELL THESE SECURITIES AND IT IS NOT A SOLICITATION OF AN OFFER TO BUY THESE SECURITIES IN ANY JURISDICTION WHERE THE OFFER OR SALE IS NOT PERMITTED.
| 28 |
| REGENT PORTFOLIO |
controlling Note A-2 had an original principal balance of $11,500,000, is currently held by Natixis Real Estate Capital LLC and is expected to be contributed to a future trust or trusts. The lender provides no assurances that any non-securitizedpari passu note will not be split further. See “Description of the Mortgage Pool—The Whole Loan—The Serviced Whole Loans—The Regent Portfolio Whole Loan” in the Preliminary Prospectus.
Note Summary
| Notes | Original Balance | Note Holder | Controlling Interest | |
| A-1 | $70,000,000 | WFCM 2016-C34 | Yes | |
| A-2 | $11,500,000 | Natixis Real Estate Capital LLC | No | |
| Total | $81,500,000 |
Following the lockout period, the borrower has the right to defease the Regent Portfolio Whole Loan in whole or in part (see “Partial Release” section) on any date before March 5, 2021. In addition, the Regent Portfolio Whole Loan Loan is prepayable without penalty on or after March 5, 2021.
Sources and Uses
| Sources | Uses | |||||||
| Original loan amount | $81,500,000 | 89.1% | Loan payoff | $84,001,537 | 91.8% | |||
| Mezzanine loan | 10,000,000 | 10.9 | Reserves | 1,296,427 | 1.4 | |||
| Closing costs | 2,605,364 | 2.8 | ||||||
| Return of equity | 3,596,672 | 3.9 | ||||||
| Total Sources | $91,500,000 | 100.0% | Total Uses | $91,500,000 | 100.0% |
The Properties. The Regent Portfolio Properties comprise 12 multi-tenant medical office properties and one warehouse property totaling 352,001 square feet and are located throughout northern New Jersey (11 properties), Westchester, New York (one property) and Miramar, Florida (one property). Two of the Regent Portfolio Properties represent condominium interests (the Miramar Medical Building and Hajjar Business Holdings - Fair Lawn properties). Built between 1955 and 2014, the Regent Portfolio Properties range in size from 6,000 square feet to 71,915 square feet. The sponsor acquired two of the Regent Portfolio Properties (Hajjar MOB - Glen Rock and HMOB - New Brunswick) in 2012 and completely renovated them therefafter. The sponsor developed the Hajjar MOB - Wayne property in 2014. The sponsor acquired the Hajjar MOB – Roseland property in March 2015 and the HMOB - Mount Kisco property in February 2016. Eight of the Regent Portfolio Properties (47.2% of net rentable area) are 100.0% occupied.
Approximately 168,846 square feet (48.0% of net rentable area) is leased directly to Sovereign Medical Services Inc. (“SMS”) or its affiliates, which is 70.0% owned and controlled by Dr. John Hajjar, the sponsor of the Regent Portfolio Mortgage Loan. Dr. Hajjar began forming the SMS predecessor companies in the early 1990’s. Headquartered in Glen Rock, NJ, SMS is a physician-led management company that oversees an integrated healthcare delivery system focused on providing readily-accessible, quality care in a cost efficient setting. In 2014, all operating entities were organized under SMS, which is organized like a holding/parent company, managing a mix of fully-owned subsidiaries, partially-owned affiliated companies and affiliated companies with which it has a management contract. Under the SMS umbrella are 13 ambulatory surgical centers (with two additional centers pending), five oncology and imaging centers, medical practice groups encompassing over 400 physicians in 19 locations, a clinical laboratory and a portfolio of ancillary support services. SMS reported an EBITDA of $5.8 million in 2013, $9.1 million in 2014 and $11.8 million in 2015, representing year-over-year increases of 56.9% and 29.7%, respectively.
The remaining 30.0% of SMS is owned by Shanghai Fosun Pharmaceutical (Group) Co., Ltd. (“Fosun International”), which made a $40.0 million equity investment in 2015. Fosun International operates diversified businesses. The company manufactures steel, develops property, manufactures pharmaceuticals and holds interests in retailers, financial services providers, and gold and iron mining operations. Fosun International is listed on the main board of the Hong Kong Stock Exchange, had a market capitalization of approximately $12.6 billion as of April 21, 2016 and is rated Ba3 and BB by Moody’s and S&P, respectively. Other tenants at the Regent Portfolio Properties include Tenet Health (rated B, B3 and B by Fitch, Moody’s and S&P, respectively), Merrill Lynch (rated A, Baa1 and BBB+ by Fitch, Moody’s and S&P, respectively), St. Josephs Hospital, Roseland Ambulatory, New Century Imaging and Westchester Health. As of April 19, 2016 and May 1, 2016, the Regent Portfolio Properties were 90.0% leased by 51 tenants and 84.8% occupied.
THE INFORMATION IN THIS STRUCTURAL AND COLLATERAL TERM SHEET IS NOT COMPLETE AND MAY BE AMENDED PRIOR TO THE TIME OF SALE. THIS TERM SHEET IS NOT AN OFFER TO SELL THESE SECURITIES AND IT IS NOT A SOLICITATION OF AN OFFER TO BUY THESE SECURITIES IN ANY JURISDICTION WHERE THE OFFER OR SALE IS NOT PERMITTED.
| 29 |
| REGENT PORTFOLIO |
The following table presents certain information relating to the Regent Portfolio Properties:
Property Name – | Specific Property Type | Allocated Cut-off Date Balance | % of Portfolio Cut-off Date Balance | Occupancy | Year Built/ Renovated | Net Rentable Area (SF) | Appraised | Allocated LTV |
| HMOB - Mount Kisco, NY | Medical Office | $11,488,334 | 16.4% | 80.4% | 1980/2003 | 71,915 | $20,400,000 | 65.6% |
| Hajjar MOB - Jersey City, NJ | Medical Office | $8,334,674 | 11.9% | 96.5% | 2011/NAP | 30,954 | $14,800,000 | 65.6% |
| Hajjar MOB - Glen Rock, NJ | Medical Office | $8,222,043 | 11.7% | 100.0% | 1970/2013 | 43,914 | $14,600,000 | 65.6% |
| Hajjar MOB - Wayne, NJ | Medical Office | $7,827,836 | 11.2% | 100.0% | 2014/NAP | 31,233 | $13,900,000 | 65.6% |
| Hajjar MOB - Carlstadt, NJ | Medical Office | $6,588,897 | 9.4% | 100.0% | 1988/NAP | 25,251 | $11,700,000 | 65.6% |
| Hajjar MOB - Oradell, NJ | Medical Office | $6,025,745 | 8.6% | 90.0% | 1979/NAP | 29,411 | $10,700,000 | 65.6% |
| HMOB - New Brunswick, NJ | Medical Office | $4,674,175 | 6.7% | 100.0% | 1985/2015 | 12,660 | $8,300,000 | 65.6% |
| Hajjar MOB - Roseland, NJ | Medical Office | $4,279,968 | 6.1% | 61.4% | 1982/NAP | 42,150 | $7,600,000 | 65.6% |
| Hajjar MOB - Fair Lawn, NJ | Medical Office | $3,660,499 | 5.2% | 100.0% | 2009/NAP | 15,000 | $6,500,000 | 65.6% |
| Miramar Medical Building – Miramar, FL | Medical Office | $3,660,499 | 5.2% | 100.0% | 2007/NAP | 15,890 | $6,500,000 | 65.6% |
| Hajjar Business Holdings - Fair Lawn, NJ | Medical Office | $2,477,876 | 3.5% | 93.3% | 1955/1983 | 11,373 | $4,400,000 | 65.6% |
| Hajjar MOB - Hackensack, NJ | Medical Office | $1,689,461 | 2.4% | 100.0% | 1974/2010 | 6,000 | $3,000,000 | 65.6% |
| Hajjar Warehouse – Hackensack, NJ | Warehouse | $1,069,992 | 1.5% | 100.0% | 1966/NAP | 16,250 | $1,900,000 | 65.6% |
| Total/Weighted Average | $70,000,000 | 100.0% | 90.0% | 352,001 | $131,000,000(1) | 62.2%(1) |
| (1) | See “Appraisal” section. |
The following table presents certain information relating to the tenancies at the Regent Portfolio Properties:
Major Tenants
| Tenant Name | Credit Rating (Fitch/ Moody’s/ S&P)(1) | Tenant NRSF | % of NRSF | Annual U/W Base Rent PSF(2) | Annual U/W Base Rent(2) | % of Total Annual U/W Base Rent | Lease Expiration Date |
| Major Tenants | |||||||
| Surgem, LLC(3) | NR/NR/NR | 88,306 | 25.1% | $24.72 | $2,182,936 | 23.1% | Various(3) |
| Sovereign Medical Group, LLC(4) | NR/NR/NR | 49,055 | 13.9% | $31.63 | $1,551,597 | 16.4% | Various(4) |
| Sovereign Oncology, LLC(5) | NR/NR/NR | 19,789 | 5.6% | $33.75 | $667,844 | 7.1% | Various(5) |
| St. Josephs Hospital (6) | NR/NR/NR | 20,108 | 5.7% | $27.99 | $562,738 | 6.0% | Various(6) |
| Roseland Ambulatory(7) | NR/NR/NR | 12,807 | 3.6% | $36.43 | $466,619 | 4.9% | 9/30/2025 |
| Total Major Tenants | 190,065 | 54.0% | $28.58 | $5,431,735 | 57.6% | ||
| Non-Major Tenants | 126,793 | 36.0% | $31.56 | $4,001,453 | 42.4% | ||
| Occupied Collateral Total | 316,858 | 90.0% | $29.77 | $9,433,187 | 100.0% | ||
| Vacant Space | 35,143 | 10.0% | |||||
| Collateral Total | 352,001 | 100.0% | |||||
| (1) | Certain ratings are those of the parent company whether or not the parent guarantees the lease. |
| (2) | Annual U/W Base Rent PSF and Annual U/W Base Rent include contractual rent steps through April 2017 totaling $54,579. |
| (3) | Surgem, LLC leases 23,000 square feet at the Hajjar MOB - Glen Rock property under a lease expiring on July 31, 2028; 16,250 square feet at the Hajjar Warehouse – Hackensack property under a lease expiring on June 30, 2027; 11,070 square feet at the Hajjar MOB - Jersey City property under a lease expring on July 31, 2026; multiple spaces at the Hajjar MOB – Oradell property totaling 10,550 square feet under leases expiring on May 31, 2024 and May 31, 2025; multiple spaces at the Hajjar MOB – Carlstadt property totaling 10,522 square feet under leases expiring on September 30, 2025 and March 31, 2030; multiple spaces at the Hajjar Business Holdings - Fair Lawn property totaling 8,914 square feet under leases expiring on Arpil 1, 2022 and March 31, 2025; and 8,000 square feet at the Hajjar MOB - Fair Lawn property under a lease expiring on May 31, 2027. |
| (4) | Sovereign Medical Group, LLC leases multiple spaces at the Hajjar MOB - Wayne property totalling 11,125 square feet under leases expiring on May 31, 2029, August 30, 2030 and November 30, 2029; multiple spaces at the Hajjar MOB - Glen Rock property totaling 10,989 square feet under leases expiring on July 31, 2028, September 30, 2029, October 31, 2030 and May 31, 2029; multiple spaces at the the Hajjar MOB – Carlstadt property totaling 10,610 square feet under leases expiring on March 31, 2033 and June 30, 2030; 10,001 square feet at the Hajjar MOB - Jersey City property under leases expring on June 30, 2030 and 6,330 square feet at theHMOB - New Brunswick property under a lease expiring in May 30, 2025. |
| (5) | Sovereign Oncology, LLCleases 7,459 square feet at the Hajjar MOB - Jersey City property under a lease expiring on July 31, 2026; 6,330 square feet at the HMOB - New Brunswick property under a lease expiring onJune 30, 2030; and 6,000 square feet at the Hajjar MOB – Hackensack propertyunder a leaseexpiring on January 31, 2021. |
| (6) | St. Josephs Hospital leases multiple spaces at the Hajjar MOB – Wayne property totaling 20,108 square feet under leases expiring on November 30, 2024 and March 31, 2026. St. Josephs Hospital has free rent through October 2016 on its expansion space covering 18,379 square feet. At closing, the borrower deposited $665,950 for upfront tenant improvements and leasing commissions and $252,711 for rent concessions related the St. Josephs Hospital lease expansion. St. Josephs Hospital has two, 5-year lease renewal options. |
| (7) | Located at the Hajjar MOB – Roseland property. |
THE INFORMATION IN THIS STRUCTURAL AND COLLATERAL TERM SHEET IS NOT COMPLETE AND MAY BE AMENDED PRIOR TO THE TIME OF SALE. THIS TERM SHEET IS NOT AN OFFER TO SELL THESE SECURITIES AND IT IS NOT A SOLICITATION OF AN OFFER TO BUY THESE SECURITIES IN ANY JURISDICTION WHERE THE OFFER OR SALE IS NOT PERMITTED.
| 30 |
| REGENT PORTFOLIO |
The following table presents certain information relating to the lease rollover schedule at the Regent Portfolio Properties:
Lease Expiration Schedule(1)(2)
| Year Ending December 31, | No. of Leases Expiring | Expiring NRSF | % of Total NRSF | Cumulative Expiring NRSF | Cumulative % of Total NRSF | Annual U/W Base Rent | % of Total Annual U/W Base Rent | Annual U/W Base Rent PSF(3) |
| MTM | 8 | 9,623 | 2.7% | 9,623 | 2.7% | $285,224 | 3.0% | $29.64 |
| 2016 | 4 | 4,454 | 1.3% | 14,077 | 4.0% | $153,370 | 1.6% | $34.43 |
| 2017 | 7 | 22,170 | 6.3% | 36,247 | 10.3% | $678,568 | 7.2% | $30.61 |
| 2018 | 5 | 9,043 | 2.6% | 45,290 | 12.9% | $330,831 | 3.5% | $36.58 |
| 2019 | 6 | 10,761 | 3.1% | 56,051 | 15.9% | $333,254 | 3.5% | $30.97 |
| 2020 | 5 | 9,297 | 2.6% | 65,348 | 18.6% | $254,325 | 2.7% | $27.36 |
| 2021 | 1 | 6,000 | 1.7% | 71,348 | 20.3% | $203,568 | 2.2% | $33.93 |
| 2022 | 7 | 27,135 | 7.7% | 98,483 | 28.0% | $875,627 | 9.3% | $32.27 |
| 2023 | 3 | 16,528 | 4.7% | 115,011 | 32.7% | $517,484 | 5.5% | $31.31 |
| 2024 | 1 | 1,729 | 0.5% | 116,740 | 33.2% | $57,316 | 0.6% | $33.15 |
| 2025 | 8 | 48,404 | 13.8% | 165,144 | 46.9% | $1,573,316 | 16.7% | $32.50 |
| 2026 | 5 | 36,908 | 10.5% | 202,052 | 57.4% | $1,120,915 | 11.9% | $30.37 |
| Thereafter | 23 | 114,806 | 32.6% | 316,858 | 90.0% | $3,049,388 | 32.3% | $26.56 |
| Vacant | 0 | 35,143 | 10.0% | 352,001 | 100.0% | $0 | 0.0% | $0.00 |
| Total/Weighted Average | 83(4) | 352,001 | 100.0% | $9,433,187 | 100.0% | $29.77 |
| (1) | Information obtained from the underwritten rent roll. |
| (2) | Certain tenants may have lease termination options that are exercisable prior to the originally stated expiration date of the subject lease and that are not considered in the Lease Expiration Table. |
| (3) | Weighted Average Annual U/W Base Rent PSF excludes vacant space. |
| (4) | The Regent Portfolio Properties are leased by 51 tenants subject to 83 leases. |
The following table presents historical occupancy percentages at the Regent Portfolio Properties:
Historical Occupancy
12/31/2012(1)(2)(4) | 12/31/2013(1)(3)(4) | 12/31/2014(1)(3)(4) | 12/31/2015(1)(4)(5) | Various(6) |
| 98.1% | 80.2% | 82.4% | 91.8% | 90.0% |
| (1) | Information obtained from the borrower. |
| (2) | 2012 occupancy excludes the Hajjar MOB - Glen Rock, Hajjar MOB – Wayne, HMOB - New Brunswick, Hajjar MOB – Roseland and HMOB - Mount Kisco properties. |
| (3) | 2013 and 2014 occupancy exclude the Hajjar MOB – Wayne, Hajjar MOB – Roseland and HMOB - Mount Kisco properties. |
| (4) | The decline in occupancy from 2012 to 2014 and subsequent increase in 2015 was due primarily to the sponsor acquiring four unstabilized properties (Hajjar MOB - Glen Rock, HMOB - New Brunswick, Hajjar MOB – Roseland, and HMOB - Mount Kisco) and developping the Hajjar MOB - Wayne property. The sponsor acquired the Hajjar MOB - Glen Rock property in 2012 when it was about approximately 20.0% occupied, according to the sponsor, and leased it up to 100.0% by year-end 2015. The sponsor purchased the HMOB - New Brunswick property in 2012 and then completely renovated it, essentially reconstructing the building, which was finished in 2015 and is now 100.0% occupied. The Hajjar MOB - Wayne property was built by the sponsor in 2014 and has subsequently been leased up to 100.0%. The Hajjar MOB – Roseland property was purchased in 2015 when it was 62.0% occupied and is in the process of being leased up. The HMOB - Mount Kisco property was acquired in February 2016 when it was approximately 80.4% occupied and the sponsor is in the process of leasing up the remaining space. |
| (5) | 2015 occupancy excludes the HMOB - Mount Kisco property. |
| (6) | Information obtained from the underwritten rent roll. As of April 19, 2016 and May 1, 2016, the Regent Portfolio Properties were 90.0% leased by 51 tenants and 84.8% occupied. St. Josephs Hospital recently expanded in three additional suites at the Hajjar MOB – Wayne property totaling 18,379 square feet (58.8% of the property’s net rentable area and 5.2% of the portfolio’s net rentable area). St. Josephs Hospital is expected to take occupancy of the three additional suites by October 2016. At closing, the borrower deposited $665,950 for upfront tenant improvements and leasing commissions and $252,711 for rent concessions related the St. Josephs Hospital lease expansion. |
THE INFORMATION IN THIS STRUCTURAL AND COLLATERAL TERM SHEET IS NOT COMPLETE AND MAY BE AMENDED PRIOR TO THE TIME OF SALE. THIS TERM SHEET IS NOT AN OFFER TO SELL THESE SECURITIES AND IT IS NOT A SOLICITATION OF AN OFFER TO BUY THESE SECURITIES IN ANY JURISDICTION WHERE THE OFFER OR SALE IS NOT PERMITTED.
| 31 |
| REGENT PORTFOLIO |
Operating History and Underwritten Net Cash Flow. The following table presents certain information relating to the historical operating performance and the underwritten net cash flow at the Regent Portfolio Properties:
Cash Flow Analysis
| 2012(1) | 2013(2) | 2014(3) | 2015(4) | U/W | % of U/W Effective Gross Income | U/W $ per SF | ||||||||||
| Base Rent | $5,895,656 | $6,538,093 | $7,709,502 | $7,962,756 | $9,433,187 | (5) | 77.7% | $26.80 | ||||||||
| Grossed Up Vacant Space | 0 | 0 | 0 | 0 | 958,676 | 7.9 | 2.72 | |||||||||
| Amortizing TI | 0 | 0 | 0 | 0 | 189,900 | (6) | 1.6 | 0.54 | ||||||||
| Total Reimbursables | 991,410 | 1,213,579 | 1,479,769 | 1,598,964 | 2,546,888 | (7) | 21.0 | 7.24 | ||||||||
| Other Income | 228,066 | 32,575 | 50,529 | 142,781 | 36,899 | 0.3 | 0.10 | |||||||||
| Less Vacancy & Free Rent | 0 | 0 | 0 | 0 | (1,020,061) | (8) | (8.4) | (2.90) | ||||||||
| Effective Gross Income | $7,115,132 | $7,784,247 | $9,239,800 | $9,704,501 | $12,145,490 | 100.0% | $34.50 | |||||||||
| Total Operating Expenses | $2,214,298 | $2,539,225 | $3,373,169 | $4,040,266 | $3,910,696 | 32.2% | $11.11 | |||||||||
| Net Operating Income | $4,900,834 | $5,245,022 | $5,866,631 | $5,664,235 | $8,234,793 | 67.8% | $23.39 | |||||||||
| TI/LC | 0 | 0 | 0 | 0 | 352,001 | 2.9 | 1.00 | |||||||||
| Capital Expenditures | 0 | 0 | 0 | 0 | 70,400 | 0.6 | 0.20 | |||||||||
| Net Cash Flow | $4,900,834 | $5,245,022 | $5,866,631 | $5,664,235 | $7,812,392 | 64.3% | $22.19 | |||||||||
| NOI DSCR | 0.91x | 0.98x | 1.09x | 1.05x | 1.53x | |||||||||||
| NCF DSCR | 0.91x | 0.98x | 1.09x | 1.05x | 1.45x | |||||||||||
| NOI DY | 6.0% | 6.4% | 7.2% | 6.9% | 10.1% | |||||||||||
| NCF DY | 6.0% | 6.4% | 7.2% | 6.9% | 9.6% |
| (1) | 2012 cash flow excludes the Hajjar MOB - Glen Rock, Hajjar MOB – Wayne, HMOB - New Brunswick and Hajjar MOB – Roseland properties. |
| (2) | 2013 cash flow excludes the Hajjar MOB – Wayne, HMOB - New Brunswick and Hajjar MOB – Roseland properties. |
| (3) | 2014 cash flow excludes the Hajjar MOB – Wayne and HMOB - New Brunswick properties. |
| (4) | 2015 cash flow includes the Hajjar MOB – Wayne and HMOB - New Brunswick properties; though both properties were leasing up in 2015. |
| (5) | The increase in Base Rent from 2015 to U/W is due to (i) leasing activity from July 2015 to April 2016 representing 22.5% of the portfolio net rentable area, including among others, the Sovereign Medical Group, LLC lease at Hajjar MOB - Jersey City commencing in July 2015, which accounts for $353,535 of U/W Base Rent, the Merrill Lynch lease at the HMOB – Mount Kisco property commencing in August 2015, which accounts for $356,990 of U/W Base Rent, the St. Josephs Hospital lease at the Hajjar MOB - Wayne property commencing in April 2016, which accounts for $505,422 of U/W Base Rent and (ii) underwritten contractual rent steps through April 2017 totalling $54,579. |
| (6) | Sovereign Oncology, LLC received $1.9 million in tenant improvements to buildout their cancer care facility at the HMOB - New Brunswick property, which requires them to repay $189,900 per year ($30 per square foot) for ten years of their 15 year lease. |
| (7) | The increase in Total Reimbursables from 2015 to U/W is due to leasing activity throughout 2015 and 2016. |
| (8) | The underwritten economic vacancy is 7.7%. The Regent Portfolio Properties were 90.0% physically occupied as of April 19, 2016 and May 1, 2016. |
Appraisal.As of the appraisal valuation date of September 29, 2015, the Regent Portfolio Properties had an aggregate portfolio “as-is” appraised value of $131,000,000. The Regent Portfolio Properties were also valued individually, with the individual values reflecting a cumulative “as-is” appraised value of $124,300,000. Due to the diversified risk of a cross-collateralized portfolio with no substitutions permitted, the aggregate portfolio “as-is” appraised value of $131,000,000 was utilized.
Environmental Matters. According to Phase I environmental site assessments dated as of April 21, 2016, there was evidence of a recognized environmental condition (“REC”) at the HMOB - Mount Kisco property related to two underground storage tanks. The environmental consultant recommended that each tank undergo a tank tightness test, which the borrower is required to obtain pursuant to the loan documents. Further investigation could be warranted depending on results.
Market Overview and Competition. The Regent Portfolio Properties are located throughout Northern New Jersey, Westchester, New York and Miramar, Florida.
Eleven of the Regent Portfolio Properties (78.4% of allocated loan balance) are located in Northern New Jersey, all of which are within 30.0 miles of New York City. As of 2015, the population within Northern New Jersey was 3.6 million encompassing 1,583 square miles (2,274 people per square mile) with an estimated average household income of $101,779. Seven of the of the Regent Portfolio Properties (42.5% of allocated loan balance) are located in Bergen County. According to a third party market research report, as of the first quarter of 2016, the Bergen County medical office submarket contained a total inventory of approximately 3.4 million square feet, overall vacancy rate of 10.6% and average asking rent of $22.89 per square foot on a triple net basis. The Hajjar MOB - Jersey City property is located less than one mile west of the 316-bed Jersey City Medical Center, which is the largest health care provider in Hudson County with more than 18,000 admissions and over 80,000 emergency room visits each year. Additionally, the Hajjar MOB - Wayne property is located within the campus of St. Joseph’s Hospital and the HMOB - New Brunswick property is located across the street from St. Peters University Hospital.
The Borrowers.The borrower structure is comprised of 13 single purpose entities, each a Delaware limited liability company with two independent directors. Legal counsel to the borrowers delivered a non-consolidation opinion in connection with the origination of the Regent Portfolio Whole Loan. John H. Hajjar is the guarantor of certain nonrecourse carveouts under the Regent Portfolio Whole Loan.
The Sponsor.The sponsor is John H. Hajjar, a medical doctor who founded the first ambulatory surgery center in Bergen County. After a medical career that spanned more than three decades, Dr. Hajjar currently devotes all of his professional energies to the growth of SMS, a fully integrated community healthcare system providing people in New Jersey and the tri-state area with clinical expertise and technology at convenient locations. Dr. John Hajjar reported a net worth of approximately $122.0 million (excluding
THE INFORMATION IN THIS STRUCTURAL AND COLLATERAL TERM SHEET IS NOT COMPLETE AND MAY BE AMENDED PRIOR TO THE TIME OF SALE. THIS TERM SHEET IS NOT AN OFFER TO SELL THESE SECURITIES AND IT IS NOT A SOLICITATION OF AN OFFER TO BUY THESE SECURITIES IN ANY JURISDICTION WHERE THE OFFER OR SALE IS NOT PERMITTED.
| 32 |
| REGENT PORTFOLIO |
equity in the Regent Portfolio Whole Loan) and liquidity of approximately $17.0 million as of September 30, 2015. Dr. Hajjar has primary ownership in SMS, which accounts for 48.0% of the net rentable area and 51.5% of underwritten base rent of the Regent Portfolio Properties. See also “Description of the Mortgage Pool—Tenant Issues—Affiliated Leases” and “Description of the Mortgage Pool—Tenant Issues—Others” in the Preliminary Prospectus.
Escrows.The loan documents provide for upfront reserves in the amount of $142,117 for real estate taxes; $13,311 for insurance premiums, $665,950 for tenant improvements and leasing commissions (“TI/LC”) for St. Josephs Hospital; $252,711 for rent concessions for St. Josephs Hospital; $184,394 for deferred maintenance and $37,944 for common charges on the properties that are subject to condominium regimes. Additionally, the loan documents require monthly deposits of an amount equal to one-twelfth of the estimated annual real estate taxes (currently equates to $142,117), an amount equal to one-twelfth of the the annual insurance premiums (currently equates to $13,311), $5,887 for replacement reserves, an amount equal to the common charges payable by the borrower under the condo regimes for the month and $29,436 for TI/LC. The TI/LC reserve, excluding the $665,950 upfront TI/LC for St. Josephs Hospital, is subject to a cap of $1,059,705 and a minimum balance of $529,853. If, at any time during the Regent Portfolio Whole Loan term, the balance of the TI/LC reserve falls below $529,853, monthly deposits are required to resume until the cap is met.
Lockbox and Cash Management. The Regent Portfolio Whole Loan requires a lender-controlled lockbox account, which is already in place, and that the borrower and property manager direct all tenants to pay rent payments directly into such lockbox account. The loan documents also require that all rents received by the borrower or property manager be deposited into the lockbox account within one business day of receipt. Funds deposited into the lockbox account are required to be swept on a daily basis into a cash management account controlled by the lender and applied and disbursed in accordance with the loan documents. Following the occurrence of a Cash Sweep Period (as defined below), excess cash will be held as additional collateral for the Regent Portfolio Whole Loan. Upon the termination of any Cash Sweep Period, excess cash will no longer be held by the the lender and, provided that no event of default has occurred and is continuing (and no other Cash Sweep Period is then in effect), all amounts then on deposit in the lockbox account will be disbursed to the borrower, unless the Regent Portfolio Mezzanine Loan (see “Subordinate and Mezzanine Indebtedness” section) is outstanding and the Regent Portfolio Mezzanine Lender (as defined below) provides an account designated to the lender in writing, in which case all such remaining funds are required to be promptly disbursed to the Regent Portfolio Mezzanine Lender to be disbursed or applied in accordance with the terms of the Regent Portfolio Mezzanine Loan agreement.
A “Cash Sweep Period” will commence upon the earlier of (i) the occurrence of an event of default; (ii) the amortizing debt service coverage ratio falling below 1.10x at the end of any calendar quarter; (iii) the commencement of any Lease Sweep Period (as defined below); or (iv) a Regent Portfolio Mezzanine Loan event of default. A Cash Sweep Period will end with respect to clause (ii), if for six consecutive months (a) no default or event of default has occurred; (b) no event that would trigger another Cash Sweep Period has occurred and (c) the amortizing debt service coverage ratio is at least 1.15x; with respect to clause (iii), such Lease Sweep Period has ended (and no other Cash Sweep Period is then continuing); and with respect to clause (iv), the receipt of a Regent Portfolio Mezzanine Loan event of default revocation notice.
A “Lease Sweep Period ” will commence upon: (i) any early termination of a Major Lease (as defined below) (or any material portion thereof) prior to its then current expiration date; (ii) any Major Tenant (as defined below) going dark or giving notice that it intends to discontinue its business; provided, however, that a Lease Sweep Period will not be deemed to have commenced solely due to a borrower affiliated tenant going dark or giving notice that it intends to discontinue its business (a “Borrower Affiliated Go Dark Tenant”), provided that (1) such Borrower Affiliated Go Dark Tenant (x) occupies less than five percent of the Regent Portfolio Properties gross leaseable area, and (y) accounts for gross annual rent of less than five percent of the total annual gross rents for the Regent Portfolio Properties and (2) such Borrower Affiliated Go Dark Tenant does not “go dark” for a period in excess of six months; (iii) the occurrence and continuance (beyond any applicable notice and cure periods) of a monetary or material non-monetary default under any Major Lease by the applicable Major Tenant thereunder; or (iv) the occurrence of an insolvency proceeding by any Major Tenant.
A Lease Sweep Period will end: (I) with respect to clauses (i), (ii), (iii), or (iv) above, if the borrower has (A) entered into one or more leases with one or more replacement tenants reasonably satisfactory to the lender demising in the aggregate the entire space under the applicable Major Lease for a term of not less than five years, each at a net effective rental rate acceptable to the lender, (B) delivered to the lender (1) a copy of each replacement lease, (2) evidence reasonably satisfactory to the lender that (a) such replacement lease is in full force and effect and no default has occurred and is continuing under such lease, (b) all of the borrower’s work to be performed in connection with the construction of the premises demised under such replacement lease has been completed, (c) all tenant improvement allowances payable by the borrower to the replacement tenant under such its lease have been paid in full by the borrower, and (d) such replacement tenant has taken possession of and is occupying all of its space (other than a borrower affiliated tenant whose Borrower Affiliated Lease is fully guaranteed by John H. Hajjar or SMS), is open for business and is paying unabated base rent (provided, however that a borrower affiliated tenant whose Borrower Affiliated Lease is fully guaranteed by John H. Hajjar or SMS may satisfy this clause (d) while it is in a lender approved abatement period) in accordance with such lease, (3) an estoppel certificate from the applicable replacement tenant confirming the statements set forth in item (B)(2) above with respect to the applicable replacement lease and (4) a subordination, non-disturbance and attornment agreement from each replacement tenant in form and substance reasonably satisfactory to the lender, and (C) paid or pre-funded all leasing brokerage commissions payable by the borrower upon execution of such lease in connection with each such replacement lease; (II) with respect to clause (iii) above, if the subject Major Tenant default has been cured, and no other Major Tenant default has occurred for a period of three consecutive months following such cure (provided that no such cure of a Lease Sweep Period may be permitted pursuant to this clause (2) more than one time with respect to any individual Major Lease); or (III) with respect to clause (iv) above, if the applicable Major Tenant insolvency proceeding has terminated and the applicable Major Lease has been affirmed, assumed or assigned in a manner satisfactory to the lender.
THE INFORMATION IN THIS STRUCTURAL AND COLLATERAL TERM SHEET IS NOT COMPLETE AND MAY BE AMENDED PRIOR TO THE TIME OF SALE. THIS TERM SHEET IS NOT AN OFFER TO SELL THESE SECURITIES AND IT IS NOT A SOLICITATION OF AN OFFER TO BUY THESE SECURITIES IN ANY JURISDICTION WHERE THE OFFER OR SALE IS NOT PERMITTED.
| 33 |
| REGENT PORTFOLIO |
A “Major Lease” means a (i) a Borrower Affiliated Lease (as defined below) or (ii) any Vacated Lease (as defined below). A “Major Tenant” is any tenant under a Major Lease.
A “Borrower Affiliated Lease” is any lease in which the tenant is an affiliate of the borrower.
A “Vacated Lease” means any non-affiliated lease or combination of non-affiliated lease that satisfies the following conditions: (i) the space demised under such non-affiliated lease, or combination of non-affiliated leases, is vacant, which, for purposes of this definition, will be deemed to have occurred if such non-affiliated lease or non-affiliated tenant under such non-affiliated lease is the subject of any of the events described in clauses (i), (ii), (iii) or (iv) of the definition of Lease Sweep Period, and (ii) such vacancy causes the non-affiliated lease occupancy rate to be less than 37.8%. For purposes of clarification, in the event that a Lease Sweep Period commences solely due to a Vacated Lease, and no Lease Sweep Period is in effect with respect to any Borrower Affiliated Lease, then in the event that (a) the lease sweep termination occurs with respect to one or more non-affiliated leases that caused such Lease Sweep Period to commence and (b) as a result of such lease sweep termination with respect to such applicable non-affiliated lease, the remaining vacant (as such term is used in this definition) non-affiliated leases no longer satisfy the definition of Vacated Lease, then a lease sweep termination will be deemed to have occurred with respect to such Lease Sweep Period.
Property Management. The Regent Portfolio Properties are managed by an affiliate of the borrower.
Assumption.The borrower is permitted to transfer the Regent Portfolio Properties, provided that certain conditions are satisfied, including (i) no event of default has occurred and is continuing; (ii) the lender has reasonably determined that the proposed transferee and guarantor satisfy the lender’s credit review and underwriting standards, taking into consideration transferee experience, financial strength and general business standing; (iii) execution of a recourse guaranty and an environmental indemnity by an affiliate of the transferee; and (iv) the lender has received confirmation from DBRS, Fitch and Moody’s that such assumption will not result in a downgrade, withdrawal or qualification of the respective ratings assigned to the Series 2016-C34 Certificates.
Right of First Refusal. New Century Imaging has a right of first refusal (“ROFR”) with respect to offers to purchase the Hajjar MOB – Oradell property. New Century Imaging has 20 days from receipt of the borrower’s notice of sale to indicate whether it is exercising its right. The tenant agreed in a subordination, nondisturbance and attornment agreement that such right of first refusal is fully subordinate to the Regent Portfolio Whole Loan and is inapplicable with respect to any foreclosure of the mortgage or acquisition of the Hajjar MOB – Oradell by lender in lieu of foreclosure.
Partial Release.Following the lockout period, the borrower is permitted to obtain the release of the Miramar Medical Building property and the Hajjar MOB – Roseland property, subject to certain conditions including (i) the release is in connection with the sale of such property to a third party; (ii) no event of default has occurred and is continuing; (iii) a portion of the principal of the Regent Portfolio Whole Loan is partially defeased in an amount equal to the greater of (x) the lender’s pro rata share of the net sale proceeds received for the property being released based on the Regent Portfolio Whole Loan and the related mezzanine loan’s then outstanding principal balances and (y) 115.0% of the allocated loan amount for the Miramar Medical Building property and 120.0% of the allocated loan amount for the Hajjar MOB – Roseland property; (iv) the net cash flow debt yield of the remaining Regent Portfolio Properties following the release is no less than the greater of (x) 8.69% and (y) the net cash flow debt yield of the Regent Portfolio Properties immediately prior to the release; (v) the loan-to-value ratio of the remaining Regent Portfolio Properties following the release is no more than the lesser of (x) 68.7% and (y) the loan-to-value ratio of the Regent Portfolio Properties immediately prior to the release; (vi) receipt of a confirmation from DBRS, Fitch and Moody’s that such defeasance will not result in a downgrade, withdrawal or qualification of the respective ratings assigned to the Series 2016-C34 Certificates; and (vii) the lender receives a legal opinion that the release satisfies REMIC requirements.
Real Estate Substitution.Not permitted.
Subordinate and Mezzanine Indebtedness.Natixis Real Estate Capital LLC (in such capacity, the “Regent Portfolio Mezzanine Lender”) has originated a $10,000,000 mezzanine loan (the “Regent Portfolio Mezzanine Loan”) to 13 single purpose entities, each a Delaware limited liability company (collectively, the “Regent Portfolio Mezzanine Borrower”). The Regent Portfolio Mezzanine Loan is subject to an intercreditor agreement between the lender and the Regent Portfolio Mezzanine Lender. The Regent Portfolio Mezzanine Loan had an initial term of 60 months and has a remaining term as of the Cut-off Date of 60 months. The Regent Portfolio Mezzanine Loan accrues interest at an interest rate of 13.000% per annum and requires interest-only payments through the term of the Regent Portfolio Mezzanine Loan. The Regent Portfolio Mezzanine Lender has the right to transfer its interest in the Regent Portfolio Mezzanine Loan at its discretion.
Ground Lease. None.
Terrorism Insurance.The loan documents require that the “all risk” insurance policy required to be maintained by the borrower provides coverage for terrorism (except for the Miramar Medical Building property) in an amount equal to the full replacement cost of the Regent Portfolio Properties. The loan documents also require business interruption insurance containing an extended period of indemnity for no less than the 18-month period following the occurrence of a casualty event. The borrower’s insurance policies that insure each of the Regent Portfolio Properties (including the improvements and betterments of the borrower’s unit at the Miramar Medical Building property) include coverage for acts of terrorism; however, the insurance obtained by the Miramar Medical Building property condominium association, which also insures the Miramar Medical Building property, does not include coverage for acts of terrorism.
THE INFORMATION IN THIS STRUCTURAL AND COLLATERAL TERM SHEET IS NOT COMPLETE AND MAY BE AMENDED PRIOR TO THE TIME OF SALE. THIS TERM SHEET IS NOT AN OFFER TO SELL THESE SECURITIES AND IT IS NOT A SOLICITATION OF AN OFFER TO BUY THESE SECURITIES IN ANY JURISDICTION WHERE THE OFFER OR SALE IS NOT PERMITTED.
| 34 |
(THIS PAGE INTENTIONALLY LEFT BLANK)
THE INFORMATION IN THIS STRUCTURAL AND COLLATERAL TERM SHEET IS NOT COMPLETE AND MAY BE AMENDED PRIOR TO THE TIME OF SALE. THIS TERM SHEET IS NOT AN OFFER TO SELL THESE SECURITIES AND IT IS NOT A SOLICITATION OF AN OFFER TO BUY THESE SECURITIES IN ANY JURISDICTION WHERE THE OFFER OR SALE IS NOT PERMITTED.
| 35 |
(THIS PAGE INTENTIONALLY LEFT BLANK)
THE INFORMATION IN THIS STRUCTURAL AND COLLATERAL TERM SHEET IS NOT COMPLETE AND MAY BE AMENDED PRIOR TO THE TIME OF SALE. THIS TERM SHEET IS NOT AN OFFER TO SELL THESE SECURITIES AND IT IS NOT A SOLICITATION OF AN OFFER TO BUY THESE SECURITIES IN ANY JURISDICTION WHERE THE OFFER OR SALE IS NOT PERMITTED.
| 36 |
| CONGRESSIONAL NORTH SHOPPING CENTER & 121 CONGRESSIONAL LANE |
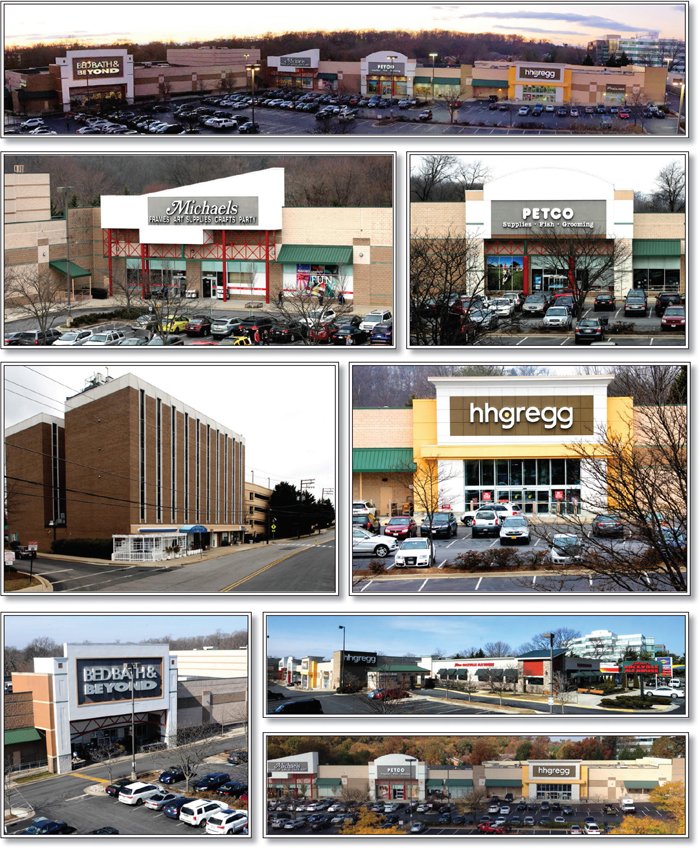
THE INFORMATION IN THIS STRUCTURAL AND COLLATERAL TERM SHEET IS NOT COMPLETE AND MAY BE AMENDED PRIOR TO THE TIME OF SALE. THIS TERM SHEET IS NOT AN OFFER TO SELL THESE SECURITIES AND IT IS NOT A SOLICITATION OF AN OFFER TO BUY THESE SECURITIES IN ANY JURISDICTION WHERE THE OFFER OR SALE IS NOT PERMITTED.
| 37 |
| CONGRESSIONAL NORTH SHOPPING CENTER & 121 CONGRESSIONAL LANE |
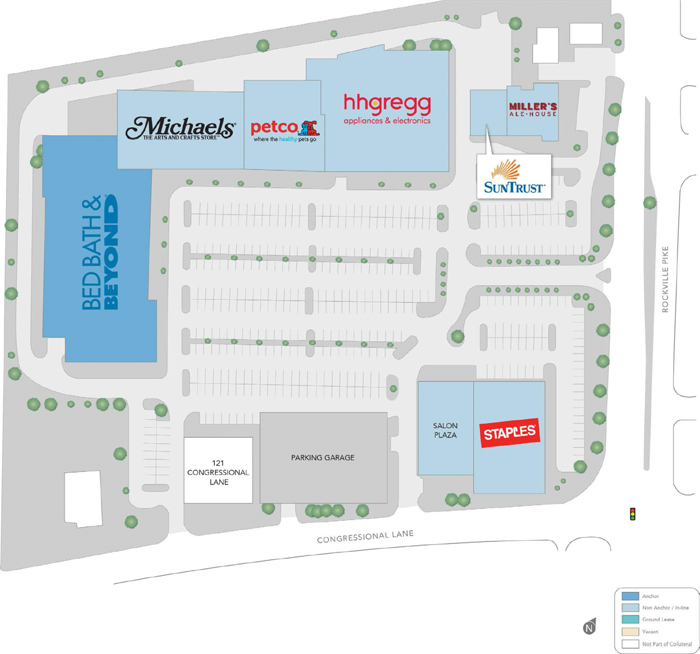
THE INFORMATION IN THIS STRUCTURAL AND COLLATERAL TERM SHEET IS NOT COMPLETE AND MAY BE AMENDED PRIOR TO THE TIME OF SALE. THIS TERM SHEET IS NOT AN OFFER TO SELL THESE SECURITIES AND IT IS NOT A SOLICITATION OF AN OFFER TO BUY THESE SECURITIES IN ANY JURISDICTION WHERE THE OFFER OR SALE IS NOT PERMITTED.
| 38 |
| CONGRESSIONAL NORTH SHOPPING CENTER & 121 CONGRESSIONAL LANE |

THE INFORMATION IN THIS STRUCTURAL AND COLLATERAL TERM SHEET IS NOT COMPLETE AND MAY BE AMENDED PRIOR TO THE TIME OF SALE. THIS TERM SHEET IS NOT AN OFFER TO SELL THESE SECURITIES AND IT IS NOT A SOLICITATION OF AN OFFER TO BUY THESE SECURITIES IN ANY JURISDICTION WHERE THE OFFER OR SALE IS NOT PERMITTED.
| 39 |
No. 2 – Congressional North Shopping Center & 121 Congressional Lane | |||||||
| Loan Information | Property Information | ||||||
| Mortgage Loan Seller: | Natixis Real Estate Capital LLC | Single Asset/Portfolio: | Portfolio | ||||
| Credit Assessment (DBRS/Fitch/Moody’s): | NR/NR/NR | Property Type: | Various – See Table | ||||
| Original Principal Balance: | $58,750,000 | Specific Property Type: | Various – See Table | ||||
| Cut-off Date Balance: | $58,750,000 | Location: | Rockville, MD | ||||
| % of Initial Pool Balance: | 8.4% | Size: | 232,201 SF | ||||
| Loan Purpose: | Refinance | Cut-off Date Balance Per SF(2): | $253.01 | ||||
| Borrower Names: | Congressional North Associates Limited Partnership; 121 Associates Limited Partnership | Year Built/Renovated: | Various – See Table | ||||
| Sponsor: | Ronald J. Cohen | Title Vesting: | Fee | ||||
| Mortgage Rate(1): | 4.369% | Property Manager: | Self-managed | ||||
| Note Date: | January 29, 2016 | 4thMost Recent Occupancy (As of): | 91.7% (12/31/2011) | ||||
| Anticipated Repayment Date: | NAP | 3rdMost Recent Occupancy (As of): | 95.4% (12/31/2012) | ||||
| Maturity Date: | February 5, 2026 | 2ndMost Recent Occupancy (As of): | 94.4% (12/31/2013) | ||||
| IO Period: | 120 months | Most Recent Occupancy (As of): | 95.5% (11/30/2014) | ||||
| Loan Term (Original): | 120 months | Current Occupancy (As of)(4): | 97.5% (Various) | ||||
| Seasoning: | 3 months | ||||||
| Amortization Term (Original): | None | Underwriting and Financial Information: | |||||
| Loan Amortization Type: | Interest-only, Balloon | ||||||
| Interest Accrual Method: | Actual/360 | 4thMost Recent NOI (As of)(5): | $4,276,096 (12/31/2012) | ||||
| Call Protection: | L(27),D(90),O(3) | 3rdMost Recent NOI (As of)(5): | $5,149,591 (12/31/2013) | ||||
| Lockbox Type: | Hard/Springing Cash Management | 2ndMost Recent NOI (As of): | $5,104,650 (12/31/2014) | ||||
| Additional Debt(2): | Yes | Most Recent NOI (As of): | $5,113,092 (12/31/2015) | ||||
| Additional Debt Type(2): | Subordinate Debt;FutureMezzanine | ||||||
| U/W Revenues: | $7,220,962 | ||||||
| U/W Expenses: | $1,981,383 | ||||||
| U/W NOI: | $5,239,579 | ||||||
| U/W NCF: | $5,085,160 | ||||||
| Escrows and Reserves(3): | U/W NOI DSCR: | 2.01x | |||||
| U/W NCF DSCR(2): | 1.95x | ||||||
| Type: | Initial | Monthly | Cap (If Any) | U/W NOI Debt Yield: | 8.9% | ||
| Taxes | $127,100 | $63,550 | NAP | U/W NCF Debt Yield(2): | 8.7% | ||
| Insurance | $21,557 | $7,186 | NAP | As-Is Appraised Value: | $91,100,000 | ||
| Replacement Reserves | $0 | $3,187 | NAP | As-Is Appraisal Valuation Date: | January 1, 2016 | ||
| TI/LC Reserve | $29,200 | $9,685 | NAP | Cut-off Date LTV Ratio(2): | 64.5% | ||
| Deferred Maintenance | $4,875 | $0 | NAP | LTV Ratio at Maturity or ARD(2): | 64.5% | ||
| (1) | The Congressional North Mortgage Loan (as defined below) accrues interest at a fixed rate equal to 4.369% through February 5, 2021, and thereafter accrues interest at a fixed rate equal to 4.874%. |
| (2) | See “Subordinate and Mezzanine Indebtedness” section. The Congressional North Whole Loan (as defined below), totaling $63,250,000, is comprised of a $58,750,000 senior note and a $4,500,000 subordinate note (the “Congressional North Subordinate Companion Loan”). The Congressional North Mortgage Loan had an original principal balance of $58,750,000, has an outstanding principal balance as of the Cut-off Date of $58,750,000 and will be contributed to the WFCM 2016-C34 Trust. The $4,500,000 Congressional North Subordinate Companion Loan accrues interest at an interest rate of 10.750% per annum. All loan-to-value, DSCR, Debt Yield and Cut-off date Balance Per SF numbers shown in the chart above are based solely on the Congressional North Mortgage Loan. As of the Cut-off Date, the Balance per SF, U/W NCF DSCR, U/W NCF Debt Yield, Cut-off Date LTV Ratio and LTV Ratio at Maturity or ARD for the Congressional North Whole Loan were $272.39, 1.64x, 8.0%, 69.4% and 69.4%, respectively. |
| (3) | See “Escrows” section. |
| (4) | See “Historical Occupancy” section. |
| (5) | See “Cash Flow” section. |
The Mortgage Loan. The mortgage loan (the “Congressional North Shopping Center & 121 Congressional Lane Mortgage Loan”, herein referred to as the “Congressional North Mortgage Loan”) is part of a loan combination (the “Congressional North Shopping Center & 121 Congressional Lane Whole Loan”), referred to herein as the “Congressional North Whole Loan”) evidenced by two separate promissory notes comprised of a senior note (“Note A”) and a subordinate note (“Note B”) that are collectively secured by a first mortgage encumbering the fee simple interest in one anchored retail property (the “Congressional North Shopping Center Property”) and one mixed-use adjacent property (the “121 Congressional Lane Property”) located in Rockville, Maryland (collectively, the “Congressional North Shopping Center & 121 Congressional Lane Properties”, herein referred to as the “Congressional North Properties”). The Congressional North Mortgage Loan was originated on January 29, 2016 by Natixis Real Estate Capital LLC. The Congressional North Mortgage Loan had an original principal balance of $58,750,000 and has an outstanding principal balance as of the Cut-off Date of $58,750,000. The Congressional North Mortgage Loan had an initial term of 120 months, has a remaining term of
THE INFORMATION IN THIS STRUCTURAL AND COLLATERAL TERM SHEET IS NOT COMPLETE AND MAY BE AMENDED PRIOR TO THE TIME OF SALE. THIS TERM SHEET IS NOT AN OFFER TO SELL THESE SECURITIES AND IT IS NOT A SOLICITATION OF AN OFFER TO BUY THESE SECURITIES IN ANY JURISDICTION WHERE THE OFFER OR SALE IS NOT PERMITTED.
| 40 |
| CONGRESSIONAL NORTH SHOPPING CENTER & 121 CONGRESSIONAL LANE |
117 months as of the Cut-off Date and requires interest-only payments through the term of the Congressional North Mortgage Loan. The Congressional North Mortgage Loan matures on February 5, 2026.
The Congressional North Whole Loan is comprised of Note A, which is the senior note in the Congressional North Whole Loan and will be contributed to the WFCM 2016-C34 Trust. Note A had an original principal balance of $58,750,000, has an outstanding principal balance as of the Cut-off Date of $58,750,000 and accrues interest at a fixed rate equal to 4.369% through February 5, 2021 and thereafter accrues interest at a fixed rate equal to 4.874%. The Congressional North Subordinate Companion Loan is comprised of Note B, which is subordinate in right of payment and in other respects to the Congressional North Mortgage Loan and will be sold prior to the closing of the WFCM 2016-C34 Trust to an affiliate of Morrison Street Capital, LLC. Note B had an original principal balance of $4,500,000, accrues interest at an interest rate of 10.750% per annum and requires interest-only payments through the term of the Congressional North Subordinate Companion Loan.
Following the lockout period, the borrower has the right to defease the Congressional North Mortgage Loan in whole or in part on any date before December 5, 2025. In addition, the Congressional North Mortgage Loan is prepayable without penalty on or after December 5, 2025.
Sources and Uses
| Sources | Uses | ||||||||
| Original loan amount | $63,250,000 | 100.0% | Loan payoff(1) | $43,755,849 | 69.2 | % | |||
| Reserves | 182,732 | 0.3 | |||||||
| Closing costs | 934,091 | 1.5 | |||||||
| Return of equity | 18,377,328 | 29.1 | |||||||
| Total Sources | $63,250,000 | 100.0% | Total Uses | $63,250,000 | 100.0 | % |
| (1) | The Congressional North Properties were previously securitized in the BACM 2006-4 transaction. |
The Properties.The Congressional North Properties comprise one anchored retail property and one adjacent mixed-use property totaling 232,201 square feet located in Rockville, Maryland, approximately 17.0 miles northwest of Washington, D.C. The Congressional North Properties feature 964 combined surface parking and garage spaces, resulting in a combined parking ratio of 4.2 spaces per 1,000 square feet of net rentable area.
Built in 1997, the Congressional North Shopping Center Property is a 179,925 square foot, one and two-story anchored power center comprised of four retail buildings and a five-story parking garage located on a 12.5-acre parcel in Rockville, Maryland. Tenants representing 71.6% of the property net rentable area have been at the Congressional North Shopping Center Property for at least 18 years. The Congressional North Shopping Center Property has had an average occupancy of 94.6% since 2009. As of January 20, 2016, the Congressional North Shopping Center Property was 100.0% occupied.
Built in 1970 and renovated in 2011, the 121 Congressional Lane Property is a 52,276 square foot, seven-story office building with ground floor retail located on a 0.2-acre parcel in Rockville, Maryland. The 121 Congressional Lane Property is primarily comprised of small-practice medical tenants who specialize in a variety of specific practices including general family medicine, audiology & speech therapy, acupuncture, physical therapy, and pharmaceutical distributions. The ground floor retail is occupied by Mykonos Grill, a Greek-style restaurant, and Congressional Deli, a full-service delicatessen and food mart. As of February 3, 2016, the 121 Congressional Lane Property was 88.7% occupied by 33 tenants.
THE INFORMATION IN THIS STRUCTURAL AND COLLATERAL TERM SHEET IS NOT COMPLETE AND MAY BE AMENDED PRIOR TO THE TIME OF SALE. THIS TERM SHEET IS NOT AN OFFER TO SELL THESE SECURITIES AND IT IS NOT A SOLICITATION OF AN OFFER TO BUY THESE SECURITIES IN ANY JURISDICTION WHERE THE OFFER OR SALE IS NOT PERMITTED.
| 41 |
| CONGRESSIONAL NORTH SHOPPING CENTER & 121 CONGRESSIONAL LANE |
The following table presents certain information relating to the Congressional North Properties:
| Property Name | Property Type | Specific Property Type | Allocated Cut-off Date Balance | % of Portfolio Cut-off Date Balance | Occupancy(1) | Year Built/ Renovated | Net Rentable Area (SF) | Appraised Value | ||
| Congressional North Shopping Center | Retail | Anchored | $51,720,637 | 88.0 | % | 100.0 | % | 1997/NAP | 179,925 | $80,200,000 |
| 121 Congressional Lane | Mixed Use | Office/Retail | $7,029,363 | 12.0 | % | 88.7 | % | 1970/2011 | 52,276 | $10,900,000(2) |
| Total/Weighted Average | $58,750,000 | 100.0 | % | 97.5 | % | 232,201 | $91,100,000 | |||
| (1) | Occupancy is as of January 20, 2016 for the Congressional North Shopping Center Property and as of February 3, 2016 for the 121 Congessional Lane Property. |
| (2) | The “as-stabilized” appraised value is $11,100,000 as of January 1, 2017 based upon the 121 Congressional Lane Property achieving a stabilized occupancy level of 92.1%. |
The following table presents certain information relating to the tenancies at the Congressional North Properties:
Major Tenants
| Tenant Name | Credit Rating S&P)(1) | Tenant NRSF | % of NRSF | Annual U/W Rent PSF(2) | Annual U/W Base Rent(2) | %of Total Annual U/W Base Rent | Sales PSF(3) | Occupancy Cost(3) | Lease Expiration Date | ||
| Anchor Tenants - Retail(4) | |||||||||||
| Bed Bath & Beyond | NR/Baa1/BBB+ | 62,040 | 26.7% | $26.90 | $1,668,938 | 26.7% | $495 | 6.6% | 1/31/2018(5) | ||
| Staples | BBB-/Baa2/BBB- | 26,586 | 11.4% | $26.65 | $708,464 | 11.3% | NAV | NAV | 10/31/2017(6) | ||
| HH Gregg | NR/NR/NR | 32,749 | 14.1% | $21.50 | $704,103 | 11.2% | $357 | 7.7% | 9/30/2020(7) | ||
| Petco | NR/B3/B | 15,457 | 6.7% | $34.81 | $538,058 | 8.6% | NAV | NAV | 9/30/2022(8) | ||
| Michael’s | NR/Ba3/B+ | 21,050 | 9.1% | $21.57 | $454,048 | 7.3% | $313 | 8.8% | 2/28/2018(9) | ||
| Total Anchor Tenants - Retail | 157,882 | 68.0% | $25.80 | $4,073,612 | 65.1% | ||||||
| Non-Major Tenants - Retail | 27,673 | 11.9% | $32.21 | $891,452 | 14.2% | ||||||
| Occupied Retail Total | 185,555 | 79.9% | $26.76 | $4,965,064 | 79.3% | ||||||
| Occupied Office Tenants(10) | 40,764 | 17.6% | $31.75 | $1,294,333 | 20.7% | ||||||
| Occupied Collateral Total(10) | 226,319 | 97.5% | $27.66 | $6,259,398 | 100.0% | ||||||
| Vacant – Retail Space | 0 | 0.0% | |||||||||
| Vacant – Office Space | 5,882 | 2.5% | |||||||||
| Collateral Total | 232,201 | 100.0% | |||||||||
| (1) | Certain ratings are those of the parent company whether or not the parent guarantees the lease. |
| (2) | The Annual U/W Base Rent and Annual U/W Base Rent PSF include contractual rent steps through April 2017, totaling $95,798. |
| (3) | Sales PSF and Occupancy Cost are as of the trailing 12-month period ending December 2015. |
| (4) | Located at the Congressional North Shopping Center Property. |
| (5) | Bed Bath & Beyond has two, 5-year lease renewal options. |
| (6) | Staples has two, 5-year lease renewal options. |
| (7) | HH Gregg has three, 5-year lease renewal options. |
| (8) | Petco has two, 5-year lease renewal options. |
| (9) | Michael’s has two, 5-year lease renewal options. |
| (10) | Located at the 121 Congressional Lane Property. Includes two cellular antennae tenants, Cellco Partnership and Sprint, which have no square footage but contribute $33,713 to the Annual U/W Base Rent. The Annual U/W Base Rent PSF for Occupied Office Tenants and Occupied Collateral Total excluding the rent related to these two tenants is $30.92 and $27.51, respectively. |
THE INFORMATION IN THIS STRUCTURAL AND COLLATERAL TERM SHEET IS NOT COMPLETE AND MAY BE AMENDED PRIOR TO THE TIME OF SALE. THIS TERM SHEET IS NOT AN OFFER TO SELL THESE SECURITIES AND IT IS NOT A SOLICITATION OF AN OFFER TO BUY THESE SECURITIES IN ANY JURISDICTION WHERE THE OFFER OR SALE IS NOT PERMITTED.
| 42 |
| CONGRESSIONAL NORTH SHOPPING CENTER & 121 CONGRESSIONAL LANE |
The following table presents certain information relating to the lease rollover schedule at the Congressional North Properties:
Lease Expiration Schedule(1)(2)
| Year Ending December 31, | No. of Leases Expiring | Expiring NRSF | % of Total NRSF | Cumulative Expiring NRSF | Cumulative % of Total NRSF | Annual U/W Base Rent | % of Total Annual U/W Base Rent | Annual U/W Base Rent PSF(3) |
| MTM | 0 | 0 | 0.0% | 0 | 0.0% | $0 | 0.0% | $0.00 |
| 2016 | 9 | 10,590 | 4.6% | 10,590 | 4.6% | $349,641 | 5.6% | $33.02 |
| 2017 | 7 | 35,949 | 15.5% | 46,539 | 20.0% | $1,041,369 | 16.6% | $28.97 |
| 2018 | 7 | 90,647 | 39.0% | 137,186 | 59.1% | $2,423,958 | 38.7% | $26.74 |
| 2019(4) | 4(4) | 1,834(4) | 0.8% | 139,020 | 59.9% | $90,227(4) | 1.4% | $49.20(4) |
| 2020 | 2 | 33,883 | 14.6% | 172,903 | 74.5% | $746,152 | 11.9% | $22.02 |
| 2021 | 3 | 5,778 | 2.5% | 178,681 | 77.0% | $170,190 | 2.7% | $29.45 |
| 2022 | 7 | 39,972 | 17.2% | 218,653 | 94.2% | $1,211,152 | 19.3% | $30.30 |
| 2023 | 0 | 0 | 0.0% | 218,653 | 94.2% | $0 | 0.0% | $0.00 |
| 2024 | 0 | 0 | 0.0% | 218,653 | 94.2% | $0 | 0.0% | $0.00 |
| 2025 | 2 | 6,101 | 2.6% | 224,754 | 96.8% | $182,106 | 2.9% | $29.85 |
| 2026 | 1 | 1,565 | 0.7% | 226,319 | 97.5% | $44,603 | 0.7% | $28.50 |
| Thereafter | 0 | 0 | 0.0% | 226,319 | 97.5% | $0 | 0.0% | $0.00 |
| Vacant | 0 | 5,882 | 2.5% | 232,201 | 100.0% | $0 | 0.0% | $0.00 |
| Total/Weighted Average | 42 | 232,201 | 100.0% | $6,259,398 | 100.0% | $27.66 |
| (1) | Information obtained from the underwritten rent rolland the borrower rent rolls as of January 20, 2016 and February 3, 2016. |
| (2) | Certain tenants may have lease termination options that are exercisable prior to the originally stated expiration date of the subject lease and that are not considered in the Lease Expiration Schedule. |
| (3) | Weighted Average Annual U/W Base Rent PSF excludes vacant space. |
| (4) | Two tenants, Cellco Partnership and Sprint, have no square footage but contribute $33,713 to the Annual U/W Base Rent. The Annual U/W Base Rent PSF excluding the rent related to Cellco Partnership and Sprint is $30.81. |
The following table presents historical occupancy percentages at the Congressional North Properties:
Historical Occupancy
12/31/2011(1) | 12/31/2012(1) | 12/31/2013(1) | 11/30/2014(1) | Various(2) | ||||
| 91.7% | 95.4% | 94.4% | 95.5% | 97.5% |
| (1) | Information obtained from the borrower. |
| (2) | Information obtained from the underwritten rent roll and the borrower rent rolls as of January 20, 2016 and February 3, 2016. |
Operating History and Underwritten Net Cash Flow. The following table presents certain information relating to the historical operating performance and underwritten net cash flow at Congressional North Properties:
Cash Flow Analysis
| 2012 | 2013 | 2014 | 2015 | U/W | % of U/W Effective Gross Income | U/W $ per SF | ||||||||
| Base Rent | $5,228,170(1) | $5,956,733(1) | $5,915,784 | $5,969,250 | $6,259,398 | 86.7% | $26.96 | |||||||
| Grossed Up Vacant Space | 0 | 0 | 0 | 0 | 176,460 | 2.4 | 0.76 | |||||||
| Percentage Rent | 0 | 0 | 0 | 0 | 0 | 0.0 | 0.00 | |||||||
| Total Reimbursables | 1,041,047 | 1,040,360 | 1,050,578 | 1,107,626 | 1,164,658 | 16.1 | 5.02 | |||||||
| Other Income | 0 | 0 | 0 | 0 | 0 | 0.0 | 0.00 | |||||||
| Less Vacancy & Credit Loss | 0 | 0 | 0 | 0 | (379,554)(2) | (5.3) | (1.63) | |||||||
| Effective Gross Income | $6,269,217 | $6,997,093 | $6,966,362 | $7,076,876 | $7,220,962 | 100.0% | $31.10 | |||||||
| Total Operating Expenses | $1,993,121 | $1,847,502 | $1,861,712 | $1,963,783 | $1,981,383 | 27.4% | $8.53 | |||||||
|
|
|
|
|
|
| ||||||||
| Net Operating Income | $4,276,096 | $5,149,591 | $5,104,650 | $5,113,092 | $5,239,579 | 72.6% | $22.56 | |||||||
| TI/LC | 0 | 0 | 0 | 0 | 116,221 | 1.6 | 0.50 | |||||||
| Capital Expenditures | 0 | 0 | 0 | 0 | 38,198 | 0.5 | 0.16 | |||||||
| Net Cash Flow | $4,276,096 | $5,149,591 | $5,104,650 | $5,113,092 | $5,085,160 | 70.4% | $21.90 | |||||||
| NOI DSCR | 1.64x | 1.98x | 1.96x | 1.96x | 2.01x | |||||||||
| NCF DSCR | 1.64x | 1.98x | 1.96x | 1.96x | 1.95x | |||||||||
| NOI DY | 7.3% | 8.8% | 8.7% | 8.7% | 8.9% | |||||||||
| NCF DY | 7.3% | 8.8% | 8.7% | 8.7% | 8.7% |
| (1) | The Base Rent increase from 2012 to 2013 is due to the expiration of HH Gregg’s rent abatement period, new lease activity (Miller’s lease accounting for $250,000) and lease renewals at higher rents (among others, SunTrust renewal accounting for $125,000) at the Congressional North Shopping Center Property. |
| (2) | The underwritten economic vacancy is 5.0%. The Congressional North Properties were 97.5% physically occupied as of January 20, 2016 and February 3, 2016. |
THE INFORMATION IN THIS STRUCTURAL AND COLLATERAL TERM SHEET IS NOT COMPLETE AND MAY BE AMENDED PRIOR TO THE TIME OF SALE. THIS TERM SHEET IS NOT AN OFFER TO SELL THESE SECURITIES AND IT IS NOT A SOLICITATION OF AN OFFER TO BUY THESE SECURITIES IN ANY JURISDICTION WHERE THE OFFER OR SALE IS NOT PERMITTED.
| 43 |
| CONGRESSIONAL NORTH SHOPPING CENTER & 121 CONGRESSIONAL LANE |
Appraisal.As of the appraisal valuation date of January 1, 2016, the Congressional North Properties had an “as-is” appraised value of $91,100,000.
Environmental Matters. According to the Phase I environmental assessments dated January 12, 2016 and January 13, 2016, respectively, there was no evidence of any recognized environmental conditions at the Congressional North Properties.
Market Overview and Competition.The Congressional North Properties are located in Rockville, Maryland, approximately 17.0 miles northwest of Washington, District of Columbia (“DC”). The Congressional North Properties are situated on Rockville Pike, which is a commercial corridor that stretches from MD Route 355 (Rockville Pike) to MD Route 187 (Old Georgetown Road). According to the Maryland Department of Transportation, the traffic count past the Congressional North Properties along Rockville Pike is 50,342 cars per day. The primary access to the Congressional North Properties is provided via Interstate 495 and 270. Interstate 495 provides access to Interstate 95. The Congressional North Properties are located within three blocks of the Twinbrook Metro Station (Red Line of the Washington Metro), which provides access to downtown Washington, DC in 45 minutes. The Congressional North Properties are located approximately 2.0 miles southeast from the Rockville Station, a joint Washington Metro (Red Line), MARC and Amtrak train station. According to the appraisal, the 2015 population within a three- and five-mile radius of the Congressional North Properties was 131,795 and 325,204, respectively, while the estimated median household income within the same radii was $88,669 and $91,358, respectively.
According to a third party market research report, the Congressional North Properties are situated within the Rockville office/retail submarket of the I-270 Corridor. According to a third party market research report, as of year-end of 2015, the retail submarket contained a total retail inventory of 4,530,984 square feet, overall vacancy rate of 6.3% and average asking rent of $24.68 per square foot, on a triple net basis. According to a third party market research report, as of year-end of 2015, the office submarket contained a total office inventory of 10,609,775 square feet, overall vacancy rate of 12.0% and average asking rent of $30.64 per square feet on a gross basis.
The following table presents certain information relating to comparable office leases for the Congressional North Properties:
Comparable Retail Leases(1)
(Congressional North Shopping Center)
| Property Name/Location | Year Built/ Renovated | Stories | Total GLA (SF) | Total Occupancy | Distance from Subject | Tenant Name | Lease Date/Term | Lease Area (SF) | Annual Base Rent PSF | Lease Type |
| Stonehenge Village Midlothian, VA | 2016/NAV | 1 | 71,000 | 82.3% | 123.0 miles | Party City | Jun 2016 / 15 Yrs | 13,096 | $35.00 | NNN |
| Stonehenge Village Midlothian, VA | 2016/NAV | 1 | 71,000 | 82.3% | 123.0 miles | La-Z-Boy | Jun 2016 / 10 Yrs | 15,700 | $34.00 | NNN |
Southgate Square Colonial Heights, VA | 1991/NAV | 1 | 273,547 | 100.0% | 142.0 miles | Burlington Coat Factory | Mar 2016 / 10 Yrs | 50,705 | $22.00 | NNN |
Best Buy Center Springfield, VA | 1994/NAV | 1 | 64,134 | 91.9% | 25.9 miles | Best Buy (Renewal) | Jan 2015 / 5 Yrs | 45,875 | $22.00 | NNN |
West Woods Village Glen Allen, VA | NAV/NAV | NAV | NAV | NAV | 122.0 miles | Golfsmith | May 2014 / 15 Yrs | 24,142 | $24.00 | NNN |
| (1) | Information obtained from the appraisal. |
Comparable Office Leases(1)
(121 Congressional Lane)
| Property Name/Location | Year Built/ Renovated | Stories | Total GLA (SF) | Total Occupancy | Distance from Subject | Tenant Name | Lease Date/Term | Lease Area (SF) | Annual Base Rent PSF | Lease Type |
Shady Grove Medical Pavilion Rockville, MD | 2000/NAV | 5 | 122,086 | 59.0% | 5.9 miles | Adventist Healthcare | Sep 2015 / 10 Yrs | 6,204 | $28.50 | FSG |
Shady Grove Plaza Rockville, MD | 1989/NAV | 4 | 182,868 | 60.5% | 5.3 miles | Rexahan Pharmaceuticals | Sep 2015 / 1 Yr | 1,637 | $28.89 | FSG |
Shady Grove Medical Pavilion Rockville, MD | 2000/NAV | 5 | 122,086 | 59.0% | 5.9 miles | Shady Grove Orthopedics | July 2015 / 3 Yrs | 13,410 | $33.50 | FSG |
One Church Street Rockville, MD | 1989/NAV | 9 | 90,600 | 78.9% | 2.2 miles | Kalibri Labs | May 2015 / 5 Yrs | 5,853 | $30.50 | FSG |
Fairview Building Gaithersburg, MD | 1982/2007 | 4 | 72,626 | 92.4% | 7.5 miles | Creative Computer Concepts | Jan 2015/ 5 Yrs | 1,877 | $25.00 | FSG |
| (1) | Information obtained from the appraisal. |
The Borrowers.The borrowers are Congressional North Associates Limited Partnership and 121 Associates Limited Partnership, each of which is a limited partnership and a single purpose entity, with two independent directors. Legal counsel to the borrower delivered a non-consolidation opinion in connection with the origination of the Congressional North Mortgage Loan. Ronald J. Cohen is the guarantor of certain nonrecourse carveouts under the Congressional North Mortgage Loan.
THE INFORMATION IN THIS STRUCTURAL AND COLLATERAL TERM SHEET IS NOT COMPLETE AND MAY BE AMENDED PRIOR TO THE TIME OF SALE. THIS TERM SHEET IS NOT AN OFFER TO SELL THESE SECURITIES AND IT IS NOT A SOLICITATION OF AN OFFER TO BUY THESE SECURITIES IN ANY JURISDICTION WHERE THE OFFER OR SALE IS NOT PERMITTED.
| 44 |
| CONGRESSIONAL NORTH SHOPPING CENTER & 121 CONGRESSIONAL LANE |
The Sponsor.The sponsor is Ronald J. Cohen who is one of the principals of Cohen Siegel Investors. Cohen Siegel Investors is a large real estate developer and investor in commercial, multifamily, and residential properties in and around the Mid-Atlantic area. Cohen Siegel Investors has developed thousands of units and millions of commercial square feet in the Washington, DC metropolitan area. Affiliates of the sponsor (the “Tenant”) are involved in litigation arising from a tenant-landlord dispute that began in late 2009. The Tenant withheld rent, claiming that the landlord was withholding building services and not crediting accounts properly, thereby violating the lease. The landlord subsequently defaulted on its mortgage in 2013 and brought suit against the Tenant claiming that the Tenant’s failure to pay rent interfered with the loan agreement between the landlord and its lender. See “Description of the Mortgage Pool—Litigation and Other Considerations” in the Preliminary Prospectus.
Escrows.The loan documents provide for upfront reserves in the amount of $127,100 for real estate taxes, $21,557 for insurance premiums, $29,200 for outstanding tenant improvements related to OBGYN Associates, a medical practice tenant and $4,875 for deferred maintenance. The loan documents require monthly deposits of an amount equal to one-twelfth of the estimated annual real estate taxes (currently equates to $63,550), an amount equal to one-twelfth of the annual insurance premiums (currently equates to $7,186), $3,187 for replacement reserves and $9,685 for tenant improvements and leasing commissions (“TI/LC”).
Lockbox and Cash Management.The Congressional North Mortgage Loan is structured with a lender-controlled hard lockbox, which is already in place, and springing cash management. The Congressional North Mortgage Loan requires all rents to be deposited directly by tenants of the Congressional North Properties into the lockbox account. Prior to the occurrence of a Cash Management Period (as defined below), all funds in the lockbox account are required to be swept to the borrower’s operating account. During a Cash Management Period, all funds in the lockbox account are required to be swept to a lender-controlled cash management account.
A “Cash Management Period” will commence upon the occurrence of any of the following: (i) an event of default; (ii) the amortizing debt service coverage ratio falling below 1.10x at the end of any calendar quarter; (iii) the commencement of a Primary Tenant Sweep Period (as defined below), or (iv) the incurrence of mezzanine debt as described in the “Subordinate and Mezzanine Indebtedness” section. A Cash Management Period will end, if for six consecutive months (a) no default or event of default has occurred; (b) no event that would trigger another Cash Management Period has occurred, (c) with respect to clause (ii), the amortizing debt service coverage ratio is at least 1.15x; and (d) with respect to clause (iii), upon the occurrence of a Primary Tenant Sweep Period Cure (as defined below).
A “Primary Tenant Sweep Period” will commence upon: (i) any termination of a Primary Tenant (as defined below) lease; (ii) any Primary Tenant becoming the subject of a bankruptcy action; (iii) any Primary Tenant “going dark” in a majority of such Primary Tenant’s premises, (iv) the occurrence of any monetary or material non-monetary default (beyond any applicable notice and/or cure period) under a Primary Tenant lease, (v) the date that is the earlier of twelve months prior to (A) any lease extension date set forth in a Primary Tenant lease or (B) the expiration of the term of a Primary Lease and, in the case of (A) or (B), such Primary Tenant lease has not been extended with a term that expires no earlier than five years after such applicable Primary Tenant lease expiration date.
A “Primary Tenant Sweep Period Cure” will occur if a Primary Tenant Replacement Event (as defined below) has occurred; and specifically with respect to clause (ii) of the Primary Tenant Sweep Period definition, if the bankruptcy action is dismissed and the Primary Tenant lease is affirmed; with respect to clause (iii) of the Primary Tenant Sweep Period definition, if the Primary Tenant or another tenant re-opens for business for a continuous period of not less than three months; or with respect to clause (iv) of the Primary Tenant Sweep Period definition, the monetary or material non-monetary default is cured and no other monetary or material nonmonetary default (beyond any applicable notice and/or cure period) exists under the Primary Tenant lease.
A “Primary Tenant Replacement Event” means the termination of any Primary Tenant lease and the borrower entering into one or more new leases for all or substantially all of such Primary Tenant premises with acceptable replacement tenants and upon such terms and conditions as are reasonably acceptable to the lender in all material respects.
A “Primary Tenant” means initially any of Bed Bath & Beyond, Petco, Staples and thereafter any acceptable replacement tenant occupying all or substantially all of the respective Primary Tenant premises.
Property Management. The Congressional North Properties are managed by an affiliate of the borrower.
Assumption.The borrower has the right to transfer the Congressional North Properties provided that certain conditions are satisfied, including (i) no event of default has occurred and is continuing; (ii) the lender has reasonably determined that the proposed transferee and guarantor satisfy the lender’s credit review and underwriting standards, taking into consideration the transferee’s experience, financial strength and general business standing; and (iii) if required by the lender, receipt of a rating agency confirmation from DBRS, Fitch and Moody’s that the transfer will not result in a downgrade, withdrawal or qualification of the respective ratings assigned to the Series 2016-C34 Certificates.
Partial Release. Not permitted.
Real Estate Substitution.Not permitted.
Subordinate and Mezzanine Indebtedness.The Congressional North Subordinate Companion Loan had an original principal balance of $4,500,000, has a cut-off date balance of $4,500,000 and is coterminous with the Congressional North Mortgage Loan. The Congressional North Subordinate Companion Loan requires interest-only payments through maturity. Subject to certain control shift events, the holder of the Congressional North Subordinate Companion Loan has consent rights with respect to certain material actions and can replace the special servicer of the Congressional North Whole Loan under the pooling and servicing agreement for the Series 2016-C34 Certificates. The Congressional North Subordinate Companion Loan accrues interest at an interest rate of
THE INFORMATION IN THIS STRUCTURAL AND COLLATERAL TERM SHEET IS NOT COMPLETE AND MAY BE AMENDED PRIOR TO THE TIME OF SALE. THIS TERM SHEET IS NOT AN OFFER TO SELL THESE SECURITIES AND IT IS NOT A SOLICITATION OF AN OFFER TO BUY THESE SECURITIES IN ANY JURISDICTION WHERE THE OFFER OR SALE IS NOT PERMITTED.
| 45 |
| CONGRESSIONAL NORTH SHOPPING CENTER & 121 CONGRESSIONAL LANE |
10.750% per annum. The Congressional North Subordinate Companion Loan will be purchased prior to closing of the WFCM 2016-C34 securitization trust by MSC – Congressional B Note HoldCo, LLC, which is owned by Morrison Street Debt Opportunities Fund, L.P., which is managed by Morrison Street Capital, LLC.
The borrower is also permitted to incur future mezzanine debt, provided the following conditions are met: (i) a maximum combined loan-to-value ratio of 75.0%; (ii) a minimum combined amortizing underwritten debt service coverage ratio of 1.10x; (iii) the receipt of a rating agency confirmation from DBRS, Fitch and Moody’s that the mezzanine financing will not result in a downgrade, withdrawal or qualification of the respective ratings assigned to the Series 2016-C34 Certificates; (iv) the execution of an intercreditor agreement acceptable to the lender; and (v) no event of default exists with respect to the Congressional North Mortgage Loan.
Ground Lease.None.
Terrorism Insurance. The loan documents provide that the required “all risk” insurance policy must include coverage for terrorism in an amount equal to the full replacement cost of the Congressional North Properties. The loan documents also require business interruption insurance covering no less than the 18-month period following the occurrence of a casualty event, together with a six-month extended period of indemnity.
Windstorm Insurance.The loan documents require windstorm insurance covering the full replacement cost of Congressional North Properties during the loan term. At the time of closing, the Congressional North Properties have windstorm insurance coverage.
THE INFORMATION IN THIS STRUCTURAL AND COLLATERAL TERM SHEET IS NOT COMPLETE AND MAY BE AMENDED PRIOR TO THE TIME OF SALE. THIS TERM SHEET IS NOT AN OFFER TO SELL THESE SECURITIES AND IT IS NOT A SOLICITATION OF AN OFFER TO BUY THESE SECURITIES IN ANY JURISDICTION WHERE THE OFFER OR SALE IS NOT PERMITTED.
| 46 |
(THIS PAGE INTENTIONALLY LEFT BLANK)
THE INFORMATION IN THIS STRUCTURAL AND COLLATERAL TERM SHEET IS NOT COMPLETE AND MAY BE AMENDED PRIOR TO THE TIME OF SALE. THIS TERM SHEET IS NOT AN OFFER TO SELL THESE SECURITIES AND IT IS NOT A SOLICITATION OF AN OFFER TO BUY THESE SECURITIES IN ANY JURISDICTION WHERE THE OFFER OR SALE IS NOT PERMITTED.
| 47 |
| HILTON & HOMEWOOD SUITES PHILADELPHIA |

THE INFORMATION IN THIS STRUCTURAL AND COLLATERAL TERM SHEET IS NOT COMPLETE AND MAY BE AMENDED PRIOR TO THE TIME OF SALE. THIS TERM SHEET IS NOT AN OFFER TO SELL THESE SECURITIES AND IT IS NOT A SOLICITATION OF AN OFFER TO BUY THESE SECURITIES IN ANY JURISDICTION WHERE THE OFFER OR SALE IS NOT PERMITTED.
| 48 |
| HILTON & HOMEWOOD SUITES PHILADELPHIA |

THE INFORMATION IN THIS STRUCTURAL AND COLLATERAL TERM SHEET IS NOT COMPLETE AND MAY BE AMENDED PRIOR TO THE TIME OF SALE. THIS TERM SHEET IS NOT AN OFFER TO SELL THESE SECURITIES AND IT IS NOT A SOLICITATION OF AN OFFER TO BUY THESE SECURITIES IN ANY JURISDICTION WHERE THE OFFER OR SALE IS NOT PERMITTED.
| 49 |
| No. 3 – Hilton & Homewood Suites Philadelphia | |||||||
| Loan Information | Property Information | ||||||
| Mortgage Loan Seller: | Wells Fargo Bank, National Association | Single Asset/Portfolio: | Single Asset | ||||
| Credit Assessment (DBRS/Fitch/Moody’s): | NR/NR/NR | Property Type: | Hospitality | ||||
| Original Principal Balance: | $45,000,000 | Specific Property Type: | Full Service | ||||
| Cut-off Date Balance: | $44,779,868 | Location: | Philadelphia, PA | ||||
| % of Initial Pool Balance: | 6.4% | Size(2): | 331 Rooms | ||||
| Loan Purpose: | Refinance | Cut-off Date Balance Per Room: | $135,287 | ||||
| Borrower Names: | Stout Road Associates, Inc.; Stout Road Hotel Development, L.L.C. | Year Built/Renovated(3): | 2002/2015 | ||||
| Sponsor: | Howard Wurzak | Title Vesting(4): | Fee | ||||
| Mortgage Rate: | 4.790% | Property Manager: | Self-managed | ||||
| Note Date: | December 18, 2015 | 4thMost Recent Occupancy (As of): | 74.0% (12/31/2011) | ||||
| Anticipated Repayment Date: | NAP | 3rdMost Recent Occupancy (As of): | 70.1% (12/31/2012) | ||||
| Maturity Date: | January 11, 2026 | 2ndMost Recent Occupancy (As of): | 68.5% (12/31/2013) | ||||
| IO Period: | None | Most Recent Occupancy (As of): | 70.8% (12/31/2014) | ||||
| Loan Term (Original): | 120 months | Current Occupancy (As of): | 69.0% (12/31/2015) | ||||
| Seasoning: | 4 months | ||||||
| Amortization Term (Original): | 360 months | Underwriting and Financial Information: | |||||
| Loan Amortization Type: | Amortizing Balloon | ||||||
| Interest Accrual Method: | Actual/360 | 4thMost Recent NOI (As of): | $5,493,728 (12/31/2012) | ||||
| Call Protection: | L(28),D(88),O(4) | 3rdMost Recent NOI (As of): | $5,332,426 (12/31/2013) | ||||
| Lockbox Type: | Springing | 2ndMost Recent NOI (As of): | $5,757,931 (12/31/2014) | ||||
| Additional Debt: | None | Most Recent NOI (As of): | $6,114,221 (12/31/2015) | ||||
| Additional Debt Type: | NAP | ||||||
| U/W Revenues: | $20,476,107 | ||||||
| U/W Expenses: | $14,896,494 | ||||||
| U/W NOI: | $5,579,613 | ||||||
| U/W NCF: | $4,760,568 | ||||||
| U/W NOI DSCR: | 1.97x | ||||||
| Escrows and Reserves(1): | U/W NCF DSCR: | 1.68x | |||||
| U/W NOI Debt Yield: | 12.5% | ||||||
| Type: | Initial | Monthly | Cap (If Any) | U/W NCF Debt Yield: | 10.6% | ||
| Taxes | $394,727 | $35,884 | NAP | As-Is Appraised Value: | $73,300,000 | ||
| Insurance | $129,640 | $21,245 | NAP | As-Is Appraisal Valuation Date: | November 3, 2015 | ||
| FF&E Reserve | $0 | $34,031 | $3,300,000 | Cut-off Date LTV Ratio: | 58.5% | ||
| PIP Reserve | $2,000,000 | Springing | NAP | LTV Ratio at Maturity or ARD: | 48.0% | ||
| (1) | See “Escrows” section. |
| (2) | The Hilton Philadelphia property is comprised of 209 rooms and the Homewood Suites Philadelphia property is comprised of 122 rooms. See “The Property” section. |
| (3) | The Hilton Philadelphia property was built in 2002 and renovated in 2015 and the Homewood Suites Philadelphia property was built in 2005 and renovated in 2013. See “The Property” section. |
| (4) | The parking lot at the Hilton & Homewood Suites Philadelphia Property is subject to a ground lease. See “Ground Lease” section. |
The Mortgage Loan. The mortgage loan (the “Hilton & Homewood Suites Philadelphia Mortgage Loan”) is evidenced by a single promissory note secured by a first mortgage encumbering the fee interest in a dual-branded hotel located in Philadelphia, Pennsylvania (the “Hilton & Homewood Suites Philadelphia Property”). The Hilton & Homewood Suites Philadelphia Mortgage Loan was originated on December 18, 2015 by Wells Fargo Bank, National Association. The Hilton & Homewood Suites Philadelphia Mortgage Loan had an original principal balance of $45,000,000, has an outstanding principal balance as of the Cut-off Date of $44,779,868 and accrues interest at an interest rate of 4.790%per annum. The Hilton & Homewood Suites Philadelphia Mortgage Loan had an initial term of 120 months, has a remaining term of 116 months as of the Cut-off Date and requires payments of principal and interest based on a 30-year amortization schedule through the term of the Hilton & Homewood Suites Philadelphia Mortgage Loan. The Hilton & Homewood Suites Philadelphia Mortgage Loan matures on January 11, 2026.
Following the lockout period, the borrower has the right to defease the Hilton & Homewood Suites Philadelphia Mortgage Loan in whole, but not in part, on any date before October 11, 2025. In addition, the Hilton & Homewood Suites Philadelphia Mortgage Loan is prepayable without penalty on or after October 11, 2025.
THE INFORMATION IN THIS STRUCTURAL AND COLLATERAL TERM SHEET IS NOT COMPLETE AND MAY BE AMENDED PRIOR TO THE TIME OF SALE. THIS TERM SHEET IS NOT AN OFFER TO SELL THESE SECURITIES AND IT IS NOT A SOLICITATION OF AN OFFER TO BUY THESE SECURITIES IN ANY JURISDICTION WHERE THE OFFER OR SALE IS NOT PERMITTED.
| 50 |
| HILTON & HOMEWOOD SUITES PHILADELPHIA |
Sources and Uses
| Sources | Uses | |||||||
| Original loan amount | $45,000,000 | 100.0% | Loan payoff(1) | $25,224,460 | 56.1% | |||
| Reserves | 2,524,367 | 5.6 | ||||||
| Closing costs | 850,960 | 1.9 | ||||||
| Return of equity | 16,400,213 | 36.4 | ||||||
| Total Sources | $45,000,000 | 100.0% | Total Uses | $45,000,000 | 100.0% |
| (1) | The Hilton & Homewood Suites Philadelphia Property was previously securitized in the CD 2007-CD4 transaction. |
The Property.The Hilton & Homewood Suites Philadelphia Property is a dual-branded hotel comprised of an 11-story, 209-room Hilton Philadelphia and a connected 12-story, 122-room Homewood Suites Philadelphia situated on a 1.9-acre site located in Philadelphia, Pennsylvania, approximately 5.6 miles northwest of the city center. The Hilton Philadelphia was built in 2002 and features 127 king guestrooms, 70 double/double guestrooms, nine queen guestrooms, two one-bedroom suites and one studio suite. Amenities at the Hilton Philadelphia (which are also fully accessible by guests staying at the Homewood Suites Philadelphia) include Delmonico’s Steakhouse and lounge, approximately 34,000 square feet of meeting and event space, a fitness center, an indoor swimming pool, a gift shop and a business center. The Homewood Suites Philadelphia was built in 2005 and features 104 studio suites, nine one-bedroom suites and nine two-bedroom suites. All guestrooms at the Homewood Suites Philadelphia include open kitchens and a dining area. Amenities at the Homewood Suites Philadelphia include daily complimentary buffet breakfast and appetizers in the evening, complimentary wireless internet access, approximately 1,817 square feet of meeting space, a gift shop and a business center. Parking for the Hilton & Homewood Suites Philadelphia Property is provided via valet or self-parking in a parking lot located directly across from the Homewood Suites Philadelphia entrance which includes 500 parking spaces, equating to a parking ratio of 1.5 spaces per room. The parking lot is subject to a ground lease with the City of Philadelphia that expires in 2043.
The Hilton Philadelphia underwent an approximate $7.0 million ($33,612 per key) property improvement plan (“PIP”) in 2015, which included a complete renovation and FF&E replacement to the guest rooms, lobby, meeting space, restaurant and bar, fitness center and common areas. The Homewood Suites Philadelphia underwent an approximate $3.0 million ($24,590 per key) renovation in 2013 that included new carpet, wall coverings, paintings, window treatments, bedding, TVs and Wi-Fi systems for the guestrooms and lobby upgrades including new flooring and furniture. According to the appraisal, the 2014 market mix of the Hilton Philadelphia was 35% leisure, 35% commercial, 25% meeting and group and 5% extended stay; and the 2014 market mix of the Homewood Suites Philadelphia was 45% extended stay, 30% leisure, 20% commercial and 5% meeting and group. The franchise agreements with Hilton for both hotels expire in August 2025.
Operating History and Underwritten Net Cash Flow. The following table presents certain information relating to the historical operating performance and the underwritten net cash flow at the Hilton & Homewood Suites Philadelphia Property:
Cash Flow Analysis
| 2012 | 2013 | 2014 | 2015 | U/W | % of U/W Total Revenue | U/W $ per Room | |||||||||
| Occupancy | 70.1% | 68.5% | 70.8% | 69.0% | 70.1% | ||||||||||
| ADR | $147.91 | $148.01 | $146.94 | $151.39 | $149.26 | ||||||||||
| RevPAR | $103.67 | $101.41 | $103.98 | $104.49 | $104.56 | ||||||||||
| Room Revenue | $12,559,153 | $12,251,527 | $12,562,889 | $12,624,025 | $12,632,571 | 61.7% | $38,165 | ||||||||
| F&B Revenue | 6,973,794 | 6,884,819 | 7,243,811 | 7,085,415 | 7,243,811 | 35.4 | 21,885 | ||||||||
| Parking Revenue | 386,153 | 399,869 | 403,480 | 308,997 | 403,480 | 2.0 | 1,219 | ||||||||
| Other Revenue | 269,979 | 245,609 | 196,245 | 194,472 | 196,245 | 1.0 | 593 | ||||||||
| Total Revenue | $20,189,079 | $19,781,824 | $20,406,425 | $20,212,909 | $20,476,107 | 100.0% | $61,861 | ||||||||
| Total Department Expenses | 7,410,075 | 7,536,499 | 7,774,308 | 7,417,291 | 7,796,801 | 38.1 | 23,555 | ||||||||
| Gross Operating Profit | $12,779,004 | $12,245,325 | $12,632,117 | $12,795,618 | $12,679,306 | 61.9% | $38,306 | ||||||||
| Total Undistributed Expenses | 6,721,697 | 6,285,559 | 6,298,730 | 6,107,601 | 6,410,893 | 31.3 | 19,368 | ||||||||
| Profit Before Fixed Charges | $6,057,307 | $5,959,766 | $6,333,387 | $6,688,017 | $6,268,413 | 30.6% | $18,938 | ||||||||
| Total Fixed Charges | 563,579 | 627,340 | 575,456 | 573,796 | 688,800 | 3.4 | 2,081 | ||||||||
| Net Operating Income | $5,493,728 | $5,332,426 | $5,757,931 | $6,114,221 | $5,579,613 | 27.2% | $16,857 | ||||||||
| FF&E | 0 | 0 | 0 | 0 | 819,044 | 4.0 | 2,474 | ||||||||
| Net Cash Flow | $5,493,728 | $5,332,426 | $5,757,931 | $6,114,221 | $4,760,568 | 23.2% | $14,382 | ||||||||
| NOI DSCR | 1.94x | 1.88x | 2.03x | 2.16x | 1.97x | ||||||||||
| NCF DSCR | 1.94x | 1.88x | 2.03x | 2.16x | 1.68x | ||||||||||
| NOI DY | 12.3% | 11.9% | 12.9% | 13.7% | 12.5% | ||||||||||
| NCF DY | 12.3% | 11.9% | 12.9% | 13.7% | 10.6% | ||||||||||
The Appraisal.As of the appraisal valuation date of November 3, 2015, the Hilton & Homewood Suites Philadelphia Property had an “as-is” appraised value of $73,300,000.
THE INFORMATION IN THIS STRUCTURAL AND COLLATERAL TERM SHEET IS NOT COMPLETE AND MAY BE AMENDED PRIOR TO THE TIME OF SALE. THIS TERM SHEET IS NOT AN OFFER TO SELL THESE SECURITIES AND IT IS NOT A SOLICITATION OF AN OFFER TO BUY THESE SECURITIES IN ANY JURISDICTION WHERE THE OFFER OR SALE IS NOT PERMITTED.
| 51 |
| HILTON & HOMEWOOD SUITES PHILADELPHIA |
Environmental Matters. According to two Phase I environmental assessments dated November 3, 2015, there was no evidence of any recognized environmental conditions at the Hilton & Homewood Suites Philadelphia Property.
Market Overview and Competition.The Hilton & Homewood Suites Philadelphia Property is located in Philadelphia, Pennsylvania, approximately 5.6 miles northwest of the city center. The Hilton & Homewood Suites Philadelphia Property is situated on the south side of City Avenue, just west of Interstate 76. City Avenue is the local name of a section of U.S. Route 1 and is a major commercial and residential arterial street that divides the city of Philadelphia and the northwestern suburban communities. Interstate 76 provides access to several colleges and universities in the area including Saint Joseph’s University, Philadelphia University and Drexel University which are all located within 3.0 miles of the Hilton & Homewood Suites Philadelphia Property. According to the appraisal, the Hilton & Homewood Suites Philadelphia Property offers corporate guests easy access to many businesses, medical facilities and educational establishments including Susquehanna International Group, Clear Channel Airports, Philadelphia Insurance Companies, Oracle and Diamond State Insurance Company which are all located within one mile. The Philadelphia College of Osteopathic Medicine is located directly adjacent to the Hilton & Homewood Suites Philadelphia Property, which has an enrollment of over 1,800 students. According to the appraisal, the estimated 2015 population within a three- and five-mile radius of the Hilton & Homewood Suites Philadelphia Property was 236,967 and 839,782, respectively; the estimated 2015 average household income within the same radii was $62,052 and $60,909, respectively. Further, there is approximately 4.0 million square feet of office space with an average 91.0% occupancy rate within a one-mile radius of the Hilton & Homewood Suites Philadelphia Property.
According to the appraisal, the construction, leisure and hospitality sectors of the Philadelphia metropolitan statistical area are growing at a particularly robust pace due to a recovering economy, increased tourism and a rise in demand for downtown living and office space. The majority of the region’s top employers are part of the Education and Health Care industries, including the Children’s Hospital of Philadelphia, located approximately 5.8 miles south of the Hilton & Homewood Suites Philadelphia Property, which employs more than 10,000 people and has announced plans to construct a series of new buildings in the hospital’s main campus over the next five years at an expected cost of approximately $650.0 million. Additionally, Comcast Corporation, the largest cable company in the U.S. and one of the region’s largest employers, recently announced that it has formed a joint venture to build a $1.2 billion, 59-story office building next to its current headquarters in downtown Philadelphia, which is located approximately 5.7 miles southeast of the Hilton & Homewood Suites Philadelphia Property.
The following table presents certain information relating to the Hilton & Homewood Suites Philadelphia Property’s competitive set:
Subject and Market Historical Occupancy, ADR and RevPAR(1)
(Hilton Philadelphia)
Competitive Set | Hilton Philadelphia | Penetration Factor | |||||||||||||||||
Year | Occupancy | ADR | RevPAR | Occupancy | ADR | RevPAR | Occupancy | ADR | RevPAR | ||||||||||
| 3/31/2016 TTM(2) | 67.8% | $150.59 | $102.17 | 66.3% | $154.19 | $102.24 | 97.7% | 102.4% | 100.1% | ||||||||||
| 3/31/2015 TTM(2) | 68.7% | $144.31 | $99.12 | 58.9% | $153.88 | $90.60 | 85.7% | 106.6% | 91.4% | ||||||||||
| 3/31/2014 TTM | 69.6% | $143.50 | $99.83 | 64.4% | $152.20 | $97.98 | 92.5% | 106.1% | 98.2% | ||||||||||
| (1) | Information obtained from a third party hospitality research report dated April 18, 2016. The competitive set includes: Crowne Plaza Philadelphia West, DoubleTree Suites Hotel Philadelphia West, Marriott Philadelphia West, Sheraton Hotel Philadelphia Society Hill and Homewood Suites Philadelphia City Avenue. |
| (2) | The Hilton Philadelphia underwent an approximate $7.0 million ($33,612 per key) renovation throughout 2015 with 82 guestrooms taken offline between January and March 2015 with remaining guestroom renovations completed by December 2015. For the trailing three-month period ending March 31, 2016, the Hilton Philadelphia property reported a 114.9% RevPAR penetration factor. |
Subject and Market Historical Occupancy, ADR and RevPAR(1)
(Homewood Suites Philadelphia)
Competitive Set | Homewood Suites Philadelphia | Penetration Factor | |||||||||||||||||
Year | Occupancy | ADR | RevPAR | Occupancy | ADR | RevPAR | Occupancy | ADR | RevPAR | ||||||||||
| 2/29/2016 TTM | 71.4% | $134.67 | $96.18 | 79.1% | $146.78 | $116.04 | 110.7% | 109.0% | 120.6% | ||||||||||
| 2/28/2015 TTM | 72.0% | $127.41 | $91.76 | 82.3% | $141.43 | $116.39 | 114.3% | 111.0% | 126.8% | ||||||||||
| 2/28/2014 TTM | 72.6% | $125.45 | $91.10 | 79.8% | $140.86 | $112.45 | 109.9% | 112.3% | 123.4% | ||||||||||
| (1) | Information obtained from a third party hospitality research report dated March 17, 2016. The competitive set includes: Crowne Plaza Philadelphia West, Windsor Suites, Hampton Inn Philadelphia Plymouth Meeting, Hyatt House Philadelphia Plymouth Meeting and Residence Inn Philadelphia Conshohocken. |
The Borrowers.The borrowers are Stout Road Associates, Inc. and Stout Road Hotel Development, L.L.C., a Pennsylvania corporation and limited liability company, respectively, each with one independent director. Legal counsel to the borrower delivered a non-consolidation opinion in connection with the origination of the Hilton & Homewood Suites Philadelphia Mortgage Loan. Howard Wurzak is the guarantor of certain nonrecourse carveouts under the Hilton & Homewood Suites Philadelphia Mortgage Loan.
The Sponsor.The sponsor is Howard Wurzak, the founder and CEO of Wurzak Hotel Group (“WHG”). WHG is a full service hospitality company with deep experience in all facets of the industry including site selection, construction management, franchise affiliation, capital markets and management of full service, extended stay and focus service hotels. WHG has over 30 years’ of development experience, over $200.0 million of completed projects and is a preferred developer and manager for Hilton Hotels Worldwide and Starwood Hotels and Resorts. Mr. Wurzak was involved in a foreclosure in 2015. See “Description of the Mortgage Pool – Loan Purpose; Default History, Bankruptcy Issues and Other Proceedings” in the Preliminary Prospectus.
THE INFORMATION IN THIS STRUCTURAL AND COLLATERAL TERM SHEET IS NOT COMPLETE AND MAY BE AMENDED PRIOR TO THE TIME OF SALE. THIS TERM SHEET IS NOT AN OFFER TO SELL THESE SECURITIES AND IT IS NOT A SOLICITATION OF AN OFFER TO BUY THESE SECURITIES IN ANY JURISDICTION WHERE THE OFFER OR SALE IS NOT PERMITTED.
| 52 |
| HILTON & HOMEWOOD SUITES PHILADELPHIA |
Escrows.The loan documents provide for upfront escrows in the amount of $394,727 for real estate taxes, $129,640 for insurance premiums and $2,000,000 for PIP renovations. The loan documents also provide for ongoing monthly reserves in the amount of $35,884 for real estate taxes, $21,245 for insurance premiums and $34,031 for FF&E reserves. The FF&E reserves are subject to a cap of $3,300,000 provided (i) no event of default has occurred and is continuing and (ii) the net cash flow debt yield based on the then outstanding principal balance is at least 12.0%. The monthly FF&E reserves amount may be adjusted to the greater of (1) the then-existing FF&E reserve monthly deposit or (2)(i) one-twelfth of 2.0% of the underwritten revenue for payment dates occurring through January 2019 and (ii) one-twelfth of 4.0% of the underwritten revenues for payment dates occurring thereafter.
Lockbox and Cash Management.Upon the occurrence and continuance of a Cash Trap Event Period (as defined below), the Hilton & Homewood Suites Philadelphia Mortgage Loan requires that the borrower establish a lender-controlled lockbox account and the borrower and manager direct all rents to be deposited directly into such lockbox account. During a Cash Trap Event Period, all excess cash funds are swept to a lender-controlled cash management account.
A “Cash Trap Event Period” will commence upon (i) the occurrence and continuance of an event of default; or (ii) the net cash flow debt yield falling below 8.5% at the end of any calendar quarter. A Cash Trap Event Period will end with respect to clause (i) upon the cure of such event of default; and with respect to clause (ii) upon the net cash flow debt yield being equal to or greater than 8.75% for two consecutive calendar quarters.
Property Management.The Hilton & Homewood Suites Philadelphia Property is managed by an affiliate of the borrower.
Assumption.The borrower has a two-time right to transfer the Hilton & Homewood Suites Philadelphia Property provided that certain conditions are satisfied, including (i) no event of default has occurred and is continuing; (ii) the lender reasonably determines that the proposed transferee and guarantor satisfy the lender’s credit review and underwriting standards, taking into consideration transferee experience, financial strength and general business standing; and (iii) the lender has received confirmation from DBRS, Fitch and Moody’s that such assumption will not result in a downgrade, withdrawal or qualification of the respective ratings assigned to the Series 2016-C34 Certificates.
Right of First Refusal.The franchisor, HLT Existing Franchise Holding LLC, has Right of First Offer (“ROFO”) to purchase the Homewood Suites Philadelphia property if the borrower decides to sell the Homewood Suites Philadelphia property, and Right of First Refusal (“ROFR”) if the borrower receives an unsolicited third-party offer to purchase the Homewood Suites Philadelphia property. The ROFO and ROFR are not extinguished by foreclosure; however, the ROFR and ROFO do not apply to foreclosure or deed in lieu thereof.
Partial Release.Not permitted.
Real Estate Substitution.Not permitted.
Subordinate and Mezzanine Indebtedness.Not permitted.
Ground Lease.The parking lot at the Hilton & Homewood Suites Philadelphia Property subject to a ground lease with the City of Philadelphia that expires in 2043.
Terrorism Insurance.The loan documents require that the “all risk” insurance policy required to be maintained by the borrower provide coverage for terrorism in an amount equal to the full replacement cost of the Hilton & Homewood Suites Philadelphia Property. The loan documents also require business interruption insurance covering no less than the 18-month period following the occurrence of a casualty event, together with a six-month extended period of indemnity.
THE INFORMATION IN THIS STRUCTURAL AND COLLATERAL TERM SHEET IS NOT COMPLETE AND MAY BE AMENDED PRIOR TO THE TIME OF SALE. THIS TERM SHEET IS NOT AN OFFER TO SELL THESE SECURITIES AND IT IS NOT A SOLICITATION OF AN OFFER TO BUY THESE SECURITIES IN ANY JURISDICTION WHERE THE OFFER OR SALE IS NOT PERMITTED.
| 53 |
(THIS PAGE INTENTIONALLY LEFT BLANK)
THE INFORMATION IN THIS STRUCTURAL AND COLLATERAL TERM SHEET IS NOT COMPLETE AND MAY BE AMENDED PRIOR TO THE TIME OF SALE. THIS TERM SHEET IS NOT AN OFFER TO SELL THESE SECURITIES AND IT IS NOT A SOLICITATION OF AN OFFER TO BUY THESE SECURITIES IN ANY JURISDICTION WHERE THE OFFER OR SALE IS NOT PERMITTED.
| 54 |
| SHELBY TOWN CENTER |
THE INFORMATION IN THIS STRUCTURAL AND COLLATERAL TERM SHEET IS NOT COMPLETE AND MAY BE AMENDED PRIOR TO THE TIME OF SALE. THIS TERM SHEET IS NOT AN OFFER TO SELL THESE SECURITIES AND IT IS NOT A SOLICITATION OF AN OFFER TO BUY THESE SECURITIES IN ANY JURISDICTION WHERE THE OFFER OR SALE IS NOT PERMITTED.
| 55 |
| SHELBY TOWN CENTER |
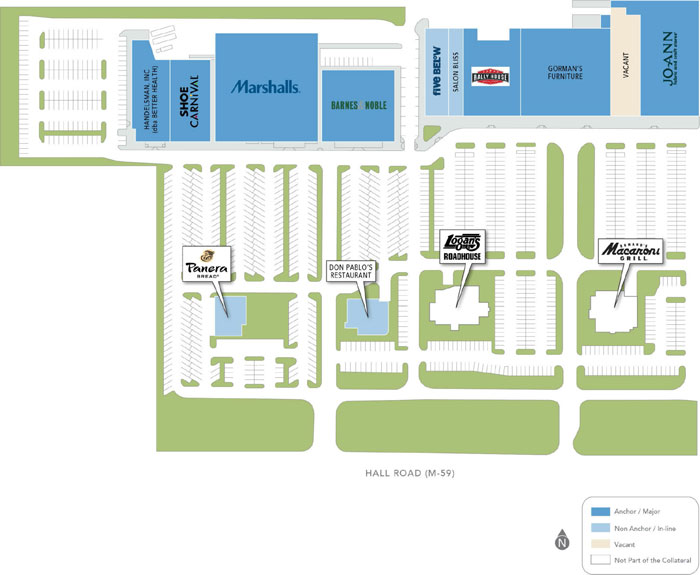
THE INFORMATION IN THIS STRUCTURAL AND COLLATERAL TERM SHEET IS NOT COMPLETE AND MAY BE AMENDED PRIOR TO THE TIME OF SALE. THIS TERM SHEET IS NOT AN OFFER TO SELL THESE SECURITIES AND IT IS NOT A SOLICITATION OF AN OFFER TO BUY THESE SECURITIES IN ANY JURISDICTION WHERE THE OFFER OR SALE IS NOT PERMITTED.
| 56 |
| SHELBY TOWN CENTER |

THE INFORMATION IN THIS STRUCTURAL AND COLLATERAL TERM SHEET IS NOT COMPLETE AND MAY BE AMENDED PRIOR TO THE TIME OF SALE. THIS TERM SHEET IS NOT AN OFFER TO SELL THESE SECURITIES AND IT IS NOT A SOLICITATION OF AN OFFER TO BUY THESE SECURITIES IN ANY JURISDICTION WHERE THE OFFER OR SALE IS NOT PERMITTED.
| 57 |
| No. 4 – Shelby Town Center | |||||||||||
| Loan Information | Property Information | ||||||||||
| Mortgage Loan Seller: | Rialto Mortgage Finance, LLC | Single Asset/Portfolio: | Single Asset | ||||||||
| Credit Assessment (DBRS/Fitch/Moody’s) | NR/NR/NR | Property Type: | Retail | ||||||||
| Original Principal Balance: | $30,000,000 | Specific Property Type: | Anchored | ||||||||
| Cut-off Date Balance: | $30,000,000 | Location: | Shelby Township, MI | ||||||||
| % of Initial Pool Balance: | 4.3% | Size: | 238,229 SF | ||||||||
| Loan Purpose: | Refinance | Cut-off Date Balance Per SF: | $125.93 | ||||||||
| Borrower Name: | Shelby Town Center I, L.L.C. | Year Built/Renovated: | 1997/NAP | ||||||||
| Sponsor: | Thomas Guastello | Title Vesting: | Fee | ||||||||
| Mortgage Rate: | 4.970% | Property Manager: | Self-managed | ||||||||
| Note Date: | April 8, 2016 | 4thMost Recent Occupancy (As of)(2): | 70.3% (12/31/2012) | ||||||||
| Anticipated Repayment Date: | NAP | 3rdMost Recent Occupancy (As of)(2): | 70.3% (12/31/2013) | ||||||||
| Maturity Date: | April 6, 2026 | 2ndMost Recent Occupancy (As of)(2): | 88.8% (12/31/2014) | ||||||||
| IO Period: | 36 months | Most Recent Occupancy (As of)(2): | 94.5% (12/31/2015) | ||||||||
| Loan Term (Original): | 120 months | Current Occupancy (As of): | 94.5% (1/26/2016) | ||||||||
| Seasoning: | 1 month | ||||||||||
| Amortization Term (Original): | 360 months | Underwriting and Financial Information: | |||||||||
| Loan Amortization Type: | Interest-only, Amortizing Balloon | ||||||||||
| Interest Accrual Method: | Actual/360 | 4thMost Recent NOI (As of)(3): | $2,112,877 (12/31/2012) | ||||||||
| Call Protection: | L(25),D(90),O(5) | 3rdMost Recent NOI (As of)(3): | $1,869,294 (12/31/2013) | ||||||||
| Lockbox Type: | Springing | 2ndMost Recent NOI (As of)(3): | $2,046,078 (12/31/2014) | ||||||||
| Additional Debt: | None | Most Recent NOI (As of)(3): | $2,826,849 (12/31/2015) | ||||||||
| Additional Debt Type: | NAP | ||||||||||
| U/W Revenues: | $3,578,808 | ||||||||||
| U/W Expenses: | $728,912 | ||||||||||
| U/W NOI: | $2,849,896 | ||||||||||
| U/W NCF: | $2,690,283 | ||||||||||
| Escrows and Reserves(1): | U/W NOI DSCR: | 1.48x | |||||||||
| U/W NCF DSCR: | 1.40x | ||||||||||
| Type: | Initial | Monthly | Cap (If Any) | U/W NOI Debt Yield: | 9.5% | ||||||
| Taxes | $0 | Springing | NAP | U/W NCF Debt Yield: | 9.0% | ||||||
| Insurance | $0 | Springing | NAP | As-Is Appraised Value: | $42,450,000 | ||||||
| Replacement Reserves | $0 | $3,375 | $121,497 | As-Is Appraisal Valuation Date: | February 3, 2016 | ||||||
| TI/LC Reserve | $0 | $9,926 | $238,229 | Cut-off Date LTV Ratio: | 70.7% | ||||||
| Deferred Maintenance | $31,875 | $0 | NAP | LTV Ratio at Maturity or ARD: | 62.5% | ||||||
| (1) | See “Escrows” section. |
| (2) | See “Historical Occupancy” section. |
| (3) | See “Cash Flow Analysis” section. |
The Mortgage Loan. The mortgage loan (the “Shelby Town Center Mortgage Loan”) is evidenced by a single promissory note that is secured by a first mortgage encumbering an anchored retail property located in Shelby Township, Michigan (the “Shelby Town Center Property”). The Shelby Town Center Mortgage Loan was originated on April 8, 2016 by Rialto Mortgage Finance, LLC. The Shelby Town Center Mortgage Loan had an original principal balance of $30,000,000, has an outstanding principal balance as of the Cut-off Date of $30,000,000 and accrues interest at an interest rate of 4.970%per annum. The Shelby Town Center Mortgage Loan had an initial term of 120 months, has a remaining term of 119 months as of the Cut-off Date and requires payments of interest-only for the first 36 payments following origination and, thereafter, requires payments of principal and interest based on a 30-year amortization schedule. The Shelby Town Center Mortgage Loan matures on April 6, 2026.
Following the lockout period, the borrower has the right to defease the Shelby Town Center Mortgage Loan in whole or in part (see “Partial Release” section) on any date before December 6, 2025. In addition, the Shelby Town Center Mortgage Loan is prepayable without penalty on or after December 6, 2025.
THE INFORMATION IN THIS STRUCTURAL AND COLLATERAL TERM SHEET IS NOT COMPLETE AND MAY BE AMENDED PRIOR TO THE TIME OF SALE. THIS TERM SHEET IS NOT AN OFFER TO SELL THESE SECURITIES AND IT IS NOT A SOLICITATION OF AN OFFER TO BUY THESE SECURITIES IN ANY JURISDICTION WHERE THE OFFER OR SALE IS NOT PERMITTED.
| 58 |
| SHELBY TOWN CENTER |
Sources and Uses
| Sources | Uses | |||||||
| Original loan amount | $30,000,000 | 100.0% | Return of equity(1) | $29,768,132 | 99.2% | |||
| Reserves | 31,875 | 0.1 | ||||||
| Closing costs | 199,993 | 0.7 | ||||||
| Total Sources | $30,000,000 | 100.0% | Total Uses | $30,000,000 | 100.0% |
| (1) | The Shelby Town Center Property was previously unencumbered. |
The Property.The Shelby Town Center Property is an anchored retail center containing approximately 238,229 square feet and located in Shelby Township, Michigan. Built between 1997 and 1999, the Shelby Town Center Property consists of four, single-story buildings situated on a 20.3-acre site. The Shelby Town Center Property is anchored by Marshall’s, Gorman’s and Jo-Ann Fabrics, all of which have been in occupancy for over 13 years. The remaining tenant base is comprised of a mix of national, regional, and local inline tenants. National and regional tenants comprise 32.2% of net rentable area and include Barnes & Noble, Rally House, Better Health and Shoe Carnival. The Shelby Town Center Property features 1,106 surface parking spaces, resulting in a parking ratio of 4.6 spaces per 1,000 square feet of net rentable area. As of January 26, 2016, the Shelby Town Center Property was 94.5% occupied by 11 tenants.
The following table presents certain information relating to the tenancies at the Shelby Town Center Property:
Major Tenants
| Tenant Name | Credit Rating (Fitch/ Moody’s/ S&P)(1) | Tenant NRSF | % of NRSF | Annual U/W Base Rent PSF(2) | Annual U/W Base Rent(2) | % of Total Annual U/W Base Rent | Sales PSF(3) | Occupancy Cost(3) | Lease Expiration Date |
| Anchor Tenant | |||||||||
| Marshall’s | NR/A2/A+ | 53,580 | 22.5% | $12.50 | $669,750 | 22.2% | $335 | 4.5% | 5/31/2017(4) |
| Jo-Ann Fabrics | NR/B3/B | 31,941 | 13.4% | $12.54 | 400,540 | 13.3% | $159 | 9.2% | 1/31/2021(5) |
| Gorman’s | NR/NR/NR | 35,533 | 14.9% | $10.00 | 355,329 | 11.8% | NAV | NAV | 6/30/2020 |
| Total Anchor Tenant | 121,054 | 50.8% | $11.78 | 1,425,619 | 47.3% | ||||
| |||||||||
| Major Tenants | |||||||||
| Barnes & Noble | NR/NR/NR | 25,000 | 10.5% | $16.32 | $408,000 | 13.5% | NAV | NAV | 1/31/2020(6) |
| Rally House | NR/NR/NR | 19,200 | 8.1% | $13.00 | $249,600 | 8.3% | NAV | NAV | 1/31/2025(7) |
| Shoe Carnival | NR/NR/NR | 15,045 | 6.3% | $15.00 | $225,675 | 7.5% | $95 | 17.7% | 6/30/2024(8) |
| Better Health | NR/NR/NR | 17,520 | 7.4% | $10.63 | $186,240 | 6.2% | NAV | NAV | 6/30/2024(9) |
| Total Major Tenants | 76,765 | 32.2% | $13.93 | $1,069,515 | 35.5% | ||||
| Non-Major Tenants | 27,211 | 11.4% | $19.10 | $519,686 | 17.2% | ||||
| Occupied Collateral Total | 225,030 | 94.5% | $13.40 | $3,014,820 | 100.0% | ||||
| Vacant Space | 13,199 | 5.5% | |||||||
| Collateral Total | 238,229 | 100.0% | |||||||
| (1) | Certain ratings are those of the parent company whether or not the parent guarantees the lease. |
| (2) | Annual U/W Base Rent PSF and Annual U/W Base Rent include contractual rent escalations through February 2017 totaling $38,574. |
| (3) | Sales PSF and Occupancy Cost are for the trailing 12-month period ending December 31, 2015. |
| (4) | Marshall’s has three, five-year lease renewal options. |
| (5) | Jo-Ann Fabrics has three, five-year lease renewal options. |
| (6) | Barnes & Noble has two, five-year lease renewal options. |
| (7) | Rally House has three, five-year lease renewal options. |
| (8) | Shoe Carnival has three, five-year lease renewal options. |
| (9) | Better Health has two, five-year lease renewal options. |
THE INFORMATION IN THIS STRUCTURAL AND COLLATERAL TERM SHEET IS NOT COMPLETE AND MAY BE AMENDED PRIOR TO THE TIME OF SALE. THIS TERM SHEET IS NOT AN OFFER TO SELL THESE SECURITIES AND IT IS NOT A SOLICITATION OF AN OFFER TO BUY THESE SECURITIES IN ANY JURISDICTION WHERE THE OFFER OR SALE IS NOT PERMITTED.
| 59 |
| SHELBY TOWN CENTER |
The following table presents certain information relating to the historical sales at the Shelby Town Center Property:
Historical Sales (PSF) and Occupancy Costs(1)
| Tenant Name | 2013 | 2014 | 2015 | Average National Sales (PSF)(2) | Current Occupancy Cost |
| Marshall’s | $311 | $303 | $335 | NAV | 4.5% |
| Gorman’s | $154 | $142 | NAV | NAV | NAV |
| Jo-Ann Fabrics | $173 | $165 | $159 | $155 | 9.2% |
| Shoe Carnival | NAV | NAV | $95(3) | $221 | 17.7% |
| (1) | Historical Sales (PSF) are based on historical statements provided by the borrower. |
| (2) | Average National Sales as of 2014. |
| (3) | Represents Shoe Carnival’s sales for fiscal year August 2014 through July 2015. |
The following table presents certain information relating to the lease rollover schedule at the Shelby Town Center Property:
Lease Expiration Schedule(1)(2)
| Year Ending December 31, | No. of Leases Expiring | Expiring NRSF | % of Total NRSF | Cumulative Expiring NRSF | Cumulative % of Total NRSF | Annual U/W Base Rent | % of Total Annual U/W Base Rent | Annual U/W Base Rent PSF(3) |
| MTM | 0 | 0 | 0.0% | 0 | 0.0% | $0 | 0.0% | $0.00 |
| 2016 | 0 | 0 | 0.0% | 0 | 0.0% | $0 | 0.0% | $0.00 |
| 2017 | 2 | 61,180 | 25.7% | 61,180 | 25.7% | $802,850 | 26.6% | $13.12 |
| 2018 | 0 | 0 | 0.0% | 61,180 | 25.7% | $0 | 0.0% | $0.00 |
| 2019 | 0 | 0 | 0.0% | 61,180 | 25.7% | $0 | 0.0% | $0.00 |
| 2020 | 3 | 65,288 | 27.4% | 126,468 | 53.1% | $896,469 | 29.7% | $13.73 |
| 2021 | 2 | 40,941 | 17.2% | 167,409 | 70.3% | $548,578 | 18.2% | $13.40 |
| 2022 | 0 | 0 | 0.0% | 167,409 | 70.3% | $0 | 0.0% | $0.00 |
| 2023 | 0 | 0 | 0.0% | 167,409 | 70.3% | $0 | 0.0% | $0.00 |
| 2024 | 3 | 38,421 | 16.1% | 205,830 | 86.4% | $517,323 | 17.2% | $13.46 |
| 2025 | 1 | 19,200 | 8.1% | 225,030 | 94.5% | $249,600 | 8.3% | $13.00 |
| 2026 | 0 | 0 | 0.0% | 225,030 | 94.5% | $0 | 0.0% | $0.00 |
| Thereafter | 0 | 0 | 0.0% | 225,030 | 94.5% | $0 | 0.0% | $0.00 |
| Vacant | 0 | 13,199 | 5.5% | 238,229 | 100.0% | $0 | 0.0% | $0.00 |
| Total/Weighted Average | 11 | 238,229 | 100.0% | $3,014,820 | 100.0% | $13.40 |
| (1) | Information obtained from the underwritten rent roll. |
| (2) | Certain tenants may have lease termination options that are exercisable prior to the originally stated expiration date of the subject lease and that are not considered in the Lease Expiration Schedule. |
| (3) | Weighted Average Annual U/W Base Rent PSF excludes vacant space. |
The following table presents historical occupancy percentages at the Shelby Town Center Property:
Historical Occupancy
12/31/2012(1)(2) | 12/31/2013(1)(2) | 12/31/2014(1)(2) | 12/31/2015(1)(2) | 1/26/2016(3) |
| 70.3% | 70.3% | 88.8% | 94.5% | 94.5% |
| (1) | Information obtained from the borrower. |
| (2) | The sponsor acquired the 32,565 square foot space currently occupied by Better Health and Shoe Carnival in 2009 when Circuit City, the prior tenant, declared bankruptcy and vacated the space. The increase in occupancy from 2013 to 2014 was due to the commencement of three new leases in July 2014, including the Better Health and Shoe Carnival leases for the vacant Circuit City space as well as the Rally House lease for another vacant space. |
| (3) | Information obtained from the underwritten rent roll. |
THE INFORMATION IN THIS STRUCTURAL AND COLLATERAL TERM SHEET IS NOT COMPLETE AND MAY BE AMENDED PRIOR TO THE TIME OF SALE. THIS TERM SHEET IS NOT AN OFFER TO SELL THESE SECURITIES AND IT IS NOT A SOLICITATION OF AN OFFER TO BUY THESE SECURITIES IN ANY JURISDICTION WHERE THE OFFER OR SALE IS NOT PERMITTED.
| 60 |
| SHELBY TOWN CENTER |
Operating History and Underwritten Net Cash Flow. The following table presents certain information relating to the historical operating performance and underwritten net cash flow at the Shelby Town Center Property:
Cash Flow Analysis
| 2012 | 2013(1) | 2014(1) | 2015(1) | U/W | % of U/W Effective Gross Income | U/W $ per SF | ||
| Base Rent | $2,319,815 | $2,207,440 | $2,453,364 | $2,951,888 | $2,976,246 | 83.2% | $12.49 | |
| Rent Steps | 0 | 0 | 0 | 0 | 38,574 | 1.1 | 0.16 | |
| Grossed Up Vacant Space | 0 | 0 | 0 | 0 | 237,582 | 6.6 | 1.00 | |
| Total Reimbursables | 525,669 | 436,192 | 386,629 | 603,774 | 592,788 | 16.6 | 2.49 | |
| Other Income | 0 | 0 | 0 | 271 | 0 | 0.0 | 0.00 | |
| Less Vacancy & Credit Loss | 0 | 0 | 0 | 0 | (266,382) | (2) | (7.4) | (1.12) |
| Effective Gross Income | $2,845,484 | $2,643,632 | $2,839,993 | $3,555,933 | $3,578,808 | 100.0% | $15.02 | |
| Total Operating Expenses | $732,607 | $774,338 | $793,915 | $729,084 | $728,912 | 20.4% | $3.06 | |
| Net Operating Income | $2,112,877 | $1,869,294 | $2,046,078 | $2,826,849 | $2,849,896 | 79.6% | $11.96 | |
| TI/LC | 0 | 0 | 0 | 0 | 119,114 | 3.3 | 0.50 | |
| Capital Expenditures | 0 | 0 | 0 | 0 | 40,499 | 1.1 | 0.17 | |
| Net Cash Flow | $2,112,877 | $1,869,294 | $2,046,078 | $2,826,849 | $2,690,283 | 75.2% | $11.29 | |
| NOI DSCR | 1.10x | 0.97x | 1.06x | 1.47x | 1.48x | |||
| NCF DSCR | 1.10x | 0.97x | 1.06x | 1.47x | 1.40x | |||
| NOI DY | 7.0% | 6.2% | 6.8% | 9.4% | 9.5% | |||
| NCF DY | 7.0% | 6.2% | 6.8% | 9.4% | 9.0% |
| (1) | The sponsor acquired the 32,565 square foot space currently occupied by Better Health and Shoe Carnival in 2009 when Circuit City, the prior tenant, declared bankruptcy and vacated the space. The increase in Net Operating Income from 2013 to 2015 was due to the commencement of three new leases in July 2014, including the Better Health and Shoe Carnival leases for the vacant Circuit City space as well as the Rally House lease for another vacant space. |
| (2) | The underwritten economic vacancy is 6.9%. The Shelby Town Center Property was 94.5% physically occupied as of January 26, 2016. |
Appraisal.As of the appraisal valuation date of February 3, 2016, the Shelby Town Center Property had an “as-is” appraised value of $42,450,000.
Environmental Matters.According to a Phase I environmental assessment dated February 8, 2016, there was no evidence of any recognized environmental conditions at the Shelby Town Center Property.
Market Overview and Competition.The Shelby Town Center Property is located in Shelby Township, Michigan, approximately 23.0 miles north of the Detroit central business district. Regional access to the neighborhood is provided by Interstate 94 (8.8 miles east of the Shelby Town Center Property), which connects to Ann Arbor and Interstate 75 (approximately 14.1 miles west of the Shelby Town Center Property), which connects to Flint to the north and Toledo to the south. The Shelby Town Center Property has frontage along State Route 59 (Hall Road), a major retail corridor. The General Growth Properties-owned Lakeside Mall is located directly across Hall Road from the Shelby Town Center Property with notable retailers including Macy’s, JC Penney’s, Sears, H&M, Express and a number of national dining options including Red Lobster, Olive Garden and Chipotle. The Starwood-owned Mall at Partridge Creek is located approximately 2.5 miles east of the Shelby Town Center Property along Hall Road, with notable retailers including Nordstrom, Carson’s, The Gap, White House Black Market, Banana Republic, Aldo, Lucky Brand Jeans and Forever 21. The Partridge Ridge Mall is also home to the MJR Digital Cinema and several dining options including P.F. Chang’s and Brio Tuscan Grille. Other major retailers located along Hall Road and within one-mile of the Shelby Town Center Property are Target, Office Depot, PetSmart, DSW Shoes, Hobby Lobby and Lifetime Fitness. Residential development surrounds the commercial growth in the area.
According to the appraisal, the 2016 estimated population within a one-, three- and five-mile radius of the Shelby Town Center Property is 11,304, 103,100 and 252,913, respectively. The 2016 estimated average household income within the same one-, three- and five-mile radii is $62,351, $73,698 and $79,514, respectively.
According to a third party market research report, the Shelby Town Center Property is located within the Macomb submarket of the Detroit retail market. As of the fourth quarter of 2015, the submarket reported a total inventory of approximately 47.9 million square feet, with a 7.8% vacancy rate and an average asking rent of $11.04 per square foot, triple net.
THE INFORMATION IN THIS STRUCTURAL AND COLLATERAL TERM SHEET IS NOT COMPLETE AND MAY BE AMENDED PRIOR TO THE TIME OF SALE. THIS TERM SHEET IS NOT AN OFFER TO SELL THESE SECURITIES AND IT IS NOT A SOLICITATION OF AN OFFER TO BUY THESE SECURITIES IN ANY JURISDICTION WHERE THE OFFER OR SALE IS NOT PERMITTED.
| 61 |
| SHELBY TOWN CENTER |
The following table presents certain information relating to comparable retail properties for the Shelby Town Center Property:
Comparable Leases(1)
| Property Name/ Location | Year Built/ Renovated | Anchor Tenants | Total GLA (SF) | Total Occupancy | Distance from Subject | Annual Base Rent PSF | Lease Type |
Delco Plaza Utica, MI | 1973/NAV | Babies R Us, Bed Bath & Beyond, Dunham’s Sports, Larry’s Performance R/C’s | 154,853 | 100.0% | 1.4 miles | $6.00- $12.00 | NNN |
| Hall Road Crossing Shelby Township, MI | 1985/NAV | Gardner Mountain, TJ Maxx, Michael’s Arts and Crafts, Old Navy | 175,503 | 100.0% | 0.3 miles | $8.00-$22.00 | NNN |
Northpointe Shopping Center Utica, MI | 1987/NAV | Dicks Sporting Goods, Salvation Army, PetSmart, Ollie’s Bargain Outlet | 176,918 | 98.8% | 1.0 miles | $5.00-$19.00 | NNN |
Shelby Corners Utica, MI | 1987/NAV | Target | 333,727 | 92.5% | 0.8 miles | $10.00-$25.00 | NNN |
Utica Park Place Utica, MI | 1992/NAV | Sam’s Club | 477,247 | 84.0% | 1.3 miles | $6.25-$14.00 | NNN |
| (1) | Information obtained from the appraisal. |
The Borrower.The borrower is Shelby Town Center I, L.L.C., a single purpose Michigan limited liability company with one independent director. Legal counsel to the borrower delivered a non-consolidation opinion in connection with the origination of the Shelby Town Center Mortgage Loan. Thomas Guastello, the indirect owner of the borrower, is the guarantor of certain nonrecourse carveouts under the Shelby Town Center Mortgage Loan.
The Sponsor.The sponsor, Thomas Guastello, has practiced law for over 40 years with specialties in real estate and municipal law. Mr. Guastello owns Center Management, which is active in finance, building and development in the construction and operation of strip shopping centers and office buildings, including development and leasebacks of several national retailers, as well as the construction, ownership and operation of two hotels. Mr. Guastello’s portfolio includes 952,221 square feet of commercial real estate properties with a reported value of approximately $180.0 million. The sponsor was a party to a prior discounted payoff. See “Description of the Mortgage Pool—Loan Purpose; Default History, Bankruptcy Issues and Other Proceedings” in the Preliminary Prospectus.
Escrows.No ongoing monthly escrows are required for real estate taxes or insurance as long as no Cash Sweep Event (as defined below) has occurred and is continuing. The loan documents provide for monthly reserves in the amount of $3,375 for replacement reserves (subject to a cap of $121,497) and $9,926 for tenant improvement and leasing commissions (“TI/LC”) (subject to a cap of $238,229). The loan documents permit the borrower to suspend monthly collections for replacement reserves and TI/LC reserves by posting a letter of credit in an amount equal to the respective capped reserve amounts. The borrower has posted a letter of credit in the amount of $359,726 and monthly collections for replacement reserves and TI/LC reserves have been suspended.
Lockbox and Cash Management.Upon the occurrence and continuance of a Cash Sweep Event (as defined below), the borrower is required to establish a lender-controlled lockbox account and cash management account. The loan documents also require that upon a Cash Sweep Event, the borrower is required to direct all tenants to deposit rents directly into the lockbox account and all revenues received by the borrower or the property manager be deposited into the lockbox account within five business days of receipt. During a Cash Sweep Event, all excess funds in the cash management account are swept to a lender-controlled subaccount.
A “Cash Sweep Event” will commence (i) if an event of default has occurred or is continuing; (ii) upon the occurrence of a bankruptcy action of the borrower, the guarantor or the property manager; (iii) upon a Cash Sweep DSCR Trigger Event (as defined below); or (iv) upon a Critical Tenant Trigger Event (as defined below). A Cash Sweep Event will end with respect to clause (i) when such event of default has been cured; with respect to clause (ii), when such bankruptcy petition has been discharged, stayed, or dismissed within 90 days for borrower and guarantor and within 120 days for the property managers, among other conditions; with respect to clause (iii), once the amortizing debt service coverage ratio is greater than 1.05x for two consecutive quarters, among other conditions; and with respect to clause (iv) on the date on which the applicable Critical Tenant Trigger Event Cure (as defined below) has occurred.
A “Cash Sweep DSCR Trigger Event” occurs on any date the amortizing debt service coverage ratio, based on the trailing 12-month period immediately preceding the date of such determination, is less than 1.05x.
A “Critical Tenant Trigger Event” occurs (i) if a Critical Tenant (as defined below) gives notice of its intention to not extend or renew its lease; (ii) on or prior to six months prior to the related lease expiration date a Critical Tenant fails to give notice of its election to renew its lease; (iii) on or prior to any date by which the Critical Tenant is required under its lease to notify the borrower of its election to renew its lease, Critical Tenant fails to give notice; (iv) an event of default under a Critical Tenant lease; (v) a bankruptcy action of the Critical Tenant; or (vi) if the Critical Tenant discontinues its normal business operations.
THE INFORMATION IN THIS STRUCTURAL AND COLLATERAL TERM SHEET IS NOT COMPLETE AND MAY BE AMENDED PRIOR TO THE TIME OF SALE. THIS TERM SHEET IS NOT AN OFFER TO SELL THESE SECURITIES AND IT IS NOT A SOLICITATION OF AN OFFER TO BUY THESE SECURITIES IN ANY JURISDICTION WHERE THE OFFER OR SALE IS NOT PERMITTED.
| 62 |
| SHELBY TOWN CENTER |
“Critical Tenant” means Marshalls of MA, Inc., doing business at the Shelby Town Center Property as Marshall’s, HomeGoods or TJ Maxx or any successor.
A “Critical Tenant Trigger Event” will end with respect to clause (i), (ii) or (iii), on the date that (1) a Critical Tenant lease extension is executed and delivered by the borrower along with related tenant improvements costs, leasing commissions and other material costs and expenses have been deposited into the critical tenant improvement and leasing commissions account; or (2) a Critical Tenant Space Re-tenanting Event (as defined below) has occurred; with respect to clause (iv), a cure of applicable event of default; with respect to clause (v), the affirmation that the Critical Tenant is actually paying all rents and other amounts under its lease; or with respect to clause (vi), a Critical Tenant re-commences its normal business operations or a Critical Tenant Space Re-tenanting Event has occurred.
A “Critical Tenant Space Re-tenanting Event” means the date each of the following conditions have been satisfied (i) the Critical Tenant space has been leased to one or more replacement tenants for a term of at least five years and on terms that are acceptable to the lender; (ii) all tenant improvement costs, leasing commissions and other material costs and expenses relating to the re-letting of the space have been paid in full; and (ii) the related tenants are conducting normal business operations at the Critical Tenant space.
Property Management.The Shelby Town Center Property is managed by an affiliate of the borrower.
Assumption.The borrower has the right to transfer the Shelby Town Center Property, provided that no event of default has occurred and is continuing and certain other conditions are satisfied, including (i) the lender’s reasonable determination that the proposed transferee and guarantor satisfy the lender’s credit review and underwriting standards, taking into consideration transferee experience, financial strength and general business standing; (ii) execution of a recourse guaranty and an environmental indemnity by an affiliate of the transferee; and (iii) if requested by the lender, rating agency confirmation from DBRS, Fitch and Moody’s that the transfer will not result in a downgrade, withdrawal or qualification of the respective ratings assigned to the Series 2016-C34 Certificates.
Partial Release.Following the lockout period and prior to December 6, 2025, the borrower is permitted to release the portion of the Shelby Town Center Property currently occupied by Better Health and Shoe Carnival and containing approximately 32,565 square feet of rentable area, subject to certain conditions, including (i) no event of default has occurred and is continuing; (ii) partial defeasance of 125% of the released property’s allocated loan balance; (iii) the amortizing debt service coverage ratio (based upon the trailing 12-month period immediately preceding the date of such determination) with respect to the remaining portion of the Shelby Town Center Property will be no less than the greater of (a) 1.45x and (b) the amortizing debt service coverage ratio immediately prior to the release; and (iv) the loan to value ratio with respect to the remaining portion of the Shelby Town Center Property will be no greater than the lesser of (a) 65.0%, and (b) the loan to value ratio immediately prior to the release.
Real Estate Substitution.Not permitted.
Subordinate and Mezzanine Indebtedness.Not permitted.
Ground Lease.None.
Terrorism Insurance.The loan documents require that the “all risk” insurance policy required to be maintained by the borrowers provide coverage for terrorism in an amount equal to the full replacement cost of the Shelby Town Center Property, as well as business interruption insurance covering no less than the 18-month period following the occurrence of a casualty event, together with a 360-day extended period of indemnity.
THE INFORMATION IN THIS STRUCTURAL AND COLLATERAL TERM SHEET IS NOT COMPLETE AND MAY BE AMENDED PRIOR TO THE TIME OF SALE. THIS TERM SHEET IS NOT AN OFFER TO SELL THESE SECURITIES AND IT IS NOT A SOLICITATION OF AN OFFER TO BUY THESE SECURITIES IN ANY JURISDICTION WHERE THE OFFER OR SALE IS NOT PERMITTED.
| 63 |
MARRIOTT MONTEREY |

THE INFORMATION IN THIS STRUCTURAL AND COLLATERAL TERM SHEET IS NOT COMPLETE AND MAY BE AMENDED PRIOR TO THE TIME OF SALE. THIS TERM SHEET IS NOT AN OFFER TO SELL THESE SECURITIES AND IT IS NOT A SOLICITATION OF AN OFFER TO BUY THESE SECURITIES IN ANY JURISDICTION WHERE THE OFFER OR SALE IS NOT PERMITTED.
| 64 |
MARRIOTT MONTEREY |
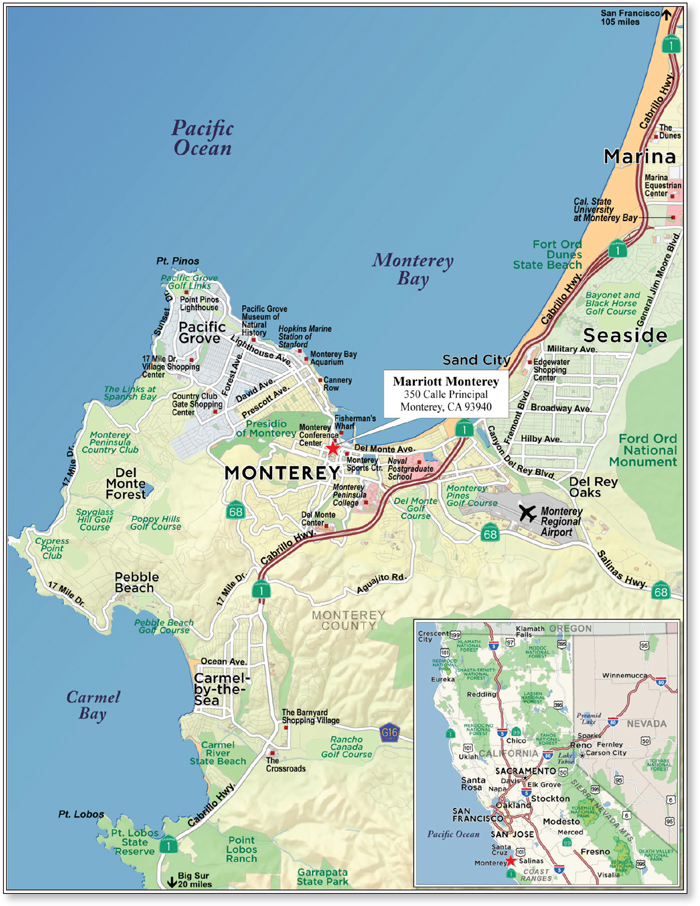
THE INFORMATION IN THIS STRUCTURAL AND COLLATERAL TERM SHEET IS NOT COMPLETE AND MAY BE AMENDED PRIOR TO THE TIME OF SALE. THIS TERM SHEET IS NOT AN OFFER TO SELL THESE SECURITIES AND IT IS NOT A SOLICITATION OF AN OFFER TO BUY THESE SECURITIES IN ANY JURISDICTION WHERE THE OFFER OR SALE IS NOT PERMITTED.
| 65 |
| No. 5 – Marriott Monterey | ||||||||
| Loan Information | Property Information | |||||||
| Mortgage Loan Seller: | Natixis Real Estate Capital LLC | Single Asset/Portfolio: | Single Asset | |||||
| Credit Assessment (DBRS/Fitch/Moody’s): | NR/NR/NR | Property Type: | Hospitality | |||||
| Original Principal Balance(1): | $30,000,000 | Specific Property Type: | Full Service | |||||
| Cut-off Date Balance(1): | $29,967,471 | Location: | Monterey, CA | |||||
| % of Initial Pool Balance: | 4.3% | Size: | 341 rooms | |||||
| Loan Purpose: | Refinance | Cut-off Date Balance Per Room(1): | $190,409 | |||||
| Borrower Name: | San Carlos Associates LLC | Year Built/Renovated: | 1984/2014 | |||||
| Sponsor(2): | San Carlos Associates LLC | Title Vesting: | Fee | |||||
| Mortgage Rate: | 5.550% | Property Manager: | Marriott Hotel Services, Inc. | |||||
| Note Date: | March 11, 2016 | 4thMost Recent Occupancy(As of): | 72.0% (12/31/2012) | |||||
| Anticipated Repayment Date: | NAP | 3rdMost Recent Occupancy(As of): | 73.9% (12/31/2013) | |||||
| Maturity Date: | April 5, 2026 | 2ndMost Recent Occupancy (As of): | 75.7% (12/31/2014) | |||||
| IO Period: | None | Most Recent Occupancy (As of): | 79.9% (12/31/2015) | |||||
| Loan Term (Original): | 120 months | Current Occupancy (As of): | 80.5% (1/31/2016) | |||||
| Seasoning: | 1 month | |||||||
| Amortization Term (Original): | 360 months | Underwriting and Financial Information: | ||||||
| Loan Amortization Type: | Amortizing Balloon | |||||||
| Interest Accrual Method: | Actual/360 | 4thMost Recent NOI (As of)(5): | $6,133,880 (12/31/2013) | |||||
| Call Protection: | L(25),GRTR 1% or YM(91),O(4) | 3rdMost Recent NOI (As of)(5): | $7,127,932 (12/31/2014) | |||||
| Lockbox Type: | Hard/Springing Cash Management | 2ndMost Recent NOI (As of)(5): | $8,138,481 (12/31/2015) | |||||
| Additional Debt(1)(3): | Yes | Most Recent NOI (As of): | $8,247,116 (TTM 1/31/2016) | |||||
| Additional Debt Type(1)(3): | Pari Passu; Future Mezzanine | |||||||
| U/W Revenues: | $29,238,032 | |||||||
| U/W Expenses(5): | $20,658,620 | |||||||
| U/W NOI: | $8,579,412 | |||||||
| U/W NCF: | $7,117,511 | |||||||
| U/W NOI DSCR(1): | 1.93x | |||||||
| Escrows and Reserves(4): | U/W NCF DSCR(1): | 1.60x | ||||||
| U/W NOI Debt Yield(1): | 13.2% | |||||||
| Type: | Initial | Monthly | Cap (If Any) | U/W NCF Debt Yield(1): | 11.0% | |||
| Taxes | $0 | Springing | NAP | As-Is Appraised Value: | $120,100,000 | |||
| Insurance | $2,024 | $1,012 | NAP | As-Is Appraisal Valuation Date: | November 12, 2015 | |||
| FF&E Reserves | $0 | Springing | NAP | Cut-off Date LTV Ratio(1): | 54.1% | |||
| Seasonality Reserve | $96,665 | (4) | NAP | LTV Ratio at Maturity or ARD(1): | 45.3% | |||
| (1) | The Marriott Monterey Whole Loan (as defined below), totaling $65,000,000, is comprised of twopari passu notes (Notes A-1 and A-2). The non-controlling Note A-2 had an original principal balance of $30,000,000, has an outstanding principal balance of $29,967,471 as of the Cut-Off Date and will be contributed to the WFCM 2016-C34 Trust. The controlling Note A-1 had an original principal balance of $35,000,000 and was contributed to the CGCMT 2016-P3 Trust. All statistical financial information related to balances per square room, loan-to-value ratios, debt service coverage ratios and debt yields are based on the Marriott Monterey Whole Loan. |
| (2) | See “The Sponsors” section. |
| (3) | See “Subordinate and Mezzanine Indebtedness” section. |
| (4) | See “Escrows” section. |
| (5) | See “Cash Flow Analysis” section. |
The Mortgage Loan.The mortgage loan (the “Marriott Monterey Mortgage Loan”) is part of a whole loan (the “Marriott Monterey Whole Loan”) that is evidenced by twopari passu promissory notes (Notes A-1 and A-2) secured by a first mortgage encumbering a 341-room full service hotel located in Monterey, California (the “Marriott Monterey Property”). The Marriott Monterey Whole Loan was originated on March 11, 2016 by Natixis, New York Branch. The Marriott Monterey Whole Loan had an original principal balance of $65,000,000, has an outstanding principal balance as of the Cut-off Date of $64,929,520 and accrues interest at an interest rate of 5.550%per annum. The Marriott Monterey Whole Loan had an initial term of 120 months, has a remaining term of 119 months as of the Cut-off Date and requires payments of principal and interest based on a 30-year amortization schedule through the term of the Marriott Monterey Whole Loan. The Marriott Monterey Whole Loan matures on April 5, 2026.
The Marriott Monterey Mortgage Loan, evidenced by the non-controlling Note A-2, will be contributed to the WFCM 2016-C34 Trust, had an original principal balance of $30,000,000 and has an outstanding principal balance as of the Cut-off Date of $29,967,471. The controlling Note A-1 had an original principal balance of $35,000,000 and was contributed to the CGCMT 2016-P3 Trust. See “Description of the Mortgage Pool—The Whole Loans—The Non-Serviced Whole Loan—The Marriott Monterey Whole Loan” in the Preliminary Prospectus.
THE INFORMATION IN THIS STRUCTURAL AND COLLATERAL TERM SHEET IS NOT COMPLETE AND MAY BE AMENDED PRIOR TO THE TIME OF SALE. THIS TERM SHEET IS NOT AN OFFER TO SELL THESE SECURITIES AND IT IS NOT A SOLICITATION OF AN OFFER TO BUY THESE SECURITIES IN ANY JURISDICTION WHERE THE OFFER OR SALE IS NOT PERMITTED.
| 66 |
MARRIOTT MONTEREY |
Note Summary
| Notes | Original Balance | Note Holder | Controlling Interest | |
| A-1 | $35,000,000 | CGCMT 2016-P3 | Yes | |
| A-2 | $30,000,000 | WFCM 2016-C34 | No | |
| Total | $65,000,000 |
Following the lockout period, the borrower has the right to prepay the Marriott Monterey Whole Loan in whole, but not in part, on any date before January 2026, provided that the borrower pays the greater of a yield maintenance premium or a prepayment premium equal to 1.0% of the principal amount being prepaid. In addition, the Marriott Monterey Whole Loan is prepayable without penalty on or after January 2026.
Sources and Uses
| Sources | Uses | |||||||
| Original loan amount | $65,000,000 | 100.0% | Loan payoff(1) | $61,500,000 | 94.6% | |||
| Reserves | 98,689 | 0.2 | ||||||
| Closing costs | 1,815,959 | 2.8 | ||||||
| Return of equity | 1,585,352 | 2.4 | ||||||
| Total Sources | $65,000,000 | 100.0% | Total Uses | $65,000,000 | 100.0% |
| (1) | The Marriott Monterey Property was previously securitized in the JPMCC 2006-LDP8 transaction. |
The Property.The Marriott Monterey Property is a AAA-rated, four-diamond, ten-story, 341-room full service hotel located on an approximately 1.0-acre site in downtown Monterey, California. Built in 1984, the borrower has invested approximately $8.0 million ($23,475 per room) since 2009 in the Marriott Monterey Property, with the most recent renovation occuring between 2011 and 2014 at a total cost of $6.2 million ($18,241 per room). Additionally, according to the borrower, there is approximately $13.3 million budgeted for capital expenditures during the 2016-2019 period. The major components of the renovation include the replacement of the soft goods and case goods in the guest rooms (approximately $6.7 million); the renovation of the lobby and restaurant space in line with Marriott’s “Great Room” concept (approximately $2.3 million); additional in-room upgrades, including the replacement of the in-room entertainment system, thermostats, sprinklers and mattresses (approximately $0.6 million); the removal of an underground storage tank (approximately $0.3 million); the replacement of guest room windows (approximately $0.3 million); and the conversion of Character Sports Bar into an event space (approximately $0.3 million).
The Marriott Monterey Property is comprised of 172 king guestrooms, 80 doubles guestrooms, 67 queen guestrooms, 13 one-bedroom suites, 7 executive suites and 2 presidential suites. Each guestroom features a 37-inch television, two night stands, mahogany dressers, red fabric lounge chairs with a matching ottoman and a work desk with an ergonomic or leather chair. Bathroom amenities feature a separate vanity finished with granite countertops, silver framed wall mirror, make-up mirror, gold fixtures, designer wall sconce lighting, and standard toilet and shower features. Marble tile walk-in showers with glass doors and rainfall shower heads are featured in approximately 75.0% of the bathrooms while the remaining bathrooms have cream-colored cloth shower curtains with Speakman shower heads. Additional in-room amenities include high-speed internet access, in-room climate control, a coffee/tea maker and 24-hour room service. Amenities at the Marriott Monterey Property include two full service restaurants (Three Flags Café and Characters Sports Bar and Grill), a lobby coffee bar, approximately 16,500 square feet of meeting and banquet space, a fitness center, a business center and an outdoor pool. The Marriott Monterey Property contains 142 subterranean parking spaces, which are utilized by a third party operator that provides valet services. The Marriott Monterey Property operates under a management agreement in lieu of a franchise agreement (see “Property Management” section).
THE INFORMATION IN THIS STRUCTURAL AND COLLATERAL TERM SHEET IS NOT COMPLETE AND MAY BE AMENDED PRIOR TO THE TIME OF SALE. THIS TERM SHEET IS NOT AN OFFER TO SELL THESE SECURITIES AND IT IS NOT A SOLICITATION OF AN OFFER TO BUY THESE SECURITIES IN ANY JURISDICTION WHERE THE OFFER OR SALE IS NOT PERMITTED.
| 67 |
MARRIOTT MONTEREY |
Operating History and Underwritten Net Cash Flow. The following table presents certain information relating to the historical operating performance and underwritten net cash flow at the Marriott Monterey Property:
Cash Flow Analysis
| 2013(1) | 2014(1) | 2015(1) | TTM 1/31/2016 | U/W | % of U/W Total Revenue | U/W $ per Room | ||||||||
| Occupancy | 73.9% | 75.7% | 79.9% | 80.5% | 80.5% | |||||||||
| ADR | $184.81 | $193.43 | $206.68 | $206.83 | $206.83 | |||||||||
| RevPAR | $136.48 | $146.35 | $165.11 | $166.45 | $166.45 | |||||||||
| Room Revenue | $16,986,725 | $18,215,957 | $20,550,079 | $20,717,202 | $20,717,202 | 70.9% | $60,754 | |||||||
| F&B Revenue | 5,992,885 | 7,123,197 | 7,710,548 | 7,653,899 | 7,653,899 | 26.2 | 22,445 | |||||||
| Other Revenue | 978,621 | 1,126,736 | 855,589 | 866,931 | 866,931 | 3.0 | 2,542 | |||||||
| Total Revenue | $23,958,231 | $26,465,890 | $29,116,216 | $29,238,032 | $29,238,032 | 100.0% | $85,742 | |||||||
| Total Department Expenses | 9,612,964 | 10,520,567 | 11,430,263 | 11,488,533 | 11,488,533 | 39.3 | 33,691 | |||||||
| Gross Operating Profit | $14,345,267 | $15,945,323 | $17,685,953 | $17,749,499 | $17,749,499 | 60.7% | $52,051 | |||||||
| Total Undistributed Expenses | 7,244,265 | 7,899,073 | 8,615,112 | 8,575,495 | 8,212,400(2) | 28.1 | 24,083 | |||||||
| Profit Before Fixed Charges | $7,101,002 | $8,046,250 | $9,070,841 | $9,174,004 | $9,537,099 | 32.6% | $27,968 | |||||||
| Total Fixed Charges | 967,122 | 918,318 | 932,360 | 926,888 | 957,686 | 3.3 | 2,808 | |||||||
| Net Operating Income | $6,133,880 | $7,127,932 | $8,138,481 | $8,247,116 | $8,579,412 | 29.3% | $25,160 | |||||||
| FF&E | 0 | 0 | 0 | 0 | 1,461,902 | 5.0 | 4,287 | |||||||
| Net Cash Flow | $6,133,880 | $7,127,932 | $8,138,481 | $8,247,116 | $7,117,511 | 24.3% | $20,872 | |||||||
| NOI DSCR | 1.38x | 1.60x | 1.83x | 1.85x | 1.93x | |||||||||
| NCF DSCR | 1.38x | 1.60x | 1.83x | 1.85x | 1.60x | |||||||||
| NOI DY | 9.4% | 11.0% | 12.5% | 12.7% | 13.2% | |||||||||
| NCF DY | 9.4% | 11.0% | 12.5% | 12.7% | 11.0% | |||||||||
| (1) | Net Operating Income has consistently increased year over year due to steady increases in RevPAR (7.2% growth in 2014 and 12.8% growth in 2015) as a result of the improving overall economy, no new supply being added to the market and a $6.2 million renovation at the Marriott Monterey Property between 2011 and 2014. |
| (2) | A management fee of 3.0% was underwritten per the new management agreement executed on March 11, 2016. |
Appraisal.As of the appraisal valuation date of November 12, 2015, the Marriott Monterey Property had an “as-is” appraised value of $120,100,000.
Environmental Matters. According to a Phase I environmental site assessment dated December 23, 2015, an eight-inch diameter monitoring well within the below grade garage floor was identified at the Marriott Monterey Property. Additional testing of the system components was performed and the engineer concluded that there was no indication of any diesel fuel leak, weep, seep or other release from any of the tested components. The Central Coast Regional Water Quality Control Board concluded no further action was required.
Market Overview and Competition.The Marriott Monterey Property is located in downtown Monterey, California, specifically in Monterey Old Town Historic District. Monterey County is a popular tourist destination on the west coast, with an estimated 8.1 million leisure and business travelers visiting the county each year, generating approximately $2.3 billion annually. The Marriott Monterey Property is located adjacent to the 58,000 square foot Monterey Conference Center (the “MCC”). The Marriott Monterey Property has an exclusive catering contract through December 2016 to provide food and beverage service for all events hosted at the MCC. According to the borrower, the Marriott Monterey Property has been awarded this contract for 15 of the past 16 years. The MCC contains meeting space, patios, galleries, terraces, and banquet facilities. The MCC is connected via pedestrian sky-bridge to both the Marriott Monterey Property and Portola Hotel & Spa, utilizing these hotels’ meeting and banquet facilities as additional function space. The MCC commenced an extensive $45.0 million renovation in November of 2015. The entire facility will be closed down for approximately 6-8 months of the Marriott Monterey Whole Loan term as it will open in phases beginning with the first floor, which is scheduled for completion by the summer of 2016, while the second and third floors are scheduled for completion by the end of 2016, and the entire facility is scheduled to reopen in January 2017. Renovation plans include reconfiguration of the existing 500-seat auditorium on the second floor, which will be altered to accommodate a 10,000-square foot ballroom and significant technological improvements. Once complete, the MCC will be transformed into a LEED-certified convention facility having the ability to host multiple meetings simultaneously, while offering more flexible meeting space and more efficient pre-function space. For risks related to the construction of the MCC (amongst other things), see also “Description of the Mortgage Pool - Redevelopment, Renovation and Expansion” in the Preliminary Prospectus.
Monterey’s Old Town Historic District is home to over 460 shops, restaurants, hotels, services business, the Old Monterey Farmers Market and a number of historical buildings that reflect the Spanish colonial era of the town. Attractions and amenities surrounding the Marriott Monterey Property include Fisherman’s Wharf, Cannery Row, Monterey Bay Aquarium, Del Monte Center, Del Monte Beach and the MCC. Fisherman’s Wharf, located less than a half-mile from the Marriott Monterey Property, features an abundance of shopping and dining options. Cannery Row, located approximately one mile north of the Marriott Monterey Property, is home to retail outlets, art galleries, restaurants and the Monterey Bay Aquarium. Located just over one and a half miles south of the Marriott Monterey Property is the Del Monte Center, one of the largest open-air lifestyle shopping centers in the Monterey Peninsula, featuring over 678,000 sqaure feet of dining and retail options. Anchored by Macy’s, Whole Foods Market and Century Theaters, Del
THE INFORMATION IN THIS STRUCTURAL AND COLLATERAL TERM SHEET IS NOT COMPLETE AND MAY BE AMENDED PRIOR TO THE TIME OF SALE. THIS TERM SHEET IS NOT AN OFFER TO SELL THESE SECURITIES AND IT IS NOT A SOLICITATION OF AN OFFER TO BUY THESE SECURITIES IN ANY JURISDICTION WHERE THE OFFER OR SALE IS NOT PERMITTED.
| 68 |
MARRIOTT MONTEREY |
Monte Center features more than 90 retailers, including Apple, GAP, Banana Republic, H&M, Pottery Barn, Victoria’s Secret and Starbucks Coffee. Del Monte Beach, located approximately two miles northeast of the Marriott Monterey Property, is home to a number of beach-related activities including body surfing, boogie boarding, surfing, dog walking, and picnicking.
The following table presents certain information relating to comparable office properties to the Marriott Monterey Property:
Subject and Market Historical Occupancy, ADR and RevPAR(1)
Competitive Set | Marriott Monterey | Penetration Factor | ||||||||||||||||
Year | Occupancy | ADR | RevPAR | Occupancy | ADR | RevPAR | Occupancy | ADR | RevPAR | |||||||||
| 1/31/2016 TTM | 79.6% | $182.13 | $144.92 | 80.5% | $206.83 | $166.45 | 101.1% | 113.6% | 114.9% | |||||||||
| 1/31/2015 TTM | 76.1% | $171.31 | $130.45 | 76.5% | $193.20 | $147.86 | 100.5% | 112.8% | 113.3% | |||||||||
| 1/31/2014 TTM | 72.9% | $162.98 | $118.89 | 72.9% | $185.94 | $135.52 | 99.9% | 114.1% | 114.0% | |||||||||
| (1) | Information obtained from a third party hospitality research report dated February 19, 2016. The competitive set includes the following hotels: Hyatt Regency Monterey Hotel & Spa on Del Monte Golf Course, Portola Hotel & Spa at Monterey, Hilton Garden Inn Monterey, and Embassy Suites Monterey Bay Seaside. |
The Borrower.The borrower is San Carlos Associates LLC, a Delaware limited liability company and single purpose entity with two independent directors. Legal counsel to the borrower delivered a non-consolidation opinion in connection with the origination of the Marriott Monterey Mortgage Whole Loan. The Marriott Monterey Whole Loan is not structured with a non-recourse carveout guarantor. The borrower, San Carlos Associates LLC, is the sole party liable for any breach or violation of the non-recourse provisions in the loan documents.
The Sponsor.The borrower, San Carlos Associates LLC, is the sole party liable for any breach or violation of the non-recourse provisions in the loan documents.San Carlos Associates LLC is owned by Old Monterey Associates, L.P. (34.5%) and Sea/Mont Associates, LP (65.5%). Old Monterey Associates, L.P. is a California limited partnership comprised of local investors in the original development of the Marriott Monterey Property. Sea/Mont Associates, LP, the managing member of the borrower, is a Washington limited partnership controlled by Stuart T. Rolfe and Frank K. Finneran.
Escrows.The loan documents provide for upfront reserves in the amount of $2,204 for insurance premiums and $96,665 for the seasonality reserve. The loan documents do not require monthly escrows for real estate taxes and insurance premiums so long as Marriot Hotel Services, Inc., the manager, is directly paying the taxes and insurance premiums for all coverages required pursuant to the loan documents. On each due date, the borrower is required to fund (i) an insurance reserve in an amount equal to one-twelfth of the amount the lender estimates will be necessary to pay the supplemental liability coverage, over the then-succeeding 12-month period, which currently equals $1,012 and (ii) a seasonality reserve in an amount equal to the applicable Seasonality Reserve Monthly Deposit (as defined below).
The “Seasonality Reserve Monthly Deposit” is equal to $238,824 on each payment date occurring in August, September, October and November during the 2016 and 2017 calendar year and $138,335 on each payment date occurring in April, August, September, October and November of each calendar year thereafter.
The loan documents do not require monthly escrows for FF&E expenses so long as either the borrower or the manager, pursuant to the terms of a franchise agreement or the management agreement, maintains a separate account for the sole purpose of reserving for approved FF&E expenses. The balance and amount of regular deposits to such account are determined at the lender’s sole discretion; the amounts currently set forth in the management agreement are acceptable to the lender. Upon the termination of the management agreement and the failure to enter into a replacement full service management agreement in accordance with the Marriott Monterrey Whole Loan agreement, the lender has the right to direct the borrower and the institution maintaining such account to transfer all amounts on deposit therein to the FF&E expense reserve account, and the borrower is required to commence making monthly payments to the FF&E expense reserve account in an amount equal to one-twelfth of 4.0% of gross revenues generated at the Marriott Monterey Property for the previous calendar year. The borrower is required to grant the lender a security interest in all accounts maintained by the borrower and, upon commencement of a Cash Management Period (as defined below), the institutions maintaining such accounts will be required to execute a control agreement satisfactory to the lender setting forth the lender’s rights to control such accounts and confirming the lender’s security interest therein.
Lockbox and Cash Management.The Marriott Monterey Whole Loan is structured with a hard lockbox and springing cash management. The borrower is required to cause all amounts payable to the borrower pursuant to the management agreement to be paid directly into such lockbox account. Upon the termination of the management agreement and the failure to enter into a replacement full service management agreement in accordance with the provisions of the loan documents, the borrower will be required to cause all rents, if any, and all credit card company payments to be paid directly into the lockbox account. Upon termination of the management agreement, all rents received by the borrower are required to be deposited into the lockbox account within two business days of receipt. During a Cash Management Period (as defined below), all funds in the lockbox account will be swept to a lender-controlled cash management account. Notwithstanding the provisions of above, for so long as the management agreement remains in effect (or a replacement thereof is entered into in accordance with provisions of the Marriott Monterey Whole Loan agreement), the amounts required to be deposited into the lockbox account by the borrower and the manager will be equal to all amounts payable or distributable to the borrower by the manager pursuant to the management agreement and the borrower is required to cause the manager to deposit such amounts directly into the lockbox account.
A “Cash Management Period” will commence upon the occurrence of: (i) an event of default under the Marriott Monterey Whole Loan; (ii) the incurrence of mezzanine debt (see “Subordinate and Mezzanine Indebtedness” section below); (iii) the debt service coverage ratio falling below 1.20x after the end of a calendar quarter; (iv) the commencement of a Franchise Sweep Event (as
THE INFORMATION IN THIS STRUCTURAL AND COLLATERAL TERM SHEET IS NOT COMPLETE AND MAY BE AMENDED PRIOR TO THE TIME OF SALE. THIS TERM SHEET IS NOT AN OFFER TO SELL THESE SECURITIES AND IT IS NOT A SOLICITATION OF AN OFFER TO BUY THESE SECURITIES IN ANY JURISDICTION WHERE THE OFFER OR SALE IS NOT PERMITTED.
| 69 |
MARRIOTT MONTEREY |
defined below); or (v) the borrower’s failure to make the Required Renovation Budget Payment (as defined below). A Cash Management Period will end with respect to clause (i) or (iii) above, if for six consecutive months (a) no default or event of default under the Marriott Monterey Whole Loan has occurred or is continuing; (b) no event that would trigger another Cash Management Period has occurred and (c) the debt service coverage ratio is at least 1.25x; with respect to clause (iv), the borrower has delivered to the lender a renewal of the existing management agreement or the borrower has entered into a replacement franchise agreement from a qualified franchisor, and any property improvement plan (“PIP”) work required pursuant to or in connection with the renewed management agreement or the replacement franchise agreement has been completed to the lender’s reasonable satisfaction and the satisfaction of the applicable franchisor/manager under the replacement franchise agreement; and with respect to clause (v), the deposit of the Required Renovation Budget Payment to the FF&E reserve maintained under the management agreement.
A “Franchise Sweep Event” will commence if on or prior to the earlier of (i) the actual date upon which the management agreement (or any replacement franchise agreement) is terminated for any reason, or (ii) the date that is 18 months prior to the scheduled expiration date of the management agreement (or any replacement franchise agreement), the borrower has not either (y) extended the existing management agreement beyond the Marriott Monterey Whole Loan term or (z) entered into a replacement franchise agreement in accordance with the Marriott Monterey Whole Loan agreement with a term extending beyond the Marriott Monterey Whole Loan term. Following the commencement and at all times during the continuance of any Cash Management Period following the occurrence of the Franchise Sweep Event, all excess cash is swept into the franchise termination reserve subaccount.
Pursuant to the annotated renovation budget approved by the lender, the borrower is required to deposit an additional $675,000 (the “Required Renovation Budget Payment”) into the FF&E reserve maintained under the management agreement on or prior to December 31, 2017. If the borrower fails to provide evidence to the lender of the payment of such amount on or before such date, then commencing on the payment date in January 2018, and so long as no event of default under the Marriott Monterey Whole Loan is continuing, the lender will be required to sweep excess cash available until such time as the balance therein equals $675,000.
Property Management. The Marriott Monterey Property is managed by Marriott Hotel Services, Inc., an affiliate of Marriott International. The management agreement expires in December 31, 2025, and is automatically renewed for one successive period of 10 years (to expire on December 31, 2035) and then one successive period of 6 years (to expire on December 31, 2041), unless Marriott Hotel Services, Inc. notifies the borrower of its election not to renew at least one year prior to the expiration of the then current term. Under the management agreement, Marriott Hotel Services, Inc. provided the borrower with $1.5 million in key money, of which a pro-rated amount must be paid back should the agreement be terminated prior to January 1, 2035. The $1.5 million in key money was deposited into the FF&E reserve that is held and controlled by Marriott Hotel Services, Inc. at origination. In addition, at closing, the borrower also deposited another $2,124,000 into the FF&E reserve to be used for the upcoming renovations.
Assumption.The borrower has the right to transfer the Marriott Monterey Property provided that certain conditions are satisfied, including (i) no event of default has occurred and is continuing; (ii) the lender has reasonably determined that the proposed transferee and guarantor satisfy the lender’s credit review and underwriting standards, taking into consideration the transferee’s experience, financial strength and general business standing; and (iii) if required by the lender, a rating agency comfort letter from DBRS, Fitch and Moody’s that the transfer will not result in a downgrade, withdrawal or qualification of the respective ratings assigned to the Series 2016-C34 Certificates.
Partial Release.Not permitted.
Real Estate Substitution.Not permitted.
Subordinate and Mezzanine Indebtedness.Future mezzanine debt is permitted subject to: (i) a maximum aggregate loan-to-value ratio of 75.0%; (ii) a minimum combined underwritten debt service coverage ratio of 1.30x; (iii) the receipt of a rating agency confirmation from DBRS, Fitch and Moody’s that the mezzanine financing will not result in a downgrade, withdrawal or qualification of the respective ratings assigned to the Series 2016-C34 Certificates; (iv) the execution of an intercreditor agreement acceptable to the lender; and (v) no event of default exists with respect to the Marriott Monterey Whole Loan.
Ground Lease.None.
Terrorism Insurance.The Loan documents provide that the required “all risk” insurance policy must include coverage for terrorism in an amount equal to the full replacement cost of the Marriott Monterey Property. The loan documents also require business interruption insurance containing an extended period of indemnity for no less than the 24-month period following the occurrence of a casualty event. If TRIPRA (or such subsequent statute, extension or reauthorization) is not in effect, the borrower will not be required to pay annual premiums for terrorism insurance in excess of an amount equal to two times the premium for a separate “special form” or “all risks” policy or equivalent policy insuring only the Marriott Monterey Property on a stand-alone basis (including, without limitation, detailed insurance requirements set forth in the Marriott Monterrey Whole Loan documents) at the time that any terrorism coverage is excluded from any applicable policy (but the borrower will be obligated to purchase the maximum amount of terrorism coverage available with funds equal to such cap).
Earthquake Insurance.The loan documents do not require earthquake insurance. The seismic report dated December 29, 2015 indicated a probable maximum loss of 7.0%.
THE INFORMATION IN THIS STRUCTURAL AND COLLATERAL TERM SHEET IS NOT COMPLETE AND MAY BE AMENDED PRIOR TO THE TIME OF SALE. THIS TERM SHEET IS NOT AN OFFER TO SELL THESE SECURITIES AND IT IS NOT A SOLICITATION OF AN OFFER TO BUY THESE SECURITIES IN ANY JURISDICTION WHERE THE OFFER OR SALE IS NOT PERMITTED.
| 70 |
(THIS PAGE INTENTIONALLY LEFT BLANK)
THE INFORMATION IN THIS STRUCTURAL AND COLLATERAL TERM SHEET IS NOT COMPLETE AND MAY BE AMENDED PRIOR TO THE TIME OF SALE. THIS TERM SHEET IS NOT AN OFFER TO SELL THESE SECURITIES AND IT IS NOT A SOLICITATION OF AN OFFER TO BUY THESE SECURITIES IN ANY JURISDICTION WHERE THE OFFER OR SALE IS NOT PERMITTED.
| 71 |
| 200 PRECISION & 425 PRIVET PORTFOLIO |
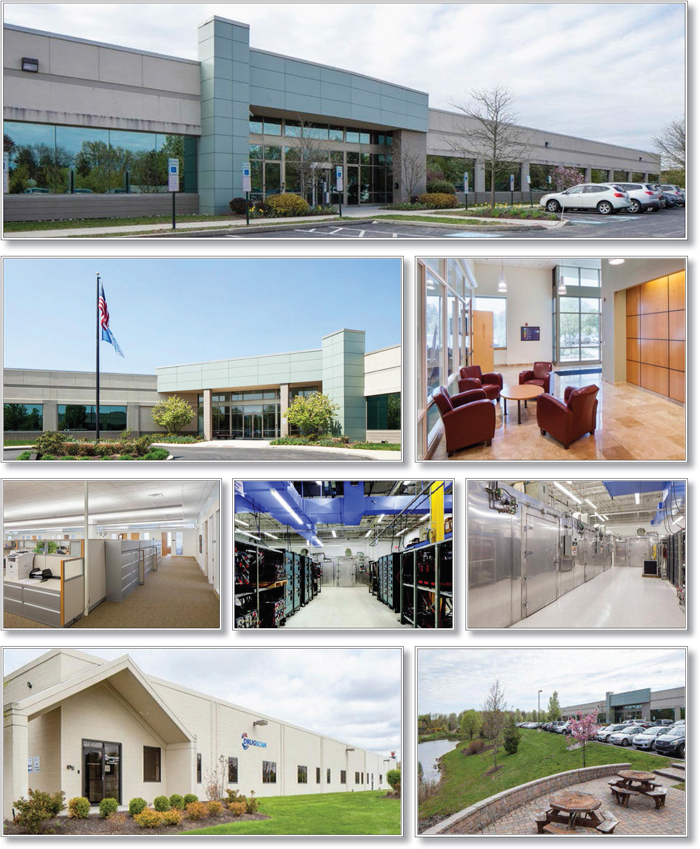
THE INFORMATION IN THIS STRUCTURAL AND COLLATERAL TERM SHEET IS NOT COMPLETE AND MAY BE AMENDED PRIOR TO THE TIME OF SALE. THIS TERM SHEET IS NOT AN OFFER TO SELL THESE SECURITIES AND IT IS NOT A SOLICITATION OF AN OFFER TO BUY THESE SECURITIES IN ANY JURISDICTION WHERE THE OFFER OR SALE IS NOT PERMITTED.
| 72 |
| 200 PRECISION & 425 PRIVET PORTFOLIO |
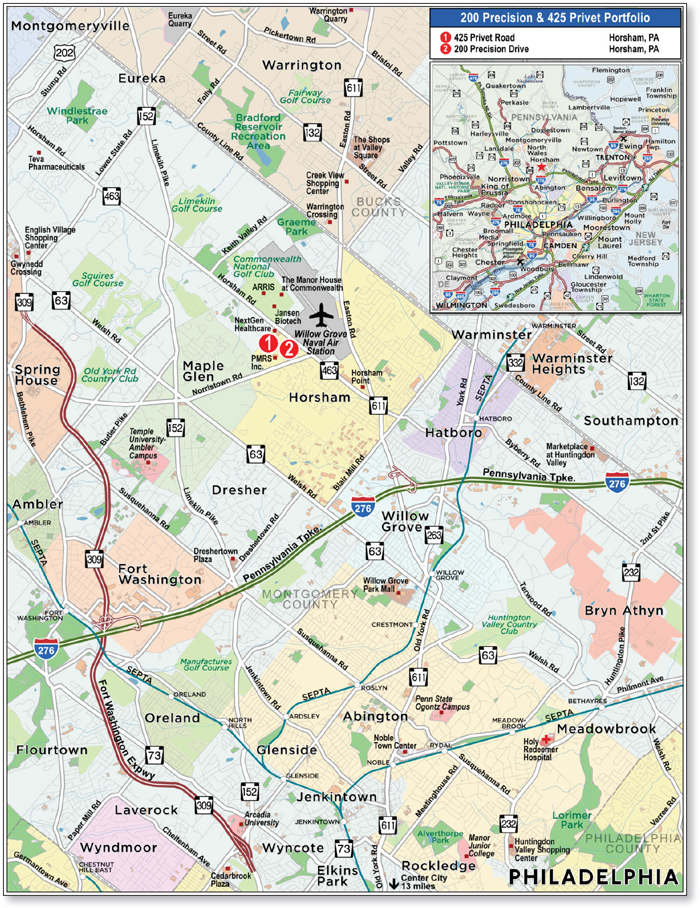
THE INFORMATION IN THIS STRUCTURAL AND COLLATERAL TERM SHEET IS NOT COMPLETE AND MAY BE AMENDED PRIOR TO THE TIME OF SALE. THIS TERM SHEET IS NOT AN OFFER TO SELL THESE SECURITIES AND IT IS NOT A SOLICITATION OF AN OFFER TO BUY THESE SECURITIES IN ANY JURISDICTION WHERE THE OFFER OR SALE IS NOT PERMITTED.
| 73 |
| No. 6 – 200 Precision & 425 Privet Portfolio | |||||||
| Loan Information | Property Information | ||||||
| Mortgage Loan Seller: | Silverpeak Real Estate Finance LLC | Single Asset/Portfolio: | Portfolio | ||||
| Credit Assessment (DBRS/Fitch/Moody’s): | NR/NR/NR | Property Type: | Various – See Table | ||||
| Original Principal Balance: | $28,000,000 | Specific Property Type: | Various – See Table | ||||
| Cut-off Date Balance: | $28,000,000 | Location: | Horsham, PA | ||||
| % of Initial Pool Balance: | 4.0% | Size: | 246,790 SF | ||||
| Loan Purpose: | Refinance | Cut-off Date Balance Per SF: | $113.46 | ||||
| Borrower Name: | Horsham Property Associates, LP | Year Built/Renovated: | Various – See Table | ||||
| Sponsors: | William A. White; Benjamin I. Cohen | Title Vesting: | Fee | ||||
| Mortgage Rate: | 4.750% | Property Manager: | Self-managed | ||||
| Note Date: | October 30, 2015 | 4th Most Recent Occupancy (As of): | 81.6% (12/31/2011) | ||||
| Anticipated Repayment Date: | NAP | 3rd Most Recent Occupancy (As of): | 100.0% (12/31/2012) | ||||
| Maturity Date: | November 6, 2025 | 2nd Most Recent Occupancy (As of): | 100.0% (12/31/2013) | ||||
| IO Period: | 48 months | Most Recent Occupancy (As of): | 100.0% (12/31/2014) | ||||
| Loan Term (Original): | 120 months | Current Occupancy (As of): | 100.0% (12/31/2015) | ||||
| Seasoning: | 6 months | ||||||
| Amortization Term (Original): | 360 months | Underwriting and Financial Information: | |||||
| Loan Amortization Type: | Interest-only, Amortizing Balloon | ||||||
| Interest Accrual Method: | Actual/360 | 4th Most Recent NOI (As of)(3): | $3,007,976 (12/31/2012) | ||||
| Call Protection: | L(30),D(83),O(7) | 3rd Most Recent NOI (As of)(3): | $2,735,679 (12/31/2013) | ||||
| Lockbox Type: | Hard/Springing Cash Management | 2nd Most Recent NOI (As of): | $2,966,342 (12/31/2014) | ||||
| Additional Debt(1): | Yes | Most Recent NOI (As of): | $3,097,537 (12/31/2015) | ||||
| Additional Debt Type(1): | Future Mezzanine | ||||||
| U/W Revenues: | $4,546,897 | ||||||
| U/W Expenses: | $1,684,576 | ||||||
| U/W NOI: | $2,862,292 | ||||||
| U/W NCF: | $2,689,539 | ||||||
| Escrows and Reserves(2): | U/W NOI DSCR: | 1.63x | |||||
| U/W NCF DSCR: | 1.53x | ||||||
| Type: | Initial | Monthly | Cap (If Any) | U/W NOI Debt Yield: | 10.2% | ||
| Taxes | $142,677 | $35,669 | NAP | U/W NCF Debt Yield: | 9.6% | ||
| Insurance | $17,222 | $5,741 | NAP | As-Is Appraised Value: | $39,100,000 | ||
| Replacement Reserves | $0 | $4,113 | $125,000 | As-Is Appraisal Valuation Date: | October 12, 2015 | ||
| TI/LC Reserve | $0 | $10,283 | $200,000 | Cut-off Date LTV Ratio: | 71.6% | ||
| Deferred Maintenance | $24,894 | $0 | NAP | LTV Ratio at Maturity or ARD: | 64.5% | ||
| (1) | See “Subordinate and Mezzanine Indebtedness” section. |
| (2) | See “Escrows” section. |
| (3) | See “Cash Flow Analysis” section. |
The Mortgage Loan. The mortgage loan (the “200 Precision & 425 Privet Portfolio Mortgage Loan”) is evidenced by a single promissory note that is secured by a first mortgage encumbering the fee interest in a 126,500 square foot flex/industrial building and a 120,290 square foot office building located in Horsham, Pennsylvania (the “200 Precision & 425 Privet Portfolio Properties”). The 200 Precision & 425 Privet Portfolio Mortgage Loan was originated on October 30, 2015 by Silverpeak Real Estate Finance LLC. The 200 Precision & 425 Privet Portfolio Mortgage Loan had an original principal balance of $28,000,000, has an outstanding principal balance as of the Cut-off Date of $28,000,000 and accrues interest at an interest rate of 4.750%per annum. The 200 Precision & 425 Privet Portfolio Mortgage Loan had an initial term of 120 months, has a remaining term of 114 months as of the Cut-off Date, requires interest-only payments for the first 48 payments following origination and, thereafter, requires payments of principal and interest based on a 30-year amortization schedule. The 200 Precision & 425 Privet Portfolio Mortgage Loan matures on November 6, 2025.
Following the lockout period, the borrower has the right to defease the 200 Precision & 425 Privet Portfolio Mortgage Loan in whole but not in part on any payment date before May 6, 2025. In addition, the 200 Precision & 425 Privet Portfolio Mortgage Loan is prepayable without penalty on or after May 6, 2025.
THE INFORMATION IN THIS STRUCTURAL AND COLLATERAL TERM SHEET IS NOT COMPLETE AND MAY BE AMENDED PRIOR TO THE TIME OF SALE. THIS TERM SHEET IS NOT AN OFFER TO SELL THESE SECURITIES AND IT IS NOT A SOLICITATION OF AN OFFER TO BUY THESE SECURITIES IN ANY JURISDICTION WHERE THE OFFER OR SALE IS NOT PERMITTED.
| 74 |
| 200 PRECISION & 425 PRIVET PORTFOLIO |
Sources and Uses
| Sources | Uses | |||||||
| Original loan amount | $28,000,000 | 100.0% | Loan payoff | $19,555,676 | 69.8% | |||
| Reserves | 184,793 | 0.7 | ||||||
| Closing costs | 372,124 | 1.3 | ||||||
| Return of equity | 7,887,407 | 28.2 | ||||||
| Total Sources | $28,000,000 | 100.0% | Total Uses | $28,000,000 | 100.0% |
The Properties. The 200 Precision & 425 Privet Portfolio Properties are comprised of two adjacent buildings totaling 246,790 square feet located at 200 Precision Drive and 425 Privet Road in Horsham, Pennsylvania, approximately 18.0 miles northwest of Center City Philadelphia. According to the sponsors, since 2007, they have invested approximately $8.1 million ($32.82 per square foot) in capital expenditures across the 200 Precision & 425 Privet Properties. The sponsors’ cost basis in the 200 Precision & 425 Privet Portfolio Properties is approximately $36.0 million.
The 425 Privet Road property is a 120,290 square foot (48.7% of the net rentable area), single story office building situated on a 13.1-acre site, which features 615 surface parking spaces, reflecting a parking ratio of 5.1 spaces per 1,000 square feet of rentable area. Formerly an industrial building that was converted into office use in 2001, the 425 Privet Road property is currently 100.0% occupied by Teva Pharmaceuticals (“Teva”), which has been at the property since 2005. Teva (NYSE: TEVA) is a leading global pharmaceutical company and the world’s largest generic medicines producer with a market capitalization of $51.7 billion as of April 22, 2016. The 425 Privet Road property was expanded by 50,000 square feet in 2008 at a cost of approximately $6.6 million, of which Teva contributed approximately $900,000.
The 200 Precision Drive property is a single story flex/industrial building totaling 126,500 square feet with 16 to 18-foot ceiling heights on an 11.1-acre parcel of land. The 200 Precision Drive property consists of 58,190 square feet of lab space (23.6% of the net rentable area), 43,010 square feet of office space (17.4% of the net rentable area) and 25,300 square feet of warehouse space (10.3% of the net rentable area) and features 478 surface parking spaces, reflecting a parking ratio of 3.8 spaces per 1,000 square feet of rentable area. The 200 Precision Drive property is currently 100.0% occupied by three tenants. Finisar Corporation (“Finisar”) (NASDAQ: FNSR) leases 63,757 square feet (25.8% of the net rentable area) and utilizes this space as one of three U.S.-based research and development facilities. Headquartered in Sunnyvale, California, Finisar is a global technology leader for subsystems and components for fiber optic communications. Finisar or an affiliated predecessor company has been at the property since 2000. DrugScan, Inc. occupies 45,525 square feet (18.4% of the net rentable area) and has invested over $2.0 million ($43.93 per square foot) into its space, which serves as its corporate headquarters. DrugScan, Inc. provides clinical and forensic toxicology, medication monitoring and drug detection laboratory services. C&D Technologies occupies 17,218 square feet (7.0% of the net rentable area) and utilizes its space as a corporate test lab with its headquarters located approximately 10.0 miles southwest from the 200 Precision Drive property. C&D Technologies is a technology company that produces and markets systems for the conversion and storage of electrical power.
The following table presents certain information relating to the 200 Precision & 425 Privet Portfolio Properties:
| Property Name – Location | Property Type | Allocated Cut-off Date Balance | % of Portfolio Cut-off Date Balance | Occupancy | Year Built/ Renovated | Net Rentable Area (SF) | Appraised Value |
| 425 Privet Road – Horsham, PA | Office | $18,583,120 | 66.4% | 100.0% | 1970/2008 | 120,290 | $25,950,000 |
| 200 Precision Drive – Horsham, PA | Industrial | $9,416,880 | 33.6% | 100.0% | 1974/1994 | 126,500 | $13,150,000 |
| Total/Weighted Average | $28,000,000 | 100.0% | 100.0% | 246,790 | $39,100,000 |
THE INFORMATION IN THIS STRUCTURAL AND COLLATERAL TERM SHEET IS NOT COMPLETE AND MAY BE AMENDED PRIOR TO THE TIME OF SALE. THIS TERM SHEET IS NOT AN OFFER TO SELL THESE SECURITIES AND IT IS NOT A SOLICITATION OF AN OFFER TO BUY THESE SECURITIES IN ANY JURISDICTION WHERE THE OFFER OR SALE IS NOT PERMITTED.
| 75 |
| 200 PRECISION & 425 PRIVET PORTFOLIO |
The following table presents certain information relating to the tenancies at the 200 Precision & 425 Privet Portfolio Properties:
Major Tenants
| Tenant Name | Credit Rating (Fitch/ Moody’s/ S&P)(1) | Tenant NRSF | % of NRSF | Annual U/W Base Rent PSF(2) | Annual U/W Base Rent(2) | % of Total Annual U/W Base Rent | Lease Expiration Date | ||
| Major Tenants | |||||||||
| Teva(3) | BBB+/Baa1/BBB+ | 120,290 | 48.7% | $17.69(4) | $2,127,847(4) | 59.8% | 1/31/2025(5) | ||
| Finisar(6) | NR/NR/NR | 63,757(7) | 25.8% | $13.25 | $844,780 | 23.7% | 6/30/2018(8) | ||
| DrugScan, Inc. (6) | NR/NR/NR | 45,525 | 18.4% | $9.55 | $434,677 | 12.2% | 8/31/2022(9) | ||
| C&D Technologies(6) | NR/NR/NR | 17,218 | 7.0% | $8.75 | $150,699 | 4.2% | 9/30/2017(10) | ||
| Total Major Tenants | 246,790 | 100.0% | $14.42 | $3,558,004 | 100.0% | ||||
| Occupied Collateral Total | 246,790 | 100.0% | $14.42 | $3,558,004 | 100.0% | ||||
| Vacant Space | 0 | 0.0% | |||||||
| Collateral Total | 246,790 | 100.0% | |||||||
| (1) | Certain ratings are those of the parent company whether or not the parent guarantees the lease. |
| (2) | Annual U/W Base Rent PSF and Annual U/W Base Rent include contractual rent steps through January 2017 totaling $32,989. |
| (3) | Located at 425 Privet Road. |
| (4) | Teva has the right to terminate its lease effective November 30, 2019 with 24 months’ written notice and payment of a termination fee of $1,250,000 ($10.39 per square foot on the Teva space), one-half of which is payable on or before December 5, 2017 and the other half payable on or before November 5, 2019. If Teva does not exercise its termination option, its base rent will step down from $18.94 psf NNN to $16.22 psf NNN on December 1, 2019 and increase 2.0% annually thereafter until the expiration of the lease. Teva’s Annual U/W Base Rent represents its average base rent over Teva’s remaining lease term, including the stepped down rent. Teva’s current annual rent is $2,147,177 ($17.85 psf NNN). |
| (5) | Teva has one, five-year lease renewal option. |
| (6) | Located at 200 Precision Drive. |
| (7) | Finisar is currently not utilizing approximately 7,000 square feet (2.8% of the total net rentable area) of its space. |
| (8) | Finisar has one, five-year lease renewal option. In the event that Finisar elects to exercise its renewal option, the borrower is required to provide Finisar with a construction allowance equal to $446,299. |
| (9) | DrugScan, Inc. has two, five-year lease renewal options. |
| (10) | C&D Technologies has one, seven-year lease renewal option. |
The following table presents certain information relating to the lease rollover schedule at the 200 Precision & 425 Privet Portfolio Properties:
Lease Expiration Schedule(1)(2)
| Year Ending December 31, | No. of Leases Expiring | Expiring NRSF | % of Total NRSF | Cumulative Expiring NRSF | Cumulative % of Total NRSF | Annual U/W Base Rent | % of Total Annual U/W Base Rent | Annual U/W Base Rent PSF |
| MTM | 0 | 0 | 0.0% | 0 | 0.0% | $0 | 0.0% | $0.00 |
| 2016 | 0 | 0 | 0.0% | 0 | 0.0% | $0 | 0.0% | $0.00 |
| 2017 | 1 | 17,218 | 7.0% | 17,218 | 7.0% | $150,699 | 4.2% | $8.75 |
| 2018 | 1 | 63,757 | 25.8% | 80,975 | 32.8% | $844,780 | 23.7% | $13.25 |
| 2019 | 0 | 0 | 0.0% | 80,975 | 32.8% | $0 | 0.0% | $0.00 |
| 2020 | 0 | 0 | 0.0% | 80,975 | 32.8% | $0 | 0.0% | $0.00 |
| 2021 | 0 | 0 | 0.0% | 80,975 | 32.8% | $0 | 0.0% | $0.00 |
| 2022 | 1 | 45,525 | 18.4% | 126,500 | 51.3% | $434,677 | 12.2% | $9.55 |
| 2023 | 0 | 0 | 0.0% | 126,500 | 51.3% | $0 | 0.0% | $0.00 |
| 2024 | 0 | 0 | 0.0% | 126,500 | 51.3% | $0 | 0.0% | $0.00 |
| 2025 | 1 | 120,290 | 48.7% | 246,790 | 100.0% | $2,127,847 | 59.8% | $17.69 |
| 2026 | 0 | 0 | 0.0% | 246,790 | 100.0% | $0 | 0.0% | $0.00 |
| Thereafter | 0 | 0 | 0.0% | 246,790 | 100.0% | $0 | 0.0% | $0.00 |
| Vacant | 0 | 0 | 0.0% | 246,790 | 100.0% | $0 | 0.0% | $0.00 |
| Total/Weighted Average | 4 | 246,790 | 100.0% | $3,558,004 | 100.0% | $14.42 |
| (1) | Information obtained from the underwritten rent roll. |
| (2) | Certain tenants may have lease termination options that are exercisable prior to the originally stated expiration date of the subject lease and that are not considered in the Lease Expiration Schedule. |
THE INFORMATION IN THIS STRUCTURAL AND COLLATERAL TERM SHEET IS NOT COMPLETE AND MAY BE AMENDED PRIOR TO THE TIME OF SALE. THIS TERM SHEET IS NOT AN OFFER TO SELL THESE SECURITIES AND IT IS NOT A SOLICITATION OF AN OFFER TO BUY THESE SECURITIES IN ANY JURISDICTION WHERE THE OFFER OR SALE IS NOT PERMITTED.
| 76 |
| 200 PRECISION & 425 PRIVET PORTFOLIO |
The following table presents historical occupancy percentages at the 200 Precision & 425 Privet Portfolio Properties:
Historical Occupancy
12/31/2011(1)(2) | 12/31/2012(1)(2) | 12/31/2013(1) | 12/31/2014(1) | 12/31/2015(3) | ||||
| 81.6% | 100.0% | 100.0% | 100.0% | 100.0% |
| (1) | Information obtained from the borrower. |
| (2) | Occupancy increased from 2011 to 2012 due to one tenant totaling 45,525 square feet (18.4% of the net rentable area) taking occupancy in 2012. |
| (3) | Information obtained from the underwritten rent roll. |
Operating History and Underwritten Net Cash Flow. The following table presents certain information relating to the historical operating performance and the underwritten net cash flow at the 200 Precision & 425 Privet Portfolio Properties:
Cash Flow Analysis
| 2012 | 2013 | 2014 | 2015 | U/W | % of U/W Effective Gross Income | U/W $ per SF | ||||||||
| Base Rent | $3,022,328 | $3,105,887 | $3,253,417 | $3,413,212 | $3,558,004(1) | 78.3% | $14.42 | |||||||
| Grossed Up Vacant Space | 0 | 0 | 0 | 0 | 0 | 0.0 | 0.00 | |||||||
| Total Reimbursables | 1,358,196 | 1,154,045 | 1,209,292 | 1,367,447 | 1,422,823 | 31.3 | 5.77 | |||||||
| Other Income | 0 | 0 | 0 | 0 | 0 | 0.0 | 0.00 | |||||||
| Less Vacancy & Free Rent | 0 | 0 | 0 | 0 | (433,959)(2) | (9.5) | (1.76) | |||||||
| Effective Gross Income | $4,380,524 | $4,259,932 | $4,462,709 | $4,780,659 | $4,546,867 | 100.0% | $18.42 | |||||||
| Total Operating Expenses | $1,372,548 | $1,524,253 | $1,496,367 | $1,683,122 | $1,684,576 | 37.0% | $6.83 | |||||||
|
|
|
|
|
|
| ||||||||
| Net Operating Income | $3,007,976(3) | $2,735,679(3) | $2,966,342 | $3,097,537 | $2,862,292 | 63.0% | $11.60 | |||||||
| TI/LC | 0 | 0 | 0 | 0 | 123,395 | 2.7 | 0.50 | |||||||
| Capital Expenditures | 0 | 0 | 0 | 0 | 49,358 | 1.1 | 0.20 | |||||||
| Net Cash Flow | $3,007,976 | $2,735,679 | $2,966,342 | $3,097,537 | $2,689,539 | 59.2% | $10.90 | |||||||
| NOI DSCR | 1.72x | 1.56x | 1.69x | 1.77x | 1.63x | |||||||||
| NCF DSCR | 1.72x | 1.56x | 1.69x | 1.77x | 1.53x | |||||||||
| NOI DY | 10.7% | 9.8% | 10.6% | 11.1% | 10.2% | |||||||||
| NCF DY | 10.7% | 9.8% | 10.6% | 11.1% | 9.6% |
| (1) | The U/W Base Rent includes contractual rent steps through January 2017 totaling $32,989. |
| (2) | The underwritten economic vacancy is 8.7%. As of December 31, 2015, the 200 Precision & 425 Privet Portfolio Properties were 100.0% occupied. |
| (3) | The Net Operating Income decreased from 2012 to 2013 primarily due to a change in Finisar’s lease structure from a triple net basis to gross over base year in 2013. Finisar agreed to a new base rent schedule in conjunction with the change in their reimbursement method. |
Appraisal.As of the appraisal valuation date of October 12, 2015, the 200 Precision & 425 Privet Portfolio Properties had an “as-is” appraised value of $39,100,000.
Environmental Matters. According to Phase I environmental site assessments dated October 19, 2015, there was no evidence of any recognized environmental conditions at the 200 Precision & 425 Privet Portfolio Properties.
Market Overview and Competition. The 200 Precision and 425 Privet Portfolio Properties are located in the northwestern quadrant of the Philadelphia Metropolitan Area in Horsham Township, Pennsylvania. The 200 Precision & 425 Privet Portfolio Properties are located approximately 18.0 miles northwest of Center City Philadelphia and approximately 3.0 miles northwest of the Pennsylvania Turnpike (Interstate 276), which provides access to major interstate highways including I-76, I-476 and I-95. Public transportation is also supplied to the neighborhood by the Southeastern Pennsylvania Transportation Authority (SEPTA). According to the appraisal, the 2015 population within a three- and five-mile radius of the 200 Precision & 425 Privet Portfolio Properties was 57,684 and 183,100, respectively, and 2015 average household income within the same radii was $107,496 and $102,640, respectively.
425 Privet Road
According to a third party research report, the 425 Privet Road property is located within the Horsham/Willow Grove office submarket of the Philadelphia market. As of the first quarter of 2016, the Horsham/Willow Grove office submarket had a total office inventory of 11,705,763 square feet, a vacancy rate of 9.4% and average asking rents of $23.45 per square foot, on a gross basis. The appraiser concluded a market rent of $23.00 per square foot, on a gross basis.
200 Precision Drive
According to a third party research report, the 200 Precision Drive property is located within the East Montgomery industrial/flex submarket of the Philadelphia market. As of the first quarter of 2016, the East Montgomery industrial/flex submarket had a total industrial/flex inventory of 11,956,640 square feet, a vacancy rate of 10.4% and average asking rents of $10.05 per square foot. The appraiser concluded a market rent of $9.00 per square foot, on a triple net basis.
THE INFORMATION IN THIS STRUCTURAL AND COLLATERAL TERM SHEET IS NOT COMPLETE AND MAY BE AMENDED PRIOR TO THE TIME OF SALE. THIS TERM SHEET IS NOT AN OFFER TO SELL THESE SECURITIES AND IT IS NOT A SOLICITATION OF AN OFFER TO BUY THESE SECURITIES IN ANY JURISDICTION WHERE THE OFFER OR SALE IS NOT PERMITTED.
| 77 |
| 200 PRECISION & 425 PRIVET PORTFOLIO |
The following table presents certain information relating to comparable leases for the 200 Precision Drive property:
Comparable Leases(1)
| Property Name/Location | Year Built/ Renovated | Total GLA (SF) | Total Occupancy | Distance from Subject | Tenant Name | Lease Date/Term | Lease Area (SF) | Annual Base Rent PSF | Lease Type |
| Valley Forge Business Campus / Norristown, PA | 1986/NAV | 38,564 | 89.6% | 25.6 miles | Insight Pest Solution | May 2015 / 5 Yrs | 3,785 | $10.00 | NNN |
| 700 Veterans Circle / Warminster, PA | 2004/NAV | 34,302 | 83.4% | 5.7 miles | Confidential | April 2014 / 7.5 Yrs | 15,463 | $10.75 | NNN |
| 702 Electronic Drive / Horsham, PA | 1983/NAV | 40,171 | 92.7% | 3.3 miles | Bioquell | January 2013 / 12 Yrs | 12,204 | $8.02 | NNN |
| 121 Green Tree Road / Phoenixville, PA | 2006/NAV | 57,600 | 100.0% | 29.4 miles | Cosentino NA | July 2013 / 6 Yrs | 32,000 | $8.65 | NNN |
| 1 Great Valley Parkway / Malvern, PA | 1982/NAV | 60,880 | 100.0% | 27.0 miles | TelaBio | February 2013 / 5.3 Yrs | 11,460 | $11.60 | NNN |
| 111-159 Gibraltar Road / Horsham, PA | 1981/NAV | 63,036 | 93.6% | 2.6 miles | Quoted | October 2015 / Negotiable | 6,000 | $10.00 | NNN |
| (1) | Information obtained from the appraisal and a third party market report. |
The following table presents certain information relating to comparable leases for the 425 Privet Road property:
Comparable Leases(1)
| Property Name/Location | Year Built/ Renovated | Total GLA (SF) | Total Occupancy | Distance from Subject | Tenant Name | Lease Date/Term | Lease Area (SF) | Annual Base Rent PSF | Lease Type |
| Montgomery Corporate Center / Dresher, PA | 2002/NAV | 225,722 | 100.0% | 3.6 miles | Ascensus, Inc. | February 2013 / 10 Yrs | 132,921 | $23.56 | FSG |
| Blair Mill Business Center / Horsham, PA | 1987/NAV | 97,123 | 81.9% | 2.8 miles | Impact RX | January 2013 / 7 Yrs | 38,000 | $16.50 | FSG |
| One Providence / Horsham, PA | 1989/NAV | 115,850 | 88.5% | 0.7 miles | Financial Software Systems, Inc. | March 2012 / 11 Yrs | 28,546 | $20.75 | FSG |
| Pennsylvania Business Campus / Horsham, PA | 1996/NAV | 64,452 | 100.0% | 2.5 miles | Severn Trent Services | June 2014 / 10.7 Yrs | 14,000 | $21.00 | FSG |
| Horsham Business Center / Horsham, PA | 1997/NAV | 26,637 | 100.0% | 2.6 miles | Bimbo Bakeries USA, Inc. | April 2014 / 9.4 Yrs | 59,338 | $19.65 | FSG |
| Horsham Business Center / Horsham, PA | 1997/NAV | 26,637 | 100.0% | 2.6 miles | iGate Corporation | January 2015 / 7.5 Yrs | 22,032 | $20.45 | MG |
| (1) | Information obtained from the appraisal and a third party market report. |
The Borrower.The borrower is Horsham Property Associates, LP, a Pennsylvania limited partnership and single purpose entity with two independent directors. Legal counsel to the borrower delivered a non-consolidation opinion in connection with the origination of the 200 Precision & 425 Privet Portfolio Mortgage Loan. William A. White and Benjamin I. Cohen are the guarantors of certain nonrecourse carveouts under the 200 Precision & 425 Privet Portfolio Mortgage Loan.
The Sponsors.The sponsors are William A. White and Benjamin I. Cohen. In 2002, Mr. White and Mr. Cohen founded Endurance Real Estate Group, LLC (“Endurance”), which is based in Bala Cynwyd, Pennsylvania. Endurance focuses on the creation, development and management of real estate projects in the Mid-Atlantic States. Since its formation, Endurance has acquired approximately $400.0 million of assets totaling 7.5 million square feet.
Escrows.The loan documents provide for upfront reserves in the amount of $142,677 for real estate taxes, $17,222 for insurance premiums and $24,894 for deferred maintenance. The loan documents provide for ongoing monthly escrows of $35,669 for real estate taxes, $5,741 for insurance premiums, $4,113 for replacement reserves (subject to a cap of $125,000) and $10,283 for tenant improvements and leasing commissions (subject to a cap of $200,000).
Lockbox and Cash Management. The 200 Precision & 425 Privet Portfolio Mortgage Loan requires a lender-controlled lockbox account, which is already in place, and that the borrower and property manager direct all tenants to pay rents directly into such lockbox account. The loan documents also require that all rents received by the borrower or property manager be deposited into the lockbox account within one business day of receipt. Prior to the occurrence of a Cash Management Period (as defined below), all funds on deposit in the lockbox account are disbursed to the borrower. During a Cash Management Period, all funds are swept to a lender-controlled cash management account. With respect to a Cash Management Period as a result of a Lease Sweep Period (as defined below), all funds are swept to a reserve subaccount, the “Special Rollover Reserve Subaccount”.
THE INFORMATION IN THIS STRUCTURAL AND COLLATERAL TERM SHEET IS NOT COMPLETE AND MAY BE AMENDED PRIOR TO THE TIME OF SALE. THIS TERM SHEET IS NOT AN OFFER TO SELL THESE SECURITIES AND IT IS NOT A SOLICITATION OF AN OFFER TO BUY THESE SECURITIES IN ANY JURISDICTION WHERE THE OFFER OR SALE IS NOT PERMITTED.
| 78 |
| 200 PRECISION & 425 PRIVET PORTFOLIO |
A “Cash Management Period” will commence upon the earlier of (i) the occurrence of an event of default; (ii) the amortizing debt service coverage ratio being less than 1.10x at the end of any calendar quarter; or (iii) the commencement of a Lease Sweep Period. A Cash Management Period will end, with regard to clause (i), upon the cure of such event of default and no other event of default has occurred and is continuing; with regard to clause (ii), upon the amortizing debt service coverage ratio being equal to or greater than 1.10x for two consecutive calendar quarters; and with regard to clause (iii), once the Lease Sweep Period has ended.
A “Lease Sweep Period” will commence upon the occurrence of any of the following: (i) the date that is 12 months prior to the end of the term of any lease (inclusive of renewal terms) at the 200 Precision & 425 Privet Portfolio Properties that represents at least 60,000 square feet or more than 20.0% of the total rentable square footage (a “Major Lease”); (ii) the date required under a Major Lease by which the applicable tenant is required to give notice of its exercise of a renewal option thereunder (and such renewal has not been so exercised); (iii) the date any Major Lease is surrendered, cancelled or terminated prior to its then current expiration date; (iv) the date any tenant under a Major Lease goes dark, discontinues its business or gives notice of its intent to discontinue its business (unless such tenant under a Major Lease or its parent entity or guarantor of the applicable Major Lease has a market capitalization over $1.0 billion and/or is rated investment grade by at least two national rating agencies); (v) the occurrence and continuance (beyond any applicable notice and cure periods) of a monetary default under any Major Lease by the applicable tenant; or (vi) an insolvency proceeding with respect to a tenant under a Major Lease.
A Lease Sweep Period will end, (a) with the exception of the Teva lease, upon collecting $15 per square foot for the applicable space demised by the Major Lease, or (b) with respect to clauses (i), (ii), (iii) or (iv) above, on the date that the Combined Adjusted Debt Yield (as defined below) is at least 8.0% and either of the following has occurred (x) a tenant under a Major Lease exercises its renewal or extension option on a lease acceptable to the lender with respect to at least 70.0% of its space and the lender determines that funds accumulated in the Special Rollover Reserve Subaccount are sufficient to cover leasing expenses and rent abatement periods in connection with such extension or (y) 70.0% of the Major Lease space being leased to one or more replacement tenants acceptable to the lender and the lender determining that funds accumulated in the Special Rollover Reserve Subaccount are sufficient to cover leasing expenses and rent abatement periods under such acceptable lease; with respect to clause (v) above, the applicable default has been cured, and no default by any other tenant under a Major Lease has occurred for a period of three consecutive months following such cure; or with respect to clause (vi) above, the applicable insolvency proceeding has terminated and the applicable Major Lease has been affirmed, assumed or assigned in a manner satisfactory to the lender.
“Combined Adjusted Debt Yield” means the ratio of the net cash flow to the amount equal to (i) the aggregate amount of the 200 Precision & 425 Privet Portfolio Mortgage Loan and the approved mezzanine loan (if any) less (ii) the balance of the Special Rollover Reserve Subaccount in excess of the amount necessary to pay all then unpaid Major Lease leasing expenses.
Property Management.The 200 Precision & 425 Privet Portfolio Properties are managed by an affiliate of the borrower.
Assumption.The borrower has the right to transfer the 200 Precision & 425 Privet Portfolio Properties, provided that certain conditions are satisfied, including (i) no event of default has occurred and is continuing; (ii) the lender has reasonably determined that the proposed transferee and guarantor satisfy the lender’s credit review and underwriting standards, taking into consideration transferee experience, financial strength and general business standing; and (iii) the lender has received confirmation from DBRS, Fitch and Moody’s that such assumption will not result in a downgrade, withdrawal or qualification of the respective ratings assigned to the Series 2016-C34 Certificates.
Partial Release.Not permitted.
Real Estate Substitution.Not permitted.
Subordinate and Mezzanine Indebtedness.The borrower is permitted to incur future mezzanine debt only in connection with a transfer and assumption of the 200 Precision & 425 Privet Portfolio Mortgage Loan, provided the following conditions are met: (i) a maximum combined loan–to-value ratio of 75.0%; (ii) a minimum combined amortizing debt coverage ratio of 1.45x; (iii) a minimum combined net cash flow debt yield of 9.5%; (iv) receipt of rating agency confirmation from DBRS, Fitch and Moody’s that the mezzanine financing will not result in a downgrade, withdrawal or qualification of the respective ratings assigned to the Series 2016-C34 Certificates; (v) the execution of an intercreditor agreement acceptable to the lender; and (vi) no event of default exists with respect to the 200 Precision & 425 Privet Portfolio Mortgage Loan.
Ground Lease. None.
Terrorism Insurance.The loan documents require that the “all risk” insurance policy required to be maintained by the borrower provide coverage for terrorism in an amount equal to the full replacement cost of the 200 Precision & 425 Privet Portfolio Properties. The loan documents also require business interruption insurance covering no less than the 18-month period following the occurrence of a casualty event, together with a six-month period of indemnity.
THE INFORMATION IN THIS STRUCTURAL AND COLLATERAL TERM SHEET IS NOT COMPLETE AND MAY BE AMENDED PRIOR TO THE TIME OF SALE. THIS TERM SHEET IS NOT AN OFFER TO SELL THESE SECURITIES AND IT IS NOT A SOLICITATION OF AN OFFER TO BUY THESE SECURITIES IN ANY JURISDICTION WHERE THE OFFER OR SALE IS NOT PERMITTED.
| 79 |
(THIS PAGE INTENTIONALLY LEFT BLANK)
THE INFORMATION IN THIS STRUCTURAL AND COLLATERAL TERM SHEET IS NOT COMPLETE AND MAY BE AMENDED PRIOR TO THE TIME OF SALE. THIS TERM SHEET IS NOT AN OFFER TO SELL THESE SECURITIES AND IT IS NOT A SOLICITATION OF AN OFFER TO BUY THESE SECURITIES IN ANY JURISDICTION WHERE THE OFFER OR SALE IS NOT PERMITTED.
| 80 |
| OLD MILL VILLAGE & ENTERPRISE CENTER |
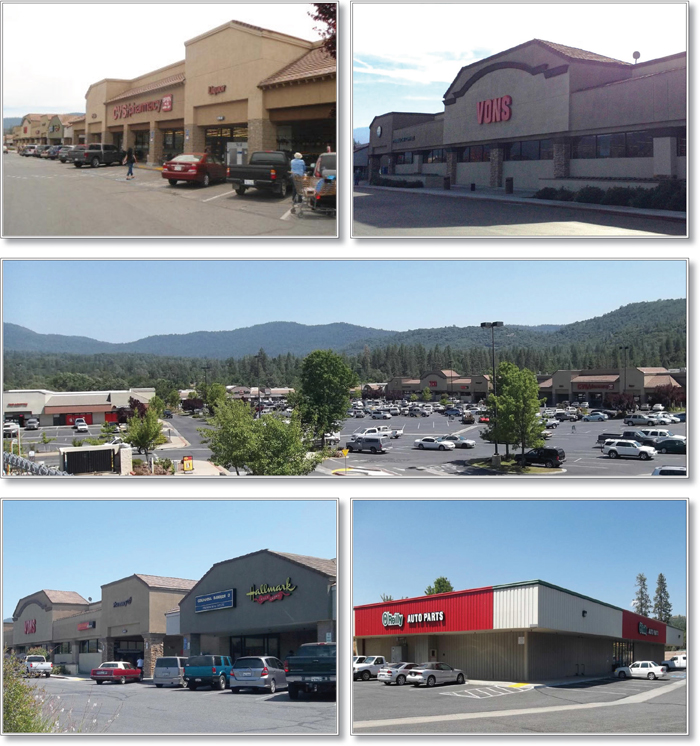
THE INFORMATION IN THIS STRUCTURAL AND COLLATERAL TERM SHEET IS NOT COMPLETE AND MAY BE AMENDED PRIOR TO THE TIME OF SALE. THIS TERM SHEET IS NOT AN OFFER TO SELL THESE SECURITIES AND IT IS NOT A SOLICITATION OF AN OFFER TO BUY THESE SECURITIES IN ANY JURISDICTION WHERE THE OFFER OR SALE IS NOT PERMITTED.
| 81 |
| OLD MILL VILLAGE & ENTERPRISE CENTER |
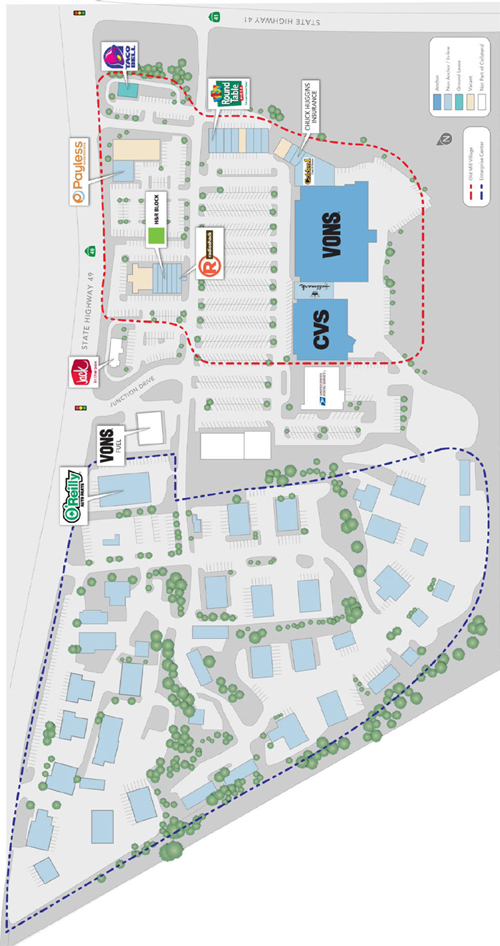
THE INFORMATION IN THIS STRUCTURAL AND COLLATERAL TERM SHEET IS NOT COMPLETE AND MAY BE AMENDED PRIOR TO THE TIME OF SALE. THIS TERM SHEET IS NOT AN OFFER TO SELL THESE SECURITIES AND IT IS NOT A SOLICITATION OF AN OFFER TO BUY THESE SECURITIES IN ANY JURISDICTION WHERE THE OFFER OR SALE IS NOT PERMITTED.
| 82 |
| OLD MILL VILLAGE & ENTERPRISE CENTER |
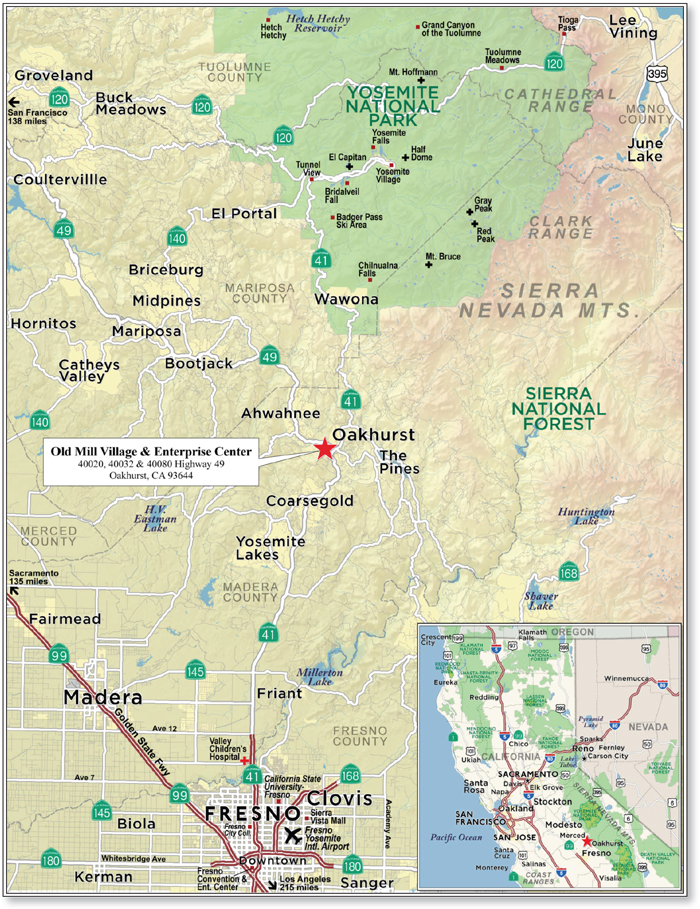
THE INFORMATION IN THIS STRUCTURAL AND COLLATERAL TERM SHEET IS NOT COMPLETE AND MAY BE AMENDED PRIOR TO THE TIME OF SALE. THIS TERM SHEET IS NOT AN OFFER TO SELL THESE SECURITIES AND IT IS NOT A SOLICITATION OF AN OFFER TO BUY THESE SECURITIES IN ANY JURISDICTION WHERE THE OFFER OR SALE IS NOT PERMITTED.
| 83 |
| No. 7 – Old Mill Village & Enterprise Center | ||||||
| Loan Information | Property Information | |||||
| Mortgage Loan Seller: | Wells Fargo Bank, National Association | Single Asset/Portfolio: | Single Asset | |||
Credit Assessment (DBRS/Fitch/Moody’s): | NR/NR/NR | Property Type: | Mixed Use | |||
| Original Principal Balance: | $24,500,000 | Specific Property Type: | Industrial/Retail | |||
| Cut-off Date Balance: | $24,314,370 | Location: | Oakhurst, CA | |||
| % of Initial Pool Balance: | 3.5% | Size: | 332,759 SF | |||
| Loan Purpose: | Refinance | Cut-off Date Balance Per SF: | $73.07 | |||
| Borrower Name: | 41/49 Highway Junction Limited Partnership | Year Built/Renovated: | 1989/NAP | |||
| Sponsor: | Garold C. Brown; Carol Brown; and April Worden | Title Vesting: | Fee | |||
| Mortgage Rate: | 4.710% | Property Manager: | Sierra Realty & Property Services | |||
| Note Date: | January 25, 2016 | 4thMost Recent Occupancy (As of): | 92.0% (12/31/2011) | |||
| Anticipated Repayment Date: | NAP | 3rdMost Recent Occupancy (As of): | 96.0% (12/31/2012) | |||
| Maturity Date: | February 11, 2026 | 2ndMost Recent Occupancy (As of): | 94.0% (12/31/2013) | |||
| IO Period: | None | Most Recent Occupancy (As of): | 92.0% (12/31/2014) | |||
| Loan Term (Original): | 120 months | Current Occupancy (As of): | 92.7% (2/29/2016) | |||
| Seasoning: | 3 months | |||||
| Amortization Term (Original): | 240 months | Underwriting and Financial Information: | ||||
| Loan Amortization Type: | Amortizing Balloon | |||||
| Interest Accrual Method: | Actual/360 | 4thMost Recent NOI (As of): | $2,455,413 (12/31/2012) | |||
| Call Protection: | L(27),D(89),O(4) | 3rdMost Recent NOI (As of): | $2,544,048 (12/31/2013) | |||
| Lockbox Type: | Springing | 2ndMost Recent NOI (As of): | $2,421,348 (12/31/2014) | |||
| Additional Debt: | None | Most Recent NOI (As of): | $2,590,151 (TTM 2/29/2016) | |||
| Additional Debt Type: | NAP | |||||
| U/W Revenues: | $3,561,378 | |||||
| U/W Expenses: | $1,006,083 | |||||
| U/W NOI: | $2,555,295 | |||||
| U/W NCF: | $2,369,389 | |||||
| Escrows and Reserves(1): | U/W NOI DSCR: | 1.35x | ||||
| U/W NCF DSCR: | 1.25x | |||||
| Type: | Initial | Monthly | Cap (If Any) | U/W NOI Debt Yield: | 10.5% | |
| Taxes | $34,378 | $17,189 | NAP | U/W NCF Debt Yield: | 9.7% | |
| Insurance | $53,131 | $5,903 | NAP | As-Is Appraised Value: | $34,500,000 | |
| Replacement Reserves | $0 | $4,205 | $100,908 | As-Is Appraisal Valuation Date: | May 28, 2015 | |
| TI/LC Reserve | $0 | $11,407 | NAP | Cut-off Date LTV Ratio: | 70.5% | |
| Deferred Maintenance | $37,563 | $0 | NAP | LTV Ratio at Maturity or ARD: | 44.2% | |
| (1) | See “Escrows” section. |
The Mortgage Loan. The mortgage loan (the “Old Mill Village & Enterprise Center Mortgage Loan”) is evidenced by a singlepromissory note that is secured by a first mortgage encumbering a mixed use property located in Oakhurst, California (the “Old Mill Village & Enterprise Center Property”). The Old Mill Village & Enterprise Center Mortgage Loan was originated on January 25, 2016 by Wells Fargo Bank, National Association. The Old Mill Village & Enterprise Center Mortgage Loan had an original principal balance of $24,500,000, has an outstanding principal balance as of the Cut-off Date of $24,314,370 and accrues interest at an interest rate of 4.710%per annum. The Old Mill Village & Enterprise Center Mortgage Loan had an initial term of 120 months, has a remaining term of 117 months as of the Cut-off Date and requires payments of principal and interest based on a 20-year amortization schedule through the term of the Old Mill Village & Enterprise Center Mortgage Loan. The Old Mill Village & Enterprise Center Mortgage Loan matures on February 11, 2026.
Following the lockout period, on any date before November 11, 2025, the borrower has the right to (i) defease the Old Mill Village & Enterprise Center Mortgage Loan in whole, but not in part; or (ii) prepay the Old Mill Village & Enterprise Center Mortgage Loan in part in connection with a release of the Taco Bell Release Parcel (see “Partial Release” section). In addition, the Old Mill Village & Enterprise Center Mortgage Loan is prepayable without penalty on or after November 11, 2025.
THE INFORMATION IN THIS STRUCTURAL AND COLLATERAL TERM SHEET IS NOT COMPLETE AND MAY BE AMENDED PRIOR TO THE TIME OF SALE. THIS TERM SHEET IS NOT AN OFFER TO SELL THESE SECURITIES AND IT IS NOT A SOLICITATION OF AN OFFER TO BUY THESE SECURITIES IN ANY JURISDICTION WHERE THE OFFER OR SALE IS NOT PERMITTED.
| 84 |
| OLD MILL VILLAGE & ENTERPRISE CENTER |
Sources and Uses
| Sources | Uses | |||||||
| Original loan amount | $24,500,000 | 100.0% | Loan payoff(1) | $23,353,632 | 95.3% | |||
| Reserves | 125,072 | 0.5 | ||||||
| Closing costs | 244,887 | 1.0 | ||||||
| Return of equity | 776,409 | 3.2 | ||||||
| Total Sources | $24,500,000 | 100.0% | Total Uses | $24,500,000 | 100.0% | |||
| (1) | The Old Mill Village & Enterprise Center Property was previously securitized in the BACM 2006-2 transaction. |
The Property.The Old Mill Village & Enterprise Center Property is a mixed-use property totaling 332,759 square feet and located in Oakhurst, California. Built in 1989 and situated on a 51.9-acre parcel, the Old Mill Village & Enterprise Center Property comprises 150,307 square feet of retail space within a grocery anchored shopping center referred to as Old Mill Village and a 182,452-square-foot industrial park referred to as the Enterprise Center. The shopping center is anchored by Vons grocery store and CVS Caremark drugstore (“CVS”), and the industrial park contains 104 industrial suites and self-storage units that are leased to commercial tenants with various uses including general warehouse, auto service, retail showroom, incubator space and storage. As of February 29, 2016, the Old Mill Village & Enterprise Center Property was 92.7% occupied by 99 tenants. The Old Mill Village & Enterprise Center Property has averaged 94.9% occupancy since 2006, and 26 tenants accounting for 46.8% of the net rentable area and 59.6% of the underwritten base rent have been in occupancy since 2001 or earlier. Vons and CVS have been in occupancy at the Old Mill Village & Enterprise Center Property since 1994 and 1993, respectively.
The following table presents certain information relating to the tenancy at the Old Mill Village & Enterprise Center Property:
Major Tenants
| Tenant Name | Credit Rating (Fitch/ Moody’s/ S&P)(1) | Tenant NRSF | % of NRSF | Annual U/W Base Rent PSF | Annual U/W Base Rent | % of Total Annual U/W Base Rent | Sales PSF(2) | Occupancy Cost(2) | Lease Expiration Date |
| Anchor Tenants | |||||||||
| Vons | NR/B2/B+ | 58,175 | 17.5% | $13.29 | $773,029 | 26.1% | $662 | 2.6% | 12/31/2019 |
| CVS | NR/Baa1/BBB+ | 26,060 | 7.8% | $11.16 | $290,706 | 9.8% | $315(3) | 4.8%(3) | 2/29/2020 |
| Total Anchor Tenants | 84,235 | 25.3% | $12.63 | $1,063,736 | 35.8% | ||||
| Major Tenants | |||||||||
| O’Reilly Automotive | NR/Baa1/BBB+ | 11,200 | 3.4% | $10.30 | $115,320 | 3.9% | NAV | NAV | 2/28/2030 |
| Sullivan’s Tire Pro’s | NR/NR/NR | 12,972 | 3.9% | $7.35 | $95,400 | 3.2% | NAV | NAV | 5/31/2019 |
| Sierra Tel Business Systems | NR/NR/NR | 5,907 | 1.8% | $14.67 | $86,628 | 2.9% | NAV | NAV | 6/30/2016 |
| South Gate Brewing Company(4) | NR/NR/NR | 3,599 | 1.1% | $18.33 | $65,952 | 2.2% | NAV | NAV | Various(4) |
| Round Table Pizza | NR/NR/NR | 3,600 | 1.1% | $17.17 | $61,800 | 2.1% | $222 | 9.5% | 5/31/2020(5) |
| Taco Bell(6) | NR/B1/BB | (6) | (6) | (6) | $55,624 | 1.9% | NAV | NAV | 7/31/2019 |
| Payless Shoe Source | NR/B3/B | 3,000 | 0.9% | $17.00 | $51,000 | 1.7% | $154 | 13.6% | 5/31/2019 |
| Dorsey’s Hallmark | NR/NR/NR | 3,185 | 1.0% | $15.60 | $49,680 | 1.7% | NAV | NAV | 12/31/2019 |
| Total Major Tenants | 43,463 | 13.1% | $12.10(6) | $581,404 | 19.6% | ||||
| Non-Major Tenants | 180,781 | 54.3% | $7.31 | $1,322,212 | 44.6% | ||||
| Occupied Collateral Total | 308,479 | 92.7% | $9.44(6) | $2,967,352 | 100.0% | ||||
| Vacant Space | 24,280 | 7.3% | |||||||
| Collateral Total | 332,759 | 100.0% | |||||||
| (1) | Certain ratings are those of the parent company whether or not the parent company guarantees the lease. |
| (2) | Sales PSF and Occupancy Costs are for the trailing 12-month period ending December 31, 2014. |
| (3) | Sales shown for CVS exclude prescription items. See “Historical Sales (PSF)” table below. |
| (4) | South Gate Brewing Company leases two spaces: 2,699 square feet with an Annual U/W Base Rent PSF of $22.68 and Lease Expiration Date of December 31, 2030; and 900 square feet with an Annual U/W Base Rent PSF of $5.28 and Lease Expiration Date of June 30, 2020. |
| (5) | Round Table Pizza has the right to terminate its lease with 90 days’ written notice and the payment of a termination fee equal to the lesser of (i) one year of rent and (ii) unamortized tenant improvement costs. |
| (6) | Taco Bell is a leased fee tenant and owns its improvements. The Annual U/W Base Rent PSF for Total Major Tenants and Occupied Collateral Total excludes the Annual U/W Base Rent associated with Taco Bell. |
THE INFORMATION IN THIS STRUCTURAL AND COLLATERAL TERM SHEET IS NOT COMPLETE AND MAY BE AMENDED PRIOR TO THE TIME OF SALE. THIS TERM SHEET IS NOT AN OFFER TO SELL THESE SECURITIES AND IT IS NOT A SOLICITATION OF AN OFFER TO BUY THESE SECURITIES IN ANY JURISDICTION WHERE THE OFFER OR SALE IS NOT PERMITTED.
| 85 |
| OLD MILL VILLAGE & ENTERPRISE CENTER |
The following table presents certain information relating to the historical sales at the retail portion of the Old Mill Village & Enterprise Center Property:
Historical Sales (PSF)(1)
| Tenant Name | 2012 | 2013 | 2014 | Average National Sales (PSF)(2) | Occupancy Cost |
| Vons | $666 | $670 | $662 | $570 | 2.6% |
| CVS | $352(3) | $344(3) | $315(3) | $875 | 4.8% |
| Round Table Pizza | $173 | $178 | $222 | NAV | 9.5% |
| Payless Shoe Source | $160 | $151 | $154 | $170 | 13.6% |
| (1) | Historical Sales (PSF) are based on historical statements provided by the borrower. |
| (2) | Obtained from a third-party research report. |
| (3) | Historical sales for CVS exclude prescription items. Per the CVS 2015 10-K filing, sales of prescription items represent approximately 70.7% of total chain-wide sales. Based on this information, the estimated Sales PSF for 2012, 2013 and 2014 for CVS including prescription items would be $1,201, $1,174 and $1,075, respectively, resulting in an Occupancy Cost of 2.4%. |
The following table presents certain information relating to the lease rollover schedule at the Old Mill Village & Enterprise Center Property:
Lease Expiration Schedule(1)(2)
| Year Ending December 31, | No. of Leases Expiring | Expiring NRSF | % of Total NRSF | Cumulative Expiring NRSF | Cumulative % of Total NRSF | Annual U/W Base Rent | % of Total Annual U/W Base Rent | Annual U/W Base Rent PSF(3) |
| MTM | 2 | 1,831 | 0.6% | 1,831 | 0.6% | $10,430 | 0.4% | $5.70 |
| 2016 | 13 | 28,387 | 8.5% | 30,218 | 9.1% | $228,106 | 7.7% | $8.04 |
| 2017 | 21 | 35,846 | 10.8% | 66,064 | 19.9% | $307,990 | 10.4% | $8.59 |
| 2018 | 16 | 40,454 | 12.2% | 106,518 | 32.0% | $282,301 | 9.5% | $6.98 |
| 2019 | 54 | 118,732 | 35.7% | 225,250 | 67.7% | $1,297,698 | 43.7% | $10.46(4) |
| 2020 | 13 | 50,670 | 15.2% | 275,920 | 82.9% | $513,690 | 17.3% | $10.14 |
| 2021 | 5 | 16,860 | 5.1% | 292,780 | 88.0% | $119,418 | 4.0% | $7.08 |
| 2022 | 0 | 0 | 0.0% | 292,780 | 88.0% | $0 | 0.0% | $0.00 |
| 2023 | 0 | 0 | 0.0% | 292,780 | 88.0% | $0 | 0.0% | $0.00 |
| 2024 | 3 | 1,800 | 0.5% | 294,580 | 88.5% | $31,200 | 1.1% | $17.33 |
| 2025 | 0 | 0 | 0.0% | 294,580 | 88.5% | $0 | 0.0% | $0.00 |
| 2026 | 0 | 0 | 0.0% | 294,580 | 88.5% | $0 | 0.0% | $0.00 |
| Thereafter | 2 | 13,899 | 4.2% | 308,479 | 92.7% | $176,520 | 5.9% | $12.70 |
| Vacant | 0 | 24,280 | 7.3% | 332,759 | 100.0% | $0 | 0.0% | $0.00 |
| Total/Weighted Average | 129 | 332,759 | 100.0% | $2,967,352 | 100.0% | $9.44(4) |
| (1) | Information obtained from the underwritten rent roll. |
| (2) | Certain tenants may have lease termination or contraction options that are exercisable prior to the originally stated expiration date of the subject lease and that are not considered in the Lease Expiration Schedule. |
| (3) | Weighted Average Annual U/W Base Rent PSF excludesvacantspace. |
| (4) | Annual U/W Base Rent PSF and Weighted AverageAnnualU/W Base Rent PSF excludes underwritten base rent associated with Taco Bell, which owns its improvements subject to a ground lease. |
The following table presents historical occupancy percentages at the Old Mill Village & Enterprise Center Property:
Historical Occupancy
12/31/2011(1) | 12/31/2012(1) | 12/31/2013(1) | 12/31/2014(1) | 2/29/2016(2) | ||||
| 92.0% | 96.0% | 94.0% | 92.0% | 92.7% |
| (1) | Information obtained from the borrower. |
| (2) | Information obtained from the underwrittenrent roll. |
THE INFORMATION IN THIS STRUCTURAL AND COLLATERAL TERM SHEET IS NOT COMPLETE AND MAY BE AMENDED PRIOR TO THE TIME OF SALE. THIS TERM SHEET IS NOT AN OFFER TO SELL THESE SECURITIES AND IT IS NOT A SOLICITATION OF AN OFFER TO BUY THESE SECURITIES IN ANY JURISDICTION WHERE THE OFFER OR SALE IS NOT PERMITTED.
| 86 |
| OLD MILL VILLAGE & ENTERPRISE CENTER |
Operating History and Underwritten Net Cash Flow. The following table presents certain information relating to the historical operating performance and underwritten net cash flow at the Old Mill Village & Enterprise Center Property:
Cash Flow Analysis
| 2012 | 2013 | 2014 | TTM 2/29/2016 | U/W | % of U/W Effective Gross Income | U/W $ per SF | ||||||||
| Base Rent | $2,712,259 | $2,900,534 | $2,835,007 | $2,993,663 | $2,967,352 | 83.3 | % | $8.92 | ||||||
| Grossed Up Vacant Space | 0 | 0 | 0 | 0 | 301,066 | 8.5 | 0.90 | |||||||
| Total Reimbursables | 539,761 | 524,928 | 513,142 | 522,339 | 531,945 | 14.9 | 1.60 | |||||||
| Other Income | 52,668 | 15,808 | 11,627 | 16,852 | 62,081 | 1.7 | 0.19 | |||||||
| Less Vacancy & Credit Loss | 0 | 0 | 0 | 0 | (301,066)(1) | (8.5 | ) | (0.90) | ||||||
| Effective Gross Income | $3,304,688 | $3,441,270 | $3,359,776 | $3,532,854 | $3,561,378 | 100.0 | % | $10.70 | ||||||
| Total Operating Expenses | $849,276 | $897,222 | $938,428 | $942,703 | $1,006,083 | 28.2 | % | $3.02 | ||||||
| Net Operating Income | $2,455,413 | $2,544,048 | $2,421,348 | $2,590,151 | $2,555,295 | 71.8 | % | $7.68 | ||||||
| TI/LC | 0 | 0 | 0 | 0 | 135,993 | 3.8 | 0.41 | |||||||
| Capital Expenditures | 0 | 0 | 0 | 0 | 49,914 | 1.4 | 0.15 | |||||||
| Net Cash Flow | $2,455,413 | $2,544,048 | $2,421,348 | $2,590,151 | $2,369,389 | 66.5 | % | $7.12 | ||||||
| NOI DSCR | 1.30x | 1.34x | 1.28x | 1.37x | 1.35x | |||||||||
| NCF DSCR | 1.30x | 1.34x | 1.28x | 1.37x | 1.25x | |||||||||
| NOI DY | 10.1% | 10.5% | 10.0% | 10.7% | 10.5% | |||||||||
| NCF DY | 10.1% | 10.5% | 10.0% | 10.7% | 9.7% |
| (1) | The underwritten economic vacancy is 9.2%. The Old Mill Village & Enterprise Center Property was 92.7% physically occupied as of February 29, 2016. |
Appraisal.As of the appraisal valuation date of May 28, 2015, the Old Mill Village & Enterprise Center Property had an “as-is” appraised value of $34,500,000.
Environmental Matters.According to the Phase I environmental report dated November 6, 2015, there was no evidence of any recognized environmental conditions at the Old Mill Village & Enterprise Center Property.
Market Overview and Competition.The Old Mill Village & Enterprise Center Property is located at the intersection of Highway 41 and Highway 49 in the community of Oakhurst, approximately 45.2 miles north of Fresno. The Old Mill Village & Enterprise Center Property is situated approximately 14.0 miles south of the south entrance to Yosemite National Park, which hosted approximately 4.2 million visitors in 2015. Primary access to the area is provided by Highway 41, which connects to Fresno to the south and Yosemite National Park to the north, and Highway 49, which connects to Mariposa to the northwest. Oakhurst represents a gateway community to Yosemite National Park, and additional demand drivers in the vicinity include Chukchansi Gold Resort & Casino (approximately 11.6 miles south of the Old Mill Village & Enterprise Center Property) and the Madera Wine Trail. There are currently two new hotels totaling 216 rooms (Holiday Inn Express & Suites and Fairfield Inn & Suites) under construction on Highway 41, approximately one mile northeast of the Old Mill Village & Enterprise Center Property, with an additional adjacent 108-room Hampton Inn planned for development.
According to a third-party market research report, the Old Mill Village & Enterprise Center Property is located within the Suburban Madera submarket of the Fresno retail market and the Madera submarket of the Fresno industrial market. As of the fourth quarter of 2015, the Suburban Madera retail submarket contained approximately 328 properties totaling 3.2 million square feet with a 6.9% vacancy rate and average asking rent of $14.54 per square foot, triple net. For the same period, the Madera industrial submarket contained approximately 144 properties totaling 4.9 million square feet with a 2.0% vacancy rate and average asking rent of $4.29 per square foot, triple net.
THE INFORMATION IN THIS STRUCTURAL AND COLLATERAL TERM SHEET IS NOT COMPLETE AND MAY BE AMENDED PRIOR TO THE TIME OF SALE. THIS TERM SHEET IS NOT AN OFFER TO SELL THESE SECURITIES AND IT IS NOT A SOLICITATION OF AN OFFER TO BUY THESE SECURITIES IN ANY JURISDICTION WHERE THE OFFER OR SALE IS NOT PERMITTED.
| 87 |
| OLD MILL VILLAGE & ENTERPRISE CENTER |
The following table presents certain information relating to comparable retail leases for the Old Mill Village & Enterprise Center Property:
Comparable Leases(1)
| Property Name/Location | Anchor / In-line | Year Built/ Renovated | Total GLA (SF) | Total Occupancy | Distance from Subject | Tenant Name | Lease Date/Term | Lease Area (SF) | Annual Base Rent PSF | Lease Type |
Marketplace at El Paseo Fresno, CA | Anchor | 2013/NAV | 400,000 | NAV | 45.6 miles | Ross | March 2014 / 10.0 Yrs | 25,000 | $13.00 | NNN |
Marketplace at El Paseo Fresno, CA | Anchor | 2013/NAV | 400,000 | NAV | 45.6 miles | Burlington Coat Factory | March 2014 / 15.0 Yrs | 60,000 | $11.00 | NNN |
Clovis Crossing – Phase II Clovis, CA | Anchor | 2013/NAV | 43,000 | 100% | 43.1 miles | Stein Mart | September 2014 / 10.3 Yrs | 31,349 | $12.50 | NNN |
Buchanan Crossroads Fresno, CA | In-line | 2001/NAV | 14,745 | 88% | 40.4 miles | P.C.H. Subs | January 2014 / 1.0 Yrs | 1,300 | $17.70 | NNN |
Atwater Shopping Center Atwater, CA | In-line | 2000/NAV | 13,074 | 82% | 72.0 miles | The Subshop | August 2014 / 3.0 Yrs | 1,200 | $13.56 | NNN |
Buchanan Crossroads North Fresno, CA | In-line | 2009/NAV | 6,761 | 100% | 40.1 miles | Nutri-Shop | June 2014 / 5.0 Yrs | 2,200 | $19.20 | NNN |
Ashlan & Fowler Center Clovis, CA | In-line | 2003/NAV | 4,829 | 100% | 47.2 miles | Shear Magic | April 2014 / 3.0 Yrs | 1,400 | $16.20 | NNN |
Oakhurst Strip Retail Oakhurst, CA | In-line | 1951/NAV | 7,320 | 80% | 0.3 miles | Parrot Cellular | 1Q2015 / NAV | 1,500 | $22.80 | NNN |
| (1) | Information obtained from the appraisal and third-party market research reports. |
The Borrower.The borrower is 41/49 Highway Junction Limited Partnership, a California Limited Partnership and single purpose entity. Legal counsel to the borrower delivered a non-consolidation opinion in connection with the origination of the Old Mill Village & Enterprise Center Mortgage Loan. Garold C. Brown, Carol Brown and April Worden are the guarantors of certain nonrecourse carveouts under the Old Mill Village & Enterprise Center Mortgage Loan.
The Sponsor.The sponsors are Garold C. Brown, Carol Brown and April Worden. Mr. Brown has over 40 years of commercial real estate experience, having developed approximately 2,000 apartment units, 72 residential condominium units, 55 custom single family homes, 2.0 million square feet of self-storage units and approximately 397,000 square feet of industrial and retail facilities, primarily in California and Arizona.
Escrows.The loan documents provide for upfront reserves of $34,378 for real estate taxes, $53,131 for insurance and $37,563 for deferred maintenance. The loan documents also provide for ongoing monthly reserves of $17,189 for real estate taxes, $5,903 for insurance, $4,205 for replacement reserves (subject to a cap of $100,908, as long as (i) no event of default has occurred and is continuing; (ii) the Old Mill Village & Enterprise Center Property is being adequately maintained, as determined by the lender; and (iii) no capital improvement cost over $25,000 is included in the approved budget) and $11,407 for tenant improvements and leasing commissions.
Lockbox and Cash Management.Upon the occurrence of a Cash Trap Event Period (as defined below), the borrower will be required to establish a lender-controlled lockbox account and direct all tenants to deposit all rents directly into such lockbox account. Additionally, all revenues and other monies received by the borrower or property manager relating to the Old Mill Village & Enterprise Center Property will be deposited into the lockbox account. During a Cash Trap Event Period, all excess funds in the lockbox account will be swept to a lender-controlled subaccount.
A “Cash Trap Event Period” will commence upon (i) the occurrence and continuance of an event of default; (ii) the debt service coverage ratio being less than 1.15x for two consecutive calendar quarters; or (iii) an Anchor Tenant Trigger Event (as defined below). A Cash Trap Event Period will end, with respect to clause (i), upon the cure of such event of default; with respect to clause (ii), upon the debt service coverage ratio being equal to or greater than 1.20x for two consecutive calendar quarters; and with respect with clause (iii), upon the occurrence of an Anchor Tenant Trigger Event Cure (as defined below).
An “Anchor Tenant Trigger Event” will occur upon anchor tenants Vons or CVS (a) experiencing a monetary or material non-monetary default under its lease; (b) receiving a rent reduction or material lease modification without the lender’s prior written consent; (c) terminating its lease or giving notice of its intent to do so; (d) ceasing business operations at the Old Mill Village & Enterprise Center Property, vacating or failing to occupy its space; (e) seeking protection under a Creditors Rights Law; or (f) failing to give notice of its renewal at least 12 months prior to its lease expiration date.
THE INFORMATION IN THIS STRUCTURAL AND COLLATERAL TERM SHEET IS NOT COMPLETE AND MAY BE AMENDED PRIOR TO THE TIME OF SALE. THIS TERM SHEET IS NOT AN OFFER TO SELL THESE SECURITIES AND IT IS NOT A SOLICITATION OF AN OFFER TO BUY THESE SECURITIES IN ANY JURISDICTION WHERE THE OFFER OR SALE IS NOT PERMITTED.
| 88 |
| OLD MILL VILLAGE & ENTERPRISE CENTER |
An “Anchor Tenant Trigger Event Cure” will occur upon (1) the applicable anchor tenant space being re-leased to an acceptable replacement tenant with such replacement tenant being open for business and paying rent; (2) with respect to clause (a) above, upon the cure of such event of default under the tenant’s lease; or (3) with respect to clause (f) above, the applicable anchor tenant extending its lease.
Property Management.The Old Mill Village & Enterprise Center Office Property is managed by Sierra Realty & Property Services.
Assumption.The borrower has the two-time right to transfer the Old Mill Village & Enterprise Center Property, provided that certain conditions are satisfied, including (i) no event of default has occurred and is continuing; (ii) the lender has reasonably determined that the proposed transferee and guarantor satisfy the lender’s credit review and underwriting standards, taking into consideration the transferee’s experience, financial strength and general business standing; and (iii) if required by lender, a rating agency confirmation from DBRS, Fitch and Moody’s that the transfer will not result in a downgrade, withdrawal or qualification of the respective ratings assigned to the Series 2016-C34 Certificates.
Right of First Refusal.Taco Bell, which is a leased fee tenant and owns its improvements, has a right of first refusal (“ROFR”) to purchase its pad site if a bona fide offer is received that the borrower is otherwise willing to accept. The ROFR is not extinguished by foreclosure; however, the ROFR does not apply to foreclosure or deed in lieu thereof.
Partial Release.Following the lockout period, the borrower is permitted to release (a) the Taco Bell pad site parcel (the “Taco Bell Release Parcel”) or (b) an unimproved parcel containing 4,344 square feet (the “Unimproved Release Parcel”), subject to certain conditions including (i) no event of default has occurred and is continuing; (ii) with respect to the Taco Bell Release Parcel, prepayment of the greater of $621,377 and 100% of the proceeds of the sale of the Taco Bell Release Parcel, along with any applicable yield maintenance payment (no prepayment is required for the release of the Unimproved Release Parcel); (iii) the debt service coverage ratio with respect to the remaining portion of the Old Mill Village & Enterprise Center Office Property is no less than the greater of 1.20x and the debt service coverage ratio immediately prior to the release; (iv) the loan-to-value ratio with respect to the remaining portion of the Old Mill Village & Enterprise Center Office Property will be no greater than the lesser of 72.0% and the loan-to-value ratio immediately prior to the release; (v) the debt yield with respect to the remaining portion of the Old Mill Village & Enterprise Center Office Property is no less than the greater of 9.0% and the debt yield immediately prior to the release; and (vi) the lender receives rating agency confirmation from DBRS, Fitch and Moody’s that the release will not result in a downgrade, withdrawal or qualification of the respective ratings assigned to the Series 2016-C34 Certificates.
Real Estate Substitution.Not permitted.
Subordinate and Mezzanine Indebtedness. Not permitted.
Ground Lease. None.
Terrorism Insurance.The loan documents require that the “all risk” insurance policy required to be maintained by the borrower provide coverage for terrorism in an amount equal to the full replacement cost of the Old Mill Village & Enterprise Center Property. The loan documents also require business interruption insurance covering no less than the 12-month period following the occurrence of a casualty event, together with a six-month extended period of indemnity.
Earthquake Insurance.The loan documents do not require earthquake insurance. The seismic report indicated a probable maximum loss of 4.0%.
THE INFORMATION IN THIS STRUCTURAL AND COLLATERAL TERM SHEET IS NOT COMPLETE AND MAY BE AMENDED PRIOR TO THE TIME OF SALE. THIS TERM SHEET IS NOT AN OFFER TO SELL THESE SECURITIES AND IT IS NOT A SOLICITATION OF AN OFFER TO BUY THESE SECURITIES IN ANY JURISDICTION WHERE THE OFFER OR SALE IS NOT PERMITTED.
| 89 |
| NOLITAN HOTEL |

THE INFORMATION IN THIS STRUCTURAL AND COLLATERAL TERM SHEET IS NOT COMPLETE AND MAY BE AMENDED PRIOR TO THE TIME OF SALE. THIS TERM SHEET IS NOT AN OFFER TO SELL THESE SECURITIES AND IT IS NOT A SOLICITATION OF AN OFFER TO BUY THESE SECURITIES IN ANY JURISDICTION WHERE THE OFFER OR SALE IS NOT PERMITTED.
| 90 |
| NOLITAN HOTEL |
THE INFORMATION IN THIS STRUCTURAL AND COLLATERAL TERM SHEET IS NOT COMPLETE AND MAY BE AMENDED PRIOR TO THE TIME OF SALE. THIS TERM SHEET IS NOT AN OFFER TO SELL THESE SECURITIES AND IT IS NOT A SOLICITATION OF AN OFFER TO BUY THESE SECURITIES IN ANY JURISDICTION WHERE THE OFFER OR SALE IS NOT PERMITTED.
| 91 |
| No. 8 – Nolitan Hotel | |||||||
| Loan Information | Property Information | ||||||
| Mortgage Loan Seller: | Silverpeak Real Estate Finance LLC | Single Asset/Portfolio: | Single Asset | ||||
Credit Assessment (DBRS/Fitch/Moody’s): | NR/NR/NR | Property Type: | Hospitality | ||||
| Original Principal Balance: | $24,000,000 | Specific Property Type: | Full Service | ||||
| Cut-off Date Balance: | $24,000,000 | Location: | New York, NY | ||||
| % of Initial Pool Balance: | 3.4% | Size: | 57 Rooms | ||||
| Loan Purpose: | Refinance | Cut-off Date Balance Per Room: | $421,053 | ||||
| Borrower Names: | 153 Elizabeth Street, LLC; 153 Elizabeth Hotel LLC | Year Built/Renovated: | 2011/NAP | ||||
| Sponsor: | Edmond Li | Title Vesting: | Fee | ||||
| Mortgage Rate: | 5.300% | Property Manager: | Self-managed | ||||
| Note Date: | April 8, 2016 | 4th Most Recent Occupancy (As of): | 83.4% (12/31/2012) | ||||
| Anticipated Repayment Date: | NAP | 3rd Most Recent Occupancy (As of): | 86.4% (12/31/2013) | ||||
| Maturity Date: | May 6, 2026 | 2nd Most Recent Occupancy (As of): | 87.3% (12/31/2014) | ||||
| IO Period: | NAP | Most Recent Occupancy (As of): | 86.1% (12/31/2015) | ||||
| Loan Term (Original): | 120 months | Current Occupancy (As of): | 87.4% (TTM 2/29/2016) | ||||
| Seasoning: | 0 months | ||||||
| Amortization Term (Original): | 360 months | Underwriting and Financial Information: | |||||
| Loan Amortization Type: | Amortizing Balloon | ||||||
| Interest Accrual Method: | Actual/360 | 4th Most Recent NOI (As of): | $ 1,887,395 (12/31/2013) | ||||
| Call Protection: | L(24),D(92),O(4) | 3rd Most Recent NOI (As of): | $ 2,112,126 (12/31/2014) | ||||
| Lockbox Type: | Springing | 2nd Most Recent NOI (As of): | $ 2,421,570 (12/31/2015) | ||||
| Additional Debt: | None | Most Recent NOI (As of): | $ 2,341,773 (TTM 2/29/2016) | ||||
| Additional Debt Type: | NAP | ||||||
| U/W Revenues: | $6,328,069 | ||||||
| U/W Expenses: | $3,839,597 | ||||||
| U/W NOI: | $2,488,473 | ||||||
| Escrows and Reserves(1): | U/W NCF: | $2,235,350 | |||||
| U/W NOI DSCR: | 1.56x | ||||||
| Type: | Initial | Monthly | Cap (If Any) | U/W NCF DSCR: | 1.40x | ||
| Taxes | $213,741 | $35,624 | NAP | U/W NOI Debt Yield: | 10.4% | ||
| Insurance | $61,500 | $5,125 | NAP | U/W NCF Debt Yield: | 9.3% | ||
| FF&E Reserve | $0 | $21,107 | NAP | As-Is Appraised Value: | $39,500,000 | ||
| Deferred Maintenance | $14,594 | NAP | NAP | As-Is Appraisal Valuation Date: | March 1, 2016 | ||
| Restaurant Rent Concession Reserve | $90,000 | NAP | NAP | Cut-off Date LTV Ratio: | 60.8% | ||
| Performance Reserve | $1,500,000 | NAP | NAP | LTV Ratio at Maturity or ARD: | 50.4% | ||
| (1) | See “Escrows” section. |
The Mortgage Loan. The mortgage loan (the “Nolitan Hotel Mortgage Loan”) is evidenced by a single promissory note secured by a first mortgage encumbering the fee interest in a full-service hotel located in New York, New York (the “Nolitan Hotel Property”). The Nolitan Hotel Mortgage Loan was originated on April 8, 2016 by Silverpeak Real Estate Finance LLC. The Nolitan Hotel Mortgage Loan had an original principal balance of $24,000,000, has an outstanding principal balance as of the Cut-off Date of $24,000,000 and accrues interest at an interest rate of 5.300%per annum. The Nolitan Hotel Mortgage Loan had an initial term of 120 months, has a remaining term of 120 months as of the Cut-off Date and requires payments of principal and interest based on a 30-year amortization schedule. The Nolitan Hotel Mortgage Loan matures on May 6, 2026.
Following the lockout period, the borrower has the right to defease the Nolitan Hotel Mortgage Loan in whole but not in part on any date before February 6, 2026. In addition, the Nolitan Hotel Mortgage Loan is prepayable without penalty on or after February 6, 2026.
THE INFORMATION IN THIS STRUCTURAL AND COLLATERAL TERM SHEET IS NOT COMPLETE AND MAY BE AMENDED PRIOR TO THE TIME OF SALE. THIS TERM SHEET IS NOT AN OFFER TO SELL THESE SECURITIES AND IT IS NOT A SOLICITATION OF AN OFFER TO BUY THESE SECURITIES IN ANY JURISDICTION WHERE THE OFFER OR SALE IS NOT PERMITTED.
| 92 |
| NOLITAN HOTEL |
Sources and Uses
| Sources | Uses | |||||||
| Original loan amount | $24,000,000 | 100.0% | Loan payoff(1) | $21,038,188 | 87.7% | |||
| Reserves | 1,879,835 | 7.8 | ||||||
| Closing costs | 533,244 | 2.2 | ||||||
| Return of equity | 548,734 | 2.3 | ||||||
| Total Sources | $24,000,000 | 100.0% | Total Uses | $24,000,000 | 100.0% |
| (1) | The Nolitan Hotel Property was previously securitized in the COMM 2012-CCRE5 transaction. |
The Property.The Nolitan Hotel Property is a 57-room, nine-story, full-service independent hotel located at 30 Kenmare Street in the Nolita neighborhood of Manhattan. The sponsor developed the Nolitan Hotel Property in 2011 for a total cost of approximately $26.3 million ($460,886 per key). In April 2014, the second floor of the Nolitan Hotel Property was renovated to add two additional guestrooms, bringing the total guestroom count to 57. In addition to the guestroom additions, the Nolitan Hotel Property has undergone various renovations since 2012 totaling approximately $551,000 ($9,666 per key). Upgrades include new soft goods, new televisions with upgraded movie system technology in each guestroom, upscale decor and art, public area reconfigurations, new computers and upgraded computer systems and upgraded ventilation systems. Moreover, new A/C ducts were installed in the guestrooms in 2015.
The Nolitan Hotel Property opened in August 2011 and is comprised of 21 king guestrooms, 35 queen guestrooms and one suite. Some of the guestrooms have balconies with views of the Empire State Building and the Williamsburg Bridge. The Nolitan Hotel Property interiors are the work of an award-winning architectural design firm based in New York City. Amenities at the Nolitan Hotel Property include a 24-hour concierge, complimentary Wi-Fi, a business center, complimentary gym membership to a nearby 24 Hour Fitness, rooftop seating area, complimentary bikes and complimentary happy hour Monday through Saturday. Guestrooms feature hardwood oak floors, flat panel LCD televisions, bluetooth stereo system, X-Box, Playstation, a work area with chair, lounge chair and a gourmet minibar.
The Nolitan Hotel Property is currently undergoing a $230,000 renovation to the existing retail/restaurant space. Upon completion of the renovation, which is expected to occur in May 2016, the Nolitan Hotel Property will feature Bread Nolita, a full-service Italian restaurant with 91 indoor seats and 42 outdoor seats. Bread Nolita previously operated at 20 Spring Street, approximately half a block from the Nolitan Hotel Property. The renovation will include relocation of the main door to align with the new bar area, relocating the bar to the front of the restaurant, separating the lobby and the restaurant with the bar serving as a dividing wall and raising the floor of the bar area to street level. The sponsor has a 40.0% interest in Bread Nolita and will also receive 9.0% of gross revenues above $2.5 million annually.
Operating History and Underwritten Net Cash Flow.The following table presents certain information relating to the historical operating performance and underwritten net cash flow at the Nolitan Hotel Property:
Cash Flow Analysis
| 2013 | 2014 | 2015 | TTM 2/29/2016 | U/W | % of U/W Total Revenue | U/W $ per Room | |||||||||
| Occupancy | 86.4% | 87.3% | 86.1% | 87.4% | 87.4% | ||||||||||
| ADR | $308.30 | $314.08 | $324.62 | $321.54 | $321.54 | ||||||||||
| RevPAR | $266.22 | $274.03 | $279.43 | $281.02 | $281.02 | ||||||||||
| Room Revenue | $5,344,437 | $5,649,955 | $5,813,226 | $5,862,652 | $5,846,634 | 92.4% | $102,573 | ||||||||
| F&B Revenue | 55,505 | 68,306 | 59,925 | 61,074 | 60,907 | 1.0 | 1,069 | ||||||||
| Other Revenue(1) | 247,712 | 315,221 | 328,911 | 285,694 | 420,528(1) | 6.6 | 7,378 | ||||||||
| Total Revenue | $5,647,654 | $6,033,482 | $6,202,062 | $6,209,420 | $6,328,069 | 100.0% | $111,019 | ||||||||
| Total Department Expenses | 1,695,751 | 1,772,551 | 1,537,251 | 1,577,862 | 1,585,966 | 25.1 | 27,824 | ||||||||
| Gross Operating Profit | $3,951,903 | $4,260,931 | $4,664,811 | $4,631,558 | $4,742,103 | 74.9% | $83,195 | ||||||||
| Total Undistributed Expenses | 1,701,394 | 1,763,692 | 1,790,686 | 1,819,948 | 1,694,379 | 26.8 | 29,726 | ||||||||
| Profit Before Fixed Charges | $2,250,509 | $2,497,239 | $2,874,125 | $2,811,610 | $3,047,724 | 48.2% | $53,469 | ||||||||
| Total Fixed Charges | 363,114 | 385,113 | 452,555 | 469,837 | 559,251 | 8.8 | 9,811 | ||||||||
| Net Operating Income | $1,887,395 | $2,112,126 | $2,421,570 | $2,341,773 | $2,488,473 | 39.3% | $43,657 | ||||||||
| FF&E | 0 | 0 | 232,529 | 236,129 | 253,123 | 4.0 | 4,441 | ||||||||
| Net Cash Flow | $1,887,395 | $2,112,126 | $2,189,041 | $2,105,644 | $2,235,350 | 35.3% | $39,217 | ||||||||
| NOI DSCR | 1.18x | 1.32x | 1.51x | 1.46x | 1.56x | ||||||||||
| NCF DSCR | 1.18x | 1.32x | 1.37x | 1.32x | 1.40x | ||||||||||
| NOI DY | 7.9% | 8.8% | 10.1% | 9.8% | 10.4% | ||||||||||
| NCF DY | 7.9% | 8.8% | 9.1% | 8.8% | 9.3% | ||||||||||
| (1) | A new restaurant lease (“Bread Nolita Lease”) was executed on February 18, 2016 between the borrower and The Food Commission, LLC with a base rent equal to $360,000 per annum. The tenant is expected to take occupancy in May 2016 and begin paying rent on August 1, 2016. A rent reserve equal to three months’ rent ($90,000) and a $1.5 million performance reserve was escrowed at origination of the Nolitan Hotel Mortgage Loan. See “Escrows” section. In addition, the sponsor will guarantee the Bread Nolita Lease for the first five years of the Nolitan Hotel Mortgage Loan term. |
THE INFORMATION IN THIS STRUCTURAL AND COLLATERAL TERM SHEET IS NOT COMPLETE AND MAY BE AMENDED PRIOR TO THE TIME OF SALE. THIS TERM SHEET IS NOT AN OFFER TO SELL THESE SECURITIES AND IT IS NOT A SOLICITATION OF AN OFFER TO BUY THESE SECURITIES IN ANY JURISDICTION WHERE THE OFFER OR SALE IS NOT PERMITTED.
| 93 |
| NOLITAN HOTEL |
The Appraisal.As of the appraisal valuation date of March 1, 2016, Nolitan Hotel Property had an “as-is” appraised value of $39,500,000.
Environmental Matters. According to a Phase I environmental assessment dated November 2, 2015, there was no evidence of any recognized environmental conditions at Nolitan Hotel Property.
Market Overview and Competition.The Nolitan Hotel Property is located at the southwestern corner of Kenmare and Elizabeth Streets within the Nolita neighborhood of Manhattan in New York City. Nolita, which stands for North of Little Italy, is situated at the nexus of other downtown neighborhoods including Soho, Noho, the Lower East Side and Little Italy. The Nolitan Hotel Property’s immediate area is densely populated by commercial loft-style office buildings, art galleries, designer boutiques, vintage shops and numerous independently run cafes, restuarants and bars. The Nolitan Hotel Property benefits from its proximity to five different subway lines (Spring Street – 6 line, Bowery – J,Z lines, Grand St – B,D lines, Prince Street – N,R lines and 2nd Avenue – F line), which are all located within 0.4 miles.
The Nolitan Hotel Property is also within walking distance from other districts such as Tribeca, East Village and Chinatown, which are all high-traffic leisure areas populated by retail stores, attractions and restaurants. Proximate tourist attractions include Tribeca Cinemas, home of the annual TriBeCa Film Festival, City Hall, St. Patrick’s Old Cathedral, Little Italy’s Feast of San Gennaro, the Brooklyn Bridge, New York City Fire Museum and Canal Street. According to the appraisal, the 2015 market mix of the Nolitan Hotel Property was 65% leisure, 30% commercial and 5% meeting and group. A third party hospitality research report identified six competitive hospitality properties, containing 674 guestrooms, which exhibited average occupancy, ADR, and RevPAR of 82.3%, $347.99, and $286.52, respectively, for the trailing 12-month period ending February 29, 2016.
The following table presents certain information relating to the Nolitan Hotel Property’s competitive set:
Subject and Market Historical Occupancy, ADR and RevPAR(1)
Competitive Set | Nolitan Hotel | Penetration Factor | ||||||||||||||||
Year | Occupancy | ADR | RevPAR | Occupancy | ADR | RevPAR | Occupancy | ADR | RevPAR | |||||||||
| 2/29/2016 TTM | 82.3% | $347.99 | $286.52 | 87.7% | $320.01 | $280.70 | 106.5% | 92.0% | 98.0% | |||||||||
| 2/28/2015 TTM | 80.3% | $339.18 | $272.31 | 86.4% | $310.31 | $267.98 | 107.6% | 91.5% | 98.4% | |||||||||
| 2/28/2014 TTM | 82.5% | $351.85 | $290.10 | 87.6% | $309.43 | $271.00 | 106.2% | 87.9% | 93.4% | |||||||||
| (1) | Information obtained from a third party hospitality report as of March 17, 2016. The competitive set includes the following hotels: Sixty SOHO, Hotel on Rivington, Sixty LES, Thompson Hotels Smyth Tribeca, The James New York Soho, and Hotel Americano. |
The Borrowers.The borrowers are 153 Elizabeth Street, LLC and 153 Elizabeth Hotel LLC, each a New York limited liability company and single purpose entity with one independent director. Legal counsel to the borrower delivered a non-consolidation opinion in connection with the origination of the Nolitan Hotel Mortgage Loan. Edmond Li is the guarantor of certain nonrecourse carveouts under the Nolitan Hotel Mortgage Loan.
The Sponsor.The sponsor is Edmond Li. Mr. Li is a managing member of Veracity Development, LLC, a private real estate investment and development firm that provides a full range of acquisition, development, financing and construction management services. Since 1994, Mr. Li has been responsible for the development of over 15 properties in downtown Manhattan. In addition, Mr. Li has been involved in the leasing of over 30 properties, including retail, office, government and warehouse spaces and has been responsible for advising on over 20 sales transactions, encompassing over 2.2 million square feet in New York City.
Escrows.The loan documents provide for upfront escrows in the amount of $213,741 for real estate taxes, $61,500 for insurance premiums, $14,594 for deferred maintenance, $90,000 for a rent concession reserve for the Bread Nolita Lease and a $1,500,000 performance reserve. The rent concession reserve for the Bread Nolita Lease will be released in equal monthly installments in June, July and August of 2016. The performance reserve will be released (no earlier than April 8, 2017) to the borrowers upon satisfaction of all of the following conditions: (i) a minimum of twelve months from the origination date of the Nolitan Hotel Mortgage Loan has elapsed; (ii) the lender has received evidence, including an estoppel certificate from the restaurant tenant confirming that the restaurant tenant is in physical occupancy of the leased premises, is paying full contractual rent, is open for business, and that there is no default by the borrower under the Bread Nolita Lease; and (iii) the Nolitan Hotel Property achieves a trailing twelve month net cash flow debt yield of at least 9.6%.
The loan documents provide for monthly escrows in the amount equal to one-twelfth of the annual real estate taxes (initially $35,624); one-twelfth of the annual insurance premiums (initially $5,125); and 4% of the annual gross revenues of the Nolitan Hotel Property for FF&E reserves (initially $21,107).
Lockbox and Cash Management.Upon the occurrence of a Cash Management Period (as defined below), the Nolitan Hotel Mortgage Loan requires that the borrower or property manager establish a lender-controlled lockbox account. All rents and profits are required to be deposited directly into such lockbox account. During a Cash Management Period, all excess funds in the lockbox account are swept to a lender-controlled subaccount.
A “Cash Management Period” will commence upon the earlier of (i) the occurrence and continuance of an event of default; or (ii) the amortizing debt service coverage ratio being less than 1.20x at the end of any calendar quarter. A Cash Management Period will end, with regard to clause (i), upon the cure of such event of default; and with regard to clause (ii), upon the amortizing debt service coverage ratio being at least equal to 1.35x for two consecutive calendar quarters.
THE INFORMATION IN THIS STRUCTURAL AND COLLATERAL TERM SHEET IS NOT COMPLETE AND MAY BE AMENDED PRIOR TO THE TIME OF SALE. THIS TERM SHEET IS NOT AN OFFER TO SELL THESE SECURITIES AND IT IS NOT A SOLICITATION OF AN OFFER TO BUY THESE SECURITIES IN ANY JURISDICTION WHERE THE OFFER OR SALE IS NOT PERMITTED.
| 94 |
| NOLITAN HOTEL |
Property Management.The Nolitan Hotel Property is managed by an affiliate of the borrower.
Assumption.The borrower has the right to transfer the Nolitan Hotel Property,provided that certain conditions are satisfied, including, (i) no event of default has occurred and is continuing; (ii) the proposed transferee and guarantor are satisfactory to the lender; and (iii) the lender has received confirmation from DBRS, Fitch and Moody’s that such assumption will not result in a downgrade, withdrawal or qualification of the respective ratings assigned to the Series 2016-C34 Certificates.
Partial Release.Not permitted.
Real Estate Substitution.Not permitted.
Subordinate and Mezzanine Indebtedness.Not permitted.
Ground Lease.None.
Terrorism Insurance.The loan documents require that the “all-risk” insurance policy required to be maintained by the borrower provides coverage for terrorism in an amount equal to the full replacement cost of the Nolitan Hotel Property, as well as business interruption insurance covering no less than the 18-month period following the occurrence of a casualty event, together with a six-month extended period of indemnity.
THE INFORMATION IN THIS STRUCTURAL AND COLLATERAL TERM SHEET IS NOT COMPLETE AND MAY BE AMENDED PRIOR TO THE TIME OF SALE. THIS TERM SHEET IS NOT AN OFFER TO SELL THESE SECURITIES AND IT IS NOT A SOLICITATION OF AN OFFER TO BUY THESE SECURITIES IN ANY JURISDICTION WHERE THE OFFER OR SALE IS NOT PERMITTED.
| 95 |
| STORAGE SOLUTIONS SELF STORAGE PORTFOLIO |
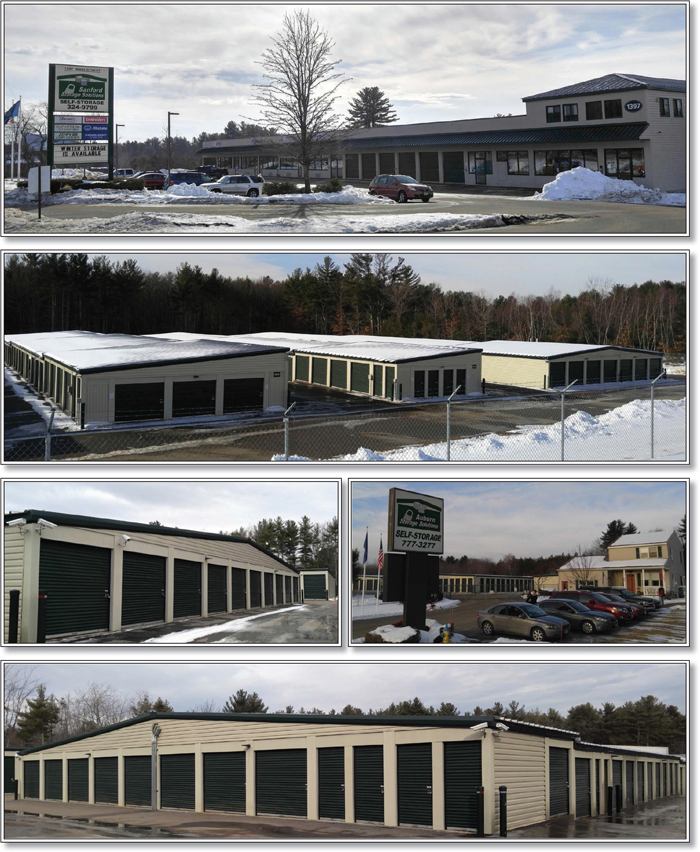
THE INFORMATION IN THIS STRUCTURAL AND COLLATERAL TERM SHEET IS NOT COMPLETE AND MAY BE AMENDED PRIOR TO THE TIME OF SALE. THIS TERM SHEET IS NOT AN OFFER TO SELL THESE SECURITIES AND IT IS NOT A SOLICITATION OF AN OFFER TO BUY THESE SECURITIES IN ANY JURISDICTION WHERE THE OFFER OR SALE IS NOT PERMITTED.
| 96 |
| STORAGE SOLUTIONS SELF STORAGE PORTFOLIO |
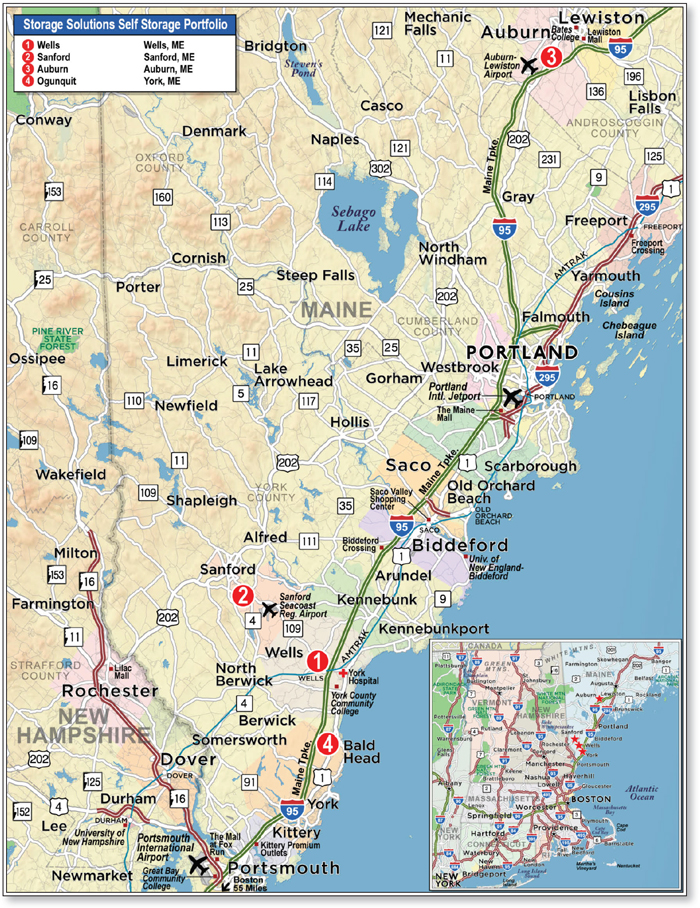
THE INFORMATION IN THIS STRUCTURAL AND COLLATERAL TERM SHEET IS NOT COMPLETE AND MAY BE AMENDED PRIOR TO THE TIME OF SALE. THIS TERM SHEET IS NOT AN OFFER TO SELL THESE SECURITIES AND IT IS NOT A SOLICITATION OF AN OFFER TO BUY THESE SECURITIES IN ANY JURISDICTION WHERE THE OFFER OR SALE IS NOT PERMITTED.
| 97 |
| No. 9 - Storage Solutions Self Storage Portfolio | |||||||
| Loan Information | Property Information | ||||||
| Mortgage Loan Seller: | Rialto Mortgage Finance, LLC | Single Asset/Portfolio: | Portfolio | ||||
| Credit Assessment (DBRS/Fitch/Moody’s): | NR/NR/NR | Property Type: | Self Storage | ||||
| Original Principal Balance: | $22,380,000 | Specific Property Type: | Self Storage | ||||
| Cut-off Date Balance: | $22,380,000 | Location: | Various - See Table | ||||
| % of Initial Pool Balance: | 3.2% | Size: | 259,420 SF | ||||
| Loan Purpose: | Acquisition | Cut-off Date Balance Per SF: | $86.27 | ||||
| Borrower Names(1): | Various | Year Built/Renovated: | Various - See Table | ||||
| Sponsors: | Robert Moser; Robert Morgan | Title Vesting: | Fee | ||||
| Mortgage Rate: | 5.250% | Property Manager: | Self-managed | ||||
| Note Date: | March 10, 2016 | 4thMost Recent Occupancy: | NAV | ||||
| Anticipated Repayment Date: | NAP | 3rdMost Recent Occupancy (As of)(4): | 75.8% (12/31/2013) | ||||
| Maturity Date: | March 6, 2021 | 2ndMost Recent Occupancy (As of)(4): | 82.9% (12/31/2014) | ||||
| IO Period: | 24 months | Most Recent Occupancy (As of)(4): | 85.9% (12/31/2015) | ||||
| Loan Term (Original): | 60 months | Current Occupancy (As of)(4): | 86.2% (1/1/2016) | ||||
| Seasoning: | 2 months | ||||||
| Amortization Term (Original): | 360 months | Underwriting and Financial Information: | |||||
| Loan Amortization Type: | Interest-only, Amortizing Balloon | 4thMost Recent NOI: | NAV | ||||
| Interest Accrual Method: | Actual/360 | 3rdMost Recent NOI (As of)(5): | $1,867,988 (12/31/2013) | ||||
| Call Protection: | L(26),D(30),O(4) | 2ndMost Recent NOI (As of)(5): | $2,049,851 (12/31/2014) | ||||
| Lockbox Type: | Springing | Most Recent NOI (As of): | $2,249,272 (TTM 1/31/2016) | ||||
| Additional Debt(2): | Yes | ||||||
| Additional Debt Type(2): | Future Mezzanine | U/W Revenues: | $2,863,194 | ||||
| U/W Expenses: | $742,957 | ||||||
| U/W NOI: | $2,120,237 | ||||||
| Escrows and Reserves(3): | U/W NCF: | $2,106,222 | |||||
| U/W NOI DSCR: | 1.43x | ||||||
| Type: | Initial | Monthly | Cap (If Any) | U/W NCF DSCR: | 1.42x | ||
| Taxes | $85,509 | $10,180 | NAP | U/W NOI Debt Yield: | 9.5% | ||
| Insurance | $13,992 | $2,665 | NAP | U/W NCF Debt Yield: | 9.4% | ||
| Replacement Reserves | $0 | $945 | NAP | As-Is Appraised Value(6): | $34,130,000 | ||
| TI/LC Reserve | $0 | $223 | $6,700 | As-Is Appraisal Valuation Date: | January 26, 2016 | ||
| Deferred Maintenance | $18,688 | $0 | NAP | Cut-off Date LTV Ratio(6): | 65.6% | ||
| Environmental Reserve | $6,500 | $0 | NAP | LTV Ratio at Maturity or ARD(6): | 62.8% | ||
| (1) | See “The Borrowers” section. |
| (2) | See “Subordinate and Mezzanine Indebtedness” section. |
| (3) | See “Escrows” section. |
| (4) | See “Historical Occupancy” section. |
| (5) | See “Cash Flow Analysis” section. |
| (6) | See “Appraisal” section. |
The Mortgage Loan. The mortgage loan (the “Storage Solutions Self Storage Portfolio Mortgage Loan”) is evidenced by a single promissory note that is secured by four first mortgages encumbering four self storage properties located in Maine (the “Storage Solutions Self Storage Portfolio Properties”). The Storage Solutions Self Storage Portfolio Mortgage Loan was originated on March 10, 2016 by Rialto Mortgage Finance, LLC. The Storage Solutions Self Storage Portfolio Mortgage Loan had an original principal balance of $22,380,000, has an outstanding principal balance as of the Cut-off Date of $22,380,000 and accrues interest at an interest rate of 5.2500%per annum. The Storage Solutions Self Storage Portfolio Mortgage Loan had an initial term of 60 months, has a remaining term of 58 months as of the Cut-off Date and requires payments of interest-only for the first 24 payments following origination and thereafter requires payments of principal and interest based on a 30-year amortization schedule. The Storage Solutions Self Storage Portfolio Mortgage Loan matures on March 6, 2021.
Following the lockout period, the borrowers have the right to defease the Storage Solutions Self Storage Portfolio Mortgage Loan in whole or in part (see “Partial Release” section) on any date before December 6, 2020. In addition, the Storage Solutions Self Storage Portfolio Mortgage Loan is prepayable without penalty on or after December 6, 2020.
THE INFORMATION IN THIS STRUCTURAL AND COLLATERAL TERM SHEET IS NOT COMPLETE AND MAY BE AMENDED PRIOR TO THE TIME OF SALE. THIS TERM SHEET IS NOT AN OFFER TO SELL THESE SECURITIES AND IT IS NOT A SOLICITATION OF AN OFFER TO BUY THESE SECURITIES IN ANY JURISDICTION WHERE THE OFFER OR SALE IS NOT PERMITTED.
| 98 |
| STORAGE SOLUTIONS SELF STORAGE PORTFOLIO |
Sources and Uses
| Sources | Uses | |||||||
| Original loan amount | $22,380,000 | 75.8% | Purchase price | $28,560,000 | 96.7% | |||
| Sponsor’s new cash contribution | 7,157,155 | 24.2 | Reserves | 124,688 | 0.4 | |||
| Closing costs | 852,466 | 2.9 | ||||||
| Total Sources | $29,537,155 | 100.0% | Total Uses | $29,537,155 | 100.0% |
The Properties. The Storage Solutions Self Storage Portfolio Properties comprise four self storage properties totaling 259,420 square feet located in Maine. The Storage Solutions Self Storage Portfolio Properties contain a mix of 582 climate controlled units (28.9% of net rentable square feet; 30.2% of units) and 1,343 non-climate controlled units (71.1% of net rentable square feet; 69.8% of units). The Storage Solutions Self Storage Portfolio Properties also include 84 RV/outdoor parking spaces, six retail units and three office units. As of January 1, 2016, the Storage Solutions Self Storage Portfolio Properties were 86.2% occupied.
The following table presents certain information relating to the unit mix of the Storage Solutions Self Storage Portfolio Properties:
| Property Name – Location | Allocated Cut-off Date Balance | % of Portfolio Cut-off Date Balance | Occupancy | Year Built/ Renovated | Net Rentable Area (SF) | As-Is Appraised Value(1) | Allocated Cut-off Date LTV(1) |
| Wells – Wells, ME | $7,280,000 | 32.5% | 93.3% | 1989/NAP | 71,245 | $9,840,000 | 74.0% |
| Sanford – Sanford, ME | $5,800,000 | 25.9% | 86.2% | 2003/NAP | 71,125 | $8,070,000 | 71.9% |
| Auburn – Auburn, ME | $4,700,000 | 21.0% | 85.3% | 2003/NAP | 59,375 | $6,630,000 | 70.9% |
| Ogunquit – York, ME | $4,600,000 | 20.6% | 78.5% | 2007/NAP | 57,675 | $7,150,000 | 64.3% |
| Total/Weighted Average | $22,380,000 | 100.0% | 86.2% | 259,420 | $34,130,000 | 65.6% |
| (1) | The Total Appraised Value and Weighted Average Allocated Cut-off Date LTV represents the portfolio “as-is” appraised value. As of the appraisal valuation date of January 26, 2016, the aggregate “as-is” appraised value of the Storage Solutions Self Storage Portfolio Properties is $31,690,000, which represents a Cut-off Date LTV Ratio and LTV Ratio at Maturity of 70.6% and 67.6%, respectively. |
The following table presents historical occupancy percentages at the Storage Solutions Self Storage Portfolio Properties:
Historical Occupancy
12/31/2012 | 12/31/2013(1)(2) | 12/31/2014(1)(2) | 12/31/2015(1) | 1/1/2016(3) | ||||
| NAV | 75.8% | 82.9% | 85.9% | 86.2% |
| (1) | Information obtained from the borrowers. |
| (2) | The Ogunquit property was constructed in three phases: 2007 (44,875 net rentable area square feet), 2013 (7,100 net rentable area square feet) and 2015 (5,700 net rentable square feet). As such, occupancy for 2013 and 2014 is based on 51,975 net rentable square feet for the Ogunquit property. |
| (3) | Information obtained from the underwritten rent roll. |
THE INFORMATION IN THIS STRUCTURAL AND COLLATERAL TERM SHEET IS NOT COMPLETE AND MAY BE AMENDED PRIOR TO THE TIME OF SALE. THIS TERM SHEET IS NOT AN OFFER TO SELL THESE SECURITIES AND IT IS NOT A SOLICITATION OF AN OFFER TO BUY THESE SECURITIES IN ANY JURISDICTION WHERE THE OFFER OR SALE IS NOT PERMITTED.
| 99 |
| STORAGE SOLUTIONS SELF STORAGE PORTFOLIO |
Operating History and Underwritten Net Cash Flow.The following table presents certain information relating to the historical operating performance and underwritten net cash flow at the Storage Solutions Self Storage Portfolio Properties:
Cash Flow Analysis
| 2013(1) | 2014(1) | TTM 1/31/2016(1) | U/W | % of U/W Effective Gross Income | U/W $ per SF | ||||||||
| Base Rent | $2,344,005 | $2,556,138 | $2,777,880 | $2,845,704 | 99.4% | $10.97 | |||||||
| Grossed Up Vacant Space | 0 | 0 | 0 | 447,432 | 15.6 | 1.72 | |||||||
| Concessions | (83,918) | (92,375) | (101,309) | (100,824) | (3.5) | (0.39) | |||||||
| Other Income(2) | 124,303 | 142,732 | 161,790 | 161,790 | 5.7 | 0.62 | |||||||
| Less Vacancy & Credit Loss | 0 | 0 | 0 | (490,909)(3) | (17.1) | (1.89) | |||||||
| Effective Gross Income | $2,384,391 | $2,606,495 | $2,838,361 | $2,863,194 | 100.0% | $11.04 | |||||||
| Total Operating Expenses | $516,403 | $556,643 | $589,089 | $740,457(4) | 25.9% | $2.85 | |||||||
| Net Operating Income | $1,867,988 | $2,049,851 | $2,249,272 | $2,122,737 | 74.1% | $8.18 | |||||||
| TI/LC | 0 | 0 | 0 | 2,670 | 0.1 | 0.01 | |||||||
| Capital Expenditures | 0 | 0 | 0 | 11,345 | 0.4 | 0.04 | |||||||
| Net Cash Flow | $1,867,988 | $2,049,851 | $2,249,272 | $2,108,722 | 73.6% | $8.13 | |||||||
| NOI DSCR | 1.26x | 1.38x | 1.52x | 1.43x | |||||||||
| NCF DSCR | 1.26x | 1.38x | 1.52x | 1.42x | |||||||||
| NOI DY | 8.3% | 9.2% | 10.1% | 9.5% | |||||||||
| NCF DY | 8.3% | 9.2% | 10.1% | 9.4% |
| (1) | The Ogunquit property (20.6% of the allocated Cut-Off Date Balance) was constructed in three phases: 2007 (44,875 net rentable area square feet); 2013 (7,100 net rentable area square feet) and 2015 (5,700 net rentable area square feet); each of which resulted in increasing revenues from 2013 through 2015. |
| (2) | Other Income includes late fees, administrative fees, merchandise sales, tenant insurance sales and miscellaneous fees. |
| (3) | The underwritten economic vacancy is 18.0%. The Storage Solutions Self Storage Portfolio Properties were 86.2% physically occupied as of January 1, 2016. |
| (4) | U/W Total Operating Expenses includes a 5.0% management fee. Historical Total Operating Expenses did not include management fees. |
Appraisal.As of the appraisal valuation date of January 26, 2016, the Storage Solutions Self Storage Portfolio Properties had a portfolio “as-is” appraised value of $34,130,000. As of January 26, 2016, the Storage Solutions Self Storage Portfolio Properties had an aggregate “as-is” appraised value of $31,690,000.
Environmental Matters.According to Phase I environmental assessments dated February 5, 2016, there was no evidence of any recognized environmental conditions at the Storage Solutions Self Storage Portfolio Properties.
The Borrowers.The borrowers are Prime Storage Auburn, LLC, Prime Storage Neddick, LLC, Prime Storage Sanford, LLC and Prime Storage Wells, LLC, four individual single purpose Delaware limited liability companies, each with one independent director in its organizational structure. Legal counsel to the borrowers delivered a non-consolidation opinion in connection with the origination of the Storage Solutions Self Storage Portfolio Mortgage Loan. Robert Morgan and Robert Moser are the guarantors of certain non-recourse carveouts under the Storage Solutions Self Storage Portfolio Mortgage Loan.
The Sponsors.The sponsors are Robert Moser and Robert Morgan, who together have developed, acquired and currently manage a portfolio of institutional-grade commercial real estate assets. Together, they own and manage over 4.6 million rentable square feet of self storage facilities in markets throughout the eastern and central United States valued at over $460.0 million. The sponsors are also the sponsors of the borrowers under the mortgage loan identified on Annex A-1 as Plantation Self Storage. The sponsors were parties to prior foreclosure litigation. See “Description of the Mortgage Pool—Loan Purpose; Default History, Bankruptcy Issues and Other Proceedings” in the Preliminary Prospectus.
Escrows.The loan documents provide for upfront reserves in the amount of$85,509 for real estate taxes, $13,992 for insurance premiums, $18,688 for deferred maintenance and $6,500 for an environmental escrow. The loan documents require ongoing monthly deposits of $10,180 for real estate taxes, $2,665 for insurance premiums, $945 for replacement reserves and $223 for tenant improvements and leasing commissions (subject to a cap of $6,700).
Lockbox and Cash Management.Upon the occurrence of a Cash Management Trigger Event (as defined below) the borrowers will be required to establish a lender-controlled lockbox account and direct each credit card company with which the borrowers have entered into merchant agreements to deliver all receipts payable with respect to the Storage Solutions Self Storage Portfolio Properties directly into such lockbox account. Additionally, all revenues received by the borrowers or the property manager relating to the Storage Solutions Self Storage Portfolio Properties are required to be deposited into the lockbox account within two business days of receipt. Other than during a Cash Sweep Event (as defined below), all excess funds on deposit are disbursed to the borrowers.
A “Cash Management Trigger Event” will commence upon the occurrence of the earlier of (i) an event of default; (ii) any bankruptcy action of the borrowers, guarantors or manager; or (iii) a Cash Management DSCR Trigger Event (as defined below). A Cash Management Trigger Event will end with respect to clause (i), when such event of default has been cured; with respect to clause (ii), when such bankruptcy action has been discharged, stayed, or dismissed within 30 days for the borrowers or guarantors and 120 days for the manager, among other conditions or, with respect to a bankruptcy action of the manager, the borrowers replacing the
THE INFORMATION IN THIS STRUCTURAL AND COLLATERAL TERM SHEET IS NOT COMPLETE AND MAY BE AMENDED PRIOR TO THE TIME OF SALE. THIS TERM SHEET IS NOT AN OFFER TO SELL THESE SECURITIES AND IT IS NOT A SOLICITATION OF AN OFFER TO BUY THESE SECURITIES IN ANY JURISDICTION WHERE THE OFFER OR SALE IS NOT PERMITTED.
| 100 |
| STORAGE SOLUTIONS SELF STORAGE PORTFOLIO |
manager with a qualified manager acceptable to the lender; and with respect to clause (iii), the amortizing debt service coverage ratio based upon the trailing 12-month period immediately preceding the date of such determination being greater than 1.25x for two consecutive calendar quarters.
A “Cash Management DSCR Trigger Event” occurs upon any date the amortizing debt service coverage ratio based on the trailing 12-month period immediately preceding the date of such determination is less than 1.20x.
A “Cash Sweep Event” means (i) an event of default; (ii) any bankruptcy action of the borrowers, guarantors or manager; or (iii) a Cash Sweep DSCR Trigger Event (as defined below). A Cash Sweep Event will end with respect to clause (i), when such event of default has been cured, and with respect to clause (ii), when such bankruptcy action has been discharged, stayed, or dismissed, within 30 days for the borrowers or guarantors and 120 days for the manager, among other conditions or, with respect to a bankruptcy action of the manager, the borrowers replacing the manager with a qualified manager acceptable to the lender; and with respect toclause (iii), the amortizing debt service coverage ratio based upon the trailing 12-month period immediately preceding the date of such determination is greater than 1.20x for two consecutive quarters.
A “Cash Sweep DSCR Trigger Event” occurs upon any date the amortizing debt service coverage ratio based on the trailing 12-month period immediately preceding the date of such determination is less than 1.15x.
Property Management. The Storage Solutions Self Storage Portfolio Properties are managed by an affiliate of the borrowers.
Assumption.The borrowers have the right to transfer the Storage Solutions Self Storage Portfolio Properties, provided that certain conditions are satisfied, including (i) no event of default has occurred and is continuing; (ii) the lender’s reasonable determination that the proposed transferee and guarantor satisfy the lender’s credit review and underwriting standards, taking into consideration transferee experience, financial strength and general business standing; (iii) execution of a recourse guaranty and an environmental indemnity by an affiliate of the transferee; and (iv) if requested by the lender, rating agency confirmation from each of DBRS, Fitch and Moody’s that the transfer will not result in a downgrade, withdrawal or qualification of the respective ratings assigned to the Series 2016-C34 Certificates.
Partial Release.Following the lockout period and prior to December 6, 2020, the borrowers are permitted to partially release any constituent properties in connection with a partial defeasance, subject to certain conditions, including (i) no event of default has occurred and is continuing; (ii) partial defeasance of 115% of the released property’s original allocated loan balance; (iii) the amortizing debt service coverage ratio (based upon the trailing 12-month period immediately preceding the date of such determination) with respect to the remaining properties will be no less than the greater of (a) 1.42x and (b) the amortizing debt service coverage ratio immediately prior to the release; and (iv) the loan-to-value ratio with respect to the remaining properties will be no greater than the lesser of (a) 65.0%, and (b) the loan-to-value ratio immediately prior to the release.
Real Estate Substitution.Not permitted.
Subordinate and Mezzanine Indebtedness.The loan documents permit mezzanine financing subject to certain conditions, including (i) the execution of an intercreditor agreement in form and substance acceptable to the lender; (ii) the combined loan-to-value ratio is not greater than 65.0%; (iii) the combined amortizing debt service coverage ratio is not less than 1.42x; and (iv) receipt of rating agency confirmation from each of DBRS, Fitch and Moody’s that the mezzanine financing will not result in a downgrade, withdrawal or qualification of the respective ratings assigned to the Series 2016-C34 Certificates.
Ground Lease.None.
Terrorism Insurance.The loan documents require that the “all risk” insurance policy required to be maintained by the borrowers provide coverage for terrorism in an amount equal to the full replacement cost of the Storage Solutions Self Storage Portfolio Properties, as well as business interruption insurance covering no less than the 18-month period following the occurrence of a casualty event, together with a 12-month extended period of indemnity.
Windstorm Insurance. The loan documents require windstorm insurance covering the full replacement cost of the Storage Solutions Self Storage Portfolio Properties during the loan term. At the time of closing, the Storage Solutions Self Storage Portfolio Properties had insurance coverage for windstorm.
THE INFORMATION IN THIS STRUCTURAL AND COLLATERAL TERM SHEET IS NOT COMPLETE AND MAY BE AMENDED PRIOR TO THE TIME OF SALE. THIS TERM SHEET IS NOT AN OFFER TO SELL THESE SECURITIES AND IT IS NOT A SOLICITATION OF AN OFFER TO BUY THESE SECURITIES IN ANY JURISDICTION WHERE THE OFFER OR SALE IS NOT PERMITTED.
| 101 |
(THIS PAGE INTENTIONALLY LEFT BLANK)
THE INFORMATION IN THIS STRUCTURAL AND COLLATERAL TERM SHEET IS NOT COMPLETE AND MAY BE AMENDED PRIOR TO THE TIME OF SALE. THIS TERM SHEET IS NOT AN OFFER TO SELL THESE SECURITIES AND IT IS NOT A SOLICITATION OF AN OFFER TO BUY THESE SECURITIES IN ANY JURISDICTION WHERE THE OFFER OR SALE IS NOT PERMITTED.
| 102 |
| SHOPPES AT ALAFAYA |
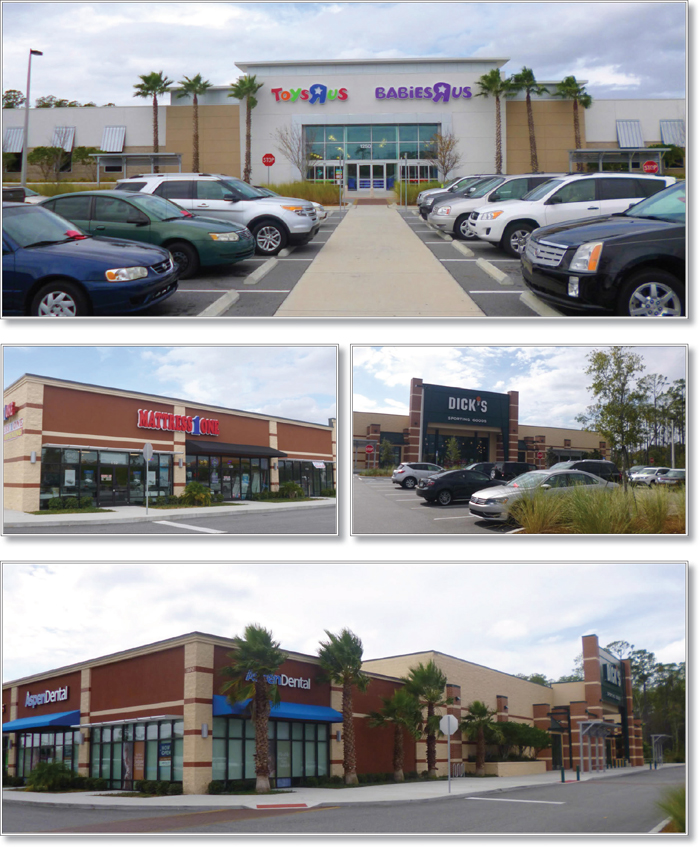
THE INFORMATION IN THIS STRUCTURAL AND COLLATERAL TERM SHEET IS NOT COMPLETE AND MAY BE AMENDED PRIOR TO THE TIME OF SALE. THIS TERM SHEET IS NOT AN OFFER TO SELL THESE SECURITIES AND IT IS NOT A SOLICITATION OF AN OFFER TO BUY THESE SECURITIES IN ANY JURISDICTION WHERE THE OFFER OR SALE IS NOT PERMITTED.
| 103 |
| SHOPPES AT ALAFAYA |
THE INFORMATION IN THIS STRUCTURAL AND COLLATERAL TERM SHEET IS NOT COMPLETE AND MAY BE AMENDED PRIOR TO THE TIME OF SALE. THIS TERM SHEET IS NOT AN OFFER TO SELL THESE SECURITIES AND IT IS NOT A SOLICITATION OF AN OFFER TO BUY THESE SECURITIES IN ANY JURISDICTION WHERE THE OFFER OR SALE IS NOT PERMITTED.
| 104 |
| SHOPPES AT ALAFAYA |
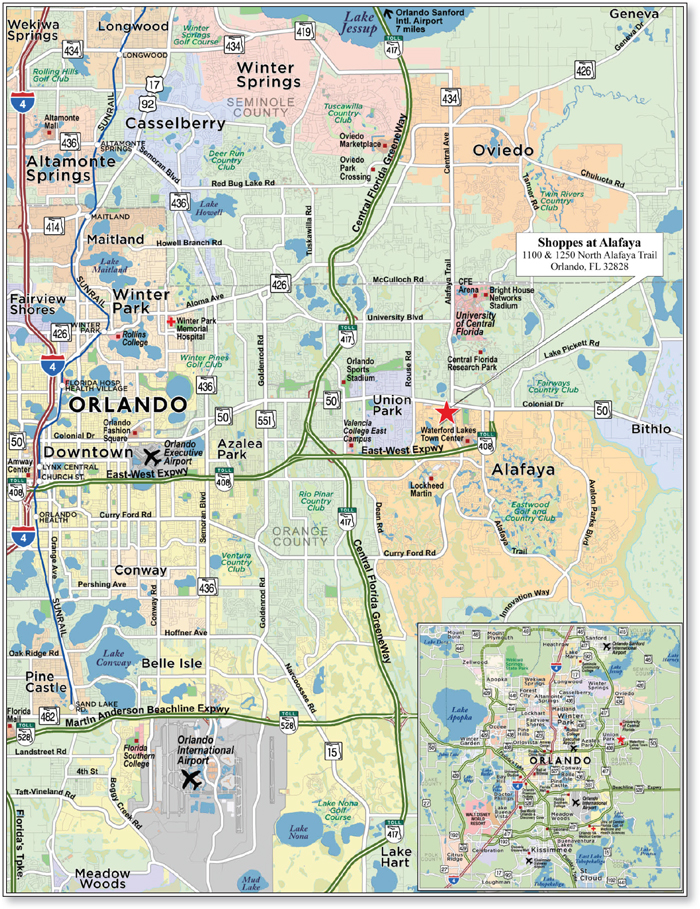
THE INFORMATION IN THIS STRUCTURAL AND COLLATERAL TERM SHEET IS NOT COMPLETE AND MAY BE AMENDED PRIOR TO THE TIME OF SALE. THIS TERM SHEET IS NOT AN OFFER TO SELL THESE SECURITIES AND IT IS NOT A SOLICITATION OF AN OFFER TO BUY THESE SECURITIES IN ANY JURISDICTION WHERE THE OFFER OR SALE IS NOT PERMITTED.
| 105 |
| No. 10 – Shoppes at Alafaya | |||||||
| Loan Information | Property Information | ||||||
| Mortgage Loan Seller: | Basis Real Estate Capital II, LLC | Single Asset/Portfolio: | Single Asset | ||||
Credit Assessment (DBRS/Fitch/Moody’s): | NR/NR/NR | Property Type: | Retail | ||||
| Original Principal Balance: | $20,950,000 | Specific Property Type: | Anchored | ||||
| Cut-off Date Balance: | $20,950,000 | Location: | Orlando, FL | ||||
| % of Initial Pool Balance: | 3.0% | Size(3): | 120,639 SF | ||||
| Loan Purpose: | Refinance | Cut-off Date Balance Per SF: | $173.66 | ||||
| Borrower Name: | HM-UP Development Alafaya Trails, LLC | Year Built/Renovated: | 2011/NAP | ||||
| Sponsors: | Eric D. Sheppard; Robert Kallman | Title Vesting: | Fee | ||||
| Mortgage Rate: | 5.300% | Property Manager: | Self-managed | ||||
| Note Date: | February 18, 2016 | 4th Most Recent Occupancy (As of)(2): | 100.0% (12/31/2011) | ||||
| Anticipated Repayment Date: | NAP | 3rdMost Recent Occupancy (As of): | 90.3% (12/31/2012) | ||||
| Maturity Date: | March 1, 2026 | 2ndMost Recent Occupancy (As of): | 97.0% (12/31/2013) | ||||
| IO Period: | 24 months | Most Recent Occupancy (As of): | 97.0% (12/31/2014) | ||||
| Loan Term (Original): | 120 months | Current Occupancy (As of): | 97.0% (2/28/2016) | ||||
| Seasoning: | 2 months | ||||||
| Amortization Term (Original): | 360 months | Underwriting and Financial Information: | |||||
| Loan Amortization Type: | Interest-only, Amortizing Balloon | ||||||
| Interest Accrual Method: | Actual/360 | 4thMost Recent NOI(3): | NAV | ||||
| Call Protection: | L(26),D(91),O(3) | 3rdMost Recent NOI (As of)(3): | $1,502,274 (12/31/2013) | ||||
| Lockbox Type: | Hard/Springing Cash Management | 2ndMost Recent NOI (As of)(3): | $1,841,207 (12/31/2014) | ||||
| Additional Debt: | None | Most Recent NOI (As of)(3): | $1,800,855 (Annualized 9 9/30/2015) | ||||
| Additional Debt Type: | NAP | ||||||
| U/W Revenues: | $2,363,245 | ||||||
| U/W Expenses: | $529,439 | ||||||
| U/W NOI: | $1,833,806 | ||||||
| U/W NCF: | $1,742,529 | ||||||
| Escrows and Reserves(1): | U/W NOI DSCR: | 1.31x | |||||
| U/W NCF DSCR: | 1.25x | ||||||
| Type: | Initial | Monthly | Cap (If Any) | U/W NOI Debt Yield: | 8.8% | ||
| Taxes | $0 | $14,867 | NAP | U/W NCF Debt Yield: | 8.3% | ||
| Insurance | $0 | $6,448 | NAP | As-Is Appraised Value: | $28,670,000 | ||
| Replacement Reserves | $0 | $1,508 | NAP | As-Is Appraisal Valuation Date: | December 15, 2015 | ||
| TI/LC Reserve | $0 | $5,000 | $150,000 | Cut-off Date LTV Ratio: | 73.1% | ||
| Integra Funds Reserve | $0 | $10,000 | $62,000 | LTV Ratio at Maturity or ARD: | 63.7% | ||
| (1) | See “Escrows” section. |
| (2) | See “Historical Occupancy” section. |
| (3) | See “Cash Flow Analysis” section. |
The Mortgage Loan.The mortgage loan (the “Shoppes at Alafaya Mortgage Loan”) is evidenced by a single promissory note that is secured by a first mortgage encumbering the fee interest in an anchored retail property located in Orlando, Florida (the “Shoppes at Alafaya Property”). The Shoppes at Alafaya Mortgage Loan was originated on February 18, 2016 by Basis Real Estate Capital II, LLC. The Shoppes at Alafaya Mortgage Loan had an original principal balance of $20,950,000, has an outstanding principal balance as of the Cut-off Date of $20,950,000 and accrues interest at an interest rate of 5.300%per annum. The Shoppes at Alafaya Mortgage Loan had an initial term of 120 months, has a remaining term of 118 months as of the Cut-off Date and requires interest-only payments for the first 24 payments following origination and, thereafter, requires payments of principal and interest based on a 30 year amortization schedule. The Shoppes at Alafaya Mortgage Loan matures on March 1, 2026.
Following the lockout period, the borrower has the right to defease the Shoppes at Alafaya Mortgage Loan in whole but not in part on any date before January 1, 2026. In addition, the Shoppes at Alafaya Mortgage Loan is prepayable without penalty on or after January 1, 2026.
THE INFORMATION IN THIS STRUCTURAL AND COLLATERAL TERM SHEET IS NOT COMPLETE AND MAY BE AMENDED PRIOR TO THE TIME OF SALE. THIS TERM SHEET IS NOT AN OFFER TO SELL THESE SECURITIES AND IT IS NOT A SOLICITATION OF AN OFFER TO BUY THESE SECURITIES IN ANY JURISDICTION WHERE THE OFFER OR SALE IS NOT PERMITTED.
| 106 |
| SHOPPES AT ALAFAYA |
Sources and Uses
| Sources | Uses | |||||||
| Original loan amount | $20,950,000 | 97.3% | Loan payoff | $19,218,761 | 89.3% | |||
| Sponsor’s new cash contribution | 583,208 | 2.7 | Closing costs | 2,114,447 | 9.8 | |||
| Partner redemption(1) | 200,000 | 0.9 | ||||||
| Total Sources | $21,533,208 | 100.0% | Total Uses | $21,533,208 | 100.0% |
| (1) | The partner who previously managed the Shoppes at Alafaya Property was bought out at origination for $200,000. |
The Property.The Shoppes at Alafaya Property is a two-building, anchored retail center totaling 120,639 square feet located in Orlando, Florida, approximately 12.4 miles east of the central business district. Built in two phases in 2011 and 2012, the Shoppes at Alafaya Property is situated on a 15.6-acre parcel along North Alafaya Trail, which has a daily traffic count of approximately 59,000 vehicles. The Shoppes at Alafaya Property is anchored by Toys R Us and Dick’s Sporting Goods, both of which occupy built-to-suit stores, and contains five inline spaces totaling 11,732 square feet. Phase III of the Shoppes at Alafaya shopping center (which is not part of the collateral) is expected to begin construction in July 2016 and will consist of apartments and additional complementary retail space (potential tenants include Marshalls/HomeGoods, Ross Dress for Less, Whole Foods Markets, Petco and Crunch Fitness). The Shoppes at Alafaya Property features 723 surface parking spaces, resulting in a parking ratio of 6.0 spaces per 1,000 square feet of rentable area. As of February 28, 2016, the Shoppes at Alafaya Property was 97.0% occupied by five tenants. There is a letter of intent signed for a prospective 2,093 square feet tenant that would raise the occupancy to 98.8%.
The following table presents certain information relating to the tenancy at the Shoppes at Alafaya Property:
Major Tenants
| Tenant Name | Credit Rating (Fitch/ Moody’s/ S&P)(1) | Tenant NRSF | % of NRSF | Annual U/W Base Rent PSF | Annual U/W Base Rent | % of Total Annual U/W Base Rent | Sales PSF(2) | Occupancy Cost(2) | Lease Expiration Date |
| Anchor Tenants | |||||||||
| Toys R Us | NR/B3/NR | 58,907 | 48.8% | $15.00 | $883,605 | 46.6% | NAV | NAV | 1/31/2027(3) |
| Dick’s Sporting Goods | NR/NR/NR | 50,000 | 41.4% | $15.00 | $750,000 | 39.6% | NAV | NAV | 1/31/2023(4) |
| Total Anchor Tenant | 108,907 | 90.3% | $15.00 | $1,633,605 | 86.2% | ||||
| Non-Major Tenants | 8,171 | 6.8% | $32.09 | $262,211 | 13.8% | ||||
| Occupied Collateral Total | 117,078 | 97.0% | $16.19 | $1,895,816 | 100.0% | ||||
| Vacant Space | 3,561 | 3.0% | |||||||
| Collateral Total | 120,639 | 100.0% | |||||||
| (1) | Certain ratings are those of the parent company whether or not the parent guarantees the lease. |
| (2) | The tenants are not required to report sales. |
| (3) | Toys R Us has five, 5-year lease extension options. |
| (4) | Dick’s Sporting Goods has four, 5-year lease extension options remaining. |
THE INFORMATION IN THIS STRUCTURAL AND COLLATERAL TERM SHEET IS NOT COMPLETE AND MAY BE AMENDED PRIOR TO THE TIME OF SALE. THIS TERM SHEET IS NOT AN OFFER TO SELL THESE SECURITIES AND IT IS NOT A SOLICITATION OF AN OFFER TO BUY THESE SECURITIES IN ANY JURISDICTION WHERE THE OFFER OR SALE IS NOT PERMITTED.
| 107 |
| SHOPPES AT ALAFAYA |
The following table presents certain information relating to the lease rollover schedule at the Shoppes at Alafaya Property:
Lease Expiration Schedule(1)
| Year Ending December 31, | No. of Leases Expiring | Expiring NRSF | % of Total NRSF | Cumulative Expiring NRSF | Cumulative % of Total NRSF | Annual U/W Base Rent | % of Total Annual U/W Base Rent | Annual U/W Base Rent PSF(2) |
| MTM | 0 | 0 | 0.0% | 0 | 0.0% | $0 | 0.0% | $0.00 |
| 2016 | 0 | 0 | 0.0% | 0 | 0.0% | $0 | 0.0% | $0.00 |
| 2017 | 0 | 0 | 0.0% | 0 | 0.0% | $0 | 0.0% | $0.00 |
| 2018 | 2 | 4,931 | 4.1% | 4,931 | 4.1% | $154,481 | 8.1% | $31.33 |
| 2019 | 0 | 0 | 0.0% | 4,931 | 4.1% | $0 | 0.0% | $0.00 |
| 2020 | 0 | 0 | 0.0% | 4,931 | 4.1% | $0 | 0.0% | $0.00 |
| 2021 | 0 | 0 | 0.0% | 4,931 | 4.1% | $0 | 0.0% | $0.00 |
| 2022 | 0 | 0 | 0.0% | 4,931 | 4.1% | $0 | 0.0% | $0.00 |
| 2023 | 2 | 53,240 | 44.1% | 58,171 | 48.2% | $857,730 | 45.2% | $16.11 |
| 2024 | 0 | 0 | 0.0% | 58,171 | 48.2% | $0 | 0.0% | $0.00 |
| 2025 | 0 | 0 | 0.0% | 58,171 | 48.2% | $0 | 0.0% | $0.00 |
| 2026 | 0 | 0 | 0.0% | 58,171 | 48.2% | $0 | 0.0% | $0.00 |
| Thereafter | 1 | 58,907 | 48.8% | 117,078 | 97.0% | $883,605 | 46.6% | $15.00 |
| Vacant | 0 | 3,561 | 3.0% | 120,639 | 100.0% | $0 | 0.0% | $0.00 |
| Total/Weighted Average | 5 | 120,639 | 100.0% | $1,895,816 | 100.0% | $16.19 |
| (1) | Information obtained from the underwritten rent roll. |
| (2) | Weighted Average Annual U/W Base Rent PSF excludes vacant space. |
The following table presents historical occupancy percentages at the Shoppes at Alafaya Property:
Historical Occupancy
12/31/2011(1)(2) | 12/31/2012(2) | 12/31/2013(2) | 12/31/2014(2) | 2/28/16(3) |
| 100.0% | 90.3% | 97.0% | 97.0% | 97.0% |
| (1) | Occupancy for 2011 is based on Phase I only (Toys R Us space), as Phase II was not completed until 2012. |
| (2) | Information calculated based on lease start dates. |
| (3) | Information obtained from the underwritten rent roll. |
Operating History and Underwritten Net Cash Flow.The following table presents certain information relating to the historical operating performance and underwritten net cash flow at the Shoppes at Alafaya Property:
Cash Flow Analysis(1)
| 2013 | 2014 | Annualized 9 9/30/2015(3) | U/W | % of U/W Effective Gross Income | U/W $ per SF | |
| Base Rent | $1,681,326 | $1,903,759 | $1,895,816 | $1,895,816 | 80.2% | $15.71 |
| Grossed Up Vacant Space | 0 | 0 | 0 | 110,391 | 4.7 | 0.92 |
| Total Reimbursables | 373,795 | 477,598 | 393,772 | 481,646 | 20.4 | 3.99 |
| Other Income | 0 | 0 | 0 | 0 | 0.0 | 0.00 |
| Less Vacancy & Credit Loss | 0 | 0 | 0 | (124,608)(4) | (5.3) | (1.03) |
| Effective Gross Income | $2,055,121 | $2,381,357(2) | $2,289,588 | $2,363,245 | 100.0% | $19.59 |
| Total Operating Expenses | $552,847 | $540,150 | $488,733 | $529,439 | 22.4% | $4.39 |
| Net Operating Income | $1,502,274 | $1,841,207 | $1,800,855 | $1,833,806 | 77.6% | $15.20 |
| TI/LC | 0 | 0 | 0 | 73,181 | 3.1 | 0.61 |
| Capital Expenditures | 0 | 0 | 0 | 18,096 | 0.8 | 0.15 |
| Net Cash Flow | $1,502,274 | $1,841,207 | $1,800,855 | $1,742,529 | 73.7% | $14.44 |
| NOI DSCR | 1.08x | 1.32x | 1.29x | 1.31x | ||
| NCF DSCR | 1.08x | 1.32x | 1.29x | 1.25x | ||
| NOI DY | 7.2% | 8.8% | 8.6% | 8.8% | ||
| NCF DY | 7.2% | 8.8% | 8.6% | 8.3% |
| (1) | Operating history prior to 2013 is not available as Phase II of the Shoppes at Alafaya Property construction was not completed until the end of 2012. |
| (2) | Effective Gross Income increased significantly in 2014 because 2014 represents the first full year that the inline tenants were in occupancy and paying rent and reimbursable expenses. |
| (3) | Year-end 2015 operating statements are not available. |
| (4) | The underwritten economic vacancy is 5.0%. The Shoppes at Alafaya Property is 97.0% physically occupied as of February 28, 2015. |
Appraisal.As of the appraisal valuation date of December 15, 2015, the Shoppes at Alafaya Property had an “as-is” appraised value of $28,670,000.
Environmental Matters.According to the Phase I environmental assessment dated December 15, 2015, there was no evidence of any recognized environmental conditions at the Shoppes at Alafaya Property.
THE INFORMATION IN THIS STRUCTURAL AND COLLATERAL TERM SHEET IS NOT COMPLETE AND MAY BE AMENDED PRIOR TO THE TIME OF SALE. THIS TERM SHEET IS NOT AN OFFER TO SELL THESE SECURITIES AND IT IS NOT A SOLICITATION OF AN OFFER TO BUY THESE SECURITIES IN ANY JURISDICTION WHERE THE OFFER OR SALE IS NOT PERMITTED.
| 108 |
| SHOPPES AT ALAFAYA |
Market Overview and Competition.The Shoppes at Alafaya Property is located along the Alafaya Trail, approximately 12.4 miles east of the Orlando central business district and 14.4 miles northeast of the Orlando International Airport. Just south of the Shoppes at Alafaya Property is the WP Glimcher-owned Waterford Lakes Town Center, a lifestyle center that is home to Super Target, Best Buy, Regal Cinemas, Bed Bath and Beyond, TJ Maxx and Ross Dress for Less. The Shoppes at Alafaya Property is located 2.6 miles north of the University of Central Florida, which had a 2014 enrollment of 60,810 students and serves as an economic driver in the area through various expansions and renovations within its campus. The Shoppes at Alafaya Property is located 3.2 miles southwest of the approximately 1,000-acre Central Florida Research Park, which is the seventh largest research park in the nation with over 116 corporations offering more than 10,000 jobs. The Shoppes at Alafaya Property is located 3.0 miles northeast of Lockheed-Martin, the largest industrial employer in Central Florida, employing approximately 6,400 people. According to the appraisal, the 2015 estimated population within a one-, three- and five-mile radius of the Shoppes at Alafaya Property was 13,751, 98,784 and 220,457, respectively,and the 2015 average estimated household income within the same radii was $52,422, $59,488 and $64,970, respectively.
According to a third party market research report, the Shoppes at Alafaya Property is located in theWest University submarket of the Greater Orlando retail market.As of the first quarter of 2016, the retail submarket contained approximately 4.39 million square feet of retail space with a 3.6% vacancy rate and average asking rent of $19.43 per square foot on a net basis.
The following table presents certain information relating to some comparable retail properties for the Shoppes at Alafaya Property:
Comparable Leases(1)
| Property Name/Location | Year Built/ Renovated | Anchor Tenants | Total GLA (SF) | Total Occupancy | Distance from Subject | Tenant Name | Lease Date / Term | Lease Area (SF) | Annual Base Rent PSF | Lease Type |
| Lake Washington Melbourne FL | 1982/NAP | Thrifty Specialty Produce, Tuesday Morning, Dollar General | 112,057 | 95.1% | 51.0 miles | LA Fitness | Feb 2013 / 10 Years
| 38,000 | $15.00 | NNN |
Family Amusement Orlando, FL | 1998/NAP | NAP | 25,000 | 100% | 18.8 miles | HuKoos | Nov 2013 / 10 Years | 25,000 | $14.00 | NNN |
Market at Town Park Orlando, FL | 2013/NAP | Anytme Fitness, McDonald’s, Allstate, Jet’s Pizza | 64,231 | 91.5% | 1.7 miles
| Publix | Sept 2012 / 20 Years | 45,600 | $12.50 | NNN |
Millenia Plaza Orlando, FL | 2001/NAP | Ross Dress for Less, Dick’s Sporting Goods, Toys R Us | 295,793 | 100% | 17.9 miles | Total Wine | Apr 2012 / 10 Years
| 26,400 | $25.00 | NNN |
| (1) | Information obtained from the appraisal, third party market research reports and underwritten rent roll. |
The Borrower.The borrower is HM-UP Development Alafaya Trails, LLC, a Delaware limited liability company. Eric D. Sheppard and Robert Kallman serve as the guarantors of certain nonrecourse carveouts under the Shoppes at Alafaya Mortgage Loan.
The Sponsors.The sponsors are Eric D. Sheppard and Robert Kallman. Mr. Sheppard is the president of HM Management/Star Island Development, has 20 years’ experience in commercial real estate development and currently owns and manages 13 commercial properties throughout the east coast. Mr. Kallman has been involved with real estate transactions for the past 12 years and specializes in the acquisition, development and construction of retail buildings. Mr. Kallman is the CEO, President and 50.0% owner of Bookzine Company, Inc., the third largest book wholesaler in the United States. Mr. Sheppard was involved in several workouts between 2009 and 2012, some of which resulted in a bankruptcy filing and/or foreclosure. See “Description of the Mortgage Pool – Loan Purpose; Default History, Bankruptcy Issues and Other Proceedings” in the Preliminary Prospectus for more details.
Escrows.The loan documents provide for ongoing monthly escrows in the amount of $14,867 for real estate taxes, $6,448 for insurance premiums, $1,508 for replacement reserves, $5,000 for tenant improvements and leasing commissions (subject to a cap of $150,000 so long as no Cash Trap Event Period exists (see “Lockbox and Cash Management” section)) and $10,000 into a reserve (“the Integra Reserve”) to pay the mortgage broker (the “Integra Monthly Deposits”) (subject to a cap of $62,000). In the event that any of the Dick’s Tax Deposit Waiver Conditions (as defined below) are not satisfied by September 1, 2016, the borrower is required to deposit an additional $51,527 into the tax escrow account on the September 2016 payment date and the monthly escrow for taxes will be increased to include the taxes attributable to the Dick’s Sporting Goods (“Dick’s”) parcel until all of the Dick’s Tax Deposit Waiver Conditions are satisfied.
“Dick’s Tax Deposit Waiver Conditions” means (i) no event of default has occurred and is continuing; (ii) delivery has occurred of reasonably acceptable evidence that the Dick’s parcel has been assigned a separate tax parcel identification number; (iii) no default under the Dick’s lease has occurred and is continuing and the Dick’s lease remains in effect; (iv) neither Dick’s nor any guarantor under the Dick’s lease is insolvent or a debtor in any bankruptcy action; (v) Dick’s lease requires the tenant to pay taxes on the Dick’s parcel directly; and (vi) delivery of reasonably acceptable evidence that Dick’s has paid all applicable taxes for the Dick’s parcel prior to such taxes becoming delinquent and/or before any fees, interest or penalties begin to accrue.
Lockbox and Cash Management.The Shoppes at Alafaya Mortgage Loan is structured with a lender-controlled hard lockbox, which is already in place, and springing cash management. The Shoppes at Alafaya Mortgage Loan documents require tenants to deposit all rents directly into such lockbox account. The loan documents also require that all rents received by the borrower or property manager be deposited to such lockbox account within two business days of receipt. Prior to the occurrence of a Cash Management Period (as
THE INFORMATION IN THIS STRUCTURAL AND COLLATERAL TERM SHEET IS NOT COMPLETE AND MAY BE AMENDED PRIOR TO THE TIME OF SALE. THIS TERM SHEET IS NOT AN OFFER TO SELL THESE SECURITIES AND IT IS NOT A SOLICITATION OF AN OFFER TO BUY THESE SECURITIES IN ANY JURISDICTION WHERE THE OFFER OR SALE IS NOT PERMITTED.
| 109 |
| SHOPPES AT ALAFAYA |
defined below) all funds in the lockbox account will be swept to the borrower’s operating account. During a Cash Management Period, all excess funds in the lockbox account will be swept to a lender-controlled cash management account.
A “Cash Management Period” will commence uponthe earlier of (i) the occurrence and continuance of an event of default; (ii) the amortizing debt service coverage ratio being less than 1.10x for two consecutive calendar quarters; (iii) commencement of a Tenant Trigger Event (as defined below); or (iv) an Integra Trigger Event (as defined below). A Cash Management Period will end, if (a) no event of default has continued beyond the applicable notice and cure period; (b) no event that would trigger another Cash Management Period has occurred; and specifically, (c) with respect to clause (ii), the amortizing debt service coverage ratio is at least 1.15x for two consecutive calendar quarters; (d) with respect to clause (iii) the Tenant Trigger Event has ended; and with respect to clause (iv), an Integra Trigger Event has ended.
A “Tenant Trigger Event” will commence upon the occurrence any of the following: (i) a bankruptcy action of Toys R Us and/or Dick’s Sporting Goods; (ii) Toys R Us and/or Dick’s Sporting Goods provides notice of its intent to terminate its lease prior to the stated termination date; (iii) Toys R Us and/or Dick’s Sporting Goods provides notice of its intent to cease operations; (iv) Toys R Us and/or Dick’s Sporting Goods defaults under its lease; or (v) Toys R Us and/or Dick’s Sporting Goods fails to provide notice of its intent to renew and extend its lease. A “Tenant Trigger Event” will end on the date that: with respect to clause (i), the tenant has unconditionally affirmed its lease in its bankruptcy action; with respect to clause (ii), the landlord has re-leased the entire premises currently leased to the tenant to an acceptable replacement tenant; with respect to clause (iii), either (x) the tenant has rescinded its notice to go dark or has re-opened to the public for a period of at least six full consecutive months, or (y) the landlord has terminated the lease and re-leased the entire premises previously leased to such tenant to an acceptable replacement tenant; with respect to clause (iv), the tenant has cured the lease default; and with respect to clause (v), the tenant has renewed its lease for a term of at least five years beyond the maturity date of the Shoppes at Alafaya Mortgage Loan, or the entire premises previously leased to such tenant has been re-leased to an acceptable replacement tenant.
An “Integra Tigger Event” will commence upon borrower’s failure to make the required Integra Monthly Deposits. The Integra Trigger Event will end upon the date on which the balance of the Integra Reserve is $62,000.
Property Management. The Shoppes at Alafaya Property is managed by an affiliate of the borrower.
Assumption.The borrower has the right to transfer the Shoppes at Alafaya Property, provided that no event of default has occurred and is continuing and certain other conditions are satisfied, including, (i) the lender’s reasonable determination that the proposed transferee and guarantor satisfy the lender’s credit review and underwriting standards, taking into consideration transferee experience, financial strength and general business standing; (ii) execution of a recourse guaranty and an environmental indemnity by an affiliate of the transferee; and (iii) if requested by the lender, rating agency confirmation from DBRS, Fitch and Moody’s that the transfer will not result in a downgrade, withdrawal or qualification of the respective ratings assigned to the Series 2016-C34 Certificates.
Partial Release.Not Permitted.
Real Estate Substitution.Not permitted.
Subordinate and Mezzanine Indebtedness.Not permitted.
Ground Lease.None.
Terrorism Insurance.The loan documents require that the “all risk” insurance policy required to be maintained by the borrower provide coverage for terrorism in an amount equal to the full replacement cost of the Shoppes at Alafaya Property, as well as business interruption insurance covering no less than the 18-month period following the occurrence of a casualty event, together with a 12-month extended period of indemnity.
THE INFORMATION IN THIS STRUCTURAL AND COLLATERAL TERM SHEET IS NOT COMPLETE AND MAY BE AMENDED PRIOR TO THE TIME OF SALE. THIS TERM SHEET IS NOT AN OFFER TO SELL THESE SECURITIES AND IT IS NOT A SOLICITATION OF AN OFFER TO BUY THESE SECURITIES IN ANY JURISDICTION WHERE THE OFFER OR SALE IS NOT PERMITTED.
| 110 |
(THIS PAGE INTENTIONALLY LEFT BLANK)
THE INFORMATION IN THIS STRUCTURAL AND COLLATERAL TERM SHEET IS NOT COMPLETE AND MAY BE AMENDED PRIOR TO THE TIME OF SALE. THIS TERM SHEET IS NOT AN OFFER TO SELL THESE SECURITIES AND IT IS NOT A SOLICITATION OF AN OFFER TO BUY THESE SECURITIES IN ANY JURISDICTION WHERE THE OFFER OR SALE IS NOT PERMITTED.
| 111 |
| No. 11 – Embassy Plaza | ||||||||||
| Loan Information | Property Information | |||||||||
| Mortgage Loan Seller: | Rialto Mortgage Finance, LLC | Single Asset/Portfolio: | Single Asset | |||||||
| Credit Assessment (DBRS/Fitch/Moody’s) | NR/NR/NR | Property Type: | Retail | |||||||
| Original Principal Balance: | $17,500,000 | Specific Property Type: | Anchored | |||||||
| Cut-off Date Balance: | $17,500,000 | Location: | Tucson, AZ | |||||||
| % of Initial Pool Balance: | 2.5% | Size: | 113,384 SF | |||||||
| Loan Purpose: | Refinance | Cut-off Date Balance Per SF: | $154.34 | |||||||
| Borrower Name: | Embassy Plaza, L.L.C. | Year Built/Renovated: | 1980/2003 | |||||||
| Sponsor(1): | James G. Horvath | Title Vesting: | Fee | |||||||
| Mortgage Rate: | 4.810% | Property Manager: | Self-managed | |||||||
| Note Date: | April 6, 2016 | 4thMost Recent Occupancy (As of): | 97.6% (12/31/2012) | |||||||
| Anticipated Repayment Date: | NAP | 3rdMost Recent Occupancy (As of): | 97.5% (12/31/2013) | |||||||
| Maturity Date: | April 6, 2026 | 2ndMost Recent Occupancy (As of): | 97.5% (12/31/2014) | |||||||
| IO Period: | 60 months | Most Recent Occupancy (As of): | 99.1% (12/31/2015) | |||||||
| Loan Term (Original): | 120 months | Current Occupancy (As of): | 99.0% (3/8/2016) | |||||||
| Seasoning: | 1 month | |||||||||
| Amortization Term (Original): | 360 months | Underwriting and Financial Information: | ||||||||
| Loan Amortization Type: | Interest-only, Amortizing Balloon | 4thMost Recent NOI (As of): | $1,403,198 (12/31/2012) | |||||||
| Interest Accrual Method: | Actual/360 | 3rdMost Recent NOI (As of): | $1,557,424 (12/31/2013) | |||||||
| Call Protection(2): | L(25),D(91),O(4) | 2ndMost Recent NOI (As of): | $1,667,412 (12/31/2014) | |||||||
| Lockbox Type: | Springing | Most Recent NOI (As of): | $1,620,863 (12/31/2015) | |||||||
| Additional Debt: | Yes | |||||||||
| Additional Debt Type(3): | Future Mezzanine | U/W Revenues: | $2,021,694 | |||||||
| U/W Expenses: | $483,648 | |||||||||
| U/W NOI: | $1,538,045 | |||||||||
| U/W NCF: | $1,458,677 | |||||||||
| U/W NOI DSCR: | 1.39x | |||||||||
| Escrows and Reserves: | U/W NCF DSCR: | 1.32x | ||||||||
| U/W NOI Debt Yield: | 8.8% | |||||||||
| Type: | Initial | Monthly | Cap (If Any) | U/W NCF Debt Yield: | 8.3% | |||||
| Taxes | $17,468 | $16,636 | NAP | As-Is Appraised Value: | $24,000,000 | |||||
| Insurance | $7,777 | $1,852 | NAP | As-Is Appraisal Valuation Date: | February 17, 2016 | |||||
| Replacement Reserves | $0 | $1,027 | $61,720 | Cut-off Date LTV Ratio: | 72.9% | |||||
| TI/LC Reserve | $250,000 | $4,724 | $350,000 | LTV Ratio at Maturity or ARD: | 67.1% | |||||
| (1) | The sponsor was involved in a prior foreclosure and discounted payoff. See “Description of the Mortgage Pool—Loan Purpose; Default History, Bankruptcy Issues and Other Proceedings” in the Preliminary Prospectus. |
| (2) | Following the lockout period and prior to January 6, 2026, the borrower is permitted to partially release each of the two parcels currently occupied by McDonald’s and Walgreens in connection with a partial defeasance, subject to certain conditions, including (i) no event of default has occurred and is continuing; (ii) partial defeasance of 125% of the released property’s original allocated loan balance; (iii) the amortizing debt service coverage ratio (based upon the trailing 12-month period immediately preceding the date of such determination) with respect to the remaining properties will be no less than the greater of (a) 1.29x and (b) the amortizing debt service coverage ratio immediately prior to the release; (iv) the loan to value ratio with respect to the remaining properties will be no greater than the lesser of (a) 72.9%, and (b) the loan to value ratio immediately prior to the release; and (v) the debt yield with respect to the remaining properties will be no less than the greater of (a) 8.3% and (b) the debt yield immediately prior to the release. |
| (3) | The borrower has the right to incur mezzanine financing subject to the satisfaction of certain conditions including (i) no event of default; (ii) the execution of an intercreditor agreement in form and substance acceptable to the lender; (iii) the combined loan-to-value ratio is not greater than 72.9%; (iv) the combined amortizing net cash flow DSCR is equal to or greater than 1.29x; and (v) receipt of rating agency confirmations from DBRS, Fitch and Moody’s that the mezzanine financing will not result in a downgrade, withdrawal or qualification of the respective ratings assigned to the Series 2016-C34 Certificates. |
The Embassy Plaza mortgage loan is evidenced by a single promissory note that is secured by a first mortgage encumbering a 113,384 square feet anchored retail property located in Tucson, Arizona (the “Embassy Plaza Property”), approximately 10 miles north of the downtown business district. Constructed in 1980 and renovated in 2003, the Embassy Plaza Property is situated on a 10.3-acre parcel. Upon acquisition, the borrower renovated and improved the Embassy Plaza Property with capital expenditures of $2,455,391 ($21.66 per square foot).The Embassy Plaza Property is leased to a diverse mix of national, regional and local tenants. National tenants include WalMart Stores, Walgreen’s, Big Lots and McDonald’s. The Embassy Plaza Property contains 488 surface parking spaces, reflecting an overall parking ratio of 4.3 spaces per 1,000 square feet of net rentable area. As of the March 8, 2016, the Embassy Plaza Property was 99.0% occupied by 23 tenants.
The Embassy Plaza Property is located within the boundaries of Linda Vista Boulevard to the north, Orange Grove Road to the south, Pusch Ridge Wilderness Area/Campbell Road Alignment to the east and Interstate 10 to the west. Primary access to the Embassy Plaza Property is provided by Magee road by way of La Cholla Boulevard and Ina Road, which is the primary east-west road through the area, linking the neighborhood with Interstate 10. The neighborhood is mainly composed of commercial uses along the main arterial road of Ina Road and residential developments along the secondary streets. Major employment sectors are located along an
THE INFORMATION IN THIS STRUCTURAL AND COLLATERAL TERM SHEET IS NOT COMPLETE AND MAY BE AMENDED PRIOR TO THE TIME OF SALE. THIS TERM SHEET IS NOT AN OFFER TO SELL THESE SECURITIES AND IT IS NOT A SOLICITATION OF AN OFFER TO BUY THESE SECURITIES IN ANY JURISDICTION WHERE THE OFFER OR SALE IS NOT PERMITTED.
| 112 |
| Embassy Plaza |
industrial corridor that spans Interstate 10 to the west, and in the downtown business district. The Coronado National Forest, which contains the Catalina Mountains and the Pusch Ridge Wilderness area, is located northeast of the defined neighborhood. The Embassy Plaza Property is located across the street from a Target anchored center and is in close proximity to the Foothills Mall, which is anchored by AMC Theaters and Ross Dress for Less.
Sources and Uses
| Sources | Uses | |||||||
| Original loan amount | $17,500,000 | 100.0% | Loan payoff | $13,150,390 | 75.1 | |||
| Reserves | 275,244 | 1.6 | ||||||
| Closing costs | 288,797 | 1.7 | ||||||
| Return of equity | 3,785,568 | 21.6 | ||||||
| Total Sources | $17,500,000 | 100.0% | Total Uses | $17,500,000 | 100.0% |
The following table presents certain information relating to the tenancies at the Embassy Plaza Property:
Major Tenants
| Tenant Name | Credit Rating (Fitch/ Moody’s/ S&P)(1) | Tenant NRSF | % of NRSF | Annual U/W Base Rent PSF(2) | Annual U/W Base Rent(2) | % of Total Annual U/W Base Rent | Sales PSF(3) | Occupancy Cost(3) | Lease Expiration Date |
| Anchor Tenant | |||||||||
| WalMart Stores | AA/Aa2/AA | 37,174 | 32.8% | $7.67 | $285,000 | 16.7% | NAV | NAV | 2/19/2032(4) |
| Total Anchor Tenant | 37,174 | 32.8% | $7.67 | $285,000 | 16.7% | ||||
| Major Tenants | |||||||||
| Walgreens | NR/Baa2/BBB | 14,490 | 12.8% | $33.37 | $483,500 | 28.3% | $166 | 22.1% | 10/2/2063(5) |
| Big 5 Corp | NR/NR/NR | 9,975 | 8.8% | $13.20 | $131,676 | 7.7% | NAV | NAV | 1/31/2017(6) |
| DES | NR/NR/NR | 5,464 | 4.8% | $21.19 | $115,808 | 6.8% | NAV | NAV | 6/30/2017(7) |
| Big Lots | NR/NR/BBB | 17,640 | 15.6% | $4.00 | $70,560 | 4.1% | $136 | 5.9% | 5/31/2020(8) |
| Total Major Tenants | 47,569 | 42.0% | $16.85 | $801,544 | 46.9% | ||||
| Outparcel / Non-Major Tenants(9) | 27,465 | 24.2% | $22.63 | $621,469 | 36.4% | ||||
| Occupied Collateral Total(9) | 112,208 | 99.0% | $15.22 | $1,708,013 | 100.0% | ||||
| Vacant Space | 1,176 | 1.0% | |||||||
| Collateral Total | 113,384 | 100.0% | |||||||
| (1) | Certain ratings are those of the parent company whether or not the parent guarantees the lease. |
| (2) | Annual U/W Base Rent PSF and Annual U/W Base Rent include contractual rent escalations through March 2017. |
| (3) | Sales PSF and Occupancy Costs are for the trailing 12-month period ending December 31, 2015. |
| (4) | Walmart Stores has twelve, 5-year lease renewal options remaining. |
| (5) | Walgreen’s has the option to terminate its lease on October 31, 2023, and every five years thereafter with 8 months’ notice. |
| (6) | Big 5 Corp has three, 5-year lease renewal options remaining. |
| (7) | DES has one, 3-year lease renewal option remaining. |
| (8) | Big Lots has one, 5-year lease renewal option remaining. |
| (9) | Outparcel/Non-Major Tenants and Occupied Collateral Total includes McDonald’s, which is subject to a ground lease. McDonald’s represents 1 square foot of the net rentable area however the annual base rent for McDonald’s of $63,055 was included in the Annual U/W Base Rent. |
THE INFORMATION IN THIS STRUCTURAL AND COLLATERAL TERM SHEET IS NOT COMPLETE AND MAY BE AMENDED PRIOR TO THE TIME OF SALE. THIS TERM SHEET IS NOT AN OFFER TO SELL THESE SECURITIES AND IT IS NOT A SOLICITATION OF AN OFFER TO BUY THESE SECURITIES IN ANY JURISDICTION WHERE THE OFFER OR SALE IS NOT PERMITTED.
| 113 |
| Embassy Plaza |
The following table presents certain information relating to the historical sales at the Embassy Plaza Property:
Historical Sales (PSF)(1)
| Tenant Name | 2013 | 2014 | 2015 | Average National Sales (PSF) | Current Occupancy Cost |
| Big Lots | $141 | $140 | $136 | $112 | 5.9% |
| Walgreens | $201 | $182 | $166 | NAV | 22.1% |
| (1) | Historical Sales (PSF) are based on historical statements provided by the borrower. |
The following table presents certain information relating to the lease rollover schedule at the Embassy Plaza Property:
Lease Expiration Schedule(1)(2)
| Year Ending December 31, | No. of Leases Expiring | Expiring NRSF | % of Total NRSF | Cumulative Expiring NRSF | Cumulative % of Total NRSF | Annual U/W Base Rent | % of Total Annual U/W Base Rent | Annual U/W Base Rent PSF(3) |
| MTM | 1 | 1,829 | 1.6% | 1,829 | 1.6% | $36,580 | 2.1% | $20.00 |
| 2016 | 1 | 3,196 | 2.8% | 5,025 | 4.4% | $67,116 | 3.9% | $21.00 |
| 2017 | 8 | 24,553 | 21.7% | 29,578 | 26.1% | $428,918 | 25.1% | $17.47 |
| 2018 | 2 | 1,903 | 1.7% | 31,481 | 27.8% | $33,293 | 1.9% | $17.50 |
| 2019 | 2 | 3,108 | 2.7% | 34,589 | 30.5% | $53,950 | 3.2% | $17.36 |
| 2020 | 3 | 20,135 | 17.8% | 54,724 | 48.3% | $125,373 | 7.3% | $6.23 |
| 2021 | 4 | 5,820 | 5.1% | 60,544 | 53.4% | $194,281 | 11.4% | $33.38(4) |
| 2022 | 0 | 0 | 0.0% | 60,544 | 53.4% | $0 | 0.0% | $0.00 |
| 2023 | 0 | 0 | 0.0% | 60,544 | 53.4% | $0 | 0.0% | $0.00 |
| 2024 | 0 | 0 | 0.0% | 60,544 | 53.4% | $0 | 0.0% | $0.00 |
| 2025 | 0 | 0 | 0.0% | 60,544 | 53.4% | $0 | 0.0% | $0.00 |
| 2026 | 0 | 0 | 0.0% | 60,544 | 53.4% | $0 | 0.0% | $0.00 |
| Thereafter | 2 | 51,664 | 45.6% | 112,208 | 99.0% | $768,500 | 45.0% | $14.87 |
| Vacant | 0 | 1,176 | 1.0% | 113,384 | 100.0% | $0 | 0.0% | $0.00 |
| Total/Weighted Average | 23 | 113,384 | 100.0% | $1,708,013 | 100.0% | $15.22 |
| (1) | Information obtained from the underwritten rent roll. |
| (2) | Certain tenants may have lease termination options that are exercisable prior to the originally stated expiration date of the subject lease and that are not considered in the Lease Expiration Schedule. |
| (3) | Weighted Average Annual U/W Base Rent PSF excludes vacant space. |
| (4) | Includes McDonald’s, which is subject to a ground lease. McDonald’s represents 1 square foot of the net rentable area and Annual U/W Base Rent of $63,055. Excluding McDonald’s Annual U/W Base Rent, the Annual U/W Base Rent PSF is $22.55. |
The following table presents historical occupancy percentages at the Embassy Plaza Property:
Historical Occupancy
12/31/2012(1) | 12/31/2013(1) | 12/31/2014(1) | 12/31/2015(1) | 3/8/2016(2) | ||||
| 97.6% | 97.5% | 97.5% | 99.1% | 99.0% |
| (1) | Information obtained from the borrower. |
| (2) | Information obtained from the underwritten rent roll. |
THE INFORMATION IN THIS STRUCTURAL AND COLLATERAL TERM SHEET IS NOT COMPLETE AND MAY BE AMENDED PRIOR TO THE TIME OF SALE. THIS TERM SHEET IS NOT AN OFFER TO SELL THESE SECURITIES AND IT IS NOT A SOLICITATION OF AN OFFER TO BUY THESE SECURITIES IN ANY JURISDICTION WHERE THE OFFER OR SALE IS NOT PERMITTED.
| 114 |
| Embassy Plaza |
Operating History and Underwritten Net Cash Flow. The following table presents certain information relating to the historical operating performance and underwritten net cash flow at the Embassy Plaza Property:
Cash Flow Analysis
| 2012 | 2013 | 2014 | 2015 | U/W | % of U/W Effective Gross Income | U/W $ per SF | ||||||||||||||||
| Base Rent | $1,544,399 | $1,664,995 | $1,727,356 | $1,788,068 | $1,695,491 | 83.9 | % | $14.95 | ||||||||||||||
| Rent Steps | 0 | 0 | 0 | 0 | 12,522 | 0.6 | 0.11 | |||||||||||||||
| Percentage Rent | 0 | 0 | 0 | 0 | 1,337 | 0.1 | 0.01 | |||||||||||||||
| Straight Line Rent(1) | 0 | 0 | 0 | 0 | 11,903 | 0.6 | 0.10 | |||||||||||||||
| Grossed Up Vacant Space | 0 | 0 | 0 | 0 | 21,168 | 1.0 | 0.19 | |||||||||||||||
| Total Reimbursables | 226,864 | 261,900 | 337,554 | 298,864 | 363,202 | 18.0 | 3.20 | |||||||||||||||
| Other Income(2) | 0 | 1,251 | 3,420 | (1,297 | ) | 844 | 0.0 | 0.01 | ||||||||||||||
| Less Vacancy & Credit Loss | 0 | 0 | 0 | 0 | (84,773) | (3) | (4.2 | ) | (0.75 | ) | ||||||||||||
| Effective Gross Income | $1,771,263 | $1,928,146 | $2,068,330 | $2,085,635 | $2,021,694 | 100.0 | % | $17.83 | ||||||||||||||
| Total Operating Expenses | $368,065 | $370,722 | $400,918 | $464,772 | $483,648 | 23.9 | % | $4.27 | ||||||||||||||
|
|
|
|
|
|
| ||||||||||||||||
| Net Operating Income | $1,403,198 | $1,557,424 | $1,667,412 | $1,620,863 | $1,538,045 | 76.1 | % | $13.56 | ||||||||||||||
| TI/LC | 0 | 0 | 0 | 0 | 56,692 | 2.8 | 0.50 | |||||||||||||||
| Capital Expenditures | 0 | 0 | 0 | 0 | 22,677 | 1.1 | 0.20 | |||||||||||||||
| Net Cash Flow | $1,403,198 | $1,557,424 | $1,667,412 | $1,620,863 | $1,458,677 | 72.2 | % | $12.86 | ||||||||||||||
| NOI DSCR | 1.27x | 1.41x | 1.51x | 1.47x | 1.39x | |||||||||||||||||
| NCF DSCR | 1.27x | 1.41x | 1.51x | 1.47x | 1.32x | |||||||||||||||||
| NOI DY | 8.0% | 8.9% | 9.5% | 9.3% | 8.8% | |||||||||||||||||
| NCF DY | 8.0% | 8.9% | 9.5% | 9.3% | 8.3% | |||||||||||||||||
| (1) | Straight Line Rent includes the present value of contractual rent steps for investment-grade rated tenants including WalMart ($9,394) and Walgreens ($2,509). |
| (2) | Other Income represents late fees. |
| (3) | The underwritten economic vacancy is 4.0%. The Embassy Plaza Property was 99.0% physically occupied as of the March 8, 2016 rent roll. |
Comparable Leases(1)
| Property Name/ Location | Year Built/ Renovated | Anchor Tenants | Total GLA (SF) | Total Occupancy | Distance from Subject | Tenant Name | Lease Date / Term | Lease Area (SF) | Annual Base Rent PSF | Lease Type |
| La Toscana Village, Tucson, AZ | 1991/NAP | Safeway | 114,190 | 94% | 4.3 miles | Trade Company | February 2016 / 3 years | 1,415 | $15.83 | NNN |
| Placita Del Oracle Tucson, AZ | 2008/NAP | NAV | 7,000 | 100% | 5.9 miles | Goldfine Jewelers | February 2015 / 5 years | 1,388 | $22.00 | NNN |
Plaza Escondida Tucson, AZ | 1986/NAP | Trader Joe’s, Marshalls | 91,121 | 100% | 5.1 miles | La Posada | February 2015 / 3 years | 3,650 | $20.50 | NNN |
Plaza Antigua Tucson, AZ | 2004/NAP | NAV | 20,251 | 100% | 8.4 miles | Costa Vida Grill | January 2015 / 10 years | 3,527 | $26.00 | NNN |
Tucson Place Tucson, AZ | 1989/NAP | NAV | 206,657 | 91% | 7.2 miles | Beall’s | February 2016 / 10 years | 18,000 | $9.72 | NNN |
Heritage Plaza Tucson, AZ | 1987/NAP | NAV | 112,394 | 98% | 1.1 miles | Goodwill | August 2015 / 10 years | 16,550 | $15.10 | NNN |
Summit Hut Tucson, AZ | 1956/NAP | NAV | 22,960 | 100% | 14.7 miles | Summit Hut | June 2015 / 15 years | 22,960 | $10.00 | NNN |
Circle Plaza Tucson, AZ | 1977/NAP | Sports Authority, Michaels, Home Goods, Ross Dress For Less, Nature’s Market | 152,434 | 100% | 18.9 miles | Nature’s Market | February 2015 / 10 years | 15,655 | $13.50 | NNN |
Walgreens Tucson, AZ | 2013/NAP | Walgreens | 13,140 | 100% | 9.8 miles | Walgreens | November 2013/ 75 Years | 14,130 | $38.59 | NNN |
| (1) | Information obtained from the appraisal dated March 9, 2016. |
THE INFORMATION IN THIS STRUCTURAL AND COLLATERAL TERM SHEET IS NOT COMPLETE AND MAY BE AMENDED PRIOR TO THE TIME OF SALE. THIS TERM SHEET IS NOT AN OFFER TO SELL THESE SECURITIES AND IT IS NOT A SOLICITATION OF AN OFFER TO BUY THESE SECURITIES IN ANY JURISDICTION WHERE THE OFFER OR SALE IS NOT PERMITTED.
| 115 |
| No. 12 – Manchester Parkade | ||||||||
| Loan Information | Property Information | |||||||
| Mortgage Loan Seller: | Wells Fargo Bank, National Association | Single Asset/Portfolio: | Single Asset | |||||
Credit Assessment (DBRS/Fitch/Moody’s): | NR/NR/NR | Property Type: | Mixed Use | |||||
| Original Principal Balance: | $16,500,000 | Specific Property Type: | Retail/Industrial/Office | |||||
| Cut-off Date Balance: | $16,439,932 | Location: | Manchester, CT | |||||
| % of Initial Pool Balance: | 2.3% | Size: | 264,893 SF | |||||
| Loan Purpose: | Refinance | Cut-off Date Balance Per SF: | $62.06 | |||||
| Borrower Name: | L&J Manchester III LLC | Year Built/Renovated: | 1956/1994 | |||||
| Sponsor: | The Main Trust Under the Charney Family 2010 Revocable Trust | Title Vesting: | Fee | |||||
| Mortgage Rate: | 4.970% | Property Manager: | Self-managed | |||||
| Note Date: | February 5, 2016 | 4thMost Recent Occupancy (As of) (2): | 87.0% (12/31/2012) | |||||
| Anticipated Repayment Date: | NAP | 3rdMost Recent Occupancy (As of) (2): | 90.0% (12/31/2013) | |||||
| Maturity Date: | February 11, 2026 | 2ndMost Recent Occupancy (As of) (2): | 87.0% (12/31/2014) | |||||
| IO Period: | None | Most Recent Occupancy (As of)(2): | 89.0% (06/30/2015) | |||||
| Loan Term (Original): | 120 months | Current Occupancy (As of): | 82.9% (1/4/2016) | |||||
| Seasoning: | 3 months | |||||||
| Amortization Term (Original): | 360 months | Underwriting and Financial Information: | ||||||
| Loan Amortization Type: | Amortizing Balloon | |||||||
| Interest Accrual Method: | Actual/360 | 4thMost Recent NOI (As of): | $1,697,701 (12/31/2012) | |||||
| Call Protection: | L(27),D(89),O(4) | 3rdMost Recent NOI (As of): | $1,553,429 (12/31/2013) | |||||
| Lockbox Type: | Soft/Springing Cash Management | 2ndMost Recent NOI (As of): | $1,550,783 (12/31/2014) | |||||
| Additional Debt: | None | Most Recent NOI (As of): | $1,686,260 (12/31/2015) | |||||
| Additional Debt Type: | NAP | |||||||
| U/W Revenues: | $2,968,905 | |||||||
| U/W Expenses: | $1,266,259 | |||||||
| U/W NOI: | $1,702,646 | |||||||
| Escrows and Reserves: | U/W NCF: | $1,495,347 | ||||||
| U/W NOI DSCR: | 1.61x | |||||||
| Type: | Initial | Monthly | Cap (If Any) | U/W NCF DSCR: | 1.41x | |||
| Taxes | $102,272 | $51,136 | NAP | U/W NOI Debt Yield: | 10.4% | |||
| Insurance | $22,839 | $7,615 | NAP | U/W NCF Debt Yield: | 9.1% | |||
| Replacement Reserve | $0 | $4,415 | NAP | As-Is Appraised Value: | $22,000,000 | |||
| TI/LC Reserve | $0 | $19,040 | $1,142,400 | As-Is Appraisal Valuation Date: | November 24, 2015 | |||
| Deferred Maintenance | $49,625 | $0 | NAP | Cut-off Date LTV Ratio: | 74.7% | |||
| Environmental Reserve(1) | $25,000 | $0 | NAP | LTV Ratio at Maturity or ARD: | 61.6% | |||
| (1) | In lieu of a Phase II Environmental Site Assessment, an environmental insurance policy was obtained in addition to an initial environmental reserve of $25,000 to be applied to the deductible of the environmental insurance policy in the event of a claim. |
| (2) | See “Historical Occupancy” section. |
The Manchester Parkade mortgage loan is evidenced by a single promissory note that is secured by a first mortgage encumbering a 264,893 square foot mixed-use center (the “Manchester Parkade Property”) located in Manchester, Connnecticut. Built in 1956 and renovated in 1994, the Manchester Parkade Property consists of four buildings situated on a 23.6-acre site comprising 186,675 square feet of retail space (70.5% of the net rentable area), 43,150 square feet of industrial space (16.3% of the net rentable area), and 35,068 square feet of office space (13.2% of the net rentable area). The Manchester Parkade Property is shadow anchored by a 69,160 square foot Stop & Shop (not part of the collateral). The Manchester Parkade Property includes 1,084 surface parking spaces, resulting in a parking ratio of 4.1 spaces per 1,000 square feet of rentable area. As of January 4, 2016, the Manchester Parkade Property was 82.9% occupied by 38 tenants and the Manchester Parkade Property has averaged 89.0% occupancy since 2005.
The Manchester Parkade Property is situated just east of Interstate 84, approximately 8.3 miles east of Hartford, Connecticut. The 2015 population within a three- and five-mile radius of the Manchester Parkade Property was 67,603 and 133,750, respectively, while the average household income within the same radii was $79,303 and $86,958, respectively. According to a third-party market research report, the Manchester Parkade Property is located within the Manchester submarket of the Hartford retail market. As of the first quarter of 2016, the submarket contained approximately 427 properties totaling approximately 6.6 million square feet with a 6.2% vacancy rate and average asking rent of $10.42 per square foot, triple net.
THE INFORMATION IN THIS STRUCTURAL AND COLLATERAL TERM SHEET IS NOT COMPLETE AND MAY BE AMENDED PRIOR TO THE TIME OF SALE. THIS TERM SHEET IS NOT AN OFFER TO SELL THESE SECURITIES AND IT IS NOT A SOLICITATION OF AN OFFER TO BUY THESE SECURITIES IN ANY JURISDICTION WHERE THE OFFER OR SALE IS NOT PERMITTED.
| 116 |
| Manchester Parkade |
Sources and Uses
| Sources | Uses | |||||||
| Original loan amount | $16,500,000 | 100.0% | Loan payoff(1) | $15,987,100 | 96.9% | |||
| Closing costs | 166,953 | 1.0 | ||||||
| Reserves | 199,736 | 1.2 | ||||||
| Return of Equity | 146,211 | 0.9 | ||||||
| Total Sources | $16,500,000 | 100.0% | Total Uses | $16,500,000 | 100.0% |
| (1) | The Manchester Parkade Property was previously securitized in the GSMS 2006-GG6 transaction. |
The following table presents certain information relating to the tenancy at the Manchester Parkade Property:
Major Tenants
| Tenant Name | Credit Rating (Fitch/Moody’s/S&P)(1) | Tenant NRSF | % of NRSF | Annual U/W Base Rent PSF(2) | Annual U/W Base Rent(2) | % of Total Annual U/W Base Rent | Sales PSF(3) | Occupancy Cost(3) | Lease Expiration Date |
| Major Tenants | |||||||||
| State of Connecticut - Dept. of Children & Families | NR/Aa3/AA | 35,068 | 13.2% | $16.00 | $561,088 | 23.3% | NAV | NAV | 12/31/2020(4) |
| Cardio Express | NR/NR/NR | 20,000 | 7.6% | $11.70 | $234,000 | 9.7% | NAV | NAV | 3/31/2025 |
| Joey’z Shopping Spree | NR/NR/NR | 26,625 | 10.1% | $6.40 | $170,465 | 7.1% | $41 | 15.5% | 5/31/2023 |
| Dollar Tree Stores | NR/Ba2/BB+ | 15,136 | 5.7% | $9.75 | $147,576 | 6.1% | NAV | NAV | 1/31/2021(5) |
| Yan Royal Buffet | NR/NR/NR | 10,600 | 4.0% | $11.90 | $126,140 | 5.2% | NAV | NAV | 6/30/2024 |
| Total Major Tenants | 107,429 | 40.6% | $11.54 | $1,239,269 | 51.6% | ||||
| Non-Major Tenants | 112,127 | 42.3% | $10.39 | $1,164,443 | 48.4% | ||||
| Occupied Collateral Total | 219,556 | 82.9% | $10.95 | $2,403,712 | 100.0% | ||||
| Vacant Space | 45,337 | 17.1% | |||||||
| Collateral Total | 264,893 | 100.0% | |||||||
| (1) | Certain ratings are those of the parent company, whether or not the parent guarantees the lease. |
| (2) | Annual U/W Base Rent PSF and Annual U/W Base Rent include contractual rent steps through October 2016 totaling $22,431. |
| (3) | Sales PSF and Occupancy Cost are for the trailing 12-month period ending December 31, 2015. |
| (4) | State of Connecticut - Dept. of Children & Families has two, 5-year lease renewal options. |
| (5) | Dollar Tree Stores has one, 5-year lease renewal option. |
The following table presents certain information relating to the lease rollover schedule at the Manchester Parkade Property:
Lease Expiration Schedule(1)(2)
| Year Ending December 31, | No. of Leases Expiring | Expiring NRSF | % of Total NRSF | Cumulative Expiring NRSF | Cumulative % of Total NRSF | Annual U/W Base Rent | % of Total Annual U/W Base Rent | Annual U/W Base Rent PSF(3) |
| MTM | 4 | 4,111 | 1.6% | 4,111 | 1.6% | $46,855 | 1.9% | $11.40 |
| 2016 | 4 | 8,490 | 3.2% | 12,601 | 4.8% | $98,227 | 4.1% | $11.57 |
| 2017 | 2 | 4,450 | 1.7% | 17,051 | 6.4% | $55,625 | 2.3% | $12.50 |
| 2018 | 5 | 28,460 | 10.7% | 45,511 | 17.2% | $284,140 | 11.8% | $9.98 |
| 2019 | 7 | 34,453 | 13.0% | 79,964 | 30.2% | $249,715 | 10.4% | $7.25 |
| 2020 | 10 | 56,356 | 21.3% | 136,320 | 51.5% | $843,968 | 35.1% | $14.98 |
| 2021 | 1 | 15,136 | 5.7% | 151,456 | 57.2% | $147,576 | 6.1% | $9.75 |
| 2022 | 2 | 7,875 | 3.0% | 159,331 | 60.1% | $116,905 | 4.9% | $14.85 |
| 2023 | 1 | 26,625 | 10.1% | 185,956 | 70.2% | $170,465 | 7.1% | $6.40 |
| 2024 | 1 | 10,600 | 4.0% | 196,556 | 74.2% | $126,140 | 5.2% | $11.90 |
| 2025 | 2 | 23,000 | 8.7% | 219,556 | 82.9% | $264,096 | 11.0% | $11.48 |
| 2026 | 0 | 0 | 0.0% | 219,556 | 82.9% | $0 | 0.0% | $0.00 |
| Thereafter | 0 | 0 | 0.0% | 219,556 | 82.9% | $0 | 0.0% | $0.00 |
| Vacant | 0 | 45,337 | 17.1% | 264,893 | 100.0% | $0 | 0.0% | $0.00 |
| Total/Weighted Average | 39 | 264,893 | 100.0% | $2,403,712 | 100% | $10.95 |
| (1) | Information obtained from the underwritten rent roll. |
| (2) | Certain tenants may have lease termination options that are exercisable prior to the stated expiration date of the subject lease and that are not considered in the Lease Expiration Schedule. |
| (3) | Weighted Average Annual U/W Base Rent PSF excludes vacant space. |
THE INFORMATION IN THIS STRUCTURAL AND COLLATERAL TERM SHEET IS NOT COMPLETE AND MAY BE AMENDED PRIOR TO THE TIME OF SALE. THIS TERM SHEET IS NOT AN OFFER TO SELL THESE SECURITIES AND IT IS NOT A SOLICITATION OF AN OFFER TO BUY THESE SECURITIES IN ANY JURISDICTION WHERE THE OFFER OR SALE IS NOT PERMITTED.
| 117 |
| Manchester Parkade |
The following table presents historical occupancy percentages at the Manchester Parkade Property:
Historical Occupancy
12/31/2012(1)(2) | 12/31/2013(1)(2) | 12/31/2014(1)(2) | 6/30/2015(1) | 1/4/2016(3) | ||||
| 87.0% | 90.0% | 87.0% | 89.0% | 82.9% | ||||
| (1) | Information obtained from a third party research report. |
| (2) | The 2012, 2013, and 2014 occupancy represent yearly averages. |
| (3) | Information obtained from the underwritten rent roll. |
Operating History and Underwritten Net Cash Flow. The following table presents certain information relating to the historical operating performance and underwritten net cash flow at the Manchester Parkade Property:
Cash Flow Analysis
| 2012 | 2013 | 2014 | 2015 | U/W | % of U/W Effective Gross Income | U/W $ per SF | ||||||||||||||||
| Base Rent | $2,406,631 | $2,396,315 | $2,416,806 | $2,428,285 | $2,403,712 | 81.0% | $9.07 | |||||||||||||||
| Grossed Up Vacant Space | 0 | 0 | 0 | 0 | 323,961 | 10.9 | 1.22 | |||||||||||||||
| Percentage Rent | 4,096 | 2,114 | 526 | 0 | 0 | 0.0 | 0.00 | |||||||||||||||
| Total Reimbursables | 571,248 | 516,874 | 547,083 | 599,850 | 565,193 | 19.0 | 2.13 | |||||||||||||||
| Other Income | 2,064 | 1,732 | 3,889 | 0 | 0 | 0.0 | 0.00 | |||||||||||||||
| Less Vacancy and Credit Loss | 0 | 0 | 0 | 0 | (323,961)(1) | (10.9) | (1.22) | |||||||||||||||
| Effective Gross Income | $2,984,038 | $2,917,036 | $2,968,304 | $3,028,134 | $2,968,905 | 100.0% | $11.21 | |||||||||||||||
| Total Operating Expenses | $1,286,336 | $1,363,607 | $1,417,521 | $1,341,874 | $1,266,259 | 42.7% | $4.78 | |||||||||||||||
|
| |||||||||||||||||||||
| Net Operating Income | $1,697,701 | $1,553,429 | $1,550,783 | $1,686,260 | $1,702,646 | 57.3% | $6.43 | |||||||||||||||
| TI/LC | 0 | 0 | 0 | 0 | 158,936 | 5.4 | 0.60 | |||||||||||||||
| Capital Expenditures | 0 | 0 | 0 | 0 | 48,364 | 1.6 | 0.18 | |||||||||||||||
| Net Cash Flow | $1,697,701 | $1,553,429 | $1,550,783 | $1,686,260 | $1,495,347 | 50.4% | $5.65 | |||||||||||||||
| NOI DSCR | 1.60x | 1.47x | 1.46x | 1.59x | 1.61x | |||||||||||||||||
| NCF DSCR | 1.60x | 1.47x | 1.46x | 1.59x | 1.41x | |||||||||||||||||
| NOI DY | 10.3% | 9.4% | 9.4% | 10.3% | 10.4% | |||||||||||||||||
| NCF DY | 10.3% | 9.4% | 9.4% | 10.3% | 9.1% | |||||||||||||||||
| (1) | The underwritten economic vacancy is 11.9%. The Manchester Parkade Property was 82.9% physically occupied as of January 4, 2016. |
The following table presents certain information relating to some comparable retail leases for the Manchester Parkade Property:
Comparable Leases(1)
| Property Name/ Location | Year Built/ Renovated | Anchor Tenants | Total GLA (SF) | Total Occupancy | Distance from Subject | Tenant Name | Lease Date / Term | Lease Area (SF) | Annual Base Rent PSF | Lease Type |
125-129 Silas Deane Hwy Wethersfield, CT | 1957/NAP | NAP | 29,550 | 92% | 8.5 miles | O’Reilly Auto Parts | October 2015 / 3 Yrs | 15,200 | $14.00 | NNN |
1267-1309 Silas Deane Hwy Wethersfield, CT | 1988/NAP | NAP | 71,493 | 100% | 11.2 miles | Planet Fitness | Jan 2015 / 3 Yrs | 22,000 | $16.00 | NNN |
Columbus Plaza New Britain, CT | 1978/NAP | NAP | 48,442 | 100% | 19.4 miles | Dollar Tree | June 2014 / 6 Yrs | 9,000 | $15.00 | NNN |
125-129 Silas Deane Hwy Wethersfield, CT | 1957/NAP | NAP | 29,550 | 92% | 8.5 miles | Family Dollar | March 2013 / 10 Yrs | 9,550 | $16.00 | NNN |
101 Hale Rd Manchester, CT | 1990/NAP | NAP | 21,500 | 100% | 3.3 miles | PETCO | August 2012 / 10 Yrs | 15,655 | $15.00 | NNN |
| (1) | Information obtained from a third party market research report. |
THE INFORMATION IN THIS STRUCTURAL AND COLLATERAL TERM SHEET IS NOT COMPLETE AND MAY BE AMENDED PRIOR TO THE TIME OF SALE. THIS TERM SHEET IS NOT AN OFFER TO SELL THESE SECURITIES AND IT IS NOT A SOLICITATION OF AN OFFER TO BUY THESE SECURITIES IN ANY JURISDICTION WHERE THE OFFER OR SALE IS NOT PERMITTED.
| 118 |
(THIS PAGE INTENTIONALLY LEFT BLANK)
THE INFORMATION IN THIS STRUCTURAL AND COLLATERAL TERM SHEET IS NOT COMPLETE AND MAY BE AMENDED PRIOR TO THE TIME OF SALE. THIS TERM SHEET IS NOT AN OFFER TO SELL THESE SECURITIES AND IT IS NOT A SOLICITATION OF AN OFFER TO BUY THESE SECURITIES IN ANY JURISDICTION WHERE THE OFFER OR SALE IS NOT PERMITTED.
| 119 |
| No. 13 - Matrix Portfolio | |||||||
| Loan Information | Property Information | ||||||
| Mortgage Loan Seller: | Natixis Real Estate Capital LLC | Single Asset/Portfolio: | Portfolio | ||||
| Credit Assessment (DBRS/Fitch/Moody’s): | NR/NR/NR | Property Type: | Various – See Table | ||||
| Original Principal Balance: | $16,370,000 | Specific Property Type: | Various – See Table | ||||
| Cut-off Date Balance: | $16,370,000 | Location: | Various – See Table | ||||
| % of Initial Pool Balance: | 2.3% | Size: | 35,815 SF | ||||
| Loan Purpose: | Refinance | Cut-off Date Balance Per SF: | $457.07 | ||||
| Borrower Names: | Jemal’s 701 King L.L.C.; Jemal’s Takoma Pad L.L.C; Jemal’s Second National Bank LLC | Year Built/Renovated: | Various – See Table | ||||
| Sponsor(1): | Norman Jemal | Title Vesting: | Fee | ||||
| Mortgage Rate: | 5.260% | Property Manager: | Self-managed | ||||
| Note Date: | March 23, 2016 | 4th Most Recent Occupancy (As of): | 100.0% (12/31/2011) | ||||
| Anticipated Repayment Date: | NAP | 3rd Most Recent Occupancy (As of): | 100.0% (12/31/2012) | ||||
| Maturity Date: | April 5, 2026 | 2nd Most Recent Occupancy (As of): | 100.0% (12/31/2013) | ||||
| IO Period: | 60 months | Most Recent Occupancy (As of): | 100.0% (12/31/2014) | ||||
| Loan Term (Original): | 120 months | Current Occupancy (As of): | 100.0% (Various – See Table) | ||||
| Seasoning: | 1 month | ||||||
| Amortization Term (Original): | 360 months | Underwriting and Financial Information: | |||||
| Loan Amortization Type: | Interest-only, Amortizing Balloon | ||||||
| Interest Accrual Method: | Actual/360 | 4th Most Recent NOI (As of): | $1,216,688 (12/31/2012) | ||||
| Call Protection(2): | L(25),D(91),O(4) | 3rd Most Recent NOI (As of): | $1,353,023 (12/31/2013) | ||||
| Lockbox Type: | Hard/Springing Cash Management | 2nd Most Recent NOI (As of): | $1,400,069 (12/31/2014) | ||||
| Additional Debt: | None | Most Recent NOI (As of): | $1,436,948 (12/31/2015) | ||||
| Additional Debt Type: | NAP | ||||||
| U/W Revenues: | $1,925,779 | ||||||
| U/W Expenses: | $516,556 | ||||||
| U/W NOI: | $1,409,223 | ||||||
| U/W NCF: | $1,348,337 | ||||||
| Escrows and Reserves: | U/W NOI DSCR | 1.30x | |||||
| U/W NCF DSCR: | 1.24x | ||||||
| Type: | Initial | Monthly | Cap (If Any) | U/W NOI Debt Yield: | 8.6% | ||
| Taxes | $22,784 | $22,784 | NAP | U/W NCF Debt Yield: | 8.2% | ||
| Insurance(3) | $2,392 | Springing | NAP | As-Is Appraised Value: | $24,900,000 | ||
| Replacement Reserve | $0 | $657 | NAP | As-Is Appraisal Valuation Date: | Various– See Table | ||
| TI/LC Reserve | $0 | $4,477 | NAP | Cut-off Date LTV Ratio: | 65.7% | ||
| Deferred Maintenance | $24,781 | $0 | NAP | LTV Ratio at Maturity or ARD: | 60.9% | ||
| (1) | The sponsor was involved in litigation. See “Description of the Mortgage Pool—Litigation and Other Considerations” in the Preliminary Prospectus. |
| (2) | Following the lockout period, in the event that Carroll St CVS (“CVS”) has not renewed its lease or entered into a replacement lease at the 110 Carroll Street NW property, the borrower is permitted to partially release the 110 Carroll Street NW property in connection with a partial defeasance, subject to certain conditions, including (i) no event of default has occurred and is continuing; (ii) partial defeasance of the greater of (a) 100.0% of the released property’s original allocated loan balance and (b) 100.0% of the net refinance proceeds or 100.0% of the net sale proceeds, as applicable; (iii) the net cash flow debt yield of the remaining properties will be no less than the greater of (a) 7.97% and (b) the net cash flow debt yield immediately prior to the release; (iv) the loan-to-value ratio with respect to the remaining properties will be no greater than the lesser of (a) 65.7%, and (b) the loan to value ratio immediately prior to the release and (v) the amortizing net cash flow debt service coverage ratio with respect to the remaining properties will be no less than the greater of (a) 1.20x and (b) the amortizing net cash flow debt service coverage ratio immediately prior to the release. |
| (3) | Ongoing monthly reserves for insurance premiums are not required as long as: (i) there is no event of default; (ii) the Matrix Portfolio Properties (as defined below) are insured by an acceptable blanket insurance policy, and (iii) the borrower provides the lender with evidence of renewal of insurance policies and timely proof of payment of insurance premiums. |
The Matrix Portfolio mortgage loan is evidenced by a single promissory note secured by a first mortgage encumbering the fee interests in two single tenant anchored retail properties and one mixed use retail/office property, totaling 35,815 square feet, located in Washington, District of Columbia (“DC”) and Alexandria, Virginia (the “Matrix Portfolio Properties”). The Matrix Portfolio Properties includes the 509 7th Street NW property and the 110 Carroll Street NW property, which are located in Washington, DC and the 701 King Street property, located in Alexandria, Virginia. Built in 1959 and renovated in 1996, the 509 7th Street NW property is a 21,190 square feet, five-story mixed use building, which was 100.0% occupied as of April 4, 2016 by two tenants: District ChopHouse (retail space: 54.0% of the property’s net rentable area) and Venturehouse Group LLC (office space: 46.0% of the property’s net rentable area). District ChopHouse is a steakhouse that has been located at 509 7th Street NW since 1997. Venturehouse Group LLC is a holding company that creates, builds, invests in and acquires technology companies with a focus on telecommunications and the internet; it has operated at the 509 7th Street NW property since 2000. The 509 7th Street NW property is located in Washington DC’s East End submarket, less than one-block south of the Gallery Place/Chinatown metro station (Red, Yellow and Green Lines) and within walking distance of the White House, the Verizon Center and the Walter E. Washington
THE INFORMATION IN THIS STRUCTURAL AND COLLATERAL TERM SHEET IS NOT COMPLETE AND MAY BE AMENDED PRIOR TO THE TIME OF SALE. THIS TERM SHEET IS NOT AN OFFER TO SELL THESE SECURITIES AND IT IS NOT A SOLICITATION OF AN OFFER TO BUY THESE SECURITIES IN ANY JURISDICTION WHERE THE OFFER OR SALE IS NOT PERMITTED.
| 120 |
MATRIX PORTFOLIO |
Convention Center. Built in 1998, the 110 Carroll Street NW property is a 10,125 square feet, one story built-to-suit retail property, which is 100.0% occupied as of May 1, 2016, by CVS (CVS pharmacy rated Baa1 and BBB+ by Moody’s and S&P, respectively). The 110 Carroll Street NW property is located in the neighborhood of Takoma Park, along the border between Washington, DC and Maryland, approximately 5.6 miles from the Washington, DC central business district. The 110 Carroll Street NW property is located three blocks southeast of the Takoma Park metro station (Red line).
Built in 1885 and renovated in 2007, the 701 King Street property is a 4,500 square feet, one story retail property, which is occupied as of May 1, 2016 by PQ Alexandria, Inc. (“Le Pain Quotidien”). Le Pain Quotidien, a French-style bakery and restaurant, has been operating at the 701 King Street property since September 2007. The 701 King Street property is located in the Old Town area of Alexandria, Virginia, approximately 8.0 miles south of Washington, DC. The 701 King Street property is approximately a half mile east of the King Street metro station (Blue and Yellow Lines), which provides direct access to downtown Washington, DC in approximately 25 minutes.
Sources and Uses
| Sources | Uses | ||||||||
| Original loan amount | $16,370,000 | 100.0% | Loan payoff(1) | $9,263,146 | 56.6 | % | |||
| Reserves | 49,957 | 0.3 | |||||||
| Closing costs | 1,758,590 | 10.7 | |||||||
| Return of equity | 5,298,307 | 32.4 | |||||||
| Total Sources | $16,370,000 | 100.0% | Total Uses | $16,370,000 | 100.0 | % | |||
| (1) | The Matrix Portfolio Properties were previously securitized in the JPMCC 2008-C2 transaction. |
The following table presents certain information relating to the Matrix Portfolio Properties:
Property Name – | Property Type | Allocated Cut-off Date Balance | % of Portfolio Cut-off Date Balance | Occupancy(1) | Year Built/ Renovated | Net Rentable Area (SF) | Appraised | Allocated LTV |
| 509 7th Street NW – Washington, DC | Mixed Use | $10,149,400 | 62.0% | 100.0% | 1959/1996 | 21,190 | $16,500,000 | 61.5% |
| 110 Carroll Street NW – Washington, DC | Retail | $4,419,900 | 27.0% | 100.0% | 1998/NAP | 10,125 | $5,500,000 | 80.4% |
| 701 King Street – Alexandria, VA | Retail | $1,800,700 | 11.0% | 100.0% | 1885/2007 | 4,500 | $2,900,000 | 62.1% |
| Total/Weighted Average | $16,370,000 | 100.0% | 100.0% | 35,815 | $24,900,000 | 65.7% |
| (1) | Information obtained from the underwritten rent roll dated as of April 4, 2016 and May 1, 2016. |
| (2) | As of the appraisal valuation dates ranging from February 16, 2016 to February 19, 2016. |
The following table presents certain information relating to the tenancy at the Matrix Portfolio Properties:
Major Tenants
| Tenant Name | Credit Rating | Tenant NRSF | % of NRSF | Annual | Annual U/W Base | % of Total Annual U/W Base Rent | Sales PSF(3) | Occupancy Cost(3) | Lease Expiration Date | |
| Anchor Tenants | ||||||||||
| District ChopHouse(4) | NR/NR/NR | 11,447 | 32.0% | $59.32 | $679,010 | 40.8% | $503 | 15.4% | 3/31/2022 | |
| Venturehouse Group LLC(4) | NR/NR/NR | 9,743 | 27.2% | $43.26 | $421,521 | 25.3% | NAV | NAV | 12/31/2016(7) | |
| CVS(5) | NR/Baa1/BBB+ | 10,125 | 28.3% | $29.95 | $303,216 | 18.2% | $467 | 8.2% | 1/31/2019(8) | |
| Le Pain Quotidien(6) | NR/NR/NR | 4,500 | 12.6% | $57.99 | $260,954 | 15.7% | $291 | 22.2% | 9/30/2017(9) | |
| Total Anchor Tenant | 35,815 | 100.0% | $46.48 | $1,664,701 | 100.0% | |||||
| Occupied Collateral Total | 35,815 | 100.0% | $46.48 | $1,664,701 | 100.0% | |||||
| Vacant Space | 0 | 0.0% | ||||||||
| Collateral Total | 35,815 | 100.0% | ||||||||
| (1) | Certain ratings are those of the parent company whether or not the parent guarantees the lease. |
| (2) | The Annual U/W Base Rent PSF and Annual U/W Base Rent includes contractual rent steps through April 1, 2017, totalling $20,914. |
| (3) | Sales PSF and Occupancy Cost are as of trailing twelve months December 2015. |
| (4) | Located at the 509 7th Street NW property. |
| (5) | Located at the 110 Carroll Street NW property. |
| (6) | Located at the 701 King Street property. |
| (7) | Venturehouse Group LLC has one, 5-year lease renewal option. |
| (8) | CVS has two, 5-year lease renewal options. |
| (9) | Le Pain Quotidien has two, 5-year lease renewal options. |
THE INFORMATION IN THIS STRUCTURAL AND COLLATERAL TERM SHEET IS NOT COMPLETE AND MAY BE AMENDED PRIOR TO THE TIME OF SALE. THIS TERM SHEET IS NOT AN OFFER TO SELL THESE SECURITIES AND IT IS NOT A SOLICITATION OF AN OFFER TO BUY THESE SECURITIES IN ANY JURISDICTION WHERE THE OFFER OR SALE IS NOT PERMITTED.
| 121 |
MATRIX PORTFOLIO |
The following table presents certain information relating to the lease rollover schedule at the Matrix Portfolio Properties:
Lease Expiration Schedule(1)
Year Ending December 31 | No. of Leases | Expiring NRSF | % of Total NRSF | Cumulative | Cumulative % of Total NRSF | Annual U/W Base Rent | % of Total Annual U/W Base Rent | Annual UW Base |
| MTM | 0 | 0 | 0.0% | 0 | 0.0% | $0 | 0.0% | $0.00 |
| 2016 | 1 | 9,743 | 27.2% | 9,743 | 27.2% | $421,521 | 25.3% | $43.26 |
| 2017 | 1 | 4,500 | 12.6% | 14,243 | 39.8% | $260,954 | 15.7% | $57.99 |
| 2018 | 0 | 0 | 0.0% | 14,243 | 39.8% | $0 | 0.0% | $0.00 |
| 2019 | 1 | 10,125 | 28.3% | 24,368 | 68.0% | $303,216 | 18.2% | $29.95 |
| 2020 | 0 | 0 | 0.0% | 24,368 | 68.0% | $0 | 0.0% | $0.00 |
| 2021 | 0 | 0 | 0.0% | 24,368 | 68.0% | $0 | 0.0% | $0.00 |
| 2022 | 1 | 11,447 | 32.0% | 35,815 | 100.0% | $679,010 | 40.8% | $59.32 |
| 2023 | 0 | 0 | 0.0% | 35,815 | 100.0% | $0 | 0.0% | $0.00 |
| 2024 | 0 | 0 | 0.0% | 35,815 | 100.0% | $0 | 0.0% | $0.00 |
| 2025 | 0 | 0 | 0.0% | 35,815 | 100.0% | $0 | 0.0% | $0.00 |
| 2026 | 0 | 0 | 0.0% | 35,815 | 100.0% | $0 | 0.0% | $0.00 |
| Thereafter | 0 | 0 | 0.0% | 35,815 | 100.0% | $0 | 0.0% | $0.00 |
| Vacant | 0 | 0 | 0.0% | 35,815 | 100.0% | $0 | 0.0% | $0.00 |
| Total/Weighted Average | 4 | 35,815 | 100.0% | $1,664,701 | 100.0% | $46.48 |
| (1) | Information obtained from the underwritten rent roll. |
The following table presents historical occupancy percentages at the Matrix Portfolio Properties:
Historical Occupancy
12/31/2011(1) | 12/31/2012(1) | 12/31/2013(1) | 12/31/2014(1) | Various(2) |
| 100.0% | 100.0% | 100.0% | 100.0% | 100.0% |
| (1) | Information obtained from the borrower. |
| (2) | Information obtained from the underwritten rent rolls dated as of April 4, 2016 and May 1, 2016. |
Operating History and Underwritten Net Cash Flow. The following table presents certain information relating to the historical operating performance and underwritten net cash flow at the Matrix Portfolio Properties:
Cash Flow Analysis
| 2012 | 2013 | 2014 | 2015 | U/W | % of U/W Effective Gross Income | U/W $ per SF | |
| Base Rent | $1,462,393 | $1,556,828 | $1,570,248 | $1,606,019 | $1,664,701 | 86.4% | $46.48 |
| Grossed Up Vacant Space | 0 | 0 | 0 | 0 | 0 | 0.0 | 0.00 |
| Total Reimbursables | 262,101 | 297,582 | 282,038 | 357,002 | 360,361 | 18.7 | 10.06 |
| Other Income | 30 | 21 | 3,219 | 2,449 | 2,073 | 0.1 | 0.06 |
| Less Vacancy & Credit Loss | 0 | 0 | 0 | 0 | (101,357)(1) | (5.3) | (2.83) |
| Effective Gross Income | $1,724,524 | $1,854,431 | $1,855,505 | $1,965,470 | $1,925,779 | 100.0% | $53.77 |
| Total Operating Expenses | $507,836 | $501,408 | $455,436 | $528,522 | $516,556 | 26.8% | $14.42 |
|
|
|
|
|
|
| |
| Net Operating Income | $1,216,688 | $1,353,023 | $1,400,069 | $1,436,948 | $1,409,223 | 73.2% | $39.35 |
| TI/LC | 0 | 0 | 0 | 0 | 53,723 | 2.8 | 1.50 |
| Capital Expenditures | 0 | 0 | 0 | 0 | 7,163 | 0.4 | 0.20 |
| Net Cash Flow | $1,216,688 | $1,353,023 | $1,400,069 | $1,436,948 | $1,348,337 | 70.0% | $37.65 |
| NOI DSCR | 1.12x | 1.25x | 1.29x | 1.32x | 1.30x | ||
| NCF DSCR | 1.12x | 1.25x | 1.29x | 1.32x | 1.24x | ||
| NOI DY | 7.4% | 8.3% | 8.6% | 8.8% | 8.6% | ||
| NCF DY | 7.4% | 8.3% | 8.6% | 8.8% | 8.2% |
| (1) | The underwritten economic vacancy is 5.0%. The Matrix Portfolio Properties were 100.0% physically occupied as of April 4, 2016 and May 1, 2016. |
THE INFORMATION IN THIS STRUCTURAL AND COLLATERAL TERM SHEET IS NOT COMPLETE AND MAY BE AMENDED PRIOR TO THE TIME OF SALE. THIS TERM SHEET IS NOT AN OFFER TO SELL THESE SECURITIES AND IT IS NOT A SOLICITATION OF AN OFFER TO BUY THESE SECURITIES IN ANY JURISDICTION WHERE THE OFFER OR SALE IS NOT PERMITTED.
| 122 |
(THIS PAGE INTENTIONALLY LEFT BLANK)
THE INFORMATION IN THIS STRUCTURAL AND COLLATERAL TERM SHEET IS NOT COMPLETE AND MAY BE AMENDED PRIOR TO THE TIME OF SALE. THIS TERM SHEET IS NOT AN OFFER TO SELL THESE SECURITIES AND IT IS NOT A SOLICITATION OF AN OFFER TO BUY THESE SECURITIES IN ANY JURISDICTION WHERE THE OFFER OR SALE IS NOT PERMITTED.
| 123 |
| No. 14 – Tempe Square | ||||||||
| Loan Information | Property Information | |||||||
| Mortgage Loan Seller: | Wells Fargo Bank, National Association | Single Asset/Portfolio: | Single Asset | |||||
Credit Assessment (DBRS/Fitch/Moody’s): | NR/NR/NR | Property Type: | Retail | |||||
| Original Principal Balance: | $15,625,000 | Specific Property Type: | Anchored | |||||
| Cut-off Date Balance: | $15,625,000 | Location: | Tempe, AZ | |||||
| % of Initial Pool Balance: | 2.2% | Size: | 113,693 SF | |||||
| Loan Purpose: | Refinance | Cut-off Date Balance Per SF: | $137.43 | |||||
| Borrower Name: | Watavision II, LLC | Year Built/Renovated: | 1990/NAP | |||||
| Sponsor: | Martin Landis | Title Vesting: | Fee | |||||
| Mortgage Rate: | 4.560% | Property Manager: | Self-managed | |||||
| Note Date: | April 11, 2016 | 4th Most Recent Occupancy (As of): | 69.6% (12/31/2012) | |||||
| Anticipated Repayment Date: | NAP | 3rd Most Recent Occupancy (As of): | 72.4% (12/31/2013) | |||||
| Maturity Date: | April 11, 2026 | 2nd Most Recent Occupancy (As of)(4): | 73.8% (12/31/2014) | |||||
| IO Period: | 84 months | Most Recent Occupancy (As of)(4): | 85.3% (12/31/2015) | |||||
| Loan Term (Original): | 120 months | Current Occupancy (As of): | 87.4% (4/7/2016) | |||||
| Seasoning: | 1 month | |||||||
| Amortization Term (Original): | 360 months | Underwriting and Financial Information: | ||||||
| Loan Amortization Type: | Interest-only, Amortizing Balloon | |||||||
| Interest Accrual Method: | Actual/360 | 4th Most Recent NOI (As of): | $1,055,858 (12/31/2012) | |||||
| Call Protection: | L(25),D(91),O(4) | 3rd Most Recent NOI (As of): | $1,060,802 (12/31/2013) | |||||
| Lockbox Type: | Springing | 2nd Most Recent NOI (As of): | $1,150,714 (12/31/2014) | |||||
| Additional Debt: | None | Most Recent NOI (As of): | $1,236,371 (12/31/2015) | |||||
| Additional Debt Type: | NAP | |||||||
| U/W Revenues: | $1,874,944 | |||||||
| U/W Expenses: | $489,771 | |||||||
| U/W NOI(5): | $1,385,172 | |||||||
| U/W NCF: | $1,302,134 | |||||||
| Escrows and Reserves: | U/W NOI DSCR: | 1.45x | ||||||
| U/W NCF DSCR: | 1.36x | |||||||
| Type: | Initial | Monthly | Cap (If Any) | U/W NOI Debt Yield: | 8.9% | |||
| Taxes | $14,041 | $14,041 | NAP | U/W NCF Debt Yield: | 8.3% | |||
| Insurance(1) | $0 | Springing | NAP | As-Is Appraised Value: | $25,100,000 | |||
| Replacement Reserve | $70,000 | $1,724 | 70,000(2) | As-Is Appraisal Valuation Date: | February 15, 2016 | |||
| TI/LC Reserve | $250,000 | $5,227 | $250,000 | Cut-off Date LTV Ratio: | 62.3% | |||
| Inner Vision Yoga Reserve(3) | $36,098 | $0 | NAP | LTV Ratio at Maturity or ARD: | 59.3% | |||
| (1) | Ongoing reserves for insurance premiums are not required as long as (i) no event of default has occurred and is continuing; (ii) the Tempe Square Property (as defined below) is insured via an acceptable blanket insurance policy; and (iii) the borrower provides the lender with evidence of renewal of the insurance policies and timely proof of payment of insurance premiums. |
| (2) | The replacement reserve is capped at $70,000 as long as (i) no event of default has occurred and is continuing and (ii) lender determines that the Tempe Square Property is being adequately maintained. |
| (3) | Represents $2,138 related to future rent abatements for Inner Vision Yoga, $25,650 related to outstanding tenant improvements for Inner Vision Yoga, and $8,310 related to outsanding leasing commissions for Inner Vision Yoga. |
| (4) | See “Historical Occupancy” section. |
| (5) | See “Cash Flow Analysis” section. |
The Tempe Square mortgage loan is evidenced by a single promissory note that is secured by a first mortgage encumbering a 113,693 square foot anchored retail center (the “Tempe Square Property”) located in Tempe, Arizona. Built in 1990, the Tempe Square Property is anchored by Walgreen’s, PetSmart, and Trader Joe’s and consists of two one-story buildings situated on a 9.8-acre site. The Tempe Square Property contains 500 surface parking spaces resulting in a parking ratio of 4.4 spaces per 1,000 square feet of rentable area. As of April 7, 2016, the Tempe Square Property was 87.4% occupied by 21 tenants.
The Tempe Square Property is located approximately 4.6 miles south of Arizona State University, which had a total enrollment of over 82,000 students as of the fall 2014 semester, and 14.1 miles southeast of the Phoenix central business district. The Tempe Square Property is situated just west of Price Freeway (Loop 101) and approximately 1.6 miles south of the Superstition Freeway (US 60), which provide primary access to the neighborhood. The 2015 population within a three- and five-mile radius of the Tempe Square Property was 131,234 and 364,941, respectively, while the estimated average household income within the same radii was $72,572 and $62,857, respectively. According to a third party market research report, as of 2015 there was approximately 7.0 million square feet of retail inventory located within a three-mile radius of the Tempe Square Property, which reported an 8.6% vacancy rate and has averaged 11.7% vacancy since 2011.
THE INFORMATION IN THIS STRUCTURAL AND COLLATERAL TERM SHEET IS NOT COMPLETE AND MAY BE AMENDED PRIOR TO THE TIME OF SALE. THIS TERM SHEET IS NOT AN OFFER TO SELL THESE SECURITIES AND IT IS NOT A SOLICITATION OF AN OFFER TO BUY THESE SECURITIES IN ANY JURISDICTION WHERE THE OFFER OR SALE IS NOT PERMITTED.
| 124 |
TEMPE SQUARE |
Sources and Uses
| Sources | Uses | ||||||||
| Original loan amount | $15,625,000 | 100.0% | Loan payoff(1) | $12,780,266 | 81.8 | % | |||
| Closing costs | 398,844 | 2.6 | |||||||
| Reserves | 370,139 | 2.4 | |||||||
| Return of equity | 2,075,751 | 13.3 | |||||||
| Total Sources | $15,625,000 | 100.0% | Total Uses | $15,625,000 | 100.0 | % | |||
| (1) | The Tempe Square Property was previously securitized in the CSMC 2006-C3 transaction. |
The following table presents certain information relating to the tenancy at the Tempe Square Property:
Major Tenants
| Tenant Name | Credit Rating (Fitch/Moody’s/ S&P)(1) | Tenant NRSF | % of NRSF | Annual U/W Base Rent PSF(2) | Annual U/W Base Rent(2) | % of Total Annual U/W Base Rent | Sales PSF(3) | Occupancy Cost(3) | Lease Expiration Date |
| Anchor Tenants | |||||||||
| Walgreen’s | NR/Baa2/BBB | 13,905 | 12.2% | $17.58 | $244,380 | 16.4% | $194(4) | 10.8%(4) | 7/31/2056(5) |
| PetSmart | NR/NR/NR | 14,990 | 13.2% | $14.30 | $214,357 | 14.4% | NAV | NAV | 2/28/2026(6) |
| Trader Joe’s | NR/NR/NR | 12,300 | 10.8% | $16.00 | $196,800 | 13.2% | NAV | NAV | 6/30/2021(7) |
| Total Anchor Tenants | 41,195 | 36.2% | $15.91 | $655,537 | 44.1% | ||||
| Major Tenants | |||||||||
| Changing Hands Bookstore | NR/NR/NR | 12,667 | 11.1% | $12.83 | $162,518 | 10.9% | $294 | 5.7% | 8/31/2019 |
| Turnstyles Consignment | NR/NR/NR | 11,160 | 9.8% | $10.69 | $119,300 | 8.0% | NAV | NAV | 5/10/2017(8) |
| Mateco, Inc. | NR/NR/NR | 5,007 | 4.4% | $14.00 | $70,098 | 4.7% | NAV | NAV | 12/31/2021 |
| Mac’s Broiler & Tap | NR/NR/NR | 3,163 | 2.8% | $22.00 | $69,586 | 4.7% | NAV | NAV | 9/30/2019 |
| Wildflower Bread Company | NR/NR/NR | 2,962 | 2.6% | $20.75 | $61,461 | 4.1% | $909(9) | 4.4%(9) | 8/31/2018 |
| Total Major Tenants | 34,959 | 30.7% | $13.82 | $482,963 | 32.5% | ||||
| Total Non-Major Tenants | 23,203 | 20.4% | $15.02 | $348,623 | 23.4% | ||||
| Occupied Collateral Total | 99,357 | 87.4% | $14.97 | $1,487,123 | 100.0% | ||||
| Vacant Space | 14,336 | 12.6% | |||||||
| Collateral Total | 113,693 | 100.0% | |||||||
| (1) | Certain ratings are those of the parent company, whether or not the parent guarantees the lease. |
| (2) | Annual U/W Base Rent PSF and Annual U/W Base Rent include contractual rent steps through September 2016 totaling $6,583. |
| (3) | Sales PSF and Occupancy Cost are for the trailing 12-month period ending December 31, 2015, unless otherwise noted. |
| (4) | Per the Walgreen’s 2015 10-K filing, sales of reimbursed prescription items represent approximately 66.0% of total chain-wide sales. Based on this information, the estimated Weighted Average Sales PSF for 2015 would be approximately $570 PSF resulting in a Weighted Average Occupancy Cost of approximately 3.7%. |
| (5) | Walgreen’s has the option to terminate its lease on July 31, 2016, and every five years thereafter with 6 months’ notice. |
| (6) | PetSmart has four, 5-year lease renewal options. |
| (7) | Trader Joe’s has three, 5-year lease renewal options. |
| (8) | Turnstyles Consignment has one, 5-year lease renewal option. |
| (9) | Sales PSF and Occupancy Cost for Wildflower Bread Company are for the trailing 12-month period ending December 31, 2014. |
THE INFORMATION IN THIS STRUCTURAL AND COLLATERAL TERM SHEET IS NOT COMPLETE AND MAY BE AMENDED PRIOR TO THE TIME OF SALE. THIS TERM SHEET IS NOT AN OFFER TO SELL THESE SECURITIES AND IT IS NOT A SOLICITATION OF AN OFFER TO BUY THESE SECURITIES IN ANY JURISDICTION WHERE THE OFFER OR SALE IS NOT PERMITTED.
| 125 |
TEMPE SQUARE |
The following table presents certain information relating to the lease rollover schedule at the Tempe Square Property:
Lease Expiration Schedule(1)(2)
| Year Ending December 31, | No. of Leases Expiring | Expiring NRSF | % of Total NRSF | Cumulative Expiring NRSF | Cumulative % of Total NRSF | Annual U/W Base Rent | % of Total Annual U/W Base Rent | Annual U/W Base Rent PSF(3) |
| MTM | 0 | 0 | 0.0% | 0 | 0.0% | $0 | 0.0% | $0.00 |
| 2016 | 0 | 0 | 0.0% | 0 | 0.0% | $0 | 0.0% | $0.00 |
| 2017 | 2 | 12,160 | 10.7% | 12,160 | 10.7% | $136,183 | 9.2% | $11.20 |
| 2018 | 3 | 8,053 | 7.1% | 20,213 | 17.8% | $138,334 | 9.3% | $17.18 |
| 2019 | 6 | 21,621 | 19.0% | 41,834 | 36.8% | $343,183 | 23.1% | $15.87 |
| 2020 | 0 | 0 | 0.0% | 41,834 | 36.8% | $0 | 0.0% | $0.00 |
| 2021 | 7 | 27,628 | 24.3% | 69,462 | 61.1% | $388,686 | 26.1% | $14.07 |
| 2022 | 0 | 0 | 0.0% | 69,462 | 61.1% | $0 | 0.0% | $0.00 |
| 2023 | 1 | 1,000 | 0.9% | 70,462 | 62.0% | $22,000 | 1.5% | $22.00 |
| 2024 | 0 | 0 | 0.0% | 70,462 | 62.0% | $0 | 0.0% | $0.00 |
| 2025 | 0 | 0 | 0.0% | 70,462 | 62.0% | $0 | 0.0% | $0.00 |
| 2026 | 1 | 14,990 | 13.2% | 85,452 | 75.2% | $214,357 | 14.4% | $14.30 |
| Thereafter | 1 | 13,905 | 12.2% | 99,357 | 87.4% | $244,380 | 16.4% | $17.58 |
| Vacant | 0 | 14,336 | 12.6% | 113,693 | 100.0% | $0 | 0.0% | $0.00 |
| Total/Weighted Average | 21 | 113,693 | 100.0% | $1,487,123 | 100% | $14.97 |
| (1) | Information obtained from the underwritten rent roll. |
| (2) | Certain tenants may have lease termination options that are exercisable prior to the stated expiration date of the subject lease and that are not considered in the Lease Expiration Schedule. |
| (3) | Weighted Average Annual U/W Base Rent PSF excludes vacant space. |
The following table presents historical occupancy percentages at the Tempe Square Property:
Historical Occupancy
12/31/2012(1) | 12/31/2013(1) | 12/31/2014(1)(2) | 12/31/2015(1)(2) | 4/7/2016(3) |
| 69.6% | 72.4% | 73.8% | 85.3% | 87.4% |
| (1) | Information obtained from the borrower. |
| (2) | The increase in occupancy from 2014 to 2015 was due to PetSmart executing a lease for 14,990 square feet (13.2% of the net rentable area). |
| (3) | Information obtained from the underwritten rent roll. |
Operating History and Underwritten Net Cash Flow. The following table presents certain information relating to the historical operating performance and underwritten net cash flow at the Tempe Square Property:
Cash Flow Analysis
| 2012 | 2013 | 2014 |
2015 | U/W | % of U/W Effective Gross Income | U/W $ per SF | |
| Base Rent | $1,296,958 | $1,286,722 | $1,362,992 | $1,414,329 | $1,487,123(1) | 79.3% | $13.08 |
| Grossed Up Vacant Space | 0 | 0 | 0 | 0 | 160,180 | 8.5 | 1.41 |
| Percentage Rent | 0 | 9,294 | 8,696 | 26,171 | 10,873 | 0.6 | 0.10 |
| Total Reimbursables | 273,639 | 283,626 | 290,408 | 299,515 | 375,361 | 20.0 | 3.30 |
| Other Income | 50 | 1,488 | 3,387 | 1,417 | 1,586 | 0.1 | 0.01 |
| Less Vacancy and Credit Loss | 0 | 0 | 0 | 0 | (160,180)(2) | (8.5) | (1.41) |
| Effective Gross Income | $1,570,647 | $1,581,131 | $1,665,483 | $1,741,432 | $1,874,944 | 100.0% | $16.49 |
| Total Operating Expenses | $514,789 | $520,329 | $514,769 | $505,060 | $489,771 | 26.1% | $4.31 |
|
|
|
|
|
|
| |
| Net Operating Income | $1,055,858 | $1,060,802 | $1,150,714 | $1,236,371 | $1,385,172(3) | 73.9% | $12.18 |
| TI/LC | 0 | 0 | 0 | 0 | 62,346 | 3.3 | 0.55 |
| Capital Expenditures | 0 | 0 | 0 | 0 | 20,692 | 1.1 | 0.18 |
| Net Cash Flow | $1,055,858 | $1,060,802 | $1,150,714 | $1,236,371 | $1,302,134 | 69.4% | $11.45 |
| NOI DSCR | 1.10x | 1.11x | 1.20x | 1.29x | 1.45x | ||
| NCF DSCR | 1.10x | 1.11x | 1.20x | 1.29x | 1.36x | ||
| NOI DY | 6.8% | 6.8% | 7.4% | 7.9% | 8.9% | ||
| NCF DY | 6.8% | 6.8% | 7.4% | 7.9% | 8.3% |
| (1) | U/W Base Rent includes contractual rent steps through September 2016 totaling $6,583. |
| (2) | The underwritten economic vacancy is 9.7%. The Tempe Square Property was 87.4% physically occupied as of April 7, 2016. |
| (3) | The increase in U/W Net Operating Income from 2015 is primarily due to contractual rent steps totaling $6,583 and an increase in occupancy due to new leases executed. |
THE INFORMATION IN THIS STRUCTURAL AND COLLATERAL TERM SHEET IS NOT COMPLETE AND MAY BE AMENDED PRIOR TO THE TIME OF SALE. THIS TERM SHEET IS NOT AN OFFER TO SELL THESE SECURITIES AND IT IS NOT A SOLICITATION OF AN OFFER TO BUY THESE SECURITIES IN ANY JURISDICTION WHERE THE OFFER OR SALE IS NOT PERMITTED.
| 126 |
TEMPE SQUARE |
The following table presents certain information relating to some comparable retail leases for the Tempe Square Property:
Comparable Leases(1)
| Property Name/ Location | Year Built/ Renovated | Anchor Tenants | Total GLA (SF) | Total Occupancy | Distance from Subject | Tenant Name | Lease Date / Term | Lease Area (SF) | Annual Base Rent PSF | Lease Type |
Albertson’s Plaza Tempe, AZ | 1989/NAP | Albertsons | 86,660 | 95% | 1.1 miles | NAV | NAV / NAV | NAV | NAV | NNN |
Crossroads Plaza Tempe, AZ | 1997/NAP | Safeway | 76,452 | 96% | 1.3 miles | Li’s Asian Cuisine | October 2013 /5 Yrs | 1,375 | $18.00 | NNN |
Pueblo Anozira Shopping Center Tempe, AZ | 1988/NAP | Fry’s Food & Drug, Petco | 146,306 | 99% | 0.1 miles | Studio ADT | March 2013 /5 Yrs | 1,222 | $22.00 | NNN |
Santa Fe Plaza Tempe, AZ | 1999/NAP | NAP | 21,749 | 94% | 0.1 miles | Tan Max | September 2012 / 5 Yrs | 1,304 | $15.50 | NNN |
| (1) | Information obtained from the appraisal. |
THE INFORMATION IN THIS STRUCTURAL AND COLLATERAL TERM SHEET IS NOT COMPLETE AND MAY BE AMENDED PRIOR TO THE TIME OF SALE. THIS TERM SHEET IS NOT AN OFFER TO SELL THESE SECURITIES AND IT IS NOT A SOLICITATION OF AN OFFER TO BUY THESE SECURITIES IN ANY JURISDICTION WHERE THE OFFER OR SALE IS NOT PERMITTED.
| 127 |
| No. 15 – Perrysburg Market Center | |||||||
| Loan Information | Property Information | ||||||
| Mortgage Loan Seller: | Rialto Mortgage Finance, LLC | Single Asset/Portfolio: | Single Asset | ||||
| Credit Assessment (DBRS/Fitch/Moody’s) | NR/NR/NR | Property Type: | Retail | ||||
| Original Principal Balance: | $14,800,000 | Specific Property Type: | Anchored | ||||
| Cut-off Date Balance: | $14,800,000 | Location: | Perrysburg, OH | ||||
| % of Initial Pool Balance: | 2.1% | Size: | 144,976 SF | ||||
| Loan Purpose: | Refinance | Cut-off Date Balance Per Unit/SF: | $102.09 | ||||
| Borrower Name: | Perrysburg Enterprise LLC | Year Built/Renovated: | 2004/NAP | ||||
| Sponsors(1)(2): | Various | Title Vesting: | Fee | ||||
| Mortgage Rate: | 5.4500% | Property Manager: | Self-managed | ||||
| Note Date: | April 26, 2016 | 4thMost Recent Occupancy (As of): | 94.5% (4/30/2012) | ||||
| Anticipated Repayment Date: | NAP | 3rdMost Recent Occupancy (As of): | 94.5% (4/30/2013) | ||||
| Maturity Date: | May 06, 2026 | 2ndMost Recent Occupancy (As of): | 94.5% (4/30/2014) | ||||
| IO Period: | None | Most Recent Occupancy (As of): | 94.5% (4/30/2015) | ||||
| Loan Term (Original): | 120 months | Current Occupancy (As of): | 95.4% (4/1/2016) | ||||
| Seasoning: | 0 months | ||||||
| Amortization Term (Original): | 360 months | Underwriting and Financial Information: | |||||
| Loan Amortization Type: | Amortizing Balloon | 4thMost Recent NOI (As of): | $1,484,695 (12/31/2013) | ||||
| Interest Accrual Method: | Actual/360 | 3rdMost Recent NOI (As of): | $1,422,855 (12/31/2014) | ||||
| Call Protection: | L(24),D(92),O(4) | 2ndMost Recent NOI (As of): | $1,468,046 (12/31/2015) | ||||
| Lockbox Type: | Hard/Upfront Cash Management | Most Recent NOI (As of): | $1,476,105 (TTM 3/31/2016) | ||||
| Additional Debt(3): | Yes | ||||||
| Additional Debt Type(3): | Other | U/W Revenues: | $2,195,738 | ||||
| U/W Expenses: | $758,159 | ||||||
| U/W NOI: | $1,437,579 | ||||||
| U/W NCF: | $1,321,164 | ||||||
| Escrows and Reserves: | U/W NOI DSCR: | 1.43x | |||||
| U/W NCF DSCR: | 1.32x | ||||||
| Type: | Initial | Monthly | Cap (If Any) | U/W NOI Debt Yield: | 9.7% | ||
| Taxes | $0 | $26,604 | NAP | U/W NCF Debt Yield: | 8.9% | ||
| Insurance | $2,884 | Springing | NAP | As-Is Appraised Value: | $20,000,000 | ||
| Replacement Reserves | $0 | $1,812 | NAP | As-Is Appraisal Valuation Date: | March 05, 2016 | ||
| TI/LC Reserve | $555,907 | $7,889 | NAP | Cut-off Date LTV Ratio: | 74.0% | ||
| Deferred Maintenance | $120,938 | $0 | NAP | LTV Ratio at Maturity or ARD: | 61.7% | ||
| (1) | The sponsors for the Perrysburg Market Center mortgage loan are William E. Watch; Warren C. Terrace; Warren Terrace Living Trust, dated November 1, 1995, as amended; William Watch Living Trust, dated December 7, 1995. The sponsors are also the sponsors of the borrowers under the mortgage loan identified on Annex A-1 as Dodge Park Plaza. |
| (2) | The sponsors were involved in a prior foreclosure and two discounted payoffs. See “Description of the Mortgage Pool-Loan Purpose; Default History, Bankruptcy Issues and Other Proceedings” in the Preliminary Prospectus. |
| (3) | The prior lender holds a note to the sole member of the borrower in the amount of $2,200,000. See “Description of the Mortgage Pool—Additional Indebtedness—Other Unsecured Indebtedness” in the Preliminary Prospectus. |
The Perrysburg Market Center mortgage loan is evidenced by a single promissory note that is secured by a first mortgage encumbering a 144,976 square foot anchored retail property located in Perrysburg, Ohio (the “Perrysburg Market Center Property”) approximately 10.9 miles southwest of the Toledo central business district. Constructed in three separate phases, 2004, 2007, and 2008, the Perrysburg Market Center Property is situated on a 19.9-acre parcel. The Perrysburg Market Center Property is leased to a mix of national, regional and local tenants. National tenants include Hobby Lobby, Best Buy, Bed Bath & Beyond, Dollar Tree and OfficeMax. The Perrysburg Market Center Property contains 678 surface spaces, reflecting an overall parking ratio of 4.68 spaces per 1,000 square feet of rentable area. As of April 1, 2016, the Perrysburg Market Center Property was 95.4% occupied by 14 tenants.
Primary access to Perrysburg Market Center Property is provided by Interstate 75 and Interstate 80. The neighborhood includes a mix of commercial, residential and agricultural uses. Commercial development is primarily concentrated along Fremont Pike and includes retail, office, and mixed-use developments. Major retailers in the area include Walmart Supercenter, Meijer, Kroger, PetSmart, T.J. Maxx, Target, Bass Pro Shops, Home Depot, Lowe’s, and Kohl’s. Residential uses include single-family and multifamily uses, which are primarily located along secondary arterials. According to a third party market research report, the Perrysburg Market Center Property is located within the Fremont Pike retail submarket, which contained approximately 1.6 million square feet of retail inventory and had an average lease rate of $15.51 per square foot as of first quarter 2016. The 2016 estimated population within a one-, three-, and five-mile radius of the Perrysburg Market Center Property is 5,117, 23,584, and 75,038, respectively; the 2016 estimated average household income within the same radii is $73,050, $64,127, and $58,589, respectively.
THE INFORMATION IN THIS STRUCTURAL AND COLLATERAL TERM SHEET IS NOT COMPLETE AND MAY BE AMENDED PRIOR TO THE TIME OF SALE. THIS TERM SHEET IS NOT AN OFFER TO SELL THESE SECURITIES AND IT IS NOT A SOLICITATION OF AN OFFER TO BUY THESE SECURITIES IN ANY JURISDICTION WHERE THE OFFER OR SALE IS NOT PERMITTED.
| 128 |
| PERRYSBURG MARKET CENTER |
Sources and Uses
| Sources | Uses | |||||||
| Original loan amount | $14,800,000 | 98.0 | % | Loan payoff(1) | $13,856,689 | 91.7% | ||
| Borrower equity | $303,908 | 2.0 | Upfront reserves | $679,728 | 4.5 | |||
| Closing costs | $567,491 | 3.8 | ||||||
| Total Sources | $15,103,908 | 100.0 | % | Total Uses | $15,103,908 | 100.0% |
| (1) | The Perrysburg Market Center Property was previously part of a larger portfolio loan with six other properties and, on the release date, had an allocated current principal balance of $16,173,908. In connection with the release of the Perrysburg Market Center Property, the prior lender accepted a payoff of $13,856,689 and retained a $2,200,000 note executed by the sole member of the borrower which is secured only by excess cash flow distributed to the sole member of borrower. See “Description of the Mortgage Pool—Additional Indebtedness—Other Unsecured—Indebtedness” in the Preliminary Prospectus. |
Major Tenants
| Tenant Name | Credit Rating (Fitch/ Moody’s/ S&P)(1) | Tenant NRSF | % of NRSF | Annual U/W Base Rent PSF | Annual U/W Base Rent | % of Total Annual U/W Base Rent | Sales PSF(2) | Occupancy Cost(2) | Lease Expiration Date |
| Anchor Tenant | |||||||||
| Hobby Lobby | NR/NR/NR | 50,092 | 34.6% | $8.50 | $425,782 | 26.3% | NAV | NAV | 9/30/2024(3) |
| Best Buy | BBB-/Baa1/BB+ | 29,497 | 20.3% | $12.46 | 367,500 | 22.7% | NAV | NAV | 1/31/2018(4) |
| Bed Bath & Beyond | NR/Baa1/BBB+ | 23,503 | 16.2% | $11.70 | 274,950 | 17.0% | NAV | NAV | 1/31/2018(5) |
| Total Anchor Tenant | 103,092 | 71.1% | $10.36 | $1,068,232 | 66.1% | ||||
| Major Tenants | |||||||||
| OfficeMax | NR/B2/B- | 14,063 | 9.7% | $13.75 | $193,366 | 12.0% | NAV | NAV | 11/30/2017(6) |
| Dollar Tree | NR/Ba2/BB+ | 9,903 | 6.8% | $13.00 | $128,739 | 8.0% | NAV | NAV | 5/31/2019(7) |
| Total Major Tenants | 23,966 | 16.5% | $13.44 | $322,105 | 19.9% | ||||
| Non-Major Tenants | 11,275 | 7.8% | $20.09 | $226,495 | 14.0% | ||||
| Occupied Collateral Total | 138,333 | 95.4% | $11.69 | $1,616,832 | 100.0% | ||||
| Vacant Space | 6,643 | 4.6% | |||||||
| Collateral Total | 144,976 | 100.0% | |||||||
| (1) | Certain ratings are those of the parent company whether or not the parent guarantees the lease. |
| (2) | Sales PSF and Occupancy Costs were not reported for any tenants. |
| (3) | Hobby Lobby has three, 5-year lease renewal options remaining. |
| (4) | Best Buy has four, 5-year lease renewal options remaining. |
| (5) | Bed Bath & Beyond has four, 5-year lease renewal options remaining. |
| (6) | OfficeMax has three, 5-year lease renewal options remaining. |
| (7) | Dollar Tree has three, 5-year lease renewal options remaining. |
THE INFORMATION IN THIS STRUCTURAL AND COLLATERAL TERM SHEET IS NOT COMPLETE AND MAY BE AMENDED PRIOR TO THE TIME OF SALE. THIS TERM SHEET IS NOT AN OFFER TO SELL THESE SECURITIES AND IT IS NOT A SOLICITATION OF AN OFFER TO BUY THESE SECURITIES IN ANY JURISDICTION WHERE THE OFFER OR SALE IS NOT PERMITTED.
| 129 |
| PERRYSBURG MARKET CENTER |
The following table presents certain information relating to the lease rollover schedule at the Perrysburg Market Center Property:
Lease Expiration Schedule(1)
| Year Ending December 31, | No. of Leases Expiring | Expiring NRSF | % of Total NRSF | Cumulative Expiring NRSF | Cumulative% of Total NRSF | Annual U/W Base Rent | % of Total Annual U/W Base Rent | Annual U/W Base Rent PSF(2) |
| MTM | 0 | 0 | 0.0% | 0 | 0.0% | $0 | 0.0% | $0.00 |
| 2016 | 0 | 0 | 0.0% | 0 | 0.0% | $0 | 0.0% | $0.00 |
| 2017 | 1 | 14,063 | 9.7% | 14,063 | 9.7% | $193,366 | 12.0% | $13.75 |
| 2018 | 4 | 55,415 | 38.2% | 69,478 | 47.9% | $687,150 | 42.5% | $12.40 |
| 2019 | 2 | 11,103 | 7.7% | 80,581 | 55.6% | $152,739 | 9.4% | $13.76 |
| 2020 | 4 | 4,710 | 3.2% | 85,291 | 58.8% | $102,555 | 6.3% | $21.77 |
| 2021 | 1 | 1,330 | 0.9% | 86,621 | 59.7% | $25,270 | 1.6% | $19.00 |
| 2022 | 0 | 0 | 0.0% | 86,621 | 59.7% | $0 | 0.0% | $0.00 |
| 2023 | 1 | 1,620 | 1.1% | 88,241 | 60.9% | $29,970 | 1.9% | $18.50 |
| 2024 | 1 | 50,092 | 34.6% | 138,333 | 95.4% | $425,782 | 26.3% | $8.50 |
| 2025 | 0 | 0 | 0.0% | 138,333 | 95.4% | $0 | 0.0% | $0.00 |
| 2026 | 0 | 0 | 0.0% | 138,333 | 95.4% | $0 | 0.0% | $0.00 |
| Thereafter | 0 | 0 | 0.0% | 138,333 | 95.4% | $0 | 0.0% | $0.00 |
| Vacant | 0 | 6,643 | 4.6% | 144,976 | 100.0% | $0 | 0.0% | $0.00 |
| Total/Weighted Average | 14 | 144,976 | 100.0% | $1,616,832 | 100.0% | $11.69 |
| (1) | Information obtained from the underwritten rent roll. |
| (2) | Weighted Average Annual U/W Base Rent PSF excludes vacant space. |
The following table presents historical occupancy percentages at the Perrysburg Market Center Property:
Historical Occupancy
4/30/2012(1) | 4/30/2013(1) | 4/30/2014(1) | 4/30/2015(1) | 4/1/2016(2) |
| 94.5% | 94.5% | 94.5% | 94.5% | 95.4% |
| (1) | Information obtained from the borrower. |
| (2) | Information obtained from the underwritten rent roll. |
Operating History and Underwritten Net Cash Flow. The following table presents certain information relating to the historical operating performance and Underwritten Net Cash Flow at the Perrysburg Market Center Property:
Cash Flow Analysis
| 2013 | 2014 | 2015 | TTM 3/31/2016 | U/W | % of U/W Effective Gross Income | U/W $ per SF | |
| Base Rent | $1,591,314 | $1,607,772 | $1,610,914 | $1,613,497 | $1,616,832 | 73.6% | $11.15 |
| Grossed Up Vacant Space | 0 | 0 | 0 | 0 | 98,146 | 4.5 | 0.68 |
| Total Reimbursables | 480,624 | 440,109 | 441,835 | 460,172 | 609,280 | 27.7 | 4.20 |
| Less Vacancy & Credit Loss | 0 | 0 | 0 | 0 | (128,520)(1) | (5.9) | (0.89) |
| Effective Gross Income | $2,071,938 | $2,047,882 | $2,052,749 | $2,073,670 | $2,195,738 | 100.0% | $15.15 |
| Total Operating Expenses | $587,244 | $625,027 | $584,703 | $597,565 | $758,159 | 34.5% | $5.23 |
|
|
|
|
|
|
| |
| Net Operating Income | $1,484,695 | $1,422,855 | $1,468,046 | $1,476,105 | $1,437,579 | 65.5% | $9.92 |
| TI/LC | 0 | 0 | 0 | 0 | 94,669 | 4.3 | 0.65 |
| Capital Expenditures | 0 | 0 | 0 | 0 | 21,746 | 1.0 | 0.15 |
| Net Cash Flow | $1,484,695 | $1,422,855 | $1,468,046 | $1,476,105 | $1,321,164 | 60.2% | $9.11 |
| NOI DSCR | 1.48x | 1.42x | 1.46x | 1.47x | 1.43x | ||
| NCF DSCR | 1.48x | 1.42x | 1.46x | 1.47x | 1.32x | ||
| NOI DY | 10.0% | 9.6% | 9.9% | 10.0% | 9.7% | ||
| NCF DY | 10.0% | 9.6% | 9.9% | 10.0% | 8.9% |
| (1) | The underwritten economic vacancy is 5.5%. The Perrysburg Market Center Property was 95.4% physically occupied as of April 1, 2016. |
THE INFORMATION IN THIS STRUCTURAL AND COLLATERAL TERM SHEET IS NOT COMPLETE AND MAY BE AMENDED PRIOR TO THE TIME OF SALE. THIS TERM SHEET IS NOT AN OFFER TO SELL THESE SECURITIES AND IT IS NOT A SOLICITATION OF AN OFFER TO BUY THESE SECURITIES IN ANY JURISDICTION WHERE THE OFFER OR SALE IS NOT PERMITTED.
| 130 |
| PERRYSBURG MARKET CENTER |
Comparable Leases(1)
| Property Name/ Location | Year Built/ Renovated | Anchor Tenants | Total GLA (SF) | Total Occupancy | Distance from Subject | Tenant Name | Lease Date/ Term | Lease Area (SF) | Annual Base Rent PSF | Lease Type | ||||||||||
Crossroads Centre | 2001/NAP | NAV | 344,045 | NAV | 0.4 miles | NAV | March 2016 / NAV | 80,021 | $6.00(2) | NNN | ||||||||||
Shops at Franklin Place | 2015/NAP | Target and Gabe’s | 241,879 | NAV | 16.6 miles | Marshalls, HomeGoods | April 2016 / NAV | 50,000 | $9.50 | NNN | ||||||||||
Camping World | 2014/NAP | Camping World, Inc. | 30,426 | 100.0% | 1.4 miles | Camping World, Inc. | August 2014 / 20 yrs | 30,426 | $18.58 | NNN | ||||||||||
| Mattress Frim Supercenter & Regional Distribution | 2014/NAP | Mattress Firm | 19,230 | 100.0% | 11.6 miles | Mattress Firm | July 2014 / | 19,230 | $16.31 | NNN | ||||||||||
Fresh Thyme Center | 1971/2016 | NAV | 45,584 | NAV | 15.9 miles | NAV | March 2016 / NAV | 10,502 | $16.00 | NNN | ||||||||||
Airport Square Shopping center | 1986/NAP | NAV | 179,538 | NAV | 11.3 miles | DaVita Dialysis | April 2014 / | 7,995 | $10.50 | NNN | ||||||||||
Crossroads Centre | 2001/NAP | NAV | 344,045 | NAV | 0.4 miles | Tuesday Morning | November 2013 / 4 yrs | 13,500 | $5.26 | Gross | ||||||||||
Crossroads Centre | 2001/NAP | NAV | 344,045 | NAV | 0.4 miles | Hancock Fabrics | November 2013 / 10 yrs | 8,552 | $9.50 | NNN | ||||||||||
Crossroads Centre | 2001/NAP | NAV | 344,045 | NAV | 0.4 miles | Kirklands | April 2012 / | 8,000 | $9.05 | NNN | ||||||||||
The Shoppes at RiverPlace | 1990/NAP | Walt Churchill’s Market & Pharmacy | 104,580 | NAV | 3.5 miles | NAV | March 2016 / NAV | 1,038 | $19.00 | NNN | ||||||||||
Preston Place I | 2006/NAP | NAV | 19,311 | NAV | 4.3 miles | NAV | March 2016 / NAV | 1,664 | $18.00 | NNN | ||||||||||
Scrambler Marie’s Commons | 2009/NAP | NAV | 11,441 | NAV | 3.8 miles | Bear Arms Tactical | September 2015 / 3 yrs | 1,912 | $16.00 | NNN | ||||||||||
The Shops at Fremont Pike | 2013/NAP | NAV | 3,887 | NAV | 1.1 miles | Orbit Communications, Inc. | November 2013 / 5 years | 2,002 | $28.00 | NNN |
| (1) | Information obtained from the appraisal dated March 5, 2016. |
| (2) | Giant Eagle vacated in May, 2014, but continues to pay its contract rent until the lease expires in 2022. |
THE INFORMATION IN THIS STRUCTURAL AND COLLATERAL TERM SHEET IS NOT COMPLETE AND MAY BE AMENDED PRIOR TO THE TIME OF SALE. THIS TERM SHEET IS NOT AN OFFER TO SELL THESE SECURITIES AND IT IS NOT A SOLICITATION OF AN OFFER TO BUY THESE SECURITIES IN ANY JURISDICTION WHERE THE OFFER OR SALE IS NOT PERMITTED.
| 131 |
| Wells Fargo Commercial Mortgage Trust 2016-C34 | Transaction Contact Information |
| VI. | Transaction Contact Information |
Questions regarding this Structural and Collateral Term Sheet may be directed to any of the following individuals:
| Wells Fargo Securities, LLC | |
| Brigid Mattingly | Tel. (312) 269-3062 |
| A.J. Sfarra | Tel. (212) 214-5613 |
| Alex Wong | Tel. (212) 214-5615 |
THE INFORMATION IN THIS STRUCTURAL AND COLLATERAL TERM SHEET IS NOT COMPLETE AND MAY BE AMENDED PRIOR TO THE TIME OF SALE. THIS TERM SHEET IS NOT AN OFFER TO SELL THESE SECURITIES AND IT IS NOT A SOLICITATION OF AN OFFER TO BUY THESE SECURITIES IN ANY JURISDICTION WHERE THE OFFER OR SALE IS NOT PERMITTED.
| 132 |