| FREE WRITING PROSPECTUS | ||
| FILED PURSUANT TO RULE 433 | ||
| REGISTRATION FILE NO.: 333-207361-02 | ||
 | May 11, 2016 |
 |
| CSAIL 2016-C6 Commercial Mortgage Trust Free Writing Prospectus Structural and Collateral Term SheetCredit Suisse Commercial Mortgage Securities Corp.as DepositorCommercial Mortgage Pass-Through Certificates Series 2016-C6 Column Financial, Inc. Benefit Street Partners CRE Finance LLC The Bank of New York Mellon MC-Five Mile Commercial Mortgage Finance LLC The Bancorp Bankas Sponsors and Mortgage Loan SellersCredit SuisseLead Manager and Sole BookrunnerAcademy SecuritiesCo-Manager |
THE DEPOSITOR HAS FILED A REGISTRATION STATEMENT (INCLUDING A PROSPECTUS) WITH THE SEC (SEC FILE NO. 333-207361) FOR THE OFFERING TO WHICH THIS COMMUNICATION RELATES. BEFORE YOU INVEST, YOU SHOULD READ THE PROSPECTUS IN THAT REGISTRATION STATEMENT AND OTHER DOCUMENTS THE ISSUER HAS FILED WITH THE SEC FOR MORE COMPLETE INFORMATION ABOUT THE ISSUER AND THIS OFFERING. YOU MAY GET THESE DOCUMENTS FOR FREE BY VISITING EDGAR ON THE SEC WEB SITE ATWWW.SEC.GOV. ALTERNATIVELY, CREDIT SUISSE WILL ARRANGE TO SEND YOU THE PROSPECTUS IF YOU REQUEST IT BY CALLING TOLL FREE 1-800-221-1037.
STATEMENT REGARDING ASSUMPTIONS AS TO
SECURITIES, PRICING ESTIMATES AND OTHER INFORMATION
This material is for your information, and none of Credit Suisse Securities (USA) LLC and the other underwriters (collectively, the “Underwriters”) are soliciting any action based upon it. This material is not to be construed as an offer to sell or the solicitation of any offer to buy any security in any jurisdiction where such an offer or solicitation would be illegal.
Neither this document nor anything contained herein shall form the basis for any contract or commitment whatsoever. The information contained herein is preliminary as of the date hereof. These materials are subject to change, completion or amendment from time to time. The information contained herein will be superseded by similar information delivered to you prior to the time of sale, including as part of the Preliminary Prospectus referred to herein relating to the CSAIL 2016-C6 Commercial Mortgage Trust, Commercial Mortgage Pass-Through Certificates (the “Offering Document”). The information supersedes any such information previously delivered. The information should be reviewed only in conjunction with the entire Offering Document. All of the information contained herein is subject to the same limitations and qualifications contained in the Offering Document. The information contained herein does not contain all relevant information relating to the underlying mortgage loans or mortgaged properties. Such information is described elsewhere in the Offering Document. The information contained herein will be more fully described elsewhere in the Offering Document. The information contained herein should not be viewed as projections, forecasts, predictions or opinions with respect to value. Prior to making any investment decision, prospective investors are strongly urged to read the Offering Document in its entirety. Neither the Securities and Exchange Commission nor any state securities commission has approved or disapproved of these securities or determined if this Free Writing Prospectus is truthful or complete. Any representation to the contrary is a criminal offense.
The attached information contains certain tables and other statistical analyses (the “Computational Materials”) which have been prepared in reliance upon information furnished by the Mortgage Loan Sellers. Numerous assumptions were used in preparing the Computational Materials, which may or may not be reflected herein. As such, no assurance can be given as to the appropriateness of the assumptions used in preparing the Computational Materials; or as to whether the Computational Materials and/or the assumptions upon which they are based reflect present market conditions or future market performance. The Computational Materials should not be construed as either projections or predictions or as legal, tax, financial or accounting advice. You should consult your own counsel, accountant and other advisors as to the legal, tax, business, financial and related aspects of a purchase of these securities. Any weighted average lives, yields and principal payment periods shown in the Computational Materials are based on prepayment and/or loss assumptions, and changes in such prepayment and/or loss assumptions may dramatically affect such weighted average lives, yields and principal payment periods. In addition, it is possible that prepayments or losses on the underlying assets will occur at rates higher or lower than the rates shown in the attached Computational Materials. The specific characteristics of the securities may differ from those shown in the Computational Materials due to differences between the final underlying assets and the preliminary underlying assets used in preparing the Computational Materials. The principal amount and designation of any security described in the Computational Materials are subject to change prior to issuance. None of the Underwriters or any of their respective affiliates makes any representation or warranty as to the actual rate or timing of payments or losses on any of the underlying assets or the payments or yield on the securities.
This document contains forward-looking statements. Those statements are subject to certain risks and uncertainties that could cause the success of collections and the actual cash flow generated to differ materially from the information set forth herein. While such information reflects projections prepared in good faith based upon methods and data that are believed to be reasonable and accurate as of the dates thereof, the depositor undertakes no obligation to revise these forward-looking statements to reflect subsequent events or circumstances. Individuals should not place undue reliance on forward-looking statements and are advised to make their own independent analysis and determination with respect to the forecasted periods, which reflect the issuer’s view only as of the date hereof.
IMPORTANT NOTICE RELATING TO AUTOMATICALLY GENERATED EMAIL DISCLAIMERS
Any legends, disclaimers or other notices that may appear at the bottom of the email communication to which this Free Writing Prospectus is attached relating to (1) these materials not constituting an offer (or a solicitation of an offer), (2) no representation being made that these materials are accurate or complete and may not be updated or (3) these materials possibly being confidential, are not applicable to these materials and should be disregarded. Such legends, disclaimers or other notices have been automatically generated as a result of these materials having been sent via Bloomberg or another system.
| 2 |

Indicative Capital Structure
Publicly Offered Certificates
| Class | Expected Ratings (Moody’s/Fitch/Morningstar) | Approximate Initial Certificate Principal Balance or Notional Amount(1) | Approximate Initial Credit Support | Expected Weighted Avg. Life (years)(2) | Expected Principal Window(2) | Certificate Principal to Value Ratio(3) | Underwritten NOI Debt Yield(4) | ||
| A-1 | Aaa(sf)/AAAsf/AAA | $17,021,000 | 30.000%(5) | 2.54 | 1-50 | 41.1% | 16.8% | ||
| A-2 | Aaa(sf)/AAAsf/AAA | $67,689,000 | 30.000%(5) | 4.59 | 50-58 | 41.1% | 16.8% | ||
| A-3 | Aaa(sf)/AAAsf/AAA | $92,701,000 | 30.000%(5) | 6.48 | 78-80 | 41.1% | 16.8% | ||
| A-4 | Aaa(sf)/AAAsf/AAA | $128,500,000 | 30.000%(5) | 9.51 | 112-116 | 41.1% | 16.8% | ||
| A-5 | Aaa(sf)/AAAsf/AAA | $198,130,000 | 30.000%(5) | 9.69 | 116-118 | 41.1% | 16.8% | ||
| A-SB | Aaa(sf)/AAAsf/AAA | $33,186,000 | 30.000%(5) | 7.18 | 58-112 | 41.1% | 16.8% | ||
| X-A | Aa1(sf)/AAAsf/AAA | $594,787,000 | (6) | N/A | N/A | N/A | N/A | N/A | |
| X-B | NR/AA-sf/AAA | $34,536,000 | (6) | N/A | N/A | N/A | N/A | N/A | |
| A-S | Aa2(sf)/AAAsf/AAA | $57,560,000 | 22.500% | 9.81 | 118-119 | 45.5% | 15.2% | ||
| B | NR/AA-sf/AA- | $34,536,000 | 18.000% | 9.89 | 119-119 | 48.2% | 14.3% | ||
| C | NR/A-sf/A- | $33,577,000 | 13.625% | 9.89 | 119-119 | 50.7% | 13.6% | ||
Privately Offered Certificates(7)
| Class | Expected Ratings (Moody’s/Fitch/Morningstar) | Approximate Initial Certificate Principal Balance or Notional Amount(1) | Approximate Initial Credit Support | Expected Weighted Avg. Life (years)(2) | Expected Principal Window(2) | Certificate Principal to Value Ratio(3) | Underwritten NOI Debt Yield(4) | ||
| X-D | NR/BBB-sf/AAA | $42,210,000 | (6) | N/A | N/A | N/A | N/A | N/A | |
| X-E | NR/BB-sf/AAA | $20,146,000 | (6) | N/A | N/A | N/A | N/A | N/A | |
| X-F | NR/B-sf/AAA | $8,634,000 | (6) | N/A | N/A | N/A | N/A | N/A | |
| X-NR | NR/NR/AAA | $33,577,461 | (6) | N/A | N/A | N/A | N/A | N/A | |
| D | NR/BBB-sf/BBB | $42,210,000 | 8.125% | 9.92 | 119-120 | 54.0% | 12.8% | ||
| E | NR/BB-sf/BB- | $20,146,000 | 5.500% | 9.97 | 120-120 | 55.5% | 12.4% | ||
| F | NR/B-sf/B | $8,634,000 | 4.375% | 9.97 | 120-120 | 56.2% | 12.3% | ||
| NR | NR/NR/NR | $33,577,461 | 0.000% | 9.97 | 120-120 | 58.7% | 11.8% | ||
| (1) | Approximate, subject to a variance of plus or minus 5%. |
| (2) | Assumes 0% CPR / 0% CDR and a May 26, 2016 closing date. Based on “Modeling Assumptions” as described in the Preliminary Prospectus relating to the Publicly Offered Certificates, dated May 11, 2016 (the “Preliminary Prospectus”). Capitalized terms used but not defined herein have the meanings ascribed to them in the Preliminary Prospectus. |
| (3) | The “Certificate Principal to Value Ratio” for any class (other than the Class A-1, Class A-2, Class A-3, Class A-4, Class A-5 and Class A-SB certificates) is calculated as the product of (a) the weighted average Cut-off Date LTV Ratio for the mortgage loans, multiplied by (b) a fraction, the numerator of which is the total initial certificate principal balance of such class of certificates and all classes of principal balance certificates senior to such class of certificates and the denominator of which is the total initial certificate principal balance of all of the principal balance certificates. The Class A-1, Class A-2, Class A-3, Class A-4, Class A-5 and Class A-SB Certificate Principal to Value Ratios are calculated in the aggregate for those classes as if they were a single class. Investors should note, however, that excess mortgaged property value associated with a mortgage loan will not be available to offset losses on any other mortgage loan. |
| (4) | The “Underwritten NOI Debt Yield” for any class (other than the Class A-1, Class A-2, Class A-3, Class A-4, Class A-5 and Class A-SB certificates) is calculated as the product of (a) the weighted average UW NOI Debt Yield for the mortgage loans and (b) the total initial certificate principal balance of all of the classes of principal balance certificates divided by the total initial certificate principal balance for such class and all classes of principal balance certificates senior to such class of certificates. The Underwritten NOI Debt Yield for each class of the Class A-1, Class A-2, Class A-3, Class A-4, Class A-5 and Class A-SB certificates is calculated in the aggregate for those classes as if they were a single class. Investors should note, however, that net operating income from any mortgaged property supports only the related mortgage loan and will not be available to support any other mortgage loan. |
| (5) | The credit support percentages set forth for the Class A-1, Class A-2, Class A-3, Class A-4, Class A-5 and Class A-SB certificates are represented in the aggregate. |
| (6) | The notional amounts of the Class X-A, Class X-B, Class X-D, Class X-E, Class X-F and Class X-NR certificates (collectively, the “Class X Certificates”) are defined in the Preliminary Prospectus. |
| (7) | The Class Z and Class R certificates are not shown above. |
THE INFORMATION IN THIS TERM SHEET IS NOT COMPLETE AND MAY BE AMENDED PRIOR TO THE TIME OF SALE. THIS TERM SHEET IS NOT AN OFFER TO SELL THESE SECURITIES AND IT IS NOT A SOLICITATION OF AN OFFER TO BUY THESE SECURITIES IN ANY JURISDICTION WHERE THE OFFER OR SALE IS NOT PERMITTED.
| 3 |
Summary of Transaction Terms
| Securities: | $767,467,461 monthly pay, multi-class, commercial mortgage REMIC Pass-Through Certificates. |
| Lead Manager and Sole Bookrunner: | Credit Suisse Securities (USA) LLC. |
| Co-Manager: | Academy Securities, Inc. |
| Mortgage Loan Sellers: | Column Financial, Inc. (“Column”) (45.4%), Benefit Street Partners CRE Finance LLC (“BSP”) (19.9%), The Bank of New York Mellon (“BNYM”) (15.9%), MC-Five Mile Commercial Mortgage Finance LLC (“MC-Five Mile”) (13.6%) and The Bancorp Bank (“Bancorp”) (5.1%). |
| Master Servicer: | KeyBank National Association (“KeyBank”). |
| Special Servicer: | Torchlight Loan Services, LLC (“Torchlight”). |
| Directing Certificateholder: | Torchlight Investors, LLC or one of its managed funds. |
| Trustee: | Wells Fargo Bank, National Association (“Wells Fargo”). |
| Certificate Administrator: | Wells Fargo. |
| Operating Advisor: | Park Bridge Lender Services LLC (“Park Bridge”). |
| Asset Representations Reviewer: | Park Bridge. |
| Closing Date: | On or about May 26, 2016. |
| Cut-off Date: | With respect to each mortgage loan, the respective due date for the monthly debt service payment that is due in May 2016 (or, in the case of any mortgage loan that has its first due date in June 2016, the date that would have been its due date in May 2016 under the terms of that mortgage loan if a monthly payment were scheduled to be due in that month.) |
| Distribution Date: | The 4th business day following each Determination Date, commencing in June 2016. |
| Determination Date: | 11thday of each month, or if the 11th day is not a business day, then the business day immediately following such 11th day, commencing in June 2016. |
| Rated Final Distribution Date: | The Distribution Date in January 2049. |
| Tax Treatment: | The Publicly Offered Certificates are expected to be treated as REMIC regular interests for U.S. federal income tax purposes. |
| Form of Offering: | The Class A-1, Class A-2, Class A-3, Class A-4, Class A-5, Class A-SB, Class X-A, Class X-B, Class A-S, Class B and Class C certificates will be offered publicly (the “Publicly Offered Certificates”). The Class X-D, Class X-E, Class X-F, Class X-NR, Class D, Class E, Class F, Class NR, Class Z and Class R certificates (the “Privately Offered Certificates”) will be offered domestically to Qualified Institutional Buyers and to Institutional Accredited Investors and to institutions that are not U.S. Persons pursuant to Regulation S. |
| SMMEA Status: | The Certificates willnot constitute “mortgage related securities” for purposes of SMMEA. |
| ERISA: | The Publicly Offered Certificates are expected to be ERISA eligible. |
| Optional Termination: | 1% clean-up call. |
| Minimum Denominations: | The Publicly Offered Certificates (other than the Class X-A and Class X-B certificates) will be issued in minimum denominations of $10,000 and integral multiples of $1 in excess of $10,000. The Class X-A and Class X-B certificates will be issued in minimum denominations of $1,000,000 and in integral multiples of $1 in excess of $1,000,000. |
| Settlement Terms: | DTC, Euroclear and Clearstream Banking. |
| Analytics: | The transaction is expected to be available on Intex Solutions, Inc., Trepp, LLC, Bloomberg Financial Markets, L.P., Thomson Reuters Corporation and BlackRock Financial Management Inc. |
THE INFORMATION IN THIS TERM SHEET IS NOT COMPLETE AND MAY BE AMENDED PRIOR TO THE TIME OF SALE. THIS TERM SHEET IS NOT AN OFFER TO SELL THESE SECURITIES AND IT IS NOT A SOLICITATION OF AN OFFER TO BUY THESE SECURITIES IN ANY JURISDICTION WHERE THE OFFER OR SALE IS NOT PERMITTED.
| 4 |
Collateral Characteristics
| Loan Pool | |
| Initial Pool Balance (“IPB”) (1): | $767,467,461 |
| Number of Mortgage Loans: | 50 |
| Number of Mortgaged Properties: | 363 |
| Average Cut-off Date Balance per Mortgage Loan: | $15,349,349 |
| Weighted Average Current Mortgage Rate: | 4.7728% |
| 10 Largest Mortgage Loans as % of IPB: | 61.6% |
| Weighted Average Remaining Term to Maturity(2): | 107 |
| Weighted Average Seasoning: | 3 |
| Credit Statistics | |
| Weighted Average UW NCF DSCR(3)(4): | 2.08x |
| Weighted Average UW NOI Debt Yield(3): | 11.8% |
| Weighted Average Cut-off Date Loan-to-Value Ratio (“LTV”)(3)(5): | 58.7% |
| Weighted Average Maturity Date/LTV(2)(3)(5): | 53.6% |
| Other Statistics | |
| % of Mortgage Loans with Additional Debt: | 30.9% |
| % of Mortgaged Properties with Single Tenants: | 10.0% |
| Amortization | |
| Weighted Average Original Amortization Term(6): | 357 |
| Weighted Average Remaining Amortization Term(6): | 356 |
| % of Mortgage Loans with Partial Interest-Only followed by Amortizing Balloon: | 40.3% |
| % of Mortgage Loans with Interest-Only: | 29.4% |
| % of Mortgage Loans with Amortizing Balloon: | 19.0% |
| % of Mortgage Loans with Interest Only followed by ARD Structure: | 11.3% |
| Cash Management(7) | |
| % of Mortgage Loans with In-Place, Hard Lockboxes: | 38.8% |
| % of Mortgage Loans with Springing Lockboxes: | 33.8% |
| % of Mortgage Loans with In-Place, Soft Lockboxes: | 26.4% |
| % of Mortgage Loans with No Lockbox: | 0.9% |
| Reserves | |
| % of Mortgage Loans Requiring Upfront or Ongoing Tax Reserves: | 70.1% |
| % of Mortgage Loans Requiring Upfront or Ongoing Insurance Reserves: | 53.8% |
| % of Mortgage Loans Requiring Upfront or Ongoing CapEx Reserves(8): | 68.0% |
| % of Mortgage Loans Requiring Upfront or Ongoing TI/LC Reserves(9): | 54.1% |
| (1) | Subject to a permitted variance of plus or minus 5%. |
| (2) | In the case of Loan No. 2 with an anticipated repayment date, calculated through or as of, as applicable, the related anticipated repayment date. |
| (3) | In the case of Loan Nos. 1, 3, 5, 8 and 10, the UW NCF DSCR, UW NOI Debt Yield, Cut-off Date LTV and Maturity Date LTV calculations include the relatedpari passu companion loan(s). In the case of Loan Nos. 1, 5, 10 and 12, the UW NCF DSCR, UW NOI Debt Yield, Cut-off Date LTV and Maturity Date LTV calculations exclude the mezzanine loan. In the case of Loan Nos. 1, 3 and 5, the UW NCF DSCR, UW NOI Debt Yield, Cut-off Date LTV and Maturity Date LTV calculations exclude the subordinate companion loan(s). |
| (4) | For each partial interest-only mortgage loan, the UW NCF DSCR is calculated using the first principal and interest payment to be made into the trust during the term of the mortgage loan once amortization has commenced. |
| (5) | In the case of Loan Nos. 11, 13, 14, 19 and 22, the Cut-off Date LTV and Maturity Date LTV are calculated based upon an “as-renovated”, “as-stabilized” or “when complete” appraised value based on certain assumptions. Refer to “Description of the Mortgage Pool—Certain Calculations and Definitions” in the Preliminary Prospectus for additional details. |
| (6) | Excludes seven mortgage loans that are interest-only for the entire term. In the case of Loan Nos. 10 and 12, the related loan will amortize based on the assumed principal payment schedule set forth on Annex F and Annex G, respectively, to the Preliminary Prospectus. |
| (7) | For a detailed description of cash management, refer to“Description of the Mortgage Pool—Certain Terms of the Mortgage Loans—Mortgaged Property Accounts—Lockbox Accounts” in the Preliminary Prospectus. |
| (8) | CapEx Reserves include FF&E reserves for hospitality properties. |
| (9) | Calculated only with respect to Cut-off Date Balance of mortgage loans secured by industrial, office and retail properties. |
THE INFORMATION IN THIS TERM SHEET IS NOT COMPLETE AND MAY BE AMENDED PRIOR TO THE TIME OF SALE. THIS TERM SHEET IS NOT AN OFFER TO SELL THESE SECURITIES AND IT IS NOT A SOLICITATION OF AN OFFER TO BUY THESE SECURITIES IN ANY JURISDICTION WHERE THE OFFER OR SALE IS NOT PERMITTED.
| 5 |
Collateral Characteristics
| Originator | Sponsor | Number of Mortgage Loans | Number of Mortgaged Properties | Aggregate Cut-off Date Balance | % of IPB | |||
| Column Financial, Inc.(1)(2) | Column Financial, Inc. | 19 | 322 | $348,672,403 | 45.4 | % | ||
| BSP | BSP | 6 | 6 | 153,072,247 | 19.9 | |||
| BNYM | BNYM | 4 | 8 | 121,917,930 | 15.9 | |||
| MC-Five Mile | MC-Five Mile | 15 | 21 | 104,352,154 | 13.6 | |||
| The Bancorp Bank | The Bancorp Bank | 6 | 6 | 39,452,727 | 5.1 | |||
| Total: | 50 | 363 | $767,467,461 | 100.0 | % | |||
| (1) | Certain of the Column mortgage loans were originated by Hunt Finance Company, LLC and acquired by Column. Column has re-underwritten such mortgage loans in accordance with the procedures described under “Transaction Parties—The Sponsors and Mortgage Loan Sellers—Column Financial, Inc.” in the Preliminary Prospectus. |
| (2) | Two (2) of the Column mortgage loans were co-originated with Morgan Stanley Bank, N. A. One (1) of the Column mortgage loans was co-originated with JPMorgan Chase Bank, National Association. |
Ten Largest Mortgage Loans
| No. | Loan Name | Mortgage Loan Seller | No. of Properties | Cut-off Date Balance | % of IPB | SF/ Rooms/ Units | Property Type | UW NCF DSCR(1)(2) | UW NOI Debt Yield(1) | Cut-off Date LTV(1) | Maturity Date LTV(1)(3) | |
| 1 | GLP Industrial Portfolio B | Column Financial, Inc. | 142 | $88,100,000 | 11.5 | % | 26,238,861 | Industrial | 4.37x | 18.4% | 30.2% | 30.2% |
| 2 | 200 Forest Street | BSP | 1 | 87,000,000 | 11.3 | 541,747 | Office | 1.72x | 8.9% | 64.0% | 64.0% | |
| 3 | Quaker Bridge Mall | Column Financial, Inc. | 1 | 66,666,667 | 8.7 | 357,221 | Retail | 2.29x | 10.2% | 45.0% | 45.0% | |
| 4 | Laurel Corporate Center | BNYM | 5 | 48,500,000 | 6.3 | 560,147 | Office | 1.54x | 11.2% | 74.8% | 65.0% | |
| 5 | GLP Industrial Portfolio A | Column Financial, Inc. | 114 | 42,900,000 | 5.6 | 26,878,777 | Industrial | 3.97x | 18.2% | 30.5% | 30.5% | |
| 6 | Mission Ridge | Column Financial, Inc. | 1 | 37,450,000 | 4.9 | 310,702 | Office | 1.41x | 11.3% | 55.9% | 51.7% | |
| 7 | Vistas at Seven Bar | BNYM | 1 | 33,000,000 | 4.3 | 572 | Multifamily | 1.28x | 8.5% | 72.8% | 63.3% | |
| 8 | Jay Scutti Plaza | MC-FiveMile | 1 | 25,000,000 | 3.3 | 288,971 | Retail | 1.25x | 8.5% | 69.0% | 60.9% | |
| 9 | West LA Office - 2730 Wilshire | BNYM | 1 | 24,450,000 | 3.2 | 58,369 | Office | 1.21x | 8.1% | 67.7% | 61.3% | |
| 10 | Starwood Capital Extended Stay Portfolio | Column Financial, Inc. | 50 | 20,000,000 | 2.6 | 6,106 | Hotel | 2.26x | 14.0% | 64.3% | 61.3% | |
| Top 3 Total/Weighted Average | 144 | $241,766,667 | 31.5 | % | 2.84x | 12.7% | 46.5% | 46.5% | ||||
| Top 5 Total/Weighted Average | 263 | $333,166,667 | 43.4 | % | 2.80x | 13.2% | 48.5% | 47.1% | ||||
| Top 10 Total/Weighted Average | 317 | $473,066,667 | 61.6 | % | 2.40x | 12.2% | 53.6% | 50.7% | ||||
| (1) | In the case of Loan Nos. 1, 3, 5, 8 and 10, the UW NCF DSCR, UW NOI Debt Yield, Cut-off Date LTV and Maturity Date LTV calculations include the relatedpari passu companion loan(s). In the case of Loan Nos. 1, 5 and 10, the UW NCF DSCR, UW NOI Debt Yield, Cut-off Date LTV and Maturity Date LTV calculations exclude the mezzanine loan. In the case of Loan Nos. 1, 3 and 5, the UW NCF DSCR, UW NOI Debt Yield, Cut-off Date LTV and Maturity Date LTV calculations exclude the subordinate companion loan(s). |
| (2) | For each partial interest-only mortgage loan, the UW NCF DSCR is calculated using the first principal and interest payment to be made into the trust during the term of the mortgage loan once amortization has commenced. |
| (3) | In the case of Loan No. 2 with an anticipated repayment date, calculated through or as of, as applicable, the related anticipated repayment date. |
THE INFORMATION IN THIS TERM SHEET IS NOT COMPLETE AND MAY BE AMENDED PRIOR TO THE TIME OF SALE. THIS TERM SHEET IS NOT AN OFFER TO SELL THESE SECURITIES AND IT IS NOT A SOLICITATION OF AN OFFER TO BUY THESE SECURITIES IN ANY JURISDICTION WHERE THE OFFER OR SALE IS NOT PERMITTED.
| 6 |
Pari Passu Loan Summary
| No. | Loan Name | Trust Cut-off Date Balance | Pari Passu Companion Loan Cut-off Date Balance(1) | Whole Loan Cut-off Date Balance(2) | Lead Pooling and Servicing Agreement | Master Servicer | Special Servicer |
| 1 | GLP Industrial Portfolio B | $88,100,000 | $875,900,000 | $964,000,000 | CSMC 2015-GLPB | KeyBank | AEGON USA Realty Advisors, LLC (“AEGON”) |
| 3 | Quaker Bridge Mall | $66,666,667 | $113,333,333 | $180,000,000 | JPMDB 2016-C2 | Wells Fargo | Midland Loan Services, a Division of PNC Bank, National Association (“Midland”) |
| 5 | GLP Industrial Portfolio A | $42,900,000 | $923,600,000 | $966,500,000 | CSMC 2015-GLPA | KeyBank | AEGON |
| 8 | Jay Scutti Plaza | $25,000,000 | $16,400,000 | $41,400,000 | CSAIL 2016-C6 | KeyBank | Torchlight |
| 10 | Starwood Capital Extended Stay Portfolio | $20,000,000 | $180,000,000 | $200,000,000 | CSAIL 2015-C3 | Midland | Rialto |
| (1) | In the case of Loan Nos. 1, 3 and 5, includes subordinate debt of one or more B notes. |
| (2) | In the case of Loan Nos. 1, 5 and 10, excludes one or more mezzanine loans. |
Additional Debt Summary
| No. | Loan Name | Trust Cut-off Date Balance | Subordinate Debt Cut-off Date Balance(1) | Total Debt Cut-off Date Balance(1)(2) | Mortgage Loan UW NCF DSCR | Total Debt UW NCF DSCR | Mortgage Loan Cut-off Date LTV | Total Debt Cut-off Date LTV | Mortgage Loan UW NOI Debt Yield | Total Debt UW NOI Debt Yield |
| 1 | GLP Industrial Portfolio B | $88,100,000 | $665,300,000 | $1,294,000,000 | 4.37x | 1.99x | 30.2% | 62.2% | 18.4% | 8.9% |
| 3 | Quaker Bridge Mall | $66,666,667 | $30,000,000 | $180,000,000 | 2.29x | 1.78x | 45.0% | 54.1% | 10.2% | 8.5% |
| 5 | GLP Industrial Portfolio A | $42,900,000 | $658,900,000 | $1,296,500,000 | 3.97x | 1.84x | 30.5% | 62.0% | 18.2% | 8.9% |
| 10 | Starwood Capital Extended Stay Portfolio | $20,000,000 | $25,000,000 | $225,000,000 | 2.26x | 1.83x | 64.3% | 72.3% | 14.0% | 12.4% |
| 12 | Palihouse Santa Monica | $19,422,501 | $3,237,083 | $22,659,584 | 1.59x | 1.22x | 63.5% | 74.1% | 11.1% | 9.5% |
| (1) | In the case of Loan Nos. 1, 5, 10 and 12, the subordinate debt includes one or more mezzanine loans. In the case of Loan Nos. 1, 3 and 5, the subordinate debt includes one or more B notes. |
| (2) | Includes the mortgage loan in this securitization and subordinate debt. In the case of Loan Nos. 1, 3 and 10, the total debt also includes one or more pari passu loans. |
THE INFORMATION IN THIS TERM SHEET IS NOT COMPLETE AND MAY BE AMENDED PRIOR TO THE TIME OF SALE. THIS TERM SHEET IS NOT AN OFFER TO SELL THESE SECURITIES AND IT IS NOT A SOLICITATION OF AN OFFER TO BUY THESE SECURITIES IN ANY JURISDICTION WHERE THE OFFER OR SALE IS NOT PERMITTED.
| 7 |
Mortgaged Properties by Type(1)
| Weighted Average | |||||||||||
| Property Type | Property Subtype | Number of Properties | Cut-off Date Principal Balance | % of IPB | Occupancy | UW NCF DSCR(2)(3) | UW NOI Debt Yield(2) | Cut-off Date LTV(2)(4) | Maturity Date LTV(2)(4)(5) | ||
| Office | |||||||||||
| Suburban | 11 | $201,150,000 | 26.2 | % | 89.5% | 1.58x | 10.1% | 65.0% | 60.5% | ||
| CBD | 1 | 24,450,000 | 3.2 | 95.9% | 1.21x | 8.1% | 67.7% | 61.3% | |||
| Office/Retail | 2 | 7,071,361 | 0.9 | 93.2% | 1.99x | 12.1% | 55.5% | 49.6% | |||
| Flex | 1 | 5,557,500 | 0.7 | 100.0% | 1.89x | 13.9% | 65.0% | 59.8% | |||
| Subtotal | 15 | $238,228,861 | 31.0 | % | 90.5% | 1.56x | 10.0% | 65.0% | 60.2% | ||
| Retail | |||||||||||
| Regional Mall | 1 | $66,666,667 | 8.7 | % | 84.2% | 2.29x | 10.2% | 45.0% | 45.0% | ||
| Unanchored | 5 | 29,374,185 | 3.8 | 98.3% | 1.36x | 9.3% | 69.4% | 59.7% | |||
| Shadow Anchored | 2 | 28,429,988 | 3.7 | 95.4% | 1.26x | 8.6% | 69.6% | 60.9% | |||
| Anchored | 4 | 19,800,072 | 2.6 | 91.7% | 1.54x | 10.9% | 69.4% | 58.4% | |||
| Single Tenant | 1 | 4,850,000 | 0.6 | 100.0% | 1.39x | 9.3% | 73.5% | 64.8% | |||
| Subtotal | 13 | $149,120,912 | 19.4 | % | 90.6% | 1.78x | 9.8% | 58.7% | 53.4% | ||
| Multifamily | |||||||||||
| Garden | 20 | $129,990,577 | 16.9 | % | 93.8% | 1.41x | 9.5% | 69.8% | 61.1% | ||
| High Rise | 1 | 14,947,759 | 1.9 | 90.3% | 1.33x | 9.3% | 69.2% | 57.5% | |||
| Subtotal | 21 | $144,938,336 | 18.9 | % | 93.5% | 1.40x | 9.5% | 69.8% | 60.7% | ||
| Industrial | |||||||||||
| Distribution Warehouse | 127 | $85,562,669 | 11.1 | % | 94.8% | 4.24x | 18.3% | 30.3% | 30.3% | ||
| Warehouse | 66 | 31,475,695 | 4.1 | 98.1% | 4.18x | 18.3% | 30.4% | 30.4% | |||
| Light Industrial | 24 | 6,031,090 | 0.8 | 97.4% | 4.37x | 18.4% | 30.2% | 30.2% | |||
| Flex | 28 | 4,908,354 | 0.6 | 89.7% | 4.29x | 18.3% | 30.3% | 30.3% | |||
| Flex, light industrial, distribution | 11 | 3,022,192 | 0.4 | 88.1% | 4.37x | 18.4% | 30.2% | 30.2% | |||
| Subtotal | 256 | $131,000,000 | 17.1 | % | 95.4% | 4.24x | 18.3% | 30.3% | 30.3% | ||
| Hotel | |||||||||||
| Full Service | 5 | $73,695,751 | 9.6 | % | 76.4% | 1.82x | 13.3% | 64.2% | 57.2% | ||
| Extended Stay | 50 | 20,000,000 | 2.6 | 79.2% | 2.26x | 14.0% | 64.3% | 61.3% | |||
| Limited Service | 1 | 6,138,601 | 0.8 | 80.8% | 2.24x | 16.2% | 68.2% | 56.2% | |||
| Subtotal | 56 | $99,834,352 | 13.0 | % | 77.2% | 1.93x | 13.6% | 64.5% | 57.9% | ||
| Manufactured Housing | |||||||||||
| Manufactured Housing | 2 | $4,345,000 | 0.6 | % | 98.0% | 1.35x | 9.3% | 74.9% | 63.8% | ||
| Subtotal | 2 | $4,345,000 | 0.6 | % | 98.0% | 1.35x | 9.3% | 74.9% | 63.8% | ||
| Total / Wtd. Avg.: | 363 | $767,467,461 | 100.0 | % | 90.2% | 2.08x | 11.8% | 58.7% | 53.6% | ||
| (1) | Because this table presents information relating to the mortgaged properties and not mortgage loans, the information for mortgage loans secured by more than one mortgaged property is based on allocated loan amounts. |
| (2) | In the case of Loan Nos. 1, 3, 5, 8 and 10, the UW NCF DSCR, UW NOI Debt Yield, Cut-off Date LTV and Maturity Date LTV calculations include the relatedpari passu companion loan(s). In the case of Loan Nos. 1, 5, 10 and 12, the UW NCF DSCR, UW NOI Debt Yield, Cut-off Date LTV and Maturity Date LTV calculations exclude the mezzanine loan. In the case of Loan Nos. 1, 3 and 5, the UW NCF DSCR, UW NOI Debt Yield, Cut-off Date LTV and Maturity Date LTV calculations exclude the subordinate companion loan(s). |
| (3) | For each partial interest-only mortgage loan, the UW NCF DSCR is calculated using the first principal and interest payment to be made into the trust during the term of the mortgage loan once amortization has commenced. |
| (4) | In the case of Loan Nos. 11, 13, 14, 19 and 22, the Cut-off Date LTV and Maturity Date LTV are calculated based upon an “as-renovated”, “as-stabilized” or “when complete” appraised value based on certain assumptions. Refer to “Description of the Mortgage Pool—Certain Calculations and Definitions” in the Preliminary Prospectus for additional details. |
| (5) | In the case of Loan No. 2 with an anticipated repayment date, the Maturity Date LTV is as of the related anticipated repayment date. |
THE INFORMATION IN THIS TERM SHEET IS NOT COMPLETE AND MAY BE AMENDED PRIOR TO THE TIME OF SALE. THIS TERM SHEET IS NOT AN OFFER TO SELL THESE SECURITIES AND IT IS NOT A SOLICITATION OF AN OFFER TO BUY THESE SECURITIES IN ANY JURISDICTION WHERE THE OFFER OR SALE IS NOT PERMITTED.
| 8 |
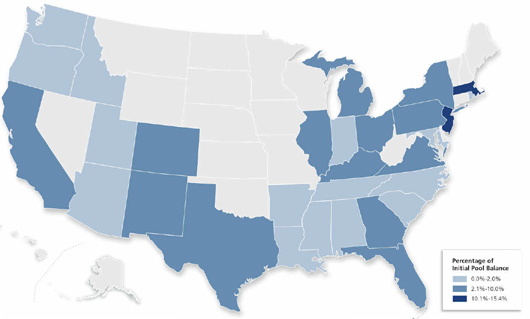
Mortgaged Properties by Location(1)
| State | Number of Properties | Cut-off Date Principal Balance | % of IPB | Occupancy | UW NCF DSCR(2)(3) | UW NOI Debt Yield(2) | Cut-off Date LTV(2)(4) | Maturity Date LTV(2)(4)(5) | |
| NJ | 15 | $118,388,789 | 15.4 | % | 84.5% | 2.03x | 10.8% | 56.9% | 52.8% |
| MA | 2 | 92,338,361 | 12.0 | 88.6% | 1.71x | 9.0% | 64.4% | 63.7% | |
| TX | 74 | 75,819,092 | 9.9 | 94.0% | 2.18x | 12.0% | 57.9% | 52.0% | |
| CA | 35 | 71,704,362 | 9.3 | 95.1% | 2.38x | 12.5% | 52.6% | 47.8% | |
| VA | 10 | 44,761,039 | 5.8 | 93.5% | 1.51x | 11.5% | 55.6% | 51.1% | |
| FL | 30 | 39,791,008 | 5.2 | 91.9% | 2.33x | 13.8% | 59.4% | 51.5% | |
| GA | 32 | 36,341,754 | 4.7 | 93.7% | 2.59x | 13.3% | 53.8% | 51.1% | |
| NM | 2 | 34,420,000 | 4.5 | 95.2% | 1.28x | 8.5% | 72.9% | 63.2% | |
| PA | 22 | 32,623,604 | 4.3 | 97.3% | 2.73x | 13.8% | 53.0% | 47.5% | |
| IL | 20 | 26,345,365 | 3.4 | 75.2% | 2.45x | 14.0% | 50.2% | 50.2% | |
| NY | 1 | 25,000,000 | 3.3 | 96.0% | 1.25x | 8.5% | 69.0% | 60.9% | |
| MI | 2 | 24,683,646 | 3.2 | 81.3% | 1.38x | 10.7% | 70.4% | 56.9% | |
| CO | 5 | 21,460,081 | 2.8 | 98.3% | 1.53x | 10.8% | 61.9% | 51.7% | |
| OH | 3 | 17,350,000 | 2.3 | 95.3% | 1.41x | 9.2% | 71.2% | 61.6% | |
| KY | 2 | 16,107,095 | 2.1 | 78.1% | 2.17x | 17.3% | 68.6% | 64.0% | |
| AZ | 17 | 14,295,699 | 1.9 | 84.4% | 3.65x | 16.2% | 40.7% | 37.6% | |
| TN | 14 | 12,390,198 | 1.6 | 92.6% | 2.86x | 15.4% | 55.0% | 48.8% | |
| IN | 8 | 9,510,823 | 1.2 | 82.5% | 1.93x | 10.8% | 59.1% | 53.0% | |
| AR | 1 | 8,569,433 | 1.1 | 72.1% | 1.72x | 12.9% | 66.4% | 55.0% | |
| MS | 9 | 7,943,250 | 1.0 | 93.6% | 2.01x | 11.6% | 65.8% | 56.5% | |
| MD | 22 | 7,727,503 | 1.0 | 92.9% | 3.97x | 18.2% | 30.5% | 30.5% | |
| NC | 8 | 6,365,369 | 0.8 | 87.6% | 1.67x | 11.6% | 70.9% | 62.3% | |
| WA | 9 | 6,150,737 | 0.8 | 100.0% | 4.37x | 18.4% | 30.2% | 30.2% | |
| RI | 1 | 4,800,000 | 0.6 | 96.2% | 1.46x | 10.1% | 69.6% | 61.3% | |
| UT | 4 | 3,802,113 | 0.5 | 100.0% | 4.37x | 18.4% | 30.2% | 30.2% | |
| ID | 1 | 2,925,000 | 0.4 | 100.0% | 1.38x | 9.2% | 75.0% | 65.1% | |
| OR | 4 | 1,945,370 | 0.3 | 100.0% | 4.37x | 18.4% | 30.2% | 30.2% | |
| LA | 3 | 1,901,922 | 0.2 | 83.3% | 2.26x | 14.0% | 64.3% | 61.3% | |
| AL | 5 | 1,332,008 | 0.2 | 65.8% | 2.26x | 14.0% | 64.3% | 61.3% | |
| DC | 1 | 395,511 | 0.1 | 100.0% | 3.97x | 18.2% | 30.5% | 30.5% | |
| SC | 1 | 278,330 | 0.0 | 64.8% | 2.26x | 14.0% | 64.3% | 61.3% | |
| Total / Wtd. Avg.: | 363 | $767,467,461 | 100.0 | % | 90.2% | 2.08x | 11.8% | 58.7% | 53.6% |
| (1) | Because this table presents information relating to the mortgaged properties and not mortgage loans, the information for mortgage loans secured by more than one mortgaged property is based on allocated loan amounts. |
| (2) | In the case of Loan Nos. 1, 3, 5, 8 and 10, the UW NCF DSCR, UW NOI Debt Yield, Cut-off Date LTV and Maturity Date LTV calculations include the relatedpari passu companion loan(s). In the case of Loan Nos. 1, 5, 10 and 12, the UW NCF DSCR, UW NOI Debt Yield, Cut-off Date LTV and Maturity Date LTV calculations exclude the mezzanine loan. In the case of Loan Nos. 1, 3 and 5, the UW NCF DSCR, UW NOI Debt Yield, Cut-off Date LTV and Maturity Date LTV calculations exclude the subordinate companion loan(s). |
| (3) | For each partial interest-only mortgage loan, the UW NCF DSCR is calculated using the first principal and interest payment to be made into the trust during the term of the mortgage loan once amortization has commenced. |
| (4) | In the case of Loan Nos. 11, 13, 14, 19 and 22, the Cut-off Date LTV and Maturity Date LTV are calculated based upon an “as-renovated”, “as-stabilized” or “when complete” appraised value based on certain assumptions. Refer to “Description of the Mortgage Pool—Certain Calculations and Definitions” in the Preliminary Prospectus for additional details. |
| (5) | In the case of Loan No. 2 with an anticipated repayment date, the Maturity Date LTV is as of the related anticipated repayment date. |
THE INFORMATION IN THIS TERM SHEET IS NOT COMPLETE AND MAY BE AMENDED PRIOR TO THE TIME OF SALE. THIS TERM SHEET IS NOT AN OFFER TO SELL THESE SECURITIES AND IT IS NOT A SOLICITATION OF AN OFFER TO BUY THESE SECURITIES IN ANY JURISDICTION WHERE THE OFFER OR SALE IS NOT PERMITTED.
| 9 |
Cut-off Date Principal Balance
| Weighted Average | |||||||||||||||||||||||||||
| Range of Principal Balances | Number of Loans | Cut-off Date Principal Balance | % of IPB | Mortgage Rate | Remaining Loan Term(1) | UW NCF DSCR(2)(3) | UW NOI Debt Yield(2) | Cut-off Date LTV(2)(4) | Maturity Date LTV(1)(2)(4) | ||||||||||||||||||
| $1,420,000 - $4,999,999 | 14 | $50,256,668 | 6.5 | % | 4.9540 | % | 116 | 1.60 | x | 10.6 | % | 63.4 | % | 54.8 | % | ||||||||||||
| $5,000,000 - $9,999,999 | 19 | 134,693,589 | 17.6 | 5.0296 | % | 116 | 1.51 | x | 10.9 | % | 69.2 | % | 58.5 | % | |||||||||||||
| $10,000,000 - $19,999,999 | 6 | 89,450,537 | 11.7 | 5.0952 | % | 99 | 1.54 | x | 10.9 | % | 68.4 | % | 60.6 | % | |||||||||||||
| $20,000,000 - $24,999,999 | 3 | 64,450,000 | 8.4 | 4.8299 | % | 78 | 1.77 | x | 11.3 | % | 63.2 | % | 59.8 | % | |||||||||||||
| $25,000,000 - $49,999,999 | 5 | 186,850,000 | 24.3 | 4.8912 | % | 116 | 1.99 | x | 12.0 | % | 59.7 | % | 53.6 | % | |||||||||||||
| $50,000,000 - $88,100,000 | 3 | 241,766,667 | 31.5 | 4.3661 | % | 104 | 2.84 | x | 12.7 | % | 46.5 | % | 46.5 | % | |||||||||||||
| Total / Wtd. Avg.: | 50 | $767,467,461 | 100.0 | % | 4.7728 | % | 107 | 2.08 | x | 11.8 | % | 58.7 | % | 53.6 | % | ||||||||||||
Mortgage Interest Rates
| Weighted Average | |||||||||||||||||||||||||||
| Range of Mortgage Interest Rates | Number of Loans | Cut-off Date Principal Balance | % of IPB | Mortgage Rate | Remaining Loan Term(1) | UW NCF DSCR(2)(3) | UW NOI Debt Yield(2) | Cut-off Date LTV(2)(4) | Maturity Date LTV(1)(2)(4) | ||||||||||||||||||
| 3.8164% - 3.9999% | 1 | $88,100,000 | 11.5 | % | 3.8164 | % | 78 | 4.37 | x | 18.4 | % | 30.2 | % | 30.2 | % | ||||||||||||
| 4.0000% - 4.2499% | 3 | 129,566,667 | 16.9 | 4.1531 | % | 107 | 2.84 | x | 13.4 | % | 43.2 | % | 42.7 | % | |||||||||||||
| 4.2500% - 4.4999% | 1 | 5,350,000 | 0.7 | 4.4600 | % | 116 | 1.49 | x | 9.2 | % | 67.7 | % | 59.2 | % | |||||||||||||
| 4.5000% - 4.7499% | 4 | 22,567,840 | 2.9 | 4.5771 | % | 117 | 1.82 | x | 12.3 | % | 54.8 | % | 45.4 | % | |||||||||||||
| 4.7500% - 4.9999% | 18 | 135,902,006 | 17.7 | 4.8638 | % | 115 | 1.45 | x | 9.8 | % | 69.6 | % | 61.2 | % | |||||||||||||
| 5.0000% - 5.9800% | 23 | 385,980,948 | 50.3 | 5.1829 | % | 110 | 1.54 | x | 10.4 | % | 66.7 | % | 60.3 | % | |||||||||||||
| Total / Wtd. Avg.: | 50 | $767,467,461 | 100.0 | % | 4.7728 | % | 107 | 2.08 | x | 11.8 | % | 58.7 | % | 53.6 | % | ||||||||||||
Original Term to Maturity/ARD in Months(1)
| Weighted Average | |||||||||||||||||||||||||||
| Original Term to Maturity/ARD in Months | Number of Loans | Cut-off Date Principal Balance | % of IPB | Mortgage Rate | Remaining Loan Term(1) | UW NCF DSCR(2)(3) | UW NOI Debt Yield(2) | Cut-off Date LTV(2)(4) | Maturity Date LTV(1) (2)(4) | ||||||||||||||||||
| 60 | 4 | $66,330,278 | 8.6 | % | 4.9493 | % | 55 | 2.01 | x | 13.7 | % | 63.6 | % | 60.8 | % | ||||||||||||
| 84 | 2 | 93,200,000 | 12.1 | 3.8752 | % | 78 | 4.21 | x | 17.9 | % | 32.4 | % | 32.0 | % | |||||||||||||
| 120 | 44 | 607,937,184 | 79.2 | 4.8912 | % | 117 | 1.76 | x | 10.6 | % | 62.3 | % | 56.1 | % | |||||||||||||
| Total / Wtd. Avg.: | 50 | $767,467,461 | 100.0 | % | 4.7728 | % | 107 | 2.08 | x | 11.8 | % | 58.7 | % | 53.6 | % | ||||||||||||
| (1) | In the case of Loan No. 2 with an anticipated repayment date, the Original Term to Maturity/ARD, Remaining Loan Term and Maturity Date LTV are as of the related anticipated repayment date. |
| (2) | In the case of Loan Nos. 1, 3, 5, 8 and 10, the UW NCF DSCR, UW NOI Debt Yield, Cut-off Date LTV and Maturity Date LTV calculations include the relatedpari passu companion loan(s). In the case of Loan Nos. 1, 5, 10 and 12, the UW NCF DSCR, UW NOI Debt Yield, Cut-off Date LTV and Maturity Date LTV calculations exclude the mezzanine loan. In the case of Loan Nos. 1, 3 and 5, the UW NCF DSCR, UW NOI Debt Yield, Cut-off Date LTV and Maturity Date LTV calculations exclude the subordinate companion loan(s). |
| (3) | For each partial interest-only mortgage loan, the UW NCF DSCR is calculated using the first principal and interest payment to be made into the trust during the term of the mortgage loan once amortization has commenced. |
| (4) | In the case of Loan Nos. 11, 13, 14, 19 and 22, the Cut-off Date LTV and Maturity Date LTV are calculated based upon an “as-renovated”, “as-stabilized” or “when complete” appraised value based on certain assumptions. Refer to “Description of the Mortgage Pool—Certain Calculations and Definitions” in the Preliminary Prospectus for additional details. |
THE INFORMATION IN THIS TERM SHEET IS NOT COMPLETE AND MAY BE AMENDED PRIOR TO THE TIME OF SALE. THIS TERM SHEET IS NOT AN OFFER TO SELL THESE SECURITIES AND IT IS NOT A SOLICITATION OF AN OFFER TO BUY THESE SECURITIES IN ANY JURISDICTION WHERE THE OFFER OR SALE IS NOT PERMITTED.
| 10 |
Remaining Term to Maturity/ARD in Months(1)
| Weighted Average | |||||||||||||||||||||||||||
| Remaining Term to Maturity/ARD in Months | Number of Loans | Cut-off Date Principal Balance | % of IPB | Mortgage Rate | Remaining Loan Term | UW NCF DSCR(2)(3) | UW NOI Debt Yield(2) | Cut-off Date LTV(2)(4) | Maturity Date LTV(2)(4) | ||||||||||||||||||
| 50 - 60 | 4 | $66,330,278 | 8.6 | % | 4.9493 | % | 55 | 2.01 | x | 13.7 | % | 63.6 | % | 60.8 | % | ||||||||||||
| 61 - 120 | 46 | 701,137,184 | 91.4 | 4.7561 | % | 112 | 2.08 | x | 11.6 | % | 58.3 | % | 52.9 | % | |||||||||||||
| Total / Wtd. Avg.: | 50 | $767,467,461 | 100.0 | % | 4.7728 | % | 107 | 2.08 | x | 11.8 | % | 58.7 | % | 53.6 | % | ||||||||||||
Original Amortization Term in Months
| Weighted Average | |||||||||||||||||||||||||||
| Original Amortization Term in Months | Number of Loans | Cut-off Date Principal Balance | % of IPB | Mortgage Rate | Remaining Loan Term(1) | UW NCF DSCR(2)(3) | UW NOI Debt Yield(2) | Cut-off Date LTV(2)(4) | Maturity Date LTV(1)(2)(4) | ||||||||||||||||||
| Interest Only | 7 | $312,359,167 | 40.7 | % | 4.4079 | % | 103 | 2.93 | x | 13.4 | % | 45.0 | % | 45.0 | % | ||||||||||||
| 240 | 1 | 2,278,861 | 0.3 | 5.4100 | % | 116 | 1.44 | x | 13.0 | % | 52.4 | % | 33.9 | % | |||||||||||||
| 300 | 3 | 20,955,887 | 2.7 | 5.2592 | % | 119 | 1.43 | x | 11.8 | % | 66.5 | % | 50.6 | % | |||||||||||||
| 360 | 39 | 431,873,546 | 56.3 | 5.0098 | % | 109 | 1.50 | x | 10.5 | % | 68.3 | % | 60.1 | % | |||||||||||||
| Total / Wtd. Avg.: | 50 | $767,467,461 | 100.0 | % | 4.7728 | % | 107 | 2.08 | x | 11.8 | % | 58.7 | % | 53.6 | % | ||||||||||||
Remaining Amortization Term in Months
| Weighted Average | |||||||||||||||||||||||||||
| Remaining Amortization Term in Months | Number of Loans | Cut-off Date Principal Balance | % of IPB | Mortgage Rate | Remaining Loan Term(1) | UW NCF DSCR(2)(3) | UW NOI Debt Yield(2) | Cut-off Date LTV(2)(4) | Maturity Date LTV(1)(2)(4) | ||||||||||||||||||
| Interest Only | 7 | $312,359,167 | 40.7 | % | 4.4079 | % | 103 | 2.93 | x | 13.4 | % | 45.0 | % | 45.0 | % | ||||||||||||
| 236 - 298 | 1 | 2,278,861 | 0.3 | 5.4100 | % | 116 | 1.44 | x | 13.0 | % | 52.4 | % | 33.9 | % | |||||||||||||
| 299 - 337 | 3 | 20,955,887 | 2.7 | 5.2592 | % | 119 | 1.43 | x | 11.8 | % | 66.5 | % | 50.6 | % | |||||||||||||
| 338 - 360 | 39 | 431,873,546 | 56.3 | 5.0098 | % | 109 | 1.50 | x | 10.5 | % | 68.3 | % | 60.1 | % | |||||||||||||
| Total / Wtd. Avg.: | 50 | $767,467,461 | 100.0 | % | 4.7728 | % | 107 | 2.08 | x | 11.8 | % | 58.7 | % | 53.6 | % | ||||||||||||
| (1) | In the case of Loan No. 2 with an anticipated repayment date, the Remaining Term to Maturity/ARD, Remaining Loan Term and Maturity Date LTV are as of the related anticipated repayment date. |
| (2) | In the case of Loan Nos. 1, 3, 5, 8 and 10, the UW NCF DSCR, UW NOI Debt Yield, Cut-off Date LTV and Maturity Date LTV calculations include the relatedpari passu companion loan(s). In the case of Loan Nos. 1, 5, 10 and 12, the UW NCF DSCR, UW NOI Debt Yield, Cut-off Date LTV and Maturity Date LTV calculations exclude the mezzanine loan. In the case of Loan Nos. 1, 3 and 5, the UW NCF DSCR, UW NOI Debt Yield, Cut-off Date LTV and Maturity Date LTV calculations exclude the subordinate companion loan(s). |
| (3) | For each partial interest-only mortgage loan, the UW NCF DSCR is calculated using the first principal and interest payment to be made into the trust during the term of the mortgage loan once amortization has commenced. |
| (4) | In the case of Loan Nos. 11, 13, 14, 19 and 22, the Cut-off Date LTV and Maturity Date LTV are calculated based upon an “as-renovated”, “as-stabilized” or “when complete” appraised value based on certain assumptions. Refer to“Description of the Mortgage Pool—Certain Calculations and Definitions”in the Preliminary Prospectus for additional details. |
THE INFORMATION IN THIS TERM SHEET IS NOT COMPLETE AND MAY BE AMENDED PRIOR TO THE TIME OF SALE. THIS TERM SHEET IS NOT AN OFFER TO SELL THESE SECURITIES AND IT IS NOT A SOLICITATION OF AN OFFER TO BUY THESE SECURITIES IN ANY JURISDICTION WHERE THE OFFER OR SALE IS NOT PERMITTED.
| 11 |
Amortization Types
| Weighted Average | |||||||||||||||||||||||||||
| Amortization Types | Number of Loans | Cut-off Date Principal Balance | % of IPB | Mortgage Rate | Remaining Loan Term(1) | UW NCF DSCR(2)(3) | UW NOI Debt Yield(2) | Cut-off Date LTV(2)(4) | Maturity Date LTV(1)(2)(4) | ||||||||||||||||||
| IO-Balloon | 25 | $309,020,000 | 40.3 | % | 4.9386 | % | 112 | 1.45 | x | 10.0 | % | 68.6 | % | 61.0 | % | ||||||||||||
| Interest Only | 6 | 225,359,167 | 29.4 | 4.1600 | % | 97 | 3.39 | x | 15.2 | % | 37.7 | % | 37.7 | % | |||||||||||||
| Balloon | 18 | 146,088,294 | 19.0 | 5.2024 | % | 106 | 1.60 | x | 11.9 | % | 67.2 | % | 56.4 | % | |||||||||||||
| Interest Only, ARD | 1 | 87,000,000 | 11.3 | 5.0500 | % | 119 | 1.72 | x | 8.9 | % | 64.0 | % | 64.0 | % | |||||||||||||
| Total / Wtd. Avg.: | 50 | $767,467,461 | 100.0 | % | 4.7728 | % | 107 | 2.08 | x | 11.8 | % | 58.7 | % | 53.6 | % | ||||||||||||
Interest Only Periods(5)
| Weighted Average | |||||||||||||||||||||||||||
| Interest Only Periods | Number of Loans | Cut-off Date Principal Balance | % of IPB | Mortgage Rate | Remaining Loan Term(1) | UW NCF DSCR(2)(3) | UW NOI Debt Yield(2) | Cut-off Date LTV(2)(4) | Maturity Date LTV(1)(2)(4) | ||||||||||||||||||
| 12 - 24 | 11 | $141,590,000 | 18.4 | % | 4.9216 | % | 106 | 1.54 | x | 10.5 | % | 72.0 | % | 63.2 | % | ||||||||||||
| 25 - 48 | 11 | 109,172,500 | 14.2 | 4.8929 | % | 116 | 1.33 | x | 8.9 | % | 68.1 | % | 60.6 | % | |||||||||||||
| 49 - 60 | 4 | 78,257,500 | 10.2 | 5.1382 | % | 102 | 1.57 | x | 11.4 | % | 59.9 | % | 56.4 | % | |||||||||||||
| 61 - 120 | 6 | 292,359,167 | 38.1 | 4.3435 | % | 106 | 2.99 | x | 13.5 | % | 44.2 | % | 44.2 | % | |||||||||||||
| Total / Wtd. Avg.: | 32 | $621,379,167 | 81.0 | % | 4.6718 | % | 107 | 2.19 | x | 11.7 | % | 56.8 | % | 53.0 | % | ||||||||||||
Underwritten Net Cash Flow Debt Service Coverage Ratios(2)(3)
| Weighted Average | |||||||||||||||||||||||||||
| Underwritten Net Cash Flow Debt Service Coverage Ratios | Number of Loans | Cut-off Date Principal Balance | % of IPB | Mortgage Rate | Remaining Loan Term(1) | UW NCF DSCR | UW NOI Debt Yield | Cut-off Date LTV(4) | Maturity Date LTV(1)(4) | ||||||||||||||||||
| 1.21 - 1.24 | 2 | $28,431,685 | 3.7 | % | 5.0783 | % | 116 | 1.22 | x | 8.1 | % | 67.5 | % | 60.4 | % | ||||||||||||
| 1.25 - 1.49 | 29 | 280,869,862 | 36.6 | 5.0559 | % | 114 | 1.36 | x | 9.6 | % | 68.2 | % | 59.3 | % | |||||||||||||
| 1.50 - 1.74 | 5 | 165,641,933 | 21.6 | 5.0739 | % | 118 | 1.65 | x | 10.1 | % | 67.3 | % | 62.6 | % | |||||||||||||
| 1.75 - 1.99 | 5 | 41,082,944 | 5.4 | 5.0984 | % | 87 | 1.90 | x | 12.9 | % | 60.7 | % | 56.0 | % | |||||||||||||
| 2.00 - 2.24 | 5 | 33,774,371 | 4.4 | 5.1613 | % | 88 | 2.19 | x | 15.6 | % | 62.1 | % | 56.7 | % | |||||||||||||
| 2.25 - 2.49 | 2 | 86,666,667 | 11.3 | 4.1576 | % | 104 | 2.28 | x | 11.1 | % | 49.5 | % | 48.8 | % | |||||||||||||
| 2.75 - 3.99 | 1 | 42,900,000 | 5.6 | 4.1439 | % | 114 | 3.97 | x | 18.2 | % | 30.5 | % | 30.5 | % | |||||||||||||
| 4.00 - 4.37 | 1 | 88,100,000 | 11.5 | 3.8164 | % | 78 | 4.37 | x | 18.4 | % | 30.2 | % | 30.2 | % | |||||||||||||
| Total / Wtd. Avg.: | 50 | $767,467,461 | 100.0 | % | 4.7728 | % | 107 | 2.08 | x | 11.8 | % | 58.7 | % | 53.6 | % | ||||||||||||
| (1) | In the case of Loan No. 2 with an anticipated repayment date, the Remaining Loan Term and Maturity Date LTV are as of the related anticipated repayment date. |
| (2) | In the case of Loan Nos. 1, 3, 5, 8 and 10, the UW NCF DSCR, UW NOI Debt Yield, Cut-off Date LTV and Maturity Date LTV calculations include the relatedpari passucompanion loan(s). In the case of Loan Nos. 1, 5, 10 and 12, the UW NCF DSCR, UW NOI Debt Yield, Cut-off Date LTV and Maturity Date LTV calculations exclude the mezzanine loan. In the case of Loan Nos. 1, 3 and 5, the UW NCF DSCR, UW NOI Debt Yield, Cut-off Date LTV and Maturity Date LTV calculations exclude the subordinate companion loan(s). |
| (3) | For each partial interest-only mortgage loan, the UW NCF DSCR is calculated using the first principal and interest payment to be made into the trust during the term of the mortgage loan once amortization has commenced. |
| (4) | In the case of Loan Nos. 11, 13, 14, 19 and 22, the Cut-off Date LTV and Maturity Date LTV are calculated based upon an “as-renovated”, “as-stabilized” or “when complete” appraised value based on certain assumptions. Refer to“Description of the Mortgage Pool—Certain Calculations and Definitions”in the Preliminary Prospectus for additional details. |
| (5) | Excluding eighteen (18) loans that have no interest-only period during the loan term. |
THE INFORMATION IN THIS TERM SHEET IS NOT COMPLETE AND MAY BE AMENDED PRIOR TO THE TIME OF SALE. THIS TERM SHEET IS NOT AN OFFER TO SELL THESE SECURITIES AND IT IS NOT A SOLICITATION OF AN OFFER TO BUY THESE SECURITIES IN ANY JURISDICTION WHERE THE OFFER OR SALE IS NOT PERMITTED.
| 12 |
LTV Ratios as of the Cut-off Date(1)(2)
| Weighted Average | |||||||||||||||||||||||||||
| Range of Cut-off Date LTVs | Number of Loans | Cut-off Date Principal Balance | % of IPB | Mortgage Rate | Remaining Loan Term(3) | UW NCF DSCR(4) | UW NOI Debt Yield | Cut-off Date LTV | Maturity Date LTV(3) | ||||||||||||||||||
| 30.2% - 34.9% | 2 | $131,000,000 | 17.1 | % | 3.9237 | % | 90 | 4.24 | x | 18.3 | % | 30.3 | % | 30.3 | % | ||||||||||||
| 35.0% - 44.9% | 1 | 2,900,000 | 0.4 | 4.9200 | % | 115 | 2.03 | x | 11.0 | % | 42.6 | % | 42.6 | % | |||||||||||||
| 45.0% - 49.9% | 3 | 74,642,007 | 9.7 | 4.2424 | % | 119 | 2.26 | x | 10.6 | % | 45.3 | % | 44.5 | % | |||||||||||||
| 50.0% - 54.9% | 1 | 2,278,861 | 0.3 | 5.4100 | % | 116 | 1.44 | x | 13.0 | % | 52.4 | % | 33.9 | % | |||||||||||||
| 55.0% - 59.9% | 4 | 72,042,500 | 9.4 | 5.1132 | % | 101 | 1.62 | x | 11.7 | % | 56.7 | % | 52.3 | % | |||||||||||||
| 60.0% - 64.9% | 5 | 136,970,917 | 17.8 | 4.8894 | % | 108 | 1.77 | x | 10.1 | % | 64.0 | % | 61.3 | % | |||||||||||||
| 65.0% - 69.9% | 17 | 172,156,118 | 22.4 | 5.0545 | % | 106 | 1.46 | x | 10.3 | % | 68.3 | % | 60.3 | % | |||||||||||||
| 70.0% - 74.9% | 15 | 166,755,031 | 21.7 | 5.1132 | % | 117 | 1.41 | x | 10.0 | % | 73.4 | % | 63.2 | % | |||||||||||||
| 75.0% - 76.4% | 2 | 8,722,027 | 1.1 | 5.1399 | % | 113 | 1.64 | x | 11.8 | % | 75.9 | % | 64.2 | % | |||||||||||||
| Total / Wtd. Avg.: | 50 | $767,467,461 | 100.0 | % | 4.7728 | % | 107 | 2.08 | x | 11.8 | % | 58.7 | % | 53.6 | % | ||||||||||||
LTV Ratios as of the Maturity Date(1)(2)(3)
| Weighted Average | |||||||||||||||||||||||||||
| Range of Maturity/ARD Date LTVs | Number of Loans | Cut-off Date Principal Balance | % of IPB | Mortgage Rate | Remaining Loan Term | UW NCF DSCR(4) | UW NOI Debt Yield | Cut-off Date LTV | Maturity Date LTV | ||||||||||||||||||
| 30.2% - 34.9% | 3 | $133,278,861 | 17.4 | % | 3.9491 | % | 90 | 4.19 | x | 18.2 | % | 30.7 | % | 30.4 | % | ||||||||||||
| 35.0% - 44.9% | 4 | 20,675,340 | 2.7 | 4.6106 | % | 117 | 1.75 | x | 12.3 | % | 52.6 | % | 42.3 | % | |||||||||||||
| 45.0% - 49.9% | 1 | 66,666,667 | 8.7 | 4.2000 | % | 120 | 2.29 | x | 10.2 | % | 45.0 | % | 45.0 | % | |||||||||||||
| 50.0% - 54.9% | 5 | 75,990,350 | 9.9 | 5.1122 | % | 117 | 1.51 | x | 11.4 | % | 60.2 | % | 52.8 | % | |||||||||||||
| 55.0% - 59.9% | 12 | 99,923,156 | 13.0 | 5.2164 | % | 106 | 1.61 | x | 11.2 | % | 66.0 | % | 57.6 | % | |||||||||||||
| 60.0% - 64.9% | 23 | 352,758,087 | 46.0 | 4.9986 | % | 108 | 1.55 | x | 10.0 | % | 69.2 | % | 63.1 | % | |||||||||||||
| 65.0% - 66.7% | 2 | 18,175,000 | 2.4 | 4.8599 | % | 115 | 1.34 | x | 8.9 | % | 73.0 | % | 66.5 | % | |||||||||||||
| Total / Wtd. Avg.: | 50 | $767,467,461 | 100.0 | % | 4.7728 | % | 107 | 2.08 | x | 11.8 | % | 58.7 | % | 53.6 | % | ||||||||||||
Prepayment Protection
| Weighted Average | |||||||||||||||||||||||||||
| Prepayment Protection | Number of Loans | Cut-off Date Principal Balance | % of IPB | Mortgage Rate | Remaining Loan Term(3) | UW NCF DSCR(1)(4) | UW NOI Debt Yield(1) | Cut-off Date LTV(1)(2) | Maturity Date LTV(1)(2)(3) | ||||||||||||||||||
| Defeasance | 46 | $592,017,461 | 77.1 | % | 4.9740 | % | 112 | 1.63 | x | 10.4 | % | 64.5 | % | 58.2 | % | ||||||||||||
| Yield Maintenance | 3 | 155,450,000 | 20.3 | 4.1040 | % | 94 | 3.76 | x | 16.7 | % | 36.2 | % | 35.2 | % | |||||||||||||
| Defeasance or Yield Maintenance | 1 | 20,000,000 | 2.6 | 4.0163 | % | 50 | 2.26 | x | 14.0 | % | 64.3 | % | 61.3 | % | |||||||||||||
| Total / Wtd. Avg.: | 50 | $767,467,461 | 100.0 | % | 4.7728 | % | 107 | 2.08 | x | 11.8 | % | 58.7 | % | 53.6 | % | ||||||||||||
| (1) | In the case of Loan Nos. 1, 3, 5, 8 and 10, the UW NCF DSCR, UW NOI Debt Yield, Cut-off Date LTV and Maturity Date LTV calculations include the relatedpari passu companion loan(s). In the case of Loan Nos. 1, 5, 10 and 12, the UW NCF DSCR, UW NOI Debt Yield, Cut-off Date LTV and Maturity Date LTV calculations exclude the mezzanine loan. In the case of Loan Nos. 1, 3 and 5, the UW NCF DSCR, UW NOI Debt Yield, Cut-off Date LTV and Maturity Date LTV calculations exclude the subordinate companion loan(s). |
| (2) | In the case of Loan Nos. 11, 13, 14, 19 and 22, the Cut-off Date LTV and Maturity Date LTV are calculated based upon an “as-renovated”, “as-stabilized” or “when complete” appraised value based on certain assumptions. Refer to“Description of the Mortgage Pool—Certain Calculations and Definitions”in the Preliminary Prospectus for additional details. |
| (3) | In the case of Loan No. 2 with an anticipated repayment date, Remaining Loan Term and Maturity Date LTV are as of the related anticipated repayment date. |
| (4) | For each partial interest-only mortgage loan, the UW NCF DSCR is calculated using the first principal and interest payment to be made into the trust during the term of the mortgage loan once amortization has commenced. |
THE INFORMATION IN THIS TERM SHEET IS NOT COMPLETE AND MAY BE AMENDED PRIOR TO THE TIME OF SALE. THIS TERM SHEET IS NOT AN OFFER TO SELL THESE SECURITIES AND IT IS NOT A SOLICITATION OF AN OFFER TO BUY THESE SECURITIES IN ANY JURISDICTION WHERE THE OFFER OR SALE IS NOT PERMITTED.
| 13 |
Loan Purpose
| Weighted Average | |||||||||||||||||||||||||||
| Loan Purpose | Number of Loans | Cut-off Date Principal Balance | % of IPB | Mortgage Rate | Remaining Loan Term(1) | UW NCF DSCR(2)(3)(4) | UW NOI Debt Yield(2) | Cut-off Date LTV(2)(3) | Maturity Date LTV(1)(2)(3) | ||||||||||||||||||
| Acquisition | 24 | $399,490,813 | 52.1 | % | 4.6763 | % | 99 | 2.48 | x | 13.8 | % | 54.4 | % | 49.5 | % | ||||||||||||
| Refinance | 25 | 301,309,981 | 39.3 | 5.0276 | % | 115 | 1.50 | x | 9.4 | % | 67.6 | % | 60.9 | % | |||||||||||||
| Recapitalization | 1 | 66,666,667 | 8.7 | 4.2000 | % | 120 | 2.29 | x | 10.2 | % | 45.0 | % | 45.0 | % | |||||||||||||
| Total / Wtd. Avg.: | 50 | $767,467,461 | 100.0 | % | 4.7728 | % | 107 | 2.08 | x | 11.8 | % | 58.7 | % | 53.6 | % | ||||||||||||
| (1) | In the case of Loan No. 2 with an anticipated repayment date, Remaining Loan Term and Maturity Date LTV are as of the related anticipated repayment date. |
| (2) | In the case of Loan Nos. 1, 3, 5, 8 and 10, the UW NCF DSCR, UW NOI Debt Yield, Cut-off Date LTV and Maturity Date LTV calculations include the relatedpari passu companion loan(s). In the case of Loan Nos. 1, 5, 10 and 12, the UW NCF DSCR, UW NOI Debt Yield, Cut-off Date LTV and Maturity Date LTV calculations exclude the mezzanine loan. In the case of Loan Nos. 1, 3 and 5, the UW NCF DSCR, UW NOI Debt Yield, Cut-off Date LTV and Maturity Date LTV calculations exclude the subordinate companion loan(s). |
| (3) | In the case of Loan Nos. 11, 13, 14, 19 and 22, the Cut-off Date LTV and Maturity Date LTV are calculated based upon an “as-renovated”, “as-stabilized” or “when complete” appraised value based on certain assumptions. Refer to“Description of the Mortgage Pool—Certain Calculations and Definitions”in the Preliminary Prospectus for additional details. |
| (4) | For each partial interest-only mortgage loan, the UW NCF DSCR is calculated using the first principal and interest payment to be made into the trust during the term of the mortgage loan once amortization has commenced. |
THE INFORMATION IN THIS TERM SHEET IS NOT COMPLETE AND MAY BE AMENDED PRIOR TO THE TIME OF SALE. THIS TERM SHEET IS NOT AN OFFER TO SELL THESE SECURITIES AND IT IS NOT A SOLICITATION OF AN OFFER TO BUY THESE SECURITIES IN ANY JURISDICTION WHERE THE OFFER OR SALE IS NOT PERMITTED.
| 14 |
Previous Securitization History(1)
| No. | Loan / Property Name | Location | Property Type | Previous Securitization |
| 5.001 | Inland Empire Indian Ave DC | Perris, CA | Industrial | WFRBS 2011-C2 |
| 5.022 | Champagne DC | Ontario, CA | Industrial | MSDWC 2001-IQA |
| 5.027 | Brandon Woods DC | Baltimore, MD | Industrial | WFRBS 2011-C3 |
| 5.031 | Franklin Square IC I | Rossville, MD | Industrial | GFCM 2003-1 |
| 5.060 | 10th Street Business Park 2 | Plano, TX | Industrial | GFCM 2003-1 |
| 5.061 | Park 55 | Bolingbrook, IL | Industrial | WBCMT 2006-C27 |
| 5.063 | Baltimore IC | Baltimore, MD | Industrial | GMACC 2001-C2 |
| 5.083 | Maple Point 2 | Woodridge, IL | Industrial | BSCMS 2007-PW17 |
| 5.092 | 10th Street Business Park 1 | Plano, TX | Industrial | GFCM 2003-1 |
| 5.098 | Park 88 | Aurora, IL | Industrial | WBCMT 2007-C31 |
| 7 | Vistas at Seven Bar | Albuquerque, NM | Multifamily | CD 2006-CD2 |
| 8 | Jay Scutti Plaza | Rochester, NY | Retail | LBUBS 2006-C1 |
| 11 | Chicago Marriott Southwest at Burr Ridge | Burr Ridge, IL | Hotel | CDGJ 2014-BXCH |
| 13 | Hilton Cincinnati Airport | Florence, KY | Hotel | CDGJ 2014-BXCH |
| 16 | The Vue | Austin, TX | Multifamily | RAITF 2014-FL3 |
| 20 | Arbor Hill Apartments | San Antonio, TX | Multifamily | CSMC 2006-C2 |
| 22 | Holiday Inn Express - Little Rock | Little Rock, AR | Hotel | BSCMS 2006-T24 |
| 23 | Walnut Street Retail Portfolio | Pittsburgh, PA | Retail | MSC 2006-HQ10 |
| 29 | Chagrin Professional Office | Beachwood, OH | Office | CSMC 2006-C2 |
| 32 | Palmer Super Center | Palmer Township, PA | Retail | JPMCC 2006-CB17 |
| 35 | Taunton Depot Shopping Center | Taunton, MA | Retail | CSFB 2003-CPN1 |
| 36 | Cumberland Pointe | Atlanta, GA | Retail | CSMC 2006-C1 |
| 37 | Banana Republic | Pittsburgh, PA | Retail | MSC 2006-HQ10 |
| 38 | Hawthorne Square | Houston, TX | Retail | FUNBC 2000-C1 |
| 42 | 515 Westheimer | Houston, TX | Retail | CSFB 2005-C6 |
| 43 | Alexander House | Houston, TX | Multifamily | CSMC 2006-C1 |
| 44 | TopSail Way Shopping Center | Sneads Ferry, NC | Retail | CSMC 2006-C2 |
| 45 | Aztec Square | Fort Mohave, AZ | Retail | CD 2006-CD3 |
| 47 | 501 Bath Street | Santa Barbara, CA | Office | JPMCC 2005-CB13 |
| 50 | Gross - Villa MHP | Roswell, NM | Manufactured Housing | CSFB 2002-CKP1 |
| (1) | The table above represents the properties for which the previously existing debt was most recently securitized, based on information provided by the related borrower or obtained through searches of a third-party database. While loans secured by the above mortgaged properties may have been securitized multiple times in prior transactions, mortgage loans in this securitization are only listed in the above chart if the mortgage loan in this securitization paid off a loan in another securitization. |
THE INFORMATION IN THIS TERM SHEET IS NOT COMPLETE AND MAY BE AMENDED PRIOR TO THE TIME OF SALE. THIS TERM SHEET IS NOT AN OFFER TO SELL THESE SECURITIES AND IT IS NOT A SOLICITATION OF AN OFFER TO BUY THESE SECURITIES IN ANY JURISDICTION WHERE THE OFFER OR SALE IS NOT PERMITTED.
| 15 |
Class A-2(1)
| No. | Loan Name | Location | Cut-off Date Balance | % of IPB | Maturity/ARD Balance | % of Certificate Class(2) | Original Loan Term | Remaining Loan Term | UW NCF DSCR(3) | UW NOI Debt Yield(3) | Cut-off Date LTV Ratio(3)(4) | Maturity Date LTV Ratio(3)(4) |
| 10 | Starwood Capital Extended Stay Portfolio | Various, Various | $20,000,000 | 2.6% | $19,070,882 | 28.2% | 60 | 50 | 2.26x | 14.0% | 64.3% | 61.3% |
| 11 | Chicago Marriott Southwest at Burr Ridge | Burr Ridge, IL | 20,000,000 | 2.6 | 20,000,000 | 29.5 | 60 | 58 | 1.96x | 12.7% | 56.5% | 56.5% |
| 13 | Hilton Cincinnati Airport | Florence, KY | 15,967,930 | 2.1 | 14,882,518 | 22.0 | 60 | 58 | 2.17x | 17.4% | 68.7% | 64.0% |
| 17 | Shadow Lake Apartments | Doraville, GA | 10,362,347 | 1.4 | 9,592,224 | 14.2 | 60 | 57 | 1.36x | 9.4% | 67.9% | 62.9% |
| Total / Weighted Average | $66,330,277 | 8.6% | $63,545,624 | 93.9% | 60 | 55 | 2.01x | 13.7% | 63.6% | 60.8% | ||
| (1) | The table above presents the mortgage loans whose balloon payments would be applied to pay down the majority of the principal balance of the Class A-2 certificates, assuming a 0% CPR and applying the “Modeling Assumptions” described in the Preliminary Prospectus, including the assumptions that (i) none of the mortgage loans in the pool experience prepayments prior to the maturity date or anticipated repayment date, as applicable, defaults or losses; (ii) there are no extensions of maturity dates of any mortgage loans in the pool; and (iii) each mortgage loan in the pool is paid in full on its stated maturity date or anticipated repayment date, as applicable. Each class of Certificates, including the Class A-2 certificates, evidences undivided ownership interests in the entire pool of mortgage loans. Debt service coverage ratio, debt yield and loan-to-value ratio information does not take into account subordinate debt (whether or not secured by the mortgaged property), if any, that is allowed under the terms of any mortgage loan. See Annex A-1 to the Preliminary Prospectus. |
| (2) | Reflects the percentage equal to the Maturity/ARD Balance divided by the initial Class A-2 certificate principal balance. The sum presented does not equal the total due to rounding. |
| (3) | In the case of Loan No. 10 the UW NCF DSCR, UW NOI Debt Yield, Cut-off Date LTV Ratio and Maturity Date LTV Ratio calculations include the relatedpari passu companion loans. In the case of Loan No. 10 the UW NCF DSCR, UW NOI Debt Yield, Cut-off Date LTV and Maturity Date LTV calculations exclude the mezzanine loan. |
| (4) | With regards to Loan No. 13, Hilton Cincinnati Airport, the value references the appraiser’s “Prospective Value Upon Stabilization” of $23,250,000 as of January 1, 2018. The appraiser also determined a “Prospective Market Value Upon Completion of the Renovation” based on the Appraised Value of $23,000,000, which assumes that the property is renovated by January 1, 2017, resulting in a Cut-Off Date LTV Ratio and Maturity Date/LTV Ratio of 69.4% and 64.7%, respectively. At origination, $4.0 million was reserved to cover capital expenditures related to renovations at the property. Based on the appraiser’s “as-is” Appraised Value of $17,000,000, the Cut-Off Date LTV Ratio and Maturity Date/ARD LTV Ratio are 93.9% and 87.5%, respectively. |
THE INFORMATION IN THIS TERM SHEET IS NOT COMPLETE AND MAY BE AMENDED PRIOR TO THE TIME OF SALE. THIS TERM SHEET IS NOT AN OFFER TO SELL THESE SECURITIES AND IT IS NOT A SOLICITATION OF AN OFFER TO BUY THESE SECURITIES IN ANY JURISDICTION WHERE THE OFFER OR SALE IS NOT PERMITTED.
| 16 |
Structural Overview
Order of Distribution:
| On each Distribution Date, funds available for distribution from the mortgage loans, net of specified trust expenses, yield maintenance charges, prepayment premiums and excess interest, will be distributed in the following amounts and order of priority (in each case to the extent of remaining available funds):
First: To interest on the Class A-1, Class A-2, Class A-3, Class A-4, Class A-5, Class A-SB, Class X-A, Class X-B, Class X-D, Class X-E, Class X-F and Class X-NR certificates, up to, andpro rata, in accordance with their respective interest entitlements.
Second: To the extent of funds allocated to principal and available for distribution: (i) first,to principal on the Class A-SB certificates, until the certificate balance of the Class A-SB certificates is reduced to the scheduled principal balance for the related distribution date set forth in Annex E to the Preliminary Prospectus, (ii) second,to principal on the Class A-1 certificates, until the certificate balance of the Class A-1 certificates has been reduced to zero, (iii)third,to principal on the Class A-2 certificates, until the certificate balance of the Class A-2 certificates has been reduced to zero, (iv) fourth,to principal on the Class A-3 certificates, until the certificate balance of the Class A-3 certificates has been reduced to zero, (v)fifth, to principal on the Class A-4 certificates until the certificate balance of the Class A-4 certificates has been reduced to zero, (vi)sixth, to principal on the Class A-5 certificates until the certificate balance of the Class A-5 has been reduced to zero and (vii)seventh, to principal on the Class A-SB certificates, until the certificate balance of the Class A-SB certificates has been reduced to zero. If the certificate balance of each and every class of certificates other than the Class A-1, Class A-2, Class A-3, Class A-4, Class A-5 and Class A-SB certificates has been reduced to zero as a result of the allocation of mortgage loan losses to those certificates, funds available for distributions of principal will be distributed to the Class A-1, Class A-2, Class A-3, Class A-4, Class A-5 and Class A-SB certificates,pro rata, based on their respective certificate balances, without regard to the distribution priorities described above or the planned principal balance of the Class A-SB certificates.
Third: To reimburse the Class A-1, Class A-2, Class A-3, Class A-4, Class A-5 and Class A-SB certificates,pro rata, for any previously unreimbursed losses on the mortgage loans allocable to principal that were previously borne by those classes, together with interest at their respective pass-through rates.
Fourth: (i)first, to interest on the Class A-S certificates in the amount of their interest entitlement; (ii)second, to the extent of funds allocated to principal remaining after any distributions in respect of principal to each class of certificates with a higher payment priority (in this case, the Class A-1, Class A-2, Class A-3, Class A-4, Class A-5 and Class A-SB certificates), to principal on the Class A-S certificates until their certificate balance is reduced to zero; and (iii)third, to reimburse the Class A-S certificates for any previously unreimbursed losses on the mortgage loans allocable to principal that were previously borne by that class, together with interest at its pass-through rate.
|
THE INFORMATION IN THIS TERM SHEET IS NOT COMPLETE AND MAY BE AMENDED PRIOR TO THE TIME OF SALE. THIS TERM SHEET IS NOT AN OFFER TO SELL THESE SECURITIES AND IT IS NOT A SOLICITATION OF AN OFFER TO BUY THESE SECURITIES IN ANY JURISDICTION WHERE THE OFFER OR SALE IS NOT PERMITTED.
| 17 |
| Order of Distribution (continued): | Fifth: (i)first, to interest on the Class B certificates in the amount of their interest entitlement; (ii)second, to the extent of funds allocated to principal remaining after any distributions in respect of principal to each class of certificates with a higher payment priority (in this case, the Class A-1, Class A-2, Class A-3, Class A-4, Class A-5, Class A-SB and Class A-S certificates), to principal on the Class B certificates until their certificate balance is reduced to zero; and (iii)third, to reimburse the Class B certificates for any previously unreimbursed losses on the mortgage loans allocable to principal that were previously borne by that class, together with interest at its pass-through rate.
Sixth: (i)first, to interest on the Class C certificates in the amount of their interest entitlement; (ii)second, to the extent of funds allocated to principal remaining after any distributions in respect of principal to each class of certificates with a higher payment priority (in this case, the Class A-1, Class A-2, Class A-3, Class A-4, Class A-5, Class A-SB, Class A-S and Class B certificates), to principal on the Class C certificates until their certificate balance is reduced to zero; and (iii)third, to reimburse the Class C certificates for any previously unreimbursed losses on the mortgage loans allocable to principal that were previously borne by that class, together with interest at its pass-through rate.
Seventh:After the Class A-1, Class A-2, Class A-3, Class A-4, Class A-5, Class A-SB, Class X-A, Class X-B, Class X-D, Class X-E, Class X-F, Class X-NR, Class A-S, Class B and Class C certificates are paid all amounts to which they are entitled, the remaining funds available for distribution will be used to pay interest and principal and to reimburse any unreimbursed losses to the Class D, Class E, Class F and Class NR certificates sequentially in that order in a manner analogous to that described in clausesixthabove with respect to the Class C certificates, until the certificate balance of each such class is reduced to zero. |
Realized Losses:
| The certificate balances of the Class A-1, Class A-2, Class A-3, Class A-4, Class A-5, Class A-SB, Class A-S, Class B, Class C, Class D, Class E, Class F and Class NR certificates will each be reduced without distribution on any Distribution Date as a write-off to the extent of any loss realized on the mortgage loans allocated to such class of certificates on such Distribution Date. On each Distribution Date, any such write-offs will be applied to such classes of certificates in the following order, in each case until the related certificate balance is reduced to zero:first, to the Class NR certificates;second, to the Class F certificates;third, to the Class E certificates;fourth, to the Class D certificates;fifth, to the Class C certificates;sixth, to the Class B certificates;seventh, to the Class A-S certificates; and,finally,pro rata, to the Class A-1, Class A-2, Class A-3, Class A-4, Class A-5 and Class A-SB certificates, based on their then-current respective certificate balances. The notional amount of the Class X-A certificates will be reduced to reflect reductions in the certificate balances of the Class A-1, Class A-2, Class A-3, Class A-4, Class A-5, Class A-SB and Class A-S certificates resulting from allocations of losses realized on the mortgage loans. The notional amount of the Class X-B certificates will be reduced to reflect reductions in the certificate balance of the Class B certificates resulting from allocations of losses realized on the mortgage loans. The notional amount of the Class X-D certificates will be reduced to reflect reductions in the certificate balance of the Class D certificates resulting from allocations of losses realized on the mortgage loans. The notional amount |
THE INFORMATION IN THIS TERM SHEET IS NOT COMPLETE AND MAY BE AMENDED PRIOR TO THE TIME OF SALE. THIS TERM SHEET IS NOT AN OFFER TO SELL THESE SECURITIES AND IT IS NOT A SOLICITATION OF AN OFFER TO BUY THESE SECURITIES IN ANY JURISDICTION WHERE THE OFFER OR SALE IS NOT PERMITTED.
| 18 |
| Realized Losses (continued): | of the Class X-E certificates will be reduced to reflect reductions in the certificate balance of the Class E certificates resulting from allocations of losses realized on the mortgage loans. The notional amount of the Class X-F certificates will be reduced to reflect reductions in the certificate balance of the Class F certificates resulting from allocations of losses realized on the mortgage loans. The notional amount of the Class X-NR certificates will be reduced to reflect reductions in the certificate balance of the Class NR certificates resulting from allocations of losses realized on the mortgage loans. |
Prepayment Premiums and Yield Maintenance Charges:
| On each Distribution Date, each yield maintenance charge collected on the mortgage loans during the one-month period ending on the related Determination Date is required to be distributed to certificateholders (excluding the Class X-E, Class X-F, Class X-NR, Class E, Class F, Class NR, Class Z and Class R certificates) as follows: (1)pro rata, between (x) the group (the “YM Group A”) of Class A-1, Class A-2, Class A-3, Class A-4, Class A-5, Class A-SB, Class X-A and Class A-S certificates, and (y) the group (the “YM Group B” and collectively with the YM Group A, the “YM Groups”) of the Class X-B, Class X-D, Class B, Class C and Class D certificates, based upon the aggregate amount of principal distributed to the classes of certificates in each YM Group on such Distribution Date, and (2) as among the respective classes of certificates in each YM Group in the following manner: (A) on apro rata basis in accordance with their respective entitlements in those yield maintenance charges, to each class of certificates in such YM Group with a certificate balance in an amount equal to the product of (x) a fraction whose numerator is the amount of principal distributed to such class of certificates on such Distribution Date and whose denominator is the total amount of principal distributed to all of the certificates in such YM Group with certificate balances on such Distribution Date, (y) the Base Interest Fraction for the related principal prepayment with respect to such class of certificates, and (z) the aggregate amount of such yield maintenance charge allocated to such YM Group; and (B) the portion of such yield maintenance charge allocated to such YM Group remaining after such distributions to the applicable class(es) of principal balance certificates in such YM Group, to the class(es) of Class X Certificates in such YM Group, and in the case of the YM Group B, on apro rata basis in accordance with their respective reductions in their notional amounts on such Distribution Date, to the Class X-B and Class X-D Certificates.
The “Base Interest Fraction” with respect to any principal prepayment on any mortgage loan and with respect to any class of Class A-1, Class A-2, Class A-3, Class A-4, Class A-5, Class A-SB, Class A-S, Class B, Class C and Class D certificates is a fraction (a) whose numerator is the amount, if any, by which (i) the pass-through rate on such class of certificates exceeds (ii) the discount rate used in accordance with the related mortgage loan documents in calculating the yield maintenance charge with respect to such principal prepayment and (b) whose denominator is the amount, if any, by which (i) the mortgage loan rate on such mortgage loan exceeds (ii) the discount rate used in accordance with the related mortgage loan documents in calculating the yield maintenance charge with respect to such principal prepayment; provided, however, that under no circumstances will the Base Interest Fraction be greater than one. If such discount rate is greater than or equal to the lesser of (x) the mortgage loan rate on the related mortgage loan and (y) the pass-through rate described in the preceding sentence, then the Base Interest Fraction will equal zero;provided, |
THE INFORMATION IN THIS TERM SHEET IS NOT COMPLETE AND MAY BE AMENDED PRIOR TO THE TIME OF SALE. THIS TERM SHEET IS NOT AN OFFER TO SELL THESE SECURITIES AND IT IS NOT A SOLICITATION OF AN OFFER TO BUY THESE SECURITIES IN ANY JURISDICTION WHERE THE OFFER OR SALE IS NOT PERMITTED.
| 19 |
| Prepayment Premiums and Yield Maintenance Charges (continued): | however, that if such discount rate is greater than or equal to the mortgage loan rate, but less than the pass-through rate, the fraction will be one.
If a prepayment premium (calculated as a fixed percentage of the amount prepaid) is imposed in connection with a prepayment rather than a yield maintenance charge, then the prepayment premium so collected will be allocated as described above. For this purpose, the discount rate used to calculate the Base Interest Fraction will be the discount rate used to determine the yield maintenance charge for mortgage loans that require payment at the greater of a yield maintenance charge or a minimum amount equal to a fixed percentage of the principal balance of the mortgage loan or, for mortgage loans that only have a prepayment premium based on a fixed percentage of the principal balance of the mortgage loan, such other discount rate as may be specified in the related loan documents.
No prepayment premiums or yield maintenance charges will be distributed to holders of the Class X-E, Class X-F, Class X-NR, Class E, Class F, Class NR, Class Z or Class R certificates. Instead, after the notional amounts of the Class X-A, Class X-B and Class X-D certificates and the certificate balances of the Class A-1, Class A-2, Class A-3, Class A-4, Class A-5, Class A-SB, Class A-S, Class B, Class C and Class D certificates have been reduced to zero, all prepayment premiums and yield maintenance charges with respect to the mortgage loans will be distributed to holders of the Class X-D certificates, regardless of whether the notional amount of the Class X-D certificates has been reduced to zero. For a description of prepayment premiums and yield maintenance charges required on the mortgage loans, see Annex A-1 to the Preliminary Prospectus. See also“Certain Legal Aspects of the Mortgage Loans—Default Interest and Limitations on Prepayments” in the Preliminary Prospectus. Prepayment premiums and yield maintenance charges will be distributed on any Distribution Date only to the extent they are received in respect of the mortgage loans as of the related Determination Date. See also“Description of the Certificates—Distributions” in the Preliminary Prospectus. |
Non-Serviced Mortgage Loans:
| Each of the GLP Industrial Portfolio B mortgage loan, the Quaker Bridge Mall mortgage loan, the GLP Industrial Portfolio A mortgage loan and the Starwood Capital Extended Stay Portfolio mortgage loan is referred to in this Term Sheet as, individually, a “non-serviced mortgage loan” and, collectively, the “non-serviced mortgage loans”. Each non-serviced mortgage loan and the related companion loan(s) are being serviced and administered in accordance with, and all decisions, consents, waivers, approvals and other actions on the part of the holders of the non-serviced mortgage loan and the related companion loan(s) will be effected in accordance with, the Lead Pooling and Servicing Agreement set forth in the “Pari Passu Loan Summary” table above and the related co-lender agreement. Consequently, the servicing provisions set forth in this Term Sheet will generally not be applicable to the non-serviced mortgage loans, but instead such servicing and administration of the non-serviced mortgage loans will, in each case, be governed by the related Lead Pooling and Servicing Agreement. Each Lead Pooling and Servicing Agreement provides for servicing in a manner acceptable for rated transactions similar in nature to this securitization. The non-serviced mortgage loans are discussed further under“—Whole Loans” below. |
THE INFORMATION IN THIS TERM SHEET IS NOT COMPLETE AND MAY BE AMENDED PRIOR TO THE TIME OF SALE. THIS TERM SHEET IS NOT AN OFFER TO SELL THESE SECURITIES AND IT IS NOT A SOLICITATION OF AN OFFER TO BUY THESE SECURITIES IN ANY JURISDICTION WHERE THE OFFER OR SALE IS NOT PERMITTED.
| 20 |
Advances:
| The master servicer and, if it fails to do so, the trustee, will be obligated to make (i) P&I advances with respect to each mortgage loan in the issuing entity and, (ii) with respect to each mortgage loan (other than the non-serviced mortgage loans) and serviced whole loan, servicing advances, including paying delinquent real estate taxes, assessments and hazard insurance premiums, but only to the extent that those advances are not deemed non-recoverable from collections on the related mortgage loan (or, if applicable, serviced whole loan) and, in the case of P&I advances, subject to reduction in connection with any appraisal reduction amounts that may occur. The special servicer will have no obligation to make property advances;providedthat with respect to a specially serviced loan, the special servicer will be entitled to make a property advance in an urgent or emergency situation, and the master servicer will be required to reimburse the special servicer for such advance, with interest;provided that the advance is not determined by the master servicer to be nonrecoverable. Notwithstanding the foregoing, servicing advances for the non-serviced mortgage loans will be made by the parties to, and pursuant to, the applicable Lead Pooling and Servicing Agreement. |
Appraisal Reduction Amounts:
| An appraisal reduction amount generally will be created with respect to a required appraisal loan (which is a serviced mortgage loan (or serviced whole loan, if applicable)) as to which certain defaults, modifications or insolvency events have occurred (as further described in the Preliminary Prospectus) in the amount, if any, by which the principal balance of such required appraisal loan, exceeds 90% of the appraised value of the related mortgaged property (as determined by one or more appraisals obtained by the special servicer) plus certain escrows and reserves (including letters of credit) held with respect to such required appraisal loan (net of other amounts overdue or advanced in connection with such required appraisal loan). In general, subject to the discussion in the next paragraphs, any appraisal reduction amount calculated with respect to a whole loan will be allocated to the related mortgage loan andpari passu companion loan(s) on apro rata basis in accordance with their respective outstanding principal balances. In the case of the non-serviced mortgage loans, any appraisal reduction amounts will be calculated pursuant to, and by a party to, the related Lead Pooling and Servicing Agreement (as discussed under “—Whole Loans” below). As a result of an appraisal reduction amount being calculated for and/or allocated to a given mortgage loan, the interest portion of any P&I advance for such mortgage loan will be reduced, which will have the effect of reducing the amount of interest available for distribution to the most subordinate class(es) of certificates (exclusive of the Class Z and Class R certificates) then outstanding (i.e., first to the Class NR certificates, then to the Class F certificates, then to the Class E certificates, then to the Class D certificates, then to the Class C certificates, then to the Class B certificates, then to the Class A-S certificates, and then,pro rata based on their respective interest entitlements, to the Class A-1, Class A-2, Class A-3, Class A-4, Class A-5, Class A-SB, Class X-A, Class X-B, Class X-D, Class X-E, Class X-F and Class X-NR certificates). In general, a mortgage loan (or whole loan, if applicable) serviced under the pooling and servicing agreement for this transaction will cease to be a required appraisal loan, and no longer be subject to an appraisal reduction amount, when the same has ceased to be a specially serviced loan (if applicable), has been brought current for at least three consecutive months and no other circumstances exist that would cause such serviced loan to be a required appraisal loan. |
THE INFORMATION IN THIS TERM SHEET IS NOT COMPLETE AND MAY BE AMENDED PRIOR TO THE TIME OF SALE. THIS TERM SHEET IS NOT AN OFFER TO SELL THESE SECURITIES AND IT IS NOT A SOLICITATION OF AN OFFER TO BUY THESE SECURITIES IN ANY JURISDICTION WHERE THE OFFER OR SALE IS NOT PERMITTED.
| 21 |
| Appraisal Reduction Amounts (continued): | Appraisal reduction amounts with respect to each of the GLP Industrial Portfolio B whole loan, the Quaker Bridge Mall whole loan and the GLP Industrial Portfolio A whole loan will be allocated to notionally reduce the outstanding principal balance of the related subordinate companion loans prior topro rata allocation to the related mortgage loan andpari passu companion loans.
At any time an appraisal is ordered under the pooling and servicing agreement with respect to a property that would result in an appraisal reduction amount with respect to a mortgage loan that would result in a change in the controlling class, certain certificate holders will have a right to request a new appraisal as described in the Preliminary Prospectus. |
Age of Appraisals:
| Appraisals (which can be an update of a prior appraisal) with respect to a mortgage loan serviced under the pooling and servicing agreement are required to be no older than 6 months for purposes of determining appraisal reduction amounts, market value, and other calculations as described in the Preliminary Prospectus. |
| Sale of Defaulted Loans: | There will be no “Fair Market Value Purchase Option”, instead defaulted loans will be sold in a process similar to the sale process for REO property. |
Cleanup Call:
| On any distribution date on which the aggregate unpaid principal balance of the mortgage loans remaining in the issuing entity is less than 1% of the aggregate principal balance of the pool of mortgage loans as of the Cut-off Date, certain specified persons will have the option to purchase all of the remaining mortgage loans (and all property acquired through exercise of remedies in respect of any mortgage loan) at the price specified in the Preliminary Prospectus. Exercise of the option will terminate the issuing entity and retire the then outstanding certificates.
If the aggregate certificate balances of all certificates (exclusive of the Class X Certificates) senior to the Class D certificates, and the notional amounts of the Class X-A and Class X-B certificates have been reduced to zero, and if the master servicer has consented, the issuing entity could also be terminated in connection with a voluntary exchange of all the then-outstanding certificates (excluding the Class Z and Class R certificates), for the mortgage loans remaining in the issuing entity, but all of the holders of those classes of outstanding certificates would have to voluntarily participate in the exchange. |
Directing Certificateholder:
| The “Directing Certificateholder” will generally be the controlling class certificateholder or other representative designated by the holder(s) of at least a majority of the voting rights of the controlling class. The controlling class is the most subordinate class of the Class E, Class F and Class NR certificates that has an aggregate certificate balance as notionally reduced by any Cumulative Appraisal Reduction Amounts allocated to such class, that is equal to or greater than 25% of the initial certificate balance of such class of certificates;provided that if at any time the certificate balances of the certificates other than the Class E, Class F and Class NR certificates have been reduced to zero as a result of the allocation of principal payments on the mortgage loans, then the controlling class will be the most subordinate class among the control eligible certificates that has an aggregate Certificate Balance greater than zero without regard to any Cumulative Appraisal Reduction Amounts. At any time when Class E is the controlling class, the majority Class E certificateholders may elect under certain circumstances to opt-out from its rights under the pooling and servicing agreement. See “The Pooling and Servicing |
THE INFORMATION IN THIS TERM SHEET IS NOT COMPLETE AND MAY BE AMENDED PRIOR TO THE TIME OF SALE. THIS TERM SHEET IS NOT AN OFFER TO SELL THESE SECURITIES AND IT IS NOT A SOLICITATION OF AN OFFER TO BUY THESE SECURITIES IN ANY JURISDICTION WHERE THE OFFER OR SALE IS NOT PERMITTED.
| 22 |
| Directing Certificateholder (continued): | Agreement—The Directing Certificateholder” in the Preliminary Prospectus. No other class of certificates will be eligible to act as the controlling class or appoint a Directing Certificateholder.
Torchlight Investors, LLC or one of its managed funds is expected to purchase the Class E, Class F, Class NR and Class Z certificates (and may also purchase certain other classes of certificates, including the Class X-D, Class X-E, Class X-F, Class X-NR and Class D Certificates) and, on the Closing Date, is expected to be the initial Directing Certificateholder.
|
Control/Consultation Rights:
| The Directing Certificateholder will be entitled to have consultation and approval rights with respect to certain major decisions (including with respect to assumptions, waivers, loan modifications and workouts) unless no class of the Class E, Class F and Class NR certificates (the “control eligible certificates”) has an outstanding certificate balance, as notionally reduced by any Cumulative Appraisal Reduction Amounts allocated to such class, that is equal to or greater than 25% of the initial certificate balance of that class of certificates (a “Control Termination Event”);provided that a Control Termination Event will not be deemed to be continuing in the event the certificate balances of all classes of principal balance certificates other than the control eligible certificates have been reduced to zero.
The “Cumulative Appraisal Reduction Amount” as of any date of determination for any mortgage loan, is equal to the sum of (i) all appraisal reduction amounts then in effect, and (ii) with respect to any AB Modified Loan, any Collateral Deficiency Amount then in effect.
“AB Modified Loan” means any corrected loan (1) that became a corrected loan (which includes for purposes of this definition any non-serviced mortgage loan that became a “corrected loan” (or any term substantially similar thereto) pursuant to the Lead Pooling and Servicing Agreement governing the servicing of such non-serviced mortgage loan) due to a modification thereto that resulted in the creation of an A/B note structure (or similar structure) and as to which the new junior note(s) did not previously exist or the principal amount of the new junior note(s) was previously part of either an A note held by the issuing entity or the original unmodified mortgage loan and (2) as to which an appraisal reduction amount is not in effect.
“Collateral Deficiency Amount” means, with respect to any AB Modified Loan as of any date of determination, the excess of (i) the principal balance of such AB Modified Loan (taking into account the related junior note(s) and any pari passu notes included therein), over (ii) the sum of (in the case of a Whole Loan, solely to the extent allocable to the subject mortgage loan) (x) the most recent Appraised Value for the related mortgaged property or mortgaged properties, plus (y) solely to the extent not reflected or taken into account in such Appraised Value (or in the calculation of any related appraisal reduction amount) and to the extent on deposit with, or otherwise under the control of, the lender as of the date of such determination, any capital or additional collateral contributed by the related borrower at the time the mortgage loan became (and as part of the modification related to) such AB Modified Loan for the benefit of the related mortgaged property or mortgaged properties (provided, that in the case of an non-serviced mortgage loan, the amounts set forth in this clause (y) will be taken into account solely to the extent relevant information is received by the master servicer), |
THE INFORMATION IN THIS TERM SHEET IS NOT COMPLETE AND MAY BE AMENDED PRIOR TO THE TIME OF SALE. THIS TERM SHEET IS NOT AN OFFER TO SELL THESE SECURITIES AND IT IS NOT A SOLICITATION OF AN OFFER TO BUY THESE SECURITIES IN ANY JURISDICTION WHERE THE OFFER OR SALE IS NOT PERMITTED.
| 23 |
Control/Consultation Rights (continued):
| plus (z) any other escrows or reserves (in addition to any amounts set forth in the immediately preceding clause (y) and solely to the extent not reflected or taken into account in the calculation of any related appraisal reduction amount) held by the lender in respect of such AB Modified Loan as of the date of such determination, which such excess, for the avoidance of doubt, will be determined separately from and exclude any related appraisal reduction amounts.
So long as a Control Termination Event does not exist, the Directing Certificateholder will be entitled to direct the special servicer to take, or refrain from taking, certain actions that would constitute major decisions with respect to a mortgage loan or whole loan serviced under the pooling and servicing agreement and will also have the right to notice and to consent to certain material actions that would constitute major decisions that the master servicer or the special servicer plan on taking with respect to any such mortgage loan or serviced whole loan subject to the servicing standard and other restrictions as described in the Preliminary Prospectus.
Following the occurrence and during the continuation of a Control Termination Event until such time as no class of the Class E, Class F and Class NR certificates has an outstanding certificate balance, without regard to the application of any Cumulative Appraisal Reduction Amounts, that is at least equal to 25% of the initial certificate balance of such class of certificates (a “Consultation Termination Event”), all of the rights of the Directing Certificateholder will terminate other than a right to consult with respect to the major decisions and other matters as to which it previously had approval rights;provided that a Consultation Termination Event will not be deemed to be continuing in the event the certificate balances of all classes of principal balance certificates other than the control eligible certificates have been reduced to zero. After the occurrence and during the continuation of a Control Termination Event, the operating advisor will be entitled to consult with the special servicer with respect to certain major decisions on behalf of the issuing entity and in the best interest of, and for the benefit of, the certificateholders, as if those certificateholders and, with respect to a servicedpari passu companion loan, the relatedpari passu companion loan holder(s) constituted a single lender.
With respect to each non-serviced whole loan, the Directing Certificateholder for this transaction will have limited consultation rights (except in the case of the GLP Industrial B whole loan, the GLP Industrial Portfolio A whole loan and, unless an AB control appraisal period exists, the Quaker Bridge Mall whole loan), and the applicable directing certificateholder (or equivalent entity) pursuant to the related Lead Pooling and Servicing Agreement (or, in the case of the Quaker Bridge Mall whole loan, unless an AB control appraisal period exists, the holder of a related subordinate companion loan) will have consultation, approval and direction rights, with respect to certain major decisions (including with respect to assumptions, waivers, loan modifications and workouts) regarding such non-serviced whole loan, as provided for in the related co-lender agreement and in the related Lead Pooling and Servicing Agreement, and as described under “Description of the Mortgage Pool—The Whole Loans” in the Preliminary Prospectus.
Notwithstanding any contrary description set forth above, in the event that, with respect to any mortgage loan, the Directing Certificateholder or any controlling class certificateholder is a Borrower Party (any of the above, as applicable, an “Excluded |
THE INFORMATION IN THIS TERM SHEET IS NOT COMPLETE AND MAY BE AMENDED PRIOR TO THE TIME OF SALE. THIS TERM SHEET IS NOT AN OFFER TO SELL THESE SECURITIES AND IT IS NOT A SOLICITATION OF AN OFFER TO BUY THESE SECURITIES IN ANY JURISDICTION WHERE THE OFFER OR SALE IS NOT PERMITTED.
| 24 |
| Control/Consultation Rights (continued): | Controlling Class Holder”), such Excluded Controlling Class Holder will not have any consultation or approval rights with respect to such mortgage loan and will have no right to receive asset status reports or such other information as may be specified in the pooling and servicing agreement. A “Borrower Party” is a borrower, a mortgagor, a manager of a mortgaged property or the holder of a mezzanine loan that has been accelerated or as to which the mezzanine lender has initiated foreclosure or enforcement proceedings against the equity collateral pledged to secure the related mezzanine loan, a person controlling or controlled by or under common control with the foregoing or any other such person owning, directly or indirectly, 25% or more of the beneficial interests in such borrower, mortgagor, manager of a mortgaged property or mezzanine lender. |
Whole Loans:
| The GLP Industrial Portfolio B mortgage loan, which will be contributed to the issuing entity and has an outstanding principal balance as of the Cut-off Date of $88,100,000, represents approximately 11.5% of the Initial Pool Balance and has (i) four related companion loans that arepari passu in right of payment with the GLP Industrial Portfolio B mortgage loan, of which (a) two notes were included in CSMC Trust 2015-GLPB (“CSMC 2015-GLPB transaction”), (b) one note is currently held by Column and is expected to be contributed to a future securitization trust and (c) one note was included in the MSCI Trust 2016-UBS9 and (ii) two related companion loans that are generally subordinate in right of payment with the GLP Industrial Portfolio B mortgage loan and which were included in the CSMC 2015-GLPB transaction. Eachpari passu companion loan described above is referred to in this Term Sheet as a “pari passu companion loan”, a “non-serviced companion loan” and a “companion loan”. Each subordinate companion loan is referred to in this Term Sheet as a “subordinate companion loan”, a “non-serviced companion loan” and a “companion loan”. The GLP Industrial Portfolio B mortgage loan and the related companion loans are collectively referred to in this Term Sheet as the “GLP Industrial Portfolio B whole loan”, a “non-serviced whole loan” and a “whole loan”. The GLP Industrial Portfolio B whole loan will be serviced by the CSMC 2015-GLPB transaction master servicer and, if and to the extent necessary, the CSMC 2015-GLPB transaction special servicer under the CSMC 2015-GLPB transaction trust and servicing agreement (referred to as the “CSMC 2015-GLPB TSA” in this Term Sheet). Wells Fargo, as the CSMC 2015-GLPB transaction trustee, or a custodian on its behalf, will hold the mortgage file for the GLP Industrial Portfolio B whole loan pursuant to the CSMC 2015-GLPB TSA (other than the promissory note for the related mortgage loan, which will be held by the custodian under the pooling and servicing agreement for this securitization).
The Quaker Bridge Mall mortgage loan, which will be contributed to the issuing entity and has an outstanding principal balance as of the Cut-off Date of $66,666,667, represents approximately 8.7% of the Initial Pool Balance and has (i) one related companion loan that ispari passu in right of payment with the Quaker Bridge Mall mortgage loan, which is expected to be contributed to the JPMDB 2016-C2 Commercial Mortgage Trust (“JPMDB 2016-C2 transaction”), and (ii) two related companion loans that are generally subordinate in right of payment with the Quaker Bridge Mall mortgage loan, which have been sold to Teachers Insurance and Annuity Association of America. Thepari passu companion loan described above is referred to in this Term Sheet as a “pari passu companion loan”, a “non-serviced companion loan” and a “companion loan”. Each subordinate companion loan is referred to in this |
THE INFORMATION IN THIS TERM SHEET IS NOT COMPLETE AND MAY BE AMENDED PRIOR TO THE TIME OF SALE. THIS TERM SHEET IS NOT AN OFFER TO SELL THESE SECURITIES AND IT IS NOT A SOLICITATION OF AN OFFER TO BUY THESE SECURITIES IN ANY JURISDICTION WHERE THE OFFER OR SALE IS NOT PERMITTED.
| 25 |
Whole Loans (continued):
| Term Sheet as a “subordinate companion loan”, a “non-serviced companion loan” and a “companion loan”. The Quaker Bridge Mall mortgage loan and the related companion loans are collectively referred to in this Term Sheet as the “Quaker Bridge Mall whole loan”, a “non-serviced whole loan” and a “whole loan”. The Quaker Bridge Mall whole loan is expected to be serviced by the JPMDB 2016-C2 transaction master servicer and, if and to the extent necessary, the JPMDB 2016-C2 transaction special servicer under the JPMDB 2016-C2 transaction pooling and servicing agreement (referred to as the “JPMDB 2016-C2 PSA” in this Term Sheet). Wells Fargo, as the JPMDB 2016-C2 transaction trustee, or a custodian on its behalf, is expected to hold the mortgage file for the Quaker Bridge Mall whole loan pursuant to the JPMDB 2016-C2 PSA (other than the promissory note for the related mortgage loan, which will be held by the custodian under the pooling and servicing agreement for this securitization).
The GLP Industrial Portfolio A mortgage loan, which will be contributed to the issuing entity and has an outstanding principal balance as of the Cut-off Date of $42,900,000, represents approximately 5.6% of the Initial Pool Balance and has (i) four related companion loans that arepari passu in right of payment with the GLP Industrial Portfolio A mortgage loan, of which (a) two notes were included in CSMC Trust 2015-GLPA (“CSMC 2015-GLPA transaction”), (b) one note was included in the CSAIL 2016-C5 Commercial Mortgage Trust and (c) one note was included in the MSBAM Trust 2016-C28 and and (ii) two related companion loans that are generally subordinate in right of payment with the GLP Industrial Portfolio A mortgage loan and which were included in the CSMC 2015-GLPA transaction. Eachpari passu companion loan described above is referred to in this Term Sheet as a “pari passu companion loan”, a “non-serviced companion loan” and a “companion loan”. Each subordinate companion loan is referred to in this Term Sheet as a “subordinate companion loan”, a “non-serviced companion loan” and a “companion loan”. The GLP Industrial Portfolio A mortgage loan and the related companion loans are collectively referred to in this Term Sheet as the “GLP Industrial Portfolio A whole loan”, a “non-serviced whole loan” and a “whole loan”. The GLP Industrial Portfolio A whole loan will be serviced by the CSMC 2015-GLPA transaction master servicer and, if and to the extent necessary, the CSMC 2015-GLPA transaction special servicer under the CSMC 2015-GLPA transaction trust and servicing agreement (referred to as the “CSMC 2015-GLPA TSA” in this Term Sheet). Wells Fargo, as the CSMC 2015-GLPA transaction trustee, or a custodian on its behalf, will hold the mortgage file for the GLP Industrial Portfolio A whole loan pursuant to the CSMC 2015-GLPA TSA (other than the promissory note for the related mortgage loan, which will be held by the custodian under the pooling and servicing agreement for this securitization).
The Jay Scutti Plaza mortgage loan, which will be contributed to the issuing entity, has an outstanding principal balance as of the Cut-off Date of $25,000,000, represents approximately 3.3% of the Initial Pool Balance, and has a related companion loan that (i) ispari passu in right of payment with the Jay Scutti Plaza mortgage loan and (ii) is currently held by MC-Five Mile, a sponsor and originator, or an affiliate and is expected to be contributed to one or more future securitization trusts. Thepari passu companion loan described above is referred to in this Term Sheet as a “pari passu companion loan”, a “serviced companion loan” and a “companion loan”. The Jay Scutti Plaza mortgage loan and the related companion loan are collectively referred to in this Term
|
THE INFORMATION IN THIS TERM SHEET IS NOT COMPLETE AND MAY BE AMENDED PRIOR TO THE TIME OF SALE. THIS TERM SHEET IS NOT AN OFFER TO SELL THESE SECURITIES AND IT IS NOT A SOLICITATION OF AN OFFER TO BUY THESE SECURITIES IN ANY JURISDICTION WHERE THE OFFER OR SALE IS NOT PERMITTED.
| 26 |
Whole Loans (continued):
| Sheet as the “Jay Scutti Plaza whole loan”, the “serviced whole loan” and a “whole loan”.
The Starwood Capital Extended Stay Portfolio mortgage loan, which will be contributed to the issuing entity, has an outstanding principal balance as of the Cut-off Date of $20,000,000, represents approximately 2.6% of the Initial Pool Balance, and has three related companion loans that arepari passu in right of payment with the Starwood Capital Extended Stay Portfolio mortgage loan, (i) one of which was included in the CSAIL 2015-C3 Commercial Mortgage Trust (the “CSAIL 2015-C3 transaction”) and (ii) two of which were included in the CSAIL 2016-C5 Commercial Mortgage Trust. Eachpari passu companion loan described above is referred to in this Term Sheet as a “pari passu companion loan”, a “non-serviced companion loan” and a “companion loan”. The Starwood Capital Extended Stay Portfolio mortgage loan and the related companion loans are collectively referred to in this Term Sheet as the “Starwood Capital Extended Stay Portfolio whole loan”, a “non-serviced whole loan” and a “whole loan”. The Starwood Capital Extended Stay Portfolio whole loan will be serviced by the CSAIL 2015-C3 transaction master servicer and, if and to the extent necessary, the CSAIL 2015-C3 transaction special servicer under the CSAIL 2015-C3 transaction pooling and servicing agreement (referred to as the “CSAIL 2015-C3 PSA” in this Term Sheet). Wells Fargo, as the CSAIL 2015-C3 transaction trustee, or a custodian on its behalf, will hold the mortgage file for the Starwood Capital Extended Stay Portfolio whole loan pursuant to the CSAIL 2015-C3 PSA (other than the promissory note for the related mortgage loan, which will be held by the custodian under the pooling and servicing agreement for this securitization).
Each of the CSMC 2015-GLPB TSA, JPMDB 2016-C2 PSA, CSMC 2015-GLPA TSA and CSAIL 2015-C3 PSA is also referred to in this Term Sheet as a “Lead Pooling and Servicing Agreement” insofar as it relates to the non-serviced whole loan serviced thereunder.
In the case of the non-serviced whole loans, the related mortgage loans are referred to as “non-serviced mortgage loans”.
The Jay Scutti Plaza whole loan will be serviced by KeyBank, as the CSAIL 2016-C6 master servicer, and special serviced by Torchlight, as the CSAIL 2016-C6 special servicer pursuant to the terms of the CSAIL 2016-C6 PSA. Wells Fargo, as the CSAIL 2016-C6 trustee, or a custodian on its behalf, will hold the mortgage file for the Jay Scutti Plaza whole loan pursuant to the CSAIL 2016-C6 PSA (other than the promissory note for the related companion loan that is not an asset of the CSAIL 2016-C6 securitization).
For more information regarding the whole loans, see “Description of the Mortgage Pool—The Whole Loans” in the Preliminary Prospectus. |
Servicing Standard:
| Each of the mortgage loans (other than the non-serviced mortgage loans) and serviced whole loan(s) will be serviced by the master servicer and the special servicer pursuant to the terms of the pooling and servicing agreement. In all circumstances, each of the master servicer and the special servicer are obligated to act in the best interests of the certificateholders (and, in the case of a serviced whole loan, the holder of the related serviced companion loan) as a collective whole as if such certificateholders (and, if applicable, such companion loan holder), constituted a single lender. The applicable |
THE INFORMATION IN THIS TERM SHEET IS NOT COMPLETE AND MAY BE AMENDED PRIOR TO THE TIME OF SALE. THIS TERM SHEET IS NOT AN OFFER TO SELL THESE SECURITIES AND IT IS NOT A SOLICITATION OF AN OFFER TO BUY THESE SECURITIES IN ANY JURISDICTION WHERE THE OFFER OR SALE IS NOT PERMITTED.
| 27 |
Servicing Standard (continued):
| special servicer is required to determine the effect on net present value of various courses of action (including workout or foreclosure), using the Calculation Rate as the discount rate, and pursue the course of action that it determines would maximize recovery on a net present value basis.
“Calculation Rate” means:
(a) for principal and interest payments on a mortgage loan or proceeds from the sale of a defaulted loan, the highest of (i) the rate determined by the master servicer or the special servicer, as applicable, that approximates the market rate that would be obtainable by borrowers on similar debt of the borrowers as of such date of determination, (ii) the mortgage loan rate and (iii) the yield on 10-year US treasuries; and
(b) for all other cash flows, including property cash flow, the “discount rate” set forth in the most recent appraisal (or update of such appraisal). |
Termination of Special Servicer:
| If a Control Termination Event has not occurred (or has occurred, but is no longer continuing), the special servicer may be replaced with respect to the mortgage loans and the serviced whole loans at the direction of the Directing Certificateholder upon satisfaction of certain conditions specified in the pooling and servicing agreement.
After the occurrence and during the continuance of a Control Termination Event, the holders of at least 25% of the voting rights of the certificates (other than the Class Z and Class R certificates) may request a vote to replace the special servicer. The subsequent vote may result in the termination and replacement of such special servicer if, within 180 days of the initial request for that vote, the holders of (a) at least 75% of a “certificateholder quorum” (holders of certificates evidencing at least 75% of the aggregate voting rights of the certificates (other than the Class X, Class Z and Class R certificates)), or (b) more than 50% of the voting rights of each class of certificates other than any Class X, Class Z and Class R certificates (but in the case of this clause (b) only such classes of certificates that, in each case, have an outstanding certificate balance, as notionally reduced by any appraisal reduction amounts allocated to such class, equal to or greater than 25% of the initial certificate balance of such class, minus all payments of principal made on such class of certificates), vote affirmatively to so replace such special servicer.
At any time after the occurrence of a Consultation Termination Event, if the operating advisor determines that the special servicer is not performing its duties as required under the pooling and servicing agreement or is otherwise not acting in accordance with the servicing standard, the operating advisor may recommend the replacement of the special servicer resulting in a solicitation of a certificateholder vote. The operating advisor’s recommendation to replace the special servicer must be confirmed by an affirmative vote of holders of certificates (other than Class X, Class Z and Class R certificates) evidencing at least a majority of the voting rights (taking into account the application of any appraisal reduction amounts to notionally reduce the certificate balances of the classes to which such appraisal reduction amounts are allocable) of all certificates (other than Class X, Class Z and Class R certificates). In the event the holders of such certificates elect to remove and replace the special servicer, the certificate administrator will be required to obtain a rating agency confirmation from each of the rating agencies at that time. |
THE INFORMATION IN THIS TERM SHEET IS NOT COMPLETE AND MAY BE AMENDED PRIOR TO THE TIME OF SALE. THIS TERM SHEET IS NOT AN OFFER TO SELL THESE SECURITIES AND IT IS NOT A SOLICITATION OF AN OFFER TO BUY THESE SECURITIES IN ANY JURISDICTION WHERE THE OFFER OR SALE IS NOT PERMITTED.
| 28 |
| Excluded Special Servicer: | In the event that, with respect to any mortgage loan, the special servicer has obtained knowledge that it is a Borrower Party with respect to a mortgage loan, the special servicer will be required to resign as special servicer of such mortgage loan (an “Excluded Special Servicer Loan”), and, prior to the occurrence and continuance of a Control Termination Event, the Directing Certificateholder will be required to appoint (and may replace with or without cause) a successor special servicer that is not a Borrower Party (an “Excluded Special Servicer”) with respect to such Excluded Special Servicer Loan unless such Excluded Special Servicer Loan is also an excluded loan with respect to such Directing Certificateholder, in which case the resigning special servicer will be required to use reasonable efforts to appoint the Excluded Special Servicer. |
Servicing Compensation:
| Modification Fees: Certain fees resulting from modifications, amendments, waivers or other changes to the terms of the loan documents, as more fully described in the Preliminary Prospectus, will be used to offset expenses on the related serviced mortgage loan (i.e., a mortgage loan other than a non-serviced mortgage loan) or serviced whole loan, if applicable (i.e., reimburse the trust for certain expenses including unreimbursed advances and interest on unreimbursed advances previously incurred (other than special servicing fees, workout fees and liquidation fees) on the related mortgage loan (other than a non-serviced mortgage loan) or serviced whole loan, if applicable, but not yet reimbursed to the trust or servicers), or to pay expenses (other than special servicing fees, workout fees and liquidation fees) that are still outstanding, in each case unless as part of the written modification the related borrower is required to pay these amounts on a going forward basis or in the future). Any excess modification fees not so applied to offset expenses will be available as compensation to the master servicer and/or applicable special servicer. Within any prior 12-month period, all excess modification fees earned by the master servicer or by the applicable special servicer (after taking into account the offset described below applied during such 12-month period) with respect to any mortgage loan (other than a non-serviced mortgage loan) or serviced whole loan, if applicable, will be subject to a cap equal to the greater of (i) 1.0% of the outstanding principal balance of such mortgage loan after giving effect to such transaction and (ii) $25,000.
All excess modification fees earned by either special servicer will be required to offset any future workout fees to the extent in excess of $25,000 or liquidation fees payable with respect to the related mortgage loan (other than a non-serviced mortgage loan) or serviced whole loan, if applicable, or related REO property;provided that if the mortgage loan (other than a non-serviced mortgage loan) or serviced whole loan, if applicable, ceases being a corrected loan, and is subject to a subsequent modification, any excess modification fees earned by the applicable special servicer prior to such mortgage loan (other than a non-serviced mortgage loan) or serviced whole loan, if applicable, ceasing to be a corrected loan will no longer be offset against future liquidation fees and workout fees unless such mortgage loan (other than a non-serviced mortgage loan) or serviced whole loan, if applicable, ceased to be a corrected loan within 12 months of it becoming a modified mortgage loan (or modified whole loan, if applicable).
Penalty Charges: All late fees and default interest will first be used to reimburse certain expenses previously incurred with respect to the related mortgage loan (other than a |
THE INFORMATION IN THIS TERM SHEET IS NOT COMPLETE AND MAY BE AMENDED PRIOR TO THE TIME OF SALE. THIS TERM SHEET IS NOT AN OFFER TO SELL THESE SECURITIES AND IT IS NOT A SOLICITATION OF AN OFFER TO BUY THESE SECURITIES IN ANY JURISDICTION WHERE THE OFFER OR SALE IS NOT PERMITTED.
| 29 |
Servicing Compensation (continued):
| non-serviced mortgage loan) or serviced whole loan, if applicable (other than special servicing fees, workout fees and liquidation fees) but not yet reimbursed to the trust, the master servicer or the applicable special servicer or to pay certain expenses (other than special servicing fees, workout fees and liquidation fees) that are still outstanding on the related mortgage loan (other than a non-serviced mortgage loan) or serviced whole loan, if applicable, and any excess received with respect to a serviced loan will be paid to the master servicer (for penalty charges accrued while a non-specially serviced loan), and the applicable special servicer (for penalty charges accrued while a specially serviced loan). To the extent any amounts reimbursed out of penalty charges are subsequently recovered on a related serviced loan, they will be paid to the master servicer or applicable special servicer who would have been entitled to the related penalty charges that were previously used to reimburse such expense.
Liquidation / Workout Fees: Liquidation fees will be calculated at the lesser of (a) 1.0% and (b) such lower rate as would result in a liquidation fee of $1,000,000, for each mortgage loan (other than a non-serviced mortgage loan) or serviced whole loan that is a specially serviced loan and any REO property, subject in any case to a minimum liquidation fee of $25,000, except that the liquidation fee will be zero with respect to certain liquidation events set forth in the pooling and servicing agreement, and the liquidation fee with respect to each mortgage loan or REO mortgage loan repurchased or substituted for after more than 180 days following the Mortgage Loan Seller’s receipt of notice or discovery of a material breach or material defect will be in an amount equal to the liquidation fee rate described above of the outstanding principal balance of such mortgage loan or REO loan. For any mortgage loan (other than a non-serviced loan) or serviced whole loan that is a corrected loan, workout fees will be calculated at the lesser of (a) 1.0% and (b) such lower rate as would result in a workout fee of $1,000,000 when applied to each expected payment of principal and interest (other than default interest) on the related mortgage loan (other than a non-serviced mortgage loan) or serviced whole loan, if applicable, from the date such serviced loan becomes a corrected loan through and including the then related maturity date; or in any case such higher rate as would result in a workout fee of $25,000 when applied to each expected payment of principal and interest (other than default interest) on any mortgage loan from the date such serviced loan becomes a corrected loan through and including the then related maturity date.
Notwithstanding the foregoing, in connection with a maturity default, no liquidation or workout fee will be payable in connection with a payoff or refinancing of the related serviced loan within 90 days of the maturity default. |
Operating Advisor:
| Prior to the occurrence and continuance of a Control Termination Event, the operating advisor will review certain information on the certificate administrator’s website, and will have access to any final asset status report but will not have any approval or consultation rights. After the occurrence and during the continuance of a Control Termination Event, the operating advisor will be entitled to consult with the special servicer in respect of the asset status report with respect to certain major decisions on behalf of the issuing entity and in the best interest of, and for the benefit of, the certificateholders, as if those certificateholders (and, with respect to a servicedpari passu companion loan, the relatedpari passucompanion loan holder(s)) constituted a single lender. Additionally, the operating advisor will be required to prepare an annual |
THE INFORMATION IN THIS TERM SHEET IS NOT COMPLETE AND MAY BE AMENDED PRIOR TO THE TIME OF SALE. THIS TERM SHEET IS NOT AN OFFER TO SELL THESE SECURITIES AND IT IS NOT A SOLICITATION OF AN OFFER TO BUY THESE SECURITIES IN ANY JURISDICTION WHERE THE OFFER OR SALE IS NOT PERMITTED.
| 30 |
| Operating Advisor (continued): | report to be provided to the trustee, the master servicer, the rating agencies, the certificate administrator and the 17g-5 information provider and to recalculate and verify the accuracy of certain calculations and their corresponding application.
After the occurrence of a Consultation Termination Event, the operating advisor may be removed without cause upon (i) the written direction of certificateholders evidencing not less than 15% of the voting rights (taking into account the application of appraisal reduction amounts to notionally reduce the certificate balances of classes to which such appraisal reduction amounts are allocable) requesting a vote to replace the operating advisor and (ii) payment by such requesting holders to the certificate administrator of all reasonable fees and expenses to be incurred by the certificate administrator in connection with administering such vote Upon the vote or written direction of holders of at least 75% of the voting rights (taking into account the application of appraisal reduction amounts to notionally reduce the certificate balances of classes to which such appraisal reduction amounts are allocable), the trustee will immediately replace the operating advisor with the replacement operating advisor. In the event there are no classes of certificates outstanding (other than the Class X-E, Class X-F, Class X-NR, Class E, Class F, Class NR, Class Z and Class R certificates and, for purposes of receiving prepayment premiums or yield maintenance charges, the Class X-D certificates), then all of the rights and obligations of the operating advisor under the pooling and servicing agreement will terminate. |
Asset Representations Reviewer:
| The asset representations reviewer will be required to review certain delinquent mortgage loans after a specified delinquency threshold has been exceeded and the required percentage of certificateholders vote to direct a review of such delinquent mortgage loans. An asset review will occur when either (1) mortgage loans with an aggregate outstanding principal balance of 25.0% or more of the aggregate outstanding principal balance of all of the mortgage loans (including any REO loans (or a portion of any REO loan in the case of a whole loan)) held by the issuing entity as of the end of the applicable collection period are delinquent loans or (2) at least 15 mortgage loans are delinquent loans as of the end of the applicable collection period and the outstanding principal balance of such delinquent loans in the aggregate constitutes at least 20.0% of the aggregate outstanding principal balance of all of the mortgage loans (including any REO loans (or a portion of any REO loan in the case of a whole loan)) held by the issuing entity as of the end of the applicable collection period. |
Replacement of the Asset Representations Reviewer:
| The asset representations reviewer may be terminated and replaced without cause. Upon (i) the written direction of certificateholders evidencing not less than 25% of the voting rights (without regard to the application of any appraisal reduction amounts) requesting a vote to terminate and replace the asset representations reviewer with a proposed successor asset representations reviewer that is an eligible asset representations reviewer, and (ii) payment by such holders to the certificate administrator of the reasonable fees and expenses to be incurred by the certificate administrator in connection with administering such vote, the certificate administrator will promptly provide notice to all certificateholders and the asset representations reviewer of such request. Upon the written direction of certificateholders evidencing at least 75% of a certificateholder quorum (without regard to the application of any appraisal reduction amounts), the trustee will terminate all of the rights and obligations |
THE INFORMATION IN THIS TERM SHEET IS NOT COMPLETE AND MAY BE AMENDED PRIOR TO THE TIME OF SALE. THIS TERM SHEET IS NOT AN OFFER TO SELL THESE SECURITIES AND IT IS NOT A SOLICITATION OF AN OFFER TO BUY THESE SECURITIES IN ANY JURISDICTION WHERE THE OFFER OR SALE IS NOT PERMITTED.
| 31 |
| Replacement of the Asset Representations Reviewer (continued): | of the asset representations reviewer under the pooling and servicing agreement, and the proposed successor asset representations reviewer will be appointed. |
| Dispute Resolution Provisions: | Each Mortgage Loan Seller will be subject to the dispute resolution provisions set forth in the pooling and servicing agreement to the extent those provisions are triggered with respect to any mortgage loan sold to the depositor by a Mortgage Loan Seller and such Mortgage Loan Seller will be obligated under the related mortgage loan purchase agreement to comply with all applicable provisions and to take part in any mediation or arbitration proceedings that may result.
Generally, in the event that a repurchase request is not “Resolved” (as defined below) within 180 days after the related Mortgage Loan Seller receives such repurchase request, then the enforcing servicer will be required to send a notice to the “initial requesting certificateholder” (if any) and to the certificate administrator who will make such notice available to all other certificateholders and certificate owners indicating the enforcing servicer’s intended course of action with respect to the repurchase request. Such notice will notify all certificateholders and certificate owners that in the event any certificateholder disagrees with the enforcing servicer’s intended course of action, the enforcing servicer will be required to follow the course of action agreed to and/or proposed by the majority of the responding certificateholders that involves referring the matter to mediation or arbitration, as the case may be. If (a) the enforcing servicer’s intended course of action with respect to the repurchase request does not involve pursuing further action to exercise rights against the related Mortgage Loan Seller with respect to the repurchase request and the initial requesting certificateholder, if any, or any other certificateholder or certificate owner wishes to exercise its right to refer the matter to mediation (including nonbinding arbitration) or arbitration, or (b) the enforcing servicer’s intended course of action is to pursue further action to exercise rights against the related Mortgage Loan Seller with respect to the repurchase request but the initial requesting certificateholder, if any, or any other certificateholder or certificate owner does not agree with the dispute resolution method selected by the enforcing servicer, then the initial requesting certificateholder, if any, or such other certificateholder or certificate owner may deliver a written notice to the enforcing servicer indicating its intent to exercise its right to refer the matter to either mediation or arbitration.
“Resolved” means, with respect to a repurchase request, (i) that related material defect has been cured, (ii) the related mortgage loan has been repurchased in accordance with the related mortgage loan purchase agreement, (iii) a mortgage loan has been substituted for the related mortgage loan in accordance with the related mortgage loan purchase agreement, (iv) the applicable Mortgage Loan Seller has paid a loss of value payment, (v) a contractually binding agreement is entered into between the enforcing servicer, on behalf of the issuing entity, and the related Mortgage Loan Seller that settles the related Mortgage Loan Seller’s obligations under the related mortgage loan purchase agreement, or (vi) the related mortgage loan is no longer property of the issuing entity as a result of a sale or other disposition in accordance with the pooling and servicing agreement. |
THE INFORMATION IN THIS TERM SHEET IS NOT COMPLETE AND MAY BE AMENDED PRIOR TO THE TIME OF SALE. THIS TERM SHEET IS NOT AN OFFER TO SELL THESE SECURITIES AND IT IS NOT A SOLICITATION OF AN OFFER TO BUY THESE SECURITIES IN ANY JURISDICTION WHERE THE OFFER OR SALE IS NOT PERMITTED.
| 32 |
| Deal Website: | The Certificate Administrator will maintain a deal website including, but not limited to:
■ all special notices delivered
■ summaries of final asset status reports
■ all appraisals in connection with appraisal reduction amounts plus any subsequent appraisal updates
■ an “Investor Q&A Forum” and a voluntary investor registry |
THE INFORMATION IN THIS TERM SHEET IS NOT COMPLETE AND MAY BE AMENDED PRIOR TO THE TIME OF SALE. THIS TERM SHEET IS NOT AN OFFER TO SELL THESE SECURITIES AND IT IS NOT A SOLICITATION OF AN OFFER TO BUY THESE SECURITIES IN ANY JURISDICTION WHERE THE OFFER OR SALE IS NOT PERMITTED.
| 33 |
| Mortgage Loan No. 1 — GLP Industrial Portfolio B |
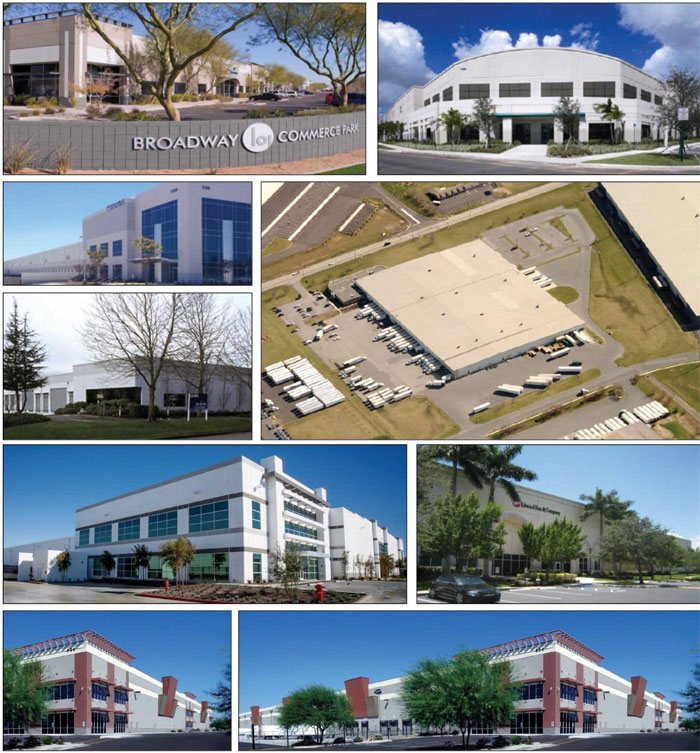
THE INFORMATION IN THIS TERM SHEET IS NOT COMPLETE AND MAY BE AMENDED PRIOR TO THE TIME OF SALE. THIS TERM SHEET IS NOT AN OFFER TO SELL THESE SECURITIES AND IT IS NOT A SOLICITATION OF AN OFFER TO BUY THESE SECURITIES IN ANY JURISDICTION WHERE THE OFFER OR SALE IS NOT PERMITTED.
| 34 |
| Mortgage Loan No. 1 — GLP Industrial Portfolio B |
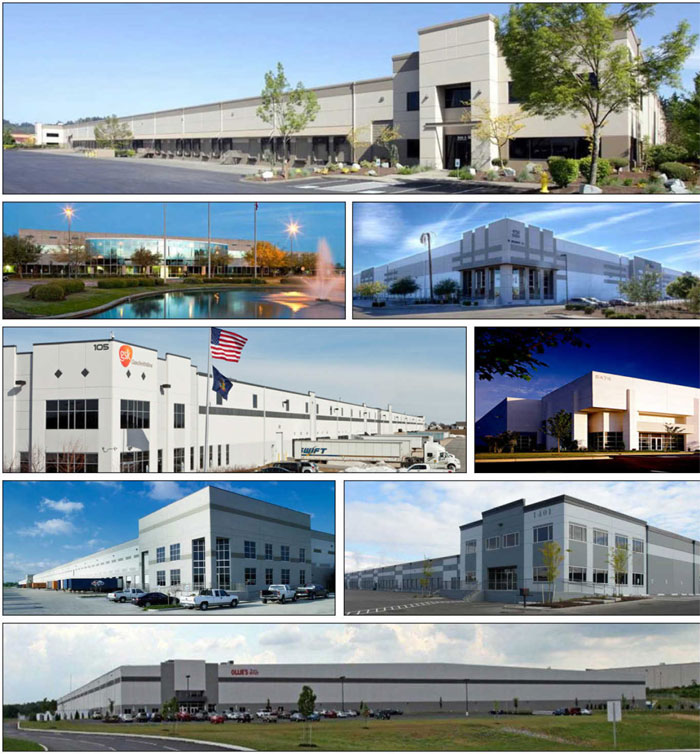
THE INFORMATION IN THIS TERM SHEET IS NOT COMPLETE AND MAY BE AMENDED PRIOR TO THE TIME OF SALE. THIS TERM SHEET IS NOT AN OFFER TO SELL THESE SECURITIES AND IT IS NOT A SOLICITATION OF AN OFFER TO BUY THESE SECURITIES IN ANY JURISDICTION WHERE THE OFFER OR SALE IS NOT PERMITTED.
| 35 |
| Mortgage Loan No. 1 — GLP Industrial Portfolio B |
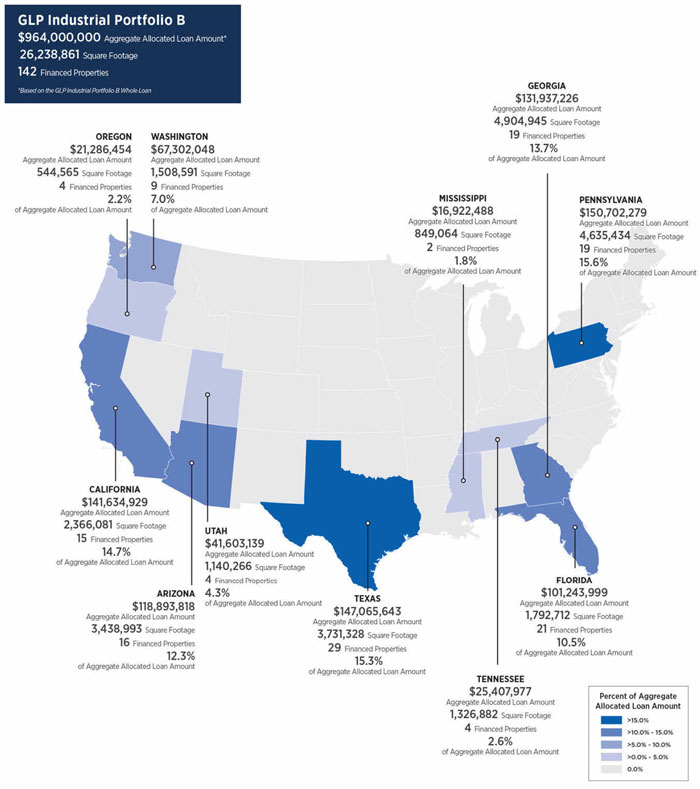
THE INFORMATION IN THIS TERM SHEET IS NOT COMPLETE AND MAY BE AMENDED PRIOR TO THE TIME OF SALE. THIS TERM SHEET IS NOT AN OFFER TO SELL THESE SECURITIES AND IT IS NOT A SOLICITATION OF AN OFFER TO BUY THESE SECURITIES IN ANY JURISDICTION WHERE THE OFFER OR SALE IS NOT PERMITTED.
| 36 |
Mortgage Loan No. 1 — GLP Industrial Portfolio B
| Mortgage Loan Information | Property Information | |||
| Mortgage Loan Seller: | Column | Single Asset / Portfolio: | Portfolio of 142 Properties | |
| Original Principal Balance(1): | $88,100,000 | Title: | Fee | |
| Cut-off Date Principal Balance(1): | $88,100,000 | Property Type - Subtype: | Industrial – Various | |
| % of Pool by IPB: | 11.5% | Net Rentable Area (SF): | 26,238,861 | |
| Credit Assessment (Fitch, Moody’s, Morningstar)(2) | AAA / Aaa / AAA | Location: | Various | |
| Loan Purpose: | Acquisition | Year Built / Renovated: | Various | |
| Borrowers(3): | Various | Occupancy(6): | 93.8% | |
| Sponsors(4): | Global Logistic Properties Limited | Occupancy Date(6): | 10/1/2015 | |
| Interest Rate: | 3.8164107% | Number of Tenants: | 321 | |
| Note Date: | 11/4/2015 | 2013 NOI: | $81,261,611 | |
| Maturity Date: | 11/6/2022 | 2014 NOI: | $97,105,129 | |
| Interest-only Period: | 84 months | 2015 NOI(7)(8): | $100,410,302 | |
| Original Term: | 84 months | TTM NOI(7): | N/A | |
| Original Amortization: | None | UW Economic Occupancy: | 94.0% | |
| Amortization Type: | Interest Only | UW Revenues: | $157,006,433 | |
| Call Protection: | YM1(77),O(7) | UW Expenses: | $41,555,299 | |
| Lockbox(5): | Hard | UW NOI: | $115,451,134 | |
| Additional Debt(1): | Yes | UW NCF: | $106,267,532 | |
| Additional Debt Balance(1): | $1,205,900,000 | Appraised Value / Per SF(9): | $2,081,000,000 / $79 | |
| Additional Debt Type(1): | Pari Passu, B-Note, Mezzanine | Appraisal Date(9): | Various | |
| Additional Future Debt Permitted: | No | |||
| Escrows and Reserves(10) | Financial Information(1) | |||||
| Initial | Monthly | Initial Cap | Cut-off Date Loan / SF: | $24 | ||
| Taxes: | $0 | Springing | N/A | Maturity Date Loan / SF: | $24 | |
| Insurance: | $0 | Springing | N/A | Cut-off Date LTV(9): | 30.2% | |
| Replacement Reserves: | $0 | Springing | (10) | Maturity Date LTV(9): | 30.2% | |
| TI/LC: | $0 | Springing | (10) | UW NCF DSCR: | 4.37x | |
| Engineering: | $1,281,668 | N/A | N/A | UW NOI Debt Yield: | 18.4% | |
| Sources and Uses | ||||||
| Sources | Proceeds | % of Total | Uses | Proceeds | % of Total | |
| Mortgage Loan (A Notes) | $628,700,000 | 28.9% | Purchase Price | $2,047,485,527 | 94.0% | |
| Mortgage Loan (B Notes) | 335,300,000 | 15.4 | Closing Costs | 129,154,208 | 5.9 | |
| Mezzanine Loans | 330,000,000 | 15.2 | Upfront Reserves | 1,281,668 | 0.1 | |
| Sponsor Equity | 883,921,403 | 40.6 | ||||
| Total Sources | $2,177,921,403 | 100.0% | Total Uses | $2,177,921,403 | 100.0% | |
| (1) | The GLP Industrial Portfolio B loan is part of a larger split whole loan evidenced by fivepari passu senior notes (collectively, “A Notes”) and two subordinate notes (collectively, “B Notes”) with an aggregate original principal balance of $964.0 million. The financial information presented in the chart above and herein reflects the cut-off date balance of the $628.7 million of A Notes, but not the $330.0 million of mezzanine loans or the $335.3 million of B Notes. The additional debt consists of fourpari passu companion loans with an outstanding principal balance of $540.6 million, $335.3 million of B Notes and $330.0 million of mezzanine loans. For a more detailed description of the additional debt, please refer to “Additional Debt” below. |
| (2) | Fitch, Moody’s and Morningstar have confirmed that the GLP Industrial Portfolio B loan has, in the context of its inclusion in the Initial Pool Balance, credit characteristics consistent with an AAA-rated obligation. |
| (3) | The loan has 24 borrowers, which are each special purpose entities. |
| (4) | The GLP Industrial Portfolio B loan’s sponsors and non-recourse carveout guarantors are eleven subsidiaries of Global Logistic Properties Limited. |
| (5) | For a more detailed description of lockbox, please refer to“Lockbox / Cash Management”below. |
| (6) | As of December 31, 2015, the occupancy of the Portfolio was 94.0%. |
THE INFORMATION IN THIS TERM SHEET IS NOT COMPLETE AND MAY BE AMENDED PRIOR TO THE TIME OF SALE. THIS TERM SHEET IS NOT AN OFFER TO SELL THESE SECURITIES AND IT IS NOT A SOLICITATION OF AN OFFER TO BUY THESE SECURITIES IN ANY JURISDICTION WHERE THE OFFER OR SALE IS NOT PERMITTED.
| 37 |
Mortgage Loan No. 1 — GLP Industrial Portfolio B
| (7) | Represents trailing twelve months ending June 30, 2015. Due to the Portfolio being acquired by the borrower on November 4, 2015, full year-end financials were not available. Based on annualized financials from November 4, 2015 to December 31, 2015, the Portfolio had an annualized NOI of $116.1 million. Based on UW NOI for the period from November 4, 2015 to December 31, 2015 the Portfolio would result in an annualized UW NOI of $115.6 million. Based on annualized financials from January 1, 2016 to March 31, 2016, the Portfolio had an annualized NOI of $119.7 million. |
| (8) | UW NOI exceeds 2015 NOI due to increases in rents on the October 2015 rent roll and the inclusion of approximately $3.3 million for rent steps and $0.6 million for straight line rents. |
| (9) | The appraised value of $2,081.0 million is reflective of the value of the Portfolio if sold in its entirety to a single buyer. The appraisal determined an appraised value on both a portfolio and an individual basis. The concluded aggregate appraised value of the individual properties was $1,988.1 million, which would result in a Cut-off Date LTV of 31.6% and a Maturity Date LTV of 31.6%. The dates of the appraised values ranged from July 9, 2015 to October 2, 2015. |
| (10) | For a more detailed description of escrows and reserves, please refer to “Escrows and Reserves” below. |
The Loan. The GLP Industrial Portfolio B loan, which is part of a larger split whole loan, is a first mortgage loan secured by the borrowers’ fee or leasehold interest in a cross-collateralized pool of 142 industrial properties located in 11 states. The whole loan has an outstanding principal balance of $964.0 million (“GLP Industrial Portfolio B Whole Loan”) as of the cut-off date, which is comprised of fivepari passu notes, Note A-1, Note A-2, Note A-3-1, Note A-3-2 and Note A-4, and $335.3 million of subordinate B Notes. Note A-1 and Note A-2, which have an aggregate outstanding principal balance as of the cut-off date of $468.7 million, were previously contributed with the B Notes to the CSMC 2015-GLPB securitization. Note A-3-1 has an outstanding principal balance as of the cut-off date of $88.1 million and is being contributed to the CSAIL 2016-C6 Commercial Mortgage Trust. Note A-4, which has an outstanding principal balance as of the cut-off date of $56.0 million, was previously contributed to the MSCI 2016-UBS9 securitization. Note A-3-2, which has an outstanding principal balance as of the cut-off date of $15.9 million, is currently held by Column Financial, Inc. and is expected to be contributed to a future securitization trust.
Whole Loan Note Summary
| Original Balance | Cut-off Date Balance | Note Holder | Note in Controlling Securitization | |
| Notes A-1, A-2 | $468,700,000 | $468,700,000 | CSMC 2015-GLPB | Yes |
| Note A-3-1 | 88,100,000 | 88,100,000 | CSAIL 2016-C6 | No |
| Note A-3-2 | 15,900,000 | 15,900,000 | Future Securitization | No |
| Note A-4 | 56,000,000 | 56,000,000 | MSCI 2016-UBS9 | No |
| Notes B-1, B-2 | 335,300,000 | 335,300,000 | CSMC 2015-GLPB | Yes |
| Total | $964,000,000 | $964,000,000 |
The Borrowers. There are 24 borrowing entities for the loan, each a special-purpose entity.
The Sponsors. The loan’s sponsors and nonrecourse carve-out guarantors are eleven subsidiaries of Global Logistic Properties Limited (“GLP”). GLP (SGX: MC0.SI; Moody’s: Baa2; Fitch: BBB+) is a public, Singapore-based investment holding company that owns, leases, manages, and develops logistics facilities. GLP began operations in 2003 and is one of the largest logistics operators by square footage globally with total assets under management valued at approximately $33 billion. GLP’s portfolio comprises approximately 2,300 properties and 521 million SF throughout 111 markets and 4,000 customers globally. GLP had a market capitalization of approximately $9.3 billion as of April 27, 2016.
The GLP Industrial Portfolio B Whole Loan is part of a larger $2.85 billion financing completed in November 2015 to facilitate GLP’s $4.8 billion acquisition of Industrial Income Trust Inc. (“IIT”), a public, non-traded REIT. GLP acquired IIT for a total cost of $4.8 billion (which includes closing costs and working capital) and invested approximately $2.0 billion of cash equity to facilitate the transaction. The financing consisted of three separate non-crossed pools. On a pro rata basis, approximately $883.9 million of invested equity was contributed for the acquisition of the Portfolio.
The Properties.The GLP Industrial Portfolio B consists of 142 properties (the “Portfolio”) totaling approximately 26.2 million SF across 11 states and 13 different markets. The top three markets in the Portfolio, by allocated loan amount, are Philadelphia (15.6%), Houston (15.3%) and Atlanta (13.7%). The top 10 properties in the Portfolio account for 23.3% of gross leasable area (“GLA”) and 24.9% of UW NOI, and the top 10 tenants in the Portfolio account for 23.3% of GLA and 23.6% of UW Base Rent. The top 3 tenants in the Portfolio by UW Base Rent are Amazon.com, LLC (4.3%), Home Depot USA Inc (3.1%) and GSK
THE INFORMATION IN THIS TERM SHEET IS NOT COMPLETE AND MAY BE AMENDED PRIOR TO THE TIME OF SALE. THIS TERM SHEET IS NOT AN OFFER TO SELL THESE SECURITIES AND IT IS NOT A SOLICITATION OF AN OFFER TO BUY THESE SECURITIES IN ANY JURISDICTION WHERE THE OFFER OR SALE IS NOT PERMITTED.
| 38 |
Mortgage Loan No. 1 — GLP Industrial Portfolio B
Consumer Healthcare (3.0%). Approximately 16.1% of the Portfolio by UW Base Rent are rated investment grade. The top 3 businesses at the properties by UW Base Rent consist of transportation / logistics (7.9%), manufacturing (6.8%) and beauty (5.9%). Tenants have an average original lease term of 8.5 years and a remaining term of 3.2 years. The properties comprising the Portfolio have a weighted average age of 16.5 years (2000), weighted average clear heights of 28.7 feet and primary truck court depth of 155.7 feet, with weighted averages of 66 dock high doors, 3 grade level doors, 48 trailer spaces and 8.5% (GLA) office space. As of October 1, 2015, the Portfolio was 93.8% occupied by 321 tenants with a weighted average base rent of $4.92 PSF and weighted average remaining lease term of 4.3 years.
Top Twenty Properties(1)
| Property | Market | GLA (SF) | Year Built | Occupancy | UW NOI | % of NOI | Allocated Loan Amount(2) | % of Allocated Loan Amount | Appraised Value(3) |
| Agave | Phoenix | 1,267,110 | 2009 | 100.0% | $5,049,477 | 4.4% | $48,294,552 | 5.0% | $99,600,000 |
| Lehigh Valley 13 | Philadelphia | 822,500 | 2000 | 100.0 | 3,630,185 | 3.1 | 25,941,351 | 2.7 | 53,500,000 |
| Frontier Logistics BTS | Houston | 600,004 | 2015 | 100.0 | 2,696,038 | 2.3 | 24,486,696 | 2.5 | 50,500,000 |
| Sugarland Interchange DC | Houston | 486,263 | 1995 | 100.0 | 2,676,204 | 2.3 | 22,207,736 | 2.3 | 45,800,000 |
| York - Willow Springs | Philadelphia | 624,000 | 2009 | 100.0 | 3,623,735 | 3.1 | 21,480,408 | 2.2 | 44,300,000 |
| Atlanta - Liberty DC | Atlanta | 851,349 | 2006 | 100.0 | 2,360,549 | 2.0 | 20,171,219 | 2.1 | 41,600,000 |
| South Bay DC | Los Angeles | 265,440 | 2013 | 100.0 | 2,047,719 | 1.8 | 19,395,403 | 2.0 | 40,000,000 |
| Sorensen Industrial | Los Angeles | 305,422 | 2012 | 100.0 | 2,156,620 | 1.9 | 19,007,495 | 2.0 | 39,200,000 |
| Miramar DC | South Florida | 289,300 | 2002 | 100.0 | 2,431,637 | 2.1 | 18,716,564 | 1.9 | 38,600,000 |
| York DC II | Philadelphia | 603,000 | 2011 | 100.0 | 2,068,207 | 1.8 | 17,455,862 | 1.8 | 36,000,000 |
| Carlisle DC Bldg 1 | Philadelphia | 511,760 | 2001 | 100.0 | 2,156,559 | 1.9 | 17,213,420 | 1.8 | 35,500,000 |
| Portside Distribution Center | Seattle/Puget Sound | 416,050 | 2007 | 100.0 | 1,963,419 | 1.7 | 16,243,650 | 1.7 | 33,500,000 |
| Marina West A | South Florida | 276,175 | 2002 | 100.0 | 2,026,355 | 1.8 | 15,952,719 | 1.7 | 32,900,000 |
| Fremont East Bay DC | East Bay/Oakland | 246,450 | 1990 | 100.0 | 1,873,546 | 1.6 | 14,255,621 | 1.5 | 29,400,000 |
| Harbor Gateway DC | Los Angeles | 184,815 | 2000 | 100.0 | 1,635,027 | 1.4 | 14,255,621 | 1.5 | 29,400,000 |
| Imperial DC 1 | Houston | 328,020 | 2014 | 100.0 | 1,483,545 | 1.3 | 14,158,646 | 1.5 | 29,200,000 |
| Westport DC Bldg B | Salt Lake City | 409,374 | 2008 | 100.0 | 1,738,070 | 1.5 | 13,867,713 | 1.4 | 28,600,000 |
| Westport DC Bldg A | Salt Lake City | 350,892 | 2007 | 100.0 | 2,065,162 | 1.8 | 13,431,317 | 1.4 | 27,700,000 |
| Auburn DC | Seattle/Puget Sound | 283,450 | 1999 | 100.0 | 1,326,039 | 1.1 | 12,413,058 | 1.3 | 25,600,000 |
| Southaven DC Bldg 2 | Memphis | 602,500 | 2004 | 100.0 | 1,871,711 | 1.6 | 11,928,172 | 1.2 | 24,600,000 |
| Subtotal/Wtd. Avg.– Top Twenty Properties | 9,723,874 | 2006 | 100.0 | 46,879,804 | 40.6 | 380,877,223 | 39.5 | 785,500,000 | |
| Total/Wtd. Avg. | 26,238,861 | 2000 | 93.8% | $115,451,134 | 100.0% | $964,000,000 | 100.0% | $1,988,100,000 |
| (1) | Based on the underwritten rent roll dated October 1, 2015. |
| (2) | Based on the GLP Industrial Portfolio B Whole Loan. |
| (3) | Source: Appraisal. The appraised value of $2,081.0 million is reflective of the value of the Portfolio if sold in its entirety to a single buyer. The appraisal determined an appraised value on both a portfolio and an individual basis. The concluded aggregate appraised value of the individual properties was $1,988.1 million. |
THE INFORMATION IN THIS TERM SHEET IS NOT COMPLETE AND MAY BE AMENDED PRIOR TO THE TIME OF SALE. THIS TERM SHEET IS NOT AN OFFER TO SELL THESE SECURITIES AND IT IS NOT A SOLICITATION OF AN OFFER TO BUY THESE SECURITIES IN ANY JURISDICTION WHERE THE OFFER OR SALE IS NOT PERMITTED.
| 39 |
Mortgage Loan No. 1 — GLP Industrial Portfolio B
The Market. According to a market research report, the overall United States national industrial market continued to strengthen with vacancy decreasing to 6.1% through Q1 2016, down from 6.8% the year prior. Over the same period asking rents increased to $5.44 PSF from $5.24 PSF. The GLP Industrial Portfolio B is geographically diversified across 13 markets.
Market Concentration(1)
| Property | Property Count | GLA (SF) | Year Built(2) | Occupancy | UW NOI | % of NOI | Allocated Loan Amount(3) | % of Allocated Loan Amount | Appraised Value(4) | |
| Philadelphia | 19 | 4,635,434 | 2000 | 99.8% | $20,944,995 | 18.1% | $150,702,279 | 15.6% | $310,800,000 | |
| Houston | 29 | 3,731,328 | 1997 | 96.9% | 17,774,047 | 15.4 | 147,065,643 | 15.3 | 303,300,000 | |
| Atlanta | 19 | 4,904,945 | 1998 | 87.2% | 14,283,015 | 12.4 | 131,937,226 | 13.7 | 272,100,000 | |
| Phoenix | 16 | 3,438,993 | 2007 | 77.6% | 11,589,819 | 10.0 | 118,893,818 | 12.3 | 245,200,000 | |
| South Florida | 21 | 1,792,712 | 1999 | 95.4% | 11,916,066 | 10.3 | 101,243,999 | 10.5 | 208,800,000 | |
| Los Angeles | 7 | 1,170,879 | 1996 | 100.0% | 8,096,826 | 7.0 | 72,975,204 | 7.6 | 150,500,000 | |
| Seattle/Puget Sound | 9 | 1,508,591 | 1995 | 100.0% | 8,081,587 | 7.0 | 67,302,048 | 7.0 | 138,800,000 | |
| East Bay/Oakland | 5 | 823,009 | 1997 | 100.0% | 5,384,505 | 4.7 | 44,463,961 | 4.6 | 91,700,000 | |
| Memphis | 6 | 2,175,946 | 2001 | 98.7% | 6,098,328 | 5.3 | 42,330,465 | 4.4 | 87,300,000 | |
| Salt Lake City | 4 | 1,140,266 | 2008 | 100.0% | 5,735,079 | 5.0 | 41,603,139 | 4.3 | 85,800,000 | |
| Portland | 4 | 544,565 | 2000 | 100.0% | 2,868,132 | 2.5 | 21,286,454 | 2.2 | 43,900,000 | |
| San Francisco | 2 | 173,918 | 1974 | 100.0% | 1,520,153 | 1.3 | 12,994,919 | 1.3 | 26,800,000 | |
| Orange County | 1 | 198,275 | 1985 | 100.0% | 1,158,582 | 1.0 | 11,200,845 | 1.2 | 23,100,000 | |
| Total/Wtd. Avg. | 142 | 26,238,861 | 2000 | 93.8% | $115,451,134 | 100.0% | $964,000,000 | 100.0% | $1,988,100,000 |
| (1) | Based on the underwritten rent roll dated October 1, 2015. |
| (2) | Weighted Average. |
| (3) | Based on the GLP Industrial Portfolio B Whole Loan. |
| (4) | Source: Appraisal. The appraised value of $2,081.0 million is reflective of the value of the Portfolio if sold in its entirety to a single buyer. The appraisal determined an appraised value on both a portfolio and an individual basis. The concluded aggregate appraised value of the individual properties was $1,988.1 million. |
Philadelphia Industrial Market: Unemployment trends in Philadelphia have largely mirrored that of the broader US economy with unemployment dropping to 4.8% in Q1 2016, down from 5.8% a year prior. The market consists of approximately 1.1 billion SF of industrial inventory across approximately 21,000 properties. Vacancy levels reached an all-time low of 7.5% following net absorption of approximately 14.9 million square feet for the trailing twelve month period through the end of Q1 2016. According to a market data provider, absorption is expected to increase further due to several build-to-suit properties set to deliver. Average asking rent for the market is approximately $4.68 PSF.
Houston Industrial Market:Vacancy through Q1 2016 was 5.4% according to market data reports despite continued weakness in the oil industry. The market is largely divided between east and west Houston with west Houston more dependent on the oil industry to drive demand. Trailing twelve month absorption through Q1 2016 was approximately 6.3 million SF. The market consists of approximately 560.7 million SF of space across approximately 18,000 properties. Average asking rent for the market is approximately $6.47 PSF.
Atlanta Industrial Market:Atlanta experienced its eleventh straight quarter of positive absorption with 3.3 million SF absorbed in Q1 2016. Vacancy increased slightly to approximately 8.5%, mostly attributed to 6.1 million SF of new construction delivered to the market. Asking rents increased over the same time period to $4.27 PSF. Significant move-ins included Smuckers, tenanting 1.0 million SF of space in South Atlanta and Google tenanting, the 1.1 million SF Fairburn Logistics Center. According to a market data provider, Atlanta has strong fundamentals coupled with increasing demand for big box space, making Atlanta one of the top markets for industrial investors and tenants. The market consists of approximately 675.2 million SF across approximately 16,000 properties.
Phoenix Industrial Market: During the twelve months ending Q1 2016, the local economy has experienced diversified job creation
THE INFORMATION IN THIS TERM SHEET IS NOT COMPLETE AND MAY BE AMENDED PRIOR TO THE TIME OF SALE. THIS TERM SHEET IS NOT AN OFFER TO SELL THESE SECURITIES AND IT IS NOT A SOLICITATION OF AN OFFER TO BUY THESE SECURITIES IN ANY JURISDICTION WHERE THE OFFER OR SALE IS NOT PERMITTED.
| 40 |
Mortgage Loan No. 1 — GLP Industrial Portfolio B
of approximately 67,000 jobs across industries such as manufacturing, construction, transportation and natural resources. Construction has been particularly strong as the market has experienced increased activity in residential home building. Vacancy for the industrial market decreased through Q1 2016 to 10.7%, the lowest vacancy rate for the market since 2007. Absorption topped 1.6 million SF and totaled approximately 7.0 million SF for the twelve month period ending Q1 2016. The market consists of approximately 314 million SF across approximately 10,000 properties. Asking rates at the end of Q1 2016 were $6.75 PSF.
South Florida Industrial Market: Market vacancy at the end of Q1 2016 was 5.0%, down from 5.5% one year prior. Absorption for the full year ending Q1 2016 was approximately 5.7 million SF. Significant lease signings included 467,000 SF by Telemundo studios and 175,000 SF by Amazon, both in the Miami Airport Submarket. Total inventory in the market is approximately 420.9 million SF across approximately 18,000 properties. Asking rent was $9.14 PSF at the end of Q1 2016.
Property Sub-Type(1)
| Property Sub-Type | Property Count | GLA (SF) | Year Built(2) | Occupancy | UW NOI | % of NOI | Allocated Loan Amount(3) | % of Allocated Loan Amount | Appraised Value(4) | |
| Distribution warehouse | 68 | 17,640,316 | 2001 | 92.0% | $71,116,520 | 61.6% | $638,399,680 | 66.2% | $1,316,600,000 | |
| Warehouse | 20 | 5,267,260 | 2000 | 100.0% | 24,880,187 | 21.6 | 182,850,159 | 19.0 | 377,100,000 | |
| Light Industrial | 24 | 1,579,620 | 1991 | 96.9% | 8,302,697 | 7.2 | 65,992,856 | 6.8 | 136,100,000 | |
| Flex | 19 | 943,246 | 1985 | 92.1% | 6,047,339 | 5.2 | 43,688,144 | 4.5 | 90,100,000 | |
| Flex, light industrial, distribution | 11 | 808,419 | 2006 | 88.6% | 5,104,391 | 4.4 | 33,069,161 | 3.4 | 68,200,000 | |
| Total/Wtd. Avg. | 142 | 26,238,861 | 2000 | 93.8% | $115,451,134 | 100.0% | $964,000,000 | 100.0% | $1,988,100,000 |
| (1) | Based on the underwritten rent roll dated October 1, 2015. |
| (2) | Weighted Average. |
| (3) | Based on the GLP Industrial Portfolio B Whole Loan. |
| (4) | Source: Appraisal. The appraised value of $2,081.0 million is reflective of the value of the Portfolio if sold in its entirety to a single buyer. The appraisal determined an appraised value on both a portfolio and an individual basis. The concluded aggregate appraised value of the individual properties was $1,988.1 million. |
Tenant Summary(1)(2)
| Tenant | Credit | % of UW | UW | |||||
| Rating | Property | UW | Base | Base | Original | Lease | ||
| (Fitch/Moody’s/S&P)(2) | Count | GLA (SF) | Base Rent | Rent | Rent PSF | Start | Expiration | |
| Amazon.com, LLC | NR/Baa1/AA- | 1 | 1,267,110 | $5,159,907 | 4.3% | $4.07 | 10/1/2011 | 7/31/2022 |
| Home Depot USA Inc | A/A2/A | 1 | 822,500 | 3,709,248 | 3.1 | 4.51 | 2/1/2010 | 9/30/2016 |
| GSK Consumer Healthcare | A+/A2/A+ | 2 | 624,000 | 3,682,573 | 3.0 | 5.90 | Various | Various |
| Frontier Logistics | NR/NR/NR | 1 | 600,004 | 2,763,378 | 2.3 | 4.61 | 6/1/2015 | 6/30/2025 |
| Phillips-Van Heusen | NR/Ba2/BB+ | 1 | 851,349 | 2,451,687 | 2.0 | 2.88 | 8/1/2010 | 8/31/2030 |
| Ollie’s Bargain Outlet, Inc. | NR/NR/B+ | 1 | 603,000 | 2,200,950 | 1.8 | 3.65 | 3/1/2013 | 3/31/2028 |
| Phoenix | NR/NR/NR | 1 | 305,422 | 2,197,620 | 1.8 | 7.20 | 9/1/2013 | 11/30/2020 |
| S.C. Johnson & Son, Inc. | NR/A/A- | 1 | 511,760 | 2,192,883 | 1.8 | 4.28 | 1/1/2012 | 12/31/2019 |
| Watson Laboratories, | NR/NR/NR | 1 | 276,175 | 2,090,005 | 1.7 | 7.57 | 2/1/2003 | 6/30/2016 |
| NYX, Los Angeles, LLC | NR/NR/NR | 1 | 265,440 | 2,131,483 | 1.8 | 8.03 | 6/1/2015 | 11/30/2020 |
| Ten Largest Tenants | 6,126,760 | $28,579,734 | 23.6% | $4.66 | ||||
| Remaining Tenants | 18,478,770 | 92,567,833 | 76.4 | 5.01 | ||||
| Vacant | 1,633,331 | 0 | 0.0 | 0.00 | ||||
| Total/Wtd. Avg. | 26,238,861 | $121,147,568 | 100.0% | $4.62 |
| (1) | Based on the underwritten rent roll dated October 1, 2015. |
| (2) | Ratings provided are for the parent company of the entity listed in the “Tenant” field whether or not the parent company guarantees the lease. |
THE INFORMATION IN THIS TERM SHEET IS NOT COMPLETE AND MAY BE AMENDED PRIOR TO THE TIME OF SALE. THIS TERM SHEET IS NOT AN OFFER TO SELL THESE SECURITIES AND IT IS NOT A SOLICITATION OF AN OFFER TO BUY THESE SECURITIES IN ANY JURISDICTION WHERE THE OFFER OR SALE IS NOT PERMITTED.
| 41 |
Mortgage Loan No. 1 — GLP Industrial Portfolio B
Historical Occupancy(1)
| 2011(2) | 2012(2) | 2013 | 2014 | 2015 |
| N/A | N/A | 89.3% | 89.6% | 94.0% |
| (1) | Historical Occupancy was provided by GLP. Occupancies are as of December 31 of each respective year. |
| (2) | Historical Occupancies prior to 2013 were not provided by GLP due to lack of availability after the acquisition. |
Lease Rollover Schedule(1)
| Year | % of | Cumulative | |||||||
| Number | % of | UW Base | Cumulative | Cumulative | Cumulative | % of UW | |||
| of Leases | GLA | GLA | UW Base | Rent | GLA | % of GLA | UW Base | Base Rent | |
| Expiring(2) | Expiring | Expiring | Rent Expiring | Expiring | Expiring | Expiring | Rent Expiring | Expiring | |
| Vacant | NAP | 1,633,331 | 6.2% | NAP | NAP | 1,633,331 | 6.2% | NAP | NAP |
| MTM | 35 | 1,614,997 | 6.2 | $6,359,182 | 5.2% | 3,248,328 | 12.4% | $6,359,182 | 5.2% |
| 2016 | 40 | 2,083,552 | 7.9 | 10,513,015 | 8.7 | 5,331,880 | 20.3% | $16,872,197 | 13.9% |
| 2017 | 81 | 3,314,390 | 12.6 | 17,049,885 | 14.1 | 8,646,270 | 33.0% | $33,922,082 | 28.0% |
| 2018 | 70 | 4,313,941 | 16.4 | 21,430,867 | 17.7 | 12,960,211 | 49.4% | $55,352,949 | 45.7% |
| 2019 | 35 | 1,894,577 | 7.2 | 10,359,797 | 8.6 | 14,854,788 | 56.6% | $65,712,745 | 54.2% |
| 2020 | 41 | 2,220,265 | 8.5 | 13,761,613 | 11.4 | 17,075,053 | 65.1% | $79,474,359 | 65.6% |
| 2021 | 14 | 868,406 | 3.3 | 5,161,448 | 4.3 | 17,943,459 | 68.4% | $84,635,806 | 69.9% |
| 2022 | 20 | 3,293,047 | 12.6 | 16,113,003 | 13.3 | 21,236,506 | 80.9% | $100,748,809 | 83.2% |
| 2023 | 13 | 1,310,754 | 5.0 | 5,799,006 | 4.8 | 22,547,260 | 85.9% | $106,547,815 | 87.9% |
| 2024 | 10 | 1,420,138 | 5.4 | 6,110,522 | 5.0 | 23,967,398 | 91.3% | $112,658,337 | 93.0% |
| 2025 | 5 | 816,756 | 3.1 | 3,836,594 | 3.2 | 24,784,154 | 94.5% | $116,494,930 | 96.2% |
| 2026 & Thereafter | 3 | 1,454,707 | 5.5 | 4,652,637 | 3.8 | 26,238,861 | 100.0% | $121,147,568 | 100.0% |
| Total/Wtd. Avg. | 367 | 26,238,861 | 100.0% | $121,147,568 | 100.0% |
| (1) | Based on the underwritten rent roll dated October 1, 2015. |
| (2) | Certain tenants have more than one lease. |
THE INFORMATION IN THIS TERM SHEET IS NOT COMPLETE AND MAY BE AMENDED PRIOR TO THE TIME OF SALE. THIS TERM SHEET IS NOT AN OFFER TO SELL THESE SECURITIES AND IT IS NOT A SOLICITATION OF AN OFFER TO BUY THESE SECURITIES IN ANY JURISDICTION WHERE THE OFFER OR SALE IS NOT PERMITTED.
| 42 |
Mortgage Loan No. 1 — GLP Industrial Portfolio B
Operating History and Underwritten Net Cash Flow(1)
| 2013 | 2014 | 2015(2) | Yr1 Budget (10/2015 - 9/2016) | Underwritten(2)(3) | PSF(3) | %(4) | |
| Rents in Place(3) | $88,544,486 | $106,078,795 | $107,985,396 | $126,040,537 | $121,147,568 | $4.62 | 72.5% |
| Vacant Income | 0 | 0 | 0 | 0 | 7,769,501 | 0.30 | 4.7% |
| Gross Potential Rent | $88,544,486 | $106,078,795 | $107,985,396 | $126,040,537 | $128,917,069 | $4.91 | 77.2% |
| Total Reimbursements | 25,440,761 | 31,201,305 | 32,193,863 | 38,511,451 | 38,141,021 | 1.45 | 22.8% |
| Net Rental Income | $113,985,246 | $137,280,100 | $140,179,260 | $164,551,988 | $167,058,090 | $6.37 | 100.0% |
| (Vacancy/Collection Loss) | (4,399,854) | (4,567,002) | (3,059,638) | (7,890,038) | (10,833,209) | (0.41) | (6.9%) |
| Other Income | 1,684,268 | 1,923,614 | 1,333,346 | 781,552 | 781,552 | 0.03 | 0.5% |
| Effective Gross Income | $111,269,661 | $134,636,713 | $138,452,968 | $157,443,502 | $157,006,433 | $5.98 | 100.0% |
| Total Expenses | 30,008,050 | 37,531,583 | 38,042,665 | 41,516,696 | 41,555,299 | 1.58 | 26.5% |
| Net Operating Income | $81,261,611 | $97,105,129 | $100,410,302 | $115,926,806 | $115,451,134 | $4.40 | 73.5% |
| Total TI/LC, Capex/RR | 0 | 0 | 0 | 11,118,416 | 9,183,601 | 0.35 | 5.8% |
| Net Cash Flow | $81,261,611 | $97,105,129 | $100,410,302 | $104,808,390 | $106,267,532 | $4.05 | 67.7% |
| Avg. Rents in Place / PSF(5) | $3.50 | $4.14 | $4.12 | $4.80 | $4.62 |
| (1) | Not all of the properties in the Portfolio were the same in each of the historical periods. “Same Store” analysis, representing 90 properties, of net operating income and occupancy for 2013, 2014, 2015 and Yr1 Budget was approximately $65.0 million, $69.1 million, $71.3 million and $78.7 million, respectively, and 90.5%, 89.9%, 91.0% and 94.9%, respectively. |
| (2) | The 2015 column represents the trailing twelve month period ending June 30, 2015. Due to the Portfolio being acquired by the borrowers, full year-end financials were not available. Based on annualized financials from November 4, 2015 to December 31, 2015, the Portfolio had an annualized NOI of $116.1 million. Based on UW NOI for the period from November 4, 2015 to December 31, 2015, the Portfolio would result in an annualized UW NOI of $115.6 million. Based on annualized financials from January 1, 2016 to March 31, 2016, the Portfolio had an annualized NOI of $119.7 million. |
| (3) | Underwritten Rents in Place are based on the October 2015 rent roll and includes approximately $3.3 million for rent steps and approximately $0.6 million for credit tenant rent steps. Rent steps reflect the difference between in-place rent and annualized contractual base rent steps through December 1, 2016. Credit tenant rent steps reflects the difference between in-place rent plus annualized contractual base rent steps through December 1, 2016 and credit tenants’ average rent from October 1, 2015 through the maturity date. |
| (4) | % column represents the percentage of Net Rental Income for all revenue lines and represents the percentage of Effective Gross Income for the remainder of fields. |
| (5) | Calculated assuming GLA of 25,310,837 SF, 25,638,857 SF, 26,238,861 SF, 26,238,861 SF and 26,238,861 SF for the 2013, 2014, 2015, Yr1 Budget and Underwritten, respectively. |
Property Management. The GLP Industrial Portfolio B properties are managed by GLP US Management LLC, an affiliate of GLP. Following the acquisition of IIT, GLP ranks as the 2nd largest logistics space owner in the U.S. after Prologis, Inc. (NYSE: PLD), with approximately 173 million SF. GLP entered the U.S. logistics market in February 2015 with its $8.1 billion acquisition of IndCor Properties, Inc. from the Blackstone Group, LP (NYSE: BX).
Escrows and Reserves. At origination, the borrowers deposited into escrow approximately $1.3 million into the deferred maintenance escrow.
Tax & Insurance Escrows – The requirement of the borrowers to make monthly deposits to the basic carrying costs reserve account is waived so long as a Trigger Period is not continuing.
TI/LC Reserves – The requirement of the borrowers to make monthly deposits to the TI/LC reserve account is waived so long as a Trigger Period is not continuing. During a Trigger Period, 1/12th of $0.25 PSF (with accumulation in the reserve capped at $0.25 PSF) is required to be deposited into the TI/LC reserve account on a monthly basis.
Capital Expenditure Reserve – The requirement of the borrowers to make monthly deposits to the capital expenditure reserve account is waived so long as a Trigger Period is not continuing. During a Trigger Period, 1/12th of $0.10 PSF (with accumulation in the reserve capped at $0.10 PSF) is required to be deposited into the capital expenditure reserve account on a monthly basis. No renovations are planned for the properties other than capital expenditures to be funded out of reserves.
THE INFORMATION IN THIS TERM SHEET IS NOT COMPLETE AND MAY BE AMENDED PRIOR TO THE TIME OF SALE. THIS TERM SHEET IS NOT AN OFFER TO SELL THESE SECURITIES AND IT IS NOT A SOLICITATION OF AN OFFER TO BUY THESE SECURITIES IN ANY JURISDICTION WHERE THE OFFER OR SALE IS NOT PERMITTED.
| 43 |
Mortgage Loan No. 1 — GLP Industrial Portfolio B
Lockbox / Cash Management. The GLP Industrial Portfolio B Whole Loan is structured with a hard lockbox and springing cash management. Tenants have been directed to remit all payments due under their respective leases directly into the lockbox account controlled by the lender. During the continuance of a Trigger Period, all funds in the lockbox account are required to be swept daily to a cash management account under the control of the lender and disbursed during each interest period of the term of the loan in accordance with the loan documents. During the continuance of a Trigger Period, all excess cash flow, after payments made in accordance with the loan documents for, amongst other things, debt service, required reserves and operating expenses, will be held as additional collateral for the loan.
“Trigger Period” means (i) any period where the net operating income debt yield (for the total debt inclusive of the mezzanine loans) for the trailing twelve month period, falls below 6.75% for two consecutive fiscal quarters until the net operating income debt yield (for the total debt inclusive of the mezzanine loans) for the trailing twelve month period is at least 6.75% for two consecutive quarters and (ii) any period during the continuance of an event of default under any related mezzanine loan. The first test period was the 12-month period ending March 30, 2016.
Property Releases.The borrowers may release a property from the mortgage by prepaying a portion of the GLP Industrial Portfolio B Whole Loan in an amount equal to the applicable allocated loan amount times (i) 105% until the first 10% of the GLP Industrial Portfolio B Whole Loan has been repaid; then (ii) 110% until 20% in aggregate of the GLP Industrial Portfolio B Whole Loan has been repaid; and (iii) thereafter 115%. All principal repayments under the GLP Industrial Portfolio B Whole Loan prior to the open prepayment date in connection with such property releases are subject to yield maintenance.
In addition, property releases (other than releases that occur as a result of the application of loss proceeds from a casualty or condemnation at any related property) are further subject to a debt yield test (based on the total debt inclusive of the mezzanine loans) under the GLP Industrial Portfolio B Whole Loan, such that the aggregate portfolio debt yield (for the total debt inclusive of the mezzanine loans) of the GLP Industrial Portfolio B Whole Loan after giving effect to such release is at least the lesser of (x) the debt yield immediately prior to such release and (y) 10.5%.
In addition, if no event of default under the GLP Industrial Portfolio B Whole Loan is continuing, the borrowers may obtain a release of certain related excess parcels from the lien of the GLP Industrial Portfolio B mortgage without the lender’s consent or approval or any requirement to prepay any portion of the GLP Industrial Portfolio B Whole Loan upon the satisfaction of certain conditions as described in the Preliminary Prospectus.
Additional Debt.In addition to Note A-3-1, the mortgaged properties are also security for thepari passu Note A-1, Note A-2, Note A-3-2, and Note A-4 and two subordinate B-Notes. The B-Notes have an outstanding principal balance as of the cut-off date of $335.3 million. The GLP Industrial Portfolio B Whole Loan (inclusive of B Notes) has a Cut-off Date LTV of 46.3%, and UW NCF DSCR of 2.85x and an UW NOI Debt Yield of 12.0%. In addition, $330.0 million of mezzanine loans were provided in connection with the financing of the Portfolio that are secured by a pledge of the direct equity interests in the borrowers and are coterminous with the mortgage loan. The mezzanine loans have a weighted average coupon of 4.8500%. Including the mezzanine loans and the B Notes, the Cut-off Date LTV is 62.2%, the UW NCF DSCR is 1.99x and the UW NOI Debt Yield is 8.9%. The mezzanine loans are owned by Teachers Insurance and Annuity Association of America.
THE INFORMATION IN THIS TERM SHEET IS NOT COMPLETE AND MAY BE AMENDED PRIOR TO THE TIME OF SALE. THIS TERM SHEET IS NOT AN OFFER TO SELL THESE SECURITIES AND IT IS NOT A SOLICITATION OF AN OFFER TO BUY THESE SECURITIES IN ANY JURISDICTION WHERE THE OFFER OR SALE IS NOT PERMITTED.
| 44 |
(THIS PAGE INTENTIONALLY LEFT BLANK)
| 45 |
Mortgage Loan No. 2 — 200 Forest Street
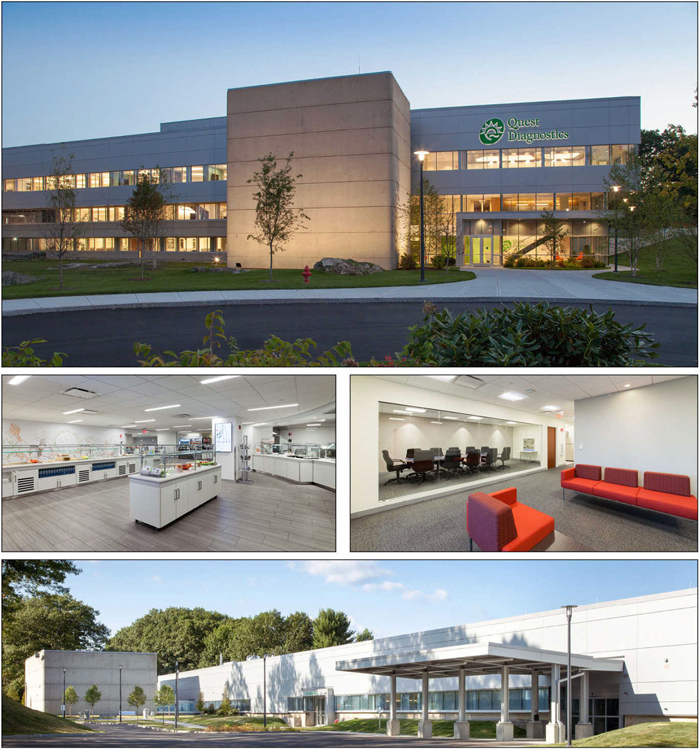
THE INFORMATION IN THIS TERM SHEET IS NOT COMPLETE AND MAY BE AMENDED PRIOR TO THE TIME OF SALE. THIS TERM SHEET IS NOT AN OFFER TO SELL THESE SECURITIES AND IT IS NOT A SOLICITATION OF AN OFFER TO BUY THESE SECURITIES IN ANY JURISDICTION WHERE THE OFFER OR SALE IS NOT PERMITTED.
| 46 |
Mortgage Loan No. 2 — 200 Forest Street
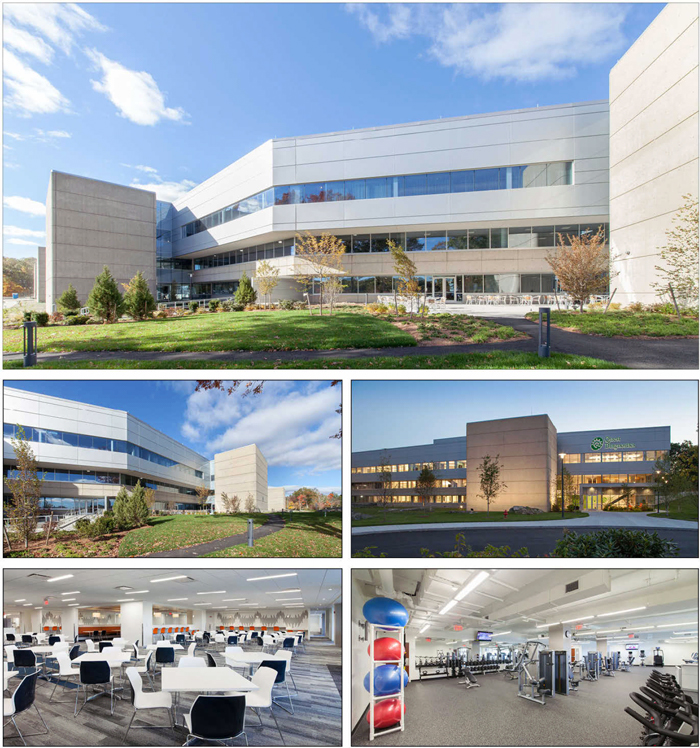
THE INFORMATION IN THIS TERM SHEET IS NOT COMPLETE AND MAY BE AMENDED PRIOR TO THE TIME OF SALE. THIS TERM SHEET IS NOT AN OFFER TO SELL THESE SECURITIES AND IT IS NOT A SOLICITATION OF AN OFFER TO BUY THESE SECURITIES IN ANY JURISDICTION WHERE THE OFFER OR SALE IS NOT PERMITTED.
| 47 |
Mortgage Loan No. 2 — 200 Forest Street

THE INFORMATION IN THIS TERM SHEET IS NOT COMPLETE AND MAY BE AMENDED PRIOR TO THE TIME OF SALE. THIS TERM SHEET IS NOT AN OFFER TO SELL THESE SECURITIES AND IT IS NOT A SOLICITATION OF AN OFFER TO BUY THESE SECURITIES IN ANY JURISDICTION WHERE THE OFFER OR SALE IS NOT PERMITTED.
| 48 |
Mortgage Loan No. 2 — 200 Forest Street
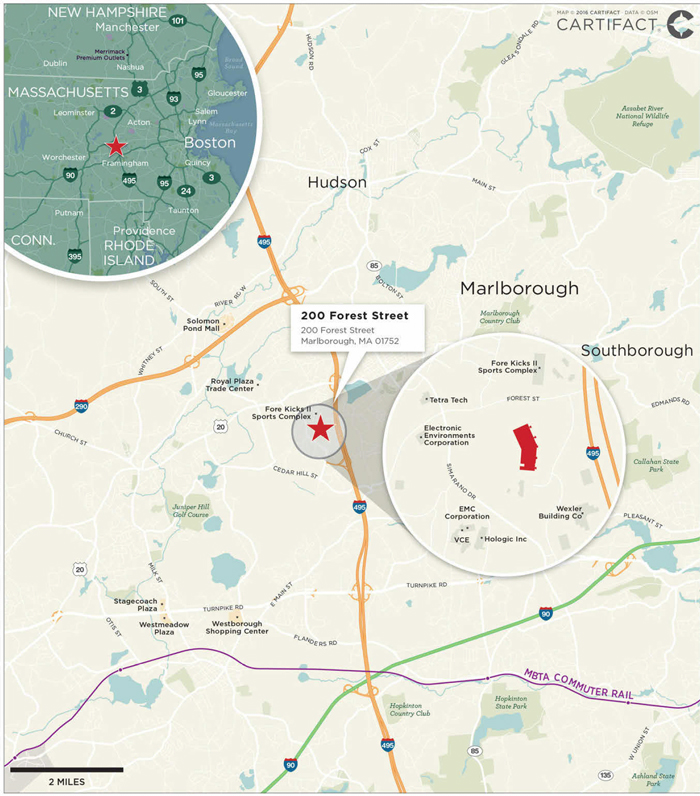
THE INFORMATION IN THIS TERM SHEET IS NOT COMPLETE AND MAY BE AMENDED PRIOR TO THE TIME OF SALE. THIS TERM SHEET IS NOT AN OFFER TO SELL THESE SECURITIES AND IT IS NOT A SOLICITATION OF AN OFFER TO BUY THESE SECURITIES IN ANY JURISDICTION WHERE THE OFFER OR SALE IS NOT PERMITTED.
| 49 |
Mortgage Loan No. 2 — 200 Forest Street
| Mortgage Loan Information | Property Information | |||
| Mortgage Loan Seller: | BSP | Single Asset / Portfolio: | Single Asset | |
| Original Principal Balance: | $87,000,000 | Title: | Fee | |
| Cut-off Date Principal Balance: | $87,000,000 | Property Type - Subtype: | Office – Suburban | |
| % of Pool by IPB: | 11.3% | Net Rentable Area (SF): | 541,747 | |
| Loan Purpose: | Refinance | Location: | Marlborough, MA | |
| Borrower: | Atlantic-Marlboro Realty IV LLC | Year Built / Renovated: | 1970 / 2012-2015 | |
| Sponsor(1): | Atlantic Management | Occupancy: | 88.4% | |
| Interest Rate: | 5.0500% | Occupancy Date: | 3/5/2016 | |
| Note Date: | 3/17/2016 | Number of Tenants: | 2 | |
| Anticipated Repayment Date(2): | 4/6/2026 | 2012 NOI(4): | N/A | |
| Interest-only Period: | 120 months | 2013 NOI(4): | N/A | |
| Original Term(2): | 120 months | 2014 NOI(4): | $1,632,038 | |
| Original Amortization: | None | 2015 NOI(4)(5): | $4,562,730 | |
| Amortization Type(2): | Interest Only, ARD | TTM NOI(4)(6): | $4,763,328 | |
| Call Protection: | L(25),Def(91),O(4) | UW Economic Occupancy: | 88.8% | |
| Lockbox(3): | Soft | UW Revenues: | $13,985,209 | |
| Additional Debt: | No | UW Expenses: | $6,231,438 | |
| Additional Debt Balance: | N/A | UW NOI(5): | $7,753,771 | |
| Additional Debt Type: | N/A | UW NCF: | $7,672,509 | |
| Additional Future Debt Permitted: | No | Appraised Value / Per SF: | $136,000,000 / $251 | |
| Appraisal Date: | 1/19/2016 |
| Escrows and Reserves(7) | Financial Information | |||||
| Initial | Monthly | Initial Cap | Cut-off Date Loan / SF: | $161 | ||
| Taxes: | $66,729 | $66,729 | N/A | Maturity Date Loan / SF(8): | $161 | |
| Insurance: | $65,612 | $13,122 | N/A | Cut-off Date LTV: | 64.0% | |
| Replacement Reserves: | $0 | $6,772 | N/A | Maturity Date LTV(8): | 64.0% | |
| TI/LC: | $0 | Springing | N/A | UW NCF DSCR: | 1.72x | |
| Duct Work Reserve: | $240,000 | $0 | N/A | UW NOI Debt Yield: | 8.9% | |
| Lease Sweep Reserve: | $0 | Springing | N/A |
Sources and Uses
| Sources | Proceeds | % of Total | Uses | Proceeds | % of Total | |
| Mortgage Loan | $87,000,000 | 100.0% | Payoff Existing Debt | $80,820,052 | 92.9% | |
| Upfront Reserves | 372,341 | 0.4 | ||||
| Closing Costs | 5,275,818 | 6.1 | ||||
| Return of Equity | 531,789 | 0.6 | ||||
| Total Sources | $87,000,000 | 100.0% | Total Uses | $87,000,000 | 100.0% |
| (1) | The Sponsor has three principals who are also non-recourse carve-out guarantors for the loan: Joseph L. Zink, Irene T. Gruber and David A. Capobianco. |
| (2) | The loan is structured with an Anticipated Repayment Date (“ARD”) of April 6, 2026. The Original Term shown above is through the ARD. The maturity date is April 6, 2031. Please refer to “The Loan” below for additional details. |
| (3) | For a more detailed description of lockbox, please refer to“Lockbox / Cash Management”below for additional details. |
| (4) | The property was purchased vacant in 2011 and redeveloped in 2012-2013. Please refer to “The Property” below for additional details. |
| (5) | The 2015 NOI reflects the property’s average 2015 occupancy of 68.9%. The UW NOI reflects the in-place occupancy of 88.4% and includes averaged rents during the loan term through ARD for both investment grade tenants whose leases expire at least three years beyond the ARD. Please refer to “Operating History and Underwritten Net Cash Flow” below for additional details. |
| (6) | The TTM NOI represents the trailing twelve months ending March 31, 2016. |
| (7) | For a more detailed description of escrows and reserves, please refer to “Escrows and Reserves” below. |
| (8) | As of the ARD. |
THE INFORMATION IN THIS TERM SHEET IS NOT COMPLETE AND MAY BE AMENDED PRIOR TO THE TIME OF SALE. THIS TERM SHEET IS NOT AN OFFER TO SELL THESE SECURITIES AND IT IS NOT A SOLICITATION OF AN OFFER TO BUY THESE SECURITIES IN ANY JURISDICTION WHERE THE OFFER OR SALE IS NOT PERMITTED.
| 50 |
Mortgage Loan No. 2 — 200 Forest Street
The Loan. The 200 Forest Street loan is an $87.0 million first mortgage loan secured by the fee interest in an 88.4% leased three-story suburban office / research and development (“R&D”) property encompassing 541,747-SF in Marlborough, Massachusetts. The loan is interest-only for 10 years from origination with an ARD of April 6, 2026 followed by a five year hyper-amortization period. If the loan has not been paid down in full by the ARD, the loan will enter a hyper-amortization period in which all excess cash flow, after payments of reserves and operating expenses, will be used to pay down the loan, and the adjusted interest rate will equal the sum of 2% plus the greater of (i) the initial interest rate on the loan and (ii) 10-year “on the run” U.S. treasury rate as of the first business day after the ARD. The payment of the additional interest (which will be the difference between the interest accrued at the adjusted interest rate and the initial interest rate) will be deferred until the entire principal balance of the loan is paid in full.
The Borrower. The borrowing entity for the loan is Atlantic-Marlboro Realty IV LLC, a Delaware limited liability company and special purpose entity. The borrowing entity is indirectly owned by Joseph L. Zink, David A. Capobianco, Irene T. Gruber, and 13 passive individual investors.
The Sponsor. The sponsor is Atlantic Management, a Boston based full-service real estate company that was formed in 1972. Atlantic Management owns and operates over 5,000,000 SF of commercial property (including 10 life sciences assets), all within the Boston area. The sponsor’s three principals and non-recourse carve-out guarantors, Joseph L. Zink, Irene T. Gruber and David A. Capobianco, have each been with Atlantic Management for over 20 years. They have a combined net worth of approximately $39 million and liquidity of $6 million.
The Property.The property is a three-story 541,747 SF, office, R&D, and technology facility located in suburban Marlborough, Massachusetts. The property is situated on approximately 44.9 acres with approximately 1,550 parking spaces. The property was built in1970 and renovated between 2012 and 2015. According to the sponsor, over the past four years the sponsor and tenants have collectively invested an estimated $220 million ($406 PSF) into the property (the sponsor has invested approximately $60 million, and GE Healthcare and Quest Diagnostics have reportedly invested approximately $60 and $100 million, respectively). The funds were invested into base building, site work and tenant improvements, to create this office, R&D and technology asset. The property’s overall buildout is approximately 60% office and 40% R&D space with average size floor plates of approximately 180,000 SF.
As of March 5, 2016, the property was 88.4% leased to two investment-grade tenants under long term leases that expire beyond the ARD. GE Healthcare (“GE”) leases 243,455 SF (44.9% of the net rentable area) through April 2030 with two, 5-year extension options that, if exercised, would extend the lease out to 2040. GE operates its US Life Sciences headquarters at the property. GE’s Life Sciences division is a $4.0 billion business segment of GE that focuses on drug discovery, DNA/protein research, bioprocessing and quality testing. GE has been a tenant at the property since 2015. Its lease is guaranteed by its parent company, General Electric Company (Moody’s: A1 / S&P: AA+ / Fitch: NR). For the year ended 2015, General Electric Company reported $117.4 billion in revenue and $11.6 billion in operating income. Quest Diagnostics (“Quest”) leases 235,638 SF (43.5% of the net rentable area) through May 2029 with three, 5-year extension options that, if exercised, would extend the lease out to 2044. Quest (Moody’s: Baa2 / S&P: BBB+/ Fitch: BBB) provides a broad range of routine and esoteric testing services through its network of laboratories and patient service centers. The company also provides consultation through its medical and scientific staff and has the largest nationwide network of labs and patient services centers in the U.S. Quest operates a diagnostic testing lab facility at the property and has been a tenant at the property since 2014. For the year ended 2015, Quest reported approximately $7.5 billion in revenue and approximately $1.4 billion in operating income.
The property is located directly off Interstate 495 and is less than four miles from the Interstate 90 (Mass Pike) interchange providing easy access to Boston and the Interstate 95/Route 128 corridor. The property is an office, R&D and technology asset situated in a corporate campus that includes a nearby 350-unit Class A apartment development, a 163-key Hilton Garden Inn that is under construction, and a to-be-built 10,000 SF daycare center. The property also features a full-service cafeteria and fitness facilities. In addition to the physical attributes of the property, tenants have been attracted to the property for its highway access, proximity to an educated and skilled workforce, amenity rich campus and the cost attractive nature of the submarket in comparison to other life science and technology clusters.
THE INFORMATION IN THIS TERM SHEET IS NOT COMPLETE AND MAY BE AMENDED PRIOR TO THE TIME OF SALE. THIS TERM SHEET IS NOT AN OFFER TO SELL THESE SECURITIES AND IT IS NOT A SOLICITATION OF AN OFFER TO BUY THESE SECURITIES IN ANY JURISDICTION WHERE THE OFFER OR SALE IS NOT PERMITTED.
| 51 |
Mortgage Loan No. 2 — 200 Forest Street
The Market. According to a third party market research report, the property is located in The Boroughs submarket within the greater Boston metropolitan statistical area. The Boroughs submarket is seen as a cost-attractive alternative for technology and medical tenants in comparison to the Framingham/Natick or East Cambridge submarkets, where rents are close to $70 PSF. Tech/medical tech firms are dominant tenants in the area with GE Healthcare, Quest Diagnostics, Boston Scientific Corporation, Cisco, IBM, EMC Corporation, Hologic, Sepracor, Verizon, and 3Com all occupying over 125,000 SF. The property’s direct competitive set includes 10 office and flex buildings in The Boroughs submarket comprising 4.7 million SF with minimum floor plate sizes of 150,000 SF. The competitive set operates at a 9.0% weighted average vacancy rate and is summarized in the table below.
Competitive Set Summary(1)
| Property | Year Built / Renovated | Total GLA (SF) | Est. Occ. | Proximity (miles) |
| 200 Forest Street | 1970/2012-2015 | 541,747(2) | 88%(2) | N/A |
| Raytheon Building | 1987 | 627,600 | 100% | 5.4 |
| 4400 Computer Drive | 1978 | 305,000 | 100% | 5.9 |
| 1455 Concord Street | 1978 | 154,515 | 40% | 12.4 |
| 21 Coslin Drive | 1968 | 261,436 | 100% | 5.7 |
| 155 Northboro Road | 1998 | 160,930 | 92% | 1.4 |
| 171 South Street | 1985 | 483,137 | 100% | 4.5 |
| 176 South Street | 2001 | 792,755 | 100% | 4.5 |
| 228 South Street | 1984 | 306,508 | 100% | 4.5 |
| 333 South Street | 1986 | 647,000 | 61% | 4.5 |
| 334 South Street | 1990 | 460,000 | 100% | 4.5 |
| (1) | Source: Third party market research report. |
| (2) | Based on the March 5 2016 underwritten rent roll. |
Historical and Current Occupancy(1)
| 2011(2) | 2012(2) | 2013(2) | 2014(2) | 2015(2) | Current(3) |
| 0.0% | 0.0% | 0.0% | 38.6% | 88.4% | 88.4% |
| (1) | Historical occupancies are as of December 31 of each respective year. |
| (2) | The property was a former Hewlett Packard campus until 2010 when it vacated the property. The sponsor acquired the property vacant in 2011 and over a two year period re-zoned and re-developed it. Quest Diagnostics signed a 209,000 SF lease in 2013 and moved into the property in June 2014. GE moved into the property in 2015 and expanded in 2016. |
| (3) | Based on the March 2016 underwritten rent roll. |
Tenant Summary(1)
| Tenant | Ratings Moody’s/S&P/Fitch(2) | Net Rentable Area (SF) | % of Total NRA | Base Rent PSF | Annual Base Rent | % of Annual Base Rent | Lease Expiration Date(3) |
| GE Healthcare | A1 /AA+/ NR | 243,455 | 44.9% | $15.26 | $3,714,442 | 45.5% | 4/30/2030 |
| Quest Diagnostics | Baa2 / BBB+ / BBB+ | 235,638 | 43.5% | $18.90 | $4,452,904 | 54.5% | 5/31/2029 |
| (1) | Based on the underwritten rent roll as of March 5, 2016. The Base Rent PSF for GE Healthcare and Quest Diagnostics is based on average rent paid through the ARD. |
| (2) | Ratings provided are for the parent company of the entity listed in the “Tenant” field. The respective parent companies guarantee the leases. |
| (3) | The tenants do not have any rights to terminate their leases. |
THE INFORMATION IN THIS TERM SHEET IS NOT COMPLETE AND MAY BE AMENDED PRIOR TO THE TIME OF SALE. THIS TERM SHEET IS NOT AN OFFER TO SELL THESE SECURITIES AND IT IS NOT A SOLICITATION OF AN OFFER TO BUY THESE SECURITIES IN ANY JURISDICTION WHERE THE OFFER OR SALE IS NOT PERMITTED.
| 52 |
Mortgage Loan No. 2 — 200 Forest Street
Lease Rollover Schedule(1)
| Year | Number of Leases Expiring | NRA (SF) Expiring | % of NRA Expiring | Base Rent Expiring | % of Base Rent Expiring | Cumulative NRA (SF) Expiring | Cumulative % of NRA Expiring | Cumulative Base Rent Expiring | Cumulative % of Base Rent Expiring |
| Vacant | NAP | 62,654 | 11.6% | NAP | NAP | 62,654 | 11.6% | NAP | NAP |
| MTM | 0 | 0 | 0.0 | $0 | 0.0% | 62,654 | 11.6% | $0 | 0.0% |
| 2016 | 0 | 0 | 0.0 | 0 | 0.0 | 62,654 | 11.6% | $0 | 0.0% |
| 2017 | 0 | 0 | 0.0 | 0 | 0.0 | 62,654 | 11.6% | $0 | 0.0% |
| 2018 | 0 | 0 | 0.0 | 0 | 0.0 | 62,654 | 11.6% | $0 | 0.0% |
| 2019 | 0 | 0 | 0.0 | 0 | 0.0 | 62,654 | 11.6% | $0 | 0.0% |
| 2020 | 0 | 0 | 0.0 | 0 | 0.0 | 62,654 | 11.6% | $0 | 0.0% |
| 2021 | 0 | 0 | 0.0 | 0 | 0.0 | 62,654 | 11.6% | $0 | 0.0% |
| 2022 | 0 | 0 | 0.0 | 0 | 0.0 | 62,654 | 11.6% | $0 | 0.0% |
| 2023 | 0 | 0 | 0.0 | 0 | 0.0 | 62,654 | 11.6% | $0 | 0.0% |
| 2024 | 0 | 0 | 0.0 | 0 | 0.0 | 62,654 | 11.6% | $0 | 0.0% |
| 2025 | 0 | 0 | 0.0 | 0 | 0.0 | 62,654 | 11.6% | $0 | 0.0% |
| 2026 & Beyond | 2 | 479,093 | 88.4% | 8,167,364 | 100.0 | 541,747 | 100.0% | $8,167,364 | 100.0% |
| Total | 2 | 541,747 | 100.0% | $8,167,364 | 100.0% |
| (1) | Based on the underwritten rent roll as of March 5, 2016. |
Operating History and Underwritten Net Cash Flow(1)
| 2014 | 2015(2) | TTM(3) | Underwritten(2)(4) | PSF | %(5) | |
| Rents in Place | $2,448,000 | $5,508,512 | $5,949,767 | $8,167,364 | $15.08 | 51.9% |
| Vacant Income | 0 | 0 | 0 | 1,002,464 | 1.85 | 6.4% |
| Gross Potential Rent | $2,448,000 | $5,508,512 | $5,949,767 | $9,169,828 | $16.93 | 58.3% |
| Total Reimbursements | 1,148,587 | 3,420,587 | 3,455,396 | 6,578,682 | 12.14 | 41.8% |
| Net Rental Income | $3,596,587 | $8,929,099 | $9,405,163 | $15,748,510 | $29.07 | 100.0% |
| (Vacancy/Collection Loss) | 0 | 0 | 0 | (1,763,300) | (3.25) | (11.2%) |
| Other Income | 280 | (5,027) | 3,077 | 0 | 0.00 | 0.0% |
| Effective Gross Income | $3,596,867 | $8,924,072 | $9,408,240 | $13,985,209 | $25.82 | 88.8% |
| Total Expenses | $1,964,829 | $4,361,342 | $4,644,912 | $6,231,438 | $11.50 | 44.6% |
| Net Operating Income | $1,632,038 | $4,562,730 | $4,763,328 | $7,753,771 | $14.31 | 55.4% |
| Total TI/LC, Capex/RR | 0 | 0 | 0 | 81,262 | $0.15 | 0.6% |
| Net Cash Flow | $1,632,038 | $4,562,730 | $4,763,328 | $7,672,509 | $14.16 | 54.9% |
| Average Annual Rent PSF | $4.52 | $10.17 | $10.98 | $15.08 |
| (1) | Operating history and cash flows for 2011 – 2013 are not available. The property was a former Hewlett Packard campus until 2010 when it vacated the property. The sponsor acquired the property vacant in 2011 and over a two year period re-zoned and re-developed it. Quest Diagnostics signed a 209,000 SF lease in 2013 and moved into the property in June 2014.GE moved into the property in 2015 and expanded in 2016. |
| (2) | The 2015 NOI reflects the property’s average 2015 occupancy of 68.9%. GE signed a new lease in April 2015 for 209,855 SF and Quest expanded in October 2015 by 26,480 SF. GE expanded in April 2016 by 33,600 SF bringing occupancy up to its in-place level of 88.4%. The UW NOI reflects the in-place occupancy and includes averaged rents during the loan term through the ARD for both investment grade tenants whose leases expire at least three years beyond the ARD. |
| (3) | The TTM column represents the trailing twelve months ending March 31, 2016. |
| (4) | Based on the underwritten rent roll as of March 5, 2016. The Underwritten Rents in Place for Quest and GE are based on average rent paid through the ARD. |
| (5) | % column represents percent of Net Rental Income for all revenue lines and represents percent of Effective Gross Income for the remainder of fields. |
THE INFORMATION IN THIS TERM SHEET IS NOT COMPLETE AND MAY BE AMENDED PRIOR TO THE TIME OF SALE. THIS TERM SHEET IS NOT AN OFFER TO SELL THESE SECURITIES AND IT IS NOT A SOLICITATION OF AN OFFER TO BUY THESE SECURITIES IN ANY JURISDICTION WHERE THE OFFER OR SALE IS NOT PERMITTED.
| 53 |
Mortgage Loan No. 2 — 200 Forest Street
Property Management. The property is managed by Atlantic Management Corporation, an affiliate of the sponsor, pursuant to a management agreement. The lender has the right to require the borrower to replace the property manager upon an event of default.
Escrows and Reserves. At origination, the borrower funded aggregate reserves of $372,341 with respect to the loan, comprised of (i) $240,000 for an outstanding landlord obligation to complete HVAC duct work for GE, (ii) $66,729 for real estate taxes and (iii) $65,612 for insurance.
Tax Escrows – On a monthly basis, the borrower is required to escrow 1/12th of the annual estimated tax payments, currently equal to $66,729.
Insurance Escrows – On a monthly basis, the borrower is required to escrow 1/12th of the annual estimated insurance payments, currently equal to $13,122.
Replacement Reserves – On a monthly basis, the borrower is required to deposit an amount equal to $6,772 for replacement reserves.
TI/LC– Monthly payments for TI/LC are currently waived. From and after the date on which any Specified Tenant (as defined below) files bankruptcy or vacates all or any portion of the property (or delivers written notice of its intent to do so), the lender may reassess its estimate of the monthly amount required for tenant improvements and leasing commissions.
Lease Sweep Reserve – On each monthly payment date during a Cash Sweep Period (as defined below) that was caused and exists solely due to a Specified Tenant Sweep Event (as defined below), the borrower is required to deposit all excess cash flow generated by the property, after the payment of debt service, required reserves and operating expenses, among other things, for the immediately preceding interest period into a lease sweep reserve.
Lockbox / Cash Management. The 200 Forest Street loan is structured with a soft lockbox and springing cash management. Funds in the lockbox are required to be transferred to the borrower unless a Cash Sweep Period (as defined below) exists. Upon the first occurrence of a Cash Sweep Period, the borrower is required to (i) establish a cash management account in the name of the borrower for the sole and exclusive benefit of the lender, and funds in the lockbox are required to be transferred daily into the cash management account, and (ii) send a tenant direction notice to all tenants occupying space at the property directing them to pay all rent and other sums directly into the lockbox.
A “Cash Sweep Period” commences upon (i) an event of default, (ii) the debt service coverage ratio being less than 1.20x for the trailing 12-month period, (iii) the occurrence of a Specified Tenant Sweep Event (as defined below) or (iv) the ARD; and expires upon, with regard to any Cash Sweep Period commenced in connection with clause (i) above, the cure of such event of default, with regard to any Cash Sweep Period commenced in connection with clause (ii) above, the date that the debt service coverage ratio is at least 1.25x for two consecutive calendar quarters, with regard to any Cash Sweep Period commenced in connection with clause (iii) above, the cure of all Specified Tenant Sweep Events and, with regard to any Cash Sweep Period commenced in connection with clause (iv) above, the full repayment of the loan pursuant to the terms and conditions of the loan documents.
A “Specified Tenant Sweep Event” means (i) an event of default by a Specified Tenant under the related lease, (ii) any Specified Tenant going dark (however, no Specified Tenant Sweep Event will occur in connection with this clause (ii) prior to (a) 3/17/2021, if each Specified Tenant causing the sweep retains an investment grade senior unsecured credit rating or (b) 3/17/2023, if only one Specified Tenant causes the sweep and such tenant retains an investment grade senior unsecured credit rating ), (iii) a bankruptcy or an insolvency of any Specified Tenant (which, as to any Specified Tenant other than GE or Quest, will include such Specified Tenant’s parent company if such Specified Tenant’s lease is guaranteed by a person that maintains an investment grade senior unsecured credit rating), (iv) termination, cancellation or surrender of the related lease, (v) the earlier of the date that is 12-months prior to the scheduled expiration date of the related lease or the date under such lease by which any Specified Tenant is required to give notice of its exercise of a renewal option, or (vi) a downgrade of the senior unsecured credit rating of any Specified Tenant below investment grade status.
THE INFORMATION IN THIS TERM SHEET IS NOT COMPLETE AND MAY BE AMENDED PRIOR TO THE TIME OF SALE. THIS TERM SHEET IS NOT AN OFFER TO SELL THESE SECURITIES AND IT IS NOT A SOLICITATION OF AN OFFER TO BUY THESE SECURITIES IN ANY JURISDICTION WHERE THE OFFER OR SALE IS NOT PERMITTED.
| 54 |
Mortgage Loan No. 2 — 200 Forest Street
A “Specified Tenant” is defined as Quest, GE, any replacement tenant thereof or any other tenant under a lease covering 100,000 rentable SF or more of the property.
Ground Lease. The lender has pre-approved a form ground lease that the borrower can enter into as ground lessor with an affiliate, so that the sponsor/ borrower affiliate can obtain financing for a potential future addition at the site. Such addition will only be allowed to accommodate either of the two existing tenants (GE or Quest), and may include construction of a parking structure. If the ground lease improvements consist of a parking structure, the ground lessor will be required to provide perpetual rights of parking to the remaining property.
Right of First Offer/ Right of First Refusal. Each of GE and Quest has rights to lease additional space at the property but no rights to purchase the property. Quest has a continuing right of first offer with respect to all of the space at the property and a continuing right of first refusal to lease any vacant space that is contiguous to any space then leased by Quest in the property. GE has a continuing right of first offer with respect to all of the existing space at the property and all future development space at the property. Prior to April 20, 2020, GE has a continuing right of first refusal with respect to all of the existing space at the property (but excluding any future development space at the property). Such rights of first offer and first refusal on the part of GE are subordinate and secondary to all rights of first offer, rights of first refusal or similar rights granted to Quest or any tenant in the property whose lease was executed prior to the GE lease (December 4, 2014).
THE INFORMATION IN THIS TERM SHEET IS NOT COMPLETE AND MAY BE AMENDED PRIOR TO THE TIME OF SALE. THIS TERM SHEET IS NOT AN OFFER TO SELL THESE SECURITIES AND IT IS NOT A SOLICITATION OF AN OFFER TO BUY THESE SECURITIES IN ANY JURISDICTION WHERE THE OFFER OR SALE IS NOT PERMITTED.
| 55 |
Mortgage Loan No. 3 — Quaker Bridge Mall
|
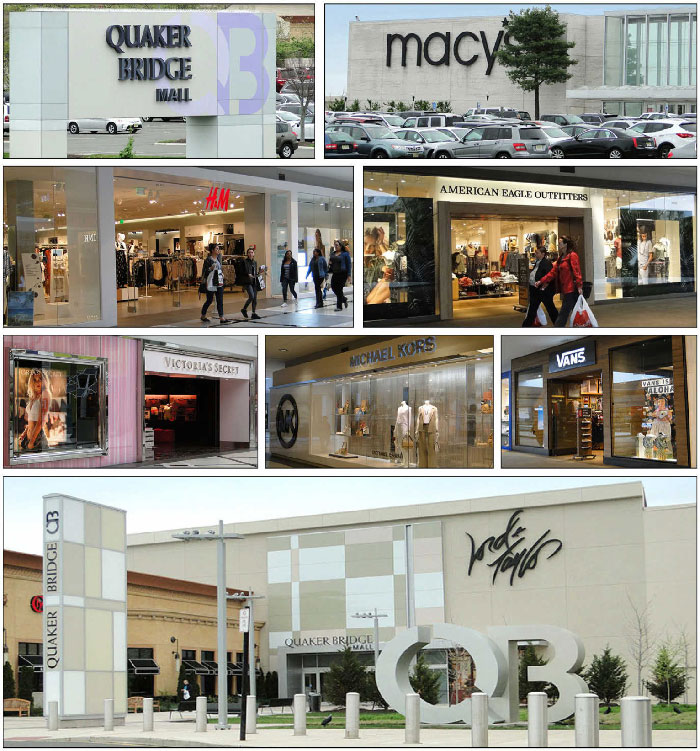 |
THE INFORMATION IN THIS TERM SHEET IS NOT COMPLETE AND MAY BE AMENDED PRIOR TO THE TIME OF SALE. THIS TERM SHEET IS NOT AN OFFER TO SELL THESE SECURITIES AND IT IS NOT A SOLICITATION OF AN OFFER TO BUY THESE SECURITIES IN ANY JURISDICTION WHERE THE OFFER OR SALE IS NOT PERMITTED.
| 56 |
Mortgage Loan No. 3 — Quaker Bridge Mall
|
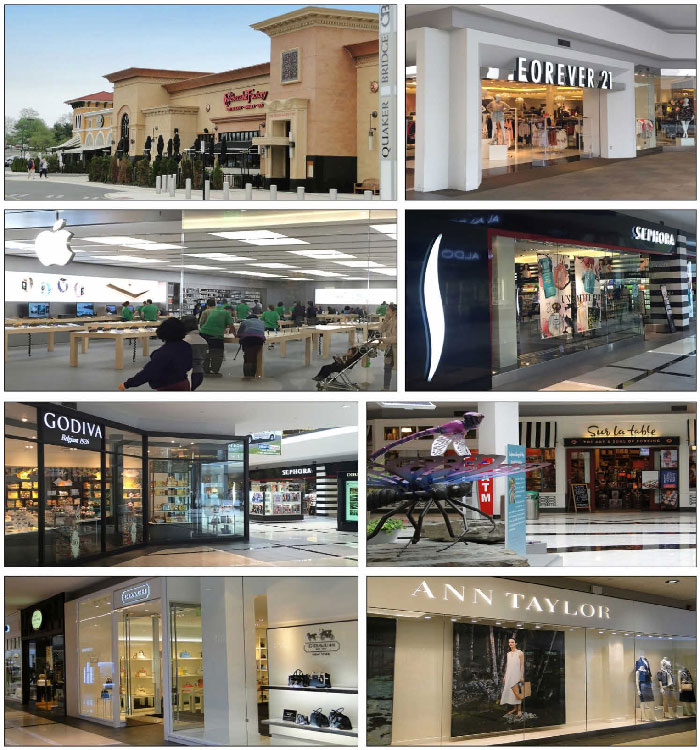 |
THE INFORMATION IN THIS TERM SHEET IS NOT COMPLETE AND MAY BE AMENDED PRIOR TO THE TIME OF SALE. THIS TERM SHEET IS NOT AN OFFER TO SELL THESE SECURITIES AND IT IS NOT A SOLICITATION OF AN OFFER TO BUY THESE SECURITIES IN ANY JURISDICTION WHERE THE OFFER OR SALE IS NOT PERMITTED.
| 57 |
Mortgage Loan No. 3 — Quaker Bridge Mall
|
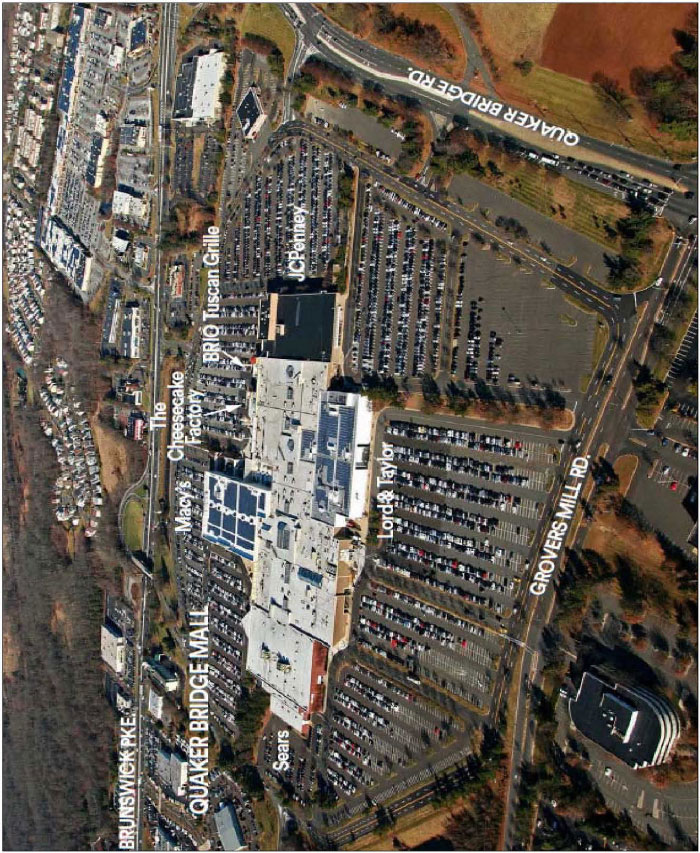 |
THE INFORMATION IN THIS TERM SHEET IS NOT COMPLETE AND MAY BE AMENDED PRIOR TO THE TIME OF SALE. THIS TERM SHEET IS NOT AN OFFER TO SELL THESE SECURITIES AND IT IS NOT A SOLICITATION OF AN OFFER TO BUY THESE SECURITIES IN ANY JURISDICTION WHERE THE OFFER OR SALE IS NOT PERMITTED.
| 58 |
Mortgage Loan No. 3 — Quaker Bridge Mall
|
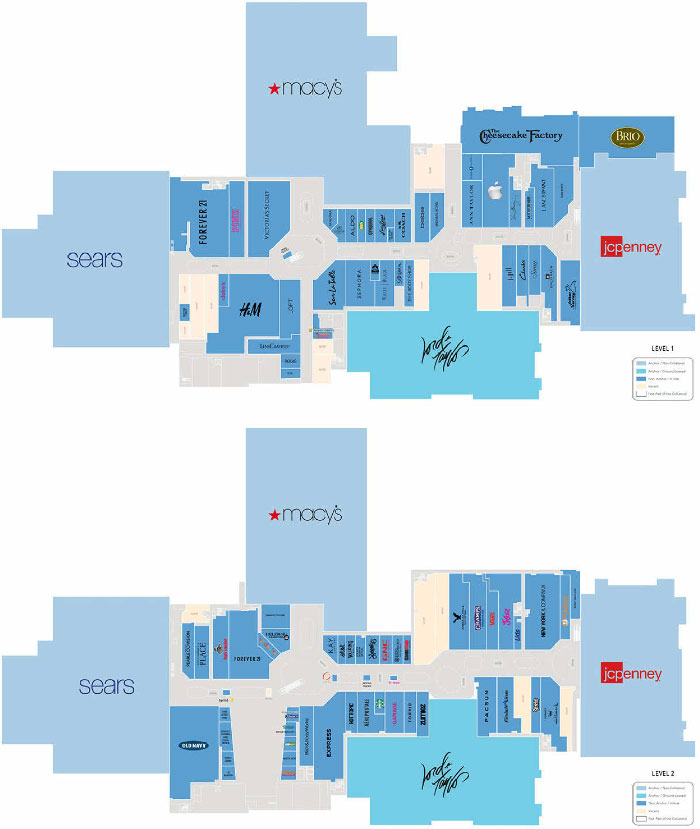 |
THE INFORMATION IN THIS TERM SHEET IS NOT COMPLETE AND MAY BE AMENDED PRIOR TO THE TIME OF SALE. THIS TERM SHEET IS NOT AN OFFER TO SELL THESE SECURITIES AND IT IS NOT A SOLICITATION OF AN OFFER TO BUY THESE SECURITIES IN ANY JURISDICTION WHERE THE OFFER OR SALE IS NOT PERMITTED.
| 59 |
Mortgage Loan No. 3 — Quaker Bridge Mall
|
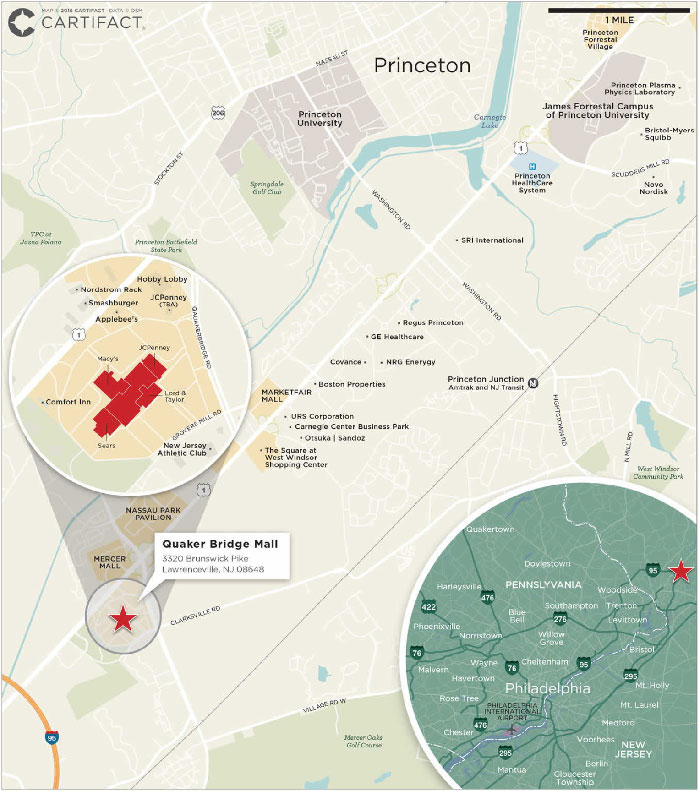 |
THE INFORMATION IN THIS TERM SHEET IS NOT COMPLETE AND MAY BE AMENDED PRIOR TO THE TIME OF SALE. THIS TERM SHEET IS NOT AN OFFER TO SELL THESE SECURITIES AND IT IS NOT A SOLICITATION OF AN OFFER TO BUY THESE SECURITIES IN ANY JURISDICTION WHERE THE OFFER OR SALE IS NOT PERMITTED.
| 60 |
Mortgage Loan No. 3 — Quaker Bridge Mall
|
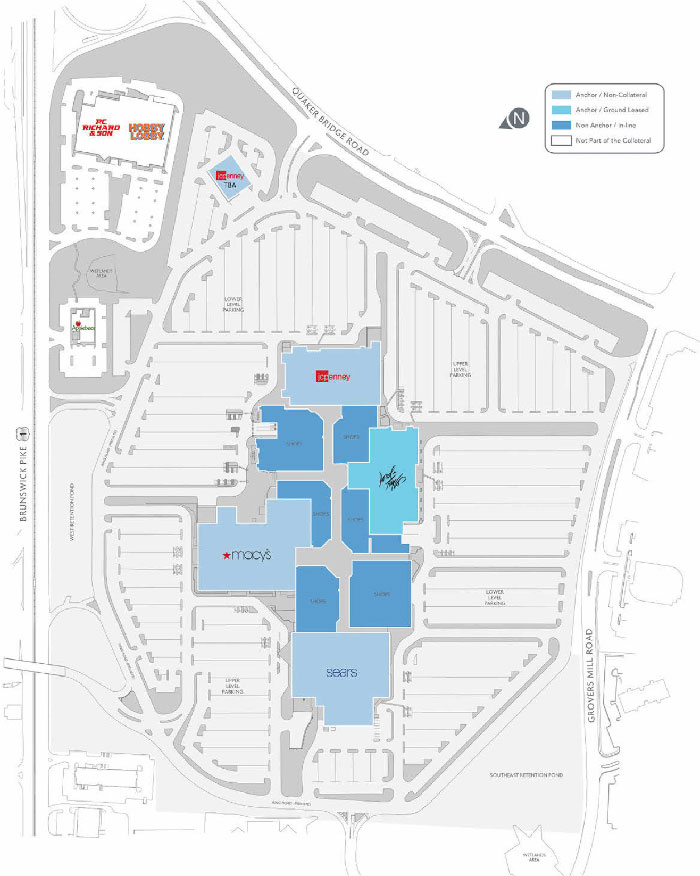 |
THE INFORMATION IN THIS TERM SHEET IS NOT COMPLETE AND MAY BE AMENDED PRIOR TO THE TIME OF SALE. THIS TERM SHEET IS NOT AN OFFER TO SELL THESE SECURITIES AND IT IS NOT A SOLICITATION OF AN OFFER TO BUY THESE SECURITIES IN ANY JURISDICTION WHERE THE OFFER OR SALE IS NOT PERMITTED.
| 61 |
Mortgage Loan No. 3 — Quaker Bridge Mall
| Mortgage Loan Information | Property Information | |||
| Mortgage Loan Seller(1): | Column | Single Asset / Portfolio: | Single Asset | |
| Original Principal Balance(2): | $66,666,667 | Title: | Fee | |
| Cut-off Date Principal Balance(2): | $66,666,667 | Property Type - Subtype: | Retail – Super Regional | |
| % of Pool by IPB: | 8.7% | Net Rentable Area (SF)(5): | 357,221 | |
| Loan Purpose: | Recapitalization | Location: | Lawrenceville, NJ | |
| Borrower: | Quaker Bridge Mall, LLC | Year Built / Renovated: | 1976 / 2011-2013 | |
| Sponsor: | Simon Property Group, L.P. | Occupancy(6): | 84.2% | |
| Interest Rate(2): | 4.2000% | Occupancy Date: | 2/23/2016 | |
| Note Date: | 4/5/2016 | Number of Tenants: | 89 | |
| Maturity Date: | 5/1/2026 | 2013 NOI(7): | $10,630,286 | |
| Interest-only Period: | 120 months | 2014 NOI(7): | $12,803,117 | |
| Original Term: | 120 months | 2015 NOI(7): | $14,158,089 | |
| Original Amortization: | None | TTM NOI: | N/A | |
| Amortization Type: | Interest Only | UW Economic Occupancy: | 92.2% | |
| Call Protection(3): | L(24),Def(89),O(7) | UW Revenues(6)(8): | $26,178,278 | |
| Lockbox(4): | Hard | UW Expenses: | $10,914,624 | |
| Additional Debt: | Yes | UW NOI(6)(8): | $15,263,654 | |
| Additional Debt Balance: | $113,333,333 | UW NCF(6)(8): | $14,622,449 | |
| Additional Debt Type: | Pari Passu, B-Note | Appraised Value / Per SF: | $333,000,000 / $932 | |
| Additional Future Debt Permitted: | No | Appraisal Date: | 3/4/2016 | |
| Escrows and Reserves(9) | Financial Information(2) | |||||
| Initial | Monthly | Initial Cap | Cut-off Date Loan / SF: | $420 | ||
| Taxes: | $0 | Springing | N/A | Maturity Date Loan / SF: | $420 | |
| Insurance: | $0 | Springing | N/A | Cut-off Date LTV: | 45.0% | |
| Replacement Reserves: | $0 | Springing | $214,345 | Maturity Date LTV: | 45.0% | |
| TI/LC: | $38,699 | $38,699 | $1,393,175 | UW NCF DSCR: | 2.29x | |
| UW NOI Debt Yield: | 10.2% | |||||
| Sources and Uses | ||||||||
| Sources | Proceeds | % of Total | Uses | Proceeds | % of Total | |||
| Mortgage Loan (A Notes)(2) | $150,000,000 | 72.3 | % | JV Equity Purchase(10) | $132,372,382 | 63.8 | % | |
| Mortgage Loan (B-Notes)(2) | 30,000,000 | 14.5 | Payoff Existing Debt | 72,755,237 | 35.1 | |||
| Sponsor Equity | 27,451,913 | 13.2 | Closing Costs | 2,285,595 | 1.1 | |||
| Reserves | 38,699 | 0.0 | ||||||
| Total Sources | $207,451,913 | 100.0 | % | Total Uses | $207,451,913 | 100.0 | % | |
| (1) | The Quaker Bridge Mall Whole Loan was co-originated by Column Financial, Inc. and JPMorgan Chase Bank, National Association. |
| (2) | The Quaker Bridge Mall loan is part of a whole loan evidenced by twopari passu senior notes, with an aggregate original principal balance of $150.0 million (the “A-Notes”) and two subordinate notes, with an aggregate original principal balance of $30.0 million (the “B-Notes”). The financial information presented in the chart above reflects the cut-off date balance of the $150.0 million senior portion of the Quaker Bridge Mall Whole Loan, exclusive of the $30.0 million B-Notes. The interest rate above reflects the interest rate on the A-Notes. The interest rate on the B-Notes is 6.0000%. |
| (3) | The lockout period will be at least 24 payment dates beginning with and including the first payment date of June 1, 2016. Defeasance of the full $180.0 million Quaker Bridge Mall Whole Loan is permitted after the earlier to occur of (i) June 1, 2019 and (ii) the date that is two years from the closing date of the securitization that includes the note to be last securitized (the “REMIC Prohibition Period”) (which is expected to be this securitization transaction). If the REMIC Prohibition Period has not expired by June 1, 2019, the borrower is permitted to prepay the Quaker Bridge Mall Whole Loan in whole, but not in part, with the payment of a yield maintenance premium. |
THE INFORMATION IN THIS TERM SHEET IS NOT COMPLETE AND MAY BE AMENDED PRIOR TO THE TIME OF SALE. THIS TERM SHEET IS NOT AN OFFER TO SELL THESE SECURITIES AND IT IS NOT A SOLICITATION OF AN OFFER TO BUY THESE SECURITIES IN ANY JURISDICTION WHERE THE OFFER OR SALE IS NOT PERMITTED.
| 62 |
Mortgage Loan No. 3 — Quaker Bridge Mall
| (4) | For a more detailed description of the lockbox, please refer to “Lockbox/Cash Management” below |
| (5) | Net Rentable Area (SF) is not inclusive of square footage associated with the Macy’s, Sears and J.C. Penney boxes. The Macy’s, Sears and J.C. Penney land and improvements are tenant owned with no attributable base rent. Additionally, Net Rentable Area (SF) is not inclusive of square footage associated with the Lord & Taylor box, for which the tenant owns their improvements but not the related land, which is ground leased from the borrower. The ground rent attributable to the Lord & Taylor space is approximately $72,000 per year through March 2046 and is included in UW Revenues. |
| (6) | Occupancy, UW Revenues, UW NOI and UW NCF include space leased by Torrid (2,150 SF), The Body Shop (1,100 SF), Lids (1,016 SF) and 30 Burgers (862 SF), accounting for a combined underwritten base rent of $203,185, for which the tenants have signed leases but are not yet in occupancy. Torrid, The Body Shop, Lids and 30 Burgers are expected to take possession and commence paying rent for their respective spaces in July 2016, June 2016, May 2016 and July 2016, respectively. Occupancy, UW Revenues, UW NOI and UW NCF include space leased by Justice (4,052 SF), Pearle Vision Express (2,875 SF) and Gymboree (1,400 SF), accounting for a combined underwritten base rent of $252,270, for which the tenants have leases out for signature. Justice, Pearle Vision Express and Gymboree are already in occupancy and paying rent. |
| (7) | The increase in 2013 NOI to 2015 NOI is associated with new and renewed leases post-2013 renovation. |
| (8) | UW Revenues includes $545,131 in underwritten base rent associated with in-line temporary tenants and $602,576 in underwritten base rent associated with temporary kiosks and carts. |
| (9) | For a more detailed description of escrows and reserves, please refer to “Escrows and Reserves” below. |
| (10) | The JV Equity Purchase represents the loan sponsor’s acquisition of the remaining 50% of the Quaker Bridge Mall from RREEF America L.L.C. |
The Loan. The Quaker Bridge Mall loan, which is part of a larger split whole loan, is a first mortgage loan secured by the fee interest in a 357,221 SF super regional mall located in Lawrenceville, New Jersey. The loan has a 10-year term and is interest-only for the full term of the loan. The whole loan was co-originated by JPMorgan Chase Bank, National Association and Column Financial, Inc. and has an outstanding principal balance as of the cut-off date of $180.0 million (the “Quaker Bridge Mall Whole Loan”), and is comprised of twopari passu senior notes, Note A-1 and Note A-2, with an aggregate outstanding principal balance as of the cut-off date of $150.0 million, and two subordinate B-Notes with an aggregate outstanding principal balance as of the cut-off date of $30.0 million (the “Quaker Bridge Mall Subordinate Companion Loan”). Note A-2, which has an outstanding principal balance as of the cut-off date of approximately $66.7 million, is being contributed to the CSAIL 2016-C6 Commercial Mortgage Trust. Note A-1, which, following a control appraisal period with respect to Note B-1, is the controlling note and has an outstanding principal balance as of the cut-off date of approximately $83.3 million, is expected to be contributed to the JPMDB 2016-C2 Trust. The Quaker Bridge Mall Whole Loan is expected to be serviced pursuant to the JPMDB 2016-C2 pooling and servicing agreement. The Quaker Bridge Mall Subordinate Companion Loan has been sold to Teachers Insurance and Annuity Association of America. Under the related intercreditor agreement, prior to a control appraisal period with respect to the Quaker Bridge Mall Subordinate Companion Loan, Note B-1 is the controlling note and, under certain circumstances, the holder of Note B-1 of the Quaker Bridge Mall Subordinate Companion Loan will have the right to approve certain major decisions with respect to the Quaker Bridge Mall Whole Loan, certain cure and purchase option rights, and the right to replace the related special servicer with or without cause. After a control appraisal period occurs with respect to the Quaker Bridge Mall Subordinate Companion Loan, Note A-1 is the controlling note and the holder of Note A-1, which is expected to be the trustee of the JPMDB 2016-C2 Trust (or, prior to the occurrence and continuance of a control termination event under the JPMDB 2016-C2 pooling and servicing agreement, the directing JPMDB 2016-C2 certificateholder), will be entitled to exercise certain of the rights of the holder of the Note B-1 of the Quaker Bridge Mall Subordinate Companion Loan with respect to the Quaker Bridge Mall Whole Loan (other than the cure and purchase option rights); however, the holder of the Quaker Bridge Mall loan will be entitled, under certain circumstances, to be consulted with respect to certain major decisions.
THE INFORMATION IN THIS TERM SHEET IS NOT COMPLETE AND MAY BE AMENDED PRIOR TO THE TIME OF SALE. THIS TERM SHEET IS NOT AN OFFER TO SELL THESE SECURITIES AND IT IS NOT A SOLICITATION OF AN OFFER TO BUY THESE SECURITIES IN ANY JURISDICTION WHERE THE OFFER OR SALE IS NOT PERMITTED.
| 63 |
Mortgage Loan No. 3 — Quaker Bridge Mall
Whole Loan Note Summary
| Original Balance | Cut-off Date Balance | Note Holder | Controlling Piece | |
| Note A-2 | $66,666,667 | $66,666,667 | CSAIL 2016-C6 | No |
| Note A-1 | 83,333,333 | 83,333,333 | JPMDB 2016-C2 | No |
| Notes B-1, B-2 | 30,000,000 | 30,000,000 | Teachers Insurance and Annuity Association of America | Yes(1) |
| Total | $180,000,000 | $180,000,000 |
| (1) | Only the holder of Note B-1 will be entitled to exercise control prior to a control appraisal period. |
The Borrower. The borrowing entity for the Quaker Bridge Mall Whole Loan is Quaker Bridge Mall, LLC, a Delaware limited liability company and special purpose entity.
The Sponsor. The borrower is indirectly owned by a 50/50 joint venture between Simon Property Group, L.P. (“Simon”) and Institutional Mall Investors (“IMI”). Simon is a wholly-owned subsidiary of Simon Property Group Inc., a publicly traded REIT (NYSE: SPG, S&P: A, Fitch: NR, Moody’s: A3) that is focused on retail property ownership and management. Simon is the largest publicly traded owner, operator and developer of retail assets in the world. IMI is a co-investment venture owned by an affiliate of Miller Capital Advisory, Inc. and CalPERS, the nation’s largest public pension fund. Simon serves as the nonrecourse carve-out guarantor for the Quaker Bridge Mall Whole Loan, subject to the borrower’s right to replace the guarantor with a replacement guarantor in accordance with the loan documents. The liability of Simon (or any guarantor that replaces Simon in accordance with the loan agreement) under the nonrecourse carve-out guaranty is capped at $36.0 million plus reasonable collection costs.
The Quaker Bridge Mall Whole Loan proceeds, together with approximately $27.5 million of newly contributedcash-equity, were used to retire approximately $72.8 million of existing debt, acquire a 50% ownership stake sold by RREEF America L.L.C, the selling JV partner, and transfer such 50% ownership stake to IMI. The implied recapitalized value of the property in connection with the purchase and sale of the ownership share was approximately $337.5 million ($945 PSF).
The Property.Quaker Bridge Mall is an approximately 1.1 million SF, regional mall located in Lawrenceville, New Jersey. Approximately 357,221 SF of the Quaker Bridge Mall serves as collateral for the Quaker Bridge Mall Whole Loan. Quaker Bridge Mall was originally built in 1976 and was last renovated in 2011-2013. In 2013, the loan sponsor completed an approximately $65.6 million renovation of the property, which included the Quaker Bridge Mall’s entrances, exterior, interior finishes, and general aesthetics. The renovation also included new elevators and escalators and a new 6,335 SF food court. The sponsor’s 2013 renovation encompassed a full-scale overhaul of the property, with the intent of re-branding and re-tenanting with a focus on a new class of customer and occupant. Since February 1, 2014, leasing activity has included 30 new and renewal leases (84,363 SF, 23.6% of collateral net rentable area) signed at a weighted average underwritten rent of $33.65 PSF. Tenants having joined since the 2013 renovation include Apple (9,000 SF), American Eagle Outfitters (6,362 SF) and The Finish Line (4,500 SF). The sponsor has been successful in executing its plan at the property as evidenced by the substantial increase in sales since 2013. The property’s total comparable collateral in-line sales for all tenants has grown from approximately $331 PSF in 2012 to $392, $515 and $697 PSF for 2013, 2014 and 2015, respectively. Total Quaker Bridge Mall sales have grown consistently, from approximately $138.1 million in 2012 to approximately $252.1 million in 2015. According to the appraisal, the nearby Princeton market is an area of upper income households and high wage employment, with an estimated average household income within a 10-, 15- and 20-mile radius of the property of $111,156, $114,671 and $110,582, respectively. The loan sponsor has made considerable effort to increase marketability beyond the immediate Lawrenceville area, leveraging the recent 2013 renovation with a focus on the Princeton market.
The mall is anchored by Macy’s, Sears, J.C. Penney and Lord & Taylor. Macy’s, Sears and J.C. Penney own their own improvements and underlying land and are not collateral for the Quaker Bridge Mall Whole Loan. Lord & Taylor owns its improvements but not the related land, which is ground leased from the borrower. Ground rent attributable to the Lord & Taylor
THE INFORMATION IN THIS TERM SHEET IS NOT COMPLETE AND MAY BE AMENDED PRIOR TO THE TIME OF SALE. THIS TERM SHEET IS NOT AN OFFER TO SELL THESE SECURITIES AND IT IS NOT A SOLICITATION OF AN OFFER TO BUY THESE SECURITIES IN ANY JURISDICTION WHERE THE OFFER OR SALE IS NOT PERMITTED.
| 64 |
Mortgage Loan No. 3 — Quaker Bridge Mall
space is approximately $72,000 per year through March 2046. Quaker Bridge Mall also has approximately 5,449 surface parking spaces resulting in a parking ratio of approximately 5.03 spaces per 1,000 SF of net rentable area including anchor space.
Non-Owned Anchors
| Anchor | Ratings Moody’s/S&P/Fitch(1) | Net Rentable Area (SF) | Sales(2) | Sales PSF(2) |
| Macy’s(3) | Baa2/BBB/BBB | 212,663 | $46,000,000 | $216 |
| Sears(3)(4) | Caa3/CCC+/C | 171,141 | $19,300,000 | $113 |
| J.C. Penney(3)(4) | B3/B/B | 151,491 | $16,100,000 | $106 |
| Lord & Taylor(5) | B1/B+/B+ | 151,465 | $31,509,264 | $208 |
| (1) | Ratings provided are for the parent company of the entity listed in the “Anchor” field whether or not the parent company guarantees the lease. |
| (2) | Macy’s, Sears and J.C. Penney based on the loan sponsor’s 2014 estimate. Lord & Taylor based on 2015 reported sales. |
| (3) | The Macy’s, Sears and J.C. Penney anchor parcels are not part of the collateral. |
| (4) | The Net Rentable Area (SF) for Sears and J.C. Penney do not include non-income producing square footage of 26,262 and 14,344, respectively. |
| (5) | Lord & Taylor owns its improvements but the related pad site is ground leased from the borrower. The ground rent attributable to the Lord & Taylor space is approximately $72,000 per year through March 2046. |
As of February 23, 2016, the property was 84.2% leased by 89 tenants. The mall, inclusive of the non-owned anchor tenants, is 94.8% occupied (97.5% including temporary tenants). The property’s tenant offering is broad with a range of higher-end and mass market tenants represented. In addition to its anchors, the property’s in-line tenants largely consist of national retailers such as Apple, American Eagle Outfitters, AT&T, Coach, Foot Locker, H&M, Forever 21 and Victoria’s Secret. The largest collateral tenant, Forever 21, leases 26,902 SF (7.5% of the collateral net rentable area) through the end of January 2023. As of February 23, 2016, Forever 21 contributes 7.9% of the total underwritten base rent and produced approximately $180 PSF in sales in 2015. The second largest collateral tenant, Old Navy, leases 18,295 SF (5.1% of the collateral net rentable area) through 2022. As of February 23, 2016, Old Navy contributes 5.0% of the total underwritten base rent and produced approximately $314 PSF in sales in 2015. The third largest collateral tenant, H&M, leases 17,418 SF (4.9% of the collateral net rentable area) through the end of January 2023. As of February 23, 2016, H&M contributes 3.1% of the total underwritten base rent and produced approximately $293 PSF in sales in 2015.
Historical and Current Occupancy(1)
| 2012(2) | 2013(2) | 2014(2) | 2015(2) | Current(3) |
| 71.5% | 83.4% | 84.3% | 81.2% | 84.2% |
| (1) | Includes collateral tenants only. |
| (2) | Historical occupancies are as of December 31 of each respective year. |
| (3) | Current Occupancy is based on the underwritten rent roll as of February 23, 2016 and includes space leased by Torrid (2,150 SF), The Body Shop (1,100 SF), Lids (1,016 SF) and 30 Burgers (862 SF), accounting for a combined underwritten base rent of $203,185, for which the tenants have signed leases but are not yet in occupancy. The tenants are expected to take possession of and commence paying rent for their spaces in July 2016, June 2016, May 2016 and July 2016, respectively. Current Occupancy includes space leased by Justice (4,052 SF), Pearle Vision Express (2,875 SF), and Gymboree (1,400 SF), accounting for a combined underwritten base rent of $252,270, for which the tenants have leases out for signature. Justice, Pearle Vision Express and Gymboree are already in occupancy and paying rent. |
THE INFORMATION IN THIS TERM SHEET IS NOT COMPLETE AND MAY BE AMENDED PRIOR TO THE TIME OF SALE. THIS TERM SHEET IS NOT AN OFFER TO SELL THESE SECURITIES AND IT IS NOT A SOLICITATION OF AN OFFER TO BUY THESE SECURITIES IN ANY JURISDICTION WHERE THE OFFER OR SALE IS NOT PERMITTED.
| 65 |
Mortgage Loan No. 3 — Quaker Bridge Mall
Historical In-line Sales and Occupancy Costs(1)
| 2012 | 2013 | 2014 | 2015 | |
| In-line Sales PSF(2) | $331 | $392 | $515 | $697 |
| Occupancy Costs(3) | 17.5% | 16.2% | 12.9% | 11.3% |
| (1) | In-line Sales PSF and Occupancy Costs are for comparable tenants less than 10,000SF that reported full year sales. |
| (2) | In-line Sales PSF excluding Apple are $331, $392, $515 and $541 for 2012, 2013, 2014 and 2015, respectively. |
| (3) | Occupancy Costs excluding Apple are 17.5%, 16.2%, 12.9% and 14.9% for 2012, 2013, 2014 and 2015, respectively. |
The Market.Quaker Bridge Mall is located in central New Jersey near the New Jersey Turnpike and State Route 1, about 30 miles southwest of New York City and 50 miles northeast of Philadelphia. As of year end 2015, central New Jersey is home to approximately 2.9 million people with an estimated population within a 10-, 15- and 20-mile radius of the property of 466,489, 812,071 and 1,495,037 people, respectively. According to the appraisal, competitive properties in the area maintained a vacancy rate of 3.6%. The appraisal does not identify any new or proposed directly competitive properties in the area. According to the appraisal, the property’s current primary and secondary competition consists of four properties detailed in the table below.
Competitive Set Summary(1)
| Property | Year Built / Renovated | Total GLA (SF) | Est. Occ. | Proximity (miles) | Anchor Tenants | ||
| Marketfair Mall | 1987 / 2015 | 246,000 | 98.0% | 1.0 | Barnes & Noble, Eastern Mountain Sports, United Artist Theatre, Pottery Barn | ||
| Nassau Park Pavilion | 1995 / 2005 | 1,106,302 | 100.0% | 0.5 | Sam’s Club, Target, Wal-Mart, Wegman’s, Home Depot, Kohl’s | ||
| Mercer Mall | 1976 / 2001 | 501,000 | 98.0% | 0.5 | Shop-Rite, Raymour & Flannigan | ||
| Oxford Valley Mall(2) | 1973 / 2006 | 1,331,000 | 83.0% | 15.0 | J.C. Penney, Macy’s, Sears | ||
| (1) | Source: Appraisal. |
| (2) | Oxford Valley Mall has a vacant anchor tenant. |
THE INFORMATION IN THIS TERM SHEET IS NOT COMPLETE AND MAY BE AMENDED PRIOR TO THE TIME OF SALE. THIS TERM SHEET IS NOT AN OFFER TO SELL THESE SECURITIES AND IT IS NOT A SOLICITATION OF AN OFFER TO BUY THESE SECURITIES IN ANY JURISDICTION WHERE THE OFFER OR SALE IS NOT PERMITTED.
| 66 |
Mortgage Loan No. 3 — Quaker Bridge Mall
Tenant Summary(1)
| Tenant | Ratings(2) Moody’s/S&P/Fitch | Net Rentable Area (SF) | % of Total NRA | Base Rent PSF | % of Total Base Rent | Most Recent Sales PSF(3) | Lease Expiration Date |
| Forever 21 | NA / NA / NA | 26,902 | 7.5% | $43.92 | 7.9% | $180 | 1/31/2023 |
| Old Navy | Baa2 / BBB- / BBB- | 18,295 | 5.1% | $40.93 | 5.0% | $314 | 3/31/2022 |
| H&M(4) | NA / NA / NA | 17,418 | 4.9% | $26.40 | 3.1% | $293 | 1/31/2023 |
| Victoria’s Secret | Ba1 / BB+ / BB+ | 12,149 | 3.4% | $42.00 | 3.4% | $632 | 1/31/2023 |
| New York & Company | NA / NA / NA | 11,015 | 3.1% | $16.70 | 1.2% | $112 | 1/31/2017 |
| Express/Express Men | NA / NA / NA | 10,515 | 2.9% | $35.72 | 2.5% | $435 | 1/31/2023 |
| Cheesecake Factory(5)(6) | NA / NA / NA | 9,123 | 2.6% | $19.32 | 1.2% | $966 | 1/31/2033 |
| Apple(7) | Aa1 / AA+ / NA | 9,000 | 2.5% | $22.00 | 1.3% | $3,280 | 6/30/2023 |
| BRIO Tuscan Grille(8) | NA / NA / NA | 7,437 | 2.1% | $37.00 | 1.9% | $392 | 12/31/2023 |
| American Eagle Outfitters | NA / NA / NA | 6,362 | 1.8% | $35.37 | 1.5% | $506 | 1/31/2024 |
| (1) | Based on the underwritten rent roll. |
| (2) | Ratings provided are for the parent company of the entity listed in the “Tenant” field whether or not the parent company guarantees the lease. |
| (3) | Most Recent Sales PSF is as of February 23, 2016. |
| (4) | H&M has the right to terminate its lease within one year beginning November 15, 2016 if its gross sales do not equal at least $4,369,050 (approximately $251 PSF) with 60 days written notice and payment of a termination fee of $582,540 (approximately $33 PSF) prorated to the unamortized number of months. Such termination will be effective one year after delivery of such notice. |
| (5) | Cheesecake Factory is expected to begin paying a Base Rent PSF of $30.00 effective October 1, 2016. The tenant currently pays 2.0% percentage rent. |
| (6) | Cheesecake Factory has the right to terminate its lease if (i) between September 19, 2017 and September 19, 2020 if its gross sales do not equal at least $6,000,000 (approximately $658 PSF) or, (ii) during any lease year after September 19, 2020, the gross sales do not equal at least $7,000,000 (approximately $767 PSF) with written notice provided within 90 days after the end of the applicable lease year and payment of a termination fee of $150 PSF prorated to the unamortized number of months. Such termination will be effective 365 days after delivery of such notice. |
| (7) | Apple has the right to terminate its lease within one year beginning June 29, 2017 if its gross sales do not equal at least $14,000,000 (approximately $1,556 PSF) with written notice provided within 60 days after June 29, 2017 and payment of a termination fee of $1,350,000 (approximately $150 PSF) prorated to the unamortized number of months. Such termination will be effective as of June 29, 2018. |
| (8) | BRIO Tuscan Grille has the right to terminate its lease within one year beginning November 14, 2018 if its gross sales do not equal at least $3,500,000 (approximately $471 PSF) with written notice provided within 30 days after November 14, 2018 and payment of a termination fee of $1,574,078 (approximately $212 PSF) prorated to the unamortized number of months. Such termination will be effective 180 days after delivery of such notice. |
THE INFORMATION IN THIS TERM SHEET IS NOT COMPLETE AND MAY BE AMENDED PRIOR TO THE TIME OF SALE. THIS TERM SHEET IS NOT AN OFFER TO SELL THESE SECURITIES AND IT IS NOT A SOLICITATION OF AN OFFER TO BUY THESE SECURITIES IN ANY JURISDICTION WHERE THE OFFER OR SALE IS NOT PERMITTED.
| 67 |
Mortgage Loan No. 3 — Quaker Bridge Mall
Lease Rollover Schedule(1)(2)
| Year | Number of Leases Expiring(3) | Net Rentable Area Expiring(4) | % of NRA Expiring | Base Rent Expiring | % of Base Rent Expiring | Cumulative Net Rentable Area Expiring | Cumulative % of NRA Expiring | Cumulative Base Rent Expiring | Cumulative % of Base Rent Expiring |
| Vacant | NAP | 56,282 | 15.8% | NAP | NAP | 56,282 | 15.8% | NAP | NAP |
| MTM | 1 | 2,875 | 0.8 | $78,000 | 0.6% | 59,157 | 16.6% | $78,000 | 0.6% |
| 2016 | 1 | 960 | 0.3 | 64,925 | 0.5 | 60,117 | 16.8% | $142,925 | 1.1% |
| 2017 | 2 | 11,165 | 3.1 | 271,789 | 2.1 | 71,282 | 20.0% | $414,714 | 3.3% |
| 2018 | 7 | 11,711 | 3.3 | 732,941 | 5.8 | 82,993 | 23.2% | $1,147,655 | 9.0% |
| 2019 | 3 | 2,365 | 0.7 | 210,666 | 1.7 | 85,358 | 23.9% | $1,358,321 | 10.7% |
| 2020 | 3 | 8,194 | 2.3 | 218,682 | 1.7 | 93,552 | 26.2% | $1,577,003 | 12.4% |
| 2021 | 2 | 3,080 | 0.9 | 134,872 | 1.1 | 96,632 | 27.1% | $1,711,876 | 13.4% |
| 2022 | 14 | 54,880 | 15.4 | 2,635,201 | 20.7 | 151,512 | 42.4% | $4,347,077 | 34.1% |
| 2023 | 26 | 121,827 | 34.1 | 5,304,607 | 41.7 | 273,339 | 76.5% | $9,651,684 | 75.8% |
| 2024 | 17 | 48,862 | 13.7 | 1,981,285 | 15.6 | 322,201 | 90.2% | $11,632,970 | 91.4% |
| 2025 | 6 | 16,306 | 4.6 | 454,782 | 3.6 | 338,507 | 94.8% | $12,087,752 | 94.9% |
| 2026 & Beyond(4) | 8 | 18,714 | 5.2 | 645,143 | 5.1 | 357,221 | 100.0% | $12,732,895 | 100.0% |
| Total | 90 | 357,221 | 100.0% | $12,732,895 | 100.0% |
| (1) | Based on the underwritten rent roll. |
| (2) | Lease Rollover Schedule is not inclusive of the square footage associated with the Macy’s, Sears and J.C. Penney boxes. The Macy’s, Sears and J.C. Penney land and improvements are tenant owned with no attributable base rent. |
| (3) | 2022 includes two leases for Old Navy which both expire in 2022. |
| (4) | 2026 & Beyond Net Rentable Area Expiring represents owned collateral only and is not inclusive of the square footage associated with the Lord & Taylor box, for which the tenant owns its improvements but not the related land, which is ground leased from the borrower. The ground rent attributable to the Lord & Taylor space is approximately $72,000 per year through March 2046 and is included in 2026 & Beyond Base Rent Expiring. |
THE INFORMATION IN THIS TERM SHEET IS NOT COMPLETE AND MAY BE AMENDED PRIOR TO THE TIME OF SALE. THIS TERM SHEET IS NOT AN OFFER TO SELL THESE SECURITIES AND IT IS NOT A SOLICITATION OF AN OFFER TO BUY THESE SECURITIES IN ANY JURISDICTION WHERE THE OFFER OR SALE IS NOT PERMITTED.
| 68 |
Mortgage Loan No. 3 — Quaker Bridge Mall
Operating History and Underwritten Net Cash Flow
| 2013 | 2014 | 2015 | Underwritten | PSF | %(1) | |
| Rents in Place(2)(3) | $9,680,777 | $11,636,486 | $11,942,767 | $12,732,895 | $35.64 | 46.3% |
| Vacant Income | 0 | 0 | 0 | 2,132,397 | 5.97 | 7.8% |
| Gross Potential Rent | $9,680,777 | $11,636,486 | $11,942,767 | $14,865,292 | $41.61 | 54.1% |
| CAM | 3,748,190 | 4,847,153 | 5,306,450 | 5,796,716 | 16.23 | 21.1% |
| Utilities | 2,466,316 | 3,018,040 | 2,992,884 | 2,917,433 | 8.17 | 10.6% |
| Real Estate | 1,135,210 | 2,132,193 | 2,201,022 | 2,334,385 | 6.53 | 8.5% |
| Percentage Rent | 347,853 | 277,760 | 318,826 | 291,416 | 0.82 | 1.1% |
| Other Rental Storage | 1,422,207 | 1,307,106 | 1,540,390 | 1,281,739 | 3.59 | 4.7% |
| Net Rental Income | $18,800,553 | $23,218,738 | $24,302,339 | $27,486,981 | $76.95 | 100.0% |
| (Vacancy/Collection Loss) | (41,561) | (50,018) | (32,933) | (2,132,397) | (5.97) | (7.8)% |
| Other Income(4) | 943,612 | 1,033,730 | 919,736 | 823,694 | 2.31 | 3.0% |
| Effective Gross Income | $19,702,604 | $24,202,450 | $25,189,142 | $26,178,278 | $73.28 | 95.2% |
| Total Expenses | $9,072,318 | $11,399,333 | $11,031,053 | $10,914,624 | $30.55 | 41.7% |
| Net Operating Income | $10,630,286 | $12,803,117 | $14,158,089 | $15,263,654 | $42.73 | 58.3% |
| Total TI/LC, Capex/RR | 0 | 0 | 0 | 641,205 | 1.79 | 2.4% |
| Net Cash Flow | $10,630,286 | $12,803,117 | $14,158,089 | $14,622,449 | $40.93 | 55.9% |
| (1) | % column represents percent of Net Rental Income for all revenue lines and percent of Effective Gross Income for the remainder of fields. |
| (2) | Underwritten Rents in Place includes space leased by Torrid (2,150 SF), The Body Shop (1,100 SF), Lids (1,016 SF) and 30 Burgers (862 SF), accounting for a combined underwritten base rent of $203,185, for which the tenants have signed leases but are not yet in occupancy. The tenants are expected to take possession of and commence paying rent for their spaces in July 2016, June 2016, May 2016 and July 2016, respectively. Underwritten Rents in Place include space leased by Justice (4,052 SF), Pearle Vision Express (2,875 SF) and Gymboree (1,400 SF), accounting for a combined Underwritten Rent in Place of $252,270, for which the tenants have leases out for signature. Justice, Pearle Vision Express and Gymboree are already in occupancy and paying rent. |
| (3) | The Macy’s, Sears and J.C. Penney land and improvements are tenant owned with no attributable base rent, and thus are not included in the Rents in Place. Ground rent attributable to the Lord & Taylor space is approximately $72,000 per year through March 2046, which is included in the Rents in Place. |
| (4) | Underwritten Other Income includes promotion reimbursements, media reimbursements and miscellaneous income. |
Property Management. The property is managed by Simon Management Associates, LLC, an affiliate of the loan sponsor. The property management agreement was effective as of February 1, 2016 with an initial term through December 31, 2023, with one five year renewal option and then consecutive automatic one-year renewal options unless terminated by the owner or manager in accordance with the management agreement.
Escrows and Reserves. At origination, the borrower deposited into escrow approximately $38,699 for tenant improvement and leasing commissions.
Tax Escrows -The requirement for the borrower to make monthly deposits into the tax escrow is waived so long as (i) there is no event of default, (ii) no DSCR Trigger Event (as defined below) exists and (iii) the borrower does not (a) fail to pay all taxes prior to the assessment of any late payment penalty and the date that such taxes become delinquent or (b) fail to provide the lender with satisfactory evidence that taxes have been paid prior to the assessment of any late payment penalty and the date that such taxes become delinquent upon request.
A “DSCR Trigger Event” means the period commencing on the date when the debt service coverage ratio (as calculated in the loan documents) based on the trailing four calendar quarters falls below 1.30x for two consecutive calendar quarters.
Insurance Escrows -The requirement for the borrower to make monthly deposits to the insurance escrow is waived so long as (i) no event of default exists and (ii) the borrower provides satisfactory evidence that the property is insured under an acceptable blanket policy in accordance with the loan documents.
Replacement Reserves -The requirement for the borrower to make monthly deposits to the replacement reserve account is waived so long as no DSCR Trigger Event exists and there is no event of default. Following the occurrence and during the continuance
THE INFORMATION IN THIS TERM SHEET IS NOT COMPLETE AND MAY BE AMENDED PRIOR TO THE TIME OF SALE. THIS TERM SHEET IS NOT AN OFFER TO SELL THESE SECURITIES AND IT IS NOT A SOLICITATION OF AN OFFER TO BUY THESE SECURITIES IN ANY JURISDICTION WHERE THE OFFER OR SALE IS NOT PERMITTED.
| 69 |
Mortgage Loan No. 3 — Quaker Bridge Mall
of a DSCR Trigger Event or an event of default, the borrower is required to deposit $5,954 per month (approximately $0.20 PSF annually) for replacement reserves. The reserve is subject to a cap of $214,345 (approximately $0.60 PSF).
TI/LC Reserves -On a monthly basis, the borrower is required to deposit approximately $38,699 (approximately $1.30 PSF annually) for TI/LC reserves. The TI/LC reserve is subject to a cap of $1,393,175 (approximately $3.90 PSF). If (i) no event of default has occurred and is continuing and (ii) no DSCR Trigger Event exists, the borrower has the right to provide a guaranty from Simon or any permitted replacement guarantor under the loan documents in lieu of making monthly deposits into the TI/LC reserve. Upon the delivery of such guaranty, any amounts on deposit in the TI/LC reserve are required to be promptly disbursed to the borrower. As of the date hereof, the borrower has not provided a guaranty in connection with the monthly TI/LC deposits.
Lockbox / Cash Management. The loan is structured with a hard lockbox and springing cash management. Tenant direction letters are required to be sent to all tenants within 30 days after the origination date instructing them to deposit all rents and payments into the lockbox account controlled by the lender. The funds are then transferred to an account controlled by the borrower until the occurrence of a Cash Sweep Event (as defined below). During the continuance of a Cash Sweep Event, all rents are required to be swept weekly to a segregated cash management account and held in trust and for the benefit of the lender. The lender has a first priority security interest in the cash management account. Upon the occurrence and during the continuance of a Cash Sweep Event until the occurrence of a Cash Sweep Event Cure (as defined below), all excess cash after payment of debt service, required reserves and budgeted operating expenses are required to be held as additional security for the Quaker Bridge Mall Whole Loan.
A “Cash Sweep Event” means (i) the occurrence and continuance of an event of default, (ii) any bankruptcy action of the borrower or any affiliated property manager (provided that the property manager is not replaced with a qualified property manager in accordance with the loan documents within 60 days), or (iii) the occurrence of a DSCR Trigger Event.
A “Cash Sweep Event Cure” means (a) with respect to the Cash Sweep Event caused solely by an event of default, the lender accepts a cure of such event of default (which cure lender is not obligated to accept and may reject or accept in its sole and absolute discretion) provided that the lender has not accelerated the loan, moved for a receiver or commenced foreclosure proceedings, (b) with respect to the Cash Sweep Event caused solely by a bankruptcy action of the property manager, replacement of such manager with a qualified manager under a replacement management agreement within 60 days or such bankruptcy action of manager is discharged or dismissed within 90 days without any adverse consequences to the property or the loan, or (c) with respect to the Cash Sweep Event caused solely by the DSCR Trigger Event, the achievement of a debt service coverage ratio of 1.30x for two consecutive calendar quarters.
Additional Debt.$30.0 million of subordinate B-Notes were provided as part of the Quaker Bridge Mall Whole Loan. The B-notes have a 6.0000% coupon. The Quaker Bridge Mall Whole Loan has a Cut-Date LTV of 54.1%, an UW NCF DSCR of 1.78x and a UW NOI Debt Yield of 8.5%.
THE INFORMATION IN THIS TERM SHEET IS NOT COMPLETE AND MAY BE AMENDED PRIOR TO THE TIME OF SALE. THIS TERM SHEET IS NOT AN OFFER TO SELL THESE SECURITIES AND IT IS NOT A SOLICITATION OF AN OFFER TO BUY THESE SECURITIES IN ANY JURISDICTION WHERE THE OFFER OR SALE IS NOT PERMITTED.
| 70 |
Mortgage Loan No. 4 — Laurel Corporate Center
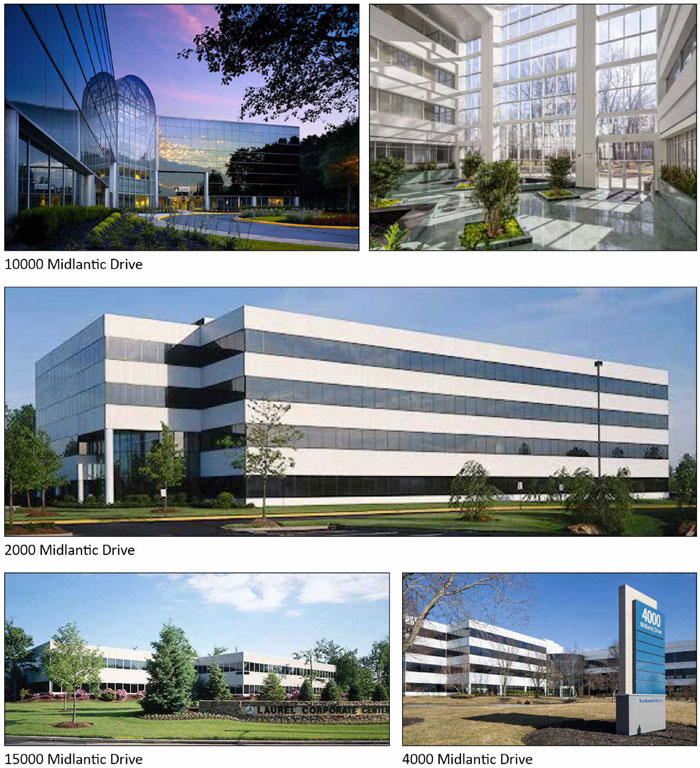
THE INFORMATION IN THIS TERM SHEET IS NOT COMPLETE AND MAY BE AMENDED PRIOR TO THE TIME OF SALE. THIS TERM SHEET IS NOT AN OFFER TO SELL THESE SECURITIES AND IT IS NOT A SOLICITATION OF AN OFFER TO BUY THESE SECURITIES IN ANY JURISDICTION WHERE THE OFFER OR SALE IS NOT PERMITTED.
| 71 |
Mortgage Loan No. 4 — Laurel Corporate Center
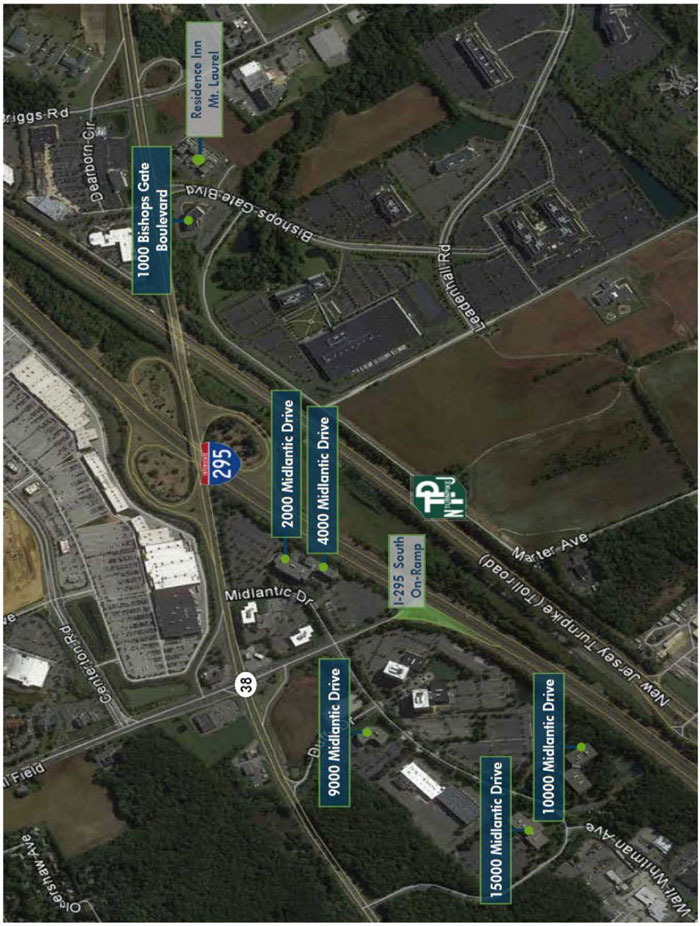
THE INFORMATION IN THIS TERM SHEET IS NOT COMPLETE AND MAY BE AMENDED PRIOR TO THE TIME OF SALE. THIS TERM SHEET IS NOT AN OFFER TO SELL THESE SECURITIES AND IT IS NOT A SOLICITATION OF AN OFFER TO BUY THESE SECURITIES IN ANY JURISDICTION WHERE THE OFFER OR SALE IS NOT PERMITTED.
| 72 |
Mortgage Loan No. 4 — Laurel Corporate Center
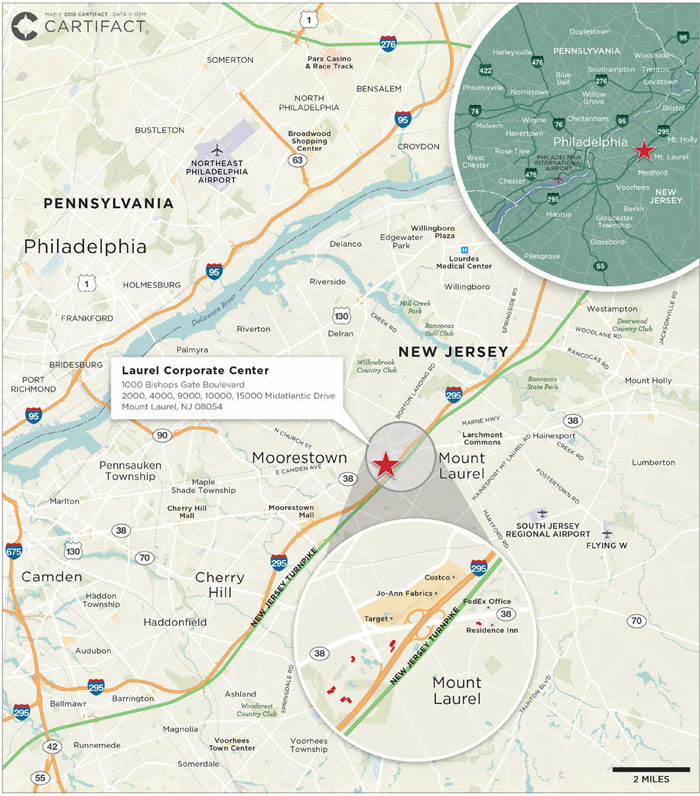
THE INFORMATION IN THIS TERM SHEET IS NOT COMPLETE AND MAY BE AMENDED PRIOR TO THE TIME OF SALE. THIS TERM SHEET IS NOT AN OFFER TO SELL THESE SECURITIES AND IT IS NOT A SOLICITATION OF AN OFFER TO BUY THESE SECURITIES IN ANY JURISDICTION WHERE THE OFFER OR SALE IS NOT PERMITTED.
| 73 |
Mortgage Loan No. 4 — Laurel Corporate Center
| Mortgage Loan Information | Property Information | |||
| Mortgage Loan Seller: | BNYM | Single Asset / Portfolio: | Portfolio of Five Properties | |
| Original Principal Balance: | $48,500,000 | Title: | Fee | |
| Cut-off Date Principal Balance: | $48,500,000 | Property Type - Subtype: | Office – Suburban | |
| % of Pool by IPB: | 6.3% | Net Rentable Area (SF): | 560,147 | |
| Loan Purpose: | Acquisition | Location: | Mount Laurel, NJ | |
| Borrower: | Laurel Corporate Center, LLC | Year Built / Renovated(2): | Various | |
| Sponsor: | Asher Roshanzamir | Occupancy: | 83.9% | |
| Interest Rate: | 5.1250% | Occupancy Date: | 3/31/2016 | |
| Note Date: | 12/29/2015 | Number of Tenants: | 37 | |
| Maturity Date: | 1/6/2026 | 2013 NOI: | $5,010,024 | |
| Interest-only Period: | 24 months | 2014 NOI: | $5,026,031 | |
| Original Term: | 120 months | 2015 NOI(3): | $4,685,769 | |
| Original Amortization: | 360 months | UW Economic Occupancy: | 83.4% | |
| Amortization Type: | IO-Balloon | UW Revenues: | $10,978,855 | |
| Call Protection: | L(28),Def(88),O(4) | UW Expenses: | $5,562,623 | |
| Lockbox(1): | Springing | UW NOI: | $5,416,232 | |
| Additional Debt: | No | UW NCF: | $4,876,011 | |
| Additional Debt Balance: | N/A | Appraised Value / Per SF(5)(6): | $64,800,000 / $116 | |
| Additional Debt Type: | N/A | Appraisal Date: | 9/8/2015 | |
| Additional Future Debt Permitted: | No | |||
| Escrows and Reserves (4) | Financial Information | |||||
| Initial | Monthly | Initial Cap | Cut-off Date Loan / SF: | $87 | ||
| Taxes: | $115,906 | $115,906 | N/A | Maturity Date Loan / SF: | $75 | |
| Insurance: | $0 | Springing | N/A | Cut-off Date LTV(5)(6): | 74.8% | |
| Replacement Reserves: | $1,947,494 | $11,671 | N/A | Maturity Date LTV(5)(6): | 65.0% | |
| TI/LC: | $3,592,892 | Springing | $2,000,000(6) | UW NCF DSCR: | 1.54x | |
| Free Rent Reserve: | $217,925 | N/A | N/A | UW NOI Debt Yield: | 11.2% | |
| Immediate Repairs: | $52,506 | N/A | N/A | |||
Sources and Uses
| Sources | Proceeds | % of Total | Uses | Proceeds | % of Total | |
| Mortgage Loan | $48,500,000 | 74.3% | Purchase Price | $56,500,000 | 86.6% | |
| Sponsor Equity | 16,761,951 | 25.7 | Upfront Reserve | 5,926,724 | 9.1 | |
| Closing Costs | 2,835,228 | 4.3 | ||||
| Total Sources | $65,261,951 | 100.0% | Total Uses | $65,261,951 | 100.0% |
| (1) | For a more detailed description of lockbox, please refer to “Lockbox / Cash Management” below. |
| (2) | Laurel Corporate Center is a 5-property portfolio. The individual buildings were constructed between 1981 and 2005, with four of the buildings renovated between 2014 and 2015. |
| (3) | Figure represents the trailing twelve month NOI ending October 31, 2015. |
| (4) | For a more detailed description of escrows and reserves, please refer to “Escrows and Reserves” below. |
| (5) | The appraised value of $64,800,000 is reflective of the value of the portfolio if sold in its entirety to a single buyer. The appraisal determined and appraised value on both a portfolio and individual basis. The concluded aggregate appraised value of the individual properties was $57,600,000, which would result in a Cut-off Date LTV of 84.2% and a Maturity Date LTV of 73.2%. |
| (6) | The “As-is” appraised value takes into account upgrades to be performed at the property for which $1.3 million was reserved at origination. |
THE INFORMATION IN THIS TERM SHEET IS NOT COMPLETE AND MAY BE AMENDED PRIOR TO THE TIME OF SALE. THIS TERM SHEET IS NOT AN OFFER TO SELL THESE SECURITIES AND IT IS NOT A SOLICITATION OF AN OFFER TO BUY THESE SECURITIES IN ANY JURISDICTION WHERE THE OFFER OR SALE IS NOT PERMITTED.
| 74 |
Mortgage Loan No. 4 — Laurel Corporate Center
The Loan. The Laurel Corporate Center loan is a $48.5 million first mortgage loan secured by the fee interests in a five-property portfolio located in Mount Laurel, New Jersey. The Laurel Corporate Center loan has a 10-year term and will amortize on a 30-year schedule after an initial 24-month interest only period.
The Borrower. The borrowing entity for the Laurel Corporate Center loan is Laurel Corporate Center, LLC, a Delaware limited liability company and special purpose entity. The borrowing entity is owned by Mr. Asher Roshanzamir and Zamir Equities, LLC.
The Sponsor. The Laurel Corporate Center loan’s sponsor and nonrecourse carve-out guarantor is Asher Roshanzamir, principal of Zamir Equities, LLC. Mr. Asher Roshanzamir has been an owner/operator of real estate since 1991. Since its inception Zamir Equities, LLC has held interests in several commercial and residential properties along the Eastern seaboard.
For information regarding recent legal settlements related to the sponsor but unrelated to the Laurel Corporate Center properties see “Description of the Mortgage Pool-Litigation and Other Considerations” in the Preliminary Prospectus.
The Properties.The Laurel Corporate Center portfolio is comprised of six Class A office buildings, with an aggregate of 560,147 SF, located in Mount Laurel, New Jersey. Five of those office buildings are located on 4 properties in the Laurel Corporate Center and one of the office buildings is located at the 1000 Bishops Gate property in the Bishops Gate Corporate Center. The Laurel Corporate Center and Bishops Gate Corporate Center are located on opposite sides of Route 38’s intersection with Interstate 295 at interchange 40 and each can be accessed by both eastbound and westbound traffic on Route 38. The individual buildings were constructed between 1981 and 2005, with four of the buildings renovated between 2014 and 2015. As of March 2016, the properties in the Laurel Corporate Center portfolio were 83.9% leased by 37 tenants.
Property Information
| Property | City | State | NRA SF(1) | Allocated Loan Amount ($) | Year Built / Renovated(2) | Appraisal Value(2) | Appraisal Date(2) | Occupancy | Average In Place Rent(3) | |||||||||
| 10000 Midlantic | Mount Laurel | NJ | 186,908 | $16,650,000 | 1990 / 2014 | $21,800,000 | 9/8/2015 | 96.6% | $12.64 | |||||||||
| 2000 & 4000 Midlantic(4) | Mount Laurel | NJ | 168,603 | 13,400,000 | 1981; 1989 / 2015 | 15,000,000 | 9/8/2015 | 90.8% | $12.38 | |||||||||
| 15000 Midlantic | Mount Laurel | NJ | 84,056 | 7,500,000 | 1991 / NA | 7,400,000 | 9/8/2015 | 41.6% | $15.13 | |||||||||
| 9000 Midlantic | Mount Laurel | NJ | 67,299 | 6,200,000 | 1989 / 2014 | 8,300,000 | 9/8/2015 | 99.8% | $15.47 | |||||||||
| 1000 Bishops Gate | Mount Laurel | NJ | 53,281 | 4,750,000 | 2005 / 2015 | 5,600,000 | 9/8/2015 | 64.6% | $13.85 | |||||||||
| Total/ Wtd. Avg.(5) | 560,147 | $48,500,000 | $64,800,000 | (5) | 83.9% | $13.39 | ||||||||||||
| (1) | Based on underwritten rent roll dated March 31, 2016. |
| (2) | Source: Appraisal. |
| (3) | Based on underwritten rent roll dated March 31, 2016; excludes vacant space. |
| (4) | 2000 & 4000 Midlantic properties are appraised together. The buildings are connected by a common corridor and are situated on one tax parcel. |
| (5) | The appraised value of $64,800,000 is reflective of the value of the portfolio if sold in its entirety to a single buyer. The appraisal determined an appraised value on both a portfolio and individual basis. The concluded aggregate appraised value of the individual properties was $57,600.000. |
10000 Midlantic
The 10000 Midlantic property is a 186,908 SF, 4-story Class A office building was built in 1990 and was constructed as a two building structure connected by a 4-story glass atrium. The property amenities include a café, fitness center, outdoor/atrium seating area, walking trail, pond views with wooded setting, loading dock, freight elevator, and 764 parking spaces. 10000 Midlantic is occupied by 17 tenants. The largest tenant, Towers Watson Delaware, leases 60,423 SF (32.3% of the property’s net rentable area, 10.8% of the portfolio) through February 2024. Towers Watson Delaware was formed in 2010 by the merger of Towers Perrin and Watson Wyatt Worldwide. The merger created the world’s largest employee benefits consulting firm by revenue. Towers Watson Delaware has over 15,000 associates in 35 countries around the world.
THE INFORMATION IN THIS TERM SHEET IS NOT COMPLETE AND MAY BE AMENDED PRIOR TO THE TIME OF SALE. THIS TERM SHEET IS NOT AN OFFER TO SELL THESE SECURITIES AND IT IS NOT A SOLICITATION OF AN OFFER TO BUY THESE SECURITIES IN ANY JURISDICTION WHERE THE OFFER OR SALE IS NOT PERMITTED.
| 75 |
Mortgage Loan No. 4 — Laurel Corporate Center
According to the appraisal, the 10000 Midlantic property’s office competitive set consists of the five office properties detailed in the table below.
Competitive Set Summary (1)
| Property | Year Built / Renovated | Total GLA (SF) | Sale Price PSF | Est. Occ. | Proximity (miles) | |||||||||
| 10000 Midlantic | 1990 / 2014 | 186,908 | $120.00 | 96.6 | % | N/A | ||||||||
| 100 Howard Boulevard | 1988 / N/A | 105,312 | $156.68 | 100.0 | % | 2.6 | ||||||||
| Bay Colony Executive Park | 1986 / N/A | 247,321 | $151.62 | 88.0 | % | 27.7 | ||||||||
| Liberty View Building | 1989 / N/A | 121,737 | $139.65 | 88.6 | % | 6.0 | ||||||||
| Atrium 1 | 1988 / 2008 | 99,668 | $113.38 | 97.6 | % | 3.2 | ||||||||
| Valleybrooke Corporate Center | 1985 / N/A | 279,934 | $135.39 | 100.0 | % | 32.8 | ||||||||
| (1) | Source: Appraisal. |
2000 & 4000 Midlantic
The 2000 & 4000 Midlantic buildings are located in Laurel Corporate Center at the intersection of Interstate 295 and Route 38 in Mount Laurel, New Jersey. The 2000 Midlantic building is a 121,658 SF, 4-story Class A office building that was built in 1989 and renovated in 2015. The property amenities include a multi-story entrance lobby, renovated first floor common areas, on-site café, fitness center, conference room, and 860 parking spaces (shared with 4000 Midlantic). The building is currently occupied by 6 tenants. The largest tenant, Speedy Title & Appraisal, leases 47,100 SF (27.9% of the property’s net rentable area, 8.4% of the portfolio) through September 2018. Speedy Title & Appraisal offers comprehensive title insurance services for the commercial and residential real estate sectors. The 4000 Midlantic building is a 46,945 SF, 3-story Class A office building that was built in 1981 and renovated in 2015. The property amenities include a fully renovated lobby with floor-to-ceiling windows, indoor access to 2000 Midlantic’s café / fitness center, and 801 parking spaces (shared with 2000 Midlantic). 4000 Midlantic is occupied by 2 tenants. The largest tenant, Gallagher Benefit Services, Inc., leases 34,868 SF (20.7% of the property’s net rentable area, 6.2% of the portfolio) through December 2026. Arthur Gallagher founded Arthur J. Gallagher & Co. in Chicago on October 1, 1927.
According to the appraisal, the 2000 & 4000 Midlantic properties’ office competitive set consists of the five office properties detailed in the table below.
Competitive Set Summary (1)(2)(3)
| Property | Year Built / Renovated | Total GLA (SF) | Sale Price PSF | Est. Occ. | Proximity (miles) | |||||||||
| 2000 & 4000 Midlantic | 1981; 1989 / 2015 | 168,603 | $110.00 | 90.8 | % | N/A | ||||||||
| 100 Howard Boulevard | 1988 / N/A | 105,312 | $156.68 | 100.0 | % | 3.0 | ||||||||
| Bay Colony Executive Park | 1986 / N/A | 247,321 | $151.62 | 88.0 | % | 27.8 | ||||||||
| Liberty View Building | 1989 / N/A | 121,737 | $139.65 | 88.6 | % | 6.5 | ||||||||
| Atrium 1 | 1988 / 2008 | 99,668 | $113.38 | 97.6 | % | 3.6 | ||||||||
| Valleybrooke Corporate Center | 1985 / N/A | 279,934 | $135.39 | 100.0 | % | 33.0 | ||||||||
| (1) | Source: Appraisal. |
| (2) | The 2000 & 4000 Midlantic properties have the same competitive property set. |
| (3) | 2000 & 4000 Midlantic properties are appraised together. The buildings are connected by a common corridor and are situated on one tax parcel. |
15000 Midlantic
The 15000 Midlantic property is an 84,056 SF, 2-story Class A office building was built in 1991. According to the appraisal, the property is the preferred location for medical uses in the region due to the building’s layout and design. 15000 Midlantic is occupied by 4 tenants. The largest tenant, Delaware Valley Urology, leases 14,986 SF (17.8% of the property’s net rentable area,
THE INFORMATION IN THIS TERM SHEET IS NOT COMPLETE AND MAY BE AMENDED PRIOR TO THE TIME OF SALE. THIS TERM SHEET IS NOT AN OFFER TO SELL THESE SECURITIES AND IT IS NOT A SOLICITATION OF AN OFFER TO BUY THESE SECURITIES IN ANY JURISDICTION WHERE THE OFFER OR SALE IS NOT PERMITTED.
| 76 |
Mortgage Loan No. 4 — Laurel Corporate Center
2.7% of the portfolio) through October 2019. Delaware Valley Urology provides advanced diagnosis and treatment for a broad range of men’s and women’s urological conditions and is the region’s largest urology practice.
According to the appraisal, the 15000 Midlantic property’s office competitive set consists of the five office properties detailed in the table below.
Competitive Set Summary (1)
| Property | Year Built / Renovated | Total GLA (SF) | Sale Price PSF | Est. Occ. | Proximity (miles) | |||||||||
| 15000 Midlantic | 1991 / N/A | 84,056 | $130.00 | 41.6 | % | N/A | ||||||||
| 402-404 Lippincott Drive | 1997 / N/A | 53,100 | $178.91 | 100.0 | % | 4.5 | ||||||||
| 2051 Briggs Road | 2000 / N/A | 22,312 | $112.05 | 0.0 | % | 1.4 | ||||||||
| Greentree Commons | 1983 / N/A | 43,719 | $108.78 | 100.0 | % | 3.9 | ||||||||
| Horizon Corporate Center | 1986 / N/A | 47,003 | $105.08 | 100.0 | % | 3.3 | ||||||||
| 1000 & 2000 Lincoln Drive | 1981 / 2009 | 55,600 | $123.23 | 100.0 | % | 3.6 | ||||||||
| (1) | Source: Appraisal. |
9000 Midlantic
The 9000 Midlantic property is located in Laurel Corporate Center at the intersection of Interstate 295 and Route 38 in Mount Laurel, New Jersey. The 67,299 SF, 3-story Class A office building was built in 1989 and renovated in 2014. The property amenities include excellent visibility from Route 38, a granite façade, renovated common areas / landscaping, and 316 parking spaces. 9000 Midlantic is occupied by 5 tenants. The largest tenant, Parker McCay, leases 49,916 SF (74.2% of the property’s net rentable area, 8.9% of the portfolio) through September 2021. Parker McCay is a regional law firm with 100 years of experience in South Jersey and beyond. The firm’s practices include banking and financial services, business and corporate, real estate, etc.
According to the appraisal, the 9000 Midlantic property’s office competitive set consists of the five office properties detailed in the table below.
Competitive Set Summary (1)
| Property | Year Built / Renovated | Total GLA (SF) | Sale Price PSF | Est. Occ. | Proximity (miles) | |||||||||
| 9000 Midlantic | 1989 / 2014 | 67,299 | $115.00 | 99.8 | % | N/A | ||||||||
| 100 Howard Boulevard | 1988 / N/A | 105,312 | $156.68 | 100.0 | % | 2.8 | ||||||||
| Liberty View Building | 1989 / N/A | 121,737 | $139.65 | 88.6 | % | 6.2 | ||||||||
| Atrium 1 | 1988 / 2008 | 99,668 | $113.38 | 97.6 | % | 3.4 | ||||||||
| Greentree Commons | 1983 / N/A | 43,719 | $108.78 | 100.0 | % | 4.1 | ||||||||
| Horizon Corporate Center | 1986 / N/A | 47,003 | $105.08 | 100.0 | % | 3.6 | ||||||||
| (1) | Source: Appraisal. |
1000 Bishops Gate
The 1000 Bishops Gate property is located in Bishops Gate Corporate Center at the intersection of Interstate 295 and Route 38 in Mount Laurel, New Jersey. The 53,281 SF, 3-story Class A office building was built in 2005 and renovated in 2015. The property amenities include marble flooring in the lobby, European style bathroom stalls with marble counter tops and 238 parking spaces. The property is currently occupied by 4 tenants. The largest tenant, Homeward Residential, leases 14,298 SF (26.8% of the property’s net rentable area, 2.6% of the portfolio) through October 2019.
According to the appraisal, the 1000 Bishops Gate property’s office competitive set consists of the four office properties detailed in the table below.
THE INFORMATION IN THIS TERM SHEET IS NOT COMPLETE AND MAY BE AMENDED PRIOR TO THE TIME OF SALE. THIS TERM SHEET IS NOT AN OFFER TO SELL THESE SECURITIES AND IT IS NOT A SOLICITATION OF AN OFFER TO BUY THESE SECURITIES IN ANY JURISDICTION WHERE THE OFFER OR SALE IS NOT PERMITTED.
| 77 |
Mortgage Loan No. 4 — Laurel Corporate Center
Competitive Set Summary (1)
| Property | Year Built / Renovated | Total GLA (SF) | Sale Price PSF | Est. Occ. | Proximity (miles) | |||||||||
| 1000 Bishops Gate | 2005 / 2015 | 53,281 | $130.00 | 64.6 | % | N/A | ||||||||
| 100 Howard Boulevard | 1988 / N/A | 105,312 | $156.68 | 100.0 | % | 3.6 | ||||||||
| Liberty View Building | 1989 / N/A | 121,737 | $139.65 | 88.6 | % | 7.1 | ||||||||
| Atrium 1 | 1988 /2008 | 99,668 | $113.38 | 97.6 | % | 4.1 | ||||||||
| Greentree Commons | 1983 / N/A | 43,719 | $108.78 | 100.0 | % | 4.6 | ||||||||
| (1) | Source: Appraisal. |
The Market. The Laurel Corporate Center portfolio is located in southern New Jersey, Burlington County, approximately 15 miles southeast from Philadelphia and is part of the Philadelphia-Camden-Wilmington MSA. Burlington County is approximately 800 square miles with an estimated population of 450,696. Burlington County’s major employment concentrations are broken out as follows: 21.4% concentration in trade, transportation, and utilities, 17.3% concentration in professional and business services, 15.3% concentration in education and health services, and 8.2% concentration in financial activities.
As of September 2015, the Burlington County office market contained 16 million SF of office space with an overall vacancy rate of 8.3%. The appraisal concluded per square foot market rents of $14.51 PSF NNN. Within the submarket, there are no new office buildings under construction.
Historical and Current Occupancy (1)
| Property | 2012 | 2013 | 2014 | 2015 | Current(2) | ||||||||||
| Laurel Corporate Center | 75.8 | % | 88.0 | % | 82.0 | % | 83.3 | % | 83.9 | % | |||||
| 10000 Midlantic | 47.2 | % | 83.1 | % | 82.1 | % | 98.4 | % | 96.6 | % | |||||
| 2000 & 4000 Midlantic(3) | 93.5 | % | 90.6 | % | 71.6 | % | 87.4 | % | 90.8 | % | |||||
| 15000 Midlantic | 93.1 | % | 94.1 | % | 94.1 | % | 40.5 | % | 41.6 | % | |||||
| 9000 Midlantic | 74.2 | % | 77.6 | % | 91.8 | % | 99.8 | % | 99.8 | % | |||||
| 1000 Bishops Gate | 100.0 | % | 100.0 | % | 82.8 | % | 64.6 | % | 64.6 | % | |||||
| (1) | Historical Occupancy is provided by the sponsor. Occupancies are as of December 31 for 2012-2014; 2015 occupancies are as of October 1, 2015. |
| (2) | Based on the March 2016 underwritten rent roll. |
| (3) | The 2000 & 4000 Midlantic properties are appraised together. The buildings are connected by a common corridor and are situated on one tax parcel. |
THE INFORMATION IN THIS TERM SHEET IS NOT COMPLETE AND MAY BE AMENDED PRIOR TO THE TIME OF SALE. THIS TERM SHEET IS NOT AN OFFER TO SELL THESE SECURITIES AND IT IS NOT A SOLICITATION OF AN OFFER TO BUY THESE SECURITIES IN ANY JURISDICTION WHERE THE OFFER OR SALE IS NOT PERMITTED.
| 78 |
Mortgage Loan No. 4 — Laurel Corporate Center
Tenant Summary (1)
| Tenant | Property | Ratings Moody’s/S&P/Fitch(2) | Net Rentable Area (SF) | % of Total NRA | Base Rent PSF | Lease Expiration Date | ||||||||
| Towers Watson Delaware(3) | 10000 Midlantic | Baa3/BBB/BBB | 60,423 | 10.8 | % | $12.55 | 2/1/2024 | |||||||
| Parker McCay | 9000 Midlantic | N/A / N/A / N/A | 49,916 | 8.9 | % | $16.70 | 9/1/2021 | |||||||
| Speedy Title & Appraisal(4) | 2000 Midlantic | N/A / N/A / N/A | 47,100 | 8.4 | % | $15.45 | 9/1/2018 | |||||||
| QAD Inc.(5) | 10000 Midlantic | N/A / N/A / N/A | 35,048 | 6.3 | % | $13.50 | 3/1/2019 | |||||||
| Gallagher Benefit & Services, Inc(6) | 4000 Midlantic | N/A / N/A / N/A | 34,868 | 6.2 | % | $12.88 | 12/31/2026 | |||||||
| Lockheed Martin Corporation(7) | 2000 Midlantic | Baa1//BBB+/BBB+ | 23,946 | 4.3 | % | $14.25 | 5/1/2017 | |||||||
| Delaware Valley Urology | 15000 Midlantic | N/A / N/A / N/A | 20,938 | 3.7 | % | $14.22 | 1/1/2025 | |||||||
| Maser Consulting | 2000 Midlantic | N/A / N/A / N/A | 16,756 | 3.0 | % | $11.70 | 5/1/2022 | |||||||
| Homeward Residential(8) | 1000 Bishops Gate | B1/ N/A / N/A | 14,298 | 2.6 | % | $13.00 | 10/1/2019 | |||||||
| Insurance Services Office(9) | 1000 Bishops Gate | N/A / N/A / N/A | 10,912 | 1.9 | % | $14.00 | 10/1/2022 | |||||||
| (1) | Based on the underwritten rent roll including rent increases occurring through March 1, 2017. |
| (2) | Certain ratings are those of the parent company whether or not the parent company guarantees the lease. |
| (3) | Towers Watson Delaware has the right to terminate its lease at the end of the 84th month term, upon not less than 12 months prior written notice accompanied by an early termination fee of $1 million. |
| (4) | Speedy Title & Appraisal has the right to terminate upon 12 months prior written notice accompanied by a termination fee effective on the last day of the 64th month after the commencement date of its lease. |
| (5) | QAD Inc., has the right to terminate its lease as of March 31, 2017 upon not less than 12 months’ written notice and payment of the termination fee. |
| (6) | Provided that no event of default has occurred by Gallagher Benefit & Services, it has the right to terminate its lease effective as of the last day of the 92nd full calendar month after the commencement date of its lease, upon the payment of a termination payment and prior written notice not less than 9 months prior to the elected termination date. One half of the termination payment is due at the time the termination notice is given. The remaining half of the termination payment is to be paid no later than 30 days prior to the termination date, otherwise this termination right is deemed waived. |
| The termination payment consists of the unamortized (i) brokerage commissions paid by land lord and (ii) tenant improvements allowance, moving allowance, and additional allowance. |
| (7) | Lockheed Martin Corporation has the right to terminate its lease at any time upon not less than 9 months prior written notice accompanied by an early termination fee in an amount based upon a calculation of the then unamortized amount of the certain operating costs and allowances. |
| (8) | Homeward Residential has the right to terminate its lease as of the last day of the 40thcalendar month of the initial term with not less than 9 months written notice accompanied by an early termination payment equal to the unamortized costs of: (i) brokerage commissions and attorneys’ fees paid by land lord, (ii) the total costs incurred by land lord for improvements to the premises, and (iii) any abated fixed rent with respect to the premises. Such termination option is personal to the originally named tenant and any of its affiliates. |
| (9) | Insurance Services Office has a right to terminate its lease effective as of October 31, 2020, upon not less than 9 months written notice accompanied by an early termination payment in an amount based upon a calculation determined by the then unamoritized portion of the Insurance Services Office lease, base rent, operating costs and certain allowances. |
THE INFORMATION IN THIS TERM SHEET IS NOT COMPLETE AND MAY BE AMENDED PRIOR TO THE TIME OF SALE. THIS TERM SHEET IS NOT AN OFFER TO SELL THESE SECURITIES AND IT IS NOT A SOLICITATION OF AN OFFER TO BUY THESE SECURITIES IN ANY JURISDICTION WHERE THE OFFER OR SALE IS NOT PERMITTED.
| 79 |
Mortgage Loan No. 4 — Laurel Corporate Center
Lease Rollover Schedule (1)
| Year | Number of Leases Expiring(2) | NRA (SF) Expiring | % of NRA Expiring | Base Rent Expiring(3) | % of Base Rent Expiring(3) | Cumulative NRA (SF) Expiring | Cumulative % of NRA Expiring | Cumulative Base Rent Expiring(3) | Cumulative % of Base Rent Expiring(3) | |||||||||||||
| Vacant | NAP | 91,344 | 16.5 | % | NAP | NAP | 91,344 | 16.5 | % | NAP | NAP | |||||||||||
| MTM | 0 | 0 | 0.0 | $0 | 0.0 | % | 91,344 | 16.5 | % | $0 | 0.0 | % | ||||||||||
| 2016 | 1 | 2,525 | 0.5 | 51,762 | 0.8 | 93,869 | 16.9 | % | $51,762 | 0.8 | % | |||||||||||
| 2017 | 2 | 26,563 | 4.8 | 383,103 | 5.9 | 120,432 | 21.7 | % | $434,865 | 6.7 | % | |||||||||||
| 2018 | 4 | 52,044 | 9.4 | 799,383 | 12.3 | 172,476 | 31.1 | % | $1,234,248 | 19.0 | % | |||||||||||
| 2019 | 9 | 100,873 | 18.2 | 1,396,128 | 21.5 | 273,349 | 49.3 | % | $2,630,375 | 40.4 | % | |||||||||||
| 2020 | 3 | 19,096 | 3.4 | 271,398 | 4.2 | 292,445 | 52.7 | % | $2,901,773 | 44.6 | % | |||||||||||
| 2021 | 7 | 79,395 | 14.3 | 1,218,799 | 18.7 | 371,840 | 67.1 | % | $4,120,573 | 63.3 | % | |||||||||||
| 2022 | 10 | 72,576 | 13.1 | 992,497 | 15.3 | 444,416 | 81.7 | % | $5,113,070 | 78.6 | % | |||||||||||
| 2023 | 2 | 8,813 | 1.6 | 119,411 | 1.8 | 453,229 | 92.6 | % | $5,232,481 | 80.4 | % | |||||||||||
| 2024 | 1 | 60,423 | 10.9 | 758,309 | 11.7 | 513,652 | 92.7 | % | $5,990,790 | 92.1 | % | |||||||||||
| 2025 | 1 | 5,952 | 1.1 | 65,472 | 1.0 | 519,604 | 93.7 | % | $6,056,262 | 93.1 | % | |||||||||||
| 2026 & Beyond | 1 | 34,868 | 6.3 | 448,926 | 6.9 | 554,472 | 100.0 | % | $6,505,187 | 100.0 | % | |||||||||||
| Total | 41 | 554,472 | 100.0 | % | $6,505,187 | 100.0 | % | |||||||||||||||
| (1) | Based on the underwritten rent roll. Certain tenants have lease termination options that may become exercisable prior to the originally stated expiration date of the tenant lease that are not considered in the lease rollover schedule. Fitness Center 3,445 SF/0.6% NRA & Abbruzzi’s Italian Market 2,230 SF/0.4% NRA has been excluded from Lease Rollover Schedule. Rent Steps include rent increases occurring through March 01, 2017. All NRA Calculations are based off of a total NRA of 554,472 SF. |
| (2) | Tenants with multiple leases with different expiration dates are to be treated as separate entities. |
| (3) | Base Rent excludes all vacant space. Rent Steps include rent increases occurring through March 1, 2017. |
Operating History and Underwritten Net Cash Flow
| 2013 | 2014 | 2015(1) | Underwritten(2) | PSF(3) | %(3) | ||||||||||
| Rents in Place | $6,331,955 | $5,961,988 | $6,038,523 | $6,505,187 | $11.62 | 53.0 | % | ||||||||
| Vacant Income | 0 | 0 | 0 | 1,295,926 | 2.31 | 10.5 | % | ||||||||
| Gross Potential Rent | $6,331,955 | $5,961,988 | $6,038,523 | $7,801,113 | $13.93 | 63.5 | % | ||||||||
| Total Reimbursements | 4,438,362 | 4,295,061 | 4,506,700 | 4,473,668 | 7.99 | 36.5 | % | ||||||||
| Net Rental Income | $10,770,317 | $10,257,049 | $10,545,223 | $12,274,781 | $21.91 | 100.0 | % | ||||||||
| (Vacancy/Collection Loss) | 0 | 0 | 0 | (1,295,926 | ) | (2.31 | ) | (11.8 | %) | ||||||
| Other Income | 45,279 | 516,449 | 64,574 | 0 | 0.00 | 0.0 | % | ||||||||
| Effective Gross Income | $10,815,596 | $10,773,498 | $10,609,797 | $10,978,855 | $19.60 | 100.0 | % | ||||||||
| Total Expenses | $5,805,572 | $5,747,467 | $5,924,028 | $5,562,623 | $9.93 | 50.7 | % | ||||||||
| Net Operating Income | $5,010,024 | $5,026,031 | $4,685,769 | $5,416,232 | $9.67 | 49.3 | % | ||||||||
| Total TI/LC, Capex/RR | 0 | 0 | 0 | 540,221 | 0.96 | 4.9 | % | ||||||||
| Net Cash Flow | $5,010,024 | $5,026,031 | $4,685,769 | $4,876,011 | $8.70 | 44.4 | % | ||||||||
| (1) | 2015 Financials represent trailing twelve months ending October 31, 2015. |
| (2) | Underwritten Rents in Place steps include rent increases occurring through March 1, 2017. |
| (3) | % column represents percent of Net Rental Income for all revenue lines and represents percent of Effective Gross Income for the remainder of fields. |
Property Management. The Laurel Corporate Center portfolio is managed by Diversified Management South Jersey II, L.L.C., a New Jersey limited liability company.
Escrows and Reserves. At origination, the borrower deposited into escrow $3,592,892 for TI/LC reserves, $1,947,494 for replacement reserves, $217,925 for free rent, $115,906 for real estate taxes and $52,506 for immediate repairs.
Tax Escrows– On a monthly basis, the borrower is required to escrow 1/12th of annual estimated tax payments, currently equal to $115,906.
THE INFORMATION IN THIS TERM SHEET IS NOT COMPLETE AND MAY BE AMENDED PRIOR TO THE TIME OF SALE. THIS TERM SHEET IS NOT AN OFFER TO SELL THESE SECURITIES AND IT IS NOT A SOLICITATION OF AN OFFER TO BUY THESE SECURITIES IN ANY JURISDICTION WHERE THE OFFER OR SALE IS NOT PERMITTED.
| 80 |
Mortgage Loan No. 4 — Laurel Corporate Center
Insurance Escrows– For so long as the Laurel Corporate Center portfolio is covered under a blanket or umbrella policy, no insurance escrows are required, provided that (i) no event of default has occurred and is continuing, (ii) the policies maintained by the borrower covering the Laurel Corporate Center portfolio are part of a blanket or umbrella policy approved by lender and (iii) the borrower provides the lender with satisfactory evidence that the Laurel Corporate Center portfolio is insured in accordance with loan documents pursuant to policies acceptable to lender.
Replacement Reserves– On a monthly basis, the borrower is required to escrow $11,671 for replacement reserves.
TI/LC Reserves –The requirement of the borrower to make monthly deposits into the TI/LC reserve account is waived so long as the accumulation in the reserve is greater than or equal to $1,500,000 and upon such time as such threshold is not met, the borrower is required to escrow $75,000 on a monthly basis (with accumulation in the reserve capped at $2,000,000).
Lockbox / Cash Management. The Laurel Corporate Center loan is structured with a springing lockbox and springing cash management structure. The lockbox must be established and a cash trap period will commence(i) upon event of default, or (ii) if the debt service coverage ratio (assuming 30 year amortization) falls below 1.15x for two consecutive quarters. During a cash trap period all excess cash flow will be held in a cash collateral reserve. So long as no event of default is continuing, the cash trap period will cease upon the Laurel Corporate Center portfolio achieving a 1.20x debt service coverage ratio for two consecutive quarters.
Property Release. The Laurel Corporate Center loan allows for release of an individual property following the expiration of a lockout period in connection with a sale of such property, subject to the borrower satisfying certain conditions, including the loan be partially defeased in an amount equal to the greater of (i) 125% of the allocated loan amount for such individual property and (ii) 100% of the net sales proceeds. In addition, (i) the loan-to-value ratio for the remaining properties must be no greater than the lesser of loan-to-value ratio for such properties immediately prior to the release and 70%, (ii) the debt service coverage ratio for the remaining properties must be no less than the greater of the debt service coverage ratio for such properties immediately prior to the release and 1.50x, and (iii) the debt yield for the remaining properties must be no less than the greater of the debt yield ratio for such properties immediately prior to the release and 10.5%.
THE INFORMATION IN THIS TERM SHEET IS NOT COMPLETE AND MAY BE AMENDED PRIOR TO THE TIME OF SALE. THIS TERM SHEET IS NOT AN OFFER TO SELL THESE SECURITIES AND IT IS NOT A SOLICITATION OF AN OFFER TO BUY THESE SECURITIES IN ANY JURISDICTION WHERE THE OFFER OR SALE IS NOT PERMITTED.
| 81 |
Mortgage Loan No. 5 — GLP Industrial Portfolio A
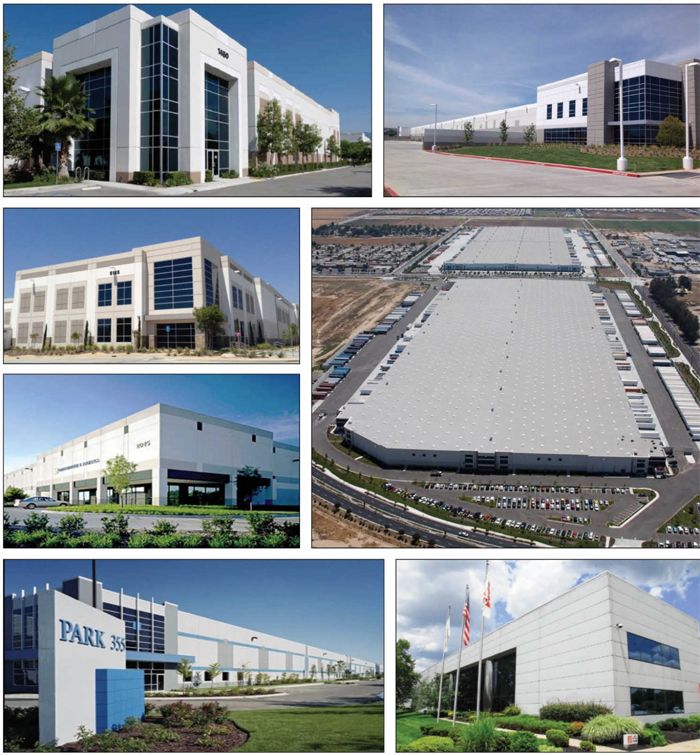 |
THE INFORMATION IN THIS TERM SHEET IS NOT COMPLETE AND MAY BE AMENDED PRIOR TO THE TIME OF SALE. THIS TERM SHEET IS NOT AN OFFER TO SELL THESE SECURITIES AND IT IS NOT A SOLICITATION OF AN OFFER TO BUY THESE SECURITIES IN ANY JURISDICTION WHERE THE OFFER OR SALE IS NOT PERMITTED.
| 82 |
Mortgage Loan No. 5 — GLP Industrial Portfolio A
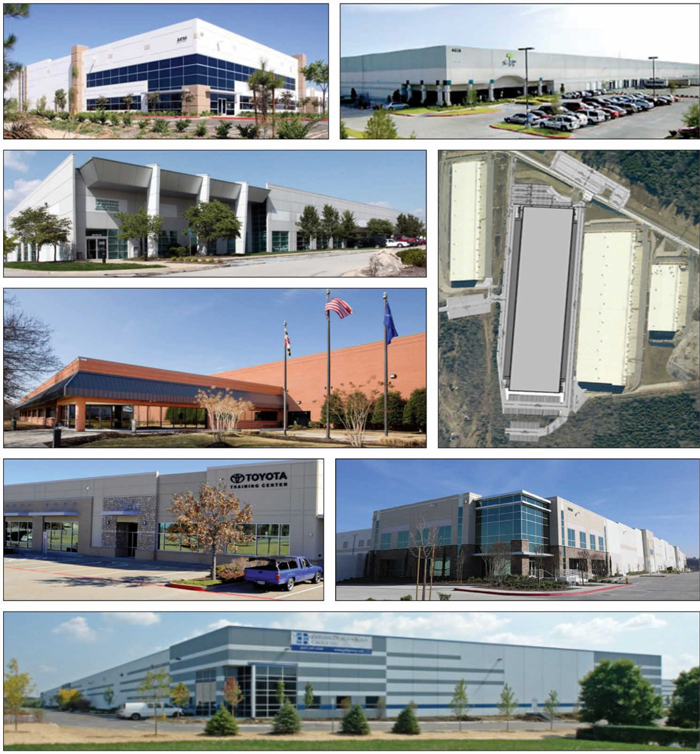 |
THE INFORMATION IN THIS TERM SHEET IS NOT COMPLETE AND MAY BE AMENDED PRIOR TO THE TIME OF SALE. THIS TERM SHEET IS NOT AN OFFER TO SELL THESE SECURITIES AND IT IS NOT A SOLICITATION OF AN OFFER TO BUY THESE SECURITIES IN ANY JURISDICTION WHERE THE OFFER OR SALE IS NOT PERMITTED.
| 83 |
Mortgage Loan No. 5 — GLP Industrial Portfolio A
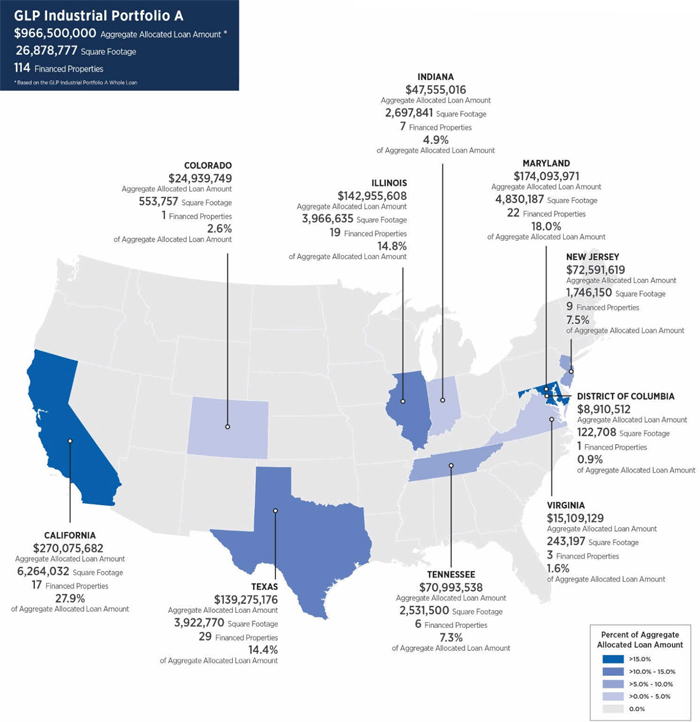 |
THE INFORMATION IN THIS TERM SHEET IS NOT COMPLETE AND MAY BE AMENDED PRIOR TO THE TIME OF SALE. THIS TERM SHEET IS NOT AN OFFER TO SELL THESE SECURITIES AND IT IS NOT A SOLICITATION OF AN OFFER TO BUY THESE SECURITIES IN ANY JURISDICTION WHERE THE OFFER OR SALE IS NOT PERMITTED.
| 84 |
Mortgage Loan No. 5 — GLP Industrial Portfolio A
| Mortgage Loan Information | Property Information | |||
| Mortgage Loan Seller: | Column | Single Asset / Portfolio: | Portfolio of 114 Properties | |
| Original Principal Balance(1): | $42,900,000 | Title: | Fee | |
| Cut-off Date Principal Balance(1): | $42,900,000 | Property Type - Subtype: | Industrial – Various | |
| % of Pool by IPB: | 5.6% | Net Rentable Area (SF): | 26,878,777 | |
| Loan Purpose: | Acquisition | Location: | Various | |
| Credit Assessment (Fitch, Moody’s, Morningstar)(2): | AAA/Aaa/AAA | Year Built / Renovated: | Various | |
| Borrowers(3): | Various | Occupancy(6): | 94.4% | |
| Sponsors(4): | Global Logistic Properties Limited | Occupancy Date(6): | 10/1/2015 | |
| Interest Rate: | 4.1439213% | Number of Tenants(6): | 193 | |
| Note Date: | 11/4/2015 | 2013 NOI: | $70,564,730 | |
| Maturity Date: | 11/6/2025 | 2014 NOI: | $98,621,458 | |
| Interest-only Period: | 120 months | 2015 NOI(7)(8): | $102,686,288 | |
| Original Term: | 120 months | TTM NOI: | N/A | |
| Original Amortization: | None | UW Economic Occupancy(7): | 94.0% | |
| Amortization Type: | Interest Only | UW Revenues: | $156,891,953 | |
| Call Protection: | YM1(113),O(7) | UW Expenses: | $41,005,138 | |
| Lockbox(5): | Hard | UW NOI(8): | $115,886,815 | |
| Additional Debt(1): | Yes | UW NCF: | $106,479,243 | |
| Additional Debt Balance(1): | $1,253,600,000 | Appraised Value / Per SF(9): | $2,090,000,000 / $78 | |
| Additional Debt Type(1): | Pari Passu, B-Note, Mezzanine | Appraisal Date(9): | Various | |
| Additional Future Debt Permitted: | No |
| Escrows and Reserves(10) | Financial Information(1) | |||||
| Initial | Monthly | Initial Cap | Cut-off Date Loan / SF: | $24 | ||
| Taxes: | $0 | Springing | N/A | Maturity Date Loan / SF: | $24 | |
| Insurance: | $0 | Springing | N/A | Cut-off Date LTV(9): | 30.5% | |
| Replacement Reserves: | $0 | Springing | (10) | Maturity Date LTV(9): | 30.5% | |
| TI/LC: | $0 | Springing | (10) | UW NCF DSCR: | 3.97x | |
| Engineering: | $1,177,541 | N/A | N/A | UW NOI Debt Yield: | 18.2% |
Sources and Uses
| Sources | Proceeds | % of Total | Uses | Proceeds | % of Total | |
| Mortgage Loan (A Notes) | $637,600,000 | 29.6% | Purchase Price | $2,026,347,948 | 94.0% | |
| Mortgage Loan (B Notes) | 328,900,000 | 15.3 | Closing Costs | 127,911,757 | 5.9 | |
| Mezzanine Loans | 330,000,000 | 15.3 | Upfront Reserves | 1,177,541 | 0.1 | |
| Sponsor Equity | 858,937,246 | 39.8 | ||||
| Total Sources | $2,155,437,246 | 100.0% | Total Uses | $2,155,437,246 | 100.0% |
| (1) | The GLP Industrial Portfolio A loan is part of a larger split whole loan evidenced by 5pari passu senior notes (collectively, “A Notes”) and two subordinate notes (collectively, “B Notes”) with an aggregate original principal balance of $966.5 million. The financial information presented in the chart above and herein reflects the cut-off date balance of the $637.6 million of A Notes, but not the $330.0 million of mezzanine loans or the $328.9 million of B Notes. The additional debt consists of 4pari passu companion loans with an outstanding principal balance of $594.7 million, $328.9 million of B Notes and $330.0 million of mezzanine loans. For more description of the additional debt, please refer to“Additional Debt”below. |
| (2) | Fitch, Moody’s and Morningstar have confirmed that the GLP Industrial Portfolio A loan has, in the context of its inclusion in the Initial Pool Balance, credit characteristics consistent with an AAA-rated obligation. |
| (3) | The loan has 33 borrowers, which are each special purpose entities. |
| (4) | The GLP Industrial Portfolio A loan’s sponsors and non-recourse carveout guarantors are eleven subsidiaries of Global Logistic Properties Limited. |
| (5) | For a more detailed description of lockbox, please refer to“Lockbox / Cash Management”below. |
| (6) | As of December 31, 2015, the occupancy of the Portfolio was 95.3%. |
THE INFORMATION IN THIS TERM SHEET IS NOT COMPLETE AND MAY BE AMENDED PRIOR TO THE TIME OF SALE. THIS TERM SHEET IS NOT AN OFFER TO SELL THESE SECURITIES AND IT IS NOT A SOLICITATION OF AN OFFER TO BUY THESE SECURITIES IN ANY JURISDICTION WHERE THE OFFER OR SALE IS NOT PERMITTED.
| 85 |
Mortgage Loan No. 5 — GLP Industrial Portfolio A
| (7) | Represents trailing twelve months ending June 30, 2015. Due to the Portfolio being acquired by the borrower in November 2015, full year-end financials were not available. Based on annualized financials from November 4, 2015 to December 31, 2015, the Portfolio had an annualized NOI of $116.6 million. Based on UW NOI for the period from November 4, 2015 to December 31, 2015, the Portfolio would result in an annualized UW NOI of $116.0 million. |
| (8) | UW NOI exceeds 2015 NOI due to increases in rents on the October 2015 rent roll and the inclusion of approximately $5.5 million for rent steps. |
| (9) | The appraised value of $2,090.0 million is reflective of the value of the Portfolio if sold in its entirety to a single buyer. The appraisal determined an appraised value on both a portfolio and an individual basis. The concluded aggregate appraised value of the individual properties was $1,995.8 million, which would result in a Cut-off Date LTV of 31.9% and a Maturity Date LTV of 31.9%.The dates of the appraised values ranged from August 10, 2015 to September 24, 2015. |
| (10) | For a more detailed description of escrows and reserves, please refer to “Escrows and Reserves” below. |
The Loan. The GLP Industrial Portfolio A loan which is part of a larger split whole loan, is a first mortgage loan secured by the borrowers’ fee interest in a cross-collateralized pool of 114 industrial properties located in nine states and the District of Columbia. The whole loan has an outstanding principal balance of $966.5 million (“GLP Industrial Portfolio A Whole Loan”) as of the cut-off date, which is comprised of fivepari passu notes, Note A-1, Note A-2, Note A-3-1, Note A-3-2 and Note A-4 and $328.9 million of subordinate B Notes. Note A-1 and Note A-2, which have an aggregate outstanding principal balance as of the cut-off date of $437.6 million, were previously contributed with the B Notes to the CSMC Trust 2015-GLPA securitization. Note A-3-1 has an outstanding principal balance as of the cut-off date of $87.1 million and was contributed to the CSAIL 2016-C5 Commercial Mortgage Trust. Note A-3-2 has an outstanding principal balance of $42.9 million and is being contributed to the CSAIL 2016-C6 Commercial Mortgage Trust. Note A-4 has an outstanding principal balance of $70.0 million and was contributed to the MSBAM 2016-C28 securitization.
Whole Loan Note Summary
| Original Balance | Cut-off Date Balance | Note Holder | Note in Controlling Securitization | |
| Notes A-1, A-2 | $437,600,000 | $437,600,000 | CSMC 2015-GLPA | Yes |
| Note A-3-1 | 87,100,000 | 87,100,000 | CSAIL 2016-C5 | No |
| Note A-3-2 | 42,900,000 | 42,900,000 | CSAIL 2016-C6 | No |
| Note A-4 | 70,000,000 | 70,000,000 | MSBAM 2016-C28 | No |
| Notes B-1, B-2 | 328,900,000 | 328,900,000 | CSMC 2015-GLPA | Yes |
| Total | $966,500,000 | $966,500,000 |
The Borrowers. There are 33 borrowing entities for the loan, each a special-purpose entity.
The Sponsors. The loan’s sponsors and nonrecourse carve-out guarantors are eleven subsidiaries of Global Logistic Properties Limited (“GLP”). GLP (SGX: MC0.SI; Moody’s: Baa2; Fitch: BBB+) is a public, Singapore-based investment holding company that owns, leases, manages, and develops logistics facilities. GLP began operations in 2003 and is one of the largest logistics operators by square footage globally with total assets under management valued at approximately $33 billion. GLP’s portfolio comprises approximately 2,300 properties and 521 million SF throughout 111 markets and 4,000 customers globally. GLP had a market capitalization of approximately $7.1 billion as of November 20, 2015.
The GLP Industrial Portfolio A Whole Loan is part of a larger $2.85 billion financing completed in November 2015 to facilitate GLP’s $4.8 billion acquisition of Industrial Income Trust Inc. (“IIT”), a public, non-traded REIT. GLP acquired IIT for a total cost of $4.8 billion (which includes closing costs and working capital) and invested approximately $2.0 billion of cash equity to facilitate the transaction. The financing consisted of financing three separate non-crossed pools. On a pro rata basis, approximately $858.9 million of invested equity was contributed for the acquisition of the Portfolio.
The Properties.The GLP Industrial Portfolio A consists of 114 properties (the “Portfolio”) totaling approximately 26.9 million SF across nine states and the District of Columbia and 11 different markets. The top three markets in the Portfolio, by allocated loan amount, are Inland Empire (27.9%), Chicago (14.8%) and Baltimore (11.8%). The top 10 properties in the Portfolio account for 28.0% of gross leasable area (“GLA”) and 31.5% of UW NOI and the top 10 tenants in the Portfolio account for 32.1% of GLA and 32.4% of UW Base Rent. The top 3 tenants in the Portfolio by UW Base Rent are HanesBrands, Inc. (5.4%), CEVA (4.4%)
THE INFORMATION IN THIS TERM SHEET IS NOT COMPLETE AND MAY BE AMENDED PRIOR TO THE TIME OF SALE. THIS TERM SHEET IS NOT AN OFFER TO SELL THESE SECURITIES AND IT IS NOT A SOLICITATION OF AN OFFER TO BUY THESE SECURITIES IN ANY JURISDICTION WHERE THE OFFER OR SALE IS NOT PERMITTED.
| 86 |
Mortgage Loan No. 5 — GLP Industrial Portfolio A
and Harbor Freight Tools (4.3%). The properties comprising the Portfolio have a weighted average age of 14 years (2001), weighted average clear heights of 29.5 feet and primary truck court depth of 155.5 feet, with weighted averages of 67 dock high doors, 4 grade level doors, 67 trailer spaces and 7.1% (GLA) office space. As of October 1, 2015, the Portfolio was 94.4% occupied by 193 tenants with a weighted average base rent of $4.86 PSF and weighted average remaining lease term of 5.1 years.
Top Twenty Properties(1)
| Property | Market | GLA (SF) | Year Built | Occupancy | UW NOI | % of NOI | Allocated Loan Amount(2) | % of Allocated Loan Amount | Appraised Value(3) |
| Inland Empire Indian Ave DC | Inland Empire | 1,309,754 | 2009 | 100.0% | $6,541,590 | 5.6% | $57,627,769 | 6.0% | $119,000,000 |
| Centerpointe 4 | Inland Empire | 1,280,446 | 2007 | 100.0% | 4,790,530 | 4.1 | 49,927,924 | 5.2 | 103,100,000 |
| Hofer Ranch IC Bldg 1 | Inland Empire | 612,104 | 2012 | 100.0% | 3,159,936 | 2.7 | 28,378,044 | 2.9 | 58,600,000 |
| Denver DC | Denver | 553,757 | 2013 | 100.0% | 3,282,162 | 2.8 | 24,939,749 | 2.6 | 51,500,000 |
| Freeport DC Bldg 4 | Dallas/Ft Worth | 727,508 | 1980 | 100.0% | 4,056,956 | 3.5 | 24,891,322 | 2.6 | 51,400,000 |
| Ontario Mills DC | Inland Empire | 520,161 | 2013 | 100.0% | 2,749,881 | 2.4 | 23,486,944 | 2.4 | 48,500,000 |
| Hagerstown Distribution Center | Washington, DC | 824,298 | 1998 | 100.0% | 3,398,847 | 2.9 | 22,276,280 | 2.3 | 46,000,000 |
| Beckwith Farms DC | Nashville | 706,500 | 2013 | 100.0% | 3,289,262 | 2.8 | 21,792,014 | 2.3 | 45,000,000 |
| Crossroads DC I | Baltimore | 456,500 | 2007 | 100.0% | 2,896,195 | 2.5 | 21,259,320 | 2.2 | 43,900,000 |
| Centerpointe 6 | Inland Empire | 532,926 | 2007 | 100.0% | 2,314,762 | 2.0 | 20,968,759 | 2.2 | 43,300,000 |
| I-95 DC | Baltimore | 449,299 | 2014 | 100.0% | 2,297,443 | 2.0 | 19,564,385 | 2.0 | 40,400,000 |
| Chino Spec Forward | Inland Empire | 409,930 | 2014 | 100.0% | 2,050,199 | 1.8 | 19,176,972 | 2.0 | 39,600,000 |
| Bedford Park II | Chicago | 470,160 | 2006 | 100.0% | 2,273,176 | 2.0 | 18,644,278 | 1.9 | 38,500,000 |
| Landover DC | Washington, DC | 507,072 | 1963 | 100.0% | 2,268,578 | 2.0 | 16,222,943 | 1.7 | 33,500,000 |
| North Plainfield 8 | Indianapolis | 798,096 | 1997 | 100.0% | 1,987,922 | 1.7 | 14,189,022 | 1.5 | 29,300,000 |
| Sterling DC | Inland Empire | 300,172 | 1990 | 100.0% | 1,804,632 | 1.6 | 13,946,889 | 1.4 | 28,800,000 |
| Beckwith Farms 3 | Nashville | 480,000 | 2009 | 100.0% | 1,396,650 | 1.2 | 13,462,621 | 1.4 | 27,800,000 |
| Clifton DC | Northern New Jersey | 230,953 | 2004 | 100.0% | 1,447,645 | 1.2 | 13,462,621 | 1.4 | 27,800,000 |
| Collington Commerce Center | Washington, DC | 239,742 | 1990 | 100.0% | 1,732,560 | 1.5 | 12,542,515 | 1.3 | 25,900,000 |
| Bedford Park IB | Chicago | 272,446 | 2006 | 100.0% | 1,322,491 | 1.1 | 12,397,234 | 1.3 | 25,600,000 |
Subtotal/Wtd. Avg. – Top Twenty Properties | 11,681,824 | 2003 | 100.0% | $55,061,417 | 47.5% | $449,157,605 | 46.5% | $927,500,000 | |
| Total/Wtd. Avg.: | 26,878,777 | 2001 | 94.4% | $115,886,815 | 100.0% | $966,500,000 | 100.0% | $1,995,800,000 |
| (1) | Based on the underwritten rent roll dated October 1, 2015. |
| (2) | Based on the GLP Industrial Portfolio A Whole Loan. |
| (3) | Source: Appraisal. The appraised value of $2,090.0 million is reflective of the value of the Portfolio if sold in its entirety to a single buyer. The appraisal determined an appraised value on both a portfolio and individual basis. The concluded aggregate appraised value of the individual properties was $1,995.8 million. |
THE INFORMATION IN THIS TERM SHEET IS NOT COMPLETE AND MAY BE AMENDED PRIOR TO THE TIME OF SALE. THIS TERM SHEET IS NOT AN OFFER TO SELL THESE SECURITIES AND IT IS NOT A SOLICITATION OF AN OFFER TO BUY THESE SECURITIES IN ANY JURISDICTION WHERE THE OFFER OR SALE IS NOT PERMITTED.
| 87 |
Mortgage Loan No. 5 — GLP Industrial Portfolio A
Market Concentration(1)
| Property | Property Count | GLA (SF) | Year Built(2) |
Occupancy | UW NOI | % of NOI | Allocated Loan Amount(3) | % of Allocated Loan Amount | Appraised Value(4) | |
| Inland Empire | 17 | 6,264,032 | 2008 | 98.4% | $28,741,404 | 24.8% | $270,075,682 | 27.9% | $557,700,000 | |
| Chicago | 19 | 3,966,635 | 2004 | 91.4% | 16,240,694 | 14.0 | 142,955,608 | 14.8 | 295,200,000 | |
| Baltimore | 17 | 2,974,705 | 1995 | 87.9% | 13,240,795 | 11.4 | 114,238,574 | 11.8 | 235,900,000 | |
| Dallas/Ft Worth | 22 | 3,175,184 | 1999 | 97.5% | 14,335,584 | 12.4 | 105,763,903 | 10.9 | 218,400,000 | |
| Washington, DC | 9 | 2,221,387 | 1985 | 99.3% | 11,942,326 | 10.3 | 83,875,038 | 8.7 | 173,200,000 | |
| Nashville | 6 | 2,531,500 | 2009 | 100.0% | 9,347,699 | 8.1 | 70,993,538 | 7.3 | 146,600,000 | |
| Indianapolis | 7 | 2,697,841 | 1998 | 82.1% | 5,320,687 | 4.6 | 47,555,016 | 4.9 | 98,200,000 | |
| Northern New Jersey | 6 | 956,250 | 1986 | 100.0% | 5,802,524 | 5.0 | 46,005,363 | 4.8 | 95,000,000 | |
| Austin | 7 | 747,586 | 2008 | 84.6% | 3,766,724 | 3.3 | 33,511,273 | 3.5 | 69,200,000 | |
| Philadelphia | 3 | 789,900 | 1989 | 100.0% | 3,866,216 | 3.3 | 26,586,256 | 2.8 | 54,900,000 | |
| Denver | 1 | 553,757 | 2013 | 100.0% | 3,282,162 | 2.8 | 24,939,749 | 2.6 | 51,500,000 | |
| Total/Wtd. Avg.: | 114 | 26,878,777 | 2001 | 94.4% | $115,886,815 | 100.0% | $966,500,000 | 100.0% | $1,995,800,000 |
| (1) | Based on the underwritten rent roll dated October 1, 2015. |
| (2) | Weighted Average. |
| (3) | Based on the GLP Industrial Portfolio A Whole Loan. |
| (4) | Source: Appraisal. The appraised value of $2,090.0 million is reflective of the value of the Portfolio if sold in its entirety to a single buyer. The appraisal determined an appraised value on both a portfolio and individual basis. The concluded aggregate appraised value of the individual properties was $1,995.8 million. |
Property Sub-Type(1)
| Property Sub-Type | Property Count | GLA (SF) | Year Built(2) | Occupancy | UW NOI | % of NOI | Allocated Loan Amount(3) | % of Allocated Loan Amount | Appraised Value(4) | |
| Distribution Warehouse | 59 | 17,518,251 | 2006 | 94.0% | $69,300,394 | 59.8% | $613,227,253 | 63.4% | $1,266,300,000 | |
| Warehouse | 46 | 8,950,487 | 1991 | 95.5% | 43,763,774 | 37.8 | 332,642,976 | 34.4 | 686,900,000 | |
| Flex | 9 | 410,039 | 2000 | 87.8% | 2,822,647 | 2.4 | 20,629,771 | 2.1 | 42,600,000 | |
| Total/Wtd. Avg.: | 114 | 26,878,777 | 2001 | 94.4% | $115,886,815 | 100.0% | $966,500,000 | 100.0% | $1,995,800,000 |
| (1) | Based on the underwritten rent roll dated October 1, 2015. |
| (2) | Weighted Average. |
| (3) | Based on the GLP Industrial Portfolio A Whole Loan. |
| (4) | Source: Appraisal. The appraised value of $2,090.0 million is reflective of the value of the Portfolio if sold in its entirety to a single buyer. The appraisal determined an appraised value on both a Portfolio and individual basis. The concluded aggregate appraised value of the individual properties was $1,995.8 million. |
THE INFORMATION IN THIS TERM SHEET IS NOT COMPLETE AND MAY BE AMENDED PRIOR TO THE TIME OF SALE. THIS TERM SHEET IS NOT AN OFFER TO SELL THESE SECURITIES AND IT IS NOT A SOLICITATION OF AN OFFER TO BUY THESE SECURITIES IN ANY JURISDICTION WHERE THE OFFER OR SALE IS NOT PERMITTED.
| 88 |
Mortgage Loan No. 5 — GLP Industrial Portfolio A
Tenant Summary(1)
| Tenant | Credit | % of UW | UW | |||||
| Rating | Property | UW | Base | Base | Original | Lease | ||
| (Fitch/MIS/S&P)(2) | Count | GLA | Base Rent | Rent | Rent PSF | Start | Expiration | |
| HanesBrands, Inc. | NR/Ba2/BB | 1 | 1,309,754 | $6,638,881 | 5.4% | $5.07 | 1/1/2011 | 10/31/2018 |
| CEVA | NR/NR/NR | 3 | 1,434,000 | 5,459,745 | 4.4 | $3.81 | Various | Various(3) |
| Harbor Freight Tools | NR/Ba3/BB- | 2 | 1,280,446 | 5,321,841 | 4.3 | $4.16 | Various | Various |
| Home Depot USA Inc | A/A2/A | 2 | 1,123,818 | 5,173,796 | 4.2 | $4.60 | Various | Various |
| United Natural Foods, Inc. | NR/NR/NR | 1 | 553,757 | 3,433,293 | 2.8 | $6.20 | 5/1/2013 | 10/31/2028 |
| Owens & Minor Distribution, Inc | BBB-/Ba1/BBB | 2 | 604,161 | 3,236,710 | 2.6 | $5.36 | Various | Various |
| Samsung Electronics | A+/A1/A+ | 1 | 612,104 | 3,202,528 | 2.6 | $5.23 | 6/1/2013 | 9/30/2019 |
| Belkin Corporation | NR/NR/NR | 1 | 798,096 | 2,793,336 | 2.3 | $3.50 | 4/1/2001 | 11/30/2019 |
| Reliable Churchill | NR/NR/NR | 1 | 449,299 | 2,407,371 | 2.0 | $5.36 | 8/1/2014 | 8/31/2029 |
| Packaging Corp of America | NR/Baa3/BBB | 1 | 470,160 | 2,320,080 | 1.9 | $4.93 | 2/1/2013 | 9/30/2025 |
| Ten Largest Tenants | 8,635,595 | $39,987,581 | 32.5% | $4.63 | ||||
| Remaining Tenants | 16,745,912 | 83,402,096 | 67.5 | $4.98 | ||||
| Vacant | 1,497,270 | 0 | 0.0 | $0.00 | ||||
| Total/Wtd. Avg.: | 26,878,777 | $123,389,677 | 100.0% | $4.59 |
| (1) | Based on the underwritten rent roll dated October 1, 2015. |
| (2) | Ratings provided are for the parent company of the entity listed in the “Tenant” field whether or not the parent company guarantees the lease. |
| (3) | CEVA has a one-time right to terminate its lease on September 14, 2018 with 12 months prior written notice and payment of a termination fee equal to $5,600,000. |
Lease Rollover Schedule(1)
| Year | % of | Cumulative | |||||||
| Number | % of | UW Base | Cumulative | Cumulative | Cumulative | % of UW | |||
| of Leases | GLA | GLA | UW Base | Rent | GLA | % of GLA | UW Base | Base Rent | |
| Expiring(2) | Expiring | Expiring | Rent Expiring | Expiring | Expiring | Expiring | Rent Expiring | Expiring | |
| Vacant | NAP | 1,497,270 | 5.6% | NAP | NAP | 1,497,270 | 5.6% | NAP | NAP |
| MTM | 13 | 654,631 | 2.4 | $4,316,272 | 3.5% | 2,151,901 | 8.0% | $4,316,272 | 3.5% |
| 2016 | 29 | 2,099,211 | 7.8 | 10,463,960 | 8.5 | 4,251,112 | 15.8% | $14,780,232 | 12.0% |
| 2017 | 32 | 2,461,727 | 9.2 | 11,426,667 | 9.3 | 6,712,839 | 25.0% | $26,206,898 | 21.2% |
| 2018 | 35 | 4,737,391 | 17.6 | 21,311,824 | 17.3 | 11,450,230 | 42.6% | $47,518,722 | 38.5% |
| 2019 | 34 | 4,329,613 | 16.1 | 19,805,396 | 16.1 | 15,779,843 | 58.7% | $67,324,118 | 54.6% |
| 2020 | 27 | 2,546,095 | 9.5 | 12,743,662 | 10.3 | 18,325,938 | 68.2% | $80,067,780 | 64.9% |
| 2021 | 12 | 1,179,561 | 4.4 | 6,624,473 | 5.4 | 19,505,499 | 72.6% | $86,692,253 | 70.3% |
| 2022 | 13 | 1,336,256 | 5.0 | 5,955,616 | 4.8 | 20,841,755 | 77.5% | $92,647,869 | 75.1% |
| 2023 | 3 | 243,225 | 0.9 | 1,275,260 | 1.0 | 21,084,980 | 78.4% | $93,923,129 | 76.1% |
| 2024 | 8 | 1,152,305 | 4.3 | 5,854,352 | 4.7 | 22,237,285 | 82.7% | $99,777,481 | 80.9% |
| 2025 | 5 | 1,270,190 | 4.7 | 7,418,711 | 6.0 | 23,507,475 | 87.5% | $107,196,192 | 86.9% |
| 2026 & Beyond | 9 | 3,371,302 | 12.5 | 16,193,483 | 13.1 | 26,878,777 | 100.0% | $123,389,677 | 100.0% |
| Total | 220 | 26,878,777 | 100.0% | $123,389,677 | 100.0% |
| (1) | Based on the underwritten rent roll dated October 1, 2015. |
| (2) | Certain tenants have more than one lease. |
THE INFORMATION IN THIS TERM SHEET IS NOT COMPLETE AND MAY BE AMENDED PRIOR TO THE TIME OF SALE. THIS TERM SHEET IS NOT AN OFFER TO SELL THESE SECURITIES AND IT IS NOT A SOLICITATION OF AN OFFER TO BUY THESE SECURITIES IN ANY JURISDICTION WHERE THE OFFER OR SALE IS NOT PERMITTED.
| 89 |
Mortgage Loan No. 5 — GLP Industrial Portfolio A
Operating History and Underwritten Net Cash Flow(1)
| Yr1 Budget | |||||||
| 2013 | 2014 | 2015(2) | (10/2015 - 9/2016) | Underwritten(3) | PSF(3) | %(4) | |
| Rents in Place(3) | $79,931,143 | $107,113,582 | $112,598,033 | $126,908,982 | $123,389,677 | $4.59 | 73.9% |
| Vacant Income | 0 | 0 | 0 | 0 | 8,256,110 | 0.31 | 4.9% |
| Gross Potential Rent | $79,931,143 | $107,113,582 | $112,598,033 | $126,908,982 | $131,645,787 | $4.90 | 78.8% |
| Total Reimbursements | 20,337,584 | 30,188,389 | 31,444,105 | 35,562,338 | 35,361,718 | 1.32 | 21.2% |
| Net Rental Income | $100,268,727 | $137,301,971 | $144,042,137 | $162,471,320 | $167,007,505 | $6.21 | 100.0% |
| (Vacancy/Collection Loss) | (3,893,316) | (3,207,494) | (5,010,206) | (9,239,767) | (10,841,311) | (0.40) | (6.5%) |
| Other Income | 363,625 | 1,683,391 | 1,365,188 | 725,759 | 725,759 | 0.03 | 0.4% |
| Effective Gross Income | $96,739,036 | $135,777,869 | $140,397,120 | $153,957,312 | $156,891,953 | $5.84 | 93.9% |
| Total Expenses | $26,174,307 | $37,156,412 | $37,710,832 | $40,905,654 | $41,005,138 | $1.53 | 26.1% |
| Net Operating Income | $70,564,730 | $98,621,458 | $102,686,288 | $113,051,658 | $115,886,815 | $4.31 | 73.9% |
| Total TI/LC, Capex/RR | 0 | 0 | 0 | 10,265,392 | 9,407,572 | 0.35 | 6.0% |
| Net Cash Flow | $70,564,730 | $98,621,458 | $102,686,288 | $102,786,266 | $106,479,243 | $3.96 | 67.9% |
| (1) | Not all of the properties in the Portfolio were the same in each of the historical periods. “Same Store” analysis, representing 91 properties, of net operating income and occupancy for 2013, 2014, 2015 and Yr1 Budget was approximately $62.6 million, $78.4 million, $79.5 million and $84.8 million, respectively, and 91.2%, 94.0%, 93.2% and 97.2%, respectively. |
| (2) | The 2015 column represents the trailing twelve month period ending June 30, 2015. Due to the Portfolio being acquired by the borrower in November 2015, full year-end financials were not available. Based on annualized financials from November 4, 2015 to December 31, 2015, the Portfolio had an annualized NOI of $116.6 million. Based on UW NOI for the period from November 4, 2015 to December 31, 2015 the Portfolio would result in an annualized UW NOI of $116.0 million. |
| (3) | Underwritten Rents in Place are based on the October 2015 rent roll and include approximately $4.5 million for rent steps and approximately $1.0 million for credit tenant rent steps. Rent steps reflects the difference between in-place rent and annualized contractual base rent steps through December 1, 2016. Credit tenant rent steps reflects the difference between in-place rent plus annualized contractual base rent steps through December 1, 2016 and credit tenants’ average rent from October 1, 2015 through the maturity date. |
| (4) | % column represents the percentage of Net Rental Income for all revenue lines and represents the percentage of Effective Gross Income for the remainder of fields. |
Property Management. The GLP Industrial Portfolio A properties are managed by GLP US Management LLC, an affiliate of GLP. Following the acquisition of IIT, GLP ranks as the 2nd largest logistics space owner in the U.S. after Prologis, Inc. (NYSE: PLD), with approximately 173 million SF. GLP entered the U.S. logistics market in February 2015 with its $8.1 billion acquisition of IndCor Properties, Inc. from the Blackstone Group, LP (NYSE: BX).
Escrows and Reserves. At origination, the borrowers deposited approximately $1.2 million into the deferred maintenance escrow.
Tax & Insurance Escrows – The requirement of the borrowers to make monthly deposits to the basic carrying costs reserve account is waived so long as a Trigger Period is not continuing.
TI/LC Reserves – The requirement of the borrowers to make monthly deposits to the TI/LC reserve account is waived so long as a Trigger Period is not continuing. During a Trigger Period, 1/12th of $0.25 PSF (with accumulation in the reserve capped at $0.25 PSF) is required to be deposited into the TI/LC reserve account on a monthly basis.
Capital Expenditure Reserve – The requirement of the borrowers to make monthly deposits to the capital expenditure reserve account is waived so long as a Trigger Period is not continuing. During a Trigger Period, 1/12th of $0.10 PSF (with accumulation in the reserve capped at $0.10 PSF) is required to be deposited into the capital expenditure reserves on a monthly basis.
Lockbox / Cash Management. The GLP Industrial Portfolio A Whole Loan is structured with a hard lockbox and springing cash management. Tenants have been directed to remit all payments due under their respective leases directly into the lockbox account controlled by the lender. During the continuance of a Trigger Period, all funds in the lockbox account are required to be swept daily to a cash management account under the control of the lender and disbursed during each interest period of the term of the loan in accordance with the loan documents. During the continuance of a Trigger Period, all excess cash flow, after payments
THE INFORMATION IN THIS TERM SHEET IS NOT COMPLETE AND MAY BE AMENDED PRIOR TO THE TIME OF SALE. THIS TERM SHEET IS NOT AN OFFER TO SELL THESE SECURITIES AND IT IS NOT A SOLICITATION OF AN OFFER TO BUY THESE SECURITIES IN ANY JURISDICTION WHERE THE OFFER OR SALE IS NOT PERMITTED.
| 90 |
Mortgage Loan No. 5 — GLP Industrial Portfolio A
made in accordance with the loan documents for, amongst other things, debt service, required reserves and operating expenses, will be held as additional collateral for the loan.
“Trigger Period” means, (i) any period where the net operating income debt yield (for the total debt inclusive of the mezzanine loans) for the trailing twelve month period, falls below 6.75% for two consecutive fiscal quarters until the net operating income debt yield for the trailing twelve month period is at least 6.75% for two consecutive quarters and (ii) any period during the continuance of an event of default under any related mezzanine loan. The first test period was the 12-month period ending March 30, 2016.
Property Releases.The applicable borrowers may release a related property from the mortgage by prepaying a portion of GLP Industrial Portfolio A Whole Loan in an amount equal to the applicable allocated loan amount times (i) 105% until the first 10% of GLP Industrial Portfolio A Whole Loan has been repaid; then (ii) 110% until 20% in aggregate of GLP Industrial Portfolio A Whole Loan has been repaid; and (iii) thereafter 115%. All principal repayments under the GLP Industrial Portfolio A Whole Loan prior to the open prepayment date in connection with such property releases are subject to yield maintenance.
In addition, property releases (other than releases that occur as a result of the application of loss proceeds from a casualty or condemnation at any related property) are further subject to a debt yield test (based on the total debt inclusive of the mezzanine loans) under the GLP Industrial Portfolio A Whole Loan, such that the aggregate portfolio debt yield (for the total debt inclusive of the mezzanine loans) of GLP Industrial Portfolio A Whole Loan after giving effect to such release is at least the lesser of (x) the debt yield immediately prior to such release and (y) 10.5%.
In addition, if no event of default under the GLP Industrial Portfolio A Whole Loan is continuing, the related borrowers may obtain a release of certain related excess parcels from the lien of the GLP Industrial Portfolio A mortgage without the related lender’s consent or approval or any requirement to prepay any portion of the GLP Industrial Portfolio A Whole Loan upon the satisfaction of certain conditions as described in the Preliminary Prospectus.
Additional Debt.In addition to Note A-3-2, the mortgaged properties are also security for thepari passu Note A-1, Note A-2, Note A-3-1, and Note A-4 and two subordinate B Notes. The B Notes have an outstanding principal balance as of the cut-off date of $328.9 million. The GLP Industrial Portfolio A Whole Loan (inclusive of B Notes) has a Cut-off Date LTV of 46.2%, and UW NCF DSCR of 2.62x and an UW NOI Debt Yield of 12.0%. In addition, $330.0 million of mezzanine loans were provided in connection with the financing of the Portfolio that are secured by a pledge of the direct equity interests in the borrowers and are coterminous with the mortgage loan. The mezzanine loans have a weighted average coupon of 5.1500%. Including the mezzanine loans and the B Notes, the Cut-off Date LTV is 62.0%, the UW NCF DSCR is 1.84x and the UW NOI debt yield is 8.9%. The mezzanine loans are owned by Teachers Insurance and Annuity Association of America.
THE INFORMATION IN THIS TERM SHEET IS NOT COMPLETE AND MAY BE AMENDED PRIOR TO THE TIME OF SALE. THIS TERM SHEET IS NOT AN OFFER TO SELL THESE SECURITIES AND IT IS NOT A SOLICITATION OF AN OFFER TO BUY THESE SECURITIES IN ANY JURISDICTION WHERE THE OFFER OR SALE IS NOT PERMITTED.
| 91 |
(THIS PAGE INTENTIONALLY LEFT BLANK)
| 92 |
| |
Mortgage Loan No. 6 — Mission Ridge |
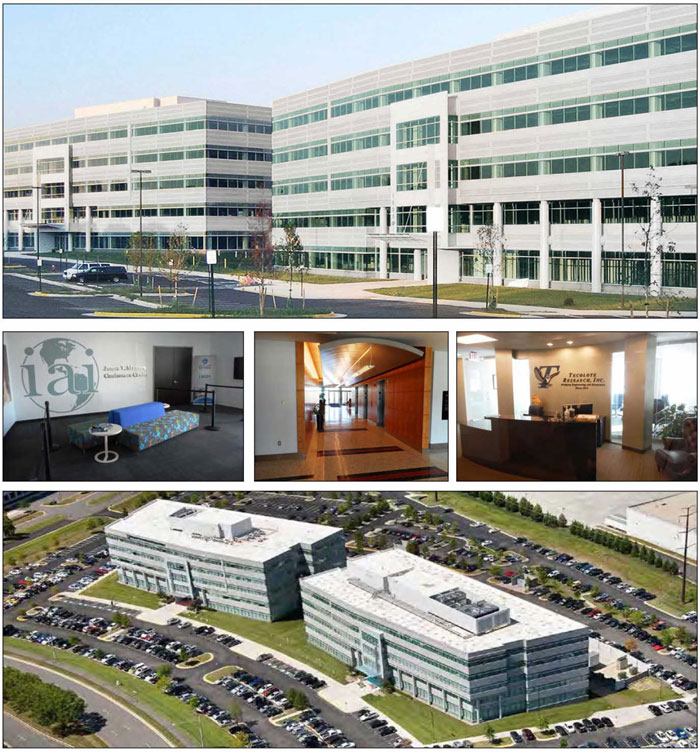 |
THE INFORMATION IN THIS TERM SHEET IS NOT COMPLETE AND MAY BE AMENDED PRIOR TO THE TIME OF SALE. THIS TERM SHEET IS NOT AN OFFER TO SELL THESE SECURITIES AND IT IS NOT A SOLICITATION OF AN OFFER TO BUY THESE SECURITIES IN ANY JURISDICTION WHERE THE OFFER OR SALE IS NOT PERMITTED.
| 93 |
| |
Mortgage Loan No. 6 — Mission Ridge |
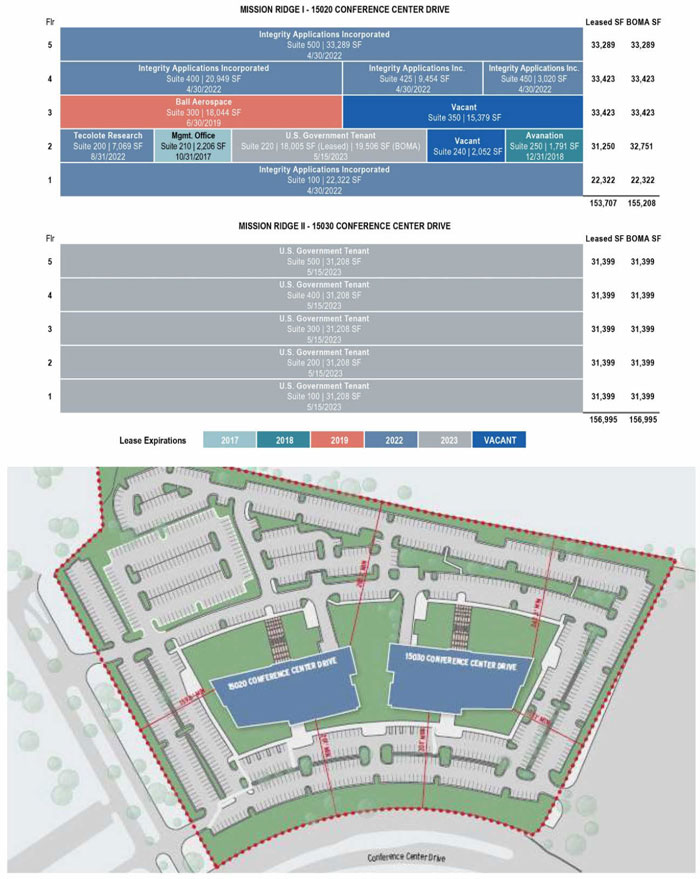 |
THE INFORMATION IN THIS TERM SHEET IS NOT COMPLETE AND MAY BE AMENDED PRIOR TO THE TIME OF SALE. THIS TERM SHEET IS NOT AN OFFER TO SELL THESE SECURITIES AND IT IS NOT A SOLICITATION OF AN OFFER TO BUY THESE SECURITIES IN ANY JURISDICTION WHERE THE OFFER OR SALE IS NOT PERMITTED.
| 94 |
| |
Mortgage Loan No. 6 — Mission Ridge |
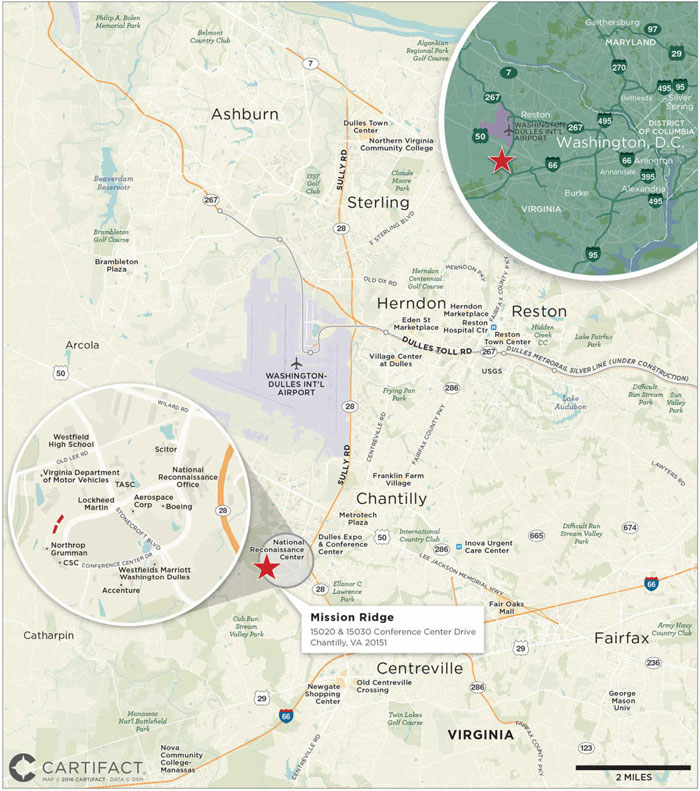 |
THE INFORMATION IN THIS TERM SHEET IS NOT COMPLETE AND MAY BE AMENDED PRIOR TO THE TIME OF SALE. THIS TERM SHEET IS NOT AN OFFER TO SELL THESE SECURITIES AND IT IS NOT A SOLICITATION OF AN OFFER TO BUY THESE SECURITIES IN ANY JURISDICTION WHERE THE OFFER OR SALE IS NOT PERMITTED.
| 95 |
| |
Mortgage Loan No. 6 — Mission Ridge |
| Mortgage Loan Information | Property Information | |||
| Mortgage Loan Seller: | Column | Single Asset / Portfolio: | Single Asset | |
| Original Principal Balance: | $37,450,000 | Title: | Leasehold | |
| Cut-off Date Principal Balance: | $37,450,000 | Property Type - Subtype: | Office – Suburban | |
| % of Pool by IPB: | 4.9% | Net Rentable Area (SF): | 310,702 | |
| Loan Purpose: | Acquisition | Location: | Chantilly, VA | |
| Borrowers: | Capstone Mission Ridge, LLC; Salus Mission Ridge, LLC | Year Built / Renovated: | 2007 / N/A | |
| Sponsor: | James M. Jacobson Jr. | Occupancy: | 93.6% | |
| Interest Rate: | 5.2000% | Occupancy Date: | 1/26/2016 | |
| Note Date: | 2/12/2016 | Number of Tenants: | 5 | |
| Maturity Date: | 3/6/2026 | 2013 NOI: | $2,499,843 | |
| Interest-only Period: | 60 months | 2014 NOI: | $4,019,367 | |
| Original Term: | 120 months | 2015 NOI(2): | $7,146,114 | |
| Original Amortization: | 360 months | TTM NOI: | N/A | |
| Amortization Type: | IO-Balloon | UW Economic Occupancy: | 94.8% | |
| Call Protection: | L(26),Def(90),O(4) | UW Revenues: | $11,252,027 | |
| Lockbox(1): | Soft | UW Expenses: | $7,014,785 | |
| Additional Debt: | No | UW NOI(2): | $4,237,241 | |
| Additional Debt Balance: | N/A | UW NCF: | $3,476,021 | |
| Additional Debt Type: | N/A | Appraised Value / Per SF: | $67,000,000 / $216 | |
| Additional Future Debt Permitted: | No | Appraisal Date: | 1/28/2016 |
| Escrows and Reserves(3) | Financial Information | |||||
| Initial | Monthly | Initial Cap | Cut-off Date Loan / SF: | $121 | ||
| Taxes: | $216,821 | $72,274 | N/A | Maturity Date Loan / SF: | $111 | |
| Insurance: | $14,389 | $7,194 | N/A | Cut-off Date LTV: | 55.9% | |
| Replacement Reserves: | $0 | $5,138 | N/A | Maturity Date LTV: | 51.7% | |
| TI/LC: | $0 | 38,838 | N/A | UW NCF DSCR: | 1.41x | |
| Ground Lease Reserve: | $145,833 | $145,833 | N/A | UW NOI Debt Yield: | 11.3% | |
Sources and Uses(4)
| Sources | Proceeds | % of Total | Uses | Proceeds | % of Total | |
| Mortgage Loan | $37,450,000 | 36.0% | Purchase Price | $96,000,000 | 92.3% | |
| Fee Buyer Proceeds | 39,414,414 | 37.9 | Upfront Reserves | 2,279,460 | 2.2 | |
| Borrower Equity | 19,203,743 | 18.5 | Closing Costs | 5,698,319 | 5.5 | |
| Seller Obligations and Other | 7,909,621 | 7.6 | ||||
| Total Sources | $103,977,779 | 100.0% | Total Uses | $103,977,779 | 100.0% |
| (1) | For a more detailed description of lockbox, please refer to“Lockbox / Cash Management”below. |
| (2) | The UW NOI is lower than the 2015 NOI mainly as a result of the ground lease payments that were previously not applicable due to the sale of the fee interest to an unaffiliated third party at the time of origination and an increase in the management fee. |
| (3) | For a more detailed description of escrows and reserves, please refer to “Escrows and Reserves” below. |
| (4) | The purchase included both the fee simple and leasehold portions of the property. The fee simple portion of the property was simultaneously sold to a third-party investor at the time of origination. |
THE INFORMATION IN THIS TERM SHEET IS NOT COMPLETE AND MAY BE AMENDED PRIOR TO THE TIME OF SALE. THIS TERM SHEET IS NOT AN OFFER TO SELL THESE SECURITIES AND IT IS NOT A SOLICITATION OF AN OFFER TO BUY THESE SECURITIES IN ANY JURISDICTION WHERE THE OFFER OR SALE IS NOT PERMITTED.
| 96 |
| |
Mortgage Loan No. 6 — Mission Ridge |
The Loan. The Mission Ridge loan is an approximately $37.5 million first mortgage loan secured by the leasehold interest in a 310,702 SF Class A office complex located in Chantilly, Virginia. The loan has a 10-year term and will amortize on a 30-year schedule following an initial interest-only period of five years.
The Borrowers. The borrowing entities for the loan are Capstone Mission Ridge, LLC and Salus Mission Ridge, LLC, jointly and severally as tenants-in-common, both Delaware limited liability companies and special purpose entities.
The Sponsor. The loan’s sponsor and nonrecourse carve-out guarantor is James M. Jacobson Jr. Mr. Jacobson Jr. is the current President of SALUS Federal Properties, LLC, a firm which focuses exclusively on acquiring and managing properties leased to federal agencies. Mr. Jacobson Jr. has more than 30 years of experience in the real estate industry.
The Property.The property consists of two buildings, Mission Ridge I and Mission Ridge II, totaling 310,702 SF of Class A office space located in Chantilly, Virginia. The buildings, each five stories, were constructed in 2007 and are situated on approximately 16.6 acres in the Northern Virginia office market. The subject consists entirely of office space and provides for 1,085 parking spaces in an open, asphalt-paved lot. The complex meets the Interagency Security Committee’s second highest level of security specifications, Level IV, which provides for a “high” level of protection required by government intelligence agencies. The complex also meets the Department of Defense’s Unified Facilities Criteria which outlines criteria for the planning, construction, operation and maintenance for government properties. Additionally, 30% of the complex consists of Sensitive Compartmented Information Facility space, in which government and government-related contractors can safely store, discuss and process sensitive information.
As of January 26, 2016, the complex was 93.6% leased by five tenants. The largest tenant at the complex, the Federal Bureau of Investigation (“FBI”), leases 175,000 SF (56.3% of the net rentable area) of the complex through May 2023. All of the 156,995 SF of Mission Ridge II and 18,005 SF of Mission Ridge I is leased by the FBI. The FBI has invested approximately $41 million in its space to meet the security and technology requirements needed by the FBI. The US Government is rated Aaa, AA+ and AAA by Moody’s, S&P and Fitch, respectively. The second largest tenant at the complex, Integrity Applications Incorporated (“IAI”), leases 89,034 SF (28.7% of the net rentable area) of Mission Ridge I through April 2022. IAI is an engineering and software services and solutions company primarily supporting the intelligence community and other civil, defense and intelligence surveillance and reconnaissance activities. The complex serves as IAI’s world headquarters. The third largest tenant at the property, Ball Aerospace Technologies, Corp., leases 18,044 SF (5.8% of the net rentable area) through June 2019 with two, three-year extension options remaining. Employing 15,000 employees and accounting for approximately $8.0 billion in 2015 annual sales, Ball Aerospace Technologies, Corp. is a provider of aerospace and other technology services to commercial and government customers. The company is listed on the NYSE as ticker “BLL”.
The property is located in the Westfields business park which has become a hub for defense and cyber-security intelligence. The subject is currently within line of site of the 2.0 million SF headquarters of the National Reconnaissance Office and a future GSA installation. Primary access to the location is provided by US Route 50 and Virginia State Route 28, which provide access to economic centers in Northern Virginia and Washington, DC.
The Market. The complex is located in the Westfields business park located in Chantilly, Virginia within the Washington-Arlington-Alexandra Metropolitan Statistical Area and the Route 28 Corridor South office submarket. The complex is located approximately 29 miles from Washington, DC, 19 miles from Tyson’s Corner, Virginia and 9 miles from Dulles International Airport.
According to a market data source, as of January 2016, the Route 28 Corridor South office submarket contained 8.9 million SF of Class A office space with an overall vacancy rate of 20.9%. According to the appraisal, the Westfields Business Park is one of the largest and most prestigious corporate communities in the Washington, DC area. The appraisal concluded market rents of $31.50 PSF. According to the appraisal, the property’s competitive set consists of the five properties detailed in the table below.
THE INFORMATION IN THIS TERM SHEET IS NOT COMPLETE AND MAY BE AMENDED PRIOR TO THE TIME OF SALE. THIS TERM SHEET IS NOT AN OFFER TO SELL THESE SECURITIES AND IT IS NOT A SOLICITATION OF AN OFFER TO BUY THESE SECURITIES IN ANY JURISDICTION WHERE THE OFFER OR SALE IS NOT PERMITTED.
| 97 |
| |
Mortgage Loan No. 6 — Mission Ridge |
Competitive Set Summary(1)
| Property | Year Built / Renovated | Total GLA (SF) | Est. Occ. | Proximity (miles) |
| Mission Ridge | 2007 / N/A | 310,702(2) | 93.6%(2) | N/A |
| Trinity Centre 2 | 2006 / N/A | 150,872 | 96.0% | 4.2 |
| Trinity Centre 4 | 2001 / N/A | 92,736 | 91.0% | 4.5 |
| One Monument Place | 1990 / N/A | 221,538 | 92.0% | 8.1 |
| Centerpointe Two | 1989 / 2009 | 212,932 | 91.0% | 8.2 |
| Greens I | 1997 / N/A | 152,667 | 17.0% | 0.3 |
| (1) | Source: Appraisal. |
| (2) | Based on the January 26, 2016 underwritten rent roll. |
Historical and Current Occupancy
| 2013(1) | 2014(1) | 2015(1) | Current(2) |
| 62.2% | 90.9% | 93.9% | 93.6% |
| (1) | Historical Occupancy is provided by the sponsor. Occupancies are as of December 31 of each respective year. |
| (2) | Based on the January 26, 2016 underwritten rent roll. |
Tenant Summary(1)
| Tenant | Ratings Moody’s/S&P/Fitch | Net Rentable Area (SF) | % of Total NRA | % of Rents in Place | Base Rent PSF | Lease Expiration Date |
| Federal Bureau of Investigation | Aaa / AA+ / AAA(2) | 175,000 | 56.3% | 60.0% | $31.50 | 5/15/2023 |
| Integrity Applications Incorporated | NA / NA / NA | 89,034 | 28.7% | 28.9% | $30.47 | 4/30/2022 |
| Ball Aerospace Technologies, Corp. | NA / NA / NA | 18,044 | 5.8% | 6.1% | $30.77 | 6/30/2019 |
| Tecolote Research Inc | NA / NA / NA | 7,069 | 2.3% | 2.5% | $31.69 | 8/31/2022(3) |
| Anavation | NA / NA / NA | 1,791 | 0.6% | 0.6% | $30.39 | 12/31/2018 |
| (1) | Based on the underwritten rent roll dated January 26, 2016, including rent increases occurring through February 28, 2017. |
| (2) | Ratings provided are for the US Government. |
| (3) | Tecolote Research Inc has a termination option which can be exercised on August 31, 2019. |
THE INFORMATION IN THIS TERM SHEET IS NOT COMPLETE AND MAY BE AMENDED PRIOR TO THE TIME OF SALE. THIS TERM SHEET IS NOT AN OFFER TO SELL THESE SECURITIES AND IT IS NOT A SOLICITATION OF AN OFFER TO BUY THESE SECURITIES IN ANY JURISDICTION WHERE THE OFFER OR SALE IS NOT PERMITTED.
| 98 |
| |
Mortgage Loan No. 6 — Mission Ridge |
Lease Rollover Schedule(1)
| Year | Number of Leases Expiring(2) | NRA Expiring | % of NRA Expiring | Base Rent Expiring | % of Base Rent Expiring | Cumulative NRA Expiring | Cumulative % of NRA Expiring | Cumulative Base Rent Expiring | Cumulative % of Base Rent Expiring |
| Vacant | 0 | 19,764 | 6.4% | NAP | NAP | 19,764 | 6.4% | NAP | NAP |
| MTM | 0 | 0 | 0.0 | $0 | 0.0% | 19,764 | 6.4% | $0 | 0.0% |
| 2016 | 0 | 0 | 0.0 | 0 | 0.0 | 19,764 | 6.4% | $0 | 0.0% |
| 2017 | 0 | 0 | 0.0 | 0 | 0.0 | 19,764 | 6.4% | $0 | 0.0% |
| 2018 | 1 | 1,791 | 0.6 | 54,428 | 0.6 | 21,555 | 6.9% | $54,428 | 0.6% |
| 2019 | 1 | 18,044 | 5.8 | 555,214 | 6.1 | 39,599 | 12.7% | $609,642 | 6.7% |
| 2020 | 0 | 0 | 0.0 | 0 | 0.0 | 39,599 | 12.7% | $609,642 | 6.7% |
| 2021 | 0 | 0 | 0.0 | 0 | 0.0 | 39,599 | 12.7% | $609,642 | 6.7% |
| 2022 | 1 | 7,069 | 2.3 | 224,017 | 2.5 | 46,668 | 15.0% | $833,659 | 9.2% |
| 2023 | 2 | 175,000 | 56.3 | 5,512,500 | 60.8 | 221,668 | 71.3% | $6,346,159 | 70.1% |
| 2024 | 0 | 0 | 0.0 | 0 | 0.0 | 221,668 | 71.3% | $6,346,159 | 70.1% |
| 2025 | 0 | 0 | 0.0 | 0 | 0.0 | 221,668 | 71.3% | $6,346,159 | 70.1% |
| 2026 & Beyond | 5 | 89,034 | 28.7 | 2,713,140 | 29.9 | 310,702 | 100.0% | $9,059,299 | 100.0% |
| Total | 10 | 310,702 | 100.0% | $9,059,299 | 100.0% |
| (1) | Based on the underwritten rent roll dated January 26, 2016 and includes rent steps occurring through February 28, 2017. |
| (2) | Certain tenants have more than one lease. |
Operating History and Underwritten Net Cash Flow
| 2013 | 2014(1) | 2015(1)(2) | Underwritten(2)(3)(4) | PSF | %(5) | |
| Rents in Place(1)(4) | $4,728,631 | $6,786,477 | $10,812,173 | $9,059,299 | $29.16 | 92.1% |
| Vacant Income | 0 | 0 | 0 | 622,566 | 2.00 | 6.3% |
| Gross Potential Rent | $4,728,631 | $6,786,477 | $10,812,173 | $9,681,865 | $31.16 | 98.4% |
| Total Reimbursements | 100,782 | 140,890 | 155,971 | 154,035 | 0.50 | 1.6% |
| Free Rent Adjustment | (277,179) | (87,213) | (8,072) | 0 | 0.00 | 0.0% |
| Net Rental Income | $4,552,234 | $6,840,154 | $10,960,072 | $9,835,900 | $31.66 | 100.0% |
| (Vacancy/Collection Loss) | 0 | 0 | 0 | (622,566) | (2.00) | (6.3%) |
| Other Income(4) | 24,410 | 24,975 | 0 | 2,038,693 | 6.56 | 20.7% |
| Effective Gross Income | $4,576,644 | $6,865,129 | $10,960,072 | $11,252,027 | $36.21 | 100.0% |
| Total Expenses | $2,076,801 | $2,845,762 | $3,813,958 | $7,014,785 | $22.58 | 62.3% |
| Net Operating Income | $2,499,843 | $4,019,367 | $7,146,114 | $4,237,241 | $13.64 | 37.6% |
| Total TI/LC, Capex/RR | 0 | 0 | 0 | 761,220 | 2.45 | 6.8% |
| Net Cash Flow | $2,499,843 | $4,019,367 | $7,146,114 | $3,476,022 | $11.19 | 31.8% |
| (1) | In October 2014, the Federal Bureau of Investigation lease was amended to increase base rent by approximately $2.4 million. |
| (2) | UW Total Expenses exceed the 2015 Total Expenses mainly due to the inclusion of the $1.75 million ground lease payment, that was not applicable in historical financials, an approximately $1.0 million budgeted increase in utilities and underwriting a 4.0% management fee when historically it’s been approximately 1.4%. |
| (3) | Underwritten Rents in Place includes base rent and rent increases occurring through February 2017. |
| (4) | Underwritten Other Income reflects a utility reimbursement under the FBI lease which was shown in Rents in Place for historic financials. |
| (5) | % column represents percent of Net Rental Income for all revenue lines and represents percent of Effective Gross Income for the remainder of fields. |
THE INFORMATION IN THIS TERM SHEET IS NOT COMPLETE AND MAY BE AMENDED PRIOR TO THE TIME OF SALE. THIS TERM SHEET IS NOT AN OFFER TO SELL THESE SECURITIES AND IT IS NOT A SOLICITATION OF AN OFFER TO BUY THESE SECURITIES IN ANY JURISDICTION WHERE THE OFFER OR SALE IS NOT PERMITTED.
| 99 |
| |
Mortgage Loan No. 6 — Mission Ridge |
Property Management. The property is managed by CB Richard Ellis of Virginia, Inc., an independent third party property manager.
Escrows and Reserves. At origination, the borrowers deposited into escrow $216,821 for real estate taxes, $145,833 for the ground lease reserve and $14,389 for insurance.
Tax Escrows - On a monthly basis, the borrowers are required to escrow 1/12th of the estimated tax payments, currently equal to $72,274.
Insurance Escrows - On a monthly basis, the borrowers are required to escrow 1/12th of the estimated insurance payments, currently equal to $7,194.
Replacement Reserves -On a monthly basis, the borrowers are required to deposit $5,138 to a replacement reserve.
TI/LC Reserves -On a monthly basis, the borrowers are required to deposit $38,838 to a TI/LC reserve.
Ground Lease Reserves -On a monthly basis, the borrowers are required to deposit 1/12th of the then current annual ground lease payment, currently equal to $145,833.
FBI and IAI Maturity Reserve - On or before the date which is twelve months prior to the both the FBI and IAI lease expirations, the borrowers will be required to provide a $2,500,000 letter of credit for the re-tenanting of the spaces. The respective letters of credit will be returned to the borrowers if the FBI or IAI leases are extended or if the borrowers lease the spaces to a tenant with an initial term of at least five years.
Lockbox / Cash Management. The loan is structured with a soft, springing hard lockbox and springing cash management. Upon the occurrence of a Cash Sweep Event (as defined below), tenants will remit monthly rent payments directly to the lockbox which is under the sole dominion and control of the lender. During the continuance of a Cash Sweep Event, all funds received into the lockbox account will be swept immediately into the cash management account and used to pay monthly reserve balances, debt service payments and outstanding expense balances. Any remaining funds are required to be held in the excess cash flow reserve account until a cash sweep cure event occurs at which time the remaining funds are required to be returned to the borrowers.
“Cash Sweep Event” means the occurrence of(i) an event of default, (ii) a bankruptcy action of borrowers or IAI, (iii) the debt service coverage ratio for the calendar quarter immediately preceding the date of determination being less than 1.25x, (iv) the FBI going dark or ceasing operations in the FBI space, (v) the FBI not renewing and extending the FBI lease, (vi) IAI going dark or ceasing operations in the IAI space, (vii) IAI not renewing and extending the IAI lease, (viii) any failure of the borrowers to pay or cause to be paid any shortfall of taxes to the lender at least ten days prior to the date such taxes are due, or (ix) the borrowers’ failure to deliver a satisfactory commitment to refinance the loan on or before the date which is three months prior to the maturity date.
Ground Lease. The borrowers hold a leasehold interest in the property pursuant to a ground lease executed in February 2016 that has an expiration date in February 2115. Rent under the ground lease is $1,750,000 in year one and grows at 2.0% per year until each rent reset date occurring every 10 years. On each rent reset date, rent is calculated as the greater of (i) 102% of the prior year’s fixed rent and (ii) the decade-to-date Consumer Price Index (“CPI”) adjustment, as calculated per the ground lease, but capped at 3% annually for the period. Should either the lessee or lessor sell their respective interest, the other party has the right of first refusal at the terms being offered to third parties. Additionally, the lessee has the right to purchase the fee estate generally once every ten years.
THE INFORMATION IN THIS TERM SHEET IS NOT COMPLETE AND MAY BE AMENDED PRIOR TO THE TIME OF SALE. THIS TERM SHEET IS NOT AN OFFER TO SELL THESE SECURITIES AND IT IS NOT A SOLICITATION OF AN OFFER TO BUY THESE SECURITIES IN ANY JURISDICTION WHERE THE OFFER OR SALE IS NOT PERMITTED.
| 100 |
Mortgage Loan No. 7 — Vistas at Seven Bar
|
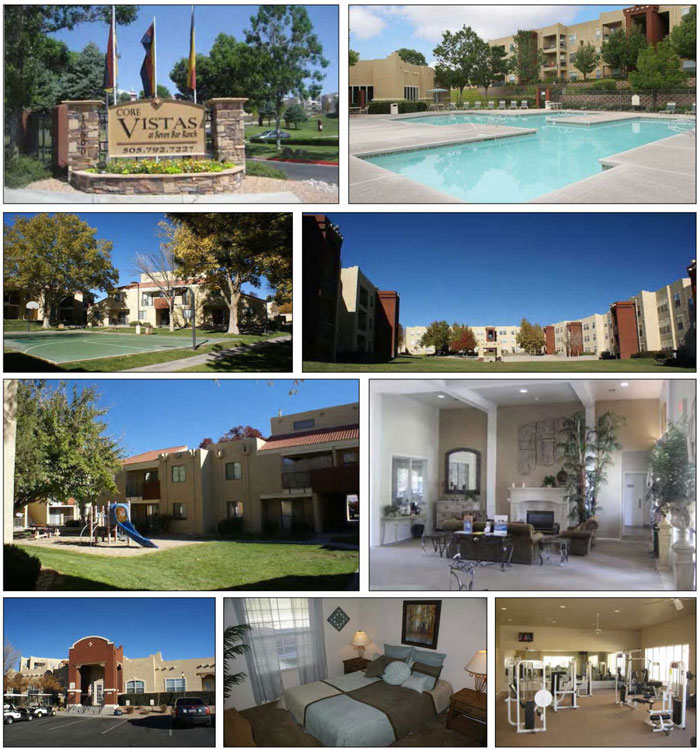
THE INFORMATION IN THIS TERM SHEET IS NOT COMPLETE AND MAY BE AMENDED PRIOR TO THE TIME OF SALE. THIS TERM SHEET IS NOT AN OFFER TO SELL THESE SECURITIES AND IT IS NOT A SOLICITATION OF AN OFFER TO BUY THESE SECURITIES IN ANY JURISDICTION WHERE THE OFFER OR SALE IS NOT PERMITTED.
| 101 |
Mortgage Loan No. 7 — Vistas at Seven Bar
|
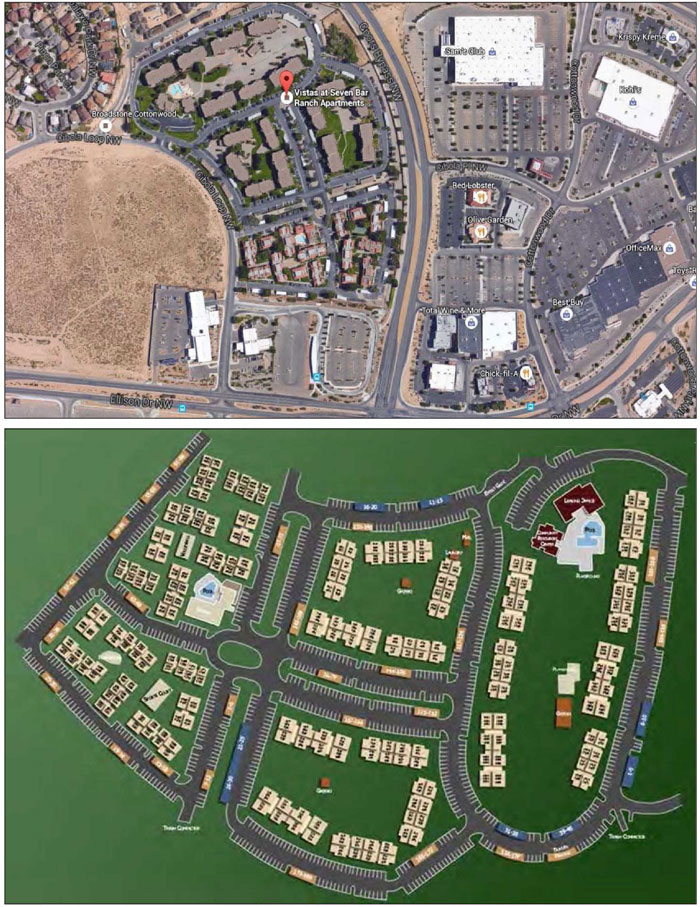
THE INFORMATION IN THIS TERM SHEET IS NOT COMPLETE AND MAY BE AMENDED PRIOR TO THE TIME OF SALE. THIS TERM SHEET IS NOT AN OFFER TO SELL THESE SECURITIES AND IT IS NOT A SOLICITATION OF AN OFFER TO BUY THESE SECURITIES IN ANY JURISDICTION WHERE THE OFFER OR SALE IS NOT PERMITTED.
| 102 |
Mortgage Loan No. 7 — Vistas at Seven Bar
|
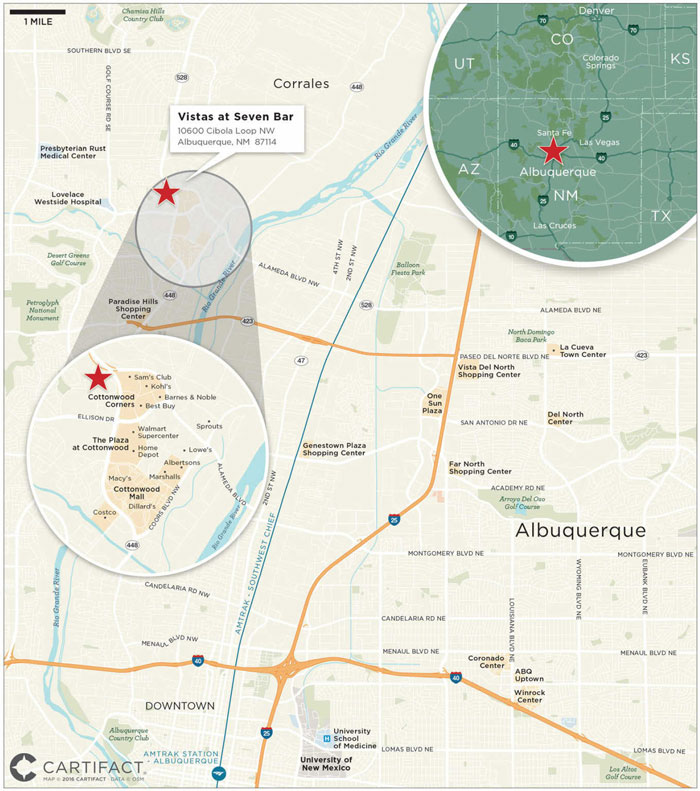
THE INFORMATION IN THIS TERM SHEET IS NOT COMPLETE AND MAY BE AMENDED PRIOR TO THE TIME OF SALE. THIS TERM SHEET IS NOT AN OFFER TO SELL THESE SECURITIES AND IT IS NOT A SOLICITATION OF AN OFFER TO BUY THESE SECURITIES IN ANY JURISDICTION WHERE THE OFFER OR SALE IS NOT PERMITTED.
| 103 |
Mortgage Loan No. 7 — Vistas at Seven Bar |
| Mortgage Loan Information | Property Information | |||
| Mortgage Loan Seller: | BNYM | Single Asset / Portfolio: | Single Asset | |
| Original Principal Balance: | $33,000,000 | Title: | Fee | |
| Cut-off Date Principal Balance: | $33,000,000 | Property Type - Subtype: | Multifamily – Garden | |
| % of Pool by IPB: | 4.3% | Net Rentable Area (Units): | 572 | |
| Loan Purpose: | Refinance | Location: | Albuquerque, NM | |
| Borrowers(1): | Various | Year Built / Renovated: | 1986, 1996 / N/A | |
| Sponsor: | CORE Realty Holdings, LLC | Occupancy: | 95.3% | |
| Interest Rate: | 5.1620% | Occupancy Date: | 3/31/2016 | |
| Note Date: | 2/12/2016 | Number of Tenants: | N/A | |
| Maturity Date: | 3/6/2026 | 2013 NOI: | $2,734,307 | |
| Interest-only Period: | 24 months | 2014 NOI: | $2,727,719 | |
| Original Term: | 120 months | 2015 NOI: | $2,706,338 | |
| Original Amortization: | 360 months | TTM NOI(3): | $2,740,764 | |
| Amortization Type: | IO-Balloon | UW Economic Occupancy: | 91.2% | |
| Call Protection: | L(26),Def(89),O(5) | UW Revenues: | $5,330,511 | |
| Lockbox(2): | Soft | UW Expenses: | $2,528,008 | |
| Additional Debt: | No | UW NOI: | $2,802,503 | |
| Additional Debt Balance: | N/A | UW NCF: | $2,780,903 | |
| Additional Debt Type: | N/A | Appraised Value / Per Unit: | $45,300,000 / $79,196 | |
| Additional Future Debt Permitted: | No | Appraisal Date: | 11/23/2015 | |
| Escrows and Reserves (4) | Financial Information | |||||
| Initial | Monthly | Initial Cap | Cut-off Date Loan / Unit: | $57,692 | ||
| Taxes: | $145,062 | $24,177 | N/A | Maturity Date Loan / Unit: | $50,128 | |
| Insurance: | $54,514 | $13,629 | N/A | Cut-off Date LTV: | 72.8% | |
| Replacement Reserve: | $1,500,000 | $14,300 | N/A | Maturity Date LTV: | 63.3% | |
| UW NCF DSCR: | 1.28x | |||||
| UW NOI Debt Yield: | 8.5% | |||||
| Sources and Uses | ||||||
| Sources | Proceeds | % of Total | Uses | Proceeds | % of Total | |
| Mortgage Loan | $33,000,000 | 100.0% | Payoff Existing Debt | $28,348,244 | 85.9% | |
| Reserves | 1,713,876 | 5.2 | ||||
| Closing Costs | 1,529,181 | 4.6 | ||||
| Cash to Borrower | 1,408,699 | 4.3 | ||||
| Total Sources | $33,000,000 | 100.0% | Total Uses | $33,000,000 | 100.0% | |
| (1) | The loan has various borrowers. For a more detailed description of the borrowers, please refer to“The Borrowers”below. |
| (2) | For a more detailed description of lockbox, please refer to“Lockbox / Cash Management”below. |
| (3) | Financials for TTM NOI represents the trailing twelve months ending February 29, 2016. |
| (4) | For a more detailed description of escrows and reserves, please refer to“Escrows and Reserves” below. |
THE INFORMATION IN THIS TERM SHEET IS NOT COMPLETE AND MAY BE AMENDED PRIOR TO THE TIME OF SALE. THIS TERM SHEET IS NOT AN OFFER TO SELL THESE SECURITIES AND IT IS NOT A SOLICITATION OF AN OFFER TO BUY THESE SECURITIES IN ANY JURISDICTION WHERE THE OFFER OR SALE IS NOT PERMITTED.
| 104 |
Mortgage Loan No. 7 — Vistas at Seven Bar |
The Loan. The Vistas at Seven Bar loan is a $33.0 million first mortgage loan secured by the fee interest in a 572-unit garden-style multifamily property located in Albuquerque, New Mexico. The loan has a 10-year term and will amortize on a 30-year schedule after a two-year interest only period.
The Borrowers.The borrowers are CORE Seven Bar H, LLC and twenty-four (24) other tenants-in-common (“TICs”), each of whom is a single purpose Delaware limited liability company structured to be bankruptcy-remote.
The Sponsor. The loan’s sponsor is CORE Realty Holdings, LLC, which is controlled by John R. Saunders. CORE Realty Holdings Management, Inc. (“CORE”), the entity which provides asset and property management services to the sponsor’s holdings, John R. Saunders along with the principals of the 24 other TIC’s are the nonrecourse carve-out guarantors. CORE and its affiliates own and professionally manage over 10.6 million SF of commercial and multi-family real estate located throughout the United States. CORE employs over 70 real estate professionals, focuses on the acquisition and management of commercial properties and provides co-ownership of real estate replacement properties for 1031 exchange investors using the tenant-in-common ownership format. Mr. Saunders owns nearly 5 million SF of commercial real estate, primarily in Orange County, California.
The Property. The Vistas at Seven Bar property is a 572-unit class B garden-style apartment complex consisting of 33 two- and three-story residential buildings, a leasing office, two community swimming pools, and 46 detached garages. The property was constructed in two phases. The first phase was constructed in 1986 and consisted of 208 units. The second phase was constructed in 1996 and consisted of 364 units. The property is located 15 miles northwest of downtown Albuquerque, New Mexico.
The property features 572 units including 20 studio units (3.5% of total units), 257 one-bedroom units (44.9% of total units), 223 two-bedroom units (39.0% of total units) and 72 three-bedroom units (12.6% of total units). Property amenities include a gated entry, community clubhouse with media room and business center, basketball court, volleyball court, racquetball court, three children’s playgrounds, three laundry facilities, covered parking, and detached garages. All units include a full energy-efficient appliance package including an electric range oven, dishwasher, and built-in microwave oven. Additional unit amenities include ceiling fans, electric stove/oven, frost-free refrigerator, dishwasher and disposal, coat/linen closet, walk-in closets, washer and dryer connections, and private patio/balcony with storage closet. Parking at the property consists of 1,221 total parking spaces for a ratio of 2.13 spaces per unit and includes 115 covered spaces, 46 detached garage spaces and 1,060 uncovered spaces.
Multifamily Unit Mix(1)
| Unit Type | No. of Units | % of Total | Occupied Units | Occupancy | Average Unit Size (SF) | Average Monthly Rental Rate | Average Monthly Rental Rate PSF | Monthly Market Rental Rate | Monthly Market Rental Rate PSF |
| Studio | 20 | 3.5% | 19 | 95.0% | 443 | $576 | $1.30 | $540 | $1.22 |
| 1 BD / 1 BA | 194 | 33.9 | 185 | 95.4% | 621 | $662 | $1.07 | $658 | $1.06 |
| 1 BD / 1 BA – Loft | 40 | 7.0 | 37 | 92.5% | 755 | $676 | $0.90 | $625 | $0.83 |
| 1 BD / 1 BA + Den | 23 | 4.0 | 21 | 91.3% | 822 | $754 | $0.92 | $744 | $0.91 |
| 2 BD / 1 BA | 65 | 11.4 | 68 | 98.5% | 822 | $755 | $0.92 | $748 | $0.91 |
| 2 BD / 2 BA | 158 | 27.6 | 151 | 95.6% | 885 | $769 | $0.87 | $789 | $0.89 |
| 3 BD / 2 BA | 72 | 12.6 | 66 | 94.4% | 1,194 | $924 | $0.77 | $970 | $0.81 |
| Total/Wtd. Avg. | 572 | 100.0% | 545 | 95.3% | 800 | $737 | $0.95 | $741 | $0.95 |
| (1) | Based on the underwritten rent roll. |
THE INFORMATION IN THIS TERM SHEET IS NOT COMPLETE AND MAY BE AMENDED PRIOR TO THE TIME OF SALE. THIS TERM SHEET IS NOT AN OFFER TO SELL THESE SECURITIES AND IT IS NOT A SOLICITATION OF AN OFFER TO BUY THESE SECURITIES IN ANY JURISDICTION WHERE THE OFFER OR SALE IS NOT PERMITTED.
| 105 |
Mortgage Loan No. 7 — Vistas at Seven Bar |
The Market.The property is located in the northwest sector of Albuquerque, near the intersection of Coors Boulevard and Ellison Drive, approximately 15 miles northwest of downtown Albuquerque, New Mexico. The neighborhood is bounded by Southern Boulevard SE to the north, Paseo Del Norte Boulevard NE to the south, the Rio Grande River to the east, and Universe Boulevard NW / Unser Boulevard NW to the west. The property is located within multiple listing service area 121 (“MLS Area 121”), a subdivision of the Albuquerque apartment market according to the appraisal. As of September 2015, MLS Area 121 had a total of 3,320 units and a weighted occupancy of 96.0%. MLS Area 121 is the 5th largest submarket, by number of units, in the Albuquerque and Central Bernalillo County area. According to the appraisal, job growth in Albuquerque has been steady, due to a stable base of education/healthcare and government jobs.
The property’s neighborhood is mostly single family residential subdivisions or vacant undeveloped desert. Commercial development has increased, primarily at the Unser Boulevard and McMahon Boulevard intersection, approximately two miles from the property. According to the appraisal, land at the new Unser Boulevard and Paradise Boulevard intersection will likely be developed with retail in the next five years as household growth continues.
According to the appraisal, the Vistas at Seven Bar property’s competitive set consists of the six properties detailed in the table below.
Competitive Set Summary (1)
| Property | Year Built | No. of Units | Avg. Unit Size (SF) | Avg. $/ Unit | Occupancy | Distance from Property |
| Vistas at Seven Bar | 1986;1996 | 572(2) | 800(2) | $737(2) | 95.3%(2) | N/A |
| Broadstone Estates | 1998 | 294 | 1,066 | $1,062 | 98.0% | 6 miles |
| Cantata at the Trails | 2013 | 260 | 1,001 | $954 | 95.0% | 4 miles |
| Oak Tree Park | 1985 | 320 | 1,137 | N/A | 96.0% | 6 miles |
| Sedona Ridge | 1980 | 339 | 696 | $668 | 93.0% | 9 miles |
| Silverado | 1985 | 256 | 717 | $648 | 95.0% | 6 miles |
| Las Mananitas Apartments | 2009 | 300 | 1,137 | $1,138 | 93.0% | 4 miles |
| Total/Wtd. Avg.(3) | 1,769 | 960 | $731 | 95.0% |
| (1) | Source: Appraisal, unless specifically indicated otherwise. |
| (2) | Based on the underwritten rent roll. |
| (3) | Excludes the subject property. |
Historical and Current Occupancy (1)
| 2013 | 2014 | 2015 | Current(2) |
| 91.1% | 91.6% | 92.5% | 95.3% |
| (1) | Historical occupancy as of December 31 of each respective year. |
| (2) | Based on the underwritten rent roll as of March 31, 2016. |
THE INFORMATION IN THIS TERM SHEET IS NOT COMPLETE AND MAY BE AMENDED PRIOR TO THE TIME OF SALE. THIS TERM SHEET IS NOT AN OFFER TO SELL THESE SECURITIES AND IT IS NOT A SOLICITATION OF AN OFFER TO BUY THESE SECURITIES IN ANY JURISDICTION WHERE THE OFFER OR SALE IS NOT PERMITTED.
| 106 |
Mortgage Loan No. 7 — Vistas at Seven Bar |
Operating History and Underwritten Net Cash Flow
| 2013 | 2014 | 2015 | TTM(1) | Underwritten | Per Unit | %(2) | |
| Rents in Place(3) | $4,889,538 | $4,957,562 | $5,053,795 | $5,064,956 | $5,060,541 | $8,847 | 92.5% |
| Vacant Income | 0 | 0 | 0 | 0 | 0 | 0 | 0.0% |
| Gross Potential Rent | $4,889,538 | $4,957,562 | $5,053,795 | $5,064,956 | $5,060,541 | $8,847 | 92.6% |
| Total Reimbursements | 304,357 | 362,705 | 396,665 | 406,914 | 406,914 | 711 | 7.4% |
| Net Rental Income | $5,193,895 | $5,320,267 | $5,450,460 | $5,471,870 | $5,467,455 | $9,558 | 100.0% |
| (Vacancy/Collection Loss) | (528,811) | (379,916) | (475,271) | (448,813) | (444,398) | (777) | (8.3%) |
| Other Income | 346,397 | 265,303 | 291,511 | 307,454 | 307,454 | 538 | 5.8% |
| Effective Gross Income | $5,011,482 | $5,205,654 | $5,266,700 | $5,330,511 | $5,330,511 | $9,319 | 97.5% |
| Total Expenses | $2,277,175 | $2,477,935 | $2,560,362 | $2,589,748 | $2,528,008 | $4,420 | 47.4% |
| Net Operating Income | $2,734,307 | $2,727,719 | $2,706,338 | $2,740,764 | $2,802,503 | $4,899 | 52.6% |
| Replacement Reserves | 0 | 0 | 0 | 0 | 171,600 | 300 | 3.2% |
| Elective Upfront Reserves | 0 | 0 | 0 | 0 | (150,000) | (262) | (2.8)% |
| Net Cash Flow | $2,734,307 | $2,727,719 | $2,706,338 | $2,740,764 | $2,780,903 | $4,862 | 52.3% |
| (1) | The TTM column represents the trailing twelve months ending February 29, 2016. |
| (2) | % column represents percent of Net Rental Income for all revenue lines and represents percent of Effective Gross Income for the remainder of fields. |
| (3) | Underwritten Rents in Place are based on the March 31, 2016 rent roll. |
Property Management.The property is managed by CORE, an affiliate of CORE Realty Holdings Management, Inc.
Escrows and Reserves.At origination, the borrowers deposited into escrow $1,500,000 for replacement reserves, $145,062 for real estate taxes, and $54,514 for insurance reserves.
Tax Escrows– On a monthly basis, the borrowers are required to escrow 1/12th of the annual estimated tax payments, currently equal to $24,177.
Insurance Escrows – On a monthly basis, the borrowers are required to escrow 1/12th of the annual estimated insurance premium payments, currently equal to $13,629.
Replacement Reserves– On a monthly basis, the borrowers are required to escrow $14,300 ($300 per unit annually) for replacement reserves. No immediate repairs or deferred maintenance was identified, however, the borrowers are required to fund an upfront CapEx reserve to be used for ongoing upgrades at property.
Lockbox / Cash Management.The loan is structured with an established soft lockbox and springing cash management. The borrowers are required to deposit or cause the property manager to deposit all rental income into the lockbox account within two (2) business days of receipt thereof. A cash management period will be triggered (i) upon an event of default (“EOD”) or (ii) if the underwritten debt service coverage ratio on a trailing twelve month period basis falls below 1.15x for four consecutive quarters. A cash management period based on clause (ii) of the prior sentence will end if the debt service coverage ratio exceeds 1.30x for four consecutive calendar quarters and any EOD is cured. During the continuance of a cash management period, all funds held in the lockbox account are swept into the cash management account, where funds are deposited monthly into subaccounts for taxes, insurance, debt service, other reserves and expenses related to the loan or property.
THE INFORMATION IN THIS TERM SHEET IS NOT COMPLETE AND MAY BE AMENDED PRIOR TO THE TIME OF SALE. THIS TERM SHEET IS NOT AN OFFER TO SELL THESE SECURITIES AND IT IS NOT A SOLICITATION OF AN OFFER TO BUY THESE SECURITIES IN ANY JURISDICTION WHERE THE OFFER OR SALE IS NOT PERMITTED.
| 107 |
(THIS PAGE INTENTIONALLY LEFT BLANK)
| 108 |
Mortgage Loan No. 8 — Jay Scutti Plaza
|
 |
THE INFORMATION IN THIS TERM SHEET IS NOT COMPLETE AND MAY BE AMENDED PRIOR TO THE TIME OF SALE. THIS TERM SHEET IS NOT AN OFFER TO SELL THESE SECURITIES AND IT IS NOT A SOLICITATION OF AN OFFER TO BUY THESE SECURITIES IN ANY JURISDICTION WHERE THE OFFER OR SALE IS NOT PERMITTED.
| 109 |
Mortgage Loan No. 8 — Jay Scutti Plaza
|
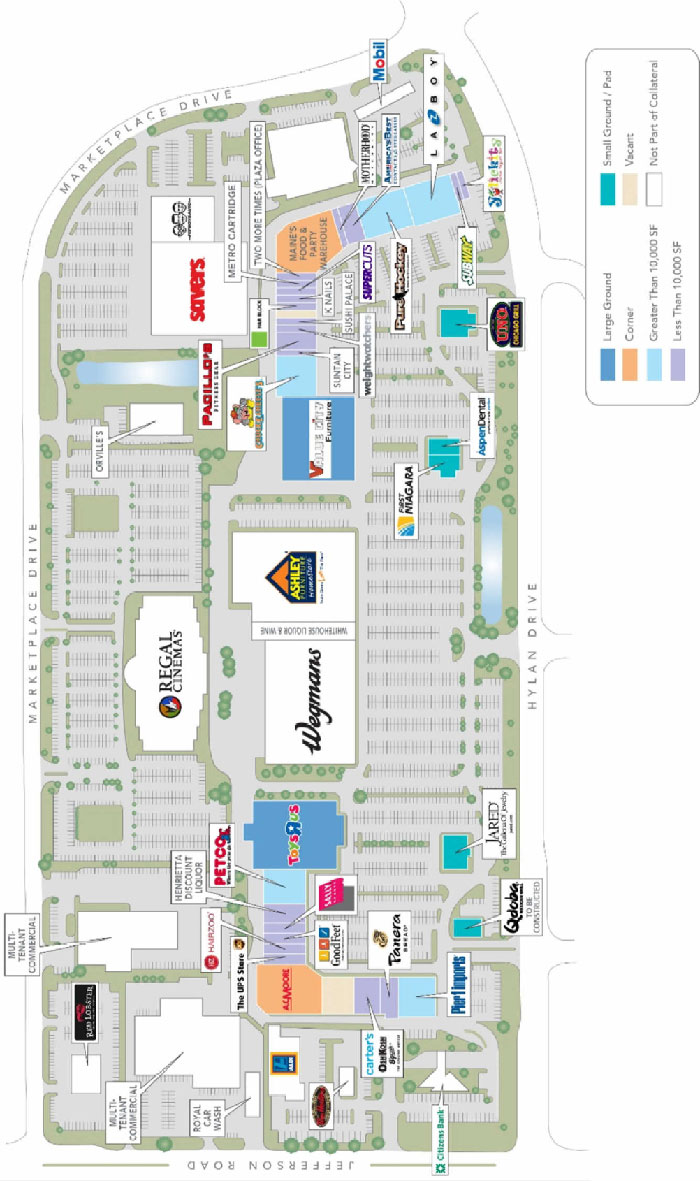 |
THE INFORMATION IN THIS TERM SHEET IS NOT COMPLETE AND MAY BE AMENDED PRIOR TO THE TIME OF SALE. THIS TERM SHEET IS NOT AN OFFER TO SELL THESE SECURITIES AND IT IS NOT A SOLICITATION OF AN OFFER TO BUY THESE SECURITIES IN ANY JURISDICTION WHERE THE OFFER OR SALE IS NOT PERMITTED.
| 110 |
Mortgage Loan No. 8 — Jay Scutti Plaza
|
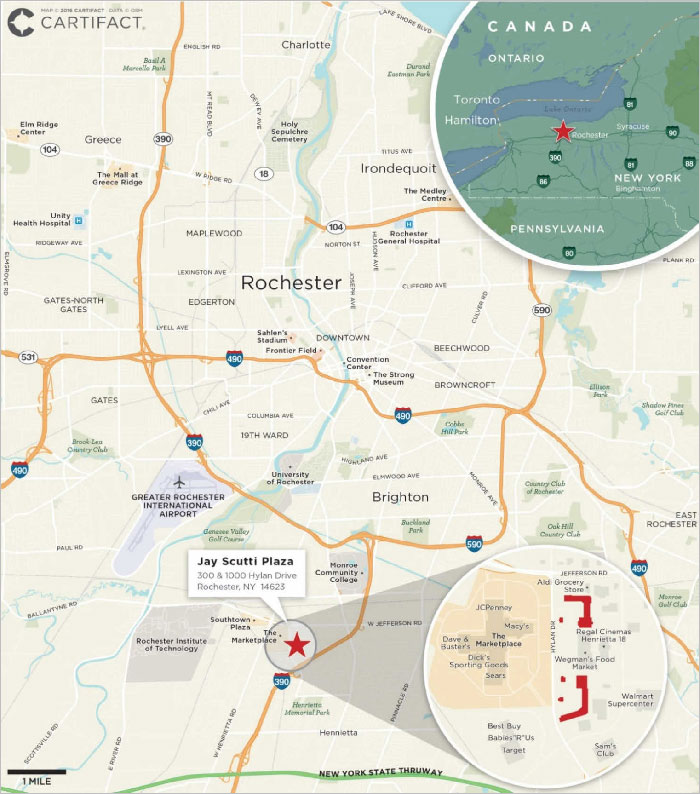 |
THE INFORMATION IN THIS TERM SHEET IS NOT COMPLETE AND MAY BE AMENDED PRIOR TO THE TIME OF SALE. THIS TERM SHEET IS NOT AN OFFER TO SELL THESE SECURITIES AND IT IS NOT A SOLICITATION OF AN OFFER TO BUY THESE SECURITIES IN ANY JURISDICTION WHERE THE OFFER OR SALE IS NOT PERMITTED.
| 111 |
Mortgage Loan No. 8 — Jay Scutti Plaza
| Mortgage Loan Information | Property Information | |||
| Mortgage Loan Seller: | MC-Five Mile | Single Asset / Portfolio: | Single Asset | |
| Original Principal Balance(1): | $25,000,000 | Title: | Fee | |
| Cut-off Date Principal Balance(1): | $25,000,000 | Property Type - Subtype: | Retail – Shadow Anchored | |
| % of Pool by IPB: | 3.3% | Net Rentable Area (SF)(3): | 288,971 | |
| Loan Purpose: | Refinance | Location: | Rochester, NY | |
| Borrower: | The Real McKeever LLC | Year Built / Renovated: | 1991, 1993, 1995, 2001, 2012 / N/A | |
| Sponsors: | Kimberlie L. Glaser, Jarred V. Scutti and Jay C. Scutti | Occupancy(4): | 96.0% | |
| Occupancy Date: | 2/4/2016 | |||
| Number of Tenants: | 33 | |||
| Interest Rate: | 4.9000% | 2013 NOI: | $3,169,218 | |
| Note Date: | 1/8/2016 | 2014 NOI: | $3,361,808 | |
| Maturity Date: | 2/6/2026 | 2015 NOI(5): | $3,236,640 | |
| Interest-only Period: | 36 months | UW Economic Occupancy: | 95.0% | |
| Original Term: | 120 months | UW Revenues(4)(5)(6): | $4,800,131 | |
| Original Amortization: | 360 months | UW Expenses: | $1,283,181 | |
| Amortization Type: | IO-Balloon | UW NOI(4)(5)(6): | $3,516,949 | |
| Call Protection: | L(27),Def(89),O(4) | UW NCF(4)(5)(6): | $3,290,991 | |
| Lockbox(2): | Hard | Appraised Value / Per SF(7): | $60,000,000 / $208 | |
| Additional Debt(1): | Yes | Appraisal Date: | 7/21/2015 | |
| Additional Debt Balance(1): | $16,400,000 | |||
| Additional Debt Type(1): | Pari Passu | |||
| Additional Future Debt Permitted: | No | |||
| Escrows and Reserves(8) | Financial Information(1) | |||||
| Initial | Monthly | Initial Cap | Cut-off Date Loan / SF(9): | $143 | ||
| Taxes: | $414,898 | $59,725 | N/A | Maturity Date Loan / SF(9): | $127 | |
| Insurance: | $48,925 | $4,966 | N/A | Cut-off Date LTV: | 69.0% | |
| Replacement Reserves: | $0 | $5,057 | N/A | Maturity Date LTV: | 60.9% | |
| TI/LC: | $139,360 | $16,667 | $450,000 | UW NCF DSCR: | 1.25x | |
| Engineering Reserve: | $29,063 | N/A | N/A | UW NOI Debt Yield: | 8.5% | |
| Carter’s Reserve: | $1,823,934 | $0 | N/A | |||
| Sources and Uses | ||||||
| Sources | Proceeds | % of Total | Uses | Proceeds | % of Total | |
| Mortgage Loan(1) | $41,400,000 | 93.8% | Payoff Existing Debt | $41,261,783 | 93.5% | |
| Sponsor Equity | 2,720,431 | 6.2 | Upfront Reserves | 2,456,179 | 5.6 | |
| Closing Costs | 402,469 | 0.9 | ||||
| Total Sources | $44,120,431 | 100.0% | Total Uses | $44,120,431 | 100.0% |
| (1) | The Jay Scutti Plaza loan is part of a larger split whole loan evidenced by two notes with an aggregate principal balance of $41.4 million. The financial information presented in the chart above reflects the cut-off date balance of the $41.4 million Jay Scutti Plaza Whole Loan. Note A-1 has an outstanding principal balance as of the cut-off date of $25.0 million and is being contributed to the CSAIL 2016-C6 Commercial Mortgage Trust. Note A-2 has an outstanding principal balance as of the cut-off date of $16.4 million and is expected to be contributed to a future securitization. |
| (2) | For a more detailed description of lockbox, please refer to“Lockbox / Cash Management”below. |
| (3) | Net Rentable Area (SF) of 288,971 SF includes four ground lease tenant spaces: Value City Furniture (50,000 SF); Toys “R” Us (46,719 SF); Uno Chicago Grill (6,360 SF); and Jared Jewelers (5,856 SF). Improvements are owned by each of the respective retailers, which will revert to borrower upon each respective lease termination. The borrower owns the underlying land parcels, which are collateral for the subject loan. |
THE INFORMATION IN THIS TERM SHEET IS NOT COMPLETE AND MAY BE AMENDED PRIOR TO THE TIME OF SALE. THIS TERM SHEET IS NOT AN OFFER TO SELL THESE SECURITIES AND IT IS NOT A SOLICITATION OF AN OFFER TO BUY THESE SECURITIES IN ANY JURISDICTION WHERE THE OFFER OR SALE IS NOT PERMITTED.
| 112 |
Mortgage Loan No. 8 — Jay Scutti Plaza
| (4) | Occupancy does not include the Subway space, which is leased to an affiliate of the Subway corporate parent. The tenant is current on its rent payments; however the space is currently dark and is expected to be occupied by a franchisee that will pay its rent directly to Subway Real Estate, LLC. Rent for the Subway space has been excluded from UW Revenues. |
| (5) | The increase in UW NOI from 2015 NOI is due primarily to two tenants that were in free rent periods during 2015. There is one tenant, Maines Food & Party Warehouse, that is still in a free rent period that ends in August 2016, at which point it will begin paying $214,550 in rent annually. Maines Food & Party Warehouse is currently paying its contractual CAM expenses. Additionally, rent steps for tenants with rent increases through November 2016 were included in the UW Revenues. The increase in UW Revenues from the inclusion of these rent steps was $13,284. |
| (6) | Underwritten Revenues include base rent and rent increases occurring through November 2016. |
| (7) | Appraised Value PSF is calculated on Net Rentable Area of 288,971 SF, which includes ground lease tenant space. |
| (8) | Since the origination of the Jay Scutti Plaza loan, the Carter’s Reserve has been released in full to the borrower. For a more detailed description of escrows and reserves, please refer to “Escrows and Reserves” below. |
| (9) | Loan PSF is calculated on a Net Rentable Area of 288,971 SF, which includes ground lease tenant space. |
The Loan. The Jay Scutti Plaza loan, which is part of a larger split whole loan, is a first mortgage loan secured by the fee interest in a 288,971 SF regional shopping center located in Rochester, New York. The loan has a ten-year term and will amortize on a 30-year schedule, after a three-year interest-only period. The whole loan has an outstanding principal balance of $41.4 million (the “Jay Scutti Plaza Whole Loan”) as of the cut-off date, which is comprised of twopari passu notes, Note A-1 and Note A-2. Note A-1 has an outstanding principal balance as of the cut-off date of $25.0 million and is being contributed to the CSAIL 2016-C6 Commercial Mortgage Trust. Note A-2 has an outstanding principal balance as of the cut-off date of $16.4 million, and is expected to be contributed to a future securitization. As the holder of Note A-1 (the “Controlling Noteholder”), the trustee of the CSAIL 2016-C6 Commercial Mortgage Trust (or, prior to the occurrence and continuance of a control termination event under the CSAIL 2016-C6 pooling and servicing agreement, the CSAIL 2016-C6 directing certificateholder) will be entitled to exercise all of the rights of the Controlling Noteholder with respect to the Jay Scutti Plaza Whole Loan; however, the holder of Note A-2 will be entitled, under certain circumstances, to consult with the Controlling Noteholder with respect to certain major decisions.
Whole Loan Note Summary
| Original Balance | Cut-off Date Balance | Note Holder | Note in Controlling Securitization | |
| Note A-1 | $25,000,000 | $25,000,000 | CSAIL 2016-C6 | Yes |
| Note A-2 | 16,400,000 | 16,400,000 | Future Securitization | No |
| Total | $41,400,000 | $41,400,000 |
The Borrower. The borrowing entity is The Real McKeever LLC, a Delaware limited liability company and special purpose entity. The borrowing entity is owned by Kimberlie L. Glaser (59.5%), Jarred V. Scutti (20%), Jay C. Scutti (20%), and Hi Ho Silver, LLC (Manager – owned solely by Kimberlie L. Glaser; 0.5%). For a more detailed description of property management, please refer to “Property Management” below.
The Sponsors. The loan’s sponsors and nonrecourse carve-out guarantors are Kimberlie L. Glaser, Jarred V. Scutti and Jay C. Scutti (collectively the “Sponsors”). Ms. Glaser is the head of Scutti Enterprises, LLC (“Scutti Enterprises”), a Rochester, New York-based real estate investment, development and property management firm that focuses on retail properties within upstate New York. Scutti Enterprises jointly developed the subject property, which was built in several phases beginning in 1991. In addition to the subject property, the Sponsors’ combined commercial real estate portfolio includes five other retail properties, four of which are located in upstate New York.
The Property.The property consists of 288,971 SF of retail space within a larger grocery-anchored regional shopping center in Rochester, New York. The remainder of the shopping center includes a Wegman’s Food Market, an Ashley Furniture store, and a single inline space, which total 170,612 SF and are not collateral for the loan. Wegman’s Food Market and Ashley Furniture each own their respective land and improvements. The Wegman’s Food Market at the center is the dominant grocer in the area and has been at the center since 1983 according to the store’s manager. The Ashley Furniture store has been at the center for more than eight years according to the store’s manager. The property is 96.4% leased (including Subway), and includes two larger spaces ground leased by Value City Furniture and Toys “R” Us; four outparcel spaces occupied by Uno Chicago Grill,
THE INFORMATION IN THIS TERM SHEET IS NOT COMPLETE AND MAY BE AMENDED PRIOR TO THE TIME OF SALE. THIS TERM SHEET IS NOT AN OFFER TO SELL THESE SECURITIES AND IT IS NOT A SOLICITATION OF AN OFFER TO BUY THESE SECURITIES IN ANY JURISDICTION WHERE THE OFFER OR SALE IS NOT PERMITTED.
| 113 |
Mortgage Loan No. 8 — Jay Scutti Plaza
Jared Jewelers, First Niagara Bank, and Aspen Dental; and 29 inline tenant spaces that are 94.0% occupied, primarily by national tenants including PetCo, La-Z-Boy, Pier 1 Imports, Panera Bread, H&R Block, Sally Beauty Co., Weight Watchers, Supercuts, and the UPS Store. Qdoba Mexican Grill recently signed an outparcel lease at the subject property and is expected to occupy a to-be-constructed 3,000 SF store plus an outdoor patio area. The outparcel leased to Qdoba Mexican Grill is part of the collateral for the loan; however, the lease was recently signed and as such it has not been included in the reported property square footage or occupancy figures and the contractual rent has not been included for cash flow underwriting purposes.
Over the last ten calendar years (2006 through 2015), the property has had an average occupancy of 96.1%. On average, tenants have been in occupancy for more than 12 years; of the 33 tenants at the property, 18 (representing 59.2% of NRA) have been in occupancy for more than ten years, and of those 18 tenants, five (representing 24.2% of NRA) have been in occupancy for more than 20 years. Specifically, the two largest tenants, Value City Furniture and Toys “R” Us, have been in occupancy for more than 14 and 28 years, respectively. Value City Furniture recently exercised an early renewal option for an additional five year term commencing in 2017. Toys “R” Us most recently extended its lease for an additional five year term which commenced in 2013. Both Value City Furniture and Toys “R” Us pay rent that is significantly below market at $3.00 PSF NNN and $6.30 PSF NNN, respectively, compared to the appraisal concluded market rent of $10.00 PSF NNN for those tenant spaces. Within the last five years, 15 tenants (52.4% of NRA), including the two largest tenants, have renewed their respective leases.
The property is located approximately six miles south of the Rochester CBD in the suburban Town of Henrietta. The surrounding area is a densely developed retail corridor. Stores within 0.50 miles of the property include a Walmart Supercenter, an 18-screen Regal Cinemas, Sam’s Club, Aldi Grocery Store, Kohl’s, Target and Lowe’s Home Improvement. The property has a visible and accessible location with three direct, signalized entrances from Hylan Drive – each with a dedicated left turn lane into the property. Hylan Drive provides direct access to and from Interstate 390 which is approximately 0.25 miles south of the property and results in heavy traffic flow directly past the center. The traffic count at the intersection of Hylan Drive and Jefferson Road, which is just north of the property, is in excess of 30,000 vehicles per day.
The Market. Within a three-mile radius of the property as of year-end 2014, there was a population of more than 150,000, with an estimated average household income of more than $40,000. Within a five-mile radius of the property as of year-end 2014, there was a population of more than 300,000 with an estimated average household income of more than $50,000. According to a third-party market research report, the subject property is located within the South Central Retail submarket of Rochester, New York which had an overall vacancy rate of 6.9% at the end of 2015. According to the appraisal, the property’s competitive set consists of the six properties listed in the table below.
THE INFORMATION IN THIS TERM SHEET IS NOT COMPLETE AND MAY BE AMENDED PRIOR TO THE TIME OF SALE. THIS TERM SHEET IS NOT AN OFFER TO SELL THESE SECURITIES AND IT IS NOT A SOLICITATION OF AN OFFER TO BUY THESE SECURITIES IN ANY JURISDICTION WHERE THE OFFER OR SALE IS NOT PERMITTED.
| 114 |
Mortgage Loan No. 8 — Jay Scutti Plaza
Competitive Set Summary(1)
| Property | Year Built / Renovated | Total GLA (SF) | Est. Occ. | Proximity (miles) | Anchor Tenants |
| Jay Scutti Plaza | 1991(2)/ N/A | 288,971(3) | 96.0% | N/A | Value City Furniture, Toys “R” Us |
| Henrietta Jefferson Plaza | 1983 / N/A | 159,517 | 93.0% | 0.0 | Bargain Outlet, Bill’s Carpet & Furniture Center |
| Henrietta Shopping Center | 1971 / N/A | 182,134 | 93.0% | 0.0 | Kohl’s |
| South Town Plaza | 1956 / N/A | 513,081 | 88.0% | 0.1 | Office Max, Burlington Coat Factory, Price Rite |
| Henrietta Plaza(4) | 1966 / N/A | 233,326 | 70.0% | 0.1 | Big Lots, Staples |
| Market Square- 720 Jefferson Road | 2006 / N/A | 142,487 | 97.5% | 0.1 | Bed Bath & Beyond, Marshalls, Party City, ULTA Beauty, DSW Shoe Warehouse |
| 621-633 Jefferson Road | 1958 / N/A | 60,000 | 100.0% | 0.1 | None |
| (1) | Source: Appraisal. |
| (2) | Represents earliest year built. The property was completed in multiple phases from 1991 to 2012. |
| (3) | Ground lease tenants Value City Furniture, Toys “R” Us, Uno Chicago Grill, and Jared Jewelers, totaling 108,935 SF, are included in Total GLA (SF). |
| (4) | The high vacancy at Henrietta Plaza is due to the relocation of Tops Friendly Market to the center across the street. |
In-Place Rent Summary(1)
| Lease Type | Total GLA (SF)(2) | % of Total NRA | Weighted Average In-Place Rent PSF(3) | Concluded Market Rent PSF |
| Greater than 10,000 SF | 110,964 | 38.4% | $13.81 | $19.00 |
| Less than 10,000 SF | 49,806 | 17.2% | $21.68 | $28.00 |
| Small Ground / Pad | 19,968 | 6.9% | $26.30 | $36.00 |
| Large Ground | 96,719 | 33.5% | $4.59 | $10.00 |
| Small Endcap | 1,101 | 0.4% | $37.47 | $32.00 |
| Total / Wtd. Avg. | 278,558 | 96.4% | $13.01 | $18.75 |
| (1) | Source: Appraisal. |
| (2) | Leased GLA only. |
| (3) | Weighted average in-place rent calculated using NNN equivalent rent for gross leases. NNN equivalent rent calculated by subtracting the weighted average reimbursement of in-place NNN leases of the same Lease Type. |
Historical and Current Occupancy(1)
| 2012 | 2013 | 2014 | 2015 | Current(2) |
| 88.8% | 94.3% | 99.3% | 95.4% | 96.0% |
| (1) | Source: Historical occupancy is provided by the Sponsors. Occupancies are as of December 31 of each respective year. |
| (2) | Based on the underwritten rent roll dated February 4, 2016, including SF for ground lease tenant improvements. |
THE INFORMATION IN THIS TERM SHEET IS NOT COMPLETE AND MAY BE AMENDED PRIOR TO THE TIME OF SALE. THIS TERM SHEET IS NOT AN OFFER TO SELL THESE SECURITIES AND IT IS NOT A SOLICITATION OF AN OFFER TO BUY THESE SECURITIES IN ANY JURISDICTION WHERE THE OFFER OR SALE IS NOT PERMITTED.
| 115 |
Mortgage Loan No. 8 — Jay Scutti Plaza
Tenant Summary(1)
| Tenant | Ratings Moody’s/S&P/Fitch(2) | Net Rentable Area (SF) | % of Total NRA(3) | Base Rent PSF | Sales PSF(4) | Occupancy Costs(4) | Lease Expiration Date | Original Occupancy Date | Most Recent Renewal Start Date |
| Value City Furniture(5) | NR/NR/NR | 50,000 | 17.3% | $3.00 | NAV | NAP | 2/28/2022 | 10/24/2001 | 3/1/2017 |
| Toys “R” Us(5) | B3/NR/NR | 46,719 | 16.2% | $6.30 | $172 | 5.9% | 1/31/2023 | 11/1/1987 | 2/1/2013 |
| AC Moore(6) | NR/NR/NR | 23,149 | 8.0% | $6.32 | $119 | 10.5% | 7/31/2021 | 7/18/2015 | NAP |
| Maines Food & Party Warehouse(7) | NR/NR/NR | 21,455 | 7.4% | $10.00 | NAV | NAP | 8/28/2026 | 8/29/2015 | NAP |
| PetCo(8) | B2/NR/NR | 14,760 | 5.1% | $17.00 | NAV | NAP | 1/31/2021 | 10/6/2000 | 2/1/2011 |
| Pure Hockey | NR/NR/NR | 14,400 | 5.0% | $16.00 | NAV | NAP | 7/31/2024 | 7/31/2014 | NAP |
| La-Z-Boy | NR/NR/NR | 14,400 | 5.0% | $17.60 | $267 | 8.3% | 5/31/2025 | 6/1/2013 | NAP |
| Chuck E Cheese | NR/NR/NR | 12,000 | 4.2% | $14.25 | NAV | NAP | 12/31/2023 | 7/1/2000 | 10/30/2012 |
| Pier 1 Imports | NR/NR/NR | 10,800 | 3.7% | $24.62 | $158 | 18.4% | 2/28/2022 | 11/1/1987 | 11/1/2016 |
| Carter’s/OshKosh(9)(10) | Ba1/NR/NR | 6,968 | 2.4% | $16.50 | NAV | NAP | 12/31/2026 | 1/4/2016 | NAP |
| (1) | Based on the underwritten rent roll dated February 4, 2016. |
| (2) | Ratings provided are for the parent company of the entity listed in the “Tenant” field whether or not the parent company guarantees the lease. |
| (3) | % of total NRA is based on SF including ground leased spaces. |
| (4) | Sales PSF and Occupancy Costs are for the twelve-month period ending on January 31,2016 for Toys “R” Us, December 31, 2015 for La-Z-Boy, February 28, 2015 for Pier 1 Imports and the six month period ending February 28, 2016, on an annualized basis, for AC Moore, as provided by the Sponsors. Total rent including reimbursements was used for purposes of calculating Occupancy Costs. |
| (5) | Tenant owns its improvements subject to a ground lease. Net Rentable Area includes the improvements. |
| (6) | AC Moore has a one-time termination option and may terminate at any time after the 4th lease year (July 2019) upon 120 days’ notice in the event that its gross sales for the prior year are less than $2,300,000. |
| (7) | Maines Food & Party Warehouse, which has executed a lease for 21,455 SF, has taken possession of its space and is currently paying CAM. The tenant is required to commence making rent payments no later than September 1, 2016. |
| (8) | PetCo has a termination option and may terminate if any 2 named tenants (AC Moore, Pier 1 Imports, Toys “R” Us, or any replacement named tenant which is a nationally or regionally known retailer with at least 25 stores which occupies at least 80% of the original named tenants’ premises) are vacant for 6 months, and tenant’s sales decrease by 25% or more, tenant can pay 3% of gross sales in lieu of base rent. PetCo has not reported its current sales data to the borrower or lender. In the event landlord is unable to lease the space within 360 days, tenant can terminate with 30 days prior notice to landlord. |
| (9) | Carter’s/OshKosh, which has executed a lease for 6,968 SF, is required to commence rent and CAM payments upon the earlier of: i) the date on which the tenant opens for business, or ii) 90 days after the final delivery date. |
| (10) | Carter’s/OshKosh has a termination option if occupancy at the property is 75% or less or one of the key tenants are not open for business (Toys R’ Us, A.C. Moore & Panera Bread) (a “Co-Tenancy Failure”). Beginning with the first calendar month that a Co-Tenancy Failure exists and continuing until the end of the month in which the Co-Tenancy Failure ends, the tenant’s base rent will equal the lesser of: (I) 6% of gross sales for the month or (2) the base rent otherwise due. After the end of the 18th month following a Co-Tenancy Failure, if the Co-Tenancy Failure continues, the tenant has the right to terminate its lease upon 90 days’ prior written notice within 60 days after the end of the eighteen-month period. If the tenant fails to exercise its termination right within the 60 day period, the tenant must resume paying 100% of base rent under its lease. Carter’s/OshKosh can additionally terminate its lease if gross sales for the 5th lease year are less than $1,300,000 for Carter’s or $1,250,000 for OshKosh, upon 60 days’ written notice within 60 days after the end of the 5th lease year. |
THE INFORMATION IN THIS TERM SHEET IS NOT COMPLETE AND MAY BE AMENDED PRIOR TO THE TIME OF SALE. THIS TERM SHEET IS NOT AN OFFER TO SELL THESE SECURITIES AND IT IS NOT A SOLICITATION OF AN OFFER TO BUY THESE SECURITIES IN ANY JURISDICTION WHERE THE OFFER OR SALE IS NOT PERMITTED.
| 116 |
Mortgage Loan No. 8 — Jay Scutti Plaza
Lease Rollover Schedule(1)
| Year | Number of Leases Expiring(2) | NRA Expiring (SF)(3) | % of NRA Expiring(3) | Base Rent Expiring | % of Base Rent Expiring | Cumulative NRA Expiring (SF)(3) | Cumulative % of NRA Expiring(3) | Cumulative Base Rent Expiring | Cumulative % of Base Rent Expiring |
| Vacant | NAP | 10,413 | 3.6% | NAP | NAP | 10,413 | 3.6% | NAP | NAP |
| MTM | 0 | 0 | 0.0 | $0 | 0.0% | 10,413 | 3.6% | $0 | 0.0% |
| 2016 | 3 | 7,286 | 2.5 | 195,489 | 5.3 | 17,699 | 6.1% | $195,489 | 5.3% |
| 2017 | 5 | 11,792 | 4.1 | 244,302 | 6.6 | 29,491 | 10.2% | $439,791 | 12.0% |
| 2018 | 2 | 2,401 | 0.8 | 71,250 | 1.9 | 31,892 | 11.0% | $511,041 | 13.9% |
| 2019 | 2 | 5,433 | 1.9 | 121,556 | 3.3 | 37,325 | 12.9% | $632,597 | 17.2% |
| 2020 | 7 | 18,063 | 6.3 | 399,389 | 10.9 | 55,388 | 19.2% | $1,031,986 | 28.1% |
| 2021 | 3 | 39,141 | 13.5 | 430,485 | 11.7 | 94,529 | 32.7% | $1,462,471 | 39.8% |
| 2022 | 4 | 70,156 | 24.3 | 697,530 | 19.0 | 164,685 | 57.0% | $2,160,001 | 58.8% |
| 2023 | 3 | 64,063 | 22.2 | 613,847 | 16.7 | 228,748 | 79.2% | $2,773,848 | 75.5% |
| 2024 | 1 | 14,400 | 5.0 | 230,400 | 6.3 | 243,148 | 84.1% | $3,004,248 | 81.7% |
| 2025 | 1 | 14,400 | 5.0 | 253,440 | 6.9 | 257,548 | 89.1% | $3,257,688 | 88.6% |
| 2026 & Beyond | 3 | 31,423 | 10.9 | 418,022 | 11.4 | 288,971 | 100.0% | $3,675,710 | 100.0% |
| Total | 34 | 288,971 | 100.0% | $3,675,710 | 100.0% |
| (1) | Based on the underwritten rent roll. |
| (2) | Certain tenants have more than one lease. |
| (3) | Ground lease tenants Value City Furniture, Toys “R” Us, Uno Chicago Grill, and Jared Jewelers, totaling 108,935 SF, are included in the schedule. |
Operating History and Underwritten Net Cash Flow
| 2013 | 2014 | 2015 | Underwritten(1) | PSF(2) | %(3) | |
| Rents in Place | $3,387,328 | $3,506,725 | $3,388,011 | $3,675,710 | $13.00 | 72.7% |
| Vacant Income | 0 | 0 | 0 | 166,608 | 0.58 | 3.3% |
| Gross Potential Rent | $3,387,328 | $3,506,725 | $3,388,011 | $3,842,318 | $13.30 | 76.0% |
| Total Reimbursements | 856,249 | 939,195 | 938,582 | 1,210,451 | 4.19 | 24.0% |
| Net Rental Income | $4,243,577 | $4,445,920 | $4,326,593 | $5,052,769 | $17.49 | 100.0% |
| (Vacancy/Collection Loss) | 0 | 0 | 0 | (252,638) | (0.87) | (5.0%) |
| Other Income | 0 | 0 | 0 | 0 | 0.00 | 0.0% |
| Effective Gross Income | $4,243,577 | $4,445,920 | $4,326,593 | $4,800,131 | $16.61 | 95.0% |
| Total Expenses | $1,074,359 | $1,084,112 | $1,089,953 | $1,283,181 | $4.44 | 26.7% |
| Net Operating Income | $3,169,218 | $3,361,808 | $3,236,640 | $3,516,949 | $12.17 | 69.6% |
| Total TI/LC, Capex/RR | 0 | 0 | 0 | 225,959 | 0.78 | 4.7% |
| Net Cash Flow | $3,169,218 | $3,361,808 | $3,236,640 | $3,290,991 | $11.39 | 65.1% |
| (1) | Underwritten Rents in Place include base rent and rent increases occurring through November 2016. |
| (2) | PSF based on total SF including ground lease tenant improvements. |
| (3) | % column represents percent of Net Rental Income for all revenue lines and represents percent of Effective Gross Income for the remainder of fields. |
Property Management. The property is managed by Scutti Enterprises, an affiliate of the borrower. Scutti Enterprises is a full service property management company that was founded in 1966. According to the Sponsors, the firm currently manages a portfolio of ten retail properties that, in aggregate, comprise approximately 700,000 SF and are 98.0% occupied.
Escrows and Reserves. At origination, the borrower funded aggregate reserves of approximately $2,456,179, comprised of (i) $1,823,934 for the Carter’s Reserve, (ii) $414,898 for real estate taxes, (iii) $139,360 for TI/LC reserves, (iv) $48,925 for insurance premiums, and (v) $29,063 for immediate repairs. Since the origination of the Jay Scutti Plaza loan, the Carter’s Reserve, which was in place prior to the lender’s receipt of executed lease documents, has been released in full to the borrower.
THE INFORMATION IN THIS TERM SHEET IS NOT COMPLETE AND MAY BE AMENDED PRIOR TO THE TIME OF SALE. THIS TERM SHEET IS NOT AN OFFER TO SELL THESE SECURITIES AND IT IS NOT A SOLICITATION OF AN OFFER TO BUY THESE SECURITIES IN ANY JURISDICTION WHERE THE OFFER OR SALE IS NOT PERMITTED.
| 117 |
Mortgage Loan No. 8 — Jay Scutti Plaza
Tax Escrows – On a monthly basis, the borrower is required to fund a tax reserve in an amount equal to 1/12th of the annual estimated tax payments. Monthly deposits currently equate to $59,725.
Insurance Escrows – On a monthly basis, the borrower is required to fund an insurance reserve in an amount equal to 1/12th of the annual estimated insurance premiums. Monthly deposits currently equate to $4,966.
Replacement Reserves – On a monthly basis, the borrower is required to fund a replacement reserve in an amount equal to $5,057.
TI/LC Reserves – On a monthly basis, the borrower is required to fund a TI/LC reserve in an amount equal to $16,667, subject to a cap of $450,000.
Lockbox / Cash Management. The Jay Scutti Plaza Whole Loan is structured with a hard lockbox and springing cash management. The tenants are required to deposit all rents directly into a lockbox account controlled by the lender. On each business day, the borrower is required to immediately deposit all other revenue, if any, derived from the property into the lockbox account. Prior to a Trigger Period (as defined below), funds deposited into the lockbox account are disbursed to the borrower’s operating account. During the continuation of a Trigger Period, all funds in the lockbox account are required to be transferred on each business day to a cash management account under the control of the lender. On each due date during the continuance of a Trigger Period, the loan documents require that all amounts on deposit in the cash management account, after payment of debt service and funding of required monthly reserves and approved operating expenses, will be held as additional collateral for the loan. During the continuance of an event of default under the loan, the lender may apply any funds in the cash management account to amounts due to the lender under the loan and/or toward the payment of expenses of the property, in such order of priority as the lender may determine.
A “Trigger Period” means a period commencing upon the earliest of (i) the occurrence and continuance of an event of default under the loan, and expiring upon the defeasance in full of the Jay Scutti Plaza Whole Loan, (ii) the debt service coverage ratio (as calculated under the loan documents) being less than 1.15x for two consecutive calendar quarters, and expiring when the debt service coverage ratio for each of the prior four calendar quarters is equal to or exceeds 1.15x, (iii) the debt yield (as calculated under the loan documents) being less than 7.0% for two consecutive calendar quarters, and expiring when the debt yield for each of the prior four quarters is equal to or greater than 7.0%, or (iv) the permitted prepayment date if, on or prior to such date, the borrower does not provide the lender a refinance commitment in form and substance reasonably satisfactory to the lender.
THE INFORMATION IN THIS TERM SHEET IS NOT COMPLETE AND MAY BE AMENDED PRIOR TO THE TIME OF SALE. THIS TERM SHEET IS NOT AN OFFER TO SELL THESE SECURITIES AND IT IS NOT A SOLICITATION OF AN OFFER TO BUY THESE SECURITIES IN ANY JURISDICTION WHERE THE OFFER OR SALE IS NOT PERMITTED.
| 118 |
Mortgage Loan No. 9 – West LA Office – 2730 Wilshire
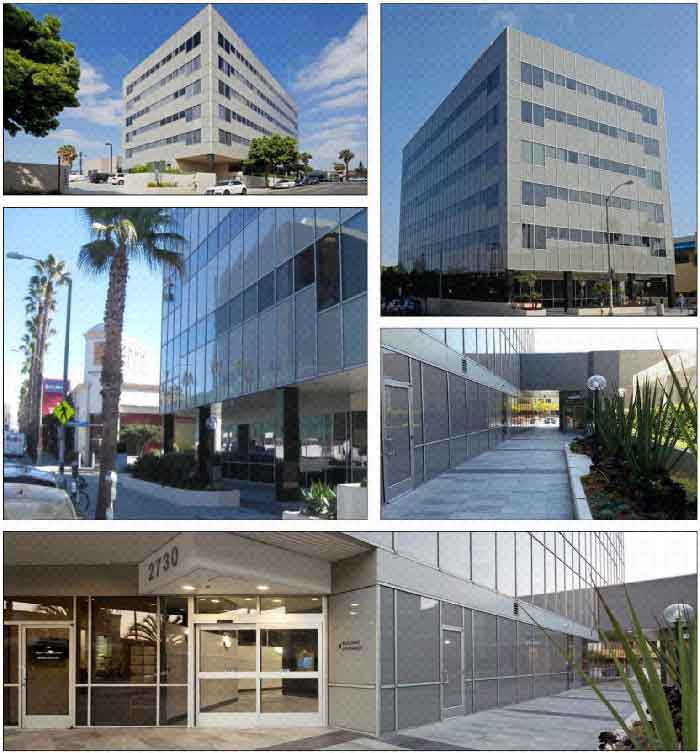
THE INFORMATION IN THIS TERM SHEET IS NOT COMPLETE AND MAY BE AMENDED PRIOR TO THE TIME OF SALE. THIS TERM SHEET IS NOT AN OFFER TO SELL THESE SECURITIES AND IT IS NOT A SOLICITATION OF AN OFFER TO BUY THESE SECURITIES IN ANY JURISDICTION WHERE THE OFFER OR SALE IS NOT PERMITTED.
| 119 |
Mortgage Loan No. 9 – West LA Office – 2730 Wilshire

THE INFORMATION IN THIS TERM SHEET IS NOT COMPLETE AND MAY BE AMENDED PRIOR TO THE TIME OF SALE. THIS TERM SHEET IS NOT AN OFFER TO SELL THESE SECURITIES AND IT IS NOT A SOLICITATION OF AN OFFER TO BUY THESE SECURITIES IN ANY JURISDICTION WHERE THE OFFER OR SALE IS NOT PERMITTED.
| 120 |
Mortgage Loan No. 9 – West LA Office – 2730 Wilshire

THE INFORMATION IN THIS TERM SHEET IS NOT COMPLETE AND MAY BE AMENDED PRIOR TO THE TIME OF SALE. THIS TERM SHEET IS NOT AN OFFER TO SELL THESE SECURITIES AND IT IS NOT A SOLICITATION OF AN OFFER TO BUY THESE SECURITIES IN ANY JURISDICTION WHERE THE OFFER OR SALE IS NOT PERMITTED.
| 121 |
Mortgage Loan No. 9 – West LA Office – 2730 Wilshire
| Mortgage Loan Information | Property Information | |||
| Mortgage Loan Seller: | BNYM | Single Asset / Portfolio: | Single Asset | |
| Original Principal Balance: | $24,450,000 | Title: | Fee | |
| Cut-off Date Principal Balance: | $24,450,000 | Property Type - Subtype: | Office - CBD | |
| % of Pool by IPB: | 3.2% | Net Rentable Area (SF): | 58,369 | |
| Loan Purpose: | Acquisition | Location: | Santa Monica, CA | |
| Borrower: | Wilshire Capital Ventures, LLC | Year Built / Renovated: | 1985 / N/A | |
| Sponsor: | Albert Taban | Occupancy: | 95.9% | |
| Interest Rate: | 5.0700% | Occupancy Date: | 3/1/2016 | |
| Note Date: | 12/29/2015 | Number of Tenants: | 26 | |
| Maturity Date: | 1/6/2026 | 2013 NOI: | $1,253,132 | |
| Interest-only Period: | 48 months | 2014 NOI: | $1,214,200 | |
| Original Term: | 120 months | 2015 NOI(2)(3): | $1,237,214 | |
| Original Amortization: | 360 months | TTM NOI: | N/A | |
| Amortization Type: | IO-Balloon | UW Economic Occupancy: | 95.0% | |
| Call Protection: | L(24),YM1(89),O(7) | UW Revenues: | $3,058,446 | |
| Lockbox(1): | Springing | UW Expenses: | $1,082,515 | |
| Additional Debt: | No | UW NOI(2): | $1,975,931 | |
| Additional Debt Balance: | N/A | UW NCF: | $1,927,294 | |
| Additional Debt Type: | N/A | Appraised Value / Per SF: | $36,100,000 / $618 | |
| Additional Future Debt Permitted: | No | Appraisal Date: | 11/11/2015 | |
| Escrows and Reserves (4) | Financial Information | |||||
| Initial | Monthly | Initial Cap | Cut-off Date Loan / SF: | $419 | ||
| Taxes: | $0 | $30,083 | N/A | Maturity Date Loan / SF: | $379 | |
| Insurance: | $0 | Springing | N/A | Cut-off Date LTV: | 67.7% | |
| Replacement Reserves: | $0 | $1,411 | $50,796 | Maturity Date LTV: | 61.3% | |
| TI/LC: | $395,000 | $6,080 | N/A | UW NCF DSCR(5): | 1.21x | |
| UW NOI Debt Yield: | 8.1% |
Sources and Uses
| Sources | Proceeds | % of Total | Uses | Proceeds | % of Total | |
| Mortgage Loan | $24,450,000 | 68.8% | Purchase Price | $35,000,000 | 98.5% | |
| Borrower Equity | 11,086,389 | 31.2 | Upfront Reserves | 395,000 | 1.1 | |
| Closing Costs | 141,389 | 0.4 | ||||
| Total Sources | $35,536,389 | 100.0% | Total Uses | $35,536,389 | 100.0% |
| (1) | For a more detailed description of lockbox, please refer to “Lockbox / Cash Management” below. |
| (2) | UW NOI exceeds 2015 NOI as a result of free rent burning off, parking income and new / renewing tenants. |
| (3) | Financials for 2015 NOI is annualized trailing 10 months ending October 31, 2015. |
| (4) | For a more detailed description of escrows and reserves, please refer to “Escrows and Reserves” below. |
| (5) | Based on amortizing debt service payments. Based on the current interest only payments, UW NOI DSCR and UW NCF DSCR are 1.57x and 1.53x, respectively. |
THE INFORMATION IN THIS TERM SHEET IS NOT COMPLETE AND MAY BE AMENDED PRIOR TO THE TIME OF SALE. THIS TERM SHEET IS NOT AN OFFER TO SELL THESE SECURITIES AND IT IS NOT A SOLICITATION OF AN OFFER TO BUY THESE SECURITIES IN ANY JURISDICTION WHERE THE OFFER OR SALE IS NOT PERMITTED.
| 122 |
Mortgage Loan No. 9 – West LA Office – 2730 Wilshire
The Loan. The West LA Office - 2730 Wilshire loan is an approximately $24.5 million first mortgage loan secured by the borrower’s fee interest in a 58,369 SF office building located at 2730 Wilshire Boulevard, Santa Monica, California. The West LA Office - 2730 Wilshire loan has a 10-year term and will amortize on a 30-year schedule after a four-year interest-only period.
The Borrower. The borrowing entity for the West LA Office - 2730 Wilshire loan is Wilshire Capital Ventures, LLC, a California limited liability company which is a special purpose entity. The borrower is managed by Mr. David Taban and controlled by JADE Enterprises, LLC.
The Sponsor. The West LA Office - 2730 Wilshire loan’s sponsor and non-recourse carve-out guarantor is Albert Taban, who is involved in a family-owned business, JADE Enterprises, LLC. JADE Enterprises, LLC is a private, family-owned developer, operator and owner with real estate holdings primarily in California, with a concentration in Los Angeles. Three brothers, Albert, David, and Jacob Taban, are the primary controllers of the business. Albert Taban has an ownership interest in over 40 properties and the combined valuation of his real estate holdings is over $1.0 billion.
The Property.The West LA Office - 2730 Wilshire property is a 58,369 SF six-story Class B office building located in Santa Monica, California. The West LA Office - 2730 Wilshire property is located approximately 15 miles west of downtown Los Angeles. The West LA Office - 2730 Wilshire property was constructed in 1985, is located on Wilshire Boulevard with immediate accessibility to the 405 and 10 Freeways and is in close proximity to the Saint John’s Health Center. The West LA Office - 2730 Wilshire property is 95.9% occupied as of March 1, 2016 with 26 tenants with no single tenant responsible for more than 16.5% of the total rental income. The borrower acquired the West LA Office 2730 Wilshire property in connection with the origination of the loan. From 2013-2015 the prior owner of the property invested $376,546 in CapEx ($2.15 PSF per year) in order to upgrade the building and increase its appeal to tenants in the area.
The West LA Office - 2730 Wilshire property collateral also includes a 206-space parking garage. Historically, the prior owner operated the garage in-house; however, the sponsor leased the parking garage to United Valet Parking, Inc. The lease is for five years at an initial rate of $370,800 per year, increasing by 3.0% annually.
The West LA Office - 2730 Wilshire property’s tenancy consists of 26 distinct tenants at a weighted average in-place rent of $42.67 PSF. The largest tenant, Schaffell Development Co. (“Schaffell Development”), is an office development contractor, and occupies 17.3% of the NRA. None of the other 25 tenants lease more than 6.5% of the West LA Office - 2730 Wilshire property. Schaffell Development has been a tenant since 2000. Nine tenants, accounting for 21,162 SF (36.3% of NRA), have each occupied space at the West LA Office - 2730 Wilshire property for at least 10 years. Furthermore, 33.0% of NRA (19,242 SF) is currently occupied by eight tenants that have each been at the West LA Office - 2730 Wilshire property for at least 15 years. In-place rents at the West LA Office - 2730 Wilshire property are $42.72 PSF, or 13.1%, below market, based upon the appraiser’s concluded market rent.
The Master Lease. The borrower entered into a 10-year master lease with JADE Enterprises, LLC to cover suite 425 (2,019 SF; 3.5% of NRA) for an annual rental amount of $115,083. The master lease payments are guaranteed by Albert Taban during the loan term. So long as no event of default is continuing under the West LA Office - 2730 Wilshire loan, if the borrower is able to lease suite 425 to a third party for rental amounts equal to or greater than the rental amounts under the master lease for a term of at least five years, the master lease may be terminated upon delivery to lender of an estoppel evidencing that a tenant has taken occupancy of suite 425 and is paying full unabated rent.
The Market. The West LA Office - 2730 Wilshire property is in the Santa Monica Office submarket located in Los Angeles, California. As of third quarter 2015, the Santa Monica submarket contained approximately 15.4 million SF of total NRA with a vacancy rate of 11.7% and average asking rent of $53.76 PSF. The overall market is characterized as having high barriers to entry, further evidenced by limited supply entering the market over the past 10 years. Total office supply increased approximately 349,724 SF between 2005 and third quarter 2015. According to the appraisal the Santa Monica submarket saw significant negative impact during the national market downturn. The submarket continues to recover with stable fundamentals and high asking rents. Overall the area is mostly built out and remains a highly desirable office location. Over 250,000 people live within the 3.0 mile radius of the West LA Office - 2730 Wilshire property and the median home value in a 3.0 mile radius is $902,036.
THE INFORMATION IN THIS TERM SHEET IS NOT COMPLETE AND MAY BE AMENDED PRIOR TO THE TIME OF SALE. THIS TERM SHEET IS NOT AN OFFER TO SELL THESE SECURITIES AND IT IS NOT A SOLICITATION OF AN OFFER TO BUY THESE SECURITIES IN ANY JURISDICTION WHERE THE OFFER OR SALE IS NOT PERMITTED.
| 123 |
Mortgage Loan No. 9 – West LA Office – 2730 Wilshire
Average household income within 3.0 miles from the West LA Office - 2730 Wilshire property is $114,376. The Santa Monica submarket has seen rent growth of 18.9% since 2011, over which time vacancy decreased market-wide from 9.8% to 8.2%. Furthermore, rents are still 12.1% below peak levels in 2008.
According to the appraisal, the West LA Office - 2730 Wilshire property’s office competitive set consists of the five office properties detailed in the table below. Based on the comparable leases below, the appraiser concluded a market rent of $49.20 PSF ($4.10 PSF per month).
Competitive Set Summary (1)
| Property | Year Built / Renovated | Total GLA (SF) | Est. Rent PSF | Est. Occ. | Proximity (miles) |
| West LA Office - 2730 Wilshire | 1985 | 58,369(2) | $42.67(2) | 95.9%(2) | N/A |
| 1447 Cloverfield Boulevard | 1998 | 16,500 | $55.20 | 100.0% | 0.5 |
| 2225 Broadway | 1905 | 1,400 | $51.00 | 100.0% | 0.5 |
| 2428 Santa Monica Boulevard | 1923 | 32,369 | $46.80 | 100.0% | 0.4 |
| 2716 Ocean Park Boulevard | 1978 | 101,440 | $39.00 | 94.0% | 1.7 |
| 2812-2820 Santa Monica Boulevard | 1990 | 15,087 | $47.04 | 100.0% | 0.3 |
| (1) | Source: Appraisal. |
| (2) | Based on underwritten rent roll dated March 1, 2016. |
Historical and Current Occupancy(1)
| 2013 | 2014 | 2015 | Current(2) |
| 91.0% | 87.1% | 88.7% | 95.9% |
| (1) | Historical Occupancies reflect the average occupancy for the indicated year as provided by the borrower. |
| (2) | Based on the underwritten rent roll dated March 1, 2016. |
Tenant Summary (1)
| Tenant | Ratings Moody’s/S&P/Fitch | Net Rentable Area (SF) | % of Total NRA | Base Rent PSF | Lease Expiration Date |
| Schaffell Development | NA / NA / NA | 10,091 | 17.3% | $40.14 | 8/31/2017 |
| B. Daniel Shabani, PHD | NA / NA / NA | 3,777 | 6.5% | $29.16 | 11/30/2017 |
| Brett P. Lent and Tricia S. Feist Dental Corporation(2) | NA / NA / NA | 3,652 | 6.3% | $48.84 | 5/31/2023(2) |
| LSG Imaging | NA / NA / NA | 2,854 | 4.9% | $50.92 | 5/31/2023 |
| Green Bridge Medical(3) | NA / NA / NA | 2,834 | 4.9% | $55.80 | 5/31/2022 |
| Skin by Lovely, a Medical Corp. | NA / NA / NA | 2,802 | 4.8% | $44.39 | 12/31/2019 |
| Samuel & Videgain | NA / NA / NA | 2,707 | 4.6% | $52.20 | 10/31/2021 |
| Rehab Specialists | NA / NA / NA | 2,360 | 4.0% | $40.87 | 12/31/2016 |
| Pablo Pazmino MD | NA / NA / NA | 2,143 | 3.7% | $40.56 | 5/31/2016 |
| Dr. Julien Chen | NA / NA / NA | 2,001 | 3.4% | $41.88 | 8/31/2022 |
| (1) | Based on underwritten rent roll dated March 1, 2016. |
| (2) | Brett P. Lent and Tricia S. Feist Dental Corporation, the third largest tenant, has the right to terminate his lease upon four months prior notice if both Brett P. Lent and Tricia S. Feist are unable to conduct their business as a result of either a physical disability that is expected to continue for at least 180 days or death. If Brett P. Lent exercises such right to terminate, Brett P. Lent is required to pay an acceleration fee equal to an amount based on a calculation determined by the then unamortized portion of the Brett P. Lent and Tricia S. Feist Dental Corporation lease, allocable base rent, operating costs and certain allowances set forth in the Brett P. Lent and Tricia S. Feist Dental Corporation lease. |
| (3) | Green Bridge Medical leases two suites; the first covers 2,019 SF ($57.00 PSF) and expires May 31, 2022 and the second lease covers 815 SF ($51.28 PSF) and expires October 31, 2017. The Base Rent PSF shown is the weighted average of the two leases. |
THE INFORMATION IN THIS TERM SHEET IS NOT COMPLETE AND MAY BE AMENDED PRIOR TO THE TIME OF SALE. THIS TERM SHEET IS NOT AN OFFER TO SELL THESE SECURITIES AND IT IS NOT A SOLICITATION OF AN OFFER TO BUY THESE SECURITIES IN ANY JURISDICTION WHERE THE OFFER OR SALE IS NOT PERMITTED.
| 124 |
Mortgage Loan No. 9 – West LA Office – 2730 Wilshire
Lease Rollover Schedule(1)
| Year | Number of Leases Expiring(2) | NRA (SF) Expiring | % of NRA Expiring | Base Rent Expiring | % of Base Rent Expiring | Cumulative NRA (SF) Expiring | Cumulative % of NRA Expiring | Cumulative Base Rent Expiring | Cumulative % of Base Rent Expiring |
| Vacant | NAP | 2,406 | 4.1% | NAP | NAP | 2,406 | 4.1% | NAP | NAP |
| MTM | 0 | 0 | 0.0 | $0 | 0.00% | 2,406 | 4.1% | $0 | 0.0% |
| 2016 | 5 | 8,215 | 14.1 | 324,261 | 13.2 | 10,621 | 18.2% | $324,261 | 13.2% |
| 2017 | 6 | 18,142 | 31.1 | 697,825 | 28.4 | 28,763 | 49.3% | $1,022,086 | 41.6% |
| 2018 | 3 | 5,167 | 8.9 | 240,888 | 9.8 | 33,930 | 58.1% | $1,262,974 | 51.4% |
| 2019 | 1 | 2,802 | 4.8 | 124,381 | 5.1 | 36,732 | 62.9% | $1,387,354 | 56.5% |
| 2020 | 4 | 4,402 | 7.5 | 211,685 | 8.6 | 41,134 | 70.5% | $1,599,040 | 65.1% |
| 2021 | 1 | 2,707 | 4.6 | 141,305 | 5.8 | 43,841 | 75.1% | $1,740,345 | 70.9% |
| 2022 | 3 | 5,151 | 8.8 | 257,459 | 10.5 | 48,992 | 83.9% | $1,997,805 | 81.4% |
| 2023 | 3 | 8,056 | 13.8 | 388,620 | 15.8 | 57,048 | 97.7% | $2,386,425 | 97.2% |
| 2024 | 0 | 0 | 0.0 | 0 | 0.00 | 57,048 | 97.7% | $2,386,425 | 97.2% |
| 2025 | 1 | 1,321 | 2.3 | 69,247 | 2.8 | 58,369 | 100.0% | $2,455,671 | 100.0% |
| 2026 & Beyond | 0 | 0 | 0.0 | 0 | 0.00 | 58,369 | 100.0% | $2,455,671 | 100.0% |
| Total | 27 | 58,369 | 100.0% | $2,455,671 | 100.0% |
| (1) | Based on the underwritten rent roll, including contractual rent increases occurring through April 1, 2017 and exclude any gross up of vacant space. |
| (2) | Tenants with multiple leases with different expiration dates are to be treated as separate entities. |
Operating History and Underwritten Net Cash Flow
| 2013 | 2014 | 2015(1) | Underwritten | PSF | %(2) | |
| Rents in Place(3) | $1,896,811 | $1,896,673 | $1,973,690 | $2,455,671 | $42.07 | 88.9% |
| Vacant Income | 0 | 0 | 0 | 122,712 | 2.10 | 4.4% |
| Rent Abatements | (128,031) | (83,334) | (111,010) | 0 | 0.00 | 0.0% |
| Gross Potential Rent | $1,768,780 | $1,813,339 | $1,862,681 | $2,578,383 | $44.17 | 93.3% |
| Total Reimbursements | 30,972 | 107,002 | 36,618 | 185,054 | 3.17 | 6.7% |
| Net Rental Income | $1,799,752 | $1,920,341 | $1,899,299 | $2,763,438 | $47.34 | 100.0% |
| (Vacancy/Collection Loss) | (1,423) | (5,284) | 0 | (139,293) | (2.39) | (5.0%) |
| Other Income | 320,430 | 339,341 | 378,845 | 434,301 | 7.44 | 15.7% |
| Effective Gross Income | $2,118,759 | $2,254,398 | $2,278,144 | $3,058,446 | $52.40 | 100.0% |
| Total Expenses | $865,627 | $1,040,198 | $1,040,929 | $1,082,515 | $18.55 | 35.4% |
| Net Operating Income | $1,253,132 | $1,214,200 | $1,237,214 | $1,975,931 | $33.85 | 64.6% |
| Total TI/LC, Capex/RR | 0 | 0 | 0 | 48,637 | 0.83 | 1.6% |
| Net Cash Flow | $1,253,132 | $1,214,200 | $1,237,214 | $1,927,294 | $33.02 | 63.0% |
| (1) | The 2015 column represents trailing 10 months ending October 31, 2015 annualized. |
| (2) | % column represents percent of Net Rental Income for all revenue lines and represents percent of Effective Gross Income for the remainder of fields. |
| (3) | Underwritten Rents in Place includes rent increases occurring through April 1, 2017. |
THE INFORMATION IN THIS TERM SHEET IS NOT COMPLETE AND MAY BE AMENDED PRIOR TO THE TIME OF SALE. THIS TERM SHEET IS NOT AN OFFER TO SELL THESE SECURITIES AND IT IS NOT A SOLICITATION OF AN OFFER TO BUY THESE SECURITIES IN ANY JURISDICTION WHERE THE OFFER OR SALE IS NOT PERMITTED.
| 125 |
Mortgage Loan No. 9 – West LA Office – 2730 Wilshire
Property Management.The West LA Office - 2730 Wilshire property is managed by Beverly Management Group, Inc., an affiliate of the sponsor.
Escrows and Reserves.At closing, the borrower deposited into escrow $395,000 for TI/LC reserves.
Tax Escrows– On a monthly basis, the borrower is required to escrow 1/12th of the annual estimated tax payments, currently equal to $30,083.
Insurance Escrows – The borrower will be required to deposit 1/12th of the annual insurance premiums into the insurance account (i) upon an event of default, (ii) if an acceptable blanket insurance policy is no longer in place, (iii) if borrower fails to provide evidence of renewal of insurance or (iv) if borrower fails to provide evidence that insurance has been paid.
Replacement Reserves– On a monthly basis, the borrower is required to escrow $1,411 ($0.29 PSF annually) for replacement reserves subject to a replacement reserve cap equal to $50,796.
TI/LC Reserves– On a monthly basis, the borrower is required to escrow $6,080 for TI/LC reserves.
Lockbox / Cash Management.The West LA Office - 2730 Wilshire loan is structured with a springing lockbox and springing cash management structure that will be triggered upon the commencement of a Cash Trap Event Period.
A “Cash Trap Event Period” will occur upon the earlier of (i) an event of default under the West LA Office - 2730 Wilshire loan, (ii) (1) notice of non-renewal or termination by Schaffell Development of its lease, or (2) the date that is 11 months prior to the expiration of the Schaffell Development lease if Schaffell Development has not renewed its lease in accordance with its terms or (iii) if the debt service coverage ratio (assuming a 30-year amortization, irrespective of any interest-only periods) falls below 1.10x. Such Cash Trap Event Period will expire (A) with respect to a Cash Trap Event Period commencing in connection with clause (i) above, upon the cure of such event of default under the West LA Office - 2730 Wilshire loan, (B) (1) with respect to a Cash Trap Event Period commencing in connection with clause (ii) (1) above, (x) upon the unconditional revocation by Schaffell Development of all termination or cancellation notices, (y) an extension of the Schaffell Development lease on terms and conditions reasonably acceptable to the lender and otherwise in accordance with the loan documents or (z) a new tenant has entered into a lease for the Schaffell Development premises on terms and conditions reasonably acceptable to the lender and otherwise in accordance with the loan documents, (B) (2) with respect to a Cash Trap Event Period commencing in connection with clause (ii) (2) above, upon (x) an extension of the Schaffell Development lease on terms and conditions in accordance with the loan documents or (y) a new tenant has entered into a lease for the Schaffell Development premises, with such lease on terms and conditions in accordance with the loan documents and (C) with respect to a Cash Trap Event Period commencing in connection with clause (iii) above, upon the date that the debt service coverage ratio is equal to or greater than 1.20x for one calendar quarter.
THE INFORMATION IN THIS TERM SHEET IS NOT COMPLETE AND MAY BE AMENDED PRIOR TO THE TIME OF SALE. THIS TERM SHEET IS NOT AN OFFER TO SELL THESE SECURITIES AND IT IS NOT A SOLICITATION OF AN OFFER TO BUY THESE SECURITIES IN ANY JURISDICTION WHERE THE OFFER OR SALE IS NOT PERMITTED.
| 126 |
Mortgage Loan No. 10 — Starwood Capital Extended Stay Portfolio

THE INFORMATION IN THIS TERM SHEET IS NOT COMPLETE AND MAY BE AMENDED PRIOR TO THE TIME OF SALE. THIS TERM SHEET IS NOT AN OFFER TO SELL THESE SECURITIES AND IT IS NOT A SOLICITATION OF AN OFFER TO BUY THESE SECURITIES IN ANY JURISDICTION WHERE THE OFFER OR SALE IS NOT PERMITTED.
| 127 |
Mortgage Loan No. 10 — Starwood Capital Extended Stay Portfolio
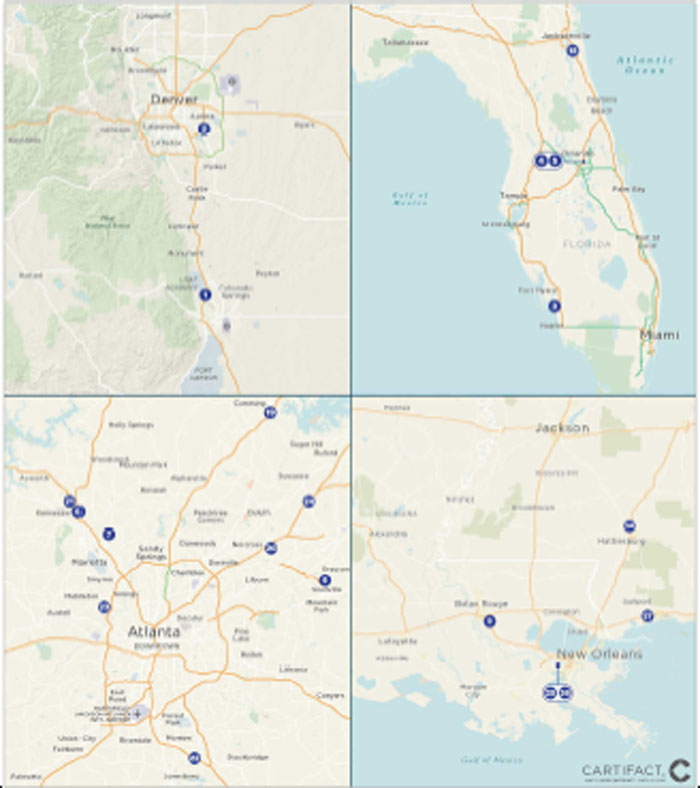
THE INFORMATION IN THIS TERM SHEET IS NOT COMPLETE AND MAY BE AMENDED PRIOR TO THE TIME OF SALE. THIS TERM SHEET IS NOT AN OFFER TO SELL THESE SECURITIES AND IT IS NOT A SOLICITATION OF AN OFFER TO BUY THESE SECURITIES IN ANY JURISDICTION WHERE THE OFFER OR SALE IS NOT PERMITTED.
| 128 |
Mortgage Loan No. 10 — Starwood Capital Extended Stay Portfolio

THE INFORMATION IN THIS TERM SHEET IS NOT COMPLETE AND MAY BE AMENDED PRIOR TO THE TIME OF SALE. THIS TERM SHEET IS NOT AN OFFER TO SELL THESE SECURITIES AND IT IS NOT A SOLICITATION OF AN OFFER TO BUY THESE SECURITIES IN ANY JURISDICTION WHERE THE OFFER OR SALE IS NOT PERMITTED.
| 129 |
Mortgage Loan No. 10 — Starwood Capital Extended Stay Portfolio
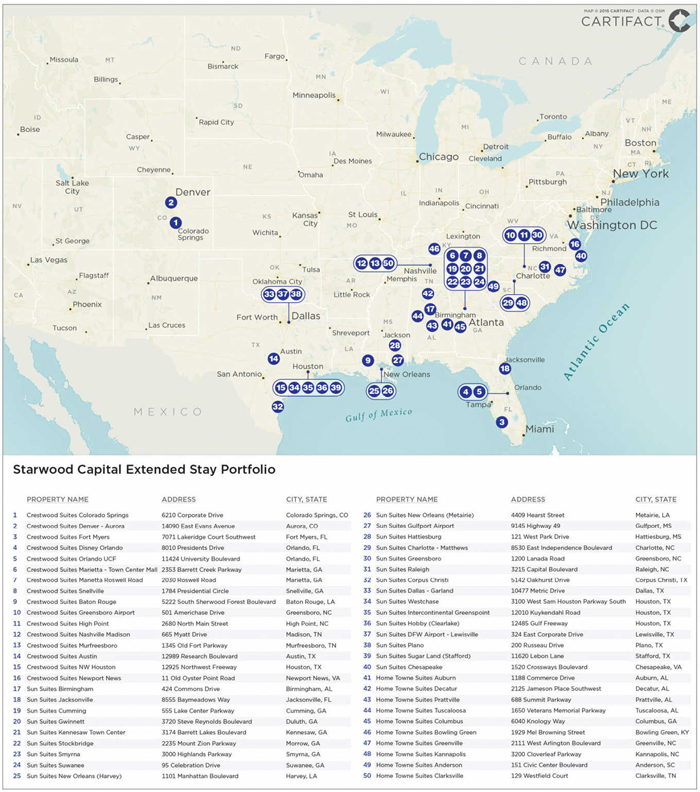
THE INFORMATION IN THIS TERM SHEET IS NOT COMPLETE AND MAY BE AMENDED PRIOR TO THE TIME OF SALE. THIS TERM SHEET IS NOT AN OFFER TO SELL THESE SECURITIES AND IT IS NOT A SOLICITATION OF AN OFFER TO BUY THESE SECURITIES IN ANY JURISDICTION WHERE THE OFFER OR SALE IS NOT PERMITTED.
| 130 |
Mortgage Loan No. 10 – Starwood Capital Extended Stay Portfolio
| Mortgage Loan Information | Property Information | |||
| Mortgage Loan Seller: | Column | Single Asset / Portfolio: | Portfolio of 50 Properties | |
| Original Principal Balance(1): | $20,000,000 | Title: | Fee | |
| Cut-off Date Principal Balance(1): | $20,000,000 | Property Type - Subtype: | Hotel – Extended Stay | |
| % of Pool by IPB: | 2.6% | Net Rentable Area (Rooms): | 6,106 | |
| Loan Purpose: | Acquisition | Location: | Various | |
| Borrowers(2): | Various | Year Built / Renovated: | Various | |
| Sponsor: | SOF-IX U.S. Holdings, L.P. | Occupancy / ADR / RevPAR(7): | 76.3% / $39.81 / $30.38 | |
| Interest Rate: | 4.01625% | Occupancy / ADR / RevPAR Date(7): | 4/30/2015 | |
| Note Date: | 6/11/2015 | Number of Tenants: | N/A | |
| Maturity Date: | 7/6/2020 | 2013 NOI: | $15,645,926 | |
| Interest-only Period: | 24 months | 2014 NOI: | $27,185,644 | |
| Original Term: | 60 months | 2015 NOI(7): | $28,792,531 | |
| Original Amortization(3): | 360 months | TTM NOI: | N/A | |
| Amortization Type: | IO-Balloon | UW Occupancy / ADR / RevPAR: | 76.3% / $39.81 / $30.38 | |
| Call Protection(4): | L(34),Def or YM1(22),O(4) | UW Revenues: | $68,907,956 | |
| Lockbox(5): | Hard | UW Expenses: | $40,932,498 | |
| Additional Debt(1)(6): | Yes | UW NOI: | $27,975,458 | |
| Additional Debt Balance(1)(6): | $205,000,000 | UW NCF: | $25,219,140 | |
| Additional Debt Type(1)(6): | Pari Passu, Mezzanine | Appraised Value / Per Room(8): | $311,000,000 / $50,934 | |
| Additional Future Debt Permitted: | No | Appraisal Date(8): | 5/4/2015 |
| Escrows and Reserves(9) | Financial Information(1) | |||||
| Initial | Monthly | Initial Cap | Cut-off Date Loan / Room: | $32,755 | ||
| Taxes: | $0 | Springing | N/A | Maturity Date Loan / Room: | $31,233 | |
| Insurance: | $0 | Springing | N/A | Cut-off Date LTV(8): | 64.3% | |
| FF&E Reserve: | $244,725 | 4% of total gross monthly revenue | N/A | Maturity Date LTV(8): | 61.3% | |
| Capital Work Reserve: | $6,500,000 | N/A | N/A | UW NCF DSCR: | 2.26x | |
| Engineering Reserve: | $1,121,206 | N/A | N/A | UW NOI Debt Yield: | 14.0% | |
Sources and Uses
| Sources | Proceeds | % of Total | Uses | Proceeds | % of Total | |
| Mortgage Loan(1) | $200,000,000 | 63.7% | Purchase Price | $300,000,000 | 95.5% | |
| Mezzanine Loan | 25,000,000 | 8.0 | Upfront Reserves | 7,865,931 | 2.5 | |
| Borrower Equity | 89,019,273 | 28.3 | Closing Costs | 6,153,341 | 2.0 | |
| Total Sources | $314,019,273 | 100.0% | Total Uses | $314,019,273 | 100.0% |
| (1) | The Starwood Capital Extended Stay Portfolio loan is part of a larger split whole loan evidenced by fourpari passu notes with an aggregate principal balance of $200.0 million. The financial information presented in the chart above reflects the cut-off date balance of the $200.0 million Starwood Capital Extended Stay Portfolio Whole Loan. |
| (2) | The borrowing entities are 50 limited partnership, special purpose entities. |
| (3) | After the interest-only period, the loan will amortize on a fixed amortization schedule. For more information see Annex F to the Preliminary Prospectus. |
| (4) | The lockout period will be at least 34 payment dates beginning with and including the first payment date of August 6, 2015. Defeasance or yield maintenance of the full Starwood Capital Extended Stay Portfolio Whole Loan is permitted following two years after the closing date of the securitization that includes the note last to be securitized. |
| (5) | For a more detailed description of lockbox, please refer to“Lockbox / Cash Management”below. |
| (6) | The additional debt balance includes $180.0 million ofpari passu debt and a $25.0 million mezzanine loan. For a more detailed description of the additional debt, please refer to“Additional Debt”below. |
| (7) | Represents trailing twelve months ending April 30, 2015. |
THE INFORMATION IN THIS TERM SHEET IS NOT COMPLETE AND MAY BE AMENDED PRIOR TO THE TIME OF SALE. THIS TERM SHEET IS NOT AN OFFER TO SELL THESE SECURITIES AND IT IS NOT A SOLICITATION OF AN OFFER TO BUY THESE SECURITIES IN ANY JURISDICTION WHERE THE OFFER OR SALE IS NOT PERMITTED.
| 131 |
Mortgage Loan No. 10 – Starwood Capital Extended Stay Portfolio
| (8) | The appraised value of $311.0 million is reflective of the value of the portfolio if sold in its entirety to a single buyer. The appraisal determined an appraised value on both a portfolio and individual basis. The concluded aggregate appraised value of the individual properties was $301.8 million, which would result in a Cut-off Date LTV of 66.3% and a Maturity Date LTV of 63.2%. |
| (9) | For a more detailed description of escrows and reserves, please refer to“Escrows and Reserves” below. |
The Loan. The Starwood Capital Extended Stay Portfolio loan, which is part of a larger split whole loan, is a first mortgage loan secured by the fee interest in 50 extended stay properties located in 12 states. The whole loan has an outstanding principal balance of $200.0 million (the “Starwood Capital Extended Stay Portfolio Whole Loan”) as of the cut-off date, which is comprised of fourpari passu notes, Note A-1-A, Note A-1-B, Note A-2 and Note A-3. Note A-1-B, has an outstanding principal balance as of the cut-off date of $20.0 million and is being contributed to the CSAIL 2016-C6 Commercial Mortgage Trust. Notes A-2 and A-3, which have an aggregate outstanding principal balance as of the cut-off date of $75.0 million, were contributed to the CSAIL 2016-C5 Commercial Mortgage Trust. Note A-1-A, which has an outstanding principal balance as of the cut-off date of approximately $105.0 million, was contributed to the CSAIL 2015-C3 Commercial Mortgage Trust. As the holder of Note A-1-A (the “Controlling Noteholder”), the trustee of the CSAIL 2015-C3 Commercial Mortgage Trust (or, prior to the occurrence and continuance of a control termination event under the CSAIL 2015-C3 pooling and servicing agreement, the CSAIL 2015-C3 controlling class representative) is entitled to exercise all of the rights of the Controlling Noteholder with respect to the Starwood Capital Extended Stay Portfolio Whole Loan; however, the holders of Notes A-1-B, A-2 and A-3 are entitled, under certain circumstances, to consult with the Controlling Noteholder with respect to certain major decisions. The loan has a 5-year term and will amortize on a 30-year schedule after a two-year interest only period.
Whole Loan Note Summary
| Original Balance | Cut-off Date Balance | Note Holder | Note in Controlling Securitization | |
| Note A-1-A | $105,000,000 | $105,000,000 | CSAIL 2015-C3 | Yes |
| Notes A-2 and A-3 | 75,000,000 | 75,000,000 | CSAIL 2016-C5 | No |
| Note A-1-B | 20,000,000 | 20,000,000 | CSAIL 2016-C6 | No |
| Total | $200,000,000 | $200,000,000 |
The Borrowers. The borrowing entities for the loan consist of 50 limited partnerships, special purpose entities which are controlled by SCG LH GP, L.L.C., a Delaware limited liability corporation and special purpose entity.
The Sponsor. The loan’s sponsor and nonrecourse carve-out guarantor is SOF-IX U.S. Holdings, L.P. which is the U.S. holding company for Starwood Opportunity Fund IX and is managed and controlled by Starwood Capital Group. The nonrecourse carve-out guarantor’s liability in connection with bankruptcy is capped at 20.0% of the then outstanding principal amount plus incurred legal expenses. Starwood Capital Group is a private investment firm with a primary focus on global real estate. Since its inception in 1991, the firm has raised over $31 billion of equity capital and currently has more than $44 billion of assets under management. Over the past 24 years, Starwood Capital Group has acquired approximately $65 billion of assets across virtually every real estate asset class.
The Properties. The portfolio consists of 50 extended stay properties totaling 6,106 rooms. The portfolio is geographically diverse in nature with properties located in 12 states including Texas, Georgia, North Carolina, Louisiana, Florida, Alabama, Colorado, Tennessee, Virginia, South Carolina, Mississippi and Kentucky. The properties were built between 1992 and 2007. The portfolio currently consist of 24 Sun Suites (3,112 rooms), 16 Crestwood Suites (2,188 rooms) and 10 Home-Towne Suites (806 rooms).
The sponsor acquired the properties in May 2015 from Mount Kellet Capital Management and Westmont Hospitality Group (“Seller”). The Seller acquired the Sun Suites and Crestwood Suites assets through the purchase of a mezzanine position and eventual foreclosure in December 2012 and acquired the Home Towne Suites assets in October 2013. The portfolio was underperforming when the Seller acquired it with 2013 NOI of approximately $15.6 million and RevPAR of $23.58. According to the sponsor, the Seller invested approximately $23.3 million ($3,819 per room) of capital to improve the assets in 2013 and 2014, which contributed to improved portfolio performance. NOI increased in 2014 to approximately $27.2 million and RevPAR to $29.36.
THE INFORMATION IN THIS TERM SHEET IS NOT COMPLETE AND MAY BE AMENDED PRIOR TO THE TIME OF SALE. THIS TERM SHEET IS NOT AN OFFER TO SELL THESE SECURITIES AND IT IS NOT A SOLICITATION OF AN OFFER TO BUY THESE SECURITIES IN ANY JURISDICTION WHERE THE OFFER OR SALE IS NOT PERMITTED.
| 132 |
Mortgage Loan No. 10 – Starwood Capital Extended Stay Portfolio
Current Portfolio Overview
| Brand | Properties | # of Rooms | Allocated Whole Loan Amount | % | Average Occ.(1) | Average Daily Rate(1) | Average RevPAR(1) | NCF(1) |
| Sun Suites | 24 | 3,112 | $108,614,977 | 54.3% | 81.2% | $36.58 | $29.68 | $14,402,358 |
| Crestwood Suites | 16 | 2,188 | 65,672,631 | 32.8 | 74.0% | $40.47 | $29.96 | 8,862,003 |
| Home-Towne Suites | 10 | 806 | 25,712,392 | 12.9 | 63.9% | $53.54 | $34.21 | 2,771,852 |
| Total/Wtd. Avg.: | 50 | 6,106 | $200,000,000 | 100.0% | 76.3% | $39.81 | $30.38 | $26,036,213 |
| (1) | Based on the trailing twelve month period ended April 30, 2015. |
Portfolio Historical Capital Expenditures
| Brand | 2013 | 2014 | Total | Per Room |
| Sun Suites | $6,388,321 | $5,343,490 | $11,731,811 | $3,770 |
| Crestwood Suites | 4,427,551 | 5,251,186 | 9,678,737 | $4,424 |
| Home-Towne Suites | 30,261 | 1,877,683 | 1,907,944 | $2,367 |
| Total/Wtd. Avg.: | $10,846,133 | $12,472,359 | $23,318,492 | $3,819 |
The sponsor acquired the portfolio in May 2015 and plans to continue investing capital into the assets in an effort to improve the performance of the portfolio. The sponsor intends to convert the properties to InTown Suites in or before 2017. $6.5 million was escrowed into a Capital Work Reserve at closing to cover expected costs of approximately $2.1 million to convert the assets to InTown Suites and an additional $4.4 million for other capital improvements and renovations.
Through affiliated entities, the sponsor owns InTown Suites (“InTown”), which currently owns and manages a portfolio of 139 extended-stay properties, encompassing approximately 18,000 rooms, located in 21 states. The company has approximately 1,100 employees; of which approximately 66 serve a corporate function. Management is led by a group of professionals possessing both institutional leadership and hospitality industry experience at both the company and sponsorship level. The InTown team will provide management oversight of the properties.
InTown Suites is expected to have over 180 locations across 22 states after the intended conversion of the portfolio. InTown Suites’ properties operate as long-term extended stay facilities with guestrooms rented on a weekly basis with an average guest stay of 84 days. Amenities include kitchens equipped with stovetops, microwaves and full-size refrigerators, dining areas, high speed internet access, flat-screen TVs, premium cable and guest laundry facilities.
InTown maximizes operating efficiencies by running a weekly pricing model (as opposed to a daily pricing model), at a higher occupancy (80% or higher) level with a longer length of stay (an average of 84 days). Average staffing at InTown properties is five to six full time employees, housekeeping services are provided on a weekly basis rather than nightly, room supplies are provided at check in and are not replenished during a guest’s stay and operating hours are generally limited to 8 hours per day, 6 days per week. Compared to the hybrid model that offers weekly and nightly rooms (utilized at 37 of the 50 properties in this portfolio at acquisition), the InTown weekly-only business model with limited amenities results in lower costs and high occupancies on average. The sponsor anticipates these efficiencies will improve operating margins and increase the performance of the portfolio to be more in-line with InTown’s current portfolio that operates at a 57% EBITDA margin.
THE INFORMATION IN THIS TERM SHEET IS NOT COMPLETE AND MAY BE AMENDED PRIOR TO THE TIME OF SALE. THIS TERM SHEET IS NOT AN OFFER TO SELL THESE SECURITIES AND IT IS NOT A SOLICITATION OF AN OFFER TO BUY THESE SECURITIES IN ANY JURISDICTION WHERE THE OFFER OR SALE IS NOT PERMITTED.
| 133 |
Mortgage Loan No. 10 – Starwood Capital Extended Stay Portfolio
Portfolio Geographic Summary
| State | # of Rooms | Allocated Whole Loan Amount | % | Average Occ.(1) | Average Daily Rate(1) | Average RevPAR(1) | NCF(1) |
| Texas | 1,380 | $51,888,668 | 25.9% | 82.1% | $37.82 | $31.04 | $6,731,635 |
| Georgia | 1,178 | 40,291,584 | 20.1 | 85.8% | $36.05 | $30.93 | 5,498,658 |
| North Carolina | 834 | 24,320,742 | 12.2 | 71.8% | $39.31 | $28.22 | 2,990,381 |
| Louisiana | 395 | 19,019,218 | 9.5 | 82.2% | $45.72 | $37.57 | 2,406,569 |
| Florida | 550 | 16,633,532 | 8.3 | 73.2% | $40.12 | $29.36 | 2,462,006 |
| Alabama | 457 | 13,320,080 | 6.7 | 64.8% | $47.22 | $30.62 | 1,519,221 |
| Colorado | 295 | 11,530,815 | 5.8 | 65.4% | $47.84 | $31.27 | 1,317,729 |
| Tennessee | 343 | 11,199,470 | 5.6 | 82.4% | $39.44 | $32.49 | 1,501,679 |
| Virginia | 244 | 4,903,910 | 2.5 | 66.7% | $40.79 | $27.20 | 660,748 |
| South Carolina | 80 | 2,783,300 | 1.4 | 64.8% | $53.50 | $34.66 | 304,306 |
| Mississippi | 244 | 2,717,031 | 1.4 | 59.6% | $34.72 | $20.69 | 434,123 |
| Kentucky | 106 | 1,391,650 | 0.7 | 56.2% | $48.39 | $27.20 | 209,158 |
| Total/Wtd. Avg. | 6,106 | $200,000,000 | 100.0% | 76.3% | $39.81 | $30.38 | $26,036,213 |
| (1) | Based on the trailing twelve month period ended April 30, 2015. |
Operating History and Underwritten Net Cash Flow
| 2012 | 2013 | 2014 | 2015(1)(2) | Underwritten | Per Room(3) | %(4) | |
| Occupancy | 56.7% | 60.5% | 76.0% | 76.3% | 76.3% | ||
| ADR | $39.98 | $38.98 | $38.63 | $39.81 | $39.81 | ||
| RevPAR | $22.68 | $23.58 | $29.36 | $30.38 | $30.38 | ||
| Room Revenue | $50,610,387 | $52,419,383 | $65,416,045 | $67,710,367 | $67,710,367 | $11,089 | 98.3% |
| Other Departmental Revenues | 559,555 | 872,100 | 1,194,449 | 1,197,589 | 1,197,589 | 196 | 1.7% |
| Total Revenue | $51,169,942 | $53,291,483 | $66,610,494 | $68,907,956 | $68,907,956 | $11,285 | 100.0% |
| Room Expense | 12,783,537 | 11,791,435 | 12,421,630 | 12,578,121 | 12,578,121 | 2,060 | 18.6% |
| Other Departmental Expenses | 825,147 | 761,913 | 564,933 | 543,307 | 543,307 | 89 | 45.4% |
| Departmental Expenses | $13,608,684 | $12,553,347 | $12,986,562 | $13,121,428 | $13,121,428 | $2,149 | 19.0% |
| Departmental Profit | $37,561,258 | $40,738,136 | $53,623,931 | $55,786,528 | $55,786,528 | $9,136 | 81.0% |
| Operating Expenses | $16,022,892 | $18,400,304 | $20,010,563 | $20,557,302 | $20,557,302 | $3,367 | 29.8% |
| Gross Operating Profit | $21,538,365 | $22,337,831 | $33,613,368 | $35,229,226 | $35,229,226 | $5,770 | 51.1% |
| Fixed Expenses | 5,551,980 | 6,691,905 | 6,427,724 | 6,436,694 | 7,253,768 | 1,188 | 10.5% |
| Net Operating Income | $15,986,386 | $15,645,926 | $27,185,644 | $28,792,531 | $27,975,458 | $4,582 | 40.6% |
| FF&E | 2,046,798 | 2,131,659 | 2,664,420 | 2,756,318 | 2,756,318 | 451 | 4.0% |
| Net Cash Flow | $13,939,588 | $13,514,267 | $24,521,224 | $26,036,213 | $25,219,140 | $4,130 | 36.6% |
| (1) | The 2015 column represents the trailing twelve month period ending April 30, 2015. |
| (2) | As of March 31, 2016 the TTM NCF was $25,892,810 with an Occupancy, ADR and RevPAR of 70.3%, $40.60 and $28.56 respectively. The portfolio was acquired on May 5, 2015 and the financials do not include the revenue or expenses from May 1, 2015 through May 4, 2015 (4 days). If the revenue for the 27 days of May are used to estimate the first 4 days of the month, the 4 days would represent an additional $747,039 of revenue. |
| (3) | Per Room values are based on 6,106 rooms. |
| (4) | % column represents percent of Total Revenue except for Room Expense and Other Departmental Expenses which is based on the corresponding revenue line items. |
THE INFORMATION IN THIS TERM SHEET IS NOT COMPLETE AND MAY BE AMENDED PRIOR TO THE TIME OF SALE. THIS TERM SHEET IS NOT AN OFFER TO SELL THESE SECURITIES AND IT IS NOT A SOLICITATION OF AN OFFER TO BUY THESE SECURITIES IN ANY JURISDICTION WHERE THE OFFER OR SALE IS NOT PERMITTED.
| 134 |
Mortgage Loan No. 10 – Starwood Capital Extended Stay Portfolio
Property Management. The properties are managed by Sleep Specialty Management, L.P., an affiliate of the sponsor.
Escrows and Reserves. At origination, the borrowers deposited into escrow $6.5 million for capital work, approximately $1.1 million for required repairs and $244,725 for FF&E reserve.
Tax Escrows – The requirement of the borrowers to make monthly deposits to the tax reserve is waived so long as a Trigger Period is not in continuance or a third party manager approved by the lender is adequately reserving and paying taxes in accordance with the loan documents.
Insurance Escrows – The requirement of the borrowers to make monthly deposits to the insurance reserve is waived so long as a Trigger Period is not in continuance or the borrowers provide satisfactory evidence that the properties are insured as part of a blanket policy in accordance with the loan documents.
FF&E Reserves – On a monthly basis, the borrowers are required to escrow an amount equal to 4.0% of gross monthly revenues.
Capital Work – The borrowers deposited $6.5 million into escrow at origination. Of that amount it is estimated that approximately $2.1 million will be used for work related to the conversion of the properties to InTown Suites and $4.4 million will be used for additional renovations and improvements to the properties.
Lockbox / Cash Management. The Starwood Capital Extended Stay Portfolio Whole Loan is structured with a hard lockbox and springing cash management. The property manager is required to deposit all rental, credit card deposits and other income directly into the lockbox account controlled by the lender. Upon the continuance of a Trigger Period, all funds in the lockbox account are required to be swept daily to a cash management account under the control of the lender and disbursed during each interest period of the term of the loan in accordance with the loan documents. During the continuance of a Trigger Period, all excess cash flow, after payments made in accordance with the loan documents for, amongst other things, debt service, required reserves and operating expenses, is required to be held as additional collateral for the loan.
“Trigger Period” means a period commencing on the earliest of (i) an event of default under the mortgage loan documents, (ii) any event of default on the mezzanine loan, and (iii) the combined debt yield on the mortgage and mezzanine loan being less than 8.0% through July 2018, 8.25% through July 2019 and 8.50% thereafter.
Property Release. Provided no event of default under the mortgage loan documents has occurred, the borrowers may release individual properties from the loan subject to the satisfaction of certain conditions including, but not limited to, the following: (i) the debt yield for the remaining properties based on the mortgage and mezzanine loans either (a) exceeds the greater of the debt yield at origination or the debt yield prior to the release of the property or (b) is above 12.0%, (ii) payment of the Release Price for any conveyance of a property to a third party or the Affiliate Release Price for any conveyance of a property to an affiliate of the borrowers, (iii) payment of any release price with respect to the mezzanine loan, and (iv) payment of any yield maintenance prior to the open period.
“Release Price” means (i) if less than $20.0 million has been prepaid, 105% of the allocated loan amount, (ii) if $20.0 million or more, but less than $40.0 million, has been prepaid, 110% of the allocated loan amount, (iii) if $40.0 million or more, but less than $60.0 million, has been prepaid, 115% of the allocated loan amount, or (iv) otherwise, 120% of the allocated loan amount. If a prepayment of a property results in the aggregate prepayments exceeding any of the forgoing thresholds, the Release Price will be applied pro rata to the respective amounts within each threshold.
“Affiliate Release Price” means (i) if less than $20.0 million has been prepaid, 110% of the allocated loan amount, (ii) if $20.0 million or more, but less than $40.0 million has been prepaid, 115% of the allocated loan amount, (iii) if $40.0 million or more, but less than $60.0 million, has been prepaid, 120% of the allocated loan amount, or (iv) otherwise, 125% of the allocated loan amount. If a prepayment of a property results in the aggregate prepayments exceeding any of the forgoing thresholds, the Affiliate Release Price will be applied pro rata to the respective amounts within each threshold.
THE INFORMATION IN THIS TERM SHEET IS NOT COMPLETE AND MAY BE AMENDED PRIOR TO THE TIME OF SALE. THIS TERM SHEET IS NOT AN OFFER TO SELL THESE SECURITIES AND IT IS NOT A SOLICITATION OF AN OFFER TO BUY THESE SECURITIES IN ANY JURISDICTION WHERE THE OFFER OR SALE IS NOT PERMITTED.
| 135 |
Mortgage Loan No. 10 – Starwood Capital Extended Stay Portfolio
Additional Debt.A $25.0 million mezzanine loan was provided with the financing that is secured by a pledge of the direct equity interests in the mortgage borrowers and is coterminous with the mortgage loan. The mezzanine loan has a 9.0000% coupon. Including the mezzanine loan, the Cut-off Date LTV is 72.3%, the UW NCF DSCR is 1.83x and the UW NOI Debt Yield is 12.4%.
THE INFORMATION IN THIS TERM SHEET IS NOT COMPLETE AND MAY BE AMENDED PRIOR TO THE TIME OF SALE. THIS TERM SHEET IS NOT AN OFFER TO SELL THESE SECURITIES AND IT IS NOT A SOLICITATION OF AN OFFER TO BUY THESE SECURITIES IN ANY JURISDICTION WHERE THE OFFER OR SALE IS NOT PERMITTED.
| 136 |
(THIS PAGE INTENTIONALLY LEFT BLANK)
| 137 |
| Mortgage Loan No. 11 — Chicago Marriott Southwest at Burr Ridge |
| Mortgage Loan Information | Property Information |
| Mortgage Loan Seller: | BSP | Single Asset / Portfolio: | Single Asset | |
| Original Principal Balance: | $20,000,000 | Title: | Fee | |
| Cut-off Date Principal Balance: | $20,000,000 | Property Type - Subtype: | Hotel – Full Service | |
| % of Pool by IPB: | 2.6% | Net Rentable Area (Rooms): | 184 | |
| Loan Purpose: | Acquisition | Location: | Burr Ridge, IL | |
| Borrowers: | Sidra Burr Ridge, LLC; Sidra BR Properties, LLC | Year Built / Renovated: | 2004 / 2016 | |
| Sponsor: | Sidra Real Estate, Inc. | Occupancy / ADR / RevPAR: | 69.7% / $147.63 / $102.84 | |
| Interest Rate: | 5.3500% | Occupancy / ADR / RevPAR Date: | 12/31/2015 | |
| Note Date: | 2/17/2016 | Number of Tenants: | N/A | |
| Maturity Date: | 3/6/2021 | 2013 NOI: | $2,704,141 | |
| Interest-only Period: | 60 months | 2014 NOI: | $2,945,076 | |
| Original Term: | 60 months | 2015 NOI: | $2,608,413 | |
| Original Amortization: | None | UW Occupancy / ADR / RevPAR: | 69.7% / $147.63 / $102.84 | |
| Amortization Type: | Interest Only | UW Revenues: | $10,093,895 | |
| Call Protection: | L(26),Def(30),O(4) | UW Expenses: | $7,560,510 | |
| Lockbox(1): | Hard | UW NOI: | $2,533,385 | |
| Additional Debt: | No | UW NCF: | $2,129,629 | |
| Additional Debt Balance: | N/A | Appraised Value / Per Room(2): | $35,400,000 / $192,391 | |
| Additional Debt Type: | N/A | Appraisal Date(2): | 1/1/2017 | |
| Additional Future Debt Permitted: | No |
| Escrows and Reserves | Financial Information |
| Initial | Monthly | Initial Cap | Cut-off Date Loan / Room: | $108,696 | ||
| Taxes: | $323,865 | $48,083 | N/A | Maturity Date Loan / Room: | $108,696 | |
| Insurance: | $0 | Springing(3) | N/A | Cut-off Date LTV(2): | 56.5% | |
| FF&E Reserve: | $0 | Springing(4) | N/A | Maturity Date LTV(2): | 56.5% | |
| PIP Reserve(2): | $6,689,991 | Springing | N/A | UW NCF DSCR: | 1.96x | |
| Engineering Reserve: | $145,980 | N/A | N/A | UW NOI Debt Yield: | 12.7% | |
| Seasonality Reserve(5): | $0 | $34,000 | $170,000 |
Sources and Uses
| Sources | Proceeds | % of Total | Uses | Proceeds | % of Total | |
| Mortgage Loan | $20,000,000 | 61.7% | Purchase Price(6) | $24,771,270 | 76.5% | |
| Sponsor Equity | 12,391,807 | 38.3 | PIP Reserve | 6,689,991 | 20.7 | |
| Other Upfront Reserves | 469,845 | 1.5 | ||||
| Closing Costs | 460,701 | 1.4 | ||||
| Total Sources | $32,391,807 | 100.0% | Total Uses | $32,391,807 | 100.0% |
| (1) | The loan is structured with a hard lockbox and springing cash management. |
| (2) | Represents the “Prospective Market Value Upon Completion” per the appraisal, based on completion of PIP work required to be completed by January 1, 2017, for which approximately $6.7 million was reserved at origination. As of December 24, 2015, the appraisal concluded to a “Market Value As-Is” of $27.9 million, which equates to a Cut-Off Date LTV of 71.7%. The appraisal also concluded a “Prospective Market Value Upon Stabilization” of $37.4 million as of January 1, 2018 which would result in a Maturity Date LTV of 53.5%. |
| (3) | Monthly insurance payments are waived for so long as (i) no event of default has occurred and is continuing, (ii) the property continues to be insured by a blanket policy, and (iii) all insurance premiums are being timely paid and the lender receives evidence of such payment. |
| (4) | Commencing on March 6, 2018, the borrowers are required to escrow, on a monthly basis, 1/12th of 4% of the greater of (i) gross revenue for the preceding calendar year and (ii) estimated gross revenue for the current calendar year according to the most recently submitted annual budget. The estimated monthly FF&E amount is $33,646. |
| (5) | Monthly Seasonality Reserve deposits required on each payment date occurring in May, June, July, August and September during the term of the loan, subject to a cap of $170,000. |
| (6) | Purchase price is net of $728,730 in seller credits. |
THE INFORMATION IN THIS TERM SHEET IS NOT COMPLETE AND MAY BE AMENDED PRIOR TO THE TIME OF SALE. THIS TERM SHEET IS NOT AN OFFER TO SELL THESE SECURITIES AND IT IS NOT A SOLICITATION OF AN OFFER TO BUY THESE SECURITIES IN ANY JURISDICTION WHERE THE OFFER OR SALE IS NOT PERMITTED.
| 138 |
| Mortgage Loan No. 11 — Chicago Marriott Southwest at Burr Ridge |
The Loan. The Chicago Marriott Southwest at Burr Ridge loan is a $20.0 million first mortgage loan secured by the fee interest in a 184-room full service hotel property located in Burr Ridge, Illinois. The loan has a 5-year term and is interest-only for the term of the loan.
The Borrowers. The borrowing entities for the loan are Sidra Burr Ridge, LLC and Sidra BR Properties, LLC, each a Delaware limited liability company and special purpose entity.
The Sponsor. The loan’s sponsor and nonrecourse carve-out guarantor is Sidra Real Estate, Inc. Sidra Real Estate, Inc. operates as the U.S. real estate arm of Sana Horizon, Ltd, which is wholly owned by The Dutco Group of Companies (“Dutco”). Dutco is a Dubai based company founded in 1947, with 4 primary businesses: construction, trading, manufacturing, oil, gas and hospitality. Outside of Sidra Real Estate, Inc., Dutco owns eight hotels in and around Dubai, Seychelles and the Maldives. David Barry is the President of Sidra Real Estate, Inc. and has over 40 years of experience as a real estate attorney and investor. Mr. Barry has been an attorney at Kelley Drye LLP since the 1970s and has been representing Dutco since 1977. In 2007, Mr. Barry began working directly for Dutco, managing its U.S. real estate portfolio. Inclusive of closing costs and the PIP and engineering reserves collected at origination, the sponsors have a cost basis of approximately $32,391,807 in the property resulting in a loan-to-cost ratio of 61.7%.
The Property. The Chicago Marriott Southwest at Burr Ridge property is a 184-room full service hotel located in Burr Ridge, Illinois. The property was originally constructed in 2004 and consists of an 8-story hotel building with a parking garage located on a 7.95-acre site. A new 20-year franchise agreement with Marriott International, Inc. (“Marriott”) was implemented at origination, which extends the property’s franchise agreement through January 2036.
The unit mix consists of 67 king guestrooms, 70 double guestrooms and 47 suites. Each of the guestrooms features a flat screen television with premium channel selection, telephone, desk with chair, dresser, nightstands, lamps and lounge chairs. Amenities at the property include a restaurant and lounge, a bar, over 10,700 SF of meeting space including an 8,024 SF grand ballroom, conference room and board room, a business center, fitness center and an indoor swimming pool and whirlpool. In addition, the property offers a 365-space parking garage.
An upfront PIP reserve of approximately $6.69 million ($36,359/room) was escrowed at origination for PIP work required by the franchise agreement to be completed by the second quarter of 2017. Planned PIP work includes extensive upgrades to the property’s site, lobby, guestrooms and bathrooms, business center, restaurant, bar/lounge, fitness center and pool, ballroom and conference/meeting room facilities. The borrowers’ PIP budget includes $3.95 million ($21,467/room) allocated to guestrooms and bathrooms, including full case-goods and soft-goods replacements that incorporate all components of Marriott’s new brand design and the new Marriott entertainment package, $525,000 allocated to ballroom, boardroom and meeting room upgrades and $285,000 for restaurant and bar/lounge improvements including a reconfiguration of the floorplans.
The Market. The Chicago Marriott Southwest at Burr Ridge is located on Burr Ridge Parkway, 13.1 miles from Midway Airport, 18.9 miles from downtown Chicago and 17 miles from O’Hare Airport. It benefits from access and visibility on the east side of Burr Ridge Parkway, immediately southwest of the Interstate 55/294 interchange connecting the area to Indiana and Chicago’s northern and western suburbs via Interstates 88 and 290.
The property is located in Burr Ridge, Illinois. The property is the only full-service hotel within a 10-mile radius, and the only hotel with conference facilities in the area. The property is situated within the Burr Ridge Village Center, a lifestyle center with a mixture of residential, retail, office and hotel uses anchored by Lifetime Fitness and national tenants such as Banana Republic, Bath & Body Works, Claire’s, Eddie Bauer, Jos. A. Bank, LOFT, Kohler Waters Spa, Sunglass Hut International and Victoria’s Secret and four restaurants.
Based on the appraiser’s estimated 2015 data for the primary competitive set and the subject hotel’s 2015 performance per the sponsor’s operating statements, the subject hotel had higher figures than its primary competitive set in terms of occupancy (107.8% penetration), ADR (113.5% penetration), and RevPAR (122.3% penetration). The hotel, similarly, had higher figures than its primary competitive set in 2013 and 2014 in terms of occupancy (113.1% and 110.7% penetration, respectively), ADR (114.0% and 110.5% penetration, respectively), and RevPAR (128.8% and 122.2% penetration, respectively). Per Trip Advisor,
THE INFORMATION IN THIS TERM SHEET IS NOT COMPLETE AND MAY BE AMENDED PRIOR TO THE TIME OF SALE. THIS TERM SHEET IS NOT AN OFFER TO SELL THESE SECURITIES AND IT IS NOT A SOLICITATION OF AN OFFER TO BUY THESE SECURITIES IN ANY JURISDICTION WHERE THE OFFER OR SALE IS NOT PERMITTED.
| 139 |
| Mortgage Loan No. 11 — Chicago Marriott Southwest at Burr Ridge |
the hotel is rated as the No. 1 hotel in Burr Ridge and holds a Certificate of Excellence. The properties in the hotel’s competitive are shown below.
Historical Occupancy, ADR, RevPAR
| Competitive Set(1) | Chicago Marriott Southwest at Burr Ridge(2) | Penetration Factor | |||||||
| Year | Occupancy | ADR | RevPAR | Occupancy | ADR | RevPAR | Occupancy | ADR | RevPAR |
| 2013 | 65.0% | $117.65 | $76.52 | 73.5% | $134.14 | $98.57 | 113.1% | 114.0% | 128.8% |
| 2014 | 68.3% | $125.84 | $85.97 | 75.6% | $139.09 | $105.09 | 110.7% | 110.5% | 122.2% |
| 2015 | 64.6% | $130.07 | $84.09 | 69.7% | $147.63 | $102.84 | 107.8% | 113.5% | 122.3% |
| (1) | Source: Appraisal. Competitive Set metrics are derived using appraiser’s estimated calendar year 2015 data for the primary competitive set. |
| (2) | Source: Borrower financials. |
Competitive Hotels Profile(1)
| Estimated Market Mix | Calendar Year 2015 | |||||||||
| Property | Rooms | Year Built | Meeting Space (SF) | Commercial | Meeting & Group | Leisure | Extended Stay | Occ | ADR | RevPAR |
| Chicago Marriott Southwest at Burr Ridge | 184 | 2004 | 10,724 | 30% | 35% | 30% | 5% | 69.7% | $147.63 | $102.84 |
| Doubletree Chicago Oak Brook | 428 | 1973 | 30,030 | 35% | 30% | 30% | 5% | 63.0% | $123.00 | $77.49 |
| Marriott Chicago Oak Brook | 350 | 1981 | 18,600 | 30% | 35% | 30% | 5% | 68.0% | $145.00 | $98.60 |
| Springhill Suites Chicago Southwest at Burr Ridge | 128 | 2000 | 770 | 40% | 15% | 35% | 10% | 61.0% | $109.00 | $66.49 |
| Total(2) | 906 | |||||||||
| (1) | Source: Appraisal. |
| (2) | Excludes the subject property. |
Operating History and Underwritten Net Cash Flow
| 2012 | 2013 | 2014 | 2015 | Underwritten | Per Room(1) | %(2) | |
| Occupancy | 75.8% | 73.5% | 75.6% | 69.7% | 69.7% | ||
| ADR | $130.24 | $134.14 | $139.09 | $147.63 | $147.63 | ||
| RevPAR | $98.67 | $98.57 | $105.09 | $102.84 | $102.84 | ||
| Room Revenue | $6,644,572 | $6,619,656 | $7,058,067 | $6,906,768 | $6,906,768 | $37,537 | 68.4% |
| Food and Beverage | 2,808,448 | 2,919,926 | 3,106,575 | 3,081,762 | 3,081,762 | 16,749 | 30.5% |
| Other Departmental Revenues | 188,472 | 165,921 | 168,949 | 105,365 | 105,365 | 573 | 1.0% |
| Total Revenue | $9,641,492 | $9,705,503 | $10,333,591 | $10,093,895 | $10,093,895 | $54,858 | 100.0% |
| Room Expense | 1,386,921 | 1,368,126 | 1,481,009 | 1,389,406 | 1,389,406 | 7,551 | 20.1% |
| Food and Beverage Expense | 1,584,694 | 1,647,753 | 1,815,515 | 2,071,403 | 2,071,403 | 11,258 | 67.2% |
| Other Departmental Expenses | 108,792 | 97,486 | 86,098 | 88,534 | 88,534 | 481 | 84.0% |
| Departmental Expenses | $3,080,407 | $3,113,365 | $3,382,622 | $3,549,343 | $3,549,343 | $19,290 | 100.0% |
| Departmental Profit | $6,561,085 | $6,592,138 | $6,950,969 | $6,544,552 | $6,544,552 | $35,568 | 64.8% |
| Operating Expenses | $3,267,975 | $3,312,627 | $3,373,431 | $3,306,553 | $3,384,517 | $18,394 | 33.5% |
| Gross Operating Profit | $3,293,110 | $3,279,511 | $3,577,538 | $3,237,999 | $3,160,035 | $17,174 | 31.3% |
| Fixed Expenses | 556,189 | 575,370 | 632,462 | 629,586 | 626,650 | 3,406 | 6.2% |
| Net Operating Income | $2,736,921 | $2,704,141 | $2,945,076 | $2,608,413 | $2,533,385 | $13,768 | 25.1% |
| FF&E | 0 | 0 | 0 | 0 | 403,756 | 2,194 | 4.0% |
| Net Cash Flow | $2,736,921 | $2,704,141 | $2,945,076 | $2,608,413 | $2,129,629 | $11,574 | 21.1% |
| (1) | Per Room values are based on 184 rooms. |
| (2) | % column represents percent of Total Revenue except for Room Expense, Food and Beverage Expense and Other Department Expenses, which are based on their corresponding revenue line items. |
THE INFORMATION IN THIS TERM SHEET IS NOT COMPLETE AND MAY BE AMENDED PRIOR TO THE TIME OF SALE. THIS TERM SHEET IS NOT AN OFFER TO SELL THESE SECURITIES AND IT IS NOT A SOLICITATION OF AN OFFER TO BUY THESE SECURITIES IN ANY JURISDICTION WHERE THE OFFER OR SALE IS NOT PERMITTED.
| 140 |
(THIS PAGE INTENTIONALLY LEFT BLANK)
| 141 |
Mortgage Loan No. 12 — Palihouse Santa Monica
| Mortgage Loan Information | Property Information | |||
| Mortgage Loan Seller: | Column | Single Asset / Portfolio: | Single Asset | |
| Original Principal Balance: | $19,500,000 | Title: | Fee | |
| Cut-off Date Principal Balance: | $19,422,501 | Property Type - Subtype: | Hotel – Full Service | |
| % of Pool by IPB: | 2.5% | Net Rentable Area (Rooms): | 38 | |
| Loan Purpose: | Refinance | Location: | Santa Monica, CA | |
| Borrower: | 1001 3rd Street LLC | Year Built / Renovated: | 1927 / 2013 | |
| Sponsors: | Avi Brosh; Ramin Kolahi | Occupancy / ADR / RevPAR: | 88.1% / $360.59 / $317.66 | |
| Interest Rate: | 5.0598% | Occupancy / ADR / RevPAR Date: | 11/2/2015 | |
| Note Date: | 12/23/2015 | Number of Tenants: | N/A | |
| Maturity Date: | 1/6/2026 | 2013 NOI(3): | N/A | |
| Interest-only Period: | 0 months | 2014 NOI: | $1,981,972 | |
| Original Term: | 120 months | 2015 NOI(4): | $2,319,110 | |
| Original Amortization(1): | 360 months | TTM NOI: | N/A | |
| Amortization Type: | Balloon | UW Occupancy/ ADR / RevPAR: | 88.1% / $360.59 / $317.68 | |
| Call Protection: | L(35),Def(81),O(4) | UW Revenues: | $4,851,219 | |
| Lockbox: | Hard | UW Expenses: | $2,702,063 | |
| Additional Debt(2): | Yes | UW NOI: | $2,149,156 | |
| Additional Debt Balance(2): | $3,237,083 | UW NCF: | $1,955,107 | |
| Additional Debt Type(2): | Mezzanine | Appraised Value / Per Room(5): | $30,600,000 / $805,263 | |
| Additional Future Debt Permitted: | No | Appraisal Date(5): | 10/14/2015 |
| Escrows and Reserves | Financial Information | |||||
| Initial | Monthly | Initial Cap | Cut-off Date Loan / Room: | $511,118 | ||
| Taxes: | $11,714 | $11,714 | N/A | Maturity Date Loan / Room: | $433,112 | |
| Insurance: | $4,062 | $4,062 | N/A | Cut-off Date LTV(5): | 63.5% | |
| FF&E Reserve: | $0 | 1/12 of 4% of TTM gross revenues | $582,147 | Maturity Date LTV(5): | 53.8% | |
| UW NCF DSCR: | 1.59x | |||||
| UW NOI Debt Yield: | 11.1% |
Sources and Uses
| Sources | Proceeds | % of Total | Uses | Proceeds | % of Total | |
| Mortgage Loan | $19,500,000 | 85.7% | Payoff Existing Debt | $17,003,361 | 74.7% | |
| Mezzanine Loan | 3,250,000 | 14.3 | Return of Equity | 5,004,353 | 22.0 | |
| Upfront Reserves | 15,775 | 0.1 | ||||
| Closing Costs | 726,511 | 3.2 | ||||
| Total Sources | $22,750,000 | 100.0% | Total Uses | $22,750,000 | 100.0% |
| (1) | The loan amortizes on a fixed amortization schedule. For more information see Annex G to the Preliminary Prospectus. |
| (2) | The additional debt consists of a mezzanine loan with an outstanding principal balance of approximately $3.2 million. For a more detailed description of the additional debt, please refer to“Additional Debt” below. |
| (3) | 2013 NOI unavailable due to hotel renovations. |
| (4) | Represents trailing twelve months ending November 2, 2015. |
| (5) | The appraisal concluded to an as-stabilized value of $33.5 million as of November 1, 2018, assuming stabilized operations following the repositioning of the property by the borrower. The as-stabilized value would result in a Cut-off Date LTV of 58.0% and Maturity Date LTV of 49.1%. |
THE INFORMATION IN THIS TERM SHEET IS NOT COMPLETE AND MAY BE AMENDED PRIOR TO THE TIME OF SALE. THIS TERM SHEET IS NOT AN OFFER TO SELL THESE SECURITIES AND IT IS NOT A SOLICITATION OF AN OFFER TO BUY THESE SECURITIES IN ANY JURISDICTION WHERE THE OFFER OR SALE IS NOT PERMITTED.
| 142 |
Mortgage Loan No. 12 — Palihouse Santa Monica
The Loan. The Palihouse Santa Monica loan is an approximately $19.5 million first mortgage loan secured by the fee interest in a 38-room, boutique hotel located in Santa Monica, California. The loan has a 10-year term and will amortize on a 30-year schedule.
The Borrower. The borrowing entity for the Palihouse Santa Monica loan is 1001 3rd Street LLC, a Delaware limited liability company and special purpose entity.
The Sponsors. The loan’s sponsors and nonrecourse carve-out guarantors are Ramin Kolahi and Avi Brosh. Ramin Kolahi is the founder of Lighthouse Investments, LLC, a privately held, national real estate investment and development firm. Mr. Kolahi has over 15 years of real estate experience in investment, development, construction, lending and consulting. Mr. Kolahi has worked on over $400.0 million of real estate transactions, of which $250.0 million was in a principal capacity. Mr. Brosh is the founder, Chief Executive Officer and President of Paligroup, a development and hospitality operating company which acquires, owns and operates hotels and residences. Mr. Brosh has been actively involved in the real estate development and hospitality industry for over 20 years and has overseen the development of over 30 residential, mixed-use and hospitality properties comprising in excess of 2.0 million SF.
The Property. The property is a 38-room, independent luxury boutique hotel located on 0.43 acres in Santa Monica, California. The property was constructed in 1927 and has a historic landmark designation with the city of Santa Monica and the state of California. The property was operated as a mixed-use hotel and residential apartment building until the current borrower acquired the property in 2012. According to the sponsors, the borrower conducted an extensive $2.4 million (approximately $64,000 per room) renovation and repositioning between January and May 2013 and re-opened as a 36-room hotel with two remaining apartment units unfinished. Renovations consisted of modifying room configurations, constructing the courtyard and back patio, upgrading common areas and fixtures and adding the lobby café and lounge. The renovation of the final two rooms was completed in November 2015.
The unit mix at the property consists of five king bedrooms, five queen bedrooms, 17 studio suites, nine one-bedroom suites and two penthouse suites. All guestrooms, and with the exception of the ten queen bedrooms and king bedrooms, contain fridges, stove ranges and kitchen appliances. Suites include a larger living area, a fully equipped kitchen and a separate vanity area. The penthouse floor features a private lobby area and an outdoor seating area. Amenities at the property include a café and lounge, a courtyard with outdoor seating and a bocce ball court. The property offers valet parking (operated by a third party) with 35 leased spaces located in an off-site garage and 38 complimentary residential parking passes which guests can use to self-park on the streets.
The Market. The property is located in Santa Monica, California in the greater Los Angeles market. Located along the Pacific Ocean, Santa Monica contains over three miles of beaches, with various lodging facilities, restaurants, shopping venues, and entertainment options and has become home to various industries such as entertainment, advertising, real estate, finance, healthcare and technology. Santa Monica has become home to major employers such as MTV Networks, Universal Music Group, Lionsgate and Sony Computers. In recent years, Santa Monica has become known as “Silicon Beach” due to the local, fast-growing technology scene.
The property is located on 3rd Street and Washington Avenue, within close proximity to several well-known demand drivers including the 3rd Street Promenade (0.3 miles) a pedestrian shopping and restaurant district, Santa Monica Beach (0.5 miles), Santa Monica Place Mall (0.6 miles), the Santa Monica Pier (1.0 miles), and Los Angeles International Airport (11.5 miles). Third Street runs parallel to Santa Monica Beach and is accessed by numerous east/west connectors. Supply of new construction in the area is limited due to Proposition S, a local ordinance passed in 1990 which limits new constructions along the Beach Overlay District, the area along the Pacific Ocean in Santa Monica. In 2015, the property received 90.0% of demand from transient guests, 4.0% from meeting and group guests and 6.0% from extended-stay guests.
THE INFORMATION IN THIS TERM SHEET IS NOT COMPLETE AND MAY BE AMENDED PRIOR TO THE TIME OF SALE. THIS TERM SHEET IS NOT AN OFFER TO SELL THESE SECURITIES AND IT IS NOT A SOLICITATION OF AN OFFER TO BUY THESE SECURITIES IN ANY JURISDICTION WHERE THE OFFER OR SALE IS NOT PERMITTED.
| 143 |
Mortgage Loan No. 12 — Palihouse Santa Monica
Historical Occupancy, ADR, RevPAR(1)(2)
| Competitive Set | Palihouse Santa Monica | Penetration Factor | |||||||
| Year | Occupancy | ADR | RevPAR | Occupancy | ADR | RevPAR | Occupancy | ADR | RevPAR |
| 2014 | 81.2% | $380.19 | $308.74 | 86.1% | $341.31 | $293.82 | 106.0% | 89.8% | 95.2% |
| 2015 | 80.7% | $401.64 | $324.29 | 87.1% | $361.51 | $314.71 | 107.8% | 90.0% | 97.0% |
| (1) | Source: Third party data provider. The competitive set consists of the following hotels: Fairmont Miramar, Huntley Santa Monica Beach, Viceroy Santa Monica, Georgian Hotel, Hotel Oceana Santa Monica, Casa Del Mar. |
| (2) | The hotel opened in 2013 and thus full year 2013 information was not available. |
Competitive Hotels Profile(1)
| Estimated Market Mix | 2014 Estimated Operating Statistics | ||||||||
| Property | Rooms | Year Built | Meeting Space (SF) | Transient | Meeting & Group | Extended Stay | Occupancy | ADR | RevPAR |
| Palihouse Santa Monica | 38 | 1927 | N/A | 90% | 4% | 6% | 84% | $341.86 | $288.45 |
| Ambrose Hotel | 77 | N/A | N/A | 75% | 20% | 5% | 79% | $360.00 | $284.40 |
| Georgian Hotel | 84 | 1933 | 1,000 | 80% | 20% | 0% | 78% | $320.00 | $249.60 |
| Hotel Shangri-La | 70 | 1939 | N/A | 92% | 5% | 3% | 88% | $357.00 | $314.16 |
| Oceana Santa Monica | 204 | 1957 | N/A | 85% | 15% | 0% | 79% | $275.00 | $217.25 |
| Total(2) | 435 | ||||||||
| (1) | Source: Appraisal and borrower financials. |
| (2) | Excludes the subject property. |
Operating History and Underwritten Net Cash Flow
| 2014 | 2015(1) | Underwritten | Per Room(2) | %(3) | |
| Occupancy | 84.4% | 88.1% | 88.1% | ||
| ADR | $341.86 | $360.59 | $360.59 | ||
| RevPAR | $288.45 | $317.66 | $317.68 | ||
| Room Revenue(4) | $3,790,188 | $4,174,107 | $4,406,219 | $115,953 | 90.8% |
| Food and Beverage | 171,389 | 183,219 | 195,000 | 5,132 | 4.0% |
| Other Departmental Revenues | 244,294 | 250,786 | 250,000 | 6,579 | 5.2% |
| Total Revenue | $4,205,871 | $4,608,112 | $4,851,219 | $127,664 | 100.0% |
| Room Expense | 711,915 | 748,943 | 793,119 | 20,872 | 18.0% |
| Food and Beverage Expense | 244,606 | 240,465 | 255,840 | 6,733 | 131.2% |
| Other Departmental Expenses | 246,554 | 247,287 | 246,500 | 6,487 | 98.6% |
| Departmental Expenses | $1,203,075 | $1,236,695 | $1,295,459 | $34,091 | 26.7% |
| Departmental Profit | $3,002,796 | $3,371,417 | $3,555,759 | $93,573 | 73.3% |
| Operating Expenses | $741,645 | $774,968 | $993,603 | $26,147 | 20.5% |
| Gross Operating Profit | $2,261,151 | $2,596,449 | $2,562,156 | $67,425 | 52.8% |
| Fixed Expenses | 279,179 | 277,339 | 413,000 | 10,868 | 8.5% |
| Net Operating Income | $1,981,972 | $2,319,110 | $2,149,156 | $56,557 | 44.3% |
| FF&E | 0 | 0 | 194,049 | 5,107 | 4.0% |
| Net Cash Flow | $1,981,972 | $2,319,110 | $1,955,107 | $51,450 | 40.3% |
| (1) | The 2015 column represents the trailing twelve month period ending November 2, 2015. |
| (2) | Per Room values are based on 38 rooms. |
| (3) | % column represents percent of Total Revenue except for Room Expense, Food and Beverage Expense and Other Department Expenses, which is based on their corresponding revenue line items. |
| (4) | Underwritten Room Revenue exceeds 2015 due to two additional rooms coming online in November 2015. |
THE INFORMATION IN THIS TERM SHEET IS NOT COMPLETE AND MAY BE AMENDED PRIOR TO THE TIME OF SALE. THIS TERM SHEET IS NOT AN OFFER TO SELL THESE SECURITIES AND IT IS NOT A SOLICITATION OF AN OFFER TO BUY THESE SECURITIES IN ANY JURISDICTION WHERE THE OFFER OR SALE IS NOT PERMITTED.
| 144 |
Mortgage Loan No. 12 — Palihouse Santa Monica
Additional Debt.An approximately $3.3 million mezzanine loan was provided in connection with the financing of the property that is secured by the mezzanine borrower’s equity interest in the borrower and is coterminous with the mortgage loan. The mezzanine loan has a coupon of 10.5000%. Including the mezzanine loan, the Cut-off Date LTV is 74.1%, the UW NCF DSCR is 1.22x and the UW NOI Debt Yield is 9.5%. The mezzanine loan lender is GCCP: P-H, LLC, an entity controlled by John Grossman of the Grossman Company Properties.
THE INFORMATION IN THIS TERM SHEET IS NOT COMPLETE AND MAY BE AMENDED PRIOR TO THE TIME OF SALE. THIS TERM SHEET IS NOT AN OFFER TO SELL THESE SECURITIES AND IT IS NOT A SOLICITATION OF AN OFFER TO BUY THESE SECURITIES IN ANY JURISDICTION WHERE THE OFFER OR SALE IS NOT PERMITTED.
| 145 |
Mortgage Loan No. 13 — Hilton Cincinnati Airport |
| Mortgage Loan Information | Property Information | |||
| Mortgage Loan Seller: | BNYM | Single Asset / Portfolio: | Single Asset | |
| Original Principal Balance: | $16,000,000 | Title: | Fee | |
| Cut-off Date Principal Balance: | $15,967,930 | Property Type – Subtype: | Hotel – Full Service | |
| % of Pool by IPB: | 2.1% | Net Rentable Area (Rooms): | 306 | |
| Loan Purpose: | Acquisition | Location: | Florence, KY | |
| Borrower: | WHG Turfway LLC | Year Built / Renovated: | 1987 / 2008 | |
| Sponsor: | R-Roof Assets, LLC | Occupancy / ADR / RevPAR: | 78.3% / $91.24 / $71.48 | |
| Interest Rate: | 5.5830% | Occupancy / ADR / RevPAR Date: | 12/31/2015 | |
| Note Date: | 2/17/2016 | Number of Tenants: | N/A | |
| Maturity Date: | 3/6/2021 | 2013 NOI: | $2,170,598 | |
| Interest-only Period: | 0 months | 2014 NOI: | $2,160,632 | |
| Original Term: | 60 months | 2015 NOI: | $2,588,771 | |
| Original Amortization: | 360 months | UW Occupancy / ADR / RevPAR: | 78.3% / $91.24 / $71.48 | |
| Amortization Type: | Balloon | UW Revenues: | $9,487,825 | |
| Call Protection: | L(26),Def(30),O(4) | UW Expenses: | $6,716,659 | |
| Lockbox: | Springing | UW NOI: | $2,771,166 | |
| Additional Debt: | No | UW NCF: | $2,391,653 | |
| Additional Debt Balance: | N/A | Appraised Value / Per Room(1): | $23, 250,000 / $75,980 | |
| Additional Debt Type: | N/A | Appraisal Date(1): | 1/1/2018 | |
| Additional Future Debt Permitted: | No |
| Escrows and Reserves | Financial Information | |||||
| Initial | Monthly | Initial Cap | Cut-off Date Loan / Room: | $52,183 | ||
| Taxes: | $63,333 | $15,833 | N/A | Maturity Date Loan / Room: | $48,636 | |
| Insurance: | $0 | Springing(2) | N/A | Cut-off Date LTV(1): | 68.7% | |
| PIP Reserve: | $4,000,000 | N/A | N/A | Maturity Date LTV(1): | 64.0% | |
| FF&E Reserve: | $0 | Springing(3) | N/A | UW NCF DSCR: | 2.17x | |
| UW NOI Debt Yield: | 17.4% | |||||
| Sources and Uses | ||||||
| Sources | Proceeds | % of Total | Uses | Proceeds | % of Total | |
| Mortgage Loan | $16,000,000 | 75.3% | Purchase Price | $16,000,000 | 75.3% | |
| Borrower Equity | 5,261,295 | 24.7 | Upfront Reserves | 4,063,333 | 19.1 | |
| Closing Costs | 1,197,962 | 5.6 | ||||
| Total Sources | $21,261,295 | 100.0% | Total Uses | $21,261,295 | 100.0% |
| (1) | The value references the appraiser’s “Prospective Value Upon Stabilization” of $23.25 million as of January 1, 2018. The appraiser also determined a “Prospective Market Value Upon Completion of the Renovation” based on the Appraised Value of $23,000,000, which assumes that the property is renovated by January 1, 2017, the Cut-Off Date LTV Ratio and Maturity Date/LTV Ratio are 69.4% and 64.7%, respectively. At origination, $4.0 million was reserved to cover capital expenditures related to renovations at the property. Based on the appraiser’s “as-is” Appraised Value of $17,000,000, the Cut-Off Date LTV Ratio and Maturity Date/ARD LTV Ratio are 93.9% and 87.5%, respectively. |
| (2) | Insurance escrows are not required so long as the property is covered under a lender-approved blanket or umbrella policy, provided that (i) no event of default is continuing and (ii) the borrower provides the lender with satisfactory evidence that the property is insured in accordance with loan documents pursuant to policies acceptable to the lender. |
| (3) | Beginning on April 6, 2017, FF&E escrows will be collected in an amount equal to the greater of (i) 4% of underwritten revenues for the second calendar month immediately prior to the applicable monthly payment date, (ii) the deposit required by the franchisor under the franchise agreement (if any), and (iii) $31,625. |
THE INFORMATION IN THIS TERM SHEET IS NOT COMPLETE AND MAY BE AMENDED PRIOR TO THE TIME OF SALE. THIS TERM SHEET IS NOT AN OFFER TO SELL THESE SECURITIES AND IT IS NOT A SOLICITATION OF AN OFFER TO BUY THESE SECURITIES IN ANY JURISDICTION WHERE THE OFFER OR SALE IS NOT PERMITTED.
| 146 |
Mortgage Loan No. 13 — Hilton Cincinnati Airport |
The Loan. The Hilton Cincinnati Airport loan is a $16.0 million first mortgage loan secured by the fee interest in a 306-room full service hotel property located in Florence, Kentucky. The loan has a five-year term and will amortize on a 30-year schedule.
The Borrower. The borrowing entity for the loan is WHG Turfway LLC, a Delaware limited liability company and a special purpose entity with one independent director. The borrowing entity is 100% indirectly owned by Westmont Investments, LLC.
The Sponsor. The loan’s sponsor and non-recourse carveout guarantor is R-Roof Assets, LLC, an affiliate of Westmont Hospitality Group (“Westmont”). Westmont is one of the largest privately-held hospitality organizations in the world and currently operates over 500 hotels across three continents and has ownership interests in excess of 400 hotels across North America, consisting of approximately 85,000 rooms. The non-recourse carveout guarantor is the sole owner of nine Red Roof Inn flagged hotels which are all held with no mortgage debt and has an estimated market value of approximately $31 million.
The Property. The Hilton Cincinnati Airport property is a 5-story, 306-room full service hotel property located in Florence, Kentucky that was built in 1987 with an expansion completed in 1998. The property was renovated in 2008 and is situated on an 8.18 acre lot that totals 181,245 SF. The property provides surface level parking and has a total of 410 outdoor parking spaces, or 1.34 parking spaces per room.
The property features ten conference rooms totaling 9,345 SF of meeting space and a grand ballroom that can accommodate up to 400 guests. The property also includes a heated indoor pool, a fitness room, a business center, and a sundry shop. The property includes one full service restaurant, Bistro 737, which serves three meals daily and has a seating capacity of 150. Bistro 737 also offers guests and patrons a lounge with a seating capacity of 40 located adjacent to the restaurant on the ground floor. Located approximately 2 miles from the Cincinnati/Northern Kentucky International Airport (“CVG”), the property offers complimentary shuttle service to and from CVG.
The property is currently undergoing a franchisor-mandated PIP as a condition to the renewal of the franchise agreement with Hilton Franchise Holding LLC, which such renewal occurred on February 17, 2016. At origination $4.0 million was escrowed and the PIP work is required to be completed by February 2017. The current franchise agreement expires in February 2031. The Hilton franchisor-mandated PIP of $1.72 million will focus on upgrades in guestrooms ($1.22 million) and elevator lobbies and corridors ($333,186). In addition to the franchisor-mandated PIP, an additional $2.28 million was escrowed at origination for elective capital improvements to the property.
The property has contracts with six airlines which allow for discounted rates in exchange for rooms the businesses reserve throughout the year. The contracts guarantee 36,800 occupied rooms per year and four of the six contracts have over 24 months remaining. The largest accounts are Atlas Air (16,000 annual room nights), Air Wisconsin (6,200 annual room nights), and Southern Air (6,300 annual room nights). Atlas Air executed a contract with DHL, which established one of its three super-global hubs at CVG, to operate a total of 17 freighters to transport shipments across the globe from CVG. DHL recently completed a $105 million expansion to boost infrastructure at CVG in 2013 and announced an additional $108 million expansion in 2015 with the expectations to double their current cargo operations, demonstrating their commitment to CVG. CVG is the eighth largest cargo hub in North America and increased the total amount of cargo landed by 6.48% in 2014 from 2013.
The Market. The property is located in Florence, Kentucky, which is part of the larger Cincinnati-Middletown metropolitan statistical area (“MSA”). Since the recession, the Cincinnati-Middletown MSA has experienced growth in gross metropolitan product, total employment, personal income growth and median household income as the population has increased each year since 2009. Major headquarters located in the MSA include Procter & Gamble, Fifth Third Bank, The Kroger Company and Macy’s Inc. Companies with regional headquarters in the Cincinnati-Middletown MSA include Citigroup, PNC Bank, US Bank, Fidelity Investments, DHL, and Duke Energy. Cincinnati’s economy has historically benefited from manufacturing but recently is experiencing a shift to professional and business services positions as consulting, tech companies, and financial services firms are accelerating their hiring. Cincinnati is home to the University of Cincinnati and Xavier. The property is situated off of Interstate 71/75 approximately two miles from the CVG airport and ten miles southwest of downtown Cincinnati. The immediate neighborhood consists of a mixture of commercial, retail, and residential uses and the St. Elizabeth Florence Hospital is across the street. Two retail centers are located within walking distance of the property, one anchored by a Sam’s Club and the other
THE INFORMATION IN THIS TERM SHEET IS NOT COMPLETE AND MAY BE AMENDED PRIOR TO THE TIME OF SALE. THIS TERM SHEET IS NOT AN OFFER TO SELL THESE SECURITIES AND IT IS NOT A SOLICITATION OF AN OFFER TO BUY THESE SECURITIES IN ANY JURISDICTION WHERE THE OFFER OR SALE IS NOT PERMITTED.
| 147 |
Mortgage Loan No. 13 — Hilton Cincinnati Airport |
anchored by a Target. The appraiser estimates that the property’s demand segmentation is 45%, 10%, 10% and 35% across commercial, meeting and group, leisure and airline crew, respectively. Cincinnati hosts several large events annually, including Oktoberfest Zinzinnati, a celebration of the German heritage of the city, Taste of Cincinnati, a culinary arts festival, and many theatre and musical performances are performed at the several venues throughout the city. Leisure demand is driven by two professional sports teams, the Cincinnati Bengals and Cincinnati Reds, Turfway Park, a horse racing track located within a mile of the property, and the Horseshoe Casino, located approximately eleven miles from the property.
According to the appraisal, the South/Airport upper tier hotel submarket was comprised of 2,804 rooms in 2015 with a demand of 2,010 rooms (71.7% occupancy). The local primary competitive set, including the Hilton Cincinnati Airport, contains 1,135 rooms across five hotels. According to the appraisal, there are currently no hotels under construction nor are proposed hotels anticipated to enter the immediate market in the near future. After the completion of the mandated PIP and the sponsor’s capital improvements the appraisal state the view that the property will be able to steadily increase ADR which is currently 13% lower than its competitive set.
Historical Occupancy, ADR, RevPAR (1)
| Competitive Set | Hilton Cincinnati Airport(2) | Penetration Factor | |||||||
| Year | Occupancy | ADR | RevPAR | Occupancy | ADR | RevPAR | Occupancy | ADR | RevPAR |
| 2013 | 58.8% | $107.38 | $63.18 | 75.1% | $84.42 | $63.38 | 129.0% | 79.5% | 102.5% |
| 2014 | 65.1% | $105.07 | $68.44 | 76.0% | $87.01 | $66.10 | 118.2% | 83.3% | 98.4% |
| 2015(3) | 70.2% | $108.83 | $76.44 | 78.3% | $91.24 | $71.48 | 112.6% | 84.6% | 95.2% |
| (1) | Source: Third Party Data Provider. The competitive set consists of the following properties: DoubleTree by Hilton Cincinnati Airport, Holiday Inn Cincinnati Airport, Courtyard Cincinnati Airport, and Marriott Cincinnati Airport. |
| (2) | Source: Borrowers underwritten rent roll. |
| (3) | Competitive set 2015 represents the trailing year to date period ending November 30, 2015. |
Operating History and Underwritten Net Cash Flow
| 2012 | 2013 | 2014 | 2015 | Underwritten | Per Room(1) | %(2) | |
| Occupancy | 71.9% | 75.1% | 76.0% | 78.3% | 78.3% | ||
| ADR | $86.37 | $84.42 | $87.01 | $91.24 | $91.24 | ||
| RevPAR | $62.09 | $63.38 | $66.10 | $71.48 | $71.48 | ||
| Room Revenue | $6,555,067 | $7,079,170 | $7,382,621 | $7,983,053 | $7,983,053 | $26,088 | 84.1% |
| Food and Beverage | 1,038,491 | 1,504,129 | 1,235,504 | 1,334,004 | 1,334,004 | 4,359 | 14.1 |
| Other Department Revenues | 122,156 | 127,402 | 133,506 | 170,768 | 170,768 | 558 | 1.8 |
| Total Revenue | $7,715,714 | $8,710,701 | $8,751,631 | $9,487,825 | $9,487,825 | $31,006 | 100.0% |
| Room Expense | 1,624,499 | 1,842,901 | 1,975,743 | 2,035,896 | 2,035,896 | 6,653 | 25.5% |
| Food and Beverage Expense | 957,240 | 1,039,626 | 923,277 | 1,052,431 | 1,052,431 | 3,439 | 78.9% |
| Other Departmental Expenses | 156,213 | 154,121 | 142,657 | 131,805 | 131,805 | 431 | 77.2% |
| Departmental Expenses | $2,737,952 | $3,036,648 | $3,041,677 | $3,220,132 | $3,220,132 | $10,523 | 33.9% |
| Departmental Profit | $4,977,762 | $5,674,053 | $5,709,954 | $6,267,693 | $6,267,693 | $20,483 | 66.1% |
| Operating Expenses | $3,004,306 | $3,186,901 | $3,261,503 | $3,406,797 | $3,213,436 | $10,501 | 33.9% |
| Gross Operating Profit | $1,973,456 | $2,487,153 | $2,448,451 | $2,860,896 | $3,054,257 | $9,981 | 32.2% |
| Fixed Expenses | 257,801 | 316,555 | 287,819 | 272,125 | 283,091 | 925 | 3.0% |
| Net Operating Income | $1,715,655 | $2,170,598 | $2,160,632 | $2,588,771 | $2,771,166 | $9,056 | 29.2% |
| FF&E(3) | 308,629 | 348,428 | 350,065 | 379,513 | 379,513 | 1,240 | 4.0% |
| Net Cash Flow | $1,407,026 | $1,822,170 | $1,810,567 | $2,209,258 | $2,391,653 | $7,816 | 25.2% |
| (1) | Per Room values based on 306 rooms. |
| (2) | % column for Room Expense, Food and Beverage Expense and Other Departmental Expenses is based on their corresponding revenue line item. |
| (3) | FF&E is underwritten at 4.0% of Total Revenue. |
THE INFORMATION IN THIS TERM SHEET IS NOT COMPLETE AND MAY BE AMENDED PRIOR TO THE TIME OF SALE. THIS TERM SHEET IS NOT AN OFFER TO SELL THESE SECURITIES AND IT IS NOT A SOLICITATION OF AN OFFER TO BUY THESE SECURITIES IN ANY JURISDICTION WHERE THE OFFER OR SALE IS NOT PERMITTED.
| 148 |
(THIS PAGE INTENTIONALLY LEFT BLANK)
| 149 |
Mortgage Loan No. 14 — Lofton Place Apartments
| Mortgage Loan Information | Property Information | |||
| Mortgage Loan Seller: | BSP | Single Asset / Portfolio: | Single Asset | |
| Original Principal Balance: | $15,250,000 | Title: | Fee | |
| Cut-off Date Principal Balance: | $15,250,000 | Property Type - Subtype: | Multifamily – Garden | |
| % of Pool by IPB: | 2.0% | Net Rentable Area (Units): | 258 | |
| Loan Purpose: | Acquisition | Location: | Fort Worth, TX | |
| Borrower: | Bentley Square POE LLC | Year Built / Renovated: | 1984 / N/A | |
| Sponsors: | Joseph G. Lubeck; Mitchell B. Robbins; Steven R. Robbins | Occupancy: | 93.4% | |
| Occupancy Date: | 12/31/2015 | |||
| Interest Rate: | 4.8100% | Number of Tenants: | N/A | |
| Note Date: | 11/24/2015 | 2013 NOI: | $1,247,140 | |
| Maturity Date: | 12/6/2025 | 2014 NOI: | $1,284,539 | |
| Interest-only Period: | 60 months | 2015 NOI: | $1,447,002 | |
| Original Term: | 120 months | TTM NOI: | N/A | |
| Original Amortization: | 360 months | UW Economic Occupancy: | 90.5% | |
| Amortization Type: | IO-Balloon | UW Revenues: | $2,459,911 | |
| Call Protection: | L(29),Def(87),O(4) | UW Expenses: | $1,119,210 | |
| Lockbox(1): | Soft | UW NOI: | $1,340,701 | |
| Additional Debt: | No | UW NCF: | $1,276,201 | |
| Additional Debt Balance: | N/A | Appraised Value / Per Unit(2): | $21,010,000 / $81,434 | |
| Additional Debt Type: | N/A | Appraisal Date(2): | 9/29/2016 | |
| Additional Future Debt Permitted: | No | |||
| Escrows and Reserves | Financial Information | |||||
| Initial | Monthly | Initial Cap | Cut-off Date Loan / Unit: | $59,109 | ||
| Taxes: | $27,082 | $27,082 | N/A | Maturity Date Loan / Unit: | $54,353 | |
| Insurance: | $29,086 | $5,817 | N/A | Cut-off Date LTV(2): | 72.6% | |
| Replacement Reserves: | $1,732,846 | $5,375 | N/A | Maturity Date LTV(2): | 66.7% | |
| Engineering Reserve: | $67,154 | N/A | N/A | UW NCF DSCR: | 1.33x | |
| UW NOI Debt Yield: | 8.8% |
| Sources and Uses | ||||||
| Sources | Proceeds | % of Total | Uses | Proceeds | % of Total | |
| Mortgage Loan | $15,250,000 | 77.0% | Purchase Price | $17,800,000 | 89.9% | |
| Sponsor’s Equity | 4,544,802 | 23.0 | Upfront Reserves | 1,856,168 | 9.4 | |
| Closing Costs | 138,634 | 0.7 | ||||
| Total Sources | $19,794,802 | 100.0% | Total Uses | $19,794,802 | 100.0% | |
| (1) | The loan is structured with a soft lockbox and springing cash management. |
| (2) | The appraisal’s “Prospective As If Renovated” value of $21,010,000 is utilized for the Cut-Off Date LTV ratio and Maturity Date LTV ratio calculations assuming that the property achieves a fully renovated operating level by September 29, 2016. A sum of $1,800,000 was escrowed at origination in Replacement Reserves and Engineering Reserve to perform planned renovations at the property. Using the “As Is” value of $18,550,000 as of September 29, 2015, the Cut-Off Date LTV ratio is 82.2% and the Maturity Date LTV ratio is 75.6%. |
THE INFORMATION IN THIS TERM SHEET IS NOT COMPLETE AND MAY BE AMENDED PRIOR TO THE TIME OF SALE. THIS TERM SHEET IS NOT AN OFFER TO SELL THESE SECURITIES AND IT IS NOT A SOLICITATION OF AN OFFER TO BUY THESE SECURITIES IN ANY JURISDICTION WHERE THE OFFER OR SALE IS NOT PERMITTED.
| 150 |
Mortgage Loan No. 14 — Lofton Place Apartments
The Loan. The Lofton Place Apartments loan is an approximately $15.3 million first mortgage loan secured by the fee interest in a 258-unit garden style multifamily property located in Fort Worth, Texas. The loan has a 10-year term and will amortize on a 30-year schedule following an initial interest-only period of five years.
The Borrower. The borrowing entity for the loan is Bentley Square POE LLC, a Delaware limited liability company and special purpose entity.
The Sponsors. The loan’s sponsors and nonrecourse carve-out guarantors are Joseph G. Lubeck, Mitchell B. Robbins and Steven R. Robbins. Joseph G. Lubeck is the founder and CEO of ELRH Investments (“ELRH”). ELRH, together with its affiliates, has acquired, operated, and sold over 150 multifamily communities with a value of over $3 billion since 1991. In 2012, Joseph G. Lubeck merged his private portfolio of approximately 40 assets with a private REIT with 15 assets, and subsequently rebranded and grew the REIT to over 109 assets and 35,000 units. Joseph G. Lubeck owns and operates 13 multifamily properties containing 4,530 units and maintains a sizable investment in ELRH. Steven R. Robbins and Mitchell B. Robbins are the founders of Robbins Property Associates (“RPA”). RPA is a multifamily owner and operator having started business operations in 2009. Since its inception RPA has acquired and sold over 13,000 units. RPA currently owns 37 communities totaling over 10,400 units. The company recently formed Robbins Elco Management LLC, a partnership with Elco Landmark Residential Holdings, to own and manage an additional 4,662 units located in Florida, Texas and Georgia.
The Property. The property is a 258-unit garden-style multifamily property located in Fort Worth, Texas that was built in 1984. The property consists of 21 one-story and two-story apartment buildings located on approximately 9.9 acres. The property has a total of 410 parking spaces, or 1.59 parking spaces per unit. As of December 31, 2015, the property was 93.4% occupied.
The property contains 194 one-bedroom units (75.2%) and 64 two-bedroom units (24.8%). One-bedroom units range from approximately 600 SF to 746 SF, and 2-bedrooms range from 876 SF to 1,170 SF, with an overall average unit size of 784 SF. Amenities at the property include two swimming pools, a fitness center, a business center, a tennis court, and on-site laundry facilities. Each unit features a full appliance package, wood cabinets and floors, washer/dryer hookups, wood burning fireplaces, and balconies/patios. The lender escrowed $1.8 million ($6,977 per unit) at origination for the purposes of capital improvements to the property. Renovations have already been made to 50% of the units by the previous owner, including upgrades to the kitchens, bathrooms, and exterior, among others. Kitchen upgrades include new countertops, new appliances, kitchen faucets, kitchen flooring, and cabinet work (painting and hardware). Remaining interior upgrades include new lighting packages in the living room and bathrooms, painting bath vanities, adding new faucets in the bathrooms, adding washers and dryers to some units, replacing carpeting and blinds, replacing the model unit furniture, and making repairs to the A/C and water heaters. Exterior renovations are expected to include landscaping and trimming, clubhouse improvements, security cameras and key track systems, and replacements of the pool furniture.
The property has frontage along Eastchase Parkway and Meadowbrook Boulevard and is located in the Fort Worth-Arlington submarket, approximately 10 miles east of the Fort Worth central business district. Located near the property are single-family residences to the west, an apartment complex and retail to the south, and retail properties to the north and east. Restaurants and retail shopping, including a Target, Ross Dress for Less, Aldi, AMC Theatres, McDonalds, Whataburger, IHOP, CiCi’s Pizza, and others are located across the street from the property. Additionally, AT&T Stadium (home of the Dallas Cowboys) and Six Flags Over Texas amusement park are located approximately 5.4 miles and 7.3 miles, respectively, west of the property in Arlington, Texas along with major retail nodes, including Eastchase Market located adjacent to the center. Located approximately 21.1 miles to the Northeast is Las Colinas, a 12,000 acre master planned community that is home to the Irving Convention Center, Four Seasons hotel, TPC Championship Golf Course, Irving Mall and a high concentration of Fortune 500 regional, national and global headquarters. Companies include Exxon Mobil, Fluor Corporation, Kimberly Clark, Toyota Motors USA and OMNI Resorts.
THE INFORMATION IN THIS TERM SHEET IS NOT COMPLETE AND MAY BE AMENDED PRIOR TO THE TIME OF SALE. THIS TERM SHEET IS NOT AN OFFER TO SELL THESE SECURITIES AND IT IS NOT A SOLICITATION OF AN OFFER TO BUY THESE SECURITIES IN ANY JURISDICTION WHERE THE OFFER OR SALE IS NOT PERMITTED.
| 151 |
Mortgage Loan No. 14 — Lofton Place Apartments
Multifamily Unit Mix
| Unit Type | No. of Units(1) | % of Total | Occupied Units(1) | Occupancy(1) | Average Unit Size (SF) (1) | Average Monthly Rental Rate(1) | Average Monthly Rental Rate PSF(1) | Monthly Market Rental Rate(2) | Monthly Market Rental Rate PSF(2) |
| One Bedroom | 194 | 75.2% | 182 | 93.8% | 696 | $684 | $0.98 | $814 | $1.17 |
| Two Bedroom | 64 | 24.8% | 59 | 92.2% | 1048 | $878 | $0.84 | $1,022 | $0.97 |
| Total/Wtd. Avg. | 258 | 100.0% | 241 | 93.4% | 784 | $732 | $0.93 | $865 | $1.10 |
| (1) | Based on the December 2015 rent roll. |
| (2) | Source: Appraisal. |
The Market. The property is located in Fort Worth, Texas in the Fort Worth-Arlington submarket. Per a third party market research report, as of 1Q 2016 the Fort Worth Apartment Market is comprised of 167,407 units with average occupancy of 95.8%. Asking rents of $852 are up 4.2% year over year. Asking rents are projected to increase approximately 4.1% per year over the next 5 years. The property is located within the North Arlington submarket per the report. The submarket is comprised of 35,853 units with average occupancy of 96.1% vs. 95.5% a year ago. Asking rents of $748 as of 1Q 2016 are up 2.2% year over year. Submarket asking rents are projected to increase approximately 4.1% per year over the next 5 years. Occupancy is expected to increase to around 96.5% throughout the forecast. The report shows submarket historical occupancy dating back to 2010; the submarket has averaged 94.4% occupancy since 2011. There have only been 735 units delivered to the submarket since 2011, according to the report. No new apartment projects have completed within the last year, and one new property totaling 392 units is currently under construction within the submarket. This new property is a Class A project with asking rents that are close to double those of the subject and will therefore not compete against the subject property.
The appraiser identified six comparable rental properties, ranging from 50 units to 356 units that were constructed between 1984 and 1994. The competitive set reported a weighted average occupancy of approximately 93%, with average rents ranging from $652 to $861 per unit. Average rents at the property are in-line with the competitive set. The properties in the appraisal’s competitive set are all located in Fort Worth within approximately 1.3 miles of the property and are shown in the below table.
Competitive Set Summary(1)
| Property | Year Built | No. of Units | Avg. Unit Size (SF) | Avg. $/ Unit | Occupancy | Distance from Property |
| Lofton Place Apartments | 1984 | 258(2) | 784(2) | $732(2) | 93.4%(2) | N/A |
| Brentwood | 1984 | 276 | 924 | $817 | 93% | 0.5 mi |
| La Jolla on Meadowbrook | 1984 | 160 | 755 | $698 | 94% | 0.6 mi |
| Place at Vanderbilt | 1986 | 333 | 866 | $766 | 91% | 0.3 mi |
| Woods of Eastchase | 1994 | 50 | 661 | $652 | 98% | 0.3 mi |
| Chestnut Ridge I & II | 1984 | 356 | 908 | $861 | 90% | 1.3 mi |
| Horizons at Sunridge | 1984 | 272 | 749 | $756 | 94% | 0.6 mi |
| Total/Wtd. Avg.(3) | 241 | 846 | $786 | 92% |
| (1) | Source: Appraisal. |
| (2) | Based on rent roll dated December 31, 2015. |
| (3) | Excludes the subject property. |
THE INFORMATION IN THIS TERM SHEET IS NOT COMPLETE AND MAY BE AMENDED PRIOR TO THE TIME OF SALE. THIS TERM SHEET IS NOT AN OFFER TO SELL THESE SECURITIES AND IT IS NOT A SOLICITATION OF AN OFFER TO BUY THESE SECURITIES IN ANY JURISDICTION WHERE THE OFFER OR SALE IS NOT PERMITTED.
| 152 |
Mortgage Loan No. 14 — Lofton Place Apartments
Historical and Current Occupancy(1)
| 2012 | 2013 | 2014 | 2015(2) |
| 92.6% | 93.7% | 93.2% | 93.4% |
| (1) | Source: Historical Occupancy is provided by the sponsor. Occupancies are as of December 31 of each respective year. |
| (2) | Based on the December 2015 underwritten rent roll. |
Operating History and Underwritten Net Cash Flow
| 2013 | 2014 | 2015 | Underwritten | Per Unit | %(1) | |
| Rents in Place | $2,003,034 | $2,130,456 | $2,215,788 | $2,265,447 | $8,781 | 83.3% |
| Vacant Gross Up | 0 | 0 | 0 | 13,660 | 53 | 0.5% |
| Gross Potential Rent | $2,003,034 | $2,130,456 | $2,215,788 | $2,279,107 | $8,834 | 83.8% |
| Other Income | 352,714 | 412,939 | 440,300 | 440,300 | 1,707 | 16.2% |
| Net Rental Income | $2,355,748 | $2,543,395 | $2,656,088 | $2,719,407 | $10,540 | 100.0% |
| (Vacancy) | (126,915) | (169,673) | (144,436) | (218,885) | (848) | (8.0%) |
| (Concessions/ Collection Loss) | (44,212) | (71,050) | (39,665) | (40,611) | (157) | (1.5%) |
| Effective Gross Income | $2,184,621 | $2,302,672 | $2,471,987 | $2,459,911 | $9,535 | 90.5% |
| Total Expenses | $937,481 | $1,018,133 | $1,024,985 | $1,119,210 | $4,338 | 45.5% |
| Net Operating Income | $1,247,140 | $1,284,539 | $1,447,002 | $1,340,701 | $5,197 | 54.5% |
| Replacement Reserves | 0 | 0 | 0 | 64,500 | 250 | 2.6% |
| Net Cash Flow | $1,247,140 | $1,284,539 | $1,447,002 | $1,276,201 | $4,947 | 51.9% |
| (1) | % column represents percent of Net Rental Income for all revenue lines and represents percent of Effective Gross Income for the remainder of fields. |
THE INFORMATION IN THIS TERM SHEET IS NOT COMPLETE AND MAY BE AMENDED PRIOR TO THE TIME OF SALE. THIS TERM SHEET IS NOT AN OFFER TO SELL THESE SECURITIES AND IT IS NOT A SOLICITATION OF AN OFFER TO BUY THESE SECURITIES IN ANY JURISDICTION WHERE THE OFFER OR SALE IS NOT PERMITTED.
| 153 |
| |
Mortgage Loan No. 15 — City Place Apartments |
| Mortgage Loan Information | Property Information | |||
| Mortgage Loan Seller: | BSP | Single Asset / Portfolio: | Single Asset | |
| Original Principal Balance: | $15,000,000 | Title: | Fee | |
| Cut-off Date Principal Balance: | $14,947,759 | Property Type - Subtype: | Multifamily – High Rise | |
| % of Pool by IPB: | 1.9% | Net Rentable Area (Units): | 320 | |
| Loan Purpose: | Refinance | Location: | Detroit, MI | |
| Borrower: | Detroit Apartment Corp. | Year Built / Renovated: | 1965 / 2015 | |
| Sponsor: | Raymond Clifford Stanton | Occupancy: | 90.3% | |
| Occupancy Date: | 1/25/2016 | |||
| Number of Tenants: | N/A | |||
| Interest Rate: | 5.2100% | 2013 NOI(2): | N/A | |
| Note Date: | 1/29/2016 | 2014 NOI(2): | N/A | |
| Maturity Date: | 2/6/2026 | 2015 NOI(3): | $700,661 | |
| Interest-only Period: | 0 months | TTM NOI(4): | $1,054,374 | |
| Original Term: | 120 months | UW Economic Occupancy: | 87.3% | |
| Original Amortization: | 360 months | UW Revenues: | $2,643,721 | |
| Amortization Type: | Balloon | UW Expenses: | $1,252,500 | |
| Call Protection: | L(27),Def(89),O(4) | UW NOI(3): | $1,391,221 | |
| Lockbox(1): | Springing | UW NCF: | $1,311,221 | |
| Additional Debt: | No | Appraised Value / Per Unit: | $21,600,000 / $67,500 | |
| Additional Debt Balance: | N/A | Appraisal Date: | 12/31/2015 | |
| Additional Debt Type: | N/A | |||
| Additional Future Debt Permitted: | No |
| Escrows and Reserves | Financial Information | |||||
| Initial | Monthly | Initial Cap | Cut-off Date Loan / Unit: | $46,712 | ||
| Taxes: | $69,820 | $13,964 | N/A | Maturity Date Loan / Unit: | $38,799 | |
| Insurance: | $15,600 | $7,800 | N/A | Cut-off Date LTV: | 69.2% | |
| Replacement Reserves: | $0 | $6,667 | N/A | Maturity Date LTV: | 57.5% | |
| Performance Holdback(5): | $1,500,000 | N/A | N/A | UW NCF DSCR: | 1.33x | |
| UW NOI Debt Yield: | 9.3% |
Sources and Uses
| Sources | Proceeds | % of Total | Uses | Proceeds | % of Total | |
| Mortgage Loan | $15,000,000 | 100.0% | Payoff Existing Debt | $4,336,061 | 28.9% | |
| Return of Equity | 8,679,597 | 57.9 | ||||
| Performance Holdback | 1,500,000 | 10.0 | ||||
| Upfront Reserves | 85,420 | 0.6 | ||||
| Closing Costs | 398,923 | 2.7 | ||||
| Total Sources | $15,000,000 | 100.0% | Total Uses | $15,000,000 | 100.0% |
| (1) | The loan is structured with a springing lockbox and springing cash management. Upon an event of default or debt service coverage ratio for the trailing 12-months falling below 1.15x, the borrower is required to set up a lockbox and cash management will commence. |
| (2) | Historical financial information was not available due to the sponsor’s acquisition of the property in 2014. |
| (3) | The property was purchased in 2014 and was undergoing renovation in 2015. The 2015 NOI reflects the property’s average 2015 occupancy of 67.9%. The UW NOI reflects the in-place rents from a 90.3% occupied property, based on the underwritten rent roll dated January 25, 2016. |
| (4) | Represents the trailing twelve months ending April 30, 2016. |
THE INFORMATION IN THIS TERM SHEET IS NOT COMPLETE AND MAY BE AMENDED PRIOR TO THE TIME OF SALE. THIS TERM SHEET IS NOT AN OFFER TO SELL THESE SECURITIES AND IT IS NOT A SOLICITATION OF AN OFFER TO BUY THESE SECURITIES IN ANY JURISDICTION WHERE THE OFFER OR SALE IS NOT PERMITTED.
| 154 |
| |
Mortgage Loan No. 15 — City Place Apartments |
| (5) | A $1,500,000 performance holdback reserve was established at origination as additional collateral for the loan. Disbursements to the borrower from the reserve are permitted so long as (i) no event of default exists, (ii) the property generates gross rents of at least $2,650,000 over a trailing 12-month period, and (iii) the property generates an underwritten cash flow of at least $1,300,000 over a trailing 12-month period. |
The Loan. The City Place Apartments loan is a $15.0 million first mortgage loan secured by the fee interest in a 320-unit high rise multifamily property located in Detroit, Michigan. The loan has a 10-year term and will amortize on a 30-year schedule.
The Borrower. The borrowing entity for the loan is Detroit Apartment Corp., a Michigan corporation and special purpose entity.
The Sponsor. The loan’s sponsor and nonrecourse carve-out guarantor is Raymond Clifford Stanton. The sponsor is the owner of London Property Corp., a real estate management, construction and development company, founded in 1988 and currently managing over 3,200 apartment units and 126,000 SF of commercial properties. The sponsor has ownership interest in 67 commercial real estate properties, including over 3,200 apartments units.
The Property. The City Place Apartments property is a 320-unit high rise multifamily property located in Detroit, Michigan. The property was built in 1965 and renovated in 2015. It consists of a 21-story building located on approximately 4.23 acres. The property has a total of 162 parking spaces, or 0.51 parking spaces per unit. There is also a 400 SF convenience store that is leased through November 2020. As of January 25, 2016, the multifamily units were 90.3% occupied.
The property contains 177 studio units (55.3%) and 143 one-bedroom units (44.7%). Each studio unit measures 480 SF and the one bedroom units range from approximately 545 SF to 580 SF, with an overall average unit size of 518 SF. Apartment units feature city views, new kitchen cabinets and appliances, garbage disposals, updated bathrooms (full vanity and shower/tub combo), walk-in closets, new light fixtures, window coverings, hardwood floors, tile floors, air conditioning, high speed Internet access, cable and satellite. Shared amenities include a fitness center, business center, Wi-Fi lounge, recreation center game room, club house, bike storage, convenience store, laundry facilities, courtyard, secure parking lot, controlled access, 24-hour security, and package receiving service. Since acquiring the property in February 2014, the sponsor reported that it has invested approximately $6.5 million in upgrades including: unit renovations, mechanical-HVAC, plumbing, hallways and laundry room, elevator refurbishment, and first floor renovations to the fitness center, guard house, convenience store, electric room, staff kitchen, and leasing office.
The property is located on the northeast edge of the Downtown Detroit submarket, within walking distance of various employers and entertainment, retail, and dining options. The property is located at the northern end of Lafayette Park, which is part of the Mies van der Rohe Residential District. The 78-acre Mies van der Rohe Residential District development is an example of modern urban architecture and urban planning and was recently added to the National Register of Historic Places. The 26 buildings by Mies van der Rohe are his only works in Michigan and the largest collection of his buildings in the world.
The property has access to the Detroit central business district and retail and entertainment options, including Ford Field (home of the Detroit Lions), Comerica Park (home of the Detroit Tigers), and Eastern Market (the largest historic public market in the United States with more than 150 food and specialty businesses – attracting as many as 45,000 people for their Saturday Market). Located a 10-minute commute from the property, Campus Martius Park is the epicenter of Detroit’s central business district. Campus Martius Park is a regional destination, home to 50 retailers as well as some of Detroit’s largest companies, including Quicken Loans, General Motors, Blue Cross Blue Shield, Wayne State, Compuware, City of Detroit and DTE Energy. Additionally, it serves as an entertainment venue and a community gathering spot, hosting the annual Winter Blast and Christmas tree lighting ceremony.
THE INFORMATION IN THIS TERM SHEET IS NOT COMPLETE AND MAY BE AMENDED PRIOR TO THE TIME OF SALE. THIS TERM SHEET IS NOT AN OFFER TO SELL THESE SECURITIES AND IT IS NOT A SOLICITATION OF AN OFFER TO BUY THESE SECURITIES IN ANY JURISDICTION WHERE THE OFFER OR SALE IS NOT PERMITTED.
| 155 |
Mortgage Loan No. 15 — City Place Apartments
Multifamily Unit Mix (1)
| Unit Type | No. of Units | % of Total | Occupied Units | Occupancy | Average Unit Size (SF) | Average Monthly Rental Rate | Average Monthly Rental Rate PSF | Monthly Market Rental Rate(2) | Monthly Market Rental Rate PSF(2) |
| Studio | 177 | 55.3% | 157 | 88.7% | 480 | $712 | $1.48 | $706 | $1.47 |
| 1 Bedroom, 1 Bath | 59 | 18.4 | 54 | 91.5% | 545 | $822 | $1.51 | $822 | $1.51 |
| 1 Bedroom, 1 Bath (Deluxe) | 84 | 26.3 | 78 | 92.9% | 580 | $899 | $1.55 | $889 | $1.53 |
| Total/Wtd. Avg. | 320 | 100.0% | 289 | 90.3% | 518 | $784 | $1.51 | $775 | $1.50 |
| (1) | Based on the underwritten rent roll dated January 25, 2016. |
| (2) | Source: Appraisal. The majority of recent leases have been executed at $729/unit for the Studios, $890/unit for the standard 1 bedroom, and $925/unit for the deluxe 1 bedroom. |
The Market.The property is located in Detroit, Michigan and is part of the Downtown submarket, which contains 10,234 market rate rental units. According to a third party market research report, as of the fourth quarter of 2015, monthly asking rents in the Downtown submarket increased to $1,044 per unit, compared to the metro Detroit monthly asking rent of $924 per unit. The submarket’s average vacancy rate was 5.8% as of the fourth quarter of 2015 compared to the Detroit metro average vacancy of 2.6% as of the fourth quarter of 2015.
The appraiser identified six comparable rental properties, ranging from 47 units to 584 units that were constructed between 1910 and 1983. The competitive set reported a weighted average occupancy of approximately 96.5%, with average rents ranging from $730 to $1,617 per unit. Average rents at the subject property are in line with the competitive set. The properties in the appraisal’s competitive set are all located within approximately 2.9 miles of the property and are shown in the below table.
Competitive Set Summary(1)
| Property | Year Built | No. of Units | Avg. Unit Size (SF) | Avg. $/ Unit | Occupancy | Distance from Property |
| City Place Apartments | 1965 | 320(2) | 518(2) | $784(2) | 90.3%(2) | |
| The Pavilion | 1957 | 340 | 709 | $855 | 96.0% | 0.4 miles |
| Lafayette Towers | 1963 | 584 | 829 | $1,076 | 97.0% | 0.6 miles |
| The Palms | 1910 | 47 | 829 | $1,097 | 96.0% | 0.9 miles |
| Elmwood Park Plaza | 1973 | 205 | 579 | $730 | 99.0% | 1.2 miles |
| Alden Park Towers | 1938 | 378 | 715 | $811 | 90.0% | 2.9 miles |
| Riverfront Towers | 1983 | 556 | 1,046 | $1,617 | 100.0% | 2.1 miles |
| Total/Wtd. Avg.(3) | 2,110 | 822 | $1,102 | 96.5% |
| (1) | Source: Appraisal. |
| (2) | Based on the underwritten rent roll dated January 25, 2016. |
| (3) | Excludes the subject property. |
Historical and Current Occupancy
| 2012(1) | 2013(1) | 2014(2) | 2015(2) | Current(3) |
| N/A | N/A | 62.1% | 90.3% | 90.3% |
| (1) | The property was purchased in 2014 and historical occupancy figures prior to 2014 were not available. |
| (2) | Occupancies are as of December 31 of each respective year. |
| (3) | Based on the January 25, 2016 rent roll. |
THE INFORMATION IN THIS TERM SHEET IS NOT COMPLETE AND MAY BE AMENDED PRIOR TO THE TIME OF SALE. THIS TERM SHEET IS NOT AN OFFER TO SELL THESE SECURITIES AND IT IS NOT A SOLICITATION OF AN OFFER TO BUY THESE SECURITIES IN ANY JURISDICTION WHERE THE OFFER OR SALE IS NOT PERMITTED.
| 156 |
Mortgage Loan No. 15 — City Place Apartments
Operating History and Underwritten Net Cash Flow(1)
| 2015(2) | TTM(3) | Underwritten(2) | Per Unit | %(4) | |
| Rents in Place | $2,776,165 | $3,026,007 | $2,714,925 | $8,484 | 89.7% |
| Vacant Gross Up | 0 | 0 | 294,960 | 922 | 9.7% |
| Gross Potential Rent | $2,776,165 | $3,026,007 | $3,009,885 | $9,406 | 99.4% |
| Other Income | 12,454 | 14,220 | 18,454 | 58 | 0.6% |
| Net Rental Income | $2,788,619 | $3,040,226 | $3,028,339 | $9,464 | 100.0% |
| (Vacancy) | (830,846) | (787,283) | (294,960) | (922) | (9.7%) |
| (Concessions & Credit Loss) | (39,155) | (39,155) | (89,658) | (280) | (3.0%) |
| Effective Gross Income | $1,918,618 | $2,213,788 | $2,643,721 | $8,262 | 87.3% |
| Total Expenses | $1,217,957 | $1,159,414 | $1,252,500 | $3,914 | 47.4% |
| Net Operating Income | $700,661 | $1,054,374 | $1,391,221 | $4,348 | 52.6% |
| Replacement Reserves | 0 | 0 | 80,000 | 250 | 3.0% |
| Non-Recurring Item(5) | 139,352 | 70,819 | 0 | 0 | 0.0% |
| Net Cash Flow | $561,309 | $983,555 | $1,311,221 | $4,098 | 49.6% |
| (1) | The property was purchased in 2014 and historical cash flows were not available. |
| (2) | The property was purchased in 2014 and was undergoing renovation in 2015. The 2015 Net Operating Income reflects the property’s average 2015 occupancy of 67.9%. The Underwritten Net Operating Income reflects the in-place rents from a 90.3% occupied property, based on the underwritten rent roll dated January 25, 2016. |
| (3) | The TTM column represents the trailing twelve months ending April 30, 2016. |
| (4) | % column represents percent of Net Rental Income for all revenue lines and represents percent of Effective Gross Income for the remainder of fields. |
| (5) | Represents one-time expenses related to the renovation of the property. |
THE INFORMATION IN THIS TERM SHEET IS NOT COMPLETE AND MAY BE AMENDED PRIOR TO THE TIME OF SALE. THIS TERM SHEET IS NOT AN OFFER TO SELL THESE SECURITIES AND IT IS NOT A SOLICITATION OF AN OFFER TO BUY THESE SECURITIES IN ANY JURISDICTION WHERE THE OFFER OR SALE IS NOT PERMITTED.
| 157 |