As filed with the Securities and Exchange Commission on March 5, 2020
SECURITIES AND EXCHANGE COMMISSION
WASHINGTON, D.C. 20549
FORMN-CSR
CERTIFIED SHAREHOLDER REPORT OF REGISTERED
MANAGEMENT INVESTMENT COMPANIES
Investment Company Act file number:811-23237
TRANSAMERICA ETF TRUST
(Exact Name of Registrant as Specified in Charter)
1801 California St., Suite 5200, Denver, CO 80202
(Address of Principal Executive Offices) (Zip Code)
Registrant’s Telephone Number, including Area Code:1-888-316-8077
Rhonda A. Mills, Esq., 1801 California St., Suite 5200, Denver, CO 80202
(Name and Address of Agent for Service)
Date of fiscal year end: December 31
Date of reporting period: December 31, 2019
| Item 1: | Report(s) to Shareholders. |
The Annual Report is attached.
DECEMBER 31, 2019
Beginning January 1, 2021, as permitted by regulations adopted by the Securities and Exchange Commission, the funds intend to no longer mail paper copies of the funds’ shareholder reports unless you specifically request paper copies of the reports from your financial intermediary (such as a broker-dealer or bank). Instead, the reports will be made available on a website, and you will be notified by mail each time a report is posted and provided with a website link to access the report.
If you already elected to receive shareholder reports electronically (“e-delivery”), you will not be affected by this change and you need not take any action. You may elect to receive shareholder reports and other communications from a fund electronically anytime by contacting your financial intermediary.
You may elect to receive all future reports in paper free of charge. Please contact your financial intermediary to request that you continue to receive paper copies of your shareholder reports. Your election to receive reports in paper will apply to all Transamerica funds held in your account.
Customer Service:1-888-316-8077
1801 California St., Suite 5200 Denver, CO 80202
Distributor: Foreside Fund Services, LLC
www.deltashares.com
Table of Contents
Authorized for distribution only when accompanied or preceded by a prospectus. Investors should carefully consider a fund’s investment goals, risks, charges and expenses before investing. A prospectus contains this and other information; please read it carefully before investing.
| | |
| Transamerica ETF Trust | | Annual Report 2019 |
Dear Shareholder,
On behalf of Transamerica DeltaShares®, we would like to thank you for your support and confidence in our products as we look forward to continuing to serve you and your financial professional in the future. We value the trust you have placed in us.
This annual report provides certain information about the investments and performance of your Exchange Traded Fund(s) (“ETFs”) during the fiscal year. The Securities and Exchange Commission currently requires that annual and semi-annual reports be sent to all shareholders. This report covers the12-month period ended December 31, 2019.
We believe it is important to understand market conditions over the fiscal year ended December 31, 2019, to provide a context for reading this report. As the year began, markets had reacted negatively to steadily rising interest rates and the fear that the U.S. Federal Reserve (“Fed”) was possibly on the verge of a major monetary policy error, that of raising rates into a slowing economy. The S&P 500® had declined by approximately 20% from its September 2018 high and credit spreads increased considerably as well. This negative sentiment had also extended into the international markets where both developed and emerging markets had suffered losses in excess of U.S. equities. While the ongoing U.S./China trade dispute shared some of the blame for investor angst going into 2019, most eyes were squarely on the Fed and what the path of interest rates might be for the new year. As the calendar turned to 2019, however, the Fed moderated its tone to one of patience, signaling that further rate hikes were likely off the table for the time being. U.S. equity markets reacted favorably in response and approachedall-time highs by late spring 2019.
U.S./China trade talks continued through the first few months of 2019 with little progress, and in May negotiations deteriorated as the U.S. announced a new round of tariffs. China immediately responded with tariffs of its own on U.S. exports. Equity markets initially declined on this news, however, the Fed responded to these renewed trade tensions by signaling it would “act as appropriate to sustain the expansion” which served to contain fears of an economic slowdown. The Fed then proceeded to cut the Fed Funds rate by 0.25% at three consecutive meetings from July through October, taking its policy rate down to a target range of 1.50%—1.75%. These represented the first interest rate cuts since the Fed had begun its tightening campaign in December of 2015, and global equity and credit markets responded favorably.
Markets finished the year strong as U.S./China trade relations improved and expectations of a stable growth economy combined with benign inflation and lower interest rates helped to emphasize optimism for the year ahead. While the manufacturing sector exhibited some weakness, consumer spending remained strong. Although the drama of impeachment and election uncertainties loomed over Washington, investors seem to have taken thosenon-market related developments in stride while focusing on the broader investment landscape featuring the lowest unemployment rate in fifty years, higher wages and the prospect of rising corporate earnings growth. The S&P 500®, NASDAQ and Dow Jones Industrial Average all closed the year near their highest levels ever.
For the12-month period ended December 31, 2019, the S&P 500® Index returned 31.49% while the MSCI EAFE Index, representing international developed market equities, returned 22.66%. During the same period, the Bloomberg Barclays U.S. Aggregate Bond Index returned 8.72%. Please keep in mind that it is important to maintain a diversified portfolio as investment returns have historically been difficult to predict.
In addition to your active involvement in the investment process, we firmly believe that a financial professional is a key resource to help you build a complete picture of your current and future financial needs. Financial professionals are familiar with the market’s history, including long-term returns and volatility of various asset classes. With your financial professional, you can develop an investment program that incorporates factors such as your goals, your investment timeline and your risk tolerance.
Please contact your financial professional if you have any questions about the contents of this report, and thanks again for the confidence you have placed in us.
Sincerely,

Marijn Smit
President & Chief Executive Officer
Transamerica ETF Trust

Tom Wald, CFA
Chief Investment Officer
Transamerica ETF Trust
Bloomberg Barclays U.S. Aggregate Bond Index: Measures investment grade, U.S. dollar denominated, fixed-rate taxable bonds, including Treasuries, government-related and corporate securities, as well as both mortgage- and asset-backed securities.
MSCI EAFE Index: A free float-adjusted market capitalization index that is designed to measure the equity market performance of developed markets, excluding the U.S. and Canada.
S&P 500®: A market-capitalization weighted index of 500 large U.S. companies with common stock listed on the New York Stock Exchange or NASDAQ Stock Market.
The views expressed in this report reflect those of the portfolio managers only and may not necessarily represent the views of Transamerica ETF Trust. These views are as of the date of this report and are subject to change based upon market conditions. These views should not be relied upon as investment advice and are not indicative of trading intent on behalf of Transamerica ETF Trust. Investing involves risk, including potential loss of principal. The performance data presented represents past performance and does not guarantee future results. Indexes are unmanaged and an investor cannot invest directly in an index.
Disclosure of Expenses
(unaudited)
SHAREHOLDER EXPENSES
Fund shareholders may incur two types of costs: (i) transaction costs including brokerage commissions on purchases and sales of fund shares; and (ii) ongoing costs, including management fees.
The following examples are intended to help you understand your ongoing costs (in dollars and cents) of investing in the Funds and to compare these costs with the ongoing costs of investing in other funds.
The examples are based on an investment of $1,000 invested at July 1, 2019, and held for the entiresix-month period until December 31, 2019.
ACTUAL EXPENSES
The information in the table below provides information about actual account values and actual expenses. You may use the information in these columns, together with the amount you invested, to estimate the expenses that you paid over the period. Simply divide your account value by $1,000 (for example, an $8,600 account value divided by $1,000 = $8.60), then multiply the result by the number in the appropriate column for your Fund titled “Expenses Paid During Period” to estimate the expenses you paid on your account during this period.
HYPOTHETICAL EXAMPLE FOR COMPARISON PURPOSES
The information in the table below provides information about hypothetical account values and hypothetical expenses based on the Funds’ actual expense ratios and assumed rates of return of 5% per year before expenses, which are not the Funds’ actual returns. The hypothetical account values and expenses may not be used to estimate the actual ending account balance or expenses you paid for the period. You may use this information to compare the ongoing costs of investing in your Fund versus other funds. To do so, compare this 5% hypothetical example with the 5% hypothetical examples that appear in the shareholder reports of the other fund(s).
Please note that the expenses shown in the table are meant to highlight your ongoing costs only and do not reflect any transactional costs, such as brokerage commissions paid on purchases and sales of Fund shares. Therefore, the information under the heading “Hypothetical Expenses” is useful in comparing ongoing costs only, and will not help you determine the relative total costs of owning different funds. If any of these transaction costs were included, your costs would be higher. The expenses shown in the table do not reflect any fees that may be charged to you by brokers, financial intermediaries, or other financial institutions.
| | | | | | | | | | | | | | | | | | | | | | | | |
| | | | | | Actual Expenses | | | Hypothetical Expenses (A) | | | | |
| Fund | | Beginning
Account Value | | | Ending
Account Value | | | Expenses Paid
During Period (B) | | | Ending
Account Value | | | Expenses Paid
During Period (B) | | | Total
Expense Ratio (C) (D) | |
DeltaShares® S&P 400 Managed Risk ETF | | $ | 1,000.00 | | | $ | 1,042.60 | | | $ | 2.32 | | | $ | 1,022.90 | | | $ | 2.29 | | | | 0.45 | % |
DeltaShares® S&P 500 Managed Risk ETF | | | 1,000.00 | | | | 1,091.00 | | | | 1.84 | | | | 1,023.40 | | | | 1.79 | | | | 0.35 | |
DeltaShares® S&P 600 Managed Risk ETF | | | 1,000.00 | | | | 1,049.40 | | | | 2.32 | | | | 1,022.90 | | | | 2.29 | | | | 0.45 | |
DeltaShares® S&P EM 100 & Managed Risk ETF | | | 1,000.00 | | | | 1,060.10 | | | | 3.12 | | | | 1,022.20 | | | | 3.06 | | | | 0.60 | |
DeltaShares® S&P International Managed Risk ETF | | | 1,000.00 | | | | 1,069.80 | | | | 2.61 | | | | 1,022.70 | | | | 2.55 | | | | 0.50 | |
| | |
| |
| (A) | | 5% return per year before expenses. |
| |
| (B) | | Expenses are calculated using each Fund’s net annualized expense ratio, as disclosed in the table, multiplied by the average account value for the period, multiplied by the number of days in the period (184 days), and divided by the number of days in the year (365 days). |
| |
| (C) | | Net annualized expense ratios, as disclosed in the table, do not include the expenses of the underlying investments in which the Funds invest. The total annual fund operating expenses, as stated in the fee table of the Prospectus, may differ from the expense ratios disclosed in this report. |
| |
| (D) | | Net annualized expense ratios are reflective of any applicable fee waivers and/or reimbursements and are based on the most recent six-months and may differ from the net expense ratio displayed in the Financial Highlights which covers a twelve-month period. |
| | |
| Transamerica ETF Trust | | Annual Report 2019 |
Page 2
DeltaShares® S&P 400 Managed Risk ETF
(unaudited)
MARKET ENVIRONMENT
Stocks across the world posted positive returns in 2019. The S&P 500® also posted strong performance in 2019.
Global stock markets began the year on a positive note, with a snap recovery from the late December 2018 trough. This continued throughout January and shrugged off the longest government shutdown in U.S. history. Markets largely continued to rally through April, but gave up roughly half of theiryear-to-date gains in May. The loss was broad based, with domestic, international developed, and emerging markets all finishing the month sharply lower. However, the second quarter of 2019 finished on a higher note, with May losses closely mirrored by June gains, to complete a low volatilityV-shaped quarter.
Domestic equity returns remained in positive territory in July with the S&P 500® hitting the 3,000 price level for the first time in history. In contrast, both developed and emerging market equities fluctuated between positive and negative territory, ending the month with losses. Equity volatility picked up in August, but remained somewhat moderate. During this time, bond markets rallied around the globe. While the U.S. Federal Reserve (“Fed”) had merely paused rate hikes for the first half of the year, the Fed commenced the first of three consecutive cuts in August. Volatility then subsided, and experienced further declines, boosted by the “Phase One Trade Deal” announced in December as markets rallied through theyear-end.
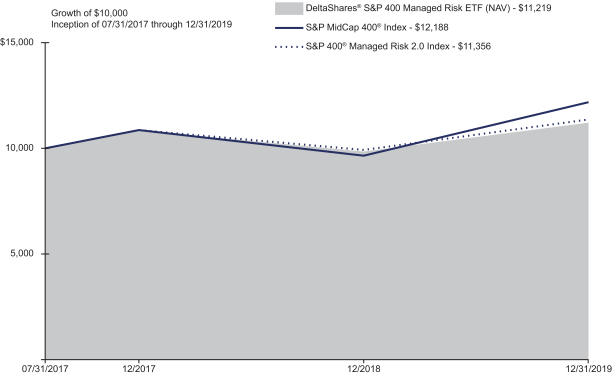
PERFORMANCE OVERVIEW
For the year ended December 31, 2019, the DeltaShares® S&P 400 Managed Risk ETF (NAV) returned 13.95%. By comparison, the S&P 400® Managed Risk 2.0 Index, (the “Underlying Index”) returned 14.50% and the S&P MidCap 400® Index returned 26.20%.
The Fund’s performance reflects annual operating expenses of the Fund, including management fees, brokerage expenses, and other fees and expenses. Index returns do not reflect fees and expenses of any kind, which would have a negative impact on returns.
STRATEGY REVIEW
The DeltaShares® S&P 400 Managed Risk ETF (the “Fund”) seeks to track the investment results, before fees and expenses, of the Underlying Index.
The Fund seeks to achieve this investment objective by holding a portfolio of securities that are included in the Underlying Index, including common stocks, U.S. Treasury bonds, and/or cash. The Underlying Index is designed to simulate, through a rules-based methodology, a dynamic portfolio with the aim of both managing the volatility of the Underlying Index and limiting losses from the Underlying Index’s equity exposure due to severe sustained market declines. The Underlying Index seeks to achieve these objectives by allocating weightings among the S&P MidCap 400® Index, the S&P U.S. Treasury Bond Current5-Year Index, and the S&P U.S. Treasury Bill0-3 Month Index. The Fund may also use derivatives in an effort to gain exposure to underlying securities and markets in a more efficient manner, to optimize the execution processes and costs for portfolio transitions or for tax management purposes. Under normal circumstances, the Fund uses a replication strategy and generally expects to invest in substantially all of the securities in the Underlying Index.
During the12-month period ended December 31, 2019, the largest contributors to the Fund’s absolute total return were equities within the information technology, industrials, and financials sectors. The largest detractors were equities within the energy sector.
During the fiscal year, the Fund used derivatives. These positions added to performance.
Blake Graves, CFA
Charles Lowery, CFA
Louis Ng
Co-Portfolio Managers
Milliman Financial Risk Management LLC
| | | | |
| Asset Allocation | | Percentage of Net
Assets | |
Common Stocks | | | 98.7 | % |
Other Investment Company | | | 9.0 | |
Short-Term Investment Company | | | 1.0 | |
Net Other Assets (Liabilities) ^ | | | (8.7 | ) |
Total | | | 100.0 | % |
| | | | |
| Current | and future portfolio holdings are subject to change and risk. |
| ^ | The Net Other Assets (Liabilities) category may include, but is not limited to, reverse repurchase agreements, forward foreign currency contracts, futures contracts, swap agreements, written options and swaptions, and cash collateral. |
| | |
| Transamerica ETF Trust | | Annual Report 2019 |
Page 3
DeltaShares® S&P 400 Managed Risk ETF
(unaudited)
| | | | | | | | | | | | | | | | | | | | | | | | | | | | |
| Performance as of December 31, 2019 | | | | | | | | | | | | | |
| | | Average Annual Total Returns | | | | | | | | Cumulative Total Returns | | | | | | | | Inception Date | |
| | | 1 Year | | | 10 Year or
Since
Inception | | | | | | 1 Year | | | 10 Year or
Since
Inception | | | | | | | |
Fund NAV | | | 13.95 | % | | | 4.86 | % | | | | | | | 13.95 | % | | | 12.19 | % | | | | | | | 07/31/2017 | |
Fund Market | | | 13.85 | % | | | 4.78 | % | | | | | | | 13.85 | % | | | 11.98 | % | | | | | | | 07/31/2017 | |
S&P MidCap 400® Index (A) | | | 26.20 | % | | | 8.51 | % | | | | | | | 26.20 | % | | | 21.88 | % | | | | | | | | |
S&P 400® Managed Risk 2.0 Index (A)(B)(C)(D) | | | 14.50 | % | | | 5.39 | % | | | | | | | 14.50 | % | | | 13.56 | % | | | | | | | | |
(A) The S&P MidCap 400® Index is a market-capitalization weighted index of 400mid-size U.S. companies with common stock listed on the NYSE or NASDAQ.
(B) The S&P MidCap 400® Managed Risk 2.0 Index is comprised of weightings amongst the S&P MidCap 400® Index, the S&P U.S. Treasury Bond Current5-Year Index, and the S&P U.S. Treasury Bill0-3 Month Index. The S&P MidCap 400® Managed Risk 2.0 Index rebalances on a daily basis.
(C) The S&P U.S. Treasury Bond Current5-Year Index is aone-security index comprising the most recently issued5-year U.S. Treasury note or bond.
(D) The S&P U.S. Treasury Bill0-3 Month Index is designed to measure the performance of U.S. Treasury bills maturing in 0 to 3 months.
The Fund’s benchmarks are unmanaged indices used as a general measure of market performance. Calculations assume dividends and capital gains are reinvested and do not include any managerial expenses. The 10 Years or the Since Inception calculation is based on the previous 10 years or since the inception date, whichever is more recent. An index is a statistical measure of a specified financial market or sector. An index does not actually hold a portfolio of securities and therefore does not reflect deductions for fees or expenses. In comparison, a Fund’s performance is negatively impacted by these deductions. You cannot invest directly in an index.
The performance data presented represents past performance and does not guarantee future results. Performance data does not reflect the deduction of taxes that would be paid on Fund distributions or the redemption of Fund shares. The Fund’s investment return and net asset value will fluctuate. Investors’ shares when sold may be worth more or less than their original cost. Current performance may be lower or higher than performance quoted. Please see www.deltashares.com for performance data current to the most recent month end. Fund performance is net of investment fees and Fund expenses.
Performance results do not include adjustments made for financial reporting purposes in accordance with U.S. generally accepted accounting principles and may differ from amounts reported in the Financial Highlights.
Fund shares are bought and sold at Market Price, not Net Asset Value (“NAV”), and are not individually redeemed from the fund. Net Asset Value is an exchange-traded fund’s per-share value. The per-share dollar amount of the Fund is derived by dividing the total value of all the securities in the portfolio, less any liabilities, by the number of Fund shares outstanding. Market Price is the price at which a share can currently be traded in the market. The market price used to calculate the market return is determined by using the midpoint between the highest bid and the lowest offer on the exchange on which the shares of the Fund are listed for trading, as of the time that the Fund’s NAV is calculated.
Exchange-Traded Funds (ETFs) are subject to market risk, including the loss of principal. Because Fund Shares trade at market prices rather than at NAV, Fund Shares may trade at a price greater than NAV (premium) or less than NAV (discount). Shares of DeltaShares® ETFs may be bought and sold throughout the day on the exchange through any brokerage account. Buying and selling shares of ETFs will result in brokerage commissions. Diversification and asset allocation may not protect against market risk or loss of principal. Investing involves risk, including the possible loss of principal. There is no guarantee the investment objective will be achieved. Investing in medium capitalization companies involves greater risk than is customarily associated with more established companies. The prices of securities of medium capitalization companies generally are more volatile and are more likely to be adversely affected by changes in earnings results and investor expectations or poor economic or market conditions. The market prices of fixed-income securities may go up or down, sometimes rapidly and unpredictably, due to general market conditions, such as real or perceived adverse economic or political conditions, inflation, changes in interest rates, lack of liquidity in the bond markets or adverse investor sentiment. The principal risks include risks related to: Equity securities, index tracking, leveraging, derivatives such as futures, forwards, swaps, options, and investing in underlying exchange-traded funds. The use of derivatives may produce disproportionate gains or losses, may increase costs, and amplify risks.
| | |
| Transamerica ETF Trust | | Annual Report 2019 |
Page 4
DeltaShares® S&P 400 Managed Risk ETF
SCHEDULE OF INVESTMENTS
At December 31, 2019
| | | | | | | | |
| | | Shares | | | Value | |
| COMMON STOCKS - 98.7% | |
| Aerospace & Defense - 1.5% | |
Axon Enterprise, Inc.(A) (B) | | | 3,137 | | | | $ 229,879 | |
Curtiss-Wright Corp. | | | 2,256 | | | | 317,848 | |
Mercury Systems, Inc.(A) | | | 2,936 | | | | 202,907 | |
Teledyne Technologies, Inc.(A) | | | 1,928 | | | | 668,129 | |
| | | | | | | | |
| | | | | | | 1,418,763 | |
| | | | | | | | |
| Air Freight & Logistics - 0.4% | |
XPO Logistics, Inc.(A) | | | 4,879 | | | | 388,856 | |
| | | | | | | | |
| Airlines - 0.3% | |
JetBlue Airways Corp.(A) | | | 15,260 | | | | 285,667 | |
| | | | | | | | |
| Auto Components - 1.4% | |
Adient PLC(A) | | | 4,601 | | | | 97,771 | |
Dana, Inc. | | | 7,608 | | | | 138,466 | |
Delphi Technologies PLC | | | 4,550 | | | | 58,376 | |
Gentex Corp. | | | 13,372 | | | | 387,520 | |
Goodyear Tire & Rubber Co. | | | 12,293 | | | | 191,218 | |
Lear Corp. | | | 2,909 | | | | 399,115 | |
Visteon Corp.(A) | | | 1,478 | | | | 127,980 | |
| | | | | | | | |
| | | | | | | 1,400,446 | |
| | | | | | | | |
| Automobiles - 0.2% | |
Thor Industries, Inc.(B) | | | 2,918 | | | | 216,778 | |
| | | | | | | | |
| Banks - 7.2% | |
Associated Banc-Corp. | | | 8,423 | | | | 185,643 | |
BancorpSouth Bank | | | 5,072 | | | | 159,312 | |
Bank of Hawaii Corp.(B) | | | 2,129 | | | | 202,596 | |
Bank OZK | | | 6,390 | | | | 194,927 | |
Cathay General Bancorp | | | 4,003 | | | | 152,314 | |
Commerce Bancshares, Inc.(B) | | | 5,482 | | | | 372,447 | |
Cullen/Frost Bankers, Inc. | | | 3,009 | | | | 294,220 | |
East West Bancorp, Inc. | | | 7,697 | | | | 374,844 | |
First Financial Bankshares, Inc. | | | 7,181 | | | | 252,053 | |
First Horizon National Corp. | | | 16,448 | | | | 272,379 | |
FNB Corp. | | | 17,175 | | | | 218,123 | |
Fulton Financial Corp. | | | 8,675 | | | | 151,205 | |
Hancock Whitney Corp. | | | 4,610 | | | | 202,287 | |
Home BancShares, Inc. | | | 8,201 | | | | 161,232 | |
International Bancshares Corp. | | | 3,033 | | | | 130,631 | |
PacWest Bancorp | | | 6,334 | | | | 242,402 | |
Pinnacle Financial Partners, Inc. | | | 3,804 | | | | 243,456 | |
Prosperity Bancshares, Inc. | | | 4,990 | | | | 358,731 | |
Signature Bank | | | 2,854 | | | | 389,885 | |
Sterling Bancorp | | | 10,680 | | | | 225,134 | |
Synovus Financial Corp. | | | 7,746 | | | | 303,643 | |
TCF Financial Corp. | | | 8,109 | | | | 379,501 | |
Texas Capital Bancshares, Inc.(A) | | | 2,660 | | | | 151,008 | |
Trustmark Corp. | | | 3,397 | | | | 117,231 | |
UMB Financial Corp. | | | 2,284 | | | | 156,774 | |
Umpqua Holdings Corp. | | | 11,640 | | | | 206,028 | |
United Bankshares, Inc. | | | 5,367 | | | | 207,488 | |
Valley National Bancorp | | | 20,704 | | | | 237,061 | |
Webster Financial Corp. | | | 4,865 | | | | 259,596 | |
Wintrust Financial Corp. | | | 3,017 | | | | 213,905 | |
| | | | | | | | |
| | | | | | | 7,016,056 | |
| | | | | | | | |
| Beverages - 0.2% | |
Boston Beer Co., Inc., Class A(A) | | | 487 | | | | 184,013 | |
| | | | | | | | |
| Biotechnology - 0.9% | |
Arrowhead Pharmaceuticals, Inc.(A) | | | 5,291 | | | | 335,608 | |
| | | | | | | | |
| | | Shares | | | Value | |
| COMMON STOCKS (continued) | |
| Biotechnology (continued) | |
Exelixis, Inc.(A) | | | 16,061 | | | | $ 282,995 | |
Ligand Pharmaceuticals, Inc.(A) (B) | | | 928 | | | | 96,781 | |
United Therapeutics Corp.(A) | | | 2,319 | | | | 204,258 | |
| | | | | | | | |
| | | | | | | 919,642 | |
| | | | | | | | |
| Building Products - 1.2% | |
Lennox International, Inc. | | | 1,853 | | | | 452,076 | |
Owens Corning | | | 5,750 | | | | 374,440 | |
Resideo Technologies, Inc.(A) | | | 6,492 | | | | 77,450 | |
Trex Co., Inc.(A) | | | 3,084 | | | | 277,190 | |
| | | | | | | | |
| | | | | | | 1,181,156 | |
| | | | | | | | |
| Capital Markets - 2.6% | |
Affiliated Managers Group, Inc. | | | 2,604 | | | | 220,663 | |
Eaton Vance Corp. | | | 5,981 | | | | 279,253 | |
Evercore, Inc., Class A | | | 2,066 | | | | 154,454 | |
FactSet Research Systems, Inc.(B) | | | 2,006 | | | | 538,210 | |
Federated Investors, Inc., Class B | | | 5,078 | | | | 165,492 | |
Interactive Brokers Group, Inc., Class A | | | 4,057 | | | | 189,137 | |
Janus Henderson Group PLC | | | 8,225 | | | | 201,101 | |
Legg Mason, Inc. | | | 4,313 | | | | 154,880 | |
SEI Investments Co. | | | 6,672 | | | | 436,883 | |
Stifel Financial Corp. | | | 3,614 | | | | 219,189 | |
| | | | | | | | |
| | | | | | | 2,559,262 | |
| | | | | | | | |
| Chemicals - 2.5% | |
Ashland Global Holdings, Inc. | | | 3,184 | | | | 243,672 | |
Cabot Corp. | | | 3,012 | | | | 143,130 | |
Chemours Co.(B) | | | 8,642 | | | | 156,334 | |
Ingevity Corp.(A) | | | 2,211 | | | | 193,197 | |
Minerals Technologies, Inc. | | | 1,842 | | | | 106,154 | |
NewMarket Corp. | | | 390 | | | | 189,743 | |
Olin Corp. | | | 8,440 | | | | 145,590 | |
PolyOne Corp. | | | 4,066 | | | | 149,588 | |
RPM International, Inc. | | | 6,855 | | | | 526,190 | |
ScottsMiracle-Gro Co. | | | 2,094 | | | | 222,341 | |
Sensient Technologies Corp. | | | 2,237 | | | | 147,843 | |
Valvoline, Inc. | | | 9,958 | | | | 213,201 | |
| | | | | | | | |
| | | | | | | 2,436,983 | |
| | | | | | | | |
| Commercial Services & Supplies - 1.9% | |
Brink’s Co. | | | 2,644 | | | | 239,758 | |
Clean Harbors, Inc.(A) | | | 2,714 | | | | 232,725 | |
Deluxe Corp. | | | 2,225 | | | | 111,072 | |
Healthcare Services Group, Inc. | | | 3,918 | | | | 95,286 | |
Herman Miller, Inc. | | | 3,122 | | | | 130,031 | |
HNI Corp. | | | 2,264 | | | | 84,809 | |
KAR Auction Services, Inc.(B) | | | 6,807 | | | | 148,325 | |
MSA Safety, Inc. | | | 1,884 | | | | 238,062 | |
Stericycle, Inc.(A) (B) | | | 4,817 | | | | 307,373 | |
Tetra Tech, Inc. | | | 2,885 | | | | 248,572 | |
| | | | | | | | |
| | | | | | | 1,836,013 | |
| | | | | | | | |
| Communications Equipment - 1.1% | |
Ciena Corp.(A) | | | 8,177 | | | | 349,076 | |
InterDigital, Inc. | | | 1,646 | | | | 89,691 | |
Lumentum Holdings, Inc.(A) | | | 4,081 | | | | 323,623 | |
NetScout Systems, Inc.(A) | | | 3,481 | | | | 83,788 | |
ViaSat, Inc.(A) | | | 3,048 | | | | 223,098 | |
| | | | | | | | |
| | | | | | | 1,069,276 | |
| | | | | | | | |
The Notes to Financial Statements are an integral part of this report.
| | |
| Transamerica ETF Trust | | Annual Report 2019 |
Page 5
DeltaShares® S&P 400 Managed Risk ETF
SCHEDULE OF INVESTMENTS (continued)
At December 31, 2019
| | | | | | | | |
| | | Shares | | | Value | |
| COMMON STOCKS (continued) | |
| Construction & Engineering - 1.2% | |
AECOM(A) | | | 8,303 | | | | $ 358,108 | |
Dycom Industries, Inc.(A) | | | 1,666 | | | | 78,552 | |
EMCOR Group, Inc. | | | 2,968 | | | | 256,138 | |
Fluor Corp. | | | 7,409 | | | | 139,882 | |
MasTec, Inc.(A) | | | 3,187 | | | | 204,478 | |
Valmont Industries, Inc. | | | 1,138 | | | | 170,450 | |
| | | | | | | | |
| | | | | | | 1,207,608 | |
| | | | | | | | |
| Construction Materials - 0.2% | |
Eagle Materials, Inc. | | | 2,201 | | | | 199,543 | |
| | | | | | | | |
| Consumer Finance - 0.6% | |
FirstCash, Inc. | | | 2,256 | | | | 181,901 | |
Green Dot Corp., Class A(A) | | | 2,504 | | | | 58,343 | |
Navient Corp. | | | 10,282 | | | | 140,658 | |
SLM Corp. | | | 22,315 | | | | 198,827 | |
| | | | | | | | |
| | | | | | | 579,729 | |
| | | | | | | | |
| Containers & Packaging - 1.0% | |
AptarGroup, Inc. | | | 3,379 | | | | 390,680 | |
Greif, Inc., Class A | | | 1,388 | | | | 61,350 | |
O-I Glass, Inc. | | | 8,226 | | | | 98,136 | |
Silgan Holdings, Inc. | | | 4,099 | | | | 127,397 | |
Sonoco Products Co. | | | 5,291 | | | | 326,560 | |
| | | | | | | | |
| | | | | | | 1,004,123 | |
| | | | | | | | |
| Distributors - 0.5% | |
Pool Corp. | | | 2,116 | | | | 449,396 | |
| | | | | | | | |
| Diversified Consumer Services - 1.1% | |
Adtalem Global Education, Inc.(A) | | | 2,854 | | | | 99,804 | |
Graham Holdings Co., Class B | | | 230 | | | | 146,968 | |
Grand Canyon Education, Inc.(A) | | | 2,549 | | | | 244,169 | |
Service Corp. International | | | 9,662 | | | | 444,742 | |
WW International, Inc.(A) | | | 2,455 | | | | 93,805 | |
| | | | | | | | |
| | | | | | | 1,029,488 | |
| | | | | | | | |
| Diversified Financial Services - 0.3% | |
Jefferies Financial Group, Inc. | | | 13,315 | | | | 284,541 | |
| | | | | | | | |
| Electric Utilities - 1.5% | |
ALLETE, Inc. | | | 2,731 | | | | 221,675 | |
Hawaiian Electric Industries, Inc. | | | 5,760 | | | | 269,914 | |
IDACORP, Inc. | | | 2,664 | | | | 284,515 | |
OGE Energy Corp. | | | 10,581 | | | | 470,537 | |
PNM Resources, Inc. | | | 4,210 | | | | 213,489 | |
| | | | | | | | |
| | | | | | | 1,460,130 | |
| | | | | | | | |
| Electrical Equipment - 1.3% | |
Acuity Brands, Inc. | | | 2,094 | | | | 288,972 | |
EnerSys | | | 2,235 | | | | 167,245 | |
Hubbell, Inc. | | | 2,875 | | | | 424,983 | |
nVent Electric PLC | | | 8,226 | | | | 210,421 | |
Regal Beloit Corp. | | | 2,164 | | | | 185,260 | |
| | | | | | | | |
| | | | | | | 1,276,881 | |
| | | | | | | | |
| Electronic Equipment, Instruments & Components - 3.7% | |
Arrow Electronics, Inc.(A) | | | 4,305 | | | | 364,806 | |
Avnet, Inc. | | | 5,337 | | | | 226,502 | |
Belden, Inc. | | | 2,042 | | | | 112,310 | |
Cognex Corp. | | | 9,033 | | | | 506,209 | |
Coherent, Inc.(A) | | | 1,277 | | | | 212,429 | |
II-VI, Inc.(A) (B) | | | 4,610 | | | | 155,219 | |
Jabil, Inc. | | | 7,343 | | | | 303,486 | |
| | | | | | | | |
| | | Shares | | | Value | |
| COMMON STOCKS (continued) | |
| Electronic Equipment, Instruments & Components (continued) | |
Littelfuse, Inc. | | | 1,288 | | | | $ 246,394 | |
National Instruments Corp. | | | 6,235 | | | | 263,990 | |
SYNNEX Corp. | | | 2,160 | | | | 278,208 | |
Tech Data Corp.(A) | | | 1,872 | | | | 268,819 | |
Trimble, Inc.(A) | | | 13,169 | | | | 549,016 | |
Vishay Intertechnology, Inc. | | | 6,996 | | | | 148,945 | |
| | | | | | | | |
| | | | | | | 3,636,333 | |
| | | | | | | | |
| Energy Equipment & Services - 0.6% | |
Apergy Corp.(A) | | | 4,094 | | | | 138,295 | |
Core Laboratories NV(B) | | | 2,346 | | | | 88,374 | |
Patterson-UTI Energy, Inc. | | | 10,283 | | | | 107,971 | |
Transocean, Ltd.(A) (B) | | | 30,401 | | | | 209,159 | |
| | | | | | | | |
| | | | | | | 543,799 | |
| | | | | | | | |
| Entertainment - 0.4% | |
Cinemark Holdings, Inc.(B) | | | 5,635 | | | | 190,745 | |
World Wrestling Entertainment, Inc., Class A(B) | | | 2,508 | | | | 162,694 | |
| | | | | | | | |
| | | | | | | 353,439 | |
| | | | | | | | |
| Equity Real Estate Investment Trusts - 10.6% | |
Alexander & Baldwin, Inc. | | | 3,590 | | | | 75,246 | |
American Campus Communities, Inc. | | | 7,263 | | | | 341,579 | |
Brixmor Property Group, Inc. | | | 15,744 | | | | 340,228 | |
Camden Property Trust | | | 5,118 | | | | 543,020 | |
CoreCivic, Inc. | | | 6,295 | | | | 109,407 | |
CoreSite Realty Corp. | | | 1,992 | | | | 223,343 | |
Corporate Office Properties Trust | | | 5,923 | | | | 174,018 | |
Cousins Properties, Inc. | | | 7,758 | | | | 319,630 | |
CyrusOne, Inc. | | | 5,984 | | | | 391,533 | |
Diversified Healthcare Trust REIT | | | 12,575 | | | | 106,133 | |
Douglas Emmett, Inc. | | | 8,713 | | | | 382,501 | |
EastGroup Properties, Inc. | | | 2,030 | | | | 269,320 | |
EPR Properties | | | 4,147 | | | | 292,944 | |
First Industrial Realty Trust, Inc. | | | 6,710 | | | | 278,532 | |
GEO Group, Inc. | | | 6,410 | | | | 106,470 | |
Healthcare Realty Trust, Inc. | | | 7,069 | | | | 235,893 | |
Highwoods Properties, Inc. | | | 5,484 | | | | 268,222 | |
JBG SMITH Properties | | | 6,239 | | | | 248,874 | |
Kilroy Realty Corp. | | | 5,155 | | | | 432,505 | |
Lamar Advertising Co., Class A | | | 4,546 | | | | 405,776 | |
Liberty Property Trust | | | 8,340 | | | | 500,817 | |
Life Storage, Inc. | | | 2,466 | | | | 267,018 | |
Macerich Co.(B) | | | 5,824 | | | | 156,782 | |
Mack-Cali Realty Corp. | | | 4,787 | | | | 110,723 | |
Medical Properties Trust, Inc. | | | 27,351 | | | | 577,380 | |
National Retail Properties, Inc. | | | 9,072 | | | | 486,441 | |
Omega Healthcare Investors, Inc. | | | 11,550 | | | | 489,142 | |
Park Hotels & Resorts, Inc. | | | 12,654 | | | | 327,359 | |
Pebblebrook Hotel Trust(B) | | | 6,905 | | | | 185,123 | |
PotlatchDeltic Corp. | | | 3,553 | | | | 153,738 | |
PS Business Parks, Inc. | | | 1,059 | | | | 174,597 | |
Rayonier, Inc. | | | 6,835 | | | | 223,915 | |
Sabra Health Care, Inc. | | | 10,239 | | | | 218,500 | |
Service Properties Trust | | | 8,699 | | | | 211,647 | |
Spirit Realty Capital, Inc. | | | 5,272 | | | | 259,277 | |
Tanger Factory Outlet Centers, Inc.(B) | | | 4,910 | | | | 72,324 | |
Taubman Centers, Inc.(B) | | | 3,236 | | | | 100,607 | |
Urban Edge Properties | | | 6,087 | | | | 116,749 | |
The Notes to Financial Statements are an integral part of this report.
| | |
| Transamerica ETF Trust | | Annual Report 2019 |
Page 6
DeltaShares® S&P 400 Managed Risk ETF
SCHEDULE OF INVESTMENTS (continued)
At December 31, 2019
| | | | | | | | |
| | | Shares | | | Value | |
| COMMON STOCKS (continued) | |
| Equity Real Estate Investment Trusts (continued) | |
Weingarten Realty Investors | | | 6,393 | | | | $ 199,717 | |
| | | | | | | | |
| | | | | | | 10,377,030 | |
| | | | | | | | |
| Food & Staples Retailing - 0.6% | |
BJ’S Wholesale Club Holdings, Inc.(A) (B) | | | 6,458 | | | | 146,855 | |
Casey’s General Stores, Inc. | | | 1,944 | | | | 309,076 | |
Sprouts Farmers Market, Inc.(A) | | | 6,245 | | | | 120,841 | |
| | | | | | | | |
| | | | | | | 576,772 | |
| | | | | | | | |
| Food Products - 1.7% | |
Flowers Foods, Inc. | | | 10,174 | | | | 221,183 | |
Hain Celestial Group, Inc.(A) (B) | | | 4,246 | | | | 110,205 | |
Ingredion, Inc. | | | 3,529 | | | | 328,021 | |
Lancaster Colony Corp. | | | 1,046 | | | | 167,465 | |
Pilgrim’s Pride Corp.(A) | | | 2,770 | | | | 90,621 | |
Post Holdings, Inc.(A) | | | 3,513 | | | | 383,268 | |
Sanderson Farms, Inc. | | | 1,042 | | | | 183,621 | |
Tootsie Roll Industries, Inc.(B) | | | 887 | | | | 30,282 | |
TreeHouse Foods, Inc.(A) | | | 2,971 | | | | 144,093 | |
| | | | | | | | |
| | | | | | | 1,658,759 | |
| | | | | | | | |
| Gas Utilities - 1.7% | |
National Fuel Gas Co.(B) | | | 4,563 | | | | 212,362 | |
New Jersey Resources Corp. | | | 5,048 | | | | 224,989 | |
ONE Gas, Inc. | | | 2,788 | | | | 260,873 | |
Southwest Gas Holdings, Inc. | | | 2,887 | | | | 219,325 | |
Spire, Inc. | | | 2,695 | | | | 224,521 | |
UGI Corp. | | | 11,048 | | | �� | 498,928 | |
| | | | | | | | |
| | | | | | | 1,640,998 | |
| | | | | | | | |
| Health Care Equipment & Supplies - 3.3% | |
Avanos Medical, Inc.(A) | | | 2,533 | | | | 85,362 | |
Cantel Medical Corp.(B) | | | 1,980 | | | | 140,382 | |
Globus Medical, Inc., Class A(A) | | | 4,069 | | | | 239,583 | |
Haemonetics Corp.(A) | | | 2,679 | | | | 307,817 | |
Hill-Rom Holdings, Inc. | | | 3,529 | | | | 400,647 | |
ICU Medical, Inc.(A) | | | 1,016 | | | | 190,114 | |
Integra LifeSciences Holdings Corp.(A) | | | 3,767 | | | | 219,541 | |
LivaNova PLC(A) | | | 2,558 | | | | 192,950 | |
Masimo Corp.(A) | | | 2,593 | | | | 409,850 | |
NuVasive, Inc.(A) | | | 2,753 | | | | 212,917 | |
Penumbra, Inc.(A) (B) | | | 1,698 | | | | 278,930 | |
West Pharmaceutical Services, Inc. | | | 3,911 | | | | 587,941 | |
| | | | | | | | |
| | | | | | | 3,266,034 | |
| | | | | | | | |
| Health Care Providers & Services - 2.4% | |
Acadia Healthcare Co., Inc.(A) | | | 4,682 | | | | 155,536 | |
Amedisys, Inc.(A) | | | 1,705 | | | | 284,599 | |
Chemed Corp. | | | 846 | | | | 371,614 | |
Encompass Health Corp. | | | 5,212 | | | | 361,035 | |
HealthEquity, Inc.(A) | | | 3,747 | | | | 277,540 | |
MEDNAX, Inc.(A) | | | 4,456 | | | | 123,832 | |
Molina Healthcare, Inc.(A) | | | 3,314 | | | | 449,677 | |
Patterson Cos., Inc.(B) | | | 4,554 | | | | 93,266 | |
Tenet Healthcare Corp.(A) | | | 5,492 | | | | 208,861 | |
| | | | | | | | |
| | | | | | | 2,325,960 | |
| | | | | | | | |
| Health Care Technology - 0.1% | |
Allscripts Healthcare Solutions, Inc.(A) | | | 8,582 | | | | 84,232 | |
| | | | | | | | |
| Hotels, Restaurants & Leisure - 4.4% | |
Boyd Gaming Corp. | | | 4,231 | | | | 126,676 | |
Brinker International, Inc.(B) | | | 1,975 | | | | 82,950 | |
| | | | | | | | |
| | | Shares | | | Value | |
| COMMON STOCKS (continued) | |
| Hotels, Restaurants & Leisure (continued) | |
Caesars Entertainment Corp.(A) | | | 29,502 | | | | $ 401,227 | |
Cheesecake Factory, Inc.(B) | | | 2,171 | | | | 84,365 | |
Choice Hotels International, Inc.(B) | | | 1,679 | | | | 173,659 | |
Churchill Downs, Inc. | | | 1,874 | | | | 257,113 | |
Cracker Barrel Old Country Store, Inc.(B) | | | 1,272 | | | | 195,557 | |
Domino’s Pizza, Inc. | | | 2,162 | | | | 635,152 | |
Dunkin’ Brands Group, Inc. | | | 4,379 | | | | 330,790 | |
Eldorado Resorts, Inc.(A) (B) | | | 3,453 | | | | 205,937 | |
Jack in the Box, Inc. | | | 1,250 | | | | 97,538 | |
Marriott Vacations Worldwide Corp. | | | 1,978 | | | | 254,687 | |
Papa John’s International, Inc.(B) | | | 1,165 | | | | 73,570 | |
Penn National Gaming, Inc.(A) | | | 5,759 | | | | 147,200 | |
Scientific Games Corp., Class A(A) | | | 2,859 | | | | 76,564 | |
Six Flags Entertainment Corp. | | | 4,155 | | | | 187,432 | |
Texas Roadhouse, Inc. | | | 3,449 | | | | 194,248 | |
Wendy’s Co. | | | 9,728 | | | | 216,059 | |
Wyndham Destinations, Inc. | | | 4,794 | | | | 247,802 | |
Wyndham Hotels & Resorts, Inc. | | | 5,030 | | | | 315,934 | |
| | | | | | | | |
| | | | | | | 4,304,460 | |
| | | | | | | | |
| Household Durables - 1.0% | |
Helen of Troy, Ltd.(A) | | | 1,330 | | | | 239,121 | |
KB Home | | | 4,528 | | | | 155,174 | |
Tempur Sealy International, Inc.(A) | | | 2,402 | | | | 209,118 | |
Toll Brothers, Inc. | | | 6,829 | | | | 269,814 | |
TRI Pointe Group, Inc.(A) | | | 7,360 | | | | 114,669 | |
| | | | | | | | |
| | | | | | | 987,896 | |
| | | | | | | | |
| Household Products - 0.2% | |
Energizer Holdings, Inc.(B) | | | 3,401 | | | | 170,798 | |
| | | | | | | | |
| Industrial Conglomerates - 0.5% | |
Carlisle Cos., Inc. | | | 2,996 | | | | 484,873 | |
| | | | | | | | |
| Insurance - 5.1% | |
Alleghany Corp.(A) | | | 761 | | | | 608,473 | |
American Financial Group, Inc. | | | 3,956 | | | | 433,775 | |
Brighthouse Financial, Inc.(A) | | | 5,776 | | | | 226,592 | |
Brown & Brown, Inc. | | | 12,361 | | | | 488,012 | |
CNO Financial Group, Inc. | | | 7,989 | | | | 144,840 | |
First American Financial Corp. | | | 5,938 | | | | 346,304 | |
Genworth Financial, Inc., Class A(A) | | | 26,604 | | | | 117,058 | |
Hanover Insurance Group, Inc. | | | 2,082 | | | | 284,547 | |
Kemper Corp. | | | 3,311 | | | | 256,602 | |
Mercury General Corp. | | | 1,434 | | | | 69,879 | |
Old Republic International Corp. | | | 15,083 | | | | 337,407 | |
Primerica, Inc. | | | 2,186 | | | | 285,404 | |
Reinsurance Group of America, Inc. | | | 3,310 | | | | 539,729 | |
RenaissanceRe Holdings, Ltd. | | | 2,334 | | | | 457,511 | |
RLI Corp. | | | 2,109 | | | | 189,852 | |
Selective Insurance Group, Inc. | | | 3,140 | | | | 204,697 | |
| | | | | | | | |
| | | | | | | 4,990,682 | |
| | | | | | | | |
| Interactive Media & Services - 0.3% | |
TripAdvisor, Inc. | | | 5,554 | | | | 168,730 | |
Yelp, Inc.(A) | | | 3,377 | | | | 117,621 | |
| | | | | | | | |
| | | | | | | 286,351 | |
| | | | | | | | |
| Internet & Direct Marketing Retail - 0.5% | |
Etsy, Inc.(A) | | | 6,263 | | | | 277,451 | |
GrubHub, Inc.(A) (B) | | | 4,834 | | | | 235,126 | |
| | | | | | | | |
| | | | | | | 512,577 | |
| | | | | | | | |
The Notes to Financial Statements are an integral part of this report.
| | |
| Transamerica ETF Trust | | Annual Report 2019 |
Page 7
DeltaShares® S&P 400 Managed Risk ETF
SCHEDULE OF INVESTMENTS (continued)
At December 31, 2019
| | | | | | | | |
| | | Shares | | | Value | |
| COMMON STOCKS (continued) | |
| IT Services - 2.4% | |
CACI International, Inc., Class A(A) | | | 1,324 | | | | $ 330,987 | |
CoreLogic, Inc.(A) | | | 4,203 | | | | 183,713 | |
KBR, Inc. | | | 7,491 | | | | 228,476 | |
LiveRamp Holdings, Inc.(A) | | | 3,578 | | | | 171,994 | |
MAXIMUS, Inc. | | | 3,382 | | | | 251,587 | |
Perspecta, Inc. | | | 7,268 | | | | 192,166 | |
Sabre Corp. | | | 14,477 | | | | 324,864 | |
Science Applications International Corp. | | | 2,594 | | | | 225,730 | |
WEX, Inc.(A) | | | 2,288 | | | | 479,244 | |
| | | | | | | | |
| | | | | | | 2,388,761 | |
| | | | | | | | |
| Leisure Products - 0.8% | |
Brunswick Corp. | | | 4,312 | | | | 258,634 | |
Mattel, Inc.(A) (B) | | | 18,327 | | | | 248,331 | |
Polaris, Inc. | | | 3,039 | | | | 309,066 | |
| | | | | | | | |
| | | | | | | 816,031 | |
| | | | | | | | |
| Life Sciences Tools & Services - 2.1% | |
Bio-Rad Laboratories, Inc., Class A(A) | | | 1,142 | | | | 422,574 | |
Bio-Techne Corp. | | | 2,015 | | | | 442,313 | |
Charles River Laboratories International, Inc.(A) | | | 2,582 | | | | 394,426 | |
PRA Health Sciences, Inc.(A) | | | 3,343 | | | | 371,574 | |
Repligen Corp.(A) | | | 2,477 | | | | 229,123 | |
Syneos Health, Inc.(A) | | | 3,292 | | | | 195,792 | |
| | | | | | | | |
| | | | | | | 2,055,802 | |
| | | | | | | | |
| Machinery - 4.4% | |
AGCO Corp. | | | 3,313 | | | | 255,929 | |
Colfax Corp.(A) | | | 4,419 | | | | 160,763 | |
Crane Co. | | | 2,695 | | | | 232,794 | |
Donaldson Co., Inc. | | | 6,690 | | | | 385,478 | |
Graco, Inc. | | | 8,816 | | | | 458,432 | |
ITT, Inc. | | | 4,636 | | | | 342,647 | |
Kennametal, Inc. | | | 4,380 | | | | 161,578 | |
Lincoln Electric Holdings, Inc. | | | 3,232 | | | | 312,631 | |
Nordson Corp. | | | 2,705 | | | | 440,482 | |
Oshkosh Corp. | | | 3,597 | | | | 340,456 | |
Terex Corp. | | | 3,467 | | | | 103,247 | |
Timken Co. | | | 3,583 | | | | 201,759 | |
Toro Co. | | | 5,635 | | | | 448,941 | |
Trinity Industries, Inc. | | | 5,188 | | | | 114,914 | |
Woodward, Inc. | | | 2,981 | | | | 353,070 | |
| | | | | | | | |
| | | | | | | 4,313,121 | |
| | | | | | | | |
| Marine - 0.3% | |
Kirby Corp.(A) | | | 3,169 | | | | 283,721 | |
| | | | | | | | |
| Media - 1.1% | |
AMC Networks, Inc., Class A(A) | | | 2,330 | | | | 92,035 | |
Cable One, Inc. | | | 266 | | | | 395,933 | |
John Wiley & Sons, Inc., Class A | | | 2,312 | | | | 112,178 | |
Meredith Corp.(B) | | | 2,125 | | | | 68,999 | |
New York Times Co., Class A(B) | | | 7,599 | | | | 244,460 | |
TEGNA, Inc. | | | 11,465 | | | | 191,351 | |
| | | | | | | | |
| | | | | | | 1,104,956 | |
| | | | | | | | |
| Metals & Mining - 2.0% | |
Allegheny Technologies, Inc.(A) (B) | | | 6,665 | | | | 137,699 | |
Carpenter Technology Corp. | | | 2,522 | | | | 125,545 | |
Commercial Metals Co. | | | 6,272 | | | | 139,677 | |
Compass Minerals International, Inc.(B) | | | 1,791 | | | | 109,179 | |
Reliance Steel & Aluminum Co. | | | 3,523 | | | | 421,915 | |
| | | | | | | | |
| | | Shares | | | Value | |
| COMMON STOCKS (continued) | |
| Metals & Mining (continued) | |
Royal Gold, Inc. | | | 3,467 | | | | $ 423,841 | |
Steel Dynamics, Inc. | | | 11,388 | | | | 387,648 | |
U.S. Steel Corp.(B) | | | 8,988 | | | | 102,553 | |
Worthington Industries, Inc. | | | 1,951 | | | | 82,293 | |
| | | | | | | | |
| | | | | | | 1,930,350 | |
| | | | | | | | |
| Multi-Utilities - 0.8% | |
Black Hills Corp. | | | 3,248 | | | | 255,098 | |
MDU Resources Group, Inc. | | | 10,592 | | | | 314,688 | |
NorthWestern Corp. | | | 2,667 | | | | 191,144 | |
| | | | | | | | |
| | | | | | | 760,930 | |
| | | | | | | | |
| Multiline Retail - 0.2% | |
Dillard’s, Inc., Class A(B) | | | 521 | | | | 38,283 | |
Ollie’s Bargain Outlet Holdings, Inc.(A) (B) | | | 2,891 | | | | 188,811 | |
| | | | | | | | |
| | | | | | | 227,094 | |
| | | | | | | | |
| Oil, Gas & Consumable Fuels - 1.5% | |
Antero Midstream Corp.(B) | | | 15,700 | | | | 119,163 | |
Chesapeake Energy Corp.(A) (B) | | | 61,976 | | | | 51,167 | |
CNX Resources Corp.(A) | | | 9,863 | | | | 87,288 | |
EQT Corp.(B) | | | 13,513 | | | | 147,292 | |
Equitrans Midstream Corp.(B) | | | 10,772 | | | | 143,914 | |
Matador Resources Co.(A) | | | 5,796 | | | | 104,154 | |
Murphy Oil Corp.(B) | | | 7,895 | | | | 211,586 | |
PBF Energy, Inc., Class A | | | 5,385 | | | | 168,927 | |
World Fuel Services Corp. | | | 3,457 | | | | 150,103 | |
WPX Energy, Inc.(A) | | | 22,028 | | | | 302,665 | |
| | | | | | | | |
| | | | | | | 1,486,259 | |
| | | | | | | | |
| Paper & Forest Products - 0.3% | |
Domtar Corp. | | | 3,027 | | | | 115,753 | |
Louisiana-Pacific Corp. | | | 6,208 | | | | 184,191 | |
| | | | | | | | |
| | | | | | | 299,944 | |
| | | | | | | | |
| Personal Products - 0.2% | |
Edgewell Personal Care Co.(A) | | | 2,865 | | | | 88,701 | |
Nu Skin Enterprises, Inc., Class A | | | 2,936 | | | | 120,317 | |
| | | | | | | | |
| | | | | | | 209,018 | |
| | | | | | | | |
| Pharmaceuticals - 0.8% | |
Catalent, Inc.(A) | | | 7,734 | | | | 435,424 | |
Nektar Therapeutics(A) (B) | | | 9,299 | | | | 200,719 | |
Prestige Consumer Healthcare, Inc.(A) | | | 2,655 | | | | 107,528 | |
| | | | | | | | |
| | | | | | | 743,671 | |
| | | | | | | | |
| Professional Services - 0.9% | |
ASGN, Inc.(A) | | | 2,791 | | | | 198,077 | |
FTI Consulting, Inc.(A) | | | 1,989 | | | | 220,103 | |
Insperity, Inc. | | | 1,987 | | | | 170,961 | |
ManpowerGroup, Inc. | | | 3,117 | | | | 302,661 | |
| | | | | | | | |
| | | | | | | 891,802 | |
| | | | | | | | |
| Real Estate Management & Development - 0.5% | |
Jones Lang LaSalle, Inc. | | | 2,724 | | | | 474,221 | |
| | | | | | | | |
| Road & Rail - 0.8% | |
Avis Budget Group, Inc.(A) | | | 3,005 | | | | 96,881 | |
Knight-Swift Transportation Holdings, Inc.(B) | | | 6,494 | | | | 232,745 | |
Landstar System, Inc. | | | 2,086 | | | | 237,533 | |
Ryder System, Inc. | | | 2,817 | | | | 152,991 | |
Werner Enterprises, Inc. | | | 2,341 | | | | 85,189 | |
| | | | | | | | |
| | | | | | | 805,339 | |
| | | | | | | | |
The Notes to Financial Statements are an integral part of this report.
| | |
| Transamerica ETF Trust | | Annual Report 2019 |
Page 8
DeltaShares® S&P 400 Managed Risk ETF
SCHEDULE OF INVESTMENTS (continued)
At December 31, 2019
| | | | | | | | |
| | | Shares | | | Value | |
| COMMON STOCKS (continued) | |
| Semiconductors & Semiconductor Equipment - 4.1% | |
Cabot Microelectronics Corp. | | | 1,538 | | | | $ 221,964 | |
Cirrus Logic, Inc.(A) | | | 3,055 | | | | 251,763 | |
Cree, Inc.(A) | | | 5,693 | | | | 262,732 | |
Cypress Semiconductor Corp. | | | 19,521 | | | | 455,425 | |
First Solar, Inc.(A) | | | 4,012 | | | | 224,511 | |
MKS Instruments, Inc. | | | 2,881 | | | | 316,939 | |
Monolithic Power Systems, Inc. | | | 2,135 | | | | 380,073 | |
Semtech Corp.(A) | | | 3,502 | | | | 185,256 | |
Silicon Laboratories, Inc.(A) | | | 2,293 | | | | 265,942 | |
SolarEdge Technologies, Inc.(A) | | | 2,569 | | | | 244,286 | |
Synaptics, Inc.(A) | | | 1,769 | | | | 116,347 | |
Teradyne, Inc. | | | 8,858 | | | | 604,027 | |
Universal Display Corp. | | | 2,241 | | | | 461,803 | |
| | | | | | | | |
| | | | | | | 3,991,068 | |
| | | | | | | | |
| Software - 3.8% | |
ACI Worldwide, Inc.(A) | | | 6,110 | | | | 231,477 | |
Blackbaud, Inc. | | | 2,600 | | | | 206,960 | |
CDK Global, Inc. | | | 6,417 | | | | 350,882 | |
Ceridian HCM Holding, Inc.(A) (B) | | | 5,327 | | | | 361,597 | |
CommVault Systems, Inc.(A) | | | 2,223 | | | | 99,235 | |
Fair Isaac Corp.(A) | | | 1,531 | | | | 573,635 | |
j2 Global, Inc.(B) | | | 2,447 | | | | 229,308 | |
LogMeIn, Inc. | | | 2,580 | | | | 221,209 | |
Manhattan Associates, Inc.(A) | | | 3,378 | | | | 269,396 | |
PTC, Inc.(A) | | | 5,494 | | | | 411,446 | |
Teradata Corp.(A) | | | 5,947 | | | | 159,201 | |
Tyler Technologies, Inc.(A) | | | 2,061 | | | | 618,341 | |
| | | | | | | | |
| | | | | | | 3,732,687 | |
| | | | | | | | |
| Specialty Retail - 2.3% | |
Aaron’s, Inc. | | | 3,550 | | | | 202,741 | |
American Eagle Outfitters, Inc. | | | 8,395 | | | | 123,407 | |
AutoNation, Inc.(A) | | | 3,112 | | | | 151,337 | |
Bed Bath & Beyond, Inc.(B) | | | 6,690 | | | | 115,737 | |
Dick’s Sporting Goods, Inc. | | | 3,362 | | | | 166,385 | |
Five Below, Inc.(A) | | | 2,943 | | | | 376,292 | |
Foot Locker, Inc. | | | 5,658 | | | | 220,605 | |
Murphy USA, Inc.(A) | | | 1,528 | | | | 178,776 | |
RH(A) | | | 862 | | | | 184,037 | |
Sally Beauty Holdings, Inc.(A) (B) | | | 6,149 | | | | 112,219 | |
Urban Outfitters, Inc.(A) | | | 3,729 | | | | 103,554 | |
Williams-Sonoma, Inc.(B) | | | 4,102 | | | | 301,251 | |
| | | | | | | | |
| | | | | | | 2,236,341 | |
| | | | | | | | |
| Technology Hardware, Storage & Peripherals - 0.2% | |
NCR Corp.(A) | | | 6,745 | | | | 237,154 | |
| | | | | | | | |
| | | | | | | | |
| | | Shares | | | Value | |
| COMMON STOCKS (continued) | |
| Textiles, Apparel & Luxury Goods - 1.0% | |
Carter’s, Inc. | | | 2,334 | | | | $ 255,199 | |
Columbia Sportswear Co.(B) | | | 1,535 | | | | 153,792 | |
Deckers Outdoor Corp.(A) | | | 1,479 | | | | 249,744 | |
Skechers U.S.A., Inc., Class A(A) | | | 7,078 | | | | 305,699 | |
| | | | | | | | |
| | | | | | | 964,434 | |
| | | | | | | | |
| Thrifts & Mortgage Finance - 0.6% | |
LendingTree, Inc.(A) (B) | | | 405 | | | | 122,893 | |
New York Community Bancorp, Inc. | | | 24,703 | | | | 296,930 | |
Washington Federal, Inc. | | | 4,141 | | | | 151,768 | |
| | | | | | | | |
| | | | | | | 571,591 | |
| | | | | | | | |
| Trading Companies & Distributors - 0.7% | |
GATX Corp. | | | 1,855 | | | | 153,687 | |
MSC Industrial Direct Co., Inc., Class A | | | 2,381 | | | | 186,837 | |
NOW, Inc.(A) | | | 5,751 | | | | 64,641 | |
Watsco, Inc. | | | 1,726 | | | | 310,939 | |
| | | | | | | | |
| | | | | | | 716,104 | |
| | | | | | | | |
| Water Utilities - 0.6% | |
Aqua America, Inc. | | | 11,409 | | | | 535,538 | |
| | | | | | | | |
| Wireless Telecommunication Services - 0.1% | |
Telephone & Data Systems, Inc. | | | 5,170 | | | | 131,473 | |
| | | | | | | | |
Total Common Stocks
(Cost $87,494,639) | | | | 96,512,753 | |
| | | | | |
|
| SHORT-TERM INVESTMENT COMPANY - 1.0% | |
| Money Market Fund - 1.0% | |
State Street Institutional Treasury Money Market Fund, 1.44%(C) | | | 926,406 | | | | 926,406 | |
| | | | | | | | |
Total Short-Term Investment Company
(Cost $926,406) | | | | 926,406 | |
| | | | | |
|
| OTHER INVESTMENT COMPANY - 9.0% | |
| Securities Lending Collateral - 9.0% | |
State Street Navigator Securities Lending Trust - Government Money Market Portfolio, 1.56%(C) | | | 8,808,019 | | | | 8,808,019 | |
| | | | | | | | |
Total Other Investment Company
(Cost $8,808,019) | | | | 8,808,019 | |
| | | | | |
Total Investments
(Cost $97,229,064) | | | | 106,247,178 | |
Net Other Assets (Liabilities) - (8.7)% | | | | | | | (8,482,495 | ) |
| | | | | | | | |
| | |
Net Assets - 100.0% | | | | | | | $ 97,764,683 | |
| | | | | | | | |
| |
FUTURES CONTRACTS:
| | | | | | | | | | | | | | | | | | | | | | | | |
Long Futures Contracts | |
| Description | | Number of
Contracts | | | Expiration
Date | | | Notional
Amount | | | Value | | | Unrealized
Appreciation | | | Unrealized
Depreciation | |
S&P Midcap 400®E-Mini Index | | | 6 | | | | 03/20/2020 | | | $ | 1,226,608 | | | $ | 1,238,880 | | | $ | 12,272 | | | $ | — | |
The Notes to Financial Statements are an integral part of this report.
| | |
| Transamerica ETF Trust | | Annual Report 2019 |
Page 9
DeltaShares® S&P 400 Managed Risk ETF
SCHEDULE OF INVESTMENTS (continued)
At December 31, 2019
SECURITY VALUATION:
Valuation Inputs(D)
| | | | | | | | | | | | | | | | | | |
| | | Level 1 -
Unadjusted
Quoted Prices | | | Level 2 -
Other Significant
Observable Inputs | | | Level 3 -
Significant
Unobservable Inputs | | | Value | |
ASSETS | |
Investments | |
Common Stocks | | $ | 96,512,753 | | | $ | — | | | $ | — | | | $ | 96,512,753 | |
Short-Term Investment Company | | | 926,406 | | | | — | | | | — | | | | 926,406 | |
Other Investment Company | | | 8,808,019 | | | | — | | | | — | | | | 8,808,019 | |
| | | | | | | | | | | | | | | | |
Total Investments | | $ | 106,247,178 | | | $ | — | | | $ | — | | | $ | 106,247,178 | |
| | | | | | | | | | | | | | | | |
Other Financial Instruments | |
Futures Contracts(E) | | $ | 12,272 | | | $ | — | | | $ | — | | | $ | 12,272 | |
| | | | | | | | | | | | | | | | |
Total Other Financial Instruments | | $ | 12,272 | | | $ | — | | | $ | — | | | $ | 12,272 | |
| | | | | | | | | | | | | | | | |
FOOTNOTES TO SCHEDULE OF INVESTMENTS:
| | |
| (A) | | Non-income producing securities. |
| (B) | | All or a portion of the securities are on loan. The total value of all securities on loan is $8,592,139. The amount of securities on loan indicated may not correspond with the securities on loan identified because securities with pending sales are in the process of recall from the brokers. |
| (C) | | Rates disclosed reflect the yields at December 31, 2019. |
| (D) | | There were no transfers in or out of Level 3 during the year ended December 31, 2019. Please reference the Security Valuation section of the Notes to Financial Statements for more information regarding security valuation and pricing inputs. |
| (E) | | Futures contracts and/or forward foreign currency contracts are valued at unrealized appreciation (depreciation). |
The Notes to Financial Statements are an integral part of this report.
| | |
| Transamerica ETF Trust | | Annual Report 2019 |
Page 10
DeltaShares® S&P 500 Managed Risk ETF
(unaudited)
MARKET ENVIRONMENT
Stocks across the world posted positive returns in 2019. The S&P 500® also posted strong performance in 2019.
Global stock markets began the year on a positive note, with a snap recovery from the late December 2018 trough. This continued throughout January and shrugged off the longest government shutdown in U.S. history. Markets largely continued to rally through April, but gave up roughly half of theiryear-to-date gains in May. The loss was broad based, with domestic, international developed, and emerging markets all finishing the month sharply lower. However, the second quarter of 2019 finished on a higher note, with May losses closely mirrored by June gains, to complete a low volatilityV-shaped quarter.
Domestic equity returns remained in positive territory in July with the S&P 500® hitting the 3,000 price level for the first time in history. In contrast, both developed and emerging market equities fluctuated between positive and negative territory, ending the month with losses. Equity volatility picked up in August, but remained somewhat moderate. During this time, bond markets rallied around the globe. While the U.S. Federal Reserve (“Fed”) had merely paused rate hikes for the first half of the year, the Fed commenced the first of three consecutive cuts in August. Volatility then subsided, and experienced further declines, boosted by the “Phase One Trade Deal” announced in December as markets rallied through the fiscal year end.
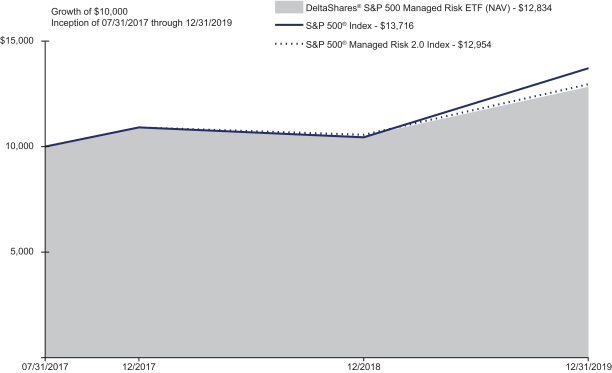
PERFORMANCE OVERVIEW
For the year ended December 31, 2019, the DeltaShares® S&P 500 Managed Risk ETF (NAV) returned 22.30%. By comparison, the S&P 500® Managed Risk 2.0 Index (the “Underlying Index”) returned 22.74% and the S&P 500® Index returned 31.49%.
The Fund’s performance reflects annual operating expenses of the Fund, including management fees, brokerage expenses, and other fees and expenses. Index returns do not reflect fees and expenses of any kind, which would have a negative impact on returns.
STRATEGY REVIEW
The DeltaShares® S&P 500 Managed Risk ETF (the “Fund”) seeks to track the investment results, before fees and expenses, of the Underlying Index.
The Fund seeks to achieve this investment objective by holding a portfolio of securities that are included in the Underlying Index, including common stocks, U.S. Treasury bonds, and/or cash. The Underlying Index is designed to simulate, through a rules-based methodology, a dynamic portfolio with the aim of both managing the volatility of the Underlying Index and limiting losses from the Underlying Index’s equity exposure due to severe sustained market declines. The Underlying Index seeks to achieve these objectives by allocating weightings among the S&P 500® Index, the S&P U.S. Treasury Bond Current5-Year Index, and the S&P U.S. Treasury Bill0-3 Month Index. The Fund may also use derivatives in an effort to gain exposure to underlying securities and markets in a more efficient manner, to optimize the execution processes and costs for portfolio transitions or for tax management purposes. Under normal circumstances, the Fund uses a replication strategy and generally expects to invest in substantially all of the securities in the Underlying Index.
During the12-month period ended December 31, 2019, the largest contributors to the Fund’s absolute total return were equities within the information technology, financials, communications services, and health care sectors. From both an asset class and equity sector perspective, there were no detractors during the period, but the least impactful contributors were U.S. Treasury bonds as well as equities within the energy and materials sectors.
During the fiscal year, the Fund used derivatives. These positions added to performance.
Blake Graves, CFA
Charles Lowery, CFA
Louis Ng
Co-Portfolio Managers
Milliman Financial Risk Management LLC
| | | | |
| Asset Allocation | | Percentage of Net
Assets | |
Common Stocks | | | 98.5 | % |
Short-Term Investment Company | | | 1.3 | |
Other Investment Company | | | 0.4 | |
Net Other Assets (Liabilities) ^ | | | (0.2 | ) |
Total | | | 100.0 | % |
| | | | |
| Current | and future portfolio holdings are subject to change and risk. |
| ^ | The Net Other Assets (Liabilities) category may include, but is not limited to, reverse repurchase agreements, forward foreign currency contracts, futures contracts, swap agreements, written options and swaptions, and cash collateral. |
| | |
| Transamerica ETF Trust | | Annual Report 2019 |
Page 11
DeltaShares® S&P 500 Managed Risk ETF
(unaudited)
| | | | | | | | | | | | | | | | | | | | | | | | | | | | |
Performance as of December 31, 2019 | | | | | | | | | | | | | | | | |
| | | Average Annual Total Returns | | | | | | | | Cumulative Total Returns | | | | | | | | Inception Date | |
| | | 1 Year | | | 10 Year or
Since
Inception | | | | | | 1 Year | | | 10 Year or
Since
Inception | | | | | | | |
Fund NAV | | | 22.30 | % | | | 10.85 | % | | | | | | | 22.30 | % | | | 28.34 | % | | | | | | | 07/31/2017 | |
Fund Market | | | 22.42 | % | | | 10.82 | % | | | | | | | 22.42 | % | | | 28.24 | % | | | | | | | 07/31/2017 | |
S&P 500® Index(A) | | | 31.49 | % | | | 13.94 | % | | | | | | | 31.49 | % | | | 37.16 | % | | | | | | | | |
S&P 500® Managed Risk 2.0 Index (A)(B)(C)(D) | | | 22.74 | % | | | 11.28 | % | | | | | | | 22.74 | % | | | 29.54 | % | | | | | | | | |
(A) The S&P 500® Index is a market-capitalization weighted index of 500 large U.S. companies with common stock listed on the NYSE or NASDAQ.
(B) The S&P 500® Managed Risk 2.0 Index is comprised of weightings amongst the S&P 500® Index, the S&P U.S. Treasury Bond Current5-Year Index, and the S&P U.S. Treasury Bill0-3 Month Index. The S&P 500® Managed Risk 2.0 Index rebalances on a daily basis.
(C) The S&P U.S. Treasury Bond Current5-Year Index is aone-security index comprising the most recently issued5-year U.S. Treasury note or bond.
(D) The S&P U.S. Treasury Bill0-3 Month Index is designed to measure the performance of U.S. Treasury bills maturing in 0 to 3 months.
The Fund’s benchmarks are unmanaged indices used as a general measure of market performance. Calculations assume dividends and capital gains are reinvested and do not include any managerial expenses. The 10 Years or the Since Inception calculation is based on the previous 10 years or since the inception date, whichever is more recent. An index is a statistical measure of a specified financial market or sector. An index does not actually hold a portfolio of securities and therefore does not reflect deductions for fees or expenses. In comparison, a Fund’s performance is negatively impacted by these deductions. You cannot invest directly in an index.
The performance data presented represents past performance and does not guarantee future results. Performance data does not reflect the deduction of taxes that would be paid on Fund distributions or the redemption of Fund shares. The Fund’s investment return and net asset value will fluctuate. Investors’ shares when sold may be worth more or less than their original cost. Current performance may be lower or higher than performance quoted. Please see www.deltashares.com for performance data current to the most recent month end. Fund performance is net of investment fees and Fund expenses.
Performance results do not include adjustments made for financial reporting purposes in accordance with U.S. generally accepted accounting principles and may differ from amounts reported in the Financial Highlights.
Fund shares are bought and sold at Market Price, not Net Asset Value (“NAV”), and are not individually redeemed from the fund. Net Asset Value is an exchange-traded fund’s per-share value. The per-share dollar amount of the Fund is derived by dividing the total value of all the securities in the portfolio, less any liabilities, by the number of Fund shares outstanding. Market Price is the price at which a share can currently be traded in the market. The market price used to calculate the market return is determined by using the midpoint between the highest bid and the lowest offer on the exchange on which the shares of the Fund are listed for trading, as of the time that the Fund’s NAV is calculated.
Exchange-Traded Funds (ETFs) are subject to market risk, including the loss of principal. Because Fund Shares trade at market prices rather than at NAV, Fund Shares may trade at a price greater than NAV (premium) or less than NAV (discount). Shares of DeltaShares® ETFs may be bought and sold throughout the day on the exchange through any brokerage account. Buying and selling shares of ETFs will result in brokerage commissions. Diversification and asset allocation may not protect against market risk or loss of principal. Investing involves risk, including the possible loss of principal. There is no guarantee the investment objective will be achieved. Equity securities represent an ownership interest in an issuer, rank junior in a company’s capital structure and consequently may entail greater risk of loss than debt securities. The market prices of fixed-income securities may go up or down, sometimes rapidly and unpredictably, due to general market conditions, such as real or perceived adverse economic or political conditions, inflation, changes in interest rates, lack of liquidity in the bond markets or adverse investor sentiment. The principal risks include risks related to: Equity securities, index tracking, leveraging, derivatives such as futures, forwards, swaps, options, and investing in underlying exchange-traded funds. The use of derivatives may produce disproportionate gains or losses, may increase costs, and amplify risks.
| | |
| Transamerica ETF Trust | | Annual Report 2019 |
Page 12
DeltaShares® S&P 500 Managed Risk ETF
SCHEDULE OF INVESTMENTS
At December 31, 2019
| | | | | | | | |
| | | Shares | | | Value | |
| COMMON STOCKS - 98.5% | |
| Aerospace & Defense - 2.4% | |
Arconic, Inc. | | | 6,107 | | | | $ 187,912 | |
Boeing Co. | | | 8,429 | | | | 2,745,831 | |
General Dynamics Corp. | | | 3,694 | | | | 651,437 | |
Huntington Ingalls Industries, Inc. | | | 645 | | | | 161,818 | |
L3 Harris Technologies, Inc. | | | 3,485 | | | | 689,577 | |
Lockheed Martin Corp. | | | 3,913 | | | | 1,523,644 | |
Northrop Grumman Corp. | | | 2,471 | | | | 849,950 | |
Raytheon Co. | | | 4,390 | | | | 964,659 | |
Textron, Inc. | | | 3,599 | | | | 160,515 | |
TransDigm Group, Inc. | | | 785 | | | | 439,600 | |
United Technologies Corp. | | | 12,790 | | | | 1,915,430 | |
| | | | | | | | |
| | | | | | | 10,290,373 | |
| | | | | | | | |
| Air Freight & Logistics - 0.5% | |
CH Robinson Worldwide, Inc. | | | 2,132 | | | | 166,722 | |
Expeditors International of Washington, Inc. | | | 2,685 | | | | 209,484 | |
FedEx Corp. | | | 3,784 | | | | 572,179 | |
United Parcel Service, Inc., Class B | | | 11,047 | | | | 1,293,162 | |
| | | | | | | | |
| | | | | | | 2,241,547 | |
| | | | | | | | |
| Airlines - 0.4% | |
Alaska Air Group, Inc. | | | 1,942 | | | | 131,570 | |
American Airlines Group, Inc.(A) | | | 6,146 | | | | 176,267 | |
Delta Air Lines, Inc. | | | 9,074 | | | | 530,648 | |
Southwest Airlines Co. | | | 7,467 | | | | 403,069 | |
United Airlines Holdings, Inc.(B) | | | 3,431 | | | | 302,237 | |
| | | | | | | | |
| | | | | | | 1,543,791 | |
| | | | | | | | |
| Auto Components - 0.1% | |
Aptiv PLC | | | 4,025 | | | | 382,254 | |
BorgWarner, Inc. | | | 3,255 | | | | 141,202 | |
| | | | | | | | |
| | | | | | | 523,456 | |
| | | | | | | | |
| Automobiles - 0.3% | |
Ford Motor Co. | | | 61,389 | | | | 570,918 | |
General Motors Co. | | | 19,821 | | | | 725,448 | |
Harley-Davidson, Inc. | | | 2,432 | | | | 90,446 | |
| | | | | | | | |
| | | | | | | 1,386,812 | |
| | | | | | | | |
| Banks - 5.5% | |
Bank of America Corp. | | | 127,625 | | | | 4,494,953 | |
Citigroup, Inc. | | | 34,417 | | | | 2,749,574 | |
Citizens Financial Group, Inc. | | | 6,853 | | | | 278,300 | |
Comerica, Inc. | | | 2,273 | | | | 163,088 | |
Fifth Third Bancorp | | | 11,188 | | | | 343,919 | |
First Republic Bank | | | 2,657 | | | | 312,065 | |
Huntington Bancshares, Inc. | | | 16,281 | | | | 245,517 | |
JPMorgan Chase & Co. | | | 49,446 | | | | 6,892,772 | |
KeyCorp | | | 15,528 | | | | 314,287 | |
M&T Bank Corp. | | | 2,080 | | | | 353,080 | |
People’s United Financial, Inc. | | | 7,001 | | | | 118,317 | |
PNC Financial Services Group, Inc. | | | 6,908 | | | | 1,102,724 | |
Regions Financial Corp. | | | 15,207 | | | | 260,952 | |
SVB Financial Group(B) | | | 813 | | | | 204,096 | |
Truist Financial Corp. | | | 21,142 | | | | 1,190,717 | |
US Bancorp | | | 22,406 | | | | 1,328,452 | |
Wells Fargo & Co. | | | 60,674 | | | | 3,264,261 | |
Zions Bancorp NA | | | 2,687 | | | | 139,509 | |
| | | | | | | | |
| | | | | | | 23,756,583 | |
| | | | | | | | |
| Beverages - 1.8% | |
Brown-Forman Corp., Class B | | | 2,872 | | | | 194,147 | |
| | | | | | | | |
| | | Shares | | | Value | |
| COMMON STOCKS (continued) | |
| Beverages (continued) | |
Coca-Cola Co. | | | 60,789 | | | | $ 3,364,671 | |
Constellation Brands, Inc., Class A | | | 2,641 | | | | 501,130 | |
Molson Coors Brewing Co., Class B | | | 2,962 | | | | 159,652 | |
Monster Beverage Corp.(B) | | | 6,018 | | | | 382,444 | |
PepsiCo, Inc. | | | 21,983 | | | | 3,004,416 | |
| | | | | | | | |
| | | | | | | 7,606,460 | |
| | | | | | | | |
| Biotechnology - 2.0% | |
AbbVie, Inc. | | | 23,313 | | | | 2,064,133 | |
Alexion Pharmaceuticals, Inc.(B) | | | 3,489 | | | | 377,335 | |
Amgen, Inc. | | | 9,367 | | | | 2,258,103 | |
Biogen, Inc.(B) | | | 2,845 | | | | 844,197 | |
Gilead Sciences, Inc. | | | 19,945 | | | | 1,296,026 | |
Incyte Corp.(B) | | | 2,818 | | | | 246,068 | |
Regeneron Pharmaceuticals, Inc.(B) | | | 1,259 | | | | 472,729 | |
Vertex Pharmaceuticals, Inc.(B) | | | 4,054 | | | | 887,623 | |
| | | | | | | | |
| | | | | | | 8,446,214 | |
| | | | | | | | |
| Building Products - 0.3% | |
A.O. Smith Corp. | | | 2,161 | | | | 102,950 | |
Allegion PLC | | | 1,465 | | | | 182,451 | |
Fortune Brands Home & Security, Inc. | | | 2,194 | | | | 143,356 | |
Johnson Controls International PLC | | | 12,161 | | | | 495,075 | |
Masco Corp. | | | 4,479 | | | | 214,947 | |
| | | | | | | | |
| | | | | | | 1,138,779 | |
| | | | | | | | |
| Capital Markets - 2.6% | |
Ameriprise Financial, Inc. | | | 1,997 | | | | 332,660 | |
Bank of New York Mellon Corp. | | | 13,230 | | | | 665,866 | |
BlackRock, Inc. | | | 1,859 | | | | 934,519 | |
Cboe Global Markets, Inc. | | | 1,748 | | | | 209,760 | |
Charles Schwab Corp. | | | 18,023 | | | | 857,174 | |
CME Group, Inc. | | | 5,649 | | | | 1,133,867 | |
E*TRADE Financial Corp. | | | 3,562 | | | | 161,608 | |
Franklin Resources, Inc. | | | 4,397 | | | | 114,234 | |
Goldman Sachs Group, Inc. | | | 5,024 | | | | 1,155,168 | |
Intercontinental Exchange, Inc. | | | 8,779 | | | | 812,496 | |
Invesco, Ltd. | | | 5,868 | | | | 105,507 | |
MarketAxess Holdings, Inc. | | | 598 | | | | 226,708 | |
Moody’s Corp. | | | 2,560 | | | | 607,770 | |
Morgan Stanley | | | 19,393 | | | | 991,370 | |
MSCI, Inc. | | | 1,335 | | | | 344,670 | |
Nasdaq, Inc. | | | 1,809 | | | | 193,744 | |
Northern Trust Corp. | | | 3,340 | | | | 354,842 | |
Raymond James Financial, Inc. | | | 1,946 | | | | 174,089 | |
S&P Global, Inc. | | | 3,853 | | | | 1,052,062 | |
State Street Corp. | | | 5,732 | | | | 453,401 | |
T. Rowe Price Group, Inc. | | | 3,684 | | | | 448,859 | |
| | | | | | | | |
| | | | | | | 11,330,374 | |
| | | | | | | | |
| Chemicals - 1.9% | |
Air Products & Chemicals, Inc. | | | 3,475 | | | | 816,590 | |
Albemarle Corp. | | | 1,672 | | | | 122,123 | |
Celanese Corp. | | | 1,906 | | | | 234,667 | |
CF Industries Holdings, Inc. | | | 3,428 | | | | 163,653 | |
Corteva, Inc. | | | 11,798 | | | | 348,749 | |
Dow, Inc. | | | 11,689 | | | | 639,739 | |
DuPont de Nemours, Inc. | | | 11,679 | | | | 749,792 | |
Eastman Chemical Co. | | | 2,144 | | | | 169,933 | |
Ecolab, Inc. | | | 3,953 | | | | 762,889 | |
The Notes to Financial Statements are an integral part of this report.
| | |
| Transamerica ETF Trust | | Annual Report 2019 |
Page 13
DeltaShares® S&P 500 Managed Risk ETF
SCHEDULE OF INVESTMENTS (continued)
At December 31, 2019
| | | | | | | | |
| | | Shares | | | Value | |
| COMMON STOCKS (continued) | |
| Chemicals (continued) | |
FMC Corp. | | | 2,043 | | | | $ 203,932 | |
International Flavors & Fragrances, Inc.(A) | | | 1,683 | | | | 217,141 | |
Linde PLC | | | 8,468 | | | | 1,802,837 | |
LyondellBasell Industries NV, Class A | | | 4,047 | | | | 382,360 | |
Mosaic Co. | | | 5,512 | | | | 119,280 | |
PPG Industries, Inc. | | | 3,728 | | | | 497,651 | |
Sherwin-Williams Co. | | | 1,295 | | | | 755,684 | |
| | | | | | | | |
| | | | | | | 7,987,020 | |
| | | | | | | | |
| Commercial Services & Supplies - 0.4% | |
Cintas Corp. | | | 1,322 | | | | 355,724 | |
Copart, Inc.(B) | | | 3,225 | | | | 293,282 | |
Republic Services, Inc. | | | 3,321 | | | | 297,661 | |
Rollins, Inc. | | | 2,220 | | | | 73,615 | |
Waste Management, Inc. | | | 6,153 | | | | 701,196 | |
| | | | | | | | |
| | | | | | | 1,721,478 | |
| | | | | | | | |
| Communications Equipment - 1.0% | |
Arista Networks, Inc.(B) | | | 855 | | | | 173,907 | |
Cisco Systems, Inc. | | | 66,878 | | | | 3,207,469 | |
F5 Networks, Inc.(B) | | | 958 | | | | 133,785 | |
Juniper Networks, Inc. | | | 5,277 | | | | 129,972 | |
Motorola Solutions, Inc. | | | 2,701 | | | | 435,239 | |
| | | | | | | | |
| | | | | | | 4,080,372 | |
| | | | | | | | |
| Construction & Engineering - 0.1% | |
Jacobs Engineering Group, Inc. | | | 2,136 | | | | 191,877 | |
Quanta Services, Inc. | | | 2,243 | | | | 91,312 | |
| | | | | | | | |
| | | | | | | 283,189 | |
| | | | | | | | |
| Construction Materials - 0.1% | |
Martin Marietta Materials, Inc. | | | 985 | | | | 275,446 | |
Vulcan Materials Co. | | | 2,087 | | | | 300,507 | |
| | | | | | | | |
| | | | | | | 575,953 | |
| | | | | | | | |
| Consumer Finance - 0.7% | |
American Express Co. | | | 10,578 | | | | 1,316,855 | |
Capital One Financial Corp. | | | 7,342 | | | | 755,565 | |
Discover Financial Services | | | 4,942 | | | | 419,181 | |
Synchrony Financial | | | 9,372 | | | | 337,486 | |
| | | | | | | | |
| | | | | | | 2,829,087 | |
| | | | | | | | |
| Containers & Packaging - 0.3% | |
Amcor PLC | | | 25,541 | | | | 276,865 | |
Avery Dennison Corp. | | | 1,316 | | | | 172,159 | |
Ball Corp. | | | 5,157 | | | | 333,503 | |
International Paper Co. | | | 6,182 | | | | 284,681 | |
Packaging Corp. of America | | | 1,492 | | | | 167,089 | |
Sealed Air Corp. | | | 2,436 | | | | 97,026 | |
WestRock Co. | | | 4,066 | | | | 174,472 | |
| | | | | | | | |
| | | | | | | 1,505,795 | |
| | | | | | | | |
| Distributors - 0.1% | |
Genuine Parts Co. | | | 2,291 | | | | 243,373 | |
LKQ Corp.(B) | | | 4,831 | | | | 172,467 | |
| | | | | | | | |
| | | | | | | 415,840 | |
| | | | | | | | |
| Diversified Consumer Services - 0.0%(C) | |
H&R Block, Inc. | | | 3,078 | | | | 72,271 | |
| | | | | | | | |
| Diversified Financial Services - 1.6% | |
Berkshire Hathaway, Inc., Class B(B) | | | 30,836 | | | | 6,984,354 | |
| | | | | | | | |
| | | | | | | | |
| | | Shares | | | Value | |
| COMMON STOCKS (continued) | |
| Diversified Telecommunication Services - 2.0% | |
AT&T, Inc. | | | 115,161 | | | | $ 4,500,492 | |
CenturyLink, Inc. | | | 15,468 | | | | 204,332 | |
Verizon Communications, Inc. | | | 65,200 | | | | 4,003,280 | |
| | | | | | | | |
| | | | | | | 8,708,104 | |
| | | | | | | | |
| Electric Utilities - 2.0% | |
Alliant Energy Corp. | | | 3,789 | | | | 207,334 | |
American Electric Power Co., Inc. | | | 7,787 | | | | 735,949 | |
Duke Energy Corp. | | | 11,493 | | | | 1,048,277 | |
Edison International | | | 5,653 | | | | 426,293 | |
Entergy Corp. | | | 3,139 | | | | 376,052 | |
Evergy, Inc. | | | 3,593 | | | | 233,868 | |
Eversource Energy | | | 5,104 | | | | 434,197 | |
Exelon Corp. | | | 15,325 | | | | 698,667 | |
FirstEnergy Corp. | | | 8,518 | | | | 413,975 | |
NextEra Energy, Inc. | | | 7,705 | | | | 1,865,843 | |
Pinnacle West Capital Corp. | | | 1,772 | | | | 159,356 | |
PPL Corp. | | | 11,398 | | | | 408,960 | |
Southern Co. | | | 16,533 | | | | 1,053,152 | |
Xcel Energy, Inc. | | | 8,267 | | | | 524,872 | |
| | | | | | | | |
| | | | | | | 8,586,795 | |
| | | | | | | | |
| Electrical Equipment - 0.5% | |
AMETEK, Inc. | | | 3,604 | | | | 359,463 | |
Eaton Corp. PLC | | | 6,517 | | | | 617,290 | |
Emerson Electric Co. | | | 9,603 | | | | 732,325 | |
Rockwell Automation, Inc. | | | 1,822 | | | | 369,265 | |
| | | | | | | | |
| | | | | | | 2,078,343 | |
| | | | | | | | |
| Electronic Equipment, Instruments & Components - 0.6% | |
Amphenol Corp., Class A | | | 4,674 | | | | 505,867 | |
CDW Corp. | | | 2,265 | | | | 323,533 | |
Corning, Inc. | | | 12,125 | | | | 352,959 | |
FLIR Systems, Inc. | | | 2,115 | | | | 110,128 | |
IPG Photonics Corp.(B) | | | 561 | | | | 81,300 | |
Keysight Technologies, Inc.(B) | | | 2,957 | | | | 303,477 | |
TE Connectivity, Ltd. | | | 5,273 | | | | 505,364 | |
Zebra Technologies Corp., Class A(B) | | | 850 | | | | 217,124 | |
| | | | | | | | |
| | | | | | | 2,399,752 | |
| | | | | | | | |
| Energy Equipment & Services - 0.4% | |
Baker Hughes Co. | | | 10,245 | | | | 262,580 | |
Halliburton Co. | | | 13,838 | | | | 338,616 | |
Helmerich & Payne, Inc. | | | 1,710 | | | | 77,685 | |
National Oilwell Varco, Inc. | | | 6,083 | | | | 152,379 | |
Schlumberger, Ltd. | | | 21,825 | | | | 877,365 | |
TechnipFMC PLC | | | 6,625 | | | | 142,040 | |
| | | | | | | | |
| | | | | | | 1,850,665 | |
| | | | | | | | |
| Entertainment - 1.9% | |
Activision Blizzard, Inc. | | | 12,111 | | | | 719,636 | |
Electronic Arts, Inc.(B) | | | 4,603 | | | | 494,869 | |
Live Nation Entertainment, Inc.(B) | | | 2,222 | | | | 158,806 | |
Netflix, Inc.(B) | | | 6,909 | | | | 2,235,545 | |
Take-Two Interactive Software, Inc.(B) | | | 1,784 | | | | 218,415 | |
Walt Disney Co. | | | 28,414 | | | | 4,109,517 | |
| | | | | | | | |
| | | | | | | 7,936,788 | |
| | | | | | | | |
| Equity Real Estate Investment Trusts - 2.8% | |
Alexandria Real Estate Equities, Inc. | | | 1,815 | | | | 293,268 | |
American Tower Corp. | | | 6,983 | | | | 1,604,833 | |
The Notes to Financial Statements are an integral part of this report.
| | |
| Transamerica ETF Trust | | Annual Report 2019 |
Page 14
DeltaShares® S&P 500 Managed Risk ETF
SCHEDULE OF INVESTMENTS (continued)
At December 31, 2019
| | | | | | | | |
| | | Shares | | | Value | |
| COMMON STOCKS (continued) | |
| Equity Real Estate Investment Trusts (continued) | |
Apartment Investment & Management Co., Class A | | | 2,347 | | | | $ 121,223 | |
AvalonBay Communities, Inc. | | | 2,202 | | | | 461,759 | |
Boston Properties, Inc. | | | 2,267 | | | | 312,529 | |
Crown Castle International Corp. | | | 6,554 | | | | 931,651 | |
Digital Realty Trust, Inc.(A) | | | 3,290 | | | | 393,945 | |
Duke Realty Corp. | | | 5,795 | | | | 200,913 | |
Equinix, Inc. | | | 1,344 | | | | 784,493 | |
Equity Residential | | | 5,503 | | | | 445,303 | |
Essex Property Trust, Inc. | | | 1,042 | | | | 313,496 | |
Extra Space Storage, Inc. | | | 2,042 | | | | 215,676 | |
Federal Realty Investment Trust | | | 1,107 | | | | 142,504 | |
Healthpeak Properties, Inc. | | | 7,803 | | | | 268,969 | |
Host Hotels & Resorts, Inc. | | | 11,306 | | | | 209,726 | |
Iron Mountain, Inc.(A) | | | 4,527 | | | | 144,275 | |
Kimco Realty Corp. | | | 6,656 | | | | 137,846 | |
Mid-America Apartment Communities, Inc. | | | 1,798 | | | | 237,084 | |
Prologis, Inc. | | | 9,959 | | | | 887,745 | |
Public Storage | | | 2,368 | | | | 504,289 | |
Realty Income Corp. | | | 5,138 | | | | 378,311 | |
Regency Centers Corp. | | | 2,642 | | | | 166,684 | |
SBA Communications Corp. | | | 1,775 | | | | 427,757 | |
Simon Property Group, Inc. | | | 4,838 | | | | 720,668 | |
SL Green Realty Corp. | | | 1,285 | | | | 118,066 | |
UDR, Inc. | | | 4,620 | | | | 215,754 | |
Ventas, Inc. | | | 5,876 | | | | 339,280 | |
Vornado Realty Trust | | | 2,497 | | | | 166,051 | |
Welltower, Inc. | | | 6,397 | | | | 523,147 | |
Weyerhaeuser Co. | | | 11,747 | | | | 354,759 | |
| | | | | | | | |
| | | | | | | 12,022,004 | |
| | | | | | | | |
| Food & Staples Retailing - 1.5% | |
Costco Wholesale Corp. | | | 6,965 | | | | 2,047,153 | |
Kroger Co. | | | 12,643 | | | | 366,520 | |
Sysco Corp. | | | 8,044 | | | | 688,084 | |
Walgreens Boots Alliance, Inc. | | | 11,819 | | | | 696,848 | |
Walmart, Inc. | | | 22,364 | | | | 2,657,738 | |
| | | | | | | | |
| | | | | | | 6,456,343 | |
| | | | | | | | |
| Food Products - 1.1% | |
Archer-Daniels-Midland Co. | | | 8,776 | | | | 406,768 | |
Campbell Soup Co. | | | 2,663 | | | | 131,606 | |
Conagra Brands, Inc. | | | 7,672 | | | | 262,689 | |
General Mills, Inc. | | | 9,528 | | | | 510,320 | |
Hershey Co. | | | 2,338 | | | | 343,639 | |
Hormel Foods Corp. | | | 4,384 | | | | 197,762 | |
J.M. Smucker Co. | | | 1,798 | | | | 187,226 | |
Kellogg Co. | | | 3,925 | | | | 271,453 | |
Kraft Heinz Co. | | | 9,818 | | | | 315,452 | |
Lamb Weston Holdings, Inc. | | | 2,303 | | | | 198,127 | |
McCormick & Co., Inc. | | | 1,948 | | | | 330,634 | |
Mondelez International, Inc., Class A | | | 22,698 | | | | 1,250,206 | |
Tyson Foods, Inc., Class A | | | 4,653 | | | | 423,609 | |
| | | | | | | | |
| | | | | | | 4,829,491 | |
| | | | | | | | |
| Gas Utilities - 0.0%(C) | |
Atmos Energy Corp. | | | 1,881 | | | | 210,409 | |
| | | | | | | | |
| Health Care Equipment & Supplies - 3.5% | |
Abbott Laboratories | | | 27,863 | | | | 2,420,180 | |
ABIOMED, Inc.(B) | | | 712 | | | | 121,460 | |
| | | | | | | | |
| | | Shares | | | Value | |
| COMMON STOCKS (continued) | |
| Health Care Equipment & Supplies (continued) | |
Align Technology, Inc.(B) | | | 1,131 | | | | $ 315,594 | |
Baxter International, Inc. | | | 8,049 | | | | 673,057 | |
Becton Dickinson and Co. | | | 4,264 | | | | 1,159,680 | |
Boston Scientific Corp.(B) | | | 21,973 | | | | 993,619 | |
Cooper Cos., Inc. | | | 782 | | | | 251,249 | |
Danaher Corp. | | | 10,078 | | | | 1,546,772 | |
DENTSPLY SIRONA, Inc. | | | 3,506 | | | | 198,405 | |
Edwards Lifesciences Corp.(B) | | | 3,288 | | | | 767,058 | |
Hologic, Inc.(B) | | | 4,227 | | | | 220,692 | |
IDEXX Laboratories, Inc.(B) | | | 1,352 | | | | 353,048 | |
Intuitive Surgical, Inc.(B) | | | 1,822 | | | | 1,077,075 | |
Medtronic PLC | | | 21,131 | | | | 2,397,312 | |
ResMed, Inc. | | | 2,267 | | | | 351,317 | |
STERIS PLC | | | 1,337 | | | | 203,786 | |
Stryker Corp. | | | 5,076 | | | | 1,065,655 | |
Teleflex, Inc. | | | 730 | | | | 274,801 | |
Varian Medical Systems, Inc.(B) | | | 1,433 | | | | 203,500 | |
Zimmer Biomet Holdings, Inc. | | | 3,243 | | | | 485,412 | |
| | | | | | | | |
| | | | | | | 15,079,672 | |
| | | | | | | | |
| Health Care Providers & Services - 2.8% | |
AmerisourceBergen Corp. | | | 2,370 | | | | 201,497 | |
Anthem, Inc. | | | 3,997 | | | | 1,207,214 | |
Cardinal Health, Inc. | | | 4,611 | | | | 233,224 | |
Centene Corp.(B) | | | 6,523 | | | | 410,101 | |
Cigna Corp. | | | 5,887 | | | | 1,203,833 | |
CVS Health Corp. | | | 20,509 | | | | 1,523,614 | |
DaVita, Inc.(B) | | | 1,414 | | | | 106,093 | |
HCA Healthcare, Inc. | | | 4,171 | | | | 616,516 | |
Henry Schein, Inc.(B) | | | 2,313 | | | | 154,323 | |
Humana, Inc. | | | 2,088 | | | | 765,294 | |
Laboratory Corp. of America Holdings(B) | | | 1,531 | | | | 258,999 | |
McKesson Corp. | | | 2,841 | | | | 392,967 | |
Quest Diagnostics, Inc. | | | 2,123 | | | | 226,715 | |
UnitedHealth Group, Inc. | | | 14,936 | | | | 4,390,885 | |
Universal Health Services, Inc., Class B | | | 1,266 | | | | 181,620 | |
WellCare Health Plans, Inc.(B) | | | 793 | | | | 261,857 | |
| | | | | | | | |
| | | | | | | 12,134,752 | |
| | | | | | | | |
| Health Care Technology - 0.1% | |
Cerner Corp. | | | 4,952 | | | | 363,427 | |
| | | | | | | | |
| Hotels, Restaurants & Leisure - 1.8% | |
Carnival Corp. | | | 6,315 | | | | 320,991 | |
Chipotle Mexican Grill, Inc.(B) | | | 403 | | | | 337,355 | |
Darden Restaurants, Inc. | | | 1,933 | | | | 210,716 | |
Hilton Worldwide Holdings, Inc. | | | 4,448 | | | | 493,328 | |
Las Vegas Sands Corp. | | | 5,327 | | | | 367,776 | |
Marriott International, Inc., Class A | | | 4,278 | | | | 647,818 | |
McDonald’s Corp. | | | 11,872 | | | | 2,346,026 | |
MGM Resorts International | | | 8,119 | | | | 270,119 | |
Norwegian Cruise Line Holdings, Ltd.(B) | | | 3,354 | | | | 195,907 | |
Royal Caribbean Cruises, Ltd. | | | 2,710 | | | | 361,812 | |
Starbucks Corp. | | | 18,618 | | | | 1,636,895 | |
Wynn Resorts, Ltd. | | | 1,523 | | | | 211,499 | |
Yum! Brands, Inc. | | | 4,768 | | | | 480,281 | |
| | | | | | | | |
| | | | | | | 7,880,523 | |
| | | | | | | | |
| Household Durables - 0.4% | |
D.R. Horton, Inc. | | | 5,286 | | | | 278,836 | |
Garmin, Ltd. | | | 2,278 | | | | 222,242 | |
The Notes to Financial Statements are an integral part of this report.
| | |
| Transamerica ETF Trust | | Annual Report 2019 |
Page 15
DeltaShares® S&P 500 Managed Risk ETF
SCHEDULE OF INVESTMENTS (continued)
At December 31, 2019
| | | | | | | | |
| | | Shares | | | Value | |
| COMMON STOCKS (continued) | |
| Household Durables (continued) | |
Leggett & Platt, Inc. | | | 2,075 | | | | $ 105,472 | |
Lennar Corp., Class A | | | 4,412 | | | | 246,145 | |
Mohawk Industries, Inc.(B) | | | 937 | | | | 127,788 | |
Newell Brands, Inc. | | | 6,007 | | | | 115,455 | |
NVR, Inc.(B) | | | 55 | | | | 209,463 | |
PulteGroup, Inc. | | | 4,016 | | | | 155,821 | |
Whirlpool Corp. | | | 996 | | | | 146,940 | |
| | | | | | | | |
| | | | | | | 1,608,162 | |
| | | | | | | | |
| Household Products - 1.7% | |
Church & Dwight Co., Inc. | | | 3,869 | | | | 272,145 | |
Clorox Co. | | | 1,979 | | | | 303,856 | |
Colgate-Palmolive Co. | | | 13,511 | | | | 930,097 | |
Kimberly-Clark Corp. | | | 5,404 | | | | 743,320 | |
Procter & Gamble Co. | | | 39,314 | | | | 4,910,319 | |
| | | | | | | | |
| | | | | | | 7,159,737 | |
| | | | | | | | |
| Independent Power & Renewable Electricity Producers - 0.1% | |
AES Corp. | | | 10,466 | | | | 208,273 | |
NRG Energy, Inc. | | | 3,966 | | | | 157,649 | |
| | | | | | | | |
| | | | | | | 365,922 | |
| | | | | | | | |
| Industrial Conglomerates - 1.3% | |
3M Co. | | | 9,066 | | | | 1,599,424 | |
General Electric Co. | | | 137,682 | | | | 1,536,531 | |
Honeywell International, Inc. | | | 11,264 | | | | 1,993,728 | |
Roper Technologies, Inc. | | | 1,640 | | | | 580,937 | |
| | | | | | | | |
| | | | | | | 5,710,620 | |
| | | | | | | | |
| Insurance - 2.3% | |
Aflac, Inc. | | | 11,572 | | | | 612,159 | |
Allstate Corp. | | | 5,107 | | | | 574,282 | |
American International Group, Inc. | | | 13,715 | | | | 703,991 | |
Aon PLC | | | 3,691 | | | | 768,799 | |
Arthur J. Gallagher & Co. | | | 2,940 | | | | 279,976 | |
Assurant, Inc. | | | 956 | | | | 125,313 | |
Chubb, Ltd. | | | 7,145 | | | | 1,112,191 | |
Cincinnati Financial Corp. | | | 2,395 | | | | 251,834 | |
Everest Re Group, Ltd. | | | 643 | | | | 178,008 | |
Globe Life, Inc. | | | 1,571 | | | | 165,348 | |
Hartford Financial Services Group, Inc. | | | 5,682 | | | | 345,295 | |
Lincoln National Corp. | | | 3,127 | | | | 184,524 | |
Loews Corp. | | | 4,033 | | | | 211,692 | |
Marsh & McLennan Cos., Inc. | | | 7,956 | | | | 886,378 | |
MetLife, Inc. | | | 12,323 | | | | 628,103 | |
Principal Financial Group, Inc. | | | 4,071 | | | | 223,905 | |
Progressive Corp. | | | 9,217 | | | | 667,219 | |
Prudential Financial, Inc. | | | 6,337 | | | | 594,030 | |
Travelers Cos., Inc. | | | 4,069 | | | | 557,250 | |
Unum Group | | | 3,252 | | | | 94,828 | |
Willis Towers Watson PLC | | | 2,027 | | | | 409,332 | |
WR Berkley Corp. | | | 2,288 | | | | 158,101 | |
| | | | | | | | |
| | | | | | | 9,732,558 | |
| | | | | | | | |
| Interactive Media & Services - 4.9% | |
Alphabet, Inc., Class A(B) | | | 4,724 | | | | 6,327,279 | |
Alphabet, Inc., Class C(B) | | | 4,712 | | | | 6,300,038 | |
Facebook, Inc., Class A(B) | | | 37,937 | | | | 7,786,569 | |
Twitter, Inc.(B) | | | 12,239 | | | | 392,260 | |
| | | | | | | | |
| | | | | | | 20,806,146 | |
| | | | | | | | |
| | | | | | | | |
| | | Shares | | | Value | |
| COMMON STOCKS (continued) | |
| Internet & Direct Marketing Retail - 3.3% | |
Amazon.com, Inc.(B) | | | 6,566 | | | | $ 12,132,918 | |
Booking Holdings, Inc.(B) | | | 660 | | | | 1,355,462 | |
eBay, Inc. | | | 12,056 | | | | 435,342 | |
Expedia Group, Inc. | | | 2,203 | | | | 238,232 | |
| | | | | | | | |
| | | | | | | 14,161,954 | |
| | | | | | | | |
| IT Services - 5.3% | |
Accenture PLC, Class A | | | 10,012 | | | | 2,108,227 | |
Akamai Technologies, Inc.(B) | | | 2,548 | | | | 220,096 | |
Alliance Data Systems Corp. | | | 646 | | | | 72,481 | |
Automatic Data Processing, Inc. | | | 6,821 | | | | 1,162,981 | |
Broadridge Financial Solutions, Inc. | | | 1,807 | | | | 223,237 | |
Cognizant Technology Solutions Corp., Class A | | | 8,632 | | | | 535,357 | |
DXC Technology Co. | | | 4,036 | | | | 151,713 | |
Fidelity National Information Services, Inc. | | | 9,689 | | | | 1,347,643 | |
Fiserv, Inc.(B) | | | 9,003 | | | | 1,041,017 | |
FleetCor Technologies, Inc.(B) | | | 1,368 | | | | 393,601 | |
Gartner, Inc.(B) | | | 1,410 | | | | 217,281 | |
Global Payments, Inc. | | | 4,738 | | | | 864,969 | |
International Business Machines Corp. | | | 13,962 | | | | 1,871,466 | |
Jack Henry & Associates, Inc. | | | 1,213 | | | | 176,698 | |
Leidos Holdings, Inc. | | | 2,098 | | | | 205,373 | |
Mastercard, Inc., Class A | | | 13,995 | | | | 4,178,767 | |
Paychex, Inc. | | | 5,022 | | | | 427,171 | |
PayPal Holdings, Inc.(B) | | | 18,511 | | | | 2,002,335 | |
VeriSign, Inc.(B) | | | 1,629 | | | | 313,876 | |
Visa, Inc., Class A | | | 26,987 | | | | 5,070,857 | |
Western Union Co.(A) | | | 6,609 | | | | 176,989 | |
| | | | | | | | |
| | | | | | | 22,762,135 | |
| | | | | | | | |
| Leisure Products - 0.0%(C) | |
Hasbro, Inc. | | | 2,006 | | | | 211,854 | |
| | | | | | | | |
| Life Sciences Tools & Services - 1.0% | |
Agilent Technologies, Inc. | | | 4,879 | | | | 416,227 | |
Illumina, Inc.(B) | | | 2,317 | | | | 768,642 | |
IQVIA Holdings, Inc.(B) | | | 2,845 | | | | 439,581 | |
Mettler-Toledo International, Inc.(B) | | | 384 | | | | 304,620 | |
PerkinElmer, Inc. | | | 1,751 | | | | 170,022 | |
Thermo Fisher Scientific, Inc. | | | 6,322 | | | | 2,053,828 | |
Waters Corp.(B) | | | 1,016 | | | | 237,388 | |
| | | | | | | | |
| | | | | | | 4,390,308 | |
| | | | | | | | |
| Machinery - 1.6% | |
Caterpillar, Inc. | | | 8,713 | | | | 1,286,736 | |
Cummins, Inc. | | | 2,415 | | | | 432,188 | |
Deere & Co. | | | 4,964 | | | | 860,063 | |
Dover Corp. | | | 2,290 | | | | 263,945 | |
Flowserve Corp. | | | 2,063 | | | | 102,676 | |
Fortive Corp. | | | 4,659 | | | | 355,901 | |
IDEX Corp. | | | 1,199 | | | | 206,228 | |
Illinois Tool Works, Inc. | | | 4,611 | | | | 828,274 | |
Ingersoll-Rand PLC | | | 3,777 | | | | 502,039 | |
PACCAR, Inc. | | | 5,453 | | | | 431,332 | |
Parker-Hannifin Corp. | | | 2,025 | | | | 416,785 | |
Pentair PLC | | | 2,650 | | | | 121,555 | |
Snap-on, Inc. | | | 865 | | | | 146,531 | |
Stanley Black & Decker, Inc. | | | 2,396 | | | | 397,113 | |
Westinghouse Air Brake Technologies Corp. | | | 2,871 | | | | 223,364 | |
The Notes to Financial Statements are an integral part of this report.
| | |
| Transamerica ETF Trust | | Annual Report 2019 |
Page 16
DeltaShares® S&P 500 Managed Risk ETF
SCHEDULE OF INVESTMENTS (continued)
At December 31, 2019
| | | | | | | | |
| | | Shares | | | Value | |
| COMMON STOCKS (continued) | |
| Machinery (continued) | |
Xylem, Inc. | | | 2,839 | | | | $ 223,685 | |
| | | | | | | | |
| | | | | | | 6,798,415 | |
| | | | | | | | |
| Media - 1.4% | |
Charter Communications, Inc., Class A(B) | | | 2,472 | | | | 1,199,118 | |
Comcast Corp., Class A | | | 71,569 | | | | 3,218,458 | |
Discovery, Inc., Class A(A) (B) | | | 2,493 | | | | 81,621 | |
Discovery, Inc., Class C(B) | | | 5,288 | | | | 161,231 | |
DISH Network Corp., Class A(B) | | | 4,036 | | | | 143,157 | |
Fox Corp., Class A | | | 5,589 | | | | 207,184 | |
Fox Corp., Class B | | | 2,560 | | | | 93,184 | |
Interpublic Group of Cos., Inc. | | | 6,112 | | | | 141,187 | |
News Corp., Class A | | | 6,125 | | | | 86,608 | |
News Corp., Class B | | | 1,920 | | | | 27,859 | |
Omnicom Group, Inc. | | | 3,432 | | | | 278,061 | |
ViacomCBS, Inc., Class B | | | 8,519 | | | | 357,542 | |
| | | | | | | | |
| | | | | | | 5,995,210 | |
| | | | | | | | |
| Metals & Mining - 0.3% | |
Freeport-McMoRan, Inc. | | | 22,873 | | | | 300,094 | |
Newmont Goldcorp Corp. | | | 12,925 | | | | 561,591 | |
Nucor Corp. | | | 4,780 | | | | 269,018 | |
| | | | | | | | |
| | | | | | | 1,130,703 | |
| | | | | | | | |
| Multi-Utilities - 1.1% | |
Ameren Corp. | | | 3,879 | | | | 297,907 | |
CenterPoint Energy, Inc. | | | 7,918 | | | | 215,924 | |
CMS Energy Corp. | | | 4,475 | | | | 281,209 | |
Consolidated Edison, Inc. | | | 5,241 | | | | 474,153 | |
Dominion Energy, Inc. | | | 12,976 | | | | 1,074,672 | |
DTE Energy Co. | | | 3,028 | | | | 393,246 | |
NiSource, Inc. | | | 5,889 | | | | 163,950 | |
Public Service Enterprise Group, Inc. | | | 7,973 | | | | 470,806 | |
Sempra Energy | | | 4,444 | | | | 673,177 | |
WEC Energy Group, Inc. | | | 4,973 | | | | 458,660 | |
| | | | | | | | |
| | | | | | | 4,503,704 | |
| | | | | | | | |
| Multiline Retail - 0.5% | |
Dollar General Corp. | | | 4,014 | | | | 626,104 | |
Dollar Tree, Inc.(B) | | | 3,731 | | | | 350,900 | |
Kohl’s Corp. | | | 2,468 | | | | 125,744 | |
Macy’s, Inc.(A) | | | 4,871 | | | | 82,807 | |
Nordstrom, Inc.(A) | | | 1,689 | | | | 69,131 | |
Target Corp. | | | 7,989 | | | | 1,024,270 | |
| | | | | | | | |
| | | | | | | 2,278,956 | |
| | | | | | | | |
| Oil, Gas & Consumable Fuels - 3.8% | |
Apache Corp. | | | 5,928 | | | | 151,698 | |
Cabot Oil & Gas Corp. | | | 6,431 | | | | 111,964 | |
Chevron Corp. | | | 29,809 | | | | 3,592,283 | |
Cimarex Energy Co. | | | 1,605 | | | | 84,247 | |
Concho Resources, Inc. | | | 3,169 | | | | 277,509 | |
ConocoPhillips | | | 17,298 | | | | 1,124,889 | |
Devon Energy Corp. | | | 6,101 | | | | 158,443 | |
Diamondback Energy, Inc. | | | 2,540 | | | | 235,864 | |
EOG Resources, Inc. | | | 9,171 | | | | 768,163 | |
Exxon Mobil Corp. | | | 66,702 | | | | 4,654,466 | |
Hess Corp. | | | 4,083 | | | | 272,785 | |
HollyFrontier Corp. | | | 2,341 | | | | 118,712 | |
Kinder Morgan, Inc. | | | 30,708 | | | | 650,088 | |
Marathon Oil Corp. | | | 12,611 | | | | 171,257 | |
| | | | | | | | |
| | | Shares | | | Value | |
| COMMON STOCKS (continued) | |
| Oil, Gas & Consumable Fuels (continued) | |
Marathon Petroleum Corp. | | | 10,236 | | | | $ 616,719 | |
Noble Energy, Inc. | | | 7,540 | | | | 187,294 | |
Occidental Petroleum Corp. | | | 14,083 | | | | 580,360 | |
ONEOK, Inc. | | | 6,512 | | | | 492,763 | |
Phillips 66 | | | 7,005 | | | | 780,427 | |
Pioneer Natural Resources Co. | | | 2,611 | | | | 395,227 | |
Valero Energy Corp. | | | 6,474 | | | | 606,290 | |
Williams Cos., Inc. | | | 19,108 | | | | 453,242 | |
| | | | | | | | |
| | | | | | | 16,484,690 | |
| | | | | | | | |
| Personal Products - 0.2% | |
Coty, Inc., Class A | | | 4,660 | | | | 52,425 | |
Estee Lauder Cos., Inc., Class A | | | 3,508 | | | | 724,542 | |
| | | | | | | | |
| | | | | | | 776,967 | |
| | | | | | | | |
| Pharmaceuticals - 4.6% | |
Allergan PLC | | | 5,175 | | | | 989,305 | |
Bristol-Myers Squibb Co. | | | 36,955 | | | | 2,372,141 | |
Eli Lilly & Co. | | | 13,320 | | | | 1,750,648 | |
Johnson & Johnson | | | 41,491 | | | | 6,052,292 | |
Merck & Co., Inc. | | | 40,137 | | | | 3,650,460 | |
Mylan NV(B) | | | 8,137 | | | | 163,554 | |
Perrigo Co. PLC | | | 2,146 | | | | 110,862 | |
Pfizer, Inc. | | | 87,244 | | | | 3,418,220 | |
Zoetis, Inc. | | | 7,509 | | | | 993,816 | |
| | | | | | | | |
| | | | | | | 19,501,298 | |
| | | | | | | | |
| Professional Services - 0.3% | |
Equifax, Inc. | | | 1,909 | | | | 267,489 | |
IHS Markit, Ltd.(B) | | | 6,321 | | | | 476,287 | |
Nielsen Holdings PLC | | | 5,609 | | | | 113,863 | |
Robert Half International, Inc. | | | 1,853 | | | | 117,017 | |
Verisk Analytics, Inc. | | | 2,583 | | | | 385,745 | |
| | | | | | | | |
| | | | | | | 1,360,401 | |
| | | | | | | | |
| Real Estate Management & Development - 0.1% | |
CBRE Group, Inc., Class A(B) | | | 5,277 | | | | 323,427 | |
| | | | | | | | |
| Road & Rail - 1.0% | |
CSX Corp. | | | 12,259 | | | | 887,061 | |
JB Hunt Transport Services, Inc. | | | 1,344 | | | | 156,952 | |
Kansas City Southern | | | 1,563 | | | | 239,389 | |
Norfolk Southern Corp. | | | 4,111 | | | | 798,068 | |
Old Dominion Freight Line, Inc. | | | 1,007 | | | | 191,109 | |
Union Pacific Corp. | | | 10,944 | | | | 1,978,566 | |
| | | | | | | | |
| | | | | | | 4,251,145 | |
| | | | | | | | |
| Semiconductors & Semiconductor Equipment - 4.2% | |
Advanced Micro Devices, Inc.(B) | | | 17,556 | | | | 805,118 | |
Analog Devices, Inc. | | | 5,806 | | | | 689,985 | |
Applied Materials, Inc. | | | 14,563 | | | | 888,926 | |
Broadcom, Inc. | | | 6,253 | | | | 1,976,073 | |
Intel Corp. | | | 68,577 | | | | 4,104,334 | |
KLA Corp. | | | 2,488 | | | | 443,287 | |
Lam Research Corp. | | | 2,287 | | | | 668,719 | |
Maxim Integrated Products, Inc. | | | 4,266 | | | | 262,402 | |
Microchip Technology, Inc.(A) | | | 3,767 | | | | 394,480 | |
Micron Technology, Inc.(B) | | | 17,452 | | | | 938,569 | |
NVIDIA Corp. | | | 9,648 | | | | 2,270,174 | |
Qorvo, Inc.(B) | | | 1,831 | | | | 212,817 | |
QUALCOMM, Inc. | | | 18,001 | | | | 1,588,228 | |
Skyworks Solutions, Inc. | | | 2,686 | | | | 324,684 | |
The Notes to Financial Statements are an integral part of this report.
| | |
| Transamerica ETF Trust | | Annual Report 2019 |
Page 17
DeltaShares® S&P 500 Managed Risk ETF
SCHEDULE OF INVESTMENTS (continued)
At December 31, 2019
| | | | | | | | |
| | | Shares | | | Value | |
| COMMON STOCKS (continued) | |
| Semiconductors & Semiconductor Equipment (continued) | |
Texas Instruments, Inc. | | | 14,736 | | | | $ 1,890,481 | |
Xilinx, Inc. | | | 3,964 | | | | 387,560 | |
| | | | | | | | |
| | | | | | | 17,845,837 | |
| | | | | | | | |
| Software - 7.0% | |
Adobe, Inc.(B) | | | 7,631 | | | | 2,516,780 | |
ANSYS, Inc.(B) | | | 1,349 | | | | 347,246 | |
Autodesk, Inc.(B) | | | 3,469 | | | | 636,423 | |
Cadence Design Systems, Inc.(B) | | | 4,423 | | | | 306,779 | |
Citrix Systems, Inc. | | | 1,930 | | | | 214,037 | |
Fortinet, Inc.(B) | | | 2,238 | | | | 238,929 | |
Intuit, Inc. | | | 4,104 | | | | 1,074,961 | |
Microsoft Corp. | | | 120,266 | | | | 18,965,948 | |
Norton Lifelock, Inc. | | | 9,039 | | | | 230,675 | |
Oracle Corp. | | | 34,154 | | | | 1,809,479 | |
salesforce.com, Inc.(B) | | | 13,983 | | | | 2,274,195 | |
ServiceNow, Inc.(B) | | | 2,973 | | | | 839,338 | |
Synopsys, Inc.(B) | | | 2,370 | | | | 329,904 | |
| | | | | | | | |
| | | | | | | 29,784,694 | |
| | | | | | | | |
| Specialty Retail - 2.2% | |
Advance Auto Parts, Inc. | | | 1,092 | | | | 174,895 | |
AutoZone, Inc.(B) | | | 376 | | | | 447,933 | |
Best Buy Co., Inc. | | | 3,590 | | | | 315,202 | |
CarMax, Inc.(B) | | | 2,592 | | | | 227,241 | |
Gap, Inc. | | | 3,354 | | | | 59,299 | |
Home Depot, Inc. | | | 17,197 | | | | 3,755,481 | |
L Brands, Inc. | | | 3,661 | | | | 66,337 | |
Lowe’s Cos., Inc. | | | 12,083 | | | | 1,447,060 | |
O’Reilly Automotive, Inc.(B) | | | 1,193 | | | | 522,844 | |
Ross Stores, Inc. | | | 5,703 | | | | 663,943 | |
Tiffany & Co. | | | 1,702 | | | | 227,472 | |
TJX Cos., Inc. | | | 19,117 | | | | 1,167,284 | |
Tractor Supply Co. | | | 1,866 | | | | 174,359 | |
Ulta Salon Cosmetics & Fragrance, Inc.(B) | | | 901 | | | | 228,079 | |
| | | | | | | | |
| | | | | | | 9,477,429 | |
| | | | | | | | |
| Technology Hardware, Storage & Peripherals - 4.9% | |
Apple, Inc. | | | 65,844 | | | | 19,335,091 | |
Hewlett Packard Enterprise Co. | | | 20,400 | | | | 323,544 | |
HP, Inc. | | | 23,362 | | | | 480,089 | |
NetApp, Inc. | | | 3,598 | | | | 223,975 | |
Seagate Technology PLC | | | 3,645 | | | | 216,877 | |
Western Digital Corp. | | | 4,689 | | | | 297,611 | |
Xerox Holdings Corp. | | | 2,931 | | | | 108,066 | |
| | | | | | | | |
| | | | | | | 20,985,253 | |
| | | | | | | | |
| Textiles, Apparel & Luxury Goods - 0.7% | |
Capri Holdings, Ltd.(B) | | | 2,390 | | | | 91,179 | |
| | | | | | | | |
| | | Shares | | | Value | |
| COMMON STOCKS (continued) | |
| Textiles, Apparel & Luxury Goods (continued) | |
Hanesbrands, Inc.(A) | | | 5,702 | | | | $ 84,675 | |
NIKE, Inc., Class B | | | 19,643 | | | | 1,990,032 | |
PVH Corp. | | | 1,169 | | | | 122,920 | |
Ralph Lauren Corp. | | | 784 | | | | 91,900 | |
Tapestry, Inc. | | | 4,350 | | | | 117,320 | |
Under Armour, Inc., Class A(A) (B) | | | 2,967 | | | | 64,087 | |
Under Armour, Inc., Class C(B) | | | 3,067 | | | | 58,825 | |
VF Corp. | | | 5,163 | | | | 514,545 | |
| | | | | | | | |
| | | | | | | 3,135,483 | |
| | | | | | | | |
| Tobacco - 0.8% | |
Altria Group, Inc. | | | 29,451 | | | | 1,469,899 | |
Philip Morris International, Inc. | | | 24,528 | | | | 2,087,088 | |
| | | | | | | | |
| | | | | | | 3,556,987 | |
| | | | | | | | |
| Trading Companies & Distributors - 0.2% | |
Fastenal Co. | | | 9,042 | | | | 334,102 | |
United Rentals, Inc.(B) | | | 1,185 | | | | 197,622 | |
WW Grainger, Inc. | | | 688 | | | | 232,902 | |
| | | | | | | | |
| | | | | | | 764,626 | |
| | | | | | | | |
| Water Utilities - 0.1% | |
American Water Works Co., Inc. | | | 2,850 | | | | 350,122 | |
| | | | | | | | |
| Wireless Telecommunication Services - 0.1% | |
T-Mobile US, Inc.(B) | | | 4,991 | | | | 391,394 | |
| | | | | | | | |
Total Common Stocks
(Cost $357,422,964) | | | | 421,862,953 | |
| | | | | |
|
| SHORT-TERM INVESTMENT COMPANY - 1.3% | |
| Money Market Fund - 1.3% | |
State Street Institutional Treasury Money Market Fund, 1.44%(D) | | | 5,450,636 | | | | 5,450,636 | |
| | | | | | | | |
Total Short-Term Investment Company
(Cost $5,450,636) | | | | 5,450,636 | |
| | | | | |
|
| OTHER INVESTMENT COMPANY - 0.4% | |
| Securities Lending Collateral - 0.4% | |
State Street Navigator Securities Lending Trust - Government Money Market Portfolio, 1.56%(D) | | | 1,630,939 | | | | 1,630,939 | |
| | | | | | | | |
Total Other Investment Company
(Cost $1,630,939) | | | | 1,630,939 | |
| | | | | |
Total Investments
(Cost $364,504,539) | | | | 428,944,528 | |
Net Other Assets (Liabilities) - (0.2)% | | | | | | | (858,417 | ) |
| | | | | | | | |
| | |
Net Assets - 100.0% | | | | | | | $ 428,086,111 | |
| | | | | | | | |
FUTURES CONTRACTS:
| | | | | | | | | | | | | | | | | | | | | | | | |
Long Futures Contracts | |
| Description | | Number of
Contracts | | | Expiration
Date | | | Notional
Amount | | | Value | | | Unrealized
Appreciation | | | Unrealized
Depreciation | |
S&P 500® E-Mini Index | | | 38 | | | | 03/20/2020 | | | $ | 6,027,698 | | | $ | 6,139,090 | | | $ | 111,392 | | | $ | — | |
The Notes to Financial Statements are an integral part of this report.
| | |
| Transamerica ETF Trust | | Annual Report 2019 |
Page 18
DeltaShares® S&P 500 Managed Risk ETF
SCHEDULE OF INVESTMENTS (continued)
At December 31, 2019
SECURITY VALUATION:
Valuation Inputs(E)
| | | | | | | | | | | | | | | | | | |
| | | Level 1 -
Unadjusted
Quoted Prices | | | Level 2 -
Other Significant
Observable Inputs | | | Level 3 -
Significant
Unobservable Inputs | | | Value | |
ASSETS | |
Investments | |
Common Stocks | | $ | 421,862,953 | | | $ | — | | | $ | — | | | $ | 421,862,953 | |
Short-Term Investment Company | | | 5,450,636 | | | | — | | | | — | | | | 5,450,636 | |
Other Investment Company | | | 1,630,939 | | | | — | | | | — | | | | 1,630,939 | |
| | | | | | | | | | | | | | | | |
Total Investments | | $ | 428,944,528 | | | $ | — | | | $ | — | | | $ | 428,944,528 | |
| | | | | | | | | | | | | | | | |
Other Financial Instruments | |
Futures Contracts(F) | | $ | 111,392 | | | $ | — | | | $ | — | | | $ | 111,392 | |
| | | | | | | | | | | | | | | | |
Total Other Financial Instruments | | $ | 111,392 | | | $ | — | | | $ | — | | | $ | 111,392 | |
| | | | | | | | | | | | | | | | |
| |
FOOTNOTES TO SCHEDULE OF INVESTMENTS:
| | |
| (A) | | All or a portion of the securities are on loan. The total value of all securities on loan is $1,592,148. The amount of securities on loan indicated may not correspond with the securities on loan identified because securities with pending sales are in the process of recall from the brokers. |
| (B) | | Non-income producing securities. |
| (C) | | Percentage rounds to less than 0.1% or (0.1)%. |
| (D) | | Rates disclosed reflect the yields at December 31, 2019. |
| (E) | | There were no transfers in or out of Level 3 during the year ended December 31, 2019. Please reference the Security Valuation section of the Notes to Financial Statements for more information regarding security valuation and pricing inputs. |
| (F) | | Futures contracts and/or forward foreign currency contracts are valued at unrealized appreciation (depreciation). |
The Notes to Financial Statements are an integral part of this report.
| | |
| Transamerica ETF Trust | | Annual Report 2019 |
Page 19
DeltaShares® S&P 600 Managed Risk ETF
(unaudited)
MARKET ENVIRONMENT
Stocks across the world posted positive returns in 2019. The S&P 500® also posted strong performance in 2019.
Global stock markets began the year on a positive note, with a snap recovery from the late December 2018 trough. This continued throughout January and shrugged off the longest government shutdown in U.S. history. Markets largely continued to rally through April, but gave up roughly half of theiryear-to-date gains in May. The loss was broad based, with domestic, international developed, and emerging markets all finishing the month sharply lower. However, the second quarter of 2019 finished on a higher note, with May losses closely mirrored by June gains, to complete a low volatilityV-shaped quarter.
Domestic equity returns remained in positive territory in July with the S&P 500® hitting the 3,000 price level for the first time in history. In contrast, both developed and emerging market equities fluctuated between positive and negative territory, ending the month with losses. Equity volatility picked up in August, but remained somewhat moderate. During this time, bond markets rallied around the globe. While the U.S. Federal Reserve (“Fed”) had merely paused rate hikes for the first half of the year, the Fed commenced the first of three consecutive cuts in August. Volatility then subsided, and experienced further declines, boosted by the “Phase One Trade Deal” announced in December as markets rallied through the fiscal year end.
PERFORMANCE OVERVIEW
For the year ended December 31, 2019, the DeltaShares® S&P 600 Managed Risk ETF (NAV) returned 11.85%. By comparison, the S&P 600® Managed Risk 2.0 Index (the “Underlying Index”) 12.40% and the S&P SmallCap 600® Index returned 22.78%.
The Fund’s performance reflects annual operating expenses of the Fund, including management fees, brokerage expenses, and other fees and expenses. Index returns do not reflect fees and expenses of any kind, which would have a negative impact on returns.
STRATEGY REVIEW
The DeltaShares® S&P 600 Managed Risk ETF (the “Fund”) seeks to track the investment results, before fees and expenses, of the Underlying Index.
The Fund seeks to achieve this investment objective by holding a portfolio of securities that are included in the Underlying Index, including common stocks, U.S. Treasury bonds, and/or cash. The Underlying Index is designed to simulate, through a rules-based methodology, a dynamic portfolio with the aim of both managing the volatility of the Underlying Index and limiting losses from the Underlying Index’s equity exposure due to severe sustained market declines. The Underlying Index seeks to achieve these objectives by allocating weightings among the S&P SmallCap 600® Index, the S&P U.S. Treasury Bond Current5-Year Index, and the S&P U.S. Treasury Bill0-3 Month Index. The Fund may also use derivatives in an effort to gain exposure to underlying securities and markets in a more efficient manner, to optimize the execution processes and costs for portfolio transitions or for tax management purposes. Under normal circumstances, the Fund uses a replication strategy and generally expects to invest in substantially all of the securities in the Underlying Index.
During the12-month period ended December 31, 2019, the largest contributors to the Fund’s absolute total return were equities within the information technology and industrials equity sectors. U.S. Treasury bonds also contributed modestly to performance. The largest detractors were equities within the energy sector.
During the fiscal year, the Fund used derivatives. These positions added to performance.
Blake Graves, CFA
Charles Lowery, CFA
Louis Ng
Co-Portfolio Managers
Milliman Financial Risk Management LLC
| | | | |
| Asset Allocation | | Percentage of Net
Assets | |
Common Stocks | | | 98.6 | % |
Other Investment Company | | | 9.1 | |
Short-Term Investment Company | | | 0.9 | |
Contingent Value Right | | | 0.0 | |
Net Other Assets (Liabilities) ^ | | | (8.6 | ) |
Total | | | 100.0 | % |
| | | | |
| Current | and future portfolio holdings are subject to change and risk. |
| ^ | The Net Other Assets (Liabilities) category may include, but is not limited to, reverse repurchase agreements, forward foreign currency contracts, futures contracts, swap agreements, written options and swaptions, and cash collateral. |
| | |
| Transamerica ETF Trust | | Annual Report 2019 |
Page 20
DeltaShares® S&P 600 Managed Risk ETF
(unaudited)
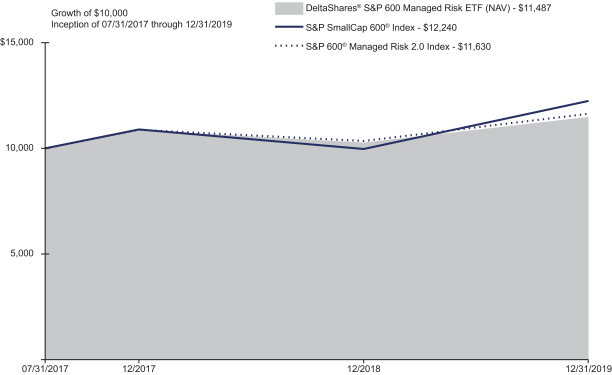
| | | | | | | | | | | | | | | | | | | | | | | | | | | | |
| Performance as of December 31, 2019 | | | | | | | | | | | | | |
| | | Average Annual Total Returns | | | | | | | | Cumulative Total Returns | | | | | | | | Inception Date | |
| | | 1 Year | | | 10 Year or
Since
Inception | | | | | | 1 Year | | | 10 Year or
Since
Inception | | | | | | | |
Fund NAV | | | 11.85 | % | | | 5.89 | % | | | | | | | 11.85 | % | | | 14.87 | % | | | | | | | 07/31/2017 | |
Fund Market | | | 11.85 | % | | | 5.85 | % | | | | | | | 11.85 | % | | | 14.77 | % | | | | | | | 07/31/2017 | |
S&P SmallCap 600® Index (A) | | | 22.78 | % | | | 8.70 | % | | | | | | | 22.78 | % | | | 22.40 | % | | | | | | | | |
S&P 600® Managed Risk 2.0 Index (A)(B)(C)(D) | | | 12.40 | % | | | 6.44 | % | | | | | | | 12.40 | % | | | 16.30 | % | | | | | | | | |
(A) The S&P SmallCap 600® Index is a market-capitalization weighted index of 600small-size U.S. companies with common stock listed on the NYSE or NASDAQ.
(B) The S&P 600® Managed Risk 2.0 Index is comprised of weightings amongst the S&P SmallCap 600® Index, the S&P U.S. Treasury Bond Current5-Year Index, and the S&P U.S. Treasury Bill0-3 Month Index. The S&P SmallCap 600® Managed Risk 2.0 Index rebalances on a daily basis.
(C) The S&P U.S. Treasury Bond Current5-Year Index is aone-security index comprising the most recently issued5-year U.S. Treasury note or bond.
(D) The S&P U.S. Treasury Bill0-3 Month Index is designed to measure the performance of U.S. Treasury bills maturing in 0 to 3 months.
The Fund’s benchmarks are unmanaged indices used as a general measure of market performance. Calculations assume dividends and capital gains are reinvested and do not include any managerial expenses. The 10 Years or the Since Inception calculation is based on the previous 10 years or since the inception date, whichever is more recent. An index is a statistical measure of a specified financial market or sector. An index does not actually hold a portfolio of securities and therefore does not reflect deductions for fees or expenses. In comparison, a Fund’s performance is negatively impacted by these deductions. You cannot invest directly in an index.
The performance data presented represents past performance and does not guarantee future results. Performance data does not reflect the deduction of taxes that would be paid on Fund distributions or the redemption of Fund shares. The Fund’s investment return and net asset value will fluctuate. Investors’ shares when sold may be worth more or less than their original cost. Current performance may be lower or higher than performance quoted. Please see www.deltashares.com for performance data current to the most recent month end. Fund performance is net of investment fees and Fund expenses.
Performance results do not include adjustments made for financial reporting purposes in accordance with U.S. generally accepted accounting principles and may differ from amounts reported in the Financial Highlights.
Fund shares are bought and sold at Market Price, not Net Asset Value (“NAV”), and are not individually redeemed from the fund. Net Asset Value is an exchange-traded fund’s per-share value. The per-share dollar amount of the Fund is derived by dividing the total value of all the securities in the portfolio, less any liabilities, by the number of Fund shares outstanding. Market Price is the price at which a share can currently be traded in the market. The market price used to calculate the market return is determined by using the midpoint between the highest bid and the lowest offer on the exchange on which the shares of the Fund are listed for trading, as of the time that the Fund’s NAV is calculated.
Exchange-Traded Funds (ETFs) are subject to market risk, including the loss of principal. Because Fund Shares trade at market prices rather than at NAV, Fund Shares may trade at a price greater than NAV (premium) or less than NAV (discount). Shares of DeltaShares® ETFs may be bought and sold throughout the day on the exchange through any brokerage account. Buying and selling shares of ETFs will result in brokerage commissions. Diversification and asset allocation may not protect against market risk or loss of principal. Investing involves risk, including the possible loss of principal. There is no guarantee the investment objective will be achieved. Small capitalization companies may be more at risk than larger capitalization companies because, among other things, they may have limited product lines, operating history, market or financial resources, or because they may depend on limited management groups. The market prices of fixed-income securities may go up or down, sometimes rapidly and unpredictably, due to general market conditions, such as real or perceived adverse economic or political conditions, inflation, changes in interest rates, lack of liquidity in the bond markets or adverse investor sentiment. The principal risks include risks related to: Equity securities, index tracking, leveraging, derivatives such as futures, forwards, swaps, options, and investing in underlying exchange-traded funds. The use of derivatives may produce disproportionate gains or losses, may increase costs, and amplify risks.
| | |
| Transamerica ETF Trust | | Annual Report 2019 |
Page 21
DeltaShares® S&P 600 Managed Risk ETF
SCHEDULE OF INVESTMENTS
At December 31, 2019
| | | | | | | | |
| | | Shares | | | Value | |
| COMMON STOCKS - 98.6% | |
| Aerospace & Defense - 1.6% | |
AAR Corp. | | | 1,731 | | | | $ 78,068 | |
Aerojet Rocketdyne Holdings, Inc.(A) | | | 3,812 | | | | 174,056 | |
AeroVironment, Inc.(A) | | | 1,137 | | | | 70,199 | |
Cubic Corp. | | | 1,647 | | | | 104,700 | |
Moog, Inc., Class A | | | 1,697 | | | | 144,805 | |
National Presto Industries, Inc.(B) | | | 265 | | | | 23,423 | |
Park Aerospace Corp. | | | 1,026 | | | | 16,693 | |
Triumph Group, Inc. | | | 2,637 | | | | 66,637 | |
| | | | | | | | |
| | | | | | | 678,581 | |
| | | | | | | | |
| Air Freight & Logistics - 0.6% | |
Atlas Air Worldwide Holdings, Inc.(A) | | | 1,362 | | | | 37,550 | |
Echo Global Logistics, Inc.(A) | | | 1,437 | | | | 29,746 | |
Forward Air Corp. | | | 1,483 | | | | 103,736 | |
Hub Group, Inc., Class A(A) | | | 1,757 | | | | 90,117 | |
| | | | | | | | |
| | | | | | | 261,149 | |
| | | | | | | | |
| Airlines - 0.9% | |
Allegiant Travel Co. | | | 695 | | | | 120,958 | |
Hawaiian Holdings, Inc. | | | 2,453 | | | | 71,848 | |
SkyWest, Inc. | | | 2,655 | | | | 171,593 | |
| | | | | | | | |
| | | | | | | 364,399 | |
| | | | | | | | |
| Auto Components - 1.8% | |
American Axle & Manufacturing Holdings, Inc.(A) | | | 5,922 | | | | 63,721 | |
Cooper Tire & Rubber Co. | | | 2,642 | | | | 75,957 | |
Cooper-Standard Holdings, Inc.(A) | | | 887 | | | | 29,413 | |
Dorman Products, Inc.(A) | | | 1,536 | | | | 116,306 | |
Fox Factory Holding Corp.(A) | | | 2,028 | | | | 141,088 | |
Garrett Motion, Inc.(A) | | | 3,940 | | | | 39,361 | |
Gentherm, Inc.(A) | | | 1,724 | | | | 76,528 | |
LCI Industries | | | 1,318 | | | | 141,197 | |
Motorcar Parts of America, Inc.(A) | | | 998 | | | | 21,986 | |
Standard Motor Products, Inc. | | | 1,064 | | | | 56,626 | |
| | | | | | | | |
| | | | | | | 762,183 | |
| | | | | | | | |
| Automobiles - 0.2% | |
Winnebago Industries, Inc. | | | 1,774 | | | | 93,986 | |
| | | | | | | | |
| Banks - 9.6% | |
Allegiance Bancshares, Inc.(A) (B) | | | 1,008 | | | | 37,901 | |
Ameris Bancorp | | | 3,448 | | | | 146,678 | |
Banc of California, Inc. | | | 2,362 | | | | 40,579 | |
Banner Corp. | | | 1,962 | | | | 111,030 | |
Berkshire Hills Bancorp, Inc. | | | 2,261 | | | | 74,342 | |
Boston Private Financial Holdings, Inc. | | | 4,383 | | | | 52,727 | |
Brookline Bancorp, Inc. | | | 4,200 | | | | 69,132 | |
Cadence BanCorp | | | 6,741 | | | | 122,214 | |
Central Pacific Financial Corp. | | | 1,494 | | | | 44,193 | |
City Holding Co. | | | 858 | | | | 70,313 | |
Columbia Banking System, Inc. | | | 3,798 | | | | 154,522 | |
Community Bank System, Inc. | | | 2,722 | | | | 193,099 | |
Customers Bancorp, Inc.(A) | | | 1,517 | | | | 36,120 | |
CVB Financial Corp. | | | 7,008 | | | | 151,233 | |
Dime Community Bancshares, Inc. | | | 1,624 | | | | 33,925 | |
Eagle Bancorp, Inc. | | | 1,768 | | | | 85,978 | |
First BanCorp | | | 11,445 | | | | 121,203 | |
First Commonwealth Financial Corp. | | | 5,177 | | | | 75,118 | |
First Financial Bancorp | | | 5,233 | | | | 133,128 | |
First Midwest Bancorp, Inc. | | | 5,791 | | | | 133,540 | |
Franklin Financial Network, Inc. | | | 705 | | | | 24,203 | |
| | | | | | | | |
| | | Shares | | | Value | |
| COMMON STOCKS (continued) | |
| Banks (continued) | |
Glacier Bancorp, Inc. | | | 4,514 | | | | $ 207,599 | |
Great Western Bancorp, Inc. | | | 2,964 | | | | 102,969 | |
Hanmi Financial Corp. | | | 1,638 | | | | 32,752 | |
Heritage Financial Corp. | | | 1,928 | | | | 54,562 | |
Hope Bancorp, Inc. | | | 6,671 | | | | 99,131 | |
Independent Bank Corp. | | | 1,810 | | | | 150,683 | |
National Bank Holdings Corp., Class A | | | 1,641 | | | | 57,796 | |
NBT Bancorp, Inc. | | | 2,306 | | | | 93,531 | |
OFG Bancorp | | | 2,704 | | | | 63,841 | |
Old National Bancorp | | | 8,953 | | | | 163,750 | |
Opus Bank | | | 1,138 | | | | 29,440 | |
Pacific Premier Bancorp, Inc. | | | 3,126 | | | | 101,923 | |
Preferred Bank | | | 716 | | | | 43,024 | |
S&T Bancorp, Inc. | | | 2,029 | | | | 81,748 | |
Seacoast Banking Corp. of Florida(A) | | | 2,711 | | | | 82,875 | |
ServisFirst Bancshares, Inc. | | | 2,427 | | | | 91,449 | |
Simmons First National Corp., Class A | | | 6,001 | | | | 160,767 | |
Southside Bancshares, Inc. | | | 1,671 | | | | 62,061 | |
Tompkins Financial Corp. | | | 645 | | | | 59,018 | |
Triumph Bancorp, Inc.(A) | | | 1,228 | | | | 46,689 | |
United Community Banks, Inc. | | | 4,159 | | | | 128,430 | |
Veritex Holdings, Inc. | | | 2,487 | | | | 72,446 | |
Westamerica Bancorporation | | | 1,425 | | | | 96,572 | |
| | | | | | | | |
| | | | | | | 3,994,234 | |
| | | | | | | | |
| Beverages - 0.3% | |
Coca-Cola Consolidated, Inc. | | | 244 | | | | 69,308 | |
MGP Ingredients, Inc.(B) | | | 699 | | | | 33,867 | |
National Beverage Corp.(A) (B) | | | 613 | | | | 31,275 | |
| | | | | | | | |
| | | | | | | 134,450 | |
| | | | | | | | |
| Biotechnology - 2.7% | |
Acorda Therapeutics, Inc.(A) (B) | | | 2,529 | | | | 5,159 | |
AMAG Pharmaceuticals, Inc.(A) (B) | | | 1,786 | | | | 21,736 | |
Anika Therapeutics, Inc.(A) | | | 751 | | | | 38,939 | |
Cytokinetics, Inc.(A) (B) | | | 3,111 | | | | 33,008 | |
Eagle Pharmaceuticals, Inc.(A) (B) | | | 533 | | | | 32,023 | |
Emergent BioSolutions, Inc.(A) | | | 2,311 | | | | 124,678 | |
Enanta Pharmaceuticals, Inc.(A) | | | 841 | | | | 51,957 | |
Medicines Co.(A) (B) | | | 3,914 | | | | 332,455 | |
Momenta Pharmaceuticals, Inc.(A) | | | 5,977 | | | | 117,926 | |
Myriad Genetics, Inc.(A) | | | 3,917 | | | | 106,660 | |
Progenics Pharmaceuticals, Inc.(A) | | | 4,551 | | | | 23,165 | |
REGENXBIO, Inc.(A) | | | 1,650 | | | | 67,601 | |
Spectrum Pharmaceuticals, Inc.(A) | | | 5,949 | | | | 21,654 | |
Vanda Pharmaceuticals, Inc.(A) | | | 2,808 | | | | 46,079 | |
Xencor, Inc.(A) (B) | | | 2,598 | | | | 89,345 | |
| | | | | | | | |
| | | | | | | 1,112,385 | |
| | | | | | | | |
| Building Products - 2.0% | |
AAON, Inc. | | | 2,140 | | | | 105,737 | |
American Woodmark Corp.(A) | | | 820 | | | | 85,698 | |
Apogee Enterprises, Inc. | | | 1,398 | | | | 45,435 | |
Gibraltar Industries, Inc.(A) | | | 1,699 | | | | 85,698 | |
Griffon Corp. | | | 2,243 | | | | 45,600 | |
Insteel Industries, Inc. | | | 963 | | | | 20,695 | |
Patrick Industries, Inc. | | | 1,176 | | | | 61,658 | |
PGT Innovations, Inc.(A) | | | 3,075 | | | | 45,848 | |
Quanex Building Products Corp. | | | 1,746 | | | | 29,822 | |
Simpson Manufacturing Co., Inc. | | | 2,124 | | | | 170,409 | |
The Notes to Financial Statements are an integral part of this report.
| | |
| Transamerica ETF Trust | | Annual Report 2019 |
Page 22
DeltaShares® S&P 600 Managed Risk ETF
SCHEDULE OF INVESTMENTS (continued)
At December 31, 2019
| | | | | | | | |
| | | Shares | | | Value | |
| COMMON STOCKS (continued) | |
| Building Products (continued) | |
Universal Forest Products, Inc. | | | 3,232 | | | | $ 154,166 | |
| | | | | | | | |
| | | | | | | 850,766 | |
| | | | | | | | |
| Capital Markets - 0.8% | |
Blucora, Inc.(A) | | | 2,577 | | | | 67,363 | |
Donnelley Financial Solutions, Inc. | | | 1,644 | | | | 17,213 | |
Greenhill & Co., Inc. | | | 784 | | | | 13,391 | |
INTL. FCStone, Inc.(A) | | | 858 | | | | 41,896 | |
Piper Jaffray Cos. | | | 756 | | | | 60,434 | |
Virtus Investment Partners, Inc. | | | 340 | | | | 41,385 | |
Waddell & Reed Financial, Inc., Class A | | | 3,703 | | | | 61,914 | |
WisdomTree Investments, Inc. | | | 6,211 | | | | 30,061 | |
| | | | | | | | |
| | | | | | | 333,657 | |
| | | | | | | | |
| Chemicals - 2.9% | |
AdvanSix, Inc.(A) | | | 1,470 | | | | 29,341 | |
American Vanguard Corp. | | | 1,399 | | | | 27,239 | |
Balchem Corp. | | | 1,694 | | | | 172,161 | |
Ferro Corp.(A) | | | 4,316 | | | | 64,006 | |
FutureFuel Corp. | | | 1,359 | | | | 16,838 | |
GCP Applied Technologies, Inc.(A) | | | 2,832 | | | | 64,315 | |
Hawkins, Inc. | | | 498 | | | | 22,813 | |
HB Fuller Co.(B) | | | 2,684 | | | | 138,414 | |
Innophos Holdings, Inc. | | | 1,037 | | | | 33,163 | |
Innospec, Inc. | | | 1,290 | | | | 133,438 | |
Koppers Holdings, Inc.(A) | | | 1,090 | | | | 41,660 | |
Kraton Corp.(A) | | | 1,669 | | | | 42,259 | |
Livent Corp.(A) (B) | | | 7,687 | | | | 65,724 | |
LSB Industries, Inc.(A) | | | 1,152 | | | | 4,838 | |
Quaker Chemical Corp.(B) | | | 682 | | | | 112,203 | |
Rayonier Advanced Materials, Inc. | | | 2,629 | | | | 10,095 | |
Stepan Co. | | | 1,055 | | | | 108,074 | |
Tredegar Corp. | | | 1,299 | | | | 29,033 | |
Trinseo SA | | | 2,063 | | | | 76,764 | |
| | | | | | | | |
| | | | | | | 1,192,378 | |
| | | | | | | | |
| Commercial Services & Supplies - 2.3% | |
ABM Industries, Inc. | | | 3,497 | | | | 131,872 | |
Brady Corp., Class A | | | 2,620 | | | | 150,021 | |
Harsco Corp.(A) | | | 4,139 | | | | 95,238 | |
Interface, Inc. | | | 3,076 | | | | 51,031 | |
Matthews International Corp., Class A | | | 1,650 | | | | 62,981 | |
Mobile Mini, Inc. | | | 2,323 | | | | 88,065 | |
Pitney Bowes, Inc.(B) | | | 8,996 | | | | 36,254 | |
R.R. Donnelley & Sons Co. | | | 3,733 | | | | 14,745 | |
Team, Inc.(A) | | | 1,599 | | | | 25,536 | |
UniFirst Corp. | | | 806 | | | | 162,796 | |
US Ecology, Inc. | | | 1,340 | | | | 77,599 | |
Viad Corp. | | | 1,070 | | | | 72,225 | |
| | | | | | | | |
| | | | | | | 968,363 | |
| | | | | | | | |
| Communications Equipment - 1.1% | |
ADTRAN, Inc. | | | 2,518 | | | | 24,903 | |
Applied Optoelectronics, Inc.(A) (B) | | | 1,006 | | | | 11,951 | |
CalAmp Corp.(A) | | | 1,797 | | | | 17,215 | |
Comtech Telecommunications Corp. | | | 1,284 | | | | 45,569 | |
Digi International, Inc.(A) | | | 1,491 | | | | 26,421 | |
Extreme Networks, Inc.(A) | | | 6,401 | | | | 47,175 | |
Harmonic, Inc.(A) | | | 4,757 | | | | 37,105 | |
NETGEAR, Inc.(A) | | | 1,587 | | | | 38,897 | |
| | | | | | | | |
| | | Shares | | | Value | |
| COMMON STOCKS (continued) | |
| Communications Equipment (continued) | |
Plantronics, Inc.(B) | | | 1,723 | | | | $ 47,107 | |
Viavi Solutions, Inc.(A) | | | 12,100 | | | | 181,500 | |
| | | | | | | | |
| | | | | | | 477,843 | |
| | | | | | | | |
| Construction & Engineering - 0.8% | |
Aegion Corp.(A) | | | 1,620 | | | | 36,239 | |
Arcosa, Inc. | | | 2,548 | | | | 113,513 | |
Comfort Systems USA, Inc. | | | 1,931 | | | | 96,260 | |
Granite Construction, Inc.(B) | | | 2,461 | | | | 68,096 | |
MYR Group, Inc.(A) | | | 877 | | | | 28,582 | |
| | | | | | | | |
| | | | | | | 342,690 | |
| | | | | | | | |
| Construction Materials - 0.1% | |
US Concrete, Inc.(A) | | | 835 | | | | 34,786 | |
| | | | | | | | |
| Consumer Finance - 0.5% | |
Encore Capital Group, Inc.(A) (B) | | | 1,456 | | | | 51,484 | |
Enova International, Inc.(A) | | | 1,778 | | | | 42,779 | |
EZCORP, Inc., Class A(A) (B) | | | 2,768 | | | | 18,878 | |
PRA Group, Inc.(A) | | | 2,391 | | | | 86,793 | |
World Acceptance Corp.(A) (B) | | | 292 | | | | 25,229 | |
| | | | | | | | |
| | | | | | | 225,163 | |
| | | | | | | | |
| Containers & Packaging - 0.1% | |
Myers Industries, Inc. | | | 1,870 | | | | 31,192 | |
| | | | | | | | |
| Distributors - 0.2% | |
Core-Mark Holding Co., Inc. | | | 2,399 | | | | 65,229 | |
| | | | | | | | |
| Diversified Consumer Services - 0.7% | |
American Public Education, Inc.(A) | | | 811 | | | | 22,213 | |
Perdoceo Education Corp. | | | 3,706 | | | | 68,153 | |
Regis Corp.(A) | | | 1,273 | | | | 22,749 | |
Strategic Education, Inc. | | | 1,157 | | | | 183,847 | |
| | | | | | | | |
| | | | | | | 296,962 | |
| | | | | | | | |
| Diversified Financial Services - 0.2% | |
FGL Holdings | | | 6,886 | | | | 73,336 | |
| | | | | | | | |
| Diversified Telecommunication Services - 1.0% | |
ATN International, Inc. | | | 573 | | | | 31,738 | |
Cincinnati Bell, Inc.(A) (B) | | | 2,655 | | | | 27,798 | |
Cogent Communications Holdings, Inc. | | | 2,195 | | | | 144,453 | |
Consolidated Communications Holdings, Inc. | | | 3,795 | | | | 14,725 | |
Iridium Communications, Inc.(A) | | | 5,108 | | | | 125,861 | |
Vonage Holdings Corp.(A) | | | 12,009 | | | | 88,987 | |
| | | | | | | | |
| | | | | | | 433,562 | |
| | | | | | | | |
| Electric Utilities - 0.3% | |
E.I. Paso Electric Co. | | | 2,145 | | | | 145,624 | |
| | | | | | | | |
| Electrical Equipment - 0.5% | |
AZZ, Inc. | | | 1,377 | | | | 63,273 | |
Encore Wire Corp. | | | 1,104 | | | | 63,370 | |
Powell Industries, Inc. | | | 464 | | | | 22,731 | |
Vicor Corp.(A) | | | 965 | | | | 45,085 | |
| | | | | | | | |
| | | | | | | 194,459 | |
| | | | | | | | |
| Electronic Equipment, Instruments & Components - 4.3% | |
Anixter International, Inc.(A) | | | 1,585 | | | | 145,978 | |
Arlo Technologies, Inc.(A) | | | 3,986 | | | | 16,781 | |
Badger Meter, Inc. | | | 1,533 | | | | 99,538 | |
Bel Fuse, Inc., Class B | | | 533 | | | | 10,927 | |
Benchmark Electronics, Inc. | | | 1,981 | | | | 68,067 | |
CTS Corp. | | | 1,717 | | | | 51,527 | |
Daktronics, Inc. | | | 1,973 | | | | 12,016 | |
The Notes to Financial Statements are an integral part of this report.
| | |
| Transamerica ETF Trust | | Annual Report 2019 |
Page 23
DeltaShares® S&P 600 Managed Risk ETF
SCHEDULE OF INVESTMENTS (continued)
At December 31, 2019
| | | | | | | | |
| | | Shares | | | Value | |
| COMMON STOCKS (continued) | |
| Electronic Equipment, Instruments & Components (continued) | |
ePlus, Inc.(A) | | | 711 | | | | $ 59,930 | |
Fabrinet(A) | | | 1,948 | | | | 126,308 | |
FARO Technologies, Inc.(A) | | | 916 | | | | 46,121 | |
Insight Enterprises, Inc.(A) | | | 1,884 | | | | 132,426 | |
Itron, Inc.(A) | | | 1,854 | | | | 155,643 | |
Kemet Corp. | | | 3,059 | | | | 82,746 | |
Knowles Corp.(A) | | | 4,531 | | | | 95,831 | |
Methode Electronics, Inc. | | | 1,953 | | | | 76,851 | |
MTS Systems Corp. | | | 937 | | | | 45,004 | |
OSI Systems, Inc.(A) | | | 899 | | | | 90,565 | |
Plexus Corp.(A) | | | 1,536 | | | | 118,180 | |
Rogers Corp.(A) | | | 978 | | | | 121,986 | |
Sanmina Corp.(A) | | | 3,685 | | | | 126,174 | |
ScanSource, Inc.(A) | | | 1,330 | | | | 49,144 | |
TTM Technologies, Inc.(A) | | | 5,166 | | | | 77,748 | |
| | | | | | | | |
| | | | | | | 1,809,491 | |
| | | | | | | | |
| Energy Equipment & Services - 1.9% | |
Archrock, Inc. | | | 6,719 | | | | 67,459 | |
Diamond Offshore Drilling, Inc.(A) (B) | | | 3,408 | | | | 24,503 | |
DMC Global, Inc.(B) | | | 771 | | | | 34,649 | |
Dril-Quip, Inc.(A) | | | 1,905 | | | | 89,363 | |
Era Group, Inc.(A) | | | 1,043 | | | | 10,607 | |
Exterran Corp.(A) | | | 1,482 | | | | 11,604 | |
Geospace Technologies Corp.(A) | | | 718 | | | | 12,041 | |
Helix Energy Solutions Group, Inc.(A) | | | 7,444 | | | | 71,686 | |
KLX Energy Services Holdings, Inc.(A) | | | 1,106 | | | | 7,123 | |
Matrix Service Co.(A) | | | 1,430 | | | | 32,718 | |
McDermott International, Inc.(A) (B) | | | 9,574 | | | | 6,478 | |
Nabors Industries, Ltd. | | | 17,796 | | | | 51,252 | |
Newpark Resources, Inc.(A) | | | 4,724 | | | | 29,619 | |
Noble Corp. PLC(A) | | | 13,122 | | | | 16,009 | |
Oceaneering International, Inc.(A) | | | 5,209 | | | | 77,666 | |
Oil States International, Inc.(A) | | | 3,186 | | | | 51,964 | |
ProPetro Holding Corp.(A) | | | 4,336 | | | | 48,780 | |
RPC, Inc.(B) | | | 2,711 | | | | 14,206 | |
SEACOR Holdings, Inc.(A) | | | 924 | | | | 39,871 | |
TETRA Technologies, Inc.(A) | | | 6,610 | | | | 12,956 | |
US Silica Holdings, Inc.(B) | | | 3,874 | | | | 23,825 | |
Valaris PLC(A) (B) | | | 10,419 | | | | 68,349 | |
| | | | | | | | |
| | | | | | | 802,728 | |
| | | | | | | | |
| Entertainment - 0.2% | |
Glu Mobile, Inc.(A) | | | 6,064 | | | | 36,687 | |
Marcus Corp. | | | 1,210 | | | | 38,442 | |
| | | | | | | | |
| | | | | | | 75,129 | |
| | | | | | | | |
| Equity Real Estate Investment Trusts - 6.9% | |
Acadia Realty Trust | | | 4,578 | | | | 118,708 | |
Agree Realty Corp. | | | 2,233 | | | | 156,690 | |
American Assets Trust, Inc. | | | 2,526 | | | | 115,943 | |
Armada Hoffler Properties, Inc. | | | 2,918 | | | | 53,545 | |
CareTrust, Inc. | | | 5,032 | | | | 103,810 | |
CBL & Associates Properties, Inc.(B) | | | 9,136 | | | | 9,593 | |
Cedar Realty Trust, Inc. | | | 4,525 | | | | 13,349 | |
Chatham Lodging Trust(B) | | | 2,471 | | | | 45,318 | |
Community Healthcare Trust, Inc. | | | 999 | | | | 42,817 | |
DiamondRock Hospitality Co. | | | 10,541 | | | | 116,794 | |
Easterly Government Properties, Inc. | | | 3,905 | | | | 92,666 | |
Essential Properties Realty Trust, Inc. | | | 4,267 | | | | 105,864 | |
| | | | | | | | |
| | | Shares | | | Value | |
| COMMON STOCKS (continued) | |
| Equity Real Estate Investment Trusts (continued) | |
Four Corners Property Trust, Inc. | | | 3,629 | | | | $ 102,301 | |
Franklin Street Properties Corp.(B) | | | 5,646 | | | | 48,330 | |
Getty Realty Corp. | | | 1,801 | | | | 59,199 | |
Global Net Lease, Inc. | | | 4,710 | | | | 95,519 | |
Hersha Hospitality Trust | | | 1,891 | | | | 27,514 | |
Independence Realty Trust, Inc. | | | 4,786 | | | | 67,387 | |
Industrial Logistics Properties Trust(B) | | | 3,432 | | | | 76,945 | |
Innovative Industrial Properties, Inc.(B) | | | 624 | | | | 47,343 | |
iStar, Inc. | | | 3,110 | | | | 45,126 | |
Kite Realty Group Trust | | | 4,422 | | | | 86,362 | |
Lexington Realty Trust | | | 13,052 | | | | 138,612 | |
LTC Properties, Inc. | | | 2,093 | | | | 93,704 | |
National Storage Affiliates Trust | | | 3,124 | | | | 105,029 | |
Office Properties Income Trust | | | 2,538 | | | | 81,571 | |
Pennsylvania Real Estate Investment Trust(B) | | | 3,146 | | | | 16,768 | |
Retail Opportunity Investments Corp. | | | 6,108 | | | | 107,867 | |
RPT Realty | | | 4,232 | | | | 63,649 | |
Safehold, Inc. | | | 654 | | | | 26,356 | |
Saul Centers, Inc. | | | 620 | | | | 32,724 | |
Summit Hotel Properties, Inc.(B) | | | 5,537 | | | | 68,327 | |
Uniti Group, Inc.(B) | | | 10,177 | | | | 83,553 | |
Universal Health Realty Income Trust | | | 666 | | | | 78,162 | |
Urstadt Biddle Properties, Inc., Class A | | | 1,574 | | | | 39,098 | |
Washington Prime Group, Inc.(B) | | | 9,825 | | | | 35,763 | |
Washington Real Estate Investment Trust | | | 4,244 | | | | 123,840 | |
Whitestone, REIT(B) | | | 2,140 | | | | 29,147 | |
Xenia Hotels & Resorts, Inc. | | | 5,931 | | | | 128,169 | |
| | | | | | | | |
| | | | | | | 2,883,462 | |
| | | | | | | | |
| Food & Staples Retailing - 0.6% | |
Andersons, Inc. | | | 1,717 | | | | 43,406 | |
Chefs’ Warehouse, Inc.(A) | | | 1,342 | | | | 51,144 | |
PriceSmart, Inc. | | | 1,174 | | | | 83,377 | |
SpartanNash Co. | | | 1,914 | | | | 27,255 | |
United Natural Foods, Inc.(A) | | | 2,808 | | | | 24,598 | |
| | | | | | | | |
| | | | | | | 229,780 | |
| | | | | | | | |
| Food Products - 1.7% | |
B&G Foods, Inc.(B) | | | 3,372 | | | | 60,460 | |
Cal-Maine Foods, Inc. | | | 1,595 | | | | 68,186 | |
Calavo Growers, Inc. | | | 862 | | | | 78,089 | |
Darling Ingredients, Inc.(A) | | | 8,620 | | | | 242,050 | |
Fresh Del Monte Produce, Inc. | | | 1,595 | | | | 55,793 | |
J&J Snack Foods Corp. | | | 786 | | | | 144,836 | |
John B Sanfilippo & Son, Inc. | | | 463 | | | | 42,263 | |
Seneca Foods Corp., Class A(A) | | | 360 | | | | 14,684 | |
| | | | | | | | |
| | | | | | | 706,361 | |
| | | | | | | | |
| Gas Utilities - 0.7% | |
NorthWest Natural Holding Co. | | | 1,603 | | | | 118,189 | |
South Jersey Industries, Inc. | | | 4,865 | | | | 160,448 | |
| | | | | | | | |
| | | | | | | 278,637 | |
| | | | | | | | |
| Health Care Equipment & Supplies - 3.2% | |
AngioDynamics, Inc.(A) | | | 1,981 | | | | 31,716 | |
Cardiovascular Systems, Inc.(A) | | | 1,853 | | | | 90,037 | |
CONMED Corp. | | | 1,494 | | | | 167,074 | |
CryoLife, Inc.(A) | | | 1,975 | | | | 53,503 | |
Cutera, Inc.(A) | | | 749 | | | | 26,822 | |
Heska Corp.(A) | | | 371 | | | | 35,594 | |
The Notes to Financial Statements are an integral part of this report.
| | |
| Transamerica ETF Trust | | Annual Report 2019 |
Page 24
DeltaShares® S&P 600 Managed Risk ETF
SCHEDULE OF INVESTMENTS (continued)
At December 31, 2019
| | | | | | | | |
| | | Shares | | | Value | |
| COMMON STOCKS (continued) | |
| Health Care Equipment & Supplies (continued) | |
Inogen, Inc.(A) | | | 961 | | | | $ 65,665 | |
Integer Holdings Corp.(A) | | | 1,721 | | | | 138,420 | |
Invacare Corp. | | | 1,773 | | | | 15,992 | |
Lantheus Holdings, Inc.(A) | | | 2,067 | | | | 42,394 | |
LeMaitre Vascular, Inc. | | | 863 | | | | 31,025 | |
Meridian Bioscience, Inc. | | | 2,251 | | | | 21,992 | |
Merit Medical Systems, Inc.(A) | | | 2,907 | | | | 90,757 | |
Mesa Laboratories, Inc. | | | 211 | | | | 52,623 | |
Natus Medical, Inc.(A) | | | 1,795 | | | | 59,217 | |
Neogen Corp.(A) | | | 2,760 | | | | 180,118 | |
OraSure Technologies, Inc.(A) | | | 3,250 | | | | 26,097 | |
Orthofix Medical, Inc.(A) | | | 1,003 | | | | 46,319 | |
Surmodics, Inc.(A) | | | 713 | | | | 29,540 | |
Tactile Systems Technology, Inc.(A) (B) | | | 1,002 | | | | 67,645 | |
Varex Imaging Corp.(A) | | | 2,020 | | | | 60,216 | |
| | | | | | | | |
| | | | | | | 1,332,766 | |
| | | | | | | | |
| Health Care Providers & Services - 3.2% | |
Addus HomeCare Corp.(A) | | | 713 | | | | 69,318 | |
AMN Healthcare Services, Inc.(A) | | | 2,460 | | | | 153,283 | |
BioTelemetry, Inc.(A) | | | 1,790 | | | | 82,877 | |
Community Health Systems, Inc.(A) | | | 6,205 | | | | 17,994 | |
Convetrus, Inc.(A) (B) | | | 5,136 | | | | 67,795 | |
CorVel Corp.(A) | | | 472 | | | | 41,234 | |
Cross Country Healthcare, Inc.(A) | | | 1,942 | | | | 22,566 | |
Diplomat Pharmacy, Inc.(A) | | | 3,040 | | | | 12,160 | |
Ensign Group, Inc. | | | 2,641 | | | | 119,822 | |
Hanger, Inc.(A) | | | 1,966 | | | | 54,281 | |
LHC Group, Inc.(A) | | | 1,560 | | | | 214,906 | |
Magellan Health, Inc.(A) | | | 1,147 | | | | 89,753 | |
Owens & Minor, Inc. | | | 3,309 | | | | 17,107 | |
Pennant Group, Inc.(A) | | | 1,378 | | | | 45,570 | |
Providence Service Corp.(A) | | | 604 | | | | 35,745 | |
RadNet, Inc.(A) | | | 2,197 | | | | 44,599 | |
Select Medical Holdings Corp.(A) | | | 5,658 | | | | 132,058 | |
Tivity Health, Inc.(A) (B) | | | 2,274 | | | | 46,264 | |
US Physical Therapy, Inc. | | | 673 | | | | 76,958 | |
| | | | | | | | |
| | | | | | | 1,344,290 | |
| | | | | | | | |
| Health Care Technology - 1.1% | |
Computer Programs & Systems, Inc. | | | 658 | | | | 17,371 | |
HealthStream, Inc.(A) | | | 1,347 | | | | 36,638 | |
HMS Holdings Corp.(A) | | | 4,639 | | | | 137,314 | |
NextGen Healthcare, Inc.(A) | | | 2,550 | | | | 40,979 | |
Omnicell, Inc.(A) | | | 2,208 | | | | 180,438 | |
Tabula Rasa HealthCare, Inc.(A) (B) | | | 1,035 | | | | 50,384 | |
| | | | | | | | |
| | | | | | | 463,124 | |
| | | | | | | | |
| Hotels, Restaurants & Leisure - 1.5% | |
BJ’s Restaurants, Inc. | | | 1,009 | | | | 38,302 | |
Bloomin’ Brands, Inc. | | | 4,574 | | | | 100,948 | |
Chuy’s Holdings, Inc.(A) | | | 875 | | | | 22,680 | |
Dave & Buster’s Entertainment, Inc.(B) | | | 1,623 | | | | 65,196 | |
Dine Brands Global, Inc.(B) | | | 884 | | | | 73,832 | |
El Pollo Loco Holdings, Inc.(A) | | | 1,029 | | | | 15,579 | |
Fiesta Restaurant Group, Inc.(A) | | | 1,128 | | | | 11,156 | |
Monarch Casino & Resort, Inc.(A) | | | 628 | | | | 30,489 | |
Red Robin Gourmet Burgers, Inc.(A) (B) | | | 681 | | | | 22,486 | |
Ruth’s Hospitality Group, Inc. | | | 1,429 | | | | 31,102 | |
Shake Shack, Inc., Class A(A) (B) | | | 1,635 | | | | 97,397 | |
| | | | | | | | |
| | | Shares | | | Value | |
| COMMON STOCKS (continued) | |
| Hotels, Restaurants & Leisure (continued) | |
Wingstop, Inc. | | | 1,551 | | | | $ 133,743 | |
| | | | | | | | |
| | | | | | | 642,910 | |
| | | | | | | | |
| Household Durables - 2.4% | |
Cavco Industries, Inc.(A) | | | 452 | | | | 88,312 | |
Century Communities, Inc.(A) | | | 1,419 | | | | 38,810 | |
Ethan Allen Interiors, Inc. | | | 1,288 | | | | 24,549 | |
Installed Building Products, Inc.(A) | | | 1,122 | | | | 77,272 | |
iRobot Corp.(A) (B) | | | 1,489 | | | | 75,388 | |
La-Z-Boy, Inc. | | | 2,442 | | | | 76,874 | |
LGI Homes, Inc.(A) | | | 1,051 | | | | 74,253 | |
M/I Homes, Inc.(A) | | | 1,482 | | | | 58,317 | |
MDC Holdings, Inc. | | | 2,637 | | | | 100,628 | |
Meritage Homes Corp.(A) | | | 1,896 | | | | 115,865 | |
TopBuild Corp.(A) | | | 1,788 | | | | 184,307 | |
Tupperware Brands Corp. | | | 2,575 | | | | 22,093 | |
Universal Electronics, Inc.(A) | | | 733 | | | | 38,307 | |
William Lyon Homes, Class A(A) | | | 1,739 | | | | 34,745 | |
| | | | | | | | |
| | | | | | | 1,009,720 | |
| | | | | | | | |
| Household Products - 0.5% | |
Central Garden & Pet Co.(A) | | | 516 | | | | 16,032 | |
Central Garden & Pet Co., Class A(A) | | | 2,116 | | | | 62,126 | |
WD-40 Co.(B) | | | 722 | | | | 140,169 | |
| | | | | | | | |
| | | | | | | 218,327 | |
| | | | | | | | |
| Industrial Conglomerates - 0.2% | |
Raven Industries, Inc. | | | 1,883 | | | | 64,888 | |
| | | | | | | | |
| Insurance - 2.6% | |
Ambac Financial Group, Inc.(A) | | | 2,399 | | | | 51,746 | |
American Equity Investment Life Holding Co. | | | 4,794 | | | | 143,484 | |
AMERISAFE, Inc. | | | 1,016 | | | | 67,086 | |
eHealth, Inc.(A) (B) | | | 1,070 | | | | 102,806 | |
Employers Holdings, Inc. | | | 1,675 | | | | 69,931 | |
HCI Group, Inc. | | | 338 | | | | 15,430 | |
Horace Mann Educators Corp. | | | 2,170 | | | | 94,742 | |
James River Group Holdings, Ltd. | | | 1,601 | | | | 65,977 | |
Kinsale Capital Group, Inc. | | | 1,085 | | | | 110,301 | |
ProAssurance Corp. | | | 2,832 | | | | 102,349 | |
Safety Insurance Group, Inc. | | | 770 | | | | 71,248 | |
Stewart Information Services Corp. | | | 1,248 | | | | 50,906 | |
Third Point Reinsurance, Ltd.(A) | | | 4,217 | | | | 44,363 | |
United Fire Group, Inc. | | | 1,120 | | | | 48,978 | |
United Insurance Holdings Corp. | | | 1,093 | | | | 13,783 | |
Universal Insurance Holdings, Inc. | | | 1,609 | | | | 45,036 | |
| | | | | | | | |
| | | | | | | 1,098,166 | |
| | | | | | | | |
| Interactive Media & Services - 0.1% | |
Care.com, Inc.(A) | | | 1,484 | | | | 22,304 | |
QuinStreet, Inc.(A) | | | 2,428 | | | | 37,173 | |
| | | | | | | | |
| | | | | | | 59,477 | |
| | | | | | | | |
| Internet & Direct Marketing Retail - 0.4% | |
Liquidity Services, Inc.(A) | | | 1,418 | | | | 8,452 | |
PetMed Express, Inc.(B) | | | 1,062 | | | | 24,978 | |
Shutterstock, Inc.(A) | | | 1,008 | | | | 43,223 | |
Stamps.com, Inc.(A) | | | 854 | | | | 71,326 | |
| | | | | | | | |
| | | | | | | 147,979 | |
| | | | | | | | |
| IT Services - 2.1% | |
Cardtronics PLC, Class A(A) | | | 1,902 | | | | 84,924 | |
CSG Systems International, Inc. | | | 1,735 | | | | 89,838 | |
The Notes to Financial Statements are an integral part of this report.
| | |
| Transamerica ETF Trust | | Annual Report 2019 |
Page 25
DeltaShares® S&P 600 Managed Risk ETF
SCHEDULE OF INVESTMENTS (continued)
At December 31, 2019
| | | | | | | | |
| | | Shares | | | Value | |
| COMMON STOCKS (continued) | |
| IT Services (continued) | |
EVERTEC, Inc. | | | 3,143 | | | | $ 106,988 | |
ExlService Holdings, Inc.(A) | | | 1,795 | | | | 124,681 | |
ManTech International Corp., Class A | | | 1,417 | | | | 113,190 | |
NIC, Inc. | | | 3,526 | | | | 78,806 | |
Perficient, Inc.(A) | | | 1,717 | | | | 79,102 | |
Sykes Enterprises, Inc.(A) | | | 2,029 | | | | 75,053 | |
TTEC Holdings, Inc. | | | 930 | | | | 36,847 | |
Unisys Corp.(A) | | | 2,727 | | | | 32,342 | |
Virtusa Corp.(A) | | | 1,571 | | | | 71,213 | |
| | | | | | | | |
| | | | | | | 892,984 | |
| | | | | | | | |
| Leisure Products - 0.4% | |
Callaway Golf Co. | | | 4,955 | | | | 105,046 | |
Sturm Ruger & Co., Inc.(B) | | | 875 | | | | 41,151 | |
Vista Outdoor, Inc.(A) | | | 3,045 | | | | 22,777 | |
| | | | | | | | |
| | | | | | | 168,974 | |
| | | | | | | | |
| Life Sciences Tools & Services - 0.8% | |
Luminex Corp. | | | 2,206 | | | | 51,091 | |
Medpace Holdings, Inc.(A) | | | 1,442 | | | | 121,215 | |
NeoGenomics, Inc.(A) | | | 5,498 | | | | 160,816 | |
| | | | | | | | |
| | | | | | | 333,122 | |
| | | | | | | | |
| Machinery - 5.5% | |
Actuant Corp., Class A | | | 2,837 | | | | 73,847 | |
Alamo Group, Inc. | | | 511 | | | | 64,156 | |
Albany International Corp., Class A | | | 1,617 | | | | 122,763 | |
Astec Industries, Inc. | | | 1,187 | | | | 49,854 | |
Barnes Group, Inc. | | | 2,510 | | | | 155,520 | |
Briggs & Stratton Corp.(B) | | | 2,237 | | | | 14,898 | |
Chart Industries, Inc.(A) | | | 1,885 | | | | 127,219 | |
CIRCOR International, Inc.(A) | | | 1,048 | | | | 48,459 | |
EnPro Industries, Inc. | | | 1,094 | | | | 73,167 | |
ESCO Technologies, Inc. | | | 1,368 | | | | 126,540 | |
Federal Signal Corp. | | | 3,186 | | | | 102,748 | |
Franklin Electric Co., Inc. | | | 2,026 | | | | 116,130 | |
Greenbrier Cos., Inc. | | | 1,716 | | | | 55,650 | |
Hillenbrand, Inc. | | | 3,902 | | | | 129,976 | |
John Bean Technologies Corp. | | | 1,667 | | | | 187,804 | |
Lindsay Corp. | | | 569 | | | | 54,618 | |
Lydall, Inc.(A) | | | 923 | | | | 18,940 | |
Mueller Industries, Inc. | | | 2,999 | | | | 95,218 | |
Proto Labs, Inc.(A) | | | 1,409 | | | | 143,084 | |
SPX Corp.(A) | | | 2,324 | | | | 118,245 | |
SPX Flow, Inc.(A) | | | 2,241 | | | | 109,518 | |
Standex International Corp. | | | 656 | | | | 52,054 | |
Tennant Co. | | | 962 | | | | 74,959 | |
Titan International, Inc. | | | 2,635 | | | | 9,539 | |
Wabash National Corp. | | | 2,848 | | | | 41,837 | |
Watts Water Technologies, Inc., Class A | | | 1,453 | | | | 144,951 | |
| | | | | | | | |
| | | | | | | 2,311,694 | |
| | | | | | | | |
| Marine - 0.2% | |
Matson, Inc. | | | 2,257 | | | | 92,086 | |
| | | | | | | | |
| Media - 0.4% | |
EW Scripps Co., Class A | | | 2,869 | | | | 45,072 | |
Gannett Co., Inc.(B) | | | 6,470 | | | | 41,279 | |
Scholastic Corp. | | | 1,619 | | | | 62,250 | |
TechTarget, Inc.(A) | | | 1,208 | | | | 31,529 | |
| | | | | | | | |
| | | | | | | 180,130 | |
| | | | | | | | |
| | | | | | | | |
| | | Shares | | | Value | |
| COMMON STOCKS (continued) | |
| Metals & Mining - 1.2% | |
AK Steel Holding Corp.(A) (B) | | | 16,663 | | | | $ 54,821 | |
Century Aluminum Co.(A) | | | 2,621 | | | | 19,697 | |
Cleveland-Cliffs, Inc.(B) | | | 14,221 | | | | 119,456 | |
Haynes International, Inc. | | | 659 | | | | 23,579 | |
Kaiser Aluminum Corp. | | | 836 | | | | 92,704 | |
Materion Corp. | | | 1,074 | | | | 63,849 | |
Olympic Steel, Inc. | | | 481 | | | | 8,620 | |
SunCoke Energy, Inc. | | | 4,568 | | | | 28,459 | |
TimkenSteel Corp.(A) | | | 2,100 | | | | 16,506 | |
Warrior Met Coal, Inc. | | | 2,689 | | | | 56,819 | |
| | | | | | | | |
| | | | | | | 484,510 | |
| | | | | | | | |
| Mortgage Real Estate Investment Trusts - 1.9% | |
Apollo Commercial Real Estate Finance, Inc. | | | 7,519 | | | | 137,522 | |
ARMOUR Residential, Inc.(B) | | | 3,101 | | | | 55,415 | |
Capstead Mortgage Corp. | | | 4,981 | | | | 39,450 | |
Granite Point Mortgage Trust, Inc. | | | 2,888 | | | | 53,081 | |
Invesco Mortgage Capital, Inc. | | | 7,519 | | | | 125,191 | |
KKR Real Estate Finance Trust, Inc.(B) | | | 1,271 | | | | 25,954 | |
New York Mortgage Trust, Inc. | | | 15,342 | | | | 95,581 | |
PennyMac Mortgage Investment Trust | | | 5,274 | | | | 117,557 | |
Ready Capital Corp.(B) | | | 1,856 | | | | 28,620 | |
Redwood Trust, Inc. | | | 5,934 | | | | 98,148 | |
| | | | | | | | |
| | | | | | | 776,519 | |
| | | | | | | | |
| Multi-Utilities - 0.4% | |
Avista Corp. | | | 3,513 | | | | 168,940 | |
| | | | | | | | |
| Multiline Retail - 0.2% | |
Big Lots, Inc.(B) | | | 2,054 | | | | 58,991 | |
JC Penney Co., Inc.(A) (B) | | | 15,838 | | | | 17,738 | |
| | | | | | | | |
| | | | | | | 76,729 | |
| | | | | | | | |
| Oil, Gas & Consumable Fuels - 2.3% | |
Bonanza Creek Energy, Inc.(A) | | | 978 | | | | 22,827 | |
Callon Petroleum Co.(A) | | | 20,560 | | | | 99,305 | |
Consol Energy, Inc.(A) | | | 1,364 | | | | 19,792 | |
Denbury Resources, Inc.(A) | | | 25,944 | | | | 36,581 | |
Green Plains, Inc. | | | 1,780 | | | | 27,465 | |
Gulfport Energy Corp.(A) (B) | | | 7,653 | | | | 23,265 | |
HighPoint Resources Corp.(A) | | | 5,738 | | | | 9,697 | |
Jagged Peak Energy, Inc.(A) (B) | | | 3,147 | | | | 26,718 | |
Laredo Petroleum, Inc.(A) | | | 9,490 | | | | 27,236 | |
Oasis Petroleum, Inc.(A) | | | 15,227 | | | | 49,640 | |
Par Pacific Holdings, Inc.(A) | | | 1,940 | | | | 45,086 | |
PDC Energy, Inc.(A) | | | 3,101 | | | | 81,153 | |
Penn Virginia Corp.(A) | | | 709 | | | | 21,518 | |
QEP Resources, Inc. | | | 12,521 | | | | 56,345 | |
Range Resources Corp.(B) | | | 10,988 | | | | 53,292 | |
Renewable Energy Group, Inc.(A) (B) | | | 2,052 | | | | 55,301 | |
REX American Resources Corp.(A) | | | 295 | | | | 24,178 | |
Ring Energy, Inc.(A) (B) | | | 3,142 | | | | 8,295 | |
SM Energy Co. | | | 5,586 | | | | 62,787 | |
Southwestern Energy Co.(A) (B) | | | 28,502 | | | | 68,975 | |
SRC Energy, Inc.(A) | | | 12,825 | | | | 52,839 | |
Talos Energy, Inc.(A) | | | 1,056 | | | | 31,838 | |
Whiting Petroleum Corp.(A) (B) | | | 4,807 | | | | 35,283 | |
| | | | | | | | |
| | | | | | | 939,416 | |
| | | | | | | | |
| Paper & Forest Products - 0.7% | |
Boise Cascade Co. | | | 2,052 | | | | 74,960 | |
The Notes to Financial Statements are an integral part of this report.
| | |
| Transamerica ETF Trust | | Annual Report 2019 |
Page 26
DeltaShares® S&P 600 Managed Risk ETF
SCHEDULE OF INVESTMENTS (continued)
At December 31, 2019
| | | | | | | | |
| | | Shares | | | Value | |
| COMMON STOCKS (continued) | |
| Paper & Forest Products (continued) | |
Clearwater Paper Corp.(A) | | | 870 | | | | $ 18,583 | |
Mercer International, Inc. | | | 2,108 | | | | 25,928 | |
Neenah, Inc. | | | 885 | | | | 62,330 | |
P.H. Glatfelter Co. | | | 2,326 | | | | 42,566 | |
Schweitzer-Mauduit International, Inc. | | | 1,627 | | | | 68,318 | |
| | | | | | | | |
| | | | | | | 292,685 | |
| | | | | | | | |
| Personal Products - 0.8% | |
Avon Products, Inc. | | | 23,327 | | | | 131,564 | |
Inter Parfums, Inc. | | | 928 | | | | 67,475 | |
Medifast, Inc.(B) | | | 612 | | | | 67,063 | |
USANA Health Sciences, Inc.(A) | | | 661 | | | | 51,922 | |
| | | | | | | | |
| | | | | | | 318,024 | |
| | | | | | | | |
| Pharmaceuticals - 1.1% | |
Akorn, Inc.(A) | | | 4,982 | | | | 7,473 | |
Amphastar Pharmaceuticals, Inc.(A) | | | 1,804 | | | | 34,799 | |
ANI Pharmaceuticals, Inc.(A) | | | 490 | | | | 30,218 | |
Corcept Therapeutics, Inc.(A) (B) | | | 5,416 | | | | 65,534 | |
Endo International PLC(A) | | | 10,627 | | | | 49,841 | |
Innoviva, Inc.(A) | | | 3,520 | | | | 49,843 | |
Lannett Co., Inc.(A) (B) | | | 1,763 | | | | 15,550 | |
Pacira BioSciences, Inc.(A) | | | 2,197 | | | | 99,524 | |
Phibro Animal Health Corp., Class A | | | 1,068 | | | | 26,518 | |
Supernus Pharmaceuticals, Inc.(A) | | | 2,762 | | | | 65,515 | |
| | | | | | | | |
| | | | | | | 444,815 | |
| | | | | | | | |
| Professional Services - 1.2% | |
Exponent, Inc. | | | 2,729 | | | | 188,328 | |
Forrester Research, Inc. | | | 559 | | | | 23,311 | |
Heidrick & Struggles International, Inc. | | | 1,009 | | | | 32,793 | |
Kelly Services, Inc., Class A | | | 1,747 | | | | 39,447 | |
Korn Ferry | | | 2,913 | | | | 123,511 | |
Resources Connection, Inc. | | | 1,585 | | | | 25,883 | |
TrueBlue, Inc.(A) | | | 2,051 | | | | 49,347 | |
| | | | | | | | |
| | | | | | | 482,620 | |
| | | | | | | | |
| Real Estate Management & Development - 0.4% | |
Marcus & Millichap, Inc.(A) | | | 1,236 | | | | 46,041 | |
RE/MAX Holdings, Inc., Class A | | | 939 | | | | 36,142 | |
Realogy Holdings Corp.(B) | | | 6,021 | | | | 58,283 | |
St. Joe Co.(A) (B) | | | 1,658 | | | | 32,878 | |
| | | | | | | | |
| | | | | | | 173,344 | |
| | | | | | | | |
| Road & Rail - 0.6% | |
ArcBest Corp. | | | 1,343 | | | | 37,067 | |
Heartland Express, Inc. | | | 2,462 | | | | 51,825 | |
Marten Transport, Ltd. | | | 2,045 | | | | 43,947 | |
Saia, Inc.(A) | | | 1,366 | | | | 127,202 | |
| | | | | | | | |
| | | | | | | 260,041 | |
| | | | | | | | |
| Semiconductors & Semiconductor Equipment - 3.5% | |
Advanced Energy Industries, Inc.(A) | | | 2,017 | | | | 143,610 | |
Axcelis Technologies, Inc.(A) | | | 1,707 | | | | 41,130 | |
Brooks Automation, Inc. | | | 3,807 | | | | 159,742 | |
CEVA, Inc.(A) | | | 1,158 | | | | 31,220 | |
Cohu, Inc. | | | 2,173 | | | | 49,653 | |
Diodes, Inc.(A) | | | 2,177 | | | | 122,717 | |
DSP Group, Inc.(A) | | | 1,211 | | | | 19,061 | |
FormFactor, Inc.(A) | | | 3,986 | | | | 103,516 | |
Ichor Holdings, Ltd.(A) | | | 1,184 | | | | 39,392 | |
Kulicke & Soffa Industries, Inc. | | | 3,339 | | | | 90,821 | |
| | | | | | | | |
| | | Shares | | | Value | |
| COMMON STOCKS (continued) | |
| Semiconductors & Semiconductor Equipment (continued) | |
MaxLinear, Inc.(A) | | | 3,429 | | | | $ 72,763 | |
Onto Innovation, Inc.(A) | | | 2,583 | | | | 94,383 | |
PDF Solutions, Inc.(A) | | | 1,465 | | | | 24,744 | |
Photronics, Inc.(A) | | | 3,538 | | | | 55,759 | |
Power Integrations, Inc. | | | 1,549 | | | | 153,212 | |
Rambus, Inc.(A) | | | 5,871 | | | | 80,873 | |
SMART Global Holdings, Inc.(A) | | | 693 | | | | 26,292 | |
Ultra Clean Holdings, Inc.(A) | | | 2,096 | | | | 49,193 | |
Veeco Instruments, Inc.(A) | | | 2,575 | | | | 37,814 | |
Xperi Corp. | | | 2,609 | | | | 48,267 | |
| | | | | | | | |
| | | | | | | 1,444,162 | |
| | | | | | | | |
| Software - 2.3% | |
8x8, Inc.(A) | | | 5,277 | | | | 96,569 | |
Agilysys, Inc.(A) | | | 1,071 | | | | 27,214 | |
Alarm.com Holdings, Inc.(A) | | | 1,918 | | | | 82,416 | |
Bottomline Technologies de, Inc.(A) | | | 2,007 | | | | 107,575 | |
Ebix, Inc.(B) | | | 1,172 | | | | 39,157 | |
LivePerson, Inc.(A) (B) | | | 3,242 | | | | 119,954 | |
MicroStrategy, Inc., Class A(A) | | | 433 | | | | 61,759 | |
Onespan, Inc.(A) | | | 1,715 | | | | 29,361 | |
Progress Software Corp. | | | 2,358 | | | | 97,975 | |
Qualys, Inc.(A) | | | 1,755 | | | | 146,314 | |
SPS Commerce, Inc.(A) | | | 1,834 | | | | 101,640 | |
TiVo Corp. | | | 6,668 | | | | 56,545 | |
| | | | | | | | |
| | | | | | | 966,479 | |
| | | | | | | | |
| Specialty Retail - 3.7% | |
Abercrombie & Fitch Co., Class A | | | 3,304 | | | | 57,126 | |
Asbury Automotive Group, Inc.(A) | | | 1,019 | | | | 113,914 | |
Barnes & Noble Education, Inc. | | | 2,035 | | | | 8,689 | |
Boot Barn Holdings, Inc.(A) | | | 1,504 | | | | 66,973 | |
Buckle, Inc.(B) | | | 1,503 | | | | 40,641 | |
Caleres, Inc. | | | 2,144 | | | | 50,920 | |
Cato Corp., Class A | | | 1,144 | | | | 19,906 | |
Chico’s FAS, Inc. | | | 6,246 | | | | 23,797 | |
Children’s Place, Inc.(B) | | | 820 | | | | 51,266 | |
Conn’s, Inc.(A) (B) | | | 1,004 | | | | 12,440 | |
Designer Brands, Inc., Class A | | | 2,905 | | | | 45,725 | |
Express, Inc.(A) | | | 3,542 | | | | 17,250 | |
GameStop Corp., Class A(B) | | | 3,470 | | | | 21,098 | |
Genesco, Inc.(A) | | | 750 | | | | 35,940 | |
Group 1 Automotive, Inc. | | | 922 | | | | 92,200 | |
Guess?, Inc.(B) | | | 2,247 | | | | 50,288 | |
Haverty Furniture Cos., Inc. | | | 953 | | | | 19,213 | |
Hibbett Sports, Inc.(A) | | | 928 | | | | 26,021 | |
Lithia Motors, Inc., Class A | | | 1,192 | | | | 175,224 | |
Lumber Liquidators Holdings, Inc.(A) (B) | | | 1,512 | | | | 14,772 | |
MarineMax, Inc.(A) | | | 1,130 | | | | 18,860 | |
Michaels Cos., Inc.(A) | | | 4,019 | | | | 32,514 | |
Monro, Inc. | | | 1,752 | | | | 137,006 | |
Office Depot, Inc. | | | 28,775 | | | | 78,844 | |
Rent-A-Center, Inc. | | | 2,595 | | | | 74,840 | |
Shoe Carnival, Inc.(B) | | | 471 | | | | 17,559 | |
Signet Jewelers, Ltd.(B) | | | 2,756 | | | | 59,915 | |
Sleep Number Corp.(A) | | | 1,497 | | | | 73,712 | |
Sonic Automotive, Inc., Class A | | | 1,278 | | | | 39,618 | |
Tailored Brands, Inc.(B) | | | 2,667 | | | | 11,041 | |
The Notes to Financial Statements are an integral part of this report.
| | |
| Transamerica ETF Trust | | Annual Report 2019 |
Page 27
DeltaShares® S&P 600 Managed Risk ETF
SCHEDULE OF INVESTMENTS (continued)
At December 31, 2019
| | | | | | | | |
| | | Shares | | | Value | |
| COMMON STOCKS (continued) | |
| Specialty Retail (continued) | |
Zumiez, Inc.(A) | | | 1,073 | | | | $ 37,061 | |
| | | | | | | | |
| | | | | | | 1,524,373 | |
| | | | | | | | |
| Technology Hardware, Storage & Peripherals - 0.2% | |
3D Systems Corp.(A) | | | 6,235 | | | | 54,556 | |
Diebold Nixdorf, Inc.(A) (B) | | | 4,044 | | | | 42,705 | |
| | | | | | | | |
| | | | | | | 97,261 | |
| | | | | | | | |
| Textiles, Apparel & Luxury Goods - 1.9% | |
Crocs, Inc.(A) | | | 3,612 | | | | 151,307 | |
Fossil Group, Inc.(A) | | | 2,447 | | | | 19,282 | |
G-III Apparel Group, Ltd.(A) | | | 2,266 | | | | 75,911 | |
Kontoor Brands, Inc.(B) | | | 2,459 | | | | 103,253 | |
Movado Group, Inc. | | | 864 | | | | 18,783 | |
Oxford Industries, Inc. | | | 897 | | | | 67,652 | |
Steven Madden, Ltd. | | | 4,074 | | | | 175,223 | |
Unifi, Inc.(A) | | | 769 | | | | 19,425 | |
Vera Bradley, Inc.(A) | | | 1,235 | | | | 14,573 | |
Wolverine World Wide, Inc. | | | 4,259 | | | | 143,699 | |
| | | | | | | | |
| | | | | | | 789,108 | |
| | | | | | | | |
| Thrifts & Mortgage Finance - 1.8% | |
Axos Financial, Inc.(A) | | | 2,808 | | | | 85,026 | |
Flagstar Bancorp, Inc. | | | 1,815 | | | | 69,424 | |
HomeStreet, Inc.(A) | | | 1,285 | | | | 43,690 | |
Meta Financial Group, Inc. | | | 1,821 | | | | 66,485 | |
NMI Holdings, Inc., Class A(A) | | | 3,580 | | | | 118,785 | |
Northfield Bancorp, Inc. | | | 2,279 | | | | 38,652 | |
Northwest Bancshares, Inc. | | | 5,280 | | | | 87,806 | |
Provident Financial Services, Inc. | | | 3,162 | | | | 77,943 | |
TrustCo Bank Corp. | | | 5,103 | | | | 44,243 | |
Walker & Dunlop, Inc. | | | 1,509 | | | | 97,602 | |
| | | | | | | | |
| | | | | | | 729,656 | |
| | | | | | | | |
| Tobacco - 0.4% | |
Universal Corp. | | | 1,306 | | | | 74,521 | |
Vector Group, Ltd.(B) | | | 6,070 | | | | 81,277 | |
| | | | | | | | |
| | | | | | | 155,798 | |
| | | | | | | | |
| Trading Companies & Distributors - 0.9% | |
Applied Industrial Technologies, Inc. | | | 2,035 | | | | 135,714 | |
DXP Enterprises, Inc.(A) | | | 843 | | | | 33,560 | |
Foundation Building Materials, Inc.(A) | | | 932 | | | | 18,034 | |
GMS, Inc.(A) | | | 2,220 | | | | 60,117 | |
| | | | | | | | |
| | | Shares | | | Value | |
| COMMON STOCKS (continued) | |
| Trading Companies & Distributors (continued) | |
Kaman Corp. | | | 1,467 | | | | $ 96,705 | |
Veritiv Corp.(A) | | | 670 | | | | 13,179 | |
| | | | | | | | |
| | | | | | | 357,309 | |
| | | | | | | | |
| Water Utilities - 0.7% | |
American States Water Co. | | | 1,940 | | | | 168,081 | |
California Water Service Group | | | 2,535 | | | | 130,705 | |
| | | | | | | | |
| | | | | | | 298,786 | |
| | | | | | | | |
| Wireless Telecommunication Services - 0.3% | |
Shenandoah Telecommunications Co. | | | 2,468 | | | | 102,694 | |
Spok Holdings, Inc. | | | 923 | | | | 11,288 | |
| | | | | | | | |
| | | | | | | 113,982 | |
| | | | | | | | |
Total Common Stocks
(Cost $38,329,513) | | | | 41,108,159 | |
| | | | | |
|
| CONTINGENT VALUE RIGHT - 0.0% | |
| Chemicals - 0.0% | |
A. Schulman, Inc.(C) (D) (E) | | | 1,541 | | | | 0 | |
| | | | | | | | |
Total Contingent Value Right
(Cost $668) | | | | 0 | |
| | | | | |
|
| SHORT-TERM INVESTMENT COMPANY - 0.9% | |
| Money Market Fund - 0.9% | |
State Street Institutional Treasury Money Market Fund, 1.44%(F) | | | 367,778 | | | | 367,778 | |
| | | | | | | | |
Total Short-Term Investment Company
(Cost $367,778) | | | | 367,778 | |
| | | | | |
|
| OTHER INVESTMENT COMPANY - 9.1% | |
| Securities Lending Collateral - 9.1% | |
State Street Navigator Securities Lending Trust - Government Money Market Portfolio, 1.56%(F) | | | 3,812,419 | | | | 3,812,419 | |
| | | | | | | | |
Total Other Investment Company
(Cost $3,812,419) | | | | 3,812,419 | |
| | | | | |
Total Investments
(Cost $42,510,378) | | | | 45,288,356 | |
Net Other Assets (Liabilities) - (8.6)% | | | | | | | (3,581,455 | ) |
| | | | | | | | |
| | |
Net Assets - 100.0% | | | | | | | $ 41,706,901 | |
| | | | | | | | |
| |
FUTURES CONTRACTS:
| | | | | | | | | | | | | | | | | | | | | | | | |
| |
Long Futures Contracts | |
| Description | | Number of
Contracts | | | Expiration
Date | | | Notional
Amount | | | Value | | | Unrealized
Appreciation | | | Unrealized
Depreciation | |
E-Mini Russell 2000® Index | | | 7 | | | | 03/20/2020 | | | $ | 579,365 | | | $ | 584,710 | | | $ | 5,345 | | | $ | — | |
The Notes to Financial Statements are an integral part of this report.
| | |
| Transamerica ETF Trust | | Annual Report 2019 |
Page 28
DeltaShares® S&P 600 Managed Risk ETF
SCHEDULE OF INVESTMENTS (continued)
At December 31, 2019
SECURITY VALUATION:
Valuation Inputs(G)
| | | | | | | | | | | | | | | | | | |
| | | Level 1 -
Unadjusted
Quoted Prices | | | Level 2 -
Other Significant
Observable Inputs | | | Level 3 -
Significant
Unobservable Inputs (H) | | | Value | |
ASSETS | |
Investments | |
Common Stocks | | $ | 41,108,159 | | | $ | — | | | $ | — | | | $ | 41,108,159 | |
Contingent Value Right | | | — | | | | — | | | | 0 | | | | 0 | |
Short-Term Investment Company | | | 367,778 | | | | — | | | | — | | | | 367,778 | |
Other Investment Company | | | 3,812,419 | | | | — | | | | — | | | | 3,812,419 | |
| | | | | | | | | | | | | | | | |
Total Investments | | $ | 45,288,356 | | | $ | — | | | $ | 0 | | | $ | 45,288,356 | |
| | | | | | | | | | | | | | | | |
Other Financial Instruments | |
Futures Contracts(I) | | $ | 5,345 | | | $ | — | | | $ | — | | | $ | 5,345 | |
| | | | | | | | | | | | | | | | |
Total Other Financial Instruments | | $ | 5,345 | | | $ | — | | | $ | — | | | $ | 5,345 | |
| | | | | | | | | | | | | | | | |
FOOTNOTES TO SCHEDULE OF INVESTMENTS:
| | | | | | | | |
| (A) | | Non-income producing securities. |
| (B) | | All or a portion of the securities are on loan. The total value of all securities on loan is $3,707,062. The amount of securities on loan indicated may not correspond with the securities on loan identified because securities with pending sales are in the process of recall from the brokers. |
| (C) | | Security deemed worthless. |
| (D) | | Fair valued as determined in good faith in accordance with procedures established by the Board. At December 31, 2019, the value of the security is $0, representing 0.00% of the Fund’s net assets. |
| (E) | | Security is Level 3 of the fair value hierarchy. |
| (F) | | Rates disclosed reflect the yields at December 31, 2019. |
| (G) | | There were no transfers in or out of Level 3 during the period ended December 31, 2019. Please reference the Security Valuation section of the Notes to Financial Statements for more information regarding security valuation and pricing inputs. |
| (H) | | Level 3 securities were not considered significant to the Fund. |
| (I) | | Futures contracts and/or forward foreign currency contracts are valued at unrealized appreciation (depreciation). |
The Notes to Financial Statements are an integral part of this report.
| | |
| Transamerica ETF Trust | | Annual Report 2019 |
Page 29
DeltaShares® S&P EM 100 & Managed Risk ETF
(unaudited)
MARKET ENVIRONMENT
Stocks across the world posted positive returns in 2019. The S&P 500® also posted strong performance in 2019.
Global stock markets began the year on a positive note, with a snap recovery from the late December 2018 trough. This continued throughout January and shrugged off the longest government shutdown in U.S. history. Markets largely continued to rally through April, but gave up roughly half of theiryear-to-date gains in May. The loss was broad based, with domestic, international developed, and emerging markets all finishing the month sharply lower. However, the second quarter of 2019 finished on a higher note, with May losses closely mirrored by June gains, to complete a low volatilityV-shaped quarter.
Domestic equity returns remained in positive territory in July with the S&P 500® hitting the 3,000 price level for the first time in history. In contrast, both developed and emerging market equities fluctuated between positive and negative territory, ending the month with losses. Equity volatility picked up in August, but remained somewhat moderate. During this time, bond markets rallied around the globe. While the U.S. Federal Reserve (“Fed”) had merely paused rate hikes for the first half of the year, the Fed commenced the first of three consecutive cuts in August. Volatility then subsided, and experienced further declines, boosted by the “Phase One Trade Deal” announced in December as markets rallied through the fiscal year end.
PERFORMANCE OVERVIEW
For the year ended December 31, 2019, the DeltaShares® S&P EM 100 & Managed Risk ETF (NAV) returned 5.85%. By comparison, the S&P EM 100 (USD) Managed Risk 2.0 Index (the “Underlying Index”) returned 7.49% and the S&P EM 100® Index returned 9.41%.
The Fund’s performance reflects annual operating expenses of the Fund, including management fees, brokerage expenses, and other fees and expenses. Index returns do not reflect fees and expenses of any kind, which would have a negative impact on returns.
STRATEGY REVIEW
The DeltaShares® EM 100 & Managed Risk ETF (the “Fund”) seeks to track the investment results, before fees and expenses, of the Underlying Index.
The Fund seeks to achieve this investment objective by holding a portfolio of securities that are included in the Underlying Index, including common stocks, U.S. Treasury bonds, and/or cash. The Underlying Index is designed to simulate, through a rules-based methodology, a dynamic portfolio with the aim of both managing the volatility of the Underlying Index and limiting losses from the Underlying Index’s equity exposure due to severe sustained market declines. The Underlying Index seeks to achieve these objectives by allocating weightings among the S&P EM 100 (USD) Index, the S&P U.S. Treasury Bond Current5-Year Index, and the S&P U.S. Treasury Bill0-3 Month Index. The Fund may also use derivatives in an effort to gain exposure to underlying securities and markets in a more efficient manner, to optimize the execution processes and costs for portfolio transitions or for tax management purposes. Under normal circumstances, the Fund uses a replication strategy and generally expects to invest in substantially all of the securities in the Underlying Index.
During the12-month period ended December 31, 2019, the largest contributors to the Fund’s absolute total return were equities within the information technology and consumer discretionary sectors. The largest detractors were equities within the communications services and materials sectors. The largest contributors from a country perspective were companies based in Taiwan and Russia, whereas the largest detractors were companies based in South Africa and Hong Kong.
During the fiscal year, the Fund used derivatives. These positions added to performance.
Blake Graves, CFA
Charles Lowery, CFA
Louis Ng
Co-Portfolio Managers
Milliman Financial Risk Management LLC
| | | | |
| Asset Allocation | | Percentage of Net
Assets | |
Common Stocks | | | 97.6 | % |
Preferred Stock | | | 1.2 | |
Short-Term Investment Company | | | 0.6 | |
Other Investment Company | | | 0.5 | |
Net Other Assets (Liabilities) ^ | | | 0.1 | |
Total | | | 100.0 | % |
| | | | |
| Current | and future portfolio holdings are subject to change and risk. |
| ^ | The Net Other Assets (Liabilities) category may include, but is not limited to, reverse repurchase agreements, forward foreign currency contracts, futures contracts, swap agreements, written options and swaptions, and cash collateral. |
| | |
| Transamerica ETF Trust | | Annual Report 2019 |
Page 30
DeltaShares® S&P EM 100 & Managed Risk ETF
(unaudited)
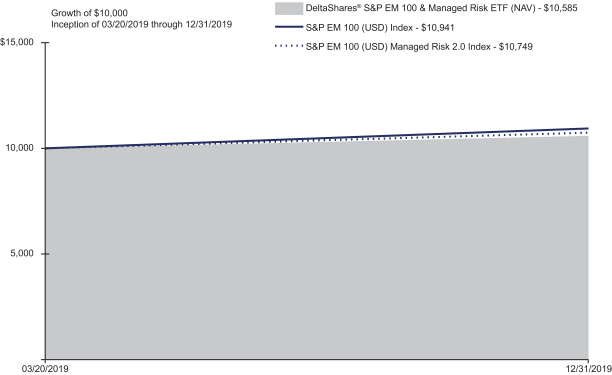
| | | | | | | | | | | | | | | | | | | | |
| Performance as of December 31, 2019 | | | | | | | |
| |
| Average Annual
Total Returns |
| | | | | |
| Cumulative
Total Returns |
| | | | | | | Inception Date | |
| | | 10 Year or
Since
Inception | | | | | | 10 Year or
Since
Inception | | | | | | | |
Fund NAV | | | 5.85 | %(A) | | | | | | | 5.85 | %(A) | | | | | | | 03/20/2019 | |
Fund Market | | | 6.04 | %(A) | | | | | | | 6.04 | %(A) | | | | | | | 03/20/2019 | |
S&P EM 100 (USD) Index (B) | | | 9.41 | %(A) | | | | | | | 9.41 | %(A) | | | | | | | | |
S&P EM 100 (USD) Managed Risk 2.0 Index (B)(C)(D)(E) | | | 7.49 | %(A) | | | | | | | 7.49 | %(A) | | | | | | | | |
(A) Not annualized.
(B) The S&P EM 100 (USD) seeks to measure the performance of 100 of the largest companies from emerging markets plus Korea.
(C) The S&P EM 100 (USD) Managed Risk 2.0 Index is comprised of weightings amongst the S&P EM 100 (USD) Index, the S&P U.S. Treasury Bond Current5-Year Index, and the S&P U.S. Treasury Bill0-3 Month Index. The S&P EM 100 (USD) Managed Risk 2.0 Index rebalances on a daily basis.
(D) The S&P U.S. Treasury Bond Current5-Year Index is aone-security index comprising the most recently issued5-year U.S. Treasury note or bond.
(E) The S&P U.S. Treasury Bill0-3 Month Index is designed to measure the performance of U.S. Treasury bills maturing in 0 to 3 months.
The Fund’s benchmarks are unmanaged indices used as a general measure of market performance. Calculations assume dividends and capital gains are reinvested and do not include any managerial expenses. The 10 Years or the Since Inception calculation is based on the previous 10 years or since the inception date, whichever is more recent. An index is a statistical measure of a specified financial market or sector. An index does not actually hold a portfolio of securities and therefore does not reflect deductions for fees or expenses. In comparison, a Fund’s performance is negatively impacted by these deductions. You cannot invest directly in an index.
The performance data presented represents past performance and does not guarantee future results. Performance data does not reflect the deduction of taxes that would be paid on Fund distributions or the redemption of Fund shares. The Fund’s investment return and net asset value will fluctuate. Investors’ shares when sold may be worth more or less than their original cost. Current performance may be lower or higher than performance quoted. Please see www.deltashares.com for performance data current to the most recent month end. Fund performance is net of investment fees and Fund expenses.
Performance results do not include adjustments made for financial reporting purposes in accordance with U.S. generally accepted accounting principles and may differ from amounts reported in the Financial Highlights.
Fund shares are bought and sold at Market Price, not Net Asset Value (“NAV”), and are not individually redeemed from the fund. Net Asset Value is an exchange-traded fund’s per-share value. The per-share dollar amount of the Fund is derived by dividing the total value of all the securities in the portfolio, less any liabilities, by the number of Fund shares outstanding. Market Price is the price at which a share can currently be traded in the market. The market price used to calculate the market return is determined by using the midpoint between the highest bid and the lowest offer on the exchange on which the shares of the Fund are listed for trading, as of the time that the Fund’s NAV is calculated.
Exchange-Traded Funds (ETFs) are subject to market risk, including the loss of principal. Because fund shares trade at market prices rather than at net asset value (NAV), Fund Shares may trade at a price greater than NAV (premium) or less than NAV (discount). Shares of DeltaShares® ETFs may be bought and sold throughout the day on the exchange through any brokerage account. Buying and selling shares of ETFs will result in brokerage commissions. Diversification and asset allocation may not protect against market risk or loss of principal. Investing involves risk, including the possible loss of principal. Investing involves risk, including the possible loss of principal. There is no guarantee the fund’s investment strategies will be successful. Investing in securities of foreign issuers or issuers with significant exposure to foreign markets involves additional risk. Foreign countries in which the fund may invest may have markets that are less liquid, less regulated and more volatile than U.S. markets. The value of investments in securities denominated in foreign currencies increases or decreases as the rates of exchange between those currencies and the U.S. dollar change. The market prices of fixed income securities may go up or down, sometimes rapidly and unpredictably, due to general market conditions, such as real or perceived adverse economic or political conditions, inflation, changes in interest rates, lack of liquidity in the bond markets or adverse investor sentiment. As the prices of bonds in the fund adjust to a rise in interest rates, the fund’s share price may decline. The use of hedging and derivatives may produce disproportionate gains or losses, may increase costs, and amplify risks.
| | |
| Transamerica ETF Trust | | Annual Report 2019 |
Page 31
DeltaShares® S&P EM 100 & Managed Risk ETF
SCHEDULE OF INVESTMENTS
At December 31, 2019
| | | | | | | | |
| | | Shares | | | Value | |
| COMMON STOCKS - 97.6% | |
| Brazil - 7.5% | |
Ambev SA, ADR | | | 77,564 | | | | $ 361,448 | |
Banco Bradesco SA, ADR | | | 71,016 | | | | 635,593 | |
Itau Unibanco Holding SA, ADR | | | 85,353 | | | | 780,980 | |
Petroleo Brasileiro SA, ADR | | | 64,700 | | | | 992,067 | |
Vale SA, ADR | | | 54,916 | | | | 724,891 | |
| | | | | | | | |
| | | | | | | 3,494,979 | |
| | | | | | | | |
| Cayman Islands - 0.5% | |
Trip.Com Group, Ltd., ADR(A) | | | 6,824 | | | | 228,877 | |
| | | | | | | | |
| China - 35.7% | |
Agricultural Bank of China, Ltd., H Shares | | | 498,000 | | | | 219,223 | |
Alibaba Group Holding, Ltd., ADR(A) | | | 11,861 | | | | 2,515,718 | |
Baidu, Inc., ADR(A) | | | 4,885 | | | | 617,464 | |
Bank of China, Ltd., H Shares | | | 1,340,000 | | | | 572,679 | |
Bank of Communications Co., Ltd., H Shares | | | 376,000 | | | | 267,337 | |
China Construction Bank Corp., H Shares | | | 1,906,000 | | | | 1,646,267 | |
China Evergrande Group(A) (B) | | | 53,000 | | | | 146,924 | |
China Life Insurance Co., Ltd., H Shares | | | 131,000 | | | | 363,992 | |
China Merchants Bank Co., Ltd., H Shares | | | 66,500 | | | | 341,811 | |
China Pacific Insurance Group Co., Ltd., H Shares | | | 45,400 | | | | 178,878 | |
China Petroleum & Chemical Corp., H Shares | | | 450,000 | | | | 270,862 | |
China Shenhua Energy Co., Ltd., H Shares | | | 60,000 | | | | 125,363 | |
China Tower Corp., Ltd., H Shares(C) | | | 780,000 | | | | 172,181 | |
CNOOC, Ltd. | | | 283,000 | | | | 470,710 | |
Country Garden Holdings Co., Ltd. | | | 126,000 | | | | 201,812 | |
CSPC Pharmaceutical Group, Ltd. | | | 82,000 | | | | 195,534 | |
Industrial & Commercial Bank of China, Ltd., H Shares | | | 1,376,000 | | | | 1,059,575 | |
JD.com, Inc., ADR(A) | | | 14,679 | | | | 517,141 | |
Meituan Dianping, Class B(A) | | | 69,900 | | | | 914,142 | |
NetEase, Inc., ADR | | | 1,262 | | | | 386,980 | |
New Oriental Education & Technology Group, Inc., ADR(A) | | | 2,061 | | | | 249,896 | |
PetroChina Co., Ltd., H Shares | | | 372,000 | | | | 186,673 | |
PICC Property & Casualty Co., Ltd., H Shares | | | 122,000 | | | | 147,024 | |
Ping An Insurance Group Co. of China, Ltd., H Shares | | | 89,000 | | | | 1,051,990 | |
Shenzhou International Group Holdings, Ltd. | | | 12,700 | | | | 185,648 | |
Sunac China Holdings, Ltd. | | | 41,000 | | | | 244,943 | |
Sunny Optical Technology Group Co., Ltd. | | | 11,800 | | | | 204,294 | |
TAL Education Group, ADR(A) | | | 6,451 | | | | 310,938 | |
Tencent Holdings, Ltd. | | | 47,300 | | | | 2,280,074 | |
Xiaomi Corp., Class B(A) (C) | | | 232,800 | | | | 322,080 | |
Yum China Holdings, Inc. | | | 6,662 | | | | 319,843 | |
| | | | | | | | |
| | | | | | | 16,687,996 | |
| | | | | | | | |
| Hong Kong - 4.3% | |
China Gas Holdings, Ltd. | | | 40,400 | | | | 151,400 | |
China Mengniu Dairy Co., Ltd.(A) | | | 48,000 | | | | 194,050 | |
China Mobile, Ltd. | | | 97,500 | | | | 819,612 | |
China Overseas Land & Investment, Ltd. | | | 66,000 | | | | 257,078 | |
China Resources Land, Ltd. | | | 48,000 | | | | 239,021 | |
CITIC, Ltd. | | | 113,000 | | | | 151,115 | |
Geely Automobile Holdings, Ltd. | | | 99,000 | | | | 193,634 | |
| | | | | | | | |
| | | | | | | 2,005,910 | |
| | | | | | | | |
| | | | | | | | |
| | | Shares | | | Value | |
| COMMON STOCKS (continued) | |
| India - 5.6% | |
HDFC Bank, Ltd., ADR | | | 23,610 | | | | $ 1,496,166 | |
ICICI Bank, Ltd., ADR(B) | | | 27,681 | | | | 417,706 | |
Infosys, Ltd., ADR | | | 66,938 | | | | 690,800 | |
| | | | | | | | |
| | | | | | | 2,604,672 | |
| | | | | | | | |
| Indonesia - 2.9% | |
Astra International Tbk PT | | | 356,500 | | | | 177,833 | |
Bank Central Asia Tbk PT | | | 195,400 | | | | 470,466 | |
Bank Mandiri Persero Tbk PT | | | 328,800 | | | | 181,778 | |
Bank Rakyat Indonesia Persero Tbk PT | | | 934,200 | | | | 296,091 | |
Telekomunikasi Indonesia Persero Tbk PT | | | 855,000 | | | | 244,506 | |
| | | | | | | | |
| | | | | | | 1,370,674 | |
| | | | | | | | |
| Malaysia - 1.2% | |
Malayan Banking Bhd. | | | 91,500 | | | | 193,267 | |
Public Bank Bhd. | | | 44,400 | | | | 211,010 | |
Tenaga Nasional Bhd. | | | 45,100 | | | | 146,199 | |
| | | | | | | | |
| | | | | | | 550,476 | |
| | | | | | | | |
| Mexico - 2.9% | |
America Movil SAB de CV, Series L | | | 411,040 | | | | 328,675 | |
Fomento Economico Mexicano SAB de CV | | | 32,737 | | | | 309,740 | |
Grupo Financiero Banorte SAB de CV, Class O | | | 50,788 | | | | 284,143 | |
Grupo Mexico SAB de CV, Series B | | | 63,076 | | | | 173,222 | |
Wal-Mart de Mexico SAB de CV | | | 86,116 | | | | 246,938 | |
| | | | | | | | |
| | | | | | | 1,342,718 | |
| | | | | | | | |
| Peru - 0.5% | |
Credicorp, Ltd. | | | 1,180 | | | | 251,493 | |
| | | | | | | | |
| Poland - 0.5% | |
Polski Koncern Naftowy Orlen SA | | | 5,123 | | | | 116,087 | |
Powszechna Kasa Oszczednosci Bank Polski SA | | | 15,192 | | | | 138,229 | |
| | | | | | | | |
| | | | | | | 254,316 | |
| | | | | | | | |
| Qatar - 0.9% | |
Qatar National Bank QPSC | | | 78,090 | | | | 441,602 | |
| | | | | | | | |
| Republic of Korea - 15.4% | |
Celltrion, Inc.(A) | | | 1,898 | | | | 297,063 | |
Hana Financial Group, Inc. | | | 5,288 | | | | 168,729 | |
Hyundai Mobis Co., Ltd. | | | 1,192 | | | | 263,870 | |
Hyundai Motor Co. | | | 2,559 | | | | 266,643 | |
KB Financial Group, Inc.(A) | | | 6,996 | | | | 288,261 | |
Kia Motors Corp. | | | 4,712 | | | | 180,502 | |
KT&G Corp.(A) | | | 2,225 | | | | 180,470 | |
LG Chem, Ltd. | | | 833 | | | | 228,698 | |
LG Corp. | | | 2,280 | | | | 145,500 | |
LG Household & Health Care, Ltd. | | | 165 | | | | 179,917 | |
NAVER Corp. | | | 2,584 | | | | 416,720 | |
POSCO | | �� | 1,413 | | | | 288,966 | |
Samsung C&T Corp. | | | 1,637 | | | | 153,586 | |
Samsung Electronics Co., Ltd. | | | 52,754 | | | | 2,545,439 | |
Samsung SDI Co., Ltd.(A) | | | 969 | | | | 197,747 | |
Shinhan Financial Group Co., Ltd.(A) | | | 8,352 | | | | 313,078 | |
SK Hynix, Inc.(A) | | | 10,258 | | | | 834,691 | |
SK Innovation Co., Ltd. | | | 1,091 | | | | 141,511 | |
SK Telecom Co., Ltd. | | | 697 | | | | 143,444 | |
| | | | | | | | |
| | | | | | | 7,234,835 | |
| | | | | | | | |
The Notes to Financial Statements are an integral part of this report.
| | |
| Transamerica ETF Trust | | Annual Report 2019 |
Page 32
DeltaShares® S&P EM 100 & Managed Risk ETF
SCHEDULE OF INVESTMENTS (continued)
At December 31, 2019
| | | | | | | | |
| | | Shares | | | Value | |
| COMMON STOCKS (continued) | |
| Republic of South Africa - 5.1% | |
FirstRand, Ltd. | | | 60,576 | | | | $ 272,047 | |
MTN Group, Ltd.(B) | | | 29,538 | | | | 174,247 | |
Naspers, Ltd., N Shares | | | 7,713 | | | | 1,263,551 | |
Sanlam, Ltd. | | | 33,020 | | | | 186,783 | |
Sasol, Ltd. | | | 9,988 | | | | 216,767 | |
Standard Bank Group, Ltd. | | | 22,806 | | | | 274,517 | |
| | | | | | | | |
| | | | | | | 2,387,912 | |
| | | | | | | | |
| Russian Federation - 7.0% | |
Gazprom PJSC, ADR | | | 106,329 | | | | 874,875 | |
Lukoil PJSC, ADR | | | 6,605 | | | | 655,084 | |
MMC Norilsk Nickel PJSC, ADR | | | 10,592 | | | | 323,586 | |
Novatek PJSC, GDR(D) | | | 1,497 | | | | 303,891 | |
Sberbank of Russia PJSC, ADR | | | 47,528 | | | | 781,360 | |
Tatneft PJSC, ADR | | | 4,605 | | | | 340,125 | |
| | | | | | | | |
| | | | | | | 3,278,921 | |
| | | | | | | | |
| Taiwan - 5.9% | |
Taiwan Semiconductor Manufacturing Co., Ltd., ADR | | | 47,231 | | | | 2,744,121 | |
| | | | | | | | |
| Thailand - 1.3% | |
Airports of Thailand PCL | | | 75,500 | | | | 187,151 | |
CP ALL PCL | | | 77,500 | | | | 186,934 | |
PTT PCL | | | 150,900 | | | | 221,662 | |
| | | | | | | | |
| | | | | | | 595,747 | |
| | | | | | | | |
| United Arab Emirates - 0.4% | |
First Abu Dhabi Bank PJSC | | | 47,986 | | | | 198,050 | |
| | | | | | | | |
Total Common Stocks
(Cost $42,089,960) | | | | 45,673,299 | |
| | | | | |
| | | | | | | | |
| | | Shares | | | Value | |
| PREFERRED STOCK - 1.2% | |
| Republic of Korea - 1.2% | |
Samsung Electronics Co., Ltd.,
2.19%(E) | | | 14,494 | | | | $ 569,006 | |
| | | | | | | | |
Total Preferred Stock
(Cost $486,427) | | | | 569,006 | |
| | | | | |
|
| SHORT-TERM INVESTMENT COMPANY - 0.6% | |
| Money Market Fund - 0.6% | |
State Street Institutional Treasury Money Market Fund, 1.44%(E) | | | 271,752 | | | | 271,752 | |
| | | | | | | | |
Total Short-Term Investment Company
(Cost $271,752) | | | | 271,752 | |
| | | | | |
|
| OTHER INVESTMENT COMPANY - 0.5% | |
| Securities Lending Collateral - 0.5% | |
State Street Navigator Securities Lending Trust - Government Money Market Portfolio, 1.56%(E) | | | 241,710 | | | | 241,710 | |
| | | | | | | | |
Total Other Investment Company
(Cost $241,710) | | | | 241,710 | |
| | | | | |
Total Investments
(Cost $43,089,849) | | | | 46,755,767 | |
Net Other Assets (Liabilities) - 0.1% | | | | | | | 26,998 | |
| | | | | | | | |
| | |
Net Assets - 100.0% | | | | | | | $ 46,782,765 | |
| | | | | | | | |
FUTURES CONTRACTS:
| | | | | | | | | | | | | | | | | | | | | | | | |
Long Futures Contracts | |
| Description | | Number of
Contracts | | | Expiration
Date | | | Notional
Amount | | | Value | | | Unrealized
Appreciation | | | Unrealized
Depreciation | |
MSCI Emerging Markets Index | | | 10 | | | | 03/20/2020 | | | $ | 546,307 | | | $ | 560,100 | | | $ | 13,793 | | | $ | — | |
INVESTMENTS BY INDUSTRY (unaudited):
| | | | | | | | |
| Industry | | Percentage of
Total Investments | | | Value | |
Banks | | | 25.5 | % | | $ | 11,929,411 | |
Internet & Direct Marketing Retail | | | 11.6 | | | | 5,439,429 | |
Oil, Gas & Consumable Fuels | | | 10.1 | | | | 4,698,910 | |
Semiconductors & Semiconductor Equipment | | | 7.7 | | | | 3,578,812 | |
Technology Hardware, Storage & Peripherals | | | 7.3 | | | | 3,436,525 | |
Interactive Media & Services | | | 7.1 | | | | 3,314,258 | |
Insurance | | | 4.1 | | | | 1,928,667 | |
Metals & Mining | | | 3.2 | | | | 1,510,665 | |
Wireless Telecommunication Services | | | 3.1 | | | | 1,465,978 | |
Real Estate Management & Development | | | 2.3 | | | | 1,089,778 | |
Automobiles | | | 1.8 | | | | 818,612 | |
IT Services | | | 1.5 | | | | 690,800 | |
Beverages | | | 1.4 | | | | 671,188 | |
Diversified Consumer Services | | | 1.2 | | | | 560,834 | |
Industrial Conglomerates | | | 1.0 | | | | 450,201 | |
The Notes to Financial Statements are an integral part of this report.
| | |
| Transamerica ETF Trust | | Annual Report 2019 |
Page 33
DeltaShares® S&P EM 100 & Managed Risk ETF
SCHEDULE OF INVESTMENTS (continued)
At December 31, 2019
INVESTMENTS BY INDUSTRY (unaudited) (continued):
| | | | | | | | |
| Industry | | Percentage of
Total Investments | | | Value | |
Chemicals | | | 1.0 | % | | $ | 445,465 | |
Food & Staples Retailing | | | 0.9 | | | | 433,872 | |
Diversified Telecommunication Services | | | 0.9 | | | | 416,687 | |
Electronic Equipment, Instruments & Components | | | 0.9 | | | | 402,041 | |
Entertainment | | | 0.8 | | | | 386,980 | |
Hotels, Restaurants & Leisure | | | 0.7 | | | | 319,843 | |
Biotechnology | | | 0.6 | | | | 297,063 | |
Diversified Financial Services | | | 0.6 | | | | 272,047 | |
Auto Components | | | 0.6 | | | | 263,870 | |
Pharmaceuticals | | | 0.4 | | | | 195,534 | |
Food Products | | | 0.4 | | | | 194,050 | |
Transportation Infrastructure | | | 0.4 | | | | 187,151 | |
Textiles, Apparel & Luxury Goods | | | 0.4 | | | | 185,648 | |
Tobacco | | | 0.4 | | | | 180,470 | |
Personal Products | | | 0.4 | | �� | | 179,917 | |
Gas Utilities | | | 0.3 | | | | 151,400 | |
Electric Utilities | | | 0.3 | | | | 146,199 | |
| | | | | | | | |
Investments | | | 98.9 | | | | 46,242,305 | |
Short-Term Investments | | | 1.1 | | | | 513,462 | |
| | | | | | | | |
Total Investments | | | 100.0 | % | | $ | 46,755,767 | |
| | | | | | | | |
SECURITY VALUATION:
Valuation Inputs(F)
| | | | | | | | | | | | | | | | |
| | | Level 1 -
Unadjusted
Quoted Prices | | | Level 2 -
Other Significant
Observable Inputs | | | Level 3 -
Significant
Unobservable Inputs | | | Value | |
ASSETS | |
Investments | |
Common Stocks | | $ | 18,863,761 | | | $ | 26,809,538 | | | $ | — | | | $ | 45,673,299 | |
Preferred Stock | | | — | | | | 569,006 | | | | — | | | | 569,006 | |
Short-Term Investment Company | | | 271,752 | | | | — | | | | — | | | | 271,752 | |
Other Investment Company | | | 241,710 | | | | — | | | | — | | | | 241,710 | |
| | | | | | | | | | | | | | | | |
Total Investments | | $ | 19,377,223 | | | $ | 27,378,544 | | | $ | — | | | $ | 46,755,767 | |
| | | | | | | | | | | | | | | | |
Other Financial Instruments | | | | | | | | | | | | | | | | |
Futures Contracts(G) | | $ | 13,793 | | | $ | — | | | $ | — | | | $ | 13,793 | |
| | | | | | | | | | | | | | | | |
Total Other Financial Instruments | | $ | 13,793 | | | $ | — | | | $ | — | | | $ | 13,793 | |
| | | | | | | | | | | | | | | | |
FOOTNOTES TO SCHEDULE OF INVESTMENTS:
| | |
| (A) | | Non-income producing securities. |
| (B) | | All or a portion of the securities are on loan. The total value of all securities on loan is $228,917. The amount of securities on loan indicated may not correspond with the securities on loan identified because securities with pending sales are in the process of recall from the brokers. |
| (C) | | Securities are registered pursuant to Rule 144A of the Securities Act of 1933. Unless otherwise indicated, the securities are deemed to be liquid for purposes of compliance limitations on holdings of illiquid securities and may be resold as transactions exempt from registration, normally to qualified institutional buyers. At December 31, 2019, the total value of 144A securities is $494,261, representing 1.1% of the Fund’s net assets. |
| (D) | | Security exempt from registration under Regulation S of the Securities Act of 1933, which exempts from registration securities offered and sold outside the United States. Security may not be offered or sold in the United States except pursuant to an exemption from, or in a transaction not subject to, the registration requirements of the Securities Act of 1933. At December 31, 2019, the value of the Regulation S security is $303,891, representing 0.6% of the Fund’s net assets. |
The Notes to Financial Statements are an integral part of this report.
| | |
| Transamerica ETF Trust | | Annual Report 2019 |
Page 34
DeltaShares® S&P EM 100 & Managed Risk ETF
SCHEDULE OF INVESTMENTS (continued)
At December 31, 2019
FOOTNOTES TO SCHEDULE OF INVESTMENTS (continued):
| | |
| (E) | | Rates disclosed reflect the yields at December 31, 2019. |
| (F) | | There were no transfers in or out of Level 3 during the period ended December 31, 2019. Please reference the Security Valuation section of the Notes to Financial Statements for more information regarding security valuation and pricing inputs. |
| (G) | | Futures contracts and/or forward foreign currency contracts are valued at unrealized appreciation (depreciation). |
PORTFOLIO ABBREVIATIONS:
| | |
| ADR | | American Depositary Receipt |
| GDR | | Global Depositary Receipt |
The Notes to Financial Statements are an integral part of this report.
| | |
| Transamerica ETF Trust | | Annual Report 2019 |
Page 35
DeltaShares® S&P International Managed Risk ETF
(unaudited)
MARKET ENVIRONMENT
Stocks across the world posted positive returns in 2019. The S&P 500®also posted strong performance in 2019.
Global stock markets began the year on a positive note, with a snap recovery from the late December 2018 trough. This continued throughout January and shrugged off the longest government shutdown in U.S. history. Markets largely continued to rally through April, but gave up roughly half of theiryear-to-date gains in May. The loss was broad based, with domestic, international developed, and emerging markets all finishing the month sharply lower. However, the second quarter of 2019 finished on a higher note, with May losses closely mirrored by June gains, to complete a low volatilityV-shaped quarter.
Domestic equity returns remained in positive territory in July with the S&P 500® hitting the 3,000 price level for the first time in history. In contrast, both developed and emerging market equities fluctuated between positive and negative territory, ending the month with losses. Equity volatility picked up in August, but remained somewhat moderate. During this time, bond markets rallied around the globe. While the U.S. Federal Reserve (“Fed”) had merely paused rate hikes for the first half of the year, the Fed commenced the first of three consecutive cuts in August. Volatility then subsided, and experienced further declines, boosted by the “Phase One Trade Deal” announced in December as markets rallied through the fiscal year end.
PERFORMANCE OVERVIEW
For the year ended December 31, 2019, the DeltaShares® S&P International Managed Risk ETF (NAV) returned 19.12%. By comparison, the S&P EPAC Ex. Korea LargeMidCap Managed Risk 2.0 Index (the “Underlying Index”) returned 19.95% and the S&P EPAC Ex. Korea LargeMidCap Index returned 22.48%.
The Fund’s performance reflects annual operating expenses of the Fund, including management fees, brokerage expenses, and other fees and expenses. Index returns do not reflect fees and expenses of any kind, which would have a negative impact on returns.
STRATEGY REVIEW
The DeltaShares® International Managed Risk ETF (the “Fund”) seeks to track the investment results, before fees and expenses, of the Underlying Index.
The Fund seeks to achieve this investment objective by using a sampling strategy and generally expects to invest in a subset of the securities in the Underlying Index that theSub-Adviser believes is designed to approximate the returns of the Underlying Index. The Underlying Index is designed to simulate, through a rules-based methodology, a dynamic portfolio with the aim of both managing the volatility of the Underlying Index and limiting losses from the Underlying Index’s equity exposure due to severe sustained market declines. The Underlying Index seeks to achieve these objectives by allocating weightings among the S&P EPAC Ex. Korea LargeMidCap Index, the S&P U.S. Treasury Bond Current5-Year Index, and the S&P U.S. Treasury Bill0-3 Month Index. The Fund may also use derivatives in an effort to gain exposure to underlying securities and markets in a more efficient manner, to optimize the execution processes and costs for portfolio transitions or for tax management purposes.
During the12-month period ended December 31, 2019, the largest contributors to the Fund’s absolute total return were equities within the financials, health care, and consumer staples sectors. From both an asset class and equity sector perspective, there were no detractors during the period, but the least impactful contributors were U.S. Treasury bonds as well as equities within the energy sector. The largest contributors from a country perspective were companies based in Japan, the United Kingdom, France, and Switzerland, whereas the small number of holdings based in Canada and Luxembourg detracted slightly.
During the fiscal year, the Fund used derivatives. These positions added to performance.
Blake Graves, CFA
Charles Lowery, CFA
Louis Ng
Co-Portfolio Managers
Milliman Financial Risk Management LLC
| | | | |
| Asset Allocation | | Percentage of Net
Assets | |
Common Stocks | | | 98.5 | % |
Other Investment Company | | | 2.7 | |
Short-Term Investment Company | | | 0.5 | |
Preferred Stocks | | | 0.5 | |
Right | | | 0.0 | |
Net Other Assets (Liabilities) ^ | | | (2.2 | ) |
Total | | | 100.0 | % |
| | | | |
| Current | and future portfolio holdings are subject to change and risk. |
| ^ | The Net Other Assets (Liabilities) category may include, but is not limited to, reverse repurchase agreements, forward foreign currency contracts, futures contracts, swap agreements, written options and swaptions, and cash collateral. |
| | |
| Transamerica ETF Trust | | Annual Report 2019 |
Page 36
DeltaShares® S&P International Managed Risk ETF
(unaudited)
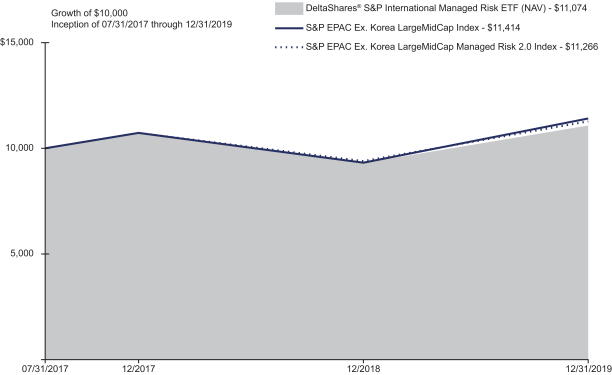
| | | | | | | | | | | | | | | | | | | | | | | | | | | | |
| Performance as of December 31, 2019 | | | | | | | |
| | | Average Annual Total Returns | | | | | | | | Cumulative Total Returns | | | | | | | | Inception Date | |
| | | 1 Year | | | 10 Year or
Since
Inception | | | | | | 1 Year | | | 10 Year or
Since
Inception | | | | | | | |
Fund NAV | | | 19.12 | % | | | 4.30 | % | | | | | | | 19.12 | % | | | 10.74 | % | | | | | | | 07/31/2017 | |
Fund Market | | | 17.55 | % | | | 4.17 | % | | | | | | | 17.55 | % | | | 10.39 | % | | | | | | | 07/31/2017 | |
S&P EPAC Ex. Korea LargeMidCap Index (A) | | | 22.48 | % | | | 5.61 | % | | | | | | | 22.48 | % | | | 14.14 | % | | | | | | | | |
S&P EPAC Ex. Korea LargeMidCap Managed Risk 2.0 Index (A)(B)(C)(D) | | | 19.95 | % | | | 5.05 | % | | | | | | | 19.95 | % | | | 12.66 | % | | | | | | | | |
(A) The S&P EPAC Ex. Korea LargeMidCap Index is designed to measure the performance of developed markets within the Europe and Asia Pacific regions, excluding Korea.
(B) The S&P EPAC Ex. Korea LargeMidCap Managed Risk 2.0 Index is comprised of weightings amongst the S&P EPAC Ex. Korea LargeMidCap Index, the S&P U.S. Treasury Bond Current5-Year Index, and the S&P U.S. Treasury Bill0-3 Month Index. The S&P EPAC Ex. Korea LargeMidCap Managed Risk 2.0 Index rebalances on a daily basis.
(C) The S&P U.S. Treasury Bond Current5-Year Index is aone-security index comprising the most recently issued5-year U.S. Treasury note or bond.
(D) The S&P U.S. Treasury Bill0-3 Month Index is designed to measure the performance of U.S. Treasury bills maturing in 0 to 3 months.
The Fund’s benchmarks are unmanaged indices used as a general measure of market performance. Calculations assume dividends and capital gains are reinvested and do not include any managerial expenses. The 10 Years or the Since Inception calculation is based on the previous 10 years or since the inception date, whichever is more recent. An index is a statistical measure of a specified financial market or sector. An index does not actually hold a portfolio of securities and therefore does not reflect deductions for fees or expenses. In comparison, a Fund’s performance is negatively impacted by these deductions. You cannot invest directly in an index.
The performance data presented represents past performance and does not guarantee future results. Performance data does not reflect the deduction of taxes that would be paid on Fund distributions or the redemption of Fund shares. The Fund’s investment return and net asset value will fluctuate. Investors’ shares when sold may be worth more or less than their original cost. Current performance may be lower or higher than performance quoted. Please see www.deltashares.com for performance data current to the most recent month end. Fund performance is net of investment fees and Fund expenses.
Performance results do not include adjustments made for financial reporting purposes in accordance with U.S. generally accepted accounting principles and may differ from amounts reported in the Financial Highlights.
Fund shares are bought and sold at Market Price, not Net Asset Value (“NAV”), and are not individually redeemed from the fund. Net Asset Value is an exchange-traded fund’s per-share value. The per-share dollar amount of the Fund is derived by dividing the total value of all the securities in the portfolio, less any liabilities, by the number of Fund shares outstanding. Market Price is the price at which a share can currently be traded in the market. The market price used to calculate the market return is determined by using the midpoint between the highest bid and the lowest offer on the exchange on which the shares of the Fund are listed for trading, as of the time that the Fund’s NAV is calculated.
Exchange-Traded Funds (ETFs) are subject to market risk, including the loss of principal. Because Fund Shares trade at market prices rather than at NAV, Fund Shares may trade at a price greater than NAV (premium) or less than NAV (discount). Shares of DeltaShares® ETFs may be bought and sold throughout the day on the exchange through any brokerage account. Buying and selling shares of ETFs will result in brokerage commissions. Diversification and asset allocation may not protect against market risk or loss of principal. Investing involves risk, including the possible loss of principal. There is no guarantee the investment objective will be achieved. Investing in securities of foreign issuers or issuers with significant exposure to foreign markets involves additional risk. Foreign countries in which the fund may invest may have markets that are less liquid, less regulated and more volatile than U.S. markets. The value of investments in securities denominated in foreign currencies increases or decreases as the rates of exchange between those currencies and the U.S. dollar change. The principal risks include risks related to: Equity securities, geographic focus, index tracking, leveraging, derivatives such as futures, forwards, swaps, options, and investing in underlying exchange traded funds. The use of derivatives may produce disproportionate gains or losses, may increase costs, and amplify risks.
| | |
| Transamerica ETF Trust | | Annual Report 2019 |
Page 37
DeltaShares® S&P International Managed Risk ETF
SCHEDULE OF INVESTMENTS
At December 31, 2019
| | | | | | | | |
| | | Shares | | | Value | |
| COMMON STOCKS - 98.5% | |
| Australia - 6.8% | |
AGL Energy, Ltd. | | | 8,495 | | | | $ 122,596 | |
Alumina, Ltd. | | | 19,245 | | | | 31,115 | |
AMP, Ltd.(A) | | | 43,554 | | | | 58,630 | |
APA Group(A) | | | 15,276 | | | | 119,195 | |
Aristocrat Leisure, Ltd. | | | 8,346 | | | | 197,536 | |
ASX, Ltd. | | | 1,664 | | | | 91,717 | |
Atlassian Corp. PLC, Class A(B) | | | 1,591 | | | | 191,461 | |
Aurizon Holdings, Ltd. | | | 17,293 | | | | 63,576 | |
AusNet Services | | | 24,147 | | | | 28,856 | |
Australia & New Zealand Banking Group, Ltd. | | | 37,399 | | | | 647,514 | |
Bendigo & Adelaide Bank, Ltd.(A) | | | 6,339 | | | | 43,580 | |
BHP Group PLC | | | 27,262 | | | | 641,698 | |
BHP Group, Ltd. | | | 37,787 | | | | 1,033,808 | |
BlueScope Steel, Ltd. | | | 7,180 | | | | 76,011 | |
Boral, Ltd. | | | 15,429 | | | | 48,589 | |
Brambles, Ltd. | | | 20,743 | | | | 170,893 | |
Caltex Australia, Ltd. | | | 3,404 | | | | 81,237 | |
Challenger, Ltd. | | | 7,548 | | | | 42,924 | |
CIMIC Group, Ltd. | | | 1,281 | | | | 29,842 | |
Coca-Cola Amatil, Ltd. | | | 6,782 | | | | 52,727 | |
Cochlear, Ltd. | | | 748 | | | | 118,165 | |
Coles Group, Ltd. | | | 14,685 | | | | 153,191 | |
Commonwealth Bank of Australia | | | 22,585 | | | | 1,268,503 | |
Computershare, Ltd.(A) | | | 6,703 | | | | 79,065 | |
Crown Resorts, Ltd. | | | 4,924 | | | | 41,570 | |
CSL, Ltd. | | | 5,856 | | | | 1,135,159 | |
Dexus, REIT | | | 14,637 | | | | 120,382 | |
Evolution Mining, Ltd. | | | 17,892 | | | | 47,793 | |
Flight Centre Travel Group, Ltd.(A) | | | 768 | | | | 23,786 | |
Fortescue Metals Group, Ltd. | | | 22,035 | | | | 165,583 | |
Goodman Group, REIT | | | 21,285 | | | | 200,046 | |
GPT Group, REIT | | | 26,089 | | | | 102,700 | |
Harvey Norman Holdings, Ltd.(A) | | | 8,222 | | | | 23,523 | |
Incitec Pivot, Ltd. | | | 21,891 | | | | 48,935 | |
Insurance Australia Group, Ltd.(A) | | | 30,725 | | | | 165,442 | |
LendLease Group | | | 7,610 | | | | 94,150 | |
Macquarie Group, Ltd. | | | 4,115 | | | | 398,750 | |
Magellan Financial Group, Ltd. | | | 1,706 | | | | 68,296 | |
Medibank Pvt, Ltd. | | | 35,881 | | | | 79,703 | |
Mirvac Group, REIT | | | 49,721 | | | | 111,145 | |
National Australia Bank, Ltd. | | | 35,285 | | | | 610,913 | |
Newcrest Mining, Ltd. | | | 9,899 | | | | 210,495 | |
Northern Star Resources, Ltd. | | | 7,678 | | | | 61,043 | |
Oil Search, Ltd. | | | 17,231 | | | | 87,816 | |
Orica, Ltd. | | | 4,894 | | | | 75,616 | |
Origin Energy, Ltd. | | | 22,746 | | | | 135,110 | |
Qantas Airways, Ltd. | | | 11,767 | | | | 58,811 | |
QBE Insurance Group, Ltd. | | | 17,720 | | | | 160,437 | |
Ramsay Health Care, Ltd. | | | 2,125 | | | | 108,343 | |
REA Group, Ltd.(A) | | | 692 | | | | 50,395 | |
Santos, Ltd. | | | 22,860 | | | | 131,448 | |
Scentre Group, REIT | | | 69,559 | | | | 187,274 | |
SEEK, Ltd. | | | 4,689 | | | | 74,328 | |
Seven Group Holdings, Ltd. | | | 534 | | | | 7,309 | |
Sonic Healthcare, Ltd. | | | 6,230 | | | | 125,907 | |
South32, Ltd. | | | 66,638 | | | | 126,477 | |
Stockland, REIT | | | 32,604 | | | | 105,886 | |
Suncorp Group, Ltd.(A) | | | 16,354 | | | | 148,989 | |
| | | | | | | | |
| | | Shares | | | Value | |
| COMMON STOCKS (continued) | |
| Australia (continued) | |
Sydney Airport | | | 14,382 | | | | $ 87,551 | |
Tabcorp Holdings, Ltd. | | | 15,395 | | | | 49,023 | |
Telstra Corp., Ltd. | | | 53,895 | | | | 134,115 | |
TPG Telecom, Ltd.(A) | | | 3,347 | | | | 15,787 | |
Transurban Group | | | 29,318 | | | | 307,282 | |
Treasury Wine Estates, Ltd.(A) | | | 9,380 | | | | 107,081 | |
Vicinity Centres, REIT | | | 43,222 | | | | 75,653 | |
Washington H Soul Pattinson & Co., Ltd.(A) | | | 1,611 | | | | 24,348 | |
Wesfarmers, Ltd. | | | 14,685 | | | | 427,365 | |
Westpac Banking Corp. | | | 44,154 | | | | 752,052 | |
WiseTech Global, Ltd.(A) | | | 1,742 | | | | 28,617 | |
Woodside Petroleum, Ltd. | | | 12,113 | | | | 292,740 | |
Woolworths Group, Ltd. | | | 17,048 | | | | 433,338 | |
Worley, Ltd.(A) | | | 3,996 | | | | 43,006 | |
| | | | | | | | |
| | | | | | | 13,463,947 | |
| | | | | | | | |
| Austria - 0.3% | |
ams AG(B) | | | 1,039 | | | | 42,135 | |
Andritz AG | | | 976 | | | | 42,069 | |
CA Immobilien Anlagen AG | | | 1,190 | | | | 50,025 | |
Erste Group Bank AG(B) | | | 4,419 | | | | 166,469 | |
Immofinanz AG(A) (B) | | | 1,457 | | | | 39,088 | |
OMV AG | | | 1,914 | | | | 107,595 | |
Raiffeisen Bank International AG | | | 1,783 | | | | 44,812 | |
Verbund AG | | | 1,215 | | | | 61,018 | |
voestalpine AG | | | 1,556 | | | | 43,421 | |
Wienerberger AG | | | 1,632 | | | | 48,399 | |
| | | | | | | | |
| | | | | | | 645,031 | |
| | | | | | | | |
| Belgium - 1.1% | |
Ackermans & van Haaren NV | | | 327 | | | | 51,278 | |
Ageas | | | 2,523 | | | | 149,193 | |
Anheuser-Busch InBev SA | | | 10,877 | | | | 887,747 | |
Colruyt SA | | | 753 | | | | 39,287 | |
Galapagos NV(A) (B) | | | 602 | | | | 126,026 | |
Groupe Bruxelles Lambert SA | | | 1,074 | | | | 113,275 | |
KBC Group NV | | | 4,423 | | | | 332,940 | |
Proximus SADP | | | 2,052 | | | | 58,782 | |
Sofina SA | | | 269 | | | | 58,156 | |
Solvay SA | | | 939 | | | | 108,881 | |
Telenet Group Holding NV | | | 745 | | | | 33,501 | |
UCB SA | | | 1,669 | | | | 132,828 | |
Umicore SA(A) | | | 2,696 | | | | 131,219 | |
| | | | | | | | |
| | | | | | | 2,223,113 | |
| | | | | | | | |
| Chile - 0.0%(C) | |
Antofagasta PLC | | | 4,434 | | | | 53,852 | |
| | | | | | | | |
| China - 0.1% | |
ENN Energy Holdings, Ltd. | | | 10,200 | | | | 111,467 | |
Fosun International, Ltd. | | | 28,500 | | | | 41,552 | |
| | | | | | | | |
| | | | | | | 153,019 | |
| | | | | | | | |
| Denmark - 1.7% | |
AP Moller - Maersk A/S, Class A | | | 37 | | | | 50,189 | |
AP Moller - Maersk A/S, Class B | | | 76 | | | | 109,690 | |
Carlsberg A/S, Class B | | | 1,399 | | | | 208,852 | |
Chr Hansen Holding A/S | | | 1,265 | | | | 100,600 | |
Coloplast A/S, Class B | | | 1,533 | | | | 190,307 | |
Danske Bank A/S | | | 9,032 | | | | 146,260 | |
Demant A/S(A) (B) | | | 1,401 | | | | 44,153 | |
The Notes to Financial Statements are an integral part of this report.
| | |
| Transamerica ETF Trust | | Annual Report 2019 |
Page 38
DeltaShares® S&P International Managed Risk ETF
SCHEDULE OF INVESTMENTS (continued)
At December 31, 2019
| | | | | | | | |
| | | Shares | | | Value | |
| COMMON STOCKS (continued) | |
| Denmark (continued) | |
DSV Panalpina A/S | | | 2,793 | | | | $ 322,137 | |
Genmab A/S(B) | | | 829 | | | | 184,492 | |
GN Store Nord A/S | | | 1,539 | | | | 72,430 | |
H. Lundbeck A/S | | | 770 | | | | 29,426 | |
ISS A/S | | | 2,288 | | | | 54,940 | |
Novo Nordisk A/S, Class B | | | 21,452 | | | | 1,245,969 | |
Novozymes A/S, B Shares | | | 2,837 | | | | 138,931 | |
Orsted A/S(D) | | | 2,306 | | | | 238,671 | |
Rockwool International A/S, B Shares | | | 43 | | | | 10,193 | |
Tryg A/S | | | 1,702 | | | | 50,495 | |
Vestas Wind Systems A/S | | | 2,646 | | | | 267,581 | |
| | | | | | | | |
| | | | | | | 3,465,316 | |
| | | | | | | | |
| Finland - 1.2% | |
Elisa OYJ | | | 2,044 | | | | 112,999 | |
Fortum Oyj | | | 5,643 | | | | 139,354 | |
Huhtamaki OYJ | | | 1,282 | | | | 59,548 | |
Kesko OYJ, B Shares | | | 949 | | | | 67,196 | |
Kone OYJ, Class B | | | 5,219 | | | | 341,423 | |
Metso OYJ | | | 1,671 | | | | 65,987 | |
Neste OYJ | | | 5,104 | | | | 177,721 | |
Nokia OYJ | | | 72,846 | | | | 269,513 | |
Nordea Bank Abp | | | 41,516 | | | | 335,461 | |
Orion OYJ, Class B | | | 1,365 | | | | 63,234 | |
Sampo OYJ, A Shares | | | 6,141 | | | | 268,217 | |
Stora Enso OYJ, R Shares | | | 7,546 | | | | 109,818 | |
UPM-Kymmene OYJ | | | 6,949 | | | | 241,106 | |
Wartsila OYJ Abp | | | 5,907 | | | | 65,311 | |
| | | | | | | | |
| | | | | | | 2,316,888 | |
| | | | | | | | |
| France - 9.6% | |
Accor SA | | | 2,411 | | | | 112,990 | |
Aeroports de Paris | | | 421 | | | | 83,220 | |
Air Liquide SA | | | 6,072 | | | | 860,156 | |
Airbus SE | | | 7,479 | | | | 1,095,402 | |
Amundi SA(D) | | | 670 | | | | 52,570 | |
AXA SA | | | 24,998 | | | | 704,593 | |
BNP Paribas SA | | | 14,519 | | | | 861,001 | |
Bollore SA | | | 12,238 | | | | 53,437 | |
Bouygues SA | | | 2,871 | | | | 122,076 | |
Bureau Veritas SA | | | 3,526 | | | | 92,061 | |
Capgemini SE | | | 2,086 | | | | 254,993 | |
Carrefour SA | | | 7,645 | | | | 128,294 | |
Christian Dior SE | | | 148 | | | | 75,888 | |
Cie de Saint-Gobain | | | 7,177 | | | | 294,050 | |
Cie Generale des Etablissements Michelin SCA | | | 2,334 | | | | 285,833 | |
CNP Assurances | | | 2,080 | | | | 41,396 | |
Credit Agricole SA | | | 15,765 | | | | 228,723 | |
Danone SA | | | 8,133 | | | | 674,654 | |
Dassault Aviation SA | | | 39 | | | | 51,220 | |
Dassault Systemes SE | | | 1,800 | | | | 296,104 | |
Electricite de France SA | | | 4,519 | | | | 50,360 | |
Engie SA | | | 20,814 | | | | 336,437 | |
EssilorLuxottica SA | | | 3,560 | | | | 542,670 | |
Hermes International | | | 383 | | | | 286,411 | |
Kering SA | | | 973 | | | | 639,151 | |
L’Oreal SA | | | 3,159 | | | | 936,138 | |
Legrand SA | | | 3,443 | | | | 280,737 | |
LVMH Moet Hennessy Louis Vuitton SE | | | 3,476 | | | | 1,616,129 | |
| | | | | | | | |
| | | Shares | | | Value | |
| COMMON STOCKS (continued) | |
| France (continued) | |
Natixis SA | | | 11,796 | | | | $ 52,408 | |
Orange SA | | | 26,584 | | | | 391,508 | |
Pernod Ricard SA | | | 2,718 | | | | 486,322 | |
Peugeot SA | | | 7,177 | | | | 171,597 | |
Publicis Groupe SA | | | 2,831 | | | | 128,256 | |
Renault SA | | | 2,488 | | | | 117,799 | |
Safran SA | | | 4,210 | | | | 650,496 | |
Sanofi | | | 14,802 | | | | 1,489,058 | |
Sartorius Stedim Biotech | | | 220 | | | | 36,474 | |
Schneider Electric SE | | | 6,973 | | | | 716,188 | |
Societe Generale SA | | | 10,294 | | | | 358,379 | |
Sodexo SA | | | 1,187 | | | | 140,769 | |
Thales SA | | | 1,378 | | | | 143,110 | |
TOTAL SA | | | 32,450 | | | | 1,792,115 | |
Unibail-Rodamco-Westfield, REIT | | | 1,767 | | | | 278,973 | |
Veolia Environnement SA | | | 7,290 | | | | 194,019 | |
Vinci SA | | | 6,632 | | | | 736,997 | |
Vivendi SA | | | 9,985 | | | | 289,395 | |
| | | | | | | | |
| | | | | | | 19,230,557 | |
| | | | | | | | |
| Germany - 7.4% | |
adidas AG | | | 2,302 | | | | 748,841 | |
Allianz SE | | | 5,565 | | | | 1,364,281 | |
BASF SE | | | 11,846 | | | | 895,562 | |
Bayer AG | | | 11,744 | | | | 959,828 | |
Bayerische Motoren Werke AG | | | 4,432 | | | | 363,865 | |
Beiersdorf AG | | | 1,288 | | | | 154,192 | |
Commerzbank AG | | | 13,620 | | | | 84,346 | |
Continental AG | | | 1,391 | | | | 179,967 | |
Covestro AG(D) | | | 1,856 | | | | 86,355 | |
Daimler AG | | | 11,688 | | | | 647,723 | |
Deutsche Bank AG | | | 24,275 | | | | 188,479 | |
Deutsche Boerse AG | | | 2,508 | | | | 394,554 | |
Deutsche Lufthansa AG | | | 3,215 | | | | 59,221 | |
Deutsche Post AG | | | 12,599 | | | | 480,982 | |
Deutsche Telekom AG | | | 41,849 | | | | 684,433 | |
Deutsche Wohnen SE | | | 4,617 | | | | 188,750 | |
E.ON SE | | | 28,341 | | | | 302,985 | |
Evonik Industries AG | | | 1,934 | | | | 59,071 | |
Fresenius Medical Care AG & Co. KGaA | | | 2,794 | | | | 206,868 | |
Fresenius SE & Co. KGaA | | | 5,335 | | | | 300,505 | |
Hannover Rueck SE | | | 784 | | | | 151,631 | |
HeidelbergCement AG | | | 1,759 | | | | 128,262 | |
Henkel AG & Co. KGaA | | | 1,322 | | | | 124,651 | |
HOCHTIEF AG | | | 274 | | | | 34,970 | |
Infineon Technologies AG | | | 16,223 | | | | 369,851 | |
Knorr-Bremse AG | | | 399 | | | | 40,645 | |
Merck KGaA | | | 1,668 | | | | 197,250 | |
MTU Aero Engines AG | | | 582 | | | | 166,329 | |
Muenchener Rueckversicherungs-Gesellschaft AG | | | 1,939 | | | | 572,426 | |
Puma SE | | | 972 | | | | 74,575 | |
RWE AG | | | 7,217 | | | | 221,564 | |
SAP SE | | | 13,659 | | | | 1,844,773 | |
Siemens AG | | | 10,518 | | | | 1,375,924 | |
Siemens Healthineers AG(D) | | | 1,469 | | | | 70,608 | |
Symrise AG | | | 1,249 | | | | 131,508 | |
Telefonica Deutschland Holding AG | | | 10,500 | | | | 30,456 | |
The Notes to Financial Statements are an integral part of this report.
| | |
| Transamerica ETF Trust | | Annual Report 2019 |
Page 39
DeltaShares® S&P International Managed Risk ETF
SCHEDULE OF INVESTMENTS (continued)
At December 31, 2019
| | | | | | | | |
| | | Shares | | | Value | |
| COMMON STOCKS (continued) | |
| Germany (continued) | |
thyssenkrupp AG | | | 5,017 | | | | $ 67,804 | |
Uniper SE | | | 1,179 | | | | 39,054 | |
Volkswagen AG | | | 407 | | | | 79,150 | |
Vonovia SE | | | 6,659 | | | | 358,787 | |
Wirecard AG | | | 1,456 | | | | 175,694 | |
Zalando SE(B) (D) | | | 1,622 | | | | 82,259 | |
| | | | | | | | |
| | | | | | | 14,688,979 | |
| | | | | | | | |
| Hong Kong - 3.1% | |
AIA Group, Ltd. | | | 153,200 | | | | 1,608,327 | |
Alibaba Health Information Technology, Ltd.(B) | | | 38,000 | | | | 43,892 | |
Bank of East Asia, Ltd. | | | 19,200 | | | | 42,876 | |
BOC Hong Kong Holdings, Ltd. | | | 46,500 | | | | 161,429 | |
Budweiser Brewing Co. APAC, Ltd.(B) (D) | | | 10,300 | | | | 34,766 | |
Chow Tai Fook Jewellery Group, Ltd. | | | 4,200 | | | | 4,016 | |
CK Asset Holdings, Ltd. | | | 34,500 | | | | 249,060 | |
CK Hutchison Holdings, Ltd. | | | 36,000 | | | | 343,284 | |
CK Infrastructure Holdings, Ltd. | | | 9,000 | | | | 64,048 | |
CLP Holdings, Ltd. | | | 23,500 | | | | 247,010 | |
Dairy Farm International Holdings, Ltd. | | | 3,900 | | | | 22,269 | |
Galaxy Entertainment Group, Ltd. | | | 32,000 | | | | 235,735 | |
Hang Lung Properties, Ltd. | | | 19,000 | | | | 41,698 | |
Hang Seng Bank, Ltd. | | | 9,300 | | | | 192,163 | |
Henderson Land Development Co., Ltd. | | | 21,000 | | | | 103,089 | |
HK Electric Investments & HK Electric Investments, Ltd. | | | 37,500 | | | | 36,962 | |
HKT Trust & HKT, Ltd. | | | 39,000 | | | | 54,958 | |
Hong Kong & China Gas Co., Ltd. | | | 136,000 | | | | 265,654 | |
Hong Kong Exchanges & Clearing, Ltd. | | | 15,000 | | | | 487,050 | |
Hongkong Land Holdings, Ltd. | | | 14,900 | | | | 85,675 | |
Jardine Matheson Holdings, Ltd. | | | 3,900 | | | | 216,840 | |
Jardine Strategic Holdings, Ltd. | | | 1,800 | | | | 55,170 | |
Link, REIT | | | 27,500 | | | | 291,171 | |
Melco Resorts & Entertainment, Ltd., ADR | | | 2,058 | | | | 49,742 | |
MTR Corp., Ltd. | | | 19,500 | | | | 115,246 | |
New World Development Co., Ltd. | | | 77,000 | | | | 105,542 | |
NWS Holdings, Ltd. | | | 18,000 | | | | 25,226 | |
Power Assets Holdings, Ltd. | | | 19,500 | | | | 142,650 | |
Sino Land Co., Ltd. | | | 38,000 | | | | 55,207 | |
Sun Hung Kai Properties, Ltd. | | | 18,000 | | | | 275,597 | |
Swire Pacific, Ltd., Class B | | | 45,000 | | | | 67,340 | |
Swire Properties, Ltd. | | | 15,000 | | | | 49,764 | |
Techtronic Industries Co., Ltd. | | | 19,500 | | | | 159,042 | |
Wharf Holdings, Ltd. | | | 18,000 | | | | 45,787 | |
Wharf Real Estate Investment Co., Ltd. | | | 17,000 | | | | 103,744 | |
Wheelock & Co., Ltd. | | | 14,000 | | | | 93,342 | |
| | | | | | | | |
| | | | | | | 6,175,371 | |
| | | | | | | | |
| Ireland - 1.0% | |
AerCap Holdings NV(B) | | | 1,617 | | | | 99,397 | |
AIB Group PLC | | | 8,573 | | | | 29,890 | |
Bank of Ireland Group PLC | | | 12,962 | | | | 71,032 | |
CRH PLC(B) | | | 10,841 | | | | 434,069 | |
DCC PLC | | | 1,324 | | | | 114,780 | |
Experian PLC | | | 11,948 | | | | 403,934 | |
Flutter Entertainment PLC | | | 1,094 | | | | 133,055 | |
Glanbia PLC | | | 2,238 | | | | 25,775 | |
ICON PLC(B) | | | 617 | | | | 106,266 | |
James Hardie Industries PLC, CDI | | | 5,799 | | | | 113,609 | |
| | | | | | | | |
| | | Shares | | | Value | |
| COMMON STOCKS (continued) | |
| Ireland (continued) | |
Kerry Group PLC, Class A | | | 1,804 | | | | $ 224,976 | |
Kingspan Group PLC | | | 1,735 | | | | 106,043 | |
Smurfit Kappa Group PLC | | | 3,439 | | | | 132,253 | |
| | | | | | | | |
| | | | | | | 1,995,079 | |
| | | | | | | | |
| Israel - 0.7% | |
Airport City, Ltd.(B) | | | 450 | | | | 8,445 | |
Alony Hetz Properties & Investments, Ltd. | | | 432 | | | | 6,829 | |
Azrieli Group, Ltd. | | | 625 | | | | 45,690 | |
Bank Hapoalim BM | | | 15,864 | | | | 131,588 | |
Bank LeumiLe-Israel BM | | | 20,943 | | | | 152,434 | |
Bezeq Israeli Telecommunication Corp., Ltd.(B) | | | 32,324 | | | | 25,970 | |
Check Point Software Technologies, Ltd.(A) (B) | | | 1,665 | | | | 184,748 | |
CyberArk Software, Ltd.(B) | | | 473 | | | | 55,142 | |
Delek Group, Ltd. | | | 50 | | | | 7,598 | |
Elbit Systems, Ltd. | | | 386 | | | | 60,079 | |
Gazit-Globe, Ltd. | | | 71 | | | | 786 | |
Inmode, Ltd.(B) | | | 62 | | | | 2,430 | |
Israel Chemicals, Ltd. | | | 8,763 | | | | 41,227 | |
Israel Corp., Ltd.(B) | | | 19 | | | | 3,942 | |
Israel Discount Bank, Ltd., A Shares | | | 20,357 | | | | 94,359 | |
Melisron, Ltd. | | | 19 | | | | 1,213 | |
Mellanox Technologies, Ltd.(B) | | | 536 | | | | 62,808 | |
Mizrahi Tefahot Bank, Ltd. | | | 2,750 | | | | 73,248 | |
Nice, Ltd.(B) | | | 960 | | | | 148,864 | |
Oil Refineries, Ltd. | | | 5,525 | | | | 2,774 | |
Paz Oil Co., Ltd. | | | 90 | | | | 12,739 | |
Phoenix Holdings, Ltd. | | | 391 | | | | 2,364 | |
Shufersal, Ltd. | | | 368 | | | | 2,342 | |
Strauss Group, Ltd. | | | 150 | | | | 4,599 | |
Taro Pharmaceutical Industries, Ltd.(B) | | | 7 | | | | 616 | |
Teva Pharmaceutical Industries, Ltd., ADR(B) | | | 13,536 | | | | 132,653 | |
Tower Semiconductor, Ltd.(B) | | | 1,441 | | | | 34,448 | |
Wix.com, Ltd.(B) | | | 544 | | | | 66,575 | |
| | | | | | | | |
| | | | | | | 1,366,510 | |
| | | | | | | | |
| Italy - 2.1% | |
A2A SpA | | | 21,943 | | | | 41,183 | |
Amplifon SpA | | | 666 | | | | 19,168 | |
Assicurazioni Generali SpA | | | 16,434 | | | | 339,335 | |
Atlantia SpA | | | 6,141 | | | | 143,311 | |
Banca Mediolanum SpA | | | 3,800 | | | | 37,771 | |
Davide Campari-Milano SpA | | | 7,245 | | | | 66,199 | |
DiaSorin SpA | | | 95 | | | | 12,306 | |
Enel SpA | | | 99,980 | | | | 793,673 | |
Eni SpA | | | 33,053 | | | | 513,714 | |
Ferrari NV | | | 1,640 | | | | 272,269 | |
FinecoBank Banca Fineco SpA | | | 5,353 | | | | 64,233 | |
Infrastrutture Wireless Italiane SpA(D) | | | 1,330 | | | | 13,033 | |
Intesa Sanpaolo SpA | | | 199,498 | | | | 525,915 | |
Leonardo SpA | | | 5,195 | | | | 60,938 | |
Mediobanca Banca di Credito Finanziario SpA | | | 8,182 | | | | 90,135 | |
Moncler SpA | | | 2,221 | | | | 99,897 | |
Nexi SpA(B) (D) | | | 2,161 | | | | 30,030 | |
Pirelli & C SpA(D) | | | 3,560 | | | | 20,540 | |
Poste Italiane SpA(D) | | | 6,481 | | | | 73,622 | |
Prada SpA | | | 4,500 | | | | 18,596 | |
Prysmian SpA | | | 3,565 | | | | 85,997 | |
Recordati SpA | | | 1,437 | | | | 60,602 | |
The Notes to Financial Statements are an integral part of this report.
| | |
| Transamerica ETF Trust | | Annual Report 2019 |
Page 40
DeltaShares® S&P International Managed Risk ETF
SCHEDULE OF INVESTMENTS (continued)
At December 31, 2019
| | | | | | | | |
| | | Shares | | | Value | |
| COMMON STOCKS (continued) | |
| Italy (continued) | |
Saipem SpA(B) | | | 5,938 | | | | $ 29,034 | |
Snam SpA | | | 29,479 | | | | 155,061 | |
Telecom Italia SpA(B) | | | 131,730 | | | | 82,273 | |
Telecom Italia SpA | | | 91,409 | | | | 56,003 | |
Terna Rete Elettrica Nazionale SpA | | | 19,141 | | | | 127,926 | |
UniCredit SpA | | | 26,794 | | | | 391,593 | |
UnipolSai Assicurazioni SpA(A) | | | 14,337 | | | | 41,682 | |
| | | | | | | | |
| | | | | | | 4,266,039 | |
| | | | | | | | |
| Japan - 26.9% | |
ABC-Mart, Inc. | | | 100 | | | | 6,846 | |
Acom Co., Ltd. | | | 5,800 | | | | 26,525 | |
Activia Properties, Inc., REIT | | | 15 | | | | 75,086 | |
Advance Residence Investment Corp., REIT | | | 19 | | | | 60,143 | |
Advantest Corp. | | | 2,500 | | | | 141,707 | |
Aeon Co., Ltd. | | | 11,500 | | | | 238,677 | |
AEON Financial Service Co., Ltd.(A) | | | 1,900 | | | | 30,194 | |
Aeon Mall Co., Ltd. | | | 1,900 | | | | 33,883 | |
AGC, Inc. | | | 3,300 | | | | 119,337 | |
Air Water, Inc. | | | 2,000 | | | | 29,446 | |
Aisin Seiki Co., Ltd. | | | 1,900 | | | | 71,157 | |
Ajinomoto Co., Inc. | | | 7,600 | | | | 126,929 | |
Alfresa Holdings Corp. | | | 3,300 | | | | 67,655 | |
Alps Alpine Co., Ltd. | | | 2,000 | | | | 45,862 | |
Amada Holdings Co., Ltd. | | | 5,800 | | | | 66,713 | |
ANA Holdings, Inc. | | | 1,900 | | | | 63,674 | |
Aozora Bank, Ltd. | | | 1,900 | | | | 50,544 | |
Asahi Group Holdings, Ltd. | | | 5,800 | | | | 265,943 | |
Asahi Intecc Co., Ltd.(A) | | | 3,100 | | | | 91,281 | |
Asahi Kasei Corp. | | | 19,200 | | | | 218,015 | |
Asics Corp. | | | 2,200 | | | | 36,763 | |
Astellas Pharma, Inc. | | | 24,200 | | | | 416,416 | |
Azbil Corp. | | | 2,900 | | | | 82,323 | |
Bandai Namco Holdings, Inc. | | | 3,000 | | | | 183,050 | |
Bank of Kyoto, Ltd. | | | 200 | | | | 8,650 | |
Benesse Holdings, Inc. | | | 1,500 | | | | 39,669 | |
Bridgestone Corp. | | | 8,300 | | | | 310,844 | |
Brother Industries, Ltd. | | | 3,900 | | | | 81,499 | |
Calbee, Inc. | | | 1,900 | | | | 62,153 | |
Canon, Inc.(A) | | | 13,300 | | | | 365,498 | |
Capcom Co., Ltd. | | | 1,000 | | | | 27,881 | |
Casio Computer Co., Ltd. | | | 3,800 | | | | 76,612 | |
Central Japan Railway Co. | | | 2,400 | | | | 485,852 | |
Chiba Bank, Ltd. | | | 11,900 | | | | 69,314 | |
Chubu Electric Power Co., Inc. | | | 9,500 | | | | 134,753 | |
Chugai Pharmaceutical Co., Ltd. | | | 2,300 | | | | 213,333 | |
Chugoku Electric Power Co., Inc.(A) | | | 3,900 | | | | 51,318 | |
Coca-Cola Bottlers Japan Holdings, Inc.(A) | | | 1,900 | | | | 48,796 | |
COMSYS Holdings Corp. | | | 2,000 | | | | 57,695 | |
Concordia Financial Group, Ltd. | | | 17,000 | | | | 70,706 | |
Cosmos Pharmaceutical Corp. | | | 200 | | | | 41,518 | |
Credit Saison Co., Ltd. | | | 2,000 | | | | 34,985 | |
CyberAgent, Inc. | | | 1,500 | | | | 52,657 | |
Dai Nippon Printing Co., Ltd. | | | 3,200 | | | | 87,159 | |
Dai-ichi Life Holdings, Inc. | | | 15,400 | | | | 257,411 | |
Daicel Corp. | | | 3,700 | | | | 35,715 | |
Daifuku Co., Ltd.(A) | | | 1,800 | | | | 110,311 | |
Daiichi Sankyo Co., Ltd. | | | 7,700 | | | | 512,129 | |
| | | | | | | | |
| | | Shares | | | Value | |
| COMMON STOCKS (continued) | |
| Japan (continued) | |
Daikin Industries, Ltd. | | | 3,900 | | | | $ 554,451 | |
Daito Trust Construction Co., Ltd. | | | 1,100 | | | | 136,444 | |
Daiwa House Industry Co., Ltd. | | | 8,900 | | | | 277,626 | |
Daiwa House Investment Corp., REIT | | | 24 | | | | 62,631 | |
Daiwa Office Investment Corp., REIT | | | 1 | | | | 7,674 | |
Daiwa Securities Group, Inc. | | | 19,400 | | | | 98,718 | |
DeNA Co., Ltd.(A) | | | 1,900 | | | | 30,683 | |
Denso Corp. | | | 7,100 | | | | 324,441 | |
Dentsu, Inc.(A) | | | 3,500 | | | | 121,578 | |
DIC Corp. | | | 1,900 | | | | 53,062 | |
Disco Corp. | | | 300 | | | | 71,498 | |
East Japan Railway Co. | | | 5,400 | | | | 489,839 | |
Ebara Corp. | | | 1,400 | | | | 42,834 | |
Eisai Co., Ltd. | | | 3,800 | | | | 286,866 | |
Electric Power Development Co., Ltd., Class C | | | 1,900 | | | | 46,278 | |
Ezaki Glico Co., Ltd. | | | 300 | | | | 13,430 | |
FamilyMart Co., Ltd.(A) | | | 3,600 | | | | 86,957 | |
Fancl Corp. | | | 900 | | | | 24,116 | |
FANUC Corp. | | | 2,200 | | | | 411,557 | |
Fast Retailing Co., Ltd. | | | 800 | | | | 478,491 | |
Fuji Electric Co., Ltd. | | | 1,600 | | | | 49,248 | |
FUJIFILM Holdings Corp. | | | 5,600 | | | | 269,501 | |
Fujitsu, Ltd. | | | 2,200 | | | | 207,904 | |
Fukuoka Financial Group, Inc. | | | 2,700 | | | | 52,298 | |
GLPJ-REIT | | | 47 | | | | 58,342 | |
GMO Payment Gateway, Inc. | | | 500 | | | | 34,415 | |
Goldwin, Inc. | | | 400 | | | | 29,519 | |
GungHo Online Entertainment, Inc.(B) | | | 500 | | | | 10,656 | |
Hachijuni Bank, Ltd. | | | 7,600 | | | | 33,428 | |
Hakuhodo DY Holdings, Inc. | | | 3,900 | | | | 63,448 | |
Hamamatsu Photonics KK(A) | | | 1,800 | | | | 74,451 | |
Hankyu Hanshin Holdings, Inc. | | | 3,900 | | | | 167,950 | |
Harmonic Drive Systems, Inc.(A) | | | 400 | | | | 19,397 | |
Haseko Corp. | | | 3,900 | | | | 52,790 | |
Hikari Tsushin, Inc. | | | 300 | | | | 75,721 | |
Hino Motors, Ltd. | | | 3,900 | | | | 41,700 | |
Hirose Electric Co., Ltd. | | | 300 | | | | 38,730 | |
Hisamitsu Pharmaceutical Co., Inc.(A) | | | 1,400 | | | | 68,921 | |
Hitachi Chemical Co., Ltd. | | | 1,700 | | | | 71,567 | |
Hitachi Construction Machinery Co., Ltd.(A) | | | 1,900 | | | | 57,433 | |
Hitachi High-Technologies Corp. | | | 1,000 | | | | 71,222 | |
Hitachi Metals, Ltd. | | | 2,000 | | | | 29,685 | |
Hitachi Transport System, Ltd. | | | 100 | | | | 2,830 | |
Hitachi, Ltd. | | | 11,600 | | | | 493,781 | |
Honda Motor Co., Ltd. | | | 23,100 | | | | 658,725 | |
Hoshizaki Corp. | | | 700 | | | | 62,738 | |
House Foods Group, Inc. | | | 1,800 | | | | 61,781 | |
Hoya Corp. | | | 5,100 | | | | 490,407 | |
Hulic Co., Ltd.(A) | | | 5,800 | | | | 70,235 | |
Ibiden Co., Ltd. | | | 1,900 | | | | 45,544 | |
Idemitsu Kosan Co., Ltd. | | | 3,000 | | | | 83,644 | |
IHI Corp.(A) | | | 1,900 | | | | 45,002 | |
Iida Group Holdings Co., Ltd. | | | 2,000 | | | | 35,316 | |
Inpex Corp. | | | 13,300 | | | | 139,089 | |
Invincible Investment Corp., REIT | | | 58 | | | | 33,036 | |
Isetan Mitsukoshi Holdings, Ltd. | | | 5,800 | | | | 52,516 | |
Isuzu Motors, Ltd. | | | 7,600 | | | | 90,843 | |
Ito En, Ltd. | | | 1,300 | | | | 65,553 | |
The Notes to Financial Statements are an integral part of this report.
| | |
| Transamerica ETF Trust | | Annual Report 2019 |
Page 41
DeltaShares® S&P International Managed Risk ETF
SCHEDULE OF INVESTMENTS (continued)
At December 31, 2019
| | | | | | | | |
| | | Shares | | | Value | |
| COMMON STOCKS (continued) | |
| Japan (continued) | |
ITOCHU Corp. | | | 20,600 | | | | $ 480,430 | |
Itochu Techno-Solutions Corp. | | | 900 | | | | 25,466 | |
Izumi Co., Ltd. | | | 300 | | | | 10,863 | |
J. Front Retailing Co., Ltd. | | | 3,900 | | | | 54,907 | |
Japan Airlines Co., Ltd. | | | 1,800 | | | | 56,265 | |
Japan Airport Terminal Co., Ltd.(A) | | | 1,200 | | | | 67,246 | |
Japan Exchange Group, Inc. | | | 7,500 | | | | 133,195 | |
Japan Hotel Investment Corp., REIT | | | 65 | | | | 48,567 | |
Japan Post Bank Co., Ltd. | | | 5,800 | | | | 56,039 | |
Japan Post Holdings Co., Ltd. | | | 12,900 | | | | 121,789 | |
Japan Prime Realty Investment Corp., REIT | | | 18 | | | | 78,923 | |
Japan Real Estate Investment Corp., REIT | | | 19 | | | | 125,880 | |
Japan Retail Fund Investment Corp., REIT | | | 39 | | | | 83,724 | |
Japan Tobacco, Inc. | | | 14,700 | | | | 329,034 | |
JFE Holdings, Inc. | | | 7,600 | | | | 98,676 | |
JGC Holdings Corp.(A) | | | 3,600 | | | | 58,137 | |
JSR Corp. | | | 2,000 | | | | 37,028 | |
JTEKT Corp. | | | 3,900 | | | | 46,689 | |
JXTG Holdings, Inc. | | | 42,100 | | | | 192,883 | |
K’s Holdings Corp. | | | 3,600 | | | | 47,404 | |
Kagome Co., Ltd.(A) | | | 1,600 | | | | 38,544 | |
Kajima Corp. | | | 7,400 | | | | 99,279 | |
Kakaku.com, Inc. | | | 1,500 | | | | 38,551 | |
Kaken Pharmaceutical Co., Ltd. | | | 100 | | | | 5,558 | |
Kamigumi Co., Ltd. | | | 100 | | | | 2,208 | |
Kaneka Corp. | | | 500 | | | | 16,195 | |
Kansai Electric Power Co., Inc.(A) | | | 11,200 | | | | 130,319 | |
Kansai Paint Co., Ltd. | | | 3,900 | | | | 96,069 | |
Kao Corp. | | | 5,800 | | | | 481,666 | |
Kawasaki Heavy Industries, Ltd. | | | 1,900 | | | | 42,100 | |
KDDI Corp. | | | 20,900 | | | | 625,606 | |
Keihan Holdings Co., Ltd. | | | 500 | | | | 24,385 | |
Keikyu Corp. | | | 2,500 | | | | 48,539 | |
Keio Corp. | | | 1,300 | | | | 79,071 | |
Keisei Electric Railway Co., Ltd. | | | 2,000 | | | | 78,031 | |
Kenedix Office Investment Corp., REIT | | | 2 | | | | 15,422 | |
Kewpie Corp. | | | 1,800 | | | | 40,629 | |
Keyence Corp. | | | 2,300 | | | | 814,603 | |
Kikkoman Corp. | | | 2,000 | | | | 98,827 | |
Kinden Corp. | | | 2,000 | | | | 31,286 | |
Kintetsu Group Holdings Co., Ltd.(A) | | | 2,000 | | | | 108,949 | |
Kirin Holdings Co., Ltd. | | | 11,500 | | | | 252,910 | |
Kobayashi Pharmaceutical Co., Ltd. | | | 500 | | | | 42,650 | |
Kobe Bussan Co., Ltd. | | | 600 | | | | 20,704 | |
Kobe Steel, Ltd. | | | 5,200 | | | | 28,183 | |
Koito Manufacturing Co., Ltd. | | | 1,900 | | | | 89,165 | |
Komatsu, Ltd. | | | 13,000 | | | | 316,043 | |
Konami Holdings Corp. | | | 1,600 | | | | 66,032 | |
Konica Minolta, Inc. | | | 7,400 | | | | 48,550 | |
Kose Corp. | | | 400 | | | | 58,891 | |
Kubota Corp. | | | 15,200 | | | | 241,410 | |
Kuraray Co., Ltd. | | | 3,900 | | | | 47,765 | |
Kurita Water Industries, Ltd. | | | 1,900 | | | | 56,908 | |
Kyocera Corp. | | | 4,000 | | | | 275,316 | |
Kyowa Exeo Corp. | | | 800 | | | | 20,369 | |
Kyowa Kirin Co., Ltd. | | | 3,900 | | | | 92,337 | |
Kyushu Electric Power Co., Inc. | | | 5,800 | | | | 50,435 | |
Kyushu Railway Co. | | | 1,900 | | | | 63,814 | |
| | | | | | | | |
| | | Shares | | | Value | |
| COMMON STOCKS (continued) | |
| Japan (continued) | |
Lawson, Inc. | | | 400 | | | | $ 22,784 | |
LINE Corp.(B) | | | 600 | | | | 29,538 | |
Lion Corp. | | | 3,900 | | | | 76,259 | |
LIXIL Group Corp. | | | 3,900 | | | | 67,790 | |
M3, Inc. | | | 5,300 | | | | 161,182 | |
Mabuchi Motor Co., Ltd. | | | 200 | | | | 7,637 | |
Makita Corp. | | | 3,900 | | | | 136,729 | |
Marubeni Corp. | | | 23,100 | | | | 172,301 | |
Marui Group Co., Ltd. | | | 3,200 | | | | 78,561 | |
Maruichi Steel Tube, Ltd. | | | 1,600 | | | | 45,346 | |
Matsumotokiyoshi Holdings Co., Ltd. | | | 800 | | | | 31,176 | |
Mazda Motor Corp. | | | 7,600 | | | | 65,597 | |
McDonald’s Holdings Co. Japan, Ltd.(A) | | | 1,500 | | | | 72,326 | |
Mebuki Financial Group, Inc. | | | 13,300 | | | | 34,267 | |
Medipal Holdings Corp. | | | 2,000 | | | | 44,408 | |
MEIJI Holdings Co., Ltd. | | | 1,900 | | | | 129,027 | |
Mercari, Inc.(B) | | | 1,100 | | | | 22,622 | |
Minebea Mitsumi, Inc. | | | 5,800 | | | | 121,524 | |
MISUMI Group, Inc. | | | 4,000 | | | | 100,189 | |
Mitsubishi Chemical Holdings Corp. | | | 19,200 | | | | 144,431 | |
Mitsubishi Corp. | | | 21,100 | | | | 563,055 | |
Mitsubishi Electric Corp. | | | 28,800 | | | | 397,118 | |
Mitsubishi Estate Co., Ltd. | | | 17,300 | | | | 332,628 | |
Mitsubishi Gas Chemical Co., Inc. | | | 3,700 | | | | 56,994 | |
Mitsubishi Heavy Industries, Ltd. | | | 3,900 | | | | 152,447 | |
Mitsubishi Logistics Corp. | | | 200 | | | | 5,239 | |
Mitsubishi Materials Corp. | | | 1,900 | | | | 52,048 | |
Mitsubishi Motors Corp. | | | 9,500 | | | | 40,037 | |
Mitsubishi Tanabe Pharma Corp. | | | 3,400 | | | | 62,822 | |
Mitsubishi UFJ Financial Group, Inc. | | | 168,100 | | | | 917,570 | |
Mitsubishi UFJ Lease & Finance Co., Ltd. | | | 7,600 | | | | 49,373 | |
Mitsui & Co., Ltd. | | | 22,500 | | | | 402,899 | |
Mitsui Chemicals, Inc. | | | 3,500 | | | | 86,312 | |
Mitsui Fudosan Co., Ltd. | | | 13,200 | | | | 324,549 | |
Mitsui O.S.K. Lines, Ltd. | | | 1,900 | | | | 52,887 | |
Miura Co., Ltd. | | | 1,100 | | | | 38,463 | |
Mizuho Financial Group, Inc. | | | 327,600 | | | | 507,339 | |
MonotaRO Co., Ltd.(A) | | | 2,000 | | | | 53,793 | |
Morinaga & Co., Ltd. | | | 400 | | | | 19,287 | |
MS&AD Insurance Group Holdings, Inc. | | | 7,000 | | | | 232,593 | |
Murata Manufacturing Co., Ltd. | | | 7,900 | | | | 490,392 | |
Nabtesco Corp.(A) | | | 1,900 | | | | 57,083 | |
Nagoya Railroad Co., Ltd.(A) | | | 4,000 | | | | 124,776 | |
Nankai Electric Railway Co., Ltd. | | | 400 | | | | 10,917 | |
NEC Corp. | | | 4,000 | | | | 166,368 | |
Nexon Co., Ltd.(B) | | | 5,700 | | | | 76,052 | |
NGK Insulators, Ltd. | | | 3,900 | | | | 68,328 | |
NGK Spark Plug Co., Ltd. | | | 1,900 | | | | 37,309 | |
NH Foods, Ltd. | | | 700 | | | | 29,050 | |
Nichirei Corp. | | | 1,900 | | | | 44,582 | |
Nidec Corp. | | | 3,600 | | | | 497,060 | |
Nihon M&A Center, Inc. | | | 2,000 | | | | 69,289 | |
Nihon Unisys, Ltd. | | | 900 | | | | 28,364 | |
Nikon Corp. | | | 5,800 | | | | 71,729 | |
Nintendo Co., Ltd. | | | 1,500 | | | | 606,901 | |
Nippon Building Fund, Inc., REIT | | | 19 | | | | 138,992 | |
Nippon Electric Glass Co., Ltd.(A) | | | 1,700 | | | | 38,184 | |
Nippon Express Co., Ltd. | | | 1,500 | | | | 88,613 | |
The Notes to Financial Statements are an integral part of this report.
| | |
| Transamerica ETF Trust | | Annual Report 2019 |
Page 42
DeltaShares® S&P International Managed Risk ETF
SCHEDULE OF INVESTMENTS (continued)
At December 31, 2019
| | | | | | | | |
| | | Shares | | | Value | |
| COMMON STOCKS (continued) | |
| Japan (continued) | |
Nippon Paint Holdings Co., Ltd. | | | 2,200 | | | | $ 114,175 | |
Nippon Paper Industries Co., Ltd. | | | 1,900 | | | | 32,309 | |
Nippon Prologis, Inc., REIT | | | 41 | | | | 104,278 | |
Nippon Shinyaku Co., Ltd. | | | 700 | | | | 60,998 | |
Nippon Shokubai Co., Ltd. | | | 300 | | | | 18,744 | |
Nippon Steel Corp. | | | 12,000 | | | | 182,636 | |
Nippon Telegraph & Telephone Corp. | | | 16,600 | | | | 421,129 | |
Nippon Yusen KK | | | 1,900 | | | | 34,634 | |
Nissan Chemical Corp. | | | 1,800 | | | | 76,108 | |
Nissan Motor Co., Ltd. | | | 30,600 | | | | 179,109 | |
Nisshin Seifun Group, Inc. | | | 3,900 | | | | 68,400 | |
Nissin Foods Holdings Co., Ltd. | | | 1,400 | | | | 104,605 | |
Nitori Holdings Co., Ltd. | | | 1,200 | | | | 190,200 | |
Nitto Denko Corp. | | | 1,900 | | | | 108,047 | |
NOK Corp. | | | 1,900 | | | | 28,690 | |
Nomura Holdings, Inc. | | | 43,300 | | | | 224,479 | |
Nomura Real Estate Holdings, Inc. | | | 1,900 | | | | 45,806 | |
Nomura Real Estate Master Fund, Inc., REIT | | | 59 | | | | 100,763 | |
Nomura Research Institute, Ltd. | | | 5,300 | | | | 114,023 | |
NS Solutions Corp. | | | 200 | | | | 6,625 | |
NSK, Ltd. | | | 5,800 | | | | 55,558 | |
NTT Data Corp. | | | 7,600 | | | | 102,592 | |
NTT DOCOMO, Inc. | | | 14,400 | | | | 402,551 | |
Obayashi Corp. | | | 9,500 | | | | 106,386 | |
OBIC Business Consultants Co., Ltd.(A) | | | 300 | | | | 14,244 | |
OBIC Co., Ltd. | | | 1,000 | | | | 135,818 | |
Odakyu Electric Railway Co., Ltd. | | | 3,900 | | | | 91,547 | |
OJI Holdings Corp. | | | 15,500 | | | | 84,863 | |
Olympus Corp. | | | 15,900 | | | | 247,114 | |
Omron Corp. | | | 3,100 | | | | 183,133 | |
Ono Pharmaceutical Co., Ltd. | | | 7,100 | | | | 163,462 | |
Open House Co., Ltd. | | | 600 | | | | 17,281 | |
Oracle Corp. | | | 300 | | | | 27,467 | |
Orient Corp. | | | 2,100 | | | | 3,188 | |
Oriental Land Co., Ltd. | | | 3,000 | | | | 410,766 | |
ORIX Corp. | | | 17,300 | | | | 288,294 | |
ORIX, Inc., REIT | | | 40 | | | | 86,607 | |
Osaka Gas Co., Ltd. | | | 3,900 | | | | 75,039 | |
Otsuka Corp. | | | 1,100 | | | | 44,283 | |
Otsuka Holdings Co., Ltd. | | | 7,300 | | | | 328,005 | |
PALTAC Corp.(A) | | | 200 | | | | 9,643 | |
Pan Pacific International Holdings Corp. | | | 7,800 | | | | 129,982 | |
Panasonic Corp. | | | 32,000 | | | | 303,142 | |
Park24 Co., Ltd. | | | 1,900 | | | | 46,663 | |
PeptiDream, Inc.(B) | | | 1,400 | | | | 72,142 | |
Persol Holdings Co., Ltd. | | | 2,100 | | | | 39,633 | |
Pigeon Corp.(A) | | | 1,800 | | | | 66,501 | |
Pola Orbis Holdings, Inc.(A) | | | 1,500 | | | | 36,080 | |
Rakuten, Inc.(B) | | | 11,200 | | | | 96,361 | |
Recruit Holdings Co., Ltd. | | | 20,700 | | | | 780,762 | |
Relo Group, Inc. | | | 1,900 | | | | 53,324 | |
Renesas Electronics Corp.(A) (B) | | | 12,700 | | | | 87,647 | |
Resona Holdings, Inc. | | | 28,800 | | | | 126,940 | |
Ricoh Co., Ltd. | | | 9,500 | | | | 104,201 | |
Rinnai Corp. | | | 300 | | | | 23,602 | |
Rohm Co., Ltd. | | | 1,500 | | | | 121,187 | |
Rohto Pharmaceutical Co., Ltd. | | | 900 | | | | 27,495 | |
Ryohin Keikaku Co., Ltd. | | | 2,900 | | | | 68,207 | |
| | | | | | | | |
| | | Shares | | | Value | |
| COMMON STOCKS (continued) | |
| Japan (continued) | |
Sankyu, Inc. | | | 500 | | | | $ 25,305 | |
Santen Pharmaceutical Co., Ltd. | | | 5,800 | | | | 111,330 | |
SBI Holdings, Inc. | | | 3,200 | | | | 68,167 | |
Screen Holdings Co., Ltd. | | | 500 | | | | 34,461 | |
SCSK Corp. | | | 300 | | | | 15,652 | |
Secom Co., Ltd. | | | 3,000 | | | | 269,896 | |
Sega Sammy Holdings, Inc. | | | 2,000 | | | | 29,133 | |
Seibu Holdings, Inc. | | | 3,900 | | | | 64,417 | |
Seiko Epson Corp. | | | 3,900 | | | | 59,393 | |
Seino Holdings Co., Ltd. | | | 1,200 | | | | 16,309 | |
Sekisui Chemical Co., Ltd. | | | 5,700 | | | | 99,865 | |
Sekisui House, Inc., REIT | | | 24 | | | | 20,185 | |
Sekisui House, Ltd. | | | 7,600 | | | | 163,189 | |
Seven & i Holdings Co., Ltd. | | | 9,600 | | | | 353,612 | |
Seven Bank, Ltd. | | | 9,600 | | | | 31,625 | |
SG Holdings Co., Ltd. | | | 2,500 | | | | 56,591 | |
Sharp Corp. | | | 2,200 | | | | 34,111 | |
Shikoku Electric Power Co., Inc. | | | 2,000 | | | | 19,839 | |
Shimadzu Corp. | | | 3,900 | | | | 123,451 | |
Shimamura Co., Ltd. | | | 200 | | | | 15,312 | |
Shimano, Inc. | | | 1,200 | | | | 196,218 | |
Shimizu Corp. | | | 9,500 | | | | 97,557 | |
Shin-Etsu Chemical Co., Ltd. | | | 5,100 | | | | 565,963 | |
Shinsei Bank, Ltd. | | | 1,900 | | | | 29,285 | |
Shionogi & Co., Ltd. | | | 3,900 | | | | 242,846 | |
Shiseido Co., Ltd. | | | 5,300 | | | | 379,522 | |
Shizuoka Bank, Ltd. | | | 3,900 | | | | 29,355 | |
Showa Denko KK(A) | | | 1,900 | | | | 50,684 | |
Skylark Holdings Co., Ltd.(A) | | | 1,900 | | | | 37,327 | |
SMC Corp. | | | 900 | | | | 416,480 | |
Softbank Corp. | | | 18,700 | | | | 251,140 | |
SoftBank Group Corp. | | | 21,100 | | | | 923,410 | |
Sohgo Security Services Co., Ltd. | | | 1,600 | | | | 87,159 | |
Sojitz Corp. | | | 15,500 | | | | 50,205 | |
Sompo Holdings, Inc. | | | 5,100 | | | | 201,794 | |
Sony Corp. | | | 16,400 | | | | 1,116,875 | |
Sony Financial Holdings, Inc.(A) | | | 1,900 | | | | 45,946 | |
Square Enix Holdings Co., Ltd. | | | 1,300 | | | | 64,955 | |
Stanley Electric Co., Ltd. | | | 1,900 | | | | 55,597 | |
Subaru Corp. | | | 7,700 | | | | 192,261 | |
Sugi Holdings Co., Ltd. | | | 100 | | | | 5,300 | |
Sumco Corp. | | | 2,600 | | | | 43,686 | |
Sumitomo Chemical Co., Ltd. | | | 19,000 | | | | 87,067 | |
Sumitomo Corp. | | | 17,100 | | | | 255,536 | |
Sumitomo Dainippon Pharma Co., Ltd.(A) | | | 2,000 | | | | 39,199 | |
Sumitomo Electric Industries, Ltd. | | | 9,600 | | | | 145,932 | |
Sumitomo Heavy Industries, Ltd. | | | 800 | | | | 23,041 | |
Sumitomo Metal Mining Co., Ltd. | | | 2,900 | | | | 94,572 | |
Sumitomo Mitsui Financial Group, Inc.(A) | | | 18,100 | | | | 672,536 | |
Sumitomo Mitsui Trust Holdings, Inc. | | | 5,600 | | | | 223,485 | |
Sumitomo Realty & Development Co., Ltd. | | | 5,100 | | | | 178,893 | |
Sumitomo Rubber Industries, Ltd. | | | 2,000 | | | | 24,605 | |
Sundrug Co., Ltd. | | | 1,300 | | | | 47,311 | |
Suntory Beverage & Food, Ltd. | | | 1,900 | | | | 79,462 | |
Suzuken Co., Ltd. | | | 1,300 | | | | 53,412 | |
Suzuki Motor Corp. | | | 5,800 | | | | 243,741 | |
Sysmex Corp. | | | 2,000 | | | | 137,088 | |
T&D Holdings, Inc. | | | 7,600 | | | | 97,557 | |
The Notes to Financial Statements are an integral part of this report.
| | |
| Transamerica ETF Trust | | Annual Report 2019 |
Page 43
DeltaShares® S&P International Managed Risk ETF
SCHEDULE OF INVESTMENTS (continued)
At December 31, 2019
| | | | | | | | |
| | | Shares | | | Value | |
| COMMON STOCKS (continued) | |
| Japan (continued) | |
Taiheiyo Cement Corp. | | | 1,900 | | | | $ 56,209 | |
Taisei Corp. | | | 3,100 | | | | 129,648 | |
Taisho Pharmaceutical Holdings Co., Ltd. | | | 400 | | | | 29,850 | |
Taiyo Nippon Sanso Corp. | | | 3,300 | | | | 73,728 | |
Taiyo Yuden Co., Ltd.(A) | | | 1,600 | | | | 49,395 | |
Takashimaya Co., Ltd. | | | 300 | | | | 3,390 | |
Takeda Pharmaceutical Co., Ltd. | | | 19,700 | | | | 785,281 | |
TDK Corp. | | | 1,800 | | | | 205,217 | |
Teijin, Ltd. | | | 2,000 | | | | 37,635 | |
Terumo Corp. | | | 8,400 | | | | 300,290 | |
THK Co., Ltd. | | | 1,900 | | | | 51,890 | |
TIS, Inc. | | | 900 | | | | 53,251 | |
Tobu Railway Co., Ltd. | | | 3,900 | | | | 141,932 | |
Toho Co., Ltd. | | | 1,900 | | | | 79,462 | |
Toho Gas Co., Ltd. | | | 900 | | | | 36,936 | |
Tohoku Electric Power Co., Inc. | | | 5,800 | | | | 57,746 | |
Tokai Carbon Co., Ltd.(A) | | | 2,500 | | | | 25,190 | |
Tokio Marine Holdings, Inc. | | | 9,400 | | | | 529,272 | |
Tokyo Century Corp. | | | 500 | | | | 26,915 | |
Tokyo Electric Power Co. Holdings, Inc.(B) | | | 11,500 | | | | 49,418 | |
Tokyo Electron, Ltd. | | | 2,000 | | | | 440,304 | |
Tokyo Gas Co., Ltd. | | | 3,900 | | | | 95,154 | |
Tokyo Tatemono Co., Ltd. | | | 3,600 | | | | 56,613 | |
Tokyu Corp. | | | 7,600 | | | | 141,195 | |
Tokyu Fudosan Holdings Corp. | | | 8,500 | | | | 59,052 | |
Toppan Printing Co., Ltd. | | | 2,700 | | | | 56,174 | |
Toray Industries, Inc. | | | 21,100 | | | | 143,890 | |
Toshiba Corp. | | | 5,800 | | | | 197,736 | |
Tosoh Corp. | | | 2,500 | | | | 38,992 | |
TOTO, Ltd. | | | 1,900 | | | | 81,123 | |
Toyo Seikan Group Holdings, Ltd. | | | 1,800 | | | | 31,304 | |
Toyo Suisan Kaisha, Ltd. | | | 1,900 | | | | 80,948 | |
Toyoda Gosei Co., Ltd. | | | 1,900 | | | | 47,992 | |
Toyota Boshoku Corp. | | | 1,900 | | | | 30,858 | |
Toyota Industries Corp. | | | 1,900 | | | | 110,669 | |
Toyota Motor Corp. | | | 33,600 | | | | 2,385,005 | |
Toyota Tsusho Corp. | | | 3,400 | | | | 120,764 | |
Trend Micro, Inc. | | | 1,900 | | | | 97,907 | |
Tsumura & Co. | | | 1,500 | | | | 44,306 | |
Tsuruha Holdings, Inc.(A) | | | 300 | | | | 38,703 | |
Ube Industries, Ltd. | | | 1,900 | | | | 41,593 | |
Unicharm Corp. | | | 5,800 | | | | 197,470 | |
United Urban Investment Corp., REIT | | | 39 | | | | 73,066 | |
USS Co., Ltd. | | | 3,600 | | | | 68,439 | |
Welcia Holdings Co., Ltd. | | | 500 | | | | 31,976 | |
West Japan Railway Co. | | | 1,900 | | | | 165,060 | |
Workman Co., Ltd. | | | 200 | | | | 18,753 | |
Yakult Honsha Co., Ltd.(A) | | | 1,800 | | | | 99,876 | |
Yamada Denki Co., Ltd. | | | 11,500 | | | | 61,164 | |
Yamaha Corp. | | | 1,900 | | | | 106,299 | |
Yamaha Motor Co., Ltd. | | | 3,900 | | | | 79,059 | |
Yamato Holdings Co., Ltd. | | | 5,800 | | | | 99,642 | |
Yamazaki Baking Co., Ltd.(A) | | | 1,900 | | | | 34,075 | |
Yaskawa Electric Corp. | | | 3,800 | | | | 145,811 | |
Yokogawa Electric Corp. | | | 3,900 | | | | 69,226 | |
Yokohama Rubber Co., Ltd. | | | 1,900 | | | | 37,257 | |
Z Holdings Corp. | | | 35,600 | | | | 151,015 | |
Zensho Holdings Co., Ltd. | | | 1,800 | | | | 40,894 | |
| | | | | | | | |
| | | Shares | | | Value | |
| COMMON STOCKS (continued) | |
| Japan (continued) | |
Zeon Corp. | | | 1,600 | | | | $ 20,111 | |
ZOZO, Inc. | | | 2,400 | | | | 46,090 | |
| | | | | | | | |
| | | | | | | 53,793,300 | |
| | | | | | | | |
| Jersey, Channel Islands - 0.0%(C) | |
Clarivate Analytics PLC(A) (B) | | | 926 | | | | 15,557 | |
| | | | | | | | |
| Luxembourg - 0.2% | |
ArcelorMittal SA | | | 8,162 | | | | 143,309 | |
Aroundtown SA | | | 8,565 | | | | 76,760 | |
Millicom International Cellular SA, SDR | | | 1,026 | | | | 49,168 | |
SES SA | | | 5,148 | | | | 72,233 | |
Tenaris SA | | | 6,065 | | | | 68,420 | |
| | | | | | | | |
| | | | | | | 409,890 | |
| | | | | | | | |
| Macau - 0.1% | |
MGM China Holdings, Ltd. | | | 12,400 | | | | 20,243 | |
Sands China, Ltd. | | | 30,000 | | | | 160,361 | |
Wynn Macau, Ltd. | | | 20,400 | | | | 50,268 | |
| | | | | | | | |
| | | | | | | 230,872 | |
| | | | | | | | |
| Mexico - 0.0%(C) | |
Fresnillo PLC | | | 2,377 | | | | 20,160 | |
| | | | | | | | |
| Netherlands - 4.7% | |
ABN AMRO Bank NV, CVA(D) | | | 5,374 | | | | 97,844 | |
Adyen NV(A) (B) (D) | | | 289 | | | | 237,138 | |
Aegon NV | | | 18,271 | | | | 83,411 | |
Akzo Nobel NV | | | 2,908 | | | | 295,870 | |
ASML Holding NV | | | 5,526 | | | | 1,635,713 | |
EXOR NV | | | 1,284 | | | | 99,564 | |
GrandVision NV(D) | | | 407 | | | | 12,527 | |
Heineken Holding NV | | | 1,543 | | | | 149,646 | |
Heineken NV | | | 2,794 | | | | 297,694 | |
ING Groep NV | | | 49,311 | | | | 591,598 | |
Koninklijke Ahold Delhaize NV | | | 15,798 | | | | 395,363 | |
Koninklijke DSM NV | | | 2,355 | | | | 306,909 | |
Koninklijke KPN NV(A) | | | 51,354 | | | | 151,664 | |
Koninklijke Philips NV | | | 12,128 | | | | 592,467 | |
NN Group NV | | | 3,951 | | | | 149,992 | |
NXP Semiconductors NV | | | 3,635 | | | | 462,590 | |
Prosus NV(B) | | | 4,973 | | | | 371,383 | |
QIAGEN NV(B) | | | 2,997 | | | | 102,471 | |
Randstad NV | | | 1,648 | | | | 100,707 | |
Royal Dutch Shell PLC, A Shares | | | 57,067 | | | | 1,689,650 | |
Royal Dutch Shell PLC, B Shares | | | 45,476 | | | | 1,349,172 | |
Wolters Kluwer NV | | | 3,651 | | | | 266,468 | |
| | | | | | | | |
| | | | | | | 9,439,841 | |
| | | | | | | | |
| New Zealand - 0.4% | |
a2 Milk Co., Ltd.(B) | | | 9,826 | | | | 99,569 | |
Air New Zealand, Ltd. | | | 11,246 | | | | 22,230 | |
Auckland International Airport, Ltd. | | | 14,627 | | | | 86,346 | |
Contact Energy, Ltd. | | | 12,148 | | | | 58,435 | |
Fisher & Paykel Healthcare Corp., Ltd. | | | 8,600 | | | | 128,804 | |
Fletcher Building, Ltd. | | | 12,092 | | | | 41,524 | |
Mercury NZ, Ltd. | | | 2,536 | | | | 8,640 | |
Meridian Energy, Ltd. | | | 19,727 | | | | 66,544 | |
Ryman Healthcare, Ltd. | | | 6,366 | | | | 70,134 | |
SkyCity Entertainment Group, Ltd. | | | 12,570 | | | | 33,667 | |
Spark New Zealand, Ltd. | | | 26,719 | | | | 78,053 | |
Xero, Ltd.(B) | | | 1,182 | | | | 66,471 | |
The Notes to Financial Statements are an integral part of this report.
| | |
| Transamerica ETF Trust | | Annual Report 2019 |
Page 44
DeltaShares® S&P International Managed Risk ETF
SCHEDULE OF INVESTMENTS (continued)
At December 31, 2019
| | | | | | | | |
| | | Shares | | | Value | |
| COMMON STOCKS (continued) | |
| New Zealand (continued) | |
Z Energy, Ltd. | | | 6,259 | | | | $ 18,580 | |
| | | | | | | | |
| | | | | | | 778,997 | |
| | | | | | | | |
| Norway - 0.8% | |
Adevinta ASA, B Shares(B) | | | 4,234 | | | | 50,110 | |
Aker BP ASA | | | 1,716 | | | | 56,241 | |
Austevoll Seafood ASA | | | 94 | | | | 963 | |
DNB ASA | | | 11,931 | | | | 222,672 | |
DNO ASA | | | 3,950 | | | | 5,201 | |
Elkem ASA(A) (D) | | | 829 | | | | 2,336 | |
Entra ASA(D) | | | 2,396 | | | | 39,537 | |
Equinor ASA | | | 14,211 | | | | 283,822 | |
Gjensidige Forsikring ASA | | | 2,770 | | | | 58,081 | |
Kongsberg Gruppen ASA | | | 228 | | | | 3,581 | |
Leroy Seafood Group ASA | | | 1,605 | | | | 10,648 | |
Mowi ASA | | | 5,706 | | | | 148,181 | |
Norsk Hydro ASA | | | 17,690 | | | | 65,709 | |
Norwegian Finans Holding ASA(B) | | | 2,307 | | | | 25,020 | |
Orkla ASA | | | 11,801 | | | | 119,470 | |
Salmar ASA | | | 479 | | | | 24,491 | |
Schibsted ASA, B Shares | | | 2,691 | | | | 77,110 | |
SFL Corp., Ltd. | | | 463 | | | | 6,732 | |
SpareBank 1SR-Bank ASA | | | 3,225 | | | | 36,701 | |
Storebrand ASA | | | 7,090 | | | | 55,688 | |
Telenor ASA | | | 8,760 | | | | 156,961 | |
TGS NOPEC Geophysical Co. ASA | | | 1,628 | | | | 49,485 | |
Tomra Systems ASA | | | 858 | | | | 27,183 | |
Yara International ASA | | | 2,355 | | | | 97,874 | |
| | | | | | | | |
| | | | | | | 1,623,797 | |
| | | | | | | | |
| Portugal - 0.2% | |
Banco Comercial Portugues SA, R Shares | | | 144,691 | | | | 32,938 | |
EDP - Energias de Portugal SA | | | 33,211 | | | | 144,047 | |
Galp Energia SGPS SA | | | 6,631 | | | | 110,905 | |
Jeronimo Martins SGPS SA | | | 3,801 | | | | 62,570 | |
| | | | | | | | |
| | | | | | | 350,460 | |
| | | | | | | | |
| Singapore - 1.4% | |
Ascendas, REIT | | | 44,900 | | | | 99,173 | |
CapitaLand Commercial Trust, REIT | | | 41,700 | | | | 61,713 | |
CapitaLand Mall Trust, REIT | | | 40,100 | | | | 73,362 | |
CapitaLand, Ltd. | | | 34,500 | | | | 96,215 | |
City Developments, Ltd. | | | 7,600 | | | | 61,890 | |
ComfortDelGro Corp., Ltd. | | | 28,800 | | | | 50,975 | |
DBS Group Holdings, Ltd. | | | 23,100 | | | | 444,597 | |
Genting Singapore, Ltd. | | | 74,800 | | | | 51,178 | |
Golden Agri-Resources, Ltd. | | | 92,100 | | | | 16,096 | |
Jardine Cycle & Carriage, Ltd. | | | 1,700 | | | | 38,054 | |
Keppel Corp., Ltd. | | | 20,400 | | | | 102,709 | |
Mapletree Commercial Trust, REIT | | | 35,200 | | | | 62,565 | |
Mapletree Logistics Trust, REIT | | | 5,900 | | | | 7,635 | |
Mapletree North Asia Commercial Trust, REIT | | | 6,500 | | | | 5,607 | |
Oversea-Chinese Banking Corp., Ltd. | | | 49,500 | | | | 404,202 | |
SATS, Ltd. | | | 11,300 | | | | 42,523 | |
Sea, Ltd., ADR(A) (B) | | | 2,387 | | | | 96,005 | |
Sembcorp Industries, Ltd. | | | 13,300 | | | | 22,650 | |
Singapore Airlines, Ltd. | | | 6,500 | | | | 43,699 | |
Singapore Exchange, Ltd. | | | 12,300 | | | | 81,046 | |
Singapore Press Holdings, Ltd.(A) | | | 23,100 | | | | 37,451 | |
Singapore Technologies Engineering, Ltd. | | | 21,100 | | | | 61,826 | |
| | | | | | | | |
| | | Shares | | | Value | |
| COMMON STOCKS (continued) | |
| Singapore (continued) | |
Singapore Telecommunications, Ltd. | | | 101,400 | | | | $ 254,132 | |
Suntec Real Estate Investment Trust | | | 36,600 | | | | 50,083 | |
United Overseas Bank, Ltd. | | | 18,000 | | | | 353,534 | |
UOL Group, Ltd. | | | 7,900 | | | | 48,881 | |
Venture Corp., Ltd. | | | 3,700 | | | | 44,577 | |
Wilmar International, Ltd. | | | 41,900 | | | | 128,381 | |
| | | | | | | | |
| | | | | | | 2,840,759 | |
| | | | | | | | |
| Spain - 2.6% | |
ACS Actividades de Construccion y Servicios SA | | | 3,578 | | | | 143,181 | |
Aena SME SA(D) | | | 958 | | | | 183,348 | |
Amadeus IT Group SA | | | 5,707 | | | | 466,364 | |
Banco Bilbao Vizcaya Argentaria SA | | | 84,879 | | | | 474,764 | |
Banco Santander SA | | | 201,914 | | | | 845,398 | |
CaixaBank SA | | | 46,321 | | | | 145,483 | |
Cellnex Telecom SA(D) | | | 2,975 | | | | 128,134 | |
Endesa SA | | | 4,092 | | | | 109,274 | |
Ferrovial SA | | | 6,483 | | | | 196,265 | |
Grifols SA | | | 3,697 | | | | 130,431 | |
Grifols SA, ADR | | | 3,742 | | | | 87,151 | |
Iberdrola SA | | | 78,089 | | | | 804,672 | |
Industria de Diseno Textil SA | | | 13,770 | | | | 486,117 | |
Mapfre SA | | | 13,067 | | | | 34,616 | |
Naturgy Energy Group SA | | | 4,461 | | | | 112,167 | |
Red Electrica Corp. SA | | | 5,704 | | | | 114,769 | |
Repsol SA | | | 16,993 | | | | 265,710 | |
Siemens Gamesa Renewable Energy SA(A) | | | 2,299 | | | | 40,348 | |
Telefonica SA | | | 59,098 | | | | 413,083 | |
| | | | | | | | |
| | | | | | | 5,181,275 | |
| | | | | | | | |
| Sweden - 2.9% | |
AAK AB | | | 1,129 | | | | 21,468 | |
Alfa Laval AB | | | 3,844 | | | | 96,869 | |
Assa Abloy AB, Class B | | | 12,768 | | | | 298,705 | |
Atlas Copco AB, A Shares | | | 7,825 | | | | 312,296 | |
Atlas Copco AB, B Shares | | | 5,560 | | | | 193,153 | |
Axfood AB | | | 1,571 | | | | 34,974 | |
Beijer Ref AB | | | 511 | | | | 15,001 | |
Boliden AB | | | 3,565 | | | | 94,637 | |
Castellum AB | | | 3,687 | | | | 86,651 | |
Electrolux AB, Series B | | | 3,075 | | | | 75,520 | |
Elekta AB, B Shares | | | 4,800 | | | | 63,249 | |
Epiroc AB, Class A | | | 7,810 | | | | 95,403 | |
Epiroc AB, Class B | | | 5,549 | | | | 65,828 | |
Essity AB, Class B | | | 7,818 | | | | 252,052 | |
Fabege AB | | | 2,146 | | | | 35,694 | |
Fastighets AB Balder, B Shares(B) | | | 1,328 | | | | 61,456 | |
Getinge AB, B Shares | | | 2,935 | | | | 54,555 | |
Hennes & Mauritz AB, B Shares | | | 10,322 | | | | 210,034 | |
Hexagon AB, B Shares | | | 3,426 | | | | 192,142 | |
Hexpol AB | | | 3,373 | | | | 33,078 | |
Holmen AB, B Shares | | | 690 | | | | 21,022 | |
Hufvudstaden AB, A Shares | | | 1,657 | | | | 32,765 | |
Husqvarna AB, B Shares(A) | | | 5,585 | | | | 44,758 | |
ICA Gruppen AB | | | 1,043 | | | | 48,712 | |
Industrivarden AB, A Shares | | | 2,037 | | | | 50,484 | |
Industrivarden AB, C Shares | | | 2,351 | | | | 56,734 | |
Intrum AB(A) | | | 963 | | | | 28,743 | |
Investment AB Latour, B Shares | | | 1,860 | | | | 30,361 | |
The Notes to Financial Statements are an integral part of this report.
| | |
| Transamerica ETF Trust | | Annual Report 2019 |
Page 45
DeltaShares® S&P International Managed Risk ETF
SCHEDULE OF INVESTMENTS (continued)
At December 31, 2019
| | | | | | | | |
| | | Shares | | | Value | |
| COMMON STOCKS (continued) | |
| Sweden (continued) | |
Investor AB, B Shares | | | 5,815 | | | | $ 317,553 | |
Kinnevik AB | | | 3,075 | | | | 75,224 | |
L E Lundbergforetagen AB, B Shares | | | 1,059 | | | | 46,496 | |
Lifco AB, B Shares | | | 260 | | | | 15,887 | |
Lundin Petroleum AB | | | 2,260 | | | | 76,846 | |
Nibe Industrier AB, B Shares | | | 5,418 | | | | 93,994 | |
Saab AB, B Shares(A) | | | 1,110 | | | | 37,209 | |
Sandvik AB | | | 14,172 | | | | 276,520 | |
Securitas AB, B Shares | | | 4,276 | | | | 73,748 | |
Skandinaviska Enskilda Banken AB, Class A | | | 21,747 | | | | 204,622 | |
Skanska AB, B Shares | | | 5,211 | | | | 117,847 | |
SKF AB, B Shares | | | 4,872 | | | | 98,574 | |
Spotify Technology SA(B) | | | 1,188 | | | | 177,665 | |
SSAB AB, B Shares | | | 10,493 | | | | 34,211 | |
Svenska Cellulosa AB SCA, Class B(A) | | | 8,100 | | | | 82,202 | |
Svenska Handelsbanken AB, A Shares | | | 19,945 | | | | 214,981 | |
Swedbank AB, A Shares | | | 12,035 | | | | 179,283 | |
Swedish Match AB | | | 2,351 | | | | 121,254 | |
Swedish Orphan Biovitrum AB(B) | | | 2,337 | | | | 38,571 | |
Tele2 AB, B Shares | | | 6,659 | | | | 96,637 | |
Telefonaktiebolaget LM Ericsson, B Shares | | | 34,986 | | | | 304,822 | |
Telia Co. AB | | | 35,212 | | | | 151,402 | |
Trelleborg AB, B Shares | | | 3,148 | | | | 56,681 | |
Volvo AB, B Shares | | | 18,351 | | | | 307,580 | |
| | | | | | | | |
| | | | | | | 5,806,153 | |
| | | | | | | | |
| Switzerland - 8.8% | |
ABB, Ltd. | | | 24,992 | | | | 603,153 | |
Alcon, Inc.(B) | | | 6,421 | | | | 363,372 | |
Chocoladefabriken Lindt & Spruengli AG | | | 20 | | | | 155,213 | |
Cie Financiere Richemont SA | | | 6,814 | | | | 535,212 | |
Credit Suisse Group AG(B) | | | 31,504 | | | | 426,354 | |
Geberit AG | | | 480 | | | | 269,258 | |
Givaudan SA | | | 95 | | | | 297,356 | |
Glencore PLC | | | 141,860 | | | | 442,291 | |
Kuehne & Nagel International AG | | | 766 | | | | 129,097 | |
LafargeHolcim, Ltd.(B) | | | 6,216 | | | | 344,709 | |
Lonza Group AG(B) | | | 958 | | | | 349,425 | |
Nestle SA | | | 38,144 | | | | 4,127,359 | |
Novartis AG | | | 32,603 | | | | 3,094,146 | |
Partners Group Holding AG(A) | | | 249 | | | | 228,185 | |
Roche Holding AG | | | 9,349 | | | | 3,028,871 | |
Schindler Holding AG | | | 805 | | | | 200,811 | |
SGS SA | | | 76 | | | | 208,061 | |
Sika AG | | | 1,772 | | | | 332,770 | |
STMicroelectronics NV | | | 8,623 | | | | 232,013 | |
Swatch Group AG | | | 1,406 | | | | 129,412 | |
Swiss Re AG | | | 3,825 | | | | 429,367 | |
Swisscom AG(A) | | | 347 | | | | 183,686 | |
UBS Group AG(B) | | | 49,572 | | | | 625,825 | |
Zurich Insurance Group AG | | | 1,943 | | | | 796,784 | |
| | | | | | | | |
| | | | | | | 17,532,730 | |
| | | | | | | | |
| United Arab Emirates - 0.0%(C) | |
NMC Health PLC(A) | | | 1,095 | | | | 25,632 | |
| | | | | | | | |
| United Kingdom - 14.3% | |
3i Group PLC | | | 12,670 | | | | 184,295 | |
Admiral Group PLC | | | 3,322 | | | | 101,615 | |
Anglo American PLC | | | 18,037 | | | | 519,228 | |
| | | | | | | | |
| | | Shares | | | Value | |
| COMMON STOCKS (continued) | |
| United Kingdom (continued) | |
Ashtead Group PLC | | | 6,547 | | | | $ 209,370 | |
Associated British Foods PLC | | | 4,594 | | | | 158,112 | |
AstraZeneca PLC | | | 16,502 | | | | 1,662,969 | |
AVEVA Group PLC | | | 620 | | | | 38,242 | |
Aviva PLC | | | 52,068 | | | | 288,807 | |
BAE Systems PLC | | | 41,260 | | | | 308,715 | |
Barclays PLC | | | 205,968 | | | | 490,159 | |
Barratt Developments PLC | | | 13,252 | | | | 131,070 | |
Berkeley Group Holdings PLC | | | 1,857 | | | | 119,534 | |
BP PLC | | | 254,698 | | | | 1,591,232 | |
British American Tobacco PLC | | | 29,087 | | | | 1,245,195 | |
British Land Co. PLC, REIT | | | 13,163 | | | | 111,392 | |
BT Group PLC | | | 106,867 | | | | 272,441 | |
Bunzl PLC | | | 4,495 | | | | 122,966 | |
Burberry Group PLC | | | 5,463 | | | | 159,578 | |
Centrica PLC | | | 72,783 | | | | 86,102 | |
CNH Industrial NV | | | 12,956 | | | | 142,377 | |
Coca-Cola European Partners PLC | | | 3,400 | | | | 172,992 | |
Compass Group PLC | | | 20,609 | | | | 516,004 | |
ConvaTec Group PLC(D) | | | 17,907 | | | | 47,077 | |
Croda International PLC | | | 1,284 | | | | 87,090 | |
Diageo PLC | | | 30,824 | | | | 1,306,896 | |
Direct Line Insurance Group PLC | | | 17,896 | | | | 74,087 | |
DS Smith PLC | | | 14,491 | | | | 73,755 | |
easyJet PLC | | | 3,520 | | | | 66,426 | |
Ferguson PLC | | | 3,128 | | | | 283,852 | |
Fiat Chrysler Automobiles NV | | | 14,196 | | | | 210,246 | |
GlaxoSmithKline PLC | | | 63,103 | | | | 1,487,168 | |
Halma PLC | | | 4,135 | | | | 115,911 | |
Hargreaves Lansdown PLC | | | 3,258 | | | | 83,515 | |
HSBC Holdings PLC | | | 258,115 | | | | 2,023,931 | |
Imperial Brands PLC | | | 12,438 | | | | 307,960 | |
Informa PLC | | | 17,037 | | | | 193,423 | |
InterContinental Hotels Group PLC | | | 2,454 | | | | 169,309 | |
Intertek Group PLC | | | 2,088 | | | | 161,871 | |
ITV PLC | | | 47,827 | | | | 95,672 | |
J Sainsbury PLC | | | 22,387 | | | | 68,182 | |
JD Sports Fashion PLC | | | 4,714 | | | | 52,295 | |
Johnson Matthey PLC | | | 2,584 | | | | 102,558 | |
Just Eat PLC(B) | | | 7,390 | | | | 81,726 | |
Kingfisher PLC | | | 28,603 | | | | 82,225 | |
Land Securities Group PLC, REIT | | | 9,908 | | | | 129,944 | |
Legal & General Group PLC | | | 76,051 | | | | 305,268 | |
Lloyds Banking Group PLC | | | 919,675 | | | | 761,463 | |
London Stock Exchange Group PLC | | | 4,096 | | | | 420,529 | |
M&G PLC(B) | | | 33,296 | | | | 104,626 | |
Marks & Spencer Group PLC | | | 25,861 | | | | 73,144 | |
Melrose Industries PLC | | | 56,328 | | | | 179,164 | |
Micro Focus International PLC | | | 4,694 | | | | 66,151 | |
Mondi PLC | | | 6,376 | | | | 149,716 | |
National Grid PLC | | | 46,524 | | | | 581,998 | |
Next PLC | | | 1,837 | | | | 170,788 | |
Ocado Group PLC(B) | | | 7,240 | | | | 122,671 | |
Pearson PLC | | | 10,251 | | | | 86,505 | |
Persimmon PLC | | | 4,040 | | | | 144,236 | |
Prudential PLC | | | 33,296 | | | | 639,138 | |
Reckitt Benckiser Group PLC | | | 8,978 | | | | 728,959 | |
RELX PLC | | | 26,548 | | | | 670,154 | |
The Notes to Financial Statements are an integral part of this report.
| | |
| Transamerica ETF Trust | | Annual Report 2019 |
Page 46
DeltaShares® S&P International Managed Risk ETF
SCHEDULE OF INVESTMENTS (continued)
At December 31, 2019
| | | | | | | | |
| | | Shares | | | Value | |
| COMMON STOCKS (continued) | |
| United Kingdom (continued) | |
Rentokil Initial PLC | | | 24,026 | | | | $ 144,183 | |
Rio Tinto PLC | | | 12,849 | | | | 766,488 | |
Rio Tinto, Ltd. | | | 4,809 | | | | 339,401 | |
Rolls-Royce Holdings PLC | | | 24,038 | | | | 217,561 | |
Royal Bank of Scotland Group PLC | | | 53,512 | | | | 170,349 | |
RSA Insurance Group PLC | | | 13,344 | | | | 99,984 | |
Sage Group PLC | | | 14,849 | | | | 147,337 | |
Schroders PLC | | | 1,515 | | | | 66,913 | |
Segro PLC, REIT | | | 9,974 | | | | 118,548 | |
Severn Trent PLC | | | 3,135 | | | | 104,450 | |
Smith & Nephew PLC | | | 11,562 | | | | 280,680 | |
Smiths Group PLC | | | 5,094 | | | | 113,844 | |
Spirax-Sarco Engineering PLC | | | 728 | | | | 85,737 | |
SSE PLC | | | 13,218 | | | | 251,889 | |
St. James’s Place PLC | | | 6,957 | | | | 107,324 | |
Standard Chartered PLC | | | 35,498 | | | | 335,013 | |
Standard Life Aberdeen PLC | | | 30,384 | | | | 132,064 | |
Subsea 7 SA | | | 3,224 | | | | 38,505 | |
Taylor Wimpey PLC | | | 42,945 | | | | 110,028 | |
Tesco PLC | | | 125,646 | | | | 424,779 | |
Unilever NV | | | 19,826 | | | | 1,140,107 | |
Unilever PLC | | | 15,416 | | | | 888,475 | |
United Utilities Group PLC | | | 8,855 | | | | 110,667 | |
Vodafone Group PLC | | | 342,842 | | | | 666,555 | |
Weir Group PLC | | | 3,357 | | | | 67,130 | |
Whitbread PLC | | | 2,004 | | | | 128,652 | |
WM Morrison Supermarkets PLC | | | 30,837 | | | | 81,621 | |
WPP PLC | | | 16,584 | | | | 234,307 | |
| | | | | | | | |
| | | | | | | 28,514,615 | |
| | | | | | | | |
| United States - 0.1% | |
Carnival PLC | | | 2,541 | | | | 122,664 | |
Flex, Ltd.(B) | | | 7,583 | | | | 95,698 | |
International Flavors & Fragrances, Inc. | | | 1 | | | | 109 | |
Stratasys, Ltd.(B) | | | 508 | | | | 10,274 | |
| | | | | | | | |
| | | | | | | 228,745 | |
| | | | | | | | |
Total Common Stocks
(Cost $181,973,637) | | | | 196,836,484 | |
| | | | | |
|
| PREFERRED STOCKS - 0.5% | |
| Germany - 0.5% | |
Bayerische Motoren Werke AG,
6.18%(E) | | | 490 | | | | 30,279 | |
| | | | | | | | |
| | | Shares | | | Value | |
|
| PREFERRED STOCKS (continued) | |
| Germany (continued) | |
Henkel AG & Co. KGaA,
1.96%(E) | | | 2,296 | | | | $ 237,623 | |
Porsche Automobil Holding SE,
3.15%(E) | | | 2,009 | | | | 150,280 | |
Sartorius AG,
0.31%(E) | | | 372 | | | | 79,672 | |
Volkswagen AG,
2.62%(E) | | | 2,388 | | | | 472,417 | |
| | | | | | | | |
Total Preferred Stocks
(Cost $879,645) | | | | 970,271 | |
| | | | | |
|
| RIGHT - 0.0% | |
| Austria - 0.0% | |
Buwog AG,(B) (F) (G) (H)
Exercise Price EUR 29,
Expiration Date 12/31/2099 | | | 152 | | | | 0 | |
| | | | | | | | |
Total Right
(Cost $0) | | | | 0 | |
| | | | | |
|
| SHORT-TERM INVESTMENT COMPANY - 0.5% | |
| United States - 0.5% | |
State Street Institutional Treasury Money Market Fund, 1.44%(E) | | | 981,846 | | | | 981,846 | |
| | | | | | | | |
Total Short-Term Investment Company
(Cost $981,846) | | | | 981,846 | |
| | | | | |
|
| OTHER INVESTMENT COMPANY - 2.7% | |
| Securities Lending Collateral - 2.7% | |
State Street Navigator Securities Lending Trust - Government Money Market Portfolio, 1.56%(E) | | | 5,319,337 | | | | 5,319,337 | |
| | | | | | | | |
Total Other Investment Company
(Cost $5,319,337) | | | | 5,319,337 | |
| | | | | |
Total Investments
(Cost $189,154,465) | | | | 204,107,938 | |
Net Other Assets (Liabilities) - (2.2)% | | | | | | | (4,347,997 | ) |
| | | | | | | | |
| | |
Net Assets - 100.0% | | | | | | | $ 199,759,941 | |
| | | | | | | | |
FUTURES CONTRACTS:
| | | | | | | | | | | | | | | | | | | | | | | | |
Long Futures Contracts | |
| Description | | Number of
Contracts | | | Expiration
Date | | | Notional
Amount | | | Value | | | Unrealized
Appreciation | | | Unrealized
Depreciation | |
MSCI EAFE Index | | | 19 | | | | 03/20/2020 | | | $ | 1,918,473 | | | $ | 1,934,675 | | | $ | 16,202 | | | $ | — | |
The Notes to Financial Statements are an integral part of this report.
| | |
| Transamerica ETF Trust | | Annual Report 2019 |
Page 47
DeltaShares® S&P International Managed Risk ETF
SCHEDULE OF INVESTMENTS (continued)
At December 31, 2019
INVESTMENTS BY INDUSTRY (unaudited):
| | | | | | | | |
| Industry | | Percentage of
Total Investments | | | Value | |
Banks | | | 9.2 | % | | $ | 18,869,781 | |
Pharmaceuticals | | | 8.3 | | | | 17,048,277 | |
Insurance | | | 5.2 | | | | 10,525,333 | |
Oil, Gas & Consumable Fuels | | | 4.5 | | | | 9,236,662 | |
Food Products | | | 3.4 | | | | 6,992,098 | |
Chemicals | | | 3.2 | | | | 6,532,479 | |
Automobiles | | | 3.2 | | | | 6,450,002 | |
Machinery | | | 2.8 | | | | 5,641,814 | |
Metals & Mining | | | 2.7 | | | | 5,515,680 | |
Textiles, Apparel & Luxury Goods | | | 2.4 | | | | 4,992,642 | |
Capital Markets | | | 2.3 | | | | 4,614,433 | |
Beverages | | | 2.2 | | | | 4,483,586 | |
Real Estate Management & Development | | | 2.1 | | | | 4,195,791 | |
Personal Products | | | 2.0 | | | | 4,169,332 | |
Electric Utilities | | | 1.9 | | | | 3,916,082 | |
Diversified Telecommunication Services | | | 1.9 | | | | 3,871,002 | |
Semiconductors & Semiconductor Equipment | | | 1.8 | | | | 3,780,048 | |
Electronic Equipment, Instruments & Components | | | 1.7 | | | | 3,549,158 | |
Health Care Equipment & Supplies | | | 1.7 | | | | 3,386,455 | |
Equity Real Estate Investment Trusts | | | 1.6 | | | | 3,366,571 | |
Software | | | 1.6 | | | | 3,207,528 | |
Electrical Equipment | | | 1.5 | | | | 3,124,231 | |
Wireless Telecommunication Services | | | 1.5 | | | | 3,015,067 | |
Professional Services | | | 1.4 | | | | 2,882,825 | |
Food & Staples Retailing | | | 1.4 | | | | 2,880,836 | |
Aerospace & Defense | | | 1.4 | | | | 2,856,466 | |
Trading Companies & Distributors | | | 1.4 | | | | 2,836,878 | |
Hotels, Restaurants & Leisure | | | 1.4 | | | | 2,797,865 | |
Industrial Conglomerates | | | 1.3 | | | | 2,680,348 | |
Road & Rail | | | 1.3 | | | | 2,624,743 | |
Household Durables | | | 1.3 | | | | 2,602,377 | |
IT Services | | | 1.1 | | | | 2,244,620 | |
Tobacco | | | 1.0 | | | | 2,003,443 | |
Construction & Engineering | | | 1.0 | | | | 1,981,535 | |
Building Products | | | 0.9 | | | | 1,894,944 | |
Multi-Utilities | | | 0.9 | | | | 1,886,884 | |
Specialty Retail | | | 0.9 | | | | 1,809,544 | |
Auto Components | | | 0.9 | | | | 1,800,856 | |
Biotechnology | | | 0.9 | | | | 1,773,972 | |
Household Products | | | 0.8 | | | | 1,683,515 | |
Entertainment | | | 0.8 | | | | 1,579,124 | |
Diversified Financial Services | | | 0.7 | | | | 1,477,297 | |
Construction Materials | | | 0.6 | | | | 1,215,370 | |
Media | | | 0.6 | | | | 1,196,141 | |
Multiline Retail | | | 0.5 | | | | 1,093,246 | |
Commercial Services & Supplies | | | 0.5 | | | | 1,046,741 | |
Health Care Providers & Services | | | 0.5 | | | | 1,022,032 | |
Transportation Infrastructure | | | 0.5 | | | | 1,008,274 | |
Gas Utilities | | | 0.5 | | | | 970,673 | |
Air Freight & Logistics | | | 0.5 | | | | 959,352 | |
Technology Hardware, Storage & Peripherals | | | 0.5 | | | | 938,916 | |
Internet & Direct Marketing Retail | | | 0.4 | | | | 823,112 | |
Paper & Forest Products | | | 0.4 | | | | 721,036 | |
Life Sciences Tools & Services | | | 0.3 | | | | 594,636 | |
Communications Equipment | | | 0.3 | | | | 574,335 | |
Leisure Products | | | 0.2 | | | | 514,700 | |
The Notes to Financial Statements are an integral part of this report.
| | |
| Transamerica ETF Trust | | Annual Report 2019 |
Page 48
DeltaShares® S&P International Managed Risk ETF
SCHEDULE OF INVESTMENTS (continued)
At December 31, 2019
INVESTMENTS BY INDUSTRY (unaudited) (continued):
| | | | | | | | |
| Industry | | Percentage of
Total Investments | | | Value | |
Marine | | | 0.2 | % | | $ | 376,497 | |
Airlines | | | 0.2 | | | | 370,326 | |
Interactive Media & Services | | | 0.2 | | | | 319,609 | |
Containers & Packaging | | | 0.1 | | | | 296,860 | |
Energy Equipment & Services | | | 0.1 | | | | 228,450 | |
Water Utilities | | | 0.1 | | | | 215,117 | |
Health Care Technology | | | 0.1 | | | | 205,074 | |
Independent Power & Renewable Electricity Producers | | | 0.1 | | | | 151,876 | |
Consumer Finance | | | 0.0 | (C) | | | 94,892 | |
Distributors | | | 0.0 | (C) | | | 47,697 | |
Diversified Consumer Services | | | 0.0 | (C) | | | 39,669 | |
| | | | | | | | |
Investments | | | 96.9 | | | | 197,806,755 | |
Short-Term Investments | | | 3.1 | | | | 6,301,183 | |
| | | | | | | | |
Total Investments | | | 100.0 | % | | $ | 204,107,938 | |
| | | | | | | | |
SECURITY VALUATION:
Valuation Inputs(I)
| | | | | | | | | | | | | | | | |
| | | Level 1 -
Unadjusted
Quoted Prices | | | Level 2 -
Other Significant
Observable Inputs | | | Level 3 -
Significant
Unobservable Inputs (J) | | | Value | |
ASSETS | |
Investments | |
Common Stocks | | $ | 2,076,502 | | | $ | 194,759,982 | | | $ | — | | | $ | 196,836,484 | |
Preferred Stocks | | | — | | | | 970,271 | | | | — | | | | 970,271 | |
Right | | | — | | | | — | | | | 0 | | | | 0 | |
Short-Term Investment Company | | | 981,846 | | | | — | | | | — | | | | 981,846 | |
Other Investment Company | | | 5,319,337 | | | | — | | | | — | | | | 5,319,337 | |
| | | | | | | | | | | | | | | | |
Total Investments | | $ | 8,377,685 | | | $ | 195,730,253 | | | $ | 0 | | | $ | 204,107,938 | |
| | | | | | | | | | | | | | | | |
Other Financial Instruments | |
Futures Contracts(K) | | $ | 16,202 | | | $ | — | | | $ | — | | | $ | 16,202 | |
| | | | | | | | | | | | | | | | |
Total Other Financial Instruments | | $ | 16,202 | | | $ | — | | | $ | — | | | $ | 16,202 | |
| | | | | | | | | | | | | | | | |
FOOTNOTES TO SCHEDULE OF INVESTMENTS:
| | | | | | | | |
| (A) | | All or a portion of the securities are on loan. The total value of all securities on loan is $5,066,527. The amount of securities on loan indicated may not correspond with the securities on loan identified because securities with pending sales are in the process of recall from the brokers. |
| (B) | | Non-income producing securities. |
| (C) | | Percentage rounds to less than 0.1% or (0.1)%. |
| (D) | | Securities are registered pursuant to Rule 144A of the Securities Act of 1933. Unless otherwise indicated, the securities are deemed to be liquid for purposes of compliance limitations on holdings of illiquid securities and may be resold as transactions exempt from registration, normally to qualified institutional buyers. At December 31, 2019, the total value of 144A securities is $1,450,395, representing 0.7% of the Fund’s net assets. |
| (E) | | Rates disclosed reflect the yields at December 31, 2019. |
| (F) | | Security is Level 3 of the fair value hierarchy. |
| (G) | | Security deemed worthless. |
| (H) | | Fair valued as determined in good faith in accordance with procedures established by the Board. At December 31, 2019, the value of the security is $0, representing 0.00% of the Fund’s net assets. |
| (I) | | There were no transfers in or out of Level 3 during the year ended December 31, 2019. Please reference the Security Valuation section of the Notes to Financial Statements for more information regarding security valuation and pricing inputs. |
| (J) | | Level 3 securities were not considered significant to the Fund. |
| (K) | | Futures contracts and/or forward foreign currency contracts are valued at unrealized appreciation (depreciation). |
The Notes to Financial Statements are an integral part of this report.
| | |
| Transamerica ETF Trust | | Annual Report 2019 |
Page 49
DeltaShares® S&P International Managed Risk ETF
SCHEDULE OF INVESTMENTS (continued)
At December 31, 2019
CURRENCY ABBREVIATION:
PORTFOLIO ABBREVIATIONS:
| | |
| ADR | | American Depositary Receipt |
| CDI | | CHESS Depositary Interests |
| CVA | | Commanditaire Vennootschap op Aandelen (Dutch Certificate) |
| EAFE | | Europe, Australasia and Far East |
| REIT | | Real Estate Investment Trust |
| SDR | | Swedish Depositary Receipt |
The Notes to Financial Statements are an integral part of this report.
| | |
| Transamerica ETF Trust | | Annual Report 2019 |
Page 50
STATEMENTS OF ASSETS AND LIABILITIES
At December 31, 2019
| | | | | | | | | | | | | | | | | | | | |
| | | DeltaShares® S&P
400 Managed
Risk ETF | | | DeltaShares® S&P
500 Managed
Risk ETF | | | DeltaShares® S&P
600 Managed
Risk ETF | | | DeltaShares® S&P
EM 100 & Managed
Risk ETF | | | DeltaShares® S&P
International
Managed Risk ETF | |
Assets: | | | | | | | | | | | | | | | | | | | | |
Investments, at value(A) (B) | | $ | 106,247,178 | | | $ | 428,944,528 | | | $ | 45,288,356 | | | $ | 46,755,767 | | | $ | 204,107,938 | |
Cash | | | 337,680 | | | | — | | | | 1,154 | | | | — | | | | — | |
Cash collateral pledged at broker for: | | | | | | | | | | | | | | | | | | | | |
Futures contracts | | | 43,200 | | | | 239,400 | | | | 21,000 | | | | 26,000 | | | | 85,500 | |
Foreign currency, at value(C) | | | — | | | | — | | | | — | | | | 139,839 | | | | 341,360 | |
Receivables and other assets: | | | | | | | | | | | | | | | | | | | | |
Investments sold | | | — | | | | — | | | | 183,606 | | | | — | | | | 43,696 | |
Net income from securities lending | | | 1,884 | | | | 271 | | | | 3,091 | | | | 122 | | | | 2,161 | |
Dividends | | | 108,798 | | | | 427,883 | | | | 51,014 | | | | 98,109 | | | | 192,951 | |
Tax reclaims | | | — | | | | — | | | | — | | | | 1,885 | | | | 312,869 | |
Variation margin receivable on futures contracts | | | 56,121 | | | | 234,494 | | | | 6,647 | | | | 26,660 | | | | 79,380 | |
Total assets | | | 106,794,861 | | | | 429,846,576 | | | | 45,554,868 | | | | 47,048,382 | | | | 205,165,855 | |
| | | | | | |
Liabilities: | | | | | | | | | | | | | | | | | | | | |
Cash collateral received upon return of: | | | | | | | | | | | | | | | | | | | | |
Securities on loan | | | 8,808,019 | | | | 1,630,939 | | | | 3,812,419 | | | | 241,710 | | | | 5,319,337 | |
Payables and other liabilities: | | | | | | | | | | | | | | | | | | | | |
Investments purchased | | | 184,037 | | | | — | | | | 19,260 | | | | — | | | | — | |
Investment management fees | | | 38,122 | | | | 129,526 | | | | 16,288 | | | | 23,907 | | | | 86,577 | |
Total liabilities | | | 9,030,178 | | | | 1,760,465 | | | | 3,847,967 | | | | 265,617 | | | | 5,405,914 | |
Net assets | | $ | 97,764,683 | | | $ | 428,086,111 | | | $ | 41,706,901 | | | $ | 46,782,765 | | | $ | 199,759,941 | |
| | | | | | |
Net assets consist of: | | | | | | | | | | | | | | | | | | | | |
Paid-in capital | | $ | 97,958,332 | | | $ | 382,730,633 | | | $ | 43,598,220 | | | $ | 45,472,846 | | | $ | 196,506,212 | |
Total distributable earnings (accumulated losses) | | | (193,649 | ) | | | 45,355,478 | | | | (1,891,319 | ) | | | 1,309,919 | | | | 3,253,729 | |
Net assets | | $ | 97,764,683 | | | $ | 428,086,111 | | | $ | 41,706,901 | | | $ | 46,782,765 | | | $ | 199,759,941 | |
Shares outstanding | | | 1,800,000 | | | | 6,950,000 | | | | 750,000 | | | | 900,000 | | | | 3,850,000 | |
Net asset value per share | | $ | 54.31 | | | $ | 61.60 | | | $ | 55.61 | | | $ | 51.98 | | | $ | 51.89 | |
| | | | | | | | | | | | | | | | | | | | | |
(A) Investments, at cost | | $ | 97,229,064 | | | $ | 364,504,539 | | | $ | 42,510,378 | | | $ | 43,089,849 | | | $ | 189,154,465 | |
(B) Securities on loan, at value | | $ | 8,592,139 | | | $ | 1,592,148 | | | $ | 3,707,062 | | | $ | 228,917 | | | $ | 5,066,527 | |
(C) Foreign currency, at cost | | $ | — | | | $ | — | | | $ | — | | | $ | 138,662 | | | $ | 334,818 | |
The Notes to Financial Statements are an integral part of this report.
| | |
| Transamerica ETF Trust | | Annual Report 2019 |
Page 51
STATEMENTS OF OPERATIONS
For the year ended December 31, 2019
| | | | | | | | | | | | | | | | | | | | |
| | | DeltaShares® S&P
400 Managed
Risk ETF | | | DeltaShares® S&P
500 Managed
Risk ETF | | | DeltaShares® S&P
600 Managed
Risk ETF | | | DeltaShares® S&P
EM 100 & Managed
Risk ETF (A) | | | DeltaShares® S&P
International
Managed Risk ETF | |
Investment Income: | | | | | | | | | | | | | | | | | | | | |
Dividend income | | $ | 1,202,472 | | | $ | 7,170,265 | | | $ | 389,416 | | | $ | 967,839 | | | $ | 6,978,844 | |
Interest income | | | 501,041 | | | | 1,157,103 | | | | 262,926 | | | | 66,760 | | | | 202,770 | |
Non-cash dividend income | | | — | | | | — | | | | — | | | | 286,453 | | | | — | |
Net income from securities lending | | | 21,145 | | | | 34,419 | | | | 17,196 | | | | 2,170 | | | | 66,476 | |
Withholding taxes on foreign income | | | (628 | ) | | | — | | | | (168 | ) | | | (107,112 | ) | | | (591,605 | ) |
Total investment income | | | 1,724,030 | | | | 8,361,787 | | | | 669,370 | | | | 1,216,110 | | | | 6,656,485 | |
| | | | | | |
Expenses: | | | | | | | | | | | | | | | | | | | | |
Investment management fees | | | 442,806 | | | | 1,453,159 | | | | 181,527 | | | | 197,569 | | | | 995,281 | |
Total expenses | | | 442,806 | | | | 1,453,159 | | | | 181,527 | | | | 197,569 | | | | 995,281 | |
| | | | | | |
Net investment income (loss) | | | 1,281,224 | | | | 6,908,628 | | | | 487,843 | | | | 1,018,541 | | | | 5,661,204 | |
| | | | | | |
Net realized gain (loss) on: | | | | | | | | | | | | | | | | | | | | |
Investments | | | (1,100,735 | ) | | | 719,682 | | | | (177,523 | ) | | | (2,855,408 | ) | | | (205,191 | ) |
In-kind redemptions | | | 1,894,059 | | | | 8,444,808 | | | | 205,815 | | | | — | | | | 3,985,075 | |
Swap agreements | | | — | | | | 4,361 | | | | 36,706 | | | | — | | | | — | |
Futures contracts | | | 381,973 | | | | 2,066,011 | | | | 152,586 | | | | 453,034 | | | | 895,332 | |
Foreign currency transactions | | | — | | | | — | | | | — | | | | (8,161 | ) | | | 8,068 | |
Net realized gain (loss) | | | 1,175,297 | | | | 11,234,862 | | | | 217,584 | | | | (2,410,535 | ) | | | 4,683,284 | |
| | | | | | |
Net change in unrealized appreciation (depreciation) on: | | | | | | | | | | | | | | | | | | | | |
Investments | | | 10,739,100 | | | | 64,976,147 | | | | 3,873,331 | | | | 3,665,918 | | | | 25,517,909 | |
Futures contracts | | | (5,041 | ) | | | 46,559 | | | | (4,254 | ) | | | 13,793 | | | | 9,063 | |
Translation of assets and liabilities denominated in foreign currencies | | | — | | | | — | | | | — | | | | 1,224 | | | | 11,744 | |
Net change in unrealized appreciation (depreciation) | | | 10,734,059 | | | | 65,022,706 | | | | 3,869,077 | | | | 3,680,935 | | | | 25,538,716 | |
Net realized and change in unrealized gain (loss) | | | 11,909,356 | | | | 76,257,568 | | | | 4,086,661 | | | | 1,270,400 | | | | 30,222,000 | |
Net increase (decrease) in net assets resulting from operations | | $ | 13,190,580 | | | $ | 83,166,196 | | | $ | 4,574,504 | | | $ | 2,288,941 | | | $ | 35,883,204 | |
| | |
| (A) | | Commenced operations on March 20, 2019. |
The Notes to Financial Statements are an integral part of this report.
| | |
| Transamerica ETF Trust | | Annual Report 2019 |
Page 52
STATEMENTS OF CHANGES IN NET ASSETS
For the years ended:
| | | | | | | | | | | | | | | | | | | | | | | | |
| | |
DeltaShares® S&P 400
Managed Risk ETF | | | DeltaShares® S&P 500
Managed Risk ETF | | | DeltaShares® S&P 600
Managed Risk ETF | |
| | | December 31,
2019 | | | December 31,
2018 | | | December 31,
2019 | | | December 31,
2018 | | | December 31,
2019 | | | December 31,
2018 | |
From operations: | | | | | | | | | | | | | | | | | | | | | | | | |
Net investment income (loss) | | $ | 1,281,224 | | | $ | 1,422,182 | | | $ | 6,908,628 | | | $ | 6,949,871 | | | $ | 487,843 | | | $ | 513,096 | |
Net realized gain (loss) | | | 1,175,297 | | | | 1,374,587 | | | | 11,234,862 | | | | 12,563,607 | | | | 217,584 | | | | 3,600,904 | |
Net change in unrealized appreciation (depreciation) | | | 10,734,059 | | | | (12,341,124 | ) | | | 65,022,706 | | | | (31,325,342 | ) | | | 3,869,077 | | | | (6,206,153 | ) |
Net increase (decrease) in net assets resulting from operations | | | 13,190,580 | | | | (9,544,355 | ) | | | 83,166,196 | | | | (11,811,864 | ) | | | 4,574,504 | | | | (2,092,153 | ) |
| | | | | | | |
Dividends and/or distributions to shareholders: | | | | | | | | | | | | | | | | | | | | | | | | |
Dividends and/or distributions to shareholders | | | (1,326,963 | ) | | | (1,403,938 | ) | | | (7,172,785 | ) | | | (6,986,427 | ) | | | (514,864 | ) | | | (555,073 | ) |
Net increase (decrease) in net assets resulting from dividends and/or distributions to shareholders | | | (1,326,963 | ) | | | (1,403,938 | ) | | | (7,172,785 | ) | | | (6,986,427 | ) | | | (514,864 | ) | | | (555,073 | ) |
| | | | | | | |
Capital share transactions: | | | | | | | | | | | | | | | | | | | | | | | | |
Proceeds from shares sold | | | — | | | | 70,966,612 | | | | 8,055,870 | | | | 280,974,489 | | | | — | | | | 45,414,201 | |
Cost of shares redeemed | | | (17,942,947 | ) | | | (88,168,320 | ) | | | (42,721,348 | ) | | | (294,728,315 | ) | | | (2,626,876 | ) | | | (61,823,421 | ) |
Net increase (decrease) in net assets resulting from capital share transactions | | | (17,942,947 | ) | | | (17,201,708 | ) | | | (34,665,478 | ) | | | (13,753,826 | ) | | | (2,626,876 | ) | | | (16,409,220 | ) |
Net increase (decrease) in net assets | | | (6,079,330 | ) | | | (28,150,001 | ) | | | 41,327,933 | | | | (32,552,117 | ) | | | 1,432,764 | | | | (19,056,446 | ) |
| | | | | | | |
Net assets: | | | | | | | | | | | | | | | | | | | | | | | | |
Beginning of year | | | 103,844,013 | | | | 131,994,014 | | | | 386,758,178 | | | | 419,310,295 | | | | 40,274,137 | | | | 59,330,583 | |
End of year | | $ | 97,764,683 | | | $ | 103,844,013 | | | $ | 428,086,111 | | | $ | 386,758,178 | | | $ | 41,706,901 | | | $ | 40,274,137 | |
| | | | | | | |
Capital share transactions - shares: | | | | | | | | | | | | | | | | | | | | | | | | |
Shares issued | | | — | | | | 1,300,000 | | | | 150,000 | | | | 5,050,000 | | | | — | | | | 800,000 | |
Shares redeemed | | | (350,000 | ) | | | (1,600,000 | ) | | | (750,000 | ) | | | (5,250,000 | ) | | | (50,000 | ) | | | (1,100,000 | ) |
Net increase (decrease) in shares outstanding | | | (350,000 | ) | | | (300,000 | ) | | | (600,000 | ) | | | (200,000 | ) | | | (50,000 | ) | | | (300,000 | ) |
The Notes to Financial Statements are an integral part of this report.
| | |
| Transamerica ETF Trust | | Annual Report 2019 |
Page 53
STATEMENTS OF CHANGES IN NET ASSETS (continued)
For the period and years ended:
| | | | | | | | | | | | |
| | | DeltaShares®
S&P EM 100 &
Managed Risk
ETF | | | DeltaShares® S&P International
Managed Risk ETF | |
| | | December 31,
2019(A) | | | December 31,
2019 | | | December 31,
2018 | |
From operations: | | | | | | | | | | | | |
Net investment income (loss) | | $ | 1,018,541 | | | $ | 5,661,204 | | | $ | 5,827,799 | |
Net realized gain (loss) | | | (2,410,535 | ) | | | 4,683,284 | | | | (9,898,343 | ) |
Net change in unrealized appreciation (depreciation) | | | 3,680,935 | | | | 25,538,716 | | | | (25,202,071 | ) |
Net increase (decrease) in net assets resulting from operations | | | 2,288,941 | | | | 35,883,204 | | | | (29,272,615 | ) |
| | | | |
Dividends and/or distributions to shareholders: | | | | | | | | | | | | |
Dividends and/or distributions to shareholders | | | (979,022 | ) | | | (6,314,088 | ) | | | (5,925,145 | ) |
Net increase (decrease) in net assets resulting from dividends and/or distributions to shareholders | | | (979,022 | ) | | | (6,314,088 | ) | | | (5,925,145 | ) |
| | | | |
Capital share transactions: | | | | | | | | | | | | |
Proceeds from shares sold | | | 45,472,846 | | | | 4,595,782 | | | | 14,936,476 | |
Cost of shares redeemed | | | — | | | | (36,595,032 | ) | | | (21,956,219 | ) |
Net increase (decrease) in net assets resulting from capital share transactions | | | 45,472,846 | | | | (31,999,250 | ) | | | (7,019,743 | ) |
Net increase (decrease) in net assets | | | 46,782,765 | | | | (2,430,134 | ) | | | (42,217,503 | ) |
| | | | |
Net assets: | | | | | | | | | | | | |
Beginning of period/year | | | — | | | | 202,190,075 | | | | 244,407,578 | |
End of period/year | | $ | 46,782,765 | | | $ | 199,759,941 | | | $ | 202,190,075 | |
| | | | |
Capital share transactions - shares: | | | | | | | | | | | | |
Shares issued | | | 900,000 | | | | 100,000 | | | | 300,000 | |
Shares redeemed | | | — | | | | (750,000 | ) | | | (400,000 | ) |
Net increase (decrease) in shares outstanding | | | 900,000 | | | | (650,000 | ) | | | (100,000 | ) |
| | | | | | | | | | | | |
| (A) | | Commenced operations on March 20, 2019. |
The Notes to Financial Statements are an integral part of this report.
| | |
| Transamerica ETF Trust | | Annual Report 2019 |
Page 54
FINANCIAL HIGHLIGHTS
| | | | | | | | | | | | |
| For a share outstanding during the period and years indicated: | | DeltaShares® S&P 400 Managed Risk ETF | |
| | | December 31,
2019 | | | December 31,
2018 | | | December 31,
2017(A) | |
Net asset value, beginning of period/year | | $ | 48.30 | | | $ | 53.88 | | | $ | 50.00 | |
| | | | |
Investment operations: | | | | | | | | | | | | |
Net investment income (loss)(B) | | | 0.67 | | | | 0.66 | | | | 0.27 | |
Net realized and unrealized gain (loss) | | | 6.03 | | | | (5.58 | ) | | | 3.94 | |
Total investment operations | | | 6.70 | | | | (4.92 | ) | | | 4.21 | |
| | | | |
Dividends and/or distributions to shareholders: | | | | | | | | | | | | |
Net investment income | | | (0.69 | ) | | | (0.66 | ) | | | (0.27 | ) |
Net realized gains | | | — | | | | — | | | | (0.06 | ) |
Total dividends and/or distributions to shareholders | | | (0.69 | ) | | | (0.66 | ) | | | (0.33 | ) |
| | | | |
Net asset value, end of period/year | | $ | 54.31 | | | $ | 48.30 | | | $ | 53.88 | |
Total return | | | 13.95 | % | | | (9.19 | )% | | | 8.42 | %(C) |
| | | | |
Ratio and supplemental data: | | | | | | | | | | | | |
Net assets end of period/year (000’s) | | $ | 97,765 | | | $ | 103,844 | | | $ | 131,994 | |
Expenses to average net assets | | | 0.45 | %(D) | | | 0.45 | % | | | 0.45 | %(E) |
Net investment income (loss) to average net assets | | | 1.30 | % | | | 1.23 | % | | | 1.25 | %(E) |
Portfolio turnover rate(F) | | | 511 | % | | | 435 | % | | | 6 | %(C) |
| | |
| (A) | | Commenced operations on July 31, 2017. |
| (B) | | Calculated based on average number of shares outstanding. |
| (C) | | Not annualized. |
| (D) | | Does not include expenses of the underlying investments in which the Fund invests. |
| (E) | | Annualized. |
| (F) | | Excludes investment securities received or delivered as a result of processingin-kind issuances or redemptions of capital share transactions in creation units. |
| | | | | | | | | | | | |
| For a share outstanding during the period and years indicated: | | DeltaShares® S&P 500 Managed Risk ETF | |
| | | December 31,
2019 | | | December 31,
2018 | | | December 31,
2017(A) | |
Net asset value, beginning of period/year | | $ | 51.23 | | | $ | 54.10 | | | $ | 50.00 | |
| | | | |
Investment operations: | | | | | | | | | | | | |
Net investment income (loss)(B) | | | 0.94 | | | | 0.91 | | | | 0.36 | |
Net realized and unrealized gain (loss) | | | 10.41 | | | | (2.86 | ) | | | 4.09 | |
Total investment operations | | | 11.35 | | | | (1.95 | ) | | | 4.45 | |
| | | | |
Dividends and/or distributions to shareholders: | | | | | | | | | | | | |
Net investment income | | | (0.98 | ) | | | (0.91 | ) | | | (0.34 | ) |
Net realized gains | | | — | | | | (0.01 | ) | | | (0.01 | ) |
Total dividends and/or distributions to shareholders | | | (0.98 | ) | | | (0.92 | ) | | | (0.35 | ) |
| | | | |
Net asset value, end of period/year | | $ | 61.60 | | | $ | 51.23 | | | $ | 54.10 | |
Total return | | | 22.30 | % | | | (3.68 | )% | | | 8.94 | %(C) |
| | | | |
Ratio and supplemental data: | | | | | | | | | | | | |
Net assets end of period/year (000’s) | | $ | 428,086 | | | $ | 386,758 | | | $ | 419,310 | |
Expenses to average net assets | | | 0.35 | %(D) | | | 0.35 | % | | | 0.35 | %(E) |
Net investment income (loss) to average net assets | | | 1.66 | % | | | 1.65 | % | | | 1.64 | %(E) |
Portfolio turnover rate(F) | | | 300 | % | | | 430 | % | | | 2 | %(C) |
| | |
| (A) | | Commenced operations on July 31, 2017. |
| (B) | | Calculated based on average number of shares outstanding. |
| (C) | | Not annualized. |
| (D) | | Does not include expenses of the underlying investments in which the Fund invests. |
| (E) | | Annualized. |
| (F) | | Excludes investment securities received or delivered as a result of processingin-kind issuances or redemptions of capital share transactions in creation units. |
The Notes to Financial Statements are an integral part of this report.
| | |
| Transamerica ETF Trust | | Annual Report 2019 |
Page 55
FINANCIAL HIGHLIGHTS (continued)
| | | | | | | | | | | | |
| For a share outstanding during the period and years indicated: | | DeltaShares® S&P 600 Managed Risk ETF | |
| | | December 31,
2019 | | | December 31,
2018 | | | December 31,
2017(A) | |
Net asset value, beginning of period/year | | $ | 50.34 | | | $ | 53.94 | | | $ | 50.00 | |
| | | | |
Investment operations: | | | | | | | | | | | | |
Net investment income (loss)(B) | | | 0.64 | | | | 0.59 | | | | 0.24 | |
Net realized and unrealized gain (loss) | | | 5.30 | | | | (3.52 | ) | | | 4.09 | |
Total investment operations | | | 5.94 | | | | (2.93 | ) | | | 4.33 | |
| | | | |
Dividends and/or distributions to shareholders: | | | | | | | | | | | | |
Net investment income | | | (0.67 | ) | | | (0.64 | ) | | | (0.24 | ) |
Net realized gains | | | — | | | | (0.03 | ) | | | (0.15 | ) |
Total dividends and/or distributions to shareholders | | | (0.67 | ) | | | (0.67 | ) | | | (0.39 | ) |
| | | | |
Net asset value, end of period/year | | $ | 55.61 | | | $ | 50.34 | | | $ | 53.94 | |
Total return | | | 11.85 | % | | | (5.47 | )% | | | 8.65 | %(C) |
| | | | |
Ratio and supplemental data: | | | | | | | | | | | | |
Net assets end of period/year (000’s) | | $ | 41,707 | | | $ | 40,274 | | | $ | 59,331 | |
Expenses to average net assets | | | 0.45 | %(D) | | | 0.45 | % | | | 0.45 | %(E) |
Net investment income (loss) to average net assets | | | 1.21 | % | | | 1.07 | % | | | 1.12 | %(E) |
Portfolio turnover rate(F) | | | 584 | % | | | 448 | % | | | 21 | %(C) |
| | |
| (A) | | Commenced operations on July 31, 2017. |
| (B) | | Calculated based on average number of shares outstanding. |
| (C) | | Not annualized. |
| (D) | | Does not include expenses of the underlying investments in which the Fund invests. |
| (E) | | Annualized. |
| (F) | | Excludes investment securities received or delivered as a result of processingin-kind issuances or redemptions of capital share transactions in creation units. |
| | | | |
| For a share outstanding during the period indicated: | | DeltaShares®
S&P EM 100 &
Managed Risk
ETF | |
| | | December 31,
2019(A) | |
Net asset value, beginning of period | | $ | 50.14 | |
| | |
Investment operations: | | | | |
Net investment income (loss)(B) | | | 1.18 | |
Net realized and unrealized gain (loss) | | | 1.75 | |
Total investment operations | | | 2.93 | |
| | |
Dividends and/or distributions to shareholders: | | | | |
Net investment income | | | (1.09 | ) |
| | |
Net asset value, end of period | | $ | 51.98 | |
Total return | | | 5.85 | %(C) |
| | |
Ratio and supplemental data: | | | | |
Net assets end of period (000’s) | | $ | 46,783 | |
Expenses to average net assets(D) | | | 0.60 | %(E) |
Net investment income (loss) to average net assets | | | 3.10 | %(E) |
Portfolio turnover rate(F) | | | 274 | %(C) |
| | |
| (A) | | Commenced operations on March 20, 2019. |
| (B) | | Calculated based on average number of shares outstanding. |
| (C) | | Not annualized. |
| (D) | | Does not include expenses of the underlying investments in which the Fund invests. |
| (E) | | Annualized. |
| (F) | | Excludes investment securities received or delivered as a result of processingin-kind issuances or redemptions of capital share transactions in creation units. |
The Notes to Financial Statements are an integral part of this report.
| | |
| Transamerica ETF Trust | | Annual Report 2019 |
Page 56
FINANCIAL HIGHLIGHTS (continued)
| | | | | | | | | | | | |
| For a share outstanding during the period and years indicated: | | DeltaShares® S&P International Managed Risk ETF | |
| | | December 31,
2019 | | | December 31,
2018 | | | December 31,
2017 (A) | |
Net asset value, beginning of period/year | | $ | 44.93 | | | $ | 53.13 | | | $ | 50.00 | |
| | | | |
Investment operations: | | | | | | | | | | | | |
Net investment income (loss)(B) | | | 1.38 | | | | 1.33 | | | | 0.32 | |
Net realized and unrealized gain (loss) | | | 7.12 | | | | (8.15 | ) | | | 3.16 | |
Total investment operations | | | 8.50 | | | | (6.82 | ) | | | 3.48 | |
| | | | |
Dividends and/or distributions to shareholders: | | | | | | | | | | | | |
Net investment income | | | (1.54 | ) | | | (1.37 | ) | | | (0.34 | ) |
Net realized gains | | | — | | | | (0.01 | ) | | | (0.01 | ) |
Total dividends and/or distributions to shareholders | | | (1.54 | ) | | | (1.38 | ) | | | (0.35 | ) |
| | | | |
Net asset value, end of period/year | | $ | 51.89 | | | $ | 44.93 | | | $ | 53.13 | |
Total return | | | 19.12 | % | | | (13.09 | )% | | | 6.97 | %(C) |
| | | | |
Ratio and supplemental data: | | | | | | | | | | | | |
Net assets end of period/year (000’s) | | $ | 199,760 | | | $ | 202,190 | | | $ | 244,408 | |
Expenses to average net assets | | | 0.50 | %(D) | | | 0.50 | % | | | 0.50 | %(E) |
Net investment income (loss) to average net assets | | | 2.85 | % | | | 2.60 | % | | | 1.47 | %(E) |
Portfolio turnover rate(F) | | | 85 | % | | | 189 | % | | | 3 | %(C) |
| | |
| (A) | | Commenced operations on July 31, 2017. |
| (B) | | Calculated based on average number of shares outstanding. |
| (C) | | Not annualized. |
| (D) | | Does not include expenses of the underlying investments in which the Fund invests. |
| (E) | | Annualized. |
| (F) | | Excludes investment securities received or delivered as a result of processingin-kind issuances or redemptions of capital share transactions in creation units. |
The Notes to Financial Statements are an integral part of this report.
| | |
| Transamerica ETF Trust | | Annual Report 2019 |
Page 57
NOTES TO FINANCIAL STATEMENTS
At December 31, 2019
1. ORGANIZATION
Transamerica ETF Trust (the “Trust”) is anopen-end management investment company registered under the Investment Company Act of 1940, as amended (the “1940 Act”), and was organized as a Delaware statutory trust dated May 5, 2016. The Trust applies investment company accounting and reporting guidance. The funds covered by this report (each, a “Fund” and collectively, the “Funds”) are each a series of the Trust and are as follows:
|
| Fund |
DeltaShares® S&P 400 Managed Risk ETF (“S&P 400 Managed Risk”) |
DeltaShares® S&P 500 Managed Risk ETF (“S&P 500 Managed Risk”) |
DeltaShares® S&P 600 Managed Risk ETF (“S&P 600 Managed Risk”) |
DeltaShares® S&P EM 100 & Managed Risk ETF (“S&P EM 100 & Managed Risk”)(A) |
DeltaShares® S&P International Managed Risk ETF (“S&P International Managed Risk”) |
| | |
| (A) | | Commenced operations on March 20, 2019. |
Each Fund is classified as a“non-diversified” investment company under the 1940 Act.
The investment objective of each Fund is to seek to track the investment results, before fees and expenses, of the respective index listed below (each, an “Underlying Index”). Each Fund uses a “passive” or indexing approach to try to achieve its investment objective.
| | |
| Fund | | Underlying Index |
S&P 400 Managed Risk | | S&P 400® Managed Risk 2.0 Index |
S&P 500 Managed Risk | | S&P 500® Managed Risk 2.0 Index |
S&P 600 Managed Risk | | S&P 600® Managed Risk 2.0 Index |
S&P EM 100 & Managed Risk | | S&P EM 100 (USD) Managed Risk 2.0 Index |
S&P International Managed Risk | | S&P EPAC Ex. Korea LargeMidCap Managed Risk 2.0 Index |
This report must be accompanied or preceded by each Fund’s current prospectus, which contains additional information about the Funds, including risks, as well as investment objectives and strategies.
Transamerica Asset Management, Inc. (“TAM”) serves as investment manager for the Funds pursuant to an investment management agreement. TAM provides continuous and regular investment management services to the Funds. TAM supervises each Fund’s investments, conducts its investment program and provides supervisory, compliance and administrative services to the Funds.
TAM currently acts as a “manager of managers” and has hired Milliman Financial Risk Management LLC as thesub-adviser to furnishday-to-day investment advice and recommendations. TAM may, in the future, determine to provide all aspects of theday-to-day management of a Fund without the use of asub-adviser. When acting as a manager of managers, TAM provides investment management services that include, without limitation, the design and development of the Funds and their investment strategies and the ongoing review and evaluation of those investment strategies including recommending changes in strategy where it believes appropriate or advisable; the selection of one or moresub-advisers for the Funds employing a combination of quantitative and qualitative screens, research, analysis and due diligence; negotiation ofsub-advisory agreements and fees; oversight and monitoring ofsub-advisers and recommending changes tosub-advisers where it believes appropriate or advisable; recommending fund combinations and liquidations where it believes appropriate or advisable; selection and oversight of transition managers, as needed; regular supervision of the Funds’ investments; regular review and evaluation ofsub-adviser performance; daily monitoring of thesub-advisers’ buying and selling of securities for the Funds; regular review of holdings; ongoing trade oversight and analysis; regular monitoring to ensure adherence to investment process; regular calls and periodicon-site visits withsub-advisers; risk management oversight and analysis; oversight of negotiation of investment documentation and agreements; design, development, implementation and regular monitoring of the valuation process; periodic due diligence reviews of pricing vendors and vendor methodology; design, development, implementation and regular monitoring of the compliance process; respond to regulatory inquiries and determine appropriate litigation strategy, as needed; review of proxies voted bysub-advisers; oversight of preparation, and review, of materials for meetings of the Funds’ Board of Trustees (the “Board”), participation in these meetings and preparation of regular communications with the Board; oversight of preparation, and review, of prospectuses, shareholder reports and other disclosure materials and regulatory filings for the Funds; oversight of other service providers to the Funds, such as the custodian, the transfer agent, the Funds’ independent accounting firm and legal counsel; supervision of the performance of recordkeeping and shareholder relations functions for the Funds; and oversight of cash management services. TAM uses a variety of quantitative and qualitative tools to carry out its investment management services. TAM, not the Funds, is responsible for paying thesub-adviser(s) for their services, andsub-advisory fees are TAM’s expense.
TAM’s investment management services also include the provision of supervisory and administrative services to the Funds. These services include performing certain administrative services for the Funds and supervising and overseeing the administrative, clerical,
| | |
| Transamerica ETF Trust | | Annual Report 2019 |
Page 58
NOTES TO FINANCIAL STATEMENTS (continued)
At December 31, 2019
1. ORGANIZATION (continued)
recordkeeping and bookkeeping services provided to the Funds by State Street Bank and Trust Company (“State Street”), to whom TAM has outsourced the provision of certain services as described below: to the extent agreed upon by TAM and the Funds from time to time, monitoring and verifying the custodian’s daily calculation of the Net Asset Values (“NAV”); shareholder relations functions; compliance services; valuation services; assisting in due diligence and in the oversight and monitoring of certain activities ofsub-advisers and certain aspects of Fund investments; assisting with Fund combinations and liquidations; oversight of the preparation and filing, and review, of all returns and reports, in connection with federal, state and local taxes; oversight and review of regulatory reporting; supervising and coordinating the Funds’ custodian and dividend disbursing agent and monitoring their services to the Funds; assisting the Funds in preparing reports to shareholders; acting as liaison with the Funds’ independent public accountants and providing, upon request, analyses, fiscal year summaries and other audit related services; assisting in the preparation of agendas and supporting documents for and minutes of meetings of trustees and committees of trustees; assisting in the preparation of regular communications with the trustees; and providing personnel and office space, telephones and other office equipment as necessary in order for TAM to perform supervisory and administrative services to the Funds.
2. SIGNIFICANT ACCOUNTING POLICIES
In preparing the Funds’ financial statements in accordance with Generally Accepted Accounting Principles in the United States of America (“GAAP”), estimates or assumptions (which could differ from actual results) may be used that affect reported amounts and disclosures. The following is a summary of significant accounting policies followed by the Funds.
Foreign currency denominated investments:The accounting records of the Funds are maintained in U.S. dollars. Securities and other assets and liabilities denominated in foreign currencies are translated into U.S. dollars based on the closing exchange rate each day. The cost of foreign securities purchased and any realized gains or losses are translated at the prevailing exchange rates in effect on the date of the respective transaction. Each Fund combines fluctuations from currency exchange rates and fluctuations in value when computing net realized and unrealized gains or losses from investments.
Net foreign currency gains and losses resulting from changes in exchange rates include, foreign currency fluctuations between trade date and settlement date of investment security transactions, gains and losses on forward foreign currency contracts, and thedifference between the receivable amounts of interest and dividends recorded in the accounting records in U.S. dollars and the amounts actually received.
Foreign currency denominated assets may involve risks not typically associated with domestic transactions. These risks include revaluation of currencies, adverse fluctuations in foreign currency values, and possible adverse political, social, and economic developments, including those particular to a specific industry, country or region.
Security transactions and investment income: Security transactions are accounted for on the trade date. Security gains and losses are calculated on the specific identification basis. Dividend income, if any, is recorded on the ex-dividend date or, in the case of foreign securities, as soon as the Funds are informed of the ex-dividend dates, net of foreign taxes. Interest income, if any, is recorded on the accrual basis from settlement date, net of foreign taxes. Fixed income premiums and discounts are amortized and/or accreted over the lives of the respective securities.
Distributions to shareholders:Distributions are recorded on theex-dividend date and are determined in accordance with federal income tax regulations, which may differ from GAAP.
Foreign taxes:The Funds may be subject to taxes imposed by the countries in which they invest, with respect to their investments in issuers existing or operating in such countries. The Funds may also be subject to foreign taxes on income, gains on investments, or currency repatriation, a portion of which may be recoverable. The Funds accrue such taxes and recoveries as applicable when the related income or capital gains are earned or unrealized, and based upon the current interpretation of tax rules and regulations that exist in the markets in which the Funds invest. Some countries require governmental approval for the repatriation of investment income, capital, or the proceeds of sales earned by foreign investors. In addition, if there is deterioration in a country’s balance of payments or for other reasons, a country may impose temporary restrictions of foreign capital remittances abroad.
Organizational and offering costs:TAM has agreed to pay all of the S&P EM 100 & Managed Risk organizational and offering costs. The offering and organizational costs are not subject to repayment to TAM by the Fund.
Indemnification:In the normal course of business, the Funds enter into contracts that contain a variety of representations that provide general indemnifications. The Funds’ maximum exposure under these arrangements is unknown, as this would involve future claims that may be made against the Funds and/or their affiliates that have not yet occurred. However, based on experience, the Funds expect the risk of loss to be remote.
| | |
| Transamerica ETF Trust | | Annual Report 2019 |
Page 59
NOTES TO FINANCIAL STATEMENTS (continued)
At December 31, 2019
3. SECURITY VALUATION
All investments in securities are recorded at their estimated fair value. The Funds value their investments at the official close of the New York Stock Exchange (“NYSE”) each day the NYSE is open for business.
The Funds utilize various methods to measure the fair value of their investments on a recurring basis. GAAP in the United States of America establishes a hierarchy that prioritizes inputs to valuation methods. The inputs or methodology used for valuing securities are not necessarily an indication of the risk associated with investing in those securities. The three levels (“Levels”) of inputs of the fair value hierarchy are defined as follows:
Level 1—Unadjusted quoted prices in active markets for identical securities.
Level 2—Inputs, other than quoted prices included in Level 1, which are observable, either directly or indirectly. These inputs may include quoted prices for the identical instrument on an inactive market, prices for similar instruments, interest rates, prepayment speeds, credit risk, yield curves, default rates, and similar data.
Level 3—Unobservable inputs based on the best information available in the circumstances, to the extent observable inputs are not available, which may include the Funds’ own assumptions used in determining the fair value of investments and derivative instruments.
The inputs used to measure fair value may fall into different Levels of the fair value hierarchy. In such cases, for disclosure purposes, the Level in the fair value hierarchy that is assigned to the fair value measurement of a security is determined based on the lowest Level input that is significant to the fair value measurement in its entirety. Certain investments that are measured at fair value using NAV per share, or its equivalent, using the “practical expedient” have not been classified in the fair value Levels. The hierarchy classification of inputs used to value the Funds’ investments at December 31, 2019, is disclosed within the Security Valuation section of each Fund’s Schedule of Investments.
The availability of observable inputs can vary from security to security and is affected by a wide variety of factors, including, but not limited to, the type of security, whether the security is new and not yet established in the marketplace, the liquidity of markets, and other characteristics particular to the security. To the extent that valuation is based on models or inputs that are less observable or unobservable in the market, the determination of fair value requires more judgment. Accordingly, the degree of judgment exercised in determining fair value is generally greatest for instruments categorized in Level 3. Due to the inherent uncertainty of valuation, the determination of values may differ significantly from values that would have been realized had a ready market for investments existed, and the differences could be material.
Fair value measurements: Descriptions of the valuation techniques applied to the Funds’ significant categories of assets and liabilities measured at fair value on a recurring basis are as follows:
Equity securities: Securities are stated at the last reported sales price or closing price on the day of valuation taken from the primary exchange where the security is principally traded. To the extent these securities are actively traded and valuation adjustments are not applied, they are categorized in Level 1 of the fair value hierarchy. Equities traded on inactive markets or valued by reference to similar instruments are generally categorized in Level 2 or Level 3 if inputs are unobservable.
Foreign equity securities: Securities in which the primary trading market closes at the same time or after the NYSE, are valued based on quotations from the primary market in which they are traded and are categorized in Level 1. Because many foreign securities markets and exchanges close prior to the close of the NYSE, closing prices for foreign securities in those markets or on those exchanges do not reflect the events that occur after that close. Certain foreign securities may be fair valued using a pricing service that considers the correlation of the trading patterns of the foreign security to the intraday trading in the U.S. markets for investments such as American Depositary Receipts, financial futures, ETFs and the movement of the certain indices of securities based on a statistical analysis of their historical relationship; such valuations generally are categorized in Level 2.
Investment companies:Certain investment companies are valued at the NAV of the underlying Funds as the practical expedient. These investment companies are not included within the fair value hierarchy. Certain other investment companies are valued at the actively traded NAV of the underlying funds and no valuation adjustments are applied. These investment companies are categorized in Level 1 of the fair value hierarchy.
Rights:Rights may be priced intrinsically using a model that incorporates the subscription or strike price, the daily market price for the underlying security, and a subscription ratio. If the inputs are unavailable, or if the subscription or strike price is higher than the market price, then the rights are priced at zero. Rights are generally categorized in Level 2 of the fair value hierarchy, or Level 3 if inputs are unobservable.
| | |
| Transamerica ETF Trust | | Annual Report 2019 |
Page 60
NOTES TO FINANCIAL STATEMENTS (continued)
At December 31, 2019
3. SECURITY VALUATION (continued)
Contingent value rights (“CVR”):CVRs for which quotations are not readily available are valued at fair value as determined in good faith by the Valuation Committee under the supervision of the Board. CVRs are normally valued using a model that incorporates market observable data such as reported sales of similar securities, broker quotes, yields, bids, offers, and reference data relating to the issuer. Depending on the relative significance of observable valuation inputs, these investments may be classified in either Level 2 or Level 3 of the fair value hierarchy.
Securities lending collateral:Securities lending collateral is invested in a money market fund which is valued at the NAV and no valuation adjustments are applied. Securities lending collateral is categorized in Level 1 of the fair value hierarchy.
Derivative instruments: Centrally cleared or listed derivatives that are actively traded are valued based on quoted prices from the exchange and are categorized in Level 1 of the fair value hierarchy.Over-the-counter (“OTC”) derivative contracts include forward, swap, swaption, and option contracts related to interest rates, foreign currencies, credit standing of reference entities, equity prices, or commodity prices. Depending on the product and the terms of the transaction, the fair value of the OTC derivative products are modeled taking into account the counterparties’ creditworthiness and using a series of techniques, including simulation models. Many pricing models do not entail material subjectivity because the methodologies employed do not necessitate significant judgments and the pricing inputs are observed from actively quoted markets, as is the case of interest rate swap and option contracts. The majority of OTC derivative products valued by the Funds using pricing models fall into this category and are categorized within Level 2 of the fair value hierarchy or Level 3 if inputs are unobservable.
4. SECURITIES AND OTHER INVESTMENTS
Contingent value rights: The Funds may invest in CVRs, which is a type of right given to investors of an acquired company (or a company facing major restructuring) that ensures additional benefit if a specified event occurs. A CVR often has an expiration date that relates to the time the contingent event must occur. CVRs generally lack liquidity since most arenon-transferable and a large number of legal and other issues can arise when negotiating and implementing these instruments.
CVRs held at December 31, 2019, if any, are identified within the Schedule of Investments.
Real estate investment trusts (“REIT”):REITs are pooled investment vehicles which invest primarily in income producing real estate, or real estate related loans or interests. Distributions received by REITs are classified at management’s estimate of the dividend income, return of capital and capital gains. Estimates are based on information available atyear-end, which includes the previous fiscal year’s classification. The actual amounts of dividend income, return of capital, and capital gains are only determined by each REIT after the fiscal year end and may differ from the estimated amounts. Upon notification from the REITs, some of the distributions received may bere-classified and recorded as a return of capital or capital gains. There are certain additional risks involved in investing in REITs. These include, but are not limited to, economic conditions, changes in zoning laws, real estate values, property taxes, and interest rates.
REITs held at December 31, 2019, if any, are identified within the Schedule of Investments.
5. BORROWINGS AND OTHER FINANCING TRANSACTIONS
The Funds may engage in borrowing transactions as a means of raising cash to satisfy redemption requests, for other temporary or emergency purposes or, to the extent permitted by their investment policies, to raise additional cash to be invested in other securities or instruments.When the Funds invest borrowing proceeds in other securities, the Funds will bear the risk that the market value of the securities in which such proceeds are invested goes down and is insufficient to repay the borrowed proceeds. The Funds may borrow on a secured or on an unsecured basis. If the Funds enter into a secured borrowing arrangement, a portion of the Funds’ assets will be used as collateral. The 1940 Act requires the Funds to maintain asset coverage of at least 300% of the amount of their borrowings. Asset coverage means the ratio that the value of the Funds’ total assets, minus liabilities other than borrowings, bears to the aggregate amount of all borrowings. Although complying with this requirement has the effect of limiting the amount that the Funds may borrow, it does not otherwise mitigate the risks of entering into borrowing transactions.
Repurchase agreements:In a repurchase agreement, the Fund purchases a security and simultaneously commits to resell that security to the seller at an agreed-upon price on an agreed-upon date.Securities purchased subject to a repurchase agreement are held at the Fund’s custodian, or designatedsub-custodian related totri-party repurchase agreements, and, pursuant to the terms of the repurchase agreement, must be collateralized by securities with an aggregate market value greater than or equal to 100% of the resale price. The Fund will bear the risk of value fluctuations until the securities can be sold and may encounter delays and incur costs in liquidating the securities. In the event of bankruptcy or insolvency of the seller, delays and costs may be incurred.
Repurchase agreements are subject to netting agreements, which are agreements between the Fund and its counterparties that provide for the net settlement of all transactions and collateral with the Fund, through a single payment, in the event of default or
| | |
| Transamerica ETF Trust | | Annual Report 2019 |
Page 61
NOTES TO FINANCIAL STATEMENTS (continued)
At December 31, 2019
5. BORROWINGS AND OTHER FINANCING TRANSACTIONS (continued)
termination. Amounts presented within the Schedule of Investments, and as part of Repurchase agreements, at value within the Statement of Assets and Liabilities are shown on a gross basis. The value of the related collateral for each repurchase agreement, as reflected within the Schedule of Investments, exceeds the value of each repurchase agreement at December 31, 2019.
Repurchase agreements at December 31, 2019, if any, are included within the Schedule of Investments and Statement of Assets and Liabilities.
Securities lending:Securities are lent to qualified financial institutions and brokers. State Street serves as securities lending agent to the Funds pursuant to a Securities Lending Agreement. The lending of securities exposes the Funds to risks such as; the borrowers may fail to return the loaned securities or may not be able to provide additional collateral, the Funds may experience delays in recovery of the loaned securities or delays in access to collateral, or the Funds may experience losses related to the investment collateral. To minimize certain risks, loan counterparties pledge cash collateral with a value of at least 102% of the current value of the loaned securities for securities traded on U.S. exchanges and a value of at least 105% for all other securities loaned. The lending agent has agreed to indemnify the Funds in the case of default of any securities borrower.
Cash collateral received is invested in the State Street Navigator Securities Lending Trust – Government Money Market Portfolio (the “Navigator”), a money market mutual fund registered under the 1940 Act. The TAM family of mutual funds is a significant shareholder of the Navigator as of December 31, 2019; however no individual fund has a significant holding in the Navigator. By lending securities, the Funds seek to increase their net investment income through the receipt of interest and fees. Such income is reflected in Net income from securities lending within the Statements of Operations and is net of fees and rebates earned by the lending agent for its services.
The value of loaned securities and related collateral outstanding at December 31, 2019, if any, are shown on a gross basis within the Schedule of Investments and Statement of Assets and Liabilities.
The following table reflects a breakdown of transactions accounted for as secured borrowings, the gross obligation by the type of collateral pledged, and the remaining contractual maturity of those transactions as of December 31, 2019.
| | | | | | | | | | | | | | | | | | | | |
| | | Remaining Contractual Maturity of the Agreements | |
| | | Overnight and
Continuous | | | Less Than
30 Days | | | Between
30 & 90 Days | | | Greater Than
90 Days | | | Total | |
S&P 400 Managed Risk | |
Securities Lending Transactions | |
Common Stocks | | $ | 8,808,019 | | | $ | — | | | $ | — | | | $ | — | | | $ | 8,808,019 | |
Total Borrowings | | $ | 8,808,019 | | | $ | �� | | | $ | — | | | $ | — | | | $ | 8,808,019 | |
| | | | | | | | | | | | | | | | | | | | | |
|
S&P 500 Managed Risk | |
Securities Lending Transactions | |
Common Stocks | | $ | 1,630,939 | | | $ | — | | | $ | — | | | $ | — | | | $ | 1,630,939 | |
Total Borrowings | | $ | 1,630,939 | | | $ | — | | | $ | — | | | $ | — | | | $ | 1,630,939 | |
| | | | | | | | | | | | | | | | | | | | | |
|
S&P 600 Managed Risk | |
Securities Lending Transactions | |
Common Stocks | | $ | 3,812,419 | | | $ | — | | | $ | — | | | $ | — | | | $ | 3,812,419 | |
Total Borrowings | | $ | 3,812,419 | | | $ | — | | | $ | — | | | $ | — | | | $ | 3,812,419 | |
| | | | | | | | | | | | | | | | | | | | | |
|
S&P EM 100 & Managed Risk | |
Securities Lending Transactions | |
Common Stocks | | $ | 241,710 | | | $ | — | | | $ | — | | | $ | — | | | $ | 241,710 | |
Total Borrowings | | $ | 241,710 | | | $ | — | | | $ | — | | | $ | — | | | $ | 241,710 | |
| | | | | | | | | | | | | | | | | | | | | |
|
S&P International Managed Risk | |
Securities Lending Transactions | |
Common Stocks | | $ | 5,319,337 | | | $ | — | | | $ | — | | | $ | — | | | $ | 5,319,337 | |
Total Borrowings | | $ | 5,319,337 | | | $ | — | | | $ | — | | | $ | — | | | $ | 5,319,337 | |
| | | | | | | | | | | | | | | | | | | | | |
| | |
| Transamerica ETF Trust | | Annual Report 2019 |
Page 62
NOTES TO FINANCIAL STATEMENTS (continued)
At December 31, 2019
6. RISK EXPOSURES AND THE USE OF DERIVATIVE INSTRUMENTS
The Funds’ investment objectives allow the Funds to use various types of derivative contracts, including option contracts, swap agreements, futures contracts, and forward foreign currency contracts. Derivatives are investments whose value is primarily derived from underlying assets, indices or reference rates and may be transacted on an exchange or OTC.
Market Risk Factors:In pursuit of the Funds’ investment objectives, the Funds may seek to use derivatives. The Funds’ use of derivatives may increase or decrease their exposure to the following market risks:
Interest rate risk:Interest rate risk relates to the fluctuations in the value of fixed income securities due to changes in the prevailing levels of market interest rates.
Foreign exchange rate risk:Foreign exchange rate risk relates to fluctuations in the value of an asset or liability due to changes in the currency exchange rates.
Equity risk:Equity risk relates to the change in value of equity securities as they relate to increases or decreases in the general market.
Credit risk:Credit risk relates to the ability of the issuer of a financial instrument to make further principal or interest payments on an obligation or commitment that it has to the Funds.
Commodity risk:Commodity risk relates to the change in value of commodities or commodity indices as they relate to increases or decreases in the commodities market. Commodities are physical assets that have tangible properties. Examples of these types of assets are crude oil, heating oil, metals, livestock, and agricultural products.
The Funds are also exposed to additional risks from investing in derivatives, such as liquidity and counterparty credit risk. Liquidity risk is the risk that the Funds will be unable to sell or close out the derivative in the open market in a timely manner. Counterparty credit risk is the risk that the counterparty will not be able to fulfill its obligations to the Funds. Investing in derivatives may also involve greater risks than investing directly in the underlying assets, such as losses in excess of any initial investment and collateral received. In addition, there may be the risk that the change in value of the derivative contract does not correspond to the change in value of the underlying instrument.
The Funds’ exposure to market risk factors and certain other associated risks are summarized by derivative type as follows:
Futures contracts:The Funds are subject to equity and commodity risk, interest rate risk, and foreign exchange rate risk in the normal course of pursuing their investment objectives. A Fund may use futures contracts to enhance the Fund’s ability to track its Underlying Index. A futures contract represents a commitment for the future purchase or sale of an asset at a specified price on a specified date. Upon entering into such contracts, the Funds are required to deposit with the broker, either in cash or in securities, an initial margin in an amount equal to a certain percentage of the contract amount. Subsequent payments (variation margin) are paid or received by the Funds, depending on the daily fluctuations in the value of the contract, and are recorded for financial statement purposes as unrealized gains or losses by the Funds. Upon entering into such contracts, the Funds bear the risk of equity and commodity prices, interest rates, or exchange rates moving unexpectedly, in which case, the Funds may not achieve the anticipated benefits of the futures contracts and may realize losses. With futures, there is minimal counterparty credit risk to the Funds since futures are exchange-traded and the exchange’s clearinghouse, as counterparty to all exchange-traded futures, guarantees the futures against default. Futures contracts are generally entered into on a regulated futures exchange and cleared through a clearinghouse associated with the exchange.
Open futures contracts at December 31, 2019, if any, are listed within the Schedule of Investments. Variation margin, if applicable, is shown in Variation margin receivable or payable on futures contracts within the Statements of Assets and Liabilities.
Swap agreements:Swap agreements are bilaterally negotiated agreements between the Fund and a counterparty to exchange or swap investments, cash flows, assets, foreign currencies, or market-linked returns at specified, future intervals. Swap agreements can be executed in a bilateral privately negotiated arrangement with a dealer in an OTC transaction or executed on a regular market. Certain swaps regardless of the venue of execution are required to be cleared through a clearinghouse (“centrally cleared swap agreements”). Centrally cleared swap agreements listed or traded on a multilateral platform, are valued at the daily settlement price determined by the corresponding exchange. For centrally cleared credit default swap agreements the clearing exchange requires all members to provide applicable levels across complete term levels. Centrally cleared interest rate swap agreements are valued using a pricing model that references the underlying rates including but not limited to the overnight index swap rate and London Interbank Offered Rate (“LIBOR”) forward rate to calculate the daily settlement price. The Fund may enter into credit default, cross-currency, interest rate, total return, including contracts for difference (“CFD”), and other forms of swap agreements to manage exposure to credit, currency, interest rate, and commodity risks. In connection with these agreements, securities or cash may be identified as collateral or margin in accordance with the terms of the respective swap agreements to provide assets of value and recourse in the event of default or bankruptcy/insolvency. Centrally cleared swap agreements aremarked-to-market daily based upon values from third party vendors,
| | |
| Transamerica ETF Trust | | Annual Report 2019 |
Page 63
NOTES TO FINANCIAL STATEMENTS (continued)
At December 31, 2019
6. RISK EXPOSURES AND THE USE OF DERIVATIVE INSTRUMENTS (continued)
which may include a registered exchange, or quotations from market makers to the extent available and the change in value, if any, is recorded as Variation margin receivable (payable) on centrally cleared swap agreements within the Statement of Assets and Liabilities.
For OTC swap agreements, payments received or made at the beginning of the measurement period are reflected in OTC swap agreements, at value within the Statement of Assets and Liabilities and represent payments made or received upon entering into the swap agreements to compensate for differences between the stated terms of the swap agreement and prevailing market conditions (credit spreads, currency exchange rates, interest rates, and other relevant factors). Additionally, these upfront payments as well as any periodic payments received or paid by the Fund, including any liquidation payment received or made at the termination of the swap are recorded as part of Net realized gain (loss) on swap agreements within the Statement of Operations.
Interest rate swap agreements: The Funds are subject to interest rate risk exposure in the normal course of pursuing its investment objectives. Because the Funds hold fixed rate bonds, the value of these bonds may decrease if interest rates rise. To help hedge against this risk, the Funds enter into interest rate swap agreements. Under an interest rate swap agreement, two parties will exchange cash flows based on a notional principal amount. Funds with interest rate agreements can elect to pay a fixed rate and receive a floating rate, or receive a fixed rate and pay a floating rate, on a notional principal amount. The risks of interest rate swap agreements include changes in market conditions which will affect the value of the contract or the cash flows, and the possible inability of the counterparty to fulfill its obligations under the agreement. A Fund’s maximum risk of loss from counterparty credit risk is the discounted net value of the cash flows to be received from/paid to the counterparties over the contracts’ remaining lives, to the extent that amount is positive. This risk is mitigated by having a master netting arrangement between the Fund and the counterparty, and by the posting of collateral.
Open centrally cleared swap agreements and open OTC swap agreements at December 31, 2019, if any, are listed within the Schedule of Investments.
The following is a summary of the location and each Fund’s fair values of derivative investments disclosed, if any, within the Statements of Assets and Liabilities, categorized by primary market risk exposure as of December 31, 2019.
| | | | | | | | | | | | | | | | | | | | | | | | |
Asset Derivatives | |
| Fund/Location | | Interest Rate
Contracts | | | Foreign
Exchange
Contracts | | | Equity
Contracts | | | Credit
Contracts | | | Commodity
Contracts | | | Total | |
S&P 400 Managed Risk | |
Futures contracts: | |
Total distributable earnings (accumulated losses) (A) (B) | | $ | — | | | $ | — | | | $ | 12,272 | | | $ | — | | | $ | — | | | $ | 12,272 | |
Total | | $ | — | | | $ | — | | | $ | 12,272 | | | $ | — | | | $ | — | | | $ | 12,272 | |
| | | | | | | | | | | | | | | | | | | | | | | | | |
S&P 500 Managed Risk | |
Futures contracts: | |
Total distributable earnings (accumulated losses) (A) (B) | | $ | — | | | $ | — | | | $ | 111,392 | | | $ | — | | | $ | — | | | $ | 111,392 | |
Total | | $ | — | | | $ | — | | | $ | 111,392 | | | $ | — | | | $ | — | | | $ | 111,392 | |
| | | | | | | | | | | | | | | | | | | | | | | | | |
S&P 600 Managed Risk | |
Futures contracts: | |
Total distributable earnings (accumulated losses) (A) (B) | | $ | — | | | $ | — | | | $ | 5,345 | | | $ | — | | | $ | — | | | $ | 5,345 | |
Total | | $ | — | | | $ | — | | | $ | 5,345 | | | $ | — | | | $ | — | | | $ | 5,345 | |
| | | | | | | | | | | | | | | | | | | | | | | | | |
S&P EM 100 & Managed Risk | |
Futures contracts: | |
Total distributable earnings (accumulated
losses) (A) (B) | | $ | — | | | $ | — | | | $ | 13,793 | | | | — | | | $ | — | | | $ | 13,793 | |
Total | | $ | — | | | $ | — | | | $ | 13,793 | | | $ | — | | | $ | — | | | $ | 13,793 | |
| | | | | | | | | | | | | | | | | | | | | | | | | |
| | |
| Transamerica ETF Trust | | Annual Report 2019 |
Page 64
NOTES TO FINANCIAL STATEMENTS (continued)
At December 31, 2019
6. RISK EXPOSURES AND THE USE OF DERIVATIVE INSTRUMENTS (continued)
| | | | | | | | | | | | | | | | | | | | | | | | |
Asset Derivatives | |
| Fund/Location | | Interest Rate
Contracts | | | Foreign
Exchange
Contracts | | | Equity
Contracts | | | Credit
Contracts | | | Commodity
Contracts | | | Total | |
S&P International Managed Risk | |
Futures contracts: | |
Total distributable earnings (accumulated losses) (A) (B) | | $ | — | | | $ | — | | | $ | 16,202 | | | $ | — | | | $ | — | | | $ | 16,202 | |
Total | | $ | — | | | $ | — | | | $ | 16,202 | | | $ | — | | | $ | — | | | $ | 16,202 | |
| | | | | | | | | | | | | | | | | | | | | | | | | |
| | | | | | | | | | | | |
| (A) | | May include exchange-traded derivatives which are not subject to a master netting arrangement, or another similar arrangement. |
| (B) | | Included within Unrealized Appreciation (Depreciation) on futures contracts as reported in the Schedule of Investments. Only current day’s variation margin is reported within the Statements of Assets and Liabilities. |
The following is a summary of the location and the effect of derivative investments, if any, within the Statements of Operations, categorized by primary market risk exposure as of December 31, 2019.
| | | | | | | | | | | | | | | | | | | | | | | | |
Realized Gain (Loss) on Derivative Instruments | |
| Fund/Location | | Interest Rate
Contracts | | | Foreign
Exchange
Contracts | | | Equity
Contracts | | | Credit
Contracts | | | Commodity
Contracts | | | Total | |
S&P 400 Managed Risk | | | | | | | | | | | | | | | | | | | | | | | | |
Futures contracts | | $ | 11,252 | | | $ | — | | | $ | 370,721 | | | $ | — | | | $ | — | | | $ | 381,973 | |
Total | | $ | 11,252 | | | $ | — | | | $ | 370,721 | | | $ | — | | | $ | — | | | $ | 381,973 | |
| | | | | | | | | | | | | | | | | | | | | | | | | |
S&P 500 Managed Risk | | | | | | | | | | | | | | | | | | | | | | | | |
Swap agreements | | $ | (252 | ) | | $ | — | | | $ | 4,613 | | | $ | — | | | $ | — | | | $ | 4,361 | |
Futures contracts | | | 7,279 | | | | — | | | | 2,058,722 | | | | — | | | | — | | | | 2,066,001 | |
Total | | $ | 7,027 | | | $ | — | | | $ | 2,063,335 | | | $ | — | | | $ | — | | | $ | 2,070,362 | |
| | | | | | | | | | | | | | | | | | | | | | | | | |
S&P 600 Managed Risk | | | | | | | | | | | | | | | | | | | | | | | | |
Swap agreements | | $ | (4,439 | ) | | $ | — | | | $ | 41,145 | | | $ | — | | | $ | — | | | $ | 36,706 | |
Futures contracts | | | 669 | | | | — | | | | 151,917 | | | | — | | | | — | | | | 152,586 | |
Total | | $ | (3,770 | ) | | $ | — | | | $ | 193,062 | | | $ | — | | | $ | — | | | $ | 189,292 | |
| | | | | | | | | | | | | | | | | | | | | | | | | |
S&P EM 100 & Managed Risk | | | | | | | | | | | | | | | | | | | | | | | | |
Futures contracts | | $ | — | | | $ | — | | | $ | 453,034 | | | $ | — | | | $ | — | | | $ | 453,034 | |
Total | | $ | — | | | $ | — | | | $ | 453,034 | | | $ | — | | | $ | — | | | $ | 453,034 | |
| | | | | | | | | | | | | | | | | | | | | | | | | |
S&P International Managed Risk | | | | | | | | | | | | | | | | | | | | | | | | |
Futures contracts | | $ | (6,585 | ) | | $ | — | | | $ | 901,917 | | | $ | — | | | $ | — | | | $ | 895,332 | |
Total | | $ | (6,585 | ) | | $ | — | | | $ | 901,917 | | | $ | — | | | $ | — | | | $ | 895,332 | |
| | | | | | | | | | | | | | | | | | | | | | | | | |
| | | | | | | | | | | | | | | | | | | | | | | | |
Net Change in Unrealized Appreciation (Depreciation) on Derivative Instruments | |
| Fund/Location | | Interest Rate
Contracts | | | Foreign
Exchange
Contracts | | | Equity
Contracts | | | Credit
Contracts | | | Commodity
Contracts | | | Total | |
S&P 400 Managed Risk | |
Futures contracts | | $ | (503 | ) | | $ | — | | | $ | (4,538 | ) | | $ | — | | | $ | — | | | $ | (5,041 | ) |
Total | | $ | (503 | ) | | $ | — | | | $ | (4,538 | ) | | $ | — | | | $ | — | | | $ | (5,041 | ) |
| | | | | | | | | | | | | | | | | | | | | | | | | |
S&P 500 Managed Risk | |
Futures contracts | | $ | (326 | ) | | $ | — | | | $ | 46,885 | | | $ | — | | | $ | — | | | $ | 46,559 | |
Total | | $ | (326 | ) | | $ | — | | | $ | 46,885 | | | $ | — | | | $ | — | | | $ | 46,559 | |
| | | | | | | | | | | | | | | | | | | | | | | | | |
S&P 600 Managed Risk | |
Futures contracts | | $ | (29 | ) | | $ | — | | | $ | (4,225 | ) | | $ | — | | | $ | — | | | $ | (4,254 | ) |
Total | | $ | (29 | ) | | $ | — | | | $ | (4,225 | ) | | $ | — | | | $ | — | | | $ | (4,254 | ) |
| | | | | | | | | | | | | | | | | | | | | | | | | |
| | |
| Transamerica ETF Trust | | Annual Report 2019 |
Page 65
NOTES TO FINANCIAL STATEMENTS (continued)
At December 31, 2019
6. RISK EXPOSURES AND THE USE OF DERIVATIVE INSTRUMENTS (continued)
| | | | | | | | | | | | | | | | | | | | | | | | |
Net Change in Unrealized Appreciation (Depreciation) on Derivative Instruments | |
| Fund/Location | | Interest Rate
Contracts | | | Foreign
Exchange
Contracts | | | Equity
Contracts | | | Credit
Contracts | | | Commodity
Contracts | | | Total | |
S&P EM 100 & Managed Risk | |
Futures contracts | | $ | — | | | $ | — | | | $ | 13,793 | | | $ | — | | | $ | — | | | $ | 13,793 | |
Total | | $ | — | | | $ | — | | | $ | 13,793 | | | $ | — | | | $ | — | | | $ | 13,793 | |
| | | | | | | | | | | | | | | | | | | | | | | | | |
S&P International Managed Risk | |
Futures contracts | | $ | (1,542 | ) | | $ | — | | | $ | 10,605 | | | $ | — | | | $ | — | | | $ | 9,063 | |
Total | | $ | (1,542 | ) | | $ | — | | | $ | 10,605 | | | $ | — | | | $ | — | | | $ | 9,063 | |
| | | | | | | | | | | | | | | | | | | | | | | | | |
The following is a summary of the ending monthly average volume on derivative activity during the year ended December 31, 2019.
| | | | | | | | | | | | |
| | | Swap
Agreements
at Notional
Amount
(Pay)/Receive | | | Futures Contracts at
Notional Amount | |
| Fund | | | | | Long | | | Short | |
S&P 400 Managed Risk | | $ | — | | | $ | 1,410,916 | | | $ | — | |
S&P 500 Managed Risk | | | (11,713 | ) | | | 5,679,697 | | | | — | |
S&P 600 Managed Risk | | | — | (A) | | | 501,045 | | | | — | |
S&P EM 100 & Managed Risk | | | — | | | | 1,079,834 | | | | — | |
S&P International Managed Risk | | | — | | | | 2,884,211 | | | | — | |
| | |
| (A) | | There were no open positions at the beginning and/or end of each month, however, the Fund periodically invested in this type of derivative instrument during the year. |
The applicable Funds typically enter into International Swaps and Derivatives Association, Inc. Master Agreements (“ISDA Master Agreements”) or similar master agreements (collectively, “Master Agreements”) with its contract counterparties for certain OTC derivatives in order to, among other things, reduce credit risk to counterparties.
ISDA Master Agreements include provisions for general obligations, representations, collateral and events of default or termination. Under an ISDA Master Agreement, the Fund typically may offset with the counterparty certain OTC derivative financial instruments payables and/or receivables with collateral held and/or posted and create one single net payment(close-out netting) in the event of default, termination and/or potential deterioration in the credit quality of the counterparty.
Various Master Agreements govern the terms of certain transactions with counterparties and typically attempt to reduce the counterparty risk associated with such transactions by specifying credit protection mechanisms and providing standardization that improves legal certainty. Cross-termination provisions under Master Agreements typically provide that a default in connection with one transaction between the Fund and a counterparty gives thenon-defaulting party the right to terminate any other transactions in place with the defaulting party to create one single net payment due to/due from the defaulting party and may be a feature in certain Master Agreements. In the event the Fund exercises its right to terminate a Master Agreement after a counterparty experiences a termination event as defined in the Master Agreement, the return of collateral with market value in excess of the Fund’s net liability may be delayed or denied.
Collateral requirements: Collateral or margin requirements are set by the broker or exchange clearing house for exchange-traded derivatives (futures contracts, exchange-traded options, and exchange-traded swap agreements) while collateral terms are contract specific for OTC derivatives (forward foreign currency exchange contracts, OTC options, and OTC swap agreements). For OTC derivatives, under standard derivatives agreements, a Fund may be required to pledge collateral on derivatives to a counterparty if the Fund is in a net liability position, and receive collateral if in a net positive position. For financial reporting purposes, cash collateral that has been pledged by a Fund to cover obligations, if any, is reported in Cash collateral at broker within the Statements of Assets and Liabilities. Cash collateral that has been received by a Fund from a counterparty, if any, is reported separately in Cash collateral pledged at custodian and/or broker within the Statements of Assets and Liabilities.Non-cash collateral pledged to each Fund, if any, is disclosed within the Schedule of Investments.
Generally, the amount of collateral due from or to a party must exceed a minimum transfer amount threshold before a transfer has been made. Typically a counterparty is not permitted to sell,re-pledge or use cash andnon-cash collateral it receives. The Fund generally does not usenon-cash collateral that it receives but may, absent default or certain other circumstances, be permitted to use cash collateral received. In such cases, interest may be paid pursuant to the collateral arrangement with the counterparty.
| | |
| Transamerica ETF Trust | | Annual Report 2019 |
Page 66
NOTES TO FINANCIAL STATEMENTS (continued)
At December 31, 2019
6. RISK EXPOSURES AND THE USE OF DERIVATIVE INSTRUMENTS (continued)
To the extent amounts due to a Fund from its counterparties are not fully collateralized, contractually or otherwise, the Fund bears the risk of loss from counterpartynon-performance. Additionally, to the extent the Fund has delivered collateral to a counterparty, the Fund bears the risk of loss from a counterparty in the event the counterparty fails to return such collateral. Counterparties may immediately terminate derivatives contracts if a Fund fails to maintain sufficient asset coverage for its contracts or its net assets decline by stated percentages. Collateral may not be required for all derivative contracts.
7. RISK FACTORS
Investing in the Funds involves certain key risks related to the Funds’ trading activity. Please reference the Funds’ prospectus for a more complete discussion of the following risk(s), as well as other risks of investing in the Funds.
Asset allocation: Each Underlying Index and, thus, each Fund allocates assets among equity and fixed income securities. These allocations and the timing of the allocations may result in performance that is less favorable than that of a portfolio that does not allocate its assets among equity and fixed income securities.
Emerging market risk: Investments in the securities of issuers located in or principally doing business in emerging markets bear heightened foreign investments risks. Emerging market countries typically have economic, political and legal systems and regulatory and accounting standards that are less fully developed, and that can be expected to be less stable than those of more developed countries. For example, the economies of such countries can be subject to rapid and unpredictable rates of inflation or deflation. Emerging market countries may have policies that restrict investment by foreigners or that prevent foreign investors from withdrawing their money at will. Emerging market securities are often particularly sensitive to market movements because their market prices tend to reflect speculative expectations. Some emerging market countries are especially vulnerable to economic conditions in other countries. Low trading volumes may result in a lack of liquidity and in extreme price volatility. A fund investing in emerging market countries may be required to establish special custody or other arrangements before investing. An investment in emerging market securities should be considered speculative.
Foreign investment risk:Investments in securities of foreign issuers (including those denominated in U.S. dollars) or issuers with significant exposure to foreign markets are subject to additional risks. Foreign countries in which a Fund may invest may have markets that are less liquid, less regulated, less transparent and more volatile than U.S. markets. The value of a fund’s investments may decline because of factors affecting the particular issuers as well as foreign markets and issuers generally, such as unfavorable or unsuccessful government actions, reduction of government or central bank support, political or financial instability or other adverse economic or political developments. Values may also be affected by restrictions on receiving the investment proceeds from a foreign country. Foreign countries in which a Fund may invest may have markets that are less liquid, less regulated, less transparent and more volatile than U.S. markets. The value of a Fund’s investments may decline because of factors affecting the particular issuer as well as foreign markets and issuers generally, such as unfavorable or unsuccessful government actions, reduction of government or central bank support, political or financial instability or other adverse economic or political developments. Lack of information and weaker accounting standards also may affect the value of these securities.
Index tracking:While theSub-Adviser seeks to track the performance of an Underlying Index (i.e., achieve a high degree of correlation with the Underlying Index), a Fund’s return may not match the return of the Underlying Index. Each Fund incurs a number of operating expenses not applicable to each Underlying Index, and incurs costs in buying and selling securities. In addition, a Fund may not be fully invested at times, either as a result of cash flows into or out of the fund or reserves of cash held by the fund to meet redemptions. Changes in the composition of the Underlying Index and regulatory requirements also may impact a Fund’s ability to match the return of the respective Underlying Index. TheSub-Adviser may apply one or more “screens” or investment techniques to refine or limit the number or types of issuers included in the Underlying Index in which a Fund may invest. Application of such screens or techniques may result in investment performance below that of the Underlying Index and may not produce results expected by the Investment Manager. Index tracking risk may be heightened during times of increased market volatility or other unusual market conditions. In addition, due to the potential for frequent rebalancing of the Underlying Indexes, there is greater risk that theSub-Adviser may fail to implement changes to a Fund’s portfolio necessary to track the performance of the relevant Underlying Index.
Small and medium capitalization risk: Small or medium capitalization companies may be more at risk than larger capitalization companies because, among other things, they may have limited product lines, operating history, market or financial resources, or because they may depend on a limited management group. The prices of securities of small and medium capitalization companies generally are more volatile than those of larger capitalization companies and are more likely to be adversely affected than large capitalization companies by changes in earnings results and investor expectations or poor economic or market conditions. Securities of small and medium capitalization companies may underperform large capitalization companies, may be harder to sell at times and at prices the portfolio managers believe appropriate and may offer greater potential for losses.
| | |
| Transamerica ETF Trust | | Annual Report 2019 |
Page 67
NOTES TO FINANCIAL STATEMENTS (continued)
At December 31, 2019
8. FEES AND OTHER AFFILIATED TRANSACTIONS
TAM, the Fund’s investment manager, is directly owned by Transamerica Premier Life Insurance Company (“TPLIC”) and AUSA Holding, LLC (“AUSA”), both of which are indirect, wholly owned subsidiaries of Aegon N.V. TPLIC is owned by Commonwealth General Corporation (“Commonwealth”). Commonwealth and AUSA are wholly owned by Transamerica Corporation, a financial services holding company whose primary emphasis is on life and health insurance, and annuity and investment products. Transamerica Corporation is owned by The Aegon Trust, which is owned by Aegon International B.V., which is owned by Aegon N.V., a Netherlands corporation, and a publicly traded international insurance group.
TAM is an affiliate of Aegon NV.
Certain officers and trustees of the Funds are also officers and/or trustees of TAM. No interested trustee who is deemed an interested person due to current or former service with TAM or an affiliate of TAM receives compensation from the Funds.
Investment management fees: TAM serves as the Funds’ investment manager, performing administration as well as investment advisory services. TAM renders investment advisory, supervisory, and administration services under an investment management agreement and each Fund pays a single management fee, which is reflected in Investment management fees within the Statements of Operations.
Each Fund pays a management fee to TAM based on daily Average Net Assets (“ANA”) at the following rates:
| | | | |
| Fund | | Rate | |
S&P 400 Managed Risk | | | 0.45 | % |
S&P 500 Managed Risk | | | 0.35 | |
S&P 600 Managed Risk | | | 0.45 | |
S&P EM 100 & Managed Risk | | | 0.60 | |
S&P International Managed Risk | | | 0.50 | |
From time to time, TAM may waive all or a portion of its management fee. TAM pays all expenses of each Fund other than the investment management fee, distribution fee pursuant to each Fund’s distribution and service plan, if any, brokerage expenses, taxes, interest, litigation expenses, fees and expenses related to securities lending services, costs of borrowing money, acquired fund fees and expenses and other extraordinary expenses.
Distribution and service fees: The Trust has a distribution plan (“Distribution Plan”) pursuant to Rule12b-1 under the 1940 Act, however, the Distribution Plan has not yet been implemented. Payments at an annual rate of up to 0.25% of each Fund’s average daily net assets may be made for the sale and distribution of capital shares. The implementation of any such payments would be approved by the Board prior to implementation.
The Trust has entered into a distribution agreement with Foreside Fund Services, LLC as the Funds’ distributor. The Distributor will not distribute Fund shares in less than creation units, and does not maintain a secondary market in Fund shares. The Distributor may enter into selected dealer agreements with other broker-dealers or other qualified financial institutions for the sale of creation units of Fund shares.
Brokerage commissions:The Funds incurred no brokerage commissions on security transactions placed with affiliates of the adviser orsub-adviser(s) for the year ended December 31, 2019.
9. PURCHASES AND SALES OF SECURITIES
For the year ended December 31, 2019, the cost of securities purchased and proceeds from securities sold (excludingin-kind transactions and short-term securities) are as follows:
| | | | | | | | | | | | | | | | |
| | | Purchases of Securities | | | Sales/Maturities of Securities | |
| Fund | | Long-Term | | | U.S. Government | | | Long-Term | | | U.S. Government | |
S&P 400 Managed Risk | | $ | 157,344,124 | | | $ | 337,224,627 | | | $ | 91,553,835 | | | $ | 404,074,408 | |
S&P 500 Managed Risk | | | 483,109,590 | | | | 737,758,998 | | | | 251,753,019 | | | | 969,375,105 | |
S&P 600 Managed Risk | | | 59,470,060 | | | | 173,257,376 | | | | 32,658,535 | | | | 200,265,618 | |
S&P EM 100 & Managed Risk | | | 56,382,214 | | | | 74,484,122 | | | | 31,848,957 | | | | 74,622,645 | |
S&P International Managed Risk | | | 116,494,941 | | | | 55,047,482 | | | | 23,348,509 | | | | 144,178,410 | |
| | |
| Transamerica ETF Trust | | Annual Report 2019 |
Page 68
NOTES TO FINANCIAL STATEMENTS (continued)
At December 31, 2019
9. PURCHASES AND SALES OF SECURITIES (continued)
For the year ended December 31, 2019, the cost ofin-kind purchases and proceeds fromin-kind sales are as follows:
| | | | | | | | | | | | |
| Fund | | In-Kind Purchases | | | | | | In-Kind Sales | |
S&P 400 Managed Risk | | $ | — | | | | | | | $ | 12,554,622 | |
S&P 500 Managed Risk | | | 5,495,276 | | | | | | | | 38,375,588 | |
S&P 600 Managed Risk | | | — | | | | | | | | 1,620,023 | |
S&P EM 100 & Managed Risk | | | 21,038,016 | | | | | | | | — | |
S&P International Managed Risk | | | 3,250,759 | | | | | | | | 35,060,858 | |
10. CAPITAL SHARE TRANSACTIONS
The Funds will issue or redeem capital shares to certain institutional investors (typically market makers or other broker-dealers) only in large blocks of 50,000 capital shares (“Creation Units”). Creation Unit transactions are typically conducted in exchange for the deposit or delivery of a designated portfolio ofin-kind securities and/or cash constituting a substantial replication, or a representation, of the securities included in each Fund’s Underlying Index.
Individual capital shares may only be purchased and sold on a national securities exchange, electronic crossing networks and other alternative trading systems through a broker-dealer at market prices. Because capital shares trade at market prices rather than at NAV, capital shares may trade at a price greater than NAV (premium) or less than NAV (discount). Transactions in capital shares for each Fund are disclosed in detail within the Statements of Changes in Net Assets.
11. FEDERAL INCOME TAXES AND DISTRIBUTIONS TO SHAREHOLDERS
The Funds have not made any provision for federal income or excise taxes due to their policy to distribute all of their taxable income and capital gains to their shareholders and otherwise qualify as regulated investment companies under Subchapter M of the Internal Revenue Code. The Funds recognize the tax benefits of uncertain tax positions only where the position is “more likely than not” to be sustained assuming examination by tax authorities. The Funds’ tax returns remain subject to examination by the Internal Revenue Service and state tax authorities three years from the date of filing for federal purposes and four years from the date of filing for state purposes. Management has evaluated the Funds’ tax provisions taken for all open tax years, and has concluded that no provision for income tax is required in the Funds’ financial statements. If applicable, the Funds recognize interest accrued related to unrecognized tax benefits in relation to interest and penalties expense in Other within the Statements of Operations. The Funds identify their major tax jurisdictions as U.S. Federal, the state of Colorado, and foreign jurisdictions where the Funds make significant investments; however, the Funds are not aware of any tax positions for which it is reasonably possible that the total amounts of unrecognized tax benefits will change materially in the next twelve months.
Distributions are determined in accordance with income tax regulations, which may differ from GAAP. These differences are primarily due to different treatment for items including, but not limited to, wash sales, futures contracts mark to market, passive foreign investment company inclusions, partnership basis adjustments and corporate action tax adjustments. Therefore, distributions determined in accordance with tax regulations may differ significantly in amount or character from net investment income and realized gains for financial reporting purposes. Financial reporting records are adjusted for permanent book/tax differences to reflect tax character. The primary permanent differences are due to redemptions in-kind, and distributions in excess of current earnings. These reclassifications have no impact on net assets or results of operations. Financial records are not adjusted for temporary differences. These permanent reclassifications are as follows:
| | | | | | | | |
| Fund | | Paid-in Capital | | | Total Distributable
Earnings | |
S&P 400 Managed Risk | | $ | 1,800,020 | | | $ | (1,800,020 | ) |
S&P 500 Managed Risk | | | 8,305,435 | | | | (8,305,435 | ) |
S&P 600 Managed Risk | | | 168,093 | | | | (168,093 | ) |
S&P EM 100 & Managed Risk | | | — | | | | — | |
S&P International Managed Risk | | | 3,825,564 | | | | (3,825,564 | ) |
| | |
| Transamerica ETF Trust | | Annual Report 2019 |
Page 69
NOTES TO FINANCIAL STATEMENTS (continued)
At December 31, 2019
11. FEDERAL INCOME TAXES AND DISTRIBUTIONS TO SHAREHOLDERS (continued)
As of December 31, 2019, the approximate cost for U.S. federal income tax purposes, and the aggregate gross/net unrealized appreciation (depreciation) in the value of investments (including securities sold short and derivatives, if any) are as follows:
| | | | | | | | | | | | | | | | |
| Fund | | Cost | | | Gross
Appreciation | | | Gross
(Depreciation) | | | Net Appreciation
(Depreciation) | |
S&P 400 Managed Risk | | $ | 98,982,749 | | | $ | 9,148,421 | | | $ | (1,883,992 | ) | | $ | 7,264,429 | |
S&P 500 Managed Risk | | | 373,713,610 | | | | 58,507,671 | | | | (3,276,753 | ) | | | 55,230,918 | |
S&P 600 Managed Risk | | | 43,733,471 | | | | 2,898,527 | | | | (1,343,642 | ) | | | 1,554,885 | |
S&P EM 100 & Managed Risk | | | 43,596,165 | | | | 3,942,825 | | | | (783,223 | ) | | | 3,159,602 | |
S&P International Managed Risk | | | 195,579,114 | | | | 18,694,496 | | | | (10,165,672 | ) | | | 8,528,824 | |
As of December 31, 2019, the capital loss carryforwards available to offset future realized capital gains are as follows.
| | | | | | | | |
| | | Unlimited | |
| Fund | | Short-Term | | | Long-Term | |
S&P 400 Managed Risk | | $ | 2,025,889 | | | $ | 5,432,189 | |
S&P 500 Managed Risk | | | — | | | | 9,881,816 | |
S&P 600 Managed Risk | | | 1,612,616 | | | | 1,833,588 | |
S&P EM 100 & Managed Risk | | | 1,894,513 | | | | — | |
S&P International Managed Risk | | | — | | | | 5,281,591 | |
During the year ended December 31, 2019, the capital loss carryforwards utilized or expired are as follows. Funds not listed in the subsequent table do not have capital loss carryforwards utilized or expired.
| | | | |
| Fund | | Capital Loss
Carryforwards
Utilized/Expired | |
S&P 500 Managed Risk | | $ | 2,273,914 | |
The tax character of distributions paid may differ from the character of distributions shown within the Statements of Changes in Net Assets due to short-term gains being treated as ordinary income for tax purposes. The tax character of distributions paid during 2019 and 2018 are as follows:
| | | | | | | | | | | | | | | | | | | | | | | | |
| | | 2019 Distributions Paid From | | | 2018 Distributions Paid From | |
| Fund | | Ordinary
Income | | | Long-Term
Capital Gain | | | Return of
Capital | | | Ordinary
Income | | | Long-Term
Capital Gain | | | Return of
Capital | |
S&P 400 Managed Risk | | $ | 1,326,963 | | | $ | — | | | $ | — | | | $ | 1,403,938 | | | $ | — | | | $ | — | |
S&P 500 Managed Risk | | | 7,172,785 | | | | — | | | | — | | | | 6,923,900 | | | | 62,527 | | | | — | |
S&P 600 Managed Risk | | | 514,864 | | | | — | | | | — | | | | 555,073 | | | | — | | | | — | |
S&P EM 100 & Managed Risk | | | 979,022 | | | | — | | | | — | | | | — | | | | — | | | | — | |
S&P International Managed Risk | | | 6,314,088 | | | | — | | | | — | | | | 5,872,442 | | | | 52,703 | | | | — | |
As of December 31, 2019, the tax basis components of distributable earnings are as follows:
| | | | | | | | | | | | | | | | | | | | | | | | | | | | |
| Fund | | Undistributed
Ordinary
Income | | | Undistributed
Tax Exempt
Income | | | Undistributed
Long-Term
Capital Gain | | | Capital Loss
Carryforwards | | | Late Year
Ordinary Loss
Deferred | | | Other
Temporary
Differences | | | Net Unrealized
Appreciation
(Depreciation) | |
S&P 400 Managed Risk | | $ | — | | | $ | — | | | $ | — | | | $ | (7,458,078 | ) | | $ | — | | | $ | — | | | $ | 7,264,429 | |
S&P 500 Managed Risk | | | 6,376 | | | | — | | | | — | | | | (9,881,816 | ) | | | — | | | | — | | | | 55,230,918 | |
S&P 600 Managed Risk | | | — | | | | — | | | | — | | | | (3,446,204 | ) | | | — | | | | — | | | | 1,554,885 | |
S&P EM 100 & Managed Risk | | | 43,606 | | | | — | | | | — | | | | (1,894,513 | ) | | | — | | | | — | | | | 3,160,826 | |
S&P International Managed Risk | | | — | | | | — | | | | — | | | | (5,281,591 | ) | | | — | | | | — | | | | 8,535,320 | |
12. NEW ACCOUNTING PRONOUNCEMENT
In August 2018, the Financial Accounting Standards Board issued Accounting Standards UpdateNo. 2018-13 (“ASU2018-13”), “Fair Value Measurement (Topic 820: Disclosure Framework), Changes to the Disclosure Requirements for Fair Value Measurement”.
| | |
| Transamerica ETF Trust | | Annual Report 2019 |
Page 70
NOTES TO FINANCIAL STATEMENTS (continued)
At December 31, 2019
12. NEW ACCOUNTING PRONOUNCEMENT (continued)
ASU 2018-13 eliminates the requirement to disclose the amount of and reasons for transfers between Level 1 and Level 2 of the fair value hierarchy, the timing of transfers between levels of the fair value hierarchy and the valuation processes for Level 3 fair value measurements. ASU2018-13 does not eliminate the requirement to disclose the range and weighted average used to develop significant unobservable inputs for Level 3 fair value measurements, or the reporting of changes in unrealized gains and losses for recurring Level 3 fair value measurements. ASU2018-13 requires that information is provided about the measurement uncertainty of Level 3 fair value measurements as of the reporting date. The amendment is effective for fiscal years, and interim periods within those fiscal years, beginning after December 15, 2019. Management has evaluated and has early adopted the disclosure requirements and the impact is reflected within the Funds’ financial statements.
13. LEGAL PROCEEDINGS
On August 27, 2018, Transamerica Asset Management, Inc. (“TAM”), Aegon USA Investment Management, LLC (“AUIM”) and Transamerica Capital, Inc. (“TCI”) reached a settlement with the Securities and Exchange Commission (the “SEC”) that resolved an investigation into asset allocation models and volatility overlays utilized by AUIM when it served assub-adviser to certain Transamerica-sponsored mutual funds, and related disclosures. TAM and TCI serve as investment manager and principal underwriter, respectively, to Transamerica-sponsored mutual funds. TAM also serves as the investment manager to the DeltaShares exchange traded funds, and TCI also serves as the principal underwriter to the variable life insurance and annuity products through which certain Transamerica-sponsored mutual funds are offered. AUIM, an affiliate of TAM and TCI, serves assub-adviser to a number of Transamerica-sponsored mutual funds.
The SEC’s order instituting administrative andcease-and-desist proceedings (the “Order”) pertains to events that occurred during the period between July 2011 and June 2015, and, among other things, the operation and/or implementation of an asset allocation model utilized by AUIM when it served assub-adviser to certain Transamerica tactical funds and asset allocation funds, the designation of the portfolio manager for certain of these funds as well as the operation and/or implementation of volatility overlays utilized by AUIM when it served assub-adviser to the asset allocation funds. The Order also states that the parties failed to make appropriate disclosures regarding these matters, including in marketing materials, and failed to have adequate compliance policies and procedures. AUIM ceased to serve assub-adviser to the Transamerica tactical funds on April 30, 2015 and to the Transamerica asset allocation funds on June 30, 2015.
Under the terms of the Order, AUIM, TAM and TCI were censured, and agreed, without admitting or denying the findings in the Order, to cease and desist from committing or causing any violations of certain statutory provisions and SEC rules. AUIM agreed to pay civil penalties of $21,000,000, $24,599,896 in disgorgement and $3,682,195 in prejudgment interest. TAM agreed to pay civil penalties of $10,500,000, $15,000,000 in disgorgement and $2,235,765 in prejudgment interest. TCI agreed to pay civil penalties of $4,000,000, $12,000,000 in disgorgement and $1,826,022 in prejudgment interest. The amounts paid in disgorgement, prejudgment interest and civil penalties have been deposited into a Fair Fund for distribution to affected investors. Affected investors are those who purchased or held the relevant mutual funds, variable life insurance and annuity investment portfolios and separately managed account strategies during the period between July 2011 and June 2015. The Order states that these investors are to receive from the Fair Fund the pro rata fees and commissions paid by them during that period, subject to any de minimis threshold.
The settlement does not impose any restrictions on the business or continued ability of AUIM, TAM or TCI to serve the funds.
The foregoing is only a brief summary of the Order. A copy of the Order is available on the SEC’s website at https://www.sec.gov.
The funds are affected by many factors and risks: for example, the risk that thesub-advisers’ judgments and investment decisions, and methods, tools, resources, information, models and analyses utilized in making investment decisions, are incorrect or flawed, do not produce the desired results, and cause the funds to lose value. See “Principal Risks” in the prospectus.
The Order and settlement has no impact on the Funds’ financial statements.
| | |
| Transamerica ETF Trust | | Annual Report 2019 |
Page 71
Report of Independent Registered Public Accounting Firm
To the Shareholders and the Board of Trustees of Transamerica ETF Trust
Opinion on the Financial Statements
We have audited the accompanying statements of assets and liabilities of Transamerica ETF Trust (the “Trust”) (comprising DeltaShares® S&P 400 Managed Risk ETF, DeltaShares® S&P 500 Managed Risk ETF, DeltaShares® S&P 600 Managed Risk ETF, DeltaShares® S&P EM 100 & Managed Risk ETF and DeltaShares® S&P International Managed Risk ETF, (collectively referred to as the “Funds”)), including the schedules of investments, as of December 31, 2019, and the related statements of operations and changes in net assets and the financial highlights for each of the periods indicated in the table below and the related notes (collectively referred to as the “financial statements”). In our opinion, the financial statements present fairly, in all material respects, the financial position of each of the Funds comprising Transamerica ETF Trust at December 31, 2019, the results of their operations, changes in net assets and financial highlights for each of the periods indicated in the table below, in conformity with U.S. generally accepted accounting principles.
| | | | | | |
Funds comprising the
Transamerica ETF Trust | | Statement of
operations | | Statements of changes
in net assets | | Financial highlights |
-DeltaShares® S&P 400 Managed Risk ETF, -DeltaShares® S&P 500 Managed Risk ETF, -DeltaShares® S&P 600 Managed Risk ETF -DeltaShares® S&P International Managed Risk ETF | | For the year ended December 31, 2019 | | For each of the two years in the period ended December 31, 2019 | | For each of the two years in the period ended December 31, 2019 and the period from July 31, 2017 (commencement of operations) through December 31, 2017 |
| -DeltaShares® S&P EM 100 & Managed Risk ETF | | For the period from March 20, 2019 (commencement of operations) through December 31, 2019 |
Basis for Opinion
These financial statements are the responsibility of the Trust’s management. Our responsibility is to express an opinion on the Funds’ financial statements based on our audits. We are a public accounting firm registered with the Public Company Accounting Oversight Board (United States) (“PCAOB”) and are required to be independent with respect to the Trust in accordance with the U.S. federal securities laws and the applicable rules and regulations of the Securities and Exchange Commission and the PCAOB.
We conducted our audits in accordance with the standards of the PCAOB. Those standards require that we plan and perform the audit to obtain reasonable assurance about whether the financial statements are free of material misstatement, whether due to error or fraud. The Trust is not required to have, nor were we engaged to perform, an audit of the Trust’s internal control over financial reporting. As part of our audits, we are required to obtain an understanding of internal control over financial reporting, but not for the purpose of expressing an opinion on the effectiveness of the Trust’s internal control over financial reporting. Accordingly, we express no such opinion.
Our audits included performing procedures to assess the risks of material misstatement of the financial statements, whether due to error or fraud, and performing procedures that respond to those risks. Such procedures included examining, on a test basis, evidence regarding the amounts and disclosures in the financial statements. Our procedures included confirmation of securities owned as of December 31, 2019, by correspondence with the custodian and others, or by other appropriate auditing procedures where replies from others were not received. Our audits also included evaluating the accounting principles used and significant estimates made by management, as well as evaluating the overall presentation of the financial statements. We believe that our audits provide a reasonable basis for our opinion.

We have served as the auditor of one or more Transamerica investment companies since 1995.
Boston, Massachusetts
February 26, 2020
| | |
| Transamerica ETF Trust | | Annual Report 2019 |
Page 72
SUPPLEMENTAL INFORMATION
(unaudited)
TAX INFORMATION
For dividends paid during the year ended December 31, 2019, the Funds designated the following maximum amounts of qualified dividend income are as follows:
| | | | |
| Fund | | Qualified Dividend
Income | |
S&P 400 Managed Risk | | $ | 849,594 | |
S&P 500 Managed Risk | | | 6,667,690 | |
S&P 600 Managed Risk | | | 257,617 | |
S&P EM 100 & Managed Risk | | | 825,424 | |
S&P International Managed Risk | | | 4,774,115 | |
For corporate shareholders, investment income (dividend income plus short-term gains, if any) which qualifies for the maximum dividends received deductions are as follows:
| | | | |
| Fund | | Dividend Received
Deduction Percentage | |
S&P 400 Managed Risk | | | 65.48 | % |
S&P 500 Managed Risk | | | 93.23 | |
S&P 600 Managed Risk | | | 51.09 | |
The amounts which represent income derived from sources within, and taxes paid to, foreign countries or possessions of the U.S. are as follows:
| | | | | | | | |
| Fund | | Foreign Source Income | | | Foreign Taxes | |
S&P EM 100 & Managed Risk | | $ | 1,053,880 | | | $ | 104,907 | |
S&P International Managed Risk | | | 5,980,592 | | | | 372,300 | |
The information and distributions reported herein may differ from the information and distributions taxable to the shareholders for the calendar year ending December 31, 2019. Complete information will be computed and reported in conjunction with your 2019Form 1099-DIV.
| | |
| Transamerica ETF Trust | | Annual Report 2019 |
Page 73
Management of the Trust
Board Members and Officers
The members of the Board (“Board Members”) and executive officers of the Trust are listed below.
“Interested Board Member” means a board member who may be deemed an “interested person” (as that term is defined in the 1940 Act) of the Trust because of his current or former service with TAM or an affiliate of TAM. Interested Board Members may also be referred to herein as “Interested Trustees.” “Independent Board Member” means a Board Member who is not an “interested person” (as defined under the 1940 Act) of the Trust and may also be referred to herein as an “Independent Trustee.”
The Board governs each fund and is responsible for protecting the interests of the shareholders. The Board Members are experienced executives who meet periodically throughout the year to oversee the business affairs of each fund and the operation of each fund by its officers. The Board also reviews the management of each fund’s assets by the Investment Manager and thesub-adviser.
The funds are among the funds managed and sponsored by TAM (collectively, “Transamerica Fund Family”). The Transamerica Fund Family consists of (i) Transamerica Funds (“TF”); (ii) Transamerica Series Trust (“TST”); (iii) Transamerica ETF Trust (“TET”) and (iv) Transamerica Asset Allocation Variable Funds (“TAAVF”). Transamerica Fund Family consists of 126 funds as of the date of this Annual Report. With the exception of Mr. Smit, none of the Board Members serve on the board of trustees of TF, TST or TAAVF. TF, TST and TAAVF are overseen by a separate board of trustees.
The mailing address of each Board Member is c/o Secretary, 1801 California Street, Suite 5200, Denver, Colorado 80202.
Further information about the Trust’s Board Members and Officers is available in the Trust’s Statement of Additional Information, which can be obtained without charge by calling1-888-233-4339 or visiting the Trust’s website at www.deltashares.com.
The Board Members, their age, their positions with the Trust, and their principal occupations for at least the past five years (their titles may have varied during that period), the number of funds in Transamerica Fund Family the Board oversees, and other board memberships they hold are set forth in the table below. The length of time served is provided from the date a Board Member became a member of the Board.
| | | | | | | | | | |
| Name and Age | | Position(s)
Held with
Trust | | Term of
Office and
Length
of Time
Served* | | Principal Occupation(s)
During Past Five Years | | Number of
Funds in
Complex
Overseen
by Board
Member | | Other
Directorships
Held By Board
Member |
INTERESTED BOARD MEMBERS |
Marijn P. Smit (45) | | Chairman of the Board, President and Chief Executive Officer | | Since 2017 | | Chairman of the Board, President and Chief Executive Officer, TF, TST and TAAVF (2014 – present); Chairman of the Board, President and Chief Executive Officer, TET (2017 – present); Chairman of the Board, President and Chief Executive Officer, Transamerica Partners Portfolio (“TPP”), Transamerica Partners Funds Group (“TPFG”) and Transamerica Partners Funds Group II (“TPFG II”) (2014 – 2018); Chairman of the Board, President and Chief Executive Officer, Transamerica Income Shares, Inc. (“TIS”) (2014 – 2015); Director, Chairman of the Board, President and Chief Executive Officer, Transamerica Asset Management, Inc. (“TAM”) and Transamerica Fund Services, Inc. (“TFS”) (2014 – present); | | 126 | | Director,
Massachusetts
Fidelity Trust
Company
(2014 – present);
Director, Aegon
Global Funds
(2016 – present);
Director –
Akaan-Aegon,
S.A.P.I. de C.V.
(financial
services joint
venture in
Mexico)
(2017 – present)
Director,
Mongeral Aegon
Seguros e
Previdencia S.A.
(2019 – present);
and Director,
Mongeral Aegon
Investimentos
Ltda.
(2018 – present) |
| | |
| Transamerica ETF Trust | | Annual Report 2019 |
Page 74
| | | | | | | | | | |
| Name and Age | | Position(s)
Held with
Trust | | Term of
Office and
Length
of Time
Served* | | Principal Occupation(s)
During Past Five Years | | Number of
Funds in
Complex
Overseen
by Board
Member | | Other
Directorships
Held By Board
Member |
INTERESTED BOARD MEMBERS — continued |
Marijn P. Smit (continued) | | | | | | Senior Vice President, Transamerica Retirement Solutions LLC (2012 – present); Trust Officer, Massachusetts Fidelity Trust Company (2014 – present); President, Investment Solutions, Transamerica Investments & Retirement (2014 – 2016); Vice President, Transamerica Premier Life Insurance Company (2010 – 2016); Vice President, Transamerica Life Insurance Company (2010 – 2016); Senior Vice President, Transamerica Financial Life Insurance Company (2013 – 2016); Senior Vice President, Transamerica Retirement Advisors, Inc. (2013 – 2016); and President and Director, Transamerica Stable Value Solutions, Inc. (2010 – 2016). | | | | |
INDEPENDENT BOARD MEMBERS |
James S. Parsons (61) | | Trustee | | Since 2017 | | Retired 2009 | | 5 | | |
Francis J. Enderle (54) | | Trustee | | Since 2017 | | Consultant, Lattice Strategies/Hartford Funds (2014 – present) | | 5 | | Chair,
BlackRock
Canada
Independent
Review
Committee
(2010 – 2017);
Director,
WineInStyle
(Japan)
(2006 – 2017) |
| * | Each Board Member shall hold office until: 1) his or her successor is elected and qualified or 2) he or she resigns, retires or his or her term as a Board Member is terminated in accordance with the Trust’s Declaration of Trust. |
| | |
| Transamerica ETF Trust | | Annual Report 2019 |
Page 75
Officers
The mailing address of each officer is c/o Secretary, 1801 California Street, Suite 5200, Denver, CO 80202. The following table shows information about the officers, including their year of birth, their positions held with the Trust and their principal occupations during the past five years (their titles may have varied during that period). Each officer will hold office until his or her successor has been duly elected or appointed or until his or her earlier death, resignation or removal.
| | | | | | |
| Name and Age | | Position | | Term of Office
and Length of
Time Served* | | Principal Occupation(s) or Employment During Past Five Years |
Marijn P. Smit (45) | | Chairman of the Board, President and Chief Executive Officer | | Since 2017 | | See Table Above. |
Timothy Bresnahan (50) | | Senior Counsel and Secretary | | Since 2019 | | Assistant Secretary, TET (2019 – present); Secretary, TET (2019); Senior Counsel, TAM (2008 – present) |
Thomas R. Wald (59) | | Chief Investment Officer | | Since 2017 | | Chief Investment Officer, Transamerica Funds, TST and TAAVF (2014 – present); TET (2017 – present); Chief Investment Officer, TPP, TPFG and TPFG II (2014 – 2018); Chief Investment Officer, TIS (2014 – 2015); Director (2017 – present), (Akaan Transamerica, S.A. de C.V., Sociedad Operadora de Fondos de Inversión (2019 – present); Senior Vice President and Chief Investment Officer, TAM (2014 – present); Chief Investment Officer, Transamerica Investments & Retirement (2014 – present); Director, Transamerica Funds Services, Inc. (2019 – present); and Trust Officer, Massachusetts Fidelity Trust Company (2015 – present). |
| Christopher A. Staples (49) | | Vice President and Chief Investment Officer | | Since 2017 | | Vice President and Chief Investment Officer, Advisory Services (2007 – present), Transamerica Funds and TST; TET (2017 – present); Vice President and Chief Investment Officer, Advisory Services (2007 – 2015), TIS; Vice President and Chief Investment Officer, Advisory Services, TAAVF (2007 – present); Vice President and Chief Investment Officer, Advisory Services, TPP, TPFG and TPFG II (2007 – 2018); Director (2005 – 2019), Senior Vice President (2006 – present), Senior Director, Investments (2016 – present), Chief Investment Officer, Advisory Services (2012 – 2016) and Lead Portfolio Manager (2007 – present), TAM; Director, TFS (2005 – 2019); Trust Officer, Massachusetts Fidelity Trust Company (2010 – present); Registered Representative (2007 – 2016), TCI; Registered Representative, TFA (2005 – present). |
| | |
| Transamerica ETF Trust | | Annual Report 2019 |
Page 76
| | | | | | |
| Name and Age | | Position | | Term of Office
and Length of
Time Served* | | Principal Occupation(s) or Employment During Past Five Years |
Francine J. Rosenberger (52) | | Chief Compliance Officer | | Since 2019 | | Chief Compliance Officer, Transamerica Funds, TST, TET and TAAVF (2019 – present); Chief Compliance Officer (2019 – present), TAM; General Counsel, Corporate Secretary and Fund Chief Compliance Officer, Steben & Company, Inc. (2013 – 2019). |
Molly Possehl (41) | | Anti-Money Laundering Officer | | Since 2019 | | Anti-Money Laundering Officer, Transamerica Funds, TST, TET and TAAVF (2019 – present); Anti-Money Laundering Officer (2019 – present), TAM; Assistant General Counsel, Transamerica Life Insurance Company/Aegon USA (2013 – present); Anti-Money Laundering Compliance Officer and Fraud Officer, Transamerica Life Insurance Company/Aegon USA (2015 – present); Attorney, Anti-Money Laundering Compliance Officer (Annuity products), Transamerica Life Insurance Company/Aegon USA (2006 – 2015). |
Erin D. Nelson (42) | | Associate General Counsel, Chief Legal Officer and Secretary | | Since 2019 | | Chief Legal Officer and Secretary, Transamerica Funds, TST, TET and TAAVF (2019 – present); Assistant General Counsel II and Assistant Secretary, TAM (2019 – present), Assistant Secretary (2019 – present, TFS; Senior Vice President and Chief Compliance Officer, ALPS Advisors, Inc. (2015 – 2019). |
Vincent J. Toner (49) | | Vice President and Treasurer | | Since 2017 | | Vice President and Treasurer, Transamerica Funds, TST and TAAVF (2014 – present), TET (2017 – present); Vice President and Treasurer, TPP, TPFG and TPFG II (2014 – 2018); Vice President and Treasurer, TIS (2014 – 2015); Vice President (2016 – present), Treasurer (2016 – 2019), Vice President, Administration and Treasurer (2014 – 2016), TAM; Vice President, Administration and Treasurer, TFS (2014 – present); Vice President (2016 – present), Transamerica Capital, Inc.; Trust Officer (2015 – present), Massachusetts Fidelity Trust Company. |
Blake Boettcher (33) | | Tax Manager | | Since 2018 | | Tax Manager, Transamerica Funds, TST, TAAVF and TET (2018 – present); Senior Manager – Tax, Charles Schwab Investment Management (2015 – 2017); Tax Manager, Deloitte Tax LLP (2012 – 2015). |
| * | Elected and serves at the pleasure of the Board of the Trust. |
| | |
| Transamerica ETF Trust | | Annual Report 2019 |
Page 77
LIQUIDITY RISK MANAGEMENT PROGRAM (“LRMP”)
(unaudited)
Per initial requirements for SEC Rule 22e-4, TAM established a LRMP in 2018. The Board appointed TAM as the LRMP Administrator in September 2018, and approved the LRMP in March of 2019. In advance of the final compliance date of June 1, 2019, TAM successfully completed the liquidity rule implementation. All Funds were on-boarded to the State Street Global Exchange (SSGX) truView system (a third-party liquidity bucketing tool) at the end of December 2018. TAM currently has policies and procedures established for the day to day monitoring of liquidity risk, and continues to test and improve these policies and procedures as may be required.
| | |
| Transamerica ETF Trust | | Annual Report 2019 |
Page 78
PROXY VOTING POLICIES AND PROCEDURES AND QUARTERLY PORTFOLIO HOLDINGS
(unaudited)
A description of the Transamerica ETF Trust’s proxy voting policies and procedures is available in the Statement of Additional Information of the Funds, available without charge upon request by calling 1-888-316-8077 (toll free) or on the Securities and Exchange Commission’s (“SEC”) website athttp://www.sec.gov.
In addition, the Funds are required to file Form N-PX, with their complete proxy voting records for the most recent 12 months ended June 30th, no later than August 31st of each year. The Form is available without charge: (1) from the Funds, upon request by calling1-888-316-8077; and (2) on the SEC’s website athttp://www.sec.gov.
Each fiscal quarter, the Funds will file with the SEC a complete schedule of their monthly portfolio holdings on Form N-PORT. The Funds’ holdings as of the end of the third month of every fiscal quarter, as reported on Form N-PORT, will be publicly available on the SEC’s website athttp://www.sec.gov within 60 days of the end of the fiscal quarter.
You may also visit the Trust’s website atwww.deltashares.com for this and other information about the Funds and the Trust.
Important Notice Regarding Delivery of Shareholder Documents
Every year we send shareholders informative materials such as the Transamerica ETF Trust’s Annual Report, the Transamerica ETF Trust’s Prospectus, and other required documents that keep you informed regarding your Funds. The Trust will only send one piece per mailing address, a method that saves your Funds’ money by reducing mailing and printing costs.We will continue to do this unless you tell us not to.To elect to receive individual mailings, simply call a Transamerica Customer Service Representative toll free at 1-888-316-8077, 8 a.m. to 7 p.m. Eastern Time, Monday-Friday. Your request will take effect within 30 days.
Premium/Discount Information
Information about differences between the per share net asset value of each Fund and the closing price of shares of each Fund are available, without charge, atwww.deltashares.com.
| | |
| Transamerica ETF Trust | | Annual Report 2019 |
Page 79
NOTICE OF PRIVACY POLICY
(unaudited)
Your privacy is very important to us. We want you to understand what information we collect and how we use it. We collect and use “nonpublic personal information” in connection with providing our customers with a broad range of financial products and services as effectively and conveniently as possible. We treat nonpublic personal information in accordance with our Privacy Policy.
What Information We Collect and From Whom We Collect It
We may collect nonpublic personal information about you from the following sources:
| • | | Information we receive from you on applications or other forms, such as your name, address, and account number; |
| • | | Information about your transactions with us, our affiliates, or others, such as your account balance and purchase/redemption history; and |
| • | | Information we receive from non-affiliated third parties, including consumer reporting agencies. |
What Information We Disclose and To Whom We Disclose It
We do not disclose any nonpublic personal information about current or former customers to anyone without their express consent, except as permitted by law. We may disclose the nonpublic personal information we collect, as described above, to persons or companies that perform services on our behalf and to other financial institutions with which we have joint marketing agreements. We will require these companies to protect the confidentiality of your nonpublic personal information and to use it only to perform the services for which we have hired them.
Our Security Procedures
We restrict access to your nonpublic personal information and only allow disclosures to persons and companies as permitted by law to assist in providing products or services to you. We maintain physical, electronic, and procedural safeguards to protect your nonpublic personal information and to safeguard the disposal of certain consumer information.
If you have any questions about our Privacy Policy, please call 1-888-316-8077 on any business day between 8 a.m. and 7 p.m. Eastern Time.
Note: This Privacy Policy applies only to customers that have a direct relationship with us or our affiliates. If you own shares of our funds in the name of a third party such as a bank or broker-dealer, its privacy policy may apply to you instead of ours.
| | |
| Transamerica ETF Trust | | Annual Report 2019 |
Page 80
Customer Service:1-888-316-8077
1801 California St., Suite 5200 Denver, CO 80202
Distributor: Foreside Fund Services, LLC
www.deltashares.com

In an effort to reduce paper mailings and conserve natural resources, we encourage you to visit our website, www.transamerica.com, to set up an account and enroll in eDelivery.
The Transamerica ETF Trust is advised by Transamerica Asset Management, Inc. and distributed by Foreside Fund Services, LLC., Member of FINRA
206978 12/19
| | (a) | The Registrant has adopted a code of ethics that applies to its principal executive officer, principal financial officer, and any other officers who serve a similar function. |
| | (b) | The Registrant’s code of ethics is reasonably designed as described in this FormN-CSR. |
| | (c) | During the period covered by the report no amendments were made to the provisions of this code of ethics. |
| | (d) | During the period covered by the report, the Registrant did not grant any waivers, including implicit waivers, from the provisions of this code of ethics. |
| | (f) | The Registrant has filed this code of ethics as an exhibit pursuant to Item 13(a)(1) of FormN-CSR. |
| Item 3: | Audit Committee Financial Experts. |
The Registrant’s Board of Trustees has determined that Francis J. Enderle is an “audit committee financial expert,” as such term is defined in Item 3 of FormN-CSR. Mr. Enderle is “independent” under the standards set forth in Item 3 of FormN-CSR. The designation of Mr. Enderle as “audit committee financial expert” pursuant to Item 3 of FormN-CSR does not (i) impose upon him any duties, obligations, or liabilities that are greater than the duties, obligations and liabilities imposed upon him as a member of the Registrant’s audit committee or Board of Trustees in the absence of such designation; or (ii) affect the duties, obligations or liabilities of any other member of the Registrant’s audit committee or Board of Trustees.
| Item 4: | Principal Accountant Fees and Services. |
| | | | | | | | | | |
| | | | | Fiscal Year Ended 12/31
(in thousands) | |
| | | | | 2019 | | | 2018 | |
(a) | | Audit Fees | | $ | 110 | | | $ | 86 | |
(b) | | Audit Related Fees(1) | | $ | 0 | | | $ | 0 | |
(c) | | Tax Fees(2) | | $ | 21 | | | $ | 22 | |
(d) | | All Other Fees(3) | | $ | 0 | | | $ | 0 | |
| (1) | Audit-Related Fees represent assurance and related services provided that are reasonably related to the performance of the audit of the financial statements of the funds comprising the Registrant, specifically data verification and agreed-upon procedures related to asset securitizations and agreed-upon procedures engagements. |
| (2) | Tax Fees represent tax compliance, tax planning and tax advice services provided in connection with the review of the distributions for excise tax purposes, fiscal year end taxable income calculations and certain fiscal year end shareholder reporting items on behalf of the funds comprising the Registrant. |
| (3) | All Other Fees represent service fees for analysis of potential Passive Foreign Investment Company holdings. |
| | (e)(1) | Audit CommitteePre-Approval Policies and Procedures. Generally, the Registrant’s Audit Committee must preapprove (i) all audit andnon-audit services performed for the Registrant by the independent accountant and (ii) allnon-audit services performed by the Registrant’s independent accountant for the Registrant’s investment adviser, and certain of the adviser’s affiliates that provide ongoing services to the Registrant, if the services to be provided by the accountant relate directly to the operations and financial reporting of the Registrant. |
The Audit Committee may delegate preapproval authority to one or more of its members. The member or members to whom such authority is delegated shall report any preapproval decisions to the Audit Committee at its next scheduled meeting.
In accordance with the Procedures, the annual audit services engagement terms and fees for the Registrant will be subject to the preapproval of the Audit Committee. In addition to the annual audit services engagement approved by the Audit Committee, the Audit Committee may grant preapproval for other audit services, which are those services that only the independent accountant reasonably can provide.
Requests or applications to provide services that require separate approval by the Audit Committee will be submitted to the Audit Committee by both the independent accountant and the Registrant’s treasurer, and must include a joint statement as to whether, in their view, the request or application is consistent with the Securities and Exchange Commissions’ rules on auditor independence.
Management will promptly report to the Chair of the Audit Committee any violation of this Procedure of which it becomes aware.
| | (e)(2) | The percentage of services described in paragraphs (b) through (d) of this Item that were approved by the audit committee pursuant to paragraph (c)(7)(i)(C) ofRule 2-01 of RegulationS-X for fiscal years ended 2019 and 2018 was zero. |
| | (h) | The Registrant’s Audit Committee has considered whether the provision ofnon-audit services that were rendered to the Registrant’s Adviser, and any entity controlling, controlled by, or under common control with the Adviser that provides ongoing services to the Registrant that were notpre-approved pursuant to paragraph (c)(7)(ii) of Rule2-01 of RegulationS-X is compatible with maintain the principal accountant’s independence. |
| Item 5: | Audit Committee of Listed Registrants. |
The Registrant has a separately-designated standing Audit Committee established in accordance with Section 3(a)(58)(A) of the Exchange Act of 1934 comprised of the following individuals: James S. Parson and Francis J. Enderle.
| Item 6: | Schedule of Investments. |
| | (a) | The schedules of investments are included in the Annual Report to shareholders filed under Item 1 of this FormN-CSR. |
| Item 7: | Disclosure of Proxy Voting Policies and Procedures forClosed-End Management Investment Companies. |
Not applicable.
| Item 8: | Portfolio Managers ofClosed-End Management Investment Companies. |
Not applicable.
| Item 9: | Purchases of Equity Securities byClosed-End Management Investment Company and Affiliated Purchasers. |
Not Applicable
| Item 10: | Submission of Matters to a Vote of Security Holders. |
There have been no material changes to the procedures by which shareholders may recommend nominees to the Registrant’s Board of Trustees that have been implemented since the Registrant last provided disclosure in response to the requirements of this Item.
| Item 11: | Controls and Procedures. |
| | (a) | The Registrant’s principal executive officer and principal financial officer evaluated the effectiveness of the Registrant’s disclosure controls and procedures within 90 days of this filing and have concluded that the Registrant’s disclosure controls and procedures (as defined in Rule30a-3(c) under the Investment Company Act of 1940, as amended (the “1940 Act”)) are appropriately designed to ensure that information required to be disclosed by the Registrant in the reports that it files on FormN-CSR (a) is accumulated and communicated to Registrant’s management, including its principal executive officer and principal financial officer, to allow timely decisions regarding required disclosure, and (b) is recorded, processed, summarized and reported, within the time periods specified in the rules and forms adopted by the U.S. Securities and Exchange Commission. |
| | (b) | The Registrant’s principal executive officer and principal financial officer are aware of no change in the Registrant’s internal control over financial reporting that occurred during the Registrant’s most recent fiscal half-year that has materially affected, or is reasonably likely to materially affect, the Registrant’s internal control over financial reporting. |
| Item 12: | Disclosure of Securities Lending Activities forClosed-End Management Investment Companies. |
Not Applicable
| | (a)(1) | The Registrant’s code of ethics (that is the subject of the disclosure required by Item 2(a)) is attached. |
| | (a)(2) | Separate certifications for Registrant’s principal executive officer and principal financial officer, as required by Rule30a-2(a) under the 1940 Act, are attached. |
| | (b) | A certification for Registrant’s principal executive officer and principal financial officer, as required by Rule30a-2(b) under the 1940 Act, is attached. The certification furnished pursuant to this paragraph is not deemed to be “filed” for purposes of Section 18 of the Securities Exchange Act of 1934, or otherwise subject to liability of that section. Such certification is not deemed to be incorporated by reference into any filing under the Securities Act of 1933 or the Securities Exchange Act of 1934, except to the extent that the Registrant specifically incorporates it by reference. |
SIGNATURES
Pursuant to the requirements of the Securities Exchange Act of 1934 and the Investment Company Act of 1940, the Registrant has duly caused this report to be signed on its behalf by the undersigned, thereunto duly authorized.
| | |
| Transamerica ETF Trust |
| (Registrant) |
| |
| By: | | /s/ Marijn P. Smit |
| | Marijn P. Smit |
| | President and Chief Executive Officer |
| | (Principal Executive Officer) |
|
| Date: March 5, 2020 |
Pursuant to the requirements of the Securities Exchange Act of 1934 and the Investment Company Act of 1940, this report has been signed below by the following persons on behalf of the Registrant and in the capacities and on the dates indicated.
| | |
| By: | | /s/ Marijn P. Smit |
| | Marijn P. Smit |
| | President and Chief Executive Officer |
| | (Principal Executive Officer) |
|
| Date: March 5, 2020 |
| |
| By: | | /s/ Vincent J. Toner |
| | Vincent J. Toner |
| | Vice President and Treasurer |
| | (Principal Financial Officer) |
|
| Date: March 5, 2020 |
EXHIBIT INDEX
| | |
Exhibit No. | | Description of Exhibit |
| |
| 13(a)(1) | | Code of Ethics for Principal Executive and Principal Financial Officers |
| |
| 13(a)(2) | | Section 302N-CSR Certification of Principal Executive Officer and Principal Financial Officer |
| |
| 13(b) | | Section 906N-CSR Certification of Principal Executive Officer and Principal Financial Officer |