 Investor Presentation December 2016 © Hilton Grand Vacations Proprietary Exhibit 99.2 |
 D I S C L A I M E R 2 © Hilton Grand Vacations Proprietary This presentation contains forward-looking statements within the meaning of Section 27A of the Securities Act of 1933, as amended, and Section 21E of the Securities Exchange Act of 1934, as amended. These statements include, but are not limited to, statements related to our expectations regarding the performance of our business, our financial results, our liquidity and capital resources, the proposed spin-offs and other non-historical statements. You can identify these forward-looking statements by the use of words such as “outlook,” “believes,” “expects,” “potential,” “continues,” “may,” “will,” “should,” “could,” “seeks,” “approximately,” “projects,” “predicts,” “intends,” “plans,” “estimates,” “anticipates” or the negative version of these words or other comparable words. Such forward-looking statements are subject to various risks and uncertainties, including, among others, risks inherent to the timeshare industry, risks related to financing transactions expected to be consummated in connection with the spin-off, macroeconomic factors beyond our control, competition for timeshare sales, risks related to doing business with third-party developers, performance of our information technology systems, risks of doing business outside of the United States and our indebtedness, as well as those described under the section entitled “Risk Factors” in our effective Registration Statement on Form 10, as filed with the Securities and Exchange Commission (“SEC”) on November 30, 2016. Accordingly, there are or will be important factors that could cause actual outcomes or results to differ materially from those indicated in these statements. These factors should not be construed as exhaustive and should be read in conjunction with the other cautionary statements that are included in this presentation and in our filings with the SEC. We undertake no obligation to publicly update or review any forward-looking statement, whether as a result of new information, future developments or otherwise, except as required by law. This presentation is not an offer to sell or the solicitation of an offer to buy any securities of the company, nor will there be any sales of securities of the company in any jurisdiction in which the offer, solicitation or sale would be unlawful prior to registration or qualification under the securities laws of any such jurisdiction. This presentation includes certain non-GAAP financial measures, including net income before interest expense, income tax expense, depreciation and amortization (“Adj. EBITDA”), Adj. EBITDA Margin, Net Debt and Net Debt / Adj. EBITDA, Contract Sales, Free Cash Flow and Return on Invested Capital (“ROIC”). Non-GAAP financial measures Adj. EBITDA, Adj. EBITDA Margin, Net Debt and Net Debt / Adj. EBITDA should be considered only as supplemental to, and not as superior to, financial measures prepared in accordance with U.S. GAAP. Please refer to the Appendix and footnotes of this presentation for a reconciliation of the historical and forward-looking non-GAAP financial measures included in this presentation to the most directly comparable financial measures prepared in accordance with U.S. GAAP. |
 3 ROBERT LAFLEUR Vice President Investor Relations, Hilton Grand Vacations © Hilton Grand Vacations Proprietary |
 |
 MARK WANG President & CEO, Hilton Grand Vacations 5 © Hilton Grand Vacations Proprietary |
 6 © Hilton Grand Vacations Proprietary |
 7 © Hilton Grand Vacations Proprietary |
 8 © Hilton Grand Vacations Proprietary V A C A T I O N O W N E R S H I P I S F L E X I B L E (1) As of October 2016 Source: Company reports |
 9 © Hilton Grand Vacations Proprietary |
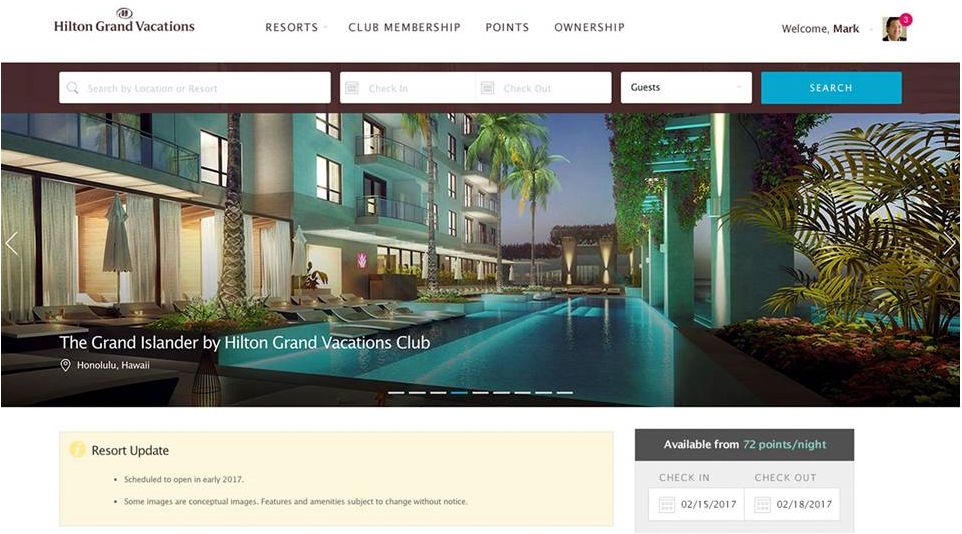
 10 G R A N D I S L A N D E R © Hilton Grand Vacations Proprietary |
 E X C E P T I O N A L V A C A T I O N O F F E R I N G S GRAND WAIKIKIAN Waikiki, Hawaii 11 © Hilton Grand Vacations Proprietary |
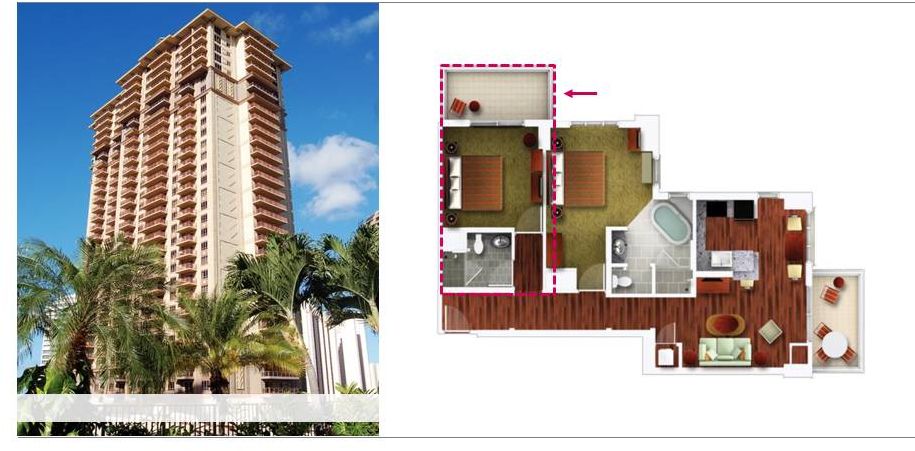 E X C E P T I O N A L V A C A T I O N O F F E R I N G S GRAND WAIKIKIAN Waikiki, Hawaii 12 Standard hotel room © Hilton Grand Vacations Proprietary |
 E X C E P T I O N A L V A C A T I O N O F F E R I N G S GRAND WAIKIKIAN Waikiki, Hawaii 13 Standard hotel room © Hilton Grand Vacations Proprietary |
 14 High-Quality Customer © Hilton Grand Vacations Proprietary |
 We consider our 265,000 members to be among the highest quality in the industry with: 93% Homeowners (Owners as of 9/30/16) $113,000 Average Household Income (Owners as of 9/30/16) 25 Leisure Travel Days Per Year 15 H I G H - Q U A L I T Y , L O Y A L C U S T O M E R S © Hilton Grand Vacations Proprietary |
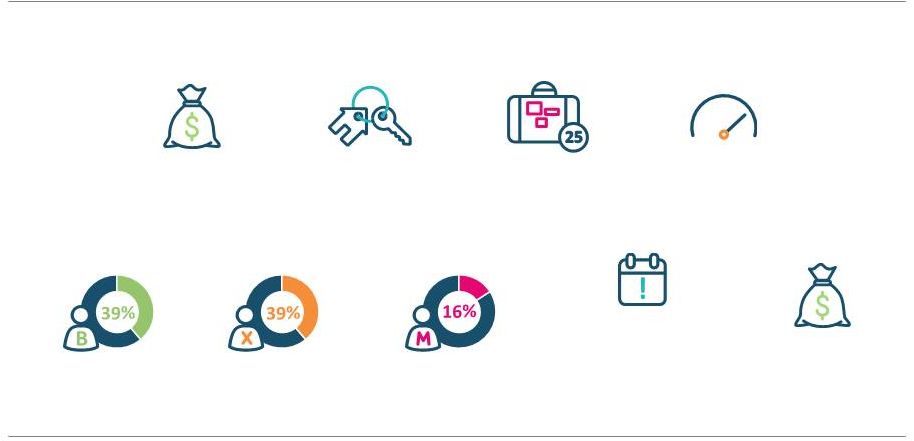
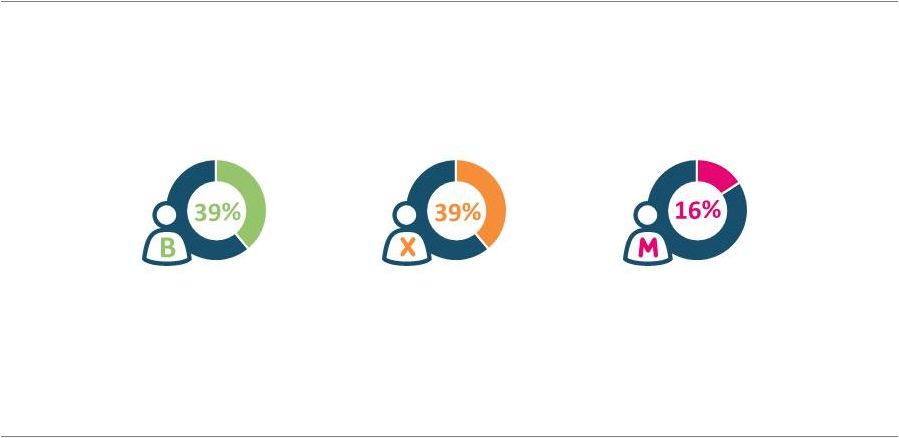 We consider our 265,000 members to be among the highest quality in the industry with: 16 H I G H - Q U A L I T Y , L O Y A L C U S T O M E R S Baby Boomers Millennials Generation X (2016 New Owners) © Hilton Grand Vacations Proprietary |
 We consider our 265,000 members to be among the highest quality in the industry with: 17 H I G H - Q U A L I T Y , L O Y A L C U S T O M E R S 1.78% Delinquency Rate (For Loans Over 30 Days Past Due Not in Default) (As of 9/30/16) 2.84% Loan Default Rate (Year ended 12/31/15) 736 Weighted Average Fico Score (9 months ended 9/30/16) (1) For new loans to U.S. and Canadian borrowers at the time of origination; (2) 2.2% HOA delinquency rate for the year ended 12/31/15 Source: Company analysis © Hilton Grand Vacations Proprietary 1 2 |
 T H E N E W P A R A D I G M I N V A C A T I O N O W N E R S H I P 18 (1) Approximate Third Party based on a range of product cost times sales value of inventory. (2) 37/9 assets in Resort/Urban destinations, respectively © Hilton Grand Vacations Proprietary |
 T H E N E W P A R A D I G M I N V A C A T I O N O W N E R S H I P 19 (2) 37/9 assets in Resort/Urban destinations, respectively © Hilton Grand Vacations Proprietary |
 T H E N E W P A R A D I G M I N V A C A T I O N O W N E R S H I P 20 (1) Approximate Third Party based on a range of product cost times sales value of inventory. © Hilton Grand Vacations Proprietary |
 T H E N E W P A R A D I G M I N V A C A T I O N O W N E R S H I P 21 © Hilton Grand Vacations Proprietary |
 T H E N E W P A R A D I G M I N V A C A T I O N O W N E R S H I P 22 © Hilton Grand Vacations Proprietary |
 T H E N E W P A R A D I G M I N V A C A T I O N O W N E R S H I P 23 (1) Approximate Third Party based on a range of product cost times sales value of inventory. (2) 37/9 assets in Resort/Urban destinations, respectively © Hilton Grand Vacations Proprietary |
 L I N E S O F B U S I N E S S Rental & Ancillary Financing Club & Resort Real Estate 24 © Hilton Grand Vacations Proprietary |
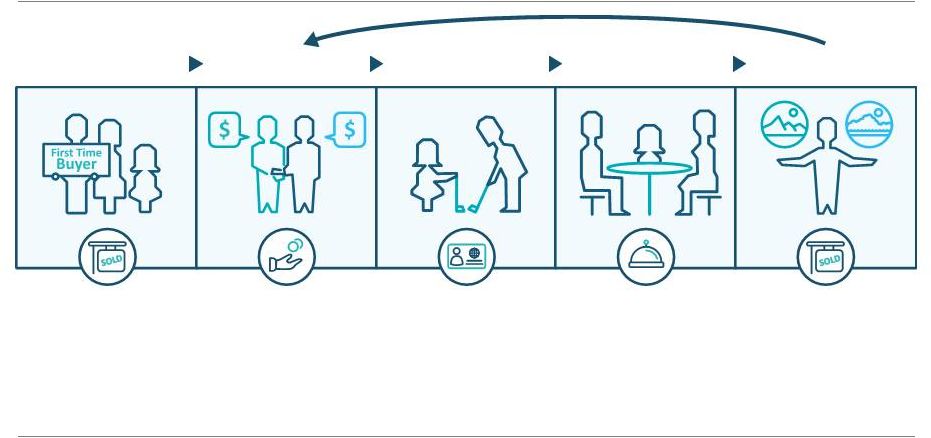 C U S T O M E R L I F E C Y C L E 25 First Time Buyer • Deeded timeshare • Real Estate margin 27.5% YE 2015 Real Estate Credit • Loans to high-quality customers • Interest income • Origination and servicing fees Financing Dues & Fees • Manage resort HOAs – HOA management fees • Operate HGV Club – Club enrollment fees, annual membership dues and transaction fees Club & Resort On Property • Market transient rental – rental revenues • Retail, F&B and spa revenues Rental & Ancillary Additional Purchase • Second sale Real Estate revenue • Incremental Management Fees, Financing, Rental & Ancillary Revenue Real Estate © Hilton Grand Vacations Proprietary |
 Note: (1) Average, including spend related to follow-on VOI purchases, adjusted for defaults and share of customers financing; includes all interest revenue for contract sales; (2) Rental sales and retail sales associated with transient and marketing stays not attributed to members. Analysis represents ancillary spend and excludes rental. Source: Company analysis R E V E N U E L I F E C Y C L E We expect to generate 60% of a customer’s lifetime value after the initial purchase. 26 © Hilton Grand Vacations Proprietary |
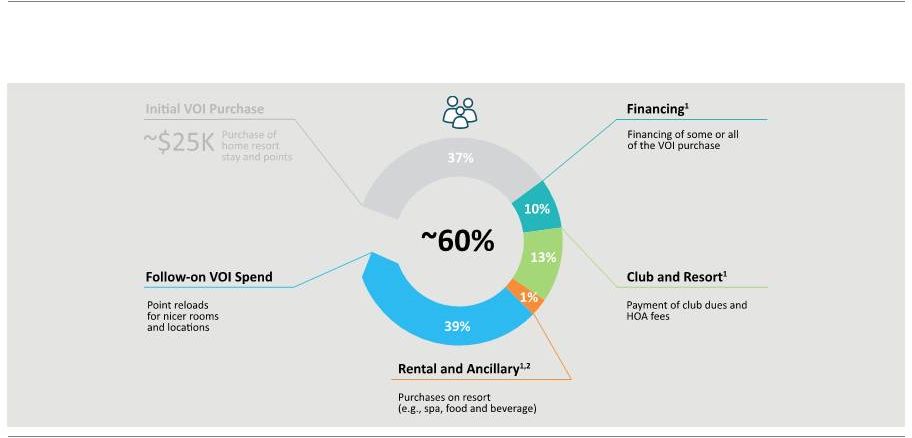 R E V E N U E L I F E C Y C L E We expect to generate 60% of a customer’s lifetime value after the initial purchase. 27 Note: (1) Average, including spend related to follow-on VOI purchases, adjusted for defaults and share of customers financing; includes all interest revenue for contract sales; (2) Rental sales and retail sales associated with transient and marketing stays not attributed to members. Analysis represents ancillary spend and excludes rental. Source: Company analysis © Hilton Grand Vacations Proprietary |
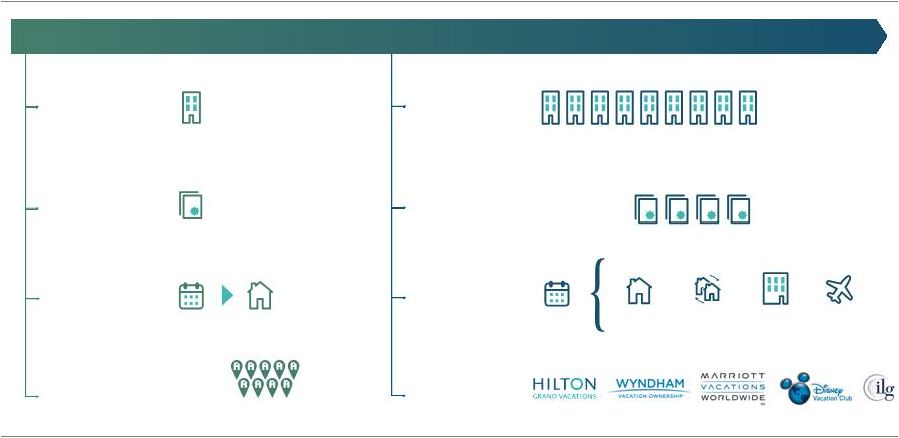 $1.0B Annual Industry VOI Sales Consumer protection Single Location Limited Single-week Classified by Small Independent Players $8.6B Annual Industry VOI Sales Meaningful Consumer Protection Points-based Global Network Led by Major Hospitality Brands DNC Cool Off Lending Laws Home Stay IN-Network Exchange Hotel Exchange Other (RCI, Airline, Car) Now: 2016 E V O L U T I O N O F T H E T I M E S H A R E I N D U S T R Y Source: AIF, Sate of the Vacation Timeshare Industry – Shared Vacation Ownership, 2016 edition 28 Then: 1985 © Hilton Grand Vacations Proprietary |
 C O N S I S T E N T G R O W T H (1) Unless otherwise noted, HGV Net VOI Sales data from historical financial statements. 1992 – 1998 HGV Net VOI Sales estimated due to lack of historic data.Note: (*) Started as Orange Lake Resort (**) Wyndham predecessor Fairfield entered the market in 1966, but went bankrupt in 1990. It emerged as the first vacation ownership company to use a points-based model. Source: ARDA; public financials; company reports . 29 © Hilton Grand Vacations Proprietary |
 S T R O N G M A R K E T P O S I T I O N I N G (1) Starwood Vacation Ownership acquired by Interval Leisure Group in May 2016. Source: Company Financials Trailing 12-Month Sales Relative to Calendar Year 2007 30 HGV Market Share: 5% 12% (‘07-‘15) © Hilton Grand Vacations Proprietary |
 S T R O N G M A R K E T P O S I T I O N I N G (1) Starwood Vacation Ownership acquired by Interval Leisure Group in May 2016. Source: Company Financials © Hilton Grand Vacations Proprietary 31 |
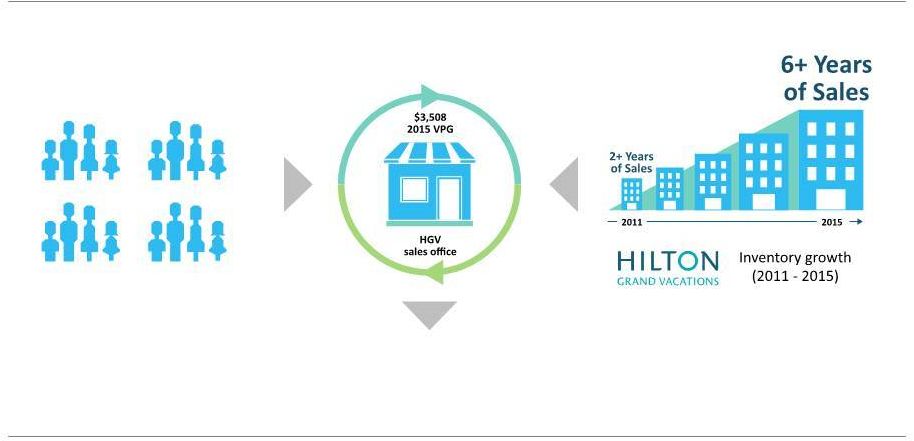 H G V ’ S K E Y D R I V E R S : D E M A N D , E N G A G E M E N T A N D I N V E N T O R Y Source: Company reports 32 Revenue Growth 2015 Real Estate Revenue $949M 2013-2015 CAGR 10% Demand Approximately 300k owners/new customer tours Customer Engagement Supply © Hilton Grand Vacations Proprietary |
 H I G H L Y E F F E C T I V E C U S T O M E R E N G A G E M E N T M O D E L 33 © Hilton Grand Vacations Proprietary Tours (000s) |
 M A R K E T I N G C H A N N E L S YTD 9/30/16 Marketing Mix 34 © Hilton Grand Vacations Proprietary 88% Hilton Affiliated Channels Hilton Hotel Marketing 8% Non-Hilton Affiliate 12% In House 25% Direct Marketing 49% Club Direct 6% |
 H I G H L Y E F F E C T I V E C U S T O M E R E N G A G E M E N T M O D E L Sophisticated and high-tech experience for customers 35 © Hilton Grand Vacations Proprietary |
 H I G H L Y E F F E C T I V E C U S T O M E R E N G A G E M E N T M O D E L Premium closing rates, cost effective model and high rate of repeat purchase 36 © Hilton Grand Vacations Proprietary |
 S C A L E A N D S T R A T E G I C D I S T R I B U T I O N L O C A T I O N S (1) Japan Population Source: In-Market Tourist Travel Board Note: Numbers denote annual visitation Hawaii 8M Southern California 34M New York 58M Las Vegas 40M Japan 126M Myrtle Beach 22M D.C. 19M Orlando 63M 37 v 200M+ © Hilton Grand Vacations Proprietary 1 |
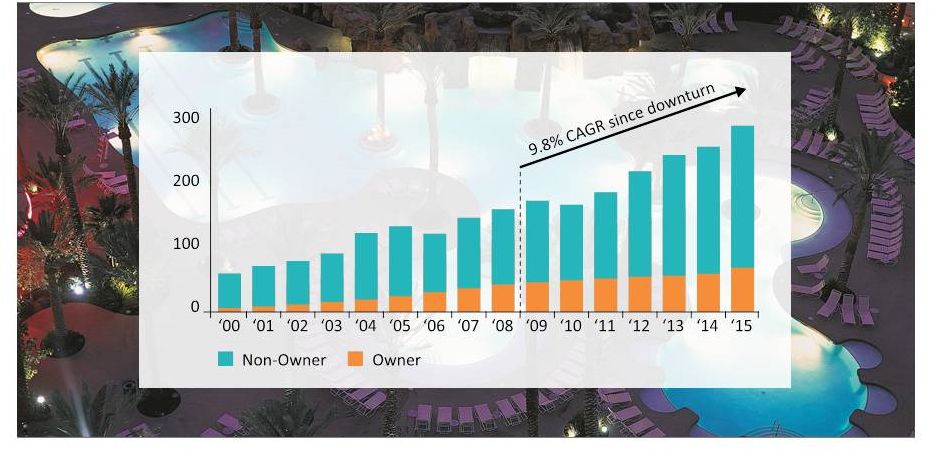
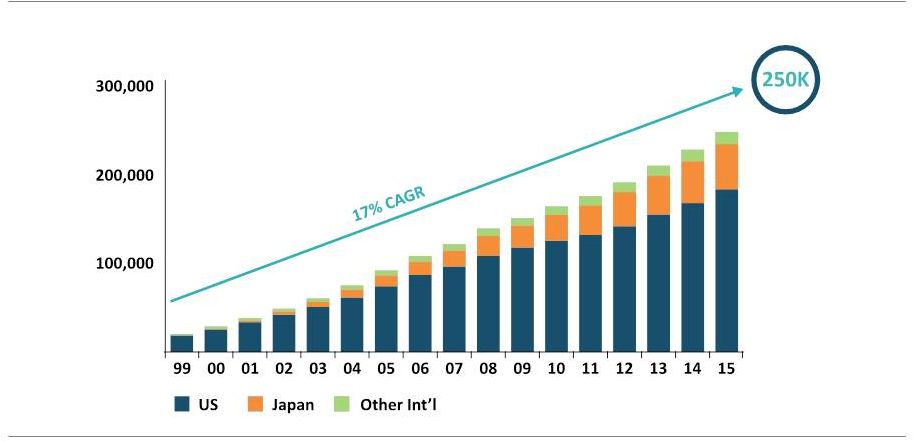 N E T O W N E R G R O W T H Member Growth (1999 – 2015) 38 © Hilton Grand Vacations Proprietary |
 Capital-Efficient Business Model 39 © Hilton Grand Vacations Proprietary |
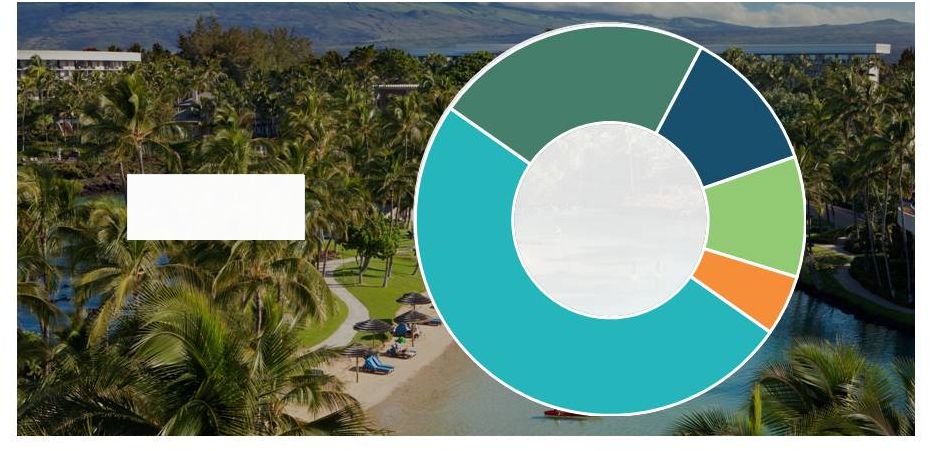
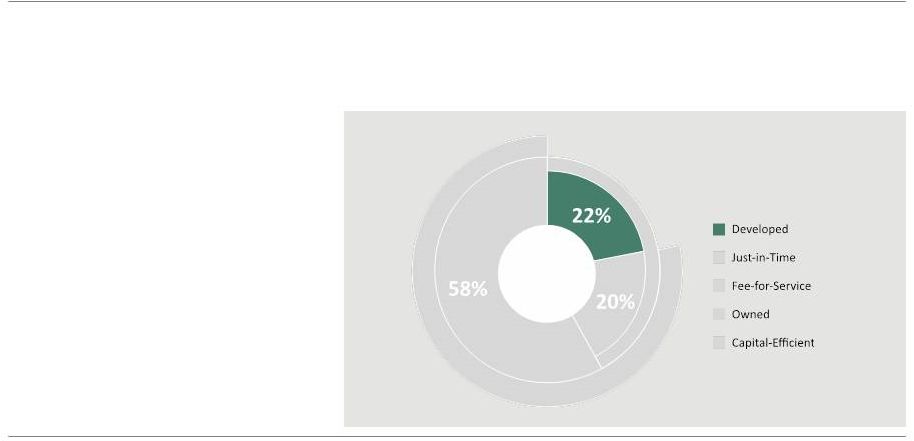
 C A P I T A L - E F F I C I E N T B U S I N E S S M O D E L Inventory Sources as a Percentage of 2015 Contract Sales ($1,068 million) Developed - VOI inventory sourced from projects developed by HGV Just-in-Time - VOI inventory sourced in transactions that are designed to closely correlate the timing of the acquisition to the sale Fee-for-Service - VOI inventory HGV sells and manages on behalf of third-party developers 40 © Hilton Grand Vacations Proprietary |
 C A P I T A L - E F F I C I E N T B U S I N E S S M O D E L HGV Developed Inventory 41 Capital: • HGV Capital Revenue Streams: • Sales of VOI • Financing • Club & Resort Management • Rental & Ancillary Margin: • vs. JIT - higher • vs. FFS - higher Return: • vs. JIT - lower • vs. FFS - lower © Hilton Grand Vacations Proprietary |
 C A P I T A L - E F F I C I E N T B U S I N E S S M O D E L Just-in-Time Inventory 42 Capital: • HGV Capital Revenue Streams: • Sales of VOI • Financing • Club & Resort Management • Rental & Ancillary Margin: • vs. Developed - lower • vs. FFS - higher Return: • vs. Developed - higher • vs. FFS - lower © Hilton Grand Vacations Proprietary |
 C A P I T A L - E F F I C I E N T B U S I N E S S M O D E L Fee-for-Service Inventory 43 Capital: • Third Party Capital Revenue Streams: • Commissions & Brand Fees • Club & Resort Management • Rental & Ancillary Margin: • vs. Developed - lower • vs. JIT - lower Return: • vs. Developed - higher • vs. JIT - higher © Hilton Grand Vacations Proprietary |
 H G V I N V E N T O R Y S P E N D I N G 44 © Hilton Grand Vacations Proprietary |
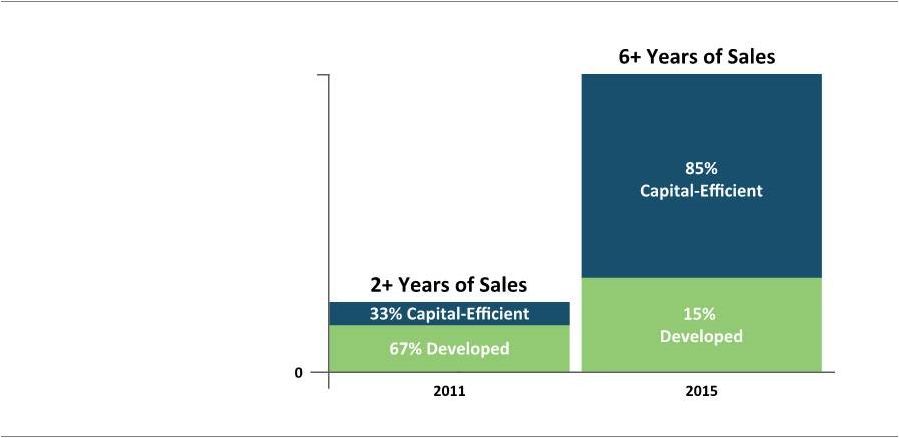 45 H G V I N V E N T O R Y P O S I T I O N We have dramatically increased inventory, 81% capital-efficient as of 9/30/16 (1) As of September 30, 2016, supply of inventory equaled 5.5+ years of sales up from 2.7 years in 2011 Source: Company 10-Ks, Company presentation © Hilton Grand Vacations Proprietary 1 |
 T H E C A P I T A L - E F F I C I E N T M O D E L A L L O W S U S T O D E V E L O P I N V E N T O R Y R A P I D L Y A N D S U P P O R T H I G H E R S A L E S HGV Contract Sales (2011-2015) (Millions of Dollars) 46 © Hilton Grand Vacations Proprietary |
 K E Y D E V E L O P M E N T P A R T N E R S (1) Represents the capital HGV would have spent if these weren’t Fee-for-Service projects: estimated product cost of 25% applied to the $5B estimated gross volume Source: Company reports 47 v $61M vs. ~$1.3B © Hilton Grand Vacations Proprietary 1 |
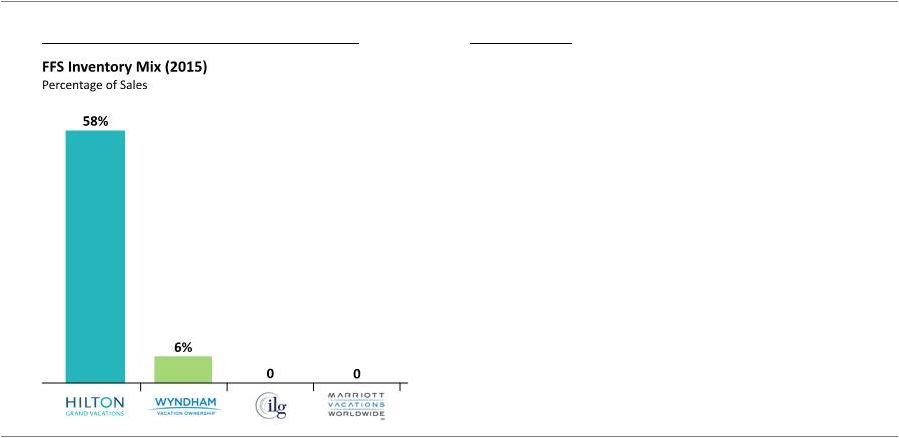 48 Source: Company 10-Ks, Company presentation We are the industry leader in fee-for-service Why HGV? I N D U S T R Y L E A D I N G F E E - F O R - S E R V I C E I N V E N T O R Y M O D E L © Hilton Grand Vacations Proprietary rd rd returns to HGV and 3 party developers • Proof of concept • Strong brand • Leading industry performance • Efficient and scalable distribution model – attractive • Strong portfolio of 3 party developers with a history of multiple projects • 3-4 year ramp-up period |
 Key Investment Highlights 49 © Hilton Grand Vacations Proprietary |
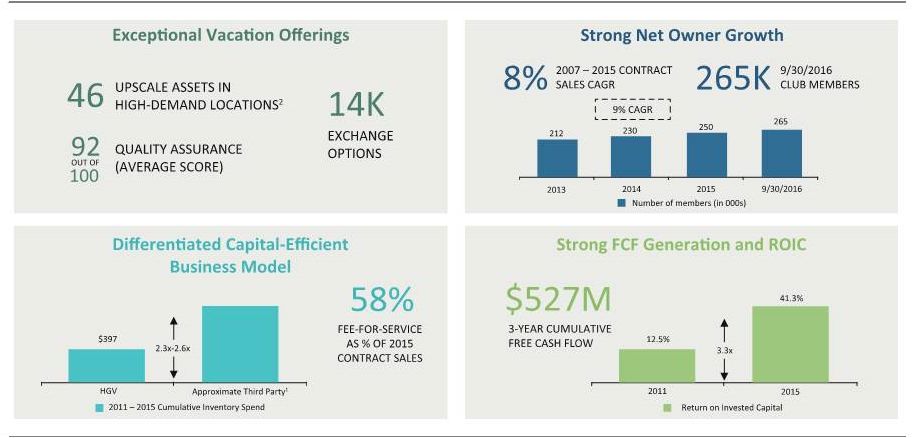
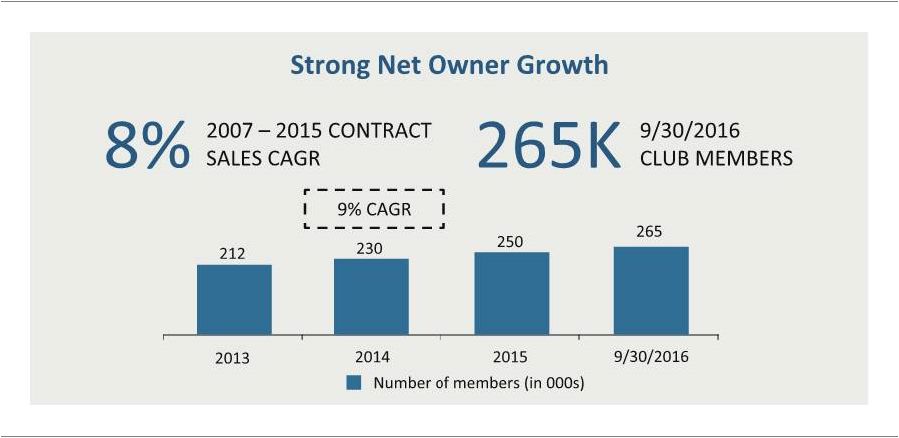
 K E Y I N V E S T M E N T H I G H L I G H T S 1 Exclusive Long-Term Relationship with Hilton 2 Sophisticated Customer Engagement Model 3 Exceptional Vacation Offerings 4 High-Quality Customers & Strong Net Owner Growth 5 Differentiated, Capital-Efficient Business Model 6 Strong Growth Opportunities 7 Experienced and Execution-Focused Management Team 50 © Hilton Grand Vacations Proprietary |
 Access to Hilton’s strong commercial engines E X C L U S I V E L O N G - T E R M R E L A T I O N S H I P W I T H H I L T O N 51 • Exclusive rights to use the Hilton brand name in the timeshare space • Access to 58 million HHonors members • Industry-leading sales & marketing platform and continued use of Hilton.com • Access to proprietary Hilton data • Access to convert HGV Club points to HHonors points • License fee is 100% variable Loyalty Program ~58M members Worldwide Sales ~$10B in annual revenue Reservations & Customer Care +40M interactions per year Online & Mobile ~570+M site visits per year Information Technology Proprietary platform © Hilton Grand Vacations Proprietary |
 S O P H I S T I C A T E D C U S T O M E R E N G A G E M E N T M O D E L 89+ Million Qualified Prospects 170+ million Unique Individuals (proven Hilton affinity) Contactable (legal and business rule compliance) Profile (wealth score) Offer Capable (income and model) 52 © Hilton Grand Vacations Proprietary |
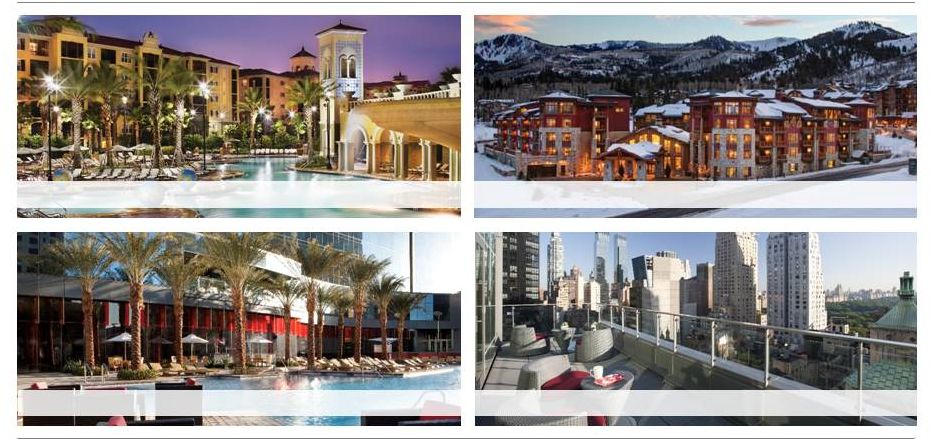 E X C E P T I O N A L V A C A T I O N O F F E R I N G S TUSCANY RESORT Orlando, Florida SUNRISE LODGE Park City, Utah ELARA Las Vegas, Nevada WEST 57 th STREET New York, New York 53 © Hilton Grand Vacations Proprietary |
 H I G H - Q U A L I T Y , L O Y A L C U S T O M E R S We consider our 265,000 members to be among the highest quality in the industry with: 93% Homeowners (Owners as of 9/30/16) $113,000 Average Household Income (Owners as of 9/30/16) 25 Leisure Travel Days Per Year 54 Baby Boomers Millennials Generation X (2016 New Owners) 736 Weighted Average Fico Score¹ (9 months ended 9/30/16) 1.78% Delinquency Rate (For Loans Over 30 Days Past Due Not in Default) (As of 9/30/16)² 2.84% Loan Default Rate (Year ended 12/31/15) (1) For new loans to U.S. and Canadian borrowers at the time of origination; (2) 2.2% HOA delinquency rate for the year ended 12/31/15 Source: Company analysis © Hilton Grand Vacations Proprietary |
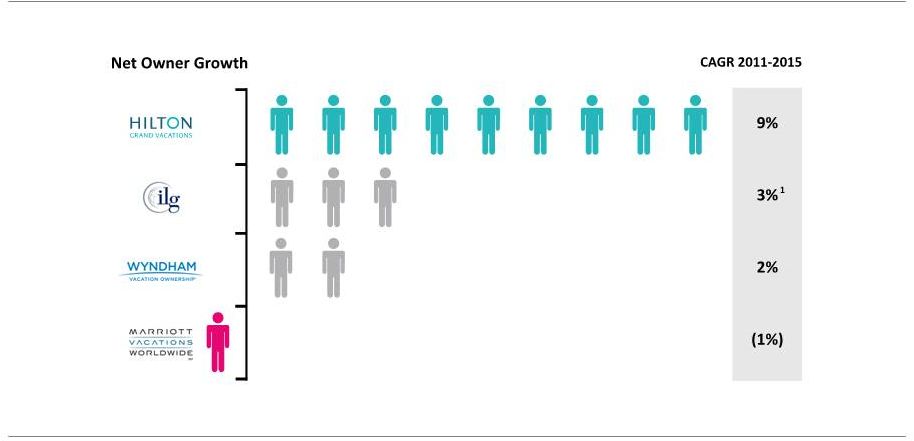 I N D U S T R Y - L E A D I N G N E T O W N E R G R O W T H (1) Reflects 2014-2015 growth in members for Vistana Signature Experiences and Hyatt Vacation Ownership Source: Company analysis 55 © Hilton Grand Vacations Proprietary |
 D I F F E R E N T I A T E D , C A P I T A L - E F F I C I E N T B U S I N E S S M O D E L Source: Company analysis 56 Development Model VOI Sales Focus Distribution Model Ability to Respond to Market Growth Traditional Timeshare Model Capital Intensive Majority Owner Sales Dispersed/ Smaller Center Model/ Less Efficient Structurally Disadvantaged Less Capital Intensive Majority New Owner Sales Concentrated Larger Centers/ Scalable/Efficient Structurally Advantaged © Hilton Grand Vacations Proprietary |
 I N T E R N A T I O N A L G R O W T H O P P O R T U N I T I E S Source: Company reports 57 © Hilton Grand Vacations Proprietary |
 S T R O N G L O N G - T E R M I N D U S T R Y F U N D A M E N T A L S 58 Consumer Spending & Employment Favorable Domestic Tourism Trends Timeshare Industry to Recover Peak Levels Allowing HGV to Outperform given reduced competition and greater market share © Hilton Grand Vacations Proprietary |
 E X P E R I E N C E D A N D E X E C U T I O N - F O C U S E D M A N A G E M E N T T E A M Mark Wang President and Chief Executive Officer James Mikolaichik Chief Financial Officer Michael Brown Chief Operating Officer 59 Stan Soroka Chief Customer Officer Barbara Holkamp Chief Human Resources Officer Charles Corbin Chief Legal Officer © Hilton Grand Vacations Proprietary |
 B O A R D OF D I R E C T O R S BRENDA J. BACON President and CEO of Brandywine Senior Living KENNETH A. CAPLAN Senior managing director and the global chief investment officer of Blackstone’s Real Estate Group, a division of The Blackstone Group DAVID W. JOHNSON President and CEO of Aimbridge Hospitality MARK LAZARUS Chairman of NBC Sports Group PAMELA PATSLEY Executive chairman of MoneyGram International LEONARD A. POTTER President and chief investment officer of Wildcat Capital Management PAUL W. WHETSELL President and CEO of CapStar Hotel Company 60 © Hilton Grand Vacations Proprietary |
 S T R A T E G I C P R I O R I T I E S Source: Company reports 61 Grow contract sales with balanced mix of new and existing owners Grow Vacation Sales Pursue expansion opportunities in new and existing markets Add urban and resort locations like Washington D.C. and Maui Grow Our Member Base Remain focused on Net Owner Growth Leverage Hilton relationship to target new, brand-loyal members Leverage new and existing marketing relationships Continue to Enhance Member Experiences Expand product, service, and technology options for our members Consistently deliver quality customer service and experiences Leverage Hilton Worldwide’s rapidly expanding global network Optimize our Sales Mix of Capital Efficient Inventory Target 50/50 sales mix of owned and fee-for-service inventory Drive premium top line growth, FCF and ROIC Expand partner relationships, pursue development/ acquisitions Pursue Opportunistic Business Ventures Use innovative platform and experience to create new products Work with Hilton Worldwide and Park to expand our footprint Pursue third-party marketing partnerships and potential M&A opportunities © Hilton Grand Vacations Proprietary |
 Financial Strengths JIM MIKOLAICHIK Chief Financial Officer, Hilton Grand Vacations 62 © Hilton Grand Vacations Proprietary |
 K E Y B U S I N E S S D R I V E R S 63 Real estate revenues driven by tours and closings Real estate margin driven by inventory, sales and marketing efficiency We finance 2/3 of our owned inventory sales and scale and low cost of funds drives financing margin Net owner growth focus expands member base Growing membership base drives resort and club margin We rent unsold/unused inventory and generate margin after covering the cost of inventory carry and HGV point conversions © Hilton Grand Vacations Proprietary |
 K E Y B U S I N E S S D R I V E R S (1) % of developed contract sales financed (excluding 90-day “same as cash” loans). 64 © Hilton Grand Vacations Proprietary |
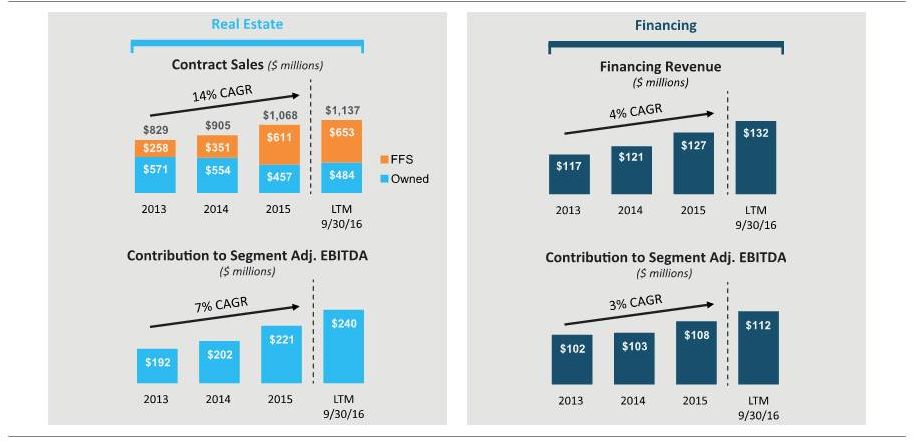 B U S I N E S S S E G M E N T : R E A L E S T A T E S A L E S A N D F I N A N C I N G 65 © Hilton Grand Vacations Proprietary |
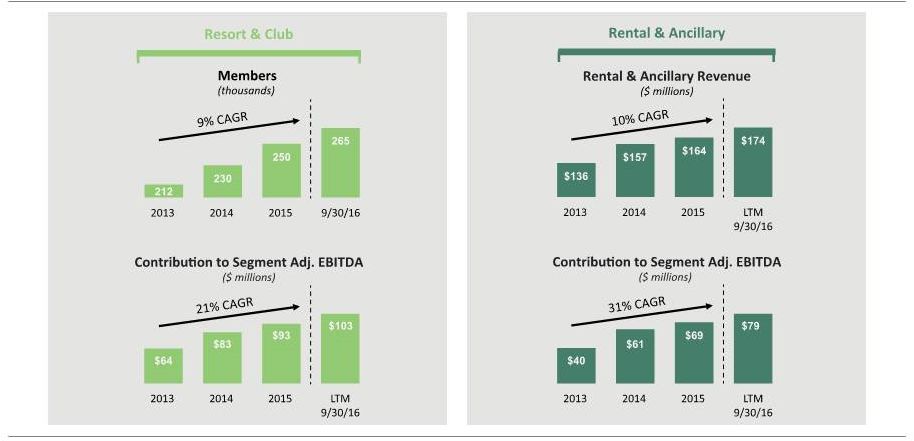 B U S I N E S S S E G M E N T : R E S O R T O P E R A T I O N S A N D C L U B M A N A G E M E N T 66 © Hilton Grand Vacations Proprietary |
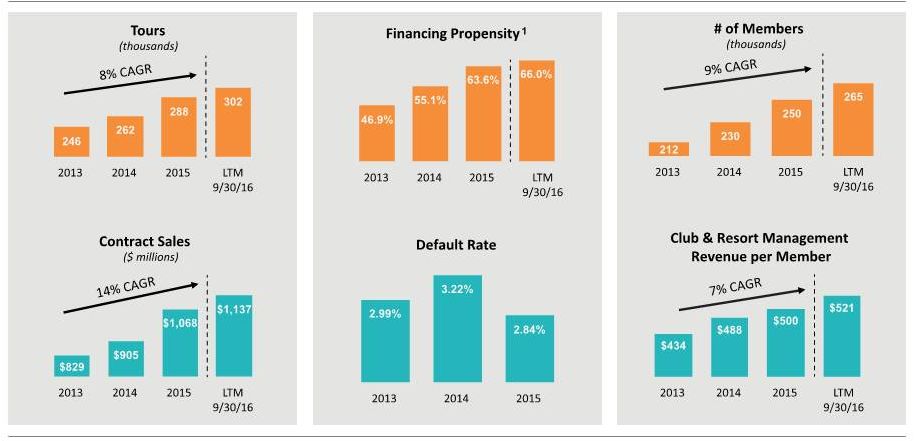
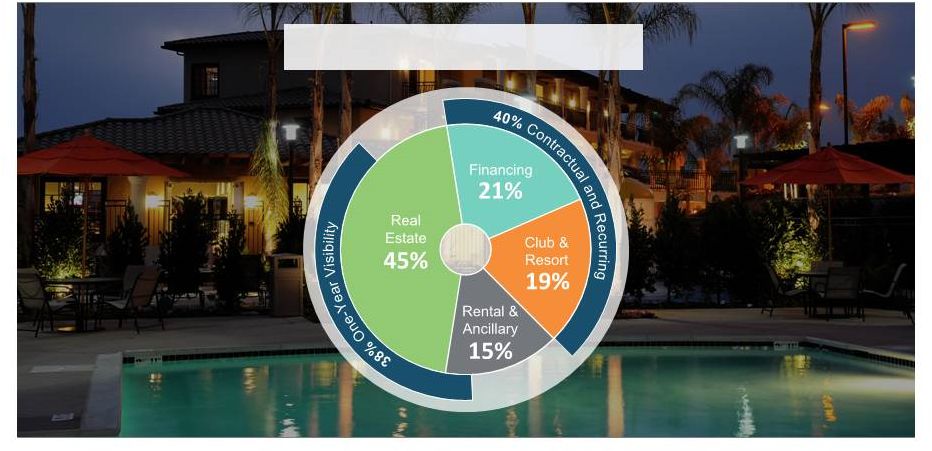 R E S I L I E N T B U S I N E S S M O D E L © Hilton Grand Vacations Proprietary 67 Contribution to Segment Adjusted EBIDTA LTM 9/30/16 |
 R E V E N U E , A D J U S T E D E B I T D A A N D F R E E C A S H F L O W (1) See appendix for a reconciliation of Adjusted EBITDA and Free Cash Flow. (2) Free cash flow calculated as cash flow from operations (adjusted for non-cash stock compensation) less non-inventory capex. Total Revenues Total Adjusted EBITDA 1 Cumulative Free Cash Flow 1 2 68 © Hilton Grand Vacations Proprietary |
 69 L O N G - T E R M T A R G E T S ( 3 - Y E A R M O D E L ) Operating Metrics • 4 to 6 percent tour flow growth • Contract sales growth of 5% to 7% • Net owner growth of 6% to 7% • Real estate margin 27% to 29% Financial Statement Metrics • Total revenue growth of 5% to 6% • G&A 18% to 20% growth rate in 2017; 2018-2019 2% to 3% CAGR • Adjusted EBITDA growth of 4% to 6% • Adjusted EBITDA margin between 23% and 25% Capital Structure • Inventory spend between $135M to $165M per year • Owned inventory balance on hand between 2 and 3 years of owned sales • $30M to $40M in annual non-inventory CapEx • 3-year average free cash flow of approximately $140M - $150M per year © Hilton Grand Vacations Proprietary |
 R E V E N U E A N D O P E R A T I N G I N C O M E G R O W T H Note: Graphs Show 2019E Range of Outcomes at 5% and 7% Contract Sales CAGR 70 Revenue Net Income © Hilton Grand Vacations Proprietary |
 A D J U S T E D E B I T D A A N D E A R N I N G S P E R S H A R E G R O W T H Note: Graphs Show 2019E Range of Outcomes at 5% and 7% Contract Sales CAGR 71 Adjusted EBITDA Earnings per Share © Hilton Grand Vacations Proprietary |
 F L E X I B L E C A P I T A L I Z A T I O N S T R U C T U R E Note: Financial figures as of 9/30/2016. • Total leverage of 1.3x and net leverage of 0.9x • Staggered debt maturity schedule with no maturities for the next 5 years • Attractive weighted average cost of debt of 4.82% • Adequate liquidity position with approximately $250 million in liquidity (between unrestricted cash and undrawn revolver capacity) 72 Debt Maturity Schedule © Hilton Grand Vacations Proprietary |
 73 O U T L O O K Net Income $160M to $176M $170M to $186M Adjusted EBITDA $383M to $409M $390M to $415M Net Cash Provided by Operating Activities $151M to $158M $174M to $191M Free Cash Flow $125M to $135M $140M to $160M Contract Sales Growth 8% to 9% 5% to 7% FFS as % of Contract Sales 55% to 57% 52% to 57% 2016 2017 21% - 23% 20% - 22% 20% - 22% Contract Sales Net Income Adjusted EBITDA Q1 2017E % of FY 2017 Results © Hilton Grand Vacations Proprietary |
 H I S T O R I C A L A D J U S T E D E B I T D A R E C O N C I L I A T I O N (1) Non-recourse debt interest expense is excluded from the definition of EBITDA as per timeshare industry standard methodology. 74 © Hilton Grand Vacations Proprietary Year Ended December 31, Nine months ended Sep. 30, LTM ended Sep. 30, 2013 2014 2015 2015 2016 2016 Total Revenues $1,224 $1,317 $1,475 $1,094 $1,168 $1,549 Net income 128 167 174 125 130 179 Non-recourse debt interest expense¹ 7 15 13 10 9 12 Recourse debt interest expense 48 36 29 22 20 27 Income tax expense 90 113 118 84 98 132 Depreciation and amortization 16 18 22 16 17 23 EBITDA $289 $349 $356 $257 $274 $373 Gain on debt extinguishment (22) - - - - - Other (gain)/loss - (5) - - 1 1 (Gain)/loss on foreign currency translation 5 2 - - (2) (2) Share-based compensation expense 22 4 13 11 7 9 Other adjustment items 12 3 4 2 21 23 Adjusted EBITDA $306 $353 $373 $270 $301 $404 Cash flow from operations 196 213 131 82 116 165 Share-based compensation 22 4 13 11 7 9 Non-inventory capital expenditures (17) (17) (18) (13) (21) (26) Free Cash Flow $201 $200 $126 $80 $102 $148 |
 L T M S A L E S A N D S E G M E N T A D J U S T E D E B I T D A R E C O N C I L I A T I O N 75 © Hilton Grand Vacations Proprietary Year Ended December 31, Nine months ended Sep. 30, LTM ended Sep. 30, 2015 2015 2016 2016 Contract Sales 1,068 794 863 1,137 Fee-for-Service Sales 611 472 514 653 Owned Sales 457 322 349 484 Business Lines Real Estate Revenues Sales of VOIs, net 492 355 359 496 Sales, marketing, brand and other fees 457 352 382 487 Expenses Cost of VOI sales (173) (144) (110) (139) Sales and marketing (541) (395) (443) (589) Intersegment Eliminations (16) (14) (16) (18) Share-based compensation add-back 2 1 2 3 Contribution to Segment Adjusted EBITDA 221 155 174 240 Financing Revenues Financing Revenue 127 95 100 132 Expenses Financing Expenses (32) (24) (24) (32) Consumer financing interest expense 13 10 9 12 Contribution to Segment Adjusted EBITDA 108 81 85 112 Club and Resort Management Revenues Club and resort management revenues 125 85 98 138 Expenses Club and resort management expense (32) (23) (25) (34) Intersegment Eliminations (1) (1) (2) (2) Share-based compensation add-back 1 1 1 1 Contribution to Segment Adjusted EBITDA 93 62 72 103 Rental and Ancillary Revenues Rental and ancillary services revenues 164 125 135 174 Intersegment Eliminations 18 15 18 21 Expenses Rental and ancillary services expense (113) (83) (86) (116) Contribution to Segment Adjusted EBITDA 69 57 67 79 Total Segment Adjusted EBITDA 491 355 398 534 |
 F O R W A R D - Y E A R A D J U S T E D E B I T D A R E C O N C I L I A T I O N 76 (1) Represents adjustments for one-time public company costs 2016E 2017E (In millions) Low Case High Case Low Case High Case Contract Sales 8% 9% 5% 7% FFS as % of contract sales 55% 57% 52% 57% Segment adjusted EBITDA 523 543 547 567 G&A 60 54 71 65 License Fee 80 80 86 87 Adjusted EBITDA 383 409 390 415 Share based comp 9 7 16 14 Other items 1 28 28 11 11 EBITDA 346 374 363 390 Non-recourse debt interest expense 12 12 18 18 Corporate debt interest expense 4 4 27 27 Allocated parent interest expense 29 29 0 0 Depreciation and amortization 23 23 27 27 Income tax expense 118 130 121 132 Net income 160 176 170 186 Cash flow from operating activities 151 158 174 191 Share based compensation 9 7 16 14 Non-inventory capex (35) (30) (50) (45) Free cash flow 125 135 140 160 © Hilton Grand Vacations Proprietary |
 © Hilton Grand Vacations Proprietary |