
November 29, 2023 Project Teal Ratings Agency Overview DRAFT C Lender Presentation January 2024 Exhibit 99.1
1 Legal Disclaimer Disclaimer This presentation, the information contained herein and the materials accompanying it (i) constitute confidential information, (ii) are provided to you on the condition that you agree to hold it in strict confidence and not reproduce, disclose, forward or distribute it in whole or in part without the prior written consent of HGV and (iii) are intended for the recipient hereof only. Acceptance of this presentation further constitutes your acknowledgment and agreement that none of HGV and its affiliates, directors, officers, employees, partners, members, controlling persons, agents or advisers makes any express or implied representation or warranty as to the accuracy or completeness of the information contained herein or shall have any liability to the recipient or its representatives relating to or arising from the information contained herein or any omissions from such information, the use or misuse of such information or any other written or oral communication transmitted to any interested party in the course of its evaluation of HGV and the credit facility described herein (the “Facility”). This presentation contains forward-looking statements within the meaning of Section 27A of the Securities Act of 1933, as amended and Section 21E of the Securities Exchange Act of 1934, as amended. Forward-looking statements convey management’s expectations as to the future of HGV, and are based on management’s beliefs, expectations, assumptions and such plans, estimates, projections and other information available to management at the time HGV makes such statements. Forward-looking statements include all statements that are not historical facts, may be identified by terminology such as the words “outlook,” “believe,” “expect,” “potential,” “goal,” “continues,” “may,” “will,” “should,” “could,” “seeks,” “approximately,” “projects,” “predicts,” “intends,” “plans,” “estimates,” “anticipates,” “future,” “guidance,” “target,” or the negative version of these words or other comparable words, although not all forward-looking statements may contain such words. The forward-looking statements contained in this presentation include statements related to HGV’s revenues, earnings, taxes, cash flow and related financial and operating measures, and expectations with respect to future operating, financial and business performance and other anticipated future events and expectations that are not historical facts, including related to the proposed transaction between HGV and Bluegreen Vacations. HGV cautions you that forward-looking statements involve known and unknown risks, uncertainties and other factors, including those that are beyond HGV’s control, that may cause its actual results, performance or achievements to be materially different from the future results. Any one or more of these risks or uncertainties, including those related to the proposed transaction between HGV and Bluegreen Vacations, could adversely impact HGV’s operations, revenue, operating profits and margins, key business operational metrics, financial condition and/or credit rating. HGV’s forward-looking statements speak only as of the date of this communication or as of the date they are made. HGV disclaims any intent or obligation to update any “forward looking statement” made in this communication to reflect changed assumptions, the occurrence of unanticipated events or changes to future operating results over time. This presentation includes discussions of terms that are not recognized terms under U.S. Generally Accepted Accounting Principles (“GAAP”), and financial measures that are not calculated in accordance with GAAP, such as Adjusted EBITDA. We derived any non-GAAP financial measures from our financial statements and Dakota Holdings, Inc.’s financial statements. We believe such non-GAAP measures provide useful information to our investors about us and our financial condition and results of operations since these measures are used by our management to evaluate our operating performance and by securities analysts and investors as common financial measures for comparison in our industry. See our most recent Annual Report on Form 10-K and our most recent Quarterly Report on Form 10-Q for a more detailed discussion of the meanings of these terms and our reasoning for providing non-GAAP financial measures and the Appendix to this presentation for a full reconciliation of these measures to the most directly comparable GAAP financial measures. This presentation also contains estimates and information concerning our industry, including market position, market size, and growth rates of the markets in which HGV participates, that are based on industry publications and reports. This information involves a number of assumptions and limitations, and you are cautioned not to give undue weight to these estimates. HGV has not independently verified the accuracy or completeness of the data contained in these industry publications and reports. The industry in which HGV operates is subject to a high degree of uncertainty and risk due to a variety of factors. These and other factors could cause results to differ materially from those expressed in these publications and reports. This presentation has been prepared to assist interested parties in making their own evaluation of HGV and the Facility and does not purport to be all-inclusive or to contain all of the information or a discussion of all of the risks that a prospective participant may consider material or desirable in making its decision to become a lender. You should take such steps as you deem necessary to assure that you have the information you consider material or desirable in making your decision to become a lender and should perform your own independent investigation and analysis of the Facility or the transactions contemplated thereby and the creditworthiness of HGV and its affiliates, including by supplementing the information contained this presentation with other evaluation materials. The information and data contained herein are not a substitute for your independent evaluation and analysis and should not be considered as a recommendation by HGV or any of its affiliates that you participate in the Facility or enter into the definitive agreements regarding the Facility.

3 Agenda Transaction Overview Combined Company Overview Key Credit Highlights Segment Overview and Update Historical Financial Performance Appendix
Transaction Overview
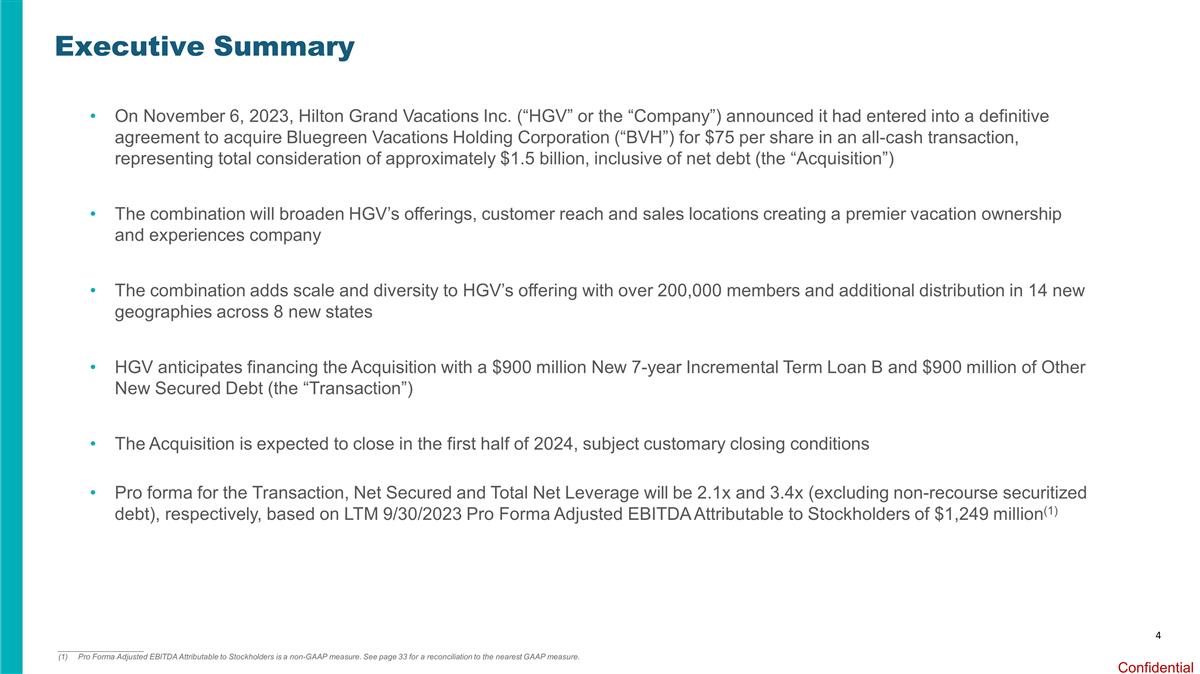
4 Executive Summary ____________________ (1)Pro Forma Adjusted EBITDA Attributable to Stockholders is a non-GAAP measure. See page 33 for a reconciliation to the nearest GAAP measure. On November 6, 2023, Hilton Grand Vacations Inc. (“HGV” or the “Company”) announced it had entered into a definitive agreement to acquire Bluegreen Vacations Holding Corporation (“BVH”) for $75 per share in an all-cash transaction, representing total consideration of approximately $1.5 billion, inclusive of net debt (the “Acquisition”) The combination will broaden HGV’s offerings, customer reach and sales locations creating a premier vacation ownership and experiences company The combination adds scale and diversity to HGV’s offering with over 200,000 members and additional distribution in 14 new geographies across 8 new states HGV anticipates financing the Acquisition with a $900 million New 7-year Incremental Term Loan B and $900 million of Other New Secured Debt (the “Transaction”) The Acquisition is expected to close in the first half of 2024, subject customary closing conditions Pro forma for the Transaction, Net Secured and Total Net Leverage will be 2.1x and 3.4x (excluding non-recourse securitized debt), respectively, based on LTM 9/30/2023 Pro Forma Adjusted EBITDA Attributable to Stockholders of $1,249 million(1)
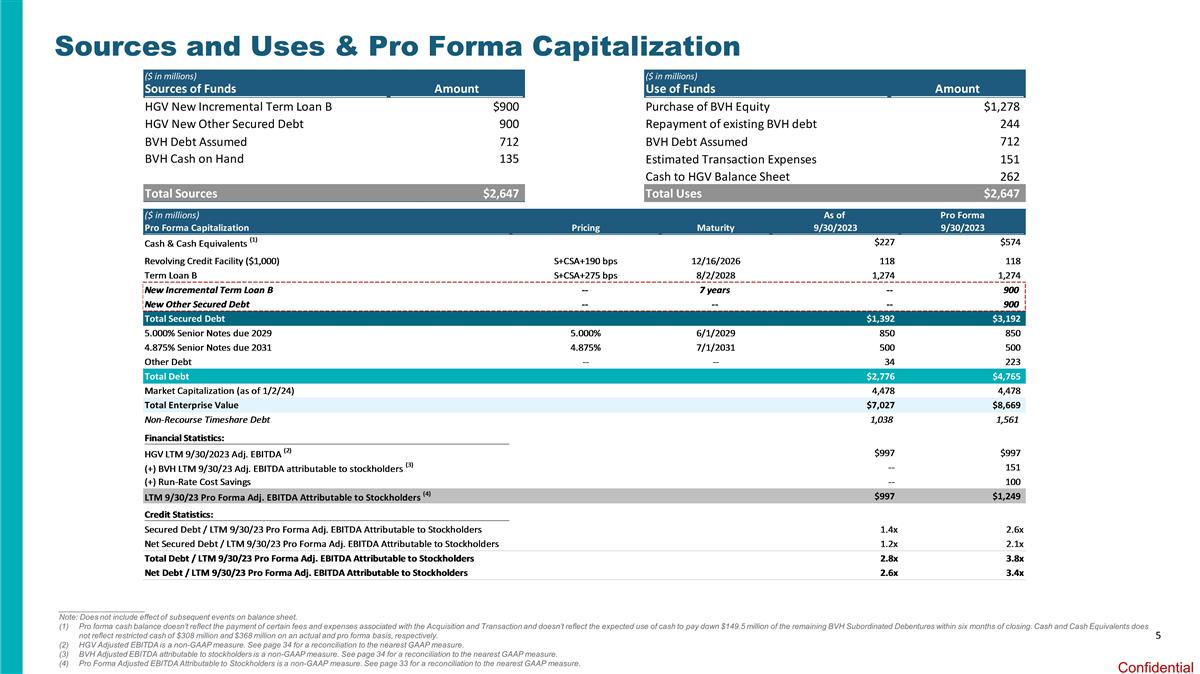
5 Sources and Uses & Pro Forma Capitalization ____________________ Note: Does not include effect of subsequent events on balance sheet. Pro forma cash balance doesn’t reflect the payment of certain fees and expenses associated with the Acquisition and Transaction and doesn’t reflect the expected use of cash to pay down $149.5 million of the remaining BVH Subordinated Debentures within six months of closing. Cash and Cash Equivalents does not reflect restricted cash of $308 million and $368 million on an actual and pro forma basis, respectively. HGV Adjusted EBITDA is a non-GAAP measure. See page 34 for a reconciliation to the nearest GAAP measure. BVH Adjusted EBITDA attributable to stockholders is a non-GAAP measure. See page 34 for a reconciliation to the nearest GAAP measure. Pro Forma Adjusted EBITDA Attributable to Stockholders is a non-GAAP measure. See page 33 for a reconciliation to the nearest GAAP measure.

Combined Company Overview
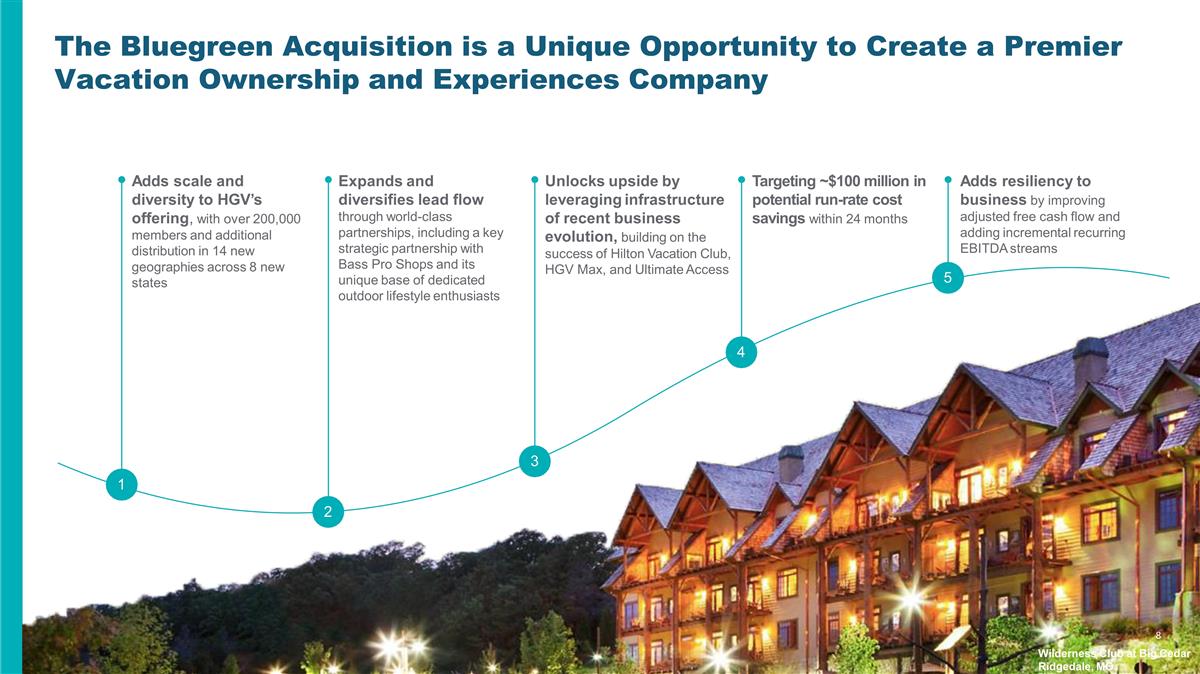
8 The Bluegreen Acquisition is a Unique Opportunity to Create a Premier Vacation Ownership and Experiences Company Wilderness Club at Big Cedar Ridgedale, MO 4 Adds scale and diversity to HGV’s offering, with over 200,000 members and additional distribution in 14 new geographies across 8 new states Expands and diversifies lead flow through world-class partnerships, including a key strategic partnership with Bass Pro Shops and its unique base of dedicated outdoor lifestyle enthusiasts Unlocks upside by leveraging infrastructure of recent business evolution, building on the success of Hilton Vacation Club, HGV Max, and Ultimate Access Targeting ~$100 million in potential run-rate cost savings within 24 months Adds resiliency to business by improving adjusted free cash flow and adding incremental recurring EBITDA streams 5 1 3 2
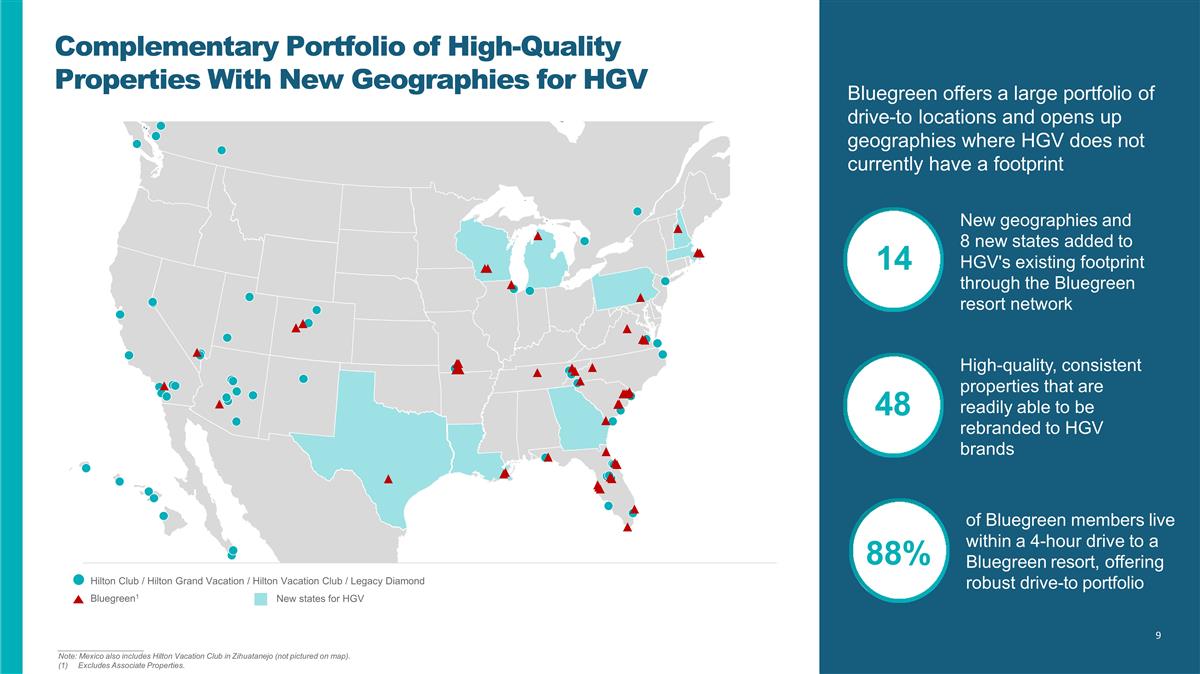
14 48 Bluegreen offers a large portfolio of drive-to locations and opens up geographies where HGV does not currently have a footprint New geographies and 8 new states added to HGV's existing footprint through the Bluegreen resort network High-quality, consistent properties that are readily able to be rebranded to HGV brands 88% of Bluegreen members live within a 4-hour drive to a Bluegreen resort, offering robust drive-to portfolio 9 Complementary Portfolio of High-Quality Properties With New Geographies for HGV ____________________ Note: Mexico also includes Hilton Vacation Club in Zihuatanejo (not pictured on map). Excludes Associate Properties. Bluegreen1 New states for HGV Hilton Club / Hilton Grand Vacation / Hilton Vacation Club / Legacy Diamond
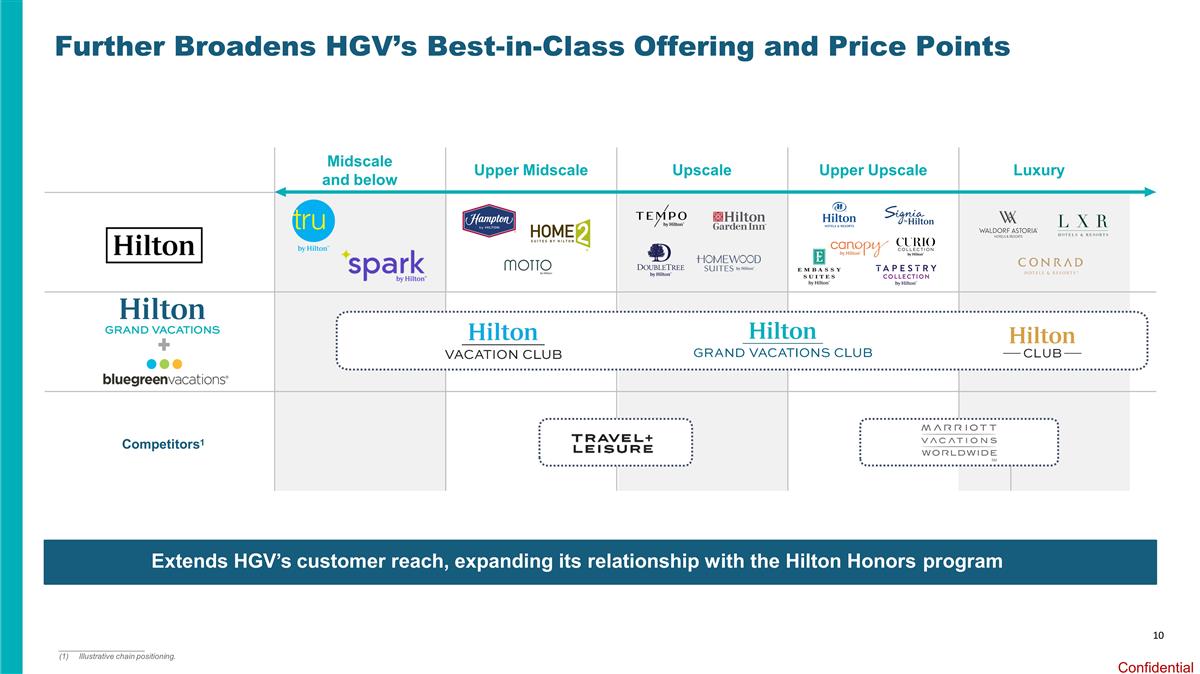
10 Further Broadens HGV’s Best-in-Class Offering and Price Points ____________________ (1)Illustrative chain positioning. Competitors1 Extends HGV’s customer reach, expanding its relationship with the Hilton Honors program Midscale and below Upper Midscale Upscale Upper Upscale Luxury
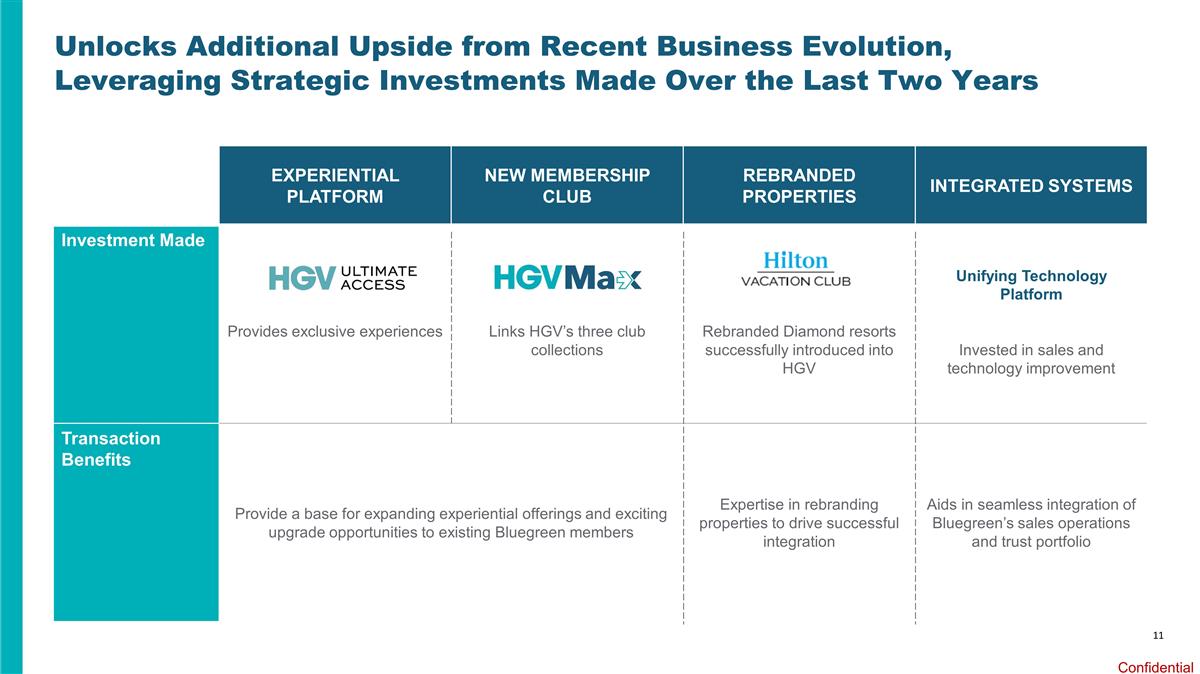
11 Unlocks Additional Upside from Recent Business Evolution, Leveraging Strategic Investments Made Over the Last Two Years EXPERIENTIAL PLATFORM NEW MEMBERSHIP CLUB REBRANDED PROPERTIES INTEGRATED SYSTEMS Investment Made Provides exclusive experiences Links HGV’s three club collections Rebranded Diamond resorts successfully introduced into HGV Unifying Technology Platform Invested in sales and technology improvement Transaction Benefits Provide a base for expanding experiential offerings and exciting upgrade opportunities to existing Bluegreen members Expertise in rebranding properties to drive successful integration Aids in seamless integration of Bluegreen’s sales operations and trust portfolio

Key Credit Highlights
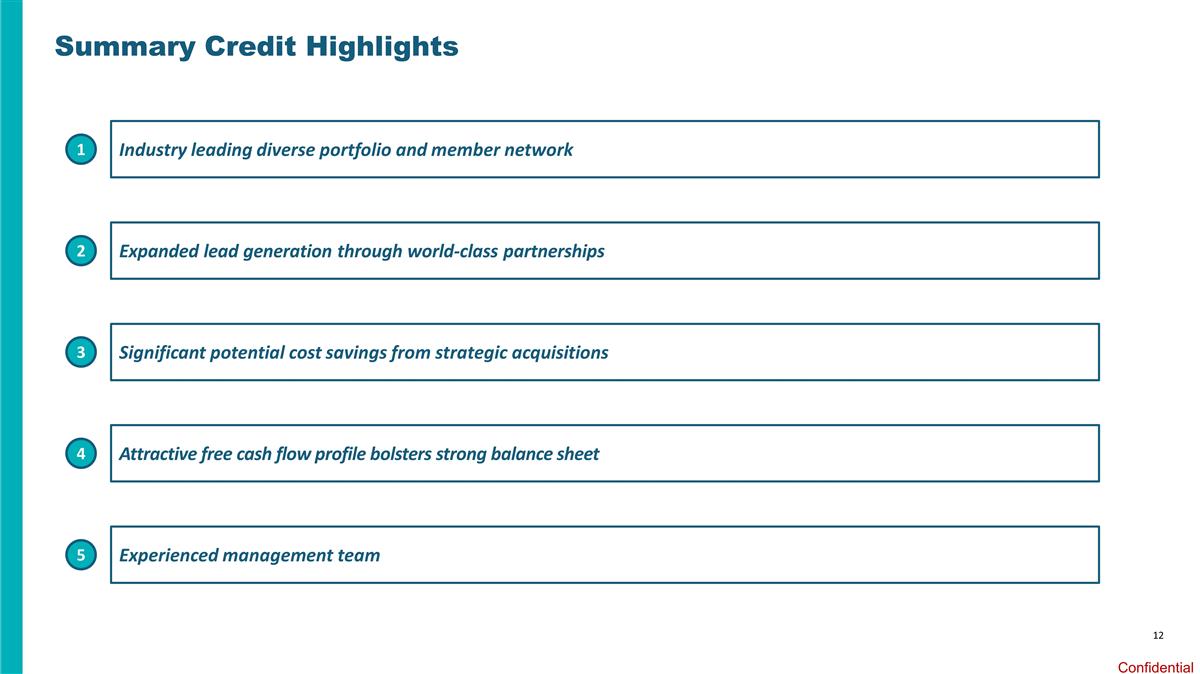
12 Summary Credit Highlights Industry leading diverse portfolio and member network 1 Experienced management team 5 Attractive free cash flow profile bolsters strong balance sheet 4 Significant potential cost savings from strategic acquisitions 3 Expanded lead generation through world-class partnerships 2
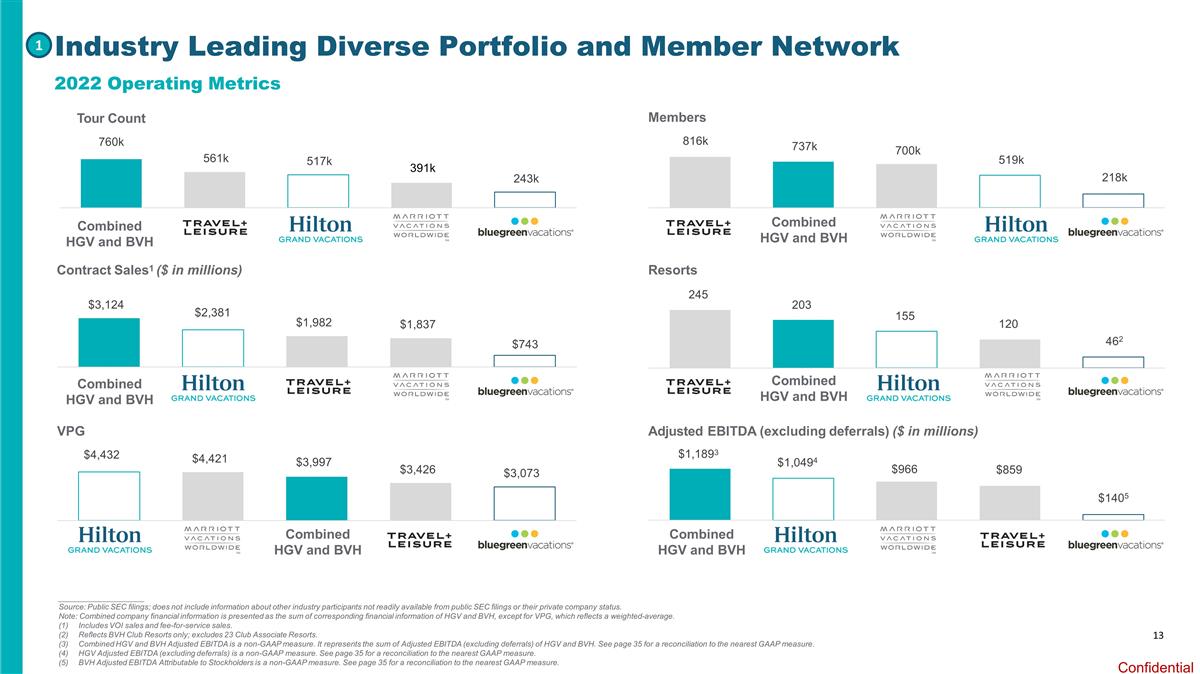
13 Industry Leading Diverse Portfolio and Member Network 1 ____________________ Source: Public SEC filings; does not include information about other industry participants not readily available from public SEC filings or their private company status. Note: Combined company financial information is presented as the sum of corresponding financial information of HGV and BVH, except for VPG, which reflects a weighted-average. Includes VOI sales and fee-for-service sales. Reflects BVH Club Resorts only; excludes 23 Club Associate Resorts. Combined HGV and BVH Adjusted EBITDA is a non-GAAP measure. It represents the sum of Adjusted EBITDA (excluding deferrals) of HGV and BVH. See page 35 for a reconciliation to the nearest GAAP measure. HGV Adjusted EBITDA (excluding deferrals) is a non-GAAP measure. See page 35 for a reconciliation to the nearest GAAP measure. BVH Adjusted EBITDA Attributable to Stockholders is a non-GAAP measure. See page 35 for a reconciliation to the nearest GAAP measure. 561k 517k 391k 243k $3,124 $2,381 $1,982 $1,837 $743 Tour Count 760k Contract Sales1 ($ in millions) $4,421 $3,997 $3,426 $3,073 VPG $4,432 737k 700k 519k 218k Members 816k $966 $859 $1405 $1,1893 $1,0494 Adjusted EBITDA (excluding deferrals) ($ in millions) 245 203 155 120 462 Resorts Combined HGV and BVH Combined HGV and BVH Combined HGV and BVH Combined HGV and BVH Combined HGV and BVH Combined HGV and BVH 2022 Operating Metrics
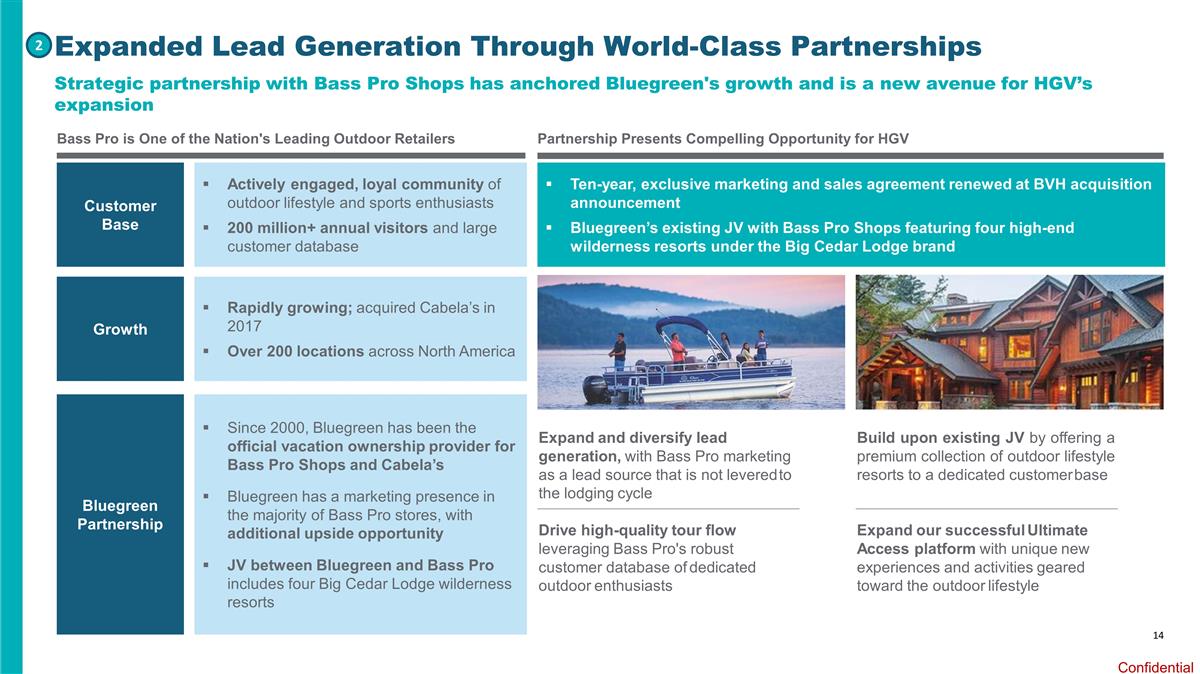
14 Expanded Lead Generation Through World-Class Partnerships 2 Strategic partnership with Bass Pro Shops has anchored Bluegreen's growth and is a new avenue for HGV’s expansion Expand and diversify lead generation, with Bass Pro marketing as a lead source that is not levered to the lodging cycle Drive high-quality tour flow leveraging Bass Pro's robust customer database of dedicated outdoor enthusiasts Build upon existing JV by offering a premium collection of outdoor lifestyle resorts to a dedicated customer base Expand our successful Ultimate Access platform with unique new experiences and activities geared toward the outdoor lifestyle Customer Base Actively engaged, loyal community of outdoor lifestyle and sports enthusiasts 200 million+ annual visitors and large customer database Growth Rapidly growing; acquired Cabela’s in 2017 Over 200 locations across North America Bluegreen Partnership Since 2000, Bluegreen has been the official vacation ownership provider for Bass Pro Shops and Cabela’s Bluegreen has a marketing presence in the majority of Bass Pro stores, with additional upside opportunity JV between Bluegreen and Bass Pro includes four Big Cedar Lodge wilderness resorts Ten-year, exclusive marketing and sales agreement renewed at BVH acquisition announcement Bluegreen’s existing JV with Bass Pro Shops featuring four high-end wilderness resorts under the Big Cedar Lodge brand Bass Pro is One of the Nation's Leading Outdoor Retailers Partnership Presents Compelling Opportunity for HGV
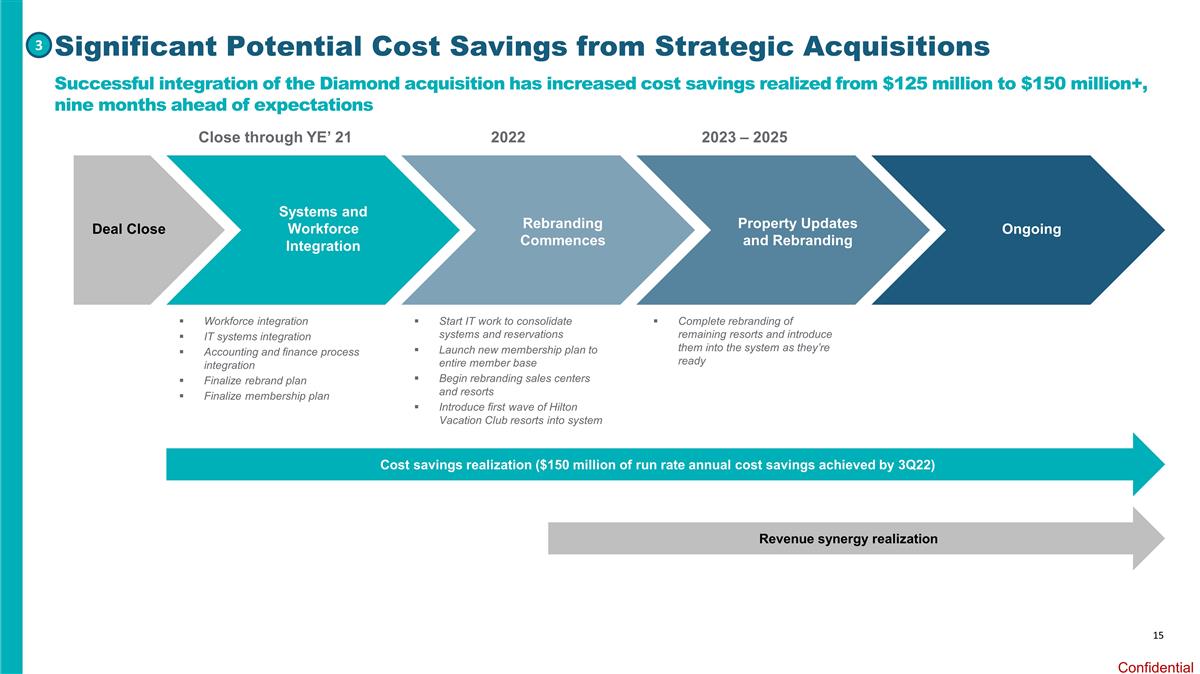
15 Systems and Workforce Integration Rebranding Commences Property Updates and Rebranding Ongoing Deal Close Close through YE’ 21 2022 2023 – 2025 Workforce integration IT systems integration Accounting and finance process integration Finalize rebrand plan Finalize membership plan Start IT work to consolidate systems and reservations Launch new membership plan to entire member base Begin rebranding sales centers and resorts Introduce first wave of Hilton Vacation Club resorts into system Complete rebranding of remaining resorts and introduce them into the system as they’re ready Cost savings realization ($150 million of run rate annual cost savings achieved by 3Q22) Revenue synergy realization Significant Potential Cost Savings from Strategic Acquisitions 3 Successful integration of the Diamond acquisition has increased cost savings realized from $125 million to $150 million+, nine months ahead of expectations
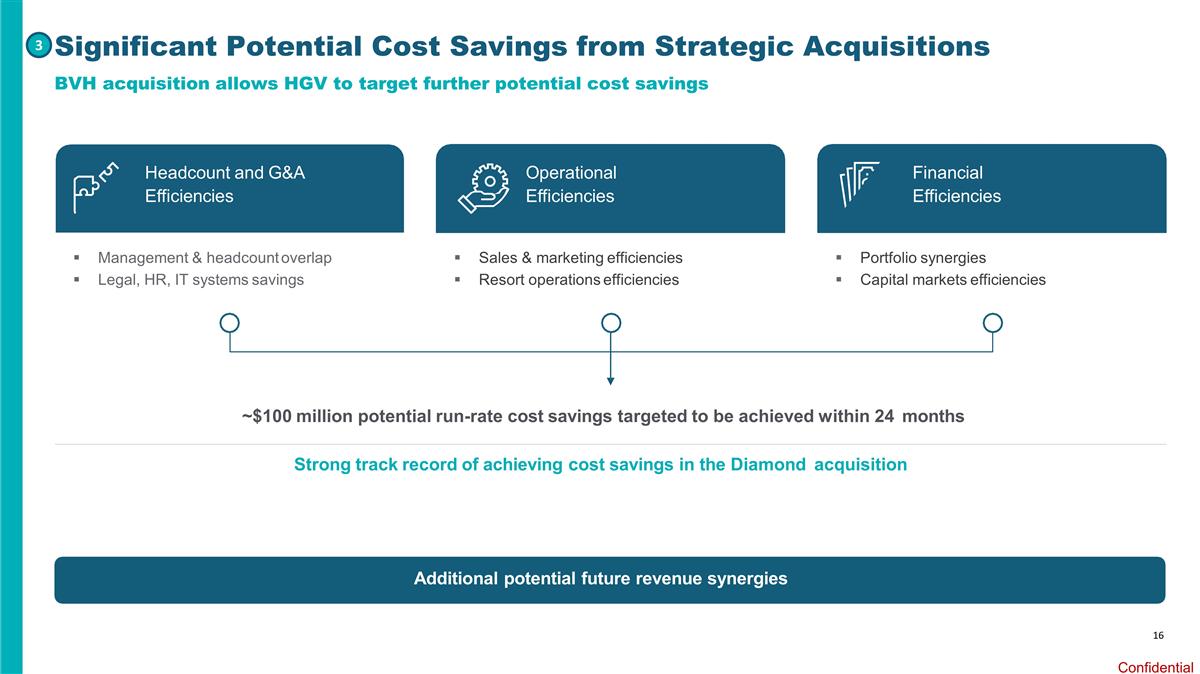
16 Significant Potential Cost Savings from Strategic Acquisitions 3 Management & headcount overlap Legal, HR, IT systems savings Sales & marketing efficiencies Resort operations efficiencies Portfolio synergies Capital markets efficiencies Headcount and G&A Efficiencies Operational Efficiencies Financial Efficiencies ~$100 million potential run-rate cost savings targeted to be achieved within 24 months Strong track record of achieving cost savings in the Diamond acquisition Additional potential future revenue synergies BVH acquisition allows HGV to target further potential cost savings
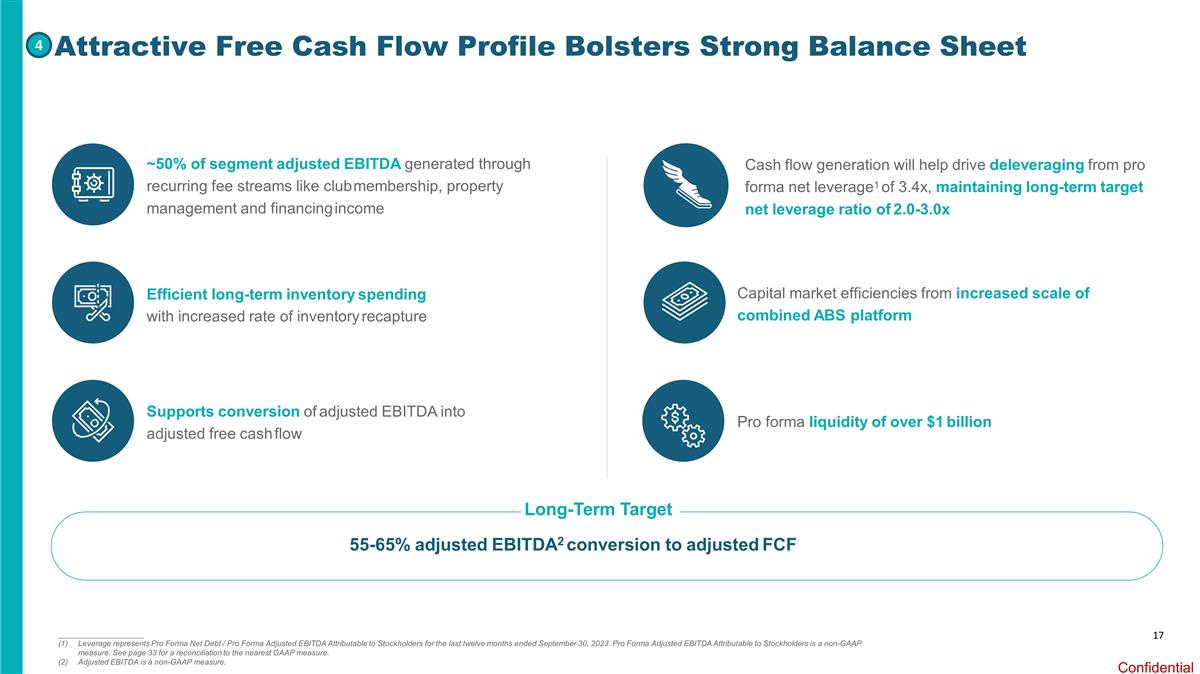
17 Attractive Free Cash Flow Profile Bolsters Strong Balance Sheet 4 Pro forma liquidity of over $1 billion Capital market efficiencies from increased scale of combined ABS platform Cash flow generation will help drive deleveraging from pro forma net leverage1 of 3.4x, maintaining long-term target net leverage ratio of 2.0-3.0x ~50% of segment adjusted EBITDA generated through recurring fee streams like club membership, property management and financing income Long-Term Target 55-65% adjusted EBITDA2 conversion to adjusted FCF Efficient long-term inventory spending with increased rate of inventory recapture Supports conversion of adjusted EBITDA into adjusted free cash flow ____________________ Leverage represents Pro Forma Net Debt / Pro Forma Adjusted EBITDA Attributable to Stockholders for the last twelve months ended September 30, 2023. Pro Forma Adjusted EBITDA Attributable to Stockholders is a non-GAAP measure. See page 33 for a reconciliation to the nearest GAAP measure. Adjusted EBITDA is a non-GAAP measure.
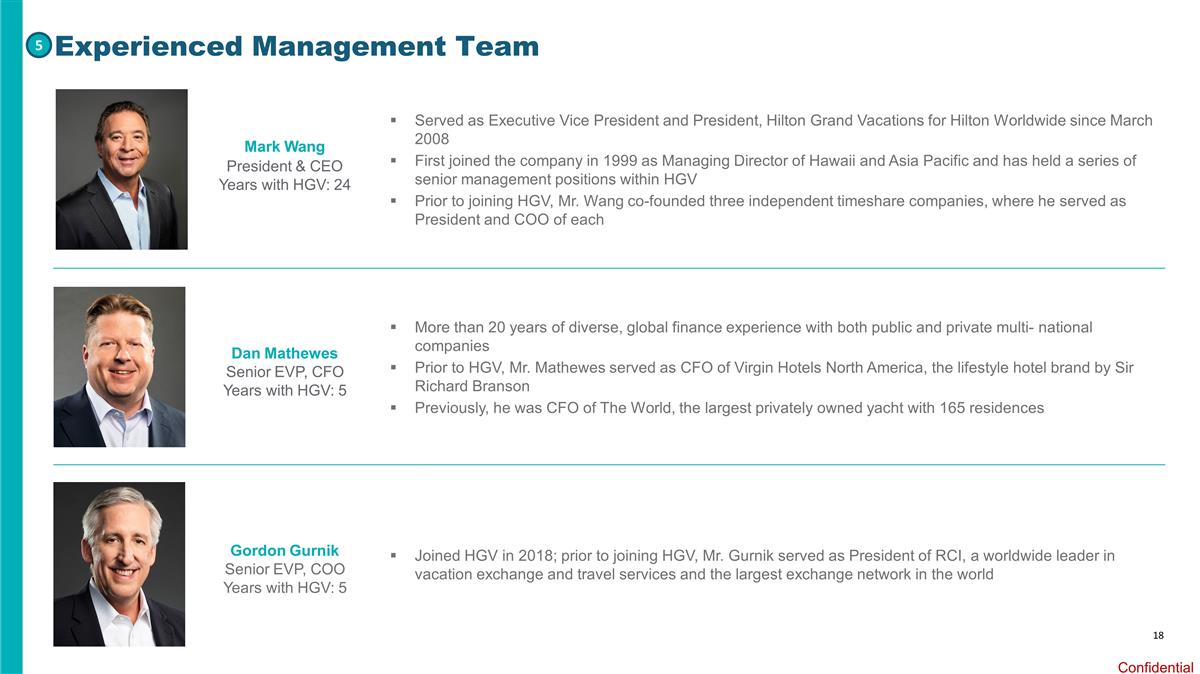
18 Experienced Management Team 5 Mark Wang President & CEO Years with HGV: 24 Gordon Gurnik Senior EVP, COO Years with HGV: 5 Dan Mathewes Senior EVP, CFO Years with HGV: 5 Served as Executive Vice President and President, Hilton Grand Vacations for Hilton Worldwide since March 2008 First joined the company in 1999 as Managing Director of Hawaii and Asia Pacific and has held a series of senior management positions within HGV Prior to joining HGV, Mr. Wang co-founded three independent timeshare companies, where he served as President and COO of each More than 20 years of diverse, global finance experience with both public and private multi- national companies Prior to HGV, Mr. Mathewes served as CFO of Virgin Hotels North America, the lifestyle hotel brand by Sir Richard Branson Previously, he was CFO of The World, the largest privately owned yacht with 165 residences Joined HGV in 2018; prior to joining HGV, Mr. Gurnik served as President of RCI, a worldwide leader in vacation exchange and travel services and the largest exchange network in the world

Segment Overview and Update
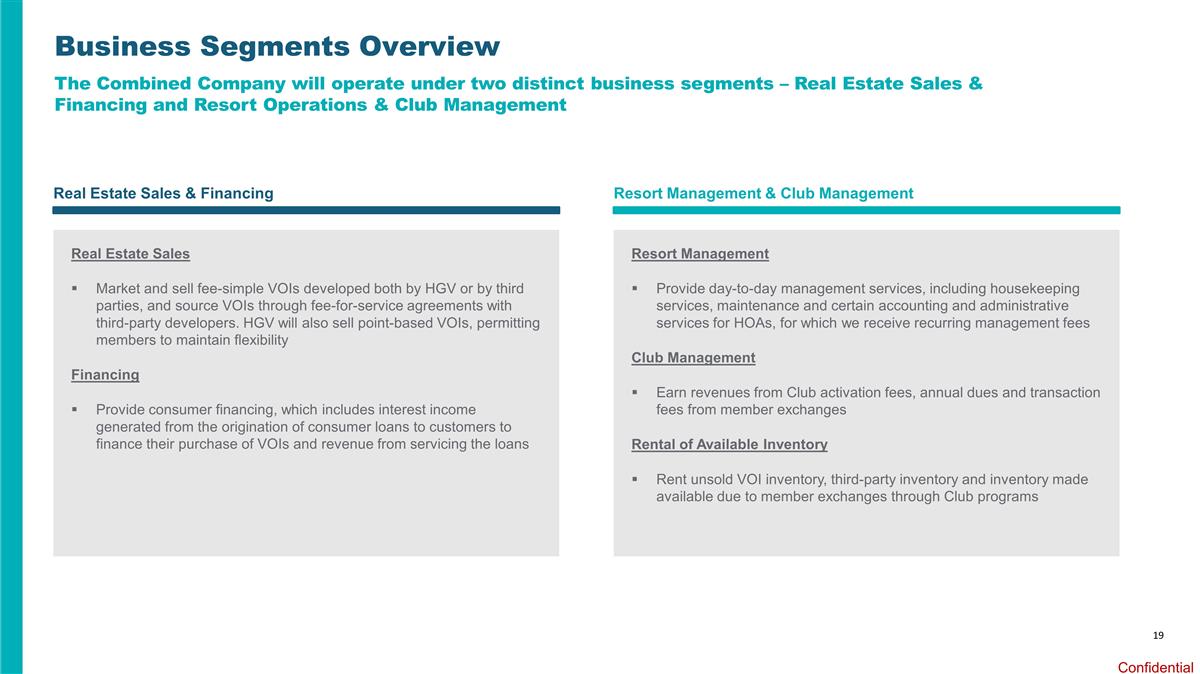
19 Business Segments Overview The Combined Company will operate under two distinct business segments – Real Estate Sales & Financing and Resort Operations & Club Management Real Estate Sales & Financing Resort Management & Club Management Real Estate Sales Market and sell fee-simple VOIs developed both by HGV or by third parties, and source VOIs through fee-for-service agreements with third-party developers. HGV will also sell point-based VOIs, permitting members to maintain flexibility Financing Provide consumer financing, which includes interest income generated from the origination of consumer loans to customers to finance their purchase of VOIs and revenue from servicing the loans Resort Management Provide day-to-day management services, including housekeeping services, maintenance and certain accounting and administrative services for HOAs, for which we receive recurring management fees Club Management Earn revenues from Club activation fees, annual dues and transaction fees from member exchanges Rental of Available Inventory Rent unsold VOI inventory, third-party inventory and inventory made available due to member exchanges through Club programs
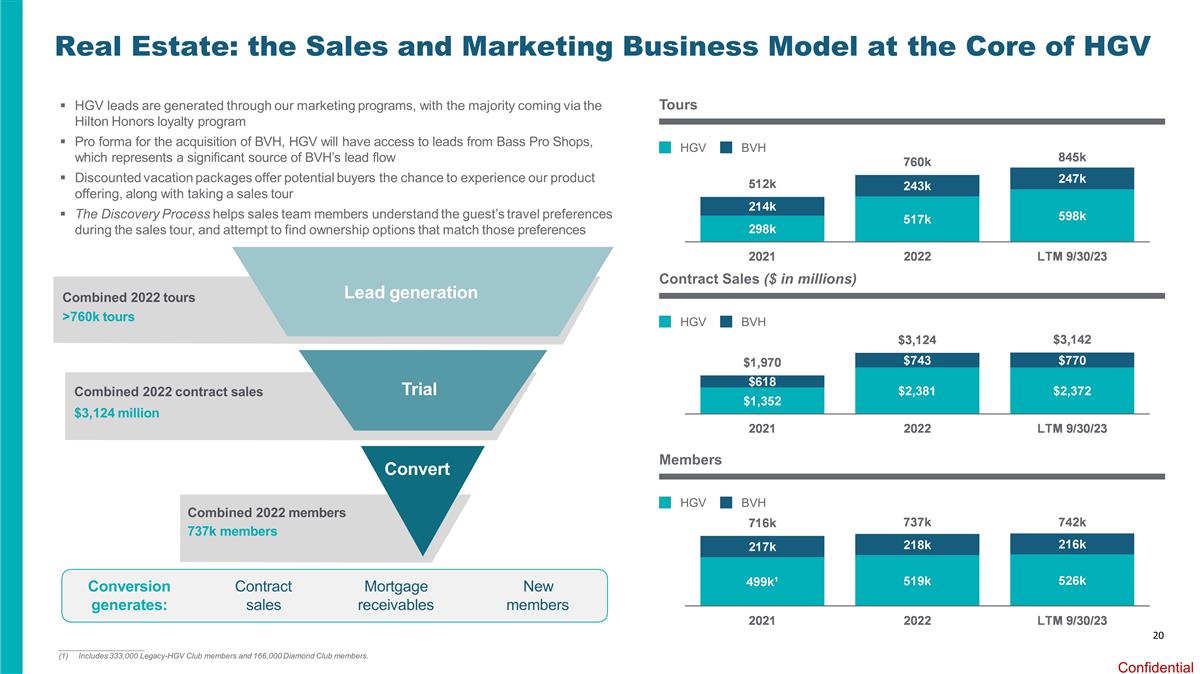
20 Real Estate: the Sales and Marketing Business Model at the Core of HGV Rental & Ancillary Monetize unutilized inventory Generate additional tours from rental guests Club & Resort Manage member clubs Manage resort operations Recurring fee business Convert Trial Lead generation Combined 2022 tours >760k tours Combined 2022 contract sales $3,124 million Combined 2022 members 737k members HGV leads are generated through our marketing programs, with the majority coming via the Hilton Honors loyalty program Pro forma for the acquisition of BVH, HGV will have access to leads from Bass Pro Shops, which represents a significant source of BVH’s lead flow Discounted vacation packages offer potential buyers the chance to experience our product offering, along with taking a sales tour The Discovery Process helps sales team members understand the guest’s travel preferences during the sales tour, and attempt to find ownership options that match those preferences Contract sales Mortgage receivables New members Conversion generates: Tours HGV BVH Contract Sales ($ in millions) HGV BVH Members HGV BVH ____________________ Includes 333,000 Legacy-HGV Club members and 166,000 Diamond Club members.
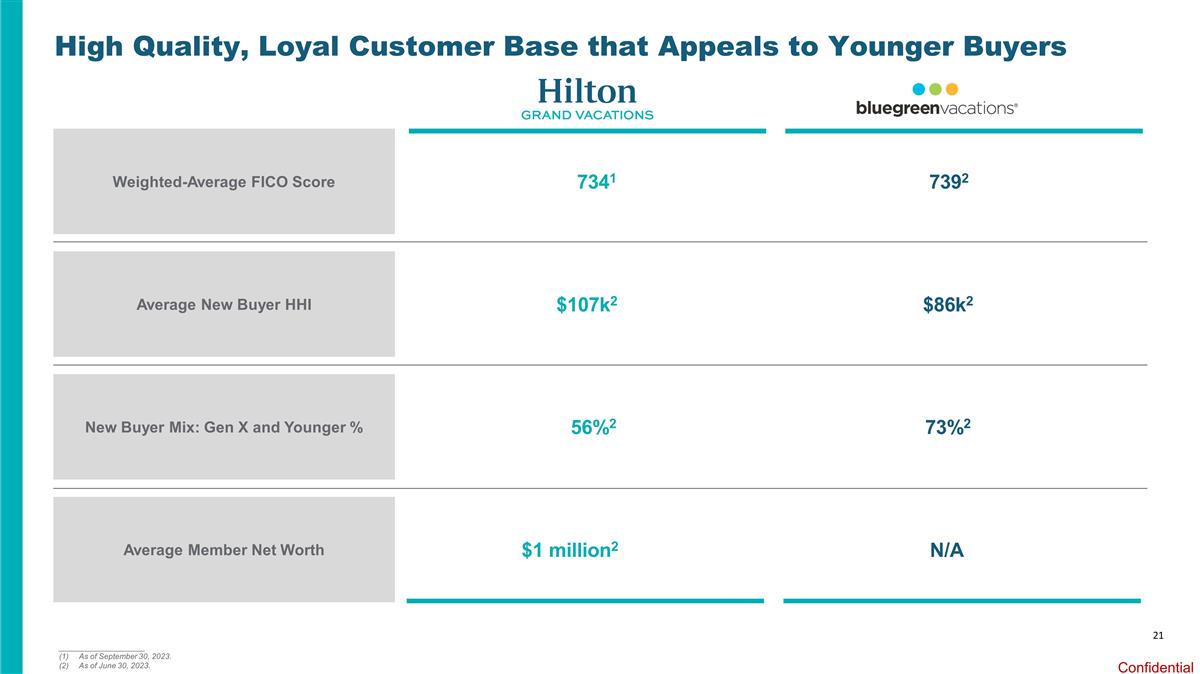
21 High Quality, Loyal Customer Base that Appeals to Younger Buyers 7341 $107k2 56%2 $1 million2 7392 $86k2 73%2 N/A ____________________ As of September 30, 2023. As of June 30, 2023. Weighted-Average FICO Score Average New Buyer HHI New Buyer Mix: Gen X and Younger % Average Member Net Worth
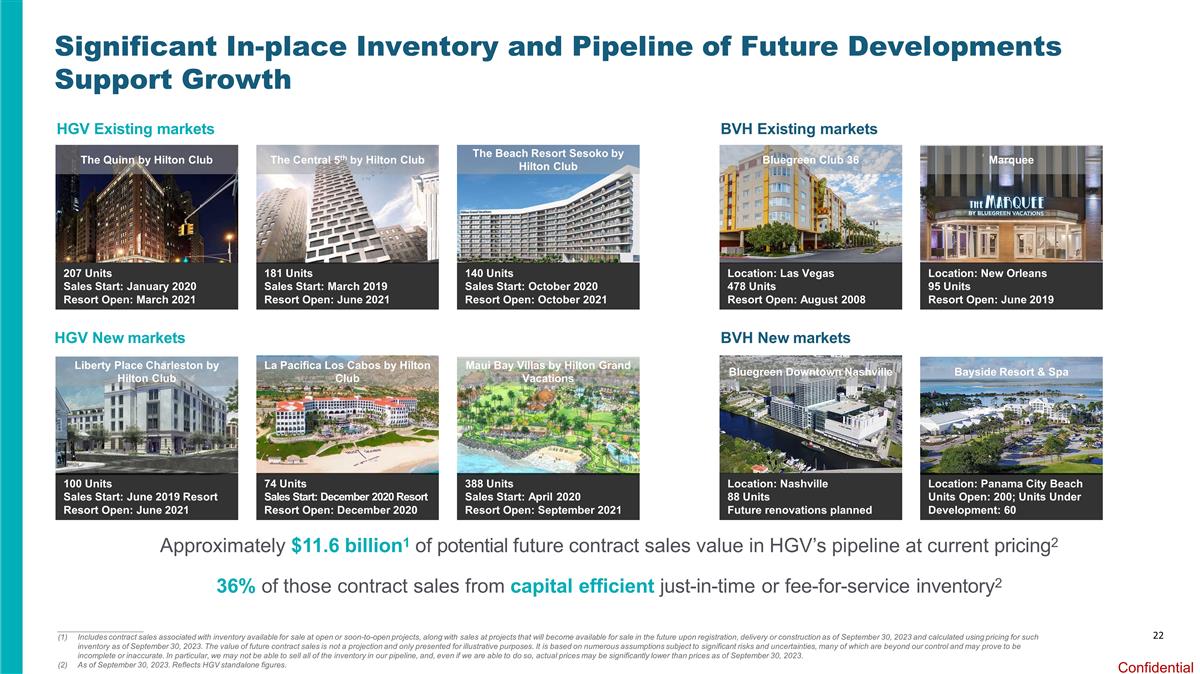
22 Significant In-place Inventory and Pipeline of Future Developments Support Growth HGV Existing markets HGV New markets Approximately $11.6 billion1 of potential future contract sales value in HGV’s pipeline at current pricing2 36% of those contract sales from capital efficient just-in-time or fee-for-service inventory2 ____________________ Includes contract sales associated with inventory available for sale at open or soon-to-open projects, along with sales at projects that will become available for sale in the future upon registration, delivery or construction as of September 30, 2023 and calculated using pricing for such inventory as of September 30, 2023. The value of future contract sales is not a projection and only presented for illustrative purposes. It is based on numerous assumptions subject to significant risks and uncertainties, many of which are beyond our control and may prove to be incomplete or inaccurate. In particular, we may not be able to sell all of the inventory in our pipeline, and, even if we are able to do so, actual prices may be significantly lower than prices as of September 30, 2023. As of September 30, 2023. Reflects HGV standalone figures. BVH Existing markets BVH New markets The Quinn by Hilton Club The Central 5th by Hilton Club The Beach Resort Sesoko by Hilton Club Liberty Place Charleston by Hilton Club La Pacifica Los Cabos by Hilton Club Maui Bay Villas by Hilton Grand Vacations 207 Units Sales Start: January 2020 Resort Open: March 2021 181 Units Sales Start: March 2019 Resort Open: June 2021 140 Units Sales Start: October 2020 Resort Open: October 2021 100 Units Sales Start: June 2019 Resort Resort Open: June 2021 74 Units Sales Start: December 2020 Resort Resort Open: December 2020 388 Units Sales Start: April 2020 Resort Open: September 2021 Location: Las Vegas 478 Units Resort Open: August 2008 Location: New Orleans 95 Units Resort Open: June 2019 Location: Nashville 88 Units Future renovations planned Location: Panama City Beach Units Open: 200; Units Under Development: 60 Bluegreen Club 36 Marquee Bluegreen Downtown Nashville Bayside Resort & Spa
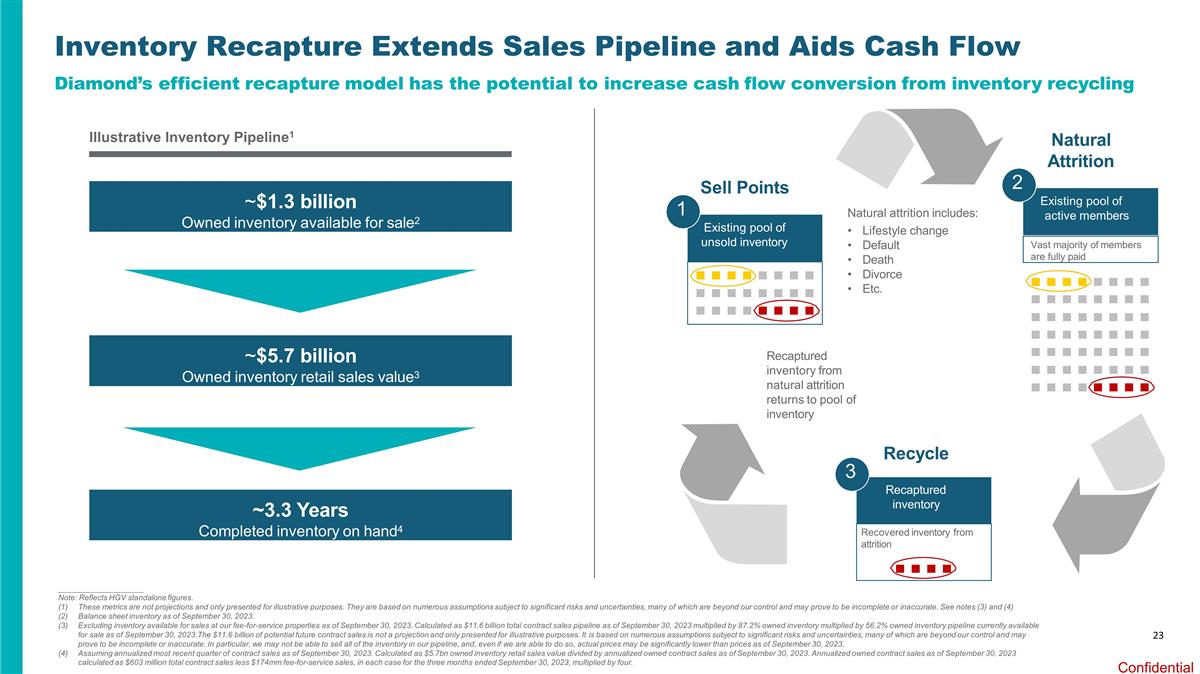
23 Inventory Recapture Extends Sales Pipeline and Aids Cash Flow Existing pool of unsold inventory 1 Existing pool of active members 2 Recaptured inventory 3 Sell Points Natural Attrition Recycle Recaptured inventory from natural attrition returns to pool of inventory Natural attrition includes: Lifestyle change Default Death Divorce Etc. ~$1.3 billion Owned inventory available for sale2 ~$5.7 billion Owned inventory retail sales value3 ~3.3 Years Completed inventory on hand4 Recovered inventory from attrition Vast majority of members are fully paid Diamond’s efficient recapture model has the potential to increase cash flow conversion from inventory recycling ____________________ Note: Reflects HGV standalone figures. These metrics are not projections and only presented for illustrative purposes. They are based on numerous assumptions subject to significant risks and uncertainties, many of which are beyond our control and may prove to be incomplete or inaccurate. See notes (3) and (4) Balance sheet inventory as of September 30, 2023. Excluding inventory available for sales at our fee-for-service properties as of September 30, 2023. Calculated as $11.6 billion total contract sales pipeline as of September 30, 2023 multiplied by 87.2% owned inventory multiplied by 56.2% owned inventory pipeline currently available for sale as of September 30, 2023.The $11.6 billion of potential future contract sales is not a projection and only presented for illustrative purposes. It is based on numerous assumptions subject to significant risks and uncertainties, many of which are beyond our control and may prove to be incomplete or inaccurate. In particular, we may not be able to sell all of the inventory in our pipeline, and, even if we are able to do so, actual prices may be significantly lower than prices as of September 30, 2023. Assuming annualized most recent quarter of contract sales as of September 30, 2023. Calculated as $5.7bn owned inventory retail sales value divided by annualized owned contract sales as of September 30, 2023. Annualized owned contract sales as of September 30, 2023 calculated as $603 million total contract sales less $174mm fee-for-service sales, in each case for the three months ended September 30, 2023, multiplied by four. Illustrative Inventory Pipeline1
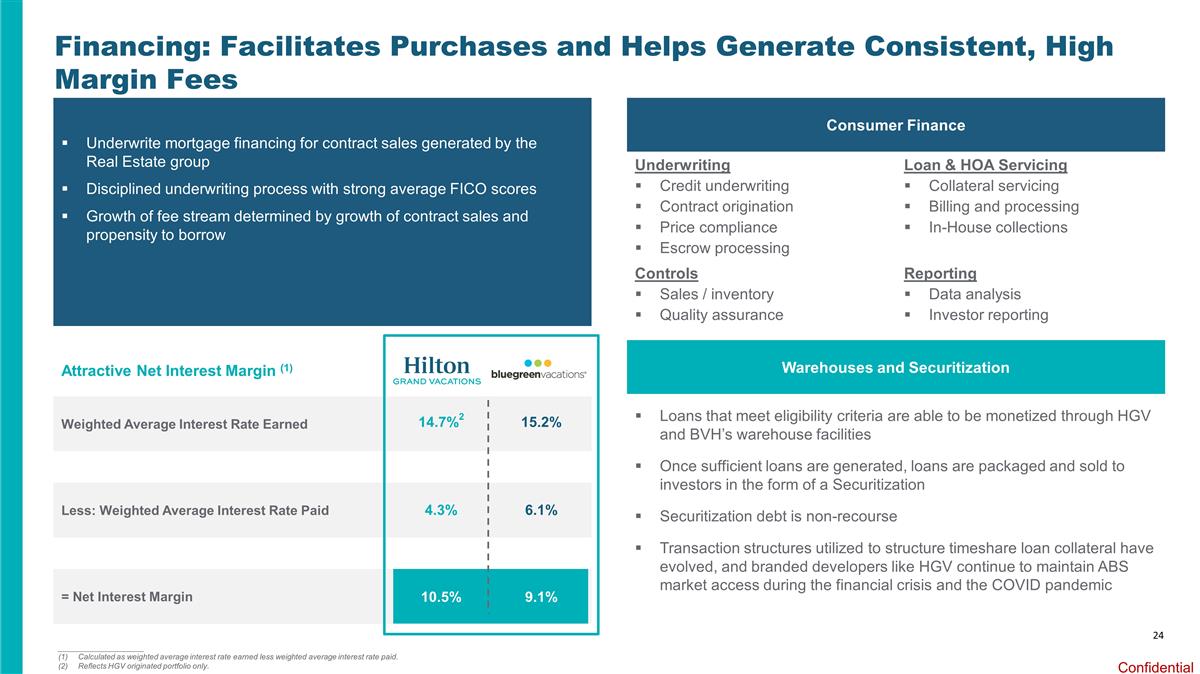
Financing: Facilitates Purchases and Helps Generate Consistent, High Margin Fees ____________________ Calculated as weighted average interest rate earned less weighted average interest rate paid. Reflects HGV originated portfolio only. Attractive Net Interest Margin (1) Consumer Finance Warehouses and Securitization Loans that meet eligibility criteria are able to be monetized through HGV and BVH’s warehouse facilities Once sufficient loans are generated, loans are packaged and sold to investors in the form of a Securitization Securitization debt is non-recourse Transaction structures utilized to structure timeshare loan collateral have evolved, and branded developers like HGV continue to maintain ABS market access during the financial crisis and the COVID pandemic Underwriting Credit underwriting Contract origination Price compliance Escrow processing Controls Sales / inventory Quality assurance Loan & HOA Servicing Collateral servicing Billing and processing In-House collections Reporting Data analysis Investor reporting Underwrite mortgage financing for contract sales generated by the Real Estate group Disciplined underwriting process with strong average FICO scores Growth of fee stream determined by growth of contract sales and propensity to borrow Weighted Average Interest Rate Earned Less: Weighted Average Interest Rate Paid = Net Interest Margin 14.7%2 4.3% 6.1% 15.2% 10.5% 9.1% 24
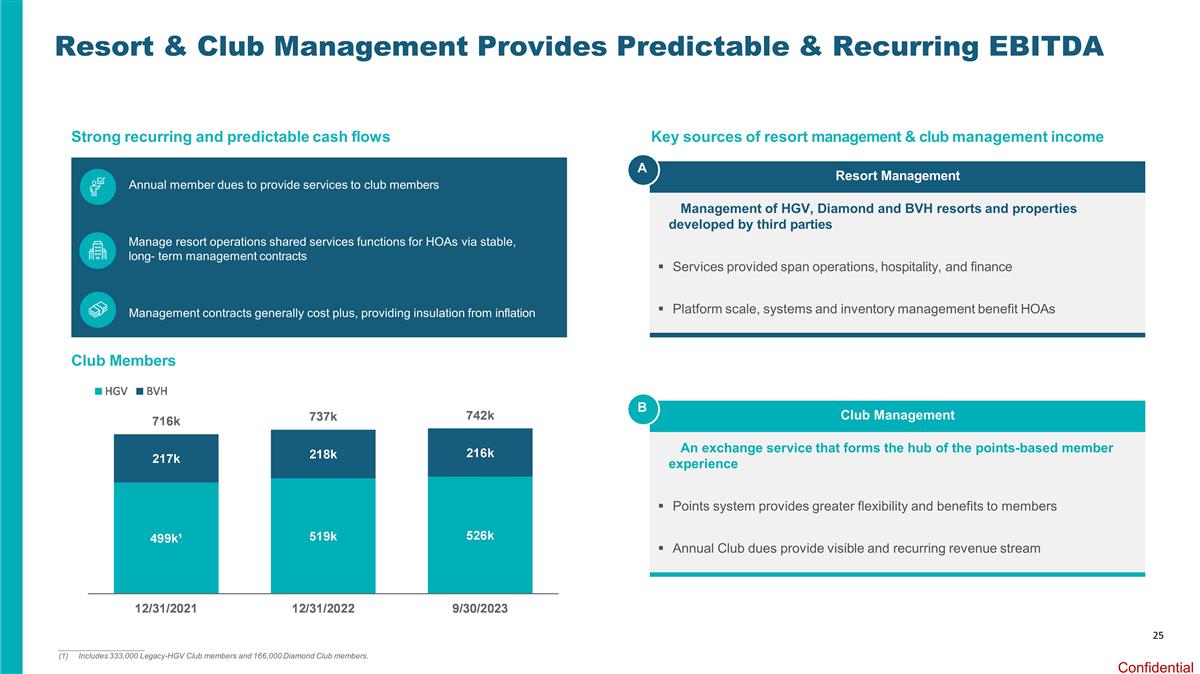
25 Resort & Club Management Provides Predictable & Recurring EBITDA Management of HGV, Diamond and BVH resorts and properties developed by third parties Services provided span operations, hospitality, and finance Platform scale, systems and inventory management benefit HOAs Resort Management Club Members A Strong recurring and predictable cash flows Annual member dues to provide services to club members Manage resort operations shared services functions for HOAs via stable, long- term management contracts Management contracts generally cost plus, providing insulation from inflation ____________________ Includes 333,000 Legacy-HGV Club members and 166,000 Diamond Club members. Key sources of resort management & club management income An exchange service that forms the hub of the points-based member experience Points system provides greater flexibility and benefits to members Annual Club dues provide visible and recurring revenue stream Club Management B
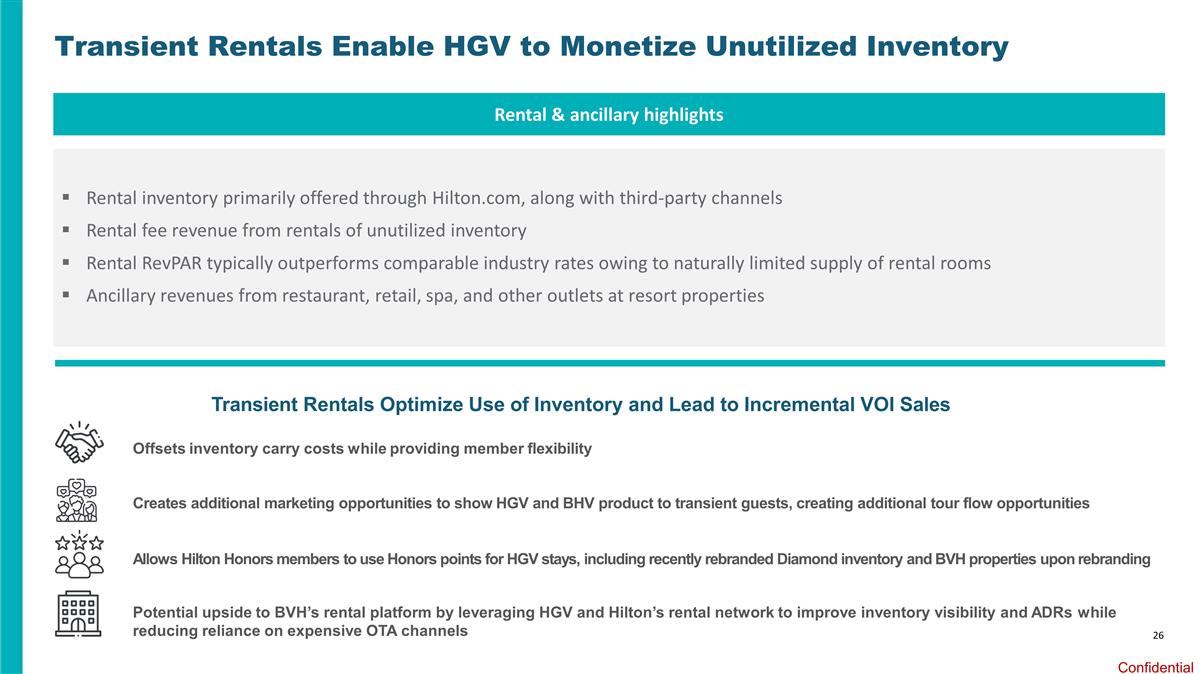
26 Transient Rentals Enable HGV to Monetize Unutilized Inventory Transient Rentals Optimize Use of Inventory and Lead to Incremental VOI Sales Offsets inventory carry costs while providing member flexibility Creates additional marketing opportunities to show HGV and BHV product to transient guests, creating additional tour flow opportunities Allows Hilton Honors members to use Honors points for HGV stays, including recently rebranded Diamond inventory and BVH properties upon rebranding Potential upside to BVH’s rental platform by leveraging HGV and Hilton’s rental network to improve inventory visibility and ADRs while reducing reliance on expensive OTA channels Rental & ancillary highlights Rental inventory primarily offered through Hilton.com, along with third-party channels Rental fee revenue from rentals of unutilized inventory Rental RevPAR typically outperforms comparable industry rates owing to naturally limited supply of rental rooms Ancillary revenues from restaurant, retail, spa, and other outlets at resort properties

Historical Financial Performance
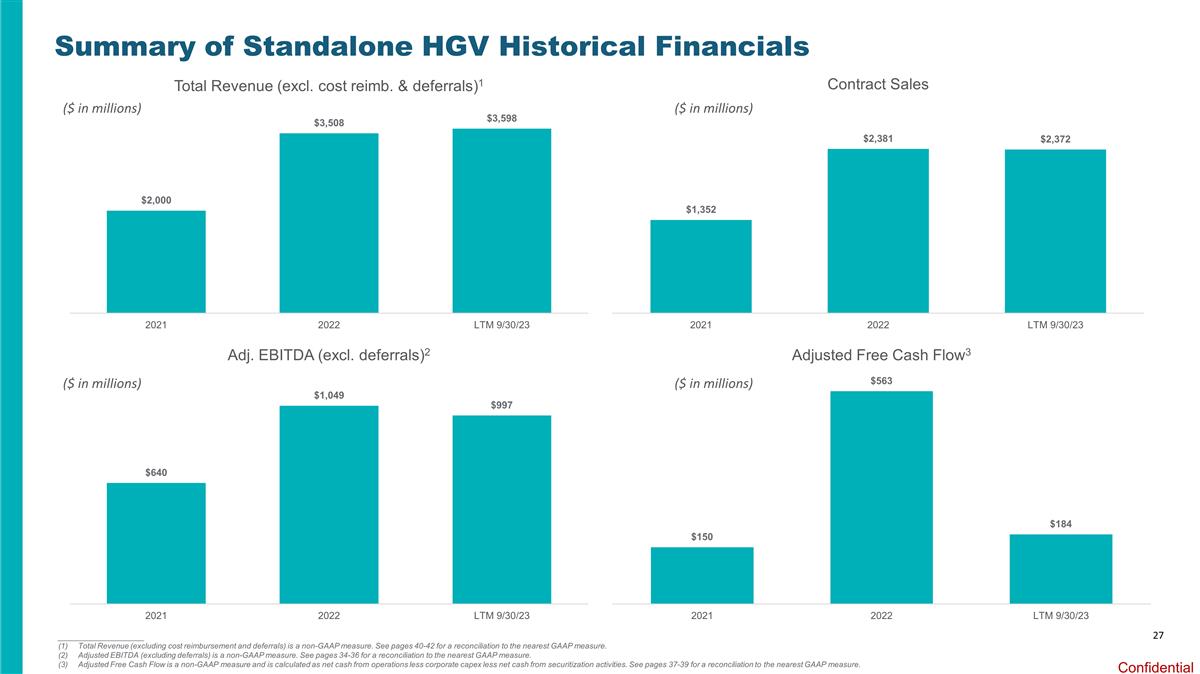
27 Summary of Standalone HGV Historical Financials ____________________ Total Revenue (excluding cost reimbursement and deferrals) is a non-GAAP measure. See pages 40-42 for a reconciliation to the nearest GAAP measure. Adjusted EBITDA (excluding deferrals) is a non-GAAP measure. See pages 34-36 for a reconciliation to the nearest GAAP measure. Adjusted Free Cash Flow is a non-GAAP measure and is calculated as net cash from operations less corporate capex less net cash from securitization activities. See pages 37-39 for a reconciliation to the nearest GAAP measure. ($ in millions) ($ in millions) ($ in millions) ($ in millions)
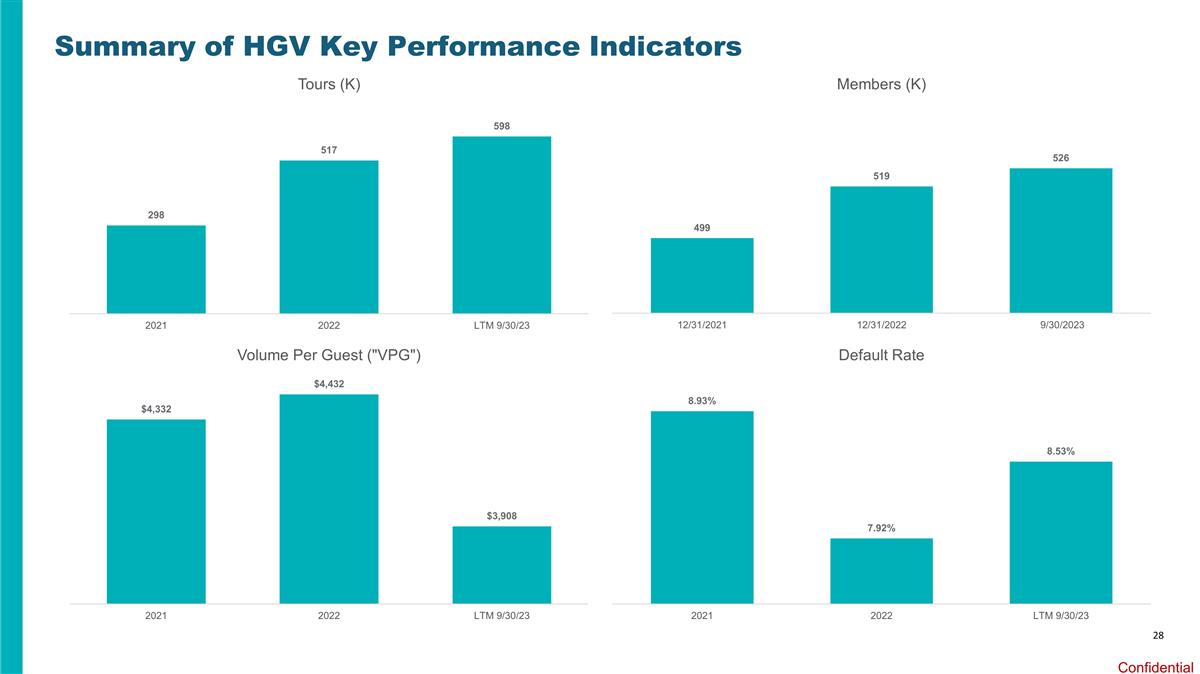
28 Summary of HGV Key Performance Indicators
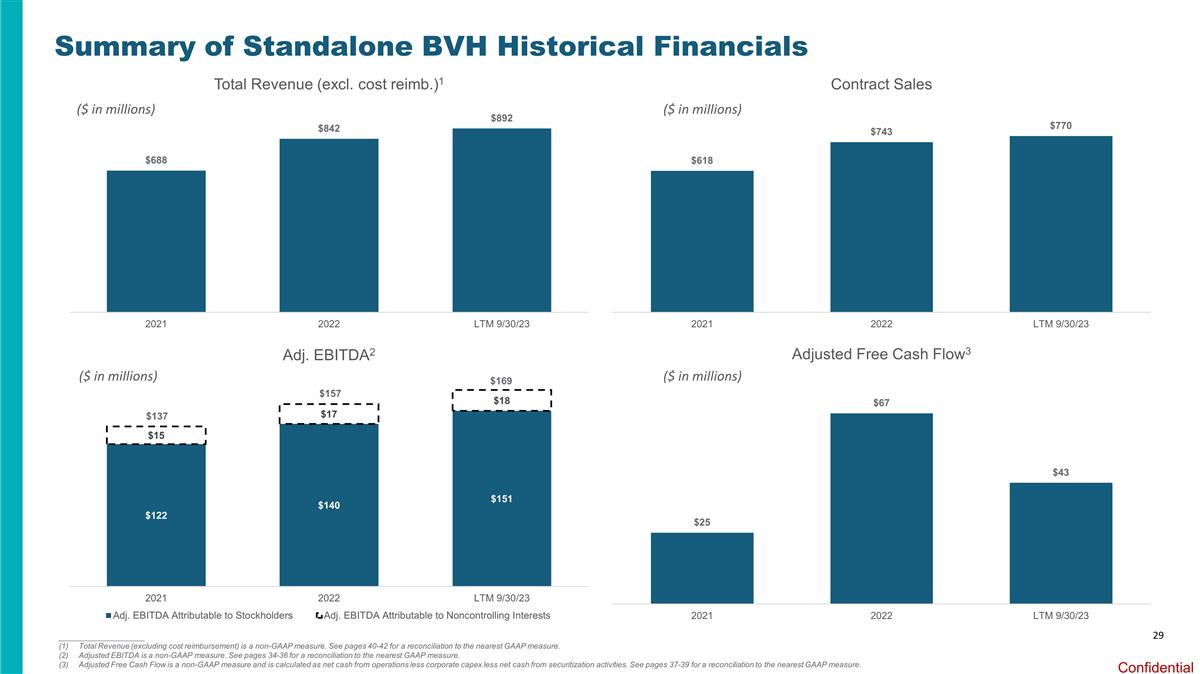
29 Summary of Standalone BVH Historical Financials ($ in millions) ($ in millions) ($ in millions) ____________________ Total Revenue (excluding cost reimbursement) is a non-GAAP measure. See pages 40-42 for a reconciliation to the nearest GAAP measure. Adjusted EBITDA is a non-GAAP measure. See pages 34-36 for a reconciliation to the nearest GAAP measure. Adjusted Free Cash Flow is a non-GAAP measure and is calculated as net cash from operations less corporate capex less net cash from securitization activities. See pages 37-39 for a reconciliation to the nearest GAAP measure. ($ in millions) $157 $169 $137
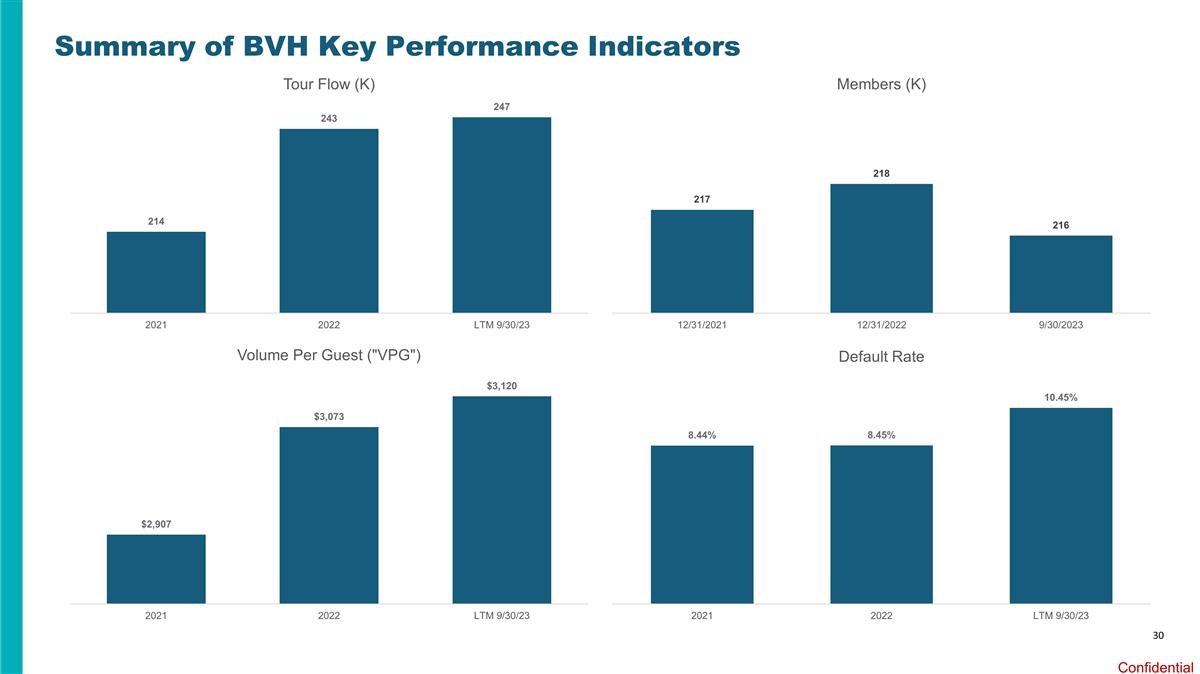
30 Summary of BVH Key Performance Indicators
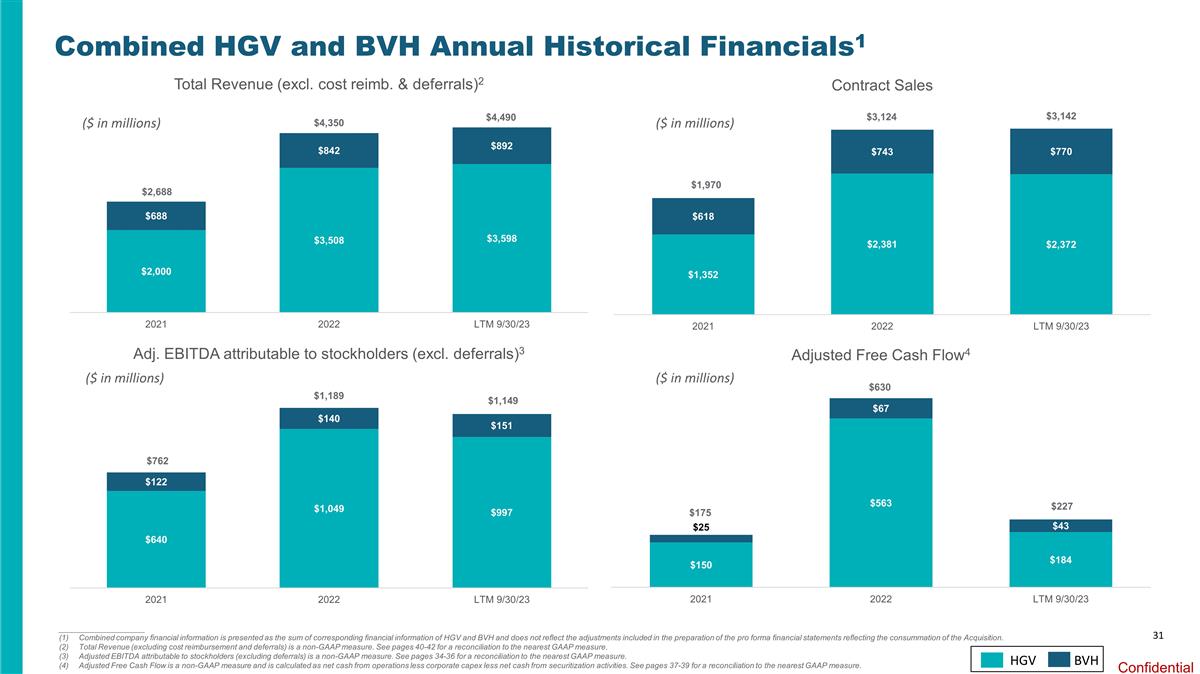
HGV 31 Combined HGV and BVH Annual Historical Financials1 ($ in millions) ($ in millions) ($ in millions) ____________________ Combined company financial information is presented as the sum of corresponding financial information of HGV and BVH and does not reflect the adjustments included in the preparation of the pro forma financial statements reflecting the consummation of the Acquisition. Total Revenue (excluding cost reimbursement and deferrals) is a non-GAAP measure. See pages 40-42 for a reconciliation to the nearest GAAP measure. Adjusted EBITDA attributable to stockholders (excluding deferrals) is a non-GAAP measure. See pages 34-36 for a reconciliation to the nearest GAAP measure. Adjusted Free Cash Flow is a non-GAAP measure and is calculated as net cash from operations less corporate capex less net cash from securitization activities. See pages 37-39 for a reconciliation to the nearest GAAP measure. $630 $227 BVH $3,124 $3,142 ($ in millions) $762 $1,189 $1,149 $2,688 $4,350 $4,490 $175 $1,970

Questions & Answers
Appendix
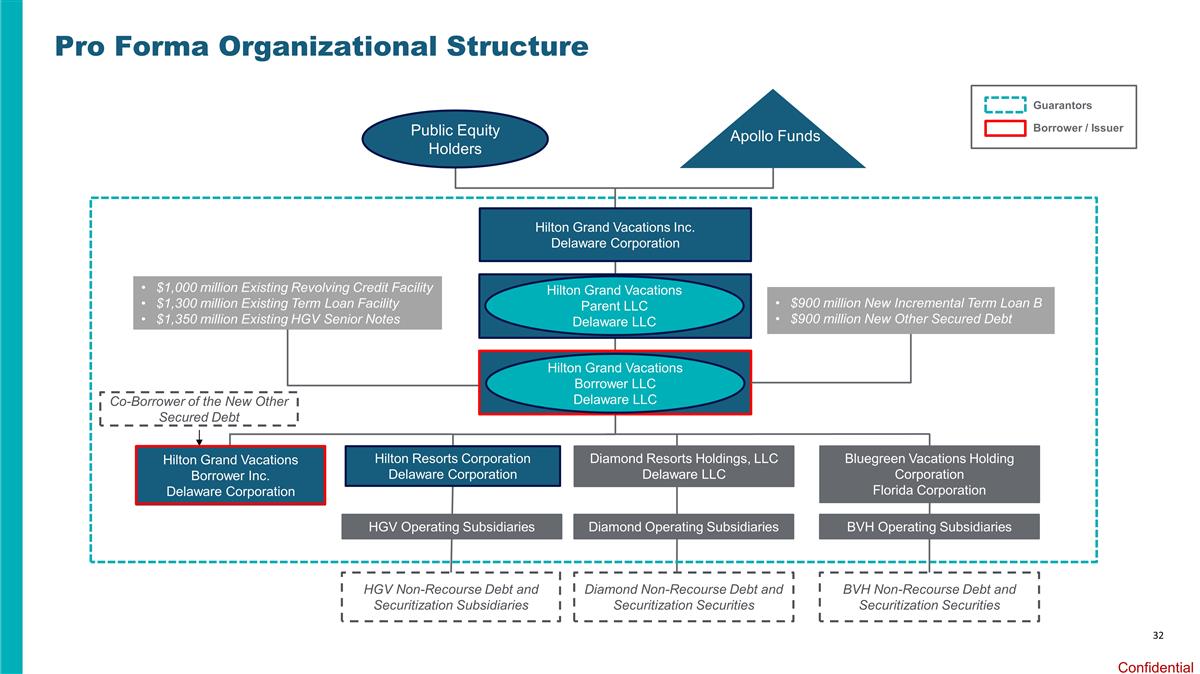
Pro Forma Organizational Structure Public Equity Holders Hilton Grand Vacations Inc. Delaware Corporation Apollo Funds & Co-Investors Hilton Grand Vacations Borrower LLC Delaware LLC Hilton Resorts Corporation Delaware Corporation HGV Operating Subsidiaries $900 million New Incremental Term Loan B $900 million New Other Secured Debt Hilton Grand Vacations Borrower Inc., a Delaware corporation wholly owned by Hilton Grand Vacations Borrower LLC, is not shown for simplicity Hilton Grand Vacations Parent LLC Delaware LLC BVH Non-Recourse Debt and Securitization Securities Diamond Resorts Holdings, LLC Delaware LLC Apollo Funds Guarantors Borrower / Issuer Bluegreen Vacations Holding Corporation Florida Corporation BVH Operating Subsidiaries Hilton Grand Vacations Borrower Inc. Delaware Corporation Co-Borrower of the New Other Secured Debt $1,000 million Existing Revolving Credit Facility $1,300 million Existing Term Loan Facility $1,350 million Existing HGV Senior Notes Diamond Operating Subsidiaries Diamond Non-Recourse Debt and Securitization Securities HGV Non-Recourse Debt and Securitization Subsidiaries 32
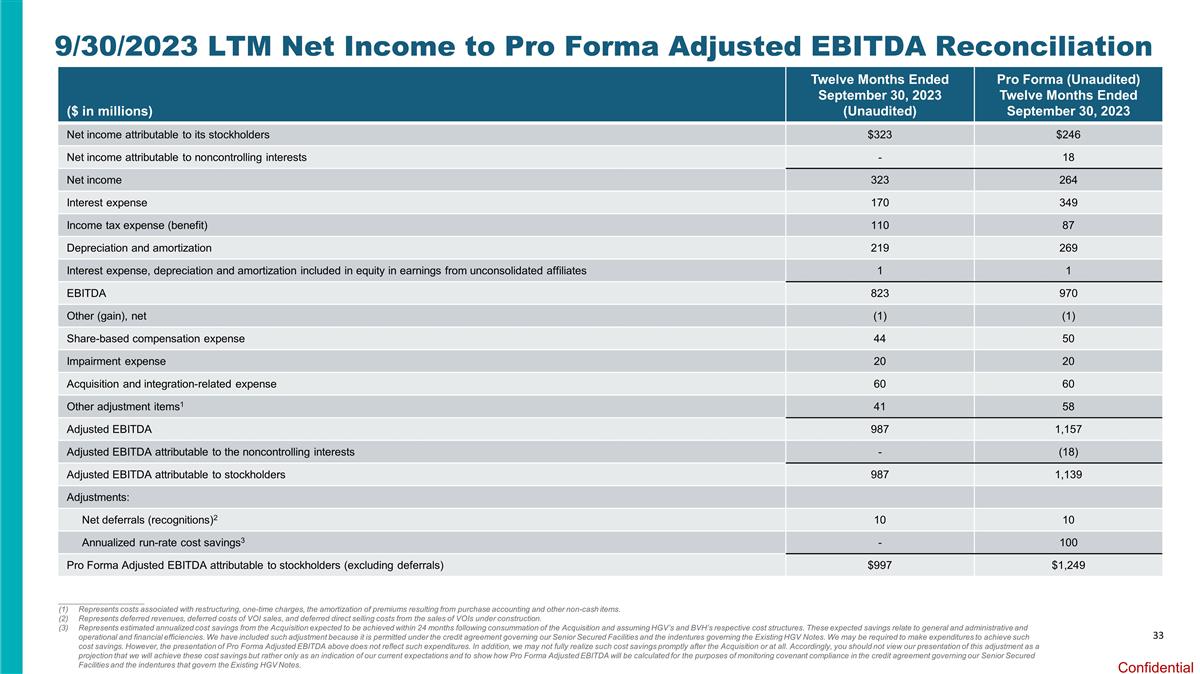
($ in millions) Twelve Months Ended September 30, 2023 (Unaudited) Pro Forma (Unaudited) Twelve Months Ended September 30, 2023 Net income attributable to its stockholders $323 $246 Net income attributable to noncontrolling interests - 18 Net income 323 264 Interest expense 170 349 Income tax expense (benefit) 110 87 Depreciation and amortization 219 269 Interest expense, depreciation and amortization included in equity in earnings from unconsolidated affiliates 1 1 EBITDA 823 970 Other (gain), net (1) (1) Share-based compensation expense 44 50 Impairment expense 20 20 Acquisition and integration-related expense 60 60 Other adjustment items1 41 58 Adjusted EBITDA 987 1,157 Adjusted EBITDA attributable to the noncontrolling interests - (18) Adjusted EBITDA attributable to stockholders 987 1,139 Adjustments: Net deferrals (recognitions)2 10 10 Annualized run-rate cost savings3 - 100 Pro Forma Adjusted EBITDA attributable to stockholders (excluding deferrals) $997 $1,249 ____________________ Represents costs associated with restructuring, one-time charges, the amortization of premiums resulting from purchase accounting and other non-cash items. Represents deferred revenues, deferred costs of VOI sales, and deferred direct selling costs from the sales of VOIs under construction. Represents estimated annualized cost savings from the Acquisition expected to be achieved within 24 months following consummation of the Acquisition and assuming HGV’s and BVH’s respective cost structures. These expected savings relate to general and administrative and operational and financial efficiencies. We have included such adjustment because it is permitted under the credit agreement governing our Senior Secured Facilities and the indentures governing the Existing HGV Notes. We may be required to make expenditures to achieve such cost savings. However, the presentation of Pro Forma Adjusted EBITDA above does not reflect such expenditures. In addition, we may not fully realize such cost savings promptly after the Acquisition or at all. Accordingly, you should not view our presentation of this adjustment as a projection that we will achieve these cost savings but rather only as an indication of our current expectations and to show how Pro Forma Adjusted EBITDA will be calculated for the purposes of monitoring covenant compliance in the credit agreement governing our Senior Secured Facilities and the indentures that govern the Existing HGV Notes. 9/30/2023 LTM Net Income to Pro Forma Adjusted EBITDA Reconciliation 33
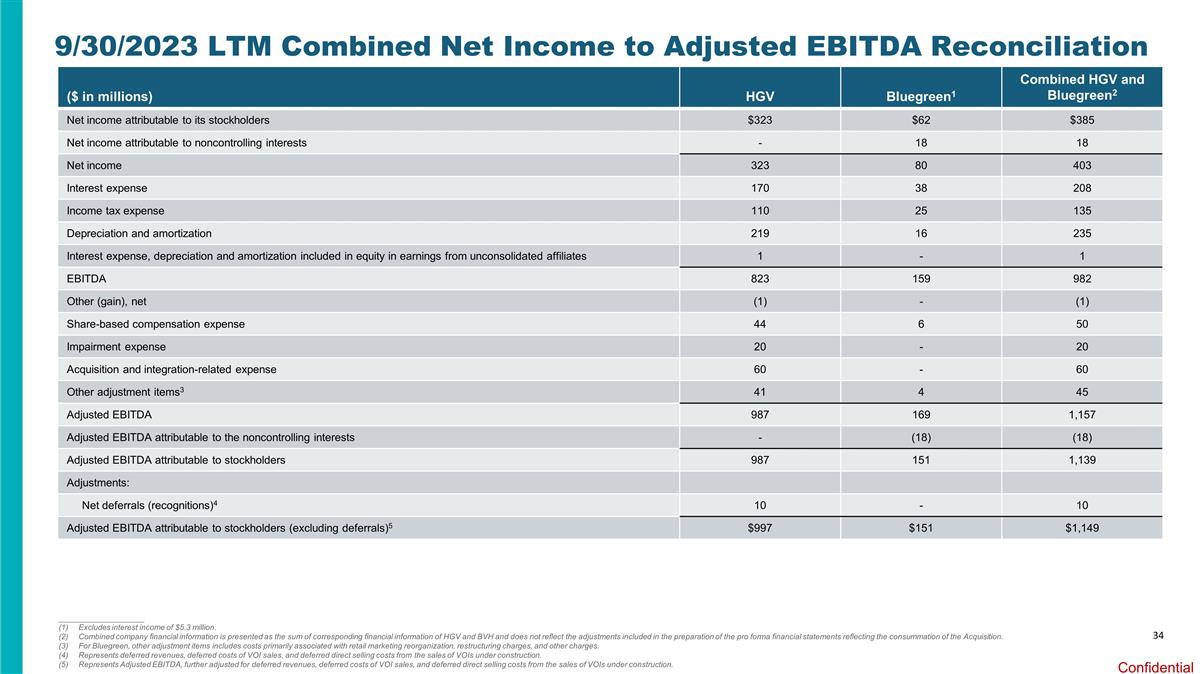
($ in millions) HGV Bluegreen1 Combined HGV and Bluegreen2 Net income attributable to its stockholders $323 $62 $385 Net income attributable to noncontrolling interests - 18 18 Net income 323 80 403 Interest expense 170 38 208 Income tax expense 110 25 135 Depreciation and amortization 219 16 235 Interest expense, depreciation and amortization included in equity in earnings from unconsolidated affiliates 1 - 1 EBITDA 823 159 982 Other (gain), net (1) - (1) Share-based compensation expense 44 6 50 Impairment expense 20 - 20 Acquisition and integration-related expense 60 - 60 Other adjustment items3 41 4 45 Adjusted EBITDA 987 169 1,157 Adjusted EBITDA attributable to the noncontrolling interests - (18) (18) Adjusted EBITDA attributable to stockholders 987 151 1,139 Adjustments: Net deferrals (recognitions)4 10 - 10 Adjusted EBITDA attributable to stockholders (excluding deferrals)5 $997 $151 $1,149 ____________________ Excludes interest income of $5.3 million. Combined company financial information is presented as the sum of corresponding financial information of HGV and BVH and does not reflect the adjustments included in the preparation of the pro forma financial statements reflecting the consummation of the Acquisition. For Bluegreen, other adjustment items includes costs primarily associated with retail marketing reorganization, restructuring charges, and other charges. Represents deferred revenues, deferred costs of VOI sales, and deferred direct selling costs from the sales of VOIs under construction. Represents Adjusted EBITDA, further adjusted for deferred revenues, deferred costs of VOI sales, and deferred direct selling costs from the sales of VOIs under construction. 9/30/2023 LTM Combined Net Income to Adjusted EBITDA Reconciliation 34
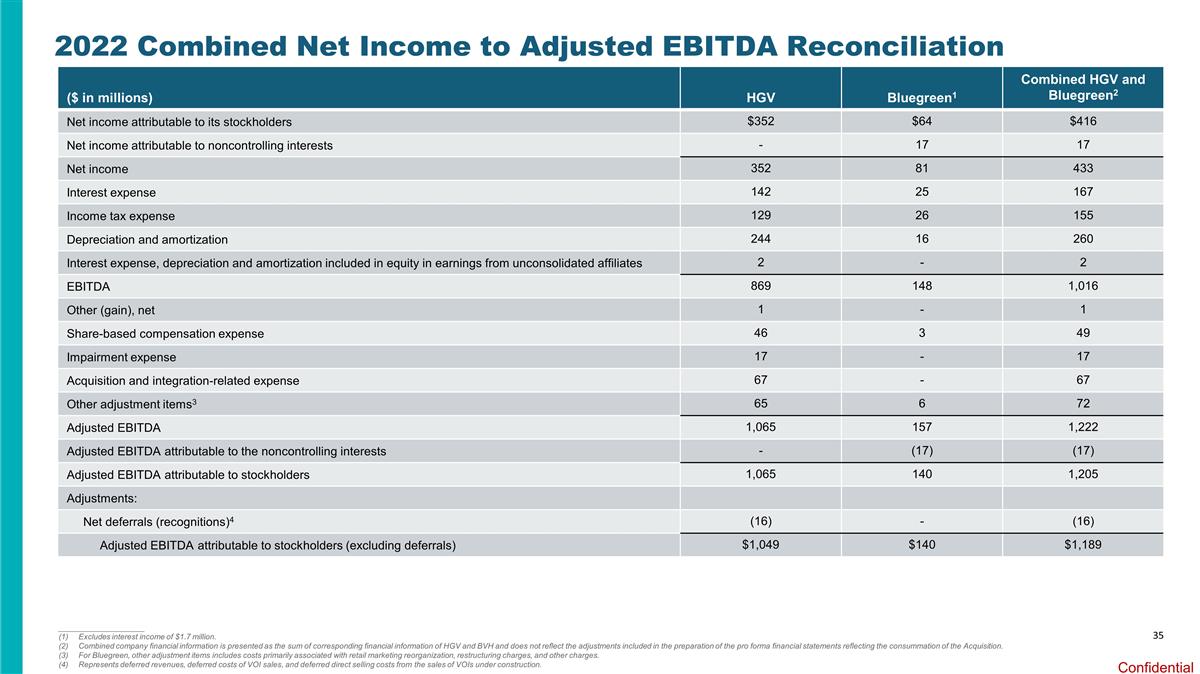
35 2022 Combined Net Income to Adjusted EBITDA Reconciliation ($ in millions) HGV Bluegreen1 Combined HGV and Bluegreen2 Net income attributable to its stockholders $352 $64 $416 Net income attributable to noncontrolling interests - 17 17 Net income 352 81 433 Interest expense 142 25 167 Income tax expense 129 26 155 Depreciation and amortization 244 16 260 Interest expense, depreciation and amortization included in equity in earnings from unconsolidated affiliates 2 - 2 EBITDA 869 148 1,016 Other (gain), net 1 - 1 Share-based compensation expense 46 3 49 Impairment expense 17 - 17 Acquisition and integration-related expense 67 - 67 Other adjustment items3 65 6 72 Adjusted EBITDA 1,065 157 1,222 Adjusted EBITDA attributable to the noncontrolling interests - (17) (17) Adjusted EBITDA attributable to stockholders 1,065 140 1,205 Adjustments: Net deferrals (recognitions)4 (16) - (16) Adjusted EBITDA attributable to stockholders (excluding deferrals) $1,049 $140 $1,189 ____________________ Excludes interest income of $1.7 million. Combined company financial information is presented as the sum of corresponding financial information of HGV and BVH and does not reflect the adjustments included in the preparation of the pro forma financial statements reflecting the consummation of the Acquisition. For Bluegreen, other adjustment items includes costs primarily associated with retail marketing reorganization, restructuring charges, and other charges. Represents deferred revenues, deferred costs of VOI sales, and deferred direct selling costs from the sales of VOIs under construction.
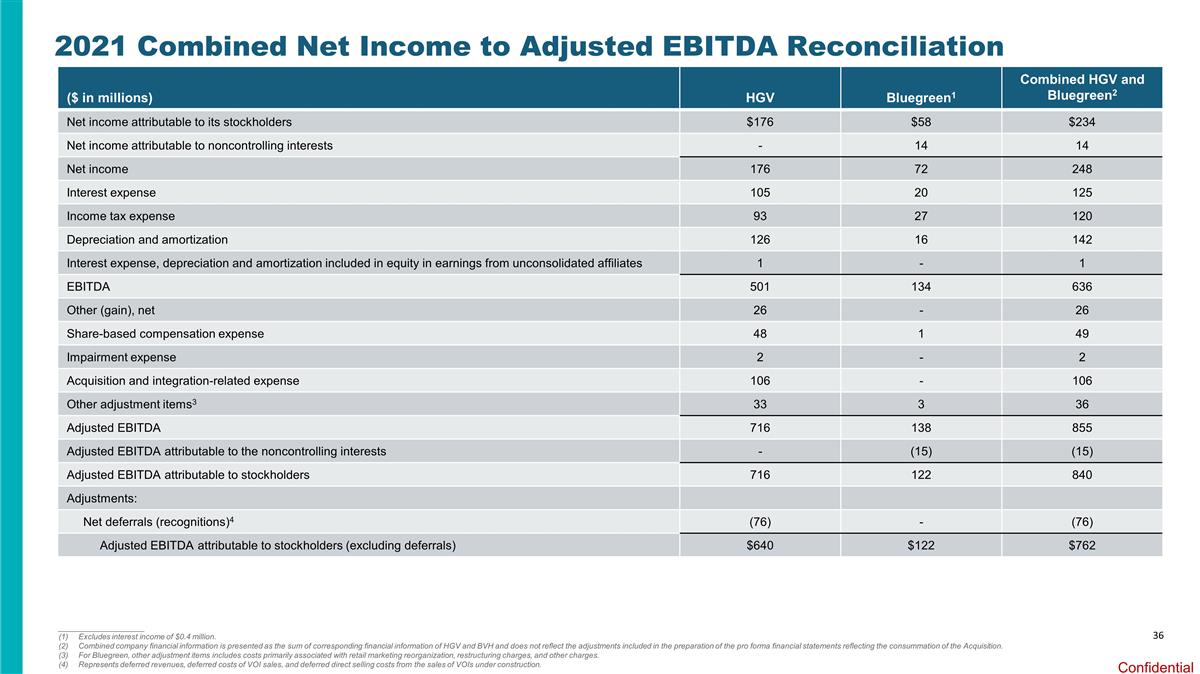
($ in millions) HGV Bluegreen1 Combined HGV and Bluegreen2 Net income attributable to its stockholders $176 $58 $234 Net income attributable to noncontrolling interests - 14 14 Net income 176 72 248 Interest expense 105 20 125 Income tax expense 93 27 120 Depreciation and amortization 126 16 142 Interest expense, depreciation and amortization included in equity in earnings from unconsolidated affiliates 1 - 1 EBITDA 501 134 636 Other (gain), net 26 - 26 Share-based compensation expense 48 1 49 Impairment expense 2 - 2 Acquisition and integration-related expense 106 - 106 Other adjustment items3 33 3 36 Adjusted EBITDA 716 138 855 Adjusted EBITDA attributable to the noncontrolling interests - (15) (15) Adjusted EBITDA attributable to stockholders 716 122 840 Adjustments: Net deferrals (recognitions)4 (76) - (76) Adjusted EBITDA attributable to stockholders (excluding deferrals) $640 $122 $762 ____________________ Excludes interest income of $0.4 million. Combined company financial information is presented as the sum of corresponding financial information of HGV and BVH and does not reflect the adjustments included in the preparation of the pro forma financial statements reflecting the consummation of the Acquisition. For Bluegreen, other adjustment items includes costs primarily associated with retail marketing reorganization, restructuring charges, and other charges. Represents deferred revenues, deferred costs of VOI sales, and deferred direct selling costs from the sales of VOIs under construction. 2021 Combined Net Income to Adjusted EBITDA Reconciliation 36
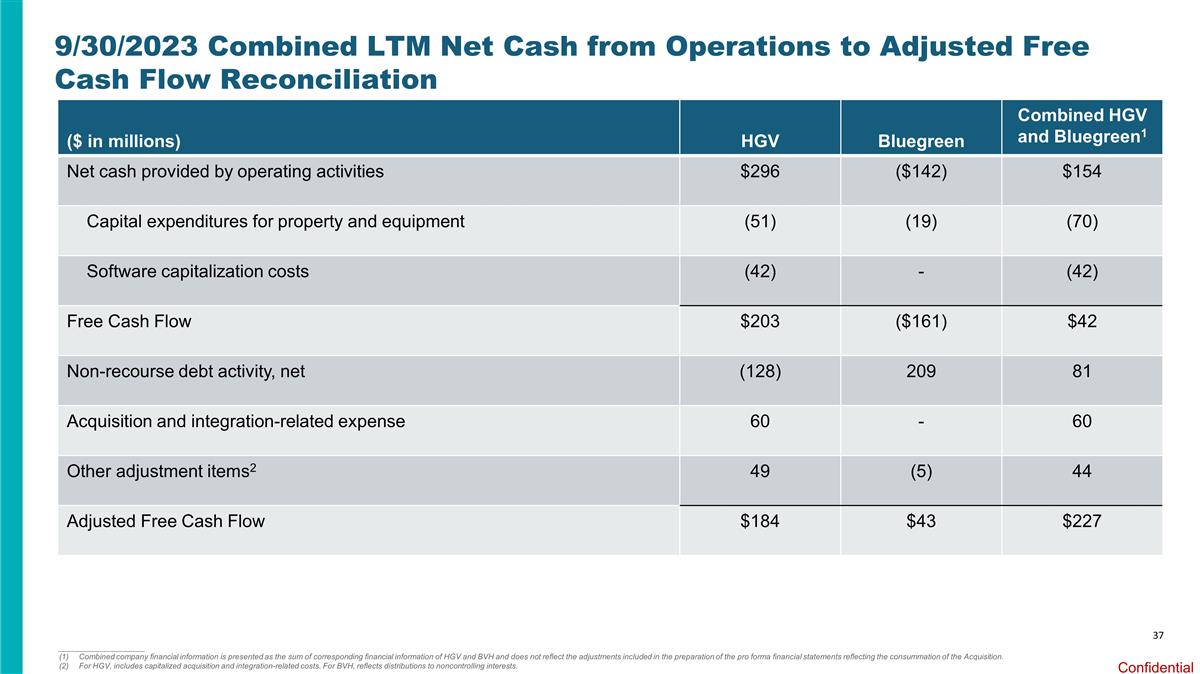
($ in millions) HGV Bluegreen Combined HGV and Bluegreen1 Net cash provided by operating activities $296 ($142) $154 Capital expenditures for property and equipment (51) (19) (70) Software capitalization costs (42) - (42) Free Cash Flow $203 ($161) $42 Non-recourse debt activity, net (128) 209 81 Acquisition and integration-related expense 60 - 60 Other adjustment items2 49 (5) 44 Adjusted Free Cash Flow $184 $43 $227 9/30/2023 Combined LTM Net Cash from Operations to Adjusted Free Cash Flow Reconciliation 37 ____________________ Combined company financial information is presented as the sum of corresponding financial information of HGV and BVH and does not reflect the adjustments included in the preparation of the pro forma financial statements reflecting the consummation of the Acquisition. For HGV, includes capitalized acquisition and integration-related costs. For BVH, reflects distributions to noncontrolling interests.
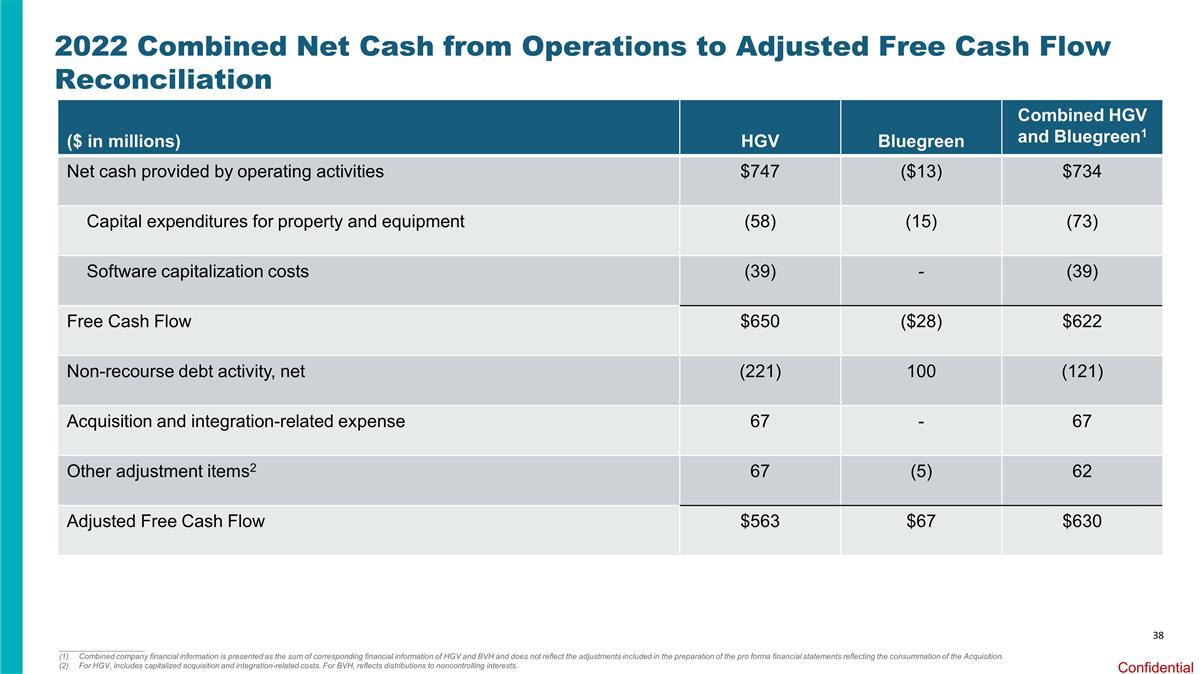
($ in millions) HGV Bluegreen Combined HGV and Bluegreen1 Net cash provided by operating activities $747 ($13) $734 Capital expenditures for property and equipment (58) (15) (73) Software capitalization costs (39) - (39) Free Cash Flow $650 ($28) $622 Non-recourse debt activity, net (221) 100 (121) Acquisition and integration-related expense 67 - 67 Other adjustment items2 67 (5) 62 Adjusted Free Cash Flow $563 $67 $630 2022 Combined Net Cash from Operations to Adjusted Free Cash Flow Reconciliation 38 ____________________ Combined company financial information is presented as the sum of corresponding financial information of HGV and BVH and does not reflect the adjustments included in the preparation of the pro forma financial statements reflecting the consummation of the Acquisition. For HGV, includes capitalized acquisition and integration-related costs. For BVH, reflects distributions to noncontrolling interests.
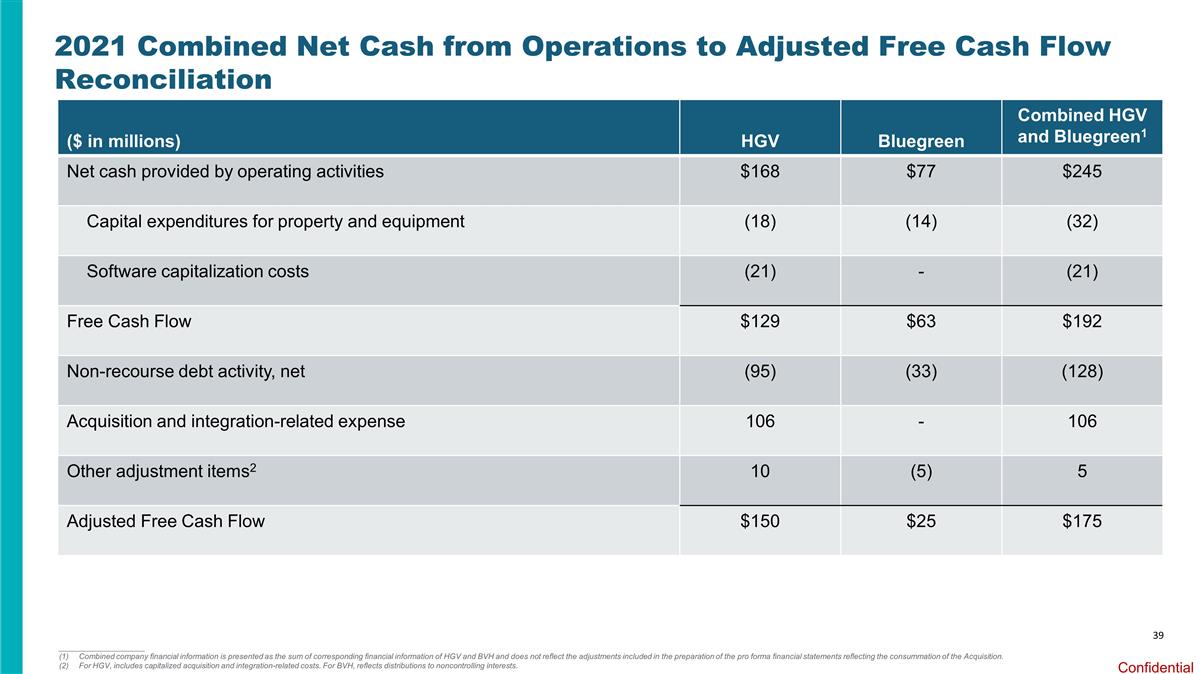
($ in millions) HGV Bluegreen Combined HGV and Bluegreen1 Net cash provided by operating activities $168 $77 $245 Capital expenditures for property and equipment (18) (14) (32) Software capitalization costs (21) - (21) Free Cash Flow $129 $63 $192 Non-recourse debt activity, net (95) (33) (128) Acquisition and integration-related expense 106 - 106 Other adjustment items2 10 (5) 5 Adjusted Free Cash Flow $150 $25 $175 2021 Combined Net Cash from Operations to Adjusted Free Cash Flow Reconciliation 39 ____________________ Combined company financial information is presented as the sum of corresponding financial information of HGV and BVH and does not reflect the adjustments included in the preparation of the pro forma financial statements reflecting the consummation of the Acquisition. For HGV, includes capitalized acquisition and integration-related costs. For BVH, reflects distributions to noncontrolling interests.
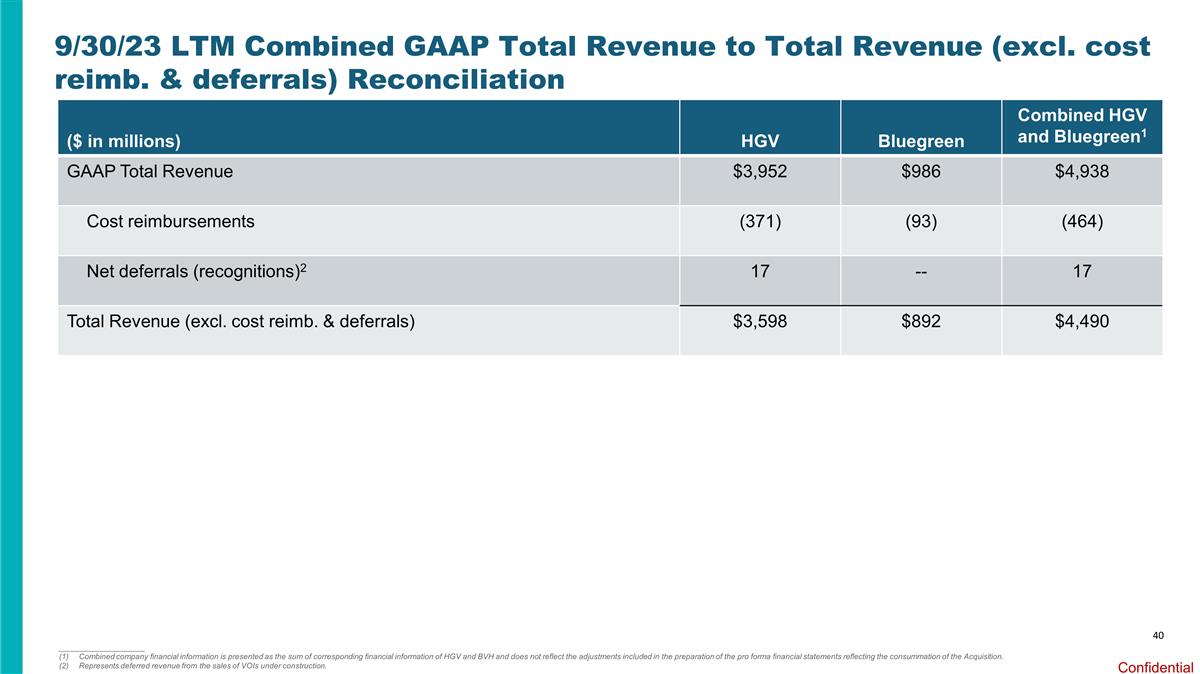
($ in millions) HGV Bluegreen Combined HGV and Bluegreen1 GAAP Total Revenue $3,952 $986 $4,938 Cost reimbursements (371) (93) (464) Net deferrals (recognitions)2 17 -- 17 Total Revenue (excl. cost reimb. & deferrals) $3,598 $892 $4,490 9/30/23 LTM Combined GAAP Total Revenue to Total Revenue (excl. cost reimb. & deferrals) Reconciliation 40 ____________________ Combined company financial information is presented as the sum of corresponding financial information of HGV and BVH and does not reflect the adjustments included in the preparation of the pro forma financial statements reflecting the consummation of the Acquisition. Represents deferred revenue from the sales of VOIs under construction.
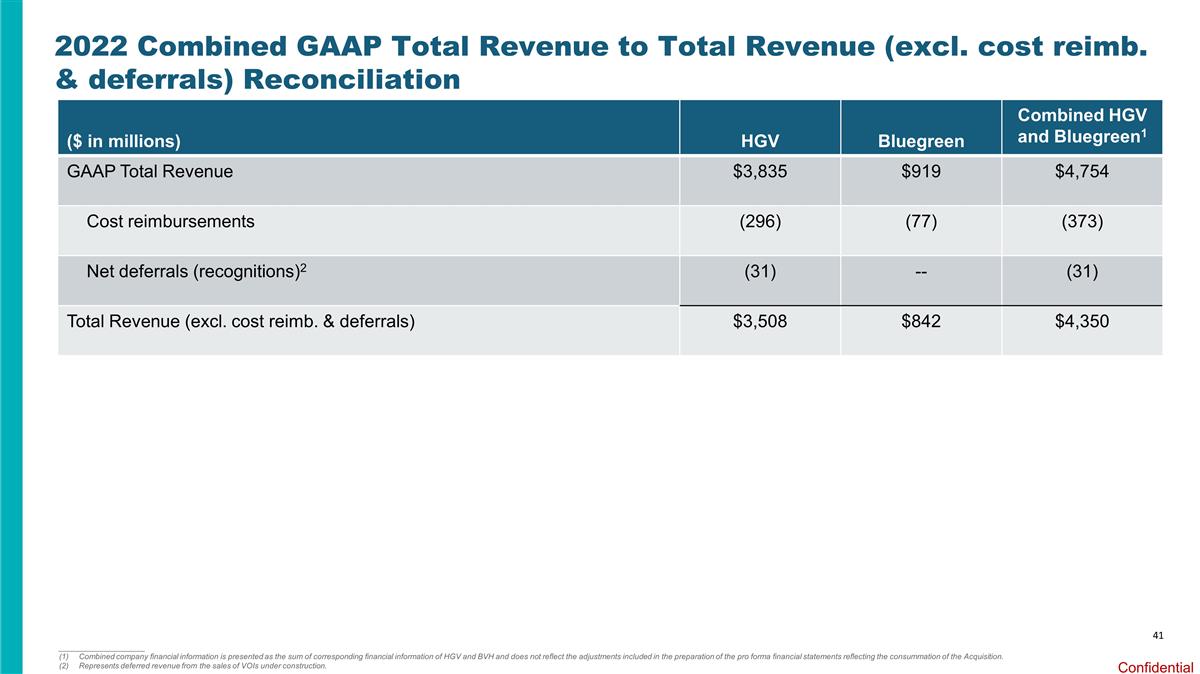
2022 Combined GAAP Total Revenue to Total Revenue (excl. cost reimb. & deferrals) Reconciliation 41 ($ in millions) HGV Bluegreen Combined HGV and Bluegreen1 GAAP Total Revenue $3,835 $919 $4,754 Cost reimbursements (296) (77) (373) Net deferrals (recognitions)2 (31) -- (31) Total Revenue (excl. cost reimb. & deferrals) $3,508 $842 $4,350 ____________________ Combined company financial information is presented as the sum of corresponding financial information of HGV and BVH and does not reflect the adjustments included in the preparation of the pro forma financial statements reflecting the consummation of the Acquisition. Represents deferred revenue from the sales of VOIs under construction.
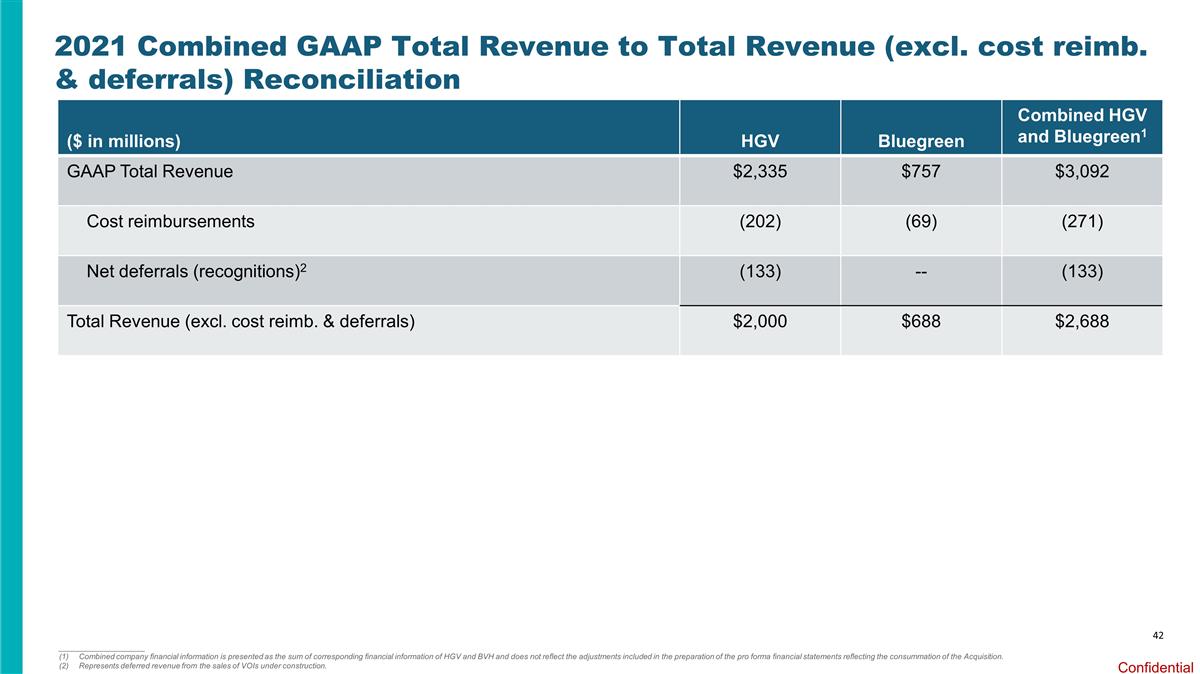
2021 Combined GAAP Total Revenue to Total Revenue (excl. cost reimb. & deferrals) Reconciliation 42 ($ in millions) HGV Bluegreen Combined HGV and Bluegreen1 GAAP Total Revenue $2,335 $757 $3,092 Cost reimbursements (202) (69) (271) Net deferrals (recognitions)2 (133) -- (133) Total Revenue (excl. cost reimb. & deferrals) $2,000 $688 $2,688 ____________________ Combined company financial information is presented as the sum of corresponding financial information of HGV and BVH and does not reflect the adjustments included in the preparation of the pro forma financial statements reflecting the consummation of the Acquisition. Represents deferred revenue from the sales of VOIs under construction.
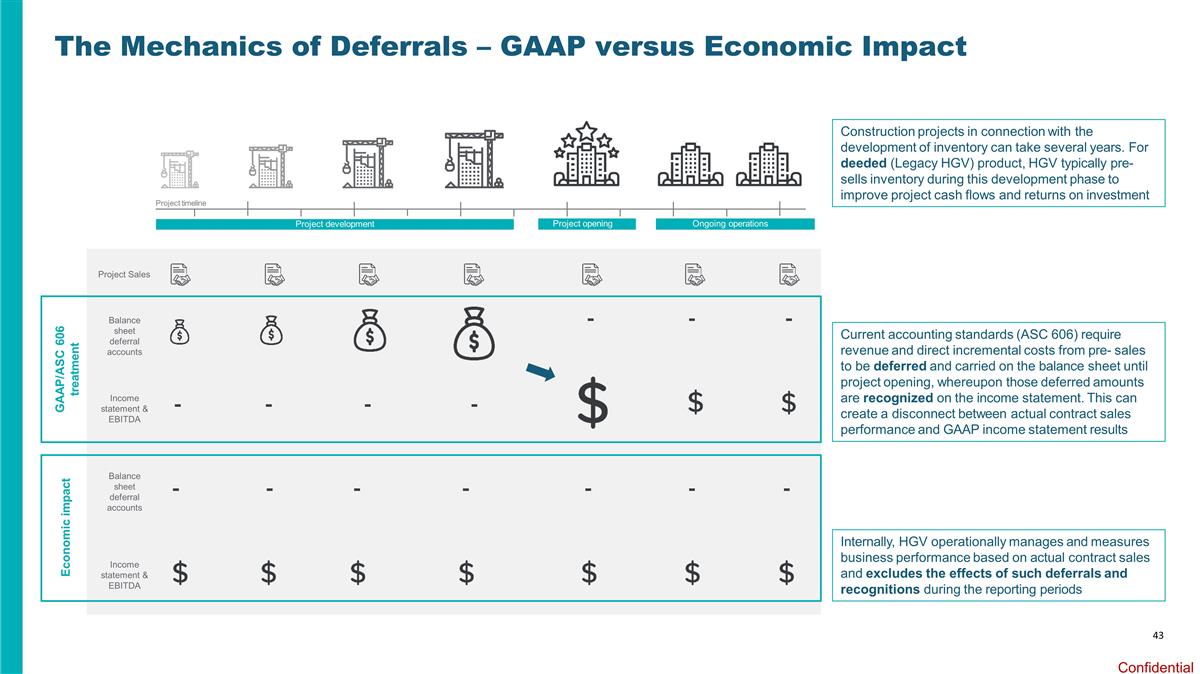
43 The Mechanics of Deferrals – GAAP versus Economic Impact Construction projects in connection with the development of inventory can take several years. For deeded (Legacy HGV) product, HGV typically pre-sells inventory during this development phase to improve project cash flows and returns on investment Current accounting standards (ASC 606) require revenue and direct incremental costs from pre- sales to be deferred and carried on the balance sheet until project opening, whereupon those deferred amounts are recognized on the income statement. This can create a disconnect between actual contract sales performance and GAAP income statement results Project timeline GAAP/ASC 606 treatment Economic impact Internally, HGV operationally manages and measures business performance based on actual contract sales and excludes the effects of such deferrals and recognitions during the reporting periods Project development Project opening Ongoing operations Project Sales Balance sheet deferral accounts Balance sheet deferral accounts Income statement & EBITDA Income statement & EBITDA


