Filed Pursuant to Rule 424(b)
File No.333-237828
Guggenheim Credit Income Fund 2021
A Business Development Company
Maximum Offering of $775,000,000 of Common Shares
Guggenheim Credit Income Fund 2021 (the “Company”) is an externally managed, non-diversified, closed-end management investment company that intends to elect to be treated as a business development company (a “BDC”) under the Investment Company Act of 1940, as amended (the “1940 Act”). We are managed by Guggenheim Partners Investment Management, LLC (“Guggenheim” or the “Advisor”), which is registered as an investment adviser with the Securities and Exchange Commission (“SEC”). We intend to elect to be treated for federal income tax purposes, beginning with our taxable year ending September 30, 2021, and intend to qualify annually thereafter, as a regulated investment company (a “RIC”) under the Internal Revenue Code of 1986, as amended (the “Code”).
Our investment objectives are to provide our shareholders with current income, capital preservation, and, to a lesser extent, long-term capital appreciation. We seek to achieve our investment objectives by investing all or substantially all of our assets in Guggenheim Credit Income Fund (the “Master Fund”), an externally managed, non-diversified, closed-end management investment company that has elected to be treated as a BDC under the 1940 Act. Thus, our investment results will be directly dependent on investment results of the Master Fund. The Master Fund has the same investment objectives as us. The Master Fund is managed by the Advisor. All portfolio company investments are made at the Master Fund level. The Master Fund invests primarily in large, privately-negotiated loans to private middle market U.S. companies, but may also invest in other debt investments, options, or other forms of equity participation. There is no minimum or maximum percentage of the Master Fund’s assets that may be invested in any of the investment categories identified above.
The Master Fund may invest in securities that are rated below investment grade (e.g., junk bonds) by rating agencies or that would be rated below investment grade if they were rated. Below investment grade securities, which are often referred to as “junk,” have predominantly speculative characteristics with respect to the issuer’s capacity to pay interest and repay principal. They may also be illiquid and difficult to value. A material amount of the Master Fund’s debt investments may contain interest rate reset provisions that may make it more difficult for the borrowers to make periodic interest payments to the Master Fund. In addition, a material amount of the Master Fund’s debt investments may not pay down principal until the end of their lifetimes, which could result in a substantial loss to the Master Fund if the portfolio companies are unable to refinance or repay their debts at maturity. There is no limit on the amount of the Master Fund's assets that may be invested in these types of securities.
We are offering on a best efforts, continuous basis up to $775,000,000 of our common shares of beneficial interest (our “Common Shares” or “Shares”) at net asset value plus any applicable sales load. Because our net asset value may fluctuate, subscriptions for this offering are for a specific dollar amount rather than a specified quantity of Shares, which may result in subscribers receiving fractional Shares. The minimum permitted purchase is $2,000 in Shares (or $2,500 for New York non-IRA investments).
There has been and is expected to be no public market for our Shares. We reserve the right to change our investment and operating policies without shareholder approval, except to the extent such approval is required by the 1940 Act. Regardless of whether or not changes in our investment and operating policies require shareholder approval, all material changes will be presented in prospectus supplements during the offering period.
Our offering period will end on or before December 31, 2022, unless otherwise extended for up to 90 days by our Board of Trustees. We will have a finite term of up to six years from the closing of this offering (contemplated to be on or before December 31, 2028) unless the Board of Trustees exercises its ability to delay pursuing a Liquidity Event for at most two additional one year periods. Guggenheim may recommend to our Board of Trustees at any time that it approve a complete Liquidity Event (as described below), and in any event will make such a recommendation no later than December 31, 2028. See “Prospectus Summary - Shareholder Liquidity Strategy.”
| |
| • | An investment in our Shares is not suitable for you if you might need access to the money you invest in the foreseeable future. |
| |
| • | We do not currently intend to list our Shares on any securities exchange and we do not expect a secondary market in the Shares to develop. |
| |
| • | Our Board of Trustees may, but is not required to, implement a share repurchase program. In addition, only a limited number of Shares will be eligible for repurchase and any such repurchases will be at a price that is estimated to be equal to our net asset value per share as of the expiration date of the tender offer, which may be more or less than the price you paid for your Shares. If a share repurchase program is implemented, we do not expect to repurchase, in any calendar year, more than 10% of the weighted average number of outstanding Shares in any 12-month period, until the year in which a Liquidity Event occurs (contemplated to be on or before December 31, 2028). Accordingly, you may not have access to the money you invest until the completion of the Company’s finite term. |
| |
| • | We have a finite term and may liquidate our assets at a time that is disadvantageous based on adverse market conditions, which may result in our incurring losses on our investments. |
| |
| • | Our distributions may be funded from offering proceeds or borrowings, which may constitute a return of capital and reduce the amount of capital available to us for investment. Any capital returned to you through distributions is |
distributed after payment of the sales load and fees and expenses of the Company, and such amounts paid is not recoverable by you.
| |
| • | Our distributions may also be funded in significant part from the reimbursement of certain expenses, which are subject to repayment to our Advisor, as well as from waivers of certain investment advisory fees, which are not subject to repayment to our Advisor. Significant portions of these distributions may not be based on our investment performance and such waivers and reimbursements by our Advisor may not continue in the future. If our Advisor does not agree to reimburse certain of our expenses, including through the waiver of their advisory fees, significant portions of these distributions may come from offering proceeds or borrowings. The repayment of any amounts owed to our Advisor reduces the future distributions to which you would otherwise be entitled. |
| |
| • | Because the Shares of the Company are not listed on a securities exchange, you are unable to sell your Shares on a securities exchange and as a result you may not be able to reduce your exposure during any market downturn. |
| |
| • | You should not expect to be able to sell your Shares regardless of how we perform. If you are able to sell your Shares, you will likely receive less than your purchase price. |
Investing in our Shares may be considered speculative and involves a high degree of risk, including the risk of a substantial loss of investment. See “Risk Factors” to read about the risks you should consider before purchasing our Shares. The use of investor return forecasts in this offering is prohibited. Any representation to the contrary and any predictions, written or oral, as to the amount or certainty of any present or future cash benefit or tax consequence that may flow from an investment in this offering is not permitted.
Our Shares are highly illiquid and appropriate only as a long-term investment. An investment in our Shares is only appropriate for investors who can bear the high degree of illiquidity and other substantial risks associated with such an investment. See “Suitability Standards” and “Risk Factors.” Depending upon the terms and pricing of any additional offerings and the value of our investments, you may experience dilution in the book value and fair value of your Shares. See “Risk Factors - Risks Related to an Investment in Our Shares - Your interest in us may be diluted if we issue additional Shares, which could reduce the overall value of an investment in us.” for more information.
This prospectus contains important information about us that a prospective investor should know before investing in our Shares. Please read this prospectus before investing and keep it for future reference. We also file with the SEC annual reports, quarterly reports, current reports, proxy statements, and other information regarding us. You may obtain a copy of any of these filings free of charge, make shareholder inquiries or request other information about us, by contacting us by mail at 330 Madison Avenue, New York, New York 10017 or by telephone at 1-888-667-4937. These documents are also available without charge at our website at www.GuggenheimCIF.com. The SEC maintains a website (www.sec.gov) that contains information regarding us.
|
| | | | | | | | |
| | | Per Share (1) | | Maximum Offering Amount (1) |
| Initial Public Offering Price | | $ | 10.53 |
| | $ | 775,000,000 |
|
Sales load (2) | | $ | 0.53 |
| | $ | 38,750,000 |
|
| Net proceeds to us (before expenses) | | $ | 10.00 |
| | $ | 736,250,000 |
|
| |
| (1) | Assumes all Shares are sold at the initial public offering price per Share, which is subject to adjustment based upon, among other things, our net asset value per Share. The price per Share and sales load per Share in this table have been rounded to the nearest penny, thus the purchase price details on your confirmation statement may differ from the price per Share and sales load per Share presented in the table above. |
| |
| (2) | The sales load on all initial and follow-on purchases of Shares includes up to 3.0% of the price per Share for selling commissions and up to 2.0% for dealer manager fees, neither of which will be paid by you for Shares issued pursuant to our Distribution Reinvestment Plan (“DRP”). In addition to the upfront selling commissions and dealer manager fees, our Advisor may pay our dealer manager an annualized fee equal to no more than 1.0% of the Company's then-current net asset value, payable quarterly. Our dealer manager will re-allow all of such amounts to participating selected dealers. Such amounts will not be paid by our shareholders. See “Plan of Distribution.” |
Because you will pay a sales load of up to 5.0% and organization and offering expenses of up to 1.5% if you invest $100 in our Shares and pay the maximum sales load, at least $93.50 but less than $95.00 of your investment will actually be available to us for investment purposes. As a result, you would have to experience a total return on your investment of between approximately 5% and 7% in order to recover these expenses. See “Use of Proceeds.”
Neither the SEC, the Attorney General of the State of New York, nor any state securities commission has approved or disapproved of these securities or determined if this prospectus is truthful or complete. Any representation to the contrary is a criminal offense. An investment in our Shares is NOT a bank deposit and is NOT insured by the Federal Deposit Insurance Corporation or any other government agency.
August 31, 2020
Table of Contents
ABOUT THIS PROSPECTUS
This prospectus is part of a registration statement we have filed with the SEC, in connection with a continuous offering process, to raise capital to invest in the Master Fund. This prospectus, together with any prospectus supplements, constitute the entire prospectus and we will supplement this prospectus as necessary to reflect subsequent material changes. As we or the Master Fund make material investments or have other material developments, we will periodically file prospectus supplements or may amend this prospectus to add, update, or change information contained in this prospectus. Shares are offered at net asset value plus any applicable sales load.
Our Board of Trustees will adjust the public offering price periodically to ensure that the public offering price, net of sales load, is equal to the net asset value per Share when we sell our Shares.
You should rely only on the information contained in this prospectus. Our dealer manager is Guggenheim Funds Distributors, LLC, which we refer to in this prospectus as "GFD" or our "Dealer Manager." Neither we nor our Dealer Manager has authorized any other person to provide you with different information from that contained in this prospectus. The information contained in this prospectus is complete and accurate only as of the date of this prospectus, regardless of the time of delivery of this prospectus or sale of our Shares. Any statement that we make in this prospectus may be modified or superseded by us in a subsequent prospectus supplement. The registration statement we filed with the SEC includes exhibits that provide more detailed descriptions of the matters discussed in this prospectus. You should read this prospectus, all prospectus supplements and the related registration statement exhibits, together with the additional information described under “Additional Information.”
We maintain a website at www.GuggenheimCIF.com. Information contained on our website is not incorporated by reference into this prospectus and you should not consider that information to be part of this prospectus.
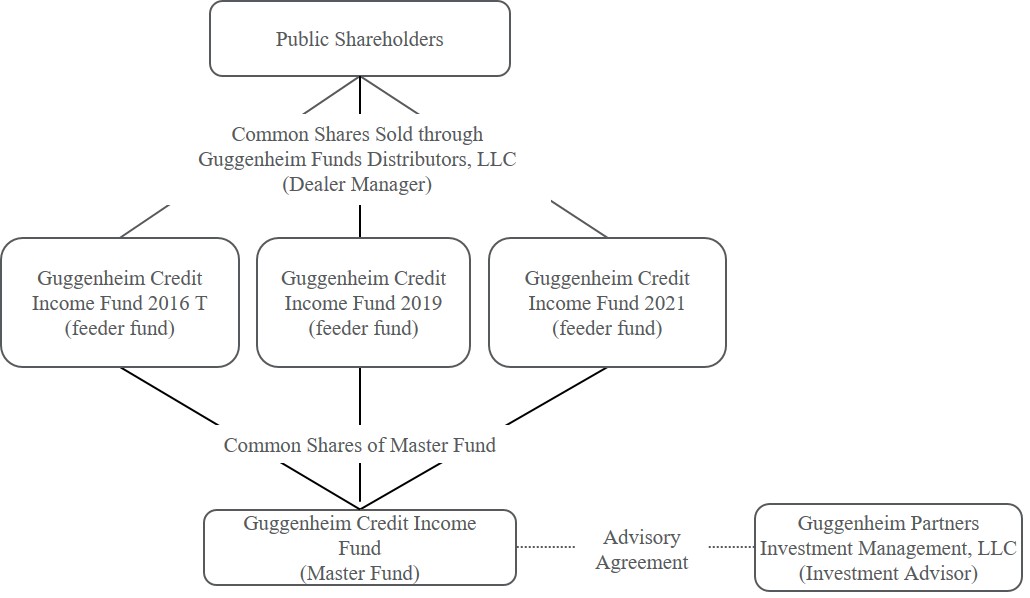
MASTER/FEEDER FUND STRUCTURE
We serve as a feeder fund in a master/feeder fund structure in that we invest all or substantially all of our assets in the common shares of the Master Fund, a separate externally managed, non-diversified, closed-end management investment company that has elected to be treated as a BDC, with the same investment objectives and strategies as our investment objectives and strategies. As we raise capital, we will invest in the Master Fund at the net asset value of the Master Fund, which varies over time. We have a Board of Trustees that has overall responsibility for overseeing our management and operations. The same Trustees also serve on the Master Fund’s Board of Trustees, where they have overall responsibility for overseeing the Master Fund’s management and operations. See “Management of the Company and the Master Fund.”
While the Master Fund is expected to continuously offer its common shares and have an indefinite life, our offering period will end on or before December 31, 2022, unless otherwise extended for up to 90 days by our Board of Trustees. We will have a finite term of up to six years from the close of this offering (contemplated to be on or before December 31, 2028) unless the Board of Trustees exercises its ability to delay pursuing a Liquidity Event for at most two additional one year periods. Other feeder funds may be created over time that will invest all or substantially all of their assets in the common shares of the Master Fund. It is the Board of Trustees’ intention that one or more feeder funds will liquidate prior to the Company’s liquidation. In the event that a feeder fund liquidates, the Master Fund may sell some of its investments, borrow additional funds, or use capital raised from other feeder funds, such as ours, to meet the liquidation needs of such liquidating feeder fund.
The Master Fund makes the investments described in this prospectus with the proceeds it receives from (i) the sale of our Shares and (ii) equity capital invested by any other BDC regulated under the 1940 Act that has a principal investment strategy of investing all or substantially all of its assets in the Master Fund.
The investment advisor to the Master Fund is Guggenheim. Guggenheim oversees the management of the Master Fund’s activities and is responsible for identifying investment opportunities, making investment decisions and corporate borrowing recommendations for the Master Fund’s portfolio, and executing on its trading strategies. Guggenheim also serves as the Company’s and the Master Fund’s administrator, providing and overseeing the administrative services needed to operate the Company and the Master Fund. See “Company Profile - Our Advisor.”
SUITABILITY STANDARDS
Our Shares offered through this prospectus are suitable only as a long-term investment for persons of adequate financial means, such that they do not have a need for liquidity in this investment. We have established financial suitability standards for initial shareholders in this offering, which require that a purchaser of Shares have either:
| |
| • | a gross annual income of at least $70,000 and a net worth of at least $70,000, or |
| |
| • | a net worth of at least $250,000. |
For purposes of determining the suitability of an investor, net worth in all cases should be calculated excluding the value of an investor’s home, home furnishings, and automobiles. In the case of sales to fiduciary accounts, these minimum standards must be met by the beneficiary, the fiduciary account, or the donor or grantor who directly or indirectly supplies the funds to purchase the Shares if the donor or grantor is the fiduciary.
Those selling Shares on our behalf, and selected dealers and registered investment advisers recommending the purchase of Shares, are required to make every reasonable effort to determine that the purchase of Shares is a suitable and appropriate investment for each investor based on information provided by the investor regarding the investor’s financial situation and investment objectives. We will maintain records of the information we use to determine that an investment in the Shares is suitable and appropriate for each investor for six years. Selected dealers and registered investment advisers will be obligated to retain such records for six years or such other period of time that is required under applicable laws and regulations. In making this determination, consideration should be given to the illiquid nature of the security and the fact that we will have a finite term of up to six years from the close of this offering (contemplated to be on or before December 31, 2028) unless the Board of Trustees exercises its ability to delay pursuing a Liquidity Event for at most two additional one year periods. The selected dealer, authorized representative, or other person selling Shares will, based on a review of the information provided by the investor, consider whether the investor:
| |
| • | meets the minimum income and net worth standards established in the investor’s state; |
| |
| • | can reasonably benefit from an investment in our Shares based on the investor’s overall investment objectives and portfolio structure; |
| |
| • | is able to bear the economic risk of the investment based on the investor’s overall financial situation, including the risk that the investor may lose its entire investment; and |
| |
| • | has an apparent understanding of the following: |
•the fundamental risks of the investment;
•the lack of liquidity of the Shares;
•the restrictions on transferability of the Shares;
•the background and qualification of Guggenheim; and
•the tax consequences of the investment.
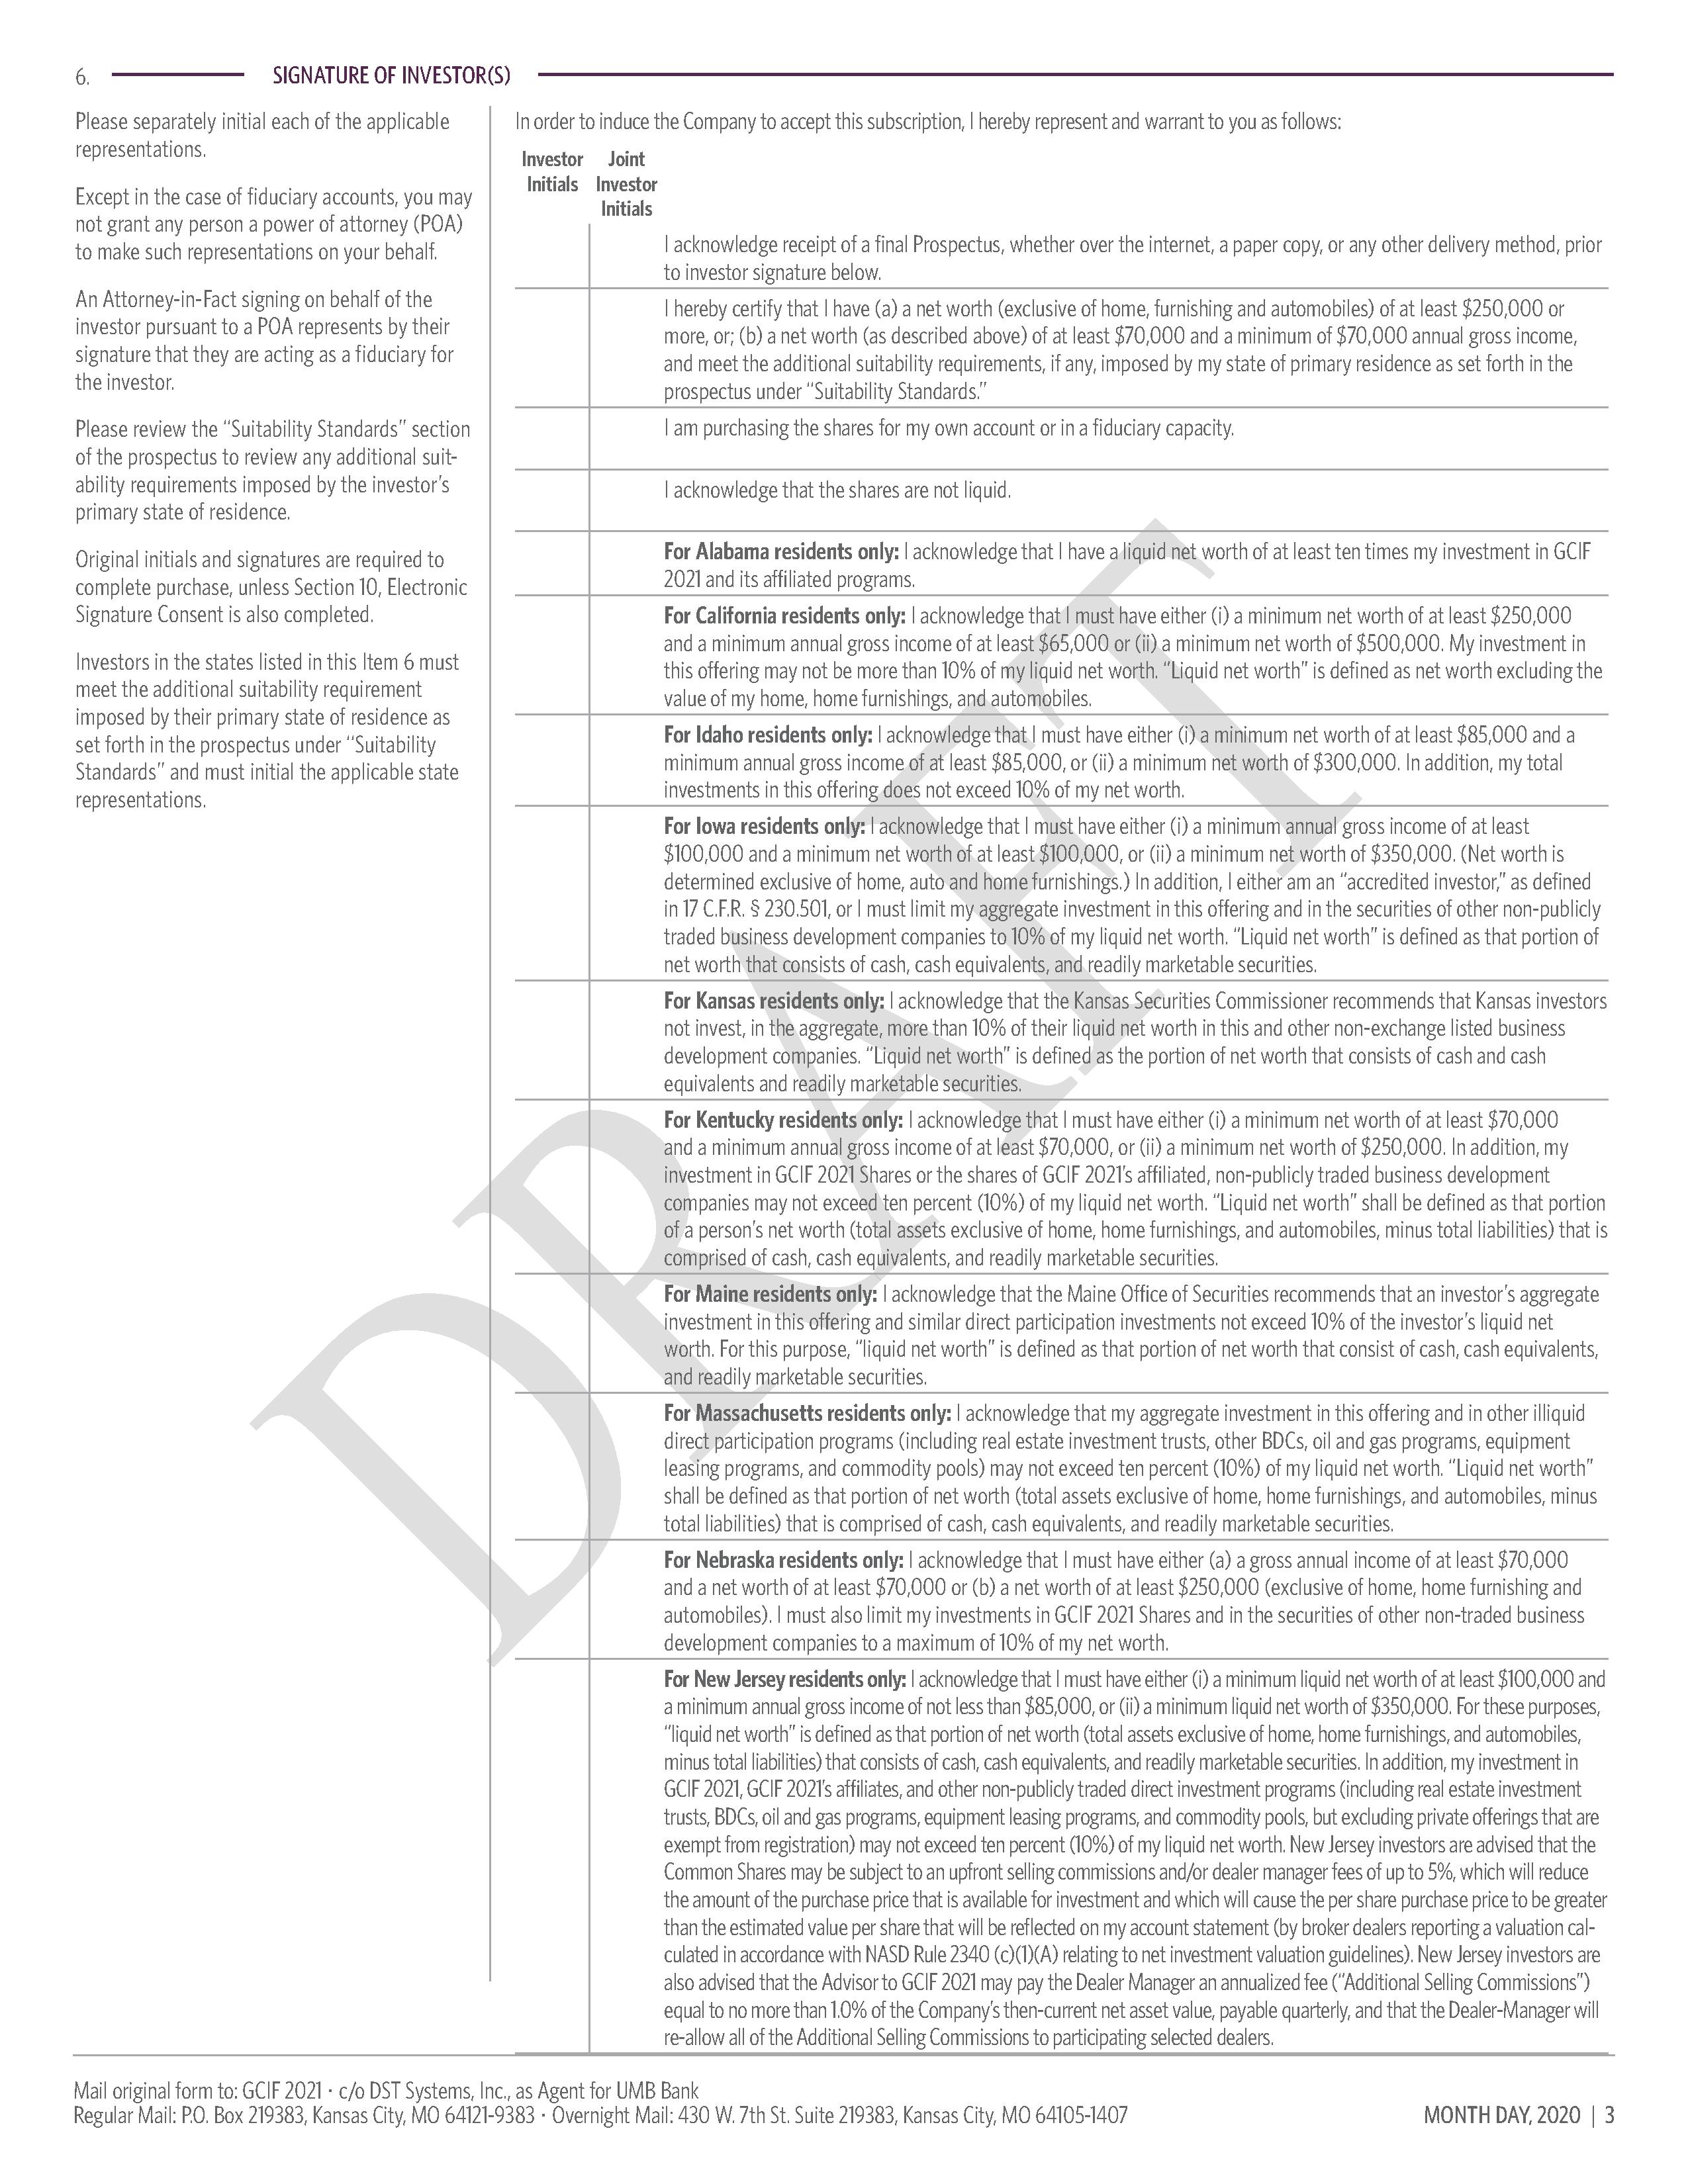
In purchasing Shares, custodians or trustees of employee pension benefit plans or individual retirement accounts (“IRAs”) may be subject to the fiduciary duties imposed by the Employee Retirement Income Security Act (“ERISA”), or other applicable laws, and to the prohibited transaction rules prescribed by ERISA and related provisions of the Code. In addition, prior to purchasing Shares, the trustee or custodian of an employee pension benefit plan or IRA should determine that such an investment would be permissible under the governing instruments of such plan or account and applicable law. In addition, we will not sell Shares to investors in the states named below unless they meet the suitability standards set forth above, as well as the additional requirements as established by those states’ securities regulators:
Alabama - Investors must have a liquid net worth of at least ten times their investment in us and our affiliated programs.
California - Investors must have either (i) a minimum net worth of at least $250,000 and a minimum annual gross income of at least $65,000 or (ii) a minimum net worth of $500,000. Each investor’s maximum investment in this offering may not be more than 10% of his or her liquid net worth. “Liquid net worth” is defined as net worth excluding the value of the investor’s home, home furnishings, and automobiles.
Idaho - Investors must have either (i) a minimum net worth of at least $85,000 and a minimum annual gross income of at least $85,000, or (ii) a minimum net worth of $300,000. In addition, an investor’s total investments in this offering shall not exceed 10% of his or her net worth.
Iowa - Investors who reside in the state of Iowa must have either (i) a minimum annual gross income of at least $100,000 and a minimum net worth of at least $100,000, or (ii) a minimum net worth of $350,000. (Net worth should be determined exclusive of home, auto and home furnishings.) In addition, each investor who is not an “accredited investor,” as defined in 17 C.F.R. § 230.501, must limit his or her aggregate investment in this offering and in the securities of other non-publicly traded business development companies to 10% of such investor's liquid net worth. (Liquid net worth should be defined as that portion of net worth that consists of cash, cash equivalents, and readily marketable securities.)
Kansas - The Kansas Securities Commissioner recommends that Kansas investors not invest, in the aggregate, more than 10% of their liquid net worth in this and other non-exchange listed BDCs. “Liquid net worth” is defined as the portion of net worth that consists of cash and cash equivalents and readily marketable securities.
Kentucky - Investors must have either (i) a minimum net worth of at least $70,000 and a minimum annual gross income of at least $70,000, or (ii) a minimum net worth of $250,000. In addition, a Kentucky resident’s investment in our Shares or the shares of our affiliated, non-publicly traded business development companies may not exceed ten percent (10%) of his or her liquid net worth. “Liquid net worth” shall be defined as that portion of a person’s net worth (total assets exclusive of home, home furnishings, and automobiles, minus total liabilities) that is comprised of cash, cash equivalents, and readily marketable securities.
Maine - The Maine Office of Securities recommends that an investor’s aggregate investment in this offering and similar direct participation investments not exceed 10% of the investor’s liquid net worth. For this purpose, “liquid net worth” is defined as that portion of net worth that consist of cash, cash equivalents, and readily marketable securities.
Massachusetts - Each investor’s aggregate investment in this offering and in other illiquid direct participation programs (including real estate investment trusts, other BDCs, oil and gas programs, equipment leasing programs, and commodity pools) may not exceed ten percent (10%) of his or her liquid net worth. “Liquid net worth” shall be defined as that portion of net worth (total assets exclusive of home, home furnishings, and automobiles, minus total liabilities) that is comprised of cash, cash equivalents, and readily marketable securities.
Missouri - Each investor's aggregate investment in our Shares may not exceed ten percent (10%) of his or her liquid net worth.
Nebraska - Each investor must have either (a) a gross annual income of at least $70,000 and a net worth of at least $70,000 or (b) a net worth of at least $250,000 (exclusive of home, home furnishing and automobiles). Each investor must also limit his or her investments in our Shares and in the securities of other non-traded business development companies to a maximum of 10% of his or her net worth.
New Jersey - Investors must have either (i) a minimum liquid net worth of at least $100,000 and a minimum annual gross income of not less than $85,000, or (ii) a minimum liquid net worth of $350,000. For these purposes, “liquid net worth” is defined as that portion of net worth (total assets exclusive of home, home furnishings, and automobiles, minus total liabilities) that consists of cash, cash equivalents, and readily marketable securities. In addition, a New Jersey investor’s investment in us, our affiliates, and other non-publicly traded direct investment programs (including real estate investment trusts, BDCs, oil and gas programs, equipment leasing programs, and commodity pools, but excluding private offerings that are exempt from registration) may not exceed ten percent (10%) of his or her liquid net worth.
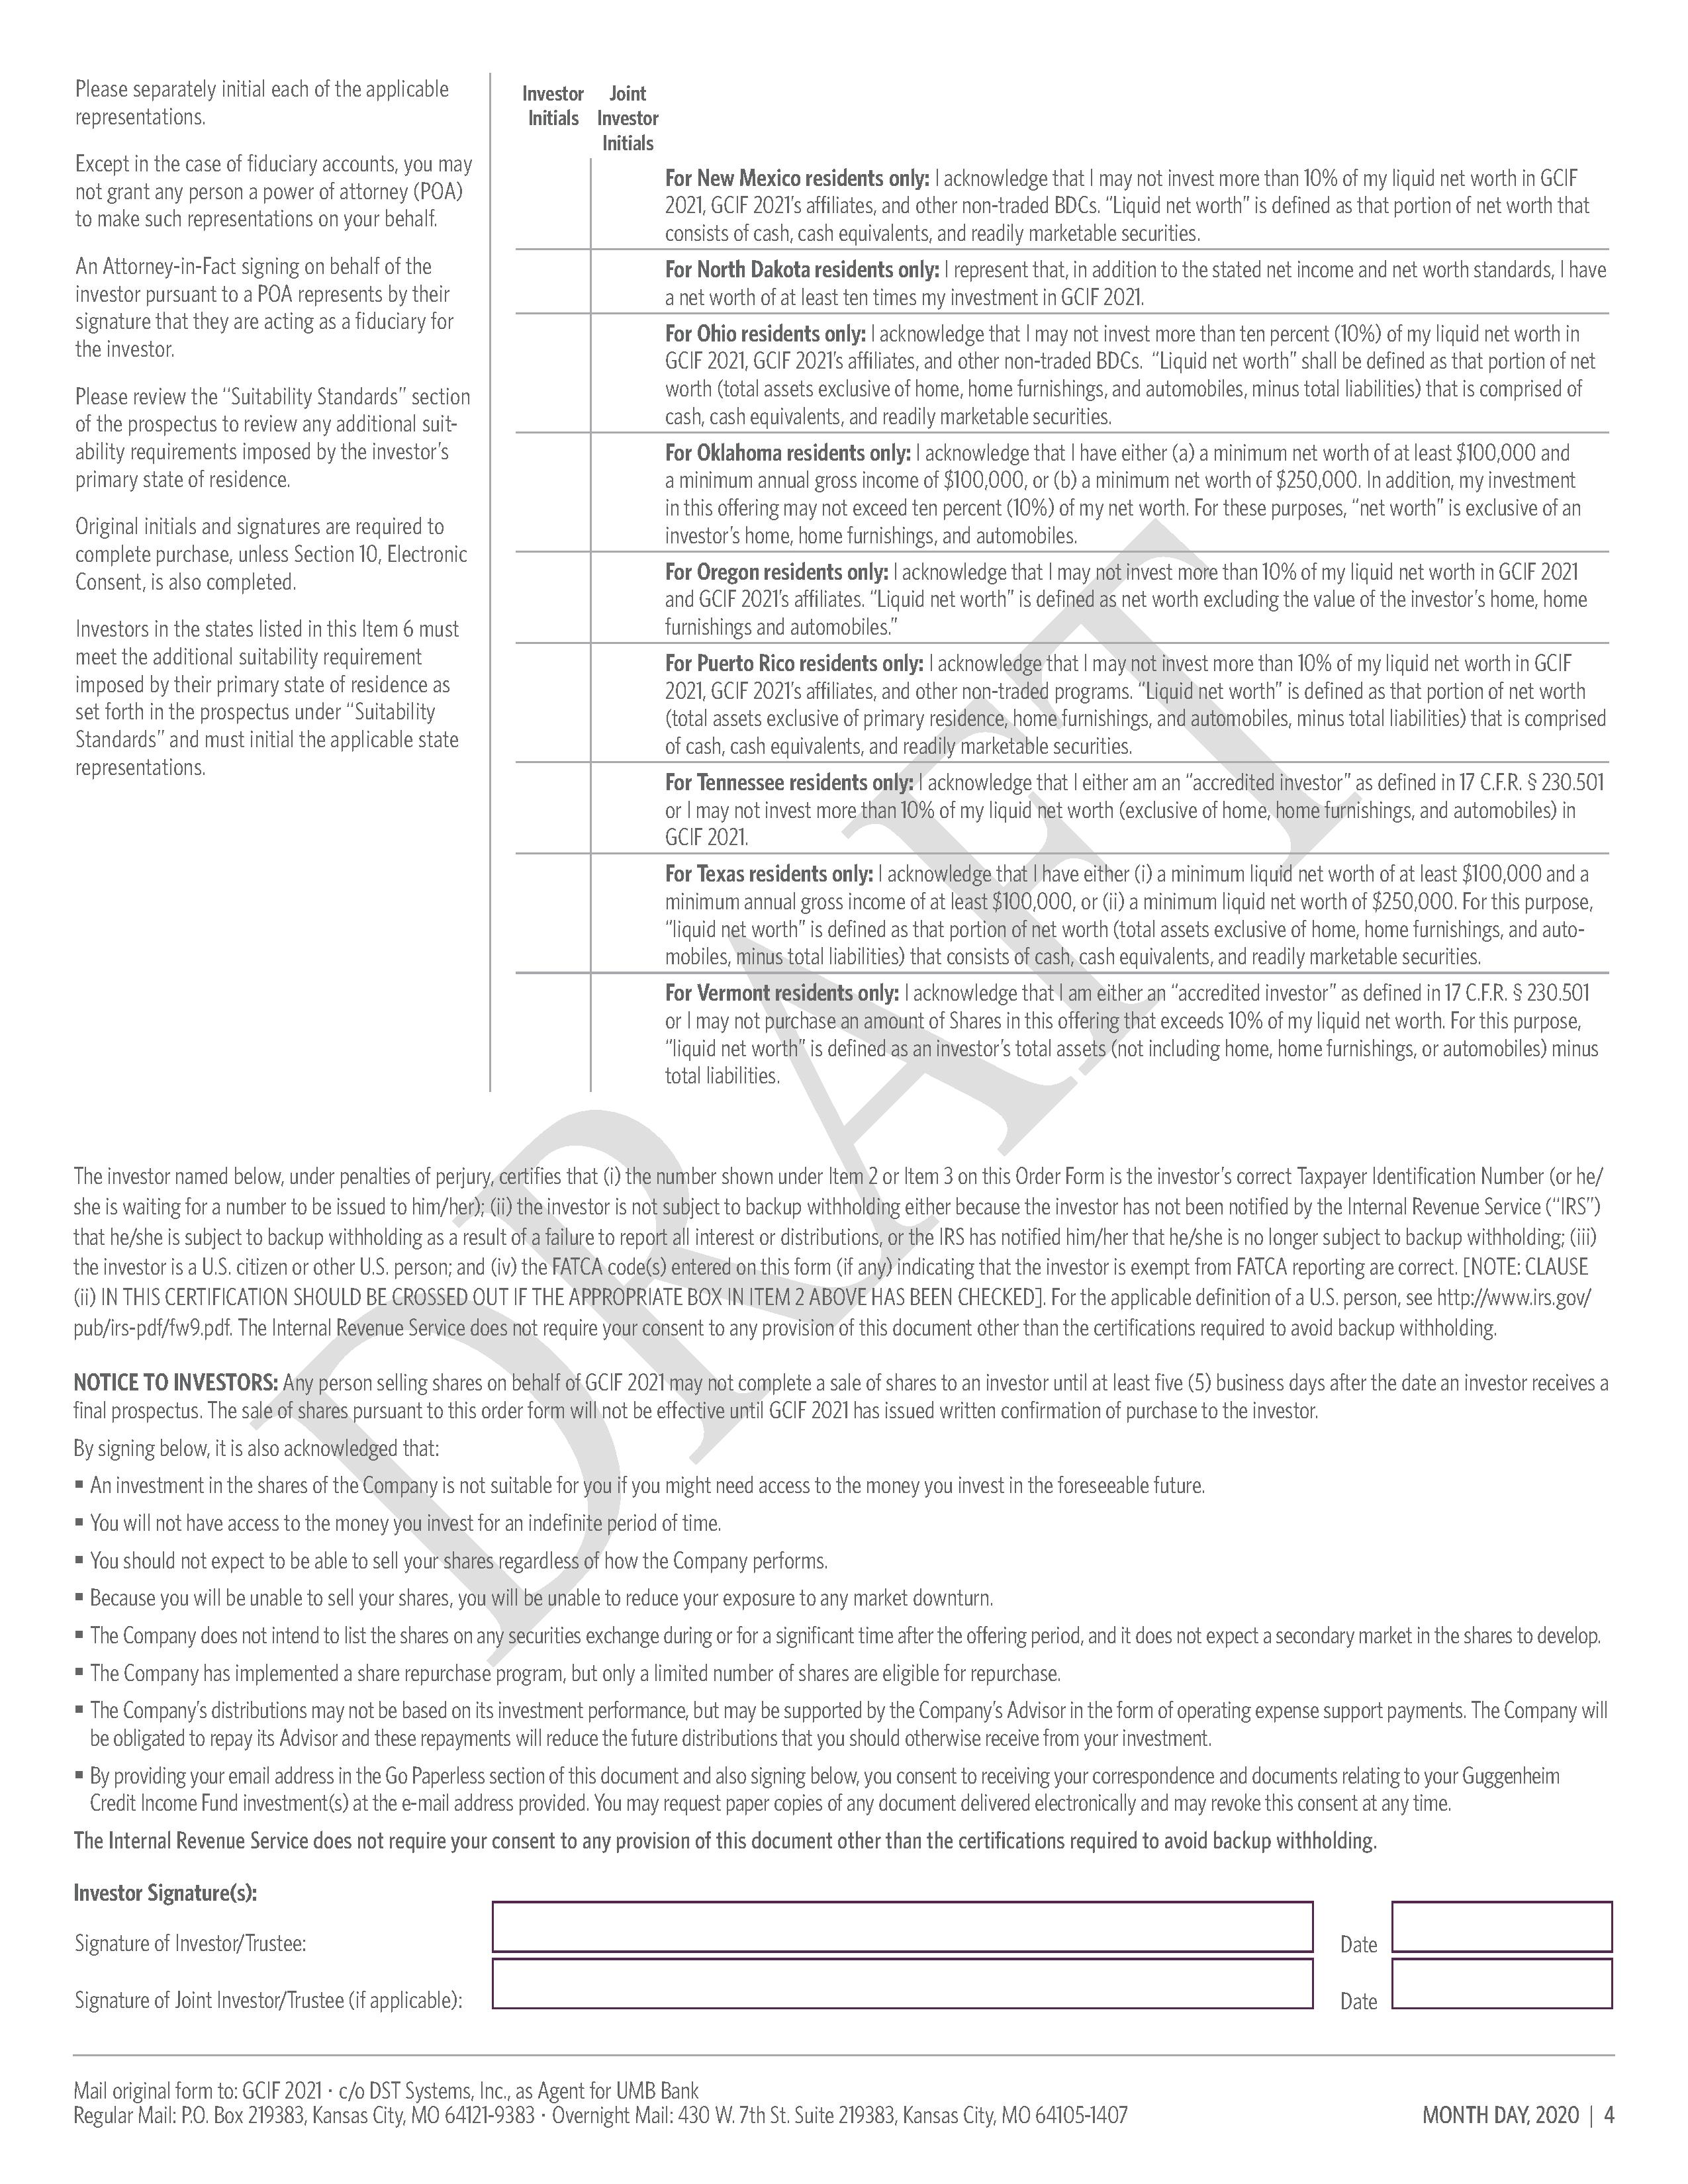
New Mexico - Investors may not invest more than 10% of their liquid net worth in us, our affiliates, and other non-traded BDCs. “Liquid net worth” is defined as that portion of net worth that consists of cash, cash equivalents, and readily marketable securities.
North Dakota - Investors must represent that, in addition to the stated net income and net worth standards, they have a net worth of at least ten times their investment in us.
Ohio - Investors may not invest more than ten percent (10%) of their liquid net worth in us, our affiliates, and other non-traded BDCs. “Liquid net worth” shall be defined as that portion of net worth (total assets exclusive of home, home furnishings, and automobiles, minus total liabilities) that is comprised of cash, cash equivalents, and readily marketable securities.
Oklahoma - Investors must have either (a) a minimum net worth of at least $100,000 and a minimum annual gross income of $100,000, or (b) a minimum net worth of $250,000. In addition, an Oklahoma investor’s investment in this offering may not exceed ten percent (10%) of his or her net worth. For these purposes, “net worth” is exclusive of an investor’s home, home furnishings, and automobiles.
Oregon - Investors may not invest more than 10% of their liquid net worth in us and our affiliates. “Liquid net worth” is defined as net worth excluding the value of the investor’s home, home furnishings and automobiles.”
Puerto Rico - Investors may not invest more than 10% of their liquid net worth in us, our affiliates, and other non-traded programs. "Liquid net worth" is defined as that portion of net worth (total assets exclusive of primary residence, home furnishings, and automobiles, minus total liabilities) consisting of cash, cash equivalents, and readily marketable securities.
Tennessee - Investors who are not “accredited investors” as defined in 17 C.F.R. § 230.501 may not invest more than 10% of their liquid net worth (exclusive of home, home furnishings, and automobiles) in us.
Texas - Investors must have either (i) a minimum liquid net worth of at least $100,000 and a minimum annual gross income of at least $100,000, or (ii) a minimum liquid net worth of $250,000. For this purpose, “liquid net worth” is defined as that portion of net worth (total assets exclusive of home, home furnishings, and automobiles, minus total liabilities) that consists of cash, cash equivalents, and readily marketable securities.
Vermont - Each investor who is not an “accredited investor” as defined in 17 C.F.R. § 230.501 may not purchase an amount of Shares in this offering that exceeds 10% of the investor’s liquid net worth. For this purpose, “liquid net worth” is defined as an investor’s total assets (not including home, home furnishings, or automobiles) minus total liabilities. Vermont residents who are “accredited investors” are not subject to the limitation described in this paragraph.
In addition to investors who meet the minimum income and net worth requirements set forth above, our Shares may be sold to financial institutions that qualify as “institutional investors” under the state securities laws of the state in which they reside. “Institutional investor” is generally defined to include banks, insurance companies, investment companies as defined in the 1940 Act, pension or profit sharing trusts, and certain other financial institutions. A financial institution that desires to purchase Shares will be required to confirm that it is an “institutional investor” under applicable state securities laws.
In addition to the suitability standards established herein, a selected dealer may impose additional suitability requirements to which an investor could be subject.
PROSPECTUS SUMMARY
This summary highlights some of the information in this prospectus. It is not complete and may not contain all of the information that you may want to consider. To understand this offering fully, you should carefully read the entire prospectus, including the section entitled “Risk Factors,” before making a decision to invest in our Shares. Unless otherwise noted, the terms “we,” “us,” “our,” “GCIF 2021,” and “Company” refer to Guggenheim Credit Income Fund 2021. We refer to Guggenheim Credit Income Fund as the “Master Fund.” As we are a feeder fund in a master/feeder fund structure, all references to our portfolio/investments, our investment process or investment strategies, and our risks refer to the Master Fund’s portfolio/investments, the Master Fund’s investment process or investment strategies, and the Master Fund’s risks. Similarly, all references to Guggenheim, our management fee, and our incentive fees refer to the Master Fund, the management fee payable by the Master Fund, and the incentive fees payable by the Master Fund. We refer to Guggenheim Partners, LLC as “Guggenheim Partners.” We refer to Guggenheim Partners Investment Management, LLC as “Guggenheim” or the “Advisor.” We refer to Guggenheim Funds Distributors, LLC as our “Dealer Manager.”
Our Company
We are a non-diversified, closed-end management investment company that intends to elect to be treated as a BDC under the 1940 Act. We were formed on March 18, 2016 as a statutory trust under the laws of Delaware and have not commenced any meaningful investment operations as of the date of this prospectus. The Master Fund is focused on lending to middle market companies and is externally managed by Guggenheim, which is responsible for sourcing potential investments, conducting due diligence on prospective investments, analyzing investment opportunities, structuring investments, and monitoring our portfolio on an ongoing basis. We intend to elect to be treated for federal income tax purposes, beginning with our taxable year ending September 30, 2021 and intend to qualify annual thereafter as a RIC under the Code. The Master Fund elected to be treated for federal income tax purposes, beginning with its taxable year ending December 31, 2015 and intends to qualify annually thereafter, as a RIC under the Code.
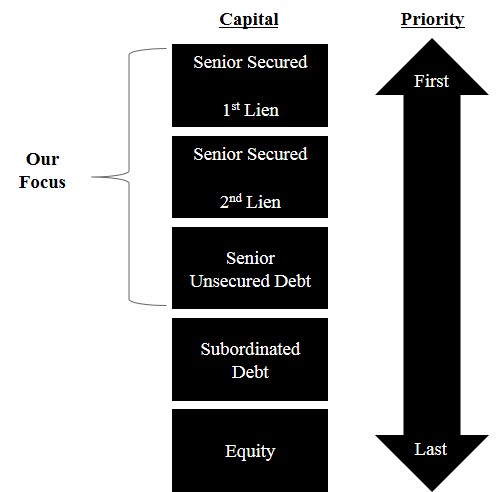
Our investment objectives are to provide our shareholders with current income, capital preservation, and, to a lesser extent, long-term capital appreciation. We seek to meet our investment objectives by investing primarily in large, privately-negotiated loans to private middle market U.S. companies. Specifically, we expect a typical borrower to have earnings before interest, taxes, depreciation, and amortization (“EBITDA”) of $25 million to $100 million and annual revenue ranging from $50 million to $1 billion. We seek to invest in businesses that have a strong reason to exist and have demonstrated competitive and strategic advantages. These companies generally possess distinguishing business characteristics, such as a leading competitive position in a well-defined market niche, unique brands, sustainable profitability and cash flow, and experienced management. We anticipate that our investments will sit senior (generally as senior secured debt) in a borrower’s capital structure and have repayment priority over other parts of a borrower’s capital structure (i.e., subordinated debt, preferred and common equity). By investing in a more senior attachment point of a borrower’s capital structure, we expect to protect our principal with less risk, which we believe provides for a distinctive risk/return profile as compared to that of a typical middle market or private equity alternative investment. In addition to privately-negotiated loans, we invest in opportunities that include more broadly syndicated assets, such as bank loans and corporate bonds. In these instances, our portfolio is more heavily weighted towards floating-rate investments, whose revenue streams may increase in a rising interest rate environment. We may also invest in fixed-rate investments, options, or other forms of equity participation, and, to a limited extent and not as a principal investment strategy, structured products such as collateralized loan obligations (“CLOs”) and collateralized debt obligations (“CDOs”). We seek to make investments which have favorable characteristics, including closing fees, prepayment premiums, lender-friendly control provisions, and lender-friendly covenants.
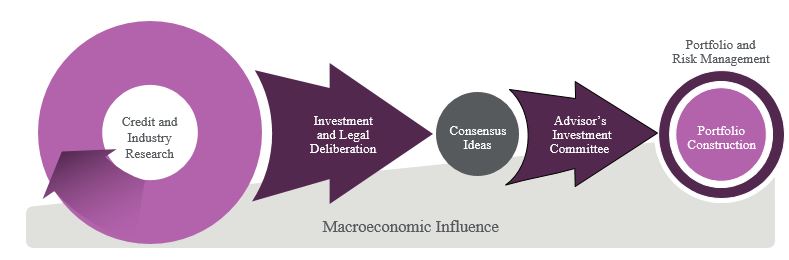
Our investment strategy leverages Guggenheim's deep research team with a relative value perspective across all corporate credit asset types. This creates a larger, proprietary opportunity set that lends itself to generating best risk-adjusted investment ideas to us. The strategy strives to create investments with a more attractive combination of risk and reward, better economics, and stronger protections than those offered in traditional transactions.
There can be no assurances that any of the investment objectives, benefits, or expectations described in the preceding paragraphs will be achieved.
Master/Feeder Fund Structure
We serve as a feeder fund in a master/feeder fund structure in that we will invest all or substantially all of our assets in the common shares of the Master Fund, a separate externally managed, non-diversified, closed-end management investment company with the same investment objectives and strategies as our investment objectives and strategies. As we raise capital, we will invest in the Master Fund at the net asset value of the Master Fund, which will vary over time. We have a Board of Trustees that has overall responsibility for overseeing our management and operations. The
same Trustees also serve on the Master Fund’s Board of Trustees. See “Management of the Company and the Master Fund.”
While the Master Fund is expected to continuously offer its common shares and have an indefinite life, our offering period will end on or before December 31, 2022, unless otherwise extended for up to 90 days by our Board of Trustees. We will have a finite term of up to six years from the close of this offering (contemplated to be on or before December 31, 2028) unless the Board of Trustees exercises its ability to delay pursuing a Liquidity Event for at most two additional one year periods. Other feeder funds may be created over time that will invest all or substantially all of their assets in the common shares of the Master Fund. It is the Board of Trustees’ intention that one or more feeder funds will liquidate prior to the Company’s liquidation. In the event that a feeder fund liquidates, the Master Fund may sell some of its investments, borrow additional funds, or use capital raised from other feeder funds, such as ours, to meet the liquidation needs of such liquidating feeder fund. If the Master Fund is required to sell a portion of its portfolio securities in order to fund the liquidation of the Company or any other feeder fund, such sales may occur at a disadvantageous time based on adverse market conditions, which may result in the Master Fund, and indirectly the Company, incurring losses or realizing a lower rate of return for its shareholders than it otherwise may realize if it did not have to sell portfolio securities to provide liquidity.
The Master Fund will make the investments described in this prospectus with the proceeds it received from (i) the direct sale of its shares, including the Seed Capital Investment (defined below), (ii) the sale of our Shares, and (iii) equity capital invested by any other BDC regulated under the 1940 Act that has a principal investment strategy of investing all or substantially all of its assets in the Master Fund.
The investment advisor to the Master Fund is Guggenheim. Guggenheim oversees the management of the Master Fund’s activities and is responsible for identifying investment opportunities, making investment decisions and corporate borrowing recommendations for the Master Fund’s portfolio, and executing on its trading strategies. Guggenheim also serves as the Company’s and the Master Fund’s administrator, providing and overseeing the administrative services needed to operate the Company and the Master Fund. See “Company Profile - Our Advisor.”
Seed Capital Investment
An affiliate of Guggenheim invested or caused to be invested $25 million in the Master Fund in exchange for Master Fund common shares (the “Seed Capital Investment”). The common shares issued by the Master Fund to the provider of its Seed Capital Investment and the common shares issued by the Master Fund to its feeder funds possess identical characteristics, rights, priorities, and preferences.
Use of Proceeds
The Master Fund began investing the proceeds of the Seed Capital Investment on April 2, 2015. We will invest the proceeds from each of our weekly subscription closings promptly in the Master Fund. Following receipt of the offering proceeds by the Master Fund, the Master Fund invests such proceeds generally within 30-90 days after each subscription date, in accordance with the Company’s and the Master Fund’s investment objectives and strategies, and consistent with market conditions and the availability of suitable investments. See “Use of Proceeds.”
Distribution Policy
Subject to our Board of Trustees' discretion and applicable legal restrictions, we intend to authorize and declare cash distributions on a weekly, semi-monthly, or monthly basis, and intend to pay such declared distributions on a monthly basis. Because we intend to qualify as a RIC, we intend to distribute at least 90% of our annual taxable income to our shareholders. A statement on Internal Revenue Service (“IRS”) Form 1099-DIV identifying the sources of the distributions will be mailed to our shareholders pursuant to IRS tax reporting requirements. See “Distributions.”
We intend to fund our cash distributions to our shareholders primarily from the income generated by our investment in the Master Fund. However, we may fund our cash distributions to shareholders from any sources of funds available to us, including expense reimbursements by our Advisor that may be subject to repayment, offering proceeds and reinvested distributions. We have not established limits on the amount of funds we may use from any available sources to make distributions. Distributions from offering proceeds and reinvested distributions could also reduce the amount of capital we ultimately invest in the Master Fund. Our distributions may not be based on our investment performance, but may be supported by our Advisor in the form of operating expense support payments pursuant to an expense support and conditional reimbursement agreement (the “Expense Support and Conditional Reimbursement Agreement”). We may be obligated to reimburse our Advisor and these reimbursement payments will reduce the future distributions that you would otherwise receive from your investment. You should understand that such distributions are not based on our investment performance. You should also understand that reimbursement payments to our Advisor in current and future periods will reduce the distributions that you would otherwise be entitled to receive. There can be no assurance that the Master Fund will achieve the performance necessary to sustain distributions
to us, or that we will be able to pay distributions at a specific rate, or at all. Guggenheim has no obligation to reduce its advisory fees or otherwise reimburse operating expenses in future periods.
Our Advisor
Guggenheim is responsible for the overall management of our investment activities, and for the day-to-day management of our investment portfolio. Under the overall supervision of our Board of Trustees, Guggenheim provides (i) investment advisory services under an investment advisory agreement with us (the “Investment Advisory Agreement”), and (ii) administrative services under an administrative services agreement with us (the “Administrative Services Agreement”). See “Advisory Agreement and Fees.” Furthermore, as required by the Omnibus Guidelines adopted by the North American Securities Administrators Association, Guggenheim and its parent company have an aggregate net worth in excess of $10.4 million. No portion of such net worth will be available to us to satisfy any of our liabilities or other obligations.
About Guggenheim
Guggenheim Investments represents the investment management businesses of Guggenheim Partners and includes Guggenheim, an SEC-registered investment adviser. Guggenheim Partners is a privately-held, global financial services firm with over 2,400 employees and more than $280 billion in assets under management as of June 30, 20201. It produces customized solutions for its clients, which include institutions, governments and agencies, corporations, insurance companies, investment advisors, family offices, and individual investors.
Guggenheim Investments manages $220 billion in assets across fixed income, equity, and alternative strategies as of June 30, 2020. Its 320+ investment professionals perform research to understand market trends and identify undervalued opportunities in areas that are often complex and underfollowed. This approach to investment management has enabled Guggenheim to deliver long-term results to its clients.
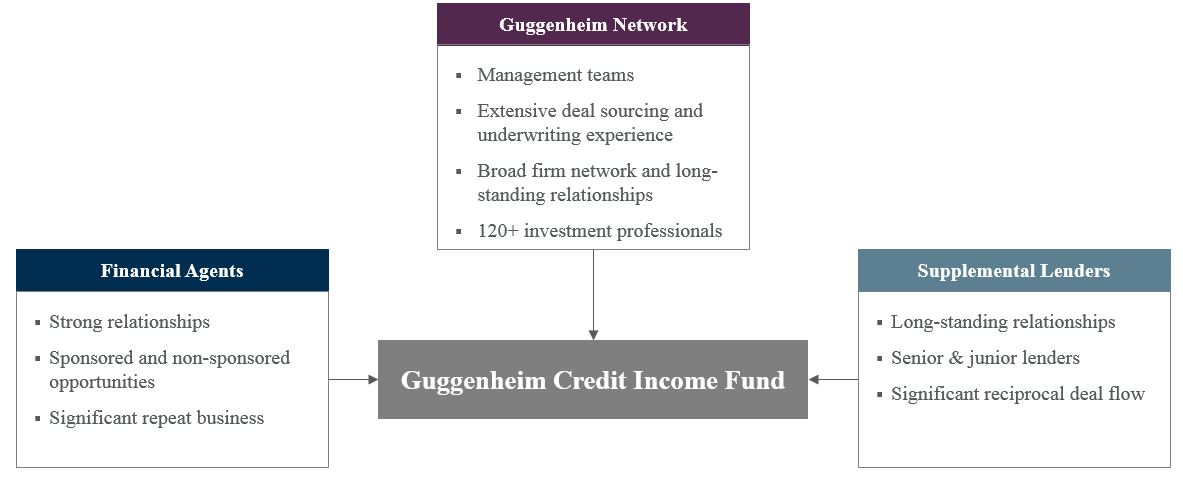
Within Guggenheim Investments is the Guggenheim Corporate Credit Team, which is responsible for all corporate credit strategies and asset management of more than $90 billion. A unified credit platform is utilized for all strategies and is organized by industry as opposed to asset class, which increases its ability to uncover relative value opportunities and to identify and source opportunities. The scale of the platform, combined with the expertise across a wide range of industries and in-house legal resources, allows Guggenheim to be a solution provider to the market and maintain an active pipeline of investment opportunities. See “Company Profile - Our Advisor.”
The following chart shows the ownership structure and relationship between the Company, Guggenheim, and the Dealer Manager:
1 Assets under management are as of 6.30.2020 and include consulting services for clients whose assets are valued at approximately $65bn.
Market Opportunity
Our investment objectives are to provide our shareholders with current income, capital preservation, and, to a lesser extent, long-term capital appreciation. We intend to meet our investment objectives by investing primarily in large, privately-negotiated loans to private middle market U.S. companies. We believe there are and will continue to be attractive investment opportunities for a variety of reasons, including the following:
| |
| • | Scarcity of Capital for Middle Market Companies. Middle market companies’ access to capital has not improved at the same pace as larger companies’ access. Because middle market borrowers have fewer options than larger borrowers, lenders to this segment achieve attractive economic terms and strong structural protections. This middle market financing gap is likely to persist as credit demand outstrips supply. Future middle market financing demand will likely increase due to impending maturities and more leveraged buyout activity, which will be met by fewer capital providers. Commercial banks are making fewer cash flow loans, in many cases focusing instead on asset based loans. Hedge funds, a primary middle market capital source in past years, have largely exited the market. Mezzanine capital remains available but is largely unsuitable as a one-stop capital solution due to high costs. |
| |
| • | Attractive Middle Market Segment. We believe the need for middle market financing combined with the lack of supply of capital to the middle market segment has created, and will continue to create, compelling investment opportunities. Compared to larger companies, middle market companies often offer more attractive economic terms and flexibility in the structuring of transactions, which we believe allows us to create more attractive debt instruments. Middle market investments are more likely to have tighter covenants and loan documentation, more attractive fees, and enhanced pricing compared to financing packages of larger companies. |
| |
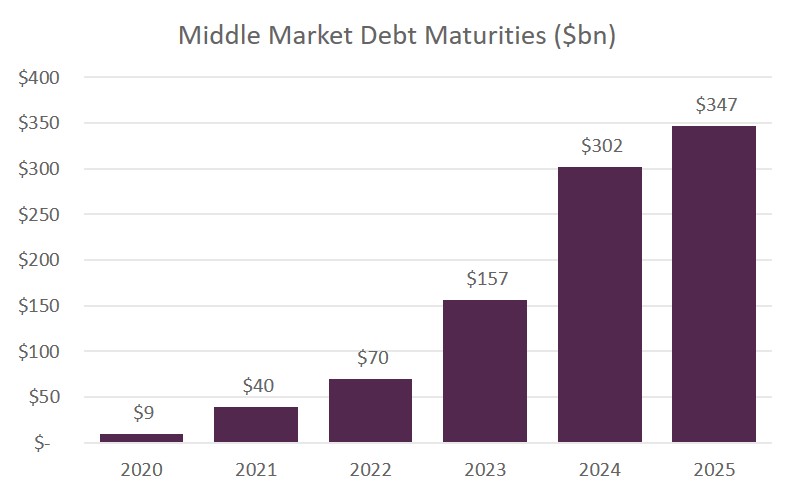
| • | Significant Amounts of Middle Market Debt Coming Due. We believe that over $577 billion of debt to middle market companies will face upcoming maturities and need to be refinanced over the next five years. We believe that the large amount of maturities combined with the scarcity of capital for middle market companies will increase demand and provide attractive investment opportunities. |
| |
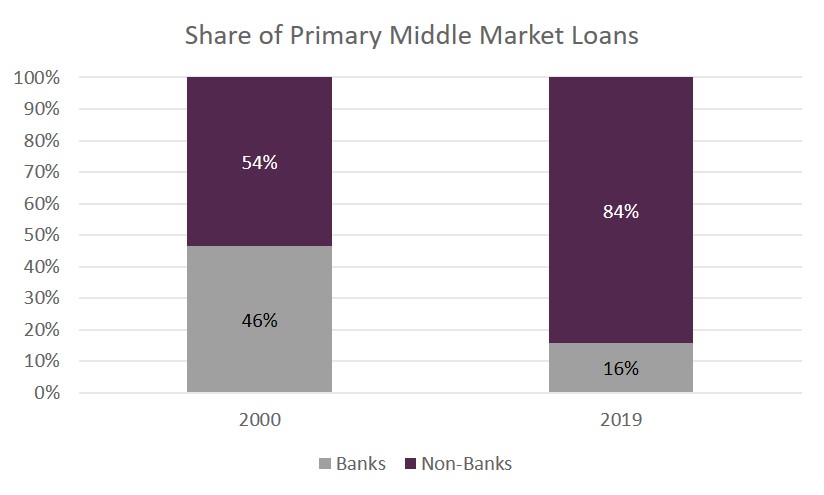
| • | Changes in the Regulatory Landscape Increasing the Demand for Additional Sources of Debt Financing. The post-crisis sector of commercial banking, driven by heightened oversight and regulatory pressure, is marked by dramatically increased risk management practices and requirements to increase capital and to deleverage. The Dodd Frank Act, Volcker Rule, Basel III, and Leveraged Lending Guidelines attempt to remove systematic risk in the commercial banking market. We believe this provides a need for non-traditional sources of debt financing to fill the gap where traditional sources play a reduced role. We believe the scale of our platform allows us to fulfill a differentiated role in deals that capitalize on these secular shifts in the debt capital markets, including, but not limited to, an active role in syndicated deals. |
See “Company Profile - Market Opportunity.”
Our Potential Competitive Strengths
As a BDC with a particular focus on lending activities, we may experience competition from other BDCs, commercial banks, specialty finance companies, open-end and closed-end investment companies, opportunity funds, private equity funds, and institutional investors, many of which generally have greater financial resources than we do for the purposes of lending to U.S. businesses within our stated investment focus. These competitors may also have a lower cost of capital, may be subject to less regulatory oversight, and may have lower overall operating costs. The level of competition impacts our ability to raise capital, find suitable corporate borrowers that meet our investment criteria, and acquire and originate loans to these corporate borrowers. We may also face competition from other funds in which affiliates of Guggenheim participate or advise.
We believe we have the following competitive strengths over other capital providers in our markets, which will allow us to capitalize on attractive market opportunities:
| |
| • | Corporate Credit Expertise. Guggenheim has extensive experience investing in corporate finance-focused credit. Guggenheim’s core team has been together since 2001, managing more than $90 billion in corporate credit strategies. This has allowed them to become a market leader in structuring and investing in middle market private debt, with approximately $13.6 billion in privately-negotiated debt transactions since 2002. |
| |
| • | Sourcing Capabilities and Breadth of Corporate Credit Platform. Guggenheim’s corporate credit team invests across the spectrum with investment grade, high yield, bank loans, and private debt all on one platform. This structure gives us perspective on relative value, access to better information and more detailed diligence on potential investments, and provides us with more sourcing opportunities. Guggenheim has investing experience and, as a result, maintains relationships with a number of important investment sources, such as private equity sponsors, investment banks, insurance companies, and commercial banks, as well as corporate entities and high |
net worth individuals. The depth and breadth of Guggenheim's resources and capabilities allow us to analyze complex transactions in a short time frame and give us the ability to finance entire or large portions of capital structures, providing a one stop solution for the borrower.
| |
| • | Ability to Evaluate, Structure, and Execute Solutions. Guggenheim's experience and expertise in evaluating, structuring, and executing investments allows us to implement a strategy with an attractive combination of risk and reward. Guggenheim's deep resources, including Guggenheim’s 20-person internal legal team, enable us to create investments with privately-negotiated economic terms and strong structural protections. |
| |
| • | Depth of Corporate Credit Research Capabilities. Guggenheim’s corporate credit team is comprised of more than 110 investment professionals with a database of more than 1,000 companies, investing across all levels of a company’s capital structure. Its investment process includes company and financial analysis, coupled with a legal due diligence team that has an active role in structuring transactions. This allows Guggenheim to select investments it believes to have the best risk/return profile, with adequate investor protection, and to quickly commit to term sheets in order to capitalize on those opportunities. |
| |
| • | Focus on Protecting Capital. With Guggenheim's large credit platform and deal structuring expertise, it is able to heavily negotiate economic terms and secure stronger structural protections for our investments. Stress testing companies in various environments is a critical part of Guggenheim's screening process, and Guggenheim intends to subject each company to a sensitivity analysis that considers many factors that could affect investment performance. After establishing a company’s enterprise value, Guggenheim focuses on asset coverage, cash flow, liquidation preference, and rules to determine the areas of a company’s capital structure that deliver the best packages of risk and return. For each potential investment, the legal team works closely with industry analysts to create a worst-case scenario that determines the level of control we would have, and that ensures we would be fairly compensated given our position in the capital structure. |
See “Company Profile - Our Potential Competitive Strengths.”
Our Investment Strategy
Our investment strategy leverages Guggenheim deep research team with a relative value perspective across all corporate credit asset types and industries, creating a larger, proprietary opportunity set that lends itself to generating best ideas. This strategy focuses on investing primarily in large, privately-negotiated loans to private middle market U.S. companies. We seek to invest in businesses that have a strong reason to exist and have demonstrated competitive and strategic advantages. These companies generally possess distinguishing business characteristics, such as a leading competitive position in a well-defined market niche, unique brands, sustainable profitability and cash flow, and experienced management.
While we intend to consider each investment opportunity independently, we generally focus on portfolio companies that share the following characteristics:
| |
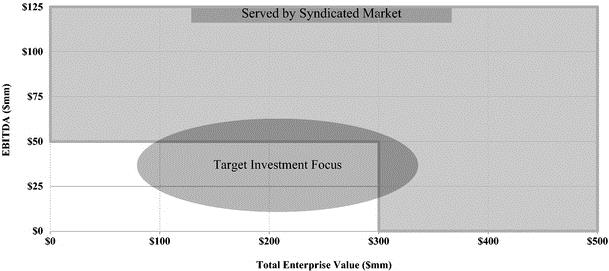
| • | Upper Middle Market Focus. We seek to invest in private middle market U.S. companies, which typically have better credit characteristics than their smaller peers. Although there are no strict lower or upper limits on the size of a company in which we may invest, we expect to focus on companies with EBITDA of $25 million to $100 million and annual revenue ranging from $50 million to $1 billion. |
| |
| • | Favorable Position in the Capital Structure. Our portfolio generally consists of senior secured debt investments. Our investment process enables us to look at investments up and down the capital structure, allowing us to make investments at points in the capital structure where we believe we can participate in the best risk-adjusted return profile. |
| |
| • | Experienced Management Team and Strong Equity Owner Support. We seek to invest in companies with management teams and equity owners that are experienced and exhibit a strong operating track record. We favor companies in which management’s incentives are tied closely to the long-term goals of the business. Additionally, we seek to invest in businesses where we believe the owners will continue to support the company. |
| |
| • | Sustainable Profitability and Cash Flow. We intend to invest in companies that have an established track record of strong profitability and stable positive cash flow. We believe these businesses will be well positioned to maintain cash flow to cover interest and principal payments due to us, and also to take advantage of growth opportunities for their businesses. Specifically, we do not intend to invest in early stage or seed companies. As a BDC, we generally must invest at least 70% of our total assets in “qualifying assets,” which, under relevant SEC rules, includes all private U.S. companies and companies whose securities are not listed on a national securities exchange. |
| |
| • | Well-defined Market Niche and Industry Focus. We intend to invest in businesses that have a strong reason to exist and have demonstrated competitive and strategic advantages in their respective industry. We expect to invest across industries and not focus on any specific industry. |
| |
| • | Broad Target Geography with a Sizeable Concentration in the U.S. We focus on and invest at least 70% of our total assets in U.S. companies. To the extent we invest in foreign companies, we intend to do so in accordance with 1940 Act limitations and only in jurisdictions with established legal frameworks and a history of respecting creditor rights. |
While we believe that the criteria listed above are important in identifying and investing in portfolio companies, we consider each investment on a case-by-case basis. It is possible that not all of these criteria will be met by each portfolio company in which we invest. There is no limit on the maturity or duration of any investment in our portfolio. We anticipate that substantially all of the investments held in our portfolio will have either a below investment grade rating by Moody’s Investors Service and/or Standard & Poor’s, or will not be rated by any rating agency but will be of similar quality to below investment grade securities (e.g., junk bonds). Debt securities rated below investment grade (e.g., junk bonds) are generally regarded as having predominantly speculative characteristics and may carry a greater risk with respect to a borrower’s ability to pay interest and repay principal. Investment sizes will vary as our capital base changes and will ultimately be at the discretion of Guggenheim, subject to oversight by our Board of Trustees.
Other Factors Affecting Portfolio Construction
As a BDC that is regulated under the 1940 Act and intends to qualify annually as a RIC under the Code, our investment activities are subject to certain regulatory restrictions that will shape our portfolio construction. These restrictions include requirements that we invest our capital primarily in U.S. companies that are privately owned, as well as investment diversification and source of income criteria that are imposed by the Code. For a description of certain valuation risks associated with our investments in privately-owned companies, see “Risk Factors - Risks Related to Our Business - A significant portion of our investment portfolio is recorded at fair value as determined in good faith in accordance with procedures established by our Board of Trustees and, as a result, there is and will be uncertainty as to the value of our portfolio investments.”
In addition, we generally are permitted to co-invest alongside certain affiliates of Guggenheim in privately-negotiated transactions, based on an exemptive order we received from the SEC on June 28, 2016 and which was subsequently updated on January 30, 2018, including certain investments originated and directly negotiated by Guggenheim. Our ability to participate in these co-investment transactions is subject to various conditions contained in the exemptive order.
Advisor's Fees
The Company does not incur a separate advisory fee, but the Company and its shareholders are indirectly subject to the Master Fund’s advisory fee on a pro rata basis. The Master Fund pays Guggenheim a fee for its services under the Investment Advisory Agreement. The fee consists of two components: a management fee and an incentive fee. The management fee is calculated at an annual rate of 1.75% based on the simple average of the Master Fund’s gross assets (i.e., total assets) at the end of the two most recently completed calendar months and is payable monthly in arrears.
The incentive fee comprises the following two parts:
| |
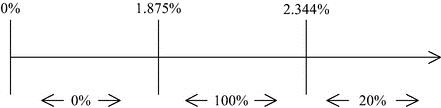
| • | An incentive fee on net investment income (the “subordinated incentive fee on income”) is calculated and payable quarterly in arrears, and is based upon pre-incentive fee net investment income for the immediately preceding quarter. No subordinated incentive fee on income is payable in any calendar quarter in which pre-incentive fee net investment income does not exceed a quarterly return to investors of 1.875% on average adjusted capital. The quarterly incentive fee on net investment income is (i) 100% of the pre-incentive fee net investment income of between 1.875% and 2.344% of average adjusted capital, plus (ii) 20% of pre-incentive fee net investment income in excess of 2.344% of average adjusted capital. For purposes of computing the subordinated incentive fee on income, the calculation methodology looks through derivatives or swaps as if the Master Fund owned the reference assets directly. Therefore, Net Interest, if any, associated with a derivative or swap (which is defined as the difference between (a) the interest income and fees received in respect of the reference assets of the derivative or swap and (b) all interest and other expenses paid by the Master Fund to the derivative or swap counterparty) is included in the calculation of quarterly pre-incentive fee net investment income for purposes of the subordinated incentive fee on income. |
| |
| • | An incentive fee on capital gains is calculated and payable in arrears as of the end of each calendar year. It is equal to 20% of realized capital gains on a cumulative basis from inception through the end of such calendar |
year, computed net of all realized capital losses and unrealized capital depreciation on a cumulative basis, less the aggregate amount of any previously paid incentive fees on capital gains as calculated in accordance with U.S. generally accepted accounting principles (“GAAP”), except as described in the next sentence. For purposes of computing the incentive fee on capital gains, the calculation methodology looks through derivatives or swaps as if the Master Fund owned the reference assets directly. Therefore, realized gains and realized losses on the disposition of any reference assets, as well as unrealized depreciation on reference assets retained in the derivative or swap, will be included on a cumulative basis in the calculation of the incentive fee on capital gains.
The incentive fee may induce Guggenheim to make investments that are more risky or more speculative than would otherwise be the case. Similarly, because the management fee is calculated based on the Master Fund’s gross assets (including any borrowings for investment purposes), Guggenheim may be encouraged to use leverage to make additional investments. See “Risk Factors - Risks Related to Guggenheim and its Respective Affiliates - Our incentive fee may induce Guggenheim to make speculative investments” and “Advisory Agreement and Fees.”
Suitability Standards
Pursuant to applicable state securities laws, Shares offered through this prospectus are suitable only as a long-term investment for persons of adequate financial means who have no need for liquidity in this investment. Initially, there is not expected to be any public market for the Shares, which means that investors will likely have limited ability to sell their Shares. As a result, we have established suitability standards that require investors to have either: (i) a net worth of at least $70,000 and an annual gross income of at least $70,000, or (ii) a net worth of at least $250,000. Under these standards, net worth does not include an investor’s home, home furnishings, or personal automobiles. In addition, our Dealer Manager requires that a potential investor (a) can reasonably benefit from an investment in us based on such investor’s overall investment objectives and portfolio structuring; (b) is able to bear the economic risk of the investment based on the prospective shareholder’s overall financial situation; and (c) has apparent understanding of (A) the fundamental risks of the investment, (B) the risk that such investor may lose his or her entire investment, (C) the lack of liquidity of the Shares, (D) the background and qualifications of Guggenheim, and (E) the tax consequences of the investment. See “Suitability Standards” for further details and additional suitability requirements that may apply to residents of specific states or clients of selected dealers.
Regulation Best Interest
The SEC adopted Regulation Best Interest ("Regulation BI") effective as of September 10, 2019. Compliance with Regulation BI was required beginning on June 30, 2020. Regulation BI establishes a new standard of conduct under the Securities Exchange Act of 1934 ("Exchange Act") for broker-dealers when making a "recommendation" of any securities transaction or investment strategy involving securities to a "retail customer," which Regulation BI defines as:
| |
| • | a natural person, or the legal representative of such natural person, who: |
| |
| • | receives a recommendation of any securities transaction or investment strategy involving securities from a broker-dealer; and |
| |
| • | uses the recommendation primarily for personal, family, or household purposes. |
When making a recommendation to a retail customer, Regulation BI requires that a broker-dealer and its associated persons act in the best interest of their retail customers at the time the recommendation is made, without placing its own financial or other interest ahead of the retail customer’s interests. This general obligation is satisfied only if a broker-dealer complies with four specific obligations:
| |
| • | Disclosure Obligation: a broker-dealer must provide certain required written disclosure before or at the time of the recommendation, about the recommendation and the relationship between the broker-dealer and its retail customer; |
| |
| • | Care Obligation: a broker-dealer must exercise reasonable diligence, care, and skill in determining that it has a reasonable basis for concluding that a recommendation satisfies the best interest standard - both with respect to the specific retail customer receiving the recommendation and at least some hypothetical retail customers; |
| |
| • | Conflict of Interest Obligation: a broker-dealer must establish, maintain, and enforce written policies and procedures reasonably designed to address conflicts of interest; and |
| |
| • | Compliance Obligation: a broker-dealer must establish, maintain, and enforce written policies and procedures reasonably designed to achieve compliance with Regulation BI. A broker-dealer must also comply with new record-making and recordkeeping requirements. |
Obligations imposed on broker-dealers under Regulation BI are in addition to and may be considered a higher standard than the obligation to apply the specific suitability standards that have been established for this offering and the obligation to make a suitability determination for each investor in this offering pursuant to other applicable laws and regulations. In adopting Regulation BI, the SEC stated that the Care Obligation "enhances" existing suitability standards. Those obligations are described above under "Suitability Standards." As of the date of this prospectus, there is limited administrative guidance and no case law regarding the interpretation and application of Regulation BI. As result, the manner in which Regulation BI will be applied to broker-dealers and their associated persons is uncertain.
In conjunction with its adoption of Regulation BI, the SEC also adopted new rules that require registered investment advisers and broker-dealers to provide a brief customer relationship summary ("CRS") to their "retail investors." Compliance with CRS and related rules was required beginning on June 30, 2020.
The CRS is designed to inform retail investors about the types of relationships and services a firm offers; the fees, costs, conflicts of interest, and required standard of conduct associated with those relationships and services; whether a firm and its financial professionals currently have reportable legal or disciplinary history; and how to obtain additional information about a firm. Firms are obligated to deliver their CRS to their current and potential retail investors, post their CRS on their website, and file their CRS with the Central Registration Depository or Investment Adviser Registration Depository. The obligation of firms to deliver their CRS to retail investors is independent of the requirement that a prospectus be delivered to you in connection with this offering. We are not responsible for any broker-dealer’s compliance with Regulation BI or any firm’s compliance with the CRS and related rules.
Plan of Distribution
We are publicly offering, through our Dealer Manager, on a best efforts basis, Shares at net asset value, calculated in accordance with Section 23(b) of the 1940 Act (as made applicable to the Company by Section 63 of the 1940 Act), plus any applicable sales load. See “Plan of Distribution.”
Our Dealer Manager is an affiliate of Guggenheim Partners and a member of the Financial Industry Regulatory Authority (“FINRA”) and the Securities Investor Protection Corporation (“SIPC”). Our Dealer Manager is not required to sell any specific number or dollar amount of Shares, but has agreed to use its best efforts to sell the Shares offered. The minimum permitted purchase is $2,000 in Shares (or $2,500 for New York non-IRA investments). This offering is available for purchase by (i) clients of financial intermediaries who charge such clients, including individuals, corporations, endowments and foundations, an ongoing fee for advisory, investment, consulting or related services, (ii) family offices and their clients, (iii) certain other institutional investors, (iv) high net worth investors, (v) investors who are clients of FINRA broker-dealer member firms receiving transaction based compensation, (vi) other non-affiliated investment companies and (vii) investors affiliated with Guggenheim and its affiliates and other individuals identified by management. Sales of this offering are subject to upfront selling commissions of up to 3.0% and Dealer Manager fees of up to 2.0% of the price per share. See "Plan of Distribution."
We will schedule weekly closings on subscriptions received and accepted by us. Subscriptions will be effective only upon our acceptance and we reserve the right to reject any subscription in whole or in part. Subscriptions will be accepted or rejected within 30 days of receipt by us and, if rejected, all funds will be returned to subscribers without deduction for any fees and expenses within ten business days from the date the subscription is rejected. We are not permitted to accept a subscription until at least five business days after the date you receive this prospectus. Additionally, we intend to update our shareholder list on a weekly basis. See “Plan of Distribution.”
Compensation Paid to the Dealer Manager and Participating Selected Dealers
Investors will pay a maximum sales load of up to 5.0% of the price per share for combined upfront selling commissions and Dealer Manager fees. The upfront selling commissions and Dealer Manager fees will not be paid in connection with purchases of shares pursuant to our DRP.
In addition to the upfront selling commissions and Dealer Manager fees, Guggenheim may pay our Dealer Manager an annualized fee (the "Additional Selling Commissions") equal to no more than 1.0% of the Company's then-current net asset value, payable quarterly. Our Dealer Manager will re-allow all of the Additional Selling Commissions to participating selected dealers. The Additional Selling Commissions will not be paid by our shareholders. Guggenheim will cease making these payments to our Dealer Manager with respect to each Share upon the earliest to occur of the following: (i) the date when the aggregate underwriting compensation would exceed that permitted under FINRA Rule 2310 over the life of the offering, which equals 10% of the gross offering proceeds from the sale of Shares in this offering (excluding Shares purchased through our DRP); (ii) the date of a Liquidity Event; (iii) the date that such Share is repurchased or is no longer outstanding; (iv) the date when the aggregate upfront selling commission, Dealer Manager fees, and Additional Selling Commissions together equal 8.0% (or such other amount, as determined by
Guggenheim) of the actual price paid for such Share; or (v) the date when Guggenheim no longer serves as our investment adviser. See "Plan of Distribution."
The maximum aggregate underwriting compensation, which includes payments of upfront selling commissions and Dealer Manager fees and all items of compensation as defined in FINRA Rule 2310 from any other sources, including, among other things, the reimbursement of training and education expenses, may not exceed 10% of the gross offering proceeds from the sale of shares in this offering (excluding shares purchased through the DRP). See "Plan of Distribution" for additional information regarding underwriting compensation.
Shareholder Liquidity Strategy
We will have a finite term of up to six years from the close of this offering (contemplated to end on or before December 31, 2028) unless the Board of Trustees exercises its ability to delay pursuing a Liquidity Event for at most two additional one year periods. At any time prior to December 31, 2028, Guggenheim may recommend to our Board of Trustees that it approve a complete Liquidity Event. A Liquidity Event could include: (i) the purchase by the Master Fund for cash of all our Master Fund shares at net asset value and the distribution of that cash to our shareholders on a pro rata basis in connection with our complete liquidation and dissolution; or (ii) subject to the approval of the shareholders of each feeder fund, a listing of the shares of the Master Fund on a national securities exchange and the liquidation and dissolution of each feeder fund, including us, at which point all shareholders of each feeder fund would become direct shareholders of the Master Fund. However, if the Board of Trustees determines that it would not be in the best interests of shareholders to pursue a Liquidity Event at that time due to adverse market conditions, the Board of Trustees could delay pursuing a Liquidity Event for at most two additional one year periods. In the sole discretion of the Board of Trustees, shareholders may be offered the ability to re-invest their liquidation proceeds into another feeder fund or exchange their shares for shares in another feeder fund.
To provide limited, interim liquidity to our shareholders, we intend to conduct quarterly tender offers in accordance with the Exchange Act. This will be the only source of liquidity for our shareholders offered by us prior to a Liquidity Event. See “Share Repurchase Program.”
Our Distribution Reinvestment Plan
We have adopted a DRP that allows our shareholders to have the full amount of their cash distributions reinvested in additional Shares. See “Distribution Reinvestment Plan.”
Share Repurchase Program
We do not currently intend to list our Shares on any securities exchange and we do not expect a secondary market in the Shares to develop. As a result, if you purchase Shares, your ability to sell your Shares will be limited. We have commenced a share repurchase program, in which we intend to repurchase, during each calendar quarter, up to 2.5% of the weighted average number of Shares outstanding in the prior four calendar quarters at a price estimated to be equal to our net asset value per share as of the expiration date of the tender offer. At the discretion of our Board of Trustees, we intend to limit the number of Shares to be repurchased during any calendar year to the number of Shares we can repurchase with cash on hand, cash available from borrowings, and cash from the sale of our investments as of the end of the applicable period to repurchase Shares. Our Board of Trustees may amend, suspend, or terminate the share repurchase program at any time. All Shares purchased by us pursuant to the share repurchase program will be retired and thereafter will be authorized and unissued shares. See “Share Repurchase Program.”
Our assets consist primarily of our investment interest in the Master Fund. Therefore, in order to finance our repurchase of Shares, we will seek to liquidate a portion of our interest in the Master Fund each quarter. Thus, each of our quarterly repurchase offers will be conducted in parallel with similar repurchase offers made by the Master Fund. Our Board of Trustees also serves as the Board of Trustees for the Master Fund and we expect that the Master Fund will conduct quarterly repurchase offers in order to permit us (and any other feeder fund) to meet our (and its) quarterly repurchase obligations. We cannot make a repurchase offer larger than that made by the Master Fund, and we expect that each quarterly repurchase offer by the Master Fund will generally apply to up to 2.5% of the Master Fund’s average number of shares outstanding in the prior four calendar quarters (or such fewer calendar quarters during the Master Fund’s first year). The Master Fund may borrow money or issue debt obligations to finance its repurchase obligations pursuant to any quarterly repurchase offer.
Reports to Shareholders
Within 45 days after the end of each fiscal quarter (other than the fourth quarter of each year), we are required to file our quarterly report on Form 10-Q. Within 90 days after the end of each fiscal year, we are required to file our annual report on Form 10-K. We intend to provide a copy of our annual report on Form 10-K to all shareholders of record as of the end of each fiscal year shortly after filing it with the SEC, or to all shareholders of record in preparation for our annual shareholders meeting. These reports, including any prospectus supplements, current reports on
Form 8-K, and any amendments to these listed reports are made available free of charge on our website at www.GuggenheimCIF.com and on the SEC’s website at www.sec.gov. See “Description of Our Capital Stock - Reports to Shareholders.”
Taxation of Our Company
We intend to elect to be treated for federal income tax purposes, beginning with our taxable year ending September 30, 2021, and intend to qualify annually thereafter, as a RIC under the Code. As a RIC, we generally will not have to pay corporate-level federal income taxes on ordinary income or capital gains we distribute to our shareholders from our tax earnings and profits. To obtain and maintain our ability to be subject to tax as a RIC, we must meet specified source-of-income and asset diversification requirements, and distribute each taxable year an amount generally at least equal to 90% of the sum of our ordinary income and realized net short-term capital gains in excess of realized net long-term capital losses, if any. We will monitor our transactions to endeavor to prevent our disqualification as a RIC. See “Tax Matters.”
Risk Factors
An investment in our Shares involves a high degree of risk and may be considered speculative. You should carefully consider the information found in “Risk Factors” before deciding to invest in our Shares. Risks involved in an investment in us include (among others) the following:
| |
| • | We are subject to all of the business risks and uncertainties associated with any business, including the risk that we will not achieve our investment objectives and that the value of our Shares could decline substantially. |
| |
| • | You should not expect to be able to sell your Shares regardless of how we perform. |
| |
| • | If you are able to sell your Shares, you will likely receive less than your purchase price and the current net asset value per share. Because you will be unable to sell your Shares, you will be unable to reduce your exposure during any market downturn. |
| |
| • | We do not intend to list our Shares on any securities exchange and we do not expect a secondary market in the Shares to develop. |
| |
| • | We have implemented a share repurchase program. Only a limited number of Shares will be eligible for repurchase and any such repurchases will be at a price estimated to be equal to our net asset value per share as of the expiration date of the tender offer. |
| |
| • | You should consider that you may not have access to the money you invest until the completion of the Company’s finite term (contemplated to be on or before December 31, 2028). |
| |
| • | An investment in our Shares is not suitable for you if you need access to the money you invest. See “Share Repurchase Program,” “Company Profile - Shareholder Liquidity Strategy,” and “Suitability Standards.” |
| |
| • | We have a finite term and we may liquidate our assets at a time that is disadvantageous based on adverse market conditions, which may result in our incurring losses on our investments. |
| |
| • | Our distributions may not be based on our investment performance, but may be supported by our Advisor in the form of operating expense support payments pursuant to the Expense Support and Conditional Reimbursement Agreement. We are conditionally obligated to reimburse our Advisor and these reimbursement payments will reduce the future distributions that you would otherwise receive from your investment. |
| |
| • | Our portfolio companies may request our assistance in the management of their affairs, however we may not have director or shareholder controls over the business affairs of the companies to which we loan capital. In addition, our investments in portfolio companies are structured to be held until maturity and may not provide us with favorable terms for short-term liquidity of the capital that we invest in them. |
| |
| • | We have not established any limit on the extent to which we may use borrowings or offering proceeds to fund distributions to shareholders, which may reduce the amount of capital we ultimately invest in assets, and there can be no assurances that we will be able to sustain distributions at any particular level. Our distributions may exceed our earnings, particularly during the period before we have substantially invested our net offering proceeds, which may result in commensurate reductions in net asset value per share. |
| |
| • | This is a “best efforts” offering; if we are unable to raise substantial funds we will be more limited in the number and type of investments we may make. |
| |
| • | Our investments may include original issue discount instruments (“OID”) and payment-in-kind (“PIK”) interest. To the extent OID and PIK interest income constitute a portion of our income, we will be exposed to typical risks associated with such income being required to be included in taxable and accounting income prior to receipt of |
the cash representing such income. We would generally be required to distribute any such OID to satisfy the distribution requirement applicable to RICs, which is described below in “Tax Matters.”
| |
| • | Portions of the distributions that we make to you may represent a return of capital, which is a return of a shareholder’s original investment in the Company, after subtracting sales load, fees, and expenses directly or indirectly paid by a shareholder. While a return of capital is not currently taxable, it will lower a shareholder’s investment tax basis in the Company, which may subject the shareholder to tax consequences in the future in connection with the sale of Company Shares, even if sold at a loss to the shareholder’s original investment. |
| |
| • | The inability of a borrower in the Company’s portfolio to pay interest and principal when due may contribute to a reduction in the net asset value per share of the Company’s Shares, the Company’s ability to pay dividends and to service its contractual obligations, and may negatively impact the market price of the Company’s Shares and other securities that it may issue. |
| |
| • | When interest rates increase, floating-rate interest rate reset features on debt instruments may make it more difficult for borrowers to repay their loans and will make it easier for Guggenheim to meet its income incentive fee threshold without any additional effort. |
| |
| • | The Company will likely recover little or no unpaid principal or interest if any of its borrowers were to default, even when such debt obligations are first lien or second lien debt obligations, or are otherwise secured. |
| |
| • | Investors may lose all or part of their investment in the Company. |
| |
| • | There are actual and potential conflicts of interest presented by an investment in the Shares of the Company. See “Potential Conflicts of Interest.” |
RISK FACTORS
Investing in our Shares involves a number of significant risks. In addition to the other information contained in this prospectus, you should consider carefully the following information before making an investment in our Shares. Because we are a BDC, there may be special risks associated with investing in our Shares, including risks associated with investing in a portfolio of small and developing or financially troubled businesses. The risks below include risks associated with investments in the Company specifically, as well as risks generally associated with investment in a company with investment objectives, investment policies, capital structure, or trading markets similar to the Company’s. The risks below are not the only risks we face. Additional risks and uncertainties not presently known to us or not presently deemed material by us may also impair our operations and performance. If any of the following events occur, our business, financial condition, and results of operations could be materially and adversely affected. In such case, the net asset value and trading price, if any, of our Shares could decline, and you may lose all or part of your investment. Investors should be aware that in light of the current uncertainty, volatility and distress in economies, financial markets, and labor and health conditions over the world, the risks below are heightened significantly compared to normal conditions and therefore subject our investments and our shareholders' investment in us to sudden and substantial losses. The fact that a particular risk below is not specifically identified as being heightened under current conditions does not mean that the risk is not greater than under normal conditions.
Risks Related to Our Business
Our ability to achieve our investment objectives depends on Guggenheim's ability to manage and support our investment process. If Guggenheim were to lose a significant number of its key professionals, or terminate the Investment Advisory Agreement, our ability to achieve our investment objectives could be significantly harmed.
We do not have employees. Additionally, we have no internal management capacity other than our appointed executive officers and are dependent upon the investment expertise, skill, and network of business contacts of Guggenheim to achieve our investment objectives. Guggenheim evaluates, negotiates, structures, executes, monitors, and services our investments. Our success will depend to a significant extent on the continued service and coordination of Guggenheim, including its key professionals. The departure of a significant number of key professionals from Guggenheim could have a material adverse effect on our ability to achieve our investment objectives.
Our ability to achieve our investment objectives also depends on the ability of Guggenheim to identify, analyze, invest in, finance, and monitor companies that meet our investment criteria. Guggenheim's capabilities in structuring the investment process, providing competent, attentive, and efficient services to us, and facilitating access to financing on acceptable terms depend on the involvement of investment professionals in an adequate number and of adequate sophistication to match the corresponding flow of transactions. To achieve our investment objectives, Guggenheim may need to retain, hire, train, supervise, and manage new investment professionals to participate in our investment selection and monitoring process. Guggenheim may not be able to find qualified investment professionals in a timely manner or at all. Any failure to do so could have a material adverse effect on our business, financial condition, and results of operations.
In addition, the Investment Advisory Agreement has termination provisions that allow the agreement to be terminated by the Master Fund upon 60 days’ notice if the Master Fund’s Board of Trustees or holders of a majority of the Master Fund’s outstanding common shares so direct. The Investment Advisory Agreement may be terminated at any time, without penalty, by Guggenheim upon 120 days’ notice to the Master Fund. The termination of the Investment Advisory Agreement may adversely affect the quality of our investment opportunities and it may be difficult for the Master Fund to replace Guggenheim.
Because our business model depends to a significant extent upon relationships with corporations, financial institutions, and investment firms, the inability of Guggenheim to maintain or develop these relationships, or the failure of these relationships to generate investment opportunities, could adversely affect our business.
We expect that Guggenheim will depend on its relationships with corporations, financial institutions, and investment firms, and we rely indirectly to a significant extent upon these relationships to provide us with potential investment opportunities. If Guggenheim fails to maintain its existing relationships, or develop new relationships or sources of investment opportunities, we may not be able to grow our investment portfolio. In addition, individuals with whom Guggenheim has relationships are not obligated to provide us with investment opportunities, and, therefore, there is no assurance that such relationships will generate investment opportunities for us.
We may face increasing competition for investment opportunities, which could delay further deployment of our capital, reduce returns, and result in losses.
We may compete for investments with other BDCs and investment funds (including registered investment companies, private equity funds, and private credit funds), as well as traditional financial services companies such as commercial
banks and other sources of funding. Moreover, alternative investment vehicles, such as hedge funds, continue to increase their investment focus in our target market of privately-owned U.S. companies. Moreover, we have experienced, and may continue to experience, increased competition from banks and investment vehicles who may continue to lend to the middle market, including lending activity in our target market of privately-owned U.S. companies. Additionally, the Federal Reserve and other bank regulators may periodically provide incentives to U.S. commercial banks to originate more loans in the middle market for private companies. As a result of these new entrants and regulatory incentives, competition for investment opportunities in privately-owned U.S. companies may intensify. Many of our competitors are substantially larger and have considerably greater financial, technical, and marketing resources than we do. For example, some competitors may have a lower cost of capital and access to funding sources that are not available to us. In addition, some of our competitors may have higher risk tolerances or different risk assessments than we have. These characteristics could allow our competitors to consider a wider variety of investments, establish more relationships, and offer better pricing and more flexible structuring than we are able to do.
We may lose investment opportunities if we do not match our competitors’ pricing, terms, and investment structure criteria. If we are forced to match these competitors’ investment terms criteria, we may not be able to achieve acceptable returns on our investments or may bear substantial risk of capital loss. A significant increase in the number and/or the size of our competitors in this target market could force us to accept less attractive investment terms. Furthermore, many of our competitors are not subject to the regulatory restrictions that the 1940 Act imposes on us as a BDC or the source of income, asset diversification, and distribution requirements we must satisfy to maintain our regulated investment company ("RIC" or "RICs") status under Subchapter M of the Code. The competitive pressures we face, and the manner in which we react or adjust to these competitive pressures, may have a material adverse effect on our business, financial condition, results of operations, effective yield on investments, investment returns, leverage ratio, and cash flows. As a result of this competition, we may not be able to take advantage of attractive investment opportunities from time to time. Also, we may not be able to identify and make investments that are consistent with our investment objectives.
The amount of any distributions we may make is uncertain. We may not be able to pay distributions or be able to sustain distributions at any particular level, and our distributions per share may not grow over time or may decline. We have not established any limit on the extent to which we may use borrowings, if any, or offering proceeds to fund distributions (which may reduce the amount of capital we ultimately invest in portfolio companies).
Subject to our Board of Trustees’ discretion and applicable legal restrictions, we intend to authorize and declare ordinary cash distributions on a weekly, semi-monthly, or monthly basis and intend to pay such distributions on a monthly basis. We expect to pay distributions out of assets legally available for distribution based on our investment performance. However, we cannot assure you that we will achieve investment results that will allow us to make a consistent targeted level of cash distributions or year-to-year increases in cash distributions. Our ability to pay distributions might be adversely affected by the impact of the risks described in this prospectus. In addition, the inability to satisfy the asset coverage test applicable to us as a BDC can limit our ability to pay distributions. Distributions from offering proceeds or from borrowings could also reduce the amount of capital we ultimately invest in interests of portfolio companies. We cannot assure you that we will pay distributions to our shareholders in the future.
Our distributions to shareholders may be funded from expense reimbursements or waivers of investment advisory fees that are subject to repayment pursuant to our expense reimbursement agreement.
We expect that for a period of time following commencement of this offering, which time period may be significant, substantial portions of our distributions will be funded through the reimbursement of certain expenses by the Advisor, that are subject to repayment by us within three years or waivers of investment advisory fees otherwise imposed by Guggenheim. Any such distributions funded through expense reimbursements will not be based on our investment performance, and can only be sustained if we achieve positive investment performance in future periods and/or the Advisor continues to make such reimbursements of certain expenses or Guggenheim waives such investment advisory fees. Our future repayments of amounts reimbursed by the Advisor will reduce the distributions that shareholders would otherwise receive in the future. There can be no assurance that we will achieve the performance necessary to be able to pay distributions at a specific rate or at all. The Advisor has no obligation to reimburse expenses in future periods.
Our distributions may exceed our taxable earnings and profits, particularly during the period before we have substantially invested the net proceeds from our securities offering. Therefore, portions of the distributions that we pay may represent a return of capital to you, which will lower your tax basis in your Shares, which may cause you to experience increases in capital gains in subsequent sales of your Shares, and reduce the amount of funds we have for investment in portfolio companies.
In the event that we encounter delays in locating suitable investment opportunities, we may pay our distributions from offering proceeds or from borrowings in anticipation of future cash flow, which may constitute a return of your capital net of sales load and fund expenses previously paid and will lower your tax basis in your Shares, which may cause you to experience increases in capital gains in subsequent sales of your Shares. Distributions from offering proceeds or from borrowings also could reduce the amount of capital we ultimately have available to invest in interests of portfolio companies.
A significant portion of our investment portfolio will be recorded at fair value as determined in good faith in accordance with procedures established by our Board of Trustees and, as a result, there is and will be uncertainty as to the value of our portfolio investments.
As a BDC, we are required to carry our portfolio investments at market value or, if there is no readily available market value, at fair value as determined in accordance with procedures established by our Board of Trustees. There is not a public market or active secondary market for many of the securities of the privately-held companies in which we intend to invest. The majority of our investments may not be publicly traded or actively traded on a secondary market but, instead, may be traded on a privately-negotiated, over-the-counter secondary market for institutional investors, if at all. As a result, we will value a significant portion of these securities at fair value as determined in good faith in accordance with procedures established by our Board of Trustees.
The determination of fair value, and thus the amount of unrealized gains or losses we may recognize in any year, is to a degree subjective, and Guggenheim has a conflict of interest in making recommendations of fair value. We will value these securities at fair value as determined in good faith in accordance with procedures established by our Board of Trustees and based on input from Guggenheim and our Audit Committee. Our Board of Trustees may utilize the services of independent third-party valuation firms to aid it in determining the fair value of any securities and generally expects to do so with respect to Level 3 assets on a quarterly basis. The types of factors that may be considered in determining the fair values of our investments include the nature and realizable value of any collateral, the portfolio company’s ability to make payments and its earnings, the markets in which the portfolio company does business, comparison to publicly-traded companies, discounted cash flow, current market interest rates, and other relevant factors. Because such valuations, and particularly valuations of private securities and private companies, are inherently uncertain, the valuations may fluctuate significantly over short periods of time due to changes in current market conditions. The determinations of fair value in accordance with procedures established by our Board of Trustees may differ materially from the values that would have been used if an active market and market quotations existed for these investments. Our net asset value could be adversely affected if the determinations regarding the fair value of our investments were materially higher than the values that we ultimately realize upon the disposal of such investments.
We are dependent on information systems and systems failures could significantly disrupt our business, which may, in turn, negatively affect our liquidity, financial condition or results of operations.
Our business is dependent on our third parties’ communications and information systems. Any failure or interruption of those systems, including as a result of the termination of an agreement with any third-party service providers, could cause delays or other problems in our activities. Our financial, accounting, data processing, backup or other operating systems and facilities may fail to operate properly or become disabled or damaged as a result of a number of factors including events that are wholly or partially beyond our control. There could be:
•sudden electrical or telecommunications outages;
•natural disasters such as earthquakes, tornadoes and hurricanes;
•disease pandemics;
•events arising from local or larger scale political or social matters, including terrorist acts; and
•cyber-attacks.
These events, in turn, could have a material adverse effect on our operating results and negatively affect the net asset value of our Shares and our ability to pay dividends to our shareholders.
Cybersecurity risks and cyber incidents may adversely affect our business by causing a disruption to our operations, a compromise or corruption of our confidential information and/or damage to our business relationships, all of which could negatively impact our business, results of operations or financial condition.
A cyber incident is considered to be any adverse event that threatens the confidentiality, integrity or availability of our information resources. These incidents may be an intentional attack or an unintentional event and could involve gaining unauthorized access to our information systems for purposes of misappropriating assets, stealing confidential information, corrupting data or causing operational disruption. The result of these incidents may include disrupted operations, misstated or unreliable financial data, liability for stolen information, misappropriation of assets, increased cybersecurity protection and insurance costs, litigation and damage to our business relationships. Any such attack could result in significant losses, reputational damage, litigation, regulatory fines or penalties, or otherwise adversely affect our business, financial condition or results of operations. In addition, we may be required to expend significant additional resources to modify our protective measures and to investigate and remediate vulnerabilities or other exposures arising from operational and security risks. We face risks posed to our information systems, both internal and those provided to us by third-party service providers. We, Guggenheim and its affiliates have implemented processes, procedures and internal controls to help mitigate cybersecurity risks and cyber intrusions, but these measures, as well as our increased awareness of the nature and extent of a risk of a cyber incident, may be ineffective and do not guarantee that a cyber incident will not occur or that our financial results, operations or confidential information will not be negatively impacted by such an incident.
Third parties with which we do business (including those that provide services to us) may also be sources or targets of cybersecurity or other technological risks. We outsource certain functions and these relationships allow for the storage and processing of our information and assets, as well as certain investor, counterparty, employee and borrower information. While we engage in actions to reduce our exposure resulting from outsourcing, ongoing threats may result in unauthorized access, loss, exposure or destruction of data, or other cybersecurity incidents, with increased costs and other consequences, including those described above. Privacy and information security laws and regulation changes, and compliance with those changes, may also result in cost increases due to system changes and the development of new administrative processes. The Company and its service providers are currently impacted by quarantines and similar measures being enacted by governments in response to COVID-19, which are obstructing the regular functioning of business workforces (including requiring employees to work from external locations and their homes). Accordingly, the risks described above are heightened under current conditions.
Any unrealized losses we experience on our portfolio may be an indication of future realized losses, which could reduce our income available for distribution.
As a BDC, we are required to carry our investments at market value or, if no market value is ascertainable, at the fair value as determined in good faith in accordance with procedures established by our Board of Trustees. Decreases in the market values or fair values of our investments relative to amortized cost will be recorded as unrealized depreciation. Any unrealized losses in our loan portfolio could be an indication of a portfolio company’s inability to meet its repayment obligations to us with respect to the affected loans. This could result in realized losses in the future and ultimately in reductions of our income available for distribution in future periods. In addition, decreases in the market value or fair value of our investments will reduce our net asset value. See “Determination of Net Asset Value.”
We are exposed to risks resulting from the current low interest rate environment.
Since we will borrow money to make investments, our net investment income depends, in part, upon the difference between the rate at which we borrow funds and the rate at which we invest those funds. The current historically low interest rate environment can, depending on our cost of capital, depress our net investment income, even though the terms of our investments generally will include a minimum interest rate. In addition, any reduction in the level of interest rates on new investments relative to interest rates on our current investments could adversely impact our net investment income, reducing our ability to service the interest obligations on, and to repay the principal of, our indebtedness, as well as our capacity to pay distributions. Any such developments would result in a decline in our net asset value and in net asset value per share. Not all investments perform alike under different interest rate scenarios. Generally, our variable interest rate debt investments provide for interest payments based on either one-month London Interbank Offered Rate ("LIBOR") or three-month LIBOR (the base interest rate) and typically, every month or every three months, the base interest rates are reset to then prevailing one-month LIBOR or three-month LIBOR, respectively. In July 2017, the head of the United Kingdom Financial Conduct Authority announced the desire to phase out the use of LIBOR by the end of 2021. The U.S. Federal Reserve, in conjunction with the Alternative Reference Rates Committee, a steering committee comprised of large U.S. financial institutions, is considering replacing U.S. dollar LIBOR with a new index calculated by short-term repurchase agreements backed by Treasury securities. A transition from LIBOR to an alternative reference rate is complex and could have a range of adverse
impacts on our investment program, financial condition and operating results. Among other negative consequences, this transition could:
| |
| • | Adversely impact the pricing, liquidity, value of, return on and trading for a broad array of financial products, including any LIBOR-linked securities, loan and/or derivatives in which we may invest; |
| |
| • | Require extensive negotiations of and/or amendments to agreements and other documentation governing LIBOR-linked investment products; |
| |
| • | Lead to disputes, litigation or other actions with counterparties or portfolio companies regarding the interpretation and enforceability of "fall back" provisions that provide for an alternative reference rate in the event of LIBOR's unavailability; and/or |
| |
| • | Cause us to incur additional costs in connection with the above. |
See “Discussion of Operating Plans - Quantitative and Qualitative Disclosures About Market Risk - Interest Rate Risk” for further information on the impact interest rate changes could have on our results of operations.
We may be subject to a greater risk of rising interest rates due to the current period of historically low rates. Increases in interest rates may cause the value of our investments to decline and this decrease in value may not be offset by higher income from new investments. A general rise in interest rates may cause investors to move out of fixed-income securities on a large scale, which could adversely affect the price and liquidity of fixed-income securities.
Our Board of Trustees may change our operating policies and strategies without prior notice or shareholder approval, the effects of which may be adverse to our shareholders.
Our Board of Trustees has the authority to modify or waive our current operating policies, investment criteria, and strategies without prior notice and without shareholder approval. We cannot predict the effect any changes to our current operating policies, investment criteria, and strategies would have on our business, net asset value, operating results, and the value of our Shares. However, the effects might be adverse, which could negatively impact our ability to pay you distributions and cause you to lose all or part of your investment. Moreover, we will have significant flexibility in investing the net proceeds of this offering and may use the net proceeds from this offering in ways that our investors may not agree with.
Certain investment analysis and decisions by Guggenheim may be undertaken with limited information.
Given the nature of our investments, the same level of information that would exist for a publicly-traded company may not be available to Guggenheim. Therefore, at times, Guggenheim may be forced to make investment decisions with limited information regarding factors that may adversely affect an investment.
Changes in laws or regulations governing our operations may adversely affect our business or cause us to alter our business strategy.
We and our portfolio companies are subject to regulation at the local, state, and federal levels. Changes to the laws and regulations governing our permitted investments may require a change to our investment strategy. Most recently, the current federal administration has called for significant changes in U.S. trade, healthcare, individual and corporate taxation, immigration, foreign and government regulatory policies. In this regard, there is significant uncertainty with respect to legislation, regulation and government policies at the federal level, as well as at the state and local government levels. Such changes could differ materially from our strategies and plans as set forth in this prospectus and may shift our investment focus from the areas of expertise of Guggenheim. Thus, any such changes, if they occur, could have a material adverse effect on our results of operations and the value of your investment.
We may experience fluctuations in our quarterly results.
We could experience fluctuations in our quarterly operating results due to a number of factors, including our ability or inability to make investments in companies that meet our investment criteria, the interest rate payable and default rates on the debt securities we acquire, the level of our expenses, variations in and the timing of the recognition of realized and unrealized gains or losses, the degree to which we encounter competition in our markets, and general economic conditions. These occurrences could have a material adverse effect on our results of operations, the value of your investment in us and our ability to pay distributions to you and our other shareholders.
Risks Related to Our Investments
We are a non-diversified investment company within the meaning of the 1940 Act and therefore we are not limited with respect to the proportion of our assets that may be invested in securities of a single issuer.
We are classified as a non-diversified investment company within the meaning of the 1940 Act, which means that we are not limited by the 1940 Act with respect to the proportion of our assets that we may invest in securities of a
single issuer. To the extent that we hold large positions in the securities of a small number of issuers, or within a particular industry, our net asset value may fluctuate to a greater extent than that of a diversified investment company as a result of changes in the issuer’s financial condition or the market’s assessment of the issuer. We may also be more susceptible to any single economic or regulatory occurrence than a diversified investment company. However, we will be subject to the diversification requirements applicable to RICs under Subchapter M of the Code.
Global capital markets could enter a period of severe disruption and instability. These conditions have historically affected and could again materially and adversely affect debt and equity capital markets in the United States and around the world and could negatively impact our business, financial condition and results of operations.
Market and macro-economic disruptions may, in the future, affect the U.S. capital markets, which could adversely affect our business and that of our portfolio companies. These market disruptions may also affect the broader financial and credit markets and may reduce the availability of debt and equity capital for the market as a whole and to financial firms, in particular. At various times, these macro-disruptions have resulted in, and may in the future result in, a lack of liquidity in parts of the debt capital markets, significant write-offs in the financial services sector and the repricing of credit risk. These conditions may reoccur for a prolonged period of time again or materially worsen in the future, including as a result of further downgrades to the U.S. government’s sovereign credit rating or the perceived credit worthiness of the United States or other large global economies. Unfavorable macro-economic conditions, including future recessions, also could increase our funding costs, limit our access to the capital markets or result in a decision by lenders not to extend credit to us. We may in the future have difficulty accessing debt and equity capital on attractive terms, or at all, and a severe disruption and instability in the global financial markets or deteriorations in credit and financing conditions may cause us to reduce the volume of loans we originate and/or fund, adversely affect the value of our portfolio investments or otherwise have a material adverse effect on our business, financial condition, results of operations and cash flows. There has been ongoing discussion and commentary regarding potential significant changes to U.S. trade policies, treaties and tariffs. The current U.S. presidential administration, along with the U.S. Congress, has created significant uncertainty about the future relationship between the United States and other countries with respect to trade policies, treaties and tariffs. These developments, or the perception that any of them could occur, may have a material adverse effect on global economic conditions and the stability of global financial markets, and may significantly reduce global trade and, in particular, trade between the impacted nations and the United States. The spread of an epidemic or pandemic and efforts to contain it may result in severe disruptions to financial markets, supply chains, availability of raw materials, goods, and services. For example, the outbreak of COVID-19 is causing materially reduced consumer demand and economic output, disrupting supply chains, resulting in market closures, travel restrictions and quarantines, and adversely impacting local and global economies. As with other serious economic disruptions, governmental authorities and regulators are responding to this crisis with significant fiscal and monetary policy changes, including by providing direct capital infusions into companies, introducing new monetary programs and considerably lowering interest rates, which, in some cases resulted in negative interest rates. These actions, including their possible unexpected or sudden reversal or potential ineffectiveness, could further increase volatility in securities and other financial markets, reduce market liquidity, heighten investor uncertainty and adversely affect the value of our investments and our overall performance. In addition, uncertainty arising from the United Kingdom's decision to leave the European Union ("Brexit") could lead to further market disruptions and currency volatility, potentially weakening consumer, corporate and financial confidence and resulting in lower economic growth for companies that rely significantly on Europe for their business activities and revenues. Any of these factors could depress economic activity and restrict our portfolio companies' access to suppliers or customers and have a material adverse effect on their business, financial condition and results of operations, which in turn would negatively impact us.
Our investments in portfolio companies may be risky and we could lose all or part of our investment.
We intend to pursue a strategy focused on investing primarily in the debt of privately-owned U.S. companies, with a focus on originated transactions sourced through the networks of Guggenheim. The following are risks associated with our investments:
| |
| • | Senior Secured Loans, Senior Unsecured Loans and Second Lien Loans. Senior loans hold the most senior position in the capital structure of a business entity, and are typically secured with specific collateral. When we invest in senior secured term loans and second lien loans, we generally seek to take a security interest in the available assets of these portfolio companies, including the equity interests of their subsidiaries. We expect this security interest to help mitigate the risk that we will not be repaid. However, there is a risk that the collateral securing our loans may decrease in value over time or lose its entire value, may be difficult to sell in a timely manner, may be difficult to appraise, and may fluctuate in value based upon the success of the business and market conditions, including as a result of the inability of the portfolio company to raise additional capital. Also, in some circumstances, with respect to our second lien loans, our security interest could be subordinated to |
claims of other creditors. In addition, deterioration in a portfolio company’s financial condition and prospects, including its inability to raise additional capital, may be accompanied by deterioration in the value of the collateral for the loan. Consequently, the fact that a loan is secured does not guarantee that we will receive principal and interest payments according to the loan’s terms, or at all, or that we will be able to collect on the loan should we be forced to enforce our remedies.
Senior unsecured loans are structured as loans that are not subordinate in right of payment to any other debt incurred by the borrower under such loan, but are not secured with any collateral that could help ensure repayment of the loan. In the event of non-payment by a borrower of a senior unsecured loan, the lender may be unable to collect the unpaid balance because there is no specific collateral on which the lender can foreclose. In particular, if there are also any outstanding secured loans, the lender of such loans may be able to foreclose on the collateral securing such loans, and such proceeds may be applied towards the repayment of such secured loans before any remaining proceeds may be applied towards repayment of senior unsecured loans. Consequently, senior unsecured loans may be subject to a greater risk of non-payment in the event of default than secured loans, particularly during periods of deteriorating economic conditions.
| |
| • | Subordinated Debt. Our subordinated, or mezzanine, debt investments will rank junior in priority of payment to senior loans and will generally be unsecured. These characteristics may result in a heightened level of risk and volatility or a loss of principal, which could lead to the loss of the entire investment. These investments may involve additional risks that could adversely affect our investment returns. To the extent interest payments associated with such debt are deferred, such debt may be subject to greater fluctuations in valuations, and such debt could subject us and our shareholders to non-cash income, including payment-in-kind ("PIK") interest, which represents contractual interest added to the loan balance and due at the end of the loan term, and original issue discount ("OID"). Loans structured with these features may represent a higher level of credit risk than loans that require interest to be paid in cash at regular intervals during the term of the loan. Since we generally will not receive any principal repayments prior to the maturity of some of our subordinated debt investments, such investments will have greater risk than amortizing loans. |
| |
| • | Structured Products. We may also invest, to a limited extent, in structured products, which may include CDOs, CLOs (including the equity tranches thereof), structured notes, and credit-linked notes. These investment entities may be structured as trusts or other types of pooled investment vehicles. They may also involve the deposit with or purchase by an entity of the underlying investments and the issuance by that entity of one or more classes of securities backed by, or representing interests in, the underlying investments or referencing an indicator related to such investments. CDOs and CLOs are types of asset-backed securities issued by special purpose vehicles created to reapportion the risk and return characteristics of a pool of assets. The underlying pool for a CLO, for example, may include domestic and foreign senior loans, senior unsecured loans, and subordinate corporate loans. Generally, these are not qualified as eligible portfolio companies ("EPCs"). Investments in the equity tranche or any similarly situated tranche of a structured product involve a greater degree of risk than investments in other tranches, and such investments will be the first to bear losses incurred by a structured product. |
| |
| • | Equity Investments. We expect to make selected equity investments in the common or preferred stock of a company. In addition, when we invest in senior and subordinated debt, we may acquire warrants or options to purchase equity securities or benefit from other types of equity participation. Our goal is ultimately to dispose of these equity interests and realize gains upon our disposition of such interests. However, the equity interests we receive may not appreciate in value and, in fact, may decline in value. Accordingly, we may not be able to realize gains from our equity interests and any gains that we do realize on the disposition of any equity interests may not be sufficient to offset any other losses we experience. |
| |
| • | Investments in Private Investment Funds. We may invest in private investment funds, including hedge funds, private equity funds, limited liability companies, and other business entities. In valuing our investments in private investment funds, we rely primarily on information provided by managers of such funds. Valuations of illiquid securities, such as interests in certain private investment funds, involve various judgments and consideration of factors that may be subjective. There is a risk that inaccurate valuations provided by managers of private investment funds could adversely affect the value of our Shares. We may not be able to withdraw our investment in certain private investment funds promptly after we have made a decision to do so, which may result in a loss to us and adversely affect our investment returns. |
| |
| • | Derivatives. We may invest in derivative investments, which have risks, including: the imperfect correlation between the value of such instruments and the underlying assets of the Company, which creates the possibility that the loss on such instruments may be greater than the gain in the value of the underlying assets in our portfolio; the loss of principal; the possible default of the other party to the transaction; and illiquidity of |
the derivative investments. If a counterparty becomes bankrupt or otherwise fails to perform its obligations under a derivative contract due to financial difficulties, we may experience significant delays in obtaining any recovery under the derivative contract in a bankruptcy or other reorganization proceeding, or may not recover at all. In addition, in the event of the insolvency of a counterparty to a derivative transaction, the derivative contract would typically be terminated at its fair value. If we are owed this fair value in the termination of the derivative contract and its claim is unsecured, we will be treated as a general creditor of such counterparty and will not have any claim with respect to the underlying security. Certain of the derivative investments in which we may invest may, in certain circumstances, give rise to a form of financial leverage, which may magnify the risk of owning such instruments. The ability to successfully use derivative investments depends on the ability of Guggenheim to predict pertinent market movements, which cannot be assured. In addition, amounts paid by us as premiums and cash or other assets held in margin accounts with respect to our derivative investments would not be available to us for other investment purposes, which may result in lost opportunities for gain.
Most debt securities in which we intend to invest will not be rated by any rating agency and, if they were rated, would be rated as below investment grade quality. Debt securities rated below investment grade quality (e.g., junk bonds) are generally regarded as having predominantly speculative characteristics and may carry a greater risk with respect to a borrower’s capacity to pay interest and repay principal.
Our portfolio companies may incur debt that ranks equally with, or senior to, our investments in such companies.
We intend to pursue a strategy focused on investing primarily in the debt of privately-owned U.S. companies with a focus on originated transactions sourced through the networks of Guggenheim. Our portfolio companies may have, or may be permitted to incur, other debt that ranks equally with, or senior to, the debt in which we invest. By their terms, such debt instruments may entitle the holders to receive payment of interest or principal on or before the dates on which we are entitled to receive payments with respect to the debt instruments in which we invest. Also, in the event of insolvency, liquidation, dissolution, reorganization, or bankruptcy of a portfolio company, holders of debt instruments ranking senior to our investment in that portfolio company would typically be entitled to receive payment in full before we receive any distribution. After repaying such senior creditors, such portfolio company may not have any remaining assets to use for repaying its obligation to us. In the case of debt ranking equally with debt instruments in which we invest, we would have to share on an equal basis any distributions with other creditors holding such debt in the event of an insolvency, liquidation, dissolution, reorganization, or bankruptcy of the relevant portfolio company.
Subordinated liens on collateral securing debt investments that we will make to our portfolio companies may be subject to control by senior creditors with first priority liens. If there is a default, the value of the collateral may not be sufficient to repay both the first priority creditors and us in full.
Certain debt investments that we will make in portfolio companies will be secured on a second priority basis by the same collateral securing senior debt of such companies. The first priority liens on the collateral will secure the portfolio company’s obligations under any outstanding senior debt and may secure certain other future debt that may be permitted to be incurred by the portfolio company under the agreements governing the debt. The holders of obligations secured by the first priority liens on the collateral will generally control the liquidation of and be entitled to receive proceeds from any realization of the collateral to repay their obligations in full before us. In addition, the value of the collateral in the event of liquidation will depend on market and economic conditions, the availability of buyers, and other factors. There can be no assurance that the proceeds, if any, from the sale or sales of all of the collateral would be sufficient to satisfy the debt obligations secured by the second priority liens after payment in full of all obligations secured by the first priority liens on the collateral. If such proceeds are not sufficient to repay amounts outstanding under the debt obligations secured by the second priority liens, then we, to the extent not repaid from the proceeds of the sale of the collateral, will only have an unsecured claim against the portfolio company’s remaining assets, if any.
We may also make unsecured debt investments in portfolio companies, meaning that such investments will not benefit from any interest in collateral of such companies. Liens on such portfolio companies’ collateral, if any, will secure the portfolio companies’ obligations under its outstanding secured debt and may secure certain future debt that is permitted to be incurred by the portfolio company under its secured debt agreements. The holders of obligations secured by such liens will generally control the liquidation of, and be entitled to receive proceeds from, any realization of such collateral to repay their obligations in full before us. In addition, the value of such collateral in the event of liquidation will depend on market and economic conditions, the availability of buyers, and other factors. There can be no assurance that the proceeds, if any, from sales of such collateral would be sufficient to satisfy our unsecured debt obligations after payment in full of all secured debt obligations. If such proceeds were not sufficient to repay
the outstanding secured debt obligations, then our unsecured claims would rank equally with the unpaid portion of such secured creditors’ claims against the portfolio company’s remaining assets, if any.
The rights we may have with respect to the collateral securing the debt investments we make in our portfolio companies with senior debt outstanding may also be limited pursuant to the terms of one or more inter-creditor agreements that we enter into with the holders of senior debt. Under such an inter-creditor agreement, at any time that obligations having the benefit of the first priority liens are outstanding, any of the following actions that may be taken in respect of the collateral will be at the direction of the holders of the obligations secured by the first priority liens: the ability to cause the commencement of enforcement proceedings against the collateral, the ability to control the conduct of such proceedings, the approval of amendments to collateral documents, releases of liens on the collateral, and waivers of past defaults under collateral documents. We may not have the ability to control or direct such actions, even if our rights are adversely affected.
There may be circumstances where our debt investments could be subordinated to claims of other creditors or we could be subject to lender liability claims.
Although we intend to generally structure certain of our investments as senior debt, if one of our portfolio companies were to file for bankruptcy proceedings, depending on the facts and circumstances, including the extent to which we provided managerial assistance to that portfolio company or a representative of us or Guggenheim sat on the board of trustees of such portfolio company, a bankruptcy court might re-characterize our debt investment and subordinate all or a portion of our claim to that of other creditors.
In addition, a number of U.S. judicial decisions have upheld judgments obtained by borrowers against lending institutions on the basis of various evolving legal theories, collectively termed “lender liability.” Generally, lender liability is founded on the premise that a lender has violated a duty (whether implied or contractual) of good faith, commercial reasonableness and fair dealing, or a similar duty owed to the borrower, or has assumed an excessive degree of control over the borrower, resulting in the creation of a fiduciary duty owed to the borrower or its other creditors or shareholders. Because of the nature of our investments in portfolio companies (including that, as a BDC, we may be required to provide managerial assistance to those portfolio companies), we may be subject to allegations of lender liability.
We generally will not control the business operations of our portfolio companies and, due to the illiquid nature of our holdings in our portfolio companies, may not be able to dispose of our interest in our portfolio companies.
We do not expect to control most of our portfolio companies, although we may have board representation or board observation rights, and our debt agreements may impose certain restrictive covenants on our borrowers. As a result, we are subject to the risk that a portfolio company in which we invest may make business decisions with which we disagree and the management of such company, as representatives of the holders of their common equity, may take risks or otherwise act in ways that do not serve our interests as debt investors. Due to the lack of liquidity for our investments in private companies, we may not be able to readily dispose of our portfolio company holdings or to sell our holdings at an appropriate valuation. As a result, a portfolio company may make decisions that could decrease the value of our portfolio holdings.
We will be exposed to risks associated with changes in interest rates.
We are subject to financial market risks, including changes in interest rates. Because we may borrow money to finance a portion of our investments, our net investment income will depend, in part, upon the difference between the rate at which we borrow funds and the rate at which we invest those funds. As a result, we can offer no assurance that a significant change in market interest rates will not have a material adverse effect on our net investment income. In periods of rising interest rates when we have debt outstanding, our cost of funds will increase, which could reduce our net investment income.
In addition, interest rates have recently been at or near historic lows. In the event of a significant rising interest rate environment, our portfolio companies with adjustable-rate loans could see their interest payments increase and there may be a significant increase in the number of our portfolio companies who are unable or unwilling to pay interest and repay their loans. Our investment portfolio of adjustable-rate loans may also decline in value in response to rising interest rates if the adjustable interest rates do not rise as much, or as quickly, as market interest rates in general. Similarly, during periods of rising interest rates, our investments with fixed interest will likely decline in value.
In periods of market volatility, the market values of fixed income securities, and portfolio companies with adjustable-rate loans, may be more sensitive to changes in interest rates. We may use interest rate risk management techniques in an effort to limit our exposure to interest rate fluctuations. These techniques may include various interest rate hedging activities to the extent such activities are not prohibited by the 1940 Act. These activities may limit our ability to participate in the benefits of lower interest rates with respect to the hedged portfolio. Adverse developments
resulting from changes in interest rates or hedging transactions could have a material adverse effect on our business, financial condition, and results of operations.
General interest rate fluctuations may have a substantial negative impact on our investments, our incentive fee, the value of our Shares, and our rate of return on invested capital. During periods of declining interest rates, borrowers or issuers may exercise their option to prepay principal earlier than scheduled. For fixed-rate securities, such payments often occur during periods of declining interest rates, forcing the Company to reinvest in lower yielding securities, resulting in a possible decline in the Company’s income and distributions to shareholders.
An increase or decrease in commodity supply or demand may adversely affect our business.
While we intend to be diversified across industry sectors, a decrease in the production of natural gas, natural gas liquids, crude oil, coal or other energy commodities, a decrease in the volume of such commodities available for transportation, mining, processing, storage or distribution, or a sustained decline in demand for such commodities may adversely impact the financial performance or prospects of energy or other commodity-focused companies in which we may invest. Energy and other commodity-focused companies are subject to supply and demand fluctuations in the markets they serve which will be impacted by a wide range of factors, including fluctuating commodity prices, weather, increased conservation or use of alternative fuel sources, increased governmental or environmental regulation, depletion of natural gas, natural gas liquids, crude oil or coal production, rising interest rates, declines in domestic or foreign production of natural gas, natural gas liquids and crude oil, accidents or catastrophic events and economic conditions, among others.
An increase or decrease in commodity pricing may adversely affect our business.
The return on our prospective investments in energy and other commodity-sensitive companies will be dependent on the margins received by those companies for the exploration, development, production, gathering, transportation, processing, storing, refining, distribution, mining, generation or marketing of natural gas, natural gas liquids, crude oil, refined products, coal or power. These margins may fluctuate widely in response to a variety of factors including global and domestic economic conditions, weather conditions, natural disasters, the supply and price of imported energy commodities, the production and storage levels of energy commodities in certain regions or in the world, political instability, terrorist activities, transportation facilities, energy conservation, domestic and foreign governmental regulation and taxation and the availability of local, intrastate and interstate transportation systems. Volatility of commodity prices may also make it more difficult for energy companies in which we may invest to raise capital to the extent the market perceives that their performance may be directly or indirectly tied to commodity prices.
We may continue to be subject to certain contingent liabilities arising from the sale or other disposition of our investments.
A significant portion of our investments involve private securities. In connection with the sale or other disposition of an investment in private securities, we may be required to make representations about the business and financial affairs of the portfolio company, typical of those made in connection with the sale of a business. We may also be required to indemnify the purchasers of such investment to the extent that any such representations are determined to be inaccurate with respect to potential liabilities. These arrangements may constitute contingent liabilities that ultimately could result in funding obligations that we must satisfy through our return of distributions previously made to us on such investment. If this occurs, we could incur losses associated with the payments of amounts in satisfaction of such liabilities. Consequently, the value of our Shares may decline and our future distributions to shareholders may be reduced, although in no event would shareholders be required to return distributions previously paid by us to them on account of such liabilities.
International investments create additional risks.
We expect to make investments in portfolio companies that are domiciled outside of the United States. We anticipate that up to 30% of our investments may be in these types of assets. Our investments in foreign portfolio companies will be deemed “non-qualifying assets,” which means, as required by the 1940 Act, they may not constitute more than 30% of our total assets at the time of our acquisition of any asset, after giving effect to the acquisition. Notwithstanding the limitation on our ownership of foreign portfolio companies, such investments may subject us to many of the same risks as our domestic investments, as well as certain additional risks, including the following:
| |
| • | foreign governmental laws, rules, and policies, including those restricting the ownership of assets in the foreign country or the repatriation of profits from the foreign country to the United States; |
| |
| • | foreign currency devaluations that reduce the value of and returns on our foreign investments; |
| |
| • | adverse changes in the availability, cost, and terms of investments due to the varying economic policies of a foreign country in which we invest; |
| |
| • | adverse changes in tax rates, the tax treatment of transaction structures, and other changes in operating expenses of a particular foreign country in which we invest; |
| |
| • | the assessment of foreign-country taxes (including withholding taxes, transfer taxes, and value added taxes, any or all of which could be significant) on income or gains from our investments in the foreign country; |
| |
| • | adverse changes in foreign-country laws, including those relating to taxation, bankruptcy, and ownership of assets; |
| |
| • | changes that adversely affect the social, political, and/or economic stability of a foreign country in which we invest; |
| |
| • | high inflation in the foreign countries in which we invest, which could increase the costs to us of investing in those countries; |
| |
| • | deflationary periods in the foreign countries in which we invest, which could reduce demand for our assets in those countries and diminish the value of such investments and the related investment returns to us; and |
| |
| • | legal and logistical barriers in the foreign countries in which we invest that materially and adversely limit our ability to enforce our contractual rights with respect to those investments. |
In addition, we may make investments in countries whose governments or economies may prove unstable. Certain of the countries in which we may invest may have political, economic, and legal systems that are unpredictable, unreliable, or otherwise inadequate with respect to the implementation, interpretation, and enforcement of laws protecting asset ownership and economic interests. In some of the countries in which we may invest, there may be a risk of nationalization, expropriation, or confiscatory taxation, which may have an adverse effect on our portfolio companies in those countries and the rates of return we are able to achieve on such investments. We may also lose the total value of any investment that is nationalized, expropriated, or confiscated. The financial results and investment opportunities available to us, particularly in developing countries and emerging markets, may be materially and adversely affected by any or all of these political, economic, and legal risks.
To the extent OID and PIK interest income constitute a portion of our income, we will be exposed to risks associated with the deferred receipt of cash representing such income.
Our investments may include OID and PIK instruments. To the extent OID and PIK interest income constitute a portion of our income, we will be exposed to risks associated with such income being required to be included in an accounting income and taxable income prior to receipt of cash, including the following:
| |
| • | OID instruments may have unreliable valuations because the accretion of OID as interest income requires judgments about its collectability. |
| |
| • | OID instruments may create heightened credit risks because the inducement to the borrower to accept higher interest rates in exchange for the deferral of cash payments typically represents, to some extent, speculation on the part of the borrower. |
| |
| • | For accounting purposes, cash distributions to shareholders that include a component of accreted OID income do not come from paid-in capital, although they may be paid from the offering proceeds. Thus, although a distribution of accreted OID income may come from the cash invested by the shareholders, the 1940 Act does not require that shareholders be given notice of this fact. |
| |
| • | The presence of accreted OID income and PIK interest income create the risk of non-refundable cash payments to Guggenheim in the form of subordinated incentive fees on income based on non-cash accreted OID income and PIK interest income accruals that may never be realized. |
| |
| • | In the case of PIK “toggle” debt (debt for which the issuer may defer an interest payment by agreeing to pay an increased coupon in the future, provided that all deferred payments must be made by the instrument’s maturity), the PIK interest election has the simultaneous effects of increasing the investment income, thus increasing the potential for realizing incentive fees. |
| |
| • | The required recognition of OID and PIK interest for U.S. federal income tax purposes may have a negative impact on liquidity, as such amount represent non-cash income that may require cash distributions to shareholders in order to maintain our ability to be subject to tax as a RIC. |
The impacts of COVID-19 may include, but are not limited to, (i) amendments and waivers being granted to borrowers permitting deferral of loan payments or allowing for PIK interest payments, (ii) additional borrower defaults and non-payments on their loans or inability of borrowers to refinance their loans at maturity, or (iii) permanent business closure. Such events, to the extent experienced, could result in a decrease in the value of our investment in any such portfolio company, or interest thereon. In addition, to the extent that the impact to our portfolio companies results in reduced interest payments or permanent impairments on our investments, we could see a decrease in our net
investment income which would increase the percentage of our cash flows dedicated to our debt obligations and could require us to reduce the future amount of distributions to our shareholders.
Our investments in private investment funds, including hedge funds, private equity funds, limited liability companies, and other business entities, subject us indirectly to the underlying risks of such private investment funds and additional fees and expenses.
Our investments in private investment funds, including hedge funds, private equity funds, limited liability companies, and other business entities, expose us to the risks associated with the businesses of such funds or entities. These private investment funds are not registered investment companies and, thus, are not subject to protections afforded by the 1940 Act covering, among other areas, liquidity requirements, governance by an independent board, affiliated transaction restrictions, leverage limitations, public disclosure requirements, and custody requirements.
We rely primarily on information provided by managers of private investment funds in valuing our investments in such funds. There is a risk that inaccurate valuations provided by managers of private investment funds could adversely affect the value of our Shares. In addition, there can be no assurance that a manager of a private investment fund will provide advance notice of any material change in such private investment fund’s investment program or policies, therefore our investment portfolio may be subject to additional risks, which may not be promptly identified by Guggenheim.
Investments in the securities of private investment funds may also involve duplication of advisory fees and certain other expenses. By investing in private investment funds indirectly through us, you bear a pro rata portion of our advisory fees and other expenses, and also indirectly bear a pro rata portion of the advisory fees, performance-based allocations, and other expenses borne by us as an investor in the private investment funds.
In addition, certain private investment funds may not provide us with the liquidity we require and would thus subject us to liquidity risk. Further, even if an investment in a private investment fund is deemed liquid at the time of investment, the private investment fund may, in the future, alter the nature of its investments and cease to be a liquid investment fund, subjecting us to liquidity risk.
We may acquire various structured financial instruments for purposes of “hedging” or reducing our risks, which may be costly and ineffective and could reduce our cash available for distribution to our shareholders.
We may seek to hedge against interest rate and currency exchange rate fluctuations and credit risk by using structured financial instruments such as futures, options, swaps, and forward contracts, subject to the requirements of the 1940 Act. Use of structured financial instruments for hedging purposes may present significant risks, including the risk of loss of the amounts invested. Defaults by the other party to a hedging transaction can result in losses in the hedging transaction. Hedging activities also involve the risk of an imperfect correlation between the hedging instrument and the asset being hedged, which could result in losses both on the hedging transaction and on the instrument being hedged. Use of hedging activities may not prevent significant losses and could increase our losses. Further, hedging transactions may reduce cash available to pay distributions to our shareholders.
Defaults by our portfolio companies will harm our operating results.
A portfolio company’s failure to satisfy financial or operating covenants imposed by us or other lenders could lead to defaults and, potentially, termination of its debt financing and foreclosure on its secured assets, which could trigger cross-defaults under other agreements and jeopardize a portfolio company’s ability to meet its obligations under the debt or equity securities that we hold. We may incur expenses to the extent necessary to seek recovery upon default or to negotiate new terms, which may include the waiver of certain financial covenants, with a defaulting portfolio company.
An investment strategy focused primarily on privately-held companies presents certain challenges, including the lack of available information about these companies.
We intend to invest primarily in privately-held companies. Investments in private companies pose certain incremental risks as compared to investments in public companies, including that they:
| |
| • | have reduced access to the capital markets, resulting in diminished capital resources and ability to withstand financial distress; |
| |
| • | may have limited financial resources and may be unable to meet their obligations under their debt securities that we hold, which may be accompanied by a deterioration in the value of any collateral and a reduction in the likelihood of us realizing any guarantees we may have obtained in connection with our investment; |
| |
| • | may have shorter operating histories, narrower product lines, and smaller market shares than larger businesses, which tend to render them more vulnerable to competitors’ actions and changing market conditions, as well as general economic downturns; |
| |
| • | are more likely to depend on the management talents and efforts of a small group of persons; therefore, the death, disability, resignation, or termination of one or more of these persons could have a material adverse impact on our portfolio company and, in turn, on us; and |
| |
| • | generally have less predictable operating results; may from time to time be parties to litigation; may be engaged in rapidly changing businesses with products subject to a substantial risk of obsolescence; and may require substantial additional capital to support their operations, finance expansion, or maintain their competitive position. In addition, our executive officers, trustees, and members of Guggenheim management may, in the ordinary course of business, be named as defendants in litigation arising from our investments in the portfolio companies. |
Finally, little public information generally exists about private companies and these companies may not have third-party credit ratings or audited financial statements. We must therefore rely on the ability of Guggenheim to obtain adequate information through due diligence to evaluate the creditworthiness and potential returns from investing in these companies. Additionally, these companies and their financial information will not generally be subject to the Sarbanes-Oxley Act of 2002 (the “Sarbanes-Oxley Act”) and other rules that govern public companies. If we are unable to uncover all material information about these companies, we may not make a fully informed investment decision and we may lose money on our investments.
The lack of liquidity in our investments may adversely affect our business.
We may acquire a significant percentage of our portfolio company investments from privately-held companies in directly negotiated transactions. The securities of private companies are not publicly traded or actively traded on the secondary market and are, instead, traded on a privately-negotiated, over-the-counter secondary market for institutional investors, if at all. These over-the-counter secondary markets may be inactive during an economic downturn or a credit crisis. In addition, the securities in these companies will be subject to legal and other restrictions on resale or will otherwise be less liquid than publicly-traded securities. We typically would be unable to exit these investments unless and until the portfolio company has a liquidity event such as a sale, refinancing, or initial public offering.
The illiquidity of our investments may make it difficult or impossible for us to sell such investments if the need arises. In addition, if we are required to liquidate all or a portion of our portfolio quickly, we may realize significantly less than the value at which we have previously recorded our investments, which could have a material adverse effect on our business, financial condition, and results of operations.
Moreover, securities purchased by us that are liquid at the time of purchase may subsequently become illiquid due to events relating to the issuer of the securities, market events, economic conditions, or investor perceptions.
We may also face other restrictions on our ability to liquidate an investment in a portfolio company to the extent that we, Guggenheim, or any of its affiliates have material nonpublic information regarding such portfolio company, or where the sale would be an impermissible joint transaction. The reduced liquidity of our investments may make it difficult for us to dispose of them at a favorable price, and, as a result, we may suffer losses.
Dislocations in certain parts of markets are resulting in reduced liquidity for certain investments. We expect that the market and business disruption created by the COVID-19 pandemic will impact certain aspects of our liquidity. It is uncertain when financial markets will improve. Liquidity of financial markets may also be affected by government intervention.
We may not have the funds or ability to make additional investments in our portfolio companies or to fund our unfunded commitments.
After our initial investment in a portfolio company, we may be called upon from time to time to provide additional funds to such company or have the opportunity to increase our investment through the exercise of a warrant or other right to purchase common stock. There is no assurance that we will make, or will have sufficient funds to make, follow-on investments. Even if we have sufficient capital to make a desired follow-on investment, we may elect not to make a follow-on investment because we may not want to increase our level of risk, we prefer other opportunities, we are limited in our ability to do so by compliance with BDC requirements, or we desire to maintain our RIC status. Our ability to make follow-on investments may also be limited by Guggenheim's allocation policies. Any decisions not to make a follow-on investment or any inability on our part to make such an investment may have a negative impact on a portfolio company in need of such an investment, may result in a missed opportunity for us to increase our participation in a successful operation, or may reduce the expected return on the investment. During periods of
market disruption, portfolio companies may be more likely to seek to draw on unfunded commitments we have made, and the risk of being unable to fund such commitments is heightened during such periods.
Prepayments of our debt investments by our portfolio companies could adversely impact our results of operations and reduce our return on equity.
We are subject to the risk that the investments we make in our portfolio companies may be repaid prior to maturity. When this occurs, we will generally reinvest these proceeds in temporary investments, pending their future investment in new portfolio companies. These temporary investments will typically have substantially lower yields than the debt being prepaid and we could experience significant delays in reinvesting these amounts. Any future investment in a new portfolio company may also be at lower yields than the debt that was repaid. As a result, our results of operations could be materially adversely affected if one or more of our portfolio companies elect to prepay amounts owed to us. Additionally, prepayments, net of prepayment fees, could negatively impact our return on equity.
To the extent that we borrow money at the Master Fund, the potential for gain or loss on amounts invested in us will be magnified and may increase the risk of investing in us. Borrowed money may also adversely affect the return on our assets, reduce cash available to service our debt or for distribution to our shareholders, and result in losses.
The use of borrowings, also known as leverage, increases the volatility of investments by magnifying the potential for gain or loss on invested equity capital. If we use leverage to partially finance our investments, through borrowing from banks and other lenders, you will experience increased risks of investing in our Shares. If the value of our assets decreases, leveraging would cause net asset value to decline more sharply than it otherwise would if we had not borrowed and employed leverage. Similarly, any decrease in our income would cause net income to decline more sharply than it would have if we had not borrowed and employed leverage. Such a decline could negatively affect our ability to make distributions to our shareholders. In addition, our shareholders will bear the burden of any increase in our expenses as a result of our use of leverage, including interest expenses and any increase in the management or incentive fees payable to Guggenheim.
The amount of leverage that we employ will depend on our assessment of market and other factors at the time of any proposed borrowing. There can be no assurance that leveraged financing will be available to us on favorable terms or at all. However, to the extent that we use leverage to finance our assets, our financing costs will reduce cash available for distributions to shareholders. Moreover, we may not be able to meet our financing obligations and, to the extent that we cannot, we risk the loss of some or all of our assets to liquidation or sale to satisfy the obligations. In such an event, we may be forced to sell assets at significantly depressed prices due to market conditions or otherwise, which may result in losses.
As a BDC, we are required to maintain a minimum coverage ratio of total assets to total borrowings and other senior securities, which include all of our borrowings and any preferred stock that we may issue in the future, subject to any then-current asset coverage requirements. We cannot incur additional debt and could be required to sell a portion of our investments to repay some debt when it is disadvantageous to do so, if any then-current asset coverage requirements are not met. This could have a material adverse effect on our operations and we may not be able to make distributions.
Illustration. The following table illustrates the effect of leverage on returns from an investment in the Master Fund common shares assuming a range of annual returns, net of expenses. The calculated results presented in the table below are hypothetical and actual returns may be higher or lower than those presented. The calculated results are based on the following assumptions:
| |
| • | $372.2 million in income earning total assets at the beginning of 2020; |
| |
| • | $172.0 million in senior securities outstanding at the beginning of 2020; |
| |
| • | $211.2 million in net assets attributable to Master Fund shareholders; and |
| |
| • | a current effective interest rate of 4.40% for 2020 (the stated interest rate is 3 month LIBOR+2.50%). |
In order to compute the “corresponding return to shareholders,” the “assumed return on our portfolio (net of expenses)” is multiplied by the total assets to obtain an assumed return to us. The interest expense is calculated as the product of the current effective interest rate and the amount of senior securities outstanding. The accrued interest expense as so calculated is then subtracted from the assumed return to us to determine the return available to shareholders. The return available to shareholders is then divided by the total amount of net assets attributable to Master Fund common shareholders to determine the “corresponding return to shareholders.” The amortization of deferred credit facility financing costs and future conditional unused commitment fees are not included in interest expense; actual interest expense may be different.
|
| | | | | | | | | | | | | | | | | | |
| | | | | | | | | | | | | Breakeven |
|
| Assumed return on our portfolio (net of expenses) | | -10.00 | % | | -5.00 | % | | 0.00 | % | | 5.00 | % | | 10.00 | % | | 2.03 | % |
| Corresponding return to shareholders | | -21.21 | % | | -12.39 | % | | -3.58 | % | | 5.23 | % | | 14.04 | % | | 0.00 | % |
The illustrative results in the table above indicate that an assumed (5.00)% annual return on our earning assets in 2020 would hypothetically result in a (12.39)% return to our shareholders. Likewise, an assumed 5.00% annual return on our earning assets in 2020 would hypothetically result in a 5.23% return to Master Fund shareholders. Finally, the Master Fund portfolio must hypothetically earn an annual return of 2.03% in 2020 to cover the annual interest expense on the assumed amount of senior securities outstanding in 2020.
The agreements governing our financing arrangements contain various covenants which, if not complied with, could accelerate repayment under the applicable arrangement, thereby materially and adversely affecting our liquidity, financial condition, results of operations and our ability to pay distributions to our shareholders.
Hamilton Finance LLC ("Hamilton"), a wholly-owned financing subsidiary of the Master Fund, has entered into a financing arrangement with a national commercial bank. The agreement governing this financing arrangement contains various default provisions and operational covenants which, if triggered, could result in the termination of the respective financing arrangement and the acceleration of any amounts outstanding thereunder, which could require the Master Fund or its subsidiary to liquidate positions at a time and/or at a price which is disadvantageous to us. This could result in losses and impact our ability to meet our investment objectives and pay distributions to shareholders.
The Master Fund's or Hamilton's failure to comply with the covenants set forth in the financing arrangement could materially and adversely affect our liquidity, financial condition, results of operations and our ability to pay distributions to our shareholders. We cannot assure shareholders that the Master Fund's or its subsidiaries will be able to borrow funds under any such financing arrangements at any particular time or at all. See "Discussion of Operating Plans—Financial Condition, Liquidity and Capital Resources" for a more detailed discussion of the terms of these financing arrangements.
Recent legislation may allow us to incur additional leverage.
Previously, under Section 61 of the 1940 act and as an existing non-traded BDC, the Master Fund was generally not permitted to incur indebtedness unless immediately after such borrowing the Master Fund had an asset coverage ratio for total borrowings of at least 200% (i.e., the amount of debt may not exceed 50% of the value of our assets). Recent legislation that has become law has modified this section of the 1940 Act and increased the amount of debt that new BDCs and certain publicly traded BDCs may incur by modifying the percentage from 200% to 150%. However, it is still uncertain as to how this modification affects existing BDCs who are not publicly traded. Currently, the Master Fund is still held to an asset coverage ratio of at least 200% but clarity in this law as to how it affects existing non-traded BDCs may allow us, in the future, to incur additional indebtedness similar to certain publicly traded BDCs, and, therefore, your risk of an investment in us may increase.
Economic recessions or downturns could impair our portfolio companies and harm our operating results.
Many of our portfolio companies may be susceptible to economic slowdowns or recessions and may be unable to repay our debt investments during these periods. Therefore, our non-performing assets may increase and the value of our portfolio is likely to decrease during these periods. Adverse economic conditions may also decrease the value of any collateral securing our senior secured first or second lien loans. A severe recession may further decrease the value of such collateral and result in losses of value in our portfolio and a decrease in our revenues, net income, assets, and net worth. Unfavorable economic conditions could also increase our funding costs, limit our access to the capital markets, or result in a decision by lenders not to extend credit to us on terms we deem acceptable. These events could prevent us from increasing investments and harm our operating results.
A return of recessionary conditions and/or continued negative developments in the domestic and international credit markets may significantly affect the markets in which we do business, the value of our loans and investments, and our ongoing operations, costs, and profitability. Any such unfavorable economic conditions, including rising interest rates, may also increase our funding costs, limit our access to capital markets, or negatively impact our ability to obtain financing, particularly from the debt markets. In addition, any future financial market uncertainty could lead to financial market disruptions and could further impact our ability to obtain financing. These events could limit our investment originations, limit our ability to grow, and negatively impact our operating results and financial condition.
We cannot predict the full impact of the COVID-19 pandemic, including its duration in the United States and worldwide, and the magnitude of the economic impact of the outbreak, including with respect to the travel restrictions, business closures and other quarantine measures imposed on service providers and other individuals by various local, state,
and federal governmental authorities, as well as non-U.S. governmental authorities. As such, we are unable to predict the duration of any business disruptions, the extent to which COVID-19 will negatively affect our portfolio companies’ operating results or the impact that such disruptions may have on our results of operations and financial condition. Though the magnitude of the impact remains to be seen, we expect our portfolio companies and, by extension, our operating results to be adversely impacted by COVID-19 and depending on the duration and extent of the disruption to the operations of our portfolio companies, we expect that certain portfolio companies will experience financial distress. We also expect that some of our portfolio companies may significantly curtail business operations, furlough or lay off employees and terminate service providers, and defer capital expenditures if subjected to prolonged and severe financial distress, which could impair their business on a permanent basis.
Guggenheim's decision to securitize loans may impact the feeder funds.
A decision by Guggenheim to securitize loans may affect the feeder funds in the following ways: (i) the securitization vehicle may be required to have separate financial statements, (ii) the securitized loans and/or the investment in the securitization vehicle would be included in the Master Fund's 30% "bucket" of Qualifying Assets (i.e. not a Qualified Asset), and (iii) securitization involves added fees and costs.
Risks Related to Guggenheim and its Affiliates
Guggenheim and its affiliates, including our officers and some of our Trustees, may face conflicts of interest caused by compensation arrangements with us and our affiliates, which could result in increased risk-taking by us.
Guggenheim and its affiliates will receive substantial fees from us in return for its services, including certain incentive fees based on the amount of appreciation of our investments. These fees could influence the advice provided to us. Generally, the more equity we sell in public offerings and the greater the risk assumed by us with respect to our investments, the greater the potential for growth in our assets and profits (and, correlatively, the fees payable by us to the Dealer Manager and Guggenheim). These compensation arrangements could affect Guggenheim or its affiliates’ judgment with respect to public offerings of equity and investments made by us, which allow the Dealer Manager to earn additional Dealer Manager fees and Guggenheim to earn increased investment advisory fees.
The time and resources that individuals associated with Guggenheim devote to us may be diverted, and we may face additional competition due to the fact that Guggenheim is not prohibited from raising money for or managing another entity that makes the same types of investments that we target.
Guggenheim currently manages other investment entities and is not prohibited from raising money for and managing future investment entities that make the same types of investments as those we target. As a result, the time and resources that Guggenheim devotes to us may be diverted, and during times of intense activity in other programs, it may devote less time and resources to our business than is necessary or appropriate. In addition, we may compete with any such investment entity for the same investors and investment opportunities.
Guggenheim will experience conflicts of interest in connection with the management of our business affairs.
Guggenheim will experience conflicts of interest in connection with the management of our business affairs, including those relating to the allocation of investment opportunities by Guggenheim and its affiliates; compensation to Guggenheim; services that may be provided by Guggenheim and its affiliates to issuers in which we invest; investments by us and other clients of Guggenheim, subject to the limitations of the 1940 Act; the formation of additional investment funds by Guggenheim; differing recommendations given by Guggenheim to us versus other clients; Guggenheim's use of information gained from issuers in our portfolio for investments by other clients, subject to applicable law; and restrictions on Guggenheim's use of “inside information” with respect to potential investments by us.
Guggenheim may face conflicts of interest with respect to services performed for issuers in which we invest.
Guggenheim and its affiliates may provide a broad range of financial services to companies in which we invest, in compliance with applicable law, and will generally be paid fees for such services. In addition, affiliates of Guggenheim may act as underwriters or placement agents in connection with an offering of securities by one of the companies in our portfolio. Any compensation received by Guggenheim for providing these services will not be shared with us and may be received before we realize a return on our investment. Guggenheim may face conflicts of interest with respect to services performed for these companies, on the one hand, and investments recommended to us, on the other hand.
Guggenheim has incentives to favor its other accounts and clients over us, which may result in conflicts of interest that could be harmful to us.
Because Guggenheim manages assets for other investment companies, pooled investment vehicles, and/or other accounts (including institutional clients, pension plans, and certain high net worth individuals), certain conflicts of interest are present. For instance, Guggenheim may receive fees from certain accounts that are higher than the fees
received by Guggenheim from us, or receive a more favorable performance-based fee on certain accounts. In those instances, a portfolio manager for Guggenheim has an incentive to favor the higher fee and/or higher performance-based fee accounts over us. In addition, a conflict of interest exists to the extent Guggenheim has proprietary investments in certain accounts, where its portfolio managers or other employees have personal investments in certain accounts, or when certain accounts are investment options in Guggenheim's employee benefit plans. Guggenheim has an incentive to favor these accounts over us. Our Board of Trustees will be responsible for monitoring these conflicts.
Guggenheim is not restricted from entering into other investment advisory relationships; Guggenheim's actions on behalf of its other accounts and clients may be adverse to us and our investments.
Guggenheim manages assets for accounts other than us, including private funds (for purposes of this section, “Advisor Funds”). Actions taken by Guggenheim on behalf of its Advisor Funds may be adverse to us and our investments, which could harm our performance. For example, we may invest in the same credit obligations as other Advisor Funds, and, to the extent permitted under the 1940 Act, our investments may include different obligations of the same issuer. Decisions made with respect to the securities held by one Advisor Fund may cause (or have the potential to cause) harm to the different class of securities of the issuer held by other Advisor Funds (including us). As a further example, Guggenheim may manage accounts that engage in short sales of (or otherwise take short positions in) securities or other instruments of the type in which we invest, which could harm our performance for the benefit of the accounts taking short positions, if such short positions cause the market value of the securities to fall.
Guggenheim will face restrictions on its use of inside information about existing or potential investments that it acquires through its relationships with other advisory clients, and those restrictions may limit the freedom of Guggenheim to enter into or exit from investments for us, which could have an adverse effect on our results of operations.
In the course of performing its duties, the members, officers, directors, employees, principals, or affiliates of Guggenheim may come into possession of material, non-public information. The possession of such information may be detrimental to us, limiting the ability of Guggenheim to buy or sell a security or otherwise to participate in an investment opportunity for us. In certain circumstances, employees of Guggenheim may serve as board members or in other capacities for portfolio or potential portfolio companies, which could restrict our ability to trade in the securities of such companies. For example, if personnel of Guggenheim come into possession of material non-public information with respect to our investments, such personnel will be restricted by Guggenheim’s information-sharing policies and procedures, or by law or contract from sharing such information with our management team, even where the disclosure of such information would be in our best interests or would otherwise influence decisions taken by the members of the management team with respect to that investment. This conflict and these procedures and practices may limit the freedom of Guggenheim to enter into or exit from potentially profitable investments for us, which could have an adverse effect on our results of operations. Accordingly, there can be no assurance that we will be able to fully leverage the resources and industry expertise of Guggenheim other businesses. Additionally, there may be circumstances in which one or more individuals associated with Guggenheim will be precluded from providing services to us because of certain confidential information available to those individuals or to other parts of Guggenheim.
We may be obligated to pay Guggenheim incentive fees even if we incur a net loss due to a decline in the value of our portfolio and even if our earned interest income is not payable in cash.
The Investment Advisory Agreement entitles Guggenheim to receive an incentive fee based on our pre-incentive fee net investment income regardless of any capital losses. In such case, we may be required to pay Guggenheim an incentive fee for a fiscal quarter even if there is a decline in the value of our portfolio or if we incur a net loss for that quarter.
Any incentive fee payable by us that relates to our pre-incentive fee net investment income may be computed and paid on income that may include interest that has been accrued but not yet received or interest in the form of securities received rather than cash (i.e., PIK income). If a portfolio company defaults on a loan that is structured to provide accrued interest income, it is possible that accrued interest income previously included in the calculation of the incentive fee will become uncollectible. Guggenheim is not obligated to reimburse us for any part of the incentive fee it received that was based on accrued interest income that we never received as a result of a subsequent default, and such circumstances would result in our paying a subordinated incentive fee on income we never receive. PIK income will be counted toward the incentive fee that we are obligated to pay Guggenheim, even though we do not receive the income in the form of cash.
The quarterly incentive fee on income that we pay is recognized and paid without regard to: (i) the trend of pre-incentive fee net investment income on adjusted capital over multiple quarters in arrears, which may in fact be
consistently less than the preference return, or (ii) the net income or net loss in the current calendar quarter, the current year, or any combination of prior periods.
For federal income tax purposes, we may be required to recognize taxable income in some circumstances in which we do not receive a corresponding payment in cash and to make distributions with respect to such income to maintain our status as a RIC. Under such circumstances, we may have difficulty meeting the annual distribution requirement necessary to maintain RIC tax treatment under the Code. This difficulty in making the required distribution may be amplified to the extent that we are required to pay a subordinated incentive fee on income with respect to such accrued income. As a result, we may have to sell some of our investments at times and/or at prices we would not consider advantageous, raise additional debt or equity capital, or forgo new investment opportunities for this purpose. If we are not able to obtain cash from other sources, we may fail to qualify for RIC tax treatment and thus become subject to corporate-level income tax.
Our incentive fee may induce Guggenheim to make speculative investments.
The incentive fee payable by us to Guggenheim may create an incentive for Guggenheim to make investments on our behalf that are riskier or more speculative than would be the case in the absence of such compensation arrangements. The way in which the incentive fee is determined may encourage Guggenheim to use leverage to increase the leveraged return on our investment portfolio.
In addition, the fact that our base management fee is payable based upon our gross assets (which includes any borrowings for investment purposes) may encourage Guggenheim to use leverage to make additional investments. Such a practice could result in our investing in more speculative securities than would otherwise be the case, which could result in higher investment losses, particularly during cyclical economic downturns. Under certain circumstances, the use of substantial leverage may increase the likelihood of our default on our borrowings, which would disfavor holders of our Shares.
Our ability to enter into transactions with our affiliates will be restricted.
We will be prohibited under the 1940 Act from participating in certain transactions with certain of our affiliates without the prior approval of a majority of the Independent Trustees and, in some cases, the SEC. Any person that owns, directly or indirectly, 5% or more of our outstanding voting securities will be our affiliate for purposes of the 1940 Act, and we will generally be prohibited from buying or selling any securities from or to such affiliate on a principal basis, absent the prior approval of our Board of Trustees and, in some cases, the SEC. The 1940 Act also prohibits certain “joint” transactions with certain of our affiliates, which in certain circumstances could include investments in the same portfolio company (whether at the same or different times to the extent the transaction is considered a joint transaction), without prior approval of our Board of Trustees and, in some cases, the SEC. If a person acquires more than 25% of our voting securities, we will be prohibited from buying or selling any security from or to such person or certain of that person’s affiliates, or entering into prohibited joint transactions with such persons, absent the prior approval of the SEC. Similar restrictions limit our ability to transact business with our officers, trustees or their affiliates. The SEC has interpreted the BDC regulations governing transactions with affiliates to prohibit certain joint transactions involving entities that share a common investment adviser. As a result of these restrictions, we may be prohibited from buying or selling any security from or to any portfolio company that is controlled by a fund managed by Guggenheim or its affiliates without the prior approval of the SEC, which may limit the scope of investment opportunities that would otherwise be available to us.
The Master Fund received an exemptive order from the SEC that permits it to, among other things, co-invest in privately-negotiated transactions alongside other funds, including funds managed by Guggenheim and certain of its affiliates. The exemptive order is subject to certain terms and conditions. Accordingly, when the Master Fund co-invests in privately-negotiated transactions with other accounts or other entities managed by Guggenheim, those transactions will be subject to the various conditions contained in the SEC exemptive order pertaining to co-investment transactions. However, if the Master Fund co-invests in transactions with other accounts or other entities managed by Guggenheim which are not subject to the various conditions contained in our exemptive order, then those transactions will be subject to the limited circumstances currently permitted by applicable SEC staff guidance and interpretations.
The Master Fund has adopted Guggenheim’s allocation policy, which is designed to fairly and equitably distribute investment opportunities among funds or pools of capital managed by Guggenheim. Such allocation policy provides that once an investment has been approved and is deemed to be in the Master Fund's best interest, then the Master Fund will receive a pro rata share of the investment. The adoption of this allocation policy will ensure that the Master Fund will be presented with all investment opportunities that fit within its investment strategy and that it will have the ability to invest in those opportunities alongside other Guggenheim clients on equal terms.
In situations when co-investment with affiliates’ other clients is not permitted under the 1940 Act and related rules, existing or future staff guidance, or the terms and conditions of exemptive relief granted to us by the SEC (as discussed above), Guggenheim will need to decide which client or clients will proceed with the investment. Generally, the Master Fund will not have an entitlement to make a co-investment in these circumstances and, to the extent that another client elects to proceed with the investment, then the Master Fund will not be permitted to participate. Moreover, except in certain circumstances, the Master Fund will be unable to invest in any issuer in which an affiliate's other client holds a controlling interest.
We may make investments that could give rise to a conflict of interest.
We do not expect to invest in, or hold securities of, companies that are controlled by our affiliates’ other clients. However, an affiliate’s other clients may invest in, and gain control over, one of our portfolio companies. If an affiliate’s other client, or clients, gains control over one of our portfolio companies, it may create conflicts of interest and may subject us to certain restrictions under the 1940 Act. As a result of these conflicts and restrictions, Guggenheim may be unable to implement our investment strategies as effectively as it could have in the absence of such conflicts or restrictions. For example, as a result of a conflict or restriction, Guggenheim may be unable to engage in certain transactions that it would otherwise pursue. In order to avoid these conflicts and restrictions, Guggenheim may choose to exit these investments prematurely and, as a result, we would forego any positive returns associated with such investments. In addition, to the extent that an affiliate’s other clients hold a different class of securities than us as a result of such transactions, our interests may not be aligned.
The recommendations given to us by Guggenheim may differ from those rendered to its other clients.
Guggenheim and its affiliates may give advice and recommend securities to other clients that may differ from advice given to, or securities recommended or bought for, us even though such other clients’ investment objectives may be similar to ours.
Guggenheim's liability is limited under the Investment Advisory Agreement, and we are required to indemnify Guggenheim against certain liabilities, which may lead Guggenheim to act in a riskier manner on our behalf than it would when acting for its own account.
Guggenheim has not assumed any responsibility to us other than to render the services described in the Investment Advisory Agreement, and its assets will not be available to satisfy our debts and obligations. Guggenheim will not be responsible for any action of our Board of Trustees in declining to follow Guggenheim's advice or recommendations. Pursuant to the Investment Advisory Agreement, Guggenheim and its directors, officers, shareholders, members, agents, employees, controlling persons, and any other person or entity affiliated with, or acting on behalf of, Guggenheim will not be liable to us for their acts under the Investment Advisory Agreement (absent willful misfeasance, bad faith, gross negligence, or reckless disregard in the performance of their duties). We have also agreed to indemnify, defend, and protect Guggenheim and its directors, officers, shareholders, members, agents, employees, controlling persons, and any other person or entity affiliated with, or acting on behalf of, Guggenheim with respect to all damages, liabilities, costs, and expenses resulting from acts of Guggenheim (not arising out of willful misfeasance, bad faith, gross negligence, or reckless disregard in the performance of their duties). These protections may lead Guggenheim to act in a riskier manner when acting on our behalf than it would when acting for its own account.
Guggenheim is party to a settlement agreement with the SEC and is subject to remedial sanctions and a cease-and-desist order.
In August 2015, Guggenheim settled all matters relating to an investigation by the SEC, including matters relating to a failure to disclose a potential conflict of interest in connection with a $50 million loan that a senior executive received from an advisory client and inadvertently billing management fees of $6.5 million to non-managed assets of one client. Guggenheim neither admitted nor denied the findings contained in the SEC order. In connection with implementing the settlement agreement, remedial sanctions and a cease-and-desist order have been entered against Guggenheim. Additionally, the SEC censured Guggenheim and ordered it to pay a $20 million civil penalty. This settlement does not impose any restrictions on Guggenheim’s future business activities.
The Dealer Manager’s affiliation with Guggenheim may cause a conflict of interest and may hinder the performance of its due diligence obligations.
Our Dealer Manager will receive Dealer Manager fees in connection with this offering, all or a portion of which it may re-allow to other dealers. Our Dealer Manager has certain obligations under the federal securities laws to undertake a due diligence investigation with respect to the parties involved in this offering, including Guggenheim. Our Dealer Manager’s affiliation with Guggenheim may cause a conflict of interest for our Dealer Manager in carrying out its due diligence obligations. While our Dealer Manager may rely on certain representations we make, our Dealer Manager
has not requested and will not obtain from counsel an opinion to the effect that the prospectus will not include any untrue statement of a material fact or omit to state a material fact necessary in order to make the statements in the prospectus, in the light of the circumstances under which they were made, not misleading. The absence of an independent due diligence review by our Dealer Manager may increase the risk and uncertainty you face as a potential investor in our Shares.
Our Dealer Manager may experience conflicts in managing competing offerings.
Our Dealer Manager may experience conflicts in fund raising for us and possibly future entities, at the same time. If the fees that we pay to the Dealer Manager are lower than those paid by such other entities, or if investors have a greater appetite for their shares than our Shares, our Dealer Manager may be incentivized to sell more shares of such other entities and thus may devote greater attention and resources to their selling efforts than to selling our Shares.
Risks Generally Related to Business Development Companies
The requirement that we invest a sufficient portion of our assets in qualifying assets could preclude us from investing in accordance with our current business strategy; conversely, the failure to invest a sufficient portion of our assets in qualifying assets could result in our failure to maintain our status as a BDC.
As a BDC, the 1940 Act prohibits us from acquiring any assets other than certain qualifying assets, unless at the time of and after giving effect to such acquisition, at least 70% of our total assets are qualifying assets. Therefore, we may be precluded from investing in what we believe are attractive investments if such investments are not qualifying assets. Conversely, if we fail to invest a sufficient portion of our assets in qualifying assets, we could lose our status as a BDC, which would have a material adverse effect on our business, financial condition, and result of operations. Similarly, these rules could prevent us from making additional investments in existing portfolio companies, which could result in the dilution of our position, or could require us to dispose of investments at an inopportune time to comply with the 1940 Act. If we were forced to sell non-qualifying investments in the portfolio for compliance purposes, the proceeds from such sale could be significantly less than the current value of such investments.
Failure to maintain our status as a BDC would reduce our operating flexibility.
If we do not remain a BDC, we might be regulated as a closed-end investment company under the 1940 Act, which would subject us to substantially more regulatory restrictions and correspondingly decrease our operating flexibility.
Regulations governing our operation as a BDC and RIC will affect our ability to raise capital and the way in which we raise additional capital or borrow for investment purposes, which may have a negative effect on our growth. As a BDC, the necessity of raising additional capital may expose us to risks, including risks associated with leverage.
As a result of our need to satisfy the annual distribution requirement in order to be subject to tax as a RIC, we may need to access the capital markets periodically to raise cash to fund new investments in portfolio companies. The Master Fund may issue "senior securities," including borrowing money from banks or other financial institutions, only in amounts such that the Master Fund's asset coverage is at least equal to any then-current asset coverage requirements under the 1940 Act. Recent legislation has reduced the asset coverage requirements for BDCs, subject to certain approvals and conditions. If the Master Fund obtains the necessary approvals and meets the applicable conditions, it may incur increased leverage and be subject to additional risk. If the Master Fund issues senior securities, we will be exposed to risks associated with leverage, including an increased risk of loss. Our ability to issue different types of securities is also limited. Compliance with these distribution requirements may unfavorably limit the Master Fund's investment opportunities and reduce our ability in comparison to other companies to profit from favorable spreads between the rates at which we can borrow and the rates at which we can lend.
The Master Fund may borrow for investment purposes. If the value of the Master Fund's assets declines, it may be unable to satisfy the asset coverage test, which would prohibit us from paying distributions and could prevent us from being subject to tax as a RIC, which would generally result in a corporate-level tax on any income and net gains. If the Master Fund cannot satisfy the asset coverage test, it may be required to sell a portion of its investments and, depending on the nature of its debt financing, repay a portion of its indebtedness at a time when such sales may be disadvantageous. Also, any amounts that the Master Fund uses to service its indebtedness would not be available for distributions to our common shareholders.
If we cannot obtain debt financing or equity capital on acceptable terms, our ability to acquire investments and to expand our operations will be adversely affected.
The net proceeds from the sale of Shares will be used for our investment opportunities, and, if necessary, the payment of operating expenses and the payment of various fees and expenses, such as management fees, incentive fees, and other fees and distributions. Any working capital reserves we maintain may not be sufficient for investment purposes, and we may require additional debt financing or equity capital to operate. Pursuant to tax rules that apply to us, we
will be required to distribute dividends for U.S. federal income tax purposes each taxable year generally of an amount at least equal to 90% of the sum of our net ordinary income and net short-term capital gains in excess of net long-term capital losses, if any, to our shareholders in order to maintain our ability to be subject to tax as a RIC. Accordingly, in the event that we need additional capital in the future for investments or for any other reason, we may need to access the capital markets periodically to issue debt or equity securities or borrow from financial institutions in order to obtain such additional capital. These sources of funding may not be available to us due to unfavorable economic conditions, which could increase our funding costs, limit our access to the capital markets, or result in a decision by lenders not to extend credit to us. Consequently, if we cannot obtain further debt or equity financing on acceptable terms, our ability to acquire additional investments and to expand our operations will be adversely affected. As a result, we would be less able to achieve portfolio diversification and our investment objectives, which may negatively impact our results of operations and reduce our ability to make distributions to our shareholders.
Risks Related to an Investment in Our Shares
Investing in our Shares involves a high degree of risk.
The investments we make in accordance with our investment objectives may result in a higher amount of risk than alternative investment options and includes volatility or loss of principal. Our investments in portfolio companies may be highly speculative and aggressive and, therefore, an investment in our Shares may not be suitable for someone with lower risk tolerance.
Investors will not know the purchase price per share at the time they submit their order forms and could receive fewer Shares than anticipated.
Shares will be offered at net asset value plus any applicable sales load. As a result, the public offering price may change for each weekly closing. Your purchase price may be higher than the prior subscription closing price and therefore you may receive a smaller number of Shares than if you had subscribed at the prior subscription closing price.
If we are unable to raise substantial funds in our ongoing, continuous “best efforts” public offering, we will be limited in the number and type of investments we may make, and the value of your investment in us may be reduced in the event our assets under-perform.
Our continuous public offering is being made on a best efforts basis, whereby our Dealer Manager and selected dealers are only required to use their best efforts to sell our Shares and have no firm commitment or obligation to purchase any of the Shares. To the extent that less than the maximum number of Shares is subscribed for, the opportunity for diversification of our investments may be decreased and the returns achieved on those investments may be reduced as a result of allocating all of our expenses among a smaller capital base. Effective as of June 30, 2020, broker-dealers are required to comply with Regulation BI, which requires that, when making a recommendation to a retail customer, broker-dealers and their associated persons act in the best interest of their retail customers at the time the recommendation is made. High cost, high risk, and complex products may be subject to greater scrutiny by broker-dealers and their associated persons under Regulation BI. Further, under Regulation BI broker-dealers have a duty to evaluate alternatives to us and whether those alternatives are in the retail customer’s best interest. Consequently, Regulation BI may have the effect of discouraging certain broker-dealers from participating in our offering, potentially reducing the diversification of our investments and the returns achieved on those investments. See "Regulation Best Interest."
Our ability to conduct our continuous public offering successfully is dependent, in part, on the ability of our Dealer Manager to successfully establish, operate, and maintain relationships with a network of selected dealers.
The success of our public offering, and correspondingly our ability to implement our business strategy, is dependent upon the ability of our Dealer Manager to establish and maintain relationships with a network of licensed securities selected dealers and other agents to sell our Shares. If our Dealer Manager fails to perform, we may not be able to raise adequate proceeds through our public offering to implement our investment strategy. If we are unsuccessful in implementing our investment strategy, you could lose all or a part of your investment.
We intend, but are not required, to offer to repurchase your Shares on a quarterly basis. As a result you will have limited opportunities to sell your Shares.
Subject to our Board of Trustees’ discretion, we intend to offer to repurchase approximately 10% of our weighted average number of outstanding Shares in any 12-month period, in order to allow you to tender your Shares to us on a quarterly basis at a price that is estimated to be equal to our net asset value per share as of the expiration date of the tender offer. The share repurchase program, if implemented, will include numerous restrictions that limit your ability to sell your Shares. At the discretion of our Board of Trustees, we intend to limit the number of Shares to be repurchased during any calendar year to the number of Shares we can repurchase with cash on hand, cash available
from borrowings, and cash from the sale of our investments as of the end of the applicable period to repurchase Shares. We will limit repurchases in each quarter to 2.5% of the weighted average number of Shares outstanding in the prior four calendar quarters. To the extent that the number of Shares put to us for repurchase exceeds the number of Shares that we are able to purchase, we will repurchase Shares on a pro rata basis, not on a first-come, first-served basis. Further, we will have no obligation to repurchase Shares if the repurchase would violate the restrictions on distributions under federal law or Delaware law, which prohibits distributions that would cause a trust to fail to meet statutory tests of solvency. These limits may prevent us from accommodating all repurchase requests made in any year. Our Board of Trustees may amend, suspend, or terminate the share repurchase program at any time. We will notify our shareholders of such developments: (i) in our quarterly reports or (ii) by means of a separate mailing to you, accompanied by disclosure in a current or periodic report under the Exchange Act. In addition, under the quarterly share repurchase program, if implemented, we will have discretion to not repurchase Shares, to suspend the program, and to cease repurchases. Further, the program will have many limitations and should not be relied upon as a method to sell Shares promptly and at a desired price.
Our Shares are not listed on a securities exchange and our shareholders have limited liquidity. In addition, the timing of our repurchase offers pursuant to our share repurchase program may be at a time that is disadvantageous to our shareholders, and to the extent you are able to sell your Shares under the share repurchase program, you may not be able to recover the amount of your investment in our Shares.
Our Shares are illiquid investments for which there is not and will likely not be a secondary market. Liquidity for your Shares will be limited to participation in our share repurchase program, which we have no obligation to maintain.
When we make quarterly repurchase offers pursuant to the share repurchase program, we will offer to repurchase Shares at a price that is estimated to be equal to our net asset value per share as of the expiration date of the tender offer, which may be lower than the price that you paid for our Shares. As a result, to the extent you paid a price that includes the related sales load and to the extent you have the ability to sell your Shares pursuant to our share repurchase program, the price at which you may sell Shares may be lower than the amount you paid in connection with the purchase of Shares in this offering.
We have a finite term and the timing of our liquidation may be at a time that is disadvantageous to our shareholders and the proceeds you receive may be less than your investment in our Shares.
We will have a finite term and we intend to liquidate our interest in the Master Fund and distribute all proceeds to shareholders on or before December 31, 2026. If market conditions are unfavorable at the time of our liquidation, you may receive liquidation proceeds that are less than your investment in our Shares.
Guggenheim Credit Income Fund 2016 T ("GCIF 2016 T") and Guggenheim Credit Income Fund 2019 ("GCIF 2019"), other feeder funds, also have finite terms and the timing of their liquidations will likely occur before any liquidation that we may have. GCIF 2016 T and GCIF 2019's liquidations may be at a times that are disadvantageous to the Master Fund and our shareholders.
GCIF 2016 T and GCIF 2019 also have finite terms and the timing of their liquidations will likely occur before any liquidation that we may have. The Master Fund may sell some of its investments, borrow additional funds, or use capital raised from other feeder funds, including us, to meet the liquidation needs of GCIF 2016 T and GCIF 2019. GCIF 2016 T and GCIF 2019's liquidations may be at a time that is disadvantageous to the Master Fund and, thus, our shareholders through our ownership of the Master Fund. GCIF 2016 T and GCIF 2019 intend to liquidate their interest in the Master Fund and distribute all proceeds to their shareholders on or before December 31, 2021 and December 31, 2026, respectively.
If a Liquidity Event were to be in the form of listing of the Master Fund’s shares on a national securities exchange, the price at which the shares of the Master Fund trade from time to time may be below the Master Fund’s then current Net Asset Value.
One of the options that our Board may recommend to pursue a Liquidity Event may be a listing of the Master Fund’s shares on a national securities exchange. Such a listing would require the approval of the shareholders of the Feeder Funds voting together as a single class, and, if approved, would result in the liquidation and dissolution of each feeder fund, including us, at which point all shareholders of each feeder fund would become direct shareholders of the Master Fund. We cannot assure you that a trading market will develop for the Master Fund’s shares after the listing or, if one develops, that such trading market will be sustained. In addition, we cannot predict the prices at which the shares of the Master Fund will trade, whether at, above or below NAV. Shares of publicly traded BDCs often trade at a discount to the initial offering price due to initial front end load cost and other related offering expenses. Also, shares of publicly traded BDCs frequently trade at a discount to NAV, and the shares of the Master Fund may also be discounted in the market. This characteristic of publicly traded BDCs is separate and distinct from the risk that our
NAV per share may decline and may be greater for investors expecting to sell shares after the Master Fund listing occurs. In addition, if shares of the Master Fund trade below its then current NAV, the Master Fund will generally not be able to sell additional shares of common stock to the public without, among other things, the requisite shareholder approval.
We may be unable to invest a significant portion of the net proceeds of this offering on acceptable terms in an acceptable timeframe.
Delays in investing the net proceeds of this offering may impair our performance. We cannot assure you that we will be able to identify investments that meet our investment objectives or that any investment that we make will produce a positive return. We may be unable to invest the net proceeds of our offering on acceptable terms within the time period that we anticipate or at all, which could harm our financial condition and operating results.
Before making investments, we will invest the net proceeds of our offering primarily in cash, cash equivalents, U.S. government securities, repurchase agreements, and/or other high-quality debt instruments maturing in one year or less from the time of investment. This will produce returns that are significantly lower than the returns we expect to achieve when our portfolio is fully invested in securities meeting our investment objectives. As a result, any distributions that we pay while our portfolio is not fully invested in securities meeting our investment objectives may be lower than the distributions that we may be able to pay when our portfolio is fully invested in securities meeting our investment objectives.
Your interest in us may be diluted if we issue additional Shares, which could reduce the overall value of an investment in us.
You do not have preemptive rights to any Shares we issue in the future. Our Declaration of Trust authorizes us to issue up to 1,000,000,000 Shares. Pursuant to our Declaration of Trust, a majority of our entire Board of Trustees may amend our Declaration of Trust to increase our authorized Shares without shareholder approval. Our Board of Trustees may elect to sell additional Shares in the future. To the extent we issue additional equity interests at or below net asset value, your percentage ownership interest in us may be diluted. In addition, depending upon the terms and pricing of any additional offerings and the value of our investments, you may also experience dilution in the book value and fair value of your Shares.
Under the 1940 Act, we generally are prohibited from issuing or selling our Shares at a price below net asset value per share, which may be a disadvantage as compared with certain public companies. We may, however, sell our Shares or warrants, options, or rights to acquire our Shares, at a price below the current net asset value of our Shares if our Board of Trustees and Independent Trustees determine that such sale is in our best interests and the best interests of our shareholders, and our shareholders, including a majority of those shareholders that are not affiliated with us, approve such sale. In any such case, the price at which our securities are to be issued and sold may not be less than a price that, in the determination of our Board of Trustees, closely approximates the fair value of such securities. If we raise additional funds by issuing Shares or senior securities convertible into, or exchangeable for, our Shares, then the percentage ownership of our shareholders at that time will decrease and you will experience dilution.
The liquidation of feeder funds could cause us to sell assets at a time when it is not advantageous to do so and could reduce our ability to take advantage of future investment opportunities.
We will periodically be required to dispose of our assets to fund the liquidation of the finite life feeder funds. Any given liquidating feeder fund may hold a significant number of Shares and we may accordingly be required to liquidate a substantial portion of our portfolio. In connection with this, we may be forced to sell assets at a time when it is not advantageous to do so and the remaining shareholders (i.e., the non-liquidating feeder funds) may incur higher expenses due to the loss of economies of scale. Raising sufficient cash to fund such liquidations could also reduce our ability to take advantage of future investment opportunities and may reduce our liquidity.
Preferred stock could be issued with rights and preferences that would adversely affect holders of our Shares.
Under the terms of our Declaration of Trust, our Board of Trustees is authorized to issue preferred stock in one or more series without shareholder approval, which could potentially adversely affect the interests of existing shareholders. The issuance of preferred stock with dividend or conversion rights, liquidation preferences or other economic terms favorable to the holders of preferred stock could adversely affect our common stock by making an investment in the Shares less attractive. In addition, the dividends on any preferred stock we issue must be cumulative. Payment of dividends and repayment of the liquidation preference of preferred stock must take preference over any distributions or other payments to our common shareholders, and holders of preferred stock are not subject to any of our expenses or losses and are not entitled to participate in any income or appreciation in excess of their stated preference (other than convertible preferred stock that converts into Shares). In addition, under the 1940 Act, participating preferred stock constitutes a "senior security" for purposes of any then-current asset coverage test.
Certain provisions of our Declaration of Trust and actions of the Board of Trustees could deter takeover attempts and have an adverse impact on the value of our Shares.
Our Declaration of Trust, as well as certain statutory and regulatory requirements, contains certain provisions that may have the effect of discouraging a third party from attempting to acquire us. Our Board of Trustees may, without shareholder action, authorize the issuance of shares in one or more classes or series; and our Board of Trustees may, without shareholder action, amend our Declaration of Trust to increase the number of our Shares, of any class or series, that we will have authority to issue. These anti-takeover provisions may inhibit a change of control in circumstances that could give the holders of our Shares the opportunity to realize a premium over the value of our Shares.
The net asset value of our Shares may fluctuate significantly.
The net asset value and liquidity, if any, of the market for our Shares may be significantly affected by numerous factors, some of which are beyond our control and may not be directly related to our operating performance. These factors include:
| |
| • | changes in the value of our portfolio of investments and derivative instruments; |
| |
| • | changes in regulatory policies or tax guidelines, particularly with respect to RICs or BDCs; |
| |
| • | loss of RIC or BDC status; |
| |
| • | distributions that exceed our net investment income and net income as reported according to GAAP; |
| |
| • | changes in earnings or variations in operating results; |
| |
| • | changes in accounting guidelines governing valuation of our investments; |
| |
| • | any shortfall in revenue or net income, or any increase in losses from levels expected by investors; |
| |
| • | departure of Guggenheim or certain of its key personnel; |
| |
| • | general economic trends and other external factors; and |
| |
| • | loss of a major funding source. |
There are special considerations for pension or profit-sharing trusts, Keoghs, or IRAs.
If you are investing the assets of a pension, profit sharing, 401(k), Keogh, or other retirement plan, or IRA or any other employee benefit plan subject to ERISA or Section 4975 of the Code in us, you should consider:
| |
| • | whether your investment is consistent with the applicable provisions of ERISA and the Code; |
| |
| • | whether your investment will produce unrelated business taxable income to the benefit plan; and |
| |
| • | your need to value the assets of the benefit plan annually. |
We believe that, under current ERISA law and regulations, our assets will not be treated as “plan assets” of a benefit plan subject to ERISA and/or Section 4975 of the Code that purchases Shares, if the facts and assumptions described in this prospectus arise as expected, and based on our related representations. Our view is not binding on the IRS or the Department of Labor. If our assets were considered to be plan assets, our assets would be subject to ERISA and/or Section 4975 of the Code, and some of the transactions we will enter into with Guggenheim and its affiliates could be considered “prohibited transactions,” which could cause us, Guggenheim, and its affiliates to be subject to liabilities and excise taxes. In addition, Guggenheim could be deemed to be a fiduciary under ERISA and subject to other conditions, restrictions, and prohibitions under Part 4 of Title I of ERISA. Even if our assets will not be considered to be plan assets, a prohibited transaction could occur if we, Guggenheim, any selected dealer, the transfer agent, or any of their affiliates is a fiduciary (within the meaning of ERISA) with respect to a purchase by a benefit plan and, therefore, unless an administrative or statutory exemption applies in the event such persons are fiduciaries (within the meaning of ERISA) with respect to your purchase, Shares should not be purchased.
Federal Income Tax Risks
We will be subject to corporate-level income tax if we are unable to maintain our qualification as a RIC under Subchapter M of the Code, if the Master Fund is unable to maintain its qualification as a RIC under Subchapter M of the Code, or if we make investments through taxable subsidiaries.
To maintain RIC tax treatment under the Code, we must meet the following minimum annual distribution, income source, and asset diversification requirements.
The minimum annual distribution requirement for a RIC will be satisfied if we distribute dividends for U.S. federal income tax purposes to our shareholders each taxable year an amount generally at least equal to 90% of the sum of our net ordinary taxable income and realized net short-term capital gains in excess of realized net long-term capital
losses, if any. In addition, a RIC may, in certain cases, satisfy the 90% distribution requirement by distributing dividends relating to a taxable year after the close of such taxable year under the “spillover dividend” provisions of Subchapter M of the Code. Upon satisfying this requirement, we would be taxed on any retained income and/or gains, including any short-term capital gains or long-term capital gains. We must also satisfy an additional annual distribution requirement in respect of each calendar year in order to avoid the imposition of a 4% excise tax on the amount of any under-distribution. Because we may use debt financing, we are subject to (i) an asset coverage ratio requirement under the 1940 Act and may, in the future, be subject to (ii) certain financial covenants under loan and credit agreements that could, under certain circumstances, restrict us from making distributions necessary to satisfy the distribution requirements. If we are unable to obtain cash from other sources, we could fail to qualify for RIC tax treatment, or could be required to retain a portion of our income or gains, and thus become subject to corporate-level income or excise tax.
The income source requirement will be satisfied if we obtain at least 90% of our gross income each taxable year from dividends, interest, gains from the sale of stock or securities, or other income derived from the business of investing in stock or securities.
The asset diversification requirement will be satisfied if we meet certain asset diversification requirements at the end of each quarter of our taxable year. To satisfy this requirement, at least 50% of the value of our assets must consist of cash, cash equivalents (including receivables), U.S. government securities, securities of other RICs, and other acceptable securities; and no more than 25% of the value of our assets can be invested in the securities, other than U.S. government securities or securities of other RICs, of one issuer, of two or more issuers that are controlled (as determined under applicable Code rules) by us and that are engaged in the same or similar or related trades or businesses, or of certain “qualified publicly-traded partnerships.” Failure to meet these requirements may result in our having to dispose of certain investments quickly in order to prevent the loss of RIC status. Because most of our investments will be in private companies, and therefore will be relatively illiquid, any such dispositions could be made at disadvantageous prices and could result in substantial losses.
If we fail to qualify for or maintain RIC tax treatment for any reason and are subject to corporate income tax, the resulting corporate taxes could substantially reduce our net assets, the amount of income available for distribution, and the amount of our distributions. Such a failure would have a material adverse effect on us, the net asset value of our Shares and the total return, if any, earned from an investment in our Shares.
We invest all or substantially all of our assets in the Master Fund, which intends to qualify as a RIC. Failure of the Master Fund to so qualify will have an adverse effect on our qualification as a RIC.
We may invest in certain debt and equity investments through taxable subsidiaries and the net taxable income of these taxable subsidiaries will be subject to federal and state corporate income taxes.
We may invest in certain debt instruments and equity securities through taxable subsidiaries, and the taxable income of these taxable subsidiaries will be subject to federal and state corporate income taxes. We may invest in certain foreign debt instruments and equity securities which could be subject to foreign taxes (such as income tax, withholding and value added taxes).
We may have difficulty paying our required distributions if we recognize income before or without receiving cash representing such income.
For federal income tax purposes, we may be required to recognize taxable income in circumstances in which we do not receive a corresponding payment in cash. For example, since we will likely hold debt instruments that are treated under applicable tax rules as having OID (such as debt instruments with PIK interest provisions, secondary market purchase of debt securities at discount to par, interest or, in certain cases, increasing interest rates or debt instruments that were issued with warrants), each taxable year we must include a portion of the OID that accrues over the life of such debt instruments in our taxable income, regardless of whether cash representing such income is received by us in the same taxable year. We may also have to include in our taxable income other amounts that we have not yet received in cash, such as deferred loan origination fees that are paid after origination of a loan or are paid in non-cash compensation such as warrants or stock. Furthermore, we may invest in non-U.S. corporations (or other non-U.S. entities treated as corporations for U.S. federal income tax purposes) that could be treated under the Code and U.S. Treasury regulations as “passive foreign investment companies” and/or “controlled foreign corporations.” The rules relating to investment in these types of non-U.S. entities are designed to ensure that U.S. taxpayers are either, in effect, subject to tax currently (or on an accelerated basis with respect to corporate level events) or taxed at increased tax rates at distribution or disposition. In certain circumstances these rules could require us to recognize income where we do not receive a corresponding payment in cash.
We anticipate that a portion of our income may constitute OID or other income required to be included in taxable income prior to receipt of cash. Further, we may elect to amortize market discount with respect to debt instruments acquired in the secondary market and include such amounts in our taxable income in the current taxable year, instead of upon disposition, as an election not to do so would limit our ability to deduct interest expense for tax purposes. Because any OID or other amounts accrued will be included in our investment company taxable income for the year of the accrual, we may be required to make a distribution to our shareholders in order to satisfy the annual distribution requirement, even if we will not have received any corresponding cash amount. As a result, we may have difficulty meeting the annual distribution requirement necessary to obtain and maintain RIC tax treatment under the Code. We may have to sell some of our investments at times and/or at prices we would not consider advantageous, raise additional debt or equity capital, make a partial share distribution, or forgo new investment opportunities for this purpose. If we are not able to obtain cash from other sources, and choose not to make a qualifying share distribution, we may fail to qualify for RIC tax treatment and thus become subject to corporate-level income tax. The resulting corporate-level taxes could substantially reduce our net assets, the amount of income available for distribution, as well as the amount of our distributions and, as such, could have a material adverse effect on us, the net asset value of our Shares and the total return, if any, earned from an investment in our Shares.
Portfolio investments held by the Master Fund may present special tax issues.
Investments in below-investment grade debt instruments and certain equity securities may present special tax issues for the Master Fund. U.S. federal income tax rules are not entirely clear about issues such as when a taxpayer may cease to accrue interest, OID or market discount, when and to what extent deductions may be taken for bad debts or worthless debt instruments or equity securities, how payments received on debt instruments in default should be allocated between principal and interest income, as well as whether exchanges of debt instruments in a bankruptcy or workout context are taxable. Such matters could cause the Master Fund to recognize taxable income for U.S. federal income tax purposes, even in the absence of cash or economic gain, and require the Master Fund to make taxable distributions to us in connection with maintaining its RIC tax status or precluding the imposition of either U.S. federal corporate income or excise taxation. Additionally, because such taxable income may not be matched by corresponding cash received by the Master Fund, the Master Fund may be required to borrow money or dispose of other investments to be able to make distributions to us.
Master Feeder Structure.
As we invest in the Master Fund, our realized losses on sales of shares of the Master Fund may be indefinitely or permanently deferred as "wash sales." Distributions of short-term capital gains by the Master Fund will be recognized as ordinary income by us and would not be offset by our capital loss carry-forwards, if any. Capital loss carry-forwards of the Master Fund, if any, would not offset our net capital gains.
FEES AND EXPENSES
The following table is intended to assist you in understanding the fees and expenses that an investor in our Shares will bear, directly or indirectly. The fees and expenses presented in the table below under the caption “Annual expenses” (i) represent estimated amounts for the Company’s next 12 months of operations, (ii) are based on the assumption that the Company raises approximately 100 million in gross proceeds over the next 12-month period of the offering, and (iii) are based on the assumption that the Master Fund has approximately 433 million in average gross assets at the conclusion of the 12-month period. The following table and example should not be considered a representation of our future expenses. Actual expenses may be greater or less than shown. Except where the context suggests otherwise, whenever this prospectus contains a reference to fees or expenses paid by “you” or “us” or that “we” will pay fees or expenses, shareholders will indirectly bear such fees or expenses.
|
| | | |
| Shareholder transaction expenses | | |
| (as a percentage of public offering price per share) | | |
Selling commissions and Dealer Manager fee (1) | | 5.00 | % |
Distribution reinvestment plan fees (2) | | — |
|
| Total shareholder transaction expenses | | 5.00 | % |
| Annual expenses | | |
(as a percentage of average net assets attributable to Shares) (3) | | |
Base management fee (4) | | 2.84 | % |
Incentive fees (20% of pre-incentive fee net investment income and capital gains) (5) | | — |
|
Interest expense for borrowed funds (6) | | 2.60 |
|
Other expenses (7) | | 3.29 |
|
| Total annual expenses | | 8.73 | % |
Example: We have provided an example of the projected dollar amount of total expenses that would be incurred over various periods with respect to a hypothetical $1,000 investment in our Shares. In calculating the following expense amounts, we have assumed that: (i) the Master Fund has indebtedness equal to approximately 81% of its average net assets (or approximately 45% of its average total assets), (ii) our annual expenses remain at the levels set forth in the table above, with the exception of the portion related to the amortization of offering expenses that is included in Other Expenses , (iii) the portion of our annual expenses pertaining to offering expenses is only applicable over the period ending 12 months after each Share issuance, (iv) the annual return on investments before fees and expenses is 5%, (v) the net annual return after payment of fees and expenses is distributed to shareholders and reinvested at net asset value at the end of each year, and (vi) subscribers to our Shares will pay an up-front selling commission of up to 3.0% and Dealer Manager fees of up to 2.0% with respect to Shares sold by us in this offering.
|
| | | | | | | | | | | | | | | | | |
| | | 1 Year | | 3 Years | | 5 Years | | 10 Years | |
| You would pay the following expenses on a $1,000 investment, assuming a 5% annual return from investment income: | | $ | 133 |
| | $ | 299 |
| | $ | 438 |
| | $ | 808 |
| |
| You would pay the following expenses on a $1,000 investment, assuming a 5% annual return solely from realized capital gains: | | $ | 150 |
| | $ | 346 |
| | $ | 509 |
| | $ | 917 |
| |
While the example assumes a 5% annual return on investment before fees and expenses, our performance will vary and may result in an annual return that is greater or less than 5%. This example should not be considered a representation of your future expenses. If we achieve sufficient returns on our investments to trigger a subordinated incentive fee on income of a material amount, our expenses would likely be higher. If the 5% annual return is generated entirely from annual realized capital gains, an incentive fee on capital gains under the Master Fund's Investment Advisory Agreement would be incurred. See “Advisory Agreement and Fees” for information concerning incentive fees.
| |
| (1) | You will pay to our Dealer Manager a maximum up-front sales load of 5.0% of the public offering price for combined selling commissions and Dealer Manager fees in accordance with the terms of the dealer manager agreement (as amended and restated, the “Dealer Manager Agreement”). Our Dealer Manager will engage unrelated, third-party selected dealers in connection with the offering of Shares. In connection with the sale of Shares by selected dealers, our Dealer Manager will re-allow and pay selected dealers up to: (i) 3.0% of the gross proceeds from their allocated sales and (ii) 2.0% for Dealer Manager fees. See “Plan of Distribution” for a description of the circumstances under which selling commissions and Dealer Manager fees may be reduced or |
eliminated in connection with certain purchases. Selling commissions and Dealer Manager fees will not be paid in connection with the purchase of Shares pursuant to the DRP. In addition to the upfront selling commissions and dealer manager fees, Guggenheim may pay our Dealer Manager annualized Additional Selling Commissions equal to no more than 1.0% of the Company's then-current net asset value, payable quarterly. Our Dealer Manager will re-allow all of the Additional Selling Commissions to participating selected dealers. The Additional Selling Commissions will not be paid by our shareholders. Guggenheim will cease making these payments to our Dealer Manager at the earlier of: (i) the date when the aggregate underwriting compensation would exceed that permitted under Conduct Rule 2310 of FINRA over the life of the offering, which equals 10% of the gross offering proceeds from the sale of Shares (excluding Shares purchased through our DRP); (ii) the date of a Liquidity Event; (iii) the date that such share is repurchased or is no longer outstanding; (iv) the date when the aggregate upfront selling commission, Dealer Manager fees, and Additional Selling Commissions together equal 8.0% (or such other amount, as determined by Guggenheim) of the actual price paid for such share; or (v) the date when Guggenheim no longer serves as our investment advisor. Fees expressed as a percentage of the public offering price per share may be higher or lower due to rounding.
| |
| (2) | The expenses of the DRP are included in “Other expenses” in the table above. See “Distribution Reinvestment Plan.” |
| |
| (3) | These amounts assume (i) the Company sells $100 million (gross proceeds) worth of its Shares over the next 12-month period of the offering, (ii) that the Master Fund has approximately $433 million of average gross assets at the conclusion of the same 12-month period and that the Company has average net assets of approximately $51 million over the 12-month period. The Company’s actual net assets will depend on the number of Shares it actually sells, realized gains/losses, unrealized appreciation/depreciation, and share repurchase activity, if any. There can be no assurance that the Master Fund will have $433 million in average gross assets. If the Company sells less than $100 million worth of its Shares in the 12-month period described above, and/or if the Master Fund has less than $433 million in average gross assets at the conclusion of the 12-month period described above, then the fees and expenses presented in this Fees and Expenses table would be higher. |
| |
| (4) | The base management fee paid by the Master Fund to Guggenheim is calculated at an annual rate of 1.75% on the average value of the Master Fund’s gross assets (i.e., total assets) at the end of the two most recently completed calendar months, and assuming the Master Fund's borrowings equal 81% of the Master Fund's average net assets. Our portion of the fee in the Fees and Expenses table is greater than 1.75% since it is computed as a percentage of net assets. If the Master Fund's borrowings exceed 81% of net assets, then our portion of the base management fee in relation to our net assets would be higher than the estimate presented in the fee table. |
| |
| (5) | The incentive fee earned by Guggenheim is incurred at the Master Fund level. The Master Fund may have capital gains and investment income in excess of threshold performance levels that could result in the payment of an incentive fee in the first year after completion of this offering. The incentive fees, if any, are divided into two parts: |
| |
| (i) | a subordinated incentive fee on income, which, at a maximum, for any calendar quarter in which pre-incentive fee net investment income exceeds 2.344% of the Master Fund’s average adjusted capital, will equal 20% of the amount of pre-incentive fee net investment income (no subordinated incentive fee on income will be payable in any calendar quarter in which pre-incentive fee net investment income does not exceed a quarterly return to investors of 1.875% on the Master Fund’s average adjusted capital); all pre-incentive fee net investment income that exceeds the quarterly preferred return, but is less than or equal to 2.344% on average adjusted capital in any quarter, will be payable to Guggenheim as a “catch-up”; and |
| |
| (ii) | an incentive fee on capital gains that will equal 20% of the Master Fund’s realized capital gains on a cumulative basis from inception, net of (A) all realized capital losses and unrealized depreciation on a cumulative basis from inception and (B) the aggregate amount, if any, of previously paid incentive fees on capital gains as calculated in accordance with GAAP. |
The estimate for incentive fees payable to Guggenheim, including the accrual for net unrealized appreciation assumes (i) the percentage of incentive fees to average net assets of the Master Fund remains unchanged from the year ended December 31, 2019 and (ii) our pro-rata ownership of the Master Fund remains unchanged from the year ended December 31, 2019
| |
| (6) | The Master Fund will borrow funds to make investments, including before it has fully invested the proceeds of the Company’s continuous offering. The costs associated with such borrowings will be indirectly borne by our investors. The estimate in the Fees and Expenses table assumes the Master Fund borrows for investment purposes an amount approximately equal to 81% of its average net assets in the following 12-month period and that the |
average annual cost on the amounts borrowed, including the amortization of costs associated with obtaining borrowings, is approximately 3.63%.
The Master Fund’s ability to borrow funds during the next 12 months depends, in large part, on (i) the amount of capital we are able to raise through the sale of Shares registered in this offering and (ii) the amount of capital other feeder funds are able to raise through the sale of their shares.
| |
| (7) | Other Expenses include the Company’s pro rata indirect share of the Master Fund’s anticipated other expenses. The category of Other Expenses include professional fees, administration fees, investor servicing fees, including fees paid to certain financial intermediaries, shareholder reporting costs, custody fees, trustee fees, insurance costs, and other expenses that the Company will bear directly or indirectly through the Master Fund. These expenses represent 174 basis points of the 3.29% for “Other expenses” in the Fees and Expenses table above. |
We expect to incur approximately $0.8 million of continuous offering costs, excluding sales load, over the next 12 month period , assuming we raise approximately $100 million in gross proceeds. Periodic offering expenses incurred by us, are regularly capitalized on the Company’s statement of assets and liabilities as deferred offering expenses and expensed to the Company’s statement of operations over 12-month periods. Therefore, 155 basis points of “Other expenses” presented in the Fees and Expenses table above represent 12 months of offering expenses that are recognized as operating expenses according to this amortization policy. At the end of our offering period, any remaining deferred offering expenses will be fully amortized within the next 12-month period after the conclusion of our offering.
Our Advisor is responsible for the payment of our organization and offering expenses to the extent they exceed 1.5% of the aggregate gross proceeds from the Company’s offering, without recourse against or reimbursement by us, regardless of the amount of Shares sold in this offering. Therefore, if we sold all registered Shares under this offering and assuming that no Shares were sold under the DRP, then the maximum organization and offering expenses to be incurred by the Company would be $11.6 million. However, we expect to incur approximately $3 million over the entire offering period, or approximately 1.50% of gross proceeds raised over the entire offering period. See “Discussion of Operating Plans - Operating Expenses.”
CERTAIN QUESTIONS AND ANSWERS
Q: What are BDCs?
| |
| A: | BDCs are closed-end funds that elect to be treated as business development companies under the 1940 Act. As such, BDCs are subject to only certain sections of and rules under the 1940 Act, as well as the Securities Act of 1933, as amended (the “Securities Act”), and the Exchange Act. BDCs typically invest in private or thinly-traded public companies in the form of long-term debt or equity capital, with the goal of generating current income and/or capital growth. BDCs can be internally or externally managed, and may qualify to elect to be taxed as RICs for federal tax purposes, if they so choose. |
Q: What is a RIC?
| |
| A: | A RIC is a regulated investment company under Subchapter M of the Code. A RIC generally does not have to pay corporate level federal income taxes on any income that it distributes to its shareholders as taxable distributions. To qualify as a RIC, a company must meet certain source-of-income and asset diversification requirements. In addition, in order to maintain RIC tax treatment, a company must distribute to its shareholders for each taxable year an amount generally at least equal to 90% of its “investment company taxable income,” which is generally its net ordinary income plus the excess of realized net short-term capital gains over realized net long-term capital losses. |
Q: What is a “best efforts” securities offering and how long will this securities offering last?
| |
| A: | When Shares are offered to the public on a “best efforts” basis, the selected dealers participating in the offering are only required to use their best efforts to sell such Shares. Selected dealers are not underwriters, and they do not have a firm commitment or obligation to purchase any of the Shares. Our offering period will end on or before December 31, 2022, unless otherwise extended for up to 90 days by our Board of Trustees. |
Q: At what periodic frequency do we intend to accept and close on subscriptions?
| |
| A: | Our intention is to schedule weekly closings on subscriptions received and accepted by us. |
Q: Will I receive a share certificate?
| |
| A: | No. Our Board of Trustees has authorized the issuance of Shares without share certificates. All Shares are issued in book-entry form only. The use of book-entry registration protects against loss, theft, or destruction of share certificates and reduces our offering costs and transfer agency costs. |
Q: Can I invest through my IRA, SEP, or after-tax deferred account?
| |
| A: | Yes, subject to the suitability standards. A custodian, trustee, or other authorized person must process and forward to us subscriptions made through IRAs, simplified employee pension plans (“SEPs”), or after-tax deferred accounts. In the case of investments through IRAs, SEPs, or after-tax deferred accounts, we will send the confirmation and notice of our acceptance to such custodian, trustee, or other authorized person. Please be aware that in purchasing Shares, custodians or trustees of employee pension benefit plans or IRAs may be subject to the fiduciary duties imposed by ERISA, or other applicable laws, and to the prohibited transaction rules prescribed by ERISA and related provisions of the Code. In addition, prior to purchasing Shares, the trustee or custodian of an employee pension benefit plan or an IRA should determine that such an investment would be permissible under the governing instruments of such plan or account and applicable law. See “Suitability Standards” for more information. |
Q: What are the risks to investing in this offering?
| |
| A: | Investing in our Shares may be considered speculative and involves a high degree of risk. See “Risk Factors” to read about the risks you should consider before purchasing our Shares. |
Q: What kinds of fees will I be paying?
| |
| A: | There are several types of fees that you will incur. First, there are shareholder transaction expenses, which are calculated as a percentage of the public offering price. Second, as an externally managed BDC, we will also incur various recurring expenses, including offering expenses, the management fees and incentive fees that are payable under the Investment Advisory Agreement, and administrative costs that are payable by the Master Fund and the Company under the Administrative Services Agreement. Finally, we will also incur offering expenses in an amount of up to 1.5% of the aggregate gross proceeds from the Company’s offering, and such offering expenses will be |
recorded as operating expenses on the Company's statement of operations. See “Fees and Expenses” and “Advisory Agreement and Fees” for more information.
Q: How will the payment of fees and expenses affect my invested capital?
| |
| A: | The payment of fees and expenses will reduce: (i) the funds available to us for investments in portfolio companies, (ii) the net income generated by us, (iii) funds available for distribution to our shareholders and (iv) the book value of your Shares. |
Q: Are there any restrictions on the transfer of Shares?
| |
| A: | No. Shares have no preemptive, exchange, conversion, or repurchase rights and are freely transferable. We do not intend to list our securities on any securities exchange during the offering period and we do not expect there to be a public market for our Shares in the foreseeable future. As a result, your ability to sell your Shares will be limited. We will not charge for transfers of our Shares, except for necessary and reasonable costs actually incurred by us. See “Risk Factors - Risks Related to an Investment in Our Shares.” |
Q: Will I be able to sell my Shares in a secondary market?
| |
| A: | We do not currently intend to list our Shares on any securities exchange and we do not expect a secondary market in the Shares to develop. Because of the lack of a trading market for our Shares, shareholders may not be able to sell their Shares promptly or at a desired price. If you are able to sell your Shares, you may have to sell them at a discount to the purchase price of your Shares. |
Q: Will I otherwise be able to liquidate my investment?
| |
| A: | We will have a finite term of up to six years from the close of this offering (contemplated to be on or before December 31, 2028) unless the Board of Trustees exercises its ability to delay pursuing a Liquidity Event for at most two additional one year periods. At any time prior to December 31, 2028, Guggenheim may recommend to our Board of Trustees that it approve a complete Liquidity Event. A Liquidity Event could include: (i) the purchase by the Master Fund for cash of all our Master Fund shares at net asset value and the distribution of that cash to our shareholders on a pro rata basis in connection with our complete liquidation and dissolution; or (ii) subject to the approval of the shareholders of each feeder fund, a listing of the shares of the Master Fund on a national securities exchange and the liquidation and dissolution of each feeder fund, including us, at which point all shareholders of each feeder fund would become direct shareholders of the Master Fund. However, if the Board of Trustees determines that it would not be in the best interests of shareholders to pursue a Liquidity Event at that time due to adverse market conditions, the Board of Trustees could delay pursuing a Liquidity Event for at most two additional one-year periods. In the sole discretion of the Board of Trustees, shareholders may be offered the ability to re-invest their liquidation proceeds into another feeder fund or exchange their shares for shares in another feeder fund. |
To provide limited interim liquidity to our shareholders, we intend to conduct quarterly tender offers in accordance with the Exchange Act. This will be the only source of liquidity for our shareholders offered by us prior to a Liquidity Event.
Q: Will the distributions I receive be taxable?
| |
| A: | Yes. Although we intend to qualify and maintain each taxable year our qualification as a RIC and generally not pay federal corporate-level taxes, distributions by us generally are taxable to U.S. shareholders as ordinary income or capital gains. Distributions of our “investment company taxable income” (generally our net ordinary income plus realized net short-term capital gains in excess of realized net long-term capital losses) will be taxable as ordinary income to U.S. shareholders to the extent of our current or accumulated earnings and profits, whether paid in cash or reinvested in additional Shares. Distributions of our net capital gains (generally our realized net long-term capital gains in excess of realized net short-term capital losses) properly designated by us as “capital gain dividends” will be taxable to a U.S. shareholder as long-term capital gains in the case of individuals, trusts, or estates, regardless of the U.S. shareholder’s holding period for his, her, or its Shares and regardless of whether paid in cash or reinvested in additional Shares. Distributions in excess of our earnings and profits, or return of capital, first will reduce a U.S. shareholder’s adjusted tax basis in such shareholder’s Shares and, after the adjusted basis is reduced to zero, will constitute capital gains to such U.S. shareholder. See “Tax Matters.” |
Q: When will I get my detailed tax information?
| |
| A: | Consistent with the requirements of the IRS, we intend to send to each of our U.S. shareholders, as promptly as possible after the end of each calendar year, a Form 1099-DIV detailing the amounts includible in such U.S. shareholder’s taxable income for such year as ordinary income and long-term capital gain, if any. |
Q: Where are the principal executive offices of GCIF 2021?
| |
| A: | Our principal executive offices are located at 330 Madison Avenue, New York, New York 10017. |
Q: Who can help answer my questions?
| |
| A: | If you have more questions about this offering and the suitability of investing, you should contact your registered representative, financial adviser, or investment advisory representative. If at any time you wish to receive this prospectus or any amendments to it, you may do so, free of charge, by contacting us through written communication at 330 Madison Avenue, New York, New York 10017, by telephone at 1-888-667-4937, or by downloading these materials on our website at www.GuggenheimCIF.com. |
POTENTIAL CONFLICTS OF INTEREST
The respective members, directors, officers, and other personnel of Guggenheim allocate their time between advising us and managing other investment and business affairs in an appropriate manner. However, Guggenheim will continue to devote the time, resources, and other services necessary to managing its other investment and business activities and Guggenheim is not precluded from conducting activities unrelated to our business affairs. As a result of these business activities, Guggenheim may have conflicts of interest in allocating management time, services, and functions among us, the Master Fund, and other business ventures or clients.
We may compete with other advisory clients or affiliates of Guggenheim for investments, subjecting Guggenheim and its affiliates to certain conflicts of interest in evaluating the suitability of investment opportunities or making acquisitions on our behalf.
Guggenheim and its respective affiliates may give advice and recommend securities to other clients which may differ from advice given to, or securities recommended or bought for, us even though their investment objectives may be similar to ours. As a result, Guggenheim may at certain times be simultaneously seeking to purchase or dispose of investments for the Master Fund and for other clients for which it serves as advisor.
To the extent not restricted by confidentiality requirements or applicable law, Guggenheim may apply experience and information gained in providing services to our portfolio companies in providing services to competing companies invested in by our affiliates’ other clients.
As a BDC, we are limited in our ability to invest in any portfolio company in which an affiliates’ other client has an investment. We are also limited in our ability to co-invest in a portfolio company with Guggenheim or one or more of its respective affiliates. Some of these co-investments are only permitted pursuant to reliance on previous no-action letters or an exemptive order from the SEC.
From time to time, and to the extent consistent with the 1940 Act and the rules and regulations promulgated thereunder, or with exemptive relief we have received from the SEC, we and other clients for which Guggenheim provide investment management services or carry on investment activities may make investments at different levels of an investment entity’s capital structure or otherwise in different classes of an issuer’s securities. These investments may inherently give rise to conflicts of interest or perceived conflicts of interest between or among the various classes of securities that may be held by us and such other clients, including in the case of financial distress of the investment entity.
Other feeder funds may be created over time that will invest all or substantially all of their assets in the common shares of the Master Fund. It is the intention that one or more feeder funds will liquidate prior to the Company’s liquidation. In the event that a feeder fund liquidates, the Master Fund may sell some of its investments, borrow additional funds, or use capital raised from other feeder funds, such as ours, to meet the liquidation needs of such liquidating feeder fund. If the Master Fund is required to sell a portion of its portfolio securities in order to fund the liquidation of the Company or any other feeder fund, such sales may occur at a disadvantageous time based on adverse market conditions, which may result in the Master Fund, and indirectly the Company, incurring losses or realizing a lower rate of return for its shareholders than it otherwise may realize if it did not have to sell portfolio securities to provide liquidity.
Guggenheim and its respective affiliates may, in the future, advise a broad range of investment funds, vehicles, and other accounts, including proprietary vehicles, that make investments worldwide. Guggenheim may also make investments for its own account.
By reason of the advisory, investment banking, and/or other activities of Guggenheim and its affiliates, Guggenheim may acquire confidential or material non-public information or be restricted from initiating transactions in certain securities. This may also happen if, for example, any members of the board of directors of a portfolio company are nominated or designated by Guggenheim or any of its affiliates. Guggenheim will not be free to divulge, or to act upon, any such confidential or material non-public information, and because of these restrictions, Guggenheim may not be able to initiate a transaction for the Master Fund that they otherwise might have initiated (including taking a new position or adding to an existing position). As a result, the Master Fund may be frozen in an investment position that it otherwise might have liquidated or closed out, or may not be able to acquire a position that it might otherwise have acquired.
Guggenheim and its respective affiliates are not restricted from forming additional investment funds, from entering into other investment advisory relationships, or from engaging in other business activities, even though such activities may compete with us or may require substantial resources.
Guggenheim may have, or enter into, advisory relationships with other advisory clients that could lead to circumstances in which a conflict of interest between Guggenheim and advisory clients could exist or develop. In
addition, to the extent that another client of Guggenheim holds a different class of securities of the same issuer than us, the interest of such client and our interest may not be aligned. As a result of these conflicts and restrictions, Guggenheim may be unable to implement our investment strategies as effectively as it could have in the absence of such conflicts or restrictions. In order to avoid these conflicts and restrictions, Guggenheim may choose to exit these investments prematurely and, as a result, we would forgo any future positive return associated with such investments.
No rebates or give-ups may be received by Guggenheim or its affiliates, nor may Guggenheim participate in any reciprocal business arrangements that would circumvent the prohibition of rebates or give-ups.
Various potential and actual conflicts of interest may arise as a result of the investment banking, commercial banking, asset management, financing and financial advisory services, and products provided by Guggenheim and its affiliates. Guggenheim and its affiliates may purchase, hold, and sell, both for its respective accounts or for the account of its respective clients, on a principal or agency basis, loans, securities, and other obligations and financial instruments and engage in private equity investment activities. Subject to applicable law, Guggenheim and its affiliates will not be restricted in its performance of any such services or in the types of debt or equity investments that it may make. In conducting the foregoing activities, Guggenheim and its affiliates will be acting for its own account or the account of its clients and, subject to applicable law, will have no obligation to act in the interest of the Master Fund.
FORWARD-LOOKING STATEMENTS
Some of the statements in this prospectus may constitute forward-looking statements because they relate to future events or our future financial conditions. Words such as “anticipate,” “believe,” “expect,” and “intend” indicate a forward-looking statement, although not all forward-looking statements include these words. The use of forecasts in this offering is prohibited. Any representations to the contrary or any predictions, written or oral, as to the amount or certainty of any present or future cash benefit or tax consequence that may flow from an investment in this program is not permitted. The forward-looking statements contained in this prospectus involve risks and uncertainties, including statements as to:
| |
| • | our future operating results; |
| |
| • | our business prospects and the prospects of our portfolio companies; |
| |
| • | the effect of investments that we expect to make; |
| |
| • | our contractual arrangements and relationships with third parties; |
| |
| • | actual and potential conflicts of interest with Guggenheim and its respective affiliates; |
| |
| • | the dependence of our future success on the general economy and its effect on the industries in which we invest; |
| |
| • | the ability of our portfolio companies to achieve their objectives; |
| |
| • | the use of borrowed money to finance a portion of our investments; |
| |
| • | the adequacy of our financing sources and working capital; |
| |
| • | the timing of cash flows, if any, from the operations of our portfolio companies; |
| |
| • | the ability of Guggenheim to locate suitable investments for us and to monitor and administer our investments; |
| |
| • | the ability of Guggenheim and its respective affiliates to attract and retain highly talented professionals; |
| |
| • | our ability to qualify and maintain our qualification as a RIC and as a BDC; and |
| |
| • | the effect of changes to tax legislation and our tax position. |
We caution you that forward-looking statements are not guarantees. Although we believe that the expectations reflected in such forward-looking statements are based upon reasonable assumptions, our actual results could differ materially from those set forth in the forward-looking statements. Some factors that might cause such a difference include the following: a global economic downturn; increased direct competition; changes in government regulations or accounting rules; changes in local, national, and global capital market conditions; our ability to obtain or maintain credit lines or credit facilities on satisfactory terms; changes in interest rates; availability of offering proceeds; our ability to identify suitable investments; our ability to close on identified investments; inaccuracies of our accounting estimates; our ability to locate suitable borrowers for our loans; and the ability of such borrowers to make payments under their respective loans.
Our actual results could differ materially from those implied or expressed in the forward-looking statements for any reason. We undertake no obligation to update or revise forward-looking statements to reflect changed assumptions, the occurrence of unanticipated events, or changes to future operating results over time, unless otherwise required by law. You are advised to consult any additional disclosures that we may make directly to you or through reports that we file with the SEC in the future, including annual reports on Form 10-K, quarterly reports on Form 10-Q, and current reports on Form 8-K.
The forward-looking statements and projections contained in this prospectus or in periodic reports we file under the Exchange Act are excluded from the safe harbor protection provided by Section 27A of the Securities Act and Section 21E of the Exchange Act.
COMPANY PROFILE
We are a non-diversified, closed-end management investment company that intends to elect to be treated as a BDC under the 1940 Act. We were formed on March 18, 2016 as a statutory trust under the laws of Delaware. The Master Fund is focused on lending to middle market companies and is externally managed by Guggenheim, which is responsible for sourcing potential investments, conducting due diligence on prospective investments, analyzing investment opportunities, structuring investments, and monitoring our portfolio on an ongoing basis. Guggenheim is registered as an investment adviser with the SEC. We intend to elect to be treated for federal income tax purposes, beginning with our taxable year ending September 30, 2021, and intend to qualify annually thereafter, as a RIC under the Code.
Our investment objectives are to provide our shareholders with current income, capital preservation, and, to a lesser extent, long-term capital appreciation. We intend to meet our investment objectives by investing all or substantially all of our assets in the Master Fund. The Master Fund has the same objective as us and will invest primarily in large, privately-negotiated loans to private middle market U.S. companies. Specifically, the Master Fund expects a typical borrower to have EBITDA of $25 million to $100 million and annual revenue ranging from $50 million to $1 billion. The Master Fund seeks to invest in businesses that have a strong reason to exist and have demonstrated competitive and strategic advantages. These companies generally possess distinguishing business characteristics, such as a leading competitive position in a well-defined market niche, unique brands, sustainable profitability and cash flow, and experienced management. The Master Fund anticipates that its investments will sit senior, generally as senior secured debt, in a borrower’s capital structure and have re-payment priority over other parts of a borrower’s capital structure (i.e., subordinated debt, preferred and common equity). By investing in a more senior attachment point of a borrower’s capital structure, the Master Fund expects to protect its principal with less risk, which the Master Fund believes provides for a distinctive risk/return profile as compared to that of a typical middle market or private equity alternative investment. In addition to privately-negotiated loans, the Master Fund invests in opportunities that include more broadly syndicated assets, such as bank loans and corporate bonds. In these instances, the Master Fund's portfolio is more heavily weighted towards floating-rate investments, whose revenue streams may increase in a rising interest rate environment. The Master Fund may also invest in fixed-rate investments, options, or other forms of equity participation, and, to a limited extent and not as a principal investment strategy, structured products such as CLOs and CDOs. The Master Fund seeks to make investments which have favorable characteristics, including closing fees, prepayment premiums, lender-friendly control provisions, and lender-friendly covenants.
The investment strategy leverages Guggenheim's deep research team with a relative value perspective across all corporate credit asset types. This creates a larger, proprietary opportunity set that lends itself to generating best risk-adjusted investment ideas to the Master Fund. The strategy strives to create investments with a more attractive combination of risk and reward, better economics, and stronger protections than those offered in traditional transactions.
There can be no assurances that any of the investment objectives, benefits, or expectations described in the preceding paragraphs will be achieved.
We are only issuing Shares in this offering and there are no classes of securities that are currently senior to the Shares in which you are investing. Each Share has equal rights to distributions, voting, liquidation, and conversion. Our Shares are non-assessable such that there is no liability for calls or assessments, nor are there any preemptive or repurchase rights in favor of existing shareholders.
Our distributions are neither set at predetermined times nor at minimum rates. See “Company Profile - Shareholder Liquidity Strategy.”
As we are a feeder fund in a master/feeder fund structure, all references to our portfolio/investments, our investment process or investment strategies, and our risks refer to the Master Fund’s portfolio/investments, the Master Fund’s investment process or investment strategies, and the Master Fund’s risks. Similarly, all references to our investment advisor or Guggenheim refer to the Master Fund’s Advisor.
The Advisor
Guggenheim serves as the investment adviser of the Master Fund, and is responsible for the overall management of the Master Fund's activities and for the day-to-day management of the Master Fund's investment portfolio. Guggenheim provides its services under the Investment Advisory Agreement and under the Administrative Services Agreement. The activities of Guggenheim are subject to the supervision and oversight of the Master Fund's Board of Trustees.
As required by the Omnibus Guidelines adopted by the North American Securities Administrators Association, Guggenheim and its parent entities have an aggregate net worth in excess of $10.4 million. No portion of such net worth will be available to us to satisfy any of our liabilities or other obligations.
About Guggenheim
Guggenheim Investments represents the investment management businesses of Guggenheim Partners and includes Guggenheim, an SEC-registered investment adviser. Guggenheim Partners is a privately-held, global financial services firm with over 2,400 employees and more than $280 billion in assets under management as of June 30, 20202. They produce customized solutions for their clients, which include institutions, governments and agencies, insurance companies, corporations, investment advisors, family offices, and individual investors.
Guggenheim Investments manages more than $220 billion in assets across fixed income, equity and alternatives as of June 30, 2020. Its 320+ investment professionals perform research to understand market trends and identify undervalued opportunities in areas that are often complex and underfollowed. This approach to investment management has enabled Guggenheim to deliver long-term results to its clients.
Within Guggenheim Investments is the Guggenheim Corporate Credit Team, which is responsible for all corporate credit strategies and asset management of more than $90 billion. A unified credit platform is utilized for all strategies and is organized by industry as opposed to asset class, which increases its ability to uncover relative value opportunities and to identify and source opportunities. The scale of the platform, combined with the expertise across a wide range of industries and in-house legal resources, allows Guggenheim to be a solution provider to the market and maintain an active pipeline of investment opportunities.
Market Opportunity
Our investment objectives are to provide our shareholders with current income, capital preservation, and, to a lesser extent, long-term capital appreciation. We intend to meet our investment objectives by investing all or substantially all of our assets in the Master Fund. The Master Fund invests primarily in large, privately-negotiated loans to private middle market U.S. companies. We believe there are and will continue to be attractive investment opportunities for a variety of reasons, including the following:
| |
| • | Scarcity of Capital for Middle Market Companies. Middle market companies’ access to capital has not improved at the same pace as larger companies’ access. Because middle market borrowers have fewer options than larger borrowers, lenders to this segment achieve attractive economic terms and strong structural protections. This middle market financing gap is likely to persist as credit demand outstrips supply. Future middle market financing demand will likely increase due to impending maturities and more leveraged buyout activity, which will be met by fewer capital providers. Commercial banks are making fewer cash flow loans, instead focused in many cases on asset based loans. Hedge funds, a primary middle market capital source in past years, have largely exited the market. Mezzanine capital remains available but is largely unsuitable as a one-stop capital solution due to the high costs. |
2 Assets under management are as of 6.30.2020 and include consulting services for clients whose assets are valued at approximately $65bn.
Source: S&P LCD (as of December 31, 2019)
| |
| • | Attractive Middle Market Segment. We believe the need for middle market financing combined with the lack of supply of capital to the middle market segment has created and will continue to create compelling investment opportunities. Compared to larger companies middle market companies often offer more attractive economic terms and flexibility in the structuring of transactions, which we believe allows us to create more attractive debt instruments. Middle market investments are more likely to have tighter covenants and loan documentation, more attractive fees, and enhanced pricing compared to financing packages of larger companies. |
| |
| • | Significant Amounts of Middle Market Debt Coming Due. We believe that over $577 billion of debt to middle market companies will face upcoming maturities and need to be refinanced over the next five years. We believe that the large amount of maturities combined with the scarcity of capital for middle market companies should increase demand and provide attractive investment opportunities. |
Source: S&P LCD (as of December 31, 2019)
| |
| • | Changes in the Regulatory Landscape Increasing the Demand for Additional Sources of Debt Financing. The post-crisis sector of commercial banking, driven by heightened oversight and regulatory pressure, is marked |
by dramatically increased risk management practices and requirements to increase capital and to deleverage. The Dodd Frank Act, Volcker Rule, Basel III, and Leveraged Lending Guidelines attempt to remove systematic risk in the commercial banking market. We believe this provides a need for non-traditional sources of debt financing to fill the gap where traditional sources play a reduced role. We believe the scale of our platform allows us to fulfill a differentiated role in deals that capitalize on these secular shifts in the debt capital markets, including, but not limited to, an active role in syndicated deals.
Our Potential Competitive Strengths
As a BDC with a particular focus on lending activities, we may experience competition from other BDCs, commercial banks, specialty finance companies, open-end and closed-end investment companies, opportunity funds, private equity funds, and institutional investors, many of which generally have had greater financial resources than we do for the purposes of lending to U.S. businesses within our stated investment focus. These competitors may also have a lower cost of capital, may be subject to less regulatory oversight, and may have lower overall operating costs. The level of competition impacts our ability to raise capital, find suitable corporate borrowers that meet our investment criteria, and acquire and originate loans to these corporate borrowers. The Master Fund may also face competition from other funds in which affiliates of Guggenheim participate or advise.
We believe we have the following competitive strengths over other capital providers in our markets which will allow us to capitalize on attractive market opportunities:
| |
| • | Corporate Credit Expertise. Guggenheim has extensive experience investing in corporate finance-focused credit. Guggenheim’s core team has been together since 2001, managing more than $90 billion in corporate credit strategies. This has allowed them to become a market leader in structuring and investing in middle market private debt, with approximately $13.6 billion in privately-negotiated debt transactions since 2002. |
| |
| • | Breadth of Corporate Credit Platform and Sourcing Capabilities. Guggenheim’s corporate credit team invests across the spectrum with investment grade, high yield, bank loans, and private debt all on one platform. This structure gives us perspective on relative value, access to better information and more detailed diligence on potential investments, and provides us with more sourcing opportunities. Guggenheim has investing experience and, as a result, maintains relationships with a number of important investment sources, such as private equity sponsors, investment banks, insurance companies, and commercial banks, as well as corporate entities and high net worth individuals. The depth and breadth of Guggenheim's resources and capabilities allow us to analyze complex transactions in a short time frame and give us the ability to finance entire or large portions of capital structures, providing a one stop solution for the borrower. |
| |
| • | Ability to Evaluate, Structure, and Execute Solutions. Guggenheim's experience and expertise in evaluating, structuring, and executing investments allows us to implement a strategy with an attractive combination of risk and reward. Guggenheim's deep resources, including Guggenheim’s 20-person internal legal team, enable us to create investments with privately-negotiated economic terms and strong structural protections. |
| |
| • | Depth of Corporate Credit Research Capabilities. The Master Fund's investment process is designed to utilize the insight of Guggenheim. Guggenheim’s corporate credit team is comprised of more than 110 investment professionals with a database of more than 1,000 companies investing across all levels of a company’s capital structure. Its investment process includes company and financial analysis, coupled with a legal due diligence team that has an active role in structuring transactions. This allows Guggenheim to select investments it believes to have the best risk/return profile, with adequate investor protection, and to quickly commit to term sheets in order to capitalize on those opportunities. |
| |
| • | Focus on Protecting Capital. With Guggenheim's large credit platform and deal structuring expertise, it is able to heavily negotiate economic terms and secure stronger structural protections for the Master Fund's investments. Stress testing companies in various environments is a critical part of Guggenheim's screening process, and Guggenheim intends to subject each company to a sensitivity analysis that considers many factors that could affect investment performance. After establishing a company’s enterprise value, Guggenheim focuses on asset coverage, cash flow, liquidation preference, and rules to determine the areas of a company’s capital structure that deliver the best packages of risk and return. For each potential investment, the legal team works closely with industry analysts to create a worst-case scenario that determines the level of control the Master Fund would have and that ensures the Master Fund would be fairly compensated given its position in the capital structure. |
Investment Strategy
The Master Fund's investment strategy leverages Guggenheim's deep research teams with a relative value perspective across all corporate credit asset types and industries, creating a larger, proprietary opportunity set that lends itself
to generating best ideas. This strategy focuses on investing primarily in large, privately-negotiated loans to private middle market U.S. companies. The Master Fund seeks to invest in businesses that have a strong reason to exist and have demonstrated competitive and strategic advantages. These companies generally possess distinguishing business characteristics, such as a leading competitive position in a well-defined market niche, unique brands, sustainable profitability and cash flow, and experienced management. The Master Fund anticipates that the Master Fund's investments will sit senior, generally as senior secured debt, in a borrower’s capital structure and have re-payment priority over other parts of a borrower’s capital structure (i.e., subordinated debt, preferred and common equity). By investing in a more senior attachment point of a borrower’s capital structure, the Master Fund expects to protect the Master Fund's principal with less risk, which the Master Fund believes provides for a distinctive risk/return profile as compared to that of a typical middle market or private equity alternative investment. In addition to privately-negotiated loans, the Master Fund invests in opportunities that include more broadly syndicated assets, such as bank loans and corporate bonds. In these instances, the Master Fund's portfolio is more heavily weighted towards floating-rate investments, whose revenue streams may increase in a rising interest rate environment. The Master Fund may also invest in fixed-rate investments, options, or other forms of equity participation, and, to a limited extent and not as a principal investment strategy, structured products such as CLOs and CDOs. The Master Fund seeks to make investments which have favorable characteristics, including closing fees, prepayment premiums, lender-friendly control provisions, and lender-friendly covenants.
Investment Focus
The Master Fund intends to meet its investment objectives by investing primarily in large, privately-negotiated loans to private middle market U.S. companies. Specifically, the Master Fund expects a typical borrower to have EBITDA of $25 million to $100 million and annual revenue ranging from $50 million to $1 billion. When investing in a privately originated deal the Master Fund seeks to represent the majority of the capital structure. The diagram below illustrates the Master Fund's intended investment focus versus the syndicated loan and high yield market.
Typical Leveraged Capital Structure
Corporations may finance their businesses through two distinct methods: they can borrow money or sell an interest in the company. The aggregation of debt (borrowing) and equity (sale of interest in company) construct a company’s capital structure. The Master Fund's approach is to invest in debt that sits senior in the capital structure and has priority in payment over other types of investments, such as junior debt or equity. By investing in a more senior point of a borrower’s capital structure, the Master Fund expects to gain superior principal protection with less risk since senior debt has a higher level of certainty that creditors will be repaid in the event of default. Senior secured debt is secured by a company’s assets, and it generally has the lowest loss rate compared to other securities. These features provide the opportunity for a better risk/return profile than that of a typical middle market or private equity alternative investment. The diagram below illustrates the placement of a typical investment in the capital structure of a portfolio company.
Investment Approach
Guggenheim operates on the principle thesis that a disciplined, research-intensive process can uncover compelling investment opportunities. Guggenheim’s research team is organized by industry and assesses opportunities across a company’s entire capital structure. By analyzing a broad set of opportunities up and down the capital structure, as well as overlaying macroeconomic research, Guggenheim gains better insight into the dynamics of the business, enterprise value, and where the Master Fund seeks to deliver the best packages of risk and return. Guggenheim's research process is outlined below:
The Investment Process
Sourcing
The depth of Guggenheim's industry coverage, combined with the size and scope of its capital markets footprint, relationships with private equity sponsors, banks, and corporate entities allows us to source transactions from multiple sources. This network of relationships enables us to source investment opportunities for not only privately-negotiated investment, but also attractive opportunities in the syndicated loan market. The chart below illustrates Guggenheim's broad network, which we believe will produce a significant pipeline of attractive investment opportunities.
Due Diligence
Guggenheim distinguishes itself by its industry expertise and valuation insights, which enables it to identify relative value and investment opportunities across the entire capital structure of a borrower. The investment process begins with the Guggenheim's research team performing deep fundamental research on the companies within its industries. This includes meeting with management teams, visits to company facilities, and discussions with customers, suppliers, competitors, and industry experts. Guggenheim's financial analysis focuses on understanding the industry and company fundamentals, enterprise value, downside scenarios, and capital market dynamics within varying capital structures.
Transaction Structuring and Execution
In addition to detailed due diligence, Guggenheim believes that protecting capital through structuring transactions is equally important. Guggenheim’s investment team includes a dedicated group of 17 in-house attorneys (as of December 31, 2019) that play an active role in reviewing and negotiating credit agreements and all legal documentation relating to a particular investment. In addition to the structuring of privately originated documents, Guggenheim strives to play an active role in the negotiation of documentation for broadly syndicated deals. Guggenheim works with the sponsor and management teams involved in the transaction to actively negotiate covenants, deal structures, and pricing in a way that attempts to mitigate downside risk and enhance total return, while providing a solution that meets the need of the prospective borrower. Privately-negotiated investments will typically include financial covenants, which are closely monitored, and allow Guggenheim to proactively manage the Master Fund's investments and protect its invested capital.
Each investment that the Master Fund makes will require the approval of Guggenheim. Certain affiliated co-investment transactions, to the extent permitted by its SEC exemptive order, may also require review and approval by its Independent Trustees. Specifically, the 1940 Act imposes significant limits on co-investment with affiliates such as other funds or pools of capital managed by Guggenheim, and the Master Fund generally is permitted to co-invest alongside its affiliates in privately-negotiated transactions, if such transactions are permitted pursuant to an SEC exemptive order or are otherwise permitted under existing regulatory guidance (such as syndicated transactions where price is the only negotiated term). The Master Fund has adopted Guggenheim’s allocation policy, which is designed to fairly and equitably distribute investment opportunities among funds or pools of capital managed by Guggenheim. Such allocation policy provides that once an investment has been approved and is deemed to be in the Master Fund's best interest, then the Master Fund will receive a pro rata share of the investment. The adoption of this allocation policy ensures that the Master Fund will be presented with all investment opportunities that fit within the Master Fund's investment strategy and that the Master Fund will have the ability to invest in those opportunities alongside the other clients of Guggenheim on equal terms.
Ongoing Monitoring
Guggenheim's investment professionals take an active approach to monitoring investments, including continuous financial review, industry analysis, and regular discussions with management and industry participants. For instance, Guggenheim’s investment team meets daily in order to discuss and review positions in the Master Fund's portfolio. The team takes an investigative approach to all news, announcements, and credit developments to achieve a detailed reporting and monitoring process. When Guggenheim' investment analysts receive new financial information or news
regarding a company, they update financial models and projections and assess how the investment is performing compared to the thesis at the time the original investment was made. In addition to company-specific news and reporting, Guggenheim's investment teams are continuously monitoring the overall industry in which they focus to be aware of trends and how they may affect investments within the Master Fund's portfolios.
Exiting Investments
Guggenheim's approach to structuring investments enables it to be as proactive as possible to work with management teams in order to identify the best ways to preserve capital and/or identify an effective exit strategy. The Master Fund seeks to invest in companies that have demonstrated strong cash flow profiles and leading business characteristics that allow them to repay their loans and offer attractive exit possibilities. The Master Fund has the ability to influence investment outcomes by using its network of resources to make introductions in order to create opportunities that can lead to mergers and acquisitions and recapitalizations. Additionally, the Master Fund also seeks to make investments in syndicated opportunities that can be sold in a secondary market, allowing the Master Fund to exit its position.
Characteristics of Investments
While the Master Fund intends to consider each investment opportunity independently, the Master Fund generally focuses on portfolio companies that share the following characteristics:
| |
| • | Upper Middle Market Focus. The Master Fund seeks to invest in private middle market U.S. companies, which typically have better credit characteristics than their smaller peers. Although there are no strict lower or upper limits on the size of a company in which the Master Fund may invest, the Master Fund expects to focus on companies with EBITDA of $25 million to $100 million and annual revenue ranging from $50 million to $1 billion. |
| |
| • | Favorable Position in the Capital Structure. The Master Fund's portfolio generally consists of senior secured debt investments. The Master Fund's investment process enables it to look at investments up and down the capital structure allowing it to make investments at points in the capital structure where the Master Fund believes it can participate in the best risk-adjusted return profile. |
| |
| • | Experienced Management Team and Strong Equity Owner Support. The Master Fund seeks to invest in companies with management teams and equity owners that are experienced and exhibit a strong operating track record. The Master Fund favors companies in which management’s incentives are tied closely to the long-term goals of the business. Additionally, the Master Fund seeks to invest in businesses where the Master Fund believes the owners will continue to support the company. |
| |
| • | Sustainable Profitability and Cash Flow. The Master Fund intends to invest in companies that have an established track record of strong profitability and stable positive cash flow. The Master Fund believes these businesses will be well positioned to maintain cash flow to cover interest and principal payments due to the Master Fund, and also to take advantage of growth opportunities for their businesses. Specifically, the Master Fund does not intend to invest in early stage or seed companies. As a BDC, the Master Fund generally must invest at least 70% of the Master Fund's total assets in “qualifying assets,” which, under relevant SEC rules, includes all private U.S. companies and companies whose securities are not listed on a national securities exchange. |
| |
| • | Well-defined Market Niche and Industry Focus. The Master Fund intends to invest in businesses that have a strong reason to exist and have demonstrated competitive and strategic advantages in their respective industry. The Master Fund expects to invest across industries and not focus on any specific industry. |
| |
| • | Broad Target Geography with a Sizable Concentration in the U.S. The Master Fund focuses on and invest at least 70% of its total assets in U.S. companies. To the extent the Master Fund invests in foreign companies, the Master Fund intends to do so in accordance with 1940 Act limitations and only in jurisdictions with established legal frameworks and a history of respecting creditor rights. |
While the Master Fund believes that the criteria listed above are important in identifying and investing in portfolio companies, it considers each investment on a case-by-case basis. It is possible that not all of these criteria will be met by each portfolio company in which the Master Fund invests. There is no limit on the maturity or duration of any investment in its portfolio. The Master Fund anticipates that substantially all of the investments held in its portfolio will have either a below investment grade rating by Moody’s Investors Service and/or Standard & Poor’s, or will not be rated by any rating agency but will be of similar quality to below investment grade securities (e.g., junk bonds). Debt securities rated below investment grade (e.g., junk bonds) are generally regarded as having predominantly speculative characteristics and may carry a greater risk with respect to a borrower’s ability to pay interest and repay
principal. Investment sizes will vary as the Master Fund's capital base changes and will ultimately be at the discretion of Guggenheim, subject to oversight by the Master Fund's Board of Trustees.
Temporary Investments
Pending investment in privately-negotiated and syndicated loans, the Master Fund intends to invest its cash primarily in cash, cash equivalents, U.S. government securities, money market funds, repurchase agreements, and high-quality debt instruments maturing in one year or less from the time of investment. The Master Fund expects to maintain cash reserves from time to time for investment opportunities, working capital, and distributions.
Securities Issued by Investment Companies
The Master Fund's investments in securities issued by any registered investment company are restricted by the 1940 Act. Under these limits, except for registered money market funds, the Master Fund generally cannot acquire more than 3% of the voting stock of any registered investment company, invest more than 5% of the value of its total assets in the securities of one registered investment company, or invest more than 10% of the value of its total assets in the securities of more than one registered investment company. With regard to the portion of its portfolio invested in securities issued by registered investment companies, it should be noted that such investments might indirectly subject the Master Fund's shareholders to additional expenses, as they will indirectly be responsible for the costs and expenses of such companies.
Other Terms
Guggenheim seeks to tailor the terms of each privately-negotiated investment in a manner that attempts to protect our rights and manage risk appropriately while creating incentives for the portfolio company to achieve its business plan and improve its profitability. The Master Fund intends to limit the downside risk exposure of its investment portfolio by:
| |
| • | applying its investment strategy guidelines for portfolio investments; |
| |
| • | requiring a total return on investments (including both interest and potential equity appreciation) that adequately compensates for credit risk; |
| |
| • | diversifying its portfolio, size permitting, with an adequate number of companies, across different industries, with different types of collateral; |
| |
| • | seeking collateral or superior positions in the portfolio company’s capital structure where possible; |
| |
| • | incorporating “put” rights and “call protection” into the investment structure where possible; and |
| |
| • | negotiating covenants that may include affirmative and negative covenants, as well as default penalties, lien protection, change of control provisions, and board rights that protect the Master Fund while affording portfolio companies flexibility in managing their businesses consistent with preservation of capital. |
Additionally, the Master Fund may seek, but is not required, to impose significant prepayment penalties in order to reduce or eliminate prepayment risk. Such prepayment penalties may be in the form of fees or repurchase premiums. The Master Fund may also enter into interest rate or currency exchange rate hedging transactions at the sole discretion of Guggenheim. Such transactions should enable the Master Fund to selectively modify interest rate or currency exchange rate exposure as market conditions dictate.
Affirmative covenants require borrowers to take actions that are meant to ensure the solvency of the company, facilitate the lender’s monitoring of the borrower, and ensure payment of interest and loan principal due to lenders. Examples of affirmative covenants include requiring portfolio companies to maintain adequate insurance and accounting and tax records, and to make frequent financial reports available to the lender.
Negative covenants impose restrictions on the borrower and are meant to protect lenders from actions that the borrower may take that could harm the credit quality of the lender’s investments. Examples of negative covenants include restrictions on the payment of dividends and on the issuance of additional debt securities without the lender’s approval. In addition, certain negative covenants restrict a borrower’s activities by requiring it to meet certain earnings interest coverage ratio, leverage ratio, or net worth requirements.
Other Factors Affecting Portfolio Construction
As a BDC that is regulated under the 1940 Act and intends to qualify annually as a RIC under the Code, the Master Fund's investment activities will be subject to certain regulatory restrictions that will impact the Master Fund's portfolio construction. These restrictions include requirements that the Master Fund invest its capital primarily in U.S. companies that are privately owned, as well as investment diversification and source of income criteria that are imposed by the Code.
Co-Investments
Opportunities for co-investments may arise when Guggenheim or its respective affiliates become aware of investment opportunities that may be appropriate for it and its affiliates’ other clients. As a BDC, the Master Fund is substantially limited in its ability to co-invest in privately-negotiated transactions with its affiliates’ other clients unless the Master Fund obtains an exemptive order from the SEC.
The Master Fund received an exemptive order from the SEC that permits the Master Fund to, among other things, co-invest in privately-negotiated transactions alongside other funds, including funds managed by Guggenheim and certain of its affiliates. The exemptive order is subject to certain terms and conditions. Accordingly, if the Master Fund co-invests in privately-negotiated transactions with other accounts or other entities managed by Guggenheim, those transactions will be subject to the various conditions contained in its exemptive order. However, if the Master Fund co-invests in transactions with other accounts or other entities managed by Guggenheim which are not subject to the various conditions contained in its exemptive order, those transactions will be subject to the limited circumstances currently permitted by applicable SEC staff guidance and interpretations.
Investment opportunities that are presented to an affiliate’s other client may be referred to the Master Fund and vice versa. For each such referral, Guggenheim intends to independently analyze and evaluate whether the co-investment transaction is appropriate for the Master Fund. In addition, co-investment transactions that are recommended and approved by Guggenheim will generally be subject to review and approval by a committee consisting of the three Independent Trustees on the Master Fund's Board of Trustees (the “Independent Trustees Committee”). For each type of co-investment transaction, the Master Fund applies a specific protocol, which has been approved by the Independent Trustees Committee and is designed to ensure the fairness to the Master Fund of the specific type of co-investment transaction. However, neither the Master Fund nor an affiliate’s other client will be obligated to invest or co-invest when investment opportunities are referred to the Master Fund or them.
Portfolio Companies
The following table sets forth certain information as of June 30, 2020 with respect to each portfolio company in which the Master Fund had a debt or equity investment. For information relating to the value of such investments and the general terms of loans to its portfolio companies at June 30, 2020, see the Master Fund’s consolidated schedule of investments, which is included in this prospectus.
|
| | | | | | |
| Address | | Description | | Fair Value ($'s in 000s) |
24-7 Intouch 240 Kennedy Street, 2nd Floor Winnipeg, Manitoba R3C 1T1 Canada | | Provider of outsourced customer support solutions via phone, email, chat, and social media. | | $ | 3,636 |
|
Accuride Corporation 7140 Office Circle Evansville, IN 47715 | | Manufacturer and supplier of wheels and wheel-end components to the North American and European commercial vehicle markets. | | $ | 7,404 |
|
Aceto Chemicals 4 Tri Harbor Court Port Washington, NY 11050 | | Distributor of specialty chemicals, agricultural intermediates and protection products, pharmaceutical active ingredients and intermediates, and nutraceutical products. | | $ | 5,574 |
|
Acquia Inc. 53 State Street, 10th Floor Boston, MA 02109 | | An open source provider of Web Content Management and Digital Experience Platform solutions. | | $ | 1,734 |
|
Addo Foods Group Queens Drive Industrial Estate Dunsil Drive Nottingham, NG2 1LU United Kingdom | | Manufacturer of savory pastries in the UK. | | $ | 12,047 |
|
Advicent Solutions 10700 West Research Drive, Suite One Milwaukee, WI 53226 | | Provider of financial planning software solutions for financial services firms. | | $ | 6,499 |
|
Alegeus Technology LLC 1601 Trapelo Road South Building, Second Floor Waltham, MA 02451 | | Provider of white labeled Consumer Directed Healthcare technology solutions and support services. | | $ | 7,902 |
|
Alexander Mann Solutions 7- 11 Bishopsgate London, EC2N 3AQ United Kingdom | | Provider of outsourced HR services. | | $ | 3,034 |
|
Alfresco Software 100 Worcester St, Suite 203 Wellesley, MA 02481 | | Open Source developer of enterprise content management software designed to improve information workflow. | | $ | 3,424 |
|
|
| | | | | | |
| Address | | Description | | Fair Value ($'s in 000s) |
American Tire Distributors, Inc. PO Box 3145 Huntersville, NC 28070 | | Replacement tire distributor in North America. | | $ | 1,976 |
|
Apptio, Inc. 11100 NE 8th Street Suite 600 Bellevue, WA 98004 | | Provider of technology business management solutions to help IT departments analyze and plan IT spending. | | $ | 4,786 |
|
Arcline FM Holdings LLC 701 White Ave. Beloit, WI 53511 | | Manufacturer of diesel marine engines and associated spare parts primarily for the US Navy. | | $ | 4,368 |
|
ASM Global 800 West Olympic Boulevard, 3rd Floor, Los Angeles, CA 90015 | | Venue management company who provides management and event services for Arenas, Stadiums, Theaters, and Convention Centers. | | $ | 2,083 |
|
At Home Group 1600 East Plano Parkway Plano, TX 75074 | | Home decor superstore, offers more than 50,000 on-trend home products to fit any budget or style, from furniture, mirrors, rugs, art and housewares to tabletop, patio and seasonal decor. | | $ | 229 |
|
Basic Energy Services Inc 801 Cherry Street, Suite 2100 Fort Worth, TX 76102 | | Oilfield services provider with a broad array of equipment services. | | $ | 805 |
|
BBB Industries 29627 Renaissance Boulevard Daphne, AL 36526 | | Remanufacturer and distributer of nondiscretionary, application specific aftermarket products in the North American light truck and automotive market. | | $ | 1,694 |
|
Belk, Inc. 2801 West Tyvola Road Charlotte, NC 28217 | | Nation's largest privately owned mainline department store company with more than 300 fashion department stores in 16 contiguous Southern states. | | $ | 412 |
|
Beverages and More, Inc. 1401 Willow Pass Rd #900 Concord, CA 94520 | | Specialty retailer of alcoholic and nonalcoholic beverages. | | $ | 747 |
|
BHI Energy 97 Libbey Industrial Parkway, 4th Floor Weymouth, MA 02189 | | Provider of maintenance, staffing and other services to the power industry. | | $ | 5,790 |
|
Bioplan USA, Inc. 1740 Broadway, Suite 14A New York, NY 10019 | | Provider of sampling solutions for the fragrance, cosmetics and healthcare markets. | | $ | 2,775 |
|
Allvue Systems 396 Alhambra Circle 11th Floor Coral Gables, FL 33134 | | Provider of software solutions to the Private Capital and Fixed Income markets. | | $ | 842 |
|
Blue Nile, Inc. 411 First Avenue South, Suite 700 Seattle, WA 98104 | | An online specialty retailer of fine jewelry. | | $ | 6,153 |
|
Blue Ribbon LLC P.O. Box 792627 San Antonio, TX 78279 | | Independently-owned brewing company in the United States. | | $ | 2,379 |
|
Boats Group 1221 Brickell Avenue, Suite 2300 Miami, FL 33131 | | Provider of online boat listings, information, and advertising to the recreational marine industry. | | $ | 5,519 |
|
Cambrex Corporation 1 Meadowlands Plaza # 1510, East Rutherford, NJ 07073 | | Small molecule company that provides drug substance, drug product and analytical services across the entire drug lifecycle. | | $ | 2,450 |
|
Capstone Logistics, LLC 30 Technology Parkway South Suite 200 Peachtree Corners, GA 30092 | | Provider of outsourced supply chain solutions to operators of distribution centers. | | $ | 4,616 |
|
Cast & Crew Payroll 2300 Empire Avenue, 5th Floor, Burbank, CA 91504 | | Provider of software and services to the entertainment production industry in the U.S. and Canada. | | $ | 2,677 |
|
Causeway Technologies Comino House, Furlong Road, Bourne End Buckinghamshire, United Kingdom SL8 5AQ | | Provider of software to the construction and maintenance sectors. | | $ | 3,650 |
|
Cleaver Brooks, Inc. 221 Law Street Thomasville, GA 31792 | | Global designer and manufacturer of fully integrated proprietary boiler room systems. | | $ | 1,695 |
|
Cologix Holdings 225 East 16th Avenue Denver, CO 80203 | | An interconnection and data center colocation provider in North America. | | $ | 1,926 |
|
CTI Foods Holdings Co., LLC 22303 Highway 95 Wilder, ID 83676 | | A manufacturer of protein, soup and bean products primarily for the quick service restaurant industry. | | $ | 4,151 |
|
|
| | | | | | |
| Address | | Description | | Fair Value ($'s in 000s) |
Cvent, Inc. 1765 Greensboro Station Place, 7th Floor McLean, VA 22102 | | Cloud-based enterprise event management platform. | | $ | 1,514 |
|
Datix Bidco Limited 311 South Wacker Drive Suite 4900 Chicago, IL 60606 | | Provider of patient safety software. | | $ | 10,061 |
|
Delta Airlines P.O. Box 20706 Atlanta, GA 30320 | | Commercial airline | | $ | 98 |
|
Diamond (BC) B.V. 1300 Altura Road, Suite 125 Fort Mill, SC 29708 | | Supplier of cleaning and sanitary solutions to institutional markets. | | $ | 3,925 |
|
Drew Marine Group Inc. 100 South Jefferson Road, Whippany, NJ 07981 | | Global provider of specialty chemicals and services, specifically catering to the marine industry. | | $ | 977 |
|
EnTrans International, LLC 1145 Congress Parkway North Athens, TN 37303 | | Manufacturer of energy and transportation equipment. | | $ | 6,049 |
|
Firstlight Fiber 41 State Street Albany, NY 12207 | | Provider of fiberoptic data, Internet, data center cloud and voice services to enterprise and carrier customers throughout the Northeast United States. | | $ | 4,309 |
|
Four Springs Capital Trust 1901 Main Street Lake Como, NJ 07719 | | Internally managed REIT focused on acquiring, owning, and actively managing a portfolio of single tenant, income producing retail, industrial, and other office properties throughout the U.S. | | $ | 5,149 |
|
GAL Manufacturing 50 East 153rd Street Bronx, NY 10451 | | Independent manufacturer of elevator components and systems. | | $ | 11,391 |
|
Galls LLC 1340 Russell Cave Road P.O. Box 54308 Lexington, KY 40505 | | Marketer and distributor of uniforms, duty gear, footwear, medical supplies, and other products used by law enforcement, fire safety, emergency medical, private security, transit and corrections personnel. | | $ | 4,587 |
|
Gladman Developments Ltd. Gladman House, Alexandria Way, Congleton, Cheshire. CW12 1LB United Kingdom | | Provider of land promotion services. | | $ | 3,746 |
|
Golden Nugget 1510 W. Loop South Houston, TX 77027 | | National, diversified, restaurant, hospitality, entertainment and gaming company principally engaged in the ownership and operation of full service restaurants and Golden Nugget gaming facilities. | | $ | 173 |
|
HealthChannels, Inc. 1200 East Las Olas Boulevard, Suite 201 Fort Lauderdale, FL 33301 | | Medical scribe staffing company in the U.S. | | $ | 2,373 |
|
Hersha Hospitality Management 44 Hersha Drive Harrisburg, PA 17102 | | Provider of third-party hotel management services. | | $ | 3,718 |
|
Houghton Mifflin Harcourt Publishers, Inc. 125 High Street Boston, MA 02110 | | Provider of K–12 core curriculum, supplemental and intervention solutions, and professional learning services. | | $ | 2,306 |
|
Hunt Companies, Inc. 4401 North Mesa El Paso, TX 79902 | | Operator of multiple segments dedicated to the development, investment, management, and financing of real estate assets. | | $ | 1,820 |
|
Husky Injection Molding Systems Ltd. 500 Queen Street South, Bolton, Ontario, Canada L7E 5S5 | | Supplier of injection molding equipment and services to the plastics industry | | $ | 1,803 |
|
Ilpea Parent, Inc. Viale delle Industrie 887 21020 - Malgesso (VA) | | Designer and manufacturer of extruded and injection molded plastic products for appliance, automotive, and building products customers. | | $ | 5,051 |
|
JZ Capital Partners Ltd. 17A Curzon Street London W1J 5HS | | Guernsey listed closed end fund which invests primarily in U.S. and European micro cap businesses and US real estate. | | $ | 367 |
|
Kar Nut Products Co. 1200 East 14 Mile Road Madison Heights, MI 48071 | | Manufacturer of branded trail mix and snack nut products. | | $ | 1,676 |
|
Kerridge Commercial Systems Unit 2A Herongate Charnham Park Hungerford Berkshire RG17 0YU United Kingdom | | Provider of ERP software to distribution focused companies in the construction, automotive parts, industrial, technology, food and pharmaceutical end markets. | | $ | 4,318 |
|
|
| | | | | | |
| Address | | Description | | Fair Value ($'s in 000s) |
Lytx, Inc. 9785 Towne Centre Drive San Diego, CA 92121 | | Provider of video based driver safety products designed to change driver behavior and prevent major accidents. | | $ | 6,288 |
|
Maverick Natural Resources, LLC 1111 Bagby Street, Suite 1600 Houston, TX 77002 | | Developer and producer of long lived oil and gas reserves throughout the U.S. | | $ | 347 |
|
Mavis Tire Express Services Corp. 358 Saw Mill River Road, Suite 17 Millwood, NY 10546 | | Independent tire retailer and wholesaler and provider of oil change and general servicing. | | $ | 3,391 |
|
McGraw-Hill Global Education Holdings 2 Penn Plaza New York, NY 10121 | | Provider of adaptive digital learning tools, digital platforms, custom publishing solutions and traditional textbook products to students, instructors, and institutions in the U.S. higher education market. | | $ | 3,937 |
|
Ministry Brands 14488 Old Stage Road Lenoir City, TN 37772 | | Provider of software solutions to the faith based, education, and association markets. | | $ | 1,513 |
|
National Technical Systems 2125 East Katella Avenue, Suite 250 Anaheim, CA 92806 | | An independent provider of environmental simulation testing, inspection, and certification services in the U.S., serving primarily in the aerospace and defense end markets. | | $ | 3,295 |
|
Navajo Nation Oil and Gas 50 Narbono Circle West Window Rock, AZ 86515 | | Federally incorporated private oil & gas company wholly owned by the Navajo Nation. | | $ | 2,956 |
|
Neon Holdings Inc 3 Waterway Square Place, Suite 1000, The Woodlands, TX 77380 | | Global, value-added distributor of plastic resins to plastic processors engaged in injection, blow, and rotation molding and extrusion | | $ | 1,057 |
|
Onyx CenterSource Two Lincoln Centre 5420 LBJ Freeway, Suite 900 Dallas, TX 75240 | | A clearing house providing commission payment processing between hotels and travel agents. | | $ | 6,476 |
|
Park Place Technologies 5910 Landerbrook Drive Cleveland, OH 44124 | | Provider of third party maintenance services for data center infrastructure focused on storage, server, and network equipment. | | $ | 5,765 |
|
Pelican Products Inc 23215 Early Avenue Torrance, CA 90505 | | Designer and manufacturer of high-performance protective cases, temperature-controlled packaging solutions, advanced portable lighting systems and rugged gear for professionals and outdoor enthusiasts. | | $ | 3,683 |
|
Penn Virginia 16285 Park Ten Place, Suite 500 Houston, TX 77084 | | An independent E&P company with core operations in the oil window of the Eagle Ford shale in southern Texas. | | $ | 1,950 |
|
Permian Production Partners 607 19th Street Golden, CO 80401 | | Private E&P company focused on long lived, mature oil assets in the Central Basin Platform of the Permian Basin. | | $ | 285 |
|
Pet Holdings ULC 225 Royal Crest Ct, Markham, ON L3R 9X6, Canada | | Specialty retailer of pet food, treats, toys, and accessories. | | $ | 3,988 |
|
Planview, Inc. 12301 Research Boulevard Research Park Plaza V, Suite 101 Austin, TX 78759 | | Provider of enterprise project and portfolio management software. | | $ | 6,481 |
|
PlayPower, Inc. 11515 Vanstory Drive, Suite 100 Huntersville, NC 28078 | | Manufacturer of commercial recreational and leisure products. | | $ | 1,125 |
|
Playtika Holding 8 Hahoshlim St. Herzliya, 4672408 Israel | | Publisher of mobile games. | | $ | 1,953 |
|
Polyvision Corp. 10700 Abbotts Bridge Rd., Suite 100 Johns Creek, GA 30097 | | Manufacturer of ceramic steel which is ultimately finished into writing surfaces (i.e. whiteboards/ blackboards). | | $ | 4,720 |
|
PSI Services LLC 611 N. Brand Blvd., 10th Floor Glendale, CA 91203 | | Provider of test delivery services for career and talent management. | | $ | 3,223 |
|
Pure Fishing, Inc. 7 Science Court Columbia, SC 29203 | | Global provider of fishing tackle, lures, rods and reels | | $ | 2,799 |
|
Resource Label Group LLC 147 Seaboard Lane Franklin, TN 37067 | | Diversified provider of pressure sensitive and digital labels, booklets, and identification labels. | | $ | 5,682 |
|
Safariland 13386 International Parkway Jacksonville, FL 32218 | | Manufacturer of personal protection equipment for law enforcement, first responders and military personal. | | $ | 5,410 |
|
|
| | | | | | |
| Address | | Description | | Fair Value ($'s in 000s) |
SandRidge Energy, Inc. 123 Robert S. Kerr Avenue Oklahoma City, OK 73102 | | An oil and natural gas exploration and production company with its principal focus on developing high return, growth oriented projects in the Mid Continent region of the U.S. | | $ | 27 |
|
Save-a-Lot 400 Northwest Plaza Drive St. Ann, MO 63074 | | Discount grocery store operator and distributor | | $ | 1,729 |
|
Seal For Life Industries US LLC Gasselterstraat 20, 9503 JB Stadskanaal, The Netherlands P.O. Box 285, 9500 AG Stadskanaal, The Netherlands | | Provider of corrosion prevention, waterproofing, and insulation products for various industries, including oil & gas, water pipelines and insulated district heating infrastructure. | | $ | 7,447 |
|
Seaport 200 Clarendon Street, 55th Floor Boston, MA 02116 | | Provides terminalling and transportation services for refined products and is responsible for storing and facilitating the movement of these products to consumers around the country. | | $ | 5,303 |
|
SLR Consulting 7 Wornal Park, Menmarsh Road, Worminghall, Aylesbury, Buckinghamshire, HP18 9PH | | Pure play environmental consulting business, providing environmental and advisory consulting services. | | $ | 2,032 |
|
Smart & Final Stores LLC 600 Citadel Drive Commerce, CA | | Specialty grocer that operates 257 value oriented grocery stores in the Western U.S. | | $ | 3,891 |
|
Springs Window Fashions, LLC 7549 Graber Rd. Middleton, WI 53562 | | Global manufacturer, marketer and distributor of window coverings. | | $ | 2,166 |
|
Teneo Holdings LLC 280 Park Ave, 4th Floor New York, NY 10017 | | Global CEO advisory firm. | | $ | 3,786 |
|
Topps Company One Whitehall Street New York, NY 10004 | | Producer of distinctive and interactive confectionery products and brand marketer of sports & entertainment cards, products and digital apps. | | $ | 4,944 |
|
Trader Interactive 999 Waterside Drive Norfolk, VA 23510 | | Provider of online marketplaces for Powersports, RV, and Commercial Trucks. | | $ | 7,576 |
|
US Foods Inc. 9399 W. Higgins Road, Suite 100 Rosemont, IL 60018 | | Foodservice distributor in the US. | | $ | 2,892 |
|
Velocity Holdings US 222 Merchandise Mart Plaza, Suite 1750 Chicago, IL 60654 | | Provider of cloud-based chemical and safety data sheet management tools. | | $ | 7,175 |
|
WESCO Group 20917 63rd Avenue W Lynnwood, WA 98036 | | Paint and equipment supplier across the Western U.S. for the automotive refinish, industrial, commercial, aerospace and marine markets. | | $ | 1,216 |
|
Wind River Systems 500 Wind River Way Alameda, CA 94501 | | Provider of embedded OS, middleware, and software design tools for the aerospace & defense, automotive, industrial, telecom, medical, and consumer markets. | | $ | 5,420 |
|
YAK Access, LLC 2438 Highway 98 East Columbia, MS 39429 | | Rental company that provides temporary roadways to remote construction sites primarily for pipeline and powerline end markets. | | $ | 3,575 |
|
Shareholder Liquidity Strategy
We will have a finite term of up to six years from the close of this offering (contemplated to be on or before December 31, 2028) unless the Board of Trustees exercises its ability to delay pursuing a Liquidity Event for at most two additional one year periods. At any time prior to December 31, 2028, Guggenheim may recommend to our Board of Trustees that it approve a complete Liquidity Event. A Liquidity Event could include: (i) the purchase by the Master Fund for cash of all our Master Fund shares at net asset value and the distribution of that cash to our shareholders on a pro rata basis in connection with our complete liquidation and dissolution; or (ii) subject to the approval of the shareholders of each feeder fund, a listing of the shares of the Master Fund on a national securities exchange and the liquidation and dissolution of each feeder fund, including us, at which point all shareholders of each feeder fund would become direct shareholders of the Master Fund. However, if the Board of Trustees determines that it would not be in the best interests of shareholders to pursue a Liquidity Event at that time due to adverse market conditions, the Board of Trustees could delay pursuing a Liquidity Event for at most two additional one year periods. In the sole discretion of the Board of Trustees, shareholders may be offered the ability to re-invest their liquidation proceeds into another feeder fund or exchange their shares for shares in another feeder fund.
To provide limited, interim liquidity to our shareholders, we intend to conduct quarterly tender offers in accordance with the Exchange Act. This will be the only source of liquidity for our shareholders offered by us prior to a Liquidity Event. See “Share Repurchase Program.”
Legal Proceedings
Neither we, Guggenheim nor our Dealer Manager are currently subject to any material legal proceedings; nor, to our knowledge, is any material legal proceeding threatened against us, Guggenheim, or our Dealer Manager.
From time to time, we and individuals employed by us, may be party to certain legal proceedings in the ordinary course of business, including proceedings relating to the enforcement of our rights under contracts with our portfolio companies. In addition, our business and the businesses of Guggenheim and Dealer Manager are subject to extensive regulation, which may result in regulatory proceedings. Legal proceedings, lawsuits, claims, and regulatory proceedings are subject to many uncertainties and their ultimate outcomes are not predictable with assurance.
MANAGEMENT OF THE COMPANY AND THE MASTER FUND
General
Pursuant to the Company’s Declaration of Trust and Bylaws, the Company’s business and affairs are managed under the direction of the Board of Trustees, which has overall responsibility for monitoring and overseeing the Company’s management and operations. The Board of Trustees consists of five members, three of whom are considered Independent Trustees (as defined below). The initial Trustees were elected by the Company’s organizational shareholders. The Trustees are subject to removal or replacement in accordance with Delaware law and the Company’s Declaration of Trust.
Guggenheim serves as the Master Fund’s investment adviser pursuant to the terms of the Investment Advisory Agreement and subject to the authority of, and any policies established by, the Board of Trustees of the Master Fund. Pursuant to the Investment Advisory Agreement, Guggenheim manages the Master Fund’s investment portfolio, directs purchases and sales of portfolio securities, and reports thereon to the Master Fund’s officers and Trustees regularly.
The Board of Trustees of the Master Fund, including the Independent Trustees, oversees and monitors the Master Fund’s investment performance and annually reviews the compensation the Master Fund pays to Guggenheim to determine that the provisions of the Investment Advisory Agreement are carried out.
Board of Trustees
Our business is managed under the direction of our Board of Trustees. The responsibilities of the Board of Trustees include the oversight of our investment activities, quarterly valuations of our assets, financing arrangements, and corporate governance activities. The Board of Trustees currently has an Independent Trustees Committee, an Audit Committee, and a Nominating and Governance Committee, and it may establish additional committees from time to time as necessary to fulfill its obligations. Our Board of Trustees consists of five members, three of whom are not “interested persons” as defined in the 1940 Act, which means that they are not affiliated with either us or Guggenheim (our “Independent Trustees”). The same Trustees also serve on the Master Fund’s Board of Trustees.
Information regarding our Board of Trustees is set forth below. Unless otherwise noted, the address for each Trustee is c/o Guggenheim Credit Income Fund 2021, 330 Madison Avenue, New York, New York 10017.
|
| | | | | | | | | | |
| Name and Age of Trustee | | Position(s) Held with Company | | Term of Office-Length of Time Served | | Principal Occupation(s) Past Five Years (1) | | Other Directorships Held by Trustee (1) | | Number of Investment Companies in Fund Complex (1) Overseen by Trustee |
| Interested Trustees (2) | | | | | | | | | | |
| Matthew S. Bloom, 42 | | Chief Executive Officer, President and Chairman of the Board of Trustees | | Appointed 2017 | | Senior Managing Director and Head of Research, Guggenheim Partners, (2006-present). | | GCIF Master/Feeder Complex (2017-present). | | 4 |
| Kevin H. Gundersen, 43 | | Interested Trustee | | Appointed 2017
| | Senior Managing Director and Head of Guggenheim's Corporate Credit Group, Guggenheim Partners, (2002-present). | | GCIF Master/Feeder Complex (2017-present). | | 4 |
|
| | | | | | | | | | |
| Name and Age of Trustee | | Position(s) Held with Company | | Term of Office-Length of Time Served | | Principal Occupation(s) Past Five Years (1) | | Other Directorships Held by Trustee (1) | | Number of Investment Companies in Fund Complex (1) Overseen by Trustee |
| Independent Trustees | | | | | | | | | | |
| Marc S. Goodman, 72 | | Trustee, Chairman of the Nominating and Governance Committee, Member of the Audit Committee, Member of the Independent Trustees Committee | | Appointed 2016 | | Managing Director, Conyers Consulting Group, (2014-present); Managing Director, Statsure Financial Services (2017-present); Co-Executive Chairman, Co-Chief Investment Officer, Kenmar Olympia Group, (1983-2014). | | GCIF Master/Feeder Complex (2015-present); Director, Duet Commodities Fund Limited, (2014-2017); Director, Electrum Special Acquisition Corporation, (2015-2018). | | 4 |
| Eric Rosenblatt, 37 | | Trustee, Chairman of the Independent Trustees Committee, Member of the Audit Committee, Member of the Nominating and Governance Committee | | Appointed 2016 | | President/Founder and Director, R Group AG, (2012-present). | | GCIF Master/Feeder Complex (2015-present); Director, R Group AG, (2012-present); Director, R Capital GmbH, (2015-present); Director, R investments GmbH, (2018-present); Director, Zeotap GmbH, (2015-present). | | 4 |
| Peter E. Roth, 61 | | Trustee, Chairman of the Audit Committee(3), Member of the Nominating and Governance Committee, Member of the Independent Trustees Committee | | Appointed 2016 | | Managing Partner, Rothpoint Group llc, (2017-present); Managing Partner, JP Charter Oak Advisors llc, (2012-2018); Chief Executive Officer, KBW Asset Management, Inc., (2006-2012). | | GCIF Master/Feeder Complex (2015-present); Non-Executive Director, City of London Investment Group plc, (2019-present); Non-Executive Director, City of London Investment Management, (2019-present); Board Member, St. Mary’s Healthcare System for Children, (2010-present). | | 4 |
______________
| |
| (1) | Guggenheim Credit Income Fund 2016 T, Guggenheim Credit Income Fund 2019, Guggenheim Credit Income Fund, and Guggenheim Partners are affiliates of Guggenheim Credit Income Fund 2021. |
| |
| (2) | Messrs. Bloom and Gundersen, our two Interested Trustees, are among the senior executives of Guggenheim, respectively, who provide services to us on behalf of Guggenheim. |
| |
| (3) | Our Board of Trustees has determined that Independent Trustee and Audit Committee Chairman Peter E. Roth is an "audit committee financial expert" as that term is defined under Item 407(d)(5) of Regulation S-K under the Exchange Act. |
Trustees’ beneficial interest in the Company as of December 31, 2019 is as follows:
|
| | |
| Name of Trustee | | Dollar Range of Equity Securities Owned in Company |
| Interested Trustees: | | |
| Matthew S. Bloom | | None |
| Kevin H. Gundersen | | None |
| Independent Trustees: | | |
| Marc S. Goodman | | None |
| Eric Rosenblatt | | None |
| Peter E. Roth | | None |
Independent Trustee ownership interest in Guggenheim, Dealer Manager, or a control person of these entities is as follows:
|
| | | | | | | | | | | | | |
| Name of Trustee | | Name of Trustee and Relationship to Trustee | | Company | | Title of Class | | Value of Security | | Percent of Class |
| Marc S. Goodman | | N/A | | none | | — | | — | | — |
| Eric Rosenblatt | | N/A | | none | | — | | — | | — |
| Peter E. Roth | | N/A | | none | | — | | — | | — |
Interested Trustees
Matthew S. Bloom serves as Senior Managing Director and Head of Research for Guggenheim’s Corporate Credit Group. He is a member of the Investment Committee overseeing Guggenheim's corporate credit investing activities, and has been with Guggenheim Partners since 2006. During his career at the firm, Mr. Bloom has been an analyst covering a variety of sectors, and subsequently led an industry team that focused on investing in the consumer, financial, food, gaming, industrials, retail, services, and transportation sectors. In addition, in his capacity as a senior analyst and as a team leader, Mr. Bloom has sourced and structured directly negotiated middle market debt investments. Prior to joining Guggenheim, Mr. Bloom worked as an attorney at Skadden, Arps, Slate, Meagher & Flom in the Mergers and Acquisitions and Banking and Institutional Investing groups. Mr. Bloom received his BS from the University of Florida and his JD from Columbia University School of Law.
Mr. Bloom was selected as one of our two Interested Trustees because of his extensive knowledge of corporate credit investing activities and the Company's business and operations. Additionally, his experience as Head of Research and an Investment Committee Member at Guggenheim Partners is particularly relevant to his trusteeship, and which we believe provides us with exceptional experience and leadership.
Kevin H. Gundersen serves as Senior Managing Director and portfolio manager in Guggenheim's Corporate Credit Group. He is a member of the Investment Committee overseeing Guggenheim's corporate credit investing activities, and has been with Guggenheim Partners since 2002. He has over a decade of experience in the high yield and leverage loan asset class. During his career at the firm, Mr. Gundersen has been an analyst covering a variety of sectors, and subsequently led an industry team that focused on investing across the capital structure in the media, telecommunications and technology sectors. In addition, Mr. Gundersen has sourced and structured directly negotiated middle market debt investments. Prior to joining Guggenheim, Mr. Gundersen worked at GeoTrust, a technology company focused on eCommerce security solutions. Mr. Gundersen received his A.B. from Harvard University. He earned the right to use the Chartered Financial Analyst® designation and is a member of the CFA Institute.
Mr. Gundersen was selected as one of our two Interested Trustees because of his extensive and broad based experience in corporate credit, including his roles as Portfolio Manager and Investment Committee Member at Guggenheim Partners. Equally significant is his industry-specific knowledge and leadership experience at Guggenheim Partners, which we believe are key qualifications for providing tactical and strategic advice and leadership to us.
Independent Trustees
Marc S. Goodman serves as an Independent Trustee, a member of the Audit Committee and the Independent Trustees Committee, and as Chairman of the Nominating and Governance Committee. He is a Co-Founder and Managing Director of Conyers Consulting Group, LLC, a consulting firm for asset management companies. Until March 31, 2014, he was
Co-Executive Chairman and Global Co-Chief Investment Officer of the Kenmar Olympia Group. Prior to that Mr. Goodman was the President, Co-Chief Executive Officer, and Co-Chief Investment Officer of The Kenmar Group. Prior to co-founding The Kenmar Group in 1983, Mr. Goodman was a Vice President and Director of Pasternak, Baum and Co., Inc., a global dealer of cash commodities. Mr. Goodman graduated from the Bernard M. Baruch School of Business of the City University of New York with a BBA degree and an MBA in Finance and Investments. He was awarded an Economics and Finance Department Fellowship during his studies. Mr. Goodman is the Chairman of the Board of the Stacy Joy Goodman Memorial Foundation, a non-profit charity committed to finding a cure for juvenile diabetes. Mr. Goodman also serves on the Diabetes Research Institute Foundation’s National Board and Executive Committee, as well as the Foundation’s Northeast Board and its Executive Committee.
Mr. Goodman was selected as one of our three Independent Trustees because of his experience in the asset management industry and as a chief investment officer; as well as his prior and current experience as a director for other non-traditional funds.
Eric Rosenblatt serves as an Independent Trustee, a member of the Audit Committee and the Nominating and Governance Committee, and as Chairman of the Independent Trustees Committee. He is the President and Founder of R Group AG ("R Group"), which he founded in 2012. R Group is a financial advisory firm based in Switzerland that serves high net worth individuals. R Group focuses on the due diligence, structuring, and monitoring of direct investments (specifically private equity and private debt) and their integration into pre-existing or currently developing financial relationships. From 2004 to 2009, Mr. Rosenblatt was a Vice President at Guggenheim Partners, an asset management firm in New York. During his tenure at Guggenheim Partners, he oversaw a portfolio of over $2 billion across multiple asset classes; these included private and public equity, high yield and investment grade bonds, credit default swaps, corporate bank debt, and distressed loans. Mr. Rosenblatt holds a BS in Physics from the Massachusetts Institute of Technology and an MBA from the New York University Stern School of Business, where he was inducted into the Beta Gamma Sigma Honors Society.
Mr. Rosenblatt was selected as one of our three Independent Trustees because of his knowledge of portfolio management across multiple asset classes and as a director for private companies.
Peter E. Roth serves as an Independent Trustee, a member of the Nominating and Governance Committee and the Independent Trustees Committee, and as Chairman of the Audit Committee. Since 2017, Mr. Roth is the Managing Partner of Rothpoint Group llc, a financial services consulting firm. From 2012 to 2018, Mr. Roth was the Managing Partner of JP Charter Oak Advisors llc, an investment and advisory firm that was focused on the financial services industry. From 2006 to 2012, he served as Chief Executive Officer of KBW Asset Management, Inc. (“KBWAM”), a wholly owned subsidiary of KBW, Inc. While at KBWAM, Mr. Roth oversaw the management of several alternative investment funds and was Managing Director and a member of the Investment Committee of KBW Capital Partners GP LLC. During the same period, he also served as a Financial Agent to the U.S. Department of the Treasury on its Capital Purchase Program and the Automotive Industry Finance Program. From 2003 to 2006, he served as the Head of Insurance Investment Banking for Keefe, Bruyette & Woods, Inc. and, from 1990 to 2003, as Head of U.S. Investment Banking for Fox-Pitt, Kelton Inc. (a division of Swiss Re since 1999).
Previously, Mr. Roth served on the Board of Directors of KBW, Inc., and as an Observer on the Board of Directors of SPARTA Insurance Holdings, Inc. and Asset Allocation & Management Company. In the non-profit sector, Mr. Roth serves on the Board of Directors of St. Mary’s Healthcare System for Children in Bayside, Queens, and is Chairman of its Finance and Investment Committee and a member of its Executive Committee. He was previously the Treasurer and Secretary. Additionally, Mr. Roth serves as a Non-Executive Director on the Board of City of London Investment Group plc and is the Chairman of the Audit Committee and a member of the Remuneration and Nomination Committees. Mr. Roth also serves as a Non-Executive Director on the Board of City of London Investment Management. Mr. Roth received a BA from the University of Pennsylvania and an MBA from The Wharton School at the University of Pennsylvania.
Mr. Roth was selected as one of our three Independent Trustees because of his prior experience in capital raising transactions and strategic planning and his leadership roles at several firms in the financial service industry. He also has finance expertise which, we believe, is beneficial in providing leadership on the Audit Committee.
Executive Officers
The following persons serve as our executive officers in the following capacities:
|
| | | | | | |
| Name and Age of Officer | | Position(s) Held with Company | | Term of Office- Length of Time Served | | Principal Occupation(s) Past Five Years (1) |
| Matthew S. Bloom, 42 | | Chief Executive Officer, President and Chairman of the Board of Trustees | | Appointed 2017 | | Senior Managing Director and Head of Research, Guggenheim Partners, (2006-present). |
| Cielo M. Ordonez, 38 | | Chief Financial Officer and Treasurer | | Appointed 2020
| | Current: Director, Guggenheim Investments, (2018-present).
Former: Controller, Apollo Investment Corporation (2015- 2018); Senior Manager, BDO USA LLP (2006-2015) |
| Amy J. Lee, 59 | | Secretary and Chief Legal Officer | | Appointed 2018
| | Current: Interested Trustee, certain other funds in the Fund Complex(2) (2018-present); Chief Legal Officer, certain other funds in the Fund Complex (2014-present); Vice President, certain other funds in the Fund Complex (2007-present); Senior Managing Director, Guggenheim Investments (2012-present).
Former: President and Chief Executive Officer, certain other funds in the Fund Complex (2017-2019); Vice President, Associate General Counsel and Assistant Secretary, Security Benefit Life Insurance Company and Security Benefit Corporation (2004-2012).
|
| Joanna M. Catalucci, 53 | | Chief Compliance Officer and Anti-Money Laundering Officer | | Appointed 2018
| | Current: Chief Compliance Officer, certain funds in the Guggenheim Fund Complex (2) (2012-present); Senior Managing Director, Guggenheim Investments (2012-present).
Former: Chief Compliance Officer and Secretary, certain other funds in the Guggenheim Fund Complex (2008-2012); Senior Vice President & Chief Compliance Officer, Security Investors, LLC and certain affiliates (2010-2012); Chief Compliance Officer and Senior Vice President, Rydex Advisors, LLC and certain affiliates (2010-2011).
|
| Richard Cheung, 41 | | Senior Vice President
| | Appointed 2017 | | Senior Managing Director, Head of Private Fund Accounting, Guggenheim Partners, (2008-present). |
| Kevin M. Robinson, 61 | | Senior Vice President | | Appointed 2017 | | General Counsel, Guggenheim Investments, (2016-present); Senior Managing Director, Guggenheim Partners, LLC, (2007-present). |
| John V. Palmer, 35 | | Senior Vice President | | Appointed 2016 | | Current: Director, Guggenheim Partners Investment Management, LLC (2017-present).
Former: First Vice President, W. P. Carey Inc., (2014-2017); First Vice President, Carey Credit Advisors, LLC, (2014-2017); Director of Fund Management, CNL Financial Group, LLC, (2009-2014).
|
|
| | | | | | |
| Name and Age of Officer | | Position(s) Held with Company | | Term of Office- Length of Time Served | | Principal Occupation(s) Past Five Years (1) |
| Brian E. Binder, 48 | | Senior Vice President | | Appointed 2018
| | Current: President and Chief Executive Officer, certain other funds in the Guggenheim Fund Complex (2) (2018-present); President, Chief Executive Officer and Chairman of the Board of Managers, Guggenheim Funds Investment Advisors, LLC (2018-present); President and Chief Executive Officer, Security Investors, LLC (2018-present); Board Member of Guggenheim Partners Fund Management (Europe) Limited (2018-present); Senior Managing Director and Chief Administrative Officer, Guggenheim Investments (2018-present).
Former: Managing Director and President, Deutsche Funds, and Head of US Product, Trading and Fund Administration, Deutsche Asset Management (2013-2018); Managing Director, Head of Business Management and Consulting, Invesco Ltd. (2010-2012).
|
______________
| |
| (1) | Guggenheim Partners, LLC, Guggenheim Partners Investment Management, LLC, Guggenheim Funds Distributors, LLC, Guggenheim Credit Income Fund 2016 T, Guggenheim Credit Income Fund 2019 and Guggenheim Credit Income Fund are affiliates of Guggenheim Credit Income Fund 2021. |
| |
| (2) | The Guggenheim Fund Complex includes all registered closed- and open-end funds (including all of their portfolios) advised by Guggenheim and any funds that have an investment adviser or servicing agent that is an affiliated person of Guggenheim. |
The address for each executive officer is c/o Guggenheim Credit Income Fund 2021, 330 Madison Avenue, New York, New York 10017.
Biographies of Executive Officers Who are Not Trustees
Cielo M. Ordonez serves as Chief Financial Officer and Treasurer of the Company, as well as Director for Guggenheim Investments. Ms. Ordonez is responsible for the oversight of finance, accounting and fund administration for the business development companies ("BDCs") which Guggenheim advises. Prior to joining Guggenheim in August 2018, Ms. Ordonez served as Controller for Apollo Investment Corporation, a BDC, where she was responsible for accounting, finance and financial reporting of the company from 2015 to 2018. Prior to joining Apollo, Ms. Ordonez was a Senior Manager at BDO USA, LLP, where she managed audit engagements in various asset management firms specializing in hedge funds and BDCs from 2006 to 2015. Ms. Ordonez graduated cum laude from University of Santo Tomas in the Philippines, with B.S. in Accountancy. She is a Certified Public Accountant.
Amy J. Lee serves as Chief Legal Officer and Secretary of the Company as well as Senior Managing Director of Guggenheim Partners and Chief Legal Officer, Interested Trustee, President, and Vice President of certain other funds in the Guggenheim Fund Complex. Ms. Lee is responsible for legal services provided to Guggenheim's retail asset management business, which includes the Funds. She also serves as a member of the Board of Trustees and the Chief Legal Officer for certain funds in the Guggenheim Fund Complex. Prior to joining Guggenheim in 2012, she served as Associate General Counsel, Vice President and Assistant Secretary of Security Benefit Corporation ("Security Benefit") from January 1987 to 2012. Ms. Lee was responsible for legal services provided to Security Benefit's asset management line of business, including legal services provided to its investment adviser and broker-dealer affiliates. Ms. Lee received a B.A. from the University of Kansas and a J.D. from the University of Kansas School of Law. She holds FINRA Series 7 and 24 licenses.
Joanna M. Catalucci serves as Chief Compliance Officer and Anti-Money Laundering Officer of the Company, as well as as Senior Managing Director for Guggenheim Investments and Chief Compliance Officer of certain other funds in the Guggenheim Fund Complex. In this role, she leads the strategic direction of the comprehensive compliance program for the registered mutual funds focusing on the compliance requirements of the investment advisors, products and distribution specific to the Intermediary business. Before joining Guggenheim, Ms. Catalucci served as senior vice president and chief compliance officer of Rydex|SGI for 12 years. In this role, Ms. Catalucci oversaw the compliance programs for Rydex|SGI’s investment advisor, mutual funds and ETFs. Before joining Rydex|SGI in 2000, Ms. Catalucci served as vice president of fund administration for Chase Global Fund Services Co., where she was responsible for compliance for the Morgan Stanley Dean Witter group of funds. Before that, she served as an audit
supervisor at PriceWaterhouseCoopers, LLP. Ms. Catalucci holds a B.S. degree in accounting from Merrimack College in Andover, MA.
Richard Cheung serves as Senior Vice President of the Company, as well as Senior Managing Director and Head of Private Fund Accounting at Guggenheim Partners. He joined Guggenheim in May 2008 and is responsible for overseeing the preparation of financial statements, financial reports, special analysis, and information reports on a monthly, quarterly and annual basis both for internal and external constituents. He manages the accounting team and coordinates the annual fund audits and relevant federal and state tax filings. Prior to joining Guggenheim, Mr. Cheung worked at Silver Point Capital, an investment advisor focused on credit and special situation investments, where he managed all aspects of the financial month end close process as well as the annual fund audits and preparation of financial statements. Before joining Silver Point Capital, Mr. Cheung was at Ernst & Young LLP where he managed audits in various asset management firms specializing in hedge funds and collateralized debt obligations. Mr. Cheung received his BS in Accounting and Finance from New York University.
Kevin M. Robinson serves as Senior Vice President of the Company, as well as Senior Managing Director of Guggenheim Partners and General Counsel of Guggenheim Investments. Mr. Robinson additionally oversees the legal, compliance and governance function for the holding company and Guggenheim’s investment advisory business. Prior to joining Guggenheim, Mr. Robinson held positions at Claymore Group, where he served as General Counsel; NYSE Group, Inc. (f/k/a Archipelago Holdings, Inc.), where he was Associate General Counsel and Assistant Corporate Secretary; and ABN Amro, Inc. where he was Senior Vice President and Associate General Counsel. Mr. Robinson’s financial services industry experience began in 1989 as Senior Counsel in the Enforcement Division of the U.S. Securities and Exchange Commission. Mr. Robinson is a graduate of Coe College and The University of Iowa College of Law.
John V. Palmer serves as Senior Vice President of the Company, as well as Director for Guggenheim’s Corporate Credit Group. In this role he leads Guggenheim’s effort in structuring and managing the Business Development Companies which Guggenheim Advises. Prior to September 2017, Mr. Palmer served as First Vice President of Investment Management for W. P. Carey, Inc. where he was responsible for new product initiatives, including new product development and partner relations. Prior to joining W. P. Carey Inc., Mr. Palmer spent six years at CNL Financial Group, Inc., where he participated in the successful development and operations of Corporate Capital Trust, Inc., a non-traded BDC with over $2 billion in gross assets. Prior to CNL Financial Group, Inc., Mr. Palmer worked in government sales for Yukon Advanced Optics, where he focused on all government marketing and sales initiatives. Mr. Palmer received his BBA with a concentration in marketing from The University of Texas at Arlington and his MBA with a concentration in finance from the Crummer Graduate School of Business at Rollins College.
Brian E. Binder serves as Senior Vice President of the Company as well as Senior Managing Director and Chief Administrative Officer of Guggenheim Investments, President and Chief Executive Officer of certain other funds in the Guggenheim Fund Complex and President and Chief Executive Officer of Guggenheim Funds Investment Advisors, LLC . Mr. Binder oversees global administrative functions for Guggenheim Investments and is responsible for board governance and product line oversight as relates to all registered investment funds. Mr. Binder has over 24 years of experience in the asset management industry. Prior to joining Guggenheim in 2017, Mr. Binder was Managing Director, President of the Deutsche Funds and Head of US Product, Trading and Fund Administration at Deutsche Asset Management. Previously, Mr. Binder was Head of Business Management and Consulting at Invesco, where he served as Chairman of the US Executive Management Committee. Prior to that, he held several senior roles at Morgan Stanley, including Chief Administrative Officer of Van Kampen Investments and Chief Administrative Officer of Americas Distribution for Morgan Stanley Investment Management. Mr. Binder received his B.S. from Eastern Illinois University.
Compensation of Trustees
In fiscal year 2019, each Independent Trustee was entitled to compensation for Trustee-related services for the Master Fund, GCIF 2016 T, and GCIF 2019 including: an annual retainer fee amount of $70,000, $2,500 for participation in each regular in-person Board of Trustees meetings, $1,000 for each (i) committee meeting held during regular Board of Trustees meetings and (ii) telephonic meeting of the Board of Trustees and committees, $250 for each consideration and approval of co-investment transaction resolutions submitted for unanimous written consent, and reasonable out-of-pocket expenses incurred in connection with attending in-person meetings of the Board of Trustees and committees. Each Independent Trustee currently serves as Chairman of one of our separate Board of Trustees committees. The Chairman of the Audit Committee is compensated with a $10,000 annual retainer fee. No pension or retirement benefits are currently contemplated for our Trustees.
The table below sets forth the compensation received by each Independent Trustee from the Master Fund (and indirectly borne by us as a feeder fund) for the fiscal year ended December 31, 2019; the Interested Trustees did not receive any compensation from the Master Fund for the fiscal year ended December 31, 2019; the Independent Trustees
did not receive any additional compensation from any feeder fund affiliated with the Master Fund and compensation for the Delaware Trustee and Independent Trustees’ travel expenses are not included in the table below.
|
| | | | | | | | | | | | | | | | | | | | | |
| Year | Name of Trustee | | Total Fees Earned and Received in Cash | | Stock Awards | | Option Awards | | Non-Equity Incentive Plan Compensation | | Change in Pension Value and Non- Qualified Deferred | | Compensation Earnings | | All Other Compensation | | Total Compensation |
| 2019 | Marc Goodman | | $96,250 | | — | | — | | — | | — | | — | | — | | $96,250 |
| 2019 | Eric Rosenblatt | | $96,250 | | — | | — | | — | | — | | — | | — | | $96,250 |
| 2019 | Peter Roth | | $106,250 | | — | | — | | — | | — | | — | | — | | $106,250 |
| 2019 | All Independent Trustees: | | $298,750 | | — | | — | | — | | — | | — | | — | | $298,750 |
In fiscal year 2020, there are no changes to the compensation schedule for each Independent Trustee.
Board of Trustees Committees
In addition to serving on our Board of Trustees, our Independent Trustees also serve on one or more of the following committees, which have been established by our Board of Trustees to handle certain designated responsibilities. The Board of Trustees has designated a Chairman of each committee. The Board of Trustees may establish additional committees, change the membership of any committee, fill all vacancies, designate alternate members to replace any absent or disqualified member of any committee, or dissolve any committee as it deems necessary and in our best interest.
See Board of Trustees table above.
Independent Trustees Committee, Audit Committee, Nominating and Governance Committee
Independent Trustees Committee. Our Independent Trustees Committee consists of all of our Independent Trustees. Eric Rosenblatt currently serves as Chairman and as the lead Independent Trustee of the Independent Trustees Committee. The Independent Trustees Committee assists the Board of Trustees by acting as a liaison between the Board of Trustees and our principal service providers, including without limitation, Guggenheim. The Independent Trustees Committee is responsible for assessing the flow of information between our management and the Board of Trustees and overseeing the annual approval process of the Investment Advisory Agreement and the Administrative Services Agreement. The Independent Trustees Committee is also responsible for addressing conflict of interest matters and directing the retention of any consultants that the Board of Trustees may deem necessary or appropriate. Time is allotted at each quarterly meeting of our Board of Trustees for the Independent Trustees to meet and discuss any issues that they deem necessary or appropriate. The Independent Trustees may also choose to meet in executive session outside the presence of the Interested Trustees during the course of other meetings of our Board of Trustees or at other times as they deem necessary or appropriate.
Audit Committee. Our Audit Committee consists of all of our Independent Trustees, each of whom meets the independence standards established by the SEC for audit committees and is not an “interested person” for purposes of the 1940 Act. Peter E. Roth serves as Chairman of the Audit Committee. Our Board of Trustees has determined that Mr. Roth is an “audit committee financial expert” as that term is defined under Item 407 of Regulation S-K of the Exchange Act. The Audit Committee operates pursuant to a written charter and meets periodically as necessary. A copy of the Audit Committee’s charter is available on our website at www.guggenheiminvestments.com/credit-income-fund/corporate-governance. The Audit Committee is responsible for selecting, engaging, and discharging our independent accountants, reviewing the plans, scope, and results of the audit engagement with our independent accountants, approving professional services provided by our independent accountants (including compensation therefore), reviewing the independence of our independent accountants, and reviewing the adequacy of our internal controls over financial reporting.
Nominating and Governance Committee. Our Nominating and Governance Committee consists of all of our Independent Trustees. Marc S. Goodman serves as Chairman of the Nominating and Governance Committee. The Nominating and Governance Committee operates pursuant to a written charter and meets periodically as necessary. A copy of the Nominating and Governance Committee’s charter is available on our website at www.guggenheiminvestments.com/credit-income-fund/corporate-governance. The Nominating and Governance Committee is responsible for selecting, researching, and nominating Trustees for election by our shareholders, selecting nominees to fill vacancies on the Board of Trustees or a committee of the Board of Trustees, developing and recommending to the Board of Trustees a set of corporate governance principles, and overseeing the evaluation
of the Board of Trustees and our management. Our Nominating and Governance Committee will consider shareholders’ proposed nominations for Trustees. A shareholder who desires to recommend a nominee must submit a request in writing pursuant to the relevant provisions of our bylaws. Our Nominating and Governance Committee will consider nominees recommended in writing by a shareholder (other than shareholder recommendations of himself or herself) to serve as Trustees, provided that: (i) such person is a shareholder of our Company at the time he, she, or it recommends such nominee and is entitled to vote at the meeting of shareholders at which Trustees will be elected; and (ii) the committee will make the final determination as to the qualifications of the individual to be nominated. The committee will evaluate each nominee recommended by a shareholder to serve as Trustee in the same manner as it would evaluate potential nominees identified by the committee.
Board of Trustees Leadership Structure
Our business and affairs are managed under the direction of our Board of Trustees. Among other things, our Board of Trustees sets broad policies for us and approves the appointment of Guggenheim, our administrator, and officers. The role of our Board of Trustees, and of any individual Trustee, is one of oversight and not of management of our day-to-day affairs.
Under our Bylaws, our Board of Trustees may designate one of our Trustees as Chairman to preside over meetings of our Board of Trustees and meetings of shareholders, and to perform such other duties as may be assigned to him or her by our Board of Trustees. Presently, Mr. Bloom serves as Chairman of our Board of Trustees and is an “interested person” by virtue of his professional association with Guggenheim. We believe that it is in the best interests of our shareholders for Mr. Bloom to serve as Chairman of our Board of Trustees because of his experience in matters of relevance to our business. Our Board of Trustees has determined that the compositions of the Audit Committee and the Independent Trustees Committee are appropriate means to address any potential conflicts of interest that may arise from the Chairman’s status as an interested person of us. We believe that our Board of Trustees’ flexibility to determine its Chairman and reorganize its leadership structure from time to time is in the best interests of us and our shareholders.
Our Independent Trustees have designated an Independent Trustee, who is also the Chairman of the Independent Trustees Committee, to serve as the lead Independent Trustee on our Board of Trustees. The designation of a lead Independent Trustee is for an indefinite term, but may be voted on from time to time. The lead Independent Trustee may succeed himself or herself in that position. If the lead Independent Trustee is unavailable for a meeting, his or her immediate predecessor or an Independent Trustee designated by the other Independent Trustees will serve as lead Independent Trustee for such meeting. The lead Independent Trustee presides over meetings of our Independent Trustees Committee. The lead Independent Trustee also serves as a liaison between our Independent Trustees Committee and our management on a wide variety of matters, including agenda items for our Board of Trustees meetings. Designation as such does not impose on the lead Independent Trustee any obligations or standards greater than or different from those of our other Trustees.
All of the Independent Trustees play an active role on the Board of Trustees. The Independent Trustees compose a majority of our Board of Trustees and are closely involved in all material deliberations related to us. Our Board of Trustees believes that, with these practices, each Independent Trustee has an equal involvement in the actions and oversight role of our Board of Trustees and equal accountability to us and our shareholders. Our Independent Trustees are expected to meet separately (i) as part of each regular Board of Trustees meeting, and (ii) with our chief compliance officer, as part of at least one Board of Trustees meeting each year. Our Independent Trustees Committee may hold additional meetings at the request of the lead Independent Trustee or another Independent Trustee.
Our Board of Trustees, which reviews its leadership structure periodically as part of its self-assessment process, further believes that its structure is presently appropriate to enable it to exercise its oversight of us.
Board of Trustees’ Role in Risk Oversight
Our Board of Trustees oversees our business and operations, including certain risk management functions. Risk management is a broad concept comprising many disparate elements (for example, investment risk, issuer and counterparty risk, compliance risk, operational risk, and business continuity risk). Our Board of Trustees implements its risk oversight function both as a whole and through its committees. In the course of providing oversight, our Board of Trustees and its committees receives reports on Guggenheim's activities, including reports regarding our investment portfolio and financial accounting and reporting. Our Board of Trustees also receives a quarterly report from our Chief Compliance Officer, who reports on our compliance with federal and state securities laws and our internal compliance policies and procedures, as well as those of Guggenheim, our Dealer Manager, administrator, and transfer agent. The Audit Committee’s meetings with our independent public accounting firm will also contribute to its oversight of certain internal control risks. In addition, our Board of Trustees will meet periodically with Guggenheim to receive
reports regarding our operations, including reports on certain investment and operational risks, and our Independent Trustees will be encouraged to communicate directly with senior members of our management.
Our Board of Trustees believes that this role in risk oversight is appropriate. We believe that we have robust internal processes in place and a strong internal control environment to identify and manage risks. However, not all risks that may affect us can be identified, or processes and controls developed to eliminate or mitigate their occurrence or effects, and some risks are beyond the control of us, Guggenheim, the administrator, and our other service providers.
The Delaware Trustee
Wilmington Trust, National Association (the “Delaware Trustee”) serves as our sole Trustee in the State of Delaware. The Delaware Trustee’s principal offices are located at 1100 North Market Street, Wilmington, Delaware 19890. The Delaware Trustee is unaffiliated with us. The Delaware Trustee’s duties and liabilities with respect to the offering of our Shares and the management of the Company are limited to its express obligations under our Declaration of Trust.
The rights and duties of the Delaware Trustee are governed by the provisions of the Delaware Statutory Trust Act and by our Declaration of Trust.
The Delaware Trustee will accept service of legal process on us in the State of Delaware. The duties of the Delaware Trustee are limited to the execution of any certificates required to be filed with the Delaware Secretary of State, which the Delaware Trustee is required to execute under the Delaware Statutory Trust Act. The Delaware Trustee does not owe any other duties to us or our shareholders. The Declaration of Trust provides that the Delaware Trustee is permitted to resign upon at least 30 days’ notice to us, provided, that any such resignation will not be effective until a successor trustee is appointed by our Board of Trustees or a court of competent jurisdiction, or a successor is appointed by a court of competent jurisdiction pursuant to a court petition by the Delaware Trustee. The Declaration of Trust provides that the Delaware Trustee is compensated by us in accordance with a separate fee agreement, and is indemnified by us, as appropriate, against any and all losses, damages, liabilities, claims, actions, suits, costs, expenses, disbursements (including the reasonable fees and expenses of counsel), taxes, and penalties of any kind and nature whatsoever, to the extent such expenses arise out of or are imposed upon the Delaware Trustee with respect to the performance of its duties pursuant to our Declaration of Trust, or the formation, operation, or termination of the Company. The Delaware Trustee shall not be indemnified by us for any expenses that result from the gross negligence, bad faith, or willful misconduct of the Delaware Trustee. Our Board of Trustees has discretion to replace the Delaware Trustee.
Under Delaware law, neither the Delaware Trustee, either in its capacity as Delaware Trustee or in its individual capacity, nor any director, officer, or controlling person of the Delaware Trustee is, or has any liability as, the issuer or a Trustee, officer, or controlling person of the issuer.
Under our Declaration of Trust, the Delaware Trustee’s duties are limited to (i) accepting legal process served on the Company in Delaware and (ii) execution of documents required to be filed with the Delaware Secretary of State under the Delaware Statutory Trust Act. The Delaware Trustee has no duty or liability to supervise or monitor the performance of our Board of Trustees, nor does the Delaware Trustee have any liability for the acts or omissions of our Board of Trustees. Because the Delaware Trustee delegates substantially all of its authority over our operations to our Board of Trustees, the Delaware Trustee itself is not registered in any capacity with the SEC.
Our Investment Advisor and Executive Officers
As an externally managed BDC, we rely on the services of Guggenheim as investment advisor under the Investment Advisory Agreement. Guggenheim also provides administrative services to us under the Administrative Services Agreement. In connection with its services, Guggenheim has also agreed to provide us with personnel to serve as our appointed officers. While associated with Guggenheim or its affiliates, several of our appointed executive officers also serve on behalf of our Company and consist of our chief executive officer, president, chief financial officer, secretary, senior vice president, and vice president. We do not pay any compensation to any of our executive officers, with the exception of agreed-upon reimbursement payments to Guggenheim pursuant to the Administrative Services Agreement and compensation arrangements for the chief compliance officer. See “Advisory Agreement and Fees - Administrative Services.”
Messrs. Bloom and Gundersen, our two Interested Trustees, are among the senior executives of Guggenheim who provide services to us on behalf of Guggenheim.
Below is biographical information relating to individuals involved in rendering advisory services to us.
Key Professionals of Guggenheim Rendering Advisory Services to Us Who Are Not Officers or Trustees
Thomas J. Hauser serves as Senior Managing Director and portfolio manager in Guggenheim’s Corporate Credit Group, and has been with Guggenheim Partners since 2002. He is also a member of the Investment Committee overseeing Guggenheim’s corporate credit investing activities. Prior to his role as a portfolio manager, Mr. Hauser ran a team with Joseph McCurdy covering a variety of sectors including Technology, Media and Telecom, Education, Metals and Mining, Homebuilding, Healthcare, and Energy and Power. He has over 10 years experience in the high yield and leverage loan class. During his career at the firm, Mr. Hauser has been an analyst covering a variety of sectors, including the Energy, Power, Transportation and Chemical sectors. Mr. Hauser received his B.S. in Finance from St. Johns University.
Joseph R. McCurdy serves as Senior Managing Director and Head of Origination in the Corporate Credit Group. He leads Guggenheim’s effort in sourcing and structuring directly negotiated transactions for both middle market private debt investments and larger underwritten co-arranger transactions. Mr. McCurdy was previously Co-Head of Research and has been with Guggenheim Partners since 2004. In the course of his career, he has covered a range of industries including Telecom, Media, Technology, Healthcare and Aerospace & Defense. Mr. McCurdy continues to be active in Guggenheim’s European Lending business based in Dublin, Ireland, an office he helped establish from 2007-2009. Mr. McCurdy also coordinates a team in Mumbai, India that augments the group’s research efforts. Prior to his time in Dublin, he covered Gaming, Lodging, Leisure and Real Estate in the New York office. Mr. McCurdy received a B.A. in History from Williams College.
Alastair McKeever serves as a portfolio manager and research team leader in the Corporate Credit Group focusing on opportunistic investments across the capital structure in all industries. He is a member of the Investment Committee overseeing Guggenheim’s corporate credit investing activities, and has been with Guggenheim Partners since 2007. In the course of his career, Mr. McKeever has covered a range of industries including Metals & Mining, Building Products & Homebuilding, Industrials, Education and Oil & Gas. Originally from Shrewsbury, England, Mr. McKeever was schooled at Shrewsbury School before attending college in the U.S. He was a Morehead Scholar at the University of North Carolina at Chapel Hill and holds a B.A. in Economics and Classics.
CONTROL PERSONS AND PRINCIPAL SHAREHOLDERS
After this offering, no person will be deemed to control us, as such term is defined in the 1940 Act. The following table sets forth, as of the date of this prospectus, information with respect to the beneficial ownership of our Shares by:
| |
| • | each person known to us to beneficially own more than 5% of the outstanding Shares; |
| |
| • | each of our Trustees and each executive officer; and |
| |
| • | all of our Trustees and executive officers as a group. |
Beneficial ownership is determined in accordance with the rules of the SEC and includes voting or investment power with respect to the securities. There are no Shares subject to options that are currently exercisable or exercisable within 60 days of the date of this prospectus. Ownership information for those individuals who beneficially own 5% or more of our Shares is based upon information furnished by the Company’s transfer agent and other information provided by such persons, if available. A shareholder that owns more than 25% of our Shares is presumed to control us (as such term is defined in the 1940 Act).
|
| | | | | | |
| Name | | Number | | Percentage of current ownership (2) |
Beneficial Owners of More Than 5%: (1)(2) | | | | | |
| None | | — | | — | % | |
| | | | | | |
Trustees and Executive Officers: (1) | | | | | |
| Interested Trustees: | | | | | |
Matthew S. Bloom (3) | | — | | — | % | |
| Kevin H. Gundersen | | — | | — | % | |
| Independent Trustees: | | | | | |
| Marc S. Goodman | | — | | — | % | |
| Eric Rosenblatt | | — | | — | % | |
| Peter E. Roth | | — | | — | % | |
| Executive Officers: | | | | | |
| Cielo M. Ordonez | | — | | — | % | |
| Richard Cheung | | — | | — | % | |
| Kevin Robinson | | — | | — | % | |
| John V. Palmer | | — | | — | % | |
| Joanna M. Catalucci | | — | | — | % | |
| Brian E. Binder | | — | | — | % | |
| Amy J. Lee | | — | | — | % | |
| All trustees and officers as a group (12 persons) | | — | | — | % | |
______________
| |
| (1) | Beneficial ownership has been determined in accordance with Rule 13d-3 under the Exchange Act. |
| |
| (2) | Based on a total of 0 Common Shares issued and outstanding as of August 14, 2020. |
| |
| (3) | Matthew S. Bloom is also the Chief Executive Officer and President of the registrant. |
ADVISORY AGREEMENT AND FEES
Our investment process benefits from the business and specific industry knowledge, transaction expertise, and deal-sourcing capabilities of Guggenheim. Through its services to the Master Fund, Guggenheim is responsible for the overall management of our activities and for the day-to-day management of our investment portfolio. Guggenheim provides its services under the Investment Advisory Agreement and the Administrative Services Agreement. The activities of Guggenheim are subject to the supervision and oversight of our Board of Trustees and the Master Fund’s Board of Trustees.
Guggenheim oversees our day-to-day operations, including the provision of general ledger accounting, fund accounting, investor relations, and other administrative services. Guggenheim also performs, or oversees the performance of, our corporate operations and required administrative services, which includes being responsible for the financial records that we are required to maintain and preparing reports for our shareholders and reports filed with the SEC. In addition, Guggenheim assists us in calculating our net asset value, overseeing the preparation and filing of tax returns, the printing and dissemination of reports to our shareholders, and generally overseeing the payment of our expenses and the performance of administrative and professional services rendered to us by others.
Advisory Services
Under the terms of the Investment Advisory Agreement, our Advisor is responsible for the following:
| |
| • | determining the composition and allocation of our portfolio, the nature and timing of the changes to our portfolio, and the manner of implementing such strategies; |
| |
| • | identifying, evaluating, negotiating, and structuring the investments we make; |
| |
| • | performing due diligence on prospective portfolio companies; |
| |
| • | executing, closing, servicing, and monitoring the investments we make; |
| |
| • | determining the securities and other assets that we will purchase, retain, or sell; |
| |
| • | arranging for debt financing on the Master Fund’s behalf, subject to oversight and approval of the Board of Trustees; and |
| |
| • | providing us with such other investment advisory, research, and related services as we may, from time to time, reasonably require for the investment of our capital. |
Guggenheim is responsible for identifying, evaluating, negotiating, and structuring our investments. These activities are carried out by its investment teams and are subject to the oversight of Guggenheim's senior investment personnel. Each investment that we make will require the approval of Guggenheim. Certain affiliated co-investment transactions, to the extent permitted by our SEC exemptive order, require the additional approval of our Independent Trustees Committee.
Additionally, as a BDC, we must offer managerial assistance to our EPCs. This managerial assistance may include monitoring the operations of our portfolio companies, participating in board and management meetings, consulting with and advising officers of our EPCs, and providing other organizational and financial guidance. Guggenheim or our administrator make available such managerial assistance, on our behalf, to our EPCs, whether or not they request this assistance. We, not Guggenheim, retain all fees for these services and reimburse Guggenheim for its allocated costs in providing such assistance, subject to review and approval by our Board of Trustees.
The compensation payable to Guggenheim has been approved by the Master Fund’s Board of Trustees, consistent with the exercise of the requisite standard of care applicable to Trustees under Delaware law. Such compensation is payable, in most cases, regardless of the quality of the assets acquired, the services provided, or whether the Master Fund makes distributions to its shareholders.
Administrative Services
Under the terms of the Administrative Services Agreement, Guggenheim performs or oversees the performance of various administrative services that we require. These include investor services, general ledger accounting, fund accounting, maintaining required financial records, calculating our net asset value, filing tax returns, preparing and filing SEC reports, preparing, printing, and disseminating shareholder reports, and generally overseeing the payment of our expenses and the performance of administrative and professional services rendered to us by others. Guggenheim also provides us with facilities and access to personnel necessary for our business and these services. For providing these services, facilities, and personnel, we will reimburse Guggenheim for administrative expenses it incurs in performing its obligations.
For providing these services, facilities, and personnel, we (indirectly through the Master Fund) will reimburse Guggenheim for administrative expenses it incurs in performing its obligations. The amount of this reimbursement is set at the lesser of (i) Guggenheim’s actual costs and (ii) the amount that we would be required to pay for comparable administrative services in the same geographic location. Guggenheim is required to allocate the cost of such services to us based on objective factors such as total assets, revenues, time allocations, and/or other reasonable metrics. Our Board of Trustees assesses the reasonableness of such reimbursements based on the breadth, depth, and quality of such services as compared to the estimated cost to us of obtaining similar services from third-party providers known to be available. In addition, our Board of Trustees considers whether any single third-party service provider would be capable of providing all such services at comparable cost and quality. Finally, our Board of Trustees compares the total amount paid to Guggenheim for administrative services as a percentage of our net assets to the same ratio as reported by other comparable BDCs. We will not reimburse Guggenheim for any administrative services for which it receives a separate fee, or for rent, depreciation, utilities, capital equipment, or other administrative items allocated to a controlling person of Guggenheim.
Term; Effective Date
Each of the Investment Advisory Agreement and the Administrative Services Agreement were approved by the Master Fund’s Board of Trustees on August 10, 2017. The Investment Advisory Agreement was subsequently approved by the Master Fund's shareholders on October 20, 2017, and became effective as of October 20, 2017. The Administrative Services Agreement became effective as of September 5, 2017. Unless earlier terminated as described below, the Investment Advisory Agreement will remain in effect year to year if approved annually by a majority of the Master Fund’s Independent Trustees and either the Master Fund’s Board of Trustees or the holders of a majority of the Master Fund’s outstanding voting securities. Unless earlier terminated as described below, the Administrative Services Agreement will remain in effect for a period of two years from September 5, 2017 and year to year if approved annually by a majority of the Company’s Board of Trustees and the Company’s Independent Trustees.
Each of the Investment Advisory Agreement and the Administrative Services Agreement will automatically terminate in the event of its assignment. In accordance with the 1940 Act, the Master Fund may terminate the Investment Advisory Agreement and the Administrative Services Agreement with Guggenheim. The decision to terminate any agreement may be made by a majority of the Master Fund’s Independent Trustees or the holders of a majority of the Master Fund’s outstanding common shares.
Guggenheim is permitted to voluntarily terminate the Investment Advisory Agreement and the Administrative Services Agreement upon 120 days’ prior written notice.
Investment Advisory Fees
The Company does not incur a separate advisory fee, but the Company and its shareholders are indirectly subject to the Master Fund’s advisory fee on a pro rata basis. The Master Fund pays Guggenheim a fee for its services under the Investment Advisory Agreement. The fee consists of two components: a management fee and an incentive fee. We believe that this fee structure benefits shareholders by aligning the compensation of Guggenheim with our overall investment performance. The cost of both the management fee and the incentive fee is ultimately borne by our shareholders.
Management Fee
The management fee is calculated at an annual rate of 1.75% based on the simple average of the Master Fund’s gross assets (i.e., total assets) at the end of the two most recently completed calendar months and is payable monthly in arrears.
The determination of gross assets will reflect changes in the fair value of portfolio investments, including both realized and unrealized capital appreciation. Although we do not anticipate making significant investments in derivative financial instruments, the fair value of any such investments, which will not necessarily equal their notional value, will be included in our calculation of gross assets.
Incentive Fee
The incentive fee consists of two parts: (i) a subordinated incentive fee on income and (ii) an incentive fee on capital gains.
The subordinated incentive fee on income will be earned on pre-incentive fee net investment income and shall be determined and payable in arrears as of the end of each calendar quarter during which the Investment Advisory Agreement is in effect. In the case of a liquidation or if the Investment Advisory Agreement is terminated, the fee will also become payable as of the effective date of the event. The subordinated incentive fee on income for each quarter will be calculated as follows:
| |
| • | No subordinated incentive fee on income will be payable in any calendar quarter in which the pre-incentive fee net investment income does not exceed a quarterly return to investors of 1.875% on average adjusted capital (the “quarterly preferred return”). |
| |
| • | All pre-incentive fee net investment income, if any, that exceeds the quarterly preferred return, but is less than or equal to 2.344% on average adjusted capital in any quarter, will be payable to Guggenheim (the “catch-up”). The catch-up is intended to provide an incentive fee of 20% on all pre-incentive fee net investment income when pre-incentive fee net investment income reaches 2.344% on average adjusted capital in any quarter. |
| |
| • | For any quarter in which pre-incentive fee net investment income exceeds 2.344% on average adjusted capital, the subordinated incentive fee on income shall equal 20% of the amount of pre-incentive fee net investment income, because the preferred return and catch up will have been achieved. |
| |
| • | Pre-incentive fee net investment income is defined as the Master Fund’s quarterly net investment income as determined by GAAP, excluding the expenses of quarterly Incentive Fee; plus Net Interest, if any, as defined below; less dividends declared in the quarter on any issued outstanding preferred stock of the Master Fund; less the quarterly operating expenses for (i) the Company and (ii) any future feeder funds as described in the prospectus, disregarding any feeder fund distribution and shareholder servicing fees; less any quarterly expense support obligations from Guggenheim under the Expense Support and Conditional Reimbursement Agreement; plus any quarterly expense support reimbursement obligation from the feeder funds to Guggenheim under the Expense Support and Conditional Reimbursement Agreement (See “Discussion of Operating Plans”). |
| |
| • | Any management fees waived by Guggenheim shall be disregarded in the calculation of the incentive fee. |
| |
| • | For purposes of computing the subordinated incentive fee on income, the calculation methodology will look through derivatives or swaps as if the Master Fund owned the reference assets directly. Therefore, Net Interest, if any, associated with a derivative or swap (which is defined as the difference between (i) the interest income and transaction fees received in respect of the reference assets of the derivative or swap and (ii) all interest and other expenses paid by the Master Fund to the derivative or swap counterparty) will be included in the calculation of quarterly pre-incentive fee net investment income for purposes of the subordinated incentive fee on income. |
| |
| • | Average adjusted capital is defined as the daily average of (i) cumulative proceeds generated from sales of the Master Fund’s common shares, (ii) reduced for (A) distributions paid to the Master Fund shareholders that represent return of capital on a tax basis and (B) the cumulative historical proceeds originally generated from sales of the Master Fund’s common shares that have been repurchased pursuant to the share repurchase program or a Liquidity Event. |
The following is a graphical representation of the calculation of the quarterly subordinated incentive fee on income:
Quarterly Subordinated Incentive Fee on
Pre-Incentive Fee Net Investment Income
(expressed as a percentage of average adjusted capital)
Percentage of Pre-Incentive Fee Net Investment Income
Allocated to Quarterly Incentive Fee
The incentive fee on capital gains will be earned on liquidated investments and shall be determined and payable in arrears as of the end of each calendar year during which the Investment Advisory Agreement is in effect. In the case of a liquidation, or if the Investment Advisory Agreement is terminated, the fee will also become payable as of the effective date of such event. The annual fee will equal 20% of realized capital gains on a cumulative basis from inception, net of (i) all realized capital losses and unrealized depreciation on a cumulative basis from inception and (ii) the aggregate amount, if any, of previously paid incentive fees on capital gains as calculated in accordance with GAAP.
For purposes of computing the incentive fee on capital gains, the calculation methodology will look through derivatives or swaps as if the Master Fund owned the reference assets directly. Therefore, realized gains and realized
losses on the disposition of any reference assets, as well as unrealized depreciation on reference assets retained in the derivative or swap, will be included on a cumulative basis in the calculation of the incentive fee on capital gains.
Because of the structure of the subordinated incentive fee on income and the incentive fee on capital gains, it is possible that the Master Fund may pay such fees in a quarter where it incurs a net loss. For example, if the Master Fund receives pre-incentive fee net investment income in excess of the 1.875% on average adjusted capital for a quarter, it will pay the applicable incentive fee even if it has incurred a net loss in the quarter due to a realized or unrealized capital loss. Guggenheim will not be under any obligation to reimburse the Master Fund for any part of the incentive fee they receive that is based on prior period accrued income that the Master Fund never receives as a result of a subsequent decline in the value of its portfolio or any borrower default.
The fees that are payable under the Investment Advisory Agreement for any partial period will be appropriately prorated. The fees are calculated using a detailed policy and procedure approved by Guggenheim and the Master Fund’s Board of Trustees, including a majority of the Independent Trustees, and such policy and procedure are consistent with the description of the calculation of the fees set forth above.
Guggenheim may elect to defer or waive all or a portion of the fees that would otherwise be paid to it in its sole discretion. Any portion of a fee deferred as to any month, quarter, or year will be deferred without interest and may be taken in any such other month (prior to the occurrence of a Liquidity Event) Guggenheim may determine in its sole discretion. Deferred fees may be paid at a later date but in any case no later than three years from the date such fees were incurred. Any fee waivers or deferrals may not be made for the purpose or effect of increasing the amount of the incentive fee to be paid by the Master Fund to Guggenheim (and indirectly borne by the feeder funds).
Examples of the two-part incentive fee:
Example 1 - Subordinated Incentive Fee on pre-incentive fee net investment income for each quarter
|
| | | | | | | | | |
| Scenarios expressed as a percentage of average adjusted capital | | Scenario 1 | | Scenario 2 | | Scenario 3 |
| Pre-incentive fee net investment income | | 0.550 | % | | 1.950 | % | | 2.800 | % |
| Catch up incentive fee (maximum of 0.469%) | | 0 | % | | (0.075 | )% | | (0.469 | )% |
| Split incentive fee (20% above 2.344%) | | 0 | % | | 0 | % | | (0.091 | )% |
| Net investment income (to shareholders) | | 0.550 | % | | 1.875 | % | | 2.240 | % |
Scenario 1 - Subordinated Incentive Fee on Income
Pre-incentive fee net investment income does not exceed the 1.875% preferred return rate; therefore, there is no catch up or split incentive fee on pre-incentive fee net investment income.
Scenario 2 - Subordinated Incentive Fee on Income
Pre-incentive fee net investment income falls between the 1.875% preferred return rate and the catch up of 2.344%; therefore, the incentive fee on pre-incentive fee net investment income is 100% of the pre-incentive fee above the 1.875% preferred return, or 0.0750% of average adjusted capital.
Scenario 3 - Subordinated Incentive Fee on Income
Pre-incentive fee net investment income exceeds the 1.875% preferred return and the 2.344% catch up provision. Therefore the catch up provision is fully satisfied by the 0.469% (rounded) of pre-incentive fee net investment income above the 1.875% preferred return rate and there is a 20% incentive fee on pre-incentive fee net investment income above the 2.344% threshold. This provides a 0.560% incentive fee, which represents 20% of pre-incentive fee net investment income.
Example 2 - Incentive Fee on Capital Gains
Assumptions
Year 1: No net realized capital gains or losses
| |
| Year 2: | 6% realized capital gains and 1% realized capital losses and unrealized capital depreciation; capital gain incentive fee = 20% × (realized capital gains for year computed net of all realized capital losses and unrealized capital depreciation at year end) |
Year 1 Incentive Fee on Capital Gains = 20% × (0)
= 0
= No Incentive Fee on Capital Gains
Year 2 Incentive Fee on Capital Gains = 20% × (6%-1%)
= 20% × 5%
= 1%
Example of Effect of Expense Support Payments on Incentive Fee Calculation
Under the Expense Support and Conditional Reimbursement Agreement, Guggenheim will reimburse us for operating expenses and we will have a conditional obligation to reimburse Guggenheim for any amounts funded by Guggenheim under such agreement, pursuant to the conditions specified under “Operating Expenses” below. Incentive fees on pre-incentive fee net investment income will not be triggered or increased based on expense support payments made under the Expense Support and Conditional Reimbursement Agreement. As the example below demonstrates, expense support payments made under the Expense Support and Conditional Reimbursement Agreement are backed out of the calculation of incentive fees on pre-incentive fee net investment income in order to avoid the triggering or increase of such incentive fees.
|
| | | | | | | | | | | | | | | | | | |
| | | Include Expense Support | | Disregard of Expense Support (Advisor Agreement) |
| Number of Days in Quarter | | | | | 92 |
| | | | | 92 |
|
Quarterly Preference Return (nominal) | | | | | 1.875 | % | | | | | 1.875 | % |
Annualized Preference Return (nominal) | | | | | 7.500 | % | | | | | 7.500 | % |
Quarterly Preference Return (actual 92/365) | | | | | 1.89041 | % | | | | | 1.89041 | % |
| Average Adjusted Capital | | | | | $ | 33,108,365 |
| | | | | $ | 33,108,365 |
|
| Preference Return Threshold | | | | | $ | 625,884 |
| | | | | $ | 625,884 |
|
| Income | | | | | $ | 750,000 |
| | | | | $ | 750,000 |
|
| Management Fees | | | $ | 166,902 |
| | | | | $ | 166,902 |
| | |
Subordinated Incentive Fee on Income | | | $ | 53,734 |
| | | | | — |
| | |
General & Administrative Expenses | | | $ | 103,480 |
| | | | | $ | 103,480 |
| | |
| Total Operating Expenses | | | | | $ | 324,116 |
| | | | | $ | 270,382 |
|
| Expense Support | | | | | $ | (200,000 | ) | | | | | — |
|
| Net Investment Income | | | | | $ | 625,884 |
| | | | | $ | 479,618 |
|
| Add Back Incentive Fees | | | | | $ | 53,734 |
| | | | | — |
|
Pre-Incentive Fee Net Investment Income | | | | | $ | 679,618 |
| | | | | $ | 479,618 |
|
| Quarterly Preference Return | | | 1.89041 | % | | Above preference return threshold | | | | | Below preference return threshold |
Indemnification of Guggenheim
The Investment Advisory Agreement provides that Guggenheim (and each of the officers, trustees, and persons associated with Guggenheim), shareholders (and owners of the shareholders), controlling persons, and agents are entitled to indemnification from the Master Fund for any damages, liabilities, costs, and expenses (including reasonable attorneys’ fees and amounts reasonably paid in settlement) incurred by them in or by reason of any pending, threatened, or completed action, suit, investigation, or other proceedings arising out of, or otherwise based on the performance of any of, Guggenheim's duties or obligations under the Investment Advisory Agreement, as applicable, or otherwise as our investment advisor, (i) to the extent such damages, liabilities, costs, and expenses (A) are not fully reimbursed by insurance, and (B) the standard of care set forth in our Declaration of Trust has been satisfied, and (ii) otherwise to the fullest extent such indemnification is consistent with the provisions of our Declaration of Trust, the 1940 Act, the laws of the State of Delaware, and other applicable law.
Proxy Voting Policies and Procedures
We have delegated the proxy voting responsibility for investments we own to Guggenheim. Guggenheim will vote proxies according to its proxy voting policies and procedures. Guggenheim's policies and procedures will be reviewed periodically by our Board of Trustees, and accordingly, are subject to change.
As an investment adviser registered under the Investment Advisers Act of 1940, Guggenheim has a fiduciary duty to act solely in the best interests of its clients. As part of this duty, Guggenheim recognizes that it must vote client securities in a timely manner, free of conflicts of interest, and in the best interests of its clients. Guggenheim's policies and procedures for voting proxies for its investment advisory clients are intended to comply with Section 206 of, and Rule 206(4)-6 under, the 1940 Act.
Proxy Policies
Guggenheim will vote proxies relating to our securities in a manner that they believe, in their discretion, to be in the best interest of our shareholders. This generally means voting proxies with a view to enhancing the value of the shares of stock held in portfolio companies, considering all relevant factors and without giving undue weight to the opinions of individuals or groups who may have an economic interest in the outcome of the proxy vote. Guggenheim utilizes the services of an outside proxy voting firm, Institutional Shareholder Services Inc. (“ISS”), to act as agent for the proxy process, to maintain records on proxy votes for its clients, and to provide independent research on corporate governance, proxy and corporate responsibility issues. Guggenheim will receive information from ISS recommending how proxies should be voted. Guggenheim will review these voting recommendations and generally votes proxies in accordance with such recommendations. If a proposal is voted in a manner different than set forth in the ISS guidelines, the reasons shall be documented in writing.
Guggenheim may occasionally be subject to conflicts of interest in the voting of proxies due to relationships it maintains with persons having an interest in the outcome of certain votes. The proxies that are not addressed by the ISS’s guidelines or are to be voted on a case-by-case basis will be forwarded to the appropriate Guggenheim investment management team. Determination of whether there is a material conflict of interest between us and Guggenheim due to (a) the provision of services or products by an affiliate of Guggenheim to the company on whose behalf proxies are being solicited, (b) personal relationships that may exist between personnel of Guggenheim or its affiliates and proponents of a proxy issue or (c) any other issue, may be made by senior members of the investment team responsible for voting the proxy. If a conflict of interest exists, the investment team will consult representatives from Guggenheim's Investment Management and Compliance (and Legal, as necessary) to determine how to vote the proxy consistent with Guggenheim's procedures and fiduciary duties.
Proxy Voting Records
You may obtain information, without charge, regarding how Guggenheim voted proxies with respect to our portfolio securities by making a written request for proxy voting information to: Chief Compliance Officer, c/o Guggenheim Credit Income Fund 2021, 330 Madison Avenue, New York, New York 10017.
Fiduciary Duties
Guggenheim has a fiduciary duty in connection with the safekeeping and use of funds and assets of the Company.
USE OF PROCEEDS
An affiliate of Guggenheim invested or caused to be invested $25 million in the Master Fund in exchange for its common shares. The Master Fund began investing the proceeds from the Seed Capital Investment on April 2, 2015.
We will invest the proceeds from each weekly subscription closing promptly in the Master Fund at the net asset value of the Master Fund, which will vary over time. The Company expects that following receipt of the weekly offering proceeds by the Master Fund, the Master Fund will invest such proceeds generally within 30-90 days after each subscription date, in accordance with the Company’s and the Master Fund’s investment objectives and strategies, and consistent with market conditions and the availability of suitable investments.
The following table sets forth the Company’s estimate of how it intends to use the gross proceeds from this offering. Information is provided assuming that the Company sells the maximum amount registered in this offering, or $775,000,000. The amount of net proceeds may be more or less than the amount depicted in the table below, depending on the actual number of Shares the Company sells in this offering.
The amounts in this table assume that the full fees are paid on all Shares offered to the public on a best efforts basis. All or a portion of the Dealer Manager fees may be reduced or eliminated in connection with certain categories of sales, such as sales to the Company’s affiliates. See “Plan of Distribution.” The reduction in these fees will be accompanied by a corresponding reduction in the per share purchase price but will not affect the amounts available to the Company for investments.
The selling commissions and Dealer Manager fees in this offering will not exceed 5.0% of the public offering price per share.
Because amounts in the following table are estimates, they may not accurately reflect the actual receipt or use of the gross proceeds from this offering.
|
| | | | | | | | | | | | | |
| | | Maximum Offering |
| | | Amount | | % of Net Proceeds (1) | | % of Gross Proceeds |
| Gross proceeds | | $ | 775,000,000 | | | | 105.26 | % | | | 100.00 | % |
| Less Sales Load | |
| | | |
|
| | | |
| Selling commissions | | 23,250,000 | | | | 3.16 | % | | | 3.00 | % |
| Dealer manager fees | | 15,500,000 | | | | 2.11 | % | | | 2.00 | % |
| Net proceeds available for investment operations | | $ | 736,250,000 | | | | 100.00% |
| | | 95.00 | % |
_________
| |
| (1) | Because sales load is contractually determined based on gross proceeds, the sales load represents a higher percentage of net proceeds than presented as a percentage of gross proceeds. |
Guggenheim is responsible for the payment of our organization and offering expenses to the extent they exceed 1.5% of the aggregate gross proceeds from the Company’s offering, without recourse against or reimbursement by us, regardless of the amount of Shares sold in this offering. Therefore, if we sold all registered Shares under this offering and assuming that no Shares were sold under the DRP, then the maximum organization and offering expenses to be incurred by the Company would be $11.6 million. Offering proceeds may be used for other purposes, such as to fund distributions, to repurchase shares, or to make payments due to Guggenheim, thereby decreasing the net proceeds available for investment operations.
DISTRIBUTIONS
Subject to our Board of Trustees’ discretion and applicable legal restrictions, we intend to authorize and declare ordinary cash distributions on a weekly, semi-monthly, or monthly basis and intend to pay such distributions on a monthly basis. We expect to pay distributions out of assets legally available for distribution based on our investment performance, although distributions may be paid from all sources, including expense support payments. See "Discussion of Operating Plans." However, we cannot assure you that we will achieve investment results that will allow us to make a consistent targeted level of cash distributions or year-to-year increases in cash distributions. Our ability to pay distributions might be adversely affected by the impact of the risks described in this prospectus. In addition, the inability to satisfy the asset coverage test applicable to us as a BDC can limit our ability to pay distributions. Distributions from offering proceeds or from borrowings could also reduce the amount of capital we ultimately invest in interests of portfolio companies. We cannot assure you that we will pay distributions to our shareholders in the future. We do not currently expect to pay distributions in-kind, and our ability to pay such distributions is limited by our Declaration of Trust. Securities received from a distribution in-kind may be illiquid and difficult or impossible to sell at a time and at a price that you desire. If you receive distributions in-kind, you should expect to incur transaction costs and be subject to market gains or losses upon the disposition of those securities. Distributions in-kind are taxable events and may result in the recognition of gain or loss for federal income tax purposes.
Each year a statement on IRS Form 1099-DIV (or such successor form) identifying the source of the distributions will be mailed to our shareholders subject to IRS tax reporting. Our distributions may exceed our earnings, especially during the period before we have substantially invested the proceeds from this offering. As a result, a portion of the distributions we make may represent a return of capital for tax purposes. The tax basis of Shares must be reduced by the amount of any return of capital distributions, which will result in an increase in the amount of any taxable gain (or a reduction in any deductible loss) on the sale of Shares.
We intend to elect to be treated for federal income tax purposes, beginning with our taxable year ending September 30, 2021, and intend to qualify annually thereafter, as a RIC under the Code. As a RIC, we generally will not have to pay corporate-level U.S. federal income taxes on any ordinary income or capital gains that we distribute as dividends to our shareholders. To obtain and maintain RIC tax treatment, we must distribute an amount generally at least equal to 90% of the sum of our net ordinary taxable income and net short-term capital gains in excess of net long-term capital losses, if any, to our shareholders. A RIC may satisfy the 90% distribution requirement by actually distributing dividends (other than capital gain dividends) during the taxable year. In addition, a RIC may, in certain cases, satisfy the 90% distribution requirement by distributing dividends relating to a taxable year after the close of such taxable year under the “spillover dividend” provisions of Subchapter M of the Code. If a RIC makes a spillover dividend, the amounts will be included in a shareholder’s gross income for the taxable year in which the spillover distribution is paid (stated differently, there is no impact of a spillover distribution to the shareholder).
In order to minimize certain excise taxes imposed on RICs, we currently intend to, but are not required to, distribute in respect of each calendar year an amount at least equal to the sum of: (i) 98% of our ordinary income (taking into account certain deferrals and elections) for the calendar year, (ii) 98.2% of our capital gains in excess of capital losses ("capital gain net income") for the one-year period generally ending on October 31 of the calendar year, and (iii) any ordinary income and capital gain net income for preceding years that were not distributed during such years and on which we paid no federal income tax.
We currently intend to distribute net capital gains (i.e., net long-term capital gains in excess of net short-term capital losses), if any, at least annually out of the assets legally available for such distributions. However, we may decide in the future to retain such capital gains for investment and elect to treat such gains as deemed distributions to you. If this happens, you will be treated for U.S. federal income tax purposes as if you had received an actual distribution of the capital gains that we retain and reinvested the net after tax proceeds in us. In this situation, you would be eligible to claim a tax credit (or, in certain circumstances, a tax refund) equal to your allocable share of the tax we paid on the capital gains deemed distributed to you. We can offer no assurance that we will achieve results that will permit the payment of any cash distributions. If we issue senior securities, we will be prohibited from making distributions if doing so causes us to fail to maintain the asset coverage ratios stipulated by the 1940 Act or if distributions are limited by the terms of any of our borrowings. See “Tax Matters.”
We have adopted an “opt-in” DRP pursuant to which you may elect to have the full amount of your cash distributions reinvested in additional Shares. See “Distribution Reinvestment Plan.”
SENIOR SECURITIES
Under a no action letter issued by the staff of the SEC to us and the Master Fund, we are not permitted to issue senior securities. The Master Fund is permitted to issue senior securities. The current asset coverage requirement is coverage at least equal to 200% of senior securities immediately after the incurrence of indebtedness and/or issuance of preferred stock.
The Master Fund’s senior securities are shown in the table below as of December 31, 2019, December 31, 2018, December 31, 2017, December 31, 2016 and December 31, 2015. The report of Ernst & Young LLP, in connection with the senior securities as of the end of each year within the two years ended December 31, 2019, appears as an exhibit to this registration statement of which this prospectus is a part. The report of PricewaterhouseCoopers LLP, in connection with the senior securities as of the end of each year within the three years ended December 31, 2017, appears as an exhibit to this registration statement of which this prospectus is a part.
For additional information about the Master Fund’s senior securities, including a description of its credit facility arrangement, this information should be read in conjunction with the Master Fund’s consolidated financial statements and related notes thereto appearing at pages F-1 through F-93. Dollar amounts in this section are presented in thousands.
|
| | | | | | | | | | | | | | | |
| As of December 31, | | Total Amount Outstanding Exclusive of Treasury Securities (1) | | Asset Coverage per Unit (2) | | Involuntary Liquidation Preference per Unit (3) | | Average Market Value per Unit (4) (Exclude Bank Loans) |
| 2019 | | $ | 172,000 |
| | | 2.23 |
| | — | | | N/A |
| 2018 | | $ | 150,000 |
| | | 2.57 |
| | — | | | N/A |
| 2017 | | $ | 150,000 |
| | | 2.66 |
| | — | | | N/A |
| 2016 | | $ | 126,000 |
| | | 2.41 |
| | — | | | N/A |
| 2015 | | $ | 39,000 |
| | | 2.15 |
| | — | | | N/A |
_______________
(1) Total amount of each class of senior securities outstanding at the end of the period presented.
| |
| (2) | Asset coverage per unit is the ratio of the carrying value of the Master Fund's total consolidated assets, less all liabilities and indebtedness not represented by senior securities, to the aggregate amount of senior securities representing indebtedness. |
| |
| (3) | The amount to which such class of senior security would be entitled upon the voluntary liquidation of the issuer in preference to any security junior to it. The “-” in this column indicates that the SEC expressly does not require this information to be disclosed for certain types of senior securities. |
(4) Not applicable because senior securities are not registered for public trading on a stock exchange.
DISCUSSION OF OPERATING PLANS
The information in this section contains forward-looking statements that involve risks and uncertainties. Please see “Risk Factors” and “Forward-Looking Statements” for a discussion of the uncertainties, risks, and assumptions associated with these statements. You should read the following discussion in conjunction with the financial statements and related notes, as well as other financial information appearing elsewhere in the prospectus.
Overview
We are a non-diversified, closed-end management investment company that intends to elect to be treated as a BDC under the 1940 Act. We were formed on March 18, 2016 as a statutory trust under the laws of Delaware. The Master Fund is externally managed by Guggenheim, which is responsible for sourcing potential investments, conducting due diligence on prospective investments, analyzing investment opportunities, structuring investments, and monitoring our portfolio on an ongoing basis. Guggenheim is registered as an investment adviser with the SEC. We intend to elect to be treated for federal income tax purposes, beginning with our taxable year ending September 30, 2021, and intend to qualify annually thereafter, as a RIC under the Code.
Investment Objectives and Investments
Our investment objectives are to provide our shareholders with current income, capital preservation, and, to a lesser extent, long-term capital appreciation. We seek to meet our investment objectives by investing substantially all of our equity capital in the Master Fund. The Master Fund's investment objectives are the same as our own. The Master Fund's investment strategy is continuously focused on growing an investment portfolio that generates superior risk-adjusted returns by carefully selecting investments through rigorous due diligence and actively managing and monitoring its investment portfolio. When evaluating an investment and the related portfolio company, the Master Fund uses Guggenheim's resources to develop an investment thesis and a proprietary view of a potential portfolio company’s intrinsic value and its expected risks and rewards.
The Master Fund primarily focuses on the following investment types that may be available within the capital structure of portfolio companies:
| |
| • | Senior Debt. Senior debt investments generally take a security interest in the available assets of the portfolio company, including equity interests in any of its subsidiaries. The senior debt classification includes senior secured first lien loans, senior secured second lien loans, senior secured bonds, and senior unsecured debt. In some circumstances, the secured lien could be subordinated to the claims of other creditors. While there is no specific collateral associated with senior unsecured debt, such positions are senior in payment priority over subordinated debt investments. |
| |
| • | Subordinated Debt. Subordinated debt investments are subordinated to senior debt and are generally unsecured. These investments are generally structured with interest-only payments throughout the life of the security with the principal due at maturity. |
| |
| • | Equity Investments. Preferred and/or common equity investments may be acquired alongside senior and subordinated debt investment activities or through the exercising of warrants or options attached to debt investments. Income is generated primarily through regular or inconstant dividends and realized gains on dispositions of such investments. |
The Master Fund intends to meet its investment objectives by investing primarily in large, privately-negotiated loans to private middle market U.S. companies. Specifically, it expects a typical borrower to have EBITDA of $25 million to $100 million and annual revenue ranging from $50 million to $1 billion. The Master Fund seeks to invest in businesses that have a strong reason to exist and have demonstrated competitive and strategic advantages. These companies generally possess distinguishing business characteristics, such as a leading competitive position in a well-defined market niche, unique brands, sustainable profitability and cash flow, and experienced management. The Master Fund anticipates that a majority of its investments will be classified as senior debt in a borrower’s capital structure and have repayment priority over other parts of a borrower’s capital structure (i.e., subordinated debt, preferred and common equity). By investing in a more senior attachment point of a borrower’s capital structure, the Master Fund expects to protect its principal with less risk, which it believes provide for a distinctive risk/return profile as compared to that of a typical middle market or private equity alternative investment.
In addition to privately-negotiated loans, the Master Fund invests in more broadly syndicated assets, such as bank loans and corporate bonds. Its portfolio is more heavily weighted towards floating-rate investments, whose interest payment obligations may increase in a rising interest rate environment. The Master Fund may also invest in fixed-rate investments, options, or other forms of equity participation, and, to a limited extent and not as a principal investment strategy, structured products such as collateralized loan obligations (“CLOs”) and collateralized debt obligations (“CDOs”). The Master Fund seeks to make investments which have favorable characteristics, including closing fees, prepayment premiums, lender-friendly control provisions, and lender-friendly covenants.
The Master Fund's portfolio includes investments in securities that are rated below investment grade (e.g., junk bonds) by rating agencies, or that would be rated below investment grade if they were rated and have predominantly speculative characteristics with respect to the issuer’s capacity to pay interest and repay principal. These investments may also be illiquid and feature variances in opinions of fair value and market prices. A material amount of the Master Fund's debt investments in portfolio companies may contain interest rate reset provisions that may present challenges for the borrowers to continue paying periodic interest to the Master Fund. In addition, a material amount of the Master Fund's debt investments may not pay down principal until the end of their lifetimes, which could result in a substantial loss to the Master Fund if the portfolio companies are unable to refinance or repay their debts at maturity.
The Master Fund's investment strategy leverages the skills and depth of Guggenheim's research team and credit investment platform which features a relative value perspective across all corporate credit asset types. The Master Fund believes these elements create a larger, proprietary opportunity set and increase the potential for the generation of a wide spectrum of value-risk investment ideas. The Master Fund intends for its investment strategy to access investments with attractive combinations of reward and risk, better economics and stronger lender protections than those offered in traditional loan transactions. The Master Fund also intends to deploy its direct loan origination investment platform and apply it to our portfolio company business relationships. As a BDC, the Master Fund is required to comply with certain regulatory requirements. For instance, it may not acquire any assets other than “qualifying assets” (as specified in the 1940 Act) unless, at the time the acquisition is made, at least 70% of its total assets are qualifying assets as determined at the end of the prior quarter (with certain limited exceptions). Qualifying assets include investments in EPCs. Under the relevant SEC rules, the term “eligible portfolio company” includes all U.S. private companies, U.S. companies whose securities are not listed on a national securities exchange, and certain U.S. public companies that have listed their securities on a national securities exchange but have a market capitalization of less than $250 million. These rules also permit the Master Fund to include as qualifying assets certain follow-on investments in companies that were EPCs at the time of initial investment, but no longer meet the definition of EPC at the time of the follow-on investment.
The Master Fund's investment activities may vary substantially from period to period depending on many factors, including: the demand for capital from creditworthy privately-owned U.S. companies, the level of merger, acquisition and refinancing activity involving private companies, the availability of credit to finance merger and acquisition transactions, the general economic environment, the competitive investment environment for the types of investments the Master Fund currently seeks and intends to seek in the future, the amount of equity capital the Master Fund raises from the sale of its common shares to us and any other feeder funds, and the amount and cost of capital that the Master Fund may borrow.
The Master Fund acquires its portfolio investments through the following investment access channels:
| |
| • | Direct Originations: This channel consists of investments that are directly originated through Guggenheim's relationship networks. Such investments are originated and/or structured by Guggenheim and are not generally available to the broader investment market. These investments may include both debt and equity investment components. |
| |
| • | Syndicated Transactions: This channel primarily includes investments in broadly syndicated loans and high yield bonds, typically originated and arranged by investment intermediaries other than Guggenheim. These investments may be purchased at the original syndication or in the secondary through various trading markets. |
The Master Fund will continue to borrow money from time to time within the borrowing limits stipulated by the 1940 Act, which generally allows the Master Fund to incur leverage of up to 50% of its total assets, less liabilities and indebtedness not represented by senior securities. The use of borrowed funds to finance investments has its own specific set of benefits and risks, and all of the costs of borrowing funds are borne by the Master Fund's shareholders.
On July 15, 2015, the staff of the SEC issued a no action letter to the Master Fund and us, permitting the Master Fund, us and any other feeder fund that may be created in the future that invests all or substantially all its assets in the Master Fund to operate in a master/feeder fund structure. More specifically, the no action letter:
| |
| • | permits a feeder fund to operate as a BDC under the 1940 Act; |
| |
| • | permits a feeder fund to look through the Master Fund and treat as its assets its proportionate ownership interest in the Master Fund’s assets; and |
| |
| • | permits the Master Fund to repurchase its shares in connection with the planned liquidation of a feeder fund at the end of the feeder fund’s finite term. |
Revenues
We generate revenues primarily in the form of dividend income derived from our ownership of the Master Fund's common shares. Our revenues will fluctuate with the operating performance of the Master Fund and its dividend distribution policies.
The Master Fund plans to generate revenue primarily in the form of interest on the debt securities of portfolio companies that it acquires and holds for investment purposes. The Master Fund expects that its investments in debt securities will generally have an expected maturity of one to eight years, although it has no lower or upper constraint on maturity, and it expects to earn interest at floating and fixed interest rates. Interest on its debt securities is generally payable to it quarterly or semi-annually. The outstanding principal amount of the Master Fund's debt securities and any accrued but unpaid interest will generally become due at the respective maturity dates. In addition, the Master Fund may generate revenue in the form of dividends from preferred and common equity investments, amortization of original issue discount, prepayment fees, commitment fees, origination fees, and fees for providing significant managerial assistance.
Operating Expenses
Our primary operating expenses include administrative services, custodian and accounting services, independent audit services, compliance services, tax services fees, legal services, transfer agent services, organization expenses and amortization of deferred offering expenses. Additionally, we indirectly bear the operating expenses of the Master Fund through our ownership of its common shares, such as base management fees, performance-based incentive fees, interest expense, third party valuation services, and various other professional fees.
Our primary annual operating expenses include (i) advisory fees (incurred at the Master Fund level) to compensate Guggenheim for its services in identifying, evaluating, negotiating, closing, and monitoring our investments, and (ii) the reimbursement of expenses (by the Master Fund) under the Investment Advisory Agreement and the Administrative Services Agreement with Guggenheim. We will bear all other expenses, which are expected to include, among other things:
| |
| • | corporate, organizational, and offering expenses relating to the offering of our Shares; |
| |
| • | the cost of calculating our net asset value, including the related fees and cost of any third-party valuation services; |
| |
| • | the cost of effecting sales and repurchases of our Shares and other securities; |
| |
| • | fees payable to third parties relating to, or associated with, monitoring our financial and legal affairs, and making and valuing investments, and performing due diligence reviews of prospective investments; |
| |
| • | fees, expenses, and interest payable on debt, if any, incurred to finance our investments; |
| |
| • | transfer agent fees, accounting services fees, fund administration fees and expenses, and custodial fees; |
| |
| • | fees to certain financial intermediaries for shareholder services they provide to their clients, for offering our Shares on platforms, and/or other distribution or marketing-related services; |
| |
| • | fees and expenses associated with our compliance program; |
| |
| • | federal and state registration fees, and any stock exchange listing fees; |
| |
| • | federal, state, and local taxes; |
| |
| • | reimbursements for travel expenses in connection with due diligence only to the extent permitted by, and in all cases subject to, the provisions of the Omnibus Guidelines adopted by the North American Securities Administrators Association; |
| |
| • | independent trustees’ fees and expenses, including travel expenses; |
| |
| • | costs of Board of Trustees and shareholder meetings; |
| |
| • | costs of fidelity bonds, trustees and officers errors and omissions liability insurance, and other types of insurance; |
| |
| • | direct costs of preparation of and printing of shareholder reports and notices, financial statements, proxy statements, advertising or sales materials, mailing, long distance telephone, and staff; |
| |
| • | fees and expenses associated with internal and independent audits and legal services, including compliance with the Sarbanes-Oxley Act, the 1940 Act, and applicable federal and state securities laws; |
| |
| • | brokerage commissions for our investments; and |
| |
| • | all other expenses incurred by us or Guggenheim in connection with administering our business, including expenses incurred by Guggenheim in performing its investment and administrative services obligations on our behalf. |
Under the Expense Support and Conditional Reimbursement Agreement, the Advisor reimburses us for expenses in an amount equal to the difference between our cumulative distributions paid to our shareholders in each quarter, less the cumulative of our investment company taxable income and net capital gains recognized by us through such quarter.
Pursuant to the Expense Support and Conditional Reimbursement Agreement, we have a conditional obligation to reimburse the Advisor for any amounts funded by the Advisor under such agreement if (and only to the extent that), (i) the Company’s total expense ratio, net of any recoupment, at the time of recoupment is equal to or less than the lesser of (A) 1.75% or (B) the Company’s total expense ratio at the time of the applicable expense support payment; (ii) the distribution rate of the Company at the time of the recoupment is equal to or greater than that at the time of the applicable expense support payment; and (iii) the recoupment occurs within three years of the applicable date of the expense support payment.
We do not pay interest on the expense support payments we receive from the Advisor. The above is fully qualified and subject to the terms of the Expense Support and Conditional Reimbursement Agreement, which is incorporated by reference as an exhibit to our registration statement.
We or the Advisor may terminate the Expense Support and Conditional Reimbursement Agreement at any time. The Advisor has indicated that it expects to continue expense support until they deem that we have achieved economies of scale sufficient to ensure that we bear a reasonable level of expenses in relation to our income.
Upon termination of the Expense Support and Conditional Reimbursement Agreement by the Advisor or the Master Fund, the Advisor will be required to fund any amounts accrued thereunder as of the date of termination. Similarly, our conditional obligation to reimburse the Advisor pursuant to the terms of the Expense Support and Conditional Reimbursement Agreement shall survive the termination of such agreement by either party.
Reimbursement of Guggenheim for Administrative Services
We (directly and indirectly through the Master Fund) reimburse Guggenheim for the administrative expenses necessary for its performance of services to us. However, such reimbursements are made at an amount equal to the lower of Guggenheim’s actual costs or the amount that we would be required to pay for comparable administrative services in the same geographic location. Also, such costs are reasonably allocated to us on the basis of assets, revenues, time records, or other reasonable methods. We do not reimburse Guggenheim for any services for which it receives a separate fee or for rent, depreciation, utilities, capital equipment, or other administrative items allocated to a controlling person of Guggenheim.
Financial Condition, Liquidity, and Capital Resources
Our primary sources of cash include (i) the sale of our Shares, (ii) reinvestment of distributions, (iii) distributions received from our ownership of the Master Fund's common shares, and (iv) expense reimbursement payments from the Advisor pursuant to the Expense Support Agreement. Our primary uses of cash include (i) investment in the Master Fund common shares, (ii) payment of our operating expenses, and (iii) cash distributions to our shareholders. We do not currently anticipate issuing any preferred stock within 12 months of the commencement of operations and we will not borrow capital.
We manage our statement of assets and liabilities such that current assets are sufficient to cover current liabilities. All remaining cash in excess of net working capital is regularly invested in the common shares of the Master Fund.
The Master Fund generates cash primarily from the net proceeds of this offering (and from the offering of other feeder funds) and from cash flows from interest, dividends, and fees earned from its investments, as well as principal repayments and proceeds from sales of its investments. Its primary use of cash will be investments in portfolio companies, payments of its expenses, and cash distributions to its shareholders.
We sell our Shares on a continuous basis at net asset value plus any applicable sales load. We will make updated pricing information available via our website.
The Master Fund may borrow funds to make investments, including before it has fully invested the proceeds of this offering, to the extent the Master Fund determines that leveraging its portfolio would be appropriate. On December 17, 2015, Hamilton Finance LLC (“Hamilton”), a newly-formed, wholly-owned, special purpose financing subsidiary of the Master Fund, initially entered into a senior-secured term loan credit facility (the “Hamilton Credit Facility”) with JPMorgan Chase Bank, National Association (“JPM”), as administrative agent, each of the lenders from time to time party thereto, and U.S. Bank National Association, as collateral agent, collateral administrator and securities
intermediary. As of December 31, 2019, the Hamilton Credit Facility provided for (i) borrowings in an aggregate principal amount of $175.0 million on a committed basis (ii) a revolving feature on all amounts above the minimum utilization amount, (iii) an interest rate of 3-month LIBOR plus 2.50%, (iv) a draw down term which ends December 29, 2021, (v) a stated maturity date of December 29, 2022, (vi) undrawn fees payable during the draw down term of 250 basis points on all undrawn amounts below the minimum utilization amount, and (vii) unused commitment fees payable during the draw-down term of 100 basis points on all undrawn amounts above the minimum utilization amount.
The Master Fund may contribute cash and sell or contribute loans or bonds (collectively, “assets,” which definition only applies to this discussion of Hamilton) to Hamilton from time to time, and will receive fair market value for any assets sold to Hamilton or will receive an increase in the value of its interests in Hamilton for any assets contributed. Hamilton may purchase additional assets directly from parties other than the Master Fund in the ordinary course of business and as deemed appropriate by Guggenheim in the course of their management of the Master Fund. Hamilton has appointed the Master Fund to manage its portfolio of assets pursuant to the terms of an investment management agreement. The investment management agreement provides that the Master Fund shall (i) supervise and direct the investment of Hamilton's assets, (ii) manage, service, administer and make collections on Hamilton's portfolio investments and (iii) perform other investment and leverage-related duties and functions. Hamilton’s obligations to JPM under the Hamilton Credit Facility are secured by a first priority security interest in substantially all of the assets of Hamilton, including its portfolio of assets. The Master Fund and Guggenheim do not receive separate compensation under the investment management agreement for providing these services to Hamilton. The obligations of Hamilton under the Hamilton Credit Facility are non-recourse to the Master Fund, and the Master Fund’s exposure under the Hamilton Credit Facility is limited to the value of the Master Fund’s investment in Hamilton.
Borrowings under the Hamilton Credit Facility are subject to a compliance condition which will be satisfied at any given time if the outstanding advances to Hamilton by the lenders minus the amount of principal and certain interest proceeds in Hamilton’s accounts is less than or equal to sixty percent (60%) of the net asset value of Hamilton’s portfolio of assets.
In connection with the Hamilton Credit Facility, Hamilton has made certain representations and warranties and is required to comply with various covenants, reporting requirements and other customary requirements for similar facilities. The Hamilton Credit Facility contains customary events of default for similar financing transactions, including: (a) the failure to make principal payment when due or any other payments under the Hamilton Credit Facility within two business days of when due; (b) the insolvency or bankruptcy of Hamilton or the Master Fund; (c) a change of control of Hamilton shall have occurred; and (d) Guggenheim or an affiliate thereof ceases to be the Master Fund’s investment advisor. Upon the occurrence and during the continuation of an event of default, JPM may declare the outstanding advances and all other obligations under the Hamilton Credit Facility immediately due and payable.
The occurrence of events of default (as described above) or events defined as “Coverage Events” in the loan agreement governing the Hamilton Credit Facility triggers (i) a requirement that Hamilton obtain the consent of JPM prior to entering into any sale or disposition with respect to portfolio assets and (ii) certain rights of JPM to direct Hamilton to enter into sales or dispositions with respect to any portfolio assets, in each case, in JPM’s sole discretion.
Borrowings of Hamilton will be considered borrowings by the Master Fund for purposes of complying with the asset coverage requirements under the 1940 Act, applicable to business development companies. Hamilton's assets will also be considered assets held by the Master Fund and will comply, on a combined "look-through" basis, with the permissible asset requirements under the 1940 Act. In no event will the Company itself directly engage in any borrowing.
The Master Fund currently does not anticipate issuing any preferred stock within 12 months of the date of this prospectus.
Critical Accounting Policies
The preparation of financial statements, which are included in this registration statement, in conformity with GAAP requires us to make estimates and assumptions that affect the reported amounts of assets and liabilities and disclosures of contingent assets and liabilities at the date of the financial statements and the reported amounts of income and expense during the reporting period. We believe that the estimates and assumptions utilized in preparing the financial statements are reasonable. Actual results could differ from those estimates.
Valuation of Investments
We invest substantially all of our equity capital in the purchase of common shares of the Master Fund. As such, we determine the fair value of our investment in the Master Fund as the Master Fund's net asset value per common share (as determined by the Master Fund) multiplied by the number of common shares of the Master Fund that we own.
The Master Fund measures the value of its investments in accordance with Topic 820, Fair Value Measurements and Disclosure, of the Financial Accounting Standards Board's Accounting Standard Codification, as amended (“ASC Topic 820”). Fair value is the price that would be received to sell an asset or paid to transfer a liability in an orderly transaction between market participants at the measurement date. Market participants are defined as buyers and sellers in the principal or most advantageous market (which may be a hypothetical market) that are independent, knowledgeable, and willing and able to transact. In accordance with ASC Topic 820, the Master Fund considers its principal market to be the market that has the greatest volume and level of activity.
ASC Topic 820 defines hierarchical levels directly related to the amount of subjectivity associated with the inputs used to determine fair values of assets and liabilities. The hierarchical levels and types of inputs used to measure fair value for each level are described as follows:
| |
| • | Level 1 - Quoted prices are available in active markets for identical investments as of the reporting date. Publicly listed equities and debt securities, publicly listed derivatives, money market/short-term investment funds and foreign currency are generally included in Level 1. The Master Fund does not adjust the quoted price for these investments. |
| |
| • | Level 2 - Valuation inputs are other than quoted prices in active markets, which are either directly or indirectly observable as of the reporting date, and fair value is determined through the use of models or other valuation methodologies. In certain cases, debt and equity securities are valued on the basis of prices from orderly transactions for similar investments in active markets between market participants and provided by reputable dealers or independent pricing services. In determining the value of a particular investment, independent pricing services may use certain information with respect to transactions in such investments, quotations from dealers, pricing matrices, market transactions in comparable investments, and various relationships between investments. Investments generally included in this category are corporate bonds and loans, convertible debt indexed to publicly listed securities, foreign currency forward contracts and certain over-the-counter derivatives. |
| |
| • | Level 3 - Valuation inputs are unobservable for the investment and include situations where there is little, if any, market activity for the investment. The inputs into the determination of fair value require significant judgment or estimation. Investments generally included in this category are illiquid corporate bonds and loans, common and preferred stock investments, and equity options that lack observable market pricing. |
In certain cases, the inputs used to measure fair value may fall into different levels of the fair value hierarchy. In such cases, an investment’s level within the fair value hierarchy are based on the lowest level of input that is significant to the fair value measurement. Our assessment of the significance of a particular input to the fair value measurement requires judgment and the consideration of factors specific to the investment.
Our investments are expected to consist primarily of investments in senior and subordinated debt of private U.S. companies and are expected to include Level 3 investments. As such, the Master Fund utilizes several valuation techniques that use unobservable inputs and assumptions in determining the fair value of its Level 3 investments. For senior debt, subordinated debt and structured products categorized as Level 3 investments, the Master Fund initially values the investment at its initial transaction price and subsequently value using (i) market data for similar instruments (e.g., recent transactions or indicative broker quotes), (ii) comparisons to benchmark derivative indices and/or (iii) valuation models. Valuation models are based on yield analysis and discounted cash flow techniques, where the key inputs are based on relative value analyses and the assignment of risk-adjusted discounted rates derived from the analysis of similar credit investments from similar issuers. In addition, an illiquidity discount is applied where appropriate. The unobservable inputs and assumptions may differ by asset and in the application of the Master Fund's valuation methodologies. The reported fair value estimates could vary materially if different unobservable inputs and other assumptions were chosen.
A determination of fair value involves subjective judgments and estimates. Due to the inherent uncertainty of determining the fair value of portfolio investments that do not have a readily available market value, the fair value of our investments may differ significantly from the values that would have been determined had a readily available market value existed for such investments, and the differences could be material. Further, such investments are generally less liquid than publicly traded securities. If the Master Fund was required to liquidate a portfolio investment that does not have a readily available market value in a forced or liquidation sale, it could realize significantly less than the fair value recorded by it.
Revenue Recognition
The Master Fund records interest income on an accrual basis to the extent that it expects to collect such amounts. The Master Fund does not accrue interest on loans and debt securities if it has reason to doubt its ability to collect such interest. OIDs and market discounts or premiums are accreted or amortized using the effective interest method as interest income. The Master Fund records prepayment premiums on loans and debt securities as interest income. Dividend income, if any, is recognized on an accrual basis to the extent that the Master Fund expects to collect such amount.
Net Realized Gains or Losses and Net Change in Unrealized Appreciation or Depreciation
The Master Fund measures net realized gains or losses by the difference between the net proceeds from the repayment or sale and the amortized cost basis of the investment, without regard to unrealized appreciation or depreciation previously recognized, but considering unamortized upfront fees and prepayment penalties. Net change in unrealized appreciation or depreciation reflects the change in portfolio investment values during the reporting period, including any reversal of previously recorded unrealized appreciation or depreciation, when gains or losses are realized.
Payment-in-Kind Interest
The Master Fund may have investments in its portfolio that contain a PIK interest provision, which represents contractual interest that is accrued and periodically added to the principal balance. The Master Fund generally does not accrue PIK interest if the portfolio company’s valuation indicates that such PIK interest is not collectible. Any accrued PIK interest is added to the investment’s principal balance and recorded as interest income, if the portfolio company’s valuation indicates that such PIK interest is collectible. In order to maintain its status as a RIC, substantially all of this income must be paid out to its shareholders in the form of dividends, even if it has not collected any cash.
Organization and Offering Expenses
Organization expenses are expensed on the Company’s statement of operations. Continuous offering expenses, excluding sales load, are capitalized on the Company’s statement of assets and liabilities as deferred offering expenses and expensed to the Company’s statement of operations over a 12-month period on a straight-line basis commencing at the later of (i) when the expense was incurred and (ii) when operations begin.
Federal Income Taxes
We intend to elect to be treated for federal income tax purposes, beginning with our taxable year ending September 30, 2021, and intend to qualify annually thereafter, as a RIC under the Code. As a RIC, we generally will not have to pay corporate-level federal income taxes on any ordinary income or capital gains that we distribute to our shareholders from our tax earnings and profits. To obtain and maintain our RIC tax treatment, we must meet specified source-of-income and asset diversification requirements, and distribute each taxable year an amount generally at least equal to 90% of the sum of our ordinary income and realized net short-term capital gains in excess of realized net long-term capital losses, if any. See “Tax Matters.”
Related Party Agreements and Transactions
We have entered into agreements with the Advisor, and certain of its affiliates, whereby we agreed to (i) receive expense support payments and to conditionally reimburse it for prior period expense support payments, (ii) to pay for administrative services, and (iii) to compensate GFD, an affiliate of Guggenheim, for capital market services in connection with the marketing and distribution of our Shares.
Quantitative and Qualitative Disclosures About Market Risk
Interest Rate Risk
We are subject to financial market risks, including changes in interest rates through our investment in the Master Fund. As of December 31, 2019, 94.8% of the Master Fund's debt investments (91.4% of the Master Fund's total investments), or $340.3 million measured at fair value, are subject to variable interest rates. The Master Fund's sole credit facility is also subject to changes in its 3-Month London Interbank Offered Rate ("LIBOR") base rate. A rise in the general level of interest rates can be expected to lead to (i) higher interest income for the Master Fund's variable rate debt investments, (ii) value declines for fixed rate investments the Master Fund may hold, and (iii) higher interest expense in connection with the Master Fund's floating rate credit facility. To the extent that a majority of the Master Fund's investments may be in variable rate investments, an increase in interest rates could also make it more difficult for borrowers to repay their loans, and a rise in interest rates may also make it easier for Guggenheim to meet or exceed the quarterly threshold for a performance-based incentive fee as described in Note 4. Related Party Agreements and Transactions of the Master Fund's audited consolidated financial statements.
DESCRIPTION OF OUR CAPITAL STOCK
The following description is based on portions of the Delaware Statutory Trust Act, the General Corporation Law of the State of Delaware (the “DGCL”) and on our Declaration of Trust, that are relevant to an investment in the Company. This summary is not intended to be complete and we refer you to our Declaration of Trust, a copy of which is filed as an exhibit to the registration statement of which this prospectus is a part, for a more detailed description of the provisions summarized below.
Outstanding Securities
|
| | | | | | | |
(1) Title of Class | | (2) Amount Authorized | | (3) Amount Held by our Company or for its Account | | (4) Amount Outstanding Exclusive of Amount Shown Under (3) As of August 14, 2020 |
| Common | | 1,000,000,000 |
| | — | | — |
| Preferred | | 100,000,000 |
| | — | | — |
Capital Stock
Our authorized shares consist of 1,100,000,000 shares of beneficial interest, par value $0.001 per share, of which 1,000,000,000 shares are classified as Shares and 100,000,000 shares are classified as shares of preferred stock. There is currently no market for our Shares and we do not expect that a market for our Shares will develop in the foreseeable future. No Shares have been authorized for issuance under any equity compensation plans. Under Delaware law, our shareholders are entitled to the same limitation of personal liability extended to shareholders of private corporations organized for profit under the DGCL and therefore generally will not be personally liable for our debts or obligations.
Common Shares
Under the terms of our Declaration of Trust, all our Shares will have equal rights as to voting and, when they are issued, will be duly authorized, validly issued, fully paid, and non-assessable. Distributions may be paid to the holders of our Shares if, as, and when authorized by our Board of Trustees and declared by us out of funds legally available therefor. Except as may be provided by our Board of Trustees in setting the terms of classified or reclassified shares, our Shares will have no preemptive, exchange, conversion, or repurchase rights and will be freely transferable, except where their transfer is restricted by federal and state securities laws or by contract. In addition, our Shares are not subject to any mandatory repurchase obligations by us. In the event of our liquidation, dissolution, or winding up, each Share would be entitled to share ratably in all of our assets that are legally available for distribution after we pay, or make reasonable provision for the payment of, all claims and obligations. Each Share will be entitled to one vote on all matters submitted to a vote of shareholders, including the election of Trustees. Except as may be provided by the Delaware Statutory Trust Act or by our Board of Trustees in setting the terms of classified or reclassified shares, the holders of our Shares will possess exclusive voting power. There will be no cumulative voting in the election of Trustees, which means that holders of a majority of the outstanding Shares will be able to elect all of our Trustees, provided that there are no shares of any other class or series of shares outstanding entitled to vote in the election of Trustees, and holders of less than a majority of such Shares will be unable to elect any Trustee.
Limitation on Liability of Trustees and Officers; Indemnification and Advance of Expenses
Delaware law permits a Delaware statutory trust to include in its declaration of trust a provision to indemnify and hold harmless any trustee, beneficial owner, or other person from and against any and all claims and demands whatsoever. Our Declaration of Trust provides that our Trustees will not be liable to us or our shareholders for monetary damages for breach of fiduciary duty to the fullest extent permitted by Delaware law. Our Declaration of Trust provides for the indemnification of any person to the fullest extent permitted, and in the manner provided, by current Delaware law or as Delaware law may hereafter be amended. In accordance with the 1940 Act, we will not indemnify certain persons for any liability to which such persons would be subject by reason of such person’s willful misconduct, bad faith, gross negligence, or reckless disregard of the duties involved in the conduct of his office.
Pursuant to our Declaration of Trust and subject to certain exceptions described therein, we will indemnify and, without requiring a preliminary determination of the ultimate entitlement to indemnification, pay or reimburse reasonable expenses in advance of final disposition of a proceeding to (i) any individual who is a present or former Trustee or officer of the Company and who is made or threatened to be made a party to the proceeding by reason of his or her service in that capacity; (ii) any individual who, while a Trustee or officer of the Company and at the request of the Company, serves or has served as a Trustee, officer, partner or trustee of any corporation, partnership, joint venture, trust, employee benefit plan, or other enterprise and who is made or threatened to be made a party to the
proceeding by reason of his or her service in that capacity or; (iii) Guggenheim or any of its affiliates acting as an agent of the Company (each such person, an “Indemnitee”), in each case to the fullest extent permitted by Delaware law. Notwithstanding the foregoing, we will not provide indemnification for any loss, liability, or expense arising from or out of an alleged violation of federal or state securities laws by an Indemnitee unless (i) there has been a successful adjudication on the merits of each count involving alleged securities law violations, (ii) such claims have been dismissed with prejudice on the merits by a court of competent jurisdiction, or (iii) a court of competent jurisdiction approves a settlement of the claims against the Indemnitee and finds that indemnification of the settlement and the related costs should be made.
We will not indemnify an Indemnitee against any liability or loss suffered by such Indemnitee unless (i) the Company determines in good faith that the course of conduct that caused the loss or liability was in the best interest of the Company, (ii) the Indemnitee was acting on behalf of or performing services for the Company, (iii) in the case that the Indemnitee is an Advisor, an affiliate of an Advisor, or an officer of the Company, such liability or loss was not the result of negligence or misconduct, (iv) in the case that the Indemnitee is a Trustee of the Company (and not also an officer of the Company, Guggenheim or an affiliate of Guggenheim), such liability or loss was not the result of gross negligence or willful misconduct, and (v) such indemnification or agreement to hold harmless is recoverable only out of assets of the Company and not from the shareholders.
In addition, Delaware law permits a trust to advance reasonable expenses to a Trustee or officer, and we will do so in advance of final disposition of a proceeding if (i) the proceeding relates to acts or omissions with respect to the performance of duties or services on behalf of the Company, (ii) the legal proceeding was initiated by a third party who is not a shareholder (or, if by a shareholder of the Company acting in his or her capacity as such, a court of competent jurisdiction approves such advancement), and (iii) upon the Company’s receipt of (A) a written affirmation by the Trustee or officer of his or her good faith belief that he or she has met the standard of conduct necessary for indemnification by the Company and (B) a written undertaking by him or her, or on his or her behalf, to repay the amount paid or reimbursed by the Company if it is ultimately determined that the standard of conduct was not met.
Provisions of Our Declaration of Trust
Our Declaration of Trust contains provisions that could make it more difficult for a potential acquirer to acquire us by means of a tender offer, proxy contest, or otherwise. These provisions are expected to discourage certain coercive takeover practices and inadequate takeover bids, and to encourage persons seeking to acquire control of us to negotiate with our Board of Trustees first. We believe that the benefits of these provisions outweigh the potential disadvantages of discouraging any such acquisition proposals because, among other things, the negotiation of such proposals may improve their terms.
Election of Trustees
As set forth in our Declaration of Trust, our Trustees may be elected to an unlimited number of successive terms. Any Trustee elected by the Board of Trustees without a shareholder vote to fill a vacancy as a result of the expansion of the size of the Board of Trustees, who remains a trustee of the Company at the time of the next annual meeting of shareholders, if held, shall be submitted to the shareholders for election to the Board of Trustees at such annual meeting of shareholders.
Number of Trustees, Vacancies, Removal
Our Declaration of Trust provides that the number of Trustees will be set by our Board of Trustees in accordance with our Bylaws. Our Bylaws provide that a majority of our entire Board of Trustees may at any time increase or decrease the number of Trustees. Our Bylaws provide that the number of Trustees generally may not be less than three or more than twelve. Except as otherwise required by applicable requirements of the 1940 Act, pursuant to an election under our Bylaws, any and all vacancies on our Board of Trustees may be filled only by the affirmative vote of a majority of the remaining Trustees in office (even if the remaining Trustees do not constitute a quorum), and any Trustee elected to fill a vacancy will serve until a successor is elected and qualified (subject to any applicable requirements of the 1940 Act). Independent Trustees will nominate replacements for any vacancies among the Independent Trustees’ positions.
Pursuant to our Declaration of Trust, our shareholders may remove a Trustee, only for cause, by the affirmative vote of at least two-thirds of all Shares entitled to vote in the election of the Trustee. For these purposes, “cause” shall mean, with respect to any particular Trustee, conviction of a felony or a final judgment of a court of competent jurisdiction holding that such Trustee caused demonstrable, material harm to us through bad faith or active and deliberate dishonesty.
Our Board of Trustees consists of five members, three of whom are Independent Trustees. Our Declaration of Trust provides that a majority of our Board of Trustees must consist of Independent Trustees, except for a period of up to
60 days after the death, removal, or resignation of an Independent Trustee and pending the election of his or her successor.
Advance Notice Provisions for Shareholder Nominations and Shareholder Proposals
Our Bylaws provide that with respect to an annual meeting of shareholders, if held, nominations of persons for election to our Board of Trustees and the proposal of business to be considered by shareholders may be made only (i) pursuant to our notice of the meeting, (ii) by our Board of Trustees, or (iii) by a shareholder who is entitled to vote at the meeting and who has complied with the advance notice procedures of the Bylaws. With respect to special meetings of shareholders, only the business specified in our notice of the meeting may be brought before the meeting. Nominations of persons for election to our Board of Trustees at a special meeting may be made only (i) pursuant to our notice of the meeting, (ii) by our Board of Trustees, or (iii) provided that our Board of Trustees has determined that Trustees will be elected at the meeting, by a shareholder who is entitled to vote at the meeting and who has complied with the advance notice provisions of the Bylaws.
The purpose of requiring shareholders to give us advance notice of nominations and other business is to afford our Board of Trustees a meaningful opportunity to consider the qualifications of the proposed nominees and the advisability of any other proposed business and, to the extent deemed necessary or desirable by our Board of Trustees, to inform shareholders and make recommendations about such qualifications or business, as well as to provide a more orderly procedure for conducting meetings of shareholders. Although our Bylaws do not give our Board of Trustees any power to disapprove shareholder nominations for the election of Trustees or proposals recommending certain action, they may have the effect of precluding a contest for the election of Trustees or the consideration of shareholder proposals if proper procedures are not followed, and of discouraging or deterring a third party from conducting a solicitation of proxies to elect its own slate of Trustees or to approve its own proposal without regard to whether consideration of such nominees or proposals might be harmful or beneficial to us and our shareholders.
Calling of Special Meetings of Shareholders
Our Bylaws provide that special meetings of shareholders may be called by our Board of Trustees and certain of our officers. In addition, our Bylaws provide that, subject to the satisfaction of certain procedural and informational requirements by the shareholders requesting the meeting, a special meeting of shareholders will be called by the secretary of the Company upon the written request of shareholders entitled to cast 10% or more of the votes entitled to be cast at the meeting. Any special meeting called by such shareholders shall be held not more than 60 days after we are provided notice by such shareholders of the request for a special meeting.
Approval of Extraordinary Trust Action; Amendment of Declaration of Trust
Pursuant to (and except as provided otherwise in) our Declaration of Trust, provided that our Trustees then in office have approved and declared the action advisable and submitted such action to the shareholders, an action that requires shareholder approval, including a dissolution, merger, or sale of all or substantially all of our assets, or a similar transaction outside the ordinary course of business, must be approved by the affirmative vote of shareholders entitled to cast at least a majority of the votes entitled to be cast on the matter. In addition, our Declaration of Trust provides that shareholders are entitled to vote upon a proposed amendment to the Declaration of Trust if the amendment would alter or change the powers, preferences, or special rights of the Shares held by such shareholders so as to affect them adversely. Approval of any such amendment shall require at least a majority of the votes cast by such shareholders at a meeting of shareholders duly called and at which a quorum is present.
Our Declaration of Trust provides that our Board of Trustees will have the exclusive power to make, alter, amend, or repeal any provision of our Bylaws.
Except as described above, our Declaration of Trust provides that our Board of Trustees may amend our Declaration of Trust without any vote of our shareholders.
No Appraisal Rights
In certain extraordinary transactions, some jurisdictions provide dissenting shareholders with the right to demand and receive the fair value of their common shares, subject to certain procedures and requirements set forth in such statute. Those rights are commonly referred to as appraisal rights. Our Declaration of Trust provides that holders of our Shares will not be entitled to exercise appraisal rights.
Conflict with 1940 Act
Our Declaration of Trust provides that if and to the extent that any provision of the Delaware Statutory Trust Act, the DGCL, or any provision of our Declaration of Trust conflicts with any provision of the 1940 Act, the applicable provision of the 1940 Act will control.
Reports to Shareholders
Within 45 days after the end of each fiscal quarter (other than the fourth quarter of each year), we are required to file our quarterly report on Form 10-Q. Within 90 days after the end of each fiscal year, we are required to file our annual report on Form 10-K. We will also file with or submit to the SEC current reports on Form 8-K, proxy statements, and other information meeting the informational requirements of the Exchange Act. In addition, we will distribute our annual report on Form 10-K to all shareholders within 120 days after the end of each fiscal year. These reports, including communications with shareholders, should not be considered a part of or as incorporated by reference into this prospectus, or the registration statement of which this prospectus is a part. You may inspect and copy these reports, proxy statements, and other information, as well as the registration statement and related exhibits and schedules. We maintain a website at www.GuggenheimCIF.com and intend to make all of our annual, quarterly, and current reports, proxy statements, and other publicly filed information available, free of charge, on or through our website. Information contained on our website is not incorporated into this prospectus, and you should not consider information on our website to be part of this prospectus. You may also obtain such information by contacting us in writing at 330 Madison Avenue, New York, New York 10017. The SEC maintains a website that contains reports, proxy and information statements, and other information we file with the SEC at www.sec.gov. Copies of these reports, proxy and information statements, and other information may also be obtained, after paying a duplicating fee, by electronic request at the following e-mail address: publicinfo@sec.gov.
Within 75 days after the end of each fiscal year, we will provide shareholders with all information necessary for the preparation of shareholder’s federal income tax returns.
Subject to availability, you may authorize us to provide prospectuses, prospectus supplements, annual reports, and other information (collectively, “documents”) electronically by so indicating on your order form, or by sending us instructions in writing in a form acceptable to us to receive such documents electronically. Unless you elect in writing to receive documents electronically, all documents will be provided in paper form by mail. You must have internet access to use electronic delivery. While we impose no additional charge for this service, there may be potential costs associated with electronic delivery, such as on-line charges. Documents will be available on our website. You may access and print all documents provided through this service. As documents become available, we will notify you of this by sending you an e-mail message that will include instructions on how to retrieve the document. If our e-mail notification is returned to us as “undeliverable,” we will contact you to obtain your updated e-mail address. If we are unable to obtain a valid e-mail address for you, we will resume sending a paper copy by regular U.S. mail to your address of record. You may revoke your consent for electronic delivery at any time and we will resume sending you a paper copy of all required documents. However, in order for us to be properly notified, your revocation must be given to us a reasonable time before electronic delivery has commenced. We will provide you with paper copies at any time upon request. Such request will not constitute revocation of your consent to receive required documents electronically.
Any shareholder may, in person or by agent, on written request inspect and obtain copies during normal business hours of our books and records in accordance with applicable Delaware and federal securities laws. Under applicable Delaware law, books and records that are available for inspection include our Certificate of Trust and Declaration of Trust, including all amendments thereto, our stock ledger, and information regarding our business and financial condition. Any shareholder may also present to any officer of the Company or our resident agent a written request for a statement of our affairs. Under Delaware law, shareholders of the Company do not have a statutory right to inspect books and records of the Master Fund. However, upon request, the Master Fund will provide shareholders of the Company with access to the Master Fund’s books and records on the same terms and conditions that would apply if the requesting shareholder was a record shareholder of the Master Fund.
Transfer Agent
DST Systems, Inc., an SS&C Technologies, Inc. company, is our transfer agent, processing agent, reinvestment agent, paying agent, and registrar. The principal business address of DST Systems, Inc. is 430 W. 7th Street, Ste. 2191383, Kansas City, Missouri 64105-1407, and its telephone number is (833) 484-4364.
Custodians
Our securities are held under a custodian agreement between us and U.S. Bank National Association. All of the Master Fund's securities and other similar investments are also held under a custodian agreement between the Master Fund and U.S. Bank National Association. The address of the custodian is U.S. Bank National Association, Corporate Trust Services, 214 North Tryon Street, 26th Floor, Charlotte, North Carolina 28203, and our custodian’s telephone number is (704) 335-2399.
Escrow Agent
[UMB Bank, N.A.] is our escrow agent. The principal business address of our escrow agent is [UMB Bank, N.A., 1010 Grand Blvd., 4th Floor, Mail Stop: 1020409, Kansas City, Missouri 64106], and our escrow agent’s telephone number is [(816) 860-3017].
DETERMINATION OF NET ASSET VALUE
Allocation of Responsibilities for Determination of Our Net Asset Value
Our Board of Trustees - with the assistance of our administrator and officers - is responsible for the determination of our net asset value. Prior to such determination, our administrator and officers will calculate, and provide to the Audit Committee of our Board of Trustees, an estimate of our net asset value. This information will be presented to our Audit Committee at its quarterly meetings and any other time as required under our policies and procedures. Our Audit Committee will review, and recommend to our Board of Trustees for adoption, our quarterly and annual financial statements for inclusion in our periodic reports on Forms 10-Q and 10-K, and such financial statements will include a determination of our net asset value and net asset value per share as of the last day of each calendar quarter. These financial statements will, in turn, be reviewed and approved by our full Board of Trustees.
Allocation of Responsibilities for Determination of Fair Value of Our Portfolio Investments
Our Board of Trustees - with the assistance of Guggenheim, officers, and independent valuation agents, if any - is responsible for determining in good faith the fair value of our portfolio investments for which market quotations are not readily available. Our Board of Trustees will make this determination on a quarterly basis and any other time when a decision is required regarding the fair value of our portfolio investments for which market quotations are not available. A determination of fair value involves subjective judgments and estimates. The notes to our financial statements will refer to the uncertainty with respect to our fair value estimates and any change in such fair value estimates. We expect that each determination of the fair value of our portfolio investments will be made upon the recommendation of our Audit Committee.
Our Board of Trustees and our Audit Committee will review and approve our pricing and valuation policies and the procedures that will be implemented and followed by Guggenheim and officers, and will review and approve any revisions to such policies and procedures. In addition, we expect that our Board of Trustees will retain one or more independent valuation agents to work with Guggenheim and officers to provide additional inputs for consideration by our Audit Committee and to work directly with our full Board of Trustees, when requested, with respect to the fair value of our portfolio investments.
In addition, our Board of Trustees meets at least quarterly with our:
| |
| • | Chief Compliance Officer, and reviews the Chief Compliance Officer’s surveillance findings in general, and the Chief Compliance Officer’s findings in particular with regard to Guggenheim's and our officers’ implementation of the valuation procedures; |
| |
| • | Guggenheim and officers to ensure that we have taken appropriate remedial action to cure deficiencies, if any, related to our internal control over financial reporting, which may impact the valuation policies and procedures adopted by our Board of Trustees; and |
| |
| • | Reviews any changes in ASC 820 against our approved valuation policies and procedures to ensure that such valuation policies and procedures are modified and approved, as appropriate, in light of current accounting guidance. |
Because our Board of Trustees has the ultimate responsibility for determining, in good faith, the fair value of our portfolio investments, our Board of Trustees will have direct access to all entities and all persons, including any independent valuation agents, that are involved in assisting with the valuation of our portfolio investments in order to discuss with them the valuation methodologies they have utilized. We believe this will enable our Board of Trustees to fulfill its responsibilities despite any conflicts of interest that may exist.
Determination of Our Net Asset Value
The Board of Trustees will determine the net asset value per share of our outstanding Shares quarterly by dividing the value of total assets minus liabilities by the total number of Shares outstanding at the time of determination.
Our net asset value will include amounts which represent our pro rata share of the Master Fund’s accrued management fee and incentive fees under the Investment Advisory Agreement.
Fair Value of Financial Instruments
Fair value is the price that would be received to sell an asset or paid to transfer a liability in an orderly transaction between market participants at the measurement date. Where available, we will base fair value on observable market prices or parameters, or derive fair value from such prices or parameters. Where observable prices or inputs are not available, we will apply valuation models. These valuation techniques used in our valuation models may involve some level of estimation and judgment, the degree of which depends on price transparency for the instruments or market and the financial instruments’ complexity. We will categorize assets and liabilities recorded at fair value in our financial
statements based upon the level of judgment associated with the inputs used to measure their value. Hierarchical levels, as defined under GAAP, are directly related to the amount of subjectivity associated with the inputs to fair valuations of these assets and liabilities, and are as follows:
Level 1: Inputs are unadjusted, quoted prices in active markets for identical assets or liabilities at the measurement date. The types of assets carried at level 1 fair value generally consist of equity securities that are listed on active security exchanges.
Level 2: Inputs, other than quoted prices included in level 1, are observable for the asset or liability, either directly or indirectly. Level 2 inputs include quoted prices for similar instruments in active markets and inputs other than quoted prices that are observable for the asset or liability.
Level 3: Inputs are unobservable inputs for the asset or liability, and include situations where there is little, if any, market activity for the asset or liability.
A significant decrease in the volume and level of activity for an asset or liability is an indication that transactions or quoted prices may not be representative of fair value because, in such market conditions, there may be increased instances of transactions that are not orderly. In those circumstances, we believe further analysis of transactions or quoted prices is needed, and a significant adjustment to the transactions or quoted prices may be necessary to estimate fair value.
The availability of observable inputs can vary depending on the financial asset or liability and is affected by a wide variety of factors, including, for example, the type of financial instrument, whether the financial instrument is new, whether the financial instrument is traded on an active exchange or in the secondary market, and current market conditions. To the extent that we base valuation upon models or inputs that are less observable or unobservable in the market, the determination of fair value requires more judgment. Accordingly, the degree of judgment exercised by us in determining fair value is greatest for instruments categorized in level 3. In certain cases, the inputs used to measure fair value may fall into different levels of the fair value hierarchy. In such cases, for disclosure purposes, the level in the fair value hierarchy within which the fair value measurement falls is determined based on the lowest level input that is significant to the fair value measurement in its entirety. Depending on the relative liquidity in the markets for certain assets, we may transfer assets to level 3 if we determine that observable quoted prices, obtained directly or indirectly, are not available. The variability of the observable inputs affected by the factors described above may cause instruments to be reallocated between levels 1, 2, and/or 3, which we will recognize at the end of the reporting period. Our assessment of the significance of a particular input to the fair value measurement in its entirety requires judgment and consideration of factors specific to the asset.
Many financial assets and liabilities have bid and ask prices that can be observed in the marketplace. Bid prices reflect the highest price that we and others are willing to pay for an asset. Ask prices represent the lowest price that we and others are willing to accept for an asset. For financial assets and liabilities whose inputs are based on bid-ask prices, we will not require that fair value always be a predetermined point in the bid-ask range. Our policy is to allow for mid-market pricing and adjusting to the point within the bid-ask range that meets our best estimate of fair value.
Net Asset Value Determinations in Connection with this Continuous Offering
We will sell our Shares on a continuous basis at net asset value, calculated in accordance with Section 23(b) of the 1940 Act (as made applicable to the Company by Section 63 of the 1940 Act), plus any applicable sales load. Except to the extent otherwise permitted under the rules and regulations of the SEC, we will sell our Shares at a price necessary to ensure that Shares are not sold at a price per share, after deducting selling commissions and Dealer Manager fees, that is below our net asset value per share. We will make updated pricing information available via our website.
Individuals who subscribe for our Shares in this offering must submit subscriptions for a certain dollar amount, rather than a number of Shares and, as a result, may receive fractional Shares.
In connection with each subscription closing on the sale of Shares offered pursuant to the prospectus on a continuous basis, except for as provided by the 1940 Act, our Board of Trustees (or officers to whom the Board of Trustees may delegate the requisite authority) will determine that the net proceeds per share from the sale of Shares are equal to our current net asset value per share on the date of each weekly subscription closing. Our officers may consult with our Board of Trustees or Audit Committee members to confirm their determination that we are not selling our Shares at a price which, after deducting selling commissions and Dealer Manager fees, is below our then current net asset value. In connection with ensuring compliance with this requirement, our administrator, pursuant to authority delegated to it by the Board of Trustees and in accordance with valuation procedures approved and overseen by the Board of Trustees, will calculate our net asset value on a regular basis, including within 48 hours prior to each weekly sale of our Shares.
Importantly, this involves the determination by Guggenheim and our officers, or by our Board of Trustees, that we are not selling our Shares at a price which, after deducting selling commissions and Dealer Manager fees, is below the then current net asset value on the date of sale. Our Board of Trustees - with the assistance of our administrator and officers - is responsible for the determination of our net asset value.
These valuation processes and procedures are part of our compliance program. Records will be made contemporaneously with all determinations described in this section and these records will be maintained with other records we are required to maintain under the 1940 Act. Promptly following any adjustment to the offering price per share of our Shares offered pursuant to the prospectus, we intend to make updated information available via our website at www.GuggenheimCIF.com.
PLAN OF DISTRIBUTION
We are publicly offering, through our Dealer Manager, Guggenheim Funds Distributors, LLC, on a best efforts basis, a maximum amount of $775,000,000 at net asset value, calculated in accordance with Section 23(b) of the 1940 Act (as made applicable to the Company by Section 63 of the 1940 Act), plus any applicable sales load.
This offering is available for purchase by (i) clients of financial intermediaries who charge such clients, including individuals, corporations, endowments and foundations, an ongoing fee for advisory, investment, consulting or related services, (ii) family offices and their clients, (iii) certain other institutional investors, (iv) high net worth investors, (v) investors who are clients of FINRA broker-dealer member firms receiving transaction based compensation, (vi) other non-affiliated investment companies and (vii) investors affiliated with Guggenheim and its affiliates and other individuals identified by management. A shareholder may purchase Shares in the offering only after receipt of a final prospectus. The sale to a shareholder may not be completed until at least five business days after the date that the shareholder receives a final prospectus. The minimum order is $2,000 (or $2,500 for New York non-IRA investments).
Investors will pay a maximum sales load of up to 5.0% of the price per share for combined upfront selling commissions of up to 3.0% and Dealer Manager fees of up to 2.0%. Furthermore, pursuant to specific agreements with selected dealers, Guggenheim may pay our Dealer Manager annualized Additional Selling Commissions equal to no more than 1.0% of the Company's then-current net asset value, payable quarterly. Our Dealer Manager will re-allow all of the Additional Selling Commissions to participating selected dealers. The Additional Selling Commissions will not be paid by our shareholders. Guggenheim will cease making these payments to our Dealer Manager with respect to each Share upon the earliest of the following: (i) the date when the aggregate underwriting compensation would exceed that permitted under FINRA Rule 2310 over the life of the offering, which equals 10% of the gross offering proceeds from the sale of Shares (excluding Shares purchased through our DRP); (ii) the date of a Liquidity Event; (iii) the date that such Share is repurchased or is no longer outstanding; (iv) the date when the aggregate upfront selling commission, Dealer Manager fees, and Additional Selling Commissions together equal 8.0% (or such other amount, as determined by Guggenheim) of the actual price paid for such Share; or (v) the date when Guggenheim no longer serves as our investment advisor.
We will sell our Shares on a continuous basis at net asset value plus any applicable sales load. We will make updated pricing information available via our website. See "Determination of Net Asset Value" for information as to how we calculate our net asset value.
Our Dealer Manager is a member of FINRA and SIPC and is headquartered at 227 West Monroe Street, Chicago, IL 60606. The Shares are being offered on a “best efforts” basis, which means generally that the Dealer Manager is required to use only its best efforts to sell the Shares and it has no firm commitment or obligation to purchase any of the Shares. Our Shares offered pursuant to this prospectus will not be listed on any national securities exchange during the offering period, and neither the Dealer Manager nor the selected dealers intend to act as market-makers with respect to our Shares. This prospectus also relates to the Shares that we will offer under our DRP. See “Distribution Reinvestment Plan.”
Our Shares may also be sold by our officers and Trustees, without receiving any selling commissions or Dealer Manager fees. All offers and sales of Shares by our officers and Trustees will be made under the safe harbor from broker-dealer registration provided by SEC Rule 3a4-1 and exemptions from state-level broker-dealer registration in the states where Shares are sold by our officers and Trustees.
This offering must be registered in every state in which we offer or sell Shares. Generally, such registrations are for a period of one year. Thus, we may have to stop selling Shares in any state in which our registration is not renewed or otherwise extended annually. We reserve the right to terminate this offering at any time prior to the stated termination date.
Our Dealer Manager and Compensation We Will Pay for the Sale of Our Shares
We expect our Dealer Manager to authorize other broker-dealers that are members of FINRA, which we refer to as selected dealers, to sell our Shares. Except as provided below, our Dealer Manager will re-allow all of its selling commission attributable to a selected dealer.
Also, the Dealer Manager may re-allow a portion of its Dealer Manager fees to a selected dealer as a marketing fee based upon such factors as:
| |
| • | the volume of sales estimated to be made by the selected dealer; or |
| |
| • | the selected dealer’s agreement to provide one or more of the following services: |
| |
| • | providing internal marketing support personnel and marketing communications vehicles to assist the Dealer Manager in our promotion; |
| |
| • | responding to investors’ inquiries concerning monthly statements, valuations, distribution rates, tax information, annual reports, reinvestment and repurchase rights and procedures, our financial status, and the markets in which we have invested; |
| |
| • | assisting investors with repurchases; or |
| |
| • | providing other services requested by investors from time to time and maintaining the technology necessary to adequately service investors. |
In addition, our Dealer Manager may reimburse certain of our selected dealers for:
| |
| • | other costs and expenses associated with the primary offering, the facilitation of the marketing of our Shares (such as the expenses associated with a web-based platform to assist in identifying potential investors) and the ownership of such Shares by our selected dealers’ customers. |
These costs will be paid out of the Dealer Manager fees. There is a possibility that these reimbursements may cause the aggregate compensation paid to a particular selected dealer to exceed ten percent of its sales. For a more complete discussion of all compensation and fees paid in connection with the offering. See “Fees and Expenses.”
Our Dealer Manager provides services to us, which include conducting broker-dealer seminars, holding informational meetings, providing information, and answering any questions concerning this offering. We pay our Dealer Manager Dealer Manager fees of up to 2.0% of the price per Share. In addition to re-allowing a portion of the Dealer Manager fees as a marketing fee as described above, the fee will also be used for certain costs that are viewed by FINRA as included in the 10% underwriting compensation limit under FINRA Rule 2310(b)(4)(B)(ii), such as the cost of the following activities:
| |
| • | travel and entertainment expenses; |
| |
| • | compensation of our Dealer Manager’s employees in connection with wholesaling activities; |
| |
| • | expenses incurred in coordinating broker-dealer seminars and meetings; |
| |
| • | wholesaling expense reimbursements paid by our Dealer Manager or its affiliates to other entities; |
| |
| • | the national and regional sales conferences of our selected dealers; |
| |
| • | training and education meetings for registered representatives of our selected dealers; and |
| |
| • | permissible forms of non-cash compensation to registered representatives of our selected dealers, such as logo apparel items and gifts that do not exceed an aggregate value of $100 per annum per registered representative and that are not pre-conditioned on achievement of a sales target (these gifts would include, but not be limited to, seasonal gifts). |
We may make payments out of our own assets to certain financial intermediaries in compensation for the provision by such financial intermediaries of certain shareholder services to their clients who hold our Shares, or for offering our Shares on their platforms and/or other distribution or marketing-related services.
We will reimburse our Dealer Manager and selected dealers for reasonable bona fide due diligence expenses incurred that are supported by a detailed and itemized invoice. Such reimbursements are subject to the limitations on organization and offering expenses as described below. In this regard, Guggenheim may advance the due diligence reimbursements to the Dealer Manager and the selected dealers for which we will reimburse our Advisor.
Under FINRA rules, the total underwriting compensation to be paid to our Dealer Manager and selected dealers from any source in connection with the offering, including selling commissions, the Dealer Manager fees, and the Additional Selling Commissions may not exceed 10% of our gross offering proceeds from the sale of Shares in our offering. We and our Dealer Manager will monitor the payment of all fees and expense reimbursements to assure that this 10% underwriting compensation limit is not exceeded. Our Dealer Manager will reimburse us for any underwriting compensation in excess of this 10% underwriting compensation limit in the event the offering is terminated before reaching the maximum offering amount.
In addition to the 10% underwriting compensation limit, FINRA and many states also limit the total organizational and offering expenses (including selling commissions, the Dealer Manager fees, and the Additional Selling Commissions) that we may incur up to 15% of our gross offering proceeds. Company shareholders may pay a sales load of up to 5.0%. We will pay our organizational and offering expenses up to 1.5% of the aggregate gross proceeds from the offering. Guggenheim has agreed to reimburse us for or pay any organizational and offering expenses (excluding the selling commissions and Dealer Manager fees) that, in the aggregate, exceed 1.5% of the aggregate
gross proceeds from the offering. Therefore, the maximum of sales load, organizational expenses and offering expenses will not exceed 6.5%.
See “Plan of Distribution - Share Distribution Channels” and “Plan of Distribution - Shares Purchased by Selected Dealers Participating in the Offering and our Affiliates” for a description of the circumstances under which selling commissions and/or Dealer Manager fees may be reduced or eliminated in connection with certain purchases. Fees expressed as a percentage of the public offering price per Share may be higher or lower due to rounding. Any reduction in selling commissions and/or Dealer Manager fees will reduce the effective purchase price per Share to the investor involved, but will not alter the proceeds available to us. All investors will be deemed to have contributed the same amount per Share to us, whether or not the investor receives a discount, and will receive the same amount of distributions per Share from us. Accordingly, for purposes of distributions, investors who pay reduced selling commissions and/or Dealer Manager fees will receive higher returns on their investments in us as compared to investors who do not pay reduced selling commissions and/or Dealer Manager fees. Any reduction in selling commissions and/or Dealer Manager fees will be credited to the purchaser in the form of additional Shares and fractional Shares will be issued, if required. Selling commissions and Dealer Manager fees will not be paid in connection with the purchase of Shares pursuant to our DRP.
To the extent permitted under applicable law and our Declaration of Trust, we have agreed to indemnify the Dealer Manager, selected dealers, and selected registered investment advisers against certain liabilities arising under the Securities Act and liabilities arising from breaches of our representations and warranties contained in the Dealer Manager Agreement.
Our Dealer Manager and selected dealers are required to deliver a copy of the prospectus to each potential investor. We may make this prospectus, our order form, certain offering documents, administrative and transfer forms, as well as certain marketing materials, available electronically to our Dealer Manager and selected dealers as an alternative to paper copies when possible. As a result, if our Dealer Manager or a selected dealer chooses, with an investor’s prior consent, it may provide an investor with the option of receiving the prospectus, an order form, offering documents, administrative and transfer forms, as well as marketing materials, electronically. If our Dealer Manager or a selected dealer chooses to offer electronic delivery of these documents to an investor, it will comply with all applicable requirements of the SEC and FINRA and any laws or regulations related to the electronic delivery of documents. In any case, an investor may always receive a paper copy of these documents upon request to our Dealer Manager or the selected dealer.
Share Distribution Channels
We expect our Dealer Manager to use multiple distribution channels to sell our Shares. These channels may have different selling commissions or Dealer Manager fees, and consequently, different purchase prices for the Shares; however, the net purchase price will be the same across all distribution channels. As set forth above, our Dealer Manager is expected to engage selected dealers in connection with the sale of the Shares in accordance with selected dealer agreements. Except as otherwise described, selling commissions and Dealer Manager fees will be paid by us to our Dealer Manager in connection with such sales.
We may sell our Shares at a discount to the offering price through the following distribution channels in the event that the investor:
| |
| • | purchases Shares through fee-based programs, also known as wrap accounts; |
| |
| • | purchases Shares through selected dealers that have alternative fee arrangements with their clients; |
| |
| • | purchases Shares through certain registered investment advisers; |
| |
| • | purchases Shares through bank trust departments or any other organization or person authorized to act in a fiduciary capacity for its clients or customers; or |
| |
| • | is an endowment, foundation, pension fund, or other institutional investor. |
Such discount will reflect that all or a portion of the Dealer Manager fee and selling commissions will not be paid in connection with such purchases. We will receive the same net proceeds per share for sales of Shares through these channels. Neither our Dealer Manager nor its affiliates are expected to compensate any person engaged as a financial adviser by a potential investor to induce such financial adviser to advise for an investment in us.
In addition, we may sell our Shares through an affiliated selected dealer at a discount to the offering price to:
| |
| • | certain closed-end investment companies registered under the 1940 Act; |
| |
| • | closed-end funds advised by investment advisors that are affiliated with a selected dealer; or |
| |
| • | private equity funds or other unregistered wealth management funds. |
Such discount will reflect that all or a portion of the Dealer Manager fees and selling commissions will not be paid in connection with such purchases. The Dealer Manager may re-allow all or a portion of the Dealer Manager fees earned on sales to the above described purchaser to the affiliated broker-dealer of such purchaser. The net proceeds to us will not be affected by such reduction in Dealer Manager fees. In connection with the distribution channels described above, any reduction in the amount of the Dealer Manager fees and selling commissions will be credited to the purchaser in the form of additional Shares. Fractional Shares will be issued. The discounted price for the Shares sold to those purchasers will not apply to any Shares sold under our DRP.
Neither our Dealer Manager nor its affiliates are expected to compensate any person engaged as a financial adviser by a potential investor to induce such financial adviser to advise for an investment in us. The net proceeds to us will not be affected by such reduction in selling commissions and Dealer Manager fees.
Shares Purchased by Selected Dealers Participating in the Offering and our Affiliates
We may sell Shares to selected dealers and their retirement plans, their representatives, employees and family members, IRAs, and the qualified plans of their representatives, net of the upfront selling commissions. For purposes of this discount, we consider a family member to be a spouse, parent, child, sibling, cousin, mother or father-in-law, son or daughter-in-law, or brother or sister-in-law. The net offering proceeds we receive will not be affected by the discounted sales price of such Shares.
Our officers and Trustees and their family members, as defined above, as well as Guggenheim and its affiliates and the officers, Trustees, and employees of Guggenheim and its affiliates and their family members and, if approved by our Board of Trustees, consultants, subject to state securities law limitations, may purchase directly from us Shares offered in this offering net of all selling commissions and Dealer Manager fees. Except for certain share ownership and transfer restrictions contained in our Declaration of Trust, there is no limit on the number of shares that may be sold to such persons. The net offering proceeds we receive will not be affected by the reduced sales price of such shares. Such persons shall be expected to hold their shares purchased as shareholders for investment and not with a view towards distribution.
Volume Discounts
We are also offering volume discounts to investors who purchase more than $1,000,000 of Shares. For purposes of determining investors eligible for volume discounts, investments made by accounts with the same primary account holder, as determined by the account tax identification number, may be combined. This includes individual accounts and joint accounts that have the same primary holder as any individual account. Investments made through IRAs may also be combined with accounts that have the same tax identification number as the beneficiary of the IRA.
An eligible investor may request their qualifying purchase within the offering be combined with their previous purchase or purchases of our Shares by checking the appropriate box and providing requested information under the “Investment” section of our order form. To the extent an investor qualified for a volume discount on a particular purchase, any subsequent purchase, regardless of the number of Shares subscribed for in that purchase (other than through the DRP), will also qualify for that volume discount or, to the extent the subsequent purchase when aggregated with the prior purchase(s) qualifies for a greater volume discount, such greater discount.
For example, if an initial purchase is for $950,000 with a hypothetical $10.53 offering price, gross of all sales load, and a second purchase is for $80,000, then the first $50,000 of the second purchase will be priced at $10.53 per share and the remaining $30,000 of the second purchase will be priced at $10.42 per share. Any request to treat a subsequent purchase cumulatively for purposes of the volume discount must be made in writing on the order form and will be subject to our verification that all of the orders were made by a single purchaser.
The net proceeds per share to us from a sale eligible for a volume discount will be the same, but the selling commissions payable to the selected dealer will be reduced. The following table shows the discounted price per share and the reduced selling commissions payable for volume sales of our Shares; the Dealer Manager fees of 2.0% will still be applied at all volume levels when applicable. The share purchase price will be reduced for each incremental share purchased in the total volume ranges set forth in the table below.
|
| | | | | |
| Dollar Amount of Shares Purchased | | Purchase Price Per Incremental Share in Volume Discount Range (1) | | Selling Commission Per Share Price For Incremental Share in Volume Discount Range |
| $2,000-$1,000,000 | | $10.53 | | 3% |
| $1,000,001-$5,000,000 | | $10.42 | | 2% |
______________
| |
| (1) | Based on a hypothetical $10.53 offering price, gross of all sales load. |
For example, a single purchaser would receive 99,765 Shares, rather than 99,715 Shares, for an investment of $1,050,000, and the selling commission would be $31,000. The discount would be calculated as follows: (i) on the first $1,000,000 of the investment, there would be no discount and the purchaser would receive 94,967 Shares at $10.53 per share; and (ii) on the remaining $50,000, the per share price would be $10.42 and the purchaser would receive 4,798 Shares.
In the event orders are combined, the commission payable with respect to the subsequent purchase of Shares will equal the commission per share that would have been payable in accordance with the commission schedule set forth above if all purchases had been made simultaneously. Any reduction of the 3% selling commission otherwise payable to the Dealer Manager or a selected dealer will be credited to the purchaser as additional Shares. Unless investors correctly indicate on the order form that orders are to be combined and provide all other requested information, we cannot be held responsible for failing to combine orders properly.
In the event that a person wishes to have his or her order combined with orders made by others for the purposes of being treated as a “single purchaser,” that person must request such treatment in writing at the time of subscription, setting forth the basis for the discount, and identifying the orders to be combined. Any request will be subject to verification that the orders to be combined may be treated as purchases made by a single purchaser. If the order forms for the combined orders of persons wishing to be treated as a single purchaser are submitted at the same time, then the commissions payable and discounted Share price will be allocated pro rata among the combined orders on the basis of the respective amounts of each order. If the order forms are not submitted at the same time, the volume discount provisions will apply only to the order that qualifies the single purchaser for the volume discount and the subsequent orders of that single purchaser.
Only Shares purchased in this offering pursuant to this prospectus are eligible for volume discounts. Shares purchased through our DRP will not be eligible for a volume discount, nor will such Shares count toward the threshold limits listed above that qualify individuals for the various discount levels.
California residents should be aware that volume discounts will not be available in connection with the sale of Shares made to California residents to the extent such discounts do not comply with the provisions of Rule 260.140.51, adopted pursuant to the California Corporate Securities Law of 1968. Pursuant to this rule, volume discounts can be made available to California residents only in accordance with the following conditions:
| |
| • | there can be no variance in the net proceeds to us from the sale of the Shares to different purchasers of the same offering at the same time; |
| |
| • | all purchasers of the Shares must be informed of the availability of quantity discounts; |
| |
| • | the same volume discounts must be allowed to all purchasers of Shares that are part of the offering; |
| |
| • | the minimum amount of Shares as to which volume discounts are allowed cannot be less than $10,000; |
| |
| • | the variance in the price of the Shares must result solely from a different range of commissions and all discounts must be based on a uniform scale of commissions; and |
| |
| • | no discounts are allowed to any group of purchasers. |
Accordingly, volume discounts for California residents will be available in accordance with the foregoing table of uniform discount levels based on dollar volume of Shares purchased, but no discounts are allowed to any group of purchasers and no subscriptions may be aggregated as part of a combined order for purposes of determining the number of Shares purchased.
Other Discounts
From time to time, we may sell equity securities to institutional investors. We may sell Shares directly to institutional investors in this offering or we may sell equity interests in other public offerings or private placement transactions. Such sales may be based upon the price at which the Shares are being sold in this offering, or they may be at negotiated prices and on terms that are different from the terms of this offering. We may pay commissions to placement agents, selected dealers, brokers and our Dealer Manager in connection with such transactions that are different from the Dealer Manager fees and selling commissions described above. In the event of a sale to an institution in this offering at a negotiated price, then we will supplement this prospectus to include:
| |
| • | the aggregate amount of the sale; |
| |
| • | the price per share paid by the institution; and |
| |
| • | a statement that other similar institutions wishing to purchase at that volume of securities will pay the same price for that volume of securities. |
The selling commissions and Dealer Manager fees for purchases of more than $5.0 million are negotiable. The selling commissions and Dealer Manager fees paid will in all cases be the same for the same level of sales and once a price is negotiated with the initial purchaser, this will be the price for all purchases at that volume. In the event of a sale of more than $5.0 million, we will supplement this prospectus to include:
| |
| • | the aggregate amount of the sale; |
| |
| • | the price per Share paid by the purchaser; and |
| |
| • | a statement that other similar investors wishing to purchase at that volume of securities will pay the same price for that volume of securities. |
Under FINRA Rule 2310(a)(18), a sponsor is defined as a person who directly or indirectly provides management services for a direct participation program whether as general partner, pursuant to contract, or otherwise. Guggenheim serves as our Master Fund’s advisor, and the Master Fund has the following feeder funds: the Company, Guggenheim Credit Income Fund 2016 T (GCIF 2016 T), and Guggenheim Credit Income Fund 2019 (GCIF 2019). Guggenheim may therefore be considered the sponsor of the Company, GCIF 2016 T and GCIF 2019 for the limited purpose of FINRA Rule 2310(b)(3)(D), which provides in part that:
Prior to executing a purchase transaction in a direct participation program or a REIT, a member or person associated with a member shall inform the prospective participant of all pertinent facts relating to the liquidity and marketability of the program or REIT during the term of the investment. Included in the pertinent facts shall be information regarding whether the sponsor has offered prior programs or REITs in which disclosed in the offering materials was a date or time period at which the program or REIT might be liquidated, and whether the prior program(s) or REIT(s) in fact liquidated on or around that date or during the time period.
In this regard, our prospectus provides that the Company might be liquidated on or around December 31, 2028, GCIF 2016 T’s prospectus provided that it might be liquidated on or around December 31, 2021, and GCIF 2019's prospectus provided that it might be liquidated on or around December 31, 2026. Thus, the time period for liquidation has not expired for us, GCIF 2016 T, or GCIF 2019.
To purchase our Shares, an investor must complete and sign the order form which is incorporated in this prospectus. An investor must pay for the Shares by delivering a check for the full purchase price of the Shares payable to UMB Bank, N.A., as escrow agent for Guggenheim Credit Income Fund 2021. Subscription proceeds will be deposited by the selected dealer in an escrow account held by the escrow agent, UMB Bank, N.A. When a selected dealer’s internal supervisory procedures are conducted at the site at which the order form and check were initially received by the selected dealer from the subscriber, the selected dealer shall transmit the order form and check to the transfer agent by the end of the next business day following receipt of the check and order form. When, pursuant to the selected dealer’s internal supervisory procedures, the selected dealer’s final internal supervisory procedures are conducted at a different location (the “Final Review Office”), the selected dealer shall transmit the check and order form to the Final Review Office by the end of the next business day following the selected dealer’s receipt of the order form and check. The Final Review Office, by the end of the next business day following its receipt of the order form and check, will forward both the order form and check to the transfer agent. It is our intention to admit shareholders generally on a weekly basis. If an order form is rejected, the funds, without interest or reductions for offering expenses, commissions or fees, will be returned to you within 10 business days after the date of such rejection.
We will sell our Shares on a continuous basis at net asset value plus any applicable sales load. Therefore, subscriptions for this offering shall be for a specific dollar amount rather than a specified quantity of Shares. Except as discussed above, the public offering price of our Shares will always include a provision for a sales load comprised of selling commissions and Dealer Manager fees of up to 5.0%, computed as a percentage of the public offering price.
DISTRIBUTION REINVESTMENT PLAN
Any investor may elect to participate in our DRP by making a written election to participate in such DRP on the investor’s order form at the time the investor subscribes for Shares.
Subject to our Board of Trustees' discretion and applicable legal restrictions, we intend to authorize and paying monthly distributions to our shareholders. We have adopted an “opt-in” DRP, pursuant to which you may elect to have the full amount of your cash distributions reinvested in additional Shares. There will be no selling commissions, Dealer Manager fees, or other sales charges to you if you elect to participate in the DRP. We will pay the reinvestment agent’s fees under the DRP.
Participation in the DRP will commence with the next distribution paid after receipt of an investor’s written election to participate in the DRP and to all other calendar months thereafter, provided such election is received at least 15 business days prior to the last day of the calendar month.
We reserve the right to amend, suspend, or terminate the DRP. Any purchases of our Shares pursuant to our DRP are dependent on the continued registration of our securities or the availability of an exemption from registration in the recipient’s home state. Participants in our DRP are free to elect or revoke reinstatement in the DRP within a reasonable time as specified in the plan. If you do not elect to participate in the DRP, you will automatically receive any distributions we declare in cash. For example, if our Board of Trustees authorizes, and we declare, a cash distribution, then if you have “opted in” to our DRP, you will have your cash distributions reinvested in additional Shares, rather than receiving the cash distributions.
Your distribution amount purchases Shares at net asset value, calculated in accordance with Section 23(b) of the 1940 Act (as made applicable to the Company by Section 63 of the 1940 Act). Shares issued pursuant to our DRP will have the same voting rights as our Shares offered pursuant to this prospectus.
We intend to pay our distributions in the form of cash out of assets legally available for distribution, unless shareholders elect to receive distributions in additional Shares under our DRP. If you wish to receive your distributions in cash, no action will be required on your part to do so. If you are a registered shareholder, you may elect to have your entire distribution reinvested in additional Shares by notifying DST Systems, Inc., the reinvestment agent and our transfer agent and registrar, in writing so that such notice is received by the reinvestment agent no later than the record date for distributions to shareholders. If you elect to reinvest your distributions in additional Shares, the reinvestment agent will set up an account for Shares you acquire through the DRP and will hold such Shares in non-certificated form. If your Shares are held in a broker-controlled account, you may “opt-in” to our DRP by notifying your broker of your election.
During each quarter, but in no event later than 30 days after the end of each calendar quarter, our transfer agent or another designated agent will mail and/or make electronically available to each participant in the DRP, a statement of account describing, as to such participant, the distributions received during such quarter, the number of Shares purchased during such quarter, and the per share purchase price for such Shares. At least annually, we will include tax information for income earned on all Shares in your account, including Shares acquired under the DRP, on a Form 1099-DIV that is mailed to shareholders subject to IRS tax reporting. If your Shares are held in a broker-controlled account, your broker will provide to you the distribution statement on Form 1099-DIV. Any distributions reinvested through the issuance of Shares through our DRP will increase our gross assets on which the management fee and the incentive fee are determined and paid under the Investment Advisory Agreement.
For additional discussion regarding the tax implications of participation in the DRP, see “Tax Matters.” Additional information about the DRP may be obtained by contacting investor relations for GCIF 2021 at 330 Madison Avenue, New York, New York 10017.
SHARE REPURCHASE PROGRAM
We do not currently intend to list our Shares on any securities exchange and we do not expect a secondary market in the Shares to develop. As a result, if you purchase Shares, your ability to sell your Shares will be limited.
We intend to conduct a share repurchase program pursuant to which we intend to conduct quarterly tender offers on approximately 10% of our weighted average number of outstanding Shares in any 12-month period, in accordance with the requirements of Rule 13e-4 under the Exchange Act and the 1940 Act, to allow our shareholders to tender their Shares at a price estimated to be equal to our net asset value per share as of the expiration date of the applicable tender offer. Our share repurchase program will include numerous restrictions that limit your ability to sell your Shares.
At the discretion of our Board of Trustees, we intend to limit the number of Shares to be repurchased during any calendar year to the number of Shares we can repurchase with cash on hand, cash available from the issuance and sale of our Shares, and cash available from the sale of our investment interests in the Master Fund. In addition, we will limit repurchases in each quarter to 2.5% of the weighted average number of Shares outstanding in the prior four calendar quarters. You may tender all of the Shares that you own. We do not plan to repurchase any Shares of any shareholder under the circumstances of death or disability of such shareholder, except through the share repurchase program.
To the extent that the number of Shares tendered to us for repurchase exceeds the number of Shares that we are able to purchase, we will repurchase Shares on a pro rata basis. Further, we will have no obligation to repurchase Shares if the repurchase would violate the restrictions on distributions under federal law or Delaware law, which prohibit distributions that would cause a trust to fail to meet statutory tests of solvency. The limitations and restriction described above may prevent us from accommodating all repurchase requests made in any year. Our share repurchase program has many limitations, including the limitations described above, and should not in any way be viewed as the equivalent of a secondary market.
We will offer to repurchase Shares on such terms as may be determined by our Board of Trustees in its complete and absolute discretion unless, in the judgment of our Independent Trustees, such repurchases would not be in the best interests of our shareholders or would violate applicable law. There is no assurance that our Board of Trustees will exercise its discretion to offer to repurchase Shares or that there will be sufficient funds available to accommodate all of our shareholders’ requests for repurchase. As a result, we may repurchase less than the full amount of Shares that you request to have repurchased. If we do not repurchase the full amount of your Shares that you have requested to be repurchased, or we determine not to make repurchases of our Shares, you will likely not be able to dispose of your Shares, even if we under-perform. Any periodic repurchase offers will be subject in part to our available cash and compliance with the RIC qualification and diversification rules and the 1940 Act. Shareholders will not pay a fee to us in connection with our repurchase of Shares under the share repurchase program.
The Company will repurchase Shares from shareholders pursuant to written tenders, on terms and conditions that the Board of Trustees determines to be fair to the Company and to all shareholders. When the Board of Trustees determines that the Company will repurchase Shares, notice will be provided to shareholders describing the terms of the offer, containing information shareholders should consider in deciding whether to participate in the repurchase opportunity, and containing information on how to participate. If a repurchase offer is oversubscribed by shareholders who tender Shares, the Company will repurchase a pro rata portion of the Shares tendered by each shareholder, extend the repurchase offer, or take any other action with respect to the repurchase offer permitted by applicable law.Repurchases of Shares from shareholders by the Company will be paid in cash. Repurchases will be effective after receipt and acceptance by the Company of eligible written tenders of Shares from shareholders by the applicable repurchase offer deadline.
Our assets will consist primarily of our investment interests in the Master Fund. Therefore, in order to finance our repurchase of Shares, we may seek to liquidate a portion of our investment interests in the Master Fund. Thus, each of our quarterly repurchase offers will be conducted in parallel with similar repurchase offers made by the Master Fund. Our Board of Trustees also serves as the Board of Trustees for the Master Fund and we expect that the Master Fund will conduct quarterly repurchase offers in order to permit us (and any other feeder fund) to meet our (and its) quarterly repurchase obligations. We cannot make a repurchase offer larger than that made by the Master Fund, and we expect that each quarterly repurchase offer by the Master Fund will generally apply to up to 2.5% of the Master Fund’s average number of shares outstanding in the prior four calendar quarters. The Master Fund may borrow money or issue debt obligations to finance its repurchase obligations pursuant to any quarterly repurchase offer.
Payment for repurchased Shares may require the Master Fund to liquidate portfolio holdings earlier than Guggenheim would otherwise have caused these holdings to be liquidated, potentially resulting in losses, and may increase the Master Fund’s investment related expenses as a result of higher portfolio turnover rates. Guggenheim intends to take
measures, subject to policies as may be established by the Master Fund’s Board of Trustees, to attempt to avoid or minimize potential losses and expenses resulting from the repurchase of Shares.
ADDITIONAL INFORMATION
Supplemental Sales Material
In addition to this prospectus, we intend to use supplemental sales materials in connection with the offering of our Shares, but only in permitted jurisdictions and only when accompanied or preceded by the delivery of this prospectus, as supplemented. We will submit all supplemental sales materials to the SEC, or to FINRA as permitted by regulation, for review prior to distributing such materials. The supplemental sales materials do not contain all of the information material to an investment decision and should only be reviewed after reading our prospectus. The supplemental sales materials expected to be used in permitted jurisdictions include:
| |
| • | investor sales promotion brochures; |
| |
| • | cover letters transmitting the prospectus; |
| |
| • | brochures containing a summary description of the offering; |
| |
| • | fact sheets describing the general nature of our business and our investment objectives; |
| |
| • | flyers describing our recent investments; |
| |
| • | financial adviser updates; |
| |
| • | online investor presentations; |
| |
| • | third-party article reprints; |
| |
| • | electronic media presentations; and |
| |
| • | client seminars and seminar advertisements and invitations. |
All of the foregoing materials will be prepared by Guggenheim or its affiliates, with the exception of any third-party article reprints. In certain jurisdictions, some or all of such sales materials may not be available.
We are offering Shares in this offering only by means of this prospectus. Although we do not expect that the information contained in our supplemental sales materials will conflict with any of the information contained in this prospectus, as supplemented, the supplemental materials do not purport to be complete and should not be considered a part of, nor as incorporated by reference in, the prospectus or the registration statement of which this prospectus is a part.
Code of Ethics
We have adopted a code of ethics pursuant to Rule 17j-1 under the 1940 Act that establishes procedures for personal investments and restricts certain personal securities transactions. Persons subject to this code may invest in securities for their personal investment accounts, including securities that may be purchased or held by us, so long as such investments are made in accordance with the code’s requirements. Our code of ethics and those of Guggenheim are or previously have been included as exhibits to our registration statement for this offering. A copy of our code of ethics is also available on our website at www.guggenheiminvestments.com/bdc/Corporate-Governance. In addition, our code of ethics is available on the EDGAR Database on the SEC’s Internet site at www.sec.gov. You may also obtain copies of our code of ethics, after paying a duplicating fee, by electronic request at the following e-mail address: publicinfo@sec.gov.
TAX MATTERS
The following is a summary of certain U.S. federal income tax consequences to a shareholder who purchases our Shares pursuant to this offering. This summary is subject to change by legislative or administrative action, and any change may be retroactive. The discussion does not purport to deal with all of the U.S. federal income tax consequences applicable to us, or which may be important to particular shareholders in light of their individual investment circumstances, or to some types of shareholders subject to special tax rules (such as financial institutions, broker-dealers, insurance companies, tax-exempt organizations, partnerships, or other pass-through entities); persons holding our Shares in connection with a hedging, straddle, conversion, or other integrated transactions; persons engaged in a trade or business in the United States; or individuals who have ceased to be U.S. citizens or to be taxed as resident aliens; or shareholders who contribute assets to us in exchange for our Shares. This discussion assumes that the shareholders hold their Shares as capital assets for U.S. federal income tax purposes (generally, assets held for investment). No attempt is made to present a detailed explanation of all U.S. federal income tax aspects affecting us and our shareholders, and the discussion set forth herein does not constitute tax advice. No ruling has been or will be sought from the IRS regarding any matter discussed herein. Tax counsel has not rendered any legal opinion regarding any tax consequences relating to us or our shareholders. Shareholders are urged to consult their own tax advisers to determine the U.S. federal, state, local, and foreign tax consequences of investing in our Shares.
Taxation of our Company
Beginning with our taxable year ending September 30, 2021, we intend to elect to be treated for federal income tax purposes, and to qualify annually thereafter, as a RIC under Subchapter M of the Code. To qualify as a RIC, we must: (i) qualify as a BDC under the 1940 Act at all times during the taxable year; (ii) derive in each taxable year at least 90% of our gross income from dividends; interest (including tax-exempt interest); payments with respect to certain securities loans; gains from the sale or other disposition of stock, securities, or foreign currencies; other income (including, but not limited to, gain from options, futures, and forward contracts) derived with respect to our business of investing in stock, securities, or currencies; or net income derived from an interest in a “qualified publicly-traded partnership” (a “QPTP”); and (iii) diversify our holdings so that, at the end of each quarter of each taxable year: (A) at least 50% of the market value of our total assets is represented by cash and cash items, U.S. government securities, the securities of other regulated investment companies (including investment interests in the Master Fund), and other securities (with other securities limited, in respect of any one issuer, to an amount not greater than 5% of the value of our total assets and not more than 10% of the outstanding voting securities of such issuer, subject to the exception described below), and (B) not more than 25% of the market value of our total assets is invested in the securities of any issuer (other than U.S. government securities and the securities of other regulated investment companies, including investment interests in the Master Fund), the securities of any two or more issuers that we control and that are determined to be engaged in the same business or similar or related trades or businesses, or the securities of one or more QPTPs.
In addition, as a RIC, we must distribute to our shareholders, for each taxable year, dividends of an amount generally at least equal to 90% of our “investment company taxable income,” which is generally our net ordinary income, plus the excess of realized net short-term capital gains over realized net long-term capital losses. In this prospectus, we refer to this distribution requirement as the annual distribution requirement. A RIC can elect to treat as paid, during the taxable year, certain dividends actually paid by the RIC in the subsequent taxable year. Such dividends commonly are referred to as spillover dividends. This election affects only the tax treatment of the RIC. The shareholders generally are taxed on dividends in the year such dividends are actually distributed. Any dividend declared by us in October, November, or December of any calendar year, payable to shareholders of record on a specified date in such a month and actually paid during January of the following calendar year, will be treated as if it had been paid by us and received by our U.S. shareholders on December 31 of the calendar year in which the dividend was declared.
As a RIC, in any taxable year with respect to which we distribute at least 90% of the sum of our: (i) “investment company taxable income,” which includes, among other items, dividends, interest, the excess of any net realized short-term capital gains over net realized long-term capital losses, and other taxable income (other than any net capital gain), reduced by deductible expenses, determined without regard to the deduction for dividends and distributions paid, and (ii) net tax exempt interest income (which is the excess of our gross tax exempt interest income over certain disallowed deductions), we (but not our shareholders) generally will not be subject to U.S. federal income tax on investment company taxable income and any realized net long-term capital gains in excess of realized net short-term capital losses, or “net capital gains,” distributed to our shareholders. We intend to distribute, in cash and/or our Shares, annually, all or substantially all of such income. To the extent that we retain our net capital gains for investment or any investment company taxable income, we will be subject to U.S. federal income tax. We may choose to retain our net capital gains for investment or any investment company taxable income, and pay the associated federal corporate income tax, including the federal excise tax described below.
We may retain some or all of our net capital gains and designate such retained net capital gains as a “deemed distribution.” In that case, among other consequences, we will pay tax on the retained amount each U.S. shareholder will be required to include his, her, or its share of the deemed distribution in income as if it had been actually distributed to the U.S. shareholder, and the U.S. shareholders will be entitled to claim a credit equal to his, her or its allocable share of the tax paid thereon by us. The amount of the deemed distribution net of such tax will be added to the U.S. shareholder’s cost basis for his, her, or its Shares. Since we expect to pay tax on any retained net capital gains at our regular corporate tax rate, and since that rate is in excess of the maximum rate currently payable by individuals on long-term capital gains, the amount of tax that individual shareholders will be treated as having paid and for which they will receive a credit will exceed the tax they owe on the retained net capital gain. Such excess generally may be claimed as a credit against the U.S. shareholder’s other federal income tax obligations or may be refunded to the extent it exceeds a shareholder’s liability for federal income tax. A shareholder that is not subject to federal income tax or otherwise required to file a federal income tax return would be required to file a federal income tax return on the appropriate form to claim a refund with respect to the allocable share of the taxes that we have paid. For federal income tax purposes, the tax basis of Shares owned by a shareholder will be increased by an amount equal to the excess of the amount of undistributed capital gains included in the shareholder’s gross income and the tax deemed paid by the shareholder as described in this paragraph. To utilize the deemed distribution approach, we must provide written notice to shareholders prior to the expiration of 60 days after the close of the relevant taxable year. We cannot treat any of our investment company taxable income as a “deemed distribution.” We may also make actual distributions to our shareholders of some or all of realized net long-term capital gains in excess of realized net short-term capital losses.
Amounts not distributed on a timely basis in accordance with a calendar year distribution requirement are subject to a nondeductible 4% U.S. federal excise tax payable by us. To avoid this tax, we must distribute (or be deemed to have distributed) during each calendar year an amount at least equal to the sum of:
| |
| 1. | at least 98% of our ordinary income (taking into account certain deferrals and elections) for the calendar year; |
| |
| 2. | at least 98.2% of the amount by which our capital gains exceed our capital losses (adjusted for certain ordinary losses) for a one-year period generally ending on October 31 of the calendar year; and |
| |
| 3. | certain undistributed amounts from previous years on which we paid no U.S. federal income tax. |
While we intend to distribute any income and capital gains in the manner necessary to minimize imposition of the 4% federal excise tax, sufficient amounts of our taxable income and capital gains may not be distributed to avoid entirely the imposition of the tax. In that event, we will be liable for the tax only on the amount by which we do not meet the foregoing distribution requirement.
We invest all or substantially all of our assets in the Master Fund, which has qualified as a RIC. Failure of the Master Fund to so qualify will have an adverse effect on our qualification as a RIC. Distributions by the Master Fund and repurchases of shares in the Master Fund may result in taxable distributions to our shareholders of ordinary income or capital gains. If Master Fund shares are acquired within 30 days before or after the repurchase of other shares of the Master Fund at a loss, all or part of that loss will not be deductible by us and, instead, will increase our basis in the newly acquired Master Fund shares.
If, in any particular taxable year, we do not satisfy the annual distribution requirement or were to otherwise fail to qualify as a RIC (for example, because we fail the 90% annual gross income requirement described above), all of our taxable income (including our net capital gains) will be subject to tax at regular corporate rates without any deduction for distributions to shareholders, and distributions will generally be taxable to our shareholders as ordinary dividends to the extent of our current and accumulated earnings and profits.
We may decide to be taxed as a regular corporation even if we would otherwise qualify as a RIC if we determine that treatment as a regular corporation for a particular taxable year would be in our best interests. If we either choose not to qualify or were unable to qualify for treatment as a RIC, we would be subject to tax on all of our taxable income at regular corporate rates, regardless of whether we make any distributions to our shareholders. Distributions would not be required, and any distributions would generally be taxable to our shareholders as ordinary dividend income. Subject to certain additional limitations in the Code, such distributions would be eligible for the preferential maximum rate applicable to individual shareholders with respect to qualifying dividends. Subject to certain limitations under the Code, corporate distributees would be eligible for the dividends-received deduction. Distributions in excess of our current and accumulated earnings and profits would be treated first as a return of capital to the extent of the shareholder’s tax basis in our Shares, and any remaining distributions would be treated as a capital gain. Moreover, if we fail to qualify as a RIC in any taxable year, to qualify again to be subject to tax as a RIC in a subsequent taxable year, we would be required to distribute our earnings and profits attributable to any of our non-RIC taxable years as
dividends to our shareholders. In addition, if we fail to qualify as a RIC for a period greater than two consecutive taxable years, to qualify as a RIC in a subsequent taxable year we may be subject to regular corporate tax on any net built-in gains with respect to certain of our assets (that is, the excess of the aggregate gains, including items of income, over aggregate losses that would have been realized with respect to such assets if we had sold the property at fair market value at the end of the taxable year) that we elect to recognize on requalification or when recognized over the next five taxable years.
The remainder of this discussion assumes that we elect and maintain our qualification as a RIC and have satisfied the annual distribution requirement.
Taxation of U.S. Shareholders
For purposes of this discussion, a “U.S. shareholder” is a holder or a beneficial holder of Shares that is for U.S. federal income tax purposes: (i) a person who is a citizen or resident of the U.S., (ii) a domestic corporation (or other entity taxable as a corporation for U.S. federal income tax purposes), (iii) an estate whose income is subject to U.S. federal income tax regardless of its source, or (iv) a trust if: (A) a U.S. court is able to exercise primary supervision over the trust’s administration and one or more U.S. persons are authorized to control all substantial decisions of the trust, or (B) the trust has in effect a valid election to be treated as a domestic trust for U.S. federal income tax purposes. A “Non-U.S. shareholder” is a holder or beneficial owner of Shares that is not a U.S. shareholder. If a partnership or other entity classified as a partnership for U.S. tax purposes holds the Shares, the tax treatment of the partnership and each partner generally will depend on the activities of the partnership and the activities of the partner. Partnerships acquiring Shares, and partners in such partnerships, should consult their own tax advisors. Prospective investors that are not U.S. shareholders are urged to consult their own tax advisors with respect to the U.S. federal income tax consequences of an investment in our Shares, including the potential application of U.S. withholding taxes.
Distributions we pay to our shareholders from our ordinary income or from an excess of net realized short-term capital gains over net realized long-term capital losses, which together we refer to in this prospectus as “ordinary income dividends,” are generally taxable to you as ordinary income whether paid in cash or reinvested in additional Shares. Due to our expected investments, in general, distributions will not be eligible for the “dividends received” deduction allowed to corporate shareholders and will not qualify for the reduced rates of tax for qualified dividend income allowed to individuals. Distributions made to you from an excess of net realized long-term capital gains over net realized short-term capital losses, which we refer to in this prospectus as “capital gain dividends,” including capital gain dividends credited to you but retained by us, are taxable to you as long-term capital gains if they have been properly designated by us, regardless of the length of time you have owned our Shares, whether paid in cash or reinvested in additional Shares. Distributions in excess of our earnings and profits will first reduce the adjusted tax basis of your Shares and, after the adjusted tax basis is reduced to zero, will constitute capital gains to you (assuming the Shares are held as a capital asset). The reduction in the tax basis of Shares by the amount of any return of capital distributions will generally result in an increase in the amount of any taxable gain (or a reduction in any deductible loss) on the sale of Shares.
Generally, you will be provided with a written notice reporting the amount of any ordinary income dividends and capital gain dividends or other distributions as promptly as practicable after the close of the taxable year.
In the event that we retain any net capital gains, we may report the retained amounts as undistributed capital gains in a notice to our shareholders. If a designation is made, shareholders would include in income, as long-term capital gains, their proportionate share of the undistributed amounts, but would be allowed a credit or refund, as the case may be, for their proportionate share of the corporate tax paid by us. In addition, the tax basis of Shares owned by a U.S. shareholder would be increased by an amount equal to the difference between: (i) the amount included in the U.S. shareholder’s income as long-term capital gains and (ii) the U.S. shareholder’s proportionate share of the corporate tax paid by us.
If, in January of any calendar year, we pay our shareholders a dividend that was declared during the final calendar quarter of the preceding calendar year to our shareholders of record as of a specified date in such calendar quarter, then the dividend will be treated for tax purposes as being paid by us and received by our shareholders on December 31 of such preceding calendar year (i.e., the calendar year in which the dividend was declared). Dividends and other taxable distributions are taxable to our shareholders even if they are reinvested in additional Shares. In addition, to the extent that a shareholder purchases additional Shares within the DRP at a discount to fair value of the Shares, the shareholder will be treated for tax purposes as having received an additional distribution equal to the amount of the purchase price discount. A shareholder designating a distribution for reinvestment will be taxed on the amount of such distribution as ordinary income to the extent such distribution is from current or accumulated earnings and profits, unless we have reported all or a portion of the distribution as a capital gain dividend or as a return of capital. In that event, such reported portion of the distribution will be taxed as long-term capital gain or as a return of capital,
respectively. Any stock received in a purchase under our DRP will have a holding period for tax purposes commencing on the day following the date on which Shares are credited to your account. If you are purchasing our Shares pursuant to a reduction in fees, as set forth elsewhere in this prospectus, you should consult with your own tax advisor before electing to participate in the DRP.
A U.S. shareholder will realize gain or loss on the sale or exchange of our Shares in an amount equal to the difference between the U.S. shareholder’s adjusted basis in the Shares sold or exchanged, and the amount realized on their disposition. Generally, a gain or loss recognized by a U.S. shareholder on the sale or other disposition of our Shares will result in capital gain or loss to such shareholder, and will be a long-term capital gain or loss if the Shares have been held for more than one year at the time of sale. Any loss realized by a shareholder upon the sale or exchange of our Shares held for six months or less will be treated as a long-term capital loss to the extent of any capital gain dividends received (including amounts credited as an undistributed capital gain dividend) by such shareholder. A loss realized on a sale or exchange of our Shares will be disallowed if other substantially identical Shares are acquired (whether through the automatic reinvestment of dividends or otherwise) within a 61-day period beginning 30 days before and ending 30 days after the date that the Shares are disposed of. In this case, the basis of the Shares acquired will be adjusted to reflect the disallowed loss. Present law taxes both long-term and short-term capital gains of corporations at the rates applicable to ordinary income.
The repurchase or transfer of our Shares may result in a taxable gain or loss to a tendering shareholder. Different tax consequences may apply to tendering and non-tendering shareholders in connection with a repurchase offer. For example, if a shareholder does not tender all of his, her, or its Shares, such repurchase may not be treated as an exchange for U.S. federal income tax purposes, and may instead constitute a distribution subject to evaluation as a deemed dividend. Alternatively, shareholders who tender all of their Shares (including Shares deemed owned by such shareholders through application of the constructive ownership rules) will be treated as having sold their Shares and generally will realize a capital gain or loss.
An additional 3.8% Medicare tax will be imposed in respect of the net investment income of certain individuals and on the undistributed net investment income of certain estates and trusts. For these purposes, “net investment income” will generally include, among other things, dividends (including dividends paid with respect to our Shares to the extent paid out of our current or accumulated earnings and profits as determined under U.S. federal income tax principles) and net gain attributable to the disposition of property not held in a trade or business (which could include net gain from the sale, exchange, or other taxable disposition of our Shares), but will be reduced by any deductions properly allocable to such income or net gain. Shareholders are advised to consult their own tax advisors regarding the additional taxation of net investment income.
Federal law generally requires us to report our shareholders’ cost basis, gain/loss, and holding period to the IRS on Form 1099-Bs when “covered” securities are sold. For purposes of these reporting requirements, all of our Shares acquired by non-tax exempt and non-corporate shareholders, including those acquired through our DRP, will be considered covered securities. We have chosen FIFO (first-in, first-out) as our standing (default) tax lot identification method for all shareholders. A tax lot identification method is the way we will determine which specific Shares are deemed to be sold when there are multiple purchases on different dates at differing transaction prices and the entire position is not sold at one time. To the extent you are subject to IRS tax reporting, our standing tax lot identification method is the method covered securities will be reported on your Form 1099 if you do not select a specific tax lot identification method. In such case, you may choose a method different than our standing method and will be able to do so from the time you are admitted as a shareholder up through and until the sale of the covered securities. For those securities defined as “covered” under current IRS cost basis tax reporting regulations, we are responsible for maintaining accurate cost basis and tax lot information for tax reporting purposes. We are not responsible for the reliability or accuracy of the information for those securities that are not “covered.” We encourage you to refer to the appropriate IRS regulations or consult your tax advisor with regard to your personal circumstances and any decisions you may make with respect to choosing a tax lot identification method.
As required by the Code, we will send each of our U.S. shareholders, as promptly as possible after the end of each calendar year, a notice detailing the amounts includible in such U.S. shareholder’s taxable income for such year as ordinary income and as long-term capital gain. In addition, the federal tax status of each year’s distributions generally will be reported to the IRS (including the amount of dividends, if any, eligible for the “qualified dividend income” rate). Distributions may also be subject to additional state, local, and foreign taxes depending on a U.S. shareholder’s particular situation. As described above, dividends distributed by us generally will not be eligible for the qualified dividend income rate (with respect to individual shareholders) or the corporate dividends received deduction (with respect to corporate shareholders).
If a shareholder recognizes a loss with respect to our Shares in excess of certain prescribed thresholds (generally, $2 million or more for an individual shareholder or $10 million or more for a corporate shareholder), the shareholder
must file with the IRS a disclosure statement on Form 8886. Direct investors of portfolio securities are in many cases excepted from this reporting requirement, but, under current guidance, equity owners of RICs are not excepted. The fact that a loss is reportable as just described does not affect the legal determination of whether the taxpayer’s treatment of the loss is proper. Shareholders should consult their tax advisors to determine the applicability of this reporting requirement in light of their particular circumstances.
We may be required to withhold federal income tax (“backup withholding”) currently at a rate of 24%, from all taxable distributions to any non-corporate U.S. shareholder: (i) who fails to furnish us with a correct taxpayer identification number or a certificate that such shareholder is exempt from backup withholding, or (ii) with respect to whom the IRS notifies us that such shareholder has failed to properly report certain interest and dividend income to the IRS and to respond to notices to that effect. An individual’s taxpayer identification number is typically his or her Social Security number. Any amount withheld under backup withholding is allowed as a credit against the U.S. shareholder’s U.S. federal income tax liability, provided that proper information is provided to the IRS.
We will be treated as a “publicly offered regulated investment company” (within the meaning of Section 67 of the Code) if either (i) our Shares are collectively being held by at least 500 persons at all times during a taxable year, (ii) our Shares are continuously offered to the public pursuant to a public offering within the meaning of Section 4 of the Securities Act, or (iii) our Shares are being treated as regularly traded on an established securities market. If we are not treated as a publicly offered regulated investment company for any calendar year, for purposes of computing the taxable income of U.S. shareholders that are individuals, trusts, or estates, (i) our earnings will be computed without taking into account such U.S. shareholders’ allocable shares of the management and incentive fees paid to Guggenheim and certain of our other expenses, (ii) each such U.S. shareholder will be treated as having received or accrued a dividend from us in the amount of such U.S. shareholder’s allocable share of these fees and expenses for the calendar year, (iii) each such U.S. shareholder will be treated as having paid or incurred such U.S. shareholder’s allocable share of these fees and expenses for the calendar year, and (iv) each such U.S. shareholder’s allocable share of these fees and expenses will be treated as miscellaneous itemized deductions by such U.S. shareholder. For taxable years beginning before 2026, miscellaneous itemized deductions generally are not deductible by a U.S. Shareholder that is an individual, trust or estate. For taxable years beginning in 2026 or later, miscellaneous itemized deductions generally are deductible by a U.S. shareholder that is an individual, trust, or estate only to the extent that the aggregate of such U.S. shareholder’s miscellaneous itemized deductions exceeds 2% of such U.S. shareholder’s adjusted gross income for U.S. federal income tax purposes, are not deductible for purposes of the alternative minimum tax, and are subject to the overall limitation on itemized deductions under Section 67 of the Code.
Shareholders should consult their own tax advisors with respect to U.S. federal income tax and withholding tax, as well as the state, local, and foreign tax consequences of an investment in our Shares.
Taxation of Non-U.S. Shareholders
This subsection applies to non-U.S. shareholders, only. If you are not a non-U.S. shareholder, this subsection does not apply to you and you should refer to “Taxation of U.S. Shareholders,” above.
Whether an investment in our Shares is appropriate for a Non-U.S. shareholder will depend upon that individual’s particular circumstances. Non-U.S. shareholders should consult their tax advisors before investing in our Shares.
Subject to the discussion in “Foreign Account Tax Compliance Act,” below, distributions of our “investment company taxable income” to Non-U.S. shareholders (including interest income, net short-term capital gain, or foreign-source dividend and interest income, which generally would be free of withholding if paid to Non-U.S. shareholders directly) will be subject to withholding of U.S. federal tax at a 30% rate (or lower rate provided by an applicable treaty) to the extent of our current and accumulated earnings and profits, unless the distributions are effectively connected with a U.S. trade or business of the Non-U.S. shareholder, in which case the distributions will generally be subject to U.S. federal income tax at the rates applicable to U.S. persons. In that case, we will not be required to withhold U.S. federal tax if the Non-U.S. shareholder complies with applicable certification and disclosure requirements. Special certification requirements apply to a Non-U.S. shareholder that is a foreign partnership or a foreign trust, and such entities are urged to consult their own tax advisors.
In addition, subject to the discussion in “Foreign Account Tax Compliance Act,” below, distributions of our investment company taxable income made to Non-U.S. shareholders will not be subject to U.S. withholding tax if (i) the distributions are properly designated in a notice timely delivered to Non-U.S. shareholders as “interest-related dividends” or “short-term capital gain dividends,” (ii) the distributions are derived from sources specified in the Code for such dividends and (iii) certain other requirements are satisfied. No assurance can be given as to whether any amount of our distributions will be eligible for this exemption from withholding or, if eligible, will be reported as such by us.
Subject to the discussion in “Foreign Account Tax Compliance Act,” below, actual or deemed distributions of our net capital gains to a Non-U.S. shareholder, and gains realized by a Non-U.S. shareholder upon the sale of our Shares, will not be subject to federal withholding tax and generally will not be subject to U.S. federal income tax; unless the distributions or gains, as the case may be, are effectively connected with a U.S. trade or business of the Non-U.S. shareholder and, if an income tax treaty applies, are attributable to a permanent establishment maintained by the Non-U.S. shareholder in the United States or, in the case of an individual Non-U.S. shareholder, the shareholder is present in the United States for 183 days or more during the year of the sale or capital gain dividend and certain other conditions are met.
If we distribute our net capital gains in the form of deemed rather than actual distributions, a Non-U.S. shareholder will be entitled to a U.S. federal income tax credit or tax refund equal to the shareholder’s allocable share of the tax we pay on the capital gains deemed to have been distributed. In order to obtain the refund, the Non-U.S. shareholder must obtain a U.S. taxpayer identification number and file a U.S. federal income tax return, even if the Non-U.S. shareholder would not otherwise be required to obtain a U.S. taxpayer identification number or file a U.S. federal income tax return. For a corporate Non-U.S. shareholder, distributions (both actual and deemed), and gains realized upon the sale of our Shares that are effectively connected with a U.S. trade or business may, under certain circumstances, be subject to an additional “branch profits tax” at a 30% rate (or at a lower rate if provided for by an applicable treaty).
A Non-U.S. shareholder who is a non-resident alien individual, and who is otherwise subject to withholding of U.S. federal income tax, may be subject to information reporting and backup withholding of U.S. federal income tax on dividends unless the Non-U.S. shareholder provides us or the dividend paying agent with an applicable IRS Form W-8BEN or IRS Form W-8BEN-E (or an acceptable substitute form) or otherwise meets documentary evidence requirements for establishing that it is a Non-U.S. shareholder or otherwise establishes an exemption from backup withholding.
Foreign Account Tax Compliance Act
We are required to withhold U.S. tax (at a 30% rate) on payments of taxable dividends made to certain non-U.S. entities that fail to comply (or be deemed compliant) with extensive new reporting and withholding requirements designed to inform the U.S. Department of the Treasury of U.S.-owned foreign investment accounts. The information required to be reported includes the identity and taxpayer identification number of each shareholder and transaction activity within each shareholder’s account. Shareholders may be requested to provide additional information to us to enable us to determine whether withholding is required.
Taxation of Investments
Certain investment practices of the Master Fund are subject to special and complex U.S. federal income tax provisions that may: (i) disallow, suspend, or otherwise limit the allowance of certain losses or deductions, including the dividends received deduction; (ii) convert lower taxed long-term capital gains and qualified dividend income into higher taxed short-term capital gains or ordinary income; (iii) convert ordinary loss or a deduction into capital loss (the deductibility of which is more limited); (iv) cause the Master Fund to recognize income or gain without a corresponding receipt of cash; (v) adversely affect the time as to when a purchase or sale of stock or securities is deemed to occur; (vi) adversely alter the characterization of certain complex financial transactions; and (vii) produce income that will not qualify as good income for purposes of the 90% annual gross income requirement described above. We will monitor the Master Fund’s transactions and may decide to have the Master Fund make certain tax elections, may require the Master Fund to borrow money, or may require the Master Fund to dispose of securities to mitigate the effect of these rules and prevent the Master Fund’s disqualification as a RIC.
Investments made by the Master Fund in securities issued at a discount or providing for deferred interest or paid-in-kind interest are subject to special tax rules that will affect the amount, timing and character of distributions to our shareholders. For example, with respect to securities issued at a discount, the Master Fund will generally be required to accrue daily, as income, a portion of the discount and to distribute such income to us each taxable year to maintain its ability to be subject to tax as a RIC and to avoid U.S. federal income and excise taxes. Since in certain circumstances the Master Fund may recognize income before or without receiving cash representing such income, the Master Fund may have difficulty making distributions in the amounts necessary to satisfy the requirements for maintaining its RIC tax status and avoiding U.S. federal income and excise taxes. Accordingly, the Master Fund may have to sell some of its investments at times the Master Fund would not consider advantageous, raise additional debt or equity capital, distribute its own shares, or reduce new investment originations to meet these distribution requirements. If the Master Fund is not able to obtain cash from other sources, we may fail to be subject to tax as a RIC and thereby be subject to corporate-level income tax.
In the event the Master Fund invests in securities of non-U.S. issuers, the Master Fund may be subject to withholding and other foreign taxes with respect to those securities. The Master Fund does not expect to satisfy the requirement to pass through to our shareholders their share of the foreign taxes paid by the Master Fund.
The Master Fund may invest in non-U.S. corporations (or other non-U.S. entities treated as corporations for U.S. federal income tax purposes). Thus, it is possible that one or more such entities in which the Master Fund invests could be treated under the Code and the U.S. Treasury regulations as a “passive foreign investment company” or a “controlled foreign corporation.” The rules relating to investment in these types of non-U.S. entities are designed to ensure that U.S. taxpayers are either, in effect, taxed currently (or on an accelerated basis with respect to corporate level events) or taxed at increased tax rates at distribution or disposition. In certain circumstances this could require the Master Fund to recognize income where the Master Fund does not receive a corresponding payment in cash and make distributions with respect to such income in order to maintain its status as a RIC. Under such circumstances, the Master Fund may have difficulty meeting the annual distribution requirement necessary to maintain RIC tax treatment under the Code. Furthermore, under certain circumstances, an investment in a passive investment company could result in a tax imposed on the Master Fund and/or an increase in the amount of taxable distributions by the Master Fund.
LEGAL MATTERS
Certain legal matters regarding the Shares offered hereby have been passed upon for us by Dechert LLP.
EXPERTS
Ernst & Young LLP is an independent registered public accounting firm and is located at 5 Times Square, New York, NY 10036. Ernst & Young LLP was engaged as the independent registered public accounting firm of Guggenheim Credit Income Fund for the fiscal years ended December 31, 2019 and December 31, 2018. On March 12, 2020, the audit committee of our board of trustees and the audit committee of the Master Fund selected Ernst & Young LLP as the independent registered public accounting firm for the fiscal year ending December 31, 2020 for Guggenheim Credit Income Fund 2021 and Guggenheim Credit Income Fund, respectively.
PricewaterhouseCoopers LLP was engaged as the independent registered public accounting firm of Guggenheim Credit Income Fund for the fiscal years ended December 31, 2017, December 31, 2016 and December 31, 2015.
The consolidated financial statements of Guggenheim Credit Income Fund for the years ended December 31, 2019 and December 31, 2018, included in this Prospectus have been so included in reliance on the report of Ernst & Young LLP given on the authority of said firm as experts in auditing and accounting.
The information set forth of Guggenheim Credit Income Fund under the heading Senior Securities as of the end of each year within the two years ended December 31, 2019 has been so included in reliance on the report of Ernst & Young LLP, an independent registered public accounting firm, given on the authority of said firm as experts in auditing and accounting.
The consolidated financial statements of Guggenheim Credit Income Fund for the year ended December 31, 2017 included in this Prospectus have been so included in reliance on the report of PricewaterhouseCoopers LLP, an independent registered public accounting firm, given on the authority of said firm as experts in auditing and accounting. The address of PricewaterhouseCoopers LLP is 300 Madison Avenue, New York, New York 10017.
The information set forth of Guggenheim Credit Income Fund under the heading Senior Securities as of the end of each year within the three years ended December 31, 2017 has been included in reliance upon the report of PricewaterhouseCoopers LLP, an independent registered public accounting firm, given on the authority of said firm as experts in auditing and accounting.
SHAREHOLDER PRIVACY NOTICE
We collect nonpublic personal information about our shareholders in the ordinary course of establishing and servicing their accounts. Nonpublic personal information means personally identifiable financial information that is not publicly available and any list, description, or other grouping of shareholders that is derived using such information. For example, it includes a shareholder’s address, Social Security number, account balance, income, investment activity, and bank account information. We collect this information from the following sources:
| |
| • | account applications or other required forms, correspondence (written or electronic), or from telephone contacts with customers inquiring about us; |
| |
| • | transaction history of a shareholder’s account; and |
We will not disclose nonpublic personal information about our shareholders or their account(s) to anyone without their consent other than to:
| |
| • | Our service providers, including our administrator, as necessary for the servicing of your account. Our service providers in turn have an obligation to protect the confidentiality of your personal information. |
| |
| • | Companies that may perform marketing services on our behalf or pursuant to joint marketing agreements. These marketing companies also have an obligation to protect confidential information. |
| |
| • | Government officials or other persons unaffiliated with us, to the extent required by federal or Delaware law or our Declaration of Trust, including in accordance with subpoenas, court orders, and requests from government regulators. |
If you decide to close your account(s), we will still adhere to the practices described in this notice.
If you invest in our Shares through a financial intermediary, such as a broker-dealer, bank, or trust company, the privacy policy of your financial intermediary will govern how your nonpublic personal information will be shared with other parties.
We maintain physical, electronic, and procedural safeguards to protect your nonpublic personal information.
GUGGENHEIM CREDIT INCOME FUND
INDEX TO FINANCIAL STATEMENTS
|
| |
Consolidated Financial Statements for the three months and six months ended June 30, 2020 (Unaudited) and the year ended December 31, 2019 | PAGE |
| |
| |
| |
| |
| |
| |
|
| |
| Consolidated Financial Statements as of and for the Years ended December 31, 2019, 2018 and 2017 | PAGE |
| |
| |
| |
| |
| |
| |
| |
GUGGENHEIM CREDIT INCOME FUND
CONSOLIDATED STATEMENTS OF ASSETS AND LIABILITIES (UNAUDITED)
(in thousands, except share and per share data)
|
| | | | | | | |
| | June 30, 2020 | | December 31, 2019 |
| Assets | | | |
| Investments at fair value (amortized cost of $358,628 and $385,802, respectively) | $ | 323,891 |
| | $ | 372,193 |
|
| Cash | 6,893 |
| | 1,454 |
|
| Restricted cash | 11,765 |
| | 7,512 |
|
| Interest and dividend income receivable | 2,243 |
| | 2,622 |
|
| Principal receivable | 3,656 |
| | — |
|
| Receivable from related parties | 20 |
| | 35 |
|
| Unrealized appreciation of foreign currency forward contracts | 408 |
| | — |
|
| Prepaid expenses and other assets | 159 |
| | 284 |
|
| Total assets | $ | 349,035 |
| | $ | 384,100 |
|
| | | | |
| Liabilities | | | |
| Credit facility payable, net of financing costs | $ | 156,052 |
| | $ | 170,862 |
|
| Unrealized depreciation on foreign currency forward contracts | — |
| | 87 |
|
| Payable for investments purchased | 1,359 |
| | — |
|
| Accrued management fee | 507 |
| | 576 |
|
| Payable to related parties | 155 |
| | 195 |
|
| Distributions payable | 1,186 |
| | — |
|
| Collateral payable for foreign currency forward contracts | 360 |
| | 320 |
|
| Accounts payable, accrued expenses and other liabilities | 685 |
| | 863 |
|
| Total liabilities | 160,304 |
| | 172,903 |
|
| Commitments and contingencies (Note 8. Commitments and Contingencies) | | | |
| Net Assets | $ | 188,731 |
| | $ | 211,197 |
|
| | | | |
| Components of Net Assets: | | | |
| Common shares, $0.001 par value, 1,000,000,000 shares authorized, 26,811,629 and 27,157,534 shares issued and outstanding at June 30, 2020 and December 31, 2019, respectively | $ | 27 |
| | $ | 27 |
|
| Paid-in-capital in excess of par value | 227,663 |
| | 229,996 |
|
| Accumulated loss, net of distributions | (38,959 | ) | | (18,826 | ) |
| Net assets | $ | 188,731 |
| | $ | 211,197 |
|
| Net asset value per Common Share | $ | 7.04 |
| | $ | 7.78 |
|
See Unaudited Notes to Consolidated Financial Statements.
GUGGENHEIM CREDIT INCOME FUND
CONSOLIDATED STATEMENTS OF OPERATIONS (UNAUDITED)
(in thousands, except share and per share data)
|
| | | | | | | | | | | | | | | |
| | For the Three Months Ended June 30, | | For the Six Months Ended June 30, |
| | 2020 | | 2019 | | 2020 | | 2019 |
| Investment Income | | | | | | | |
| Interest income | $ | 6,959 |
| | $ | 8,697 |
| | $ | 14,621 |
| | $ | 17,231 |
|
| Dividend income | 203 |
| | 278 |
| | 456 |
| | 539 |
|
| Fee income | 34 |
| | 139 |
| | 232 |
| | 267 |
|
| Total investment income | 7,196 |
| | 9,114 |
| | 15,309 |
| | 18,037 |
|
| Operating Expenses | | | | | | | |
| Interest expense | 1,447 |
| | 2,139 |
| | 3,304 |
| | 4,269 |
|
| Management fee | 1,524 |
| | 1,718 |
| | 3,161 |
| | 3,412 |
|
| Performance-based incentive fee | — |
| | — |
| | — |
| | 11 |
|
| Administrative services | 44 |
| | 50 |
| | 93 |
| | 101 |
|
| Custody services | 24 |
| | 25 |
| | 49 |
| | 49 |
|
| Trustees fees | 80 |
| | 80 |
| | 174 |
| | 160 |
|
| Related party reimbursements | 154 |
| | 201 |
| | 348 |
| | 420 |
|
| Professional services fees | 217 |
| | 239 |
| | 433 |
| | 489 |
|
| Other expenses | 91 |
| | 59 |
| | 133 |
| | 125 |
|
| Total expenses | 3,581 |
| | 4,511 |
| | 7,695 |
| | 9,036 |
|
| Net investment income | 3,615 |
| | 4,603 |
| | 7,614 |
| | 9,001 |
|
| Realized and unrealized gains (losses): | | | | | | | |
| Net realized gains (losses) on: | | | | | | | |
| Investments | (2,339 | ) | | (6,838 | ) | | (635 | ) | | (6,805 | ) |
| Foreign currency forward contracts | 42 |
| | 861 |
| | 1,051 |
| | (126 | ) |
| Foreign currency transactions | 4 |
| | (2 | ) | | 161 |
| | 86 |
|
| Net realized gains (losses) | (2,293 | ) | | (5,979 | ) | | 577 |
| | (6,845 | ) |
| Net change in unrealized appreciation (depreciation) on: | | | | | | | |
| Investments | 16,008 |
| | 5,736 |
| | (21,128 | ) | | 5,785 |
|
| Foreign currency forward contracts | 17 |
| | (144 | ) | | 495 |
| | 379 |
|
| Foreign currency transactions | — |
| | — |
| | (1 | ) | | (17 | ) |
| Net change in unrealized appreciation (depreciation) | 16,025 |
| | 5,592 |
| | (20,634 | ) | | 6,147 |
|
| Net realized and unrealized gains (losses) | 13,732 |
| | (387 | ) | | (20,057 | ) | | (698 | ) |
| Net increase (decrease) in net assets resulting from operations | $ | 17,347 |
| | $ | 4,216 |
| | $ | (12,443 | ) | | $ | 8,303 |
|
| Per Common Share information: | | | | | | | |
| Net investment income per Common Share outstanding - basic and diluted | $ | 0.13 |
| | $ | 0.16 |
| | $ | 0.28 |
| | $ | 0.31 |
|
| Earnings (loss) per Common Share - basic and diluted | $ | 0.64 |
| | $ | 0.14 |
| | $ | (0.46 | ) | | $ | 0.28 |
|
| Weighted average Common Shares outstanding - basic and diluted | 27,040,652 |
| | 29,178,344 |
| | 27,274,171 |
| | 29,192,124 |
|
| Distribution per Common Share | $ | 0.13 |
| | $ | 0.17 |
| | $ | 0.28 |
| | $ | 0.34 |
|
See Unaudited Notes to Consolidated Financial Statements.
GUGGENHEIM CREDIT INCOME FUND
CONSOLIDATED STATEMENTS OF CHANGES IN NET ASSETS (UNAUDITED)
(in thousands, except share and per share data)
|
| | | | | | | | | | | | | | | | | | |
| | Common Shares | | Paid-in-Capital in Excess of Par Value | | Accumulated Earnings (Loss), net of Distributions | | |
| | Shares | | Amount | | | | Total |
| Balance at December 31, 2019 | 27,157,534 |
| | $ | 27 |
| | $ | 229,996 |
| | $ | (18,826 | ) | | $ | 211,197 |
|
| Operations: | | | | | | | | | |
| Net investment income | — |
| | — |
| | — |
| | 3,999 |
| | 3,999 |
|
| Net realized gains | — |
| | — |
| | — |
| | 2,870 |
| | 2,870 |
|
| Net change in unrealized depreciation | — |
| | — |
| | — |
| | (36,659 | ) | | (36,659 | ) |
| Net decrease in net assets resulting from operations | — |
| | — |
| | — |
| | (29,790 | ) | | (29,790 | ) |
| Shareholder distributions: | | | | | | | | | |
| Distributions from earnings | — |
| | — |
| | — |
| | (4,066 | ) | | (4,066 | ) |
| Net decrease in net assets resulting from shareholder distributions | — |
| | — |
| | — |
| | (4,066 | ) | | (4,066 | ) |
| Capital share transactions: | | | | | | | | | |
| Issuance of Common Shares | 639,552 |
| | 1 |
| | 4,999 |
| | — |
| | 5,000 |
|
| Repurchase of Common Shares | (718,264 | ) | | (1 | ) | | (5,494 | ) | | — |
| | (5,495 | ) |
| Net decrease in net assets resulting from capital share transactions | (78,712 | ) | | — |
| | (495 | ) | | — |
| | (495 | ) |
| Net decrease for the period | (78,712 | ) | | — |
| | (495 | ) | | (33,856 | ) | | (34,351 | ) |
| Balance at March 31, 2020 | 27,078,822 |
| | $ | 27 |
| | $ | 229,501 |
| | $ | (52,682 | ) | | $ | 176,846 |
|
| Operations: | | | | | | | | | |
| Net investment income | — |
| | — |
| | — |
| | 3,615 |
| | 3,615 |
|
| Net realized losses | — |
| | — |
| | — |
| | (2,293 | ) | | (2,293 | ) |
| Net change in unrealized appreciation | — |
| | — |
| | — |
| | 16,025 |
| | 16,025 |
|
| Net increase in net assets resulting from operations | — |
| | — |
| | — |
| | 17,347 |
| | 17,347 |
|
| Shareholder distributions: | | | | | | | | | |
| Distributions from earnings | — |
| | — |
| | — |
| | (3,624 | ) | | (3,624 | ) |
| Net decrease in net assets resulting from shareholder distributions | — |
| | — |
| | — |
| | (3,624 | ) | | (3,624 | ) |
| Capital share transactions: | | | | | | | | | |
| Repurchase of Common Shares | (267,193 | ) | | — |
| (1) | (1,838 | ) | | — |
| | (1,838 | ) |
| Net decrease in net assets resulting from capital share transactions | (267,193 | ) | | — |
| | (1,838 | ) | | — |
| | (1,838 | ) |
| Net increase (decrease) for the period | (267,193 | ) | | — |
| | (1,838 | ) | | 13,723 |
| | 11,885 |
|
| Balance at June 30, 2020 | 26,811,629 |
| | $ | 27 |
| | $ | 227,663 |
| | $ | (38,959 | ) | | $ | 188,731 |
|
|
| | | | | | | | | | | | | | | | | | |
| | Common Shares | | Paid-in-Capital in Excess of Par Value | | Accumulated Earnings (Loss), net of Distributions | | |
| | Shares | | Amount | | | | Total |
| Balance at December 31, 2018 | 29,195,002 |
| | $ | 29 |
| | $ | 246,083 |
| | $ | (9,880 | ) | | $ | 236,232 |
|
| Operations: | | | | | | | | | |
| Net investment income | — |
| | — |
| | — |
| | 4,398 |
| | 4,398 |
|
| Net realized losses | — |
| | — |
| | — |
| | (866 | ) | | (866 | ) |
| Net change in unrealized appreciation | — |
| | — |
| | — |
| | 555 |
| | 555 |
|
| Net increase in net assets resulting from operations | — |
| | — |
| | — |
| | 4,087 |
| | 4,087 |
|
| Shareholder distributions: | | | | | | | | | |
| Distributions from earnings | — |
| | — |
| | — |
| | (4,717 | ) | | (4,717 | ) |
| Net decrease in net assets resulting from shareholder distributions | — |
| | — |
| | — |
| | (4,717 | ) | | (4,717 | ) |
| Capital share transactions: | | | | | | | | | |
| Issuance of Common Shares | 124,070 |
| | — |
| (1) | 1,000 |
| | — |
| | 1,000 |
|
| Repurchase of Common Shares | (38,000 | ) | | — |
| (1) | (307 | ) | | — |
| | (307 | ) |
| Net increase in net assets resulting from capital share transactions | 86,070 |
| | — |
| | 693 |
| | — |
| | 693 |
|
| Net increase (decrease) for the period | 86,070 |
| | — |
| | 693 |
| | (630 | ) | | 63 |
|
| Balance at March 31, 2019 | 29,281,072 |
| | $ | 29 |
| | $ | 246,776 |
| | $ | (10,510 | ) | | $ | 236,295 |
|
| Operations: | | | | | | | | | |
| Net investment income | — |
| | — |
| | — |
| | 4,603 |
| | 4,603 |
|
| Net realized losses | — |
| | — |
| | — |
| | (5,979 | ) | | (5,979 | ) |
| Net change in unrealized appreciation | — |
| | — |
| | — |
| | 5,592 |
| | 5,592 |
|
| Net increase in net assets resulting from operations | — |
| | — |
| | — |
| | 4,216 |
| | 4,216 |
|
| Shareholder distributions: | | | | | | | | | |
| Distributions from earnings | — |
| | — |
| | — |
| | (5,106 | ) | | (5,106 | ) |
| Net decrease in net assets resulting from shareholder distributions | — |
| | — |
| | — |
| | (5,106 | ) | | (5,106 | ) |
| Capital share transactions: | | | | | | | | | |
| Repurchase of Common Shares | (667,727 | ) | | — |
| (1) | (5,375 | ) | | — |
| | (5,375 | ) |
| Net decrease in net assets resulting from capital share transactions | (667,727 | ) | | — |
| | (5,375 | ) | | — |
| | (5,375 | ) |
| Net decrease for the period | (667,727 | ) | | — |
| | (5,375 | ) | | (890 | ) | | (6,265 | ) |
| Balance at June 30, 2019 | 28,613,345 |
| | $ | 29 |
| | $ | 241,401 |
| | $ | (11,400 | ) | | $ | 230,030 |
|
_____________________
| |
| (1) | Amount is less than $1,000. |
See Unaudited Notes to Consolidated Financial Statements.
GUGGENHEIM CREDIT INCOME FUND
CONSOLIDATED STATEMENTS OF CASH FLOWS (UNAUDITED)
(in thousands)
|
| | | | | | | |
| | For the Six Months Ended June 30, |
| | 2020 | | 2019 |
| Operating activities | | | |
| Net increase (decrease) in net assets resulting from operations | $ | (12,443 | ) | | $ | 8,303 |
|
| Adjustments to reconcile net increase (decrease) in net assets resulting from operations to net cash provided by operating activities: | | | |
| Capitalized paid-in-kind income | (459 | ) | | (535 | ) |
| Amortization of premium/accretion of discount, net | (682 | ) | | (707 | ) |
| Proceeds from sales of investments | 13,011 |
| | 23,376 |
|
| Proceeds from paydowns on investments | 68,731 |
| | 13,958 |
|
| Net receipt of settlement of derivatives | 3,308 |
| | 1,731 |
|
| Net payment of settlement of derivatives | (2,257 | ) | | (1,605 | ) |
| Net realized gains on derivatives | (1,051 | ) | | (126 | ) |
| Purchases of investments | (54,062 | ) | | (39,170 | ) |
| Net realized losses on investments | 635 |
| | 6,805 |
|
| Net change in unrealized (appreciation) depreciation on investments | 21,128 |
| | (5,785 | ) |
| Net change in unrealized appreciation on foreign currency forward contracts | (495 | ) | | (379 | ) |
| Amortization of deferred financing costs | 190 |
| | 188 |
|
| (Increase) decrease in operating assets: | | | |
| Interest and dividend income receivable | 379 |
| | (274 | ) |
| Principal receivable | (3,656 | ) | | 2,581 |
|
| Receivable from related parties | 15 |
| | 16 |
|
| Prepaid expenses and other assets | 125 |
| | 106 |
|
| Increase (decrease) in operating liabilities: | | | |
| Payable for investments purchased | 1,359 |
| | (2,670 | ) |
| Accrued management fee | (69 | ) | | 563 |
|
| Payable to related parties | (40 | ) | | 24 |
|
| Collateral payable for foreign currency forward contracts | 40 |
| | — |
|
| Accounts payable, accrued expenses and other liabilities | (178 | ) | | (12 | ) |
| Net cash provided by operating activities | 33,529 |
| | 6,388 |
|
| Financing activities | | | |
| Issuance of Common Shares | 5,000 |
| | 1,000 |
|
| Repurchase of Common Shares | (7,333 | ) | | (5,682 | ) |
| Credit facility borrowings | — |
| | 12,000 |
|
| Credit facility repayments | (15,000 | ) | | — |
|
| Distributions paid | (6,504 | ) | | (13,217 | ) |
| Net cash used in financing activities | (23,837 | ) | | (5,899 | ) |
| Net increase in restricted and unrestricted cash | 9,692 |
| | 489 |
|
| Restricted and unrestricted cash, beginning of period | 8,966 |
| | 10,302 |
|
| Restricted and unrestricted cash, end of period | $ | 18,658 |
| | $ | 10,791 |
|
| Reconciliation of restricted and unrestricted cash | | | |
| Cash | 6,893 |
| | 2,702 |
|
| Restricted cash | 11,765 |
| | 8,089 |
|
| Total restricted and unrestricted cash | $ | 18,658 |
| | $ | 10,791 |
|
| Supplemental disclosure of cash flow information and non-cash financing activities: | | | |
| Cash paid for interest | $ | 3,179 |
| | $ | 4,003 |
|
See Unaudited Notes to Consolidated Financial Statements.
GUGGENHEIM CREDIT INCOME FUND
CONSOLIDATED SCHEDULE OF INVESTMENTS (UNAUDITED)
|
| | | | | | | | | | | | | | | | | | | | | | | | | |
June 30, 2020 (in thousands) |
Portfolio Company (1) (2) (3) | | Footnotes | | Investment | | Spread
Above
Reference
Rate (4) | | Interest
Rate (4) (5) | | Maturity Date | | Principal / Par Amount / Shares (6) | | Amortized Cost (7) (8) | | Fair Value | | % of Net Assets |
| INVESTMENTS | | | | | | | | | | | | | | | | | | |
| Debt investments - 167.6% | | | | | | | | | | | | | | | | | | |
| Aerospace & Defense | | | | | | | | | | | | | | | | |
| Arcline FM Holdings LLC | | (15) | | Senior Secured Loans - First Lien | | L+6.00% | | 7.11% | | 1/21/2025 | | 4,353 |
| | $ | 4,263 |
| | $ | 4,272 |
| | 2.3 | % |
| Arcline FM Holdings LLC | | (9)(13)(15) | | Senior Secured Loans - First Lien | | L+6.00% | | 6.61% | | 1/21/2025 | | 145 |
| | 91 |
| | 96 |
| | 0.1 | % |
| | | | | | | | | | | | | | | 4,354 |
| | 4,368 |
| | 2.4 | % |
| | | | | | | | | | | | | | | | | | | |
| National Technical Systems | | (15) | | Senior Secured Loans - First Lien | | L+6.00% | | 7.43% | | 6/12/2021 | | 3,397 |
| | 3,388 |
| | 3,295 |
| | 1.7 | % |
| Total Aerospace & Defense | | | | | | | | | | | | 7,742 |
| | 7,663 |
| | 4.1 | % |
| Automotive | | | | | | | | | | | | | | | | |
| Accuride Corporation | | | | Senior Secured Loans - First Lien | | L+5.25% | | 6.25% | | 11/17/2023 | | 11,580 |
| | 11,339 |
| | 7,404 |
| | 3.9 | % |
| American Tire Distributors Inc. | | | | Senior Secured Loans - First Lien | | L+7.50% | | 8.50% | | 8/30/2024 | | 2,955 |
| | 2,684 |
| | 1,976 |
| | 1.0 | % |
| BBB Industries | | | | Senior Secured Loans - First Lien | | L+4.50% | | 5.58% | | 8/1/2025 | | 1,965 |
| | 1,950 |
| | 1,694 |
| | 0.9 | % |
| EnTrans International, LLC | | (13) | | Senior Secured Loans - First Lien | | L+6.00% | | 6.17% | | 11/1/2024 | | 7,545 |
| | 6,315 |
| | 6,049 |
| | 3.2 | % |
| | | | | | | | | | | | | | | | | | | |
| Mavis Tire Express Services Corp. (Revolver) | | (9)(13)(15) | | Senior Secured Loans - First Lien | | L+3.25% | | 4.39% | | 3/20/2023 | | 130 |
| | 115 |
| | 110 |
| | 0.1 | % |
| Mavis Tire Express Services Corp. (Delayed Draw) | | | | Senior Secured Loans - First Lien | | L+3.25% | | 3.56% | | 3/20/2025 | | 3,624 |
| | 3,610 |
| | 3,281 |
| | 1.8 | % |
| | | | | | | | | | | | | | | 3,725 |
| | 3,391 |
| | 1.9 | % |
| | | | | | | | | | | | | | | | | | | |
| Wesco Group | | (15) | | Senior Secured Loans - First Lien | | L+4.25% | | 5.33% | | 6/14/2024 | | 1,241 |
| | 1,229 |
| | 1,216 |
| | 0.6 | % |
| Total Automotive | | | | | | | | | | | | 27,242 |
| | 21,730 |
| | 11.5 | % |
| Banking, Finance, Insurance & Real Estate | | | | | | | | | | | | | | | | |
| Gladman Developments Ltd. | | UK(10)(11)(14)(15) | | Senior Secured Loans - First Lien | | G+9.50% | | 9.77% | | 8/16/2024 | | £ | 2,405 |
| | 3,011 |
| | 2,882 |
| | 1.5 | % |
| Gladman Developments Ltd. (Delayed Draw) | | UK(9)(10)(11)(13)(14)(15) | | Senior Secured Loans - First Lien | | G+9.50% | | 9.93% | | 8/16/2024 | | £ | 740 |
| | 946 |
| | 864 |
| | 0.4 | % |
| | | | | | | | | | | | | | | 3,957 |
| | 3,746 |
| | 1.9 | % |
| | | | | | | | | | | | | | | | | | | |
| Hunt Companies, Inc. | | (11) | | Senior Secured Bonds | | N/A | | 6.25% | | 2/15/2026 | | 2,000 |
| | 2,000 |
| | 1,820 |
| | 1.0 | % |
| JZ Capital Partners Ltd. | | UK(10)(11)(15) | | Senior Secured Loans - First Lien | | L+5.75% | | 6.75% | | 6/14/2021 | | 375 |
| | 372 |
| | 367 |
| | 0.2 | % |
| Total Banking, Finance, Insurance & Real Estate | | | | | | | | | | 6,329 |
| | 5,933 |
| | 3.1 | % |
| Beverage, Food & Tobacco | | | | | | | | | | | | | | | | |
| Addo Foods Group | | UK(10)(11)(14)(15) | | Senior Secured Loans - First Lien | | G+8.00% | | 9.00% | | 4/19/2024 | | £ | 9,995 |
| | 12,250 |
| | 12,047 |
| | 6.4 | % |
| Blue Ribbon LLC | | | | Senior Secured Loans - First Lien | | L+4.00% | | 5.00% | | 11/15/2021 | | 2,762 |
| | 2,364 |
| | 2,379 |
| | 1.3 | % |
GUGGENHEIM CREDIT INCOME FUND
CONSOLIDATED SCHEDULE OF INVESTMENTS (UNAUDITED)
|
| | | | | | | | | | | | | | | | | | | | | | | | | |
| | | | | | | | | | | | | | | | | | | |
| CTI Foods Holdings Co., LLC (First Out) | | (14)(15) | | Senior Secured Loans - First Lien | | L+7.00% | | 8.77% | | 5/3/2024 | | 1,967 |
| | 1,967 |
| | 1,849 |
| | 1.0 | % |
| CTI Foods Holdings Co., LLC (Last Out) | | (13)(14)(15) | | Senior Secured Loans - First Lien | | L+9.00% | | 10.77% | | 5/3/2024 | | 778 |
| | 778 |
| | 708 |
| | 0.3 | % |
| | | | | | | | | | | | | | | 2,745 |
| | 2,557 |
| | 1.3 | % |
| | | | | | | | | | | | | | | | | | | |
| Kar Nut Products Co. | | (15) | | Senior Secured Loans - First Lien | | L+4.50% | | 5.50% | | 3/31/2023 | | 874 |
| | 870 |
| | 868 |
| | 0.5 | % |
| Kar Nut Products Co. | | (15) | | Senior Secured Loans - First Lien | | L+4.50% | | 5.50% | | 3/31/2023 | | 814 |
| | 809 |
| | 808 |
| | 0.4 | % |
| | | | | | | | | | | | | | | 1,679 |
| | 1,676 |
| | 0.9 | % |
| | | | | | | | | | | | | | | | | | | |
| Topps Company | | (15) | | Senior Secured Loans - First Lien | | L+5.25% | | 6.50% | | 10/2/2022 | | 4,962 |
| | 4,938 |
| | 4,944 |
| | 2.6 | % |
| US Foods Inc. | | (11)(13)(15) | | Senior Secured Loans - First Lien | | L+3.25% | | 4.25% | | 4/24/2025 | | 2,981 |
| | 2,773 |
| | 2,892 |
| | 1.5 | % |
| Total Beverage, Food & Tobacco | | | | | | | | | | | | 26,749 |
| | 26,495 |
| | 14.0 | % |
| Capital Equipment | | | | | | | | | | | | | | | | |
| Cleaver Brooks, Inc. | | | | Senior Secured Bonds | | N/A | | 7.88% | | 3/1/2023 | | 2,000 |
| | 2,000 |
| | 1,695 |
| | 0.9 | % |
| Total Capital Equipment | | | | | | | | | | | | 2,000 |
| | 1,695 |
| | 0.9 | % |
| Chemicals, Plastics & Rubber | | | | | | | | | | | | | | | | |
| Aceto Chemicals | | (15) | | Senior Secured Loans - First Lien | | L+5.75% | | 6.75% | | 4/29/2025 | | 5,148 |
| | 5,118 |
| | 5,121 |
| | 2.7 | % |
| Aceto Chemicals (Revolver) | | (9)(13)(15) | | Senior Secured Loans - First Lien | | L+5.50% | | 6.50% | | 4/29/2025 | | 533 |
| | 451 |
| | 453 |
| | 0.3 | % |
| | | | | | | | | | | | | | | 5,569 |
| | 5,574 |
| | 3.0 | % |
| | | | | | | | | | | | | | | | | | | |
| Drew Marine Group Inc. | | (15) | | Senior Secured Loans - First Lien | | L+4.00% | | 4.43% | | 6/26/2026 | | 990 |
| | 977 |
| | 977 |
| | 0.5 | % |
| Ilpea Parent, Inc. | | IT(10)(11)(15) | | Senior Secured Loans - First Lien | | L+4.75% | | 5.75% | | 3/2/2023 | | 5,373 |
| | 5,332 |
| | 5,051 |
| | 2.7 | % |
| Neon Holdings Inc | | | | Senior Secured Bonds | | N/A | | 10.13% | | 4/1/2026 | | 1,065 |
| | 1,048 |
| | 1,057 |
| | 0.6 | % |
| | | | | | | | | | | | | | | | | | | |
| Seal For Life Industries US LLC (Revolver) | | (11)(13)(15) | | Senior Secured Loans - First Lien | | L+6.00% | | 7.00% | | 7/24/2024 | | 650 |
| | 582 |
| | 584 |
| | 0.3 | % |
| Seal For Life Industries US LLC | | (11)(15) | | Senior Secured Loans - First Lien | | L+6.00% | | 7.04% | | 7/23/2025 | | 6,956 |
| | 6,836 |
| | 6,863 |
| | 3.6 | % |
| | | | | | | | | | | | | | | 7,418 |
| | 7,447 |
| | 3.9 | % |
| Total Chemicals, Plastics & Rubber | | | | | | | | | | | | 20,344 |
| | 20,106 |
| | 10.7 | % |
| Construction & Building | | | | | | | | | | | | | | | | |
| GAL Manufacturing | | (15) | | Senior Secured Loans - First Lien | | L+4.25% | | 5.32% | | 6/26/2023 | | 5,400 |
| | 5,347 |
| | 5,373 |
| | 2.8 | % |
| GAL Manufacturing | | (15) | | Senior Secured Loans - Second Lien | | L+8.25% | | 9.32% | | 6/26/2024 | | 6,000 |
| | 5,919 |
| | 5,866 |
| | 3.1 | % |
| GAL Manufacturing (Revolver) | | (9)(13)(15) | | Senior Secured Loans - First Lien | | L+4.25% | | 4.43% | | 6/24/2022 | | 173 |
| | 151 |
| | 152 |
| | 0.1 | % |
| | | | | | | | | | | | | | | 11,417 |
| | 11,391 |
| | 6.0 | % |
| | | | | | | | | | | | | | | | | | | |
| Springs Window Fashions, LLC | | | | Senior Secured Loans - First Lien | | L+4.25% | | 6.05% | | 6/15/2025 | | 875 |
| | 868 |
| | 820 |
| | 0.5 | % |
| Springs Window Fashions, LLC | | | | Senior Secured Loans - Second Lien | | L+8.50% | | 9.57% | | 6/15/2026 | | 1,588 |
| | 1,523 |
| | 1,346 |
| | 0.7 | % |
| | | | | | | | | | | | | | | 2,391 |
| | 2,166 |
| | 1.2 | % |
| Total Construction & Building | | | | | | | | | | | | 13,808 |
| | 13,557 |
| | 7.2 | % |
GUGGENHEIM CREDIT INCOME FUND
CONSOLIDATED SCHEDULE OF INVESTMENTS (UNAUDITED)
|
| | | | | | | | | | | | | | | | | | | | | | | | | |
| Consumer Goods: Non-Durable | | | | | | | | | | | | | | | | |
| Diamond (BC) B.V. | | | | Senior Secured Loans - First Lien | | L+5.00% | | 6.00% | | 9/6/2024 | | 4,000 |
| | 3,900 |
| | 3,925 |
| | 2.1 | % |
| | | | | | | | | | | | | | | | | | | |
| Galls LLC | | (14)(15) | | Senior Secured Loans - First Lien | | L+6.75% | | 7.75% | | 1/31/2025 | | 3,681 |
| | 3,654 |
| | 3,616 |
| | 1.9 | % |
| Galls LLC (Delayed Draw B) | | (15) | | Senior Secured Loans - First Lien | | L+6.25% | | 7.06% | | 1/31/2025 | | 540 |
| | 536 |
| | 531 |
| | 0.3 | % |
| Galls LLC (Revolver) | | (9)(13)(15) | | Senior Secured Loans - First Lien | | L+6.25% | | 7.25% | | 1/31/2024 | | 490 |
| | 435 |
| | 440 |
| | 0.2 | % |
| | | | | | | | | | | | | | | 4,625 |
| | 4,587 |
| | 2.4 | % |
| | | | | | | | | | | | | | | | | | | |
| Pure Fishing, Inc. | | (12)(13)(15) | | Senior Secured Loans - First Lien | | L+4.50% | | 4.68% | | 12/19/2025 | | 3,333 |
| | 2,980 |
| | 2,799 |
| | 1.5 | % |
| | | | | | | | | | | | | | | | | | | |
| Safariland | | (15) | | Senior Secured Loans - First Lien | | L+7.55% | | 8.55% | | 11/17/2023 | | 123 |
| | 109 |
| | 111 |
| | 0.1 | % |
| Safariland | | (15) | | Senior Secured Loans - First Lien | | L+7.55% | | 8.55% | | 11/17/2023 | | 5,877 |
| | 5,351 |
| | 5,299 |
| | 2.8 | % |
| | | | | | | | | | | | | | | 5,460 |
| | 5,410 |
| | 2.9 | % |
| Total Consumer Goods: Non-Durable | | | | | | | | | | | | 16,965 |
| | 16,721 |
| | 8.9 | % |
| Consumer Goods: Durable | | | | | | | | | | | | | | | | |
| PlayPower, Inc. | | | | Senior Secured Loans - First Lien | | L+5.50% | | 5.68% | | 4/29/2026 | | 1,268 |
| | 1,257 |
| | 1,125 |
| | 0.6 | % |
| Total Consumer Goods: Durable | | | | | | | | | | | | 1,257 |
| | 1,125 |
| | 0.6 | % |
| Containers, Packaging & Glass | | | | | | | | | | | | | | | | |
| Bioplan USA, Inc. | | | | Senior Secured Loans - First Lien | | L+4.75% | | 5.82% | | 9/23/2021 | | 4,901 |
| | 4,749 |
| | 2,775 |
| | 1.4 | % |
| Husky Injection Molding Systems Ltd. | | CN(10)(11) | | Senior Secured Loans - First Lien | | L+3.00% | | 4.45% | | 3/28/2025 | | 1,962 |
| | 1,848 |
| | 1,803 |
| | 1.0 | % |
| Pelican Products Inc | | (12) | | Senior Secured Loans - First Lien | | L+3.50% | | 4.50% | | 5/31/2025 | | 3,989 |
| | 3,495 |
| | 3,683 |
| | 2.0 | % |
| | | | | | | | | | | | | | | | | | | |
| Resource Label Group LLC | | | | Senior Secured Loans - First Lien | | L+4.50% | | 5.95% | | 5/26/2023 | | 3,403 |
| | 3,383 |
| | 3,147 |
| | 1.7 | % |
| Resource Label Group LLC | | (15) | | Senior Secured Loans - Second Lien | | L+8.50% | | 9.95% | | 11/26/2023 | | 3,000 |
| | 2,972 |
| | 2,535 |
| | 1.3 | % |
| | | | | | | | | | | | | | | 6,355 |
| | 5,682 |
| | 3.0 | % |
| Total Containers, Packaging & Glass | | | | | | | | | | | | 16,447 |
| | 13,943 |
| | 7.4 | % |
| Energy: Oil & Gas | | | | | | | | | | | | | | | | |
| Basic Energy Services Inc | | (13) | | Senior Secured Bonds | | N/A | | 10.75% | | 10/15/2023 | | 2,000 |
| | 1,986 |
| | 805 |
| | 0.4 | % |
| Navajo Nation Oil and Gas | | (15) | | Senior Secured Loans - First Lien | | L+7.50% | | 9.00% | | 6/14/2022 | | 3,063 |
| | 3,046 |
| | 2,956 |
| | 1.6 | % |
| Penn Virginia | | (11)(15) | | Senior Secured Loans - Second Lien | | L+7.00% | | 8.00% | | 9/29/2022 | | 3,000 |
| | 2,967 |
| | 1,950 |
| | 1.0 | % |
| Permian Production Partners | | (13)(15)(18) | | Senior Secured Loans - First Lien | | N/A | | N/A | | 5/20/2024 | | 3,800 |
| | 3,693 |
| | 285 |
| | 0.1 | % |
| Total Energy: Oil & Gas | | | | | | | | | | | | 11,692 |
| | 5,996 |
| | 3.1 | % |
| Healthcare & Pharmaceuticals | | | | | | | | | | | | | | | | |
| Alegeus Technologies LLC | | (15) | | Senior Secured Loans - First Lien | | L+6.25% | | 7.25% | | 9/5/2024 | | 8,000 |
| | 7,960 |
| | 7,902 |
| | 4.2 | % |
| | | | | | | | | | | | | | | | | | | |
| Cambrex Corporation | | (15) | | Senior Secured Loans - First Lien | | L+5.00% | | 6.00% | | 11/20/2026 | | 2,488 |
| | 2,438 |
| | 2,450 |
| | 1.3 | % |
| Total Healthcare & Pharmaceuticals | | | | | | | | | | | | 10,398 |
| | 10,352 |
| | 5.5 | % |
| Hotel, Gaming & Leisure | | | | | | | | | | | | | | | | |
| ASM Global | | | | Senior Secured Loans - First Lien | | L+2.50% | | 2.67% | | 1/23/2025 | | 2,346 |
| | 2,343 |
| | 2,083 |
| | 1.1 | % |
GUGGENHEIM CREDIT INCOME FUND
CONSOLIDATED SCHEDULE OF INVESTMENTS (UNAUDITED)
|
| | | | | | | | | | | | | | | | | | | | | | | | | |
| | | | | | | | | | | | | | | | | | | |
| Golden Nugget | | (13)(15) | | Senior Secured Loans - First Lien | | L+12.00% | | 13.00% | | 10/4/2023 | | 11 |
| | 11 |
| | 12 |
| | — | % |
| Golden Nugget | | (13)(15) | | Senior Secured Loans - First Lien | | L+12.00% | | 13.00% | | 10/4/2023 | | 139 |
| | 133 |
| | 161 |
| | 0.1 | % |
| | | | | | | | | | | | | | | 144 |
| | 173 |
| | 0.1 | % |
| | | | | | | | | | | | | | | | | | | |
| Playtika Holding | | (11) | | Senior Secured Loans - First Lien | | L+6.00% | | 7.07% | | 12/31/2024 | | 1,950 |
| | 1,915 |
| | 1,953 |
| | 1.0 | % |
| Total Hotel, Gaming & Leisure | | | | | | | | | | | | 4,402 |
| | 4,209 |
| | 2.2 | % |
| Media: Advertising, Printing & Publishing | | | | | | | | | | | | | | | | |
| Boats Group | | (15) | | Senior Secured Loans - First Lien | | L+5.75% | | 6.75% | | 5/17/2024 | | 5,693 |
| | 5,639 |
| | 5,552 |
| | 2.9 | % |
| Boats Group (Revolver) | | (9)(13)(15)(17) | | Senior Secured Loans - First Lien | | L+4.25% | | N/A | | 9/12/2022 | | — |
| | (48 | ) | | (33 | ) | | — | % |
| | | | | | | | | | | | | | | 5,591 |
| | 5,519 |
| | 2.9 | % |
| | | | | | | | | | | | | | | | | | | |
| Houghton Mifflin Harcourt Publishers, Inc. | | (11) | | Senior Secured Loans - First Lien | | L+6.25% | | 7.25% | | 11/19/2024 | | 2,438 |
| | 2,340 |
| | 2,306 |
| | 1.2 | % |
| | | | | | | | | | | | | | | | | | | |
| McGraw-Hill Global Education Holdings | | | | Senior Secured Loans - First Lien | | L+4.00% | | 5.45% | | 5/4/2022 | | 1,880 |
| | 1,870 |
| | 1,602 |
| | 0.9 | % |
| McGraw-Hill Global Education Holdings | | (14)(15) | | Senior Unsecured Debt | | N/A | | 11.00% | | 4/20/2022 | | 2,000 |
| | 1,974 |
| | 1,498 |
| | 0.8 | % |
| McGraw-Hill Global Education Holdings | | (13) | | Senior Unsecured Debt | | N/A | | 7.88% | | 5/15/2024 | | 1,259 |
| | 1,227 |
| | 837 |
| | 0.4 | % |
| | | | | | | | | | | | | | | 5,071 |
| | 3,937 |
| | 2.1 | % |
| | | | | | | | | | | | | | | | | | | |
| Trader Interactive | | (15) | | Senior Secured Loans - First Lien | | L+6.50% | | 7.57% | | 6/15/2024 | | 8,071 |
| | 8,033 |
| | 7,602 |
| | 4.0 | % |
| Trader Interactive (Revolver) | | (9)(13)(15)(17) | | Senior Secured Loans - First Lien | | N/A | | N/A | | 6/15/2023 | | — |
| | (26 | ) | | (26 | ) | | — | % |
| | | | | | | | | | | | | | | 8,007 |
| | 7,576 |
| | 4.0 | % |
| Total Media: Advertising, Printing & Publishing | | | | | | | | | | 21,009 |
| | 19,338 |
| | 10.2 | % |
| Metals & Mining | | | | | | | | | | | | | | | | |
| Polyvision Corp. | | (15) | | Senior Secured Loans - First Lien | | L+6.50% | | 8.20% | | 2/21/2026 | | 3,585 |
| | 3,550 |
| | 3,424 |
| | 1.8 | % |
| Polyvision Corp. | | (15) | | Senior Secured Loans - First Lien | | L+6.50% | | 8.20% | | 2/21/2026 | | 1,010 |
| | 1,000 |
| | 964 |
| | 0.5 | % |
| Polyvision Corp. | | (9)(15) | | Senior Secured Loans - First Lien | | L+6.50% | | 7.52% | | 2/21/2026 | | 139 |
| | 139 |
| | 118 |
| | 0.1 | % |
| Polyvision Corp. | | (9)(13)(15) | | Senior Secured Loans - First Lien | | L+6.50% | | 7.50% | | 8/21/2025 | | 279 |
| | 209 |
| | 214 |
| | 0.1 | % |
| Total Metals & Mining | | | | | | | | | | | | 4,898 |
| | 4,720 |
| | 2.5 | % |
| Retail | | | | | | | | | | | | | | | | |
| At Home Group | | (11) | | Senior Secured Loans - First Lien | | L+3.50% | | 4.50% | | 6/3/2022 | | 316 |
| | 294 |
| | 229 |
| | 0.1 | % |
| Belk, Inc. | | | | Senior Secured Loans - First Lien | | L+6.75% | | 7.75% | | 7/31/2025 | | 1,126 |
| | 1,073 |
| | 412 |
| | 0.2 | % |
| Beverages and More, Inc. | | (13) | | Senior Secured Bonds | | N/A | | 11.50% | | 6/15/2022 | | 900 |
| | 782 |
| | 747 |
| | 0.4 | % |
| Blue Nile, Inc. | | | | Senior Secured Loans - First Lien | | L+6.50% | | 7.50% | | 2/17/2023 | | 10,200 |
| | 10,046 |
| | 6,153 |
| | 3.3 | % |
| | | | | | | | | | | | | | | | | | | |
| Pet Holdings ULC | | CN(10)(11)(15) | | Senior Secured Loans - First Lien | | L+5.50% | | 6.93% | | 7/5/2022 | | 4,318 |
| | 4,290 |
| | 3,584 |
| | 1.9 | % |
GUGGENHEIM CREDIT INCOME FUND
CONSOLIDATED SCHEDULE OF INVESTMENTS (UNAUDITED)
|
| | | | | | | | | | | | | | | | | | | | | | | | | |
| Pet Holdings ULC (Delayed Draw) | | CN(10)(11)(15) | | Senior Secured Loans - First Lien | | L+5.50% | | 6.93% | | 7/5/2022 | | 487 |
| | 487 |
| | 404 |
| | 0.2 | % |
| | | | | | | | | | | | | | | 4,777 |
| | 3,988 |
| | 2.1 | % |
| | | | | | | | | | | | | | | | | | | |
| Save-a-Lot | | (13)(14)(15) | | Senior Secured Loans - First Lien | | L+7.00% | | 7.00% | | 3/12/2024 | | 875 |
| | 789 |
| | 793 |
| | 0.4 | % |
| Save-a-Lot | | (13)(14)(15) | | Senior Secured Loans - Second Lien | | L+11.75% | | 11.75% | | 10/1/2024 | | 1,044 |
| | 2,104 |
| | 936 |
| | 0.5 | % |
| | | | | | | | | | | | | | | 2,893 |
| | 1,729 |
| | 0.9 | % |
| | | | | | | | | | | | | | | | | | | |
| Smart & Final Stores LLC | | (15) | | Senior Secured Loans - First Lien | | L+6.75% | | 6.92% | | 6/20/2025 | | 3,960 |
| | 3,611 |
| | 3,891 |
| | 2.1 | % |
| Total Retail | | | | | | | | | | | | 23,476 |
| | 17,149 |
| | 9.1 | % |
| Services: Business | | | | | | | | | | | | | | | | |
| 24-7 Intouch | | CN(10)(11)(15) | | Senior Secured Loans - First Lien | | L+4.75% | | 4.92% | | 8/25/2025 | | 3,930 |
| | 3,713 |
| | 3,636 |
| | 1.9 | % |
| | | | | | | | | | | | | | | | | | | |
| Alexander Mann Solutions (GBP Term Loan) | | UK(10)(11)(13) | | Senior Secured Loans - First Lien | | G+5.00% | | 5.73% | | 6/16/2025 | | £ | 2,060 |
| | 2,554 |
| | 2,021 |
| | 1.0 | % |
| Alexander Mann Solutions (USD Term Loan) | | UK(10)(11)(13) | | Senior Secured Loans - First Lien | | L+5.50% | | 6.65% | | 6/16/2025 | | 890 |
| | 853 |
| | 701 |
| | 0.4 | % |
| Alexander Mann Solutions (Revolver) | | UK(9)(10)(11)(13)(15) | | Senior Secured Loans - First Lien | | L+3.75% | | 4.43% | | 12/16/2024 | | 324 |
| | 339 |
| | 312 |
| | 0.2 | % |
| | | | | | | | | | | | | | | 3,746 |
| | 3,034 |
| | 1.6 | % |
| | | | | | | | | | | | | | | | | | | |
| Capstone Logistics, LLC | | | | Senior Secured Loans - First Lien | | L+4.50% | | 5.57% | | 10/7/2021 | | 4,755 | | 4,737 |
| | 4,616 |
| | 2.4 | % |
| Cast & Crew Payroll | | | | Senior Secured Loans - First Lien | | L+3.75% | | 3.93% | | 1/16/2026 | | 2,905 | | 2,538 |
| | 2,677 |
| | 1.4 | % |
| HealthChannels, Inc. | | (15) | | Senior Secured Loans - First Lien | | L+4.50% | | 4.67% | | 4/3/2025 | | 2,842 | | 2,794 |
| | 2,373 |
| | 1.3 | % |
| | | | | | | | | | | | | | | | | | | |
| Hersha Hospitality Management | | (15) | | Senior Secured Loans - First Lien | | L+5.00% | | 6.45% | | 3/2/2026 | | 4,275 | | 4,189 |
| | 3,847 |
| | 2.0 | % |
| Hersha Hospitality Management (Delayed Draw) | | (9)(15)(17) | | Senior Secured Loans - First Lien | | L+5.00% | | 6.22% | | 3/2/2026 | | 43 |
| | 8 |
| | (129 | ) | | — | % |
| | | | | | | | | | | | | | | 4,197 |
| | 3,718 |
| | 2.0 | % |
| | | | | | | | | | | | | | | | | | | |
| Park Place Technologies | | | | Senior Secured Loans - First Lien | | L+4.00% | | 5.00% | | 3/29/2025 | | 2,658 | | 2,649 |
| | 2,549 |
| | 1.4 | % |
| Park Place Technologies | | (15) | | Senior Secured Loans - Second Lien | | L+8.00% | | 9.00% | | 3/29/2026 | | 3,404 | | 3,384 |
| | 3,216 |
| | 1.7 | % |
| | | | | | | | | | | | | | | 6,033 |
| | 5,765 |
| | 3.1 | % |
| | | | | | | | | | | | | | | | | | | |
| PSI Services LLC | | (9)(13)(15) | | Senior Secured Loans - First Lien | | L+5.75% | | 6.75% | | 10/4/2025 | | 104 | | 104 |
| | 71 |
| | — | % |
| PSI Services LLC | | (9)(15)(17) | | Senior Secured Loans - First Lien | | L+5.75% | | 6.75% | | 10/4/2026 | | — |
| | — |
| | (9 | ) | | — | % |
| PSI Services LLC | | (15) | | Senior Secured Loans - First Lien | | L+5.75% | | 6.75% | | 10/4/2026 | | 427 | | 427 |
| | 412 |
| | 0.2 | % |
| PSI Services LLC | | (15) | | Senior Secured Loans - First Lien | | L+5.75% | | 6.75% | | 10/16/2026 | | 2,851 | | 2,817 |
| | 2,749 |
| | 1.5 | % |
| | | | | | | | | | | | | | | 3,348 |
| | 3,223 |
| | 1.7 | % |
| | | | | | | | | | | | | | | | | | | |
| SLR Consulting | | (11)(15) | | Senior Secured Loans - First Lien | | L+4.00% | | 4.98% | | 6/23/2025 | | 1,588 | | 1,556 |
| | 1,536 |
| | 0.8 | % |
GUGGENHEIM CREDIT INCOME FUND
CONSOLIDATED SCHEDULE OF INVESTMENTS (UNAUDITED)
|
| | | | | | | | | | | | | | | | | | | | | | | | | |
| SLR Consulting (Delayed Draw) | | (11)(15) | | Senior Secured Loans - First Lien | | L+4.00% | | 5.50% | | 5/23/2025 | | 494 |
| | 512 |
| | 496 |
| | 0.3 | % |
| | | | | | | | | | | | | | | 2,068 |
| | 2,032 |
| | 1.1 | % |
| | | | | | | | | | | | | | | | | | | |
| Teneo Holdings LLC | | | | Senior Secured Loans - First Lien | | L+5.25% | | 6.25% | | 7/12/2025 | | 3,970 | | 3,797 |
| | 3,786 |
| | 2.0 | % |
| YAK Access, LLC | | | | Senior Secured Loans - Second Lien | | L+10.00% | | 10.30% | | 7/10/2026 | | 5,000 | | 4,705 |
| | 3,575 |
| | 1.9 | % |
| Total Services: Business | | | | | | | | | | | | 41,676 |
| | 38,435 |
| | 20.4 | % |
| Technology | | | | | | | | | | | | | | | | |
| Acquia Inc. | | (13)(15) | | Senior Secured Loans - First Lien | | L+7.00% | | 8.00% | | 10/31/2025 | | 1,789 |
| | 1,754 |
| | 1,757 |
| | 0.9 | % |
| Acquia Inc. | | (9)(13)(15)(17) | | Senior Secured Loans - First Lien | | L+7.00% | | N/A | | 10/31/2025 | | — |
| | (4 | ) | | (23 | ) | | — | % |
| | | | | | | | | | | | | | | 1,750 |
| | 1,734 |
| | 0.9 | % |
| | | | | | | | | | | | | | | | | | | |
| Advicent Solutions | | (15) | | Senior Secured Loans - First Lien | | L+8.25% | | 9.71% | | 2/28/2022 | | 6,945 |
| | 6,884 |
| | 4,852 |
| | 2.6 | % |
| Advicent Solutions | | (9)(13)(15) | | Senior Secured Loans - First Lien | | P+4.50% | | 7.75% | | 2/28/2022 | | 14 |
| | 14 |
| | 12 |
| | — | % |
| Advicent Solutions | | (14)(15) | | Senior Secured Loans - First Lien | | L+3.5% | | 4.50% | | 2/28/2022 | | 1,643 |
| | 1,636 |
| | 1,635 |
| | 0.9 | % |
| | | | | | | | | | | | | | | 8,534 |
| | 6,499 |
| | 3.5 | % |
| | | | | | | | | | | | | | | | | | | |
| Alfresco Software | | (15) | | Senior Secured Loans - First Lien | | L+8.50% | | 9.50% | | 9/9/2024 | | 3,270 | | 3,213 |
| | 3,219 |
| | 1.7 | % |
| | | | | | | | | | | | | | | | | | | |
| Allvue Systems (Revolver) | | (9)(13)(15)(17) | | Senior Secured Loans - First Lien | | L+4.25% | | N/A | | 9/6/2024 | | — |
| | (13 | ) | | (11 | ) | | — | % |
| Allvue Systems (Term Loan) | | (15) | | Senior Secured Loans - First Lien | | L+4.25% | | 4.25% | | 9/4/2026 | | 864 | | 862 |
| | 853 |
| | 0.5 | % |
| | | | | | | | | | | | | | | 849 |
| | 842 |
| | 0.5 | % |
| | | | | | | | | | | | | | | | | | | |
| Apptio, Inc. (Revolver) | | (9)(13)(15)(17) | | Senior Secured Loans - First Lien | | L+7.25% | | N/A | | 12/3/2024 | | — |
| | (31 | ) | | (30 | ) | | — | % |
| Apptio, Inc. | | (15) | | Senior Secured Loans - First Lien | | L+7.25% | | 8.25% | | 1/10/2025 | | 4,900 | | 4,845 |
| | 4,816 |
| | 2.5 | % |
| | | | | | | | | | | | | | | 4,814 |
| | 4,786 |
| | 2.5 | % |
| | | | | | | | | | | | | | | | | | | |
| Causeway Technologies | | UK(10)(11)(15) | | Senior Secured Loans - First Lien | | G+6.25% | | 6.76% | | 6/8/2024 | | £ | 2,638 |
| | 3,350 |
| | 3,232 |
| | 1.7 | % |
| Causeway Technologies | | UK(10)(11)(15) | | Senior Secured Loans - First Lien | | G+7.00% | | 7.68% | | 6/8/2024 | | £ | 338 |
| | 426 |
| | 418 |
| | 0.2 | % |
| | | | | | | | | | | | | | | 3,776 |
| | 3,650 |
| | 1.9 | % |
| | | | | | | | | | | | | | | | | | | |
| Cologix Holdings | | | | Senior Secured Loans - First Lien | | L+3.75% | | 4.75% | | 3/20/2024 | | 2,000 |
| | 1,938 |
| | 1,926 |
| | 1.0 | % |
| Cvent, Inc. | | | | Senior Secured Loans - First Lien | | L+3.75% | | 3.92% | | 11/29/2024 | | 1,745 |
| | 1,727 |
| | 1,514 |
| | 0.8 | % |
| | | | | | | | | | | | | | | | | | | |
| Datix Bidco Limited | | (15) | | Senior Secured Loans - First Lien | | L+4.50% | | 5.36% | | 4/28/2025 | | 1,931 |
| | 1,903 |
| | 1,917 |
| | 1.0 | % |
| Datix Bidco Limited | | (15) | | Senior Secured Loans - Second Lien | | L+7.75% | | 8.61% | | 4/27/2026 | | 462 |
| | 454 |
| | 458 |
| | 0.2 | % |
| Datix Bidco Limited | | (15) | | Senior Secured Loans - First Lien | | L+4.50% | | 4.68% | | 4/28/2025 | | 3,048 |
| | 3,011 |
| | 3,027 |
| | 1.6 | % |
| Datix Bidco Limited | | (15) | | Senior Secured Loans - Second Lien | | L+7.75% | | 7.68% | | 4/27/2026 | | 4,696 |
| | 4,636 |
| | 4,659 |
| | 2.5 | % |
| | | | | | | | | | | | | | | 10,004 |
| | 10,061 |
| | 5.3 | % |
| | | | | | | | | | | | | | | | | | | |
GUGGENHEIM CREDIT INCOME FUND
CONSOLIDATED SCHEDULE OF INVESTMENTS (UNAUDITED)
|
| | | | | | | | | | | | | | | | | | | | | | | | | |
| Kerridge Commercial Systems (USD Term Loan) | | UK(10)(11)(14)(15) | | Senior Secured Loans - First Lien | | L+6.25% | | 7.32% | | 1/22/2024 | | 637 |
| | 626 |
| | 633 |
| | 0.3 | % |
| Kerridge Commercial Systems (GBP Term Loan) | | UK(10)(11)(14)(15) | | Senior Secured Loans - First Lien | | G+6.25% | | 7.04% | | 1/22/2024 | | £ | 530 |
| | 732 |
| | 653 |
| | 0.3 | % |
| Kerridge Commercial Systems (Euro Delayed Draw) | | UK(10)(11)(14)(15) | | Senior Secured Loans - First Lien | | E+6.25% | | 6.75% | | 1/22/2024 | | € | 97 |
| | 118 |
| | 109 |
| | 0.1 | % |
| Kerridge Commercial Systems (GBP Delayed Draw) | | UK(10)(11)(14)(15) | | Senior Secured Loans - First Lien | | G+6.25% | | 7.04% | | 1/22/2024 | | £ | 326 |
| | 423 |
| | 402 |
| | 0.2 | % |
| Kerridge Commercial Systems (Bidco) Limited | | (11)(14)(15) | | Senior Secured Loans - First Lien | | L+6.25% | | 7.32% | | 1/22/2024 | | 2,211 |
| | 2,178 |
| | 2,198 |
| | 1.2 | % |
| Kerridge Commercial Systems (Bidco) Limited | | UK(10)(11)(14)(15) | | Senior Secured Loans - First Lien | | E+6.25% | | 6.75% | | 1/25/2024 | | 289 |
| | 317 |
| | 323 |
| | 0.2 | % |
| | | | | | | | | | | | | | | 4,394 |
| | 4,318 |
| | 2.3 | % |
| | | | | | | | | | | | | | | | | | | |
| Lytx, Inc. | | (9)(15)(16) | | Senior Secured Loans - First Lien | | L+6.00% | | 7.00% | | 2/28/2026 | | 512 |
| | 491 |
| | 483 |
| | 0.3 | % |
| Lytx, Inc. | | (15)(16) | | Senior Secured Loans - First Lien | | L+6.00% | | 7.00% | | 2/27/2026 | | 5,888 |
| | 5,791 |
| | 5,805 |
| | 3.1 | % |
| | | | | | | | | | | | | | | 6,282 |
| | 6,288 |
| | 3.4 | % |
| | | | | | | | | | | | | | | | | | | |
| Ministry Brands | | (15) | | Senior Secured Loans - First Lien | | L+4.00% | | 5.00% | | 12/2/2022 | | 949 |
| | 944 |
| | 877 |
| | 0.5 | % |
| Ministry Brands (Delayed Draw) | | (15) | | Senior Secured Loans - First Lien | | L+4.00% | | 5.00% | | 12/2/2022 | | 504 |
| | 503 |
| | 467 |
| | 0.2 | % |
| Ministry Brands (Delayed Draw) | | (15) | | Senior Secured Loans - First Lien | | L+4.00% | | 5.00% | | 12/2/2022 | | 183 |
| | 183 |
| | 169 |
| | 0.1 | % |
| | | | | | | | | | | | | | | 1,630 |
| | 1,513 |
| | 0.8 | % |
| | | | | | | | | | | | | | | | | | | |
| Onyx CenterSource | | (15) | | Senior Secured Loans - First Lien | | L+6.25% | | 7.25% | | 12/20/2021 | | 6,616 |
| | 6,606 |
| | 6,169 |
| | 3.2 | % |
| Onyx CenterSource (Revolver) | | (13)(15) | | Senior Secured Loans - First Lien | | L+6.25% | | 7.25% | | 12/20/2021 | | 329 |
| | 317 |
| | 307 |
| | 0.2 | % |
| | | | | | | | | | | | | | | 6,923 |
| | 6,476 |
| | 3.4 | % |
| | | | | | | | | | | | | | | | | | | |
| Planview, Inc. | | (15) | | Senior Secured Loans - First Lien | | L+5.25% | | 6.25% | | 1/27/2023 | | 6,121 |
| | 6,088 |
| | 6,094 |
| | 3.2 | % |
| Planview, Inc. | | (15) | | Senior Secured Loans - First Lien | | L+5.25% | | 6.25% | | 1/27/2023 | | 389 |
| | 389 |
| | 387 |
| | 0.2 | % |
| | | | | | | | | | | | | | | 6,477 |
| | 6,481 |
| | 3.4 | % |
| | | | | | | | | | | | | | | | | | | |
| Velocity Holdings US | | (15) | | Senior Secured Loans - First Lien | | L+7.00% | | 8.00% | | 12/12/2023 | | 5,400 |
| | 5,322 |
| | 5,323 |
| | 2.8 | % |
| Velocity Holdings US | | (15) | | Senior Secured Loans - First Lien | | L+7.00% | | 8.00% | | 12/12/2023 | | 1,139 |
| | 1,113 |
| | 1,123 |
| | 0.6 | % |
| Velocity Holdings US (Revolver) | | (13)(15) | | Senior Secured Loans - First Lien | | L+7.00% | | 8.05% | | 12/12/2022 | | 462 |
| | 430 |
| | 433 |
| | 0.2 | % |
| | | | | | | | | | | | | | | 6,865 |
| | 6,879 |
| | 3.6 | % |
| | | | | | | | | | | | | | | | | | | |
| Wind River Systems | | (15) | | Senior Secured Loans - First Lien | | L+6.75% | | 7.75% | | 6/24/2024 | | 5,449 |
| | 5,360 |
| | 5,390 |
| | 2.9 | % |
| Total Technology | | | | | | | | | | | | 74,536 |
| | 71,576 |
| | 37.9 | % |
| Telecommunications | | | | | | | | | | | | | | | | |
| Firstlight Fiber | | | | Senior Secured Loans - First Lien | | L+3.50% | | 3.67% | | 7/23/2025 | | 2,220 |
| | 2,210 |
| | 2,121 |
| | 1.1 | % |
| Firstlight Fiber | | (15) | | Senior Secured Loans - Second Lien | | L+7.50% | | 7.67% | | 7/23/2026 | | 2,500 |
| | 2,477 |
| | 2,188 |
| | 1.2 | % |
GUGGENHEIM CREDIT INCOME FUND
CONSOLIDATED SCHEDULE OF INVESTMENTS (UNAUDITED)
|
| | | | | | | | | | | | | | | | | | | | | | | | | |
| | | | | | | | | | | | | | | 4,687 |
| | 4,309 |
| | 2.3 | % |
| Total Telecommunications | | | | | | | | | | | | 4,687 |
| | 4,309 |
| | 2.3 | % |
| Transportation: Consumer | | | | | | | | | | | | | | | | |
| Delta Airlines | | (11) | | Senior Secured Loans - First Lien | | L+4.75% | | 5.75% | | 5/1/2023 | | 100 |
| | 97 |
| | 98 |
| | 0.1 | % |
| Total Transportation: Consumer | | | | | | | | | | | | 97 |
| | 98 |
| | 0.1 | % |
| Utilities: Electric | | | | | | | | | | | | | | | | |
| BHI Energy | | (15) | | Senior Secured Loans - Second Lien | | L+8.75% | | 9.75% | | 2/28/2025 | | 6,000 |
| | 5,915 |
| | 5,790 |
| | 3.1 | % |
| Total Utilities: Electric | | | | | | | | | | | | 5,915 |
| | 5,790 |
| | 3.1 | % |
| Utilities: Oil & Gas | | | | | | | | | | | | | | | | |
| SeaPort | | (15) | | Senior Secured Loans - First Lien | | L+5.50% | | 5.68% | | 10/31/2025 | | 5,892 |
| | 5,748 |
| | 5,303 |
| | 2.8 | % |
| Total Utilities: Oil & Gas | | | | | | | | | | | | 5,748 |
| | 5,303 |
| | 2.8 | % |
| Total Debt Investments | | | | | | | | | | | | | | $ | 347,417 |
| | $ | 316,243 |
| | 167.6 | % |
| | | | | | | | | | | | | | | | | | | |
| Equity investments - 4.0% | | | | | | | | | | | | | | | | | | |
| Banking, Finance, Insurance & Real Estate | | | | | | | | | | | | | | | | |
| Four Springs Capital Trust (Preferred Equity) | | (11)(13)(14)(15) | | Equity and Other | | N/A | | 16.50% | | | | 257,464 |
| | $ | 5,101 |
| | $ | 5,149 |
| | 2.7 | % |
| Total Banking, Finance, Insurance & Real Estate | | | | | | | | | | | | 5,101 |
| | 5,149 |
| | 2.7 | % |
| Beverage, Food & Tobacco | | | | | | | | | | | | | | | | |
| Chef's Holdings Inc. | | (13)(15)(16) | | Equity and Other | | N/A | | N/A | | | | 19,540 |
| | 2,459 |
| | 1,594 |
| | 0.8 | % |
| Total Beverage, Food & Tobacco | | | | | | | | | | | | 2,459 |
| | 1,594 |
| | 0.8 | % |
| Energy: Oil & Gas | | | | | | | | | | | | | | | | |
| Maverick Natural Resources, LLC (Common Equity) | | (15)(16) | | Equity and Other | | N/A | | N/A | | | | 4,625 |
| | 2,777 |
| | 347 |
| | 0.2 | % |
| SandRidge Energy, Inc. (Common Equity) | | (11)(13)(16) | | Equity and Other | | N/A | | N/A | | | | 21,224 |
| | 448 |
| | 27 |
| | — | % |
| Total Energy: Oil & Gas | | | | | | | | | | | | 3,225 |
| | 374 |
| | 0.2 | % |
| Retail | | | | | | | | | | | | | | | | |
| Save-a-Lot | | (13)(15) | | Equity and Other | | N/A | | N/A | | | | 53,097 |
| | — |
| | — |
| | — | % |
| Total Retail | | | | | | | | | | | | — |
| | — |
| | — | % |
| Technology | | | | | | | | | | | | | | | | |
| Alfresco Software (Common Equity) | | (13)(15)(16) | | Equity and Other | | N/A | | N/A | | | | 66,230 |
| | 166 |
| | 205 |
| | 0.1 | % |
| Velocity Holdings US (Class A Units) | | (13)(15)(16) | | Equity and Other | | N/A | | N/A | | | | 231 |
| | 230 |
| | 296 |
| | 0.2 | % |
| Wolfhound Parent Inc. (Warrants) | | (13)(15)(16) | | Equity and Other | | N/A | | N/A | | | | 1,975 |
| | 30 |
| | 30 |
| | — | % |
| Total Technology | | | | | | | | | | | | 426 |
| | 531 |
| | 0.3 | % |
| Total Equity Investments | | | | | | | | | | | | | | $ | 11,211 |
| | $ | 7,648 |
| | 4.0 | % |
| | | | | | | | | | | | | | | | | | | |
| Total Investments - 171.6% | | | | | | | | | | | | | | $ | 358,628 |
| | $ | 323,891 |
| | 171.6 | % |
GUGGENHEIM CREDIT INCOME FUND
CONSOLIDATED SCHEDULE OF INVESTMENTS (UNAUDITED)
|
| | | | | | | | | | | | | | | | | | | | |
| June 30, 2020 (in thousands) |
| Derivative Counterparty | | Settlement Date | | Amount Purchased | | Amount Sold | | Amortized Cost (7) (8) | | Fair Value | | % of Net Assets |
| Foreign Currency Forward Contracts | | | | | | | | | | | |
| JPMorgan Chase Bank | | 7/17/2020 | | $ | 440 |
| | € | 387 |
| | — |
| | $ | 5 |
| | — | % |
| JPMorgan Chase Bank | | 7/17/2020 | | $ | 23,614 |
| | £ | 18,730 |
| | — |
| | $ | 403 |
| | 0.2 | % |
| | | | | | | | | | | $ | 408 |
| | 0.2 | % |
_______________________
| |
| (1) | Security may be an obligation of one or more entities affiliated with the named portfolio company. |
| |
| (2) | All debt and equity investments are income producing unless otherwise noted. |
| |
| (3) | All investments are non-controlled/non-affiliated investments as defined by the Investment Company Act of 1940 (the "1940 Act"). The provisions of the 1940 Act classify investments based on the level of control that we maintain in a particular portfolio company. As defined in the 1940 Act, a company is generally presumed to be “non-controlled” when we own 25% or less of the portfolio company’s voting securities and “controlled” when we own more than 25% of the portfolio company’s voting securities. The provisions of the 1940 Act also classify investments further based on the level of ownership that we maintain in a particular portfolio company. As defined in the 1940 Act, a company is generally deemed as “non-affiliated” when we own less than 5% of a portfolio company’s voting securities and “affiliated” when we own 5% or more of a portfolio company’s voting securities. |
| |
| (4) | The periodic interest rate for all floating rate loans is indexed to London Interbank Offered Rate ("LIBOR" or "LIBO rate") (denoted as "L"), Euro Interbank Offered Rate ("EURIBOR") (denoted as "E"), British Pound Sterling LIBOR ("GBP LIBOR") (denoted as "G") or Prime Rate (denoted as "P"). Pursuant to the terms of the underlying credit agreements, the base interest rates typically reset annually, semi-annually, quarterly or monthly at the borrower's option. The borrower may also elect to have multiple interest reset periods for each loan. For each of these floating rate loans, the Consolidated Schedule of Investments presents the applicable margin over LIBOR, EURIBOR, GBP LIBOR or Prime based on each respective credit agreement. As of June 30, 2020, LIBO rates ranged between 0.16% for 1-month LIBOR to 0.30% for 3-month LIBOR. |
| |
| (5) | For portfolio companies with multiple interest rate contracts under a single credit agreement, the interest rate shown is a weighted average current interest rate in effect at June 30, 2020. |
| |
| (6) | Unless noted otherwise, the principal amount (par amount) for all debt securities is denominated in U.S. dollars. Equity investments are recorded as number of shares owned. |
| |
| (7) | Cost represents amortized cost, inclusive of any capitalized paid-in-kind income ("PIK"), for debt securities, and cost plus capitalized PIK, if any, for preferred stock. |
| |
| (8) | As of June 30, 2020, the aggregate gross unrealized appreciation for all securities, including foreign currency forward contracts, in which there was an excess of value over tax cost was $3.7 million; the aggregate gross unrealized depreciation for all securities, including foreign currency forward contracts, in which there was an excess of tax cost over value was $36.0 million; the net unrealized depreciation was $32.3 million; the aggregate cost of securities for Federal income tax purposes was $356.2 million. |
| |
| (9) | The investment is either a delayed draw loan or a revolving credit facility whereby some or all of the investment commitment is undrawn as of June 30, 2020 (see Note 8. Commitments and Contingencies). |
| |
| (10) | A portfolio company domiciled in a foreign country. The regulatory jurisdiction of security issuance may be a different country than the domicile of the portfolio company. |
| |
| (11) | The investment is not a qualifying asset as defined in Section 55(a) of the 1940 Act. As of June 30, 2020, qualifying assets represented 81% of total assets. Under the 1940 Act we may not acquire any non-qualifying assets unless, at the time the acquisition is made, qualifying assets represent at least 70% of our total assets. |
| |
| (12) | Investment position or portion thereof unsettled as of June 30, 2020. |
| |
| (13) | The investment position, or a portion thereof, was not pledged as collateral supporting the amounts outstanding under our credit facility as of June 30, 2020; (see Note 7. Borrowings). |
| |
| (14) | The underlying credit agreement or indenture contains a PIK provision, whereby the issuer has either the option or the obligation to make interest payments with the issuance of additional securities. The interest rate in the schedule represents the current interest rate in effect for these investments. |
GUGGENHEIM CREDIT INCOME FUND
CONSOLIDATED SCHEDULE OF INVESTMENTS (UNAUDITED)
|
| | | | | | | |
| | Coupon Rate | PIK Component | Cash Component | PIK Option |
| Addo Foods Group | G+ 8.00% |
| 0.75 | % | G+7.25% |
| The Portfolio Company may elect PIK up to 0.75%. |
| Advicent Solutions | L+3.5% |
| 0.75 | % | L+2.75% |
| The Portfolio Company may elect PIK up to 0.75%. |
| CTI Foods Holdings Co., LLC (First Out) | L+7.00% |
| 3.00 | % | L+4.00% |
| The Portfolio Company may elect PIK up to 3.00%. |
| CTI Foods Holdings Co., LLC (Last Out) | L+9.00% |
| 6.00 | % | L+3.00% |
| The Portfolio Company may elect PIK up to 6.00%. |
| Four Springs Capital Trust | 16.50 | % | 16.50 | % | — | % | The Portfolio Company may elect PIK up to 16.50%. |
| Galls LLC | L+6.75% |
| 0.50 | % | L+6.25% |
| The Portfolio Company may elect PIK up to 6.75%. |
| Gladman Developments Ltd. | G+9.50% |
| 2.75 | % | G+6.75% |
| The Portfolio Company may elect PIK up to 2.75%. |
| Gladman Developments Ltd. (Delayed Draw) | G+9.50% |
| 2.75 | % | G+6.75% |
| The Portfolio Company may elect PIK up to 2.75%. |
| Kerridge Commercial Systems (GBP Term Loan) | G+6.25% |
| 1.74 | % | G+4.51% |
| The Portfolio Company has elected to exercise PIK Toggle option of 25% of applicable all-in rate. |
| Kerridge Commercial Systems (USD Term Loan) | L+6.25% |
| 1.83 | % | L+4.42% |
| The Portfolio Company has elected to exercise PIK Toggle option of 25% of applicable all-in rate. |
| Kerridge Commercial Systems (GBP Delayed Draw) | G+6.25% |
| 1.74 | % | G+4.25% |
| The Portfolio Company has elected to exercise PIK Toggle option of 25% of applicable all-in rate. |
| Kerridge Commercial Systems (Euro Delayed Draw) | E+6.25% |
| 1.69 | % | E+4.56% |
| The Portfolio Company has elected to exercise PIK Toggle option of 25% of applicable all-in rate. |
| Kerridge Commercial Systems (Bidco) Limited | L+6.25% |
| 1.83 | % | L+4.42% |
| The Portfolio Company has elected to exercise PIK Toggle option of 25% of applicable all-in rate. |
| Kerridge Commercial Systems (Bidco) Limited | E+6.25% |
| 1.69 | % | E+4.56% |
| The Portfolio Company has elected to exercise PIK Toggle option of 25% of applicable all-in rate. |
| McGraw-Hill Global Education Holdings | 11.00 | % | 11.00 | % | — | % | The Portfolio Company may elect partial PIK up to 50% of the interest of the period or full PIK of 11.75%. |
| Save-a-Lot | L+7.00% |
| 6.00 | % | L+1.00% |
| The Portfolio Company may elect to PIK up to 6.00%. |
| Save-a-Lot | L+11.75% |
| 10.75 | % | L+1.00% |
| The Portfolio Company may elect to PIK up to 10.75%. |
| |
| (15) | Investments value was determined using significant unobservable inputs (see Note 2. Significant Accounting Policies). |
| |
| (16) | Non-income producing security. |
| |
| (17) | The negative fair value is the result of the unfunded commitment being valued below par. The negative amortized cost is the result of the capitalized discount being greater than the principal amount outstanding on the loan. |
| |
| (18) | Investment was on non-accrual status as of June 30, 2020, meaning that the Master Fund has ceased recognizing interest income on these investments. As of June 30, 2020, debt investments on non-accrual status represented 1.0% and 0.1% of total investments on an amortized cost basis and fair value basis, respectively. |
Abbreviations:
CN = Canada; UK = United Kingdom; IT = Italy; IR=Ireland
See Unaudited Notes to Consolidated Financial Statements.
GUGGENHEIM CREDIT INCOME FUND
CONSOLIDATED SCHEDULE OF INVESTMENTS
|
| | | | | | | | | | | | | | | | | | | | | | | | | |
December 31, 2019 (in thousands) |
Portfolio Company (1) (2) (3) | | Footnotes | | Investment | | Spread
Above
Reference
Rate (4) | | Interest
Rate (4) (5) | | Maturity Date | | Principal / Par Amount / Shares (6) | | Amortized Cost (7) (8) | | Fair Value | | % of Net Assets |
| INVESTMENTS | | | | | | | | | | | | | | | | | | |
| Debt investments - 170.0% | | | | | | | | | | | | | | | | | | |
| Aerospace & Defense | | | | | | | | | | | | | | | | |
| National Technical Systems | | (15) | | Senior Secured Loans - First Lien | | L+6.25% | | 7.94% | | 6/12/2021 | | 3,434 |
| | $ | 3,420 |
| | $ | 3,365 |
| | 1.6 | % |
| Tronair, Inc | | (15) | | Senior Secured Loans - First Lien | | L+4.75% | | 6.66% | | 9/8/2023 | | 3,880 |
| | 3,854 |
| | 3,512 |
| | 1.7 | % |
| Total Aerospace & Defense | | | | | | | | | | | | 7,274 |
| | 6,877 |
| | 3.3 | % |
| Automotive | | | | | | | | | | | | | | | | |
| Accuride Corporation | | | | Senior Secured Loans - First Lien | | L+5.25% | | 7.35% | | 11/17/2023 | | 11,640 |
| | 11,366 |
| | 9,254 |
| | 4.4 | % |
| American Tire Distributors Inc. | | | | Senior Secured Loans - First Lien | | L+7.50% | | 9.30% | | 8/30/2024 | | 2,970 |
| | 2,674 |
| | 2,666 |
| | 1.3 | % |
| BBB Industries | | | | Senior Secured Loans - First Lien | | L+4.50% | | 6.30% | | 8/1/2025 | | 1,975 |
| | 1,958 |
| | 1,928 |
| | 0.9 | % |
| EnTrans International, LLC | | | | Senior Secured Loans - First Lien | | L+6.00% | | 7.80% | | 11/1/2024 | | 3,700 |
| | 3,543 |
| | 3,588 |
| | 1.7 | % |
| | | | | | | | | | | | | | | | | | | |
| Mavis Tire Express Services Corp. | | | | Senior Secured Loans - First Lien | | L+3.25% | | 5.05% | | 3/20/2025 | | 3,231 |
| | 3,218 |
| | 3,158 |
| | 1.5 | % |
| Mavis Tire Express Services Corp. (Revolver) | | (9)(13)(15) | | Senior Secured Loans - First Lien | | L+3.25% | | 5.04% | | 3/20/2023 | | 28 |
| | 10 |
| | 11 |
| | — | % |
| Mavis Tire Express Services Corp. (Delayed Draw) | | (9) | | Senior Secured Loans - First Lien | | L+3.25% | | 5.05% | | 3/20/2025 | | 92 |
| | 92 |
| | 90 |
| | — | % |
| | | | | | | | | | | | | | | 3,320 |
| | 3,259 |
| | 1.5 | % |
| | | | | | | | | | | | | | | | | | | |
| Wesco Group | | (15) | | Senior Secured Loans - First Lien | | L+4.25% | | 6.36% | | 6/14/2024 | | 1,247 |
| | 1,234 |
| | 1,243 |
| | 0.6 | % |
| Total Automotive | | | | | | | | | | | | 24,095 |
| | 21,938 |
| | 10.4 | % |
| Banking, Finance, Insurance & Real Estate | | | | | | | | | | | | | | | | |
| Gladman Developments Ltd. | | UK(10)(11)(13)(14)(15) | | Senior Secured Loans - First Lien | | G+9.50% | | 10.30% | | 8/16/2024 | | £ | 2,405 |
| | 3,007 |
| | 3,137 |
| | 1.5 | % |
| Gladman Developments Ltd. (Delayed Draw) | | UK(9)(10)(11)(13)(14)(15) | | Senior Secured Loans - First Lien | | G+9.50% | | 10.30% | | 8/16/2024 | | £ | 740 |
| | 944 |
| | 954 |
| | 0.5 | % |
| | | | | | | | | | | | | | | 3,951 |
| | 4,091 |
| | 2.0 | % |
| | | | | | | | | | | | | | | | | | | |
| Hunt Companies, Inc. | | (11) | | Senior Secured Bonds | | N/A | | 6.25% | | 2/15/2026 | | 2,000 |
| | 2,000 |
| | 1,974 |
| | 0.9 | % |
| JZ Capital Partners Ltd. | | UK(10)(11)(13)(15) | | Senior Secured Loans - First Lien | | L+5.75% | | 7.88% | | 6/14/2021 | | 375 |
| | 370 |
| | 374 |
| | 0.2 | % |
| Total Banking, Finance, Insurance & Real Estate | | | | | | | | | | 6,321 |
| | 6,439 |
| | 3.1 | % |
| Beverage, Food & Tobacco | | | | | | | | | | | | | | | | |
| Addo Foods Group | | UK(10)(11)(14)(15) | | Senior Secured Loans - First Lien | | G+8.00% | | 9.00% | | 4/19/2024 | | £ | 9,995 |
| | 12,232 |
| | 12,879 |
| | 6.1 | % |
| | | | | | | | | | | | | | | | | | | |
| CTI Foods Holdings Co., LLC (First Out) | | (14)(15) | | Senior Secured Loans - First Lien | | L+7.00% | | 9.26% | | 5/3/2024 | | 1,962 |
| | 1,962 |
| | 1,962 |
| | 0.9 | % |
GUGGENHEIM CREDIT INCOME FUND
CONSOLIDATED SCHEDULE OF INVESTMENTS
|
| | | | | | | | | | | | | | | | | | | | | | | | | |
| CTI Foods Holdings Co., LLC (Last Out) | | (13)(14)(15) | | Senior Secured Loans - First Lien | | L+9.00% | | 10.91% | | 5/3/2024 | | 770 |
| | 770 |
| | 731 |
| | 0.3 | % |
| | | | | | | | | | | | | | | 2,732 |
| | 2,693 |
| | 1.2 | % |
| | | | | | | | | | | | | | | | | | | |
| Kar Nut Products Co. | | (15) | | Senior Secured Loans - First Lien | | L+4.50% | | 6.20% | | 3/31/2023 | | 897 |
| | 891 |
| | 891 |
| | 0.4 | % |
| Kar Nut Products Co. | | (15) | | Senior Secured Loans - First Lien | | L+4.50% | | 6.20% | | 3/31/2023 | | 833 |
| | 827 |
| | 827 |
| | 0.4 | % |
| | | | | | | | | | | | | | | 1,718 |
| | 1,718 |
| | 0.8 | % |
| | | | | | | | | | | | | | | | | | | |
| Topps Company | | (15) | | Senior Secured Loans - First Lien | | L+5.25% | | 7.19% | | 10/2/2022 | | 4,988 |
| | 4,963 |
| | 4,981 |
| | 2.4 | % |
| Total Beverage, Food & Tobacco | | | | | | | | | | | | 21,645 |
| | 22,271 |
| | 10.5 | % |
| Capital Equipment | | | | | | | | | | | | | | | | |
| Cleaver Brooks, Inc. | | | | Senior Secured Bonds | | N/A | | 7.88% | | 3/1/2023 | | 2,000 |
| | 2,000 |
| | 1,995 |
| | 0.9 | % |
| Total Capital Equipment | | | | | | | | | | | | 2,000 |
| | 1,995 |
| | 0.9 | % |
| Chemicals, Plastics & Rubber | | | | | | | | | | | | | | | | |
| Aceto Chemicals | | (15) | | Senior Secured Loans - First Lien | | L+5.50% | | 7.62% | | 4/29/2025 | | 5,174 |
| | 5,142 |
| | 5,144 |
| | 2.4 | % |
| Aceto Chemicals (Revolver) | | (9)(13)(15)(17) | | Senior Secured Loans - First Lien | | N/A | | N/A | | 4/29/2025 | | — |
| | (90 | ) | | (89 | ) | | — | % |
| | | | | | | | | | | | | | | 5,052 |
| | 5,055 |
| | 2.4 | % |
| | | | | | | | | | | | | | | | | | | |
| Drew Marine Group Inc. | | (15) | | Senior Secured Loans - First Lien | | L+4.25% | | 6.19% | | 6/26/2026 | | 995 |
| | 981 |
| | 981 |
| | 0.5 | % |
| Ilpea Parent, Inc. | | IT(10)(11) | | Senior Secured Loans - First Lien | | L+4.75% | | 6.46% | | 3/2/2023 | | 5,496 |
| | 5,447 |
| | 5,468 |
| | 2.6 | % |
| Neon Holdings Inc | | | | Senior Secured Bonds | | N/A | | 10.13% | | 4/1/2026 | | 1,500 |
| | 1,475 |
| | 1,493 |
| | 0.7 | % |
| | | | | | | | | | | | | | | | | | | |
| Seal For Life Industries US LLC (Revolver) | | (9)(11)(13)(15) | | Senior Secured Loans - First Lien | | L+6.00% | | 8.20% | | 7/24/2024 | | 260 |
| | 185 |
| | 186 |
| | 0.1 | % |
| Seal For Life Industries US LLC | | (11)(15) | | Senior Secured Loans - First Lien | | E+6.00% | | 8.26% | | 7/23/2025 | | 6,991 |
| | 6,870 |
| | 6,889 |
| | 3.2 | % |
| | | | | | | | | | | | | | | 7,055 |
| | 7,075 |
| | 3.3 | % |
| Total Chemicals, Plastics & Rubber | | | | | | | | | | | | 20,010 |
| | 20,072 |
| | 9.5 | % |
| Construction & Building | | | | | | | | | | | | | | | | |
| GAL Manufacturing | | (15) | | Senior Secured Loans - First Lien | | L+4.00% | | 6.20% | | 6/26/2023 | | 5,428 |
| | 5,368 |
| | 5,396 |
| | 2.5 | % |
| GAL Manufacturing | | (15) | | Senior Secured Loans - Second Lien | | L+8.25% | | 10.45% | | 6/26/2024 | | 6,000 |
| | 5,910 |
| | 5,865 |
| | 2.8 | % |
| GAL Manufacturing (Revolver) | | (9)(13)(15) | | Senior Secured Loans - First Lien | | L+4.00% | | 6.09% | | 6/24/2022 | | 173 |
| | 145 |
| | 146 |
| | 0.1 | % |
| | | | | | | | | | | | | | | 11,423 |
| | 11,407 |
| | 5.4 | % |
| | | | | | | | | | | | | | | | | | | |
| Springs Window Fashions, LLC | | | | Senior Secured Loans - First Lien | | L+4.25% | | 5.95% | | 6/15/2025 | | 1,744 |
| | 1,730 |
| | 1,743 |
| | 0.8 | % |
| Springs Window Fashions, LLC | | | | Senior Secured Loans - Second Lien | | L+8.50% | | 10.20% | | 6/15/2026 | | 1,756 |
| | 1,679 |
| | 1,668 |
| | 0.8 | % |
| | | | | | | | | | | | | | | 3,409 |
| | 3,411 |
| | 1.6 | % |
| Total Construction & Building | | | | | | | | | | | | 14,832 |
| | 14,818 |
| | 7.0 | % |
| Consumer Goods: Non-Durable | | | | | | | | | | | | | | | | |
| Galls LLC | | (15) | | Senior Secured Loans - First Lien | | L+6.25% | | 8.37% | | 1/31/2025 | | 3,620 |
| | 3,590 |
| | 3,591 |
| | 1.7 | % |
| Galls LLC (Delayed Draw B) | | (9)(15) | | Senior Secured Loans - First Lien | | L+6.25% | | 8.25% | | 1/31/2025 | | 533 |
| | 528 |
| | 528 |
| | 0.3 | % |
| Galls LLC (Revolver) | | (9)(13)(15) | | Senior Secured Loans - First Lien | | P+5.25% | | 10.00% | | 1/31/2024 | | 487 |
| | 430 |
| | 434 |
| | 0.2 | % |
GUGGENHEIM CREDIT INCOME FUND
CONSOLIDATED SCHEDULE OF INVESTMENTS
|
| | | | | | | | | | | | | | | | | | | | | | | | | |
| Total Consumer Goods: Non-Durable | | | | | | | | | | | | 4,548 |
| | 4,553 |
| | 2.2 | % |
| Consumer Goods: Durable | | | | | | | | | | | | | | | | |
| PlayPower, Inc. | | | | Senior Secured Loans - First Lien | | L+5.50% | | 7.30% | | 4/29/2026 | | 1,294 |
| | 1,281 |
| | 1,284 |
| | 0.6 | % |
| Total Consumer Goods: Durable | | | | | | | | | | | | 1,281 |
| | 1,284 |
| | 0.6 | % |
| Containers, Packaging & Glass | | | | | | | | | | | | | | | | |
| Bioplan USA, Inc. | | | | Senior Secured Loans - First Lien | | L+4.75% | | 6.45% | | 9/23/2021 | | 5,239 |
| | 5,010 |
| | 4,610 |
| | 2.2 | % |
| Husky Injection Molding Systems Ltd. | | CN(10)(11) | | Senior Secured Loans - First Lien | | L+3.00% | | 4.70% | | 3/28/2025 | | 1,980 |
| | 1,854 |
| | 1,952 |
| | 0.9 | % |
| | | | | | | | | | | | | | | | | | | |
| Resource Label Group LLC | | (15) | | Senior Secured Loans - First Lien | | L+4.50% | | 6.60% | | 5/26/2023 | | 3,449 |
| | 3,426 |
| | 3,121 |
| | 1.5 | % |
| Resource Label Group LLC | | (15) | | Senior Secured Loans - Second Lien | | L+8.50% | | 10.60% | | 11/26/2023 | | 3,000 |
| | 2,969 |
| | 2,550 |
| | 1.2 | % |
| | | | | | | | | | | | | | | 6,395 |
| | 5,671 |
| | 2.7 | % |
| Total Containers, Packaging & Glass | | | | | | | | | | | | 13,259 |
| | 12,233 |
| | 5.8 | % |
| Energy: Oil & Gas | | | | | | | | | | | | | | | | |
| Basic Energy Services Inc | | (13) | | Senior Secured Bonds | | N/A | | 10.75% | | 10/15/2023 | | 2,000 |
| | 1,985 |
| | 1,430 |
| | 0.7 | % |
| Navajo Nation Oil and Gas | | (15) | | Senior Secured Loans - First Lien | | L+7.50% | | 9.60% | | 6/14/2022 | | 3,438 |
| | 3,415 |
| | 3,417 |
| | 1.6 | % |
| Penn Virginia | | (11)(15) | | Senior Secured Loans - Second Lien | | L+7.00% | | 8.71% | | 9/29/2022 | | 3,000 |
| | 2,961 |
| | 2,955 |
| | 1.4 | % |
| Permian Production Partners | | (15)(18) | | Senior Secured Loans - First Lien | | N/A | | N/A | | 5/20/2024 | | 3,800 |
| | 3,680 |
| | 1,805 |
| | 0.8 | % |
| Total Energy: Oil & Gas | | | | | | | | | | | | 12,041 |
| | 9,607 |
| | 4.5 | % |
| Healthcare & Pharmaceuticals | | | | | | | | | | | | | | | | |
| Alegeus Technologies LLC | | (15) | | Senior Secured Loans - First Lien | | L+6.25% | | 8.28% | | 9/5/2024 | | 8,000 |
| | 7,938 |
| | 7,969 |
| | 3.8 | % |
| | | | | | | | | | | | | | | | | | | |
| Alltech | | (13)(15) | | Senior Unsecured Debt | | L+10.25% | | 11.95% | | 7/21/2023 | | 14,375 |
| | 14,257 |
| | 14,258 |
| | 6.8 | % |
| Alltech | | (13)(15) | | Senior Unsecured Debt | | E+10.25% | | 11.25% | | 7/21/2023 | | € | 601 |
| | 622 |
| | 669 |
| | 0.3 | % |
| | | | | | | | | | | | | | | 14,879 |
| | 14,927 |
| | 7.1 | % |
| | | | | | | | | | | | | | | | | | | |
| Cambrex Corporation | | | | Senior Secured Loans - First Lien | | L+5.00% | | 6.70% | | 11/20/2026 | | 2,500 |
| | 2,450 |
| | 2,498 |
| | 1.2 | % |
| Endo Pharmaceuticals Finance Co. | | IR(10)(11)(13) | | Senior Unsecured Debt | | N/A | | 6.00% | | 7/15/2023 | | 4,965 |
| | 4,104 |
| | 3,587 |
| | 1.7 | % |
| WIRB-Copernicus Group | | (15) | | Senior Secured Loans - Second Lien | | L+8.25% | | 9.87% | | 8/15/2023 | | 12,000 |
| | 11,823 |
| | 12,120 |
| | 5.7 | % |
| Total Healthcare & Pharmaceuticals | | | | | | | | | | | | 41,194 |
| | 41,101 |
| | 19.5 | % |
| Hotel, Gaming & Leisure | | | | | | | | | | | | | | | | |
| ASM Global | | | | Senior Secured Loans - First Lien | | L+3.00% | | 4.70% | | 1/23/2025 | | 2,358 |
| | 2,356 |
| | 2,371 |
| | 1.1 | % |
| ASM Global | | | | Senior Secured Loans - Second Lien | | L+7.00% | | 8.70% | | 1/23/2026 | | 2,400 |
| | 2,395 |
| | 2,428 |
| | 1.1 | % |
| | | | | | | | | | | | | | | 4,751 |
| | 4,799 |
| | 2.2 | % |
| | | | | | | | | | | | | | | | | | | |
| Playtika Holding | | (11) | | Senior Secured Loans - First Lien | | L+6.00% | | 7.80% | | 12/31/2024 | | 2,000 |
| | 1,960 |
| | 2,025 |
| | 1.0 | % |
| Total Hotel, Gaming & Leisure | | | | | | | | | | | | 6,711 |
| | 6,824 |
| | 3.2 | % |
| Media: Advertising, Printing & Publishing | | | | | | | | | | | | | | | | |
| Boats Group | | (15) | | Senior Secured Loans - First Lien | | L+4.25% | | 5.95% | | 5/17/2024 | | 5,722 |
| | 5,665 |
| | 5,722 |
| | 2.7 | % |
| Boats Group | | (15) | | Senior Secured Loans - Second Lien | | L+8.00% | | 9.80% | | 11/18/2024 | | 3,338 |
| | 3,306 |
| | 3,372 |
| | 1.6 | % |
GUGGENHEIM CREDIT INCOME FUND
CONSOLIDATED SCHEDULE OF INVESTMENTS
|
| | | | | | | | | | | | | | | | | | | | | | | | | |
| Boats Group (Revolver) | | (9)(13)(15)(17) | | Senior Secured Loans - First Lien | | N/A | | N/A | | 9/12/2022 | | — |
| | (44 | ) | | (41 | ) | | — | % |
| | | | | | | | | | | | | | | 8,927 |
| | 9,053 |
| | 4.3 | % |
| | | | | | | | | | | | | | | | | | | |
| Houghton Mifflin Harcourt Publishers, Inc. | | (11) | | Senior Secured Loans - First Lien | | L+6.25% | | 8.04% | | 11/19/2024 | | 2,500 |
| | 2,400 |
| | 2,500 |
| | 1.2 | % |
| | | | | | | | | | | | | | | | | | | |
| McGraw-Hill Global Education Holdings | | | | Senior Secured Loans - First Lien | | L+4.00% | | 5.70% | | 5/4/2022 | | 1,943 |
| | 1,930 |
| | 1,863 |
| | 0.9 | % |
| McGraw-Hill Global Education Holdings | | (13)(14)(15) | | Senior Unsecured Debt | | N/A | | 11.00% | | 4/20/2022 | | 2,000 |
| | 1,968 |
| | 1,871 |
| | 0.9 | % |
| McGraw-Hill Global Education Holdings | | (13) | | Senior Unsecured Debt | | N/A | | 7.88% | | 5/15/2024 | | 1,340 |
| | 1,302 |
| | 1,152 |
| | 0.5 | % |
| | | | | | | | | | | | | | | 5,200 |
| | 4,886 |
| | 2.3 | % |
| | | | | | | | | | | | | | | | | | | |
| Trader Interactive | | (15) | | Senior Secured Loans - First Lien | | L+6.50% | | 8.30% | | 6/15/2024 | | 8,113 |
| | 8,070 |
| | 8,023 |
| | 3.8 | % |
| Trader Interactive (Revolver) | | (9)(13)(15)(17) | | Senior Secured Loans - First Lien | | N/A | | N/A | | 6/15/2023 | | — |
| | (31 | ) | | (30 | ) | | — | % |
| | | | | | | | | | | | | | | 8,039 |
| | 7,993 |
| | 3.8 | % |
| Total Media: Advertising, Printing & Publishing | | | | | | | | | | 24,566 |
| | 24,432 |
| | 11.6 | % |
| Retail | | | | | | | | | | | | | | | | |
| At Home Group | | (11)(15) | | Senior Secured Loans - First Lien | | L+3.50% | | 5.43% | | 6/3/2022 | | 318 |
| | 291 |
| | 278 |
| | 0.1 | % |
| Belk, Inc. | | | | Senior Secured Loans - First Lien | | L+6.75% | | 8.80% | | 12/12/2022 | | 1,146 |
| | 1,083 |
| | 807 |
| | 0.4 | % |
| Beverages and More, Inc. | | (13) | | Senior Secured Bonds | | N/A | | 11.50% | | 6/15/2022 | | 900 |
| | 758 |
| | 617 |
| | 0.3 | % |
| Blue Nile, Inc. | | (15) | | Senior Secured Loans - First Lien | | L+6.50% | | 8.41% | | 2/17/2023 | | 10,500 |
| | 10,316 |
| | 4,568 |
| | 2.2 | % |
| Buddys Newco, LLC | | (13)(15) | | Senior Secured Loans - First Lien | | L+8.00% | | 10.21% | | 7/10/2024 | | 3,900 |
| | 3,827 |
| | 4,088 |
| | 1.9 | % |
| | | | | | | | | | | | | | | | | | | |
| Pet Holdings ULC | | CN(10)(11)(15) | | Senior Secured Loans - First Lien | | L+5.50% | | 7.60% | | 7/5/2022 | | 4,340 |
| | 4,306 |
| | 4,080 |
| | 1.9 | % |
| Pet Holdings ULC (Delayed Draw) | | CN(10)(11)(15) | | Senior Secured Loans - First Lien | | L+5.50% | | 7.60% | | 7/5/2022 | | 489 |
| | 489 |
| | 460 |
| | 0.2 | % |
| | | | | | | | | | | | | | | 4,795 |
| | 4,540 |
| | 2.1 | % |
| | | | | | | | | | | | | | | | | | | |
| Save-a-Lot | | (13) | | Senior Secured Loans - First Lien | | L+6.00% | | 8.10% | | 12/5/2023 | | 4,064 |
| | 2,261 |
| | 1,488 |
| | 0.7 | % |
| Sears Outlet | | (11)(13)(15) | | Senior Secured Loans - First Lien | | L+6.50% | | 8.43% | | 10/23/2023 | | 2,625 |
| | 2,575 |
| | 2,644 |
| | 1.3 | % |
| Smart & Final Stores LLC | | (15) | | Senior Secured Loans - First Lien | | L+6.75% | | 8.55% | | 6/20/2025 | | 3,980 |
| | 3,605 |
| | 3,850 |
| | 1.8 | % |
| Total Retail | | | | | | | | | | | | 29,511 |
| | 22,880 |
| | 10.8 | % |
| Services: Business | | | | | | | | | | | | | | | | |
| 24-7 Intouch | | CN(10)(11) | | Senior Secured Loans - First Lien | | L+4.25% | | 5.95% | | 8/25/2025 | | 3,950 |
| | 3,715 |
| | 3,851 |
| | 1.8 | % |
| | | | | | | | | | | | | | | | | | | |
| Alexander Mann Solutions (GBP Term Loan) | | UK(10)(11)(13) | | Senior Secured Loans - First Lien | | G+5.00% | | 5.71% | | 6/16/2025 | | £ | 2,060 |
| | 2,546 |
| | 2,603 |
| | 1.2 | % |
| Alexander Mann Solutions (USD Term Loan) | | UK(10)(11)(13)(15) | | Senior Secured Loans - First Lien | | L+5.50% | | 6.80% | | 6/16/2025 | | 890 |
| | 850 |
| | 863 |
| | 0.4 | % |
| Alexander Mann Solutions (Revolver) | | UK(9)(10)(11)(13)(15)(17) | | Senior Secured Loans - First Lien | | N/A | | N/A | | 12/16/2024 | | — |
| | (45 | ) | | (45 | ) | | — | % |
GUGGENHEIM CREDIT INCOME FUND
CONSOLIDATED SCHEDULE OF INVESTMENTS
|
| | | | | | | | | | | | | | | | | | | | | | | | | |
| | | | | | | | | | | | | | | 3,351 |
| | 3,421 |
| | 1.6 | % |
| | | | | | | | | | | | | | | | | | | |
| Capstone Logistics, LLC | | | | Senior Secured Loans - First Lien | | L+4.50% | | 6.21% | | 10/7/2021 | | 4,755 | | 4,730 |
| | 4,687 |
| | 2.2 | % |
| Clarion (Comet Bidco) | | UK(10)(11)(13) | | Senior Secured Loans - First Lien | | L+5.00% | | 7.12% | | 9/30/2024 | | 5,881 | | 5,790 |
| | 5,779 |
| | 2.7 | % |
| HealthChannels, Inc. | | | | Senior Secured Loans - First Lien | | L+4.50% | | 6.24% | | 4/3/2025 | | 2,857 | | 2,805 |
| | 2,810 |
| | 1.3 | % |
| Lifelong Learner Holdings T/L | | (15) | | Senior Secured Loans - First Lien | | L+5.75% | | 7.49% | | 10/16/2026 | | 2,866 | | 2,831 |
| | 2,834 |
| | 1.4 | % |
| | | | | | | | | | | | | | | | | | | |
| Park Place Technologies | | | | Senior Secured Loans - First Lien | | L+4.00% | | 5.80% | | 3/29/2025 | | 2,672 | | 2,662 |
| | 2,663 |
| | 1.3 | % |
| Park Place Technologies | | | | Senior Secured Loans - Second Lien | | L+8.00% | | 9.80% | | 3/29/2026 | | 3,404 | | 3,383 |
| | 3,378 |
| | 1.6 | % |
| | | | | | | | | | | | | | | 6,045 |
| | 6,041 |
| | 2.9 | % |
| | | | | | | | | | | | | | | | | | | |
| PSI Services LLC | | (9)(13)(15)(17) | | Senior Secured Loans - First Lien | | L+5.75% | | 7.69% | | 10/4/2025 | | 30 | | 30 |
| | (6 | ) | | — | % |
| PSI Services LLC | | (9)(15) | | Senior Secured Loans - First Lien | | N/A | | N/A | | 10/4/2026 | | — |
| | — |
| | — |
| | — | % |
| PSI Services LLC | | (9)(15) | | Senior Secured Loans - First Lien | | L+5.75% | | 7.63% | | 10/4/2026 | | 429 | | 429 |
| | 422 |
| | 0.2 | % |
| | | | | | | | | | | | | | | 459 |
| | 416 |
| | 0.2 | % |
| | | | | | | | | | | | | | | | | | | |
| SLR Consulting | | UK(10)(11)(15) | | Senior Secured Loans - First Lien | | L+4.00% | | 5.79% | | 6/23/2025 | | 1,588 | | 1,551 |
| | 1,554 |
| | 0.7 | % |
| SLR Consulting (Delayed Draw) | | UK(10)(11)(13)(15) | | Senior Secured Loans - First Lien | | L+4.00% | | 5.18% | | 5/23/2025 | | 494 |
| | 512 |
| | 508 |
| | 0.3 | % |
| | | | | | | | | | | | | | | 2,063 |
| | 2,062 |
| | 1.0 | % |
| | | | | | | | | | | | | | | | | | | |
| Teneo Holdings LLC | | | | Senior Secured Loans - First Lien | | L+5.25% | | 6.99% | | 7/12/2025 | | 3,990 | | 3,802 |
| | 3,805 |
| | 1.8 | % |
| YAK Access, LLC | | | | Senior Secured Loans - Second Lien | | L+10.00% | | 11.79% | | 7/10/2026 | | 5,000 | | 4,688 |
| | 4,409 |
| | 2.1 | % |
| Total Services: Business | | | | | | | | | | | | 40,279 |
| | 40,115 |
| | 19.0 | % |
| Technology | | | | | | | | | | | | | | | | |
| Advicent Solutions | | (15) | | Senior Secured Loans - First Lien | | L+8.25% | | 10.35% | | 2/28/2022 | | 6,983 | | 6,904 |
| | 5,795 |
| | 2.7 | % |
| Alfresco Software | | (15) | | Senior Secured Loans - First Lien | | L+8.50% | | 10.64% | | 9/9/2024 | | 3,287 | | 3,223 |
| | 3,229 |
| | 1.5 | % |
| | | | | | | | | | | | | | | | | | | |
| Acquia Inc. | | (13)(15) | | Senior Secured Loans - First Lien | | L+7.00% | | 8.91% | | 10/31/2025 | | 1,789 |
| | 1,754 |
| | 1,776 |
| | 0.8 | % |
| Acquia Inc. | | (9)(13)(15)(17) | | Senior Secured Loans - First Lien | | N/A | | N/A | | 10/31/2025 | | — |
| | (4 | ) | | (26 | ) | | — | % |
| | | | | | | | | | | | | | | 1,750 |
| | 1,750 |
| | 0.8 | % |
| | | | | | | | | | | | | | | | | | | |
| Allvue Systems (Revolver) | | (9)(13)(15)(17) | | Senior Secured Loans - First Lien | | N/A | | N/A | | 9/6/2024 | | — |
| | (13 | ) | | (12 | ) | | — | % |
| Allvue Systems (Term Loan) | | (15) | | Senior Secured Loans - First Lien | | L+4.25% | | 6.36% | | 9/4/2026 | | 868 | | 866 |
| | 860 |
| | 0.4 | % |
| | | | | | | | | | | | | | | 853 |
| | 848 |
| | 0.4 | % |
| | | | | | | | | | | | | | | | | | | |
| Apptio, Inc. (Revolver) | | (9)(13)(15)(17) | | Senior Secured Loans - First Lien | | N/A | | N/A | | 12/3/2024 | | — |
| | (35 | ) | | (34 | ) | | — | % |
| Apptio, Inc. | | (15) | | Senior Secured Loans - First Lien | | L+7.25% | | 8.96% | | 1/10/2025 | | 4,900 | | 4,841 |
| | 4,855 |
| | 2.3 | % |
| | | | | | | | | | | | | | | 4,806 |
| | 4,821 |
| | 2.3 | % |
| | | | | | | | | | | | | | | | | | | |
| Causeway Technologies | | UK(10)(11)(15) | | Senior Secured Loans - First Lien | | G+6.25% | | 7.03% | | 6/8/2024 | | £ | 2,638 |
| | 3,346 |
| | 3,450 |
| | 1.7 | % |
GUGGENHEIM CREDIT INCOME FUND
CONSOLIDATED SCHEDULE OF INVESTMENTS
|
| | | | | | | | | | | | | | | | | | | | | | | | | |
| Causeway Technologies | | UK(10)(11)(15) | | Senior Secured Loans - First Lien | | G+6.25% | | 7.01% | | 6/8/2024 | | £ | 338 |
| | 426 |
| | 447 |
| | 0.2 | % |
| | | | | | | | | | | | | | | 3,772 |
| | 3,897 |
| | 1.9 | % |
| | | | | | | | | | | | | | | | | | | |
| Cologix Holdings | | | | Senior Secured Loans - First Lien | | L+3.75% | | 5.45% | | 3/20/2024 | | 2,000 |
| | 1,931 |
| | 1,990 |
| | 0.9 | % |
| Cvent, Inc. | | | | Senior Secured Loans - First Lien | | L+3.75% | | 5.55% | | 11/29/2024 | | 1,975 |
| | 1,952 |
| | 1,976 |
| | 0.9 | % |
| | | | | | | | | | | | | | | | | | | |
| Datix Bidco Limited | | (15) | | Senior Secured Loans - First Lien | | L+4.50% | | 6.76% | | 4/28/2025 | | 1,931 |
| | 1,900 |
| | 1,916 |
| | 0.9 | % |
| Datix Bidco Limited | | (15) | | Senior Secured Loans - Second Lien | | L+7.75% | | 9.68% | | 4/27/2026 | | 462 |
| | 454 |
| | 458 |
| | 0.2 | % |
| Datix Bidco Limited | | (15) | | Senior Secured Loans - First Lien | | L+4.50% | | 6.76% | | 4/28/2025 | | 3,048 |
| | 3,006 |
| | 3,025 |
| | 1.5 | % |
| Datix Bidco Limited | | (15) | | Senior Secured Loans - Second Lien | | L+7.75% | | 9.68% | | 4/27/2026 | | 4,696 |
| | 4,631 |
| | 4,656 |
| | 2.2 | % |
| | | | | | | | | | | | | | | 9,991 |
| | 10,055 |
| | 4.8 | % |
| | | | | | | | | | | | | | | | | | | |
| Kerridge Commercial Systems (USD Term Loan) | | UK(10)(11)(15) | | Senior Secured Loans - First Lien | | L+4.25% | | 6.35% | | 1/22/2024 | | 634 |
| | 625 |
| | 630 |
| | 0.3 | % |
| Kerridge Commercial Systems (GBP Term Loan) | | UK(10)(11)(13)(15) | | Senior Secured Loans - First Lien | | G+4.25% | | 5.01% | | 1/22/2024 | | £ | 528 |
| | 729 |
| | 695 |
| | 0.3 | % |
| Kerridge Commercial Systems (Euro Delayed Draw) | | UK(10)(11)(13)(15) | | Senior Secured Loans - First Lien | | E+4.75% | | 4.75% | | 1/22/2024 | | € | 97 |
| | 118 |
| | 108 |
| | 0.1 | % |
| Kerridge Commercial Systems (GBP Delayed Draw) | | UK(10)(11)(13)(15) | | Senior Secured Loans - First Lien | | G+4.25% | | 5.01% | | 1/22/2024 | | £ | 325 |
| | 421 |
| | 427 |
| | 0.2 | % |
| Kerridge Commercial Systems (Bidco) Limited | | (11)(13)(15) | | Senior Secured Loans - First Lien | | L+6.25% | | 8.19% | | 1/22/2024 | | 2,200 |
| | 2,167 |
| | 2,184 |
| | 1.0 | % |
| | | | | | | | | | | | | | | 4,060 |
| | 4,044 |
| | 1.9 | % |
| | | | | | | | | | | | | | | | | | | |
| Lytx, Inc. | | (15) | | Senior Secured Loans - First Lien | | L+6.75% | | 8.45% | | 8/31/2023 | | 6,482 |
| | 6,379 |
| | 6,473 |
| | 3.1 | % |
| Lytx, Inc. | | (15) | | Senior Secured Loans - First Lien | | L+6.75% | | 8.45% | | 8/31/2023 | | 1,453 |
| | 1,422 |
| | 1,451 |
| | 0.7 | % |
| Lytx, Inc. (Revolver) | | (9)(13)(15)(17) | | Senior Secured Loans - First Lien | | N/A | | N/A | | 8/31/2022 | | — |
| | (25 | ) | | (25 | ) | | — | % |
| | | | | | | | | | | | | | | 7,776 |
| | 7,899 |
| | 3.8 | % |
| | | | | | | | | | | | | | | | | | | |
| Ministry Brands | | (15) | | Senior Secured Loans - First Lien | | L+4.00% | | 5.86% | | 12/2/2022 | | 953 |
| | 948 |
| | 953 |
| | 0.5 | % |
| Ministry Brands (Delayed Draw) | | (15) | | Senior Secured Loans - First Lien | | L+4.00% | | 5.86% | | 12/2/2022 | | 507 |
| | 505 |
| | 507 |
| | 0.2 | % |
| Ministry Brands (Delayed Draw) | | (15) | | Senior Secured Loans - First Lien | | L+4.00% | | 5.86% | | 12/2/2022 | | 184 |
| | 184 |
| | 184 |
| | 0.1 | % |
| | | | | | | | | | | | | | | 1,637 |
| | 1,644 |
| | 0.8 | % |
| | | | | | | | | | | | | | | | | | | |
| Onyx CenterSource | | (15) | | Senior Secured Loans - First Lien | | L+6.25% | | 8.36% | | 12/20/2021 | | 6,652 |
| | 6,639 |
| | 6,640 |
| | 3.1 | % |
| Onyx CenterSource (Revolver) | | (9)(13)(15)(17) | | Senior Secured Loans - First Lien | | N/A | | N/A | | 12/20/2021 | | — |
| | (16 | ) | | (16 | ) | | — | % |
| | | | | | | | | | | | | | | 6,623 |
| | 6,624 |
| | 3.1 | % |
| | | | | | | | | | | | | | | | | | | |
| Planview, Inc. | | (15) | | Senior Secured Loans - First Lien | | L+5.25% | | 6.95% | | 1/27/2023 | | 6,152 |
| | 6,114 |
| | 6,121 |
| | 2.9 | % |
| Planview, Inc. | | (15) | | Senior Secured Loans - First Lien | | L+5.25% | | 6.95% | | 1/27/2023 | | 391 |
| | 391 |
| | 389 |
| | 0.2 | % |
| Planview, Inc. | | (15) | | Senior Secured Loans - Second Lien | | L+9.75% | | 11.45% | | 7/27/2023 | | 4,388 |
| | 4,330 |
| | 4,386 |
| | 2.1 | % |
GUGGENHEIM CREDIT INCOME FUND
CONSOLIDATED SCHEDULE OF INVESTMENTS
|
| | | | | | | | | | | | | | | | | | | | | | | | | |
| | | | | | | | | | | | | | | 10,835 |
| | 10,896 |
| | 5.2 | % |
| | | | | | | | | | | | | | | | | | | |
| Velocity Holdings US | | (15) | | Senior Secured Loans - First Lien | | L+7.00% | | 8.90% | | 12/12/2023 | | 5,428 |
| | 5,335 |
| | 5,339 |
| | 2.5 | % |
| Velocity Holdings US | | (15) | | Senior Secured Loans - First Lien | | L+7.00% | | 8.90% | | 12/12/2023 | | 1,145 |
| | 1,115 |
| | 1,127 |
| | 0.6 | % |
| Velocity Holdings US (Revolver) | | (13)(15) | | Senior Secured Loans - First Lien | | L+7.00% | | 9.05% | | 12/12/2022 | | 462 |
| | 424 |
| | 428 |
| | 0.2 | % |
| | | | | | | | | | | | | | | 6,874 |
| | 6,894 |
| | 3.3 | % |
| | | | | | | | | | | | | | | | | | | |
| Wind River Systems | | (15) | | Senior Secured Loans - First Lien | | L+6.75% | | 8.45% | | 6/24/2024 | | 5,534 |
| | 5,435 |
| | 5,467 |
| | 2.6 | % |
| Total Technology | | | | | | | | | | | | 78,422 |
| | 77,829 |
| | 36.9 | % |
| Telecommunications | | | | | | | | | | | | | | | | |
| Firstlight Fiber | | | | Senior Secured Loans - First Lien | | L+3.50% | | 5.20% | | 7/23/2025 | | 2,231 |
| | 2,221 |
| | 2,237 |
| | 1.0 | % |
| Firstlight Fiber | | | | Senior Secured Loans - Second Lien | | L+7.50% | | 9.30% | | 7/23/2026 | | 2,500 |
| | 2,476 |
| | 2,481 |
| | 1.2 | % |
| | | | | | | | | | | | | | | 4,697 |
| | 4,718 |
| | 2.2 | % |
| Total Telecommunications | | | | | | | | | | | | 4,697 |
| | 4,718 |
| | 2.2 | % |
| Transportation: Cargo | | | | | | | | | | | | | | | | |
| Flexi-Van Leasing Corp | | | | Senior Secured Bonds | | N/A | | 10.00% | | 2/15/2023 | | 4,975 |
| | 4,778 |
| | 4,714 |
| | 2.2 | % |
| Total Transportation: Cargo | | | | | | | | | | | | 4,778 |
| | 4,714 |
| | 2.2 | % |
| Utilities: Electric | | | | | | | | | | | | | | | | |
| BHI Energy | | (15) | | Senior Secured Loans - Second Lien | | L+8.75% | | 10.95% | | 2/28/2025 | | 6,000 |
| | 5,908 |
| | 5,925 |
| | 2.8 | % |
| Moxie Liberty, LLC | | | | Senior Secured Loans - First Lien | | L+6.50% | | 8.60% | | 8/21/2020 | | 2,892 |
| | 2,878 |
| | 2,583 |
| | 1.2 | % |
| Total Utilities: Electric | | | | | | | | | | | | 8,786 |
| | 8,508 |
| | 4.0 | % |
| Utilities: Oil & Gas | | | | | | | | | | | | | | | | |
| SeaPort | | (15) | | Senior Secured Loans - First Lien | | L+5.50% | | 7.21% | | 10/31/2025 | | 5,940 |
| | 5,784 |
| | 5,881 |
| | 2.8 | % |
| Total Utilities: Oil & Gas | | | | | | | | | | | | 5,784 |
| | 5,881 |
| | 2.8 | % |
| Total Debt Investments | | | | | | | | | | | | | | $ | 372,034 |
| | $ | 359,089 |
| | 170.0 | % |
| | | | | | | | | | | | | | | | | | | |
| Equity investments - 6.2% | | | | | | | | | | | | | | | | | | |
| Banking, Finance, Insurance & Real Estate | | | | | | | | | | | | | | | | |
| Four Springs Capital Trust (Preferred Equity) | | (11)(13)(14)(15) | | Equity and Other | | N/A | | 16.75% | | | | 237,576 |
| | $ | 4,700 |
| | $ | 4,752 |
| | 2.3 | % |
| Total Banking, Finance, Insurance & Real Estate | | | | | | | | | | | | 4,700 |
| | 4,752 |
| | 2.3 | % |
| Beverage, Food & Tobacco | | | | | | | | | | | | | | | | |
| Chef's Holdings Inc. | | (13)(15)(16) | | Equity and Other | | N/A | | N/A | | | | 19,540 |
| | 2,459 |
| | 2,284 |
| | 1.1 | % |
| Total Beverage, Food & Tobacco | | | | | | | | | | | | 2,459 |
| | 2,284 |
| | 1.1 | % |
| Energy: Oil & Gas | | | | | | | | | | | | | | | | |
| Maverick Natural Resources, LLC (Common Equity) | | (15)(16) | | Equity and Other | | N/A | | N/A | | | | 4,625 |
| | 2,777 |
| | 2,081 |
| | 1.0 | % |
| SandRidge Energy, Inc. (Common Equity) | | (11)(13)(16) | | Equity and Other | | N/A | | N/A | | | | 21,224 |
| | 448 |
| | 90 |
| | — | % |
| Total Energy: Oil & Gas | | | | | | | | | | | | 3,225 |
| | 2,171 |
| | 1.0 | % |
| Technology | | | | | | | | | | | | | | | | |
GUGGENHEIM CREDIT INCOME FUND
CONSOLIDATED SCHEDULE OF INVESTMENTS
|
| | | | | | | | | | | | | | | | | | | | | | | | | |
| Alfresco Software (Common Equity) | | (13)(15)(16) | | Equity and Other | | N/A | | N/A | | | | 66,230 |
| | 166 |
| | 203 |
| | 0.1 | % |
| Lytx, Inc. (Preferred Equity) | | (13)(14)(15) | | Equity and Other | | N/A | | 14.75% | | | | 2,958 |
| | 2,957 |
| | 3,303 |
| | 1.6 | % |
| Lytx, Inc. (Warrants) | | (13)(15)(16) | | Equity and Other | | N/A | | N/A | | | | 130 |
| | — |
| | 81 |
| | — | % |
| Velocity Holdings US (Class A Units) | | (13)(15)(16) | | Equity and Other | | N/A | | N/A | | | | 231 |
| | 231 |
| | 280 |
| | 0.1 | % |
| Wolfhound Parent Inc. (Warrants) | | (13)(15)(16) | | Equity and Other | | N/A | | N/A | | | | 1,975 |
| | 30 |
| | 30 |
| | — | % |
| Total Technology | | | | | | | | | | | | 3,384 |
| | 3,897 |
| | 1.8 | % |
| Total Equity Investments | | | | | | | | | | | | | | $ | 13,768 |
| | $ | 13,104 |
| | 6.2 | % |
| | | | | | | | | | | | | | | | | | | |
| Total Investments - 176.2% | | | | | | | | | | | | | | $ | 385,802 |
| | $ | 372,193 |
| | 176.2 | % |
|
| | | | | | | | | | | | | | | | | | | | |
| December 31, 2019 (in thousands) |
| Derivative Counterparty | | Settlement Date | | Amount Purchased | | Amount Sold | | Amortized Cost (7) (8) | | Fair Value | | % of Net Assets |
| Foreign Currency Forward Contracts | | | | | | | | | | | |
| JPMorgan Chase Bank | | 1/14/2020 | | € | 772 |
| | $ | 694 |
| | — |
| | $ | (7 | ) | | — | % |
| JPMorgan Chase Bank | | 1/14/2020 | | £ | 24,936 |
| | $ | 18,878 |
| | — |
| | $ | (80 | ) | | — | % |
| | | | | | | | | | | $ | (87 | ) | | — | % |
_______________________
| |
| (1) | Security may be an obligation of one or more entities affiliated with the named portfolio company. |
| |
| (2) | All debt and equity investments are income producing unless otherwise noted. |
| |
| (3) | All investments are non-controlled/non-affiliated investments as defined by the Investment Company Act of 1940 (the "1940 Act"). The provisions of the 1940 Act classify investments based on the level of control that we maintain in a particular portfolio company. As defined in the 1940 Act, a company is generally presumed to be “non-controlled” when we own 25% or less of the portfolio company’s voting securities and “controlled” when we own more than 25% of the portfolio company’s voting securities. The provisions of the 1940 Act also classify investments further based on the level of ownership that we maintain in a particular portfolio company. As defined in the 1940 Act, a company is generally deemed as “non-affiliated” when we own less than 5% of a portfolio company’s voting securities and “affiliated” when we own 5% or more of a portfolio company’s voting securities. |
| |
| (4) | The periodic interest rate for all floating rate loans is indexed to London Interbank Offered Rate ("LIBOR" or "LIBO rate") (denoted as "L"), Euro Interbank Offered Rate ("EURIBOR") (denoted as "E"), British Pound Sterling LIBOR ("GBP LIBOR") (denoted as "G") or Prime Rate (denoted as "P"). Pursuant to the terms of the underlying credit agreements, the base interest rates typically reset annually, semi-annually, quarterly or monthly at the borrower's option. The borrower may also elect to have multiple interest reset periods for each loan. For each of these floating rate loans, the Consolidated Schedule of Investments presents the applicable margin over LIBOR, EURIBOR, GBP LIBOR or Prime based on each respective credit agreement. As of December 31, 2019, LIBO rates ranged between 1.76% for 1-month LIBOR to 1.91% for 3-month LIBOR. |
| |
| (5) | For portfolio companies with multiple interest rate contracts under a single credit agreement, the interest rate shown is a weighted average current interest rate in effect at December 31, 2019. |
| |
| (6) | Unless noted otherwise, the principal amount (par amount) for all debt securities is denominated in U.S. dollars. Equity investments are recorded as number of shares owned. |
| |
| (7) | Cost represents amortized cost, inclusive of any capitalized paid-in-kind income ("PIK"), for debt securities, and cost plus capitalized PIK, if any, for preferred stock. |
GUGGENHEIM CREDIT INCOME FUND
CONSOLIDATED SCHEDULE OF INVESTMENTS
| |
| (8) | As of December 31, 2019, the aggregate gross unrealized appreciation for all securities, including foreign currency forward contracts, in which there was an excess of value over tax cost was $4.8 million; the aggregate gross unrealized depreciation for all securities, including foreign currency forward contracts, in which there was an excess of tax cost over value was $17.6 million; the net unrealized depreciation was $12.8 million; the aggregate cost of securities for Federal income tax purposes was $384.9 million. |
| |
| (9) | The investment is either a delayed draw loan or a revolving credit facility whereby some or all of the investment commitment is undrawn as of December 31, 2019 (see Note 8. Commitments and Contingencies). |
| |
| (10) | A portfolio company domiciled in a foreign country. The regulatory jurisdiction of security issuance may be a different country than the domicile of the portfolio company. |
| |
| (11) | The investment is not a qualifying asset as defined in Section 55(a) of the 1940 Act. As of December 31, 2019, qualifying assets represented 79% of total assets. Under the 1940 Act we may not acquire any non-qualifying assets unless, at the time the acquisition is made, qualifying assets represent at least 70% of our total assets. |
| |
| (12) | Investment position or portion thereof unsettled as of December 31, 2019. |
| |
| (13) | The investment position, or a portion thereof, was not pledged as collateral supporting the amounts outstanding under our credit facility as of December 31, 2019; (see Note 7. Borrowings). |
| |
| (14) | The underlying credit agreement or indenture contains a PIK provision, whereby the issuer has either the option or the obligation to make interest payments with the issuance of additional securities. The interest rate in the schedule represents the current interest rate in effect for these investments. |
|
| | | | | | | |
| | Coupon Rate | PIK Component | Cash Component | PIK Option |
| Addo Foods Group | G+ 8.00% |
| 0.75 | % | G+7.25% |
| The Portfolio Company may elect PIK up to 0.75% |
| CTI Foods Holdings Co., LLC (First Out) | L+7.00% |
| 3.00 | % | L+4.00% |
| The Portfolio Company may elect PIK up to 3.00% |
| CTI Foods Holdings Co., LLC (Last Out) | L+9.00% |
| 6.00 | % | L+3.00% |
| The Portfolio Company may elect PIK up to 6.00% |
| Four Springs Capital Trust | 16.75 | % | 16.75 | % | — | % | The Portfolio Company may elect PIK up to 16.75% |
| Gladman Developments Ltd. | G+9.50% |
| 2.75 | % | G+6.75% |
| The Portfolio Company may elect PIK up to 2.75% |
| Gladman Developments Ltd. (Delayed Draw) | G+9.50% |
| 2.75 | % | G+6.75% |
| The Portfolio Company may elect PIK up to 2.75% |
| Lytx, Inc. | 14.75 | % | 14.75 | % | — | % | The Portfolio Company may elect PIK up to 14.75% |
| McGraw-Hill Global Education Holdings | 11.00 | % | 11.75 | % | — | % | The Portfolio Company may elect partial PIK up to 50% of the interest of the period or full PIK of 11.75% |
| |
| (15) | Investments value was determined using significant unobservable inputs (see Note 2. Significant Accounting Policies). |
| |
| (16) | Non-income producing security. |
| |
| (17) | The negative fair value is the result of the unfunded commitment being valued below par. The negative amortized cost is the result of the capitalized discount being greater than the principal amount outstanding on the loan. |
| |
| (18) | Investment was on non-accrual status as of December 31, 2019, meaning that the Master Fund has ceased recognizing interest income on these investments. As of December 31, 2019, debt investments on non-accrual status represented 1.0% and 0.5% of total investments on an amortized cost basis and fair value basis, respectively. |
Abbreviations:
CN = Canada; UK = United Kingdom; IT = Italy; IR=Ireland
See Unaudited Notes to Consolidated Financial Statements.
GUGGENHEIM CREDIT INCOME FUND
NOTES TO CONSOLIDATED FINANCIAL STATEMENTS (UNAUDITED)
(in thousands, except share and per share data, percentages and as otherwise indicated;
for example, with the word “million” or otherwise)
Note 1. Principal Business and Organization
Guggenheim Credit Income Fund (the “Master Fund”) was formed as a Delaware statutory trust on September 5, 2014. The Master Fund's investment objectives are to provide its shareholders with current income, capital preservation and, to a lesser extent, long-term capital appreciation by investing primarily in privately-negotiated loans to private middle market United States (U.S.) companies. On April 1, 2015, the Master Fund elected to be regulated as a business development company ("BDC") under the Investment Company Act of 1940, as amended (the "1940 Act"). The Master Fund commenced investment operations on April 2, 2015. The Master Fund serves as the master fund in a master fund/feeder fund structure. The Master Fund issues its shares ("Shares" or "Common Shares") to one or more affiliated feeder funds in a continuous series of private placement transactions.
Guggenheim Partners Investment Management, LLC ("Guggenheim" or the "Advisor") is responsible for sourcing potential investments, analyzing and conducting due diligence on prospective investment opportunities, structuring investments and ongoing monitoring of the Master Fund’s investment portfolio.
As of June 30, 2020, the Master Fund had one wholly-owned subsidiary, Hamilton Finance LLC ("Hamilton"), a special purpose financing subsidiary organized for the purpose of arranging secured debt financing, entering into credit agreements and borrowing money to invest in portfolio companies.
Note 2. Significant Accounting Policies
Basis of Presentation
Management has determined that the Master Fund meets the definition of an investment company and adheres to the accounting and reporting guidance in the Financial Accounting Standards Board ("FASB") Accounting Standards Codification ("ASC") Topic 946 — Financial Services — Investment Companies ("ASC 946").
The Master Fund's interim consolidated financial statements have been prepared pursuant to the requirements for reporting on Form 10-Q and the disclosure requirements as stipulated in Articles 6 and 10 of Regulation S-X, and therefore do not necessarily include all information and notes necessary for a fair statement of financial position and results of operations in accordance with accounting principles generally accepted in the U.S. ("GAAP"). In the opinion of management, the unaudited consolidated financial information for the interim period presented in this Report reflects all normal and recurring adjustments necessary for a fair statement of financial position and results from operations. Operating results for interim periods are not necessarily indicative of operating results for an entire year.
Principles of Consolidation
As provided under ASC 946, the Master Fund will generally not consolidate its investment in a company other than an investment in an investment company or an operating company whose business consists of providing substantially all of its services to the benefit of the Master Fund. Accordingly, the Master Fund consolidated the results of its wholly-owned subsidiary in its consolidated financial statements. All intercompany balances and transactions have been eliminated.
Reclassifications
Certain prior period amounts may be reclassified to conform to the current presentation, with no effect on our financial condition, results of operations or cash flows.
Use of Estimates
The preparation of financial statements in conformity with GAAP requires management to make estimates and assumptions that affect (i) the reported amounts of assets and liabilities at the date of the financial statements, (ii) the reported amounts of income and expenses during the reported period and (iii) disclosure of contingent assets and liabilities at the date of the financial statements. Actual results could differ materially from those estimates under different assumptions and conditions.
Notes to Consolidated Financial Statements (Unaudited)
Cash
Cash consists of demand deposits held at a major U.S. financial institution and the amount recorded on the consolidated statements of assets and liabilities exceeds the Federal Deposit Insurance Corporation insured limit. Management believes the credit risk related to its demand deposits is minimal.
Restricted Cash
Restricted cash consists of cash collateral that has been pledged to cover obligations of the Master Fund according to its derivative contracts and demand deposits held at a major U.S. financial institution on behalf of Hamilton. Hamilton may be restricted in the distribution of cash to the Master Fund, as governed by the terms of the Hamilton Credit Facility (see Note 7. Borrowings). Management believes the credit risk related to its demand deposits is minimal.
Valuation of Investments
The Master Fund measures the value of its investments in accordance with ASC Topic 820 — Fair Value Measurement (“ASC 820”), issued by the FASB. Fair value is the price that would be received to sell an asset or paid to transfer a liability in an orderly transaction between market participants at the measurement date. Market participants are defined as buyers and sellers in the principal or most advantageous market (which may be a hypothetical market) that are independent, knowledgeable and willing and able to transact. In accordance with ASC 820, the Master Fund considers its principal market to be the market that has the greatest volume and level of activity.
ASC 820 defines hierarchical levels directly related to the amount of subjectivity associated with the inputs used to determine fair values of assets and liabilities. The hierarchical levels and types of inputs used to measure fair value for each level are described as follows:
Level 1 - Quoted prices are available in active markets for identical investments as of the reporting date. Publicly listed equities and debt securities, publicly listed derivatives, money market/short-term investment funds and foreign currency are generally included in Level 1. The Master Fund does not adjust the quoted price for these investments.
Level 2 - Valuation inputs are other than quoted prices in active markets, which are either directly or indirectly observable as of the reporting date, and fair value is determined through the use of models or other valuation methodologies. In certain cases, debt and equity securities are valued on the basis of prices from orderly transactions for similar investments in active markets between market participants and provided by reputable dealers or independent pricing services. In determining the value of a particular investment, independent pricing services may use certain information with respect to transactions in such investments, quotations from multiple dealers or brokers, pricing matrices, market transactions in comparable investments and various relationships between investments. Investments generally included in this category are corporate bonds and loans.
Level 3 - Valuation inputs are unobservable for the investment and include situations where there is little, if any, market activity for the investment. The inputs into the determination of fair value require significant judgment or estimation. Investments generally included in this category are illiquid corporate bonds and loans and preferred stock investments that lack observable market pricing.
In certain cases, the inputs used to measure fair value may fall within different levels of the fair value hierarchy. In such cases, an investment’s level within the fair value hierarchy is based on the lowest level of input that is significant to the fair value measurement. Depending on the relative liquidity in the markets for certain investments, the Master Fund may transfer assets to Level 3 if it determines that observable quoted prices, obtained directly or indirectly, are severely limited, or not available, or otherwise not reliable. The Master Fund’s assessment of the significance of a particular input to the fair value measurement requires judgment, and the consideration of factors specific to the investment.
Investments for which market quotations are readily available are valued using market quotations, which are generally obtained from independent pricing services, broker-dealers or market makers. With respect to the Master Fund’s portfolio investments for which market quotations are not readily available, the Master Fund's board of trustees ("Board of Trustees"), including our trustees who are not "interested persons" as defined in the 1940 Act (the "Independent Trustees"), is responsible for determining in good faith the fair value of the Master Fund’s portfolio investments in accordance with the valuation policy and procedures approved by the Board of Trustees, based on, among other things, the input of Guggenheim and management, its audit committee and independent third-party valuation firms. The Master Fund and the Board of Trustees conduct their fair value determination process on a quarterly basis and any other time when a decision regarding the fair value of the portfolio investments is required.
The valuation techniques used by the Master Fund for the assets that are classified as Level 3 in the fair value hierarchy are described below.
Notes to Consolidated Financial Statements (Unaudited)
Senior Debt and Subordinated Debt: Senior debt and subordinated debt investments are valued at initial transaction price and are subsequently valued using (i) market data for similar instruments (e.g., recent transactions or indicative broker quotes), and/or (ii) valuation models. Valuation models may be based on investment yield analysis and discounted cash flow techniques, where the key inputs include risk-adjusted discount rates and required rates of return, based on the analysis of similar debt investments issued by similar issuers.
Equity/Other Investments: Equity/other investments are valued at initial transaction price and are subsequently valued using valuation models in the absence of readily observable market prices. Valuation models are generally based on (i) market and income (discounted cash flow) approaches, in which various internal and external factors are considered, and (ii) earnings before interest, taxes, depreciation and amortization ("EBITDA") multiples analysis. Factors include key financial inputs and recent public and private transactions for comparable investments. Key inputs used for the discounted cash flow approach include the weighted average cost of capital and investment terminal values derived from EBITDA multiples. An illiquidity discount may be applied where appropriate.
The Master Fund utilizes several valuation techniques that use unobservable pricing inputs and assumptions in determining the fair value of its Level 3 investments. The valuation techniques, as well as the key unobservable inputs that have a significant impact on the Master Fund’s investments classified and valued as Level 3 in the valuation hierarchy, are described in Note 5. Fair Value of Financial Instruments. The unobservable inputs and assumptions may differ by asset and in the application of the Master Fund’s valuation methodologies. The reported fair value estimates could vary materially if the Master Fund had chosen to incorporate different unobservable pricing inputs and assumptions.
The determination of fair value involves subjective judgments and estimates. Due to the inherent uncertainty of determining the fair value of portfolio investments that do not have a readily available market value, the fair value of investments may differ materially from the values that would have been determined had a readily available market value existed for such investments. Further, such investments are generally less liquid than publicly traded securities. If the Master Fund was required to liquidate a portfolio investment that does not have a readily available market value in a forced or liquidation sale, the Master Fund could realize significantly less value than the value recorded by the Master Fund.
Security Transactions and Realized/Unrealized Gains or Losses
Investments purchased on a secondary market basis are recorded on the trade date. Loan originations are recorded on the funding date. All investments sold are derecognized on the trade date. The Master Fund measures realized gains or losses from the repayment or sale of investments using the specific lot identification method. Realized gains or losses are measured by the difference between (i) the net proceeds from the repayment or sale, inclusive of any prepayment premiums and (ii) the amortized cost basis of the investment without regard to unrealized appreciation or depreciation previously recognized and include investments charged off during the period, net of recoveries. Unrealized appreciation or depreciation primarily measures the change in investment values, including the reversal of previously recorded unrealized appreciation or depreciation when gains or losses are realized. The amortized cost basis of investments includes (i) the original cost, net of original issue discount and loan origination fees, if any, and (ii) adjustments for the accretion/amortization of market discounts and premiums. The Master Fund reports changes in fair value of investments as net change in unrealized appreciation (depreciation) on investments in the consolidated statements of operations.
Interest Income
Interest income is recorded on an accrual basis and includes amortization of premiums to par value and accretion of discounts to par value. Discounts and premiums to par value on securities purchased are accreted/amortized into interest income over the life of the respective security using the effective interest method, or straight-line method, as applicable. Loan origination, closing and other fees received by the Master Fund directly or indirectly from borrowers in connection with the closing of investments are accreted over the contractual life of the debt investment as interest income based on the effective interest method.
Certain of the Master Fund’s investments in debt securities may contain a contractual payment-in-kind ("PIK") interest provision. The PIK provisions generally feature the obligation, or the option, at each interest payment date of making interest payments in (i) cash, (ii) additional securities or (iii) a combination of cash and additional securities. PIK interest, computed at the contractual rate specified in the investment’s credit agreement, is accrued as interest income and recorded as interest receivable up to the interest payment date. On the interest payment date, the Master Fund will capitalize the accrued interest receivable attributable to PIK as additional principal due from the borrower. When additional PIK securities are received on the interest payment date, they typically have the same terms, including maturity dates and interest rates, as the original securities issued. PIK interest generally becomes due on the investment's maturity date or call date.
If the portfolio company's valuation indicates the value of the PIK security is not sufficient to cover the contractual PIK interest, the Master Fund will not accrue additional PIK interest income and will record an allowance for any accrued PIK interest receivable as a reduction of interest income in the period the Master Fund determines it is not collectible.
Notes to Consolidated Financial Statements (Unaudited)
Debt securities are placed on non-accrual status when principal or interest payments are at least 90 days past due or when there is reasonable doubt that principal or interest will be collected. Generally, accrued interest is reversed against interest income when a debt security is placed on non-accrual status. Interest payments received on debt securities on non-accrual status may be recognized as interest income or applied to principal based on management’s judgment. Debt securities on non-accrual status are restored to accrual status when past due principal and interest are paid, and, in management’s judgment, such securities are likely to remain current on interest payment obligations. The Master Fund may make exceptions to this treatment if the debt security has sufficient collateral value and is in the process of collection.
Dividend Income
Dividend income on preferred equity securities is recorded as dividend income on an accrual basis to the extent that such amounts are payable by the portfolio company and are expected to be collected. Dividend income on equity securities is recorded on the record date for private portfolio companies or on the ex-dividend date for publicly traded portfolio companies. Each distribution received from limited liability company (“LLC”) and limited partnership (“LP”) equity investments is evaluated to determine if the distribution should be recorded as dividend income or a return of capital. Generally, the Master Fund will not record distributions from equity investments in LLCs and LPs as dividend income unless there are sufficient accumulated tax basis earnings and profits in the LLC or LP prior to the distribution. Distributions that are classified as a return of capital are recorded as a reduction in the cost basis of the investment.
Fee Income
Guggenheim, or its affiliates, may provide financial advisory services to portfolio companies and in return may receive fees for capital structuring services. Guggenheim is obligated to remit to the Master Fund any earned capital structuring fees based on the pro rata portion of the Master Fund’s investment in originated co-investment transactions. These fees are generally non-recurring and are recognized as fee income by the Master Fund upon the earlier of the investment commitment date or investment closing date. The Master Fund may also receive fees for investment commitments, amendments to credit agreements and other services rendered to portfolio companies. Such fees are recognized as fee income when earned or when the services are rendered.
Derivative Instruments
Derivative instruments solely consist of foreign currency forward contracts. The Master Fund recognizes all derivative instruments as assets or liabilities at fair value in its consolidated financial statements. Foreign currency forward contracts entered into by the Master Fund are not designated as hedging instruments, and as a result, the Master Fund presents changes in fair value through net change in unrealized appreciation (depreciation) on foreign currency forward contracts in the consolidated statements of operations. Realized gains and losses that occur upon the cash settlement of the foreign currency forward contracts are included in net realized gains (losses) on foreign currency forward contracts on the consolidated statements of operations.
Foreign Currency Translation, Transactions and Gains (Losses)
Foreign currency amounts are translated into U.S. dollars on the following basis: (i) at the exchange rate on the last business day of the reporting period for the fair value of investment securities, other assets and liabilities; and (ii) at the prevailing exchange rate on the respective recording dates for the purchase and sale of investment securities, income, expenses, gains and losses.
Net assets and fair values are presented based on the applicable foreign exchange rates described above and the Master Fund does not isolate that portion of the results of operations resulting from changes in foreign exchange rates on investments from the fluctuations arising from changes in fair values of investments held; therefore, fluctuations related to foreign exchange rate conversions are included with the net realized gains (losses) and unrealized appreciation (depreciation) on investments.
Net realized gains or losses on foreign currency transactions arise from sales of foreign currency, currency gains or losses realized between the trade and settlement dates on securities transactions and the difference between the amounts of dividends, interest and foreign withholding taxes recorded by the Master Fund and the U.S. dollar equivalent of the amounts actually received or paid by the Master Fund.
Unrealized appreciation (depreciation) from foreign currency translation for foreign currency forward contracts is included in net change in unrealized appreciation (depreciation) on foreign currency forward contracts in the consolidated statements of operations and is included in accumulated earnings (loss), net of distributions on the consolidated statements of assets and liabilities.
Notes to Consolidated Financial Statements (Unaudited)
Investment Advisory Fees
The Master Fund incurs investment advisory fees including: (i) a base management fee and (ii) a performance-based incentive fee which includes (a) an incentive fee on income and (b) an incentive fee on capital gains, due to Guggenheim pursuant to an investment advisory agreement between the Master Fund and Guggenheim (the "Investment Advisory Agreement") as described in Note 6. Related Party Agreements and Transactions. The two components of the performance-based incentive fee will be combined and expensed in the consolidated statements of operations and accrued in the consolidated statements of assets and liabilities as accrued performance-based incentive fee. Pursuant to the terms of the Investment Advisory Agreement, the incentive fee on capital gains is determined and payable in arrears as of the end of each calendar year (or upon termination of the Investment Advisory Agreement) based on the Master Fund’s realized capital gains on a cumulative basis from inception, net of all realized capital losses and unrealized depreciation on a cumulative basis, less the aggregate amount of any previously paid capital gains incentive fees. Although the terms of the Investment Advisory Agreement do not provide for the inclusion of unrealized gains in the calculation of the incentive fee on capital gains, the Master Fund includes unrealized gains in the calculation of the incentive fee on capital gains in accordance with GAAP. Therefore the accrued amount, if any, represents an estimate of the incentive fees that may be payable to Guggenheim if the Master Fund’s entire investment portfolio was liquidated at its fair value as of the date of the consolidated statements of assets and liabilities, even though Guggenheim is not entitled to any incentive fee based on unrealized appreciation unless and until such unrealized appreciation is realized.
Deferred Financing Costs
Deferred financing costs represent fees and other direct incremental costs incurred in connection with the arrangement of the Master Fund's borrowings. These costs are presented in the consolidated statements of assets and liabilities as a direct deduction of the debt liability to which the costs pertain. These costs are amortized using the effective interest method and are included in interest expense on the consolidated statements of operations over the life of the borrowings.
Distributions
Distributions to the Master Fund's common shareholders are periodically declared by its Board of Trustees and recognized as a liability on the record date.
Federal Income Taxes
Beginning with its tax year ended December 31, 2015, the Master Fund has elected to be treated for federal income tax purposes, and thereafter intends to maintain its qualification, as a regulated investment company ("RIC") under Subchapter M of the Internal Revenue Code of 1986, as amended (the "Code"). Generally, a RIC is not subject to federal income taxes on distributed income and gains if it distributes dividends in a timely manner out of assets legally available for distributions to its shareholders of an amount generally at least equal to 90% of its “Investment Company Taxable Income,” as defined in the Code. The Master Fund intends to distribute sufficient dividends to maintain its RIC status each year and it does not anticipate paying a material level of federal income taxes.
The Master Fund is generally subject to nondeductible federal excise taxes if it does not distribute dividends to its shareholders in respect of each calendar year of an amount at least equal to the sum of (i) 98% of its net ordinary income (taking into account certain deferrals and elections) for the calendar year, (ii) 98.2% of its capital gain net income (i.e., capital gains in excess of capital losses), adjusted for certain ordinary losses, for the one-year period generally ending on October 31st of the calendar year and (iii) any net ordinary income and capital gain net income for preceding calendar years that were not distributed during such calendar years and on which the Master Fund paid no federal income tax. The Master Fund may, at its discretion, pay a 4% nondeductible federal excise tax on under-distribution of taxable ordinary income and capital gains.
The Master Fund follows ASC 740, Income Taxes (“ASC 740”). ASC 740 provides guidance for how uncertain tax positions should be recognized, measured, presented and disclosed in the financial statements. ASC 740 requires the evaluation of tax positions taken or expected to be taken in the course of preparing our tax returns to determine whether the tax positions are “more-likely-than-not” of being sustained by the applicable tax authority. Tax positions not deemed to meet the more-likely-than-not threshold are recorded as a tax benefit or expense in the current year. Penalties or interest, if applicable, that may be assessed relating to income taxes would be classified as other expenses in the statements of operations. Management has reviewed all open tax years and concluded that there is no effect to the Master Funds’ financial positions or results of operations and no tax liability was required to be recorded resulting from unrecognized tax benefits relating to uncertain income tax position taken or expected to be taken on a tax return. During this period, the Master Fund did not incur any material interest or penalties. Open tax years are those years that are open for examination by the relevant income taxing authority. As of June 30, 2020, open U.S. Federal and state income tax years include the tax years ended December 31, 2016 through December 31, 2019. The Master Fund has no examinations in progress. Management’s determinations regarding ASC 740 may be subject to review and adjustment at a later date based upon factors including, but not limited to, an on-going analysis of tax laws, regulations and interpretations thereof.
Notes to Consolidated Financial Statements (Unaudited)
Note 3. Investments
The following table presents the composition of the investment portfolio at amortized cost and fair value as of June 30, 2020 and December 31, 2019, respectively, with corresponding percentages of total investments at fair value:
|
| | | | | | | | | | | | | | | | | | | | | |
| | June 30, 2020 | | December 31, 2019 |
| | Amortized Cost | | Fair Value | | Percentage of Investments at Fair Value | | Amortized Cost | | Fair Value | | Percentage of Investments at Fair Value |
| Senior secured loans - first lien | $ | 299,344 |
| | $ | 275,265 |
| | 85.0 | % | | $ | 279,872 |
| | $ | 268,678 |
| | 72.2 | % |
| Senior secured loans - second lien | 37,056 |
| | 32,519 |
| | 10.0 |
| | 56,913 |
| | 56,651 |
| | 15.2 |
|
| Senior secured bonds | 7,816 |
| | 6,124 |
| | 1.9 |
| | 12,996 |
| | 12,223 |
| | 3.3 |
|
| Senior unsecured debt | 3,201 |
| | 2,335 |
| | 0.7 |
| | 22,253 |
| | 21,537 |
| | 5.8 |
|
| Total senior debt | $ | 347,417 |
| | $ | 316,243 |
| | 97.6 | % | | $ | 372,034 |
| | $ | 359,089 |
| | 96.5 | % |
| Equity and other | 11,211 |
| | 7,648 |
| | 2.4 |
| | 13,768 |
| | 13,104 |
| | 3.5 |
|
| Total investments | $ | 358,628 |
| | $ | 323,891 |
| | 100.0 | % | | $ | 385,802 |
| | $ | 372,193 |
| | 100.0 | % |
Notes to Consolidated Financial Statements (Unaudited)
The following table presents the composition of the investment portfolio by industry classifications at amortized cost and fair value as of June 30, 2020 and December 31, 2019, respectively, with corresponding percentages of total investments at fair value:
|
| | | | | | | | | | | | | | | | | | | | | | |
| | | June 30, 2020 | | December 31, 2019 |
| Industry Classification | | Amortized Cost | |
Fair Value | | Percentage of Investments at Fair Value | | Amortized Cost | |
Fair Value | | Percentage of Investments at Fair Value |
| Technology | | $ | 74,962 |
| | $ | 72,107 |
| | 22.2 | % | | $ | 81,806 |
| | $ | 81,726 |
| | 22.0 | % |
| Services: Business | | 41,676 |
| | 38,435 |
| | 11.9 |
| | 40,279 |
| | 40,115 |
| | 10.8 |
|
| Beverage, Food & Tobacco | | 29,208 |
| | 28,089 |
| | 8.7 |
| | 24,104 |
| | 24,555 |
| | 6.6 |
|
| Automotive | | 27,242 |
| | 21,730 |
| | 6.7 |
| | 24,095 |
| | 21,938 |
| | 5.9 |
|
| Chemicals, Plastics & Rubber | | 20,344 |
| | 20,106 |
| | 6.2 |
| | 20,010 |
| | 20,072 |
| | 5.4 |
|
| Media: Advertising, Printing & Publishing | | 21,009 |
| | 19,338 |
| | 6.0 |
| | 24,566 |
| | 24,432 |
| | 6.6 |
|
| Retail | | 23,476 |
| | 17,149 |
| | 5.3 |
| | 29,511 |
| | 22,880 |
| | 6.1 |
|
| Consumer goods: Non-durable | | 16,965 |
| | 16,721 |
| | 5.2 |
| | 4,548 |
| | 4,553 |
| | 1.2 |
|
| Containers, Packaging & Glass | | 16,447 |
| | 13,943 |
| | 4.3 |
| | 13,259 |
| | 12,233 |
| | 3.3 |
|
| Construction & Building | | 13,808 |
| | 13,557 |
| | 4.2 |
| | 14,832 |
| | 14,818 |
| | 4.0 |
|
Banking, Finance, Insurance & Real Estate (1) | | 11,430 |
| | 11,082 |
| | 3.4 |
| | 11,021 |
| | 11,191 |
| | 3.0 |
|
| Healthcare & Pharmaceuticals | | 10,398 |
| | 10,352 |
| | 3.2 |
| | 41,194 |
| | 41,101 |
| | 11.0 |
|
| Aerospace & Defense | | 7,742 |
| | 7,663 |
| | 2.4 |
| | 7,274 |
| | 6,877 |
| | 1.8 |
|
| Energy: Oil & Gas | | 14,917 |
| | 6,370 |
| | 2.0 |
| | 15,266 |
| | 11,778 |
| | 3.2 |
|
| Utilities: Electric | | 5,915 |
| | 5,790 |
| | 1.8 |
| | 8,786 |
| | 8,508 |
| | 2.3 |
|
| Utilities: Oil & Gas | | 5,748 |
| | 5,303 |
| | 1.6 |
| | 5,784 |
| | 5,881 |
| | 1.6 |
|
| Metals & Mining | | 4,898 |
| | 4,720 |
| | 1.5 |
| | — |
| | — |
| | — |
|
| Telecommunications | | 4,687 |
| | 4,309 |
| | 1.3 |
| | 4,697 |
| | 4,718 |
| | 1.3 |
|
| Hotel, Gaming & Leisure | | 4,402 |
| | 4,209 |
| | 1.3 |
| | 6,711 |
| | 6,824 |
| | 1.8 |
|
| Capital Equipment | | 2,000 |
| | 1,695 |
| | 0.5 |
| | 2,000 |
| | 1,995 |
| | 0.5 |
|
| Consumer Goods: Durable | | 1,257 |
| | 1,125 |
| | 0.3 |
| | 1,281 |
| | 1,284 |
| | 0.3 |
|
| Transportation: Consumer | | 97 |
| | 98 |
| | — |
| | — |
| | — |
| | — |
|
| Transportation: Cargo | | — |
| | — |
| | — |
| | 4,778 |
| | 4,714 |
| | 1.3 |
|
| Total investments | | $ | 358,628 |
| | $ | 323,891 |
| | 100.0 | % | | $ | 385,802 |
| | $ | 372,193 |
| | 100.0 | % |
______________
| |
| (1) | Portfolio companies included in this classification may include insurance brokers that are not classified as insurance companies. |
Notes to Consolidated Financial Statements (Unaudited)
The following table presents the geographic dispersion of the investment portfolio as a percentage of total investments at fair value as of June 30, 2020 and December 31, 2019.
|
| | | | | | |
| Geographic Dispersion | | June 30, 2020 | | December 31, 2019 |
| United States of America | | 87.8 | % | | 85.5 | % |
| United Kingdom | | 7.7 |
| | 9.2 |
|
| Canada | | 2.9 |
| | 2.8 |
|
| Italy | | 1.6 |
| | 1.5 |
|
| Ireland | | — |
| | 1.0 |
|
| Total investments | | 100.0 | % | | 100.0 | % |
Note 4. Derivative Instruments
The Master Fund may enter into foreign currency forward contracts from time to time to facilitate settlement of purchases and sales of investments denominated in foreign currencies and to economically hedge the impact that an adverse change in foreign exchange rates would have on the value of the Master Fund's investments denominated in foreign currencies. A foreign currency forward contract is a commitment to purchase or sell a foreign currency at a future date at a negotiated forward rate. These contracts are marked-to-market by recognizing the difference between the contract forward exchange rate and the forward market exchange rate on the last day of the period presented as unrealized appreciation or depreciation. Realized gains or losses are recognized when forward contracts are settled. Risks arise as a result of the potential inability of the counterparties to meet the terms of their contracts; the Master Fund attempts to limit counterparty risk by only dealing with well-known counterparties and those that it believes have the financial resources to honor their obligations. The foreign currency forward contracts open at the end of the period are generally indicative of the volume of activity during the period.
The following tables present the Master Fund's open foreign currency forward contracts as of June 30, 2020 and December 31, 2019:
|
| | | | | | | | | | | | | | | | | | | | | | |
| June 30, 2020 |
| Foreign Currency | | Settlement Date | | Statement Location | | Counterparty | | Amount Transacted | | Notional Value at Settlement | | Notional Value at Period End | | Fair Value |
| EUR | | July 17, 2020 | | Unrealized appreciation on foreign currency forward contracts | | JPMorgan Chase Bank, N.A. | | € | 387 |
| | $ | 440 |
| | $ | 435 |
| | $ | 5 |
|
| GBP | | July 17, 2020 | | Unrealized appreciation on foreign currency forward contracts | | JPMorgan Chase Bank, N.A. | | £ | 18,730 |
| | 23,614 |
| | 23,211 |
| | 403 |
|
| Total | | | | | | | | | | $ | 24,054 |
| | $ | 23,646 |
| | $ | 408 |
|
|
| | | | | | | | | | | | | | | | | | | | | | |
| December 31, 2019 |
| Foreign Currency | | Settlement Date | | Statement Location | | Counterparty | | Amount Transacted | | Notional Value at Settlement | | Notional Value at Period End | | Fair Value |
| EUR | | January 14, 2020 | | Unrealized depreciation on foreign currency forward contracts | | JPMorgan Chase Bank, N.A. | | € | 694 |
| | $ | 772 |
| | $ | 779 |
| | $ | (7 | ) |
| GBP | | January 14, 2020 | | Unrealized depreciation on foreign currency forward contracts | | JPMorgan Chase Bank, N.A. | | £ | 18,878 |
| | 24,936 |
| | 25,016 |
| | (80 | ) |
| Total | | | | | | | | | | $ | 25,708 |
| | $ | 25,795 |
| | $ | (87 | ) |
Notes to Consolidated Financial Statements (Unaudited)
The following table presents the net realized and unrealized gains and losses on derivative instruments recorded by the Master Fund for the three and six months ended June 30, 2020 and June 30, 2019:
|
| | | | | | | | | | | | | | | | | | |
| | | | | For the Three Months Ended June 30, | | For the Six Months Ended June 30, |
| | | Statement Location | | 2020 | | 2019 | | 2020 | | 2019 |
| Net realized gains (losses) | | | | | | | | | | |
| Foreign currency forward contracts | | Net realized gains (losses) on foreign currency forward contracts | | $ | 42 |
| | $ | 861 |
| | $ | 1,051 |
| | $ | (126 | ) |
| Net change in unrealized appreciation (depreciation) | | | | | | | | |
| Foreign currency forward contracts | | Net change in unrealized appreciation (depreciation) on foreign currency forward contracts | | 17 |
| | (144 | ) | | 495 |
| | 379 |
|
| Net realized and unrealized gains on foreign currency forward contracts | | $ | 59 |
| | $ | 717 |
| | $ | 1,546 |
| | $ | 253 |
|
For derivatives traded under an International Swaps and Derivatives Association Master Agreement ("ISDA Master Agreement"), the collateral requirements are typically calculated by netting the mark-to-market amount for each transaction under such agreement and comparing that amount to the value of any collateral currently pledged by the Master Fund and/or the counterparty. Cash collateral that has been pledged, if any, to cover obligations of the Master Fund and cash collateral received from the counterparty, if any, is reported on the consolidated statements of assets and liabilities as collateral deposits (received) for foreign currency forward contracts. Generally, the amount of collateral due from or to a party has to exceed a minimum transfer amount threshold before a transfer is required. To the extent amounts due to the Master Fund from a counterparty are not fully collateralized, the Master Fund bears the risk of loss from counterparty non-performance.
The following table presents the Master Fund's derivative assets and liabilities by counterparty, net of amounts available for offset under a master netting agreement or similar arrangement, and net of related collateral received by the Master Fund for assets or pledged for liabilities as of June 30, 2020 and December 31, 2019:
|
| | | | | | | | | | | | | | | | | | |
| As of | | Counterparty | | Gross Derivative Assets in Statement of Assets and Liabilities | | Gross Derivative Liabilities in Statement of Assets and Liabilities | | Collateral Pledged | | Net position of Derivative Assets, Liabilities and Pledged Collateral |
| June 30, 2020 | | JP Morgan Chase Bank, N.A. | | $ | 408 |
| | $ | — |
| | $ | (360 | ) | | $ | 48 |
|
| December 31, 2019 | | JP Morgan Chase Bank, N.A. | | $ | — |
| | $ | (87 | ) | | $ | (320 | ) | | $ | (407 | ) |
Note 5. Fair Value of Financial Instruments
The following tables present the segmentation of the investment portfolio at fair value, as of June 30, 2020 and December 31, 2019, according to the fair value hierarchy as described in Note 2. Significant Accounting Policies:
|
| | | | | | | | | | | | | | | |
| | June 30, 2020 |
| | Level 1 | | Level 2 | | Level 3 | | Total |
| Investments | | | | | | | |
| Senior secured loans - first lien | $ | — |
| | $ | 76,808 |
| | $ | 198,457 |
| | $ | 275,265 |
|
| Senior secured loans - second lien | — |
| | 4,921 |
| | 27,598 |
| | 32,519 |
|
| Senior secured bonds | — |
| | 6,124 |
| | — |
| | 6,124 |
|
| Senior unsecured debt | — |
| | 837 |
| | 1,498 |
| | 2,335 |
|
| Total senior debt | $ | — |
| | $ | 88,690 |
| | $ | 227,553 |
| | $ | 316,243 |
|
| Equity and other | 27 |
| | — |
| | 7,621 |
| | 7,648 |
|
| Total investments | $ | 27 |
| | $ | 88,690 |
| | $ | 235,174 |
| | $ | 323,891 |
|
| Percentage | 0.0 | % | | 27.4 | % | | 72.6 | % | | 100.0 | % |
| Derivative Instruments | | | | | | | |
| Foreign currency forward contracts | $ | — |
| | $ | 408 |
| | $ | — |
| | $ | 408 |
|
Notes to Consolidated Financial Statements (Unaudited)
|
| | | | | | | | | | | | | | | |
| | December 31, 2019 |
| | Level 1 | | Level 2 | | Level 3 | | Total |
| Investments | | | | | | | |
| Senior secured loans - first lien | $ | — |
| | $ | 80,704 |
| | $ | 187,974 |
| | $ | 268,678 |
|
| Senior secured loans - second lien | — |
| | 14,364 |
| | 42,287 |
| | 56,651 |
|
| Senior secured bonds | — |
| | 12,223 |
| | — |
| | 12,223 |
|
| Senior unsecured debt | — |
| | 4,739 |
| | 16,798 |
| | 21,537 |
|
| Total senior debt | $ | — |
| | $ | 112,030 |
| | $ | 247,059 |
| | $ | 359,089 |
|
| Equity and other | 90 |
| | — |
| | 13,014 |
| | 13,104 |
|
| Total investments | $ | 90 |
| | $ | 112,030 |
| | $ | 260,073 |
| | $ | 372,193 |
|
| Percentage | 0.0 | % | | 30.1 | % | | 69.9 | % | | 100.0 | % |
| Derivative Instruments | | | | | | | |
| Foreign currency forward contracts | $ | — |
| | $ | (87 | ) | | $ | — |
| | $ | (87 | ) |
Significant Level 3 Unobservable Inputs
The following tables present quantitative information related to the significant Level 3 unobservable inputs associated with the determination of fair value for certain investments as of June 30, 2020 and December 31, 2019:
|
| | | | | | | | |
| June 30, 2020 |
| Asset Category | Fair
Value | Valuation Techniques (1) | Unobservable Inputs (2) | Weighted Average | Range (3) | Impact to Valuation from an Increase in Input (4) |
| Senior secured loans - first lien | $ | 157,616 |
| Yield analysis | Yield | 7.55% | 4.33% - 17.81% | Decrease |
| | $ | 1,635 |
| Transacted value | Cost | 99.50 | 99.50 | Increase |
| | $ | 2,799 |
| Transacted value | Price | 84.00 | 84.00 | Increase |
| | $ | 4,852 |
| Transacted value | Bid | 42.30 | 42.30 | Increase |
| | | Discounted cash flow | Discount Rate | 18.00% | 18.00% | Decrease |
| | | Discounted cash flow | Perpetuity Growth Rate | (10.00)% | (10.00)% | Increase |
| | | Discounted cash flow | Terminal EBITDA Multiple | 7.2x | 7.2x | Increase |
| Senior secured loans - second lien | $ | 17,709 |
| Yield analysis | Yield | 10.08% | 8.29% - 25.73% | Decrease |
| Senior unsecured debt | $ | 1,498 |
| Yield analysis | Yield | 29.40% | 29.40% | Decrease |
| Equity and other | $ | 30 |
| Transacted value | Cost(5) | 15.36 | 15.36 | Increase |
| | $ | 5,149 |
| Market comparable | Capitalization Rate | 7.00% | 7.00% | Increase |
| | $ | 347 |
| Market comparable | Cash Flow Multiple | 1.6x | 1.6x | Increase |
| | | Market comparable | Oil production multiple (6) | 7121x | 7121x | Increase |
| | | Market comparable | Oil reserve multiple (7) | 2.7x | 2.7x | Increase |
| | $ | 2,095 |
| Discounted cash flow | Discount Rate | 17.00% | 13.27% - 17.5% | Decrease |
| | | Discounted cash flow | EBITDA multiple | 15.1x | 14.2x - 15.8x | Increase |
| | | Discounted cash flow | Perpetuity Growth Rate | 6.77% | 5% - 8% | Increase |
| | | Discounted cash flow | Terminal EBITDA Multiple | 8x | 7x - 13x | Increase |
| Total | $ | 193,730 |
| | | | | |
Notes to Consolidated Financial Statements (Unaudited)
______________
| |
| (1) | For the investments that have more than one valuation technique, the Master Fund may rely on the stated techniques individually or in the aggregate based on a weight ascribed to each valuation technique, ranging from 0% to 100%. |
| |
| (2) | The Master Fund generally uses prices provided by an independent pricing service, or directly from an independent broker, which are non-binding indicative prices on or near the valuation date as the primary basis for the fair valuation determinations for quoted senior secured bonds and loans. Since these prices are non-binding, they may not be indicative of fair value. Each quoted price is evaluated by Guggenheim in conjunction with additional information compiled by it, including financial performance, recent business developments and various other factors. Investments with fair values determined in this manner were not included in the table above. As of June 30, 2020, the Master Fund had investments of this nature measured at fair value totaling $41.4 million. |
| |
| (3) | A range is not provided when there is only one investment within the classification or multiple investments that have the same unobservable input; weighted average amounts are based on the estimated fair values. |
| |
| (4) | This column represents the directional change in the fair value of the Level 3 investments that would result from an increase to the corresponding unobservable input. A decrease to the unobservable input would have the opposite effect. Significant changes in these inputs in isolation could result in significantly higher or lower fair value measurements. |
| |
| (5) | Investments may be valued at cost for a period of time after acquisition as the best indicator of fair value. |
| |
| (6) | Oil production multiple is valued based on thousand barrels of oil equivalent per day (MBOE/d). |
| |
| (7) | Oil reserve multiple is valued based on million barrels of oil equivalent (MMBOE). |
Notes to Consolidated Financial Statements (Unaudited)
|
| | | | | | | | |
| December 31, 2019 |
| Asset Category | Fair
Value | Valuation Techniques (1) | Unobservable Inputs (2) | Weighted Average | Range (3) | Impact to Valuation from an Increase in Input (4) |
| Senior secured loans - first lien | $ | 121,594 |
| Yield analysis | Yield | 8.44% | 4.64% - 12.05% | Decrease |
| | $ | 5,722 |
| Transacted value | Potential transaction | 100.00 | 100.00 | Increase |
| | $ | 14,656 |
| Yield analysis | Yield | 7.88% | 6.47% - 8.5% | Decrease |
| | | Transacted value | Potential transaction | 101.73 | 100 - 105.57 | Increase |
| | $ | 5,795 |
| Yield analysis | Yield | 20.23% | 20.23% | Decrease |
| | | Transacted value | Bid | 61.27 | 61.27 | Increase |
| | | Discounted cash flow | Discount Rate | 17.50% | 17.50% | Decrease |
| | | Discounted cash flow | Perpetuity Growth Rate | (10.00)% | (10.00)% | Increase |
| | | Discounted cash flow | Terminal EBITDA Multiple | 5.9x | 5.9x | Increase |
| Senior secured loans - second lien | $ | 16,904 |
| Yield analysis | Yield | 9.91% | 7.67% - 11.27% | Decrease |
| | $ | 15,492 |
| Transacted value | Potential transaction | 101.00 | 101.00 | Increase |
| | $ | 4,386 |
| Yield analysis | Yield | 11.46% | 11.46% | Decrease |
| | | Transacted value | Potential transaction | 100.00 | 100.00 | Increase |
| Senior unsecured debt | $ | 16,798 |
| Yield analysis | Yield | 12.44% | 11.53% - 14.33% | Decrease |
| Equity and other | $ | 30 |
| Transacted value | Cost (5) | 15.36 | 15.36 | Increase |
| | $ | 3,303 |
| Transacted value | Potential transaction | 1,116.45 | 1,116.45 | Increase |
| | $ | 4,752 |
| Market comparable | Capitalization Rate | 7.00% | 7.00% | Increase |
| | $ | 81 |
| Discounted cash flow | EBITDA multiple | 16.7x | 16.7x | Increase |
| | $ | 2,081 |
| Market comparable | Cash Flow Multiple | 3.6x | 3.6x | Increase |
| | | Market comparable | Oil production multiple (6) | 19,650x | 19,650x | Increase |
| | | Market comparable | Oil reserve multiple (7) | 6.6x | 6.6x | Increase |
| | $ | 2,767 |
| Discounted cash flow | Discount Rate | 20.01% | 14.08% - 15% | Decrease |
| | | Discounted cash flow | EBITDA multiple | 14.5x | 13.2x - 15.4x | Increase |
| | | Discounted cash flow | Perpetuity Growth Rate | 6.74% | 5% - 8% | Increase |
| | | Discounted cash flow | Terminal EBITDA Multiple | 8.2x | 7.5x - 13x | Increase |
| Total | $ | 214,361 |
| | | | | |
_______________
| |
| (1) | For the investments that have more than one valuation technique, the Master Fund may rely on the stated techniques individually or in the aggregate based on a weight ascribed to each valuation technique, ranging from 0% to 100%. |
| |
| (2) | The Master Fund generally uses prices provided by an independent pricing service, or directly from an independent broker, which are non-binding indicative prices on or near the valuation date as the primary basis for the fair valuation determinations for quoted senior secured bonds and loans. Since these prices are non-binding, they may not be indicative of fair value. Each quoted price is evaluated by Guggenheim in conjunction with additional information compiled by it, including financial performance, recent business developments and various other factors. Investments with fair values determined in this manner were not included in the table above. As of December 31, 2019, the Master Fund had investments of this nature measured at fair value totaling $45.7 million. |
| |
| (3) | A range is not provided when there is only one investment within the classification or multiple investments that have the same unobservable input; weighted average amounts are based on the estimated fair values. |
| |
| (4) | This column represents the directional change in the fair value of the Level 3 investments that would result from an increase to the corresponding unobservable input. A decrease to the unobservable input would have the opposite effect. Significant changes in these inputs in isolation could result in significantly higher or lower fair value measurements. |
| |
| (5) | Investments may be valued at cost for a period of time after acquisition as the best indicator of fair value. |
| |
| (6) | Oil production multiple is valued based on thousand barrels of oil equivalent per day (MBOE/d). |
| |
| (7) | Oil reserve multiple is valued based on million barrels of oil equivalent (MMBOE). |
Notes to Consolidated Financial Statements (Unaudited)
In addition to the Level 3 valuation methodologies and unobservable inputs noted above, the Master Fund, in accordance with its valuation policy, may also use other valuation techniques and methodologies when determining the fair value estimates for its investments.
The following tables present a roll-forward of the fair value changes for all investments for which the Master Fund determines fair value using Level 3 unobservable inputs for the three and six months ended June 30, 2020 and June 30, 2019:
|
| | | | | | | | | | | | | | | | | | | |
| | For the Three Months Ended June 30, 2020 |
| | Senior Secured Loans - First Lien | | Senior Secured Loans - Second Lien | | Senior Unsecured Debt | | Equity and Other | | Total |
| Balance as of April 1, 2020 | $ | 196,161 |
| | $ | 27,177 |
| | $ | 16,858 |
| | $ | 7,599 |
| | $ | 247,795 |
|
Additions (1) | 5,502 |
| | 2,166 |
| | — |
| | 203 |
| | 7,871 |
|
Sales and repayments (2) | (6,320 | ) | | — |
| | (15,354 | ) | | — |
| | (21,674 | ) |
Net realized gains (losses) (3) | (770 | ) | | — |
| | 465 |
| | — |
| | (305 | ) |
Net change in unrealized appreciation (depreciation) on investments (4) | 6,926 |
| | (1,089 | ) | | (478 | ) | | (181 | ) | | 5,178 |
|
| Net discount accretion | 171 |
| | (46 | ) | | 7 |
| | — |
| | 132 |
|
Transfers into Level 3 (5) | 9,609 |
| | 3,340 |
| | — |
| | — |
| | 12,949 |
|
Transfers out of Level 3 (6) | (12,822 | ) | | (3,950 | ) | | — |
| | — |
| | (16,772 | ) |
| Fair value balance as of June 30, 2020 | $ | 198,457 |
| | $ | 27,598 |
| | $ | 1,498 |
| | $ | 7,621 |
| | $ | 235,174 |
|
| Change in net unrealized appreciation (depreciation) on investments held as of June 30, 2020 | $ | 6,176 |
| | $ | (1,090 | ) | | $ | (219 | ) | | $ | (181 | ) | | $ | 4,686 |
|
|
| | | | | | | | | | | | | | | | | | | |
| | For the Six Months Ended June 30, 2020 |
| | Senior Secured Loans - First Lien | | Senior Secured Loans - Second Lien | | Senior Unsecured Debt | | Equity and Other | | Total |
| Balance as of January 1, 2020 | $ | 187,974 |
| | $ | 42,287 |
| | $ | 16,798 |
| | $ | 13,014 |
| | $ | 260,073 |
|
Additions (1) | 36,506 |
| | 2,166 |
| | — |
| | 401 |
| | 39,073 |
|
Sales and repayments (2) | (21,937 | ) | | (19,881 | ) | | (15,354 | ) | | (3,375 | ) | | (60,547 | ) |
Net realized gains (losses) (3) | (379 | ) | | 425 |
| | 465 |
| | 417 |
| | 928 |
|
Net change in unrealized depreciation on investments (4) | (9,789 | ) | | (3,650 | ) | | (427 | ) | | (2,836 | ) | | (16,702 | ) |
| Net discount accretion | 335 |
| | (29 | ) | | 16 |
| | — |
| | 322 |
|
Transfers into Level 3 (5) | 30,108 |
| | 10,230 |
| | — |
| | — |
| | 40,338 |
|
Transfers out of Level 3 (6) | (24,361 | ) | | (3,950 | ) | | — |
| | — |
| | (28,311 | ) |
| Fair value balance as of June 30, 2020 | $ | 198,457 |
| | $ | 27,598 |
| | $ | 1,498 |
| | $ | 7,621 |
| | $ | 235,174 |
|
| Change in net unrealized depreciation on investments held as of June 30, 2020 | $ | (8,703 | ) | | $ | (1,639 | ) | | $ | (379 | ) | | $ | (2,410 | ) | | $ | (13,131 | ) |
___________
| |
| (1) | Includes increases in the cost basis of investments resulting from new and incremental portfolio investments, including the capitalization of PIK income. |
| |
| (2) | Includes principal payments/paydowns on debt investments and proceeds from sales of investments. |
| |
| (3) | Included in net realized gains (losses) on investments on the consolidated statements of operations. |
| |
| (4) | Included in net change in unrealized appreciation (depreciation) on investments on the consolidated statements of operations. |
| |
| (5) | For the three and six months ended June 30, 2020, investments were transferred from Level 2 to Level 3 as valuation coverage was reduced to one independent pricing service without any corroborating recent trade or another broker quotation. |
| |
| (6) | For the three and six months ended June 30, 2020, investments were transferred from Level 3 to Level 2 as valuation coverage was initiated by more than one independent pricing services or by one independent pricing service with a corroborating recent trade or another broker quotation. |
Notes to Consolidated Financial Statements (Unaudited)
|
| | | | | | | | | | | | | | | | | | | |
| | For the Three Months Ended June 30, 2019 |
| | Senior Secured Loans - First Lien | | Senior Secured Loans - Second Lien | | Senior Unsecured Debt | | Equity and Other | | Total |
| Balance as of April 1, 2019 | $ | 195,804 |
| | $ | 42,611 |
| | $ | 16,696 |
| | $ | 10,624 |
| | $ | 265,735 |
|
Additions (1) | 9,818 |
| | 4,469 |
| | — |
| | 2,825 |
| | 17,112 |
|
Sales and repayments (2) | (11,739 | ) | | (267 | ) | | — |
| | (116 | ) | | (12,122 | ) |
Net realized gains (losses) (3) | 106 |
| | (4,614 | ) | | — |
| | — |
| | (4,508 | ) |
Net change in unrealized appreciation (depreciation) on investments (4) | (2,080 | ) | | 4,230 |
| | 161 |
| | (15 | ) | | 2,296 |
|
| Net discount accretion | 168 |
| | 23 |
| | 10 |
| | — |
| | 201 |
|
Transfers into Level 3 (5) | 4,704 |
| | — |
| | — |
| | — |
| | 4,704 |
|
Transfers out of Level 3 (6) | (20,260 | ) | | — |
| | — |
| | — |
| | (20,260 | ) |
| Fair value balance as of June 30, 2019 | $ | 176,521 |
| | $ | 46,452 |
| | $ | 16,867 |
| | $ | 13,318 |
| | $ | 253,158 |
|
| Change in net unrealized appreciation (depreciation) on investments held as of June 30, 2019 | $ | (2,070 | ) | | $ | (169 | ) | | $ | 161 |
| | $ | (15 | ) | | $ | (2,093 | ) |
|
| | | | | | | | | | | | | | | | | | | |
| | For the Six Months Ended June 30, 2019 |
| | Senior Secured Loans - First Lien | | Senior Secured Loans - Second Lien | | Senior Unsecured Debt | | Equity and Other | | Total |
| Balance as of January 1, 2019 | $ | 204,558 |
| | $ | 51,898 |
| | $ | 16,666 |
| | $ | 10,325 |
| | $ | 283,447 |
|
Additions (1) | 13,851 |
| | 4,469 |
| | — |
| | 3,023 |
| | 21,343 |
|
Sales and repayments (2) | (14,382 | ) | | (2,674 | ) | | — |
| | (116 | ) | | (17,172 | ) |
Net realized gains (losses) (3) | 143 |
| | (4,501 | ) | | — |
| | — |
| | (4,358 | ) |
Net change in unrealized appreciation (depreciation) on investments (4) | (1,032 | ) | | 4,118 |
| | 181 |
| | 86 |
| | 3,353 |
|
| Net discount accretion | 328 |
| | 46 |
| | 20 |
| | — |
| | 394 |
|
Transfers into Level 3 (5) | 15,090 |
| | 533 |
| | — |
| | — |
| | 15,623 |
|
Transfers out of Level 3 (6) | (42,035 | ) | | (7,437 | ) | | — |
| | — |
| | (49,472 | ) |
| Fair value balance as of June 30, 2019 | $ | 176,521 |
| | $ | 46,452 |
| | $ | 16,867 |
| | $ | 13,318 |
| | $ | 253,158 |
|
| Change in net unrealized appreciation (depreciation) on investments held as of June 30, 2019 | $ | (1,100 | ) | | $ | (81 | ) | | $ | 181 |
| | $ | 86 |
| | $ | (914 | ) |
______________
| |
| (1) | Includes increases in the cost basis of investments resulting from new and incremental portfolio investments, including the capitalization of PIK income. |
| |
| (2) | Includes principal payments/paydowns on debt investments and proceeds from sales of investments. |
| |
| (3) | Included in net realized gains (losses) on investments on the consolidated statements of operations. |
| |
| (4) | Included in net change in unrealized appreciation (depreciation) on investments on the consolidated statements of operations. |
| |
| (5) | For the three and six months ended June 30, 2019, investments were transferred from Level 2 to Level 3 as valuation coverage was reduced to one independent pricing service without any corroborating recent trade. |
| |
| (6) | For the three and six months ended June 30, 2019, investments were transferred from Level 3 to Level 2 as valuation coverage was initiated by one or more independent pricing services or by one independent pricing service with a corroborating recent trade. |
Financial Instruments Disclosed, But Not Carried at Fair Value
The fair value of the credit facility payable, which would have been categorized as Level 3 within the fair value hierarchy as of June 30, 2020, approximates its carrying value.
Notes to Consolidated Financial Statements (Unaudited)
Note 6. Related Party Agreements and Transactions
The Master Fund is affiliated with Guggenheim Credit Income Fund 2016 T ("GCIF 2016T") and Guggenheim Credit Income Fund 2019 ("GCIF 2019") (together, the "Feeder Funds"). The membership of the Boards of Trustees for the Master Fund, GCIF 2016T and GCIF 2019 are identical. The Feeder Funds have invested, and/or intend to invest, substantially all of the proceeds from their public offerings of common shares in the acquisition of the Master Fund's Common Shares.
Two of the Master Fund’s executive officers, Kevin Robinson, Senior Vice President and Brian Binder, Senior Vice President, serve as executive officers of Guggenheim. All of the Master Fund's executive officers also serve as executive officers of the Feeder Funds.
Guggenheim and/or its affiliates receive, as applicable, compensation for (i) investment advisory services, (ii) reimbursement of expenses in connection with investment advisory activities, administrative services and organizing the Master Fund and (iii) capital markets services in connection with the raising of equity capital for Feeder Funds affiliated with the Master Fund, as more fully discussed below.
Investment Advisory Agreements and Compensation of the Advisor
The Master Fund is party to an Investment Advisory Agreement with Guggenheim, pursuant to which the Master Fund agreed to pay Guggenheim an investment advisory fee consisting of two components: (i) a management fee and (ii) a performance-based incentive fee. Guggenheim continues to be entitled to reimbursement of certain expenses incurred on behalf of the Master Fund in connection with investment operations and investment transactions.
Management Fees: The management fee is calculated at an annual rate of 1.75% based on the simple average of the Master Fund's gross assets at the end of the two most recently completed calendar months and it is payable in arrears.
Performance-based Incentive Fee: The performance-based incentive fee consists of two parts: (i) an incentive fee on income and (ii) an incentive fee on capital gains.
| |
| (i) | The incentive fee on income is paid quarterly, if earned; it is computed as the sum of (A) 100% of quarterly pre-incentive fee net investment income in excess of 1.875% of average adjusted capital up to a limit of 2.344% of average adjusted capital, and (B) 20% of pre-incentive fee net investment income in excess of 2.344% of average adjusted capital. |
| |
| (ii) | The incentive fee on capital gains is paid annually, if earned; it is equal to 20% of realized capital gains on a cumulative basis from inception, net of (A) all realized capital losses and unrealized depreciation on a cumulative basis from inception, and (B) the aggregate amount, if any, of previously paid incentive fees on capital gains. |
All fees are computed in accordance with a detailed fee calculation methodology as approved by the Board of Trustees.
The Investment Advisory Agreement may be terminated at any time, without the payment of any penalty: (i) by the Master Fund upon 60 days' written notice to Guggenheim, or (ii) by Guggenheim upon not less than 120 days' written notice to the Master Fund. In the event that the Investment Advisory Agreement is terminated by Guggenheim, and if the Independent Trustees elect to continue the Master Fund, then Guggenheim shall pay all direct expenses incurred by the Master Fund as a result of Guggenheim's withdrawal, up to, but not exceeding $250,000. Unless earlier terminated, the Investment Advisory Agreement will remain in effect for a period of two years from the date on which the Master Fund's shareholders approved the Investment Advisory Agreement and will remain in effect year to year thereafter if approved annually (i) by a majority of the Master Fund's Independent Trustees and (ii) the Master Fund's Board of Trustees or the holders of a majority of the Master Fund's outstanding voting securities.
Administrative Services Agreement
The Master Fund entered into an administrative services agreement with Guggenheim (the "Administrative Services Agreement") whereby Guggenheim agreed to provide administrative services to the Master Fund, including office facilities and equipment, and clerical, bookkeeping and record-keeping services. More specifically, Guggenheim, serving as the administrator (the "Administrator"), performs and oversees the Master Fund's required administrative services, which included financial and corporate record-keeping, preparing and disseminating the Master Fund's reports to its shareholders and filing reports with the SEC. In addition, the Administrator assists in determining net asset value, overseeing the preparation and filing of tax returns, overseeing the payment of expenses and distributions and overseeing the performance of administrative and professional services fees rendered by others. For providing these services, facilities and personnel, the Master Fund reimburses the Administrator for the allocable portion of overhead and other expenses incurred by the Administrator in performing its obligations under the Administrative Services Agreement. To the extent that the Administrator outsources any of its functions, the Master Fund may pay the fees associated with such functions on a direct basis, without incremental profit to the Administrator.
Notes to Consolidated Financial Statements (Unaudited)
The Administrative Services Agreement may be terminated at any time, without the payment of any penalty: (i) by the Master Fund upon 60 days' written notice to the Administrator upon the vote of the Master Fund's Independent Trustees, or (ii) by the Administrator upon not less than 120 days' written notice to the Master Fund. Unless earlier terminated, the Administrative Services Agreement will remain in effect for two years, and thereafter shall continue automatically for successive one-year periods if approved annually by a majority of the Board of Trustees and the Master Fund's Independent Trustees.
Dealer Manager Agreement
The Master fund is party to a dealer manager agreement, as amended (the "Dealer Manager Agreement") with Guggenheim Funds Distributors, LLC ("GFD") an affiliate of Guggenheim. Under the terms of the Dealer Manager Agreement, GFD is to act on a best efforts basis as the exclusive dealer manager for (i) GCIF 2016T's and GCIF 2019's public offerings of common shares and (ii) the public offering of common shares for future feeder funds affiliated with the Master Fund. The Master Fund is not responsible for the compensation of GFD pursuant to the terms of the Dealer Manager Agreement; therefore, fees compensating GFD are not presented in this periodic report. As to a Feeder Fund, the Deal Manager Agreement may be terminated by a Feeder Fund or GFD upon 60 calendar days' written notice to the other party.
Capital Structuring Fees and Administrative Agency Fees
Guggenheim and its affiliates are obligated to remit to the Master Fund any earned capital structuring fees and administrative agency fees (i.e. loan administration fees) based on the Master Fund's pro rata portion of the co-investment transactions or originated investments in which the Master Fund participates.
Summary of Related Party Transactions
The following table presents the related party fees, expenses and transactions for the three and six months ended June 30, 2020 and June 30, 2019:
|
| | | | | | | | | | | | | | | | | | |
Related Party (1) (2) | | | | For the Three Months Ended June 30, | | For the Six Months Ended June 30, |
| | Source Agreement & Description | | 2020 | | 2019 | | 2020 | | 2019 |
| | | Expenses: | | | | | | | | |
| Guggenheim | | Investment Advisory Agreement - management fee | | $ | 1,524 |
| | $ | 1,718 |
| | $ | 3,161 |
| | $ | 3,412 |
|
| Guggenheim | | Administrative Services Agreement - expense reimbursement | | 154 |
| | 201 |
| | 348 |
| | 420 |
|
| | | Income: | | | | | | | | |
| Guggenheim | | Share on capital structuring fees and administrative agency fees | | 9 |
| | 92 |
| | 16 |
| | 152 |
|
____________________
| |
| (1) | Related party transactions not included in the table above consist of Independent Trustees fees and expenses and sales and repurchase of the Master Fund Shares to/from affiliated Feeder Funds as disclosed in the Master Fund's consolidated statements of operations and consolidated statements of changes in net assets, respectively. |
| |
| (2) | As of June 30, 2020 and June 30, 2019, the Master Fund had accumulated net realized capital losses and net unrealized depreciation and therefore, Guggenheim did not earn any performance-based incentive fee during the period. |
Co-Investment Transactions Exemptive Relief
The Master Fund was granted an SEC exemptive order which grants the Master Fund exemptive relief permitting the Master Fund, subject to the satisfaction of specific conditions and requirements, to co-invest in privately negotiated investment transactions with certain affiliates of Guggenheim.
Indemnification
The Investment Advisory Agreement and Administrative Services Agreement provide certain indemnifications to Guggenheim, its directors, officers, persons associated with Guggenheim and its affiliates, including the administrator. In addition, the Master Fund's Declaration of Trust, as amended, provides certain indemnifications to its officers, trustees, agents and certain other persons. As of June 30, 2020, management believes that the risk of incurring any losses for such indemnifications is remote.
Notes to Consolidated Financial Statements (Unaudited)
Note 7. Borrowings
Hamilton Credit Facility
On December 17, 2015, Hamilton initially entered into a senior-secured term loan, as amended (the “Hamilton Credit Facility”) with JPMorgan Chase Bank, National Association ("JPM"), as administrative agent, each of the lenders from time to time party thereto, and U.S. Bank National Association, as collateral agent, collateral administrator and securities intermediary. As of June 30, 2020, the Hamilton Credit Facility provided for (i) borrowings in an aggregate principal amount of $175.0 million on a committed basis, (ii) a revolving feature on all amounts above the minimum utilization amount, (iii) an interest rate of 3-month LIBOR +2.50%, (iv) a draw-down term which ends December 29, 2021, (v) a stated maturity date of December 29, 2022, (vi) undrawn fees payable during the draw-down term of 250 basis points on all undrawn amounts below the minimum utilization amount and (vii) unused commitment fees payable during the draw-down term of 100 basis points on all undrawn amounts above the minimum utilization amount. All investments owned by, and all cash on hand with, Hamilton are held as collateral for the Hamilton Credit Facility.
Hamilton and JPM amended the Hamilton Credit Facility on June 29, 2018 to, among other things, (i) extend the term from December 17, 2019 to December 29, 2022, (ii) extend the draw-down term from December 17, 2018 to December 29, 2021, (iii) reduce the interest rate from 3-month LIBOR +2.65% per annum to 3-month LIBOR +2.50% per annum, (iv) include a revolving feature on all amounts above the minimum utilization amount and (v) reduce the undrawn fee charged on all amounts below the facility's minimum utilization amount from 265 basis points per annum to 250 basis points per annum.
Hamilton's borrowings as of June 30, 2020 and December 31, 2019 were as follows:
|
| | | | | | | | | | | | | | | | | | | | |
| | Hamilton Credit Facility - Borrowing Summary |
| As of | Principal Amount Committed | | Principal Amount Outstanding | | Carrying Value (1) | | Interest Rate (2) | | Maturity Date | | Maturity Term |
| June 30, 2020 | $ | 175,000 |
| | $ | 157,000 |
| | $ | 156,052 |
| | 2.80 | % | | 12/29/22 | | 2.5 |
| years |
| December 31, 2019 | $ | 175,000 |
| | $ | 172,000 |
| | $ | 170,862 |
| | 4.40 | % | | 12/29/22 | | 3.0 |
| years |
_________________
| |
| (1) | Carrying value is equal to outstanding principal amount net of unamortized financing costs. |
| |
| (2) | Interest rate as of the end of the reporting period (3-month LIBOR +2.50% as of June 30, 2020 and December 31, 2019) is subject to quarterly reset. Interest rate is calculated as the weighted average interest rates of all tranches currently outstanding. Interest rate does not include the amortization of upfront fees, undrawn or unused fees and expenses that were incurred in connection with the Hamilton Credit Facility. |
The components of the Master Fund's interest expense and other financing costs for the three and six months ended June 30, 2020 and June 30, 2019 were as follows:
|
| | | | | | | | | | | | | | | | |
| | | For the Three Months Ended June 30, | | For the Six Months Ended June 30, |
| | | 2020 | | 2019 | | 2020 | | 2019 |
| Stated interest expense | | $ | 1,312 |
| | $ | 1,995 |
| | $ | 3,040 |
| | $ | 3,969 |
|
| Unused/undrawn fees | | 40 |
| | 50 |
| | 74 |
| | 112 |
|
| Amortization of deferred financing costs | | 95 |
| | 94 |
| | 190 |
| | 188 |
|
| Total interest expense | | $ | 1,447 |
| | $ | 2,139 |
| | $ | 3,304 |
| | $ | 4,269 |
|
| Average borrowings | | $ | 159,242 |
| | $ | 155,396 |
| | $ | 160,478 |
| | $ | 152,851 |
|
| | | | | | | | | |
Weighted average interest rate (1) | | 3.36 | % | | 5.21 | % | | 3.84 | % | | 5.31 | % |
| Amortized financing costs | | 0.24 | % | | 0.24 | % | | 0.23 | % | | 0.25 | % |
| Total borrowing cost | | 3.60 | % | | 5.45 | % | | 4.07 | % | | 5.56 | % |
_________________
| |
| (1) | Calculated as the amount of the stated interest expense and undrawn or unused fees divided by the average borrowings during the reporting period. |
Notes to Consolidated Financial Statements (Unaudited)
Note 8. Commitments and Contingencies
The amounts associated with unfunded commitments to provide funds to portfolio companies are not recorded in the Master Fund’s consolidated statements of assets and liabilities. Since these commitments and the associated amounts may expire without being drawn upon, the total commitment amount does not necessarily represent a future cash requirement. As of June 30, 2020 and December 31, 2019, the Master Fund’s unfunded commitments consisted of the following:
|
| | | | | | | | |
| | | Total Unfunded Commitments |
Category / Portfolio Company (1) | | June 30, 2020 | | December 31, 2019 |
| Aceto Chemical (Revolver) | | $ | 267 |
| | $ | 800 |
|
| Acquia Inc. (Revolver) | | 211 |
| | 211 |
|
| Advicent Solutions (Revolver) | | 339 |
| | — |
|
Alexander Mann Solutions (Revolver) (2) | | 28 |
| | 446 |
|
| Allvue Systems (Revolver) | | 132 |
| | 132 |
|
| Apptio, Inc. (Revolver) | | 326 |
| | 326 |
|
| Arcline FM Holdings LLC (Revolver) | | 291 |
| | — |
|
| Boats Group (Revolver) | | 1,000 |
| | 1,000 |
|
| GAL Manufacturing (Revolver) | | 260 |
| | 260 |
|
| Galls LLC (Delayed Draw) | | — |
| | 1,518 |
|
| Galls LLC (Revolver) | | 113 |
| | 113 |
|
Gladman Developments Ltd. (Delayed Draw) (2) | | 706 |
| | 706 |
|
| Hersha Hospitality Management (Delayed Draw) | | 1,671 |
| | — |
|
| Lytx, Inc. (Revolver) | | 1,540 |
| | 368 |
|
| Mavis Tire Express Services Corp. (Delayed Draw) | | — |
| | 319 |
|
| Mavis Tire Express Services Corp. (Revolver) | | 87 |
| | 189 |
|
| Onyx CenterSource (Revolver) | | — |
| | 329 |
|
| Polyvision Corp. (Delayed Draw) | | 325 |
| | — |
|
| Polyvision Corp. (Revolver) | | 650 |
| | — |
|
| PSI Services LLC (Delayed Draw) | | 239 |
| | 239 |
|
| PSI Services LLC (Delayed Draw) | | — |
| | 168 |
|
| PSI Services LLC (Revolver) | | 195 |
| | 269 |
|
| Seal For Life Industries US LLC (Revolver) | | — |
| | 390 |
|
| Trader Interactive (Revolver) | | 346 |
| | 346 |
|
| Total Unfunded Commitments | | $ | 8,726 |
| | $ | 8,129 |
|
______________________
| |
| (1) | May pertain to commitments to one or more entities affiliated with the named portfolio company. |
| |
| (2) | This commitment is in foreign currency and has been converted to USD using the June 30, 2020 and December 31, 2019 exchange rates, respectively. |
Indemnification
In the normal course of business, the Master Fund enters into contracts and agreements that contain a variety of representations and warranties that provide general indemnifications. The Master Fund's maximum exposure under these arrangements is unknown, as these involve future claims that may be made against the Master Fund but that have not occurred. The Master Fund expects the risk of any future obligations under these indemnifications to be remote.
Notes to Consolidated Financial Statements (Unaudited)
Note 9. Financial Highlights
The following per Common Share data and financial ratios have been derived from information provided in the consolidated financial statements. The following is a schedule of financial highlights during the six months ended June 30, 2020 and June 30, 2019:
|
| | | | | | | |
| | For the Six Months Ended June 30, |
| | 2020 | | 2019 |
| PER COMMON SHARE OPERATING PERFORMANCE | | | |
| Net asset value, beginning of period | $ | 7.78 |
| | $ | 8.09 |
|
Net investment income (1) | 0.28 |
| | 0.31 |
|
Net realized gains (losses) (1) | 0.02 |
| | (0.23 | ) |
Net change in unrealized appreciation (depreciation) (2) | (0.76 | ) | | 0.21 |
|
| Net increase (decrease) resulting from operations | (0.46 | ) | | 0.29 |
|
Distributions to Common Shareholders (3) | | | |
| Distributions from net investment income | (0.28 | ) | | (0.31 | ) |
| Distributions from realized gains | — |
| | (0.01 | ) |
| Distributions in excess of net investment income | — |
| | (0.02 | ) |
| Net decrease resulting from distributions | (0.28 | ) | | (0.34 | ) |
| Net asset value, end of period | $ | 7.04 |
| | $ | 8.04 |
|
| | | | |
| INVESTMENT RETURNS | | | |
Total investment return (4) | (5.83 | )% | | 3.56 | % |
| | | | |
| RATIOS/SUPPLEMENTAL DATA | | | |
| Net assets, end of period | $ | 188,731 |
| | $ | 230,030 |
|
Average net assets (5) | $ | 196,940 |
| | $ | 235,428 |
|
| Common Shares outstanding, end of period | 26,811,629 |
| | 28,613,345 |
|
| Weighted average Common Shares outstanding | 27,274,171 |
| | 29,192,124 |
|
| | | | |
Ratios-to-average net assets: (5) | | | |
| Total expenses | 3.91 | % | | 3.84 | % |
| Net investment income | 3.87 | % | | 3.82 | % |
| | | | |
Average outstanding borrowings (5) | $ | 160,478 |
| | $ | 152,851 |
|
Portfolio turnover rate (5) (6) | 16 | % | | 10 | % |
Asset coverage ratio (7) | 2.20 |
| | 2.42 |
|
_____________________
| |
| (1) | The per Common Share data was derived by using the weighted average Common Shares outstanding during the period presented. |
| |
| (2) | The amount shown at this caption is the balancing figure derived from the other figures in the schedule. The amount shown at this caption for a Common Share outstanding throughout the period may not agree with the change in the aggregate appreciation and depreciation in portfolio securities for the period because of the timing of sales of the Master Fund’s Common Shares in relation to fluctuating market values for the portfolio. |
| |
| (3) | The per Common Share data for distributions is the actual amount of distributions declared per Common Share outstanding during the entire period; distributions per Common Share are rounded to the nearest $0.01. For income tax purposes, distributions made to shareholders are reported as ordinary income, capital gains, non-taxable return of capital or a combination thereof, based on taxable income calculated in accordance with income tax regulations which may differ from amounts determined under GAAP. As of June 30, 2020, the Master Fund estimated distributions to be composed of ordinary income. The final determination of the tax character of distributions will not be made until we file our tax return. |
Notes to Consolidated Financial Statements (Unaudited)
| |
| (4) | Total investment return is based on (i) the purchase of Common Shares at net asset value on the first day of the period, (ii) the sale at the net asset value per Common Share on the last day of the period, of (A) all purchased Common Shares plus (B) any fractional Common Shares issued in connection with the reinvestment of distributions and (iii) distributions payable relating to the ownership of Common Shares, if any, on the last day of the period. The total investment return calculation assumes that cash distributions are reinvested concurrent with the issuance of Common Shares at the most recent transaction price on or prior to each distribution payment date. Since there is no public market for the Master Fund’s Common Shares, then the terminal sales price per Common Share is assumed to be equal to net asset value per Common Share on the last day of the period. Total investment return is not annualized. The Master Fund’s performance changes over time and currently may be different than that shown above. Past performance is no guarantee of future results. |
| |
| (5) | The computation of average net assets, average outstanding borrowings and average value of portfolio securities during the period is based on averaging the amount on the first day of the first month of the period and the last day of each month during the period. Ratios-to-average net assets are not annualized. |
| |
| (6) | Portfolio turnover is calculated as the lesser of (i) purchases of portfolio securities or (ii) the aggregate total of sales of portfolio securities plus any repayments received divided by the monthly average of the value of investment portfolio owned by the Master Fund during the period. |
| |
| (7) | Asset coverage ratio is equal to (i) the sum of (A) net assets at the end of the period and (B) total senior securities issued at the end of the period, divided by (ii) total senior securities at the end of the period. |
Note 10. Distributions
The following table summarizes the distributions that the Master Fund declared on its Common Shares during the six months ended June 30, 2020 and June 30, 2019:
|
| | | | | | | | | | | | | | |
| Record Date | | Payment Date | | Distribution Per Common Share at Record Date | | Distribution Per Common Share at Payment Date | | Cash Distribution |
| For Calendar Year 2020 | | | | | | | | |
| January 2, 6, 13, 20 | | January 22 | | $ | 0.01100 |
| | $ | 0.04400 |
| | $ | 1,195 |
|
| January 27, February 3, 10, 17 | | February 19 | | 0.01100 |
| | 0.04400 |
| | 1,217 |
|
| February 24, March 2, 9, 14, 23 | | March 25 | | 0.01000 |
| | 0.05000 |
| | 1,383 |
|
| March 30, April 6, 13, 20 | | April 22 | | 0.01000 |
| | 0.04000 |
| | 1,084 |
|
| April 27, May 4, 11, 18 ,25, June 1 | | June 2 | | 0.01000 |
| | 0.06000 |
| | 1,625 |
|
| June 8, 15, 22, 29 | | July 2 | | 0.01100 |
| | 0.04400 |
| | 1,186 |
|
| | | | | | | $ | 0.28200 |
| | $ | 7,690 |
|
| | | | | | | | | |
| For Calendar Year 2019 | | | | | | | | |
| January 7, 14, 21, 28 | | January 30 | | $ | 0.01346 |
| | $ | 0.05384 |
| | $ | 1,572 |
|
| February 4, 11, 18, 25 | | February 27 | | 0.01346 |
| | 0.05384 |
| | 1,572 |
|
| March 4, 11, 18, 25 | | March 27 | | 0.01346 |
| | 0.05384 |
| | 1,573 |
|
| April 1, 8, 15, 22, 29 | | May 1 | | 0.01346 |
| | 0.06730 |
| | 1,971 |
|
| May 6, 13, 20, 27 | | May 29 | | 0.01346 |
| | 0.05384 |
| | 1,576 |
|
| June 3, 10, 17, 24 | | June 26 | | 0.01346 |
| | 0.05384 |
| | 1,559 |
|
| | | | | | | $ | 0.33650 |
| | $ | 9,823 |
|
Note 11. Subsequent Events
Management has evaluated subsequent events through the date of issuance of these consolidated financial statements and has determined that there are no subsequent events outside the ordinary scope of business that require adjustment to, or disclosure in, the consolidated financial statements.
Report of Independent Registered Public Accounting Firm
To the Shareholders and Board of Trustees of Guggenheim Credit Income Fund
Opinion on the Financial Statements
We have audited the accompanying consolidated statements of assets and liabilities of Guggenheim Credit Income Fund and its subsidiary (the “Master Fund”), including the consolidated schedules of investments, as of December 31, 2019 and 2018, the related consolidated statements of operations, changes in net assets and cash flows for each of the two years in the period ended December 31, 2019, and the related notes (collectively referred to as the “consolidated financial statements”). In our opinion, the consolidated financial statements present fairly, in all material respects, the financial position of the Master Fund at December 31, 2019 and 2018, and the results of its operations, changes in its net assets and its cash flows for each of the two years in the period ended December 31, 2019, in conformity with U.S. generally accepted accounting principles.
Basis for Opinion
These financial statements are the responsibility of the Master Fund’s management. Our responsibility is to express an opinion on the Master Fund’s financial statements based on our audits. We are a public accounting firm registered with the Public Company Accounting Oversight Board (United States) (“PCAOB”) and are required to be independent with respect to the Master Fund in accordance with the U.S. federal securities laws and the applicable rules and regulations of the Securities and Exchange Commission and the PCAOB.
We conducted our audits in accordance with the standards of the PCAOB. Those standards require that we plan and perform the audit to obtain reasonable assurance about whether the financial statements are free of material misstatement, whether due to error or fraud. The Master Fund is not required to have, nor were we engaged to perform, an audit of its internal control over financial reporting. As part of our audits we are required to obtain an understanding of internal control over financial reporting but not for the purpose of expressing an opinion on the effectiveness of the Master Fund’s internal control over financial reporting. Accordingly, we express no such opinion.
Our audits included performing procedures to assess the risks of material misstatement of the financial statements, whether due to error or fraud, and performing procedures that respond to those risks. Such procedures included examining, on a test basis, evidence regarding the amounts and disclosures in the financial statements. Our procedures included confirmation of investments owned as of December 31, 2019 and 2018, by correspondence with the custodian, brokers or the underlying investees, or by other appropriate auditing procedures where replies from brokers or underlying investees were not received. Our audits also included evaluating the accounting principles used and significant estimates made by management, as well as evaluating the overall presentation of the financial statements. We believe that our audits provide a reasonable basis for our opinion.
/s/ Ernst & Young LLP
We have served as the auditor of one or more investment companies in the Guggenheim Credit Income Funds business development company group since 2018.
New York, NY
March 13, 2020
Report of Independent Registered Public Accounting Firm
To the Board of Trustees and Shareholders of Guggenheim Credit Income Fund
Opinion on the Financial Statements
We have audited the consolidated statements of operations, of changes in net assets and of cash flows of Guggenheim Credit Income Fund and its subsidiary (the “Company”) for the year ended December 31, 2017, including the related notes (collectively referred to as the “consolidated financial statements”). In our opinion, the consolidated financial statements present fairly, in all material respects, the results of operations and cash flows of the Company for the year ended December 31, 2017 in conformity with accounting principles generally accepted in the United States of America.
Basis for Opinion
These consolidated financial statements are the responsibility of the Company's management. Our responsibility is to express an opinion on the Company’s consolidated financial statements based on our audit. We are a public accounting firm registered with the Public Company Accounting Oversight Board (United States) (PCAOB) and are required to be independent with respect to the Company in accordance with the U.S. federal securities laws and the applicable rules and regulations of the Securities and Exchange Commission and the PCAOB.
We conducted our audit of these consolidated financial statements in accordance with the standards of the PCAOB. Those standards require that we plan and perform the audit to obtain reasonable assurance about whether the consolidated financial statements are free of material misstatement, whether due to error or fraud.
Our audit included performing procedures to assess the risks of material misstatement of the consolidated financial statements, whether due to error or fraud, and performing procedures that respond to those risks. Such procedures included examining, on a test basis, evidence regarding the amounts and disclosures in the consolidated financial statements. Our audit also included evaluating the accounting principles used and significant estimates made by management, as well as evaluating the overall presentation of the consolidated financial statements. We believe that our audit provides a reasonable basis for our opinion.
/s/ PricewaterhouseCoopers LLP
New York, New York
March 12, 2018
We served as the Company's auditor from 2015 to 2018.
GUGGENHEIM CREDIT INCOME FUND
CONSOLIDATED STATEMENTS OF ASSETS AND LIABILITIES
(in thousands, except share and per share data)
|
| | | | | | | |
| | As of December 31, |
| | 2019 | | 2018 |
| Assets | | | |
| Investments at fair value (amortized cost of $385,802 and $384,784, respectively) | $ | 372,193 |
| | $ | 374,114 |
|
| Cash | 1,454 |
| | 2,555 |
|
| Restricted cash | 7,512 |
| | 7,587 |
|
| Collateral deposits for foreign currency forward contracts | — |
| | 160 |
|
| Interest and dividend income receivable | 2,622 |
| | 2,518 |
|
| Principal receivable | — |
| | 7,701 |
|
| Receivable from related parties | 35 |
| | 36 |
|
| Prepaid expenses and other assets | 284 |
| | 177 |
|
| Total assets | $ | 384,100 |
| | $ | 394,848 |
|
| | | | |
| Liabilities | | | |
| Credit facility payable, net of financing costs | $ | 170,862 |
| | $ | 148,482 |
|
| Unrealized depreciation on foreign currency forward contracts | 87 |
| | 384 |
|
| Payable for investments purchased | — |
| | 4,736 |
|
| Accrued management fee | 576 |
| | 590 |
|
| Payable to related parties | 195 |
| | 177 |
|
| Distributions payable | — |
| | 3,394 |
|
| Collateral payable for foreign currency forward contracts | 320 |
| | — |
|
| Accounts payable, accrued expenses and other liabilities | 863 |
| | 853 |
|
| Total liabilities | 172,903 |
| | 158,616 |
|
| Commitments and contingencies (Note 8. Commitments and Contingencies) | | | |
| Net Assets | $ | 211,197 |
| | $ | 236,232 |
|
| | | | |
| Components of Net Assets: | | | |
| Common shares, $0.001 par value, 1,000,000,000 shares authorized, 27,157,534 and 29,195,002 shares issued and outstanding at December 31, 2019 and December 31, 2018, respectively | $ | 27 |
| | $ | 29 |
|
| Paid-in-capital in excess of par value | 229,996 |
| | 246,083 |
|
Accumulated loss, net of distributions (1) | (18,826 | ) | | (9,880 | ) |
| Net assets | $ | 211,197 |
| | $ | 236,232 |
|
| Net asset value per Common Share | $ | 7.78 |
| | $ | 8.09 |
|
_______________________
| |
| (1) | See Note 2. Significant Accounting Policies and Recent Accounting Standards. |
See Notes to Consolidated Financial Statements.
GUGGENHEIM CREDIT INCOME FUND
CONSOLIDATED STATEMENTS OF OPERATIONS
(in thousands, except share and per share data)
|
| | | | | | | | | | | |
| | For the Year Ended December 31, |
| | 2019 | | 2018 | | 2017 |
| Investment Income | | | | | |
| Interest income | $ | 34,652 |
| | $ | 33,366 |
| | $ | 30,207 |
|
| Dividend income | 1,059 |
| | 856 |
| | — |
|
| Fee income | 396 |
| | 537 |
| | 702 |
|
| Total investment income | 36,107 |
| | 34,759 |
| | 30,909 |
|
| Operating Expenses | | | | | |
| Interest expense | 8,552 |
| | 7,885 |
| | 6,535 |
|
| Management fee | 6,889 |
| | 7,195 |
| | 7,396 |
|
| Performance-based incentive fee | 11 |
| | (1,346 | ) | | 818 |
|
| Administrative services | 198 |
| | 209 |
| | 194 |
|
| Custody services | 95 |
| | 106 |
| | 85 |
|
| Trustees fees | 310 |
| | 383 |
| | 467 |
|
| Related party reimbursements | 818 |
| | 645 |
| | 471 |
|
| Professional services fees | 917 |
| | 893 |
| | 976 |
|
| Advisor transition costs | — |
| | — |
| | 798 |
|
| Other expenses | 251 |
| | 232 |
| | 249 |
|
| Total expenses before incentive fee waiver and reimbursement of advisor transition costs | 18,041 |
| | 16,202 |
| | 17,989 |
|
| Incentive fee waiver | — |
| | — |
| | (20 | ) |
| Reimbursement of advisor transition costs | — |
| | — |
| | (798 | ) |
| Total expenses | 18,041 |
| | 16,202 |
| | 17,171 |
|
| Net investment income | 18,066 |
| | 18,557 |
| | 13,738 |
|
| Realized and unrealized gains (losses): | | | | | |
| Net realized gains (losses) on: | | | | | |
| Investments | (6,321 | ) | | 4,819 |
| | 4,790 |
|
| Foreign currency forward contracts | (873 | ) | | 2,316 |
| | (1,327 | ) |
| Foreign currency transactions | 86 |
| | 10 |
| | (119 | ) |
| Net realized gains (losses) | (7,108 | ) | | 7,145 |
| | 3,344 |
|
| Net change in unrealized appreciation (depreciation) on: | | | | | |
| Investments | (2,939 | ) | | (13,574 | ) | | 817 |
|
| Foreign currency forward contracts | 297 |
| | (185 | ) | | (191 | ) |
| Foreign currency transactions | (16 | ) | | 17 |
| | — |
|
| Net change in unrealized appreciation (depreciation) | (2,658 | ) | | (13,742 | ) | | 626 |
|
| Net realized and unrealized gains (losses) | (9,766 | ) | | (6,597 | ) | | 3,970 |
|
| Net increase in net assets resulting from operations | $ | 8,300 |
| | $ | 11,960 |
| | $ | 17,708 |
|
| Per Common Share information: | | | | | |
| Net investment income per Common Share outstanding - basic and diluted | $ | 0.63 |
| | $ | 0.64 |
| | $ | 0.50 |
|
| Earnings per Common Share - basic and diluted | $ | 0.29 |
| | $ | 0.41 |
| | $ | 0.64 |
|
| Weighted average Common Shares outstanding - basic and diluted | 28,730,579 |
| | 29,163,651 |
| | 27,524,615 |
|
| Distribution per Common Share | $ | 0.60 |
| | $ | 0.84 |
| | $ | 0.59 |
|
See Notes to Consolidated Financial Statements.
GUGGENHEIM CREDIT INCOME FUND
CONSOLIDATED STATEMENTS OF CHANGES IN NET ASSETS
(in thousands, except share and per share data)
|
| | | | | | | | | | | | | | | | | | |
| | Common Shares | | Paid-in-Capital in Excess of Par Value | | Accumulated Earnings (Loss), net of Distributions (2) | | |
| | Shares | | Amount | | | | Total |
| Balance at December 31, 2016 | 21,016,797 |
| | $ | 21 |
| | $ | 176,411 |
| | $ | 1,634 |
| | $ | 178,066 |
|
| Operations: | | | | | | | | | |
| Net investment income | — |
| | — |
| | — |
| | 13,738 |
| | 13,738 |
|
| Net realized gains | — |
| | — |
| | — |
| | 3,344 |
| | 3,344 |
|
| Net change in unrealized appreciation | — |
| | — |
| | — |
| | 626 |
| | 626 |
|
| Net increase in net assets resulting from operations | — |
| | — |
| | — |
| | 17,708 |
| | 17,708 |
|
| Shareholder distributions: | | | | | | | | | |
| Distributions from earnings | — |
| | — |
| | — |
| | (16,678 | ) | | (16,678 | ) |
| Net decrease in net assets resulting from shareholder distributions | — |
| | — |
| | — |
| | (16,678 | ) | | (16,678 | ) |
| Capital share transactions: | | | | | | | | | |
| Issuance of Common Shares | 8,285,299 |
| | 8 |
| | 70,668 |
| | — |
| | 70,676 |
|
| Repurchase of Common Shares | (151,000 | ) | | — |
| (1) | (1,291 | ) | | — |
| | (1,291 | ) |
| Net increase in net assets resulting from capital share transactions | 8,134,299 |
| | 8 |
| | 69,377 |
| | — |
| | 69,385 |
|
| Reclassification of permanent book-to-tax differences | — |
| | — |
| | (67 | ) | | 67 |
| | — |
|
| Net increase for the period | 8,134,299 |
| | 8 |
| | 69,310 |
| | 1,097 |
| | 70,415 |
|
| Balance at December 31, 2017 | 29,151,096 |
| | $ | 29 |
| | $ | 245,721 |
| | $ | 2,731 |
| | $ | 248,481 |
|
| Operations: | | | | | | | | | |
| Net investment income | — |
| | — |
| | — |
| | 18,557 |
| | 18,557 |
|
| Net realized gains | — |
| | — |
| | — |
| | 7,145 |
| | 7,145 |
|
| Net change in unrealized depreciation | — |
| | — |
| | — |
| | (13,742 | ) | | (13,742 | ) |
| Net increase in net assets resulting from operations | — |
| | — |
| | — |
| | 11,960 |
| | 11,960 |
|
| Shareholder distributions: | | | | | | | | | |
| Distributions from earnings | — |
| | — |
| | — |
| | (24,572 | ) | | (24,572 | ) |
| Net decrease in net assets resulting from shareholder distributions | — |
| | — |
| | — |
| | (24,572 | ) | | (24,572 | ) |
| Capital share transactions: | | | | | | | | | |
| Issuance of Common Shares | 118,906 |
| | — |
| (1) | 1,000 |
| | — |
| | 1,000 |
|
| Repurchase of Common Shares | (75,000 | ) | | — |
| (1) | (637 | ) | | — |
| | (637 | ) |
| Net increase in net assets resulting from capital share transactions | 43,906 |
| | — |
| | 363 |
| | — |
| | 363 |
|
| Reclassification of permanent book-to-tax differences | — |
| | — |
| | (1 | ) | | 1 |
| | — |
|
| Net increase (decrease) for the period | 43,906 |
| | — |
| | 362 |
| | (12,611 | ) | | (12,249 | ) |
| Balance at December 31, 2018 | 29,195,002 |
| | $ | 29 |
| | $ | 246,083 |
| | $ | (9,880 | ) | | $ | 236,232 |
|
| Operations: | | | | | | | | | |
| Net investment income | — |
| | — |
| | — |
| | 18,066 |
| | 18,066 |
|
| Net realized losses | — |
| | — |
| | — |
| | (7,108 | ) | | (7,108 | ) |
| Net change in unrealized depreciation | — |
| | — |
| | — |
| | (2,658 | ) | | (2,658 | ) |
| Net increase in net assets resulting from operations | — |
| | — |
| | — |
| | 8,300 |
| | 8,300 |
|
| Shareholder distributions: | | | | | | | | | |
| Distributions from earnings | — |
| | — |
| | — |
| | (17,246 | ) | | (17,246 | ) |
| Net decrease in net assets resulting from shareholder distributions | — |
| | — |
| | — |
| | (17,246 | ) | | (17,246 | ) |
| Capital share transactions: | | | | | | | | | |
| Issuance of Common Shares | 124,070 |
| | — |
| (1) | 1,000 |
| | — |
| | 1,000 |
|
| Repurchase of Common Shares | (2,161,538 | ) | | (2 | ) | | (17,087 | ) | | — |
| | (17,089 | ) |
| Net decrease in net assets resulting from capital share transactions | (2,037,468 | ) | | (2 | ) | | (16,087 | ) | | — |
| | (16,089 | ) |
| Net decrease for the period | (2,037,468 | ) | | (2 | ) | | (16,087 | ) | | (8,946 | ) | | (25,035 | ) |
| Balance at December 31, 2019 | 27,157,534 |
| | $ | 27 |
| | $ | 229,996 |
| | $ | (18,826 | ) | | $ | 211,197 |
|
_____________________
| |
| (1) | Amount is less than $1,000. |
| |
| (2) | See Note 2. Significant Accounting Policies and Recent Accounting Standards. |
See Notes to Consolidated Financial Statements.
GUGGENHEIM CREDIT INCOME FUND
CONSOLIDATED STATEMENTS OF CASH FLOWS
(in thousands)
|
| | | | | | | | | | | |
| | For the Year Ended December 31, |
| | 2019 | | 2018 | | 2017 |
| Operating activities | | | | | |
| Net increase in net assets resulting from operations | $ | 8,300 |
| | $ | 11,960 |
| | $ | 17,708 |
|
| Adjustments to reconcile net increase in net assets resulting from operations to net cash provided by (used in) operating activities: | | | | | |
| Capitalized paid-in-kind income | (1,071 | ) | | (906 | ) | | (288 | ) |
| Amortization of premium/accretion of discount, net | (1,624 | ) | | (1,425 | ) | | (1,294 | ) |
| Proceeds from sales of investments | 37,828 |
| | 48,526 |
| | 56,581 |
|
| Proceeds from paydowns on investments | 35,563 |
| | 136,799 |
| | 92,021 |
|
| Net receipt of settlement of derivatives | 3,962 |
| | 5,600 |
| | — |
|
| Net payment of settlement of derivatives | (4,835 | ) | | (3,284 | ) | | (1,327 | ) |
| Net realized (gains) losses on derivatives | 873 |
| | (2,316 | ) | | 1,327 |
|
| Purchases of investments | (78,035 | ) | | (193,429 | ) | | (238,763 | ) |
| Net realized (gains) losses on investments | 6,321 |
| | (4,819 | ) | | (4,790 | ) |
| Net change in unrealized (appreciation) depreciation on investments | 2,939 |
| | 13,574 |
| | (817 | ) |
| Net change in unrealized (appreciation) depreciation on foreign currency forward contracts | (297 | ) | | 185 |
| | 191 |
|
| Amortization of deferred financing costs | 380 |
| | 439 |
| | 483 |
|
| (Increase) decrease in operating assets: | | | | | |
| Interest and dividend income receivable | (104 | ) | | (306 | ) | | (655 | ) |
| Principal receivable | 7,701 |
| | (7,587 | ) | | 2,407 |
|
| Receivable from related parties | 1 |
| | 94 |
| | (130 | ) |
| Prepaid expenses and other assets | (107 | ) | | — |
| | (75 | ) |
| Increase (decrease) in operating liabilities: | | | | | |
| Payable for investments purchased | (4,736 | ) | | 4,736 |
| | (1,093 | ) |
| Accrued management fee | (14 | ) | | (6 | ) | | 107 |
|
| Accrued performance-based incentive fee | — |
| | (1,334 | ) | | 798 |
|
| Payable to related parties | 18 |
| | 9 |
| | 135 |
|
| Collateral payable for foreign currency forward contracts | 320 |
| | — |
| | — |
|
| Accounts payable, accrued expenses and other liabilities | 10 |
| | (68 | ) | | 219 |
|
| Net cash provided by (used in) operating activities | 13,393 |
| | 6,442 |
| | (77,255 | ) |
| Financing activities | | | | | |
| Issuance of Common Shares | 1,000 |
| | 1,000 |
| | 70,676 |
|
| Repurchase of Common Shares | (17,089 | ) | | (637 | ) | | (1,291 | ) |
| Credit facility borrowings | 27,000 |
| | — |
| | 24,000 |
|
| Credit facility repayments | (5,000 | ) | | — |
| | — |
|
| Payment of financing costs | — |
| | (945 | ) | | — |
|
| Distributions paid | (20,640 | ) | | (21,178 | ) | | (16,678 | ) |
| Net cash provided by (used in) financing activities | (14,729 | ) | | (21,760 | ) | | 76,707 |
|
| Net decrease in restricted and unrestricted cash | (1,336 | ) | | (15,318 | ) | | (548 | ) |
| Restricted and unrestricted cash, beginning of year | 10,302 |
| | 25,620 |
| | 26,168 |
|
| Restricted and unrestricted cash, end of year | $ | 8,966 |
| | $ | 10,302 |
| | $ | 25,620 |
|
| Reconciliation of restricted and unrestricted cash | | | | | |
| Cash | 1,454 |
| | 2,555 |
| | 1,294 |
|
| Restricted cash | 7,512 |
| | 7,587 |
| | 24,326 |
|
| Collateral deposits for foreign currency forward contracts | — |
| | 160 |
| | — |
|
| Total restricted and unrestricted cash | $ | 8,966 |
| | $ | 10,302 |
| | $ | 25,620 |
|
| Supplemental disclosure of cash flow information and non-cash financing activities: | | | | | |
| Cash paid for interest | $ | 8,048 |
| | $ | 7,418 |
| | $ | 5,928 |
|
GUGGENHEIM CREDIT INCOME FUND
CONSOLIDATED SCHEDULE OF INVESTMENTS
|
| | | | | | | | | | | | | | | | | | | | | | | | | |
December 31, 2019 (in thousands) |
Portfolio Company (1) (2) (3) | | Footnotes | | Investment | | Spread
Above
Reference
Rate (4) | | Interest
Rate (4) (5) | | Maturity Date | | Principal / Par Amount / Shares (6) | | Amortized Cost (7) (8) | | Fair Value | | % of Net Assets |
| INVESTMENTS | | | | | | | | | | | | | | | | | | |
| Debt investments - 170.0% | | | | | | | | | | | | | | | | | | |
| Aerospace & Defense | | | | | | | | | | | | | | | | |
| National Technical Systems | | (15) | | Senior Secured Loans - First Lien | | L+6.25% | | 7.94% | | 6/12/2021 | | 3,434 |
| | $ | 3,420 |
| | $ | 3,365 |
| | 1.6 | % |
| Tronair, Inc | | (15) | | Senior Secured Loans - First Lien | | L+4.75% | | 6.66% | | 9/8/2023 | | 3,880 |
| | 3,854 |
| | 3,512 |
| | 1.7 | % |
| Total Aerospace & Defense | | | | | | | | | | | | 7,274 |
| | 6,877 |
| | 3.3 | % |
| Automotive | | | | | | | | | | | | | | | | |
| Accuride Corporation | | | | Senior Secured Loans - First Lien | | L+5.25% | | 7.35% | | 11/17/2023 | | 11,640 |
| | 11,366 |
| | 9,254 |
| | 4.4 | % |
| American Tire Distributors Inc. | | | | Senior Secured Loans - First Lien | | L+7.50% | | 9.30% | | 8/30/2024 | | 2,970 |
| | 2,674 |
| | 2,666 |
| | 1.3 | % |
| BBB Industries | | | | Senior Secured Loans - First Lien | | L+4.50% | | 6.30% | | 8/1/2025 | | 1,975 |
| | 1,958 |
| | 1,928 |
| | 0.9 | % |
| EnTrans International, LLC | | | | Senior Secured Loans - First Lien | | L+6.00% | | 7.80% | | 11/1/2024 | | 3,700 |
| | 3,543 |
| | 3,588 |
| | 1.7 | % |
| | | | | | | | | | | | | | | | | | | |
| Mavis Tire Express Services Corp. | | | | Senior Secured Loans - First Lien | | L+3.25% | | 5.05% | | 3/20/2025 | | 3,231 |
| | 3,218 |
| | 3,158 |
| | 1.5 | % |
| Mavis Tire Express Services Corp. (Revolver) | | (9)(13)(15) | | Senior Secured Loans - First Lien | | L+3.25% | | 5.04% | | 3/20/2023 | | 28 |
| | 10 |
| | 11 |
| | — | % |
| Mavis Tire Express Services Corp. (Delayed Draw) | | (9) | | Senior Secured Loans - First Lien | | L+3.25% | | 5.05% | | 3/20/2025 | | 92 |
| | 92 |
| | 90 |
| | — | % |
| | | | | | | | | | | | | | | 3,320 |
| | 3,259 |
| | 1.5 | % |
| | | | | | | | | | | | | | | | | | | |
| Wesco Group | | (15) | | Senior Secured Loans - First Lien | | L+4.25% | | 6.36% | | 6/14/2024 | | 1,247 |
| | 1,234 |
| | 1,243 |
| | 0.6 | % |
| Total Automotive | | | | | | | | | | | | 24,095 |
| | 21,938 |
| | 10.4 | % |
| Banking, Finance, Insurance & Real Estate | | | | | | | | | | | | | | | | |
| Gladman Developments Ltd. | | UK(10)(11)(13)(14)(15) | | Senior Secured Loans - First Lien | | G+9.50% | | 10.30% | | 8/16/2024 | | £ | 2,405 |
| | 3,007 |
| | 3,137 |
| | 1.5 | % |
| Gladman Developments Ltd. (Delayed Draw) | | UK(9)(10)(11)(13)(14)(15) | | Senior Secured Loans - First Lien | | G+9.50% | | 10.30% | | 8/16/2024 | | £ | 740 |
| | 944 |
| | 954 |
| | 0.5 | % |
| | | | | | | | | | | | | | | 3,951 |
| | 4,091 |
| | 2.0 | % |
| | | | | | | | | | | | | | | | | | | |
| Hunt Companies, Inc. | | (11) | | Senior Secured Bonds | | N/A | | 6.25% | | 2/15/2026 | | 2,000 |
| | 2,000 |
| | 1,974 |
| | 0.9 | % |
| JZ Capital Partners Ltd. | | UK(10)(11)(13)(15) | | Senior Secured Loans - First Lien | | L+5.75% | | 7.88% | | 6/14/2021 | | 375 |
| | 370 |
| | 374 |
| | 0.2 | % |
| Total Banking, Finance, Insurance & Real Estate | | | | | | | | | | 6,321 |
| | 6,439 |
| | 3.1 | % |
| Beverage, Food & Tobacco | | | | | | | | | | | | | | | | |
| Addo Foods Group | | UK(10)(11)(14)(15) | | Senior Secured Loans - First Lien | | G+8.00% | | 9.00% | | 4/19/2024 | | £ | 9,995 |
| | 12,232 |
| | 12,879 |
| | 6.1 | % |
| | | | | | | | | | | | | | | | | | | |
| CTI Foods Holdings Co., LLC (First Out) | | (14)(15) | | Senior Secured Loans - First Lien | | L+7.00% | | 9.26% | | 5/3/2024 | | 1,962 |
| | 1,962 |
| | 1,962 |
| | 0.9 | % |
GUGGENHEIM CREDIT INCOME FUND
CONSOLIDATED SCHEDULE OF INVESTMENTS
|
| | | | | | | | | | | | | | | | | | | | | | | | | |
December 31, 2019 (in thousands) |
Portfolio Company (1) (2) (3) | | Footnotes | | Investment | | Spread
Above
Reference
Rate (4) | | Interest
Rate (4) (5) | | Maturity Date | | Principal / Par Amount / Shares (6) | | Amortized Cost (7) (8) | | Fair Value | | % of Net Assets |
| CTI Foods Holdings Co., LLC (Last Out) | | (13)(14)(15) | | Senior Secured Loans - First Lien | | L+9.00% | | 10.91% | | 5/3/2024 | | 770 |
| | 770 |
| | 731 |
| | 0.3 | % |
| | | | | | | | | | | | | | | 2,732 |
| | 2,693 |
| | 1.2 | % |
| | | | | | | | | | | | | | | | | | | |
| Kar Nut Products Co. | | (15) | | Senior Secured Loans - First Lien | | L+4.50% | | 6.20% | | 3/31/2023 | | 897 |
| | 891 |
| | 891 |
| | 0.4 | % |
| Kar Nut Products Co. | | (15) | | Senior Secured Loans - First Lien | | L+4.50% | | 6.20% | | 3/31/2023 | | 833 |
| | 827 |
| | 827 |
| | 0.4 | % |
| | | | | | | | | | | | | | | 1,718 |
| | 1,718 |
| | 0.8 | % |
| | | | | | | | | | | | | | | | | | | |
| Topps Company | | (15) | | Senior Secured Loans - First Lien | | L+5.25% | | 7.19% | | 10/2/2022 | | 4,988 |
| | 4,963 |
| | 4,981 |
| | 2.4 | % |
| Total Beverage, Food & Tobacco | | | | | | | | | | | | 21,645 |
| | 22,271 |
| | 10.5 | % |
| Capital Equipment | | | | | | | | | | | | | | | | |
| Cleaver Brooks, Inc. | | | | Senior Secured Bonds | | N/A | | 7.88% | | 3/1/2023 | | 2,000 |
| | 2,000 |
| | 1,995 |
| | 0.9 | % |
| Total Capital Equipment | | | | | | | | | | | | 2,000 |
| | 1,995 |
| | 0.9 | % |
| Chemicals, Plastics & Rubber | | | | | | | | | | | | | | | | |
| Aceto Chemicals | | (15) | | Senior Secured Loans - First Lien | | L+5.50% | | 7.62% | | 4/29/2025 | | 5,174 |
| | 5,142 |
| | 5,144 |
| | 2.4 | % |
| Aceto Chemicals (Revolver) | | (9)(13)(15)(17) | | Senior Secured Loans - First Lien | | N/A | | N/A | | 4/29/2025 | | — |
| | (90 | ) | | (89 | ) | | — | % |
| | | | | | | | | | | | | | | 5,052 |
| | 5,055 |
| | 2.4 | % |
| | | | | | | | | | | | | | | | | | | |
| Drew Marine Group Inc. | | (15) | | Senior Secured Loans - First Lien | | L+4.25% | | 6.19% | | 6/26/2026 | | 995 |
| | 981 |
| | 981 |
| | 0.5 | % |
| Ilpea Parent, Inc. | | IT(10)(11) | | Senior Secured Loans - First Lien | | L+4.75% | | 6.46% | | 3/2/2023 | | 5,496 |
| | 5,447 |
| | 5,468 |
| | 2.6 | % |
| Neon Holdings Inc | | | | Senior Secured Bonds | | N/A | | 10.13% | | 4/1/2026 | | 1,500 |
| | 1,475 |
| | 1,493 |
| | 0.7 | % |
| | | | | | | | | | | | | | | | | | | |
| Seal For Life Industries US LLC (Revolver) | | (9)(11)(13)(15) | | Senior Secured Loans - First Lien | | L+6.00% | | 8.20% | | 7/24/2024 | | 260 |
| | 185 |
| | 186 |
| | 0.1 | % |
| Seal For Life Industries US LLC | | (11)(15) | | Senior Secured Loans - First Lien | | E+6.00% | | 8.26% | | 7/23/2025 | | 6,991 |
| | 6,870 |
| | 6,889 |
| | 3.2 | % |
| | | | | | | | | | | | | | | 7,055 |
| | 7,075 |
| | 3.3 | % |
| Total Chemicals, Plastics & Rubber | | | | | | | | | | | | 20,010 |
| | 20,072 |
| | 9.5 | % |
| Construction & Building | | | | | | | | | | | | | | | | |
| GAL Manufacturing | | (15) | | Senior Secured Loans - First Lien | | L+4.00% | | 6.20% | | 6/26/2023 | | 5,428 |
| | 5,368 |
| | 5,396 |
| | 2.5 | % |
| GAL Manufacturing | | (15) | | Senior Secured Loans - Second Lien | | L+8.25% | | 10.45% | | 6/26/2024 | | 6,000 |
| | 5,910 |
| | 5,865 |
| | 2.8 | % |
| GAL Manufacturing (Revolver) | | (9)(13)(15) | | Senior Secured Loans - First Lien | | L+4.00% | | 6.09% | | 6/24/2022 | | 173 |
| | 145 |
| | 146 |
| | 0.1 | % |
| | | | | | | | | | | | | | | 11,423 |
| | 11,407 |
| | 5.4 | % |
| | | | | | | | | | | | | | | | | | | |
| Springs Window Fashions, LLC | | | | Senior Secured Loans - First Lien | | L+4.25% | | 5.95% | | 6/15/2025 | | 1,744 |
| | 1,730 |
| | 1,743 |
| | 0.8 | % |
| Springs Window Fashions, LLC | | | | Senior Secured Loans - Second Lien | | L+8.50% | | 10.20% | | 6/15/2026 | | 1,756 |
| | 1,679 |
| | 1,668 |
| | 0.8 | % |
| | | | | | | | | | | | | | | 3,409 |
| | 3,411 |
| | 1.6 | % |
GUGGENHEIM CREDIT INCOME FUND
CONSOLIDATED SCHEDULE OF INVESTMENTS
|
| | | | | | | | | | | | | | | | | | | | | | | | | |
December 31, 2019 (in thousands) |
Portfolio Company (1) (2) (3) | | Footnotes | | Investment | | Spread
Above
Reference
Rate (4) | | Interest
Rate (4) (5) | | Maturity Date | | Principal / Par Amount / Shares (6) | | Amortized Cost (7) (8) | | Fair Value | | % of Net Assets |
| Total Construction & Building | | | | | | | | | | | | 14,832 |
| | 14,818 |
| | 7.0 | % |
| Consumer Goods: Non-Durable | | | | | | | | | | | | | | | | |
| Galls LLC | | (15) | | Senior Secured Loans - First Lien | | L+6.25% | | 8.37% | | 1/31/2025 | | 3,620 |
| | 3,590 |
| | 3,591 |
| | 1.7 | % |
| Galls LLC (Delayed Draw B) | | (9)(15) | | Senior Secured Loans - First Lien | | L+6.25% | | 8.25% | | 1/31/2025 | | 533 |
| | 528 |
| | 528 |
| | 0.3 | % |
| Galls LLC (Revolver) | | (9)(13)(15) | | Senior Secured Loans - First Lien | | P+5.25% | | 10.00% | | 1/31/2024 | | 487 |
| | 430 |
| | 434 |
| | 0.2 | % |
| Total Consumer Goods: Non-Durable | | | | | | | | | | | | 4,548 |
| | 4,553 |
| | 2.2 | % |
| Consumer Goods: Durable | | | | | | | | | | | | | | | | |
| PlayPower, Inc. | | | | Senior Secured Loans - First Lien | | L+5.50% | | 7.30% | | 4/29/2026 | | 1,294 |
| | 1,281 |
| | 1,284 |
| | 0.6 | % |
| Total Consumer Goods: Durable | | | | | | | | | | | | 1,281 |
| | 1,284 |
| | 0.6 | % |
| Containers, Packaging & Glass | | | | | | | | | | | | | | | | |
| Bioplan USA, Inc. | | | | Senior Secured Loans - First Lien | | L+4.75% | | 6.45% | | 9/23/2021 | | 5,239 |
| | 5,010 |
| | 4,610 |
| | 2.2 | % |
| Husky Injection Molding Systems Ltd. | | CN(10)(11) | | Senior Secured Loans - First Lien | | L+3.00% | | 4.70% | | 3/28/2025 | | 1,980 |
| | 1,854 |
| | 1,952 |
| | 0.9 | % |
| | | | | | | | | | | | | | | | | | | |
| Resource Label Group LLC | | (15) | | Senior Secured Loans - First Lien | | L+4.50% | | 6.60% | | 5/26/2023 | | 3,449 |
| | 3,426 |
| | 3,121 |
| | 1.5 | % |
| Resource Label Group LLC | | (15) | | Senior Secured Loans - Second Lien | | L+8.50% | | 10.60% | | 11/26/2023 | | 3,000 |
| | 2,969 |
| | 2,550 |
| | 1.2 | % |
| | | | | | | | | | | | | | | 6,395 |
| | 5,671 |
| | 2.7 | % |
| Total Containers, Packaging & Glass | | | | | | | | | | | | 13,259 |
| | 12,233 |
| | 5.8 | % |
| Energy: Oil & Gas | | | | | | | | | | | | | | | | |
| Basic Energy Services Inc | | (13) | | Senior Secured Bonds | | N/A | | 10.75% | | 10/15/2023 | | 2,000 |
| | 1,985 |
| | 1,430 |
| | 0.7 | % |
| Navajo Nation Oil and Gas | | (15) | | Senior Secured Loans - First Lien | | L+7.50% | | 9.60% | | 6/14/2022 | | 3,438 |
| | 3,415 |
| | 3,417 |
| | 1.6 | % |
| Penn Virginia | | (11)(15) | | Senior Secured Loans - Second Lien | | L+7.00% | | 8.71% | | 9/29/2022 | | 3,000 |
| | 2,961 |
| | 2,955 |
| | 1.4 | % |
| Permian Production Partners | | (15)(18) | | Senior Secured Loans - First Lien | | N/A | | N/A | | 5/20/2024 | | 3,800 |
| | 3,680 |
| | 1,805 |
| | 0.8 | % |
| Total Energy: Oil & Gas | | | | | | | | | | | | 12,041 |
| | 9,607 |
| | 4.5 | % |
| Healthcare & Pharmaceuticals | | | | | | | | | | | | | | | | |
| Alegeus Technologies LLC | | (15) | | Senior Secured Loans - First Lien | | L+6.25% | | 8.28% | | 9/5/2024 | | 8,000 |
| | 7,938 |
| | 7,969 |
| | 3.8 | % |
| | | | | | | | | | | | | | | | | | | |
| Alltech | | (13)(15) | | Senior Unsecured Debt | | L+10.25% | | 11.95% | | 7/21/2023 | | 14,375 |
| | 14,257 |
| | 14,258 |
| | 6.8 | % |
| Alltech | | (13)(15) | | Senior Unsecured Debt | | E+10.25% | | 11.25% | | 7/21/2023 | | € | 601 |
| | 622 |
| | 669 |
| | 0.3 | % |
| | | | | | | | | | | | | | | 14,879 |
| | 14,927 |
| | 7.1 | % |
| | | | | | | | | | | | | | | | | | | |
| Cambrex Corporation | | | | Senior Secured Loans - First Lien | | L+5.00% | | 6.70% | | 11/20/2026 | | 2,500 |
| | 2,450 |
| | 2,498 |
| | 1.2 | % |
| Endo Pharmaceuticals Finance Co. | | IR(10)(11)(13) | | Senior Unsecured Debt | | N/A | | 6.00% | | 7/15/2023 | | 4,965 |
| | 4,104 |
| | 3,587 |
| | 1.7 | % |
| WIRB-Copernicus Group | | (15) | | Senior Secured Loans - Second Lien | | L+8.25% | | 9.87% | | 8/15/2023 | | 12,000 |
| | 11,823 |
| | 12,120 |
| | 5.7 | % |
| Total Healthcare & Pharmaceuticals | | | | | | | | | | | | 41,194 |
| | 41,101 |
| | 19.5 | % |
GUGGENHEIM CREDIT INCOME FUND
CONSOLIDATED SCHEDULE OF INVESTMENTS
|
| | | | | | | | | | | | | | | | | | | | | | | | | |
December 31, 2019 (in thousands) |
Portfolio Company (1) (2) (3) | | Footnotes | | Investment | | Spread
Above
Reference
Rate (4) | | Interest
Rate (4) (5) | | Maturity Date | | Principal / Par Amount / Shares (6) | | Amortized Cost (7) (8) | | Fair Value | | % of Net Assets |
| Hotel, Gaming & Leisure | | | | | | | | | | | | | | | | |
| Playtika Holding | | (11) | | Senior Secured Loans - First Lien | | L+6.00% | | 7.80% | | 12/31/2024 | | 2,000 |
| | 1,960 |
| | 2,025 |
| | 1.0 | % |
| | | | | | | | | | | | | | | | | | | |
| Stadium Management Group | | | | Senior Secured Loans - First Lien | | L+3.00% | | 4.70% | | 1/23/2025 | | 2,358 |
| | 2,356 |
| | 2,371 |
| | 1.1 | % |
| Stadium Management Group | | | | Senior Secured Loans - Second Lien | | L+7.00% | | 8.70% | | 1/23/2026 | | 2,400 |
| | 2,395 |
| | 2,428 |
| | 1.1 | % |
| | | | | | | | | | | | | | | 4,751 |
| | 4,799 |
| | 2.2 | % |
| Total Hotel, Gaming & Leisure | | | | | | | | | | | | 6,711 |
| | 6,824 |
| | 3.2 | % |
| Media: Advertising, Printing & Publishing | | | | | | | | | | | | | | | | |
| Boats Group | | (15) | | Senior Secured Loans - First Lien | | L+4.25% | | 5.95% | | 5/17/2024 | | 5,722 |
| | 5,665 |
| | 5,722 |
| | 2.7 | % |
| Boats Group | | (15) | | Senior Secured Loans - Second Lien | | L+8.00% | | 9.80% | | 11/18/2024 | | 3,338 |
| | 3,306 |
| | 3,372 |
| | 1.6 | % |
| Boats Group (Revolver) | | (9)(13)(15)(17) | | Senior Secured Loans - First Lien | | N/A | | N/A | | 9/12/2022 | | — |
| | (44 | ) | | (41 | ) | | — | % |
| | | | | | | | | | | | | | | 8,927 |
| | 9,053 |
| | 4.3 | % |
| | | | | | | | | | | | | | | | | | | |
| Houghton Mifflin Harcourt Publishers, Inc. | | (11) | | Senior Secured Loans - First Lien | | L+6.25% | | 8.04% | | 11/19/2024 | | 2,500 |
| | 2,400 |
| | 2,500 |
| | 1.2 | % |
| | | | | | | | | | | | | | | | | | | |
| McGraw-Hill Global Education Holdings | | | | Senior Secured Loans - First Lien | | L+4.00% | | 5.70% | | 5/4/2022 | | 1,943 |
| | 1,930 |
| | 1,863 |
| | 0.9 | % |
| McGraw-Hill Global Education Holdings | | (13)(14)(15) | | Senior Unsecured Debt | | N/A | | 11.00% | | 4/20/2022 | | 2,000 |
| | 1,968 |
| | 1,871 |
| | 0.9 | % |
| McGraw-Hill Global Education Holdings | | (13) | | Senior Unsecured Debt | | N/A | | 7.88% | | 5/15/2024 | | 1,340 |
| | 1,302 |
| | 1,152 |
| | 0.5 | % |
| | | | | | | | | | | | | | | 5,200 |
| | 4,886 |
| | 2.3 | % |
| | | | | | | | | | | | | | | | | | | |
| Trader Interactive | | (15) | | Senior Secured Loans - First Lien | | L+6.50% | | 8.30% | | 6/15/2024 | | 8,113 |
| | 8,070 |
| | 8,023 |
| | 3.8 | % |
| Trader Interactive (Revolver) | | (9)(13)(15)(17) | | Senior Secured Loans - First Lien | | N/A | | N/A | | 6/15/2023 | | — |
| | (31 | ) | | (30 | ) | | — | % |
| | | | | | | | | | | | | | | 8,039 |
| | 7,993 |
| | 3.8 | % |
| Total Media: Advertising, Printing & Publishing | | | | | | | | | | 24,566 |
| | 24,432 |
| | 11.6 | % |
| Retail | | | | | | | | | | | | | | | | |
| At Home Group | | (11)(15) | | Senior Secured Loans - First Lien | | L+3.50% | | 5.43% | | 6/3/2022 | | 318 |
| | 291 |
| | 278 |
| | 0.1 | % |
| Belk, Inc. | | | | Senior Secured Loans - First Lien | | L+6.75% | | 8.80% | | 12/12/2022 | | 1,146 |
| | 1,083 |
| | 807 |
| | 0.4 | % |
| Beverages and More, Inc. | | (13) | | Senior Secured Bonds | | N/A | | 11.50% | | 6/15/2022 | | 900 |
| | 758 |
| | 617 |
| | 0.3 | % |
| Blue Nile, Inc. | | (15) | | Senior Secured Loans - First Lien | | L+6.50% | | 8.41% | | 2/17/2023 | | 10,500 |
| | 10,316 |
| | 4,568 |
| | 2.2 | % |
| Buddys Newco, LLC | | (13)(15) | | Senior Secured Loans - First Lien | | L+8.00% | | 10.21% | | 7/10/2024 | | 3,900 |
| | 3,827 |
| | 4,088 |
| | 1.9 | % |
| | | | | | | | | | | | | | | | | | | |
| Pet Holdings ULC | | CN(10)(11)(15) | | Senior Secured Loans - First Lien | | L+5.50% | | 7.60% | | 7/5/2022 | | 4,340 |
| | 4,306 |
| | 4,080 |
| | 1.9 | % |
GUGGENHEIM CREDIT INCOME FUND
CONSOLIDATED SCHEDULE OF INVESTMENTS
|
| | | | | | | | | | | | | | | | | | | | | | | | | |
December 31, 2019 (in thousands) |
Portfolio Company (1) (2) (3) | | Footnotes | | Investment | | Spread
Above
Reference
Rate (4) | | Interest
Rate (4) (5) | | Maturity Date | | Principal / Par Amount / Shares (6) | | Amortized Cost (7) (8) | | Fair Value | | % of Net Assets |
| Pet Holdings ULC (Delayed Draw) | | CN(10)(11)(15) | | Senior Secured Loans - First Lien | | L+5.50% | | 7.60% | | 7/5/2022 | | 489 |
| | 489 |
| | 460 |
| | 0.2 | % |
| | | | | | | | | | | | | | | 4,795 |
| | 4,540 |
| | 2.1 | % |
| | | | | | | | | | | | | | | | | | | |
| Save-a-Lot | | (13) | | Senior Secured Loans - First Lien | | L+6.00% | | 8.10% | | 12/5/2023 | | 4,064 |
| | 2,261 |
| | 1,488 |
| | 0.7 | % |
| Sears Outlet | | (11)(13)(15) | | Senior Secured Loans - First Lien | | L+6.50% | | 8.43% | | 10/23/2023 | | 2,625 |
| | 2,575 |
| | 2,644 |
| | 1.3 | % |
| Smart & Final Stores LLC | | (15) | | Senior Secured Loans - First Lien | | L+6.75% | | 8.55% | | 6/20/2025 | | 3,980 |
| | 3,605 |
| | 3,850 |
| | 1.8 | % |
| Total Retail | | | | | | | | | | | | 29,511 |
| | 22,880 |
| | 10.8 | % |
| Services: Business | | | | | | | | | | | | | | | | |
| 24-7 Intouch | | CN(10)(11) | | Senior Secured Loans - First Lien | | L+4.25% | | 5.95% | | 8/25/2025 | | 3,950 |
| | 3,715 |
| | 3,851 |
| | 1.8 | % |
| | | | | | | | | | | | | | | | | | | |
| Alexander Mann Solutions (GBP Term Loan) | | UK(10)(11)(13) | | Senior Secured Loans - First Lien | | G+5.00% | | 5.71% | | 6/16/2025 | | £ | 2,060 |
| | 2,546 |
| | 2,603 |
| | 1.2 | % |
| Alexander Mann Solutions (USD Term Loan) | | UK(10)(11)(13)(15) | | Senior Secured Loans - First Lien | | L+5.50% | | 6.80% | | 6/16/2025 | | 890 |
| | 850 |
| | 863 |
| | 0.4 | % |
| Alexander Mann Solutions (Revolver) | | UK(9)(10)(11)(13)(15)(17) | | Senior Secured Loans - First Lien | | N/A | | N/A | | 12/16/2024 | | — |
| | (45 | ) | | (45 | ) | | — | % |
| | | | | | | | | | | | | | | 3,351 |
| | 3,421 |
| | 1.6 | % |
| | | | | | | | | | | | | �� | | | | | | |
| Capstone Logistics, LLC | | | | Senior Secured Loans - First Lien | | L+4.50% | | 6.21% | | 10/7/2021 | | 4,755 | | 4,730 |
| | 4,687 |
| | 2.2 | % |
| Clarion (Comet Bidco) | | UK(10)(11)(13) | | Senior Secured Loans - First Lien | | L+5.00% | | 7.12% | | 9/30/2024 | | 5,881 | | 5,790 |
| | 5,779 |
| | 2.7 | % |
| HealthChannels, Inc. | | | | Senior Secured Loans - First Lien | | L+4.50% | | 6.24% | | 4/3/2025 | | 2,857 | | 2,805 |
| | 2,810 |
| | 1.3 | % |
| Lifelong Learner Holdings T/L | | (15) | | Senior Secured Loans - First Lien | | L+5.75% | | 7.49% | | 10/16/2026 | | 2,866 | | 2,831 |
| | 2,834 |
| | 1.4 | % |
| | | | | | | | | | | | | | | | | | | |
| Park Place Technologies | | | | Senior Secured Loans - First Lien | | L+4.00% | | 5.80% | | 3/29/2025 | | 2,672 | | 2,662 |
| | 2,663 |
| | 1.3 | % |
| Park Place Technologies | | | | Senior Secured Loans - Second Lien | | L+8.00% | | 9.80% | | 3/29/2026 | | 3,404 | | 3,383 |
| | 3,378 |
| | 1.6 | % |
| | | | | | | | | | | | | | | 6,045 |
| | 6,041 |
| | 2.9 | % |
| | | | | | | | | | | | | | | | | | | |
| PSI Services LLC | | (9)(13)(15)(17) | | Senior Secured Loans - First Lien | | L+5.75% | | 7.69% | | 10/4/2025 | | 30 | | 30 |
| | (6 | ) | | — | % |
| PSI Services LLC | | (9)(15) | | Senior Secured Loans - First Lien | | N/A | | N/A | | 10/4/2026 | | — |
| | — |
| | — |
| | — | % |
| PSI Services LLC | | (9)(15) | | Senior Secured Loans - First Lien | | L+5.75% | | 7.63% | | 10/4/2026 | | 429 | | 429 |
| | 422 |
| | 0.2 | % |
| | | | | | | | | | | | | | | 459 |
| | 416 |
| | 0.2 | % |
| | | | | | | | | | | | | | | | | | | |
| SLR Consulting | | UK(10)(11)(15) | | Senior Secured Loans - First Lien | | L+4.00% | | 5.79% | | 6/23/2025 | | 1,588 | | 1,551 |
| | 1,554 |
| | 0.7 | % |
| SLR Consulting (Delayed Draw) | | UK(10)(11)(13)(15) | | Senior Secured Loans - First Lien | | L+4.00% | | 5.18% | | 5/23/2025 | | 494 |
| | 512 |
| | 508 |
| | 0.3 | % |
| | | | | | | | | | | | | | | 2,063 |
| | 2,062 |
| | 1.0 | % |
GUGGENHEIM CREDIT INCOME FUND
CONSOLIDATED SCHEDULE OF INVESTMENTS
|
| | | | | | | | | | | | | | | | | | | | | | | | | |
December 31, 2019 (in thousands) |
Portfolio Company (1) (2) (3) | | Footnotes | | Investment | | Spread
Above
Reference
Rate (4) | | Interest
Rate (4) (5) | | Maturity Date | | Principal / Par Amount / Shares (6) | | Amortized Cost (7) (8) | | Fair Value | | % of Net Assets |
| | | | | | | | | | | | | | | | | | | |
| Teneo Holdings LLC | | | | Senior Secured Loans - First Lien | | L+5.25% | | 6.99% | | 7/12/2025 | | 3,990 | | 3,802 |
| | 3,805 |
| | 1.8 | % |
| YAK Access, LLC | | | | Senior Secured Loans - Second Lien | | L+10.00% | | 11.79% | | 7/10/2026 | | 5,000 | | 4,688 |
| | 4,409 |
| | 2.1 | % |
| Total Services: Business | | | | | | | | | | | | 40,279 |
| | 40,115 |
| | 19.0 | % |
| Technology | | | | | | | | | | | | | | | | |
| Advicent Solutions | | (15) | | Senior Secured Loans - First Lien | | L+8.25% | | 10.35% | | 2/28/2022 | | 6,983 | | 6,904 |
| | 5,795 |
| | 2.7 | % |
| Alfresco Software | | (15) | | Senior Secured Loans - First Lien | | L+8.50% | | 10.64% | | 9/9/2024 | | 3,287 | | 3,223 |
| | 3,229 |
| | 1.5 | % |
| | | | | | | | | | | | | | | | | | | |
| Acquia Inc. | | (13)(15) | | Senior Secured Loans - First Lien | | L+7.00% | | 8.91% | | 10/31/2025 | | 1,789 |
| | 1,754 |
| | 1,776 |
| | 0.8 | % |
| Acquia Inc. | | (9)(13)(15)(17) | | Senior Secured Loans - First Lien | | N/A | | N/A | | 10/31/2025 | | — |
| | (4 | ) | | (26 | ) | | — | % |
| | | | | | | | | | | | | | | 1,750 |
| | 1,750 |
| | 0.8 | % |
| | | | | | | | | | | | | | | | | | | |
| Apptio, Inc. (Revolver) | | (9)(13)(15)(17) | | Senior Secured Loans - First Lien | | N/A | | N/A | | 12/3/2024 | | — |
| | (35 | ) | | (34 | ) | | — | % |
| Apptio, Inc. | | (15) | | Senior Secured Loans - First Lien | | L+7.25% | | 8.96% | | 1/10/2025 | | 4,900 | | 4,841 |
| | 4,855 |
| | 2.3 | % |
| | | | | | | | | | | | | | | 4,806 |
| | 4,821 |
| | 2.3 | % |
| | | | | | | | | | | | | | | | | | | |
| Bluefin Holding, LLC (Revolver) | | (9)(13)(15)(17) | | Senior Secured Loans - First Lien | | N/A | | N/A | | 9/6/2024 | | — |
| | (13 | ) | | (12 | ) | | — | % |
| Bluefin Holding, LLC (Term Loan) | | (15) | | Senior Secured Loans - First Lien | | L+4.25% | | 6.36% | | 9/4/2026 | | 868 | | 866 |
| | 860 |
| | 0.4 | % |
| | | | | | | | | | | | | | | 853 |
| | 848 |
| | 0.4 | % |
| | | | | | | | | | | | | | | | | | | |
| Causeway Technologies | | UK(10)(11)(15) | | Senior Secured Loans - First Lien | | G+6.25% | | 7.03% | | 6/8/2024 | | £ | 2,638 |
| | 3,346 |
| | 3,450 |
| | 1.7 | % |
| Causeway Technologies | | UK(10)(11)(15) | | Senior Secured Loans - First Lien | | G+6.25% | | 7.01% | | 6/8/2024 | | £ | 338 |
| | 426 |
| | 447 |
| | 0.2 | % |
| | | | | | | | | | | | | | | 3,772 |
| | 3,897 |
| | 1.9 | % |
| | | | | | | | | | | | | | | | | | | |
| Cologix Holdings | | | | Senior Secured Loans - First Lien | | L+3.75% | | 5.45% | | 3/20/2024 | | 2,000 |
| | 1,931 |
| | 1,990 |
| | 0.9 | % |
| Cvent, Inc. | | | | Senior Secured Loans - First Lien | | L+3.75% | | 5.55% | | 11/29/2024 | | 1,975 |
| | 1,952 |
| | 1,976 |
| | 0.9 | % |
| | | | | | | | | | | | | | | | | | | |
| Datix Bidco Limited | | (15) | | Senior Secured Loans - First Lien | | L+4.50% | | 6.76% | | 4/28/2025 | | 1,931 |
| | 1,900 |
| | 1,916 |
| | 0.9 | % |
| Datix Bidco Limited | | (15) | | Senior Secured Loans - Second Lien | | L+7.75% | | 9.68% | | 4/27/2026 | | 462 |
| | 454 |
| | 458 |
| | 0.2 | % |
| Datix Bidco 1L TL B3 | | (15) | | Senior Secured Loans - First Lien | | L+4.50% | | 6.76% | | 4/28/2025 | | 3,048 |
| | 3,006 |
| | 3,025 |
| | 1.5 | % |
| Datix Bidco 2L TL TRANCHE 3 | | (15) | | Senior Secured Loans - Second Lien | | L+7.75% | | 9.68% | | 4/27/2026 | | 4,696 |
| | 4,631 |
| | 4,656 |
| | 2.2 | % |
| | | | | | | | | | | | | | | 9,991 |
| | 10,055 |
| | 4.8 | % |
| | | | | | | | | | | | | | | | | | | |
| Kerridge Commercial Systems (USD Term Loan) | | UK(10)(11)(15) | | Senior Secured Loans - First Lien | | L+4.25% | | 6.35% | | 1/22/2024 | | 634 |
| | 625 |
| | 630 |
| | 0.3 | % |
GUGGENHEIM CREDIT INCOME FUND
CONSOLIDATED SCHEDULE OF INVESTMENTS
|
| | | | | | | | | | | | | | | | | | | | | | | | | |
December 31, 2019 (in thousands) |
Portfolio Company (1) (2) (3) | | Footnotes | | Investment | | Spread
Above
Reference
Rate (4) | | Interest
Rate (4) (5) | | Maturity Date | | Principal / Par Amount / Shares (6) | | Amortized Cost (7) (8) | | Fair Value | | % of Net Assets |
| Kerridge Commercial Systems (GBP Term Loan) | | UK(10)(11)(13)(15) | | Senior Secured Loans - First Lien | | G+4.25% | | 5.01% | | 1/22/2024 | | £ | 528 |
| | 729 |
| | 695 |
| | 0.3 | % |
| Kerridge Commercial Systems (Euro Delayed Draw) | | UK(10)(11)(13)(15) | | Senior Secured Loans - First Lien | | E+4.75% | | 4.75% | | 1/22/2024 | | € | 97 |
| | 118 |
| | 108 |
| | 0.1 | % |
| Kerridge Commercial Systems (GBP Delayed Draw) | | UK(10)(11)(13)(15) | | Senior Secured Loans - First Lien | | G+4.25% | | 5.01% | | 1/22/2024 | | £ | 325 |
| | 421 |
| | 427 |
| | 0.2 | % |
| Kerridge Commercial Systems (Bidco) Limited | | (11)(13)(15) | | Senior Secured Loans - First Lien | | L+6.25% | | 8.19% | | 1/22/2024 | | 2,200 |
| | 2,167 |
| | 2,184 |
| | 1.0 | % |
| | | | | | | | | | | | | | | 4,060 |
| | 4,044 |
| | 1.9 | % |
| | | | | | | | | | | | | | | | | | | |
| Lytx, Inc. | | (15) | | Senior Secured Loans - First Lien | | L+6.75% | | 8.45% | | 8/31/2023 | | 6,482 |
| | 6,379 |
| | 6,473 |
| | 3.1 | % |
| Lytx, Inc. | | (15) | | Senior Secured Loans - First Lien | | L+6.75% | | 8.45% | | 8/31/2023 | | 1,453 |
| | 1,422 |
| | 1,451 |
| | 0.7 | % |
| Lytx, Inc. (Revolver) | | (9)(13)(15)(17) | | Senior Secured Loans - First Lien | | N/A | | N/A | | 8/31/2022 | | — |
| | (25 | ) | | (25 | ) | | — | % |
| | | | | | | | | | | | | | | 7,776 |
| | 7,899 |
| | 3.8 | % |
| | | | | | | | | | | | | | | | | | | |
| Ministry Brands | | (15) | | Senior Secured Loans - First Lien | | L+4.00% | | 5.86% | | 12/2/2022 | | 953 |
| | 948 |
| | 953 |
| | 0.5 | % |
| Ministry Brands (Delayed Draw) | | (15) | | Senior Secured Loans - First Lien | | L+4.00% | | 5.86% | | 12/2/2022 | | 507 |
| | 505 |
| | 507 |
| | 0.2 | % |
| Ministry Brands (Delayed Draw) | | (15) | | Senior Secured Loans - First Lien | | L+4.00% | | 5.86% | | 12/2/2022 | | 184 |
| | 184 |
| | 184 |
| | 0.1 | % |
| | | | | | | | | | | | | | | 1,637 |
| | 1,644 |
| | 0.8 | % |
| | | | | | | | | | | | | | | | | | | |
| Onyx CenterSource | | (15) | | Senior Secured Loans - First Lien | | L+6.25% | | 8.36% | | 12/20/2021 | | 6,652 |
| | 6,639 |
| | 6,640 |
| | 3.1 | % |
| Onyx CenterSource (Revolver) | | (9)(13)(15)(17) | | Senior Secured Loans - First Lien | | N/A | | N/A | | 12/20/2021 | | — |
| | (16 | ) | | (16 | ) | | — | % |
| | | | | | | | | | | | | | | 6,623 |
| | 6,624 |
| | 3.1 | % |
| | | | | | | | | | | | | | | | | | | |
| Planview, Inc. | | (15) | | Senior Secured Loans - First Lien | | L+5.25% | | 6.95% | | 1/27/2023 | | 6,152 |
| | 6,114 |
| | 6,121 |
| | 2.9 | % |
| Planview, Inc. | | (15) | | Senior Secured Loans - First Lien | | L+5.25% | | 6.95% | | 1/27/2023 | | 391 |
| | 391 |
| | 389 |
| | 0.2 | % |
| Planview, Inc. | | (15) | | Senior Secured Loans - Second Lien | | L+9.75% | | 11.45% | | 7/27/2023 | | 4,388 |
| | 4,330 |
| | 4,386 |
| | 2.1 | % |
| | | | | | | | | | | | | | | 10,835 |
| | 10,896 |
| | 5.2 | % |
| | | | | | | | | | | | | | | | | | | |
| Velocity Holdings US | | (15) | | Senior Secured Loans - First Lien | | L+7.00% | | 8.90% | | 12/12/2023 | | 5,428 |
| | 5,335 |
| | 5,339 |
| | 2.5 | % |
| Velocity Holdings US | | (15) | | Senior Secured Loans - First Lien | | L+7.00% | | 8.90% | | 12/12/2023 | | 1,145 |
| | 1,115 |
| | 1,127 |
| | 0.6 | % |
| Velocity Holdings US (Revolver) | | (13)(15) | | Senior Secured Loans - First Lien | | L+7.00% | | 9.05% | | 12/12/2022 | | 462 |
| | 424 |
| | 428 |
| | 0.2 | % |
| | | | | | | | | | | | | | | 6,874 |
| | 6,894 |
| | 3.3 | % |
| | | | | | | | | | | | | | | | | | | |
| Wind River Systems | | (15) | | Senior Secured Loans - First Lien | | L+6.75% | | 8.45% | | 6/24/2024 | | 5,534 |
| | 5,435 |
| | 5,467 |
| | 2.6 | % |
| Total Technology | | | | | | | | | | | | 78,422 |
| | 77,829 |
| | 36.9 | % |
| Telecommunications | | | | | | | | | | | | | | | | |
GUGGENHEIM CREDIT INCOME FUND
CONSOLIDATED SCHEDULE OF INVESTMENTS
|
| | | | | | | | | | | | | | | | | | | | | | | | | |
December 31, 2019 (in thousands) |
Portfolio Company (1) (2) (3) | | Footnotes | | Investment | | Spread
Above
Reference
Rate (4) | | Interest
Rate (4) (5) | | Maturity Date | | Principal / Par Amount / Shares (6) | | Amortized Cost (7) (8) | | Fair Value | | % of Net Assets |
| Firstlight Fiber | | | | Senior Secured Loans - First Lien | | L+3.50% | | 5.20% | | 7/23/2025 | | 2,231 |
| | 2,221 |
| | 2,237 |
| | 1.0 | % |
| Firstlight Fiber | | | | Senior Secured Loans - Second Lien | | L+7.50% | | 9.30% | | 7/23/2026 | | 2,500 |
| | 2,476 |
| | 2,481 |
| | 1.2 | % |
| | | | | | | | | | | | | | | 4,697 |
| | 4,718 |
| | 2.2 | % |
| Total Telecommunications | | | | | | | | | | | | 4,697 |
| | 4,718 |
| | 2.2 | % |
| Transportation: Cargo | | | | | | | | | | | | | | | | |
| Flexi-Van Leasing Corp | | | | Senior Secured Bonds | | N/A | | 10.00% | | 2/15/2023 | | 4,975 |
| | 4,778 |
| | 4,714 |
| | 2.2 | % |
| Total Transportation: Cargo | | | | | | | | | | | | 4,778 |
| | 4,714 |
| | 2.2 | % |
| Utilities: Electric | | | | | | | | | | | | | | | | |
| BHI Energy | | (15) | | Senior Secured Loans - Second Lien | | L+8.75% | | 10.95% | | 2/28/2025 | | 6,000 |
| | 5,908 |
| | 5,925 |
| | 2.8 | % |
| Moxie Liberty, LLC | | | | Senior Secured Loans - First Lien | | L+6.50% | | 8.60% | | 8/21/2020 | | 2,892 |
| | 2,878 |
| | 2,583 |
| | 1.2 | % |
| Total Utilities: Electric | | | | | | | | | | | | 8,786 |
| | 8,508 |
| | 4.0 | % |
| Utilities: Oil & Gas | | | | | | | | | | | | | | | | |
| SeaPort | | (15) | | Senior Secured Loans - First Lien | | L+5.50% | | 7.21% | | 10/31/2025 | | 5,940 |
| | 5,784 |
| | 5,881 |
| | 2.8 | % |
| Total Utilities: Oil & Gas | | | | | | | | | | | | 5,784 |
| | 5,881 |
| | 2.8 | % |
| Total Debt Investments | | | | | | | | | | | | | | $ | 372,034 |
| | $ | 359,089 |
| | 170.0 | % |
| | | | | | | | | | | | | | | | | | | |
| Equity investments - 6.2% | | | | | | | | | | | | | | | | | | |
| Banking, Finance, Insurance & Real Estate | | | | | | | | | | | | | | | | |
| Four Springs Capital Trust (Preferred Equity) | | (11)(13)(14)(15) | | Equity and Other | | N/A | | 16.75% | | | | 237,576 |
| | $ | 4,700 |
| | $ | 4,752 |
| | 2.3 | % |
| Total Banking, Finance, Insurance & Real Estate | | | | | | | | | | | | 4,700 |
| | 4,752 |
| | 2.3 | % |
| Beverage, Food & Tobacco | | | | | | | | | | | | | | | | |
| Chef's Holdings Inc. | | (13)(15)(16) | | Equity and Other | | N/A | | N/A | | | | 19,540 |
| | 2,459 |
| | 2,284 |
| | 1.1 | % |
| Total Beverage, Food & Tobacco | | | | | | | | | | | | 2,459 |
| | 2,284 |
| | 1.1 | % |
| Energy: Oil & Gas | | | | | | | | | | | | | | | | |
| Maverick Natural Resources, LLC (Common Equity) | | (15)(16) | | Equity and Other | | N/A | | N/A | | | | 4,625 |
| | 2,777 |
| | 2,081 |
| | 1.0 | % |
| SandRidge Energy, Inc. (Common Equity) | | (11)(13)(16) | | Equity and Other | | N/A | | N/A | | | | 21,224 |
| | 448 |
| | 90 |
| | — | % |
| Total Energy: Oil & Gas | | | | | | | | | | | | 3,225 |
| | 2,171 |
| | 1.0 | % |
| Technology | | | | | | | | | | | | | | | | |
| Alfresco Software (Common Equity) | | (13)(15)(16) | | Equity and Other | | N/A | | N/A | | | | 66,230 |
| | 166 |
| | 203 |
| | 0.1 | % |
| Lytx, Inc. (Preferred Equity) | | (13)(14)(15) | | Equity and Other | | N/A | | 14.75% | | | | 2,958 |
| | 2,957 |
| | 3,303 |
| | 1.6 | % |
| Lytx, Inc. (Warrants) | | (13)(15)(16) | | Equity and Other | | N/A | | N/A | | | | 130 |
| | — |
| | 81 |
| | — | % |
GUGGENHEIM CREDIT INCOME FUND
CONSOLIDATED SCHEDULE OF INVESTMENTS
|
| | | | | | | | | | | | | | | | | | | | | | | | | |
December 31, 2019 (in thousands) |
Portfolio Company (1) (2) (3) | | Footnotes | | Investment | | Spread
Above
Reference
Rate (4) | | Interest
Rate (4) (5) | | Maturity Date | | Principal / Par Amount / Shares (6) | | Amortized Cost (7) (8) | | Fair Value | | % of Net Assets |
| Velocity Holdings US (Class A Units) | | (13)(15)(16) | | Equity and Other | | N/A | | N/A | | | | 231 |
| | 231 |
| | 280 |
| | 0.1 | % |
| Wolfhound Parent Inc. (Warrants) | | (13)(15)(16) | | Equity and Other | | N/A | | N/A | | | | 1,975 |
| | 30 |
| | 30 |
| | — | % |
| Total Technology | | | | | | | | | | | | 3,384 |
| | 3,897 |
| | 1.8 | % |
| Total Equity Investments | | | | | | | | | | | | | | $ | 13,768 |
| | $ | 13,104 |
| | 6.2 | % |
| | | | | | | | | | | | | | | | | | | |
| Total Investments - 176.2% | | | | | | | | | | | | | | $ | 385,802 |
| | $ | 372,193 |
| | 176.2 | % |
|
| | | | | | | | | | | | | | | | | | | | |
| December 31, 2019 (in thousands) |
| Derivative Counterparty | | Settlement Date | | Amount Purchased | | Amount Sold | | Amortized Cost (7) (8) | | Fair Value | | % of Net Assets |
| Foreign Currency Forward Contracts | | | | | | | | | | | |
| JPMorgan Chase Bank | | 1/14/2020 | | € | 772 |
| | $ | 694 |
| | — |
| | $ | (7 | ) | | — | % |
| JPMorgan Chase Bank | | 1/14/2020 | | £ | 24,936 |
| | $ | 18,878 |
| | — |
| | $ | (80 | ) | | — | % |
| | | | | | | | | | | $ | (87 | ) | | — | % |
_______________________
| |
| (1) | Security may be an obligation of one or more entities affiliated with the named portfolio company. |
| |
| (2) | All debt and equity investments are income producing unless otherwise noted. |
| |
| (3) | All investments are non-controlled/non-affiliated investments as defined by the Investment Company Act of 1940 (the "1940 Act"). The provisions of the 1940 Act classify investments based on the level of control that we maintain in a particular portfolio company. As defined in the 1940 Act, a company is generally presumed to be “non-controlled” when we own 25% or less of the portfolio company’s voting securities and “controlled” when we own more than 25% of the portfolio company’s voting securities. The provisions of the 1940 Act also classify investments further based on the level of ownership that we maintain in a particular portfolio company. As defined in the 1940 Act, a company is generally deemed as “non-affiliated” when we own less than 5% of a portfolio company’s voting securities and “affiliated” when we own 5% or more of a portfolio company’s voting securities. |
| |
| (4) | The periodic interest rate for all floating rate loans is indexed to London Interbank Offered Rate ("LIBOR" or "LIBO rate") (denoted as "L"), Euro Interbank Offered Rate ("EURIBOR") (denoted as "E"), British Pound Sterling LIBOR ("GBP LIBOR") (denoted as "G") or Prime Rate (denoted as "P"). Pursuant to the terms of the underlying credit agreements, the base interest rates typically reset annually, semi-annually, quarterly or monthly at the borrower's option. The borrower may also elect to have multiple interest reset periods for each loan. For each of these floating rate loans, the Consolidated Schedule of Investments presents the applicable margin over LIBOR, EURIBOR, GBP LIBOR or Prime based on each respective credit agreement. As of December 31, 2019, LIBO rates ranged between 1.76% for 1-month LIBOR to 1.91% for 3-month LIBOR. |
| |
| (5) | For portfolio companies with multiple interest rate contracts under a single credit agreement, the interest rate shown is a weighted average current interest rate in effect at December 31, 2019. |
| |
| (6) | Unless noted otherwise, the principal amount (par amount) for all debt securities is denominated in U.S. dollars. Equity investments are recorded as number of shares owned. |
| |
| (7) | Cost represents amortized cost, inclusive of any capitalized paid-in-kind income ("PIK"), for debt securities, and cost plus capitalized PIK, if any, for preferred stock. |
GUGGENHEIM CREDIT INCOME FUND
CONSOLIDATED SCHEDULE OF INVESTMENTS
| |
| (8) | As of December 31, 2019, the aggregate gross unrealized appreciation for all securities, including foreign currency forward contracts, in which there was an excess of value over tax cost was $4.8 million; the aggregate gross unrealized depreciation for all securities, including foreign currency forward contracts, in which there was an excess of tax cost over value was $17.6 million; the net unrealized depreciation was $12.8 million; the aggregate cost of securities for Federal income tax purposes was $384.9 million. |
| |
| (9) | The investment is either a delayed draw loan or a revolving credit facility whereby some or all of the investment commitment is undrawn as of December 31, 2019 (see Note 8. Commitments and Contingencies). |
| |
| (10) | A portfolio company domiciled in a foreign country. The regulatory jurisdiction of security issuance may be a different country than the domicile of the portfolio company. |
| |
| (11) | The investment is not a qualifying asset as defined in Section 55(a) of the 1940 Act. As of December 31, 2019, qualifying assets represented 79% of total assets. Under the 1940 Act we may not acquire any non-qualifying assets unless, at the time the acquisition is made, qualifying assets represent at least 70% of our total assets. |
| |
| (12) | Investment position or portion thereof unsettled as of December 31, 2019. |
| |
| (13) | The investment position, or a portion thereof, was not pledged as collateral supporting the amounts outstanding under our credit facility as of December 31, 2019; (see Note 7. Borrowings). |
| |
| (14) | The underlying credit agreement or indenture contains a PIK provision, whereby the issuer has either the option or the obligation to make interest payments with the issuance of additional securities. The interest rate in the schedule represents the current interest rate in effect for these investments. |
|
| | | | | | | |
| | Coupon Rate | PIK Component | Cash Component | PIK Option |
| Addo Foods Group | G+ 8.00% |
| 0.75 | % | G+7.25% |
| The Portfolio Company may elect PIK up to 0.75% |
| CTI Foods Holdings Co., LLC (First Out) | L+7.00% |
| 3.00 | % | L+4.00% |
| The Portfolio Company may elect PIK up to 3.00% |
| CTI Foods Holdings Co., LLC (Last Out) | L+9.00% |
| 6.00 | % | L+3.00% |
| The Portfolio Company may elect PIK up to 6.00% |
| Four Springs Capital Trust | 16.75 | % | 16.75 | % | — | % | The Portfolio Company may elect PIK up to 16.75% |
| Gladman Developments Ltd. | G+9.50% |
| 2.75 | % | G+6.75% |
| The Portfolio Company may elect PIK up to 2.75% |
| Gladman Developments Ltd. (Delayed Draw) | G+9.50% |
| 2.75 | % | G+6.75% |
| The Portfolio Company may elect PIK up to 2.75% |
| Lytx, Inc. | 14.75 | % | 14.75 | % | — | % | The Portfolio Company may elect PIK up to 14.75% |
| McGraw-Hill Global Education Holdings | 11.00 | % | 11.75 | % | — | % | The Portfolio Company may elect partial PIK up to 50% of the interest of the period or full PIK of 11.75% |
| |
| (15) | Investments value was determined using significant unobservable inputs (see Note 2. Significant Accounting Policies). |
| |
| (16) | Non-income producing security. |
| |
| (17) | The negative fair value is the result of the unfunded commitment being valued below par. The negative amortized cost is the result of the capitalized discount being greater than the principal amount outstanding on the loan. |
| |
| (18) | Investment was on non-accrual status as of December 31, 2019, meaning that the Master Fund has ceased recognizing interest income on these investments. As of December 31, 2019, debt investments on non-accrual status represented 1.0% and 0.5% of total investments on an amortized cost basis and fair value basis, respectively. |
Abbreviations:
CN = Canada; UK = United Kingdom; IT = Italy; IR=Ireland
See Notes to Consolidated Financial Statements.
GUGGENHEIM CREDIT INCOME FUND
CONSOLIDATED SCHEDULE OF INVESTMENTS
|
| | | | | | | | | | | | | | | | | | | | | | | | | |
December 31, 2018 (in thousands) |
Portfolio Company (1) (2) (3) | | Footnotes | | Investment | | Spread
Above
Reference
Rate (4) | | Interest
Rate (4) (5) | | Maturity Date | | Principal / Par Amount / Shares (6) | | Amortized Cost (7) (8) | | Fair Value | | % of Net Assets |
| INVESTMENTS | | | | | | | | | | | | | | | | | | |
| Debt investments - 153.9% | | | | | | | | | | | | | | | | | | |
| Aerospace & Defense | | | | | | | | | | | | | | | | |
| Advanced Integration Technology | | (15) | | Senior Secured Loans - First Lien | | L+4.75% | | 7.46% | | 4/3/2023 | | 1,256 |
| | $ | 1,256 |
| | $ | 1,244 |
| | 0.5 | % |
| National Technical Systems | | (15) | | Senior Secured Loans - First Lien | | L+6.25% | | 8.60% | | 6/12/2021 | | 3,470 |
| | 3,448 |
| | 3,331 |
| | 1.4 | % |
| Tronair, Inc | | (15) | | Senior Secured Loans - First Lien | | L+4.75% | | 7.56% | | 9/8/2023 | | 3,910 |
| | 3,879 |
| | 3,792 |
| | 1.6 | % |
| Total Aerospace & Defense | | | | | | | | | | | | 8,583 |
| | 8,367 |
| | 3.5 | % |
| Automotive | | | | | | | | | | | | | | | | |
| Accuride Corp. | | | | Senior Secured Loans - First Lien | | L+5.25% | | 8.05% | | 11/17/2023 | | 11,760 |
| | 11,425 |
| | 11,270 |
| | 4.8 | % |
| BBB Industries | | | | Senior Secured Loans - First Lien | | L+4.50% | | 6.88% | | 8/1/2025 | | 1,995 |
| | 1,976 |
| | 1,960 |
| | 0.8 | % |
| EnTrans International, LLC | | (15) | | Senior Secured Loans - First Lien | | L+6.00% | | 8.52% | | 11/1/2024 | | 4,000 |
| | 3,804 |
| | 3,980 |
| | 1.7 | % |
| | | | | | | | | | | | | | | | | | | |
| Mavis Tire Express Services Corp. | | (15) | | Senior Secured Loans - First Lien | | L+3.25% | | 5.75% | | 3/20/2025 | | 3,165 |
| | 3,151 |
| | 3,063 |
| | 1.3 | % |
| Mavis Tire Express Services Corp. (Delayed Draw) | | (15) | | Senior Secured Loans - First Lien | | L+3.25% | | 5.75% | | 3/20/2025 | | 76 |
| | 75 |
| | 73 |
| | — | % |
| Mavis Tire Express Services Corp. (Revolver) | | (9)(13)(15)(17) | | Senior Secured Loans - First Lien | | L+3.25% | | N/A | | 2/28/2025 | | — |
| | (24 | ) | | (23 | ) | | — | % |
| Mavis Tire Express Services Corp. (Delayed Draw) | | (9)(15)(17) | | Senior Secured Loans - First Lien | | N/A | | N/A | | 3/20/2025 | | — |
| | — |
| | (14 | ) | | — | % |
| | | | | | | | | | | | | | | 3,202 |
| | 3,099 |
| | 1.3 | % |
| | | | | | | | | | | | | | | | | | | |
| Trico Group LLC | | (15) | | Senior Secured Loans - First Lien | | L+6.50% | | 9.21% | | 2/2/2024 | | 5,366 |
| | 5,235 |
| | 5,272 |
| | 2.2 | % |
| WESCO Group | | (13)(15) | | Senior Secured Loans - First Lien | | L+4.25% | | 7.06% | | 6/14/2024 | | 1,260 |
| | 1,244 |
| | 1,246 |
| | 0.5 | % |
| Total Automotive | | | | | | | | | | | | 26,886 |
| | 26,827 |
| | 11.3 | % |
| Banking, Finance, Insurance & Real Estate | | | | | | | | | | | | | | | | |
| Gladman Developments Ltd. | | UK(10)(11)(13)(14)(15) | | Senior Secured Loans - First Lien | | G+6.75% | | 10.39% | | 8/16/2024 | | £ | 2,405 |
| | 2,999 |
| | 2,975 |
| | 1.3 | % |
| Gladman Developments Ltd. (Delayed Draw) | | UK(9)(10)(11)(13)(15)(17) | | Senior Secured Loans - First Lien | | G+6.75% | | N/A | | 8/16/2024 | | £ | — |
| | (31 | ) | | (49 | ) | | — | % |
| | | | | | | | | | | | | | | 2,968 |
| | 2,926 |
| | 1.3 | % |
| | | | | | | | | | | | | | | | | | | |
| Hunt Companies, Inc. | | (11) | | Senior Secured Bonds | | N/A | | 6.25% | | 2/15/2026 | | 4,000 |
| | 4,000 |
| | 3,418 |
| | 1.4 | % |
| JZ Capital Partners Ltd. | | UK(10)(11)(13)(15) | | Senior Secured Loans - First Lien | | L+5.75% | | 8.53% | | 6/14/2021 | | 375 |
| | 367 |
| | 371 |
| | 0.2 | % |
| Total Banking, Finance, Insurance & Real Estate | | | | | | | | | | 7,335 |
| | 6,715 |
| | 2.9 | % |
| Beverage, Food & Tobacco | | | | | | | | | | | | | | | | |
GUGGENHEIM CREDIT INCOME FUND
CONSOLIDATED SCHEDULE OF INVESTMENTS
|
| | | | | | | | | | | | | | | | | | | | | | | | | |
December 31, 2018 (in thousands) |
Portfolio Company (1) (2) (3) | | Footnotes | | Investment | | Spread
Above
Reference
Rate (4) | | Interest
Rate (4) (5) | | Maturity Date | | Principal / Par Amount / Shares (6) | | Amortized Cost (7) (8) | | Fair Value | | % of Net Assets |
| Addo Foods Group | | UK(10)(11)(15) | | Senior Secured Loans - First Lien | | G+8.00% | | 9.00% | | 4/19/2024 | | £ | 10,000 |
| | 12,192 |
| | 12,380 |
| | 5.2 | % |
| Blue Harvest Fisheries | | (15) | | Senior Secured Loans - First Lien | | L+7.00% | | 9.53% | | 7/29/2022 | | 4,800 |
| | 4,754 |
| | 4,757 |
| | 2.0 | % |
| | | | | | | | | | | | | | | | | | | |
| CTI Foods | | (12) | | Senior Secured Loans - First Lien | | L+3.50% | | 6.10% | | 6/29/2020 | | 5,370 |
| | 5,001 |
| | 4,077 |
| | 1.7 | % |
| CTI Foods | | (18) | | Senior Secured Loans - Second Lien | | L+7.25% | | 9.85% | | 6/28/2021 | | 5,000 |
| | 4,774 |
| | 533 |
| | 0.2 | % |
| | | | | | | | | | | | | | | 9,775 |
| | 4,610 |
| | 1.9 | % |
| | | | | | | | | | | | | | | | | | | |
| Kar Nut Products Co. | | (15) | | Senior Secured Loans - First Lien | | L+4.50% | | 7.02% | | 3/31/2023 | | 907 |
| | 900 |
| | 896 |
| | 0.4 | % |
| Kar Nut Products Co. | | (15) | | Senior Secured Loans - First Lien | | L+4.50% | | 7.02% | | 3/31/2023 | | 844 |
| | 836 |
| | 833 |
| | 0.4 | % |
| | | | | | | | | | | | | | | 1,736 |
| | 1,729 |
| | 0.8 | % |
| | | | | | | | | | | | | | | | | | | |
| Parts Town, LLC | | (15) | | Senior Secured Loans - First Lien | | L+4.00% | | 6.80% | | 12/9/2024 | | 4,208 |
| | 4,190 |
| | 4,123 |
| | 1.7 | % |
| Parts Town, LLC | | (13)(15) | | Senior Secured Loans - Second Lien | | L+8.00% | | 10.80% | | 12/8/2025 | | 4,250 |
| | 4,215 |
| | 4,208 |
| | 1.8 | % |
| | | | | | | | | | | | | | | 8,405 |
| | 8,331 |
| | 3.5 | % |
| Total Beverage, Food & Tobacco | | | | | | | | | | | | 36,862 |
| | 31,807 |
| | 13.4 | % |
| Capital Equipment | | | | | | | | | | | | | | | | |
| Cleaver Brooks, Inc. | | | | Senior Secured Bonds | | N/A | | 7.88% | | 3/1/2023 | | 2,000 |
| | 2,000 |
| | 1,930 |
| | 0.8 | % |
| Great Lakes Dredge and Dock | | (11)(13) | | Senior Unsecured Debt | | N/A | | 8.00% | | 5/15/2022 | | 1,488 |
| | 1,514 |
| | 1,512 |
| | 0.7 | % |
| Total Capital Equipment | | | | | | | | | | | | 3,514 |
| | 3,442 |
| | 1.5 | % |
| Chemicals, Plastics & Rubber | | | | | | | | | | | | | | | | |
| Ilpea Parent, Inc | | IT(10)(11)(15) | | Senior Secured Loans - First Lien | | L+4.75% | | 7.28% | | 3/2/2023 | | 5,665 |
| | 5,602 |
| | 5,608 |
| | 2.4 | % |
| Total Chemicals, Plastics & Rubber | | | | | | | | | | | | 5,602 |
| | 5,608 |
| | 2.4 | % |
| Construction & Building | | | | | | | | | | | | | | | | |
| GAL Manufacturing | | (15) | | Senior Secured Loans - First Lien | | L+4.00% | | 6.52% | | 6/26/2023 | | 5,483 |
| | 5,409 |
| | 5,325 |
| | 2.2 | % |
| GAL Manufacturing | | (13)(15) | | Senior Secured Loans - Second Lien | | L+8.25% | | 10.77% | | 6/26/2024 | | 6,000 |
| | 5,894 |
| | 5,847 |
| | 2.5 | % |
| GAL Manufacturing (Revolver) | | (9)(13)(15) | | Senior Secured Loans - First Lien | | L+4.25% | | N/A | | 6/24/2022 | | 49 |
| | 10 |
| | 11 |
| | — | % |
| | | | | | | | | | | | | | | 11,313 |
| | 11,183 |
| | 4.7 | % |
| | | | | | | | | | | | | | | | | | | |
| Springs Window Fashions, LLC | | | | Senior Secured Loans - First Lien | | L+4.25% | | 6.72% | | 6/15/2025 | | 2,985 |
| | 2,957 |
| | 2,909 |
| | 1.2 | % |
| Springs Window Fashions, LLC | | | | Senior Secured Loans - Second Lien | | L+8.50% | | 10.97% | | 6/15/2026 | | 3,000 |
| | 2,856 |
| | 2,783 |
| | 1.2 | % |
| | | | | | | | | | | | | | | 5,813 |
| | 5,692 |
| | 2.4 | % |
| Total Construction & Building | | | | | | | | | | | | 17,126 |
| | 16,875 |
| | 7.1 | % |
| Consumer Goods: Non-Durable | | | | | | | | | | | | | | | | |
| Galls LLC | | (15) | | Senior Secured Loans - First Lien | | L+6.25% | | 8.77% | | 1/31/2025 | | 3,657 |
| | 3,621 |
| | 3,584 |
| | 1.5 | % |
| Galls LLC (Delayed Draw) | | (15) | | Senior Secured Loans - First Lien | | L+6.25% | | 8.62% | | 1/31/2025 | | 411 |
| | 407 |
| | 403 |
| | 0.2 | % |
GUGGENHEIM CREDIT INCOME FUND
CONSOLIDATED SCHEDULE OF INVESTMENTS
|
| | | | | | | | | | | | | | | | | | | | | | | | | |
December 31, 2018 (in thousands) |
Portfolio Company (1) (2) (3) | | Footnotes | | Investment | | Spread
Above
Reference
Rate (4) | | Interest
Rate (4) (5) | | Maturity Date | | Principal / Par Amount / Shares (6) | | Amortized Cost (7) (8) | | Fair Value | | % of Net Assets |
| Galls LLC (Revolver) | | (9)(13)(15) | | Senior Secured Loans - First Lien | | L+6.25% | | 8.49% | | 1/31/2024 | | 274 |
| | 207 |
| | 208 |
| | 0.1 | % |
| Galls LLC (Delayed Draw) | | (9)(15)(17) | | Senior Secured Loans - First Lien | | N/A | | N/A | | 1/31/2025 | | — |
| | — |
| | (14 | ) | | — | % |
| | | | | | | | | | | | | | | 4,235 |
| | 4,181 |
| | 1.8 | % |
| | | | | | | | | | | | | | | | �� | | | |
| Implus Footcare, LLC | | (15) | | Senior Secured Loans - First Lien | | L+6.75% | | 9.55% | | 4/30/2021 | | 894 |
| | 887 |
| | 889 |
| | 0.4 | % |
| Implus Footcare, LLC | | (15) | | Senior Secured Loans - First Lien | | L+6.75% | | 9.55% | | 4/30/2021 | | 4,610 |
| | 4,577 |
| | 4,583 |
| | 1.9 | % |
| | | | | | | | | | | | | | | 5,464 |
| | 5,472 |
| | 2.3 | % |
| Total Consumer Goods: Non-Durable | | | | | | | | | | | | 9,699 |
| | 9,653 |
| | 4.1 | % |
| Consumer Goods: Durable | | | | | | | | | | | | | | | | |
| Williams Scotsman International, Inc. | | (11)(13) | | Senior Secured Bonds | | N/A | | 7.88% | | 12/15/2022 | | 4,000 |
| | 4,129 |
| | 3,910 |
| | 1.7 | % |
| Total Consumer Goods: Durable | | | | | | | | | | | | 4,129 |
| | 3,910 |
| | 1.7 | % |
| Containers, Packaging & Glass | | | | | | | | | | | | | | | | |
| Bioplan USA, Inc. | | | | Senior Secured Loans - First Lien | | L+4.75% | | 7.27% | | 9/23/2021 | | 5,294 |
| | 4,944 |
| | 4,994 |
| | 2.1 | % |
| | | | | | | | | | | | | | | | | | | |
| Resource Label Group LLC | | (15) | | Senior Secured Loans - First Lien | | L+4.50% | | 7.15% | | 5/26/2023 | | 3,484 |
| | 3,457 |
| | 3,431 |
| | 1.4 | % |
| Resource Label Group LLC | | (15) | | Senior Secured Loans - Second Lien | | L+8.50% | | 11.15% | | 11/26/2023 | | 3,000 |
| | 2,962 |
| | 2,978 |
| | 1.3 | % |
| | | | | | | | | | | | | | | 6,419 |
| | 6,409 |
| | 2.7 | % |
| Total Containers, Packaging & Glass | | | | | | | | | | | | 11,363 |
| | 11,403 |
| | 4.8 | % |
| Energy: Oil & Gas | | | | | | | | | | | | | | | | |
| Basic Energy Services Inc | | (13) | | Senior Secured Bonds | | N/A | | 10.75% | | 10/15/2023 | | 2,000 |
| | 1,982 |
| | 1,709 |
| | 0.7 | % |
| Navajo Nation Oil and Gas | | (15) | | Senior Secured Loans - First Lien | | L+7.50% | | 10.30% | | 6/14/2022 | | 4,813 |
| | 4,770 |
| | 4,722 |
| | 2.0 | % |
| Penn Virginia | | (11)(13)(15) | | Senior Secured Loans - Second Lien | | L+7.00% | | 9.53% | | 9/29/2022 | | 3,000 |
| | 2,951 |
| | 3,000 |
| | 1.3 | % |
| Permian Production Partners | | (15) | | Senior Secured Loans - First Lien | | L+6.00% | | 8.51% | | 5/20/2024 | | 3,900 |
| | 3,756 |
| | 3,822 |
| | 1.6 | % |
| Total Energy: Oil & Gas | | | | | | | | | | | | 13,459 |
| | 13,253 |
| | 5.6 | % |
| Healthcare & Pharmaceuticals | | | | | | | | | | | | | | | | |
| Alegeus Technologies, LLC. | | (15) | | Senior Secured Loans - First Lien | | L+6.25% | | 8.66% | | 9/5/2024 | | 8,000 |
| | 7,924 |
| | 7,860 |
| | 3.3 | % |
| | | | | | | | | | | | | | | | | | | |
| Alltech | | (13)(15) | | Senior Unsecured Debt | | L+8.25% | | 10.77% | | 7/21/2023 | | 14,375 |
| | 14,230 |
| | 14,238 |
| | 6.0 | % |
| Alltech | | (13)(15) | | Senior Unsecured Debt | | E+8.25% | | 9.25% | | 7/21/2023 | | € | 601 |
| | 621 |
| | 682 |
| | 0.3 | % |
| | | | | | | | | | | | | | | 14,851 |
| | 14,920 |
| | 6.3 | % |
| | | | | | | | | | | | | | | | | | | |
| Endo Pharmaceuticals Finance Co. | | IR(10)(11)(13) | | Senior Unsecured Debt | | N/A | | 5.38% | | 1/15/2023 | | 4,250 |
| | 3,480 |
| | 3,230 |
| | 1.4 | % |
| WIRB-Copernicus Group | | (15) | | Senior Secured Loans - Second Lien | | L+8.25% | | 10.77% | | 8/15/2023 | | 12,000 |
| | 11,798 |
| | 11,891 |
| | 5.0 | % |
| Total Healthcare & Pharmaceuticals | | | | | | | | | | | | 38,053 |
| | 37,901 |
| | 16.0 | % |
GUGGENHEIM CREDIT INCOME FUND
CONSOLIDATED SCHEDULE OF INVESTMENTS
|
| | | | | | | | | | | | | | | | | | | | | | | | | |
December 31, 2018 (in thousands) |
Portfolio Company (1) (2) (3) | | Footnotes | | Investment | | Spread
Above
Reference
Rate (4) | | Interest
Rate (4) (5) | | Maturity Date | | Principal / Par Amount / Shares (6) | | Amortized Cost (7) (8) | | Fair Value | | % of Net Assets |
| Hotel, Gaming & Leisure | | | | | | | | | | | | | | | | |
| Stadium Management Group | | | | Senior Secured Loans - First Lien | | L+3.00% | | 5.52% | | 1/23/2025 | | 2,382 |
| | 2,379 |
| | 2,315 |
| | 1.0 | % |
| Stadium Management Group | | (13) | | Senior Secured Loans - Second Lien | | L+7.00% | | 9.52% | | 1/23/2026 | | 2,400 |
| | 2,395 |
| | 2,372 |
| | 1.0 | % |
| | | | | | | | | | | | | | | 4,774 |
| | 4,687 |
| | 2.0 | % |
| Total Hotel, Gaming & Leisure | | | | | | | | | | | | 4,774 |
| | 4,687 |
| | 2.0 | % |
| Media: Advertising, Printing & Publishing | | | | | | | | | | | | | | | | |
| Boats Group | | (15) | | Senior Secured Loans - First Lien | | L+4.25% | | 6.77% | | 5/17/2024 | | 6,480 |
| | 6,413 |
| | 6,419 |
| | 2.7 | % |
| Boats Group | | (15) | | Senior Secured Loans - Second Lien | | L+8.00% | | 10.50% | | 11/18/2024 | | 4,000 |
| | 3,956 |
| | 3,922 |
| | 1.6 | % |
| Boats Group (Revolver) | | (9)(13)(15)(17) | | Senior Secured Loans - First Lien | | L+4.25% | | N/A | | 9/9/2021 | | — |
| | (69 | ) | | (57 | ) | | — | % |
| | | | | | | | | | | | | | | 10,300 |
| | 10,284 |
| | 4.3 | % |
| | | | | | | | | | | | | | | | | | | |
| McGraw-Hill Global Education Holdings | | | | Senior Secured Loans - First Lien | | L+4.00% | | 6.52% | | 5/4/2022 | | 1,980 |
| | 1,961 |
| | 1,795 |
| | 0.7 | % |
| McGraw-Hill Global Education Holdings | | (13)(14)(15) | | Senior Unsecured Debt | | N/A | | 11.00% | | 4/20/2022 | | 2,000 |
| | 1,957 |
| | 1,746 |
| | 0.7 | % |
| McGraw-Hill Global Education Holdings | | (13) | | Senior Unsecured Debt | | N/A | | 7.88% | | 5/15/2024 | | 2,000 |
| | 1,933 |
| | 1,560 |
| | 0.7 | % |
| | | | | | | | | | | | | | | 5,851 |
| | 5,101 |
| | 2.1 | % |
| | | | | | | | | | | | | | | | | | | |
| Trader Interactive | | (15) | | Senior Secured Loans - First Lien | | L+6.50% | | 9.02% | | 6/15/2024 | | 8,196 |
| | 8,147 |
| | 7,919 |
| | 3.4 | % |
| Trader Interactive (Revolver) | | (9)(13)(15)(17) | | Senior Secured Loans - First Lien | | L+6.50% | | N/A | | 6/15/2023 | | — |
| | (39 | ) | | (39 | ) | | — | % |
| | | | | | | | | | | | | | | 8,108 |
| | 7,880 |
| | 3.4 | % |
| Total Media: Advertising, Printing & Publishing | | | | | | | | | | 24,259 |
| | 23,265 |
| | 9.8 | % |
| Retail | | | | | | | | | | | | | | | | |
| Belk, Inc. | | | | Senior Secured Loans - First Lien | | L+4.75% | | 7.36% | | 12/12/2022 | | 1,433 |
| | 1,331 |
| | 1,163 |
| | 0.5 | % |
| Blue Nile, Inc. | | (15) | | Senior Secured Loans - First Lien | | L+6.50% | | 9.02% | | 2/17/2023 | | 11,100 |
| | 10,852 |
| | 11,072 |
| | 4.7 | % |
| Beverages and More, Inc. | | (13) | | Senior Secured Bonds | | N/A | | 11.50% | | 6/15/2022 | | 900 |
| | 717 |
| | 693 |
| | 0.3 | % |
| | | | | | | | | | | | | | | | | | | |
| Pet Holdings ULC | | CN(10)(11)(15) | | Senior Secured Loans - First Lien | | L+5.50% | | 7.90% | | 7/5/2022 | | 4,385 |
| | 4,339 |
| | 4,319 |
| | 1.8 | % |
| Pet Holdings ULC (Delayed Draw) | | CN(10)(11)(15) | | Senior Secured Loans - First Lien | | L+5.50% | | 7.90% | | 7/5/2022 | | 494 |
| | 494 |
| | 487 |
| | 0.2 | % |
| | | | | | | | | | | | | | | 4,833 |
| | 4,806 |
| | 2.0 | % |
| | | | | | | | | | | | | | | | | | | |
| Welcome Break Limited | | UK(10)(11)(15) | | Senior Secured Loans - Second Lien | | G+8.00% | | 8.82% | | 1/30/2023 | | 1,540 |
| | 1,902 |
| | 1,943 |
| | 0.8 | % |
| Total Retail | | | | | | | | | | | | 19,635 |
| | 19,677 |
| | 8.3 | % |
| Services: Business | | | | | | | | | | | | | | | | |
| 24-7 Intouch | | CN(10)(11)(15) | | Senior Secured Loans - First Lien | | L+4.25% | | 6.76% | | 8/20/2025 | | 3,990 |
| | 3,720 |
| | 3,821 |
| | 1.6 | % |
| | | | | | | | | | | | | | | | | | | |
GUGGENHEIM CREDIT INCOME FUND
CONSOLIDATED SCHEDULE OF INVESTMENTS
|
| | | | | | | | | | | | | | | | | | | | | | | | | |
December 31, 2018 (in thousands) |
Portfolio Company (1) (2) (3) | | Footnotes | | Investment | | Spread
Above
Reference
Rate (4) | | Interest
Rate (4) (5) | | Maturity Date | | Principal / Par Amount / Shares (6) | | Amortized Cost (7) (8) | | Fair Value | | % of Net Assets |
| Alexander Mann Solutions (USD Term Loan) | | UK(10)(11)(13)(15) | | Senior Secured Loans - First Lien | | L+5.50% | | 7.97% | | 8/11/2025 | | 890 |
| | 844 |
| | 857 |
| | 0.4 | % |
| Alexander Mann Solutions (GBP Term Loan) | | UK(10)(11)(13) | | Senior Secured Loans - First Lien | | G+5.50% | | 6.23% | | 8/11/2025 | | £ | 2,060 |
| | 2,528 |
| | 2,539 |
| | 1.1 | % |
| Alexander Mann Solutions (Revolver) | | UK(9)(10)(11)(13)(15)(17) | | Senior Secured Loans - First Lien | | L+5.50% | | N/A | | 8/9/2024 | | — |
| | (53 | ) | | (52 | ) | | — | % |
| | | | | | | | | | | | | | | 3,319 |
| | 3,344 |
| | 1.5 | % |
| | | | | | | | | | | | | | | | | | | |
| Capstone Logistics | | | | Senior Secured Loans - First Lien | | L+4.50% | | 7.02% | | 10/7/2021 | | 4,867 | | 4,838 |
| | 4,810 |
| | 2.0 | % |
| Clarion (Comet Bidco) | | UK(10)(11)(13) | | Senior Secured Loans - First Lien | | L+5.00% | | 7.71% | | 9/30/2024 | | 5,940 | | 5,832 |
| | 5,792 |
| | 2.5 | % |
| ECG Management Consultants | | (15) | | Senior Secured Loans - First Lien | | L+4.50% | | 7.30% | | 6/20/2024 | | 1,522 | | 1,508 |
| | 1,499 |
| | 0.6 | % |
| HealthChannels, Inc. | | | | Senior Secured Loans - First Lien | | L+4.50% | | 6.88% | | 4/3/2025 | | 2,886 | | 2,827 |
| | 2,835 |
| | 1.2 | % |
| | | | | | | | | | | | | | | | | | | |
| Park Place Technologies | | (15) | | Senior Secured Loans - First Lien | | L+4.00% | | 6.52% | | 3/29/2025 | | 2,699 | | 2,688 |
| | 2,675 |
| | 1.1 | % |
| Park Place Technologies | | (13)(15) | | Senior Secured Loans - Second Lien | | L+8.00% | | 10.52% | | 3/29/2026 | | 3,404 | | 3,381 |
| | 3,387 |
| | 1.4 | % |
| | | | | | | | | | | | | | | 6,069 |
| | 6,062 |
| | 2.5 | % |
| | | | | | | | | | | | | | | | | | | |
| SLR Consulting | | UK(10)(11)(13)(15) | | Senior Secured Loans - First Lien | | L+4.00% | | 6.50% | | 5/23/2025 | | 1,588 | | 1,547 |
| | 1,498 |
| | 0.7 | % |
| SLR Consulting (Delayed Draw) | | UK(9)(10)(11)(13)(15)(17) | | Senior Secured Loans - First Lien | | L+4.00% | | 1.40% | | 5/23/2025 | | — |
| | (8 | ) | | (29 | ) | | — | % |
| | | | | | | | | | | | | | | 1,539 |
| | 1,469 |
| | 0.7 | % |
| | | | | | | | | | | | | | | | | | | |
| YAK Access, LLC | | (13)(15) | | Senior Secured Loans - Second Lien | | L+10.00% | | 12.43% | | 7/10/2026 | | 5,000 | | 4,661 |
| | 4,050 |
| | 1.7 | % |
| Total Services: Business | | | | | | | | | | | | 34,313 |
| | 33,682 |
| | 14.3 | % |
| Technology | | | | | | | | | | | | | | | | |
| Advicent Solutions | | (15) | | Senior Secured Loans - First Lien | | L+8.25% | | 11.05% | | 2/28/2022 | | 7,054 | | 6,941 |
| | 6,945 |
| | 2.9 | % |
| Air Newco, LLC | | (11) | | Senior Secured Loans - First Lien | | L+4.75% | | 7.14% | | 5/31/2024 | | 2,805 | | 2,798 |
| | 2,784 |
| | 1.2 | % |
| Alfresco Software | | (15) | | Senior Secured Loans - First Lien | | L+8.50% | | 11.27% | | 9/9/2024 | | 3,311 | | 3,238 |
| | 3,232 |
| | 1.4 | % |
| | | | | | | | | | | | | | | | | | | |
| Apptio, Inc. | | (9)(12)(13)(15)(17) | | Senior Secured Loans - First Lien | | N/A | | N/A | | 12/3/2024 | | — |
| | (41 | ) | | (40 | ) | | — | % |
| Apptio, Inc. | | (12)(15) | | Senior Secured Loans - First Lien | | L+7.25% | | 9.77% | | 12/3/2024 | | 3,916 | | 3,872 |
| | 3,872 |
| | 1.6 | % |
| | | | | | | | | | | | | | | 3,831 |
| | 3,832 |
| | 1.6 | % |
| | | | | | | | | | | | | | | | | | | |
| Bullhorn, Inc. | | (15) | | Senior Secured Loans - First Lien | | L+6.75% | | 9.40% | | 11/21/2022 | | 5,671 | | 5,643 |
| | 5,533 |
| | 2.3 | % |
| Bullhorn, Inc. (Delayed Draw) | | (13)(15) | | Senior Secured Loans - First Lien | | L+6.75% | | 9.40% | | 11/21/2022 | | 1,501 | | 1,494 |
| | 1,464 |
| | 0.6 | % |
GUGGENHEIM CREDIT INCOME FUND
CONSOLIDATED SCHEDULE OF INVESTMENTS
|
| | | | | | | | | | | | | | | | | | | | | | | | | |
December 31, 2018 (in thousands) |
Portfolio Company (1) (2) (3) | | Footnotes | | Investment | | Spread
Above
Reference
Rate (4) | | Interest
Rate (4) (5) | | Maturity Date | | Principal / Par Amount / Shares (6) | | Amortized Cost (7) (8) | | Fair Value | | % of Net Assets |
| Bullhorn, Inc. (Revolver) | | (13)(15) | | Senior Secured Loans - First Lien | | L+6.75% | | 0.50% | | 11/21/2022 | | 296 | | 266 |
| | 268 |
| | 0.1 | % |
| | | | | | | | | | | | | | | 7,403 |
| | 7,265 |
| | 3.0 | % |
| | | | | | | | | | | | | | | | | | | |
| Causeway Technologies | | UK(10)(11)(12)(15) | | Senior Secured Loans - First Lien | | G+6.50% | | 7.41% | | 6/2/2024 | | 2,638 |
| | 3,335 |
| | 3,296 |
| | 1.4 | % |
| Causeway Technologies | | UK(10)(11)(12)(15) | | Senior Secured Loans - First Lien | | G+7.00% | | 7.00% | | 6/2/2024 | | 338 |
| | 426 |
| | 430 |
| | 0.2 | % |
| | | | | | | | | | | | | | | 3,761 |
| | 3,726 |
| | 1.6 | % |
| | | | | | | | | | | | | | | | | | | |
| Cologix Holdings | | | | Senior Secured Loans - Second Lien | | L+7.00% | | 9.52% | | 3/20/2025 | | 3,000 |
| | 2,974 |
| | 2,925 |
| | 1.2 | % |
| Cvent, Inc. | | (13)(15) | | Senior Secured Loans - First Lien | | L+3.75% | | 6.27% | | 11/29/2024 | | 1,995 |
| | 1,968 |
| | 1,915 |
| | 0.8 | % |
| | | | | | | | | | | | | | | | | | | |
| Datix Bidco Limited | | (15) | | Senior Secured Loans - First Lien | | L+4.50% | | 7.28% | | 4/28/2025 | | 1,931 |
| | 1,895 |
| | 1,899 |
| | 0.8 | % |
| Datix Bidco Limited | | (15) | | Senior Secured Loans - Second Lien | | L+7.75% | | 10.53% | | 9/24/2026 | | 462 |
| | 453 |
| | 451 |
| | 0.2 | % |
| | | | | | | | | | | | | | | 2,348 |
| | 2,350 |
| | 1.0 | % |
| | | | | | | | | | | | | | | | | | | |
| Kerridge Commercial Systems (USD Term Loan) | | UK(10)(11)(13)(15) | | Senior Secured Loans - First Lien | | L+4.75% | | 7.05% | | 1/22/2024 | | 634 |
| | 624 |
| | 622 |
| | 0.3 | % |
| Kerridge Commercial Systems (GBP Term Loan) | | UK(10)(11)(13)(15) | | Senior Secured Loans - First Lien | | G+4.25% | | 5.16% | | 1/22/2024 | | £ | 528 |
| | 728 |
| | 660 |
| | 0.3 | % |
| Kerridge Commercial Systems (Euro Delayed Draw) | | UK(10)(11)(13)(15) | | Senior Secured Loans - First Lien | | E+4.75% | | 4.75% | | 1/22/2024 | | € | 97 |
| | 117 |
| | 110 |
| | — | % |
| Kerridge Commercial Systems (GBP Term Loan) | | UK(10)(11)(13)(15) | | Senior Secured Loans - First Lien | | G+4.25% | | 5.16% | | 1/22/2024 | | £ | 325 |
| | 420 |
| | 412 |
| | 0.2 | % |
| | | | | | | | | | | | | | | 1,889 |
| | 1,804 |
| | 0.8 | % |
| | | | | | | | | | | | | | | | | | | |
| Lytx, Inc. | | (15) | | Senior Secured Loans - First Lien | | L+6.75% | | 9.27% | | 8/31/2023 | | 6,549 |
| | 6,421 |
| | 6,394 |
| | 2.7 | % |
| Lytx, Inc. | | (15) | | Senior Secured Loans - First Lien | | L+6.75% | | 9.27% | | 8/31/2023 | | 1,468 |
| | 1,429 |
| | 1,433 |
| | 0.6 | % |
| Lytx, Inc. (Revolver) | | (9)(13)(15)(17) | | Senior Secured Loans - First Lien | | L+6.75% | | N/A | | 8/31/2022 | | — |
| | (34 | ) | | (34 | ) | | — | % |
| | | | | | | | | | | | | | | 7,816 |
| | 7,793 |
| | 3.3 | % |
| | | | | | | | | | | | | | | | | | | |
| Ministry Brands | | (13)(15) | | Senior Secured Loans - First Lien | | L+4.00% | | 6.52% | | 12/2/2022 | | 963 |
| | 956 |
| | 963 |
| | 0.4 | % |
| Ministry Brands (Delayed Draw) | | (13)(15) | | Senior Secured Loans - First Lien | | L+4.00% | | 6.52% | | 12/2/2022 | | 512 |
| | 510 |
| | 512 |
| | 0.2 | % |
| Ministry Brands (Delayed Draw) | | (13)(15) | | Senior Secured Loans - First Lien | | L+4.00% | | 6.52% | | 12/2/2022 | | 186 |
| | 186 |
| | 186 |
| | 0.1 | % |
| | | | | | | | | | | | | | | 1,652 |
| | 1,661 |
| | 0.7 | % |
| | | | | | | | | | | | | | | | | | | |
| Onyx CenterSource | | (15) | | Senior Secured Loans - First Lien | | L+6.25% | | 9.06% | | 12/20/2021 | | 6,993 |
| | 6,972 |
| | 6,993 |
| | 3.0 | % |
| Onyx CenterSource (Revolver) | | (9)(13)(15)(17) | | Senior Secured Loans - First Lien | | L+6.25% | | N/A | | 12/20/2021 | | — |
| | (24 | ) | | (24 | ) | | — | % |
GUGGENHEIM CREDIT INCOME FUND
CONSOLIDATED SCHEDULE OF INVESTMENTS
|
| | | | | | | | | | | | | | | | | | | | | | | | | |
December 31, 2018 (in thousands) |
Portfolio Company (1) (2) (3) | | Footnotes | | Investment | | Spread
Above
Reference
Rate (4) | | Interest
Rate (4) (5) | | Maturity Date | | Principal / Par Amount / Shares (6) | | Amortized Cost (7) (8) | | Fair Value | | % of Net Assets |
| | | | | | | | | | | | | | | 6,948 |
| | 6,969 |
| | 3.0 | % |
| | | | | | | | | | | | | | | | | | | |
| Planview, Inc. | | (15) | | Senior Secured Loans - First Lien | | L+5.25% | | 7.77% | | 1/27/2023 | | 6,215 |
| | 6,167 |
| | 6,215 |
| | 2.6 | % |
| Planview, Inc. | | (15) | | Senior Secured Loans - First Lien | | L+5.25% | | 7.77% | | 1/27/2023 | | 395 |
| | 395 |
| | 395 |
| | 0.2 | % |
| Planview, Inc. | | (15) | | Senior Secured Loans - Second Lien | | L+9.75% | | 12.27% | | 7/27/2023 | | 4,388 |
| | 4,328 |
| | 4,341 |
| | 1.9 | % |
| | | | | | | | | | | | | | | 10,890 |
| | 10,951 |
| | 4.7 | % |
| | | | | | | | | | | | | | | | | | | |
| Velocity Holdings US | | (15) | | Senior Secured Loans - First Lien | | L+7.00% | | 9.79% | | 12/12/2023 | | 5,483 |
| | 5,368 |
| | 5,341 |
| | 2.3 | % |
| Velocity Holdings US (Revolver) | | (9)(13)(15) | | Senior Secured Loans - First Lien | | L+7.00% | | 9.33% | | 12/12/2022 | | 346 |
| | 299 |
| | 299 |
| | 0.1 | % |
| | | | | | | | | | | | | | | 5,667 |
| | 5,640 |
| | 2.4 | % |
| | | | | | | | | | | | | | | | | | | |
| Wind River Systems | | (9)(13)(15)(17) | | Senior Secured Loans - First Lien | | N/A | | N/A | | 3/17/2019 | | — |
| | (30 | ) | | (34 | ) | | — | % |
| Wind River Systems | | (13)(15) | | Senior Secured Loans - First Lien | | L+6.75% | | 9.57% | | 6/24/2024 | | 5,647 |
| | 5,482 |
| | 5,562 |
| | 2.4 | % |
| | | | | | | | | | | | | | | 5,452 |
| | 5,528 |
| | 2.4 | % |
| Total Technology | | | | | | | | | | | | 75,576 |
| | 75,320 |
| | 32.0 | % |
| Telecommunications | | | | | | | | | | | | | | | | |
| Firstlight Fiber | | | | Senior Secured Loans - First Lien | | L+3.50% | | 6.02% | | 7/23/2025 | | 2,253 |
| | 2,242 |
| | 2,240 |
| | 1.0 | % |
| Firstlight Fiber | | (13) | | Senior Secured Loans - Second Lien | | L+7.50% | | 10.02% | | 7/23/2026 | | 2,500 |
| | 2,476 |
| | 2,456 |
| | 1.0 | % |
| | | | | | | | | | | | | | | 4,718 |
| | 4,696 |
| | 2.0 | % |
| Total Telecommunications | | | | | | | | | | | | 4,718 |
| | 4,696 |
| | 2.0 | % |
| Transportation: Cargo | | | | | | | | | | | | | | | | |
| Flexi-Van Leasing Inc. | | | | Senior Secured Bonds | | N/A | | 10.00% | | 2/15/2023 | | 4,975 |
| | 4,730 |
| | 4,030 |
| | 1.7 | % |
| Total Transportation: Cargo | | | | | | | | | | | | 4,730 |
| | 4,030 |
| | 1.7 | % |
| Utilities: Electric | | | | | | | | | | | | | | | | |
| BHI Energy | | (15) | | Senior Secured Loans - Second Lien | | L+8.75% | | 11.63% | | 2/28/2025 | | 6,000 |
| | 5,895 |
| | 5,880 |
| | 2.5 | % |
| Moxie Patriot, LLC | | | | Senior Secured Loans - First Lien | | L+6.50% | | 9.30% | | 8/21/2020 | | 2,922 |
| | 2,888 |
| | 2,634 |
| | 1.1 | % |
| MRP Generation Holdings, LLC | | (15) | | Senior Secured Loans - First Lien | | L+7.00% | | 9.80% | | 10/18/2022 | | 4,888 |
| | 4,687 |
| | 4,668 |
| | 2.0 | % |
| Total Utilities: Electric | | | | | | | | | | | | 13,470 |
| | 13,182 |
| | 5.6 | % |
| | | | | | | | | | | | | | | | | | | |
| Utilities: Oil & Gas | | | | | | | | | | | | | | | | |
| Ferrellgas, LP | | (11) | | Senior Unsecured Debt | | N/A | | 6.75% | | 1/15/2022 | | 2,250 |
| | 2,219 |
| | 1,834 |
| | 0.8 | % |
| Ferrellgas, LP | | (11) | | Senior Unsecured Debt | | N/A | | 6.75% | | 6/15/2023 | | 1,855 |
| | 1,782 |
| | 1,493 |
| | 0.6 | % |
| | | | | | | | | | | | | | | 4,001 |
| | 3,327 |
| | 1.4 | % |
| | | | | | | | | | | | | | | | | | | |
| SeaPort | | (15) | | Senior Secured Loans - First Lien | | L+5.50% | | 8.03% | | 10/31/2025 | | 6,000 |
| | 5,823 |
| | 6,000 |
| | 2.5 | % |
GUGGENHEIM CREDIT INCOME FUND
CONSOLIDATED SCHEDULE OF INVESTMENTS
|
| | | | | | | | | | | | | | | | | | | | | | | | | |
December 31, 2018 (in thousands) |
Portfolio Company (1) (2) (3) | | Footnotes | | Investment | | Spread
Above
Reference
Rate (4) | | Interest
Rate (4) (5) | | Maturity Date | | Principal / Par Amount / Shares (6) | | Amortized Cost (7) (8) | | Fair Value | | % of Net Assets |
| Total Utilities: Oil & Gas | | | | | | | | | | | | 9,824 |
| | 9,327 |
| | 3.9 | % |
| Total Debt Investments | | | | | | | | | | | | | | $ | 373,910 |
| | $ | 363,627 |
| | 153.9 | % |
| | | | | | | | | | | | | | | | | | | |
| Equity investments - 4.4% | | | | | | | | | | | | | | | | | | |
| Banking, Finance, Insurance & Real Estate | | | | | | | | | | | | | | | | |
| Four Springs Capital Trust (Preferred Equity) | | (11)(13)(14)(15) | | Equity and Other | | N/A | | 16.75% | | | | 201,713 |
| | $ | 3,983 |
| | $ | 4,034 |
| | 1.7 | % |
| Total Banking, Finance, Insurance & Real Estate | | | | | | | | | | | | 3,983 |
| | 4,034 |
| | 1.7 | % |
| Energy: Oil & Gas | | | | | | | | | | | | | | | | |
| Maverick Natural Resources, LLC (Common Equity) | | (15)(16) | | Equity and Other | | N/A | | N/A | | | | 4,625 |
| | 3,413 |
| | 3,222 |
| | 1.3 | % |
| SandRidge Energy, Inc. (Common Equity) | | (11)(13)(16) | | Equity and Other | | N/A | | N/A | | | | 21,224 |
| | 448 |
| | 162 |
| | 0.1 | % |
| Total Energy: Oil & Gas | | | | | | | | | | | | 3,861 |
| | 3,384 |
| | 1.4 | % |
| Technology | | | | | | | | | | | | | | | | |
| Alfresco Software (Common Equity) | | (13)(15)(16) | | Equity and Other | | N/A | | N/A | | | | 1,656 |
| | 165 |
| | 204 |
| | 0.1 | % |
| Lytx, Inc. (Preferred Equity) | | (13)(14)(15) | | Equity and Other | | N/A | | 14.75% | | | | 2,604 |
| | 2,604 |
| | 2,604 |
| | 1.1 | % |
| Velocity Holdings US (Class A Units) | | (13)(15)(16) | | Equity and Other | | N/A | | N/A | | | | 231 |
| | 231 |
| | 231 |
| | 0.1 | % |
| Wolfhound Parent Inc. | | (13)(15)(16) | | Equity and Other | | N/A | | N/A | | | | 1,975 |
| | 30 |
| | 30 |
| | — | % |
| Total Technology | | | | | | | | | | | | 3,030 |
| | 3,069 |
| | 1.3 | % |
| Total Equity Investments | | | | | | | | | | | | | | $ | 10,874 |
| | $ | 10,487 |
| | 4.4 | % |
| | | | | | | | | | | | | | | | | | | |
| Total Investments - 158.3% | | | | | | | | | | | | | | $ | 384,784 |
| | $ | 374,114 |
| | 158.3 | % |
|
| | | | | | | | | | | | | | | | | | | | |
December 31, 2018 (in thousands) |
| Derivative Counterparty | | Settlement Date | | Amount Purchased | | Amount Sold | | Amortized Cost (7) (8) | | Fair Value | | % of Net Assets |
| Foreign Currency Forward Contracts | | | | | | | | | | | |
| JPMorgan Chase Bank | | 1/14/2019 | | £ | (108 | ) | | $ | (85 | ) | | — |
| | $ | 1 |
| | — | % |
| JPMorgan Chase Bank | | 1/14/2019 | | $ | 841 |
| | £ | 665 |
| | — |
| | $ | (7 | ) | | — | % |
| JPMorgan Chase Bank | | 1/14/2019 | | $ | 27,982 |
| | £ | 22,230 |
| | — |
| | $ | (373 | ) | | (0.2 | )% |
| JPMorgan Chase Bank | | 1/14/2019 | | $ | 795 |
| | € | 697 |
| | — |
| | $ | (5 | ) | | — | % |
| | | | | | | | | | | $ | (384 | ) | | (0.2 | )% |
_______________________
| |
| (1) | Security may be an obligation of one or more entities affiliated with the named portfolio company. |
| |
| (2) | All debt and equity investments are income producing unless otherwise noted. |
GUGGENHEIM CREDIT INCOME FUND
CONSOLIDATED SCHEDULE OF INVESTMENTS
| |
| (3) | All investments are non-controlled/non-affiliated investments as defined by the Investment Company Act of 1940 (the "1940 Act"). The provisions of the 1940 Act classify investments based on the level of control that we maintain in a particular portfolio company. As defined in the 1940 Act, a company is generally presumed to be “non-controlled” when we own 25% or less of the portfolio company’s voting securities and “controlled” when we own more than 25% of the portfolio company’s voting securities. The provisions of the 1940 Act also classify investments further based on the level of ownership that we maintain in a particular portfolio company. As defined in the 1940 Act, a company is generally deemed as “non-affiliated” when we own less than 5% of a portfolio company’s voting securities and “affiliated” when we own 5% or more of a portfolio company’s voting securities. |
| |
| (4) | The periodic interest rate for all floating rate loans is indexed to London Interbank Offered Rate ("LIBOR" or "LIBO rate") (denoted as "L"), Euro Interbank Offered Rate ("EURIBOR") (denoted as "E"), British Pound Sterling LIBOR ("GBP LIBOR") (denoted as "G") or Prime Rate (denoted as "P"). Pursuant to the terms of the underlying credit agreements, the base interest rates typically reset annually, semi-annually, quarterly or monthly at the borrower's option. The borrower may also elect to have multiple interest reset periods for each loan. For each of these floating rate loans, the Consolidated Schedule of Investments presents the applicable margin over LIBOR, EURIBOR, GBP LIBOR or Prime based on each respective credit agreement. As of December 31, 2018, LIBO rates ranged between 2.50% for 1-month LIBOR to 2.81% for 3-month LIBOR. |
| |
| (5) | For portfolio companies with multiple interest rate contracts under a single credit agreement, the interest rate shown is a weighted average current interest rate in effect at December 31, 2018. |
| |
| (6) | Unless noted otherwise, the principal amount (par amount) for all debt securities is denominated in U.S. dollars. Equity investments are recorded as number of shares owned. |
| |
| (7) | Cost represents amortized cost, inclusive of any capitalized paid-in-kind income ("PIK"), for debt securities, and cost plus capitalized PIK, if any, for preferred stock. |
| |
| (8) | As of December 31, 2018, the aggregate gross unrealized appreciation for all securities, including foreign currency forward contracts, in which there was an excess of value over tax cost was $1.6 million; the aggregate gross unrealized depreciation for all securities, including foreign currency forward contracts, in which there was an excess of tax cost over value was $12.7 million; the net unrealized depreciation was $11.1 million; the aggregate cost of securities for Federal income tax purposes was $384.8 million. |
| |
| (9) | The investment is either a delayed draw loan or a revolving credit facility whereby some or all of the investment commitment is undrawn as of December 31, 2018 (see Note 8. Commitments and Contingencies). |
| |
| (10) | A portfolio company domiciled in a foreign country. The regulatory jurisdiction of security issuance may be a different country than the domicile of the portfolio company. |
| |
| (11) | The investment is not a qualifying asset as defined in Section 55(a) of the 1940 Act. As of December 31, 2018, qualifying assets represented 81% of total assets. Under the 1940 Act we may not acquire any non-qualifying assets unless, at the time the acquisition is made, qualifying assets represent at least 70% of our total assets. |
| |
| (12) | Investment position or portion thereof unsettled as of December 31, 2018. |
| |
| (13) | The investment position, or a portion thereof, was not pledged as collateral supporting the amounts outstanding under our credit facility as of December 31, 2018; (see Note 7. Borrowings). |
| |
| (14) | The underlying credit agreement or indenture contains a PIK provision, whereby the issuer has either the option or the obligation to make interest payments with the issuance of additional securities. The interest rate in the schedule represents the current interest rate in effect for these investments. |
|
| | | | | | | |
| | Coupon Rate | PIK Component | Cash Component | PIK Option |
| Four Springs Capital Trust | 16.75 | % | 16.75 | % | — | % | The Portfolio Company may elect PIK up to 16.75% |
| Gladman Developments Ltd. | G+9.50% |
| 2.75 | % | G+6.75% |
| The Portfolio Company may elect PIK up to 2.75% |
| Lytx, Inc. | 14.75 | % | 14.75 | % | — | % | The Portfolio Company may elect PIK up to 14.75% |
| McGraw-Hill Global Education Holdings | 11.00 | % | — | % | 11.00 | % | The Portfolio Company may elect partial PIK up to 50% of the interest of the period or full PIK of 11.75% |
| |
| (15) | Investments value was determined using significant unobservable inputs (see Note 2. Significant Accounting Policies). |
| |
| (16) | Non-income producing security. |
GUGGENHEIM CREDIT INCOME FUND
CONSOLIDATED SCHEDULE OF INVESTMENTS
| |
| (17) | The negative fair value is the result of the unfunded commitment being valued below par. The negative amortized cost is the result of the capitalized discount being greater than the principal amount outstanding on the loan. |
| |
| (18) | Investment was on non-accrual status as of December 31, 2018, meaning that the Master Fund has ceased recognizing interest income on these investments. As of December 31, 2018, debt investments on non-accrual status represented 1.2% and 0.1% of total investments on an amortized cost basis and fair value basis, respectively. |
Abbreviations:
CN = Canada; UK = United Kingdom; IT = Italy; IR=Ireland
See Notes to Consolidated Financial Statements.
GUGGENHEIM CREDIT INCOME FUND
NOTES TO CONSOLIDATED FINANCIAL STATEMENTS
(in thousands, except share and per share data, percentages and as otherwise indicated;
for example, with the word “million” or otherwise)
Note 1. Principal Business and Organization
Guggenheim Credit Income Fund (the “Master Fund”) was formed as a Delaware statutory trust on September 5, 2014. The Master Fund's investment objectives are to provide its shareholders with current income, capital preservation and, to a lesser extent, long-term capital appreciation by investing primarily in privately-negotiated loans to private middle market United States (U.S.) companies. On April 1, 2015, the Master Fund elected to be regulated as a business development company ("BDC") under the Investment Company Act of 1940, as amended (the "1940 Act"). The Master Fund commenced investment operations on April 2, 2015. The Master Fund serves as the master fund in a master fund/feeder fund structure. The Master Fund issues its shares ("Shares" or "Common Shares") to one or more affiliated feeder funds in a continuous series of private placement transactions.
Guggenheim Partners Investment Management, LLC ("Guggenheim" or the "Advisor") is responsible for sourcing potential investments, analyzing and conducting due diligence on prospective investment opportunities, structuring investments and ongoing monitoring of the Master Fund’s investment portfolio.
As of December 31, 2019, the Master Fund had one wholly-owned subsidiary, Hamilton Finance LLC ("Hamilton"), a special purpose financing subsidiary organized for the purpose of arranging secured debt financing, entering into credit agreements and borrowing money to invest in portfolio companies.
Note 2. Significant Accounting Policies
Basis of Presentation
Management has determined that the Master Fund meets the definition of an investment company and adheres to the accounting and reporting guidance in the Financial Accounting Standards Board ("FASB") Accounting Standards Codification ("ASC") Topic 946 — Financial Services — Investment Companies ("ASC 946").
The accompanying consolidated financial statements of the Master Fund and related financial information have been prepared in accordance with accounting principles generally accepted in the U.S. ("GAAP") and pursuant to the requirements for reporting on Form 10-K and Regulation S-X under the Securities Act of 1933, as amended.
Principles of Consolidation
As provided under ASC 946, the Master Fund will generally not consolidate its investment in a company other than an investment in an investment company or an operating company whose business consists of providing substantially all of its services to the benefit of the Master Fund. Accordingly, the Master Fund consolidated the results of its wholly-owned subsidiary in its consolidated financial statements. All intercompany balances and transactions have been eliminated.
Reclassifications
Certain prior period amounts may be reclassified to conform to the current presentation, with no effect on our financial condition, results of operations or cash flows.
Use of Estimates
The preparation of financial statements in conformity with GAAP requires management to make estimates and assumptions that affect (i) the reported amounts of assets and liabilities at the date of the financial statements, (ii) the reported amounts of income and expenses during the reported period and (iii) disclosure of contingent assets and liabilities at the date of the financial statements. Actual results could differ materially from those estimates under different assumptions and conditions.
Cash
Cash consists of demand deposits held at a major U.S. financial institution and the amount recorded on the consolidated statements of assets and liabilities exceeds the Federal Deposit Insurance Corporation insured limit. Management believes the credit risk related to its demand deposits is minimal.
Restricted Cash
Restricted cash consists of cash collateral that has been pledged to cover obligations of the Master Fund according to its derivative contracts and demand deposits held at a major U.S. financial institution on behalf of Hamilton. Hamilton may be restricted in the distribution of cash to the Master Fund, as governed by the terms of the Hamilton Credit Facility (see Note 7. Borrowings). Management believes the credit risk related to its demand deposits is minimal.
Notes to Consolidated Financial Statements
Valuation of Investments
The Master Fund measures the value of its investments in accordance with ASC Topic 820 — Fair Value Measurement (“ASC 820”), issued by the FASB. Fair value is the price that would be received to sell an asset or paid to transfer a liability in an orderly transaction between market participants at the measurement date. Market participants are defined as buyers and sellers in the principal or most advantageous market (which may be a hypothetical market) that are independent, knowledgeable and willing and able to transact. In accordance with ASC 820, the Master Fund considers its principal market to be the market that has the greatest volume and level of activity.
ASC 820 defines hierarchical levels directly related to the amount of subjectivity associated with the inputs used to determine fair values of assets and liabilities. The hierarchical levels and types of inputs used to measure fair value for each level are described as follows:
Level 1 - Quoted prices are available in active markets for identical investments as of the reporting date. Publicly listed equities and debt securities, publicly listed derivatives, money market/short-term investment funds and foreign currency are generally included in Level 1. The Master Fund does not adjust the quoted price for these investments.
Level 2 - Valuation inputs are other than quoted prices in active markets, which are either directly or indirectly observable as of the reporting date, and fair value is determined through the use of models or other valuation methodologies. In certain cases, debt and equity securities are valued on the basis of prices from orderly transactions for similar investments in active markets between market participants and provided by reputable dealers or independent pricing services. In determining the value of a particular investment, independent pricing services may use certain information with respect to transactions in such investments, quotations from multiple dealers or brokers, pricing matrices, market transactions in comparable investments and various relationships between investments. Investments generally included in this category are corporate bonds and loans.
Level 3 - Valuation inputs are unobservable for the investment and include situations where there is little, if any, market activity for the investment. The inputs into the determination of fair value require significant judgment or estimation. Investments generally included in this category are illiquid corporate bonds and loans and preferred stock investments that lack observable market pricing.
In certain cases, the inputs used to measure fair value may fall within different levels of the fair value hierarchy. In such cases, an investment’s level within the fair value hierarchy is based on the lowest level of input that is significant to the fair value measurement. Depending on the relative liquidity in the markets for certain investments, the Master Fund may transfer assets to Level 3 if it determines that observable quoted prices, obtained directly or indirectly, are severely limited, or not available, or otherwise not reliable. The Master Fund’s assessment of the significance of a particular input to the fair value measurement requires judgment, and the consideration of factors specific to the investment.
Investments for which market quotations are readily available are valued using market quotations, which are generally obtained from independent pricing services, broker-dealers or market makers. With respect to the Master Fund’s portfolio investments for which market quotations are not readily available, the Master Fund's board of trustees ("Board of Trustees"), including our trustees who are not "interested persons" as defined in the 1940 Act (the "Independent Trustees"), is responsible for determining in good faith the fair value of the Master Fund’s portfolio investments in accordance with the valuation policy and procedures approved by the Board of Trustees, based on, among other things, the input of Guggenheim and management, its audit committee and independent third-party valuation firms. The Master Fund and the Board of Trustees conduct their fair value determination process on a quarterly basis and any other time when a decision regarding the fair value of the portfolio investments is required.
The valuation techniques used by the Master Fund for the assets that are classified as Level 3 in the fair value hierarchy are described below.
Senior Debt and Subordinated Debt: Senior debt and subordinated debt investments are valued at initial transaction price and are subsequently valued using (i) market data for similar instruments (e.g., recent transactions or indicative broker quotes), and/or (ii) valuation models. Valuation models may be based on investment yield analysis and discounted cash flow techniques, where the key inputs include risk-adjusted discount rates and required rates of return, based on the analysis of similar debt investments issued by similar issuers.
Equity/Other Investments: Equity/other investments are valued at initial transaction price and are subsequently valued using valuation models in the absence of readily observable market prices. Valuation models are generally based on (i) market and income (discounted cash flow) approaches, in which various internal and external factors are considered, and (ii) earnings before interest, taxes, depreciation and amortization ("EBITDA") multiples analysis. Factors include key financial inputs and recent public and private transactions for comparable investments. Key inputs used for the discounted cash flow approach include the weighted average cost of capital and investment terminal values derived from EBITDA multiples. An illiquidity discount may be applied where appropriate.
Notes to Consolidated Financial Statements
The Master Fund utilizes several valuation techniques that use unobservable pricing inputs and assumptions in determining the fair value of its Level 3 investments. The valuation techniques, as well as the key unobservable inputs that have a significant impact on the Master Fund’s investments classified and valued as Level 3 in the valuation hierarchy, are described in Note 5. Fair Value of Financial Instruments. The unobservable inputs and assumptions may differ by asset and in the application of the Master Fund’s valuation methodologies. The reported fair value estimates could vary materially if the Master Fund had chosen to incorporate different unobservable pricing inputs and assumptions.
The determination of fair value involves subjective judgments and estimates. Due to the inherent uncertainty of determining the fair value of portfolio investments that do not have a readily available market value, the fair value of investments may differ materially from the values that would have been determined had a readily available market value existed for such investments. Further, such investments are generally less liquid than publicly traded securities. If the Master Fund was required to liquidate a portfolio investment that does not have a readily available market value in a forced or liquidation sale, the Master Fund could realize significantly less value than the value recorded by the Master Fund.
Security Transactions and Realized/Unrealized Gains or Losses
Investments purchased on a secondary market basis are recorded on the trade date. Loan originations are recorded on the funding date. All investments sold are derecognized on the trade date. The Master Fund measures realized gains or losses from the repayment or sale of investments using the specific lot identification method. Realized gains or losses are measured by the difference between (i) the net proceeds from the repayment or sale, inclusive of any prepayment premiums and (ii) the amortized cost basis of the investment without regard to unrealized appreciation or depreciation previously recognized and include investments charged off during the period, net of recoveries. Unrealized appreciation or depreciation primarily measures the change in investment values, including the reversal of previously recorded unrealized appreciation or depreciation when gains or losses are realized. The amortized cost basis of investments includes (i) the original cost, net of original issue discount and loan origination fees, if any, and (ii) adjustments for the accretion/amortization of market discounts and premiums. The Master Fund reports changes in fair value of investments as net change in unrealized appreciation (depreciation) on investments in the consolidated statements of operations.
Interest Income
Interest income is recorded on an accrual basis and includes amortization of premiums to par value and accretion of discounts to par value. Discounts and premiums to par value on securities purchased are accreted/amortized into interest income over the life of the respective security using the effective interest method, or straight-line method, as applicable. Loan origination, closing and other fees received by the Master Fund directly or indirectly from borrowers in connection with the closing of investments are accreted over the contractual life of the debt investment as interest income based on the effective interest method.
Certain of the Master Fund’s investments in debt securities may contain a contractual payment-in-kind ("PIK") interest provision. The PIK provisions generally feature the obligation, or the option, at each interest payment date of making interest payments in (i) cash, (ii) additional securities or (iii) a combination of cash and additional securities. PIK interest, computed at the contractual rate specified in the investment’s credit agreement, is accrued as interest income and recorded as interest receivable up to the interest payment date. On the interest payment date, the Master Fund will capitalize the accrued interest receivable attributable to PIK as additional principal due from the borrower. When additional PIK securities are received on the interest payment date, they typically have the same terms, including maturity dates and interest rates, as the original securities issued. PIK interest generally becomes due on the investment's maturity date or call date.
If the portfolio company's valuation indicates the value of the PIK security is not sufficient to cover the contractual PIK interest, the Master Fund will not accrue additional PIK interest income and will record an allowance for any accrued PIK interest receivable as a reduction of interest income in the period the Master Fund determines it is not collectible.
Debt securities are placed on non-accrual status when principal or interest payments are at least 90 days past due or when there is reasonable doubt that principal or interest will be collected. Generally, accrued interest is reversed against interest income when a debt security is placed on non-accrual status. Interest payments received on debt securities on non-accrual status may be recognized as interest income or applied to principal based on management’s judgment. Debt securities on non-accrual status are restored to accrual status when past due principal and interest are paid, and, in management’s judgment, such securities are likely to remain current on interest payment obligations. The Master Fund may make exceptions to this treatment if the debt security has sufficient collateral value and is in the process of collection.
Dividend Income
Dividend income on preferred equity securities is recorded as dividend income on an accrual basis to the extent that such amounts are payable by the portfolio company and are expected to be collected. Dividend income on equity securities is recorded on the record date for private portfolio companies or on the ex-dividend date for publicly traded portfolio companies. Each distribution received from limited liability company (“LLC”) and limited partnership (“LP”) equity investments is evaluated to determine if the distribution should be recorded as dividend income or a return of capital. Generally, the Master Fund will not record distributions from equity investments in LLCs and LPs as dividend income unless
Notes to Consolidated Financial Statements
there are sufficient accumulated tax basis earnings and profits in the LLC or LP prior to the distribution. Distributions that are classified as a return of capital are recorded as a reduction in the cost basis of the investment.
Fee Income
Guggenheim, or its affiliates, may provide financial advisory services to portfolio companies and in return may receive fees for capital structuring services. Guggenheim is obligated to remit to the Master Fund any earned capital structuring fees based on the pro rata portion of the Master Fund’s investment in originated co-investment transactions. These fees are generally non-recurring and are recognized as fee income by the Master Fund upon the earlier of the investment commitment date or investment closing date. The Master Fund may also receive fees for investment commitments, amendments to credit agreements and other services rendered to portfolio companies. Such fees are recognized as fee income when earned or when the services are rendered.
Derivative Instruments
Derivative instruments solely consist of foreign currency forward contracts. The Master Fund recognizes all derivative instruments as assets or liabilities at fair value in its consolidated financial statements. Foreign currency forward contracts entered into by the Master Fund are not designated as hedging instruments, and as a result, the Master Fund presents changes in fair value through net change in unrealized appreciation (depreciation) on foreign currency forward contracts in the consolidated statements of operations. Realized gains and losses that occur upon the cash settlement of the foreign currency forward contracts are included in net realized gains (losses) on foreign currency forward contracts on the consolidated statements of operations.
Foreign Currency Translation, Transactions and Gains (Losses)
Foreign currency amounts are translated into U.S. dollars on the following basis: (i) at the exchange rate on the last business day of the reporting period for the fair value of investment securities, other assets and liabilities; and (ii) at the prevailing exchange rate on the respective recording dates for the purchase and sale of investment securities, income, expenses, gains and losses.
Net assets and fair values are presented based on the applicable foreign exchange rates described above and the Master Fund does not isolate that portion of the results of operations resulting from changes in foreign exchange rates on investments from the fluctuations arising from changes in fair values of investments held; therefore, fluctuations related to foreign exchange rate conversions are included with the net realized gains (losses) and unrealized appreciation (depreciation) on investments.
Net realized gains or losses on foreign currency transactions arise from sales of foreign currency, currency gains or losses realized between the trade and settlement dates on securities transactions and the difference between the amounts of dividends, interest and foreign withholding taxes recorded by the Master Fund and the U.S. dollar equivalent of the amounts actually received or paid by the Master Fund.
Unrealized appreciation (depreciation) from foreign currency translation for foreign currency forward contracts is included in net change in unrealized appreciation (depreciation) on foreign currency forward contracts in the consolidated statements of operations and is included in accumulated earnings (loss), net of distributions on the consolidated statements of assets and liabilities.
Investment Advisory Fees
The Master Fund incurs investment advisory fees including: (i) a base management fee and (ii) a performance-based incentive fee which includes (a) an incentive fee on income and (b) an incentive fee on capital gains, due to Guggenheim pursuant to an investment advisory agreement between the Master Fund and Guggenheim (the "Investment Advisory Agreement") as described in Note 6. Related Party Agreements and Transactions. The two components of the performance-based incentive fee will be combined and expensed in the consolidated statements of operations and accrued in the consolidated statements of assets and liabilities as accrued performance-based incentive fee. Pursuant to the terms of the Investment Advisory Agreement, the incentive fee on capital gains is determined and payable in arrears as of the end of each calendar year (or upon termination of the Investment Advisory Agreement) based on the Master Fund’s realized capital gains on a cumulative basis from inception, net of all realized capital losses and unrealized depreciation on a cumulative basis, less the aggregate amount of any previously paid capital gains incentive fees. Although the terms of the Investment Advisory Agreement do not provide for the inclusion of unrealized gains in the calculation of the incentive fee on capital gains, the Master Fund includes unrealized gains in the calculation of the incentive fee on capital gains in accordance with GAAP. Therefore the accrued amount, if any, represents an estimate of the incentive fees that may be payable to Guggenheim if the Master Fund’s entire investment portfolio was liquidated at its fair value as of the date of the consolidated statements of assets and liabilities, even though Guggenheim is not entitled to any incentive fee based on unrealized appreciation unless and until such unrealized appreciation is realized.
Deferred Financing Costs
Deferred financing costs represent fees and other direct incremental costs incurred in connection with the arrangement of the Master Fund's borrowings. These costs are presented in the consolidated statements of assets and
Notes to Consolidated Financial Statements
liabilities as a direct deduction of the debt liability to which the costs pertain. These costs are amortized using the effective interest method and are included in interest expense on the consolidated statements of operations over the life of the borrowings.
Distributions
Distributions to the Master Fund's common shareholders are periodically declared by its Board of Trustees and recognized as a liability on the record date.
Federal Income Taxes
Beginning with its tax year ended December 31, 2015, the Master Fund has elected to be treated for federal income tax purposes, and thereafter intends to maintain its qualification, as a regulated investment company ("RIC") under Subchapter M of the Internal Revenue Code of 1986, as amended (the "Code"). Generally, a RIC is not subject to federal income taxes on distributed income and gains if it distributes dividends in a timely manner out of assets legally available for distributions to its shareholders of an amount generally at least equal to 90% of its “Investment Company Taxable Income,” as defined in the Code. The Master Fund intends to distribute sufficient dividends to maintain its RIC status each year and it does not anticipate paying a material level of federal income taxes.
The Master Fund is generally subject to nondeductible federal excise taxes if it does not distribute dividends to its shareholders in respect of each calendar year of an amount at least equal to the sum of (i) 98% of its net ordinary income (taking into account certain deferrals and elections) for the calendar year, (ii) 98.2% of its capital gain net income (i.e., capital gains in excess of capital losses), adjusted for certain ordinary losses, for the one-year period generally ending on October 31st of the calendar year and (iii) any net ordinary income and capital gain net income for preceding calendar years that were not distributed during such calendar years and on which the Master Fund paid no federal income tax. The Master Fund may, at its discretion, pay a 4% nondeductible federal excise tax on under-distribution of taxable ordinary income and capital gains.
The Master Fund follows ASC 740, Income Taxes (“ASC 740”). ASC 740 provides guidance for how uncertain tax positions should be recognized, measured, presented and disclosed in the financial statements. ASC 740 requires the evaluation of tax positions taken or expected to be taken in the course of preparing our tax returns to determine whether the tax positions are “more-likely-than-not” of being sustained by the applicable tax authority. Tax positions not deemed to meet the more-likely-than-not threshold are recorded as a tax benefit or expense in the current year. Penalties or interest, if applicable, that may be assessed relating to income taxes would be classified as other expenses in the statements of operations. Management has reviewed all open tax years and concluded that there is no effect to the Master Funds’ financial positions or results of operations and no tax liability was required to be recorded resulting from unrecognized tax benefits relating to uncertain income tax position taken or expected to be taken on a tax return. During this period, the Master Fund did not incur any material interest or penalties. Open tax years are those years that are open for examination by the relevant income taxing authority. As of December 31, 2019, open U.S. Federal and state income tax years include the tax years ended December 31, 2016 through December 31, 2018. The Master Fund has no examinations in progress. Management’s determinations regarding ASC 740 may be subject to review and adjustment at a later date based upon factors including, but not limited to, an on-going analysis of tax laws, regulations and interpretations thereof.
Recent Accounting Standards
Securities and Exchange Commission (“SEC”) Disclosure Update and Simplification:
In August 2018, the SEC adopted the final rule under SEC Release No. 33-10532, Disclosure Update and Simplification (the "SEC Release"), amending certain disclosure requirements intended to facilitate the disclosure of information to investors and simplify compliance. The SEC Release is effective for all filings on or after November 5, 2018. The Company first adopted the SEC Release for the fiscal quarter ended March 31, 2019. The SEC Release required presentation changes to the Company's consolidated statements of assets and liabilities and consolidated statements of changes in net assets. Prior to adoption, the Company presented, in accordance with previous SEC rules, accumulated earnings (loss), net of distributions, on the consolidated statements of assets and liabilities, as three components: 1) accumulated undistributed (distributions in excess of) net investment income; 2) accumulated undistributed net realized gain (loss) and 3) net unrealized appreciation (depreciation) and presented distributions from earnings on the consolidated statements of changes in net assets as three components: 1) distributions from net investment income; 2) distributions from net realized gains and 3) distributions in excess of net investment income. In accordance with the SEC Release, accumulated earnings and distributions from earnings are shown in total on the consolidated statements of assets and liabilities and consolidated statements of changes in net assets, respectively. The changes in presentation have been retrospectively applied to comparative periods presented in the consolidated financial statements.
Notes to Consolidated Financial Statements
The following table provides the reconciliation of the components of distributions from earnings to conform to the current period presentation for the years ended December 31, 2018 and December 31, 2017:
|
| | | | | | |
| | December 31, 2018 | December 31, 2017 |
| Shareholder Distributions: | | |
| Distribution from net investment income | $ | (18,311 | ) | $ | (13,738 | ) |
| Distribution from realized gains | (6,261 | ) | (1,978 | ) |
| Distribution in excess of net investment income | — |
| (962 | ) |
| Distributions from earnings | $ | (24,572 | ) | $ | (16,678 | ) |
The following table presents a breakout of accumulated loss, net of distributions, as of December 31, 2018:
|
| | | |
| | As of December 31, 2018 |
| Accumulated distributions in excess of net investment income | $ | (32 | ) |
| Accumulated undistributed net realized gain | 1,189 |
|
| Net unrealized depreciation | (11,037 | ) |
| Accumulated loss, net of distributions | $ | (9,880 | ) |
Note 3. Investments
The following table presents the composition of the investment portfolio at amortized cost and fair value as of December 31, 2019 and December 31, 2018, respectively, with corresponding percentages of total investments at fair value:
|
| | | | | | | | | | | | | | | | | | | | | |
| | December 31, 2019 | | December 31, 2018 |
| | Amortized Cost | | Fair Value | | Percentage of Investments at Fair Value | | Amortized Cost | | Fair Value | | Percentage of Investments at Fair Value |
| Senior secured loans - first lien | $ | 279,872 |
| | $ | 268,678 |
| | 72.2 | % | | $ | 260,745 |
| | $ | 258,675 |
| | 69.2 | % |
| Senior secured loans - second lien | 56,913 |
| | 56,651 |
| | 15.2 |
| | 67,871 |
| | 62,967 |
| | 16.8 | % |
| Senior secured bonds | 12,996 |
| | 12,223 |
| | 3.3 |
| | 17,558 |
| | 15,690 |
| | 4.2 | % |
| Senior unsecured debt | 22,253 |
| | 21,537 |
| | 5.8 |
| | 27,736 |
| | 26,295 |
| | 7.0 | % |
| Total senior debt | $ | 372,034 |
| | $ | 359,089 |
| | 96.5 | % | | $ | 373,910 |
| | $ | 363,627 |
| | 97.2 | % |
| Equity and other | 13,768 |
| | 13,104 |
| | 3.5 |
| | 10,874 |
| | 10,487 |
| | 2.8 |
|
| Total investments | $ | 385,802 |
| | $ | 372,193 |
| | 100.0 | % | | $ | 384,784 |
| | $ | 374,114 |
| | 100.0 | % |
Notes to Consolidated Financial Statements
The following table presents the composition of the investment portfolio by industry classifications at amortized cost and fair value as of December 31, 2019 and December 31, 2018, respectively, with corresponding percentages of total investments at fair value:
|
| | | | | | | | | | | | | | | | | | | | | | |
| | | December 31, 2019 | | December 31, 2018 |
| Industry Classification | | Amortized Cost | |
Fair Value | | Percentage of Investments at Fair Value | | Amortized Cost | |
Fair Value | | Percentage of Investments at Fair Value |
| Technology | | $ | 81,806 |
| | $ | 81,726 |
| | 22.0 | % | | $ | 78,606 |
| | $ | 78,389 |
| | 21.0 | % |
| Healthcare & Pharmaceuticals | | 41,194 |
| | 41,101 |
| | 11.0 |
| | 38,053 |
| | 37,901 |
| | 10.1 |
|
| Services: Business | | 40,279 |
| | 40,115 |
| | 10.8 |
| | 34,313 |
| | 33,682 |
| | 9.0 |
|
| Beverage, Food & Tobacco | | 24,104 |
| | 24,555 |
| | 6.6 |
| | 36,862 |
| | 31,807 |
| | 8.5 |
|
| Media: Advertising, Printing & Publishing | | 24,566 |
| | 24,432 |
| | 6.6 |
| | 24,259 |
| | 23,265 |
| | 6.2 |
|
| Retail | | 29,511 |
| | 22,880 |
| | 6.1 |
| | 19,635 |
| | 19,677 |
| | 5.3 |
|
| Automotive | | 24,095 |
| | 21,938 |
| | 5.9 |
| | 26,886 |
| | 26,827 |
| | 7.2 |
|
| Chemicals, Plastics & Rubber | | 20,010 |
| | 20,072 |
| | 5.4 |
| | 5,602 |
| | 5,608 |
| | 1.5 |
|
| Construction & Building | | 14,832 |
| | 14,818 |
| | 4.0 |
| | 17,126 |
| | 16,875 |
| | 4.5 |
|
| Containers, Packaging & Glass | | 13,259 |
| | 12,233 |
| | 3.3 |
| | 11,363 |
| | 11,403 |
| | 3.0 |
|
| Energy: Oil & Gas | | 15,266 |
| | 11,778 |
| | 3.2 |
| | 17,320 |
| | 16,637 |
| | 4.4 |
|
Banking, Finance, Insurance & Real Estate (1) | | 11,021 |
| | 11,191 |
| | 3.0 |
| | 11,318 |
| | 10,749 |
| | 2.9 |
|
| Utilities: Electric | | 8,786 |
| | 8,508 |
| | 2.3 |
| | 13,470 |
| | 13,182 |
| | 3.5 |
|
| Aerospace & Defense | | 7,274 |
| | 6,877 |
| | 1.8 |
| | 8,583 |
| | 8,367 |
| | 2.2 |
|
| Hotel, Gaming & Leisure | | 6,711 |
| | 6,824 |
| | 1.8 |
| | 4,774 |
| | 4,687 |
| | 1.3 |
|
| Utilities: Oil & Gas | | 5,784 |
| | 5,881 |
| | 1.6 |
| | 9,824 |
| | 9,327 |
| | 2.5 |
|
| Telecommunications | | 4,697 |
| | 4,718 |
| | 1.3 |
| | 4,718 |
| | 4,696 |
| | 1.3 |
|
| Transportation: Cargo | | 4,778 |
| | 4,714 |
| | 1.3 |
| | 4,730 |
| | 4,030 |
| | 1.1 |
|
| Consumer goods: Non-durable | | 4,548 |
| | 4,553 |
| | 1.2 |
| | 9,699 |
| | 9,653 |
| | 2.6 |
|
| Capital Equipment | | 2,000 |
| | 1,995 |
| | 0.5 |
| | 3,514 |
| | 3,442 |
| | 0.9 |
|
| Consumer Goods: Durable | | 1,281 |
| | 1,284 |
| | 0.3 |
| | 4,129 |
| | 3,910 |
| | 1.0 |
|
| Total investments | | $ | 385,802 |
| | $ | 372,193 |
| | 100.0 | % | | $ | 384,784 |
| | $ | 374,114 |
| | 100.0 | % |
______________
| |
| (1) | Portfolio companies included in this classification may include insurance brokers that are not classified as insurance companies. |
The following table presents the geographic dispersion of the investment portfolio as a percentage of total investments at fair value as of December 31, 2019 and December 31, 2018.
|
| | | | | | |
| Geographic Dispersion | | December 31, 2019 | | December 31, 2018 |
| United States of America | | 85.5 | % | | 86.3 | % |
| United Kingdom | | 9.2 |
| | 9.0 |
|
| Canada | | 2.8 |
| | 2.3 |
|
| Italy | | 1.5 |
| | 1.5 |
|
| Ireland | | 1.0 |
| | 0.9 |
|
| Total investments | | 100.0 | % | | 100.0 | % |
Notes to Consolidated Financial Statements
Note 4. Derivative Instruments
The Master Fund may enter into foreign currency forward contracts from time to time to facilitate settlement of purchases and sales of investments denominated in foreign currencies and to economically hedge the impact that an adverse change in foreign exchange rates would have on the value of the Master Fund's investments denominated in foreign currencies. A foreign currency forward contract is a commitment to purchase or sell a foreign currency at a future date at a negotiated forward rate. These contracts are marked-to-market by recognizing the difference between the contract forward exchange rate and the forward market exchange rate on the last day of the period presented as unrealized appreciation or depreciation. Realized gains or losses are recognized when forward contracts are settled. Risks arise as a result of the potential inability of the counterparties to meet the terms of their contracts; the Master Fund attempts to limit counterparty risk by only dealing with well-known counterparties and those that it believes have the financial resources to honor their obligations. The foreign currency forward contracts open at the end of the period are generally indicative of the volume of activity during the period.
The following tables present the Master Fund's open foreign currency forward contracts as of December 31, 2019 and December 31, 2018:
|
| | | | | | | | | | | | | | | | | | | | | | |
| December 31, 2019 |
| Foreign Currency | | Settlement Date | | Statement Location | | Counterparty | | Amount Transacted | | Notional Value at Settlement | | Notional Value at Period End | | Fair Value |
| EUR | | January 14, 2020 | | Unrealized depreciation on foreign currency forward contracts | | JPMorgan Chase Bank, N.A. | | € | 694 |
| | $ | 772 |
| | $ | 779 |
| | $ | (7 | ) |
| GBP | | January 14, 2020 | | Unrealized depreciation on foreign currency forward contracts | | JPMorgan Chase Bank, N.A. | | £ | 18,878 |
| | 24,936 |
| | 25,016 |
| | (80 | ) |
| Total | | | | | | | | | | $ | 25,708 |
| | $ | 25,795 |
| | $ | (87 | ) |
|
| | | | | | | | | | | | | | | | | | | | | | |
| December 31, 2018 |
| Foreign Currency | | Settlement Date | | Statement Location | | Counterparty | | Amount Transacted | | Notional Value at Settlement | | Notional Value at Period End | | Fair Value |
| GBP | | January 14, 2019 | | Unrealized depreciation on foreign currency forward contracts | | JPMorgan Chase Bank, N.A. | | £ | (85 | ) | | $ | (108 | ) | | $ | (109 | ) | | $ | 1 |
|
| GBP | | January 14, 2019 | | Unrealized depreciation on foreign currency forward contracts | | JPMorgan Chase Bank, N.A. | | £ | 665 |
| | 841 |
| | 848 |
| | (7 | ) |
| GBP | | January 14, 2019 | | Unrealized depreciation on foreign currency forward contracts | | JPMorgan Chase Bank, N.A. | | £ | 22,230 |
| | 27,982 |
| | 28,355 |
| | (373 | ) |
| EUR | | January 14, 2019 | | Unrealized depreciation on foreign currency forward contracts | | JPMorgan Chase Bank, N.A. | | € | 697 |
| | 795 |
| | 800 |
| | (5 | ) |
| Total | | | | | | | | | | $ | 29,510 |
| | $ | 29,894 |
| | $ | (384 | ) |
The following table presents the net realized and unrealized gains and losses on derivative instruments recorded by the Master Fund for the years ended December 31, 2019, December 31, 2018 and December 31, 2017:
|
| | | | | | | | | | | | | | |
| | | | | For the Years Ended December 31, |
| | | Statement Location | | 2019 | | 2018 | | 2017 |
| Net realized gains (losses) | | | | | | | | |
| Foreign currency forward contracts | | Net realized gains (losses) on foreign currency forward contracts | | $ | (873 | ) | | $ | 2,316 |
| | $ | (1,327 | ) |
| Net change in unrealized appreciation (depreciation) | | | | | | |
| Foreign currency forward contracts | | Net change in unrealized appreciation (depreciation) on foreign currency forward contracts | | 297 |
| | (185 | ) | | (191 | ) |
| Net realized and unrealized gains (losses) on foreign currency forward contracts | | $ | (576 | ) | | $ | 2,131 |
| | $ | (1,518 | ) |
Notes to Consolidated Financial Statements
For derivatives traded under an International Swaps and Derivatives Association Master Agreement ("ISDA Master Agreement"), the collateral requirements are typically calculated by netting the mark-to-market amount for each transaction under such agreement and comparing that amount to the value of any collateral currently pledged by the Master Fund and/or the counterparty. Cash collateral that has been pledged, if any, to cover obligations of the Master Fund and cash collateral received from the counterparty, if any, is reported on the consolidated statements of assets and liabilities as collateral deposits (received) for foreign currency forward contracts. Generally, the amount of collateral due from or to a party has to exceed a minimum transfer amount threshold before a transfer is required. To the extent amounts due to the Master Fund from a counterparty are not fully collateralized, the Master Fund bears the risk of loss from counterparty non-performance.
The following table presents the Master Fund's derivative assets and liabilities by counterparty, net of amounts available for offset under a master netting agreement or similar arrangement, and net of related collateral received by the Master Fund for assets or pledged for liabilities as of December 31, 2019 and December 31, 2018:
|
| | | | | | | | | | | | | | | | | | |
| As of | | Counterparty | | Gross Derivative Assets in Statement of Assets and Liabilities | | Gross Derivative Liabilities in Statement of Assets and Liabilities | | Collateral Pledged | | Net position of Derivative Assets, Liabilities and Pledged Collateral |
| December 31, 2019 | | JP Morgan Chase Bank, N.A. | | $ | — |
| | $ | (87 | ) | | $ | (320 | ) | | $ | (407 | ) |
| December 31, 2018 | | JP Morgan Chase Bank, N.A. | | $ | — |
| | $ | (384 | ) | | $ | 160 |
| | $ | (224 | ) |
Note 5. Fair Value of Financial Instruments
The following tables present the segmentation of the investment portfolio at fair value, as of December 31, 2019 and December 31, 2018, according to the fair value hierarchy as described in Note 2. Significant Accounting Policies:
|
| | | | | | | | | | | | | | | |
| | December 31, 2019 |
| | Level 1 | | Level 2 | | Level 3 | | Total |
| Investments | | | | | | | |
| Senior secured loans - first lien | $ | — |
| | $ | 80,704 |
| | $ | 187,974 |
| | $ | 268,678 |
|
| Senior secured loans - second lien | — |
| | 14,364 |
| | 42,287 |
| | 56,651 |
|
| Senior secured bonds | — |
| | 12,223 |
| | — |
| | 12,223 |
|
| Senior unsecured debt | — |
| | 4,739 |
| | 16,798 |
| | 21,537 |
|
| Total senior debt | $ | — |
| | $ | 112,030 |
| | $ | 247,059 |
| | $ | 359,089 |
|
| Equity and other | 90 |
| | — |
| | 13,014 |
| | 13,104 |
|
| Total investments | $ | 90 |
| | $ | 112,030 |
| | $ | 260,073 |
| | $ | 372,193 |
|
| Percentage | 0.0 | % | | 30.1 | % | | 69.9 | % | | 100.0 | % |
| Derivative Instruments | | | | | | | |
| Foreign currency forward contracts | $ | — |
| | $ | (87 | ) | | $ | — |
| | $ | (87 | ) |
|
| | | | | | | | | | | | | | | |
| | December 31, 2018 |
| | Level 1 | | Level 2 | | Level 3 | | Total |
| Investments | | | | | | | |
| Senior secured loans - first lien | $ | — |
| | $ | 54,117 |
| | $ | 204,558 |
| | $ | 258,675 |
|
| Senior secured loans - second lien | — |
| | 11,069 |
| | 51,898 |
| | 62,967 |
|
| Senior secured bonds | — |
| | 15,690 |
| | — |
| | 15,690 |
|
| Senior unsecured debt | — |
| | 9,629 |
| | 16,666 |
| | 26,295 |
|
| Total senior debt | $ | — |
| | $ | 90,505 |
| | $ | 273,122 |
| | $ | 363,627 |
|
| Equity and other | 162 |
| | — |
| | 10,325 |
| | 10,487 |
|
| Total investments | $ | 162 |
| | $ | 90,505 |
| | $ | 283,447 |
| | $ | 374,114 |
|
| Percentage | 0.0 | % | | 24.2 | % | | 75.8 | % | | 100.0 | % |
| Derivative Instruments | | | | | | | |
| Foreign currency forward contracts | $ | — |
| | $ | (384 | ) | | $ | — |
| | $ | (384 | ) |
Notes to Consolidated Financial Statements
Significant Level 3 Unobservable Inputs
The following tables present quantitative information related to the significant Level 3 unobservable inputs associated with the determination of fair value for certain investments as of December 31, 2019 and December 31, 2018:
|
| | | | | | | | |
| December 31, 2019 |
| Asset Category | Fair
Value | Valuation Techniques (1) | Unobservable Inputs (2) | Weighted Average | Range (3) | Impact to Valuation from an Increase in Input (4) |
| Senior secured loans - first lien | $ | 121,594 |
| Yield analysis | Yield | 8.44% | 4.64% - 12.05% | Decrease |
| | $ | 5,722 |
| Transacted value | Potential transaction | 100.00 | 100.00 | Increase |
| | $ | 14,656 |
| Yield analysis | Yield | 7.88% | 6.47% - 8.5% | Decrease |
| | | Transacted value | Potential transaction | 101.73 | 100 - 105.57 | Increase |
| | $ | 5,795 |
| Yield analysis | Yield | 20.23% | 20.23% | Decrease |
| | | Transacted value | Bid | 61.27 | 61.27 | Increase |
| | | Discounted cash flow | Discount Rate | 17.50% | 17.50% | Decrease |
| | | Discounted cash flow | Perpetuity Growth Rate | (10.00)% | (10.00)% | Increase |
| | | Discounted cash flow | Terminal EBITDA Multiple | 5.9x | 5.9x | Increase |
| Senior secured loans - second lien | $ | 16,904 |
| Yield analysis | Yield | 9.91% | 7.67% - 11.27% | Decrease |
| | $ | 15,492 |
| Transacted value | Potential transaction | 101.00 | 101.00 | Increase |
| | $ | 4,386 |
| Yield analysis | Yield | 11.46% | 11.46% | Decrease |
| | | Transacted value | Potential transaction | 100.00 | 100.00 | Increase |
| Senior unsecured debt | $ | 16,798 |
| Yield analysis | Yield | 12.44% | 11.53% - 14.33% | Decrease |
| Equity and other | $ | 30 |
| Transacted value | Cost | 15.36 | 15.36 | Increase |
| | $ | 3,303 |
| Transacted value | Potential transaction | 1,116.45 | 1,116.45 | Increase |
| | $ | 4,752 |
| Market comparable | Capitalization Rate | 7.00% | 7.00% | Increase |
| | $ | 81 |
| Discounted cash flow | EBITDA multiple | 16.7x | 16.7x | Increase |
| | $ | 2,081 |
| Market comparable | Cash Flow Multiple | 3.6x | 3.6x | Increase |
| | | Market comparable | Oil production multiple (6) | 19,650x | 19,650x | Increase |
| | | Market comparable | Oil reserve multiple (7) | 6.6x | 6.6x | Increase |
| | $ | 2,767 |
| Discounted cash flow | Discount Rate | 20.01% | 14.08% - 15% | Decrease |
| | | Discounted cash flow | EBITDA multiple | 14.5x | 13.2x - 15.4x | Increase |
| | | Discounted cash flow | Perpetuity Growth Rate | 6.74% | 5% - 8% | Increase |
| | | Discounted cash flow | Terminal EBITDA Multiple | 8.2x | 7.5x - 13x | Increase |
| Total | $ | 214,361 |
| | | | | |
______________
| |
| (1) | For the investments that have more than one valuation technique, the Master Fund may rely on the stated techniques individually or in the aggregate based on a weight ascribed to each valuation technique, ranging from 0% to 100%. |
| |
| (2) | The Master Fund generally uses prices provided by an independent pricing service, or directly from an independent broker, which are non-binding indicative prices on or near the valuation date as the primary basis for the fair valuation determinations for quoted senior secured bonds and loans. Since these prices are non-binding, they may not be indicative of fair value. Each quoted price is evaluated by Guggenheim in conjunction with additional information compiled by it, including financial performance, recent business developments and various other factors. Investments with fair values determined in this manner were not included in the table above. As of December 31, 2019, the Master Fund had investments of this nature measured at fair value totaling $45.7 million. |
Notes to Consolidated Financial Statements
| |
| (3) | A range is not provided when there is only one investment within the classification or multiple investments that have the same unobservable input; weighted average amounts are based on the estimated fair values. |
| |
| (4) | This column represents the directional change in the fair value of the Level 3 investments that would result from an increase to the corresponding unobservable input. A decrease to the unobservable input would have the opposite effect. Significant changes in these inputs in isolation could result in significantly higher or lower fair value measurements. |
| |
| (5) | Investments may be valued at cost for a period of time after acquisition as the best indicator of fair value. |
| |
| (6) | Oil production multiple is valued based on thousand barrels of oil equivalent per day (MBOE/d). |
| |
| (7) | Oil reserve multiple is valued based on million barrels of oil equivalent (MMBOE). |
|
| | | | | | | | |
| December 31, 2018 |
| Asset Category | Fair
Value | Valuation Techniques (1) | Unobservable Inputs (2) | Weighted Average | Range (3) | Impact to Valuation from an Increase in Input (4) |
| Senior secured loans - first lien | $ | 122,898 |
| Yield analysis | Yield | 9.37% | 2.63% - 12.72% | Decrease |
| | $ | 9,790 |
| Transaction value | Cost (5) | 98.79 | 87.65-100.00 | Increase |
| Senior secured loans - second lien | $ | 34,275 |
| Yield analysis | Yield | 11.35% | 9.12% - 12.58% | Decrease |
| Senior unsecured debt | $ | 16,666 |
| Yield analysis | Yield | 11.50% | 9.51% - 16.01% | Decrease |
| Equity and other | $ | 4,034 |
| Market Comparables | Capitalization rate | 7.00% | 7.00% | Increase |
| | $ | 3,222 |
| Market Comparables | Cash flow multiple | 4.7x | 4.7x | Increase |
| | | Market Comparables | Oil production multiple (6) | 24,740 | 24,740 | Increase |
| | | Market Comparables | Oil reserve multiple (7) | 6.60 | 6.60 | Increase |
| | $ | 2,634 |
| Transaction Value | Cost (5) | 988.79 | 15.36-1000.00 | Increase |
| | $ | 231 |
| Discounted Cash Flow | Discount Rate | 14.58% | 14.58% | Decrease |
| | | Discounted Cash Flow | Perpetuity Growth rate | 8.00% | 8.00% | Increase |
| | | Discounted Cash Flow | EBITDA Multiple | 13.0x | 13.0x | Increase |
| | $ | 204 |
| Discounted Cash Flow | Discount Rate | 15.05% | 15.05% | Decrease |
| | | Discounted Cash Flow | Perpetuity Growth rate | 5.00% | 5.00% | Increase |
| | | Discounted Cash Flow | EBITDA Multiple | 9.0x | 9.0x | Increase |
| | | Transaction value | EBITDA Multiple | 13.2x | 13.2x | Increase |
| Total | $ | 193,954 |
| | | | | |
_______________
| |
| (1) | For the investments that have more than one valuation technique, the Master Fund may rely on the stated techniques individually or in the aggregate based on a weight ascribed to each valuation technique, ranging from 0% to 100%. |
| |
| (2) | The Master Fund generally uses prices provided by an independent pricing service, or directly from an independent broker, which are non-binding indicative prices on or near the valuation date as the primary basis for the fair valuation determinations for quoted senior secured bonds and loans. Since these prices are non-binding, they may not be indicative of fair value. Each quoted price is evaluated by Guggenheim in conjunction with additional information compiled by it, including financial performance, recent business developments and various other factors. Investments with fair values determined in this manner were not included in the table above. As of December 31, 2018, the Master Fund had investments of this nature measured at fair value totaling $89.5 million. |
| |
| (3) | A range is not provided when there is only one investment within the classification or multiple investments that have the same unobservable input; weighted average amounts are based on the estimated fair values. |
| |
| (4) | This column represents the directional change in the fair value of the Level 3 investments that would result from an increase to the corresponding unobservable input. A decrease to the unobservable input would have the opposite effect. Significant changes in these inputs in isolation could result in significantly higher or lower fair value measurements. |
| |
| (5) | Investments may be valued at cost for a period of time after acquisition as the best indicator of fair value. |
| |
| (6) | Oil production multiple is valued based on thousand barrels of oil equivalent per day (MBOE/d). |
Notes to Consolidated Financial Statements
| |
| (7) | Oil reserve multiple is valued based on million barrels of oil equivalent (MMBOE). |
In addition to the Level 3 valuation methodologies and unobservable inputs noted above, the Master Fund, in accordance with its valuation policy, may also use other valuation techniques and methodologies when determining the fair value estimates for its investments.
The following tables present a roll-forward of the fair value changes for all investments for which the Master Fund determines fair value using Level 3 unobservable inputs for the years ended December 31, 2019 and December 31, 2018:
|
| | | | | | | | | | | | | | | | | | | |
| | For the Year Ended December 31, 2019 |
| | Senior Secured Loans - First Lien | | Senior Secured Loans - Second Lien | | Senior Unsecured Debt | | Equity and Other | | Total |
| Balance as of January 1, 2019 | $ | 204,558 |
| | $ | 51,898 |
| | $ | 16,666 |
| | $ | 10,325 |
| | $ | 283,447 |
|
Additions (1) | 41,376 |
| | 4,469 |
| | — |
| | 3,560 |
| | 49,405 |
|
Sales and repayments (2) | (31,640 | ) | | (6,967 | ) | | — |
| | (636 | ) | | (39,243 | ) |
Net realized gains (losses) (3) | 503 |
| | (4,428 | ) | | — |
| | — |
| | (3,925 | ) |
Net change in unrealized appreciation (depreciation) on investments (4) | (7,141 | ) | | 4,132 |
| | 93 |
| | (235 | ) | | (3,151 | ) |
| Net discount accretion | 666 |
| | 87 |
| | 39 |
| | — |
| | 792 |
|
Transfers into Level 3 (5) | 35,926 |
| | 3,488 |
| | — |
| | — |
| | 39,414 |
|
Transfers out of Level 3 (6) | (56,274 | ) | | (10,392 | ) | | — |
| | — |
| | (66,666 | ) |
| Fair value balance as of December 31, 2019 | $ | 187,974 |
| | $ | 42,287 |
| | $ | 16,798 |
| | $ | 13,014 |
| | $ | 260,073 |
|
| Change in net unrealized appreciation (depreciation) on investments held as of December 31, 2019 | $ | (7,579 | ) | | $ | (78 | ) | | $ | 93 |
| | $ | (317 | ) | | $ | (7,881 | ) |
___________
| |
| (1) | Includes increases in the cost basis of investments resulting from new and incremental portfolio investments, including the capitalization of PIK income. |
| |
| (2) | Includes principal payments/paydowns on debt investments and proceeds from sales of investments. |
| |
| (3) | Included in net realized gains (losses) on investments on the consolidated statements of operations. |
| |
| (4) | Included in net change in unrealized appreciation (depreciation) on investments on the consolidated statements of operations. |
| |
| (5) | For the year ended December 31, 2019, investments were transferred from Level 2 to Level 3 as valuation coverage was reduced to one independent pricing service without any corroborating recent trade. |
| |
| (6) | For the year ended December 31, 2019, investments were transferred from Level 3 to Level 2 as valuation coverage was initiated by more than one independent pricing services or by one independent pricing service with a corroborating recent trade. |
Notes to Consolidated Financial Statements
|
| | | | | | | | | | | | | | | | | | | | | | | | | | | |
| | For the Year Ended December 31, 2018 |
| | Senior Secured Loans - First Lien | | Senior Secured Loans - Second Lien | | Senior Secured Bonds | | Senior Unsecured Debt | | Subordinated Debt | | Equity and Other | | Total |
| Balance as of January 1, 2018 | $ | 197,008 |
| | $ | 66,464 |
| | $ | 8,273 |
| | $ | 21,313 |
| | $ | 14,923 |
| | $ | 231 |
| | $ | 308,212 |
|
Additions (1) | 90,075 |
| | 25,143 |
| | — |
| | 2,036 |
| | — |
| | 6,784 |
| | 124,038 |
|
Sales and repayments (2) | (63,733 | ) | | (25,661 | ) | | (5,081 | ) | | (22,546 | ) | | — |
| | (300 | ) | | (117,321 | ) |
Net realized gains (losses) (3) | 2,395 |
| | 525 |
| | 445 |
| | 1,823 |
| | — |
| | (1,586 | ) | | 3,602 |
|
Net change in unrealized appreciation (depreciation) on investments (4) | (2,190 | ) | | (1,427 | ) | | (235 | ) | | (917 | ) | | (19 | ) | | 1,783 |
| | (3,005 | ) |
| Net discount accretion | 610 |
| | 85 |
| | 11 |
| | 34 |
| | 19 |
| | — |
| | 759 |
|
| Restructuring | — |
| | — |
| | (3,413 | ) | | 14,923 |
| | (14,923 | ) | | 3,413 |
| | — |
|
Transfers into Level 3 (5) (6) | 28,223 |
| | 3,068 |
| | — |
| | — |
| | — |
| | — |
| | 31,291 |
|
Transfers out of Level 3 (5) (7) | (47,830 | ) | | (16,299 | ) | | — |
| | — |
| | — |
| | — |
| | (64,129 | ) |
| Fair value balance as of December 31, 2018 | $ | 204,558 |
| | $ | 51,898 |
| | $ | — |
| | $ | 16,666 |
| | $ | — |
| | $ | 10,325 |
| | $ | 283,447 |
|
| Change in net unrealized depreciation on investments held as of December 31, 2018 | $ | (1,990 | ) | | $ | (1,337 | ) | | $ | — |
| | $ | (241 | ) | | $ | — |
| | $ | (102 | ) | | $ | (3,670 | ) |
| |
| (1) | Includes increases in the cost basis of investments resulting from new and incremental portfolio investments, including the capitalization of PIK income. |
| |
| (2) | Includes principal payments/paydowns on debt investments and proceeds from sales of investments. |
| |
| (3) | Included in net realized gains (losses) on investments on the consolidated statements of operations. |
| |
| (4) | Included in net change in unrealized appreciation (depreciation) on investments on the consolidated statements of operations. |
| |
| (5) | The Master Fund transfers investments in and out of Level 1, 2 and 3 securities at the value of the investment as of the beginning of the period based on changes in the use of observable inputs utilized to perform the valuation for the period. |
| |
| (6) | For the year ended December 31, 2018, investments were transferred from Level 2 to Level 3 as valuation coverage was reduced to one independent pricing service. |
| |
| (7) | For the year ended December 31, 2018, investments were transferred from Level 3 to Level 2 as valuation coverage was initiated by one or more independent pricing services. |
Financial Instruments Disclosed, But Not Carried at Fair Value
The fair value of the credit facility payable, which would have been categorized as Level 3 within the fair value hierarchy as of December 31, 2019, approximates its carrying value.
Note 6. Related Party Agreements and Transactions
The Master Fund is affiliated with Guggenheim Credit Income Fund 2016 T ("GCIF 2016T") and Guggenheim Credit Income Fund 2019 ("GCIF 2019") (together, the "Feeder Funds"). The membership of the Boards of Trustees for the Master Fund, GCIF 2016T and GCIF 2019 are identical. The Feeder Funds have invested, and/or intend to invest, substantially all of the proceeds from their public offerings of common shares in the acquisition of the Master Fund's Common Shares.
Two of the Master Fund’s executive officers, Kevin Robinson, Senior Vice President and Brian Binder, Senior Vice President, serve as executive officers of Guggenheim. All of the Master Fund's executive officers also serve as executive officers of the Feeder Funds.
Guggenheim and/or its affiliates receive, as applicable, compensation for (i) investment advisory services, (ii) reimbursement of expenses in connection with investment advisory activities, administrative services and organizing the Master Fund and (iii) capital markets services in connection with the raising of equity capital for Feeder Funds affiliated with the Master Fund, as more fully discussed below.
Investment Advisory Agreements and Compensation of the Advisor
The Master Fund is party to an Investment Advisory Agreement with Guggenheim, pursuant to which the Master Fund agreed to pay Guggenheim an investment advisory fee consisting of two components: (i) a management fee and (ii) a performance-based incentive fee. Guggenheim continues to be entitled to reimbursement of certain expenses incurred on behalf of the Master Fund in connection with investment operations and investment transactions.
Notes to Consolidated Financial Statements
Management Fees: The management fee is calculated at an annual rate of 1.75% based on the simple average of the Master Fund's gross assets at the end of the two most recently completed calendar months and it is payable in arrears.
Performance-based Incentive Fee: The performance-based incentive fee consists of two parts: (i) an incentive fee on income and (ii) an incentive fee on capital gains.
| |
| (i) | The incentive fee on income is paid quarterly, if earned; it is computed as the sum of (A) 100% of quarterly pre-incentive fee net investment income in excess of 1.875% of average adjusted capital up to a limit of 2.344% of average adjusted capital, and (B) 20% of pre-incentive fee net investment income in excess of 2.344% of average adjusted capital. |
| |
| (ii) | The incentive fee on capital gains is paid annually, if earned; it is equal to 20% of realized capital gains on a cumulative basis from inception, net of (A) all realized capital losses and unrealized depreciation on a cumulative basis from inception, and (B) the aggregate amount, if any, of previously paid incentive fees on capital gains. |
All fees are computed in accordance with a detailed fee calculation methodology as approved by the Board of Trustees.
The Investment Advisory Agreement may be terminated at any time, without the payment of any penalty: (i) by the Master Fund upon 60 days' written notice to Guggenheim, or (ii) by Guggenheim upon not less than 120 days' written notice to the Master Fund. In the event that the Investment Advisory Agreement is terminated by Guggenheim, and if the Independent Trustees elect to continue the Master Fund, then Guggenheim shall pay all direct expenses incurred by the Master Fund as a result of Guggenheim's withdrawal, up to, but not exceeding $250,000. Unless earlier terminated, the Investment Advisory Agreement will remain in effect for a period of two years from the date on which the Master Fund's shareholders approved the Investment Advisory Agreement and will remain in effect year to year thereafter if approved annually (i) by a majority of the Master Fund's Independent Trustees and (ii) the Master Fund's Board of Trustees or the holders of a majority of the Master Fund's outstanding voting securities.
Administrative Services Agreement
The Master Fund entered into an administrative services agreement with Guggenheim (the "Administrative Services Agreement") whereby Guggenheim agreed to provide administrative services to the Master Fund, including office facilities and equipment, and clerical, bookkeeping and record-keeping services. More specifically, Guggenheim, serving as the administrator (the "Administrator"), performs and oversees the Master Fund's required administrative services, which included financial and corporate record-keeping, preparing and disseminating the Master Fund's reports to its shareholders and filing reports with the SEC. In addition, the Administrator assists in determining net asset value, overseeing the preparation and filing of tax returns, overseeing the payment of expenses and distributions and overseeing the performance of administrative and professional services fees rendered by others. For providing these services, facilities and personnel, the Master Fund reimburses the Administrator for the allocable portion of overhead and other expenses incurred by the Administrator in performing its obligations under the Administrative Services Agreement. To the extent that the Administrator outsources any of its functions, the Master Fund may pay the fees associated with such functions on a direct basis, without incremental profit to the Administrator.
The Administrative Services Agreement may be terminated at any time, without the payment of any penalty: (i) by the Master Fund upon 60 days' written notice to the Administrator upon the vote of the Master Fund's Independent Trustees, or (ii) by the Administrator upon not less than 120 days' written notice to the Master Fund. Unless earlier terminated, the Administrative Services Agreement will remain in effect for two years, and thereafter shall continue automatically for successive one-year periods if approved annually by a majority of the Board of Trustees and the Master Fund's Independent Trustees.
Dealer Manager Agreement
The Master fund is party to a dealer manager agreement, as amended (the "Dealer Manager Agreement") with Guggenheim Funds Distributors, LLC ("GFD") an affiliate of Guggenheim. Under the terms of the Dealer Manager Agreement, GFD is to act on a best efforts basis as the exclusive dealer manager for (i) GCIF 2016T's and GCIF 2019's public offerings of common shares and (ii) the public offering of common shares for future feeder funds affiliated with the Master Fund. The Master Fund is not responsible for the compensation of GFD pursuant to the terms of the Dealer Manager Agreement; therefore, fees compensating GFD are not presented in this periodic report. As to a Feeder Fund, the Deal Manager Agreement may be terminated by a Feeder Fund or GFD upon 60 calendar days' written notice to the other party.
Capital Structuring Fees and Administrative Agency Fees
Guggenheim and its affiliates are obligated to remit to the Master Fund any earned capital structuring fees and administrative agency fees (i.e. loan administration fees) based on the Master Fund's pro rata portion of the co-investment transactions or originated investments in which the Master Fund participates.
Notes to Consolidated Financial Statements
Summary of Related Party Transactions
The following table presents the related party fees, expenses and transactions for the years ended December 31, 2019, December 31, 2018 and December 31, 2017:
|
| | | | | | | | | | | | | | |
Related Party (1) (2) | | | | For the Years Ended December 31, |
| | Source Agreement & Description | | 2019 | | 2018 | | 2017 |
| | | Expenses: | | | | | | |
| CCA & Guggenheim | | Prior Investment Advisory Agreement - management fee | | $ | — |
| | $ | — |
| | $ | 5,229 |
|
| Guggenheim | | Investment Advisory Agreement - management fee | | 6,889 |
| | 7,195 |
| | 2,167 |
|
| CCA & Guggenheim | | Prior Administrative Services Agreement - expense reimbursement | | — |
| | — |
| | 303 |
|
| Guggenheim | | Administrative Services Agreement - expense reimbursement | | 818 |
| | 645 |
| | 168 |
|
| | | Income: | | | | | | |
| Guggenheim | | Share on capital structuring fees and administrative agency fees | | 271 |
| | 164 |
| | 371 |
|
| WPC & Guggenheim | | Reimbursement of advisor transition costs
| | — |
| | — |
| | 798 |
|
____________________
| |
| (1) | Related party transactions not included in the table above consist of Independent Trustees fees and expenses and sales and repurchase of the Master Fund Shares to/from affiliated Feeder Funds as disclosed in the Master Fund's consolidated statements of operations and consolidated statements of changes in net assets, respectively. |
| |
| (2) | As of December 31, 2019 and December 31, 2018, the Master Fund's accumulated unrealized depreciation exceeded its accumulated net realized capital gains and therefore, Guggenheim did not earn any performance-based incentive fee during the year. During the year ended December 31, 2017, Guggenheim contractually earned and subsequently waived, an incentive fee on capital gains in the amount of less than $0.1 million. |
Co-Investment Transactions Exemptive Relief
The Master Fund was granted an SEC exemptive order which grants the Master Fund exemptive relief permitting the Master Fund, subject to the satisfaction of specific conditions and requirements, to co-invest in privately negotiated investment transactions with certain affiliates of Guggenheim.
Indemnification
The Investment Advisory Agreement and Administrative Services Agreement provide certain indemnifications to Guggenheim, its directors, officers, persons associated with Guggenheim and its affiliates, including the administrator. In addition, the Master Fund's Declaration of Trust, as amended, provides certain indemnifications to its officers, trustees, agents and certain other persons. As of December 31, 2019, management believes that the risk of incurring any losses for such indemnifications is remote.
Note 7. Borrowings
Hamilton Credit Facility
On December 17, 2015, Hamilton initially entered into a senior-secured term loan, as amended (the “Hamilton Credit Facility”) with JPMorgan Chase Bank, National Association ("JPM"), as administrative agent, each of the lenders from time to time party thereto, and U.S. Bank National Association, as collateral agent, collateral administrator and securities intermediary. As of December 31, 2019, the Hamilton Credit Facility provided for (i) borrowings in an aggregate principal amount of $175.0 million on a committed basis, (ii) a revolving feature on all amounts above the minimum utilization amount, (iii) an interest rate of 3-month LIBOR +2.50%, (iv) a draw-down term which ends December 29, 2021, (v) a stated maturity date of December 29, 2022, (vi) undrawn fees payable during the draw-down term of 250 basis points on all undrawn amounts below the minimum utilization amount and (vii) unused commitment fees payable during the draw-down term of 100 basis points on all undrawn amounts above the minimum utilization amount. All investments owned by, and all cash on hand with, Hamilton are held as collateral for the Hamilton Credit Facility.
Hamilton and JPM amended the Hamilton Credit Facility on June 29, 2018 to, among other things, (i) extend the term from December 17, 2019 to December 29, 2022, (ii) extend the draw-down term from December 17, 2018 to December 29, 2021, (iii) reduce the interest rate from 3-month LIBOR +2.65% per annum to 3-month LIBOR +2.50% per annum, (iv) include a revolving feature on all amounts above the minimum utilization amount and (v) reduce the undrawn fee charged on all amounts below the facility's minimum utilization amount from 265 basis points per annum to 250 basis points per annum.
Notes to Consolidated Financial Statements
Hamilton's borrowings as of December 31, 2019 and December 31, 2018 were as follows:
|
| | | | | | | | | | | | | | | | | | | | |
| | Hamilton Credit Facility - Borrowing Summary |
| As of | Principal Amount Committed | | Principal Amount Outstanding | | Carrying Value (1) | | Interest Rate (2) | | Maturity Date | | Maturity Term |
| December 31, 2019 | $ | 175,000 |
| | $ | 172,000 |
| | $ | 170,862 |
| | 4.40 | % | | 12/29/22 | | 3.0 |
| years |
| December 31, 2018 | $ | 175,000 |
| | $ | 150,000 |
| | $ | 148,482 |
| | 5.29 | % | | 12/29/22 | | 4.0 |
| years |
_________________
| |
| (1) | Carrying value is equal to outstanding principal amount net of unamortized financing costs. |
| |
| (2) | Interest rate as of the end of the reporting period (3-month LIBOR +2.50% as of December 31, 2019 and December 31, 2018) is subject to quarterly reset. Interest rate is calculated as the weighted average interest rates of all tranches currently outstanding. Interest rate does not include the amortization of upfront fees, undrawn or unused fees and expenses that were incurred in connection with the Hamilton Credit Facility. |
The components of the Master Fund's interest expense and other financing costs for the years ended December 31, 2019, December 31, 2018 and December 31, 2017 were as follows:
|
| | | | | | | | | | | | |
| | | For the Years Ended December 31, |
| | | 2019 | | 2018 | | 2017 |
| Stated interest expense | | $ | 8,023 |
| | $ | 7,193 |
| | $ | 5,593 |
|
| Unused/undrawn fees | | 149 |
| | 253 |
| | 459 |
|
| Amortization of deferred financing costs | | 380 |
| | 439 |
| | 483 |
|
| Total interest expense | | $ | 8,552 |
| | $ | 7,885 |
| | $ | 6,535 |
|
| Average borrowings | | $ | 160,312 |
| | $ | 150,000 |
| | $ | 142,615 |
|
| | | | | | | |
Weighted average interest rate (1) | | 5.03 | % | | 4.90 | % | | 4.19 | % |
| Amortized financing costs | | 0.23 | % | | 0.29 | % | | 0.33 | % |
| Total borrowing cost | | 5.26 | % | | 5.19 | % | | 4.52 | % |
_________________
| |
| (1) | Calculated as the amount of the stated interest expense and undrawn or unused fees divided by the average borrowings during the reporting period. |
Notes to Consolidated Financial Statements
Note 8. Commitments and Contingencies
The amounts associated with unfunded commitments to provide funds to portfolio companies are not recorded in the Master Fund’s consolidated statements of assets and liabilities. Since these commitments and the associated amounts may expire without being drawn upon, the total commitment amount does not necessarily represent a future cash requirement. As of December 31, 2019 and December 31, 2018, the Master Fund’s unfunded commitments consisted of the following:
|
| | | | | | | | |
| | | Total Unfunded Commitments |
Category / Portfolio Company (1) | | December 31, 2019 | | December 31, 2018 |
| Aceto Chemical (Revolver) | | $ | 800 |
| | $ | — |
|
| Acquia Inc. (Revolver) | | 211 |
| | — |
|
Alexander Mann Solutions (Revolver) (2) | | 446 |
| | 446 |
|
| Apptio, Inc. (Revolver) | | 326 |
| | 326 |
|
| Bluefin Holding, LLC (Revolver) | | 132 |
| | — |
|
| Boats Group (Revolver) | | 1,000 |
| | 1,000 |
|
| GAL Manufacturing (Revolver) | | 260 |
| | 384 |
|
| Galls LLC (Delayed Draw) | | 1,518 |
| | 1,644 |
|
| Galls LLC (Revolver) | | 113 |
| | 326 |
|
Gladman Developments Ltd. (Delayed Draw) (2) | | 706 |
| | 1,648 |
|
| Lytx, Inc. (Revolver) | | 368 |
| | 368 |
|
| Mavis Tire Express Services Corp. (Delayed Draw) | | 319 |
| | 435 |
|
| Mavis Tire Express Services Corp. (Revolver) | | 189 |
| | 217 |
|
| Onyx CenterSource (Revolver) | | 329 |
| | 329 |
|
| PSI Services LLC (Delayed Draw) | | 239 |
| | — |
|
| PSI Services LLC (Delayed Draw) | | 168 |
| | — |
|
| PSI Services LLC (Revolver) | | 269 |
| | — |
|
| Seal For Life Industries US LLC (Revolver) | | 390 |
| | — |
|
SLR Consulting (Delayed Draw) (2) | | — |
| | 534 |
|
| Trader Interactive (Revolver) | | 346 |
| | 346 |
|
| Velocity Holdings US (Revolver) | | — |
| | 115 |
|
| Wind River Systems (Bridge Loan) | | — |
| | 353 |
|
| Total Unfunded Commitments | | $ | 8,129 |
| | $ | 8,471 |
|
______________________
| |
| (1) | May pertain to commitments to one or more entities affiliated with the named portfolio company. |
| |
| (2) | This commitment is in foreign currency and has been converted to USD using the December 31, 2019 and December 31, 2018 exchange rates, respectively. |
Indemnification
In the normal course of business, the Master Fund enters into contracts and agreements that contain a variety of representations and warranties that provide general indemnifications. The Master Fund's maximum exposure under these arrangements is unknown, as these involve future claims that may be made against the Master Fund but that have not occurred. The Master Fund expects the risk of any future obligations under these indemnifications to be remote.
Notes to Consolidated Financial Statements
Note 9. Financial Highlights
The following per Common Share data and financial ratios have been derived from information provided in the consolidated financial statements. The following is a schedule of financial highlights during the years ended December 31, 2019, December 31, 2018, December 31, 2017, December 31, 2016 and December 31, 2015:
|
| | | | | | | | | | | | | | | | | | | |
| | For the Years Ended December 31, |
| | 2019 | | 2018 | | 2017 | | 2016 | | 2015 |
| PER COMMON SHARE OPERATING PERFORMANCE | | | | | | | | | |
| Net asset value, beginning of year | $ | 8.09 |
| | $ | 8.52 |
| | $ | 8.47 |
| | $ | 8.00 |
| | $ | 9.00 |
|
Net investment income (1) | 0.63 |
| | 0.64 |
| | 0.50 |
| | 0.21 |
| | 0.30 |
|
Net realized gains (losses) (1) | (0.25 | ) | | 0.24 |
| | 0.12 |
| | 0.05 |
| | 0.01 |
|
Net change in unrealized appreciation (depreciation) (2) | (0.09 | ) | | (0.47 | ) | | 0.02 |
| | 0.45 |
| | (1.01 | ) |
| Net increase (decrease) resulting from operations | 0.29 |
| | 0.41 |
| | 0.64 |
| | 0.71 |
| | (0.70 | ) |
Distributions to Common Shareholders (3) | | | | | | | | | |
| Distributions from net investment income | (0.59 | ) | | (0.63 | ) | | (0.49 | ) | | (0.17 | ) | | (0.30 | ) |
| Distributions from realized gains | (0.01 | ) | | (0.21 | ) | | (0.07 | ) | | (0.04 | ) | | — |
|
| Distributions in excess of net investment income | — |
| | — |
| | (0.03 | ) | | (0.03 | ) | | — |
|
| Net decrease resulting from distributions | (0.60 | ) | | (0.84 | ) | | (0.59 | ) | | (0.24 | ) | | (0.30 | ) |
| Net asset value, end of year | $ | 7.78 |
| | $ | 8.09 |
| | $ | 8.52 |
| | $ | 8.47 |
| | $ | 8.00 |
|
| | | | | | | | | | |
| INVESTMENT RETURNS | | | | | | | | | |
Total investment return (4) | 3.55 | % | | 4.87 | % | | 7.80 | % | | 9.14 | % | | (7.91 | )% |
| | | | | | | | | | |
| RATIOS/SUPPLEMENTAL DATA | | | | | | | | | |
| Net assets, end of year | $ | 211,197 |
| | $ | 236,232 |
| | $ | 248,481 |
| | $ | 178,066 |
| | $ | 46,704 |
|
Average net assets (5) | $ | 229,144 |
| | $ | 247,249 |
| | $ | 233,765 |
| | $ | 101,825 |
| | $ | 49,119 |
|
| Common Shares outstanding, end of year | 27,157,534 |
| | 29,195,002 |
| | 29,151,096 |
| | 21,016,797 |
| | 5,840,060 |
|
| Weighted average Common Shares outstanding | 28,730,579 |
| | 29,163,651 |
| | 27,524,615 |
| | 12,370,464 |
| | 5,571,531 |
|
| | | | | | | | | | |
Ratios-to-average net assets: (5) | | | | | | | | | |
| Total expenses before incentive fee waiver and reimbursement of advisor transition costs | 7.87 | % | | 6.55 | % | | 7.70 | % | | 9.65 | % | | 5.16 | % |
| Effect of incentive fee waiver and reimbursement of advisor transition costs | — | % | | — | % | | (0.35 | )% | | — | % | | (1.78 | )% |
| Total expenses | 7.87 | % | | 6.55 | % | | 7.35 | % | | 9.65 | % | | 3.38 | % |
| Net investment income | 7.88 | % | | 7.51 | % | | 5.88 | % | | 2.53 | % | | 3.45 | % |
| | | | | | | | | | |
Average outstanding borrowings (5) | $ | 160,312 |
| | $ | 150,000 |
| | $ | 142,615 |
| | $ | 67,000 |
| | $ | 16,385 |
|
Portfolio turnover rate (5) (6) | 20 | % | | 49 | % | | 43 | % | | 51 | % | | 39 | % |
Asset coverage ratio (7) | 2.23 |
| | 2.57 |
| | 2.66 |
| | 2.41 |
| | 2.15 |
|
_____________________
| |
| (1) | The per Common Share data was derived by using the weighted average Common Shares outstanding during the period presented. |
| |
| (2) | The amount shown at this caption is the balancing figure derived from the other figures in the schedule. The amount shown at this caption for a Common Share outstanding throughout the year may not agree with the change in the aggregate appreciation and depreciation in portfolio securities for the year because of the timing of sales of the Master Fund’s Common Shares in relation to fluctuating market values for the portfolio. |
Notes to Consolidated Financial Statements
| |
| (3) | The per Common Share data for distributions is the actual amount of distributions declared per Common Share outstanding during the entire year; distributions per Common Share are rounded to the nearest $0.01. For income tax purposes, distributions made to shareholders are reported as ordinary income, capital gains, non-taxable return of capital or a combination thereof, based on taxable income calculated in accordance with income tax regulations which may differ from amounts determined under GAAP. As of December 31, 2019, the Master Fund estimated distributions to be composed of either ordinary income or capital gains. The final determination of the tax character of distributions will not be made until we file our tax return. |
| |
| (4) | Total investment return is based on (i) the purchase of Common Shares at net asset value on the first day of the year, (ii) the sale at the net asset value per Common Share on the last day of the year, of (A) all purchased Common Shares plus (B) any fractional Common Shares issued in connection with the reinvestment of distributions and (iii) distributions payable relating to the ownership of Common Shares, if any, on the last day of the year. The total investment return calculation assumes that cash distributions are reinvested concurrent with the issuance of Common Shares at the most recent transaction price on or prior to each distribution payment date. Since there is no public market for the Master Fund’s Common Shares, then the terminal sales price per Common Share is assumed to be equal to net asset value per Common Share on the last day of the year. Total investment return is not annualized. The Master Fund’s performance changes over time and currently may be different than that shown above. Past performance is no guarantee of future results. |
| |
| (5) | The computation of average net assets, average outstanding borrowings and average value of portfolio securities during the year is based on averaging the amount on the first day of the first month of the year and the last day of each month during the period. |
| |
| (6) | Portfolio turnover is calculated as the lesser of (i) purchases of portfolio securities or (ii) the aggregate total of sales of portfolio securities plus any repayments received divided by the monthly average of the value of investment portfolio owned by the Master Fund during the period. |
| |
| (7) | Asset coverage ratio is equal to (i) the sum of (A) net assets at the end of the year and (B) total senior securities issued at the end of the year, divided by (ii) total senior securities at the end of the period. |
Note 10. Distributions
The following table summarizes the distributions that the Master Fund declared on its Common Shares during the years ended December 31, 2019, December 31, 2018 and December 31, 2017:
|
| | | | | | | | | | | | | | |
| Record Date | | Payment Date | | Distribution Per Common Share at Record Date | | Distribution Per Common Share at Payment Date | | Cash Distribution |
| For Calendar Year 2019 | | | | | | | | |
| January 7, 14, 21, 28 | | January 30 | | $ | 0.01346 |
| | $ | 0.05384 |
| | $ | 1,572 |
|
| February 4, 11, 18, 25 | | February 27 | | 0.01346 |
| | 0.05384 |
| | 1,572 |
|
| March 4, 11, 18, 25 | | March 27 | | 0.01346 |
| | 0.05384 |
| | 1,573 |
|
| April 1, 8, 15, 22, 29 | | May 1 | | 0.01346 |
| | 0.06730 |
| | 1,971 |
|
| May 6, 13, 20, 27 | | May 29 | | 0.01346 |
| | 0.05384 |
| | 1,576 |
|
| June 3, 10, 17, 24 | | June 26 | | 0.01346 |
| | 0.05384 |
| | 1,559 |
|
| July 1, 8, 15, 22, 29 | | July 31 | | 0.01346 |
| | 0.06730 |
| | 1,926 |
|
| August 5, 12, 19, 26 | | August 28 | | 0.00776 |
| | 0.03104 |
| | 888 |
|
| September 2, 9, 16, 23, 30 | | October 2 | | 0.00776 |
| | 0.03880 |
| | 1,110 |
|
| October 7, 14, 21 | | October 23 | | 0.00776 |
| | 0.02328 |
| | 666 |
|
| October 28, November 4, 11, 18 | | November 20 | | 0.01049 |
| | 0.04196 |
| | 1,170 |
|
| November 25, December 2, 9, 16, 23 | | December 26 | | 0.01200 |
| | 0.06000 |
| | 1,663 |
|
| | | | | | | $ | 0.59888 |
| | $ | 17,246 |
|
| | | | | | | | | |
| For Calendar Year 2018 | | | | | | | | |
| January 25 | | January 26 | | $ | 0.05832 |
| | $ | 0.05832 |
| | $ | 1,700 |
|
| February 22 | | February 23 | | 0.05832 |
| | 0.05832 |
| | 1,700 |
|
| March 22 | | March 23 | | 0.05832 |
| | 0.05832 |
| | 1,700 |
|
| April 19 | | April 20 | | 0.04803 |
| | 0.04803 |
| | 1,400 |
|
| May 24 | | May 25 | | 0.06861 |
| | 0.06861 |
| | 2,000 |
|
| June 21 | | June 22 | | 0.06861 |
| | 0.06861 |
| | 2,000 |
|
Notes to Consolidated Financial Statements
|
| | | | | | | | | | | | | | |
| July 26 | | July 27 | | 0.06861 |
| | 0.06861 |
| | 2,000 |
|
| August 23 | | August 24 | | 0.06861 |
| | 0.06861 |
| | 2,000 |
|
| September 4, 11, 18, 25 | | September 26 | | 0.01346 |
| | 0.05384 |
| | 1,570 |
|
| October 2, 9, 16, 23, 30 | | October 31 | | 0.01346 |
| | 0.06730 |
| | 1,962 |
|
| November 6, 13, 20, 27 | | November 28 | | 0.01346 |
| | 0.05384 |
| | 1,573 |
|
| December 3, 10, 17, 24 | | December 26 | | 0.01346 |
| | 0.05384 |
| | 1,573 |
|
| December 28 | | January 9, 2019 | | 0.10276 |
| | 0.10276 |
| | 3,000 |
|
| December 31 | | January 30, 2019 | | 0.01346 |
| | 0.01346 |
| | 394 |
|
| | | | | | | $ | 0.84247 |
| | $ | 24,572 |
|
| | | | | | | | | |
| For Calendar Year 2017 | | | | | | | | |
| January 31 | | February 1 | | 0.03015 |
| | $ | 0.03015 |
| | $ | 691 |
|
| February 28 | | March 1 | | 0.03300 |
| | 0.03300 |
| | 803 |
|
| March 28 | | March 29 | | 0.03101 |
| | 0.03101 |
| | 806 |
|
| April 28 | | May 1 | | 0.03900 |
| | 0.03900 |
| | 1,093 |
|
| May 30 | | May 31 | | 0.04603 |
| | 0.04603 |
| | 1,299 |
|
| June 29 | | June 30 | | 0.03852 |
| | 0.03852 |
| | 1,100 |
|
| July 25 | | July 27 | | 0.06877 |
| | 0.06877 |
| | 2,000 |
|
| August 29 | | August 30 | | 0.04437 |
| | 0.04437 |
| | 1,300 |
|
| September 26 | | September 27 | | 0.04437 |
| | 0.04437 |
| | 1,300 |
|
| October 30 | | October 31 | | 0.07500 |
| | 0.07500 |
| | 2,186 |
|
| November 27 | | November 28 | | 0.05489 |
| | 0.05489 |
| | 1,600 |
|
| December 21 | | December 22 | | 0.08576 |
| | 0.08576 |
| | 2,500 |
|
| | | | | | | $ | 0.59087 |
| | $ | 16,678 |
|
For income tax purposes, the Master Fund estimates that its 2019 calendar year distributions are fully covered by taxable income before the paid distributions deduction (see Note 11. Taxable/Distributable Income).
Note 11. Taxable/Distributable Income
Income and capital gain distributions are determined in accordance with the Code and federal tax regulations, which may differ from amounts determined in accordance with GAAP. The book-to-tax basis differences, which could be material, may be due to differing treatments of income and gains on various investment securities held by the Master Fund and expenses incurred by the Master Fund. Permanent book-to-tax basis differences result in reclassifications to paid-in capital in excess of par value and accumulated distributions in excess of net investment income. Undistributed (distributions in excess of) net investment income, accumulated net realized gains and accumulated net unrealized appreciation on investments, may include temporary book and tax basis differences which will reverse in subsequent periods.
For the years ended December 31, 2019, December 31, 2018 and December 31, 2017, the Master Fund made the following reclassifications of permanent book and tax basis differences:
|
| | | | | | | | | | | |
| | For the Years Ended December 31, |
| Capital Accounts | 2019 | | 2018 | | 2017 |
| Paid in capital in excess of par value | $ | — |
| | $ | (1 | ) | | $ | (67 | ) |
| Undistributed net investment income | (707 | ) | | 1,062 |
| | 67 |
|
| Accumulated realized gains | 707 |
| | (1,061 | ) | | — |
|
| Total | $ | — |
| | $ | — |
| | $ | — |
|
Notes to Consolidated Financial Statements
The following table reconciles net increase in net assets resulting from operations to total taxable income available for distributions for the years ended December 31, 2019, December 31, 2018 and December 31, 2017:
|
| | | | | | | | | | | |
| | For the Years Ended December 31, |
| | 2019 | | 2018 | | 2017 |
| Net increase in net assets resulting from operations | $ | 8,300 |
| | $ | 11,960 |
| | $ | 17,708 |
|
| Net realized losses | 7,108 |
| | — |
| | — |
|
| Net change in unrealized (appreciation) depreciation | 2,658 |
| | 13,742 |
| | (626 | ) |
| Unearned performance-based incentive fee on unrealized gains (losses) | 11 |
| | (1,346 | ) | | 798 |
|
| Offering expense | — |
| | — |
| | 68 |
|
| Other book-tax difference | (589 | ) | | 48 |
| | (199 | ) |
| Total taxable income and gains available for distributions | $ | 17,488 |
| | $ | 24,404 |
| | $ | 17,749 |
|
The Company did not incur U.S. federal excise tax for the calendar years ended December 31, 2018 and December 31, 2017 and the Company does not expect to incur a U.S. federal excise tax for the calendar year ended December 31, 2019. The tax character of shareholder distributions attributable to the fiscal years ended December 31, 2019, December 31, 2018 and December 31, 2017 was as follows:
|
| | | | | | | | | | | |
| | For the Years Ended December 31, |
| Distributions Attributable To: | 2019 | | 2018 | | 2017 |
| Ordinary income (including short-term capital gains) | $ | 16,911 |
| | $ | 21,113 |
| | $ | 16,321 |
|
Long-term capital gains (1) | 335 |
| | 3,459 |
| | 357 |
|
| Total distributions | $ | 17,246 |
| | $ | 24,572 |
| | $ | 16,678 |
|
Distributions as a percentage of taxable income and gains available for distributions (2) | 98.6 | % | | 100.7 | % | | 94.0 | % |
(1) The Company designates as long term capital gain dividends, pursuant to Internal Revenue Code Section 852(b)(3).
(2) The total distributions declared during the year includes payment of prior year undistributed taxable income and gains.
As of December 31, 2019 and December 31, 2018, the components of tax basis accumulated earnings (loss) were as follows:
|
| | | | | | | |
| | As of December 31, |
| | 2019 | | 2018 |
| Undistributed ordinary income, net | $ | 577 |
| | $ | 508 |
|
| Undistributed capital gains | (6,402 | ) | | 681 |
|
| Unrealized loss | (12,834 | ) | | (11,037 | ) |
| Other temporary adjustments | (167 | ) | | (32 | ) |
| Total accumulated (loss), net | $ | (18,826 | ) | | $ | (9,880 | ) |
Under the current tax law, the Company may carry forward net capital losses indefinitely to use to offset capital gains realized in future years, and their character is retained as either short-term and/or long-term. At December 31, 2019, the Company incurred $(6,402) of long-term capital losses.
Notes to Consolidated Financial Statements
Note 12. Selected Quarterly Financial Data (Unaudited)
Selected unaudited quarterly financial data for the years ended December 31, 2019, December 31, 2018 and December 31, 2017 are presented below:
|
| | | | | | | | | | | | | | | |
| | As of and for the three months ended |
| | December 31, 2019 | | September 30, 2019 | | June 30, 2019 | | March 31, 2019 |
| Total investment income | $ | 8,908 |
| | $ | 9,162 |
| | $ | 9,114 |
| | $ | 8,923 |
|
| Net investment income | 4,498 |
| | 4,567 |
| | 4,603 |
| | 4,398 |
|
| Net realized and unrealized losses | (4,094 | ) | | (4,974 | ) | | (387 | ) | | (311 | ) |
| Net increase (decrease) in net assets resulting from operations | 404 |
| | (407 | ) | | 4,216 |
| | 4,087 |
|
| Net assets | 211,197 |
| | 225,699 |
| | 230,030 |
| | 236,295 |
|
| Total investment income per Common Share - basic and diluted | 0.32 |
| | 0.32 |
| | 0.31 |
| | 0.31 |
|
| Net investment income per Common Share - basic and diluted | 0.16 |
| | 0.16 |
| | 0.16 |
| | 0.15 |
|
| Earnings (loss) per Common Share - basic and diluted | 0.01 |
| | (0.01 | ) | | 0.14 |
| | 0.14 |
|
| Net asset value per Common Share at end of quarter | 7.78 |
| | 7.89 |
| | 8.04 |
| | 8.07 |
|
|
| | | | | | | | | | | | | | | |
| | As of and for the three months ended |
| | December 31, 2018 | | September 30, 2018 | | June 30, 2018 | | March 31, 2018 |
| Total investment income | $ | 8,963 |
| | $ | 8,678 |
| | $ | 8,853 |
| | $ | 8,265 |
|
| Net investment income | 6,345 |
| | 4,343 |
| | 4,476 |
| | 3,393 |
|
| Net realized and unrealized gains (losses) | (9,105 | ) | | (592 | ) | | (28 | ) | | 3,128 |
|
| Net increase (decrease) in net assets resulting from operations | (2,760 | ) | | 3,751 |
| | 4,448 |
| | 6,521 |
|
| Net assets | 236,232 |
| | 247,131 |
| | 248,950 |
| | 249,901 |
|
| Total investment income per Common Share - basic and diluted | 0.31 |
| | 0.30 |
| | 0.30 |
| | 0.28 |
|
| Net investment income per Common Share - basic and diluted | 0.22 |
| | 0.15 |
| | 0.15 |
| | 0.12 |
|
| Earnings (loss) per Common Share - basic and diluted | (0.09 | ) | | 0.13 |
| | 0.15 |
| | 0.22 |
|
| Net asset value per Common Share at end of quarter | 8.09 |
| | 8.48 |
| | 8.54 |
| | 8.57 |
|
|
| | | | | | | | | | | | | | | |
| | As of and for the three months ended |
| | December 31, 2017 | | September 30, 2017 | | June 30, 2017 | | March 31, 2017 |
| Total investment income | $ | 8,661 |
| | $ | 8,331 |
| | $ | 7,745 |
| | $ | 6,172 |
|
| Net investment income | 4,402 |
| | 3,862 |
| | 3,555 |
| | 1,919 |
|
| Net realized and unrealized gains (losses) | 998 |
| | 956 |
| | (256 | ) | | 2,272 |
|
| Net increase in net assets resulting from operations | 5,400 |
| | 4,818 |
| | 3,299 |
| | 4,191 |
|
| Net assets | 248,481 |
| | 249,367 |
| | 248,564 |
| | 236,398 |
|
| Total investment income per Common Share - basic and diluted | 0.30 |
| | 0.29 |
| | 0.28 |
| | 0.26 |
|
| Net investment income per Common Share - basic and diluted | 0.15 |
| | 0.13 |
| | 0.13 |
| | 0.08 |
|
| Earnings per Common Share - basic and diluted | 0.19 |
| | 0.16 |
| | 0.12 |
| | 0.18 |
|
| Net asset value per Common Share at end of quarter | 8.52 |
| | 8.55 |
| | 8.55 |
| | 8.55 |
|
Note 13. Subsequent Events
Management has evaluated subsequent events through the date of issuance of these consolidated financial statements and has determined that there are no subsequent events outside the ordinary scope of business that require adjustment to, or disclosure in, the consolidated financial statements.
|
| | | | | |
| | | | | | |
| TABLE OF CONTENTS | | | | For more information: | |
| | | Page | | | |
| | | | Contacting us: You can request free copies of this prospectus and discuss your questions about us by contacting us at: |
| | | |
| | | |
| | | | Guggenheim Credit Income Fund 2021 330 Madison Avenue New York, New York 10017 1-888-667-4937 |
| | | |
| | | |
| | | |
| | | | | |
| | | | Securities and Exchange Commission Information: You can also review our filings and the prospectus on the SEC's website at www.sec.gov. You can get copies of this information, for a fee, by e-mailing or writing to: E-mail address: publicinfo@sec.gov
|
| | | |
| | | |
| | | |
| | | |
| | | | | |
| | | |
|
| | | |
| | | |
| | | | | |
| | | | SEC File No. 333-237828 |
| | | | | |
| | | | Dealer Manager: Guggenheim Funds Distributors, LLC, member of FINRA/SIPC |
| | | |
| | | | |
| | | |
| | | |
| | | |
| | | |
| | | | GUGGENHEIM CREDIT INCOME FUND 2021 |
| | | | A Business Development Company |
| | | | | | |
| | | | | | |
| | | | | | |