Valvoline: Ready to Stand Alone –Start Your Engines!
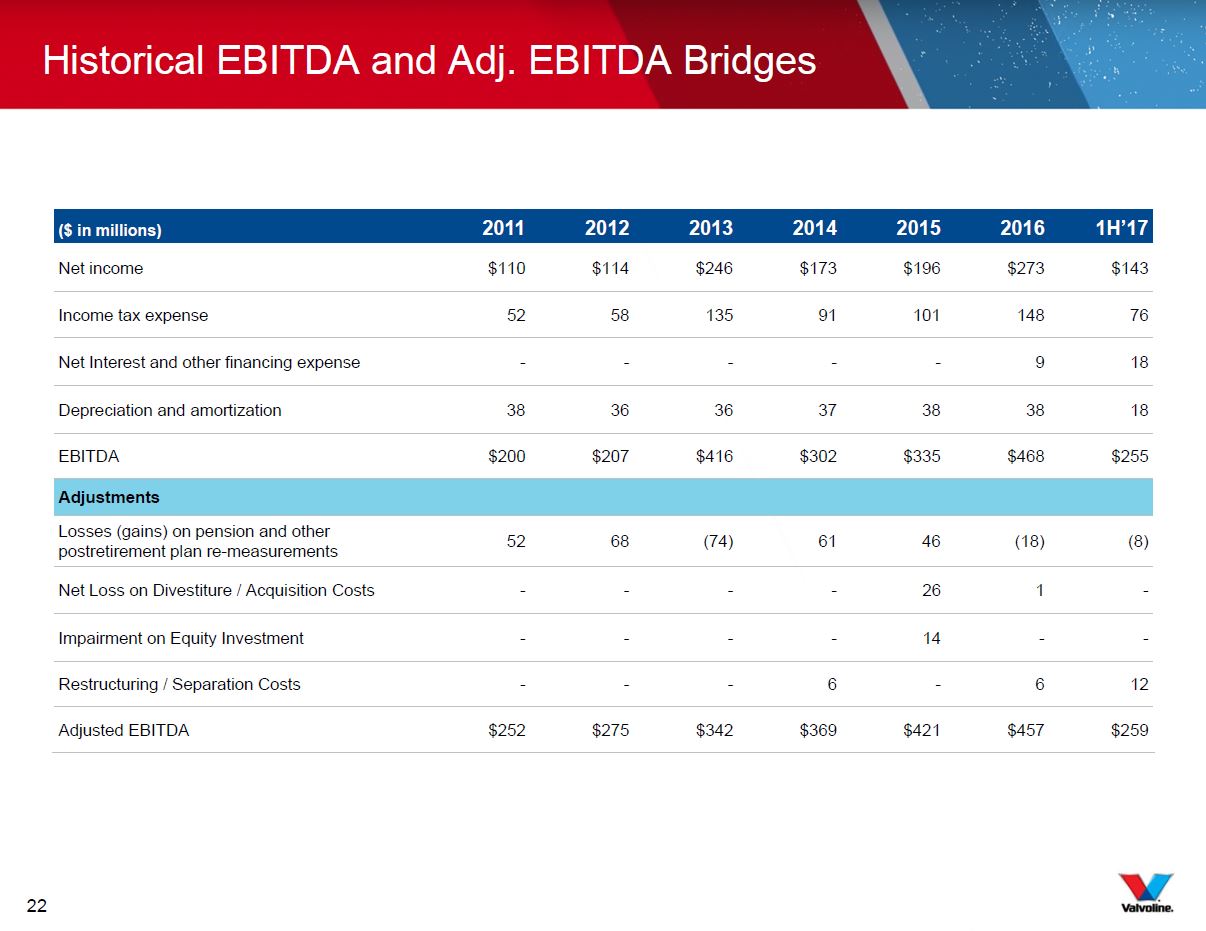
Forward-Looking StatementsThis presentation contains forward-looking statements within the meaning of Section 27A of the Securities Act of 1933, as amended, and Section 21E of the Securities Exchange Act of 1934, as amended. All statements, other than statements of historical facts, contained in the presentation, including statements regarding our industry, position, goals, strategy, operations, financial position, revenues, estimated costs, prospects, margins, profitability, capital expenditures, liquidity, capital resources, dividends, plans and objectives of management are forward-looking statements. Valvoline has identified some of these forward-looking statements with words such as “anticipates,” “believes,” “expects,” “estimates,” “is likely,” “predicts,” “projects,” “forecasts,” “may,” “will,” “should” and “intends” and the negative of these words or other comparable terminology. In addition, Valvoline™ may, from time to time, make forward-looking statements in its annual report, quarterly reports and other filings with the Securities and Exchange Commission (“SEC”), news releases and other written and oral communications. These forward-looking statements are based on Valvoline’s current expectations and assumptions regarding, as of the date such statements are made, Valvoline’s future operating performance and financial condition, including Valvoline’s separation from Ashland (the “Separation”), the expected timetable for Ashland’s potential distribution of its remaining Valvoline common stock to Ashland shareholders (the “Stock Distribution”) and Valvoline’s future financial and operating performance, strategic and competitive advantages, leadership and future opportunities, as well as the economy and other future events or circumstances. Valvoline’s expectations and assumptions include, without limitation, internal forecasts and analyses of current and future market conditions and trends, management plans and strategies, operating efficiencies and economic conditions (such as prices, supply and demand, cost of raw materials, and the ability to recover raw-material cost increases through price increases), and risks and uncertainties associated with the following: demand for Valvoline’s products and services; sales growth in emerging markets; the prices and margins of Valvoline’s products and services; the strength of Valvoline’s reputation and brand; Valvoline’s ability to develop and successfully market new products and implement its digital platforms; Valvoline’s ability to retain its largest customers; potential product liability claims; achievement of the expected benefits of the Separation; Valvoline’s substantial indebtedness (including the possibility that such indebtedness and related restrictive covenants may adversely affect Valvoline’s future cash flows, results of operations, financial condition and Valvoline’s ability to repay debt) and other liabilities; operating as a stand-alone public company; Valvoline’s ongoing relationship with Ashland; failure, caused by Valvoline, of the Stock Distribution to Ashland shareholders to qualify for tax-free treatment, which may result in significant tax liabilities to Ashland for which Valvoline may be required to indemnify Ashland; and the impact of acquisitions and/or divestitures Valvoline has made or may make (including the possibility that Valvoline may not realize the anticipated benefits from such transactions or difficulties with integration). These forward-looking statements are subject to a number of known and unknown risks, uncertainties and assumptions, including, without limitation, risks and uncertainties affecting Valvoline that are described in its most recent Form 10-K (including in Item 1A Risk Factors and “Use of estimates, risks and uncertainties” in Note 2 of Notes to Consolidated Financial Statements) filed with the SEC, which is available on Valvoline’s website at http://investors.valvoline.com/sec-filings. In light of these risks, uncertainties and assumptions, the forward-looking events and circumstances discussed in this presentation may not occur, and actual results could differ materially and adversely from those anticipated or implied in the forward-looking statements. You should not rely upon forward-looking statements as predictions of future events. Although Valvoline believes that the expectations reflected in these forward-looking statements are reasonable, Valvoline cannot guarantee that the expectations reflected herein will be achieved. In light of the significant uncertainties in these forward-looking statements, you should not regard these statements as a representation or warranty by Valvoline or any other person that Valvoline will achieve its objectives and plans in any specified time frame, or at all. These forward-looking statements speak only as of the date of this presentation. Except as required by law, Valvoline assumes no obligation to update or revise these forward-looking statements for any reason, even if new information becomes available in the future. All forward-looking statements attributable to Valvoline are expressly qualified in their entirety by these cautionary statements as well as others made in this presentation and hereafter in Valvoline’s other SEC filings and public communications. You should evaluate all forward-looking statements made by Valvoline in the context of these risks and uncertainties.Regulation G: Non-GAAP Financial InformationThe information presented herein regarding certain financial measures that do not conform to generally accepted accounting principles in the United States (U.S. GAAP), including EBITDA, Adjusted EBITDA and Free Cash Flow, should not be construed as an alternative to the reported results determined in accordance with U.S. GAAP. Valvoline has included this non-GAAP information to assist in understanding the operating performance of Valvoline and its reportable segments. The non-GAAP information provided may not be consistent with the methodologies used by other companies. Information regarding Valvoline’s definition and calculations of non-GAAP measures is included in Valvoline’s most recent Form 10-K filed with the SEC, which is available on Valvoline’s website at http://investors.valvoline.com/sec-filings. Additionally, a reconciliation of EBITDA and Adjusted EBITDA is included in the Appendix herein.
Name Title Industry Experience Selected Experience Sam Mitchell Chief Executive Officer 20 Joined Ashland in 1997 as Director of Marketing for Valvoline’s brand management group; became President of Valvoline in 2002Held brand and category management leadership positions at The Clorox CompanyGraduate of the Harvard Business School’s Advanced Management Program; M.B.A. from the University of Chicago; B.S. from Miami University, Oxford, Ohio Mary Meixelsperger Chief Financial Officer 17 Joined Valvoline as CFO in 2016, assuming responsibility for global financial organizationOver 25 years of CFO experience, including DSW Inc., Shopko Stores, two non-profit organizations and a private equity firmBegan career in public accounting at Arthur Young and Co.B.B.A. with distinction from the University of Wisconsin-Madison Jason Thompson Head of Treasury & Investor Relations 7 Joined Ashland in 2010; held multiple positions before becoming Director of Finance in 2015M.B.A. from Indiana University; B.S. from Oklahoma State University Today’s Presenters 1
Who We Are and How We Win
Our Goal 150Years independent Never idle Hands-on expertise Building The world’s leading engine and automotive maintenance business FocusedConnected to our customers Every moment of time we have is an investment. At Valvoline, we choose to invest our time in creating greater value for our customers, our organization and our shareholders. That means supplying best-in-class automotive and engine maintenance products and services to our customers and doing it with an unyielding pursuit of excellence. For more than 150 years, it has meant being relentlessly focused on innovating through our hands-on approach. Our approach makes engine and vehicle maintenance easy for consumers and lowers the total cost of ownership for heavy duty engine customers. It‘s what drives competitive advantage, profitability and growth for Valvoline and for our trade customers, franchisees and channel partners. TO make everything we touch run better A team of experts that gets the job done Relentlessly improving For more than 150 years, Valvoline stands for quality and innovation 2
Our Strategy leveraging the Valvoline brand AND CAPABILITIES Across channels & around the world DIY RETAILERS RAP / MASS QUICK LUBES VALVOLINE INSTANTOIL CHANGE /EXPRESS CARE It starts with great products, and no matter the application, everything we produce is specifically designed to keep engines running at peak performance. Our commitment to providing great service continually sets Valvoline apart. That focus on customer experience has led to 10-straight years of same-store sales growth in our quick lube business. (1) Valvoline has been able to create multiple industry-changing firsts and continues to develop groundbreaking innovation. Everything we do is built upon a forward-facing adoption of technology, designed to help better serve our customers and create profitability for the company and our partners. DIGITAL MARKETING | PACKAGING SOLUTIONS | ENGINE DIAGNOSTICS | DATA ANALYTICS CATEGORY MANAGEMENT | TRAINING | RECRUITING SERVICES | BUSINESS ADVISORY | CUSTOM FORMULATIONS | SUPPLY CHAIN SOLUTIONS MOTOR OILS | COOLANTS | AUTO FLUIDS | COMMERCIAL LUBRICANTS | CHEMICALS | FILTERS | WIPERS Core North America HEAVY DUTY ON-ROAD /OFF-ROAD Core North America / International OEM PASSENGER CAR /HEAVY DUTY Core North America / International INSTALLERS TIRE & REPAIR /CAR DEALERS Core North America / International ____________________System-wide (i.e., company-owned and franchised) SSS growth. SSS growth determined on a fiscal year basis with new stores included after first full fiscal year of operation. 3
Our Brand Is Driving a Growing Global Platform 25% Quick Lubes 49% Core North America 26% International Our Sales Are Diversified Across 3 Distinct Channels (4) ____________________Note: All data shown are as of fiscal 2017 quarter ended 3/31 unless otherwise noted. By Volume in the United States DIY market in 2016.As of fiscal 2016 year-end 9/30. For a reconciliation of Adj. EBITDA to Net Income, see the Appendix to this presentation.SSS growth determined on a fiscal year basis with new stores included after first full fiscal year of operation.Figures are for six months ended 3/31/17. ~$2.0Bn In Annual Sales 23.7% Adj. EBITDA Margin (2) Over 140 Countries With Valvoline Sales ~5,500 Employees Top 3 Premium Motor Oil Brand (1) 3 Winning Segments 10 Consecutive Years of System-Wide SSS Growth (3) 1,108 Valvoline Instant Oil Change Units Best-in-class Retail Model 4
A Proven Track Record of Earnings Growth Our Strong Cash Flow Affords Investment in All Our Growth Segments Mix shift towards premium products: ~45% in 2016 from ~31% in 2011 (1)10 consecutive years of system-wide SSS growth in VIOC stores (2)Consistent volume and profit growth in international marketsProactive product pricing and raw material cost management Growth in Adj. EBITDA and Adj. EBITDA Margins (3)(4) $MM; % ____________________U.S. branded lubricants.Systemwide (i.e., company-owned and franchised) SSS growth. SSS growth determined on a fiscal year basis with new stores included after first full fiscal year of operation.For a reconciliation of Adj. EBITDA to Net Income, see the Appendix to this presentation.All full-year data as of fiscal year-end 9/30 unless otherwise noted. 5
Our Roadmap for Success: Valvoline’s Investment Highlights Iconic Brand WithPremium Products Strong and Growing Quick Lube Channel History of Innovation InternationalGrowth Solid Market Fundamentals Unique Multi-Channel Route to Market Significant Free Cash Flow Generation Disciplined Margin Management 6
Margin Management and Pricing Power Quick Lubes Growth Opportunity International Growth Opportunity The Future of Core North America The Critical Aspects to Understanding Valvoline 7
Margin Management and Pricing Power
Long Base Oil Market Expected to Continue Through 2020 and Provide Base Oil Pricing Stability Fundamentals of Base Oil Market & Our Pricing Strategy ____________________Source: Polk and Experian data, IHS Chemical Report and internal estimates. Based on raw material pricing for six months ended 3/31/17. Group II and Group III base oils are key components of higher quality lubricantsFrom 2011 – 2016 Group II and Group III global capacity has increased 66% and 129%At the same time Group I capacity has dropped by 21%Base oil inflation since Summer 2016Rising crudeTemporary supply tightness Channels Price Change Drivers Average Lag Market Based DIY / Installer Major base oil changes, competitive changes, retail pricing, Valvoline brand strength 60 - 120 days Index Based Installer (national / regional accounts), VIOC Franchisees Posted base oil indices 45 days Private Label / Other DIY / Warehouse Distributor, OEM, Other Major base oil changes 30 - 60 days Pricing U.S. Finished Lubricant Cost Components (1) Base Oil Additives, Packaging & Operations Billions of Gallons Supply Demand 8
Valvoline Unit Margins Improving Despite Changes in Base Oil Pricing Prices in USD A Strong Track Record of Managing Unit Margin Improved Unit Margins Through Business and Product Mix Long Base Oil Market Has Enabled Us to Improve Our Purchasing Terms Protected Unit Margins in Rising Cost Environment ____________________Note: Historical gross profit / gallon based on Valvoline financials as a subsidiary of Ashland. All full-year data as of fiscal year-end 9/30 unless otherwise noted.Figures are for six months ended 3/31/17. 1 2 3 1H’2017 (1) 9
Quick Lubes Growth Opportunity
Our VIOC Business Model ...Driving 10 Years of Same-Store Sales Growth (2) System-Wide Average Sales per Store(dollars in thousands) ’07-’16 CAGR: 5.4% ____________________Data represented on a fiscal year basis.SSS growth determined on a fiscal year basis with new stores included after first full fiscal year of operation. Digital platforms driving growth in number of carsCore programs generate ~6 month payback Customer database enabled Marketing Platforms Quick, Easy, Trusted Overall customer satisfaction 4.6 of 5 starsCustomer retention over 70% Customer Experience Improved Safety Total Recordable Rate over 50%Reduced turnover by over 50%, store growth creates career path Entry level technicians go through 270+ hours of training Talent Operating Stores Strengthens Business Model Performance Our Sales Per Store Has Grown Steadily... (1) Point of Sale System SuperPro Management SystemLabor and Inventory Management Proprietary Tools YTD Q2’17 System-Wide SSS 6.4% 10 Year Average of System-Wide SSS 4.9% 10
Significant Opportunities for Growth ____________________Includes 374 company-owned stores and 734 franchised locations as of fiscal 2017 quarter ended 3/31. Does not include Express Care operators. Broad VIOC Geographic Footprint (1) Significant Whitespace for New Stores Franchised Company-Owned New Construction is an ~18 Month Process Substantial Opportunity For Organic Expansion Consolidation Opportunity in Fragmented Market Identifying Acquisition TargetsHigh quality regional acquisitionsMultiple small acquisitions 1–3 Months Market Planning 1 6 Months Site Selection 2 6 Months Permitting 3 4 Months Construction 4 Mapped to Local Market Level for New StoresData driven, highly analytical approachCompany-Owned and Franchised 11
Introduce Valvoline branded products to realize benefits of vertical integrationInstall proprietary POS technologyImplement and train store team on SuperPro management systemLaunch Valvoline’s digital & direct marketing programsRebrand to Valvoline Instant Oil Change and leverage operational synergies 5 Step Process... Valvoline’s Playbook for Acquisition Integration …With Proven Ability to Drive Value More Oil Changes Per Day Greater Sales and Profitability Increased Customer Acquisition Rates Increased Customer Retention Rates 12
International Growth Opportunity
We Target Some of the Largest International Growth Markets, including China, India & Latin America Latin AmericaRecent rapid growthAggressive new channel developmentExpanding beyond passenger car products IndiaStrong C&I marketVery strong channelsCummins JVChanging emission rulesGood C&I OEM penetration ChinaSecond largest passenger car marketRapidly changing emission rulesGrowing, consolidating DIFM channelGood OEM penetration ____________________Includes unconsolidated JVs.Emerging Markets consist of all countries outside of the U.S., Canada, Australia and Europe. EuropeStable cash flow generatorModerate growth from channel extensions Australia / PacificLeading market shareStrong cash flow generator 67% EmergingMarkets (2) FY 2016 Sales Breakdown (1) Europe Australia / Pacific China India Latin America Valvoline Emerging Markets Sales Volume (1) (2) (MM Gal) CAGR of 10% Rest of Asia MEA 13
Leveraging the Cummins Relationship… …To Provide Ongoing Value Model For Leveraging OEM Relationship Global marketing partnershipFragmented markets provide significant opportunities to expand shareJoint ventures in India & ChinaTechnology partnership to develop products tailored to today’s modern enginesLeveraging co-branded products Strong growth rates in China and IndiaUse of Cummins’ channels to market accelerates growthFurther potential as Cummins grows its services businessOpportunistic expansion into other marketsMiningPower generationLeverage Cummins’ link to other OEMs 14
The Future of Core North America
Core North America Strategic Pillars Leading brand in a key category that drives traffic for retailers Continuous innovation around next-generation, fast growing, higher margin synthetics Packaging innovation that delivers both consumer and customer value Targeted digital marketing to high potential consumers and influencersTeam Valvoline loyalty platform delivering relevant content and building brand engagementCustomized programs for key accounts, driving stronger partnershipsOnline to offline linkage increases effectiveness and reach Best in class retail category management capabilities to grow customers’ businessesService representative training to help drive profitable consumer engagement at the store levelCustomer portal and e-commerce improve customers’ overall experience, drive incremental sales Innovative Products & Packaging Targeted Marketing Enhanced Services Strategic Pillars are Sources of Differentiation for Valvoline, Driving Competitive Advantage 15
Packaging Innovation Drives Value for Installer Customers Bay Box Rack Benefits to Customers Improves working capital & inventory controlEases space constraintsReduces product waste & increases speed of service Benefits to Valvoline Increases volume & premium penetrationSolidifies current customer relationshipsDrives new customer acquisition 5 Gallon Box 16
Marketing Relationships Create Excitement with Consumers and Retail Associates Then return to submit receipt to redeem action figure offer Retail promotions are critical in the categoryValvoline leverages partnership brands such as Hendrick Motorsports to:Provide video content to retailersDrive Valvoline purchases Obtain valuable consumer information from redemptions Assets are also used to create momentum with retail associates Worked with Dale Earnhardt Jr. to update an El CaminoAwards for store managers based on performance Multi-Faceted Approach to Generating Excitement 17
a Valvoline leverages digital marketing to help both DIY and Installer customers market more effectivelyProvides custom content to retailers in the DIY and Installer spaces for use in their own loyalty programsLaunches Valvoline Drives in 2017 in order to drive both customer acquisition and retention for installer customers Making a significant, multi-year investment in technology infrastructure to enable enhanced capabilitiesCRM tool and customer portal launching in second half of fiscal 2017 will offer more efficient management and customer communicationeCommerce site launching 2018 will improve efficiency of ordering and increase purchase value Expertise Allows Customers to Build Their Own Businesses Technology Facilitates Business With Valvoline Investing in Digital Capabilities to Improve the Customer Experience & Grow Sales By Providing a Better Customer Experience, Technology Drives Growth Through Customer Acquisition & Retention 18
Long Term Priorities
We Have a Disciplined Approach to Value Creation Opportunistic acquisitions focused on Quick LubeGrow dividend over timeRecently announced $150mm share repurchase program Strong Gross Profit CAGR & Adj. EBITDA Active management of gross marginValue enhancing quick lube expansionDisciplined approach to managing costs Attractive Free Cash Flow Profile Disciplined working capital managementSystematic approach to capital expendituresDeploy capital to high-return projects Disciplined Capital Allocation Strong Volume Growth Market share gains driven by innovationExpansion of quick lube platforms as well as mid single digit SSS growth (1)Continue growth in premium synthetics and high mileage oilExpand and grow international presence, especially in Emerging Markets (2) ____________________SSS growth determined on a fiscal year basis with new stores included after first full fiscal year of operation.Emerging Markets includes unconsolidated JVs and consist of all countries outside of the U.S., Canada, Australia and Europe. Core Priorities Strategic Initiatives 19
2017 YTD Financial Results
Consolidated Adjusted Results (1) ____________________ For a reconciliation of EBITDA and Adjusted EBITDA to Net Income, see the Appendix to this presentation. Factors Affecting Y-o-Y EBITDAFrom Operating Segments (1) 20
____________________For a reconciliation of EBITDA to Net Income, see the Appendix to this presentation. Segment Adjusted Results (1) Core North America Quick Lubes International Factors Affecting Y-o-Y EBITDA 21
Appendix
Historical EBITDA and Adj. EBITDA Bridges ($ in millions) 2011 2012 2013 2014 2015 2016 1H’17 Net income $110 $114 $246 $173 $196 $273 $143 Income tax expense 52 58 135 91 101 148 76 Net Interest and other financing expense - - - - - 9 18 Depreciation and amortization 38 36 36 37 38 38 18 EBITDA $200 $207 $416 $302 $335 $468 $255 Adjustments Losses (gains) on pension and other postretirement plan re-measurements 52 68 (74) 61 46 (18) (8) Net Loss on Divestiture / Acquisition Costs - - - - 26 1 - Impairment on Equity Investment - - - - 14 - - Restructuring / Separation Costs - - - 6 - 6 12 Adjusted EBITDA $252 $275 $342 $369 $421 $457 $259 22
Fiscal 2017 Outlook Current Expectations 2017 Outlook Operating Segments Lubricant gallons 3-5% Sales 4-7% New stores VIOC company-owned 31-3328 acquired, 3-5 new builds VIOC franchised 15 – 25 VIOC same-store sales 5-7% EBITDA from operating segments $440 - $455 mm Corporate Items Pension income $70 mm One-time separation-related expenses $25 - $30 mm Diluted adjusted earnings per share $1.36-$1.43 Capital expenditures $70 - $80 mm Free cash flow $130 - $150 mm (1) ____________________Free cash flow is defined as cash flows provided by operating activities less capital expenditures. 23