Exhibit 99.1 INVESTOR DAY May 2019
Safe Harbor Forward-Looking Statements Certain statements in this presentation, other than statements of historical fact, including estimates, projections, statements related to Valvoline’s business plans and operating results are forward-looking statements within the meaning of the Private Securities Litigation Reform Act of 1995. Valvoline has identified some of these forward-looking statements with words such as “anticipates,” “believes,” “expects,” “estimates,” “is likely,” “predicts,” “projects,” “forecasts,” “may,” “will,” “should” and “intends” and the negative of these words or other comparable terminology. These forward-looking statements are based on Valvoline’s current expectations, estimates, projections and assumptions as of the date such statements are made, and are subject to risks and uncertainties that may cause results to differ materially from those expressed or implied in the forward-looking statements. Additional information regarding these risks and uncertainties are described in the Company’s filings with the Securities and Exchange Commission, including in the “Risk Factors” and “Management’s Discussion and Analysis of Financial Condition and Results of Operations” sections of Valvoline’s most recently filed periodic reports on Forms 10-K and Forms 10-Q, which are available on Valvoline’s website at http://investors.valvoline.com/sec-filings or the SEC’s website at http://sec.gov. Valvoline assumes no obligation to update or revise these forward-looking statements for any reason, even if new information becomes available in the future. Regulation G: Adjusted Results The information presented herein, regarding certain financial measures that do not conform to generally accepted accounting principles in the United States (U.S. GAAP), should not be construed as an alternative to the reported results determined in accordance with U.S. GAAP. Valvoline has included this non-GAAP information to assist in understanding the operating performance of the company and its reportable segments. The non-GAAP information provided may not be consistent with the methodologies used by other companies. Information regarding Valvoline’s definition, calculation and reconciliation of non-GAAP measures can be found in the tables attached to Valvoline’s most recent earnings press release dated May 1, 2019, which is available on Valvoline’s website at http://investors.valvoline.com/financial-reports/quarterly-reports. 2
Agenda • Roadmap to Drive Shareholder Value Sam Mitchell, CEO • Quick Lubes Review Tony Puckett, SVP & Rob Stravitz, VP Marketing • Core North America Review Tom Gerrald, SVP & Tim Ferrell, VP Marketing • International Review Jamal Muashsher, SVP • Break • Financial Review Mary Meixelsperger, CFO • Driving Transformation & Closing Remarks Sam Mitchell, CEO • Q&A 3
Sam Mitchell Chief executive officer 4
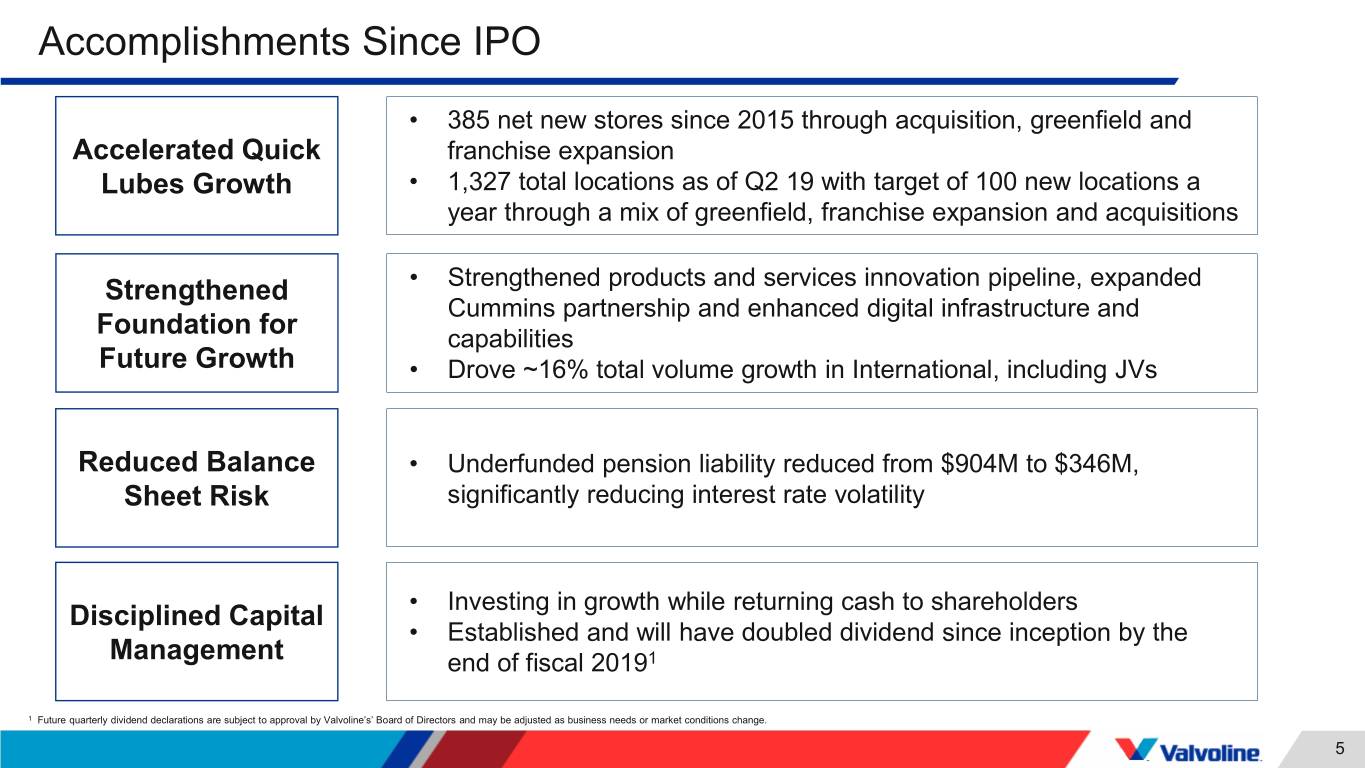
Accomplishments Since IPO • 385 net new stores since 2015 through acquisition, greenfield and Accelerated Quick franchise expansion Lubes Growth • 1,327 total locations as of Q2 19 with target of 100 new locations a year through a mix of greenfield, franchise expansion and acquisitions • Strengthened products and services innovation pipeline, expanded Strengthened Cummins partnership and enhanced digital infrastructure and Foundation for capabilities Future Growth • Drove ~16% total volume growth in International, including JVs Reduced Balance • Underfunded pension liability reduced from $904M to $346M, Sheet Risk significantly reducing interest rate volatility • Investing in growth while returning cash to shareholders Disciplined Capital • Established and will have doubled dividend since inception by the Management end of fiscal 20191 1 Future quarterly dividend declarations are subject to approval by Valvoline’s’ Board of Directors and may be adjusted as business needs or market conditions change. 5
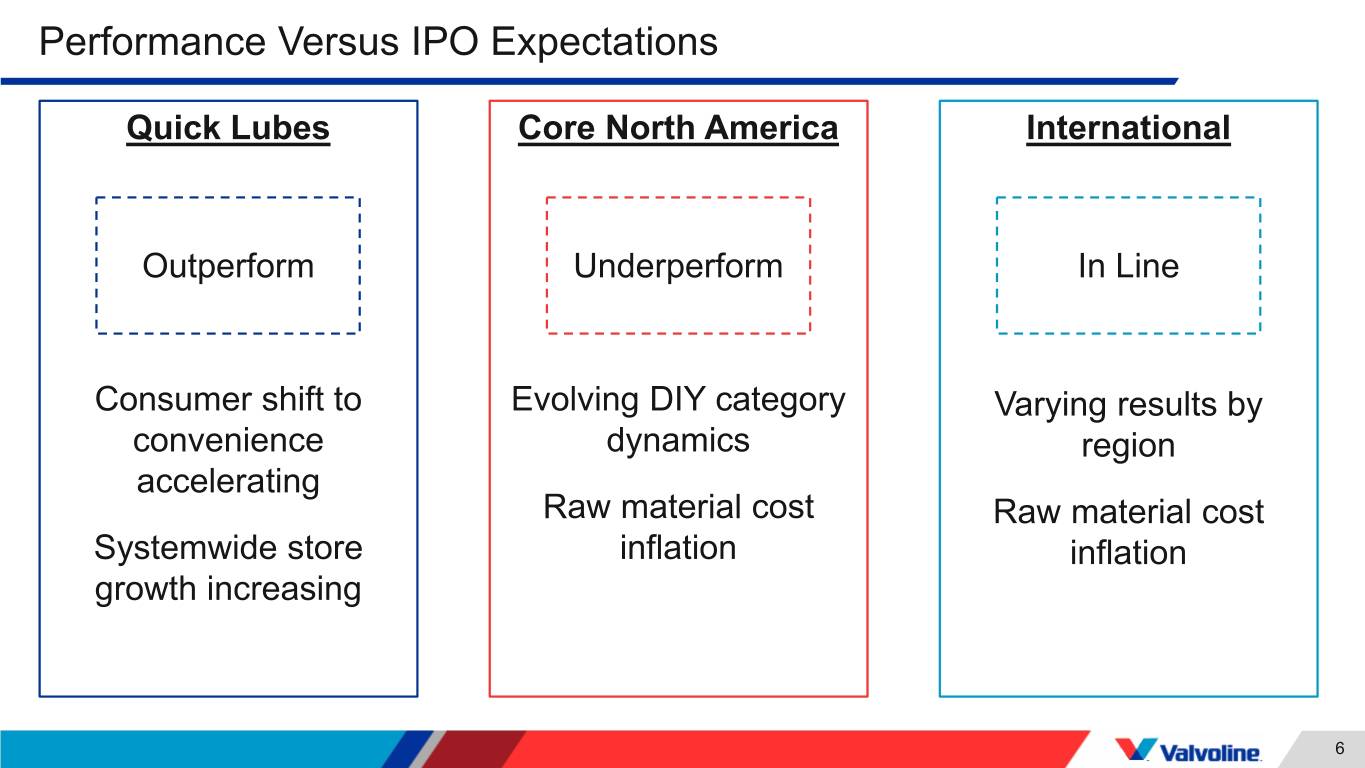
Performance Versus IPO Expectations Quick Lubes Core North America International Outperform Underperform In Line Consumer shift to Evolving DIY category Varying results by convenience dynamics region accelerating Raw material cost Raw material cost Systemwide store inflation inflation growth increasing 6
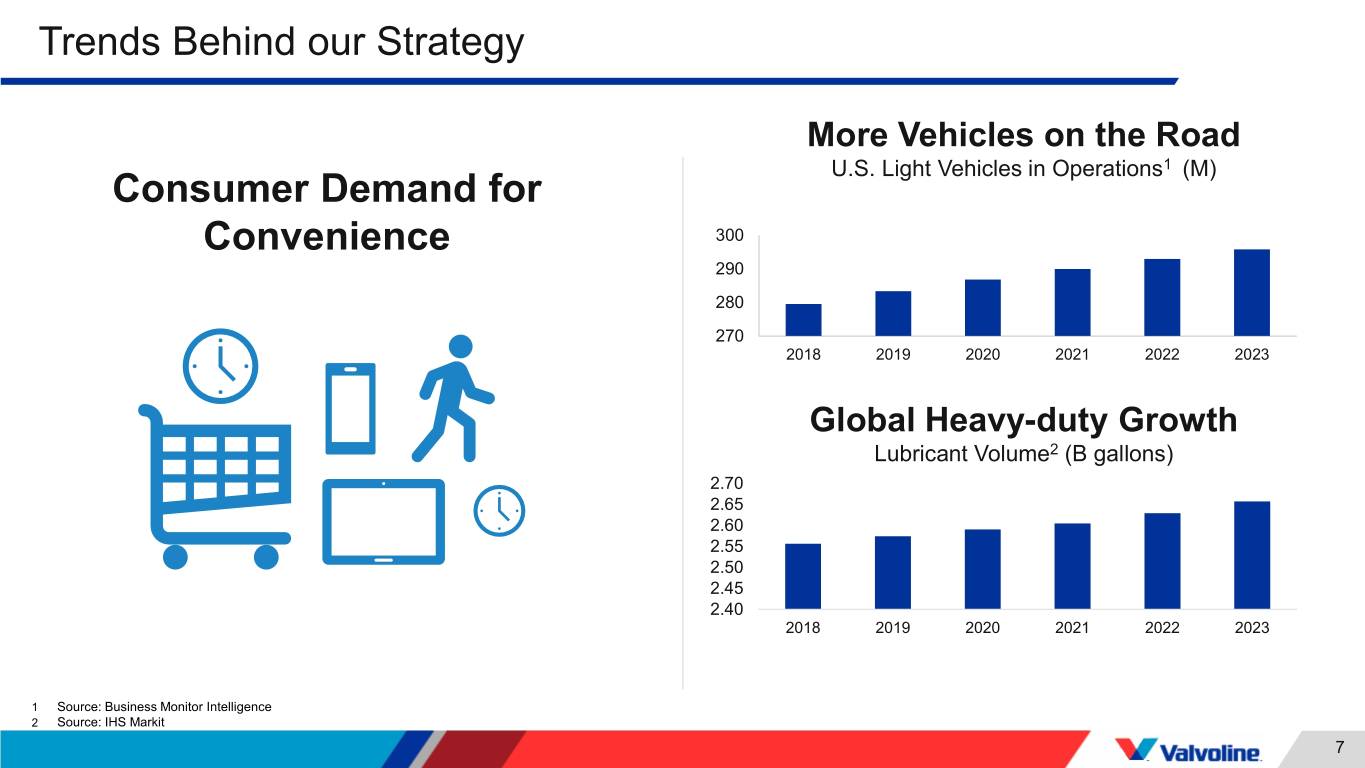
Trends Behind our Strategy More Vehicles on the Road U.S. Light Vehicles in Operations1 (M) Consumer Demand for Convenience 300 290 280 270 2018 2019 2020 2021 2022 2023 Global Heavy-duty Growth Lubricant Volume2 (B gallons) 2.70 2.65 2.60 2.55 2.50 2.45 2.40 2018 2019 2020 2021 2022 2023 1 Source: Business Monitor Intelligence 2 Source: IHS Markit 7
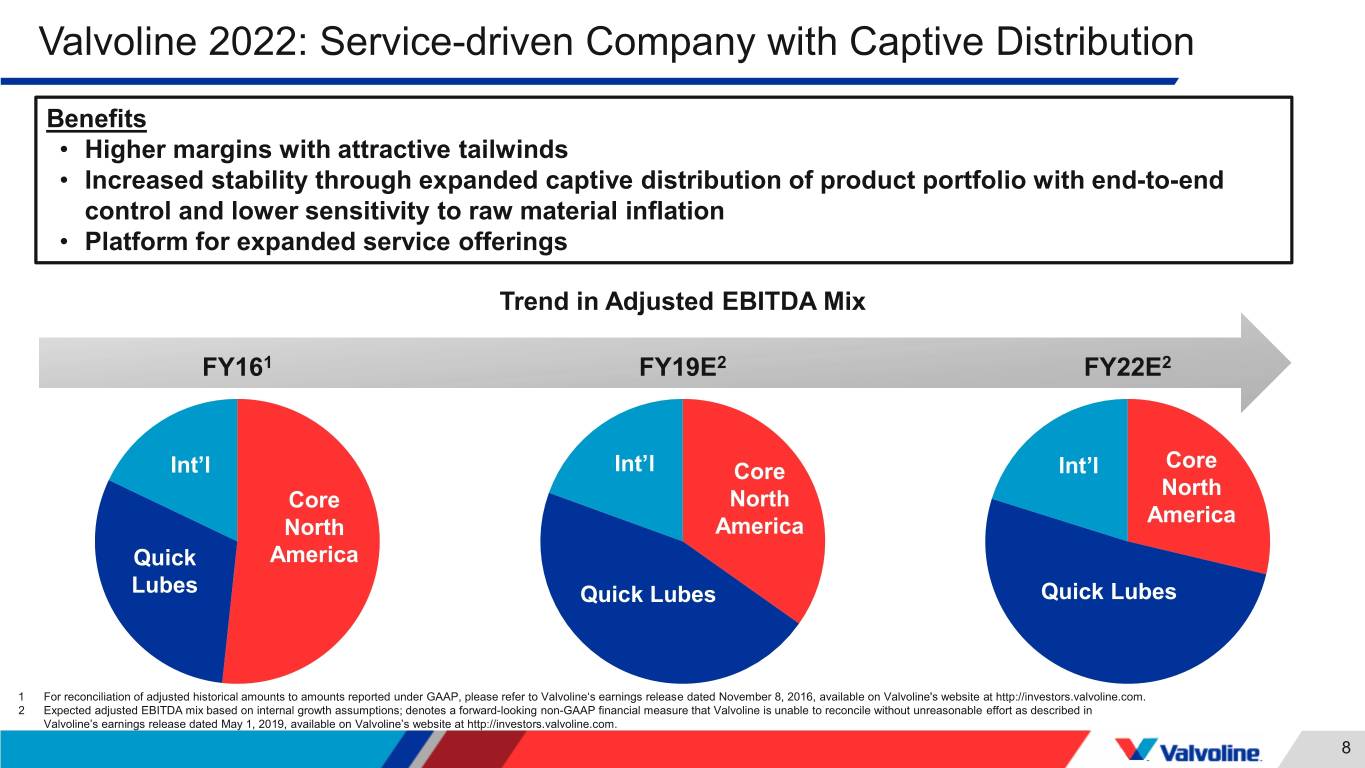
Valvoline 2022: Service-driven Company with Captive Distribution Benefits • Higher margins with attractive tailwinds • Increased stability through expanded captive distribution of product portfolio with end-to-end control and lower sensitivity to raw material inflation • Platform for expanded service offerings Trend in Adjusted EBITDA Mix FY161 FY19E2 FY22E2 Core Int’l Int’l Core Int’l North Core North America North America Quick America Lubes Quick Lubes Quick Lubes 1 For reconciliation of adjusted historical amounts to amounts reported under GAAP, please refer to Valvoline‘s earnings release dated November 8, 2016, available on Valvoline's website at http://investors.valvoline.com. 2 Expected adjusted EBITDA mix based on internal growth assumptions; denotes a forward-looking non-GAAP financial measure that Valvoline is unable to reconcile without unreasonable effort as described in Valvoline’s earnings release dated May 1, 2019, available on Valvoline’s website at http://investors.valvoline.com. 8
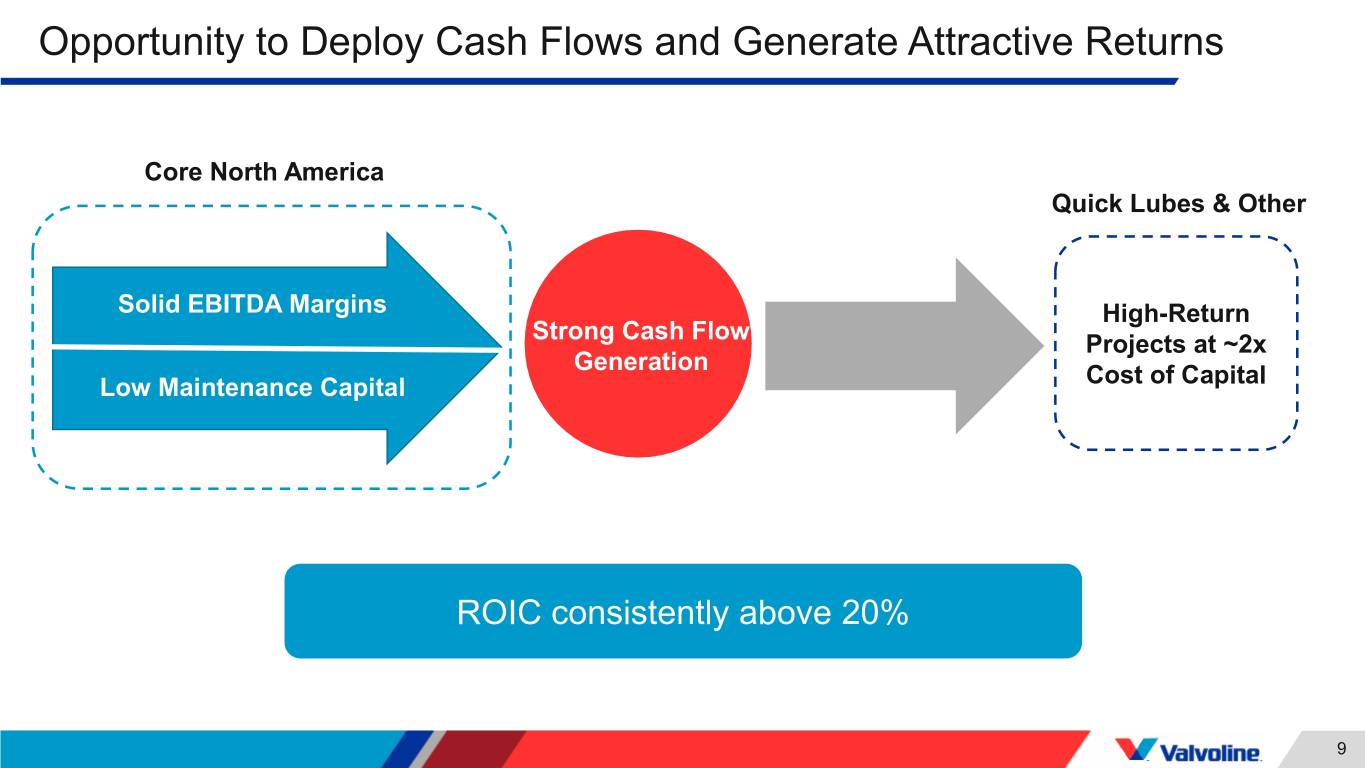
Opportunity to Deploy Cash Flows and Generate Attractive Returns Core North America Quick Lubes & Other Solid EBITDA Margins High-Return Strong Cash Flow Projects at ~2x Generation Low Maintenance Capital Cost of Capital ROIC consistently above 20% 9
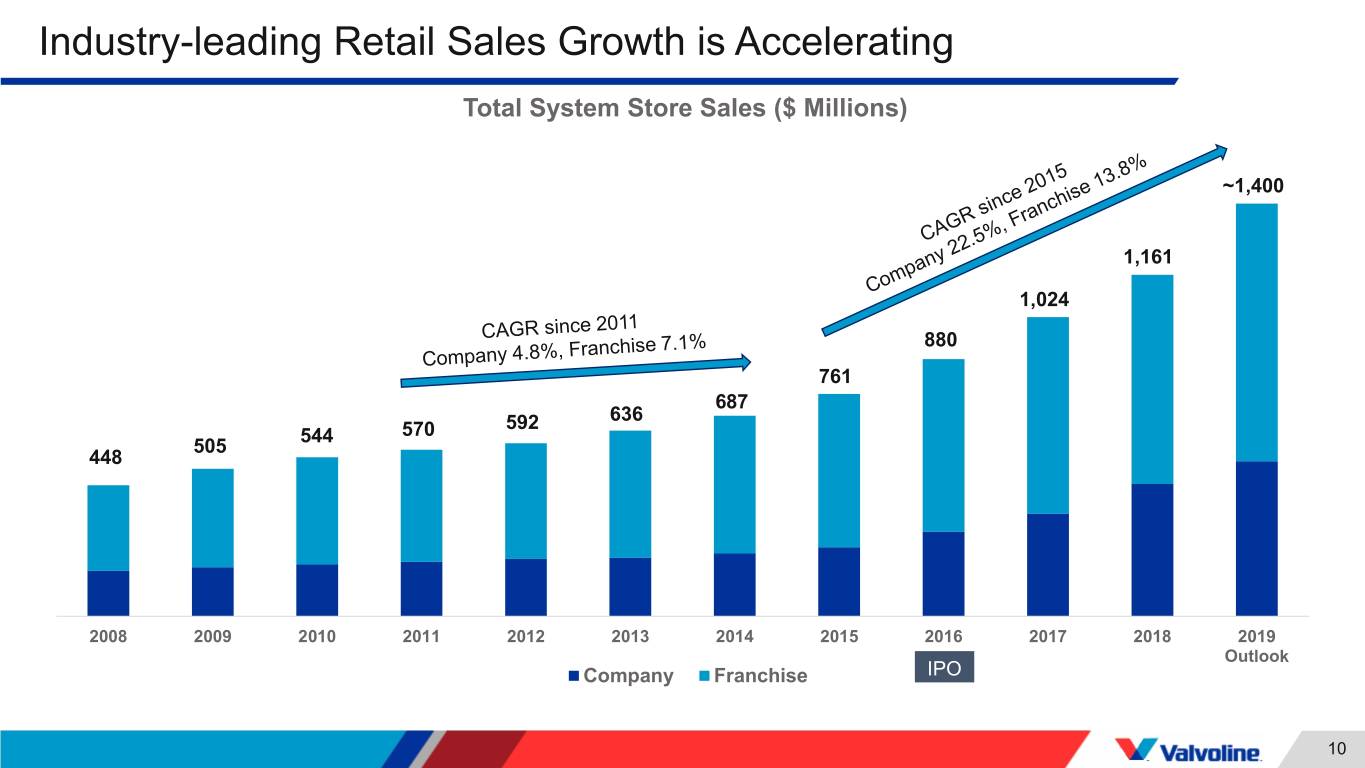
Industry-leading Retail Sales Growth is Accelerating Total System Store Sales ($ Millions) ~1,400 1,161 1,024 880 761 687 592 636 544 570 505 448 2008 2009 2010 2011 2012 2013 2014 2015 2016 2017 2018 2019 Outlook Company Franchise IPO 10
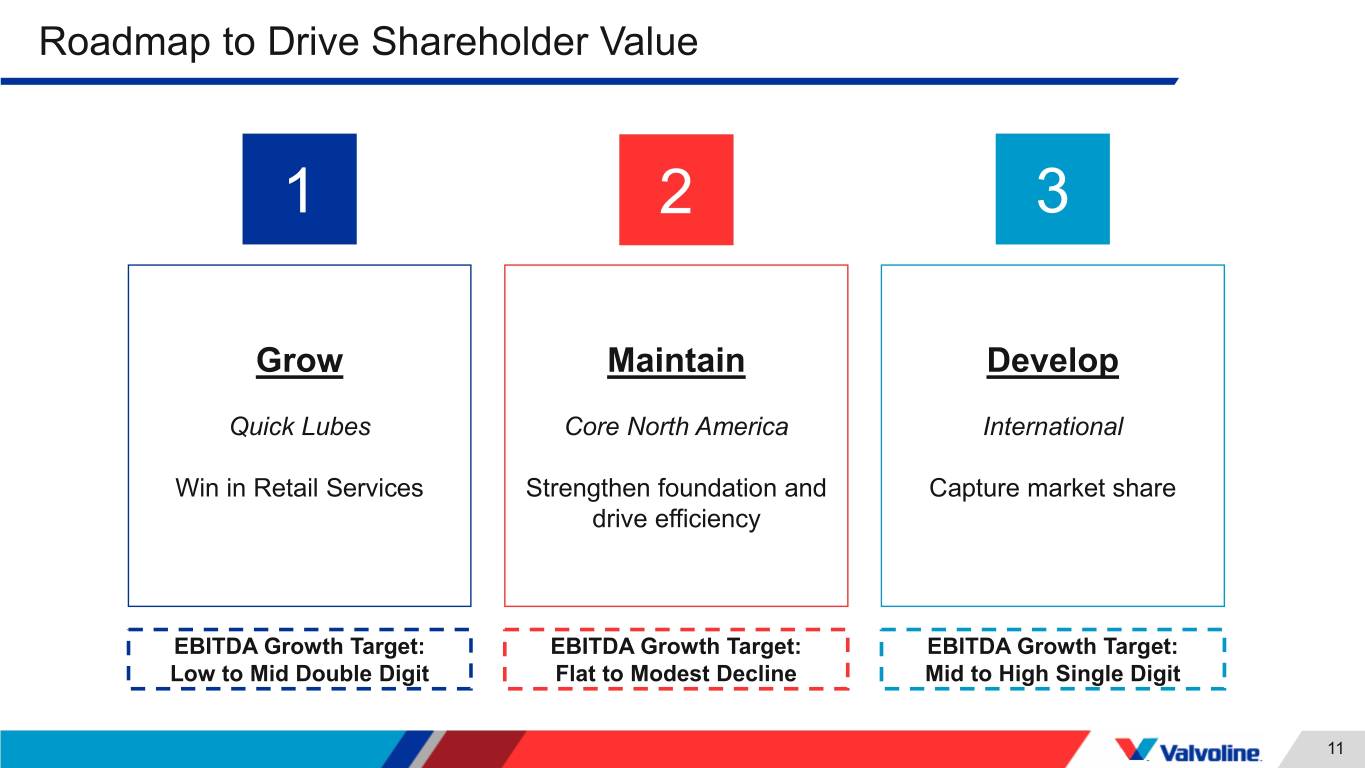
Roadmap to Drive Shareholder Value 1 2 3 Grow Maintain Develop Quick Lubes Core North America International Win in Retail Services Strengthen foundation and Capture market share drive efficiency EBITDA Growth Target: EBITDA Growth Target: EBITDA Growth Target: Low to Mid Double Digit Flat to Modest Decline Mid to High Single Digit 11
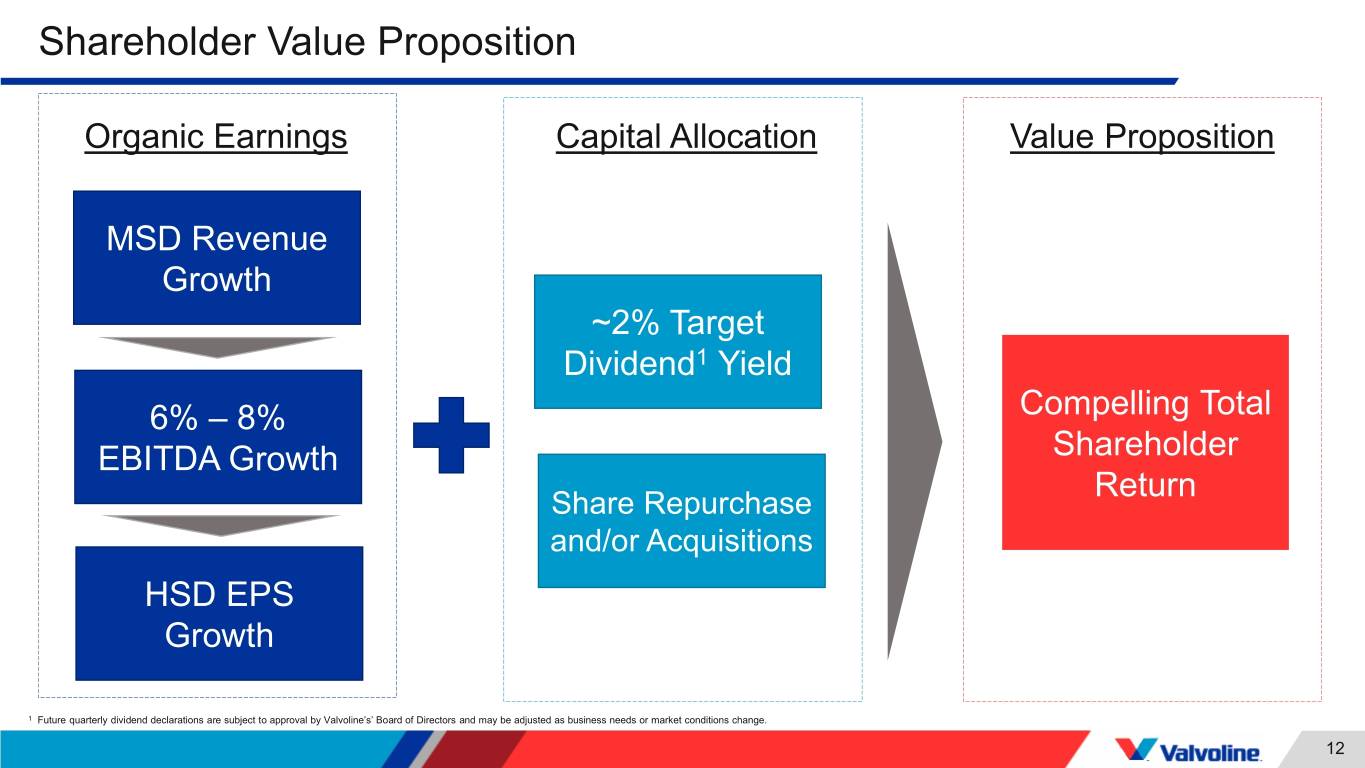
Shareholder Value Proposition Organic Earnings Capital Allocation Value Proposition MSD Revenue Growth ~2% Target Dividend1 Yield 6% – 8% Compelling Total EBITDA Growth Shareholder Return Share Repurchase and/or Acquisitions HSD EPS Growth 1 Future quarterly dividend declarations are subject to approval by Valvoline’s’ Board of Directors and may be adjusted as business needs or market conditions change. 12

Tony Puckett Rob Stravitz Senior vice president, Vice president, and president, Quick Lubes Quick Lubes marketing

Valvoline Instant Oil Change (VIOC) 1 Grow • Entered Quick Lubes business in 1985 • Preventive maintenance model - “Replace Fluids and Parts, No Repair” • Stay in Your Car Drive Thru Service • No appointment needed • Serving ~18M customer visits1 per year • #2 in US, #3 in Canada2 - VIOC and Great Canadian Oil Change Quick.Quick. Easy. Easy. Trusted.Trusted. 1 Includes U.S and Canada 2 Based on number of stores using industry data 14
Most Asked Questions About Quick Lubes Business 1 Grow Can VIOC continue strong same store sales growth trends? How fast can VIOC grow store count? 15
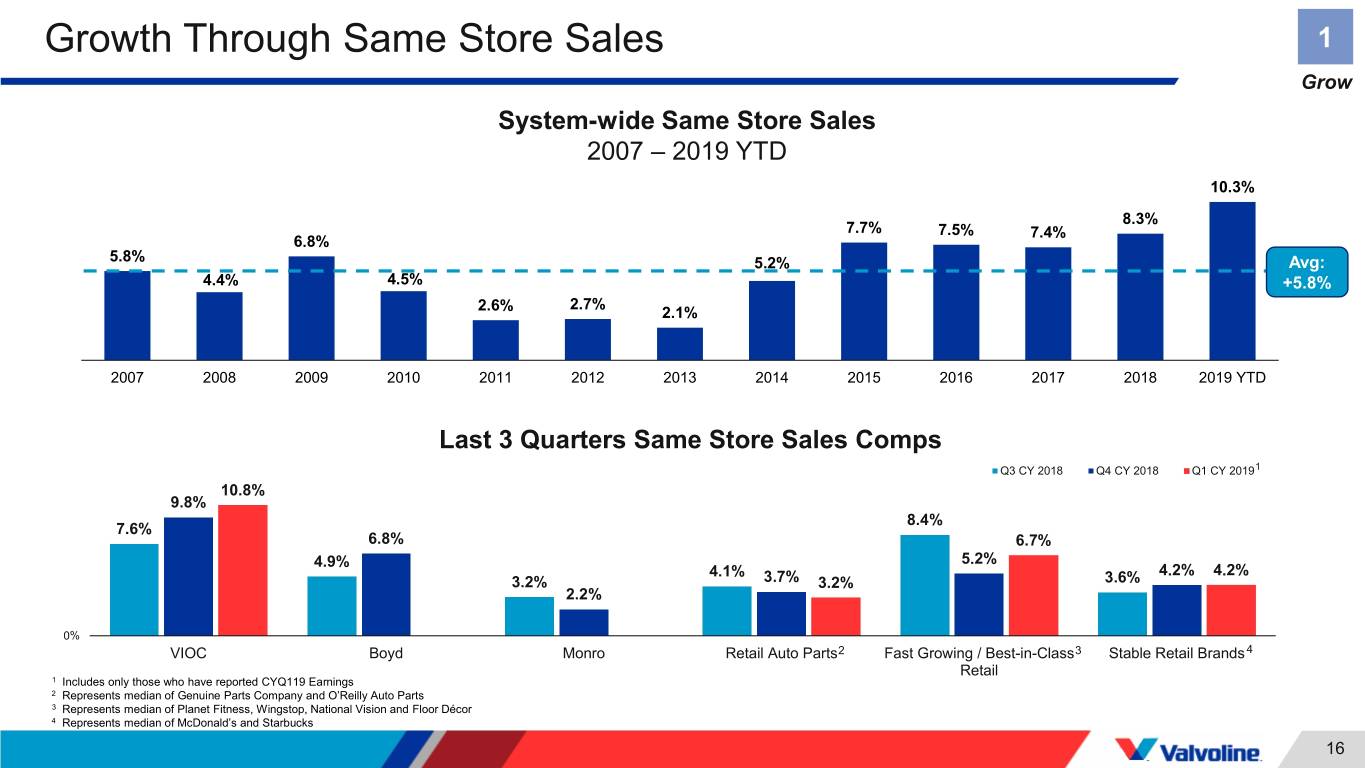
Growth Through Same Store Sales 1 Grow System-wide Same Store Sales 2007 – 2019 YTD 10.3% 8.3% 7.7% 7.5% 7.4% 6.8% 5.8% 5.2% Avg: 4.4% 4.5% +5.8% 2.7% 2.6% 2.1% 2007 2008 2009 2010 2011 2012 2013 2014 2015 2016 2017 2018 2019 YTD Last 3 Quarters Same Store Sales Comps Q3 CY 2018 Q4 CY 2018 Q1 CY 20191 10.8% 9.8% 8.4% 7.6% 6.8% 6.7% 4.9% 5.2% 4.1% 4.2% 4.2% 3.2% 3.7% 3.2% 3.6% 2.2% 0% VIOC Boyd Monro Retail Auto Parts2 Fast Growing / Best-in-Class3 Stable Retail Brands 4 Retail 1 Includes only those who have reported CYQ119 Earnings 2 Represents median of Genuine Parts Company and O’Reilly Auto Parts 3 Represents median of Planet Fitness, Wingstop, National Vision and Floor Décor 4 Represents median of McDonald’s and Starbucks 16
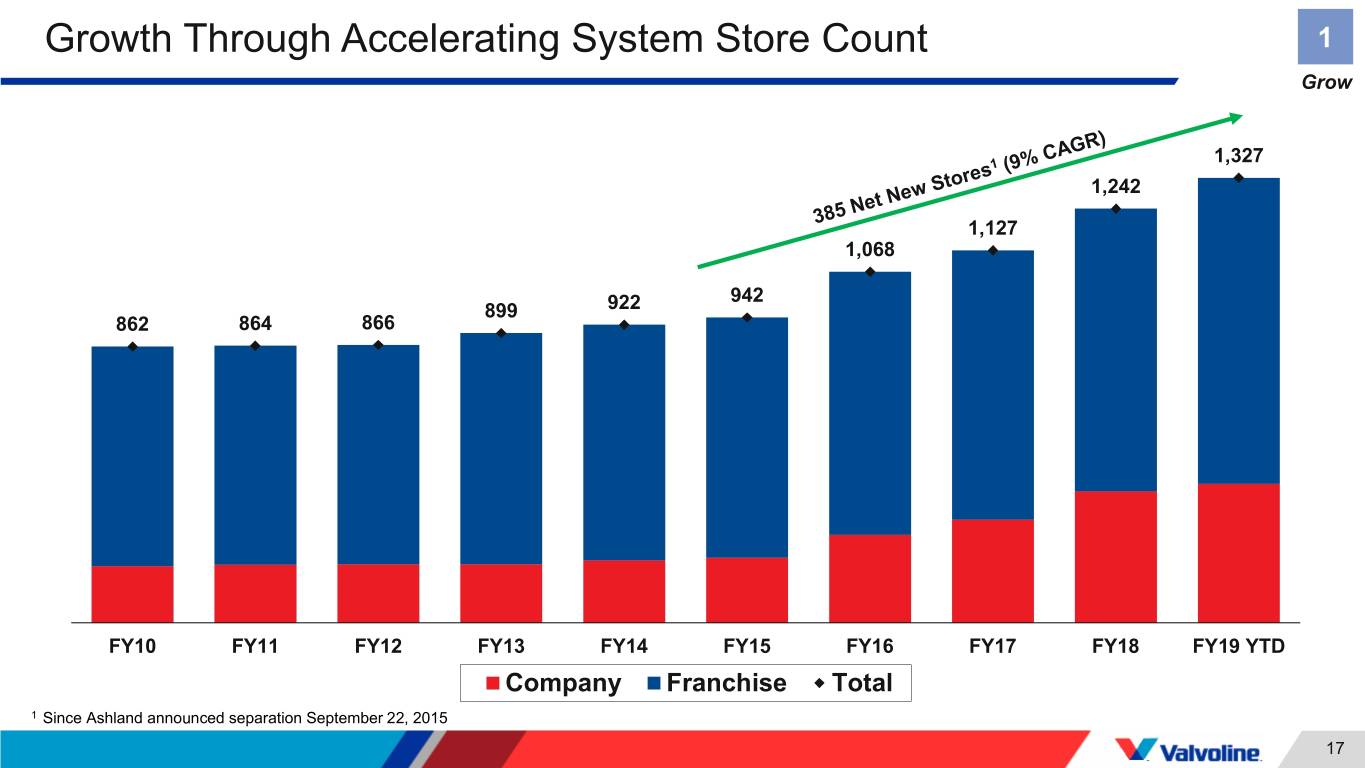
Growth Through Accelerating System Store Count 1 Grow 1,327 1,242 1,127 1,068 942 899 922 862 864 866 FY10 FY11 FY12 FY13 FY14 FY15 FY16 FY17 FY18 FY19 YTD Company Franchise Total 1 Since Ashland announced separation September 22, 2015 17
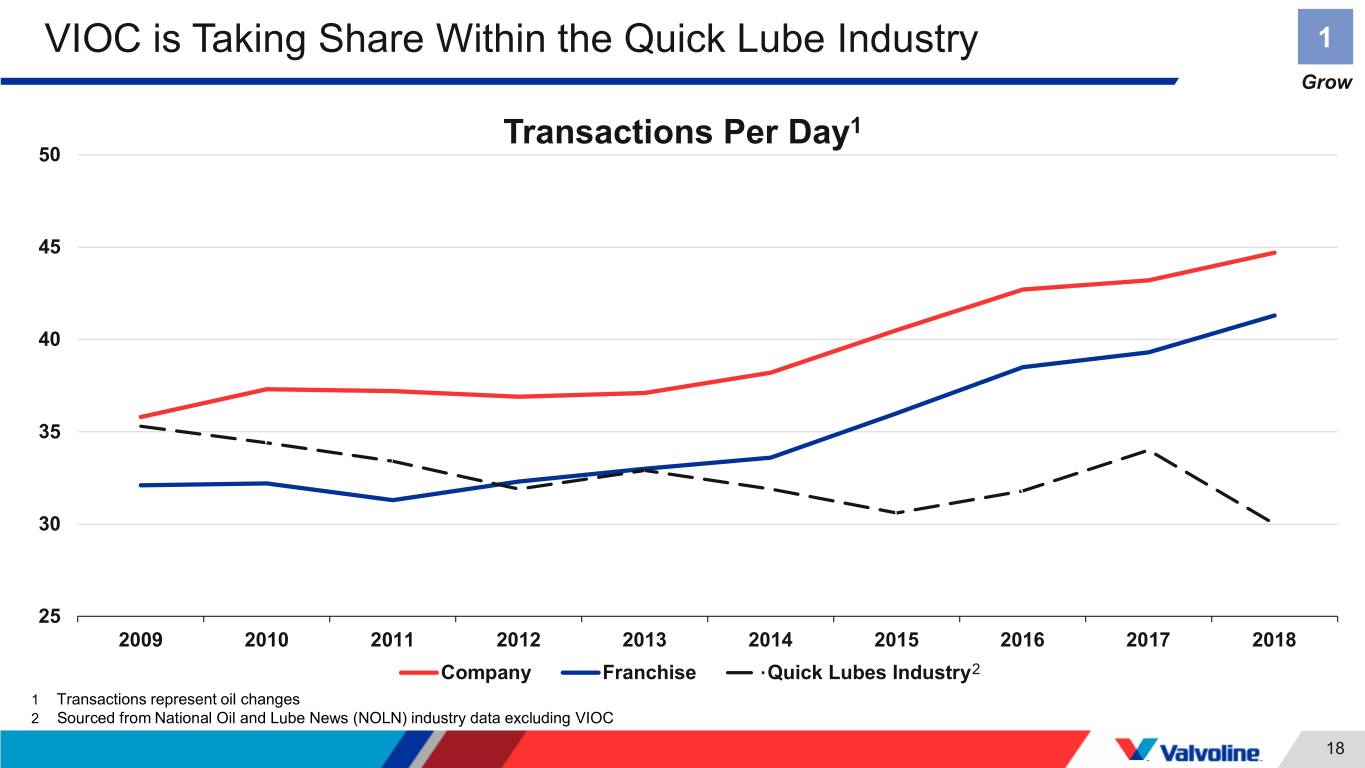
VIOC is Taking Share Within the Quick Lube Industry 1 Grow Transactions Per Day1 50 45 40 35 30 25 2009 2010 2011 2012 2013 2014 2015 2016 2017 2018 Company Franchise Quick Lubes Industry2 1 Transactions represent oil changes 2 Sourced from National Oil and Lube News (NOLN) industry data excluding VIOC 18
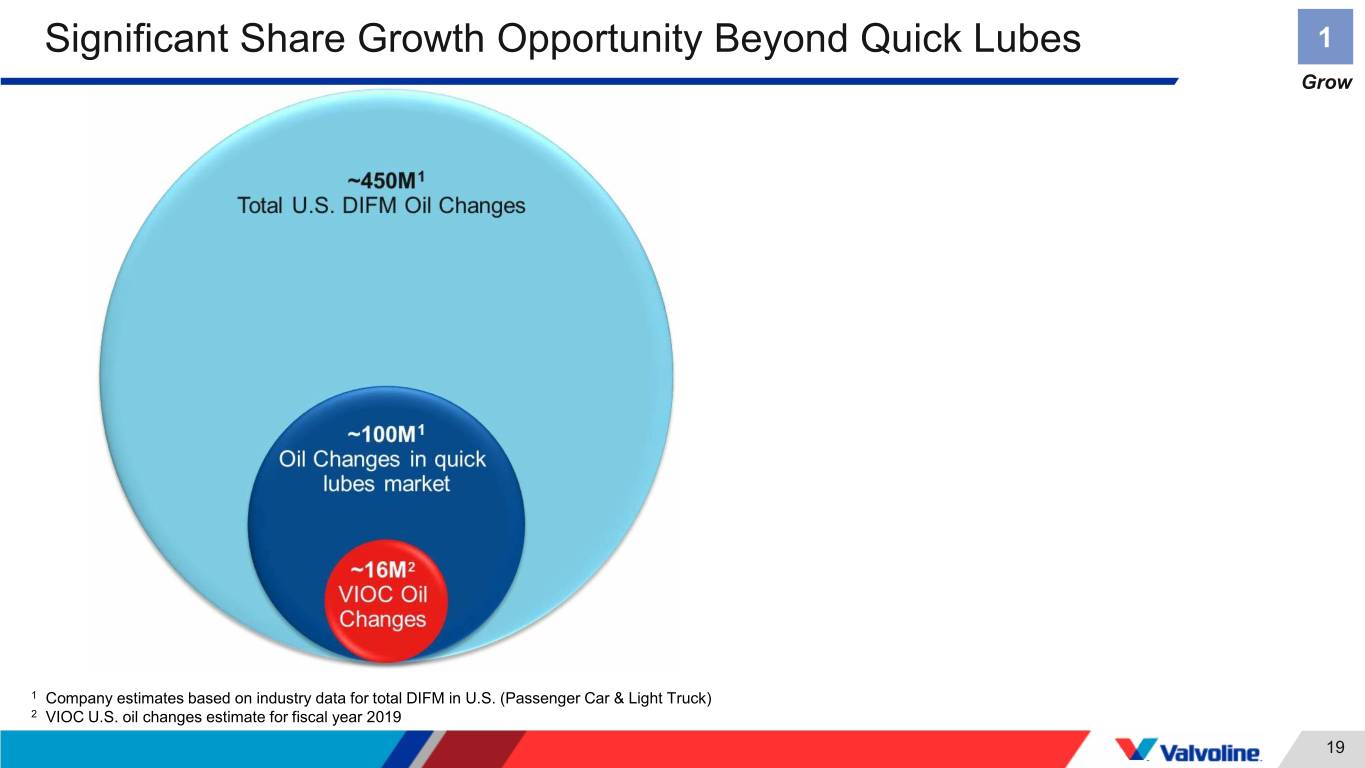
Significant Share Growth Opportunity Beyond Quick Lubes 1 Grow 1 Company estimates based on industry data for total DIFM in U.S. (Passenger Car & Light Truck) 2 VIOC U.S. oil changes estimate for fiscal year 2019 19
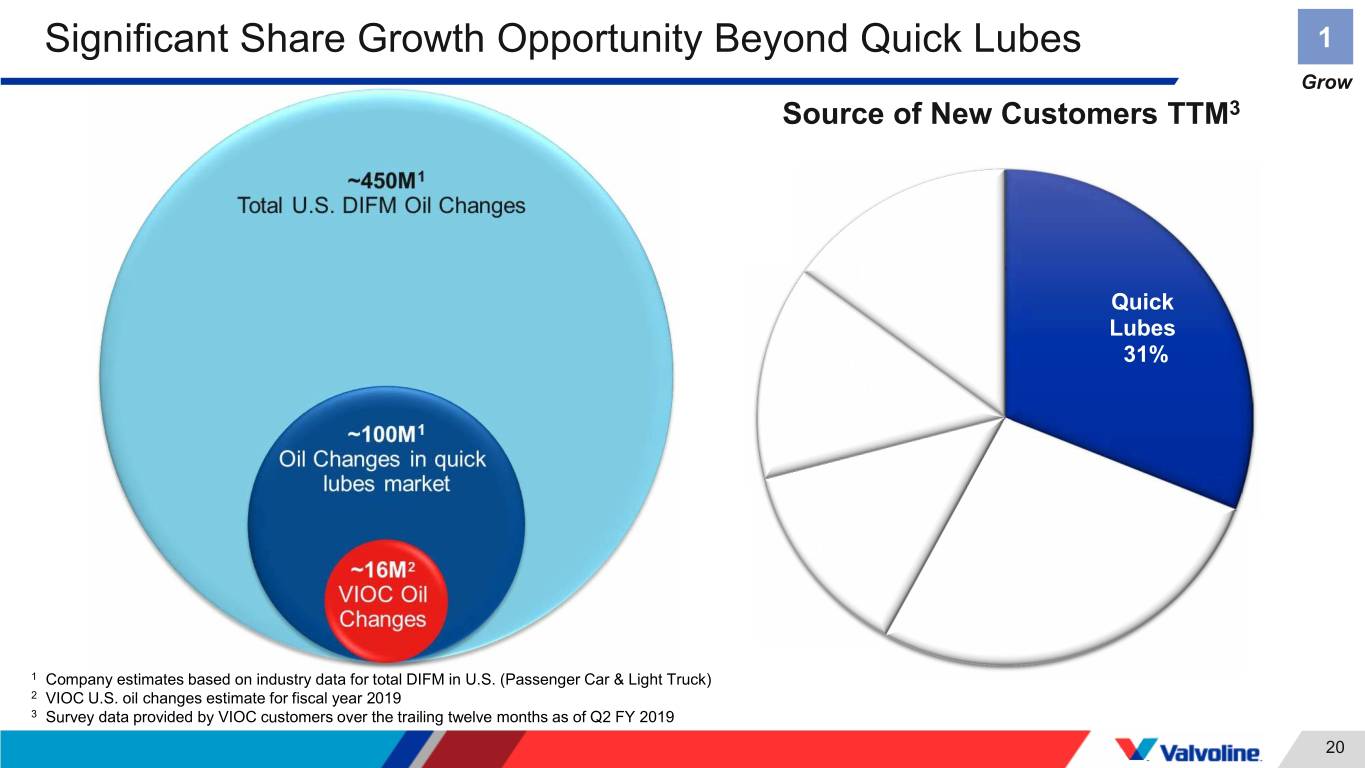
Significant Share Growth Opportunity Beyond Quick Lubes 1 Grow Source of New Customers TTM3 DIY, 15% Quick Lubes Other 31% Installer, 14% ASC/Tire Store, 13% Car Dealer, 27% 1 Company estimates based on industry data for total DIFM in U.S. (Passenger Car & Light Truck) 2 VIOC U.S. oil changes estimate for fiscal year 2019 3 Survey data provided by VIOC customers over the trailing twelve months as of Q2 FY 2019 20
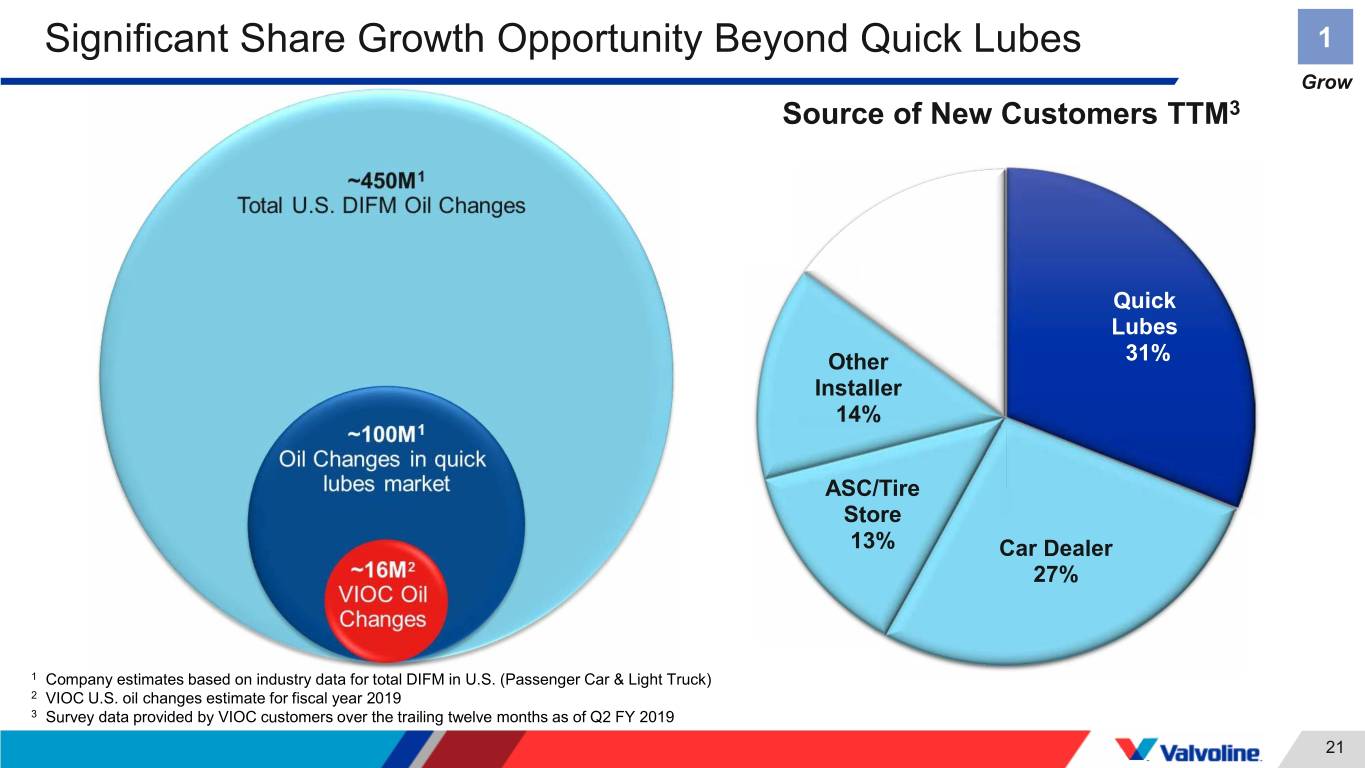
Significant Share Growth Opportunity Beyond Quick Lubes 1 Grow Source of New Customers TTM3 DIY, 15% Quick Lubes Other 31% Installer 14% ASC/Tire Store 13% Car Dealer 27% 1 Company estimates based on industry data for total DIFM in U.S. (Passenger Car & Light Truck) 2 VIOC U.S. oil changes estimate for fiscal year 2019 3 Survey data provided by VIOC customers over the trailing twelve months as of Q2 FY 2019 21
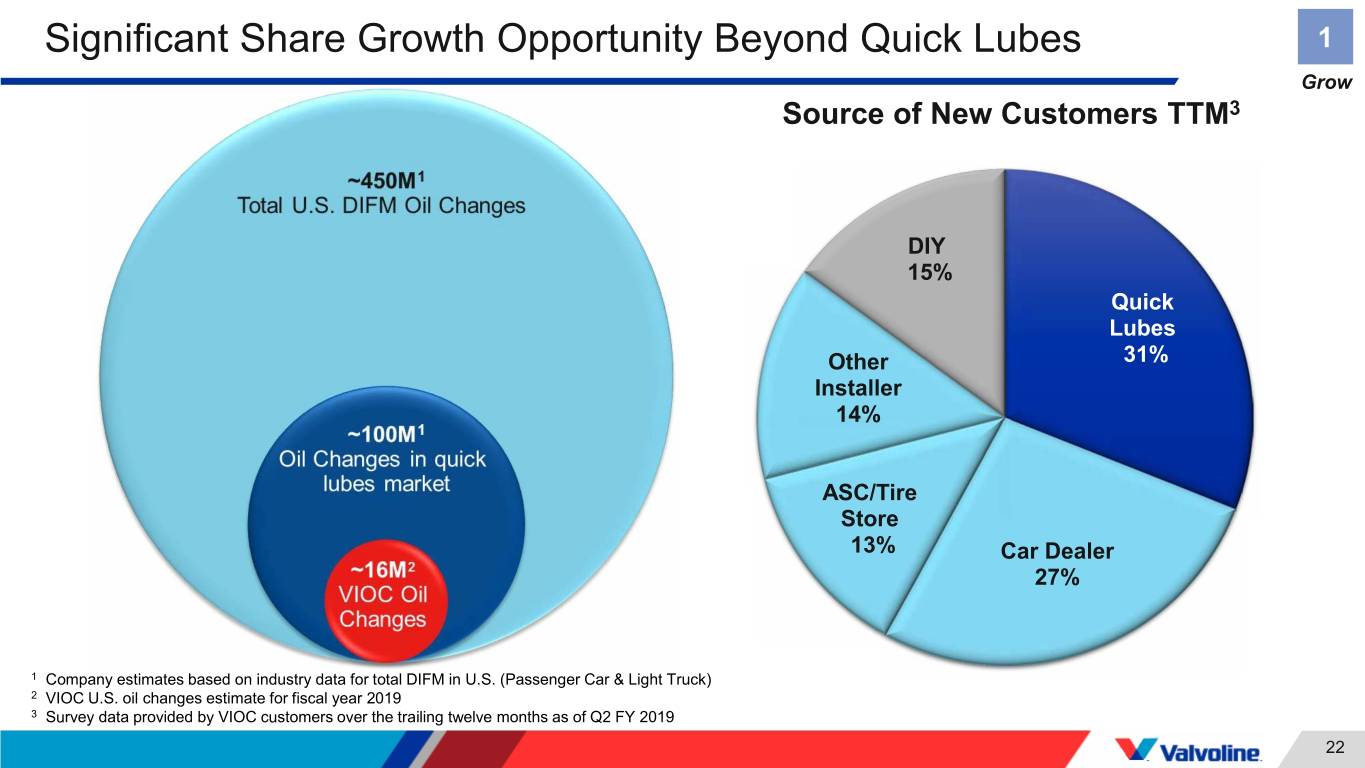
Significant Share Growth Opportunity Beyond Quick Lubes 1 Grow Source of New Customers TTM3 DIY 15% Quick Lubes Other 31% Installer 14% ASC/Tire Store 13% Car Dealer 27% 1 Company estimates based on industry data for total DIFM in U.S. (Passenger Car & Light Truck) 2 VIOC U.S. oil changes estimate for fiscal year 2019 3 Survey data provided by VIOC customers over the trailing twelve months as of Q2 FY 2019 22
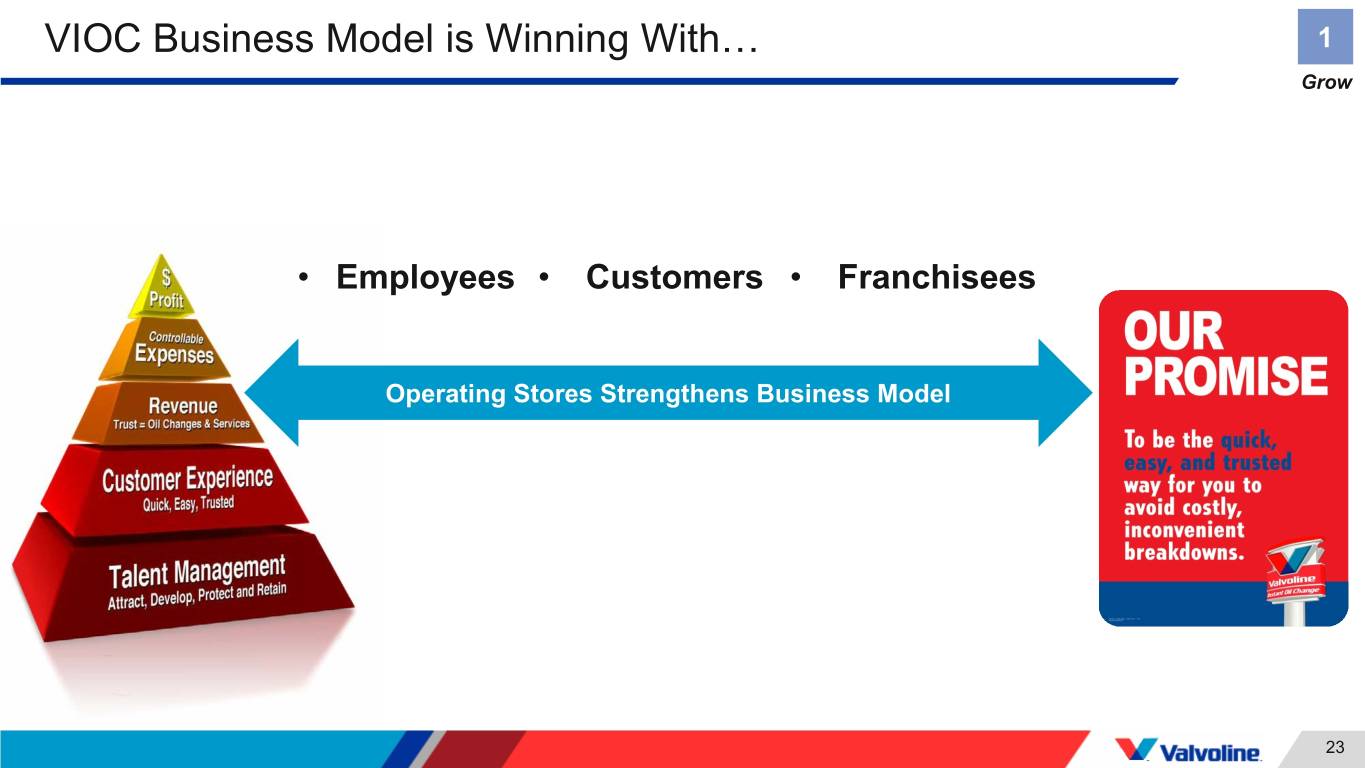
VIOC Business Model is Winning With… 1 Grow • Employees • Customers • Franchisees Operating Stores Strengthens Business Model 23
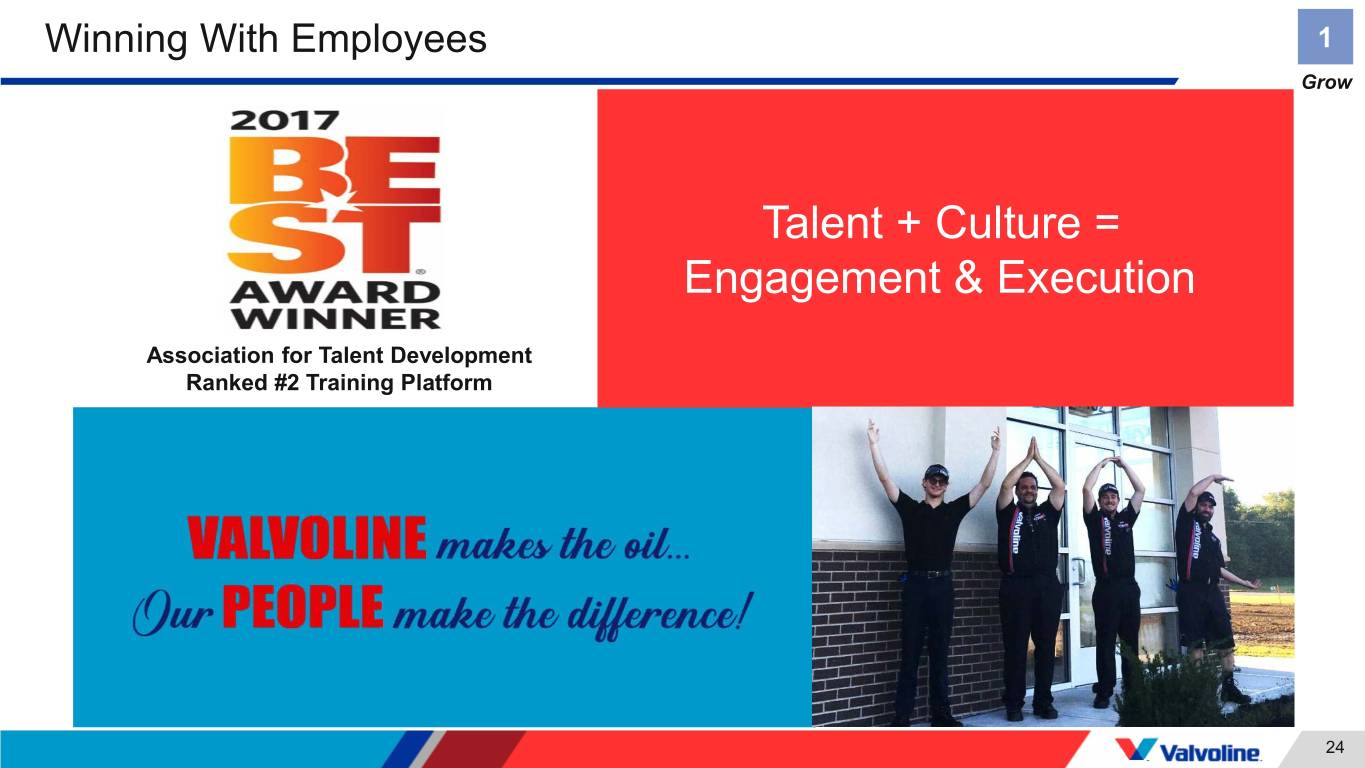
Winning With Employees 1 Grow Talent + Culture = Engagement & Execution Association for Talent Development Ranked #2 Training Platform 24
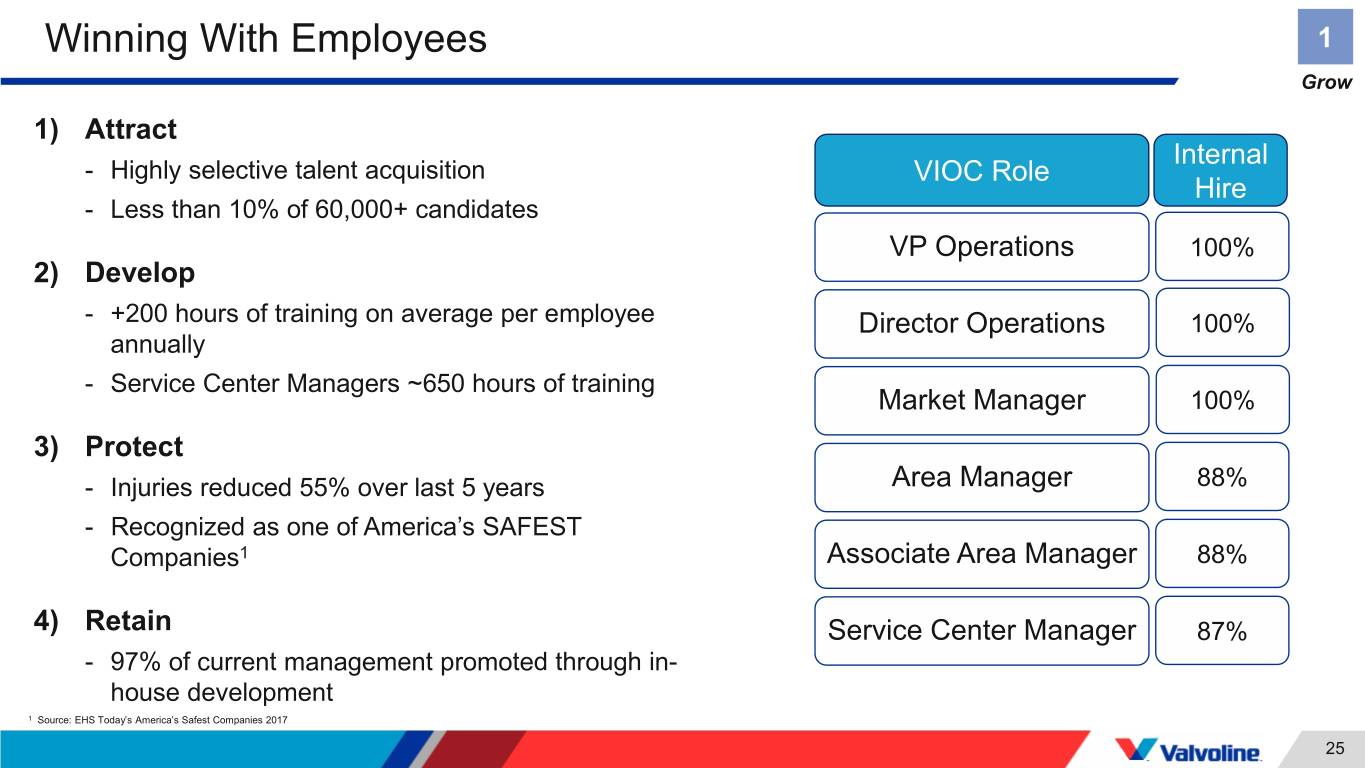
Winning With Employees 1 Grow 1) Attract Internal - Highly selective talent acquisition VIOC Role Hire - Less than 10% of 60,000+ candidates VP Operations 100% 2) Develop - +200 hours of training on average per employee Director Operations 100% annually - Service Center Managers ~650 hours of training Market Manager 100% 3) Protect - Injuries reduced 55% over last 5 years Area Manager 88% - Recognized as one of America’s SAFEST Companies1 Associate Area Manager 88% 4) Retain Service Center Manager 87% - 97% of current management promoted through in- house development 1 Source: EHS Today’s America’s Safest Companies 2017 25
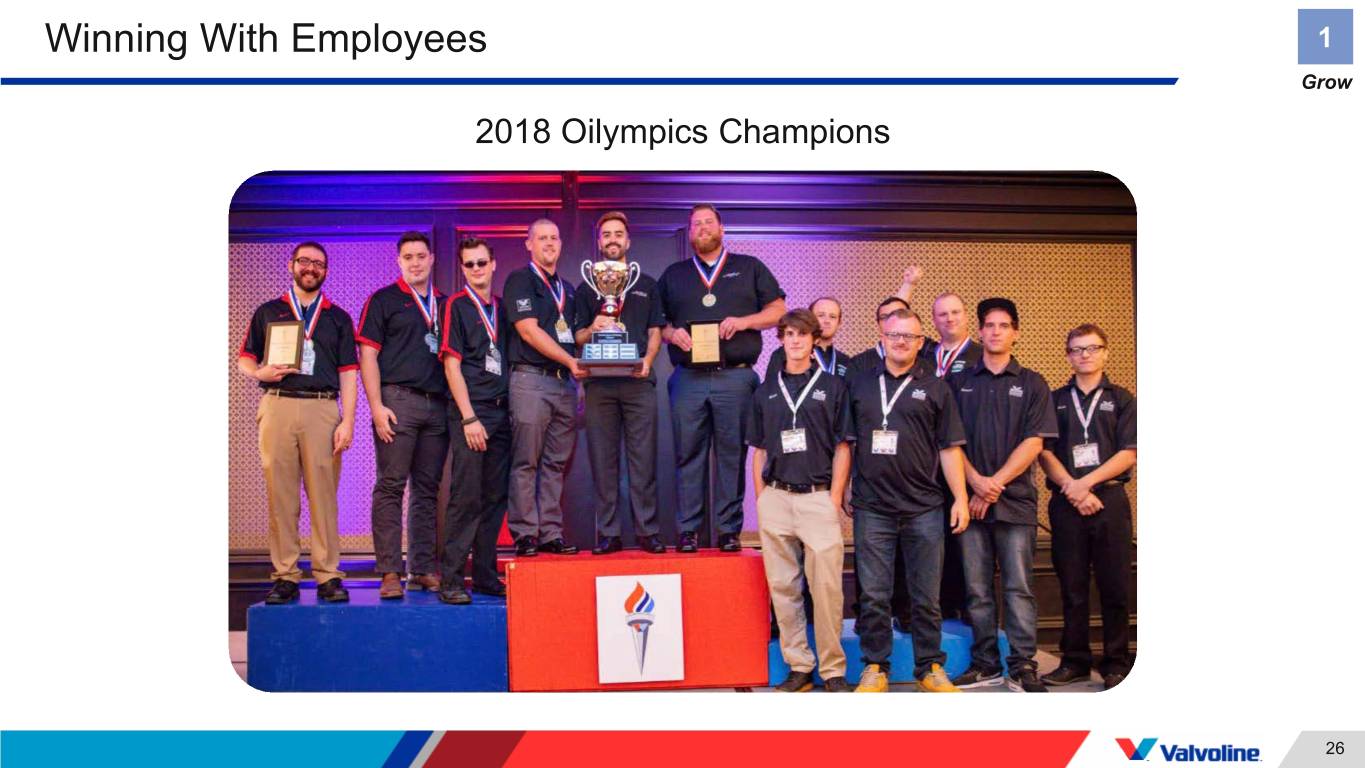
Winning With Employees 1 Grow 2018 Oilympics Champions 26

Winning With Customers 1 Grow Quick. Easy. Trusted. Preferred Customer Experience Drives Same Store Sales Growth 27

Winning With Customers 1 Grow OEM Recommends: 1st Service Proprietary POS after 100,000 miles • Directly linked to Super-Pro Management Process • Enables consistent customer experience • Seek to educate customers versus upsell • Captures customer data and service preferences Actual POS customer presentation screen 28

Winning With Customers 1 Grow Industry Leading Technology to Drive Transparency and Trust 29
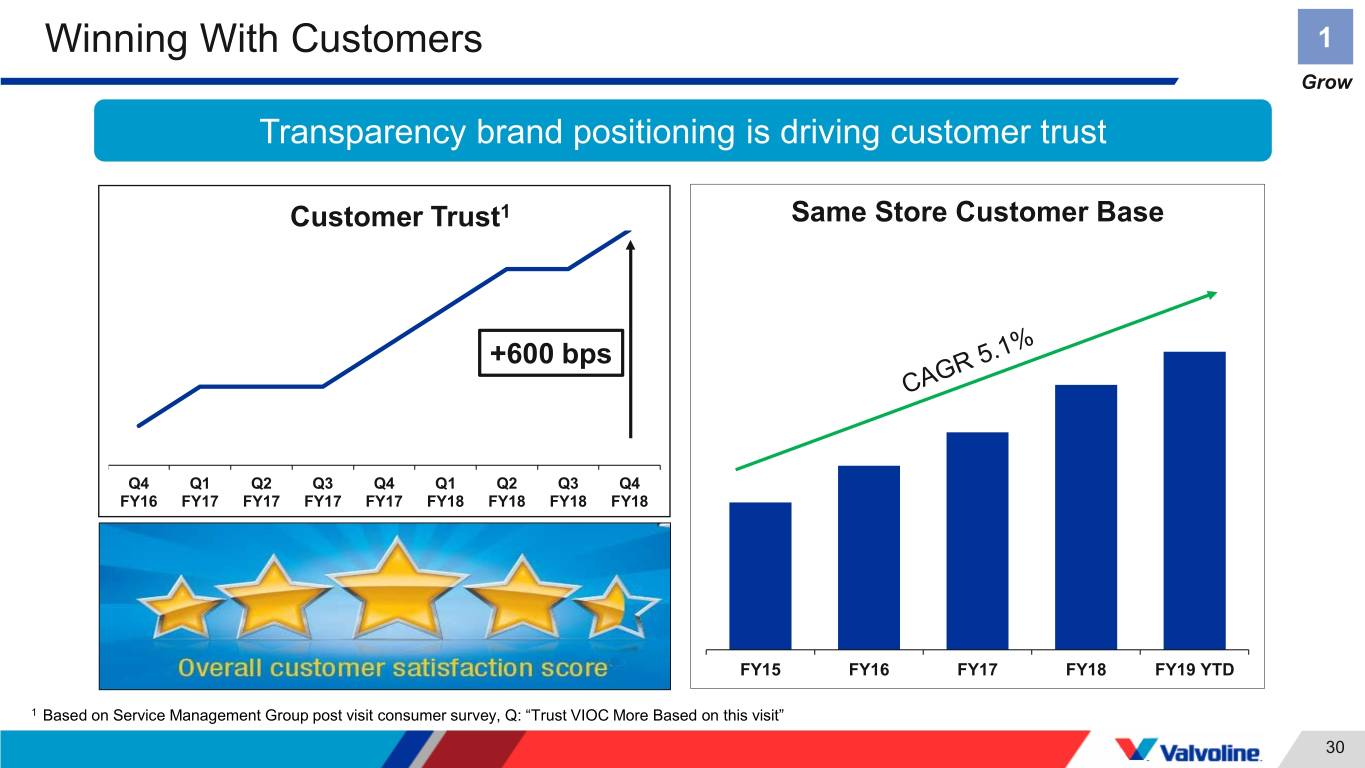
Winning With Customers 1 Grow Transparency brand positioning is driving customer trust Customer Trust1 Same Store Customer Base +600 bps Q4 Q1 Q2 Q3 Q4 Q1 Q2 Q3 Q4 FY16 FY17 FY17 FY17 FY17 FY18 FY18 FY18 FY18 FY15 FY16 FY17 FY18 FY19 YTD 1 Based on Service Management Group post visit consumer survey, Q: “Trust VIOC More Based on this visit” 30

Winning With Customers 1 Grow Leveraging Bay Tracker technology to address key dissatisfiers… Satisfaction vs Wait Time1 74% 73% 68% 67% Bay Tracker Impact 58% 59% 45% 41% Service Time: 14% < 5 minutes 5-10 minutes 10-15 minutes > 15 minutes Wait Time: 15% Overall Satisfaction Return Next Oil Change 1 Based on Service Management Group post visit consumer survey for the satisfaction/likelihood to return 31

Winning With Customers 1 Grow …And drive increased customer retention Consumer App App & Customer Retention1 +1,100 bps Non Users App Users 1 VIOC 2019 Company Store App Pilot 32
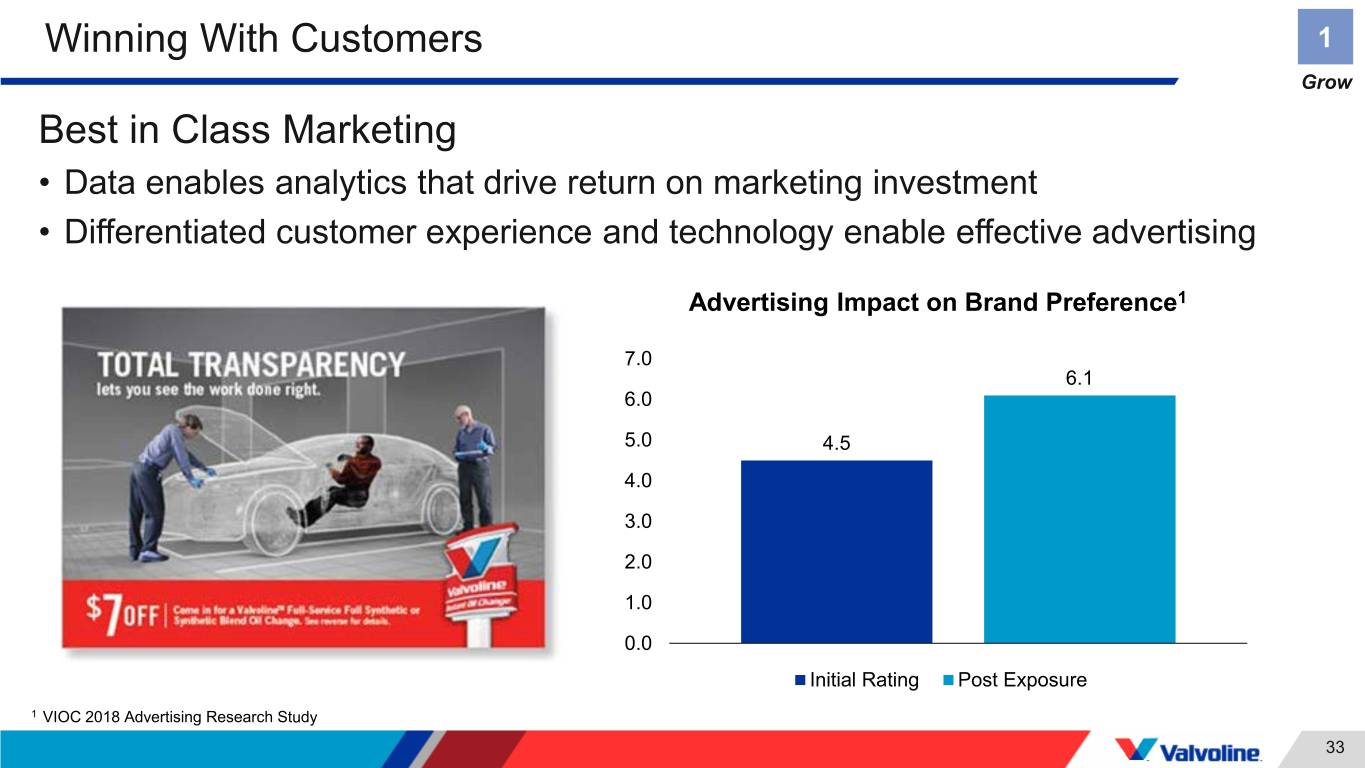
Winning With Customers 1 Grow Best in Class Marketing • Data enables analytics that drive return on marketing investment • Differentiated customer experience and technology enable effective advertising Advertising Impact on Brand Preference1 7.0 6.1 6.0 5.0 4.5 4.0 3.0 2.0 1.0 0.0 Initial Rating Post Exposure 1 VIOC 2018 Advertising Research Study 33
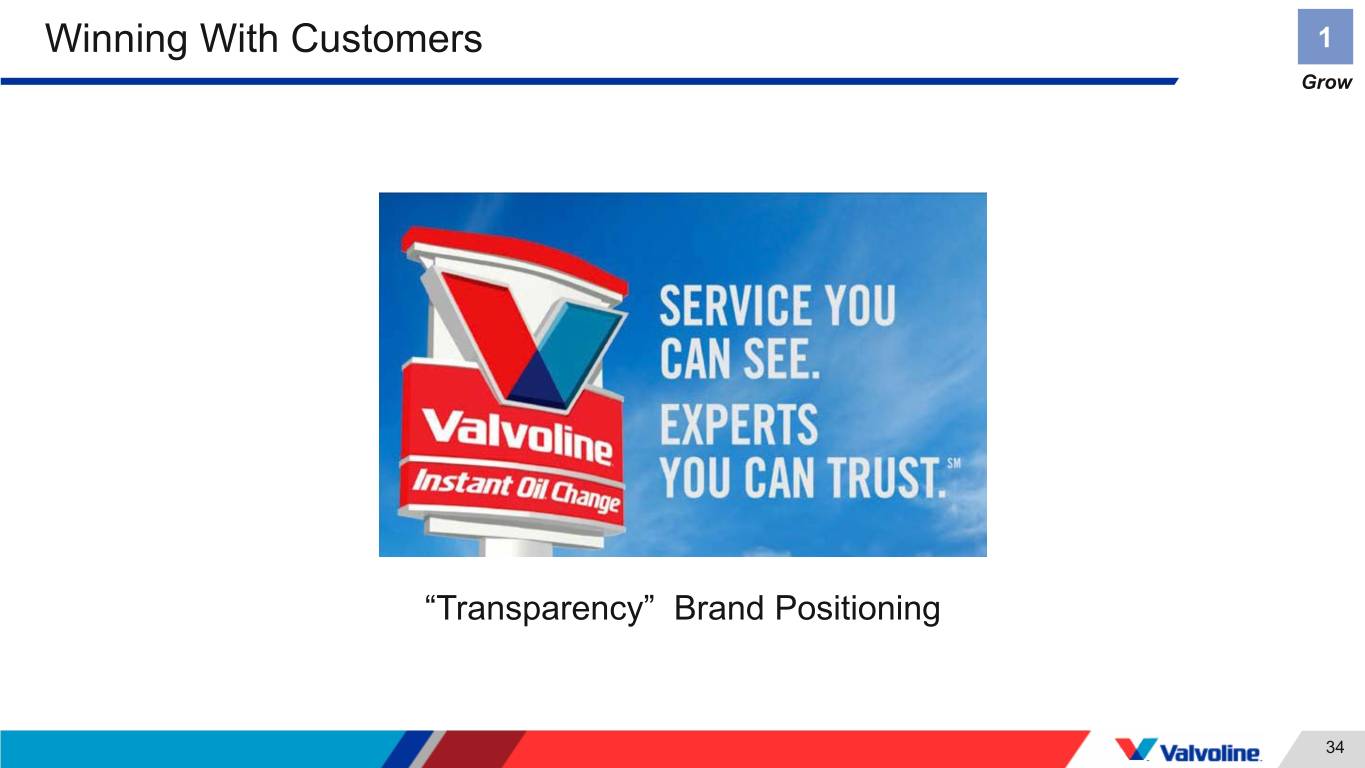
Winning With Customers 1 Grow “Transparency” Brand Positioning 34
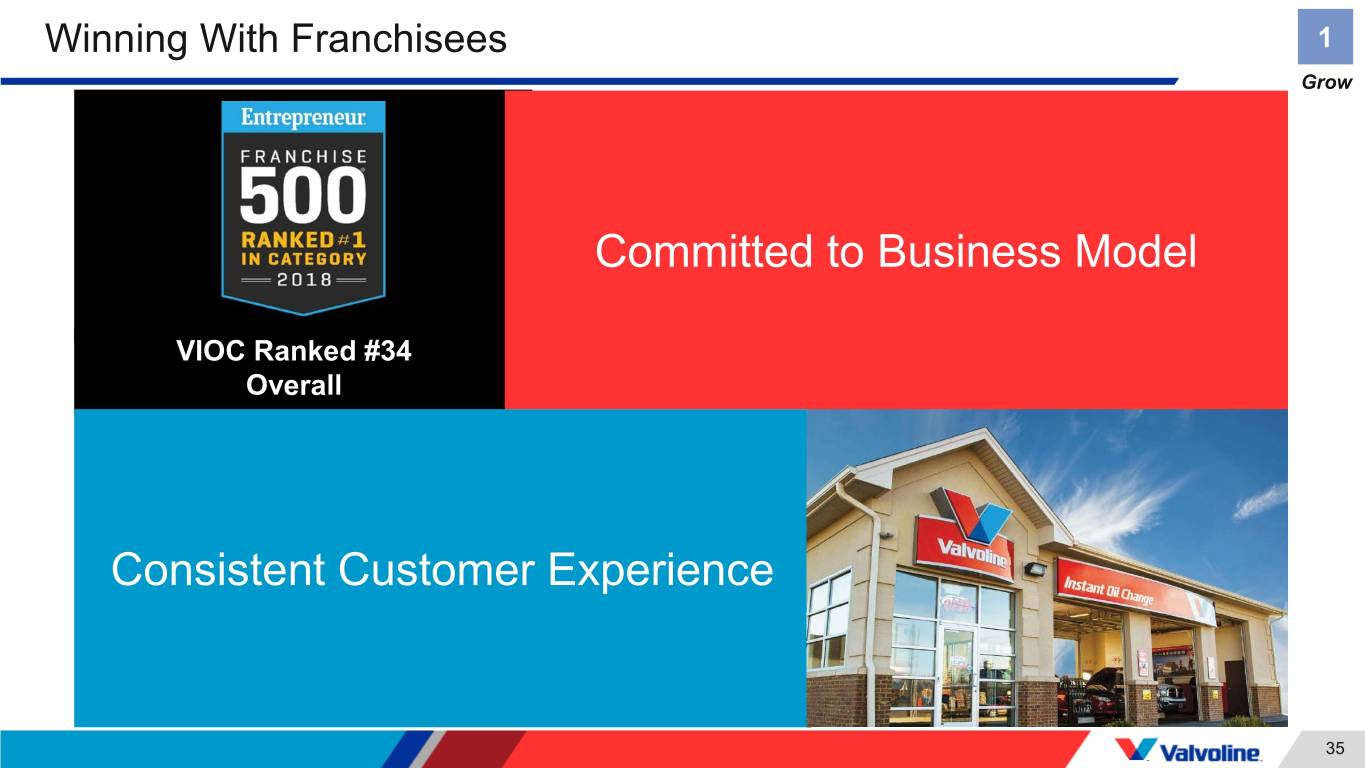
Winning With Franchisees 1 Grow Committed to Business Model VIOC Ranked #34 Overall Consistent Customer Experience 35
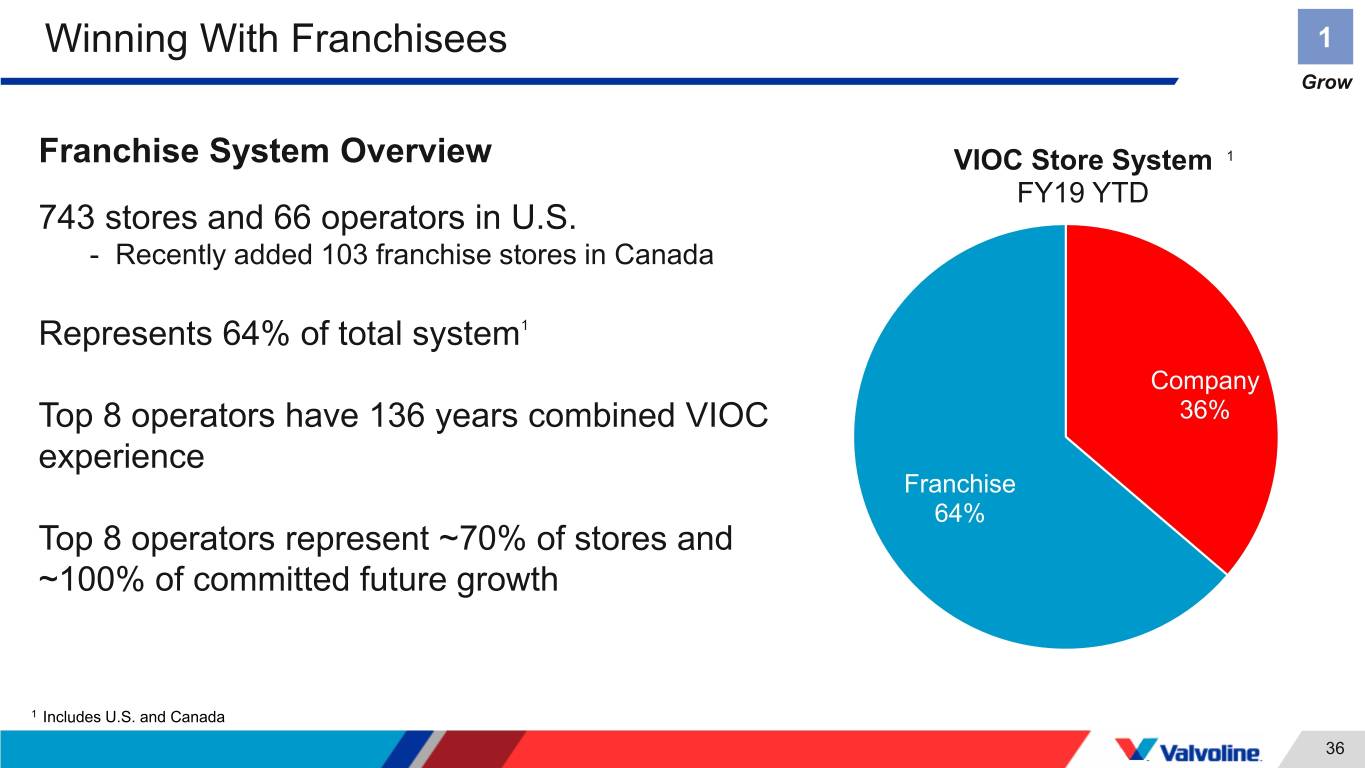
Winning With Franchisees 1 Grow Franchise System Overview VIOC Store System 1 FY19 YTD 743 stores and 66 operators in U.S. - Recently added 103 franchise stores in Canada Represents 64% of total system 1 Company Top 8 operators have 136 years combined VIOC 36% experience Franchise 64% Top 8 operators represent ~70% of stores and ~100% of committed future growth 1 Includes U.S. and Canada 36
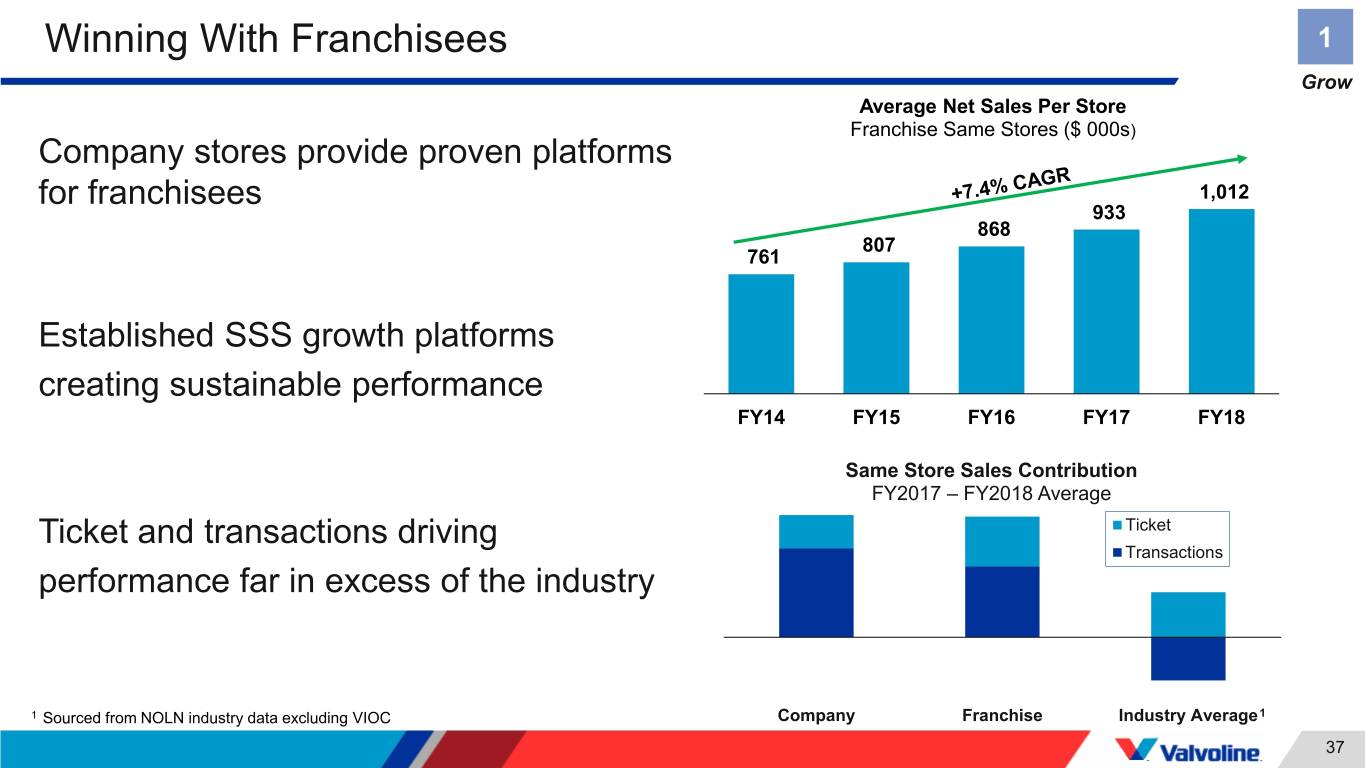
Winning With Franchisees 1 Grow Average Net Sales Per Store • Company stores help us win with Franchise Same Stores ($ 000s) Company stores provide proven platforms franchisees by proving platforms for franchisees 1,012 933 868 807 761 • Strong model means strong unit Establishedeconomics… SSS growth platforms creating sustainable performance FY14 FY15 FY16 FY17 FY18 • …So franchisees want to invest to Same Store Sales Contribution drive SSS and new store units FY2017 – FY2018 Average Ticket and transactions driving Ticket - Agreements for 227 additional units Transactions performanceby 2024 far in excess of the industry 1 Sourced from NOLN industry data excluding VIOC Company Franchise Industry Average 1 37
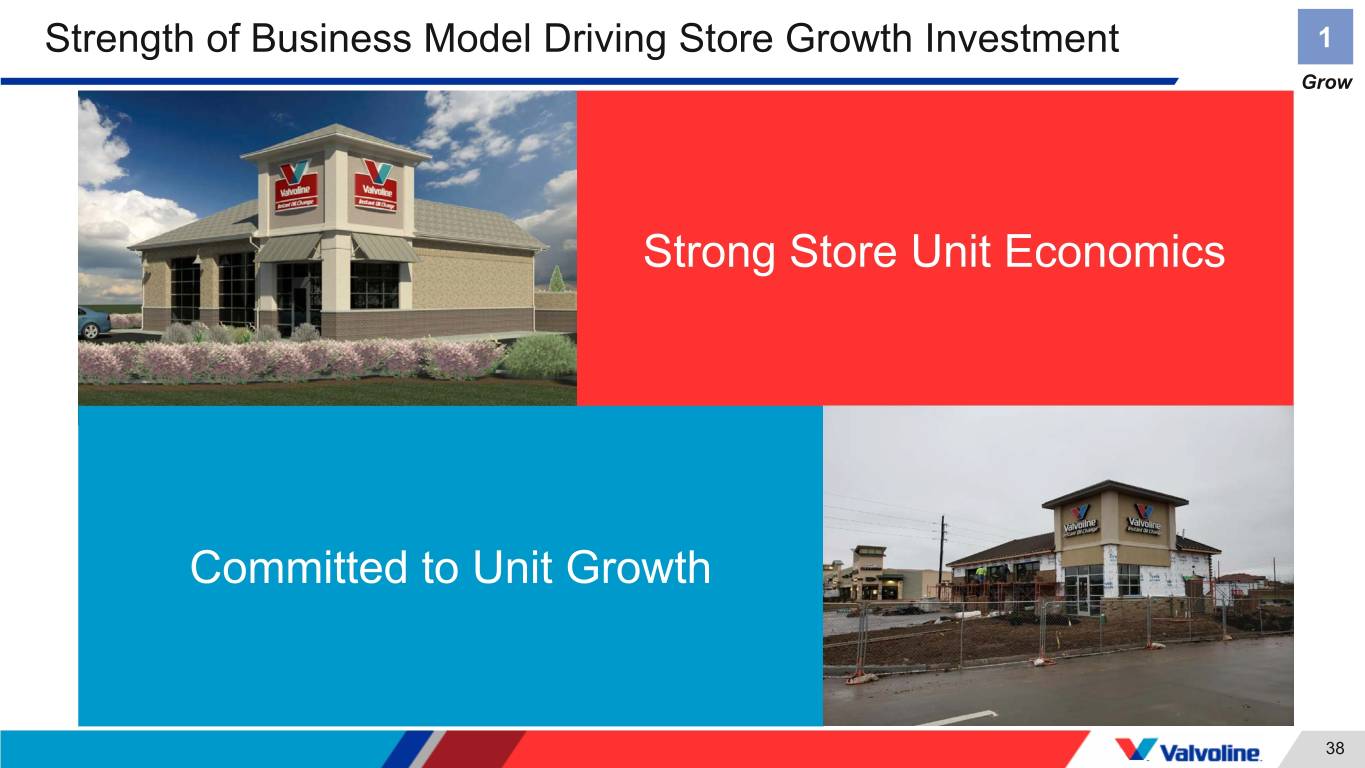
Strength of Business Model Driving Store Growth Investment 1 Grow Strong Store Unit Economics Committed to Unit Growth 38
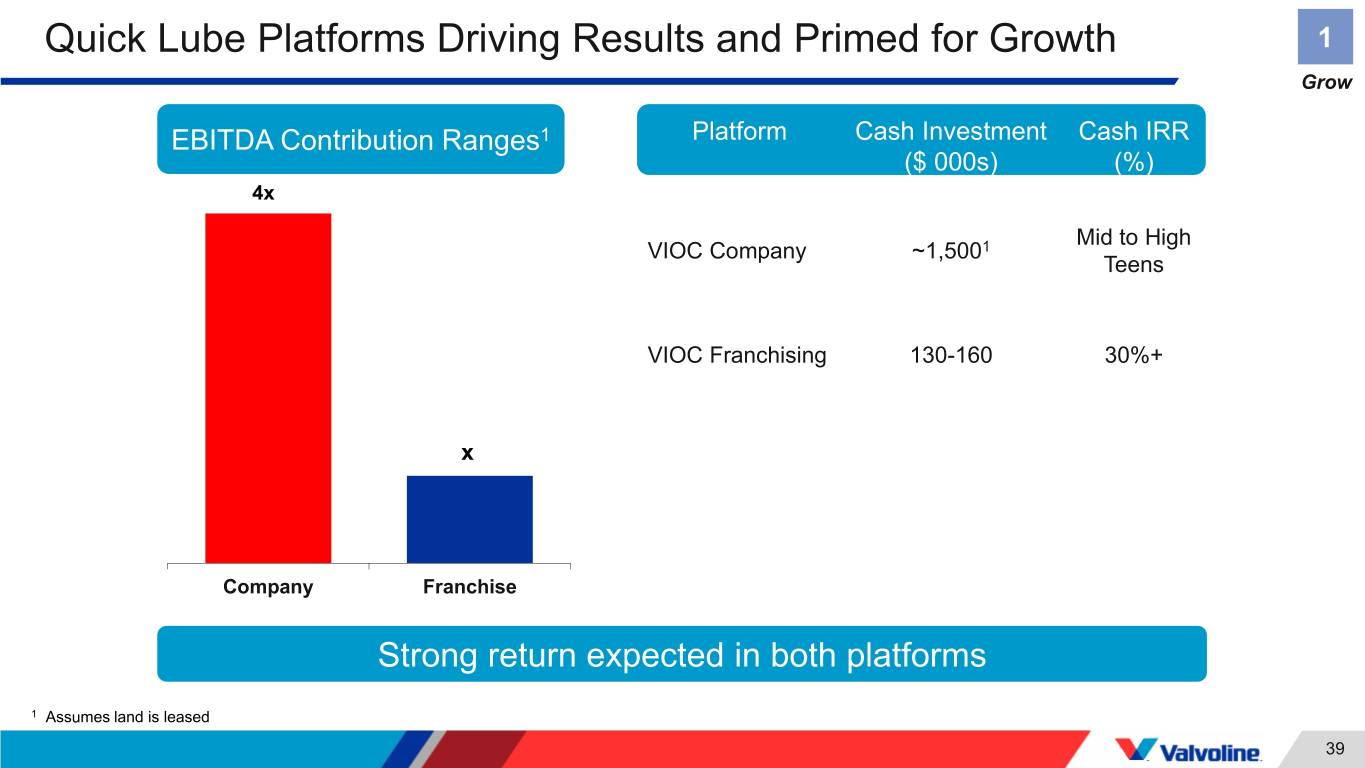
Quick Lube Platforms Driving Results and Primed for Growth 1 Grow EBITDA Contribution Ranges1 Platform Cash Investment Cash IRR ($ 000s) (%) 4x Mid to High VIOC Company ~1,5001 Product Sales Teens VIOC Franchising 130-160 30%+ Product Sales Services IncomeRoyalties x Company Franchise Strong return expected in both platforms 1 Assumes land is leased 39
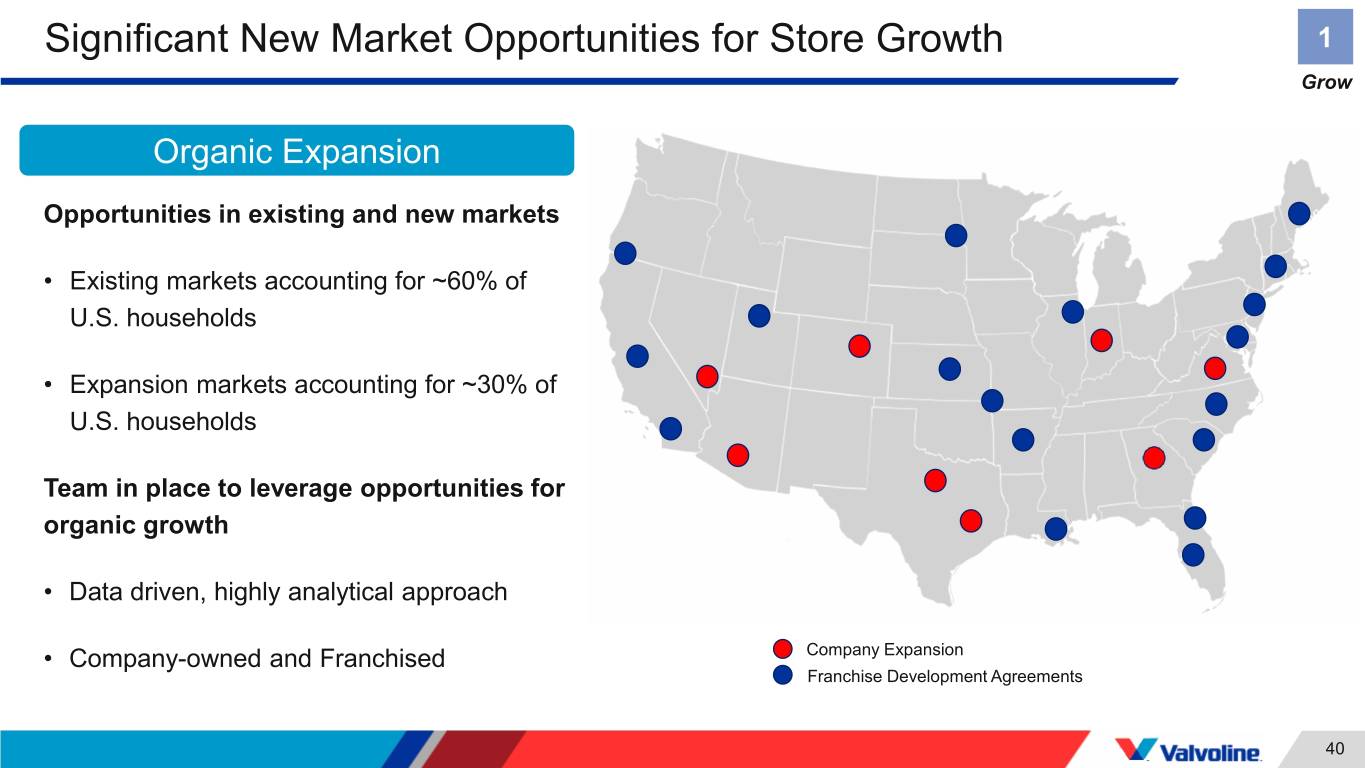
Significant New Market Opportunities for Store Growth 1 Grow Organic Expansion Opportunities in existing and new markets • Existing markets accounting for ~60% of U.S. households • Expansion markets accounting for ~30% of U.S. households Team in place to leverage opportunities for organic growth • Data driven, highly analytical approach • Company-owned and Franchised Company Expansion Franchise Development Agreements 40
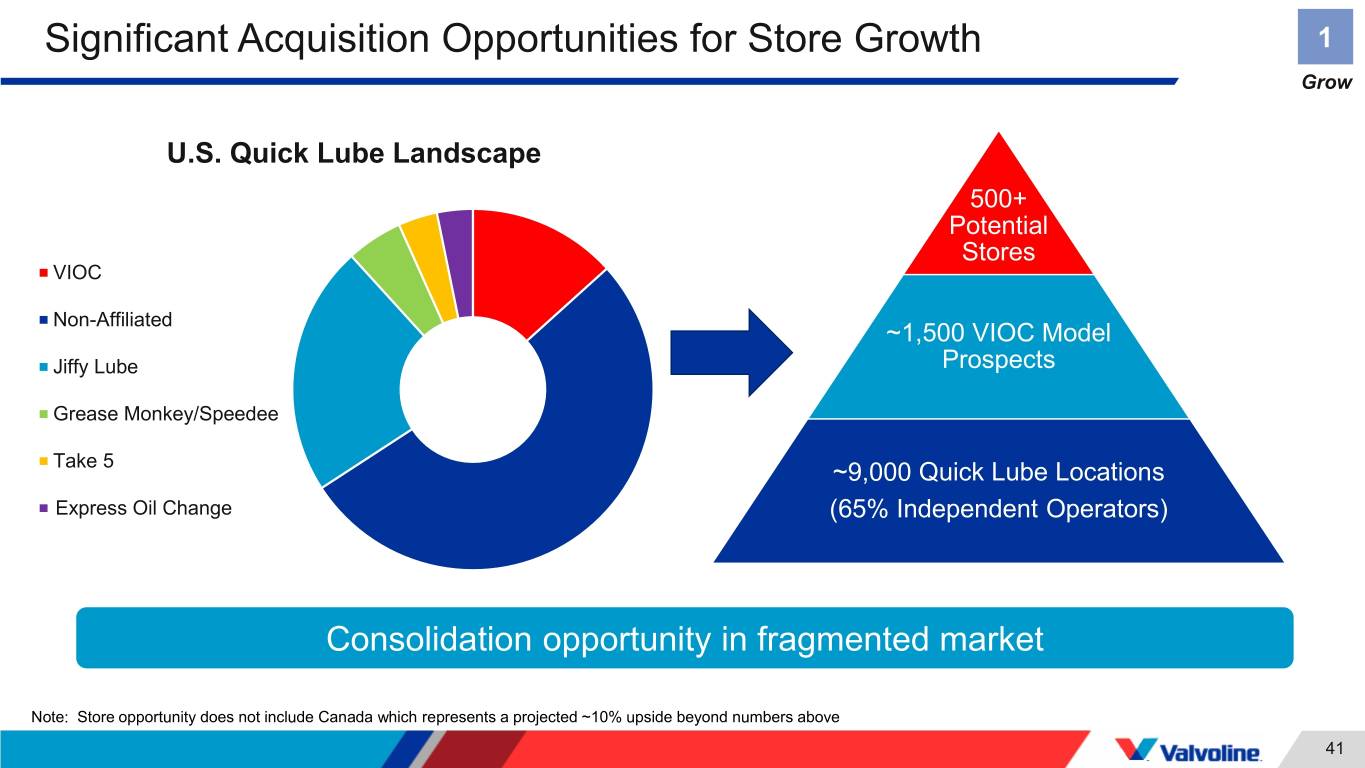
Significant Acquisition Opportunities for Store Growth 1 Grow U.S. Quick Lube Landscape 500+ Potential Stores VIOC Non-Affiliated ~1,500 VIOC Model Jiffy Lube Prospects Grease Monkey/Speedee Take 5 ~9,000 Quick Lube Locations ExpressExpress OilOil ChangeChgChange (65% Independent Operators) Consolidation opportunity in fragmented market Note: Store opportunity does not include Canada which represents a projected ~10% upside beyond numbers above 41
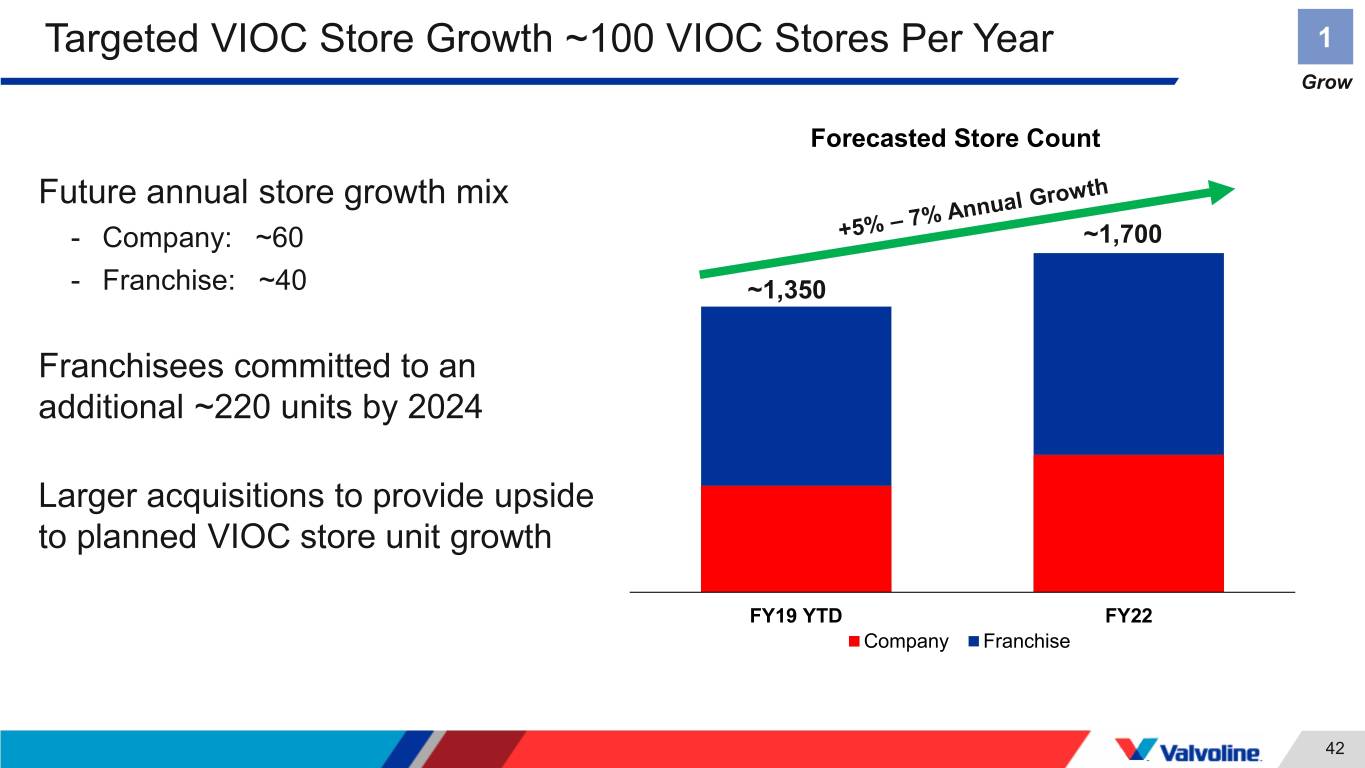
Targeted VIOC Store Growth ~100 VIOC Stores Per Year 1 Grow Forecasted Store Count Future annual store growth mix - Company: ~60 ~1,700 - Franchise: ~40 ~1,350 Franchisees committed to an additional ~220 units by 2024 Larger acquisitions to provide upside to planned VIOC store unit growth FY19 YTD FY22 Company Franchise 42

Key Takeaways – Quick Lubes 1 Grow Proprietary Talent, Tools Company & Franchise Industry Leading Retail & Technology Platforms Systems Positioned for Service Model Drive Execution & Accelerated Store Same Store Sales Growth Quick, easy and trusted customer experience expected to fuel: • 6% - 8% same store sales • ~100 new stores per year 43

Tom Gerrald Tim Ferrell Senior vice president, Vice president, Core North America brand equity and consumer marketing

Core North America – U.S. Market Overview 2 Maintain U.S. Transportation Lubricant Volume U.S. Passenger Car Oil Changes (~1B gallons) (~600M) DIY Heavy Duty (20%) (34%) Passenger DIFM Car (80%) (66%) Source: IHS Markit 2018 and internal company estimates 45

Core North America – Balanced Split Between Installer and Retail 2 Maintain FY18 Volume by Channel Retail Branded Installer Passenger Car Retail Non- Installer Heavy branded Duty Other Retail: DIY (auto parts & mass merchandise) and warehouse-distributor accounts Installer: DIFM outlets and heavy-duty fleet accounts Other: OEM accounts and specialty 46
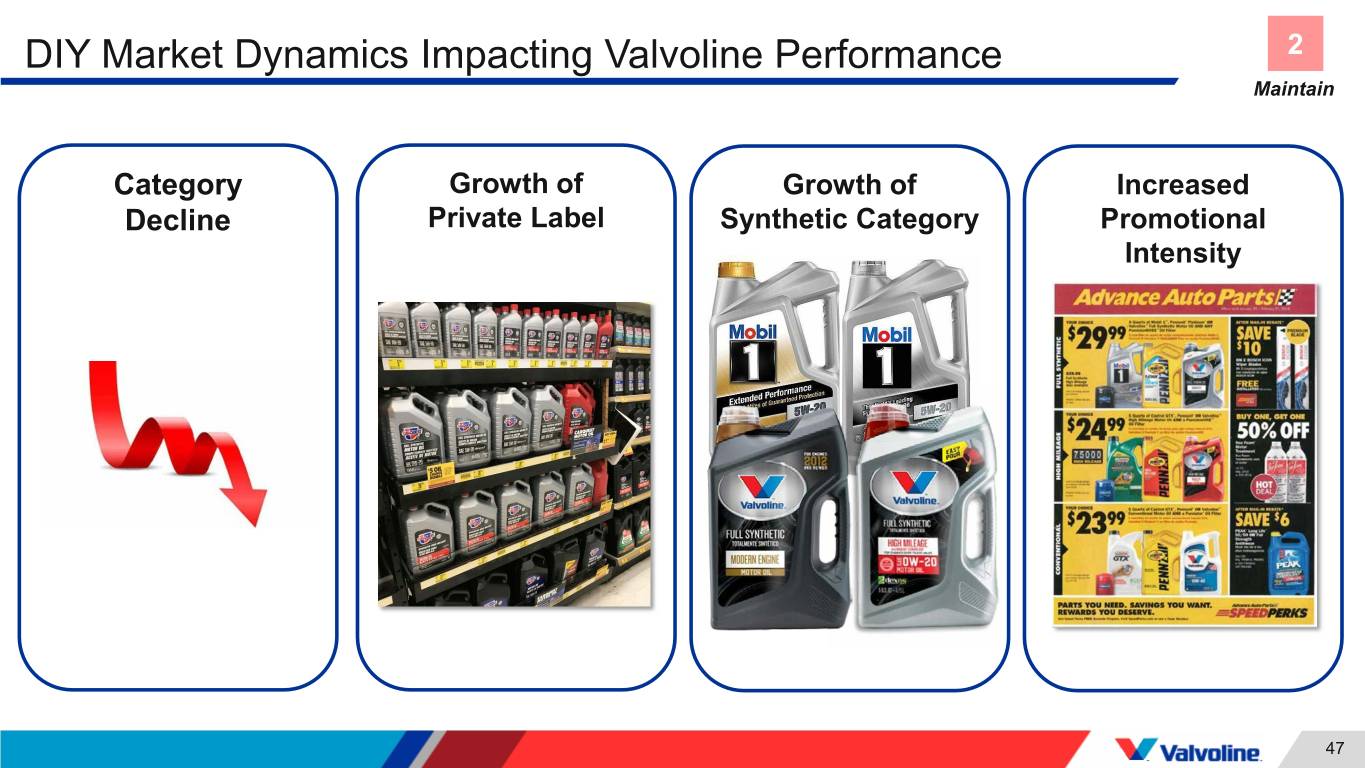
DIY Market Dynamics Impacting Valvoline Performance 2 Maintain Category Growth of Growth of Increased Decline Private Label Synthetic Category Promotional Intensity 47
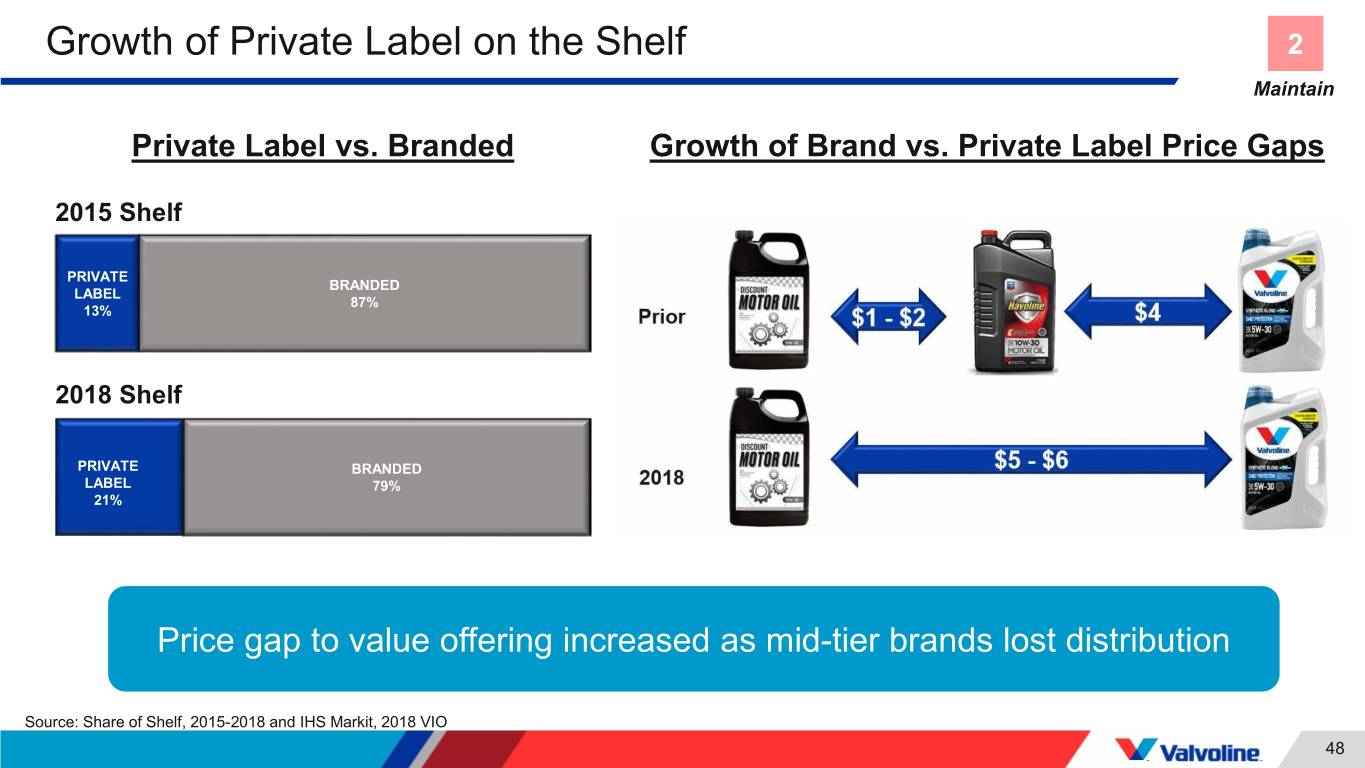
Growth of Private Label on the Shelf 2 Maintain Private Label vs. Branded Growth of Brand vs. Private Label Price Gaps 2015 Shelf PRIVATE BRANDED LABEL 87% 13% 2018 Shelf PRIVATE BRANDED LABEL 79% 21% Price gap to value offering increased as mid-tier brands lost distribution Source: Share of Shelf, 2015-2018 and IHS Markit, 2018 VIO 48
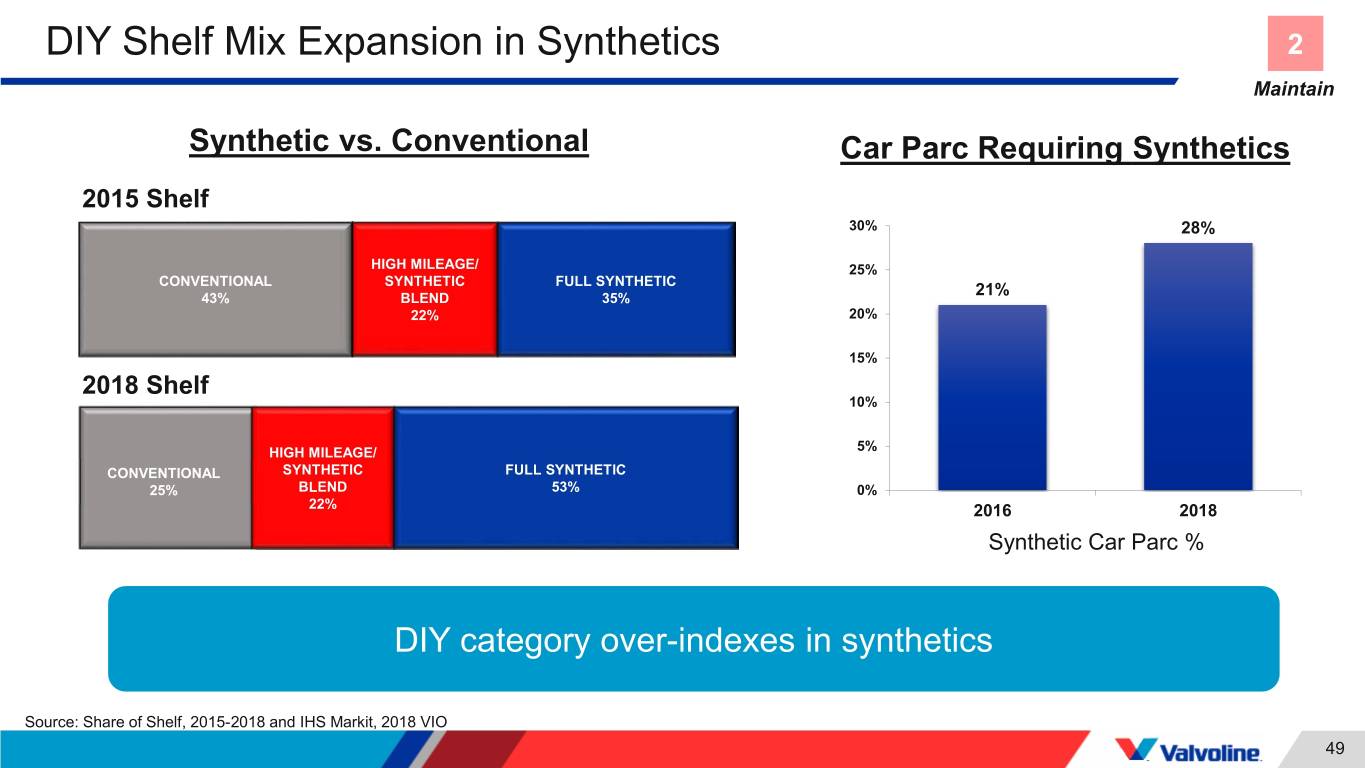
DIY Shelf Mix Expansion in Synthetics 2 Maintain Synthetic vs. Conventional Car Parc Requiring Synthetics 2015 Shelf 30% 28% HIGH MILEAGE/ 25% CONVENTIONAL SYNTHETIC FULL SYNTHETIC 43% BLEND 35% 21% 22% 20% 15% 2018 Shelf 10% HIGH MILEAGE/ 5% CONVENTIONAL SYNTHETIC FULL SYNTHETIC 25% BLEND 53% 0% 22% 2016 2018 Synthetic Car Parc % DIY category over-indexes in synthetics Source: Share of Shelf, 2015-2018 and IHS Markit, 2018 VIO 49
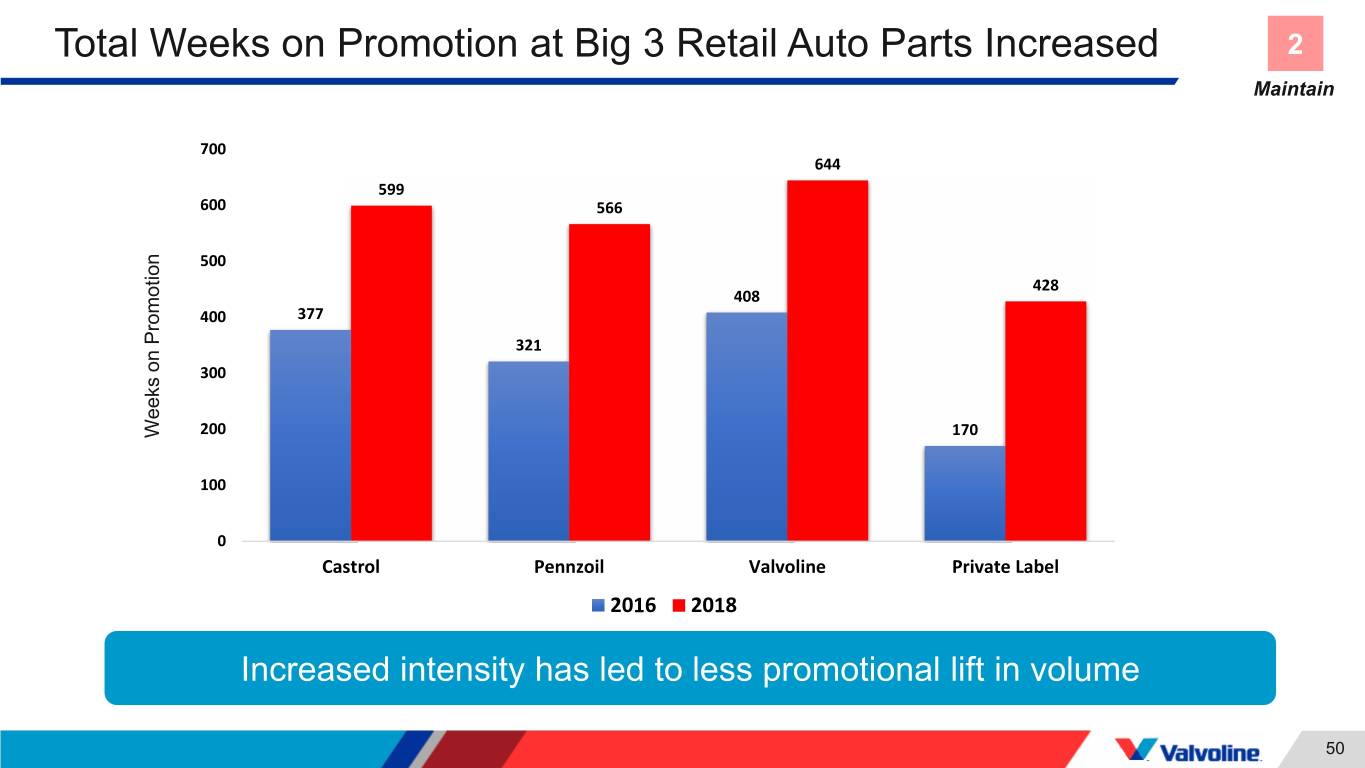
Total Weeks on Promotion at Big 3 Retail Auto Parts Increased 2 Maintain 700 644 599 600 566 500 428 408 400 377 321 300 Weeks onWeeks Promotion 200 170 100 0 Castrol Pennzoil Valvoline Private Label 2016 2018 Increased intensity has led to less promotional lift in volume 50
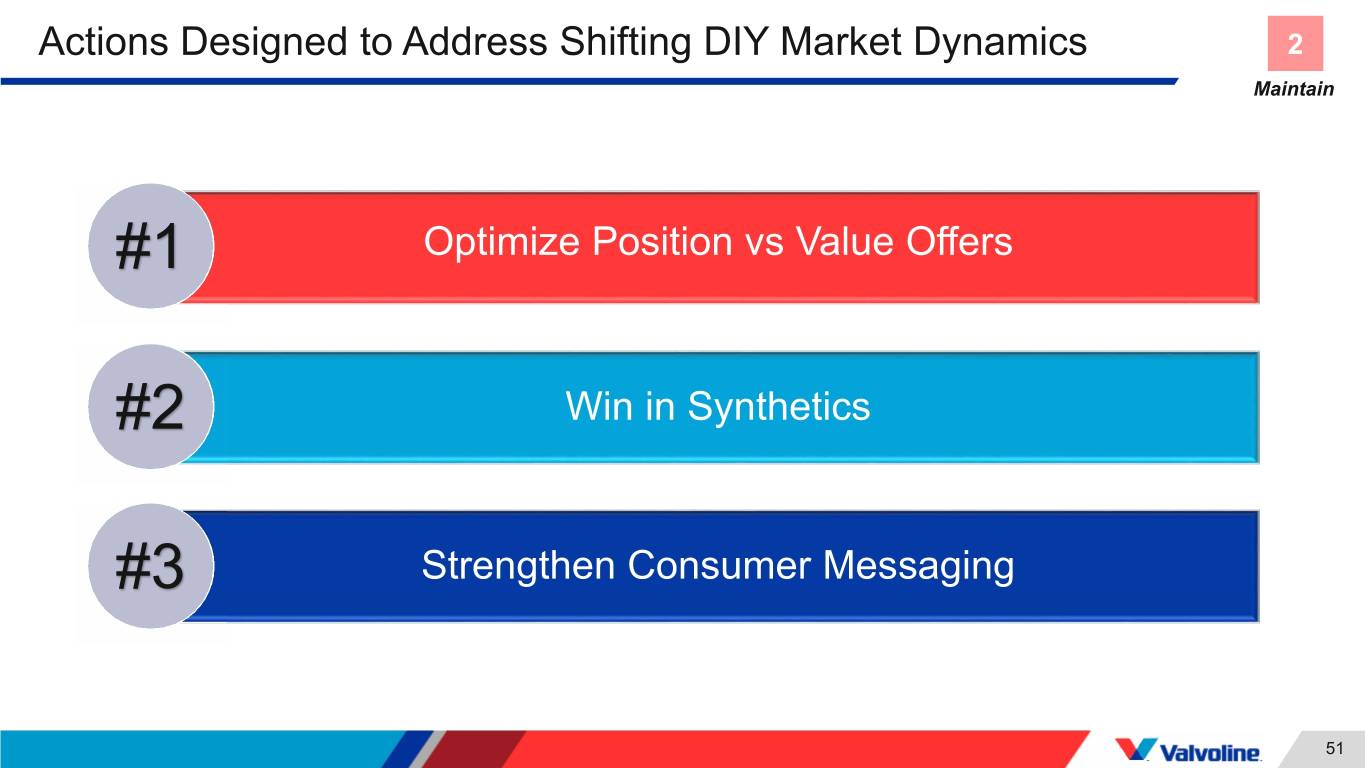
Actions Designed to Address Shifting DIY Market Dynamics 2 Maintain #1 Optimize Position vs Value Offers #2 Win in Synthetics #3 Strengthen Consumer Messaging 51
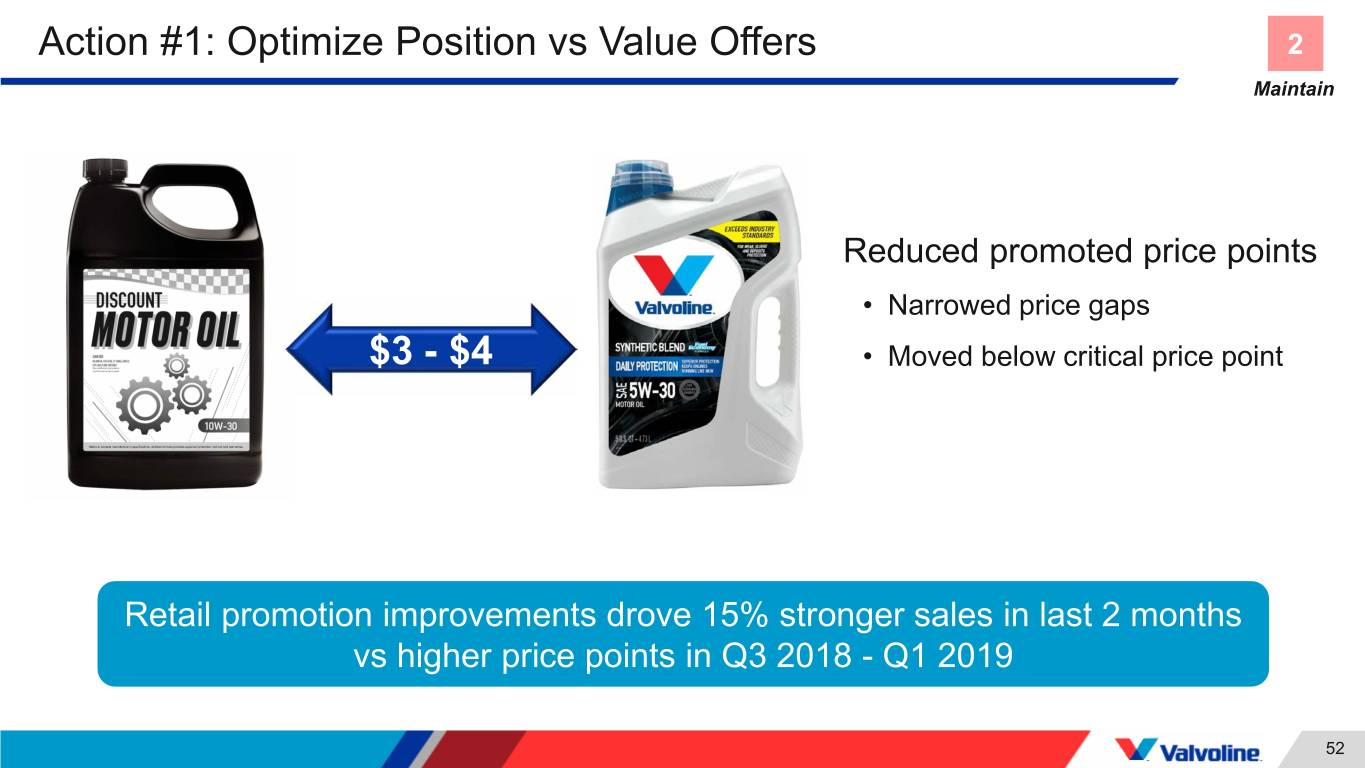
Action #1: Optimize Position vs Value Offers 2 Maintain Reduced promoted price points • Narrowed price gaps $3 - $4 • Moved below critical price point Retail promotion improvements drove 15% stronger sales in last 2 months vs higher price points in Q3 2018 - Q1 2019 52

Action #1: You Saved What? Quality of Valvoline vs Private Label 2 Maintain BRAND SPOT PLACEHOLDER 53
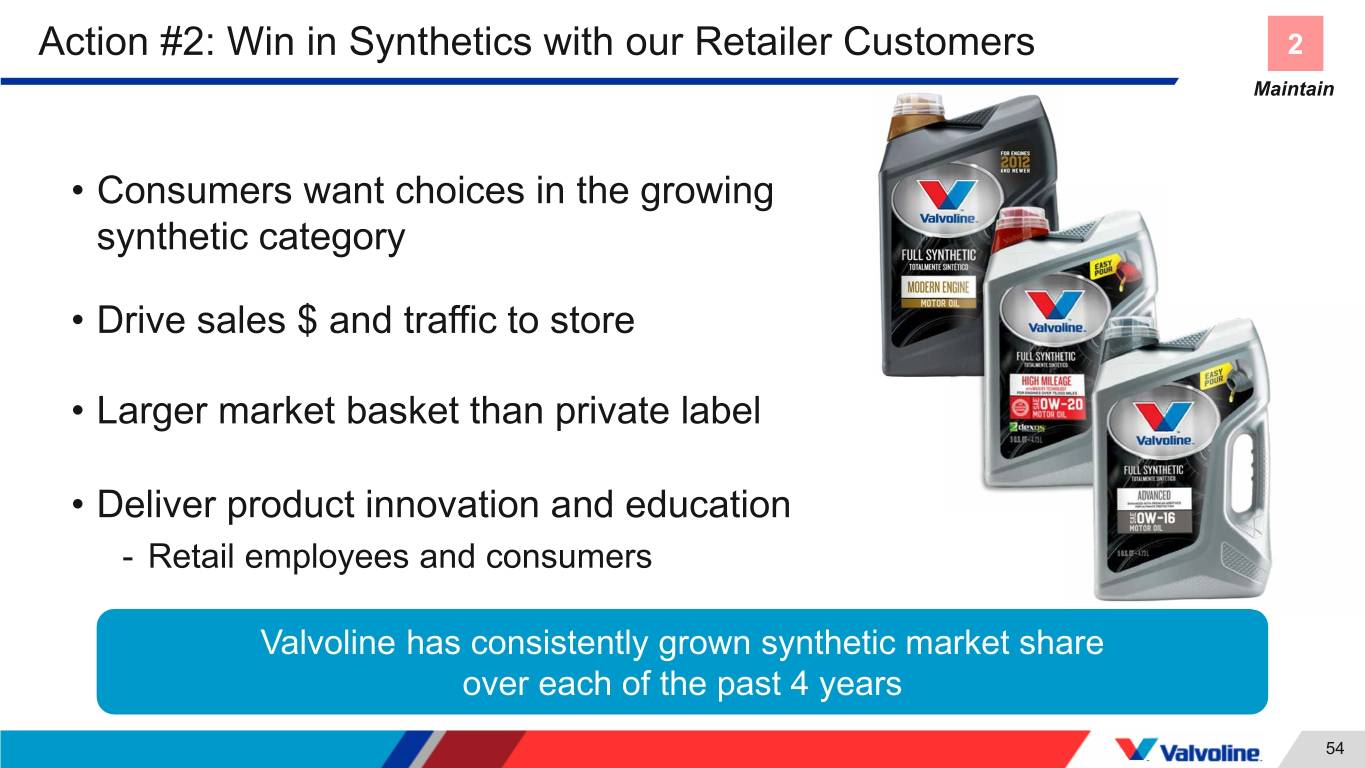
Action #2: Win in Synthetics with our Retailer Customers 2 Maintain • Consumers want choices in the growing synthetic category • Drive sales $ and traffic to store • Larger market basket than private label • Deliver product innovation and education - Retail employees and consumers Valvoline has consistently grown synthetic market share over each of the past 4 years 54
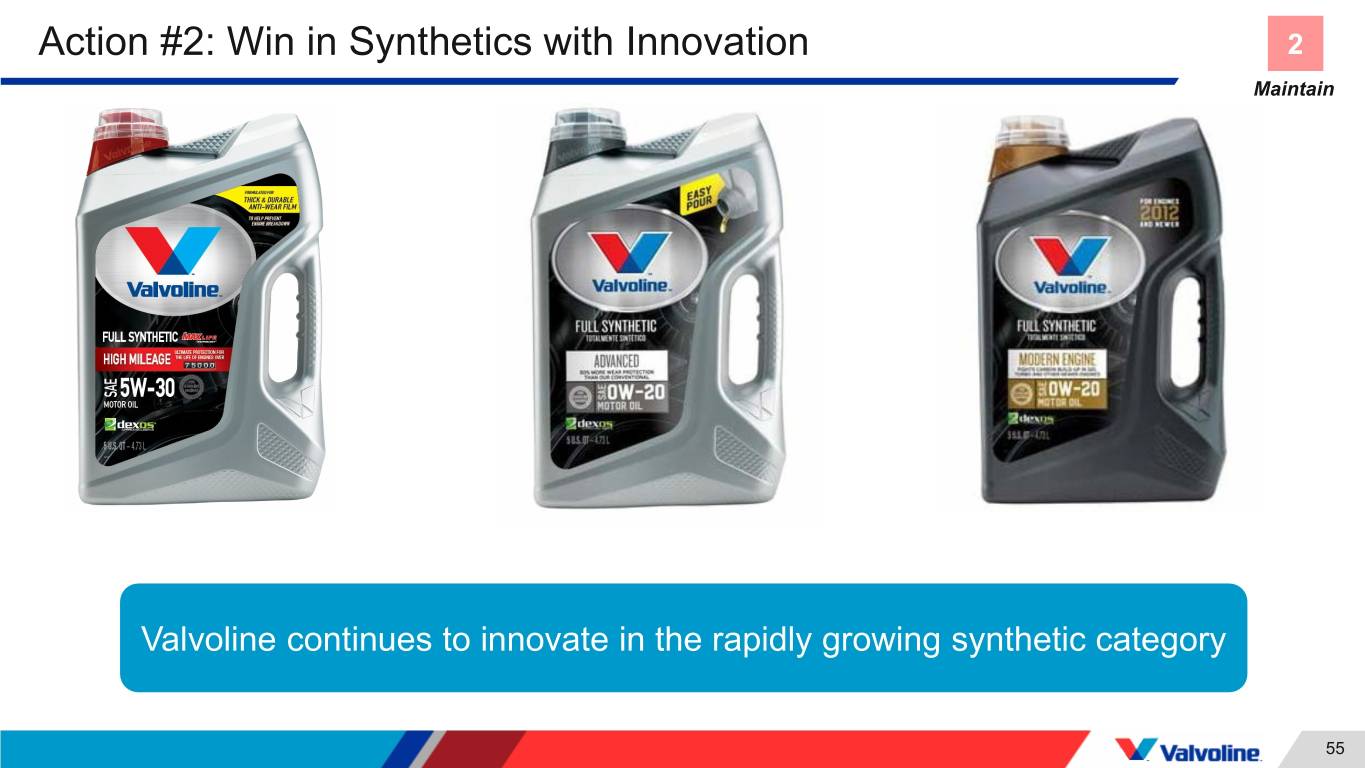
Action #2: Win in Synthetics with Innovation 2 Maintain Valvoline continues to innovate in the rapidly growing synthetic category 55
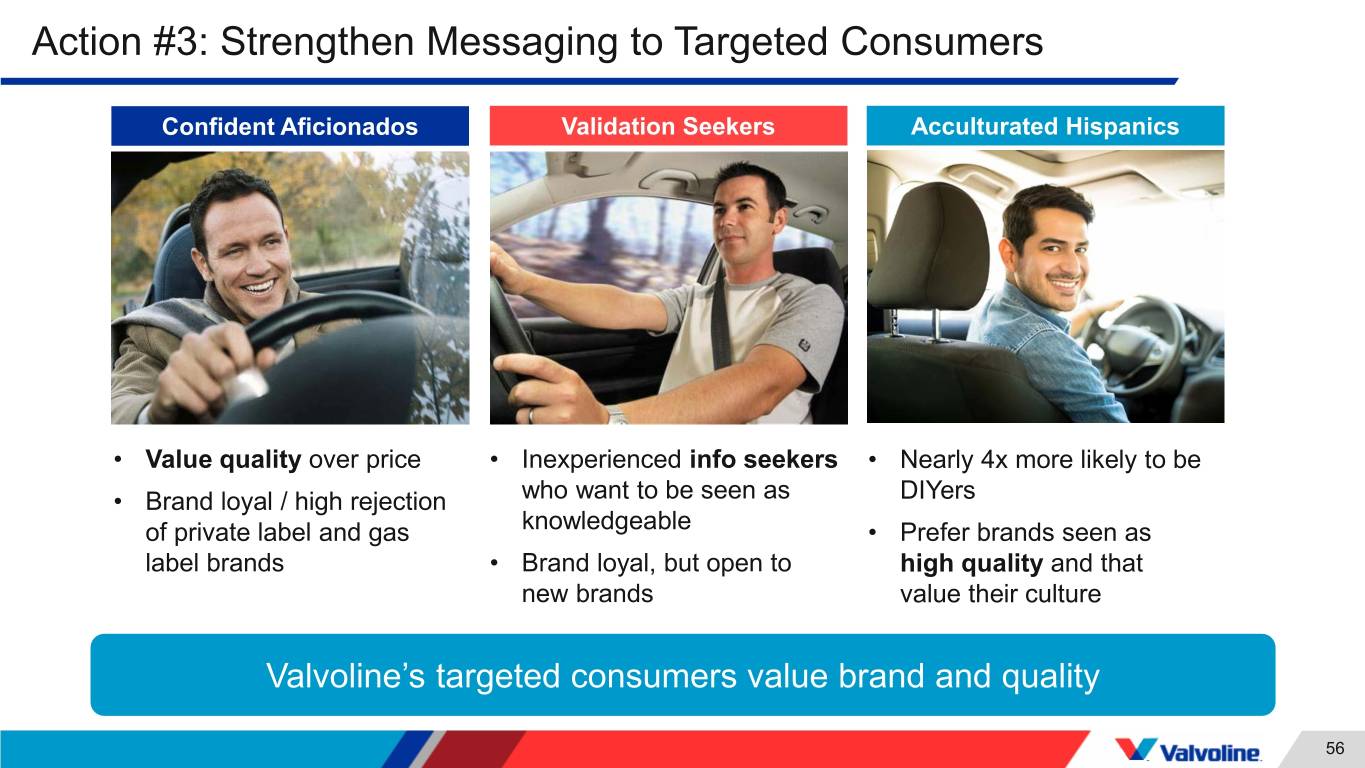
Action #3: Strengthen Messaging to Targeted Consumers Confident Aficionados Validation Seekers Acculturated Hispanics • Value quality over price • Inexperienced info seekers • Nearly 4x more likely to be • Brand loyal / high rejection who want to be seen as DIYers of private label and gas knowledgeable • Prefer brands seen as label brands • Brand loyal, but open to high quality and that new brands value their culture Valvoline’s targeted consumers value brand and quality 56
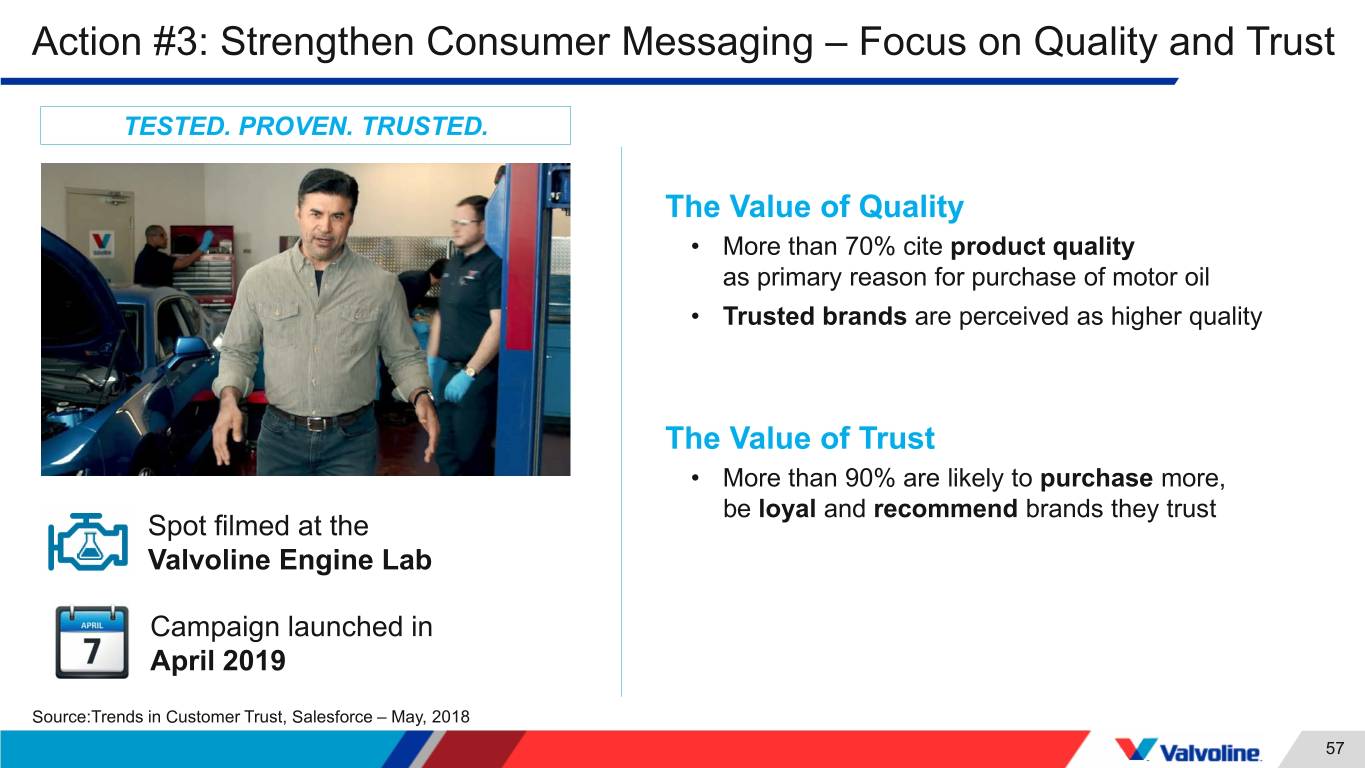
Action #3: Strengthen Consumer Messaging – Focus on Quality and Trust TESTED. PROVEN. TRUSTED. The Value of Quality • More than 70% cite product quality as primary reason for purchase of motor oil • Trusted brands are perceived as higher quality The Value of Trust • More than 90% are likely to purchase more, be loyal and recommend brands they trust Spot filmed at the Valvoline Engine Lab Campaign launched in April 2019 Source:Trends in Customer Trust, Salesforce – May, 2018 57

Action #3: Strengthen Consumer Messaging – Tested. Proven. Trusted. 58
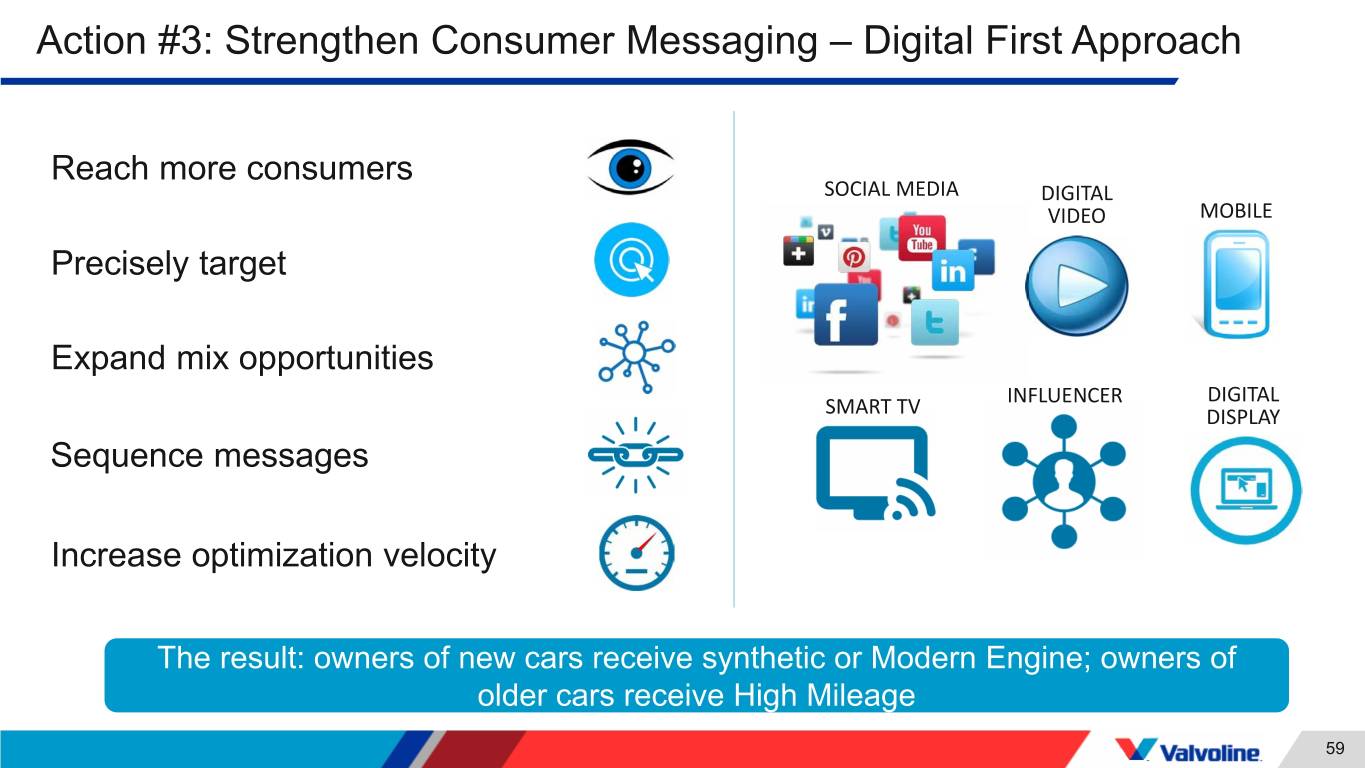
Action #3: Strengthen Consumer Messaging – Digital First Approach Reach more consumers SOCIAL MEDIA DIGITAL VIDEO MOBILE Precisely target Expand mix opportunities INFLUENCER DIGITAL SMART TV DISPLAY Sequence messages Increase optimization velocity The result: owners of new cars receive synthetic or Modern Engine; owners of older cars receive High Mileage 59
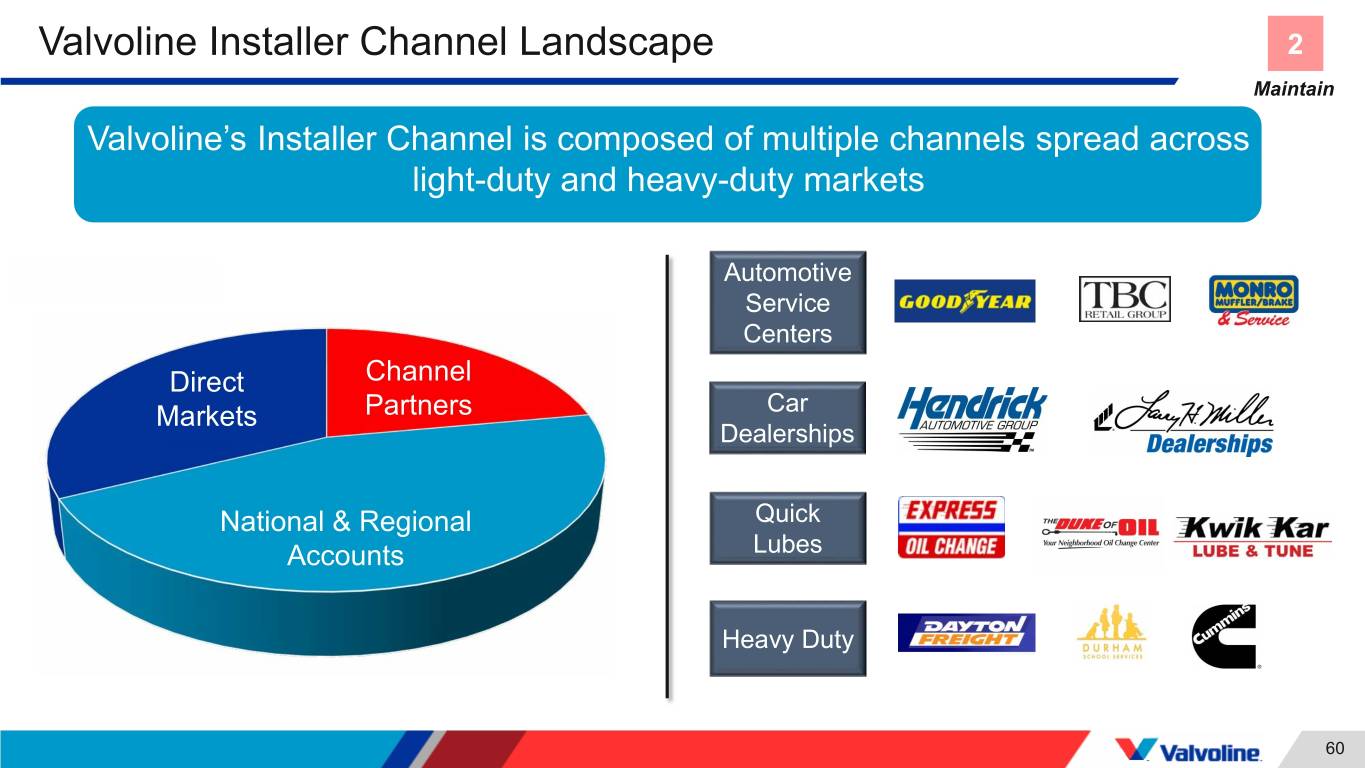
Valvoline Installer Channel Landscape 2 Maintain Valvoline’s Installer Channel is composed of multiple channels spread across light-duty and heavy-duty markets Automotive Service Centers Canada Direct Channel PartnersChannel Car Markets Partners National Dealerships Accounts Quick National & DirectRegional Markets Accounts Lubes Heavy Duty 60
Actions Designed to Capture Installer Opportunities 2 Maintain #1 Win Customers With Stronger Value Proposition #2 Expand Value at Existing Accounts #3 Grow Share in Heavy Duty 61
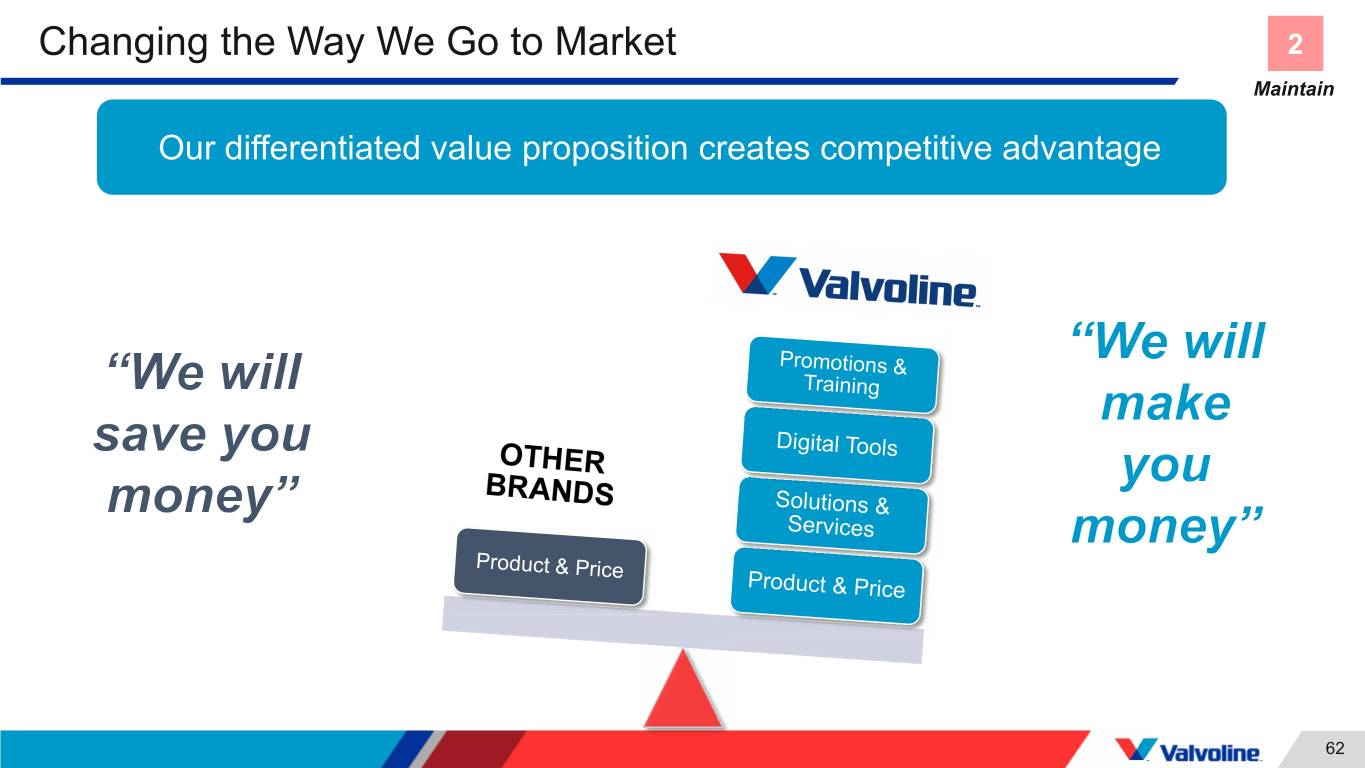
Changing the Way We Go to Market 2 Maintain Our differentiated value proposition creates competitive advantage Valvoline Competition 62
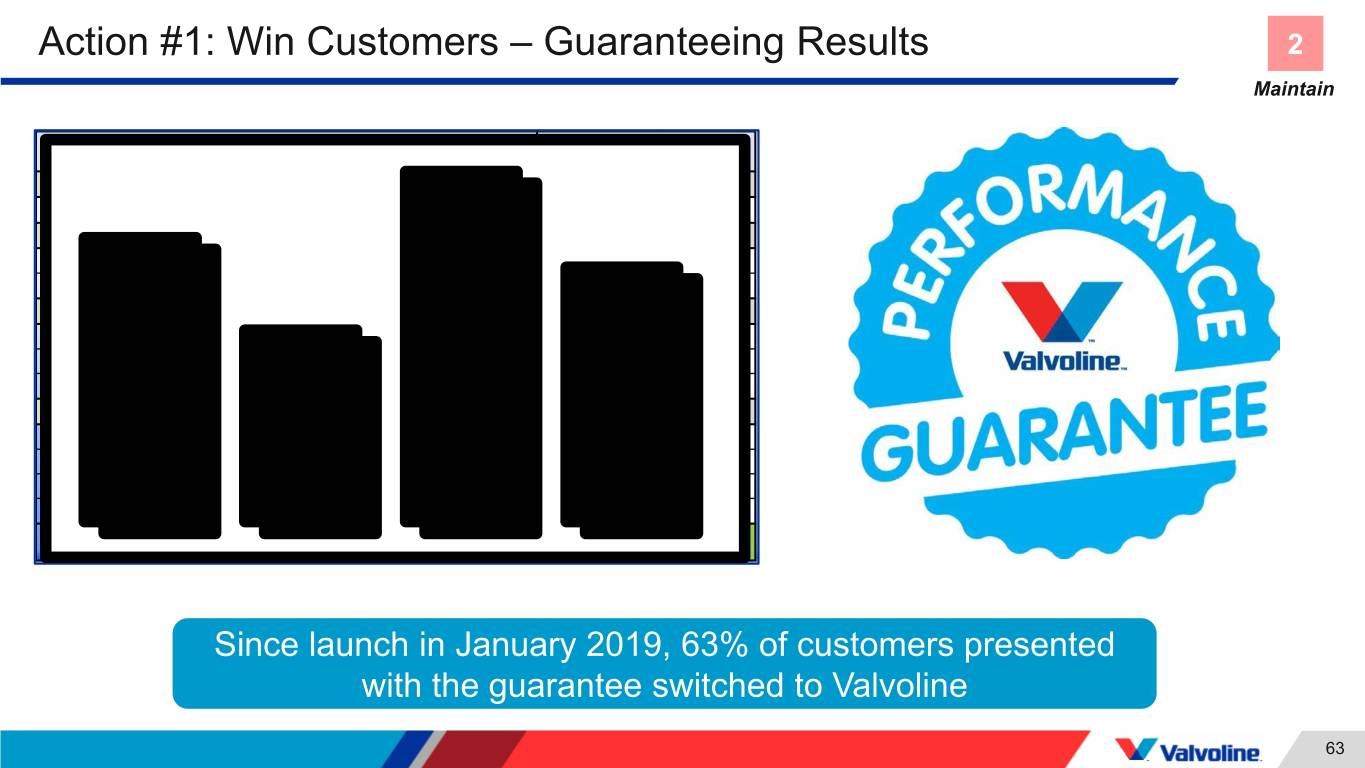
Action #1: Win Customers – Guaranteeing Results 2 Maintain Annual Gallons 25,000 Potential Gross Profit Valvoline Brand Valvoline Brand Impact $ 11,408 Valvoline Account Incentive Programs Valvoline PFP Program $ 29,308 Valvoline Incentive Program (BDF/IIF) $ 7,032 Valvoline Promotions Valvoline Drives $ 33,750 VPS Lifetime Guarantee $ 23,400 VPS Stickerbucks $ 26,700 Valvoline Capabilities Safety Program $ 14,813 National Training Program $ 7,355 Recruiting $ 13,850 Virtual Call Control (For 5 or More Stores) $ 29,925 Valvoline Partner Solutions Total $ 197,541 Since launch in January 2019, 63% of customers presented with the guarantee switched to Valvoline 63
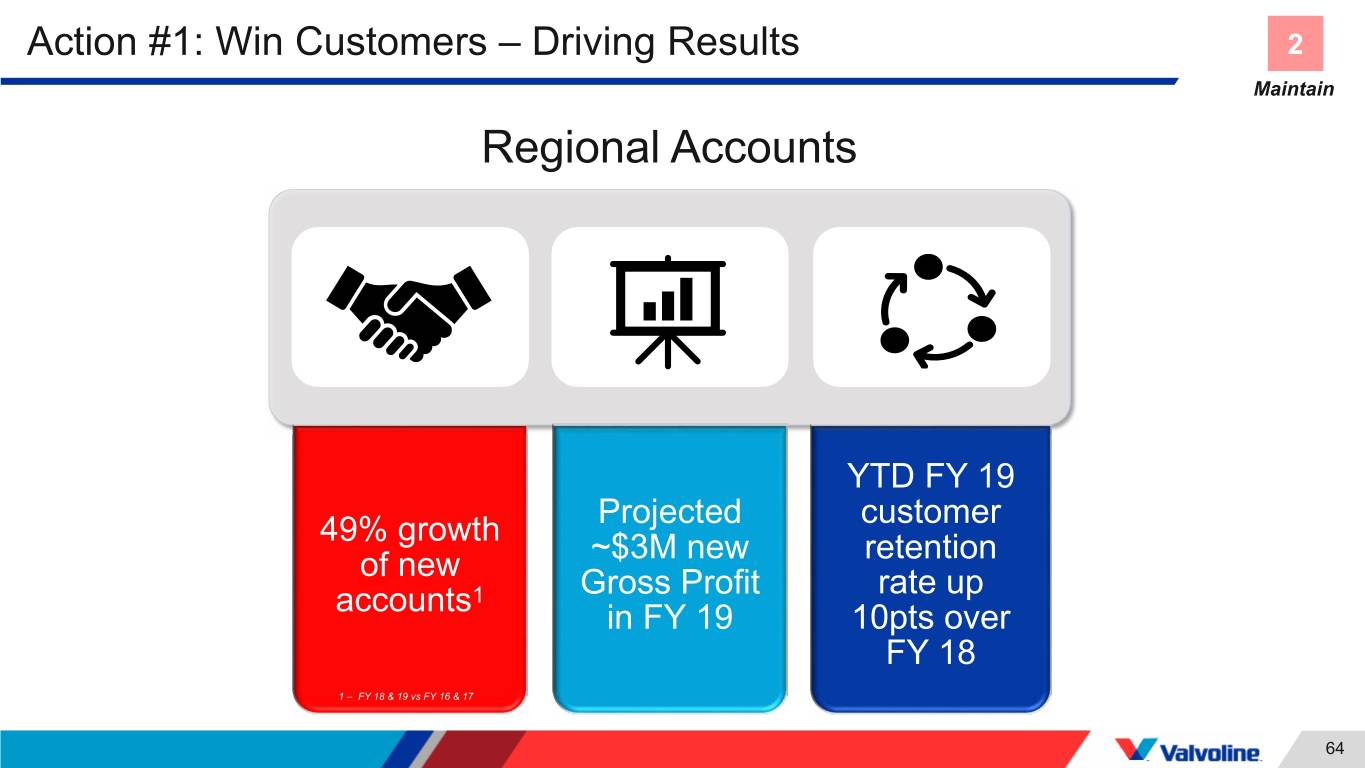
Action #1: Win Customers – Driving Results 2 Maintain Regional Accounts YTD FY 19 Projected customer 49% growth ~$3M new retention of new Gross Profit rate up accounts1 in FY 19 10pts over FY 18 1 – FY 18 & 19 vs FY 16 & 17 64
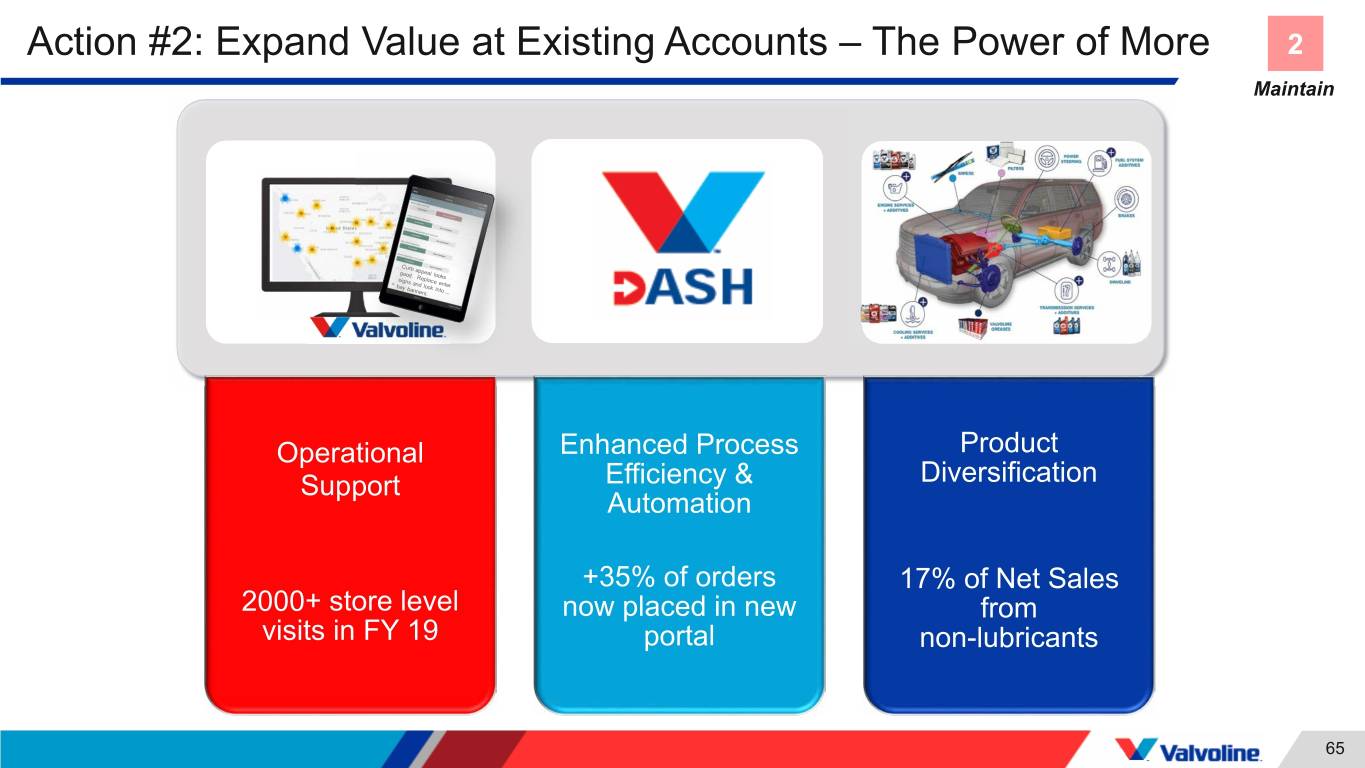
Action #2: Expand Value at Existing Accounts – The Power of More 2 Maintain Operational Enhanced Process Product Support Efficiency & Diversification Automation +35% of orders 17% of Net Sales 2000+ store level now placed in new from visits in FY 19 portal non-lubricants 65
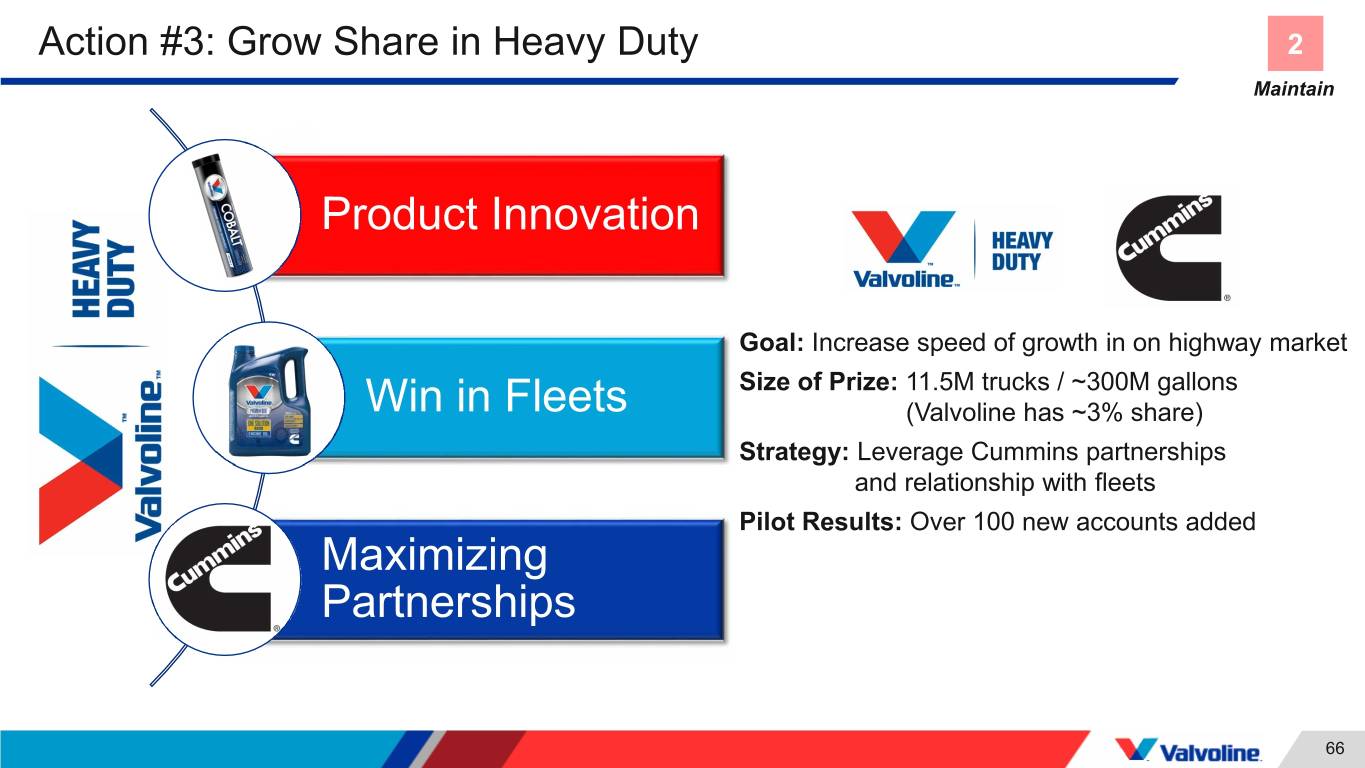
Action #3: Grow Share in Heavy Duty 2 Maintain Product Innovation Goal: Increase speed of growth in on highway market Size of Prize: 11.5M trucks / ~300M gallons Win in Fleets (Valvoline has ~3% share) Strategy: Leverage Cummins partnerships and relationship with fleets Pilot Results: Over 100 new accounts added Maximizing Partnerships 66
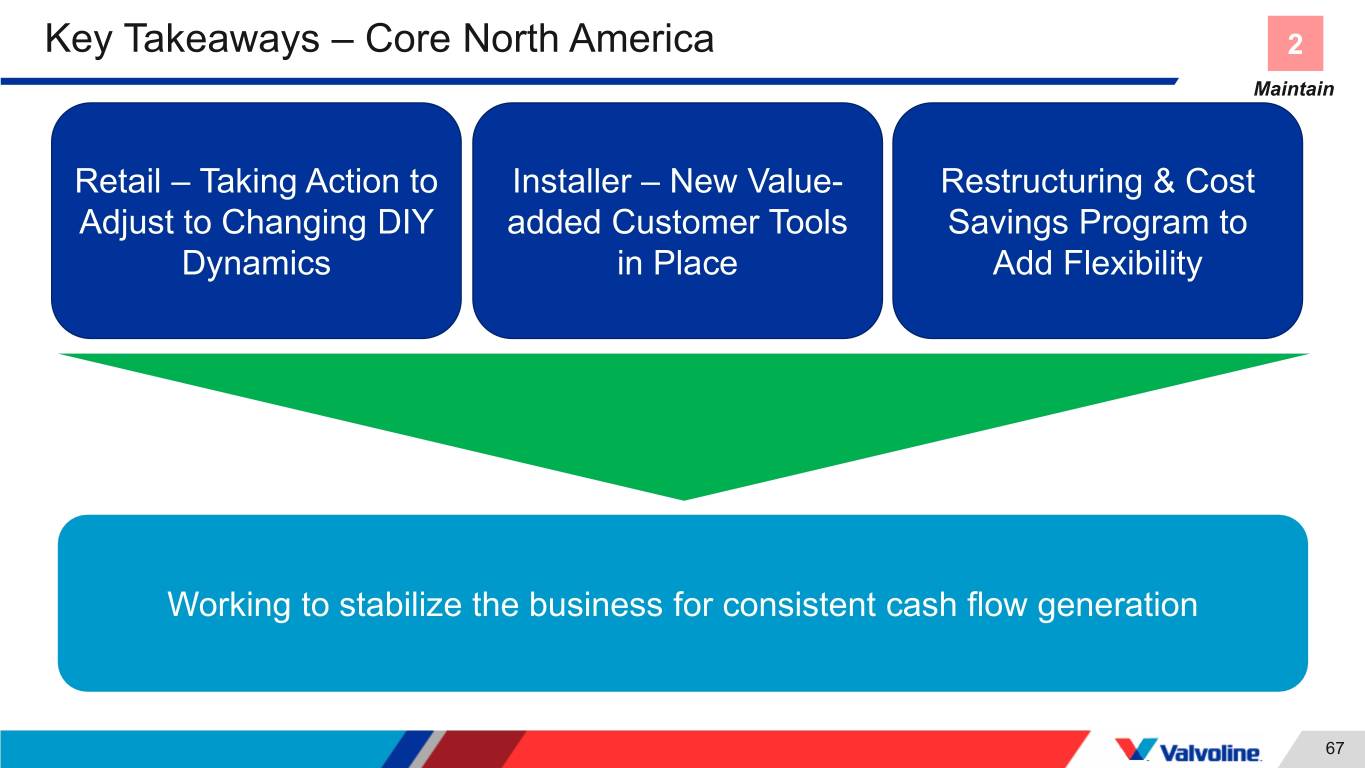
Key Takeaways – Core North America 2 Maintain Retail – Taking Action to Installer – New Value- Restructuring & Cost Adjust to Changing DIY added Customer Tools Savings Program to Dynamics in Place Add Flexibility Working to stabilize the business for consistent cash flow generation 67

Jamal Muashsher Senior vice president, International
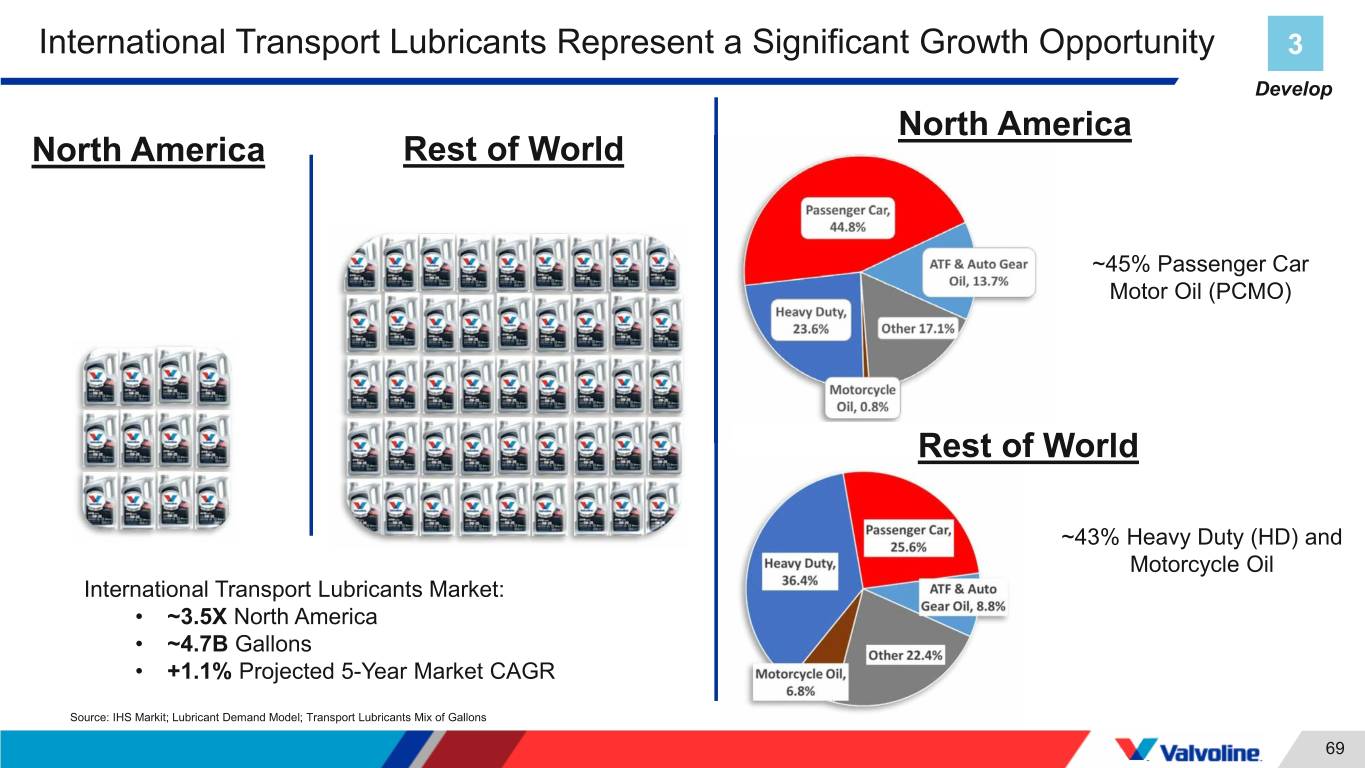
International Transport Lubricants Represent a Significant Growth Opportunity 3 Develop North America North America Rest of World ~45% Passenger Car Motor Oil (PCMO) Rest of World ~43% Heavy Duty (HD) and Motorcycle Oil International Transport Lubricants Market: • ~3.5X North America • ~4.7B Gallons • +1.1% Projected 5-Year Market CAGR Source: IHS Markit; Lubricant Demand Model; Transport Lubricants Mix of Gallons 69
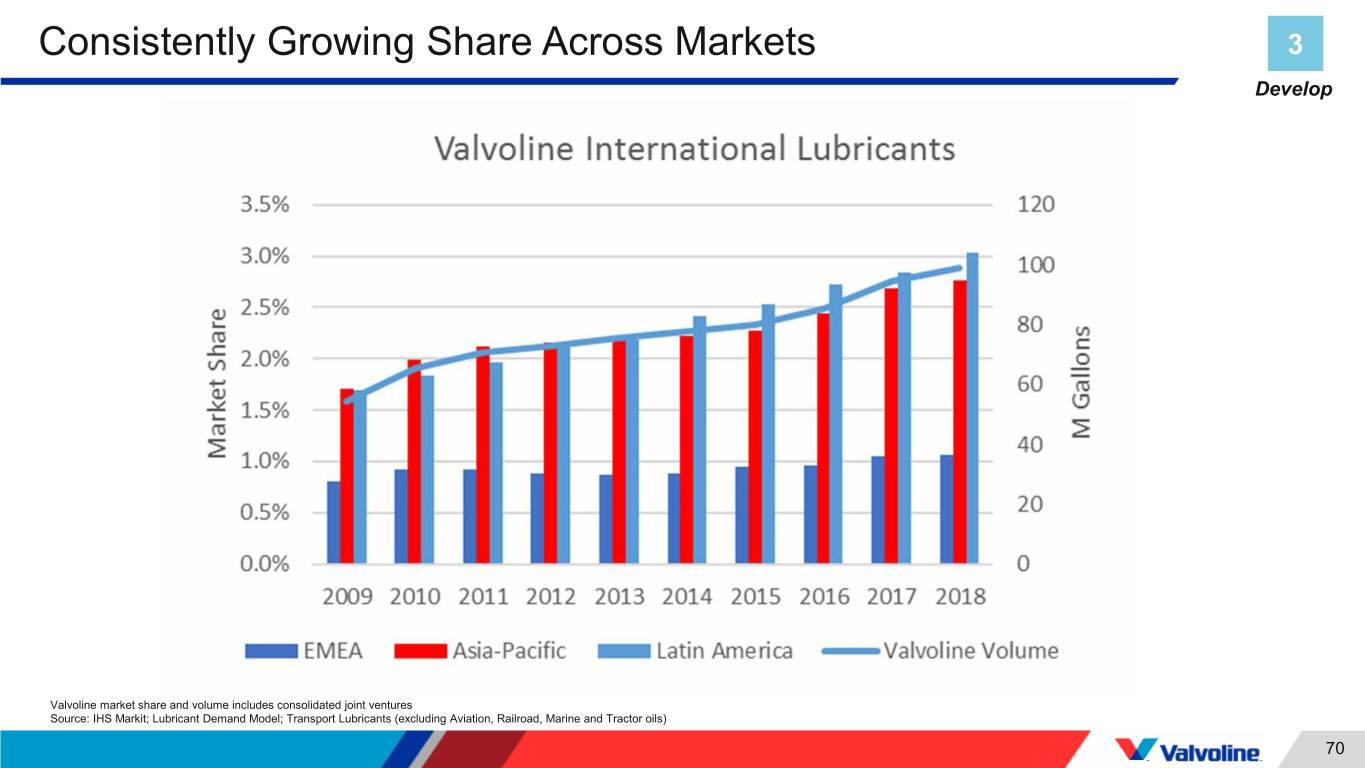
Consistently Growing Share Across Markets 3 Develop Valvoline market share and volume includes consolidated joint ventures Source: IHS Markit; Lubricant Demand Model; Transport Lubricants (excluding Aviation, Railroad, Marine and Tractor oils) 70

Focused on Winning in High Value Markets and Categories 3 Develop China Latin America India Total Transport Market: 1.1B Gal Total Transport Market: 590M Gal Total Transport Market: 307M Gal 5-Year Market CAGR: 2.1% 5-Year Market CAGR: 0.9% 5-Year Market CAGR: 2.7% Valvoline Market Share: 1.6% Valvoline Market Share: 3.2% Valvoline Market Share: 8.6% Opportunities for Growth: Opportunities for Growth: Opportunities for Growth: • 22M Passenger Cars Added Annually • Major Retailer Partnership Expanding • 4.7% 5-Year Passenger Car Market Across Mexico CAGR • Evolving Heavy Duty Specification Landscape • Channel Development in South • Evolving Heavy Duty Specification America Landscape Source: IHS Markit; Lubricant Demand Model; Transport Lubricants Mix of Gallons Source: China Passenger Car Association (CPCA) 71

3 Core Strategies to Deliver Long-Term, Profitable Share Growth 3 Develop Established Growth Model Brand Building: Build Brand Awareness & Equity that Supports Premium Positioning Service Platforms: Expand Value to Win New Accounts and Support Premium Margins Profit Channel Development: Optimize Distributor & Supply Chain Network Growth 72
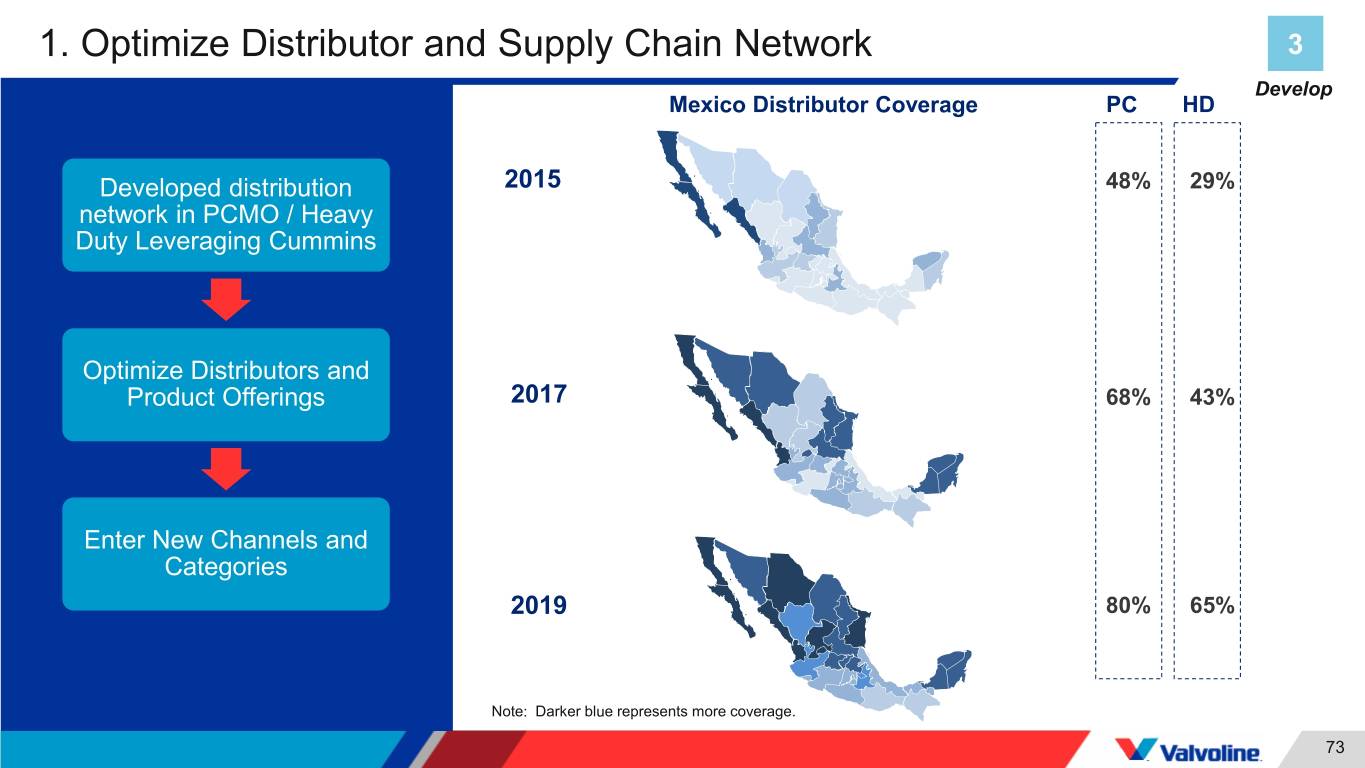
1. Optimize Distributor and Supply Chain Network 3 Develop Mexico Distributor Coverage PC HD Developed distribution 2015 48% 29% network in PCMO / Heavy Duty Leveraging Cummins Optimize Distributors and Product Offerings 2017 68% 43% Enter New Channels and Categories 2019 80% 65% Note: Darker blue represents more coverage. 73
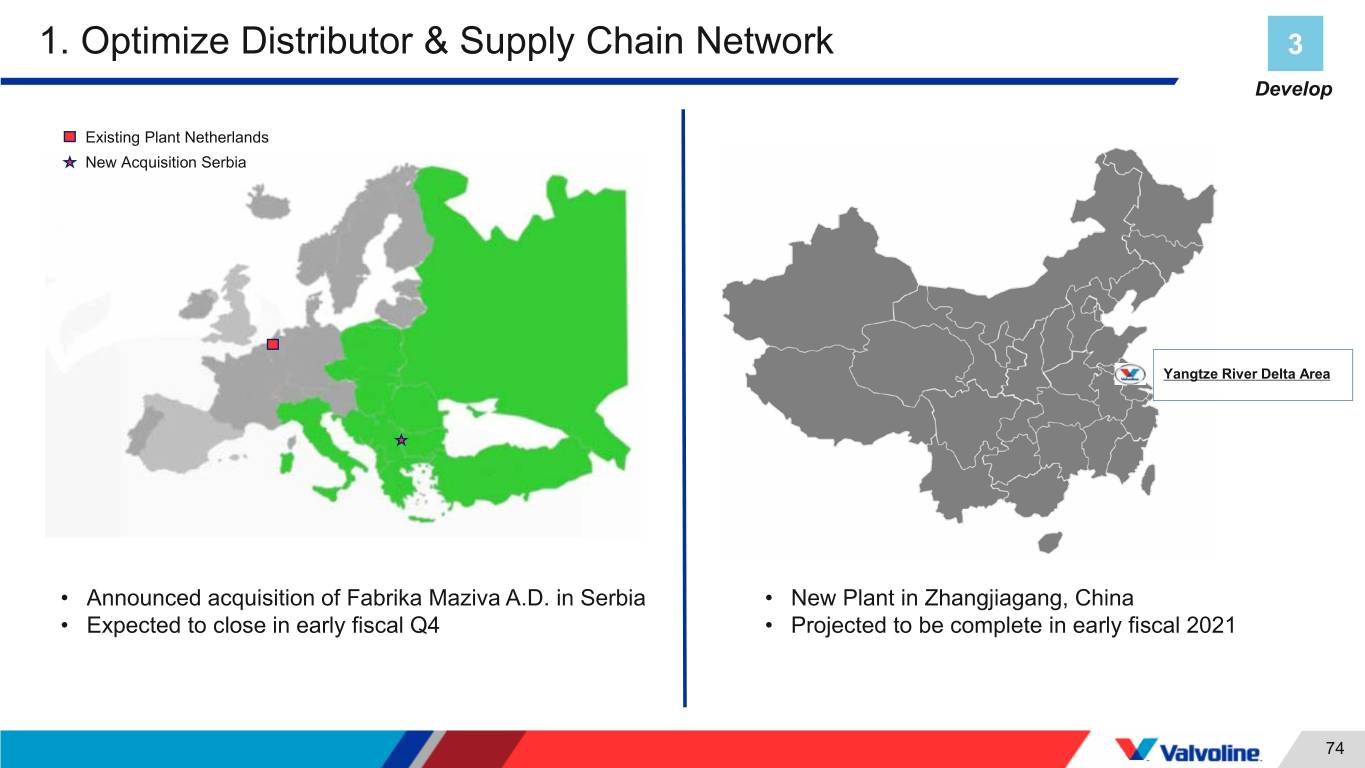
1. Optimize Distributor & Supply Chain Network 3 Develop Existing Plant Netherlands New Acquisition Serbia Yangtze River Delta Area • Announced acquisition of Fabrika Maziva A.D. in Serbia • New Plant in Zhangjiagang, China • Expected to close in early fiscal Q4 • Projected to be complete in early fiscal 2021 74
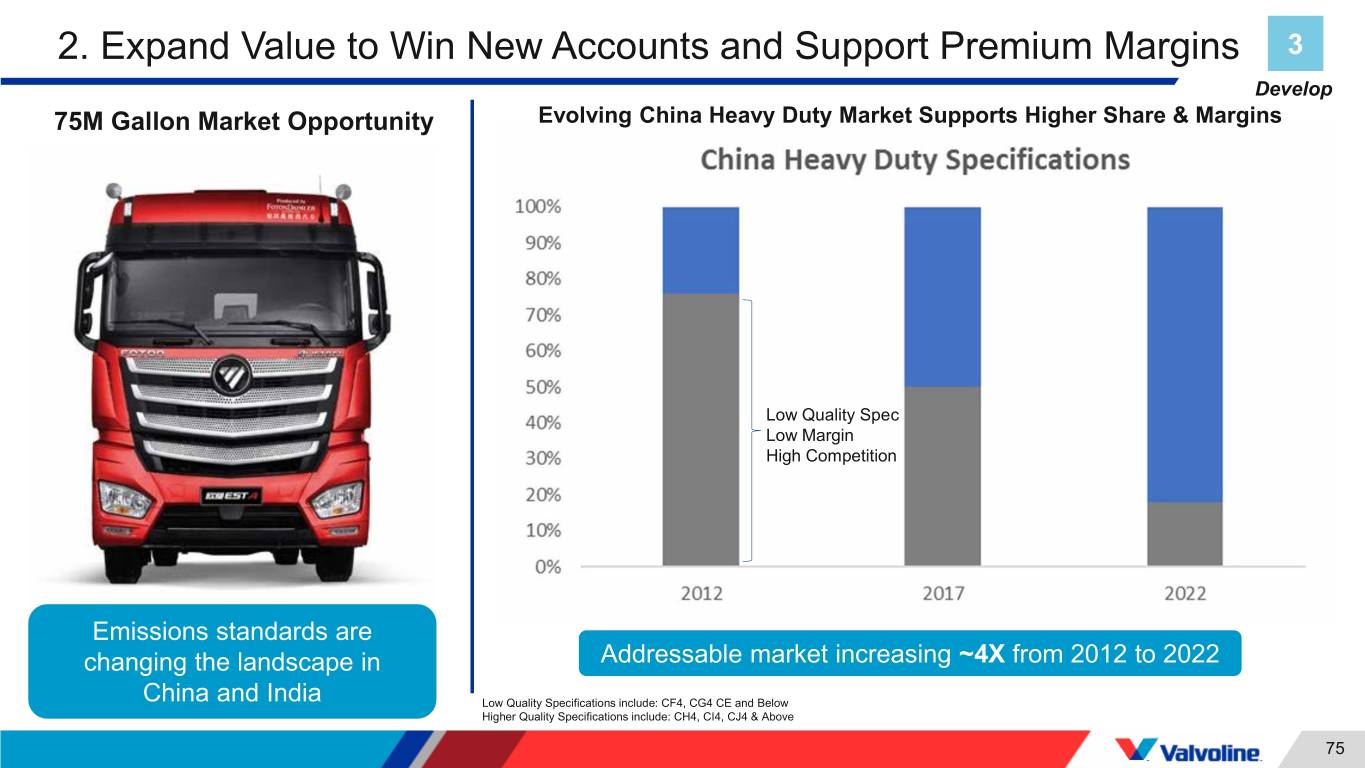
2. Expand Value to Win New Accounts and Support Premium Margins 3 Develop 75M Gallon Market Opportunity Evolving China Heavy Duty Market Supports Higher Share & Margins Low Quality Spec Low Margin High Competition Emissions standards are changing the landscape in Addressable market increasing ~4X from 2012 to 2022 China and India Low Quality Specifications include: CF4, CG4 CE and Below Higher Quality Specifications include: CH4, CI4, CJ4 & Above 75
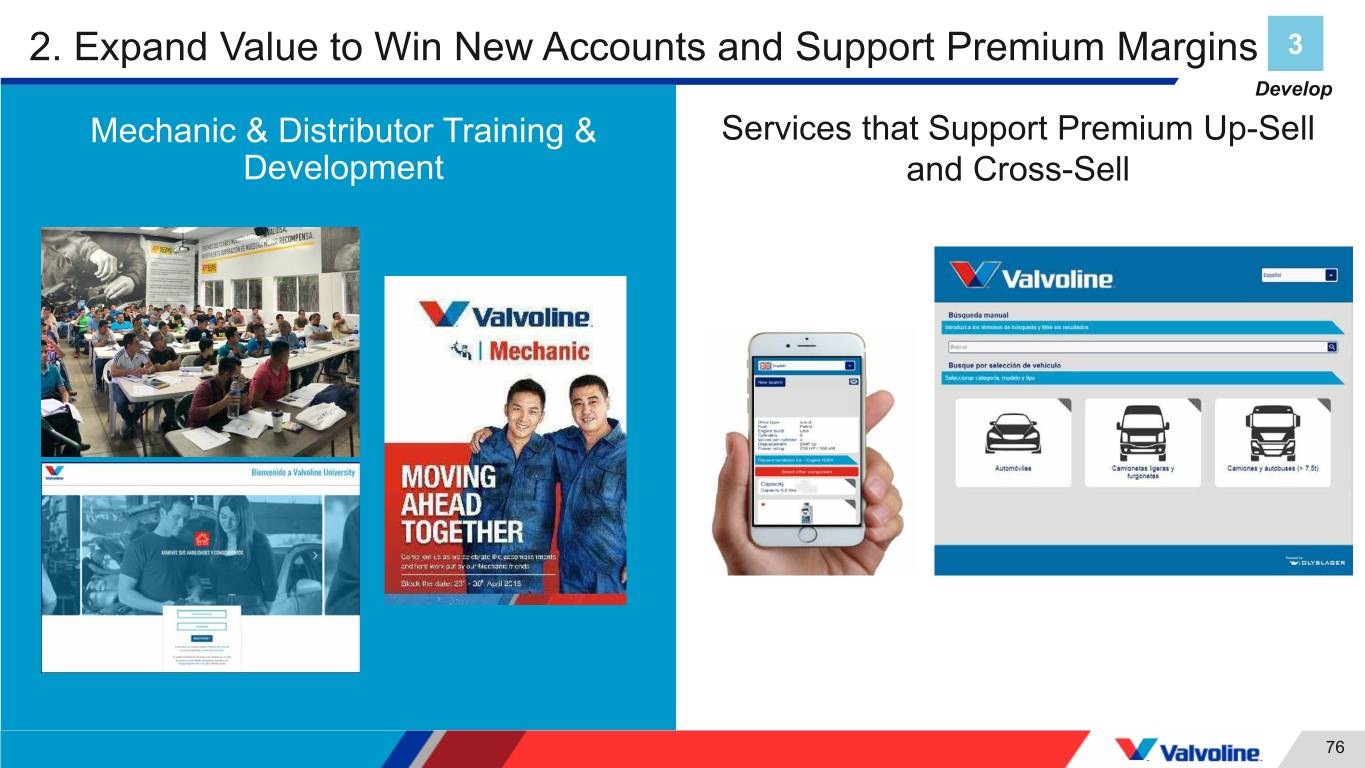
2. Expand Value to Win New Accounts and Support Premium Margins 3 Develop Mechanic & Distributor Training & Services that Support Premium Up-Sell Development and Cross-Sell 76
3. Build Brand Awareness & Equity that Supports Premium Positioning 3 Develop Cummins & Valvoline: Global Partnership 77
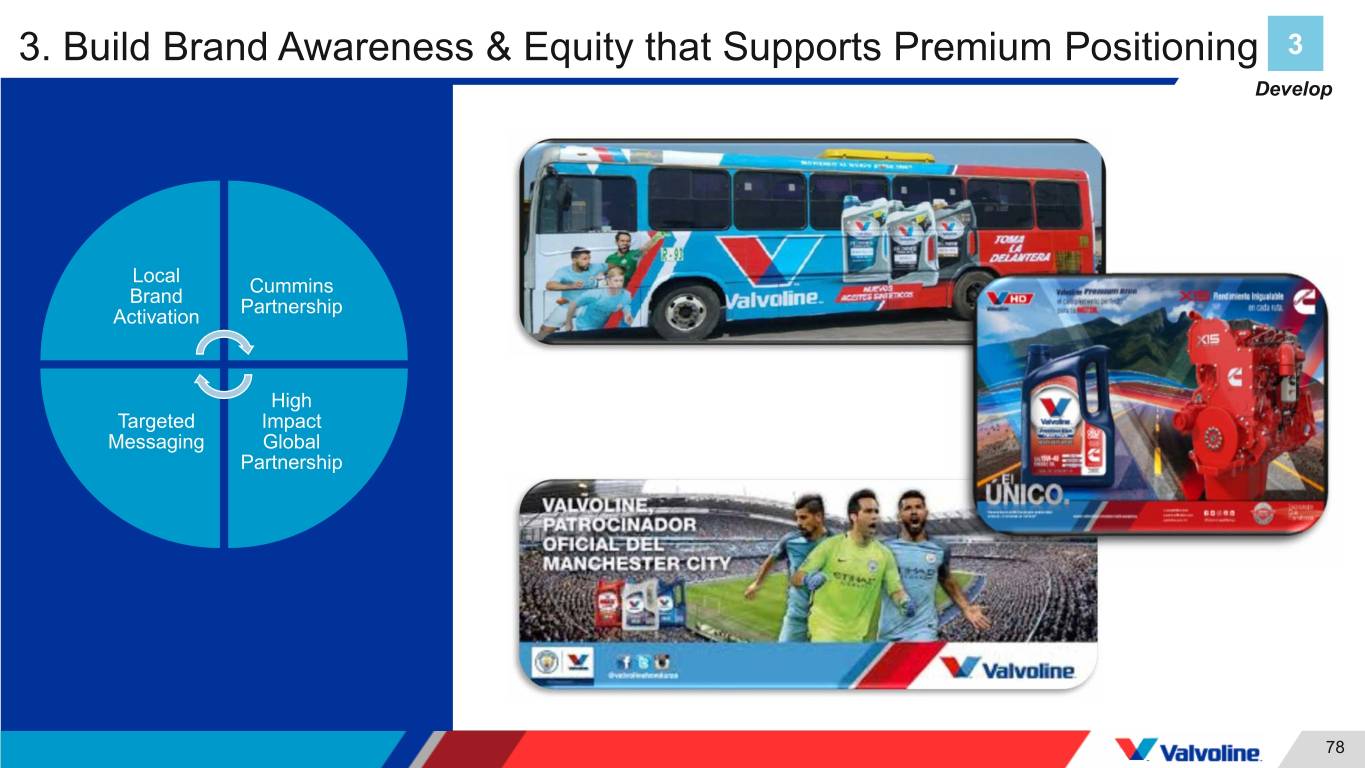
3. Build Brand Awareness & Equity that Supports Premium Positioning 3 Develop Local Cummins Brand Partnership Activation High Targeted Impact Messaging Global Partnership 78
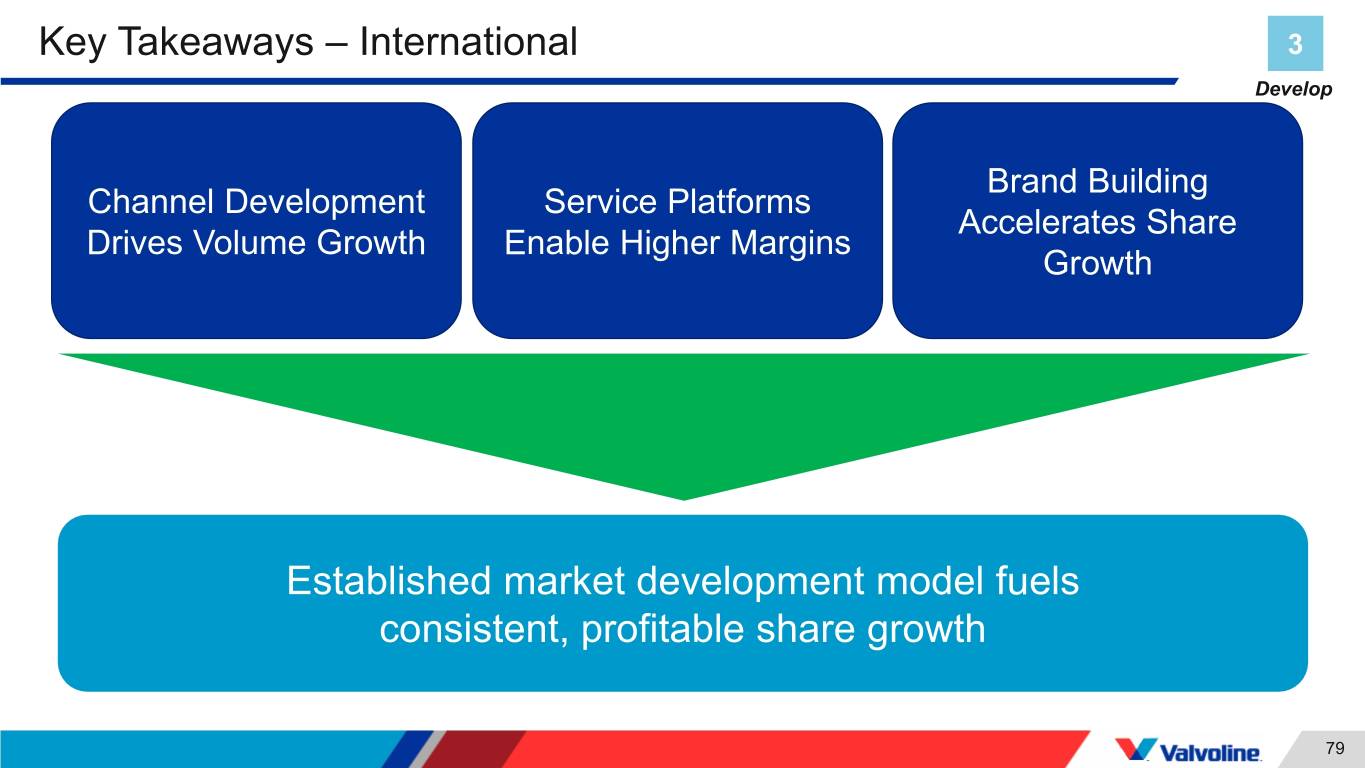
Key Takeaways – International 3 Develop Brand Building Channel Development Service Platforms Accelerates Share Drives Volume Growth Enable Higher Margins Growth Established market development model fuels consistent, profitable share growth 79
Break 80
Mary Meixelsperger Chief financial officer 81
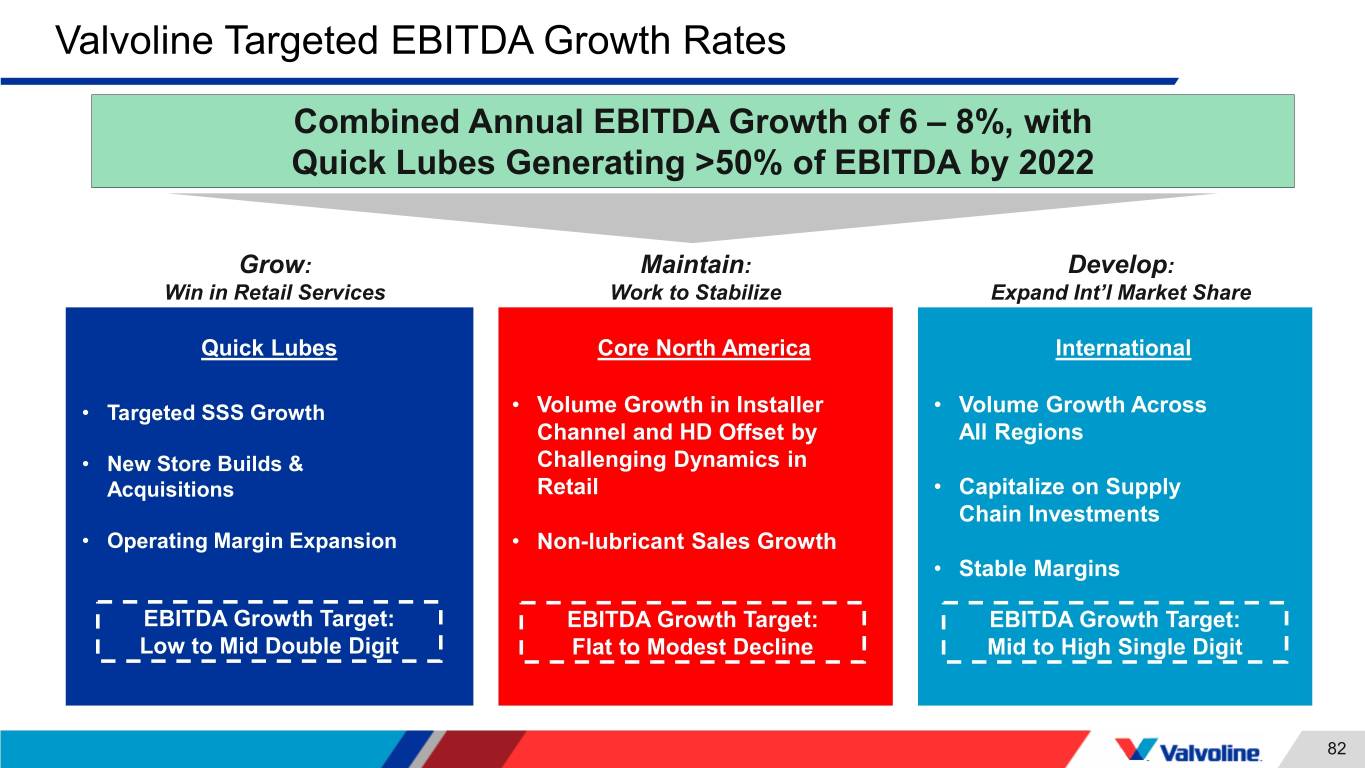
Valvoline Targeted EBITDA Growth Rates Combined Annual EBITDA Growth of 6 – 8%, with Quick Lubes Generating >50% of EBITDA by 2022 Grow: Maintain: Develop: Win in Retail Services Work to Stabilize Expand Int’l Market Share Quick Lubes Core North America International • Targeted SSS Growth • Volume Growth in Installer • Volume Growth Across Channel and HD Offset by All Regions • New Store Builds & Challenging Dynamics in Acquisitions Retail • Capitalize on Supply Chain Investments • Operating Margin Expansion • Non-lubricant Sales Growth • Stable Margins EBITDA Growth Target: EBITDA Growth Target: EBITDA Growth Target: Low to Mid Double Digit Flat to Modest Decline Mid to High Single Digit 82
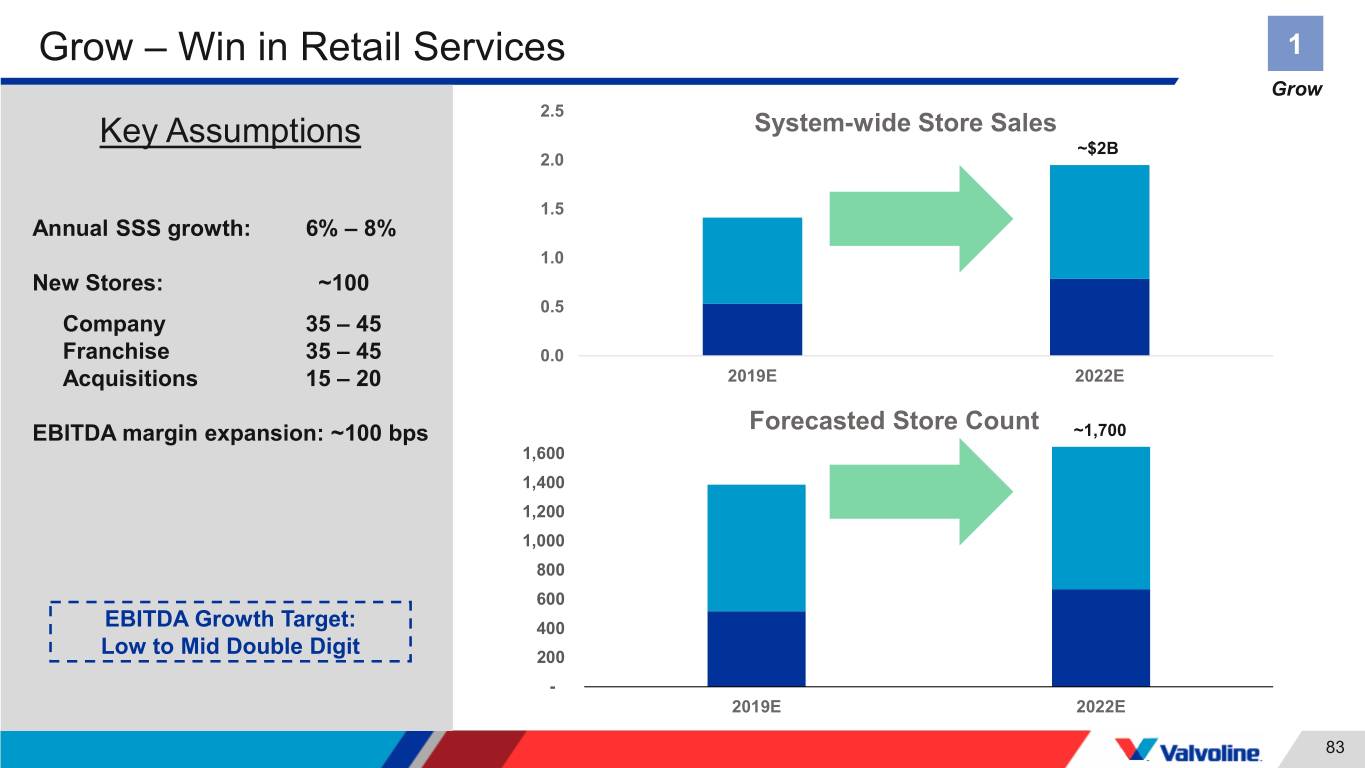
Grow – Win in Retail Services 1 Grow 2.5 System-wide Store Sales Key Assumptions ~$2B 2.0 1.5 Annual SSS growth: 6% – 8% 1.0 New Stores: ~100 0.5 Company 35 – 45 Franchise 35 – 45 0.0 Acquisitions 15 – 20 2019E 2022E EBITDA margin expansion: ~100 bps Forecasted Store Count ~1,700 1,600 1,400 1,200 1,000 800 600 EBITDA Growth Target: 400 Low to Mid Double Digit 200 - 2019E 2022E 83
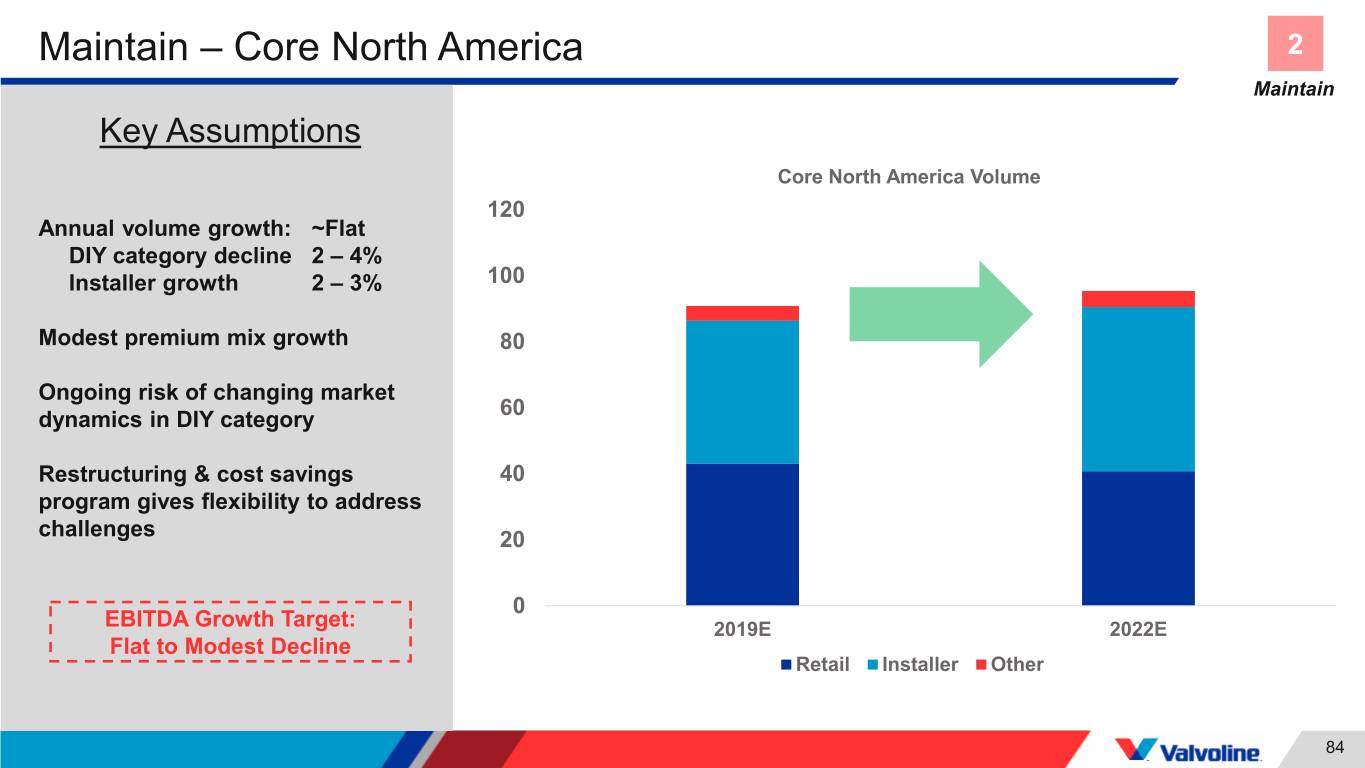
Maintain – Core North America 2 Maintain Key Assumptions Core North America Volume 120 Annual volume growth: ~Flat DIY category decline 2 – 4% Installer growth 2 – 3% 100 Modest premium mix growth 80 Ongoing risk of changing market 60 dynamics in DIY category Restructuring & cost savings 40 program gives flexibility to address challenges 20 0 EBITDA Growth Target: 2019E 2022E Flat to Modest Decline Retail Installer Other 84
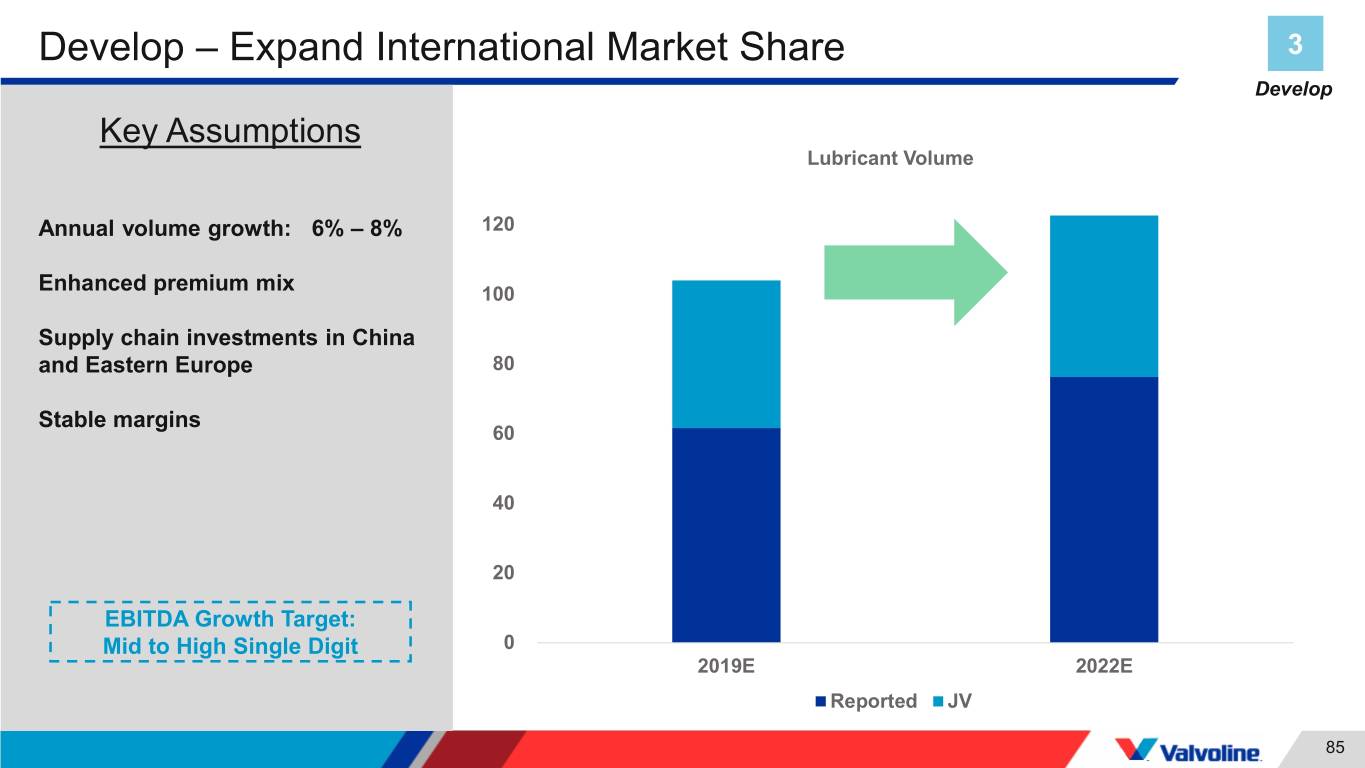
Develop – Expand International Market Share 3 Develop Key Assumptions Lubricant Volume Annual volume growth: 6% – 8% 120 Enhanced premium mix 100 Supply chain investments in China and Eastern Europe 80 Stable margins 60 40 20 EBITDA Growth Target: Mid to High Single Digit 0 2019E 2022E Reported JV 85
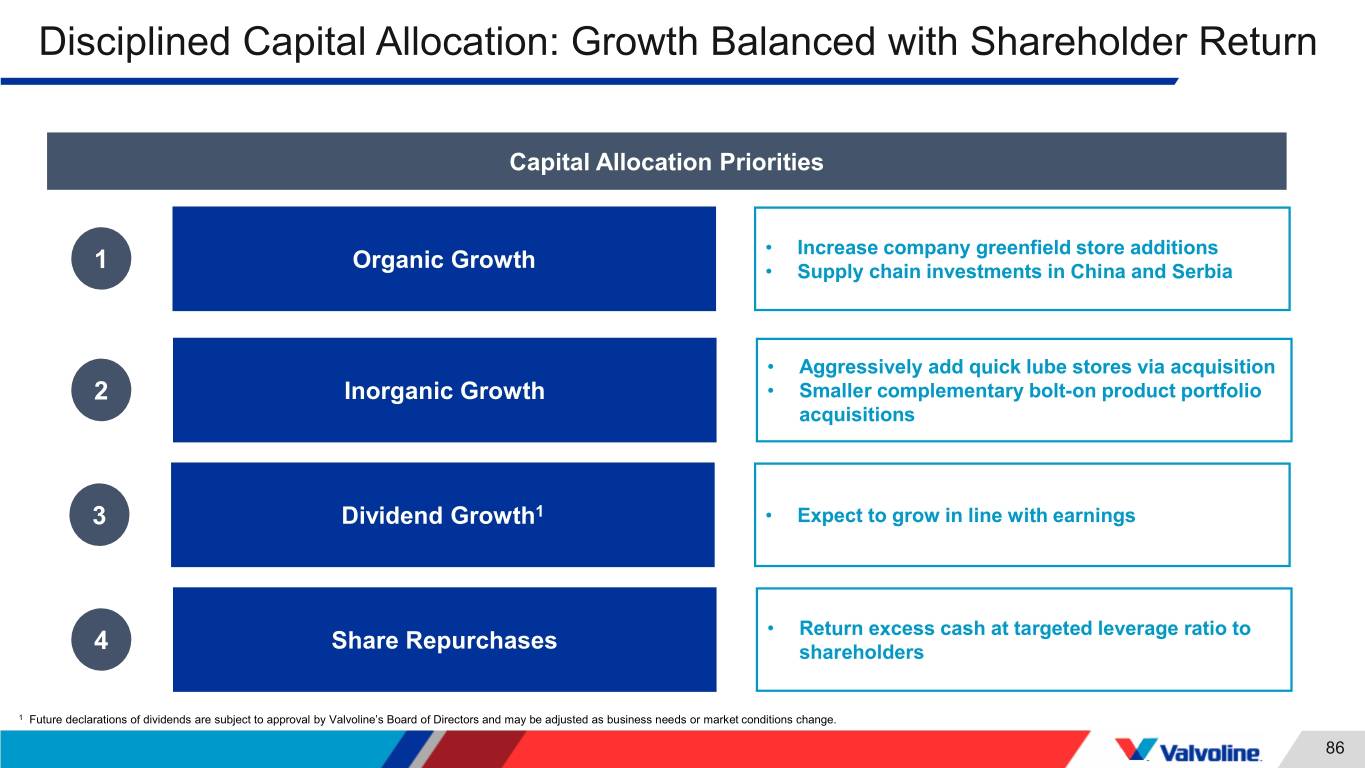
Disciplined Capital Allocation: Growth Balanced with Shareholder Return Capital Allocation Priorities • Increase company greenfield store additions 1 Organic Growth • Supply chain investments in China and Serbia • Aggressively add quick lube stores via acquisition 2 Inorganic Growth • Smaller complementary bolt-on product portfolio acquisitions 3 Dividend Growth1 • Expect to grow in line with earnings • Return excess cash at targeted leverage ratio to 4 Share Repurchases shareholders 1 Future declarations of dividends are subject to approval by Valvoline’s Board of Directors and may be adjusted as business needs or market conditions change. 86
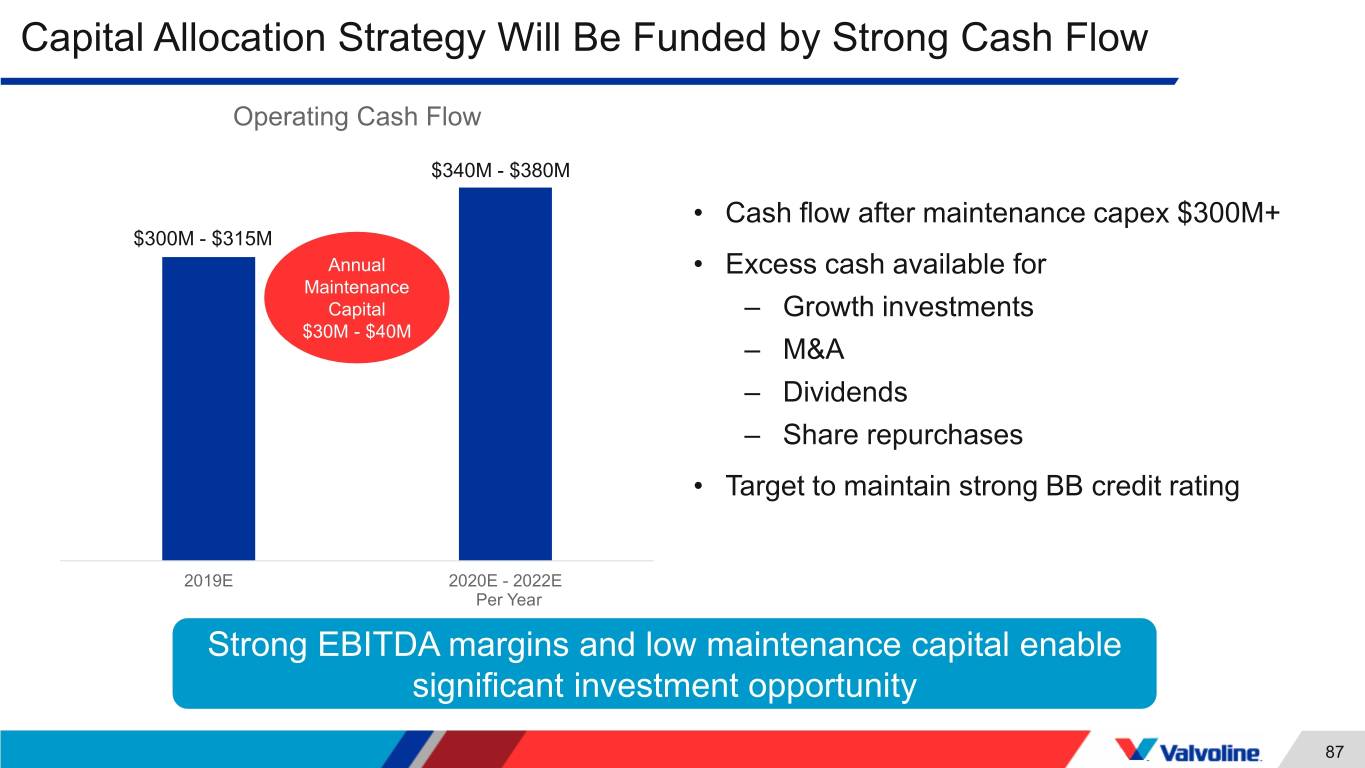
Capital Allocation Strategy Will Be Funded by Strong Cash Flow Operating Cash Flow $340M - $380M • Cash flow after maintenance capex $300M+ $300M - $315M Annual • Excess cash available for Maintenance Capital – Growth investments $30M - $40M – M&A – Dividends – Share repurchases • Target to maintain strong BB credit rating 2019E 2020E - 2022E Per Year Strong EBITDA margins and low maintenance capital enable significant investment opportunity 87

Shareholder Value Proposition Organic Earnings Capital Allocation Value Proposition MSD Revenue Growth ~2% Target Dividend1 Yield 6% – 8% Compelling Total EBITDA Growth Shareholder Return Share Repurchase and/or Acquisitions HSD EPS Growth 1 Future quarterly dividend declarations are subject to approval by Valvoline’s’ Board of Directors and may be adjusted as business needs or market conditions change. 88
Sam Mitchell Chief executive officer 89
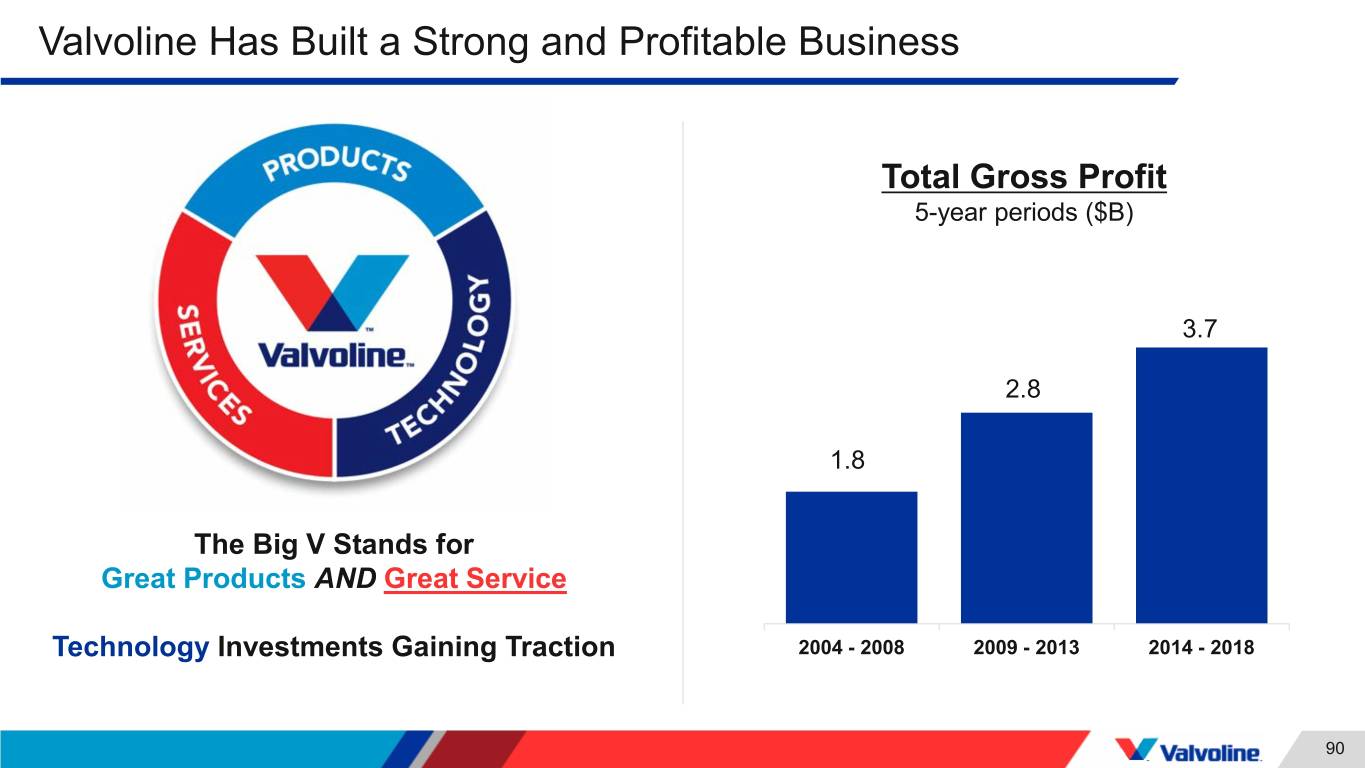
Valvoline Has Built a Strong and Profitable Business Total Gross Profit 5-year periods ($B) 3.7 2.8 1.8 The Big V Stands for Great Products AND Great Service Technology Investments Gaining Traction 2004 - 2008 2009 - 2013 2014 - 2018 90
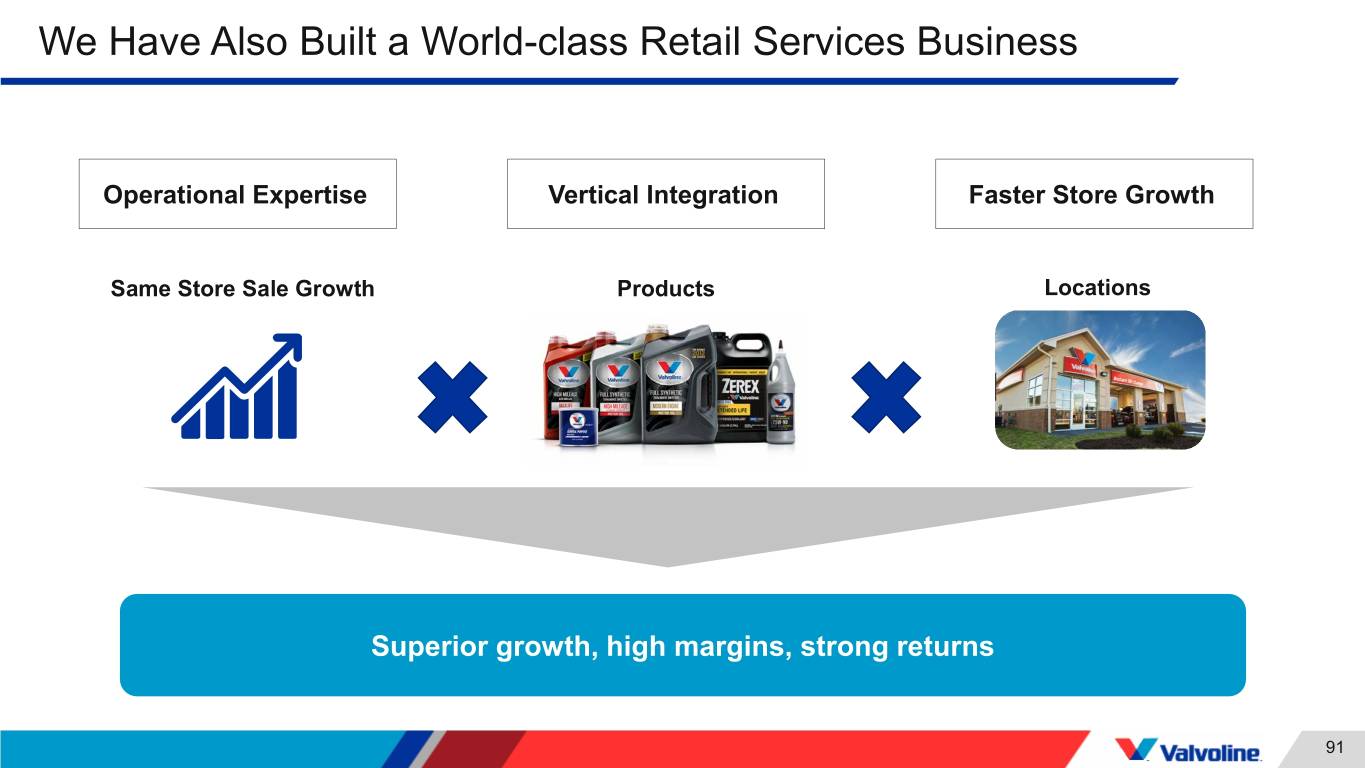
We Have Also Built a World-class Retail Services Business Operational Expertise Vertical Integration Faster Store Growth Same Store Sale Growth Products Locations Superior growth, high margins, strong returns 91

Trends Driving Our Longer-term Strategy Consumer demand More vehicles for convenience on the road Valvoline is uniquely positioned to benefit from broad industry and consumer trends 92
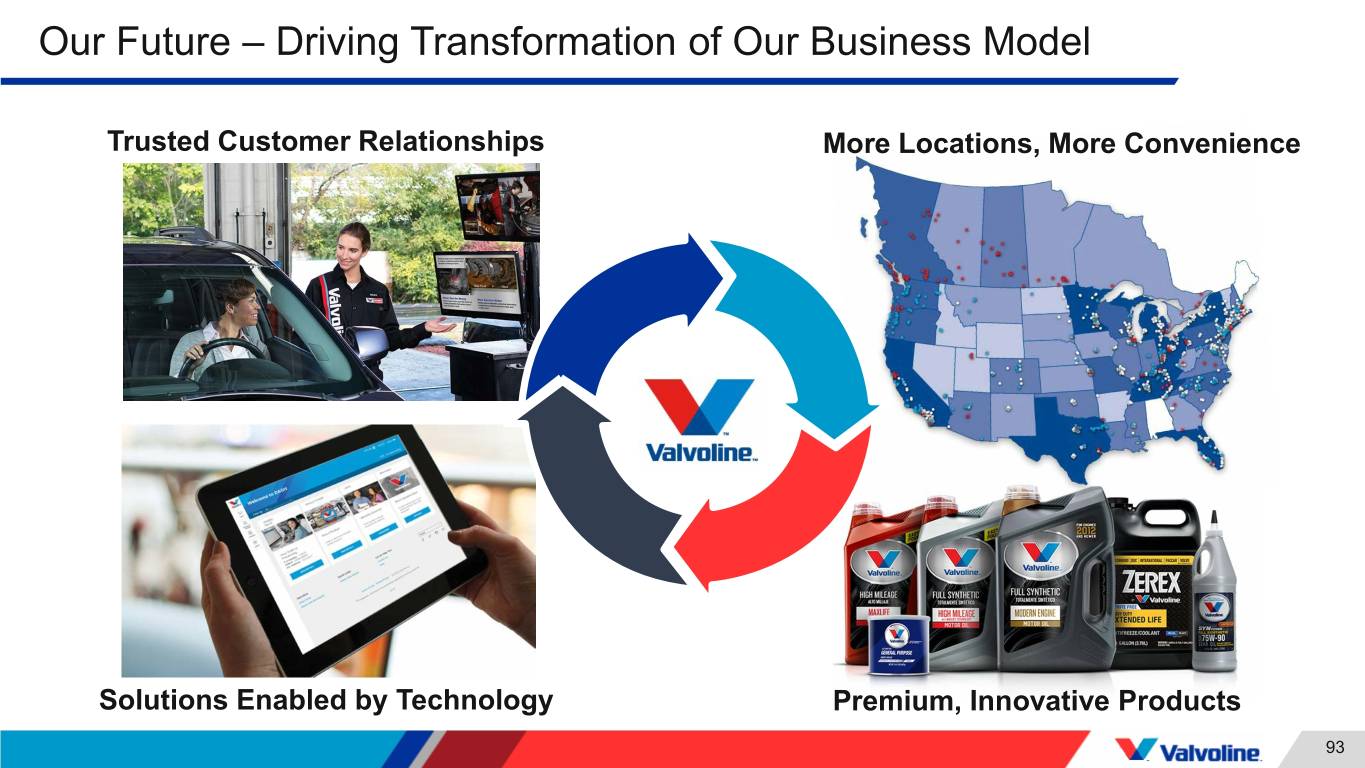
Our Future – Driving Transformation of Our Business Model Trusted Customer Relationships More Locations, More Convenience Solutions Enabled by Technology Premium, Innovative Products 93
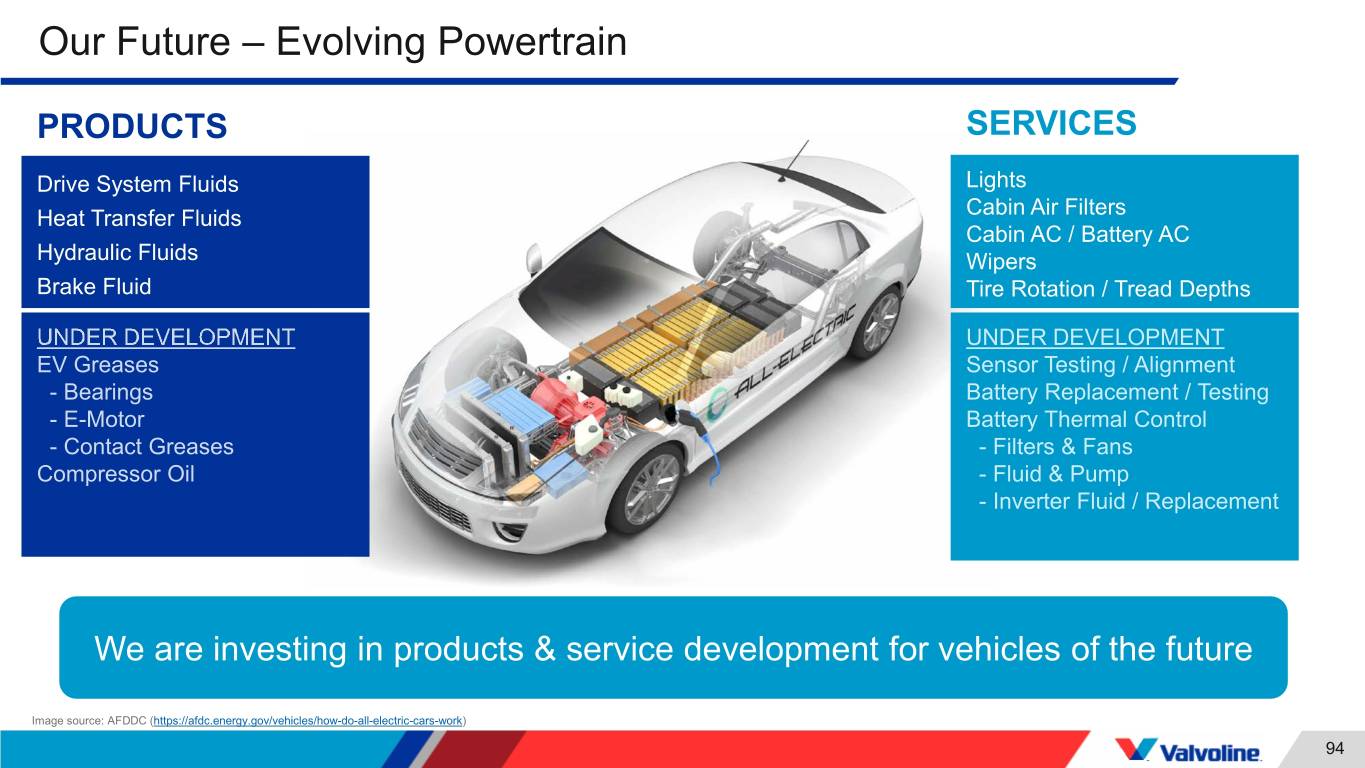
Our Future – Evolving Powertrain PRODUCTS SERVICES Drive System Fluids Lights Heat Transfer Fluids Cabin Air Filters Cabin AC / Battery AC Hydraulic Fluids Wipers Brake Fluid Tire Rotation / Tread Depths We are investing in products & service development for vehicles of the future Image source: AFDDC (https://afdc.energy.gov/vehicles/how-do-all-electric-cars-work) 94
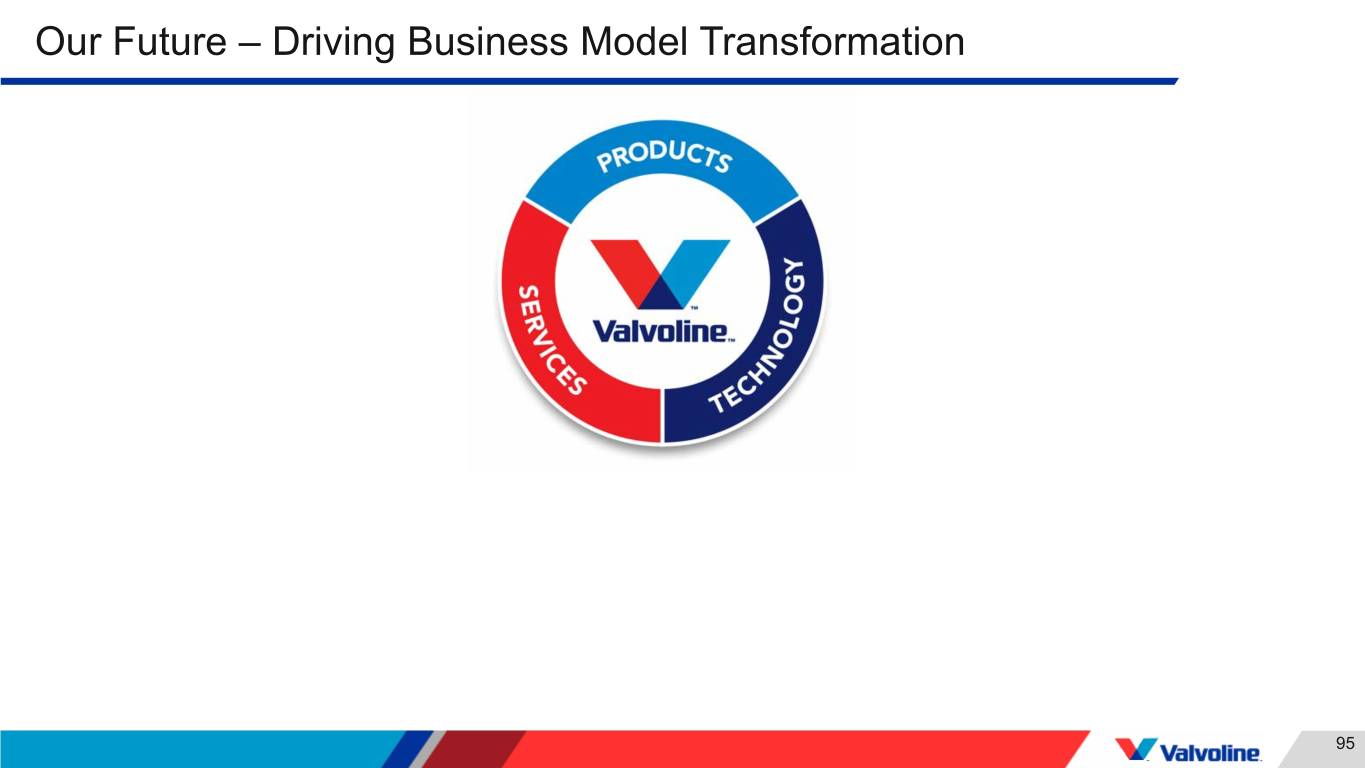
Our Future – Driving Business Model Transformation 95
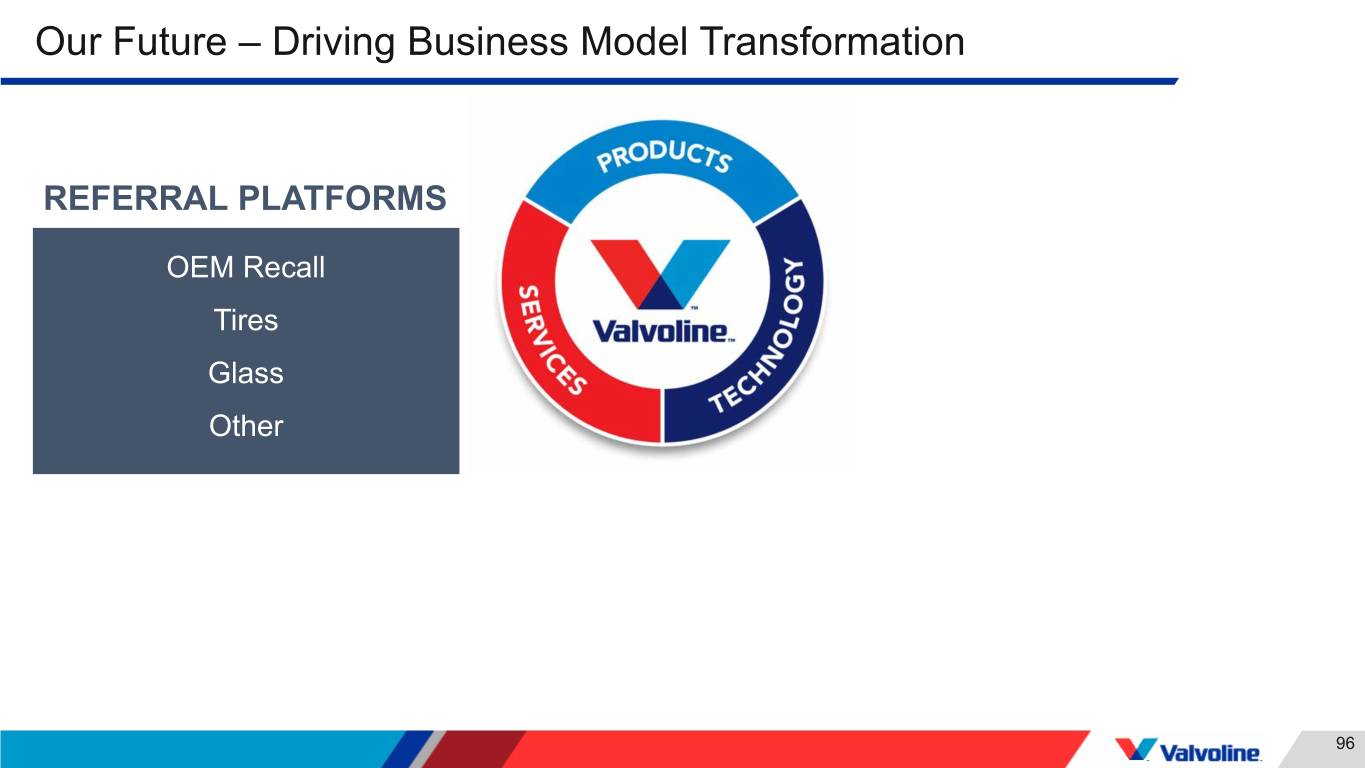
Our Future – Driving Business Model Transformation REFERRAL PLATFORMS OEM Recall Tires Glass Other 96
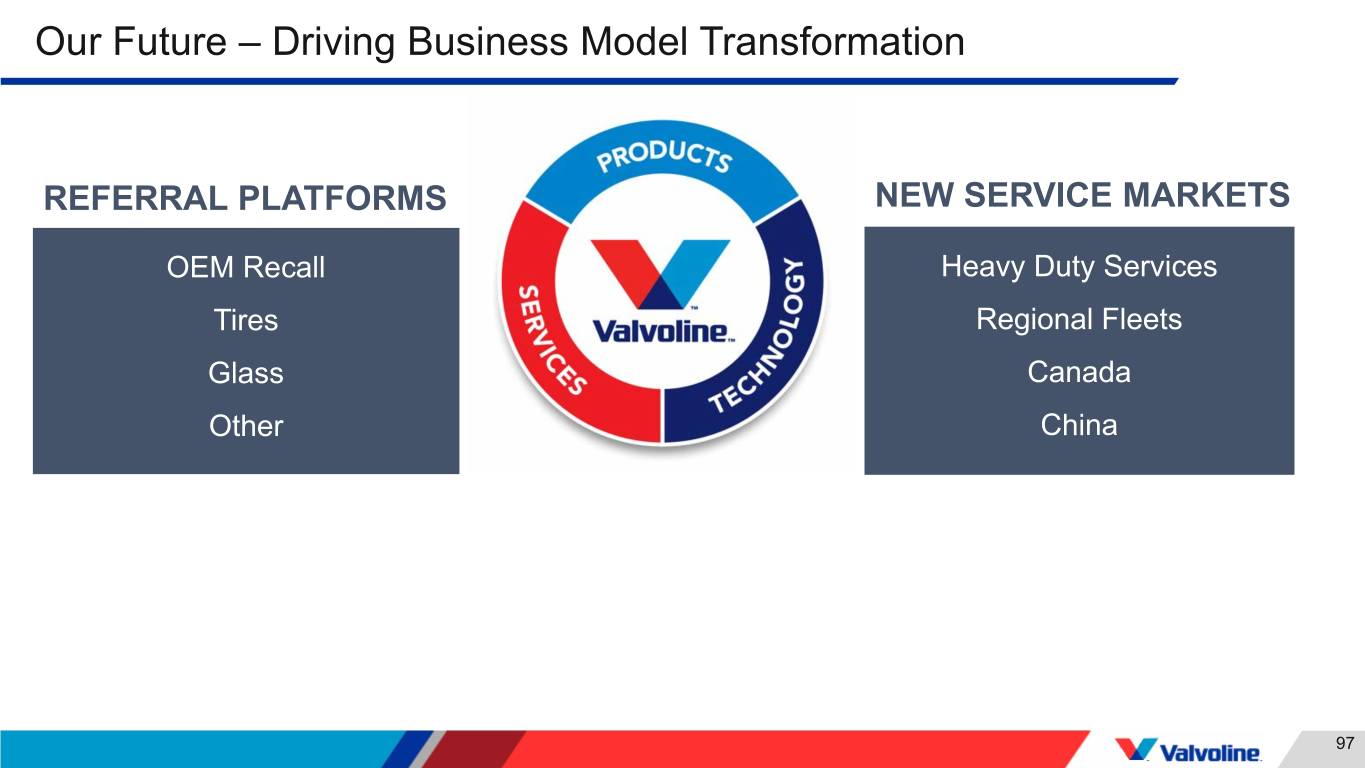
Our Future – Driving Business Model Transformation REFERRAL PLATFORMS NEW SERVICE MARKETS OEM Recall Heavy Duty Services Tires Regional Fleets Glass Canada Other China 97

Our Future – Driving Business Model Transformation REFERRAL PLATFORMS NEW SERVICE MARKETS OEM Recall Heavy Duty Services Tires Regional Fleets Glass Canada Other China Growth through our service-driven model built on trusted customer relationships, convenient locations and fueled by products 98
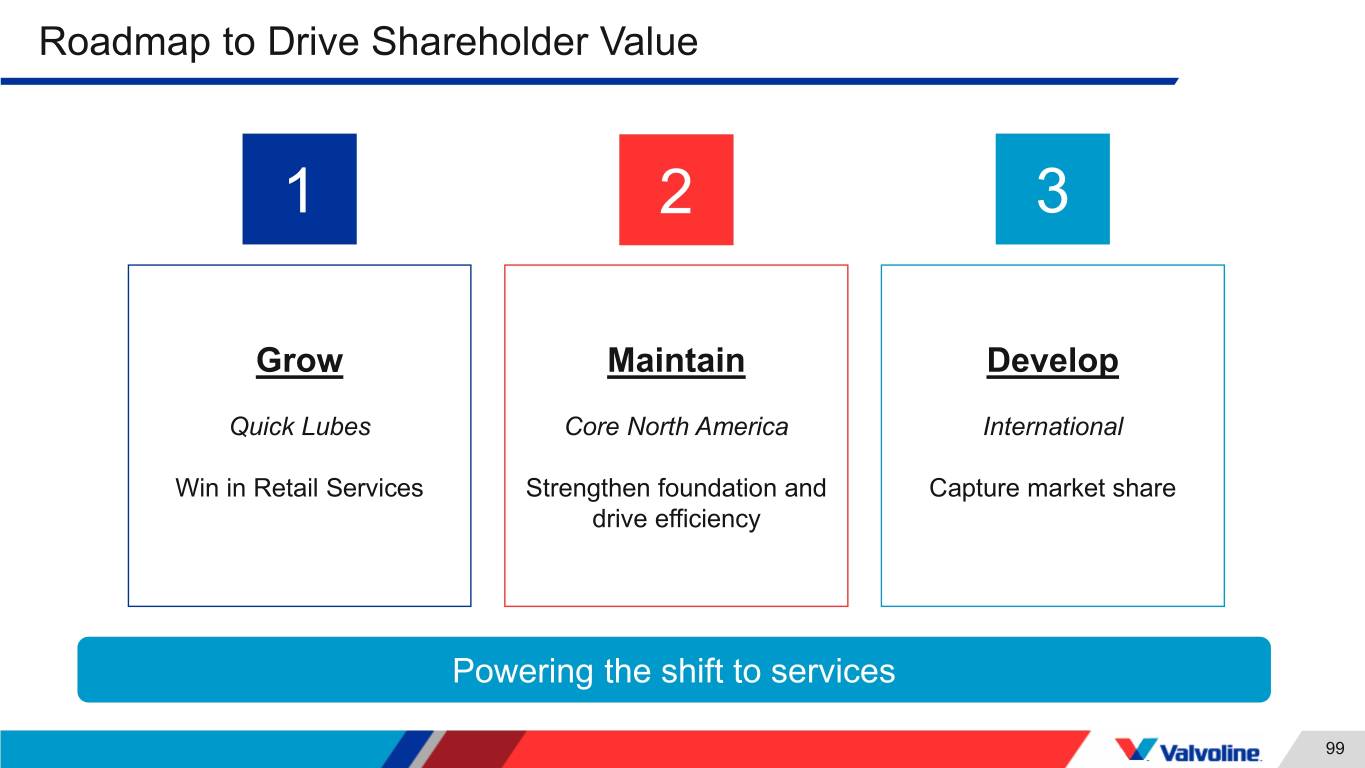
Roadmap to Drive Shareholder Value 1 2 3 Grow Maintain Develop Quick Lubes Core North America International Win in Retail Services Strengthen foundation and Capture market share drive efficiency Powering the shift to services 99
Q&A 100
Thank You! 101


