UNITED STATES
SECURITIES AND EXCHANGE COMMISSION
WASHINGTON, D.C. 20549
______________________
FORM 10-Q
(Mark one)
| | | | | |
| ☑ | QUARTERLY REPORT PURSUANT TO SECTION 13 OR 15(d) OF THE SECURITIES EXCHANGE ACT OF 1934 |
For the quarterly period ended December 31, 2024
OR
| | | | | |
| ☐ | TRANSITION REPORT PURSUANT TO SECTION 13 OR 15(d) OF THE SECURITIES EXCHANGE ACT OF 1934 |
For the transition period from _________ to ___________
Commission file number 001-37884
VALVOLINE INC.
(Exact name of registrant as specified in its charter)
| | | | | |
| Kentucky | 30-0939371 |
| (State or other jurisdiction of incorporation or organization) | (I.R.S. Employer Identification No.) |
100 Valvoline Way, Suite 100
Lexington, Kentucky 40509
(Address of principal executive offices) (Zip Code)
Telephone Number (859) 357-7777
(Registrant’s telephone number, including area code)
Securities registered pursuant to Section 12(b) of the Act:
| | | | | | | | | | | | | | |
| Title of each class | | Trading Symbol(s) | | Name of each exchange on which registered |
| Common stock, par value $0.01 per share | | VVV | | New York Stock Exchange |
Indicate by check mark whether the registrant (1) has filed all reports required to be filed by Section 13 or 15(d) of the Securities Exchange Act of 1934 during the preceding 12 months (or for such shorter period that the Registrant was required to file such reports), and (2) has been subject to such filing requirements for the past 90 days. Yes þ No o
Indicate by check mark whether the registrant has submitted electronically every Interactive Data File required to be submitted pursuant to Rule 405 of Regulation S-T (§232.405 of this chapter) during the preceding 12 months (or for such shorter period that the registrant was required to submit such files). Yes þ No o
Indicate by check mark whether the registrant is a large accelerated filer, an accelerated filer, a non-accelerated filer, a smaller reporting company or an emerging growth company. See the definitions of “large accelerated filer,” “accelerated filer,” “smaller reporting company,” and “emerging growth company” in Rule 12b-2 of the Exchange Act.
| | | | | | | | | | | |
| Large accelerated filer | ☑ | Accelerated filer | ☐ |
| Non-accelerated filer | ☐ | Smaller reporting company | ☐ |
| | Emerging growth company | ☐ |
If an emerging growth company, indicate by check mark if the registrant has elected not to use the extended transition period for complying with any new or revised financial accounting standards provided pursuant to Section 13(a) of the Exchange Act. ☐
Indicate by check mark whether the registrant is a shell company (as defined in Rule 12b-2 of the Act). Yes ☐ No þ
At February 3, 2025, there were 127,100,499 shares of the registrant’s common stock outstanding.
TABLE OF CONTENTS | | | | | |
| Page |
| PART I – FINANCIAL INFORMATION |
| |
| |
| |
| |
| |
| |
| |
| |
| |
| |
| |
| |
| |
| |
| |
| |
| |
| |
| |
| |
| |
| PART II – OTHER INFORMATION |
| |
| |
| |
| |
| |
| |
| |
| |
| |
| |
PART I - FINANCIAL INFORMATION
ITEM 1. FINANCIAL STATEMENTS
Valvoline Inc. and Consolidated Subsidiaries
Condensed Consolidated Statements of Comprehensive Income
| | | | | | | | | | | | | | | | | | |
| | Three months ended
December 31 | | |
| (In millions, except per share amounts - unaudited) | | 2024 | | 2023 | | | | |
| Net revenues | | $ | 414.3 | | | $ | 373.4 | | | | | |
| Cost of sales | | 261.4 | | | 238.6 | | | | | |
| Gross profit | 152.9 | | | 134.8 | | | | | |
| | | | | | | | |
| Selling, general and administrative expenses | | 82.8 | | | 74.5 | | | | | |
| Net legacy and separation-related expenses | | 0.4 | | | 0.1 | | | | | |
| Other income, net | | (74.1) | | | (2.6) | | | | | |
| Operating income | 143.8 | | | 62.8 | | | | | |
| Net pension and other postretirement plan (income) expenses | | (0.9) | | | 3.4 | | | | | |
| Net interest and other financing expenses | | 17.5 | | | 13.6 | | | | | |
| Income before income taxes | 127.2 | | | 45.8 | | | | | |
| Income tax expense | | 33.3 | | | 11.9 | | | | | |
| Income from continuing operations | | 93.9 | | | 33.9 | | | | | |
| Loss from discontinued operations, net of tax | | (2.3) | | | (2.0) | | | | | |
| Net income | $ | 91.6 | | | $ | 31.9 | | | | | |
| | | | | | | | |
| Net earnings per share | | | | | | | | |
| Basic earnings (loss) per share | | | | | | | |
| Continuing operations | $ | 0.73 | | | $ | 0.26 | | | | | |
| Discontinued operations | (0.02) | | | (0.02) | | | | | |
| Basic earnings per share | $ | 0.71 | | | $ | 0.24 | | | | | |
| | | | | | | | |
| Diluted earnings (loss) per share | | | | | | | |
| Continuing operations | $ | 0.73 | | | $ | 0.26 | | | | | |
| Discontinued operations | (0.02) | | | (0.02) | | | | | |
| Diluted earnings per share | $ | 0.71 | | | $ | 0.24 | | | | | |
| | | | | | | | |
| Weighted average common shares outstanding | | | | | | | | |
| Basic | | 128.7 | | | 131.8 | | | | | |
| Diluted | | 129.5 | | | 132.7 | | | | | |
| | | | | | | | |
| Comprehensive income | | | | | | | | |
| Net income | | $ | 91.6 | | | $ | 31.9 | | | | | |
| Other comprehensive (loss) income, net of tax | | | | | | | | |
| Currency translation adjustments | | (6.5) | | | 6.6 | | | | | |
| Amortization of pension and other postretirement plan prior service credits | | (0.4) | | | (0.5) | | | | | |
| Unrealized loss on cash flow hedges | | — | | | (1.9) | | | | | |
| Other comprehensive (loss) income | | (6.9) | | | 4.2 | | | | | |
| Comprehensive income | | $ | 84.7 | | | $ | 36.1 | | | | | |
| | | | | | | | |
The accompanying Notes to Condensed Consolidated Financial Statements are an integral part of these Condensed Consolidated Financial Statements.
Valvoline Inc. and Consolidated Subsidiaries
Condensed Consolidated Balance Sheets | | | | | | | | | | | | | | |
| (In millions, except per share amounts - unaudited) | | December 31
2024 | | September 30 2024 |
| Assets |
| Current assets | | | | |
| Cash and cash equivalents | | $ | 60.0 | | | $ | 68.3 | |
| Receivables, net | | 84.7 | | | 86.4 | |
| Inventories, net | | 38.0 | | | 39.7 | |
| Prepaid expenses and other current assets | | 30.0 | | | 61.0 | |
| | | | |
| | | | |
| Total current assets | | 212.7 | | | 255.4 | |
| Noncurrent assets | | | | |
| Property, plant and equipment, net | | 934.1 | | | 958.7 | |
| Operating lease assets | | 290.7 | | | 298.6 | |
| Goodwill and intangibles, net | | 689.5 | | | 705.6 | |
| | | | |
| Other noncurrent assets | | 222.8 | | | 220.4 | |
| | | | |
| Total noncurrent assets | | 2,137.1 | | | 2,183.3 | |
| Total assets | | $ | 2,349.8 | | | $ | 2,438.7 | |
| | | | |
| Liabilities and Stockholders’ Equity | | | | |
| Current liabilities | | | | |
| | | | |
| Current portion of long-term debt | | $ | 23.8 | | | $ | 23.8 | |
| Trade and other payables | | 88.3 | | | 117.4 | |
| Accrued expenses and other liabilities | | 191.5 | | | 212.7 | |
| | | | |
| Total current liabilities | | 303.6 | | | 353.9 | |
| Noncurrent liabilities | | | | |
| Long-term debt | | 1,009.3 | | | 1,070.0 | |
| Employee benefit obligations | | 174.5 | | | 176.2 | |
| Operating lease liabilities | | 273.1 | | | 279.7 | |
| | | | |
| Other noncurrent liabilities | | 359.5 | | | 373.3 | |
| | | | |
| Total noncurrent liabilities | | 1,816.4 | | | 1,899.2 | |
| Commitments and contingencies | | | | |
| Stockholders' equity | | | | |
| Preferred stock, no par value, 40.0 shares authorized; no shares issued and outstanding | | — | | | — | |
| Common stock, par value $0.01 per share, 400.0 shares authorized; 127.6 and 128.5 shares issued and outstanding at December 31, 2024 and September 30, 2024, respectively | | 1.3 | | | 1.3 | |
| Paid-in capital | | 50.3 | | | 51.2 | |
| Retained earnings | | 175.2 | | | 123.2 | |
| | | | |
| | | | |
| Accumulated other comprehensive income | | 3.0 | | | 9.9 | |
| Stockholders' equity | | 229.8 | | | 185.6 | |
| Total liabilities and stockholders’ equity | | $ | 2,349.8 | | | $ | 2,438.7 | |
| | | | |
The accompanying Notes to Condensed Consolidated Financial Statements are an integral part of these Condensed Consolidated Financial Statements.
Valvoline Inc. and Consolidated Subsidiaries
Condensed Consolidated Statements of Cash Flows | | | | | | | | | | | | | | |
| | Three months ended
December 31 |
| (In millions - unaudited) | | 2024 | | 2023 |
| Cash flows from operating activities | | | | |
| Net income | | $ | 91.6 | | | $ | 31.9 | |
| Adjustments to reconcile net income to cash flows from operating activities: | | | | |
| Loss from discontinued operations | | 2.3 | | | 2.0 | |
| | | | |
| Gain on sale of operations | | (71.2) | | | — | |
| Depreciation and amortization | | 28.0 | | | 24.6 | |
| | | | |
| | | | |
| | | | |
| | | | |
| | | | |
| | | | |
| | | | |
| Stock-based compensation expense | | 2.0 | | | 2.4 | |
| Other, net | | 0.2 | | | 1.0 | |
| Change in operating assets and liabilities | | | | |
| Receivables | | 1.6 | | | 2.4 | |
| Inventories | | (0.6) | | | 3.0 | |
| Payables and accrued liabilities | | (38.5) | | | (43.7) | |
| Other assets and liabilities | | 26.0 | | | (1.7) | |
| Operating cash flows from continuing operations | | 41.4 | | | 21.9 | |
| Operating cash flows from discontinued operations | | (0.2) | | | (2.0) | |
| Total cash provided by operating activities | | 41.2 | | | 19.9 | |
| Cash flows from investing activities | | | | |
| Additions to property, plant and equipment | | (53.6) | | | (42.3) | |
| | | | |
| Acquisitions of businesses | | (4.4) | | | (8.3) | |
| | | | |
| Proceeds from sale of operations, net of cash disposed | | 121.0 | | | — | |
| Proceeds from investments | | — | | | 230.0 | |
| Other investing activities, net | | 1.0 | | | (7.1) | |
| Investing cash flows from continuing operations | | 64.0 | | | 172.3 | |
| Investing cash flows from discontinued operations | | — | | | — | |
| Total cash provided by investing activities | | 64.0 | | | 172.3 | |
| Cash flows from financing activities | | | | |
| Proceeds from borrowings | | 25.0 | | | — | |
| | | | |
| Repayments on borrowings | | (85.9) | | | (5.9) | |
| | | | |
| Repurchases of common stock, including excise taxes of $14.3 in fiscal 2025 | | (45.7) | | | (171.7) | |
| | | | |
| | | | |
| Other financing activities | | (6.1) | | | (7.1) | |
| Financing cash flows from continuing operations | | (112.7) | | | (184.7) | |
| Financing cash flows from discontinued operations | | — | | | — | |
| Total cash used in financing activities | | (112.7) | | | (184.7) | |
| Effect of currency exchange rate changes on cash, cash equivalents and restricted cash | | (0.8) | | | 0.1 | |
| (Decrease) increase in cash, cash equivalents and restricted cash | | (8.3) | | | 7.6 | |
| Cash, cash equivalents and restricted cash - beginning of period | | 68.7 | | | 413.1 | |
| Cash, cash equivalents and restricted cash - end of period | | $ | 60.4 | | | $ | 420.7 | |
| | | | |
The accompanying Notes to Condensed Consolidated Financial Statements are an integral part of these Condensed Consolidated Financial Statements.
Valvoline Inc. and Consolidated Subsidiaries
Condensed Consolidated Statements of Stockholders' Equity
| | | | | | | | | | | | | | | | | | | | | | | | | | | | | | | | | | | | | | |
| | Three months ended December 31, 2024 |
| (In millions, except per share amounts - unaudited) | | Common stock | | Paid-in capital | | Retained earnings | | Accumulated other comprehensive income | | Totals |
| Shares | | Amount |
| Balance at September 30, 2024 | | 128.5 | | | $ | 1.3 | | | $ | 51.2 | | | $ | 123.2 | | | $ | 9.9 | | | $ | 185.6 | |
| Net income | | — | | | — | | | — | | | 91.6 | | | — | | | 91.6 | |
| | | | | | | | | | | | |
| Stock-based compensation, net of issuances | | 0.1 | | | — | | | (0.9) | | | — | | | — | | | (0.9) | |
| Repurchases of common stock | | (1.0) | | | — | | | — | | | (39.6) | | | — | | | (39.6) | |
| Other comprehensive loss, net of tax | | — | | | — | | | — | | | — | | | (6.9) | | | (6.9) | |
| Balance at December 31, 2024 | | 127.6 | | | $ | 1.3 | | | $ | 50.3 | | | $ | 175.2 | | | $ | 3.0 | | | $ | 229.8 | |
| | | | | | | | | | | | |
| | | | | | | | | | | | |
| | | | | | | | | | | | |
| | | | | | | | | | | | |
| | | | | | | | | | | | |
| | | | | | | | | | | | |
| | | | | | | | | | | | |
| | | | | | | | | | | | |
| | | | | | | | | | | | |
| | | | | | | | | | | | |
| | | | | | | | | | | | |
| | | | | | | | | | | | |
| | | | | | | | | | | | |
| | | | | | | | | | | | |
| | | | | | | | | | | | |
| | | | | | | | | | | | |
| | | | | | | | | | | | |
| | | | | | | | | | | | |
| | | | | | | | | | | | |
| | | | | | | | | | | | |
| | | | | | | | | | | | |
| | | | | | | | | | | | |
| | | | | | | | | | | | |
| | | | | | | | | | | | |
| | | | | | | | | | | | |
| | | | | | | | | | | | |
| | | | | | | | | | | | |
| | | | | | | | | | | | |
| | | | | | | | | | | | |
| | | | | | | | | | | | |
| | | | | | | | | | | | |
| | | | | | | | | | | | |
| | | | | | | | | | | | |
| | | | | | | | | | | | |
| | | | | | | | | | | | |
| | | | | | | | | | | | |
| | | | | | | | | | | | |
| | | | | | | | | | | | |
| | | | | | | | | | | | |
| | | | | | | | | | | | |
| | | | | | | | | | | | |
| | Three months ended December 31, 2023 |
| (In millions, except per share amounts - unaudited) | | Common stock | | Paid-in capital | | Retained earnings (deficit) | | Accumulated other comprehensive income | | Totals |
| Shares | | Amount |
| Balance at September 30, 2023 | | 134.8 | | | $ | 1.3 | | | $ | 48.0 | | | $ | 140.7 | | | $ | 13.2 | | | $ | 203.2 | |
| Net income | | — | | | — | | | — | | | 31.9 | | | — | | | 31.9 | |
| | | | | | | | | | | | |
| Stock-based compensation, net of issuances | | 0.2 | | | — | | | (1.7) | | | — | | | — | | | (1.7) | |
| Repurchases of common stock | | (5.4) | | | — | | | — | | | (172.8) | | | — | | | (172.8) | |
| | | | | | | | | | | | |
| Other comprehensive income, net of tax | | — | | | — | | | — | | | — | | | 4.2 | | | 4.2 | |
| Balance at December 31, 2023 | | 129.6 | | | $ | 1.3 | | | $ | 46.3 | | | $ | (0.2) | | | $ | 17.4 | | | $ | 64.8 | |
| | | | | | | | | | | | |
| | | | | | | | | | | | |
| | | | | | | | | | | | |
| | | | | | | | | | | | |
| | | | | | | | | | | | |
| | | | | | | | | | | | |
| | | | | | | | | | | | |
| | | | | | | | | | | | |
| | | | | | | | | | | | |
| | | | | | | | | | | | |
| | | | | | | | | | | | |
| | | | | | | | | | | | |
| | | | | | | | | | | | |
The accompanying Notes to Condensed Consolidated Financial Statements are an integral part of these Condensed Consolidated Financial Statements.
| | | | | |
| Index to Notes to Condensed Consolidated Financial Statements | Page |
| |
| |
| |
| |
| |
| |
| |
| |
| |
| |
| |
Valvoline Inc. and Consolidated Subsidiaries
Notes to Condensed Consolidated Financial Statements (Unaudited)
NOTE 1 – BASIS OF PRESENTATION AND SIGNIFICANT ACCOUNTING POLICIES
The accompanying unaudited condensed consolidated financial statements have been prepared by Valvoline Inc. (“Valvoline” or the “Company”) in accordance with accounting principles generally accepted in the United States of America (“U.S. GAAP”) and Securities and Exchange Commission regulations for interim financial reporting, which do not include all information and footnote disclosures normally included in annual financial statements. Therefore, these condensed consolidated financial statements should be read in conjunction with Valvoline’s Annual Report on Form 10-K for the fiscal year ended September 30, 2024.
Use of estimates, risks and uncertainties
The preparation of the condensed consolidated financial statements in conformity with U.S. GAAP requires management to make estimates and judgments that affect the reported amounts of assets, liabilities, revenues and expenses, and the disclosures of contingent matters. Although management bases its estimates on historical experience and various other assumptions that are believed to be reasonable under the circumstances, actual results could differ significantly from the estimates under different assumptions or conditions.
Sale of Global Products business
On March 1, 2023, Valvoline completed the sale of its former Global Products reportable segment (“Global Products”) to Aramco Overseas Company B.V. (the “Transaction”). The operating results and cash flows associated with and directly attributed to the Global Products disposal group are reflected as discontinued operations within these condensed consolidated financial statements. Unless otherwise noted, disclosures within these remaining Notes to Condensed Consolidated Financial Statements relate solely to the Company's continuing operations.
Recent accounting pronouncements
The following accounting guidance relevant to Valvoline was either issued or adopted in the current fiscal year or is expected to have a meaningful impact on Valvoline in future periods upon adoption.
Issued but not yet adopted
In November 2023, the Financial Accounting Standards Board (“FASB”) issued new guidance to enhance reportable segment disclosures. This guidance requires entities, including those with a single reportable segment, to disclose significant reportable segment expenses and other items regularly provided to the Chief Operating Decision Maker (“CODM”) that are included in a segment’s profit or loss measures. While the guidance enhances disclosures regarding the Company’s CODM and the information regularly provided to the CODM, including significant expenses, the adoption of this guidance will not impact the Company’s operating results, financial condition, or cash flows. The Company will adopt this guidance and applicable disclosures will be conformed retrospectively in the Annual Report on Form 10-K for the year ending September 30, 2025.
In December 2023, the FASB issued guidance which enhances income tax disclosure requirements to include additional disaggregation within the effective tax rate reconciliation and income taxes paid. This guidance will be effective for Valvoline beginning with its fiscal 2026 annual financial statements, with early adoption permitted. The guidance must be applied prospectively, while retrospective application is permitted. The Company is continuing to assess the new guidance which is expected to result in enhanced income tax disclosures but does not expect there will be any impact to its results of operations, cash flows, or financial condition.
In November 2024, the FASB issued new guidance which requires enhanced disclosure of specified categories of expenses (purchases of inventory, employee compensation, depreciation and amortization) included in certain expense captions presented on the face of the income statement. This guidance will be effective for Valvoline beginning with its fiscal 2028 Form 10-K and interim periods beginning in fiscal 2029, with early adoption permitted, in addition to either prospective or retrospective application. The Company is currently evaluating the new guidance to determine its adoption approach and the impact on the presentation and disclosure of its consolidated income
statement and expenses. The Company anticipates its processes will be enhanced to address the disaggregation and disclosure requirements, though it does not expect adoption to impact its overall results from operations.
NOTE 2 - FAIR VALUE MEASUREMENTS
Recurring fair value measurements
The following tables set forth the Company’s financial assets and liabilities by level within the fair value hierarchy for those measured at fair value on a recurring basis:
| | | | | | | | | | | | | | | | | | | | | | | | | | | | | | | | |
| | As of December 31, 2024 |
| (In millions) | | Total | | Level 1 | | Level 2 | | Level 3 | | NAV (a) |
| Cash and cash equivalents | | | | | | | | | | |
| Money market funds | | $ | 0.4 | | | $ | 0.4 | | | $ | — | | | $ | — | | | $ | — | |
| Time deposits | | 2.6 | | | — | | | 2.6 | | | — | | | — | |
| | | | | | | | | | |
| | | | | | | | | | |
| | | | | | | | | | |
| | | | | | | | | | |
| Other noncurrent assets | | | | | | | | | | |
| Non-qualified trust funds | | 1.1 | | | — | | | — | | | — | | | 1.1 | |
| | | | | | | | | | |
| Deferred compensation investments | | 23.1 | | | 23.1 | | | — | | | — | | | — | |
| Total assets at fair value | | $ | 27.2 | | | $ | 23.5 | | | $ | 2.6 | | | $ | — | | | $ | 1.1 | |
| | | | | | | | | | |
| | | | | | | | | | |
| | | | | | | | | | |
| | | | | | | | | | |
| Other noncurrent liabilities | | | | | | | | | | |
| Deferred compensation obligations | | $ | 22.8 | | | $ | — | | | $ | — | | | $ | — | | | $ | 22.8 | |
| Total liabilities at fair value | | $ | 22.8 | | | $ | — | | | $ | — | | | $ | — | | | $ | 22.8 | |
| | | | | | | | | | | | | | | | | | | | | | | | | | | | | | | | |
| | As of September 30, 2024 |
| (In millions) | | Total | | Level 1 | | Level 2 | | Level 3 | | NAV (a) |
| Cash and cash equivalents | | | | | | | | | | |
| Money market funds | | $ | 0.3 | | | $ | 0.3 | | | $ | — | | | $ | — | | | $ | — | |
| Time deposits | | 2.6 | | | — | | | 2.6 | | | — | | | — | |
| | | | | | | | | | |
| | | | | | | | | | |
| | | | | | | | | | |
| Other noncurrent assets | | | | | | | | | | |
| Non-qualified trust funds | | 1.9 | | | — | | | — | | | — | | | 1.9 | |
| | | | | | | | | | |
| Deferred compensation investments | | 23.0 | | | 23.0 | | | — | | | — | | | — | |
| Total assets at fair value | | $ | 27.8 | | | $ | 23.3 | | | $ | 2.6 | | | $ | — | | | $ | 1.9 | |
| | | | | | | | | | |
| | | | | | | | | | |
| | | | | | | | | | |
| | | | | | | | | | |
| Other noncurrent liabilities | | | | | | | | | | |
| Deferred compensation obligations | | $ | 22.3 | | | $ | — | | | $ | — | | | $ | — | | | $ | 22.3 | |
| Total liabilities at fair value | | $ | 22.3 | | | $ | — | | | $ | — | | | $ | — | | | $ | 22.3 | |
| | | | | | | | | | |
(a)Funds measured at fair value using the net asset value ("NAV") per share practical expedient have not been classified in the fair value hierarchy.
Fair value disclosures
Long-term debt is reported in the Company’s Condensed Consolidated Balance Sheets at carrying value, rather than fair value and is therefore excluded from the disclosure above of financial assets and liabilities measured at fair value within the condensed consolidated financial statements on a recurring basis. The fair value of the Company's outstanding fixed rate senior notes shown below is based on recent trading values, which is considered a Level 2 input within the fair value hierarchy.
| | | | | | | | | | | | | | | | | | | | | | | | | | | | | | | | | | | | | | |
| | December 31, 2024 | | September 30, 2024 |
| (In millions) | | Fair value | | Carrying value (a) | | Unamortized
discounts and
issuance costs | | Fair value | | Carrying value (a) | | Unamortized
discounts and
issuance costs |
| | | | | | | | | | | | |
| 2031 Notes | | $ | 457.2 | | | $ | 530.6 | | | $ | (4.4) | | | $ | 478.5 | | | $ | 530.4 | | | $ | (4.6) | |
| | | | | | | | | | | | |
| | | | | | | | | | | | |
(a)Carrying values shown are net of unamortized discounts and debt issuance costs.
Refer to Note 4 for details of the senior notes as well as Valvoline's other debt instruments that have variable interest rates with carrying amounts that approximate fair value.
NOTE 3 - DISPOSITIONS
In early December 2024, Valvoline completed the sale of 39 company-operated service center stores to a new franchisee. Upon completion of the transaction, Valvoline derecognized the net assets associated with the service center stores and recorded a gain of $73.9 million in Other income, net in the Condensed Consolidated Statements of Comprehensive Income during the three months ended December 31, 2024. This gain is preliminary and subject to final customary closing settlements.
NOTE 4 - DEBT
The following table summarizes Valvoline’s total debt as of:
| | | | | | | | | | | | | | |
| (In millions) | | December 31
2024 | | September 30 2024 |
| 2031 Notes | | $ | 535.0 | | | $ | 535.0 | |
| | | | |
| Term Loan | | 433.4 | | | 439.4 | |
Revolver (a) | | 70.0 | | | 125.0 | |
| | | | |
| | | | |
| | | | |
| Debt issuance costs and discounts | | (5.3) | | | (5.6) | |
| Total debt | | 1,033.1 | | | 1,093.8 | |
| | | | |
| Current portion of long-term debt | | 23.8 | | | 23.8 | |
| Long-term debt | | $ | 1,009.3 | | | $ | 1,070.0 | |
| | | | | |
(a)As of December 31, 2024, the total borrowing capacity remaining under the $475.0 million revolving credit facility was $401.5 million due to a reduction of $70.0 million from borrowings and $3.5 million for letters of credit outstanding.
Covenants and guarantees
The Company guaranteed future payments related to certain lease assignments in connection with refranchising retail stores and selling the Global Products business. Valvoline is obligated to perform if the buyers of the divested businesses default on the leases, which have remaining terms ranging from one to 16 years. The undiscounted maximum potential future payments under the lease guarantees were $69.8 million as of December 31, 2024. In addition, the Company guarantees certain outstanding franchisee debt obligations that have remaining terms ranging from one month to five years and total $14.0 million as of December 31, 2024. The Company has not recorded a liability for these guarantees as the likelihood of making future payments is not considered probable.
As of December 31, 2024, Valvoline was in compliance with all covenants under its long-term borrowings.
NOTE 5 – INCOME TAXES
Income tax provisions for interim quarterly periods are based on an estimated annual effective income tax rate calculated separately from the effect of significant, infrequent or unusual discrete items related specifically to interim periods. The following summarizes income tax expense and the effective tax rate in each interim period:
| | | | | | | | | | | | | | | | | | |
| | Three months ended
December 31 | | |
| | |
| (In millions) | | 2024 | | 2023 | | | | |
| Income tax expense | | $ | 33.3 | | | $ | 11.9 | | | | | |
| Effective tax rate percentage | | 26.2 | % | | 26.0 | % | | | | |
The respective increases in income tax expense and effective tax rate for the three months ended December 31, 2024 is primarily driven by an increase in pre-tax income and unfavorable discrete items compared to favorable discrete items in the prior year.
NOTE 6 – EMPLOYEE BENEFIT PLANS
The following table summarizes the components of pension and other postretirement plan (income) expense:
| | | | | | | | | | | | | | | | | | | | | | | | | | |
| | Pension benefits | | Other postretirement benefits |
| | |
| (In millions) | | 2024 | | 2023 | | 2024 | | 2023 |
| Three months ended December 31 | | | | | | | | |
| | | | | | | | |
| Interest cost | | $ | 17.4 | | | $ | 20.9 | | | $ | 0.3 | | | $ | 0.3 | |
| Expected return on plan assets | | (18.0) | | | (17.2) | | | — | | | — | |
| Amortization of prior service credits | | — | | | — | | | (0.6) | | | (0.6) | |
| | | | | | | | |
| Net periodic benefit (income) costs | | $ | (0.6) | | | $ | 3.7 | | | $ | (0.3) | | | $ | (0.3) | |
| | | | | | | | |
| | | | | | | | |
| | | | | | | | |
| | | | | | | | |
| | | | | | | | |
| | | | | | | | |
| | | | | | | | |
| | | | | | | | |
NOTE 7 – LITIGATION, CLAIMS AND CONTINGENCIES
From time to time, Valvoline is party to lawsuits, claims and other legal proceedings that arise in the ordinary course of business. The Company establishes liabilities for the outcome of such matters where losses are determined to be probable and reasonably estimable. Where appropriate, the Company has recorded liabilities with respect to these matters, which were not material for the periods presented as reflected in the condensed consolidated financial statements herein. There are certain claims and legal proceedings pending where loss is not determined to be probable or reasonably estimable, and therefore, accruals have not been made. In addition, Valvoline discloses matters when management believes a material loss is at least reasonably possible.
In all instances, management has assessed each matter based on current information available and made a judgment concerning its potential outcome, giving due consideration to the amount and nature of the claim and the probability of success. The Company believes it has established adequate accruals for liabilities that are probable and reasonably estimable.
Although the ultimate resolution of these matters cannot be predicted with certainty and there can be no assurances that the actual amounts required to satisfy liabilities from these matters will not exceed the amounts reflected in the condensed consolidated financial statements, based on information available at this time, it is the opinion of management that such pending claims or proceedings will not have a material adverse effect on its condensed consolidated financial statements.
NOTE 8 - EARNINGS PER SHARE
The following table summarizes basic and diluted earnings per share:
| | | | | | | | | | | | | | | | | | |
| | Three months ended
December 31 | | |
| | |
| (In millions, except per share amounts) | | 2024 | | 2023 | | | | |
| Numerator | | | | | | | | |
| Income from continuing operations | | $ | 93.9 | | | $ | 33.9 | | | | | |
| Loss from discontinued operations, net of tax | | (2.3) | | | (2.0) | | | | | |
| Net income | | $ | 91.6 | | | $ | 31.9 | | | | | |
| | | | | | | | |
| Denominator | | | | | | | | |
| Weighted average common shares outstanding | | 128.7 | | | 131.8 | | | | | |
Effect of potentially dilutive securities (a) | | 0.8 | | | 0.9 | | | | | |
| Weighted average diluted shares outstanding | | 129.5 | | | 132.7 | | | | | |
| | | | | | | | | |
| Basic earnings (loss) per share | | | | | | | | |
| Continuing operations | | $ | 0.73 | | | $ | 0.26 | | | | | |
| Discontinued operations | | (0.02) | | | (0.02) | | | | | |
| Basic earnings per share | | $ | 0.71 | | | $ | 0.24 | | | | | |
| | | | | | | | |
| Diluted earnings (loss) per share | | | | | | | | |
| Continuing operations | | $ | 0.73 | | | $ | 0.26 | | | | | |
| Discontinued operations | | (0.02) | | | (0.02) | | | | | |
| Diluted earnings per share | | $ | 0.71 | | | $ | 0.24 | | | | | |
|
(a)There were 0.2 million outstanding stock appreciation rights not included in the computation of diluted earnings per share in the three months ended December 31, 2023, respectively, because the effect would have been antidilutive.
NOTE 9 - SUPPLEMENTAL FINANCIAL INFORMATION
Cash, cash equivalents and restricted cash
The following provides a reconciliation of cash, cash equivalents and restricted cash reported within the Condensed Consolidated Statements of Cash Flows to the Condensed Consolidated Balance Sheets:
| | | | | | | | | | | | | | | | | | | | |
| (In millions) | | December 31
2024 | | September 30
2024 | | December 31
2023 |
| Cash and cash equivalents - continuing operations | | $ | 60.0 | | | $ | 68.3 | | | $ | 420.7 | |
| | | | | | |
| | | | | | |
Restricted cash - continuing operations (a) | | 0.4 | | | 0.4 | | | — | |
| | | | | | |
| Total cash, cash equivalents and restricted cash | | $ | 60.4 | | | $ | 68.7 | | | $ | 420.7 | |
| | | | | | |
(a)Included in Prepaid expenses and other current assets within the Condensed Consolidated Balance Sheets.
Accounts and other receivables
The following summarizes Valvoline’s accounts and other receivables in the Condensed Consolidated Balance Sheets as of:
| | | | | | | | | | | | | | |
| (In millions) | | December 31
2024 | | September 30 2024 |
| Current | | | | |
| Trade | | $ | 73.3 | | | $ | 73.2 | |
| Notes receivable from franchisees | | 5.7 | | | 5.4 | |
| Other | | 7.3 | | | 9.1 | |
| Receivables, gross | | 86.3 | | | 87.7 | |
| Allowance for credit losses | | (1.6) | | | (1.3) | |
| Receivables, net | | $ | 84.7 | | | $ | 86.4 | |
| | | | |
Non-current (a) | | | | |
| | | | |
| Notes receivable | | $ | 2.5 | | | $ | 2.5 | |
| Other | | 4.5 | | | 4.4 | |
| Noncurrent notes receivable, gross | | 7.0 | | | 6.9 | |
| Allowance for losses | | (2.6) | | | (2.6) | |
| Noncurrent notes receivable, net | | $ | 4.4 | | | $ | 4.3 | |
| | | | |
(a)Included in Other noncurrent assets within the Condensed Consolidated Balance Sheets.
Revenue recognition
The following disaggregates the Company’s net revenues by timing of revenue recognized:
| | | | | | | | | | | | | | | | | | |
| | Three months ended
December 31 | | |
| | |
| (In millions) | | 2024 | | 2023 | | | | |
| Net revenues transferred at a point in time | | $ | 394.1 | | | $ | 355.9 | | | | | |
| Franchised revenues transferred over time | | 20.2 | | | 17.5 | | | | | |
| Net revenues | | $ | 414.3 | | | $ | 373.4 | | | | | |
The following table summarizes net revenues by category:
| | | | | | | | | | | | | | | | | | |
| | Three months ended
December 31 | | |
| | |
| (In millions) | | 2024 | | 2023 | | | | |
| Retail Services | | | | | | | | |
| Oil changes and related fees | | $ | 301.7 | | | $ | 277.5 | | | | | |
| Non-oil changes and related fees | | 91.4 | | | 78.2 | | | | | |
| Franchise fees and other | | 21.2 | | | 17.7 | | | | | |
| Total | | $ | 414.3 | | | $ | 373.4 | | | | | |
| | | | | | | | |
| | | | | | | | |
| | | | | | | | |
| | | | | | | | |
| | | | | | | | |
| | | | | | | | |
| | | | | | | | |
| | | | | | | | |
NOTE 10 – SUBSEQUENT EVENTS
Share repurchases
The Company repurchased 0.6 million of its shares for an aggregate amount of $20.5 million from January 1, 2025 through February 3, 2025. These repurchases leave $325.0 million in authority remaining as of February 3, 2025 under the authorization announced during July 2024 from the Valvoline Board of Directors (the “Board”) to repurchase up to $400.0 million of common stock which has no expiration date (the “2024 Share Repurchase Authorization”).
FORWARD-LOOKING STATEMENTS
Certain statements in this Quarterly Report on Form 10-Q, other than statements of historical fact, are forward-looking statements within the meaning of the Private Securities Litigation Reform Act of 1995. Such forward-looking statements may include, without limitation, executing on the growth strategy to create shareholder value by driving the full potential in the Company’s core business, accelerating network growth and innovating to meet the needs of customers and the evolving car parc; realizing the benefits from the refranchising transactions; and future opportunities for the stand-alone retail business; and any other statements regarding Valvoline's future operations, financial or operating results, capital allocation, debt leverage ratio, anticipated business levels, dividend policy, anticipated growth, market opportunities, strategies, competition, and other expectations and targets for future periods. Valvoline has identified some of these forward-looking statements with words such as “anticipates,” “believes,” “expects,” “estimates,” “is likely,” “predicts,” “projects,” “forecasts,” “may,” “will,” “should,” and “intends,” and the negative of these words or other comparable terminology. These forward-looking statements are based on Valvoline’s current expectations, estimates, projections, and assumptions as of the date such statements are made and are subject to risks and uncertainties that may cause results to differ materially from those expressed or implied in the forward-looking statements. Factors that might cause such differences include, but are not limited to, those discussed under the headings “Risk Factors,” “Management’s Discussion and Analysis of Financial Condition and Results of Operations,” and “Quantitative and Qualitative Disclosures about Market Risk” in this Quarterly Report on Form 10-Q and Valvoline’s most recently filed Annual Report on Form 10-K. Valvoline assumes no obligation to update or revise these forward-looking statements for any reason, even if new information becomes available in the future, unless required by law.
| | | | | |
| Index to Management’s Discussion and Analysis of Financial Condition and Results of Operations | Page |
| |
| |
| |
| |
| |
| |
| |
ITEM 2. MANAGEMENT’S DISCUSSION AND ANALYSIS OF FINANCIAL CONDITION AND RESULTS OF OPERATIONS
The following discussion and analysis should be read in conjunction with the Annual Report on Form 10-K for the fiscal year ended September 30, 2024, as well as the condensed consolidated financial statements and the accompanying Notes to Condensed Consolidated Financial Statements included in Item 1 of Part I in this Quarterly Report on Form 10-Q. Unless otherwise noted, disclosures within Item 2. Management’s Discussion and Analysis of Financial Condition and Results of Operations relate solely to the Company's continuing operations.
BUSINESS OVERVIEW AND PURPOSE
As the quick, easy, trusted leader in automotive preventive maintenance. Valvoline Inc. is creating shareholder value by driving the full potential in its core business, accelerating network growth and innovating to meet the needs of customers and the evolving car parc. With average customer ratings that indicate high levels of service satisfaction, Valvoline and the Company’s franchise partners keep customers moving with about 15-minute stay-in-your-car oil changes; battery, bulb and wiper replacements; tire rotations; and other manufacturer recommended maintenance services. The Company operates and franchises more than 2,000 service center locations through its Valvoline Instant Oil ChangeSM and Great Canadian Oil Change retail locations and supports nearly 270 locations through its Express CareTM platform.
BUSINESS STRATEGY
As a pure play automotive retail services provider and the trusted leader in preventive automotive maintenance, Valvoline is well positioned to create long-term shareholder value through executing the Company’s strategic initiatives, which include:
•Driving the full potential of the core business through increasing market share and improving operational efficiency in existing stores by building on Valvoline’s strong foundation in marketing, technology, and data insights;
•Aggressively growing the retail footprint with company-operated store growth and an increased emphasis on franchisee store growth; and
•Targeting customer and service expansion with a focus on fleet business, driving non-oil change service penetration, and meeting the needs of the evolving car parc.
FIRST FISCAL QUARTER 2025 OVERVIEW
The following were the significant events for the first fiscal quarter of 2025, each of which is discussed more fully in this Quarterly Report on Form 10-Q:
•Valvoline’s net revenues grew 11% over the prior year period driven by system-wide same-store sales ("SSS") growth of 8.0% and the addition of 155 net store additions to the system from the prior year.
•Income from continuing operations grew 177% to $93.9 million and diluted earnings per share increased 181% to $0.73 in the three months ended December 31, 2024 compared to the prior year period. This growth was primarily attributable the gain recognized from refranchising initiatives intended to accelerate franchise store growth, in addition to gross profit expansion from operations.
•Adjusted EBITDA increased 14% over the prior year period driven by strong top-line growth from higher average ticket, increased transactions, and unit growth. Additional benefits from operational efficiencies in labor and materials costs were partially offset by growth investments in selling, general and administrative expenses.
•The Company returned $39.3 million to its shareholders during the quarter through repurchases of 1.0 million shares of Valvoline common stock.
Use of Non-GAAP Measures
To aid in the understanding of Valvoline’s ongoing business performance, certain items within this document are presented on an adjusted, non-GAAP basis. These non-GAAP measures have limitations as analytical tools and should not be considered in isolation from, or as an alternative to, or more meaningful than, the financial statements presented in accordance with U.S. GAAP. The financial results presented in accordance with U.S. GAAP and reconciliations of non-GAAP measures included within this Quarterly Report on Form 10-Q should be carefully evaluated.
The following are the non-GAAP measures management has included and how management defines them:
•EBITDA - net income/loss, plus income tax expense/benefit, net interest and other financing expenses, and depreciation and amortization;
•Adjusted EBITDA - EBITDA adjusted for the impacts of certain unusual, infrequent or non-operational activity not directly attributable to the underlying business, which management believes impacts the comparability of operational results between periods ("key items," as further described below);
•Free cash flow - cash flows from operating activities less capital expenditures and certain other adjustments as applicable; and
•Discretionary free cash flow - cash flows from operating activities less maintenance capital expenditures and certain other adjustments as applicable.
Non-GAAP measures include adjustments from results based on U.S. GAAP that management believes enables comparison of certain financial trends and results between periods and provides a useful supplemental presentation of Valvoline's operating performance that allows for transparency with respect to key metrics used by management in operating the business and measuring performance. The manner used to compute non-GAAP information used by management may differ from the methods used by other companies and may not be comparable. For a reconciliation of the most comparable U.S. GAAP measures to the non-GAAP measures, refer to the “Results of Operations” and “Financial Position, Liquidity and Capital Resources” sections below.
Management believes EBITDA measures provide a meaningful supplemental presentation of Valvoline’s operating performance between periods on a comparable basis due to the depreciable assets associated with the nature of the Company’s operations as well as income tax and interest costs related to Valvoline’s tax and capital structures, respectively. Adjusted EBITDA measures enable comparison of financial trends and results between periods where certain items may not be reflective of the Company’s underlying and ongoing operations performance or vary independent of business performance.
Management uses free cash flow and discretionary free cash flow as additional non-GAAP metrics of cash flow generation. By including capital expenditures and certain other adjustments, as applicable, management is able to provide an indication of the ongoing cash being generated that is ultimately available for both debt and equity holders as well as other investment opportunities. Free cash flow includes the impact of capital expenditures, providing a supplemental view of cash generation. Discretionary free cash flow includes maintenance capital expenditures, which are routine uses of cash that are necessary to maintain the Company's operations and provides a supplemental view of cash flow generation to maintain operations before discretionary investments in growth. Free cash flow and discretionary free cash flow have certain limitations, including that they do not reflect adjustments for certain non-discretionary cash flows, such as mandatory debt repayments.
The non-GAAP measures used by management exclude key items. Key items are often related to legacy matters or market-driven events considered by management to not be reflective of the ongoing operating performance. Key items may consist of adjustments related to: legacy businesses, including the separation from Valvoline's former parent company, the former Global Products reportable segment, and associated impacts of related activity and indemnities; non-service pension and other postretirement plan activity; restructuring-related matters, including organizational restructuring plans, the separation of Valvoline’s businesses, significant acquisitions or divestitures, debt extinguishment and modification, and tax reform legislation; in addition to other matters that management considers non-operational, infrequent or unusual in nature.
Details with respect to the description and composition of key items recognized during the respective periods presented herein are set forth below in the “EBITDA and Adjusted EBITDA” section of “Results of Operations” that follows.
Key Business Measures
Valvoline tracks its operating performance and manages its business using certain key measures, including system-wide, company-operated and franchised store counts and SSS; and system-wide store sales. Management believes these measures are useful to evaluating and understanding Valvoline's operating performance and should be considered as supplements to, not substitutes for, Valvoline's net revenues and operating income, as determined in accordance with U.S. GAAP.
Net revenues are influenced by the number of service center stores and the business performance of those stores. Stores are considered open upon acquisition or opening for business. Temporary store closings remain in the respective store counts with only permanent store closures reflected in the activity and end of period store counts. For the periods presented herein, SSS is defined as net revenues of U.S. Valvoline Instant Oil ChangeSM (VIOCSM) stores (company-operated, franchised and the combination of these for system-wide SSS) with same stores defined at the beginning of the month following the completion of 12 full months in operation within the system.
Net revenues are limited to sales at company-operated stores, in addition to royalties and other fees from independent franchised and Express Care stores. Although Valvoline does not recognize store-level sales from
franchised stores as net revenues in its Statements of Condensed Consolidated Income, management believes system-wide and franchised SSS comparisons, store counts, and total system-wide store sales are useful to assess market position relative to competitors and overall store and operating performance.
RESULTS OF OPERATIONS
The following summarizes the results of the Company’s continuing operations for the periods ended December 31:
| | | | | | | | | | | | | | | | | | | | | | | | | | | | | | | | | | | | | | |
| | Three months ended December 31 | | | | | | |
| | 2024 | | 2023 | | | | | | | | |
| (In millions) | | Amount | | % of Net revenues | | Amount | | % of Net revenues | | | | | | | | | | |
| Net revenues | | $ | 414.3 | | | 100.0% | | $ | 373.4 | | | 100.0% | | | | | | | | | | | | |
| Gross profit | | $ | 152.9 | | | 36.9% | | $ | 134.8 | | | 36.1% | | | | | | | | | | | | |
| Net operating expenses | | $ | 9.1 | | | 2.2% | | $ | 72.0 | | | 19.3% | | | | | | | | | | | | |
| Operating income | | $ | 143.8 | | | 34.7% | | $ | 62.8 | | | 16.8% | | | | | | | | | | | | |
| Income from continuing operations | | $ | 93.9 | | | 22.7% | | $ | 33.9 | | | 9.1% | | | | | | | | | | | | |
| | | | | | | | | | | | | | | | | | | | |
EBITDA (a) | | $ | 172.7 | | | 41.7% | | $ | 84.0 | | | 22.5% | | | | | | | | | | | | |
Adjusted EBITDA (a) | | $ | 102.8 | | | 24.8% | | $ | 90.2 | | | 24.2% | | | | | | | | | | | | |
|
(a)Refer to the “Use of Non-GAAP Measures” and Continuing operations EBITDA and Adjusted EBITDA for management’s definitions of the metrics presented above and reconciliation to the corresponding GAAP measures, where applicable.
| | | | | | | | | | | | | | | | | | | | | | |
| | Three months ended
December 31 | | | | | | |
| | | |
| 2024 | | 2023 | | | | | | | |
System-wide store sales - in millions (a) | | $ | 820.3 | | | $ | 722.9 | | | | | | | | | |
Year-over-year growth (a) | | 13.5 | % | | 12.3 | % | | | | | | | | |
| | | | | | | | | | | | |
Same-store sales growth (b) | | | | | | | | | | | | |
| Company-operated | | 8.2 | % | | 6.2 | % | | | | | | | | |
Franchised (a) | | 7.8 | % | | 8.0 | % | | | | | | | | |
System-wide (a) | | 8.0 | % | | 7.2 | % | | | | | | | | |
| | | | | | | | | | | | | | | | | | | | | | | | | | | | | | | | | | | |
| | | | | |
| | | | | | | | | | | |
| | | | | | | | | | | |
| | | | | | | | | | |
| | | | | | | | | | | |
| | | | | | | | | | | |
| | | | | | | | | | | |
| | | | | | | | | | |
| | | | | | | | | | | |
| | | Number of stores at end of period |
| | | First Quarter
2025 | | Fourth Quarter
2024 | | Third Quarter
2024 | | Second Quarter
2024 | | First Quarter
2024 |
| | | | | | | | | | | |
| Company-operated | | 932 | | | 950 | | | 937 | | | 919 | | | 895 | |
Franchised (a) | | 1,113 | | | 1,060 | | | 1,024 | | | 1,009 | | | 995 | |
Total system-wide stores (a) | | 2,045 | | | 2,010 | | | 1,961 | | | 1,928 | | | 1,890 | |
| |
| | |
| | | | | | | | | | |
| | | | | | | | | | |
| | | | | | | | | | | |
| (a) | Measures include Valvoline franchisees, which are independent legal entities. Valvoline does not consolidate the results of operations of its franchisees. |
| (b) | Beginning in fiscal 2025, Valvoline determines SSS growth as the year-over-year change in net revenues of U.S. VIOC same stores (company-operated, franchised and the combination of these for system-wide SSS) with same stores defined as those that have been in operation within the system for at least 12 full months. Previously, SSS was determined utilizing net revenues of U.S. VIOC stores, with new stores, including franchised conversions, excluded from the metric until the completion of their first full fiscal year in operation. Prior period measures presented herein have been revised to conform with the current approach. |
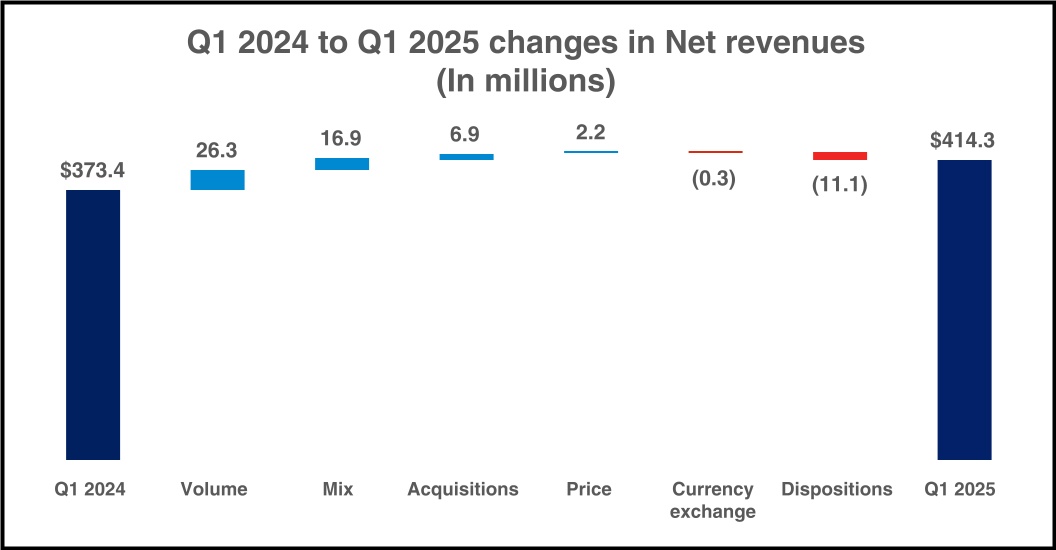
Net revenues
Net revenues increased $40.9 million, or 11.0% for the three months ended December 31, 2024 compared to the prior year period. System-wide SSS grew 8.0% year-over-year, driven by balanced contribution from both average ticket and transactions. Average ticket benefited from increased non-oil change service penetration, premiumization, as well as pricing, while transaction growth reflected an expanding customer base. Additionally, net revenue growth was supported by the addition of 155 net new stores over the prior year, which was partially offset by lower net revenues due to the recent refranchising transactions. The following reconciles the year-over-year change in net revenues:
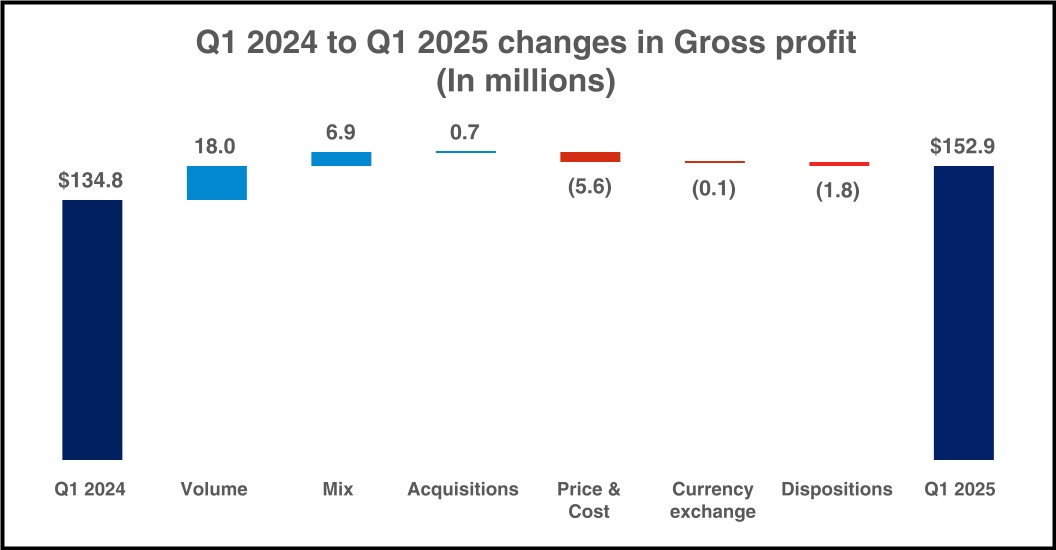
Gross profit
Gross profit increased $18.1 million, or 13.4%, for the three months ended December 31, 2024 compared to the prior year period. Profitability rose largely due to volume expansion from transaction and store growth, in addition to mix improvements from non-oil change service penetration and premiumization. Cost management from labor and materials also supported profit expansion and were partially offset by higher store operating expenses, including higher depreciation. The following reconciles the year-over-year change in gross profit:
Gross profit margin improved in the three months ended December 31, 2024 compared to the prior year, driven by increased labor efficiency from effective management and scheduling, modestly lower product costs, along with
benefits from service mix. This margin leverage was partially offset by higher operating expenses, primarily new store depreciation.
Net operating expenses
Details of the components of net operating expenses are summarized below for the periods ended December 31:
| | | | | | | | | | | | | | | | | | | | | | | | | | | | | | | | | | |
| | Three months ended December 31 | | |
| | 2024 | | 2023 | | | | |
| (In millions) | | Amount | | % of Net revenues | | Amount | | % of Net revenues | | | | | | | | |
| Selling, general and administrative expenses | | $ | 82.8 | | | 20.0 | % | | $ | 74.5 | | | 20.0 | % | | | | | | | | |
| Net legacy and separation-related expenses | | 0.4 | | | 0.1 | % | | 0.1 | | | — | % | | | | | | | | |
| Other income, net | | (74.1) | | | (17.9) | % | | (2.6) | | | (0.7) | % | | | | | | | | |
| Net operating expenses | | $ | 9.1 | | | 2.2 | % | | $ | 72.0 | | | 19.3 | % | | | | | | | | |
Selling, general and administrative expenses increased $8.3 million for the three months ended December 31, 2024 compared to the prior year primarily due to investments to drive continued growth and support scaling of the business. These investments were led by technology, talent and advertising to support the growing stand-alone retail business and its customer base.
Net legacy and separation-related expenses increased $0.3 million for the three months ended December 31, 2024 compared to the prior year due to certain limited realignment expenses incurred to support the stand-alone retail business following the sale of the former Global Products reportable segment.
Other income, net increased $71.5 million in the three months ended December 31, 2024 compared to the prior year primarily driven by the $73.9 million gain on sale of operations recognized commensurate with closing a refranchising transaction to sell company-owned service center stores to a new franchisee.
Net pension and other postretirement plan activity
Net pension and other postretirement plan activity was favorable from the prior year by $4.3 million. The benefits were generally attributable to higher recurring expected returns on plan assets and lower interest cost as a result of the decline in discount rates in the most recent annual remeasurement of the plans.
Net interest and other financing expenses
Net interest and other financing expenses increased $3.9 million for the three months ended December 31, 2024 due to a $6.9 million decline in interest income partially offset by lower interest expense on borrowings. Lower interest income was driven by the invested net proceeds from the sale of Global Products that fully matured in the second quarter of fiscal 2024 and were utilized to repurchase the 4.250% senior unsecured notes with an aggregate principal amount of $600.0 million in the third quarter of fiscal 2024. This repurchase drove lower outstanding borrowings and reductions in interest expense in fiscal 2025 that were partially offset by lower interest expense benefits due to the prior year maturity of interest rate swaps.
Income tax provision
The following table summarizes the income tax provision and the effective tax rate for the current and prior year periods:
| | | | | | | | | | | | | | | | | | |
| | Three months ended
December 31 | | |
| | |
| (In millions) | | 2024 | | 2023 | | | | |
| Income tax expense | | $ | 33.3 | | | $ | 11.9 | | | | | |
| Effective tax rate percentage | | 26.2 | % | | 26.0 | % | | | | |
The increases in income tax expense and effective tax rate for the three months ended December 31, 2024 is primarily driven by an increase in pre-tax income and unfavorable discrete items compared to favorable discrete items in the prior year.
Loss from discontinued operations, net of tax
The following summarizes Loss from discontinued operations, net of tax for the current and prior year periods:
| | | | | | | | | | | | | | | | | | |
| | Three months ended
December 31 | | |
| | |
| (In millions) | | 2024 | | 2023 | | | | |
| Loss from discontinued operations, net of tax | | $ | (2.3) | | | $ | (2.0) | | | | | |
| | | | | | | | |
The loss from discontinued operations, net of tax increased $0.3 million in the three months ended December 31, 2024 from the prior year due to a $2.1 million increase in discrete tax expense and was partially offset by lower costs associated with the separation of processes and systems related to the sale of Global Products in March 2023.
Continuing operations EBITDA and Adjusted EBITDA
The following table reconciles Income from continuing operations to EBITDA and Adjusted EBITDA for the current and prior year periods:
| | | | | | | | | | | | | | | | | | |
| | Three months ended
December 31 | | |
| (In millions) | | 2024 | | 2023 | | | | |
| Income from continuing operations | | $ | 93.9 | | | $ | 33.9 | | | | | |
| Income tax expense | | 33.3 | | | 11.9 | | | | | |
| Net interest and other financing expenses | | 17.5 | | | 13.6 | | | | | |
| Depreciation and amortization | | 28.0 | | | 24.6 | | | | | |
EBITDA from continuing operations (a) | | 172.7 | | | 84.0 | | | | | |
Net pension and other postretirement plan (income) expenses (b) | | (0.9) | | | 3.4 | | | | | |
Net legacy and separation-related expenses (c) | | 0.4 | | | 0.1 | | | | | |
Information technology transition costs (d) | | 1.5 | | | 2.7 | | | | | |
Investment and divestiture-related income (e) | | (70.9) | | | — | | | | | |
| | | | | | | | |
Adjusted EBITDA from continuing operations (a) | | $ | 102.8 | | | $ | 90.2 | | | | | |
| | | | | | | | | |
| | | | | |
| (a) | EBITDA from continuing operations is defined as income from continuing operations, plus income tax expense, net interest and other financing expenses, and depreciation and amortization attributable to continuing operations. Adjusted EBITDA from continuing operations is EBITDA adjusted for key items attributable to continuing operations. |
| | | | | |
| (b) | Includes several elements impacted by changes in plan assets and obligations that are primarily driven by the debt and equity markets, including remeasurement gains and losses, when applicable; and recurring non-service pension and other postretirement net periodic activity, which consists of interest cost, expected return on plan assets and amortization of prior service credits. Management considers these elements are more reflective of changes in current conditions in global markets (in particular, interest rates), outside the operational performance of the business, and are also legacy amounts that are not directly related to the underlying business and do not have an impact on the compensation and benefits provided to eligible employees for current service. Refer to Note 6 in the Notes to Condensed Consolidated Financial Statements in Item 1 of Part I in this Quarterly Report on Form 10-Q for further details. |
| (c) | Activity associated with legacy businesses, including the separation from Valvoline’s former parent company and its former Global Products reportable segment. This activity includes the recognition of and adjustments to indemnity obligations to its former parent company; certain legal, financial, professional advisory and consulting fees; and other expenses incurred by the continuing operations in connection with and directly related to these separation transactions and legacy matters. This incremental activity directly attributable to legacy matters and separation transactions is not considered reflective of the underlying operating performance of the Company’s continuing operations. |
| (d) | Consists of expenses incurred related to the Company’s information technology transitions, primarily efforts related to implementing stand-alone enterprise resource planning and human resource information systems that generally began in fiscal 2023 following the sale of the former Global Products reportable segment. These expenses include data conversion, temporary support, training, and redundant expenses incurred from duplicative technology platforms, which are incremental costs directly associated with technology transitions and are not considered to be reflective of the ongoing expenses of operating the Company’s technology platforms. |
| (e) | Consists of activity associated with significant acquisitions, investments and divestitures, including legal, advisory and consulting fees, such as diligence costs, in addition to gains or losses recognized upon disposition and expense recognized to reduce the carrying values of investments determined to be impaired. These costs are not considered to be reflective of the underlying performance of the Company’s ongoing continuing operations. |
Adjusted EBITDA from continuing operations increased $12.6 million for the three months ended December 31, 2024 compared to the prior year period driven by strong operational performance, which was partially offset by increased SG&A investments to support the stand-alone business and future growth.
FINANCIAL POSITION, LIQUIDITY AND CAPITAL RESOURCES
Overview
The Company closely manages its liquidity and capital resources. Valvoline’s liquidity requirements depend on key variables, including the level of investment needed to support business strategies, the performance of the business, capital expenditures, borrowing arrangements, and working capital management. Capital expenditures, acquisitions, and share repurchases are components of the Company’s cash flow and capital management strategy, which to a large extent, can be adjusted in response to economic and other changes in the business environment. The Company has a disciplined approach to capital allocation, which focuses on investing in key priorities that support Valvoline’s business and growth strategies and returning capital to shareholders, while funding ongoing operations.
Continuing operations cash flows
Valvoline’s continuing operations cash flows as reflected in the Condensed Consolidated Statements of Cash Flows are summarized as follows for the three months ended December 31:
| | | | | | | | | | | | | | |
| (In millions) | | 2024 | | 2023 |
| | | | |
| | | | |
| Cash provided by (used in): | | | | |
| Operating activities | | $ | 41.4 | | | $ | 21.9 | |
| Investing activities | | $ | 64.0 | | | $ | 172.3 | |
| Financing activities | | $ | (112.7) | | | $ | (184.7) | |
| | | | |
| | | | |
| | | | |
| | | | |
Operating activities
The increase in cash flows provided by operating activities of $19.5 million from the prior year was due to higher cash earnings and lower interest payments. These favorable changes were partially offset by unfavorable changes in net working capital primarily driven by the timing of payments.
Investing activities
The decrease in cash flow provided by investing activities of $108.3 million was substantially driven by net proceeds from investments of $230.0 million during the prior year and increased capital expenditures of $11.3 million in the current year to support store growth. These year-over-year changes in investing cash flows were partially offset by increased proceeds from the sale of operations, net of cash disposed, primarily driven by completing a refranchising transaction in the current year for $121.0 million.
Financing activities
Cash flows used in financing activities decreased $72.0 million from the prior year due to a $140.3 million reduction in share repurchases, partially offset by $14.3 million in payments of excise taxes on share repurchases and a $55.0 million increase in net repayments on borrowings.
Continuing operations free cash flow
The following sets forth free cash flow and discretionary free cash flow and reconciles cash flows from operating activities to both measures. These free cash flow measures have certain limitations, including that they do not reflect adjustments for certain non-discretionary cash flows, such as mandatory debt repayments. Refer to the “Use of Non-GAAP Measures” section included above in this Item 2 for additional information regarding these non-GAAP measures.
| | | | | | | | | | | | | | |
| | Three months ended
December 31 |
| (In millions) | | 2024 | | 2023 |
| Cash flows provided by operating activities | | $ | 41.4 | | | $ | 21.9 | |
| Less: Maintenance capital expenditures | | (5.7) | | | (7.0) | |
| Discretionary free cash flow | | 35.7 | | | 14.9 | |
| Less: Growth capital expenditures | | (47.9) | | | (35.3) | |
| Free cash flow | | $ | (12.2) | | | $ | (20.4) | |
The increase in free cash flow from continuing operations over the prior year was driven primarily by higher cash flows provided by operating activities as described above. This increase was partially offset by higher capital expenditures in the current year from new store construction as the Company continues to focus the majority of its capital spend toward growth, which is expected to drive a high return on invested capital.
Debt
Approximately 52% of Valvoline's outstanding borrowings at December 31, 2024 had fixed interest rates, with the remainder bearing variable rates. As of December 31, 2024, Valvoline was in compliance with all covenants of its debt obligations and had borrowing capacity remaining of $401.5 million under its Revolver.
Refer to Note 4 of the Notes to Condensed Consolidated Financial Statements for additional details regarding the Company’s debt instruments.
Share repurchases
During the three months ended December 31, 2024, the Company repurchased 1.0 million shares of its common stock for $39.3 million. As of December 31, 2024, $345.5 million remained available for repurchase under the 2024 Share Repurchase Authorization. Additionally, the Company repurchased 0.6 million shares for an aggregate amount of $20.5 million from January 1, 2025 through February 3, 2025 pursuant to the 2024 Share Repurchase Authorization, leaving $325.0 million in aggregate repurchase authority remaining as of February 3, 2025.
The timing and amount of any repurchases of common stock will be solely at the discretion of the Company and is subject to general business and market conditions, as well as other factors. The share repurchase authorization is
part of a broader capital allocation framework to deliver value to shareholders by first, driving profitable growth in the business, organically and through acquisitions and franchise development; second, to remain within a ratings agency target adjusted EBITDA net leverage ratio of 2.5 to 3.5 times; and third, to continue returning excess capital to shareholders.
Summary
Valvoline had cash and cash equivalents of $60.0 million, total debt of $1,033.1 million, and total remaining borrowing capacity of $401.5 million as of December 31, 2024. Valvoline’s ability to continue to generate positive cash flows from operations is dependent on general economic conditions, the competitive environment in the industry, and is subject to the business and other risk factors described in Item 1A of Part I of the Annual Report on Form 10-K for the fiscal year ended September 30, 2024.
Management believes that the Company has sufficient liquidity based on its current cash, cash equivalents, cash generated from business operations and existing financing to meet its pension and other postretirement plan, debt servicing, tax-related and other material cash and operating requirements for the next twelve months.
NEW ACCOUNTING PRONOUNCEMENTS
For a discussion and analysis of recently issued accounting pronouncements and the impacts on Valvoline, refer to Note 1 in the Notes to Condensed Consolidated Financial Statements in Item 1 of Part I of this Quarterly Report on Form 10-Q.
CRITICAL ACCOUNTING ESTIMATES
The Company’s critical accounting estimates are described in Item 7 of Part II in Valvoline’s Annual Report on Form 10-K for the fiscal year ended September 30, 2024. Management reassessed the critical accounting estimates as disclosed in the Annual Report on Form 10-K, and determined there were no changes in the three months ended December 31, 2024.
ITEM 3. QUANTITATIVE AND QUALITATIVE DISCLOSURES ABOUT MARKET RISK
The Company’s market risks are discussed in Item 7A of Part II in Valvoline's Annual Report on Form 10-K for the fiscal year ended September 30, 2024. Management reassessed the quantitative and qualitative market risk disclosures as described in the Annual Report on Form 10-K and determined there were no material changes to market risks in the three months ended December 31, 2024.
ITEM 4. CONTROLS AND PROCEDURES
Evaluation of Disclosure Controls and Procedures
Disclosure controls and procedures (as defined in Rules 13a-15(e) and 15d-15(e) under the Securities Exchange Act of 1934, as amended (“Exchange Act”)) are designed to ensure that information required to be disclosed in the reports that are filed or submitted under the Exchange Act is recorded, processed, summarized, and reported within the time periods specified in the rules and forms of the Securities and Exchange Commission, and that such information is accumulated and communicated to Valvoline’s management, including the Chief Executive Officer (“CEO”) and Chief Financial Officer (“CFO”), to allow timely decisions regarding required disclosure. Management recognizes that any controls and procedures, no matter how well designed and operated, can provide only reasonable assurance of achieving their objectives.
Valvoline’s CEO and CFO, with the assistance of management, have evaluated the effectiveness of the Company’s disclosure controls and procedures, as of the end of the period covered by this Quarterly Report on Form 10-Q (the “Evaluation Date”), and based upon such evaluation, have concluded that as of the Evaluation Date, the Company’s
disclosure controls and procedures were not effective at the reasonable assurance level due to a material weakness in internal control over financial reporting as described below.
Notwithstanding the conclusion that disclosure controls and procedures were not effective as of December 31, 2024 due to the material weakness, management continued performing additional analyses and other procedures, including enhancing certain manual procedures and controls intended to ensure the condensed consolidated financial statements included in this Quarterly Report on Form 10-Q are fairly presented in all material respects. The material weakness did not result in any identified material misstatements in the current or prior period consolidated financial statements. Accordingly, the Company believes there are no material inaccuracies or omissions of material fact in its condensed consolidated financial statements included in this Quarterly Report on Form 10-Q and that such financial statements present fairly, in all material respects, the financial position, results of operations and cash flows as of and for each of the periods presented herein in accordance with U.S. GAAP.
Changes in Internal Control
Other than with respect to the remediation efforts discussed below, there have been no significant changes in Valvoline’s internal control over financial reporting that occurred during the fiscal quarter ended December 31, 2024 that materially affected, or are reasonably likely to materially affect, Valvoline’s internal control over financial reporting.
Material Weakness in Internal Control over Financial Reporting
The sale of the former Global Products reportable segment on March 1, 2023 resulted in material changes in the Company’s internal control over financial reporting, including the implementation of a new enterprise resource planning system (“ERP”) on January 1, 2024. A material weakness in internal control over financial reporting was initially reported during the quarter ended March 31, 2024 due to the ERP implementation and the related ineffective information technology general controls (“ITGCs”) and design of certain business process controls. A material weakness is a deficiency, or a combination of deficiencies, in internal control over financial reporting, such that there is a reasonable possibility that a material misstatement of the annual or interim financial statements will not be prevented or detected on a timely basis.
Specifically, the Company did not ensure adequate (a) user access controls for certain applications to ensure segregation of duties risks were addressed and that user and privileged access reviews were completed timely and sufficiently evidenced, (b) change management controls for certain applications, including sufficient documentation of effectiveness of underlying tools and evaluation of all potential risks, (c) evidence of the effectiveness of controls at its third party IT service organization hosting the ERP, and (d) design for certain business process controls (automated and manual), including those that are dependent on effective ITGCs. While significant progress has been made to address the control deficiencies, a material weakness continued to exist as of December 31, 2024.
Although management has performed procedures to gain comfort that the consolidated financial statements are fairly stated in all material respects, these control deficiencies aggregate to allow for the possibility that material misstatements could impact most financial statement accounts and disclosures that may not be prevented or detected. Accordingly, these control deficiencies aggregate within the control activities component of the Committee of Sponsoring Organizations of the Treadway Commission in the 2013 Internal Control - Integrated Framework and constitute a material weakness. The material weakness did not result in any identified material misstatements to the consolidated financial statements.
Remedial Measures
Management has been actively developing, executing, and enhancing its remedial efforts, which began during the quarter ended March 31, 2024 following the ERP implementation. The remedial efforts include the following:
•Established a plan to stabilize the ERP for the classes of transactions with inadequate initial system design, including the continued execution of manual control activities, analyses and procedures to address the periods of time with systematic deficiencies;
•Enhanced the design of access controls, including reviews of ERP privileged access and segregation of duties in user provisioning to increase the rigor of review and centrally retain supporting evidence, while
continuing to enhance the reviews and documentation retained to support reviews of segregation of duties conflicts and user access within certain other relevant applications;
•Implemented tools to directly oversee access and change management for a key application that was previously managed by a third party;
•Increased the support of an outside consulting firm to enhance management’s remediation efforts, including advice regarding best practices for documentation, design and execution of IT general controls and related transactional-level controls;
•Improved the consistency of manually reviewing the appropriateness of changes to the ERP environment for proper authorization, testing, and implementation and deployed a change management tool to centrally retain this evidence, while continuing to enhance change management evidence and reviews for other relevant applications;
•Obtained and evaluated evidence of the continued operating effectiveness of controls for its ERP service organization as of and through the prior fiscal year end, which will be supplemented in fiscal 2025 with timely documented assessments; and
•Conducted end-to-end business process walkthroughs to identify the points in the process for each significant class of transactions where risks of material misstatement exist to validate the design and operational effectiveness of responsive controls, including application controls, such as system configuration, reports, automated jobs and interfaces. Based on these procedures, management is supplementing its pre-existing review controls with certain preventative transaction-level controls to align with each point in the process where a reasonable possibility of material misstatement exists.
Management believes completion of the foregoing efforts will result in implementing appropriately designed remedial plans to address the material weakness and expects these efforts to be completed during fiscal 2025. Following implementation of the measures outlined above, remediation will be considered complete upon management’s consistent execution and subsequent validation of operational effectiveness through sufficient testing.
ITEM 5. OTHER INFORMATION
Rule 10b5-1 Trading Plans
During the three months ended December 31, 2024, Ms. Carol H. Kruse, a Company Director, and Mr. Jonathan L. Caldwell, the Company’s Senior Vice President and Chief People Officer, entered into Rule 10b5-1 Trading Plans with their brokers. Ms. Kruse entered into a Rule 10b5-1 Trading Plan on November 22, 2024, for the sale of up to 3,740 shares of Valvoline common stock. Ms. Kruse’s Rule 10b5-1 Trading Plan expires upon the earlier of February 28, 2025 or the date all trades pursuant to such trading plan are executed. Mr. Caldwell entered into a Rule 10b5-1 Trading Plan on November 29, 2024, for the sale of up to 3,835 shares of Valvoline common stock and to exercise up to 8,877 stock appreciation rights and sell the shares, net of amounts withheld by the Company for the exercise price and applicable withholding taxes. Mr. Caldwell’s Rule 10b5-1 Trading Plan expires upon the earlier of December 1, 2025 or the date all trades pursuant to such trading plan are executed.
PART II - OTHER INFORMATION
ITEM 1. LEGAL PROCEEDINGS
From time to time, Valvoline is party to lawsuits, claims and other legal proceedings that arise in the ordinary course of business. For a description of Valvoline's legal proceedings, refer to Note 7 of the Notes to Condensed Consolidated Financial Statements included in Item 1 of Part I of this Quarterly Report on Form 10-Q.
ITEM 1A. RISK FACTORS
During the period covered by this report, there were no material changes to the Company’s risk factors previously disclosed in Item 1A of Part I in Valvoline’s Annual Report on Form 10-K for the fiscal year ended September 30, 2024.
ITEM 2. UNREGISTERED SALES OF EQUITY SECURITIES AND USE OF PROCEEDS
Repurchases of the Company’s common stock during the three months ended December 31, 2024 pursuant to the 2024 Share Repurchase Authorization were:
| | | | | | | | | | | | | | |
| Monthly period | Total number of shares purchased | Average price paid per share | Total number of shares purchased as part of publicly announced plans or programs | Dollar value of shares that may yet be purchased
under the plans or programs
(in millions) |
| October 1, 2024 - October 31, 2024 | 239,384 | | $ | 41.06 | | 239,384 | | $ | 375.0 | |
| November 1, 2024 - November 30, 2024 | 101,073 | | $ | 39.57 | | 101,073 | | $ | 371.0 | |
| December 1, 2024 - December 31, 2024 | 678,689 | | $ | 37.57 | | 678,689 | | $ | 345.5 | |
| Total | 1,019,146 | | $ | 38.59 | | 1,019,146 | | |
ITEM 6. EXHIBITS
| | | | | |
| |
| |
| |
| |
| |
| |
| |
| |
| |
| |
| |
| |
| |
| |
| 31.1* | |
| 31.2* | |
| 32** | |
| |
| 101.INS | XBRL Instance Document - the instance document does not appear in the Interactive Data File because its XBRL tags are embedded within the Inline XBRL document. |
| 101.SCH | XBRL Taxonomy Extension Schema Document. |
| 101.CAL | XBRL Taxonomy Extension Calculation Linkbase Document. |
| 101.DEF | XBRL Taxonomy Extension Definition Linkbase Document. |
| 101.LAB | XBRL Taxonomy Extension Label Linkbase Document. |
| 101.PRE | XBRL Taxonomy Extension Presentation Linkbase Document. |
| 104 | Cover Page Interactive Data File (formatted as inline XBRL and contained in Exhibit 101). |
* Filed herewith.
** Furnished herewith.
™ Trademark, Valvoline or its subsidiaries, registered in various countries.
SM Service mark, Valvoline or its subsidiaries, registered in various countries.
SIGNATURE
Pursuant to the requirements of the Securities Exchange Act of 1934, the Registrant has duly caused this report to be signed on its behalf by the undersigned thereunto duly authorized.
| | | | | | | | |
| VALVOLINE INC. |
| (Registrant) |
| | |
| February 6, 2025 | By: | /s/ Mary E. Meixelsperger |
| | Mary E. Meixelsperger |
| | Chief Financial Officer |
| | |