
Company announcement — No. 50/2017
Interim report for the first nine months of 2017
Copenhagen, November 8, 2017 — Zealand Pharma A/S (“ZEAL”) announces financial results and continued strong progress for its product candidates and business for the first nine months of 2017. Financial guidance for 2017 has been revised with 4-6% lower operating expenses.
Financial results for the first nine months of 2017
· Revenue of DKK 128.5 million/USD 20.4 million(1) (DKK 54.3 million/USD 8.1 million(2) in the first nine months of 2016).
· Net operating expenses(3) of DKK 251.7 million/USD 39.9 million(1) (DKK 220.9 million/USD 33.1 million(2) in the first nine months of 2016).
· Net result of DKK -162.3 million/USD -25.7 million(1) (DKK -206.7 million/USD -31.0 million(2) in the first nine months of 2016).
· Cash position of DKK 780.6 million/USD 123.8 million(1) per September 30, 2017 (December 31, 2016: DKK 642.1 million/USD 91.0 million(4), including restricted cash).
Business highlights for Q3 2017
· Listing on the Nasdaq Global Select Market in the U.S. raising gross DKK 567 million/USD 90 million(1).
· Initiation of Phase 3 trial with dasiglucagon for the treatment of severe hypoglycemia.
· Orphan drug designation for dasiglucagon for the treatment of congenital hyperinsulinism was granted by FDA in the U.S.
· Boehringer Ingelheim initiated Phase 1 trial in the amylin analog program, triggering a EUR 4 million milestone payment to Zealand.
· Boehringer Ingelheim initiated Phase 1 trial in the GLP-1/glucagon dual agonist program.
· Soliqua® 100/33 revenue increased 37% and payer coverage increased 4%-point over the previous quarter to cover 65% of commercial lives.
Business highlights for the period thereafter
· Orphan drug designation for glepaglutide for the treatment of short bowel syndrome granted by FDA in the U.S.
· The potential for less than once-daily dosing with glepaglutide is being evaluated in a clinical trial, following positive results in the Phase 2 trial for Short Bowel Syndrome.
· Patient enrolment completed for Phase 3 trial with dasiglucagon for the treatment of severe hypoglycemia.
Britt Meelby Jensen, President and CEO of Zealand, comments:
“We continue to see strong results and progress with our clinical product candidates, and following the U.S. IPO in August, where we raised USD 90 million, we are in a solid position to advance our late stage clinical programs at full speed. For glepaglutide, we are in preparation to start Phase 3 mid-2018, we received orphan drug designation and we are finalizing a trial to assess the potential for a better dosing option for patients. In addition, two of our partnered programs have advanced to Phase 1 for treatment of obesity and/or diabetes. With this, I am convinced that Zealand is set for a successful future.”
Revised financial guidance for 2017
For 2017, Zealand maintains its revenue guidance of a continued increase in royalty payments from Sanofi. No specific guidance on the level of royalties can be provided as Sanofi has not provided any guidance on expected 2017 sales.
Milestone revenue of DKK 101 million has been received from partners.
Net operating expenses in 2017 are expected to be within the range of DKK 375-385 million, 4-6 % lower than previously guided (DKK 390-410 million). The decrease relates to timing of clinical studies as well as tight cost control.
Operating loss before royalty income/expenses has been reduced from DKK 290-310 million to DKK 275-285 million.
Marketed products
Soliqua® 100/33 and Suliqua® (combination of lixisenatide and Lantus®)
Soliqua® 100/33 was launched in the U.S. by Sanofi on January 4, 2017. Soliqua 100/33® sales in Q3 grew 37% versus the previous quarter and U.S. market access reached 65% of commercial lives, a 4%-point increase over the previous quarter.
Suliqua® was approved in January 2017 in the EU and has been launched in the Netherlands and Austria, and launch preparations are ongoing in other markets.
Adlyxin®/Lyxumia® (lixisenatide, GLP-1 receptor agonist)
Lixisenatide is marketed under the brand name Lyxumia® in more than 45 countries and was made available in the U.S. under the brand name Adlyxin® in January 2017.
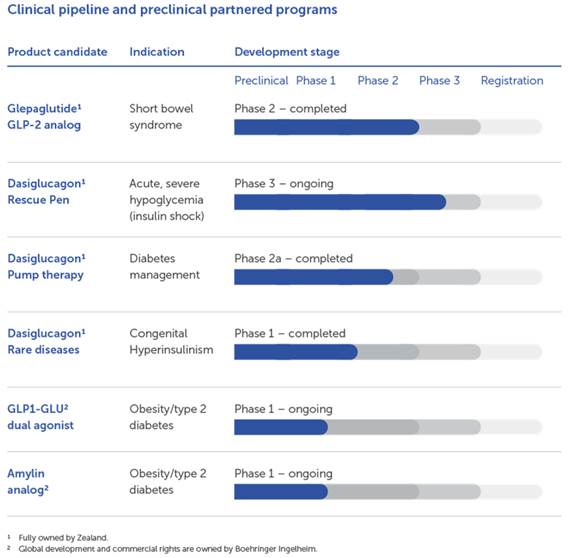
Glepaglutide (GLP-2 analog) for short bowel syndrome
Glepaglutide is a Zealand-invented long-acting GLP-2 analog for the treatment of short bowel syndrome, for which positive Phase 2 results were reported in June 2017. A clinical trial to evaluate the potential for less than once-daily dosing was initiated in October, 2017. Orphan drug designation for glepaglutide for the treatment of short bowel syndrome was granted by the FDA in October 2017. Initiation of Phase 3 is expected mid-2018.
Dasiglucagon (glucagon analog stable in liquid formulation) franchise
Dasiglucagon is a Zealand-invented glucagon analog with a unique stability profile in liquid formulation and is in development for three different indications.
· Dasiglucagon Rescue pen for severe hypoglycemia
The ready-to-use dasiglucagon rescue pen is expected to offer diabetes patients and their families a fast treatment solution for severe hypoglycemia. The first Phase 3 trial with dasiglucagon for the treatment of severe hypoglycemia in diabetes was initiated in July 2017 with recruitment completed in October 2017. Results are expected in Q2 2018, ahead of previous expectations. A second Phase 3 trial is planned to start during December 2017 with expected results in H2 2018.
· Dasiglucagon Dual Hormone Pump Therapy for diabetes treatment
A next-generation artificial pancreas pump device containing both insulin and glucagon (dasiglucagon) that could improve blood sugar control, with limited patient intervention, is in development. Zealand reported positive results from two Phase 2a trials during the second quarter and further development steps are planned for 2018.
· Dasiglucagon for Congenital hyperinsulinism
A treatment option is in development for orphan diseases where insulin levels are elevated, such as congenital hyperinsulinism (CHI), covering several congenital disorders caused by gene mutations or neonatal stress during late pregnancy/childbirth. In May 2017, the Committee for Orphan Medicinal Products (COMP) in the EU issued a positive opinion on an orphan medicinal product application for Zealand’s glucagon analogue. This was followed by a similar positive decision from the U.S. FDA in August 2017. A Phase 2 clinical trial is expected to start during H1 2018.
GLP1-GLU dual agonist for obesity and/or diabetes treatment (with Boehringer Ingelheim)
Boehringer Ingelheim has initiated a Phase 1 trial of the glucagon/GLP-1 dual agonist for once-weekly dosing. The glucagon/GLP-1 dual agonist activates two key gut hormone receptors at the same time and may offer better blood sugar and weight loss control than currently available single-hormone receptor agonist treatments. Boehringer Ingelheim is funding all research, development and commercialization activities. Zealand is eligible to receive up to EUR 386 million in milestone payments (of which EUR 365 million is outstanding) and royalties on global sales.
Long-acting amylin analog for obesity and/or diabetes treatment (with Boehringer Ingelheim)
The Phase 1 trial of the long-acting amylin analog with the potential for once-weekly administration for the treatment of obesity and obesity-related comorbidities was initiated in August 2017. In preclinical studies, Zealand and Boehringer Ingelheim observed that the novel long-acting amylin analog may prevent the development of obesity in preclinical models, suggesting its potential use in treating obesity and obesity-related comorbidities. Boehringer Ingelheim is funding all research, development and commercialization activities. Zealand is eligible to receive up to EUR 295 million in milestone payments (of which EUR 283 million is outstanding) and royalties on global sales.
Research collaborations with Orbit Discovery and Torrey Pines
In line with Zealand’s strategy to access cutting-edge technology, Zealand has initiated two new research collaborations, both focused on identifying novel peptides that act on targets relevant to specialty gastrointestinal and metabolic diseases.
Orbit Discovery has a technology that enables generation of diverse random and focused libraries of linear and cyclic peptides and the collaboration will screen Orbit’s peptide libraries against undisclosed targets to identify novel drug candidates for optimization by Zealand.
Torrey Pines Institute for Molecular Studies’ technology provides access to large peptide libraries with a screening process enabling the testing of millions of novel peptide compounds in combination reducing the complexity to hundreds of samples to identify hits. The technology is complimentary to the Orbit approach and the aim of the collaboration is to identify novel peptides acting on additional targets relevant to specialty gastrointestinal and metabolic diseases.
Conference call today at 4 pm CET/10 am EST
Zealand’s management will be hosting a conference call today at 4 pm CET/10 am EST to present the results for the first nine months of 2017. Participating in the call will be President and Chief Executive Officer Britt Meelby Jensen, Executive Vice President and Chief Financial Officer Mats Blom and Executive Vice President and Chief Medical and Development Officer Adam Steensberg. The presentation will be followed by a Q&A session.
The dial-in numbers are:
DK standard access | +45 32711658 |
UK and international | +44 (0) 20 3427 1907 |
U.S. (free dial-in) | +1 646 254 3366 |
Passcode | 3321181 |
A live audio webcast of the call, including an accompanying slide presentation, will be available via the following link, https://edge.media-server.com/m6/p/wr84wf2d also accessible on the Investor section of Zealand’s website (www.zealandpharma.com). Participants are advised to register for the webcast approximately 10 minutes before the start. A recording of the event will be made available on the Investor section of Zealand’s website after the call.
For further information, please contact:
Britt Meelby Jensen, President and Chief Executive Officer
Tel.: +45 51 67 61 28, e-mail: bmj@zealandpharma.com
Mats Blom, Executive Vice President and Chief Financial Officer
Tel.: +45 31 53 79 73, e-mail: mabl@zealandpharma.com
About Zealand Pharma A/S
Zealand Pharma A/S (Nasdaq Copenhagen and New York: ZEAL) (“Zealand”) is a biotechnology company focused on the discovery, design and development of innovative peptide-based medicines. Zealand has a portfolio of medicines and product candidates under license collaborations with Sanofi, Boehringer Ingelheim and a pipeline of internal product candidates focusing on specialty gastrointestinal and metabolic diseases.
Zealand is based in Copenhagen (Glostrup), Denmark. For further information about the Company’s business and activities, please visit www.zealandpharma.com or follow Zealand on Linked-in or Twitter @ZealandPharma.
Safe Harbor/Forward-Looking Statements
The above information contains forward-looking statements that provide our expectations or forecasts of future events such as new product introductions, clinical development activities and anticipated results, product approvals and financial performance. Such forward-looking statements are subject to risks, uncertainties and inaccurate assumptions. This may cause actual results to differ materially from expectations and it may cause any or all of our forward-looking statements here or in other publications to be wrong. Factors that may affect future results include interest rate and currency exchange rate fluctuations, delay or failure of clinical trials and other development activities, production problems, unexpected contract breaches or terminations, government-mandated or market-driven price decreases for Zealand’s products, introduction of competing products, Zealand’s ability to successfully market both new and existing products, exposure to product liability and other lawsuits, changes in reimbursement rules and governmental laws and related interpretation thereof, and unexpected growth in costs and expenses.
Certain assumptions made by Zealand are required by Danish Securities Law for full disclosure of material corporate information. Some assumptions, including assumptions relating to sales associated with a product that is prescribed for unapproved uses, are made taking into account past performances of other similar drugs for similar disease states or past performance of the same drug in other regions where the product is currently marketed. It is important to note that although physicians may, as part of their freedom to practice medicine in the United States, prescribe approved drugs for any use they deem appropriate, including unapproved uses, at Zealand, promotion of unapproved uses is strictly prohibited.
(1) Translated solely for convenience into U.S. dollars at an assumed exchange rate of DKK 6.30 per USD 1.00, which was the rounded official exchange rate of such currencies at September 30, 2017.
(2) Translated solely for convenience into U.S. dollars at an assumed exchange rate of DKK 6.68 per USD 1.00, which was the rounded official exchange rate of such currencies at September 30, 2016.
(3) Net operating expenses consist of research, development and administrative expenses less other operating income.
(4) Translated solely for convenience into U.S. dollars at an assumed exchange rate of DKK 7.05 per USD 1.00, which was the rounded official exchange rate of such currencies at December 31, 2016.
Key figures for the Group
DKK thousand |
| Note |
| 1.7-30.9.17 |
| 1.7-30.9.16 |
| 1.1-30.9.17 |
| 1.1-30.9.16 |
| 1.1-31.12.16 |
|
|
|
|
|
|
| Restated (1) |
|
|
| Restated (1) |
|
|
|
INCOME STATEMENT AND COMPREHENSIVE INCOME |
|
|
|
|
|
|
|
|
|
|
|
|
|
Revenue |
|
|
| 40,079 |
| 39,586 |
| 128,500 |
| 54,272 |
| 234,778 |
|
Royalty expenses |
|
|
| -1,395 |
| -5,327 |
| -13,107 |
| -7,091 |
| -31,459 |
|
Research and development expenses |
|
|
| -69,059 |
| -50,424 |
| -221,204 |
| -190,381 |
| -268,159 |
|
Administrative expenses |
|
|
| -7,936 |
| -5,207 |
| -30,991 |
| -31,738 |
| -52,503 |
|
Other operating income |
|
|
| 96 |
| 186 |
| 493 |
| 1,251 |
| 1,697 |
|
Operating result |
|
|
| -38,215 |
| -21,186 |
| -136,309 |
| -173,687 |
| -115,646 |
|
Net financial items |
|
|
| -5,424 |
| -10,681 |
| -30,082 |
| -36,164 |
| -43,764 |
|
Result before tax |
|
|
| -43,639 |
| -31,867 |
| -166,391 |
| -209,851 |
| -159,410 |
|
Income tax benefit |
| (2) |
| 1,375 |
| 964 |
| 4,125 |
| 3,199 |
| 5,500 |
|
Net result for the period |
|
|
| -42,264 |
| -30,903 |
| -162,266 |
| -206,652 |
| -153,910 |
|
Comprehensive income/loss for the period |
|
|
| -42,264 |
| -30,903 |
| -162,266 |
| -206,652 |
| -153,910 |
|
Earnings/loss per share - basic (DKK) |
|
|
| -1.48 |
| -1.29 |
| -6.13 |
| -8.65 |
| -6.33 |
|
Earnings/loss per share - diluted (DKK) |
|
|
| -1.48 |
| -1.29 |
| -6.13 |
| -8.65 |
| -6.33 |
|
|
|
|
|
|
|
|
|
|
|
|
|
|
|
STATEMENT OF FINANCIAL POSITION |
|
|
|
|
|
|
|
|
|
|
|
|
|
Cash and cash equivalents |
|
|
|
|
|
|
| 774,654 |
| 224,636 |
| 323,330 |
|
Restricted cash |
| (3) |
|
|
|
|
| 5,980 |
| 157,306 |
| 318,737 |
|
Total assets |
|
|
|
|
|
|
| 828,627 |
| 569,706 |
| 694,626 |
|
Share capital (‘000 shares) |
|
|
|
|
|
|
| 30,749 |
| 26,062 |
| 26,142 |
|
Equity |
|
|
|
|
|
|
| 638,977 |
| 217,630 |
| 278,194 |
|
Equity ratio |
| (4) |
|
|
|
|
| 0.77 |
| 0.38 |
| 0.40 |
|
Royalty bond |
|
|
|
|
|
|
| 141,897 |
| 312,145 |
| 332,243 |
|
|
|
|
|
|
|
|
|
|
|
|
|
|
|
CASH FLOW |
|
|
|
|
|
|
|
|
|
|
|
|
|
Cash flow from operating activities |
|
|
|
|
|
|
| -172,792 |
| -67,704 |
| 40,904 |
|
Cash flow from investing activities |
|
|
|
|
|
|
| 308,905 |
| -137,792 |
| -299,958 |
|
Cash flow from financing activities |
|
|
|
|
|
|
| 326,396 |
| 16,214 |
| 157,146 |
|
Purchase of property, plant and equipment |
|
|
|
|
|
|
| -3,933 |
| -1,871 |
| -2,600 |
|
Free cash flow |
| (5) |
|
|
|
|
| -176,725 |
| -69,575 |
| 38,304 |
|
|
|
|
|
|
|
|
|
|
|
|
|
|
|
OTHER |
|
|
|
|
|
|
|
|
|
|
|
|
|
Share price (DKK) |
|
|
|
|
|
|
| 121.50 |
| 98.5 |
| 106.5 |
|
Market capitalization (MDKK) |
| (6) |
|
|
|
|
| 3,736 |
| 2,567 |
| 2,784 |
|
Equity per share (DKK) |
| (7) |
|
|
|
|
| 20.82 |
| 8.54 |
| 11.69 |
|
Average number of employees |
|
|
|
|
|
|
| 128 |
| 125 |
| 124 |
|
Notes:
(1) Figures for the period ended September 30, 2016 have been restated. See note 1 to the financial statements.
(2) According to Danish tax legislation Zealand is eligible to receive DKK 5.5 million in cash relating to the tax loss of 2016. Zealand expects to be eligible to receive up to DKK 5.5 million in income tax benefit for 2017 of which 4.1 millon has been recognized for the period.
(3) Restricted cash serves as collateral for the royalty bond issued in 2014.
(4) Equity ratio is calculated as equity at the balance sheet date divided by total assets at the balance sheet date.
(5) Free cash flow is calculated as cash flow from operating activities less purchase of property, plant and equipment.
(6) Market capitalization is calculated as outstanding shares at the balance sheet date times the share price at the balance sheet date.
(7) Equity per share is calculated as shareholders equity divided by total number of shares less treasury shares.
Financial review
(Comparative figures for the corresponding period of 2016 are shown in brackets, except for the financial position which expresses the comparative figures at December 31, 2016)
In preparing the financial statements for the first nine month of 2016, the need for some restatements relating to previous periods was identified (see Note 1 to the condensed consolidated interim financial statements).
Income statement
The net result for the first nine months of 2017 was a loss of DKK 162.3 million compared with a loss of DKK 206.7 million for the same period of 2016. The improved result is primarily a consequence of an increase in revenue compared with the same period of 2016, which was partly offset by increased research and development expenses.
Revenue
Revenue for the first nine months of 2017 amounted to DKK 128.5 million (54.3), of which DKK 15.3 million (19.0) related to royalty revenue on Sanofi’s sales of Lyxumia®/Adlyxin® (lixisenatide) and DKK 12.2 million (0.0) to royalty revenue on Sanofi’s sales of Soliqua® 100/33.
Milestone revenue amounted to DKK 101.0 million (35.3) and primarily comprised a USD 10 million milestone related to the approval of Suliqua® in the EU in January 2017 and a EUR 4 million milestone from Boehringer Ingelheim related to initiation of Phase 1 with the long-acting amylin analog in August 2017.
Royalty expenses
Royalty expenses for the first nine months of 2017 were DKK 13.1 million (7.1). Royalty expenses are payments by Zealand to third parties based on license payments received for Lyxumia®/Adlyxin® (lixisenatide) and Soliqua® 100/33/Suliqua®.
Research and development expenses
Research and development expenses for first nine months of 2017 amounted to DKK 221.2 million (190.2). The increase of DKK 31.0 million compared with 2016 is due to increased development costs mainly related to the clinical development of dasiglucagon (both single- and multiple-dose formulations) and of glepaglutide for short bowel syndrome, as well as preclinical research activities.
Administrative expenses
Administrative expenses for the first nine months of 2017 amounted to DKK 31.0 million (31.9).
Other operating income
Other operating income for the first nine months of 2017 amounted to DKK 0.5 million (1.3).
Operating loss
The operating result for the first nine months of 2017 was a loss of DKK 136.3 million (173.7).
Net financial items
Net financial items consist of interest expenses on the royalty bond, amortization of costs relating to the royalty bond, interest income, banking fees and adjustments based on changes in exchange rates. Net financial items for the first nine months of 2017 amounted to DKK -30.1 million (-36.2) — a decrease of DKK 6.1 million in net financial expenses compared with the same period in 2016. It is the net result of an increase in financial expenses related to the repayment of half of the outstanding royalty bond of USD 50 million in Q1
2017, as described below, a decrease in actual interest expenses in Q2 and Q3 2017 and a decrease in amortization expenses as a result of the deferral of the expected repayment of the royalty bond in Q3 2017.
Loss before tax
Loss before tax for the first nine months of 2017 came to DKK 166.4 million (209.9).
Income tax benefit
With a negative result in the first nine months of 2017 and financial guidance also pointing toward a negative result for the full year, Zealand expects to be eligible to receive up to DKK 5.5 million in income tax benefit for 2017, of which DKK 4.1 million (3.2) has been recognized for the period.
No deferred tax asset has been recognized in the statement of financial position due to uncertainty as to whether tax losses carried forward can be utilized.
Net loss and comprehensive loss
Net loss and comprehensive loss for the first nine months of 2017 amounted to DKK 162.3 million (206.7).
Equity
On August 9, 2017, American Depositary Shares (ADSs) representing Zealand shares started trading on the Nasdaq Global Select Market in the United States under the symbol ZEAL.
On August 14, 2017, Zealand registered a capital increase of 4,375,000 new shares and completed its initial public offering of American Depositary Shares on the Nasdaq Global Select Market in the United States. Following full exercise of a 15% overallotment option, an additional 156,250 new shares were issued on August 15, 2017. In addition, 500,000 treasury shares were sold. Total gross proceeds of the offering amounted to DKK 567.1 million.
Equity stood at DKK 639.0 million (278.2) at the end of the period, corresponding to an equity ratio of 77% (40%).
Capital expenditure
Investments in new laboratory equipment for the period amounted to DKK 3.9 million (1.9).
Royalty bond
In December 2014, Zealand entered into a USD 50 million royalty bond financing arrangement, based on part of the royalties from lixisenatide as a standalone product. The bond carries an interest rate of 9.375%. As security for the royalty bond, certain milestone payments relating to lixisenatide were held as collateral in the form of restricted cash. On March 15, 2017, Zealand used restricted cash of USD 25 million (DKK 175 million) to repay half of the outstanding bond. Furthermore, the remaining restricted cash of USD 26.9 million (DKK 184 million) held as collateral for the bond was released to Zealand in exchange for a parent company guarantee.
At September 30, 2017, the outstanding royalty bond amounted to nominal USD 24.8 million (DKK 156.2 million). In the consolidated statement of financial position, this is reported net of capitalized financing costs, amounting to DKK 141.9 million at September 30, 2017 (332.2), excluding accrued interest expenses, which is reported in other liabilities.
Cash and cash equivalents
At September 30, 2017, Zealand had cash and cash equivalents of DKK 774.7 million (323.3). In addition, DKK 6.0 million (318.7) was held as collateral for the royalty bond. The total cash position including restricted cash at September 30, 2017 was DKK 780.6 million (642.1).
Cash flow
Cash flow from operating activities amounted to DKK -172.8 million (-67.7). Cash flow from investing activities amounted to DKK 308.9 million (-137.8) as a consequence of transferring net DKK 305.1 million from restricted cash as collateral for the royalty bond. Cash flow from financing activities amounted to DKK 326.4 million (16.2), relating to the capital increase and repayment of half of the outstanding royalty bond. The total cash flow for the first nine months of 2017 amounted to DKK 462.5 million (-189.3).
Key financial developments in Q3 2017
Revenue in the third quarter amounted to DKK 40.1 million (DKK 39.6 million), of which DKK 29.8 million related to the EUR 4 million milestone related to initiation of Phase 1 with the long-acting amylin analog and DKK 10.3 million related to royalties on Lyxumia®/Adlyxin® (lixisenatide) and Soliqua® sales during the quarter.
Net operating expenses amounted to DKK 76.9 million (55.4). The increase is explained by increased research and development expenses.
Net loss for the third quarter amounted to DKK 42.3 million (30.9).
Risk factors
This interim report contains forward-looking statements, including forecasts of future expenses as well as expected business-related events. Such statements are subject to risks and uncertainties as various factors — some of which are beyond the control of Zealand — may cause actual results and performance to differ materially from the forecasts made in this interim report. Without being exhaustive, such factors include general economic and business conditions, e.g. legal issues, scientific and clinical results, and fluctuations in currencies. A more extensive description of risk factors can be found in the Annual Report 2016 under the section Risk management and internal control.
Management’s statement on the interim report
The Board of Directors and the Executive Management have today considered and adopted the interim report of Zealand Pharma A/S for the period January 1 — September 30, 2017.
The report has been prepared in accordance with IAS 34 as adopted by the EU and additional Danish disclosure requirements for listed companies.
In our opinion, the interim report gives a true and fair view of the Group’s assets, equity and liabilities and financial position at September 30, 2017 as well as of the results of the Group’s operations and cash flow for the period January 1 — September 30, 2017.
Moreover, in our opinion, the Management’s Review gives a true and fair view of the development in the Company’s operations and financial conditions, of the net result for the period and the financial position while also describing the most significant risks and uncertainty factors that may affect the Group.
Copenhagen, November 8, 2017
Executive Management | |
|
|
Britt Meelby Jensen | Mats Peter Blom |
President and CEO | Executive Vice President and CFO |
|
|
Board of Directors |
|
|
|
Martin Nicklasson | Rosemary Crane Catherine Moukheibir |
Chairman | Vice Chairman |
|
|
Alain Munoz | Michael Owen Hanne Heidenheim Bak |
|
|
Rasmus Just | Jens Peter Stenvang |
Independent auditor’s review report
To the shareholders of Zealand Pharma A/S
Independent auditor’s review report on the condensed consolidated interim financial statements
We have reviewed the condensed consolidated interim financial statements of Zealand Pharma A/S for the period January 1 – September 30, 2017, pages 12-22, which comprise the income statement, statement of comprehensive income (loss), statement of cash flows, statement of financial position and statement of changes in equity as well as notes.
Management’s responsibility for the condensed consolidated interim financial statements
Management is responsible for the preparation of the condensed consolidated interim financial statements in accordance with IAS 34, Interim Financial Reporting, as adopted by the EU and additional Danish requirements for listed companies. It is also responsible for such internal control as management determines is necessary to enable the preparation of the condensed consolidated interim financial statements that is free from material misstatement, whether due to fraud or error.
Auditor’s responsibility
Our responsibility is to express a conclusion on the condensed consolidated interim financial statements. We conducted our review in accordance with the International Standard on Review of Interim Financial Information Performed by the Independent Auditor of the Group and additional requirements under Danish audit regulation. This requires us to conclude whether anything has come to our attention that causes us to believe that the condensed consolidated interim financial statements, taken as a whole, has not been prepared, in all material respects, in accordance with the applicable financial reporting framework. This also requires us to comply with ethical requirements.
A review of the condensed consolidated interim financial statements in accordance with the International Standard on Review of Interim Financial Information Performed by the Independent Auditor of the Group is a limited assurance engagement. The auditor performs procedures, primarily consisting of making enquiries of management and others within the Group, as appropriate, and applying analytical procedures, and evaluates the evidence obtained.
The procedures performed in a review are substantially minor in scope than those performed in an audit conducted in accordance with International Standards on Auditing. Accordingly, we do not express an audit opinion on the condensed consolidated interim financial statements.
Conclusion
Based on our review, nothing has come to our attention that causes us to believe that the condensed consolidated interim financial statements have not been prepared, in all material respects, in accordance with IAS 34, Interim Financial Reporting, as adopted by the EU and additional Danish requirements for listed companies.
Copenhagen, November 8, 2017
Deloitte
Statsautoriseret Revisionspartnerselskab
Company reg. no. 33 96 35 56
Martin Norin Faarborg Sumit Sudan
State-Authorized Public Accountant State-Authorized Public Accountant
Condensed consolidated interim financial statements
Condensed consolidated income statements for the three- and nine-month periods ended September 30, 2017 and 2016 and the 12-month period ended December 31, 2016
DKK thousand |
| Note |
| 1.7 - 30.9.17 |
| 1.7-30.9.16 |
| 1.1 - 30.9.17 |
| 1.1-30.9.16 |
| 1.1 - 31.12.16 |
|
|
|
|
|
|
| Restated |
|
|
| Restated |
|
|
|
Revenue |
| 2 |
| 40,079 |
| 39,586 |
| 128,500 |
| 54,272 |
| 234,778 |
|
Royatly expenses |
|
|
| -1,395 |
| -5,327 |
| -13,107 |
| -7,091 |
| -31,459 |
|
Research and development expenses |
|
|
| -69,059 |
| -50,424 |
| -221,204 |
| -190,381 |
| -268,159 |
|
Administrative expenses |
|
|
| -7,936 |
| -5,207 |
| -30,991 |
| -31,738 |
| -52,503 |
|
Other operating income |
|
|
| 96 |
| 186 |
| 493 |
| 1,251 |
| 1,697 |
|
Operating loss |
|
|
| -38,215 |
| -21,186 |
| -136,309 |
| -173,687 |
| -115,646 |
|
|
|
|
|
|
|
|
|
|
|
|
|
|
|
Financial income |
|
|
| 1,016 |
| 10,140 |
| 2,252 |
| 13,622 |
| 592 |
|
Financial expenses |
| 6 |
| -6,440 |
| -20,821 |
| -32,334 |
| -49,786 |
| -44,356 |
|
Loss before tax |
|
|
| -43,639 |
| -31,867 |
| -166,391 |
| -209,851 |
| -159,410 |
|
|
|
|
|
|
|
|
|
|
|
|
|
|
|
Income tax benefit |
|
|
| 1,375 |
| 964 |
| 4,125 |
| 3,199 |
| 5,500 |
|
Net loss for the period |
|
|
| -42,264 |
| -30,903 |
| -162,266 |
| -206,652 |
| -153,910 |
|
|
|
|
|
|
|
|
|
|
|
|
|
|
|
Basic loss per share |
| 4 |
| -1.48 |
| -1.29 |
| -6.13 |
| -8.65 |
| -6.33 |
|
Diluted loss per share |
| 4 |
| -1.48 |
| -1.29 |
| -6.13 |
| -8.65 |
| -6.33 |
|
Condensed consolidated statements of comprehensive income (loss) for the three- and nine-month periods ended September 30, 2017 and 2016 and the 12-month period ended December 31, 2016
DKK thousand |
| Note |
| 1.7-30.9.17 |
| 1.7-30.9.16 |
| 1.1 - 30.9.17 |
| 1.1-30.9.16 |
| 1.1 - 31.12.16 |
|
|
|
|
|
|
|
|
|
|
|
|
|
|
|
Net loss for the period |
|
|
| -42,264 |
| -30,903 |
| -162,266 |
| -206,652 |
| -153,910 |
|
Other comprehensive income |
|
|
| 0 |
| 0 |
| 0 |
| 0 |
| 0 |
|
Comprehensive loss for the period |
|
|
| -42,264 |
| -30,903 |
| -162,266 |
| -206,652 |
| -153,910 |
|
Condensed consolidated statement of cash flow for the nine-month periods ended September 30, 2017 and 2016
DKK thousand |
|
|
| 1.1-30.9.17 |
| 1.1-30.9.16 |
|
|
|
|
|
|
|
|
|
Net loss for the period |
|
|
| -162,266 |
| -206,652 |
|
Adjustments for non-cash items |
|
|
| 35,855 |
| 195,842 |
|
Change in working capital |
|
|
| -27,262 |
| -27,928 |
|
Financial income received |
|
|
| 1,262 |
| 5,727 |
|
Financial expenses paid |
|
|
| -20,381 |
| -31,494 |
|
Income tax receipt |
|
|
| 0 |
| -3,199 |
|
Cash flow from operating activities |
|
|
| -172,792 |
| -67,704 |
|
|
|
|
|
|
|
|
|
Transfer to restricted cash related to the royalty bond |
| 6 |
| -60,675 |
| 0 |
|
Transfer from restricted cash related to the royalty bond |
| 6 |
| 365,795 |
| -144,420 |
|
Transfer from restricted cash for royalty bond interest payments |
|
|
| 7,637 |
| 8,517 |
|
Change in deposit |
|
|
| -39 |
| -18 |
|
Purchase of property, plant and equipment |
|
|
| -3,933 |
| -1,871 |
|
Sale of fixed assets |
|
|
| 120 |
| 0 |
|
Cash flow from investing activities |
|
|
| 308,905 |
| -137,792 |
|
|
|
|
|
|
|
|
|
Proceeds from issue of shares related to exercise of warrants |
|
|
| 6,572 |
| 16,214 |
|
Proceeds from initial public offering |
|
|
| 567,076 |
| 0 |
|
Costs related to initial public offering |
|
|
| -70,892 |
| 0 |
|
Repayment of royalty bond |
| 6 |
| -176,360 |
| 0 |
|
Cash flow from financing activities |
|
|
| 326,396 |
| 16,214 |
|
|
|
|
|
|
|
|
|
Decrease/increase in cash and cash equivalents |
|
|
| 462,509 |
| -189,282 |
|
Cash and cash equivalents at beginning of period |
|
|
| 323,330 |
| 418,796 |
|
Exchange rate adjustments |
|
|
| -11,185 |
| -4,878 |
|
Cash and cash equivalents at end of period |
|
|
| 774,654 |
| 224,636 |
|
Condensed consolidated statement of financial position at September 30, 2017 and December 31, 2016
DKK thousand |
| Note |
| 30.9.17 |
| 31.12.16 |
|
ASSETS |
|
|
|
|
|
|
|
|
|
|
|
|
|
|
|
Non-current assets |
|
|
|
|
|
|
|
Plant and machinery |
|
|
| 12,682 |
| 12,081 |
|
Other fixtures and fittings, tools and equipment |
|
|
| 1,099 |
| 1,154 |
|
Leasehold improvements |
|
|
| 306 |
| 408 |
|
Restricted cash |
|
|
| 0 |
| 305,120 |
|
Deposits |
|
|
| 2,729 |
| 2,690 |
|
Total non-current assets |
|
|
| 16,816 |
| 321,453 |
|
|
|
|
|
|
|
|
|
Current assets |
|
|
|
|
|
|
|
Trade receivables |
|
|
| 10,367 |
| 11,510 |
|
Prepaid expenses |
|
|
| 6,915 |
| 13,837 |
|
Income tax receivable |
|
|
| 9,625 |
| 5,500 |
|
Other receivables |
|
|
| 4,270 |
| 5,379 |
|
Restricted cash |
|
|
| 5,980 |
| 13,617 |
|
Cash and cash equivalents |
| 5 |
| 774,654 |
| 323,330 |
|
Total current assets |
|
|
| 811,811 |
| 373,173 |
|
|
|
|
|
|
|
|
|
Total assets |
|
|
| 828,627 |
| 694,626 |
|
|
|
|
|
|
|
|
|
EQUITY AND LIABILITIES |
|
|
|
|
|
|
|
Share capital |
| 3 |
| 30,749 |
| 26,142 |
|
Share premium |
|
|
| 1,959,705 |
| 1,441,263 |
|
Retained losses |
|
|
| -1,351,477 |
| -1,189,211 |
|
Equity |
|
|
| 638,977 |
| 278,194 |
|
|
|
|
|
|
|
|
|
Royalty bond |
| 6 |
| 125,375 |
| 328,878 |
|
Non-current liabilities |
|
|
| 125,375 |
| 328,878 |
|
|
|
|
|
|
|
|
|
Trade payables |
|
|
| 25,919 |
| 19,739 |
|
Royalty bond |
| 6 |
| 16,522 |
| 3,365 |
|
Other liabilities |
|
|
| 21,834 |
| 64,450 |
|
Current liabilities |
|
|
| 64,275 |
| 87,554 |
|
|
|
|
|
|
|
|
|
Total liabilities |
|
|
| 189,650 |
| 416,432 |
|
|
|
|
|
|
|
|
|
Total equity and liabilities |
|
|
| 828,627 |
| 694,626 |
|
Condensed consolidated statement of changes in equity at September 30, 2017 and 2016
|
| Share |
| Share |
| Retained |
|
|
|
DKK thousand |
| capital |
| premium |
| earnings |
| Total |
|
Equity at January 1, 2016 |
| 24,353 |
| 1,263,179 |
| -1,035,301 |
| 252,231 |
|
Comprehensive loss for the period |
|
|
|
|
|
|
|
|
|
Net loss for the period |
| 0 |
| 0 |
| -206,652 |
| -206,652 |
|
Warrants compensation expenses |
| 234 |
| 20,323 |
| 0 |
| 20,557 |
|
Capital increase |
| 1,475 |
| 157,455 |
| 0 |
| 158,930 |
|
Costs related to capital increase |
| 0 |
| -7,436 |
| 0 |
| -7,436 |
|
Equity at September 30, 2016 |
| 26,062 |
| 1,433,521 |
| -1,241,953 |
| 217,630 |
|
|
|
|
|
|
|
|
|
|
|
Equity at January 1, 2017 |
| 26,142 |
| 1,441,263 |
| -1,189,211 |
| 278,194 |
|
Comprehensive loss for the period |
|
|
|
|
|
|
|
|
|
Net loss for the period |
| 0 |
| 0 |
| -162,266 |
| -162,266 |
|
Warrant compensation expenses |
| 76 |
| 20,293 |
| 0 |
| 20,369 |
|
Capital increase |
| 4,531 |
| 569,041 |
| 0 |
| 573,572 |
|
Costs related to capital increase |
| 0 |
| -70,892 |
| 0 |
| -70,892 |
|
Equity at September 30, 2017 |
| 30,749 |
| 1,959,705 |
| -1,351,477 |
| 638,977 |
|
Note 1 — Significant accounting policies and significant accounting estimates and assessments
The condensed consolidated interim financial statements of Zealand Pharma A/S (“the Company”) have been prepared in accordance with IAS 34, Interim Financial Reporting, as adopted by the EU and additional Danish requirements for submission of interim reports for companies listed on Nasdaq Copenhagen.
The condensed consolidated interim financial statements are presented in Danish kroner (DKK), which is the functional currency of the parent company.
Accounting policies
The condensed consolidated interim financial statements should be read in conjunction with the Company’s Annual Report for the year ended December 31, 2016, which was prepared in accordance with International Financial Reporting Standards (IFRS) as approved by the EU. The accounting policies used in the condensed consolidated interim financial statements are consistent with those used in the Company’s Annual Report for the year ended December 31, 2016. No new IFRS or IFRS Interpretation Committee (IFRIC) interpretations effective for this financial year have had a material impact on the Company’s financial statements.
Significant accounting estimates and assessments
In the preparation of the condensed consolidated interim financial statements, Management makes several accounting estimates that form the basis for the presentation, recognition and measurement of the Company’s assets and liabilities.
In the application of the Company’s accounting policies, the Management of the Company is required to make judgments, estimates and assumptions about the carrying amounts of assets and liabilities that are not readily apparent from other sources. The estimates and associated assumptions are based on historical experience and other factors that are considered to be relevant. Actual results may differ from these estimates. The estimates and underlying assumptions are reviewed on an ongoing basis. Revisions to accounting estimates are recognized in the period in which the estimate is revised if the revision affects only that period, or in the period of the revision and future periods if the revision affects both current and future periods.
The estimates used are based on assumptions assessed as reasonable by Management; however, estimates are inherently uncertain and unpredictable. The assumptions can be incomplete or inaccurate, and unexpected events or circumstances might occur. Furthermore, the Company is subject to risks and uncertainties that might result in deviations in actual results compared with estimates.
For further information regarding significant accounting estimates and assessments related to revenue recognition and employee incentive programs, please see Note 1 in the Annual Report 2016.
No significant changes have been made in accounting estimates and assessments in the period January 1 – September 30, 2017.
Restatement
A few adjustments have been made to the condensed consolidated statement of comprehensive income (loss) related to the correction of the allocation of overhead costs based on the number of employees in various areas such as Research, Development and Administration. Previously, the allocation was based on the total salary in the respective areas.
The table below reflects the individual lines in the condensed consolidated statement of comprehensive income (loss) impacted by the restatements.
Condensed consolidated statement of comprehensive income (loss) for the three-month period ended September 30, 2016
DKK thousand |
| As originally |
| Restatement |
| Amount as |
|
Revenue |
| 39,586 |
| 0 |
| 39,586 |
|
Royalty expenses |
| -5,327 |
| 0 |
| -5,327 |
|
Research and development expenses |
| -53,572 |
| 3,148 |
| -50,424 |
|
Administrative expenses |
| -2,059 |
| -3,148 |
| -5,207 |
|
Other operating income |
| 186 |
| 0 |
| 186 |
|
Operating loss |
| -21,186 |
| 0 |
| -21,186 |
|
|
|
|
|
|
|
|
|
Financial income |
| 10,140 |
| 0 |
| 10,140 |
|
Financial expenses |
| -20,821 |
| 0 |
| -20,821 |
|
Loss before tax |
| -31,867 |
| 0 |
| -31,867 |
|
|
|
|
|
|
|
|
|
Income tax benefit |
| 964 |
| 0 |
| 964 |
|
Net loss for the period |
| -30,903 |
| 0 |
| -30,903 |
|
|
|
|
|
|
|
|
|
Loss per share - basic (DKK) |
| -1.29 |
| 0.00 |
| -1.29 |
|
Loss per share - diluted (DKK) |
| -1.29 |
| 0.00 |
| -1.29 |
|
Statement of comprehensive loss
DKK thousand |
|
|
|
|
|
|
|
Net loss for the period |
| -30,903 |
| 0 |
| -30,903 |
|
Other comprehensive income (loss) |
| 0 |
| 0 |
| 0 |
|
Net loss for the period |
| -30,903 |
| 0 |
| -30,903 |
|
Condensed consolidated statement of comprehensive income (loss) for the nine-month period ended September 30, 2016
DKK thousand |
| As originally |
| Restatement |
| Amount as |
|
Revenue |
| 54,272 |
| 0 |
| 54,272 |
|
Royalty expenses |
| -7,091 |
| 0 |
| -7,091 |
|
Research and development expenses |
| -191,255 |
| 874 |
| -190,381 |
|
Administrative expenses |
| -30,864 |
| -874 |
| -31,738 |
|
Other operating income |
| 1,251 |
|
|
| 1,251 |
|
Operating loss |
| -173,687 |
| 0 |
| -173,687 |
|
|
|
|
|
|
|
|
|
Financial income |
| 13,622 |
| 0 |
| 13,622 |
|
Financial expenses |
| -49,786 |
| 0 |
| -49,786 |
|
Loss before tax |
| -209,851 |
| 0 |
| -209,851 |
|
|
|
|
|
|
|
|
|
Income tax benefit |
| 3,199 |
| 0 |
| 3,199 |
|
Net loss for the period |
| -206,652 |
| 0 |
| -206,652 |
|
|
|
|
|
|
|
|
|
Loss per share - basic (DKK) |
| -8.65 |
| 0.00 |
| -8.65 |
|
Loss per share - diluted (DKK) |
| -8.65 |
| 0.00 |
| -8.65 |
|
Statement of comprehensive loss
DKK thousand |
|
|
|
|
|
|
|
Net loss for the period |
| -206,652 |
| 0 |
| -206,652 |
|
Other comprehensive income (loss) |
| 0 |
| 0 |
| 0 |
|
Net loss for the period |
| -206,652 |
| 0 |
| -206,652 |
|
Note 2 — Revenue
DKK thousand |
| 1.7-30.9.17 |
| 1.7-30.9.16 |
| 1.1-30.9.17 |
| 1.1-30.9.16 |
| 1.1-31.12.16 |
|
|
|
|
|
|
|
|
|
|
|
|
|
Sanofi-Aventis Deutschland GmbH |
| 0 |
| 33,504 |
| 69,603 |
| 33,504 |
| 208,692 |
|
Boehringer Ingelheim International GmbH |
| 29,750 |
| 0 |
| 29,750 |
| 0 |
| 0 |
|
Helsinn Healthcare S.A. |
| 0 |
| 112 |
| 0 |
| 112 |
| 112 |
|
Protagonist Therapeutics, Inc. |
| 0 |
| 0 |
| 1,662 |
| 1,636 |
| 1,636 |
|
Total license and milestone revenue |
| 29,750 |
| 33,616 |
| 101,015 |
| 35,252 |
| 210,440 |
|
Sanofi-Aventis Deutschland GmbH |
| 10,329 |
| 5,970 |
| 27,485 |
| 19,020 |
| 24,338 |
|
Total royalty income |
| 10,329 |
| 5,970 |
| 27,485 |
| 19,020 |
| 24,338 |
|
Total revenue |
| 40,079 |
| 39,586 |
| 128,500 |
| 54,272 |
| 234,778 |
|
Milestone revenue amounted to DKK 101.0 million (35.3) in the first nine months of 2017 and primarily consisted of a USD 10 million milestone from Sanofi related to the approval of Suliqua® in the EU in January 2017 and a EUR 4 million milestone from Boehringer Ingelheim related to initiation of Phase 1 with the long-acting amylin analog.
Out of the total royalty income of DKK 27.5 million (19.0) in the first nine months of 2017, DKK 15.3 million (19.0) related to royalty revenue on Sanofi’s sales of Lyxumia®/Adlyxin® (lixisenatide) and DKK 12.2 million (0.0) to royalty revenue on Sanofi’s first sales of Soliqua® 100/33.
Note 3 — Changes in share capital
The following changes have occurred in the share capital during the respective interim periods:
|
| No. of shares |
|
Share capital at January 1, 2016 |
| 24.352.769 |
|
Capital increase on March 30, 2016 |
| 46.613 |
|
Capital increase on April 14, 2016 |
| 50.453 |
|
Capital increase on May 26, 2016 |
| 43.071 |
|
Capital increase on June 16, 2016 |
| 41.269 |
|
Capital increase on September 6, 2016 |
| 7.400 |
|
Capital increase on September 23, 2016 |
| 45.457 |
|
Capital increase on September 29, 2016 |
| 1.475.221 |
|
Share capital at September 30, 2016 |
| 26.062.253 |
|
|
|
|
|
Share capital at January 1, 2017 |
| 26.142.365 |
|
Capital increase on March 23, 2017 |
| 9.500 |
|
Capital increase on April 13, 2017 |
| 22.000 |
|
Capital increase on May 30, 2017 |
| 5.000 |
|
Capital increase on June 15, 2017 |
| 8.537 |
|
Capital increase on August 14, 2017 |
| 4.375.000 |
|
Capital increase on August 18, 2017 |
| 156.250 |
|
Capital increase on September 1, 2017 |
| 1.500 |
|
Capital increase on September 22, 2017 |
| 28.675 |
|
Share capital at September 30, 2017 |
| 30.748.827 |
|
On August 9, 2017, American Depositary Shares (ADSs) representing Zealand shares started trading on the Nasdaq Global Select Market in the United States under the symbol ZEAL.
On August 14, 2017, Zealand registered a capital increase of 4,375,000 new shares and completed its initial public offering of American Depositary Shares on the Nasdaq Global Select Market in the United States. Following full exercise of a 15% overallotment option, an additional 156,250 new shares were issued on August 15, 2017. In addition, 500,000 treasury shares were sold. Total gross proceeds of the offering amounted to DKK 567.1 million.
Note 4 — Loss per share
The loss and weighted average number of ordinary shares used in the calculation of basic and diluted loss per share are as follows:
DKK thousand |
| 1.7-30.9.17 |
| 1.7-30.9.16 |
| 1.1-30.9.17 |
| 1.1-30.9.16 |
| 1.1-31.12.16 |
|
|
|
|
|
|
|
|
|
|
|
|
|
Net loss for the period |
| -42,264 |
| -30,903 |
| -162,266 |
| -206,652 |
| -153,910 |
|
Net loss used in the calculation of basic and diluted loss per share |
| -42,264 |
| -30,903 |
| -162,266 |
| -206,652 |
| -153,910 |
|
|
|
|
|
|
|
|
|
|
|
|
|
Weighted average number of ordinary shares |
| 28,811,622 |
| 24,572,209 |
| 26,947,290 |
| 24,464,551 |
| 24,873,940 |
|
Weighted average number of treasury shares |
| -334,160 |
| -564,223 |
| -485,468 |
| -564,223 |
| -564,223 |
|
Weighted average number of ordinary shares used in the calculation of basic and diluted loss per share |
| 28,477,462 |
| 24,007,986 |
| 26,461,822 |
| 23,900,328 |
| 24,309,717 |
|
|
|
|
|
|
|
|
|
|
|
|
|
Basic loss per share (DKK) |
| -1.48 |
| -1.29 |
| -6.13 |
| -8.65 |
| -6.33 |
|
|
|
|
|
|
|
|
|
|
|
|
|
Diluted loss per share (DKK) |
| -1.48 |
| -1.29 |
| -6.13 |
| -8.65 |
| -6.33 |
|
The following potential ordinary shares are antidilutive and are therefore excluded from the weighted average number of ordinary shares for the purpose of calculating the diluted loss per share:
Potential ordinary shares excluded due to antidilutive effect related to:
|
| September 30, |
| September 30, |
| December 31, |
|
|
|
|
|
|
|
|
|
Outstanding warrants under the 2010 Employee incentive program |
| 647,167 |
| 808,741 |
| 728,629 |
|
Outstanding warrants under the 2015 Employee incentive program |
| 1,442,000 |
| 943,750 |
| 942,250 |
|
Total outstanding warrants, which are anti-dilutive |
| 2,089,167 |
| 1,752,491 |
| 1,670,879 |
|
Note 5 — Cash and cash equivalents
DKK thousand |
| September 30, |
| December 31, |
|
DKK |
| 17.647 |
| 16.609 |
|
USD |
| 278.061 |
| 214.915 |
|
EUR |
| 478.946 |
| 91.806 |
|
Total cash and cash equivalents |
| 774.654 |
| 323.330 |
|
At September 30, 2017, Zealand had cash and cash equivalents of DKK 774.7 million (December 31, 2016: DKK 323.3 million). In addition, DKK 6.0 million (December 31, 2016: DKK 318.8 million) is held as collateral for the royalty bond. The total cash position, including restricted cash, at September 30, 2017 is DKK 780.7 million (December 31, 2016: DKK 642.1 million).
Note 6 — Royalty bond
In December 2014, Zealand entered into a USD 50 million royalty bond financing arrangement, based on part of the royalties from lixisenatide as a standalone product. The bond carries an interest rate of 9.375%. As security for the royalty bond, certain milestone payments relating to lixisenatide have been held as collateral in the form of restricted cash. In February 2017, USD 8.7 million (DKK 60.7 million) was transferred to the restricted cash account following receipt of the USD 10 million milestone payment from Sanofi related to the approval of Suliqua® in the EU. On March 15, 2017, Zealand used restricted cash of USD 25 million (DKK 175 million) to repay half of the outstanding bond. Furthermore, the remaining restricted cash of USD 26.9 million (DKK 184 million) held as collateral for the bond was released to Zealand in exchange for a parent company guarantee. The maturity date of the royalty bond was also changed from March 15, 2026 to March 15, 2021.
As a consequence of the repayment of the royalty bond, the carrying amount of the royalty bond was adjusted. This resulted in a loss of DKK 11.2 million, which was recognized in the condensed consolidated income statement for the three-month period ended March 31, 2017 in net financial items. Furthermore, a fee of DKK 5.2 million was paid due to the repayment and amendment of the financing agreement. DKK 3.5 million of this fee has been capitalized, and DKK 1.7 million was recognized in the condensed consolidated income statement for the three-month period ended March 31, 2017 in net financial items.
As a consequence of the deferral of the expected repayment of the royalty bond at June 30, 2017, the carrying amount of the royalty bond was adjusted again. This had a positive impact on net financial items of DKK 6.5 million, which was recognized in the condensed consolidated income statement for the three-month period ended June 30, 2017.
At September 30, 2017, the outstanding royalty bond amounted to nominal USD 24.8 million (DKK 156.2 million).
In the consolidated statements of financial position, this is reported net of capitalized financing costs amounting to DKK 141.9 million at September 30, 2017 (332.2), excluding accrued interest expenses, which is reported in other liabilities.
For further information regarding the royalty bond, please see Note 19 in the Annual Report 2016.
Note 7 — Financial instruments
At September 30, 2017 and December 31, 2016, there were no financial instruments carried at fair value.
Except as detailed in the following table with respect to the royalty bond, at September 30, 2017 and December 31, 2016, the carrying amount of financial assets and financial liabilities approximated the fair value.
|
| September 30, 2017 |
| December 31, 2016 |
| ||||
DKK thousand |
| Carrying |
| Fair value |
| Carrying |
| Fair value |
|
|
|
|
|
|
|
|
|
|
|
Royalty bond |
| 141,897 |
| 142,480 |
| 332,243 |
| 356,626 |
|
Note 8 — Warrant programs
On April 6, 2017, Zealand granted 517,392 new warrants to Executive Management, other members of Senior Management and employees. The warrants give the holders the right to subscribe for 517,392 new Zealand shares with a nominal value of DKK 1 each, corresponding to 2.0% of the Company’s total outstanding share capital. The exercise price is fixed at DKK 135.30, reflecting the closing price of Zealand’s shares on Nasdaq Copenhagen on April 5, 2017 plus 10%.
The total number of new warrants granted has a combined market value of DKK 20.1 million calculated on the basis of the Black—Scholes model, including a five-year historic volatility of 43.6%, a risk-free interest rate of -0.24% and a share price of DKK 123.00.
The Board of Directors became aware that 14,566 warrants issued to the Chief Executive Officer of the Company on April 5, 2016 was an invalid issuance of warrants contrary to the Company’s guidelines regarding incentive pay. As a result, the Board of Directors has canceled these warrants amounting to DKK 0.6 million, which was reversed in the condensed consolidated income statement for the three month period ended June 30, 2017.
On August 25, 2017, Zealand granted 21,174 new warrants to the Chief Executive Officer. The warrants give the holders the right to subscribe for 21,174 new Zealand shares with a nominal value of DKK 1 each, corresponding to 0.1% of the Company’s total outstanding share capital. 14,566 warrants have an exercise price equal to DKK 142.45 per share and 6,608 warrants have an exercise price equal to DKK 135.30 per share. The total number of new warrants granted has a combined market value of DKK 0.8 million calculated on the basis of the Black—Scholes model, including a five-year historic volatility of 43.0%, a risk-free interest rate of -0.16% and a share price of DKK 118.50.
Warrants are considered vested at grant date and may be exercised, in whole or in part, in defined exercise windows from August 25, 2017 through August 25, 2022 in respect of the 14,566 warrants and from April 6, 2018 through April 6, 2022 in respect of the 6,608 warrants. The exercise windows for all granted warrants are four weeks following the publication of Zealand’s full-year reports or interim reports for the first quarter, first half or first nine months respectively.
The exercise of warrants is by default subject to continuing employment with the Group. The warrants granted are subject to the provisions of the Danish Public Companies Act regarding termination of employees prior to their exercise of warrants in the case of recipients who are subject to the act.
Warrants expire automatically after five years. Warrants are considered vested at grant date and may be exercised after three years. The exercise of the warrants may take place four times a year during a four-week period starting from the time of the publication of Zealand’s annual report or quarterly or semi-annual reports.
Effect on income statement
For the nine-month periods ended September 30, 2017 and 2016, the fair value of warrants recognized in the income statement amounted to DKK 20.3 million (20.3), of which DKK 6.5 million (5.6) related to the Executive Management.
DKK thousand |
| 1.1-30.9.17 |
| 1.1-30.9.16 |
|
|
|
|
|
|
|
Research and development expenses |
| 12.261 |
| 12.170 |
|
Administrative expenses |
| 8.036 |
| 8.153 |
|
Total |
| 20.297 |
| 20.323 |
|
Note 9 — Significant events after the end of the reporting period
No significant events have occurred after the end of the reporting period.