
Company announcement — No. 20 / 2018
Zealand Pharma — Interim report for the first half of 2018
Copenhagen, August 16, 2018 — Zealand Pharma A/S (“Zealand”) (Company reg. No. 20 04 50 78), a Copenhagen-based biotechnology company focused on the discovery, design and development of innovative peptide-based medicines, today announced its financial results for the first half 2018.
“In this past quarter we took important steps towards Phase 3 initiation with both glepaglutide for short bowel syndrome and dasiglucagon for congenital hyperinsulinism, our two leading rare disease programs. We also received positive feedback from the regulatory authorities and have committed more clinical study sites for both programs across North America and Europe to engage in the trials which will commence in September,” said Britt Meelby Jensen, the Company’s President and Chief Executive Officer. “We are also pleased to have completed the pivotal Phase 3 trial with the HypoPal® rescue pen for severe hypoglycemia and we expect to receive the final data in September. Finally, I am encouraged by the growth of the royalty revenues.”
Financial results for the first half of 2018
· Revenue of DKK 24.9 million / USD 3.9 million(1) (DKK 86.7 million / USD 13.3 million(2) in first half of 2017).
· Royalty revenue increased by 60% vs first half of 2017.
· There was no milestone revenue in first half of 2018 (DKK 71.3 million / USD 10.9 million(2) in first half of 2017 primarily related to EU Suliqua® approval).
· Net operating expenses(3) of DKK 236.9 million/USD 37.1 million(1) (DKK 174.8 million /USD 26.8 million(2) in first half of 2017).
Net result of DKK -219.5 million/USD -34.3 million(1) (DKK -121.5 million DKK/USD -18.6 million(2) in first half of 2017).
· Cash and cash equivalents, restricted cash and securities amounted to DKK 467.4 million/USD 73.1 million(1) as of June 30, 2018 (December 31, 2017: DKK 669.7 million/USD 107.9 million(4)).
· A restatement related to royalty revenue and royalty expenses has been incorporated in the interim report for the first half of 2018 with retrospective impact. Refer to Note 1 of the condensed consolidated interim financial statements.
Business highlights from the second quarter of 2018
· Glepaglutide for short bowel syndrome on track for Phase 3 initiation in September 2018:
· Successful End-of-Phase 2 meetings with FDA in the U.S. and CHMP scientific advisory committee in Europe.
· Phase 3 protocol submitted to authorities in U.S., Canada and Europe, including both once- and twice weekly dosing.
· Scientific presentation of PK trial demonstrating an effective half-life of ~50 hours
· Additional Phase 2 results presented at scientific conferences.
· HypoPal® rescue pen Phase 3 completed with results expected in September 2018:
· Immunogenicity Phase 3 trial met its primary objective, confirming dasiglucagon’s safety profile with no treatment-induced or treatment-boosted anti-drug antibodies.
· The pivotal Phase 3 efficacy trial was completed in May, with results expected in September 2018.
· Dasiglucagon for treatment of congenital hyperinsulinism (CHI) on track for Phase 3 initiation in September 2018:
· The FDA approved the Investigational New Drug (IND) application for initiation of two Phase 3 clinical trials.
· Collaboration agreement with Roche Diabetes Care to use its Accu-Chek® Combo pump system in the Phase 3 trials.
· Phase 3 trial protocols submitted to authorities in U.S. and Europe.
· Soliqua® 100/33/Suliqua royalty increase:
· 85% increase in Soliqua® 100/33/ Suliqua® royalty revenue from first to second quarter of 2018 and 192% versus second quarter last year.
· Increased formulary coverage in the U.S., both Commercial and Medicare.
Full-year guidance for 2018
Zealand maintains its financial guidance for full-year 2018 as announced in the Company’s 2017 Annual Report.
Net operating expenses in 2018 are expected to be within the range of DKK 475-495 million (USD 76-80 million). Most of the spend is related to the increased clinical development costs associated with Phase 3 trials of the Company’s glepaglutide and dasiglucagon programs.
The Company expects an increase in royalty from Sanofi for sales of Soliqua® 100/33 and will provide updates as additional information is available from Sanofi. Zealand receives royalty revenue of 10% on Sanofi’s net sales of Lyxumia® / Adlyxin® (lixisenatide) in countries with a valid IP protection and potentially up to USD 100 million in future commercial milestones.
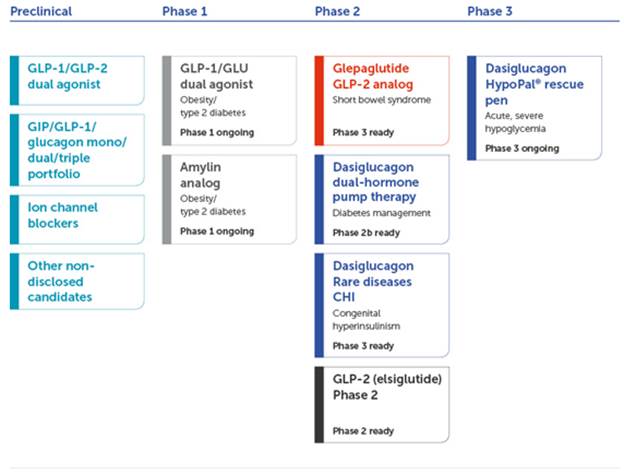
Clinical pipeline
Glepaglutide (GLP-2 analog for short bowel syndrome)
Glepaglutide is a long-acting GLP-2 analog with an effective half-life of 50 hours. Following a successful End-of-Phase 2 meeting with the FDA and a CHMP Advisory meeting, we plan to initiate the pivotal Phase 3 trial in September 2018. The trial will be a randomized, double-blind and placebo-controlled study, with both once- and twice-weekly dosing regimens. The trial is expected to enroll 129 patients at multiple sites across the United States, Europe and Canada.
Dasiglucagon (glucagon analog stable in liquid formulation)
Dasiglucagon is a potential first-in-class glucagon analog with a unique stability profile in liquid formulation. The Company is pursuing several indications where a stable profile would provide new treatment options:
· Dasiglucagon HypoPal® rescue pen for severe hypoglycemia
The ready-to-use dasiglucagon rescue pen, the HypoPal®, is designed to offer people with diabetes a fast treatment solution for severe hypoglycemia. The pivotal Phase 3 efficacy trial is completed with results expected in September 2018. A pediatric trial will be initiated in September 2018 with readout in H1 2019 and with an expected New Drug Application (NDA) filing H2 2019.
· Dasiglucagon for congenital hyperinsulism (CHI)
We are developing dasiglucagon as a potential treatment option for CHI, a rare disease which affects mainly newborns and toddlers with devastating consequences including brain damage and often requires surgical intervention, pancreatectomy, to manage the condition. The FDA’s approval of our IND application allows us to proceed into Phase 3 development of dasiglucagon and we will initiate two Phase 3 trials enrolling 32 and 16 patients respectively. The first trial is expected to start in September 2018 and the second during Q4 2018.
· Dasiglucagon dual-hormone pump therapy for diabetes
A next-generation artificial pancreas pump system, the iLetTM containing both insulin and glucagon (dasiglucagon) is in development by our partner Beta Bionics. The addition of dasiglucagon to the pump system provides the means to elevate blood sugar levels with potential to control blood sugar levels more accurately than with insulin alone.
In May, Beta Bionics received an Investigational Device Exemption (IDE) approval from FDA, allowing them to use the iLetTM pump in clinical trials. In June, Zealand and Beta Bionics met with the FDA to discuss the path towards Phase 3 trials. The feedback indicates that considerable less effort is required than earlier expected. A Phase 2b trial is planned to start later this year to test dasiglucagon in a home-use setting in the iLet.
Long-acting GLP1-GLU dual agonist for obesity and/or diabetes (with Boehringer Ingelheim)
Boehringer Ingelheim has initiated a Phase 1b trial of the glucagon/GLP-1 dual agonist for once-weekly dosing. The glucagon/GLP-1 dual agonist activates two key gut hormone receptors simultaneously and may offer better blood sugar and weight-loss control than current single-hormone receptor agonist treatments. Boehringer Ingelheim is funding all research, development and commercialization activities related to the treatment. Zealand is eligible to receive up to EUR 386 million in milestone payments (of which EUR 365 million is outstanding) and royalties on global sales.
Long-acting amylin analog for obesity and/or diabetes (with Boehringer Ingelheim)
The Phase 1 trial of the long-acting amylin analog with the potential for once-weekly administration for the treatment of obesity and obesity-related comorbidities started in August 2017. In pre-clinical studies, Zealand and Boehringer Ingelheim observed that the novel, long-acting amylin analog may prevent the development of obesity in pre-clinical models, suggesting its potential use in treating obesity and obesity-related comorbidities. Boehringer Ingelheim is funding all research, development and commercialization activities related to the treatment. Zealand is eligible to receive up to EUR 295 million in milestone payments (of which EUR 283 million is outstanding) and royalties on global sales.
Marketed products
Zealand has two products on the market, which are both commercialized worldwide by Sanofi:
· Soliqua® 100/33 and Suliqua® (combination of lixisenatide and Lantus®) was launched in the United States by Sanofi in 2017 and approved by the European Commission in 2017. The product has so far been made available in the US and a few smaller EU countries. Royalty income increased by 85% in Q2 2018 versus Q1 2018. The market access continues to expand in the U.S. with 71% commercially insured patients and 71% MediCare coverage as of July 31.
· Adlyxin®/Lyxumia® (lixisenatide, GLP-1 receptor agonist) was first launched in 2013 and has been available in the United States since 2017.
Conference call today at 4 pm CET/10 am ET
Zealand’s management will be hosting a conference call today at 4:00 p.m. CET/10:00 a.m. ET to present the results for the first half of 2018. Participating in the call will be President and Chief Executive Officer Britt Meelby Jensen, Executive Vice President and Chief Financial Officer Mats Blom and Executive Vice President and Chief Medical and Development Officer Adam Steensberg. The presentation will be followed by a Q&A session.
The conference call will be conducted in English, and the dial-in numbers are:
Denmark | +45 35 15 81 21 |
United Kingdom: | +44 (0)330 336 9411 |
United States: | +1 929 477 0324 |
Passcode | 2973222 |
A live audio webcast of the call, including an accompanying slide presentation, will be available via the following link, https://edge.media-server.com/m6/p/2jzj5h4j, and also will be accessible on the Investor section of Zealand’s website (www.zealandpharma.com). Participants are advised to register for the webcast approximately 10 minutes before the scheduled start.
A recording of the event and a transcript will be available on the Investor section of Zealand’s website after the call.
For further information, please contact:
Britt Meelby Jensen, President and Chief Executive Officer
Tel.: +45 51 67 61 28, e-mail: bmj@zealandpharma.com
Mats Blom, Executive Vice President, Chief Financial Officer
Tel.: +45 31 53 79 73, e-mail: mabl@zealandpharma.com
About Zealand Pharma A/S
Zealand Pharma A/S (Nasdaq Copenhagen and New York: ZEAL) (“Zealand”) is a biotechnology company focused on the discovery, design and development of innovative peptide-based medicines. Zealand has a late-stage clinical portfolio of proprietary product candidates focusing on specialty gastrointestinal and metabolic diseases. In addition, it has two marketed products, commercialized by Sanofi, and two product candidates under license collaboration with Boehringer Ingelheim.
Zealand is based in Copenhagen (Glostrup), Denmark. For further information about the Company’s business and activities, please visit www.zealandpharma.com or follow Zealand on LinkedIn or Twitter @ZealandPharma.
Safe Harbor/Forward-Looking Statements
The above information contains forward-looking statements that provide our expectations or forecasts of future events such as new product introductions, clinical development activities and anticipated results, product approvals and financial performance. Such forward-looking statements are subject to risks, uncertainties and inaccurate assumptions. This may cause actual results to differ materially from expectations and it may cause any or all of our forward-looking statements here or in other publications to be wrong. Factors that may affect future results include interest rate and currency exchange rate fluctuations, delay or failure of clinical trials and other development activities, production problems, unexpected contract breaches or terminations, government-mandated or market-driven price decreases for Zealand’s products, introduction of competing products, Zealand’s ability to successfully market both new and existing products, exposure to product liability and other lawsuits, changes in reimbursement rules and governmental laws and related interpretation thereof, and unexpected growth in costs and expenses.
Certain assumptions made by Zealand are required by Danish Securities Law for full disclosure of material corporate information. Some assumptions, including assumptions relating to sales associated with a product that is prescribed for unapproved uses, are made taking into account past performances of other similar drugs for similar disease states or past performance of the same drug in other regions where the product is currently marketed. It is important to note that although physicians may, as part of their freedom to practice medicine in the United States, prescribe approved drugs for any use they deem appropriate, including unapproved uses, at Zealand, promotion of unapproved uses is strictly prohibited.
(1) Translated solely for convenience into U.S. dollars at an assumed exchange rate of DKK 6.39 per USD 1.00, which was the rounded official exchange rate of such currencies at June 30, 2018.
(2) Translated solely for convenience into U.S. dollars at an assumed exchange rate of DKK 6.52 per USD 1.00, which was the rounded official exchange rate of such currencies at June 30, 2017.
(3) Net operating expenses consist of research, development and administrative expenses less other operating income.
(4) Translated solely for convenience into U.S. dollars at an assumed exchange rate of DKK 6.21 per USD 1.00, which was the rounded official exchange rate of such currencies at December 31, 2017.
Key figures for the Group
DKK thousand |
| Note |
| 1.4-30.6.18 |
| 1.4-30.6.17 |
| 1.1-30.6.18 |
| 1.1-30.6.17 |
| 1.1-31.12.17 |
|
|
|
|
|
|
| Restated (7) |
|
|
| Restated (7) |
| Restated (7) |
|
INCOME STATEMENT AND COMPREHENSIVE INCOME |
|
|
|
|
|
|
|
|
|
|
|
|
|
Revenue |
|
|
| 15,136 |
| 9,977 |
| 24,858 |
| 86,710 |
| 136,322 |
|
Royalty expenses |
|
|
| -2,043 |
| -1,122 |
| -3,356 |
| -11,481 |
| -14,163 |
|
Research and development expenses |
|
|
| -130,474 |
| -91,449 |
| -216,172 |
| -152,145 |
| -324,667 |
|
Administrative expenses |
|
|
| -14,749 |
| -13,169 |
| -20,982 |
| -23,055 |
| -47,470 |
|
Other operating income |
|
|
| 199 |
| 277 |
| 249 |
| 397 |
| 607 |
|
Operating result |
|
|
| -131,931 |
| -95,486 |
| -215,403 |
| -99,574 |
| -249,371 |
|
Net financial items |
|
|
| 3,393 |
| -278 |
| -6,873 |
| -24,658 |
| -31,387 |
|
Result before tax |
|
|
| -128,538 |
| -95,764 |
| -222,276 |
| -124,232 |
| -280,758 |
|
Income tax benefit |
| (1) |
| 1,375 |
| 1,375 |
| 2,750 |
| 2,750 |
| 5,500 |
|
Net result for the period |
|
|
| -127,163 |
| -94,389 |
| -219,526 |
| -121,482 |
| -275,258 |
|
Comprehensive income/loss for the period |
|
|
| -127,163 |
| -94,389 |
| -219,526 |
| -121,482 |
| -275,258 |
|
Earnings/loss per share - basic (DKK) |
|
|
| -4.18 |
| -3.69 |
| -7.15 |
| -4.75 |
| -9.88 |
|
Earnings/loss per share - diluted (DKK) |
|
|
| -4.18 |
| -3.69 |
| -7.15 |
| -4.75 |
| -9.88 |
|
|
|
|
|
|
|
|
|
|
|
|
|
|
|
STATEMENT OF FINANCIAL POSITION |
|
|
|
|
|
|
|
|
|
|
|
|
|
Cash and cash equivalents |
|
|
|
|
|
|
| 387,022 |
| 302,114 |
| 588,718 |
|
Restricted cash |
| (2) |
|
|
|
|
| 6,074 |
| 6,179 |
| 5,892 |
|
Securities |
|
|
|
|
|
|
| 74,315 |
| 0 |
| 75,111 |
|
Total assets |
|
|
|
|
|
|
| 522,130 |
| 366,857 |
| 721,285 |
|
Share capital (‘000 shares) |
|
|
|
|
|
|
| 30,751 |
| 26,187 |
| 30,751 |
|
Equity |
|
|
|
|
|
|
| 316,237 |
| 169,234 |
| 514,669 |
|
Equity ratio |
| (3) |
|
|
|
|
| 0.61 |
| 0.46 |
| 0.71 |
|
Royalty bond |
|
|
|
|
|
|
| 143,435 |
| 146,050 |
| 135,734 |
|
|
|
|
|
|
|
|
|
|
|
|
|
|
|
CASH FLOW |
|
|
|
|
|
|
|
|
|
|
|
|
|
Cash flow from operating activities |
|
|
|
|
|
|
| -206,380 |
| -175,017 |
| -278,746 |
|
Cash flow from investing activities |
|
|
|
|
|
|
| -1,602 |
| 310,572 |
| 221,351 |
|
Cash flow from financing activities |
|
|
|
|
|
|
| -702 |
| -171,078 |
| 337,930 |
|
Purchase of property, plant and equipment |
|
|
|
|
|
|
| -1,585 |
| -2,091 |
| -7,226 |
|
Free cash flow |
| (4) |
|
|
|
|
| -207,965 |
| -177,108 |
| -285,972 |
|
|
|
|
|
|
|
|
|
|
|
|
|
|
|
OTHER |
|
|
|
|
|
|
|
|
|
|
|
|
|
Share price (DKK) |
|
|
|
|
|
|
| 84.00 |
| 130.50 |
| 85.00 |
|
Market capitalization (MDKK) |
| (5) |
|
|
|
|
| 2,583 |
| 3,417 |
| 2,614 |
|
Equity per share (DKK) |
| (6) |
|
|
|
|
| 10.31 |
| 6.60 |
| 16.77 |
|
Average number of employees |
|
|
|
|
|
|
| 143 |
| 129 |
| 128 |
|
(1) According to Danish tax legislation, Zealand is eligible to receive DKK 5.5 million in cash relating to the tax loss in 2017. Zealand expects to be eligible to receive up to DKK 5.5 million in income tax benefit for 2018 of which DKK 2.8 million has been recognized for the period.
(2) Restricted cash serves as collateral for the royalty bond issued in 2014.
(3) Equity ratio is calculated as equity at the balance sheet date divided by total assets at the balance sheet date.
(4) Free cash flow is calculated as cash flow from operating activities less purchase of property, plant and equipment.
(5) Market capitalization is calculated as outstanding shares at the balance sheet date times the share price at the balance sheet date.
(6) Equity per share is calculated as shareholders’ equity divided by total number of shares less treasury shares.
(7) Figures for the three months ended March 31, 2018, three and six month periods ended June 30, 2017 and the years ended December 31, 2017, 2016 and 2015 have been restated due to certain misstatements. See Note 1 to the condensed consolidated interim financial statements.
Financial review
(Comparative figures for the corresponding period in 2017 are shown in brackets except for the financial position which expresses the comparative figures as of December 31, 2017)
Income statement
The net result for the first half of 2018 was a loss of DKK 219.5 million compared to a loss of DKK 121.5 million for the same period of 2017. The decreased result is primarily a consequence of a decrease in revenue as compared to the same period in 2017 when a milestone payment of DKK 69.6 million was received as well as increased net operating expenses of DKK 62.1 million. In addition net financial items (expenses) decreased by DKK 17.8 million.
Revenue
Revenue for the first half of 2018 amounted to DKK 24.9 million (86.7) of which DKK 17.8 million (6.7) related to royalty revenue on Sanofi’s sales of Soliqua® 100/33 and DKK 7.1 million (8.7) related to royalty revenue on Sanofi’s sales of Lyxumia® / Adlyxin® (lixisenatide).
Zealand receives royalty revenue of 10% on Sanofi’s net sales of Lyxumia® / Adlyxin® (lixisenatide) in countries with a valid IP protection for Zealand and potentially up to USD 100 million in commercial milestones. During Q2 2018 it was determined that royalty revenue recognized from 2013 until Q1 2018 included DKK 17.1 million of royalty revenue on net sales in countries with no valid IP protection for Zealand. Such misstatement has been corrected in the first half of 2018 with retrospective impact and as such comparable periods as of and for the three month period ended March 31, 2018, three and six month periods ended June 30, 2017 and the years ended December 31, 2017, 2016 and 2015 have been restated, as presented in note 1 to the condensed consolidated interim financial statements. The restatement also includes correction of a misstatement related to royalty expenses as discussed below under “Royalty expenses”.
Milestone revenue amounted to DKK 0.0 million (71.3). The milestone in the first half of 2017 primarily related to a USD 10 million milestone for the approval of Suliqua® in the EU.
Royalty expenses
Royalty expenses for the first half of 2018 were DKK 3.4 million (11.5). Royalty expenses are payments by Zealand to third parties based on license payments received from Lyxumia® / Adlyxin® (lixisenatide) and Soliqua® 100/33 / Suliqua®. As a consequence of the restatement mentioned above royalty expenses from 2013 until Q1 2018 were misstated by DKK 2.3 million. Such misstatement has been corrected in the first half of 2018 with retrospective impact and as such comparable periods as of and for the three month period ended March 31, 2018, three and six month periods ended June 30, 2017 and the years ended December 31, 2017, 2016 and 2015 have been restated, as presented in note 1 to the condensed consolidated interim financial statements.
Research and development expenses
Research and development expenses for the first half of 2018 amounted to DKK 216.2 million (152.1), an increase of 42% versus the same period 2017. The costs mainly relates to the clinical development of the three dasiglucagon programs and of glepaglutide for short bowel syndrome, as well as pre-clinical research activities.
Administrative expenses
Administrative expenses for the first half of 2018 amounted to DKK 21.0 million (23.1) and consisted of expenses for administrative personnel, company premises, operating leases, investor relations, etc. The decrease is due to a change in the composition of employees working in R&D and Administration in comparison to the previous year.
Other operating income
Other operating income for the first half of 2018 amounted to DKK 0.2 million (0.4).
Operating loss
The operating result for the first half of 2018 was a loss of DKK -215.4 million (-99.6).
Net financial items
Net financial items consists of interest expenses on the royalty bond, amortization of costs relating to the royalty bond, interest income, banking fees and adjustments based on changes in exchange rates. Net financial items for the first half of 2018 amounted to DKK -6.9 million (-24.7). The decrease in the first half of 2018 as compared to the same period of 2017 is a result of the repayment of half of the outstanding royalty bond during the first half of 2017 and exchange rate adjustments.
Loss before tax
Loss before tax for the first half of 2018 came to DKK -222.3 million (-124.2).
Income tax benefit
With a negative result in the first half of 2018 and financial guidance also pointing towards a negative result for the full year, Zealand expects to be eligible to receive up to DKK 5.5 million in income tax benefit for 2018 of which DKK 2.8 million (2.8) has been recognized for the period.
No deferred tax asset has been recognized in the statement of financial position due to uncertainty as to whether tax losses carried forward can be utilized.
Net loss and comprehensive loss
Net loss and comprehensive loss for the first half of 2018 amounted to DKK -219.5 million (-121.5).
Equity
Equity stood at DKK 316.2 million (514.7) at the end of the period, corresponding to an equity ratio of 61% (71%). The decrease in equity is mainly due to the net loss for the period.
Capital expenditure
Capital expenditure for the period amounted to DKK 1.6 million (1.8).
Royalty bond
In December 2014, Zealand entered into a USD 50 million royalty bond financing arrangement, based on part of the royalties from lixisenatide as a stand-alone product. The bond carries an interest rate of 9.375%. As security for the royalty bond, certain milestone payments relating to lixisenatide have been held as collateral in the form of restricted cash. On March 15, 2017, Zealand used restricted cash of USD 25 million (DKK 175 million) to repay half of the outstanding bond. Furthermore, additional restricted cash of USD 26.9 million (DKK 184 million) held as collateral for the bond was released to Zealand in exchange for a parent company guarantee.
At June 30, 2018, the outstanding royalty bond amounted to nominal USD 24.7 million (DKK 157.6 million). In the consolidated statements of financial position this is reported net of capitalized financing costs, amounting to DKK 143.4 million at June 30, 2018 (135.7), excluding accrued interest expenses, which is reported in other liabilities.
Securities, cash and cash equivalents
As of June 30, 2018, securities, cash and cash equivalents amounted to DKK 461.3 million (663.8).
In addition, DKK 6.1 million (5.9) was held as collateral for the royalty bond. The decrease in cash and cash equivalents is a consequence of the net loss for the period.
Cash flow
Cash flow from operating activities amounted to DKK -206.4 million (-175.0) mainly driven by the net loss for the period.
Cash flow from investing activities amounted to DKK -1.6 million (310.6) related to investments in laboratory equipment.
Cash flow from financing activities amounted to DKK -0.7 million (-171.1) relating to a minor repayment of the outstanding royalty bond.
The total cash flow for the first half of 2018 amounted to DKK -208.7 million (-35.5).
Risk factors
This interim report contains forward-looking statements, including forecasts of future expenses as well as expected business related events. Such statements are subject to risks and uncertainties as various factors, some of which are beyond the control of Zealand, may cause actual results and performance to differ materially from the forecasts made in this interim report. Without being exhaustive, such factors include e.g. general economic and business conditions, including legal issues, scientific and clinical results, fluctuations in currencies, etc. A more extensive description of risk factors can be found in the 2017 Annual Report under the section Risk management and internal control.
Management’s statement on the interim report
The Board of Directors and the Executive Management have today considered and adopted the interim report of Zealand Pharma A/S for the period January 1 — June 30, 2018.
The report has been prepared in accordance with IAS 34 as endorsed by the EU and the additional Danish disclosure requirements for listed companies.
In our opinion, the interim report gives a true and fair view of the Group’s assets, equity and liabilities and financial position at June 30, 2018 as well as of the results of the Group’s operations and cash flow for the period January 1 — June 30, 2018.
Moreover, in our opinion, the Management’s Review gives a true and fair view of the development in the Company’s operations and financial conditions, of the net result for the period and the financial position while also describing the most significant risks and uncertainty factors that may affect the Group.
Copenhagen, August 16, 2018
Executive Management
Britt Meelby Jensen | Mats Peter Blom | |
President and CEO | Executive Vice President and CFO | |
|
| |
Board of Directors |
| |
|
|
|
Alf Gunnar Martin Nicklasson | Rosemary Crane | Catherine Moukheibir |
Chairman | Board member | Board member |
|
|
|
Alain Munoz | Michael John Owen | Kirsten Aarup Drejer |
Board member | Board member | Board member |
|
|
|
Hanne Heidenheim Bak | Jens Peter Stenvang |
|
Board member | Board member |
|
Employee elected | Employee elected |
|
Independent auditor’s review report on the condensed consolidated interim financial statements
To the shareholders of Zealand Pharma A/S
We have reviewed the condensed consolidated interim financial statements of Zealand Pharma A/S for the period January 1 — June 30, 2018, pages 13-31, which comprise the income statement, statement of comprehensive income (loss), statement of cash flows, statement of financial position and statement of changes in equity as well as notes.
Management’s responsibility for the condensed consolidated interim financial statements
Management is responsible for the preparation of the condensed consolidated interim financial statements in accordance with IAS 34, Interim Financial Reporting, as adopted by the EU and additional Danish requirements for listed companies. It is also responsible for such internal control as management determines is necessary to enable the preparation of the condensed consolidated interim financial statements that is free from material misstatement, whether due to fraud or error.
Auditor’s responsibility
Our responsibility is to express a conclusion on the condensed consolidated interim financial statements. We conducted our review in accordance with the International Standard on Review of Interim Financial Information Performed by the Independent Auditor of the Group and additional requirements under Danish audit regulation. This requires us to conclude whether anything has come to our attention that causes us to believe that the condensed consolidated interim financial statements, taken as a whole, has not been prepared, in all material respects, in accordance with the applicable financial reporting framework. This also requires us to comply with ethical requirements.
A review of the condensed consolidated interim financial statements in accordance with the International Standard on Review of Interim Financial Information Performed by the Independent Auditor of the Group is a limited assurance engagement. The auditor performs procedures, primarily consisting of making inquiries of management and others within the Group, as appropriate, and applying analytical procedures, and evaluates the evidence obtained.
The procedures performed in a review are substantially less than those performed in an audit conducted in accordance with International Standards on Auditing. Accordingly, we do not express an audit opinion on the condensed consolidated interim financial statements.
Conclusion
Based on our review, nothing has come to our attention that causes us to believe that the condensed consolidated interim financial statements have not been prepared, in all material respects, in accordance with IAS 34, Interim Financial Reporting, as adopted by the EU and additional Danish requirements for listed companies.
Emphasis of matter
We draw attention to note 1 of the condensed consolidated interim financial statements, which describes the effects of the restatement of prior period figures related to royalty revenue and royalty expense. Our report is not modified in respect of this matter.
Copenhagen, August 16, 2018
Deloitte
Statsautoriseret Revisionspartnerselskab
Business Registration No 33 96 35 56
Martin Norin Faarborg | Sumit Sudan |
State-Authorized Public Accountant | State-Authorized Public Accountant |
MNE no mne29395 | MNE no mne33716 |
Condensed consolidated interim financial statements
Condensed consolidated income statements for the three and six month periods ended June 30, 2018 and 2017 and the twelve month period ended December 31, 2017
|
|
|
|
|
| Restated |
|
|
| Restated |
| Restated |
|
DKK thousand |
| Note |
| 1.4-30.6.18 |
| 1.4-30.6.17 |
| 1.1-30.6.18 |
| 1.1-30.6.17 |
| 1.1-31.12.17 |
|
|
|
|
|
|
|
|
|
|
|
|
|
|
|
Revenue |
| 2 |
| 15,136 |
| 9,977 |
| 24,858 |
| 86,710 |
| 136,322 |
|
Royatly expenses |
|
|
| -2,043 |
| -1,122 |
| -3,356 |
| -11,481 |
| -14,163 |
|
Research and development expenses |
|
|
| -130,474 |
| -91,449 |
| -216,172 |
| -152,145 |
| -324,667 |
|
Administrative expenses |
|
|
| -14,749 |
| -13,169 |
| -20,982 |
| -23,055 |
| -47,470 |
|
Other operating income |
|
|
| 199 |
| 277 |
| 249 |
| 397 |
| 607 |
|
Operating loss |
|
|
| -131,931 |
| -95,486 |
| -215,403 |
| -99,574 |
| -249,371 |
|
|
|
|
|
|
|
|
|
|
|
|
|
|
|
Financial income |
|
|
| 7,060 |
| 456 |
| 8,936 |
| 1,236 |
| 2,122 |
|
Financial expenses |
| 6 |
| -3,667 |
| -734 |
| -15,809 |
| -25,894 |
| -33,509 |
|
Loss before tax |
|
|
| -128,538 |
| -95,764 |
| -222,276 |
| -124,232 |
| -280,758 |
|
|
|
|
|
|
|
|
|
|
|
|
|
|
|
Income tax benefit |
|
|
| 1,375 |
| 1,375 |
| 2,750 |
| 2,750 |
| 5,500 |
|
Net loss for the period |
|
|
| -127,163 |
| -94,389 |
| -219,526 |
| -121,482 |
| -275,258 |
|
|
|
|
|
|
|
|
|
|
|
|
|
|
|
Basic loss per share |
| 4 |
| -4.18 |
| -3.69 |
| -7.15 |
| -4.75 |
| -9.88 |
|
Diluted loss per share |
| 4 |
| -4.18 |
| -3.69 |
| -7.15 |
| -4.75 |
| -9.88 |
|
Condensed consolidated statements of comprehensive income (loss) for the three and six month periods ended June 30, 2018 and 2017 and the twelve month period ended December 31, 2017
|
|
|
|
|
| Restated |
|
|
| Restated |
| Restated |
|
DKK thousand |
| Note |
| 1.4-30.6.18 |
| 1.4-30.6.17 |
| 1.1-30.6.18 |
| 1.1-30.6.17 |
| 1.1-31.12.17 |
|
|
|
|
|
|
|
|
|
|
|
|
|
|
|
Net loss for the period |
|
|
| -127,163 |
| -94,389 |
| -219,526 |
| -121,482 |
| -275,258 |
|
Other comprehensive income |
|
|
| 0 |
| 0 |
| 0 |
| 0 |
| 0 |
|
Comprehensive loss for the period |
|
|
| -127,163 |
| -94,389 |
| -219,526 |
| -121,482 |
| -275,258 |
|
Condensed consolidated statements of cash flow for the six month periods ended June 30, 2018 and 2017
|
|
|
|
|
| Restated |
|
DKK thousand |
|
|
| 1.1-30.6.18 |
| 1.1-30.6.17 |
|
|
|
|
|
|
|
|
|
Net loss for the period |
|
|
| -219,526 |
| -121,482 |
|
Adjustments for non-cash items |
|
|
| 27,079 |
| 9,758 |
|
Change in working capital |
|
|
| -9,194 |
| -46,927 |
|
Financial income received |
|
|
| 2,884 |
| 583 |
|
Financial expenses paid |
|
|
| -7,623 |
| -16,949 |
|
Cash flow from operating activities |
|
|
| -206,380 |
| -175,017 |
|
|
|
|
|
|
|
|
|
Transfer to restricted cash related to the royalty bond |
| 6 |
| 0 |
| -60,675 |
|
Transfer from restricted cash related to the royalty bond |
| 6 |
| 0 |
| 365,795 |
|
Transfer from restricted cash for royalty bond interest payments |
|
|
| 0 |
| 7,438 |
|
Change in deposit |
|
|
| -17 |
| -15 |
|
Purchase of property, plant and equipment |
|
|
| -1,585 |
| -2,091 |
|
Sale of fixed assets |
|
|
| 0 |
| 120 |
|
Cash flow from investing activities |
|
|
| -1,602 |
| 310,572 |
|
|
|
|
|
|
|
|
|
Proceeds from issue of shares related to exercise of warrants |
|
|
| 0 |
| 3,887 |
|
Repayment of royalty bond |
| 6 |
| -702 |
| -174,965 |
|
Cash flow from financing activities |
|
|
| -702 |
| -171,078 |
|
|
|
|
|
|
|
|
|
Decrease/increase in cash and cash equivalents |
|
|
| -208,684 |
| -35,523 |
|
Cash and cash equivalents at beginning of period |
|
|
| 588,718 |
| 323,330 |
|
Exchange rate adjustments |
|
|
| 6,988 |
| 14,307 |
|
Cash and cash equivalents at end of period |
|
|
| 387,022 |
| 302,114 |
|
Condensed consolidated statements of financial position as of June 30, 2018 and December 31, 2017
|
|
|
|
|
| Restated |
|
|
|
|
| June 30, |
| December 31, |
|
DKK thousand |
| Note |
| 2018 |
| 2017 |
|
ASSETS |
|
|
|
|
|
|
|
|
|
|
|
|
|
|
|
Non-current assets |
|
|
|
|
|
|
|
Plant and machinery |
|
|
| 14,137 |
| 14,855 |
|
Other fixtures and fittings, tools and equipment |
|
|
| 1,070 |
| 953 |
|
Leasehold improvements |
|
|
| 246 |
| 304 |
|
Deposits |
|
|
| 2,746 |
| 2,729 |
|
Restricted cash |
|
|
| 6,074 |
| 5,892 |
|
Other investments |
| 7 |
| 9,589 |
| 9,312 |
|
Total non-current assets |
|
|
| 33,862 |
| 34,045 |
|
|
|
|
|
|
|
|
|
Current assets |
|
|
|
|
|
|
|
Trade receivables |
|
|
| 8,916 |
| 5,679 |
|
Prepaid expenses |
|
|
| 7,725 |
| 7,253 |
|
Income tax receivable |
|
|
| 8,250 |
| 5,500 |
|
Other receivables |
|
|
| 2,040 |
| 4,979 |
|
Securities |
| 7 |
| 74,315 |
| 75,111 |
|
Cash and cash equivalents |
| 5 |
| 387,022 |
| 588,718 |
|
Total current assets |
|
|
| 488,268 |
| 687,240 |
|
|
|
|
|
|
|
|
|
Total assets |
|
|
| 522,130 |
| 721,285 |
|
|
|
|
|
|
|
|
|
EQUITY AND LIABILITIES |
|
|
|
|
|
|
|
Share capital |
| 3 |
| 30,751 |
| 30,751 |
|
Share premium |
| 8 |
| 1,980,293 |
| 1,959,199 |
|
Retained loss |
|
|
| -1,694,807 |
| -1,475,281 |
|
Equity |
|
|
| 316,237 |
| 514,669 |
|
|
|
|
|
|
|
|
|
Royalty bond |
| 6 |
| 143,435 |
| 132,986 |
|
Non-current liabilities |
|
|
| 143,435 |
| 132,986 |
|
|
|
|
|
|
|
|
|
Trade payables |
|
|
| 29,636 |
| 29,428 |
|
Royalty bond |
| 6 |
| 0 |
| 2,748 |
|
Other liabilities |
|
|
| 32,822 |
| 41,454 |
|
Current liabilities |
|
|
| 62,458 |
| 73,630 |
|
|
|
|
|
|
|
|
|
Total liabilities |
|
|
| 205,893 |
| 206,616 |
|
|
|
|
|
|
|
|
|
Total equity and liabilities |
|
|
| 522,130 |
| 721,285 |
|
Condensed consolidated statements of changes in equity at June 30, 2018 and 2017
|
|
|
|
|
| Retained |
|
|
|
|
| Share |
| Share |
| loss |
|
|
|
DKK thousand |
| capital |
| premium |
| (restated) |
| Total |
|
Equity at January 1, 2017 |
| 26,142 |
| 1,441,263 |
| -1,189,211 |
| 278,194 |
|
Restatement |
| 0 |
| 0 |
| -10,813 |
| -10,813 |
|
Comprehensive loss for the period |
|
|
|
|
|
|
|
|
|
Net loss for the period |
| 0 |
| 0 |
| -121,482 |
| -121,482 |
|
Warrants compensation expenses |
| 0 |
| 19,448 |
| 0 |
| 19,448 |
|
Capital increase |
| 45 |
| 3,842 |
| 0 |
| 3,887 |
|
Equity at June 30, 2017 |
| 26,187 |
| 1,464,553 |
| -1,321,506 |
| 169,234 |
|
|
|
|
|
|
|
|
|
|
|
Equity at January 1, 2018 |
| 30,751 |
| 1,959,199 |
| -1,461,482 |
| 528,468 |
|
Restatement |
| 0 |
| 0 |
| -13,799 |
| -13,799 |
|
Comprehensive loss for the period |
|
|
|
|
|
|
|
|
|
Net loss for the period |
| 0 |
| 0 |
| -219,526 |
| -219,526 |
|
Warrant compensation expenses |
| 0 |
| 21,094 |
| 0 |
| 21,094 |
|
Equity at June 30, 2018 |
| 30,751 |
| 1,980,293 |
| -1,694,807 |
| 316,237 |
|
Equity at January 1, 2017 and 2018 have been restated due to certain misstatements. See Note 1 to the condensed consolidated interim financial statements.
Note 1 — Significant accounting policies and significant accounting estimates and assessments
The condensed consolidated interim financial statements of Zealand Pharma A/S (“the Company”) have been prepared in accordance with IAS 34, Interim Financial Reporting, as adopted by EU and the additional Danish requirements for submission of interim reports for companies listed on Nasdaq Copenhagen. The condensed consolidated interim financial statements are presented in Danish kroner (DKK) which is the functional currency of the parent company.
Accounting policies
The accounting policies used in the condensed consolidated interim financial statements are consistent with those used in the Company’s Annual report for the year ended December 31, 2017, except for all new, amended or revised accounting standards and interpretations endorsed by the EU effective for the accounting period beginning on January 1, 2018, being IFRS 9 ‘Financial Instruments’ and IFRS 15 ‘Revenue from contracts with customers’.
The Group’s implementation of IFRS 9 ‘Financial Instruments’, that replaces IAS 39 ‘Financial Instruments: Recognition and Measurement’, has lead to the implementation of a new impairment model that requires the recognition of impairment provisions based on the “expected credit loss model” rather than the “incurred-loss model.” The majority of Zealand’s receivables are receivables from sales with its strategic partners, Boehringer Ingelheim and Sanofi, and due to the low credit risk in the Group, the new rules have not had a significant impact on the valuation of trade receivables. In the annual report for 2017, Management indicated an expected increase of DKK 5 million to financial liabilities. Based on further analyses, Management has concluded that the current accounting treatment is in line with IFRS 9 ‘Financial Instruments’, hence no impact is recognized as the cost of the amendment to the royalty bond from March 2017 is considered transaction costs, which are deducted in financial liabilities.
The Group has implemented IFRS 15 ‘Revenue from Contracts with Customers’ using the modified retrospective approach. IFRS 15 replaces the current standards on revenue (IAS 11 ‘Construction Contracts’ and IAS 18 ‘Revenue’). There is no significant effect on the interim financial statements related to the implementation of IFRS 15 ‘Revenue from Contracts with Customers’.
Significant accounting estimates and assessments
In the preparation of the condensed consolidated interim financial statements, Management makes several accounting estimates that form the basis for the presentation, recognition and measurement of the Company’s assets and liabilities.
In the application of the Company’s accounting policies, the Management of the Company is required to make judgments, estimates and assumptions about the carrying amounts of assets and liabilities that are not readily apparent from other sources. The estimates and associated assumptions are based on historical experience and other factors that are considered to be relevant. Actual results may differ from these estimates. The estimates and underlying assumptions are reviewed on an ongoing basis.
Revisions to accounting estimates are recognized in the period in which the estimate is revised if the revision affects only that period, or in the period of the revision and future periods if the revision affects both current and future periods. The estimates used are based on assumptions assessed as reasonable by Management; however, estimates are inherently uncertain and unpredictable. The assumptions can be incomplete or inaccurate, and unexpected events or circumstances might occur. Furthermore, the Company is subject to risks and uncertainties that might result in deviations in actual results compared with estimates.
For further information regarding significant accounting estimates and assessments related to revenue recognition and employee incentive programs, please see Note 1 in the Annual Report 2017.
No significant changes have been made in accounting estimates and assessments in the period January 1 — June 30, 2018.
Restatement
The Company receives royalty revenue of 10% on Sanofi’s net sales of Lyxumia® / Adlyxin® (lixisenatide) in countries with a valid IP protection for Zealand and potentially up to USD 100 million in commercial milestones.
During Q2 2018 it was determined that royalty revenue from Sanofi recognized from 2013 until Q1 2018 included DKK 17.1 million of royalty revenue on net sales in countries with no valid IP protection for Zealand and therefore revenue has been overstated in this period. As a consequence of this, royalty expenses from 2013 until Q1 2018 were misstated by DKK 2.3 million and therefore royalty expense has been overstated in this same period. Such misstatements have been corrected in the first half of 2018 with retrospective impact and thus comparable periods as of and for the three month period ended March 31, 2018, three and six month periods ended June 30, 2017 and the years ended December 31, 2017, 2016 and, 2015 have been restated to reflect this impact.
The nature and impact of each restatement is described below, including tickmarks linking the descriptions to the restated condensed consolidated income statements and condensed consolidated statement of financial position for Zealand.
Income statement:
A) Revenue
Royalty revenue has been restated as Zealand has previously recognized royalty revenue on net sales in countries with no valid IP protection.
B) Royalty expenses
Royalty expenses comprise contractual amounts due to third parties that are derived from royalty revenue earned from the corresponding collaboration agreements. The restatement on royalty revenue therefore leads to a corresponding restatement of royalty expenses.
Statement of financial position:
C) Trade receivables and other liabilities
The restatement related to trade receivables and other liabilities corresponds to the restatement on royalty revenue and royalty expenses, as discussed in tickmark A and B.
D) Retained loss
The restatement related to net loss for the period amounts to the combined impact of the restatements on royalty revenue and royalty expenses from 2013 through December 2017.
Statement of cash flow:
The impact of the restatement on the statement of cash flow is solely a reclassification between “Net loss for the period” and “Change in working capital”. The restatement related to net loss for the period amounts to the net impact of the restatements for the respective years on royalty revenue and royalty expenses while the restatement related to working capital for the period amounts to the net impact of the misstatements in trade receivables and other liabilities in the statement of financial position. Hence, there is no impact on the cash flow from operating activities. Based on the above outlined factors, the Company deemed irrelevant to present restated statements of cash flow for the
three month period ended March 31, 2018, three and six month periods ended June 30, 2017 and the years ended December 31, 2017, 2016 and 2015.
Condensed consolidated income statement for the three month period ended March 31, 2018
|
| As originally |
|
|
|
|
| Amount as |
|
|
| reported, |
|
|
|
|
| adjusted, |
|
|
| March 31, |
|
|
|
|
| March 31, |
|
DKK thousand |
| 2018 |
| Restatement |
| Tickmark |
| 2018 |
|
Revenue |
| 10,829 |
| -1,107 |
| A |
| 9,722 |
|
Royalty expenses |
| -1,462 |
| 149 |
| B |
| -1,313 |
|
Research and development expenses |
| -85,697 |
| 0 |
|
|
| -85,697 |
|
Administrative expenses |
| -6,234 |
| 0 |
|
|
| -6,234 |
|
Other operating income |
| 50 |
| 0 |
|
|
| 50 |
|
Operating loss |
| -82,514 |
| -958 |
|
|
| -83,472 |
|
|
|
|
|
|
|
|
|
|
|
Financial income |
| 1,876 |
| 0 |
|
|
| 1,876 |
|
Financial expenses |
| -12,142 |
| 0 |
|
|
| -12,142 |
|
Loss before tax |
| -92,780 |
| -958 |
|
|
| -93,738 |
|
|
|
|
|
|
|
|
|
|
|
Income tax benefit |
| 1,375 |
| 0 |
|
|
| 1,375 |
|
Net loss for the period |
| -91,405 |
| -958 |
|
|
| -92,363 |
|
|
|
|
|
|
|
|
|
|
|
Loss per share - basic (DKK) |
| -2.98 |
| -0.03 |
|
|
| -3.01 |
|
Loss per share - diluted (DKK) |
| -2.98 |
| -0.03 |
|
|
| -3.01 |
|
Condensed consolidated statements of comprehensive income for the three month period ended March 31, 2018
DKK thousand |
|
|
|
|
|
|
|
|
|
Net loss for the period |
| -91,405 |
| -958 |
|
|
| -92,363 |
|
Other comprehensive income (loss) |
| 0 |
| 0 |
|
|
| 0 |
|
Net loss for the period |
| -91,405 |
| -958 |
|
|
| -92,363 |
|
Condensed consolidated income statement for the three month period ended June 30, 2017
|
| As originally |
|
|
|
|
| Amount as |
|
|
| reported, |
|
|
|
|
| adjusted, |
|
|
| June 30, |
|
|
|
|
| June 30, |
|
DKK thousand |
| 2017 |
| Restatement |
| Tickmark |
| 2017 |
|
Revenue |
| 10,802 |
| -825 |
| A |
| 9,977 |
|
Royalty expenses |
| -1,233 |
| 111 |
| B |
| -1,122 |
|
Research and development expenses |
| -91,449 |
| 0 |
|
|
| -91,449 |
|
Administrative expenses |
| -13,169 |
| 0 |
|
|
| -13,169 |
|
Other operating income |
| 277 |
| 0 |
|
|
| 277 |
|
Operating loss |
| -94,772 |
| -714 |
|
|
| -95,486 |
|
|
|
|
|
|
|
|
|
|
|
Financial income |
| 456 |
| 0 |
|
|
| 456 |
|
Financial expenses |
| -734 |
| 0 |
|
|
| -734 |
|
Loss before tax |
| -95,050 |
| -714 |
|
|
| -95,764 |
|
|
|
|
|
|
|
|
|
|
|
Income tax benefit |
| 1,375 |
| 0 |
|
|
| 1,375 |
|
Net loss for the period |
| -93,675 |
| -714 |
|
|
| -94,389 |
|
|
|
|
|
|
|
|
|
|
|
Loss per share - basic (DKK) |
| -3.66 |
| -0.03 |
|
|
| -3.69 |
|
Loss per share - diluted (DKK) |
| -3.66 |
| -0.03 |
|
|
| -3.69 |
|
Condensed consolidated statements of comprehensive income for the three month period ended June 30, 2017
DKK thousand |
|
|
|
|
|
|
|
|
|
Net loss for the period |
| -93,675 |
| -714 |
|
|
| -94,389 |
|
Other comprehensive income (loss) |
| 0 |
| 0 |
|
|
| 0 |
|
Net loss for the period |
| -93,675 |
| -714 |
|
|
| -94,389 |
|
Condensed consolidated income statement for the six month period ended June 30, 2017
|
| As originally |
|
|
|
|
| Amount as |
|
|
| reported, |
|
|
|
|
| adjusted, |
|
|
| June 30, |
|
|
|
|
| June 30, |
|
DKK thousand |
| 2017 |
| Restatement |
| Tickmark |
| 2017 |
|
Revenue |
| 88,421 |
| -1,711 |
| A |
| 86,710 |
|
Royalty expenses |
| -11,712 |
| 231 |
| B |
| -11,481 |
|
Research and development expenses |
| -152,145 |
| 0 |
|
|
| -152,145 |
|
Administrative expenses |
| -23,055 |
| 0 |
|
|
| -23,055 |
|
Other operating income |
| 397 |
| 0 |
|
|
| 397 |
|
Operating loss |
| -98,094 |
| -1,480 |
|
|
| -99,574 |
|
|
|
|
|
|
|
|
|
|
|
Financial income |
| 1,236 |
| 0 |
|
|
| 1,236 |
|
Financial expenses |
| -25,894 |
| 0 |
|
|
| -25,894 |
|
Loss before tax |
| -122,752 |
| -1,480 |
|
|
| -124,232 |
|
|
|
|
|
|
|
|
|
|
|
Income tax benefit |
| 2,750 |
| 0 |
|
|
| 2,750 |
|
Net loss for the period |
| -120,002 |
| -1,480 |
|
|
| -121,482 |
|
|
|
|
|
|
|
|
|
|
|
Loss per share - basic (DKK) |
| -4.69 |
| -0.06 |
|
|
| -4.75 |
|
Loss per share - diluted (DKK) |
| -4.69 |
| -0.06 |
|
|
| -4.75 |
|
Condensed consolidated statements of comprehensive income for the six month period ended June 30, 2017
DKK thousand |
|
|
|
|
|
|
|
|
|
Net loss for the period |
| -120,002 |
| -1,480 |
|
|
| -121,482 |
|
Other comprehensive income (loss) |
| 0 |
| 0 |
|
|
| 0 |
|
Net loss for the period |
| -120,002 |
| -1,480 |
|
|
| -121,482 |
|
Condensed consolidated income statement for the twelve month period ended December 31, 2017
|
| As originally |
|
|
|
|
| Amount as |
|
|
| reported, |
|
|
|
|
| adjusted, |
|
|
| December 31, |
|
|
|
|
| December 31, |
|
DKK thousand |
| 2017 |
| Restatement |
| Tickmark |
| 2017 |
|
Revenue |
| 139,775 |
| -3,453 |
| A |
| 136,322 |
|
Royalty expenses |
| -14,629 |
| 466 |
| B |
| -14,163 |
|
Research and development expenses |
| -324,667 |
| 0 |
|
|
| -324,667 |
|
Administrative expenses |
| -47,470 |
| 0 |
|
|
| -47,470 |
|
Other operating income |
| 607 |
| 0 |
|
|
| 607 |
|
Operating loss |
| -246,384 |
| -2,987 |
|
|
| -249,371 |
|
|
|
|
|
|
|
|
|
|
|
Financial income |
| 2,122 |
| 0 |
|
|
| 2,122 |
|
Financial expenses |
| -33,509 |
| 0 |
|
|
| -33,509 |
|
Loss before tax |
| -277,771 |
| -2,987 |
|
|
| -280,758 |
|
|
|
|
|
|
|
|
|
|
|
Income tax benefit |
| 5,500 |
| 0 |
|
|
| 5,500 |
|
Net loss for the period |
| -272,271 |
| -2,987 |
|
|
| -275,258 |
|
|
|
|
|
|
|
|
|
|
|
Loss per share - basic (DKK) |
| -9.77 |
| -0.11 |
|
|
| -9.88 |
|
Loss per share - diluted (DKK) |
| -9.77 |
| -0.11 |
|
|
| -9.88 |
|
Condensed consolidated statements of comprehensive income for the twelve month period ended December 31, 2017
DKK thousand |
|
|
|
|
|
|
|
|
|
Net loss for the period |
| -272,271 |
| -2,987 |
|
|
| -275,258 |
|
Other comprehensive income (loss) |
| 0 |
| 0 |
|
|
| 0 |
|
Net loss for the period |
| -272,271 |
| -2,987 |
|
|
| -275,258 |
|
Condensed consolidated income statement for the twelve month period ended December 31, 2016
|
| As originally |
|
|
|
|
| Amount as |
|
|
| reported, |
|
|
|
|
| adjusted, |
|
|
| December 31, |
|
|
|
|
| December 31, |
|
DKK thousand |
| 2016 |
| Restatement |
| Tickmark |
| 2016 |
|
Revenue |
| 234,778 |
| -3,914 |
| A |
| 230,864 |
|
Royalty expenses |
| -31,459 |
| 528 |
| B |
| -30,931 |
|
Research and development expenses |
| -268,159 |
| 0 |
|
|
| -268,159 |
|
Administrative expenses |
| -52,503 |
| 0 |
|
|
| -52,503 |
|
Other operating income |
| 1,697 |
| 0 |
|
|
| 1,697 |
|
Operating loss |
| -115,646 |
| -3,386 |
|
|
| -119,032 |
|
|
|
|
|
|
|
|
|
|
|
Financial income |
| 592 |
| 0 |
|
|
| 592 |
|
Financial expenses |
| -44,356 |
| 0 |
|
|
| -44,356 |
|
Loss before tax |
| -159,410 |
| -3,386 |
|
|
| -162,796 |
|
|
|
|
|
|
|
|
|
|
|
Income tax benefit |
| 5,500 |
| 0 |
|
|
| 5,500 |
|
Net loss for the period |
| -153,910 |
| -3,386 |
|
|
| -157,296 |
|
|
|
|
|
|
|
|
|
|
|
Loss per share - basic (DKK) |
| -6.33 |
| -0.14 |
|
|
| -6.47 |
|
Loss per share - diluted (DKK) |
| -6.33 |
| -0.14 |
|
|
| -6.47 |
|
Condensed consolidated statements of comprehensive income for the twelve month period ended December 31, 2016
DKK thousand |
|
|
|
|
|
|
|
|
|
Net loss for the period |
| -153,910 |
| -3,386 |
|
|
| -157,296 |
|
Other comprehensive income (loss) |
| 0 |
| 0 |
|
|
| 0 |
|
Net loss for the period |
| -153,910 |
| -3,386 |
|
|
| -157,296 |
|
Condensed consolidated income statement for the twelve month period ended December 31, 2015
|
| As originally |
|
|
|
|
| Amount as |
|
|
| reported, |
|
|
|
|
| adjusted, |
|
|
| December 31, |
|
|
|
|
| December 31, |
|
DKK thousand |
| 2015 |
| Restatement |
| Tickmark |
| 2015 |
|
Revenue |
| 187,677 |
| -5,104 |
| A |
| 182,573 |
|
Royalty expenses |
| -22,267 |
| 689 |
| B |
| -21,578 |
|
Research and development expenses |
| -217,741 |
| 0 |
|
|
| -217,741 |
|
Administrative expenses |
| -41,824 |
| 0 |
|
|
| -41,824 |
|
Other operating income |
| 12,828 |
| 0 |
|
|
| 12,828 |
|
Operating loss |
| -81,327 |
| -4,415 |
|
|
| -85,742 |
|
|
|
|
|
|
|
|
|
|
|
Financial income |
| 3,889 |
| 0 |
|
|
| 3,889 |
|
Financial expenses |
| -42,394 |
| 0 |
|
|
| -42,394 |
|
Loss before tax |
| -119,832 |
| -4,415 |
|
|
| -124,247 |
|
|
|
|
|
|
|
|
|
|
|
Income tax benefit |
| 5,875 |
| 0 |
|
|
| 5,875 |
|
Net loss for the period |
| -113,957 |
| -4,415 |
|
|
| -118,372 |
|
|
|
|
|
|
|
|
|
|
|
Loss per share - basic (DKK) |
| -4.94 |
| -0.19 |
|
|
| -5.13 |
|
Loss per share - diluted (DKK) |
| -4.94 |
| -0.19 |
|
|
| -5.13 |
|
Condensed consolidated statements of comprehensive income for the twelve month period ended December 31, 2015
DKK thousand |
|
|
|
|
|
|
|
|
|
Net loss for the period |
| -113,957 |
| -4,415 |
|
|
| -118,372 |
|
Other comprehensive income (loss) |
| 0 |
| 0 |
|
|
| 0 |
|
Net loss for the period |
| -113,957 |
| -4,415 |
|
|
| -118,372 |
|
Condensed consolidated statement of financial position as of December 31, 2017
|
| As originally |
|
|
|
|
| Amount as |
|
|
| reported, |
|
|
|
|
| adjusted, |
|
|
| December 31, |
|
|
|
|
| December 31, |
|
DKK thousand |
| 2017 |
| Restatement |
| Tickmark |
| 2017 |
|
ASSETS |
|
|
|
|
|
|
|
|
|
|
|
|
|
|
|
|
|
|
|
Non-current assets |
|
|
|
|
|
|
|
|
|
Plant and machinery |
| 14,855 |
|
|
|
|
| 14,855 |
|
Other fixtures and fittings, tools and equipment |
| 953 |
|
|
|
|
| 953 |
|
Leasehold improvements |
| 304 |
|
|
|
|
| 304 |
|
Deposits |
| 2,729 |
|
|
|
|
| 2,729 |
|
Restricted cash |
| 5,892 |
|
|
|
|
| 5,892 |
|
Other investments |
| 9,312 |
|
|
|
|
| 9,312 |
|
Total non-current assets |
| 34,045 |
| 0 |
|
|
| 34,045 |
|
|
|
|
|
|
|
|
|
|
|
Current assets |
|
|
|
|
|
|
|
|
|
Trade receivables |
| 21,632 |
| -15,953 |
| C |
| 5,679 |
|
Prepaid expenses |
| 7,253 |
|
|
|
|
| 7,253 |
|
Income tax receivable |
| 5,500 |
|
|
|
|
| 5,500 |
|
Other receivables |
| 4,979 |
|
|
|
|
| 4,979 |
|
Securities |
| 75,111 |
|
|
|
|
| 75,111 |
|
Cash and cash equivalents |
| 588,718 |
|
|
|
|
| 588,718 |
|
Total current assets |
| 703,193 |
| -15,953 |
|
|
| 687,240 |
|
|
|
|
|
|
|
|
|
|
|
Total assets |
| 737,238 |
| -15,953 |
|
|
| 721,285 |
|
|
|
|
|
|
|
|
|
|
|
EQUITY AND LIABILITIES |
|
|
|
|
|
|
|
|
|
Share capital |
| 30,751 |
|
|
|
|
| 30,751 |
|
Share premium |
| 1,959,199 |
|
|
|
|
| 1,959,199 |
|
Retained loss |
| -1,461,482 |
| -13,799 |
| D |
| -1,475,281 |
|
Equity |
| 528,468 |
| -13,799 |
|
|
| 514,669 |
|
|
|
|
|
|
|
|
|
|
|
Royalty bond |
| 132,986 |
|
|
|
|
| 132,986 |
|
Non-current liabilities |
| 132,986 |
| 0 |
|
|
| 132,986 |
|
|
|
|
|
|
|
|
|
|
|
Trade payables |
| 29,428 |
|
|
|
|
| 29,428 |
|
Royalty bond |
| 2,748 |
|
|
|
|
| 2,748 |
|
Other liabilities |
| 43,608 |
| -2,154 |
| C |
| 41,454 |
|
Current liabilities |
| 75,784 |
| -2,154 |
|
|
| 73,630 |
|
|
|
|
|
|
|
|
|
|
|
Total liabilities |
| 208,770 |
| -2,154 |
|
|
| 206,616 |
|
|
|
|
|
|
|
|
|
|
|
Total equity and liabilities |
| 737,238 |
| -15,953 |
|
|
| 721,285 |
|
Condensed consolidated statement of financial position as of December 31, 2016
|
| As originally |
|
|
|
|
| Amount as |
|
|
| reported, |
|
|
|
|
| adjusted, |
|
|
| December 31, |
|
|
|
|
| December 31, |
|
DKK thousand |
| 2016 |
| Restatement |
| Tickmark |
| 2016 |
|
ASSETS |
|
|
|
|
|
|
|
|
|
|
|
|
|
|
|
|
|
|
|
Non-current assets |
|
|
|
|
|
|
|
|
|
Plant and machinery |
| 12,081 |
|
|
|
|
| 12,081 |
|
Other fixtures and fittings, tools and equipment |
| 1,154 |
|
|
|
|
| 1,154 |
|
Leasehold improvements |
| 408 |
|
|
|
|
| 408 |
|
Deposits |
| 2,690 |
|
|
|
|
| 2,690 |
|
Restricted cash |
| 305,120 |
|
|
|
|
| 305,120 |
|
Total non-current assets |
| 321,453 |
| 0 |
|
|
| 321,453 |
|
|
|
|
|
|
|
|
|
|
|
Current assets |
|
|
|
|
|
|
|
|
|
Trade receivables |
| 11,510 |
| -11,510 |
| C |
| 0 |
|
Prepaid expenses |
| 13,837 |
|
|
|
|
| 13,837 |
|
Income tax receivable |
| 5,500 |
|
|
|
|
| 5,500 |
|
Other receivables |
| 5,379 |
|
|
|
|
| 5,379 |
|
Restricted cash |
| 13,617 |
|
|
|
|
| 13,617 |
|
Cash and cash equivalents |
| 323,330 |
|
|
|
|
| 323,330 |
|
Total current assets |
| 373,173 |
| -11,510 |
|
|
| 361,663 |
|
|
|
|
|
|
|
|
|
|
|
Total assets |
| 694,626 |
| -11,510 |
|
|
| 683,116 |
|
|
|
|
|
|
|
|
|
|
|
EQUITY AND LIABILITIES |
|
|
|
|
|
|
|
|
|
Share capital |
| 26,142 |
|
|
|
|
| 26,142 |
|
Share premium |
| 1,441,263 |
|
|
|
|
| 1,441,263 |
|
Retained loss |
| -1,189,211 |
| -10,813 |
| D |
| -1,200,024 |
|
Equity |
| 278,194 |
| -10,813 |
|
|
| 267,381 |
|
|
|
|
|
|
|
|
|
|
|
Royalty bond |
| 328,878 |
|
|
|
|
| 328,878 |
|
Non-current liabilities |
| 328,878 |
| 0 |
|
|
| 328,878 |
|
|
|
|
|
|
|
|
|
|
|
Trade payables |
| 19,739 |
|
|
|
|
| 19,739 |
|
Royalty bond |
| 3,365 |
|
|
|
|
| 3,365 |
|
Other liabilities |
| 64,450 |
| -697 |
| C |
| 63,753 |
|
Current liabilities |
| 87,554 |
| -697 |
|
|
| 86,857 |
|
|
|
|
|
|
|
|
|
|
|
Total liabilities |
| 416,432 |
| -697 |
|
|
| 415,735 |
|
|
|
|
|
|
|
|
|
|
|
Total equity and liabilities |
| 694,626 |
| -11,510 |
|
|
| 683,116 |
|
Condensed consolidated statement of financial position as of December 31, 2015
|
| As originally |
|
|
|
|
| Amount as |
|
|
| reported, |
|
|
|
|
| adjusted, |
|
|
| December 31, |
|
|
|
|
| December 31, |
|
DKK thousand |
| 2015 |
| Restatement |
| Tickmark |
| 2015 |
|
ASSETS |
|
|
|
|
|
|
|
|
|
|
|
|
|
|
|
|
|
|
|
Non-current assets |
|
|
|
|
|
|
|
|
|
Plant and machinery |
| 14,672 |
|
|
|
|
| 14,672 |
|
Other fixtures and fittings, tools and equipment |
| 1,153 |
|
|
|
|
| 1,153 |
|
Leasehold improvements |
| 628 |
|
|
|
|
| 628 |
|
Deposits |
| 2,666 |
|
|
|
|
| 2,666 |
|
Total non-current assets |
| 19,119 |
| 0 |
|
|
| 19,119 |
|
|
|
|
|
|
|
|
|
|
|
Current assets |
|
|
|
|
|
|
|
|
|
Trade receivables |
| 158,158 |
| -8,587 |
| C |
| 149,571 |
|
Prepaid expenses |
| 2,430 |
|
|
|
|
| 2,430 |
|
Income tax receivable |
| 5,875 |
|
|
|
|
| 5,875 |
|
Other receivables |
| 10,427 |
|
|
|
|
| 10,427 |
|
Restricted cash |
| 21,403 |
|
|
|
|
| 21,403 |
|
Cash and cash equivalents |
| 418,796 |
|
|
|
|
| 418,796 |
|
Total current assets |
| 617,089 |
| -8,587 |
|
|
| 608,502 |
|
|
|
|
|
|
|
|
|
|
|
Total assets |
| 636,208 |
| -8,587 |
|
|
| 627,621 |
|
|
|
|
|
|
|
|
|
|
|
EQUITY AND LIABILITIES |
|
|
|
|
|
|
|
|
|
Share capital |
| 24,353 |
|
|
|
|
| 24,353 |
|
Share premium |
| 1,263,179 |
|
|
|
|
| 1,263,179 |
|
Retained loss |
| -1,035,301 |
| -7,428 |
| D |
| -1,042,729 |
|
Equity |
| 252,231 |
| -7,428 |
|
|
| 244,803 |
|
|
|
|
|
|
|
|
|
|
|
Royalty bond |
| 312,951 |
|
|
|
|
| 312,951 |
|
Non-current liabilities |
| 312,951 |
| 0 |
|
|
| 312,951 |
|
|
|
|
|
|
|
|
|
|
|
Trade payables |
| 21,676 |
|
|
|
|
| 21,676 |
|
Other liabilities |
| 49,350 |
| -1,159 |
| C |
| 48,191 |
|
Current liabilities |
| 71,026 |
| -1,159 |
|
|
| 69,867 |
|
|
|
|
|
|
|
|
|
|
|
Total liabilities |
| 383,977 |
| -1,159 |
|
|
| 382,818 |
|
|
|
|
|
|
|
|
|
|
|
Total equity and liabilities |
| 636,208 |
| -8,587 |
|
|
| 627,621 |
|
Note 2 — Revenue
|
|
|
| Restated |
|
|
| Restated |
| Restated |
|
DKK thousand |
| 1.4-30.6.18 |
| 1.4-30.6.17 |
| 1.1-30.6.18 |
| 1.1-30.6.17 |
| 1.1-31.12.17 |
|
|
|
|
|
|
|
|
|
|
|
|
|
Sanofi-Aventis Deutschland GmbH |
| 0 |
| 0 |
| 0 |
| 69,603 |
| 69,603 |
|
Boehringer Ingelheim International GmbH |
| 0 |
| 0 |
| 0 |
| 0 |
| 29,750 |
|
Protagonist Therapeutics, Inc. |
| 0 |
| 1,662 |
| 0 |
| 1,662 |
| 1,662 |
|
Total license and milestone revenue |
| 0 |
| 1,662 |
| 0 |
| 71,265 |
| 101,015 |
|
|
|
|
|
|
|
|
|
|
|
|
|
Sanofi-Aventis Deutschland GmbH |
| 15,136 |
| 8,315 |
| 24,858 |
| 15,445 |
| 35,307 |
|
Total royalty income |
| 15,136 |
| 8,315 |
| 24,858 |
| 15,445 |
| 35,307 |
|
Total revenue |
| 15,136 |
| 9,977 |
| 24,858 |
| 86,710 |
| 136,322 |
|
Milestone revenue amounted to DKK 0.0 million (71.3) in the first half of 2018. The milestone revenue in the first half of 2017 primarily related to a USD 10 million milestone for the approval of Suliqua® in the EU in January 2017.
DKK 17.8 million (6.7) related to royalty revenue on Sanofi’s sales of Soliqua® 100/33 and DKK 7.1 million (8.7) related to royalty revenue on Sanofi’s sales of Lyxumia® / Adlyxin™ (lixisenatide).
Note 3 — Changes in share capital
The following changes have occurred in the share capital during the respective interim periods:
|
| No. of shares |
|
Share capital at January 1, 2017 |
| 26,142,365 |
|
Capital increase on March 23, 2017 |
| 9,500 |
|
Capital increase on April 13, 2017 |
| 22,000 |
|
Capital increase on May 30, 2017 |
| 5,000 |
|
Capital increase on June 15, 2017 |
| 8,537 |
|
Share capital at June 30, 2017 |
| 26,187,402 |
|
|
|
|
|
Share capital at January 1, 2018 |
| 30,751,327 |
|
Share capital at June 30, 2018 |
| 30,751,327 |
|
Note 4 — Loss per share
The loss and weighted average number of ordinary shares used in the calculation of basic and diluted loss per share are as follows:
|
|
|
| Restated |
|
|
| Restated |
| Restated |
|
DKK thousand |
| 1.4-30.6.18 |
| 1.4-30.6.17 |
| 1.1-30.6.18 |
| 1.1-30.6.17 |
| 1.1-31.12.17 |
|
|
|
|
|
|
|
|
|
|
|
|
|
Net loss for the period |
| -127,163 |
| -94,389 |
| -219,526 |
| -121,482 |
| -275,258 |
|
Net loss used in the calculation of basic and diluted loss per share |
| -127,163 |
| -94,389 |
| -219,526 |
| -121,482 |
| -275,258 |
|
|
|
|
|
|
|
|
|
|
|
|
|
Weighted average number of ordinary shares |
| 30,751,327 |
| 26,174,223 |
| 30,751,327 |
| 26,158,854 |
| 27,918,271 |
|
Weighted average number of treasury shares |
| -64,223 |
| -564,223 |
| -64,223 |
| -564,223 |
| -64,223 |
|
Weighted average number of ordinary shares used in the calculation of basic and diluted loss per share |
| 30,687,104 |
| 25,610,000 |
| 30,687,104 |
| 25,594,631 |
| 27,854,048 |
|
|
|
|
|
|
|
|
|
|
|
|
|
Basic loss per share (DKK) |
| -4.14 |
| -3.69 |
| -7.15 |
| -4.75 |
| -9.88 |
|
|
|
|
|
|
|
|
|
|
|
|
|
Diluted loss per share (DKK) |
| -4.14 |
| -3.69 |
| -7.15 |
| -4.75 |
| -9.88 |
|
The following potential ordinary shares are anti-dilutive and are therefore excluded from the weighted average number of ordinary shares for the purpose of diluted loss per share:
Potential ordinary shares excluded due to anti-dilutive effect related to:
|
| June 30, |
| June 30, |
| December 31, |
|
|
| 2018 |
| 2017 |
| 2017 |
|
|
|
|
|
|
|
|
|
Outstanding warrants under the 2010 Employee incentive program |
| 246,359 |
| 677,342 |
| 429,784 |
|
Outstanding warrants under the 2015 Employee incentive program |
| 2,015,000 |
| 1,438,326 |
| 1,424,000 |
|
Total outstanding warrants, which are anti-dilutive |
| 2,261,359 |
| 2,115,668 |
| 1,853,784 |
|
Note 5 - Cash and cash equivalents
|
| June 30, |
| December 31, |
|
DKK thousand |
| 2018 |
| 2017 |
|
|
|
|
|
|
|
DKK |
| 14,740 |
| 12,824 |
|
USD |
| 236,810 |
| 252,884 |
|
EUR |
| 135,472 |
| 323,010 |
|
Total cash and cash equivalents |
| 387,022 |
| 588,718 |
|
As of June 30, 2018, Zealand had cash and cash equivalents of DKK 387.0 million (December 31, 2017: DKK 588.7 million). In addition, DKK 6.1 million (December 31, 2017: DKK 5.9 million) are held as collateral for the royalty bond. The total cash position, including restricted cash, as of June 30, 2018 is DKK 393.1 million (December 31, 2017: DKK 594.6 million).
Note 6 — Royalty bond
In December 2014, Zealand entered into a USD 50 million royalty bond financing arrangement, based on part of the royalties from lixisenatide as a stand-alone product. The bond carries an interest rate of 9.375%. As security for the royalty bond, certain milestone payments relating to lixisenatide have been held as collateral in the form of restricted cash. On March 15, 2017, Zealand used restricted cash of USD 25 million (DKK 175 million) to repay half of the outstanding bond. Furthermore, additional restricted cash of USD 25 million (DKK 175 million) held as collateral for the bond was released to Zealand in exchange for a parent company guarantee.
The outstanding royalty bond amounts to USD 24.7 million (DKK 157.6 million). In the consolidated statements of financial position this is reported net of capitalized financing costs.
For further information regarding the royalty bond please see note 20 in the Annual Report for 2017.
Note 7 - Financial instruments
As of June 30, 2018 and December 31, 2017, the following financial instruments are carried at fair value:
|
| June 30, |
| December 31, |
|
|
| 2018 |
| 2017 |
|
|
|
|
|
|
|
Securities |
| 74,315 |
| 75,111 |
|
Other investments |
| 9,589 |
| 9,312 |
|
Financial assets measured at fair value |
| 83,904 |
| 84,423 |
|
The fair value of securities is based on Level 1 in the fair value hierarchy.
The fair value of other investments is based on level 3 in the fair value hierarchy.
Below shows the fair value hierarchy for financial instruments measured at fair value in the balance sheet. The financial instruments in question are grouped into levels 1 to 3 based on the degree to which the fair value is observable.
· Level 1 fair value measurements are those derived from quoted prices (unadjusted) in active markets for identical assets or liabilities
· Level 2 fair value measurements are those derived from input other than quoted prices included within level 1 that are observable for the asset or liability, either directly (as prices) or indirectly (derived from prices)
· Level 3 fair value measurements are those derived from valuation techniques that include input for the asset or liability that are not based on observable market data (unobservable input)
Except as detailed in the following table with respect to the royalty bond, as of June 30, 2018 and December 31, 2017, the carrying amount of financial assets and financial liabilities approximates the fair value.
|
| June 30, 2018 |
| December 31, 2017 |
| ||||
|
| Carrying |
|
|
| Carrying |
|
|
|
DKK thousand |
| amount |
| Fair value |
| amount |
| Fair value |
|
|
|
|
|
|
|
|
|
|
|
Royalty bond |
| 143,435 |
| 145,436 |
| 135,734 |
| 139,991 |
|
Note 8 — Warrant programs
On May 22, 2018, Zealand granted 615,500 new warrants to the Company’s Executive Management, Corporate Management and employees. The warrants give the holders the right to subscribe for 615,500 new Zealand shares with a nominal value of DKK 1 each, corresponding to 2.0% of the Company’s total outstanding share capital. The exercise price is fixed at DKK 100.80, reflecting the closing price of Zealand’s shares on Nasdaq Copenhagen on May 18, 2018.
The total number of new warrants granted has a combined market value of DKK 21.1 million calculated on the basis of the Black—Scholes model, including a five-year historic volatility of 42.6%, a five-year historic risk-free interest rate of 0.05% and a share price of DKK 100.80.
The exercise of warrants is by default subject to continuing employment with the Group. The warrants granted are subject to the provisions of the Danish Public Companies Act regarding termination of employees prior to their exercise of warrants in the case of recipients who are subject to the act.
Warrants expire automatically after five years. Warrants are considered vested at grant date and may be exercised after three years. The exercise of the warrants may take place four times a year during a four-week period starting from the time of the publication of Zealand’s annual report or quarterly or semi-annual reports.
Effect on income statement
For the six-month periods ended June 30, 2018 and 2017, the fair value of warrants recognized in the income statement amounted to DKK 21.1 million (19.5), of which DKK 5.9 million (5.7) related to the Executive Management.
DKK thousand |
| 1.1-30.6.18 |
| 1.1-30.6.17 |
|
|
|
|
|
|
|
Research and development expenses |
| 13,761 |
| 12,261 |
|
Administrative expenses |
| 7,334 |
| 7,190 |
|
Total |
| 21,094 |
| 19,451 |
|
Note 9 — Significant events after the end of the reporting period
No significant events have occurred after the end of the reporting period.