UNITED STATES
SECURITIES AND EXCHANGE COMMISSION
Washington, D.C. 20549
SCHEDULE 14A
(Rule 14a-101)
INFORMATION REQUIRED IN PROXY STATEMENT
SCHEDULE 14A INFORMATION
Proxy Statement Pursuant to Section 14(a) of the Securities Exchange Act of 1934
(Amendment No. )
Filed by the Registrant ☒
Filed by a Party other than the Registrant ☐
Check the appropriate box:
| | ☐ | Preliminary Proxy Statement |
| | ☐ | Confidential, for Use of the Commission Only (as permitted by Rule 14a-6(e)(2)) |
| | ☐ | Definitive Proxy Statement |
| | ☐ | Definitive Additional Materials |
| | ☒ | Soliciting Material Under Rule 14a-12 |
| ALCOA CORPORATION |
| (Name of Registrant as Specified in Its Charter) |
| |
| |
| (Name of Persons(s) Filing Proxy Statement, if other than the Registrant) |
Payment of Filing Fee (Check the appropriate box):
| | ☐ | Fee computed on table below per Exchange Act Rules 14a-6(i)(1) and 0-11. |
| | (1) | Title of each class of securities to which transaction applies: |
| | (2) | Aggregate number of securities to which transaction applies: |
| | (3) | Per unit price or other underlying value of transaction computed pursuant to Exchange Act Rule 0-11 (set forth the amount on which the filing fee is calculated and state how it was determined): |
| | (4) | Proposed maximum aggregate value of transaction: |
| | ☐ | Fee paid previously with preliminary materials: |
| | ☐ | Check box if any part of the fee is offset as provided by Exchange Act Rule 0-11(a)(2) and identify the filing for which the offsetting fee was paid previously. Identify the previous filing by registration statement number, or the form or schedule and the date of its filing. |
| | (1) | Amount previously paid: |
| | (2) | Form, Schedule or Registration Statement No.: |
Alcoa Corporation (“Alcoa”) expects to file a preliminary proxy statement with the Securities and Exchange Commission (the “SEC”) to be used to solicit proxies to approve the issuance of shares of common stock of Alcoa in connection with a proposed transaction to acquire all of the shares of Alumina Limited (“Alumina”) in an all-stock transaction (the “Transaction”) at a special meeting of its stockholders.
Item 1: On April 29, 2024, Alcoa made available an investor presentation regarding the Transaction, a copy of which is filed herewith as Exhibit 1.
Caution Concerning Forward-Looking Statements
This communication contains statements that relate to future events and expectations and as such constitute forward-looking statements within the meaning of the Private Securities Litigation Reform Act of 1995. Forward-looking statements include those containing such words as “aims,” “ambition,” “anticipates,” “believes,” “could,” “develop,” “endeavors,” “estimates,” “expects,” “forecasts,” “goal,” “intends,” “may,” “outlook,” “potential,” “plans,” “projects,” “reach,” “seeks,” “sees,” “should,” “strive,” “targets,” “will,” “working,” “would,” or other words of similar meaning. All statements by Alcoa Corporation (“Alcoa”) that reflect expectations, assumptions or projections about the future, other than statements of historical fact, are forward-looking statements, including, without limitation, statements regarding the proposed transaction; the ability of the parties to complete the proposed transaction; the expected benefits of the proposed transaction, the competitive ability and position following completion of the proposed transaction; forecasts concerning global demand growth for bauxite, alumina, and aluminum, and supply/demand balances; statements, projections or forecasts of future or targeted financial results, or operating performance (including our ability to execute on strategies related to environmental, social and governance matters); statements about strategies, outlook, and business and financial prospects; and statements about capital allocation and return of capital. These statements reflect beliefs and assumptions that are based on Alcoa’s perception of historical trends, current conditions, and expected future developments, as well as other factors that management believes are appropriate in the circumstances. Forward-looking statements are not guarantees of future performance and are subject to known and unknown risks, uncertainties, and changes in circumstances that are difficult to predict. Although Alcoa believes that the expectations reflected in any forward-looking statements are based on reasonable assumptions, it can give no assurance that these expectations will be attained and it is possible that actual results may differ materially from those indicated by these forward-looking statements due to a variety of risks and uncertainties. Such risks and uncertainties include, but are not limited to: (1) the non-satisfaction or non-waiver, on a timely basis or otherwise, of one or more closing conditions to the proposed transaction; (2) the prohibition or delay of the consummation of the proposed transaction by a governmental entity; (3) the risk that the proposed transaction may not be completed in the expected time frame or at all; (4) unexpected costs, charges or expenses resulting from the proposed transaction; (5) uncertainty of the expected financial performance following completion of the proposed transaction; (6) failure to realize the anticipated benefits of the proposed transaction; (7) the occurrence of any event that could give rise to termination of the proposed transaction; (8) potential litigation in connection with the proposed transaction or other settlements or investigations that may affect the timing or occurrence of the contemplated transaction or result in significant costs of defense, indemnification and liability; (9) the impact of global economic conditions on the aluminum industry and aluminum end-use markets; (10) volatility and declines in aluminum and alumina demand and pricing, including global, regional, and product-specific prices, or significant changes in production costs which are linked to LME or other commodities; (11) the disruption of market-driven balancing of global aluminum supply and demand by non-market forces; (12) competitive and complex conditions in global markets; (13) our ability to obtain, maintain, or renew permits or approvals necessary for our mining operations; (14) rising energy costs and interruptions or uncertainty in energy supplies; (15) unfavorable changes in the cost, quality, or availability of raw materials or other key inputs, or by disruptions in the supply chain; (16) our ability to execute on our strategy to be a lower cost, competitive, and integrated aluminum production business and to realize the anticipated benefits from announced plans, programs, initiatives relating to our portfolio, capital investments, and developing technologies; (17) our ability to integrate and achieve intended results from joint ventures, other strategic alliances, and strategic business transactions; (18) economic, political, and social conditions, including the impact of trade policies and adverse industry publicity; (19) fluctuations in foreign currency exchange rates and interest rates, inflation and other economic factors in the countries in which we operate; (20) changes in tax laws or exposure to additional tax liabilities; (21) global competition within and beyond the aluminum industry; (22) our ability to obtain or maintain adequate insurance coverage; (23) disruptions in the global economy caused by ongoing regional conflicts; (24) legal proceedings, investigations, or changes in foreign and/or U.S. federal, state, or local laws, regulations, or policies; (25) climate change, climate change legislation or regulations, and efforts to reduce emissions and build operational resilience to extreme weather conditions; (26) our ability to achieve our strategies or expectations relating to environmental, social, and governance considerations; (27) claims, costs and liabilities related to health, safety, and environmental laws, regulations, and other requirements, in the jurisdictions in which we operate; (28) liabilities resulting from impoundment structures, which could impact the environment or cause exposure to hazardous substances or other damage; (29) our ability to fund capital expenditures; (30) deterioration in our credit profile or increases in interest rates; (31) restrictions on our current and future operations due to our indebtedness; (32) our ability to continue to return capital to our stockholders through the payment of cash dividends and/or the repurchase of our common stock; (33) cyber attacks, security breaches, system failures, software or application vulnerabilities, or other cyber incidents; (34) labor market conditions, union disputes and other employee relations issues; (35) a decline in the liability discount rate or lower-than-expected investment returns on pension assets; and (36) the other risk factors discussed in Part I Item 1A of Alcoa’s Annual Report on Form 10-K for the fiscal year ended December 31, 2023 and other reports filed by Alcoa with the SEC. These risks, as well as other risks associated with the proposed transaction, will be more fully discussed in the proxy statement. Alcoa cautions readers not to place undue reliance upon any such forward-looking statements, which speak only as of the date they are made. Alcoa disclaims any obligation to update publicly any forward-looking statements, whether in response to new information, future events or otherwise, except as required by applicable law. Market projections are subject to the risks described above and other risks in the market. Neither Alcoa nor any other person assumes responsibility for the accuracy and completeness of any of these forward-looking statements and none of the information contained herein should be regarded as a representation that the forward-looking statements contained herein will be achieved.
Additional Information and Where to Find It
This communication does not constitute an offer to buy or sell or the solicitation of an offer to buy or sell any securities. This communication relates to the proposed transaction. In connection with the proposed transaction, Alcoa plans to file with the SEC a proxy statement on Schedule 14A (the “Proxy Statement”). This communication is not a substitute for the Proxy Statement or any other document that Alcoa may file with the SEC and send to its stockholders in connection with the proposed transaction. The issuance of the stock consideration in the proposed transaction will be submitted to Alcoa’s stockholders for their consideration. The Proxy Statement will contain important information about Alcoa, the proposed transaction and related matters. Before making any voting decision, Alcoa’s stockholders should read all relevant documents filed or to be filed with the SEC completely and in their entirety, including the Proxy Statement, as well as any amendments or supplements to those documents, when they become available, because they will contain important information about Alcoa and the proposed transaction. Alcoa’s stockholders will be able to obtain a free copy of the Proxy Statement, as well as other filings containing information about Alcoa, free of charge, at the SEC’s website (www.sec.gov). Copies of the Proxy Statement and other documents filed by Alcoa with the SEC may be obtained, without charge, by contacting Alcoa through its website at https://investors.alcoa.com/.
Participants in the Solicitation
Alcoa, its directors, executive officers and other persons related to Alcoa may be deemed to be participants in the solicitation of proxies from Alcoa’s stockholders in connection with the proposed transaction. Information about the directors and executive officers of Alcoa and their ownership of common stock of Alcoa is set forth in the section entitled “Information about our Executive Officers” included in Alcoa’s annual report on Form 10-K for the fiscal year ended December 31, 2023, which was filed with the SEC on February 21, 2024 (and which is available at https://www.sec.gov/ixviewer/ix.html?doc=/Archives/edgar/data/1675149/000095017024018069/aa-20231231.htm), and in the sections entitled “Director Nominees” and “Stock Ownership of Directors and Executive Officers” included in its proxy statement for its 2024 annual meeting of stockholders, which was filed with the SEC on March 19, 2024 (and which is available at https://www.sec.gov/ix?doc=/Archives/edgar/data/1675149/000119312524071354/d207257ddef14a.htm). Additional information regarding the persons who may, under the rules of the SEC, be deemed participants in the proxy solicitation and a description of their direct and indirect interests, by security holdings or otherwise, will be included in the Proxy Statement and other relevant materials to be filed with the SEC in connection with the proposed transaction when they become available. Free copies of these documents may be obtained as described in the preceding paragraph.
Exhibit 1
1 OUR VALUES Act with Integrity Operate with Excellence Care for People Lead with Courage Investor Presentation April / May 2024
2 Cautionary Statement regarding Forward - Looking Statements This presentation contains statements that relate to future events and expectations and as such constitute forward - looking statements within the meaning of the Private Securities Litigation Reform Act of 1995 . Forward - looking statements include those containing such words as "aims," "ambition," "anticipates," "believes," "could," "develop," "endeavors," "estimates," "expects," "forecasts," "goal," "intends," "may," "outlook," "potential," "plans," "projects," "reach," "seeks," "sees," "should," "strive," "targets," "will," "working," "would," or other words of similar meaning . All statements by Alcoa Corporation ("Alcoa") that reflect expectations, assumptions or projections about the future, other than statements of historical fact, are forward - looking statements, including, without limitation, statements regarding the proposed transaction ; the ability of the parties to complete the proposed transaction ; the expected benefits of the proposed transaction, the competitive ability and position following completion of the proposed transaction ; forecasts concerning global demand growth for bauxite, alumina, and aluminum, and supply/demand balances ; statements, projections or forecasts of future or targeted financial results, or operating performance (including our ability to execute on strategies related to environmental, social and governance matters) ; statements about strategies, outlook, and business and financial prospects ; and statements about capital allocation and return of capital . These statements reflect beliefs and assumptions that are based on Alcoa's perception of historical trends, current conditions, and expected future developments, as well as other factors that management believes are appropriate in the circumstances . Forward - looking statements are not guarantees of future performance and are subject to known and unknown risks, uncertainties, and changes in circumstances that are difficult to predict . Although Alcoa believes that the expectations reflected in any forward - looking statements are based on reasonable assumptions, it can give no assurance that these expectations will be attained and it is possible that actual results may differ materially from those indicated by these forward - looking statements due to a variety of risks and uncertainties . Such risks and uncertainties include, but are not limited to : ( 1 ) the non - satisfaction or non - waiver, on a timely basis or otherwise, of one or more closing conditions to the proposed transaction ; ( 2 ) the prohibition or delay of the consummation of the proposed transaction by a governmental entity ; ( 3 ) the risk that the proposed transaction may not be completed in the expected time frame or at all ; ( 4 ) unexpected costs, charges or expenses resulting from the proposed transaction ; ( 5 ) uncertainty of the expected financial performance following completion of the proposed transaction ; ( 6 ) failure to realize the anticipated benefits of the proposed transaction ; ( 7 ) the occurrence of any event that could give rise to termination of the proposed transaction ; ( 8 ) potential litigation in connection with the proposed transaction or other settlements or investigations that may affect the timing or occurrence of the contemplated transaction or result in significant costs of defense, indemnification and liability ; ( 9 ) the impact of global economic conditions on the aluminum industry and aluminum end - use markets ; ( 10 ) volatility and declines in aluminum and alumina demand and pricing, including global, regional, and product - specific prices, or significant changes in production costs which are linked to LME or other commodities ; ( 11 ) the disruption of market - driven balancing of global aluminum supply and demand by non - market forces ; ( 12 ) competitive and complex conditions in global markets ; ( 13 ) our ability to obtain, maintain, or renew permits or approvals necessary for our mining operations ; ( 14 ) rising energy costs and interruptions or uncertainty in energy supplies ; ( 15 ) unfavorable changes in the cost, quality, or availability of raw materials or other key inputs, or by disruptions in the supply chain ; ( 16 ) our ability to execute on our strategy to be a lower cost, competitive, and integrated aluminum production business and to realize the anticipated benefits from announced plans, programs, initiatives relating to our portfolio, capital investments, and developing technologies ; ( 17 ) our ability to integrate and achieve intended results from joint ventures, other strategic alliances, and strategic business transactions ; ( 18 ) economic, political, and social conditions, including the impact of trade policies and adverse industry publicity ; ( 19 ) fluctuations in foreign currency exchange rates and interest rates, inflation and other economic factors in the countries in which we operate ; ( 20 ) changes in tax laws or exposure to additional tax liabilities ; ( 21 ) global competition within and beyond the aluminum industry ; ( 22 ) our ability to obtain or maintain adequate insurance coverage ; ( 23 ) disruptions in the global economy caused by ongoing regional conflicts ; ( 24 ) legal proceedings, investigations, or changes in foreign and/or U . S . federal, state, or local laws, regulations, or policies ; ( 25 ) climate change, climate change legislation or regulations, and efforts to reduce emissions and build operational resilience to extreme weather conditions ; ( 26 ) our ability to achieve our strategies or expectations relating to environmental, social, and governance considerations ; ( 27 ) claims, costs and liabilities related to health, safety, and environmental laws, regulations, and other requirements, in the jurisdictions in which we operate ; ( 28 ) liabilities resulting from impoundment structures, which could impact the environment or cause exposure to hazardous substances or other damage ; ( 29 ) our ability to fund capital expenditures ; ( 30 ) deterioration in our credit profile or increases in interest rates ; ( 31 ) restrictions on our current and future operations due to our indebtedness ; ( 32 ) our ability to continue to return capital to our stockholders through the payment of cash dividends and/or the repurchase of our common stock ; ( 33 ) cyber attacks, security breaches, system failures, software or application vulnerabilities, or other cyber incidents ; ( 34 ) labor market conditions, union disputes and other employee relations issues ; ( 35 ) a decline in the liability discount rate or lower - than - expected investment returns on pension assets ; and ( 36 ) the other risk factors discussed in Part I Item 1 A of Alcoa's Annual Report on Form 10 - K for the fiscal year ended December 31 , 2023 and other reports filed by Alcoa with the SEC . These risks, as well as other risks associated with the proposed transaction, will be more fully discussed in the proxy statement . Alcoa cautions readers not to place undue reliance upon any such forward - looking statements, which speak only as of the date they are made . Alcoa disclaims any obligation to update publicly any forward - looking statements, whether in response to new information, future events or otherwise, except as required by applicable law . Market projections are subject to the risks described above and other risks in the market . Neither Alcoa nor any other person assumes responsibility for the accuracy and completeness of any of these forward - looking statements and none of the information contained herein should be regarded as a representation that the forward - looking statements contained herein will be achieved .

3 Important information Additional Information and Where to Find It This communication does not constitute an offer to buy or sell or the solicitation of an offer to buy or sell any securities . This communication relates to the proposed transaction . In connection with the proposed transaction, Alcoa plans to file with the SEC a proxy statement on Schedule 14 A (the “Proxy Statement”) . This communication is not a substitute for the Proxy Statement or any other document that Alcoa may file with the SEC and send to its stockholders in connection with the proposed transaction . The issuance of the stock consideration in the proposed transaction will be submitted to Alcoa’s stockholders for their consideration . The Proxy Statement will contain important information about Alcoa, the proposed transaction and related matters . Before making any voting decision, Alcoa’s stockholders should read all relevant documents filed or to be filed with the SEC completely and in their entirety, including the Proxy Statement, as well as any amendments or supplements to those documents, when they become available, because they will contain important information about Alcoa and the proposed transaction . Alcoa’s stockholders will be able to obtain a free copy of the Proxy Statement, as well as other filings containing information about Alcoa, free of charge, at the SEC’s website ( www . sec . gov ) . Copies of the Proxy Statement and other documents filed by Alcoa with the SEC may be obtained, without charge, by contacting Alcoa through its website at https : //investors . alcoa . com/ . Participants in the Solicitation Alcoa, its directors, executive officers and other persons related to Alcoa may be deemed to be participants in the solicitat ion of proxies from Alcoa’s stockholders in connection with the proposed transaction. Information about the directors and executive officers of Alcoa and their ownership of common stock of Alcoa is set forth in the section entitled “ Information about our Executive Officers ” included in Alcoa’s annual report on Form 10 - K for the fiscal year ended December 31, 2023, which was filed with the SEC on Fe bruary 21, 2024 (and which is available at https://www.sec.gov/ixviewer/ix.html?doc=/Archives/edgar/data/1675149/000095017024018069/aa - 20231231.htm ), and in the sections entitled “ Director Nominees ” and “ Stock Ownership of Directors and Executive Officers ” included in its proxy statement for its 2024 annual meeting of stockholders, which was filed with the SEC on March 19, 2024 (a nd which is available at https://www.sec.gov/ix?doc=/Archives/edgar/data/1675149/000119312524071354/d207257ddef14a.htm ). Additional information regarding the persons who may, under the rules of the SEC, be deemed participants in the proxy solicitation and a description of their direct and indirect interests, by security holdings or otherwise, will be included in the Proxy Statement and other relevant materials to be filed with the SEC in connection with the proposed transaction when they become available. Free copies of the se documents may be obtained as described in the preceding paragraph. Non - GAAP Financial Measures This presentation contains reference to certain financial measures that are not calculated and presented in accordance with generally accepted accounting principles in the United States (GAAP) . Alcoa Corporation believes that the presentation of these non - GAAP financial measures is useful to investors because such measures provide both additional information about the operating performance of Alcoa Corporation and insight on the ability of Alcoa Corporation to meet its financial obligations by adjusting the most directly comparable GAAP financial measure for the impact of, among others, “special items” as defined by the Company, non - cash items in nature, and/or nonoperating expense or income items . The presentation of non - GAAP financial measures is not intended to be a substitute for, and should not be considered in isolation from, the financial measures reported in accordance with GAAP . Certain definitions, reconciliations to the most directly comparable GAAP financial measures and additional details regarding management’s rationale for the use of the non - GAAP financial measures can be found in the appendix to this presentation . Alcoa Corporation does not provide reconciliations of the forward - looking non - GAAP financial measures Adjusted EBITDA and Adjusted Net Income, including t ransformation, intersegment eliminations and other corporate Adjusted EBITDA ; operational tax expense ; and other expense ; each excluding special items, to the most directly comparable forward - looking GAAP financial measures because it is impractical to forecast certain special items, such as restructuring charges and mark - to - market contracts without unreasonable efforts due to the variability and complexity associated with predicting the occurrence and financial impact of such special items . For the same reasons, we are unable to address the probabl e significance of the unavailable information, which could be material to future results . Resources This presentation can be found under the “Events and Presentations” tab of the “Investors” section of the Company’s website, www . alcoa . com .
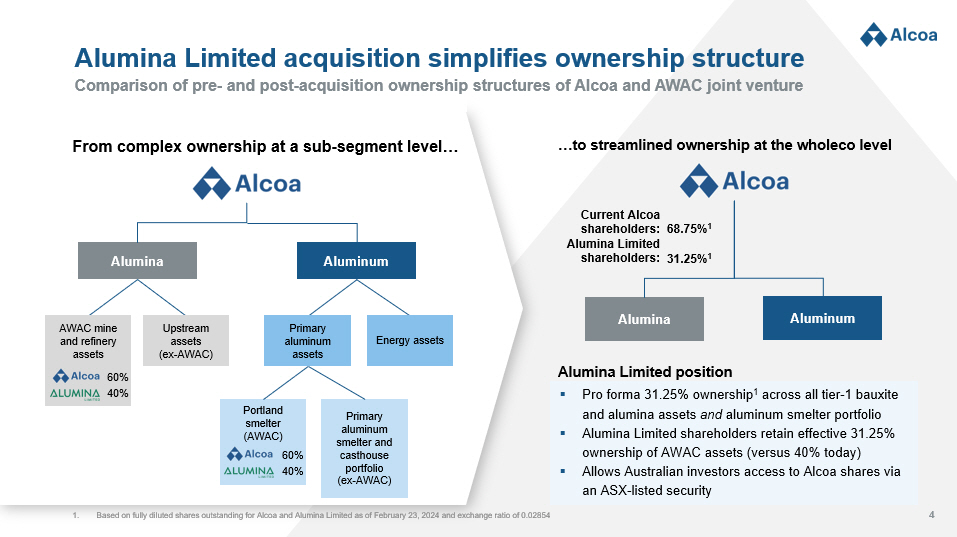
4 Comparison of pre - and post - acquisition ownership structures of Alcoa and AWAC joint venture Alumina Limited acquisition simplifies ownership structure Portland smelter (AWAC) Primary aluminum smelter and casthouse portfolio (ex - AWAC) Alumina Aluminum AWAC mine and refinery assets Upstream assets (ex - AWAC) Primary aluminum assets Energy assets From complex ownership at a sub - segment level… Alumina Aluminum 31.25% 1 ▪ Pro forma 31.25% ownership 1 across all tier - 1 bauxite and alumina assets and aluminum smelter portfolio ▪ Alumina Limited shareholders retain effective 31.25% ownership of AWAC assets (versus 40% today) ▪ Allows Australian investors access to Alcoa shares via an ASX - listed security …to streamlined ownership at the wholeco level Current Alcoa shareholders: 1. Based on fully diluted shares outstanding for Alcoa and Alumina Limited as of February 23, 2024 and exchange ratio of 0.02854 68.75% 1 Alumina Limited shareholders: 60% 40% 60% 40% Alumina Limited position
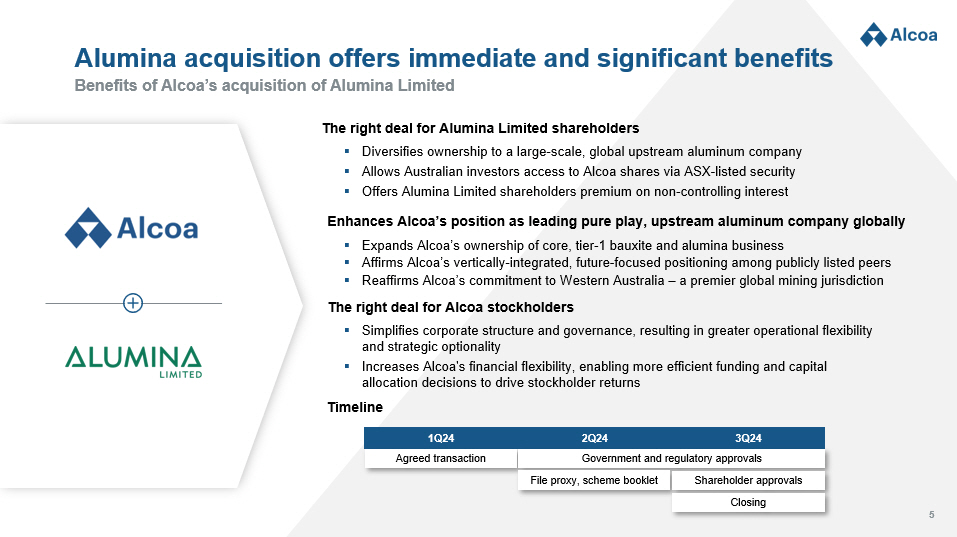
5 Benefits of Alcoa’s acquisition of Alumina Limited Alumina acquisition offers immediate and significant benefits The right deal for Alumina Limited shareholders Enhances Alcoa’s position as leading pure play, upstream aluminum company globally The right deal for Alcoa stockholders ▪ Diversifies ownership to a large - scale, global upstream aluminum company ▪ Allows Australian investors access to Alcoa shares via ASX - listed security ▪ Offers Alumina Limited shareholders premium on non - controlling interest ▪ Simplifies corporate structure and governance, resulting in greater operational flexibility and strategic optionality ▪ Increases Alcoa's financial flexibility, enabling more efficient funding and capital allocation decisions to drive stockholder returns ▪ Expands Alcoa’s ownership of core, tier - 1 bauxite and alumina business ▪ Affirms Alcoa’s vertically - integrated, future - focused positioning among publicly listed peers ▪ Reaffirms Alcoa’s commitment to Western Australia – a premier global mining jurisdiction 3Q24 2Q24 1Q24 Agreed transaction Government and regulatory approvals File proxy, scheme booklet Shareholder approvals Closing Timeline

6 Overview of key facets of combined company, 1 of 2 Advances global, pure play, upstream aluminum position Smelting STRONG BALANCE SHEET LOW CARBON PRODUCTS TECHNOLOGY FOCUSED Refining Ba1 BB+ BB 41.0 Mdmt bauxite production (2023) 10.9 Mmt alumina production (2023) 2.1 Mmt aluminum production (2023) Largest third party alumina long ex China ▪ Full product suite with carbon advantages and recycled content ▪ Long - term technology projects under development addressing upstream aluminum value chain ASTRAEA TM ▪ Sufficient capacity to self - fund upcoming capital requirements and pipeline of technology projects ▪ Greater flexibility to navigate volatility in market conditions ▪ Increased exposure to bauxite & alumina earnings provides greater stability throughout the commodity cycle ▪ Full value chain integration from upstream bauxite mines to aluminum smelters – with tier - 1 assets at every step INTEGRATED ACROSS THE VALUE CHAIN Mining Refinery of the Future Project Source: Company analyses and CRU Note: All production figures represent consolidated amounts as reported in company filings TM

7 Overview of key facets of combined company, 2 of 2 Advances global, pure play, upstream aluminum position 41.0 15.8 9.9 1.1 1.0 Category 1 10.9 4.0 3.6 0.4 0.2 Category 1 4.1 2.1 1.8 0.7 0.3 Category 1 #1 bauxite producer ( Mdmt ) 1 ▪ Strategic global presence with locations in proximity to Alcoa’s refineries ▪ 1st quartile cost curve position (2023) Bauxite #1 alumina producer ( Mmt ) 1 Alumina #2 aluminum producer ( Mmt ) 1 Aluminum ▪ Refinery portfolio with 1st quartile emissions intensity ▪ 1st quartile cost curve position (2023) 2 ▪ Global smelting portfolio with 87% of production from renewable energy ▪ 2nd quartile cost curve position (2023) Source: Company filings for Alcoa + Alumina Limited production; CRU as of December 2023 for peers’ production 1. Denotes rank among publicly - listed pure play aluminum peers 2. First quartile by CRU analysis as of October 2023; full impacts of lower bauxite grade in Australia, San Ciprián curtailment and operational issues in Brazil being assessed could place Alumina in second quartile in 2024
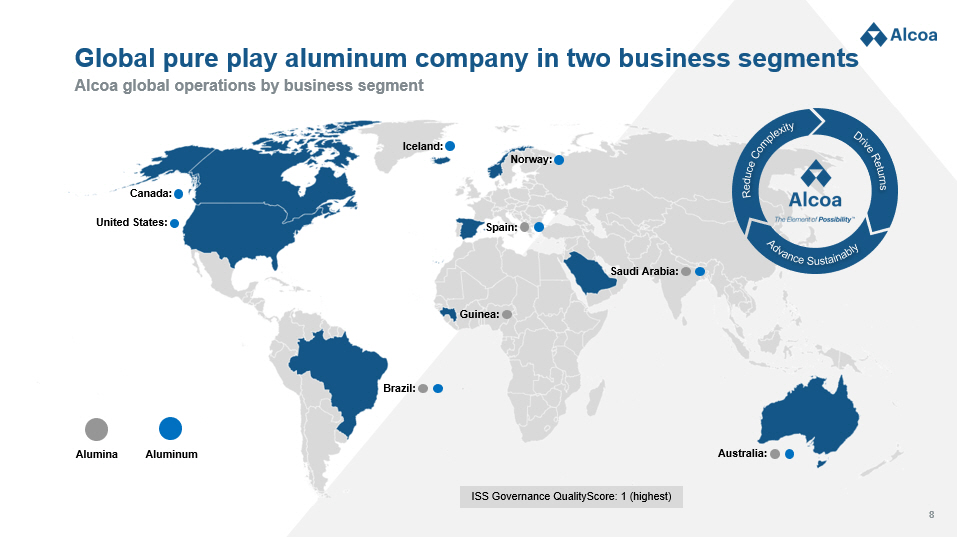
8 Alcoa global operations by business segment Global pure play aluminum company in two business segments United States: Brazil: Canada : Iceland : Spain: Norway: Saudi Arabia: Australia: Guinea : Alumina Aluminum ISS Governance QualityScore : 1 (highest)
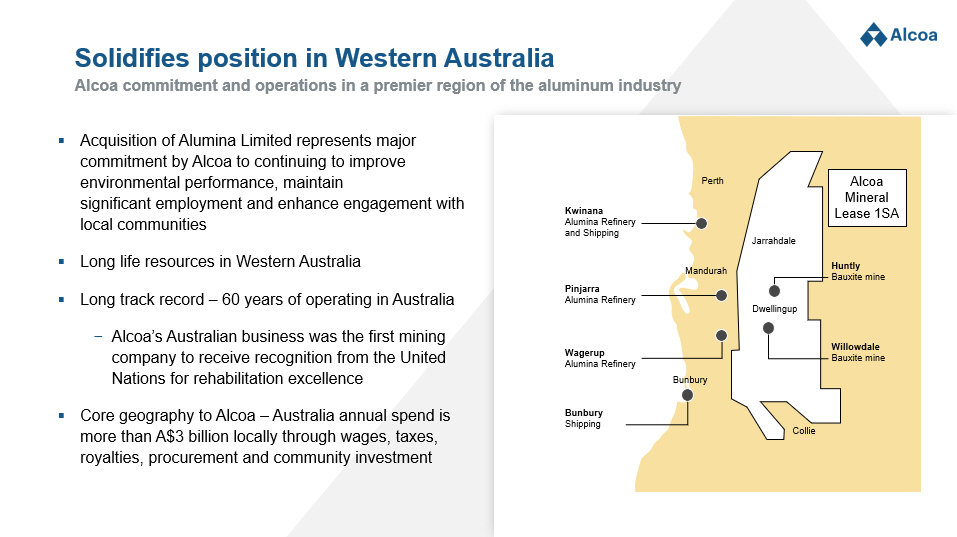
9 Alcoa commitment and operations in a premier region of the aluminum industry Solidifies position in Western Australia ▪ Acquisition of Alumina Limited represents major commitment by Alcoa to continuing to improve environmental performance, maintain significant employment and enhance engagement with local communities ▪ Long life resources in Western Australia ▪ Long track record – 60 years of operating in Australia − Alcoa’s Australian business was the first mining company to receive recognition from the United Nations for rehabilitation excellence ▪ Core geography to Alcoa – Australia annual spend is more than A$3 billion locally through wages, taxes, royalties, procurement and community investment Jarrahdale Dwellingup Huntly Bauxite mine Willowdale Bauxite mine Pinjarra Alumina Refinery Wagerup Alumina Refinery Kwinana Alumina Refinery and Shipping Bunbury Shipping Bunbury Collie Perth Mandurah Alcoa Mineral Lease 1SA
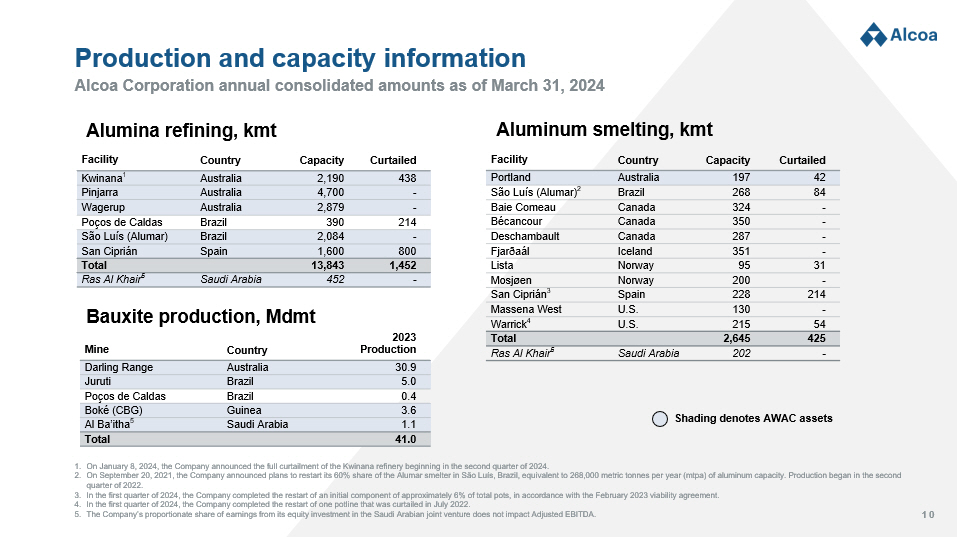
10 Alcoa Corporation annual consolidated amounts as of March 31, 2024 Production and capacity information Bauxite production, Mdmt 2023 Production Country Mine 30.9 Australia Darling Range 5.0 Brazil Juruti 0.4 Brazil Poços de Caldas 3.6 Guinea Boké (CBG) 1.1 Saudi Arabia Al Ba’itha 5 41.0 Total Alumina refining, kmt Curtailed Capacity Country Facility 438 2,190 Australia Kwinana 1 - 4,700 Australia Pinjarra - 2,879 Australia Wagerup 214 390 Brazil Poços de Caldas - 2,084 Brazil São Luís (Alumar) 800 1,600 Spain San Ciprián 1,452 13,843 Total - 452 Saudi Arabia Ras Al Khair 5 Aluminum smelting, kmt Curtailed Capacity Country Facility 42 197 Australia Portland 84 268 Brazil São Luís (Alumar) 2 - 324 Canada Baie Comeau - 350 Canada Bécancour - 287 Canada Deschambault - 351 Iceland Fjarðaál 31 95 Norway Lista - 200 Norway Mosjøen 214 228 Spain San Ciprián 3 - 130 U.S. Massena West 54 215 U.S. Warrick 4 425 2,645 Total - 202 Saudi Arabia Ras Al Khair 5 1. On January 8, 2024, the Company announced the full curtailment of the Kwinana refinery beginning in the second quarter of 202 4. 2. On September 20, 2021, the Company announced plans to restart its 60% share of the Alumar smelter in São Luís, Brazil, equiva len t to 268,000 metric tonnes per year ( mtpa ) of aluminum capacity. Production began in the second quarter of 2022. 3. In the first quarter of 2024, the Company completed the restart of an initial component of approximately 6% of total pots, in ac cordance with the February 2023 viability agreement. 4. In the first quarter of 2024, the Company completed the restart of one potline that was curtailed in July 2022. 5. The Company’s proportionate share of earnings from its equity investment in the Saudi Arabian joint venture does not impact A dju sted EBITDA. Shading denotes AWAC assets
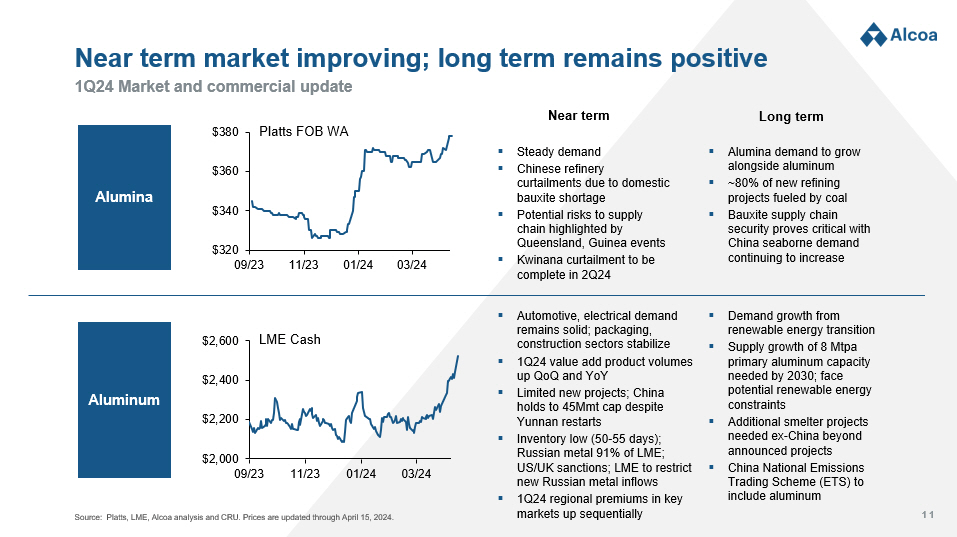
11 1Q24 Market and commercial update Near term market improving; long term remains positive Source: Platts, LME, Alcoa analysis and CRU. Prices are updated through April 15, 2024. Alumina Aluminum $320 $340 $360 $380 09/23 11/23 01/24 03/24 05/24 $2,000 $2,200 $2,400 $2,600 09/23 11/23 01/24 03/24 05/24 LME Cash Platts FOB WA ▪ Automotive, electrical demand remains solid; packaging, construction sectors stabilize ▪ 1Q24 value add product volumes up QoQ and YoY ▪ Limited new projects; China holds to 45Mmt cap despite Yunnan restarts ▪ Inventory low (50 - 55 days); Russian metal 91% of LME; US/UK sanctions; LME to restrict new Russian metal inflows ▪ 1Q24 regional premiums in key markets up sequentially ▪ Demand growth from renewable energy transition ▪ Supply growth of 8 Mtpa primary aluminum capacity needed by 2030; face potential renewable energy constraints ▪ Additional smelter projects needed ex - China beyond announced projects ▪ China National Emissions Trading Scheme (ETS) to include aluminum ▪ Alumina demand to grow alongside aluminum ▪ ~80% of new refining projects fueled by coal ▪ Bauxite supply chain security proves critical with China seaborne demand continuing to increase Near term Long term ▪ Steady demand ▪ Chinese refinery curtailments due to domestic bauxite shortage ▪ Potential risks to supply chain highlighted by Queensland, Guinea events ▪ Kwinana curtailment to be complete in 2Q24
12 Appendix
13 v Information as presented on February 25, 2024

14 1. Based on Alcoa’s share price of $26.52 as of NYSE close on 02/23/24 and AUD/USD exchange rate of 0.656 2. Based on fully diluted shares outstanding for Alcoa and Alumina Limited as of February 23, 2024 Transaction to deliver significant value and upside potential for shareholders of both companies Agreed terms and process for Alcoa to acquire Alumina Limited ▪ Exchange ratio of 0.02854x Alcoa shares for each Alumina Limited share ▪ Consideration implies a value of A$1.15 per Alumina Limited share 1 , equating to a 13.1% premium to the closing price of Alumina Limited on February 23, 2024 ▪ Implies an equity value of approximately $2.2 billion for Alumina Limited 1 AGREED TERMS FOR ACQUISITION OF 100% OF ALUMINA LIMITED ▪ Pro forma ownership: 68.75% Alcoa; 31.25% Alumina Limited 2 ▪ Two mutually agreed upon directors from Alumina Limited’s Board of Directors would be appointed to Alcoa’s Board of Directors ▪ Alcoa to establish secondary listing in Australia via CHESS Depositary Interests (“CDIs”) OWNERSHIP & GOVERNANCE ▪ Parties have executed a process deed and will work to finalize scheme implementation deed in the near - term ▪ No diligence or financing conditions ▪ Alumina Limited Board intends to recommend the transaction, subject to entry into a scheme implementation deed ▪ Transaction will be subject to customary closing conditions, including approval of Alcoa and Alumina Limited shareholders and regulatory approvals CLEAR PATH FOR EXECUTING AND COMPLETING TRANSACTION ▪ Alumina Limited's largest holder, Allan Gray Australia, has entered into an agreement with Alcoa which gives Alcoa the right to acquire up to a 19.9% stake in Alumina Limited ALUMINA LIMITED SHAREHOLDER SUPPORT

15 Proposed transaction collapses AWAC joint venture Alumina Limited’s sole asset is a minority stake in AWAC 1 ▪ Alumina Limited is ASX - listed ▪ Sole asset is 40% ownership of non - operating interest in AWAC ▪ AWAC assets are operated by Alcoa; AWAC financial results are fully consolidated by Alcoa AWAC Joint Venture 2 40% ownership 60% ownership ALUMINA REFINING OPERATIONS ▪ Australia (Kwinana 3 , Pinjarra , Wagerup ) ▪ South America (São Luís ( Alumar )) ▪ Europe and Rest of World (San Ciprián , Ras Al Khair (MBAC equity interest)) BAUXITE MINING OPERATIONS ▪ Australia (Huntly, Willowdale) ▪ South America ( Juruti ) ▪ Africa (CBG equity interest) ALUMINUM SMELTING OPERATIONS ▪ Australia (Portland) 1. Alcoa World Alumina and Chemicals ("AWAC") 2. The list of assets shown excludes Alcoa Steamship Company LLC, refinery assets at the closed facility in Point Comfort, Texas , U nited States, and 100% interest in various assets formerly used for mining and refining in the Republic of Suriname. 3. On January 8, 2024, the Company announced the full curtailment of the Kwinana refinery.
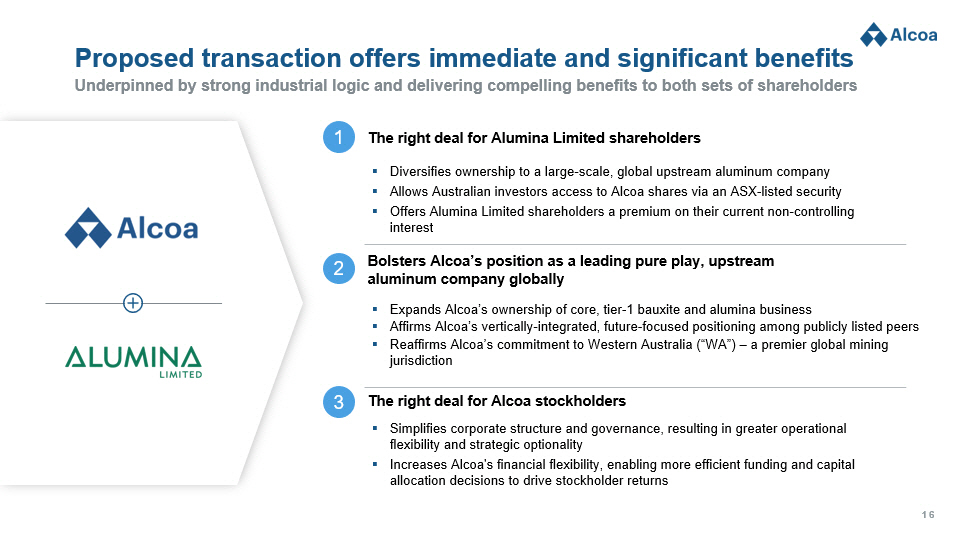
16 Underpinned by strong industrial logic and delivering compelling benefits to both sets of shareholders Proposed transaction offers immediate and significant benefits The right deal for Alumina Limited shareholders 1 Bolsters Alcoa’s position as a leading pure play, upstream aluminum company globally The right deal for Alcoa stockholders ▪ Diversifies ownership to a large - scale, global upstream aluminum company ▪ Allows Australian investors access to Alcoa shares via an ASX - listed security ▪ Offers Alumina Limited shareholders a premium on their current non - controlling interest ▪ Simplifies corporate structure and governance, resulting in greater operational flexibility and strategic optionality ▪ Increases Alcoa's financial flexibility, enabling more efficient funding and capital allocation decisions to drive stockholder returns ▪ Expands Alcoa’s ownership of core, tier - 1 bauxite and alumina business ▪ Affirms Alcoa’s vertically - integrated, future - focused positioning among publicly listed peers ▪ Reaffirms Alcoa’s commitment to Western Australia (“WA”) – a premier global mining jurisdiction 2 3
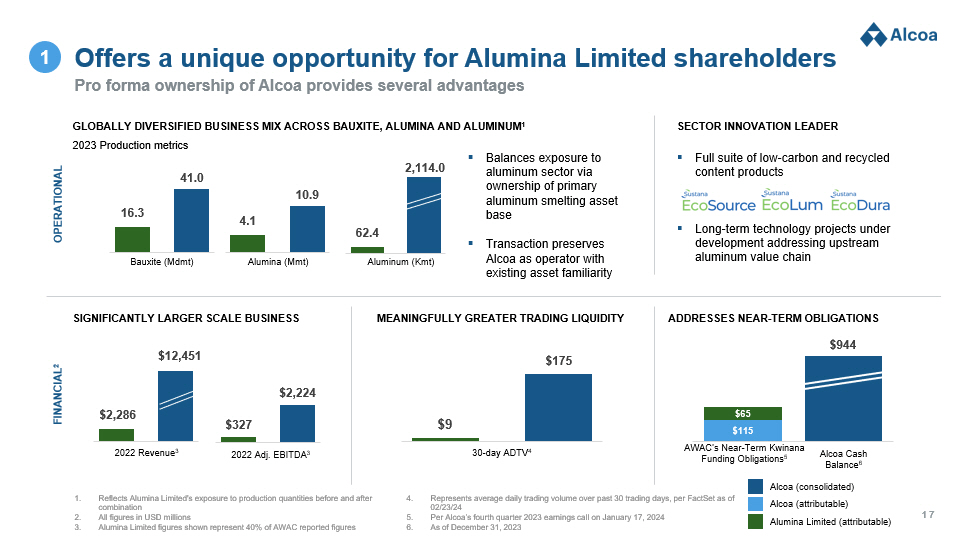
17 $2,286 $12,451 4.1 10.9 1. Reflects Alumina Limited's exposure to production quantities before and after combination 2. All figures in USD millions 3. Alumina Limited figures shown represent 40% of AWAC reported figures 4. Represents average daily trading volume over past 30 trading days, per FactSet as of 02/23/24 5. Per Alcoa’s fourth quarter 2023 earnings call on January 17, 2024 6. As of December 31, 2023 Pro forma ownership of Alcoa provides several advantages Offers a unique opportunity for Alumina Limited shareholders GLOBALLY DIVERSIFIED BUSINESS MIX ACROSS BAUXITE, ALUMINA AND ALUMINUM 1 OPERATIONAL FINANCIAL 2 ▪ Balances exposure to aluminum sector via ownership of primary aluminum smelting asset base ▪ Transaction preserves Alcoa as operator with existing asset familiarity 16.3 41.0 Bauxite ( Mdmt ) Alumina ( Mmt ) Aluminum ( Kmt ) 2022 Revenue 3 $9 $175 30 - day ADTV 4 $115 $65 AWAC’s Near - Term Kwinana Funding Obligations 5 Alcoa Cash Balance 6 62.4 2,114.0 Alumina Limited (attributable) Alcoa (consolidated) SIGNIFICANTLY LARGER SCALE BUSINESS MEANINGFULLY GREATER TRADING LIQUIDITY ADDRESSES NEAR - TERM OBLIGATIONS SECTOR INNOVATION LEADER ▪ Full suite of low - carbon and recycled content products ▪ Long - term technology projects under development addressing upstream aluminum value chain $327 $2,224 2022 Adj. EBITDA 3 $944 1 2023 Production metrics Alcoa (attributable)
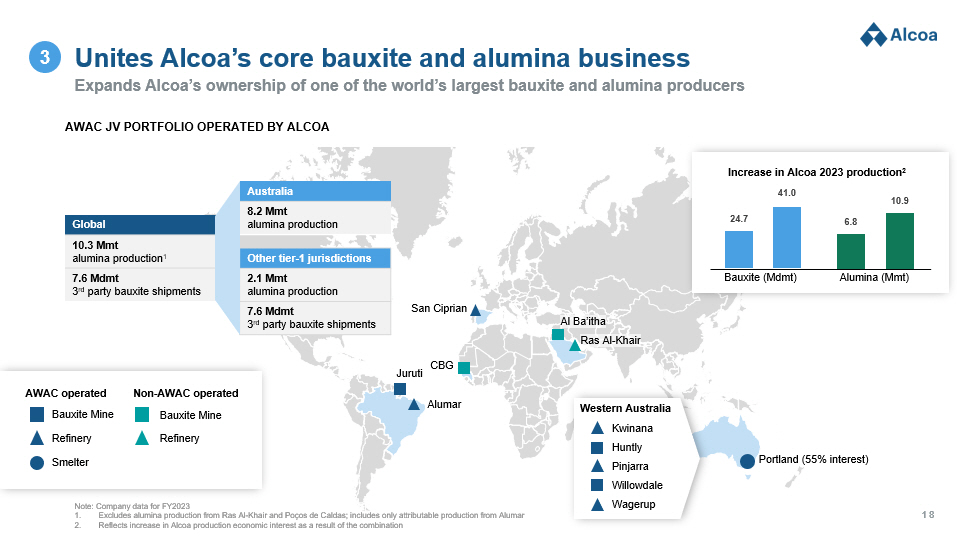
18 Note: Company data for FY2023 1. Excludes alumina production from Ras Al - Khair and Poços de Caldas; includes only attributable production from Alumar 2. Reflects increase in Alcoa production economic interest as a result of the combination Expands Alcoa’s ownership of one of the world’s largest bauxite and alumina producers Unites Alcoa’s core bauxite and alumina business AWAC JV PORTFOLIO OPERATED BY ALCOA Portland (55% interest) Ras Al - Khair Al Ba’itha San Ciprian CBG Juruti Alumar Australia 8.2 Mmt alumina production Other tier - 1 jurisdictions 2.1 Mmt alumina production 7.6 Mdmt 3 rd party bauxite shipments Global 10.3 Mmt alumina production 1 7.6 Mdmt 3 rd party bauxite shipments AWAC operated Bauxite Mine Smelter Refinery Non - AWAC operated Bauxite Mine Refinery 24.7 41.0 6.8 10.9 Increase in Alcoa 2023 production 2 Bauxite ( Mdmt ) Alumina ( Mmt ) Western Australia Kwinana Huntly Pinjarra Willowdale Wagerup 3
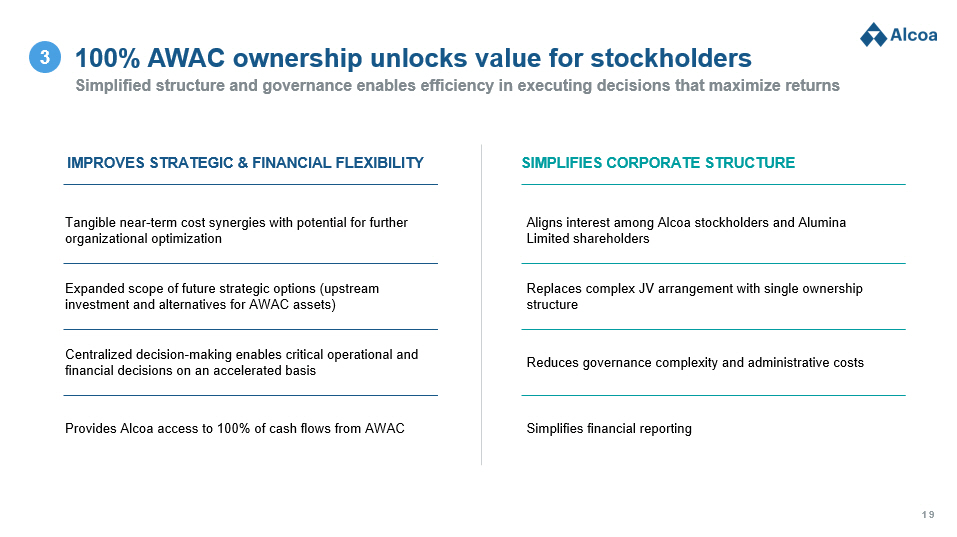
19 Simplified structure and governance enables efficiency in executing decisions that maximize returns 100% AWAC ownership unlocks value for stockholders IMPROVES STRATEGIC & FINANCIAL FLEXIBILITY Tangible near - term cost synergies with potential for further organizational optimization SIMPLIFIES CORPORATE STRUCTURE Aligns interest among Alcoa stockholders and Alumina Limited shareholders Expanded scope of future strategic options (upstream investment and alternatives for AWAC assets) Centralized decision - making enables critical operational and financial decisions on an accelerated basis Replaces complex JV arrangement with single ownership structure Reduces governance complexity and administrative costs Simplifies financial reporting Provides Alcoa access to 100% of cash flows from AWAC 3
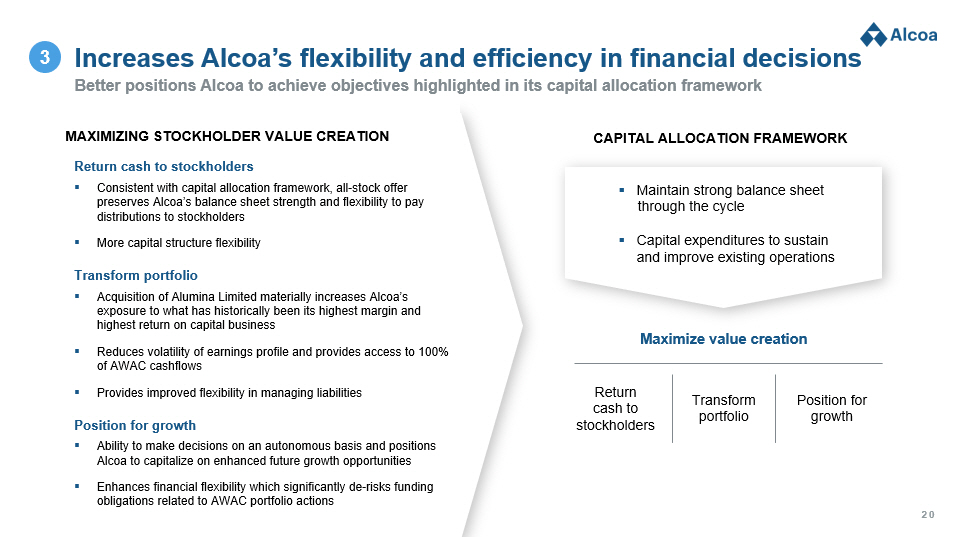
20 Better positions Alcoa to achieve objectives highlighted in its capital allocation framework Increases Alcoa’s flexibility and efficiency in financial decisions MAXIMIZING STOCKHOLDER VALUE CREATION Return cash to stockholders ▪ Consistent with capital allocation framework, all - stock offer preserves Alcoa’s balance sheet strength and flexibility to pay distributions to stockholders ▪ More capital structure flexibility Transform portfolio ▪ Acquisition of Alumina Limited materially increases Alcoa’s exposure to what has historically been its highest margin and highest return on capital business ▪ Reduces volatility of earnings profile and provides access to 100% of AWAC cashflows ▪ Provides improved flexibility in managing liabilities Position for growth ▪ Ability to make decisions on an autonomous basis and positions Alcoa to capitalize on enhanced future growth opportunities ▪ Enhances financial flexibility which significantly de - risks funding obligations related to AWAC portfolio actions CAPITAL ALLOCATION FRAMEWORK ▪ Maintain strong balance sheet through the cycle ▪ Capital expenditures to sustain and improve existing operations Maximize value creation Return cash to stockholders Transform portfolio Position for growth 3
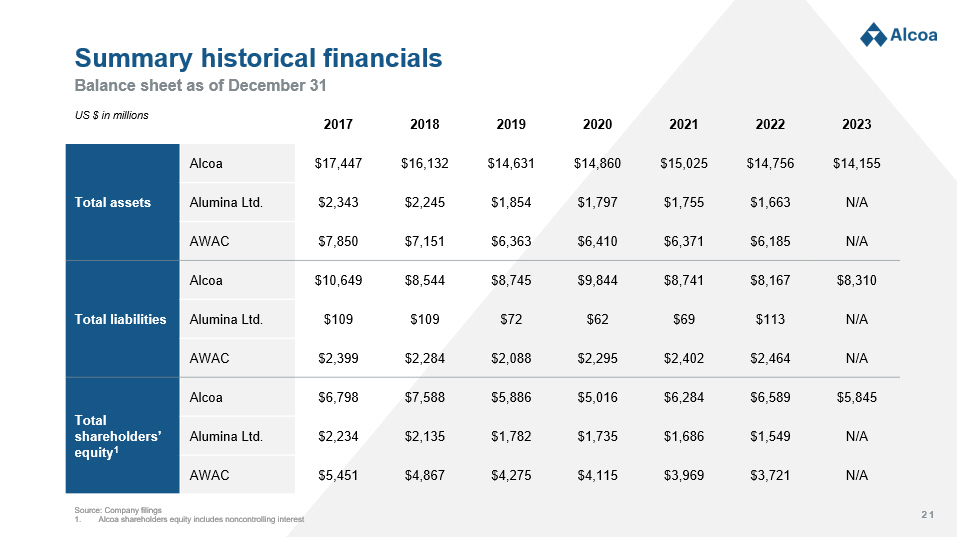
21 Balance sheet as of December 31 Summary historical financials 2023 2022 2021 2020 2019 2018 2017 US $ in millions $14,155 $14,756 $15,025 $14,860 $14,631 $16,132 $17,447 Alcoa Total assets N/A $1,663 $1,755 $1,797 $1,854 $2,245 $2,343 Alumina Ltd. N/A $6,185 $6,371 $6,410 $6,363 $7,151 $7,850 AWAC $8,310 $8,167 $8,741 $9,844 $8,745 $8,544 $10,649 Alcoa Total liabilities N/A $113 $69 $62 $72 $109 $109 Alumina Ltd. N/A $2,464 $2,402 $2,295 $2,088 $2,284 $2,399 AWAC $5,845 $6,589 $6,284 $5,016 $5,886 $7,588 $6,798 Alcoa Total shareholders’ equity 1 N/A $1,549 $1,686 $1,735 $1,782 $2,135 $2,234 Alumina Ltd. N/A $3,721 $3,969 $4,115 $4,275 $4,867 $5,451 AWAC Source: Company filings 1. Alcoa shareholders equity includes noncontrolling interest
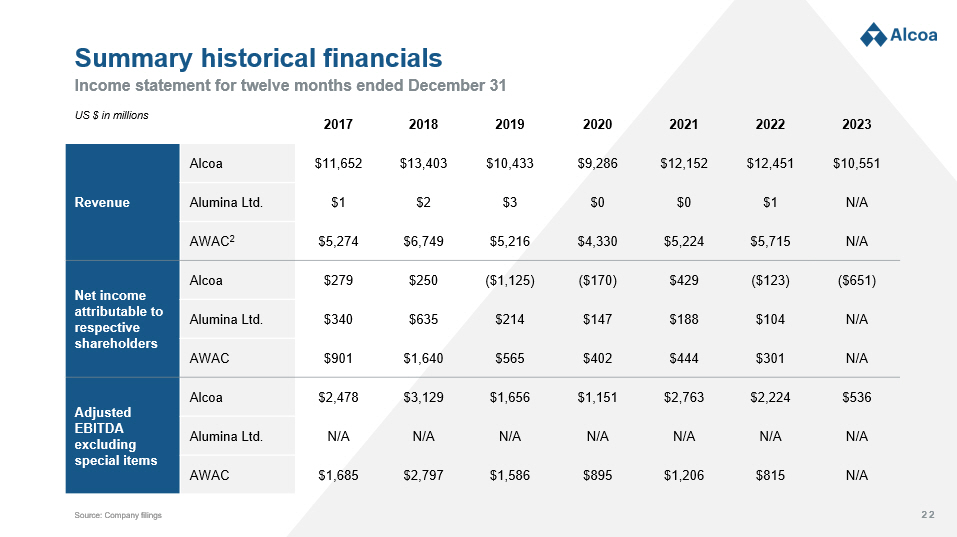
22 Income statement for twelve months ended December 31 Summary historical financials Source: Company filings 2023 2022 2021 2020 2019 2018 2017 US $ in millions $10,551 $12,451 $12,152 $9,286 $10,433 $13,403 $11,652 Alcoa Revenue N/A $1 $0 $0 $3 $2 $1 Alumina Ltd. N/A $5,715 $5,224 $4,330 $5,216 $6,749 $5,274 AWAC 2 ($651) ($123) $429 ($170) ($1,125) $250 $279 Alcoa Net income attributable to respective shareholders N/A $104 $188 $147 $214 $635 $340 Alumina Ltd. N/A $301 $444 $402 $565 $1,640 $901 AWAC $536 $2,224 $2,763 $1,151 $1,656 $3,129 $2,478 Alcoa Adjusted EBITDA excluding special items N/A N/A N/A N/A N/A N/A N/A Alumina Ltd. N/A $815 $1,206 $895 $1,586 $2,797 $1,685 AWAC
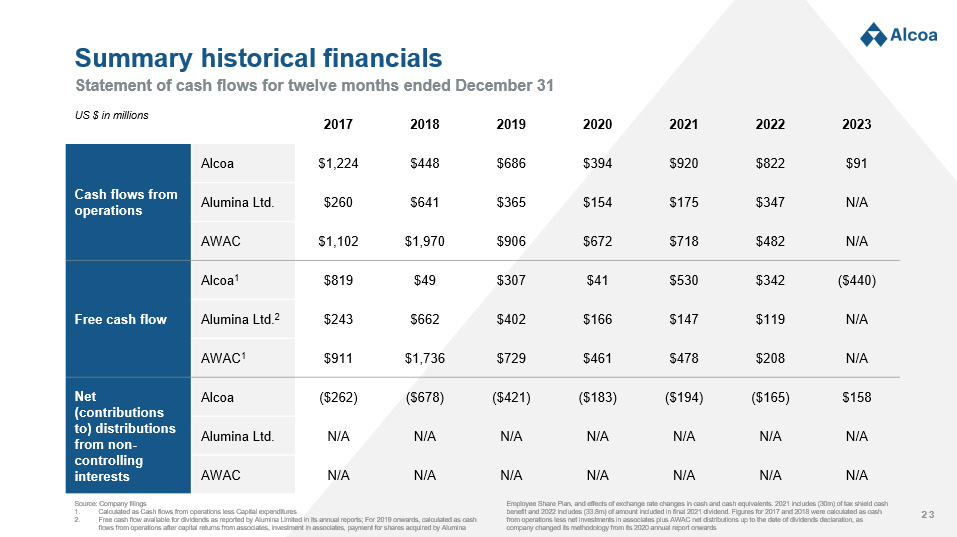
23 Statement of cash flows for twelve months ended December 31 Summary historical financials Source: Company filings 1. Calculated as Cash flows from operations less Capital expenditures 2. Free cash flow available for dividends as reported by Alumina Limited in its annual reports; For 2019 onwards, calculated as cas h flows from operations after capital returns from associates, investment in associates, payment for shares acquired by Alumina Employee Share Plan, and effects of exchange rate changes in cash and cash equivalents. 2021 includes (30m) of tax shield cas h benefit and 2022 includes (33.8m) of amount included in final 2021 dividend. Figures for 2017 and 2018 were calculated as cas h from operations less net investments in associates plus AWAC net distributions up to the date of dividends declaration, as company changed its methodology from its 2020 annual report onwards 2023 2022 2021 2020 2019 2018 2017 US $ in millions $91 $822 $920 $394 $686 $448 $1,224 Alcoa Cash flows from operations N/A $347 $175 $154 $365 $641 $260 Alumina Ltd. N/A $482 $718 $672 $906 $1,970 $1,102 AWAC ($440) $342 $530 $41 $307 $49 $819 Alcoa 1 Free cash flow N/A $119 $147 $166 $402 $662 $243 Alumina Ltd. 2 N/A $208 $478 $461 $729 $1,736 $911 AWAC 1 $158 ($165) ($194) ($183) ($421) ($678) ($262) Alcoa Net (contributions to) distributions from non - controlling interests N/A N/A N/A N/A N/A N/A N/A Alumina Ltd. N/A N/A N/A N/A N/A N/A N/A AWAC

24 Sources: IAI, CRU, Alcoa analysis 1. Considering the same emission scopes for comparison purposes 2. Third - party verified 3. Al coa’s third - party verified EcoLum cradle - to - gate carbon footprint numbers have been calculated using a location - based scope 2 reporting approach aligned with EN15804+A2 and ISO14040 an d ISO14044 requirements. 4. Recycled content is defined using mass balance / credit allocation system at product line and production facility level Summary of Sustana TM products and position on carbon emissions curves Future facing with a full suite of low carbon and recycled products ALCOA SUSTANA PRODUCT LINE METRIC TONS OF CO 2 E/MT, BY PRODUCT ▪ Primary aluminum with emissions less than 4.0 tonne CO 2 e per tonne aluminum (scope 1 and 2, from mining, refining, smelting and casting) ▪ Emission intensity less than one third the industry average 1 ▪ Cradle - to - gate carbon footprint 3 information for all product groups (ingot, foundry, slab, billet, wire rod) ▪ Alumina products from a refinery portfolio with average emissions intensity below 0.6 tonne CO 2 e per tonne of alumina (scope 1 and 2, mining and refining) ▪ Emission intensity less than half the industry average 1 ▪ Cradle - to - gate carbon footprint information 2 for Smelter - grade alumina, and certain Non - metallurgical grades ▪ Minimum 50% recycled content 4 (pre - consumer scrap) ▪ Available globally 65 40 10 20 55 45 35 30 20 30 50 10 60 0 0 5 15 25 Aluminum production, Mt 2 1 0 7 Alumina production, Mt Alumina EcoSource Œ Aluminum EcoLum Œ ASI certifications available for all products and 1 8 sites Learn more at www.Alcoa.com/sustana
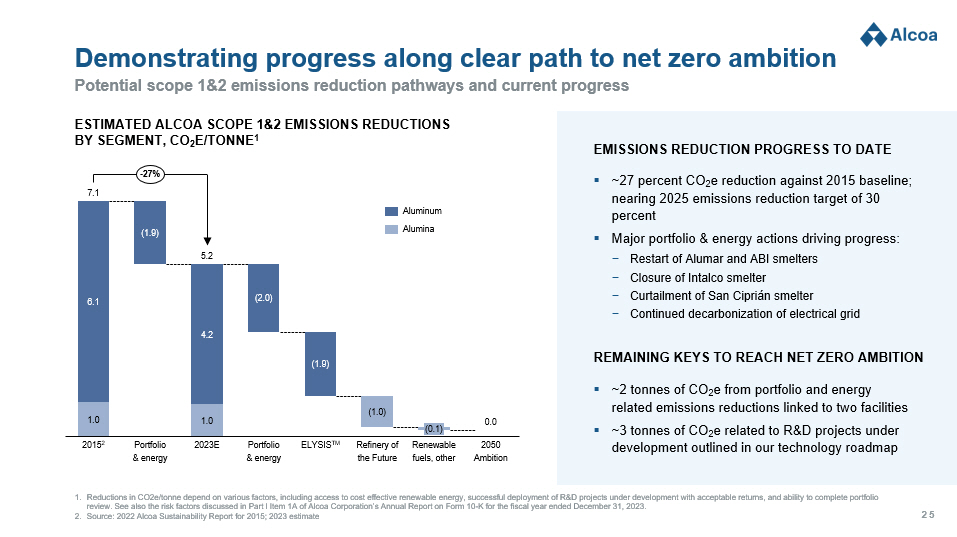
25 Potential scope 1&2 emissions reduction pathways and current progress Demonstrating progress along clear path to net zero ambition ESTIMATED ALCOA SCOPE 1&2 EMISSIONS REDUCTIONS BY SEGMENT, CO 2 E/TONNE 1 1.0 1.0 6.1 4.2 2015 2 (1.9) Portfolio & energy 2023E (2.0) Portfolio & energy (1.9) ELYSIS TM (1.0) Refinery of the Future (0.1) Renewable fuels, other 2050 Ambition 7.1 5.2 0.0 - 27% 1. Reductions in CO2e/ tonne depend on various factors, including access to cost effective renewable energy, successful deployment of R&D projects under d ev elopment with acceptable returns, and ability to complete portfolio review. See also the risk factors discussed in Part I Item 1A of Alcoa Corporation’s Annual Report on Form 10 - K for the fiscal y ear ended December 31, 2023. 2. Source: 2022 Alcoa Sustainability Report for 2015; 2023 estimate Aluminum Alumina ▪ ~27 percent CO 2 e reduction against 2015 baseline; nearing 2025 emissions reduction target of 30 percent ▪ Major portfolio & energy actions driving progress: − Restart of Alumar and ABI smelters − Closure of Intalco smelter − Curtailment of San Ciprián smelter − Continued decarbonization of electrical grid EMISSIONS REDUCTION PROGRESS TO DATE ▪ ~2 tonnes of CO 2 e from portfolio and energy related emissions reductions linked to two facilities ▪ ~3 tonnes of CO 2 e related to R&D projects under development outlined in our technology roadmap REMAINING KEYS TO REACH NET ZERO AMBITION

26 A compelling opportunity for Alcoa and Alumina Limited The right deal for Alumina Limited shareholders 1 Bolsters Alcoa’s position as a leading pure play, upstream aluminum company globally 2 The right deal for Alcoa stockholders 3
27 v 1Q24 Financial and other information as presented on April 17, 2024
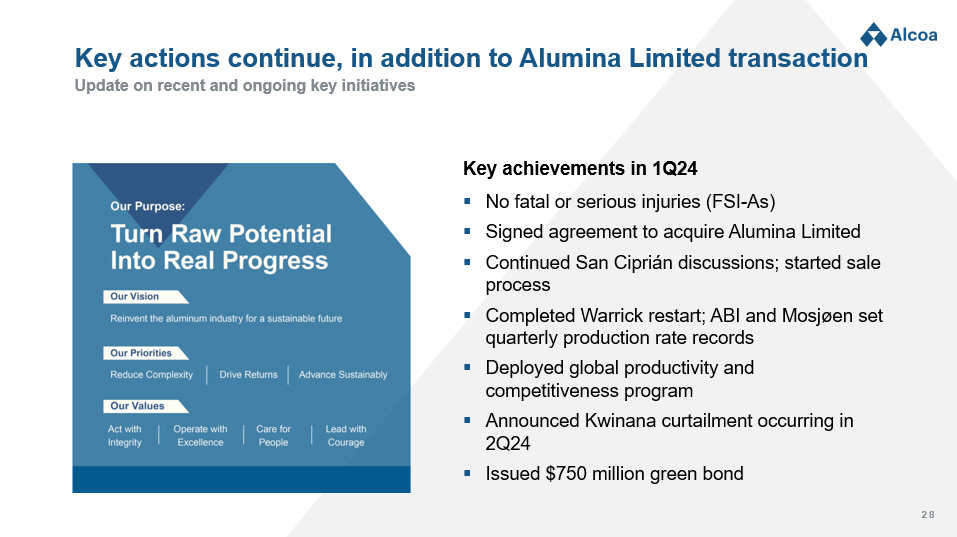
28 Update on recent and ongoing key initiatives Key actions continue, in addition to Alumina Limited transaction Key achievements in 1Q24 ▪ No fatal or serious injuries (FSI - As) ▪ Signed agreement to acquire Alumina Limited ▪ Continued San Ciprián discussions; started sale process ▪ Completed Warrick restart; ABI and Mosjøen set quarterly production rate records ▪ Deployed global productivity and competitiveness program ▪ Announced Kwinana curtailment occurring in 2Q24 ▪ Issued $750 million green bond
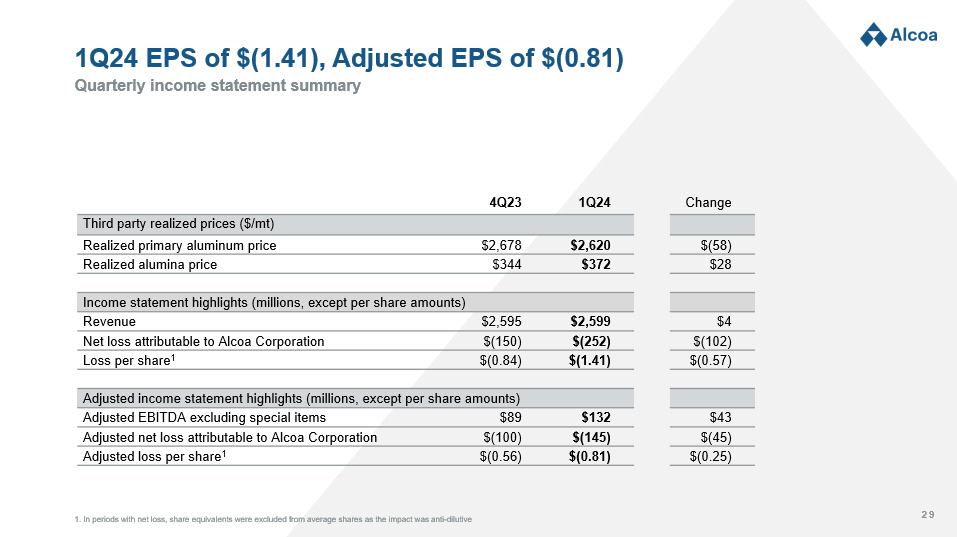
29 Quarterly income statement summary 1Q24 EPS of $(1.41), Adjusted EPS of $(0.81) Change 1Q24 4Q23 Third party realized prices ($/mt) $(58) $2,620 $2,678 Realized primary aluminum price $28 $372 $344 Realized alumina price Income statement highlights (millions, except per share amounts) $4 $2,599 $2,595 Revenue $(102) $(252) $(150) Net loss attributable to Alcoa Corporation $(0.57) $(1.41) $(0.84) Loss per share 1 Adjusted income statement highlights (millions, except per share amounts) $43 $132 $89 Adjusted EBITDA excluding special items $(45) $(145) $(100) Adjusted net loss attributable to Alcoa Corporation $(0.25) $(0.81) $(0.56) Adjusted loss per share 1 1. In periods with net loss, share equivalents were excluded from average shares as the impact was anti - dilutive
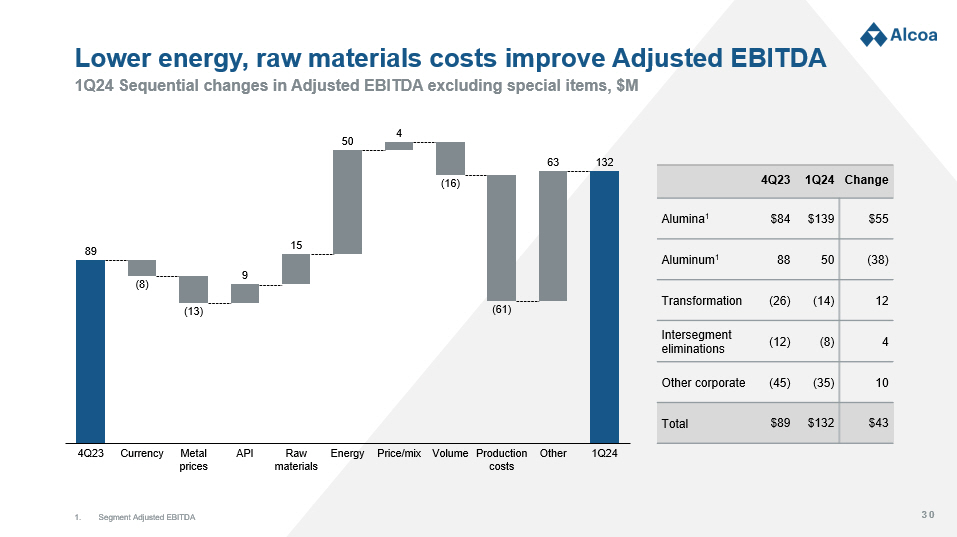
30 1Q24 Sequential changes in Adjusted EBITDA excluding special items, $M Lower energy, raw materials costs improve Adjusted EBITDA 89 132 9 15 50 4 63 4Q23 Currency Metal prices API Raw materials Energy Price/mix Volume Production costs Other 1Q24 (13) (16) (61) (8) Change 1Q24 4Q23 $55 $139 $84 Alumina 1 (38) 50 88 Aluminum 1 12 (14) (26) Transformation 4 (8) (12) Intersegment eliminations 10 (35) (45) Other corporate $43 $132 $89 Total 1. Segment Adjusted EBITDA
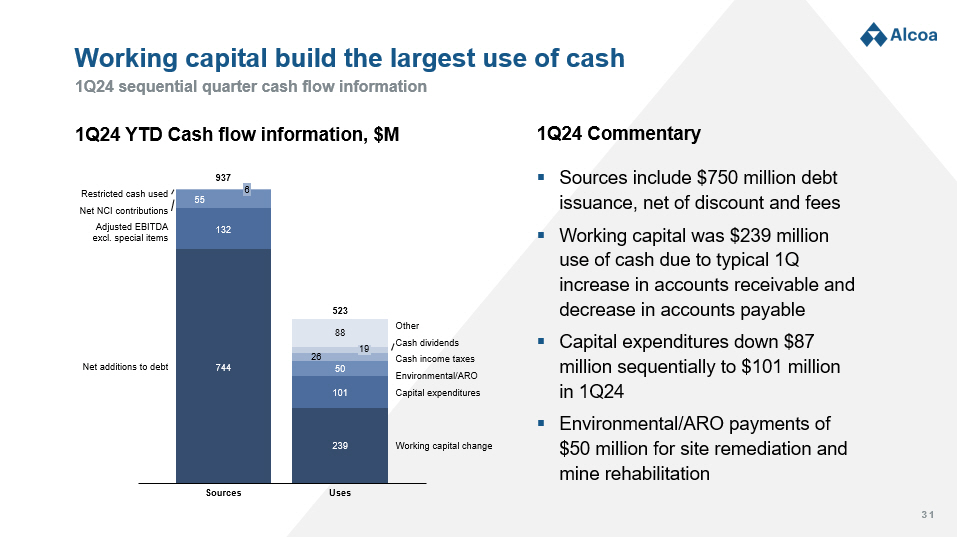
31 Working capital build the largest use of cash 1Q24 sequential quarter cash flow information ▪ Sources include $750 million debt issuance, net of discount and fees ▪ Working capital was $239 million use of cash due to typical 1Q increase in accounts receivable and decrease in accounts payable ▪ Capital expenditures down $87 million sequentially to $101 million in 1Q24 ▪ Environmental/ARO payments of $50 million for site remediation and mine rehabilitation 1Q24 Commentary 1Q24 YTD Cash flow information, $M 239 101 50 26 88 19 Uses Working capital change Capital expenditures Environmental/ARO Cash income taxes Cash dividends Other 523 744 132 55 6 Sources Net additions to debt Adjusted EBITDA excl. special items Net NCI contributions Restricted cash used 937
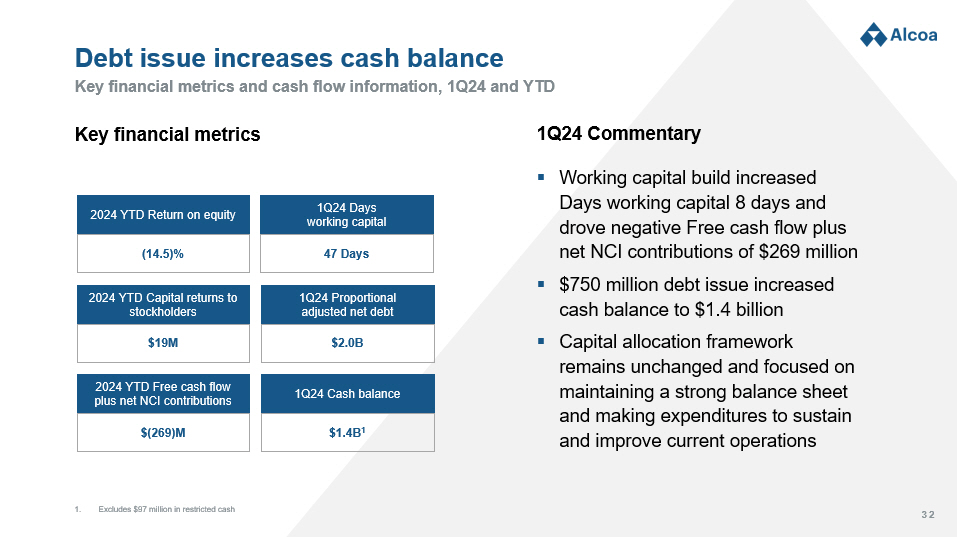
32 Debt issue increases cash balance Key financial metrics and cash flow information, 1Q24 and YTD 1. Excludes $97 million in restricted cash Key financial metrics 2024 YTD Return on equity (14.5)% 1Q24 Days working capital 2024 YTD Capital returns to stockholders 1Q24 Proportional adjusted net debt 2024 YTD Free cash flow plus net NCI contributions 1Q24 Cash balance $19M $(269)M $1.4B 1 47 Days $2.0B ▪ Working capital build increased Days working capital 8 days and drove negative Free cash flow plus net NCI contributions of $269 million ▪ $750 million debt issue increased cash balance to $1.4 billion ▪ Capital allocation framework remains unchanged and focused on maintaining a strong balance sheet and making expenditures to sustain and improve current operations 1Q24 Commentary
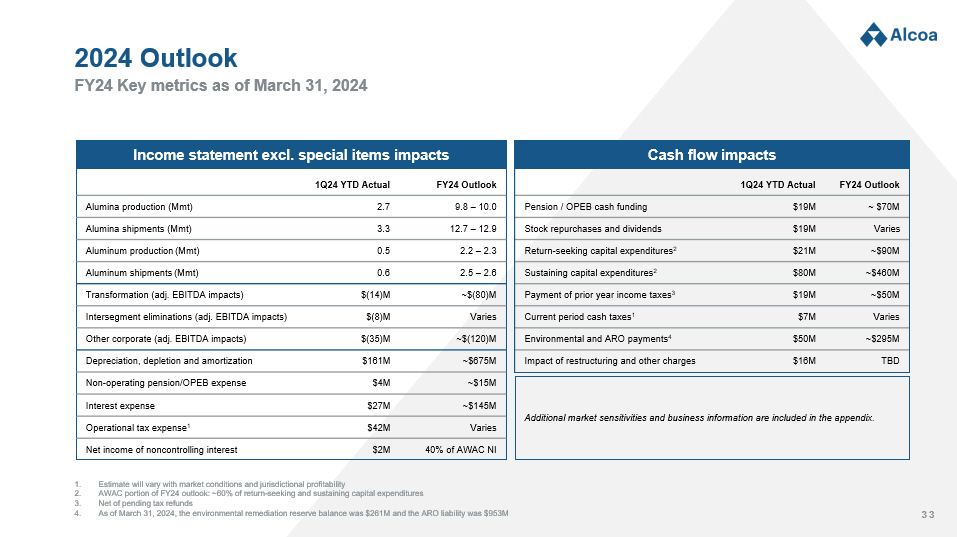
33 1. Estimate will vary with market conditions and jurisdictional profitability 2. AWAC portion of FY24 outlook: ~60% of return - seeking and sustaining capital expenditures 3. Net of pending tax refunds 4. As of March 31, 2024, the environmental remediation reserve balance was $ 261 M and the ARO liability was $ 953 M FY24 Key metrics as of March 31, 2024 2024 Outlook Income statement excl. special items impacts FY24 Outlook 1Q24 YTD Actual 9.8 – 10.0 2.7 Alumina production ( Mmt ) 12.7 – 12.9 3.3 Alumina shipments (Mmt) 2.2 – 2.3 0.5 Aluminum production ( Mmt ) 2.5 – 2.6 0.6 Aluminum shipments (Mmt) ~$(80)M $(14)M Transformation (adj. EBITDA impacts) Varies $(8)M Intersegment eliminations (adj. EBITDA impacts) ~$(120)M $(35)M Other corporate (adj. EBITDA impacts) ~$675M $161M Depreciation, depletion and amortization ~$15M $4M Non - operating pension/OPEB expense ~$145M $27M Interest expense Varies $42M Operational tax expense 1 40% of AWAC NI $2M Net income of noncontrolling interest Cash flow impacts FY24 Outlook 1Q24 YTD Actual ~ $70M $19M Pension / OPEB cash funding Varies $19M Stock repurchases and dividends ~$90M $21M Return - seeking capital expenditures 2 ~$460M $80M Sustaining capital expenditures 2 ~$50M $19M Payment of prior year income taxes 3 Varies $7M Current period cash taxes 1 ~$295M $50M Environmental and ARO payments 4 TBD $16M Impact of restructuring and other charges Additional market sensitivities and business information are included in the appendix.

34 Path forward for near term annual profitability improvement Key operational activities underway, including at San Ciprián ▪ Raw materials savings − Benefits being realized as expected, or better ▪ Productivity and competitiveness program − Fully deployed; some savings realization starting in 2Q24 ▪ Warrick optimization and Inflation R eduction Act (IRA) funding improvements − Potline restart complete − Awaiting decision on additional IRA funding ▪ Alumar smelter restart − Restart challenges remain ▪ Kwinana curtailment − Expected to reach full curtailment in 2Q24 ▪ Pots restarted (6%) in 1Q24 in compliance with viability agreement ▪ Some market improvements in energy and API pricing although business remains unviable; near - term government support appears unlikely ▪ Operational optimization project identified limited short and medium term potential savings; executing with focus on cash preservation ▪ Sale process commenced; success depends upon involvement of government and flexibility from unions; bid process expected to conclude in 2Q24 ▪ Cash expected to run out in second half of 2024; Alcoa will not provide additional funds Near term actions San Ciprián solution
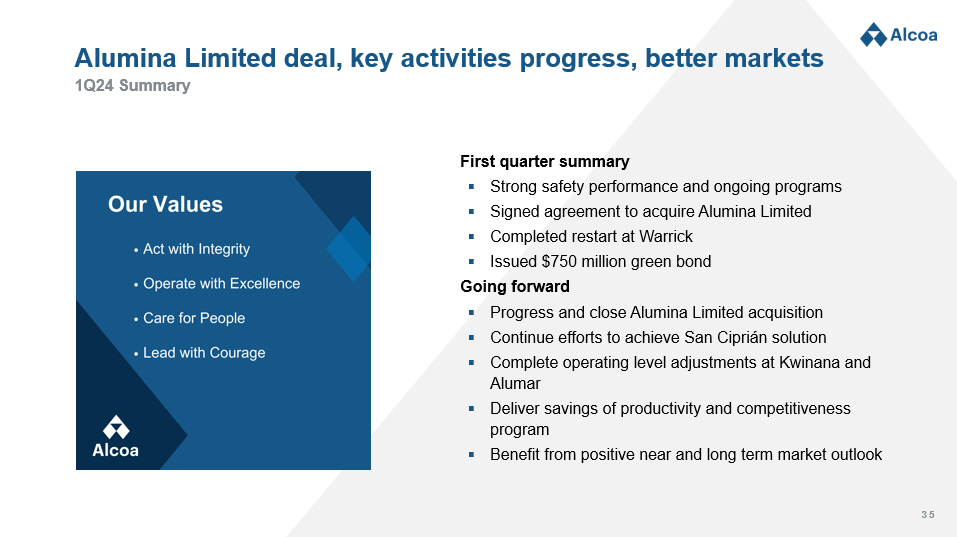
35 1Q24 Summary Alumina Limited deal, key activities progress, better markets First quarter summary ▪ Strong safety performance and ongoing programs ▪ Signed agreement to acquire Alumina Limited ▪ Completed restart at Warrick ▪ Issued $750 million green bond Going forward ▪ Progress and close Alumina Limited acquisition ▪ Continue efforts to achieve San Ciprián solution ▪ Complete operating level adjustments at Kwinana and Alumar ▪ Deliver savings of productivity and competitiveness program ▪ Benefit from positive near and long term market outlook
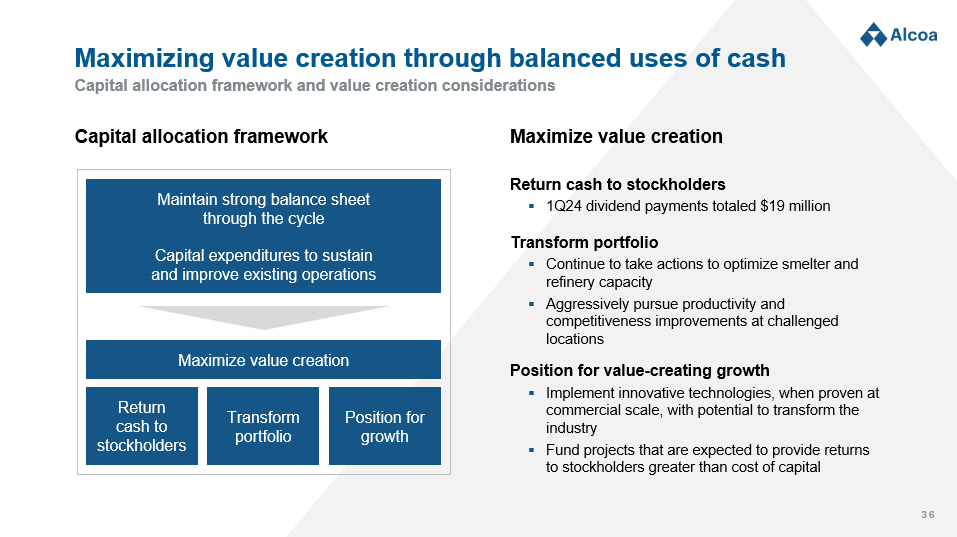
36 Capital expenditures to sustain and improve existing operations Maintain strong balance sheet through the cycle Return cash to stockholders Position for growth Transform portfolio Maximize value creation Capital a llocation f ramework Maximize value creation Return cash to stockholders ▪ 1Q24 dividend payments totaled $19 million Transform portfolio ▪ Continue to take actions to optimize smelter and refinery capacity ▪ Aggressively pursue productivity and competitiveness improvements at challenged locations Position for value - creating growth ▪ Implement innovative technologies, when proven at commercial scale, with potential to transform the industry ▪ Fund projects that are expected to provide returns to stockholders greater than cost of capital Capital allocation framework and value creation considerations Maximizing value creation through balanced uses of cash
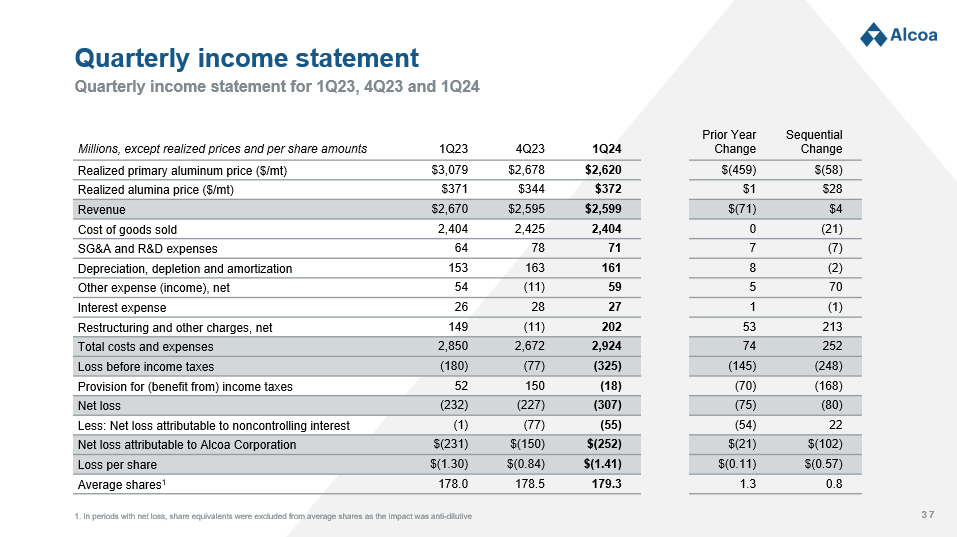
37 Quarterly income statement for 1Q23, 4Q23 and 1Q24 Quarterly income statement Sequential Change Prior Year Change 1Q24 4Q23 1Q23 Millions, except realized prices and per share amounts $(58) $(459) $2,620 $2,678 $3,079 Realized primary aluminum price ($ /mt) $28 $1 $372 $344 $371 Realized alumina price ($/mt) $4 $(71) $2,599 $2,595 $2,670 Revenue (21) 0 2,404 2,425 2,404 Cost of goods sold (7) 7 71 78 64 SG&A and R&D expenses (2) 8 161 163 153 Depreciation, depletion and amortization 70 5 59 (11) 54 Other expense (income), net (1) 1 27 28 26 Interest expense 213 53 202 (11) 149 Restructuring and other charges, net 252 74 2,924 2,672 2,850 Total costs and expenses (248) (145) (325) (77) (180) Loss before income taxes (168) (70) (18) 150 52 Provision for (benefit from) income taxes (80) (75) (307) (227) (232) Net loss 22 (54) (55) (77) (1) Less: Net loss attributable to noncontrolling interest $(102) $(21) $(252) $(150) $(231) Net loss attributable to Alcoa Corporation $(0.57) $(0.11) $(1.41) $(0.84) $(1.30) Loss per share 0.8 1.3 179.3 178.5 178.0 Average shares 1 1. In periods with net loss, share equivalents were excluded from average shares as the impact was anti - dilutive
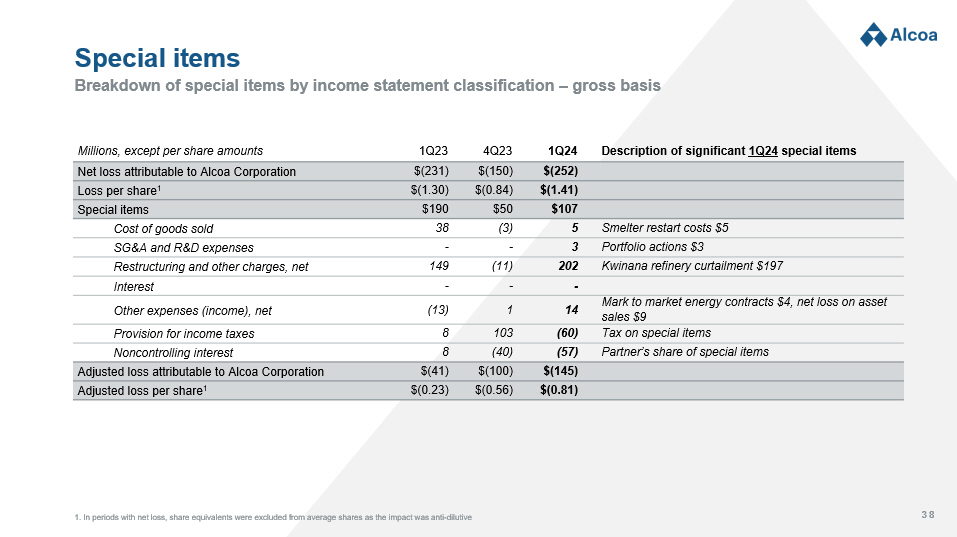
38 Breakdown of special items by income statement classification – gross basis Special items Description of significant 1Q24 special items 1Q24 4Q23 1Q23 Millions, except per share amounts $(252) $(150) $(231) Net loss attributable to Alcoa Corporation $(1.41) $(0.84) $(1.30) Loss per share 1 $107 $50 $190 Special items Smelter restart costs $5 5 (3) 38 Cost of goods sold Portfolio actions $3 3 - - SG&A and R&D expenses Kwinana refinery curtailment $197 202 (11) 149 Restructuring and other charges, net - - - Interest Mark to market energy contracts $4, net loss on asset sales $9 14 1 (13) Other expenses (income) , net Tax on special items (60) 103 8 Provision for income taxes Partner’s share of special items (57) (40) 8 Noncontrolling interest $(145) $(100) $(41) Adjusted loss attributable to Alcoa Corporation $(0.81) $(0.56) $(0.23) Adjusted loss per share 1 1. In periods with net loss, share equivalents were excluded from average shares as the impact was anti - dilutive
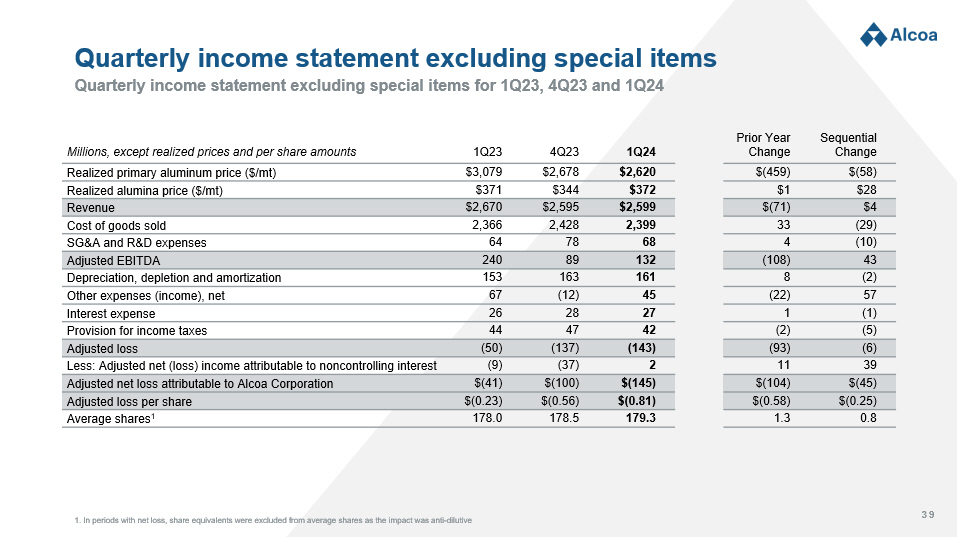
39 Quarterly income statement excluding special items for 1Q23, 4Q23 and 1Q24 Quarterly income statement excluding special items Sequential Change Prior Year Change 1Q24 4Q23 1Q23 Millions, except realized prices and per share amounts $(58) $(459) $2,620 $2,678 $3,079 Realized primary aluminum price ($ /mt) $28 $1 $372 $344 $371 Realized alumina price ($/mt) $4 $(71) $2,599 $2,595 $2,670 Revenue (29) 33 2,399 2,428 2,366 Cost of goods sold (10) 4 68 78 64 SG&A and R&D expenses 43 (108) 132 89 240 Adjusted EBITDA (2) 8 161 163 153 Depreciation, depletion and amortization 57 (22) 45 (12) 67 Other expenses (income) , net (1) 1 27 28 26 Interest expense (5) (2) 42 47 44 Provision for income taxes (6) (93) (143) (137) (50) Adjusted loss 39 11 2 (37) (9) Less: Adjusted net (loss) income attributable to noncontrolling interest $(45) $(104) $(145) $(100) $(41) Adjusted net loss attributable to Alcoa Corporation $(0.25) $(0.58) $(0.81) $(0.56) $(0.23) Adjusted loss per share 0.8 1.3 179.3 178.5 178.0 Average shares 1 1. In periods with net loss, share equivalents were excluded from average shares as the impact was anti - dilutive
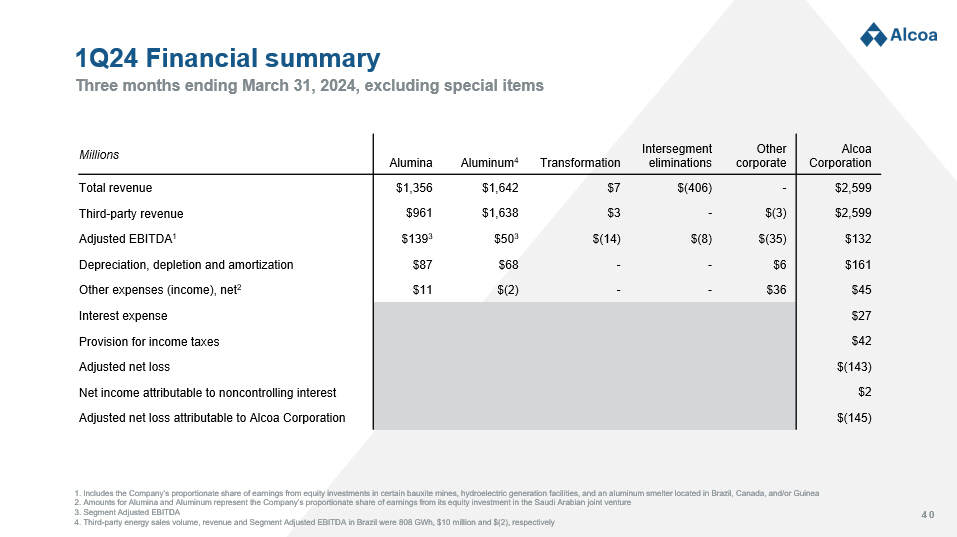
40 Three months ending March 31, 2024, excluding special items 1Q24 Financial summary Alcoa Corporation Other corporate Intersegment eliminations Transformation Aluminum 4 Alumina Millions $2,599 - $(406) $7 $1,642 $1,356 Total revenue $2,599 $(3) - $3 $1,638 $961 Third - party revenue $132 $(35) $(8) $(14) $50 3 $139 3 Adjusted EBITDA 1 $161 $6 - - $68 $87 Depreciation, depletion and amortization $45 $36 - - $(2) $11 Other expenses (income) , net 2 $27 Interest expense $42 Provision for income taxes $(143) Adjusted net loss $2 Net income attributable to noncontrolling interest $(145) Adjusted net loss attributable to Alcoa Corporation 1. Includes the Company’s proportionate share of earnings from equity investments in certain bauxite mines, hydroelectric gen era tion facilities, and an aluminum smelter located in Brazil, Canada, and/or Guinea 2. Amounts for Alumina and Aluminum represent the Company’s proportionate share of earnings from its equity investment in the Sa udi Arabian joint venture 3. Segment Adjusted EBITDA 4. Third - party energy sales volume, revenue and Segment Adjusted EBITDA in Brazil were 808 GWh, $10 million and $(2), respective ly
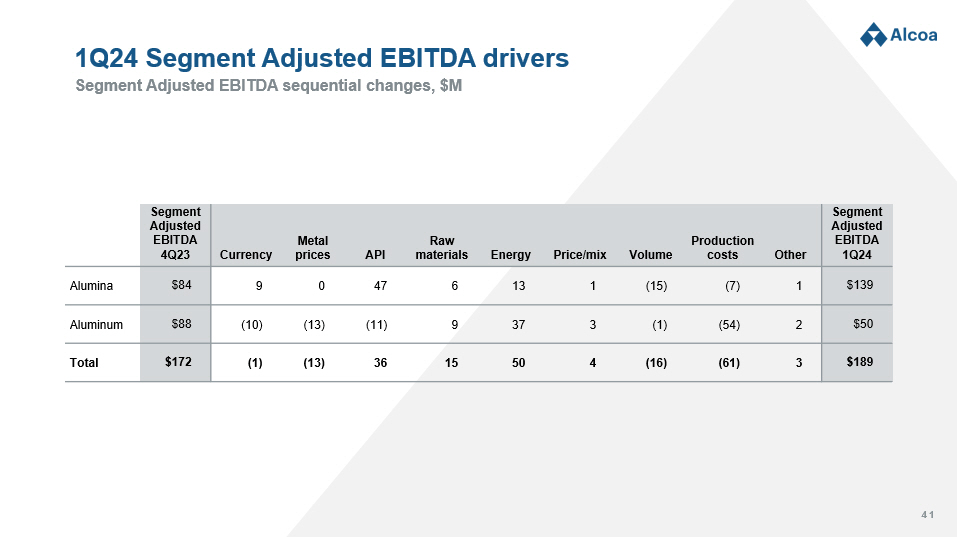
41 Segment Adjusted EBITDA sequential changes, $M 1Q24 Segment Adjusted EBITDA drivers Segment Adjusted EBITDA 1Q24 Other Production costs Volume Price/mix Energy Raw materials API Metal prices Currency Segment Adjusted EBITDA 4Q23 $139 1 (7) (15) 1 13 6 47 0 9 $84 Alumina $50 2 (54) (1) 3 37 9 (11) (13) (10) $88 Aluminum $189 3 (61) (16) 4 50 15 36 (13) (1) $172 Total
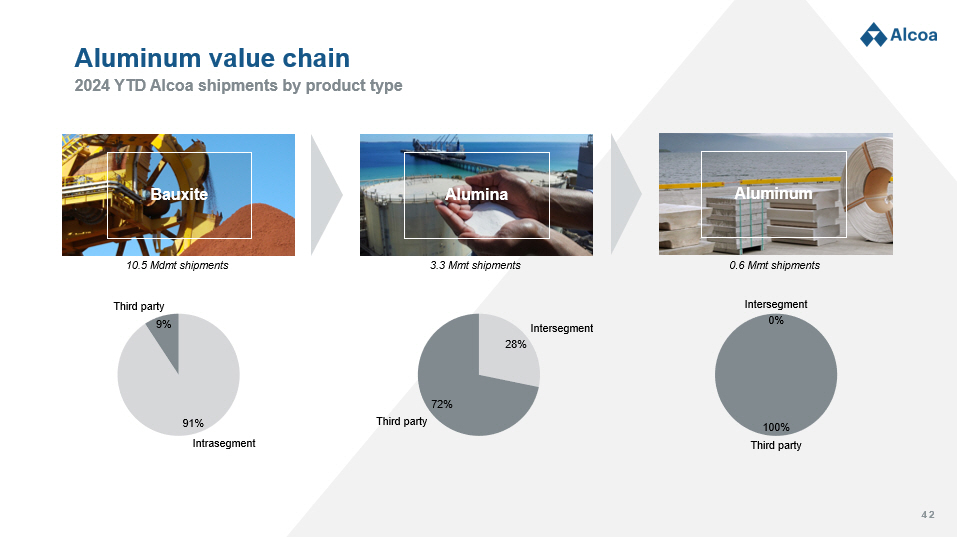
42 2024 YTD Alcoa shipments by product type Aluminum value chain 10.5 Mdmt shipments 3.3 Mmt shipments 0.6 Mmt shipments Aluminum Alumina Bauxite 91% 9% Intrasegment Third party 28% 72% Intersegment Third party 100% 0% Intersegment Third party
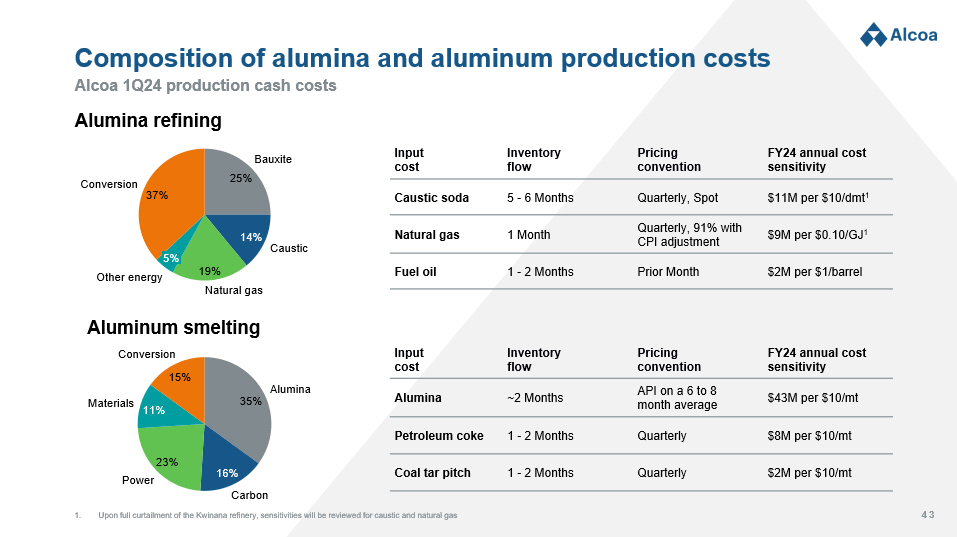
43 Alcoa 1Q24 production cash costs Composition of alumina and aluminum production costs FY24 annual cost sensitivity Pricing convention Inventory flow Input cost $11M per $ 10/dmt 1 Quarterly, Spot 5 - 6 Months Caustic soda $9M per $0.10/GJ 1 Quarterly, 91% with CPI adjustment 1 Month Natural gas $2M per $1/barrel Prior Month 1 - 2 Months Fuel oil FY24 annual cost sensitivity Pricing convention Inventory flow Input cost $43M per $10/mt API on a 6 to 8 month average ~2 Months Alumina $8M per $10/mt Quarterly 1 - 2 Months Petroleum coke $2M per $10/mt Quarterly 1 - 2 Months Coal tar pitch Alumina refining 25% 14% 19% 37% Bauxite Caustic Natural gas 5% Other energy Conversion Aluminum smelting 35% 16% 23% 11% 15% Alumina Carbon Power Materials Conversion 1. Upon full curtailment of the Kwinana refinery, sensitivities will be reviewed for caustic and natural gas

44 1. Average 1Q24 exchange rates 2. Upon full curtailment of the Kwinana refinery, sensitivities will be reviewed for API and AUD Estimated annual Segment Adjusted EBITDA sensitivities 2024 Business information NOK + 0.10 10.49 1 ISK + 10 137.12 1 EUR + 0.01 1.09 1 CAD + 0.01 1.35 1 BRL + 0.10 4.95 1 AUD + 0.01 0.66 1 Japan + $100/mt Europe + $100/mt Midwest + $100/mt API + $10/mt LME + $100/mt $Millions Segment (1) 7 (22) 2 101 2 Alumina 1 9 (2) 4 4 (3) 30 67 140 (43) 205 Aluminum 1 9 (3) 4 11 (25) 30 67 140 58 205 Total Pricing conventions Third party revenue Segment ▪ ~95% of third - party smelter grade alumina priced on API/spot ▪ API based on prior month average of spot prices ▪ Negotiated bauxite prices Alumina ▪ LME + regional premium + product premium ▪ Primary aluminum 15 - day lag ▪ Brazilian hydroelectric sales at market prices Aluminum Regional premium breakdown % of 2024 Primary aluminum s hipments Regional premiums ~50% Midwest ~40% Rotterdam Duty Paid ~10% CIF Japan
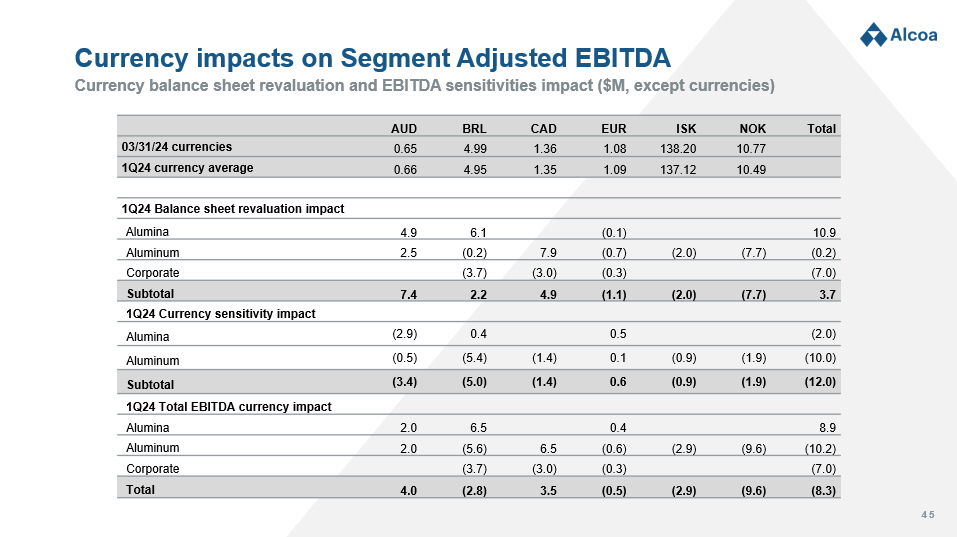
45 Currency balance sheet revaluation and EBITDA sensitivities impact ($M, except currencies) Currency impacts on Segment Adjusted EBITDA Total NOK ISK EUR CAD BRL AUD 10.77 138.20 1.08 1.36 4.99 0.65 03/31/24 currencies 10.49 137.12 1.09 1.35 4.95 0.66 1Q24 currency average 1Q24 Balance sheet revaluation impact 10.9 (0.1) 6.1 4.9 Alumina (0.2) (7.7) (2.0) (0.7) 7.9 (0.2) 2.5 Aluminum (7.0) (0.3) (3.0) (3.7) Corporate 3.7 (7.7) (2.0) (1.1) 4.9 2.2 7.4 Subtotal 1Q24 Currency sensitivity impact (2.0) 0.5 0.4 (2.9) Alumina (10.0) (1.9) (0.9) 0.1 (1.4) (5.4) (0.5) Aluminum (12.0) (1.9) (0.9) 0.6 (1.4) (5.0) (3.4) Subtotal 1Q24 Total EBITDA currency impact 8.9 0.4 6.5 2.0 Alumina (10.2) (9.6) (2.9) (0.6) 6.5 (5.6) 2.0 Aluminum (7.0) (0.3) (3.0) (3.7) Corporate (8.3) (9.6) (2.9) (0.5) 3.5 (2.8) 4.0 Total
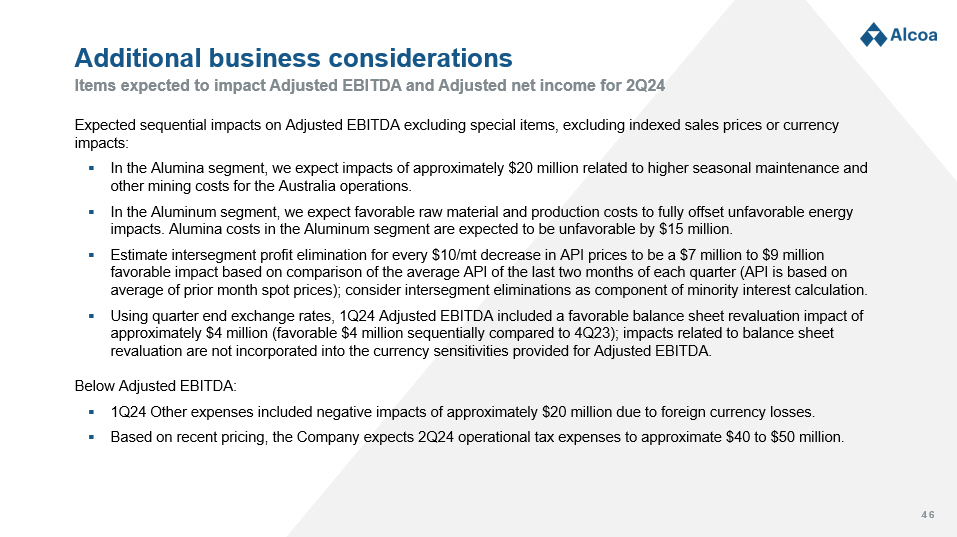
46 Items expected to impact Adjusted EBITDA and Adjusted net income for 2Q24 Additional business considerations Expected sequential impacts on Adjusted EBITDA excluding special items, excluding indexed sales prices or currency impacts: ▪ In the Alumina segment, we expect impacts of approximately $20 million related to higher seasonal maintenance and other mining costs for the Australia operations. ▪ In the Aluminum segment, we expect favorable raw material and production costs to fully offset unfavorable energy impacts. Alumina costs in the Aluminum segment are expected to be unfavorable by $15 million. ▪ Estimate intersegment profit elimination for every $10/mt decrease in API prices to be a $7 million to $9 million favorable impact based on comparison of the average API of the last two months of each quarter (API is based on average of prior month spot prices); consider intersegment eliminations as component of minority interest calculation. ▪ Using quarter end exchange rates, 1Q24 Adjusted EBITDA included a favorable balance sheet revaluation impact of approximately $4 million (favorable $4 million sequentially compared to 4Q23); impacts related to balance sheet revaluation are not incorporated into the currency sensitivities provided for Adjusted EBITDA. Below Adjusted EBITDA: ▪ 1Q24 Other expenses included negative impacts of approximately $20 million due to foreign currency losses. ▪ Based on recent pricing, the Company expects 2Q24 operational tax expenses to approximate $40 to $50 million.
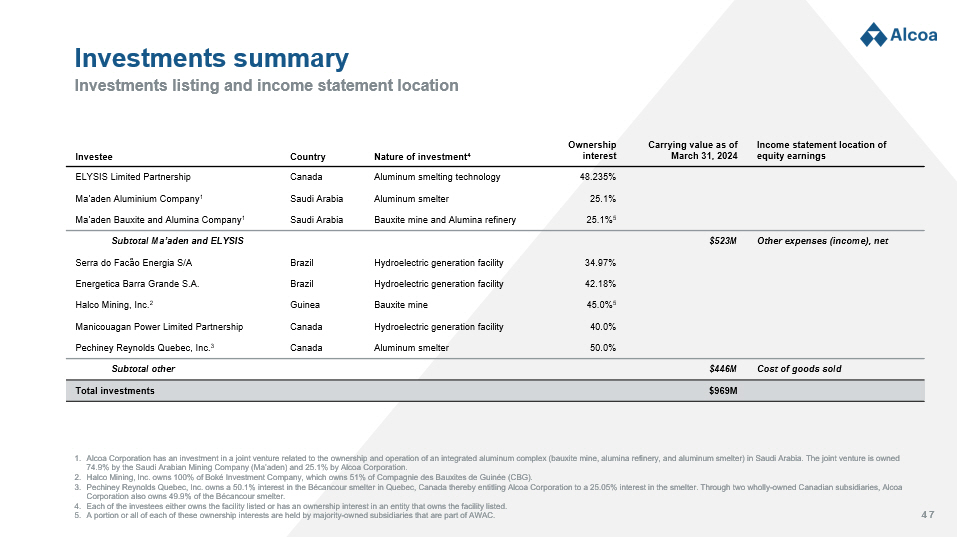
47 1. Alcoa Corporation has an investment in a joint venture related to the ownership and operation of an integrated aluminum compl ex (bauxite mine, alumina refinery, and aluminum smelter) in Saudi Arabia. The joint venture is owned 74.9% by the Saudi Arabian Mining Company ( Ma’aden ) and 25.1% by Alcoa Corporation. 2. Halco Mining, Inc. owns 100% of Boké Investment Company, which owns 51% of Compagnie des Bauxites de Guinée (CBG). 3. Pechiney Reynolds Quebec, Inc. owns a 50.1% interest in the Bécancour smelter in Quebec, Canada thereby entitling Alcoa Corporation to a 25.05% interest in the smelter. Through two wholly - owned Can adian subsidiaries, Alcoa Corporation also owns 49.9% of the Bécancour smelter. 4. Each of the investees either owns the facility listed or has an ownership interest in an entity that owns the facility listed . 5. A portion or all of each of these ownership interests are held by majority - owned subsidiaries that are part of AWAC. Investments listing and income statement location Investments summary Income statement location of equity earnings Carrying value as of March 31, 2024 Ownership interest Nature of investment 4 Country Investee 48.235% Aluminum smelting technology Canada ELYSIS Limited Partnership 25.1% Aluminum smelter Saudi Arabia Ma’aden Aluminium Company 1 25.1% 5 Bauxite mine and Alumina refinery Saudi Arabia Ma’aden Bauxite and Alumina Company 1 Other expenses (income), net $523M Subtotal Ma’aden and ELYSIS 34.97% Hydroelectric generation facility Brazil Serra do Facão Energia S/A 42.18% Hydroelectric generation facility Brazil E nergetica Barra Grande S.A. 45.0% 5 Bauxite mine Guinea H alco Mining, Inc. 2 40.0% Hydroelectric generation facility Canada M anicouagan Power Limited Partnership 50.0% Aluminum smelter Canada P echiney Reynolds Quebec, Inc. 3 Cost of goods sold $446M Subtotal other $969M Total investments

48 Source: 2022 Sustainability Report; 2023 Sustainability Report expected to be issued in 2Q24 Alcoa strategic long - term sustainability goals, baseline and progress Alcoa sustainability goals 2022 Progress 2015 Baseline Description Goal 0 fatalities and 1 serious injury/illness 5 fatal or serious injuries/illnesses Zero fatalities and serious injuries (life - threatening, life - altering injury or illness) Safety 18.4% global women N/A Attain an inclusive ‘everyone culture’ that reflects the diversity of the communities in which we operate Diversity and inclusion 0.82:1 N/A Maintain a corporate - wide running 5 - year average ratio of 1:1 or better for active mining disturbance (excluding long - term infrastructure) to mine rehabilitation Mine rehabilitation 15.6% reduction 53.2 m2/kmt Ala From a 2015 baseline, reduce bauxite residue land requirements per metric tonne of alumina produced by 15% by 2030 Bauxite residue 37.6% reduction 131.7 mt From a 2015 baseline, reduce landfilled waste 15% by 2025 and 25% by 2030. Baseline restated to reflect divestiture of Warrick Rolling. Waste 5.3% reduction 3.79 m3/mt From a 2015 baseline, reduce the intensity of our total water use from Alcoa - defined water - scarce locations by 5% by 2025 and 10% by 2030 Water 25.1% reduction 7.10 mt CO 2 e/mt Align our greenhouse gas (direct + indirect) emissions reduction targets with the 2ºC decarbonization path by reducing greenhouse gas intensity by 30% by 2025, and 50% by 2030 from a 2015 baseline Greenhouse gas emissions Launched SP360 – Alcoa Social Management System in 2021 N/A By 2022, implement a social management system at all locations, including the definition of performance metrics and long - term goals to be accomplished by 2025 and 2030 Sustainable value chain
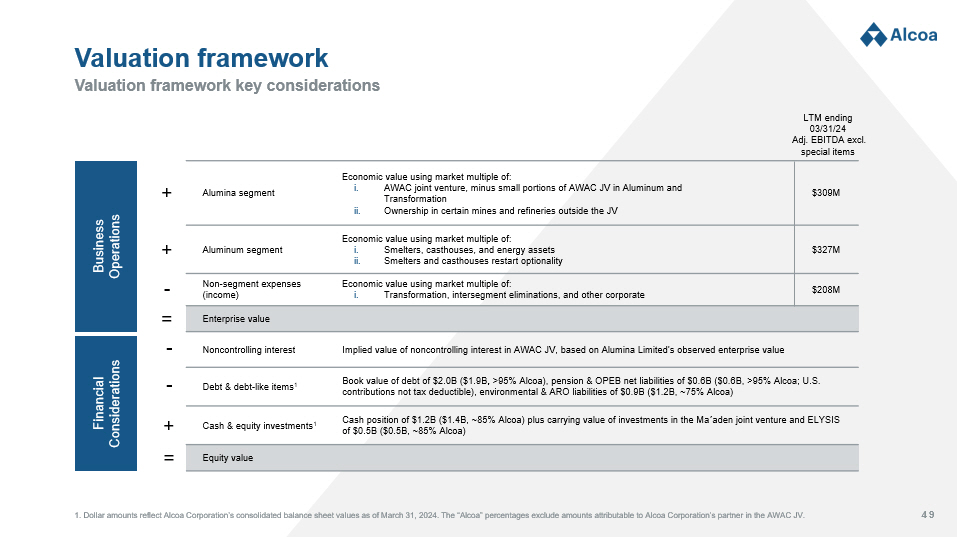
49 1. Dollar amounts reflect Alcoa Corporation’s consolidated balance sheet values as of March 31, 2024. The “Alcoa” percentages ex clude amounts attributable to Alcoa Corporation’s partner in the AWAC JV. Valuation framework key considerations Valuation framework Business Operations + - = + Financial Considerations + - - = $309M Economic value using market multiple of: i. AWAC joint venture, minus small portions of AWAC JV in Aluminum and Transformation ii. Ownership in certain mines and refineries outside the JV Alumina segment $327M Economic value using market multiple of: i. Smelters, casthouses , and energy assets ii. Smelters and casthouses restart optionality Aluminum segment $208M Economic value using market multiple of: i. Transformation, intersegment eliminations, and other corporate Non - segment expenses (income) Enterprise value Implied value of noncontrolling interest in AWAC JV, based on Alumina Limited’s observed enterprise value Noncontrolling interest Book value of debt of $2.0B ($1.9B , >95% Alcoa), pension & OPEB net liabilities of $0.6B ($0.6B, >95% Alcoa; U.S. contributions not tax deductible), environmental & ARO liabilities of $0.9B ($1.2B, ~75% Alcoa) Debt & debt - like items 1 Cash position of $1.2B ($1.4B, ~85% Alcoa) plus carrying value of investments in the Ma aden joint venture and ELYSIS of $0.5B ($0.5B, ~85% Alcoa) Cash & equity investments 1 Equity value LTM ending 03/31/24 Adj. EBITDA excl. special items

50 Adjusted EBITDA reconciliations 1Q24 FY23 4Q23 3Q23 2Q23 1Q23 Millions $(252) $(651) $(150) $(168) $(102) $(231) Net loss attributable to Alcoa Add: (55) (122) (77) (25) (19) (1) Net loss attributable to noncontrolling interest (18) 189 150 (35) 22 52 Provision for (benefit from) income taxes 59 134 (11) 85 6 54 Other expenses (income), net 27 107 28 26 27 26 Interest expense 202 184 (11) 22 24 149 Restructuring and other charges, net 161 632 163 163 153 153 Depreciation, depletion and amortization 124 473 92 68 111 202 Adjusted EBITDA 8 63 (3) 2 26 38 Special items before tax and noncontrolling interest $132 $536 $89 $70 $137 $240 Adjusted EBITDA excl. special items Alcoa Corporation’s definition of Adjusted EBITDA is net margin plus an add - back for depreciation, depletion, and amortization. Net margin is equivalent to Sales minus the following items: Cost of goods sold; Selling, general administrative, and other expenses; Research and development expenses; and Provis ion for depreciation, depletion, and amortization. Adjusted EBITDA is a non - GAAP financial measure. Management believes that this measure is meaningful to investors because Adjust ed EBITDA provides additional information with respect to Alcoa Corporation’s operating performance and the Company’s ability to meet its financial obligations. The Ad jus ted EBITDA presented may not be comparable to similarly titled measures of other companies. $139 $273 $84 $53 $33 $103 Alumina Segment Adjusted EBITDA 50 461 88 79 110 184 Aluminum Segment Adjusted EBITDA (14) (80) (26) (29) (17) (8) Transformation (8) 7 (12) (4) 31 (8) Intersegment eliminations (35) (125) (45) (29) (20) (31) Other corporate $132 $536 $89 $70 $137 $240 Adjusted EBITDA excl. special items
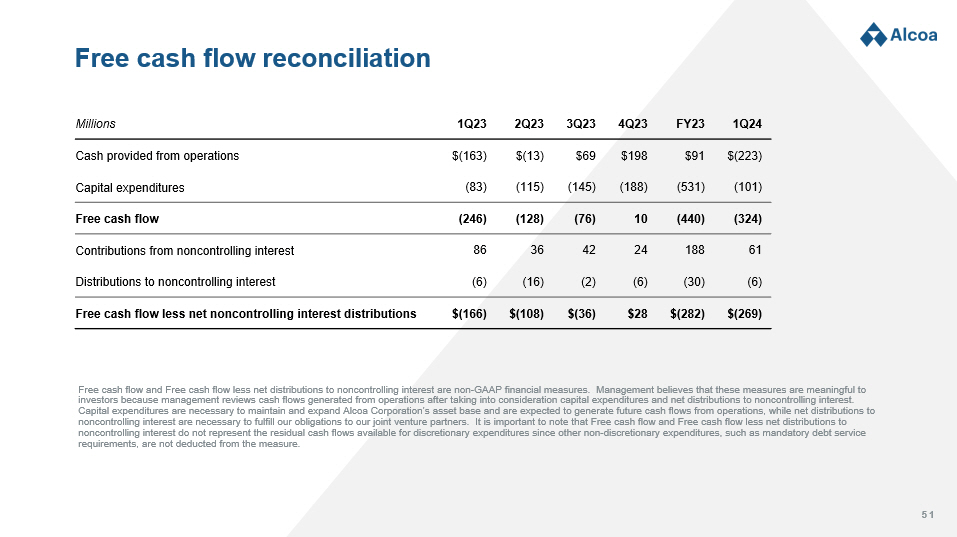
51 Free cash flow reconciliation 1Q24 FY23 4Q23 3Q23 2Q23 1Q23 Millions $(223) $91 $198 $69 $(13) $(163) Cash provided from operations (101) (531) (188) (145) (115) (83) Capital expenditures (324) (440) 10 (76) (128) (246) Free cash flow 61 188 24 42 36 86 Contributions from noncontrolling interest (6) (30) (6) (2) (16) (6) Distributions to noncontrolling interest $(269) $(282) $28 $(36) $(108) $(166) Free cash flow less net noncontrolling interest distributions Free cash flow and Free cash flow less net distributions to noncontrolling interest are non - GAAP financial measures. Management believes that these measures are meaningful to investors because management reviews cash flows generated from operations after taking into consideration capital expenditure s a nd net distributions to noncontrolling interest. Capital expenditures are necessary to maintain and expand Alcoa Corporation’s asset base and are expected to generate future cas h flows from operations, while net distributions to noncontrolling interest are necessary to fulfill our obligations to our joint venture partners. It is important to note that Fr ee cash flow and Free cash flow less net distributions to noncontrolling interest do not represent the residual cash flows available for discretionary expenditures since other non - discre tionary expenditures, such as mandatory debt service requirements, are not deducted from the measure.
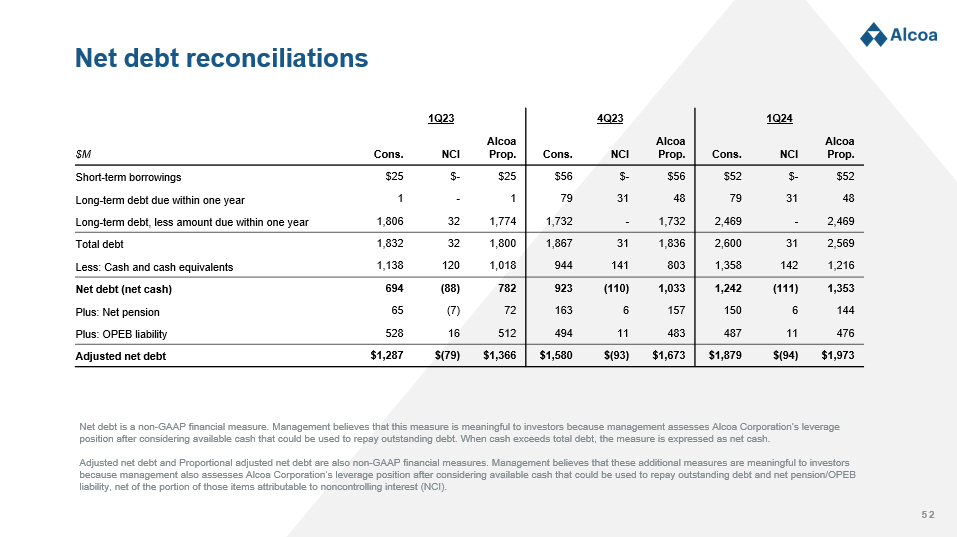
52 Net debt reconciliations 1Q24 4Q23 1Q23 Alcoa Prop. NCI Cons. Alcoa Prop. NCI Cons. Alcoa Prop. NCI Cons. $M $52 $ - $52 $56 $ - $56 $25 $ - $25 Short - term borrowings 48 31 79 48 31 79 1 - 1 Long - term debt due within one year 2,469 - 2,469 1,732 - 1,732 1,774 32 1,806 Long - term debt, less amount due within one year 2,569 31 2,600 1,836 31 1,867 1,800 32 1,832 Total debt 1,216 142 1,358 803 141 944 1,018 120 1,138 Less: Cash and cash equivalents 1,353 (111) 1,242 1,033 (110) 923 782 (88) 694 Net debt (net cash) 144 6 150 157 6 163 72 (7) 65 Plus: Net pension 476 11 487 483 11 494 512 16 528 Plus: OPEB liability $1,973 $(94) $1,879 $1,673 $(93) $1,580 $1,366 $(79) $1,287 Adjusted net debt Net debt is a non - GAAP financial measure. Management believes that this measure is meaningful to investors because management as sesses Alcoa Corporation’s leverage position after considering available cash that could be used to repay outstanding debt. When cash exceeds total debt, the mea sur e is expressed as net cash. Adjusted net debt and Proportional adjusted net debt are also non - GAAP financial measures. Management believes that these additi onal measures are meaningful to investors because management also assesses Alcoa Corporation’s leverage position after considering available cash that could be used to re pay outstanding debt and net pension/OPEB liability, net of the portion of those items attributable to noncontrolling interest (NCI).
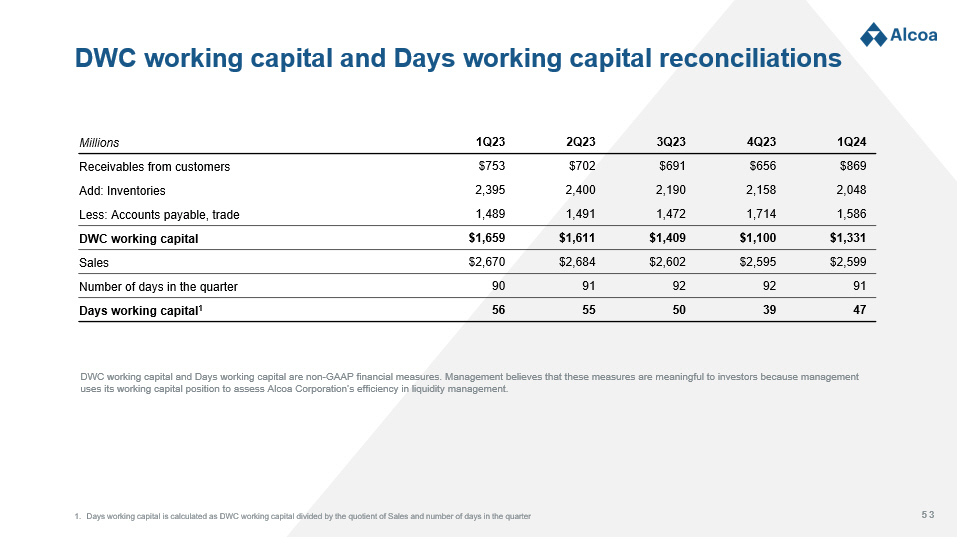
53 DWC working capital and Days working capital reconciliations 1Q24 4Q23 3Q23 2Q23 1Q23 Millions $869 $656 $691 $702 $753 Receivables from customers 2,048 2,158 2,190 2,400 2,395 Add: Inventories 1,586 1,714 1,472 1,491 1,489 Less: Accounts payable, trade $1,331 $1,100 $1,409 $1,611 $1,659 DWC working capital $2,599 $2,595 $2,602 $2,684 $2,670 Sales 91 92 92 91 90 Number of days in the quarter 47 39 50 55 56 Days working capital 1 DWC working capital and Days working capital are non - GAAP financial measures. Management believes that these measures are meanin gful to investors because management uses its working capital position to assess Alcoa Corporation’s efficiency in liquidity management. 1. Days working capital is calculated as DWC working capital divided by the quotient of Sales and number of days in the quarter
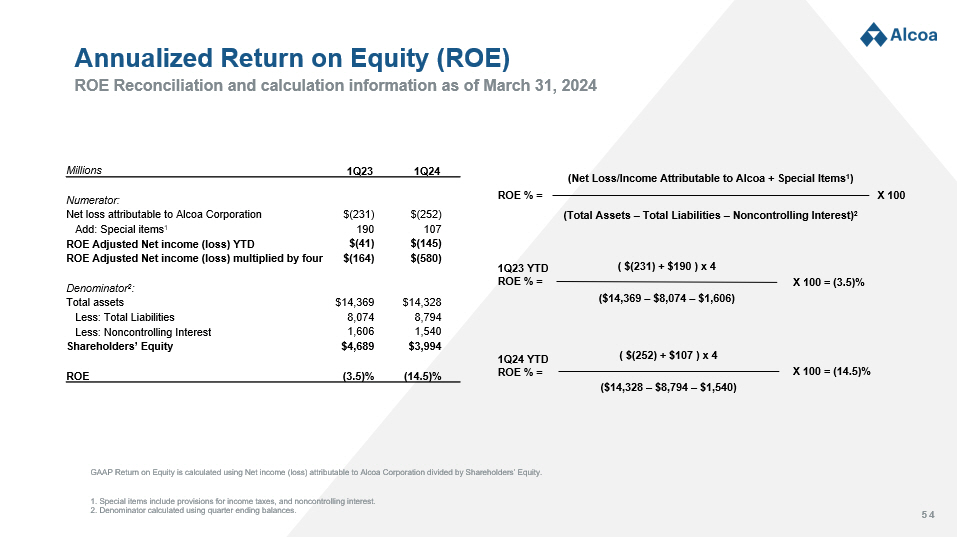
54 X 100 ROE Reconciliation and calculation information as of March 31, 2024 Annualized Return on Equity (ROE) 1Q24 1Q23 Millions Numerator: $(252) $(231) Net loss attributable to Alcoa Corporation 107 190 Add: Special items 1 $(145) $(41) ROE Adjusted Net income (loss) YTD $(580) $(164) ROE Adjusted Net income (loss) multiplied by four Denominator 2 : $14,328 $14,369 Total assets 8,794 8,074 Less: Total Liabilities 1,540 1,606 Less: Noncontrolling Interest $3,994 $4,689 Shareholders’ Equity (14.5)% (3.5)% ROE (Net Loss/Income Attributable to Alcoa + Special Items 1 ) (Total Assets – Total Liabilities – Noncontrolling Interest) 2 ROE % = ( $(231) + $190 ) x 4 ($14,369 – $8,074 – $1,606) 1Q23 YTD ROE % = = (3.5)% ( $(252) + $107 ) x 4 ($14,328 – $8,794 – $1,540) 1Q24 YTD ROE % = X 100 = (14.5)% X 100 GAAP Return on Equity is calculated using Net income (loss) attributable to Alcoa Corporation divided by Shareholders’ Equity . 1. Special items include provisions for income taxes, and noncontrolling interest. 2. Denominator calculated using quarter ending balances.

55 Abbreviations listed in alphanumeric order Glossary of terms Description Abbreviation Percentage points % pts Six months ending June 30 1H## Three months ending March 31 1Q## Six months ending December 31 2H## Three months ending June 30 2Q## Three months ending September 30 3Q## Three months ending December 31 4Q## Adjusted Adj. Alumina Price Index API Asset retirement obligations ARO Australian dollar AUD Alcoa World Alumina and Chemicals AWAC Billion B Brazilian real BRL Canadian dollar CAD Cost, insurance and freight CIF Carbon dioxide equivalent CO 2 e Cost of goods sold COGS Consolidated Cons. Consumer Price Index CPI Dry metric tonne dmt Days working capital DWC Earnings before interest, taxes, depreciation and amortization EBITDA Eliminations Elims . Earnings per share EPS Employee Retirement Income Security Act of 1974 ERISA Euro EUR Estimated Est. Excluding excl. or ex. Description Abbreviation Freight on board Western Australia FOB WA Twelve months ending December 31 FY## Accounting principles generally accepted in the United States of America GAAP Gigajoule GJ Gigawatt hour GWh Icelandic krona ISK Joint venture JV Thousand metric tonnes/Thousand dry metric tonnes kmt/ kdmt London Metal Exchange LME Last twelve months LTM Million M Million metric tonnes/Million dry metric tonnes Mmt / Mdmt Metric tonnes per annum/thousand metric tonnes per annum Mtpa/ kmtpa Metric tonne mt Noncontrolling interest NCI Net income NI Norwegian krone NOK Other postretirement employee benefits OPEB Profit before taxes PBT Proportional Prop. Research and development R&D Rest of world RoW Securities and Exchange Commission SEC Selling, general administrative and other SG&A Shanghai Futures Exchange SHFE To be determined TBD United States of America U.S. United States dollar USD Year to date, year over year YTD, YoY

56