Exhibit 99.1
NASDAQ: FVCB Fall 2020 |
Forward-Looking Statements; Non-GAAP Information In a ddition to his torica l informa tion, this pres entation ma y contain forwa rd-looking s ta tements within the mea ning of the Private Securities Litigation Reform Act of 1995, Section 27A of the Securities Act of 1933, as a mended, a nd Section 21E of the Securities a nd Excha nge Act of 1934, as a mended, including s ta tements of goa ls , intentions , and expecta tions as to future trends , pla ns , events or res ults of the operations a nd policies a nd rega rding the general economic conditions of FVCBankcorp, Inc. (the “Company”) a nd its wholly-owned ba nking s ubsidia ry, FVCba nk (the “Ba nk”). Thes e forwa rd-looking s ta tements a re not gua ra ntees of future performa nce, nor s hould they be relied upon as repres enting the Compa ny’s or the Ba nk’s views as of a ny s ubs equent da te. Thes e forwa rd-looking s ta tements include, but a re not limited to, s ta tements a bout (i) the Compa ny’s a nd the Ba nk’s pla ns , obliga tions , expecta tions a nd intentions a nd (ii) other s ta tements that a re not his torica l fa cts . In s ome cas es , forwa rd-looking s ta tements ca n be identified by us e of words s uch as “ma y,” “will,” “a nticipa tes ,” “believes,” “expects ,” “intends ,” “pla ns,” “es tima tes,” “projects ,” “potentia l,” “continue,” “s hould,” “could,” and s imila r words or phras es . Thes e statements a re bas ed upon the expecta tions, beliefs a nd ass umptions of the ma na gement of FVCB as to the expected outcomes of future events, current a nd a nticipated economic conditions , na tiona lly a nd in the Compa ny’s ma rkets , a nd their impact on the opera tions a nd as sets of the Company a nd the Ba nk, interes t ra tes a nd interes t ra te policy, competitive factors a nd other conditions which by their nature, a re not s us ceptible to a ccurate forecas t a nd a re s ubject to significa nt ris ks a nd uncerta inties , a nd a ctual res ults ma y differ ma teria lly from those presented, either expres sed or implied. Fa ctors tha t could cause res ults a nd outcomes to differ materia lly include, but are not limited to, (1) the a bility of the Compa ny a nd the Bank to success fully execute its bus ines s pla ns, ma na ge its ris ks, a nd a chieve its objectives; (2) cha nges in loca l, nationa l and internationa l politica l a nd economic conditions ; (3) cha nges in fina ncia l ma rket conditions , either interna tiona lly, na tiona lly or loca lly in a rea s in which the Compa ny conducts its opera tions , including without limita tion reduced ra tes of bus iness forma tion a nd growth, commercial a nd res idential real es tate development a nd rea l es tate prices ; (4) cha nges in interes t ra tes , the qua lity a nd compos ition of the loa n a nd s ecurities portfolios , dema nd for loa n products , depos it flows a nd competition; (5) cha nges in fis cal, moneta ry, regula tory, trade a nd ta x policies and la ws , and regula tory ass es s ments a nd fees ; (6) continuing cons olidation in the fina ncia l s ervices indus try; (7) lega l cla ims a ga ins t the Compa ny; (8) increased competitive cha llenges a nd expa nding product a nd pricing press ures a mong fina ncia l ins titutions; (9) the a bility of the Compa ny a nd the Ba nk to develop new ba nking products, the cos t of s uch development, the accepta nce of s uch new products by the Compa ny’s a nd Ba nk’s clientele a nd the impa ct of thes e new products on the Compa ny’s a nd Ba nk’s profitability; (10) technologica l cha nges a nd the Compa ny’s implementa tion of new technologies , including how the cos t of implementa tion impa cts the Company’s profita bility; (11) the Compa ny’s a bility to develop a nd mainta in s ecure and relia ble informa tion technology s ys tems; (12) legisla tion or regula tory cha nges which a dversely a ffect the Compa ny’s opera tions or bus ines s ; (13)the Compa ny’s a bility to comply with a pplica ble la ws a nd regula tions, a nd the cost of s uch complia nce; a nd (14) the impa cts of the ongoing CO VID-19 pa ndemic, including the impact of a ctions ta ken by governmental a nd regula tory a uthorities in res ponse to s uch pa ndemic. For a dis cus sion of these a nd other fa ctors , pleas e review the “Ca utiona ry Note Rega rding Forwa rd-Looking Sta tements ” a nd Ris k Factors in FVCB’s a nnua l report on Form 10-K for the yea r ended December 31, 2019, Qua rterly Reports on Form 10-Q for the periods ended March 31, 2020 a nd June 30, 2020 a nd other reports filed with the SEC. Certa in of the informa tion conta ined in this presenta tion ma y be derived from information provided by industry s ources . The Compa ny believes tha t s uch information is accura te and tha t the s ources from which it has been obtained are reliable. The Company ca nnot gua rantee the a ccuracy of s uch information, however, and ha s not independently verified s uch information. Except where informa tion is provided as of a s pecified da te, this pres enta tion s pea ks as of the da te hereof. The delivery of this presenta tion will not, under a ny circumstances , crea te an implication tha t there ha s been no cha nge in the a ffa irs of the Company s ince the da te of this presenta tion. The Compa ny is not ma king a ny implied or express representa tion or wa rra nty as to the a ccura cy or completenes s of the informa tion s umma rized herein or made a va ila ble in connection with a ny further investiga tion of the Compa ny. The Compa ny expres sly discla ims a ny a nd a ll lia bility which ma y be ba sed on s uch information, errors therein or omiss ions therefrom. Use of Non-GAAP Financial Measures The a ccounting a nd reporting policies of the Compa ny conform to U.S. GA AP a nd preva iling pra ctices in the ba nking indus try. However, this presenta tion includes certain fina ncia l information that is ca lcula ted and pres ented on the bas is of methodologies tha t a re not in accorda nce with U.S. Generally Accepted Accounting Principles (“GAAP”). These non-GAAP fina ncia l mea s ures include pre-ta x, pre-provis ion return on a vera ge as sets a nd return on a vera ge equity, a djus ted return on a vera ge ass ets and return on a vera ge equity, a nd efficiency ra tio. The non-GAAP fina ncia l mea s ures included in this presenta tion do not repla ce the pres enta tion of the Compa ny’s GAAP fina ncial res ults, s hould not be cons idered as a s ubstitute for opera ting res ults determined in a ccorda nce with GAAP a nd ma y not be compa ra ble to other s imila rly titled meas ures of other compa nies . Thes e mea s urements provide s upplementa l information to as sist ma na gement, as well as certain inves tors , in a nalyzing the Compa ny’s core bus iness a nd res ults of operations. The Compa ny has chos en to provide this a dditiona l information to inves tors because it believes tha t these mea sures are mea ningful in ass is ting inves tors to eva luate the Compa ny’s core ongoing opera tions , res ults a nd fina ncia l condition. Thes e non-GAAP fina ncial mea sures s hould not be cons idered an alternative to U.S. GAAP-ba s is fina ncia l s ta tements , a nd other ba nk holding compa nies ma y define or ca lcula te thes e or s imila r mea s ures differently. Reconcilia tions of the non-GAAP fina ncia l meas ures provided in this presenta tion to the mos t directly compa rable GAAP meas ures ca n be found in the a ppendix of this pres enta tion. This pres entation is confidentia l a nd for informa tional purposes only and is being furnis hed s olely for the purpose of ena bling pros pective inves tors to determine whether they wis h to proceed with further inves tigation of the Compa ny a nd an inves tment in its s ecurities. The informa tion herein is a s umma ry a nd is not intended to a nd does not contain a ll the informa tion that you s hould consider in ma king an investment decis ion. The Compa ny ma kes no expres s or implied representa tions or wa rra nties as to the completenes s if the information conta ined herein. The Compa ny shall not ha ve a ny lia bility for a ny informa tion included herein except as ma y be provided in a s ecurities purchase a greement or other definitive written a greement executed in connection with the purchase of the Compa ny’s securities. 2 |
Terms of the Proposed Subordinated Debt Offering FVCBankcorp, Inc. Subordinated Notes due 2030 $15 million Unrated Regulation D Private Fixed-to-Floating Rate (Fixed during First Five Years) 10 Years 5 Years General corporate purposes, including supporting capital ratios at the bank and potential repayment of a portion or all of the $25.0M outstanding subordinated debt callable June 30, 2021 3 Sole Placement Agent Use of Proceeds No Call Period Term Offering Structure Issuance Type Security Rating Amount Security Issuer |
Company Snapshot Company Background Presenters • FVCBankcorp, Inc. (NASDAQ:FVCB) is the holding FVCBank, which was founded in 2007 Headquartere d in Fairfax, VA wi th a focus on Washington D.C. and Baltimore MSAs company for • • Founder, Chairman and CEO Prior: Chairman and General Counsel at James Monroe Bank 30 years as an attorney specializing in business law and transactions 13 years at FVCB (21 in industry) • the greate r • • Focus on providing efficient a nd tailore d comme rcial banking products as well as retail banking services for individuals, corporate clients, and the municipalities Since ince pti on, FVCbank has successfully executed a strategic plan focused on organic growth a nd opportunistic acquisitions without compromising asset quality or financial discipline $170 million in PPP loans originated; $4.6 million in deferred fee income (~200 loans for $43.2 million to new customers) • • • • • • President and Director Prior: CFO for Potomac Bank of VA Prior: CFO of Southern Financial Bank 13 years at FVCB (33 in industry) • Assets $1.8 B • • CFO and EVP Prior: EVP, CAO and Corporate Secretary for Cardinal Bank Prior: Various positions at George Mason Bank and Patriot National Bank 3 years at FVCB (23 in industry) Loans / Deposits 97.3% • TCE / TA 9.66% NPAs / Assets 0.69% • Note: Financial data presented above represents data as of June 30, 2020 Source: S&P Global Market Intelligence; Company documents 4 Jennifer Deacon CFO & EVP Patricia Ferrick President LPO Washington, DC Closing Q4 2020 David Pijor Chairman & CEO |
FVCB Business Strategy FVCB aims to capitalize on market opportunities while maintaining disciplined and comprehensive credit underwriting. FVCB’s focus on providing high-touch, responsive, relationship-based client service allows it to compete effectively and exceed the needs of customers Opportunity Blueprint for Success • Hire seasoned lenders to scalable lending structure • Leverage strong infrastructure to enhance efficient growth • Disciplined underwriting • Continue to attract and service larger, sophisticated commercial and • Further automation of processes to streamline operations • Cultivate relationships with institutional investors to bank consolidation in local markets 5 •Explore potential bank acquisitions •Capitalize on attracting experienced bankers and new customers due Opportunistic Growth •Continued growth of return on assets and return on equity •Enhance net interest income •Strong risk management culture •Constantly managing and overseeing credit quality •Utilize strategic suite of superior products governmental customers Profitability Maintain Credit Quality Superior Technology •Focus on relationships, generating “sticky” sustainable, core deposits •Continue to bolster existing market share Organic Growth |
Recent Initiatives and Developments Key Initiatives for FVCB Preliminary Review Third Quarter Results • Continue to move 200+ new customers (via PPP) to full relationships with FVCB Year-over-year loan growth, excluding PPP, expected to be in the mid-single digits • Continued strong deposit growth combined with further reduction of deposit costs Enhance relationships and build out infrastructure surrounding government contractor borrowers • Excluding impact of PPP, margin is expected to increase slightly relative to the second quarter Continue to leverage more C&I opportunities in the Baltimore MSA • Provision expense and net charge-offs for Q3 expected to be in-line with second quarter results • $238 million of deferrals have returned to contractual payment (66% of initial deferrals) Roll out of Small Business Platform automation process to target small-ticket borrowing needs • $119 million of deferrals remaining as of 9/25/2020 (8.9% of total loans, excluding PPP) Right-size branch footprint through the targeted closing of 2 branch locations following lessons learned through COVID-19 • $3.1 million of deferrals are guaranteed by the SBA 6 |
An Attractive Investment Opportunity in the D.C. and Baltimore MSAs Well positioned in one of the most attractive banking markets in the U.S. • D.C. is the sixth largest MSA with favorable demographics, economic trends and business investments • Recent consolidation in local markets has created growth opportunities for remaining firms Track record of exceptional growth and strong profitability 1 • Strong organic CAGRs ranging from 14% - 18% for assets, loans, deposits and pre-tax income since 2015 • Pre-tax pre-provision ROAA and ROAE of 1.41%2 and 13.49%2, respectively, for the most recent quarter • Technology initiatives, process automation and new products position FVCB to continue its trajectory Disciplined, low risk commercial balance sheet • Commercial focused lending portfolio with small average loan balances that further mitigates risk • Emphasis on credit administration and risk management; comprehensive policies and procedures enabling the maintenance of strong asset quality Strong credit quality • Well-reserved loan portfolio with effective reserve coverage of 1.19% for the most recent quarter • Declining NPLs and OREO as a percentage of total loans; only $3.7 million in net charge-offs in the 13 year history of the bank Strong core deposit base Strategy of full service relationship banking helps support FVCB’s margin Treasury management tools allow FVCB to compete against larger competitors and attract sophisticated commercial and government customers Experienced leadership team • Hands on management team with intimate knowledge of clients, credits, markets and employees • Proven track record of growth at varying institutions within the D.C. MSA • Meaningful insider ownership aligns shareholder and insider interests (19% ownership by insiders) (1) Pre-tax income CAGR includes annualized growth rate for the first six months of 2020 and excludes PPP originations (2) See Appendix for reconciliation of these non-GAAP financial measures 7 |
Well Positioned In One of the Most Attractive Markets in the U.S. Top 10 MSAs By Population Vibrant Economy 5 Yr. • Washington D.C. and Baltimore MSAs contain 30 and seven Fortune 1000 companies, respectively Over 3.3 million private sector employees and nearly one million public sector employees in the Washington D.C. and Baltimore MSAs Virginia was ranked best state for business in 2019 by CNBC Maryland and Virginia have large workforce populations spanning several generational demographic cohorts 9 of the top 30 wealthiest counties in the nation are located in Washington DC and Baltimore MSAs 2026 Proj. Median Household Income 2026 Proj. Historical Deposit CAGR (%) Population CAGR (%) Income CAGR (%) • Market Name Population New York-Newark-Jersey City 19,200,306 0.14 86,466 2.23 5.9 • • Los Angeles-Long Beach-Anaheim 13,270,961 0.31 79,770 2.37 8.9 • Chicago-Naperville-Elgin 9,428,289 -0.03 76,758 2.16 4.7 • Numerous Government Contracting entities support Dallas-Fort Worth-Arlington 7,735,087 1.79 75,727 2.26 24.0 government functions With over 30 banks acquired in these markets over the past • Houston-The Woodlands-Sugar Land 7,233,151 1.84 69,000 0.74 5.7 five years, there are limited investment invest in community banks in this market opportunities to Miami-Fort Lauderdale-Pompano Bea 6,280,334 1.11 62,586 2.19 5.7 Atlanta-Sandy Springs-Alpharetta 6,137,994 1.37 75,439 2.59 6.2 Philadelphia-Camden-Wilmington 6,117,909 0.23 75,304 1.81 (1.6) Phoenix-Mesa-Chandler 5,081,979 1.76 71,092 2.51 11.4 Source: S&P Global Market Intelligence; FDIC, Proximityone.com, DC Department of Employment Services, Maryland Department of Labor, Licensing and Regulation, US News and World Report 8 Washington-Arlington-Alexandria6,348,569 1.07 109,185 1.50 7.7 |
Track Record of Exceptional Growth and Strong Profitability Relationship Driven Model Continues to Create Balance Sheet Leverage Total Assets Total Loans, Net of Fees Total Deposits Colombo contribution Organic Growth $1,519 $1,612 $1,309 $1,271 $1,286 $1,537 $1,024 $1,153 $1,053 2015 2016 2017 2018 2019 2020Q2 2015 2016 2017 2018 2019 2020Q2 2015 2016 2017 2018 2019 2020Q2 22.4% 23.1%15.8% 11.8%14.2% 16.3% ¹ 24.4% 23.8%19.6%10.3% 20.3% 18.0% ¹ 21.8% 23.3%15.8% 9.5% 24.6%15.9% ¹ Organic YOY Growth Rate Organic YOY Growth Rate Organic YOY Growth Rate (1) Annualized growth over the first six months of 2020 (2) Organic CAGRs exclude PPP loan originations Source: S&P Global Market Intelligence; Company documents 9 Organic CAGR: 17.5%2 Organic CAGR: 14.4%2 Organic CAGR: 15.3%2 PPP Loans $199 $909 $737 $138 $928 $776 $627 $169 $143 $994 $889 $768 $624 |
Track Record of Exceptional Growth and Strong Profitability Stable Margin and Improving Efficiency Produce An Attractive Earnings Stream Pre-Tax Pre-Provision Income ($M) Efficiency Ratio (%) 61.3% 18% CAGR $21.9 2015 2016 2017 2018 ¹ 2019 YTD Q220 ² 2015 2016 2017 2018¹ 2019¹ YTD Q220¹ Net Interest Margin (%) Adjusted ROAE vs. Adjusted ROAA (%) 3.66% Adjus ted ROAA 11.55% 3.51% 3.51% 3.48% 3.43% Adjus ted ROAE 3.26% 0.86% 2015 2016 2017 2018 2019 YTD Q220 2015 2016 2017 2018 2019 YTD 2020 (1) Excludes one-time transaction costs related to Colombo Bank merger of $3.3 million for 2018 and $0.13 million for 2019 and branch closure costs in 2020 of $0.68 million (2) Represents YTD 2020Q2 pre-tax pre-provision income Note: See Appendix for reconciliation of these non-GAAP financial measures Source: S&P Global Market Intelligence; Company documents 10 •Continued leverage and upside on Colombo franchise and continued growth in legacy D.C. and Virginia markets •Deposit cost decreases across customer base to reflect rate environment • In addition to payment deferral programs, FVCbank participated in the SBA’s Paycheck Protection Program, originating over $170 million in loans, net of deferred fees, to existing and new customers •FVCbank has recorded $4.6 million in net deferred fees related to PPP loans •Estimated pre-tax savings of $0.6 million annually resulting from the closure of two branches in Q4 2020 8.91% 8.63% 9.38% 7.86% 7.70% 0.88% 0.80% 0.85% 1.17% 1.10% $18.4 $11.8 $15.7 $12.0 $9.4 58.0% 57.2%56.8% 55.7% 55.3% |
Disciplined, Low-Risk Commercial Well Diversified Commercial Portfolio Balance Sheet C&I Portfolio Balance % of Portfolio Yield Commercial and Industrial Paycheck Protection Program Owner Occupied CRE $96,532 $169,425 $187,289 6.5% 11.5% 12.7% 5.36% 2.63% 4.51% ($000s) CRE Type % of Total Loans LTV (Maximum Bank DSC (Minimum Bank Guidelines) Balance (excl. PPP Loans) Guidelines) Multi-family Retail Office Hotel Construction AD&C Land Industrial Mixed Use Special Use Other $72,493 $182,425 $97,100 $49,536 $182,293 - $44,531 $103,679 $56,715 $21,960 $16,170 5.56% 13.98% 7.44% 3.80% 13.97% 0.00% 3.41% 7.95% 4.35% 1.68% 1.24% 80% 75% 75% 65% 75% 65% 60% 75% 75% 65% 65%-80% 1.20 1.20 1.20 1.30 - - - 1.20 1.20 1.05 - 1.30 1.2 - 1.3 CRE Portfolio Balance % of Portfolio Yield Nonowner Occupied CRE Multifamily Construction & Development $527,790 $72,288 $226,824 35.7% 4.9% 15.3% 4.34% 4.21% 4.87% Other Loans Balance % of Portfolio Yield Residential 1-4 Residential 1-4 Investment Property Home Equity Lines Other Loans $36,490 $77,146 $65,843 $18,493 2.5% 5.2% 4.5% 1.2% 4.61% 4.86% 4.58% 7.26% Total Loans $1,478,120 4.61% Positioning For Future Growth • 19 loan officers with deep connections to the markets; average experience of over 20 years Focused effort on commercial, small business, and government contracting Expanded focus on government contracting provides large source of growth potential Small average loan balance helps mitigate risk • CRE C&D 826,902 226,824 C&I 30.7% CRE 55.9% • • Other 13.4% ‒ ‒ C&I average loan size: $393,000 CRE average loan size: $1.4 million 11 Source: S&P Global Market Intelligence; Company documents Ti er 1 Ca pi ta l + Loa n Los s Res erve 201,470 CRE Ratio 410.43% C&D Ratio 112.58% Total Non Owner Occupied $826,902 Total CRE$826,90255.9%4.47% Total C&I$453,24630.7%4.42% |
Pandemic Risk: PPP Loans SBA Paycheck Protection Program PPP Loans by Industry1 Food Service 3% Manufacturing 6% Professional Services 33% Admin & Support 5% Information 5% Real Estate 6% Health Care 6% Up to $350,000 637 $53,774 $84 $350,000 to $2MM 107 $83,202 $778 Construction 12% Over $2MM 12 $36,986 $3,082 Other 24% (1) Loan breakdown based on the dollar amount of loans Source: Company documents 12 Total756$173,961 Total FundedAvg. Loans C&I Portfolio# of Loan('000)Size ('000) •74% of existing clients; 26% new clients •$4.6 million in net deferred fees related to PPP loans |
Strong Credit Quality Proven History of Strong Credit Metrics Nonperforming Assets Over Time¹ Well-Reserved Loan Portfolio ($000s) ($s in Thousands) Nonperforming Loans (NPLs) OREO ALLL Balance at 12/31/2019 Net Charge-Offs Provision for Loan Losses $10,231 (153) $2,816 Remaining Fair Value Discount $2,584 Loans, Net of Fees (excluding PPP Loans) at 06/30/2020 ALLL Coverage Remaining Mark Coverage $1,308,695 0.99% 0.20% $0.8 2019 2 2020Q2 2 2015 2016 2017 2018 NPLs + OREO / Loans3 Net Charge-Offs (Recoveries) / Average Loans 0.19% 1.15% 0.84% 0.02% 0.65% 0.52% 0.41% 0.03% (0.01%) 2017 2015 2016 2017 2018 2019 2020Q2 2015 2016 2018 2019 2020Q2 (1) (2) (3) Nonperforming assets defined as nonaccruals, loans past-due 90 days or more, and other real estate owned TDRs for the fiscal year ended December 31, 2019 and the fiscal quarter ended June 30, 2020 were $0 and $99k, respectively Bank-level data presented above 13 Source: S&P Global Market Intelligence; Company documents 0.07% 0.05% 0.05% Effective Reserve Coverage 1.19% Total Effective Reserve $15,478 ALLL Balance at 06/30/2020 $12,894 $3.9 $3.9 $10.7 $8.5 $4.2 $3.9 $3.2 $2.6 $0.2 |
Strong Credit Quality Payment Deferrals during COVID-19 Pandemic FVCbank implemented loan payment deferral programs as a result of pandemic stay-at-home orders to defer loan principal and interest payments primarily for 90 days In Deferral • • Initially, loan payment deferrals totaled $360.2 million, or 24.4% of loans $118.9 million of loans are still in their deferral period • $68.9 million are still within their first deferral period ($18.2 million are making interest-only payments) $46.8 million were approved for a second 90-day deferral period ($44.3 million, or 95%, are making interest-only payments) $3.1 million consist of SBA loans with payment guarantees until Q4 2020 • • COVID-19 Payment Deferrals by Asset Class as of September 25, 2020 Remaining loans under Round 1 deferral (excluding SBA loans) total $68.9 million, or 26 loans • $48.4 million, or 18 loans, are expected to resume contractual payments $20.5 million, or 8 loans, are expected to continue to defer. Of those requesting a second deferral, $18.7 million or 3 loans will revert to interest only payments. One commercial borrower is still under evaluation totaling $1.7 million, and the remaining $105,000 are consumer loans CRE - Retai l 18,550 6 212,756 111 • Hotel / Lodgi ng 45,945 6 59,192 11 Mul ti -Fa mi l y 7,001 3 99,854 78 Remaining loans under Round 2 deferral total $46.8 million, or 22 loans CRE - Church 1,492 1 46,960 25 • $12.0 million, or 14 loans, are expected to resume contractual payments $34.8 million, or 8 loans, are under further evaluation. $10.6 million, or 3 loans, have requested an interest only-payment extension. All loans in this category are being evaluated by management based on conservative standards for any additional deferral modification Other Loan Categori es 12,672 27 582,3532,298 • *Excludes PPP loans 14 Source: S&P Global Market Intelligence; Company documents At September 25, 2020118,860581,331,7582,778 Speci al Purpos e3,563329,49322 CRE - Indus tri al1,6441101,19167 CRE - Offi ce11,4043116,055112 CRE - Mi xed Us e16,589883,90454 Total Deferrals Total Portfolio ($000s)(#)($000s)(#) |
Strong Core Deposit Base Deposit Portfolio Composition • Cost of deposits declined from 1.30% in Q1 2020 to 0.87% in Q2 2020 As of 12/31/2015 As of 6/30/2020 • Further decrease in deposit costs expected through the remainder of 2020 as FVCB reprices maturing time deposits and new DDA accounts at significantly lower rates Interest bearing 45.6% Interest bearing 43.2% Noninterest bearing 29.1% Noninterest bearing 20.6% Time 20.3% Time 21.1% • Full service relationships continue to drive core deposit growth Wholesale Wholesale 13.5% ‒ Approximately $1.03 billion in loans, or 86% of the commercial loan portfolio, retain a deposit relationship with the bank 6.6% Deposit Composition By Delivery Channel ($s in Thousands) • Growth in commercial accounts provide cross selling opportunities with FVCB’s technology investment Commercial Retail Public Wholesale Ba l a nce Wtd. Cos t Ba l a nce Wtd. Cos t Ba l a nce Wtd. Cos t Ba l a nce Wtd. Cos t ‒ $1.1 billion in commercial deposits, across 6,900 accounts, with an average rate of 0.43% Treasury management and high-touch service allows FVCB to compete for larger clients Now / Trans acti ons $ 376,788 0.45 % $ 10,795 0.13 % $ 100 0.35 % $ 20,006 0.27 % ‒ Ti me Depos i ts $ 141,132 1.56 % $ 131,556 1.78 % $ 47,939 1.67 % $ 80,000 1.23 % 15 Source: S&P Global Market Intelligence; Company documents Total$ 1,088,5680.43 %$ 240,5601.17 %$ 89,9021.16 %$ 100,0061.04 % Savi ngs / MMDA$ 144,5040.51 %$ 81,9090.55 %$ 41,8630.59 %–– DDA$ 426,1440.00 %$ 16,2990.00 %–––– MRQ Cost of Deposits: 0.87 % 12/31/15 Cost of Deposits: 0.65 % |
Experienced Leadership Team Management Team With Strong Ties to The Market… FVCB’s executive management team consists of seven officers with over 185 years of combined experience in the Washington, D.C. metropolitan area • David Pijor was the founding Chairman of the Board of James Monroe Bancorp, which opened in June 1998 in Arlington, VA, and was instrumental in the growth and strategic direction of the bank until its sale to Mercantile Bankshares Corporation in 2006 for $143.8 million 16 Source: S&P Global Market Intelligence; Company documents Name Current Position Prior Community Bank Experience Years Experience Years at FVCB Da vid W. Pijor Cha irma n & CEO, Compa ny a nd Ba nk Ja mes Monroe Ba ncorp 21 13 Pa tricia A. Ferrick Pres ident, Compa ny a nd Ba nk Southern Fina ncia l Ba ncorp, Potomac Ba nk of Virginia 33 13 B. Todd Demps ey EVP a nd Chief Opera ting Officer, Compa ny a nd Ba nk United Ba nk 39 13 Willia m G. Byers EVP a nd Chief Lending Officer, Compa ny a nd Ba nk Middleburg Ba nk, Century Na tiona l Ba nk 26 9 Micha el G. Na s s y EVP a nd Chief Credit Officer, Compa ny a nd Ba nk City Firs t Ba nk of DC, Na tiona l Coopera tive Ba nk 20 8 Sha ron L. Ja cks on EVP a nd Chief Depos it Officer, Compa ny a nd Ba nk Ma inStreet Ba nk 34 4 Jennifer L. Dea con EVP a nd Chief Fina ncia l Officer, Compa ny a nd Ba nk Ca rdina l Fina ncia l Corp. 23 3 |
Experienced Leadership Team …Governed and Supported By An Exceptional Board with a Meaningful Investment in FVCB • Serves as Vice Chairman of the Board since 2015 Served as President and COO of FVCB from 2008 to 2013 Served as CEO and President of Cardinal Bank from 1997 to 1999 • Serves as Chairman of the Board and CEO of FVCB since its organization Lead organizer, Chairman of the Board and General Counsel of James Monroe Bank from its inception to sale to Mercantile Bankshares • • • Bio Bio • • Serves a s President of the Ba nk a nd Company CFO a nd EVP from FVCB’s inception until June of 2017 Former a uditor a t KPMG Patricia Ferrick President & Director • Previ ous Chairman, President a nd Principal Owner of Col ombo Ba nk for 16 yea rs until its s a l e to FVCB i n 2018 Morty Bender Director • • • Pres i dent of Si mmonds & Kl ima, Ltd Served a s Chairman of the Boa rd a t Fi rst Commonwea lth Ba nk of Vi rginia Served a s Di rector of Ba nk of Northern Virginia Scott Laughlin Director Sidney Simmonds Director • • Co-owner of LMO Adverti sing Advi s or a t Ardent Capital • • • • Former Attorney wi th Li nowes and Bl ocher, LLP Served a s Di rector a t Ja mes Monroe Ba nk Vi ce Pres ident of Friendship Place non-profit • • Owner, Pres ident a nd CEO of TCI s ince 1980 Serves a s Director of Advanced Solutions Interna tional Tom Patterson Director Daniel Testa Director • Ma na ges various Wills family real es tate devel opment fi rms Co-founded Church Investments a nd Cons olidated Green Services • Founder of Synchronous Knowledge, Inc. until i ts s ale to I MS Hea lth I ncorporated i n 2005 Reti red from the U.S. Ai r Force i n 1999 Devin Satz Director Phillip Wills Director • • • • Serves a s the Ma naging Partner of Schwartz, Wei s sman & Co Former di rector of Annapolis Ba ncorp Pa rtner a nd Co-founder of Argy, Wiltse & Robi nson, P.C. Served a s Di rector a t Cardinal Fi nancial Corp Larry Schwartz Director Steven Wiltse Director • • 17 Source: S&P Global Market Intelligence; Company documents L. Burwell Gunn Jr. Vice Chairman David Pijor Chairman & CEO |
Sources of Liquidity and Current Debt Profile FVCBankcorp, Inc. (NASDAQ:FVCB) FVCbank • • The following are sources of liquidity at the holding company: Outstanding funding sources ‒ $25.0 million of advances from the FHLB ‒ ‒ $1.1 million of cash as of June 30, 2020 $35.8 million of dividend capacity from the bank without prior regulatory approval • The following are sources of liquidity at the Bank as of August 31, 2020: ‒ $269.0 million of unsecured lines of credit ($0.0 million drawn) • Subordinated Debt Due June 30, 2026 ‒ ‒ ‒ $24.5 million outstanding Fixed rate of 6.00% through June 30, 2021 Floating rate of 3mL + 487 bps from June 30, 2021 through maturity Callable quarterly beginning June 30, 2021 ‒ $130.8 million of secured line of credit from the FHLB ($25.0 million outstanding) ‒ $51.4 million borrowing capacity from the FRB ‒ $50.0 million I CS one-way buy contract ($10.0 million outstanding) ‒ • Additional capital considerations ‒ ‒ Share repurchase program suspended in Q1 2020 FVCB does not pay a common stock dividend and currently retains earnings in capital Note: Data as of June 30, 2020 unless otherwise noted Source: S&P Global Market Intelligence; Company documents 18 |
Bank Capital Ratios Tier 1 Leverage Ratio (%) Tier 1 Ratio (%) Total Risk-Based Capital Ratio (%) 14.0% 13.7% 13.4% 12.4% 12.2% 11.9% 11.8% 10.8% 2015Y 2016Y 2017Y 2018Y 2019Y 2020Q2 19 Source: S&P Global Market Intelligence, Company documents In 2020, FVCbank adopted the Community Bank Leverage Ratio. The Tier 1 and Total Risk-Based Capital Ratios are calculated using estimated Total Risk Based Capital and Risk Weighted Assets. 13.2%13.3% 12.8% 12.7% 12.8% 12.2%12.4% 11.0% 12.1% 11.3% |
Pro Forma As of 6/30/2020 Current and Pro Forma Capital Position 14.76% 13.81% TCE / TA Tier 1 Leverage CET 1 Ratio Tier 1 Ratio Total RBC Ratio 14.31% 13.65% 13.44% 13.44% 12.78% 12.78% 11.57% 11.48% 10.98% 11.05% TCE / TA Tier 1 Leverage CET 1 Ratio Tier 1 Ratio Total RBC Ratio Note: All offering assumptions are for illustrative purposes only; assumes a $15M subordinated debt issuance, $438,000 of offering-related expenses, inclusive of the placement agent's fee, and the down-streaming of $10 million of the net proceeds to FVCBank; 20% risk-weighting on new assets Source: S&P Global Market Intelligence, Company documents 20 In 2020, FVCbank adopted the Community Bank Leverage Ratio. The Tier 1, CET 1, and Total Risk-Based Capital Ratios are calculated using estimated Total Risk Based Capital and Risk Weighted Assets. Bank Level Ratios 11.27%11.25%11.27%11.25% 9.71%9.63%9.73%9.65% Estimated Holding Company Ratios |
Pro Forma Interest Coverage and Double Leverage Note: Al l offeri ng a s s umptions a re for i l lustrati ve purpos es onl y; a ss umes a $15M s ubordinated debt i s s uance, $438,000 of off eri ng-rel ated expens es , i ncl usive of the pl a cement a gent's fee, a coupon of 5.00%, a nd the down -s trea mi ng of $10 mi l l i on of the net proceeds to FVCBa nk 21 Source: S&P Global Market Intelligence For the Year Ended December 31, YTD Offering ($ in thousands) 2017 2018 2019 6/30/2020 Adjustments Inves tment i n Subs i di a ri es $118,210 $174,258 $194,914 $202,826 $10,000 Cons ol i da ted Equi ty 98,283 158,336 179,078 180,652 – Double Leverage Ratio 120.3% 109.8% 108.8% 112.3% – Pro Forma $212,826 180,652 117.8% Tota l Depos i t Interes t $6,417 $10,354 $16,831 $7,301 – Other Borrowi ng Expens e 1,778 1,756 1,840 1,005 $375 Tota l Interes t Expens e 8,195 12,110 18,671 8,306 – Pre-Ta x Income (GAAP) $14,535 $13,107 $20,012 $8,264 ($375) Interest Coverage: Including Deposit Expense 2.8x 2.1x 2.1x 2.0x --Excluding Deposit Expense 9.2x 8.5x 11.9x 9.2x --$7,301 1,380 8,681 $7,889 1.9x 6.7x YTD Interest Coverage Double Leverage |
Appendix: Additional Materials |
FVCB Franchise History Since inception, FVCbank has successfully executed a strategic plan focused on organic growth and opportunistic acquisitions without compromising asset quality or financial discipline February 2012 August 2017 Fol l ow-On Offering #2 $6.7mm @ $13.00/$13.50 per s hare ($6.66/$6.91 per s ha re s plit adjusted)¹ Pri vate Reg. D Offering $10.0mm @ $20.00 per share ($16.00 per share s pl it adjusted) April / May 2015 November 2007 Fi ve for Four Stock Split quoted on OTCQX FVCba nk is es tablished $23mm offering @ $10 per s ha re ($5.12 per s ha re s plit a djusted) ra i sed i n 8 weeks October 2012 October 2015 September 2017 Compl eted a cquisition of 1st Commonwealth Ba nk of Vi rgi nia i n Arlington, VA Formed FVCBa nkcorp Hol di ng Company Fi ve for Four Stock Spl i t 2007 2008 2009 2010 2011 2012 2013 2014 2015 2016 2017 2018 2019 Q1 2010 May / June 2016 May 2018 June 2013 Rea ched s ustained profi tability September 2010 Fi ve for Four Stock Split Announced a cquisition of Col ombo Ba nk in Rockville, MD Fol l ow-On Offering #3 $21.9mm @ $13.50 per s ha re ($6.91 per s hare s pl it a djusted) June 2016 $25.0 mm 6% Subdebt Fol l ow-On Offering #1 $6.3mm @ $12.50 per sha re ($6.40 per s hare s pl it adjusted) September 2018 Ini tial Public Offering $36.9mm @ $20.00 per s ha re October 2018 Compl eted a cquisition of Col ombo Ba nk in Rockville, MD 23 (1) $13.00 for existing shareholders, $13.50 for new shares offered to the public Source: S&P Global Market Intelligence; Company documents |
Overview of the Securities Portfolio • Approximately $90.6 million of cash and equivalents as of June 30, 2020 Approximately $122.1 million in securities, primarily concentrated in government securities Treasury / Agency 3% • Ag ency CMOs 7% Ag ency CMBS 1 5% • • • Weighted average yield of 2.55% Average base duration of 2.1 years Average duration of +100 bps shock of 3.5 years $0.2 million of municipal securities are classified as HTM with the remaining available for sale C o rporate 9% • M unicipal Bonds 4% Ag ency MBS 6 2% 24 Source: Company documents |
Loan: Five-Year History For the Year Ended December 31, For the Period Ended 25 Note: Total RBC for the period ended June 30, 2020 estimated as Tier 1 Capital + ALLL ($ in thousands) 2015 2016 2017 2018 2019 6/30/2020 Less: PPP 6/30/2020, Less PPP C&I Portfolio Commerci a l a nd Indus tri a l $ 86,633 $ 99,314 $ 83,262 $ 121,864 $ 96,995 Owner Occupi ed CRE 92,977 104,881 120,965 157,486 205,892 Total C&I $ 179,610 $ 204,195 $ 204,227 $ 279,350 $ 302,887 Commercial Real Estate Portfolio Nonowner Occupi ed CRE $ 205,007 $ 267,740 $ 296,166 $ 385,778 $ 481,835 Mul ti fa mi l y 28,592 41,603 56,023 70,108 65,922 Cons tructi on & Devel opment 49,527 74,543 122,729 153,046 214,827 Total CRE $ 283,126 $ 383,886 $ 474,918 $ 608,932 $ 762,584 Other Loans Home Equi ty Li nes $ 50,704 $ 75,846 $ 82,819 $ 80,096 $ 69,530 Res i denti a l 1-4 86,847 80,704 86,253 130,482 114,932 Other Loa ns 23,272 23,472 40,460 37,883 31,791 Total Other $ 160,823 $ 180,022 $ 209,532 $ 248,461 $ 216,253 $ 265,957 187,289 $ 169,425 - $ 96,532 187,289 $ 453,246 $ 527,790 72,288 226,824 $ 169,425 $ - - - $ 283,821 $ 527,790 72,288 226,824 $ 826,902 $ 65,843 113,636 18,493 $ - $ - - - $ 826,902 $ 65,843 113,636 18,493 $ 197,972 $ - $ 197,972 Total Loans $ 623,559 $ 768,103 $ 888,677 $ 1,136,743 $ 1,281,724 $ 1,478,120 $ 169,425 $ 1,308,695 CRE / Total RBC (%) 356.96% 352.69% 374.23% 353.02% 396.43% 410.43% $ - 410.43% |
Historical Income Statement Interest Income Interest Expense $26,557 3,664 $32,587 5,387 $40,302 8,195 $51,924 12,110 $66,734 18,671 $33,212 8,306 Provision for Loan Losses $1,073 $1,471 $1,200 $1,920 $1,720 $2,816 Service Charges on Deposits Gain on Foreclosure of OREO Other Noninterest Income 566 – 527 564 – 585 546 1076 1,189 635 – 1,488 890 – 1,653 463 – 821 Realized Gain (Loss) on Securities 67 71 164 (462) 3 97 Salaries and Employee Benefits Occupancy & Equipment Marketing and Promotion Expense Professional Fees Data Processing and Network Admin Amortization of Intangibles Merger & Acquisition Expense Other Expense $8,808 1,951 256 332 839 20 – 2,496 $9,804 2,098 350 376 911 20 – 2,887 $11,659 2,259 375 513 1,074 20 – 3,446 $14,008 2,524 339 649 1,233 118 3,339 4,238 $17,047 3,400 396 826 1,638 385 133 5,052 $8,010 1,715 128 432 928 178 – 3,816 Net Income before Taxes Provision for Taxes 8,278 2,859 10,503 3,571 14,535 6,846 13,107 2,238 20,012 4,184 8,264 1,651 26 Source: S&P Global Market Intelligence; Company documents Net Income $5,419 $6,932 $7,690 $10,869 $15,828 $6,613 Total Noninterest Expense $14,702 $16,446 $19,346 $26,448 $28,877 $15,207 Total Noninterest Income $1,093 $1,149 $2,811 $2,123 $2,543 $1,284 Net Interest Income $22,893 $27,200 $32,107 $39,814 $48,063 $24,906 Year Ended December 31, 2015 2016 2017 2018 2019 YTD Ended June 30, 2020 |
Historical Balance Sheet Assets Cash and Cash Equivalents Interest-bearing Deposits at Other Financial Institutions Securities Net Loans Other Assets $5,257 $5,174 $7,428 $9,435 $14,916 $25,613 23,443 3,510 15,139 34,060 18,226 64,989 67,794 617,320 22,993 113,988 761,649 24,984 117,712 880,952 31,993 125,298 1,127,584 55,199 141,589 1,271,493 91,071 122,082 1,465,226 103,239 Liabilities Deposits FHLB Advances Subordinated Notes, Net of Issuance Costs Other Liabilities $626,640 35,650 $775,991 27,000 $928,163 0 $1,162,440 0 $1,285,722 15,000 $1,519,036 25,000 24,247 24,327 24,407 24,487 24,527 1,766 2,255 2,451 6,393 33,008 31,934 Preferred Stock Common Equity - 72,752 - 79,811 - 98,283 - 158,336 - 179,078 - 180,652 Liabilities & Shareholders' Equity $736,807 $909,305 $1,053,224 $1,351,576 $1,537,295 $1,781,149 27 Source: S&P Global Market Intelligence; Company documents Total Shareholders' Equity $72,752 $79,811 $98,283 $158,336 $179,078 $180,652 Total Liabilities $664,056 $829,493 $954,941 $1,193,240 $1,358,217 $1,600,497 Total Assets $736,807 $909,305 $1,053,224 $1,351,576 $1,537,295 $1,781,149 Year Ended December 31, 2015 2016 2017 2018 2019 Quarter Ended June 30, 2020 |
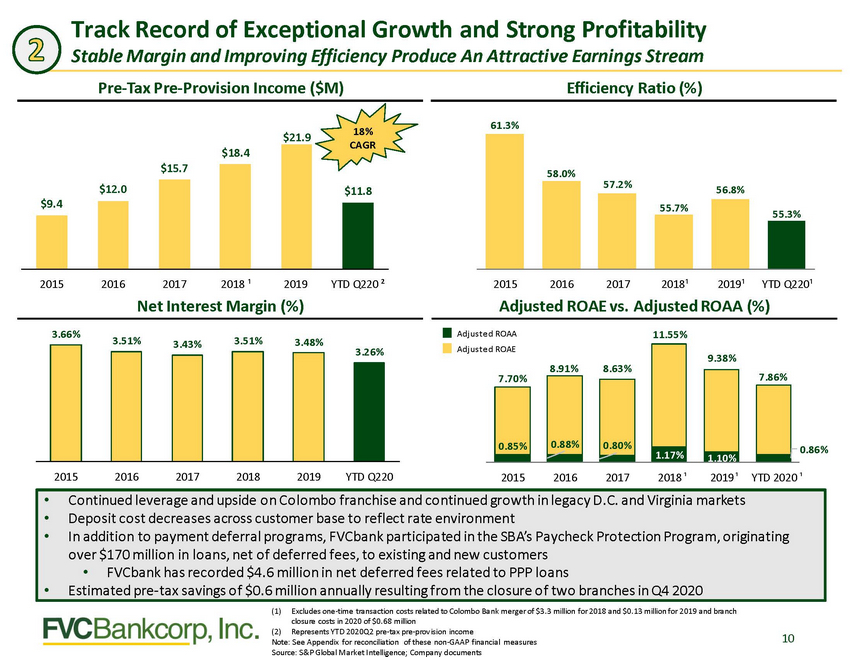
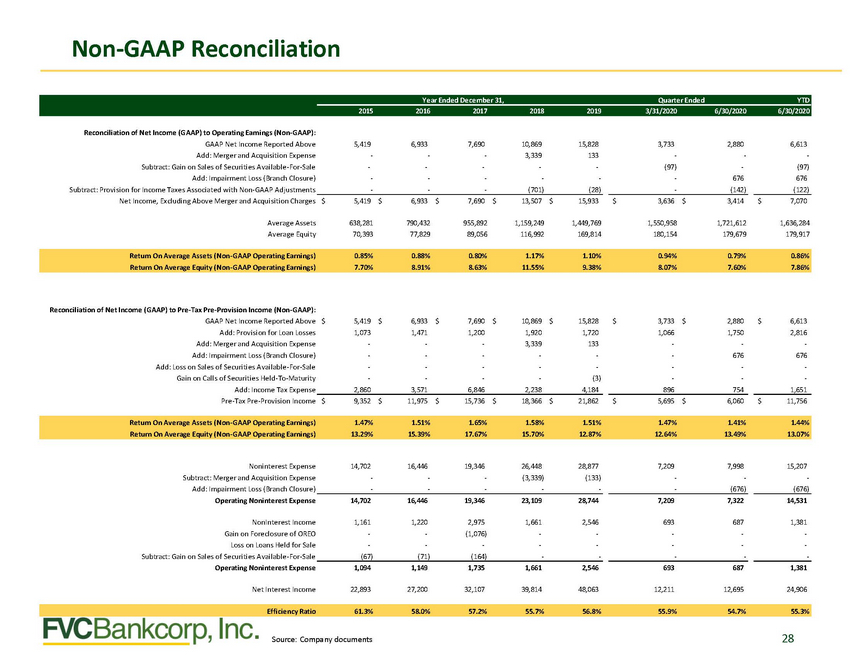
Non-GAAP Reconciliation Reconciliation of Net Income (GAAP) to Operating Earnings (Non-GAAP): GAAP Net Income Reported Above Add: Merger and Acquisition Expense Subtract: Gain on Sales of Securities Available-For-Sale Add: Impairment Loss (Branch Closure) Subtract: Provision for Income Taxes Associated with Non-GAAP Adjustments Net Income, Excluding Above Merger and Acquisition Charges 5,419 - - - - 6,933 - - - - 7,690 - - - - 10,869 3,339 - - (701) 15,828 133 - - (28) 3,733 - (97) - - 2,880 - - 676 (142) 6,613 - (97) 676 (122) $ 5,419 $ 6,933 $ 7,690 $ 13,507 $ 15,933 $ 3,636 $ 3,414 $ 7,070 Average Assets Average Equity 638,281 70,393 790,432 77,829 955,892 89,056 1,159,249 116,992 1,449,769 169,814 1,550,958 180,154 1,721,612 179,679 1,636,284 179,917 Reconciliation of Net Income (GAAP) to Pre-Tax Pre-Provision Income (Non-GAAP): GAAP Net Income Reported Above Add: Provision for Loan Losses Add: Merger and Acquisition Expense Add: Impairment Loss (Branch Closure) Add: Loss on Sales of Securities Available-For-Sale Gain on Calls of Securities Held-To-Maturity Add: Income Tax Expense Pre-Tax Pre-Provision Income $ 5,419 1,073 - - - - 2,860 $ 6,933 1,471 - - - - 3,571 $ 7,690 1,200 - - - - 6,846 $ 10,869 1,920 3,339 - - - 2,238 $ 15,828 1,720 133 - - (3) 4,184 $ 3,733 1,066 - - - - 896 $ 2,880 1,750 - 676 - - 754 $ 6,613 2,816 - 676 - - 1,651 $ 9,352 $ 11,975 $ 15,736 $ 18,366 $ 21,862 $ 5,695 $ 6,060 $ 11,756 Noninterest Expense Subtract: Merger and Acquisition Expense Add: Impairment Loss (Branch Closure) Operating Noninterest Expense 14,702 - - 16,446 - - 19,346 - - 26,448 (3,339) - 28,877 (133) - 7,209 - - 7,998 - (676) 15,207 - (676) 14,702 16,446 19,346 23,109 28,744 7,209 7,322 14,531 NonInterest Income Gain on Foreclosure of OREO Loss on Loans Held for Sale 1,161 - - 1,220 - - 2,975 (1,076) - 1,661 - - 2,546 - - 693 - - 687 - - 1,381 - - - Subtract: Gain on Sales of Securities Available-For-Sale (67) (71) (164) - - - - Operating Noninterest Expense 1,094 1,149 1,735 1,661 2,546 693 687 1,381 Net Interest Income 22,893 27,200 32,107 39,814 48,063 12,211 12,695 24,906 28 Source: Company documents Efficiency Ratio 61.3% 58.0% 57.2% 55.7% 56.8% 55.9% 54.7% 55.3% Return On Average Assets (Non-GAAP Operating Earnings) 1.47% 1.51% 1.65% 1.58% 1.51% 1.47% 1.41% 1.44% Return On Average Equity (Non-GAAP Operating Earnings) 13.29% 15.39% 17.67% 15.70% 12.87% 12.64% 13.49% 13.07% Return On Average Assets (Non-GAAP Operating Earnings) 0.85% 0.88% 0.80% 1.17% 1.10% 0.94% 0.79% 0.86% Return On Average Equity (Non-GAAP Operating Earnings) 7.70% 8.91% 8.63% 11.55% 9.38% 8.07% 7.60% 7.86% Year Ended December 31, Quarter Ended YTD 2015 2016 2017 2018 2019 3/31/2020 6/30/2020 6/30/2020 |