Exhibit 99.1
Quality Care Properties, Inc. Investor Presentation October 2016 1
Disclaimer / Forward-Looking Statements IMPORTANT NOTICE This investor presentation should be read in connection with the Registration Statement on Form 10 filed with the Securities and Exchange Commission by Quality Care Properties, Inc. (“QCP”) and any amendments thereto (“Form 10"), including, in particular, the “Risk Factors” included therein. The information in this investor presentation supersedes the information included in the Form 10 to the extent inconsistent therewith. FORWARD-LOOKING STATEMENTS The statements in this presentation, as well as statements made by management, include “forward-looking statements” within the meaning of Section 27A of the Securities Act of 1933, as amended, and Section 21E of the Securities Exchange Act of 1934, as amended. Forward-looking statements include all statements that are not historical statements of fact and those regarding our intent, belief or expectations, including, but not limited to, statements regarding: the anticipated timing, structure, benefits and tax treatment of QCP’s pending spin-off from HCP, Inc.; future financing plans, business strategies, growth prospects and operating and financial performance; expectations regarding the making of distributions and the payment of dividends; and compliance with and changes in governmental regulations. These statements are based on management’s current expectations and beliefs and are subject to a number of risks and uncertainties that could lead to actual results differing materially from those projected, forecasted or expected. Although we believe that the assumptions underlying the forward-looking statements are reasonable, we can give no assurance that our expectations will be attained. Factors which could have a material adverse effect on our operations and future prospects or which could cause actual results to differ materially from our expectations include, but are not limited to: the post-acute/skilled nursing properties and memory care/assisted living properties leased to HCR ManorCare, Inc. (“HCRMC”) representing substantially all of QCP’s assets, QCP’s reliance on HCRMC for substantially all of our revenues and dependency on HCRMC’s ability to meet its contractual obligations under its master lease and risks related to the impact of HCRMC’s decline in operating performance and fixed charge coverage, and risks related to the impact of the U.S. Department of Justice lawsuit against HCRMC and other legal proceedings involving HCRMC, including the possibility of larger than expected litigation costs, adverse results and related developments; the financial condition of HCRMC and our other existing and future tenants and operators, including potential bankruptcies and downturns in their businesses, and their legal and regulatory proceedings, which results in uncertainties regarding our ability to continue to realize the full benefit of such tenants’ and operators’ leases; ongoing trends in the healthcare industry, including a shift away from a traditional fee-for-service model and increased penetration of government reimbursement programs with lower reimbursement rates, average length of stay and average daily census, and increased competition in the industry, including for skilled management and other key personnel; the effect on our tenants and operators of legislation and other legal requirements, including licensure, certification and inspection requirements, and laws addressing entitlement programs and related services, including Medicare and Medicaid which may result in future reductions in reimbursement; the ability of HCRMC and our other existing and future tenants and operators to conduct their respective businesses in a manner sufficient to maintain or increase their revenues and to generate sufficient income to make rent payments to us and our ability to recover investments made, if applicable, in their operations; and other risks and uncertainties described in the Form 10 and in our other SEC filings. Forward-looking statements speak only as of the date hereof. We expressly disclaim any obligation to update any of the foregoing or any other forward looking statements as a result of new information or new or future developments or otherwise, except as required by law. NON-GAAP FINANCIAL MEASURES This presentation contains certain supplemental non-GAAP financial measures. While QCP believes these non-GAAP financial measures are meaningful to understanding our performance during the periods presented and our ongoing business, the use of non-GAAP financial measures in this presentation should not be considered in isolation from, or as an alternative for, a measure of financial or operating performance as defined by GAAP or as a measure of cash flow. You are cautioned that there are inherent limitations associated with the use of each of these supplemental non-GAAP financial measures as an analytical tool. Additionally, QCP’s computation of non-GAAP financial measures may not be comparable to those reported by other REITs or real estate companies. Reconciliations of the non-GAAP financial measures contained in this presentation to their most comparable GAAP financial measures are included in the Appendix of this presentation. TENANT INFORMATION This presentation includes information regarding HCRMC that has been provided to us by HCRMC or has been derived by us from information HCRMC provided to us. We are providing this data for informational purposes only. 2
Overview and Spin Transaction Transaction Highlights Name Exchange / Ticker Portfolio Distribution Ratio Pro Forma Shares Outstanding Anticipated Timing Notes: 1. Regular-Way ticker. When-Issued ticker of “QCP WI” 2. Excludes 17 non-strategic assets held for sale which are expected to be sold by the end of the first quarter of 2017 3 Quality Care Properties, Inc. NYSE: QCP (1) 257 post-acute / skilled nursing properties, 62 memory care / assisted living properties, one hospital and one medical office building (2) One Quality Care Properties common share for every five HCP common shares Approximately 93.6 million shares • Form 10 Effective: October 14, 2016 • When-Issued Trading Begins: October 20, 2016 • Record Date: October 24, 2016 • Distribution Date: October 31, 2016 • Regular-Way Trading Begins: On or about October 31, 2016
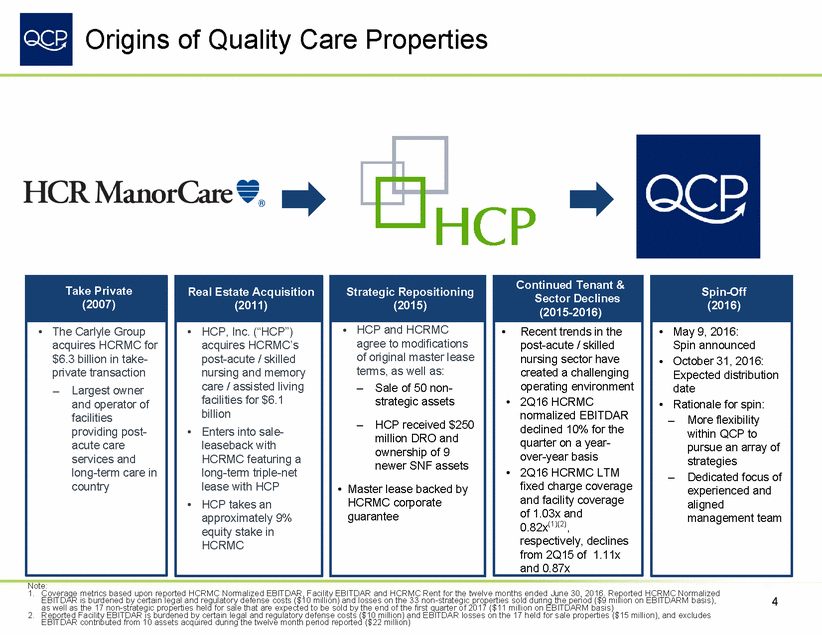
Origins of Quality Care Properties Sector Declines created a challenging • 2Q16 HCRMC – quarter on a year-• 2Q16 HCRMC LTM and facility coverage 0.82x(1)(2), from 2Q15 of 1.11x Note: 1. Coverage metrics based upon reported HCRMC Normalized EBITDAR, Facility EBITDAR and HCRMC Rent for the twelve months ended June 30, 2016. Reported HCRMC Normalized EBITDAR is burdened by certain legal and regulatory defense costs ($10 million) and losses on the 33 non-strategic properties sold during the period ($9 million on EBITDARM basis), as well as the 17 non-strategic properties held for sale that are expected to be sold by the end of the first quarter of 2017 ($11 million on EBITDARM basis) 2. Reported Facility EBITDAR is burdened by certain legal and regulatory defense costs ($10 million) and EBITDAR losses on the 17 held for sale properties ($15 million), and excludes EBITDAR contributed from 10 assets acquired during the twelve month period reported ($22 million) 4 Continued Tenant & (2015-2016) •Recent trends in the post-acute / skilled nursing sector have operating environment normalized EBITDAR declined 10% for the over-year basis fixed charge coverage of 1.03x and respectively, declines and 0.87x Take Private (2007) • The Carlyle Group acquires HCRMC for $6.3 billion in take-private transaction – Largest owner and operator of facilities providing post-acute care services and long-term care in country Spin-Off (2016) • May 9, 2016: Spin announced • October 31, 2016: Expected distribution date • Rationale for spin: More flexibility within QCP to pursue an array of strategies – Dedicated focus of experienced and aligned management team Strategic Repositioning (2015) • HCP and HCRMC agree to modifications of original master lease terms, as well as: – Sale of 50 non-strategic assets – HCP received $250 million DRO and ownership of 9 newer SNF assets • Master lease backed by HCRMC corporate guarantee Real Estate Acquisition (2011) • HCP, Inc. (“HCP”) acquires HCRMC’s post-acute / skilled nursing and memory care / assisted living facilities for $6.1 billion • Enters into sale-leaseback with HCRMC featuring a long-term triple-net lease with HCP • HCP takes an approximately 9% equity stake in HCRMC
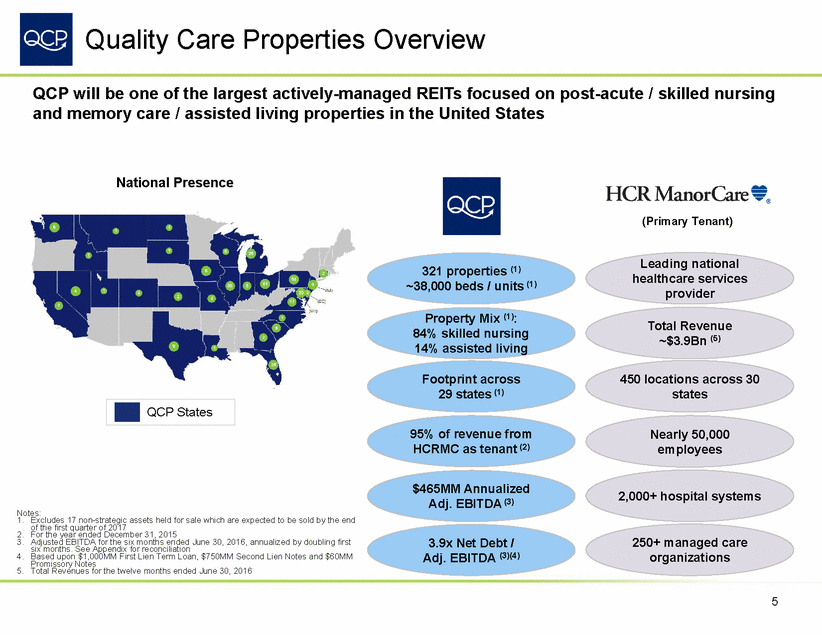
Quality Care Properties Overview QCP will be one of the largest actively-managed REITs focused on post-acute / skilled nursing and memory care / assisted living properties in the United States National Presence (Primary Tenant) Leading national healthcare services provider 321 properties (1) ~38,000 beds / units (1) Property Mix (1): 84% skilled nursing 14% assisted living Total Revenue ~$3.9Bn (5) Footprint across 29 states (1) 450 locations across 30 states 95% of revenue from HCRMC as tenant (2) Nearly 50,000 employees $465MM Annualized Adj. EBITDA (3) 2,000+ hospital systems Notes: 1. Excludes 17 non-strategic assets held for sale which are expected to be sold by the end of the first quarter of 2017 2. For the year ended December 31, 2015 3. Adjusted EBITDA for the six months ended June 30, 2016, annualized by doubling first six months. See Appendix for reconciliation 4. Based upon $1,000MM First Lien Term Loan, $750MM Second Lien Notes and $60MM Promissory Notes 5. Total Revenues for the twelve months ended June 30, 2016 250+ managed care organizations 3.9x Net Debt / Adj. EBITDA (3)(4) 5 QCP States
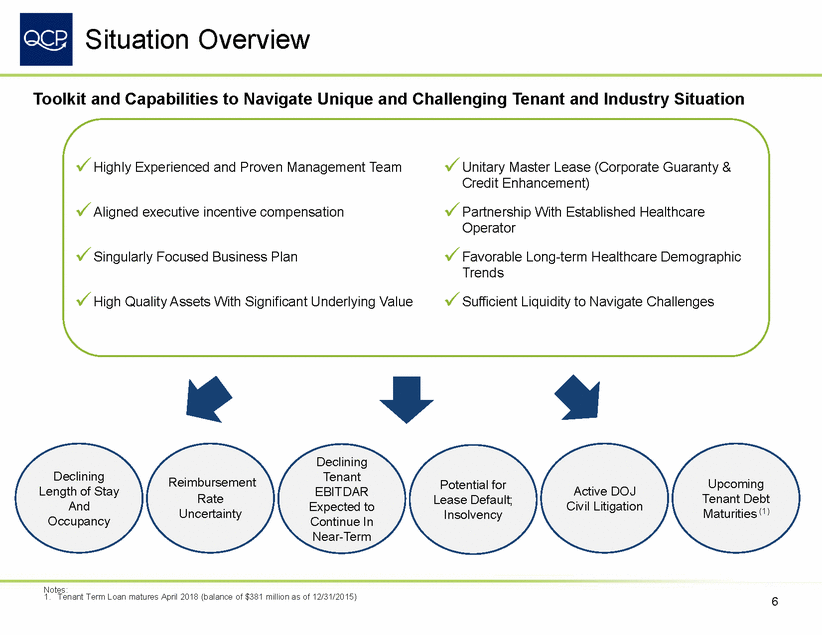
Situation Overview Toolkit and Capabilities to Navigate Unique and Challenging Tenant and Industry Situation Highly Experienced and Proven Management Team . Aligned executive incentive compensation . Unitary Master Lease (Corporate Guaranty & Credit Enhancement) Partnership With Established Healthcare Operator Favorable Long-term Healthcare Demographic Trends Sufficient Liquidity to Navigate Challenges Singularly Focused Business Plan . . High Quality Assets With Significant Underlying Value Declining Tenant EBITDAR Expected to Continue In Near-Term Declining Length of Stay And Occupancy Reimbursement Rate Uncertainty Upcoming Tenant Debt Maturities (1) Potential for Lease Default; Insolvency Active DOJ Civil Litigation Notes: 1. Tenant Term Loan matures April 2018 (balance of $381 million as of 12/31/2015) 6
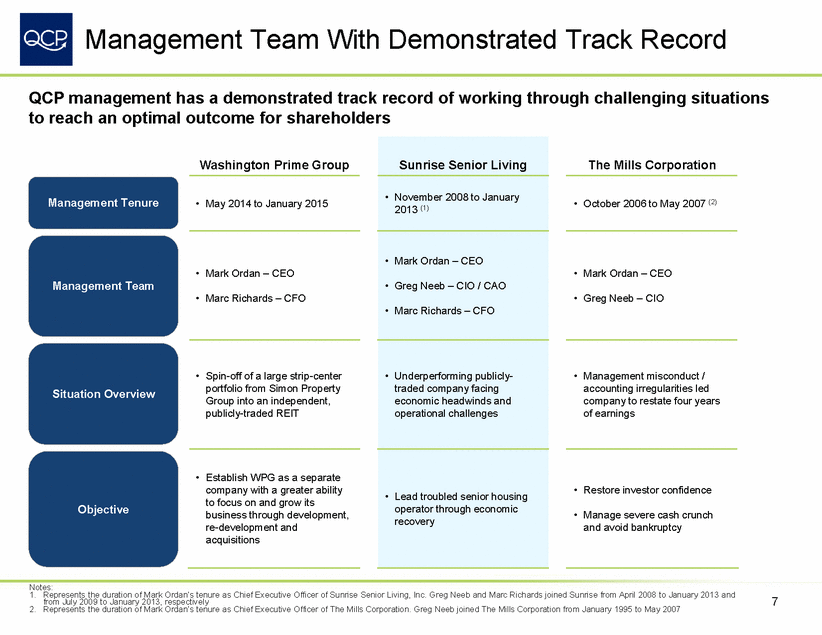
Management Team With Demonstrated Track Record QCP management has a demonstrated track record of working through challenging situations to reach an optimal outcome for shareholders Management Tenure Management Team Situation Overview Objective and avoid bankruptcy Notes: 1. Represents the duration of Mark Ordan’s tenure as Chief Executive Officer of Sunrise Senior Living, Inc. Greg Neeb and Marc Richards joined Sunrise from April 2008 to January 2013 and from July 2009 to January 2013, respectively 2. Represents the duration of Mark Ordan’s tenure as Chief Executive Officer of The Mills Corporation. Greg Neeb joined The Mills Corporation from January 1995 to May 2007 7 Washington Prime Group Sunrise Senior Living The Mills Corporation • May 2014 to January 2015 • November 2008 to January 2013 (1) • October 2006 to May 2007 (2) • Mark Ordan – CEO • Marc Richards – CFO • Mark Ordan – CEO • Greg Neeb – CIO / CAO • Marc Richards – CFO • Mark Ordan – CEO • Greg Neeb – CIO • Spin-off of a large strip-center portfolio from Simon Property Group into an independent, publicly-traded REIT • Underperforming publicly-traded company facing economic headwinds and operational challenges • Management misconduct / accounting irregularities led company to restate four years of earnings • Establish WPG as a separate company with a greater ability to focus on and grow its business through development, re-development and acquisitions • Lead troubled senior housing operator through economic recovery • Restore investor confidence • Manage severe cash crunch
Experienced Independent Board 6 of 7 board nominees are independent with a unique range of experiences across the real estate and healthcare industries, including significant public company experience • Former COO and CFO of U.S. Balloon Manufacturing Company and CFO of EMCO Sales and • Director of KPMG from 2007 to 2012 • Director of Post Properties, Inc. (NYSE: PPS) 8 Board Nominee Profile Mark S. Ordan Chief Executive Officer • Independent Director at VEREIT, Inc. and Washington Prime Group • Former Non-Executive Chairman of the Board of WP Glimcher Inc. • Former President, CEO and Director of Washington Prime Group, Inc., CEO and Director of Sunrise Senior Living, Inc., and President & CEO of The Mills Corporation Glenn G. Cohen • Executive Vice President, CFO and Treasurer of Kimco Realty Corp. (NYSE:KIM) since 2010; Treasurer since 1997 Service, L.P. Jerry L. Doctrow • Founder and principal of Robust Retirement • Formerly a senior advisor in investment banking at Stifel Nicolaus & Company for 15 years, and healthcare equity research analyst at Stifel and Legg Mason Wood Walker for 15 years Paul J. Klaassen • Co-Founder and Former Chairman and CEO of Sunrise Senior Living Inc.; current Non-Executive Chairman • Director at The Netherland-American Foundation and U.S. Chamber of Commerce Philip R. Schimmel • Served as an Audit Partner of KMPG LLP from 1985 until 2012 M. Kathleen Smalley • Partner at the law firm of Locke Lord LLP • Previously employed as counsel and as a partner at Boies, Schiller & Flexner, LLP from 2011 to 2015 Donald C. Wood • President and CEO of Federal Realty Investment Trust (NYSE: FRT) since 2003
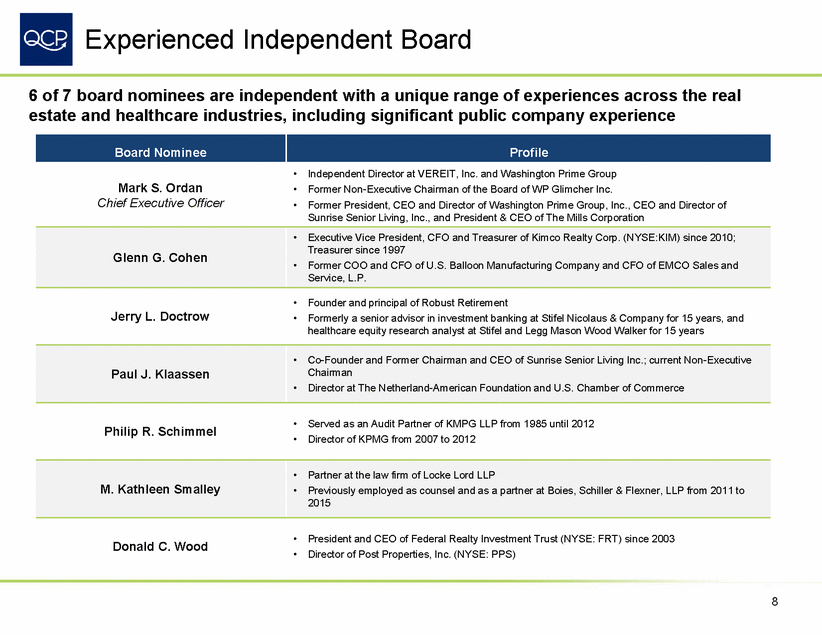
Focused Business Plan QCP will seek to maximize the value of its portfolio through proactive asset management • Experienced and dedicated management team with singular focus to proactively engage with HCRMC to help improve performance and to actively manage the HCRMC portfolio • QCP to pursue various possible strategies through its proactive engagement with HCRMC and active management of the HCRMC portfolio • While QCP intends to qualify as a REIT, it will have the flexibility to change its business model and/or corporate structure to suit the optimal long-term solution for its portfolio New Rent Payment Streams Obtain Necessary Transparency into Tenant’s Business RIDEA Structure For Select Assets Establishing More Secure Income Stream New Master Lease Terms Potential Active ProacAtisvseeAt sMsaentaMgaenmaegnetment Strategies Controls and Performance Based Provisions Increased Landlord Rights Skilled Nursing Industry Consolidation Asset Sales 9
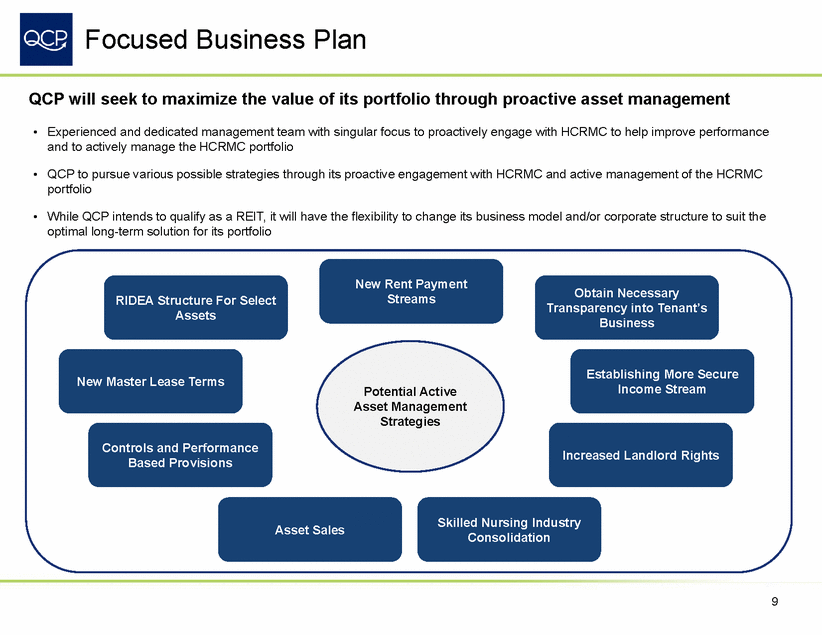
Large-Scale Valuable Portfolio QCP’s diversified portfolio consists of 257 post-acute / skilled nursing and 62 memory care / assisted living properties, a surgical hospital and a medical office building Portfolio Summary (1) Annualized Total Revenues (2) Number of Properties Operator Asset Class $ (MM) % HCRMC ALF 61 69 14% Total Non-HCRMC 28 29 6% Geographic Diversification (By State) (2) Property Type Breakdown (1)(2) By Total Revenues % Other, 17% By Total Revenues % Other 2% ALF 14% PA, 23% WA, 3% NJ, 3% VA, 4% OH, 11% MD, 5% CA, 5% SNF 84% IL, 10% MI, 9% FL, 10% Notes: 1. Excludes 17 assets expected to be sold by the end of the first quarter of 2017 2. Represents Total Revenues for the six months ended June 30, 2016, annualized by doubling first six months 10 Total QCP321483100% Total HCRMC29345494% HCRMCSNF23238580%
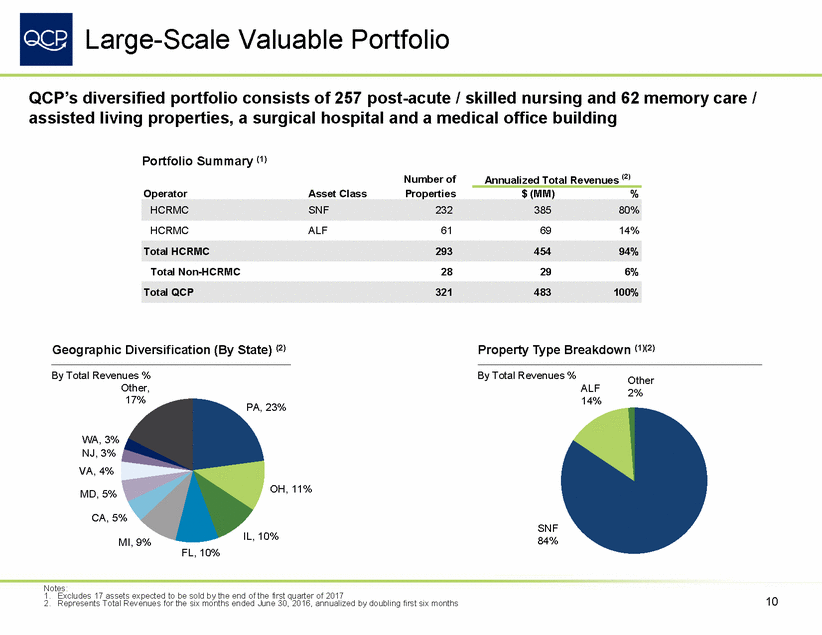
Relationship With a Leading Healthcare Operator • Leading post-acute operator with significant scale (1) Payor Mix by Revenue Other, 29.0% – Operates post-acute / skilled nursing facilities in addition to its higher-growth Arden Court memory care / assisted living and hospice and home health businesses More than 450 locations in 30 states and nearly 50,000 employees Owned by The Carlyle Group and HCRMC management (91%) and QCP (9%) High quality reputation Medicaid, 38.4% – – Medicare, 32.6% HCRMC Overview – • Trailing twelve months ended June 30, 2016 financial information: – Revenue: $3.9 billion / Normalized EBITDAR: $501 million – Facility EBITDAR cash flow coverage: 0.82x / Normalized fixed charge coverage: 1.03x (2)(3) Annualized Cash Rent: $466 million Managed Care, 18.7% • Other, 48.7% • Unitary master lease with credit enhancement Medicare, 32.6% Master Lease Overview • Full corporate guarantee, providing QCP additional benefits from HCRMC’s high-growth hospice and home health care business • Structured as one triple-net lease with annual escalators fixed at 3% Notes: 1. Quality mix relates to percentage of total revenues not derived from Medicaid. Skilled mix relates to percentage of total revenues derived from Medicare and managed care. Data for the twelve months ended June 30, 2016 for the post-acute/skilled-nursing portfolio; represents QCP’s portfolio including 17 non-strategic properties held-for-sale and excluding 9 properties acquired in the fourth quarter of 2015 and the first quarter of 2016 2. Coverage metrics based upon reported HCRMC Normalized EBITDAR, Facility EBITDAR and HCRMC Rent for the twelve months ended June 30, 2016. Reported HCRMC Normalized EBITDAR is burdened by certain legal and regulatory defense costs ($10 million) and losses on the 33 non-strategic properties sold during the period ($9 million on EBITDARM basis), as well as the 17 non-strategic properties held for sale that are expected to be sold by the end of the first quarter of 2017 ($11 million on EBITDARM basis) 3. Reported Facility EBITDAR is burdened by certain legal and regulatory defense costs ($10 million) and EBITDAR losses on the 17 held for sale properties ($15 million), and excludes EBITDAR contributed from 10 assets acquired during the twelve month period reported ($22 million) 11 Skilled Mix: 51.3% Quality Mix: 61.6%
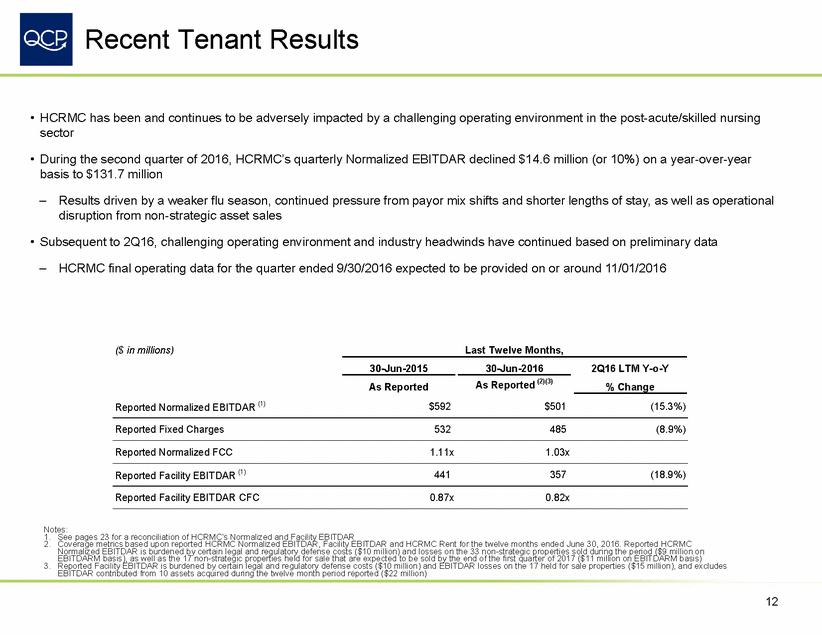
Recent Tenant Results • HCRMC has been and continues to be adversely impacted by a challenging operating environment in the post-acute/skilled nursing sector • During the second quarter of 2016, HCRMC’s quarterly Normalized EBITDAR declined $14.6 million (or 10%) on a year-over-year basis to $131.7 million –Results driven by a weaker flu season, continued pressure from payor mix shifts and shorter lengths of stay, as well as operational disruption from non-strategic asset sales • Subsequent to 2Q16, challenging operating environment and industry headwinds have continued based on preliminary data – HCRMC final operating data for the quarter ended 9/30/2016 expected to be provided on or around 11/01/2016 ($ in millions) Last Twelve Months, 30-Jun-2015 30-Jun-2016 2Q16 LTM Y-o-Y % Change As Reported (2)(3) $501 As Reported Reported Normalized EBITDAR (1) $592 (15.3%) Reported Fixed Charges 532 485 (8.9%) Reported Normalized FCC 1.11x 1.03x Reported Facility EBITDAR (1) 441 357 (18.9%) Reported Facility EBITDAR CFC 0.87x 0.82x Notes: 1. See pages 23 for a reconciliation of HCRMC’s Normalized and Facility EBITDAR 2. Coverage metrics based upon reported HCRMC Normalized EBITDAR, Facility EBITDAR and HCRMC Rent for the twelve months ended June 30, 2016. Reported HCRMC Normalized EBITDAR is burdened by certain legal and regulatory defense costs ($10 million) and losses on the 33 non-strategic properties sold during the period ($9 million on EBITDARM basis), as well as the 17 non-strategic properties held for sale that are expected to be sold by the end of the first quarter of 2017 ($11 million on EBITDARM basis) 3. Reported Facility EBITDAR is burdened by certain legal and regulatory defense costs ($10 million) and EBITDAR losses on the 17 held for sale properties ($15 million), and excludes EBITDAR contributed from 10 assets acquired during the twelve month period reported ($22 million) 12
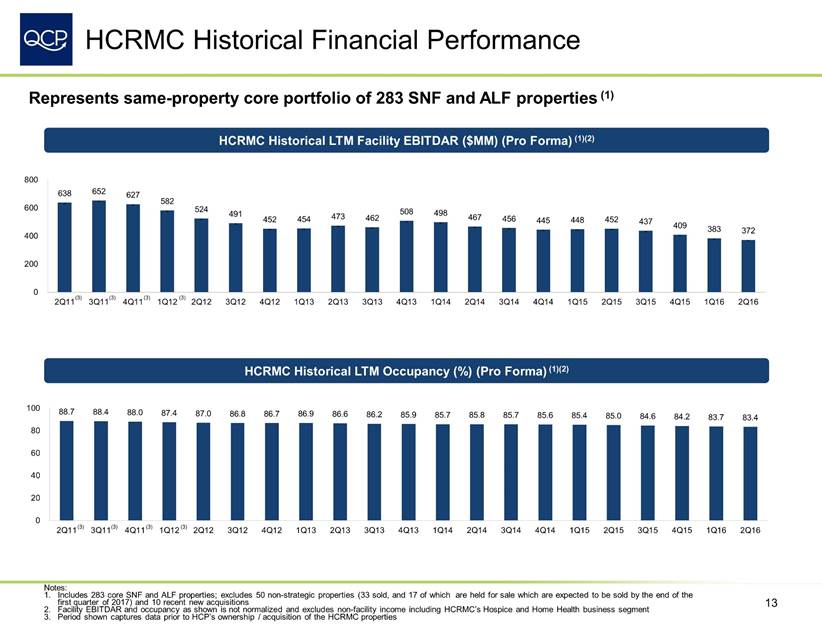
HCRMC Historical Financial Performance Represents same-property core portfolio of 283 SNF and ALF properties (1) HCRMC Historical LTM Facility EBITDAR ($MM) (Pro Forma) (1)(2) 800 652 638 627 582 - 600 524 508 498 491 473 467 462 452 454 456 452 445 448 - 437 - - 409 - - - - - 383 372 - 400 - - 200 0 (3) (3) (3) (3) 2Q11 3Q114Q11 1Q12 2Q12 3Q12 4Q12 1Q13 2Q13 3Q13 4Q13 1Q14 2Q14 3Q14 4Q14 1Q15 2Q15 3Q15 4Q15 1Q16 2Q16 HCRMC Historical LTM Occupancy (%) (Pro Forma) (1)(2) 100 88.7 88.4 88.0 87.4 87.0 86.8 86.9 86.7 86.6 86.2 85.9 85.7 85.8 85.7 85.6 85.4 85.0 84.6 84.2 83.7 83.4 80 60 40 20 0 2Q11 (3) 3Q11(3) 4Q11 (3) 1Q12 (3) 2Q12 3Q12 4Q12 1Q13 2Q13 3Q13 4Q13 1Q14 2Q14 3Q14 4Q14 1Q15 2Q15 3Q15 4Q15 1Q16 2Q16 Notes: 1. Includes 283 core SNF and ALF properties; excludes 50 non-strategic properties (33 sold, and 17 of which are held for sale which are expected to be sold by the end of the first quarter of 2017) and 10 recent new acquisitions 2. Facility EBITDAR and occupancy as shown is not normalized and excludes non-facility income including HCRMC’s Hospice and Home Health business segment 3. Period shown captures data prior to HCP’s ownership / acquisition of the HCRMC properties 13 - - - - -----
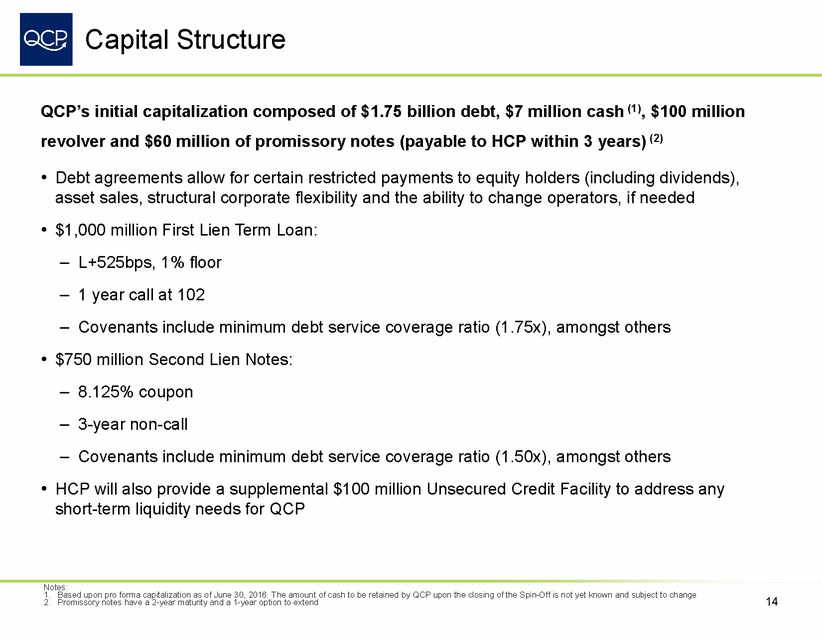
Capital Structure QCP’s initial capitalization composed of $1.75 billion debt, $7 million cash (1), $100 million revolver and $60 million of promissory notes (payable to HCP within 3 years) (2) • Debt agreements allow for certain restricted payments to equity holders (including dividends), asset sales, structural corporate flexibility and the ability to change operators, if needed $1,000 million First Lien Term Loan: • – – – L+525bps, 1% floor 1 year call at 102 Covenants include minimum debt service coverage ratio (1.75x), amongst others • $750 million Second Lien Notes: – – – 8.125% coupon 3-year non-call Covenants include minimum debt service coverage ratio (1.50x), amongst others • HCP will also provide a supplemental $100 million Unsecured Credit Facility to address any short-term liquidity needs for QCP Notes: 1. Based upon pro forma capitalization as of June 30, 2016. The amount of cash to be retained by QCP upon the closing of the Spin-Off is not yet known and subject to change 2. Promissory notes have a 2-year maturity and a 1-year option to extend 14
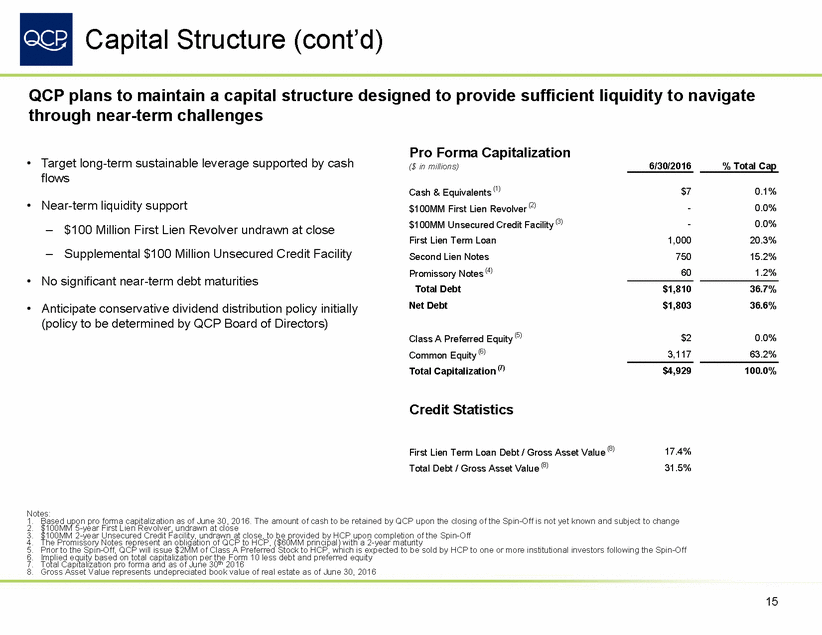
Capital Structure (cont’d) QCP plans to maintain a capital structure designed to provide sufficient liquidity to navigate through near-term challenges Pro Forma Capitalization ($ in millions) • Target long-term sustainable leverage supported by cash flows 6/30/2016 % Total Cap Cash & Equivalents (1) $100MM First Lien Revolver (2) $100MM Unsecured Credit Facility First Lien Term Loan Second Lien Notes Promissory Notes (4) Total Debt Net Debt $7 - - 1,000 750 60 0.1% 0.0% 0.0% 20.3% 15.2% 1.2% • Near-term liquidity support – $100 Million First Lien Revolver undrawn at close – Supplemental $100 Million Unsecured Credit Facility (3) • No significant near-term debt maturities $1,810 $1,803 36.7% 36.6% • Anticipate conservative dividend distribution policy initially (policy to be determined by QCP Board of Directors) Class A Preferred Equity (5) Common Equity (6) Total Capitalization (7) $2 3,117 0.0% 63.2% $4,929 100.0% Credit Statistics First Lien Term Loan Debt / Gross Asset Value (8) Total Debt / Gross Asset Value (8) 17.4% 31.5% Notes: 1. Based upon pro forma capitalization as of June 30, 2016. The amount of cash to be retained by QCP upon the closing of the Spin-Off is not yet known and subject to change 2. $100MM 5-year First Lien Revolver, undrawn at close 3. $100MM 2-year Unsecured Credit Facility, undrawn at close, to be provided by HCP upon completion of the Spin-Off 4. The Promissory Notes represent an obligation of QCP to HCP, ($60MM principal) with a 2-year maturity 5. Prior to the Spin-Off, QCP will issue $2MM of Class A Preferred Stock to HCP, which is expected to be sold by HCP to one or more institutional investors following the Spin-Off 6. Implied equity based on total capitalization per the Form 10 less debt and preferred equity 7. Total Capitalization pro forma and as of June 30th 2016 8. Gross Asset Value represents undepreciated book value of real estate as of June 30, 2016 15
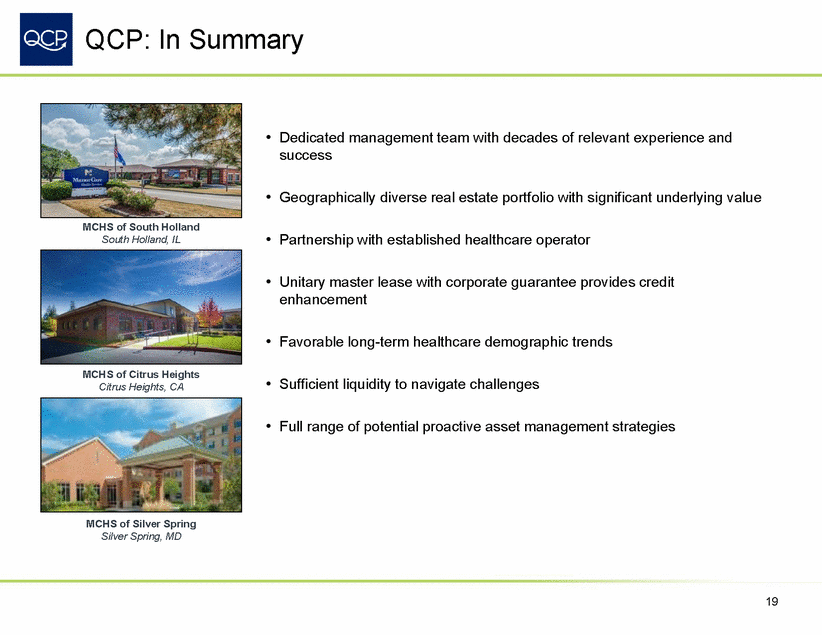
Hypothetical Illustrative Rent Analysis Recognizing the current and ongoing operating challenges in the post-acute / skilled nursing sector and HCRMC’s low coverage metrics, below is an analysis of hypothetical illustrative rent scenarios ($ in millions) Illustrative Rent Sensitivities 1.25x Facility Coverage Minimum Debt Service Coverage (1) HCRMC LTM 6/30/2016 (2) In-Place Rent (3) HCRMC Rent $254 $303 $459 % Reduction in HCRMC Rent (45%) (34%) - 1.03x (5)(6) HCRMC Implied Fixed Charge Coverage 1.54x 0.82x (5)(6) HCRMC Implied Facility Coverage 1.25x QCP Implied Net Debt / EBITDA 6.9x 5.8x 3.9x Notes: 1.Represents implied Adjusted EBITDA needed to maintain compliance with minimum Debt Service Coverage Ratio covenant of 1.75x. Assumes $148 million of annual debt service payments based upon pro forma capital structure as of 6/30/2016, LIBOR of 2.0% (vs. 1.0% floor on First Lien Term Loan) and undrawn balances on First Lien and Unsecured Credit Facilities 2.Based upon reported Facility EBITDAR for the twelve months ended June 30, 2016 ($357 million), as adjusted. Reported Facility EBITDAR reflects an imputed management fee of 4% of revenues (compared to actual HCRMC G&A of approximately 3.5% of revenues), and is burdened by certain legal and regulatory defense costs ($10 million) and EBITDAR losses related to 17 non-strategic properties held for sale that are expected to be sold by the end of the first quarter of 2017 ($15 million). Reported Facility EBITDAR has been adjusted herein to include EBITDAR contributed from 10 assets acquired during the twelve month period reported ($22 million) 3.Represents HCRMC Rent and QCP Adjusted EBITDA for the six months ended June 30, 2016, annualized by doubling first six months. See Appendix for reconciliation 4.Includes $25 million of non-HCRMC NOI and $19 million of estimated G&A 5.Coverage metrics based upon reported HCRMC Normalized EBITDAR, Facility EBITDAR and HCRMC Rent for the twelve months ended June 30, 2016. Reported HCRMC Normalized EBITDAR is burdened by certain legal and regulatory defense costs ($10 million) and losses on the 33 non-strategic properties sold during the period ($9 million on EBITDARM basis), as well as the 17 non-strategic properties held for sale that are expected to be sold by the end of the first quarter of 2017 ($11 million on EBITDARM basis) 6.Reported Facility EBITDAR is burdened by certain legal and regulatory defense costs ($10 million) and EBITDAR losses on the 17 held for sale properties ($15 million), and excludes EBITDAR contributed from 10 assets acquired during the twelve month period reported ($22 million) The hypothetical illustrative analysis should not be considered indicative of any future events. Any actual reduction in rental income from HCRMC may materially exceed the amounts reflected in the hypothetical illustrative rent analysis above 16 465 309 260 QCP Adjusted EBITDA (4)
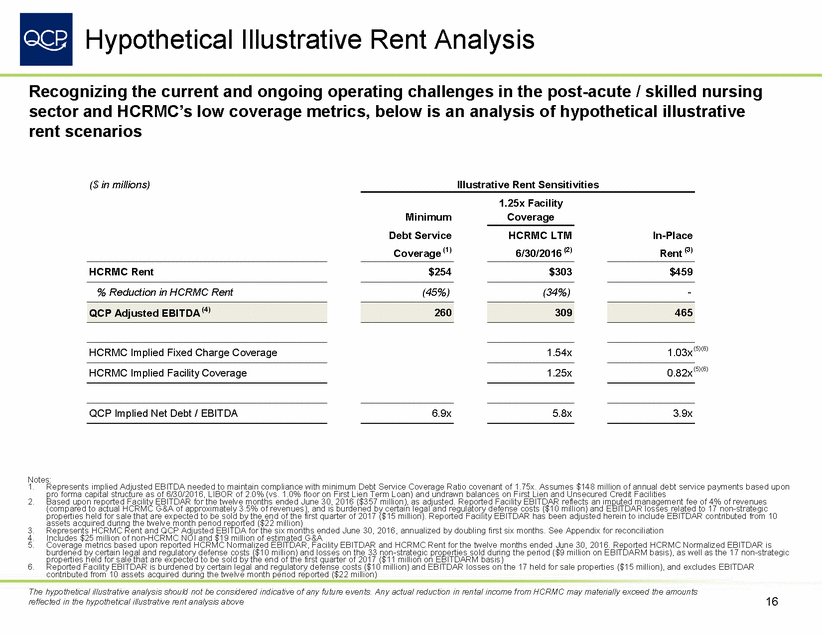
Favorable Long-Term Industry Demographics As the baby-boomer population ages and life expectancies increase, the demand for post-acute and memory care services will continue to grow Increasing population of U.S. seniors 65+ Population In millions 85+ Population In millions • 120 50% 25 10% According to the U.S. Census Bureau, Americans aged 65 or older are expected to increase significantly beginning in about 2019 40% 20 100 8% 14.6 82.3 30% 15 79.2 74.1 80 5% 65.9 56.4 20% 10 47.8 7.5 6.3 6.7 21.4% 21.7% 20.6% • These sub-sets of the population are key drivers of demand for post-acute / skilled nursing and memory care / assisted living services, as they are the segments most susceptible to Alzheimer’s disease, chronic ailments and spousal loss 19.0% 60 3% 10% 5 16.9% 14.9% 40 0% 0 0% 2015 2020 2025 2030 2035 2040 2015 2020 2025 2030 2035 2040 65+ Population % of Total Population 85+ Population % of Total Population Projected Alzheimer’s Patients Aged 65 and Older 2016E Costs of Alzheimer’s Growing demand for Alzheimer’s services Other, $30bn, (13%) In millions • In 2015, there were 5.1 million Americans living with Alzheimer’s disease Medicare, $117bn, (50%) 12 Out-of-Pocket, $46bn, (19%) • The number of Americans living with Alzheimer’s disease and memory impairment is expected to increase to 12 million by 2040 Medicaid, $43bn, (18%) Total: $236 billion 2015 2020 2030 2040 Sources: Census Bureau, MedPac and Alzheimer’s Association 17 8 6 5 11.9 3.8% 9.1 3.2% 2.5% 2.2% 2.0% 2.0%
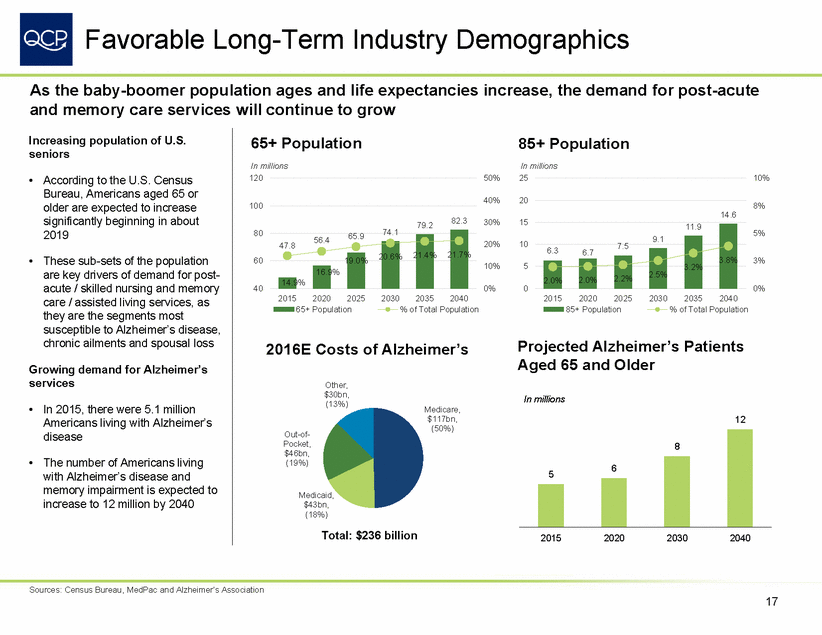
Payment Changes for Medicare SNFs Fiscal Year 2017 Payment Changes—aggregate SNF payments to grow by 2.4% (effective Oct. 1st, 2016) and Hospice reimbursement rate to increase by 2.1% • On July 29, 2016, the Centers for Medicare & Medicaid Services (CMS) issued a final rule outlining fiscal year 2017 Medicare payment policies and rates for the Skilled Nursing Facility Prospective Payment System, the SNF Quality Reporting Program and the SNF Value-Based Purchasing Program – The policies in the final rule continue to shift Medicare payments from volume to value Overview • The Administration has set measurable goals and a timeline to move the Medicare program, and the health care system at large, toward paying providers based on the quality, rather than the quantity of care they provide to their patients • CMS projects that aggregate payments to SNFs will increase in FY 2017 by $920 million, or 2.4 percent, from payments in FY 2016 This estimated increase is attributable to a 2.7 percent market basket increase reduced by 0.3 percentage points, in accordance with the multifactor productivity adjustment required by law Rate Changes • Medicare Payment System Evolution • There has been a shift away from traditional Fee-for-Service (FFS) since 2010 2010 2015E 2020E Duals Demos 1% ACOs 16% Duals Demos 1% Traditional Fee-for-Service 75% ACOs 14% Medicare Advantage 25% Traditional Fee-for-Service 54% Traditional Fee-for-Service 49% Medicare Advantage 31% Medicare Advantage 34% N = 47.7 million N = 58.8 million N = 64.5 million Source: CMS Office of the Actuary for Spending and Enrollment. Avalere analysis for alternative payment model projections 18
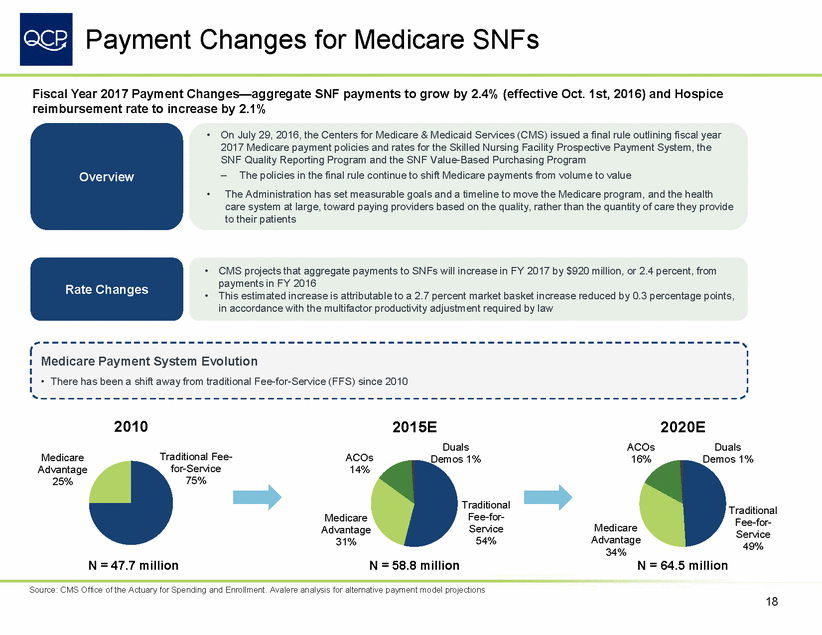
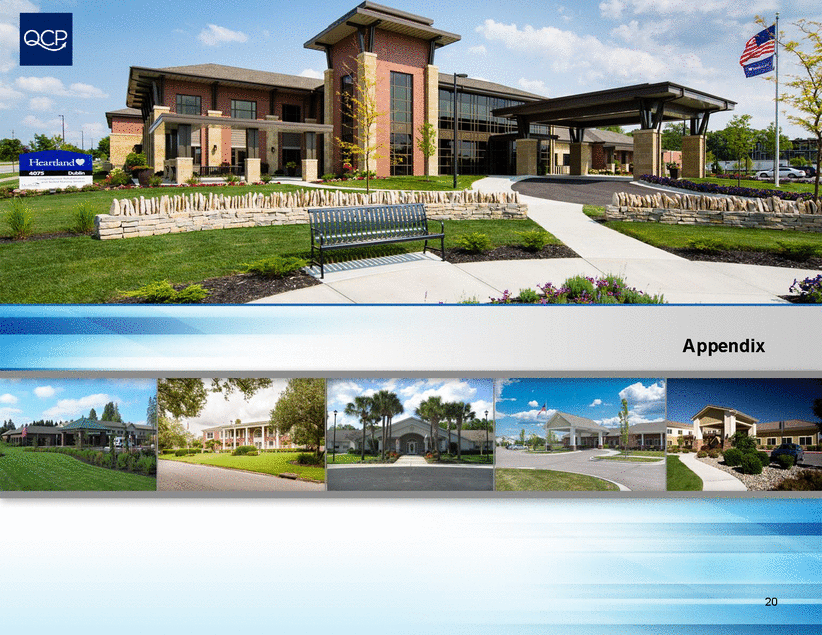
QCP: In Summary • Dedicated management team with decades of relevant experience and success • Geographically diverse real estate portfolio with significant underlying value MCHS of South Holland South Holland, IL • Partnership with established healthcare operator • Unitary master lease with corporate guarantee provides credit enhancement • Favorable long-term healthcare demographic trends MCHS of Citrus Heights Citrus Heights, CA • Sufficient liquidity to navigate challenges • Full range of potential proactive asset management strategies MCHS of Silver Spring Silver Spring, MD 19
Appendix 20
Non-GAAP Measures This presentation contains certain supplemental non-GAAP financial measures, including earnings before interest, taxes, depreciation and amortization (“EBITDA”) and Adjusted EBITDA. While QCP believes that non-GAAP financial measures are helpful in evaluating its operating performance, the use of non-GAAP financial measures in this presentation should not be considered in isolation from, or as an alternative for, a measure of financial or operating performance as defined by GAAP. You are cautioned that there are inherent limitations associated with the use of each of these supplemental non-GAAP financial measures as an analytical tool. Additionally, QCP’s computation of non-GAAP financial measures may not be comparable to those reported by other REITs or real estate companies. EBITDA is defined as earnings before interest, taxes, depreciation, and amortization. Adjusted EBITDA is defined as EBITDA after eliminating the effects of gain (loss) on sales of real estate, impairments, severance-related charges and transaction costs. We consider EBITDA and Adjusted EBITDA important supplemental measures to net income (loss) because they provide an additional manner in which to evaluate our operating performance. We believe that net income (loss) is the most directly comparable GAAP measure to EBITDA and Adjusted EBITDA. EBITDA and Adjusted EBITDA should not be viewed as alternative measures of operating performance to net income (loss) as defined by GAAP since they do not reflect various excluded items or as alternative measures of cash flows. Further, our definition of EBITDA and Adjusted EBITDA may not be comparable to the definition used by other REITs or real estate companies, as they may use different methodologies for calculating EBITDA and Adjusted EBITDA. 21
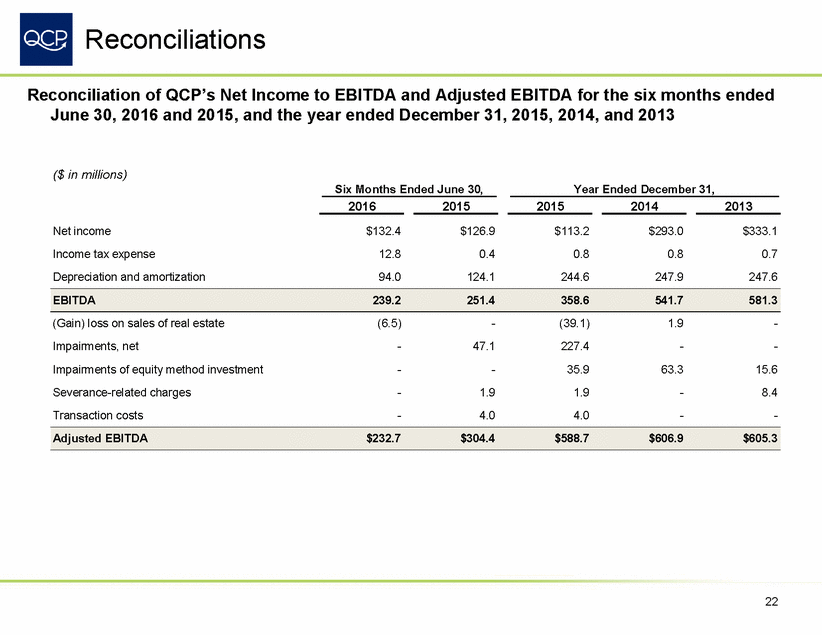
Reconciliations Reconciliation of QCP’s Net Income to EBITDA and Adjusted EBITDA for the six months ended June 30, 2016 and 2015, and the year ended December 31, 2015, 2014, and 2013 ($ in millions) Six Months Ended June 30, Year Ended December 31, 2016 2015 2015 2014 2013 Net income Income tax expense Depreciation and amortization $132.4 12.8 94.0 $126.9 0.4 124.1 $113.2 0.8 244.6 $293.0 0.8 247.9 $333.1 0.7 247.6 (Gain) loss on sales of real estate (6.5) - (39.1) 1.9 - Impairments, net Impairments of equity method investment Severance-related charges Transaction costs - - - - 47.1 - 1.9 4.0 227.4 35.9 1.9 4.0 - 63.3 - - - 15.6 8.4 - 22 Adjusted EBITDA$232.7$304.4$588.7$606.9$605.3 EBITDA239.2251.4358.6541.7581.3
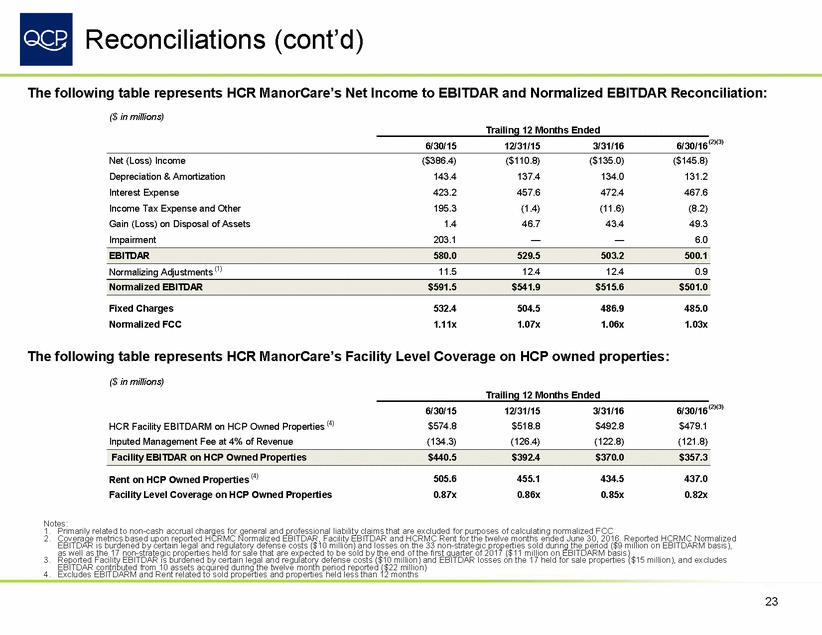
Reconciliations (cont’d) The following table represents HCR ManorCare’s Net Income to EBITDAR and Normalized EBITDAR Reconciliation: ($ in millions) Trailing 12 Months Ended 6/30/16 (2)(3) 6/30/15 12/31/15 3/31/16 Net (Loss) Income Depreciation & Amortization Interest Expense Income Tax Expense and Other Gain (Loss) on Disposal of Assets Impairment ($386.4) 143.4 423.2 195.3 1.4 203.1 ($110.8) 137.4 457.6 (1.4) 46.7 — ($135.0) 134.0 472.4 (11.6) 43.4 — ($145.8) 131.2 467.6 (8.2) 49.3 6.0 Normalizing Adjustments (1) 11.5 12.4 12.4 0.9 Fixed Charges Normalized FCC 532.4 1.11x 504.5 1.07x 486.9 1.06x 485.0 1.03x The following table represents HCR ManorCare’s Facility Level Coverage on HCP owned properties: ($ in millions) Trailing 12 Months Ended 6/30/16 (2)(3) $479.1 (121.8) 6/30/15 $574.8 (134.3) 12/31/15 $518.8 (126.4) 3/31/16 $492.8 (122.8) HCR Facility EBITDARM on HCP Owned Properties (4) Inputed Management Fee at 4% of Revenue Rent on HCP Owned Properties (4) Facility Level Coverage on HCP Owned Properties 505.6 0.87x 455.1 0.86x 434.5 0.85x 437.0 0.82x Notes: 1. Primarily related to non-cash accrual charges for general and professional liability claims that are excluded for purposes of calculating normalized FCC 2. Coverage metrics based upon reported HCRMC Normalized EBITDAR, Facility EBITDAR and HCRMC Rent for the twelve months ended June 30, 2016. Reported HCRMC Normalized EBITDAR is burdened by certain legal and regulatory defense costs ($10 million) and losses on the 33 non-strategic properties sold during the period ($9 million on EBITDARM basis), as well as the 17 non-strategic properties held for sale that are expected to be sold by the end of the first quarter of 2017 ($11 million on EBITDARM basis) 3. Reported Facility EBITDAR is burdened by certain legal and regulatory defense costs ($10 million) and EBITDAR losses on the 17 held for sale properties ($15 million), and excludes EBITDAR contributed from 10 assets acquired during the twelve month period reported ($22 million) 4. Excludes EBITDARM and Rent related to sold properties and properties held less than 12 months 23 Facility EBITDAR on HCP Owned Properties$440.5$392.4$370.0$357.3 Normalized EBITDAR$591.5$541.9$515.6$501.0 EBITDAR580.0529.5503.2500.1
[LOGO]
