ZTO Express (Cayman) Inc.
Building One, No. 1685 Huazhi Road
Qingpu District, Shanghai 201708
People’s Republic of China
November 4, 2022
VIA EDGAR
Mr. Karl Hiller
Ms. Lily Dang
Mr. John Cannarella
Office of Energy & Transportation
Division of Corporate Finance
100 F Street, NE
Washington, D.C., 20549
| Re: | ZTO Express (Cayman) Inc. (the “Company”) |
| Form 20-F for the Fiscal Year Ended December 31, 2021 | |
| Filed April 28, 2022 | |
| File No. 001-37922 |
Dear Mr. Hiller, Ms. Dang and Mr. Cannarella,
This letter sets forth the Company’s responses to the comments contained in the letter dated September 15, 2022 from the staff (the “Staff”) of the Securities and Exchange Commission (the “Commission”) regarding the Company’s annual report on Form 20-F for the fiscal year ended December 31, 2021 filed with the Commission on April 28, 2022 (the “2021 Form 20-F”). The Staff’s comments are repeated below in bold and are followed by the Company’s responses thereto. All capitalized terms used but not defined in this letter shall have the meaning ascribed to such terms in the 2021 Form 20-F.
Form 20-F for the Fiscal Year ended December 31, 2021
Introduction, page 1
| 1. | We note your disclosure on page 3 indicating that terms such as “we,” “us,” our company” or “our” refer to ZTO Express (Cayman) Inc. and its subsidiaries, although when describing your operations and the consolidated financial information, you are using these same terms to refer to the consolidated variable interest entity (VIE) and the subsidiaries of the consolidated VIE in China, including but not limited to ZTO Express. |
Please revise disclosures throughout your filing as necessary to provide distinct references for the holding company and its subsidiaries, and separately for the VIE and its subsidiaries, so that it is clear to investors which entities the disclosures are referencing, and which subsidiaries or entities are conducting the business operations.
Division of Corporation Finance
Office of Energy & Transportation
Securities and Exchange Commission
November 4, 2022
Page 2
Given that you do not have a controlling ownership interest in the VIE, please refrain from using terms such as “we,” “us,” “our company” and “our” when describing operations and the consolidated financial information of the VIE.
Also revise the organizational chart on page 6 to label the VIE and to identify the subsidiaries of the VIE that are referenced in your disclosure on page 3.
In response to the Staff’s comment, the Company will refrain from using terms such as “we,” “us,” “our company” and “our” when describing operations and the consolidated financial information of the VIE, and provide distinct references for the holding company and its subsidiaries, and separately for the VIE and its subsidiaries, and make necessary revisions in future filings of its annual report on Form 20-F.
For illustration purpose, the Company respectfully proposes to revise the referenced disclosure as follows (page references are made to the 2021 Form 20-F to illustrate the approximate location of the disclosure) in its future Form 20-F filings (with deletions in strike-through and additions underlined), subject to updates and adjustments to be made in connection with any material development of the subject matter being disclosed.
Page 1:
INTRODUCTION
ZTO Express (Cayman) Inc. is not a Chinese operating company but rather a Cayman Islands holding company with operations primarily conducted by its subsidiaries in China and through contractual arrangements with ZTO Express based in China. PRC laws and regulations restrict and impose conditions on foreign direct investment in companies involved in the provision of domestic mail delivery services. Therefore, we operate such business in China through ZTO Express and its subsidiaries, and rely on contractual arrangements among Shanghai Zhongtongji Network, ZTO Express and its shareholders to consolidate its financial results with ours under U.S. GAAP. These contractual arrangements enable us to exercise effective control over ZTO Express, receive the economic benefits that could potentially be significant to ZTO Express in consideration for the services provided by Shanghai Zhongtongji Network, and hold an exclusive option to purchase all or part of the equity interests in ZTO Express when and to the extent permitted by PRC law. Because of these contractual arrangements, we are the primary beneficiary of ZTO Express and hence consolidate its financial results with ours under U.S. GAAP. Revenues contributed by ZTO Express accounted for97.1%,94.1%,and 97.7% and % of our total revenues for the fiscal years2019, 2020,and 2021 and 2022, respectively. As used in this annual report, “ZTO” refers to ZTO Express (Cayman) Inc., and “we,” “us,” “our company” or “our” refers to ZTO Express (Cayman) Inc.,and its subsidiaries, and, in the context of describing our operations and consolidated financial information, ZTO Express and its subsidiaries in China. Investors in our ADSs and/or Class A ordinary shares thus are not purchasing equity interest in ZTO Express but instead are purchasing equity interest in ZTO Express (Cayman) Inc., a Cayman Islands holding company.
Division of Corporation Finance
Office of Energy & Transportation
Securities and Exchange Commission
November 4, 2022
Page 3
Page 3:
| • | “we,” “us,” “our company” or “our” are to ZTO Express (Cayman) Inc. and its subsidiaries |
| · | “VIE” or “consolidated affiliated entity” are to ZTO Express Co. Ltd., a PRC entity in which we do not have equity interests but whose financial results are consolidated into our consolidated financial statements in accordance with U.S. GAAP;” |
The Company further undertakes to adopt similar revisions to the disclosure in connection with the operations and the consolidated financial information of the VIE throughout the Form 20-F in future filings.
In response to the Staff’s comment regarding the organizational chart, the Company respectfully proposes to revise the referenced disclosure as follows (page reference is made to the 2021 Form 20-F to illustrate the approximate location of the disclosure) in its future Form 20-F filings (with deletions in strike-through and additions underlined), subject to updates and adjustments to be made in connection with any material development of the subject matter being disclosed.
Division of Corporation Finance
Office of Energy & Transportation
Securities and Exchange Commission
November 4, 2022
Page 4
Page 6:
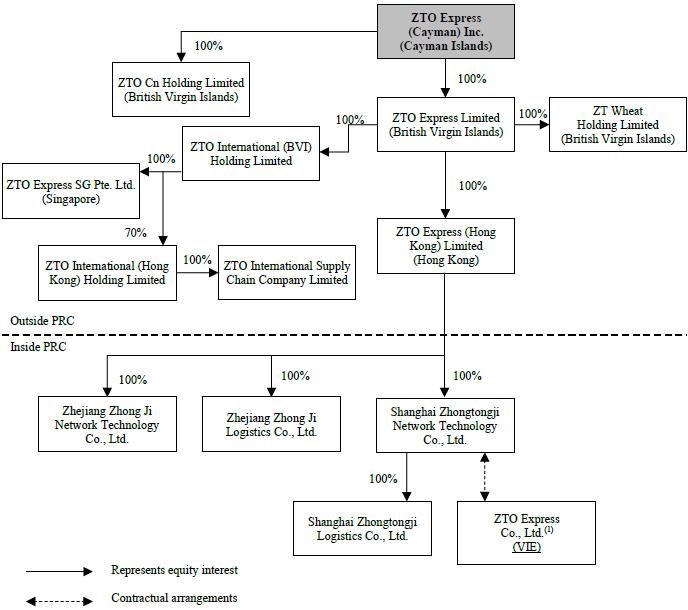
(1) ZTO Express Co., Ltd., or ZTO Express is the VIE, with which we have maintained contractual arrangements. To the knowledge of our company, Meisong Lai, Jianfa Lai, Jilei Wang. Xiangliang Hu, Shunchang Zhang, Jianying Teng, Xuebing Shang, Baixi Lan and Jianchang Lai are beneficial owners of the shares of our company and hold 34.35%, 12.00%, 10.00%, 7.05%, 6.00%, 5.02%, 4.40%, 1.40% and 1.06% equity interests in ZTO ExpressCo., Ltd., respectively. Among them, Meisong Lai, Jianfa Lai, Jilei Wang are also directors of our company. The remaining 18.72% equity interest in ZTO ExpressCo., Ltd. are held by 34 other shareholders. None of these 34 shareholders hold more than 4.00% of the equity interest in ZTO ExpressCo., Ltd. As of September 30, 2022, ZTO Express directly wholly owned 64 subsidiaries.
Key Information, page 11
Financial Information related to ZTO Express, page 14
| 2. | We note that you present condensed consolidating statements on pages 14, 15 and 16, although limit details in the Balance Sheet data to assets and liabilities, and limit details in the Statements of Operations data to revenue and net income. |
Division of Corporation Finance
Office of Energy & Transportation
Securities and Exchange Commission
November 4, 2022
Page 5
Please revise your tabulations in an amendment to your filing to include the equity accounts for the entities and to present additional details for the Statements of Operations, commensurate with the guidance on condensed financial information of the parent in Schedule I of Rule 5-04(c) of Regulation S-X, also as utilized in preparing consolidated Statements of Operations under Rule 10-01(a)(3), with reference to the guidance in Rule 5-03(b) of Regulation S-X, though also including the interests of the parent in earnings of your subsidiaries, and the interests of your subsidiaries in earnings of the VIE.
Also revise the header to these tabulations from “Financial Information Related to ZTO Express” to “Condensed Consolidating Financial Information of ZTO Express (Cayman) Inc.,” or similar language to more clearly convey the scope of the presentation, and revise the “ZTO Express” columnar headers to use “VIE” or “VIE and subsidiaries,” either incrementally to, or in lieu of, the current labels, as appropriate.
The Company respectfully advises the Staff that the tabulations for the condensed consolidating financial information (the “condensed financial tables”) presented on pages 14, 15 and 16 of the 2021 Form 20-F, were prepared by the Company with reference and consideration to comment #10 in the Sample Letter to China-based Companies released by the Staff in December 2021 (the “Sample Letter”).
The Company noted that Comment #10 of the Sample Letter provides that “the schedule should present major line items, such as revenue and cost of goods/services, and subtotals and disaggregated intercompany amounts, such as separate line items for intercompany receivables and investment in subsidiary” and “the objective of this disclosure is to allow an investor to evaluate the nature of assets held by, and the operations of, entities apart from the VIE, as well as the nature and amounts associated with intercompany transactions.” The Company has followed guidelines set out in the Sample Letter and presented major line items in the condensed financial tables, which allows investors to evaluate the nature of assets held by, and operations of, entities apart from the VIE.
In response to the Staff’s comment to include additional details to the condensed financial tables to commensurate with the guidance set out in Regulation S-X in connection with presentation of certain information in audited or interim financial statements and certain schedule to audited financial statements, the Company respectfully presents the revised disclosure as shown below in its 2021 Form 20-F with supplemental information added to the existing major line items in the condensed financial tables. However, as mentioned above, the Company is of the view that the existing disclosure in the condensed financial tables in the 2021 Form 20-F already captures the key financial information of the VIE and entities apart from the VIE. The absence of the supplemental information included in the tables below will not meaningfully affect investors’ understanding or assessment of the risks related to the Company's use of the VIE structure. The Company therefore respectfully proposes not to file an amendment to its current Form 20-F filing, and undertakes to include the changes made in the referenced disclosure below in its future Form 20-F filings (with deletions in strike-through and additions underlined), subject to updates and adjustments to be made in connection with any material development of the subject matter being disclosed.
Division of Corporation Finance
Office of Energy & Transportation
Securities and Exchange Commission
November 4, 2022
Page 6
In response to the Staff’s comment regarding tabulation and columnar headers, the Company respectfully undertakes to revise the referenced disclosure as shown below in its future Form 20-F filings (with deletions in strike-through and additions underlined).
Pages 14-16
Financial Information Related to ZTO ExpressCondensed Consolidating Financial Information of ZTO Express (Cayman) Inc.
The following table presents the condensed consolidating balance sheet data for ZTO Express (Cayman) Inc., ZTO Express,the VIE and VIE’s subsidiaries, and other entities as of the dates presented. For the purpose of this presentation, (i) the intercompany transactions among entities within our subsidiaries or among entities within the VIE and VIE’s subsidiaries were eliminated; and (ii) the equity method is used to account for ZTO Express (Cayman) Inc.’s investments in our subsidiaries and our subsidiary’s investment in the VIE, as presented below under “Investments in consolidated subsidiaries, VIE and other equity investees.”
Division of Corporation Finance
Office of Energy & Transportation
Securities and Exchange Commission
November 4, 2022
Page 7
| As of December 31, 2021 | ||||||||||||||||||||
(Cayman) Inc. | Subsidiaries |
VIE’s subsidiaries | Elimination | Consolidated Total | ||||||||||||||||
| RMB | ||||||||||||||||||||
| (in thousands) | ||||||||||||||||||||
| Assets | ||||||||||||||||||||
| Current assets: | ||||||||||||||||||||
| Cash and cash equivalents | 621,034 | 8,169,249 | 930,942 | — | 9,721,225 | |||||||||||||||
| Restricted cash | — | 27,736 | — | — | 27,736 | |||||||||||||||
| Accounts receivable, net | — | 262,167 | 671,277 | — | 933,444 | |||||||||||||||
| Financing receivables, net | — | 133,541 | 977,920 | — | 1,111,461 | |||||||||||||||
| Short-term investment | 196,462 | 2,328,857 | 320,000 | — | 2,845,319 | |||||||||||||||
| Inventories | — | 52,747 | 30,214 | — | 82,961 | |||||||||||||||
| Advances to suppliers | — | 612,842 | 55,013 | — | 667,855 | |||||||||||||||
| Prepayments and other current assets | — | 1,218,172 | 1,924,196 | — | 3,142,368 | |||||||||||||||
| Amounts due from related parties outside the consolidated group |
| 96,288 |
|
| 133,990 | |||||||||||||||
| Amounts due from related parties within the consolidated group | 2,692,898 | — | 402,488 | (3,095,386 | ) | — | ||||||||||||||
| Total current assets | 3,510,394 | 12,901,599 | 5,349,752 | (3,095,386 | ) | 18,666,359 | ||||||||||||||
| Investments in consolidated subsidiaries, VIE and other equity investees | 45,807,179 |
| 300,380 | (55,465,597 | ) | 3,730,448 | ||||||||||||||
| Property and equipment, net | — | 19,063,363 | 5,866,534 | — | 24,929,897 | |||||||||||||||
| Land use rights, net | — | 4,141,241 | 1,194,308 | — | 5,335,549 | |||||||||||||||
| Intangible assets, net | — | 35,634 | — | — | 35,634 | |||||||||||||||
| Operating lease right-of-use assets | — | 26,407 | 870,831 | — | 897,238 | |||||||||||||||
| Goodwill | — | 84,430 | 4,157,111 | — | 4,241,541 | |||||||||||||||
| Deferred tax assets | — | 284,139 | 650,709 | — | 934,848 | |||||||||||||||
| Long-term investment | — | 1,214,500 | — | — | 1,214,500 | |||||||||||||||
| Long-term financing receivables, net | — | 295,953 | 1,117,003 | — | 1,412,956 | |||||||||||||||
| Other non-current assets | — | 377,643 | 384,630 | — | 762,273 | |||||||||||||||
| Amounts due from related parties-non current | — | 611,100 | — | — | 611,100 | |||||||||||||||
| TOTAL ASSETS | 49,317,573 |
| 19,891,258 | (58,560,983 | ) | 62,772,343 | ||||||||||||||
| Liabilities | ||||||||||||||||||||
| Current liabilities | ||||||||||||||||||||
| Short-term bank borrowings | 637,260 | — | 2,821,457 | — | 3,458,717 | |||||||||||||||
| Accounts payable | — | 400,880 | 1,556,649 | — | 1,957,529 | |||||||||||||||
| Notes payable | — | 45,000 | 129,920 | — | 174,920 | |||||||||||||||
| Advances from customers | — | 12,752 | 1,213,797 | — | 1,226,549 | |||||||||||||||
| Income tax payable | — | 86,789 | — | — | 86,789 | |||||||||||||||
| Amounts due to related parties outside the consolidated group | — |
| 14,434 | — | 22,786 | |||||||||||||||
| Amounts due to related parties within the consolidated group | — | 3,095,386 | — | (3,095,386 | ) | — | ||||||||||||||
| Operating lease liabilities, current | — | 12,022 | 238,973 | — | 250,995 | |||||||||||||||
| Acquisition consideration payables | — | 22,942 | — | — | 22,942 | |||||||||||||||
| Dividends payable | 708 | — | — | — | 708 | |||||||||||||||
| Other current liabilities | 42,358 | 3,196,742 | 2,555,280 | — | 5,794,380 | |||||||||||||||
| Total current liabilities | 680,326 | 6,880,865 | 8,530,510 | (3,095,386 | ) | 12,996,315 | ||||||||||||||
| Non-current operating lease liabilities | — | 22,351 | 533,740 | — | 556,091 | |||||||||||||||
| Deferred tax liabilities | — | 179,813 | 112,543 | — | 292,356 | |||||||||||||||
TOTAL LIABILITIES | 680,326 | 7,083,029 | 9,176,793 | (3,095,386 | ) | 13,844,762 | ||||||||||||||
| Equity | ||||||||||||||||||||
| Ordinary shares | 535 | 15,084,658 | 600,000 | (15,684,658 | ) | 535 | ||||||||||||||
| Additional paid-in capital | 28,229,026 | 600,000 | 3,923,412 | (4,523,412 | ) | 28,229,026 | ||||||||||||||
| Treasury shares, at cost | (2,067,009 | ) | — | — | — | (2,067,009 | ) | |||||||||||||
| Retained earnings | 22,716,799 | 28,414,359 | 6,162,247 | (34,576,606 | ) | 22,716,799 | ||||||||||||||
| Accumulated other comprehensive loss | (242,104 | ) | 680,921 | — | (680,921 | ) | (242,104 | ) | ||||||||||||
| Non-controlling interests | — | 261,528 | 28,806 | — | 290,334 | |||||||||||||||
| Total Equity | 48,637,247 | 45,041,466 | 10,714,465 | (55,465,597 | ) | 48,927,581 | ||||||||||||||
| TOTAL LIABILITIES AND EQUITY | 49,317,573 | 52,124,495 | 19,891,258 | (58,560,983 | ) | 62,772,343 | ||||||||||||||
Division of Corporation Finance
Office of Energy & Transportation
Securities and Exchange Commission
November 4, 2022
Page 8
| As of December 31, 2020 | ||||||||||||||||||||
(Cayman) Inc. | Subsidiaries |
VIE’s subsidiaries | Elimination | Consolidated Total | ||||||||||||||||
| RMB | ||||||||||||||||||||
| (in thousands) | ||||||||||||||||||||
| Assets | ||||||||||||||||||||
| Current assets: | ||||||||||||||||||||
| Cash and cash equivalents | 3,443,624 | 9,992,429 | 776,725 | — | 14,212,778 | |||||||||||||||
| Restricted cash | — | 133,196 | — | — | 133,196 | |||||||||||||||
| Accounts receivable, net | — | 231,347 | 514,666 | — | 746,013 | |||||||||||||||
| Financing receivables, net | — | 150,673 | 341,486 | — | 492,159 | |||||||||||||||
| Short-term investment | 2,509,137 | 1,181,265 | — | — | 3,690,402 | |||||||||||||||
| Inventories | — | 10,295 | 42,775 | — | 53,070 | |||||||||||||||
| Advances to suppliers | — | 543,421 | 45,621 | — | 589,042 | |||||||||||||||
| Prepayments and other current assets | 13,013 | 1,168,598 | 1,153,077 | — | 2,334,688 | |||||||||||||||
| Amounts due from related parties outside the consolidated group |
|
| 34,034 | — | 73,278 | |||||||||||||||
| Amounts due from related parties within the consolidated group | 4,993,853 | 603,835 | — | (5,597,688 | ) | — | ||||||||||||||
| Total current assets | 10,959,627 | 14,054,303 | 2,908,384 | (5,597,688 | ) | 22,324,626 | ||||||||||||||
| Investments in consolidated subsidiaries, VIE and other equity investees | 37,391,446 |
| 110,570 | (45,766,318 | ) | 3,224,463 | ||||||||||||||
| Property and equipment, net | — | 12,540,008 | 6,025,153 | — | 18,565,161 | |||||||||||||||
| Land use rights, net | — | 3,221,824 | 1,138,849 | — | 4,360,673 | |||||||||||||||
| Intangible assets, net | — | 41,832 | — | — | 41,832 | |||||||||||||||
| Operating lease right-of-use assets | — | 41,275 | 834,984 | — | 876,259 | |||||||||||||||
| Goodwill | — | 84,430 | 4,157,111 | — | 4,241,541 | |||||||||||||||
| Deferred tax assets | — | 206,029 | 514,532 | — | 720,561 | |||||||||||||||
| Long-term investment | 652,500 | 1,189,500 | — | — | 1,842,000 | |||||||||||||||
| Long-term financing receivables, net | — | 185,350 | 1,784,990 | — | 1,970,340 | |||||||||||||||
| Other non-current assets | — | 437,838 | 99,456 | — | 537,294 | |||||||||||||||
| Amounts due from related parties-non current | — | 500,000 | — | — | 500,000 | |||||||||||||||
| TOTAL ASSETS | 49,003,573 |
| 17,574,029 | (51,364,006 | ) | 59,204,750 | ||||||||||||||
| Liabilities | ||||||||||||||||||||
| Current liabilities | ||||||||||||||||||||
| Short-term bank borrowings | — | — | 1,432,929 | — | 1,432,929 | |||||||||||||||
| Accounts payable | — | 480,819 | 1,155,069 | — | 1,635,888 | |||||||||||||||
| Notes payable | — | 168,062 | 158,138 | — | 326,200 | |||||||||||||||
| Advances from customers | — | 50,739 | 1,068,927 | — | 1,119,666 | |||||||||||||||
| Income tax payable | — | (202,098 | ) | 250,726 | — | 48,628 | ||||||||||||||
| Amounts due to related parties outside the consolidated group | — |
|
| — | 16,655 | |||||||||||||||
| Amounts due to related parties within the consolidated group | — | 4,993,853 | 603,835 | (5,597,688 | ) | — | ||||||||||||||
| Operating lease liabilities, current | — | 12,323 | 234,071 | — | 246,394 | |||||||||||||||
| Acquisition consideration payables | — | 22,942 | — | — | 22,942 | |||||||||||||||
| Dividends payable | 11,198 | — | — | — | 11,198 | |||||||||||||||
| Other current liabilities | 13,562 | 1,878,721 | 2,594,801 | — | 4,487,084 | |||||||||||||||
| Total current liabilities | 24,760 | 7,405,361 | 7,515,151 | (5,597,688 | ) | 9,347,584 | ||||||||||||||
| Non-current operating lease liabilities | — | 34,354 | 468,127 | — | 502,481 | |||||||||||||||
| Deferred tax liabilities | — | 127,171 | 127,816 | — | 254,987 | |||||||||||||||
| TOTAL LIABILITIES | 24,760 | 7,566,886 | 8,111,094 | (5,597,688 | ) | 10,105,052 | ||||||||||||||
| Equity | ||||||||||||||||||||
| Ordinary shares | 553 | 11,882,495 | 600,000 | (12,482,495 | ) | 553 | ||||||||||||||
| Additional paid-in capital | 30,613,948 | 600,000 | 3,923,412 | (4,523,412 | ) | 30,613,948 | ||||||||||||||
| Treasury shares, at cost | (2,578,870 | ) | — | — | — | (2,578,870 | ) | |||||||||||||
| Retained earnings | 21,038,753 | 23,469,770 | 4,903,267 | (28,373,037 | ) | 21,038,753 | ||||||||||||||
| Accumulated other comprehensive loss | (95,571 | ) | 387,374 | — | (387,374 | ) | (95,571 | ) | ||||||||||||
| Non-controlling interests | — | 84,629 | 36,256 | — | 120,885 | |||||||||||||||
| Total Equity | 48,978,813 | 36,424,268 | 9,462,935 | (45,766,318 | ) | 49,099,698 | ||||||||||||||
| TOTAL LIABILITIES AND EQUITY | 49,003,573 | 43,991,154 | 17,574,029 | (51,364,006 | ) | 59,204,750 | ||||||||||||||
The following table presents the condensed consolidatingstatements of operations data for ZTO Express (Cayman) Inc.,ZTO Express,the VIE and VIE’s subsidiaries, and other entities for the periods presented. For the purpose of this presentation, (i) the intercompany transactions among entities within our subsidiaries or among entities within the VIE and VIE’s subsidiaries were eliminated; and (ii) the equity method is used to account for the interests of ZTO Express (Cayman) Inc. in earnings of our subsidiaries, and the interests of our subsidiary in earnings of the VIE, as presented below under “Share of profit/(loss) in subsidiaries, consolidated VIE, and equity method investments.”
Division of Corporation Finance
Office of Energy & Transportation
Securities and Exchange Commission
November 4, 2022
Page 9
| For the Year Ended December 31, 2021 | ||||||||||||||||||||
ZTO Express | Subsidiaries |
VIE and | Elimination | Consolidated Total | ||||||||||||||||
| RMB | ||||||||||||||||||||
| (in thousands) | ||||||||||||||||||||
| Revenue | — | 15,651,997 | 29,721,135 | (14,967,293 | ) | 30,405,839 | ||||||||||||||
| Cost of revenues | — | (10,882,964 | ) | (27,900,791 | ) | 14,967,293 | (23,816,462 | ) | ||||||||||||
| Gross profit | — | 4,769,033 | 1,820,344 | — | 6,589,377 | |||||||||||||||
| Operating (expenses)/income | ||||||||||||||||||||
| Selling, general and administrative | (251,146 | ) | (1,203,138 | ) | (492,962 | ) | 71,377 | (1,875,869 | ) | |||||||||||
| Other operating income, net | 54,620 | 253,530 | 552,730 | (71,377 | ) | 789,503 | ||||||||||||||
| Other income/(expenses) | 29,865 | 272,703 | (66,382 | ) | — | 236,186 | ||||||||||||||
| Income before income tax and share of profit/(loss) in subsidiaries, consolidated VIE, and equity method investments | (166,661 | ) | 4,092,128 | 1,813,730 | — | 5,739,197 | ||||||||||||||
| Income tax expense | (23,101 | ) | (407,123 | ) | (575,227 | ) | — | (1,005,451 | ) | |||||||||||
| Share of profit/(loss) in subsidiaries, consolidated VIE, and equity method investments | 4,944,589 | 1,227,540 | (979 | ) | (6,203,569 | ) | (32,419 | ) | ||||||||||||
| Net income | 4,754,827 |
| 1,237,524 |
| ) ) | 4,701,327 | ||||||||||||||
| For the Year Ended December 31, 2020 | ||||||||||||||||||||
(Cayman) Inc. | Subsidiaries |
VIE’s subsidiaries | Elimination | Consolidated Total | ||||||||||||||||
| RMB | ||||||||||||||||||||
| (in thousands) | ||||||||||||||||||||
| Revenue | — | 12,999,401 | 23,734,103 | (11,519,214 | ) | 25,214,290 | ||||||||||||||
| Cost of revenues | — | (7,715,427 | ) | (23,180,971 | ) | 11,519,214 | (19,377,184 | ) | ||||||||||||
| Gross profit | — | 5,283,974 | 553,132 | — | 5,837,106 | |||||||||||||||
| Operating (expenses)/income | ||||||||||||||||||||
| Selling, general and administrative | (284,193 | ) | (1,325,374 | ) | (71,867 | ) | 17,722 | (1,663,712 | ) | |||||||||||
| Other operating income, net | 146,168 | 159,244 | 293,283 | (17,722 | ) | 580,973 | ||||||||||||||
| Other income/(expenses) | 197,043 | 125,859 | (42,483 | ) | — | 280,419 | ||||||||||||||
| Income before income tax and share of profit/(loss) in subsidiaries, consolidated VIE, and equity method investments | 59,018 | 4,243,703 | 732,065 | — | 5,034,786 | |||||||||||||||
| Income tax expense | (62,887 | ) | (374,236 | ) | (252,710 | ) | — | (689,833 | ) | |||||||||||
| Share of profit/(loss) in subsidiaries, consolidated VIE, and equity method investments | 4,316,082 | 458,935 | (1,187 | ) | (4,792,337 | ) | (18,507 | ) | ||||||||||||
| Net income | 4,312,213 |
4,328,402 | 478,168 |
| ) ) | 4,326,446 | ||||||||||||||
Division of Corporation Finance
Office of Energy & Transportation
Securities and Exchange Commission
November 4, 2022
Page 10
| For the Year Ended December 31, 2019 | ||||||||||||||||||||
(Cayman) Inc. | Subsidiaries |
VIE’s subsidiaries | Elimination | Consolidated Total | ||||||||||||||||
| RMB | ||||||||||||||||||||
| (in thousands) | ||||||||||||||||||||
| Revenue | — | 10,064,443 | 21,465,515 | (9,420,012 | ) | 22,109,946 | ||||||||||||||
| Cost of revenues | — | (4,646,385 | ) | (20,262,405 | ) | 9,420,012 | (15,488,778 | ) | ||||||||||||
| Gross profit | — | 5,418,058 | 1,203,110 | — | 6,621,168 | |||||||||||||||
| Operating (expenses)/income | ||||||||||||||||||||
| Selling, general and administrative | (325,559 | ) | (1,019,787 | ) | (286,712 | ) | 85,831 | (1,546,227 | ) | |||||||||||
| Other operating income, net | 52,937 | 112,534 | 308,250 | (85,831 | ) | 387,890 | ||||||||||||||
| Other income/(expenses) | 412,311 | 877,504 | 4,472 | — | 1,294,287 | |||||||||||||||
| Income before income tax and share of loss in equity method investments | 139,689 | 5,388,309 | 1,229,120 | — | 6,757,118 | |||||||||||||||
| Income tax expense | (61,505 | ) | (627,449 | ) | (389,341 | ) | — | (1,078,295 | ) | |||||||||||
| Share of profit/(loss) in subsidiaries, consolidated VIE, and equity method investments | 5,595,961 | 846,408 | 1,928 | (6,451,853 | ) | (7,556 | ) | |||||||||||||
| Net income | 5,674,145 |
| 841,707 |
| ) ) |
| ||||||||||||||
The following table presents condensed consolidating cash flow data for ZTO Express (Cayman) Inc.,ZTO Express,the VIE and VIE’s subsidiaries, and other entities for the years ended presented. For the purpose of this presentation, the intercompany transactions among entities within our subsidiaries or among entities within the VIE and VIE’s subsidiaries were eliminated.
Division of Corporation Finance
Office of Energy & Transportation
Securities and Exchange Commission
November 4, 2022
Page 11
| For the Year Ended December 31, 2021 | ||||||||||||||||||||
(Cayman) Inc. | Subsidiaries |
VIE’s subsidiaries | Elimination | Consolidated Total | ||||||||||||||||
| RMB | ||||||||||||||||||||
| (in thousands) | ||||||||||||||||||||
| Net cash provided by operating activities | 88,876 | 6,155,051 | 976,290 | — | 7,220,217 | |||||||||||||||
| Net cash provided by/(used in) investing activities | 1,679,330 | (10,808,233 | ) | (877,285 | ) | 1,249,655 | (8,756,533 | ) | ||||||||||||
| Net cash (used in)/provided by financing activities | (4,518,056 | ) | 2,808,514 | 55,212 | (1,249,655 | ) | (2,903,985 | ) | ||||||||||||
| For the Year Ended December 31, 2020 | ||||||||||||||||||||
(Cayman) Inc. | Subsidiaries |
VIE’s subsidiaries | Elimination | Consolidated Total | ||||||||||||||||
| RMB | ||||||||||||||||||||
| (in thousands) | ||||||||||||||||||||
| Net cash provided by/(used in) operating activities | 303,164 | 5,185,341 | (537,756 | ) | — | 4,950,749 | ||||||||||||||
| Net cash (used in)/provided by investing activities | (3,808,613 | ) | (9,104,151 | ) | (647,170 | ) | 10,010,593 | (3,549,341 | ) | |||||||||||
| Net cash provided by/(used in) financing activities | 6,894,133 | 10,020,938 | 1,432,929 | (10,010,593 | ) | 8,337,407 | ||||||||||||||
| For the Year Ended December 31, 2019 | ||||||||||||||||||||
(Cayman) Inc. | Subsidiaries |
VIE’s subsidiaries | Elimination | Consolidated Total | ||||||||||||||||
| RMB | ||||||||||||||||||||
| (in thousands) | ||||||||||||||||||||
| Net cash provided by operating activities | 433,172 | 4,087,296 | 1,783,718 | — | 6,304,186 | |||||||||||||||
| Net cash provided by/(used in) investing activities | 1,223,284 | (4,957,929 | ) | (1,831,001 | ) | 1,901,433 | (3,664,213 | ) | ||||||||||||
| Net cash (used in)/provided by financing activities | (2,033,666 | ) | 1,952,793 | — | (1,901,433 | ) | (1,982,306 | ) | ||||||||||||
* * *
Division of Corporation Finance
Office of Energy & Transportation
Securities and Exchange Commission
November 4, 2022
Page 12
If you have any additional questions or comments regarding the 2021 Form 20-F, please contact the undersigned at +86 21 5980 4508 or the Company’s U.S. counsel, Haiping Li of Skadden, Arps, Slate, Meagher & Flom LLP at +86 21 6193 8210 or haiping.li@skadden.com, or Yuting Wu of Skadden, Arps, Slate, Meagher & Flom LLP at +86 21 6193 8225 or yuting.wu@skadden.com. Thank you very much.
| Very truly yours, | |
| /s/ Huiping Yan | |
| Huiping Yan | |
| Chief Financial Officer |
cc: Meisong Lai, Chairman of the Board of Directors and Chief Executive Officer, ZTO Express (Cayman) Inc.
Haiping Li, Esq., Partner, Skadden, Arps, Slate, Meagher & Flom LLP
Yuting Wu, Esq., Partner, Skadden, Arps, Slate, Meagher & Flom LLP
Anna Li, Partner, Deloitte Touche Tohmatsu Certified Public Accountants LLP