UNITED STATES
SECURITIES AND EXCHANGE COMMISSION
Washington, D.C. 20549
FORM N-CSR
CERTIFIED SHAREHOLDER REPORT OF REGISTERED
MANAGEMENT INVESTMENT COMPANIES
Investment Company Act file number: 811-23166
RiverNorth/DoubleLine Strategic Opportunity Fund, Inc.
(Exact name of registrant as specified in charter)
325 North LaSalle Street, Suite 645, Chicago, Illinois 60654
(Address of principal executive offices) (Zip code)
Marcus L. Collins, Esq.
RiverNorth Capital Management, LLC
325 North LaSalle Street, Suite 645
Chicago, Illinois 60654
(Name and address of agent for service)
(312)832-1440
Registrant's telephone number, including area code
Date of fiscal year end: June 30, 2018
Date of reporting period: June 30, 2018
Item 1. Reports to Stockholders.

RiverNorth/DoubleLine Strategic Opportunity Fund, Inc. | Table of Contents |
Portfolio Update | 2 |
Asset Allocation | 4 |
Schedule of Investments | 5 |
Statement of Assets and Liabilities | 13 |
Statement of Operations | 14 |
Statements of Changes in Net Assets | 15 |
Statement of Cash Flows | 16 |
Financial Highlights | 17 |
Notes to Financial Statements | 18 |
Report of Independent Registered Public Accounting Firm | 27 |
Additional Information | 28 |
Directors & Officers | 30 |
RiverNorth/DoubleLine Strategic Opportunity Fund, Inc. |
Portfolio Update | June 30, 2018 (Unaudited) |
What is the Fund’s investment strategy?
The RiverNorth/DoubleLine Strategic Opportunity Fund (“the Fund”) seeks to provide current income and overall total return.
RiverNorth Capital Management, LLC (“RiverNorth”) allocates the Fund’s Managed Assets among two principal strategies: Tactical Closed-End Fund (CEF) Income Strategy and Opportunistic Income Strategy. RiverNorth manages the Tactical Closed-End Fund Income Strategy and DoubleLine Capital LP (“DoubleLine”) manages the Opportunistic Income Strategy.
RiverNorth determines which portion of the Fund’s assets is allocated to each strategy based on market conditions. The Fund may allocate between 10% to 35% of its Managed Assets to the Tactical CEF Income Strategy and 65% to 90% of its Managed Assets to the Opportunistic Income Strategy.
The Tactical CEF Income Strategy typically invests in CEFs, business development companies (BDCs) and exchange-traded funds (ETFs). The Opportunistic Income Strategy primarily invests in agency and non-agency residential mortgage-backed securities (RMBS) and commercial mortgage-backed securities (CMBS) seeking to derive value from inefficiencies within the subsectors of the fixed income market while maintaining active risk constraints.
How did the Fund perform relative to its benchmark during the reporting period?
For the year ended June 30, 2018, the Fund returned 2.12% on a net asset value (NAV) basis and -0.65% on a market price basis. The Bloomberg Barclays U.S. Aggregate Bond Index (the “Agg”) returned -0.40% during the same period.
What contributing factors were responsible for the RiverNorth/DoubleLine Strategic Opportunity Fund’s relative performance during the period?
RiverNorth Tactical CEF Income Sleeve
The RiverNorth sleeve outperformed the benchmark index during the period. The Fund benefitted from positive NAV performance among CEFs that invest in lower credit quality securities. The sleeve’s exposure to global income CEFs detracted from performance as emerging market debt significantly underperformed the Fund’s benchmark.
DoubleLine Opportunistic Income Sleeve
For the year ended June 30, 2018, the DoubleLine sleeve outperformed the Agg return of -0.40%. Alt-A securities were the largest contributors to performance within the portfolio. Other securitized sectors including asset-backed securities (ABS) and commercial mortgage-backed securities (CMBS) were also accretive to performance due primarily to interest income. Agency MBS detracted from performance as the flattening yield curve negatively impacted valuations across the sector. Fixed rate collateralized mortgage obligations (CMOs) outperformed within the sector due to interest income.
2 | (888) 848-7569 | www.rivernorth.com |
RiverNorth/DoubleLine Strategic Opportunity Fund, Inc. |
Portfolio Update | June 30, 2018 (Unaudited) |
How was the Fund positioned at the end of June 2018?
The Fund allocation was 22% RiverNorth Tactical CEF Income, and 78% DoubleLine Opportunistic Income, based on managed assets. The biggest sector allocations are to Non-Agency MBS, Agency MBS, and High Yield. The Fund is utilizing a line of credit to leverage the portfolio approximately 25%.
Past performance is no guarantee of future results.
The Bloomberg Barclays U.S. Aggregate Bond Index is an unmanaged index of investment-grade fixed-rate debt issues with maturities of at least one year. The index cannot be invested in directly and does not reflect fees and expenses.
A credit spread is the difference in yield between two bonds of similar maturity but different credit quality. Widening credit spreads indicate growing concern about the ability of corporate (and other private) borrowers to service their debt. Narrowing credit spreads indicate improving private creditworthiness.
Yield curve is a line that plots the interest rates, at a set point in time, of bonds having equal credit quality, but differing maturity dates. The shape of the yield curve is closely scrutinized because it helps to give an idea of future interest rate change and economic activity. There are three main types of yield curve shapes: normal (steep), inverted (negative), and flat. A normal yield curve is one in which longer maturity bonds have a higher yield compared to shorter-term bonds due to the risks associated with time. An inverted yield curve is one in which the shorter-term yields are higher than the longer-term yields. A flat yield curve is one in which the shorter- and longer-term yields are very close to each other. The slope of the yield curve is also seen as important: the greater the slope, the greater the gap between short- and long-term rates.
Annual Report | June 30, 2018 | 3 |
RiverNorth/DoubleLine Strategic Opportunity Fund, Inc. |
Asset Allocation | June 30, 2018 (Unaudited) |
ASSET ALLOCATION as of June 30, 2018
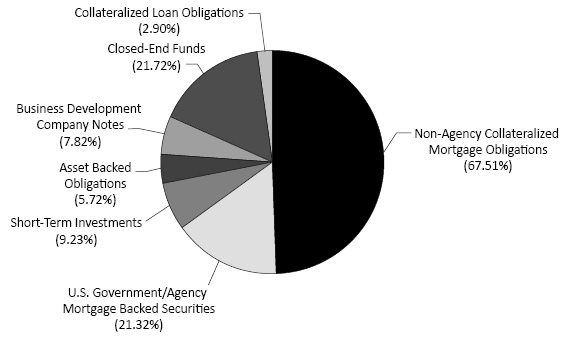
Percentages are based on total net assets of the Fund.
4 | (888) 848-7569 | www.rivernorth.com |
RiverNorth/DoubleLine Strategic Opportunity Fund, Inc. |
Schedule of Investments | June 30, 2018 |
| Principal Amount/Description | | Rate | | | Maturity | | | Value | |
ASSET BACKED OBLIGATIONS - 5.72%(a)(b) | |
| 2,734,375 | | | Blackbird Capital Aircraft(c) | | | 5.68 | % | | | 12/16/2041 | | | $ | 2,805,635 | |
| 1,732,500 | | | Coinstar Funding, LLC | | | 5.22 | % | | | 4/25/2047 | | | | 1,759,843 | |
| 3,000,000 | | | InSite Issuer LLC | | | 6.41 | % | | | 11/15/2046 | | | | 2,993,536 | |
| 2,734,375 | | | Labrador Aviation Finance Limited | | | 5.68 | % | | | 1/15/2042 | | | | 2,736,943 | |
| 489,583 | | | Sapphire Aviation Finance | | | 5.93 | % | | | 12/15/2040 | | | | 496,532 | |
| 1,000,000 | | | SOFI Consumer Loan Program Trust(d) | | | 4.73 | % | | | 1/26/2026 | | | | 1,026,983 | |
| | | | | | | | | | | | | | | | |
TOTAL ASSET BACKED OBLIGATIONS | | | | | | | | | | | | |
(Cost $11,690,433) | | | | | | | | | | | 11,819,472 | |
| Shares/Description | | Rate | | | Maturity | | | Value | |
BUSINESS DEVELOPMENT COMPANY NOTES - 7.82%(a) | |
| 39,541 | | | Capital Southwest Corp | | | 5.95 | % | | | 12/15/2022 | | | | 998,410 | |
| 54,795 | | | KCAP Financial Inc | | | 6.13 | % | | | 9/30/2022 | | | | 1,381,930 | |
| 230,209 | | | Oxford Square Capital Corp | | | 6.50 | % | | | 3/30/2024 | | | | 5,927,882 | |
| 19,165 | | | Saratoga Investment Corp | | | 6.75 | % | | | 12/30/2023 | | | | 496,565 | |
| 30,193 | | | Stellus Capital Investments | | | 5.75 | % | | | 9/15/2022 | | | | 758,448 | |
| 160,200 | | | THL Credit, Inc. | | | 6.75 | % | | | 12/30/2022 | | | | 4,089,906 | |
| 87 | | | THL Credit, Inc. | | | 6.75 | % | | | 11/15/2021 | | | | 2,198 | |
| 15,415 | | | Triangle Capital Corporation | | | 6.38 | % | | | 12/15/2022 | | | | 387,533 | |
| 42,890 | | | Triangle Capital Corporation | | | 6.38 | % | | | 3/15/2022 | | | | 1,078,684 | |
| 41,359 | | | TriplePoint Venture Growth BDC Corp | | | 5.75 | % | | | 7/15/2022 | | | | 1,033,561 | |
| | | | | | | | | | | | | | | | |
TOTAL BUSINESS DEVELOPMENT COMPANY NOTES | | | | | | | | | | | | |
(Cost $15,887,875) | | | | | | | | | | | 16,155,117 | |
| Shares/Description | | Value | |
CLOSED-END FUNDS - 21.72%(a) | |
| 560,511 | | | BlackRock Corporate High Yield Fund, Inc. | | | 5,862,945 | |
| 387,576 | | | BlackRock Credit Allocation Income Trust | | | 4,681,918 | |
| 351,322 | | | BradywineGlobal Global Income Opportunities Fund, Inc. | | | 4,001,558 | |
| 317,292 | | | Eaton Vance Limited Duration Income Fund | | | 3,991,533 | |
| 442,614 | | | Invesco Senior Income Trust | | | 1,894,388 | |
| 108,261 | | | NexPoint Credit Strategies Fund | | | 2,376,329 | |
| 55,148 | | | Nuveen AMT-Free Quality Municipal Income Fund | | | 717,475 | |
| 510,168 | | | Nuveen Credit Strategies Income Fund | | | 4,055,836 | |
| 5,402 | | | Nuveen Mortgage Opportunity Term Fund | | | 127,001 | |
| 69,466 | | | Nuveen Quality Municipal Income Fund | | | 923,898 | |
| 160,041 | | | Prudential Global Short Duration High Yield Fund | | | 2,186,160 | |
See Notes to Financial Statements.
Annual Report | June 30, 2018 | 5 |
RiverNorth/DoubleLine Strategic Opportunity Fund, Inc. |
Schedule of Investments | June 30, 2018 |
| Shares/Description | | Value | |
| 44,106 | | | Templeton Emerging Markets Income Fund | | $ | 452,969 | |
| 290,734 | | | Wells Fargo Income Opportunities Fund | | | 2,322,965 | |
| 229,696 | | | Western Asset Emerging Markets Debt Fund Inc. | | | 3,048,066 | |
| 320,670 | | | Western Asset Global High Income Fund Inc. | | | 2,924,510 | |
| 1,097,928 | | | Western Asset Global High Income Opportunity Fund Inc. | | | 5,292,013 | |
| | | | | | | | |
TOTAL CLOSED-END FUNDS | | | | |
(Cost $46,910,554) | | | 44,859,564 | |
| Principal Amount/Description | | Rate | | | Maturity | | | Value | |
COLLATERALIZED LOAN OBLIGATIONS - 2.90%(a)(d) | |
| | | | Apidos Ltd. | | | | | | | | | |
| 500,000 | | | Series 2015-21A
(3 Month LIBOR USD + 8.25%)(b) | | | 10.58 | % | | | 7/18/2027 | | | | 500,000 | |
| | | | Atrium CDO Corp | | | | | | | | | | | | |
| 500,000 | | | Series XIII 2017-13
(3 Month LIBOR USD + 6.05%)(b) | | | 8.41 | % | | | 11/21/2030 | | | | 505,000 | |
| | | | Canyon Capital Ltd. | | | | | | | | | | | | |
| 500,000 | | | Series 2016-1R
(3 Month LIBOR USD + 5.75%)(b) | | | 8.10 | % | | | 7/15/2031 | | | | 495,941 | |
| | | | Dorchester Park CLO Ltd. | | | | | | | | | | | | |
| 500,000 | | | Series 2015-1A
(3 Month LIBOR USD + 5.00%)(b) | | | 7.08 | % | | | 4/20/2028 | | | | 500,000 | |
| | | | Dryden Senior Loan Fund | | | | | | | | | | | | |
| 500,000 | | | Series 2015-37R
(3 Month LIBOR USD + 5.15%)(b) | | | 7.50 | % | | | 1/15/2030 | | | | 494,703 | |
| | | | Fillmore Park CLO, Ltd. | | | | | | | | | | | | |
| 500,000 | | | Series 2018-1A
(3 Month LIBOR USD + 5.40%) | | | 7.65 | % | | | 7/20/2030 | | | | 500,000 | |
| | | | LCM Ltd Partnership | | | | | | | | | | | | |
| 500,000 | | | Series 14A
(3 Month LIBOR USD + 5.50%)(b) | | | 7.90 | % | | | 7/20/2031 | | | | 493,300 | |
| | | | Neuberger Berman Loan Advisors Ltd. | | | | | | | | | | | | |
| 500,000 | | | Series 2016-23A
(3 Month LIBOR USD + 6.58%)(b) | | | 8.93 | % | | | 10/17/2027 | | | | 505,956 | |
| | | | Octagon Investment Partners Ltd. | | | | | | | | | | | | |
| 500,000 | | | Series 2016-26R
(3 Month LIBOR USD + 8.09%)(b) | | | 10.14 | % | | | 7/15/2030 | | | | 495,558 | |
| 500,000 | | | Series 2013-1A
(3 Month LIBOR USD + 5.75%)(b) | | | 8.09 | % | | | 7/17/2030 | | | | 500,000 | |
See Notes to Financial Statements.
6 | (888) 848-7569 | www.rivernorth.com |
RiverNorth/DoubleLine Strategic Opportunity Fund, Inc. |
Schedule of Investments | June 30, 2018 |
| Principal Amount/Description | Rate | | | Maturity | | | Value | |
| | | | Voya Ltd. | | | | | | | | | |
| 500,000 | | | Series 2018-2A
(3 Month LIBOR USD + 5.25%)(b) | | | 7.62 | % | | | 7/15/2031 | | | $ | 499,143 | |
| | | | Webster Park CLO Ltd. | | | | | | | | | | | | |
| 500,000 | | | Series 2015-1A
(3 Month LIBOR USD + 5.50%)(b) | | | 7.85 | % | | | 7/20/2030 | | | | 500,000 | |
| | | | | | | | | | | | | | | | |
TOTAL COLLATERALIZED LOAN OBLIGATIONS | | | | | | | | | | | | |
(Cost $6,008,099) | | | | | | | | | | | 5,989,601 | |
| Principal Amount/Description | | Rate | | | Maturity | | | Value | |
NON-AGENCY COLLATERALIZED MORTGAGE OBLIGATIONS - 67.51%(a) | |
| | | | Atrium Hotel Portfolio Trust | | | | | | | | | |
| 433,000 | | | Series 2018-ATRM
(1 Month LIBOR USD + 3.40%)(b)(d) | | | 5.36 | % | | | 6/15/2035 | | | | 435,128 | |
| | | | Bank of America Alternative Loan Trust | | | | | | | | | | | | |
| 2,340,296 | | | Series 2004-12 | | | 6.00 | % | | | 1/25/2035 | | | | 2,378,968 | |
| | | | Banc of America Funding Corporation | | | | | | | | | | | | |
| 2,666,625 | | | Series 2006-D(d) | | | 3.43 | % | | | 5/20/2036 | | | | 2,377,180 | |
| | | | Banc of America Mortgage Securities Inc. | | | | | | | | | | | | |
| 2,833,889 | | | Series 2007-3 | | | 6.00 | % | | | 9/25/2037 | | | | 2,753,598 | |
| | | | BB-UBS Trust | | | | | | | | | | | | |
| 500,000 | | | Series 2012 - TFT(b)(d) | | | 3.56 | % | | | 6/5/2030 | | | | 457,811 | |
| | | | BCAP LLC Trust | | | | | | | | | | | | |
| 2,403,233 | | | Series 2011-RR4(b)(d) | | | 6.00 | % | | | 8/26/2037 | | | | 2,377,780 | |
| 2,258,995 | | | Series 2011-RR4(b)(d) | | | 6.00 | % | | | 8/26/2037 | | | | 2,235,070 | |
| | | | Bear Stearns Alt-A Trust | | | | | | | | | | | | |
| 2,518,349 | | | Series 2005-10(d) | | | 3.93 | % | | | 1/25/2036 | | | | 2,376,666 | |
| | | | Bear Stearns Adjustable Rate Mortgage Trust | | | | | | | | | | | | |
| 2,067,725 | | | Series 2006-2(d) | | | 3.99 | % | | | 7/25/2036 | | | | 1,877,471 | |
| | | | Chase Mortgage Finance Corporation | | | | | | | | | | | | |
| 3,968,231 | | | Series 2007-S4
(1 Month LIBOR USD + 0.60%)(d) | | | 2.69 | % | | | 6/25/2037 | | | | 2,174,996 | |
| | | | ChaseFlex Trust | | | | | | | | | | | | |
| 3,270,151 | | | Series 2007-1 | | | 6.50 | % | | | 2/25/2037 | | | | 2,193,062 | |
| | | | CHL GMSR Trust | | | | | | | | | | | | |
| 3,930,000 | | | Series 2018-GT1
(1 Month LIBOR USD + 2.75%)(b)(d) | | | 4.84 | % | | | 5/25/2023 | | | | 3,944,668 | |
| | | | CIM Trust | | | | | | | | | | | | |
| 3,720,000 | | | Series 2017-3RR-B2(b)(d) | | | 12.31 | % | | | 1/29/2057 | | | | 3,912,464 | |
See Notes to Financial Statements.
Annual Report | June 30, 2018 | 7 |
RiverNorth/DoubleLine Strategic Opportunity Fund, Inc. |
Schedule of Investments | June 30, 2018 |
| Principal Amount/Description | Rate | | | Maturity | | | Value | |
| | | | Citigroup Mortgage Loan Trust Inc. | | | | | | | | | |
| 171,000 | | | Series 2015-GC27 D(b)(d) | | | 4.58 | % | | | 2/12/2048 | | | $ | 148,260 | |
| 2,686,851 | | | Series 2005-5(d) | | | 3.54 | % | | | 10/25/2035 | | | | 2,096,169 | |
| 2,140,760 | | | Series 2007-AR5(d) | | | 3.77 | % | | | 4/25/2037 | | | | 2,039,002 | |
| 399,000 | | | Series 2016-GC36 D(b) | | | 2.85 | % | | | 2/10/2049 | | | | 307,512 | |
| | | | Commercial Mortgage Trust | | | | | | | | | | | | |
| 500,000 | | | Series 2012-CR4(b)(d) | | | 4.73 | % | | | 10/17/2045 | | | | 257,644 | |
| 537,000 | | | Series 2012-CR4(b)(d) | | | 4.73 | % | | | 10/17/2045 | | | | 162,552 | |
| 500,000 | | | Series 2013-LC13(b)(d) | | | 5.13 | % | | | 8/10/2046 | | | | 483,115 | |
| | | | Countrywide Alternative Loan Trust | | | | | | | | | | | | |
| 1,168,742 | | | Series 2005-48T1 | | | 5.50 | % | | | 11/25/2035 | | | | 1,070,008 | |
| 1,876,376 | | | Series 2005-63(d) | | | 3.44 | % | | | 12/25/2035 | | | | 1,731,101 | |
| 4,025,176 | | | Series 2005-64CB | | | 5.50 | % | | | 12/25/2035 | | | | 3,578,990 | |
| 1,540,706 | | | Series 2006-26CB | | | 6.50 | % | | | 9/25/2036 | | | | 1,264,300 | |
| 4,443,734 | | | Series 2006-32CB | | | 6.00 | % | | | 11/25/2036 | | | | 3,907,320 | |
| 3,284,291 | | | Series 2007-14T2 | | | 6.00 | % | | | 7/25/2037 | | | | 2,487,663 | |
| 3,413,023 | | | Series 2007-2CB | | | 5.75 | % | | | 3/25/2037 | | | | 2,994,856 | |
| 2,704,093 | | | Series 2007-16CB | | | 6.25 | % | | | 8/25/2037 | | | | 2,345,036 | |
| | | | Countrywide Home Loans | | | | | | | | | | | | |
| 2,582,144 | | | Series 2005-HYB1
(1 Month LIBOR USD + 0.30%)(c)(d) | | | 2.69 | % | | | 3/25/2035 | | | | 2,416,409 | |
| 3,218,588 | | | Series 2007-9 | | | 5.75 | % | | | 7/25/2037 | | | | 2,924,261 | |
| 2,636,115 | | | Series 2007-HYB1(d) | | | 3.26 | % | | | 3/25/2037 | | | | 2,461,241 | |
| | | | Credit Suisse First Boston Mortgage Securities Corp. | | | | | | | | | | | | |
| 1,941,854 | | | Series 2005-9 | | | 5.50 | % | | | 10/25/2035 | | | | 1,801,671 | |
| | | | Credit Suisse Mortgage Trust | | | | | | | | | | | | |
| 2,526,124 | | | Series 2006-7 | | | 6.75 | % | | | 8/25/2036 | | | | 2,245,260 | |
| 2,436,552 | | | Series 2007-1 | | | 6.00 | % | | | 2/25/2037 | | | | 2,160,977 | |
| 569,000 | | | Series 2017-PFHP
(1 Month LIBOR USD + 6.15%)(b)(d) | | | 8.22 | % | | | 12/15/2030 | | | | 559,196 | |
| | | | First Horizon Alternative Mortgage Securities Trust | | | | | | | | | | | | |
| 1,053,883 | | | Series 2005-AA8(d) | | | 3.40 | % | | | 10/25/2035 | | | | 975,545 | |
| | | | FREMF Mortgage Trust | | | | | | | | | | | | |
| 318,389 | | | Series 2016-KF22
(1 Month LIBOR USD + 5.05%)(b)(d) | | | 7.05 | % | | | 7/25/2023 | | | | 340,046 | |
| | | | GMAC Commercial Mortgage Securities Inc. | | | | | | | | | | | | |
| 500,000 | | | Series 2004-C3(b)(d) | | | 5.14 | % | | | 12/10/2041 | | | | 489,947 | |
See Notes to Financial Statements.
8 | (888) 848-7569 | www.rivernorth.com |
RiverNorth/DoubleLine Strategic Opportunity Fund, Inc. |
Schedule of Investments | June 30, 2018 |
| Principal Amount/Description | | Rate | | | Maturity | | | Value | |
| | | | Greenpoint Mortgage Securites Trust | | | | | | | | | |
| 4,669,303 | | | Series 2007-AR2
(1 Month LIBOR USD + 0.24%)(c)(d) | | | 2.33 | % | | | 4/25/2047 | | | $ | 4,340,204 | |
| | | | GS Mortgage Securities Trust | | | | | | | | | | | | |
| 500,000 | | | Series 2013-GC13(b)(d) | | | 4.08 | % | | | 7/10/2046 | | | | 459,233 | |
| 604,000 | | | Series 2014-GC26(b)(d) | | | 4.51 | % | | | 11/10/2047 | | | | 519,239 | |
| 500,000 | | | Series 2015-GC28(b)(d) | | | 4.47 | % | | | 2/12/2048 | | | | 400,463 | |
| | | | Harborview Mortgage Loan Trust | | | | | | | | | | | | |
| 2,047,978 | | | Series 2004-2
(1 Month LIBOR USD + 0.52%)(c)(d) | | | 2.60 | % | | | 6/19/2034 | | | | 2,020,872 | |
| | | | IndyMac INDX Mortgage Loan Trust | | | | | | | | | | | | |
| 1,784,563 | | | Series 04-AR4(d) | | | 3.98 | % | | | 8/25/2034 | | | | 1,766,932 | |
| 3,548,326 | | | Series 2007-FLX6
(1 Month LIBOR USD + 0.25%)(c)(d) | | | 2.34 | % | | | 9/25/2037 | | | | 3,411,171 | |
| | | | JP Morgan Chase Commercial Mortgage Securities Corp. | | | | | | | | | | | | |
| 499,000 | | | Series 2006-LDP9 | | | 5.34 | % | | | 5/15/2047 | | | | 497,690 | |
| 41,722 | | | Series 2007-LDPX(d) | | | 5.46 | % | | | 1/15/2049 | | | | 41,763 | |
| 199,201 | | | Series 2007-C1(d) | | | 6.11 | % | | | 2/15/2051 | | | | 198,815 | |
| 549,000 | | | Series 2015-JP1(b)(d) | | | 4.90 | % | | | 1/15/2049 | | | | 386,180 | |
| 500,000 | | | Series 2016-WIKI(b)(d) | | | 4.01 | % | | | 10/5/2031 | | | | 486,472 | |
| | | | JPMBB Commercial Mortgage Securities Trust | | | | | | | | | | | | |
| 9,475,000 | | | Series 2013-C14(b)(d)(e) | | | 1.12 | % | | | 8/17/2046 | | | | 427,441 | |
| 1,000,000 | | | Series 2013-C17(b)(d) | | | 3.87 | % | | | 1/17/2047 | | | | 750,654 | |
| 632,000 | | | Series 2015-C27(b)(d) | | | 3.98 | % | | | 2/18/2048 | | | | 557,855 | |
| | | | Luminent Mortgage Trust | | | | | | | | | | | | |
| 3,253,845 | | | Series 06-3-11A1
(1 Month LIBOR USD + 0.20%)(c)(d) | | | 2.29 | % | | | 5/25/2036 | | | | 3,190,879 | |
| 2,921,369 | | | Series 06-3-12A1
(1 Month LIBOR USD + 0.21%)(c)(d) | | | 2.30 | % | | | 5/25/2036 | | | | 2,763,155 | |
| | | | Morgan Stanley BAML Trust | | | | | | | | | | | | |
| 656,000 | | | Series 2015-C20(b) | | | 3.07 | % | | | 2/15/2048 | | | | 528,215 | |
| | | | New Century Home Equity Loan Trust | | | | | | | | | | | | |
| 3,020,701 | | | Series 2006-1-A2B
(1 Month LIBOR USD + 0.18%)(c)(d) | | | 2.27 | % | | | 5/25/2036 | | | | 2,839,857 | |
| | | | Nomura Asset Acceptance Corporation | | | | | | | | | | | | |
| 2,548,906 | | | Series 2005-AP3(c) | | | 5.19 | % | | | 8/25/2035 | | | | 1,732,763 | |
| | | | PR Mortgage Loan Trust | | | | | | | | | | | | |
| 2,790,887 | | | Series 2014-1(b)(d) | | | 5.91 | % | | | 10/25/2049 | | | | 2,785,109 | |
See Notes to Financial Statements.
Annual Report | June 30, 2018 | 9 |
RiverNorth/DoubleLine Strategic Opportunity Fund, Inc. |
Schedule of Investments | June 30, 2018 |
| Principal Amount/Description | | Rate | | | Maturity | | | Value | |
| | | | Residential Accredit Loans, Inc. | | | | | | | | | |
| 2,577,317 | | | Series 2007-QA5(d) | | | 5.81 | % | | | 9/25/2037 | | | $ | 2,362,638 | |
| 5,174,772 | | | Series 2006-QO5
(1 Month LIBOR USD + 0.19%)(c)(d) | | | 2.28 | % | | | 5/25/2046 | | | | 4,722,325 | |
| | | | Residential Asset Securitization Trust | | | | | | | | | | | | |
| 2,958,666 | | | Series 2005-A15 | | | 5.75 | % | | | 2/25/2036 | | | | 2,274,208 | |
| 2,934,271 | | | Series 2007-A5 | | | 6.00 | % | | | 5/25/2037 | | | | 2,579,349 | |
| | | | Residential Funding Mortgage Securities I Trust | | | | | | | | | | | | |
| 1,788,909 | | | Series 2005-SA2(d) | | | 4.15 | % | | | 6/25/2035 | | | | 1,590,956 | |
| 3,598,181 | | | Series 2006-S8 | | | 6.00 | % | | | 9/25/2036 | | | | 3,420,733 | |
| | | | RMAT | | | | | | | | | | | | |
| 1,473,491 | | | Series 2015-PR2(b)(c) | | | 8.85 | % | | | 11/25/2035 | | | | 1,419,447 | |
| | | | Structured Adjustable Rate Mortgage Loan Trust | | | | | | | | | | | | |
| 2,111,944 | | | Series 2005-22(d) | | | 3.75 | % | | | 12/25/2035 | | | | 2,032,338 | |
| 3,053,848 | | | Series 2007-8(d) | | | 3.90 | % | | | 9/25/2037 | | | | 3,364,234 | |
| | | | Structured Asset Mortgage Investments Inc. | | | | | | | | | | | | |
| 894,539 | | | Series 2005-AR7
(12 Month US Treasury Average + 1.05%)(d) | | | 2.61 | % | | | 3/25/2046 | | | | 933,007 | |
| | | | UBS-Barclays Commercial Mortgage Trust | | | | | | | | | | | | |
| 500,000 | | | Series 2013-C5(b)(d) | | | 4.08 | % | | | 3/10/2046 | | | | 378,575 | |
| | | | Wachovia Bank Commercial Mortgage Trust | | | | | | | | | | | | |
| 71,132 | | | Series 2006-C26(d) | | | 6.20 | % | | | 6/15/2045 | | | | 71,846 | |
| 246,883 | | | Series 2007-C30(d) | | | 5.41 | % | | | 12/15/2043 | | | | 248,925 | |
| | | | Washington Mutual Mortgage Pass-Through Certificates Trust | | | | | | | | | | | | |
| 2,158,766 | | | Series 2005-8 | | | 4.98 | % | | | 10/25/2035 | | | | 2,081,382 | |
| 2,060,704 | | | Series 2006-AR6(d) | | | 3.41 | % | | | 8/25/2036 | | | | 2,011,087 | |
| 2,586,652 | | | Series 2006-AR10(d) | | | 3.35 | % | | | 8/25/2046 | | | | 2,507,607 | |
| 1,762,306 | | | Series 2006-2 | | | 6.00 | % | | | 3/25/2036 | | | | 1,797,516 | |
| 2,474,980 | | | Series 2007-HY3(d) | | | 3.48 | % | | | 3/25/2037 | | | | 2,316,538 | |
| | | | Wells Fargo Mortgage Backed Securities | | | | | | | | | | | | |
| 2,501,709 | | | Series 2006-9 | | | 6.00 | % | | | 8/25/2036 | | | | 2,496,000 | |
| | | | | | | | | | | | | | | | |
TOTAL NON-AGENCY COLLATERALIZED MORTGAGE OBLIGATIONS | | | | | | | | | | | | |
(Cost $140,688,010) | | | | | | | | | | | 139,456,616 | |
See Notes to Financial Statements.
10 | (888) 848-7569 | www.rivernorth.com |
RiverNorth/DoubleLine Strategic Opportunity Fund, Inc. |
Schedule of Investments | June 30, 2018 |
| Principal Amount/Description | | Rate | | | Maturity | | | Value | |
U.S. GOVERNMENT/AGENCY MORTGAGE BACKED SECURITIES - 21.32%(a) | |
| | | | Federal Home Loan Mortgage Corporation | | | | | | | | | |
| 4,047,557 | | | Series 3770 | | | 4.00 | % | | | 12/15/2040 | | | $ | 4,176,645 | |
| 2,279,826 | | | Series 3806
(1 Month LIBOR USD + 6.45%)(e)(d)(f) | | | 4.38 | % | | | 12/15/2037 | | | | 61,365 | |
| 7,970,737 | | | Series 3966
(1 Month LIBOR USD + 5.90%)(e)(d)(f) | | | 3.83 | % | | | 12/15/2041 | | | | 944,068 | |
| 4,463,222 | | | Series 4605 | | | 3.00 | % | | | 8/15/2046 | | | | 3,851,798 | |
| 4,683,415 | | | Series 4657 | | | 3.00 | % | | | 2/15/2047 | | | | 4,156,395 | |
| 4,176,843 | | | Series 4686 | | | 4.00 | % | | | 3/15/2047 | | | | 4,380,466 | |
| | | | Federal National Mortgage Association | | | | | | | | | | | | |
| 6,183,619 | | | Series 2011-101
(1 Month LIBOR USD + 5.90%)(e)(d)(f) | | | 3.81 | % | | | 10/25/2041 | | | | 792,807 | |
| 5,549,562 | | | Series 2011-124
(1 Month LIBOR USD + 6.50%)(e)(d)(f) | | | 4.41 | % | | | 12/25/2041 | | | | 882,908 | |
| 6,400,619 | | | Series 2012-20
(1 Month LIBOR USD + 6.45%)(e)(d)(f) | | | 4.36 | % | | | 3/25/2042 | | | | 950,637 | |
| 4,096,227 | | | Series 2013-36 | | | 3.00 | % | | | 4/25/2043 | | | | 3,775,719 | |
| 6,000,000 | | | Series 2013-109(g) | | | 0.00 | % | | | 7/25/2043 | | | | 3,697,961 | |
| 2,818,320 | | | Series 2014-38 | | | 3.00 | % | | | 9/25/2043 | | | | 2,465,813 | |
| 6,169,418 | | | Series 2014-58 | | | 3.00 | % | | | 9/25/2044 | | | | 5,580,932 | |
| 4,035,600 | | | Series 2016-75 | | | 3.00 | % | | | 10/25/2046 | | | | 3,622,000 | |
| | | | Government National Mortgage Association | | | | | | | | | | | | |
| 20,139,425 | | | Series 2013-155(d)(e) | | | 0.23 | % | | | 9/16/2053 | | | | 471,810 | |
| 4,378,615 | | | Series 2017-17 | | | 3.50 | % | | | 2/20/2047 | | | | 4,220,509 | |
| | | | | | | | | | | | | | | | |
TOTAL U.S. GOVERNMENT/AGENCY MORTGAGE BACKED SECURITIES | | | | | | | | | | | | |
(Cost $45,751,181) | | | | | | | | | | | 44,031,833 | |
See Notes to Financial Statements.
Annual Report | June 30, 2018 | 11 |
RiverNorth/DoubleLine Strategic Opportunity Fund, Inc. |
Schedule of Investments | June 30, 2018 |
| Shares/Description | | Value | |
SHORT-TERM INVESTMENTS - 9.23%(a) |
| Money Market Fund | | | |
| 19,055,515 | | Fidelity Institutional Government Portfolio (7 Day Yield 1.77%)(h) | | $ | 19,055,515 | |
| | | | | | | |
| TOTAL SHORT-TERM INVESTMENTS | | | | |
| (Cost $19,055,515) | | | | 19,055,515 | |
| | | | | | | |
| TOTAL INVESTMENTS - 136.22% | | | | |
| (Cost $285,991,667) | | | 281,367,718 | |
| LIABILITIES IN EXCESS OF OTHER ASSETS (36.22)% | | | (74,806,945 | ) |
| NET ASSETS - 100.00% | | $ | 206,560,773 | |
(a) | All or a portion of the security has been pledged as collateral in connection with an open credit agreement. At June 30, 2018, the value of securities pledged amounted to $281,367,718, which represents approximately 136.22% of net assets. |
(b) | Security exempt from registration under Rule 144A of the Securities Act of 1933. These securities have been deemed liquid under procedures approved by the Fund’s Board of Directors and may normally be sold to qualified institutional buyers in transactions exempt from registration. Total fair value of Rule 144A securities amounts to $42,519,149 which represents approximately 20.58% of net assets as of June 30, 2018. |
(c) | Step-up bond; the interest rate shown is the rate in effect as of June 30, 2018. |
(d) | Variable rate investment. Interest rates reset periodically. Interest rate shown reflects the rate in effect at June 30, 2018. For securities based on a published reference rate and spread, the reference rate and spread are indicated in the description above. Certain variable rate securities are not based on a published reference rate and spread but are determined by the issuer or agent and are based on current market conditions. These securities do not indicate a reference rate and spread in their description above. |
(e) | Interest only security. |
(f) | Inverse floating rate security whose interest rate moves in the opposite direction of reference interest rates. Reference interest rates are typically based on a negative multiplier or slope. Interest rate may also be subject to a cap or floor. |
(g) | Denotes zero-coupon bonds. |
(h) | Seven-day yield as of June 30, 2018. |
See Notes to Financial Statements.
12 | (888) 848-7569 | www.rivernorth.com |
RiverNorth/DoubleLine Strategic Opportunity Fund, Inc. |
Statement of Assets and Liabilities | June 30, 2018 |
| ASSETS: | | | |
| Investment in securities: | | | |
| At cost | | $ | 285,991,667 | |
| At value | | $ | 281,367,718 | |
| Receivable for fund investments sold | | | 43,487 | |
| Interest receivable | | | 784,315 | |
| Dividends receivable | | | 354,718 | |
| Prepaid expenses and other assets | | | 20,154 | |
| Total Assets | | | 282,570,392 | |
| | | | | |
| LIABILITIES: | | | | |
| Payable for fund investments purchased | | | 2,000,000 | |
| Facility loan payable | | | 73,500,000 | |
| Interest payable on facility loan | | | 53,349 | |
| Payable for distributions | | | 74,083 | |
| Payable to Adviser | | | 230,545 | |
| Payable to Chief Compliance Officer | | | 2,583 | |
| Payable for fund accounting, administration and transfer agent fees | | | 97,574 | |
| Payable for audit fees | | | 30,893 | |
| Payable for custodian fees | | | 4,039 | |
| Other accrued expenses | | | 16,553 | |
| Total Liabilities | | | 76,009,619 | |
| Net Assets | | $ | 206,560,773 | |
| | | | | |
| NET ASSETS CONSIST OF: | | | | |
| Paid-in capital | | | 212,012,978 | |
| Accumulated net realized loss on investments | | | (828,256 | ) |
| Net unrealized depreciation on investments | | | (4,623,949 | ) |
| Net Assets | | $ | 206,560,773 | |
| | | | | |
| PRICING OF SHARES: | | | | |
| Shares of common stock outstanding (50,000,000 shares authorized, $0.0001 par value) | | | 11,013,787 | |
| Net Asset Value Per Share | | $ | 18.75 | |
See Notes to Financial Statements.
Annual Report | June 30, 2018 | 13 |
RiverNorth/DoubleLine Strategic Opportunity Fund, Inc. |
Statement of Operations | For the year ended June 30, 2018 |
| INVESTMENT INCOME: | | | |
| Interest income | | $ | 12,812,522 | |
| Dividend income | | | 4,619,751 | |
| Total Investment Income | | | 17,432,273 | |
| | | | | |
| EXPENSES: | | | | |
| Investment Adviser fee | | | 2,872,854 | |
| Interest expense on facility loan | | | 1,881,929 | |
| Fund accounting, administration and transfer agent fees | | | 590,623 | |
| Director expenses | | | 100,081 | |
| Legal expenses | | | 76,889 | |
| Printing expenses | | | 50,358 | |
| Compliance expenses | | | 44,223 | |
| Audit expenses | | | 39,992 | |
| Facility loan fees | | | 35,753 | |
| Registration expenses | | | 27,344 | |
| Custodian expenses | | | 23,301 | |
| Insurance fees | | | 6,667 | |
| Other expenses | | | 1,626 | |
| Total Expenses | | | 5,751,640 | |
| Net Investment Income | | | 11,680,633 | |
| | | | | |
| REALIZED AND UNREALIZED GAIN/(LOSS): | | | | |
| Net realized gain on: | | | | |
| Investments | | | 1,689,084 | |
| Distributions from other investment companies | | | 371 | |
| Net realized gain | | | 1,689,455 | |
| Net change in unrealized depreciation on: | | | | |
| Investments | | | (8,744,049 | ) |
| Net Realized and Unrealized Loss on Investments | | $ | (7,054,594 | ) |
| Net Increase in Net Assets Resulting from Operations | | $ | 4,626,039 | |
See Notes to Financial Statements.
14 | (888) 848-7569 | www.rivernorth.com |
RiverNorth/DoubleLine Strategic Opportunity Fund, Inc. |
Statements of Changes in Net Assets | |
| | | For the
Year Ended
June 30, 2018 | | | Period from
September 28, 2016(1)
through
June 30, 2017 | |
| NET INCREASE/(DECREASE) IN NET ASSETS FROM OPERATIONS: |
| Net investment income | | $ | 11,680,633 | | | $ | 8,675,404 | |
| Net realized gain on investments and long-term capital gains from other investment companies | | | 1,689,455 | | | | 2,655,454 | |
| Net change in unrealized appreciation/(depreciation) on investments | | | (8,744,049 | ) | | | 4,120,100 | |
| Net increase in net assets resulting from operations | | | 4,626,039 | | | | 15,450,958 | |
| | | | | | | | | |
| DISTRIBUTIONS TO SHAREHOLDERS: | | | | | | | | |
| From net investment income | | | (14,447,147 | ) | | | (10,132,666 | ) |
| From net realized gains on investments | | | (949,389 | ) | | | — | |
| From tax return of capital | | | (3,437,041 | ) | | | — | |
| Net decrease in net assets from distributions to shareholders | | | (18,833,577 | ) | | | (10,132,666 | ) |
| | | | | | | | | |
| CAPITAL SHARE TRANSACTIONS: | | | | | | | | |
| Proceeds from issuance of common shares, net of offering costs | | | — | | | | 215,346,768 | |
| Reinvestment of distributions | | | — | | | | 3,251 | |
| Net increase in net assets from capital share transactions | | | — | | | | 215,350,019 | |
| Net Increase/(Decrease) in Net Assets | | | (14,207,538 | ) | | | 220,668,311 | |
| | | | | | | | | |
| NET ASSETS: | | | | | | | | |
| Beginning of period | | | 220,768,311 | | | | 100,000 | |
| End of period (including accumulated undistributed net investment income of $0 and $284,143, respectively) | | $ | 206,560,773 | | | $ | 220,768,311 | |
| | | | | | | | | |
| SHARE TRANSACTIONS: | | | | | | | | |
| Shares sold | | | — | | | | 11,008,519 | |
| Shares issued in reinvestment of distributions | | | — | | | | 166 | |
| Beginning of period | | | 11,013,787 | | | | 5,102 | |
| End of period | | | 11,013,787 | | | | 11,013,787 | |
(1) | Commencement of operations. |
See Notes to Financial Statements.
Annual Report | June 30, 2018 | 15 |
RiverNorth/DoubleLine Strategic Opportunity Fund, Inc. |
Statement of Cash Flows | For the year ended June 30, 2018 |
| CASH FLOWS PROVIDED BY OPERATING ACTIVITIES |
| Net increase in net assets resulting from operations | | $ | 4,626,039 | |
| Adjustments to reconcile the change in net assets from operations to net cash provided by operating activities: | | | | |
| Purchases of long term investments | | | (61,271,408 | ) |
| Proceeds from sale of long term investments | | | 65,959,050 | |
| Net purchases of short-term investments | | | 1,575,265 | |
| Net accretion of premiums/discounts | | | (3,414,523 | ) |
| Net realized gain on investments | | | (1,689,084 | ) |
| Net realized gain on distributions from other investment companies | | | (371 | ) |
| Net change in unrealized depreciation on investments | | | 8,744,049 | |
| Return of capital from other investment companies | | | 296,970 | |
| Net realized paydown gain | | | (1,593,272 | ) |
| Interest-only bond amortization | | | 1,503,874 | |
| (Increase) and decrease in: | | | | |
| Interest and dividends receivable | | | (118,476 | ) |
| Prepaid expenses and other assets | | | 33,161 | |
| Receivable for fund investments sold | | | 269,396 | |
| Increase and (decrease) in: | | | | |
| Payable for investments purchased | | | 2,000,000 | |
| Payable to Adviser | | | (11,206 | ) |
| Compliance expenses | | | 2,583 | |
| Interest payable on facility loan | | | (119,440 | ) |
| Other accrued expenses | | | (71 | ) |
| Payable for fund accounting, administration and transfer agent fees | | | (862 | ) |
| Payable for custodian fees | | | 233 | |
| Other accrued expenses | | | 8,992 | |
| Net cash provided by operating activities | | | 16,800,899 | |
| | | | | |
| CASH FLOWS USED IN FINANCING ACTIVITIES | | | | |
| Advances from credit facility | | | 2,000,000 | |
| Cash dividends paid to common stockholders | | | (18,800,899 | ) |
| Net cash used in financing activities | | | (16,800,899 | ) |
| | | | | |
| NET CHANGE IN CASH | | | — | |
| Cash at beginning of year | | | — | |
| Cash at end of year | | $ | — | |
| | | | | |
| SUPPLEMENTAL DISCLOSURE OF CASH FLOW AND NON-CASH INFORMATION |
| Payable for distributions | | $ | 74,083 | |
| Cash paid for interest on facility loan | | | 1,906,101 | |
See Notes to Financial Statements.
16 | (888) 848-7569 | www.rivernorth.com |
RiverNorth/DoubleLine Strategic Opportunity Fund, Inc. |
Financial Highlights | |
| | | For the
Year Ended
June 30, 2018 | | | For the
Period from
September 28, 2016(a)
through
June 30, 2017 | |
| Net asset value - beginning of period | | $ | 20.04 | | | $ | 19.60 | |
| Income from investment operations: | | | | | | | | |
Net investment income(b) | | | 1.06 | | | | 0.94 | |
| Net realized and unrealized gain on investments | | | (0.64 | ) | | | 0.46 | |
| Total income from investment operations | | | 0.42 | | | | 1.40 | |
| | | | | | | | | |
| Less distributions: | | | | | | | | |
| From net investment income | | | (1.31 | ) | | | (0.92 | ) |
| From net realized gain on investments | | | (0.09 | ) | | | — | |
| From tax return of capital | | | (0.31 | ) | | | — | |
| Total distributions | | | (1.71 | ) | | | (0.92 | ) |
| Offering costs on issuance of common stock | | | — | | | | (0.04 | ) |
| Net increase/(decrease) in net asset value | | | (1.29 | ) | | | 0.44 | |
| Net asset value - end of period | | $ | 18.75 | | | | 20.04 | |
| Per common share market value - end of period | | $ | 17.69 | | | | 19.54 | |
| | | | | | | | | |
Total return based on net asset value(c) | | | 2.12 | % | | | 7.10 | %(d) |
| | | | | | | | | |
Total return based on market value(c) | | | (0.65 | )% | | | 2.50 | %(d) |
| | | | | | | | | |
| Ratios/Supplemental Data: | | | | | | | | |
| Net assets, end of period (in thousands) | | $ | 206,561 | | | $ | 220,768 | |
Ratio of expenses to average net assets(e)(f) | | | 2.67 | % | | | 2.14 | %(g) |
Ratio of net investment income to average net assets(b) | | | 5.42 | % | | | 5.28 | %(g) |
| Portfolio turnover rate | | | 23 | % | | | 35 | %(d) |
| Facility loan payable (in thousands) | | $ | 73,500 | | | $ | 71,500 | |
Asset coverage per $1,000 of facility loan payable(h) | | $ | 3,811 | | | $ | 4,090 | |
(a) | Commencement of operations. |
(b) | Recognition of net investment income by the Fund is affected by the timing of the declarations of dividends by the underlying funds in which the Fund invests. The ratio does include net investment income of the closed-end funds in which the Fund invests. |
(c) | Total return in the above table represents the rate that the investor would have earned or lost on an investment in the Fund, assuming reinvestment of dividends. The net asset value and market price returns will differ depending upon the level of any discount from or premium to net asset value at which the Fund’s shares traded during the period. Total return based on market value does not reflect sales load. |
(e) | Includes interest expenses of 0.87% for the year ended June 30, 2018 and 0.46%(d) for the period from September 28, 2016 (commencement of operations) through June 30, 2017. |
(f) | Does not include expenses of the closed-end funds in which the Fund invests. |
(h) | Calculated by subtracting the Fund’s total liabilities (excluding the facility loan and accumulated unpaid interest on facility loan) from the Fund’s total assets and dividing by the outstanding facility loan balance. |
See Notes to Financial Statements.
Annual Report | June 30, 2018 | 17 |
RiverNorth/DoubleLine Strategic Opportunity Fund, Inc. |
Notes To Financial Statements | June 30, 2018 |
1. ORGANIZATION
RiverNorth/DoubleLine Strategic Opportunity Fund, Inc. (the “Fund”) is a closed end management investment company that was organized as a Maryland corporation on June 22, 2016, and commenced investment operations on September 28, 2016. The investment adviser to the Fund is RiverNorth Capital Management, LLC (the “Adviser”). The Fund’s sub-adviser is DoubleLine Capital, LP (“Sub-Adviser”). The Fund is a diversified investment company with an investment objective to seek current income and overall total return.
The Fund seeks to achieve its investment objective by allocating its Managed Assets among two principal strategies; under normal market conditions, the Fund may allocate between 10% and 35% of its Managed Assets to the Tactical Closed-End Fund Income Strategy and 65% to 90% of its Managed Assets to the Opportunistic Income Strategy. The Adviser will determine the portion of the Fund’s Managed Assets to allocate to each strategy and may, from time to time, adjust the allocations.
2. SIGNIFICANT ACCOUNTING POLICIES
The following is a summary of significant accounting policies followed by the Fund. These policies are in conformity with accounting principles generally accepted in the United States of America (“GAAP”). The preparation of financial statements in accordance with GAAP requires management to make estimates and assumptions that affect the reported amounts and disclosures in the financial statements during the reporting period. Management believes the estimates and security valuations are appropriate; however, actual results may differ from those estimates, and the security valuations reflected in the financial statements may differ from the value the Fund ultimately realizes upon sale of the securities. The Fund is considered an investment company for financial reporting purposes under GAAP and follows the accounting and reporting guidance applicable to investment companies as codified in Accounting Standards Codification (“ASC”) 946 – Investment Companies.
Security Valuation: The Fund’s assets and other financial instruments are generally valued at their market value using market quotations. If a market quotation is unavailable, a security may be valued at its estimated fair value as described in Note 3.
Security Transactions and Related Income: The Fund follows industry practice and records security transactions on the trade date basis. The specific identification cost basis method is used for determining gains or losses for financial statements and income tax purposes. Dividend income is recorded on the ex-dividend date or for certain foreign securities, when the information becomes available to the Fund and interest income and expenses are recorded on an accrual basis. Discounts and premiums on securities purchased are amortized or accreted using the effective interest method. Paydown gains and losses on mortgage-related and other asset-backed securities are recorded as components of interest income on the Statement of Operations.
Other: The Fund holds certain investments which pay dividends to their shareholders based upon available funds from operations. It is possible for these dividends to exceed the underlying investments’ taxable earnings and profits resulting in the excess portion of such dividends being designated as a return of capital. Distributions received from investments in securities that represent a return of capital or long-term capital gains are recorded as a reduction of the cost of investments or as a realized gain, respectively.
18 | (888) 848-7569 | www.rivernorth.com |
RiverNorth/DoubleLine Strategic Opportunity Fund, Inc. |
Notes To Financial Statements | June 30, 2018 |
Share Valuation: The net asset value (the “NAV”) is generally calculated as of the close of trading on the New York Stock Exchange (“the Exchange”) (normally 4:00 p.m. Eastern time) every day the Exchange is open. The NAV is calculated by dividing the value of all of the securities and other assets of the Fund, less the liabilities (including accrued expenses and indebtedness), by the total number of common shares outstanding.
Federal Income Taxes: The Fund has been treated as, and intends to qualify each year for special tax treatment afforded to, a regulated investment company (“RIC”) under Subchapter M of the Internal Revenue Code (“IRC”). In order to qualify as a RIC, the Fund must, among other things, satisfy income, asset diversification and distribution requirements. As long as it so qualifies, the Fund will not be subject to U.S. federal income tax to the extent that it distributes annually its investment company taxable income and its “net capital gain”. If the Fund retains any investment company taxable income or net capital gain, it will be subject to U.S. federal income tax on the retained amount at regular corporate tax rates. In addition, if the Fund fails to qualify as a RIC for any taxable year, it will be subject to U.S. federal income tax on all of its income and gains at regular corporate tax rates.
Distributions to Shareholders: Distributions to shareholders, which are determined in accordance with income tax regulations, are recorded on the ex-dividend date. The treatment for financial reporting purposes of distributions made to shareholders during the year from net investment income or net realized capital gains may differ from their ultimate treatment for federal income tax purposes. These differences are caused primarily by differences in the timing of recognition of certain components of income, expense, or realized capital gain for federal income tax purposes. Where such differences are permanent in nature, they are reclassified in the components of the net assets based on their ultimate characterization for federal income tax purposes. Any such reclassification will have no effect on net assets, results of operations, or net asset values per share of the Fund.
The Fund maintains a level distribution policy. The Fund distributes to shareholders regular monthly cash distributions of its net investment income. In addition, the Fund distributes its net realized capital gains, if any, at least annually.
At times, to maintain a stable level of distributions, the Fund may pay out less than all of its net investment income or pay out accumulated undistributed income, or return capital, in addition to current net investment income. Any distribution that is treated as a return of capital generally will reduce a shareholder’s basis in his or her shares, which may increase the capital gain or reduce the capital loss realized upon the sale of such shares. Any amounts received in excess of a shareholder’s basis are generally treated as capital gain, assuming the shares are held as capital assets.
The Board of Directors (“Board”) approved the adoption of a managed distribution plan in accordance with Section 19(b) exemptive order whereby the Fund makes monthly distributions to common shareholders set at a fixed monthly rate of $0.15 per common share. For the period from July 2017 through September 2017, the Fund made regular monthly distributions of $0.12 per share.
The amount of the Fund’s distributions pursuant to the managed distribution plan are not related to the Fund’s performance and, therefore, investors should not make any conclusions about the Fund’s investment performance from the amount of the Fund’s distributions or from the terms of the Fund’s managed distribution plan. The Board may amend, suspend or terminate the managed distribution plan at any time without notice to shareholders.
Annual Report | June 30, 2018 | 19 |
RiverNorth/DoubleLine Strategic Opportunity Fund, Inc. |
Notes To Financial Statements | June 30, 2018 |
3. SECURITIES VALUATION AND FAIR VALUE MEASUREMENTS
Fair value is defined as the price that a fund might reasonably expect to receive upon selling an investment in a timely transaction to an independent buyer in the principal or most advantageous market of the investment. GAAP establishes a three-tier hierarchy to maximize the use of observable market data and minimize the use of unobservable inputs and to establish classification of fair value measurements for disclosure purposes.
Inputs refer broadly to the assumptions that market participants would use in pricing the asset or liability. This includes assumptions about risk, such as the risk inherent in a particular valuation technique used to measure fair value including using such a pricing model and/or the risk inherent in the inputs to the valuation technique. Inputs may be observable or unobservable. Observable inputs are inputs that reflect the assumptions market participants would use in pricing the asset or liability developed based on market data obtained from sources independent of the reporting entity. Unobservable inputs are inputs that reflect the reporting entity’s own assumptions about the assumptions market participants would use in pricing the asset or liability developed based on the best information available in the circumstances.
Various inputs are used in determining the value of the Fund’s investments. These inputs are summarized in the three broad levels listed below.
| | ● | Level 1 – Unadjusted quoted prices in active markets for identical, unrestricted assets or liabilities that the Fund has the ability to access at the measurement date; |
| | ● | Level 2 – Quoted prices which are not active, quoted prices for similar assets or liabilities in active markets or inputs other than quoted prices that are observable (either directly or indirectly) for substantially the full term of the asset or liability; and |
| | ● | Level 3 – Significant unobservable prices or inputs (including the Fund’s own assumptions in determining the fair value of investments) where there is little or no market activity for the asset or liability at the measurement date. |
The inputs used to measure fair value may fall into different levels of the fair value hierarchy. In such cases, for disclosure purposes, the level in the fair value hierarchy within which the fair value measurement falls in its entirety, is determined based on the lowest level input that is significant to the fair value measurement in its entirety.
Equity securities, including closed-end funds and business development company notes, are generally valued by using market quotations, but may be valued on the basis of prices furnished by a pricing service when the Adviser or Sub-Adviser believes such prices more accurately reflect the fair market value of such securities. Securities that are traded on any stock exchange are generally valued by the pricing service at the last quoted sale price. Lacking a last sale price, an exchange traded security is generally valued by the pricing service at its mean price. Securities traded in the NASDAQ over-the-counter market are generally valued by the pricing service at the NASDAQ Official Closing Price.
Investments in mutual funds, including money market mutual funds, are generally priced at the ending net asset value (NAV) provided by the service agent of the funds. These securities will be categorized as Level 1 securities.
20 | (888) 848-7569 | www.rivernorth.com |
RiverNorth/DoubleLine Strategic Opportunity Fund, Inc. |
Notes To Financial Statements | June 30, 2018 |
Fair values for long-term debt securities, including asset-backed obligations, non-agency collateralized mortgage obligations, and U.S. government/agency mortgage-backed securities are normally determined on the basis of the mean valuations provided by independent pricing services. Vendors typically value such securities based on one or more inputs, including but not limited to benchmark yields, transactions, bids, offers, quotations from dealers and trading systems, new issues, spreads and other relationships observed in the markets among comparable securities, and pricing models such as yield measurers calculated using factors such as cash flows, financial or collateral performance and other reference data. In addition to these inputs, mortgage-backed and asset-backed obligations may utilize cash flows, prepayment information, default rates, delinquency and loss assumptions, collateral characteristics, credit enhancements, and specific deal information. Securities that use similar valuation techniques and inputs are categorized as Level 2 of the fair value hierarchy. To the extent the significant inputs are unobservable, the values generally would be categorized as Level 3.
Short-term investments in fixed income securities, excluding money market funds with maturities of less than 60 days when acquired, or which subsequently are within 60 days of maturity, are valued by using the amortized cost method of valuation, which the Board has determined will represent fair value. These securities will be classified as Level 2 securities.
In accordance with the Fund’s good faith pricing guidelines, the Adviser, Sub-Adviser, or Valuation Committee is required to consider all appropriate factors relevant to the value of securities for which it has determined other pricing sources are not available or reliable as described above. No single standard exists for determining fair value, because fair value depends upon the circumstances of each individual case. As a general principle, the current fair value of an issue of securities being valued by the Adviser, Sub-Adviser, or Valuation Committee would appear to be the amount which the owner might reasonably expect to receive for them upon their current sale. Methods which are in accordance with this principle may, for example, be based on (i) a multiple of earnings; (ii) a discount from market of a similar freely traded security (including a derivative security or a basket of securities traded on other markets, exchanges or among dealers); or (iii) yield to maturity with respect to debt issues, or a combination of these and other methods. Good faith pricing is permitted if, in the Adviser’s, Sub-Adviser’s, or the Valuation Committee’s opinion, the validity of market quotations appears to be questionable based on factors such as evidence of a thin market in the security based on a small number of quotations, a significant event occurs after the close of a market but before the Fund’s NAV calculation that may affect a security’s value, or the Adviser, Sub-Adviser or Valuation Committee is aware of any other data that calls into question the reliability of market quotations.
Good faith pricing may also be used in instances when the bonds the Fund invests in default or otherwise cease to have market quotations readily available. Investments in foreign securities, junk bonds or other thinly traded securities are more likely to trigger good faith pricing than other securities.
Annual Report | June 30, 2018 | 21 |
RiverNorth/DoubleLine Strategic Opportunity Fund, Inc. |
Notes To Financial Statements | June 30, 2018 |
The following is a summary of the inputs used at June 30, 2018 involving the Fund’s assets:
| | | Valuation Inputs | | | | |
| Investments in Securities at Value* | | Level 1 –
Quoted Prices | | | Level 2 –
Other
Significant
Observable
Inputs | | | Level 3 –
Significant
Unobservable
Inputs | | | Total | |
| Asset Backed Obligations | | $ | — | | | $ | 11,819,472 | | | $ | — | | | $ | 11,819,472 | |
| Business Development Company Notes | | | 11,568,646 | | | | 4,586,471 | | | | — | | | | 16,155,117 | |
| Closed-End Funds | | | 44,859,564 | | | | — | | | | — | | | | 44,859,564 | |
| Collateralized Loan Obligations | | | — | | | | 5,989,601 | | | | — | | | | 5,989,601 | |
| Non-Agency Collateralized Mortgage Obligations | | | — | | | | 139,456,616 | | | | — | | | | 139,456,616 | |
| U.S. Government/Agency Mortgage Backed Securities | | | — | | | | 44,031,833 | | | | — | | | | 44,031,833 | |
| Short-Term Investments | | | 19,055,515 | | | | — | | | | — | | | | 19,055,515 | |
| Total | | $ | 75,483,725 | | | $ | 205,883,993 | | | $ | — | | | $ | 281,367,718 | |
* | Refer to the Fund’s Schedule of Investments for a listing of securities by type. |
The Fund recognizes transfers between levels as of the end of the year. For the year ended June 30, 2018, the Fund had transfers between Level 1 and Level 2 securities. Based on end of period market values, $496,565 was transferred from Level 1 to Level 2 due to use of an evaluated mean pricing method.
| | | Level 1 - Quoted Prices | | | Level 2 - Other Significant
Observable Inputs | |
| | | Transfers In | | | Transfers (Out) | | | Transfers In | | | Transfers (Out) | |
| Business Development Company Notes | | $ | — | | | $ | (496,565 | ) | | $ | 496,565 | | | $ | — | |
| Total | | $ | — | | | $ | (496,565 | ) | | $ | 496,565 | | | $ | — | |
4. INVESTMENT ADVISORY FEE AND OTHER TRANSACTIONS WITH AFFILIATES
The Adviser serves as the investment adviser to the Fund. Under the terms of the management agreement (the “Agreement”), the Adviser, subject to the supervision of the Board, provides or arranges to be provided to the Fund such investment advice as it deems advisable and will furnish or arrange to be furnished a continuous investment program for the Fund consistent with the Fund’s investment objectives and policies. As compensation for its management services, the Fund is obligated to pay the Adviser a fee computed and accrued daily and paid monthly in arrears at an annual rate of 1.00% of the average daily managed assets of the Fund. Managed assets are defined as the total assets of the Fund, including assets attributable to leverage, minus liabilities.
22 | (888) 848-7569 | www.rivernorth.com |
RiverNorth/DoubleLine Strategic Opportunity Fund, Inc. |
Notes To Financial Statements | June 30, 2018 |
DoubleLine Capital, LP is the investment sub-adviser to the Fund. Under the terms of the sub-advisory agreement, the Sub-Adviser, subject to the supervision of the Adviser and the Board, provides or arranges to be provided to the Fund such investment advice as deemed advisable and will furnish or arrange to be furnished a continuous investment program for the portion of assets managed in the Fund consistent with the Fund’s investment objective and policies. As compensation for its sub-advisory services, the Adviser is obligated to pay the Sub-Adviser a fee computed and accrued daily and paid monthly in arrears based on an annual rate of 0.50% of the average daily managed assets of the Fund.
U.S. Bancorp Fund Services, LLC (“USBFS”) provides the Fund with fund administration and fund accounting services. USBFS also serves as transfer, dividend paying and shareholder servicing agent for the Fund (“Transfer Agent”). As compensation for its services to the Fund, USBFS receives an annual fee based on the Fund’s average daily managed assets, subject to certain minimums.
Officers of the Fund and Directors who are “interested persons” of the Fund or the Adviser receive no salary or fees from the Fund, except the Chief Compliance Officer. Each Director who is not an “interested person” receive a fee of $16,500 per year plus $1,500 per meeting attended. In addition, the lead Independent Director receives $250 annually, the Chair of the Audit Committee receives $500 annually, and the Chair of the Nominating and Corporate Governance Committee receives $250 annually. The Fund reimburses each Director and Officer for his or her travel and other expenses relating to the attendance at such meetings. Certain officers and/or interested directors of the Fund are also officers of the Adviser.
The Adviser provides a Chief Compliance Officer to the Fund. For the year ended June 30, 2018, the Fund incurred expenses of $44,200 for these services. In addition, the Fund owed the Adviser $2,583 as of June 30, 2018.
5. FEDERAL INCOME TAXES
It is the Fund’s policy to meet the requirements of the Internal Revenue Code applicable to regulated investment companies, and to distribute all of their taxable net income to their shareholders. In addition, the Fund intends to pay distributions as required to avoid imposition of excise tax. Therefore, no federal income tax provision is required.
Tax Basis of Distributions to Shareholders: The character of distributions made during the year from net investment income or net realized gains may differ from its ultimate characterization for federal income tax purposes. Also, due to the timing of dividend distributions, the fiscal year in which amounts are distributed may differ from the fiscal year in which the income or realized gain were recorded by the Fund.
The tax character of distributions paid by the Fund during the fiscal years ended June 30, 2017 and June 30, 2018, were as follows:
| Fiscal Year Ended | | | Ordinary
Income | | | Net Long Term
Capital Gains | | | Return of
Capital | | | Total | |
June 30, 2017 | | | $ | 10,132,666 | | | $ | — | | | $ | — | | | $ | 10,132,666 | |
June 30, 2018 | | | | 15,389,348 | | | | 7,188 | | | | 3,437,041 | | | | 18,833,577 | |
Annual Report | June 30, 2018 | 23 |
RiverNorth/DoubleLine Strategic Opportunity Fund, Inc. |
Notes To Financial Statements | June 30, 2018 |
Components of Distributable Earnings on a Tax Basis: The tax components of distributable earnings are determined in accordance with income tax regulations which may differ from the composition of net assets reported under GAAP. Accordingly, for the year ended June 30, 2018, certain differences were reclassified. These differences were primarily due to book/tax distribution differences and to the different tax treatment of certain other investments; the amounts reclassified did not affect net assets. The reclassifications were as follows:
Paid-in Capital | Accumulated Net
Investment Income/(Loss) | Accumulated Net
Realized Gain/(Loss) |
$— | $2,482,371 | $(2,482,371) |
At June 30, 2018, the components of distributable earnings on a tax basis for the Fund was as follows:
Undistributed
Ordinary Income | Undistributed
Long Term
Gain/(Loss) | Net Unrealized
Appreciation/
(Depreciation) | Other Accumulated
Gain/(Loss) | Total |
$— | $— | $(4,646,180) | $(806,025) | $(5,452,205) |
Unrealized Appreciation and Depreciation on Investments: As of June 30, 2018, net unrealized appreciation (depreciation) of investments based on federal tax costs was as follows:
Gross Appreciation
(excess of value over tax) | Gross Depreciation
(excess of tax cost
over value) | Net Unrealized
Appreciation/
(Depreciation) | Cost of Investments for
Income Tax Purposes |
$3,765,857 | $8,412,037 | $(4,646,180) | $286,013,898 |
The difference between book and tax basis unrealized appreciation/(depreciation) for the Fund is attributable to wash sales.
The Fund recognizes the tax benefits of uncertain tax positions only where the position is “more likely than not” to be sustained assuming examination by tax authorities. Management has analyzed the Fund’s tax positions, and has concluded that no liability for unrecognized tax benefits should be recorded related to uncertain tax positions taken on U.S. tax returns and state tax returns filed since inception of the Fund. No income tax returns are currently under examination. All tax years since commencement of operations remain subject to examination by the tax authorities in the United States. The Fund is not aware of any tax positions for which it is reasonably possible that the total amounts of unrecognized tax benefits will change materially in the next 12 months.
Capital Losses: As of June 30, 2018, the Fund had capital loss carryforwards which may reduce the Fund’s taxable income arising from future net realized gains on investments, if any, to the extent permitted by the Internal Revenue Code and thus may reduce the amount of the distributions to
24 | (888) 848-7569 | www.rivernorth.com |
RiverNorth/DoubleLine Strategic Opportunity Fund, Inc. |
Notes To Financial Statements | June 30, 2018 |
shareholders which would otherwise be necessary to relieve the Fund of any liability for federal tax pursuant to the Internal Revenue Code. The capital loss carryforwards may be carried forward indefinitely. Capital losses carried forward for the year ended June 30, 2018, were as follows:
Non-Expiring Short-Term | Non-Expiring Long –Term |
$— | $806,025 |
6. INVESTMENT TRANSACTIONS
Investment transactions for the year ended June 30, 2018, excluding short-term investments, were as follows:
Purchases of Securities | Proceeds from Sales of Securities |
$61,271,408 | $65,959,050 |
7. REVOLVING CREDIT FACILITY
The Fund may borrow money and/or issue preferred stock, notes or debt securities for investment purposes. These practices are known as leveraging. The Fund may use leverage through borrowings or the issuance of preferred stock, in an aggregate amount of up to 33 1/3% of the Fund’s Total Assets immediately after such borrowings or issuance.
On December 16, 2016, the Fund entered into a $75,000,000 secured, revolving, evergreen credit facility with U.S. Bank National Association (“U.S. Bank”). The Fund incurred a $75,000 administrative fee upon entering into the credit facility. The credit facility has a variable annual interest rate equal to one-month LIBOR plus 0.95 percent. The credit facility will accrue a commitment fee equal to an annual rate of 0.10 percent on $75,000,000.
The average principal balance and interest rate for the year during which the credit facility was utilized from July 1, 2017 through June 30, 2018 was approximately $71,700,000 and 2.49 percent, respectively. At June 30, 2018, the principal balance outstanding was $73,500,000 at an interest rate of 3.08 percent. For the year ended June 30, 2018, the Fund reached its maximum amount outstanding of $73,500,000 on May 30, 2018. Securities that have been pledged as collateral for the borrowings are indicated in the Schedule of Investments.
8. INDEMNIFICATIONS
Under the Fund’s organizational documents, its officers and Directors are indemnified against certain liability arising out of the performance of their duties to the Fund. Additionally, in the normal course of business, the Fund enters into contracts with service providers that may contain general indemnification clauses. The Fund’s maximum exposure under these arrangements is unknown, as this would involve future claims that may be made against the Fund that have not yet occurred.
Annual Report | June 30, 2018 | 25 |
RiverNorth/DoubleLine Strategic Opportunity Fund, Inc. |
Notes To Financial Statements | June 30, 2018 |
9. CAPITAL SHARE TRANSACTIONS
The Fund’s authorized capital stock consists of 50,000,000 shares of common stock, $0.0001 par value per share, all of which is initially classified as common shares. Under the rules of the NYSE applicable to listed companies, the Fund is required to hold an annual meeting of stockholders in each year.
On September 28, 2016, the Fund completed the initial public offering of 10,500,000 shares of common stock. These common shares were issued at $20.00 per share before the underwriting discount of $0.40 per share. Proceeds paid to the Fund amounted to $205,800,000 after the deduction of underwriting commissions of $4,200,000.
On November 16, 2016, the Fund completed a subsequent offering in connection with the underwriter’s over-allotment option of 508,519 shares of common stock. These common shares were issued at $20.00 per share before the underwriting discount of $0.40 per share. Proceeds paid to the Fund amounted to $9,966,972 after the deduction of underwriting commissions of $203,400.
Offering costs of $420,204 (representing approximately $0.04 per share) were offset against the proceeds of the offering and over-allotment option and have been charged to paid-in capital in excess of par.
10. SUBSEQUENT EVENTS
On July 31, 2018, the Fund paid a distribution in the amount of $0.15 per share, for a total of $1,652,068.
The Fund has performed an evaluation of subsequent events through the date the financial statements were issued and has determined that no additional items require recognition or disclosure.
26 | (888) 848-7569 | www.rivernorth.com |
RiverNorth/DoubleLine Strategic Opportunity Fund, Inc. |
Report of Independent Registered Public Accounting Firm | June 30, 2018 |
To the Shareholders and Board of Directors of
RiverNorth/DoubleLine Strategic Opportunity Fund, Inc.
Opinion on the Financial Statements
We have audited the accompanying statement of assets and liabilities, including the schedule of investments, of RiverNorth/DoubleLine Strategic Opportunity Fund, Inc. (the “Fund”) as of June 30, 2018, and the related statements of operations and cash flows for the year then ended, and the statements of changes in net assets and the financial highlights for each of the two periods in the period then ended, including the related notes (collectively referred to as the “financial statements”). In our opinion, the financial statements present fairly, in all material respects, the financial position of the Fund as of June 30, 2018, the results of its operations and its cash flows for the year then ended and the changes in its net assets and the financial highlights for each of the two periods in the period then ended, in conformity with accounting principles generally accepted in the United States of America.
Basis for Opinion
These financial statements are the responsibility of the Fund’s management. Our responsibility is to express an opinion on the Fund’s financial statements based on our audits. We are a public accounting firm registered with the Public Company Accounting Oversight Board (United States) (“PCAOB”) and are required to be independent with respect to the Fund in accordance with the U.S. federal securities laws and the applicable rules and regulations of the Securities and Exchange Commission and the PCAOB.
We conducted our audits in accordance with the standards of the PCAOB. Those standards require that we plan and perform the audit to obtain reasonable assurance about whether the financial statements are free of material misstatement, whether due to error or fraud.
Our audits include performing procedures to assess the risks of material misstatement of the financial statements, whether due to error or fraud, and performing procedures that respond to those risks. Such procedures include examining, on a test basis, evidence regarding the amounts and disclosures in the financial statements and confirmation of securities owned as of June 30, 2018, by correspondence with the custodian and brokers. Our audits also included evaluating the accounting principles used and significant estimates made by management, as well as evaluating the overall presentation of the financial statements. We believe that our audits provide a reasonable basis for our opinion.
We have served as the auditor of one or more of RiverNorth Capital Management, LLC’s investment companies since 2006.
COHEN & COMPANY, LTD.
Cleveland, Ohio
August 29, 2018
Annual Report | June 30, 2018 | 27 |
RiverNorth/DoubleLine Strategic Opportunity Fund, Inc. |
Additional Information | June 30, 2018 (Unaudited) |
PROXY VOTING POLICY
The Board of Directors of the Fund has delegated the voting of proxies for Fund securities to the Adviser pursuant to the Adviser’s proxy voting policies and procedures. Under these policies and procedures, the Adviser will vote proxies related to Fund securities in the best interest of the Fund and its shareholders.
A description of the Fund’s proxy voting policies and procedures is available (1) without charge, upon request, by calling 888-848-7569, (2) on the Fund’s website at http://rivernorth.com/closed-end-funds/opp, or (3) on the SEC’s website at http://sec.gov. Information regarding how the Fund voted proxies relating to portfolio securities during the period ended June 30th is available on the SEC’s website at http://sec.gov.
PORTFOLIO HOLDINGS DISCLOSURE POLICY
The Fund files a complete schedule of investments with the SEC for the first and third quarter of each fiscal year on Form N-Q. The Fund’s first and third quarters end on March 31 and September 30. The Form N-Q filing must be made within 60 days of the end of the quarter. The Fund’s Form N-Qs are available on the SEC’s website at www.sec.gov, or they may be reviewed and copied at the SEC’s Public Reference Room in Washington, DC (call 1-800-732-0330 for information on the operations of the Public Reference Room). You may also obtain copies by calling the Fund at 1-888-848-7569.
CERTIFICATIONS
The Fund’s President submitted to the New York Stock Exchange the initial CEO/CFO certification as required by Section 303A.12(a) of the NYSE listed Fund Manual.
TAX INFORMATION
Of the distributions paid by the Fund from ordinary income for the year ended June 30, 2018, the following percentages met the requirements to be treated as qualifying for the corporate dividends received deduction and qualified dividend income:
Dividends Received Deduction | Qualified Dividend Income |
8.29% | 7.97% |
In addition, the Fund designated 67.39% of its taxable ordinary income distributions as interest related dividends under Internal Revenue Code §871(k)(1)(C), and 6.01% of its taxable ordinary income distributions as short-term capital gain distributions under Internal Revenue Code §871(k)(2)(C).
DIVIDEND REINVESTMENT PLAN
The Fund has a dividend reinvestment plan (the “Plan”) commonly referred to as an “opt out” plan. Each Common Shareholder who participates in the Plan will have all distributions of dividends and capital gains automatically reinvested in additional Common Shares. The automatic reinvestment of dividends and distributions in Common Shares will not relieve participants of any federal, state or
28 | (888) 848-7569 | www.rivernorth.com |
RiverNorth/DoubleLine Strategic Opportunity Fund, Inc. |
Additional Information | June 30, 2018 (Unaudited) |
local income tax that may be payable (or required to be withheld) on such dividends and distributions, even though such participants have not received any cash with which to pay the resulting tax. Common Shareholders who elect not to participate in the Plan will receive all distributions in cash. All correspondence or questions concerning the Plan, including how a Common Shareholder may opt out of the Plan, should be directed to U.S. Bancorp Fund Services, LLC, (855) 862-6092, 615 East Michigan Street, Milwaukee, Wisconsin 53202 (the “Plan Administrator”). Beneficial owners of Common Shares who hold their Common Shares in the name of a broker or nominee should contact the broker or nominee to determine whether and how they may participate in, or opt out of, the Plan.
PRIVACY POLICY
The Fund is committed to ensuring your financial privacy. This notice is being sent to comply with privacy regulations of the Securities and Exchange Commission. The Fund has in effect the following policy with respect to nonpublic personal information about its customers:
| | ● | Only such information received from you, through application forms or otherwise, and information about your Fund transactions will be collected. |
| | ● | None of such information about you (or former customers) will be disclosed to anyone, except as permitted by law (which includes disclosure to employees necessary to service your account). |
| | ● | Policies and procedures (including physical, electronic and procedural safeguards) are in place that are designed to protect the confidentiality of such information. |
| | ● | The Fund does not currently obtain consumer information. If the Fund were to obtain consumer information at any time in the future, it would employ appropriate procedural safeguards that comply with federal standards to protect against unauthorized access to and properly dispose of consumer information. For more information about the Fund’s privacy policies call (855) 830 1222 (toll free). |
Annual Report | June 30, 2018 | 29 |
RiverNorth/DoubleLine Strategic Opportunity Fund, Inc. |
Independent Directors | June 30, 2018 |
Name,
Address1
and Year of
Birth | Position(s)
Held with
Fund | Term of
Office/
Length
of Time
Served | Principal
Occupation(s)
During Past 5 Years | Number
of
Portfolios
in Fund
Complex
Overseen
by
Director2 | Other Directorships
Held by Director
During Past 5 Years |
John K. Carter Y.O.B. 1961 | Director | Indefinite/September 2015 to present | Partner, Law Office of John K. Carter, P.A. (2015 to present); Managing Partner, Global Recruiters of St. Petersburg (a financial services consulting and recruiting firm) (2012 to present). | 6 | Eagle Mutual Funds (9 funds) (2016 to present); RiverNorth Marketplace Lending Corporation (1 fund) (2016 to present); RiverNorth Opportunities Fund (1 fund) (2015 to present); RiverNorth Funds (3 funds) (2013 to present); Director, Chairman, Transamerica Funds (120 funds) (2006 to 2012). |
James G. Kelley Y.O.B. 1948 | Director | Indefinite/September 2015 to present | Certified Business Coach, JGK & Associates (2000 to present). | 5 | RiverNorth Marketplace Lending Corporation (1 fund) (2016 to present); RiverNorth Funds (3 funds) (2013 to present). |
John S. Oakes Y.O.B. 1943 | Director | Indefinite/September 2015 to present | Principal, Financial Search and Consulting (a recruiting and consulting firm) (2013 to 2016); Regional Vice President, Securities America (a broker-dealer) (2007 to 2013). | 6 | RiverNorth Marketplace Lending Corporation (1 fund) (2016 to present); RiverNorth Opportunities Fund (1 fund) (2015 to present); RiverNorth Funds (3 funds) (2013 to present). |
30 | (888) 848-7569 | www.rivernorth.com |
RiverNorth/DoubleLine Strategic Opportunity Fund, Inc. |
Independent Directors | June 30, 2018 |
Name,
Address1
and Year of
Birth | Position(s)
Held with
Fund | Term of
Office/
Length
of Time
Served | Principal
Occupation(s)
During Past 5 Years | Number
of
Portfolios
in Fund
Complex
Overseen
by
Director2 | Other Directorships
Held by Director
During Past 5 Years |
Fred G. Steingraber Y.O.B. 1938 | Director | Indefinite/September 2015 to present | Chairman, Board Advisors LLC (a consulting firm) (2001 to present). Retired, Chairman Emeritus, A.T. Kearney (a business consulting firm) (2001 to present). | 5 | Director, Diamond Hill Financial Trends Fund (a closed-end fund) (1989 to 2013). Director, Elkay Manufacturing (2004 to present). Director, Talent Intelligence (leadership development) (2004 to present). Chairman Emeritus, A.T. Kearney (management consulting) (2001 to present). Chairman, Board Advisors (Board consulting) (2001 to present). RiverNorth Marketplace Lending Corporation (1 fund) (2016 to present); RiverNorth Funds (3 funds) (2013 to present). |
1 | The mailing address of each Director is 325 N. LaSalle Street, Suite 645, Chicago, IL 60654. |
2 | The “Fund Complex” consists of the RiverNorth Core Opportunity Fund, the RiverNorth/DoubleLine Strategic Income Fund and the RiverNorth/Oaktree High Income Fund, each a series of RiverNorth Funds Trust, RiverNorth Opportunities Fund, Inc., RiverNorth/DoubleLine Strategic Opportunity Fund, Inc. and RiverNorth Marketplace Lending Corporation. |
Annual Report | June 30, 2018 | 31 |
RiverNorth/DoubleLine Strategic Opportunity Fund, Inc. |
Interested Director and Officers | June 30, 2018 |
Name,
Address1
and Year of
Birth | Position(s)
Held with
Fund | Term of
Office/
Length
of Time
Served | Principal
Occupation(s)
During Past 5 Years | Number
of
Portfolios
in Fund
Complex
Overseen
by
Director2 | Other Directorships
Held by Director
During Past 5 Years |
Patrick W. Galley3
Y.O.B. 1975 | President, Principal Executive Officer and Trustee | Indefinite/September 2016 to present | Chief Investment Officer, RiverNorth Capital Management, LLC. (2004 to present). | 6 | Board of Managers RiverNorth Capital Management, LLC (2010 to present), Board of Managers RiverNorth Financial Holdings, LLC (2014 to present) and Board of Directors RiverNorth Holdings, Co. (2010 to present). |
Jonathan M. Mohrhardt Y.O.B. 1974 | Treasurer and Chief Financial Officer | Indefinite/September 2016 to present | Chief Operating Officer, RiverNorth Capital Management, LLC (2011 to present). | N/A | Board of Managers RiverNorth Capital Management, LLC (2010 to present), Board of Managers RiverNorth Financial Holdings, LLC (2014 to present) and Board of Directors RiverNorth Holdings, Co. (2010 to present). |
Marcus L. Collins
Y.O.B. 1968 | Chief Compliance Officer and Secretary | Indefinite/September 2016 to Present | General Counsel, RiverNorth Capital Management, LLC (2012 to present), Chief Compliance Officer, RiverNorth Capital Management, LLC (2012 to present). | N/A | N/A |
32 | (888) 848-7569 | www.rivernorth.com |
RiverNorth/DoubleLine Strategic Opportunity Fund, Inc. |
Interested Director and Officers | June 30, 2018 |
Name,
Address1
and Year of
Birth | Position(s)
Held with
Fund | Term of
Office/
Length
of Time
Served | Principal
Occupation(s)
During Past 5 Years | Number
of
Portfolios
in Fund
Complex
Overseen
by
Director2 | Other Directorships
Held by Director
During Past 5 Years |
Angela Ter Maat Y.O.B. 1981 c/o US Bancorp Fund Services LLC 777 East Wisconsin Ave. Milwaukee, WI 53202 | Assistant Secretary | Indefinite/August 2016 to Present | Vice President, US Bancorp Fund Services LLC (2004 to present). | N/A | N/A |
1 | The mailing address of each Director and officer, unless otherwise noted, is 325 N. LaSalle Street, Suite 645, Chicago, IL 60654. |
2 | The “Fund Complex” consists of the RiverNorth Core Opportunity Fund, the RiverNorth/DoubleLine Strategic Income Fund and the RiverNorth/Oaktree High Income Fund, each a series of RiverNorth Funds Trust, RiverNorth Opportunities Fund, Inc., RiverNorth/DoubleLine Strategic Opportunity Fund, Inc. and RiverNorth Marketplace Lending Corporation. |
3 | Patrick W. Galley is considered an “Interested” Director as defined in the 1940 Act, because he is an officer of the Company and Chief Investment Officer of the Fund’s investment adviser. |
Annual Report | June 30, 2018 | 33 |
This page intentionally left blank.
This page intentionally left blank.
This page intentionally left blank.

RiverNorth Capital Management, LLC
325 N. LaSalle Street, Suite 645
Chicago, IL 60654
rivernorth.com
Item 2. Code of Ethics.
(a) The registrant, as of the end of the period covered by this report, has adopted a code of ethics that applies to the registrant's principal executive officer, principal financial officer, principal accounting officer or controller or any persons performing similar functions on behalf of the registrant.
(b) For purposes of this item, “code of ethics” means written standards that are reasonably designed to deter wrongdoing and to promote:
(1) Honest and ethical conduct, including the ethical handling of actual or apparent conflicts of interest between personal and professional relationships;
(2) Full, fair, accurate, timely, and understandable disclosure in reports and documents that a registrant files with, or submits to, the Commission and in other public communications made by the registrant;
(3) Compliance with applicable governmental laws, rules, and regulations;
(4) The prompt internal reporting of violations of the code of ethics to an appropriate person or persons identified in the code of ethics; and
(5) Accountability for adherence to the code of ethics.
(c) Amendments: During the period covered by this report, no amendments were made to the provisions of the code of ethics adopted in 2(a) above.
(d) Waivers: During the period covered by this report, no implicit or explicit waivers to the provisions of the code of ethics adopted in 2(a) above were granted.
(e) Posting: We do not intend to post the code of ethics for the Officers or any amendments or waivers on a website.
(f) Availability: The code of ethics for the Officers can be obtained, free of charge by calling the toll free number for the appropriate Fund.
Item 3. Audit Committee Financial Expert.
The registrant’s board of directors has determined that there is at least one audit committee financial expert serving on its audit committee. James G. Kelly is the “audit committee financial expert” and is considered to be “independent” as each term is defined in Item 3 of Form N-CSR.
Item 4. Principal Accountant Fees and Services.
The registrant has engaged its principal accountant to perform audit services, audit-related services, tax services and other services during the past fiscal year. “Audit services” refer to performing an audit of the registrant's annual financial statements or services that are normally provided by the accountant in connection with statutory and regulatory filings or engagements for that fiscal year. “Audit-related services” refer to the assurance and related services by the principal accountant that are reasonably related to the performance of the audit. “Tax services” refer to professional services rendered by the principal accountant for tax compliance, tax advice, and tax planning. The following table details the aggregate fees billed or expected to be billed for each of the last two fiscal years for audit fees, audit-related fees, tax fees and other fees by the principal accountant.
| Year Ended 6/30/2018 | Period from 9/28/2016 (inception) to 6/30/2017 |
| Audit Fees | $26,000 | $31,000 |
| Audit-Related Fees | $ - | $ - |
| Tax Fees | $5,000 | $5,000 |
| All Other Fees | $ - | $ - |
The Audit Committee has adopted pre-approval policies and procedures that require the audit committee to pre-approve all audit and non-audit services of the registrant, including services provided to any entity affiliated with the registrant.
The percentage of fees billed by Cohen Fund Audit Services applicable to non-audit services pursuant to waiver of pre-approval requirement were as follows:
| | Year Ended 6/30/2018 | Period from 9/28/2016 (inception) to 6/30/2017 |
| Audit-Related Fees | 0% | 0% |
| Tax Fees | 0% | 0% |
| All Other Fees | 0% | 0% |
All of the principal accountant’s hours spent on auditing the registrant’s financial statements were attributed to work performed by full-time permanent employees of the principal accountant. The following table indicates the non-audit fees billed or expected to be billed by the registrant’s accountant for services to the registrant and to the registrant’s investment adviser (and any other controlling entity, etc.—not sub-adviser) for the last year. The Audit Committee has considered whether the provision of non-audit services billed to the Adviser were compatible with maintaining the principal accountant's independence and has concluded that the provision of such non-audit services by the accountant has not compromised the accountant’s independence.
Non-Audit Related Fees | Year Ended 6/30/2018 | Period from 9/28/2016 (inception) to 6/30/2017 |
| Registrant | $- | $- |
| Registrant’s Investment Adviser | $- | $- |
Item 5. Audit Committee of Listed Registrants.
The registrant is an issuer as defined in Rule 10A-3 under the Securities Exchange Act of 1934, (the “Act”) and has a separately-designated standing audit committee established in accordance with Section 3(a)(58)(A) of the Act. The independent members of the committee are as follows: John K. Carter, James G. Kelley, John S. Oakes and Fred G. Steingraber.
Item 6. Investments.
| (a) | Schedule of Investments is included as part of the report to shareholders filed under Item 1 of this Form. |
Item 7. Disclosure of Proxy Voting Policies and Procedures for Closed-End Management Investment Companies.
The Board of Directors of the Fund has delegated responsibilities for decisions regarding proxy voting for securities held by the Fund to the Adviser or Subadviser. The Adviser or Subadviser will vote such proxies in accordance with its proxy policies and procedures. In some instances, the Adviser or Subadviser may be asked to cast a proxy vote that presents a conflict between the interests of the Fund’s shareholders, and those of the Adviser or Subadviser or an affiliated person of the Adviser or Subadviser. In such a case, the Adviser or Subadviser will abstain from making a voting decision and will forward all necessary proxy voting materials to the Fund to enable the Board of Directors to make a voting decision. The Adviser or Subadviser shall make a written recommendation of the voting decision to the Board of Directors, which shall include: (i) an explanation of why it has a conflict of interest; (ii) the reasons for its recommendation; and (iii) an explanation of why the recommendation is consistent with the Adviser’s (or Subadviser’s) proxy voting policies. The Board of Directors shall make the proxy voting decision that in its judgment, after reviewing the recommendation of the Adviser or Subadviser, is most consistent with the Adviser’s or Subadviser’s proxy voting policies and in the best interests of Fund shareholders. When the Board of Directors of the Fund is required to make a proxy voting decision, only the directors without a conflict of interest with regard to the security in question or the matter to be voted upon shall be permitted to participate in the decision of how the Fund’s vote will be cast. The Adviser and Subadviser vote proxies pursuant to the proxy voting policies and guidelines set forth in Appendix A and B, respectively, to this SAI.
Item 8. Portfolio Managers of Closed-End Management Investment Companies.
Portfolio Managers
Patrick W. Galley and Stephen O’Neill are co-portfolio managers for the Fund for the Tactical Closed-End Fund Income Strategy.
Patrick W. Galley, CFA is a portfolio manager of the Fund. Mr. Galley is the Chief Investment Officer for the Adviser. Mr. Galley heads the Adviser’s research and investment team and oversees all portfolio management activities at the Adviser. Mr. Galley also serves as the President and Chairman of the RiverNorth Funds. Prior to joining the Adviser in 2004, he was most recently a Vice President at Bank of America in the Global Investment Bank’s Portfolio Management group, where he specialized in analyzing and structuring corporate transactions for investment management firms in addition to closed-end and open-end funds, hedge funds, funds of funds, structured investment vehicles and insurance/reinsurance companies. Mr. Galley graduated with honors from Rochester Institute of Technology with a B.S. in Finance. He has received the Chartered Financial Analyst (CFA) designation, is a member of the CFA Institute and is a member of the CFA Society of Chicago.
Stephen O’Neill, CFA is the Fund’s co-portfolio manager. Mr. O’Neill conducts qualitative and quantitative analysis of closed-end funds and their respective asset classes. Prior to joining RiverNorth Capital, Mr. O’Neill was most recently an Assistant Vice President at Bank of America in the Global Investment Bank’s Portfolio Management group. At Bank of America, he specialized in the corporate real estate, asset management and structured finance industries. Mr. O’Neill graduated magna cum laude from Miami University in Oxford, Ohio with a B.S. in Finance. Mr. O’Neill has received the Chartered Financial Analyst (CFA®) designation, is a member of the CFA Institute and is a member of the CFA Society of Chicago.
Compensation of Portfolio Managers
Mr. Galley’s and Mr. O’Neill’s total compensation includes a base salary fixed from year to year and a variable performance bonus consisting of cash incentives, which may include mandatory notional investments in the Fund. The amounts paid to Mr. Galley and Mr. O’Neill are based on a percentage of the fees earned by the Adviser from managing the Fund and other investment accounts. The performance bonus reflects individual performance of the funds managed by the portfolio managers and the performance of the Adviser’s business as a whole. Mr. Galley and Mr. O’Neill also participate in a 401K program on the same basis as other officers of the Adviser.
Portfolio Manager Ownership of Fund Shares
The following table shows the dollar range of equity securities of the Fund beneficially owned by the portfolio managers of the Fund as of June 30, 2018.
| Name of Portfolio Manager | Dollar Range of Equity
Securities of the Fund |
| Patrick W. Galley | 0 |
| Stephen A. O’Neill | 0 |
Conflicts of Interest
Actual or apparent conflicts of interest may arise when a portfolio manager has day-to-day management responsibilities with respect to more than one fund or other accounts. More specifically, portfolio managers who manage multiple funds are presented with the following potential conflicts:
The management of multiple accounts may result in a portfolio manager devoting unequal time and attention to the management of each account. The management of multiple funds and accounts also may give rise to potential conflicts of interest if the funds and accounts have different objectives, benchmarks, time horizons and fees as the portfolio manager must allocate his time and investment ideas across multiple funds and accounts. Another potential conflict of interest may arise where another account has the same investment objective as the Fund, whereby the portfolio manager could favor one account over another.
With respect to securities transactions for the Fund, the Adviser determines which broker to use to execute each order, consistent with the duty to seek best execution of the transaction. A portfolio manager may execute transactions for another fund or account that may adversely impact the value of securities held by the Fund. Securities selected for funds or accounts other than the Fund may outperform the securities selected for the Fund. Further, a potential conflict could include a portfolio manager’s knowledge about the size, timing and possible market impact of Fund trades, whereby they could use this information to the advantage of other accounts and to the disadvantage of the Fund. These potential conflicts of interest could create the appearance that a portfolio manager is favoring one investment vehicle over another.
The management of personal accounts also may give rise to potential conflicts of interest. Although the portfolio manager generally does not trade securities in his or her own personal account, the Adviser and the Fund have each adopted a code of ethics that, among other things, permits personal trading by employees (including trading in securities that can be purchased, sold or held by the Fund) under conditions where it has been determined that such trades would not adversely impact client accounts. Nevertheless, the management of personal accounts may give rise to potential conflicts of interest, and there is no assurance that these codes of ethics will adequately address such conflicts.
The Adviser has adopted certain compliance procedures which are designed to address these types of conflicts. However, there is no guarantee that such procedures will detect each and every situation in which a conflict arises.
Other Accounts Managed
As of June 30, 2018, the portfolio managers of the Fund were responsible for the management of the following other accounts (in addition to the Fund):
| | Number of Other Accounts Managed and Assets by Account Type
As of June 30, 2018 |
| Portfolio Manager | Registered Investment
Companies
(other than the Fund) | Registered Investment Companies Subject to Performance-Based Advisory Fees | Other Pooled Investment Vehicles | Other Pooled Investment Vehicles Subject to Performance-Based Advisory Fees | Other Accounts | Other Accounts Subject to Performance-Based Advisory Fees |
| Stephen A. O’Neill | Number: 8
Assets: $2.47B | Number: 0
Assets: $0 | Number: 2
Assets: $290.97M | Number: 2
Assets: $290.97M | Number: 1
Assets: $20.8M | Number: 0
Assets: $0 |
| Patrick W. Galley | Number: 9
Assets: $2.81B | Number: 0
Assets: $0 | Number: 3
Assets: $328.5M | Number: 3
Assets: $328.5M | Number: 1
Assets: $20.8M | Number: 0
Assets: $0 |
Item 9. Purchases of Equity Securities by Closed-End Management Investment Company and Affiliated Purchasers.
| Period | (a)
Total Number of Shares (or Units) Purchased | (b)
Average Price Paid per Share (or Unit) | (c)
Total Number of Shares (or Units) Purchased as Part of Publicly Announced Plans or Programs | (d)
Maximum Number (or Approximate Dollar Value) of Shares (or Units) that May Yet Be Purchased Under the Plans or Programs |
| Month #1 1/1/18 – 1/31/18 | 0 | 0 | 0 | 0 |
| Month #2 2/1/18 – 2/28/18 | 0 | 0 | 0 | 0 |
| Month #3 3/1/18 – 3/31/18 | 0 | 0 | 0 | 0 |
| Month #4 4/1/18 – 4/30/18 | 0 | 0 | 0 | 0 |
| Month #5 5/1/18 – 5/31/18 | 0 | 0 | 0 | 0 |
| Month #6 6/1/18 – 6/30/18 | 0 | 0 | 0 | 0 |
| Total | 0 | 0 | 0 | 0 |
Item 10. Submission of Matters to a Vote of Security Holders.
There have been no material changes to the procedures by which shareholders may recommend nominees to the registrant’s board of directors.
Item 11. Controls and Procedures.
| (a) | The Registrant’s President and Chief Financial Officer have reviewed the Registrant's disclosure controls and procedures (as defined in Rule 30a-3(c) under the Investment Company Act of 1940 (the “Act”)) as of a date within 90 days of the filing of this report, as required by Rule 30a-3(b) under the Act and Rules 13a-15(b) or 15d-15(b) under the Securities Exchange Act of 1934. Based on their review, such officers have concluded that the disclosure controls and procedures are effective in ensuring that information required to be disclosed in this report is appropriately recorded, processed, summarized and reported and made known to them by others within the Registrant and by the Registrant’s service provider. |
| (b) | There were no changes in the Registrant's internal control over financial reporting (as defined in Rule 30a-3(d) under the Act) that occurred during the second fiscal quarter of the period covered by this report that has materially affected, or is reasonably likely to materially affect, the Registrant's internal control over financial reporting. |
Item 12. Disclosure of Securities Lending Activities for Closed-End Management Investment Companies
The registrant did not engage in securities lending activities during the fiscal year reported on this Form N-CSR.
Item 13. Exhibits.
| (a) | (1) Any code of ethics or amendment thereto, that is the subject of the disclosure required by Item 2, to the extent that the Registrant intends to satisfy Item 2 requirements through filing of an exhibit. Filed herewith. |
(2) Certifications pursuant to Section 302 of the Sarbanes-Oxley Act of 2002. Filed herewith.
(3) Any written solicitation to purchase securities under Rule 23c-1 under the Act sent or given during the period covered by the report by or on behalf of the Registrant to 10 or more persons. None.
| (b) | Certification pursuant to Section 906 of the Sarbanes-Oxley Act of 2002. Furnished herewith. |
SIGNATURES
Pursuant to the requirements of the Securities Exchange Act of 1934 and the Investment Company Act of 1940, the registrant has duly caused this report to be signed on its behalf by the undersigned, thereunto duly authorized.
| | (Registrant) | RiverNorth/DoubleLine Strategic Opportunity Fund, Inc. | |
| | | | |
| | By (Signature and Title) | /s/ Patrick W. Galley | |
| | | Patrick W. Galley, President | |
| | | | |
| | Date | 9/10/2018 | |
Pursuant to the requirements of the Securities Exchange Act of 1934 and the Investment Company Act of 1940, this report has been signed below by the following persons on behalf of the registrant and in the capacities and on the dates indicated.
| | By (Signature and Title) | /s/ Patrick W. Galley | |
| | | Patrick W. Galley, President | |
| | | | |
| | Date | 9/10/2018 | |
| | | | |
| | By (Signature and Title) | /s/ Jonathan M. Mohrhardt | |
| | | Jonathan M. Mohrhardt, Chief Financial Officer | |
| | | | |
| | Date | 9/10/2018 | |