UNITED STATES
SECURITIES AND EXCHANGE COMMISSION
Washington, D.C. 20549
FORM N-CSR
CERTIFIED SHAREHOLDER REPORT OF REGISTERED
MANAGEMENT INVESTMENT COMPANIES
811-23166
(Investment Company Act File Number)
RiverNorth/DoubleLine Strategic Opportunity Fund, Inc.
(Exact Name of Registrant as Specified in Charter)
360 S. Rosemary Avenue, Suite 1420
West Palm Beach, FL 33401
(Address of Principal Executive Offices)
Marcus L. Collins, Esq.
RiverNorth Capital Management, LLC
360 South Rosemary Avenue, Suite 1420
West Palm Beach, FL 33401
(Name and Address of Agent for Service)
(312) 832-1440
(Registrant’s Telephone Number)
Date of Fiscal Year End: June 30
Date of Reporting Period: June 30, 2022
| Item 1. | Reports to Stockholders. |
RiverNorth/DoubleLine Strategic Opportunity Fund, Inc.
Table of Contents
| Shareholder Letter | 2 |
| Performance Overview | 4 |
| Schedule of Investments | 9 |
| Statement of Assets and Liabilities | 34 |
| Statement of Operations | 35 |
| Statements of Changes in Net Assets Attributable to Common Shareholders | 36 |
| Statement of Cash Flows | 38 |
| Financial Highlights | 40 |
| Notes to Financial Statements | 43 |
| Report of Independent Registered Public Accounting Firm | 56 |
| Dividend Reinvestment Plan | 57 |
| Summary of Updated Information Regarding the Fund | 59 |
| Directors and Officers | 86 |
| Additional Information | 93 |
RiverNorth/DoubleLine Strategic Opportunity Fund, Inc.
| Shareholder Letter | June 30, 2022 (Unaudited) |
Dear Fellow Shareholders,
Last year, we started off one of our shareholder letters with the following sentence: “The economic environment in the U.S. has changed meaningfully relative to a year ago.” Those words were written as the global economy was sharply rebounding from the depths of the COVID-19 pandemic. For different reasons, those words ring true again as we pen this year’s annual letter.
Inflation is running at levels we haven’t seen in decades. Interest rates are ratcheting up accordingly. The Federal Reserve (“Fed”) is aggressively hiking short term rates to slow the pace of rising prices while implementing its plan to reduce the size of its balance sheet which had grown by several trillion dollars while fighting the economic effects of the pandemic.
While financial pundits debate the probability of aggressive Fed monetary policy throwing the U.S. economy into a recession, higher long-term rates have thrown some cold water on the red-hot U.S. residential real estate market.
Add geopolitical uncertainty to the mix, mainly from the Russian invasion of Ukraine, and it’s no surprise that broad based equity and fixed income asset classes have experienced steep losses over the past several months. Many fixed income indices have experienced the worst start to a calendar year ever. A common theme surrounding recent market performance has been, “no place to hide,” as assets across the risk spectrum have experienced significant volatility.
RiverNorth’s investment strategies have historically benefitted from volatility. We believe the asset classes we specialize in including closed-end funds (“CEFs”), business development companies (“BDCs”) and special-purpose acquisition companies (“SPACs”) tend to be under-followed, less-liquid, and misunderstood by the general investing public. Our view is that those characteristics, combined with volatility, may create opportunities to add value through our trading strategies. After reaching fully valued levels last summer, we are seeing attractive discounts again in both CEFs and BDCs. After record issuance in 2020 and Q1 2021, the SPAC market has cooled considerably. While these developments sound negative on the surface, we believe that they may create opportunity for RiverNorth.
Combined with our efforts to grow the Fund's net asset value ("NAV") through prudent and opportunistic portfolio management, RiverNorth utilizes its 18+ years of experience in researching and trading CEFs to design the structure of our listed CEFs. To that end, our objective is to set a level distribution policy that may appeal to investors. We also utilize our CEF capital markets experience as we strive to optimize the Fund’s use of leverage, especially considering the interest rate volatility mentioned at the top of this letter. For example, towards the end of 2021, OPP locked in permanent, fixed-rate financing through the issuance of a preferred security at a very attractive coupon of 4.75%.
We’d be remiss if we didn’t highlight the strong relationship we share with the very distinguished DoubleLine Capital. We believe DoubleLine’s opportunistic fixed income strategy pairs nicely with RiverNorth’s tactical CEF trading strategy. Overall, we remain optimistic about the Fund’s portfolio and prospects looking forward, especially relative to other fixed income asset classes.
We are pleased to provide you with the following 2022 Annual Report.
| 2 | (888) 848-7569 | www.rivernorth.com |
RiverNorth/DoubleLine Strategic Opportunity Fund, Inc.
| Shareholder Letter | June 30, 2022 (Unaudited) |
Please visit www.rivernorth.com for additional information.
We thank you for your investment and trust in managing your assets.
Respectfully,
RiverNorth Capital Management, LLC
Opinions and estimates offered constitute our judgement and are subject to change.
| Annual Report | June 30, 2022 | 3 |
RiverNorth/DoubleLine Strategic Opportunity Fund, Inc.
| Performance Overview | June 30, 2022 (Unaudited) |
WHAT IS THE FUND’S INVESTMENT STRATEGY?
The RiverNorth/DoubleLine Strategic Opportunity Fund (“the Fund”) seeks to achieve its investment objective by allocating its Managed Assets among the three principal investment strategies described below:
Tactical Closed-End Fund Income Strategy: This strategy seeks to (i) generate returns through investments in closed-end funds, special purpose acquisition companies ("SPACs"), exchange-traded funds and business development companies (collectively, the “Underlying Funds”) that invest primarily in income- producing securities, and (ii) derive value from the discount and premium spreads associated with closed-end funds.
Opportunistic Income Strategy: This strategy seeks to generate attractive risk-adjusted returns through investments in fixed income instruments and other investments, including agency and non-agency residential mortgage-backed and other asset-backed securities, corporate bonds, municipal bonds, and real estate investment trusts. At least 50% of the Managed Assets allocated to this strategy is invested in mortgage-backed securities.
Alternative Credit Strategy: This strategy seeks to achieve a high level of income by investing in alternative credit instruments. The Fund's alternative credit investments may be made through a combination of: (i) investing in loans to small and mid-sized companies (“SMEs”); (ii) investing in notes or other pass-through obligations issued by an alternative credit platform (or an affiliate) representing the right to receive the principal and interest payments on an alternative credit investment (or fractional portions thereof) originated through the platform (“Pass-Through Notes”); or (iii) purchasing asset-backed securities representing ownership in a pool of alternative credit. The Fund may invest in income-producing securities of any maturity and credit quality, including unrated or below investment grade.
RiverNorth Capital Management, LLC (“RiverNorth”) allocates the Fund’s Managed Assets among three principal strategies: Tactical CEF Income Strategy, Alternative Credit Strategy, and Opportunistic Income Strategy. RiverNorth manages the Tactical CEF Income Strategy and the Alternative Credit Strategy, DoubleLine Capital, LP ("DoubleLine") manages the Opportunistic Income Strategy.
RiverNorth determines which portion of the Fund’s assets is allocated to each strategy based on market conditions.
The Tactical CEF Income Strategy typically invests in CEFs, BDCs, SPACs and ETFs. The Opportunistic Income Strategy primarily invests in agency and non-agency residential mortgage-backed securities and commercial mortgage-backed securities ("CMBS") seeking to derive value from inefficiencies within the subsectors of the fixed income market while maintaining active risk constraints. The Alternative Credit Strategy invests primarily in a portfolio of small and medium size business loans and related instruments originated from alternative credit platforms.
| 4 | (888) 848-7569 | www.rivernorth.com |
RiverNorth/DoubleLine Strategic Opportunity Fund, Inc.
| Performance Overview | June 30, 2022 (Unaudited) |
HOW DID THE FUND PERFORM RELATIVE TO ITS BENCHMARK DURING THE PERIOD?
PERFORMANCE as of June 30, 2022
| | Cumulative | Annualized |
| TOTAL RETURN(1) | 6 Months | 1 Year | 3 Years(3) | 5 Years(3) | Since
Inception(2)(3) |
| RiverNorth/DoubleLine Strategic Opportunity Fund, Inc. – NAV(4) | -14.89% | -14.82% | -2.40% | 0.43% | 1.60% |
| RiverNorth/DoubleLine Strategic Opportunity Fund, Inc. – Market(5) | -17.56% | -19.86% | -1.15% | 0.81% | 1.14% |
| Bloomberg U.S. Aggregate Bond Index(6) | -10.35% | -10.29% | -0.93% | 0.88% | 0.59% |
| (1) | Total returns assume reinvestment of all distributions. |
| (2) | The Fund commenced operations on September 28, 2016. |
| (4) | Performance returns are net of management fees and other Fund expenses. |
| (5) | Market price is the value at which the Fund trades on an exchange. This market price can be more or less than its NAV. |
| (6) | The Bloomberg Barclays U.S. Aggregate Bond Index is an unmanaged index of investment grade fixed-rate debt issues with maturities of at least one year. The index cannot be invested in directly and does not reflect fees and expenses. |
The total annual expense ratio as a percentage of net assets attributable to common shares as of June 30, 2022 is 1.88% (excluding interest on facility loan payable). Including interest on facility loan payable, the expense ratio is 1.93%.
Performance data quoted represents past performance, which is not a guarantee of future results. Current performance may be lower or higher than the performance quoted. The principal value and investment return of an investment will fluctuate so that your shares may be worth more or less than their original cost. You can obtain performance data current to the most recent month end by calling (844) 569-4750. Total return measures net investment income and capital gain or loss from portfolio investments. All performance shown assumes reinvestment of dividends and capital gains distributions but does not reflect the deduction of taxes that a shareholder would pay on Fund distributions or the sale of Fund shares.
WHAT CONTRIBUTING FACTORS WERE RESPONSIBLE FOR THE FUND’S RELATIVE PERFORMANCE DURING THE PERIOD?
RiverNorth Tactical Closed-End Fund Income Sleeve
The sleeve’s exposure to the underlying net asset values of CEFs was the largest detractor from returns for the period. The sleeve’s exposure to BDCs contributed positively over the period. While the first half of the fiscal year was a period of general strength in the CEF market, a dramatic shift in expectations for higher interest rates drove a significant sell-off in the back half of the fiscal year.
| Annual Report | June 30, 2022 | 5 |
RiverNorth/DoubleLine Strategic Opportunity Fund, Inc.
| Performance Overview | June 30, 2022 (Unaudited) |
In addition to the contributing factors referenced above, RiverNorth believes that the Fund's level distribution policy did not have a material impact on the Fund's ability to execute on its investment strategy during the fiscal year ended June 30, 2022.
The Fund made monthly distributions to common shareholders set at a level monthly rate of $0.1586 per common share for the period from July 1, 2021 to December 31, 2021, and $0.1478 per common share for the period from January 1, 2022 to June 30, 2022. These distributions are made from net assets and are reflected in the Fund Performance numbers provided in the section above. For the fiscal year ended June 30, 2022, a majority of the distribution was characterized as a return of capital.
DoubleLine Opportunistic Income Sleeve
During the Period, the DoubleLine sleeve generated a negative total return but still outperformed the Bloomberg US Aggregate Bond Index (the "Index") return of -10.29%. The primary driver of the relative outperformance was duration positioning; the portfolio consistently maintained a lower duration than the Index which helped relative performance as interest rates rose sharply over this period. A secondary driver of outperformance was credit selection because the credit holdings in the portfolio predominantly outperformed the credit holdings in the Index. The top-performing sectors in the portfolio for the period were asset-backed securities and CMBS. These sectors were especially hard-hit by the COVID-19 pandemic and still had some room for price recovery during the second half of 2021 as the US economy fully reopened. During the first half of 2022, their relatively low durations and high levels of monthly interest income helped shield them from steeper losses as interest rates rose. The worst-performing sectors were emerging market debt and Agency mortgage-backed securities (“MBS”). The emerging market holdings experienced credit spread widening during the latter portion of this performance period as recessionary fears gripped global markets. Agency MBS experienced duration-related price declines as well as some negative sentiment in the market stemming from the Fed's tapering of monthly asset purchases.
HOW WAS THE RIVERNORTH/DOUBLELINE STRATEGIC OPPORTUNITY FUND POSITIONED AT THE END OF THE PERIOD?
The Fund's Managed Assets were allocated 26% RiverNorth Tactical CEF Income and 74% DoubleLine Opportunistic Income. The biggest asset class allocations were to non-agency MBS, cash and SPACs. The Alternative Credit Sleeve was added to the Fund's strategy after the Fund's fiscal year end.
The Fund issued a Series B preferred in November 2021. Total leverage of the portfolio at period end was ~ 35%.
DEFINITIONS:
Alternative Credit refers to debt asset types that fall outside of traditional fixed income markets.
Asset-Backed Securities (ABS) are investment securities—a bond or note—which is collateralized by a pool of assets, such as loans, leases, credit card debt, royalties, or receivables.
| 6 | (888) 848-7569 | www.rivernorth.com |
RiverNorth/DoubleLine Strategic Opportunity Fund, Inc.
| Performance Overview | June 30, 2022 (Unaudited) |
Business Development Companies (BDC) are organizations that invests in small-and medium-sized companies as well as distressed companies. A BDC helps the small-and medium-sized firms grow in the initial stages of their development.
Mortgage-Backed Securities (MBS) are asset-backed securities that are secured by a mortgage or collection of mortgages.
Pass-Through securities are pools of fixed-income securities backed by a package of assets. A servicing intermediary collects the monthly payments from issuers and, after deducting a fee, remits or passes them through to the holders of the pass-through security.
Residential Mortgage-Backed Securities (RMBS) are fixed-income investment products that are backed by mortgages on residential properties rather than commercial real estate.
Commercial Mortgage-Backed Securities (CMBS) are fixed-income investment products that are backed by mortgages on commercial properties rather than residential real estate.
Special Purpose Acquisition Companies (SPAC) are companies with no commercial operations that is formed strictly to raise capital through an initial public offering (IPO) for the purpose of acquiring an existing company.
GROWTH OF A HYPOTHETICAL $10,000 INVESTMENT
The graph below illustrates the growth of a hypothetical $10,000 investment assuming the purchase of common shares at the closing market price (NYSE: OPP) of $20.00 on September 28, 2016 (commencement of operations) and tracking its progress through June 30, 2022.
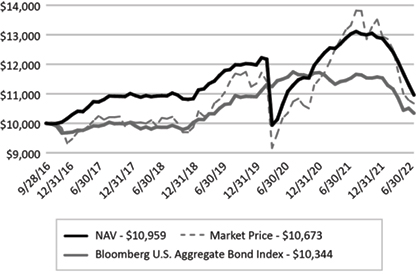
Past performance does not guarantee future results. Performance will fluctuate with changes in market conditions. Current performance may be lower or higher than the performance data shown. Performance information does not reflect the deduction of taxes that shareholders would pay on Fund distributions or the sale of Fund shares. An investment in the Fund involves risk, including loss of principal.
| Annual Report | June 30, 2022 | 7 |
RiverNorth/DoubleLine Strategic Opportunity Fund, Inc.
| Performance Overview | June 30, 2022 (Unaudited) |
TOP TEN HOLDINGS* as of June 30, 2022
| | % of Net Assets |
| U.S. Treasury Bond, 1.63%, 11/15/2050 | 7.43% |
| Oxford Square Capital Corp., 0.00%, 03/30/2024 | 2.69% |
| Legacy Mortgage Asset Trust, 4.50%, 11/25/2059 | 2.68% |
| Invesco Dynamic Credit Opportunities Fund, | 2.44% |
| Government National Mortgage Association, 3.50%, 02/20/2047 | 1.97% |
| Freddie Mac REMICS, 4.00%, 12/15/2040 | 1.91% |
| CHL GMSR Issuer Trust, 4.37%, 05/25/2023 | 1.78% |
| PennantPark Floating Rate Capital, Ltd., 4.25%, 04/01/2026 | 1.70% |
| COLT 2021-4 Mortgage Loan Trust, 4.14%, 10/25/2066 | 1.48% |
| Nuveen Credit Strategies Income Fund, | 1.28% |
| | 25.36% |
| * | Holdings are subject to change and exclude short-term investments. |
ASSET ALLOCATION as of June 30, 2022^
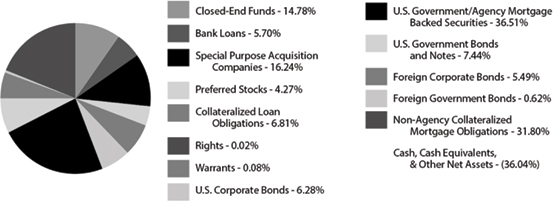
| ^ | Holdings are subject to change. |
Percentages are based on net assets of the Fund and do not include derivatives.
| 8 | (888) 848-7569 | www.rivernorth.com |
RiverNorth/DoubleLine Strategic Opportunity Fund, Inc.
| Schedule of Investments | June 30, 2022 |
| Shares/Description | | Value | |
| CLOSED-END FUNDS (14.78%) | | | | |
| | 19,109 | | | Apollo Senior Floating Rate Fund, Inc. | | $ | 245,168 | |
| | 148,397 | | | Apollo Tactical Income Fund, Inc. | | | 1,786,700 | |
| | 153,742 | | | Barings Global Short Duration High Yield Fund | | | 2,000,183 | |
| | 356,322 | | | BlackRock 2022 Global Income Opportunity Trust | | | 15,037 | |
| | 86,404 | | | BrandywineGLOBAL - Global Income Opportunities Fund, Inc. | | | 727,522 | |
| | 145,033 | | | Cohen & Steers Tax-Advantaged Preferred Securities & Income Fund | | | 2,764,329 | |
| | 142,624 | | | First Trust High Yield Opportunities 2027 Term Fund | | | 2,072,327 | |
| | 96,061 | | | GDL Fund | | | 788,661 | |
| | 475,840 | | | Invesco Dynamic Credit Opportunities Fund | | | 5,343,681 | |
| | 378,236 | | | Morgan Stanley Emerging Markets Domestic Debt Fund, Inc. | | | 1,698,280 | |
| | 114,786 | | | Nuveen Core Plus Impact Fund | | | 1,345,292 | |
| | 541,486 | | | Nuveen Credit Strategies Income Fund | | | 2,815,727 | |
| | 189,813 | | | PGIM Global High Yield Fund, Inc. | | | 2,177,155 | |
| | 113,940 | | | PGIM Short Duration High Yield Opportunities Fund | | | 1,698,845 | |
| | 152,496 | | | PIMCO Dynamic Income Opportunities Fund | | | 2,112,070 | |
| | 149,631 | | | Western Asset Diversified Income Fund | | | 2,073,886 | |
| | 683,035 | | | Western Asset High Income Opportunity Fund, Inc. | | | 2,704,819 | |
| | | | | |
| TOTAL CLOSED-END FUNDS | | | | |
| (Cost $39,043,472) | | | 32,369,682 | |
| Principal Amount/Description | | Rate | | | Maturity | | | Value | |
| BANK LOANS (5.70%) | | | | | | | | | | | |
| $ | 104,210 | | | Aegion Corp., First Lien - Initial Term Loan(a) | | 3M US L + 4.75% | | | | 05/17/28 | | | $ | 95,613 | |
| | 509,077 | | | Air Methods Corp., First Lien - Initial Term Loan(a) | | 3M US L + 3.50% | | | | 04/22/24 | | | | 453,715 | |
| | 315,000 | | | American Tire Distributors, Inc., First Lien - Initial Term Loan | | 3M US L + 6.25% | | | | 10/08/28 | | | | 298,620 | |
| | 645,000 | | | Applied Systems, Inc., Second Lien - 2021 Term Loan(a) | | 3M US L + 5.50% | | | | 09/19/25 | | | | 626,053 | |
| | 680,000 | | | Astra Acquisition Corp., Second Lien - Initial Term Loan | | 1M US L + 8.875% | | | | 10/22/29 | | | | 632,399 | |
| | 583,538 | | | Astra Acquisition Corp., First Lien - Initial Term Loan | | 3M US L + 5.25% | | | | 10/22/28 | | | | 510,108 | |
| | 95,000 | | | Asurion LLC, Second Lien - New B-3 Term Loan(a) | | 1M US L + 5.25% | | | | 01/31/28 | | | | 81,581 | |
| | 521,063 | | | Atlas Purchaser, Inc., First Lien - Initial Term Loan(a) | | 3M US L + 3.00% | | | | 05/18/28 | | | | 432,482 | |
| | 600,000 | | | Aveanna Healthcare LLC, Second Lien - Initial Term Loan(a) | | 3M US L + 7.50% | | | | 12/10/29 | | | | 537,000 | |
| | 65,000 | | | Blackhawk Network Holdings, Inc., Second Lien (a) | | 1M US L + 7.00% | | | | 06/15/26 | | | | 63,754 | |
See Notes to Financial Statements.
| Annual Report | June 30, 2022 | 9 |
RiverNorth/DoubleLine Strategic Opportunity Fund, Inc.
| Schedule of Investments | June 30, 2022 |
| Principal Amount/Description | | Rate | | | Maturity | | | Value | |
| BANK LOANS (continued) | | | | | | | | | | | |
| $ | 402,593 | | | Bright Bidco B.V., First Lien - 2018 Refinancing B Term Loan(a) | | 3M US L + 3.50% | | | | 06/30/24 | | | $ | 180,015 | |
| | 248,117 | | | Cengage Learning, Inc., First Lien - B Term Loan | | 3M US L + 5.00% | | | | 06/29/26 | | | | 224,546 | |
| | 765,000 | | | Constant Contact, Inc., Second Lien - Initial Term Loan(a) | | 3M US L + 7.50% | | | | 02/12/29 | | | | 742,051 | |
| | 208,546 | | | Cyxtera DC Holdings, Inc., First Lien - Initial Term Loan(a) | | 3M US L + 3.00% | | | | 05/01/24 | | | | 197,319 | |
| | 295,000 | | | DCert Buyer, Inc., Second Lien - First Amendment Refinancing Term Loan(a) | | 1M US L + 7.00% | | | | 02/19/29 | | | | 275,825 | |
| | 250,000 | | | DG Investment Intermediate Holdings 2, Inc., Second Lien - Initial Term Loan(a) | | 1M US L + 6.75% | | | | 03/30/29 | | | | 242,500 | |
| | 172,421 | | | Edgewater Generation LLC, First Lien (a) | | 1M US L + 3.75% | | | | 12/13/25 | | | | 147,657 | |
| | 580,954 | | | Envision Healthcare Corp., First Lien - Initial Term Loan(a) | | 1M US L + 3.75% | | | | 10/10/25 | | | | 197,669 | |
| | 517,073 | | | Envision Healthcare Corp., First Lien - Series 2020 New Term Loan(a) | | 1M US L + 3.75% | | | | 10/10/25 | | | | 177,527 | |
| | 244,882 | | | Gainwell Acquisition Corp., First Lien - B Term Loan(a) | | 3M US L + 4.00% | | | | 10/01/27 | | | | 232,256 | |
| | 330,805 | | | Grab Holdings, Inc., First Lien - Initial Term Loan(a) | | 3M US L + 4.50% | | | | 01/29/26 | | | | 303,513 | |
| | 255,032 | | | Gulf Finance, LLC TL 1L | | 1M US L + 6.75% | | | | 08/25/26 | | | | 190,478 | |
| | 266,785 | | | Intelsat Jackson Holdings S.A.TLB 1L | | 3M US L + 4.00% | | | | 01/26/29 | | | | 245,394 | |
| | 123,002 | | | ION Trading Finance, Ltd., First Lien - Initial Dollar (2021) Term Loan(a) | | 3M US L + 4.75% | | | | 04/01/28 | | | | 113,815 | |
| | 135,000 | | | Kenan Advantage Group, Inc, Second Lien - Initial Term Loan | | 1M US L + 7.25% | | | | 08/18/27 | | | | 123,525 | |
| | 32,443 | | | Lealand Finance Company B.V., First Lien - Take-Back Term Loan(a) | | 3M US L + 1.00% | | | | 06/30/25 | | | | 16,640 | |
| | 2,433 | | | Lealand Finance Company B.V., First Lien - Make-Whole Term Loan(a) | | 3M US L + 3.00% | | | | 06/28/24 | | | | 1,582 | |
| | 165,000 | | | LSF9 ATLANTIS HOLDINGS, LLC, First Lien - B Term Loan | | 8.00% | | | | 03/29/29 | | | | 152,130 | |
| | 319,860 | | | Minotaur Acquisition, Inc., First Lien - B Term Loan(a) | | 1M US L + 4.75% | | | | 03/27/26 | | | | 303,601 | |
| | 204,516 | | | Misys, Ltd., First Lien - Dollar Term Loan(a) | | 3M US L + 3.50% | | | | 06/13/24 | | | | 184,927 | |
| | 230,000 | | | Misys, Ltd., Second Lien - Dollar Term Loan(a) | | 3M US L + 7.25% | | | | 06/13/25 | | | | 199,443 | |
See Notes to Financial Statements.
| 10 | | (888) 848-7569 | www.rivernorth.com | |
RiverNorth/DoubleLine Strategic Opportunity Fund, Inc.
| Schedule of Investments | June 30, 2022 |
| Principal Amount/Description | | Rate | | | Maturity | | | Value | |
| BANK LOANS (continued) | | | | | | | | | | | |
| $ | 164,588 | | | Ola Singapore/OLA Netherlands 12/21 TL, First Lien - Initial Term Loan | | 1M US L + 6.25% | | | | 12/03/26 | | | $ | 140,997 | |
| | 336,822 | | | Riverbed Technology, Inc., First Lien - Initial Term Loan | | 4M US L + 8.00% | | | | 12/06/26 | | | | 201,989 | |
| | 112,141 | | | Sweetwater Borrower, LLC, First Lien - Initial Term Loan | | 1M US L + 4.25% | | | | 08/03/28 | | | | 96,722 | |
| | 379,000 | | | Team Health Holdings, Inc., First Lien - Initial Term Loan(a) | | 1M US L + 2.75% | | | | 02/06/24 | | | | 338,684 | |
| | 218,900 | | | Think & Learn Private, Ltd., First Lien - B Term Loan | | 3M US L + 5.50% | | | | 11/05/26 | | | | 187,160 | |
| | 220,000 | | | TIBCO Software, Inc., Second Lien (a) | | 1M US L + 7.25% | | | | 03/04/28 | | | | 217,085 | |
| | 597,834 | | | Travel Leaders Group LLC, First Lien - 2018 Refinancing Term Loan(a) | | 1M US L + 4.00% | | | | 01/25/24 | | | | 536,183 | |
| | 757,898 | | | Travelport Finance Luxembourg SARL 1L, 2021, First Lien - Initial (Priority) Term Loan(a) | | 3M US L + 8.75% | | | | 02/28/25 | | | | 751,740 | |
| | 89,842 | | | Travelport Finance S.a r.l., First Lien - 2021 Consented Term Loan(a) | | 3M US L + 6.75% | | | | 05/29/26 | | | | 70,162 | |
| | 550,000 | | | UKG, Inc. TL 2L | | 3M US L + 5.25% | | | | 05/03/27 | | | | 511,775 | |
| | 554,765 | | | Vantage Specialty Chemicals, Inc., First Lien - Closing Date Term Loan(a) | | 3M US L + 3.50% | | | | 10/28/24 | | | | 527,373 | |
| | 233,825 | | | Viad Corp, First Lien - Initial Term Loan(a) | | 3M US L + 5.00% | | | | 07/30/28 | | | | 220,965 | |
| | 533,793 | | | WaterBridge Midstream Operating LLC, First Lien - Initial Term Loan(a) | | 3M US L + 5.75% | | | | 06/22/26 | | | | 506,169 | |
| | | | | | | | | | | | |
| TOTAL BANK LOANS | | | | | | | | | | | |
| (Cost $14,023,730) | | | | | | | | | | 12,490,742 | |
| Shares/Description | | Value | |
| SPECIAL PURPOSE ACQUISITION COMPANIES (16.24%) | | | | |
| | 51,583 | | | 8i ACQUISITION 2 Corp.(b) | | | 509,124 | |
| | 42,066 | | | Accretion Acquisition Corp.(b) | | | 414,342 | |
| | 36,143 | | | Achari Ventures Holdings Corp. I(b) | | | 361,069 | |
| | 81,790 | | | ALSP Orchid Acquisition Corp. I(b) | | | 816,264 | |
| | 29,842 | | | AltEnergy Acquisition Corp.(b) | | | 296,331 | |
| | 7,413 | | | Apeiron Capital Investment Corp.(b) | | | 73,833 | |
| | 36,781 | | | Arisz Acquisition Corp.(b) | | | 362,661 | |
| | 138,896 | | | Avalon Acquisition, Inc.(b) | | | 1,387,572 | |
| | 114,259 | | | Barings BDC, Inc. | | | 1,063,751 | |
| | 29,282 | | | BioPlus Acquisition Corp.(b) | | | 289,599 | |
| | 49,448 | | | Black Mountain Acquisition Corp.(b) | | | 492,008 | |
| | 14,842 | | | Blockchain Coinvestors Acquisition Corp. I(b) | | | 147,233 | |
See Notes to Financial Statements.
| Annual Report | June 30, 2022 | 11 |
RiverNorth/DoubleLine Strategic Opportunity Fund, Inc.
| Schedule of Investments | June 30, 2022 |
| Shares/Description | | Value | |
| SPECIAL PURPOSE ACQUISITION COMPANIES (continued) | | | | |
| | 36,149 | | | Blockchain Moon Acquisition Corp.(b) | | $ | 357,514 | |
| | 109,883 | | | Blue Ocean Acquisition Corp.(b) | | | 1,090,039 | |
| | 73,502 | | | Bullpen Parlay Acquisition Co.(b) | | | 728,405 | |
| | 59,686 | | | Cactus Acquisition Corp. 1, Ltd.(b) | | | 594,473 | |
| | 22,012 | | | Crescera Capital Acquisition Corp.(b) | | | 219,460 | |
| | 2,146 | | | CW TRAVEL(b) | | | 42,920 | |
| | 35,646 | | | Deep Medicine Acquisition Corp.(b) | | | 355,391 | |
| | 24,051 | | | Digital Health Acquisition Corp.(b) | | | 241,232 | |
| | 38,368 | | | Direct Selling Acquisition Corp.(b) | | | 384,447 | |
| | 12,048 | | | Enterprise 4.0 Technology Acquisition Corp.(b) | | | 119,998 | |
| | 32,156 | | | Everest Consolidator Acquisition Corp.(b) | | | 320,917 | |
| | 12,019 | | | ExcelFin Acquisition Corp.(b) | | | 119,589 | |
| | 40,085 | | | Finnovate Acquisition Corp.(b) | | | 398,445 | |
| | 215,585 | | | First Eagle Alternative Capital BDC, Inc. | | | 763,171 | |
| | 15,126 | | | Founder SPAC(b) | | | 153,529 | |
| | 58,432 | | | Games & Esports Experience Acquisition Corp.(b) | | | 584,320 | |
| | 46,043 | | | GigCapital5, Inc.(b) | | | 463,653 | |
| | 62,828 | | | Globalink Investment, Inc.(b) | | | 622,625 | |
| | 29,652 | | | Green Visor Financial Technology Acquisition Corp. I(b) | | | 296,520 | |
| | 18,354 | | | Hunt Cos. Acquisition Corp. I(b) | | | 184,458 | |
| | 24,074 | | | Industrial Human Capital, Inc.(b) | | | 241,462 | |
| | 17,822 | | | Innovative International Acquisition Corp.(b) | | | 178,576 | |
| | 73,254 | | | Integrated Rail and Resources Acquisition Corp.(b) | | | 728,877 | |
| | 8,038 | | | Intelligent Medicine Acquisition Corp.(b) | | | 80,782 | |
| | 880 | | | Intelsat Jackson Holdings SA(b) | | | 3,410 | |
| | 4,203 | | | Intelsat New Common(b) | | | 113,481 | |
| | 44,245 | | | Jupiter Wellness Acquisition Corp.(b) | | | 439,795 | |
| | 51,780 | | | LAMF Global Ventures Corp. I(b) | | | 515,729 | |
| | 12,126 | | | Learn CW Investment Corp.(b) | | | 120,532 | |
| | 88,428 | | | Legato Merger Corp. II(b) | | | 877,206 | |
| | 36,722 | | | LF Capital Acquisition Corp. II, Class A(b) | | | 366,118 | |
| | 128,274 | | | Lionheart III Corp.(b) | | | 1,280,176 | |
| | 62,178 | | | LIV Capital Acquisition Corp. II(b) | | | 621,780 | |
| | 24,030 | | | M3-Brigade Acquisition III Corp.(b) | | | 239,579 | |
| | 29,228 | | | Mana Capital Acquisition Corp.(b) | | | 290,526 | |
| | 13,637 | | | McDermott International, Ltd.(b) | | | 7,500 | |
| | 16,082 | | | McLaren Technology Acquisition Corp.(b) | | | 160,981 | |
| | 80,170 | | | Mercato Partners Acquisition Corp.(b) | | | 798,493 | |
| | 53,922 | | | Mount Rainier Acquisition Corp.(b) | | | 542,455 | |
| | 63,000 | | | Mountain Crest Acquisition Corp. V(b) | | | 623,070 | |
| | 58,756 | | | Nabors Energy Transition Corp.(b) | | | 587,560 | |
| | 24,074 | | | Newcourt Acquisition Corp.(b) | | | 241,462 | |
| | 86,683 | | | OmniLit Acquisition Corp.(b) | | | 869,430 | |
| | 20,906 | | | Onyx Acquisition Co. I(b) | | | 209,060 | |
| | 71,293 | | | OPY Acquisition Corp. I(b) | | | 701,523 | |
See Notes to Financial Statements.
| 12 | (888) 848-7569 | www.rivernorth.com |
RiverNorth/DoubleLine Strategic Opportunity Fund, Inc.
| Schedule of Investments | June 30, 2022 |
| Shares/Description | | Value | |
| SPECIAL PURPOSE ACQUISITION COMPANIES (continued) | | | | |
| | 38,618 | | | Pershing Square Tontine Holdings, Ltd.(b) | | $ | 771,201 | |
| | 13,488 | | | Phoenix Biotech Acquisition Corp.(b) | | | 135,150 | |
| | 47,750 | | | Project Energy Reimagined Acquisition Corp.(b) | | | 465,085 | |
| | 64,779 | | | PROOF Acquisition Corp. I(b) | | | 639,369 | |
| | 5,941 | | | Pyrophyte Acquisition Corp.(b) | | | 59,766 | |
| | 87,648 | | | ROC Energy Acquisition Corp.(b) | | | 880,862 | |
| | 58,888 | | | Roth CH Acquisition V Co.(b) | | | 578,869 | |
| | 12,046 | | | Sanaby Health Acquisition Corp. I(b) | | | 120,942 | |
| | 27,067 | | | Screaming Eagle Acquisition Corp.(b) | | | 262,821 | |
| | 8,017 | | | Semper Paratus Acquisition Corp.(b) | | | 80,330 | |
| | 104,224 | | | Sizzle Acquisition Corp.(b) | | | 1,043,282 | |
| | 75,000 | | | Social Capital Hedosophia Holdings Corp. VI(b) | | | 744,750 | |
| | 16,034 | | | Spindletop Health Acquisition Corp.(b) | | | 159,859 | |
| | 18,072 | | | SportsMap Tech Acquisition Corp.(b) | | | 179,816 | |
| | 58,567 | | | ST Energy Transition I, Ltd.(b) | | | 583,913 | |
| | 32,164 | | | TG Venture Acquisition Corp.(b) | | | 319,163 | |
| | 12,018 | | | Thrive Acquisition Corp.(b) | | | 120,541 | |
| | 2,376 | | | TKB Critical Technologies 1(b) | | | 23,855 | |
| | 11,778 | | | TLGY Acquisition Corp.(b) | | | 118,016 | |
| | 96,492 | | | Trine II Acquisition Corp.(b) | | | 959,130 | |
| | 49,450 | | | Tristar Acquisition I Corp.(b) | | | 487,083 | |
| | 87,648 | | | UTA Acquisition Corp.(b) | | | 879,986 | |
| | 29,228 | | | Vahanna Tech Edge Acquisition I Corp.(b) | | | 291,695 | |
| | 61,760 | | | Worldwide Webb Acquisition Corp.(b) | | | 608,954 | |
| | | | | |
| TOTAL SPECIAL PURPOSE ACQUISITION COMPANIES | | | | |
| (Cost $35,659,052) | | | 35,608,894 | |
| Shares/Description | Value | |
| PREFERRED STOCKS (4.27%) | | | | |
| | 106,658 | | | First Eagle Alternative Capital BDC, Inc., 5.00%, 05/25/2026 | | $ | 2,458,467 | |
| | 235,511 | | | Oxford Square Capital Corp., 6.50%, 03/30/2024 | | | 5,887,775 | |
| | 2,946 | | | Riverbed Tech Pref A, 1.50%, 11/17/28(b) | | | 17,676 | |
| | 39,726 | | | XAI Octagon Floating Rate Alternative Income Term Trust, Series 2026, 6.50%, 03/31/2026 | | | 1,001,095 | |
| | | | | | | | | |
| TOTAL PREFERRED STOCKS | | | | |
| (Cost $9,615,146) | | | 9,365,013 | |
| Principal Amount/Description | | Rate | | | Maturity | | | Value | |
| COLLATERALIZED LOAN OBLIGATIONS (6.81%) | | | | | | | | | | | |
| $ | 500,000 | | | Apidos CLO XXIV(a)(c) | | 3M US L + 5.80% | | | | 10/20/30 | | | $ | 428,890 | |
| | 500,000 | | | Apidos CLO XXXII(a)(c) | | 3M US L + 6.75% | | | | 01/20/33 | | | | 454,969 | |
See Notes to Financial Statements.
| Annual Report | June 30, 2022 | 13 |
RiverNorth/DoubleLine Strategic Opportunity Fund, Inc.
| Schedule of Investments | June 30, 2022 |
| Principal Amount/Description | | Rate | | | Maturity | | | Value | |
| COLLATERALIZED LOAN OBLIGATIONS (continued) | | | | | | | | | | | |
| $ | 500,000 | | | Bain Capital Credit Clo 2019-3, Ltd.(a)(c) | | 3M US L + 7.10% | | | | 10/21/34 | | | $ | 453,207 | |
| | 500,000 | | | Bain Capital Credit CLO 2021-2, Ltd.(a)(c) | | 3M US L + 3.15% | | | | 07/16/34 | | | | 467,363 | |
| | 500,000 | | | Bain Capital Credit CLO 2022-3, Ltd.(a)(c) | | 3M US SOFR + 7.35% | | | | 07/17/35 | | | | 465,755 | |
| | 500,000 | | | Barings CLO, Ltd.(a)(c) | | 3M US L + 5.82% | | | | 10/15/30 | | | | 413,417 | |
| | 500,000 | | | Canyon Capital CLO, Ltd.(a)(c) | | 3M US L + 5.75% | | | | 07/15/31 | | | | 414,165 | |
| | 500,000 | | | Carlyle Global Market Strategies CLO, Ltd.(a)(c) | | 3M US L + 5.35% | | | | 05/15/31 | | | | 404,107 | |
| | 500,000 | | | Carlyle Global Market Strategies CLO, Ltd.(a)(c) | | 3M US L + 5.50% | | | | 10/15/30 | | | | 404,586 | |
| | 1,000,000 | | | Carlyle US CLO 2020-2, Ltd.(a)(c) | | 3M US L + 6.70% | | | | 01/25/35 | | | | 910,556 | |
| | 500,000 | | | Carlyle US CLO 2021-1, Ltd.(a)(c) | | 3M US L + 6.00% | | | | 04/15/34 | | | | 425,426 | |
| | 500,000 | | | Chenango Park CLO, Ltd.(a)(c) | | 3M US L + 5.80% | | | | 04/15/30 | | | | 444,603 | |
| | 500,000 | | | Fillmore Park CLO, Ltd.(a)(c) | | 3M US L + 5.40% | | | | 07/15/30 | | | | 442,604 | |
| | 1,000,000 | | | Galaxy XIX CLO, Ltd.(a)(c) | | 3M US L + 6.53% | | | | 07/24/30 | | | | 865,096 | |
| | 500,000 | | | Goldentree Loan Management US Clo 10, Ltd.(a)(c) | | 3M US L + 6.20% | | | | 07/20/34 | | | | 427,363 | |
| | 500,000 | | | Goldentree Loan Management US CLO 3, Ltd.(a)(c) | | 3M US L + 2.85% | | | | 04/20/30 | | | | 470,820 | |
| | 500,000 | | | Milos CLO, Ltd.(a)(c) | | 3M US L + 6.15% | | | | 10/20/30 | | | | 434,231 | |
| | 500,000 | | | Myers Park CLO, Ltd.(a)(c) | | 3M US L + 5.50% | | | | 10/20/30 | | | | 445,061 | |
| | 500,000 | | | Neuberger Berman Loan Advisers CLO 37, Ltd.(a)(c) | | 3M US L + 5.75% | | | | 07/20/31 | | | | 453,837 | |
| | 500,000 | | | Neuberger Berman Loan Advisers CLO 42, Ltd.(a)(c) | | 3M US L + 5.95% | | | | 07/16/35 | | | | 437,014 | |
| | 500,000 | | | Neuberger Berman Loan Advisers Clo 44, Ltd.(a)(c) | | 3M US L + 6.00% | | | | 10/16/34 | | | | 435,863 | |
| | 500,000 | | | Ocean Trails CLO V(a)(c) | | 3M US L + 3.45% | | | | 10/13/31 | | | | 457,021 | |
| | 500,000 | | | REESE PARK CLO, Ltd.(a)(c) | | 3M US L + 6.50% | | | | 10/15/34 | | | | 447,559 | |
See Notes to Financial Statements.
| 14 | (888) 848-7569 | www.rivernorth.com |
RiverNorth/DoubleLine Strategic Opportunity Fund, Inc.
| Schedule of Investments | June 30, 2022 |
| Principal Amount/Description | | Rate | | | Maturity | | | Value | |
| COLLATERALIZED LOAN OBLIGATIONS (continued) | | | | | | | | | | | |
| $ | 500,000 | | | Sound Point CLO XXVI, Ltd.(a)(c) | | 3M US L + 6.86% | | | | 07/20/34 | | | $ | 438,094 | |
| | 500,000 | | | Sound Point CLO XXXII, Ltd.(a)(c) | | 3M US L + 6.70% | | | | 10/25/34 | | | | 430,193 | |
| | 500,000 | | | THL Credit Wind River 2017-3 CLO, Ltd.(a)(c) | | 3M US L + 7.08% | | | | 04/15/35 | | | | 456,875 | |
| | 500,000 | | | THL Credit Wind River CLO, Ltd.(a)(c) | | 3M US L + 5.75% | | | | 07/15/30 | | | | 434,620 | |
| | 500,000 | | | Unity-Peace Park CLO, Ltd.(a)(c) | | 3M US SOFR + 7.175% | | | | 04/20/35 | | | | 464,142 | |
| | 500,000 | | | Voya CLO 2019-1, Ltd.(a)(c) | | 3M US L + 6.12% | | | | 04/15/31 | | | | 451,521 | |
| | 500,000 | | | Voya CLO, Ltd.(a)(c) | | 3M US L + 5.25% | | | | 07/15/31 | | | | 401,367 | |
| | 500,000 | | | Voya CLO, Ltd.(a)(c) | | 3M US L + 5.95% | | | | 07/14/31 | | | | 416,541 | |
| | 500,000 | | | Webster Park CLO, Ltd.(a)(c) | | 3M US L + 5.50% | | | | 07/20/30 | | | | 439,771 | |
| TOTAL COLLATERALIZED LOAN OBLIGATIONS | | | | | | | | | | | |
| (Cost $16,765,406) | | | | | | | | | | 14,936,637 | |
| Shares/Description | | Value | |
| RIGHTS (0.02%)(d) | | | |
| | 51,583 | | | 8i ACQUISITION 2 Corp., Strike Price $11.50, Expires 11/24/2022 | | | 11,864 | |
| | 42,066 | | | Accretion Acquisition Corp., Strike Price $0.01, Expires 12/31/2049 | | | 5,069 | |
| | 36,781 | | | Arisz Acquisition Corp., Strike Price $11.50, Expires 05/01/2023 | | | 3,678 | |
| | 36,149 | | | Blockchain Moon Acquisition Corp., Strike Price $0.01, Expires 12/31/2049 | | | 1,959 | |
| | 35,646 | | | Deep Medicine Acquisition Corp., Strike Price $11.50, Expires 12/09/2022 | | | 3,925 | |
| | 62,828 | | | Globalink Investment, Inc., Strike Price $11.50, Expires 08/19/2023 | | | 4,712 | |
| | 44,245 | | | Jupiter Wellness Acquisition Corp., Strike Price $11.50, Expires 12/31/2049 | | | 5,314 | |
See Notes to Financial Statements.
| Annual Report | June 30, 2022 | 15 |
RiverNorth/DoubleLine Strategic Opportunity Fund, Inc.
| Schedule of Investments | June 30, 2022 |
| Shares/Description | | Value | |
| RIGHTS (continued) | | | | |
| | 29,228 | | | Mana Capital Acquisition Corp., Strike Price $11.50, Expires 12/01/2026 | | $ | 4,706 | |
| | | | | | | | | |
| TOTAL RIGHTS | | | | | |
| (Cost $83,776) | | | | 41,227 | |
| | | | | | | | | |
| Shares/Description | | | Value | |
| WARRANTS (0.08%)(d) |
| | 51,583 | | | 8i ACQUISITION 2 Corp., Strike Price $11.50, Expires 11/24/2022 | | | 10,316 | |
| | 21,033 | | | Accretion Acquisition Corp., Strike Price $11.50, Expires 02/19/2023 | | | 1,891 | |
| | 36,143 | | | Achari Ventures Holdings Corp. I, Strike Price $11.50, Expires 02/05/2023 | | | 4,699 | |
| | 40,895 | | | ALSP Orchid Acquisition Corp. I, Strike Price $11.50, Expires 05/03/2023 | | | 4,192 | |
| | 14,921 | | | AltEnergy Acquisition Corp., Strike Price $11.50, Expires 02/06/2023 | | | 2,504 | |
| | 36,781 | | | Arisz Acquisition Corp., Strike Price $11.50, Expires 05/01/2023 | | | 3,310 | |
| | 104,172 | | | Avalon Acquisition, Inc., Strike Price $11.50, Expires 02/26/2023 | | | 9,428 | |
| | 37,086 | | | Black Mountain Acquisition Corp., Strike Price $11.50, Expires 10/15/2027 | | | 6,675 | |
| | 7,421 | | | Blockchain Coinvestors Acquisition Corp. I, Strike Price $11.50, Expires 01/03/2024 | | | 594 | |
| | 36,149 | | | Blockchain Moon Acquisition Corp., Strike Price $11.50, Expires 03/24/2023 | | | 2,711 | |
| | 29,843 | | | Cactus Acquisition Corp. 1, Ltd., Strike Price $11.50, Expires 07/20/2023 | | | 3,283 | |
| | 11,006 | | | Crescera Capital Acquisition Corp., Strike Price $11.50, Expires 04/20/2023 | | | 1,761 | |
| | 24,051 | | | Digital Health Acquisition Corp., Strike Price $11.50, Expires 10/14/2023 | | | 2,646 | |
| | 19,184 | | | Direct Selling Acquisition Corp., Strike Price $11.50, Expires 11/23/2023 | | | 1,938 | |
| | 6,024 | | | Enterprise 4.0 Technology Acquisition Corp., Strike Price $11.50, Expires 09/24/2023 | | | 1,024 | |
| | 16,078 | | | Everest Consolidator Acquisition Corp., Strike Price $11.50, Expires 07/19/2023 | | | 1,608 | |
| | 6,010 | | | ExcelFin Acquisition Corp., Strike Price $11.50, Expires 07/05/2023 | | | 1,142 | |
| | 30,063 | | | Finnovate Acquisition Corp., Strike Price $11.50, Expires 04/15/2023 | | | 3,112 | |
| | 46,043 | | | GigCapital5, Inc., Strike Price $11.50, Expires 12/31/2028 | | | 2,956 | |
See Notes to Financial Statements.
| 16 | (888) 848-7569 | www.rivernorth.com |
RiverNorth/DoubleLine Strategic Opportunity Fund, Inc.
| Schedule of Investments | June 30, 2022 |
| Shares/Description | | Value | |
| WARRANTS (continued) |
| | 62,828 | | | Globalink Investment, Inc., Strike Price $11.50, Expires 08/19/2023 | | $ | 2,727 | |
| | 14,826 | | | Green Visor Financial Technology Acquisition Corp. I, Strike Price $11.50, Expires 05/08/2023 | | | 2,002 | |
| | 9,177 | | | Hunt Cos. Acquisition Corp. I, Strike Price $11.50, Expires 12/31/2028 | | | 1,377 | |
| | 24,074 | | | Industrial Human Capital, Inc., Strike Price $11.50, Expires 12/31/2028 | | | 964 | |
| | 8,911 | | | Innovative International Acquisition Corp., Strike Price $11.50, Expires 04/03/2023 | | | 669 | |
| | 36,627 | | | Integrated Rail and Resources Acquisition Corp., Strike Price $11.50, Expires 05/21/2023 | | | 10,622 | |
| | 25,890 | | | LAMF Global Ventures Corp. I, Strike Price $11.50, Expires 04/04/2023 | | | 2,071 | |
| | 6,063 | | | Learn CW Investment Corp., Strike Price $11.50, Expires 12/31/2028 | | | 485 | |
| | 44,214 | | | Legato Merger Corp. II, Strike Price $11.50, Expires 02/05/2023 | | | 11,614 | |
| | 18,361 | | | LF Capital Acquisition Corp. II, Strike Price $11.50, Expires 01/07/2026 | | | 1,838 | |
| | 64,137 | | | Lionheart III Corp., Strike Price $11.50, Expires 03/19/2023 | | | 10,902 | |
| | 8,010 | | | M3-Brigade Acquisition III Corp., Strike Price $11.50, Expires 05/11/2023 | | | 801 | |
| | 14,614 | | | Mana Capital Acquisition Corp., Strike Price $11.50, Expires 12/01/2026 | | | 2,338 | |
| | 8,041 | | | McLaren Technology Acquisition Corp., Strike Price $11.50, Expires 03/03/2023 | | | 874 | |
| | 40,085 | | | Mercato Partners Acquisition Corp., Strike Price $11.50, Expires 12/28/2026 | | | 5,211 | |
| | 53,922 | | | Mount Rainier Acquisition Corp., Strike Price $11.50, Expires 12/04/2022 | | | 7,549 | |
| | 29,378 | | | Nabors Energy Transition Corp., Strike Price $11.50, Expires 06/08/2023 | | | 7,638 | |
| | 12,037 | | | Newcourt Acquisition Corp., Strike Price $11.50, Expires 04/12/2028 | | | 811 | |
| | 10,453 | | | Onyx Acquisition Co. I, Strike Price $11.50, Expires 01/07/2023 | | | 1,045 | |
| | 35,646 | | | OPY Acquisition Corp. I, Strike Price $11.50, Expires 04/08/2023 | | | 8,908 | |
| | 6,744 | | | Phoenix Biotech Acquisition Corp., Strike Price $11.50, Expires 09/01/2026 | | | 674 | |
| | 23,875 | | | Project Energy Reimagined Acquisition Corp., Strike Price $11.50, Expires 12/31/2028 | | | 3,374 | |
| | 29,444 | | | Roth CH Acquisition V Co., Strike Price $11.50, Expires 05/24/2023 | | | 4,858 | |
See Notes to Financial Statements.
| Annual Report | June 30, 2022 | 17 |
RiverNorth/DoubleLine Strategic Opportunity Fund, Inc.
| Schedule of Investments | June 30, 2022 |
| Shares/Description | | Value | |
| WARRANTS (continued) |
| | 6,023 | | | Sanaby Health Acquisition Corp. I, Strike Price $11.50, Expires 07/30/2028 | | $ | 693 | |
| | 8,017 | | | Spindletop Health Acquisition Corp., Strike Price $11.50, Expires 12/31/2028 | | | 641 | |
| | 13,554 | | | SportsMap Tech Acquisition Corp., Strike Price $11.50, Expires 09/01/2027 | | | 2,169 | |
| | 32,164 | | | TG Venture Acquisition Corp., Strike Price $11.50, Expires 08/13/2023 | | | 3,860 | |
| | 6,009 | | | Thrive Acquisition Corp., Strike Price $11.50, Expires 03/09/2023 | | | 667 | |
| | 48,246 | | | Trine II Acquisition Corp., Strike Price $11.50, Expires 12/31/2027 | | | 7,237 | |
| | 24,725 | | | Tristar Acquisition I Corp., Strike Price $11.50, Expires 12/31/2028 | | | 3,023 | |
| | 14,614 | | | Vahanna Tech Edge Acquisition I Corp., Strike Price $11.50, Expires 07/13/2024 | | | 2,338 | |
| | 30,880 | | | Worldwide Webb Acquisition Corp., Strike Price $11.50, Expires 03/27/2023 | | | 2,683 | |
| | | | | | | | | |
| TOTAL WARRANTS | | | | |
| (Cost $329,683) | | | 178,453 | |
| Principal Amount/Description | Rate | | | Maturity | | | Value | |
| U.S. CORPORATE BONDS (6.28%) | | |
| Basic Materials (0.21%) | | | | | | | | |
| $ | 175,000 | | | ASP Unifrax Holdings, Inc.(c) | | 7.50 | % | | | 09/30/29 | | | $ | 121,795 | |
| | 260,000 | | | Illuminate Buyer LLC / Illuminate Holdings IV, Inc.(c) | | 9.00 | % | | | 07/01/28 | | | | 205,739 | |
| | 195,000 | | | Vibrantz Technologies, Inc.(c) | | 9.00 | % | | | 02/15/30 | | | | 137,737 | |
| | | | | | | | | | | | | | | 465,271 | |
| Communications (0.57%) | | | | | | | | |
| | 275,000 | | | Cengage Learning, Inc.(c) | | 9.50 | % | | | 06/15/24 | | | | 254,768 | |
| | 545,000 | | | Embarq Corp Eq | | 8.00 | % | | | 06/01/36 | | | | 410,486 | |
| | 510,000 | | | Endurance International Group Holdings, Inc.(c) | | 6.00 | % | | | 02/15/29 | | | | 368,817 | |
| | 225,000 | | | McGraw-Hill Education, Inc.(c) | | 5.75 | % | | | 08/01/28 | | | | 193,094 | |
| | | | | | | | | | | | | | | 1,227,165 | |
| Consumer, Cyclical (0.66%) | | | | | | | | |
| | 45,000 | | | Carnival Corp.(c) | | 7.63 | % | | | 03/01/26 | | | | 34,959 | |
| | 330,000 | | | Dealer Tire LLC / DT Issuer LLC(c) | | 8.00 | % | | | 02/01/28 | | | | 285,519 | |
| | 60,000 | | | Park River Holdings, Inc.(c) | | 5.63 | % | | | 02/01/29 | | | | 37,478 | |
| | 300,000 | | | PetSmart, Inc. / PetSmart Finance Corp.(c) | | 7.75 | % | | | 02/15/29 | | | | 270,826 | |
| | 155,000 | | | Premier Entertainment Sub LLC(c) | | 5.63 | % | | | 09/01/29 | | | | 110,589 | |
See Notes to Financial Statements.
| 18 | (888) 848-7569 | www.rivernorth.com |
RiverNorth/DoubleLine Strategic Opportunity Fund, Inc.
| Schedule of Investments | June 30, 2022 |
| Principal Amount/Description | Rate | | | Maturity | | | Value | |
| Consumer, Cyclical (continued) | | | | | | | | |
| $ | 125,000 | | | Premier Entertainment Sub LLC(c) | | 5.88 | % | | | 09/01/31 | | | $ | 86,925 | |
| | 280,000 | | | SWF Escrow Issuer Corp.(c) | | 6.50 | % | | | 10/01/29 | | | | 188,699 | |
| | 190,000 | | | TKC Holdings, Inc.(c) | | 10.50 | % | | | 05/15/29 | | | | 155,743 | |
| | 405,000 | | | Wheel Pros, Inc.(c) | | 6.50 | % | | | 05/15/29 | | | | 286,759 | |
| | | | | | | | | | | | | | | 1,457,497 | |
| Consumer, Non-cyclical (0.46%) | | | | | | | | |
| | 270,000 | | | Air Methods Corp.(c) | | 8.00 | % | | | 05/15/25 | | | | 177,233 | |
| | 160,000 | | | CHS/Community Health Systems, Inc.(c) | | 6.88 | % | | | 04/15/29 | | | | 103,666 | |
| | 40,000 | | | Coty, Inc.(c) | | 6.50 | % | | | 04/15/26 | | | | 36,937 | |
| | 150,000 | | | PECF USS Intermediate Holding III Corp.(c) | | 8.00 | % | | | 11/15/29 | | | | 119,085 | |
| | 127,656 | | | Pyxus Holdings, Inc. | | 10.00 | % | | | 08/24/24 | | | | 106,459 | |
| | 305,000 | | | Radiology Partners, Inc.(c) | | 9.25 | % | | | 02/01/28 | | | | 229,506 | |
| | 110,000 | | | Sabre GLBL, Inc.(c) | | 7.38 | % | | | 09/01/25 | | | | 102,240 | |
| | 190,000 | | | Triton Water Holdings, Inc.(c) | | 6.25 | % | | | 04/01/29 | | | | 135,215 | |
| | | | | | | | | | | | | | | 1,010,341 | |
| Energy (0.40%) | | | | | | | | |
| | 200,000 | | | Kosmos Energy, Ltd.(e) | | 7.50 | % | | | 03/01/28 | | | | 166,106 | |
| | 580,000 | | | NGL Energy Operating LLC / NGL Energy Finance Corp.(c) | | 7.50 | % | | | 02/01/26 | | | | 524,045 | |
| | 250,000 | | | SierraCol Energy Andina LLC(c) | | 6.00 | % | | | 06/15/28 | | | | 182,876 | |
| | | | | | | | | | | | | | | 873,027 | |
| Financial (3.37%) | | | | | | | | |
| | 2,000,000 | | | Bain Capital Specialty Finance, Inc. | | 8.50 | % | | | 06/10/23 | | | | 2,000,000 | |
| | 1,648,448 | | | New Mountain Finance Corp. | | 5.75 | % | | | 08/15/23 | | | | 1,650,096 | |
| | 4,150,000 | | | PennantPark Floating Rate Capital, Ltd. | | 4.25 | % | | | 04/01/26 | | | | 3,728,438 | |
| | | | | | | | | | | | | | | 7,378,534 | |
| Industrial (0.22%) | | | | | | | | |
| | 105,000 | | | Artera Services LLC(c) | | 9.03 | % | | | 12/04/25 | | | | 84,887 | |
| | 365,000 | | | Triumph Group, Inc.(c) | | 6.25 | % | | | 09/15/24 | | | | 326,043 | |
| | 90,000 | | | Triumph Group, Inc. | | 7.75 | % | | | 08/15/25 | | | | 69,426 | |
| | | | | | | | | | | | | | | 480,356 | |
| Technology (0.31%) | | | | | | | | |
| | 510,000 | | | Castle US Holding Corp.(c) | | 9.50 | % | | | 02/15/28 | | | | 436,195 | |
| | 72,390 | | | CWT Travel Group, Inc.(c) | | 8.50 | % | | | 11/19/26 | | | | 65,422 | |
| | 225,000 | | | Virtusa Corp.(c) | | 7.13 | % | | | 12/15/28 | | | | 181,198 | |
| | | | | | | | | | | | | | | 682,815 | |
| Utilities (0.08%) | | | | | | | | | | | |
| | 200,000 | | | Mercury Chile Holdco LLC(c) | | 6.50 | % | | | 01/24/27 | | | | 173,684 | |
| | | | | | | | | | | | | | | | |
| TOTAL U.S. CORPORATE BONDS | | | | | | | | | | | |
| (Cost $15,793,888) | | | | | | | | | | 13,748,690 | |
See Notes to Financial Statements.
| Annual Report | June 30, 2022 | 19 |
RiverNorth/DoubleLine Strategic Opportunity Fund, Inc.
| Schedule of Investments | June 30, 2022 |
| Principal Amount/Description | Rate | | | Maturity | | | Value | |
| U.S. GOVERNMENT / AGENCY MORTGAGE BACKED SECURITIES (36.51%) | | | | | | | | |
| $ | 204,466 | | | Alternative Loan Trust(a) | | 3.37 | % | | | 12/25/35 | | | $ | 192,914 | |
| | 548,038 | | | Alternative Loan Trust | | 5.50 | % | | | 11/25/35 | | | | 383,138 | |
| | 1,917,736 | | | Alternative Loan Trust | | 5.50 | % | | | 12/25/35 | | | | 1,579,354 | |
| | 1,898,590 | | | Alternative Loan Trust | | 5.75 | % | | | 03/25/37 | | | | 1,215,257 | |
| | 2,195,772 | | | Alternative Loan Trust | | 6.00 | % | | | 07/25/37 | | | | 1,297,483 | |
| | 1,864,104 | | | Alternative Loan Trust | | 6.25 | % | | | 08/25/37 | | | | 1,170,429 | |
| | 1,053,340 | | | Alternative Loan Trust | | 6.50 | % | | | 09/25/36 | | | | 648,159 | |
| | 1,631,773 | | | Banc of America Funding Trust(a) | | 2.70 | % | | | 05/20/36 | | | | 1,351,565 | |
| | 894,394 | | | Banc of America Mortgage Trust | | 6.00 | % | | | 09/25/37 | | | | 815,980 | |
| | 1,214,959 | | | Bear Stearns ALT-A Trust(a) | | 3.25 | % | | | 01/25/36 | | | | 1,142,944 | |
| | 781,079 | | | Bear Stearns ARM Trust(a) | | 3.25 | % | | | 07/25/36 | | | | 699,943 | |
| | 2,519,873 | | | Chase Mortgage Finance Trust Series(a) | | 1M US L + 0.60 | % | | | 06/25/37 | | | | 844,978 | |
| | 2,320,330 | | | ChaseFlex Trust Series 2007-1 | | 6.50 | % | | | 02/25/37 | | | | 996,635 | |
| | 3,930,000 | | | CHL GMSR Issuer Trust(a)(c) | | 1M US L + 2.75 | % | | | 05/25/23 | | | | 3,892,615 | |
| | 1,427,049 | | | CHL Mortgage Pass-Through Trust(a) | | 3.05 | % | | | 03/25/37 | | | | 1,265,200 | |
| | 1,425,385 | | | CHL Mortgage Pass-Through Trust | | 5.75 | % | | | 07/25/37 | | | | 843,321 | |
| | 1,458,865 | | | CHL Mortgage Pass-Through Trust(a) | | 1M US L + 0.60 | % | | | 03/25/35 | | | | 1,343,086 | |
| | 331,756 | | | Citigroup Mortgage Loan Trust(a) | | 2.97 | % | | | 04/25/37 | | | | 323,408 | |
| | 1,168,239 | | | Citigroup Mortgage Loan Trust, Inc.(a) | | 2.98 | % | | | 10/25/35 | | | | 759,418 | |
| | 4,500,000 | | | COLT 2021-4 Mortgage Loan Trust(a)(c) | | 4.14 | % | | | 10/25/66 | | | | 3,253,623 | |
| | 2,000,000 | | | Connecticut Avenue Securities Trust 2022-R02(a)(c) | | 30D US SOFR + 7.65 | % | | | 01/25/27 | | | | 1,753,414 | |
| | 1,000,000 | | | Connecticut Avenue Securities Trust 2022-R03(a)(c) | | 30D US SOFR + 9.85 | % | | | 03/25/42 | | | | 960,743 | |
| | 705,865 | | | CSFB Mortgage-Backed Pass-Through Certificates | | 5.50 | % | | | 10/25/35 | | | | 425,347 | |
| | 1,371,002 | | | CSMC Mortgage-Backed Trust | | 6.00 | % | | | 02/25/37 | | | | 920,030 | |
| | 1,626,872 | | | CSMC Mortgage-Backed Trust | | 6.75 | % | | | 08/25/36 | | | | 1,065,589 | |
| | 1,585,407 | | | Fannie Mae REMICS(a)(f) | | 0.00 | % | | | 07/25/43 | | | | 1,039,429 | |
| | 1,587,368 | | | Fannie Mae REMICS(a)(g) | | 5.90% - 1M US L | | | | 10/25/41 | | | | 213,879 | |
| | 4,398,876 | | | Fannie Mae REMICS(a)(g) | | 6.05% - 1M US L | | | | 07/25/49 | | | | 573,460 | |
| | 1,681,384 | | | Fannie Mae REMICS(a)(g) | | 6.45% - 1M US L | | | | 03/25/42 | | | | 231,978 | |
| | 1,395,926 | | | Fannie Mae REMICS(a)(g) | | 6.50% - 1M US L | | | | 12/25/41 | | | | 186,728 | |
See Notes to Financial Statements.
| 20 | (888) 848-7569 | www.rivernorth.com |
RiverNorth/DoubleLine Strategic Opportunity Fund, Inc.
| Schedule of Investments | June 30, 2022 |
| Principal Amount/Description | Rate | | | Maturity | | | Value | |
| U.S. GOVERNMENT / AGENCY MORTGAGE BACKED SECURITIES (continued) | | | | | | | | |
| $ | 497,268 | | | Fannie Mae REMICS(a) | | 7.62% - 1M US L | | | | 11/25/42 | | | $ | 355,689 | |
| | 699,311 | | | Federal Home Loan Mortgage Corp. REMICS(a) | | 4.05% - 1M US L | | | | 01/15/33 | | | | 635,808 | |
| | 297,875 | | | First Horizon Alternative Mortgage Securities Trust(a) | | 3.20 | % | | | 10/25/35 | | | | 264,997 | |
| | 11,987,627 | | | Freddie Mac REMICS(g) | | 2.00 | % | | | 11/25/50 | | | | 1,503,297 | |
| | 4,137,237 | | | Freddie Mac REMICS | | 4.00 | % | | | 12/15/40 | | | | 4,176,960 | |
| | 2,864,245 | | | Freddie Mac REMICS(a)(g) | | 5.90% - 1M US L | | | | 12/15/41 | | | | 315,515 | |
| | 3,618,367 | | | Freddie Mac REMICS(a)(g) | | 6.10% - 1M US L | | | | 08/25/50 | | | | 568,087 | |
| | 2,000,000 | | | Freddie Mac STACR REMIC Trust 2020-DNA6(a)(c) | | 30D US SOFR + 5.65 | % | | | 12/25/50 | | | | 1,711,509 | |
| | 1,700,000 | | | Freddie Mac STACR REMIC Trust 2021-DNA1(a)(c) | | 30D US SOFR + 4.75 | % | | | 01/25/51 | | | | 1,332,910 | |
| | 1,250,000 | | | Freddie Mac STACR REMIC Trust 2022-DNA1(a)(c) | | 30D US SOFR + 7.10 | % | | | 01/25/42 | | | | 1,016,667 | |
| | 5,133,882 | | | Government National Mortgage Association(a)(g) | | 0.73 | % | | | 09/16/58 | | | | 188,389 | |
| | 8,404,847 | | | Government National Mortgage Association(a)(g) | | 0.81 | % | | | 11/20/69 | | | | 422,556 | |
| | 6,050,069 | | | Government National Mortgage Association(a)(g) | | 0.98 | % | | | 12/16/62 | | | | 446,001 | |
| | 5,990,904 | | | Government National Mortgage Association(a)(g) | | 1.35 | % | | | 11/20/70 | | | | 396,564 | |
| | 7,478,339 | | | Government National Mortgage Association(a)(g) | | 1.36 | % | | | 09/20/70 | | | | 419,177 | |
| | 7,441,851 | | | Government National Mortgage Association(a)(g) | | 1.74 | % | | | 09/20/66 | | | | 436,375 | |
| | 7,353,607 | | | Government National Mortgage Association(a)(g) | | 1.98 | % | | | 06/20/70 | | | | 366,107 | |
| | 9,826,858 | | | Government National Mortgage Association(a)(g) | | 2.20 | % | | | 11/20/71 | | | | 540,860 | |
| | 4,443,768 | | | Government National Mortgage Association | | 3.50 | % | | | 02/20/47 | | | | 4,326,892 | |
| | 16,651,398 | | | Government National Mortgage Association(a)(g) | | 2.65% - 30D US SOFR | | | | 01/20/52 | | | | 347,493 | |
See Notes to Financial Statements.
| Annual Report | June 30, 2022 | 21 |
RiverNorth/DoubleLine Strategic Opportunity Fund, Inc.
| Schedule of Investments | June 30, 2022 |
| Principal Amount/Description | | Rate | | | Maturity | | | Value | |
| U.S. GOVERNMENT / AGENCY MORTGAGE BACKED SECURITIES (continued) | | | | | | | | |
| $ | 6,891,005 | | | Government National Mortgage Association(a)(g) | | 3.20% - 30D US SOFR | | | | 12/20/51 | | | $ | 217,577 | |
| | 7,752,523 | | | Government National Mortgage Association(a)(g) | | 3.70% - 30D US SOFR | | | | 09/20/51 | | | | 436,408 | |
| | 6,275,408 | | | Government National Mortgage Association(a)(g) | | 3.75% - 1M US L | | | | 10/20/50 | | | | 403,728 | |
| | 7,139,515 | | | Government National Mortgage Association(a)(g) | | 3.75% - 1M US L | | | | 11/20/50 | | | | 314,640 | |
| | 14,877,453 | | | Government National Mortgage Association(a)(g) | | 3M US L + 2.44 | % | | | 06/20/51 | | | | 260,263 | |
| | 8,415,177 | | | Government National Mortgage Association(a)(g) | | 5.37% - 1M US L | | | | 07/20/44 | | | | 784,155 | |
| | 3,983,453 | | | Government National Mortgage Association(a)(g) | | 6.30% - 1M US L | | | | 09/20/50 | | | | 646,793 | |
| | 3,574,302 | | | Government National Mortgage Association(a)(g) | | 6.30% - 1M US L | | | | 10/20/50 | | | | 525,365 | |
| | 3,970,088 | | | Government National Mortgage Association(a)(g) | | 6.30% - 1M US L | | | | 01/20/51 | | | | 590,377 | |
| | 834,225 | | | Homeward Opportunities Fund Trust 2020-BPL1(c)(h) | | 5.44 | % | | | 08/25/25 | | | | 831,539 | |
| | 1,700,000 | | | Imperial Fund Mortgage Trust 2021-NQM3(a)(c) | | 4.18 | % | | | 11/25/56 | | | | 1,207,906 | |
| | 5,900,000 | | | Legacy Mortgage Asset Trust(c)(h) | | 4.50 | % | | | 11/25/59 | | | | 5,872,209 | |
| | 1,543,638 | | | Luminent Mortgage Trust(a) | | 1M US L + 0.40 | % | | | 05/25/36 | | | | 1,334,667 | |
| | 949,894 | | | Luminent Mortgage Trust(a) | | 1M US L + 0.42 | % | | | 05/25/36 | | | | 892,774 | |
| | 1,803,262 | | | Nomura Asset Acceptance Corp. Alternative Loan Trust(h) | | 5.69 | % | | | 08/25/35 | | | | 1,038,071 | |
| | 7,363,971 | | | Nomura Asset Acceptance Corp. Alternative Loan Trust(a) | | 1M US L + 0.54 | % | | | 02/25/36 | | | | 1,171,478 | |
| | 1,447,043 | | | RALI Series Trust(a) | | 5.36 | % | | | 09/25/37 | | | | 1,256,127 | |
| | 1,994,334 | | | Residential Asset Securitization Trust | | 5.75 | % | | | 02/25/36 | | | | 933,975 | |
| | 1,873,685 | | | Residential Asset Securitization Trust | | 6.00 | % | | | 05/25/37 | | | | 1,242,313 | |
| | 683,859 | | | RFMSI Trust(a) | | 2.75 | % | | | 06/25/35 | | | | 479,535 | |
| | 1,470,022 | | | RFMSI Trust | | 6.00 | % | | | 09/25/36 | | | | 1,243,146 | |
| | 1,936,000 | | | Spruce Hill Mortgage Loan Trust 2020-SH1(a)(c) | | 4.68 | % | | | 01/28/50 | | | | 1,767,601 | |
| | 473,074 | | | Structured Adjustable Rate Mortgage Loan Trust(a) | | 3.04 | % | | | 12/25/35 | | | | 428,168 | |
See Notes to Financial Statements.
| 22 | (888) 848-7569 | www.rivernorth.com |
RiverNorth/DoubleLine Strategic Opportunity Fund, Inc.
| Schedule of Investments | June 30, 2022 |
| Principal Amount/Description | Rate | | | Maturity | | | Value | |
| U.S. GOVERNMENT / AGENCY MORTGAGE BACKED SECURITIES (continued) | | | | | | | | |
| $ | 1,377,147 | | | Structured Adjustable Rate Mortgage Loan Trust(a) | | 3.48 | % | | | 09/25/37 | | | $ | 1,265,126 | |
| | 282,151 | | | Structured Asset Mortgage Investments II Trust(a) | | 1.16 | % | | | 03/25/46 | | | | 282,163 | |
| | 1,000,000 | | | Verus Securitization Trust 2021-7(a)(c) | | 4.19 | % | | | 10/25/66 | | | | 698,482 | |
| | 1,031,445 | | | WaMu Mortgage Pass-Through Certificates Trust(a) | | 2.92 | % | | | 08/25/46 | | | | 956,601 | |
| | 912,968 | | | WaMu Mortgage Pass-Through Certificates Trust(a) | | 3.10 | % | | | 08/25/36 | | | | 795,094 | |
| | 1,040,497 | | | WaMu Mortgage Pass-Through Certificates Trust(a) | | 3.29 | % | | | 03/25/37 | | | | 989,696 | |
| | | | | | | | | | | | | | | | |
| TOTAL U.S. GOVERNMENT / AGENCY MORTGAGE BACKED SECURITIES | | | | | | | | |
| (Cost $102,883,291) | | | | | | | | | | 80,027,877 | |
| Principal Amount/Description | Rate | | | Maturity | | | Value | |
| U.S. GOVERNMENT BONDS AND NOTES (7.44%) | | | | | | | | |
| | 23,150,000 | | | U.S. Treasury Bond | | 1.63 | % | | | 11/15/50 | | | | 16,292,265 | |
| | | | | | | | | | | | | | | | |
| TOTAL U.S. GOVERNMENT BONDS AND NOTES | | | | | | | | |
| (Cost $22,030,703) | | | | | | | | | | 16,292,265 | |
| Principal Amount/Description | Rate | | | Maturity | | | Value | |
| FOREIGN CORPORATE BONDS (5.49%) | | |
| Basic Materials (0.55%) | | | | | | | | | | | |
| | 300,000 | | | Braskem Idesa SAPI(c) | | 6.99 | % | | | 02/20/32 | | | | 232,454 | |
| | 200,000 | | | CAP SA(e) | | 3.90 | % | | | 04/27/31 | | | | 157,143 | |
| | 350,000 | | | Metinvest BV(e) | | 7.75 | % | | | 10/17/29 | | | | 191,853 | |
| | 400,000 | | | OCP SA(e) | | 5.13 | % | | | 06/23/51 | | | | 266,654 | |
| | 200,000 | | | Unigel Luxembourg SA(e) | | 8.75 | % | | | 10/01/26 | | | | 198,280 | |
| | 250,000 | | | Vedanta Resources Finance II PLC(c) | | 9.25 | % | | | 04/23/26 | | | | 149,631 | |
| | | | | | | | | | | | | | | 1,196,015 | |
| Communications (0.39%) | | | | | | | | |
| | 435,000 | | | Intelsat Escrow Shares | | 0.00 | % | | | 12/31/49 | | | | – | |
| $ | 350,000 | | | Oi SA(i) | | 10.00 | % | | | 07/27/25 | | | $ | 171,829 | |
| | 300,000 | | | Telecommunications Services of Trinidad & Tobago, Ltd.(e) | | 8.88 | % | | | 10/18/29 | | | | 288,965 | |
| | 205,000 | | | Telesat Canada / Telesat LLC(c) | | 5.63 | % | | | 12/06/26 | | | | 129,814 | |
| | 400,000 | | | VTR Finance NV(e) | | 6.38 | % | | | 07/15/28 | | | | 286,047 | |
| | | | | | | | | | | | | | | 876,655 | |
See Notes to Financial Statements.
| Annual Report | June 30, 2022 | 23 |
RiverNorth/DoubleLine Strategic Opportunity Fund, Inc.
| Schedule of Investments | June 30, 2022 |
| Principal Amount/Description | Rate | | | Maturity | | | Value | |
| Consumer, Cyclical (0.07%) | | | | | | | | |
| $ | 200,000 | | | Gajah Tunggal Tbk PT | | 8.95 | % | | | 06/23/26 | | | $ | 152,000 | |
| | | | | | | | | |
| Consumer, Non-cyclical (0.79%) | | | | | | | | |
| | 150,000 | | | Atento Luxco 1 SA(c) | | 8.00 | % | | | 02/10/26 | | | | 107,271 | |
| | 150,000 | | | Camposol SA(c) | | 6.00 | % | | | 02/03/27 | | | | 126,355 | |
| | 150,000 | | | Camposol SA(e) | | 6.00 | % | | | 02/03/27 | | | | 126,355 | |
| | 200,000 | | | Coruripe Netherlands BV(e) | | 10.00 | % | | | 02/10/27 | | | | 172,510 | |
| | 225,000 | | | Endo Luxembourg Finance Co. I SARL / Endo US, Inc.(c) | | 6.13 | % | | | 04/01/29 | | | | 170,530 | |
| | 450,000 | | | Frigorifico Concepcion SA(c) | | 7.70 | % | | | 07/21/28 | | | | 354,285 | |
| | 450,000 | | | Kronos Acquisition Holdings, Inc. / KIK Custom Products, Inc.(c) | | 7.00 | % | | | 12/31/27 | | | | 338,074 | |
| | 200,000 | | | Movida Europe SA(e) | | 5.25 | % | | | 02/08/31 | | | | 155,281 | |
| | 200,000 | | | SSMS Plantation Holdings Pte, Ltd. | | 7.75 | % | | | 01/23/23 | | | | 177,000 | |
| | | | | | | | | | | | | | | 1,727,661 | |
| Diversified (0.08%) | | | | | | | | |
| | 200,000 | | | ABM Investama Tbk PT(c) | | 9.50 | % | | | 08/05/26 | | | | 177,070 | |
| | | | | | | | | |
| Energy (1.32%) | | | | | | | | |
| | 250,000 | | | AI Candelaria Spain SA(c) | | 5.75 | % | | | 06/15/33 | | | | 183,396 | |
| | 350,000 | | | Ecopetrol SA | | 5.88 | % | | | 05/28/45 | | | | 238,875 | |
| | 200,000 | | | Ecopetrol SA | | 5.88 | % | | | 11/02/51 | | | | 131,175 | |
| | 250,000 | | | Gran Tierra Energy, Inc.(c) | | 7.75 | % | | | 05/23/27 | | | | 214,030 | |
| | 183,200 | | | Hunt Oil Co. of Peru LLC Sucursal Del Peru(e) | | 6.38 | % | | | 06/01/28 | | | | 168,086 | |
| | 400,000 | | | MC Brazil Downstream Trading SARL(e) | | 7.25 | % | | | 06/30/31 | | | | 318,938 | |
| | 100,000 | | | NGD Holdings BV | | 6.75 | % | | | 12/31/26 | | | | 44,600 | |
| | 200,000 | | | Pertamina Persero PT(e) | | 4.15 | % | | | 02/25/60 | | | | 149,307 | |
| | 150,000 | | | Petrobras Global Finance BV | | 5.50 | % | | | 06/10/51 | | | | 114,067 | |
| | 240,000 | | | Petrobras Global Finance BV | | 6.90 | % | | | 03/19/49 | | | | 214,962 | |
| | 400,000 | | | Petroleos del Peru SA(e) | | 5.63 | % | | | 06/19/47 | | | | 272,662 | |
| | 250,000 | | | Petroleos Mexicanos | | 6.38 | % | | | 01/23/45 | | | | 151,966 | |
| | 150,000 | | | Petroleos Mexicanos | | 6.75 | % | | | 09/21/47 | | | | 93,143 | |
| | 200,000 | | | Tullow Oil PLC(c) | | 10.25 | % | | | 05/15/26 | | | | 191,531 | |
| | 189,725 | | | UEP Penonome II SA(c) | | 6.50 | % | | | 10/01/38 | | | | 177,585 | |
| | 350,000 | | | YPF SA | | 7.00 | % | | | 12/15/47 | | | | 172,429 | |
| | 100,000 | | | YPF SA | | 8.50 | % | | | 06/27/29 | | | | 61,935 | |
| | | | | | | | | | | | | | | 2,898,687 | |
| Financial (1.23%) | | | | | | | | |
| | 200,000 | | | Agile Group Holdings, Ltd.(a)(j) | | 6.88 | % | | | Perpetual Maturity | | | | 43,900 | |
| | 300,000 | | | Alpha Holding SA de CV(c) | | 9.00 | % | | | 02/10/25 | | | | 19,500 | |
See Notes to Financial Statements.
| 24 | (888) 848-7569 | www.rivernorth.com |
RiverNorth/DoubleLine Strategic Opportunity Fund, Inc.
| Schedule of Investments | June 30, 2022 |
| Principal Amount/Description | Rate | | | Maturity | | | Value | |
| Financial (continued) | | | | | | | | |
| $ | 200,000 | | | Banco Davivienda SA(a)(c)(j) | | 10Y US TI + 5.10 | % | | | Perpetual Maturity | | | $ | 160,127 | |
| | 300,000 | | | Banco do Brasil SA(a)(j) | | 6.25 | % | | | Perpetual Maturity | | | | 264,000 | |
| | 100,000 | | | Banco GNB Sudameris SA(a)(e) | | 5Y US TI + 4.56 | % | | | 04/03/27 | | | | 89,963 | |
| | 200,000 | | | Banco GNB Sudameris SA(a)(c) | | 5Y US TI + 6.66 | % | | | 04/16/31 | | | | 171,199 | |
| | 250,000 | | | Banco Mercantil del Norte SA/Grand Cayman(a)(c)(j) | | 10Y US TI + 5.034 | % | | | Perpetual Maturity | | | | 204,625 | |
| | 200,000 | | | Banco Mercantil del Norte SA/Grand Cayman(a)(e)(j) | | 10Y US TI + 5.034 | % | | | Perpetual Maturity | | | | 163,700 | |
| | 300,000 | | | Bangkok Bank PCL(a)(c)(j) | | 5Y US TI + 4.73 | % | | | Perpetual Maturity | | | | 276,198 | |
| | 200,000 | | | Central China Real Estate, Ltd. | | 7.25 | % | | | 07/16/24 | | | | 64,500 | |
| | 200,000 | | | Credivalores-Crediservicios SAS(c) | | 8.88 | % | | | 02/07/25 | | | | 110,632 | |
| | 250,000 | | | Gilex Holding SARL | | 8.50 | % | | | 05/02/23 | | | | 244,425 | |
| | 350,000 | | | Itau Unibanco Holding SA Island(a)(e)(j) | | 5Y US TI + 4.63 | % | | | Perpetual Maturity | | | | 280,482 | |
| | 200,000 | | | Jababeka International BV(e) | | 6.50 | % | | | 10/05/23 | | | | 131,200 | |
| | 250,000 | | | Mexarrend SAPI de CV(c) | | 10.25 | % | | | 07/24/24 | | | | 119,447 | |
| | 200,000 | | | Operadora de Servicios Mega SA de CV Sofom ER(c) | | 8.25 | % | | | 02/11/25 | | | | 130,273 | |
| | 200,000 | | | RKP Overseas Finance, Ltd.(j) | | 7.95 | % | | | Perpetual Maturity | | | | 90,802 | |
| | 200,000 | | | Ronshine China Holdings, Ltd. | | 6.75 | % | | | 08/05/24 | | | | 18,000 | |
| | 250,000 | | | Unifin Financiera SAB de CV(a)(e)(j) | | 8.88 | % | | | Perpetual Maturity | | | | 81,767 | |
| | 200,000 | | | Yuzhou Group Holdings Co., Ltd. | | 8.30 | % | | | 05/27/25 | | | | 15,000 | |
| | | | | | | | | | | | | | | 2,679,740 | |
| Industrial (0.27%) | | | | | | | | |
| | 400,000 | | | Mexico City Airport Trust(e) | | 5.50 | % | | | 07/31/47 | | | | 275,468 | |
| | 400,000 | | | Simpar Europe SA(e) | | 5.20 | % | | | 01/26/31 | | | | 309,614 | |
| | | | | | | | | | | | | | | 585,082 | |
| Utilities (0.79%) | | | | | | | | |
| | 200,000 | | | AES Andres BV(c) | | 5.70 | % | | | 05/04/28 | | | | 170,732 | |
| | 292,600 | | | Empresa Electrica Cochrane SpA(e) | | 5.50 | % | | | 05/14/27 | | | | 246,513 | |
| | 300,000 | | | Empresas Publicas de Medellin ESP(e) | | 4.38 | % | | | 02/15/31 | | | | 230,051 | |
| | 400,000 | | | EnfraGen Energia Sur SA / EnfraGen Spain SA / Prime Energia SpA(e) | | 5.38 | % | | | 12/30/30 | | | | 270,682 | |
| | 200,000 | | | Guacolda Energia SA(e) | | 4.56 | % | | | 04/30/25 | | | | 70,763 | |
| | 200,000 | | | Inkia Energy, Ltd.(e) | | 5.88 | % | | | 11/09/27 | | | | 183,400 | |
| | 450,000 | | | Minejesa Capital BV | | 5.63 | % | | | 08/10/37 | | | | 364,956 | |
See Notes to Financial Statements.
| Annual Report | June 30, 2022 | 25 |
RiverNorth/DoubleLine Strategic Opportunity Fund, Inc.
| Schedule of Investments | June 30, 2022 |
| Principal Amount/Description | Rate | | | Maturity | | | Value | |
| Utilities (continued) | | | | | | | | | | | |
| $ | 250,000 | | | Mong Duong Finance Holdings BV(e) | | 5.13 | % | | | 05/07/29 | | | $ | 202,188 | |
| | | | | | | | | | | | | | 1,739,285 | |
| TOTAL FOREIGN CORPORATE BONDS | | | | | | | |
| (Cost $15,911,854) | | | | | | | | | | 12,032,195 | |
| Principal Amount/Description | Rate | | | Maturity | | | Value | |
| FOREIGN GOVERNMENT BONDS (0.62%) | | |
| Government (0.62%) | | | | | | | | |
| | 450,000 | | | Brazilian Government International Bond | | 4.75 | % | | | 01/14/50 | | | | 306,238 | |
| | 200,000 | | | Colombia Government International Bond | | 4.13 | % | | | 02/22/42 | | | | 124,765 | |
| | 200,000 | | | Colombia Government International Bond | | 5.00 | % | | | 06/15/45 | | | | 134,410 | |
| | 200,000 | | | Colombia Government International Bond | | 5.20 | % | | | 05/15/49 | | | | 136,160 | |
| | 250,000 | | | Dominican Republic International Bond(e) | | 5.30 | % | | | 01/21/41 | | | | 174,136 | |
| | 200,000 | | | Dominican Republic International Bond(c) | | 6.00 | % | | | 02/22/33 | | | | 167,112 | |
| | 350,000 | | | Republic of South Africa Government International Bond | | 5.65 | % | | | 09/27/47 | | | | 239,872 | |
| | 300,000 | | | Ukraine Government International Bond(e) | | 7.25 | % | | | 03/15/33 | | | | 75,376 | |
| | | | | | | | | | | | | | | 1,358,069 | |
| TOTAL FOREIGN GOVERNMENT BONDS | | | | | | | | |
| (Cost $2,033,450) | | | | | | | | | | 1,358,069 | |
| Principal Amount/Description | Rate | | | Maturity | | | Value | |
| NON-AGENCY COLLATERALIZED MORTGAGE OBLIGATIONS (31.80%) | | | | | | | | |
| | 28,899 | | | Affirm Asset Securitization Trust 2021-Z1(c) | | 0.00 | % | | | 08/15/24 | | | | 210,239 | |
| | 372,000 | | | Alen 2021-ACEN Mortgage Trust(a)(c) | | 1M US L + 4.00 | % | | | 04/15/26 | | | | 353,531 | |
| | 700,000 | | | AMSR 2021-SFR3 Trust(c) | | 4.90 | % | | | 10/17/26 | | | | 622,649 | |
| | 1,550,000 | | | AMSR 2021-SFR3 Trust(c) | | 5.88 | % | | | 10/17/26 | | | | 1,385,628 | |
| | 538,000 | | | AREIT Trust(a)(c) | | 30D SOFR + 2.76 | % | | | 09/16/36 | | | | 528,376 | |
| | 433,000 | | | Atrium Hotel Portfolio Trust(a)(c) | | 1M US L + 3.40 | % | | | 06/15/35 | | | | 395,949 | |
| | 500,000 | | | Atrium XIII(a)(c) | | 3M US L + 6.05 | % | | | 11/21/30 | | | | 437,779 | |
See Notes to Financial Statements.
| 26 | (888) 848-7569 | www.rivernorth.com |
RiverNorth/DoubleLine Strategic Opportunity Fund, Inc.
| Schedule of Investments | June 30, 2022 |
| Principal Amount/Description | Rate | | | Maturity | | | Value | |
| NON-AGENCY COLLATERALIZED MORTGAGE OBLIGATIONS (continued) | | | | | | | | |
| $ | 500,000 | | | Atrium XIV LLC(a)(c) | | 3M US L + 5.65 | % | | | 08/23/30 | | | $ | 448,218 | |
| | 730,000 | | | BAMLL Commercial Mortgage Securities Trust(a)(c) | | 2.57 | % | | | 03/15/34 | | | | 701,980 | |
| | 682,000 | | | BBCMS Trust(a)(c) | | 1M US L + 3.55 | % | | | 07/15/37 | | | | 647,536 | |
| | 463,247 | | | BB-UBS Trust(a)(c) | | 3.68 | % | | | 06/05/30 | | | | 348,594 | |
| | 498,000 | | | Benchmark 2018-B4 Mortgage Trust(a)(c) | | 2.95 | % | | | 07/17/51 | | | | 383,086 | |
| | 546,000 | | | Benchmark 2021-B31 Mortgage Trust(c) | | 2.25 | % | | | 11/15/31 | | | | 323,980 | |
| | 315,000 | | | BF Mortgage Trust(a)(c) | | 1M US L + 3.00 | % | | | 12/15/35 | | | | 285,059 | |
| | 2,133,074 | | | Blackbird Capital Aircraft Lease Securitization, Ltd.(c)(h) | | 5.68 | % | | | 12/16/41 | | | | 1,804,524 | |
| | 321,000 | | | BX Commercial Mortgage Trust(a)(c) | | 1M US L + 1.90 | % | | | 04/15/34 | | | | 305,428 | |
| | 325,000 | | | BX Trust(a)(c) | | 4.08 | % | | | 12/06/41 | | | | 262,823 | |
| | 167,283 | | | Carbon Capital VI Commercial Mortgage Trust(a)(c) | | 1M US L + 2.85 | % | | | 11/15/21 | | | | 163,443 | |
| | 5,000 | | | Carvana Auto Receivables Trust(c) | | 0.00 | % | | | 05/10/28 | | | | 2,200,644 | |
| | 416,111 | | | Castlelake Aircraft Securitization Trust(c) | | 6.63 | % | | | 06/15/43 | | | | 279,748 | |
| | 1,250,000 | | | Castlelake Aircraft Structured Trust(c) | | 0.00 | % | | | 04/15/39 | | | | 218,750 | |
| | 500,000 | | | CIFC Funding 2019-III, Ltd.(a)(c) | | 3M US L + 6.80 | % | | | 10/16/34 | | | | 458,880 | |
| | 500,000 | | | CIFC Funding, Ltd.(a)(c) | | 3M US L + 6.50 | % | | | 07/15/34 | | | | 448,341 | |
| | 138,000 | | | Citigroup Commercial Mortgage Trust(c) | | 2.85 | % | | | 02/12/49 | | | | 90,985 | |
| | 475,000 | | | Citigroup Commercial Mortgage Trust(a)(c) | | 3.62 | % | | | 12/12/41 | | | | 323,294 | |
| | 196,000 | | | Citigroup Commercial Mortgage Trust(a)(c) | | 4.42 | % | | | 02/12/48 | | | | 175,829 | |
| | 319,000 | | | Citigroup Commercial Mortgage Trust(a)(c) | | 1M US L + 3.65 | % | | | 12/15/36 | | | | 299,345 | |
| | 320,000 | | | Citigroup Commercial Mortgage Trust 2019-SMRT(a)(c) | | 4.75 | % | | | 01/10/36 | | | | 310,363 | |
| | 1,500,000 | | | Cologix Data Centers US Issuer LLC(c) | | 5.99 | % | | | 12/28/26 | | | | 1,359,336 | |
| | 878,000 | | | COMM Mortgage Trust(a)(c) | | 1M US L + 2.18 | % | | | 09/15/33 | | | | 817,805 | |
| | 428,000 | | | CSAIL 2016-C6 Commercial Mortgage Trust(a)(c) | | 5.09 | % | | | 01/15/49 | | | | 360,499 | |
See Notes to Financial Statements.
| Annual Report | June 30, 2022 | 27 |
RiverNorth/DoubleLine Strategic Opportunity Fund, Inc.
| Schedule of Investments | June 30, 2022 |
| Principal Amount/Description | Rate | | | Maturity | | | Value | |
| NON-AGENCY COLLATERALIZED MORTGAGE OBLIGATIONS (continued) | | | | | | | | |
| $ | 264,991 | | | DBGS 2018-BIOD Mortgage Trust(a)(c) | | 1M US L + 2.00 | % | | | 05/15/35 | | | $ | 250,655 | |
| | 416,000 | | | DBJPM 16-C1 Mortgage Trust(a) | | 3.33 | % | | | 05/12/49 | | | | 363,052 | |
| | 500,000 | | | Dryden 37 Senior Loan Fund(a)(c) | | 3M US L + 5.15 | % | | | 01/15/31 | | | | 402,442 | |
| | 500,000 | | | Dryden 38 Senior Loan Fund(a)(c) | | 3M US L + 5.60 | % | | | 07/15/30 | | | | 409,553 | |
| | 500,000 | | | Dryden 40 Senior Loan Fund(a)(c) | | 3M US L + 5.75 | % | | | 08/15/31 | | | | 412,566 | |
| | 496,942 | | | Extended Stay America Trust 2021-ESH(a)(c) | | 1M US L + 3.70 | % | | | 07/15/26 | | | | 468,614 | |
| | 35,207,599 | | | Fannie Mae-Aces(a)(g) | | 0.22 | % | | | 10/25/29 | | | | 455,713 | |
| | 46,440,000 | | | Fannie Mae-Aces(a)(g) | | 0.27 | % | | | 05/25/30 | | | | 629,216 | |
| | 16,832,098 | | | Fannie Mae-Aces(a)(g) | | 0.35 | % | | | 04/25/29 | | | | 329,004 | |
| | 9,024,808 | | | Fannie Mae-Aces(a)(g) | | 0.58 | % | | | 12/25/30 | | | | 240,427 | |
| | 18,030,032 | | | Fannie Mae-Aces(a)(g) | | 0.63 | % | | | 02/25/29 | | | | 508,328 | |
| | 16,640,154 | | | Fannie Mae-Aces(a)(g) | | 0.67 | % | | | 11/01/31 | | | | 587,144 | |
| | 15,959,338 | | | Fannie Mae-Aces(a)(g) | | 0.87 | % | | | 07/25/32 | | | | 1,045,111 | |
| | 5,416,338 | | | Fannie Mae-Aces(a)(g) | | 1.15 | % | | | 03/25/31 | | | | 391,610 | |
| | 4,786,345 | | | Fannie Mae-Aces(a)(g) | | 1.30 | % | | | 09/25/30 | | | | 332,356 | |
| | 700,000 | | | FirstKey Homes 2020-SFR1 Trust(c) | | 4.28 | % | | | 08/19/37 | | | | 659,547 | |
| | 1,700,000 | | | FMC GMSR Issuer Trust(a)(c) | | 4.36 | % | | | 07/25/26 | | | | 1,532,978 | |
| | 1,750,000 | | | FMC GMSR Issuer Trust(a)(c) | | 4.44 | % | | | 10/25/26 | | | | 1,570,073 | |
| | 546,000 | | | Fontainebleau Miami Beach Trust(a)(c) | | 3.96 | % | | | 12/12/36 | | | | 479,442 | |
| | 750,000 | | | Freddie Mac Multifamily Structured Credit Risk(a)(c) | | 30D US SOFR + 3.75 | % | | | 01/25/51 | | | | 653,324 | |
| | 267,035 | | | FREMF 2015-KF07 Mortgage Trust(a)(c) | | 1M US L + 4.95 | % | | | 02/25/25 | | | | 266,865 | |
| | 299,980 | | | FREMF 2016-KF19 Mortgage Trust(a)(c) | | 1M US L + 5.50 | % | | | 06/25/23 | | | | 299,962 | |
| | 266,080 | | | FREMF 2016-KF25 Mortgage Trust(a)(c) | | 1M US L + 5.00 | % | | | 10/25/23 | | | | 265,995 | |
| | 795,901 | | | FREMF 2018-KF56 Mortgage Trust(a)(c) | | 1M US L + 5.80 | % | | | 11/25/28 | | | | 783,787 | |
| | 994,040 | | | FREMF 2019-KF71 Mortgage Trust(a)(c) | | 1M US L + 6.00 | % | | | 10/25/29 | | | | 995,369 | |
| | 1,200,000 | | | FRTKL 2021-SFR1(c) | | 4.11 | % | | | 09/17/26 | | | | 1,039,719 | |
| | 500,000 | | | FS Rialto 2022-FL5 Issuer LLC(a)(c) | | 1M US SOFR + 4.818 | % | | | 06/19/37 | | | | 493,839 | |
| | 5,994,895 | | | Ginnie Mae Strip(g) | | 1.40 | % | | | 09/16/45 | | | | 505,238 | |
See Notes to Financial Statements.
| 28 | (888) 848-7569 | www.rivernorth.com |
RiverNorth/DoubleLine Strategic Opportunity Fund, Inc.
| Schedule of Investments | June 30, 2022 |
| Principal Amount/Description | Rate | | | Maturity | | | Value | |
| NON-AGENCY COLLATERALIZED MORTGAGE OBLIGATIONS (continued) | | | | | | | | |
| $ | 4,224,104 | | | Government National Mortgage Association(a)(g) | | 0.16 | % | | | 09/16/53 | | | $ | 28,140 | |
| | 5,561,821 | | | Government National Mortgage Association(a)(g) | | 0.99 | % | | | 05/16/63 | | | | 439,173 | |
| | 1,100,000 | | | Great Wolf Trust(a)(c) | | 1M US L + 3.13 | % | | | 12/15/36 | | | | 1,010,685 | |
| | 500,000 | | | GS Mortgage Securities Corp. II(a)(c) | | 1M US L + 5.00 | % | | | 11/15/23 | | | | 473,668 | |
| | 500,000 | | | GS Mortgage Securities Corp. II(a)(c) | | 1M US L + 5.9332 | % | | | 11/15/23 | | | | 473,716 | |
| | 300,000 | | | GS Mortgage Securities Corp. Trust 2018-RIVR(a)(c) | | 1M US L + 1.55 | % | | | 07/15/35 | | | | 267,927 | |
| | 1,078,000 | | | GS Mortgage Securities Trust(a)(c) | | 4.51 | % | | | 11/10/47 | | | | 774,815 | |
| | 655,000 | | | GS Mortgage Securities Trust(a)(c) | | 1M US L + 3.92 | % | | | 07/15/31 | | | | 586,352 | |
| | 373,000 | | | GS Mortgage Securities Trust 2015-GC28(a)(c) | | 4.46 | % | | | 02/10/48 | | | | 335,971 | |
| | 3,680,000 | | | GS Mortgage Securities Trust 2021-GSA3(a)(c)(g) | | 1.53 | % | | | 12/15/31 | | | | 373,870 | |
| | 230,000 | | | Hawaii Hotel Trust(a)(c) | | 1M US L + 2.75 | % | | | 05/15/38 | | | | 213,012 | |
| | 500,000 | | | Highbridge Loan Management 4-2014, Ltd.(a)(c) | | 3M US L + 5.55 | % | | | 01/28/30 | | | | 420,391 | |
| | 500,000 | | | Highbridge Loan Management, Ltd.(a)(c) | | 3M US L + 5.10 | % | | | 02/05/31 | | | | 420,076 | |
| | 178,457 | | | HPLY Trust(a)(c) | | 1M US L + 3.90 | % | | | 11/17/36 | | | | 168,361 | |
| | 1,062,000 | | | JP Morgan BB Commercial Mortgage Securities Trust(a)(c) | | 3.36 | % | | | 11/18/48 | | | | 831,333 | |
| | 632,000 | | | JP Morgan BB Commercial Mortgage Securities Trust(a)(c) | | 3.94 | % | | | 02/18/48 | | | | 525,753 | |
| | 109,000 | | | JP Morgan Chase Commercial Mortgage Securities Trust(c) | | 4.34 | % | | | 05/05/32 | | | | 104,905 | |
| | 111,000 | | | JP Morgan Chase Commercial Mortgage Securities Trust(a)(c) | | 4.45 | % | | | 05/05/32 | | | | 105,179 | |
| | 130,000 | | | JP Morgan Chase Commercial Mortgage Securities Trust(a)(c) | | 4.45 | % | | | 05/05/32 | | | | 121,947 | |
| | 136,000 | | | JP Morgan Chase Commercial Mortgage Securities Trust(a)(c) | | 4.45 | % | | | 05/05/32 | | | | 120,098 | |
| | 148,000 | | | JP Morgan Chase Commercial Mortgage Securities Trust(a)(c) | | 4.45 | % | | | 05/05/32 | | | | 130,526 | |
See Notes to Financial Statements.
| Annual Report | June 30, 2022 | 29 |
RiverNorth/DoubleLine Strategic Opportunity Fund, Inc.
| Schedule of Investments | June 30, 2022 |
| Principal Amount/Description | Rate | | | Maturity | | | Value | |
| NON-AGENCY COLLATERALIZED MORTGAGE OBLIGATIONS (continued) | | | | | | | | |
| $ | 411,000 | | | JP Morgan Chase Commercial Mortgage Securities Trust(a)(c) | | 5.71 | % | | | 02/15/46 | | | $ | 148,414 | |
| | 320,000 | | | JP Morgan Chase Commercial Mortgage Securities Trust(a)(c) | | 1M US L + 3.00 | % | | | 07/15/36 | | | | 295,265 | |
| | 6,089,560 | | | JPMBB Commercial Mortgage Securities Trust(a)(g) | | 1.01 | % | | | 09/17/47 | | | | 85,869 | |
| | 7,319,676 | | | JPMBB Commercial Mortgage Securities Trust(a)(c)(g) | | 1.10 | % | | | 08/17/46 | | | | 86,268 | |
| | 372,000 | | | JPMBB Commercial Mortgage Securities Trust 2014-C26(a)(c) | | 4.02 | % | | | 12/15/24 | | | | 332,438 | |
| | 500,000 | | | LCM Loan Income Fund I Income Note Issuer, Ltd.(a)(c) | | 3M US L + 5.60 | % | | | 07/16/31 | | | | 401,990 | |
| | 500,000 | | | LCM XIV LP(a)(c) | | 3M US L + 5.50 | % | | | 07/20/31 | | | | 407,573 | |
| | 500,000 | | | LCM XVII LP(a)(c) | | 3M US L + 6.00 | % | | | 10/15/31 | | | | 416,785 | |
| | 348,680 | | | LLPL Capital Pte, Ltd.(e) | | 6.88 | % | | | 02/04/39 | | | | 325,040 | |
| | 335,000 | | | LSTAR Commercial Mortgage Trust 2017-5(a)(c) | | 4.83 | % | | | 03/10/27 | | | | 282,571 | |
| | 500,000 | | | Madison Park Funding XXVI, Ltd.(a)(c) | | 3M US L + 6.50 | % | | | 07/29/30 | | | | 458,937 | |
| | 650,000 | | | Madison Park Funding XXXVIII, Ltd.(a)(c) | | 3M US L + 6.00 | % | | | 07/17/34 | | | | 564,905 | |
| | 500,000 | | | Med Trust 2021-MDLN(a)(c) | | 1M US L + 5.25 | % | | | 11/15/23 | | | | 454,123 | |
| | 365,000 | | | MFT Trust 2020-ABC(a)(c) | | 3.48 | % | | | 02/10/30 | | | | 269,702 | |
| | 751,000 | | | Morgan Stanley Bank of America Merrill Lynch Trust 2016-C31(a)(c) | | 3.00 | % | | | 10/15/26 | | | | 550,732 | |
| | 371,000 | | | Morgan Stanley Bank of America Merrill Lynch Trust 2017-C34(c) | | 2.70 | % | | | 10/15/27 | | | | 273,167 | |
| | 350,000 | | | Morgan Stanley Capital I Trust(a)(c) | | 1M US L + 3.05 | % | | | 07/15/35 | | | | 327,009 | |
| | 372,000 | | | Morgan Stanley Capital I Trust 2018-H4(c) | | 3.00 | % | | | 12/15/28 | | | | 273,022 | |
| | 552,923 | | | Mosaic Solar Loan Trust(c) | | 0.00 | % | | | 04/20/46 | | | | 537,104 | |
| | 1,060,104 | | | New Century Home Equity Loan Trust(a) | | 1M US L + 0.36 | % | | | 05/25/36 | | | | 1,036,050 | |
| | 1,000,000 | | | Octagon 57, Ltd.(a)(c) | | 3M US L + 6.60 | % | | | 10/15/34 | | | | 901,222 | |
| | 500,000 | | | Octagon Investment Partners 26, Ltd.(a)(c) | | 3M US L + 8.09 | % | | | 07/15/30 | | | | 418,989 | |
| | 500,000 | | | Octagon Investment Partners 29, Ltd.(a)(c) | | 3M US L + 7.25 | % | | | 01/24/33 | | | | 430,384 | |
See Notes to Financial Statements.
| 30 | (888) 848-7569 | www.rivernorth.com |
RiverNorth/DoubleLine Strategic Opportunity Fund, Inc.
| Schedule of Investments | June 30, 2022 |
| Principal Amount/Description | Rate | | | Maturity | | | Value | |
| NON-AGENCY COLLATERALIZED MORTGAGE OBLIGATIONS (continued) | | | | | | | | |
| $ | 500,000 | | | Octagon Investment Partners 40, Ltd.(a)(c) | | 3M US L + 7.00 | % | | | 01/20/35 | | | $ | 434,813 | |
| | 500,000 | | | Octagon Investment Partners 42, Ltd.(a)(c) | | 3M US L + 6.75 | % | | | 07/15/34 | | | | 432,814 | |
| | 500,000 | | | Octagon Investment Partners XVI, Ltd.(a)(c) | | 3M US L + 5.75 | % | | | 07/17/30 | | | | 411,914 | |
| | 500,000 | | | Octagon Investment Partners XXI, Ltd.(a)(c) | | 3M US L + 7.00 | % | | | 02/14/31 | | | | 450,008 | |
| | 500,000 | | | Octagon Investment Partners XXII, Ltd.(a)(c) | | 3M US L + 1.90 | % | | | 01/22/30 | | | | 468,681 | |
| | 500,000 | | | OHA Credit Funding 3, Ltd.(a)(c) | | 3M US L + 6.25 | % | | | 07/02/35 | | | | 442,291 | |
| | 319,000 | | | One Market Plaza Trust(c) | | 4.14 | % | | | 02/10/32 | | | | 296,335 | |
| | 800,000 | | | Pagaya AI Debt Selection Trust 2021-5(c) | | 0.00 | % | | | 08/15/29 | | | | 1,176,297 | |
| | 1,672,136 | | | PR Mortgage Loan Trust(a)(c) | | 5.88 | % | | | 10/25/49 | | | | 1,577,568 | |
| | 1,800,000 | | | Progress Residential 2021-SFR8 Trust(c) | | 4.01 | % | | | 10/17/26 | | | | 1,561,160 | |
| | 1,800,000 | | | Progress Residential Trust(c) | | 4.00 | % | | | 07/17/26 | | | | 1,571,798 | |
| | 500,000 | | | RR 6, Ltd.(a)(c) | | 3M US L + 5.85 | % | | | 04/15/36 | | | | 419,699 | |
| | 964,590 | | | SMR 2022-IND Mortgage Trust(a)(c) | | 1M US SOFR + 7.50 | % | | | 02/15/24 | | | | 931,330 | |
| | 10,000 | | | SoFi Professional Loan Program 2021-B Trust(c) | | 0.00 | % | | | 02/15/47 | | | | 553,666 | |
| | 35,000 | | | Sofi Professional Loan Program Trust(c) | �� | 0.00 | % | | | 08/17/43 | | | | 691,101 | |
| | 50,000 | | | Sofi Professional Loan Program Trust(c) | | 0.00 | % | | | 01/25/48 | | | | 842,609 | |
| | 20,000 | | | SoFi Professional Loan Program Trust(c) | | 0.00 | % | | | 05/15/46 | | | | 652,206 | |
| | 500,000 | | | SREIT Trust 2021-MFP2(a)(c) | | 1M US L + 3.9155 | % | | | 11/15/23 | | | | 469,154 | |
| | 500,000 | | | Trimaran CAVU, Ltd.(a)(c) | | 3M US L + 4.72 | % | | | 11/26/32 | | | | 471,302 | |
| | 333,000 | | | UBS-Barclays Commercial MortgageTrust(a)(c) | | 4.08 | % | | | 03/12/46 | | | | 257,076 | |
| | 300,000 | | | UBS-Barclays Commercial Mortgage Trust 2013-C5(a)(c) | | 4.08 | % | | | 03/12/46 | | | | 275,508 | |
| | 735,000 | | | Upstart Pass-Through Trust Series 2021-ST8(c) | | 0.00 | % | | | 10/20/29 | | | | 513,228 | |
| | 1,000 | | | Upstart Securitization Trust 2021-2 | | 0.00 | % | | | 06/20/31 | | | | 487,728 | |
| | 440,481 | | | VMC Finance LLC(a)(c) | | 1M US L + 2.65 | % | | | 09/15/36 | | | | 427,847 | |
| | 1,200,000 | | | VOLT XCVI LLC(c)(h) | | 4.83 | % | | | 03/27/51 | | | | 1,140,862 | |
See Notes to Financial Statements.
| Annual Report | June 30, 2022 | 31 |
RiverNorth/DoubleLine Strategic Opportunity Fund, Inc.
| Schedule of Investments | June 30, 2022 |
| Principal Amount/Description | Rate | | | Maturity | | | Value | |
| NON-AGENCY COLLATERALIZED MORTGAGE OBLIGATIONS (continued) | | | | | | | | |
| $ | 541,266 | | | WAVE LLC(c) | | 7.00 | % | | | 09/15/44 | | | $ | 371,809 | |
| | 332,000 | | | Wells Fargo Commercial Mortgage Trust(c) | | 3.12 | % | | | 03/15/59 | | | | 273,416 | |
| | 372,000 | | | WFRBS Commercial Mortgage Trust 2012-C8(a)(c) | | 5.03 | % | | | 08/15/45 | | | | 370,701 | |
| | 1,512,027 | | | Willis Engine Structured Trust VI(c) | | 7.39 | % | | | 05/15/46 | | | | 1,147,462 | |
| | | | | | | | | | | | | | | | |
| TOTAL NON-AGENCY COLLATERALIZED MORTGAGE OBLIGATIONS | | | | | | | | |
| (Cost $78,635,762) | | | | | | | | | | 69,648,410 | |
| Shares/Description | | Value | |
| SHORT-TERM INVESTMENTS (18.40%) |
| 40,316,875 | | | State Street Institutional Trust (7 Day Yield 1.03%) | | $ | 40,316,875 | |
| | | | | | | | |
| TOTAL SHORT-TERM INVESTMENTS |
| (Cost $40,316,875) | | | 40,316,875 | |
| | | | | | | | |
| TOTAL INVESTMENTS (154.44%) |
| (Cost $393,126,088) | | | $ | 338,415,029 | |
| | | | | | | | |
| Series A Cumulative Perpetual Preferred Shares (-28.49%) | | | (60,000,000 | ) |
| Series B Cumulative Perpetual Preferred Shares (-28.49%) | | | (60,000,000 | ) |
| Other Assets In Excess Of Liabilities (2.55%) | | | 707,955 | |
| NET ASSETS ATTRIBUTABLE TO COMMON SHAREHOLDERS (100.00%) | | $ | 219,122,984 | |
Investment Abbreviations:
LIBOR - London Interbank Offered Rate
SOFR - Secured Overnight Financing Rate
TI - Treasury Index
Reference Rates:
1M US L - 1 Month LIBOR as of June 30, 2022 was 1.79%
3M US L - 3 Month LIBOR as of June 30, 2022 was 2.29%
30D US SOFR - 30 Day SOFR as of June 30, 2022 was 1.09%
180D US SOFR - 180 Day SOFR as of June 30, 2022 was 0.39%
5Y US TI - 5 Year US Treasury Index as of June 30, 2022 was 3.01%
10Y US TI - 10 Year US Treasury Index as of June 30, 2022 was 2.98%
| (a) | Variable rate investment. Interest rates reset periodically. Interest rate shown reflects the rate in effect at June 30, 2022. For securities based on a published reference rate and spread, the reference rate and spread are indicated the description above. Certain variable rate securities are not based on a published reference rate and spread but are determined by the issuer or agent and are based on current market conditions. These securities do not indicate a reference rate and spread in their description above. |
See Notes to Financial Statements.
| 32 | (888) 848-7569 | www.rivernorth.com |
RiverNorth/DoubleLine Strategic Opportunity Fund, Inc.
| Schedule of Investments | June 30, 2022 |
| (b) | Non-income producing security. |
| (c) | Security exempt from registration under Rule 144A of the Securities Act of 1933. Such securities may normally be sold to qualified institutional buyers in transactions exempt from registration. The total value of Rule 144A securities amounts to $110,794,620, which represents 50.56% of net assets as of June 30, 2022. |
| (d) | Non-income producing security. |
| (e) | Securities were purchased pursuant to Regulation S under the Securities Act of 1933, which exempts securities offered and sold outside of the United States from registration. Such securities cannot be sold in the United States without either an effective registration statement filed pursuant to the Securities Act of 1933, or pursuant to an exemption from registration. These securities have been deemed liquid under procedures approved by the Fund's Board of Directors (the "Board"). As of June 30, 2022, the aggregate fair value of those securities was $6,028,525, representing 2.75% of net assets. |
| (f) | Issued with a zero coupon. |
| (g) | Interest only securities. |
| (h) | Step up bond. Coupon changes periodically based upon a predetermined schedule. Interest rate disclosed is that which is in effect at June 30, 2022. |
| (i) | Pay-in-kind securities. Rate paid in-kind is shown in parenthesis. |
| (j) | Security has no contractual maturity date, is not redeemable and contractually pays an indefinite stream of interest. |
See Notes to Financial Statements.
| Annual Report | June 30, 2022 | 33 |
RiverNorth/DoubleLine Strategic Opportunity Fund, Inc.
| Statement of Assets and Liabilities | June 30, 2022 |
| ASSETS: | | | |
| Investments in securities: | | | | |
| At cost | | $ | 393,126,088 | |
| At value | | $ | 338,415,029 | |
| | | | | |
| Cash | | | 10,955 | |
| Receivable for investments sold | | | 18,855 | |
| Interest receivable | | | 1,846,126 | |
| Dividends receivable | | | 139,661 | |
| Prepaid and other assets | | | 58,007 | |
| Total Assets | | | 340,488,633 | |
| | | | | |
| LIABILITIES: | | | | |
| Facility loan fee payable | | | 10,417 | |
| Dividend payable - Series A Cumulative Perpetual Preferred Shares | | | 328,125 | |
| Dividend payable - Series B Cumulative Perpetual Preferred Shares | | | 356,250 | |
| Payable for shareholder servicing | | | 28,283 | |
| Payable to Adviser | | | 282,830 | |
| Payable to fund accounting and administration | | | 123,696 | |
| Payable to Transfer agency | | | 5,193 | |
| Payable for Compliance fees | | | 3,225 | |
| Payable for Custodian fees | | | 33,728 | |
| Payable for Audit fees | | | 34,266 | |
| Other payables | | | 159,636 | |
| Total Liabilities | | | 1,365,649 | |
| Cumulative Perpetual Preferred Shares, $0.0001 par value per share, 4,930,000 of shares authorized | | | | |
| Series A Cumulative Perpetual Preferred Shares (4.375%, $25 liquidation value, 2,400,000 shares issued and outstanding) | | $ | 60,000,000 | |
| Series B Cumulative Perpetual Preferred Shares (4.75%, $25 liquidation value, 2,400,000 shares issued and outstanding) | | $ | 60,000,000 | |
| Net Assets Attributable to Common Shareholders | | $ | 219,122,984 | |
| | | | | |
| NET ASSETS ATTRIBUTABLE TO COMMON SHAREHOLDERS CONSIST OF: | | | | |
| Paid-in capital | | $ | 278,733,473 | |
| Total distributable earnings | | | (59,610,489 | ) |
| Net Assets Attributable to Common Shareholders | | $ | 219,122,984 | |
| | | | | |
| PRICING OF SHARES: | | | | |
| Net Assets Attributable to Common Shareholders | | $ | 219,122,984 | |
| Shares of common stock outstanding (50,000,000 of shares authorized, at $0.0001 par value per share) | | | 19,443,627 | |
| Net asset value per share Attributable to Common Shareholders | | $ | 11.27 | |
See Notes to Financial Statements.
| 34 | (888) 848-7569 | www.rivernorth.com |
RiverNorth/DoubleLine Strategic Opportunity Fund, Inc.
| Statement of Operations | For the Year Ended June 30, 2022 |
| INVESTMENT INCOME: | | | |
| Interest | | $ | 17,995,877 | |
| Dividends | | | 2,798,153 | |
| Other Income | | | 7,845 | |
| Total Investment Income | | | 20,801,875 | |
| | | | | |
| EXPENSES: | | | | |
| Investment Adviser fee | | | 3,580,427 | |
| Shareholder servicing expenses | | | 324,308 | |
| Accounting and Administration fees | | | 294,071 | |
| Printing expenses | | | 122,603 | |
| Interest expense on loan payable | | | 116,312 | |
| Director expenses | | | 112,039 | |
| Legal expenses | | | 80,768 | |
| Transfer agent expenses | | | 59,954 | |
| Compliance expense | | | 39,764 | |
| Listing expense | | | 38,236 | |
| Audit expenses | | | 37,699 | |
| Facility Loan Fees | | | 14,825 | |
| Custodian fees | | | 13,366 | |
| Insurance fee | | | 3,464 | |
| Other expenses | | | 22,109 | |
| Total Expenses | | | 4,859,945 | |
| Net Investment Income | | | 15,941,930 | |
| | | | | |
| REALIZED AND UNREALIZED GAIN/(LOSS): | | | | |
| Net realized gain on: | | | | |
| Investments | | | 2,894,301 | |
| Net realized gain | | | 2,894,301 | |
| Net change in unrealized appreciation/depreciation on: | | | | |
| Investments | | | (52,145,724 | ) |
| Net change in unrealized appreciation/depreciation | | | (52,145,724 | ) |
| Net Realized and Unrealized Loss on Investments | | | (49,251,423 | ) |
| Dividends to Series A Cumulative Perpetual Preferred Shares | | | (2,625,018 | ) |
| Dividends to Series B Cumulative Perpetual Preferred Shares | | | (1,726,080 | ) |
| Net Decrease in Net Assets Attributable to Common Shareholders Resulting from Operations | | $ | (37,660,591 | ) |
See Notes to Financial Statements.
| Annual Report | June 30, 2022 | 35 |
RiverNorth/DoubleLine Strategic Opportunity Fund, Inc.
Statements of Changes in Net Assets Attributable to Common Shareholders
| | | For the Year Ended June 30, 2022 | | | For the Year Ended June 30, 2021 | |
| NET INCREASE/(DECREASE) IN NET ASSETS | | | | | | | | |
| ATTRIBUTABLE TO COMMON SHAREHOLDERS FROM OPERATIONS: | | | | | | | | |
| Net investment income | | $ | 15,941,930 | | | $ | 12,750,646 | |
| Net realized gain | | | 2,894,301 | | | | 3,302,859 | |
| Net change in unrealized appreciation/depreciation | | | (52,145,724 | ) | | | 20,337,186 | |
| Net increase/(decrease) in net assets resulting from operations | | | (33,309,493 | ) | | | 36,390,691 | |
| Distributions to Series A Preferred Shareholders | | | (2,625,018 | ) | | | (1,799,690 | ) |
| Distributions to Series B Preferred Shareholders | | | (1,726,080 | ) | | | – | |
| Net increase/(decrease) in net assets attributable to common shareholders resulting from operations | | | (37,660,591 | ) | | | 34,591,001 | |
| | | | | | | | | |
| DISTRIBUTIONS TO COMMON SHAREHOLDERS: | | | | | | | | |
| From distributable earnings | | | (14,847,964 | ) | | | (14,029,045 | ) |
| From tax return of capital | | | (18,971,451 | ) | | | (14,002,069 | ) |
| Net decrease in net assets attributable to common shareholders from distributions to common shareholders | | | (33,819,415 | ) | | | (28,031,114 | ) |
| | | | | | | | | |
| PREFERRED SHARE TRANSACTIONS: | | | | | | | | |
| Issuance and offering costs for Series A Cumulative Perpetual Preferred Shares | | | – | | | | (2,538,182 | ) |
| Issuance and offering costs for Series B Cumulative Perpetual Preferred Shares | | | (2,438,300 | ) | | | – | |
| Net decrease in net assets attributable to common shareholders from preferred share transactions | | | (2,438,300 | ) | | | (2,538,182 | ) |
| | | | | | | | | |
| COMMON SHARE TRANSACTIONS: | | | | | | | | |
| Proceeds from common shares sold, net of offering costs | | | 67,529,800 | | | | 21,179,313 | |
| Reinvestment of distributions | | | 685,086 | | | | 115,824 | |
| Net increase in net assets attributable to common shareholders from capital share transactions | | | 68,214,886 | | | | 21,295,137 | |
| | | | | | | | | |
| Net Increase/(Decrease) in Net Assets attributable to common shareholders | | | (5,703,420 | ) | | | 25,316,842 | |
| | | | | | | | | |
| NET ASSETS ATTRIBUTABLE TO COMMON SHAREHOLDERS: | | | | | | | | |
| Beginning of period | | | 224,826,404 | | | | 199,509,562 | |
| End of period | | $ | 219,122,984 | | | $ | 224,826,404 | |
See Notes to Financial Statements.
| 36 | (888) 848-7569 | www.rivernorth.com |
RiverNorth/DoubleLine Strategic Opportunity Fund, Inc.
Statements of Changes in Net Assets Attributable to Common Shareholders
| | | For the Year Ended June 30, 2022 | | | For the Year Ended June 30, 2021 | |
| OTHER INFORMATION: | | | | | | | | |
| Common Share Transactions: | | | | | | | | |
| Common Shares outstanding - beginning of period | | | 14,821,557 | | | | 13,384,868 | |
| Common Shares sold | | | 4,574,333 | | | | 1,429,104 | |
| Common Shares issued in reinvestment of distributions | | | 47,737 | | | | 7,585 | |
| Common Shares outstanding - end of period | | | 19,443,627 | | | | 14,821,557 | |
See Notes to Financial Statements.
| Annual Report | June 30, 2022 | 37 |
RiverNorth/DoubleLine Strategic Opportunity Fund, Inc.
| Statement of Cash Flows | For the Year Ended June 30, 2022 |
| CASH FLOWS FROM OPERATING ACTIVITIES: | | | |
| Net decrease in net assets resulting from operations | | $ | (33,309,493 | ) |
| Adjustments to reconcile net increase in net assets attributable to common shareholders from operations to net cash used in operating activities: | | | | |
| Purchases of investment securities | | | (219,274,949 | ) |
| Proceeds from disposition on investment securities | | | 148,680,203 | |
| Amortization of premium and accretion of discount on investments, net | | | 3,117,311 | |
| Net purchases of short-term investment securities | | | (17,414,919 | ) |
| Net realized (gain)/loss on: | | | | |
| Investments | | | (2,894,301 | ) |
| Net change in unrealized appreciation/depreciation on: | | | | |
| Investments | | | 52,145,724 | |
| (Increase)/Decrease in assets: | | | | |
| Interest receivable | | | (368,030 | ) |
| Dividends receivable | | | (14,521 | ) |
| Deferred offering costs | | | 219,298 | |
| Prepaid and other assets | | | (37,686 | ) |
| Increase/(Decrease) in liabilities: | | | | |
| Facility Loan Fee payable | | | 7,156 | |
| Decrease in interest due on loan payable | | | (4,888 | ) |
| Payable for shareholder servicing | | | 3,317 | |
| Payable to Transfer agency | | | 943 | |
| Payable to Adviser | | | 30,973 | |
| Payable to fund accounting and administration fees | | | 57,319 | |
| Payable to Directors and Officers | | | (3,613 | ) |
| Payable for Audit fees | | | 1,766 | |
| Payable for Compliance fees | | | 1,623 | |
| Payable for Custodian fees | | | 13,366 | |
| Other payables | | | 82,924 | |
| Net cash used in operating activities | | $ | (68,960,477 | ) |
| | | | | |
| CASH FLOWS FROM FINANCING ACTIVITIES: | | | | |
| Proceeds from issuance of Series B Cumulative Perpetual Preferred Shares | | $ | 60,000,000 | |
| Issuance and offering costs for issuance of Series A Cumulative Perpetual Preferred Shares | | | (2,438,300 | ) |
| Payments on loan payable | | | (21,000,000 | ) |
| Proceeds from sale of capital shares | | | 67,529,799 | |
| Cash distributions paid to common shareholders - net of distributions reinvested | | | (33,134,329 | ) |
| Cash distributions paid to preferred shareholders | | | (3,994,848 | ) |
| Net cash provided by financing activities | | $ | 66,962,322 | |
| | | | | |
| Net decrease in cash and restricted cash | | $ | (1,998,155 | ) |
| Cash and restricted cash, beginning of period | | $ | 2,009,110 | |
| Cash and restricted cash, end of period | | $ | 10,955 | |
| | | | | |
| SUPPLEMENTAL DISCLOSURE OF CASH FLOW INFORMATION: | | | | |
See Notes to Financial Statements.
| 38 | (888) 848-7569 | www.rivernorth.com |
RiverNorth/DoubleLine Strategic Opportunity Fund, Inc.
| Statement of Cash Flows | For the Year Ended June 30, 2022 |
| Cash paid for interest expense and fees for line of credit | | $ | 121,200 | |
| Reinvestment of distributions | | $ | 685,086 | |
| | | | | |
| Reconciliation of restricted and unrestricted cash at the beginning of period to the statement of assets and liabilities: | | | | |
| Cash | | $ | 2,009,110 | |
| | | | | |
| Reconciliation of restricted and unrestricted cash at the end of the period to the statement of assets and liabilities: | | | | |
| Cash | | $ | 10,955 | |
See Notes to Financial Statements.
| Annual Report | June 30, 2022 | 39 |
RiverNorth/DoubleLine Strategic Opportunity Fund, Inc.
| Financial Highlights | For a common share outstanding throughout the periods presented |
| Net asset value - beginning of period |
| Income/(loss) from investment operations: |
| Net investment income(a) |
| Net realized and unrealized gain/(loss)(b) |
| Total income/(loss) from investment operations |
| Less distributions to common shareholders: |
| From net investment income |
| From tax return of capital |
| Total distributions to common shareholders |
| Less distributions to preferred shareholders: |
| From net investment income(d) |
| Total distributions to preferred shareholders |
| Common share transactions: |
| Dilutive effect of rights offering |
| Common share offering costs charged to paid-in capital |
| Total common share transactions |
| Preferred Share issuance and offering costs charged to paid-in capital |
| Total preferred share transactions |
| Net increase/(decrease) in net asset value |
| Net asset value - end of period |
| Market price - end of period |
| Total Return(g) |
| Total Return - Market Price(g) |
| Supplemental Data: |
| Net assets, end of period (in thousands) |
| Ratio of expenses to average net assets(h)(i) |
| Ratio of net investment income |
| Portfolio turnover rate |
| Loan payable (in thousands) |
| Asset coverage per $1,000 of loan payable(j) |
| Cumulative Perpetual Preferred Stock (in thousands) |
| Asset coverage of Cumulative Perpetual Preferred Stock(k) |
| |
| Involuntary liquidating preference per unit of Series A Cumulative Preferred Stock Average market value per unit of Series A Cumulative Preferred Stock |
| |
| Involuntary liquidating preference per unit of Series B Cumulative Preferred Stock Average market value per unit of Series B Cumulative Preferred Stock |
See Notes to Financial Statements.
| 40 | (888) 848-7569 | www.rivernorth.com |
RiverNorth/DoubleLine Strategic Opportunity Fund, Inc.
| Financial Highlights | For a common share outstanding throughout the periods presented |
For the Year Ended June 30, 2022 | | | For the Year Ended June 30, 2021 | | | For the Year Ended June 30, 2020 | | | For the Year Ended June 30, 2019 | | | For the Year Ended June 30, 2018 | |
| $ | 15.17 | | | $ | 14.91 | | | $ | 18.09 | | | $ | 18.75 | | | $ | 20.04 | |
| | | | | | | | | | | | | | | | | | | |
| | 0.87 | | | | 0.92 | | | | 0.95 | | | | 0.94 | | | | 1.06 | |
| | (2.49 | ) | | | 1.73 | | | | (1.72 | ) | | | 0.40 | | | | (0.64 | ) |
| | (1.62 | ) | | | 2.65 | | | | (0.77 | ) | | | 1.34 | | | | 0.42 | |
| | | | | | | | | | | | | | | | | | | |
| | (0.81 | ) | | | (1.02 | ) | | | (1.11 | ) | | | (1.18 | ) | | | (1.40 | )(c) |
| | (1.03 | ) | | | (1.01 | ) | | | (1.07 | ) | | | (0.82 | ) | | | (0.31 | ) |
| | (1.84 | ) | | | (2.03 | ) | | | (2.18 | ) | | | (2.00 | ) | | | (1.71 | ) |
| | | | | | | | | | | | | | | | | | | |
| | (0.24 | ) | | | (0.13 | ) | | | – | | | | – | | | | – | |
| | (0.24 | ) | | | (0.13 | ) | | | – | | | | – | | | | – | |
| | | | | | | | | | | | | | | | | | | |
| | (0.06 | )(e) | | | (0.05 | )(e) | | | (0.22 | )(e) | | | – | | | | – | |
| | (0.01 | ) | | | 0.00 | (f) | | | (0.01 | ) | | | – | | | | – | |
| | (0.07 | ) | | | (0.05 | ) | | | (0.23 | ) | | | – | | | | – | |
| | (0.13 | ) | | | (0.18 | ) | | | – | | | | – | | | | – | |
| | (0.13 | ) | | | (0.18 | ) | | | – | | | | – | | | | – | |
| | (3.90 | ) | | | 0.26 | | | | (3.18 | ) | | | (0.66 | ) | | | (1.29 | ) |
| $ | 11.27 | | | $ | 15.17 | | | $ | 14.91 | | | $ | 18.09 | | | $ | 18.75 | |
| $ | 10.89 | | | $ | 15.58 | | | $ | 13.91 | | | $ | 17.06 | | | $ | 17.69 | |
| | (14.82 | %) | | | 16.88 | % | | | (5.31 | %) | | | 7.78 | % | | | 2.12 | % |
| | (19.86 | %) | | | 28.67 | % | | | (6.33 | %) | | | 8.50 | % | | | (0.65 | %) |
| | | | | | | | | | | | | | | | | | | |
| $ | 219,123 | | | $ | 224,826 | | | $ | 199,510 | | | $ | 199,213 | | | $ | 206,561 | |
| | 1.93 | % | | | 2.10 | % | | | 2.84 | % | | | 3.16 | % | | | 2.67 | % |
| | 6.32 | % | | | 6.15 | % | | | 5.73 | % | | | 5.17 | % | | | 5.42 | % |
| | 44 | % | | | 54 | % | | | 43 | % | | | 27 | % | | | 23 | % |
| $ | – | | | $ | 21,000 | | | $ | 65,500 | | | $ | 73,500 | | | $ | 73,500 | |
| | – | | | | 14,563 | | | | 4,046 | | | | 3,711 | | | | 3,811 | |
| $ | 120,000 | | | $ | 60,000 | | | $ | – | | | $ | – | | | $ | – | |
| | 71 | | | | 119 | | | | – | | | | – | | | | – | |
| | | | | | | | | | | | | | | | | | | |
| $ | 25.00 | | | $ | 25.00 | | | $ | – | | | $ | – | | | $ | – | |
| $ | 22.98 | | | $ | 24.44 | | | $ | – | | | $ | – | | | $ | – | |
| | | | | | | | | | | | | | | | | | | |
| $ | 25.00 | | | $ | – | | | $ | – | | | $ | – | | | $ | – | |
| $ | 22.93 | | | $ | – | | | $ | – | | | $ | – | | | $ | – | |
See Notes to Financial Statements.
| Annual Report | June 30, 2022 | 41 |
RiverNorth/DoubleLine Strategic Opportunity Fund, Inc.
| Financial Highlights | For a common share outstanding throughout the periods presented |
| (a) | Based on average shares outstanding during the period. |
| (b) | Recognition of net investment income by the Fund is affected by the timing of the declarations of dividends by the underlying closed-end funds in which the Fund invests. The ratio does not include net investment income of the closed-end funds in which the Fund invests. |
| (c) | Includes net realized gain distributions of (0.09). |
| (d) | Calculated using the average shares method. |
| (e) | Represents the impact of the Fund's rights offering of 2,926,441 in October 2021 and 472,995 shares in October 2020 and 2,371,081 shares in December 2019 at a subscription price per share based on a formula. For more details please refer to Note 9 of the Notes to Financial Statements. |
| (f) | Less than $0.005 per share. |
| (g) | Total investment return is calculated assuming a purchase of common shares at the opening on the first day and a sale at closing on the last day of each period reported. For purposes of this calculation, dividends and distributions, if any, are assumed to be reinvested at prices obtained under the Fund’s dividend reinvestment plan. Total investment returns do not reflect brokerage commissions, if any. Periods less than one year are not annualized. |
| (h) | Includes interest expenses, as applicable, of 0.05% for the year ended June 30, 2022, 0.21% for the year ended June 30, 2021, 0.91% for the year ended June 30, 2020, 1.23% for the year ended June 30, 2019 and 0.87% for the year ended June 30, 2018. |
| (i) | Does not include expenses of the closed-end funds in which the Fund invests. |
| (j) | Calculated by subtracting the Fund's total liabilities (excluding the debt balance and accumulated unpaid interest) from the Fund's total assets and dividing by the outstanding debt balance. |
| (k) | The asset coverage ratio for a class of senior securities representing stock is calculated as the Fund's total assets, less all liabilities and indebtedness not represented by the Fund's senior securities, divided by secured senior securities representing indebtedness plus the aggregate of the involuntary liquidation preference of secured senior securities which are stock. With respect to the Preferred Stock, the asset coverage per unit figure is expressed in terms of dollar amounts per share of outstanding Preferred Stock (based on a liquidation preference of $25). |
See Notes to Financial Statements.
| 42 | (888) 848-7569 | www.rivernorth.com |
RiverNorth/DoubleLine Strategic Opportunity Fund, Inc.
| Notes to Financial Statements | June 30, 2022 |
1. ORGANIZATION
RiverNorth/DoubleLine Strategic Opportunity Fund, Inc. (the “Fund”) is a closed-end management investment company that was organized as a Maryland corporation on June 22, 2016, and commenced investment operations on September 28, 2016. The investment adviser to the Fund is RiverNorth Capital Management, LLC (the “Adviser”). The Fund’s sub-adviser is DoubleLine Capital, LP (“Sub-Adviser”). The Fund is a diversified investment company with an investment objective to seek current income and overall total return.
The Fund seeks to achieve its investment objective by allocating its Managed Assets among three principal strategies: Tactical Closed End Fund Income Strategy, Alternative Credit Strategy and Opportunistic Income Strategy. The Adviser will determine the portion of the Fund’s Managed Assets to allocate to each strategy and may, from time to time, adjust the allocations.
2. SIGNIFICANT ACCOUNTING POLICIES
The following is a summary of significant accounting policies followed by the Fund. These policies are in conformity with generally accepted accounting principles in the United States of America (“GAAP”). The financial statements are prepared in accordance with GAAP, which requires management to make estimates and assumptions that affect the reported amounts and disclosures, including the disclosure of contingent assets and liabilities, in the financial statements during the reporting period. Management believes the estimates and security valuations are appropriate; however, actual results may differ from those estimates, and the security valuations reflected in the financial statements may differ from the value the Fund ultimately realizes upon sale of the securities. The Fund is considered an investment company for financial reporting purposes under GAAP and follows the accounting and reporting guidance applicable to investment companies as codified in Accounting Standards Codification (“ASC”) 946 – Investment Companies. The financial statements have been prepared as of the close of the New York Stock Exchange (“NYSE”) on June 30, 2022.
Security Valuation: The Fund’s investments are generally valued at their fair value using market quotations. If a market value quotation is unavailable a security may be valued at its estimated fair value as described in Note 3.
Security Transactions and Related Income: The Fund follows industry practice and records security transactions on the trade date basis. The specific identification method is used for determining gains or losses for financial statements and income tax purposes. Dividend income is recorded on the ex-dividend date or for certain foreign securities, when the information becomes available to the Fund and interest income and expenses are recorded on an accrual basis. Discounts and premiums on securities purchased are amortized or accreted using the effective interest method. Paydown gains and losses on mortgage-related and other asset-backed securities are recorded as components of interest income on the Statement of Operations. Withholding taxes on foreign dividends have been provided for in accordance with the Fund’s understanding of the applicable country’s tax rules and rates. The ability of issuers of debt securities held by the Fund to meet their obligations may be affected by economic and political developments in a specific country or region. Settlement on bank loans transactions may be in excess of seven business days. Interest only stripped mortgage backed securities (“IO Strips”) are securities that receive only interest payments from a pool of mortgage loans. Little to no principal will be received by the Fund upon maturity of an IO Strip. Periodic adjustments are recorded to reduce the cost of the security until maturity, which are included in interest income.
| Annual Report | June 30, 2022 | 43 |
RiverNorth/DoubleLine Strategic Opportunity Fund, Inc.
| Notes to Financial Statements | June 30, 2022 |
Foreign Currency Translation: The books and records of the Funds are maintained in U.S. dollars. Investment valuations and other assets and liabilities initially expressed in foreign currencies are converted each business day into U.S. dollars based upon current exchange rates. Prevailing foreign exchange rates may generally be obtained at the close of the NYSE (normally, 4:00 p.m. Eastern time). The portion of realized and unrealized gains or losses on investments due to fluctuations in foreign currency exchange rates is not separately disclosed and is included in realized and unrealized gains or losses on investments, when applicable.
Preferred Stock: In accordance with ASC 480-10-25, the Fund's Series A Term preferred shares have been classified as equity on the Statement of Assets and Liabilities. Refer to "Note 8. Cumulative Perpetual Preferred Stock" for further details.
Other: The Fund holds certain investments which pay dividends to their shareholders based upon available funds from operations. It is possible for these dividends to exceed the underlying investments’ taxable earnings and profits resulting in the excess portion of such dividends being designated as a return of capital. Distributions received from investments in securities that represent a return of capital or long-term capital gains are recorded as a reduction of the cost of investments or as a realized gain, respectively.
The Fund invests in closed-end funds, each of which has its own investment risks. Those risks can affect the value of the Fund's investments and therefore the value of the Fund's shares. To the extent that the Fund invests more of its assets in one closed end fund than in another, the Fund will have greater exposure to the risks of that closed end fund.
Common Share Valuation: The NAV is generally calculated as of the close of trading on the NYSE (normally 4:00 p.m. Eastern time) every day the NYSE is open. The NAV is calculated by dividing the value of all of the securities and other assets of the Fund, less the liabilities (including accrued expenses and indebtedness), by the total number of common shares outstanding.
Federal Income Taxes: The Fund has been treated as, and intends to qualify each year for special tax treatment afforded to, a regulated investment company (“RIC”) under Subchapter M of the Internal Revenue Code, as amended (“IRC”). In order to qualify as a RIC, the Fund must, among other things, satisfy income, asset diversification and distribution requirements. As long as it so qualifies, the Fund will not be subject to U.S. federal income tax to the extent that it distributes annually its investment company taxable income and its “net capital gain”. If the Fund retains any investment company taxable income or net capital gain, it will be subject to U.S. federal income tax on the retained amount at regular corporate tax rates. In addition, if the Fund fails to qualify as a RIC for any taxable year, it will be subject to U.S. federal income tax on all of its income and gains at regular corporate tax rates.
As of and during the year ended June 30, 2022, the Fund did not have a liability for any unrecognized tax benefits. The Fund files U.S. federal, state, and local tax returns as required. The Fund’s tax returns are subject to examination by the relevant tax authorities until expiration of the applicable statute of limitations, which is generally three years after the filing of the tax return for federal purposes and four years for most state returns. Tax returns for open years have incorporated no uncertain tax positions that require a provision for income taxes.
| 44 | (888) 848-7569 | www.rivernorth.com |
RiverNorth/DoubleLine Strategic Opportunity Fund, Inc.
| Notes to Financial Statements | June 30, 2022 |
The Fund recognizes interest and penalties, if any, related to unrecognized tax benefits as income tax expenses on the Statement of Operations. During the year ended June 30, 2022, the Fund did not incur any interest or penalties.
Distributions to Shareholders: Distributions to shareholders, which are determined in accordance with income tax regulations, are recorded on the ex-dividend date. The treatment for financial reporting purposes of distributions made to common shareholders during the year from net investment income or net realized capital gains may differ from their ultimate treatment for federal income tax purposes. These differences are caused primarily by differences in the timing of recognition of certain components of income, expense, or realized capital gain for federal income tax purposes. Where such differences are permanent in nature, they are reclassified in the components of the net assets based on their ultimate characterization for federal income tax purposes. Any such reclassification will have no effect on net assets, results of operations, or net asset values (“NAV”) per common share of the Fund.
The Fund maintains a level distribution policy. The Fund distributes to common shareholders regular monthly cash distributions of its net investment income. In addition, the Fund distributes its net realized capital gains, if any, at least annually. At times, to maintain a stable level of distributions, the Fund may pay out less than all of its net investment income or pay out accumulated undistributed income, or return of capital, in addition to current net investment income. Any distribution that is treated as a return of capital generally will reduce a common shareholder’s basis in his or her shares, which may increase the capital gain or reduce the capital loss realized upon the sale of such shares. Any amounts received in excess of a common shareholder’s basis are generally treated as capital gain, assuming the shares are held as capital assets. The Board approved the implementation of the level distribution policy to make monthly cash distributions to common shareholders, stated in terms of a rate equal to 12.5% of the average of the Fund’s NAV per common share for the final five trading days of the previous calendar year. The Fund made monthly distributions to common shareholders set at a level monthly rate of $0.1586 per common share for the period from July 1, 2021 to December 31, 2021, and $0.1478 per common share for the period from January 1, 2022 to June 30, 2022.
Previously, the Board approved the adoption of a managed distribution plan in accordance with a Section 19(b) exemptive order whereby the Fund made monthly distributions to common shareholders set at a fixed monthly rate of $0.18 per common share.
The amount of the Fund’s distributions pursuant to the managed distribution plan are not related to the Fund’s performance and, therefore, investors should not make any conclusions about the Fund’s investment performance from the amount of the Fund’s distributions or from the terms of the Fund’s managed distribution plan. The Board may amend, suspend or terminate the managed distribution plan at any time without notice to common shareholders.
Distributions to holders of cumulative perpetual preferred stock are accrued on a daily basis as described in Note 8.
| Annual Report | June 30, 2022 | 45 |
RiverNorth/DoubleLine Strategic Opportunity Fund, Inc.
| Notes to Financial Statements | June 30, 2022 |
3. SECURITIES VALUATION AND FAIR VALUE MEASUREMENTS
Fair value is defined as the price that the Fund might reasonably expect to receive upon selling an investment in a timely transaction to an independent buyer in the principal or most advantageous market of the investment. GAAP establishes a three-tier hierarchy to maximize the use of observable market data and minimize the use of unobservable inputs and to establish classification of fair value measurements for disclosure purposes.
Inputs refer broadly to the assumptions that market participants would use in pricing the asset or liability, including assumptions about risk, for example, the risk inherent in a particular valuation technique used to measure fair value including using such a pricing model and/or the risk inherent in the inputs to the valuation technique. Inputs may be observable or unobservable. Observable inputs are inputs that reflect the assumptions market participants would use in pricing the asset or liability developed based on market data obtained from sources independent of the reporting entity. Unobservable inputs are inputs that reflect the reporting entity’s own assumptions about the assumptions market participants would use in pricing the asset or liability developed based on the best information available in the circumstances.
Various inputs are used in determining the value of the Fund’s investments. These inputs are summarized in the three broad levels listed below.
| | Level 1 – | Unadjusted quoted prices in active markets for identical, unrestricted assets or liabilities that the Fund has the ability to access at the measurement date; |
| | | |
| | Level 2 – | Quoted prices which are not active, quoted prices for similar assets or liabilities in active markets or inputs other than quoted prices that are observable (either directly or indirectly) for substantially the full term of the asset or liability; and |
| | | |
| | Level 3 – | Significant unobservable prices or inputs (including the Fund’s own assumptions in determining the fair value of investments) where there is little or no market activity for the asset or liability at the measurement date. |
The inputs used to measure fair value may fall into different levels of the fair value hierarchy. In such cases, for disclosure purposes, the level in the fair value hierarchy within which the fair value measurement falls in its entirety is determined based on the lowest level input that is significant to the fair value measurement in its entirety.
Equity securities, including closed-end funds and business development company notes, are generally valued by using market quotations, but may be valued on the basis of prices furnished by a pricing service when the Adviser or the Sub-Adviser believes such prices more accurately reflect the fair market value of such securities. Securities that are traded on any stock exchange are generally valued by the pricing service at the last quoted sale price. Lacking a last sale price, an exchange traded security is generally valued by the pricing service at its last bid price. Securities traded in the NASDAQ over-the-counter market are generally valued by the pricing service at the NASDAQ Official Closing Price. When using the market quotations or close prices provided by the pricing service and when the market is considered active, the security will be classified as a Level 1 security. Sometimes, an equity security owned by the Fund will be valued by the pricing service with factors other than market quotations or when the market is considered inactive. When this happens, the security will be classified as a Level 2 security. When market quotations are not readily available, when the Adviser or the Sub-Adviser determines that the market quotation or the price provided by the pricing service does not accurately reflect the current fair value, or when restricted or illiquid securities are being valued, such securities are valued as determined in good faith by the Adviser, Sub-Adviser, or Valuation Committee in conformity with guidelines adopted by and subject to review by the Board. These securities will be categorized as Level 3 securities.
| 46 | (888) 848-7569 | www.rivernorth.com |
RiverNorth/DoubleLine Strategic Opportunity Fund, Inc.
| Notes to Financial Statements | June 30, 2022 |
Investments in mutual funds, including short term investments, are generally priced at the ending NAV provided by the service agent of the funds. These securities will be classified as Level 1 securities.
Domestic and foreign fixed income securities, including foreign and U.S. corporate bonds, foreign and U.S. government bonds, non-agency collateralized mortgage obligations, U.S. Government/ Agency mortgage backed securities, bank loans, and collateralized loan obligations are normally valued on the basis of quotes obtained from brokers and dealers or independent pricing services. Foreign currency positions, including forward foreign currency contracts, are priced at the mean between the closing bid and asked prices at 4:00 p.m. Eastern Time. Prices obtained from independent pricing services typically use information provided by market makers or estimates of market values obtained from yield data relating to investments or securities with similar characteristics. Data used to establish quotes includes analysis of cash flows, pre-payment speeds, default rates, delinquency assumptions and assumptions regarding collateral and loss assumptions. These securities will be classified as Level 2 securities.
Short-term investments in fixed income securities, excluding money market funds, with maturities of less than 60 days when acquired, or which subsequently are within 60 days of maturity, are valued by using the amortized cost method of valuation, which the Board has determined will represent fair value. These securities will be classified as Level 2 securities.
In accordance with the Fund’s good faith pricing guidelines, the Adviser, Sub-Adviser, or Valuation Committee is required to consider all appropriate factors relevant to the value of securities for which it has determined other pricing sources are not available or reliable as described above. No single standard exists for determining fair value, because fair value depends upon the circumstances of each individual case. As a general principle, the current fair value of an issue of securities being valued by the Adviser, Sub-Adviser, or valuation committee would appear to be the amount which the owner might reasonably expect to receive for them upon their current sale. Methods which are in accordance with this principle may, for example, be based on (i) a multiple of earnings; (ii) discounted cash flow models; (iii) weighted average cost or weighted average price; (iv) a discount from market of a similar freely traded security (including a derivative security or a basket of securities traded on other markets, exchanges or among dealers); or (v) yield to maturity with respect to debt issues, or a combination of these and other methods. Good faith pricing is permitted if, in the Adviser’s, a Sub-Adviser’s, or the Valuation Committee’s opinion, the validity of market quotations appears to be questionable based on factors such as evidence of a thin market in the security based on a small number of quotations, a significant event occurs after the close of a market but before the Fund’s NAV calculation that may affect a security’s value, or the Adviser or a Sub-Adviser is aware of any other data that calls into question the reliability of market quotations.
| Annual Report | June 30, 2022 | 47 |
RiverNorth/DoubleLine Strategic Opportunity Fund, Inc.
| Notes to Financial Statements | June 30, 2022 |
Good faith pricing may also be used in instances when the bonds in which the Fund invests default or otherwise cease to have market quotations readily available.
The following is a summary of the inputs used at June 30, 2022 in valuing the Fund’s assets and liabilities:
| Investments in Securities at Value* | | Level 1 - Quoted Prices | | | Level 2 - Other Significant Observable Inputs | | | Level 3 - Significant Unobservable Inputs | | | Total | |
| Closed-End Funds | | $ | 32,354,645 | | | $ | 15,037 | | | $ | – | | | $ | 32,369,682 | |
| Bank Loans | | | – | | | | 12,490,742 | | | | – | | | | 12,490,742 | |
| Special Purpose Acquisition Companies | | | 35,441,583 | | | | 167,311 | | | | – | | | | 35,608,894 | |
| Rights | | | 41,227 | | | | – | | | | – | | | | 41,227 | |
| Warrants | | | 178,453 | | | | – | | | | – | | | | 178,453 | |
| Preferred Stocks | | | 9,347,337 | | | | 17,676 | | | | – | | | | 9,365,013 | |
| Foreign Government Bonds | | | – | | | | 1,358,069 | | | | – | | | | 1,358,069 | |
| Collateralized Loan Obligations | | | – | | | | 14,936,637 | | | | – | | | | 14,936,637 | |
| U.S. Corporate Bonds | | | – | | | | 13,748,690 | | | | – | | | | 13,748,690 | |
| U.S. Government / Agency Mortgage Backed Securities | | | – | | | | 80,027,877 | | | | – | | | | 80,027,877 | |
| U.S. Government Bonds and Notes | | | – | | | | 16,292,265 | | | | – | | | | 16,292,265 | |
| Foreign Corporate Bonds | | | – | | | | 12,032,195 | | | | – | | | | 12,032,195 | |
| Non-Agency Collateralized Mortgage Obligations | | | – | | | | 69,648,410 | | | | – | | | | 69,648,410 | |
| Short-Term Investments | | | 40,316,875 | | | | – | | | | – | | | | 40,316,875 | |
| Total | | $ | 117,680,120 | | | $ | 220,734,909 | | | $ | – | | | $ | 338,415,029 | |
| * | Refer to the Fund's Schedule of Investments for a listing of securities by type. |
4. ADVISORY FEES, DIRECTOR FEES AND OTHER AGREEMENTS
RiverNorth serves as the investment adviser to the Fund. Under the terms of the management agreement (the “Agreement”), the Adviser, subject to the supervision of the Board, provides or arranges to be provided to the Fund such investment advice as it deems advisable and will furnish or arrange to be furnished a continuous investment program for the Fund consistent with the Fund’s investment objectives and policies. As compensation for its management services, the Fund is obligated to pay the Adviser a fee computed and accrued daily and paid monthly in arrears at an annual rate of 1.00% of the average daily managed assets of the Fund. Managed assets are defined as the total assets of the Fund, including assets attributable to leverage, minus liabilities other than debt representing leverage and any preferred stock that may be outstanding.
| 48 | (888) 848-7569 | www.rivernorth.com |
RiverNorth/DoubleLine Strategic Opportunity Fund, Inc.
| Notes to Financial Statements | June 30, 2022 |
DoubleLine Capital, LP is the investment sub-adviser to the Fund. Under the terms of the sub- advisory agreement, the Sub-Adviser, subject to the supervision of the Adviser and the Board, provides or arranges to be provided to the Fund such investment advice as deemed advisable and will furnish or arrange to be furnished a continuous investment program for the portion of assets managed in the Fund consistent with the Fund’s investment objective and policies. As compensation for its sub-advisory services, the Adviser is obligated to pay the Sub-Adviser a fee computed and accrued daily and paid monthly in arrears based on an annual rate of 0.50% of the average daily managed assets of the Fund.
ALPS Fund Services, Inc. (“ALPS”) provides the Fund with fund administration and fund accounting services. As compensation for its services to the Fund, ALPS receives an annual fee based on the Fund’s average daily net assets, subject to certain minimums.
State Street Bank & Trust, Co. serves as the Fund’s custodian. Following the Fund's fiscal year end, Millennium Trust was added as a custodian for electronic loan documents related to the Alternative Credit Strategy.
DST Systems, Inc. (“DST”), the parent company of ALPS, serves as the Transfer Agent to the Fund. Under the Transfer Agency Agreement, DST is responsible for maintaining all shareholder records of the Fund. DST is a wholly-owned subsidiary of SS&C Technologies Holdings, Inc. (“SS&C”), a publicly traded company listed on the NASDAQ Global Select Market.
The Fund pays no salaries or compensation to its officers or to any interested Director employed by the Adviser or Sub-Adviser, and the Fund has no employees except as noted below. For their services, the Directors of the Fund who are not employed by the Adviser or Sub-Adviser, receive an annual retainer in the amount of $16,500, and an additional $1,500 for attending each quarterly meeting of the Board. In addition, the lead Independent Director receives $250 annually, the Chair of the Audit Committee receives $500 annually and the Chair of the Nominating and Corporate Governance Committee receives $250 annually. The Directors not employed by the Adviser or Sub- Adviser are also reimbursed for all reasonable out-of-pocket expenses relating to attendance at meetings of the Board.
The Chief Compliance Officer (“CCO”) of the Fund is an employee of the Adviser. The Fund reimburses the Adviser for certain compliance costs related to the Fund, including a portion of the CCO's compensation.
5. NEW ACCOUNTING PRONOUNCEMENTS AND RULE ISSUANCES
In December 2020, the SEC voted to adopt a new rule providing a framework for fund valuation practices (“Rule 2a-5”). Rule 2a-5 establishes requirements for determining fair value in good faith for purposes of the 1940 Act. Rule 2a-5 will permit fund boards to designate certain parties to perform fair value determinations, subject to board oversight and certain other conditions. Rule 2a-5 also defines when market quotations are “readily available” for purposes of Section 2(a)(41) of the 1940 Act, which requires a fund to fair value a security when market quotations are not readily available, and the threshold for determining whether a fund must fair value a security. The SEC also adopted new Rule 31a-4 under the 1940 Act, which sets forth the recordkeeping requirements associated with fair value determinations. Finally, the SEC is rescinding previously issued guidance on related issues, including the role of a board in determining fair value and the accounting and auditing of fund investments. Rule 2a-5 and Rule 31a-4 became effective on March 8, 2021, with a compliance date of September 8, 2022. Management is currently assessing the potential impact of the new rules on the Fund's financial statements and does not expect the implementation to have a material impact on the Fund's financial statements.
| Annual Report | June 30, 2022 | 49 |
RiverNorth/DoubleLine Strategic Opportunity Fund, Inc.
| Notes to Financial Statements | June 30, 2022 |
6. CREDIT AGREEMENT
The Fund may borrow money and/or issue preferred stock, notes or debt securities for investment purposes. These practices are known as leveraging. The Fund may use leverage through borrowings or the issuance of preferred stock, in an aggregate amount of up to 33 1/3% of the Fund’s total assets immediately after such borrowings or issuance.
On December 16, 2016, the Fund entered into a $75,000,000 secured, revolving, evergreen credit facility with U.S. Bank National Association (“U.S. Bank”). The credit facility had a variable annual interest rate equal to one-month LIBOR plus 0.95 percent. The credit facility accrued a commitment fee equal to an annual rate of 0.10 percent on $75,000,000.
On April 1, 2022, the Fund entered into an amended $50,000,000 secured, revolving, evergreen credit facility with U.S. Bank. The amended credit facility has a variable annual interest rate equal to SOFR plus 1.10 percent. The amended credit facility will accrue a commitment fee equal to an annual rate of 0.25 percent if the drawn amount is less than $37,500,000 and 0.125 percent if the drawn amount is $37,500,000 or more.The average principal balance and interest rate for the period during which the credit facility was utilized for the year ended June 30, 2022 was approximately $8,506,849 and 1.16%, respectively, and the maximum borrowing during the year was $31,000,000. There was no outstanding balance on the credit facility as of June 30, 2022.
7. TAX BASIS INFORMATION
It is the Fund’s policy to meet the requirements of the IRC applicable to regulated investment companies, and to distribute all of its taxable net income to its shareholders. In addition, the Fund intends to pay distributions as required to avoid imposition of excise tax. Therefore, no federal income tax provision is required.
Tax Basis of Distributions to Shareholders: The character of distributions made during the year from net investment income or net realized gains may differ from its ultimate characterization for federal income tax purposes. Also, due to the timing of dividend distributions, the fiscal year in which amounts are distributed may differ from the fiscal year in which the income or realized gains were recorded by the Fund.
| 50 | (888) 848-7569 | www.rivernorth.com |
RiverNorth/DoubleLine Strategic Opportunity Fund, Inc.
| Notes to Financial Statements | June 30, 2022 |
The tax character of the distributions paid by the Fund during the fiscal years ended June 30, 2022 and June 30, 2021, was as follows:
| | | For the Year Ended June 30, 2022 | | | For the Year Ended June 30, 2021 | |
| Ordinary Income | | $ | 18,842,812 | | | $ | 14,029,045 | |
| Return of Capital | | | 18,971,451 | | | | 15,473,634 | |
| Total | | $ | 37,814,263 | | | $ | 29,502,679 | |
Components of Distributable Earnings on a Tax Basis: The tax components of distributable earnings are determined in accordance with income tax regulations which may differ from the composition of net assets reported under GAAP. Accordingly, for the year ended June 30, 2022, certain differences were reclassified. The amounts reclassified did not affect net assets and were primarily related to the treatment of tender option bonds. The reclassifications were as follows:
| Paid-in capital | Total distributable earnings |
| $437,759 | $(437,759) |
At June 30, 2022, the components of distributable earnings on a tax basis for the Fund was as follows:
| Preferred Distributions Payable | | $ | (684,375 | ) |
| Accumulated Capital Loss | | $ | (2,300,978 | ) |
| Unrealized Depreciation | | $ | (56,625,136 | ) |
| Total | | $ | (59,610,489 | ) |
Capital Losses: Capital loss carryovers used during the period ended June 30, 2022, were $939,115.
Under current law, capital losses maintain their character as short-term or long-term and are carried forward to the next tax year without expiration. As of the current fiscal year end, the following amounts are available as carry forwards to the next tax year:
| Short-Term | Long-Term |
| $─ | $2,300,978 |
Unrealized Appreciation and Depreciation on Investments: As of June 30, 2022, net unrealized appreciation/(depreciation) of investments based on federal tax costs was as follows:
| Cost of investments for income tax purposes | | $ | 395,040,165 | |
| Gross appreciation on investments (excess of value over tax cost) | | | 4,612,481 | |
| Gross depreciation on investments (excess of tax cost over value) | | | (61,237,617 | ) |
| Net unrealized depreciation on investments | | $ | (56,625,136 | ) |
| Annual Report | June 30, 2022 | 51 |
RiverNorth/DoubleLine Strategic Opportunity Fund, Inc.
| Notes to Financial Statements | June 30, 2022 |
The difference between book and tax basis unrealized appreciation/(depreciation) for the Fund is primarily attributable to wash sales and grantor trusts.
The Fund recognizes the tax benefits of uncertain tax positions only where the position is “more likely than not” to be sustained assuming examination by tax authorities. Management has analyzed the Fund’s tax positions, and has concluded that no liability for unrecognized tax benefits should be recorded related to uncertain tax positions taken on U.S. tax returns and state tax returns filed since inception of the Fund. No income tax returns are currently under examination. The tax years since 2018 remain subject to examination by the tax authorities in the United States. The Fund is not aware of any tax positions for which it is reasonably possible that the total amounts of unrecognized tax benefits will change materially in the next 12 months.
8. INVESTMENT TRANSACTIONS
Investment transactions for the year ended June 30, 2022, excluding short-term investments, were as follows:
| Purchases | Sales |
| $206,059,018 | $144,321,594 |
Investment Transactions in long term U.S. Government Obligations for the year ended June 30, 2022 were as follows:
| | Purchases of Securities | | | Proceeds from Sales of Securities | |
| | $ | 1,694,751 | | | $ | 307,000 | |
9. CUMULATIVE PERPETUAL PREFERRED STOCK
At June 30, 2022, the Fund had issued and outstanding 2,400,000 shares of Series A Cumulative Perpetual Preferred Stock, listed under trading symbol OPPPRA on the NYSE, with a par value of $0.0001 per share and a liquidation preference of $25.00 per share plus accrued and unpaid dividends (whether or not declared) and 2,400,000 shares of Series B Cumulative Perpetual Preferred Stock, listed under trading symbol OPPPRB on the NYSE, with a par value of $0.0001 per share and a liquidation preference of $25.00 per share plus accrued and unpaid dividends (whether or not declared). The Fund issued 2,400,000 shares of Series A Cumulative Perpetual Preferred Stock on October 23, 2020 and 2,400,000 shares of Series B Cumulative Perpetual Preferred Stock on November 22, 2021. The Series A Cumulative Perpetual Preferred Stock is entitled to voting rights and a dividend at a rate of 4.375% per year, paid quarterly, based on the $25.00 liquidation preference before the common stock is entitled to receive any dividends. The Series B Cumulative Perpetual Preferred Stock is entitled to voting rights and a dividend at a rate of 4.75% per year, paid quarterly, based on the $25.00 liquidation preference before the common stock is entitled to receive any dividends. The Series A Cumulative Perpetual Preferred Stock is generally not redeemable at the Fund’s option prior to November 15, 2025, and is subject to mandatory redemption by the Fund in certain circumstances. The Series B Cumulative Perpetual Preferred Stock is generally not redeemable at the Fund’s option prior to February 15, 2027, and is subject to mandatory redemption by the Fund in certain circumstances. On or after November 15, 2025, the Fund may redeem in whole, or from time to time in part, outstanding Series A Cumulative Perpetual Preferred Stock at a redemption price per share equal to the per share liquidation preference of $25.00 per share, plus accumulated and unpaid dividends, if any, through the date of redemption. On or after February 15, 2027, the Fund may redeem in whole, or from time to time in part, outstanding Series B Cumulative Perpetual Preferred Stock at a redemption price per share equal to the per share liquidation preference of $25.00 per share, plus accumulated and unpaid dividends, if any, through the date of redemption.
| 52 | (888) 848-7569 | www.rivernorth.com |
RiverNorth/DoubleLine Strategic Opportunity Fund, Inc.
| Notes to Financial Statements | June 30, 2022 |
| Series | | First Redemption Date | | Fixed Rate | | | Shares Outstanding | | | Aggregate Liquidation Preference | | | Estimated Fair Value | |
| Series A | | November 15, 2025 | | | 4.375 | % | | | 2,400,000 | | | $ | 60,000,000 | | | $ | 45,672,000 | |
| Series B | | February 15, 2027 | | | 4.750 | % | | | 2,400,000 | | | $ | 60,000,000 | | | $ | 48,480,000 | |
10. CAPITAL SHARE TRANSACTIONS
The Fund’s authorized capital stock consists of 50,000,000 shares of common stock, $0.0001 par value per share, all of which is initially classified as common shares. Under the rules of the NYSE applicable to listed companies, the Fund is required to hold an annual meeting of stockholders in each year.
On August 12-13, 2020, and August 10-11, 2021, respectively, the Board approved rights offerings to participating shareholders of record who were allowed to subscribe for new common shares of the Fund (the “Primary Subscription”). Record date shareholders received one right for each common share held on the Record Date ("Right"). For every three Rights held, a holder of the Rights was entitled to buy one new common share of the Fund. Record date shareholders who fully exercised all Rights initially issued to them in the Primary Subscription were entitled to buy those common shares that were not purchased by other record date shareholders. The Fund issued new shares of common stock at a subscription price that represented 92.5% of the reported net asset value on the expiration date of each rights offering. Offering costs were charged to paid-in-capital upon the exercise of the Rights.
The shares of common stock issued, subscription price, and offering costs for the rights offerings were as follows:
| Record Date | Expiration Date | Shares of Common Stock Issued | Subscription Price | Offering Costs |
| September 3, 2020 | October 1, 2020 | 472,995 | $13.88 | $122,545 |
| September 7, 2021 | October 1, 2021 | 2,926,441 | $14.48 | $292,000 |
On April 7, 2021 and December 29, 2021, the Fund entered into a distribution agreement with ALPS Distributors, Inc. ("ADI"). Pursuant to the distribution agreement with ADI, the Fund may offer to sell up to 10,000,000 of the Fund's common stock from time to time through ADI.
| Annual Report | June 30, 2022 | 53 |
RiverNorth/DoubleLine Strategic Opportunity Fund, Inc.
| Notes to Financial Statements | June 30, 2022 |
The shares of common stock issued, gross proceeds from the sales of shares, and commissions to ADI were as follows:
| Year Ended | Shares of Common Stock Issued | Gross Proceeds | Commissions | Offering Costs | Net Proceeds |
| June 30, 2021 | 956,109 | $14,893,419 | $149,010 | $22,831 | $14,721,578 |
| June 30, 2022 | 1,647,892 | $25,745,539 | $257,587 | $41,019 | $25,446,933 |
The Fund has issued and outstanding 19,443,627 shares of common stock at June 30, 2022. Additional shares of the Fund may be issued under certain circumstances, including pursuant to the Fund’s Automatic Dividend Reinvestment Plan, as defined within the Fund’s organizational documents. Additional information concerning the Automatic Dividend Reinvestment Plan is included within this report.
11. INDEMNIFICATIONS
Under the Fund’s organizational documents, its Officers and Directors are indemnified against certain liabilities arising out of the performance of their duties to the Fund. Additionally, in the normal course of business, the Fund enters into contracts with service providers that may contain general indemnification clauses. The Fund’s maximum exposure under those arrangements is unknown, as this would involve future claims that may be made against the Fund that have not yet occurred.
12. CORONAVIRUS (COVID-19) PANDEMIC
Beginning in the first quarter of 2020, financial markets in the United States and around the world experienced extreme and in many cases unprecedented volatility and severe losses due to the global pandemic caused by COVID-19, a novel coronavirus. The outbreak was first detected in December 2019 and subsequently spread globally, and since then, the number of cases has fluctuated and new "variants" have been confirmed around the world. The pandemic has resulted in a wide range of social and economic disruptions, including closed borders, voluntary or compelled quarantines of large populations, stressed healthcare systems, reduced or prohibited domestic or international travel, supply chain disruptions, and so-called “stay-at-home” orders throughout much of the United States and many other countries. The fall-out from these disruptions has included the rapid closure of businesses deemed “non-essential” by federal, state, or local governments and rapidly increasing unemployment, as well as greatly reduced liquidity for certain instruments at times. Some sectors of the economy and individual issuers have experienced particularly large losses. Such disruptions may continue for an extended period of time or reoccur in the future to a similar or greater extent. In response, the U.S. government and the Federal Reserve have taken extraordinary actions to support the domestic economy and financial markets, resulting in very low interest rates and in some cases negative yields. Although vaccines for COVID-19 have become widely available, it is unknown how long circumstances related to the pandemic will persist, whether they will reoccur in the future, whether efforts to support the economy and financial markets will be successful, and what additional implications may follow from the pandemic. The impact of these events and other epidemics or pandemics in the future could adversely affect Fund performance.
| 54 | (888) 848-7569 | www.rivernorth.com |
RiverNorth/DoubleLine Strategic Opportunity Fund, Inc.
| Notes to Financial Statements | June 30, 2022 |
13. SUBSEQUENT EVENTS
Subsequent to June 30, 2022, the Fund paid the following distributions:
| Ex-Date | Record Date | Payable Date | Rate (per share) |
| July 14, 2022 | July 15, 2022 | July 29, 2022 | $0.1478 |
| August 16, 2022 | August 17, 2022 | August 31, 2022 | $0.1478 |
On July 20, 2022, the Board declared Series A and Series B preferred stock dividend in the amount of $0.27344 and $0.29688 per share, respectively, payable on August 15, 2022 to preferred shareholders of record on August 2, 2022 with an ex date of August 1, 2022.
| Annual Report | June 30, 2022 | 55 |
RiverNorth/DoubleLine Strategic Opportunity Fund, Inc.
| Report of Independent Registered Public Accounting Firm | June 30, 2022 |
To the Shareholders and Board of Directors of
RiverNorth/DoubleLine Strategic Opportunity Fund, Inc.
Opinion on the Financial Statements
We have audited the accompanying statement of assets and liabilities, including the schedule of investments, of RiverNorth/DoubleLine Strategic Opportunity Fund, Inc. (the “Fund”) as of June 30, 2022, the related statements of operations and cash flows for the year then ended, the statements of changes in net assets attributable to common shareholders for each of the two years in the period then ended, the related notes, and the financial highlights for each of the five years in the period then ended (collectively referred to as the “financial statements”). In our opinion, the financial statements present fairly, in all material respects, the financial position of the Fund as of June 30, 2022, the results of its operations and its cash flows for the year then ended, the changes in net assets for each of the two years in the period then ended, and the financial highlights for each of the five years in the period then ended, in conformity with accounting principles generally accepted in the United States of America.
Basis for Opinion
These financial statements are the responsibility of the Fund’s management. Our responsibility is to express an opinion on the Fund’s financial statements based on our audits. We are a public accounting firm registered with the Public Company Accounting Oversight Board (United States) (“PCAOB”) and are required to be independent with respect to the Fund in accordance with the U.S. federal securities laws and the applicable rules and regulations of the Securities and Exchange Commission and the PCAOB.
We conducted our audits in accordance with the standards of the PCAOB. Those standards require that we plan and perform the audit to obtain reasonable assurance about whether the financial statements are free of material misstatement whether due to error or fraud.
Our audits included performing procedures to assess the risks of material misstatement of the financial statements, whether due to error or fraud, and performing procedures that respond to those risks. Such procedures included examining, on a test basis, evidence regarding the amounts and disclosures in the financial statements. Our procedures included confirmation of securities owned as of June 30, 2022, by correspondence with the custodian, agent banks, and brokers; when replies were not received from agent banks or brokers, we performed other auditing procedures. Our audits also included evaluating the accounting principles used and significant estimates made by management, as well as evaluating the overall presentation of the financial statements. We believe that our audits provide a reasonable basis for our opinion.
We have served as the auditor of one or more of RiverNorth Capital Management, LLC’s investment companies since 2006.

COHEN & COMPANY, LTD.
Cleveland, Ohio
August 29, 2022
| 56 | (888) 848-7569 | www.rivernorth.com |
RiverNorth/DoubleLine Strategic Opportunity Fund, Inc.
| Dividend Reinvestment Plan | June 30, 2022 (Unaudited) |
The Fund has an automatic dividend reinvestment plan commonly referred to as an “opt-out” plan. Unless the registered owner of common shares elects to receive cash by contacting DST Systems, Inc. (the “Plan Administrator”), all dividends declared on common shares will be automatically reinvested by the Plan Administrator for shareholders in the Fund’s Automatic Dividend Reinvestment Plan (the “Plan”), in additional common shares. Common shareholders who elect not to participate in the Plan will receive all dividends and other distributions in cash paid by check mailed directly to the shareholder of record (or, if the common shares are held in street or other nominee name, then to such nominee) by the Plan Administrator as dividend disbursing agent. Participation in the Plan is completely voluntary and may be terminated or resumed at any time without penalty by notice if received and processed by the Plan Administrator prior to the dividend record date; otherwise such termination or resumption will be effective with respect to any subsequently declared dividend or other distribution. Such notice will be effective with respect to a particular dividend or other distribution (together, a “Dividend”). Some brokers may automatically elect to receive cash on behalf of common shareholders and may re-invest that cash in additional common shares. Reinvested Dividends will increase the Fund’s Managed Assets on which the management fee is payable to the Adviser (and by the Adviser to the Sub-Adviser).
Whenever the Fund declares a Dividend payable in cash, non-participants in the Plan will receive cash and participants in the Plan will receive the equivalent in common shares. The common shares will be acquired by the Plan Administrator for the participants’ accounts, depending upon the circumstances described below, either (i) through receipt of additional unissued but authorized common shares from the Fund (“Newly Issued Common Shares”) or (ii) by purchase of outstanding common shares on the open market (“Open-Market Purchases”) on the NYSE or elsewhere. If, on the payment date for any Dividend, the closing market price plus estimated brokerage commissions per common share is equal to or greater than the NAV per common share, the Plan Administrator will invest the Dividend amount in Newly Issued common shares on behalf of the participants. The number of Newly Issued common shares to be credited to each participant’s account will be determined by dividing the dollar amount of the Dividend by the Fund’s NAV per common share on the payment date. If, on the payment date for any Dividend, the NAV per common share is greater than the closing market value plus estimated brokerage commissions (i.e., the Fund’s common shares are trading at a discount), the Plan Administrator will invest the Dividend amount in common shares acquired on behalf of the participants in Open-Market Purchases.
In the event of a market discount on the payment date for any Dividend, the Plan Administrator will have until the last business day before the next date on which the common shares trade on an “ex- dividend” basis or 30 days after the payment date for such Dividend, whichever is sooner (the “Last Purchase Date”), to invest the Dividend amount in common shares acquired in Open-Market Purchases. It is contemplated that the Fund will pay monthly income Dividends. If, before the Plan Administrator has completed its Open-Market Purchases, the market price per common share exceeds the NAV per common share, the average per common share purchase price paid by the Plan Administrator may exceed the NAV of the common shares, resulting in the acquisition of fewer common shares than if the Dividend had been paid in Newly Issued common shares on the Dividend payment date. Because of the foregoing difficulty with respect to Open-Market Purchases, the Plan provides that if the Plan Administrator is unable to invest the full Dividend amount in Open-Market Purchases during the purchase period or if the market discount shifts to a market premium during the purchase period, the Plan Administrator may cease making Open-Market Purchases and may invest the uninvested portion of the Dividend amount in Newly Issued common shares at the NAV per common share at the close of business on the Last Purchase Date.
| Annual Report | June 30, 2022 | 57 |
RiverNorth/DoubleLine Strategic Opportunity Fund, Inc.
| Dividend Reinvestment Plan | June 30, 2022 (Unaudited) |
The Plan Administrator maintains all shareholders’ accounts in the Plan and furnishes written confirmation of all transactions in the accounts, including information needed by shareholders for tax records. Common shares in the account of each Plan participant will be held by the Plan Administrator on behalf of the Plan participant, and each shareholder proxy will include those shares purchased or received pursuant to the Plan. The Plan Administrator will forward all proxy solicitation materials to participants and vote proxies for shares held under the Plan in accordance with the instructions of the participants.
Beneficial owners of common shares who hold their common shares in the name of a broker or nominee should contact the broker or nominee to determine whether and how they may participate in the Plan. In the case of common shareholders such as banks, brokers or nominees which hold shares for others who are the beneficial owners, the Plan Administrator will administer the Plan on the basis of the number of common shares certified from time to time by the record shareholder’s name and held for the account of beneficial owners who participate in the Plan.
There will be no brokerage charges with respect to common shares issued directly by the Fund. However, each participant will pay a pro rata share of brokerage commissions incurred in connection with Open-Market Purchases. The automatic reinvestment of Dividends will not relieve participants of any federal, state or local income tax that may be payable (or required to be withheld) on such Dividends, even though such participants have not received any cash with which to pay the resulting tax. Participants that request a sale of common shares through the Plan Administrator are subject to brokerage commissions.
The Fund reserves the right to amend or terminate the Plan. There is no direct service charge to participants with regard to purchases in the Plan; however, the Fund reserves the right to amend the Plan to include a service charge payable by the participants. All correspondence or questions concerning the Plan should be directed to the Plan Administrator at (844) 569-4750.
| 58 | (888) 848-7569 | www.rivernorth.com |
RiverNorth/DoubleLine Strategic Opportunity Fund, Inc.
| Summary of Updated Information Regarding the Fund | June 30, 2022 (Unaudited) |
The following information in this annual report is a summary of certain information about the Fund and changes since the Fund’s most recent annual report dated June 30, 2021 (the “prior disclosure date”). This information may not reflect all of the changes that have occurred since you purchased the Fund.
Investment Objectives
There have been no changes in the Fund’s investment objectives since the prior disclosure date that have not been approved by shareholders.
The Fund’s investment objective is current income and overall total return.
Principal Investment Strategies and Policies
Since the prior disclosure date, investments in Square small business loans was added to the Fund's investment strategy. Additionally, the limitations related to the maximum and minimum amounts of the Fund's assets that can be managed by RiverNorth Captial Management, LLC (the "Adviser") and DoubleLine Capital LP (the "Subadviser") have been eliminated.
Following the Fund's fiscal year end, the Alternative Credit Strategy was added to the Fund's strategy.
The Fund seeks to achieve its investment objective by allocating its Managed Assets between the three principal strategies described below. The Adviser determines the portion of the Fund’s Managed Assets to allocate to each strategy and may, from time to time, adjust the allocations.
Tactical Closed-End Fund Income Strategy. This strategy seeks to (i) generate returns through investments in closed-end funds, special purpose acquisition companies (“SPACs”), exchange-traded funds (“ETFs”) and business development companies (“BDCs,” and, together with the Fund’s investments in closed-end funds, SPACs and ETFs, the “Underlying Funds”) that invest primarily in income-producing securities, and (ii) derive value from the discount and premium spreads associated with closed-end funds. All Underlying Funds in which the Fund invests are registered under the Securities Act of 1933, as amended (the “Securities Act”).
Under normal market conditions: (i) no more than 20% of the Fund’s Managed Assets allocated to the Tactical Closed-End Fund Income Strategy is invested in “equity” Underlying Funds; (ii) no more than 60% of the Fund’s Managed Assets allocated to the Tactical Closed-End Fund Income Strategy is invested in below investment grade (also known as “high yield” and “junk”) and “senior loan” Underlying Funds; and (iii) no more than 25% of the Fund’s Managed Assets allocated to the Tactical Closed-End Fund Income Strategy is invested in “emerging market income” Underlying Funds. The Fund will also limit its investments in closed-end funds (including BDCs) that have been in operation for less than one year to no more than 10% of the Fund’s Managed Assets allocated to the Tactical Closed-End Fund Income Strategy. The Fund will not invest in inverse ETFs or leveraged ETFs. The types of Underlying Funds referenced in this paragraph are categorized in accordance with the fund categories established and maintained by Morningstar, Inc. The investment parameters stated above (and elsewhere in this disclosure) apply only at the time of purchase. The Fund’s shareholders indirectly bear the expenses, including the management fees, of the Underlying Funds.
| Annual Report | June 30, 2022 | 59 |
RiverNorth/DoubleLine Strategic Opportunity Fund, Inc.
| Summary of Updated Information Regarding the Fund | June 30, 2022 (Unaudited) |
The Underlying Funds in which the Adviser seeks to invest will generally focus on a broad range of fixed income securities or sectors, including Underlying Funds that invest in the following securities or sectors: convertible securities, preferred stocks, high yield securities, exchange-traded notes, structured notes, dividend strategies, covered call option strategies, real estate-related investments, energy, utility and other income-oriented strategies. In addition, the Fund may invest directly in debt securities issued by certain credit-oriented, unlisted Underlying Funds, including BDCs, identified by the Adviser in its due diligence process (“Private Debt”). The Adviser believes investments in Private Debt can provide the Fund with the opportunity to obtain more favorable terms than similar publicly traded debt investments with similar risk profiles.
The Fund may invest in Underlying Funds that invest in securities that are rated below investment grade, including those receiving the lowest ratings from S&P® Global Ratings Services (“S&P”), Fitch Ratings, a part of the Fitch Group (“Fitch”), or Moody’s Investor Services, Inc. (“Moody’s”), or comparably rated by another nationally recognized statistical rating organization (“NRSRO”) or, if unrated, determined by the Adviser or the Subadviser to be of comparable credit quality, which indicates that the security is in default or has little prospect for full recovery of principal or interest. Below investment grade securities are commonly referred to as “junk” and “high yield” securities. Below investment grade securities are considered speculative with respect to the issuer’s capacity to pay interest and repay principal. Lower rated below investment grade securities are considered more vulnerable to nonpayment than other below investment grade securities and their issuers are more dependent on favorable business, financial and economic conditions to meet their financial commitments. The lowest rated below investment grade securities are typically already in default.
The Underlying Funds in which the Fund invests will not include those that are advised or subadvised by the Adviser, the Subadviser or their affiliates.
Under normal circumstances, the Fund intends to maintain long positions in Underlying Funds and other portfolio securities; however, the Fund may at times establish hedging positions. Hedging positions may include short sales and derivatives, such as options, futures and swaps (“Hedging Positions”). Under normal market conditions, no more than 30% of the Fund’s Managed Assets is in Hedging Positions (as determined based on the market value of such Hedging Positions).
A short sale is a transaction in which the Fund sells a security that it does not own in anticipation of a decline in the market price of the security. The Fund will not engage in any short sales of securities issued by closed-end funds and BDCs. To complete the short sale, the Fund must arrange through a broker to borrow the security in order to deliver it to the buyer. The Fund is obligated to replace the borrowed security by purchasing it at a market price at or prior to the time it must be returned to the lender. The price at which the Fund is required to replace the borrowed security may be more or less than the price at which the security was sold by the Fund. The Fund will incur a loss if the price of the security sold short increases between the date of the short sale and the date on which the Fund replaces the borrowed security. The Fund will realize a gain if the price of the security declines between those dates.
Under the Tactical Closed-End Fund Income Strategy, the Fund also may attempt to enhance the return on the cash portion of its portfolio by investing in total return swap agreements. A total return swap agreement provides the Fund with a return based on the performance of an underlying asset, in exchange for fee payments to a counterparty based on a specific rate. The difference in the value of these income streams is recorded daily by the Fund, and is typically settled in cash at least monthly. If the underlying asset declines in value over the term of the swap, the Fund would be required to pay the dollar value of that decline plus any applicable fees to the counterparty. The Fund may use its own net asset value or any other reference asset that the Adviser chooses as the underlying asset in a total return swap. The Fund will limit the notional amount of all total return swaps in the aggregate to 15% of the Fund’s Managed Assets. Using the Fund’s own net asset value as the underlying asset in the total return swap serves to reduce cash drag (the impact of cash on the Fund’s overall return) by replacing it with the impact of market exposure based upon the Fund’s own investment holdings. This type of total return swap would provide the Fund with a return based on its net asset value. Like any total return swap, the Fund would be subject to counterparty risk and the risk that its own net asset value declines in value.
| 60 | (888) 848-7569 | www.rivernorth.com |
RiverNorth/DoubleLine Strategic Opportunity Fund, Inc.
| Summary of Updated Information Regarding the Fund | June 30, 2022 (Unaudited) |
The Fund anticipates that its SPAC investments will be primarily composed of: (i) units issued by SPACs comprised of common stock and warrants to purchase common stock; (ii) common stock issued by SPACs, including “founder” shares; and (iii) warrants to purchase common stock, including “founder” warrants. In addition, the Fund’s SPAC investments could also consist of debt instruments issued by SPACs; securities of other investment companies that primarily invest in SPACs; and securities of SPACs that have completed a business combination transaction with an operating company within the last two calendar years.
The Fund’s SPAC investments may be obtained (among other means) through initial public offerings (“IPOs”) of SPACs; secondary market transactions; private placements, including private investment in public equity (“PIPE”) transactions and investments in vehicles formed by SPAC sponsors to hold founder shares and founder warrants; and/or forward purchase agreements pursuant to which investors commit to purchasing a SPAC’s securities to the extent the SPAC requires additional funding at the time of a business combination. Through its investments in SPACs, the Fund will seek to (i) obtain attractive risk-adjusted investment returns, and (ii) derive value from buying and selling SPAC securities to take advantage of pricing discrepancies in the SPAC market (e.g., the difference between the price of a SPAC security and the pro rata value of the SPAC’s trust account).
The SPACs in which the Adviser may invest may focus on a broad range of industries and sectors and may generally pursue initial business combinations in any business, industry or geographic location, including outside of the United States. Certain SPACs may seek acquisitions only in limited industries or regions, which may increase the volatility of their securities’ prices.
Opportunistic Income Strategy. This strategy seeks to generate attractive risk-adjusted returns through investments in fixed income instruments and other investments, including agency and non- agency residential mortgage-backed and other asset-backed securities, corporate bonds, municipal bonds, and real estate investment trusts (“REITs”). At least 50% of the Managed Assets allocated to this strategy is invested in mortgage-backed securities.
Under this strategy, the Fund may invest in securities of any credit quality, including, without limit, securities that are rated below investment grade, except that the Fund invests at least 20% of the Managed Assets allocated to this strategy in securities rated investment grade (or unrated securities judged by the Subadviser to be of comparable quality). In addition, the Subadviser does not currently expect that the Fund will invest more than 15% of the Managed Assets allocated to this strategy in corporate debt securities (excluding mortgage-backed securities) or sovereign debt instruments rated below B-by Moody’s and below B3 by S&P or Fitch (or unrated securities determined by the Subadviser to be of comparable quality). The Fund’s investments in below investment grade securities under this strategy may include securities receiving the lowest ratings from S&P (i.e., D-), Fitch (i.e., D-) or Moody’s (i.e., C3), or comparably rated by another NRSRO or, if unrated, determined by the Adviser or Subadviser to be of comparable credit quality, which indicates that the security is in default or has little prospect for full recovery of principal or interest. Below investment grade securities are commonly referred to as “junk” and “high yield” securities. Below investment grade securities are considered speculative with respect to the issuer’s capacity to pay interest and repay principal. Lower rated below investment grade securities are considered more vulnerable to nonpayment than other below investment grade securities and their issuers are more dependent on favorable business, financial and economic conditions to meet their financial commitments. The lowest rated below investment grade securities are typically already in default.
| Annual Report | June 30, 2022 | 61 |
RiverNorth/DoubleLine Strategic Opportunity Fund, Inc.
| Summary of Updated Information Regarding the Fund | June 30, 2022 (Unaudited) |
The Fund invests no more than 20% of its Managed Assets allocated to the Opportunistic Income Strategy in non-U.S. investments, including emerging market investments.
Investments under the Opportunistic Income Strategy may include, without limitation as to the Fund’s Managed Assets allocated to this strategy, mortgage-backed securities, including agency and non-agency residential mortgage-backed securities (“RMBS”). These RMBS investments have undergone extreme volatility over the past several years, driven primarily by high default rates and the securities being downgraded to “junk” status.
Investments under the Opportunistic Income Strategy may include mortgage- or asset-backed securities of any kind, including, by way of example, mortgage- or asset-related securities not subject to the credit support of the U.S. Government or any agency or instrumentality of the U.S. Government, including obligations backed or supported by sub-prime mortgages, which are subject to certain special risks.
Mortgage- or asset-backed securities may include, among other things, securities issued or guaranteed by the United States Government, its agencies, or its instrumentalities or sponsored corporations, or securities of domestic or foreign private issuers. Mortgage- or asset-backed securities may be issued or guaranteed by banks or other financial institutions, special-purpose vehicles established for such purpose, or private issuers, or by government agencies or instrumentalities. Privately issued mortgage- backed securities include any mortgage-backed security other than those issued or guaranteed as to principal or interest by the U.S. Government or its agencies or instrumentalities. Mortgage-backed securities may include, without limitation, interests in pools of residential mortgages or commercial mortgages, and may relate to domestic or non-U.S. mortgages. Mortgage-backed securities include, but are not limited to, securities representing interests in, collateralized or backed by, or whose values are determined in whole or in part by reference to any number of mortgages or pools of mortgages or the payment experience of such mortgages or pools of mortgages, including Real Estate Mortgage Investment Conduits (“REMICs”), which could include resecuritizations of REMICs, mortgage pass-through securities, inverse floaters, collateralized mortgage obligations, collateralized loan obligations, collateralized debt obligations, multiclass pass-through securities, private mortgage pass-through securities, stripped mortgage securities (generally interest-only and principal-only securities), and securitizations of various receivables, including, for example, credit card and automobile finance receivables. Certain mortgage-backed securities in which the Fund may invest may represent an inverse interest-only class of security for which the holders are entitled to receive no payments of principal and are entitled only to receive interest at a rate that will vary inversely with a specified index or reference rate, or a multiple thereof.
| 62 | (888) 848-7569 | www.rivernorth.com |
RiverNorth/DoubleLine Strategic Opportunity Fund, Inc.
| Summary of Updated Information Regarding the Fund | June 30, 2022 (Unaudited) |
The Fund may purchase other types of debt securities and other income-producing investments of any kind, including, by way of example, U.S. Government securities; debt securities issued by domestic or foreign corporations; obligations of foreign sovereigns or their agencies or instrumentalities; equity, mortgage, or hybrid REIT securities; bank loans (including, among others, participations, assignments, senior loans, delayed funding loans and revolving credit facilities); municipal securities and other debt securities issued by states or local governments and their agencies, authorities and other government- sponsored enterprises.
Alternative Credit Strategy. This strategy may invest in a combination of: (i) investing in loans to SMEs; investing in notes or other pass-through obligations issued by an alternative credit platform (or an affiliate) representing the right to receive the principal and interest payments on an Alternative Credit investment (or fractional portions thereof) originated through the platform (“Pass-Through Notes”); purchasing asset-backed securities representing ownership in a pool of Alternative Credit; (the foregoing listed investments are collectively referred to herein as the “Alternative Credit Instruments”).
The Alternative Credit in which the Fund typically invests are newly issued and/or current as to interest and principal payments at the time of investment. Unless the context suggests otherwise, all references to loans generally refer to Alternative Credit. Alternative Credit Instruments are generally not rated by the nationally recognized statistical rating organizations (“NRSROs”). The Alternative Credit Instruments in which the Fund may invest may have varying degrees of credit risk. There can be no assurance that payments due on underlying Alternative Credit investments will be made. At any given time, the Fund’s portfolio may be substantially illiquid and subject to increased credit and default risk. If a borrower is unable to make its payments on a loan, the Fund may be greatly limited in its ability to recover any outstanding principal and interest under such loan.
| Annual Report | June 30, 2022 | 63 |
RiverNorth/DoubleLine Strategic Opportunity Fund, Inc.
| Summary of Updated Information Regarding the Fund | June 30, 2022 (Unaudited) |
The Adviser believes that the recent and continuing growth of the online and mobile alternative credit industry has created a relatively untapped and attractive investment opportunity, with the potential for large returns. The Adviser seeks to capitalize on this opportunity by participating in the evolution of this industry, which has served as an alternative to, and has begun to take market share from, the more traditional lending operations of large commercial banks. The ability of borrowers to obtain loans through alternative credit with interest rates that may be lower than those otherwise available to them (or to obtain loans that would otherwise be unavailable to them) has contributed to the significant rise of the use of Alternative Credit. At the same time, alternative credit has also enabled investors to purchase or invest in loans with interest rates and credit characteristics that can offer attractive returns. In selecting the Fund’s Alternative Credit investments, the Adviser employs a bottom-up approach to evaluate the expected returns of loans by loan segment (e.g., consumer, SME and student loans) and by platform origination (as discussed below), as well as a top-down approach to seek to identify investment opportunities across the various segments of the alternative credit industry. In doing so, the Adviser conducts an analysis of each segment’s anticipated returns relative to its associated risks, which takes into consideration for each segment duration, scheduled amortization, seniority of the claim of the loan, prepayment terms and prepayment expectations, current coupons and trends in coupon pricing, origination fees, servicing fees and anticipated losses based on historical performance of similar credit instruments. The Adviser then seeks to allocate Fund assets to the segments identified as being the most attractive on a risk-adjusted return basis. Within each segment, the Adviser conducts a platform-specific analysis, as opposed to a loan-specific analysis, and, as such, the Adviser’s investment process does not result in a review of each individual Alternative Credit investment to which the Fund has investment exposure. Instead, the Adviser generally seeks loans that have originated from platforms that have met the Adviser’s minimum requirements related to, among other things, loan default history and overall borrower credit quality. In this regard, the Adviser engages in ongoing due diligence process of each platform to assess, among other things, the viability of the platform to sustain its business for the foreseeable future; whether the platform has the appropriate expertise, ability and operational systems to conduct its business; the financial condition and outlook of the platform; and the platform’s ability to manage regulatory, business and operational risk. In conducting such due diligence, the Adviser has access to, and reviews, the platform’s credit models as well. As part of the foregoing due diligence efforts, the Adviser monitors on an ongoing basis the underwriting quality of each platform through which it invests in Alternative Credit, including (i) an analysis of the historical and ongoing “loan tapes” that includes loan underwriting data and actual payment experience for all individual loans originated by the platform since inception that are comparable to the loans purchased, or to be purchased, by the Fund, (ii) reviews of the credit model used in the platform’s underwriting processes, including with respect to the assignment of credit grades by the platform to its Alternative Credit and the reconciliation of the underlying data used in the model, (iii) an assessment of any issues identified in the underwriting of the Alternative Credit and the resulting remediation efforts of the platform to address such issues, and (iv) a validation process to confirm that loans purchased by the Fund conform with the terms and conditions of any applicable purchase agreement entered into with the platform. Although the Adviser does not review each individual Alternative Credit investment prior to investment, it is able to impose minimum quantitative and qualitative criteria on the loans in which it will invest by limiting the Fund’s loans to the loan segments and platforms selected by the Adviser, as noted above. In effect, the Adviser adopts the minimum investment criteria inherent in a loan segment or imposed by a platform that it has identified as having the appropriate characteristics for investment. Furthermore, each platform assigns the Alternative Credit it originates a platform-specific credit grade reflecting the potential risk-adjusted return of the loan, which may be based on various factors such as: (i) the term, interest rate and other characteristics of the loans; (ii) the location of the borrowers; (iii) if applicable, the purpose of the loans within the platform (e.g., consumer, SME or student loans); and (iv) the credit and risk profile of the borrowers, including, without limitation (to the extent applicable based on the type of loan), the borrower’s annual income, debt-to-income ratio, credit score (e.g., FICO score), delinquency rate and liens. In purchasing Alternative Credit from a platform, the Fund provides the applicable platform with instructions as to which platform credit grades are eligible for purchase (or, conversely, which platform credit grades are ineligible for Fund purchase). The Adviser performs an ongoing analysis of each of the criteria within a platform’s credit grades to determine historical and predicted prepayment, charge-off, delinquency and recovery rates acceptable to the Adviser. While, under normal circumstances, the Adviser does not provide instructions to the platforms as to any individual criterion used to determine platform-specific grades prior to purchasing Alternative Credit (except as noted below), the Adviser does retain the flexibility to provide more specific instructions (e.g., term; interest rate; geographic location of borrower) if the Adviser believes that investment circumstances dictate any such further instructions. Specifically, the Adviser instructs platforms that the Fund will not purchase any Alternative Credit that are of “subprime quality” (as determined at the time of investment). Although there is no specific legal or market definition of subprime quality, it is generally understood in the industry to signify that there is a material likelihood that the loan will not be repaid in full. The Fund considers an SME loan to be of “subprime quality” if the likelihood of repayment on such loan is determined by the Adviser based on its due diligence and the credit underwriting policies of the originating platform to be similar to that of consumer loans that are of subprime quality. In determining whether an SME loan is of subprime quality, the Adviser generally looks to a number of borrower-specific factors, which will include the payment history of the borrower and, as available, financial statements, tax returns and sales data. The Adviser will not invest the Fund’s assets in loans originated by platforms for which the Adviser cannot evaluate to its satisfaction the completeness and accuracy of the individual Alternative Credit investment data provided by such platform relevant to determining the existence and valuation of such Alternative Credit investment and utilized in the accounting of the loans (i.e., in order to select a platform, the Adviser must assess that it believes all relevant loan data for all loans purchased from the platform is included and correct). The Adviser significantly relies on borrower credit information provided by the platforms through which they make the Fund’s investments. In addition, the Adviser has adopted various protections for itself, including a business continuity plan which provides procedures related to the recovery and restoration of its business, particularly with respect to any critical functions and systems of the Adviser, following an interruption in service or disaster.
| 64 | (888) 848-7569 | www.rivernorth.com |
RiverNorth/DoubleLine Strategic Opportunity Fund, Inc.
| Summary of Updated Information Regarding the Fund | June 30, 2022 (Unaudited) |
“Managed Assets” means the total assets of the Fund, including assets attributable to leverage, minus liabilities (other than debt representing leverage and any preferred stock that may be outstanding).
In addition to the foregoing principal investment strategies of the Fund, the Adviser also may allocate the Fund’s Managed Assets among cash and short-term investments. There are no limits on the Fund’s portfolio turnover, and the Fund may buy and sell securities to take advantage of potential short-term trading opportunities without regard to length of time and when the Adviser or Subadviser believes investment considerations warrant such action.
Unless otherwise specified, the investment policies and limitations of the Fund are not considered to be fundamental by the Fund and can be changed without a vote of the common shareholders. The Fund’s investment objective and certain investment restrictions specifically identified as such in the Fund’s Statement of Additional Information are considered fundamental and may not be changed without the approval of the holders of a majority of the outstanding voting securities of the Fund, as defined in the 1940 Act, which includes common shares and Preferred Shares, if any, voting together as a single class, and the holders of the outstanding Preferred Shares, if any, voting as a single class.
Use of Leverage
The Fund may borrow money and/or issue Preferred Shares, notes or debt securities for investment purposes. These practices are known as leveraging. The Adviser determines whether or not to engage in leverage based on its assessment of conditions in the debt and credit markets. On April 1, 2022, the Fund entered into an amended $50,000,000 secured, revolving, evergreen credit facility with U.S. Bank National Association (the “USB Facility”). The borrowing rate under the USB Facility is equal to SOFR plus 1.10%. The average principal balance and interest rate for the fiscal year ended June 30, 2022 was approximately $8,506,849, and 1.16%, respectively. As of June 30, 2022, the Fund had no outstanding principal amount of borrowings outstanding.
In addition to the USB Facility, as of June 30, 2022, the Fund had outstanding 2,400,000 shares of Series A Preferred Stock, and 2,400,000 shares of Series B Preferred Stock. As of the same date, the average liquidation preference of the Series A Preferred stock, and Series B Preferred stock was $25.00. The Series A Preferred Stock and Series B Preferred Stock rank senior in right of payment to the Common Shares and is subordinated in right of payment to borrowings under the USB Facility. The Fund’s issuance of preferred shares is not treated as leverage for financial reporting purposes.
| Annual Report | June 30, 2022 | 65 |
RiverNorth/DoubleLine Strategic Opportunity Fund, Inc.
| Summary of Updated Information Regarding the Fund | June 30, 2022 (Unaudited) |
Issuance of common shares will enable the Fund to increase the aggregate amount of its leverage. The Fund may achieve such increase in leverage through additional borrowings and/or the issuance of Preferred Shares and/or debt securities. However, there is no assurance that the Fund will increase the amount of its leverage or utilize leverage in addition to the credit facility or that, if additional leverage is utilized, it will be successful in enhancing the level of the Fund’s current distributions. It is possible that the Fund will be unable to obtain additional leverage. If the Fund is unable to increase its leverage after the issuance of additional common shares, there could be an adverse impact on the return to common shareholders. In addition, to the extent additional leverage is utilized, the Fund may consequently be subject to certain financial covenants and restrictions that are not currently imposed on the Fund. The Fund’s common shares are likely to be junior in liquidation and distribution rights to amounts owed pursuant to any additional leverage instruments that may be utilized by the Fund in the future.
The Fund may be subject to certain restrictions on investments imposed by lenders or by one or more rating agencies that may issue ratings for any senior securities issued by the Fund. Borrowing covenants or rating agency guidelines may impose asset coverage or Fund composition requirements that are more stringent than those imposed on the Fund by the 1940 Act. For example, under the agreement for the USB Facility, the Fund may be restricted from issuing senior securities representing indebtedness to an amount that could be less than what it might otherwise be permitted to issue under the 1940 Act.
The Fund also invest in reverse repurchase agreements, total return swaps and derivatives or other transactions with leverage embedded in them in a limited manner or subject to a limit on leverage risk calculated based on value-at-risk, as required by Rule 18f-4 under the 1940 Act. These additional transactions will not cause the Fund to pay higher advisory or administration fee rates than it would pay in the absence of such transactions. However, these transactions entail additional expenses (e.g., transaction costs) which are borne by the Fund.
The use of leverage by the Fund can magnify the effect of any losses. If the income and gains earned on the securities and investments purchased with leverage proceeds are greater than the cost of the leverage, returns will be greater than if leverage had not been used. Conversely, if the income and gains from the securities and investments purchased with such proceeds do not cover the cost of leverage, returns will be less than if leverage had not been used. The use of leverage magnifies gains and losses to common shareholders. Since the holders of common stock pay all expenses related to the issuance of debt or use of leverage, any use of leverage would create a greater risk of loss for the common shares than if leverage is not used. There can be no assurance that a leveraging strategy will be successful during any period in which it is employed.
Under the 1940 Act, the Fund is not permitted to incur indebtedness unless immediately after doing so the Fund has an asset coverage of at least 300% of the aggregate outstanding principal balance of indebtedness (i.e., such indebtedness may not exceed 33 1/3% of the value of the Fund’s total assets including the amount borrowed). Additionally, under the 1940 Act, the Fund may not declare any dividend or other distribution upon any class of its shares, or purchase any such shares, unless the aggregate indebtedness of the Fund has, at the time of the declaration of any such dividend or distribution or at the time of any such purchase, asset coverage of at least 300% after deducting the amount of such dividend, distribution, or purchase price, as the case may be. Under the 1940 Act, the Fund is not permitted to issue Preferred Shares unless immediately after such issuance the total asset value of the Fund’s portfolio is at least 200% of the liquidation value of the outstanding Preferred Shares (i.e., such liquidation value may not exceed 50% of the Fund’s Managed Assets). In addition, the Fund is not permitted to declare any cash dividend or other distribution on its common shares unless, at the time of such declaration, the net asset value of the Fund’s portfolio (determined after deducting the amount of such dividend or other distribution) is at least 200% of such liquidation value of the Preferred Shares. If Preferred Shares are issued, the Fund intends, to the extent possible, to purchase or redeem shares, from time to time, to maintain coverage of any Preferred Shares of at least 200%. Normally, common shareholders will elect the directors of the Fund except that the holders of any Preferred Shares will elect two directors. In the event the Fund failed to pay dividends on its Preferred Shares for two years, holders of Preferred Shares would be entitled to elect a majority of the directors until the dividends are paid.
| 66 | (888) 848-7569 | www.rivernorth.com |
RiverNorth/DoubleLine Strategic Opportunity Fund, Inc.
| Summary of Updated Information Regarding the Fund | June 30, 2022 (Unaudited) |
Due to the Fund’s issuance of Series A and Series B Preferred Stock, for tax purposes, the Fund is required to allocate net capital gain and other taxable income, if any, between the Common Shares and shares of the Series A and Series B Preferred Stock in proportion to the total dividends paid to each class for the year in which the net capital gain or other taxable income was realized.
Effects of Leverage. Assuming the utilization of leverage through borrowings and issuance of Preferred Shares by the Fund in the aggregate amount of approximately 54.76% of the Fund’s net assets, at a weighted average interest rate or payment rate of 4.56% payable on such leverage, the return generated by the Fund’s portfolio (net of estimated non-leveraged expenses) must exceed 2.50% in order to cover such interest or payment rates and other expenses specifically related to leverage. Of course, these numbers are merely estimates for illustration. Actual interest or payment rates on the leverage utilized by the Fund will vary frequently and may be significantly higher or lower than the rate estimated above.
The following table is furnished in response to requirements of the SEC. It is designed to illustrate the effect of leverage on total return assuming investment portfolio returns (comprised of income and changes in the value of securities held in the Fund’s portfolio net of expenses) of -10%, -5%, 0%, 5% and 10%. These assumed investment portfolio returns are hypothetical figures and are not necessarily indicative of the investment portfolio returns experienced or expected to be experienced by the Fund.
| Assumed Portfolio Return | -10.00% | -5.00% | 0.00% | 5.00% | 10.00% |
| Common Share Total Return | -17.97% | -10.24% | -2.50% | 5.24% | 12.98% |
Total return is composed of two elements—the dividends on shares paid by the Fund (the amount of which is largely determined by the Fund’s net investment income after paying the cost of leverage) and realized and unrealized gains or losses on the value of the securities the Fund owns. As the table shows, leverage generally increases the return to shareholders when portfolio return is positive or greater than the costs of leverage and decreases return when the portfolio return is negative or less than the costs of leverage.
During the time in which the Fund is using leverage, the amount of the fees paid to the Adviser (and from the Adviser to the Subadviser) for investment management services (and subadvisory services) is higher than if the Fund did not use leverage because the fees paid are calculated based on the Fund’s Managed Assets. This may create a conflict of interest between the Adviser and the Subadviser, on the one hand, and common shareholders, on the other. Also, because the leverage costs are borne by the Fund at a specified interest rate, only the Fund’s common shareholders bear the cost of the Fund’s management fees and other expenses. There can be no assurance that a leveraging strategy will be successful during any period in which it is employed.
| Annual Report | June 30, 2022 | 67 |
RiverNorth/DoubleLine Strategic Opportunity Fund, Inc.
| Summary of Updated Information Regarding the Fund | June 30, 2022 (Unaudited) |
Risk Factors
Investing in the Fund involves certain risks relating to its structure and investment objective. You should carefully consider these risk factors, together with all of the other information included in this report, before deciding whether to make an investment in the Fund. An investment in the Fund may not be appropriate for all investors, and an investment in the Common Shares of the Fund should not be considered a complete investment program.
The risks set forth below are not the only risks of the Fund, and the Fund may face other risks that have not yet been identified, which are not currently deemed material or which are not yet predictable. If any of the following risks occur, the Fund’s financial condition and results of operations could be materially adversely affected. In such case, the Fund’s NAV and the trading price of its securities could decline, and you may lose all or part of your investment.
Various risk factors included below have been updated since the prior disclosure date to reflect certain updates.
Investment-Related Risks:
With the exception of underlying fund risk (and except as otherwise noted below), the following risks apply to the direct investments the Fund may make, and generally apply to the Fund’s investments in Underlying Funds. That being said, each risk described below may not apply to each Underlying Fund.
Investment and Market Risks. An investment in the Fund is subject to investment risk, including the possible loss of the entire principal amount invested. The value of the Fund or the Underlying Funds, like other market investments, may move up or down, sometimes rapidly and unpredictably. Overall stock market risks may also affect the net asset value of the Fund or the Underlying Funds. Factors such as economic growth and market conditions, interest rate levels and political events affect the securities markets. An investment in the Fund may at any point in time be worth less than the original investment, even after taking into account any reinvestment of dividends and distributions.
Management Risks. The Adviser’s and the Subadviser’s judgments about the attractiveness, value and potential appreciation of a particular asset class or individual security in which the Fund invests may prove to be incorrect and there is no guarantee that the Adviser’s or the Subadviser’s judgment, as applicable, will produce the desired results.
Fixed Income Securities Risks. The Fund and the Underlying Funds may invest in fixed income securities. Fixed income securities generally represent the obligation of an issuer to repay to the investor (or lender) the amount borrowed plus interest over a specified time period. Fixed income securities increase or decrease in value based on changes in interest rates. If rates increase, the value of the Fund’s or an Underlying Fund’s fixed income securities generally declines. On the other hand, if rates fall, the value of the fixed income securities generally increases. The issuer of a fixed income security may not be able to make interest and principal payments when due. This risk is increased in the case of issuers of high yield securities, also known as “junk” bonds. The Fund and the Underlying Funds may invest in fixed income securities of any credit quality, maturity or duration. Fixed income securities risks include components of the following additional risks (in addition to those described elsewhere):
| 68 | (888) 848-7569 | www.rivernorth.com |
RiverNorth/DoubleLine Strategic Opportunity Fund, Inc.
| Summary of Updated Information Regarding the Fund | June 30, 2022 (Unaudited) |
Issuer Risk. The value of fixed income securities may decline for a number of reasons which directly relate to the issuer, such as management performance, leverage, reduced demand for the issuer’s goods and services, historical and projected earnings, and the value of its assets. Changes in an issuer’s credit ratings or the market’s perception of an issuer’s creditworthiness may also affect the value of the fund’s investment in that issuer.
Credit Risk. The issuer of a fixed income security may not be able to make interest and principal payments when due. Generally, the lower the credit rating of a security, the greater the risk that the issuer will default on its obligation, which could result in a loss to a fund. The Fund and the Underlying Funds in which it invests may invest in securities that are rated in the lowest investment grade category. Issuers of these securities are more vulnerable to changes in economic conditions than issuers of higher grade securities.
High Yield Securities/Junk Bond Risk. The Fund and the Underlying Funds may invest in high yield securities, also known as “junk bonds.” High yield securities are not considered to be investment grade. High yield securities may provide greater income and opportunity for gain, but entail greater risk of loss of principal. High yield securities are predominantly speculative with respect to the issuer’s capacity to pay interest and repay principal in accordance with the terms of the obligation. The market for high yield securities is generally less active than the market for higher quality securities. This may limit the ability of a fund to sell high yield securities at the price at which it is being valued for purposes of calculating net asset value.
Interest Rate Risk. The Fund’s or an Underlying Fund’s share price and total return will vary in response to changes in interest rates. If rates increase, the value of the Fund’s or an Underlying Fund’s investments generally will decline. Securities with longer maturities tend to produce higher yields, but are more sensitive to changes in interest rates and are subject to greater fluctuations in value. A rise in interest rates may negatively impact the Fund’s or the Underlying Fund’s future income relating to leverage, as the Fund will be required to earn more income on its investments to recoup any increased costs of leverage.
LIBOR Risk. The Fund’s or the Underlying Funds’, interest payment obligations and financing terms may be based on floating rates, such as the London Interbank Offered Rate (“LIBOR”). In July of 2017, the head of the UK Financial Conduct Authority ("FCA") announced a desire to phase out the use of LIBOR by the end of 2021. The FCA and ICE Benchmark Administrator have since announced that most LIBOR settings will no longer be published after December 31, 2021 and a majority of U.S. dollar LIBOR settings will cease publication after June 30, 2023. The U.S. Federal Reserve, based on the recommendations of the New York Federal Reserve's Alternative Reference Rate Committee (comprised of major derivative market participants and their regulators), has begun publishing Secured Overnight Financial Rate Data ("SOFR") that is intended to replace U.S. dollar LIBOR. Proposals for alternative reference rates for other currencies have also been announced or have already begun publication. Markets are slowly developing in response to these new reference rates. Uncertainty related to the liquidity impact of the change in rates, and how to appropriately adjust these rates at the time of transition, poses risks for the Fund. The expected discontinuation of LIBOR could have a significant impact on the financial markets in general and may also present heightened risk to market participants, including public companies, investment advisers, investment companies, and broker-dealers. The risks associated with this discontinuation and transition will be exacerbated if the work necessary to effect an orderly transition to an alternative reference rate is not completed in a timely manner. Accordingly, it is difficult to predict the full impact of the transition away from LIBOR on the Fund or the Underlying Funds until new reference rates and fallbacks for both legacy and new instruments and contracts are commercially accepted and market practices become settled.
| Annual Report | June 30, 2022 | 69 |
RiverNorth/DoubleLine Strategic Opportunity Fund, Inc.
| Summary of Updated Information Regarding the Fund | June 30, 2022 (Unaudited) |
The transition process might lead to increased volatility and illiquidity in markets for instruments whose terms currently include LIBOR. It could also lead to a reduction in the value of some LIBOR-based investments. Since the usefulness of LIBOR as a benchmark could deteriorate during the transition period, these effects could occur prior to the completion of the transition. All of the aforementioned may adversely affect the Fund’s performance or NAV.
Mortgage-Backed Securities Risks. Mortgage-backed securities represent participation interests in pools of residential mortgage loans purchased from individual lenders by a federal agency or originated and issued by private lenders. The Fund invests in mortgage-backed securities and is subject to the following risks:
Credit and Market Risks of Mortgage-Backed Securities. The mortgage loans or the guarantees underlying mortgage-backed securities may default or otherwise fail leading to non-payment of interest and principal.
Prepayment and Extension Risk of Mortgage-Backed Securities: In times of declining interest rates, the Fund’s higher yielding securities may be prepaid and the Fund will have to replace them with securities having a lower yield. Extension risk is the possibility that rising interest rates may cause prepayments to occur at a slower than expected rate. This particular risk may effectively change a security which was considered short or intermediate-term into a long-term security. Long-term securities generally fluctuate more widely in response to changes in interest rates than short or intermediate-term securities. If a mortgage-backed security held by a Fund is called for redemption, the Fund will be required to permit the issuer to redeem or “pay-off” the security, which could have an adverse effect on the Fund’s ability to achieve its investment objective.
Illiquidity Risk of Mortgage-Backed Securities and Mortgage Markets. The liquidity of mortgage-backed securities varies by type of security; at certain times the Fund may encounter difficulty in disposing of such investments. Because mortgage-backed securities may be less liquid than other securities, the Fund may be more susceptible to liquidity risks than funds that invest in other securities. In the past, in stressed markets, certain types of mortgage-backed securities suffered periods of illiquidity if disfavored by the market. The mortgage markets are facing additional economic pressures such as the devaluation of the underlying collateral, increased loan underwriting standards which limits the number of real estate purchasers, and excess supply of properties in certain geographic regions, which puts additional downward pressure on the value of real estate in these regions.
| 70 | (888) 848-7569 | www.rivernorth.com |
RiverNorth/DoubleLine Strategic Opportunity Fund, Inc.
| Summary of Updated Information Regarding the Fund | June 30, 2022 (Unaudited) |
Commercial Mortgage-Backed Securities. Many of the risks of investing in commercial mortgage-backed securities reflect the risks of investing in the real estate securing the underlying mortgage loans. These risks reflect the effects of local and other economic conditions on real estate markets, the ability of tenants to make loan payments and the ability of a property to attract and retain tenants. Commercial mortgage-backed securities may be less liquid and exhibit greater price volatility than other types of mortgage-backed securities.
Collateralized Mortgage Obligations. There are certain risks associated specifically with collateralized mortgage obligations (“CMOs”). CMOs are debt obligations collateralized by mortgage loans or mortgage pass-through securities, which utilize estimates of future economic conditions. These estimates may vary from actual future results, particularly during periods of extreme market volatility. CMOs issued by private entities are not guaranteed by any government agency; if the collateral securing the CMO, as well as any third party credit support or guarantees, is insufficient to make payment, the holder could sustain a loss.
Residual and Equity Tranches. Investments in lower tranches of a mortgage-related security are especially sensitive to the rate of defaults in the collateral pool. The Fund’s exposure to lower tranches of non-agency mortgage-backed securities may be greater than those set out in the Fund’s investment limits as a result of any investments in such securities by the Underlying Funds in which the Fund invests.
Adjustable Rate Mortgages. Adjustable rate mortgages (“ARMs”) contain maximum and minimum rates beyond which the mortgage interest rate may not vary over the lifetime of the security. In addition, many ARMs provide for additional limitations on the maximum amount by which the mortgage interest rate may adjust for any single adjustment period. In the event that a monthly payment is not sufficient to pay the interest accruing on an ARM, any excess interest is added to the principal balance of the mortgage loan, which is repaid through future monthly payments. In addition, certain ARMs may provide for an initial fixed, below-market or “teaser” interest rate. During this initial fixed-rate period, the payment due from the related mortgagor may be less than that of a traditional loan. However, after the “teaser” rate expires, the monthly payment required to be made by the mortgagor may increase dramatically when the interest rate on the mortgage loan adjusts. This increased burden on the mortgagor may increase the risk of delinquency or default on the mortgage loan and in turn, losses on the mortgage-backed securities.
Interest and Principal Only Securities Risk. The Fund may invest in “stripped mortgage-backed securities,” which pay to one class all of the interest from the mortgage assets (the interest-only, or “IO” class), while the other class will receive all of the principal (the principal-only, or “PO” class). If the assets underlying the IO class experience greater than anticipated prepayments of principal, the Fund may fail to recoup fully, or at all, its initial investment in these securities. Conversely, PO class securities tend to decline in value if prepayments are slower than anticipated.
| Annual Report | June 30, 2022 | 71 |
RiverNorth/DoubleLine Strategic Opportunity Fund, Inc.
| Summary of Updated Information Regarding the Fund | June 30, 2022 (Unaudited) |
Mortgage Market/Sub-Prime Risk. The residential mortgage market in the United States has experienced difficulties that, when present, may adversely affect the performance and market value of certain of the Fund’s mortgage-related investments. Delinquencies and losses on residential mortgage loans (especially subprime loans, which refer to loans made to borrowers with weakened credit histories or with a lower capacity to make timely payments on their loans, and second-lien mortgage loans), and a decline in or flattening of housing values (as has been experienced in many housing markets) may exacerbate such delinquencies and losses. Borrowers with adjustable rate mortgage loans are more sensitive to changes in interest rates, which affect their monthly mortgage payments, and may be unable to secure replacement mortgages at comparably low interest rates. During periods of market difficulties reduced investor demand and increased investor yield requirements have at times caused limited liquidity in the secondary market for mortgage-related securities, reducing the value of such securities.
Corporate Debt Securities Risk. The Fund and Underlying Funds may invest in corporate debt securities. Corporate debt securities are fixed income securities issued by businesses. Notes, bonds, debentures, and commercial paper are the most prevalent types of corporate debt securities. The credit risks of corporate debt securities vary widely among issuers. In addition, the credit risk of an issuer's debt security may vary based on its priority for repayment, meaning that issuers might not make payments on subordinated securities while continuing to make payments on senior securities or, in the event of bankruptcy, holders of senior securities may receive amounts otherwise payable to the holders of subordinated securities.
Credit and Below Investment Grade Securities Risks. Credit risk is the risk that an issuer of a security may be unable or unwilling to make dividend, interest and principal payments when due and the related risk that the value of a security may decline because of concerns about the issuer’s ability or willingness to make such payments. Credit risk may be heightened for the Fund because it and the Underlying Funds may invest in below investment grade securities (“junk” and “high yield” securities). Securities of below investment grade quality are regarded as having speculative characteristics with respect to the issuer’s capacity to pay interest and repay principal, and may be subject to higher price volatility and default risk than investment grade securities of comparable terms and duration. Issuers of lower grade securities may be highly leveraged and may not have available to them more traditional methods of financing. The prices of these lower grade securities are typically more sensitive to negative developments, such as a decline in the issuer’s revenues or a general economic downturn. The secondary market for lower rated securities may not be as liquid as the secondary market for more highly rated securities, a factor which may have an adverse effect on the Fund’s ability to dispose of a particular security.
Tactical Municipal Closed-End Fund Strategy Risk. The Fund invests in closed-end funds as a principal part of the Tactical Municipal Closed-End Fund Strategy. The Fund may invest in shares of closed-end funds that are trading at a discount to NAV or at a premium to NAV. There can be no assurance that the market discount on shares of any closed-end fund purchased by the Fund will ever decrease.
In fact, it is possible that this market discount may increase and the Fund may suffer realized or unrealized capital losses due to further decline in the market price of the securities of such closed-end funds, thereby adversely affecting the NAV of the Fund’s Common Shares. Similarly, there can be no assurance that any shares of a closed-end fund purchased by the Fund at a premium will continue to trade at a premium or that the premium will not decrease subsequent to a purchase of such shares by the Fund.
| 72 | (888) 848-7569 | www.rivernorth.com |
RiverNorth/DoubleLine Strategic Opportunity Fund, Inc.
| Summary of Updated Information Regarding the Fund | June 30, 2022 (Unaudited) |
The Fund may invest in BDCs as a principal part of the Tactical Closed-End Fund Strategy. BDCs generally invest in less mature U.S. private companies or thinly traded U.S. public companies which involve greater risk than well-established publicly traded companies. While BDCs are expected to generate income in the form of dividends, certain BDCs during certain periods of time may not generate such income. A BDC may make investments with a larger amount of risk of volatility and loss of principal than other investment options and may also be highly speculative and aggressive.
Underlying Fund Risks. The expenses of the Fund will generally be higher than the direct expenses of other fund shares because the Fund indirectly bears fees and expenses charged by the Underlying Funds in which it invests, and the Fund may also incur brokerage costs when it purchases shares of Underlying Funds. Additionally, the risks associated with investing in the Fund are closely related to the risks associated with the securities and other investments held by the Underlying Funds. The ability of the Fund to achieve its investment objective will depend upon the ability of the Underlying Funds to achieve their investment objectives. There can be no assurance that the investment objective of any Underlying Fund will be achieved.
The Fund’s net asset value will fluctuate in response to changes in the net asset values of the Underlying Funds in which it invests and will be particularly sensitive to the risks associated with each of the Underlying Funds. Shareholders will bear additional layers of fees and expenses with respect to the Fund’s investments in Underlying Funds because each of the Fund and the Underlying Fund will charge fees and incur separate expenses, which may be magnified if the Underlying Funds use leverage.
SPAC Risks. SPACs are collective investment structures that pool funds in order to seek potential acquisition opportunities. Unless and until an acquisition is completed, a SPAC generally invests its assets (less an amount to cover expenses) in U.S. government securities, money market fund securities and cash. SPACs and similar entities may be blank check companies with no operating history or ongoing business other than to seek a potential acquisition. Accordingly, the value of their securities is particularly dependent on the ability of the entity’s management to identify and complete a profitable acquisition. Certain SPACs may seek acquisitions only in limited industries or regions, which may increase the volatility of their prices. If an acquisition that meets the requirements for the SPAC is not completed within a predetermined period of time, the invested funds are returned to the entity’s shareholders. Investments in SPACs may be illiquid and/or be subject to restrictions on resale. To the extent the SPAC is invested in cash or similar securities, this may impact a Fund’s ability to meet its investment objective.
The officers and directors of a SPAC may operate multiple SPACs and could have conflicts of interest in determining to which SPAC a particular business opportunity should be presented. In such circumstances, there can be no assurance that a given business opportunity would be presented to the SPAC in which the Fund holds an investment.
Investing in any investment company security involves risk, including the risk that you may receive little or no return on your investment or even that you may lose part or all of your investment. You should carefully consider these risks and uncertainties as well as the other information described in this Prospectus (as incorporated by reference) and in any applicable prospectus supplement before you decide whether to invest in the Fund. In addition, the SAI contains further information regarding the risks associated with an investment in the Fund. The risks in these documents are not the only risks that the Fund may face, and the Fund may face other risks that we have not yet identified, which we do not currently deem material or which are not yet predictable. If any of these risks occur, the Fund’s business, financial condition and results of operations could be materially adversely affected. In such case, the Fund’s NAV and the trading price of its securities could decline, and you may lose all or part of your investment.
| Annual Report | June 30, 2022 | 73 |
RiverNorth/DoubleLine Strategic Opportunity Fund, Inc.
| Summary of Updated Information Regarding the Fund | June 30, 2022 (Unaudited) |
Private Debt Risk. In addition to the general risks of all debt, private debt often may be illiquid and is typically not listed on an exchange and traded less actively than similar securities issued by public funds. For certain private debt, trading may only be possible through the assistance of the broker who originally brought the security to the market and has a relationship with the issuer. Due to the limited trading market, valuation of such debt might be more difficult.
Defaulted and Distressed Securities Risks. The Fund and the Underlying Funds may invest in defaulted and distressed securities. Defaulted or distressed issuers may be insolvent, in bankruptcy or undergoing some other form of financial restructuring. In the event of a default, the Fund or an Underlying Fund may incur additional expenses to seek recovery. The repayment of defaulted bonds is subject to significant uncertainties, may be delayed, or there may be partial or no recovery of repayment. There is often a time lag between when the Fund and an Underlying Fund makes an investment and when the Fund and the Underlying Fund realizes the value of the investment.
Loan Risk. The Fund or an Underlying Fund’s investment in loans includes the risk that (i) if a fund holds a loan through another financial intermediary, or relies on a financial intermediary to administer the loan, its receipt of principal and interest on the loan may be subject to the credit risk of that financial intermediary; (ii) it is possible that any collateral securing a loan may be insufficient or unavailable to the fund, because, for example, the value of the collateral securing a loan can decline, be insufficient to meet the obligations of the borrower, or be difficult to liquidate, and that the fund’s rights to collateral may be limited by bankruptcy or insolvency laws; (iii) investments in highly leveraged loans or loans of stressed, distressed, or defaulted issuers may be subject to significant credit and liquidity risk; (iv) a bankruptcy or other court proceeding could delay or limit the ability of the fund to collect the principal and interest payments on that borrower’s loans or adversely affect the fund’s rights in collateral relating to a loan; (v) there may be limited public information available regarding the loan; (vi) the use of a particular interest rate benchmark, such as LIBOR, may limit the fund’s ability to achieve a net return to shareholders that consistently approximates the average published Prime Rate of U.S. banks; (vii) the prices of certain floating rate loans that include a feature that prevents their interest rates from adjusting if market interest rates are below a specified minimum level may be more sensitive to changes in interest rates should interest rates rise but remain below the applicable minimum level; (viii) if a borrower fails to comply with various restrictive covenants that are typically in loan agreements, the borrower may default in payment of the loan; (ix) the fund’s investments in loans may be subject to increased liquidity and valuation risks, risks associated with collateral impairment or access, and risks associated with investing in unsecured loans; (x) opportunities to invest in loans or certain types of loans, such as senior loans, may be limited; (xi) transactions in loans may settle on a delayed basis, and the fund may not receive the proceeds from the sale of a loan for a substantial period of time after the sale, which may result in sale proceeds related to the sale of loans not being available to make additional investments or to meet a fund’s redemption obligations until potentially a substantial period after the sale of the loans; and (xii) loans may be difficult to value and may be illiquid, which may adversely affect an investment in the Fund.
| 74 | (888) 848-7569 | www.rivernorth.com |
RiverNorth/DoubleLine Strategic Opportunity Fund, Inc.
| Summary of Updated Information Regarding the Fund | June 30, 2022 (Unaudited) |
Asset-Backed Securities Risk. An investment in asset-backed securities involves the risk that borrowers may default on the obligations that underlie the asset-backed security and that, during periods of falling interest rates, asset-backed securities may be called or prepaid, which may result in the Fund having to reinvest proceeds in other investments at a lower interest rate, and the risk that the impairment of the value of the collateral underlying a security in which the Fund invests (due, for example, to non-payment of loans) will result in a reduction in the value of the security.
Certain asset-backed securities do not have the benefit of the same security interest in the related collateral as do mortgage-backed securities; nor are they provided government guarantees of repayment. Credit card receivables are generally unsecured, and the debtors are entitled to the protection of a number of state and federal consumer credit laws, many of which give such debtors the right to set off certain amounts owed on the credit cards, thereby reducing the balance due. In addition, some issuers of automobile receivables permit the servicers to retain possession of the underlying obligations. If the servicer were to sell these obligations to another party, there is a risk that the purchaser would acquire an interest superior to that of the holders of the related automobile receivables. The impairment of the value of assets (tangible or intangible) underlying an asset-backed security, such as a result of non-payment of loans or non-performance of other collateral or underlying assets, may result in a reduction in the value of such asset-backed securities and losses to the Fund.
Illiquid Securities Risks. The Fund and the Underlying Funds may invest in illiquid securities. It may not be possible to sell or otherwise dispose of illiquid securities both at the price and within the time period deemed desirable by a fund. Illiquid securities also may be difficult to value or be more volatile investments.
Micro-, Small- and Medium-Sized Company Risks. The Fund, and the Underlying Funds in which it invests, may invest in securities without regard to market capitalization. Investments in securities of micro-, small- and medium-sized companies may be subject to more abrupt or erratic market movements than larger, more established companies. These companies also often trade in lower volumes, have narrower markets for their goods and/or services and more limited managerial and financial resources than larger, more established companies. Since these stocks are often less well known, there will normally be less publicly available information concerning these securities compared to what is available for the securities of larger companies. Micro-, small- and medium-sized companies’ performance can be more volatile and the companies face greater risk of business failure, which could increase the volatility of the Fund’s portfolio. The risks are intensified for investments in micro-cap companies.
Collateralized Debt Obligations Risk. The risks of an investment in a collateralized debt obligation (“CDO”) depend largely on the quality and type of the collateral and the tranche of the CDO in which the Fund invests. Normally, collateralized bond obligations (“CBOs”), collateralized loan obligations and other CDOs are privately offered and may be characterized by the Fund as illiquid securities; however, an active dealer market, or other relevant measures of liquidity, may exist for CDOs allowing a CDO potentially to be deemed liquid by the Adviser or Subadviser under liquidity policies approved by the Board. In addition to the risks associated with debt instruments (e.g., interest rate risk and credit risk), CDOs carry additional risks including, but not limited to: (i) the possibility that distributions from collateral will not be adequate to make interest or other payments; (ii) the quality of the collateral may decline in value or default; (iii) the possibility that the Fund may invest in CDOs that are subordinate to other classes; and (iv) the complex structure of the security may not be fully understood at the time of investment and may produce disputes with the issuer or unexpected investment results.
| Annual Report | June 30, 2022 | 75 |
RiverNorth/DoubleLine Strategic Opportunity Fund, Inc.
| Summary of Updated Information Regarding the Fund | June 30, 2022 (Unaudited) |
REIT Risks. Investing in REITs involves certain unique risks in addition to those risks associated with investing in the real estate industry in general. The value of equity REITs may be affected by changes in the value of the underlying property owned by the REITs, while the value of mortgage REITs may be affected by the quality of any credit extended. REITs are dependent upon management skills, are not diversified, and are subject to heavy cash flow dependency, default by borrowers and self-liquidation. REITs also are subject to the possibilities of failing to qualify for tax free pass-through of income under the Internal Revenue Code of 1986, as amended (the “Code”), and failing to maintain their exemption from registration under the 1940 Act. Investment in REITs involves risks similar to those associated with investing in small capitalization companies, and REITs (especially mortgage REITs) are subject to interest rate risks. By investing in REITs directly or indirectly through the Underlying Funds, the Fund indirectly bears its proportionate share of the expenses of the REITs, which are not included in the Fund’s expense table as acquired fund fees and expenses.
Equity Securities Risk. Underlying Funds may invest in equity securities, which are subject to general movements in the stock market, and a significant drop in the stock market may depress the price of securities to which the Underlying Funds have exposure. Equity securities typically have greater price volatility than fixed-income securities. The market price of equity securities owned by Underlying Funds may go down, sometimes rapidly or unpredictably. Equity securities may decline in value due to factors affecting equity securities markets generally, particular industries represented by those markets, or factors directly related to a specific company, such as decisions made by its management.
Preferred Stock Risk. Preferred stock is subject to many of the risks associated with debt securities, including interest rate risk. In addition, preferred stocks may not pay dividends, an issuer may suspend payment of dividends on U.S. preferred stock at any time, and in certain situations an issuer may call or redeem its preferred stock or convert it to common stock. Declining common stock values may also cause the value of the Fund’s investments in preferred stocks to decline.
Warrants Risks. The Fund and the Underlying Funds may invest in warrants. Warrants do not carry with them the right to dividends or voting rights with respect to the securities that they entitle their holder to purchase and they do not represent any rights in the assets of the issuer. As a result, warrants may be considered to have more speculative characteristics than certain other types of investments. In addition, the value of a warrant does not necessarily change with the value of the underlying securities and a warrant ceases to have value if it is not exercised prior to its expiration date.
Derivatives Risks. The Fund and the Underlying Funds may enter into derivatives which have risks different from those associated with the Fund’s other investments. Generally, a derivative is a financial contract, the value of which depends upon, or is derived from, the value of an underlying asset, reference rate, or index, and may relate to individual debt or equity instruments, interest rates, currencies or currency exchange rates, commodities, related indexes, and other assets.
Derivatives may entail investment exposures that are greater than their cost would suggest, meaning that a small investment in a derivative could have a large potential impact on the performance of the Fund or an Underlying Fund. The Fund or an Underlying Fund could experience a loss if derivatives do not perform as anticipated, if they are not correlated with the performance of other investments which they are used to hedge or if the fund is unable to liquidate a position because of an illiquid secondary market. Except with respect to the Fund’s investments in total return swaps, the Fund expects its use of derivative instruments will be for hedging purposes. When used for speculative purposes, derivatives will produce enhanced investment exposure, which will magnify gains and losses. The Fund and the Underlying Funds also will be subject to credit risk with respect to the counterparties to the derivatives contracts purchased by such fund. If a counterparty becomes bankrupt or otherwise fails to perform its obligations under a derivative contract, the Fund or an Underlying Fund may obtain only a limited recovery or may obtain no recovery in such circumstances.
| 76 | (888) 848-7569 | www.rivernorth.com |
RiverNorth/DoubleLine Strategic Opportunity Fund, Inc.
| Summary of Updated Information Regarding the Fund | June 30, 2022 (Unaudited) |
Options and Futures Risks. Options and futures contracts may be more volatile than investments made directly in the underlying securities, involve additional costs, and may involve a small initial investment relative to the risk assumed. In addition, futures and options markets could be illiquid in some circumstances and certain over-the-counter options could have no markets. As a result, in certain markets, a fund may not be able to close out a transaction without incurring substantial losses. Although a fund’s use of futures and options transactions for hedging should tend to minimize the risk of loss due to a decline in the value of the hedged position, at the same time, it will tend to limit any potential gain to a fund that might result from an increase in value of the position.
Swap Risks. The Fund and the Underlying Funds may enter into various swap agreements. Swap agreements are subject to interest rate risks; credit risks; the risk that the counterparty to the swap will default on its obligation to pay the Fund and the risk that the Fund will not be able to meet its obligations to pay the counterparty to the swap. In addition, there is the risk that a swap may be terminated by the Fund or the counterparty in accordance with its terms. Each of these could cause the Fund to incur losses and fail to obtain its investment objective.
Short Sale Risks. A short sale is a transaction in which a fund sells a security it does not own in anticipation that the market price of that security will decline. Positions in shorted securities are speculative and riskier than long positions (purchases) in securities because the maximum sustainable loss on a security purchased is limited to the amount paid for the security plus the transaction costs, whereas there is no maximum attainable price of the shorted security. Therefore, in theory, securities sold short have unlimited risk, will also result in higher transaction costs and may result in higher taxes.
Reverse Repurchase Agreements Risks. The use by the Fund of reverse repurchase agreements involves many of the same risks associated with the Fund’s use of bank borrowings since the proceeds derived from such reverse repurchase agreements may be invested in additional securities. Reverse repurchase agreements involve the risk that the market value of the securities acquired in connection with the reverse repurchase agreement may decline below the price of the securities the Fund has sold but is obligated to repurchase, and that the securities may not be returned to the Fund. Also, reverse repurchase agreements involve the risk that the market value of the securities retained in lieu of sale by the Fund in connection with the reverse repurchase agreement may decline in price.
Foreign Investing Risk. Investments in foreign securities may be affected by currency controls and exchange rates, different accounting, auditing, financial reporting, and legal standards and practices; expropriation, changes in tax policy, greater market volatility, differing securities market structures, higher transaction costs, and various administrative difficulties, such as delays in clearing and settling portfolio transactions or in receiving payment of dividends. These risks may be heightened in connection with investments in emerging or developing countries.
| Annual Report | June 30, 2022 | 77 |
RiverNorth/DoubleLine Strategic Opportunity Fund, Inc.
| Summary of Updated Information Regarding the Fund | June 30, 2022 (Unaudited) |
Currency Risk. To the extent that the Fund invests in securities denominated in, and/or receiving revenues in, foreign currencies, it will be subject to currency risk. This is the risk that those currencies will decline in value relative to the U.S. dollar, or, in the case of hedging positions, that the U.S. dollar will decline in value relative to the currency hedged. In either event, the dollar value of an investment in the Fund would be adversely affected. Currencies may fluctuate significantly over short periods of time for a number of reasons, including changes in interest rates, intervention by U.S. or foreign governments, central banks or supranational agencies, such as the International Monetary Fund, or by the imposition of currency controls or other political developments in the United States or abroad.
Emerging Markets Risk. Investment in emerging market securities involves greater risk than that associated with investment in securities of issuers in developed foreign countries. These risks include volatile currency exchange rates, periods of high inflation, increased risk of default, greater social, economic and political uncertainty and instability, less governmental supervision and regulation of securities markets, weaker auditing and financial reporting standards, lack of liquidity in the markets, and the significantly smaller market capitalizations of emerging market issuers.
Sovereign Debt Obligation Risk. Investment in sovereign debt obligations involves special risks not present in corporate debt obligations. The issuer of the sovereign debt or the governmental authorities that control the repayment of the debt may be unable or unwilling to repay principal or interest when due, and the Fund and the Underlying Funds may have limited recourse in the event of a default. During periods of economic uncertainty, the market prices of sovereign debt may be more volatile than prices of U.S. debt obligations. In the past, certain emerging markets have encountered difficulties in servicing their debt obligations, withheld payments of principal and interest, and declared moratoria on the payment of principal and interest on their sovereign debts. Sovereign debt obligations are also subject to political risks (e.g., government instability, poor socioeconomic conditions, corruption, lack of democratic accountability, internal and external conflict, poor quality of bureaucracy, and religious and ethnic tensions) and economic risks (e.g., the relative size of the governmental entity’s debt position in relation to the economy, high foreign debt as a percentage of gross domestic product or exports, high inflation or deflation, or an overvalued exchange rate) or a combination of these risks, such as the failure to put in place economic reforms required by the International Monetary Fund or other multilateral agencies.
U.S. Government Securities Risk. The Fund and the Underlying Funds may invest in U.S. government securities, which are obligations of, or guaranteed by, the U.S. government or its agencies, instrumentalities or government-sponsored enterprises. Some U.S. government securities are supported by the full faith and credit of the United States; others are supported by the right of the issuer to borrow from the U.S. Treasury; others are supported by the discretionary authority of the U.S. government to purchase the agency’s obligations; and still others are supported only by the credit of the instrumentality. The U.S. government’s guarantee of ultimate payment of principal and timely payment of interest on certain U.S. government securities owned by the Fund or an Underlying Fund does not imply that the Fund’s or the Underlying Fund’s shares are guaranteed or that the price of the Fund’s or the Underlying Fund’s shares will not fluctuate. In addition, securities issued by Freddie Mac, Fannie Mae and Federal Home Loan Banks are not obligations of, or insured by, the U.S. government. If a U.S. government agency or instrumentality in which the Fund or an Underlying Fund invests defaults, and the U.S. government does not stand behind the obligation, the Fund’s or an Underlying Fund’s share price or yield could fall. Securities of certain U.S. government sponsored entities are neither issued nor guaranteed by the U.S. government. All U.S. government obligations are subject to interest rate risk.
| 78 | (888) 848-7569 | www.rivernorth.com |
RiverNorth/DoubleLine Strategic Opportunity Fund, Inc.
| Summary of Updated Information Regarding the Fund | June 30, 2022 (Unaudited) |
Municipal Securities Risk. Municipal securities are long-term fixed rate debt obligations that generally decline in value with increases in interest rates, when an issuer’s financial condition worsens or when the rating on a bond is decreased. Many municipal securities may be called or redeemed prior to their stated maturity. Lower-quality revenue bonds and other credit-sensitive municipal securities carry higher risks of default than general obligation bonds. In addition, the amount of public information available about municipal securities is generally less than that for corporate equities or bonds and municipal securities may be less liquid than such securities. Special factors, such as legislative changes and local and business developments, may adversely affect the yield and/or value of the Fund’s or Underlying Fund’s investments in municipal securities. Other factors include the general conditions of the municipal securities market, the size of the particular offering, the maturity and the rating of the issue. The ability of municipal issuers to make timely payments of interest and principal may be diminished during general economic downturns and as cost burdens are reallocated among federal, state and local governments. Issuers of municipal securities might seek protection under bankruptcy laws. In the event of bankruptcy of such an issuer, holders of municipal securities could experience delays in collecting principal and interest and such holders may not be able to collect all principal and interest to which they are entitled.
Structured Notes Risk. Structured notes are subject to a number of fixed income risks including general market risk, interest rate risk, and the risk that the issuer on the note may fail to make interest and/or principal payments when due, or may default on its obligations entirely. In addition, as a result of the imbedded derivative features, structured notes generally are subject to more risk than investing in a simple note or bond issued by the same issuer. To the extent that the fixed income portion of the Fund’s portfolio includes structured notes, the Fund may be more volatile. The actual trading prices of structured notes may be significantly different from the principal amount of the notes. If the Fund sells the structured notes prior to maturity, it may suffer a loss of principal.
Rating Agency Risk. Ratings represent an NRSRO's opinion regarding the quality of the security and are not a guarantee of quality. NRSROs may fail to make timely credit ratings in response to subsequent events. In addition, NRSROs are subject to an inherent conflict of interest because they are often compensated by the same issuers whose securities they grade.
Legislation and Regulatory Risks. At any time, legislation or additional regulations may be enacted that could negatively affect the assets of the Fund, securities held by the Fund or the issuers of such securities. Fund shareholders may incur increased costs resulting from such legislation or additional regulation. There can be no assurance that future legislation, regulation or deregulation will not have a material adverse effect on the Fund or will not impair the ability of the Fund to achieve its investment objective.
On October 28, 2020, the SEC adopted Rule 18f-4 under the 1940 Act providing for the regulation of the use of derivatives and certain related instruments by registered investment companies. Rule 18f-4 prescribes specific value-at-risk leverage limits for certain derivatives users. In addition, Rule 18f-4 requires certain derivatives users to adopt and implement a derivatives risk management program (including the appointment of a derivatives risk manager and the implementation of certain testing requirements) and prescribes reporting requirements in respect of derivatives. Subject to certain conditions, if a fund qualifies as a “limited derivatives user,” as defined in Rule 18f-4, it is not subject to the full requirements of Rule 18f-4. In connection with the adoption of Rule 18f-4, the SEC rescinded certain of its prior guidance regarding asset segregation and coverage requirements in respect of derivatives transactions and related instruments. The Fund was required to comply with Rule 18f-4 beginning August 19, 2022 and has adopted procedures for investing in derivatives and other transactions in compliance with Rule 18f-4.
| Annual Report | June 30, 2022 | 79 |
RiverNorth/DoubleLine Strategic Opportunity Fund, Inc.
| Summary of Updated Information Regarding the Fund | June 30, 2022 (Unaudited) |
Market Disruption and Geopolitical Risks. The Fund and Underlying Funds may be adversely affected by uncertainties and events around the world, such as terrorism, political developments, and changes in government policies, taxation, restrictions on foreign investment and currency repatriation, currency fluctuations and other developments in the laws and regulations of the countries in which they are invested. Assets of issuers, including those held in the Fund’s or an Underlying Fund’s portfolio, could be direct targets, or indirect casualties, of an act of terrorism.
Russia/Ukraine Market Risk. In February 2022, Russia commenced a military attack on Ukraine. The outbreak of hostilities between the two countries and the threat of wider-spread hostilities could have a severe adverse effect on the region and global economies, including significant negative impacts on the markets for certain securities and commodities, such as oil and natural gas. In addition, sanctions imposed on Russia by the United States and other countries, and any sanctions imposed in the future, could have a significant adverse impact on the Russian economy and related markets. The price and liquidity of investments may fluctuate widely as a result of the conflict and related events. How long the armed conflict and related events will last cannot be predicted. These tensions and any related events could have a significant impact on Fund performance and the value of Fund investments. The inclusion of Russia/Ukraine Market Risk under the Risk Factors section is a material change since the prior disclosure date.
Pandemic Risk. Beginning in the first quarter of 2020, financial markets in the United States and around the world experienced extreme and in many cases unprecedented volatility and severe losses due to the global pandemic caused by COVID-19, a novel coronavirus, and since then, the number of cases has fluctuated and new “variants” have been confirmed around the world. The pandemic has resulted in a wide range of social and economic disruptions, including closed borders, voluntary or compelled quarantines of large populations, stressed healthcare systems, reduced or prohibited domestic or international travel, supply chain disruptions, and so-called “stay-at-home” orders throughout much of the United States and many other countries. The fall-out from these disruptions has included the rapid closure of businesses deemed “non-essential” by federal, state, or local governments and rapidly increasing unemployment, as well as greatly reduced liquidity for certain instruments at times. Some sectors of the economy and individual issuers have experienced particularly large losses. Such disruptions may continue for an extended period of time or reoccur in the future to a similar or greater extent. In response, the U.S. government and the Federal Reserve have taken extraordinary actions to support the domestic economy and financial markets, resulting in very low interest rates and in some cases negative yields. Although vaccines for COVID-19 have become more widely available, it is unknown how long circumstances related to the pandemic will persist, whether they will reoccur in the future, whether efforts to support the economy and financial markets will be successful, and what additional implications may follow from the pandemic. The impact of these events and other epidemics or pandemics in the future could adversely affect Fund performance.
| 80 | (888) 848-7569 | www.rivernorth.com |
RiverNorth/DoubleLine Strategic Opportunity Fund, Inc.
| Summary of Updated Information Regarding the Fund | June 30, 2022 (Unaudited) |
Defensive Measures. The Fund may invest up to 100% of its assets in cash, cash equivalents and short-term investments as a defensive measure in response to adverse market conditions or opportunistically at the discretion of the Adviser or Subadviser. During these periods, the Fund may not be pursuing its investment objectives.
Alternative Credit and Pass-Through Notes Risk. Alternative Credit Instruments are generally not rated and constitute a highly risky and speculative investment, similar to an investment in “junk” bonds. There can be no assurance that payments due on underlying Alternative Credit investments will be made. The Shares therefore should be purchased only by investors who could afford the loss of the entire amount of their investment. A substantial portion of the Alternative Credit in which the Fund may invest will not be secured by any collateral, will not be guaranteed or insured by a third party and will not be backed by any governmental authority. Accordingly, the platforms and any third-party collection agencies will be limited in their ability to collect on defaulted Alternative Credit. With respect to Alternative Credit secured by collateral, there can be no assurance that the liquidation of any such collateral would satisfy a borrower’s obligation in the event of a default under its Alternative Credit. Furthermore, Alternative Credit may not contain any cross-default or similar provisions. A cross-default provision makes a default under certain debt of a borrower an automatic default on other debt of that borrower. The effect of this can be to allow other creditors to move more quickly to claim any assets of the borrower. To the extent an Alternative Credit investment does not contain a cross-default provision, the loan will not be placed automatically in default upon that borrower’s default on any of the borrower’s other debt obligations, unless there are relevant independent grounds for a default on the loan. In addition, the Alternative Credit investment will not be referred to a third-party collection agency for collection because of a borrower’s default on debt obligations other than the Alternative Credit investment. If a borrower first defaults on debt obligations other than the Alternative Credit investment, the creditors to such other debt obligations may seize the borrower’s assets or pursue other legal action against the borrower, which may adversely impact the ability to recoup any principal and interest payments on the Alternative Credit investment if the borrower subsequently defaults on the loan. In addition, an operator of a platform is generally not required to repurchase Alternative Credit investments from a lender except under very narrow circumstances, such as in cases of verifiable identity fraud by the borrower. Borrowers may seek protection under federal bankruptcy law or similar laws. If a borrower files for bankruptcy (or becomes the subject of an involuntary petition), a stay will go into effect that will automatically put any pending collection actions on hold and prevent further collection action absent bankruptcy court approval. Whether any payment will ultimately be made or received on an Alternative Credit investment after bankruptcy status is declared depends on the borrower’s particular financial situation and the determination of the court. It is possible that the borrower’s liability on the Alternative Credit investment will be discharged in bankruptcy. In most cases involving the bankruptcy of a borrower with an unsecured Alternative Credit investment, unsecured creditors will receive only a fraction of any amount outstanding on their loan, if anything at all. As Pass- Through Notes generally are pass-through obligations of the operators of the lending platforms and are not direct obligations of the borrowers under the underlying Alternative Credit investment originated by such platforms, holders of certain Pass-Through Notes are exposed to the credit risk of the operator. An operator that becomes subject to bankruptcy proceedings may be unable to make full and timely payments on its Pass-Through Notes even if the borrowers of the underlying Alternative Credit investment timely make all payments due from them. Although some operators have chosen to address operator insolvency risk by organizing special purpose subsidiaries to issue the Pass-Through Notes, there can no assurance that any such subsidiary would not be consolidated into the operator’s bankruptcy estate should the operator become subject to bankruptcy proceedings. In such event, the holders of the Pass-Through Notes would remain subject to all the risks associated with an operator insolvency. In addition, Pass-Through Notes are non-recourse obligations (except to the extent that the operator receives payments from the borrower on the loan). Accordingly, lenders assume all the borrower credit risk on the loans they fund and are not entitled to recover any deficiency of principal or interest from the operator if the borrower defaults on its payments. There may be a delay between the time the Fund commits to purchase a Pass-Through Note and the issuance of such note and, during such delay, the funds committed to such an investment will not be available for investment in other Alternative Credit Instruments. Because the funds committed to an investment in Pass-Through Notes do not earn interest until the issuance of the note, the delay in issuance will have the effect of reducing the effective rate of return on the investment
| Annual Report | June 30, 2022 | 81 |
RiverNorth/DoubleLine Strategic Opportunity Fund, Inc.
| Summary of Updated Information Regarding the Fund | June 30, 2022 (Unaudited) |
Platform Concentration Risk. The Fund may invest 25% or more of its Managed Assets in Alternative Credit originated from one or a limited number of platform(s). A concentration in select platforms may subject the Fund to increased dependency and risks associated with those platforms than it would otherwise be subject to if it were more broadly diversified across a greater number of platforms. The Fund may be more susceptible to adverse events affecting such platforms, particularly if such platforms were unable to sustain their current lending models. In addition, many platforms and/or their affiliated entities have incurred operating losses since their inception and may continue to incur net losses in the future. The Fund’s concentration in certain platforms may also expose it to increased risk of default and loss on the Alternative Credit in which it invests through such platforms if such platforms have, among other characteristics, lower borrower credit criteria or other minimum eligibility requirements, or have deficient procedures for conducting credit and interest rate analyses as part of their loan origination processes, relative to other platforms. In addition, the fewer platforms through which the Fund invests, the greater the risks associated with those platforms changing their arrangements will become. For instance, the platforms may change their underwriting and credit models, borrower acquisition channels and quality of debt collection procedures in ways which may make the loans originated through such platforms unsuitable for investment by the Fund. Moreover, a platform may become involved in a lawsuit, which may adversely impact that platform’s performance and reputation and, in turn, the Fund’s portfolio performance. -55- An investor may become dissatisfied with a platform’s marketplace if a loan underlying its investment is not repaid and it does not receive full payment. As a result, such platform’s reputation may suffer and the platform may lose investor confidence, which could adversely affect investor participation on the platform’s marketplace.
Platform Reliance Risk. The Fund is dependent on the continued success of the platforms that originate the Fund’s Alternative Credit Instruments and the Fund materially depends on such platforms for loan data and the origination, sourcing and servicing of Alternative Credit investments. If such platforms were unable or impaired in their ability to operate their lending business, the Adviser may be required to seek alternative sources of investments (e.g., Alternative Credit originated by other platforms), which could adversely affect the Fund’s performance and/or prevent the Fund from pursuing its investment objective and strategies. In order to sustain its business, platforms and their affiliated entities may be dependent in large part on their ability to raise additional capital to fund their operations. If a platform and its affiliated entities are unable to raise additional funding, they may be unable to continue their operations. The Fund may have limited knowledge about the underlying Alternative Credit in which it invests and will be dependent upon the platform originating such loans for information on the loans. Some investors of Alternative Credit Instruments, including the Fund, may not review the particular characteristics of the loans in which they invest at the time of investment, but rather negotiate in advance with platforms the general criteria of the investments. As a result, the Fund is dependent on the platforms’ ability to collect, verify and provide information to the Fund about each Alternative Credit investment and borrower. Each of the platforms from which the Fund will purchase Alternative Credit Instruments retains an independent auditor to conduct audits on a routine basis.
| 82 | (888) 848-7569 | www.rivernorth.com |
RiverNorth/DoubleLine Strategic Opportunity Fund, Inc.
| Summary of Updated Information Regarding the Fund | June 30, 2022 (Unaudited) |
Structural Risks:
Market Discount. Common stock of closed-end funds frequently trades at a discount from its net asset value. This risk may be greater for investors selling their shares in a relatively short period of time after completion of the initial offering. The Fund’s Common Shares may trade at a price that is less than the initial offering price. This risk would also apply to the Fund’s investments in closed-end funds.
Investment Style Risk. The Fund is managed by allocating the Fund’s assets to two different strategies, which could cause the Fund to underperform funds that do not limit their investments to these two strategies during periods when these strategies underperform other types of investments.
Multi-Manager Risk. The Adviser and the Subadviser’s investment styles may not always be complementary, which could adversely affect the performance of the Fund. The Adviser and the Subadviser may, at any time, take positions that in effect may be opposite of positions taken by each other, incurring brokerage and other transaction costs without accomplishing any net investment results. The multi-manager approach could increase the Fund’s portfolio turnover rates, which may result in higher trading costs and tax consequences associated with portfolio turnover that may adversely affect the Fund’s performance. Further, if the Subadviser is not retained, Fund performance will become dependent on the Adviser or a new subadviser successfully implementing the municipal bond income strategy, which might have adverse effect on an investment in the Fund.
Asset Allocation Risk. To the extent that the Adviser’s asset allocation between the Fund’s principal investment strategies may fail to produce the intended result, the Fund’s return may suffer. Additionally, the potentially active asset allocation style of the Fund may lead to changing allocations over time and represent a risk to investors who target fixed asset allocations.
Leverage Risks. Leverage is a speculative technique that exposes the Fund to greater risk and increased costs than if it were not implemented. Increases and decreases in the value of the Fund’s portfolio will be magnified when the Fund uses leverage. As a result, leverage may cause greater changes in the Fund’s net asset value. The leverage costs may be greater than the Fund’s return on the underlying investments made from the proceeds of leverage. The Fund’s leveraging strategy may not be successful. Leverage risk would also apply to the Fund’s investments in Underlying Funds to the extent an Underlying Fund uses leverage. To the extent the Fund uses leverage and invests in Underlying Funds that also use leverage, the risks associated with leverage will be magnified, potentially significantly.
Potential Conflicts of Interest Risk. The Adviser and the Subadviser each manages and/or advises other investment funds or accounts with the same or similar investment objectives and strategies as the Fund, and, as a result may face conflict of interests regarding the implementation of the Fund’s strategy and allocation between funds and accounts. This may limit the Fund’s ability to take full advantage of the investment opportunity or affect the market price of the investment. Each party may also have incentives to favor one account over another due to different fees paid to such accounts. While each party has adopted policies and procedures that address these potential conflicts of interest, there is no guarantee that the policies will be successful in mitigating the conflicts of interest that arise. In addition, the Fund’s use of leverage will increase the amount of the fees paid to the Adviser and Subadviser, creating a financial incentive to for the Adviser to leverage the Fund.
| Annual Report | June 30, 2022 | 83 |
RiverNorth/DoubleLine Strategic Opportunity Fund, Inc.
| Summary of Updated Information Regarding the Fund | June 30, 2022 (Unaudited) |
Stockholder Activism. The Fund may in the future become the target of stockholder activism. Stockholder activism could result in substantial costs and divert management’s and the Board’s attention and resources from its business. Also, the Fund may be required to incur significant legal and other expenses related to any activist stockholder matters. Further, the Fund’s stock price could be subject to significant fluctuation or otherwise be adversely affected by the events, risks and uncertainties of any stockholder activism.
Cybersecurity Risk. A cybersecurity breach may disrupt the business operations of the Fund or its service providers. A breach may allow an unauthorized party to gain access to Fund assets, customer data, or proprietary information, or cause the Fund and/or its service providers to suffer data corruption or lose operational functionality.
Anti-Takeover Provisions. Maryland law and the Fund’s Charter and Bylaws include provisions that could limit the ability of other entities or persons to acquire control of the Fund or to convert the Fund to open-end status, including the adoption of a staggered Board of Directors and the supermajority voting requirements. These provisions could deprive the common shareholders of opportunities to sell their common shares at a premium over the then current market price of the common shares or at NAV.
Risks Associated with Additional Offerings. There are risks associated with offerings of additional common or preferred shares of the Fund. The voting power of current shareholders will be diluted to the extent that current shareholders do not purchase shares in any future offerings of shares or do not purchase sufficient shares to maintain their percentage interest. In addition, the sale of shares in an offering may have an adverse effect on prices in the secondary market for the Fund’s shares by increasing the number of shares available, which may put downward pressure on the market price of the Fund’s Shares. These sales also might make it more difficult for the Fund to sell additional equity securities in the future at a time and price the Fund deems appropriate.
In the event any additional series of fixed rate preferred shares are issued and such shares are intended to be listed on an exchange, prior application will have been made to list such shares. During an initial period, which is not expected to exceed 30 days after the date of its initial issuance, such shares may not be listed on any securities exchange. During such period, the underwriters may make a market in such shares, although they will have no obligation to do so. Consequently, an investment in such shares may be illiquid during such period. Fixed rate preferred shares may trade at a premium to or discount from liquidation value.
There are risks associated with an offering of Rights (in addition to the risks discussed herein related to the offering of shares and preferred shares). Shareholders who do not exercise their rights may, at the completion of such an offering, own a smaller proportional interest in the Fund than if they exercised their rights. As a result of such an offering, a shareholder may experience dilution in net asset value per share if the subscription price per share is below the net asset value per share on the expiration date. In addition to the economic dilution described above, if a shareholder does not exercise all of their Rights, the shareholder will incur voting dilution as a result of the Rights offering. This voting dilution will occur because the shareholder will own a smaller proportionate interest in the Fund after the rights offering than prior to the Rights offering.
| 84 | (888) 848-7569 | www.rivernorth.com |
RiverNorth/DoubleLine Strategic Opportunity Fund, Inc.
| Summary of Updated Information Regarding the Fund | June 30, 2022 (Unaudited) |
There is a risk that changes in market conditions may result in the underlying common shares or preferred shares purchasable upon exercise of Rights being less attractive to investors at the conclusion of the subscription period. This may reduce or eliminate the value of the Rights. If investors exercise only a portion of the rights, the number of shares issued may be reduced, and the shares may trade at less favorable prices than larger offerings for similar securities. Rights issued by the Fund may be transferable or non-transferable rights.
Secondary Market for the Common Shares. The issuance of shares of the Fund through the Fund’s dividend reinvestment plan (“Plan“) may have an adverse effect on the secondary market for the Fund’s shares. The increase in the number of outstanding shares resulting from the issuances pursuant to the Plan and the discount to the market price at which such shares may be issued, may put downward pressure on the market price for the Common Shares. When the shares are trading at a premium, the Fund may also issue shares that may be sold through private transactions effected on the NYSE or through broker-dealers. The increase in the number of outstanding shares resulting from these offerings may put downward pressure on the market price for such shares.
Portfolio Manager Information
There have been no changes in the Fund’s portfolio managers or background since the prior disclosure date.
Fund Organizational Structure
Since the prior disclosure date, there have been no changes in the Fund’s charter or by-laws that would delay or prevent a change of control of the Fund that have not been approved by shareholders.
| Annual Report | June 30, 2022 | 85 |
RiverNorth/DoubleLine Strategic Opportunity Fund, Inc.
| Directors and Officers | June 30, 2022 (Unaudited) |
The following table provides information regarding each Director who is not an “interested person” of the Fund, as defined in the 1940 Act.
INDEPENDENT DIRECTORS
Name, Address1
and Year
of Birth | Position(s)
Held with
the Fund | Term of
Office and
Length of
Time Served | Principal
Occupation(s)
During Past
5 Years | Number of
Funds in
Fund Complex
Overseen by
Director2 | Other Directorships
Held by the
Director During
the Past 5 Years |
John K. Carter
(1961) | Director | Current term expires in 2024. Has served since 2016. | Managing Partner, Law Office of John K. Carter, P.A. (a general practice and corporate law firm) (2015 to present); Managing Partner, Global Recruiters of St. Petersburg (a financial services consulting and recruiting firm) (2012 to present). | 10 | Carillon Mutual Funds (14 funds) (2016 to present); RiverNorth Specialty Finance Corporation (1 fund) (2016 to present); RiverNorth Funds (3 funds) (2013 to present); RiverNorth Opportunities Fund, Inc. (1 fund)(2013 to present); RiverNorth Opportunistic Municipal Income Fund, Inc. (1 fund) (2018 to present); RiverNorth Managed Duration Municipal Income Fund, Inc. (2019 to present)(1 fund); RiverNorth Flexible Municipal Income Fund, Inc. (2020 to present)(1 Fund); RiverNorth Flexible Municipal Income Fund II, Inc. (1 fund)(2021 to present); RiverNorth Managed Duration Municipal Income Fund II, Inc. (1 fund)(2022 to present). |
| 86 | (888) 848-7569 | www.rivernorth.com |
RiverNorth/DoubleLine Strategic Opportunity Fund, Inc.
| Directors and Officers | June 30, 2022 (Unaudited) |
INDEPENDENT DIRECTORS
Name, Address1
and Year
of Birth | Position(s)
Held with
the Fund | Term of
Office and
Length of
Time Served | Principal
Occupation(s)
During Past
5 Years | Number of
Funds in
Fund Complex
Overseen by
Director2 | Other Directorships
Held by the
Director During
the Past 5 Years |
J. Wayne
Hutchens
(1944) | Director | Current term expires in 2022. Has served since 2018. | Currently retired; Trustee of the Denver Museum of Nature and Science (2000 to 2020); Director of AMG National Trust Bank (June 2012 to present); Trustee of Children’s Hospital Colorado (May 2012 to 2020). | 7 | ALPS Series Trust (11 funds) (2012 to present); RiverNorth Specialty Finance Corporation (1 fund) (2016 to present); RiverNorth Funds (3 funds) (2013 to present); RiverNorth Opportunities Fund, Inc. (1 fund)(2013 to present); RiverNorth Opportunistic Municipal Income Fund, Inc. (1 fund) (2018 to present); RiverNorth Managed Duration Municipal Income Fund, Inc. (2019 to present)(1 fund); RiverNorth Flexible Municipal Income Fund, Inc. (2020 to present)(1 Fund); RiverNorth Flexible Municipal Income Fund II, Inc. (1 fund)(2021 to present); RiverNorth Managed Duration Municipal Income Fund II, Inc. (1 fund) (2022 to present). |
| Annual Report | June 30, 2022 | 87 |
RiverNorth/DoubleLine Strategic Opportunity Fund, Inc.
| Directors and Officers | | | June 30, 2022 (Unaudited) |
INDEPENDENT DIRECTORS
Name, Address1
and Year
of Birth | Position(s)
Held with
the Fund | Term of
Office and
Length of
Time Served | Principal
Occupation(s)
During Past
5 Years | Number of
Funds in
Fund Complex
Overseen by
Director2 | Other Directorships
Held by the
Director During
the Past 5 Years |
John S. Oakes
(1943) | Director | Current term expires in 2024. Has served since 2016. | Currently retired; Principal, Financial Search and Consulting (a recruiting and consulting firm) 2013 to 2017). | 10 | RiverNorth Specialty Finance Corporation (1 fund) (2016 to present); RiverNorth Funds (3 funds) (2013 to present); RiverNorth Opportunities Fund, Inc. (1 fund)(2013 to present); RiverNorth Opportunistic Municipal Income Fund, Inc. (1 fund) (2018 to present); RiverNorth Managed Duration Municipal Income Fund, Inc. (2019 to present)(1 fund); RiverNorth Flexible Municipal Income Fund, Inc. (2020 to present)(1 Fund); RiverNorth Flexible Municipal Income Fund II, Inc. (1 fund)(2021 to present); RiverNorth Managed Duration Municipal Income Fund II, Inc. (1 fund)(2022 to present). |
| 88 | (888) 848-7569 | www.rivernorth.com |
RiverNorth/DoubleLine Strategic Opportunity Fund, Inc.
| Directors and Officers | June 30, 2022 (Unaudited) |
INDEPENDENT DIRECTORS
Name, Address1
and Year
of Birth | Position(s)
Held with
the Fund | Term of
Office and
Length of
Time Served | Principal
Occupation(s)
During Past
5 Years | Number of
Funds in
Fund Complex
Overseen by
Director2 | Other Directorships
Held by the
Director During
the Past 5 Years |
David M.
Swanson
(1957) | Director | Current term expires in 2022. Has served since 2018. | Founder & Managing Partner, SwanDog Strategic Marketing (2006 to present). | 10 | RiverNorth Specialty Finance Corporation (1 fund) (2016 to present); RiverNorth Funds (3 funds) (2013 to present); RiverNorth Opportunities Fund, Inc. (1 fund)(2013 to present); RiverNorth Opportunistic Municipal Income Fund, Inc. (1 fund) (2018 to present); RiverNorth Managed Duration Municipal Income Fund, Inc. (2019 to present)(1 fund); RiverNorth Flexible Municipal Income Fund, Inc. (2020 to present)(1 Fund); RiverNorth Flexible Municipal Income Fund II, Inc. (1 fund)(2021 to present); RiverNorth Managed Duration Municipal Income Fund II, Inc. (1 fund)(2022 to present); ALPS Variable Investment Trust (7 funds) (2006 to present). |
| 1. | The mailing address of each Director is 360 South Rosemary Avenue, Suite 1420, West Palm Beach, FL 33401. |
| 2. | The Fund Complex consists of the RiverNorth Core Opportunity Fund, the RiverNorth/DoubleLine Strategic Income Fund, and the RiverNorth/Oaktree High Income Fund, each a series of the RiverNorth Funds, RiverNorth Opportunities Fund, Inc., RiverNorth DoubleLine Strategic Opportunity Fund, Inc., RiverNorth Opportunistic Municipal Income Fund, Inc., RiverNorth Flexible Municipal Income Fund, Inc., RiverNorth Flexible Municipal Income Fund II, Inc., RiverNorth Managed Duration Municipal Income Fund, Inc., RiverNorth Managed Duration Municipal Income Fund II, Inc. and RiverNorth Specialty Finance Corporation. |
| Annual Report | June 30, 2022 | 89 |
RiverNorth/DoubleLine Strategic Opportunity Fund, Inc.
| Directors and Officers | June 30, 2022 (Unaudited) |
The following table provides information regarding each Director who is an “interested person” of the Fund, as defined in the 1940 Act, and each officer of the Fund.
INTERESTED DIRECTORS AND OFFICERS
Name, Address1
and Year
of Birth | Position(s)
Held with
Registrant | Term of
Office and
Length of
Time Served | Principal
Occupation(s)
During Past
5 Years | Number of
Funds in Fund
Complex2
Overseen by
Director | Other Directorships
Held by the
Director During
the Past 5 Years |
Patrick W.
Galley3
(1975) | Interested Director, Chairman and President | Current term expires in 2023. Has served since 2016. | Chief Investment Officer, RiverNorth Capital Management, LLC (2004 to present); Board of Managers of RiverNorth Capital Management, LLC and RiverNorth Securities, LLC (since 2010) and Board of Directors RiverNorth Holdings, Co. (since 2010). | 10 | RiverNorth Specialty Finance Corporation (1 fund) (2016 to present); RiverNorth Funds (3 funds) (2013 to present); RiverNorth Opportunities Fund, Inc. (1 fund)(2013 to present); RiverNorth Opportunistic Municipal Income Fund, Inc. (1 fund) (2018 to present); RiverNorth Managed Duration Municipal Income Fund, Inc. (2019 to present)(1 fund); RiverNorth Flexible Municipal Income Fund, Inc. (2020 to present)(1 Fund); RiverNorth Flexible Municipal Income Fund II, Inc. (1 fund)(2021 to present); RiverNorth Managed Duration Municipal Income Fund II, Inc. (1 fund)(2022 to present). |
| 90 | (888) 848-7569 | www.rivernorth.com |
RiverNorth/DoubleLine Strategic Opportunity Fund, Inc.
| Directors and Officers | June 30, 2022 (Unaudited) |
INTERESTED DIRECTORS AND OFFICERS
Name, Address1
and Year
of Birth | Position(s)
Held with
Registrant | Term of
Office and
Length of
Time Served | Principal
Occupation(s)
During Past
5 Years | Number of
Funds in Fund
Complex2
Overseen by
Director | Other Directorships
Held by the
Director During
the Past 5 Years |
Jerry R. Raio
(1964)4 | Interested Director | Current term expires in 2023. Has served since 2018. | Head of Capital Markets, ClickIPO (Since 2018); President, Arbor Lane Advisors, Inc. (Since 2018); Managing Director, Head of Retail Origination, Wells Fargo Securities, LLC (2005 to 2018). | 7 | RiverNorth Specialty Finance Corporation (1 fund) (2016 to present); RiverNorth Opportunities Fund, Inc. (1 fund)(2013 to present); RiverNorth Opportunistic Municipal Income Fund, Inc. (1 fund) (2018 to present); RiverNorth Managed Duration Municipal Income Fund, Inc. (2019 to present)(1 fund); RiverNorth Flexible Municipal Income Fund, Inc. (2020 to present)(1 Fund); RiverNorth Flexible Municipal Income Fund II, Inc. (1 fund)(2021 to present); RiverNorth Managed Duration Municipal Income Fund II, Inc. (1 fund)(2022 to present). |
Jonathan M.
Mohrhardt
(1974) | Treasurer and Chief Financial Officer | Indefinite. Has served since inception. | Chief Compliance Officer, RiverNorth Capital Management, LLC (2009 to 2012); Chief Operating Officer, RiverNorth Capital Management, LLC (2011 to present) and President, Chief Executive Officer and Chief Compliance Officer, RiverNorth Securities, LLC (2010 to 2012). | N/A | N/A |
| Annual Report | June 30, 2022 | 91 |
RiverNorth/DoubleLine Strategic Opportunity Fund, Inc.
| Directors and Officers | June 30, 2022 (Unaudited) |
INTERESTED DIRECTORS AND OFFICERS
Name, Address1
and Year
of Birth | Position(s)
Held with
Registrant | Term of
Office and
Length of
Time Served | Principal
Occupation(s)
During Past
5 Years | Number of
Funds in Fund
Complex2
Overseen by
Director | Other Directorships
Held by the
Director During
the Past 5 Years |
Marcus L.
Collins (1968) | Chief Compliance Officer; Secretary | Indefinite. Has served since inception. | General Counsel, RiverNorth Capital Management, LLC (2012 to present); Chief Compliance Officer, RiverNorth Capital Management, LLC (2012 to present). | N/A | N/A |
| 1. | The mailing address of each Director is 360 South Rosemary Avenue, Suite 1420, West Palm Beach, FL 33401. |
| 2. | The Fund Complex consists of the RiverNorth Core Opportunity Fund, the RiverNorth/DoubleLine Strategic Income Fund, and the RiverNorth/Oaktree High Income Fund, each a series of the RiverNorth Funds, RiverNorth Opportunities Fund, Inc., RiverNorth DoubleLine Strategic Opportunity Fund, Inc., RiverNorth Opportunistic Municipal Income Fund, Inc., RiverNorth Flexible Municipal Income Fund, Inc., RiverNorth Flexible Municipal Income Fund II, Inc., RiverNorth Managed Duration Municipal Income Fund, Inc., RiverNorth Managed Duration Municipal Income Fund II, Inc. and RiverNorth Specialty Finance Corporation. |
| 3. | Patrick W. Galley is considered an “Interested” Director as defined in the Investment Company Act of 1940, as amended, because he is an officer of the Fund and Chief Executive Officer and Chief Investment Officer of the Fund’s investment adviser. |
| 4. | Jerry Raio is considered an “Interested” Director as defined in the Investment Company Act of 1940, as amended, because of his current position as a director of FLX Distribution, which the Adviser is an investor in and Mr. Galley is a Director of; and because of his prior position as Managing Director – Head of Retail Origination at Wells Fargo, which had previously served as a broker and principal underwriter for certain funds advised by the Adviser. |
The Statement of Additional Information includes additional information about the Fund’s Directors and is available, without charge, upon request by calling (toll-free) 1-888-848-7569.
| 92 | (888) 848-7569 | www.rivernorth.com |
RiverNorth/DoubleLine Strategic Opportunity Fund, Inc.
| Additional Information | June 30, 2022 (Unaudited) |
PROXY VOTING GUIDELINES
A description of the policies and procedures that the Fund used to determine how to vote proxies relating to portfolio securities and information regarding how the Fund voted proxies during the most recent 12-month period ended June 30, are available without charge upon request by (1) calling the Fund at (888) 848-7569 and (2) from Form N-PX filed by the Fund with the SEC on the SEC’s website at www.sec.gov.
PORTFOLIO HOLDINGS DISCLOSURE POLICY
The Fund files a complete schedule of investments with the SEC for the first and third quarter of the fiscal year on Part F of Form N-PORT. The Fund’s first and third fiscal quarters end on September 30 and March 31. The Form N-PORT filing must be filed within 60 days of the end of the quarter. The Fund's Form N-PORT are available on the SEC's website at www.sec.gov. You may also obtain copies by calling the Fund at 1-888-848-7569.
UNAUDITED TAX INFORMATION
In early 2022, if applicable, shareholders of record received this information for the distributions paid to them by the Fund during the calendar year 2021 via Form 1099. The Fund will notify shareholders in early 2023 of amounts paid to them by the Fund, if any, during the calendar year 2022.
| Annual Report | June 30, 2022 | 93 |
Board of Directors
Patrick W. Galley, CFA, Chairman
John K. Carter
John S. Oakes
J. Wayne Hutchens
David M. Swanson
Jerry R. Raio
Investment Adviser
RiverNorth Capital Management, LLC
Sub Adviser
DoubleLine Capital LP
Fund Administrator
ALPS Fund Services, Inc.
Transfer Agent and
Dividend Disbursing Agent
DST Systems, Inc.
Custodian
State Street Bank and Trust Company
Independent Registered
Public Accounting Firm
Cohen & Company, Ltd.

RiverNorth Capital Management, LLC
360 South Rosemary Avenue, Suite 1420
West Palm Beach, FL 33401
Secondary market support provided to the Fund by ALPS Fund Services, Inc.’s affiliate ALPS Distributors, Inc., a FINRA member.
This report is provided for the general information of the shareholders of the RiverNorth/DoubleLine Strategic Opportunity Fund, Inc. This report is not intended for distribution to prospective investors in the Fund, unless preceded or accompanied by an effective prospectus.
| (a) | The Registrant, as of the end of the period covered by the report, has adopted a Code of Ethics that applies to the Registrant’s Principal Executive Officer, Principal Financial Officer, Principal Accounting Officer or Controller or any persons performing similar functions on behalf of the Registrant. |
| (c) | During the period covered by this report, no amendments were made to the provisions of the Code of Ethics referenced in 2 (a) above. |
| (d) | During the period covered by this report, no implicit or explicit waivers to the provision of the Code of Ethics referenced in 2 (a) above were granted. |
| (f) | The Registrant’s Code of Ethics is attached as Exhibit 13(a)(1) hereto. |
| Item 3. | Audit Committee Financial Expert. |
The Registrant’s Board of Directors has determined that the Registrant has as least one audit committee financial expert serving on its Audit Committee. The Board of Directors has designated J. Wayne Hutchens as the Registrant’s “audit committee financial expert.” Mr. Hutchens is “independent” as defined in paragraph (a)(2) of Item 3 to Form N-CSR.
| Item 4. | Principal Accountant Fees and Services. |
| (a) | Audit Fees: For the registrant’s fiscal years ended June 30, 2022 and June 30, 2021 the aggregate fees billed for professional services rendered by Cohen & Company, Ltd. (“Cohen”) for the audit of the Registrant's annual financial statements or services that are normally provided by the accountant in connection with statutory and regulatory filings or engagements were $35,500 and $30,000, respectively. |
| (b) | Audit-Related Fees: For the registrant’s fiscal years ended June 30, 2022 and June 30, 2021, the aggregate fees billed for assurance and related services by Cohen that are reasonably related to the performance of the audit of the Registrant's financial statements and are not reported under paragraph (a) of this Item were $16,415.25 and $7,699, respectively. |
| (c) | Tax Fees: For the registrant’s fiscal years ended June 30, 2022 and June 30, 2021, the aggregate fees billed for professional services rendered by Cohen for tax compliance, tax advice, and tax planning were $5,000 and $5,000, respectively. This fee is comprised of fees relating income tax return preparation fees, excise tax return preparation fees and review of dividend distribution calculation fees. |
| (d) | All Other Fees: For the registrant’s fiscal years ended June 30, 2022 and June 30, 2021 the aggregate fees billed for products and services provided by Cohen, other than the services reported in paragraphs (a) through (c) of this Item were $0 and $0, respectively. |
| (e)(1) | Audit Committee Pre-Approval Policies and Procedures: All services to be performed by the Registrant's principal auditors must be pre-approved by the Registrant's Audit Committee or by the Audit Committee’s designee pursuant to the Audit Committee’s Pre-Approval Policies and Procedures. |
| (e)(2) | No services described in paragraphs (b) through (d) were approved pursuant to paragraph (c)(7)(i)(C) of Rule 2-01 of Regulation S-X. |
| (g) | The aggregate non-audit fees billed by the Registrant’s accountant for services rendered to the Registrant, and rendered to the Registrant’s investment adviser, and any entity controlling, controlled by, or under common control with the investment adviser that provides ongoing services to the Registrant for the fiscal years ended June 30, 2022 and June 30, 2021 were $0 and $0, respectively. For the fiscal years ended June 30, 2022 and June 30, 2021, Cohen did not bill the Registrant for products and services other than the services reported above. |
| Item 5. | Audit Committee of Listed Registrants. |
The Registrant has a separately designated standing Audit Committee established in accordance with Section 3 (a)(58)(A) of the Exchange Act and is comprised of the following members:
J. Wayne Hutchens, Chairman
John K. Carter
John S. Oakes
David M. Swanson
| Item 6. | Schedule of Investments. |
| (a) | Schedule of Investments is included as part of the Report to Stockholders filed under Item 1 of this form. |
| (b) | Not applicable to the Registrant. |
| Item 7. | Disclosure of Proxy Voting Policies and Procedures for Closed-End Management Investment Companies. |
Attached, as Exhibit 13(c), is a copy of the policies and procedures of the Registrant.
| Item 8. | Portfolio Managers of Closed-End Management Investment Companies. |
RiverNorth Capital Management LLC (the “Adviser”)
Patrick W. Galley, CFA is a co-portfolio manager of the Tactical Closed-End Fund Income Strategy for the Fund. Mr. Galley is the Chief Investment Officer for the Adviser. Mr. Galley heads the Adviser’s research and investment team and oversees all portfolio management activities at the Adviser. Mr. Galley also serves as the President and Chairman of the RiverNorth Funds, a mutual fund complex for which RiverNorth serves as the investment adviser. Prior to joining the Adviser in 2004, he was most recently a Vice President at Bank of America in the Global Investment Bank’s Portfolio Management group, where he specialized in analyzing and structuring corporate transactions for investment management firms in addition to closed-end and open-end funds, hedge funds, funds of funds, structured investment vehicles and insurance/reinsurance companies. Mr. Galley graduated with honors from Rochester Institute of Technology with a B.S. in Finance. He has received the Chartered Financial Analyst (CFA) designation, is a member of the CFA Institute and is a member of the CFA Society of Chicago.
Stephen O’Neill, CFA is a co-portfolio manager of the Tactical Closed-End Fund Income Strategy for the Fund. Mr. O’Neill conducts qualitative and quantitative analysis of closed-end funds and their respective asset classes at RiverNorth. Prior to joining RiverNorth Capital in 2007, Mr. O’Neill was most recently an Assistant Vice President at Bank of America in the Global Investment Bank’s Portfolio Management group. At Bank of America, he specialized in the corporate real estate, asset management, and structured finance industries. Mr. O’Neill graduated magna cum laude from Miami University in Oxford, Ohio with a B.S. in Finance. Mr. O’Neill has received the Chartered Financial Analyst (CFA) designation, is a member of the CFA Institute, and is a member of the CFA Society of Chicago.
DoubleLine® Capital LP (the “Subadviser”)
Jeffrey E. Gundlach is a co-portfolio manager of the Opportunistic Income Strategy for the Fund. Mr. Gundlach is the founder, Chief Executive Officer and Chief Investment Officer of the Subadviser. He is also the Chairman of the Subadviser’s Fixed Income Asset Allocation Committee. Mr. Gundlach is a graduate of Dartmouth College, summa cum laude, with degrees in Mathematics and Philosophy. He attended Yale University as a Ph.D. candidate in Mathematics.
Jeffrey J. Sherman is a co-portfolio manager of the Opportunistic Income Strategy for the Fund Mr. Sherman joined the Subadviser in December 2009. He is the Deputy Chief Investment Officer, participates on the Fixed Income Asset Allocation Committee and is a portfolio manager for derivative-based and multi-asset strategies. Mr. Sherman was previously a statistics and mathematics instructor at both the University of the Pacific and Florida State University. Mr. Sherman holds a B.S. in Applied Mathematics from the University of the Pacific and a M.S. in Financial Engineering from the Claremont Graduate University. He is a CFA charterholder.
| (a)(2) | As of June 30, 2022, the Portfolio Managers listed above are also responsible for the day-to-day management of the following: |
| | Number of Other Accounts Managed and Assets by Account Type
As of June 30, 2022 |
| Portfolio Manager | Registered Investment
Companies
(other than the Fund) | Registered Investment Companies Subject to Performance-Based Advisory Fees | Other Pooled Investment Vehicles | Other Pooled Investment Vehicles Subject to Performance-Based Advisory Fees | Other Accounts | Other Accounts Subject to Performance-Based Advisory Fees |
| Patrick W. Galley | 12 $4 Billion | 0 $0 | 4 $929 Million | 4 $929 Million | 4 $81.46 Million | 4 $81.46 Million |
| Stephen O’Neill | 10 $3.89 Billion | 0 $0 | 4 $929 Million | 4 $929 Million | 4 $81.46 Million | 4 $81.46 Million |
| Jeffrey E. Gundlach | 31 $78,298,121,730 | 0 $0 | 17 $7,353,681,768 | 2 $1,587,696,169 | 78 $16,168,648,184 | 2 $869,005,112 |
| Jeffrey J. Sherman | 21 $ 33,154,413,364 | 0 $0 | 9 $2,841,300,195 | 0 $0 | 21 $4,242,217,330 | 0 $0 |
| (a)(3) | Compensation of Portfolio Managers and Material Conflicts of Interest |
Adviser Compensation
Mr. Galley’s and Mr. O’Neill’s total compensation includes a base salary fixed from year to year and a variable performance bonus consisting of cash incentives. The amounts paid to Mr. Galley and Mr. O’Neill are based on a percentage of the fees earned by the Adviser from managing the Fund and other investment accounts. The performance bonus reflects individual performance of the funds managed by the portfolio managers and the performance of the Adviser’s business as a whole. Mr. Galley and Mr. O’Neill also participate in a 401K program on the same basis as other officers of the Adviser.
Subadviser Compensation
Mr. Gundlach’s and Mr. Sherman’s total compensation is determined by the Subadviser. The overall objective of the compensation program for portfolio managers employed by the Subadviser is for the Subadviser to attract competent and expert investment professionals and to retain them over the long term. Compensation is comprised of several components which, in the aggregate, are designed to achieve these objectives and to reward the Subadviser’s portfolio managers for their contribution to the success of their clients and the Subadviser. The Subadviser portfolio managers are compensated through a combination of base salary, discretionary bonus and equity participation in the Subadviser.
| • | Salary. Salary is agreed to with managers at time of employment and is reviewed from time to time. It does not change significantly and often does not constitute a significant part of the portfolio managers’ compensation. |
| • | Discretionary Bonus/Guaranteed Minimums. Portfolio managers receive discretionary bonuses. However, in some cases, pursuant to contractual arrangements, some portfolio managers may be entitled to a mandatory minimum bonus if the sum of their salary and profit sharing does not reach certain levels. |
| • | Equity Incentives. Portfolio managers participate in equity incentives based on overall firm performance of the Subadviser, through direct ownership interests in the Subadviser. These ownership interests or participation interests provide eligible portfolio managers the opportunity to participate in the financial performance of the Subadviser as a whole. Participation is generally determined in the discretion of the Subadviser, taking into account factors relevant to the portfolio manager’s contribution to the success of Subadviser. |
| • | Other Plans and Compensation Vehicles. Portfolio managers may elect to participate in the Subadviser’s 401(k) plan, to which they may contribute a portion of their pre- and post-tax compensation to the plan for investment on a tax-deferred basis. The Subadviser may also choose, from time to time to offer certain other compensation plans and vehicles, such as a deferred compensation plan, to portfolio managers. |
| • | Summary. As described above, an investment professional’s total compensation is determined through a subjective process that evaluates numerous quantitative and qualitative factors, including the contribution made to the overall investment process. Not all factors apply to each investment professional and there is no particular weighting or formula for considering certain factors. Among the factors considered are: relative investment performance of portfolios (although there are no specific benchmarks or periods of time used in measuring performance); complexity of investment strategies; participation in the investment team’s dialogue; contribution to business results and overall business strategy; success of marketing/business development efforts and client servicing; seniority/length of service with the firm; management and supervisory responsibilities; and fulfillment of the Subadviser’s leadership criteria. |
Conflicts of Interest
Actual or apparent conflicts of interest may arise when a portfolio manager has day-to-day management responsibilities with respect to more than one fund or other accounts. More specifically, portfolio managers who manage multiple funds are presented with the following potential conflicts, among others:
The management of multiple accounts may result in a portfolio manager devoting unequal time and attention to the management of each account. The management of multiple funds and accounts also may give rise to potential conflicts of interest if the funds and accounts have different objectives, benchmarks, time horizons and fees as the portfolio manager must allocate his time and investment ideas across multiple funds and accounts. Another potential conflict of interest may arise where another account has the same or similar investment objective as the Fund, whereby the portfolio manager could favor one account over another.
With respect to securities transactions for the Fund, the Adviser or Subadviser determines which broker to use to execute each order, consistent with the duty to seek best execution of the transaction. A portfolio manager may execute transactions for another fund or account that may adversely impact the value of securities held by the Fund. Securities selected for funds or accounts other than the Fund may outperform the securities selected for the Fund. Further, a potential conflict could include a portfolio manager’s knowledge about the size, timing and possible market impact of Fund trades, whereby they could use this information to the advantage of other accounts and to the disadvantage of the Fund. These potential conflicts of interest could create the appearance that a portfolio manager is favoring one investment vehicle over another.
The management of personal accounts also may give rise to potential conflicts of interest. Although the portfolio manager generally does not trade securities in his or her own personal account, the Adviser, the Subadviser and the Fund have each adopted a code of ethics that, among other things, permits personal trading by employees (including trading in securities that can be purchased, sold or held by the Fund) under conditions where it has been determined that such trades would not adversely impact client accounts. Nevertheless, the management of personal accounts may give rise to potential conflicts of interest, and there is no assurance that these codes of ethics will adequately address such conflicts.
Conflicts potentially limiting the Fund’s investment opportunities may also arise when the Fund and other clients of the Adviser or Subadviser invest in, or even conduct research relating to, different parts of an issuer’s capital structure, such as when the Fund owns senior debt obligations of an issuer and other clients own junior tranches of the same issuer. In such circumstances, decisions over whether to trigger an event of default, over the terms of any workout, or how to exit an investment may result in conflicts of interest. In order to minimize such conflicts, a portfolio manager may avoid certain investment opportunities that would potentially give rise to conflicts with other clients of the Adviser or Subadviser or result in the Adviser or Subadviser receiving material, non-public information, or the Adviser or Subadviser may enact internal procedures designed to minimize such conflicts, which could have the effect of limiting the Fund’s investment opportunities. Additionally, if the Adviser or Subadviser acquires material non-public confidential information in connection with its business activities for other clients, a portfolio manager or other investment personnel may be restricted from purchasing securities or selling certain securities for the Fund or other clients. When making investment decisions where a conflict of interest may arise, the Adviser and Subadviser will endeavor to act in a fair and equitable manner between the Fund and other clients; however, in certain instances the resolution of the conflict may result in the Adviser or Subadviser acting on behalf of another client in a manner that may not be in the best interest, or may be opposed to the best interest, of the Fund.
The Adviser and Subadviser have adopted certain compliance procedures which are designed to address these types of conflicts. However, there is no guarantee that such procedures will detect each and every situation in which a conflict arises.
The Underlying Funds in which the Fund invests will not include those that are advised or subadvised by the Adviser, the Subadviser or their affiliate
| (a)(4) | Portfolio Manager Ownership of Fund Shares |
The following table shows the dollar range of equity securities of the Fund beneficially owned by the portfolio managers of the Fund as of June 30, 2022.
| Name of Portfolio Manager | Dollar Range of Equity Securities of the Fund |
| Patrick W. Galley | $100,001-$500,000 |
| Stephen A. O’Neill | $0 |
| Jeffrey E. Gundlach | $0 |
| Jeffrey J. Sherman | $0 |
| Item 9. | Purchases of Equity Securities by Closed-End Management Company and Affiliated Purchasers. |
Not applicable, due to no such purchases occurring during the period covered by this report.
| Item 10. | Submission of Matters to a Vote of Security Holders. |
There have been no material changes to the procedures by which shareholders may recommend nominees to the Board of Directors of the Registrant.
| Item 11. | Controls and Procedures. |
| (a) | The Registrant’s principal executive officer and principal financial officer have concluded that the Registrant’s disclosure controls and procedures (as defined in Rule 30a-3(c) under the Investment Company Act of 1940, as amended) are effective based on their evaluation of these controls and procedures as of a date within 90 days of the filing date of this document. |
| (b) | There were no significant changes in the Registrant's internal control over financial reporting (as defined in Rule 30a-3(d) under the Investment Company Act of 1940, as amended) during the second fiscal quarter of the period covered by this report that has materially affected, or is reasonably likely to materially affect, the Registrant's internal control over financial reporting. |
| Item 12. | Disclosure of Securities Lending Activities for Closed-End Management Investment Companies. |
Not applicable.
SIGNATURES
Pursuant to the requirements of the Securities Exchange Act of 1934 and the Investment Company Act of 1940, the registrant has duly caused this report to be signed on its behalf by the undersigned, thereunto duly authorized.
| Registrant: | RiverNorth/DoubleLine Strategic Opportunity Fund, Inc. | |
| By: | /s/ Patrick W. Galley | |
| Name: | Patrick W. Galley | |
| Title: | President | |
| | | |
| Date: | September 8, 2022 | |
Pursuant to the requirements of the Securities Exchange Act of 1934 and the Investment Company Act of 1940, this report has been signed below by the following persons on behalf of the registrant and in the capacities and on the dates indicated.
| By: | /s/ Patrick W. Galley | |
| Name: | Patrick W. Galley | |
| Title: | President | |
| | | |
| Date: | September 8, 2022 | |
| By: | /s/ Jonathan M. Mohrhardt | |
| Name: | Jonathan M. Mohrhardt | |
| Title: | Treasurer and Chief Financial Officer | |
| | | |
| Date: | September 8, 2022 | |