Exhibit 99.1
International Seaways, Inc. 1 International Seaways, Inc. Investor and Analyst Day December 12, 2018

International Seaways, Inc. Disclaimer Forward - Looking Statements During the course of this presentation, the Company (International Seaways, Inc. (INSW)) may make forward - looking statements or provide forward - looking information. All statements other than statements of historical facts should be considered forward - looking state ments. Some of these statements include words such as ‘‘outlook,’’ ‘‘believe,’’ ‘‘expect,’’ ‘‘potential,’’ ‘‘continue,’’ ‘‘may,’’ ‘‘will,’’ ‘‘should,’’ ‘‘could,’’ ‘‘seek,’’ ‘‘predict,’’ ‘‘intend,’’ ‘‘plan,’’ ‘‘estimate,’’ ‘‘anticipate,’’ ‘‘target,’’ ‘‘project,’’ ‘‘forecast,’’ ‘‘shall,’’ ‘‘contempl ate ’’ or the negative version of those words or other comparable words. Although they reflect INSW’s current expectations, these statements are not guarantees of future performance, but involve a number of risks, uncertainties, and assumptions which are difficult to predict. Some of the factor s t hat may cause actual outcomes and results to differ materially from those expressed in, or implied by, the forward - looking statements include, but are not necessarily limited to, vessel acquisitions, general economic conditions, competitive pressures, the nature of the Company’s ser vices and their price movements, and the ability to retain key employees. The Company does not undertake to update any forward - looking statement s as a result of future developments, new information or otherwise. Non - GAAP Financial Measures Included in this presentation are certain non - GAAP financial measures, including Time Charter Equivalent (“TCE”) revenue, EBITDA , Adjusted EBITDA, and total leverage ratios, designed to complement the financial information presented in accordance with generally ac cep ted accounting principles in the United States of America because management believes such measures are useful to investors. TCE revenues, w hic h represents shipping revenues less voyage expenses, is a measure to compare revenue generated from a voyage charter to revenue generated fro m a time charter. EBITDA represents net (loss)/income before interest expense, income taxes and depreciation and amortization expense. Ad justed EBITDA consists of EBITDA adjusted for the impact of certain items that we do not consider indicative of our ongoing operating perfo rma nce. Total leverage ratios are calculated as total debt divided by Adjusted EBITDA. We present non - GAAP measures when we believe that the a dditional information is useful and meaningful to investors. Non - GAAP financial measures do not have any standardized meaning and are ther efore unlikely to be comparable to similar measures presented by other companies. The presentation of non - GAAP financial measures is not intend ed to be a substitute for, and should not be considered in isolation from, the financial measures reported in accordance with GAAP. See App endix for a reconciliation of certain non - GAAP measures to the comparable GAAP measures. This presentation also contains estimates and other information concerning our industry that are based on industry publicatio ns, surveys and forecasts. This information involves a number of assumptions and limitations, and we have not independently verified the accu rac y or completeness of the information. Additional Information You should read the Company’s Annual Report on Form 10 - K for the year ended December 31, 2017, the Company’s Quarterly Reports o n Form 10 - Q for the quarter ended June 30, 2018 and September 30, 2018, and the other documents the Company has filed with the SEC for additional information regarding the Company, its operations and the risks and uncertainties it faces. You may obtain these documents fo r f ree by visiting EDGAR on the SEC Web site at www.sec.gov , or from the Company’s website at www.intlseas.com. 2
International Seaways, Inc. Agenda 3 Introduction to International Seaways and Investment Highlights Commercial Update Operations Update Financial Overview Environmental, Social, Governance (ESG) Update Key Takeaways Q & A
International Seaways, Inc. Presenters 4 Lois K. Zabrocky President & CEO Jeffrey D. Pribor Chief Financial Officer

Introduction to International Seaways – Lois Zabrocky
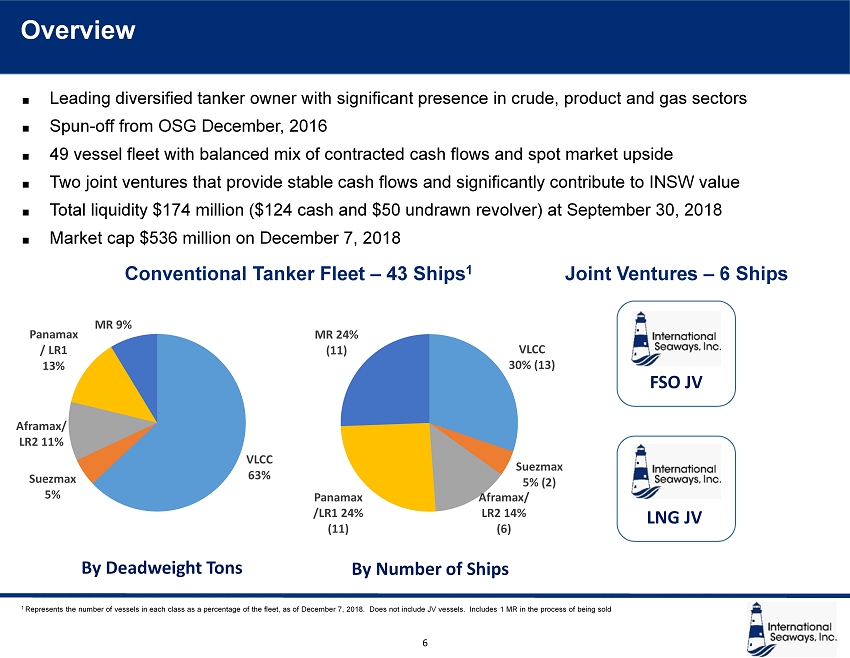
International Seaways, Inc. Overview 6 1 Represents the number of vessels in each class as a percentage of the fleet, as of December 7, 2018. Does not include JV ves sel s. Includes 1 MR in the process of being sold Leading diversified tanker owner with significant presence in crude, product and gas sectors Spun - off from OSG December, 2016 49 vessel fleet with balanced mix of contracted cash flows and spot market upside Two joint ventures that provide stable cash flows and significantly contribute to INSW value Total liquidity $174 million ($124 cash and $50 undrawn revolver) at September 30, 2018 Market cap $536 million on December 7 , 2018 Conventional Tanker Fleet – 43 Ships 1 Joint Ventures – 6 Ships FSO JV LNG JV VLCC 63% Suezmax 5% Aframax/ LR2 11% Panamax / LR1 13% MR 9% VLCC 30% (13) Suezmax 5% (2) Aframax/ LR2 14% (6) Panamax /LR1 24% (11) MR 24% (11) By Deadweight Tons By Number of Ships
International Seaways, Inc. Macro tanker environment looking favorable for 2019 / 2020 INSW has begun to book significantly higher rates Well positioned to further capitalize on a developing tanker market recovery • High quality fleet, of which a significant portion acquired at lowest point in the cycle • Strong balance sheet with flexible and cost efficient capital structure • Low cash breakeven • Tremendous operating leverage and earnings growth prospects Leading tanker platform creates value for all stakeholders • 43 vessel crude and product tanker fleet • Two joint ventures with six vessels that provide stable cash flows and significantly contribute to INSW value • Dedicated and experienced team and member of leading pools • Strong Environmental, Social, Governance (ESG) footprint • Diversified shareholder base with liquid stock trading Key Takeaways 7

International Seaways, Inc. • Our FSO and LNG JVs provide stable cash flow • Strategic foothold in offshore and LNG sectors • Significant value - $8.72 book value per share • $20,200 Fleetwide Cash Breakeven Q3 2018 • Effectively $18,200/day when factoring in JV contributions • Competitive OPEX and low G&A • Strengthened our fleet profile and earnings power since our spin - off ahead of market recovery • Invested $600 million in modern vessels at the bottom of the tanker cycle • Increased total DWT by 12% while reducing age from 11.5 to 8.7 years Younger and Larger Fleet Appropriate Financial Leverage Stable Cash Flow and Value from JVs Significant Operating Leverage Low Cash Breakeven Strong Governance and ESG Footprint • Completed this fleet upgrade while remaining one of the lowest leverage profiles in the tanker space and without issuing equity • 55% Net Debt to Asset Value • 42% Net Debt to Capital • Experienced management team • Independent board with shareholder representation • #1 tanker company in Wells Fargo Corporate Governance rankings • 38 vessels in spot market provide significant operating leverage • Every $5,000 improvement in the Time Charter Equivalent daily rate (TCE) provides $68 million in incremental EBITDA and $2.34 EPS Achievements and Investment Highlights 8
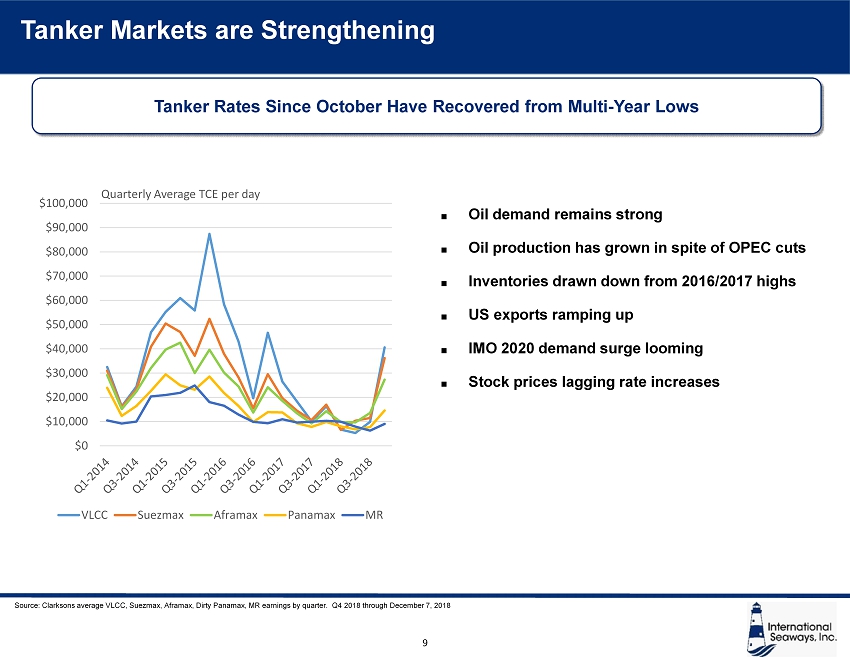
International Seaways, Inc. Tanker Markets are Strengthening Tanker Rates Since October Have Recovered from Multi - Year Lows 9 $0 $10,000 $20,000 $30,000 $40,000 $50,000 $60,000 $70,000 $80,000 $90,000 $100,000 VLCC Suezmax Aframax Panamax MR Quarterly Average TCE per day Oil demand remains strong Oil production has grown in spite of OPEC cuts Inventories drawn down from 2016/2017 highs US exports ramping up IMO 2020 demand surge looming Stock prices lagging rate increases Source: Clarksons average VLCC, Suezmax, Aframax, Dirty Panamax, MR earnings by quarter. Q4 2018 through December 7, 2018

International Seaways, Inc. 10 Sizable, Diverse Tanker Fleet VLCC (330 meters) Suezmax (275 meters) Aframax/LR2 (250 meters) Panamax/LR1 (230 meters) MR (180 meters) Capacity Our Fleet 2 million barrels 300,000 DWT 13 1 million barrels 160,000 DWT 2 750,000 barrels 110,000 DWT 6 500,000 barrels 70,000 DWT 11 350,000 barrels 50,000 DWT 11 3 million barrels 440,000 DWT 2 (JV) 215,000 cubic meters 4 (JV) CRUDE PRODUCTS 10 FSO (380 meters) LNG (315 meters) JV
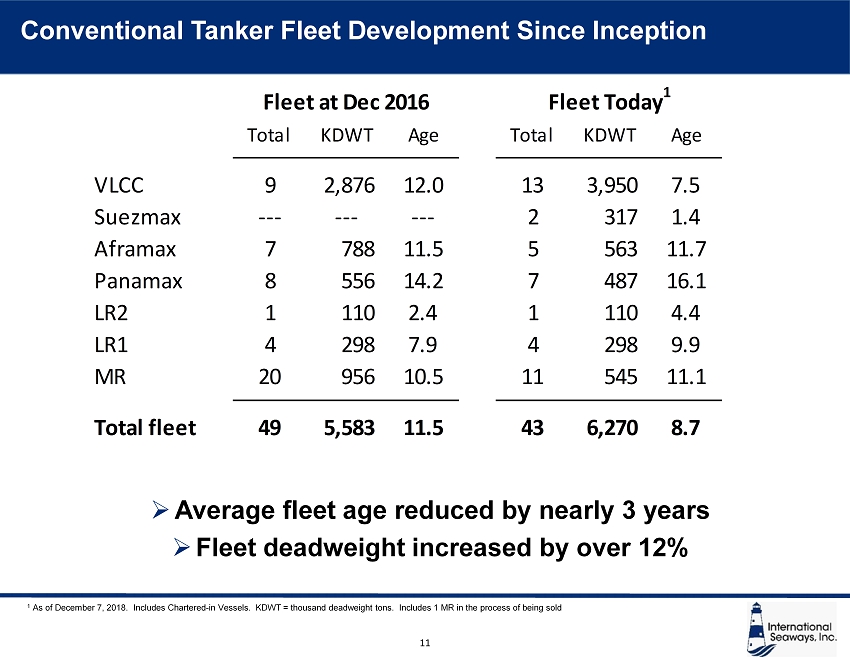
International Seaways, Inc. 11 1 As of December 7, 2018. Includes Chartered - in Vessels. KDWT = thousand deadweight tons. Includes 1 MR in the process of bein g sold Conventional Tanker Fleet Development Since Inception Total KDWT Age Total KDWT Age VLCC 9 2,876 12.0 13 3,950 7.5 Suezmax --- --- --- 2 317 1.4 Aframax 7 788 11.5 5 563 11.7 Panamax 8 556 14.2 7 487 16.1 LR2 1 110 2.4 1 110 4.4 LR1 4 298 7.9 4 298 9.9 MR 20 956 10.5 11 545 11.1 Total fleet 49 5,583 11.5 43 6,270 8.7 Fleet at Dec 2016 Fleet Today 1 » Average fleet age reduced by nearly 3 years » Fleet deadweight increased by over 12%

International Seaways, Inc. 12 ▪ Acquired Modern, Large Crude Ships o Acquired 6 VLCCs from Euronav NV for $434 million in June 2018 o 300,000 DWT VLCCs constructed at Shanghai Waigaoqiao Shipbuilding Co. o 5 built in 2016 and 1 built in 2015 o Acquired another VLCC (Seaways Raffles) in 2017 o Acquired two Suezmax (Seaways Hatteras and Seaways Montauk) newbuilding resales in 2017 ▪ Strengthened Fleet Profile and Operating Leverage o Meaningfully increased the size of INSW’s fleet – over 12% on a deadweight ton basis since December 2016. o Reduced fleet age from 11.5 to 8.7 years 1 o Acquisitions made at historically low asset prices o Further positions INSW to capitalize on a recovery in the tanker market o Newly acquired assets represent 39% of total conventional DWT ▪ Funded Acquisitions While Maintaining Balance Sheet Strength o Assumed attractive $311 million Sinosure debt (now $299 million) o LIBOR +200 bps, Matures between 2027 and 2028 o Amongst lowest loan to value profiles in the sector o No equity raised Renewing and Growing Fleet 1 As of December 7, 2018
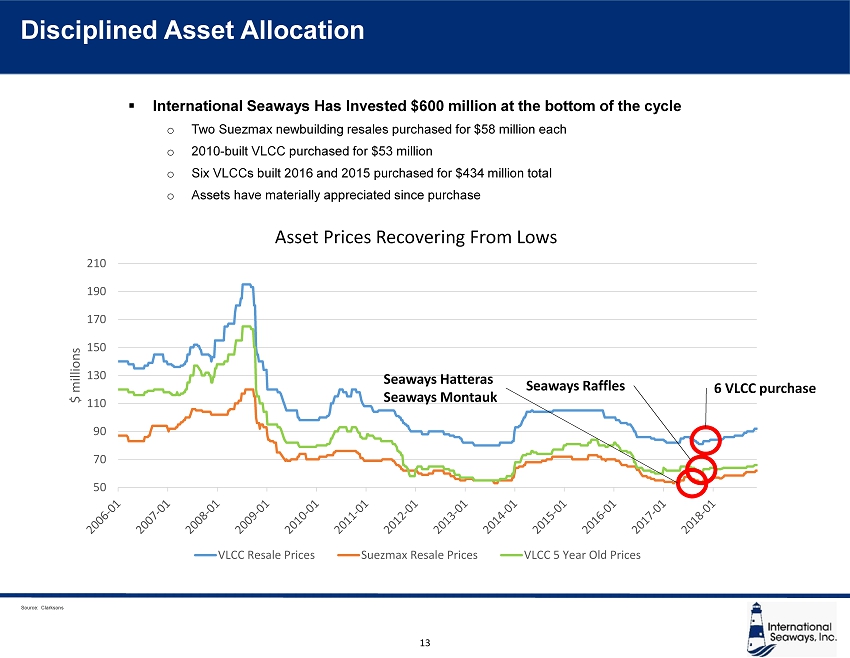
International Seaways, Inc. 13 ▪ International Seaways Has Invested $600 million at the bottom of the cycle o Two Suezmax newbuilding resales purchased for $58 million each o 2010 - built VLCC purchased for $53 million o Six VLCCs built 2016 and 2015 purchased for $434 million total o Assets have materially appreciated since purchase Source: Clarksons 50 70 90 110 130 150 170 190 210 $ millions Asset Prices Recovering From Lows VLCC Resale Prices Suezmax Resale Prices VLCC 5 Year Old Prices Seaways Raffles Seaways Hatteras Seaways Montauk 6 VLCC purchase Disciplined Asset Allocation
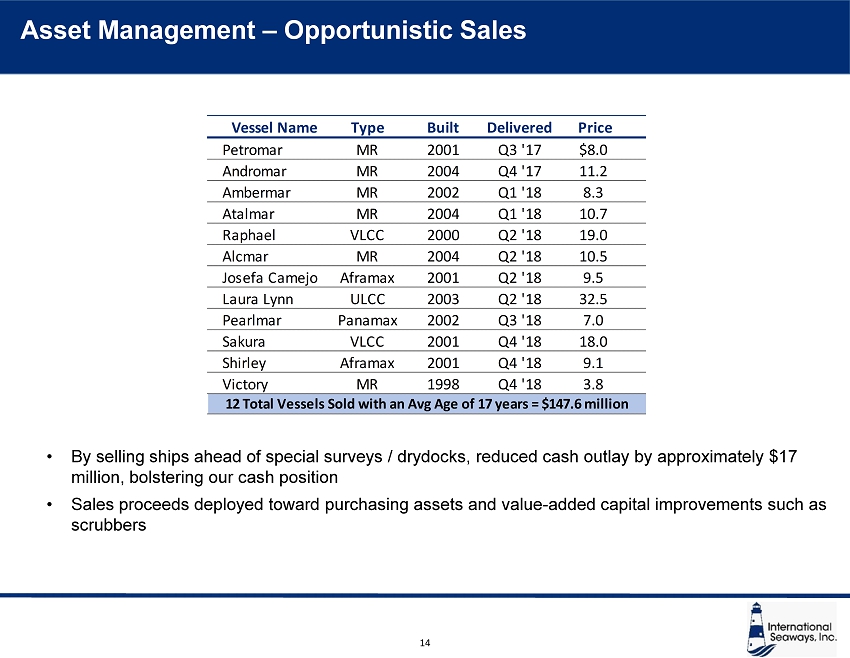
International Seaways, Inc. 14 Asset Management – Opportunistic Sales • By selling ships ahead of special surveys / drydocks, reduced cash outlay by approximately $17 million, bolstering our cash position • Sales proceeds deployed toward purchasing assets and value - added capital improvements such as scrubbers Type Built Delivered Price Petromar MR 2001 Q3 '17 $8.0 Andromar MR 2004 Q4 '17 11.2 Ambermar MR 2002 Q1 '18 8.3 Atalmar MR 2004 Q1 '18 10.7 Raphael VLCC 2000 Q2 '18 19.0 Alcmar MR 2004 Q2 '18 10.5 Josefa Camejo Aframax 2001 Q2 '18 9.5 Laura Lynn ULCC 2003 Q2 '18 32.5 Pearlmar Panamax 2002 Q3 '18 7.0 Sakura VLCC 2001 Q4 '18 18.0 Shirley Aframax 2001 Q4 '18 9.1 Victory MR 1998 Q4 '18 3.8 12 Total Vessels Sold with an Avg Age of 17 years = $147.6 million Vessel Name

International Seaways, Inc. 15 ▪ Global 0.5% Sulfur Emissions Cap Enters Into Force January 1, 2020 o Seaways installing scrubbers on its 10 modern VLCCs o Represents approximately 40% of our total fleet fuel consumption o Prudent portfolio approach – balance of fleet to use compliant fuel o At least 7 to be installed prior to 2020, balance in Q1 2020 ▪ Clean Marine AS Providing Scrubber Units o Norwegian engineering company o Leading provider of scrubbers for tankers o Proven track record ▪ Hyundai Global Service Providing Engineering and Installation o Leading marine service provider based in South Korea ▪ Technology o Fully compliant with IMO 2020 regulations o Proven technology that’s been in use for years o Scrubber works by spraying seawater on the exhaust gas, converting sulfur dioxide, which causes acid rain, to sulfates, a naturally occurring mineral abundant in the ocean o Open loop, hybrid - ready design IMO 2020 – Addressing Low - Sulfur Emissions Regulations

International Seaways, Inc. Pro v ides global di v ersific at i on w ith expande d customer base • New five - year contracts commenced in the third quarter of 2017 and are expected to generate in excess of $180 million of EBITDA over the five - year term to International Seaways based on ownership percentage • Refinanced in Q2 2018, $110 million in proceeds to INSW • $147 million in total cash distributions to INSW since 2014 through December 31, 2018, including $21 million YTD 2018 1 . After debt servicing we expect $18 million in cash in 2019 • Vessels trading lives extend through 2032, ten years after the current contract • Hire rate has an OpEx escalation component • Book value as of September 30, 2018 $142 million Source of Significant Cash Contributions Specialized Assets Enhance Value of Exported Crude Assets specifically designed to process 100% of crude oil exports from Al Shaheen field in Qatar: • Field produces 270,000 – 300,000 bpd of crude with high water content • JV initially approached by field operator as the partners owned the only double hull ULCCs • Large 3 million barrel units provide the field operator with spare capacity allowing production to continue uninterrupted • FSOs have sophisticated oil/water separation plant that process oil and increases the quality of the crude • Tailored to field requirements • Top tier technical management and safety performance Contracted Cash from FSO JV 50% owner of a Joint Venture which owns two Floating Storage and Offloading (FSO) units with multi year contracts to process oil for export for Qatar Petroleum 1 Includes $5.1 million repayment of withholding tax in December 2018 from previous MOQ contract. 16
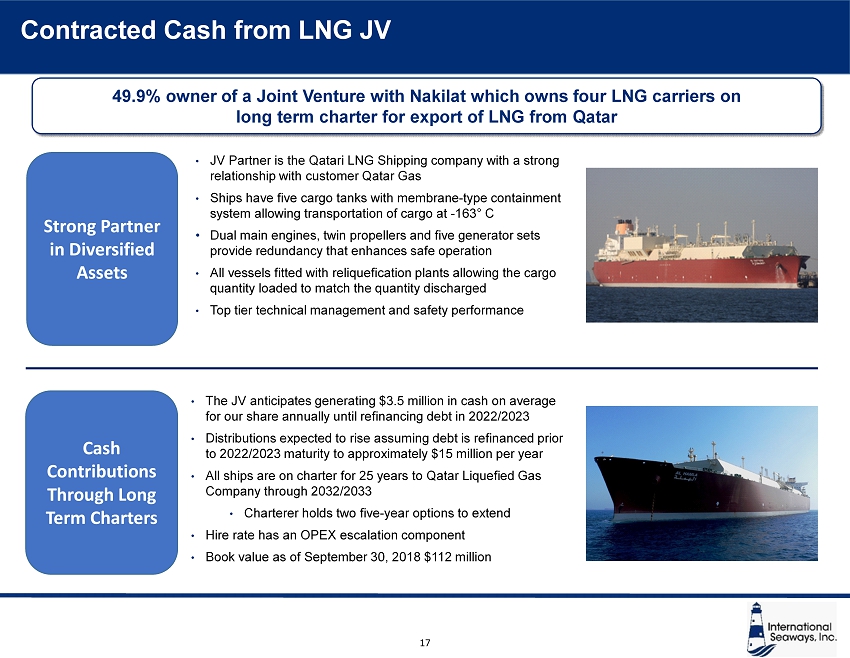
International Seaways, Inc. Pro v ides global di v ersific at i on w ith expande d customer base • The JV anticipates generating $3.5 million in cash on average for our share annually until refinancing debt in 2022/2023 • Distributions expected to rise assuming debt is refinanced prior to 2022/2023 maturity to approximately $15 million per year • All ships are on charter for 25 years to Qatar Liquefied Gas Company through 2032/2033 • Charterer holds two five - year options to extend • Hire rate has an OPEX escalation component • Book value as of September 30, 2018 $112 million • JV Partner is the Qatari LNG Shipping company with a strong relationship with customer Qatar Gas • Ships have five cargo tanks with membrane - type containment system allowing transportation of cargo at - 163 ƒ C • Dual main engines, twin propellers and five generator sets provide redundancy that enhances safe operation • All vessels fitted with reliquefication plants allowing the cargo quantity loaded to match the quantity discharged • Top tier technical management and safety performance Contracted Cash from LNG JV Strong Partner in Diversified Assets Cash Contributions Through Long Term Charters 49.9% owner of a Joint Venture with Nakilat which owns four LNG carriers on long term charter for export of LNG from Qatar 17
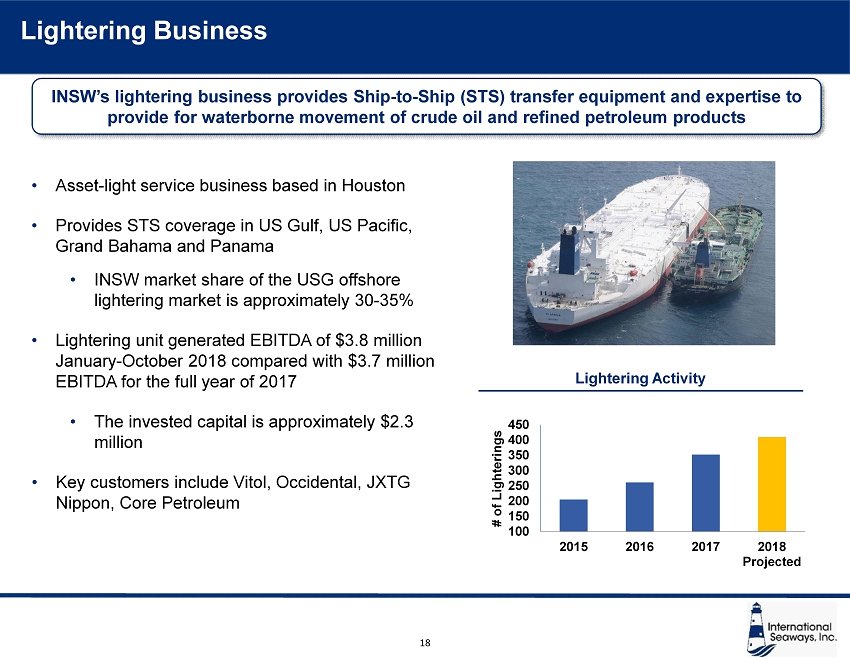
International Seaways, Inc. • Asset - light service business based in Houston • Provides STS coverage in US Gulf, US Pacific, Grand Bahama and Panama • INSW market share of the USG offshore lightering market is approximately 30 - 35% • Lightering unit generated EBITDA of $3.8 million January - October 2018 compared with $3.7 million EBITDA for the full year of 2017 • The invested capital is approximately $2.3 million • Key customers include Vitol, Occidental, JXTG Nippon, Core Petroleum 100 150 200 250 300 350 400 450 2015 2016 2017 2018 Projected # of Lighterings Lightering Business INSW’s lightering business provides Ship - to - Ship (STS) transfer equipment and expertise to provide for waterborne movement of crude oil and refined petroleum products Lightering Activity 18
International Seaways, Inc. Experienced INSW Management Team Lois K. Zabrocky President & CEO • Most recently served as President for OSG’S International Flag strategic business unit, International Seaways’ predecessor company • Joined OSG in 1992, previously held positions as Head of International Product Carrier & Gas Strategic Business Unit and head of the Aframax International Pool • Elected to Board of Directors on May 24, 2018 Jeffrey D. Pribor Chief Financial Officer • Joined International Seaways in 2016, as Chief Financial Officer • Prior to joining International Seaways, was Global Head of Maritime Investment Banking at Jefferies LLC and earlier CFO of General Maritime Corporation James D. Small Chief Administrative Officer & General Counsel • Joined OSG in 2015, prior to which he worked at Cleary Gottlieb Steen & Hamilton since 1996 • At Cleary, he worked in New York, London and Hong Kong focusing on corporate and financial transactions, US securities law, capital markets and corporate governance William Nugent Head of International Fleet Operations • Joined OSG in 2000 and rejoined OSG in 2006, most recently as Head of International Fleet Operations • After rejoining in 2006 , he was Vice President of New Construction and Head of the Technical Services Group Derek Solon Chief Commercial Officer • Joined OSG in 2012 as Vice President, Commercial • Prior to joining OSG, worked as a tanker broker at Poten & Partners and served as an intelligence officer in the US Navy 19
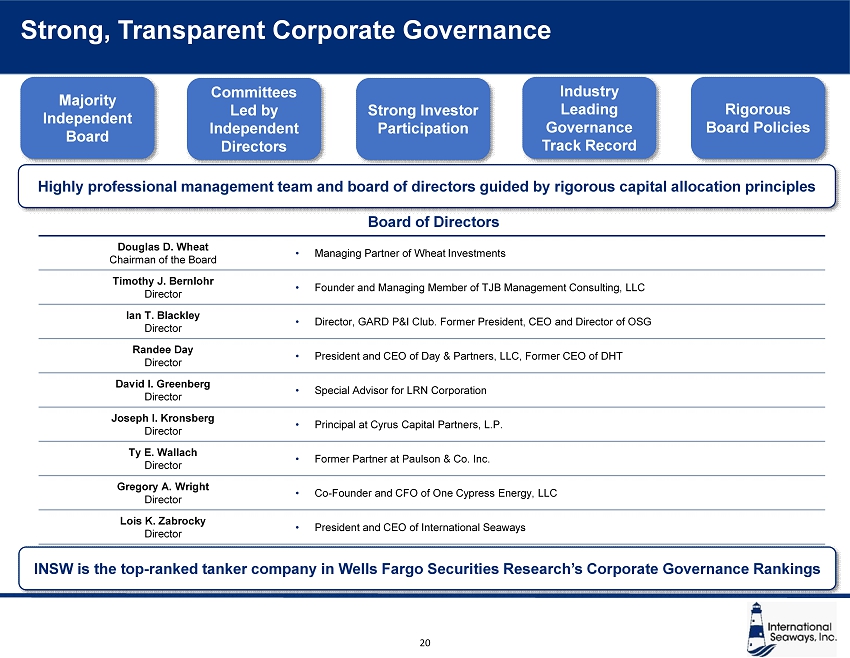
International Seaways, Inc. Strong, Transparent Corporate Governance Douglas D. Wheat Chairman of the Board • Managing Partner of Wheat Investments Timothy J. Bernlohr Director • Founder and Managing Member of TJB Management Consulting, LLC Ian T. Blackley Director • Director, GARD P&I Club. Former President, CEO and Director of OSG Randee Day Director • President and CEO of Day & Partners, LLC, Former CEO of DHT David I. Greenberg Director • Special Advisor for LRN Corporation Joseph I. Kro nsbe rg Director • Principal at Cyrus Capital Partners, L.P. Ty E. Wallach Director • Former Partner at Paulson & Co. Inc. Gregory A. Wright Director • Co - Founder and CFO of One Cypress Energy, LLC Lois K. Zabrocky Director • President and CEO of International Seaways Majority Independent Board Rigorous Board Policies Committees Led by Independent Directors Board of Directors Industry Leading Governance Track Record Highly professional management team and board of directors guided by rigorous capital allocation principles Strong Investor Participation INSW is the top - ranked tanker company in Wells Fargo Securities Research’s Corporate Governance Rankings 20
Commercial Update

International Seaways, Inc. 22 Pools VLCC Suezmax Aframax Aframax/LR2 Panamax / LR1 MR Total # of INSW Vessels 12 2 5 1 5 11 36 1 # of Total Vessels 60 23 43 12 34 18 190 Other Participants Rationale for Participation Largest VLCC pool and provides best access to China and Caribbean VLCC - style markets with regional flexibility Concentration in the best Western shipping routes Clean petroleum focused management Consistently highest spot rates via South America Partnership Expertise in the Americas High vessel utilization rates Commercial pools selected for specific expertise Offers customers greater flexibility and higher service levels Capitalize on attractive time charter opportunities Source: commercial pool websites. Note: Number of total vessels per pool as of December 1, 2018 1 INSW vessels not operating in pools include 5 Panamaxes on time charters and one VLCC and one Panamax operating on commercial m anagement INSW participates in six market - leading commercial pools, generating increased utilization and cash flow, managed by experienced in - house commercial team Heidmar Alpha8 Pool Heidmar Pool Strategy and Deployment
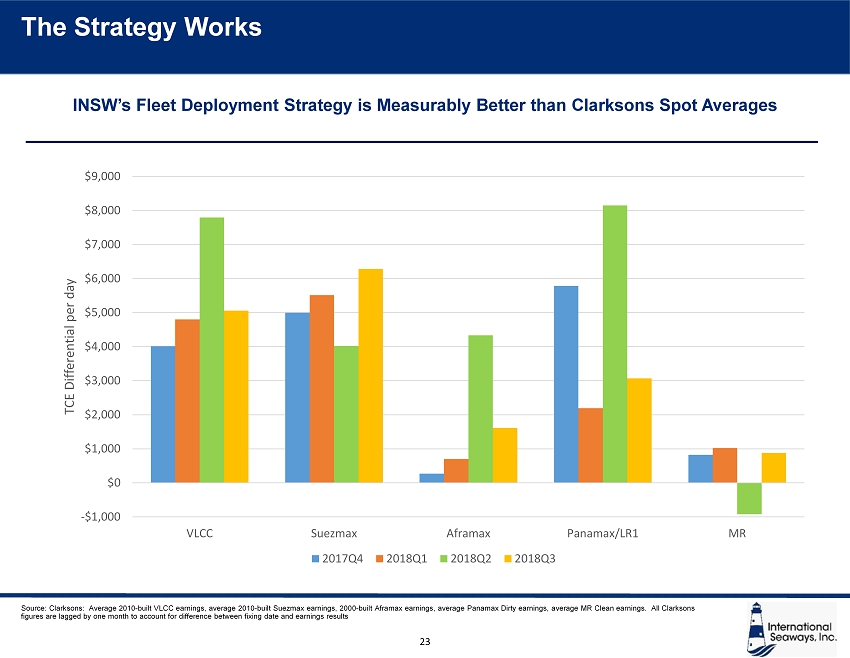
International Seaways, Inc. -$1,000 $0 $1,000 $2,000 $3,000 $4,000 $5,000 $6,000 $7,000 $8,000 $9,000 VLCC Suezmax Aframax Panamax/LR1 MR TCE Differential per day 2017Q4 2018Q1 2018Q2 2018Q3 Source: Clarksons: Average 2010 - built VLCC earnings, average 2010 - built Suezmax earnings, 2000 - built Aframax earnings, average Panamax Dirty earnings, average MR Clean earnings. All Clarksons figures are lagged by one month to account for difference between fixing date and earnings results INSW’s Fleet Deployment Strategy is Measurably Better than Clarksons Spot Averages The Strategy Works 23
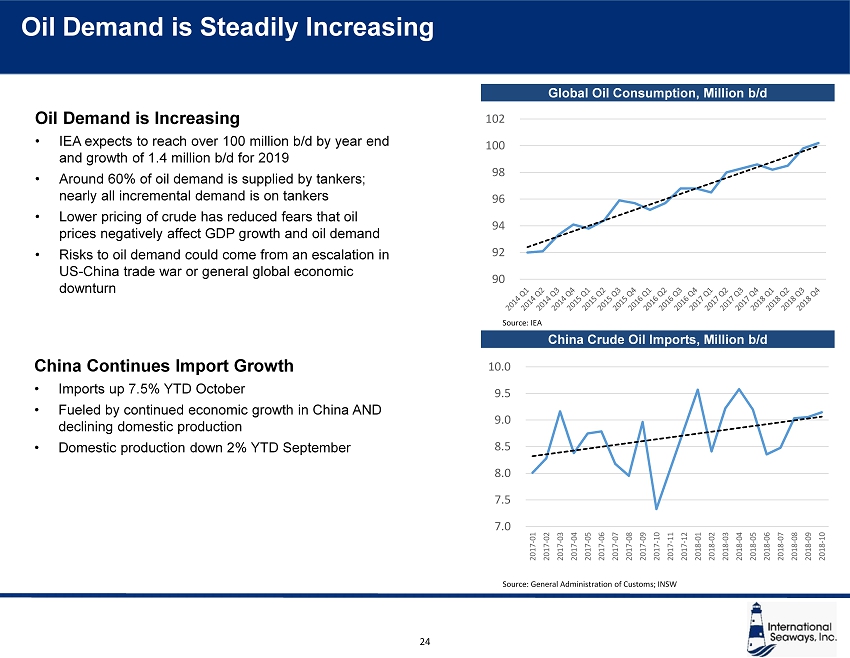
International Seaways, Inc. Oil Demand is Increasing • IEA expects to reach over 100 million b/d by year end and growth of 1.4 million b/d for 2019 • Around 60% of oil demand is supplied by tankers; nearly all incremental demand is on tankers • Lower pricing of crude has reduced fears that oil prices negatively affect GDP growth and oil demand • Risks to oil demand could come from an escalation in US - China trade war or general global economic downturn Global Oil Consumption, Million b/d 24 China Crude Oil Imports, Million b/d Source: IEA 90 92 94 96 98 100 102 China Continues Import Growth • Imports up 7.5% YTD October • Fueled by continued economic growth in China AND declining domestic production • Domestic production down 2% YTD September 7.0 7.5 8.0 8.5 9.0 9.5 10.0 2017-01 2017-02 2017-03 2017-04 2017-05 2017-06 2017-07 2017-08 2017-09 2017-10 2017-11 2017-12 2018-01 2018-02 2018-03 2018-04 2018-05 2018-06 2018-07 2018-08 2018-09 2018-10 Source: General Administration of Customs; INSW Oil Demand is Steadily Increasing
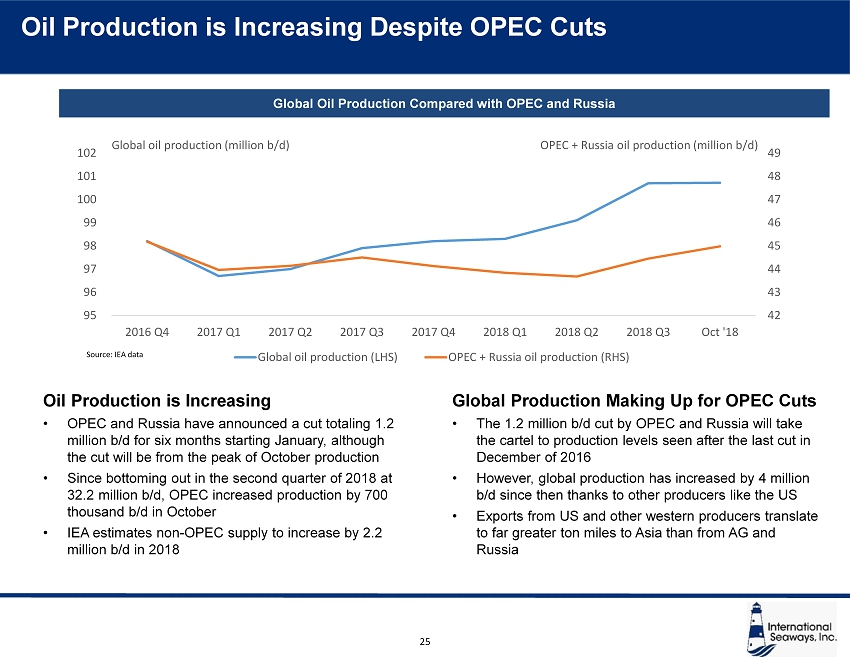
International Seaways, Inc. Oil Production is Increasing • OPEC and Russia have announced a cut totaling 1.2 million b/d for six months starting January, although the cut will be from the peak of October production • Since bottoming out in the second quarter of 2018 at 32.2 million b/d, OPEC increased production by 700 thousand b/d in October • IEA estimates non - OPEC supply to increase by 2.2 million b/d in 2018 25 Global Oil Production Compared with OPEC and Russia Global Production Making Up for OPEC Cuts • The 1.2 million b/d cut by OPEC and Russia will take the cartel to production levels seen after the last cut in December of 2016 • However, global production has increased by 4 million b/d since then thanks to other producers like the US • Exports from US and other western producers translate to far greater ton miles to Asia than from AG and Russia Source: IEA data Oil Production is Increasing Despite OPEC Cuts 42 43 44 45 46 47 48 49 95 96 97 98 99 100 101 102 2016 Q4 2017 Q1 2017 Q2 2017 Q3 2017 Q4 2018 Q1 2018 Q2 2018 Q3 Oct '18 Global oil production (LHS) OPEC + Russia oil production (RHS) Global oil production (million b/d) OPEC + Russia oil production (million b/d)

International Seaways, Inc. US Crude Exports are Ramping Up • US Crude exports averaged nearly 2 million b/d in 2018, the equivalent of one VLCC per day • Every 1 million b/d in US exports to Far East requires approximately 60 - 65 VLCCs • China did not import any oil from the US in August or September, however exports to other Asian destinations continue to grow • Recent trade discussions between US and China positive and potentially signal a return to oil sales to China • Pipeline expansion in the Permian Basin expected to add additional export capacity in 2019 and 2020 • Additional 2 million b/d pipeline capacity to US Gulf hubs US Crude Exports by Destination, Million b/d 26 US Products Exports by Destination, Million b/d US Product Exports Continue to Grow • Until 2011 US was net importer of petroleum products • Refining investments and growth in domestic crude production have reversed that • Cheap domestic supplies driving growth 0.0 0.5 1.0 1.5 2.0 2.5 2015-01 2015-03 2015-05 2015-07 2015-09 2015-11 2016-01 2016-03 2016-05 2016-07 2016-09 2016-11 2017-01 2017-03 2017-05 2017-07 2017-09 2017-11 2018-01 2018-03 2018-05 2018-07 2018-09 Canada China Other Asia Europe Latin Amer Others Source: EIA data 0.0 1.0 2.0 3.0 4.0 5.0 6.0 7.0 2015-01 2015-03 2015-05 2015-07 2015-09 2015-11 2016-01 2016-03 2016-05 2016-07 2016-09 2016-11 2017-01 2017-03 2017-05 2017-07 2017-09 2017-11 2018-01 2018-03 2018-05 2018-07 2018-09 Canada China Other Asia Europe Latin America Others Source: EIA data, INSW Source: Financial Times, Nov 28, 2018 US Crude Exports are Increasing
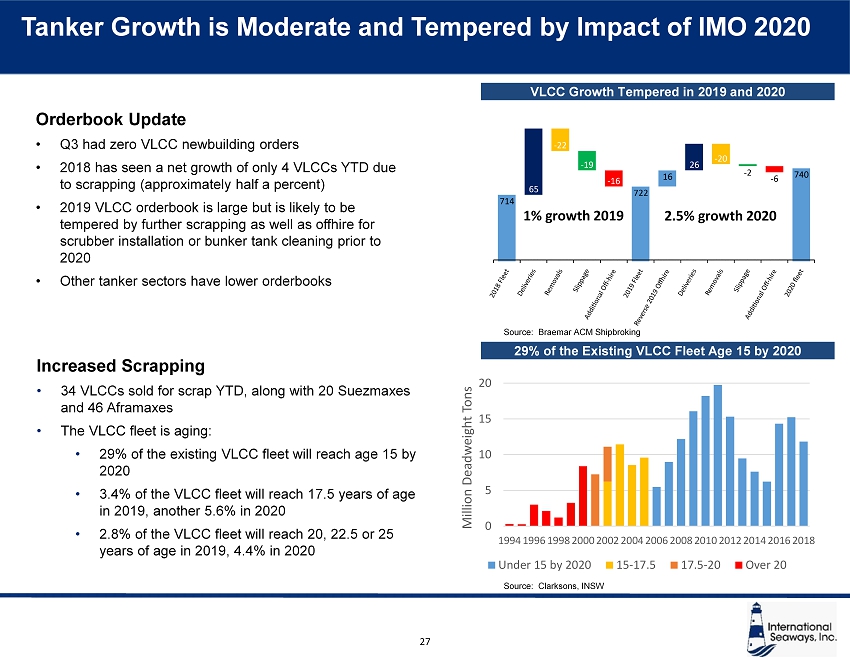
International Seaways, Inc. VLCC Growth Tempered in 2019 and 2020 Orderbook Update • Q3 had zero VLCC newbuilding orders • 2018 has seen a net growth of only 4 VLCCs YTD due to scrapping (approximately half a percent) • 2019 VLCC orderbook is large but is likely to be tempered by further scrapping as well as offhire for scrubber installation or bunker tank cleaning prior to 2020 • Other tanker sectors have lower orderbooks 27 Source: Braemar ACM Shipbroking 29% of the Existing VLCC Fleet Age 15 by 2020 Source: Clarksons, INSW Increased Scrapping • 34 VLCCs sold for scrap YTD, along with 20 Suezmaxes and 46 Aframaxes • The VLCC fleet is aging: • 29% of the existing VLCC fleet will reach age 15 by 2020 • 3.4% of the VLCC fleet will reach 17.5 years of age in 2019, another 5.6% in 2020 • 2.8% of the VLCC fleet will reach 20, 22.5 or 25 years of age in 2019, 4.4% in 2020 1% growth 2019 2.5% growth 2020 0 5 10 15 20 1994 1996 1998 2000 2002 2004 2006 2008 2010 2012 2014 2016 2018 Million Deadweight Tons Under 15 by 2020 15-17.5 17.5-20 Over 20 Tanker Growth is Moderate and Tempered by Impact of IMO 2020
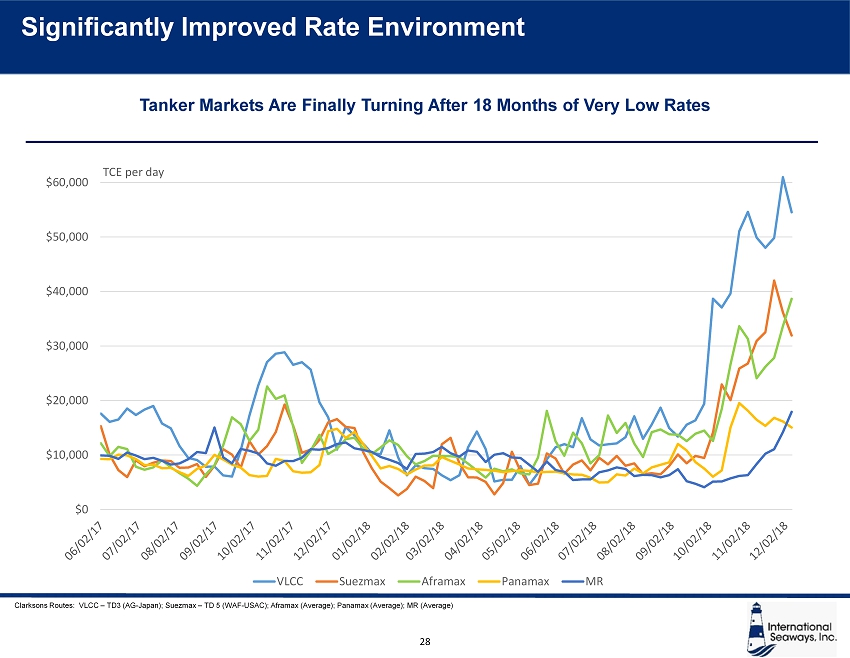
International Seaways, Inc. 28 $0 $10,000 $20,000 $30,000 $40,000 $50,000 $60,000 VLCC Suezmax Aframax Panamax MR Clarksons Routes: VLCC – TD3 (AG - Japan); Suezmax – TD 5 (WAF - USAC); Aframax (Average); Panamax (Average); MR (Average) Tanker Markets Are Finally Turning After 18 Months of Very Low Rates Significantly Improved Rate Environment TCE per day

International Seaways, Inc. Increased Crude Runs • Need to replace approximately 3 million barrels HSFO with 0.5% compliant fuel will increase refinery runs • Estimates as high as 1.8 million bpd increase in runs during first half of 2020 Adjusting Crude Slates • Crude slates will adjust with sweeter crudes moving to simpler refineries and sour crudes moving to more sophisticated refineries • Expect increased exports of US shale oil to flow to simpler refining facilities in Asia and Europe • Sour crudes to flow to sophisticated refineries in the US and newer refineries in Asia Distribution of Compliant Fuels • Increased movements on clean tankers to meet demand of compliant marine fuels globally Increased Ton Mile Demand 29 IMO 2020 Impact on Tanker Markets Decrease in Ship Supply Slow Steaming • High bunker environment leads to slow steaming of fleet to preserve TCE • 1 knot reduction in average ballast speed results in the “removal” of 20 VLCCs Storage Opportunities • High sulfur residual fuel oil may find home in seaborne storage as demand reduces • Traders may take advantage of any Contango that develops for this product Retrofit Associated Offhire • Scrubber retrofits will take ships out of service in 2019 • Estimates of roughly 90+ VLCCs to be retrofitted will reduce supply by 16 ships

Operations Update

International Seaways, Inc. 31 • abcd 1,500+ Seafarers 99% Retention Rate 10 Year Average Length of Service 14 Years Experience Masters 11.5 Years Experience Chief Engineers 99 Seafarers 20+ years with Company 20 Senior Officers started as Cadets 54 Cadets today Dedicated well trained employees Culture of Compliance Focus on Constant Improvement Safe Efficient Reliable Operation Top Quartile Benchmarks for Safety Customer Expectations Met The Software
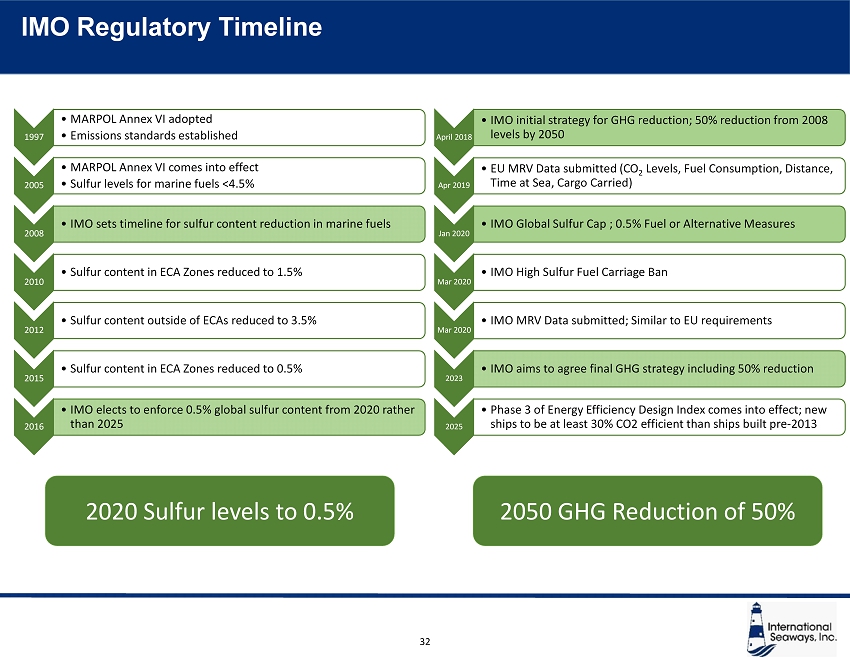
International Seaways, Inc. 32 1997 • MARPOL Annex VI adopted • Emissions standards established 2005 • MARPOL Annex VI comes into effect • Sulfur levels for marine fuels <4.5% 2008 • IMO sets timeline for sulfur content reduction in marine fuels 2010 • Sulfur content in ECA Zones reduced to 1.5% 2012 • Sulfur content outside of ECAs reduced to 3.5% 2015 • Sulfur content in ECA Zones reduced to 0.5% 2016 • IMO elects to enforce 0.5% global sulfur content from 2020 rather than 2025 April 2018 • IMO initial strategy for GHG reduction; 50% reduction from 2008 levels by 2050 Apr 2019 • EU MRV Data submitted (CO 2 Levels, Fuel Consumption, Distance, Time at Sea, Cargo Carried) Jan 2020 • IMO Global Sulfur Cap ; 0.5% Fuel or Alternative Measures Mar 2020 • IMO High Sulfur Fuel Carriage Ban Mar 2020 • IMO MRV Data submitted; Similar to EU requirements 2023 • IMO aims to agree final GHG strategy including 50% reduction 2025 • Phase 3 of Energy Efficiency Design Index comes into effect; new ships to be at least 30% CO2 efficient than ships built pre - 2013 2050 GHG Reduction of 50% 2020 Sulfur levels to 0.5% IMO Regulatory Timeline
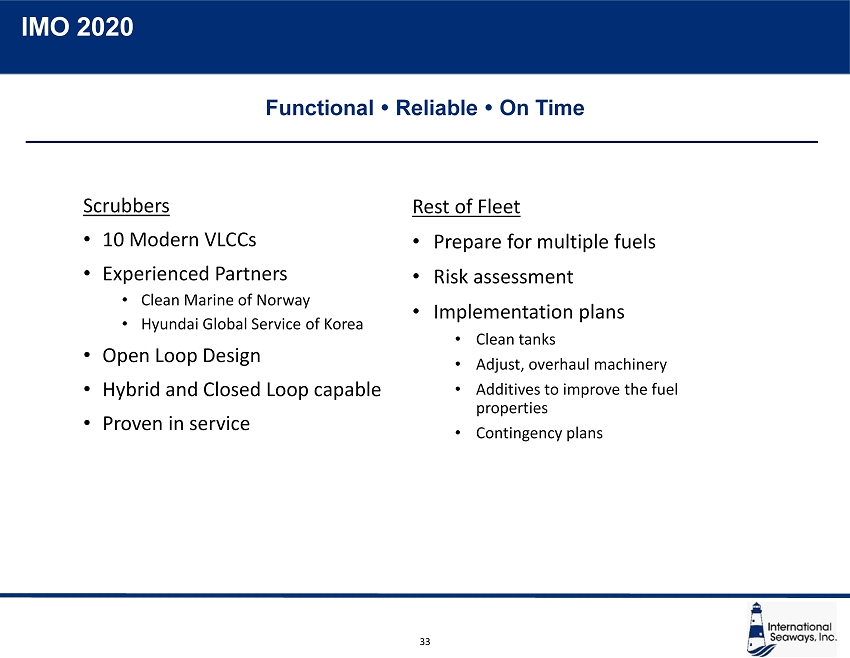
International Seaways, Inc. 33 Rest of Fleet • Prepare for multiple fuels • Risk assessment • Implementation plans • Clean tanks • Adjust, overhaul machinery • Additives to improve the fuel properties • Contingency plans Scrubbers • 10 Modern VLCCs • Experienced Partners • Clean Marine of Norway • Hyundai Global Service of Korea • Open Loop Design • Hybrid and Closed Loop capable • Proven in service IMO 2020 Functional Reliable On Time
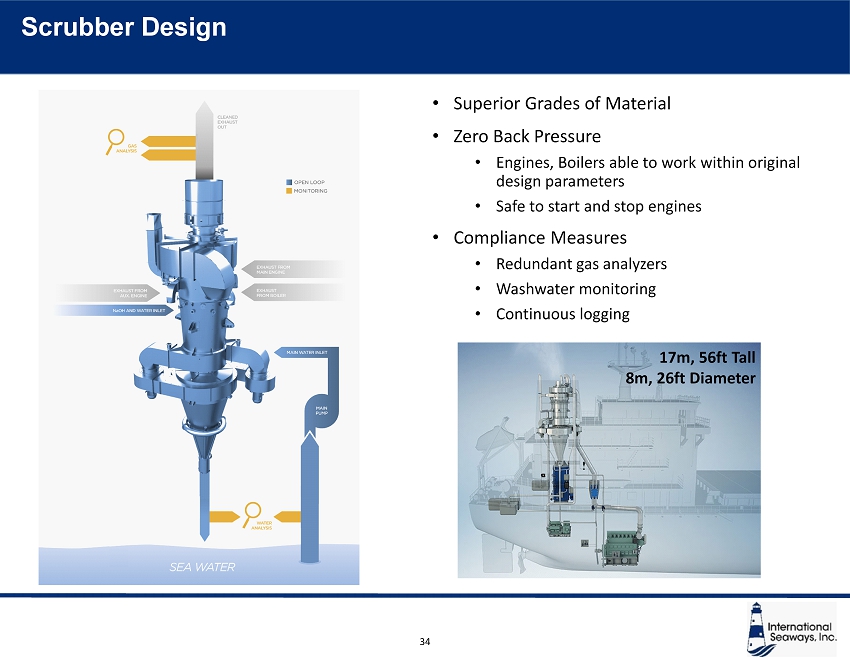
International Seaways, Inc. • Superior Grades of Material • Zero Back Pressure • Engines, Boilers able to work within original design parameters • Safe to start and stop engines • Compliance Measures • Redundant gas analyzers • Washwater monitoring • Continuous logging 17m, 56ft Tall 8m, 26ft Diameter 34 Scrubber Design
International Seaways, Inc. 35 • Shipping produces about 3% of the global CO 2 and GHG emissions annually • Each year, ships consume ~430 million tons of fuel and produce 1.21 billion tons of CO 2 • Preparing for 2020 and beyond • Every ton of fuel we do not burn reduces our CO 2 output by three tons • Every ton of fuel we do not burn reduces our SOx, NOx and PM emissions • Reduce our emissions footprint • Prepare for decarbonization IMO 2020 and IMO 2050
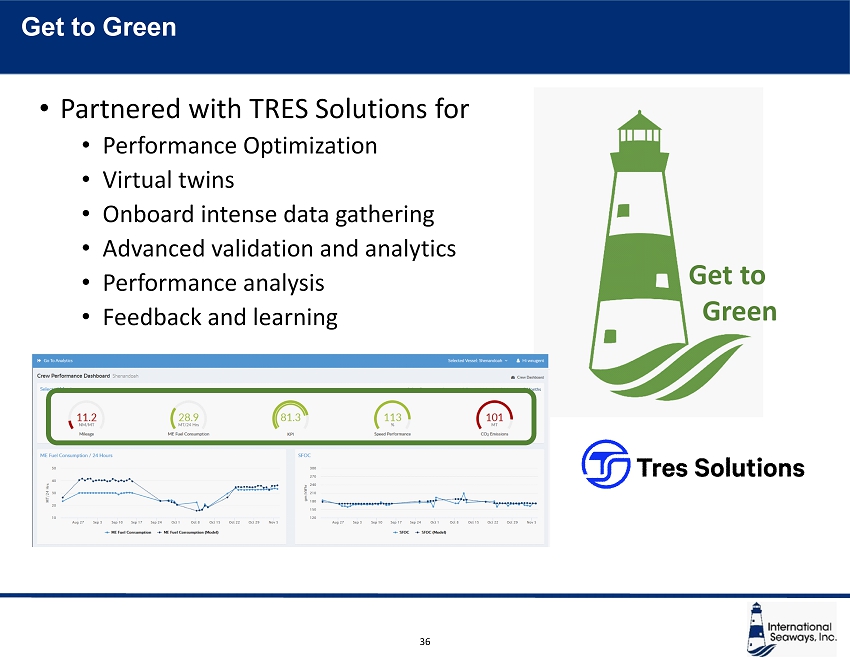
International Seaways, Inc. 36 • Partnered with TRES Solutions for • Performance Optimization • Virtual twins • Onboard intense data gathering • Advanced validation and analytics • Performance analysis • Feedback and learning Get to Green Get to Green
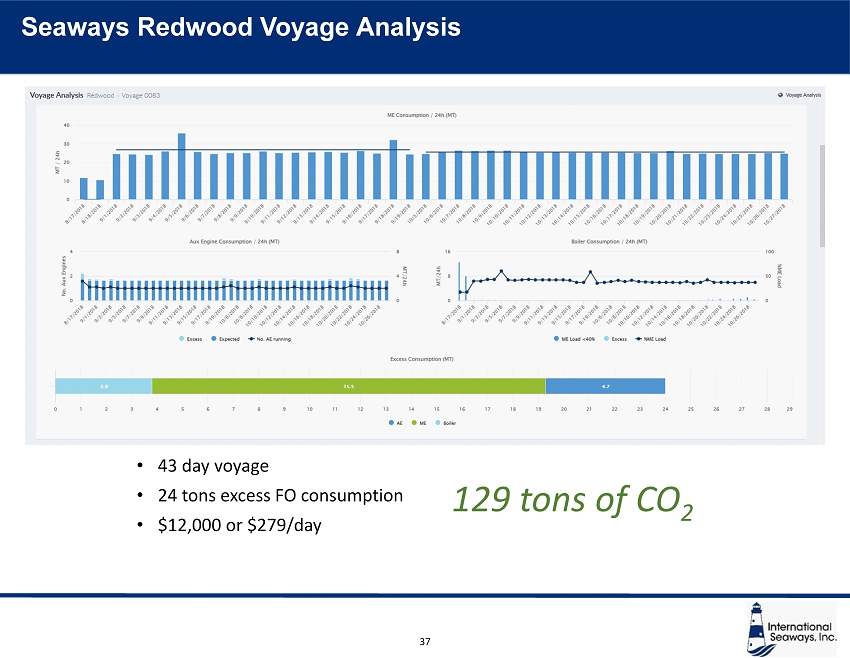
International Seaways, Inc. • 43 day voyage • 24 tons excess FO consumption • $12,000 or $279/day 129 tons of CO 2 37 Seaways Redwood Voyage Analysis
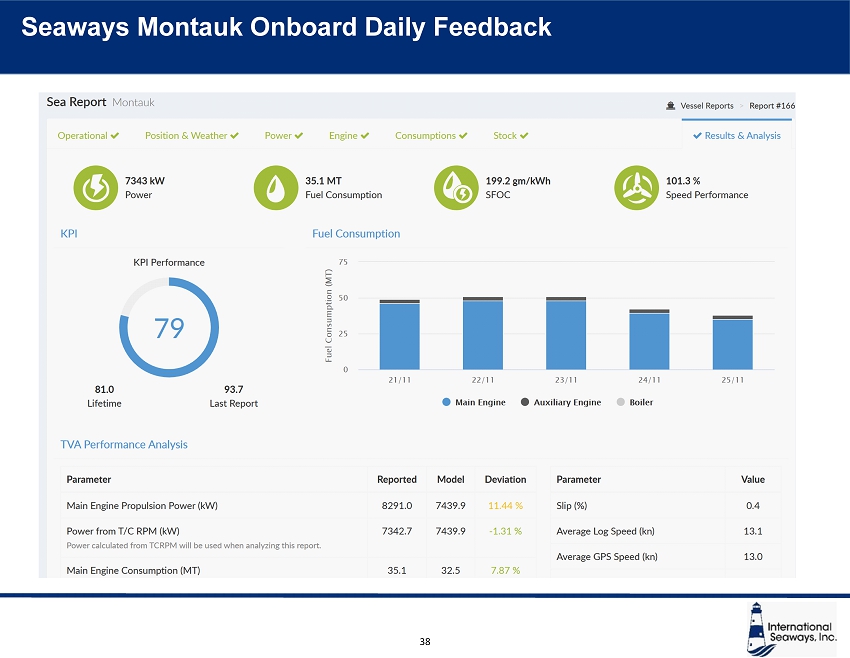
International Seaways, Inc. 38 Seaways Montauk Onboard Daily Feedback

International Seaways, Inc. Comparison to Twin Comparison to Twin Get to Green Get to Green 39 Seaways Montauk Onboard Feedback
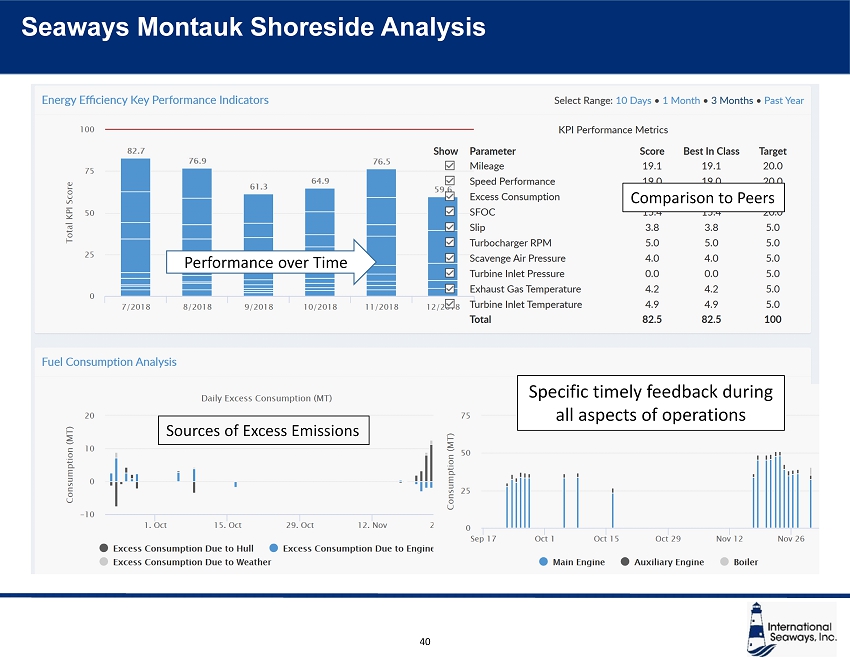
International Seaways, Inc. Performance over Time Sources of Excess Emissions Comparison to Peers Specific timely feedback during all aspects of operations 40 Seaways Montauk Shoreside Analysis
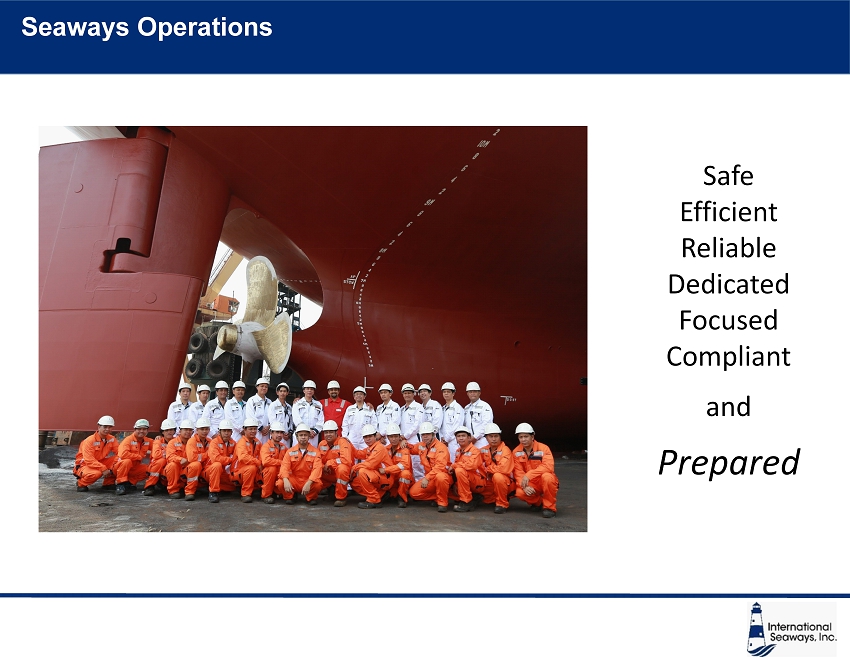
International Seaways, Inc. Safe Efficient Reliable Dedicated Focused Compliant and Prepared Seaways Operations

Financial Overview – Jeff Pribor
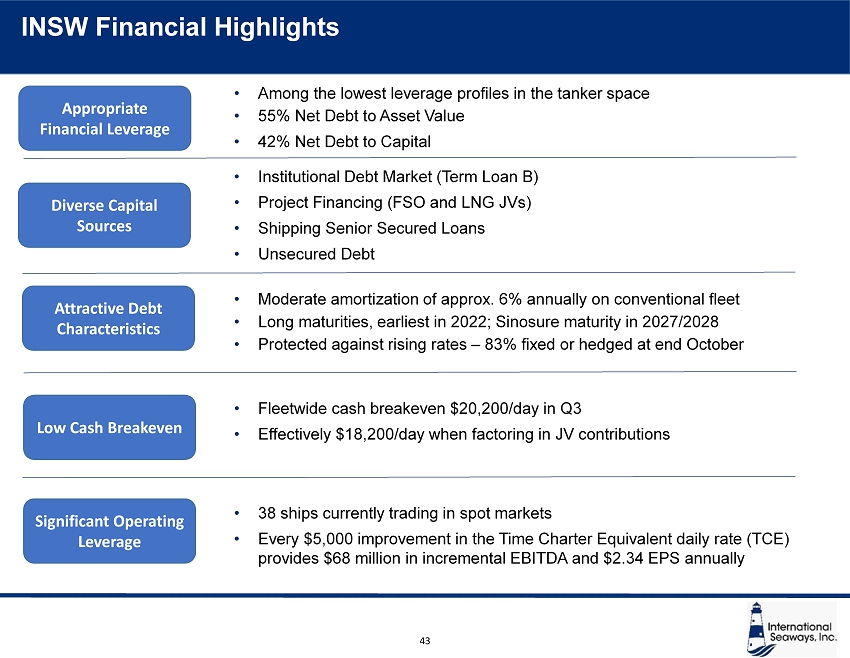
International Seaways, Inc. 43 • Moderate amortization of approx. 6% annually on conventional fleet • Long maturities, earliest in 2022; Sinosure maturity in 2027/2028 • Protected against rising rates – 83% fixed or hedged at end October Appropriate Financial Leverage Diverse Capital Sources Attractive Debt Characteristics Low Cash Breakeven • Among the lowest leverage profiles in the tanker space • 55% Net Debt to Asset Value • 42% Net Debt to Capital • Fleetwide cash breakeven $20,200/day in Q3 • Effectively $18,200/day when factoring in JV contributions • Institutional Debt Market (Term Loan B) • Project Financing (FSO and LNG JVs) • Shipping Senior Secured Loans • Unsecured Debt Significant Operating Leverage • 38 ships currently trading in spot markets • Every $5,000 improvement in the Time Charter Equivalent daily rate (TCE) provides $68 million in incremental EBITDA and $2.34 EPS annually INSW Financial Highlights
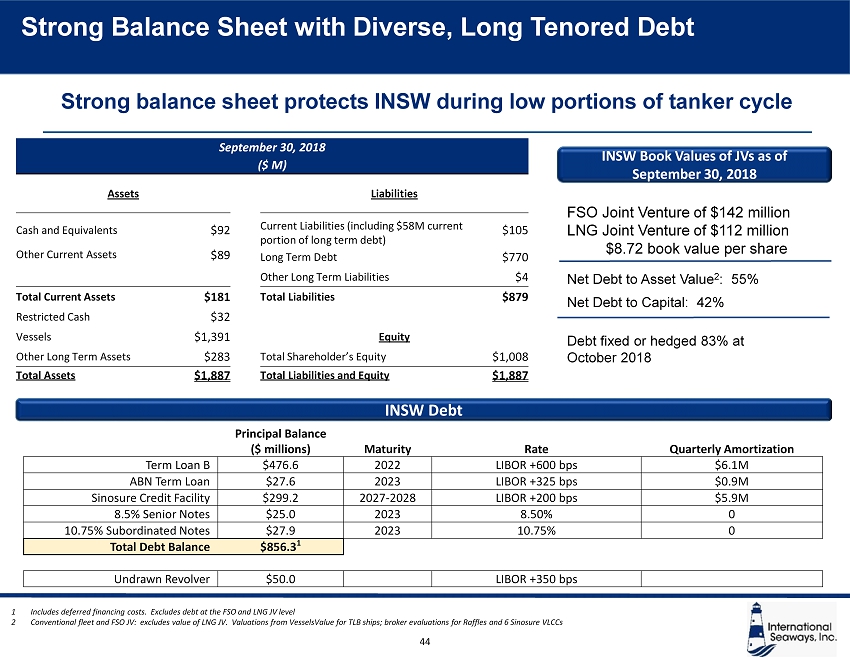
International Seaways, Inc. 44 Strong balance sheet protects INSW during low portions of tanker cycle Net Debt to Asset Value 2 : 55% Net Debt to Capital: 42% INSW Debt 1 Includes deferred financing costs. Excludes debt at the FSO and LNG JV level 2 Conventional fleet and FSO JV: excludes value of LNG JV. Valuations from VesselsValue for TLB ships; broker evaluations for Raffles and 6 Sinosure VLCCs FSO Joint Venture of $142 million LNG Joint Venture of $112 million $8.72 book value per share INSW Book Values of JVs as of September 30, 2018 Principal Balance ($ millions) Maturity Rate Quarterly Amortization Term Loan B $476.6 2022 LIBOR +600 bps $6.1M ABN Term Loan $27.6 2023 LIBOR +325 bps $0.9M Sinosure Credit Facility $299.2 2027 - 2028 LIBOR +200 bps $5.9M 8.5% Senior Notes $25.0 2023 8.50% 0 10.75% Subordinated Notes $27.9 2023 10.75% 0 Total Debt Balance $856.3 1 Undrawn Revolver $50.0 LIBOR +350 bps September 30, 2018 ($ M) Assets Liabilities Cash and Equivalents $92 Current Liabilities (including $58M current portion of long term debt) $105 Other Current Assets $89 Long Term Debt $770 Other Long Term Liabilities $4 Total Current Assets $181 Total Liabilities $879 Restricted Cash $32 Vessels $1,391 Equity Other Long Term Assets $283 Total Shareholder’s Equity $1,008 Total Assets $1,887 Total Liabilities and Equity $1,887 Strong Balance Sheet with Diverse, Long Tenored Debt Debt fixed or hedged 83% at October 2018
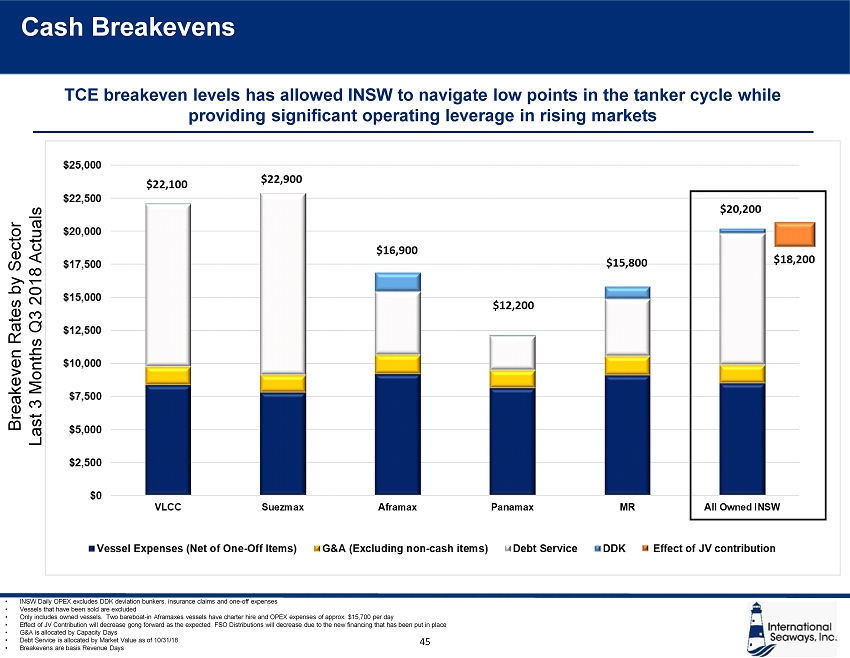
International Seaways, Inc. • INSW Daily OPEX excludes DDK deviation bunkers, insurance claims and one - off expenses • Vessels that have been sold are excluded • Only includes owned vessels. Two bareboat - in Aframaxes vessels have charter hire and OPEX expenses of approx. $15,700 per day • Effect of JV Contribution will decrease gong forward as the expected FSO Distributions will decrease due to the new financin g t hat has been put in place • G&A is allocated by Capacity Days • Debt Service is allocated by Market Value as of 10/31/18 • Breakevens are basis Revenue Days TCE breakeven levels has allowed INSW to navigate low points in the tanker cycle while providing significant operating leverage in rising markets Breakeven Rates by Sector Last 3 Months Q3 2018 Actuals 45 Cash Breakevens
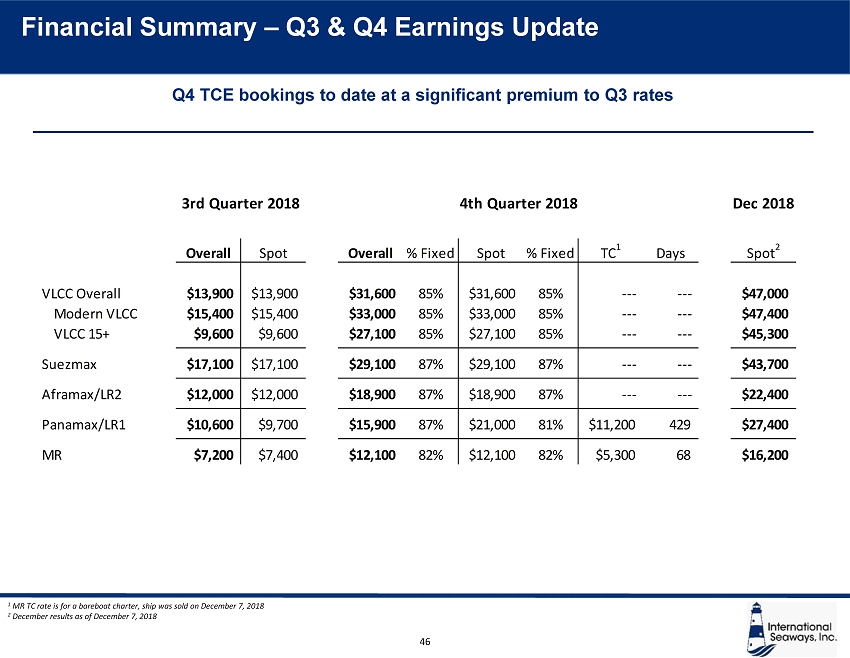
International Seaways, Inc. 46 1 MR TC rate is for a bareboat charter, ship was sold on December 7, 2018 2 December results as of December 7, 2018 Financial Summary – Q3 & Q4 Earnings Update Q4 TCE bookings to date at a significant premium to Q3 rates Dec 2018 Overall Spot Overall % Fixed Spot % Fixed TC 1 Days Spot 2 VLCC Overall $13,900 $13,900 $31,600 85% $31,600 85% --- --- $47,000 Modern VLCC $15,400 $15,400 $33,000 85% $33,000 85% --- --- $47,400 VLCC 15+ $9,600 $9,600 $27,100 85% $27,100 85% --- --- $45,300 Suezmax $17,100 $17,100 $29,100 87% $29,100 87% --- --- $43,700 Aframax/LR2 $12,000 $12,000 $18,900 87% $18,900 87% --- --- $22,400 Panamax/LR1 $10,600 $9,700 $15,900 87% $21,000 81% $11,200 429 $27,400 MR $7,200 $7,400 $12,100 82% $12,100 82% $5,300 68 $16,200 3rd Quarter 2018 4th Quarter 2018

International Seaways, Inc. 47 Note: 12 Year Average, 2015 Average and 2008 Average TCE are Clarksons Average rates for each ship class. EBITDA/EPS calculations include 5 Panamax on short term charters and exclude 1 MR in the process of being sold. Circled figu res are incremental from annualized 2018 Q3 results Operating Leverage Our Fleet Provides Tremendous Upside Exposure INSW (Mid cycle) (Recent peak) (Historical peak) 2018 Q3 TCE 12 Year Average 2015 Average 2008 Average VLCC $13,900 $37,500 $66,000 $97,200 Suezmax $17,100 $29,800 $40,300 $73,900 Aframax/LR2 $12,000 $22,600 $38,000 $50,000 Panamax/LR1 $9,700 $17,400 $26,500 $38,600 MR $7,400 $13,800 $21,400 $21,200 Incremental annual EBITDA ($ millions) $196 $433 $677 Incremental annual EPS $6.72 $14.86 $23.22
Environmental, Social, Governance Update
International Seaways, Inc. 49 • INSW is committed to industry leading Environmental, Social and Governance practices as part of our core culture • Key pillars of this commitment are as follows: Environmental • Commitment to minimizing risk of marine and atmospheric pollution from spills and emissions • Zero spills to sea for 2017, YTD 2018 • IMO 2020 compliance programs in place; preparing for IMO 2050 • Ballast Water Treatment Systems installed in 10 ships; more being installed in 2019 Social • International Seaways strives to meet, and when possible, exceed compliance with all applicable rules and regulations governing the maritime industry • Safe, healthy and secure working conditions for all employees on land and at sea, reinforced with strong safety statistics, e.g. under 1.5 incidents per million hours 2018 YTD • Clean recycling – INSW is committed to environmentally and socially responsible ship recycling • Training is provided to ensure that sea staff understand all environmental policies and procedures Environmental, Social, Governance (ESG) Update

International Seaways, Inc. 50 Governance • Six members of Board of Directors fully independent • Split non - Executive Chairman and CEO • Commitment to diversity exemplified by two female Directors, one of whom is CEO • Shareholder representation on Board • Board includes former CEOs, former CFOs, and experts in shipping, compensation practices and compliance/governance • Annual election for all Board Members • Robust management and director stock ownership guidelines External Validation • Wells Fargo Securities Corporate Governance Ranking: • #1 among tanker shipping companies • #2 of 56 shipping companies overall Environmental, Social, Governance (ESG) Update (continued)
Key Takeaways – Lois Zabrocky

International Seaways, Inc. Macro tanker environment looking favorable for 2019 / 2020 INSW has begun to book significantly higher rates Well positioned to further capitalize on a developing tanker market recovery • High quality fleet, of which a significant portion acquired at lowest point in the cycle • Strong balance sheet with flexible and cost efficient capital structure • Low cash breakeven • Tremendous operating leverage and earnings growth prospects Leading tanker platform creates value for all stakeholders • 43 vessel crude and product tanker fleet • Two joint ventures with six vessels that provide stable cash flows and significantly contribute to INSW value • Dedicated and experienced team and member of leading pools • Strong Environmental, Social, Governance (ESG) footprint • Diversified shareholder base with liquid stock trading Key Takeaways 52
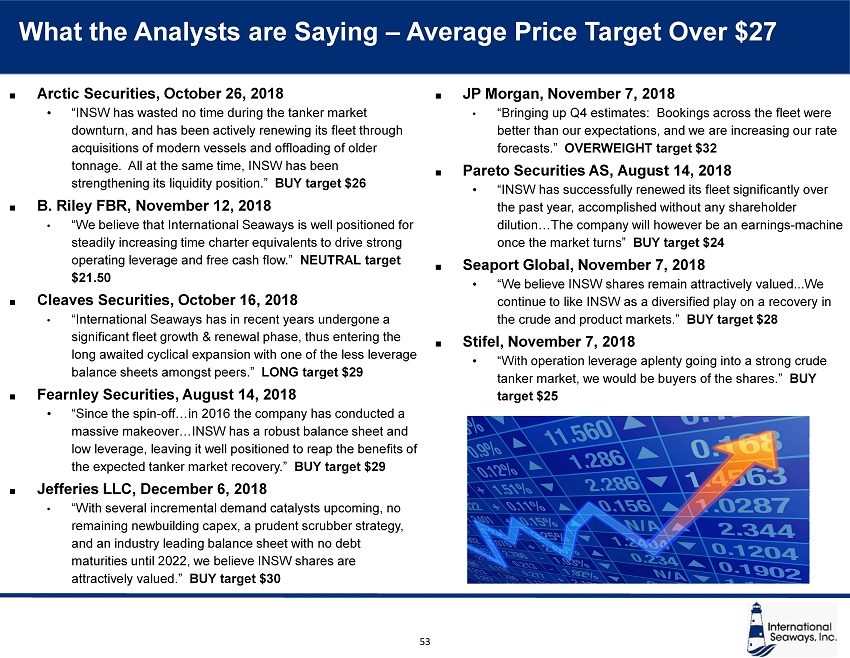
International Seaways, Inc. 53 What the Analysts are Saying – Average Price Target Over $27 Arctic Securities, October 26, 2018 • “INSW has wasted no time during the tanker market downturn, and has been actively renewing its fleet through acquisitions of modern vessels and offloading of older tonnage. All at the same time, INSW has been strengthening its liquidity position.” BUY target $26 B. Riley FBR, November 12, 2018 • “We believe that International Seaways is well positioned for steadily increasing time charter equivalents to drive strong operating leverage and free cash flow.” NEUTRAL target $21.50 Cleaves Securities, October 16, 2018 • “International Seaways has in recent years undergone a significant fleet growth & renewal phase, thus entering the long awaited cyclical expansion with one of the less leverage balance sheets amongst peers.” LONG target $29 Fearnley Securities, August 14, 2018 • “Since the spin - off…in 2016 the company has conducted a massive makeover…INSW has a robust balance sheet and low leverage, leaving it well positioned to reap the benefits of the expected tanker market recovery.” BUY target $29 Jefferies LLC, December 6, 2018 • “With several incremental demand catalysts upcoming, no remaining newbuilding capex, a prudent scrubber strategy, and an industry leading balance sheet with no debt maturities until 2022, we believe INSW shares are attractively valued.” BUY target $30 JP Morgan, November 7, 2018 • “Bringing up Q4 estimates: Bookings across the fleet were better than our expectations, and we are increasing our rate forecasts.” OVERWEIGHT target $32 Pareto Securities AS, August 14, 2018 • “INSW has successfully renewed its fleet significantly over the past year, accomplished without any shareholder dilution…The company will however be an earnings - machine once the market turns” BUY target $24 Seaport Global, November 7, 2018 • “We believe INSW shares remain attractively valued...We continue to like INSW as a diversified play on a recovery in the crude and product markets.” BUY target $28 Stifel, November 7, 2018 • “With operation leverage aplenty going into a strong crude tanker market, we would be buyers of the shares.” BUY target $25

Q&A