Use these links to rapidly review the document
Exhibit 2
FINANCIAL STATEMENTS OF JAPAN INTERNATIONAL COOPERATION AGENCY ("JICA")
AND REPORTS OF THE INDEPENDENT AUDITOR
Index to Financial Statements
General Account | ||||
Independent Auditor's Report | F-2 | |||
Balance Sheet (as of March 31, 2015) | F-3 | |||
Statement of Income (April 1, 2014 - March 31, 2015) | F-5 | |||
Statement of Cash Flows (April 1, 2014 - March 31, 2015) | F-6 | |||
Statement of Administrative Service Operation Cost (April 1, 2014 - March 31, 2015) | F-7 | |||
Basis of Presenting Financial Statements | F-8 | |||
Significant Accounting Policies | F-8 | |||
Notes to the financial statements | F-10 | |||
Detailed Statement | F-16 | |||
Finance and Investment Account | ||||
Independent Auditor's Report | F-37 | |||
Balance Sheet (as of March 31, 2015) | F-38 | |||
Statement of Income (April 1, 2014 - March 31, 2015) | F-40 | |||
Statement of Cash Flows (April 1, 2014 - March 31, 2015) | F-41 | |||
Statement of Administrative Service Operation Cost (April 1, 2014 - March 31, 2015) | F-42 | |||
Basis of Presenting Financial Statements | F-43 | |||
Significant Accounting Policies | F-43 | |||
Notes to the financial statements | F-46 | |||
Detailed Statement | F-52 | |||
General Account | ||||
Independent Auditor's Report | F-63 | |||
Balance Sheet (as of March 31, 2016) | F-64 | |||
Statement of Income (April 1, 2015 - March 31, 2016) | F-66 | |||
Statement of Cash Flows (April 1, 2015 - March 31, 2016) | F-67 | |||
Statement of Administrative Service Operation Cost (April 1, 2015 - March 31, 2016) | F-68 | |||
Basis of Presenting Financial Statements | F-69 | |||
Significant Accounting Policies | F-69 | |||
Notes to the financial statements | F-71 | |||
The Accompanying Supplementary Schedules | F-76 | |||
Finance and Investment Account | ||||
Independent Auditor's Report | F-101 | |||
Balance Sheet (as of March 31, 2016) | F-102 | |||
Statement of Income (April 1, 2015 - March 31, 2016) | F-104 | |||
Statement of Cash Flows (April 1, 2015 - March 31, 2016) | F-105 | |||
Statement of Administrative Service Operation Cost (April 1, 2015 - March 31, 2016) | F-106 | |||
Basis of Presenting Financial Statements | F-107 | |||
Significant Accounting Policies | F-107 | |||
Notes to the financial statements | F-110 | |||
The Accompanying Supplementary Schedules | F-117 |
F-1
To Mr. Akihiko Tanaka, President
Japan International Cooperation Agency
We have audited the accompanying financial statements related to the general account of Japan International Cooperation Agency, which comprise the balance sheet as of March 31, 2015, and the statement of income, statement of cash flows and statement of administrative service operation cost for the year then ended, and a summary of significant accounting policies and other explanatory information, and the accompanying supplementary schedules (except for the information described based on the financial statements and business reports relating to the associated public interest corporations; the same shall apply hereinafter).
President's Responsibility for the Financial Statements
The president is responsible for the preparation and fair presentation of these financial statements in accordance with accounting principles for incorporated administrative agencies generally accepted in Japan, and for such internal control as the president determines is necessary to enable the preparation of financial statements that are free from material misstatement, whether due to fraud or error, or illegal acts.
Auditor's Responsibility
Our responsibility is to express an opinion on these financial statements based on our audit. We conducted our audit in accordance with auditing standards for incorporated administrative agencies generally accepted in Japan. Those standards require that we plan and perform the audit to obtain reasonable assurance about whether the financial statements are free from material misstatement. The audit was planned with adequate attention being paid to the possibility that any fraud or error, or illegal acts, of the president, other executive officers or staff members may result in material misstatement in the financial statements.
An audit involves performing procedures to obtain audit evidence about the amounts and disclosures in the financial statements. The procedures selected depend on the auditor's judgment, including the assessment of the risks of material misstatement of the financial statements, whether due to fraud or error, or illegal acts. In making those risk assessments, the auditor considers internal control relevant to the entity's preparation and fair presentation of the financial statements in order to design audit procedures that are appropriate in the circumstances, but not for the purpose of expressing an opinion on the effectiveness of the entity's internal control. An audit also includes evaluating the appropriateness of accounting policies used and the reasonableness of accounting estimates made by the president, as well as evaluating the overall presentation of the financial statements.
We believe that the audit evidence we have obtained is sufficient and appropriate to provide a basis for our audit opinion. The basis includes the fact that no such fraud or error, or illegal acts, of the president, other executive officers or staff members was found, to the extent that we conducted our audit. The audit we conducted is not intended to express an opinion on whether there was any fraud or error, or illegal acts, of the president, other executive officers or staff members, which would not result in material misstatement in the financial statements.
Opinion
In our opinion, the financial statements referred to above present fairly, in all material respects, the financial position of Japan International Cooperation Agency's general account as of March 31, 2015 and the results of its operations, cash flows and administrative service operation cost for the year then ended in accordance with accounting principles for incorporated administrative agencies generally accepted in Japan.
/s/ DELOITTE TOUCHE TOHMATSU LLC
June 22, 2015
(July 31, 2015 as to "Significant subsequent events")
F-2
Balance Sheet
(as of March 31, 2015)
General Account
| (Unit: Yen) |
Assets | ||||||||||||||||
I. | Current assets | |||||||||||||||
Cash and deposits | 74,554,177,039 | |||||||||||||||
Securities | 99,000,000,000 | |||||||||||||||
Inventories | ||||||||||||||||
Stored goods | 359,251,392 | |||||||||||||||
Payments for uncompleted contracted programs | 837,734,760 | 1,196,986,152 | ||||||||||||||
| | | | | | | | | | | | | | | | | |
Advance payments | 16,597,621,506 | |||||||||||||||
Prepaid expenses | 353,171,138 | |||||||||||||||
Accrued income | 5,403,764 | |||||||||||||||
Accounts receivable | 1,452,106,641 | |||||||||||||||
Short-term loans for development projects | 412,684,000 | |||||||||||||||
Allowance for loan losses | (979,324 | ) | 411,704,676 | |||||||||||||
| | | | | | | | | | | | | | | | | |
Short-term loans for emigration projects | 10,218,835 | |||||||||||||||
Allowance for loan losses | (751,873 | ) | 9,466,962 | |||||||||||||
| | | | | | | | | | | | | | | | | |
Short-term installments receivable on settlement projects | 54,838 | |||||||||||||||
Consignment | 5,281,251 | |||||||||||||||
Suspense payments | 20,065,082 | |||||||||||||||
Advances paid | 2,672,063 | |||||||||||||||
| | | | | | | | | | | | | | | | | |
Total current assets | 193,608,711,112 | |||||||||||||||
II. | Non-current assets | |||||||||||||||
| 1 | Tangible assets | |||||||||||||||
Buildings | 41,011,124,927 | |||||||||||||||
Accumulated depreciation | (15,534,748,099 | ) | ||||||||||||||
Accumulated impairment loss | (46,536,790 | ) | 25,429,840,038 | |||||||||||||
| | | | | | | | | | | | | | | | | |
Structures | 1,547,203,577 | |||||||||||||||
Accumulated depreciation | (964,641,540 | ) | ||||||||||||||
Accumulated impairment loss | (375,844 | ) | 582,186,193 | |||||||||||||
| | | | | | | | | | | | | | | | | |
Machinery and equipment | 181,248,166 | |||||||||||||||
Accumulated depreciation | (118,888,447 | ) | 62,359,719 | |||||||||||||
| | | | | | | | | | | | | | | | | |
Vehicles | 1,818,730,579 | |||||||||||||||
Accumulated depreciation | (1,254,355,675 | ) | 564,374,904 | |||||||||||||
| | | | | | | | | | | | | | | | | |
Tools, furniture, and fixtures | 2,347,946,151 | |||||||||||||||
Accumulated depreciation | (1,367,466,507 | ) | 980,479,644 | |||||||||||||
| | | | | | | | | | | | | | | | | |
Land | 14,970,513,458 | |||||||||||||||
Accumulated impairment loss | (234,596,912 | ) | 14,735,916,546 | |||||||||||||
| | | | | | | | | | | | | | | | | |
Construction in progress | 71,060,898 | |||||||||||||||
| | | | | | | | | | | | | | | | | |
Total tangible assets | 42,426,217,942 | |||||||||||||||
| 2 | Intangible assets | |||||||||||||||
Trademark right | 2,430,660 | |||||||||||||||
Telephone subscription right | 4,216,750 | |||||||||||||||
| | | | | | | | | | | | | | | | | |
Total intangible assets | 6,647,410 | |||||||||||||||
| 3 | Investments and other assets | |||||||||||||||
Long-term deposits | 300,000,000 | |||||||||||||||
Long-term loans for development projects | 396,075,484 | |||||||||||||||
Allowance for loan losses | (9,085,486 | ) | 386,989,998 | |||||||||||||
| | | | | | | | | | | | | | | | | |
Long-term loans for emigration projects | 105,451,790 | |||||||||||||||
Allowance for loan losses | (57,308,430 | ) | 48,143,360 | |||||||||||||
| | | | | | | | | | | | | | | | | |
Long-term installments receivable on settlement projects | 162,930 | |||||||||||||||
Claims probable in bankruptcy, claims probable in rehabilitation, and other pertaining to loans for development projects | 191,110,477 | |||||||||||||||
Allowance for loan losses | (120,093,330 | ) | 71,017,147 | |||||||||||||
| | | | | | | | | | | | | | | | | |
Claims probable in bankruptcy, claims probable in rehabilitation, and other pertaining to loans for emigration projects | 809,673,108 | |||||||||||||||
Allowance for loan losses | (809,673,108 | ) | 0 | |||||||||||||
| | | | | | | | | | | | | | | | | |
Claims probable in bankruptcy, claims probable in rehabilitation, and other pertaining to installments receivable on settlement projects | 2,641,747 | |||||||||||||||
Allowance for loan losses | (2,641,747 | ) | 0 | |||||||||||||
| | | | | | | | | | | | | | | | | |
Long-term prepaid expenses | 110,434,929 | |||||||||||||||
Long-term guarantee deposits | 1,539,197,577 | |||||||||||||||
| | | | | | | | | | | | | | | | | |
Total investments and other assets | 2,455,945,941 | |||||||||||||||
| | | | | | | | | | | | | | | | | |
Total non-current assets | 44,888,811,293 | |||||||||||||||
| | | | | | | | | | | | | | | | | |
Total assets | 238,497,522,405 | |||||||||||||||
| | | | | | | | | | | | | | | | | |
| | | | | | | | | | | | | | | | | |
| | | | | | | | | | | | | | | | | |
F-3
Balance Sheet (Continued)
(as of March 31, 2015)
| (Unit: Yen) |
Liabilities | ||||||||||||||
I. | Current liabilities | |||||||||||||
Operational grant liabilities | 46,240,982,302 | |||||||||||||
Funds for grant aid | 116,675,616,138 | |||||||||||||
Donations received | 353,037,002 | |||||||||||||
Accounts payable | 19,111,832,826 | |||||||||||||
Accrued expenses | 229,817,568 | |||||||||||||
Lease obligations | 141,519,737 | |||||||||||||
Advance payments received | 812,668,000 | |||||||||||||
Deposits received | 495,746,843 | |||||||||||||
Suspense receipt | 294,460 | |||||||||||||
| | | | | | | | | | | | | | | |
Total current liabilities | 184,061,514,876 | |||||||||||||
II. | Non-current liabilities | |||||||||||||
Contra accounts for assets | ||||||||||||||
Contra accounts for assets funded by operational grants | 2,162,108,162 | 2,162,108,162 | ||||||||||||
| | | | | | | | | | | | | | | |
Long-term lease obligations | 230,285,943 | |||||||||||||
Long-term deposits received | 142,147,519 | |||||||||||||
Asset retirement obligations | 276,125,850 | |||||||||||||
| | | | | | | | | | | | | | | |
Total non-current liabilities | 2,810,667,474 | |||||||||||||
| | | | | | | | | | | | | | | |
Total liabilities | 186,872,182,350 | |||||||||||||
Net assets | ||||||||||||||
I. | Capital | |||||||||||||
Government investment | 63,217,211,863 | |||||||||||||
| | | | | | | | | | | | | | | |
Total capital | 63,217,211,863 | |||||||||||||
II. | Capital surplus | |||||||||||||
Capital surplus | 331,674,203 | |||||||||||||
Accumulated depreciation not included in expenses | (16,778,074,305 | ) | ||||||||||||
Accumulated impairment loss not included in expenses | (289,381,446 | ) | ||||||||||||
Accumulated interest expenses not included in expenses | (7,189,037 | ) | ||||||||||||
| | | | | | | | | | | | | | | |
Total capital surplus | (16,742,970,585 | ) | ||||||||||||
III | Retained earnings | |||||||||||||
Reserve fund carried over from the previous mid-term Objective period | 2,033,044,826 | |||||||||||||
Reserve fund | 1,681,756,203 | |||||||||||||
Unappropriated income for the current business year | 1,436,297,748 | |||||||||||||
| | | | | | | | | | | | | | | |
(Total income for the current business year) | (1,436,297,748 | ) | ||||||||||||
Total retained earnings | 5,151,098,777 | |||||||||||||
| | | | | | | | | | | | | | | |
Total net assets | 51,625,340,055 | |||||||||||||
| | | | | | | | | | | | | | | |
Total of liabilities and net assets | 238,497,522,405 | |||||||||||||
| | | | | | | | | | | | | | | |
| | | | | | | | | | | | | | | |
| | | | | | | | | | | | | | | |
F-4
Statement of Income
(April 1, 2014-March 31, 2015)
General Account
| (Unit: Yen) |
Ordinary expenses | ||||||||||
Operating expenses | ||||||||||
Expenses for technical cooperation projects | 71,067,788,315 | |||||||||
Expenses for grant aid (operation support) | 173,204,507 | |||||||||
Expenses for public participation-based cooperation | 15,723,182,122 | |||||||||
Expenses for emigration projects | 304,637,764 | |||||||||
Expenses for disaster relief activities | 1,424,272,171 | |||||||||
Expenses for training and securing the personnel | 240,653,255 | |||||||||
Expenses for assistance promotion | 12,443,562,099 | |||||||||
Expenses related to operation | 6,321,990,020 | |||||||||
Expenses for operation support | 28,482,570,923 | |||||||||
Expenses for grant aid | 106,527,822,879 | |||||||||
Expenses for facilities | 12,120,563 | |||||||||
Expenses for contracted programs | 1,128,383,920 | |||||||||
Expenses for donation projects | 10,533,389 | |||||||||
Depreciation | 470,490,348 | 244,331,212,275 | ||||||||
| | | | | | | | | | | |
General administrative expenses | 8,842,943,130 | |||||||||
Loan losses | 55,669,760 | |||||||||
Provision of allowance for loan losses | 64,716,150 | |||||||||
Financial expenses | ||||||||||
Foreign exchange losses | 22,888,573 | 22,888,573 | ||||||||
| | | | | | | | | | | |
Miscellaneous loss | 1,416,279 | |||||||||
| | | | | | | | | | | |
Total ordinary expenses | 253,318,846,167 | |||||||||
Ordinary revenues | ||||||||||
Revenues from operational grants | 144,188,719,346 | |||||||||
Revenues from grant aid | 106,527,822,879 | |||||||||
Revenues from contracted programs | ||||||||||
Revenues from contracted programs from Japanese government and local governments | 1,086,004,955 | |||||||||
Revenues from contracted programs from other parties | 44,937,971 | 1,130,942,926 | ||||||||
| | | | | | | | | | | |
Revenues from interest on development projects | 23,894,869 | |||||||||
Revenues from settlement projects | 6,508,214 | |||||||||
Revenues from emigration projects | 16,237,252 | |||||||||
Donation revenues | 10,533,389 | |||||||||
Revenues from subsidy for facilities | 7,023,830 | |||||||||
Reversal of contra accounts for assets funded by operational grants | 458,295,548 | |||||||||
Financial revenues | ||||||||||
Interest income | 38,314,948 | 38,314,948 | ||||||||
| | | | | | | | | | | |
Miscellaneous income | 1,930,933,987 | |||||||||
| | | | | | | | | | | |
Total ordinary revenues | 254,339,227,188 | |||||||||
| | | | | | | | | | | |
Ordinary income | 1,020,381,021 | |||||||||
Extraordinary losses | ||||||||||
Loss on disposal of non-current assets | 75,243,209 | |||||||||
Loss on sales of non-current assets | 1,089,333 | |||||||||
Payments to national treasury | 12,218,985 | 88,551,527 | ||||||||
| | | | | | | | | | | |
Extraordinary income | ||||||||||
Reversal of contra accounts for assets funded by operational grants | 29,656,011 | |||||||||
Gain on sales of non-current assets | 10,180,805 | 39,836,816 | ||||||||
| | | | | | | | | | | |
Net income | 971,666,310 | |||||||||
| | | | | | | | | | | |
Reversal of reserve fund carried over from the previous Mid-term Objective period | 464,631,438 | |||||||||
| | | | | | | | | | | |
Total income for the current business year | 1,436,297,748 | |||||||||
| | | | | | | | | | | |
| | | | | | | | | | | |
| | | | | | | | | | | |
F-5
Statement of Cash Flows
(April 1, 2014-March 31, 2015)
General Account
| (Unit: Yen) |
I. Cash flows from operating activities | ||||
Payments of operating expenses | (131,255,840,155 | ) | ||
Payments for grant aid | (104,537,854,844 | ) | ||
Payments for contracted programs | (962,091,975 | ) | ||
Payments of personnel expenses | (15,426,688,082 | ) | ||
Payments for other operations | (663,161,242 | ) | ||
Proceeds from operational grants | 159,293,481,000 | |||
Proceeds from grant aid | 108,121,355,217 | |||
Proceeds from contracted programs | 1,073,015,522 | |||
Proceeds from interest on loans | 43,278,783 | |||
Proceeds from settlement projects | 12,883,473 | |||
Interest revenues | 6,505,667 | |||
Installments receivable | 6,377,806 | |||
Donation revenues | 21,558,233 | |||
Proceeds from other operations | 2,372,343,308 | |||
Subtotal | 18,092,279,238 | |||
Interest income received | 38,439,012 | |||
| | | | | |
Net cash provided by operating activities | 18,130,718,250 | |||
II. Cash flows from investing activities | ||||
Payments for purchase of non-current assets | (1,737,077,433 | ) | ||
Proceeds from sales of non-current assets | 371,685,380 | |||
Proceeds from subsidy for facilities | 1,974,145,641 | |||
Proceeds from collection of loans | 601,554,644 | |||
Payments into time deposits | (413,000,000,000 | ) | ||
Proceeds from time deposit refund | 428,000,000,000 | |||
Payments for purchase of negotiable deposits | (819,000,000,000 | ) | ||
Proceeds from refund of negotiable deposits | 820,000,000,000 | |||
| | | | | |
Net cash provided by investing activities | 17,210,308,232 | |||
III. Cash flows from financing activities | ||||
Repayments of lease obligations | (151,618,859 | ) | ||
Payments to national treasury for unnecessary property | (342,011,070 | ) | ||
| | | | | |
Net cash used in financing activities | (493,629,929 | ) | ||
IV. Effect of exchange rate fluctuation on funds | 12,130,892 | |||
| | | | | |
V. Net increase in funds | 34,859,527,445 | |||
VI. Funds at the beginning of the business year | 34,694,649,594 | |||
| | | | | |
VII. Funds at the end of the business year | 69,554,177,039 | |||
| | | | | |
| | | | | |
| | | | | |
F-6
Statement of Administrative Service Operation Cost
(April 1, 2014 - March 31, 2015)
General Account
| (Unit: Yen | ) | |||||||||||
I. | Operating expenses | |||||||||||
(1) Expenses on statement of income | ||||||||||||
Operating expenses | 244,331,212,275 | |||||||||||
General administrative expenses | 8,842,943,130 | |||||||||||
Loan losses | 55,669,760 | |||||||||||
Provision of allowance for loan losses | 64,716,150 | |||||||||||
Financial expenses | 22,888,573 | |||||||||||
Miscellaneous loss | 1,416,279 | |||||||||||
Loss on disposal of non-current assets | 75,243,209 | |||||||||||
Loss on sales of non-current assets | 1,089,333 | |||||||||||
Payments to national treasury | 12,218,985 | 253,407,397,694 | ||||||||||
| | | | | | | | | | | | | |
(2) (Deduction) Self-revenues, etc. | ||||||||||||
Revenues from contracted programs | (1,130,942,926 | ) | ||||||||||
Revenues from interest on development projects | (23,894,869 | ) | ||||||||||
Revenues from settlement projects | (6,508,214 | ) | ||||||||||
Revenues from emigration projects | (16,237,252 | ) | ||||||||||
Donation revenues | (10,533,389 | ) | ||||||||||
Financial revenues | (38,314,948 | ) | ||||||||||
Miscellaneous income | (1,930,933,987 | ) | ||||||||||
Gain on sales of non-current assets | (10,180,805 | ) | (3,167,546,390 | ) | ||||||||
| | | | | | | | | | | | | |
Total operating expenses | 250,239,851,304 | |||||||||||
II. | Depreciation not included in expenses | 1,403,681,223 | ||||||||||
III. | Impairment loss not included in expenses | 8,767,600 | ||||||||||
IV. | Interest expenses not included in expenses | 480,344 | ||||||||||
V. | Disposal and sale differential not included in expenses | (4,126,622 | ) | |||||||||
VI. | Estimated bonus payments not included in provision | 141,980,963 | ||||||||||
VII. | Estimated increase in retirement benefits not included in provision | (3,415,223,845 | ) | |||||||||
VIII. | Opportunity cost | |||||||||||
Opportunity cost of government investment | 183,469,798 | |||||||||||
IX. | (Deduction) Corporation taxes, payments to national treasury | (12,218,985 | ) | |||||||||
| | | | | | | | | | | | | |
X. | Administrative service operation cost | 248,546,661,780 | ||||||||||
| | | | | | | | | | | | | |
| | | | | | | | | | | | | |
| | | | | | | | | | | | | |
F-7
Basis of Presenting Financial Statements
The accompanying financial statements have been prepared in accordance with accounting principles for incorporated administrative agencies generally accepted in Japan, which are different in many respects as to application and disclosure requirements of accounting principles for business enterprises generally accepted in Japan.
Significant Accounting Policies
General Account
1. Revenue recognition method of operational grants
Revenue from operational grants is recognized as the related expenses are incurred. This is attributable to the difficulties associated with the application of a revenue recognition method based on operation achievement and a revenue recognition method based on term, specifically the significant amount of time required to evaluate operating results objectively, as well as other complexities.
2. Depreciation method
- (1)
- Tangible assets
Straight-line method
The useful lives of major assets are as follows:
Buildings: | 1 - 50 years | |||
Structures: | 1 - 42 years | |||
Machinery and equipment: | 1 - 17 years | |||
Vehicles: | 1 - 6 years | |||
Tools, furniture, and fixtures: | 1 - 18 years |
The estimated depreciation costs for specific depreciable assets (Accounting Standard for Incorporated Administrative Agency No. 87) and specific removal costs, etc., associated with asset retirement obligations (Accounting Standard for Incorporated Administrative Agency No. 91) are indirectly deducted from the capital surplus and reported as accumulated depreciation not included in expenses.
- (2)
- Intangible assets
Straight-line method
3. Standard for appropriation of provision and estimation for bonuses
A provision for bonuses is not appropriated since the financial source is secured by operational grants. The estimated bonus payments not included in the provision in the statement of administrative service operation cost is reported as a current business year estimate of the provision for bonuses, calculated according to the Accounting Standard for Incorporated Administrative Agency No. 88.
4. Standard for appropriation of provision and estimation for retirement benefits
A provision for retirement benefits is not appropriated since the financial source is secured by operational grants.
A provision for retirement benefits is not provided for pension benefits from the Employees' Pension Funds since the financial source for Employees' Pension Funds' insurance fees and reserve shortfall is secured by operational grants.
F-8
The estimated increase in retirement benefits not included in the provision in the statement of administrative service operation cost is reported as the current business year increase of provision for retirement benefits, calculated according to the Accounting Standard for Incorporated Administrative Agency No. 38.
5. Basis and standard for appropriation of allowances, etc.
Allowance for loan losses
To provide for loan losses, JICA records the estimated amount of default, taking into account the transition rate to delinquent loans for ordinary loans and specific collectibility of doubtful loans, etc.
6. Standard and method for the valuation of securities
Held-to-maturity securities
Valued using the amortized cost method (straight-line method)
7. Standard and method for the valuation of inventories
- (1)
- Stored goods
- (2)
- Payments for uncompleted contracted programs
Stored goods valuation is based on the lower of cost or market using the first-in, first-out (FIFO) method.
Payments for uncompleted contracted programs valuation is based on the lower of cost or market using the specific identification method.
8. Translation standard for foreign currency-denominated assets and liabilities into yen
Foreign currency money claims and liabilities are translated into Japanese yen at the spot exchange rate at the balance sheet date. Exchange differences are recognized as profit or loss.
9. Method for computing opportunity cost in the Statement of Administrative Service Operation Cost
Interest rate used to compute opportunity cost of government investment:
0.400% with reference to the yield of 10-year fixed-rate Japanese government bonds at the end of March 2015
10. Accounting treatment for lease transactions
Finance lease transactions with total lease fees of ¥3 million or more are accounted for in a similar manner as ordinary sale and purchase transactions.
Finance lease transactions with total lease fees of less than ¥3 million are accounted for in a similar manner as ordinary rental transactions.
11. Accounting treatment for consumption taxes
Consumption taxes are included in transaction amounts.
F-9
Notes to the financial statements
General Account
(Balance Sheet)
- 1.
- Estimated retirement benefits to be provided from the operational grants
¥28,273,243,689
- (1)
- Breakdown of retirement benefit obligations
(Unit: Yen) | ||||||||||
| | | | | | | | | | | |
| End of business year 2014 | |||||||||
| | | | | | | | | | | |
| (1) | Retirement benefit obligations | (42,711,782,584) | |||||||
| (2) | Plan assets | 14,438,538,895 | |||||||
| (3) | Non-accumulated projected benefit obligations (1) + (2) | (28,273,243,689) | |||||||
| (4) | Unrecognized actuarial differences | 0 | |||||||
| (5) | Unrecognized past service liabilities (decrease in liabilities) | 0 | |||||||
| (6) | Net reported amount on balance sheet (3) + (4) + (5) | (28,273,243,689) | |||||||
| (7) | Prepaid pension expenses | 0 | |||||||
| (8) | Provision for retirement benefits (6) – (7) | (28,273,243,689) | |||||||
| | | | | | | | | | | |
| (Note 1) | On March 1, 2014, JICA obtained approval from the Minister of Health, Labour and Welfare for exemption from the obligations of future payments related to return of a substitutional part of Employees' Pension Fund. | ||
The amount corresponding to the refund (minimum actuarial liability) measured at the end of the current business year was ¥6,707,659,149. Assuming this amount had been transferred at the end of the current business year, the estimated deduction amount in the statement of administrative service operation cost would be ¥11,683,928,148, in accordance with Paragraph 44-2 of "Practical Guidelines concerning Accounting Standard for Retirement Benefits (Interim Report)" (Japan Institute of Certified Public Accountants, Accounting System Committee Report No. 13 issued on September 14, 1999). | |||
(Note 2) | The plan assets include ¥6,259,175,610 payments to national treasury in relation to the return of the substitutional portion of the Employee's pension fund. |
- (2)
- Breakdown of retirement benefit expenses
(Unit: Yen) | ||||||||||
| | | | | | | | | | | |
| Business year 2014 | |||||||||
| | | | | | | | | | | |
| (1) | Service cost | 1,232,253,676 | |||||||
| (2) | Interest cost | 539,375,505 | |||||||
| (3) | Expected return on plan assets | 0 | |||||||
| (4) | Amortization of past service liabilities | (3,967,020,568) | |||||||
| (5) | Amortization of actuarial differences | (51,531,831) | |||||||
| (6) | Others (premiums collected for Employees' Pension Fund) | (88,570,299) | |||||||
| | | | | | | | | | | |
F-10
- (3)
- Assumptions for retirement benefit obligations, etc.
| | | | | | | | | | | | | |
| Business year 2014 | |||||||||||
| | | | | | | | | | | | | |
| (1) | Discount rate: | Employees' Pension Fund | 1.40% | ||||||||
| Retirement benefits | 0.74% | ||||||||||
| (2) | Expected rate of return on plan assets | 0.0% | |||||||||
| (3) | Method of attributing expected benefit to periods | Straight-line basis | |||||||||
| (4) | Recognition period of actuarial differences | 1 year | |||||||||
| (5) | Amortization period of past service liabilities | 1 year | |||||||||
| | | | | | | | | | | | | |
- 2.
- Estimated bonus to be provided from the operational grants
¥934,999,515
- 3.
- Impairment loss on non-current assets
- (1)
- The non-current assets for which the impairment loss was recognized
- [1]
- Outline of the usage, type, location, book value, etc.
Impairment loss was recognized in the following assets:
| (Unit: Yen) | |||||||||||||||||||||||||||||||
| | | | | | | | | | | | | | | | | | | | | | | | | | | | | | | | |
| Name of asset | Usage | Location | Type | Book value before impairment loss | Impairment loss during the period | Accumulated impairment loss at the end of the period | |||||||||||||||||||||||||
| | | | | | | | | | | | | | | | | | | | | | | | | | | | | | | | |
Shinoharacho employee housing | Employee | Yokohama City, | Buildings | 214,600 | 34,738 | 34,738 | |||||||||||||||||||||||||
| | | | | | | | | | | | | | | | | | | | | | | | | | | | | | | | |
| housing | Kanagawa Prefecture | Land | 53,949,000 | 8,732,862 | 8,732,862 | ||||||||||||||||||||||||||
| | | | | | | | | | | | | | | | | | | | | | | | | | | | | | | | |
- [2]
- Background relating to the recognition of impairment loss
JICA decided to dispose of the Shinoharacho employee housing in September 2013, and the previous occupants have all vacated the employee housing units. As a result, the book value of the employee housing units was reduced to the recoverable service value in the current business year. This reduction was treated as an accumulated impairment loss not included in expenses, which is deducted from the capital surplus.
- [3]
- Breakdown of impairment loss which is not recognized in the statement of income and impairment loss which is recognized in the statement of income for each major
F-11
non-current asset, and an overview of the calculation method for the recoverable service value:
| (Unit: Yen) | ||||||||||||||||||||||
| | | | | | | | | | | | | | | | | | | | | | | |
| Name of asset | Type | Impairment loss (Not recognized in the statement of income) | Impairment loss (Recognized in the statement of income) | Calculation method for recoverable service value | ||||||||||||||||||
| | | | | | | | | | | | | | | | | | | | | | | |
Shinoharacho employee housing | Buildings | 34,738 | — | Recoverable service value is measured by using the net realizable value, which is a | ||||||||||||||||||
| | | | | | | | | | | | | | | | | | | | | | | |
| Land | 8,732,862 | — | valuation by a third party less the estimated expenses for disposal. | |||||||||||||||||||
| | | | | | | | | | | | | | | | | | | | | | | |
- (2)
- Non-current assets indicating impairment loss
Not applicable
- 4.
- Donated funds for grant aid
Grant aid is received in the form of donated funds from the government of Japan. JICA administers this grant aid based on Grant Agreements with the government of the recipient country. At the end of business year 2014, the outstanding balance of unexecuted Grant Agreements stood at ¥199,699,693,668.
(Statement of Cash Flows)
The funds shown in the statement of cash flows are cash, deposit accounts, and checking accounts.
- 1.
- Breakdown of balance sheet items and ending balance of funds
| (as of March 31, 2015) | | |||
|---|---|---|---|---|
Cash and deposits | ¥ | 74,554,177,039 | ||
Time deposits | ¥ | (5,000,000,000 | ) | |
| | | | | |
Ending balance of funds | ¥ | 69,554,177,039 | ||
- 2.
- Description of significant non-cash transactions
- (1)
- Payment to the national treasury of unnecessary property
Buildings | ¥ | 827,504,343 | ||
Structures | ¥ | 824,368 | ||
Machinery and equipment | ¥ | 489,475 | ||
Tools, furniture, and fixtures | ¥ | 1,640,532 | ||
Land | ¥ | 1,342,939,195 |
- (2)
- Assets granted under finance lease
Tools, furniture, and fixtures | ¥ | 192,331,311 |
(Statement of Administrative Service Operation Cost)
Number of public officers temporarily transferred to JICA and accounted for as opportunity cost
Of the estimated increase in retirement benefits not included in the provision, ¥19,110,076 was recognized as the current business year increase of provision for retirement benefits for 31 public officers temporarily transferred to JICA according to JICA's internal rules.
F-12
(Status of financial instruments)
The General Account's fund management is limited to short-term deposits and public and corporate bonds while fund-raising consists mainly of operational grants approved by the competent minister. The General Account does not borrow from the government fund for Fiscal Investment and Loan Program (FILP), nor does it borrow funds from financial institutions or issue FILP Agency Bonds.
(Fair value of financial instruments)
Balance sheet amounts, fair value, and difference at the balance sheet date are as follows:
(Unit: Yen) | |||||||||||||||||||||
| | | | | | | | | | | | | | | | | | | | | | |
| Balance sheet amount | Fair value | Difference | ||||||||||||||||||
| | | | | | | | | | | | | | | | | | | | | | |
| (1) | Cash and deposits | 74,554,177,039 | 74,554,177,039 | 0 | ||||||||||||||||
| (2) | Securities | 99,000,000,000 | 99,000,000,000 | 0 | ||||||||||||||||
| (3) | Accounts payable | (19,111,832,826 | ) | (19,111,832,826 | ) | 0 | ||||||||||||||
| | | | | | | | | | | | | | | | | | | | | | |
- (Note)
- Liabilities are shown in parentheses.
- (Note
- 1) Calculation method for fair value of financial instruments and matters concerning securities
- [1]
- Cash and deposits
Cash and deposits are short term and fair value approximates book value. Thus, fair value for cash and deposits is calculated at book value.
- [2]
- Securities (negotiable deposits)
Negotiable deposits are valued at book value because fair value approximates book value due to the short-term nature of these instruments.
- [3]
- Accounts payable
Accounts payable are short term and fair value approximates book value. Thus, fair value for accounts payable is calculated at book value.
(Lease transactions)
- 1.
- Future minimum lease payments related to operating lease transactions are as follows
Future minimum lease payments due within one year of the balance sheet date ¥8,937,433
Future minimum lease payments corresponding to periods more than one year from the balance sheet date ¥19,182,857
- 2.
- The amount of the finance lease transactions that influenced the current business year's profits and losses was ¥12,243,396. Total income for the current business year after the deduction of this amount was ¥1,448,541,144.
(Asset retirement obligations)
JICA has a building lease agreement for its head office building and has obligations to restore the building to its original state at the termination of the lease period. Therefore, these asset retirement obligations have been recorded. The estimate for the asset retirement obligations assumes a five-year lease period for the projected period of use and a discount rate of 0.529%.
At the end of the previous business year, the amount recorded for asset retirement obligations was ¥275,645,506. The balance of asset retirement obligations at the end of the current business year
F-13
was ¥276,125,850; consisting of the sum of the above ¥275,645,506 and a ¥480,344 adjustment amount for the asset retirement obligations are due to passage of time.
(Payments to the national treasury, etc., for unnecessary property)
A summary of payments to the national treasury for unnecessary property in the current business year is as follows.
Regarding the transfer of 27 employee housing units, the transfer balance of the transactions that were designated as "transfer transactions whose transfer balance shall not be recorded in the profit and loss for calculating profits and losses" as per Article 13-2 of the Ordinance of the Ministry for the Operations, Finances and Accounting of the Japan International Cooperation Agency (Ordinance of Ministry of Foreign Affairs No. 22 of September 30, 2003 (final amendment, March 31, 2015)) and the costs required for the transfer were not recorded in the profit and loss for calculating profits and losses and were deducted from the capital surplus by applying Accounting Standard for Incorporated Administrative Agency No. 99.
- 1.
- Employee housing in sectional ownership (27 Units)
- (1)
- Outline of the type and book value, etc., of assets that were paid to the national treasury as unnecessary property
| | | | | | | | | | | | |||||||||||
|---|---|---|---|---|---|---|---|---|---|---|---|---|---|---|---|---|---|---|---|---|---|
| (Unit: Yen) | |||||||||||||||||||||
| | | | | | | | | | | | | | | | | | | | | | |
| Name of asset | Usage | Location | Type | Book value at time of transfer | |||||||||||||||||
| | | | | | | | | | | | | | | | | | | | | | |
| Shuwa Koiwa Residence 302 and 27 units | Employee | Edogawa-Ward, | Buildings | 119,402,541 | |||||||||||||||||
| | | | | | | | | | | | | | | | | | | | | | |
| housing | Tokyo, etc. | Land | 164,057,452 | ||||||||||||||||||
| | | | | | | | | | | | | | | | | | | | | | |
- (2)
- Reason for unnecessary property
Based on the Midterm Plan, etc., it was decided that unnecessary property would be disposed of by payments to the national treasury, in accordance with the Act for partial revision of the Act on General Rules for Incorporated Administrative Agencies (Act No. 37 of 2010), which prescribed returns of unnecessary property to the national treasury by Incorporated Administrative Agencies.
- (3)
- Method of payments to the national treasury: Transfer by payment of sales revenue pursuant to Paragraph 2 of Article 46-2 of the Act on General Rules for Incorporated Administrative Agencies.
- (4)
- Amount of sales revenue of unnecessary property: ¥343,477,039 (excluding tax)
- (5)
- Costs deducted from sales revenue: ¥6,093,520 (excluding tax)
- (6)
- Amount and date of payment to the national treasury: ¥337,383,519, March 12, 2015
- (7)
- Capital reduction: ¥433,160,130
F-14
- 2.
- Former Hiroo Center
- (1)
- Outline of the type and book value, etc., of assets that were transferred to the national treasury as unnecessary property
| | | | | | | | | | | | |||||||||||
|---|---|---|---|---|---|---|---|---|---|---|---|---|---|---|---|---|---|---|---|---|---|
| (Unit: Yen) | |||||||||||||||||||||
| | | | | | | | | | | | | | | | | | | | | | |
| Name of asset | Usage | Location | Type | Book value at time of transfer | |||||||||||||||||
| | | | | | | | | | | | | | | | | | | | | | |
| Former Hiroo Center | Operational | Shibuya-Ward, | Buildings | 827,504,343 | |||||||||||||||||
| | | | | | | | | | | | | | | | | | | | | | |
| facilities | Tokyo | Structures | 824,368 | ||||||||||||||||||
| | | | | | | | | | | | | | | | | | | | | | |
| Machinery and equipment | 489,475 | ||||||||||||||||||||
| | | | | | | | | | | | | | | | | | | | | | |
| Tools, furniture, and fixtures | 1,640,532 | ||||||||||||||||||||
| | | | | | | | | | | | | | | | | | | | | | |
| Land | 1,342,939,195 | ||||||||||||||||||||
| | | | | | | | | | | | | | | | | | | | | | |
- (2)
- Reason for unnecessary property
Based on the Midterm Plan, etc., it was decided that unnecessary property would be disposed of by payments to the national treasury, in accordance with the Act for partial revision of the Act on General Rules for Incorporated Administrative Agencies (Act No. 37 of 2010), which prescribed returns of unnecessary property to the national treasury by Incorporated Administrative Agencies.
- (3)
- Method of payment to the national treasury: Transfer by payment in kind pursuant to Paragraph 1 of Article 46-2 of the Act on General Rules for Incorporated Administrative Agencies.
- (4)
- Amount and date of payment to the national treasury: Payment in kind, December 19, 2014
- (5)
- Capital reduction: ¥3,050,273,698
(Significant Contractual Liabilities)
Contractual liabilities JICA is obligated to pay from the next business year onward are ¥6,115,524,053
(Significant subsequent events)
On April 1, 2015, JICA obtained approval from the Minister of Health, Labour and Welfare for exemption from the obligations of future payments related to return of a substitutional portion of the Employees' Pension Fund. Accordingly, based on Paragraph 44-2 of the "Practical Guidelines concerning Accounting Standard for Retirement Benefits (Interim Report)" (Japan Institute of Certified Public Accountants, Accounting System Committee Report No. 13), the expiry of retirement benefit obligations corresponding to the substitutional portion and related gain (loss) were recognized as of the date of the approval. In business year 2015, a provisional deduction of ¥11,683,928,148 in the administrative service operation cost is to be recorded as a result of the expiry of retirement benefit obligations corresponding to the substitutional portion.
Appropriation of profit was approved as follows on July 31, 2015:
| (Unit: Yen) | ||||||||
I. | Unappropriated income for the current business year | 1,436,297,748 | |||||||
| | | | | | | | | | |
Total income for the current business year | 1,436,297,748 | ||||||||
II. | Profit appropriation amount | ||||||||
Reserve fund | 1,436,297,748 | 1,436,297,748 | |||||||
| | | | | | | | | | |
| | | | | | | | | | |
| | | | | | | | | | |
F-15
General Account
- (1)
- Details of acquisition and disposal of noncurrent assets, depreciation (including depreciation not included in expenses, in accordance with "No. 87 Accounting for the Depreciation of Specific Depreciable Assets" and "No. 91 Accounting for Specific Removal Costs, etc., associated with Asset Retirement Obligations"), and accumulated impairment loss
| (Unit: Yen) | |||||||||||||||||||||||||||||||||||||||||||||||||||||||||||||||
| | | | | | | | | | | | | | | | | | | | | | | | | | | | | | | | | | | | | | | | | | | | | | | | | | | | | | | | | | | | | | | | |
| Accumulated depreciation | Accumulated impairment loss | ||||||||||||||||||||||||||||||||||||||||||||||||||||||||||||||
| | | | | | | | | | | | | | | | | | | | | | | | | | | | | | | | | | | | | | | | | | | | | | | | | | | | | | | | | | | | | | | | |
| Type | Balance at the beginning of the period | Increase during the period | Decrease during the period | Balance at the end of the period | Depreciation during the period | Impairment loss during the period (recognized in the statement of income) | Impairment loss during the period (not recognized in the statement of income) | Net assets at the end of the period | Remarks | ||||||||||||||||||||||||||||||||||||||||||||||||||||||
| | | | | | | | | | | | | | | | | | | | | | | | | | | | | | | | | | | | | | | | | | | | | | | | | | | | | | | | | | | | | | | | |
| Buildings | 1,101,324,028 | 183,021,977 | 104,118,070 | 1,180,227,935 | 283,750,656 | 62,836,620 | 0 | 0 | 0 | 896,477,279 | |||||||||||||||||||||||||||||||||||||||||||||||||||||
| | | | | | | | | | | | | | | | | | | | | | | | | | | | | | | | | | | | | | | | | | | | | | | | | | | | | | | | | | | | | | | | |
| Structures | 62,026,200 | 23,369,263 | 2,257,500 | 83,137,963 | 19,286,297 | 4,495,839 | 0 | 0 | 0 | 63,851,666 | |||||||||||||||||||||||||||||||||||||||||||||||||||||
| | | | | | | | | | | | | | | | | | | | | | | | | | | | | | | | | | | | | | | | | | | | | | | | | | | | | | | | | | | | | | | | |
| Tangible assets (depreciation included in expenses) | Machinery and equipment | 104,782,756 | 1,562,008 | 6,467,115 | 99,877,649 | 49,216,346 | 9,050,901 | 0 | 0 | 0 | 50,661,303 | ||||||||||||||||||||||||||||||||||||||||||||||||||||
| | | | | | | | | | | | | | | | | | | | | | | | | | | | | | | | | | | | | | | | | | | | | | | | | | | | | | | | | | | | | | | | |
| Vehicles | 1,683,551,132 | 93,937,956 | 102,133,984 | 1,675,355,104 | 1,125,317,748 | 155,622,625 | 0 | �� | 0 | 0 | 550,037,356 | ||||||||||||||||||||||||||||||||||||||||||||||||||||
| | | | | | | | | | | | | | | | | | | | | | | | | | | | | | | | | | | | | | | | | | | | | | | | | | | | | | | | | | | | | | | | |
| Tools, furniture, and fixtures | 1,567,101,114 | 272,522,433 | 70,945,456 | 1,768,678,091 | 1,021,631,999 | 238,101,258 | 0 | 0 | 0 | 747,046,092 | |||||||||||||||||||||||||||||||||||||||||||||||||||||
| | | | | | | | | | | | | | | | | | | | | | | | | | | | | | | | | | | | | | | | | | | | | | | | | | | | | | | | | | | | | | | | |
| Total | 4,518,785,230 | 574,413,637 | 285,922,125 | 4,807,276,742 | 2,499,203,046 | 470,107,243 | 0 | 0 | 0 | 2,308,073,696 | |||||||||||||||||||||||||||||||||||||||||||||||||||||
| | | | | | | | | | | | | | | | | | | | | | | | | | | | | | | | | | | | | | | | | | | | | | | | | | | | | | | | | | | | | | | | |
| Buildings | 41,454,466,666 | 221,043,852 | 1,844,613,526 | 39,830,896,992 | 15,250,997,443 | 1,333,999,901 | 46,536,790 | 0 | 34,738 | 24,533,362,759 | |||||||||||||||||||||||||||||||||||||||||||||||||||||
| | | | | | | | | | | | | | | | | | | | | | | | | | | | | | | | | | | | | | | | | | | | | | | | | | | | | | | | | | | | | | | | |
| Structures | 1,473,786,541 | 0 | 9,720,927 | 1,464,065,614 | 945,355,243 | 53,534,447 | 375,844 | 0 | 0 | 518,334,527 | |||||||||||||||||||||||||||||||||||||||||||||||||||||
| | | | | | | | | | | | | | | | | | | | | | | | | | | | | | | | | | | | | | | | | | | | | | | | | | | | | | | | | | | | | | | | |
| Tangible assets (depreciation not included in expenses) | Machinery and equipment | 83,942,444 | 4,024,135 | 6,596,062 | 81,370,517 | 69,672,101 | 60,362 | 0 | 0 | 0 | 11,698,416 | ||||||||||||||||||||||||||||||||||||||||||||||||||||
| | | | | | | | | | | | | | | | | | | | | | | | | | | | | | | | | | | | | | | | | | | | | | | | | | | | | | | | | | | | | | | | |
| Vehicles | 158,456,316 | 0 | 15,080,841 | 143,375,475 | 129,037,927 | 0 | 0 | 0 | 0 | 14,337,548 | |||||||||||||||||||||||||||||||||||||||||||||||||||||
| | | | | | | | | | | | | | | | | | | | | | | | | | | | | | | | | | | | | | | | | | | | | | | | | | | | | | | | | | | | | | | | |
| Tools, furniture, and fixtures | 597,592,903 | 0 | 18,324,843 | 579,268,060 | 345,834,508 | 16,067,521 | 0 | 0 | 0 | 233,433,552 | |||||||||||||||||||||||||||||||||||||||||||||||||||||
| | | | | | | | | | | | | | | | | | | | | | | | | | | | | | | | | | | | | | | | | | | | | | | | | | | | | | | | | | | | | | | | |
| Total | 43,768,244,870 | 225,067,987 | 1,894,336,199 | 42,098,976,658 | 16,740,897,222 | 1,403,662,231 | 46,912,634 | 0 | 34,738 | 25,311,166,802 | |||||||||||||||||||||||||||||||||||||||||||||||||||||
| | | | | | | | | | | | | | | | | | | | | | | | | | | | | | | | | | | | | | | | | | | | | | | | | | | | | | | | | | | | | | | | |
| Land | 16,754,683,536 | 0 | 1,784,170,078 | 14,970,513,458 | 0 | 0 | 234,596,912 | 0 | 8,732,862 | 14,735,916,546 | |||||||||||||||||||||||||||||||||||||||||||||||||||||
| | | | | | | | | | | | | | | | | | | | | | | | | | | | | | | | | | | | | | | | | | | | | | | | | | | | | | | | | | | | | | | | |
| Nondepreciable assets | Construction in progress | 18,900,000 | 74,872,458 | 22,711,560 | 71,060,898 | 0 | 0 | 0 | 0 | 0 | 71,060,898 | ||||||||||||||||||||||||||||||||||||||||||||||||||||
| | | | | | | | | | | | | | | | | | | | | | | | | | | | | | | | | | | | | | | | | | | | | | | | | | | | | | | | | | | | | | | | |
| Total | 16,773,583,536 | 74,872,458 | 1,806,881,638 | 15,041,574,356 | 0 | 0 | 234,596,912 | 0 | 8,732,862 | 14,806,977,444 | |||||||||||||||||||||||||||||||||||||||||||||||||||||
| | | | | | | | | | | | | | | | | | | | | | | | | | | | | | | | | | | | | | | | | | | | | | | | | | | | | | | | | | | | | | | | |
| Buildings | 42,555,790,694 | 404,065,829 | 1,948,731,596 | 41,011,124,927 | 15,534,748,099 | 1,396,836,521 | 46,536,790 | 0 | 34,738 | 25,429,840,038 | |||||||||||||||||||||||||||||||||||||||||||||||||||||
| | | | | | | | | | | | | | | | | | | | | | | | | | | | | | | | | | | | | | | | | | | | | | | | | | | | | | | | | | | | | | | | |
| Structures | 1,535,812,741 | 23,369,263 | 11,978,427 | 1,547,203,577 | 964,641,540 | 58,030,286 | 375,844 | 0 | 0 | 582,186,193 | |||||||||||||||||||||||||||||||||||||||||||||||||||||
| | | | | | | | | | | | | | | | | | | | | | | | | | | | | | | | | | | | | | | | | | | | | | | | | | | | | | | | | | | | | | | | |
| Machinery and equipment | 188,725,200 | 5,586,143 | 13,063,177 | 181,248,166 | 118,888,447 | 9,111,263 | 0 | 0 | 0 | 62,359,719 | |||||||||||||||||||||||||||||||||||||||||||||||||||||
| | | | | | | | | | | | | | | | | | | | | | | | | | | | | | | | | | | | | | | | | | | | | | | | | | | | | | | | | | | | | | | | |
| Total tangible assets | Vehicles | 1,842,007,448 | 93,937,956 | 117,214,825 | 1,818,730,579 | 1,254,355,675 | 155,622,625 | 0 | 0 | 0 | 564,374,904 | ||||||||||||||||||||||||||||||||||||||||||||||||||||
| | | | | | | | | | | | | | | | | | | | | | | | | | | | | | | | | | | | | | | | | | | | | | | | | | | | | | | | | | | | | | | | |
| Tools, furniture, and fixtures | 2,164,694,017 | 272,522,433 | 89,270,299 | 2,347,946,151 | 1,367,466,507 | 254,168,779 | 0 | 0 | 0 | 980,479,644 | |||||||||||||||||||||||||||||||||||||||||||||||||||||
| | | | | | | | | | | | | | | | | | | | | | | | | | | | | | | | | | | | | | | | | | | | | | | | | | | | | | | | | | | | | | | | |
| Land | 16,754,683,536 | 0 | 1,784,170,078 | 14,970,513,458 | 0 | 0 | 234,596,912 | 0 | 8,732,862 | 14,735,916,546 | |||||||||||||||||||||||||||||||||||||||||||||||||||||
| | | | | | | | | | | | | | | | | | | | | | | | | | | | | | | | | | | | | | | | | | | | | | | | | | | | | | | | | | | | | | | | |
| Construction in progress | 18,900,000 | 74,872,458 | 22,711,560 | 71,060,898 | 0 | 0 | 0 | 0 | 0 | 71,060,898 | |||||||||||||||||||||||||||||||||||||||||||||||||||||
| | | | | | | | | | | | | | | | | | | | | | | | | | | | | | | | | | | | | | | | | | | | | | | | | | | | | | | | | | | | | | | | |
| Total | 65,060,613,636 | 874,354,082 | 3,987,139,962 | 61,947,827,756 | 19,240,100,268 | 1,873,769,474 | 281,509,546 | 0 | 8,767,600 | 42,426,217,942 | |||||||||||||||||||||||||||||||||||||||||||||||||||||
| | | | | | | | | | | | | | | | | | | | | | | | | | | | | | | | | | | | | | | | | | | | | | | | | | | | | | | | | | | | | | | | |
| Intangible assets (depreciation included in expenses) | Trademark right | 5,176,537 | 2,268,036 | 0 | 7,444,573 | 5,013,913 | 383,105 | 0 | 0 | 0 | 2,430,660 | ||||||||||||||||||||||||||||||||||||||||||||||||||||
| | | | | | | | | | | | | | | | | | | | | | | | | | | | | | | | | | | | | | | | | | | | | | | | | | | | | | | | | | | | | | | | |
| Telephone subscription right | 0 | 0 | 0 | 0 | 0 | 0 | 0 | 0 | 0 | 0 | |||||||||||||||||||||||||||||||||||||||||||||||||||||
| | | | | | | | | | | | | | | | | | | | | | | | | | | | | | | | | | | | | | | | | | | | | | | | | | | | | | | | | | | | | | | | |
| Total | 5,176,537 | 2,268,036 | 0 | 7,444,573 | 5,013,913 | 383,105 | 0 | 0 | 0 | 2,430,660 | |||||||||||||||||||||||||||||||||||||||||||||||||||||
| | | | | | | | | | | | | | | | | | | | | | | | | | | | | | | | | | | | | | | | | | | | | | | | | | | | | | | | | | | | | | | | |
| Intangible assets (depreciation not included in expenses) | Trademark right | 1,139,550 | 0 | 0 | 1,139,550 | 1,139,550 | 18,992 | 0 | 0 | 0 | 0 | ||||||||||||||||||||||||||||||||||||||||||||||||||||
| | | | | | | | | | | | | | | | | | | | | | | | | | | | | | | | | | | | | | | | | | | | | | | | | | | | | | | | | | | | | | | | |
| Telephone subscription right | 12,088,650 | 0 | 0 | 12,088,650 | 0 | 0 | 7,871,900 | 0 | 0 | 4,216,750 | |||||||||||||||||||||||||||||||||||||||||||||||||||||
| | | | | | | | | | | | | | | | | | | | | | | | | | | | | | | | | | | | | | | | | | | | | | | | | | | | | | | | | | | | | | | | |
| Total | 13,228,200 | 0 | 0 | 13,228,200 | 1,139,550 | 18,992 | 7,871,900 | 0 | 0 | 4,216,750 | |||||||||||||||||||||||||||||||||||||||||||||||||||||
| | | | | | | | | | | | | | | | | | | | | | | | | | | | | | | | | | | | | | | | | | | | | | | | | | | | | | | | | | | | | | | | |
| Trademark right | 6,316,087 | 2,268,036 | 0 | 8,584,123 | 6,153,463 | 402,097 | 0 | 0 | 0 | 2,430,660 | |||||||||||||||||||||||||||||||||||||||||||||||||||||
| | | | | | | | | | | | | | | | | | | | | | | | | | | | | | | | | | | | | | | | | | | | | | | | | | | | | | | | | | | | | | | | |
| Total intangible assets | Telephone subscription right | 12,088,650 | 0 | 0 | 12,088,650 | 0 | 0 | 7,871,900 | 0 | 0 | 4,216,750 | ||||||||||||||||||||||||||||||||||||||||||||||||||||
| | | | | | | | | | | | | | | | | | | | | | | | | | | | | | | | | | | | | | | | | | | | | | | | | | | | | | | | | | | | | | | | |
| Total | 18,404,737 | 2,268,036 | 0 | 20,672,773 | 6,153,463 | 402,097 | 7,871,900 | 0 | 0 | 6,647,410 | |||||||||||||||||||||||||||||||||||||||||||||||||||||
| | | | | | | | | | | | | | | | | | | | | | | | | | | | | | | | | | | | | | | | | | | | | | | | | | | | | | | | | | | | | | | | |
| Long-term deposits | 300,000,000 | 0 | 0 | 300,000,000 | 0 | 0 | 0 | 0 | 0 | 300,000,000 | |||||||||||||||||||||||||||||||||||||||||||||||||||||
| | | | | | | | | | | | | | | | | | | | | | | | | | | | | | | | | | | | | | | | | | | | | | | | | | | | | | | | | | | | | | | | |
| Long-term loans for development projects | 808,759,484 | 0 | 412,684,000 | 396,075,484 | 0 | 0 | 0 | 0 | 0 | 396,075,484 | |||||||||||||||||||||||||||||||||||||||||||||||||||||
| | | | | | | | | | | | | | | | | | | | | | | | | | | | | | | | | | | | | | | | | | | | | | | | | | | | | | | | | | | | | | | | |
| Allowance for loan losses (non-current) | (10,942,908 | ) | 0 | (1,857,422 | ) | (9,085,486 | ) | 0 | 0 | 0 | 0 | 0 | (9,085,486 | ) | |||||||||||||||||||||||||||||||||||||||||||||||||
| | | | | | | | | | | | | | | | | | | | | | | | | | | | | | | | | | | | | | | | | | | | | | | | | | | | | | | | | | | | | | | | |
| Long-term loans for emigration projects | 200,536,281 | 1,301,005 | 96,385,496 | 105,451,790 | 0 | 0 | 0 | 0 | 0 | 105,451,790 | |||||||||||||||||||||||||||||||||||||||||||||||||||||
| | | | | | | | | | | | | | | | | | | | | | | | | | | | | | | | | | | | | | | | | | | | | | | | | | | | | | | | | | | | | | | | |
| Allowance for loan losses (non-current) | (82,803,362 | ) | 0 | (25,494,932 | ) | (57,308,430 | ) | 0 | 0 | 0 | 0 | 0 | (57,308,430 | ) | |||||||||||||||||||||||||||||||||||||||||||||||||
| | | | | | | | | | | | | | | | | | | | | | | | | | | | | | | | | | | | | | | | | | | | | | | | | | | | | | | | | | | | | | | | |
| Long-term installments receivable on settlement projects | 0 | 0 | (162,930 | ) | 162,930 | 0 | 0 | 0 | 0 | 0 | 162,930 | ||||||||||||||||||||||||||||||||||||||||||||||||||||
| | | | | | | | | | | | | | | | | | | | | | | | | | | | | | | | | | | | | | | | | | | | | | | | | | | | | | | | | | | | | | | | |
| Claims probable in bankruptcy, claims probable in rehabilitation, and other pertaining to loans for development projects | 204,122,076 | 0 | 13,011,599 | 191,110,477 | 0 | 0 | 0 | 0 | 0 | 191,110,477 | |||||||||||||||||||||||||||||||||||||||||||||||||||||
| | | | | | | | | | | | | | | | | | | | | | | | | | | | | | | | | | | | | | | | | | | | | | | | | | | | | | | | | | | | | | | | |
| Investments and other assets | Allowance for loan losses (non-current) | (120,257,680 | ) | 0 | (164,350 | ) | (120,093,330 | ) | 0 | 0 | 0 | 0 | 0 | (120,093,330 | ) | ||||||||||||||||||||||||||||||||||||||||||||||||
| | | | | | | | | | | | | | | | | | | | | | | | | | | | | | | | | | | | | | | | | | | | | | | | | | | | | | | | | | | | | | | | |
| Claims probable in bankruptcy, claims probable in rehabilitation, and other pertaining to loans for emigration projects | 835,740,990 | 1,000,630 | 27,068,512 | 809,673,108 | 0 | 0 | 0 | 0 | 0 | 809,673,108 | |||||||||||||||||||||||||||||||||||||||||||||||||||||
| | | | | | | | | | | | | | | | | | | | | | | | | | | | | | | | | | | | | | | | | | | | | | | | | | | | | | | | | | | | | | | | |
| Allowance for loan losses (non-current) | (835,740,990 | ) | 0 | (26,067,882 | ) | (809,673,108 | ) | 0 | 0 | 0 | 0 | 0 | (809,673,108 | ) | |||||||||||||||||||||||||||||||||||||||||||||||||
| | | | | | | | | | | | | | | | | | | | | | | | | | | | | | | | | | | | | | | | | | | | | | | | | | | | | | | | | | | | | | | | |
| Claims probable in bankruptcy, claims probable in rehabilitation, and other pertaining to installments receivable on settlement projects | 10,798,689 | 0 | 8,156,942 | 2,641,747 | 0 | 0 | 0 | 0 | 0 | 2,641,747 | |||||||||||||||||||||||||||||||||||||||||||||||||||||
| | | | | | | | | | | | | | | | | | | | | | | | | | | | | | | | | | | | | | | | | | | | | | | | | | | | | | | | | | | | | | | | |
| Allowance for loan losses (non-current) | (10,798,689 | ) | 0 | (8,156,942 | ) | (2,641,747 | ) | 0 | 0 | 0 | 0 | 0 | (2,641,747 | ) | |||||||||||||||||||||||||||||||||||||||||||||||||
| | | | | | | | | | | | | | | | | | | | | | | | | | | | | | | | | | | | | | | | | | | | | | | | | | | | | | | | | | | | | | | | |
| Long-term prepaid expenses | 33,594,971 | 110,434,929 | 33,594,971 | 110,434,929 | 0 | 0 | 0 | 0 | 0 | 110,434,929 | |||||||||||||||||||||||||||||||||||||||||||||||||||||
| | | | | | | | | | | | | | | | | | | | | | | | | | | | | | | | | | | | | | | | | | | | | | | | | | | | | | | | | | | | | | | | |
| Long-term guarantee deposits | 1,543,409,157 | 69,867,437 | 74,079,017 | 1,539,197,577 | 0 | 0 | 0 | 0 | 0 | 1,539,197,577 | |||||||||||||||||||||||||||||||||||||||||||||||||||||
| | | | | | | | | | | | | | | | | | | | | | | | | | | | | | | | | | | | | | | | | | | | | | | | | | | | | | | | | | | | | | | | |
| Total | 2,876,418,019 | 182,604,001 | 603,076,079 | 2,455,945,941 | 0 | 0 | 0 | 0 | 0 | 2,455,945,941 | |||||||||||||||||||||||||||||||||||||||||||||||||||||
| | | | | | | | | | | | | | | | | | | | | | | | | | | | | | | | | | | | | | | | | | | | | | | | | | | | | | | | | | | | | | | | |
F-16
(2) Details of inventories
| (Unit: Yen) | |||||||||||||||||||||||||||||||||||||||
| | | | | | | | | | | | | | | | | | | | | | | | | | | | | | | | | | | | | | | | |
| Increase during the period | Decrease during the period | ||||||||||||||||||||||||||||||||||||||
| | | | | | | | | | | | | | | | | | | | | | | | | | | | | | | | | | | | | | | | |
| Type | Balance at the beginning of the period | Purchase, manufacturing and transfer for the current business year | Others | Delivery and transfer | Others | Balance at the end of the period | Remarks | ||||||||||||||||||||||||||||||||
| | | | | | | | | | | | | | | | | | | | | | | | | | | | | | | | | | | | | | | | |
| Stored goods | 377,487,425 | 149,651,825 | 0 | 167,887,858 | 0 | 359,251,392 | |||||||||||||||||||||||||||||||||
| | | | | | | | | | | | | | | | | | | | | | | | | | | | | | | | | | | | | | | | |
Stockpile | 377,487,425 | 149,651,825 | 0 | 167,887,858 | 0 | 359,251,392 | |||||||||||||||||||||||||||||||||
| | | | | | | | | | | | | | | | | | | | | | | | | | | | | | | | | | | | | | | | |
Japan | 51,432,766 | 0 | 0 | 0 | 0 | 51,432,766 | |||||||||||||||||||||||||||||||||
| | | | | | | | | | | | | | | | | | | | | | | | | | | | | | | | | | | | | | | | |
USA | 79,302,676 | 20,676,706 | 0 | 18,849,141 | 0 | 81,130,241 | |||||||||||||||||||||||||||||||||
| | | | | | | | | | | | | | | | | | | | | | | | | | | | | | | | | | | | | | | | |
Germany | 27,334,795 | 0 | 0 | 27,334,795 | 0 | 0 | |||||||||||||||||||||||||||||||||
| | | | | | | | | | | | | | | | | | | | | | | | | | | | | | | | | | | | | | | | |
Singapore | 158,794,774 | 30,188,671 | 0 | 27,422,491 | 0 | 161,560,954 | |||||||||||||||||||||||||||||||||
| | | | | | | | | | | | | | | | | | | | | | | | | | | | | | | | | | | | | | | | |
Malaysia | 22,777,607 | 493,580 | 0 | 23,271,187 | 0 | 0 | |||||||||||||||||||||||||||||||||
| | | | | | | | | | | | | | | | | | | | | | | | | | | | | | | | | | | | | | | | |
Ghana | 13,851,474 | 6,583,978 | 0 | 14,572,626 | 0 | 5,862,826 | |||||||||||||||||||||||||||||||||
| | | | | | | | | | | | | | | | | | | | | | | | | | | | | | | | | | | | | | | | |
UAE | 23,993,333 | 91,708,890 | 0 | 56,437,618 | 0 | 59,264,605 | |||||||||||||||||||||||||||||||||
| | | | | | | | | | | | | | | | | | | | | | | | | | | | | | | | | | | | | | | | |
| Payments for uncompleted contracted programs | 883,872,816 | 837,734,760 | 0 | 883,872,816 | 0 | 837,734,760 | |||||||||||||||||||||||||||||||||
| | | | | | | | | | | | | | | | | | | | | | | | | | | | | | | | | | | | | | | | |
| Total | 1,261,360,241 | 987,386,585 | 0 | 1,051,760,674 | 0 | 1,196,986,152 | |||||||||||||||||||||||||||||||||
| | | | | | | | | | | | | | | | | | | | | | | | | | | | | | | | | | | | | | | | |
(3) Details of securities
Securities reported as current assets
(Unit: Yen) | |||||||||||||||||||||||||||||||||
| | | | | | | | | | | | | | | | | | | | | | | | | | | | | | | | | | |
|
| Type and name | Acquisition cost | Aggregate face amount | Balance sheet amount | Valuation difference included in current expenses | Remarks | ||||||||||||||||||||||||||
| | | | | | | | | | | | | | | | | | | | | | | | | | | | | | | | | | |
| Negotiable deposits | 99,000,000,000 | 99,000,000,000 | 99,000,000,000 | 0 | ||||||||||||||||||||||||||||
| | | | | | | | | | | | | | | | | | | | | | | | | | | | | | | | | | |
F-17
(4) Details of loans
| (Unit: Yen) | ||||||||||||||||||||||||||||||||||
| | | | | | | | | | | | | | | | | | | | | | | | | | | | | | | | | | | |
| Decrease during the period | ||||||||||||||||||||||||||||||||||
| | | | | | | | | | | | | | | | | | | | | | | | | | | | | | | | | | | |
| Classification | Balance at the beginning of the period | Increase during the period | Collection | Others | Balance at the end of the period | Remarks | ||||||||||||||||||||||||||||
| | | | | | | | | | | | | | | | | | | | | | | | | | | | | | | | | | | |
| Other short-term loans | ||||||||||||||||||||||||||||||||||
| | | | | | | | | | | | | | | | | | | | | | | | | | | | | | | | | | | |
Loans for development projects | 416,234,000 | 412,684,000 | 416,234,000 | 0 | 412,684,000 | |||||||||||||||||||||||||||||
| | | | | | | | | | | | | | | | | | | | | | | | | | | | | | | | | | | |
Loans for emigration projects | 110,201,965 | 9,061,905 | 108,830,436 | 214,599 | 10,218,835 | |||||||||||||||||||||||||||||
| | | | | | | | | | | | | | | | | | | | | | | | | | | | | | | | | | | |
Installments receivable on settlement projects | 0 | 52,337 | 0 | (2,501 | ) | 54,838 | ||||||||||||||||||||||||||||
| | | | | | | | | | | | | | | | | | | | | | | | | | | | | | | | | | | |
| (Subtotal) | 526,435,965 | 421,798,242 | 525,064,436 | 212,098 | 422,957,673 | |||||||||||||||||||||||||||||
| | | | | | | | | | | | | | | | | | | | | | | | | | | | | | | | | | | |
| Other long-term loans | ||||||||||||||||||||||||||||||||||
| | | | | | | | | | | | | | | | | | | | | | | | | | | | | | | | | | | |
Loans for development projects | 1,012,881,560 | 0 | 13,011,599 | 412,684,000 | 587,185,961 | |||||||||||||||||||||||||||||
| | | | | | | | | | | | | | | | | | | | | | | | | | | | | | | | | | | |
Loans for emigration projects | 1,036,277,271 | 2,301,635 | 48,483,898 | 74,970,110 | 915,124,898 | |||||||||||||||||||||||||||||
| | | | | | | | | | | | | | | | | | | | | | | | | | | | | | | | | | | |
Installments receivable on settlement projects | 10,798,689 | 0 | 4,484,562 | 3,509,450 | 2,804,677 | |||||||||||||||||||||||||||||
| | | | | | | | | | | | | | | | | | | | | | | | | | | | | | | | | | | |
| (Subtotal) | 2,059,957,520 | 2,301,635 | 65,980,059 | 491,163,560 | 1,505,115,536 | |||||||||||||||||||||||||||||
| | | | | | | | | | | | | | | | | | | | | | | | | | | | | | | | | | | |
| Total | 2,586,393,485 | 424,099,877 | 591,044,495 | 491,375,658 | 1,928,073,209 | |||||||||||||||||||||||||||||
| | | | | | | | | | | | | | | | | | | | | | | | | | | | | | | | | | | |
- *
- "Others" shown under decrease during the period is due to transfer from long-term to short-term loans as well as from short-term to long-term loans, assignment of claim, year-end translation difference, etc.
F-18
(5) Details of allowance for loan losses, etc.
| (Unit: Yen) | ||||||||||||||||||||||||||||||||||||||
| | | | | | | | | | | | | | | | | | | | | | | | | | | | | | | | | | | | | | | |
| Balance of loans, etc. | Balance of allowance for loan losses | |||||||||||||||||||||||||||||||||||||
| | | | | | | | | | | | | | | | | | | | | | | | | | | | | | | | | | | | | | | |
Classification | Balance at the beginning of the period | Increase or decrease during the period | Balance at the end of the period | Balance at the beginning of the period | Increase or decrease during the period | Balance at the end of the period | Remarks | |||||||||||||||||||||||||||||||
| | | | | | | | | | | | | | | | | | | | | | | | | | | | | | | | | | | | | | | |
| (Development projects) | ||||||||||||||||||||||||||||||||||||||
| | | | | | | | | | | | | | | | | | | | | | | | | | | | | | | | | | | | | | | |
| Short-term loans for development projects | 416,234,000 | (3,550,000 | ) | 412,684,000 | 1,336,349 | (357,025 | ) | 979,324 | ||||||||||||||||||||||||||||||
| | | | | | | | | | | | | | | | | | | | | | | | | | | | | | | | | | | | | | | |
| Ordinary loans | 416,234,000 | (3,550,000 | ) | 412,684,000 | 1,336,349 | (357,025 | ) | 979,324 | Year-end balance of loans is preserved as follows: Bank guarantee ¥29,184,000 Joint and several guarantee ¥6,500,000 Loans to the Federative Republic of Brazil ¥377,000,000 | |||||||||||||||||||||||||||||
| | | | | | | | | | | | | | | | | | | | | | | | | | | | | | | | | | | | | | | |
| Long-term loans for development projects | 1,012,881,560 | (425,695,599 | ) | 587,185,961 | 131,200,588 | (2,021,772 | ) | 129,178,816 | ||||||||||||||||||||||||||||||
| | | | | | | | | | | | | | | | | | | | | | | | | | | | | | | | | | | | | | | |
Ordinary loans | 808,759,484 | (412,684,000 | ) | 396,075,484 | 10,942,908 | (1,857,422 | ) | 9,085,486 | Year-end balance of loans is preserved as follows: Bank guarantee ¥129,261,477 | |||||||||||||||||||||||||||||
| | | | | | | | | | | | | | | | | | | | | | | | | | | | | | | | | | | | | | | |
Doubtful loans | 0 | 0 | 0 | 0 | 0 | 0 | Joint and several guarantee ¥224,093,330 Provision of collateral (government bonds) | |||||||||||||||||||||||||||||||
| | | | | | | | | | | | | | | | | | | | | | | | | | | | | | | | | | | | | | | |
Claims probable in bankruptcy, claims probable in rehabilitation, and other | 204,122,076 | (13,011,599 | ) | 191,110,477 | 120,257,680 | (164,350 | ) | 120,093,330 | ¥46,206,670 Loans to the Federative Republic of Brazil ¥187,624,484 | |||||||||||||||||||||||||||||
| | | | | | | | | | | | | | | | | | | | | | | | | | | | | | | | | | | | | | | |
(Development projects in total) | 1,429,115,560 | (429,245,599 | ) | 999,869,961 | 132,536,937 | (2,378,797 | ) | 130,158,140 | ||||||||||||||||||||||||||||||
| | | | | | | | | | | | | | | | | | | | | | | | | | | | | | | | | | | | | | | |
| (Emigration projects) | ||||||||||||||||||||||||||||||||||||||
| | | | | | | | | | | | | | | | | | | | | | | | | | | | | | | | | | | | | | | |
| Short-term loans for emigration projects | 110,201,965 | (99,983,130 | ) | 10,218,835 | 5,026,232 | (4,274,359 | ) | 751,873 | ||||||||||||||||||||||||||||||
| | | | | | | | | | | | | | | | | | | | | | | | | | | | | | | | | | | | | | | |
Ordinary loans | 110,201,965 | (99,983,130 | ) | 10,218,835 | 5,026,232 | (4,274,359 | ) | 751,873 | ||||||||||||||||||||||||||||||
| | | | | | | | | | | | | | | | | | | | | | | | | | | | | | | | | | | | | | | |
| Long-term loans for emigration projects | 1,036,277,271 | (121,152,373 | ) | 915,124,898 | 918,544,352 | (51,562,814 | ) | 866,981,538 | ||||||||||||||||||||||||||||||
| | | | | | | | | | | | | | | | | | | | | | | | | | | | | | | | | | | | | | | |
Ordinary loans | 122,811,456 | (70,547,521 | ) | 52,263,935 | 5,078,537 | (957,962 | ) | 4,120,575 | ||||||||||||||||||||||||||||||
| | | | | | | | | | | | | | | | | | | | | | | | | | | | | | | | | | | | | | | |
Doubtful loans | 77,724,825 | (24,536,970 | ) | 53,187,855 | 77,724,825 | (24,536,970 | ) | 53,187,855 | ||||||||||||||||||||||||||||||
| | | | | | | | | | | | | | | | | | | | | | | | | | | | | | | | | | | | | | | |
Claims probable in bankruptcy, claims probable in rehabilitation, and other | 835,740,990 | (26,067,882 | ) | 809,673,108 | 835,740,990 | (26,067,882 | ) | 809,673,108 | ||||||||||||||||||||||||||||||
| | | | | | | | | | | | | | | | | | | | | | | | | | | | | | | | | | | | | | | |
(Emigration projects in total) | 1,146,479,236 | (221,135,503 | ) | 925,343,733 | 923,570,584 | (55,837,173 | ) | 867,733,411 | ||||||||||||||||||||||||||||||
| | | | | | | | | | | | | | | | | | | | | | | | | | | | | | | | | | | | | | | |
| (Installments receivable on settlement projects) | ||||||||||||||||||||||||||||||||||||||
| | | | | | | | | | | | | | | | | | | | | | | | | | | | | | | | | | | | | | | |
| Short-term installments receivable on settlement projects | 0 | 54,838 | 54,838 | 0 | 0 | 0 | ||||||||||||||||||||||||||||||||
| | | | | | | | | | | | | | | | | | | | | | | | | | | | | | | | | | | | | | | |
Ordinary loans | 0 | 54,838 | 54,838 | 0 | 0 | 0 | ||||||||||||||||||||||||||||||||
| | | | | | | | | | | | | | | | | | | | | | | | | | | | | | | | | | | | | | | |
| Long-term installments receivable on settlement projects | 10,798,689 | (7,994,012 | ) | 2,804,677 | 10,798,689 | (8,156,942 | ) | 2,641,747 | ||||||||||||||||||||||||||||||
| | | | | | | | | | | | | | | | | | | | | | | | | | | | | | | | | | | | | | | |
Ordinary loans | 0 | 162,930 | 162,930 | 0 | 0 | 0 | ||||||||||||||||||||||||||||||||
| | | | | | | | | | | | | | | | | | | | | | | | | | | | | | | | | | | | | | | |
Doubtful loans | 0 | 0 | 0 | 0 | 0 | 0 | ||||||||||||||||||||||||||||||||
| | | | | | | | | | | | | | | | | | | | | | | | | | | | | | | | | | | | | | | |
Claims probable in bankruptcy, claims probable in rehabilitation, and other | 10,798,689 | (8,156,942 | ) | 2,641,747 | 10,798,689 | (8,156,942 | ) | 2,641,747 | ||||||||||||||||||||||||||||||
| | | | | | | | | | | | | | | | | | | | | | | | | | | | | | | | | | | | | | | |
| (Installments receivable on settlement projects in total) | 10,798,689 | (7,939,174 | ) | 2,859,515 | 10,798,689 | (8,156,942 | ) | 2,641,747 | ||||||||||||||||||||||||||||||
| | | | | | | | | | | | | | | | | | | | | | | | | | | | | | | | | | | | | | | |
| Total | 2,586,393,485 | (658,320,276 | ) | 1,928,073,209 | 1,066,906,210 | (66,372,912 | ) | 1,000,533,298 | ||||||||||||||||||||||||||||||
| | | | | | | | | | | | | | | | | | | | | | | | | | | | | | | | | | | | | | | |
- *
- Standard for appropriation of allowance for loan losses is described in No. 5 of Significant Accounting Policies.
F-19
(6) Details of asset retirement obligations
| (Unit: Yen) | ||||||||||||||||||||||||||||
| | | | | | | | | | | | | | | | | | | | | | | | | | | | | |
| Classification | Balance at the beginning of the period | Increase during the period | Decrease during the period | Balance at the end of the period | Remarks | |||||||||||||||||||||||
| | | | | | | | | | | | | | | | | | | | | | | | | | | | | |
| Obligations of restoration to original state based on a building lease agreement | 275,645,506 | 480,344 | 0 | 276,125,850 | Specified expenses in Accounting Standard for Incorporated Administrative Agency No. 91 | |||||||||||||||||||||||
| | | | | | | | | | | | | | | | | | | | | | | | | | | | | |
(7) Details of capital and capital surplus
| (Unit: Yen) | |||||||||||||||||||||||||||||||||
| Classification | Balance at the beginning of the period | Increase during the period | Decrease during the period | Balance at the end of the period | Remarks | ||||||||||||||||||||||||||||
| Capital | Government investment | 66,700,645,691 | 0 | 3,483,433,828 | 63,217,211,863 | Capital reduction due to payments to the national treasury for unnecessary property | |||||||||||||||||||||||||||
| Total | 66,700,645,691 | 0 | 3,483,433,828 | 63,217,211,863 | |||||||||||||||||||||||||||||
| Capital surplus | |||||||||||||||||||||||||||||||||
Facility expenses | 1,693,914,117 | 164,588,170 | 0 | 1,858,502,287 | Increase due to acquisition of non-current assets | ||||||||||||||||||||||||||||
Operational grants | 147,492,722 | 34,010,117 | 15,725,728 | 165,777,111 | Increase/decrease due to long-term guarantee deposits | ||||||||||||||||||||||||||||
Specified assets in Accounting Standard for Incorporated Administrative Agency No. 87 | (122,494,000 | ) | 0 | 0 | (122,494,000 | ) | |||||||||||||||||||||||||||
Accumulated disposal and sale differential of non-current assets not included in expenses | (3,646,095,613 | ) | 0 | 270,832,104 | (3,916,927,717 | ) | Decrease due to sale or disposal of inherited assets | ||||||||||||||||||||||||||
Lease contracts | (113,690,859 | ) | 0 | 0 | (113,690,859 | ) | |||||||||||||||||||||||||||
Reserve fund carried over from the previous Mid-term Objective period | 75,889 | 5,560,950 | 75,889 | 5,560,950 | Increase due to acquisition of non-current assets | ||||||||||||||||||||||||||||
| Capital surplus | Specified expenses in Accounting Standard for Incorporated Administrative Agency No. 99 | 2,365,696,558 | 95,776,611 | 6,526,738 | 2,454,946,431 | Expenses for disposal of unnecessary property, etc. | |||||||||||||||||||||||||||
| Total | 324,898,814 | 299,935,848 | 293,160,459 | 331,674,203 | |||||||||||||||||||||||||||||
| Accumulated depreciation not included in expenses | (16,055,133,336 | ) | (1,403,681,223 | ) | (680,740,254 | ) | (16,778,074,305 | ) | Increase due to depreciation of non-current assets | ||||||||||||||||||||||||
| Total | (16,055,133,336 | ) | (1,403,681,223 | ) | (680,740,254 | ) | (16,778,074,305 | ) | |||||||||||||||||||||||||
| Accumulated impairment loss not included in expenses | (770,453,826 | ) | (8,767,600 | ) | (489,839,980 | ) | (289,381,446 | ) | Increase due to impairment of non-current assets | ||||||||||||||||||||||||
| Total | (770,453,826 | ) | (8,767,600 | ) | (489,839,980 | ) | (289,381,446 | ) | |||||||||||||||||||||||||
| Accumulated interest expenses not included in expenses | (6,708,693 | ) | (480,344 | ) | 0 | (7,189,037 | ) | Interest due to asset retirement obligations | |||||||||||||||||||||||||
| Total | (6,708,693 | ) | (480,344 | ) | 0 | (7,189,037 | ) | ||||||||||||||||||||||||||
| Total balance | (16,507,397,041 | ) | (1,112,993,319 | ) | (877,419,775 | ) | (16,742,970,585 | ) | |||||||||||||||||||||||||
F-20
(8) Details of reserve fund and details of reversal of reserve fund for specific purpose
- 1.
- Details of reserve fund
(Unit: Yen) | ||||||||||||||||||||||||||||
| | | | | | | | | | | | | | | | | | | | | | | | | | | | | |
| Classification | Balance at the beginning of the period | Increase during the period | Decrease during the period | Balance at the end of the period | Remarks | ||||||||||||||||||||||
| | | | | | | | | | | | | | | | | | | | | | | | | | | | | |
| Reserve fund carried over from the previous Mid-term Objective period | 2,503,237,214 | 0 | 470,192,388 | 2,033,044,826 | |||||||||||||||||||||||
| | | | | | | | | | | | | | | | | | | | | | | | | | | | | |
| Reserve fund of Paragraph 1 Article 44 of the Act on General Rules | 0 | 1,681,756,203 | 0 | 1,681,756,203 | Increase from the profit appropriation for Business Year 2013 | ||||||||||||||||||||||
| | | | | | | | | | | | | | | | | | | | | | | | | | | | | |
| Total | 2,503,237,214 | 1,681,756,203 | 470,192,388 | 3,714,801,029 | |||||||||||||||||||||||
| | | | | | | | | | | | | | | | | | | | | | | | | | | | | |
- 2.
- Details of reversal of reserve fund for specific purpose
| (Unit: Yen) | ||||||||||||||||||||||
| | | | | | | | | | | | | | | | | | | | | | | |
| Classification | Amount | Remarks | ||||||||||||||||||||
| | | | | | | | | | | | | | | | | | | | | | | |
Reversal amount of reserve fund for specific purpose | Reserve fund carried over from previous Mid-term Objective period | 464,631,438 | Advance payments and prepaid expenses expensed for the current period | 464,631,438 | ||||||||||||||||||
| | | | | | | | | | | | | | | | | | | | | | | |
| Others | Reserve fund carried over from previous Mid-term Objective period | 5,560,950 | Purchase of assets | 5,560,950 | ||||||||||||||||||
| | | | | | | | | | | | | | | | | | | | | | | |
Total | 470,192,388 | |||||||||||||||||||||
| | | | | | | | | | | | | | | | | | | | | | | |
(9) Details of operational grant liabilities, transfer for the current period, etc.
- 1.
- Details of changes in operational grant liabilities
| (Unit: Yen) | |||||||||||||||||||||||||||||||||||||||
| | | | | | | | | | | | | | | | | | | | | | | | | | | | | | | | | | | | | | | | |
| Transfer for the current period | |||||||||||||||||||||||||||||||||||||||
| | | | | | | | | | | | | | | | | | | | | | | | | | | | | | | | | | | | | | | | |
| The year of grant | Balance at the beginning of the period | Operational grants for the current period | Revenues from operational grants | Contra accounts for assets funded by operational grants | Capital surplus | Subtotal | Balance at the end of the period | ||||||||||||||||||||||||||||||||
| | | | | | | | | | | | | | | | | | | | | | | | | | | | | | | | | | | | | | | | |
| Business year 2012 | 4,733,508,600 | 0 | 2,579,722,422 | 0 | 0 | 2,579,722,422 | 2,153,786,178 | ||||||||||||||||||||||||||||||||
| | | | | | | | | | | | | | | | | | | | | | | | | | | | | | | | | | | | | | | | |
| Business year 2013 | 26,998,127,805 | 0 | 19,312,239,295 | 2,268,036 | 0 | 19,314,507,331 | 7,683,620,474 | ||||||||||||||||||||||||||||||||
| | | | | | | | | | | | | | | | | | | | | | | | | | | | | | | | | | | | | | | | |
| Business year 2014 | 0 | 159,293,481,000 | 122,296,757,629 | 560,587,321 | 32,560,400 | 122,889,905,350 | 36,403,575,650 | ||||||||||||||||||||||||||||||||
| | | | | | | | | | | | | | | | | | | | | | | | | | | | | | | | | | | | | | | | |
| Total | 31,731,636,405 | 159,293,481,000 | 144,188,719,346 | 562,855,357 | 32,560,400 | 144,784,135,103 | 46,240,982,302 | ||||||||||||||||||||||||||||||||
| | | | | | | | | | | | | | | | | | | | | | | | | | | | | | | | | | | | | | | | |
F-21
- 2.
- Details of transfer of operational grant liabilities for the current period
- (1)
- Grant provided in business year 2012
| (Unit: Yen) | |||||||||||||||||||||
| | | | | | | | | | | | | | | | | | | | | | |
| Classification | Amount | Breakdown | |||||||||||||||||||
| | | | | | | | | | | | | | | | | | | | | | |
| Revenues from operational grants | 2,579,722,422 | (1) | Operation to which the revenue recognition method based on incurred expenses is applied: all operations financed by operational grants | ||||||||||||||||||
| | | | | | | | | | | | | | | | | | | | | | |
| Transfer amount in accordance with the revenue recognition method based on incurred expenses | Contra accounts for assets funded by operational grants | 0 | (2) | Profit and loss in relation to the operation a) Amount of expenses recorded in the statement of income: ¥2,579,722,422 (Operating expenses: ¥2,579,722,422) | |||||||||||||||||
| | | | | | | | | | | | | | | | | | | | | | |
| Capital surplus | 0 | ||||||||||||||||||||
| | | | | | | | | | | | | | | | | | | | | | |
| Total | 2,579,722,422 | ||||||||||||||||||||
| | | | | | | | | | | | | | | | | | | | | | |
- (2)
- Grant provided in business year 2013
| (Unit: Yen) | |||||||||||||||||||||
| | | | | | | | | | | | | | | | | | | | | | |
| Classification | Amount | Breakdown | |||||||||||||||||||
| | | | | | | | | | | | | | | | | | | | | | |
| Revenues from operational grants | 19,312,239,295 | (1) | Operation to which the revenue recognition method based on incurred expenses is applied: all operations financed by operational grants | ||||||||||||||||||
| | | | | | | | | | | | | | | | | | | | | | |
| Transfer amount in accordance with the revenue recognition method based on incurred expenses | Contra accounts for assets funded by operational grants | 2,268,036 | (2) | Profit and loss in relation to the operation a) Amount of expenses recorded in the statement of income: ¥19,312,239,295 (Operating expenses: ¥19,225,927,425, General administrative expenses: ¥86,311,870) b) Acquisition cost of non-current assets: ¥2,268,036 Trademark right: ¥2,268,036 | |||||||||||||||||
| | | | | | | | | | | | | | | | | | | | | | |
| Capital surplus | 0 | ||||||||||||||||||||
| | | | | | | | | | | | | | | | | | | | | | |
| Total | 19,314,507,331 | ||||||||||||||||||||
| | | | | | | | | | | | | | | | | | | | | | |
- (3)
- Grant provided in business year 2014
| (Unit: Yen) | |||||||||||||||||||||
| | | | | | | | | | | | | | | | | | | | | | |
| Classification | Amount | Breakdown | |||||||||||||||||||
| | | | | | | | | | | | | | | | | | | | | | |
| (1) (2) | Operation to which the revenue recognition method based on incurred expenses is applied: all operations financed by operational grants Profit and loss in relation to the operation | ||||||||||||||||||||
Revenues from operational grants | 122,296,757,629 | a) Amount of expenses recorded in the statement of income: ¥231,282,193,688 (Operating expenses: ¥222,525,562,428, General administrative expenses: ¥8,756,631,260) b) Repayment amount for lease obligations: ¥151,618,859 | |||||||||||||||||||
| | | | | | | | | | | | | | | | | | | | | | |
| c) Revenues recorded in relation to self-revenues: ¥3,174,570,220 | |||||||||||||||||||||
| (Revenues from contracted programs: ¥1,130,942,926, Revenues from interest on development projects: ¥23,894,869, Donation revenues: ¥10,533,389 | |||||||||||||||||||||
| Transfer amount in accordance with the revenue recognition method based on incurred expenses | Contra accounts for assets funded by operational grants | 560,587,321 | Revenues from subsidy for facilities: ¥7,023,830, Revenues from settlement projects: ¥6,508,214, Revenues from emigration projects: ¥16,237,252 Miscellaneous income: ¥1,930,933,987, Interest income: ¥38,314,948, Gain on sales of non-current assets: ¥10,180,805) d) Acquisition cost of non-current assets: ¥560,587,321 Stockpile: ¥149,651,825, Consignment: ¥5,281,251, Buildings: ¥179,346,977, Structures: ¥23,369,263 Machinery and equipment: ¥1,562,008, Vehicles ¥91,150,385, Tools, furniture, and fixtures: ¥79,376,636, Construction in progress: ¥30,236,898 Long-term guarantee deposits: ¥612,078) | ||||||||||||||||||
| | | | | | | | | | | | | | | | | | | | | | |
| e) Amount recorded as long-term guarantee deposits: ¥32,560,400 | |||||||||||||||||||||
| Capital surplus | 32,560,400 | (3) | Estimation basis of transfer amount of operational grants Repayment amount of lease obligations (B) is added to the amount of expenses recorded in the statement of income (A), from which expenditure financed by resources other than operational grants (reserve fund carried over from the previous Mid-term Objective period and funds for grant aid) (C), expenditure to which self-revenues are allocated (D) and depreciation, etc., (E) are deducted. The calculation result is transferred to revenue. | ||||||||||||||||||
| | | | | | | | | | | | | | | | | | | | | | |
| Total | 122,889,905,350 | (A) ¥231,282,193,688 + (B) ¥151,618,859–(C) ¥106,992,454,317–(D) ¥1,491,477,872–(E) ¥653,122,729 = ¥122,296,757,629 | |||||||||||||||||||
| | | | | | | | | | | | | | | | | | | | | | |
F-22
- 3.
- Details of the balance of operational grant liabilities
(Unit: Yen) | |||||||||||||||||||||
| | | | | | | | | | | | | | | | | | | | | | |
| The year of grant | Balance of operational grant liabilities | Reasons for the accrual of balance and revenue generation plan | ||||||||||||||||||
| | | | | | | | | | | | | | | | | | | | | | |
|
| Balance in relation to operations to which the revenue recognition method based on incurred expenses is applied | 2,153,786,178 | Reasons for the accrual of balance of operational grant liabilities are as follows: carryover to the next business year due to inevitable reasons, etc., and posting as advance payments, prepaid expenses, etc. The balance of operational grant liabilities carried forward to the next business year will be transferred to revenue in the next business year. | |||||||||||||||||
| | | | | | | | | | | | | | | | | | | | | | |
| Total | 2,153,786,178 | |||||||||||||||||||
| | | | | | | | | | | | | | | | | | | | | | |
|
| Balance in relation to operations to which the revenue recognition method based on incurred expenses is applied | 7,683,620,474 | Reasons for the accrual of balance of operational grant liabilities are as follows: carryover to the next business year due to inevitable reasons, etc., and posting as advance payments, prepaid expenses, etc. The balance of operational grant liabilities carried forward to the next business year will be transferred to revenue in the next business year. Out of the balance of operational grant liabilities, the balance of special operating expenses amounts to ¥219. | |||||||||||||||||
| | | | | | | | | | | | | | | | | | | | | | |
| Total | 7,683,620,474 | |||||||||||||||||||
| | | | | | | | | | | | | | | | | | | | | | |
|
| Balance in relation to operations to which the revenue recognition method based on incurred expenses is applied | 36,403,575,650 | Reasons for the accrual of balance of operational grant liabilities are as follows: carryover to the next business year due to inevitable reasons, etc., and posting as advance payments, prepaid expenses, etc. The balance of operational grant liabilities carried forward to the next business year will be transferred to revenue in the next business year. | |||||||||||||||||
| | | | | | | | | | | | | | | | | | | | | | |
| Total | 36,403,575,650 | |||||||||||||||||||
| | | | | | | | | | | | | | | | | | | | | | |
(10) Details of facility expenses
| (Unit: Yen) | ||||||||||||||||||||||||||||
| | | | | | | | | | | | | | | | | | | | | | | | | | | | | |
| Breakdown of the accounting treatment mentioned on the left side | Remarks | |||||||||||||||||||||||||||
| | | | | | | | | | | | | | | | | | | | | | | | | | | | | |
Classification | Amount granted in the current period | Construction in progress facility expenses | Capital surplus | Revenues from subsidy for facilities | ||||||||||||||||||||||||
| | | | | | | | | | | | | | | | | | | | | | | | | | | | | |
| Subsidy for facilities | 152,712,000 | 0 | 145,688,170 | 7,023,830 | ||||||||||||||||||||||||
| | | | | | | | | | | | | | | | | | | | | | | | | | | | | |
| Total | 152,712,000 | 0 | 145,688,170 | 7,023,830 | ||||||||||||||||||||||||
| | | | | | | | | | | | | | | | | | | | | | | | | | | | | |
(11) Details of remunerations and salaries of officers and employees
| (Unit: Thousands of yen, persons) | ||||||||||||||||||||||||
| | | | | | | | | | | | | | | | | | | | | | | | | |
| Remunerations or salaries | Retirement benefits | |||||||||||||||||||||||
| | | | | | | | | | | | | | | | | | | | | | | | | |
| Classification | Payment amount | Number of people | Payment amount | Number of people | ||||||||||||||||||||
| | | | | | | | | | | | | | | | | | | | | | | | | |
| Officers | 166,867 | 12 | 3,094 | 2 | ||||||||||||||||||||
| | | | | | | | | | | | | | | | | | | | | | | | | |
| Employees | 14,732,308 | 1,853 | 537,886 | 71 | ||||||||||||||||||||
| | | | | | | | | | | | | | | | | | | | | | | | | |
| Total | 14,899,175 | 1,865 | 540,980 | 73 | ||||||||||||||||||||
| | | | | | | | | | | | | | | | | | | | | | | | | |
| (Notes) | 1. | Standard of payment of remunerations and retirement benefits to officers | |||
Remunerations and retirement benefits to officers are paid based on "Rules on Remuneration for Officers" and "Rules on Retirement Benefits for Officers" in place for Incorporated Administrative Agency—Japan International Cooperation Agency. | |||||
2. | Standard of payment of salaries and retirement benefits to employees | ||||
Salaries and retirement benefits to employees are paid based on "Rules on Salaries for Employees" and "Rules on Retirement Benefits for Employees" in place for Incorporated Administrative Agency—Japan International Cooperation Agency. | |||||
3. | Number of people | ||||
As for the number of people to whom remunerations or salaries are paid, the average number of JICA officers and employees during the period is used. | |||||
4. | Others | ||||
There are no part-time officers or employees classified as external members. |
F-23
(12) Segment information to be disclosed
(Unit: Yen) | ||||||||||||||||||||||||||||||||||||||||||||||||||||||||||||||||
| | | | | | | | | | | | | | | | | | | | | | | | | | | | | | | | | | | | | | | | | | | | | | | | | | | | | | | | | | | | | | | | | |
| Classification | (1) Technical cooperation | (2) Grant aid | (3) Citizens' cooperation activities, etc. | (4) Emigration | (5) Disaster relief activities | (6) Personnel training and securing | (7) Research and study | (8) Contracted programs | (9) Other operations | Subtotal | (10) Corporate common expenses, etc. | Total | |||||||||||||||||||||||||||||||||||||||||||||||||||
| | | | | | | | | | | | | | | | | | | | | | | | | | | | | | | | | | | | | | | | | | | | | | | | | | | | | | | | | | | | | | | | | |
| I. Operating expenses, revenues, and profits and losses | |||||||||||||||||||||||||||||||||||||||||||||||||||||||||||||||
| | | | | | | | | | | | | | | | | | | | | | | | | | | | | | | | | | | | | | | | | | | | | | | | | | | | | | | | | | | | | | | | | |
| Operating expenses | 71,067,788,315 | 106,701,027,386 | 15,723,182,122 | 304,637,764 | 1,424,272,171 | 240,653,255 | 12,443,562,099 | 1,128,383,920 | 10,533,389 | 209,044,040,421 | 34,816,681,506 | 243,860,721,927 | |||||||||||||||||||||||||||||||||||||||||||||||||||
| | | | | | | | | | | | | | | | | | | | | | | | | | | | | | | | | | | | | | | | | | | | | | | | | | | | | | | | | | | | | | | | | |
| Outsourcing expenses | 33,440,693,305 | 150,568,082 | 3,822,408,862 | 152,609,065 | 331,086,446 | 0 | 9,087,720,582 | 991,145,209 | 8,924,026 | 47,985,155,577 | 0 | 47,985,155,577 | |||||||||||||||||||||||||||||||||||||||||||||||||||
| | | | | | | | | | | | | | | | | | | | | | | | | | | | | | | | | | | | | | | | | | | | | | | | | | | | | | | | | | | | | | | | | |
| Fees paid to experts | 10,278,185,707 | 0 | 6,411,415,642 | 0 | 0 | 236,921,551 | 947,597,967 | 0 | 0 | 17,874,120,867 | 10,683,365,062 | 28,557,485,929 | |||||||||||||||||||||||||||||||||||||||||||||||||||
| | | | | | | | | | | | | | | | | | | | | | | | | | | | | | | | | | | | | | | | | | | | | | | | | | | | | | | | | | | | | | | | | |
| Travelling and transportation expenses | 10,459,564,893 | 0 | 2,008,024,061 | 21,368,318 | 194,474,549 | 0 | 0 | 0 | 0 | 12,683,431,821 | 3,332,237,029 | 16,015,668,850 | |||||||||||||||||||||||||||||||||||||||||||||||||||
| | | | | | | | | | | | | | | | | | | | | | | | | | | | | | | | | | | | | | | | | | | | | | | | | | | | | | | | | | | | | | | | | |
| Personnel expenses | — | — | — | — | — | — | — | — | — | — | 13,050,315,115 | 13,050,315,115 | |||||||||||||||||||||||||||||||||||||||||||||||||||
| | | | | | | | | | | | | | | | | | | | | | | | | | | | | | | | | | | | | | | | | | | | | | | | | | | | | | | | | | | | | | | | | |
| Expenses for purchasing and sending equipment | 0 | 0 | 0 | 0 | 755,333,809 | 0 | 1,052,472,856 | 0 | 0 | 1,807,806,665 | 0 | 1,807,806,665 | |||||||||||||||||||||||||||||||||||||||||||||||||||
| | | | | | | | | | | | | | | | | | | | | | | | | | | | | | | | | | | | | | | | | | | | | | | | | | | | | | | | | | | | | | | | | |
| Insurance premiums | 0 | 0 | 0 | 0 | 0 | 0 | 0 | 0 | 0 | 0 | 0 | 0 | |||||||||||||||||||||||||||||||||||||||||||||||||||
| | | | | | | | | | | | | | | | | | | | | | | | | | | | | | | | | | | | | | | | | | | | | | | | | | | | | | | | | | | | | | | | | |
| Subsidies | 0 | 0 | 0 | 73,673,363 | 0 | 0 | 0 | 0 | 0 | 73,673,363 | 0 | 73,673,363 | |||||||||||||||||||||||||||||||||||||||||||||||||||
| | | | | | | | | | | | | | | | | | | | | | | | | | | | | | | | | | | | | | | | | | | | | | | | | | | | | | | | | | | | | | | | | |
| Fund provision | 0 | 106,527,822,879 | 0 | 0 | 0 | 0 | 0 | 0 | 0 | 106,527,822,879 | 0 | 106,527,822,879 | |||||||||||||||||||||||||||||||||||||||||||||||||||
| | | | | | | | | | | | | | | | | | | | | | | | | | | | | | | | | | | | | | | | | | | | | | | | | | | | | | | | | | | | | | | | | |
| Other expenses | 16,889,344,410 | 22,636,425 | 3,481,333,557 | 56,987,018 | 143,377,367 | 3,731,704 | 1,355,770,694 | 137,238,711 | 1,609,363 | 22,092,029,249 | 7,750,764,300 | 29,842,793,549 | |||||||||||||||||||||||||||||||||||||||||||||||||||
| | | | | | | | | | | | | | | | | | | | | | | | | | | | | | | | | | | | | | | | | | | | | | | | | | | | | | | | | | | | | | | | | |
| General administrative expenses | — | — | — | — | — | — | — | — | — | — | 8,842,943,130 | 8,842,943,130 | |||||||||||||||||||||||||||||||||||||||||||||||||||
| | | | | | | | | | | | | | | | | | | | | | | | | | | | | | | | | | | | | | | | | | | | | | | | | | | | | | | | | | | | | | | | | |
| Fees paid to experts | — | — | — | — | — | — | — | — | — | — | 1,050,752,266 | 1,050,752,266 | |||||||||||||||||||||||||||||||||||||||||||||||||||
| | | | | | | | | | | | | | | | | | | | | | | | | | | | | | | | | | | | | | | | | | | | | | | | | | | | | | | | | | | | | | | | | |
| Travelling and transportation expenses | — | — | — | — | — | — | — | — | — | — | 505,092,025 | 505,092,025 | |||||||||||||||||||||||||||||||||||||||||||||||||||
| | | | | | | | | | | | | | | | | | | | | | | | | | | | | | | | | | | | | | | | | | | | | | | | | | | | | | | | | | | | | | | | | |
| Personnel expenses | — | — | — | — | — | — | — | — | — | — | 2,389,840,324 | 2,389,840,324 | |||||||||||||||||||||||||||||||||||||||||||||||||||
| | | | | | | | | | | | | | | | | | | | | | | | | | | | | | | | | | | | | | | | | | | | | | | | | | | | | | | | | | | | | | | | | |
| Rents | — | — | — | — | — | — | — | — | — | — | 2,336,409,594 | 2,336,409,594 | |||||||||||||||||||||||||||||||||||||||||||||||||||
| | | | | | | | | | | | | | | | | | | | | | | | | | | | | | | | | | | | | | | | | | | | | | | | | | | | | | | | | | | | | | | | | |
| Other expenses | — | — | — | — | — | — | — | — | — | — | 2,560,848,921 | 2,560,848,921 | |||||||||||||||||||||||||||||||||||||||||||||||||||
| | | | | | | | | | | | | | | | | | | | | | | | | | | | | | | | | | | | | | | | | | | | | | | | | | | | | | | | | | | | | | | | | |
| Depreciation | — | — | — | — | — | — | — | — | — | — | 470,490,348 | 470,490,348 | |||||||||||||||||||||||||||||||||||||||||||||||||||
| | | | | | | | | | | | | | | | | | | | | | | | | | | | | | | | | | | | | | | | | | | | | | | | | | | | | | | | | | | | | | | | | |
| Loan losses | 0 | 0 | 0 | 0 | 0 | 0 | 0 | 0 | 55,669,760 | 55,669,760 | 0 | 55,669,760 | |||||||||||||||||||||||||||||||||||||||||||||||||||
| | | | | | | | | | | | | | | | | | | | | | | | | | | | | | | | | | | | | | | | | | | | | | | | | | | | | | | | | | | | | | | | | |
| Provision of allowance for loan losses | 0 | 0 | 0 | 0 | 0 | 0 | 0 | 0 | 64,716,150 | 64,716,150 | 0 | 64,716,150 | |||||||||||||||||||||||||||||||||||||||||||||||||||
| | | | | | | | | | | | | | | | | | | | | | | | | | | | | | | | | | | | | | | | | | | | | | | | | | | | | | | | | | | | | | | | | |
| Financial expenses | — | — | — | — | — | — | — | — | — | — | 22,888,573 | 22,888,573 | |||||||||||||||||||||||||||||||||||||||||||||||||||
| | | | | | | | | | | | | | | | | | | | | | | | | | | | | | | | | | | | | | | | | | | | | | | | | | | | | | | | | | | | | | | | | |
| Miscellaneous loss | 0 | 0 | 0 | 0 | 0 | 0 | 0 | 0 | 0 | 0 | 1,416,279 | 1,416,279 | |||||||||||||||||||||||||||||||||||||||||||||||||||
| | | | | | | | | | | | | | | | | | | | | | | | | | | | | | | | | | | | | | | | | | | | | | | | | | | | | | | | | | | | | | | | | |
| Total | 71,067,788,315 | 106,701,027,386 | 15,723,182,122 | 304,637,764 | 1,424,272,171 | 240,653,255 | 12,443,562,099 | 1,128,383,920 | 130,919,299 | 209,164,426,331 | 44,154,419,836 | 253,318,846,167 | |||||||||||||||||||||||||||||||||||||||||||||||||||
| | | | | | | | | | | | | | | | | | | | | | | | | | | | | | | | | | | | | | | | | | | | | | | | | | | | | | | | | | | | | | | | | |
| Operating revenues | |||||||||||||||||||||||||||||||||||||||||||||||||||||||||||||||
| | | | | | | | | | | | | | | | | | | | | | | | | | | | | | | | | | | | | | | | | | | | | | | | | | | | | | | | | | | | | | | | | |
| Revenues from operational grants | 70,317,162,687 | 173,204,507 | 15,697,367,550 | 304,637,764 | 1,256,384,313 | 238,775,374 | 12,443,562,099 | 0 | 0 | 100,431,094,294 | 43,757,625,052 | 144,188,719,346 | |||||||||||||||||||||||||||||||||||||||||||||||||||
| | | | | | | | | | | | | | | | | | | | | | | | | | | | | | | | | | | | | | | | | | | | | | | | | | | | | | | | | | | | | | | | | |
| Revenues from grant aid | 0 | 106,527,822,879 | 0 | 0 | 0 | 0 | 0 | 0 | 0 | 106,527,822,879 | 0 | 106,527,822,879 | |||||||||||||||||||||||||||||||||||||||||||||||||||
| | | | | | | | | | | | | | | | | | | | | | | | | | | | | | | | | | | | | | | | | | | | | | | | | | | | | | | | | | | | | | | | | |
| Revenues from contracted programs | 0 | 0 | 0 | 0 | 0 | 0 | 0 | 1,130,942,926 | 0 | 1,130,942,926 | 0 | 1,130,942,926 | |||||||||||||||||||||||||||||||||||||||||||||||||||
| | | | | | | | | | | | | | | | | | | | | | | | | | | | | | | | | | | | | | | | | | | | | | | | | | | | | | | | | | | | | | | | | |
| Revenues from interest on development projects | 0 | 0 | 0 | 0 | 0 | 0 | 0 | 0 | 23,894,869 | 23,894,869 | 0 | 23,894,869 | |||||||||||||||||||||||||||||||||||||||||||||||||||
| | | | | | | | | | | | | | | | | | | | | | | | | | | | | | | | | | | | | | | | | | | | | | | | | | | | | | | | | | | | | | | | | |
| Revenues from settlement projects | 0 | 0 | 0 | 0 | 0 | 0 | 0 | 0 | 6,508,214 | 6,508,214 | 0 | 6,508,214 | |||||||||||||||||||||||||||||||||||||||||||||||||||
| | | | | | | | | | | | | | | | | | | | | | | | | | | | | | | | | | | | | | | | | | | | | | | | | | | | | | | | | | | | | | | | | |
| Revenues from emigration projects | 0 | 0 | 0 | 0 | 0 | 0 | 0 | 0 | 16,237,252 | 16,237,252 | 0 | 16,237,252 | |||||||||||||||||||||||||||||||||||||||||||||||||||
| | | | | | | | | | | | | | | | | | | | | | | | | | | | | | | | | | | | | | | | | | | | | | | | | | | | | | | | | | | | | | | | | |
| Donation revenues | 0 | 0 | 0 | 0 | 0 | 0 | 0 | 0 | 10,533,389 | 10,533,389 | 0 | 10,533,389 | |||||||||||||||||||||||||||||||||||||||||||||||||||
| | | | | | | | | | | | | | | | | | | | | | | | | | | | | | | | | | | | | | | | | | | | | | | | | | | | | | | | | | | | | | | | | |
| Revenues from subsidy for facilities | — | — | — | — | — | — | — | — | — | — | 7,023,830 | 7,023,830 | |||||||||||||||||||||||||||||||||||||||||||||||||||
| �� | | | | | | | | | | | | | | | | | | | | | | | | | | | | | | | | | | | | | | | | | | | | | | | | | | | | | | | | | | | | | | | | |
| Reversal of contra accounts for assets funded by operational grants | 0 | 0 | 0 | 0 | 167,887,858 | 0 | 0 | 0 | 0 | 167,887,858 | 290,407,690 | 458,295,548 | |||||||||||||||||||||||||||||||||||||||||||||||||||
| | | | | | | | | | | | | | | | | | | | | | | | | | | | | | | | | | | | | | | | | | | | | | | | | | | | | | | | | | | | | | | | | |
| Financial revenues | — | — | — | — | — | — | — | — | — | — | 38,314,948 | 38,314,948 | |||||||||||||||||||||||||||||||||||||||||||||||||||
| | | | | | | | | | | | | | | | | | | | | | | | | | | | | | | | | | | | | | | | | | | | | | | | | | | | | | | | | | | | | | | | | |
| Miscellaneous income | 293,119,288 | 0 | 25,814,572 | 0 | 0 | 0 | 0 | 0 | 0 | 318,933,860 | 1,612,000,127 | 1,930,933,987 | |||||||||||||||||||||||||||||||||||||||||||||||||||
| | | | | | | | | | | | | | | | | | | | | | | | | | | | | | | | | | | | | | | | | | | | | | | | | | | | | | | | | | | | | | | | | |
| Total | 70,610,281,975 | 106,701,027,386 | 15,723,182,122 | 304,637,764 | 1,424,272,171 | 238,775,374 | 12,443,562,099 | 1,130,942,926 | 57,173,724 | 208,633,855,541 | 45,705,371,647 | 254,339,227,188 | |||||||||||||||||||||||||||||||||||||||||||||||||||
| | | | | | | | | | | | | | | | | | | | | | | | | | | | | | | | | | | | | | | | | | | | | | | | | | | | | | | | | | | | | | | | | |
| Operating income and loss | (457,506,340 | ) | 0 | 0 | 0 | 0 | (1,877,881 | ) | 0 | 2,559,006 | (73,745,575 | ) | (530,570,790 | ) | 1,550,951,811 | 1,020,381,021 | |||||||||||||||||||||||||||||||||||||||||||||||
| | | | | | | | | | | | | | | | | | | | | | | | | | | | | | | | | | | | | | | | | | | | | | | | | | | | | | | | | | | | | | | | | |
| II. Total assets | |||||||||||||||||||||||||||||||||||||||||||||||||||||||||||||||
| | | | | | | | | | | | | | | | | | | | | | | | | | | | | | | | | | | | | | | | | | | | | | | | | | | | | | | | | | | | | | | | | |
| Cash and deposits | 0 | 19,889,550,052 | 0 | 0 | 0 | 0 | 0 | 20,242,304 | 2,440,593,109 | 22,350,385,465 | 52,203,791,574 | 74,554,177,039 | |||||||||||||||||||||||||||||||||||||||||||||||||||
| | | | | | | | | | | | | | | | | | | | | | | | | | | | | | | | | | | | | | | | | | | | | | | | | | | | | | | | | | | | | | | | | |
| Securities | 0 | 99,000,000,000 | 0 | 0 | 0 | 0 | 0 | 0 | 0 | 99,000,000,000 | 0 | 99,000,000,000 | |||||||||||||||||||||||||||||||||||||||||||||||||||
| | | | | | | | | | | | | | | | | | | | | | | | | | | | | | | | | | | | | | | | | | | | | | | | | | | | | | | | | | | | | | | | | |
| Advance payments | 12,753,955,473 | 34,500,000 | 274,346,893 | 0 | 0 | 0 | 3,236,894,239 | 23,052,197 | 0 | 16,322,748,802 | 274,872,704 | 16,597,621,506 | |||||||||||||||||||||||||||||||||||||||||||||||||||
| | | | | | | | | | | | | | | | | | | | | | | | | | | | | | | | | | | | | | | | | | | | | | | | | | | | | | | | | | | | | | | | | |
| Buildings | — | — | — | — | — | — | — | — | — | — | 25,429,840,038 | 25,429,840,038 | |||||||||||||||||||||||||||||||||||||||||||||||||||
| | | | | | | | | | | | | | | | | | | | | | | | | | | | | | | | | | | | | | | | | | | | | | | | | | | | | | | | | | | | | | | | | |
| Land | — | — | — | — | — | — | — | — | — | — | 14,735,916,546 | 14,735,916,546 | |||||||||||||||||||||||||||||||||||||||||||||||||||
| | | | | | | | | | | | | | | | | | | | | | | | | | | | | | | | | | | | | | | | | | | | | | | | | | | | | | | | | | | | | | | | | |
| Other assets | 83,111,451 | 820,662 | 55,452,777 | 892,741 | 359,251,395 | 0 | 3,354,743 | 842,314,960 | 1,231,643,884 | 2,576,842,613 | 5,603,124,663 | 8,179,967,276 | |||||||||||||||||||||||||||||||||||||||||||||||||||
| | | | | | | | | | | | | | | | | | | | | | | | | | | | | | | | | | | | | | | | | | | | | | | | | | | | | | | | | | | | | | | | | |
| Total | 12,837,066,924 | 118,924,870,714 | 329,799,670 | 892,741 | 359,251,395 | 0 | 3,240,248,982 | 885,609,461 | 3,672,236,993 | 140,249,976,880 | 98,247,545,525 | 238,497,522,405 | |||||||||||||||||||||||||||||||||||||||||||||||||||
| | | | | | | | | | | | | | | | | | | | | | | | | | | | | | | | | | | | | | | | | | | | | | | | | | | | | | | | | | | | | | | | | |
- (Notes)
- 1. Segment classification and main descriptions
Operations are classified into eight segments in accordance with descriptions of the Mid-term Plan based on operations specified in Article 13 of the Act of the Incorporated Administrative Agency—Japan International Cooperation Agency.
Operations in relation to donations and operations in relation to management and collection of loans for development projects and other claims as well as operations prescribed in Article 13 are organized as other operations.
- 1)
- Operations in relation to technical cooperation
- 2)
- Operations in relation to grant aid
- 3)
- Operations in relation to citizens' cooperation activities, etc.
- 4)
- Operations in relation to emigration projects
F-24
- 5)
- Operations in relation to disaster relief activities
- 6)
- Operations in relation to personnel training and securing
- 7)
- Operations in relation to research and study
- 8)
- Operations in relation to contracted programs
- 2.
- Disclosure of operating expenses
- (1)
- Operating expenses in the statement of income are shown as operating expenses according to natural expense classification. Items that account for less than 5% of the total amount allocated to each segment are included in other expenses.
The relationship between operating expenses in this list and operating expenses in the statement of income is as follows:
- 1)
- Technical cooperation: amount of expenses for technical cooperation projects
- 2)
- Grant aid: amount of expenses for grant aid (operation support) and expenses for grant aid
- 3)
- Citizens' cooperation activities, etc.: amount of expenses for public participation-based cooperation
- 4)
- Emigration: amount of expenses for emigration projects
- 5)
- Disaster relief activities: amount of expenses for disaster relief activities
- 6)
- Personnel training and securing: amount of expenses for training and securing the personnel
- 7)
- Research and study: amount of expenses for assistance promotion * The amount includes expenses for surveys, such as cooperation preparation surveys
- 8)
- Contracted programs: amount of expenses for contracted programs
- 9)
- Other operations: amount of expenses for donation projects
- 10)
- Corporate common expenses, etc.: amounts of expenses related to operation, expenses for operation support, and facility expenses
- (2)
- Personnel expenses and rents, which accrue in relation to expenses related to operation and expenses for operation support that have been classified as corporate common expenses, etc., cannot be allocated to each segment due to the following reasons:
- 1)
- Personnel expenses: employees are in charge of several operations and their involvement in each operation is not uniform
- 2)
- Rents: a wide variety of buildings are included in target property and they are used for multiple operations
- 3.
- Disclosure of total assets
Assets are shown in account items of the balance sheet. Items that account for less than 5% of total assets are included in other assets.
- 4.
- Costs that are not reported as expenses in the statement of income and that should be disclosed are as follows, and they are classified as corporate common expenses, etc.
- (1)
- Accumulated depreciation not included in expenses amounts to ¥1,403,681,223.
- (2)
- Accumulated impairment loss not included in expenses amounts to ¥8,767,600.
- (3)
- Accumulated interest expenses not included in expenses amounts to ¥480,344.
- (4)
- Accumulated disposal and sale differential not included in expenses amounts to a loss of ¥4,126,622.
- (5)
- Estimated bonus payments not included in provision amounts to ¥141,980,963.
- (6)
- Estimated increase in retirement benefits not included in provision amounts to a loss of ¥3,415,223,845.
- 5.
- Partial operating expenses and general administrative expenses are financed by operational grants and reserve fund carried over from the previous Mid-term Objective period, which amount to ¥464,631,438, and the classifications and amounts are as follows:
- (1)
- Technical cooperation: ¥457,506,340; (10) Corporate common expenses, etc.: ¥7,125,098
- 6.
- Because operating expenses for (1) Technical cooperation and (3) Citizens' cooperation activities, etc., are financed by operational grants and revenues from operations, equivalent amounts are shown as miscellaneous income in operating revenues.
- 7.
- "—" is shown in the columns of amounts of items that have been organized only as corporate common expenses, etc., because they cannot be allocated to individual segments.
F-25
(13) Details of main assets and liabilities other than those mentioned above
- 1.
- Cash and deposits
| (Unit: Yen) | ||||||||||||
| | | | | | | | | | | | | |
| Classification | Amount | Remarks | ||||||||||
| | | | | | | | | | | | | |
| Cash | 1,870,329 | |||||||||||
Cash in foreign currency | 62,273,934 | |||||||||||
Deposit accounts | 66,559,571,559 | |||||||||||
Checking accounts | 5,078 | |||||||||||
Checking accounts in foreign currency | 2,930,456,139 | |||||||||||
Time deposits | 5,000,000,000 | |||||||||||
| | | | | | | | | | | | | |
Total | 74,554,177,039 | |||||||||||
| | | | | | | | | | | | | |
- 2.
- Funds for grant aid
| (Unit: Yen) | ||||||||||||||||
| | | | | | | | | | | | | | | | | |
| Classification | Amount | Counterparty | Remarks | |||||||||||||
| | | | | | | | | | | | | | | | | |
| Funds for grant aid | 116,675,616,138 | The Republic of the Union of Myanmar, etc. | ||||||||||||||
| | | | | | | | | | | | | | | | | |
Total | 116,675,616,138 | |||||||||||||||
| | | | | | | | | | | | | | | | | |
- 3.
- Accounts payable
| (Unit: Yen) | ||||||||||||||||||||
| | | | | | | | | | | | | | | | | | | | | |
| Classification | Amount | Counterparty | Date of accrual | Remarks | ||||||||||||||||
| | | | | | | | | | | | | | | | | | | | | |
| Operating expenses | 15,134,430,128 | Hakuhodo,Inc., etc. | March 31, 2015 | |||||||||||||||||
General administrative expenses | 845,853,591 | NTT Communications Co., Ltd., etc. | March 31, 2015 | |||||||||||||||||
Expenses for contracted programs | 715,749,984 | West Japan Engineering Consultants, Inc., etc. | March 31, 2015 | |||||||||||||||||
Facility expenses | 75,340,000 | ACA Sekkei Co., Ltd., etc. | March 31, 2015 | |||||||||||||||||
Expenses for grant aid | 2,214,754,576 | Republic of the Union of Myanmar, etc. | March 31, 2015 | |||||||||||||||||
Expenses for donation projects | 77,668 | Sonorite Co., Ltd., etc. | March 31, 2015 | |||||||||||||||||
Others | 125,626,879 | Mutual Aid Association of JICA, etc. | March 31, 2015 | |||||||||||||||||
| | | | | | | | | | | | | | | | | | | | | |
Total | 19,111,832,826 | |||||||||||||||||||
| | | | | | | | | | | | | | | | | | | | | |
F-26
(14) Details of affiliated companies and relevant public interest corporations
| | | | | | | | | | | | | | | | | |
| Corporation type and name | (Relevant public interest corporations, etc.) | (Relevant public interest corporations, etc.) | ||||||||||||||
| | | | | | | | | | | | | | | | | |
| Items | Japan Overseas Cooperative Association | The Association of Nikkei & Japanese Abroad | ||||||||||||||
| | | | | | | | | | | | | | | | | |
| Outline of operations | (1) International cooperative activities in developing countries and activities pertaining to the promotion, promulgation, and edification of international exchange and global understanding. (2) Assistance for postdisaster restoration and peace-building activities. (3) Activities pertaining to cooperation and collaboration with international and domestic support agencies, international cooperation associations, and other institutions. (4) Activities pertaining to support for the development of a multicultural symbiotic society and vitalization and internationalization of societies. (5) Other activities necessary to achieve the objectives of the Association. | (1) Support and promulgation of economic, cultural, educational, and social activities in cooperation with overseas and domestic Japan-related organizations or by itself. (2) Cooperation pertaining to carrying out of international cooperative activities and international exchange activities. (3) Collaboration with municipalities and international exchange associations (4) Promulgation both at home and abroad of research outcomes and knowledge regarding activities pertaining international cooperation and international exchange endeavors (5) Provision of information and collaboration regarding migration and overseas expansion of businesses (6) Establishment and operation of centers for Japanese abroad (7) Consultations and intermediation for and regarding Japanese abroad (8) Publicity of and edification regarding situations in Japan (9) Organizing of the convention of Nikkei and Japanese abroad (10) Edification regarding investment from overseas, investment overseas, and businesses (11) Other activities necessary for the fulfillment of public good | ||||||||||||||
| | | | | | | | | | | | | | | | | |
| Name of officers | Number of officers: 28 President: Yozo Kaneko (Former Director General, Secretariat of Japan Overseas Cooperation Volunteers of JICA) Secretary General: Masaaki Otuka (Former Director General, Secretariat of Japan Overseas Cooperation Volunteers of JICA) | Number of officers: 17 President: Keiji Yamada Director: Hiroyo Sasaki (Former Vice-President of JICA) | ||||||||||||||
| | | | | | | | | | | | | | | | | |
| Association chart on transactions between relevant public interest corporations and JICA |  | |||||||||||||||
| | | | | | | | | | | | | | | | | |
| Assets | 1,610,981,495 yen | 187,161,664 yen | ||||||||||||||
| | | | | | | | | | | | | | | | | |
| Liabilities | 505,842,359 yen | 141,427,928 yen | ||||||||||||||
| | | | | | | | | | | | | | | | | |
| Balance of net assets at the beginning of the business year | 1,196,290,222 yen | 53,624,521 yen | ||||||||||||||
| | | | | | | | | | | | | | | | | |
| Changes in net assets for the current period | ||||||||||||||||
| | | | | | | | | | | | | | | | | |
Changes in general net assets | ||||||||||||||||
o Revenues | o Revenues | o Revenues | ||||||||||||||
—Subsidy received, etc. | —Subsidy received, etc. | 0 yen | —Subsidy received, etc. | 0 yen | ||||||||||||
—Other revenues | —Other revenues | 3,345,485,055 yen | —Other revenues | 361,129,813 yen | ||||||||||||
o Expenses | o Expenses | 3,436,636,141 yen | o Expenses | 369,020,598 yen | ||||||||||||
| | | | | | | | | | | | | | | | | |
Changes in specified net assets | ||||||||||||||||
o Revenues | o Revenues | o Revenues | ||||||||||||||
—Subsidy received, etc. | —Subsidy received, etc. | 0 yen | —Subsidy received, etc. | 0 yen | ||||||||||||
—Other revenues | —Other revenues | 0 yen | —Other revenues | 0 yen | ||||||||||||
o Expenses | o Expenses | 0 yen | o Expenses | 0 yen | ||||||||||||
| | | | | | | | | | | | | | | | | |
| Balance of net assets at the end of the business year | 1,105,139,136 yen | 45,733,736 yen | ||||||||||||||
| | | | | | | | | | | | | | | | | |
| Total revenues for the current period | — | 381,130,644 yen | ||||||||||||||
| | | | | | | | | | | | | | | | | |
| Total expenditures for the current period | — | 388,598,932 yen | ||||||||||||||
| | | | | | | | | | | | | | | | | |
| Amount of difference between revenues and expenditures for the current period | — | (7,468,288) yen | ||||||||||||||
| | | | | | | | | | | | | | | | | |
| Details of contributions and donations to basic funds of relevant public interest corporations, etc. Details of membership expenses and burden charges to be borne in order to be allocated to management expenses, operating expenses, etc. | N/A | N/A | ||||||||||||||
| | | | | | | | | | | | | | | | | |
| Details of receivables and payables to relevant public interest corporations | Accounts payable: ¥327,268,979, Accounts receivable: ¥273,073 | Accounts payable: ¥53,376,300, Accounts receivable: ¥927,474 | ||||||||||||||
| | | | | | | | | | | | | | | | | |
| Details of debt guarantee | N/A | N/A | ||||||||||||||
| | | | | | | | | | | | | | | | | |
| Amounts and ratios in relation to operating revenues, order placement by JICA, etc. (amounts and ratios of competitive contracts, planning competitions and public selections, and noncompetitive negotiated contracts) | Total operating revenues: (Breakdown: JICA transactions, Competitive contract Planning competition and public selection Noncompetitive negotiated contracts | 2,850,739,102 yen 1,626,804,979 yen 57.1%) (1,105,972,291 yen 68.0%) (66,543,822 yen 4.1%) (0 yen 0.0%) | Total operating revenues: (Breakdown: JICA transactions, Competitive contract Planning competition and public selection Noncompetitive negotiated contracts | 349,971,570 yen 203,791,328 yen 58.2%) (126,229,429 yen 61.9%) (29,363,829 yen 14.4%) (45,944,842 yen 22.5%) | ||||||||||||
| | | | | | | | | | | | | | | | | |
(Note) Pursuant to "Concerning the revision of the accounting standards for public-interest corporations (agreement from the liaison council of relevant agencies guidance, supervision, etc., of public-interest corporations, etc., of October 14, 2004) ("Accounting Standards for Public-interest Corporations" hereinafter)," the entity is not legally required to create a statement of revenues and expenses; hence, such a statement is not prepared. | ||||||||||||||||
F-27
| | | | | | | | | | | | | | | | | |
| Corporation type and name | (Relevant public interest corporations, etc.) | (Relevant public interest corporations, etc.) | ||||||||||||||
| | | | | | | | | | | | | | | | | |
| Items | Kitakyushu International Techno-Cooperative Association | The International Nursing Foundation of Japan | ||||||||||||||
| | | | | | | | | | | | | | | | | |
| Outline of operations | (1) Development of necessary research studies and educational curriculums, creation and undertaking of training programs, dispatch of experts, and transfer of technologies overseas (2) Planning and undertaking of activities to promote international goodwill (3) Planning and undertaking of other activities for the purpose of fulfilling the aims of this association | (1) Organizing lectures and seminars (2) Providing scholarships to graduate students who engage in international nursing studies (3) Undertaking of technological cooperation for developing nations, etc. (4) Other activities necessary for the purpose of fulfilling the aims of this foundation | ||||||||||||||
| | | | | | | | | | | | | | | | | |
| Name of officers | Number of officers: 13 President: Hideki Furuno | Number of officers: 8 President: Kayoko Shimizu | ||||||||||||||
| | | | | | | | | | | | | | | | | |
| Association chart on transactions between relevant public interest corporations and JICA |  |  | ||||||||||||||
| | | | | | | | | | | | | | | | | |
| Assets | 644,824,987 yen | 134,494,472 yen | ||||||||||||||
| | | | | | | | | | | | | | | | | |
| Liabilities | 32,558,783 yen | 1,357,607 yen | ||||||||||||||
| | | | | | | | | | | | | | | | | |
| Balance of net assets at the beginning of the business year | 620,357,677 yen | 168,569,756 yen | ||||||||||||||
| | | | | | | | | | | | | | | | | |
| Changes in net assets for the current period | ||||||||||||||||
| | | | | | | | | | | | | | | | | |
Changes in general net assets | ||||||||||||||||
o Revenues | o Revenues | o Revenues | ||||||||||||||
—Subsidy received, etc. | —Subsidy received, etc. | 32,750,000 yen | —Subsidy received, etc. | 1,500,000 yen | ||||||||||||
—Other revenues | —Other revenues | 193,701,733 yen | —Other revenues | 69,343,457 yen | ||||||||||||
o Expenses | o Expenses | 234,543,206 yen | o Expenses | 76,933,761 yen | ||||||||||||
| | | | | | | | | | | | | | | | | |
Changes in specified net assets | ||||||||||||||||
o Revenues | o Revenues | o Revenues | ||||||||||||||
—Subsidy received, etc. | —Subsidy received, etc. | 0 yen | —Subsidy received, etc. | 0 yen | ||||||||||||
—Other revenues | —Other revenues | 0 yen | —Other revenues | 0 yen | ||||||||||||
o Expenses | o Expenses | 0 yen | o Expenses | 29,342,587 yen | ||||||||||||
| | | | | | | | | | | | | | | | | |
| Balance of net assets at the end of the business year | 612,266,204 yen | 133,136,865 yen | ||||||||||||||
| | | | | | | | | | | | | | | | | |
| Total revenues for the current period | 254,497,333 yen | — | ||||||||||||||
| | | | | | | | | | | | | | | | | |
| Total expenditures for the current period | 258,303,047 yen | — | ||||||||||||||
| | | | | | | | | | | | | | | | | |
| Amount of difference between revenues and expenditures for the current period | (3,805,714) yen | — | ||||||||||||||
| | | | | | | | | | | | | | | | | |
| Details of contributions and donations to basic funds of relevant public interest corporations, etc. Details of membership expenses and burden charges to be borne in order to be allocated to management expenses, operating expenses, etc. | N/A | N/A | ||||||||||||||
| | | | | | | | | | | | | | | | | |
| Details of receivables and payables to relevant public interest corporations | Accounts payable: ¥16,670,143, Accounts receivable: ¥324,427 | Accounts payable: ¥1,348,501 | ||||||||||||||
| | | | | | | | | | | | | | | | | |
| Details of debt guarantee | N/A | N/A | ||||||||||||||
| | | | | | | | | | | | | | | | | |
| Amounts and ratios in relation to operating revenues, order placement by JICA, etc. (amounts and ratios of competitive contracts, planning competitions and public selections, and noncompetitive negotiated contracts) | Total operating revenues: (Breakdown: JICA transactions, Competitive contract Planning competition and public selection Noncompetitive negotiated contracts | 187,538,383 yen 90,627,541 yen 48.3%) (0 yen 0.0%) (90,627,541 yen 100.0%) (0 yen 0.0%) | Total operating revenues: (Breakdown: JICA transactions, Competitive contract Planning competition and public selection Noncompetitive negotiated contracts | 70,843,457 yen 32,369,743 yen 45.7%) (0 yen 0.0%) (32,369,743 yen 100.0%) (0 yen 0.0%) | ||||||||||||
| | | | | | | | | | | | | | | | | |
(Note) The entity is not legally required to create a statement of revenues and expenses pursuant to the "Accounting Standards for Public-interest Corporations"; hence, such a statement is not prepared. | ||||||||||||||||
F-28
| | | | | | | | | | | | | | | | | |
| Corporation type and name | (Relevant public interest corporations, etc.) | (Relevant public interest corporations, etc.) | ||||||||||||||
| | | | | | | | | | | | | | | | | |
| Items | International Civil and Commercial Law Centre Foundation | Pacific Resource Exchange Center | ||||||||||||||
| | | | | | | | | | | | | | | | | |
| Outline of operations | (1) Carrying out of training of personnel handling civil and commercial law chiefly in Asia and support (2) Invitation and dispatch, both from and to Japan, of researchers and experts on civil and commercial law and support (3) Organizing and support of lectures, study sessions, symposiums, seminars and other meetings for the purpose of research, study, training, and information exchange on civil and commercial law both in Japan and abroad (4) Gathering of information and material on civil and commercial law both in Japan abroad and conducting and support of such research and study (5) Publication of journals and other documents and distribution (6) Collaboration and cooperation with related institutes and organizations both in Japan and abroad (7) Other activities necessary to fulfill the aims | (1) Fostering human resources to contribute mainly to the growth of developing countries, etc. (2) Economic, cultural, and personal exchange activities mainly with developing countries, etc. (3) Cultivating human resources tasked with economic, cultural, and personal exchange activities mainly with developing countries. (4) Gathering information and research/study related to economic cooperation (5) Public awareness and publicity concerning the aforementioned activities (6) Other activities necessary for the achievement of objectives of this corporate body | ||||||||||||||
| | | | | | | | | | | | | | | | | |
| Name of officers | Number of officers: 9 Representative director and chairman: Kenji Miyahara Director: Kyotaro Ogawa (Former JICA head of general administration) | Number of officers: 17 Chairman: Yoshikuni Inoue | ||||||||||||||
| | | | | | | | | | | | | | | | | |
| Association chart on transactions between relevant public interest corporations and JICA |  |  | ||||||||||||||
| | | | | | | | | | | | | | | | | |
| Assets | 85,031,557 yen | 4,392,892,113 yen | ||||||||||||||
| | | | | | | | | | | | | | | | | |
| Liabilities | 2,167,483 yen | 51,383,463 yen | ||||||||||||||
| | | | | | | | | | | | | | | | | |
| Balance of net assets at the beginning of the business year | 84,029,240 yen | 4,110,395,206 yen | ||||||||||||||
| | | | | | | | | | | | | | | | | |
| Changes in net assets for the current period | ||||||||||||||||
| | | | | | | | | | | | | | | | | |
Changes in general net assets | ||||||||||||||||
o Revenues | o Revenues | o Revenues | ||||||||||||||
—Subsidy received, etc. | —Subsidy received, etc. | 0 yen | —Subsidy received, etc. | 0 yen | ||||||||||||
—Other revenues | —Other revenues | 87,870,269 yen | —Other revenues | 375,593,297 yen | ||||||||||||
o Expenses | o Expenses | 89,035,435 yen | o Expenses | 144,479,853 yen | ||||||||||||
| | | | | | | | | | | | | | | | | |
Changes in specified net assets | ||||||||||||||||
o Revenues | o Revenues | o Revenues | ||||||||||||||
—Subsidy received, etc. | —Subsidy received, etc. | 0 yen | —Subsidy received, etc. | 0 yen | ||||||||||||
—Other revenues | —Other revenues | 0 yen | —Other revenues | 0 yen | ||||||||||||
o Expenses | o Expenses | 0 yen | o Expenses | 0 yen | ||||||||||||
| | | | | | | | | | | | | | | | | |
| Balance of net assets at the end of the business year | 82,864,074 yen | 4,341,508,650 yen | ||||||||||||||
| | | | | | | | | | | | | | | | | |
| Total revenues for the current period | — | — | ||||||||||||||
| | | | | | | | | | | | | | | | | |
| Total expenditures for the current period | — | — | ||||||||||||||
| | | | | | | | | | | | | | | | | |
| Amount of difference between revenues and expenditures for the current period | — | — | ||||||||||||||
| | | | | | | | | | | | | | | | | |
| Details of contributions and donations to basic funds of relevant public interest corporations, etc. Details of membership expenses and burden charges to be borne in order to be allocated to management expenses, operating expenses, etc. | N/A | N/A | ||||||||||||||
| | | | | | | | | | | | | | | | | |
| Details of receivables and payables to relevant public interest corporations | Accounts payable: ¥19,692,269 | Accounts payable: ¥5,590,278, Accounts receivable: ¥3,461,231 | ||||||||||||||
| | | | | | | | | | | | | | | | | |
| Details of debt guarantee | N/A | N/A | ||||||||||||||
| | | | | | | | | | | | | | | | | |
| Amounts and ratios in relation to operating revenues, order placement by JICA, etc. (amounts and ratios of competitive contracts, planning competitions and public selections, and noncompetitive negotiated contracts) | Total operating revenues: (Breakdown: JICA transactions, Competitive contract Planning competition and public selection Noncompetitive negotiated contracts | 64,499,935 yen 64,499,935 yen 100.0%) (64,499,935 yen 100.0%) (0 yen 0.0%) (0 yen 0.0%) | Total operating revenues: (Breakdown: JICA transactions, Competitive contract Planning competition and public selection Noncompetitive negotiated contracts | 93,447,367 yen 66,328,403 yen 71.0%) (0 yen 0.0%) (66,328,403 yen 100.0%) (0 yen 0.0%) | ||||||||||||
| | | | | | | | | | | | | | | | | |
(Note) The entity is not legally required to create a statement of revenues and expenses pursuant to the "Accounting Standards for Public-interest Corporations"; hence, such a statement is not prepared. | (Note) The entity is not legally required to create a statement of revenues and expenses pursuant to the "Accounting Standards for Public-interest Corporations"; hence, such a statement is not prepared. | |||||||||||||||
F-29
| | | | | | | | | | | | | | | | | |
| Corporation type and name | (Relevant public interest corporations, etc.) | (Relevant public interest corporations, etc.) | ||||||||||||||
| | | | | | | | | | | | | | | | | |
| Items | i-i-network (Research and Action for Community Governance) | Overseas Agricultural Development Association | ||||||||||||||
| | | | | | | | | | | | | | | | | |
| Outline of operations | (1) Activities to promote sharing of experiences regarding community-based development (2) Education and training, providing of information regarding international cooperation, and community-based development (3) Support for community-based development in Japan and around the world (4) Research, study, and publication activities regarding community-based development and international cooperation (5) Introducing products made by people engaged in community-based development in Japan and around the world (6) Other activities necessary to fulfill the aims of this organization | (1) Proposal regarding effective undertaking of overseas agricultural development cooperation (2) Guidance and advice for overseas agricultural development cooperation by private-sector companies (3) Cooperation for activities by the government and private-sector companies regarding overseas agricultural development cooperation (4) Research and study regarding overseas agricultural development cooperation (5) Gathering and providing of information regarding overseas agricultural development cooperation (6) Carrying out of collaborative activities with community organizations regarding rural community promotion in Japan (7) Capacity building and securing of personnel who engage in rural community promotion in Japan (8) Establishment and operation of necessary facilities for aforementioned activities (9) Other activities necessary to fulfill the aims of this organization | ||||||||||||||
| | | | | | | | | | | | | | | | | |
| Name of officers | Number of officers: 7 Representative director: Makoto Nagahata | Number of officers: 10 President: Hidekazu Toyohara | ||||||||||||||
| | | | | | | | | | | | | | | | | |
| Association chart on transactions between relevant public interest corporations and JICA |  |  | ||||||||||||||
| | | | | | | | | | | | | | | | | |
| Assets | 8,268,541 yen | 18,066,255 yen | ||||||||||||||
| | | | | | | | | | | | | | | | | |
| Liabilities | 3,510,348 yen | 18,039,319 yen | ||||||||||||||
| | | | | | | | | | | | | | | | | |
| Balance of net assets at the beginning of the business year | 3,249,305 yen | 4,988,000 yen | ||||||||||||||
| | | | | | | | | | | | | | | | | |
| Changes in net assets for the current period | ||||||||||||||||
| | | | | | | | | | | | | | | | | |
Changes in general net assets | ||||||||||||||||
o Revenues | o Revenues | o Revenues | ||||||||||||||
—Subsidy received, etc. | —Subsidy received, etc. | 19,832,951 yen | —Subsidy received, etc. | 0 yen | ||||||||||||
—Other revenues | —Other revenues | 35,540,772 yen | —Other revenues | 154,095,338 yen | ||||||||||||
o Expenses | o Expenses | 53,864,835 yen | o Expenses | 159,056,402 yen | ||||||||||||
| | | | | | | | | | | | | | | | | |
Changes in specified net assets | ||||||||||||||||
o Revenues | o Revenues | o Revenues | ||||||||||||||
—Subsidy received, etc. | —Subsidy received, etc. | 0 yen | —Subsidy received, etc. | 0 yen | ||||||||||||
—Other revenues | —Other revenues | 0 yen | —Other revenues | 0 yen | ||||||||||||
o Expenses | o Expenses | 0 yen | o Expenses | 0 yen | ||||||||||||
| | | | | | | | | | | | | | | | | |
| Balance of net assets at the end of the business year | 4,758,193 yen | 26,936 yen | ||||||||||||||
| | | | | | | | | | | | | | | | | |
| Total revenues for the current period | 55,373,723 yen | — | ||||||||||||||
| | | | | | | | | | | | | | | | | |
| Total expenditures for the current period | 53,864,835 yen | — | ||||||||||||||
| | | | | | | | | | | | | | | | | |
| Amount of difference between revenues and expenditures for the current period | 1,508,888 yen | — | ||||||||||||||
| | | | | | | | | | | | | | | | | |
| Details of contributions and donations to basic funds of relevant public interest corporations, etc. Details of membership expenses and burden charges to be borne in order to be allocated to management expenses, operating expenses, etc. | N/A | N/A | ||||||||||||||
| | | | | | | | | | | | | | | | | |
| Details of receivables and payables to relevant public interest corporations | N/A | Accounts payable: ¥7,938,744, Accounts receivable: ¥25,854 | ||||||||||||||
| | | | | | | | | | | | | | | | | |
| Details of debt guarantee | N/A | N/A | ||||||||||||||
| | | | | | | | | | | | | | | | | |
| Amounts and ratios in relation to operating revenues, order placement by JICA, etc. (amounts and ratios of competitive contracts, planning competitions and public selections, and noncompetitive negotiated contracts) | Total operating revenues: (Breakdown: JICA transactions, Competitive contract Planning competition and public selection Noncompetitive negotiated contracts | 54,817,741 yen 54,127,406 yen 98.7%) (0 yen 0.0%) 51,183,660 yen 94.6%) (2,943,746 yen 5.4%) | Total operating revenues: (Breakdown: JICA transactions, Competitive contract Planning competition and public selection Noncompetitive negotiated contracts | 150,144,566 yen 136,096,618 yen 90.6%) (0 yen 0.0%) (134,265,742 yen 98.7%) (0 yen 0.0%) | ||||||||||||
| | | | | | | | | | | | | | | | | |
(Note) The above amount pertains to the period from July 1, 2013, through June 30, 2014. | (Note) The entity is not legally required to create a statement of revenues and expenses pursuant to the "Accounting Standards for Public-interest Corporations"; hence, such a statement is not prepared. | |||||||||||||||
F-30
| | | | | | | | | | | | | | | | | |
| Corporation type and name | (Relevant public interest corporations, etc.) | (Relevant public interest corporations, etc.) | ||||||||||||||
| | | | | | | | | | | | | | | | | |
| Items | Agricultural Development Consultants Association | Japan Overseas Forestry Consultants Association | ||||||||||||||
| | | | | | | | | | | | | | | | | |
| Outline of operations | (1) Technical research to create projects for overseas agricultural development (2) Research of information and gathering of material regarding overseas agricultural development (3) Guidance and advice for consulting firms and organizations (4) Organizing lectures and symposiums regarding overseas technical assistance (5) Intermediation regarding activities for overseas agricultural development (6) Other activities necessary to fulfill the aims of this association | (1) Survey regarding overseas forest and forestry (2) Technical development regarding overseas forest and forestry (3) Afforestation in developing countries (4) Guidance and advice regarding overseas forest and forestry (5) Implementation of training regarding overseas forest and forestry (6) Gathering and provision of material and information on overseas forest and forestry (7) Other activities necessary to fulfill the purposes of the Association | ||||||||||||||
| | | | | | | | | | | | | | | | | |
| Name of officers | Number of officers: 8 Chairman: Shigeyasu Aoyama Director: Hisashi Mochizuki (Former Vice- President of JICA) | Number of officers: 11 President: Fusho Ozawa | ||||||||||||||
| | | | | | | | | | | | | | | | | |
Association chart on transactions between relevant public interest corporations and JICA |  |  | ||||||||||||||
| | | | | | | | | | | | | | | | | |
| Assets | 106,093,969 yen | 175,626,190 yen | ||||||||||||||
| | | | | | | | | | | | | | | | | |
| Liabilities | 9,117,467 yen | 126,373,088 yen | ||||||||||||||
| | | | | | | | | | | | | | | | | |
| Balance of net assets at the beginning of the business year | 101,353,205 yen | 54,760,958 yen | ||||||||||||||
| | | | | | | | | | | | | | | | | |
| Changes in net assets for the current period | ||||||||||||||||
| | | | | | | | | | | | | | | | | |
Changes in general net assets | ||||||||||||||||
o Revenues | o Revenues | o Revenues | ||||||||||||||
—Subsidy received, etc. | —Subsidy received, etc. | 30,518,000 yen | —Subsidy received, etc. | 15,646,000 yen | ||||||||||||
—Other revenues | —Other revenues | 41,791,233 yen | —Other revenues | 293,489,517 yen | ||||||||||||
o Expenses | o Expenses | 76,685,936 yen | o Expenses | 314,643,373 yen | ||||||||||||
| | | | | | | | | | | | | | | | | |
Changes in specified net assets | ||||||||||||||||
o Revenues | o Revenues | o Revenues | ||||||||||||||
—Subsidy received, etc. | —Subsidy received, etc. | 0 yen | —Subsidy received, etc. | 0 yen | ||||||||||||
—Other revenues | —Other revenues | 0 yen | —Other revenues | 0 yen | ||||||||||||
o Expenses | o Expenses | 0 yen | o Expenses | 0 yen | ||||||||||||
| | | | | | | | | | | | | | | | | |
| Balance of net assets at the end of the business year | 96,976,502 yen | 49,253,102 yen | ||||||||||||||
| | | | | | | | | | | | | | | | | |
| Total revenues for the current period | — | 309,135,517 yen | ||||||||||||||
| | | | | | | | | | | | | | | | | |
| Total expenditures for the current period | — | 314,505,359 yen | ||||||||||||||
| | | | | | | | | | | | | | | | | |
| Amount of difference between revenues and expenditures for the current period | — | (5,369,842) yen | ||||||||||||||
| | | | | | | | | | | | | | | | | |
| Details of contributions and donations to basic funds of relevant public interest corporations, etc. Details of membership expenses and burden charges to be borne in order to be allocated to management expenses, operating expenses, etc. | N/A | N/A | ||||||||||||||
| | | | | | | | | | | | | | | | | |
| Details of receivables and payables to relevant public interest corporations | Accounts receivable: ¥233,854 | Accounts payable: ¥29,103,392 | ||||||||||||||
| | | | | | | | | | | | | | | | | |
| Details of debt guarantee | N/A | N/A | ||||||||||||||
| | | | | | | | | | | | | | | | | |
| Amounts and ratios in relation to operating revenues, order placement by JICA, etc. (amounts and ratios of competitive contracts, planning competitions and public selections, and noncompetitive negotiated contracts) | Total operating revenues: (Breakdown: JICA transactions, Competitive contract Planning competition and public selection Noncompetitive negotiated contracts | 34,814,282 yen 34,814,282 yen 100.0%) (0 yen 0.0%) (34,814,282 yen 100.0%) ( yen 0.0%) | Total operating revenues: (Breakdown: JICA transactions, Competitive contract Planning competition and public selection Noncompetitive negotiated contracts | 261,556,241 yen 206,137,612 yen 78.8%) (0 yen 0.0%) (200,810,284 yen 97.4%) (5,327,328 yen 2.6%) | ||||||||||||
| | | | | | | | | | | | | | | | | |
(Note) The entity is not legally required to create a statement of revenues and expenses pursuant to the "Accounting Standards for Public-interest Corporations"; hence, such a statement is not prepared. | ||||||||||||||||
F-31
| | | | | | | | | | | | | | | | | |
| Corporation type and name | (Relevant public interest corporations, etc.) | (Relevant public interest corporations, etc.) | ||||||||||||||
| | | | | | | | | | | | | | | | | |
| Items | Supporting Organization of J.O.C.V. | Overseas Vocational Training Association | ||||||||||||||
| | | | | | | | | | | | | | | | | |
| Outline of operations | (1) Activities for the diffusion of cooperation volunteers' activities for awareness raising and for understanding promotion (2) Activities for promoting participation in cooperation volunteers (3) Activities for assisting cooperation volunteers' local activities (4) Activities for leveraging cooperation volunteers' experience for society (5) Social contribution projects based on collaboration with citizen volunteers (6) Other activities necessary to achieve the objectives of this corporation | (1) Capacity building of necessary personnel for the planning and promotion of overseas vocational training (2) Undertaking of necessary international cooperation such as guidance and advice regarding establishment and operation of training institutions for the planning and promotion of overseas vocational training (3) Development and providing of necessary training material and methodology for the planning and promotion of overseas vocational training (4) Gathering and providing necessary information and material for the planning and promoting of overseas vocational training (5) Assisting the training for foreign trainees in Japan (6) Promotion of exchange between foreign trainees and Japanese local communities and families (7) Other activities necessary to fulfill the aims of this organization | ||||||||||||||
| | | | | | | | | | | | | | | | | |
| Name of officers | Number of officers: 13 President: Fusao Adachi Standing Director General: Kazuhisa Matsuoka (Former Vice-President of JICA) | Number of officers: 8 President: Isao Aoki | ||||||||||||||
| | | | | | | | | | | | | | | | | |
| Association chart on transactions between relevant public interest corporations and JICA |  | |||||||||||||||
| | | | | | | | | | | | | | | | | |
| Assets | 81,331,783 yen | 460,246,684 yen | ||||||||||||||
| | | | | | | | | | | | | | | | | |
| Liabilities | 7,330,461 yen | 135,525,618 yen | ||||||||||||||
| | | | | | | | | | | | | | | | | |
| Balance of net assets at the beginning of the business year | 73,158,174 yen | 382,615,136 yen | ||||||||||||||
| | | | | | | | | | | | | | | | | |
| Changes in net assets for the current period | ||||||||||||||||
| | | | | | | | | | | | | | | | | |
Changes in general net assets | ||||||||||||||||
o Revenues | o Revenues | o Revenues | ||||||||||||||
—Subsidy received, etc. | —Subsidy received, etc. | 3,000,000 yen | —Subsidy received, etc. | 0 yen | ||||||||||||
—Other revenues | —Other revenues | 151,926,727 yen | —Other revenues | 222,964,164 yen | ||||||||||||
o Expenses | o Expenses | 154,083,579 yen | o Expenses | 280,858,234 yen | ||||||||||||
| | | | | | | | | | | | | | | | | |
Changes in specified net assets | ||||||||||||||||
o Revenues | o Revenues | o Revenues | ||||||||||||||
—Subsidy received, etc. | —Subsidy received, etc. | 0 yen | —Subsidy received, etc. | 0 yen | ||||||||||||
—Other revenues | —Other revenues | 0 yen | —Other revenues | 0 yen | ||||||||||||
o Expenses | o Expenses | 0 yen | o Expenses | 0 yen | ||||||||||||
| | | | | | | | | | | | | | | | | |
| Balance of net assets at the end of the business year | 74,001,322 yen | 324,721,066 yen | ||||||||||||||
| | | | | | | | | | | | | | | | | |
| Total revenues for the current period | — | — | ||||||||||||||
| | | | | | | | | | | | | | | | | |
| Total expenditures for the current period | — | — | ||||||||||||||
| | | | | | | | | | | | | | | | | |
| Amount of difference between revenues and expenditures for the current period | — | — | ||||||||||||||
| | | | | | | | | | | | | | | | | |
| Details of contributions and donations to basic funds of relevant public interest corporations, etc. Details of membership expenses and burden charges to be borne in order to be allocated to management expenses, operating expenses, etc. | N/A | N/A | ||||||||||||||
| | | | | | | | | | | | | | | | | |
| Details of receivables and payables to relevant public interest corporations | Accounts payable: ¥23,004,496 | N/A | ||||||||||||||
| | | | | | | | | | | | | | | | | |
| Details of debt guarantee | N/A | N/A | ||||||||||||||
| | | | | | | | | | | | | | | | | |
| Amounts and ratios in relation to operating revenues, order placement by JICA, etc. (amounts and ratios of competitive contracts, planning competitions and public selections, and noncompetitive negotiated contracts) | Total operating revenues: (Breakdown: JICA transactions, Competitive contract Planning competition and public selection Noncompetitive negotiated contracts | 132,586,802 yen 101,175,799 yen 76.3%) (98,693,460 yen 97.5%) (0 yen 0.0%) (0 yen 0.0%) | Total operating revenues: (Breakdown: JICA transactions, Competitive contract Planning competition and public selection Noncompetitive negotiated contracts | 208,712,726 yen 149,662,382 yen 71.7%) (0 yen 0.0%) (145,933,401 yen 97.5%) (3,728,981 yen 2.5%) | ||||||||||||
| | | | | | | | | | | | | | | | | |
(Note) The entity is not legally required to create a statement of revenues and expenses pursuant to the "Accounting Standards for Public-interest Corporations"; hence, such a statement is not prepared. | (Note 1) The above amount pertains to the period from April 1, 2013 through March 31, 2014. (Note 2) The entity is not legally required to create a statement of revenues and expenses pursuant to the "Accounting Standards for Public-interest Corporations"; hence, such a statement is not prepared. | |||||||||||||||
F-32
| | | | | | | | | | | | | | | | | |
| Corporation type and name | (Relevant public interest corporations, etc.) | (Relevant public interest corporations, etc.) | ||||||||||||||
| | | | | | | | | | | | | | | | | |
| Items | Foundation for Advanced Studies on International Development | The Overseas Coastal Area Development Institute of Japan | ||||||||||||||
| | | | | | | | | | | | | | | | | |
| Outline of operations | (1) Cultivation of human resources for international development (2) Research and surveys for international development and assistance policy (3) Cooperation for advanced studies regarding international development (4) Technical cooperation projects overseas (5) Cooperation for private-sector business activities contributing to international development (6) Dissemination of information, edification, and publicity regarding international development (7) Activities in Japan drawing on insights from aforementioned activities (8) Other activities necessary to fulfill the aims of this foundation | (1) Research and studies for projects 1. Research and studies on global coastal development and international logistics 2. Undertaking cooperative projects related to coastal development and logistics overseas (2) International cooperation support activities 1. Transfer of Japanese technology concerning coastal development and logistics 2. Gathering and analyzing information on global coastal development and international logistics (3) International exchange and publicity 1. Promotion of international relations with overseas researchers and experts on coastal development and logistics 2. Organizing of study sessions and lectures and publications on global coastal development and international logistics 3. Joint research on global coastal development and international logistics with domestic and overseas institutions (4) Other activities necessary for fulfilling the aims of this institution | ||||||||||||||
| | | | | | | | | | | | | | | | | |
| Name of officers | Number of officers: 7 President: Tsuneo Sugishita | Number of officers: 10 Chairman: Koreshige Anami | ||||||||||||||
| | | | | | | | | | | | | | | | | |
| Association chart on transactions between relevant public interest corporations and JICA |  |  | ||||||||||||||
| | | | | | | | | | | | | | | | | |
| Assets | 851,333,109 yen | 1,444,460,275 yen | ||||||||||||||
| | | | | | | | | | | | | | | | | |
| Liabilities | 106,479,695 yen | 141,991,340 yen | ||||||||||||||
| | | | | | | | | | | | | | | | | |
| Balance of net assets at the beginning of the business year | 778,677,020 yen | 1,401,713,857 yen | ||||||||||||||
| | | | | | | | | | | | | | | | | |
| Changes in net assets for the current period | ||||||||||||||||
| | | | | | | | | | | | | | | | | |
Changes in general net assets | ||||||||||||||||
o Revenues | o Revenues | o Revenues | ||||||||||||||
—Subsidy received, etc. | —Subsidy received, etc. | 6,919,988 yen | —Subsidy received, etc. | 0 yen | ||||||||||||
—Other revenues | —Other revenues | 192,012,156 yen | —Other revenues | 695,872,343 yen | ||||||||||||
o Expenses | o Expenses | 232,755,750 yen | o Expenses | 795,117,265 yen | ||||||||||||
| | | | | | | | | | | | | | | | | |
Changes in specified net assets | ||||||||||||||||
o Revenues | o Revenues | o Revenues | ||||||||||||||
—Subsidy received, etc. | —Subsidy received, etc. | 0 yen | —Subsidy received, etc. | 0 yen | ||||||||||||
—Other revenues | —Other revenues | 0 yen | —Other revenues | 0 yen | ||||||||||||
o Expenses | o Expenses | 0 yen | o Expenses | 0 yen | ||||||||||||
| | | | | | | | | | | | | | | | | |
| Balance of net assets at the end of the business year | 744,853,414 yen | 1,302,468,935 yen | ||||||||||||||
| | | | | | | | | | | | | | | | | |
| Total revenues for the current period | — | — | ||||||||||||||
| | | | | | | | | | | | | | | | | |
| Total expenditures for the current period | — | — | ||||||||||||||
| | | | | | | | | | | | | | | | | |
| Amount of difference between revenues and expenditures for the current period | — | — | ||||||||||||||
| | | | | | | | | | | | | | | | | |
| Details of contributions and donations to basic funds of relevant public interest corporations, etc. Details of membership expenses and burden charges to be borne in order to be allocated to management expenses, operating expenses, etc. | N/A | N/A | ||||||||||||||
| | | | | | | | | | | | | | | | | |
| Details of receivables and payables to relevant public interest corporations | Accounts payable: ¥41,397,401 | Accounts payable: ¥38,309,560 | ||||||||||||||
| | | | | | | | | | | | | | | | | |
| Details of debt guarantee | N/A | N/A | ||||||||||||||
| | | | | | | | | | | | | | | | | |
| Amounts and ratios in relation to operating revenues, order placement by JICA, etc. (amounts and ratios of competitive contracts, planning competitions and public selections, and noncompetitive negotiated contracts) | Total operating revenues: (Breakdown: JICA transactions, Competitive contract Planning competition and public selection Noncompetitive negotiated contracts | 183,843,090 yen 146,949,334 yen 79.9%) (25,559,142 yen 17.4%) (117,012,935 yen 79.6%) (0 yen 0.0%) | Total operating revenues: (Breakdown: JICA transactions, Competitive contract Planning competition and public selection Noncompetitive negotiated contracts | 678,740,743 yen 276,593,008 yen 40.8%) (2,929,000 yen 1.1%) (273,664,008 yen 98.9%) (0 yen 0.0%) | ||||||||||||
| | | | | | | | | | | | | | | | | |
(Note) The entity is not legally required to create a statement of revenues and expenses pursuant to the "Accounting Standards for Public-interest Corporations"; hence, such a statement is not prepared. | (Note) The entity is not legally required to create a statement of revenues and expenses pursuant to the "Accounting Standards for Public-interest Corporations"; hence, such a statement is not prepared. | |||||||||||||||
F-33
| | | | | | | | | | | | | | | | | |
| Corporation type and name | (Relevant public interest corporations, etc.) | (Relevant public interest corporations, etc.) | ||||||||||||||
| | | | | | | | | | | | | | | | | |
| Items | HANDS (Health and Development Service) | Okinawa Environment Club | ||||||||||||||
| | | | | | | | | | | | | | | | | |
| Outline of operations | (1) Training of international health care cooperation experts and leaders in the area of population and health care (2) Establishment and undertaking of high-quality international health care cooperation and technical cooperation projects that match the needs of developing nations (3) Research and development of cooperation methods regarding comprehensive health care advancement in developing nations (4) Creation and providing of information and material regarding international health care cooperation (5) Advocacy to promote understanding of international health care cooperation (6) Activities regarding reduction of poverty and starvation, which are related to international health care cooperation, promulgation of elementary education, promotion of gender equality, and securing of environmental sustainability (7) Other activities necessary for fulfilling the aims of this organization | (1) Conservation of regional nature and environmen (2) Promotion of environmental education (3) Community development making use of natural and environmental features (4) Necessary research and studies; gathering and providing of information (5) Publication of newsletters, etc. | ||||||||||||||
| | | | | | | | | | | | | | | | | |
| Name of officers | Number of officers: 8 Representative director: Yasuhide Nakamura | Number of officers: 7 President: Kuniki Shimoji | ||||||||||||||
| | | | | | | | | | | | | | | | | |
| Association chart on transactions between relevant public interest corporations and JICA |  |  | ||||||||||||||
| | | | | | | | | | | | | | | | | |
| Assets | 171,337,980 yen | 39,478,000 yen | ||||||||||||||
| | | | | | | | | | | | | | | | | |
| Liabilities | 158,909,429 yen | 6,137,549 yen | ||||||||||||||
| | | | | | | | | | | | | | | | | |
| Balance of net assets at the beginning of the business year | 15,763,675 yen | 35,532,650 yen | ||||||||||||||
| | | | | | | | | | | | | | | | | |
| Changes in net assets for the current period | ||||||||||||||||
| | | | | | | | | | | | | | | | | |
Changes in general net assets | ||||||||||||||||
o Revenues | o Revenues | o Revenues | ||||||||||||||
—Subsidy received, etc. | —Subsidy received, etc. | — | —Subsidy received, etc. | — | ||||||||||||
—Other revenues | —Other revenues | — | —Other revenues | — | ||||||||||||
o Expenses | o Expenses | — | o Expenses | — | ||||||||||||
| | | | | | | | | | | | | | | | | |
Changes in specified net assets | ||||||||||||||||
o Revenues | o Revenues | o Revenues | ||||||||||||||
—Subsidy received, etc. | —Subsidy received, etc. | — | —Subsidy received, etc. | — | ||||||||||||
—Other revenues | —Other revenues | — | —Other revenues | — | ||||||||||||
o Expenses | o Expenses | — | o Expenses | — | ||||||||||||
| | | | | | | | | | | | | | | | | |
| Balance of net assets at the end of the business year | 12,428,551 yen | 33,340,451 yen | ||||||||||||||
| | | | | | | | | | | | | | | | | |
| Total revenues for the current period | 438,308,336 yen | 49,178,676 yen | ||||||||||||||
| | | | | | | | | | | | | | | | | |
| Total expenditures for the current period | 435,346,142 yen | 51,370,875 yen | ||||||||||||||
| | | | | | | | | | | | | | | | | |
| Amount of difference between revenues and expenditures for the current period | 2,962,194 yen | (2,192,199) yen | ||||||||||||||
| | | | | | | | | | | | | | | | | |
| Details of contributions and donations to basic funds of relevant public interest corporations, etc. Details of membership expenses and burden charges to be borne in order to be allocated to management expenses, operating expenses, etc. | N/A | N/A | ||||||||||||||
| | | | | | | | | | | | | | | | | |
| Details of receivables and payables to relevant public interest corporations | N/A | N/A | ||||||||||||||
| | | | | | | | | | | | | | | | | |
| Details of debt guarantee | N/A | N/A | ||||||||||||||
| | | | | | | | | | | | | | | | | |
| Amounts and ratios in relation to operating revenues, order placement by JICA, etc. (amounts and ratios of competitive contracts, planning competitions and public selections, and noncompetitive negotiated contracts) | Total operating revenues: (Breakdown: JICA transactions, Competitive contract Planning competition and public selection Noncompetitive negotiated contracts | 414,308,336 yen 385,802,834 yen 93.1%) (4,677,750 yen 1.2%) (381,125,084 yen 98.8%) (0 yen 0.0%) | Total operating revenues: (Breakdown: JICA transactions, Competitive contract Planning competition and public selection Noncompetitive negotiated contracts | 49,058,996 yen 47,768,616 yen 97.4%) (0 yen 0.0%) (47,768,616 yen 100.0%) (0 yen 0.0%) | ||||||||||||
| | | | | | | | | | | | | | | | | |
(Note 1) The above amount pertains to the period July 1, 2013, through June 30, 2014. (Note 2) Pursuant to the "Act amending part of the Act to Promote Specified Nonprofit Activities" (Act No. 70 of 2011) ("Act to Promote Specified Nonprofit Activities" hereinafter), the entity is not legally required to create a statement of changes in net assets; hence, such a statement is not prepared. | (Note) Pursuant to the Act to Promote Specified Nonprofit Activities, the entity is not legally required to create a statement of changes in net assets; hence, such a statement is not prepared. | |||||||||||||||
F-34
| | | �� | | | | | | | | | | | | | | |
| Corporation type and name | (Relevant public interest corporations, etc.) | (Relevant public interest corporations, etc.) | ||||||||||||||
| | | | | | | | | | | | | | | | | |
| Items | Mura no Mirai | Lequio Wings | ||||||||||||||
| | | | | | | | | | | | | | | | | |
| Outline of operations | (1) Activities regarding community development and support for community sustainability (2) Activities related to capacity building and receiving trainees (3) Activities related to research and studies (4) Activities related to promotion of international understanding and edification (5) Activities related to support of community promotion (6) Other activities necessary for fulfilling the aims of this organization | (1) International cooperation activities (2) International exchange activities (3) Activities regarding to capacity building (4) Activities regarding culture, sports, education, and academic exchange (5) Activities regarding promotion of communities in Okinawa (6) Support for the socially vulnerable and activities to promote peace (7) Other activities necessary for fulfilling the aims of this organization | ||||||||||||||
| | | | | | | | | | | | | | | | | |
| Name of officers | Number of officers: 12 Representative director: Nobuaki Wada | Number of officers: 7 Exective director: Chochu Awa | ||||||||||||||
| | | | | | | | | | | | | | | | | |
| Association chart on transactions between relevant public interest corporations and JICA |  |  | ||||||||||||||
| | | | | | | | | | | | | | | | | |
| Assets | 10,750,505 yen | 8,527,579 yen | ||||||||||||||
| | | | | | | | | | | | | | | | | |
| Liabilities | 9,244,205 yen | 21,030 yen | ||||||||||||||
| | | | | | | | | | | | | | | | | |
| Balance of net assets at the beginning of the business year | 1,886,080 yen | 1,485,084 yen | ||||||||||||||
| | | | | | | | | | | | | | | | | |
| Changes in net assets for the current period | ||||||||||||||||
| | | | | | | | | | | | | | | | | |
Changes in general net assets | ||||||||||||||||
o Revenues | o Revenues | o Revenues | ||||||||||||||
—Subsidy received, etc. | —Subsidy received, etc. | — | —Subsidy received, etc. | — | ||||||||||||
—Other revenues | —Other revenues | — | —Other revenues | — | ||||||||||||
o Expenses | o Expenses | — | o Expenses | — | ||||||||||||
| | | | | | | | | | | | | | | | | |
Changes in specified net assets | ||||||||||||||||
o Revenues | o Revenues | o Revenues | ||||||||||||||
—Subsidy received, etc. | —Subsidy received, etc. | — | —Subsidy received, etc. | — | ||||||||||||
—Other revenues | —Other revenues | — | —Other revenues | — | ||||||||||||
o Expenses | o Expenses | — | o Expenses | — | ||||||||||||
| | | | | | | | | | | | | | | | | |
| Balance of net assets at the end of the business year | 1,506,300 yen | 8,506,549 yen | ||||||||||||||
| | | | | | | | | | | | | | | | | |
| Total revenues for the current period | 106,938,570 yen | 21,944,011 yen | ||||||||||||||
| | | | | | | | | | | | | | | | | |
| Total expenditures for the current period | 107,318,350 yen | 14,922,546 yen | ||||||||||||||
| | | | | | | | | | | | | | | | | |
| Amount of difference between revenues and expenditures for the current period | (379,780) yen | 7,021,465 yen | ||||||||||||||
| | | | | | | | | | | | | | | | | |
| Details of contributions and donations to basic funds of relevant public interest corporations, etc. Details of membership expenses and burden charges to be borne in order to be allocated to management expenses, operating expenses, etc. | N/A | N/A | ||||||||||||||
| | | | | | | | | | | | | | | | | |
| Details of receivables and payables to relevant public interest corporations | N/A | Accounts payable: ¥2,277,084 | ||||||||||||||
| | | | | | | | | | | | | | | | | |
| Details of debt guarantee | N/A | N/A | ||||||||||||||
| | | | | | | | | | | | | | | | | |
| Amounts and ratios in relation to operating revenues, order placement by JICA, etc. (amounts and ratios of competitive contracts, planning competitions and public selections, and noncompetitive negotiated contracts) | Total operating revenues: (Breakdown: JICA transactions, Competitive contract Planning competition and public selection Noncompetitive negotiated contracts | 72,321,254 yen 59,005,802 yen 81.6%) (0 yen 0.0%) (59,005,802 yen 100.0%) (0 yen 0.0%) | Total operating revenues: (Breakdown: JICA transactions, Competitive contract Planning competition and public selection Noncompetitive negotiated contracts | 21,814,085 yen 21,814,085 yen 100.0%) (0 yen 0.0%) (21,814,085 yen 100.0%) (0 yen 0.0%) | ||||||||||||
| | | | | | | | | | | | | | | | | |
(Note) Pursuant to the Act to Promote Specified Nonprofit Activities, the entity is not legally required to create a statement of changes in net assets; hence, such a statement is not prepared. | (Note) Pursuant to the Act to Promote Specified Nonprofit Activities, the entity is not legally required to create a statement of changes in net assets; hence, such a statement is not prepared. | |||||||||||||||
F-35
| | | | | | | | | | | | | | | | | |
| Corporation type and name | (Relevant public interest corporations, etc.) | (Relevant public interest corporations, etc.) | ||||||||||||||
| | | | | | | | | | | | | | | | | |
| Items | Japan Overseas Cooperative Association of Kyushu | International Farmers Participation Technical Net-work | ||||||||||||||
| | | | | | | | | | | | | | | | | |
| Outline of operations | (1) Activities to provide advice to overseas volunteer undertaking, such as government development assistance activities, support for research, studies and evaluation, and cooperation (2) Activities including international exchange by municipalities and various organizations, planning for international cooperation undertaking, and support and cooperation for research and studies (3) Organizing training and lectures, etc., to promote self-development of young people through international understanding and publicity (4) Activities to promote international cooperation through personnel exchange and cultural and technical assistance with regional communities of developing nations, etc. (5) Activities to help returnees of overseas cooperation volunteers find jobs, with a view to disseminating volunteer experiences throughout society | (1) Activities regarding international cooperation 1. As support for small-scale farmers, development of appropriate technologies regarding upland crop, rice cultivation, vegetable cultivation, improvement of agricultural instruments, and irrigation 2. Gathering and providing information on agricultural technology for small-scale farmers 3. Survey of situations of local agriculture, and research and development for appropriate technologies 4. Capacity building of local residents and technological support 5. Training in Japan as well as at operation site 6. Support through dispatching experts (2) Activities related to revitalization of economic activities 1. Cooperation for participatory rural development through appropriate agricultural technology 2. Cooperation for farmers to participate in local agricultural cooperatives, etc. 3. Cooperation for training of appropriate agricultural technology for local farmers (3) Activities related to promotion of learning 1. Development, research, and study of appropriate technology for local small-scale farmers 2. Exchange with Japanese farmers, students and experts engaging in international cooperation 3. Support and cooperation to universities and research institutions | ||||||||||||||
| | | | | | | | | | | | | | | | | |
| Name of officers | Number of officers: 16 President: Ikuzo Yamabe Board member: Masato Hanada Former director General of the Nihon-matsu Training Center of JICA | Number of officers: 7 President: Nobutaka Ito Director: Toshiyuki Tsujimoto (Former Deputy director of the Tsukuba International Center of JICA) Director: Kazuo Nagai (Former director General of the Tsukuba International Center of JICA) Director: Yoshiaki Kono (Former director General of the Tokyo International Center of JICA) Director: Yoshihiko Nishimura (Former Deputy director of the Tsukuba International Center of JICA) | ||||||||||||||
| | | | | | | | | | | | | | | | | |
| Association chart on transactions between relevant public interest corporations and JICA | 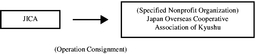 | 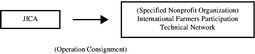 | ||||||||||||||
| | | | | | | | | | | | | | | | | |
| Assets | 34,454,386 yen | 46,058,583 yen | ||||||||||||||
| | | | | | | | | | | | | | | | | |
| Liabilities | 6,714,311 yen | 19,079,782 yen | ||||||||||||||
| | | | | | | | | | | | | | | | | |
| Balance of net assets at the beginning of the business year | 25,184,430 yen | 23,917,017 yen | ||||||||||||||
| | | | | | | | | | | | | | | | | |
| Changes in net assets for the current period | ||||||||||||||||
| | | | | | | | | | | | | | | | | |
Changes in general net assets | ||||||||||||||||
o Revenues | o Revenues | o Revenues | ||||||||||||||
—Subsidy received, etc. | —Subsidy received, etc. | — | —Subsidy received, etc. | — | ||||||||||||
—Other revenues | —Other revenues | — | —Other revenues | — | ||||||||||||
o Expenses | o Expenses | — | o Expenses | — | ||||||||||||
| | | | | | | | | | | | | | | | | |
Changes in specified net assets | ||||||||||||||||
o Revenues | o Revenues | o Revenues | ||||||||||||||
—Subsidy received, etc. | —Subsidy received, etc. | — | —Subsidy received, etc. | — | ||||||||||||
—Other revenues | —Other revenues | — | —Other revenues | — | ||||||||||||
o Expenses | o Expenses | — | o Expenses | — | ||||||||||||
| | | | | | | | | | | | | | | | | |
| Balance of net assets at the end of the business year | 27,740,075 yen | 26,978,801 yen | ||||||||||||||
| | | | | | | | | | | | | | | | | |
| Total revenues for the current period | 64,521,062 yen | 67,650,741 yen | ||||||||||||||
| | | | | | | | | | | | | | | | | |
| Total expenditures for the current period | 61,965,417 yen | 64,588,957 yen | ||||||||||||||
| | | | | | | | | | | | | | | | | |
| Amount of difference between revenues and expenditures for the current period | 2,555,645 yen | 3,061,784 yen | ||||||||||||||
| | | | | | | | | | | | | | | | | |
| Details of contributions and donations to basic funds of relevant public interest corporations, etc. Details of membership expenses and burden charges to be borne in order to be allocated to management expenses, operating expenses, etc. | N/A | N/A | ||||||||||||||
| | | | | | | | | | | | | | | | | |
| Details of receivables and payables to relevant public interest corporations | Accounts payable: ¥10,475,184 | Accounts payable: ¥8,242,560, Accounts receivable: ¥201,326 | ||||||||||||||
| | | | | | | | | | | | | | | | | |
| Details of debt guarantee | N/A | N/A | ||||||||||||||
| | | | | | | | | | | | | | | | | |
| Amounts and ratios in relation to operating revenues, order placement by JICA, etc. (amounts and ratios of competitive contracts, planning competitions and public selections, and noncompetitive negotiated contracts) | Total operating revenues: (Breakdown: JICA transactions, Competitive contract Planning competition and public selection Noncompetitive negotiated contracts | 64,050,868 yen 43,873,213 yen 68.5%) (36,344,365 yen 82.8%) (7,528,848 yen 17.2%) (0 yen 0.0%) | Total operating revenues: (Breakdown: JICA transactions, Competitive contract Planning competition and public selection Noncompetitive negotiated contracts | 66,540,154 yen 65,395,996 yen 98.3%) (0 yen 0.0%) (65,395,996 yen 100.0%) (0 yen 0.0%) | ||||||||||||
| | | | | | | | | | | | | | | | | |
(Note) Pursuant to the Act to Promote Specified Nonprofit Activities, the entity is not legally required to create a statement of changes in net assets, and it is difficult to identify the requested figure from the entity's financial statements; hence, the box is left blank. | (Note) Pursuant to the Act to Promote Specified Nonprofit Activities, the entity is not legally required to create a statement of changes in net assets; hence, such a statement is not prepared. | |||||||||||||||
F-36
To Mr. Akihiko Tanaka, President
Japan International Cooperation Agency
We have audited the accompanying financial statements related to the finance and investment account of Japan International Cooperation Agency, which comprise the balance sheet as of March 31, 2015, and the statement of income, statement of cash flows and statement of administrative service operation cost for the year then ended, and a summary of significant accounting policies and other explanatory information, and the accompanying supplementary schedules (except for the information described based on the financial statements and business reports relating to the associated companies; the same shall apply hereinafter).
President's Responsibility for the Financial Statements
The president is responsible for the preparation and fair presentation of these financial statements in accordance with accounting principles for incorporated administrative agencies generally accepted in Japan, and for such internal control as the president determines is necessary to enable the preparation of financial statements that are free from material misstatement, whether due to fraud or error, or illegal acts.
Auditor's Responsibility
Our responsibility is to express an opinion on these financial statements based on our audit. We conducted our audit in accordance with auditing standards for incorporated administrative agencies generally accepted in Japan. Those standards require that we plan and perform the audit to obtain reasonable assurance about whether the financial statements are free from material misstatement. The audit was planned with adequate attention being paid to the possibility that any fraud or error, or illegal acts, of the president, other executive officers or staff members may result in material misstatement in the financial statements.
An audit involves performing procedures to obtain audit evidence about the amounts and disclosures in the financial statements. The procedures selected depend on the auditor's judgment, including the assessment of the risks of material misstatement of the financial statements, whether due to fraud or error, or illegal acts. In making those risk assessments, the auditor considers internal control relevant to the entity's preparation and fair presentation of the financial statements in order to design audit procedures that are appropriate in the circumstances, but not for the purpose of expressing an opinion on the effectiveness of the entity's internal control. An audit also includes evaluating the appropriateness of accounting policies used and the reasonableness of accounting estimates made by the president, as well as evaluating the overall presentation of the financial statements.
We believe that the audit evidence we have obtained is sufficient and appropriate to provide a basis for our audit opinion. The basis includes the fact that no such fraud or error, or illegal acts, of the president, other executive officers or staff members was found, to the extent that we conducted our audit. The audit we conducted is not intended to express an opinion on whether there was any fraud or error, or illegal acts, of the president, other executive officers or staff members, which would not result in material misstatement in the financial statements.
Opinion
In our opinion, the financial statements referred to above present fairly, in all material respects, the financial position of Japan International Cooperation Agency's finance and investment account as of March 31, 2015 and the results of its operations, cash flows and administrative service operation cost for the year then ended in accordance with accounting principles for incorporated administrative agencies generally accepted in Japan.
/s/ DELOITTE TOUCHE TOHMATSU LLC
June 22, 2015
F-37
Balance Sheet
(as of March 31, 2015)
Finance and Investment Account
| (Unit: Yen) |
Assets | |||||||||||||||||
I | Current assets | ||||||||||||||||
Cash and deposits | 127,049,693,819 | ||||||||||||||||
Loans | 11,223,480,672,780 | ||||||||||||||||
Allowance for loan losses | (145,266,937,934 | ) | 11,078,213,734,846 | ||||||||||||||
| | | | | | | | | | | | | | | | | | |
Advance payments | 6,226,877,243 | ||||||||||||||||
Prepaid expenses | 110,041,101 | ||||||||||||||||
Accrued income | |||||||||||||||||
Accrued interest on loans | 36,472,458,905 | ||||||||||||||||
Accrued commitment charges | 1,069,427,149 | ||||||||||||||||
Accrued interest | 1,954,640 | 37,543,840,694 | |||||||||||||||
| | | | | | | | | | | | | | | | | | |
Accounts receivable | 501,958,961 | ||||||||||||||||
Consignment | 1,369,361 | ||||||||||||||||
Suspense payments | 3,953,933 | ||||||||||||||||
Advances paid | 118,112 | ||||||||||||||||
Short-term guarantee deposits | 26,946,000,000 | ||||||||||||||||
| | | | | | | | | | | | | | | | | | |
Total current assets | 11,276,597,588,070 | ||||||||||||||||
II | Non-current assets | ||||||||||||||||
| 1 | Tangible assets | ||||||||||||||||
Buildings | 3,198,330,904 | ||||||||||||||||
Accumulated depreciation | (808,400,708 | ) | |||||||||||||||
Accumulated impairment loss | (675,214,797 | ) | 1,714,715,399 | ||||||||||||||
| | | | | | | | | | | | | | | | | | |
Structures | 50,459,764 | ||||||||||||||||
Accumulated depreciation | (18,920,081 | ) | |||||||||||||||
Accumulated impairment loss | (11,670,468 | ) | 19,869,215 | ||||||||||||||
| | | | | | | | | | | | | | | | | | |
Machinery and equipment | 194,618,606 | ||||||||||||||||
Accumulated depreciation | (58,815,038 | ) | |||||||||||||||
Accumulated impairment loss | (102,287,680 | ) | 33,515,888 | ||||||||||||||
| | | | | | | | | | | | | | | | | | |
Vehicles | 350,083,187 | ||||||||||||||||
Accumulated depreciation | (223,130,393 | ) | 126,952,794 | ||||||||||||||
| | | | | | | | | | | | | | | | | | |
Tools, furniture, and fixtures | 642,072,291 | ||||||||||||||||
Accumulated depreciation | (415,166,038 | ) | 226,906,253 | ||||||||||||||
| | | | | | | | | | | | | | | | | | |
Land | 12,703,270,000 | ||||||||||||||||
Accumulated impairment loss | (6,091,196,973 | ) | 6,612,073,027 | ||||||||||||||
| | | | | | | | | | | | | | | | | | |
Construction in progress | 7,840,044 | ||||||||||||||||
| | | | | | | | | | | | | | | | | | |
Total tangible assets | 8,741,872,620 | ||||||||||||||||
| 2 | Intangible assets | ||||||||||||||||
Trademark right | 605,633 | ||||||||||||||||
| | | | | | | | | | | | | | | | | | |
Total intangible assets | 605,633 | ||||||||||||||||
| 3 | Investments and other assets | ||||||||||||||||
Investment securities | 139,850,556 | ||||||||||||||||
Shares of affiliated companies | 43,046,266,782 | ||||||||||||||||
Claims probable in bankruptcy, claims probable in rehabilitation, and other | 68,324,707,686 | ||||||||||||||||
Allowance for loan losses | (60,988,674,161 | ) | 7,336,033,525 | ||||||||||||||
| | | | | | | | | | | | | | | | | | |
Long-term prepaid expenses | 28,634,369 | ||||||||||||||||
Long-term guarantee deposits | 830,565,893 | ||||||||||||||||
| | | | | | | | | | | | | | | | | | |
Total investments and other assets | 51,381,351,125 | ||||||||||||||||
| | | | | | | | | | | | | | | | | | |
Total non-current assets | 60,123,829,378 | ||||||||||||||||
| | | | | | | | | | | | | | | | | | |
Total assets | 11,336,721,417,448 | ||||||||||||||||
| | | | | | | | | | | | | | | | | | |
| | | | | | | | | | | | | | | | | | |
| | | | | | | | | | | | | | | | | | |
F-38
Balance Sheet (Continued)
(as of March 31, 2015)
| (Unit: Yen) |
Liabilities | |||||||||||||||||
I | Current liabilities | ||||||||||||||||
Current portion of bonds | 10,000,000,000 | ||||||||||||||||
Current portion of borrowings from government fund for Fiscal Investment and Loan Program | 244,354,953,000 | ||||||||||||||||
Accounts payable | 6,645,706,569 | ||||||||||||||||
Accrued expenses | 7,471,885,088 | ||||||||||||||||
Derivatives | 35,132,994,389 | ||||||||||||||||
Lease obligations | 92,710,228 | ||||||||||||||||
Deposits received | 31,798,513 | �� | |||||||||||||||
Unearned revenue | 38,605,287 | ||||||||||||||||
Provision | |||||||||||||||||
Provision for bonuses | 234,605,336 | ||||||||||||||||
Provision for contingent losses | 11,697,233,092 | 11,931,838,428 | |||||||||||||||
| | | | | | | | | | | | | | | | | | |
Suspense receipt | 560,034,041 | ||||||||||||||||
| | | | | | | | | | | | | | | | | | |
Total current liabilities | 316,260,525,543 | ||||||||||||||||
II | Non-current liabilities | ||||||||||||||||
Bonds | 417,305,000,000 | ||||||||||||||||
Discounts on bonds payable | (216,421,883 | ) | |||||||||||||||
Borrowings from government fund for Fiscal Investment and Loan Program | 1,459,230,577,000 | ||||||||||||||||
Long-term lease obligations | 55,292,859 | ||||||||||||||||
Long-term deposits received | 533,265,000 | ||||||||||||||||
Provision for retirement benefits | 7,330,891,418 | ||||||||||||||||
Asset retirement obligations | 70,374,150 | ||||||||||||||||
| | | | | | | | | | | | | | | | | | |
Total non-current liabilities | 1,884,308,978,544 | ||||||||||||||||
| | | | | | | | | | | | | | | | | | |
Total liabilities | 2,200,569,504,087 | ||||||||||||||||
Net assets | |||||||||||||||||
I | Capital | ||||||||||||||||
Government investment | 7,813,897,840,510 | ||||||||||||||||
| | | | | | | | | | | | | | | | | | |
Total capital | 7,813,897,840,510 | ||||||||||||||||
II | Retained earnings | ||||||||||||||||
Reserve fund | 1,255,357,507,833 | ||||||||||||||||
Unappropriated income for the current business year | 114,438,092,876 | ||||||||||||||||
| | | | | | | | | | | | | | | | | | |
[Total income for the current business year] | (114,438,092,876 | ) | |||||||||||||||
Total retained earnings | 1,369,795,600,709 | ||||||||||||||||
III | Valuation and translation adjustments | ||||||||||||||||
Valuation difference on available-for-sale securities | (971,347 | ) | |||||||||||||||
Deferred gains or losses on hedges | (47,540,556,511 | ) | |||||||||||||||
| | | | | | | | | | | | | | | | | | |
Total valuation and translation adjustments | (47,541,527,858 | ) | |||||||||||||||
| | | | | | | | | | | | | | | | | | |
Total net assets | 9,136,151,913,361 | ||||||||||||||||
| | | | | | | | | | | | | | | | | | |
Total liabilities and net assets | 11,336,721,417,448 | ||||||||||||||||
| | | | | | | | | | | | | | | | | | |
| | | | | | | | | | | | | | | | | | |
| | | | | | | | | | | | | | | | | | |
F-39
Statement of Income
(April 1, 2014-March 31, 2015)
Finance and Investment Account
| (Unit: Yen) |
Ordinary expenses | ||||||||||
Expenses related to operations of cooperation through finance and investment | ||||||||||
Interest on bonds and notes | 5,430,887,222 | |||||||||
Interest on borrowings | 24,068,325,806 | |||||||||
Interest on interest rate swaps | 9,290,988,795 | |||||||||
Operations consignment expenses | 18,977,879,774 | |||||||||
Bond issuance cost | 444,645,451 | |||||||||
Foreign exchange losses | 1,190,507 | |||||||||
Personnel expenses | 3,233,220,013 | |||||||||
Provision for bonuses | 234,605,336 | |||||||||
Operating and administrative expenses | 13,067,775,332 | |||||||||
Depreciation | 252,918,716 | |||||||||
Taxes | 82,834,949 | |||||||||
Interest expenses | 122,421 | |||||||||
Provision for allowance for loan losses | 17,076,091,297 | |||||||||
Provision for allowance for contingent losses | 2,526,330,904 | |||||||||
Other ordinary expenses | 25,123 | 94,687,841,646 | ||||||||
| | | | | | | | | | | |
Total ordinary expenses | 94,687,841,646 | |||||||||
Ordinary revenues | ||||||||||
Revenues from operations of cooperation through finance and investment | ||||||||||
Interest on loans | 169,039,022,558 | |||||||||
Interest on bonds | 8,783,099 | |||||||||
Dividends on investments | 36,186,666,890 | |||||||||
Commissions | 3,451,121,979 | |||||||||
Gain on valuation of shares of affiliated companies | 2,736,894 | 208,688,331,420 | ||||||||
| | | | | | | | | | | |
Financial revenues | ||||||||||
Interest income | 30,324,289 | 30,324,289 | ||||||||
| | | | | | | | | | | |
Miscellaneous income | 405,864,089 | |||||||||
Recoveries of written-off claims | 19,878,116 | |||||||||
| | | | | | | | | | | |
Total ordinary revenues | 209,144,397,914 | |||||||||
| | | | | | | | | | | |
Ordinary income | 114,456,556,268 | |||||||||
Extraordinary losses | ||||||||||
Loss on disposal of non-current assets | 19,202,905 | |||||||||
Loss on sales of non-current assets | 126,645 | 19,329,550 | ||||||||
| | | | | | | | | | | |
Extraordinary income | ||||||||||
Gain on sales of non-current assets | 866,158 | 866,158 | ||||||||
| | | | | | | | | | | |
Net income | 114,438,092,876 | |||||||||
| | | | | | | | | | | |
Total income for the current business year | 114,438,092,876 | |||||||||
| | | | | | | �� | | | | |
| | | | | | | | | | | |
| | | | | | | | | | | |
F-40
Statement of Cash Flows
(April 1, 2014-March 31, 2015)
Finance and Investment Account
| (Unit: Yen) | |||||
I. | Cash flows from operating activities | |||||
Payments for loans | (820,438,667,416 | ) | ||||
Repayments of borrowings from the private sector | (60,700,000,000 | ) | ||||
Repayments of borrowings from government fund for Fiscal Investment and Loan Program | (275,875,802,000 | ) | ||||
Interest expenses paid | (50,380,445,654 | ) | ||||
Payments for personnel expenses | (3,998,416,109 | ) | ||||
Payments for other operations | (86,946,989,397 | ) | ||||
Proceeds from collection of loans | 672,813,919,210 | |||||
Proceeds from borrowings from the private sector | 60,700,000,000 | |||||
Proceeds from borrowings from government fund for Fiscal Investment and Loan Program | 197,500,000,000 | |||||
Proceeds from issuance of bonds | 106,620,787,949 | |||||
Proceeds from interest on loans | 164,814,947,604 | |||||
Proceeds from commissions | 3,504,605,318 | |||||
Proceeds from other operations | 44,445,610,651 | |||||
Subtotal | (47,940,449,844 | ) | ||||
Interest and dividend income received | 36,225,956,578 | |||||
| | | | | | | |
Net cash used in operating activities | (11,714,493,266 | ) | ||||
II. | Cash flows from investing activities | |||||
Payments for purchase of non-current assets | (90,217,679 | ) | ||||
Proceeds from sales of non-current assets | 11,788,638 | |||||
Payments for purchase of investment securities | (188,445,035 | ) | ||||
Payments for purchase of shares of affiliated companies | (327,159,000 | ) | ||||
Proceeds from sales and collection of shares of affiliated companies | 24,576,313,000 | |||||
Payments for purchase of negotiable deposits | (246,500,000,000 | ) | ||||
Proceeds from refund of negotiable deposits | 246,500,000,000 | |||||
| | | | | | | |
Net cash provided by investing activities | 23,982,279,924 | |||||
III. | Cash flows from financing activities | |||||
Repayments of lease obligations | (94,210,551 | ) | ||||
Receipt of government investment | 48,500,000,000 | |||||
| | | | | | | |
Net cash provided by financing activities | 48,405,789,449 | |||||
| | | | | | | |
IV. | Net increase in funds | 60,673,576,107 | ||||
V. | Funds at the beginning of the business year | 66,376,117,712 | ||||
| | | | | | | |
VI. | Funds at the end of the business year | 127,049,693,819 | ||||
| | | | | | | |
| | | | | | | |
| | | | | | | |
F-41
Statement of Administrative Service Operation Cost
(April 1, 2014-March 31, 2015)
Finance and Investment Account
| (Unit: Yen) |
I Operating expenses | ||||||||||
(1) Expenses in the statement of income | ||||||||||
Expenses related to operations of cooperation through finance and investment | 94,687,841,646 | |||||||||
Loss on disposal of non-current assets | 19,202,905 | |||||||||
Loss on sales of non-current assets | 126,645 | 94,707,171,196 | ||||||||
| | | | | | | | | | | |
(2) (Deduction) Self-revenues, etc. | ||||||||||
Revenues from operations of cooperation through finance and investment | (208,688,331,420 | ) | ||||||||
Financial revenues | (30,324,289 | ) | ||||||||
Miscellaneous income | (405,864,089 | ) | ||||||||
Recoveries of written-off claims | (19,878,116 | ) | ||||||||
Gain on sales of non-current assets | (866,158 | ) | (209,145,264,072 | ) | ||||||
| | | | | | | | | | | |
Total operating expenses | (114,438,092,876 | ) | ||||||||
II. Estimated increase in retirement benefits not included in provision | 4,954,995 | |||||||||
III. Opportunity cost | ||||||||||
Opportunity cost of government investment | 31,158,591,362 | |||||||||
| | | | | | | | | | | |
IV. Administrative service operation cost | (83,274,546,519 | ) | ||||||||
| | | | | | | | | | | |
| | | | | | | | | | | |
| | | | | | | | | | | |
F-42
Basis of Presenting Financial Statements
The accompanying financial statements have been prepared in accordance with accounting principles for incorporated administrative agencies generally accepted in Japan, which are different in many respects as to application and disclosure requirements of accounting principles for business enterprises generally accepted in Japan.
Significant Accounting Policies
Finance and Investment Account
1. Depreciation method
- (1)
- Tangible assets
Straight-line method
The useful lives of major assets are as follows:
Buildings: | 2 - 50 years | |||
Structures: | 2 - 46 years | |||
Machinery and equipment: | 2 - 17 years | |||
Vehicles: | 2 - 6 years | |||
Tools, furniture, and fixtures: | 2 - 15 years |
- (2)
- Intangible assets
Straight-line method
2. Standard for appropriation of provision and estimation for bonuses
The provision for bonuses is calculated and provided for based on estimated amounts of future payments attributable to the services that have been rendered by officers and employees applicable to the current business year.
3. Standard for appropriation of provision and estimation for retirement benefits
The provision for retirement benefits is calculated and provided for based on estimated amounts of future payments attributable to the retirement of employees, and is accrued in line with the projected benefit obligations and estimated plan assets applicable to the business year ended March 31, 2015. The profit and loss appropriation method for actuarial differences and past service liabilities are presented as follows:
Actuarial differences are recognized as a lump-sum gain or loss in the business year in which they occur.
Past service liabilities are recognized as a lump-sum gain or loss in the business year in which they occur.
The estimated increase in retirement benefits not included in provision in the statement of administrative service operation cost is reported as the current-year increase of provision for retirement benefits, calculated according to the Accounting Standard for Incorporated Administrative Agency No. 38.
F-43
4. Basis and standard for appropriation of allowance, etc.
- (1)
- Allowance for loan losses
The allowance for claims on debtors who are legally bankrupt ("Bankrupt borrowers") or substantially bankrupt ("Substantially bankrupt borrowers") is provided based on the outstanding balance of loan claims after the deductions of the amount expected to be collected through the disposal of collateral and execution of guarantees, or the same amount is written off directly. The allowance for claims on debtors who are not legally bankrupt, but are likely to become bankrupt ("Potentially bankrupt borrowers") is provided based on an overall assessment of the solvency of the debtors after the deductions of the amount expected to be collected through the disposal of collateral and the execution of guarantees, or the same amount is written off directly. There were no write-offs from the above-mentioned outstanding balance of loan claims.
The allowance for claims on debtors other than Bankrupt borrowers, Substantially bankrupt borrowers, and Potentially bankrupt borrowers is provided primarily based on the default rate, which is calculated based on the actual defaults during a certain period in the past. The allowance for possible losses on specific overseas loans is provided based on the expected loss amount taking into consideration the political and economic situation of these countries.
All claims are assessed initially by the operational departments (including regional departments) based on internal rules for self-assessment of asset quality. The Internal Audit Department, which is independent from the operational departments, reviews these self-assessments, and an allowance is provided based on the results of the assessments.
- (2)
- Provision for contingent losses
Provision for contingent losses is provided to prepare for the occurrence of contingent losses for a portion of the undisbursed balance of loan commitments, which JICA is absolutely obligated to extend. The amount of the provision is estimated based on possible losses in the future.
5. Standard and method for the valuation of securities
- (1)
- Shares of affiliated companies
Shares of affiliated companies are stated at cost, determined using the moving-average method.
However, when the equity-equivalent price has fallen below the cost at acquisition, the equity-equivalent price is used.
- (2)
- Other investment securities (whose fair value is extremely difficult to determine)
Other investment securities are stated at cost, determined using the moving-average method.
6. Standard and method for the valuation of derivative transactions
All derivative financial instruments are carried at fair value.
7. Method for amortization of discount on bonds payable
Discount on bonds payable is amortized over the duration of the bonds.
8. Translation standard for foreign currency-denominated assets and liabilities into yen
Foreign currency money claims and liabilities are translated into Japanese yen mainly at the spot exchange rate at the balance sheet date. Exchange differences are recognized as profit or loss.
F-44
9. Method for computing opportunity cost in the statement of administrative service operation cost
Interest rate used to compute opportunity cost concerning government investment:
0.400% with reference to the yield of 10-year fixed-rate Japanese government bonds at the end of March 2015.
10. Accounting treatment for lease transactions
Finance lease transactions with total lease fees of ¥3 million or more are accounted for in a similar manner as ordinary sales and purchase transactions.
Finance lease transactions with total lease fees of less than ¥3 million are accounted for in a similar manner as ordinary rental transactions.
11. Method of hedge accounting
- (1)
- Method of hedge accounting
Interest rate swaps are accounted for using the deferral hedge accounting method. As for interest rate and currency swaps, the interest rate part is accounted for using the accrual method and the currency part is accounted for by the assignment method.
- (2)
- Hedging instruments and hedged items
- [1]
- Hedging instruments...Interest rate swaps
- [2]
- Hedging instruments...Interest rate and currency swaps
Hedged items...Loans and bonds
Hedged items...Foreign currency bonds
- (3)
- Hedging policy
JICA engages in interest rate swaps or interest rate and currency swaps for the purpose of hedging interest rate or currency fluctuation risks.
- (4)
- Method of evaluation of hedge effectiveness
Hedges that offset market fluctuations of loans are assessed based on discrepancies with regard to maturity and notional principal and others between hedged loans and hedging instruments.
Hedges that offset market fluctuations of bonds are assessed by measuring and comparing the change in fair value of both hedging instruments and corresponding hedged items from the date of inception of the hedges to the assessment date. As for interest rate and currency swaps that satisfy the requirements of the accrual method and the assignment method, JICA is not required to periodically evaluate hedge effectiveness.
12. Accounting treatment for consumption taxes
Consumption taxes are included in transaction amounts.
F-45
Notes to the financial statements
Finance and Investment Account
(Balance Sheet)
- 1.
- Joint obligations
JICA is jointly liable for obligations arising from the following bonds issued by the former Japan Bank for International Cooperation which was succeeded by the Japan Bank for International Cooperation:
Fiscal Investment and Loan Program (FILP) Agency Bonds | 350,000,000,000 | Yen | |||
Government-Guaranteed Foreign Bonds | 650,000,000 | U.S. Dollars |
- 2.
- Financial assets received as collateral
The market value of the financial assets received as collateral at our disposal was ¥3,794,858,800.
- 3.
- Undisbursed balance of loan commitments
Most of JICA's loans are long term. Ordinarily, when receiving a request for disbursement of a loan from a borrower, corresponding to the intended use of funds as stipulated by the loan agreement, and upon confirming the fulfillment of conditions prescribed under the loan agreement, JICA promises to loan a certain amount of funds within a certain range of the amount required by the borrower, with an outstanding balance within the limit of loan commitments. The undisbursed balance of loan commitments as of March 31, 2015 was ¥4,692,025,149,989.
(Statement of Income)
- 1.
- Gain (loss) on valuation of shares of affiliated companies
Gain (loss) on valuation of shares of affiliated companies includes gain (loss) on valuation, sale, or liquidation of shares of affiliated companies.
- 2.
- Recoveries of written-off claims
Recoveries of written-off claims include the amount recovered in excess of book value of the loans transferred to JICA on October 1, 2008, that are associated with the Overseas Economic Cooperation Account of the former Japan Bank for International Cooperation.
(Statement of Cash Flows)
The funds shown in the statement of cash flows are deposit accounts and checking accounts.
- 1.
- Breakdown of balance sheet items and ending balance of funds
(as of March 31, 2015) | | |||
|---|---|---|---|---|
Cash and deposits | ¥127,049,693,819 | |||
| | | | | |
Ending balance of funds | ¥127,049,693,819 | |||
- 2.
- Description of significant non-cash transactions
Assets granted under finance lease
Tools, furniture, and fixtures | ¥38,676,568 |
F-46
(Statement of Administrative Service Operation Cost)
Number of public officers temporarily transferred to JICA and accounted for as opportunity cost
Of the estimated increase in retirement benefits not included in the provision, ¥4,954,995 was recognized as the current-business-year increase of provision for retirement benefits for 31 public officers temporarily transferred to JICA according to JICA's internal rules.
(Financial instruments)
- 1.
- Status of financial instruments
- (1)
- Policy regarding financial instruments
- (2)
- Details of financial instruments and related risks
The Finance and Investment Account undertakes financial cooperation operations by providing debt and equity financing. In undertaking these operations, it raises funds by borrowing from the Japanese Government under the FILP, borrowing from financial institutions, issuing bonds, and receiving capital investment from the Japanese Government. From the perspective of asset-liability management (ALM), derivative transactions are conducted for mitigating the adverse impact caused by interest rate and foreign exchange fluctuations.
- (3)
- Risk management system for financial instruments
- [1]
- Credit risk management
The financial assets held in the Finance and Investment Account are loans mainly to developing regions, and are exposed to credit risk attributed to defaults by its borrowers and interest rate risk. Securities, investment securities, and shares of affiliated companies are held for policy-oriented purposes, and are exposed to credit risk of issuers, interest rate risk, and market price volatility risk.
Borrowings and bonds are exposed to liquidity risk as their payments or repayments cannot be duly serviced in such a situation where the account is unable to have access to markets for certain reasons. In addition to the above, foreign currency bonds are exposed to foreign exchange fluctuation risk.
The Finance and Investment Account has established and operates a system for credit management. This system encompasses credit appraisal, credit limit setting, credit information monitoring, internal rating, guarantee and collateral setting, problem loan management, etc., in accordance with integrated risk management rules and various credit risk-monitoring rules. This credit management is carried out by the respective departments responsible for each region in addition to the Credit Risk Analysis and Environmental Review Department and General Affairs Department. Additionally, the Risk Management Committee of the Finance and Investment Account and Board of Directors convene on a regular basis for the purpose of deliberating or reporting. Moreover, the Office of Audit monitors the status of credit management.
The credit risks of issuers of investment securities and shares of affiliated companies are monitored by the Private Sector Partnership and Finance Department, which regularly confirms their credit information, etc.
Counterparty risk in derivative transactions is monitored by regularly confirming the exposure and credit standing of counterparties and by securing collateral as necessary.
F-47
- [2]
- Market risk management
- (i)
- Interest rate risk management
- (ii)
- Foreign exchange risk management
- (iii)
- Price volatility risk management
Interest rates are determined in accordance with the methods prescribed by laws or statements of operational procedures. Interest rate swap transactions are conducted to hedge against the risk of interest rate fluctuations in light of their possible adverse impact.
Foreign currency bonds are exposed to foreign exchange fluctuation risk; as such, interest rate and currency swaps are employed to avert or reduce foreign exchange risk.
- [3]
- Liquidity risk management related to fund raising
Stocks that are held for policy-oriented purposes are monitored for changes in value affected by the market environment or financial condition of the companies, exchange rates, and other factors.
This information is reported on a regular basis to the Risk Management Committee of the Finance and Investment Account and Board of Directors.
- [4]
- Derivative transaction management
The Finance and Investment Account prepares a funding plan and executes fund raising based on the government-affiliated agencies' budgets, as resolved by the National Diet.
Pursuant to rules concerning swaps, derivative transactions are implemented and managed by separating the sections related to execution of transactions, assessment of hedge effectiveness, and logistics management based on a mechanism with an established internal system of checks and balances.
- 2.
- Fair value of financial instruments
Balance sheet amount, fair value, and difference at the balance sheet date are as follows:
| (Unit: Yen) | ||||||||||||||||||
| | | | | | | | | | | | | | | | | | | |
| Balance sheet amount | Fair value | Difference | ||||||||||||||||
| | | | | | | | | | | | | | | | | | | |
| (1) | Loans | 11,223,480,672,780 | ||||||||||||||||
| | | | | | | | | | | | | | | | | | | |
| Allowance for loan losses | (145,266,937,934 | ) | ||||||||||||||||
| | | | | | | | | | | | | | | | | | | |
| 11,078,213,734,846 | 11,246,854,590,044 | 168,640,855,198 | ||||||||||||||||
| | | | | | | | | | | | | | | | | | | |
| (2) | Claims probable in bankruptcy, claims probable in rehabilitation, and other | 68,324,707,686 | ||||||||||||||||
| | | | | | | | | | | | | | | | | | | |
| Allowance for loan losses | (60,988,674,161 | ) | ||||||||||||||||
| | | | | | | | | | | | | | | | | | | |
| 7,336,033,525 | 7,336,033,525 | 0 | ||||||||||||||||
| | | | | | | | | | | | | | | | | | | |
| (3) | Borrowings from government fund for FILP (including borrowings due within one year) | (1,703,585,530,000 | ) | (1,786,676,890,929 | ) | (83,091,360,929 | ) | |||||||||||
| | | | | | | | | | | | | | | | | | | |
| (4) | Derivative transactions | (35,132,994,389 | ) | (35,132,994,389 | ) | 0 | ||||||||||||
| | | | | | | | | | | | | | | | | | | |
- *
- Liabilities are shown in parentheses ( ).
F-48
- (Note
- 1) Method for calculating fair values of financial instruments
- [1]
- Loans
- [2]
- Claims probable in bankruptcy, claims probable in rehabilitation, and other
Fair values of loans with floating interest rates are calculated at their book values, as policy interest rates (bank rates) are immediately reflected in their floating interest rates, and therefore, fair value approximates book value. On the other hand, fair values of loans with fixed interest rates are calculated by discounting the total amount of the principal and interest using a rate that combines a risk-free rate with the respective borrowers' credit risk.
- [3]
- Borrowings from government fund for FILP (including borrowings due within one year)
Regarding claims probable in bankruptcy, claims probable in rehabilitation, and other, the estimated uncollectible amount is calculated based on the expected recoverable amount through collateral and guarantees. Therefore, fair value approximates the balance sheet amount, less the current estimated uncollectible amount, and hence is calculated accordingly.
- [4]
- Derivative transactions
Fair value of borrowings from government fund for FILP (including borrowings due within one year) is calculated by discounting the total amount of principal and interest using interest rates expected to be applied to new borrowings for the same total amount.
Derivative transactions are interest rate-related transactions (interest rate swaps), and fair values are based on discounted present values.
(Note- 2) The following are financial instruments whose fair values are deemed to be extremely difficult to determine. They are not included in the fair value information of financial instruments.
| (Unit: Yen) | ||||||||
| | | | | | | | | |
| Balance sheet amount | ||||||||
| | | | | | | | | |
| Investment securities*(1) | 139,850,556 | |||||||
| | | | | | | | | |
Shares of affiliated companies*(1) | 43,046,266,782 | |||||||
| | | | | | | | | |
Undisbursed balance of loan commitments*(2) | 0 | |||||||
| | | | | | | | | |
- *(1)
- These financial instruments have no market prices, and the calculation of their fair values is deemed to be extremely difficult.
- *(2)
- The fair values of the undisbursed balances of loan commitments are deemed to be extremely difficult to determine. The main reason is the difficulty of reasonably estimating future extensions of loans, because of the extremely diverse range of implementation formats for projects in the developing countries where these loans are provided.
F-49
(Retirement benefits)
- 1.
- Breakdown of retirement benefit obligations
| (Unit: Yen) | ||||||||||
| | | | | | | | | | | |
| End of business year 2014 | ||||||||||
| | | | | | | | | | | |
| (1) | Retirement benefit obligations | (11,074,620,367 | ) | |||||||
(2) | Plan assets | 3,743,728,949 | ||||||||
(3) | Non-accumulated retirement benefit obligations (1) + (2) | (7,330,891,418 | ) | |||||||
(4) | Unrecognized actuarial differences | 0 | ||||||||
(5) | Unrecognized past service liabilities (decrease in liabilities) | 0 | ||||||||
(6) | Net reported amount in the balance sheet (3) + (4) + (5) | (7,330,891,418 | ) | |||||||
(7) | Prepaid pension expenses | 0 | ||||||||
(8) | Provision for retirement benefits (6) – (7) | (7,330,891,418 | ) | |||||||
| | | | | | | | | | | |
- (Note
- 1) On March 1, 2014, JICA obtained approval from the Minister of Health, Labour and Welfare for exemption from the obligations of future payments related to return of a substitutional portion of Employees' Pension Fund.
The amount corresponding to the refund (minimum actuarial liability) measured at the end of the current business year was ¥1,739,210,451. Assuming this amount had been transferred at the end of the current business year, an estimated gain and an estimated deduction amount in the statement of administrative service operation cost would be ¥3,029,493,522, in accordance with Paragraph 44-2 of "Practical Guidelines concerning Accounting Standard for Retirement Benefits (Interim Report)" (Japan Institute of Certified Public Accountants, Accounting System Committee Report No. 13 issued on September 14, 1999)
- (Note
- 2) Plan assets include ¥1,622,924,390 paid in advance to the National Treasury in relation to the return of the substitutional portion of the Employees' Pension Funds.
- 2.
- Breakdown of retirement benefit expenses
(Unit: Yen) | ||||||||
| | | | | | | | | |
| Business year 2014 | |||||||
| | | | | | | | | |
| (1) Service cost | 319,507,659 | ||||||
| (2) Interest cost | 139,853,189 | ||||||
| (3) Expected return on plan assets | 0 | ||||||
| (4) Amortization of past service liabilities | (1,028,597,828) | ||||||
| (5) Amortization of actuarial differences | 301,564,239 | ||||||
| (6) Others (premiums collected for Employees' Pension Fund) | (21,022,682) | ||||||
| | | | | | | | | |
F-50
- 3.
- Assumptions for retirement benefit obligations, etc.
| | | | | | | | | |
| Business year 2014 | |||||||
| | | | | | | | | |
| (1) Discount rate: Employees' Pension Fund | 1.40% | ||||||
| Retirement benefits | 0.74% | ||||||
| (2) Expected rate of return on plan assets | 0.0% | ||||||
| (3) Method of attributing expected benefit to periods | Straight-line basis | ||||||
| (4) Recognition period of actuarial differences | 1 year | ||||||
| (5) Amortization period of past service liabilities | 1 year | ||||||
| | | | | | | | | |
(Lease transactions)
Future minimum lease payments related to operating lease transactions are as follows
Future minimum lease payments due within one year of the balance sheet date | ¥ | 161,903 | ||
Future minimum lease payments corresponding to periods more than one year from the balance sheet date | ¥ | 0 |
(Asset retirement obligations)
JICA has a building lease agreement for its head office building, and has an obligation to restore the building to its original state at the termination of the lease period. Therefore, the asset retirement obligations have been recorded. The estimate for the asset retirement obligations assumes a five-year lease period for the projected period of use and a discount rate of 0.529%.
At the end of the previous business year, the amount recorded for asset retirement obligations was ¥70,251,729. The balance of the asset retirement obligations at the end of the current business year was ¥70,251,729; consisting of the sum of the above ¥122,421 and a ¥70,374,150 adjustment amount for the asset retirement obligations are due to passage of time.
(Profit and loss under the equity method)
JICA does not maintain any specific affiliated companies and, as such, does not prepare consolidated financial statements. However, profit and loss under the equity method related to affiliated companies are as follows:
Investment amount in affiliated companies | ¥ | 43,046,266,782 | ||
Investment amount when applying the equity method | ¥ | 57,344,816,592 | ||
Capital gain amount from investments when applying the equity method | ¥ | 35,891,477,087 |
(Significant act to assume debts)
Not applicable.
F-51
(Significant subsequent events)
On April 1, 2015, JICA obtained approval from the Minister of Health, Labour and Welfare for exemption from the obligations of future payments related to return of a substitutional portion of the Employees' Pension Fund. Accordingly, based on Paragraph 44-2 of the "Practical Guidelines concerning Accounting Standard for Retirement Benefits (Interim Report)" (Japan Institute of Certified Public Accountants, Accounting System Committee Report No. 13), the expiry of retirement benefit obligations corresponding to the substitutional portion and related gain (loss) were recognized as of the date of the approval. As for the related gain (loss), ¥3,029,493,522 in gain from the return of a substitutional portion is to be reported in the financial statements for business year 2015.
Appropriation of profit was approved as follows on May 29, 2015:
(Unit: Yen) | |||||||
I. | Unappropriated income for the current business year | 114,438,092,876 | |||||
Total income for the current business year | 114,438,092,876 | ||||||
II. | Profit appropriation amount | 114,438,092,876 | |||||
Reserve fund | 114,438,092,876 | ||||||
Finance and Investment Account
(1) Details of acquisition and disposal of non-current assets, depreciation, and accumulated impairment loss
| (Unit: Yen) | |||||||||||||||||||||||||||||||||||||||||||||||||||||||||||||||
| | | | | | | | | | | | | | | | | | | | | | | | | | | | | | | | | | | | | | | | | | | | | | | | | | | | | | | | | | | | | | | | |
| Accumulated depreciation | Accumulated impairment loss | ||||||||||||||||||||||||||||||||||||||||||||||||||||||||||||||
| | | | | | | | | | | | | | | | | | | | | | | | | | | | | | | | | | | | | | | | | | | | | | | | | | | | | | | | | | | | | | | | |
Type | Balance at the beginning of the period | Increase during the period | Decrease during the period | Balance at the end of the period | Depreciation during the period | Impairment loss during the period (recognized in the statement of income) | Impairment loss during the period (not recognized in the statement of income) | Net assets at the end of the period | Remarks | ||||||||||||||||||||||||||||||||||||||||||||||||||||||
| | | | | | | | | | | | | | | | | | | | | | | | | | | | | | | | | | | | | | | | | | ��� | | | | | | | | | | | | | | | | | | | | | | |
| Buildings | 3,192,515,710 | 29,428,968 | 23,613,774 | 3,198,330,904 | 808,400,708 | 102,740,334 | 675,214,797 | 0 | 0 | 1,714,715,399 | |||||||||||||||||||||||||||||||||||||||||||||||||||||
| | | | | | | | | | | | | | | | | | | | | | | | | | | | | | | | | | | | | | | | | | | | | | | | | | | | | | | | | | | | | | | | |
| Structures | 50,459,764 | 0 | 0 | 50,459,764 | 18,920,081 | 2,410,072 | 11,670,468 | 0 | 0 | 19,869,215 | |||||||||||||||||||||||||||||||||||||||||||||||||||||
| | | | | | | | | | | | | | | | | | | | | | | | | | | | | | | | | | | | | | | | | | | | | | | | | | | | | | | | | | | | | | | | |
| Tangible assets (Depreciation included in expenses) | Machinery and equipment | 195,283,381 | 0 | 664,775 | 194,618,606 | 58,815,038 | 3,766,887 | 102,287,680 | 0 | 0 | 33,515,888 | ||||||||||||||||||||||||||||||||||||||||||||||||||||
| | | | | | | | | | | | | | | | | | | | | | | | | | | | | | | | | | | | | | | | | | | | | | | | | | | | | | | | | | | | | | | | |
| Vehicles | 341,829,503 | 23,634,133 | 15,380,449 | �� | 350,083,187 | 223,130,393 | 31,702,851 | 0 | 0 | 0 | 126,952,794 | ||||||||||||||||||||||||||||||||||||||||||||||||||||
| | | | | | | | | | | | | | | | | | | | | | | | | | | | | | | | | | | | | | | | | | | | | | | | | | | | | | | | | | | | | | | | |
| Tools, furniture, and fixtures | 593,643,692 | 52,859,786 | 4,431,187 | 642,072,291 | 415,166,038 | 112,239,603 | 0 | 0 | 0 | 226,906,253 | |||||||||||||||||||||||||||||||||||||||||||||||||||||
| | | | | | | | | | | | | | | | | | | | | | | | | | | | | | | | | | | | | | | | | | | | | | | | | | | | | | | | | | | | | | | | |
| Total | 4,373,732,050 | 105,922,887 | 44,090,185 | 4,435,564,752 | 1,524,432,258 | 252,859,747 | 789,172,945 | 0 | 0 | 2,121,959,549 | |||||||||||||||||||||||||||||||||||||||||||||||||||||
| | | | | | | | | | | | | | | | | | | | | | | | | | | | | | | | | | | | | | | | | | | | | | | | | | | | | | | | | | | | | | | | |
| Land | 12,703,270,000 | 0 | 0 | 12,703,270,000 | 0 | 0 | 6,091,196,973 | 0 | 0 | 6,612,073,027 | |||||||||||||||||||||||||||||||||||||||||||||||||||||
| | | | | | | | | | | | | | | | | | | | | | | | | | | | | | | | | | | | | | | | | | | | | | | | | | | | | | | | | | | | | | | | |
| Non-depreciable assets | Construction in progress | 0 | 7,875,452 | 35,408 | 7,840,044 | 0 | 0 | 0 | 0 | 0 | 7,840,044 | ||||||||||||||||||||||||||||||||||||||||||||||||||||
| | | | | | | | | | | | | | | | | | | | | | | | | | | | | | | | | | | | | | | | | | | | | | | | | | | | | | | | | | | | | | | | |
| Total | 12,703,270,000 | 7,875,452 | 35,408 | 12,711,110,044 | 0 | 0 | 6,091,196,973 | 0 | 0 | 6,619,913,071 | |||||||||||||||||||||||||||||||||||||||||||||||||||||
| | | | | | | | | | | | | | | | | | | | | | | | | | | | | | | | | | | | | | | | | | | | | | | | | | | | | | | | | | | | | | | | |
| Buildings | 3,192,515,710 | 29,428,968 | 23,613,774 | 3,198,330,904 | 808,400,708 | 102,740,334 | 675,214,797 | 0 | 0 | 1,714,715,399 | |||||||||||||||||||||||||||||||||||||||||||||||||||||
| | | | | | | | | | | | | | | | | | | | | | | | | | | | | | | | | | | | | | | | | | | | | | | | | | | | | | | | | | | | | | | | |
| Structures | 50,459,764 | 0 | 0 | 50,459,764 | 18,920,081 | 2,410,072 | 11,670,468 | 0 | 0 | 19,869,215 | |||||||||||||||||||||||||||||||||||||||||||||||||||||
| | | | | | | | | | | | | | | | | | | | | | | | | | | | | | | | | | | | | | | | | | | | | | | | | | | | | | | | | | | | | | | | |
| Machinery and equipment | 195,283,381 | 0 | 664,775 | 194,618,606 | 58,815,038 | 3,766,887 | 102,287,680 | 0 | 0 | 33,515,888 | |||||||||||||||||||||||||||||||||||||||||||||||||||||
| | | | | | | | | | | | | | | | | | | | | | | | | | | | | | | | | | | | | | | | | | | | | | | | | | | | | | | | | | | | | | | | |
| Total tangible assets | Vehicles | 341,829,503 | 23,634,133 | 15,380,449 | 350,083,187 | 223,130,393 | 31,702,851 | 0 | 0 | 0 | 126,952,794 | ||||||||||||||||||||||||||||||||||||||||||||||||||||
| | | | | | | | | | | | | | | | | | | | | | | | | | | | | | | | | | | | | | | | | | | | | | | | | | | | | | | | | | | | | | | | |
| Tools, furniture, and fixtures | 593,643,692 | 52,859,786 | 4,431,187 | 642,072,291 | 415,166,038 | 112,239,603 | 0 | 0 | 0 | 226,906,253 | |||||||||||||||||||||||||||||||||||||||||||||||||||||
| | | | | | | | | | | | | | | | | | | | | | | | | | | | | | | | | | | | | | | | | | | | | | | | | | | | | | | | | | | | | | | | |
| Land | 12,703,270,000 | 0 | 0 | 12,703,270,000 | 0 | 0 | 6,091,196,973 | 0 | 0 | 6,612,073,027 | |||||||||||||||||||||||||||||||||||||||||||||||||||||
| | | | | | | | | | | | | | | | | | | | | | | | | | | | | | | | | | | | | | | | | | | | | | | | | | | | | | | | | | | | | | | | |
| Construction in progress | 0 | 7,875,452 | 35,408 | 7,840,044 | 0 | 0 | 0 | 0 | 0 | 7,840,044 | |||||||||||||||||||||||||||||||||||||||||||||||||||||
| | | | | | | | | | | | | | | | | | | | | | | | | | | | | | | | | | | | | | | | | | | | | | | | | | | | | | | | | | | | | | | | |
| Total | 17,077,002,050 | 113,798,339 | 44,125,593 | 17,146,674,796 | 1,524,432,258 | 252,859,747 | 6,880,369,918 | 0 | 0 | 8,741,872,620 | |||||||||||||||||||||||||||||||||||||||||||||||||||||
| | | | | | | | | | | | | | | | | | | | | | | | | | | | | | | | | | | | | | | | | | | | | | | | | | | | | | | | | | | | | | | | |
| Intangible assets (Depreciation included in expenses) | Trademark right | 166,786 | 564,530 | 0 | 731,316 | 125,683 | 58,969 | 0 | 0 | 0 | 605,633 | ||||||||||||||||||||||||||||||||||||||||||||||||||||
| | | | | | | | | | | | | | | | | | | | | | | | | | | | | | | | | | | | | | | | | | | | | | | | | | | | | | | | | | | | | | | | |
| Total | 166,786 | 564,530 | 0 | 731,316 | 125,683 | 58,969 | 0 | 0 | 0 | 605,633 | |||||||||||||||||||||||||||||||||||||||||||||||||||||
| | | | | | | | | | | | | | | | | | | | | | | | | | | | | | | | | | | | | | | | | | | | | | | | | | | | | | | | | | | | | | | | |
| Total intangible assets | Trademark right | 166,786 | 564,530 | 0 | 731,316 | 125,683 | 58,969 | 0 | 0 | 0 | 605,633 | ||||||||||||||||||||||||||||||||||||||||||||||||||||
| | | | | | | | | | | | | | | | | | | | | | | | | | | | | | | | | | | | | | | | | | | | | | | | | | | | | | | | | | | | | | | | |
| Total | 166,786 | 564,530 | 0 | 731,316 | 125,683 | 58,969 | 0 | 0 | 0 | 605,633 | |||||||||||||||||||||||||||||||||||||||||||||||||||||
| | | | | | | | | | | | | | | | | | | | | | | | | | | | | | | | | | | | | | | | | | | | | | | | | | | | | | | | | | | | | | | | |
| Investment securities | 1 | 193,440,060 | 53,589,505 | 139,850,556 | 0 | 0 | 0 | 0 | 0 | 139,850,556 | |||||||||||||||||||||||||||||||||||||||||||||||||||||
| | | | | | | | | | | | | | | | | | | | | | | | | | | | | | | | | | | | | | | | | | | | | | | | | | | | | | | | | | | | | | | | |
| Shares of affiliated companies | 67,298,469,988 | 324,109,794 | 24,576,313,000 | 43,046,266,782 | 0 | 0 | 0 | 0 | 0 | 43,046,266,782 | |||||||||||||||||||||||||||||||||||||||||||||||||||||
| | | | | | | | | | | | | | | | | | | | | | | | | | | | | | | | | | | | | | | | | | | | | | | | | | | | | | | | | | | | | | | | |
| Claims probable in bankruptcy, claims probable in rehabilitation, and other | 68,575,237,686 | 0 | 250,530,000 | 68,324,707,686 | 0 | 0 | 0 | 0 | 0 | 68,324,707,686 | |||||||||||||||||||||||||||||||||||||||||||||||||||||
| | | | | | | | | | | | | | | | | | | | | | | | | | | | | | | | | | | | | | | | | | | | | | | | | | | | | | | | | | | | | | | | |
| Investments and other assets | Allowance for loan losses (non-current) | (46,566,256,747 | ) | (14,422,417,414 | ) | 0 | (60,988,674,161 | ) | 0 | 0 | 0 | 0 | 0 | (60,988,674,161 | ) | ||||||||||||||||||||||||||||||||||||||||||||||||
| | | | | | | | | | | | | | | | | | | | | | | | | | | | | | | | | | | | | | | | | | | | | | | | | | | | | | | | | | | | | | | | |
| Long-term prepaid expenses | 7,960,548 | 28,634,379 | 7,960,558 | 28,634,369 | 0 | 0 | 0 | 0 | 0 | 28,634,369 | |||||||||||||||||||||||||||||||||||||||||||||||||||||
| | | | | | | | | | | | | | | | | | | | | | | | | | | | | | | | | | | | | | | | | | | | | | | | | | | | | | | | | | | | | | | | |
| Long-term guarantee deposits | 830,689,963 | 42,800,112 | 42,924,182 | 830,565,893 | 0 | 0 | 0 | 0 | 0 | 830,565,893 | |||||||||||||||||||||||||||||||||||||||||||||||||||||
| | | | | | | | | | | | | | | | | | | | | | | | | | | | | | | | | | | | | | | | | | | | | | | | | | | | | | | | | | | | | | | | |
| Total | 90,146,101,439 | (13,833,433,069 | ) | 24,931,317,245 | 51,381,351,125 | 0 | 0 | 0 | 0 | 0 | 51,381,351,125 | ||||||||||||||||||||||||||||||||||||||||||||||||||||
| | | | | | | | | | | | | | | | | | | | | | | | | | | | | | | | | | | | | | | | | | | | | | | | | | | | | | | | | | | | | | | | |
F-52
(2) Details of securities
Securities recorded under investments and other assets
| (Unit: Yen) |
| | | | | | | | | | | | | | | | | | | | | | | | | | | | | | | | | | | | | | | |
| Name | Acquisition cost | Value obtained by multiplying the net asset value by the percentage of shareholding | Balance sheet amount | Valuation difference recognized in the statement of income of the period | Remarks | ||||||||||||||||||||||||||||||||
| | | | | | | | | | | | | | | | | | | | | | | | | | | | | | | | | | | | | | | |
| Sumatra Pulp Corporation | 883,835,338 | 804,114,099 | 804,114,099 | (79,721,239 | ) | ||||||||||||||||||||||||||||||||
| | | | | | | | | | | | | | | | | | | | | | | | | | | | | | | | | | | | | | | |
| Japan Saudi Arabia Methanol Co., Inc. | 7,149,297,104 | 5,503,908,430 | 5,503,908,430 | 31,847,023 | |||||||||||||||||||||||||||||||||
| | | | | | | | | | | | | | | | | | | | | | | | | | | | | | | | | | | | | | | |
| Shares of affiliated companies | SPDC Ltd. | 7,269,880,619 | 21,049,870,698 | 7,269,880,619 | 0 | ||||||||||||||||||||||||||||||||
| | | | | | | | | | | | | | | | | | | | | | | | | | | | | | | | | | | | | | | |
| KAFCO Japan Investment Co., Ltd. | 2,436,204,983 | 2,499,985,982 | 2,436,204,983 | 0 | |||||||||||||||||||||||||||||||||
| | | | | | | | | | | | | | | | | | | | | | | | | | | | | | | | | | | | | | | |
| Nippon Asahan Aluminum Co., Ltd. | 448,349,250 | 466,236,166 | 448,349,250 | 0 | |||||||||||||||||||||||||||||||||
| | | | | | | | | | | | | | | | | | | | | | | | | | | | | | | | | | | | | | | |
| Nippon Amazon Aluminum Co., Ltd | 26,002,629,979 | 26,355,841,810 | 26,002,629,979 | 0 | |||||||||||||||||||||||||||||||||
| | | | | | | | | | | | | | | | | | | | | | | | | | | | | | | | | | | | | | | |
| The First MicroFinanceBank Ltd. | 218,880,000 | 259,806,522 | 259,806,522 | 50,611,110 | |||||||||||||||||||||||||||||||||
| | | | | | | | | | | | | | | | | | | | | | | | | | | | | | | | | | | | | | | |
| Myanmar Japan Thilawa Development Ltd. | 321,372,900 | 321,372,900 | 321,372,900 | 0 | |||||||||||||||||||||||||||||||||
| | | | | | | | | | | | | | | | | | | | | | | | | | | | | | | | | | | | | | | |
| Total | 44,730,450,173 | 57,261,136,607 | 43,046,266,782 | 2,736,894 | |||||||||||||||||||||||||||||||||
| | | | | | | | | | | | | | | | | | | | | | | | | | | | | | | | | | | | | | | |
| Type and name | Acquisition cost | Fair value | Balance sheet amount | Valuation difference recognized in the statement of income of the period | Valuation difference on other securities | Remarks | |||||||||||||||||||||||||||||||
| | | | | | | | | | | | | | | | | | | | | | | | | | | | | | | | | | | | | | | |
| Other securities | Prototype Carbon Fund | 1 | — | 1 | 0 | 0 | |||||||||||||||||||||||||||||||
| | | | | | | | | | | | | | | | | | | | | | | | | | | | | | | | | | | | | | | |
| MGM Sustainable Energy Fund L.P. | 140,821,902 | 139,850,555 | 139,850,555 | 0 | (971,347 | ) | |||||||||||||||||||||||||||||||
| | | | | | | | | | | | | | | | | | | | | | | | | | | | | | | | | | | | | | | |
| Total | 140,821,903 | 139,850,555 | 139,850,556 | 0 | (971,347 | ) | |||||||||||||||||||||||||||||||
| | | | | | | | | | | | | | | | | | | | | | | | | | | | | | | | | | | | | | | |
| Total balance sheet amount | 43,186,117,338 | (971,347 | ) | ||||||||||||||||||||||||||||||||||
| | | | | | | | | | | | | | | | | | | | | | | | | | | | | | | | | | | | | | | |
(3) Details of loans
| (Unit: Yen) |
| | | | | | | | | | | | | | | | | | | | | | | | | | | | | | | | | | | |
| Balance at the beginning of | Increase during the | Decrease during the period | Balance at the end of | ||||||||||||||||||||||||||||||
| | | | | | | | | | | | | | | | | | | | | | | | | | | | | | | | | | | |
| Classification | the period | period | Collection, etc. | Write-off | the period | Remarks | |||||||||||||||||||||||||||
| | | | | | | | | | | | | | | | | | | | | | | | | | | | | | | | | | | |
| Loans | 11,068,668,714,779 | 827,375,347,211 | 672,563,389,210 | 0 | 11,223,480,672,780 | ||||||||||||||||||||||||||||
| | | | | | | | | | | | | | | | | | | | | | | | | | | | | | | | | | | |
| Claims probable in bankruptcy, claims probable in rehabilitation, and other | 68,575,237,686 | 0 | 250,530,000 | 0 | 68,324,707,686 | ||||||||||||||||||||||||||||
| | | | | | | | | | | | | | | | | | | | | | | | | | | | | | | | | | | |
| Total | 11,137,243,952,465 | 827,375,347,211 | 672,813,919,210 | 0 | 11,291,805,380,466 | ||||||||||||||||||||||||||||
| | | | | | | | | | | | | | | | | | | | | | | | | | | | | | | | | | | |
(4) Details of borrowings
| (Unit: Yen) |
| | | | | | | | | | | | | | | | | | | | | | | | | | | | | | | | | | | | | | | |
| Classification | Balance at the beginning of the period | Increase during the period | Decrease during the period | Balance at the end of the period | Average interest rate (%) | Maturity date | Remarks | ||||||||||||||||||||||||||||||
| | | | | | | | | | | | | | | | | | | | | | | | | | | | | | | | | | | | | | | |
| Borrowings from government fund for Fiscal Investment and Loan Program | 1,781,961,332,000 | 197,500,000,000 | 275,875,802,000 | 1,703,585,530,000 (244,354,953,000) | 1.337 | June 2015- February 2039 | |||||||||||||||||||||||||||||||
| | | | | | | | | | | | | | | | | | | | | | | | | | | | | | | | | | | | | | | |
- *
- Figures in parentheses indicate the amount of borrowings repayable within one year.
F-53
(5) Details of bonds
(Unit: Yen) | ||||||||||||||||||||||||||||||||||||
| | | | | | | | | | | | | | | | | | | | | | | | | | | | | | | | | | | | | |
| Security name | Balance at the beginning of the period | Increase during the period | Decrease during the period | Balance at the end of the period | Coupon (%) | Maturity date | Remarks | ||||||||||||||||||||||||||||
| | | | | | | | | | | | | | | | | | | | | | | | | | | | | | | | | | | | | |
| FILP Agency Bonds | |||||||||||||||||||||||||||||||||||
| | | | | | | | | | | | | | | | | | | | | | | | | | | | | | | | | | | | | |
| FILP Agency Bonds (1st) | 30,000,000,000 | 0 | 0 | 30,000,000,000 (0 | ) | 2.470 | September 2028 | ||||||||||||||||||||||||||||
| | | | | | | | | | | | | | | | | | | | | | | | | | | | | | | | | | | | | |
| FILP Agency Bonds (2nd) | 30,000,000,000 | 0 | 0 | 30,000,000,000 (0 | ) | 2.341 | June 2029 | ||||||||||||||||||||||||||||
| | | | | | | | | | | | | | | | | | | | | | | | | | | | | | | | | | | | | |
| FILP Agency Bonds (3rd) | 20,000,000,000 | 0 | 0 | 20,000,000,000 (0 | ) | 2.134 | December 2029 | ||||||||||||||||||||||||||||
| | | | | | | | | | | | | | | | | | | | | | | | | | | | | | | | | | | | | |
| FILP Agency Bonds (4th) | 20,000,000,000 | 0 | 0 | 20,000,000,000 (0 | ) | 2.079 | June 2030 | ||||||||||||||||||||||||||||
| | | | | | | | | | | | | | | | | | | | | | | | | | | | | | | | | | | | | |
| FILP Agency Bonds (5th) | 20,000,000,000 | 0 | 0 | 20,000,000,000 (0 | ) | 1.918 | September 2030 | ||||||||||||||||||||||||||||
| | | | | | | | | | | | | | | | | | | | | | | | | | | | | | | | | | | | | |
| FILP Agency Bonds (6th) | 20,000,000,000 | 0 | 0 | 20,000,000,000 (0 | ) | 2.098 | December 2030 | ||||||||||||||||||||||||||||
| | | | | | | | | | | | | | | | | | | | | | | | | | | | | | | | | | | | | |
| FILP Agency Bonds (7th) | 20,000,000,000 | 0 | 0 | 20,000,000,000 (0 | ) | 1.991 | June 2031 | ||||||||||||||||||||||||||||
| | | | | | | | | | | | | | | | | | | | | | | | | | | | | | | | | | | | | |
| FILP Agency Bonds (8th) | 15,000,000,000 | 0 | 0 | 15,000,000,000 (0 | ) | 1.554 | September 2026 | ||||||||||||||||||||||||||||
| | | | | | | | | | | | | | | | | | | | | | | | | | | | | | | | | | | | | |
| FILP Agency Bonds (9th) | 5,000,000,000 | 0 | 0 | 5,000,000,000 (0 | ) | 2.129 | September 2041 | ||||||||||||||||||||||||||||
| | | | | | | | | | | | | | | | | | | | | | | | | | | | | | | | | | | | | |
| FILP Agency Bonds (10th) | 10,000,000,000 | 0 | 0 | 10,000,000,000 (10,000,000,000 | ) | 0.380 | December 2015 | ||||||||||||||||||||||||||||
| | | | | | | | | | | | | | | | | | | | | | | | | | | | | | | | | | | | | |
| FILP Agency Bonds (11th) | 10,000,000,000 | 0 | 0 | 10,000,000,000 (0 | ) | 1.140 | December 2021 | ||||||||||||||||||||||||||||
| | | | | | | | | | | | | | | | | | | | | | | | | | | | | | | | | | | | | |
| FILP Agency Bonds (12th) | 10,000,000,000 | 0 | 0 | 10,000,000,000 (0 | ) | 0.901 | June 2022 | ||||||||||||||||||||||||||||
| | | | | | | | | | | | | | | | | | | | | | | | | | | | | | | | | | | | | |
| FILP Agency Bonds (13th) | 10,000,000,000 | 0 | 0 | 10,000,000,000 (0 | ) | 1.752 | June 2032 | ||||||||||||||||||||||||||||
| | | | | | | | | | | | | | | | | | | | | | | | | | | | | | | | | | | | | |
| FILP Agency Bonds (14th) | 10,000,000,000 | 0 | 0 | 10,000,000,000 (0 | ) | 0.825 | September 2022 | ||||||||||||||||||||||||||||
| | | | | | | | | | | | | | | | | | | | | | | | | | | | | | | | | | | | | |
| FILP Agency Bonds (15th) | 10,000,000,000 | 0 | 0 | 10,000,000,000 (0 | ) | 1.724 | September 2032 | ||||||||||||||||||||||||||||
| | | | | | | | | | | | | | | | | | | | | | | | | | | | | | | | | | | | | |
| FILP Agency Bonds (16th) | 10,000,000,000 | 0 | 0 | 10,000,000,000 (0 | ) | 0.300 | December 2018 | ||||||||||||||||||||||||||||
| | | | | | | | | | | | | | | | | | | | | | | | | | | | | | | | | | | | | |
| FILP Agency Bonds (17th) | 10,000,000,000 | 0 | 0 | 10,000,000,000 (0 | ) | 0.720 | December 2022 | ||||||||||||||||||||||||||||
| | | | | | | | | | | | | | | | | | | | | | | | | | | | | | | | | | | | | |
| FILP Agency Bonds (18th) | 10,000,000,000 | 0 | 0 | 10,000,000,000 (0 | ) | 0.868 | June 2023 | ||||||||||||||||||||||||||||
| | | | | | | | | | | | | | | | | | | | | | | | | | | | | | | | | | | | | |
| FILP Agency Bonds (19th) | 10,000,000,000 | 0 | 0 | 10,000,000,000 (0 | ) | 1.725 | June 2033 | ||||||||||||||||||||||||||||
| | | | | | | | | | | | | | | | | | | | | | | | | | | | | | | | | | | | | |
| FILP Agency Bonds (20th) | 10,000,000,000 | 0 | 0 | 10,000,000,000 (0 | ) | 0.787 | September 2023 | ||||||||||||||||||||||||||||
| | | | | | | | | | | | | | | | | | | | | | | | | | | | | | | | | | | | | |
| FILP Agency Bonds (21st) | 10,000,000,000 | 0 | 0 | 10,000,000,000 (0 | ) | 1.734 | September 2033 | ||||||||||||||||||||||||||||
| | | | | | | | | | | | | | | | | | | | | | | | | | | | | | | | | | | | | |
| FILP Agency Bonds (22nd) | 10,000,000,000 | 0 | 0 | 10,000,000,000 (0 | ) | 0.260 | December 2018 | ||||||||||||||||||||||||||||
| | | | | | | | | | | | | | | | | | | | | | | | | | | | | | | | | | | | | |
| FILP Agency Bonds (23rd) | 10,000,000,000 | 0 | 0 | 10,000,000,000 (0 | ) | 0.684 | February 2024 | ||||||||||||||||||||||||||||
| | | | | | | | | | | | | | | | | | | | | | | | | | | | | | | | | | | | | |
| FILP Agency Bonds (24th) | 0 | 10,000,000,000 | 0 | 10,000,000,000 (0 | ) | 0.655 | June 2024 | ||||||||||||||||||||||||||||
| | | | | | | | | | | | | | | | | | | | | | | | | | | | | | | | | | | | | |
| FILP Agency Bonds (25th) | 0 | 10,000,000,000 | 0 | 10,000,000,000 (0 | ) | 1.520 | June 2034 | ||||||||||||||||||||||||||||
| | | | | | | | | | | | | | | | | | | | | | | | | | | | | | | | | | | | | |
| FILP Agency Bonds (26th) | 0 | 10,000,000,000 | 0 | 10,000,000,000 (0 | ) | 0.588 | September 2024 | ||||||||||||||||||||||||||||
| | | | | | | | | | | | | | | | | | | | | | | | | | | | | | | | | | | | | |
| FILP Agency Bonds (27th) | 0 | 10,000,000,000 | 0 | 10,000,000,000 (0 | ) | 1.451 | September 2034 | ||||||||||||||||||||||||||||
| | | | | | | | | | | | | | | | | | | | | | | | | | | | | | | | | | | | | |
| FILP Agency Bonds (28th) | 0 | 10,000,000,000 | 0 | 10,000,000,000 (0 | ) | 0.150 | December 2019 | ||||||||||||||||||||||||||||
| | | | | | | | | | | | | | | | | | | | | | | | | | | | | | | | | | | | | |
| Subtotal | 320,000,000,000 | 50,000,000,000 | 0 | 370,000,000,000 (10,000,000,000 | ) | ||||||||||||||||||||||||||||||
| | | | | | | | | | | | | | | | | | | | | | | | | | | | | | | | | | | | | |
| Government-guaranteed bonds | |||||||||||||||||||||||||||||||||||
| | | | | | | | | | | | | | | | | | | | | | | | | | | | | | | | | | | | | |
| Japan International Cooperation Agency Government-guaranteed bonds (1st) | 0 | 57,305,000,000 [$500,000,000] | 0 | 57,305,000,000 [$500,000,000] (0 | ) | 1.875 | November 2019 | ||||||||||||||||||||||||||||
| | | | | | | | | | | | | | | | | | | | | | | | | | | | | | | | | | | | | |
| Subtotal | 0 | 57,305,000,000 | 0 | 57,305,000,000 (0 | ) | ||||||||||||||||||||||||||||||
| | | | | | | | | | | | | | | | | | | | | | | | | | | | | | | | | | | | | |
| Total | 320,000,000,000 | 107,305,000,000 | 0 | 427,305,000,000 (10,000,000,000 | ) | ||||||||||||||||||||||||||||||
| | | | | | | | | | | | | | | | | | | | | | | | | | | | | | | | | | | | | |
- *
- Figures in parentheses indicate the amount of bonds redeemable within one year.
The amount in [ ] is denominated in a foreign currency
F-54
(6) Details of provisions
(Unit: Yen) | ||||||||||||||||||||||||||||||||||
| | | | | | | | | | | | | | | | | | | | | | | | | | | | | | | | | | | |
|
| Decrease during the period | ||||||||||||||||||||||||||||||||
| | | | | | | | | | | | | | | | | | | | | | | | | | | | | | | | | | | |
| Classification | Balance at the beginning of the period | Increase during the period | Use for purpose | Others | Balance at the end of the period | Remarks | |||||||||||||||||||||||||||
| | | | | | | | | | | | | | | | | | | | | | | | | | | | | | | | | | | |
| Provision for bonuses | 208,862,215 | 234,605,336 | 208,862,215 | 0 | 234,605,336 | ||||||||||||||||||||||||||||
| | | | | | | | | | | | | | | | | | | | | | | | | | | | | | | | | | | |
| Provision for contingent losses | 9,220,214,271 | 11,598,964,991 | 49,312,083 | 9,072,634,087 | 11,697,233,092 | ||||||||||||||||||||||||||||
| | | | | | | | | | | | | | | | | | | | | | | | | | | | | | | | | | | |
| Total | 9,429,076,486 | 11,833,570,327 | 258,174,298 | 9,072,634,087 | 11,931,838,428 | ||||||||||||||||||||||||||||
| | | | | | | | | | | | | | | | | | | | | | | | | | | | | | | | | | | |
- *
- Decrease during the period (others) for the provision for contingent losses indicates the amount of reversal of the provision after revaluation.
(7) Details of allowance for loan losses, etc.
| (Unit: Yen) | ||||||||||||||||||||||||||||||||||||||
| | | | | | | | | | | | | | | | | | | | | | | | | | | | | | | | | | | | | | | |
| Balance of loans, etc. | Balance of allowance for loan losses | |||||||||||||||||||||||||||||||||||||
| | | | | | | | | | | | | | | | | | | | | | | | | | | | | | | | | | | | | | | |
| Classification | Balance at the beginning of the period | Increase or decrease during the period | Balance at the end of the period | Balance at the beginning of the period | Increase or decrease during the period | Balance at the end of the period | Remarks | |||||||||||||||||||||||||||||||
| | | | | | | | | | | | | | | | | | | | | | | | | | | | | | | | | | | | | | | |
| Loans | 11,068,668,714,779 | 154,811,958,001 | 11,223,480,672,780 | 142,613,264,051 | 2,653,673,883 | 145,266,937,934 | ||||||||||||||||||||||||||||||||
| | | | | | | | | | | | | | | | | | | | | | | | | | | | | | | | | | | | | | | |
| Claims probable in bankruptcy, claims probable in rehabilitation, and other | 68,575,237,686 | (250,530,000 | ) | 68,324,707,686 | 46,566,256,747 | 14,422,417,414 | 60,988,674,161 | |||||||||||||||||||||||||||||||
| | | | | | | | | | | | | | | | | | | | | | | | | | | | | | | | | | | | | | | |
| Total | 11,137,243,952,465 | 154,561,428,001 | 11,291,805,380,466 | 189,179,520,798 | 17,076,091,297 | 206,255,612,095 | ||||||||||||||||||||||||||||||||
| | | | | | | | | | | | | | | | | | | | | | | | | | | | | | | | | | | | | | | |
- *
- The standard for appropriation of allowance for loan losses is described in No. 4 of Significant Accounting Policies.
(8) Details of provision for retirement benefits
| (Unit: Yen) | |||||||||||||||||||||||||||||||||
| | | | | | | | | | | | | | | | | | | | | | | | | | | | | | | | | | |
| Classification | Balance at the beginning of the period | Increase during the period | Decrease during the period | Balance at the end of the period | Remarks | ||||||||||||||||||||||||||||
| | | | | | | | | | | | | | | | | | | | | | | | | | | | | | | | | | |
Total retirement benefit obligations | 11,378,180,356 | 1,116,805,693 | 1,420,365,682 | 11,074,620,367 | |||||||||||||||||||||||||||||
| | | | | | | | | | | | | | | | | | | | | | | | | | | | | | | | | | |
Retirement benefits | 3,267,119,606 | 368,774,506 | 140,269,251 | 3,495,624,861 | |||||||||||||||||||||||||||||
| | | | | | | | | | | | | | | | | | | | | | | | | | | | | | | | | | |
Employees' Pension Fund | 8,111,060,750 | 748,031,187 | 1,280,096,431 | 7,578,995,506 | |||||||||||||||||||||||||||||
| | | | | | | | | | | | | | | | | | | | | | | | | | | | | | | | | | |
Unrecognized past service liabilities and unrecognized actuarial differences | 0 | (727,033,589 | ) | (727,033,589 | ) | 0 | |||||||||||||||||||||||||||
| | | | | | | | | | | | | | | | | | | | | | | | | | | | | | | | | | |
Plan assets | 3,485,935,798 | 509,291,754 | 251,498,603 | 3,743,728,949 | |||||||||||||||||||||||||||||
| | | | | | | | | | | | | | | | | | | | | | | | | | | | | | | | | | |
Provision for retirement benefits | 7,892,244,558 | 1,334,547,528 | 1,895,900,668 | 7,330,891,418 | |||||||||||||||||||||||||||||
| | | | | | | | | | | | | | | | | | | | | | | | | | | | | | | | | | |
F-55
(9) Details of asset retirement obligations
| (Unit: Yen) | ||||||||||||||||||||||||||||
| | | | | | | | | | | | | | | | | | | | | | | | | | | | | |
| Classification | Balance at the beginning of the period | Increase during the period | Decrease during the period | Balance at the end of the period | Remarks | |||||||||||||||||||||||
| | | | | | | | | | | | | | | | | | | | | | | | | | | | | |
Obligation of restoration to original state based on building lease agreement | 70,251,729 | 122,421 | 0 | 70,374,150 | Specified expenses in Accounting Standard for Incorporated Administrative Agency No. 91: N/A | |||||||||||||||||||||||
| | | | | | | | | | | | | | | | | | | | | | | | | | | | | |
(10) Details of liabilities for guarantee
| (Unit: Yen) | ||||||||||||||||||||||||||||||||||||||||
| | | | | | | | | | | | | | | | | | | | | | | | | | | | | | | | | | | | | | | | | |
| Balance at the beginning of the period | Increase during the period | Decrease during the period | Balance at the end of the period | |||||||||||||||||||||||||||||||||||||
| | | | | | | | | | | | | | | | | | | | | | | | | | | | | | | | | | | | | | | | | |
| Classification | Number of bonds | Amount | Number of bonds | Amount | Number of bonds | Amount | Number of bonds | Amount | Remarks | |||||||||||||||||||||||||||||||
| | | | | | | | | | | | | | | | | | | | | | | | | | | | | | | | | | | | | | | | | |
| FILP Agency Bonds (Public offering) | 12 | 450,000,000,000 | 0 | 0 | 2 | 100,000,000,000 | 10 | 350,000,000,000 | ||||||||||||||||||||||||||||||||
| | | | | | | | | | | | | | | | | | | | | | | | | | | | | | | | | | | | | | | | | |
(Unit: U.S. Dollars) | |||||||||||||||||||||||||||||||||||||||||
| | | | | | | | | | | | | | | | | | | | | | | | | | | | | | | | | | | | | | | | | | |
| Balance at the beginning of the period | Increase during the period | Decrease during the period | Balance at the end of the period | ||||||||||||||||||||||||||||||||||||||
| | | | | | | | | | | | | | | | | | | | | | | | | | | | | | | | | | | | | | | | | | |
| Classification | Number of bonds | Amount | Number of bonds | Amount | Number of bonds | Amount | Number of bonds | Amount | Remarks | ||||||||||||||||||||||||||||||||
| | | | | | | | | | | | | | | | | | | | | | | | | | | | | | | | | | | | | | | | | | |
| Government-Guaranteed Foreign Bonds (Eurodollar bond [Public offering]) | 2 | 1,150,000,000 | 0 | 0 | 1 | 500,000,000 | 1 | 650,000,000 | |||||||||||||||||||||||||||||||||
| | | | | | | | | | | | | | | | | | | | | | | | | | | | | | | | | | | | | | | | | | |
(Unit: Euro) | ||||||||||||||||||||||||||||||||||||||||||||
| | | | | | | | | | | | | | | | | | | | | | | | | | | | | | | | | | | | | | | | | | | | | |
| Balance at the beginning of the period | Increase during the period | Decrease during the period | Balance at the end of the period | |||||||||||||||||||||||||||||||||||||||||
| | | | | | | | | | | | | | | | | | | | | | | | | | | | | | | | | | | | | | | | | | | | | |
| Classification | Number of bonds | Amount | Number of bonds | Amount | Number of bonds | Amount | Number of bonds | Amount | Remarks | |||||||||||||||||||||||||||||||||||
| | | | | | | | | | | | | | | | | | | | | | | | | | | | | | | | | | | | | | | | | | | | | |
| Government-Guaranteed Foreign Bonds (Euroeuro bond [Public offering]) | 1 | 750,000,000 | 0 | 0 | 1 | 750,000,000 | 0 | 0 | ||||||||||||||||||||||||||||||||||||
| | | | | | | | | | | | | | | | | | | | | | | | | | | | | | | | | | | | | | | | | | | | | |
- *
- JICA is jointly liable for obligations arising from the above bonds issued by the former Japan Bank for International Cooperation which was succeeded by the Japan Bank for International Cooperation.
(11) Details of capital and capital surplus
| (Unit: Yen) | |||||||||||||||||||||||||||||||
| | | | | | | | | | | | | | | | | | | | | | | | | | | | | | | | |
| Classification | Balance at the beginning of the period | Increase during the period | Decrease during the period | Balance at the end of the period | Remarks | ||||||||||||||||||||||||||
| | | | | | | | | | | | | | | | | | | | | | | | | | | | | | | | |
| Capital | Government investment | 7,765,397,840,510 | 48,500,000,000 | 0 | 7,813,897,840,510 | Increase in capital resulting from the receipt of government investment | |||||||||||||||||||||||||
| | | | | | | | | | | | | | | | | | | | | | | | | | | | | | | | |
F-56
(12) Details of reserves
| (Unit: Yen) | |||||||||||||||||||||||||||||||
| | | | | | | | | | | | | | | | | | | | | | | | | | | | | | | | |
| Classification | Balance at the beginning of the period | Increase during the period | Decrease during the period | Balance at the end of the period | Remarks | ||||||||||||||||||||||||||
| | | | | | | | | | | | | | | | | | | | | | | | | | | | | | | | |
Reserve fund stipulated in Paragraph 5 of Article 31 of the Act of the Incorporated Administrative Agency—Japan International Cooperation Agency | 1,129,788,882,032 | 125,568,625,801 | 0 | 1,255,357,507,833 | Increase resulting from the appropriation of profits for business year 2013 | ||||||||||||||||||||||||||
| | | | | | | | | | | | | | | | | | | | | | | | | | | | | | | | |
(13) Details of remunerations and salaries of officers and employees
(Unit: Thousands of yen, persons) | ||||||||||||||||||||
| | | | | | | | | | | | | | | | | | | | | |
| Remunerations or salaries | Retirement benefits | ||||||||||||||||||
| | | | | | | | | | | | | | | | | | | | | |
| Classification | Payment amount | Number of people | Payment amount | Number of people | |||||||||||||||
| | | | | | | | | | | | | | | | | | | | | |
| Officers | 43,267 | 12 | 802 | 2 | |||||||||||||||
| | | | | | | | | | | | | | | | | | | | | |
| Employees | 3,819,900 | 1,853 | 139,467 | 71 | |||||||||||||||
| | | | | | | | | | | | | | | | | | | | | |
| Total | 3,863,166 | 1,865 | 140,269 | 73 | |||||||||||||||
| | | | | | | | | | | | | | | | | | | | | |
| (Notes) | 1. | Payment standard of remunerations and retirement benefits to officers | ||
| Remunerations and retirement benefits to officers are paid based on "Rules on Remuneration for Officers" and "Rules on Retirement Benefits for Officers" in place for Incorporated Administrative Agency—Japan International Cooperation Agency. | ||||
2. | Payment standard of salaries and retirement benefits to employees | |||
| Salaries and retirement benefits to employees are paid based on "Rules on Salaries for Employees" and "Rules on Retirement Benefits for Employees" in place for Incorporated Administrative Agency—Japan International Cooperation Agency. | ||||
3. | Number of people | |||
| As for the number of people to whom remunerations or salaries are paid, the average number of JICA officers or employees during the period is used. | ||||
4. | Others | |||
| There are no part-time officers or employees classified as external members. |
(14) Details of main assets, liabilities, and expenses, except those mentioned above
Operating and administrative expenses | (Unit: Yen) | |||||||
| | | | | | | | | |
| Classification | Amount | ||||||
| | | | | | | | | |
| Operating expenses | 5,717,527,090 | ||||||
| Information system-related expenses | 2,238,491,943 | ||||||
| Rent expenses on real estate | 864,431,005 | ||||||
| Travelling and transportation expenses | 1,185,439,372 | ||||||
| Other expenses | 3,061,885,922 | ||||||
| | | | | | | | | |
| Total | 13,067,775,332 | ||||||
| | | | | | | | | |
F-57
(15) Details of affiliated companies
| | | | | | | | | | | | | | | |
| Corporation type and name | (Affiliated company) | (Affiliated company) | ||||||||||||
| | | | | | | | ||||||||
| Items | Nippon Asahan Aluminum Co., Ltd. | KAFCO Japan Investment Co., Ltd. | ||||||||||||
| | | | | | | | | | | | | | | |
| | | | | | | | | | | | | | | |
| Outline of operations | Electric power generation utilizing hydropower resources of the Asahan River and aluminum smelting in North Sumatra, Indonesia | Production of urea and ammonia in Chittagong, Bangladesh | ||||||||||||
| | | | | | | | | | | | | | | |
| Number of officers: 10 | Number of officers: 9 | |||||||||||||
| President and CEO: Takahiko Okamoto Senior Managing Director: Koji Haruta (former Executive Advisor for Foreign Affairs of African Area, former Japan Bank for International Cooperation) | President and CEO: Tomomi Kawai Executive Vice President: Kazuhide Usui (former Deputy General Manager of the International Credit Analysis Department, former Japan Bank for International Cooperation) | |||||||||||||
| Name of officers | Auditor: Toru Nomura (former General Manager of the Environmental Surveillance Department, former Japan Bank for International Cooperation) | |||||||||||||
| | | | | | | | | | | | | | | |
| Association chart on transactions between affiliated companies and JICA | ||||||||||||||
| | | | | | | | | | | | | | | |
| Assets | 15,535,388,793 yen | 7,335,371,590 yen | ||||||||||||
| | | | | | | | | | | | | | | |
| Liabilities | 535,026,961 yen | 36,563,127 yen | ||||||||||||
| | | | | | | | | | | | | | | |
| Capital | 10,098,485,000 yen | 5,023,900,000 yen | ||||||||||||
| | | | | | | | | | | | | | | |
| Retained earnings | 3,045,322,332 yen | 2,274,908,463 yen | ||||||||||||
| | | | | | | | | | | | | | | |
| Operating revenues | 38,808,933 yen | 1,198,611,581 yen | ||||||||||||
| | | | | | | | | | | | | | | |
| Ordinary income | 2,026,222,426 yen | 1,138,845,817 yen | ||||||||||||
| | | | | | | | | | | | | | | |
| Net income | 1,514,880,607 yen | 1,018,263,759 yen | ||||||||||||
| | | | | | | | | | | | | | | |
| Unappropriated income for the current fiscal year | 2,371,423,432 yen | 1,018,933,463 yen | ||||||||||||
| | | | | | | | | | | | | | | |
| Number of company shares owned by JICA, acquisition cost, balance sheet amount, etc. | • Number of company shares owned by JICA: 99,985,000 shares • Acquisition cost: ¥448,349,250 • Balance sheet amount: ¥448,349,250 (A decrease of ¥24,576,313,000 from the end of the previous business year) • Legal basis: Item 2 (b), Paragraph 1, Article 13 of the Act of the Incorporated Administrative Agency—Japan International Cooperation Agency • Applicable provision of the act: To lend a person designated by the Minister for Foreign Affairs, such as an organization like a juridical person in Japan or the Development Areas, the funds required for the execution of their Development Projects or making capital contributions to such persons where there is a special necessity in order to effectuate Development Projects. • Purpose of investment: Capital contribution to the manufacturing of aluminum by the company • Date of the initial investment: December 27, 1975 | • Number of company shares owned by JICA: 46,606 shares • Acquisition cost: ¥2,436,204,983 • Balance sheet amount: ¥2,436,204,983 (No changes from the end of the previous business year) • Legal basis: Item 2 (b), Paragraph 1, Article 13 of the Act of the Incorporated Administrative Agency—Japan International Cooperation Agency • Applicable provision of the act: To lend a person designated by the Minister for Foreign Affairs, such as an organization like a juridical person in Japan or the Development Areas, the funds required for the execution of their Development Projects or making capital contributions to such persons where there is a special necessity in order to effectuate Development Projects. • Purpose of investment: Capital contribution to the production of urea and ammonia by the company • Date of the initial investment: July 27, 1990 | ||||||||||||
| | | | | | | | | | | | | | | |
| Details of receivables and payables | N/A | N/A | ||||||||||||
| | | | | | | | | | | | | | | |
| Details of debt guarantee | N/A | N/A | ||||||||||||
| | | | | | | | | | | | | | | |
| Amounts and ratios in relation to gross sales, order placement by JICA, etc. (Amounts and ratios of competitive contracts, planning competitions and public selections, and non- competitive negotiated contracts) | N/A | N/A | ||||||||||||
| | | | | | | | | | | | | | | |
F-58
| | | | | | | | | | | | | | | |
| Corporation type and name | (Affiliated company) | (Affiliated company) | ||||||||||||
| | | | | | | | ||||||||
| Items | Karnaphuli Fertilizer Company Limited | Nippon Amazon Aluminum Co., Ltd. | ||||||||||||
| | | | | | | | | | | | | | | |
| | | | | | | | | | | | | | | |
| Outline of operations | Production of urea and ammonia in Chittagong, Bangladesh | Production of alumina and smelting ammonium in the Amazon region | ||||||||||||
| | | | | | | | | | | | | | | |
| Name of officers | — | Number of officers: 15 President and CEO: Michitaka Nakatomi Auditor: Nobuhiro Ikuro (Deputy Director General of the Global Environment Department, JICA) | ||||||||||||
| | | | | | | | | | | | | | | |
| Association chart on transactions between affiliated companies and JICA | 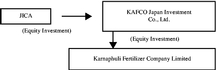 | |||||||||||||
| | | | | | | | | | | | | | | |
| Assets | — | 61,185,194,298 yen | ||||||||||||
| | | | | | | | | | | | | | | |
| Liabilities | — | 203,740,666 yen | ||||||||||||
| | | | | | | | | | | | | | | |
| Capital | — | 57,350,000,000 yen | ||||||||||||
| | | | | | | | | | | | | | | |
| Retained earnings | — | 3,631,453,632 yen | ||||||||||||
| | | | | | | | | | | | | | | |
| Operating revenues | — | 2,317,751,380 yen | ||||||||||||
| | | | | | | | | | | | | | | |
| Ordinary income | — | 2,583,411,034 yen | ||||||||||||
| | | | | | | | | | | | | | | |
| Net income | — | 2,557,760,557 yen | ||||||||||||
| | | | | | | | | | | | | | | |
| Unappropriated income for the current fiscal year | — | 2,609,476,632 yen | ||||||||||||
| | | | | | | | | | | | | | | |
| Number of company shares owned by JICA, acquisition cost, balance sheet amount, etc. | • Number of company shares owned by JICA— • Acquisition cost:— • Balance sheet amount:— • Legal basis:— • Applicable provision of the act:— • Purpose of investment:— • Date of the initial investment:— | • Number of company shares owned by JICA: 51,520,000 shares • Acquisition cost: ¥26,002,629,979 • Balance sheet amount: ¥26,002,629,979 (No changes from the end of the previous business year) • Legal basis: Item 2 (b), Paragraph 1, Article 13 of the Act of the Incorporated Administrative Agency—Japan International Cooperation Agency • Applicable provision of the act: To lend a person designated by the Minister for Foreign Affairs, such as an organization like a juridical person in Japan or the Development Areas, the funds required for the execution of their Development Projects or making capital contributions to such persons where there is a special necessity in order to effectuate Development Projects. • Purpose of investment: Capital contribution to the smelting of alumina and aluminum • Date of the initial investment: August 29, 1978 | ||||||||||||
| | | | | | | | | | | | | | | |
| Details of receivables and payables | — | N/A | ||||||||||||
| | | | | | | | | | | | | | | |
| Details of debt guarantee | — | N/A | ||||||||||||
| | | | | | | | | | | | | | | |
| Amounts and ratios in relation to gross sales, order placement by JICA, etc. (Amounts and ratios of competitive contracts, planning competitions and public selections, and non-competitive negotiated contracts) | — | N/A | ||||||||||||
| | | | | | | | | | | | | | | |
F-59
| | | | | | | | | | | | | | | |
| Corporation type and name | (Affiliated company) | (Affiliated company) | ||||||||||||
| | | | | | | | ||||||||
| Items | SPDC Ltd. | Eastern Petrochemical Company | ||||||||||||
| | | | | | | | | | | | | | | |
| | | | | | | | | | | | | | | |
| Outline of operations | Production and sales of ethylene glycol and other petrochemical products in the Al Jubail Industrial Area | Production and sales of ethylene glycol and other petrochemical products in the Al Jubail Industrial Area | ||||||||||||
| | | | | | | | | | | | | | | |
| Name of officers | Number of officers: 17 President and CEO: Hiroshi Kanamori Managing Director: Osamu Murata (Executive Advisor of the Southeast Asia and Pacific Department, JICA) | — | ||||||||||||
| | | | | | | | | | | | | | | |
| Association chart on transactions between affiliated companies and JICA | 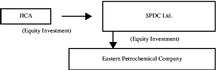 | |||||||||||||
| | | | | | | | | | | | | | | |
| Assets | 99,801,009,702 yen | — | ||||||||||||
| | | | | | | | | | | | | | | |
| Liabilities | 33,128,736,597 yen | — | ||||||||||||
| | | | | | | | | | | | | | | |
| Capital | 14,200,000,000 yen | — | ||||||||||||
| | | | | | | | | | | | | | | |
| Retained earnings | 52,472,273,105 yen | — | ||||||||||||
| | | | | | | | | | | | | | | |
| Operating revenues | 127,804,020,181 yen | — | ||||||||||||
| | | | | | | | | | | | | | | |
| Ordinary income | 37,780,501,250 yen | — | ||||||||||||
| | | | | | | | | | | | | | | |
| Net income | 34,660,797,318 yen | — | ||||||||||||
| | | | | | | | | | | | | | | |
| Unappropriated income for the current fiscal year | 27,372,273,105 yen | — | ||||||||||||
| | | | | | | | | | | | | | | |
| Number of company shares owned by JICA, acquisition cost, balance sheet amount, etc. | • Number of company shares owned by JICA: 2,107,500 shares • Acquisition cost: ¥7,269,880,619 • Balance sheet amount: ¥7,269,880,619 (No changes from the end of the previous business year) • Legal basis: Item 2 (b), Paragraph 1, Article 13 of the Act of the Incorporated Administrative Agency—Japan International Cooperation Agency • Applicable provision of the act: To lend a person designated by the Minister for Foreign Affairs, such as an organization like a juridical person in Japan or the Development Areas, the funds required for the execution of their Development Projects or making capital contributions to such persons where there is a special necessity in order to effectuate Development Projects. • Purpose of investment: Capital contribution to the manufacturing of ethylene glycol and other petrochemical products • Date of the initial investment: June 17, 1981 | • Number of company shares owned by JICA— • Acquisition cost:— • Balance sheet amount:— • Legal basis:— • Applicable provision of the act:— • Purpose of investment:— • Date of the initial investment:— | ||||||||||||
| | | | | | | | | | | | | | | |
| Details of receivables and payables | N/A | — | ||||||||||||
| | | | | | | | | | | | | | | |
| Details of debt guarantee | N/A | — | ||||||||||||
| | | | | | | | | | | | | | | |
| Amounts and ratios in relation to gross sales, order placement by JICA, etc. (Amounts and ratios of competitive contracts, planning competitions and public selections, and non-competitive negotiated contracts) | N/A | — | ||||||||||||
| | | | | | | | | | | | | | | |
F-60
| | | | | | | | | | | | | | | |
| Corporation type and name | (Affiliated company) | (Affiliated company) | ||||||||||||
| | | | | | | | ||||||||
| Items | Sumatra Pulp Corporation | Japan Saudi Arabia Methanol Co., Inc. | ||||||||||||
| | | | | | | | | | | | | | | |
| | | | | | | | | | | | | | | |
| Outline of operations | Construction of a pulp mill to manufacture wood pulp from afforested acacia mangium, and production and sale of wood pulp in Muara Enim, South Sumatra | Production of methanol in the Al-Jubail Industrial Area | ||||||||||||
| | | | | | | | | | | | | | | |
| Name of officers | Number of officers: 7 President and CEO: Yoshiharu Kanbe Executive Vice President: Hiroshi Tanaka (former General Manager of the Sector Strategy Development Department, former Japan Bank for International Cooperation) Auditor: Rentaro Tamaishi (former Senior Advisor of the Development Assistance Department I, former Japan Bank for International Cooperation) | Number of officers: 12 Chairman: Norio Konishi Managing Director and General Manager of the General Affairs Department: Yutaka Ohashi (former General Manager of the Development Assistance Department IV, former Japan Bank for International Cooperation) Auditor: Shigeru Takeda (former Executive Director, former Japan Bank for International Cooperation) | ||||||||||||
| | | | | | | | | | | | | | | |
| Association chart on transactions between affiliated companies and JICA | ||||||||||||||
| | | | | | | | | | | | | | | |
| Assets | 2,391,587,658 yen | 66,095,118,761 yen | ||||||||||||
| | | | | | | | | | | | | | | |
| Liabilities | 508,676,419 yen | 10,011,627,292 yen | ||||||||||||
| | | | | | | | | | | | | | | |
| Capital | 13,350,850,000 yen | 2,310,000,000 yen | ||||||||||||
| | | | | | | | | | | | | | | |
| Retained earnings | (11,467,938,761) yen | 54,055,080,469 yen | ||||||||||||
| | | | | | | | | | | | | | | |
| Operating revenues | 33,079,362 yen | 107,588,304,195 yen | ||||||||||||
| | | | | | | | | | | | | | | |
| Ordinary (loss) income | (64,764,194) yen | 61,324,353,577 yen | ||||||||||||
| | | | | | | | | | | | | | | |
| Net (loss) income | (4,266,139,540) yen | 57,276,936,779 yen | ||||||||||||
| | | | | | | | | | | | | | | |
| Unappropriated (loss) income for the current fiscal year | (11,467,938,761) yen | 37,904,480,469 yen | ||||||||||||
| | | | | | | | | | | | | | | |
| Number of company shares owned by JICA, acquisition cost, balance sheet amount, etc. | • Number of company shares owned by JICA: 114,032 shares • Acquisition cost: ¥883,835,338 • Balance sheet amount: ¥804,114,009 (A decrease of ¥79,721,239 from the end of the previous business year) • Legal basis: Item 2 (b), Paragraph 1, Article 13 of the Act of the Incorporated Administrative Agency—Japan International Cooperation Agency • Applicable provision of the act: To lend a person designated by the Minister for Foreign Affairs, such as an organization like a juridical person in Japan or the Development Areas, the funds required for the execution of their Development Projects or making capital contributions to such persons where there is a special necessity in order to effectuate Development Projects. • Purpose of investment: Capital contribution to the pulp manufacturing business • Date of the initial investment: April 21, 1995 | • Number of company shares owned by JICA: 1,386,000 shares • Acquisition cost: ¥7,149,297,104 • Balance sheet amount: ¥5,503,908,430 (An increase of ¥31,847,023 from the end of the previous business year) • Legal basis: Item 2 (b), Paragraph 1, Article 13 of the Act of the Incorporated Administrative Agency—Japan International Cooperation Agency • Applicable provision of the act: To lend a person designated by the Minister for Foreign Affairs, such as an organization like a juridical person in Japan or the Development Areas, the funds required for the execution of their Development Projects or making capital contributions to such persons where there is a special necessity in order to effectuate Development Projects. • Purpose of investment: Capital contribution to the methanol manufacturing business • Date of the initial investment: December 17, 1979 | ||||||||||||
| | | | | | | | | | | | | | | |
| Details of receivables and payables | N/A | N/A | ||||||||||||
| | | | | | | | | | | | | | | |
| Details of debt guarantee | N/A | N/A | ||||||||||||
| | | | | | | | | | | | | | | |
| Amounts and ratios in relation to gross sales, order placement by JICA, etc. (Amounts and ratios of competitive contracts, planning competitions and public selections, and non-competitive negotiated contracts) | N/A | N/A | ||||||||||||
| | | | | | | | | | | | | | | |
F-61
| | | | | | | | | | | | | | | |
| Corporation type and name | (Affiliated company) | (Affiliated company) | ||||||||||||
| | | | | | | | ||||||||
| Items | JSMC PANAMA S.A. | The First MicroFinanceBank Ltd. | ||||||||||||
| | | | | | | | | | | | | | | |
| | | | | | | | | | | | | | | |
| Outline of operations | Transportation of methanol business | Microfinance business | ||||||||||||
| | | | | | | | | | | | | | | |
| Name of officers | — | Number of officers: 8 Chairman: Akbarali Pesnani Director: Hironobu Takahashi (Senior Advisor of the Private Sector Partnership and Finance Department, JICA) | ||||||||||||
| | | | | | | | | | | | | | | |
| Association chart on transactions between affiliated companies and JICA |  | |||||||||||||
| | | | | | | | | | | | | | | |
| Assets | — | 12,708,994,593 yen | ||||||||||||
| | | | | | | | | | | | | | | |
| Liabilities | — | 11,245,958,249 yen | ||||||||||||
| | | | | | | | | | | | | | | |
| Capital | — | 1,608,421,340 yen | ||||||||||||
| | | | | | | | | | | | | | | |
| Retained earnings | — | (277,030,288) yen | ||||||||||||
| | | | | | | | | | | | | | | |
| Operating revenues | — | 1,970,315,279 yen | ||||||||||||
| | | | | | | | | | | | | | | |
| Ordinary income | — | 104,941,828 yen | ||||||||||||
| | | | | | | | | | | | | | | |
| Net income | — | 120,927,251 yen | ||||||||||||
| | | | | | | | | | | | | | | |
| Unappropriated loss for the current fiscal year | — | (277,030,288) yen | ||||||||||||
| | | | | | | | | | | | | | | |
| Number of company shares owned by JICA, acquisition cost, balance sheet amount, etc. | • Number of company shares owned by JICA— • Acquisition cost:— • Balance sheet amount:— • Legal basis:— • Applicable provision of the act:— • Purpose of investment:— • Date of the initial investment:— | • Number of company shares owned by JICA: 24,000,000 shares • Acquisition cost: ¥218,880,000 • Balance sheet amount: ¥259,806,522 (An increase of ¥50,611,110 from the end of the previous business year) • Legal basis: Item 2 (b), Paragraph 1, Article 13 of the Act of the Incorporated Administrative Agency—Japan International Cooperation Agency • Applicable provision of the act: To lend a person designated by the Minister for Foreign Affairs, such as an organization like a juridical person in Japan or the Development Areas, the funds required for the execution of their Development Projects or making capital contributions to such persons where there is a special necessity in order to effectuate Development Projects. • Purpose of investment: Capital contribution to microfinance business • Date of the initial investment: April 27, 2012 | ||||||||||||
| | | | | | | | | | | | | | | |
| Details of receivables and payables | — | N/A | ||||||||||||
| | | | | | | | | | | | | | | |
| Details of debt guarantee | — | N/A | ||||||||||||
| | | | | | | | | | | | | | | |
| Amounts and ratios in relation to gross sales, order placement by JICA, etc. (Amounts and ratios of competitive contracts, planning competitions and public selections, and non-competitive negotiated contracts) | — | N/A | ||||||||||||
| | | | | | | | | | | | | | | |
F-62
To Mr. Shinichi Kitaoka, President
Japan International Cooperation Agency
We have audited the accompanying financial statements related to the general account of Japan International Cooperation Agency, which comprise the balance sheet as of March 31, 2016, and the statement of income, statement of cash flows and statement of administrative service operation cost for the year then ended, and a summary of significant accounting policies and other explanatory information, and the accompanying supplementary schedules (except for the information described based on the financial statements and business reports relating to the associated public interest corporations; the same shall apply hereinafter).
President's Responsibility for the Financial Statements
The president is responsible for the preparation and fair presentation of these financial statements in accordance with accounting principles for incorporated administrative agencies generally accepted in Japan, and for such internal control as the president determines is necessary to enable the preparation of financial statements that are free from material misstatement, whether due to fraud or error, or illegal acts.
Auditor's Responsibility
Our responsibility is to express an opinion on these financial statements based on our audit. We conducted our audit in accordance with auditing standards for incorporated administrative agencies generally accepted in Japan. Those standards require that we plan and perform the audit to obtain reasonable assurance about whether the financial statements are free from material misstatement. The audit was planned with adequate attention being paid to the possibility that any fraud or error, or illegal acts, of the president, other executive officers or staff members may result in material misstatement in the financial statements.
An audit involves performing procedures to obtain audit evidence about the amounts and disclosures in the financial statements. The procedures selected depend on the auditor's judgment, including the assessment of the risks of material misstatement of the financial statements, whether due to fraud or error, or illegal acts. In making those risk assessments, the auditor considers internal control relevant to the entity's preparation and fair presentation of the financial statements in order to design audit procedures that are appropriate in the circumstances, but not for the purpose of expressing an opinion on the effectiveness of the entity's internal control. An audit also includes evaluating the appropriateness of accounting policies used and the reasonableness of accounting estimates made by the president, as well as evaluating the overall presentation of the financial statements.
We believe that the audit evidence we have obtained is sufficient and appropriate to provide a basis for our audit opinion. The basis includes the fact that no such fraud or error, or illegal acts, of the president, other executive officers or staff members was found, to the extent that we conducted our audit. The audit we conducted is not intended to express an opinion on whether there was any fraud or error, or illegal acts, of the president, other executive officers or staff members, which would not result in material misstatement in the financial statements.
Opinion
In our opinion, the financial statements referred to above present fairly, in all material respects, the financial position of Japan International Cooperation Agency's general account as of March 31, 2016 and the results of its operations, cash flows and administrative service operation cost for the year then ended in accordance with accounting principles for incorporated administrative agencies generally accepted in Japan.
/s/ DELOITTE TOUCHE TOHMATSU LLC
June 22, 2016
(July 29, 2016 as to "Significant subsequent events")
F-63
Balance Sheet
(as of March 31, 2016)
General Account
| (Unit: Yen) |
Assets | |||||||||||||||||
I. | Current assets | ||||||||||||||||
Cash and deposits | 97,614,651,637 | ||||||||||||||||
Securities | 84,000,000,000 | ||||||||||||||||
Inventories | |||||||||||||||||
Stored goods | 410,808,865 | 410,808,865 | |||||||||||||||
| | | | | | | | | | | | | | | | | | |
Advance payments | 23,361,624,246 | ||||||||||||||||
Prepaid expenses | 346,172,680 | ||||||||||||||||
Accrued income | 1,330,404 | ||||||||||||||||
Accounts receivable | 1,935,080,436 | ||||||||||||||||
Short-term loans for development projects | 219,758,484 | ||||||||||||||||
Allowance for loan losses | (3,938,947 | ) | 215,819,537 | ||||||||||||||
| | | | | | | | | | | | | | | | | | |
Short-term loans for emigration projects | 2,659,755 | ||||||||||||||||
Allowance for loan losses | (328,519 | ) | 2,331,236 | ||||||||||||||
| | | | | | | | | | | | | | | | | | |
Short-term installments receivable on settlement projects | 46,447 | ||||||||||||||||
Suspense payments | 33,414,980 | ||||||||||||||||
Advances paid | 4,038,439 | ||||||||||||||||
| | | | | | | | | | | | | | | | | | |
Total current assets | 207,925,318,907 | ||||||||||||||||
II. | Non-current assets | ||||||||||||||||
| 1 | Tangible assets | ||||||||||||||||
Buildings | 41,261,045,678 | ||||||||||||||||
Accumulated depreciation | (16,556,128,158 | ) | |||||||||||||||
Accumulated impairment loss | (46,536,790 | ) | 24,658,380,730 | ||||||||||||||
| | | | | | | | | | | | | | | | | | |
Structures | 1,585,514,122 | ||||||||||||||||
Accumulated depreciation | (1,012,149,307 | ) | |||||||||||||||
Accumulated impairment loss | (375,844 | ) | 572,988,971 | ||||||||||||||
| | | | | | | | | | | | | | | | | | |
Machinery and equipment | 180,347,701 | ||||||||||||||||
Accumulated depreciation | (121,808,514 | ) | 58,539,187 | ||||||||||||||
| | | | | | | | | | | | | | | | | | |
Vehicles | 1,785,071,900 | ||||||||||||||||
Accumulated depreciation | (1,229,268,986 | ) | 555,802,914 | ||||||||||||||
| | | | | | | | | | | | | | | | | | |
Tools, furniture, and fixtures | 2,297,937,445 | ||||||||||||||||
Accumulated depreciation | (1,443,885,342 | ) | 854,052,103 | ||||||||||||||
| | | | | | | | | | | | | | | | | | |
Land | 14,970,513,458 | ||||||||||||||||
Accumulated impairment loss | (234,596,912 | ) | 14,735,916,546 | ||||||||||||||
| | | | | | | | | | | | | | | | | | |
Construction in progress | 465,131,140 | ||||||||||||||||
| | | | | | | | | | | | | | | | | | |
Total tangible assets | 41,900,811,591 | ||||||||||||||||
| 2 | Intangible assets | ||||||||||||||||
Trademark right | 2,124,369 | ||||||||||||||||
Telephone subscription right | 4,216,750 | ||||||||||||||||
Software in progress | 47,656,245 | ||||||||||||||||
| | | | | | | | | | | | | | | | | | |
Total intangible assets | 53,997,364 | ||||||||||||||||
| 3 | Investments and other assets | ||||||||||||||||
Long-term deposits | 300,000,000 | ||||||||||||||||
Long-term loans for development projects | 342,617,000 | ||||||||||||||||
Allowance for loan losses | (119,951,617 | ) | 222,665,383 | ||||||||||||||
| | | | | | | | | | | | | | | | | | |
Long-term loans for emigration projects | 39,386,633 | ||||||||||||||||
Allowance for loan losses | (33,039,414 | ) | 6,347,219 | ||||||||||||||
| | | | | | | | | | | | | | | | | | |
Long-term installments receivable on settlement projects | 46,447 | ||||||||||||||||
Claims probable in bankruptcy, claims probable in rehabilitation, and other pertaining to loans for emigration projects | 619,331,369 | ||||||||||||||||
Allowance for loan losses | (619,331,369 | ) | 0 | ||||||||||||||
| | | | | | | | | | | | | | | | | | |
Claims probable in bankruptcy, claims probable in rehabilitation, and other pertaining to installments receivable on settlement projects | 1,368,212 | ||||||||||||||||
Allowance for loan losses | (1,368,212 | ) | 0 | ||||||||||||||
| | | | | | | | | | | | | | | | | | |
Long-term prepaid expenses | 70,680,161 | ||||||||||||||||
Long-term guarantee deposits | 1,532,628,187 | ||||||||||||||||
| | | | | | | | | | | | | | | | | | |
Total investments and other assets | 2,132,367,397 | ||||||||||||||||
| | | | | | | | | | | | | | | | | | |
Total non-current assets | 44,087,176,352 | ||||||||||||||||
| | | | | | | | | | | | | | | | | | |
Total assets | 252,012,495,259 | ||||||||||||||||
| | | | | | | | | | | | | | | | | | |
| | | | | | | | | | | | | | | | | | |
| | | | | | | | | | | | | | | | | | |
F-64
Balance Sheet (Continued)
(as of March 31, 2016)
| (Unit: Yen) |
Liabilities | |||||||||||||||||
I. | Current liabilities | ||||||||||||||||
Operational grant liabilities | 46,637,436,636 | ||||||||||||||||
Funds for grant aid | 130,378,380,429 | ||||||||||||||||
Donations received | 378,497,588 | ||||||||||||||||
Accounts payable | 18,249,827,613 | ||||||||||||||||
Accrued expenses | 239,334,136 | ||||||||||||||||
Lease obligations | 137,849,701 | ||||||||||||||||
Advance payments received | 3,056,164 | ||||||||||||||||
Deposits received | 783,828,000 | ||||||||||||||||
Total current liabilities | 196,808,210,267 | ||||||||||||||||
II. | Non-current liabilities | ||||||||||||||||
Contra-accounts for assets | |||||||||||||||||
Contra-accounts for assets funded by operational grants | 2,531,247,026 | 2,531,247,026 | |||||||||||||||
| | | | | | | | | | | | | | | | | | |
Long-term lease obligations | 130,137,219 | ||||||||||||||||
Long-term deposits received | 125,097,515 | ||||||||||||||||
Asset retirement obligations | 276,125,850 | ||||||||||||||||
| | | | | | | | | | | | | | | | | | |
Total non-current liabilities | 3,062,607,610 | ||||||||||||||||
| | | | | | | | | | | | | | | | | | |
Total liabilities | 199,870,817,877 | ||||||||||||||||
Net assets | |||||||||||||||||
I. | Capital | ||||||||||||||||
Government investment | 63,217,211,863 | ||||||||||||||||
| | | | | | | | | | | | | | | | | | |
Total capital | 63,217,211,863 | ||||||||||||||||
II. | Capital surplus | ||||||||||||||||
Capital surplus | 155,419,614 | ||||||||||||||||
| Accumulated depreciation not included in expenses | (17,725,966,082 | ) | ||||||||||||||
Accumulated impairment loss not included in expenses | (289,381,446 | ) | |||||||||||||||
Accumulated interest expenses not included in expenses | (7,189,037 | ) | |||||||||||||||
| | | | | | | | | | | | | | | | | | |
Total capital surplus | (17,867,116,951 | ) | |||||||||||||||
III | Retained earnings | ||||||||||||||||
Reserve fund carried over from the previous Mid-term Objective period | 1,777,135,447 | ||||||||||||||||
Reserve fund | 3,118,053,951 | ||||||||||||||||
Unappropriated income for the current business year | 1,896,393,072 | ||||||||||||||||
| | | | | | | | | | | | | | | | | | |
[Total income for the current business year] | [1,896,393,072] | ||||||||||||||||
Total retained earnings | 6,791,582,470 | ||||||||||||||||
| | | | | | | | | | | | | | | | | | |
Total net assets | 52,141,677,382 | ||||||||||||||||
| | | | | | | | | | | | | | | | | | |
Total liabilities and net assets | 252,012,495,259 | ||||||||||||||||
| | | | | | | | | | | | | | | | | | |
| | | | | | | | | | | | | | | | | | |
| | | | | | | | | | | | | | | | | | |
F-65
Statement of Income
(April 1, 2015-March 31, 2016)
General Account
| (Unit: Yen) |
Ordinary expenses | ||||||||||
Operating expenses | ||||||||||
Expenses for technical cooperation projects | 73,432,971,993 | |||||||||
Expenses for grant aid (operation support) | 191,609,857 | |||||||||
Expenses for public participation-based cooperation | 16,512,543,070 | |||||||||
Expenses for emigration projects | 359,652,926 | |||||||||
Expenses for disaster relief activities | 784,796,431 | |||||||||
Expenses for training and securing the personnel | 1,422,250,225 | |||||||||
Expenses for assistance promotion | 16,372,806,036 | |||||||||
Expenses for related to operation | 6,400,034,265 | |||||||||
Expenses for operation support | 28,288,401,514 | |||||||||
Expenses for grant aid | 91,151,663,724 | |||||||||
Expenses for facilities | 15,541,406 | |||||||||
Expenses for contracted programs | 1,231,475,994 | |||||||||
Expenses for donation projects | 11,744,374 | |||||||||
Depreciation | 454,820,354 | 236,630,312,169 | ||||||||
| | | | | | | | | | | |
General administrative expenses | 9,631,123,059 | |||||||||
Loan losses | 32,185,656 | |||||||||
Financial expenses | ||||||||||
Foreign exchange losses | 324,482,111 | 324,482,111 | ||||||||
| | | | | | | | | | | |
Miscellaneous loss | 556,813 | |||||||||
| | | | | | | | | | | |
Total ordinary expenses | 246,618,659,808 | |||||||||
Ordinary revenues | ||||||||||
Revenues from operational grants | 152,870,676,151 | |||||||||
Revenues from grant aid | 91,151,663,724 | |||||||||
Revenues from contracted programs | ||||||||||
Revenues from contracted programs from Japanese government and local governments | 1,231,475,994 | 1,231,475,994 | ||||||||
Revenues from interest on development projects | 15,958,529 | |||||||||
Revenues from settlement projects | 174,057 | |||||||||
Revenues from emigration projects | 3,552,080 | |||||||||
Donations | 11,744,374 | |||||||||
Revenues from subsidy for facilities | 10,446,402 | |||||||||
Reversal of allowance for loan losses | 61,604,856 | |||||||||
Reversal of contra-accounts for assets funded by operational grants | 361,003,474 | |||||||||
Financial revenues | ||||||||||
Interest income | 43,283,139 | 43,283,139 | ||||||||
| | | | | | | | | | | |
Miscellaneous income | 2,490,631,392 | |||||||||
| | | | | | | | | | | |
Total ordinary revenues | 248,252,214,172 | |||||||||
| | | | | | | | | | | |
Ordinary income | 1,633,554,364 | |||||||||
Extraordinary losses | ||||||||||
Loss on disposal of non-current assets | 28,464,676 | |||||||||
Loss on sales of non-current assets | 9,876,233 | 38,340,909 | ||||||||
Extraordinary income | ||||||||||
Reversal of contra-accounts for assets funded by operational grants | 39,200,325 | |||||||||
Gain on sales of non-current assets | 9,256,353 | 48,456,678 | ||||||||
| | | | | | | | | | | |
Net income | 1,643,670,133 | |||||||||
| | | | | | | | | | | |
Reversal of reserve fund carried over from the previous Mid-term Objective period | 252,722,939 | |||||||||
| | | | | | | | | | | |
Total income for the current business year | 1,896,393,072 | |||||||||
| | | | | | | | | | | |
| | | | | | | | | | | |
| | | | | | | | | | | |
F-66
Statement of Cash Flows
(April 1, 2015-March 31, 2016)
General Account
(Unit: Yen) | ||||||
I. | Cash flows from operating activities | |||||
Payments of operating expenses | (143,413,457,647 | ) | ||||
Payments for grant aid | (91,901,750,433 | ) | ||||
Payments for contracted programs | (891,146,998 | ) | ||||
Payments of personnel expenses | (16,272,890,574 | ) | ||||
Payments for other operations | (113,366,951 | ) | ||||
Proceeds from operational grants | 154,035,701,000 | |||||
Proceeds from grant aid | 105,423,654,766 | |||||
Proceeds from contracted programs | 579,056,427 | |||||
Proceeds from interest on loans | 21,771,406 | |||||
Proceeds from settlement projects | 1,743,197 | |||||
Interest revenues | 175,509 | |||||
Installments receivable | 1,567,688 | |||||
Proceeds from donations | 37,151,641 | |||||
Proceeds from other operations | 2,166,822,174 | |||||
Subtotal | 9,673,288,008 | |||||
Interest income received | 43,917,022 | |||||
Payments to national treasury | (568,453,808 | ) | ||||
| | | | | | | |
Net cash provided by operating activities | 9,148,751,222 | |||||
II. | Cash flows from investing activities | |||||
Payments for purchase of non-current assets | (1,450,007,910 | ) | ||||
Proceeds from sales of non-current assets | 21,613,813 | |||||
Proceeds from subsidy for facilities | 250,074,000 | |||||
Proceeds from collection of loans | 462,844,855 | |||||
Payments into time deposits | (508,000,000,000 | ) | ||||
Proceeds from time deposit refund | 507,000,000,000 | |||||
Payments for purchase of negotiable deposits | (873,000,000,000 | ) | ||||
Proceeds from refund of negotiable deposits | 888,000,000,000 | |||||
| | | | | | | |
Net cash provided by investing activities | 13,284,524,758 | |||||
III. | Cash flows from financing activities | |||||
Repayments of lease obligations | (149,399,986 | ) | ||||
Net cash used in financing activities | (149,399,986 | ) | ||||
IV. | Effect of exchange rate fluctuation on funds | (223,401,396 | ) | |||
| | | | | | | |
V. | Net increase in funds (decrease) | 22,060,474,598 | ||||
VI. | Funds at the beginning of the business year | 69,554,177,039 | ||||
| | | | | | | |
VII. | Funds at the end of the business year | 91,614,651,637 | ||||
| | | | | | | |
| | | | | | | |
| | | | | | | |
F-67
Statement of Administrative Service Operation Cost
(April 1, 2015-March 31, 2016)
General Account
| (Unit: Yen) |
I. | Operating expenses | |||||||||||
(1) Expenses on statement of income | 236,630,312,169 | |||||||||||
General administrative expenses | 9,631,123,059 | |||||||||||
Loan losses | 32,185,656 | |||||||||||
Financial expenses | 324,482,111 | |||||||||||
Miscellaneous loss | 556,813 | |||||||||||
Loss on disposal of non-current assets | 28,464,676 | |||||||||||
Loss on sales of non-current assets | 9,876,233 | 246,657,000,717 | ||||||||||
| | | | | | | | | | | | | |
(2) (Deduction) Self-revenues, etc. | ||||||||||||
Revenues from contracted programs | (1,231,475,994 | ) | ||||||||||
Revenues from interest on development projects | (15,958,529 | ) | ||||||||||
Revenues from settlement projects | (174,057 | ) | ||||||||||
Revenues from emigration projects | (3,552,080 | ) | ||||||||||
Donations | (11,744,374 | ) | ||||||||||
Reversal of allowance for loan losses | (61,604,856 | ) | ||||||||||
Financial revenues | (43,283,139 | ) | ||||||||||
Miscellaneous income | (2,490,631,392 | ) | ||||||||||
Gain on sales of non-current assets | (9,256,353 | ) | (3,867,680,774 | ) | ||||||||
| | | | | | | | | | | | | |
Total operating expenses | 242,789,319,943 | |||||||||||
II. | Depreciation not included in expenses | 1,316,411,162 | ||||||||||
III. | Disposal and sale differential not included in expenses | 76,476,608 | ||||||||||
IV. | Estimated bonus payments not included in provision | 90,095,805 | ||||||||||
V. | Estimated increase in retirement benefits not included in provision | (12,604,721,620 | ) | |||||||||
VI. | Opportunity cost | |||||||||||
Opportunity cost of government investment | 0 | |||||||||||
| | | | | | | | | | | | | |
VII. | Administrative service operation cost | 231,667,581,898 | ||||||||||
| | | | | | | | | | | | | |
| | | | | | | | | | | | | |
| | | | | | | | | | | | | |
F-68
Basis of Presenting Financial Statements
The accompanying financial statements of JICA have been prepared in accordance with accounting principles for incorporated administrative agencies generally accepted in Japan, which are different in many respects as to application and disclosure requirements of accounting principles for business enterprises generally accepted in Japan.
Significant Accounting Policies
General Account
Effective for the year ended March 31, 2016, JICA adopted the "Accounting Standards for Incorporated Administrative Agencies" and "Notes to Accounting Standards for Incorporated Administrative Agencies"(February 16, 2000 (Revised January 27, 2015), and the "Q&A on Accounting Standards for Incorporated Administrative Agencies and Notes to Accounting Standards for Incorporated Administrative Agencies" (August 2000 (Finally revised February 2016)).
However, the provisions prior to the revisions are applied regarding the disclosures of segment information and the accounting for operational grants in accordance with the transitional measures of Accounting Standards for Incorporated Administrative Agencies.
1. Revenue recognition method of operational grants
Revenue from operational grants is recognized as the related expenses are incurred. This is attributable to the difficulties associated with the application of a revenue recognition method based on operation achievement and a revenue recognition method based on term, specifically the significant amount of time required to evaluate operating results objectively, as well as other complexities.
2. Depreciation method
- (1)
- Tangible assets (except for lease assets)
Straight-line method
The useful lives of major assets are as follows:
Buildings: | 1 - 50 years | |
Structures: | 1 - 42 years | |
Machinery and equipment: | 1 - 17 years | |
Vehicles: | 1 - 6 years | |
Tools, furniture, and fixtures: | 1 - 15 years |
The estimated depreciation costs for specific depreciable assets (Accounting Standard for Incorporated Administrative Agency No. 87) and specific removal costs, etc., associated with asset retirement obligations (Accounting Standard for Incorporated Administrative Agency No. 91) are indirectly deducted from the capital surplus and reported as accumulated depreciation not included in expenses.
- (2)
- Intangible assets (except for lease assets)
Straight-line method
- (3)
- Lease assets
Lease assets are depreciated by the straight-line method over the lease term. Depreciation for lease assets is calculated with zero residual value being assigned to the asset.
F-69
3. Standard for appropriation of provision and estimation for bonuses
A provision for bonuses is not appropriated since the financial source is secured by operational grants. The estimated bonus payments not included in the provision in the statement of administrative service operation cost is reported as a current business year estimate of the provision for bonuses, calculated according to the Accounting Standard for Incorporated Administrative Agency No. 88.
4. Standard for appropriation of provision and estimation for retirement benefits
A provision for retirement benefits is not appropriated for retirement benefits since the financial source is secured by operational grants.
A provision for retirement benefits is not provided for pension benefits from the defined benefit corporate pension plan since the financial source for defined benefit corporate pension plan insurance fees and reserve shortfall is secured by operational grants.
The estimated increase in retirement benefits not included in the provision in the statement of administrative service operation cost is reported as the current business year increase of provision for retirement benefits regarding retirement benefits and employees' pension fund, calculated according to the Accounting Standard for Incorporated Administrative Agency No. 38.
5. Basis and standard for appropriation of allowances, etc.
Allowance for loan losses
To provide for loan losses, JICA records the estimated amount of default, taking into account the transition rate to delinquent loans for ordinary loans and specific collectibility of doubtful loans, etc.
6. Standard and method for the valuation of securities
Held-to-maturity securities
Valued using the amortized cost method (straight-line method)
7. Standard and method for the valuation of inventories
Stored goods
Stored goods valuation is based on the lower of cost or market using the first-in, first-out (FIFO) method.
8. Translation standard for foreign currency-denominated assets and liabilities into yen
Foreign currency money claims and liabilities are translated into Japanese yen at the spot exchange rate at the balance sheet date. Exchange differences are recognized as profit or loss.
9. Method for computing opportunity cost in the Statement of Administrative Service Operation Cost
Interest rate used to compute opportunity cost of government investment:
0.000% with reference to the yield of 10-year fixed-rate Japanese government bonds at the end of March 2016.
10. Accounting treatment for consumption taxes
Consumption taxes and local consumption taxes are included in transaction amounts.
F-70
Notes to the financial statements
General Account
(Balance Sheet)
- 1.
- Estimated retirement benefits to be provided from the operational grants
¥ 15,652,321,311
- 2.
- Estimated bonus to be provided from the operational grants
¥ 1,025,095,320
- 3.
- Donated funds for grant aid
Grant aid is received in the form of donated funds from the government of Japan. JICA administers this grant aid based on Grant Agreements with the government of the recipient country. At the end of business year 2015, the outstanding balance of unexecuted Grant Agreements stood at ¥233,127,929,955.
(Statement of Cash Flows)
The funds shown in the statement of cash flows are cash, deposit accounts, and checking accounts.
- 1.
- Breakdown of balance sheet items and ending balance of funds
(as of March 31, 2016)
Cash and deposits | ¥ | 97,614,651,637 | ||
Time deposits | ¥ | (6,000,000,000 | ) | |
| | | | | |
Ending balance of funds | ¥ | 91,614,651,637 |
- 2.
- Description of significant non-cash transactions
Assets granted under finance lease
Tools, furniture, and fixtures | ¥45,581,226 |
(Statement of Administrative Service Operation Cost)
Number of public officers temporarily transferred to JICA and accounted for as opportunity cost
Of the estimated increase in retirement benefits not included in the provision, ¥16,200,758 was recognized as the current-business-year increase in provision for retirement benefits for 29 public officers temporarily transferred to JICA according to JICA's internal rules.
(Status of financial instruments)
The General Account's fund management is limited to short-term deposits and public and corporate bonds while fund-raising consists mainly of operational grants approved by the competent minister. The General Account does not borrow from the government fund for Fiscal Investment and Loan Program (FILP), nor does it borrow funds from financial institutions or issue FILP Agency Bonds.
F-71
(Fair value of financial instruments)
Balance sheet amounts, fair value, and difference at the balance sheet date are as follows:
(Unit: Yen) | ||||||||||||||||||
| | | | | | | | | | | | | | | | | | | |
| Balance sheet amount | Fair value | Difference | ||||||||||||||||
| | | | | | | | | | | | | | | | | | | |
| (1) Cash and deposits | 97,614,651,637 | 97,614,651,637 | 0 | |||||||||||||||
| (2) Securities | 84,000,000,000 | 84,000,000,000 | 0 | |||||||||||||||
| (3) Accounts payable | (18,249,827,613) | (18,249,827,613) | 0 | |||||||||||||||
| | | | | | | | | | | | | | | | | | | |
- (Note)
- Liabilities are shown in parentheses.
(Note- 1) Calculation method for fair value of financial instruments and matters concerning securities
- [1]
- Cash and deposits
Cash and deposits are valued at book value because fair value approximates book value due to the short term nature of these instruments.
- [2]
- Securities (negotiable deposits)
Negotiable deposits are valued at book value because fair value approximates book value due to the short-term nature of these instruments.
- [3]
- Accounts payable
Accounts payable are valued at book value because fair value approximates book value due to the short term nature of these instruments.
(Retirement benefits)
- 1.
- Overview of retirement benefit plans
To provide retirement benefits for employees, JICA has a defined benefit pension plan comprised of a defined benefit corporate pension plan and a lump-sum severance indemnity plan, and a defined contribution plan comprised of a defined contribution pension plan.
Effective March 1, 2014, JICA has been authorized by the Minister of Health, Labour and Welfare to be exempt from the obligations to pay future amounts in respect of the part of the welfare pension fund it manages for the government. Subsequently on April 1, 2015, JICA has been authorized to transfer to the government the past substitutional portion.
- 2.
- Defined benefit pension plan
- (1)
- The changes in the retirement benefit obligation are as follows:
(Unit: Yen) | ||||
Retirement benefit obligation at the beginning of the fiscal year | 42,711,782,584 | |||
| | | | | |
Current service cost | 1,114,615,374 | |||
Interest cost | 345,323,951 | |||
Actuarial difference | (642,482,207 | ) | ||
Retirement benefit paid | (1,328,733,003 | ) | ||
Past service cost | 0 | |||
Contribution by the employee | 0 | |||
Decrease associated with the return of a substitutional portion of the Employees' Pension Fund | (11,680,985,464 | ) | ||
| | | | | |
Retirement benefit obligation at the end of the fiscal year | 30,519,521,235 | |||
| | | | | |
| | | | | |
| | | | | |
F-72
- (2)
- The changes in the plan assets are as follows:
(Unit: Yen) | ||||
Plan assets at the beginning of the fiscal year | 14,438,538,895 | |||
| | | | | |
Expected return on plan assets | 0 | |||
Actuarial difference | 355,413,455 | |||
Contribution by the company | 488,695,547 | |||
Retirement benefit paid | (488,416,607 | ) | ||
Contribution by the employee | 72,968,634 | |||
| | | | | |
Plan assets at the end of the fiscal year | 14,867,199,924 | |||
| | | | | |
| | | | | |
| | | | | |
- (Note)
- Plan assets include ¥ 6,257,599,190 paid in advance to the National Treasury in relation to the return of the substitutional portion of the Employees' Pension Funds.
- (3)
- Reconciliation of the projected benefit obligations and plan assets and provision for retirement benefits and prepaid pension expenses in the balance sheets
(Unit: Yen) | ||||
Funded retirement benefit obligation | 16,934,552,849 | |||
Plan assets | (14,867,199,924 | ) | ||
| | | | | |
Unfunded benefit obligations of funded pension plan | 2,067,352,925 | |||
Unfunded benefit obligations of unfunded pension plan | 13,584,968,386 | |||
| | | | | |
Subtotal | 15,652,321,311 | |||
Unrecognized actuarial differences | 0 | |||
Unrecognized past service cost | 0 | |||
| | | | | |
Net amount of assets and liabilities in the balance sheets | 0 | |||
| | | | | |
| | | | | |
| | | | | |
Provision for retirement benefits | 0 | |||
Prepaid pension expenses | 0 | |||
| | | | | |
Net amount of assets and liabilities in the balance sheets | 0 | |||
| | | | | |
| | | | | |
| | | | | |
- (Note)
- A provision for retirement benefits is not appropriated for the difference between retirement benefit obligations and plan assets and net amount of assets and liabilities in the balance sheet, ¥ 15,652,321,311, since the financial source is secured by operational grants.
- (4)
- Profit or loss regarding retirement benefits
(Unit: Yen) | ||||
Current service cost | 1,114,615,374 | |||
Interest cost | 345,323,951 | |||
Expected return on plans assets | 0 | |||
Realized actuarial differences | (997,895,662 | ) | ||
Amortization of past service cost | 0 | |||
Extraordinary additional retirement payments | 0 | |||
| | | | | |
Total | 462,043,663 | |||
| | | | | |
| | | | | |
| | | | | |
Profit or loss associated with the return of a substitutional portion of the Employees' Pension Fund (Note) | (11,680,985,464 | ) | ||
| | | | | |
- (Note)
- Profit or loss regarding retirement benefits is calculated as deduction amount on the Statement of Administrative Service Operation Cost.
F-73
- (5)
- Major components of plan assets
Percentages of components to the total (excluding plan assets paid in advance) are as follows;
Bonds | 38 | % | ||
Stocks | 31 | % | ||
General account of life insurance company | 21 | % | ||
Others | 10 | % | ||
| | | | | |
Total | 100 | % | ||
| | | | | |
| | | | | |
| | | | | |
- (6)
- Method of determining the long-term expected rate of return on plan assets
- (7)
- Assumptions used
The long-term expected rate of return on plan assets is determined based on components of plan assets, its performance and market condition, etc.
Principal assumptions used in actuarial calculations at the end of the fiscal year
Discount rate | Defined benefit corporate pension plan | 0.23 | % | |||
| Retirement benefits | 0.74 | % | ||||
Long-term expected rate of return on plan assets | 0.00 | % | ||||
- 3.
- Defined contribution plan
The amount of contribution required to be made to the defined contribution plan is ¥52,224,609.
(Lease transactions)
- 1.
- Future minimum lease payments related to operating lease transactions are as follows:
Future minimum lease payments due within one year of the balance sheet date | ¥ | 8,180,471 | ||
Future minimum lease payments corresponding to periods more than one year from the balance sheet date | ¥ | 14,589,963 |
- 2.
- The amount of the finance lease transactions that influenced the current business year's profits and losses was ¥1,066,542. Total income for the current business year after the deduction of this amount was ¥1,897,459,614.
(Asset retirement obligations)
JICA has a building lease agreement for its head office building, and has obligations to restore the building to its original state at the termination of the lease period. Therefore, these asset retirement obligations have been recorded. The estimate for the asset retirement obligations assumes a five-year lease period for the projected period of use and a discount rate of 0.529%.
The balance of the asset retirement obligations at the end of the current business year was ¥276,125,850.
(Significant Contractual Liabilities)
Contractual liabilities JICA is obligated to pay from during the next business year and thereafter are ¥5,364,156,052
F-74
(Significant subsequent events)
Appropriation of profit was approved as follows on July 29, 2016:
(Unit: Yen) | ||||||||||
I. | Unappropriated income for the current business year | 1,896,393,072 | ||||||||
| | | | | | | | | | | |
Total income for the current business year | 1,896,393,072 | |||||||||
II. | Profit appropriation amount | |||||||||
Reserve fund | 1,896,393,072 | 1,896,393,072 | ||||||||
| | | | | | | | | | | |
| | | | | | | | | | | |
| | | | | | | | | | | |
F-75
The Accompanying Supplementary Schedules
General Account
- (1)
- Details of acquisition and disposal of noncurrent assets, depreciation (including depreciation not included in expenses, in accordance with "No. 87, Accounting for the Depreciation of Specific Depreciable Assets" and "No. 91, Accounting for Specific Removal Costs, etc., associated with Asset Retirement Obligations"), and accumulated impairment loss
| (Unit: Yen) | |||||||||||||||||||||||||||||||||||||||||||||||||||||||||||||||
| | | | | | | | | | | | | | | | | | | | | | | | | | | | | | | | | | | | | | | | | | | | | | | | | | | | | | | | | | | | | | | | |
| Accumulated depreciation | Accumulated impairment loss | ||||||||||||||||||||||||||||||||||||||||||||||||||||||||||||||
| | | | | | | | | | | | | | | | | | | | | | | | | | | | | | | | | | | | | | | | | | | | | | | | | | | | | | | | | | | | | | | | |
Type | Balance at the beginning of the period | Increase during the period | Decrease during the period | Balance at the end of the period | Depreciation during the period | Impairment loss during the period (recognized in the statement of income) | Impairment loss during the period (not recognized in the statement of income) | Net assets at the end of the period | Remarks | ||||||||||||||||||||||||||||||||||||||||||||||||||||||
| | | | | | | | | | | | | | | | | | | | | | | | | | | | | | | | | | | | | | | | | | | | | | | | | | | | | | | | | | | | | | | | |
| Buildings | 1,180,227,935 | 326,403,684 | 25,284,209 | 1,481,347,410 | 340,168,854 | 71,531,491 | 0 | 0 | 0 | 1,141,178,556 | |||||||||||||||||||||||||||||||||||||||||||||||||||||
| | | | | | | | | | | | | | | | | | | | | | | | | | | | | | | | | | | | | | | | | | | | | | | | | | | | | | | | | | | | | | | | |
| Structures | 83,137,963 | 42,009,685 | 0 | 125,147,648 | 25,197,768 | 5,911,471 | 0 | 0 | 0 | 99,949,880 | |||||||||||||||||||||||||||||||||||||||||||||||||||||
| | | | | | | | | | | | | | | | | | | | | | | | | | | | | | | | | | | | | | | | | | | | | | | | | | | | | | | | | | | | | | | | |
| Tangible assets (depreciation included in expenses) | Machinery and equipment | 99,877,649 | 7,432,279 | 11,519,184 | 95,790,744 | 51,412,069 | 8,363,834 | 0 | 0 | 0 | 44,378,675 | ||||||||||||||||||||||||||||||||||||||||||||||||||||
| | | | | | | | | | | | | | | | | | | | | | | | | | | | | | | | | | | | | | | | | | | | | | | | | | | | | | | | | | | | | | | | |
| Vehicles | 1,675,355,104 | 164,107,773 | 155,042,330 | 1,684,420,547 | 1,138,682,768 | 145,862,911 | 0 | 0 | 0 | 545,737,779 | |||||||||||||||||||||||||||||||||||||||||||||||||||||
| | | | | | | | | | | | | | | | | | | | | | | | | | | | | | | | | | | | | | | | | | | | | | | | | | | | | | | | | | | | | | | | |
| Tools, furniture, and fixtures | 1,768,678,091 | 122,261,359 | 133,764,227 | 1,757,175,223 | 1,118,989,849 | 222,844,356 | 0 | 0 | 0 | 638,185,374 | |||||||||||||||||||||||||||||||||||||||||||||||||||||
| | | | | | | | | | | | | | | | | | | | | | | | | | | | | | | | | | | | | | | | | | | | | | | | | | | | | | | | | | | | | | | | |
| Total | 4,807,276,742 | 662,214,780 | 325,609,950 | 5,143,881,572 | 2,674,451,308 | 454,514,063 | 0 | 0 | 0 | 2,469,430,264 | |||||||||||||||||||||||||||||||||||||||||||||||||||||
| | | | | | | | | | | | | | | | | | | | | | | | | | | | | | | | | | | | | | | | | | | | | | | | | | | | | | | | | | | | | | | | |
| Buildings | 39,830,896,992 | 313,804,594 | 365,003,318 | 39,779,698,268 | 16,215,959,304 | 1,257,045,058 | 46,536,790 | 0 | 0 | 23,517,202,174 | |||||||||||||||||||||||||||||||||||||||||||||||||||||
| | | | | | | | | | | | | | | | | | | | | | | | | | | | | | | | | | | | | | | | | | | | | | | | | | | | | | | | | | | | | | | | |
| Structures | 1,464,065,614 | 0 | 3,699,140 | 1,460,366,474 | 986,951,539 | 44,925,522 | 375,844 | 0 | 0 | 473,039,091 | |||||||||||||||||||||||||||||||||||||||||||||||||||||
| | | | | | | | | | | | | | | | | | | | | | | | | | | | | | | | | | | | | | | | | | | | | | | | | | | | | | | | | | | | | | | | |
| Tangible assets (depreciation not included in expenses) | Machinery and equipment | 81,370,517 | 3,186,440 | 0 | 84,556,957 | 70,396,445 | 724,344 | 0 | 0 | 0 | 14,160,512 | ||||||||||||||||||||||||||||||||||||||||||||||||||||
| | | | | | | | | | | | | | | | | | | | | | | | | | | | | | | | | | | | | | | | | | | | | | | | | | | | | | | | | | | | | | | | |
| Vehicles | 143,375,475 | 0 | 42,724,122 | 100,651,353 | 90,586,218 | 0 | 0 | 0 | 0 | 10,065,135 | |||||||||||||||||||||||||||||||||||||||||||||||||||||
| | | | | | | | | | | | | | | | | | | | | | | | | | | | | | | | | | | | | | | | | | | | | | | | | | | | | | | | | | | | | | | | |
| Tools, furniture, and fixtures | 579,268,060 | 0 | 38,505,838 | 540,762,222 | 324,895,493 | 13,716,238 | 0 | 0 | 0 | 215,866,729 | |||||||||||||||||||||||||||||||||||||||||||||||||||||
| | | | | | | | | | | | | | | | | | | | | | | | | | | | | | | | | | | | | | | | | | | | | | | | | | | | | | | | | | | | | | | | |
| Total | 42,098,976,658 | 316,991,034 | 449,932,418 | 41,966,035,274 | 17,688,788,999 | 1,316,411,162 | 46,912,634 | 0 | 0 | 24,230,333,641 | |||||||||||||||||||||||||||||||||||||||||||||||||||||
| | | | | | | | | | | | | | | | | | | | | | | | | | | | | | | | | | | | | | | | | | | | | | | | | | | | | | | | | | | | | | | | |
Tangible assets (Non-depreciable assets) | Land | 14,970,513,458 | 0 | 0 | 14,970,513,458 | 0 | 0 | 234,596,912 | 0 | 0 | 14,735,916,546 | ||||||||||||||||||||||||||||||||||||||||||||||||||||
| | | | | | | | | | | | | | | | | | | | | | | | | | | | | | | | | | | | | | | | | | | | | | | | | | | | | | | | | | | | | | | | |
| Construction in progress | 71,060,898 | 427,070,070 | 32,999,828 | 465,131,140 | 0 | 0 | 0 | 0 | 0 | 465,131,140 | |||||||||||||||||||||||||||||||||||||||||||||||||||||
| | | | | | | | | | | | | | | | | | | | | | | | | | | | | | | | | | | | | | | | | | | | | | | | | | | | | | | | | | | | | | | | |
| Total | 15,041,574,356 | 427,070,070 | 32,999,828 | 15,435,644,598 | 0 | 0 | 234,596,912 | 0 | 0 | 15,201,047,686 | |||||||||||||||||||||||||||||||||||||||||||||||||||||
| | | | | | | | | | | | | | | | | | | | | | | | | | | | | | | | | | | | | | | | | | | | | | | | | | | | | | | | | | | | | | | | |
| Buildings | 41,011,124,927 | 640,208,278 | 390,287,527 | 41,261,045,678 | 16,556,128,158 | 1,328,576,549 | 46,536,790 | 0 | 0 | 24,658,380,730 | |||||||||||||||||||||||||||||||||||||||||||||||||||||
| | | | | | | | | | | | | | | | | | | | | | | | | | | | | | | | | | | | | | | | | | | | | | | | | | | | | | | | | | | | | | | | |
| Structures | 1,547,203,577 | 42,009,685 | 3,699,140 | 1,585,514,122 | 1,012,149,307 | 50,836,993 | 375,844 | 0 | 0 | 572,988,971 | |||||||||||||||||||||||||||||||||||||||||||||||||||||
| | | | | | | | | | | | | | | | | | | | | | | | | | | | | | | | | | | | | | | | | | | | | | | | | | | | | | | | | | | | | | | | |
| Machinery and equipment | 181,248,166 | 10,618,719 | 11,519,184 | 180,347,701 | 121,808,514 | 9,088,178 | 0 | 0 | 0 | 58,539,187 | |||||||||||||||||||||||||||||||||||||||||||||||||||||
| | | | | | | | | | | | | | | | | | | | | | | | | | | | | | | | | | | | | | | | | | | | | | | | | | | | | | | | | | | | | | | | |
| Total tangible assets | Vehicles | 1,818,730,579 | 164,107,773 | 197,766,452 | 1,785,071,900 | 1,229,268,986 | 145,862,911 | 0 | 0 | 0 | 555,802,914 | ||||||||||||||||||||||||||||||||||||||||||||||||||||
| | | | | | | | | | | | | | | | | | | | | | | | | | | | | | | | | | | | | | | | | | | | | | | | | | | | | | | | | | | | | | | | |
| Tools, furniture, and fixtures | 2,347,946,151 | 122,261,359 | 172,270,065 | 2,297,937,445 | 1,443,885,342 | 236,560,594 | 0 | 0 | 0 | 854,052,103 | |||||||||||||||||||||||||||||||||||||||||||||||||||||
| | | | | | | | | | | | | | | | | | | | | | | | | | | | | | | | | | | | | | | | | | | | | | | | | | | | | | | | | | | | | | | | |
| Land | 14,970,513,458 | 0 | 0 | 14,970,513,458 | 0 | 0 | 234,596,912 | 0 | 0 | 14,735,916,546 | |||||||||||||||||||||||||||||||||||||||||||||||||||||
| | | | | | | | | | | | | | | | | | | | | | | | | | | | | | | | | | | | | | | | | | | | | | | | | | | | | | | | | | | | | | | | |
| Construction in progress | 71,060,898 | 427,070,070 | 32,999,828 | 465,131,140 | 0 | 0 | 0 | 0 | 0 | 465,131,140 | |||||||||||||||||||||||||||||||||||||||||||||||||||||
| | | | | | | | | | | | | | | | | | | | | | | | | | | | | | | | | | | | | | | | | | | | | | | | | | | | | | | | | | | | | | | | |
| Total | 61,947,827,756 | 1,406,275,884 | 808,542,196 | 62,545,561,444 | 20,363,240,307 | 1,770,925,225 | 281,509,546 | 0 | 0 | 41,900,811,591 | |||||||||||||||||||||||||||||||||||||||||||||||||||||
| | | | | | | | | | | | | | | | | | | | | | | | | | | | | | | | | | | | | | | | | | | | | | | | | | | | | | | | | | | | | | | | |
| Intangible assets (depreciation included in expenses) | Trademark right | 7,444,573 | 0 | 0 | 7,444,573 | 5,320,204 | 306,291 | 0 | 0 | 0 | 2,124,369 | ||||||||||||||||||||||||||||||||||||||||||||||||||||
| | | | | | | | | | | | | | | | | | | | | | | | | | | | | | | | | | | | | | | | | | | | | | | | | | | | | | | | | | | | | | | | |
| Total | 7,444,573 | 0 | 0 | 7,444,573 | 5,320,204 | 306,291 | 0 | 0 | 0 | 2,124,369 | |||||||||||||||||||||||||||||||||||||||||||||||||||||
| | | | | | | | | | | | | | | | | | | | | | | | | | | | | | | | | | | | | | | | | | | | | | | | | | | | | | | | | | | | | | | | |
| Intangible assets (depreciation not included in expenses) | Trademark right | 1,139,550 | 0 | 0 | 1,139,550 | 1,139,550 | 0 | 0 | 0 | 0 | 0 | ||||||||||||||||||||||||||||||||||||||||||||||||||||
| | | | | | | | | | | | | | | | | | | | | | | | | | | | | | | | | | | | | | | | | | | | | | | | | | | | | | | | | | | | | | | | |
| Telephone subscription right | 12,088,650 | 0 | 0 | 12,088,650 | 0 | 0 | 7,871,900 | 0 | 0 | 4,216,750 | |||||||||||||||||||||||||||||||||||||||||||||||||||||
| | | | | | | | | | | | | | | | | | | | | | | | | | | | | | | | | | | | | | | | | | | | | | | | | | | | | | | | | | | | | | | | |
| Total | 13,228,200 | 0 | 0 | 13,228,200 | 1,139,550 | 0 | 7,871,900 | 0 | 0 | 4,216,750 | |||||||||||||||||||||||||||||||||||||||||||||||||||||
| | | | | | | | | | | | | | | | | | | | | | | | | | | | | | | | | | | | | | | | | | | | | | | | | | | | | | | | | | | | | | | | |
| Intangible assets (Non-depreciable assets) | Software in progress | 0 | 47,656,245 | 0 | 47,656,245 | 0 | 0 | 0 | 0 | 0 | 47,656,245 | ||||||||||||||||||||||||||||||||||||||||||||||||||||
| | | | | | | | | | | | | | | | | | | | | | | | | | | | | | | | | | | | | | | | | | | | | | | | | | | | | | | | | | | | | | | | |
| Total | 0 | 47,656,245 | 0 | 47,656,245 | 0 | 0 | 0 | 0 | 0 | 47,656,245 | |||||||||||||||||||||||||||||||||||||||||||||||||||||
| | | | | | | | | | | | | | | | | | | | | | | | | | | | | | | | | | | | | | | | | | | | | | | | | | | | | | | | | | | | | | | | |
| Trademark right | 8,584,123 | 0 | 0 | 8,584,123 | 6,459,754 | 306,291 | 0 | 0 | 0 | 2,124,369 | |||||||||||||||||||||||||||||||||||||||||||||||||||||
| | | | | | | | | | | | | | | | | | | | | | | | | | | | | | | | | | | | | | | | | | | | | | | | | | | | | | | | | | | | | | | | |
| Total intangible assets | Telephone subscription right | 12,088,650 | 0 | 0 | 12,088,650 | 0 | 0 | 7,871,900 | 0 | 0 | 4,216,750 | ||||||||||||||||||||||||||||||||||||||||||||||||||||
| | | | | | | | | | | | | | | | | | | | | | | | | | | | | | | | | | | | | | | | | | | | | | | | | | | | | | | | | | | | | | | | |
| Software in progress | 0 | 47,656,245 | 0 | 47,656,245 | 0 | 0 | 0 | 0 | 0 | 47,656,245 | |||||||||||||||||||||||||||||||||||||||||||||||||||||
| | | | | | | | | | | | | | | | | | | | | | | | | | | | | | | | | | | | | | | | | | | | | | | | | | | | | | | | | | | | | | | | |
| Total | 20,672,773 | 47,656,245 | 0 | 68,329,018 | 6,459,754 | 306,291 | 7,871,900 | 0 | 0 | 53,997,364 | |||||||||||||||||||||||||||||||||||||||||||||||||||||
| | | | | | | | | | | | | | | | | | | | | | | | | | | | | | | | | | | | | | | | | | | | | | | | | | | | | | | | | | | | | | | | |
| Long-term deposits | 300,000,000 | 0 | 0 | 300,000,000 | 0 | 0 | 0 | 0 | 0 | 300,000,000 | |||||||||||||||||||||||||||||||||||||||||||||||||||||
| | | | | | | | | | | | | | | | | | | | | | | | | | | | | | | | | | | | | | | | | | | | | | | | | | | | | | | | | | | | | | | | |
| Long-term loans for development projects | 396,075,484 | 166,300,000 | 219,758,484 | 342,617,000 | 0 | 0 | 0 | 0 | 0 | 342,617,000 | |||||||||||||||||||||||||||||||||||||||||||||||||||||
| | | | | | | | | | | | | | | | | | | | | | | | | | | | | | | | | | | | | | | | | | | | | | | | | | | | | | | | | | | | | | | | |
| Allowance for loan losses (non-current) | (9,085,486 | ) | 8,902,489 | 119,768,620 | (119,951,617 | ) | 0 | 0 | 0 | 0 | 0 | (119,951,617 | ) | ||||||||||||||||||||||||||||||||||||||||||||||||||
| | | | | | | | | | | | | | | | | | | | | | | | | | | | | | | | | | | | | | | | | | | | | | | | | | | | | | | | | | | | | | | | |
| Long-term loans for emigration projects | 105,451,790 | 0 | 66,065,157 | 39,386,633 | 0 | 0 | 0 | 0 | 0 | 39,386,633 | |||||||||||||||||||||||||||||||||||||||||||||||||||||
| | | | | | | | | | | | | | | | | | | | | | | | | | | | | | | | | | | | | | | | | | | | | | | | | | | | | | | | | | | | | | | | |
| Allowance for loan losses (non-current) | (57,308,430 | ) | 0 | (24,269,016 | ) | (33,039,414 | ) | 0 | 0 | 0 | 0 | 0 | (33,039,414 | ) | |||||||||||||||||||||||||||||||||||||||||||||||||
| | | | | | | | | | | | | | | | | | | | | | | | | | | | | | | | | | | | | | | | | | | | | | | | | | | | | | | | | | | | | | | | |
| Long-term installments receivable on settlement projects | 162,930 | 0 | 116,483 | 46,447 | 0 | 0 | 0 | 0 | 0 | 46,447 | |||||||||||||||||||||||||||||||||||||||||||||||||||||
| | | | | | | | | | | | | | | | | | | | | | | | | | | | | | | | | | | | | | | | | | | | | | | | | | | | | | | | | | | | | | | | |
| Investments and other assets | Claims probable in bankruptcy, claims probable in rehabilitation, and other pertaining to loans for development projects | 191,110,477 | 0 | 191,110,477 | 0 | 0 | 0 | 0 | 0 | 0 | 0 | ||||||||||||||||||||||||||||||||||||||||||||||||||||
| | | | | | | | | | | | | | | | | | | | | | | | | | | | | | | | | | | | | | | | | | | | | | | | | | | | | | | | | | | | | | | | |
| Allowance for loan losses (non-current) | (120,093,330 | ) | 0 | (120,093,330 | ) | 0 | 0 | 0 | 0 | 0 | 0 | 0 | |||||||||||||||||||||||||||||||||||||||||||||||||||
| | | | | | | | | | | | | | | | | | | | | | | | | | | | | | | | | | | | | | | | | | | | | | | | | | | | | | | | | | | | | | | | |
| Claims probable in bankruptcy, claims probable in rehabilitation, and other pertaining to loans for emigration projects | 809,673,108 | 0 | 190,341,739 | 619,331,369 | 0 | 0 | 0 | 0 | 0 | 619,331,369 | |||||||||||||||||||||||||||||||||||||||||||||||||||||
| | | | | | | | | | | | | | | | | | | | | | | | | | | | | | | | | | | | | | | | | | | | | | | | | | | | | | | | | | | | | | | | |
| Allowance for loan losses (non-current) | (809,673,108 | ) | 0 | (190,341,739 | ) | (619,331,369 | ) | 0 | 0 | 0 | 0 | 0 | (619,331,369 | ) | |||||||||||||||||||||||||||||||||||||||||||||||||
| | | | | | | | | | | | | | | | | | | | | | | | | | | | | | | | | | | | | | | | | | | | | | | | | | | | | | | | | | | | | | | | |
| Claims probable in bankruptcy, claims probable in rehabilitation, and other pertaining to installments receivable on settlement projects | 2,641,747 | 0 | 1,273,535 | 1,368,212 | 0 | 0 | 0 | 0 | 0 | 1,368,212 | |||||||||||||||||||||||||||||||||||||||||||||||||||||
| | | | | | | | | | | | | | | | | | | | | | | | | | | | | | | | | | | | | | | | | | | | | | | | | | | | | | | | | | | | | | | | |
| Allowance for loan losses (non-current) | (2,641,747 | ) | 0 | (1,273,535 | ) | (1,368,212 | ) | 0 | 0 | 0 | 0 | 0 | (1,368,212 | ) | |||||||||||||||||||||||||||||||||||||||||||||||||
| | | | | | | | | | | | | | | | | | | | | | | | | | | | | | | | | | | | | | | | | | | | | | | | | | | | | | | | | | | | | | | | |
| Long-term prepaid expenses | 110,434,929 | 21,017,567 | 60,772,335 | 70,680,161 | 0 | 0 | 0 | 0 | 0 | 70,680,161 | |||||||||||||||||||||||||||||||||||||||||||||||||||||
| | | | | | | | | | | | | | | | | | | | | | | | | | | | | | | | | | | | | | | | | | | | | | | | | | | | | | | | | | | | | | | | |
| Long-term guarantee deposits | 1,539,197,577 | 61,245,571 | 67,814,961 | 1,532,628,187 | 0 | 0 | 0 | 0 | 0 | 1,532,628,187 | |||||||||||||||||||||||||||||||||||||||||||||||||||||
| | | | | | | | | | | | | | | | | | | | | | | | | | | | | | | | | | | | | | | | | | | | | | | | | | | | | | | | | | | | | | | | |
| Total | 2,455,945,941 | 257,465,627 | 581,044,171 | 2,132,367,397 | 0 | 0 | 0 | 0 | 0 | 2,132,367,397 | |||||||||||||||||||||||||||||||||||||||||||||||||||||
| | | | | | | | | | | | | | | | | | | | | | | | | | | | | | | | | | | | | | | | | | | | | | | | | | | | | | | | | | | | | | | | |
F-76
(2) Details of inventories
| (Unit: Yen) | |||||||||||||||||||||||||||||||||||||||
| | | | | | | | | | | | | | | | | | | | | | | | | | | | | | | | | | | | | | | | |
| Increase during the period | Decrease during the period | ||||||||||||||||||||||||||||||||||||||
| | | | | | | | | | | | | | | | | | | | | | | | | | | | | | | | | | | | | | | | |
| Type | Balance at the beginning of the period | Purchase, manufacturing and transfer for the current business year | Others | Delivery and transfer | Others | Balance at the end of the period | Remarks | ||||||||||||||||||||||||||||||||
| | | | | | | | | | | | | | | | | | | | | | | | | | | | | | | | | | | | | | | | |
| Stored goods | 359,251,392 | 132,721,534 | 0 | 81,164,061 | 0 | 410,808,865 | |||||||||||||||||||||||||||||||||
| | | | | | | | | | | | | | | | | | | | | | | | | | | | | | | | | | | | | | | | |
Stockpile | 359,251,392 | 132,721,534 | 0 | 81,164,061 | 0 | 410,808,865 | |||||||||||||||||||||||||||||||||
| | | | | | | | | | | | | | | | | | | | | | | | | | | | | | | | | | | | | | | | |
Japan | 51,432,766 | 0 | 0 | 8,129,610 | 0 | 43,303,156 | |||||||||||||||||||||||||||||||||
| | | | | | | | | | | | | | | | | | | | | | | | | | | | | | | | | | | | | | | | |
USA | 81,130,241 | 7,388,845 | 0 | 5,964,472 | 0 | 82,554,614 | |||||||||||||||||||||||||||||||||
| | | | | | | | | | | | | | | | | | | | | | | | | | | | | | | | | | | | | | | | |
Singapore | 161,560,954 | 74,728,513 | 0 | 57,468,394 | 0 | 178,821,073 | |||||||||||||||||||||||||||||||||
| | | | | | | | | | | | | | | | | | | | | | | | | | | | | | | | | | | | | | | | |
Ghana | 5,862,826 | 0 | 0 | 5,862,826 | 0 | 0 | |||||||||||||||||||||||||||||||||
| | | | | | | | | | | | | | | | | | | | | | | | | | | | | | | | | | | | | | | | |
UAE | 59,264,605 | 40,377,333 | 0 | 0 | 0 | 99,641,938 | |||||||||||||||||||||||||||||||||
| | | | | | | | | | | | | | | | | | | | | | | | | | | | | | | | | | | | | | | | |
Palau | 0 | 5,560,256 | 0 | 0 | 0 | 5,560,256 | |||||||||||||||||||||||||||||||||
| | | | | | | | | | | | | | | | | | | | | | | | | | | | | | | | | | | | | | | | |
Marshall Islands | 0 | 4,666,587 | 0 | 3,738,759 | 0 | 927,828 | |||||||||||||||||||||||||||||||||
| | | | | | | | | | | | | | | | | | | | | | | | | | | | | | | | | | | | | | | | |
| Payments for uncompleted contracted programs | 837,734,760 | 0 | 0 | 837,734,760 | 0 | 0 | |||||||||||||||||||||||||||||||||
| | | | | | | | | | | | | | | | | | | | | | | | | | | | | | | | | | | | | | | | |
| Total | 1,196,986,152 | 132,721,534 | 0 | 918,898,821 | 0 | 410,808,865 | |||||||||||||||||||||||||||||||||
| | | | | | | | | | | | | | | | | | | | | | | | | | | | | | | | | | | | | | | | |
(3) Details of securities
Securities reported as current assets
| (Unit: Yen) | |||||||||||||||||||||||||||||||||
| | | | | | | | | | | | | | | | | | | | | | | | | | | | | | | | | | |
Held-to-maturity securities | Type and name | Acquisition cost | Aggregate face amount | Balance sheet amount | Valuation difference included in current expenses | Remarks | |||||||||||||||||||||||||||
| | | | | | | | | | | | | | | | | | | | | | | | | | | | | | | | | | |
| Negotiable deposits | 84,000,000,000 | 84,000,000,000 | 84,000,000,000 | 0 | |||||||||||||||||||||||||||||
| | | | | | | | | | | | | | | | | | | | | | | | | | | | | | | | | | |
F-77
(4) Details of loans
(Unit: Yen) | ||||||||||||||||||||||||||||||||||
| | | | | | | | | | | | | | | | | | | | | | | | | | | | | | | | | | | |
|
| Decrease during the period | ||||||||||||||||||||||||||||||||
| | | | | | | | | | | | | | | | | | | | | | | | | | | | | | | | | | | |
| Classification | Balance at the beginning of the period | Increase during the period | Collection | Others | Balance at the end of the period | Remarks | |||||||||||||||||||||||||||
| | | | | | | | | | | | | | | | | | | | | | | | | | | | | | | | | | | |
| Other short-term loans | |||||||||||||||||||||||||||||||||
| | | | | | | | | | | | | | | | | | | | | | | | | | | | | | | | | | | |
| Loans for development projects | 412,684,000 | 219,758,484 | 412,684,000 | 0 | 219,758,484 | ||||||||||||||||||||||||||||
| | | | | | | | | | | | | | | | | | | | | | | | | | | | | | | | | | | |
| Loans for emigration projects | 10,218,835 | 3,562,420 | 6,151,446 | 4,970,054 | 2,659,755 | ||||||||||||||||||||||||||||
| | | | | | | | | | | | | | | | | | | | | | | | | | | | | | | | | | | |
| Installments receivable on settlement projects | 54,838 | 81,466 | 54,838 | 35,019 | 46,447 | ||||||||||||||||||||||||||||
| | | | | | | | | | | | | | | | | | | | | | | | | | | | | | | | | | | |
| (Subtotal) | 422,957,673 | 223,402,370 | 418,890,284 | 5,005,073 | 222,464,686 | ||||||||||||||||||||||||||||
| | | | | | | | | | | | | | | | | | | | | | | | | | | | | | | | | | | |
| Other long-term loans | |||||||||||||||||||||||||||||||||
| | | | | | | | | | | | | | | | | | | | | | | | | | | | | | | | | | | |
| Loans for development projects | 587,185,961 | 0 | 24,810,477 | 219,758,484 | 342,617,000 | ||||||||||||||||||||||||||||
| | | | | | | | | | | | | | | | | | | | | | | | | | | | | | | | | | | |
| Loans for emigration projects | 915,124,898 | 501,153 | 10,105,519 | 246,802,530 | 658,718,002 | ||||||||||||||||||||||||||||
| | | | | | | | | | | | | | | | | | | | | | | | | | | | | | | | | | | |
| Installments receivable on settlement projects | 2,804,677 | 0 | 241,985 | 1,148,033 | 1,414,659 | ||||||||||||||||||||||||||||
| | | | | | | | | | | | | | | | | | | | | | | | | | | | | | | | | | | |
| (Subtotal) | 1,505,115,536 | 501,153 | 35,157,981 | 467,709,047 | 1,002,749,661 | ||||||||||||||||||||||||||||
| | | | | | | | | | | | | | | | | | | | | | | | | | | | | | | | | | | |
| Total | 1,928,073,209 | 223,903,523 | 454,048,265 | 472,714,120 | 1,225,214,347 | ||||||||||||||||||||||||||||
| | | | | | | | | | | | | | | | | | | | | | | | | | | | | | | | | | | |
- *
- "Others" shown under decrease during the period is due to transfer from long-term to short-term loans as well as from short-term to long-term loans, assignment of claim, year-end translation difference, etc.
F-78
(5) Details of allowance for loan losses, etc.
| (Unit: Yen) | ||||||||||||||||||||||||||||||||||||||
| | | | | | | | | | | | | | | | | | | | | | | | | | | | | | | | | | | | | | | |
| Balance of loans, etc. | Balance of allowance for loan losses | |||||||||||||||||||||||||||||||||||||
| | | | | | | | | | | | | | | | | | | | | | | | | | | | | | | | | | | | | | | |
| Classification | Balance at the beginning of the period | Increase or decrease during the period | Balance at the end of the period | Balance at the beginning of the period | Increase or decrease during the period | Balance at the end of the period | Remarks | |||||||||||||||||||||||||||||||
| | | | | | | | | | | | | | | | | | | | | | | | | | | | | | | | | | | | | | | |
| (Development projects) | ||||||||||||||||||||||||||||||||||||||
| | | | | | | | | | | | | | | | | | | | | | | | | | | | | | | | | | | | | | | |
| Short-term loans for development projects | 412,684,000 | (192,925,516 | ) | 219,758,484 | 979,324 | 2,959,623 | 3,938,947 | |||||||||||||||||||||||||||||||
| | | | | | | | | | | | | | | | | | | | | | | | | | | | | | | | | | | | | | | |
| Ordinary loans | 412,684,000 | (192,925,516 | ) | 219,758,484 | 979,324 | 2,959,623 | 3,938,947 | Breakdown of the guarantee for the Year-end balance of loans is as follows: Bank guarantee ¥25,634,000 Joint and several guarantee ¥6,500,000 Loans to the Federative Republic of Brazil ¥187,624,484 | ||||||||||||||||||||||||||||||
| | | | | | | | | | | | | | | | | | | | | | | | | | | | | | | | | | | | | | | |
| Long-term loans for development projects | 587,185,961 | (244,568,961 | ) | 342,617,000 | 129,178,816 | (9,227,199 | ) | 119,951,617 | ||||||||||||||||||||||||||||||
| | | | | | | | | | | | | | | | | | | | | | | | | | | | | | | | | | | | | | | |
Ordinary loans | 396,075,484 | (219,758,484 | ) | 176,317,000 | 9,085,486 | (8,902,489 | ) | 182,997 | Breakdown of the guarantee for the Year-end balance of loans is as follows: Bank guarantee ¥78,817,000 | |||||||||||||||||||||||||||||
| | | | | | | | | | | | | | | | | | | | | | | | | | | | | | | | | | | | | | | |
Doubtful loans | 0 | 166,300,000 | 166,300,000 | 0 | 119,768,620 | 119,768,620 | Joint and several guarantee ¥97,500,000 Provision of collateral (government bonds) ¥166,300,000 | |||||||||||||||||||||||||||||||
| | | | | | | | | | | | | | | | | | | | | | | | | | | | | | | | | | | | | | | |
Claims probable in bankruptcy, | 191,110,477 | (191,110,477 | ) | 0 | 120,093,330 | (120,093,330 | ) | 0 | ||||||||||||||||||||||||||||||
| | | | | | | | | | | | | | | | | | | | | | | | | | | | | | | | | | | | | | | |
(Development projects in total) | 999,869,961 | (437,494,477 | ) | 562,375,484 | 130,158,140 | (6,267,576 | ) | 123,890,564 | ||||||||||||||||||||||||||||||
| | | | | | | | | | | | | | | | | | | | | | | | | | | | | | | | | | | | | | | |
| (Emigration projects) | ||||||||||||||||||||||||||||||||||||||
| | | | | | | | | | | | | | | | | | | | | | | | | | | | | | | | | | | | | | | |
| Short-term loans for emigration projects | 10,218,835 | (7,559,080 | ) | 2,659,755 | 751,873 | (423,354 | ) | 328,519 | ||||||||||||||||||||||||||||||
| | | | | | | | | | | | | | | | | | | | | | | | | | | | | | | | | | | | | | | |
Ordinary loans | 10,218,835 | (7,559,080 | ) | 2,659,755 | 751,873 | (423,354 | ) | 328,519 | ||||||||||||||||||||||||||||||
| | | | | | | | | | | | | | | | | | | | | | | | | | | | | | | | | | | | | | | |
| Long-term loans for emigration projects | 915,124,898 | (256,406,896 | ) | 658,718,002 | 866,981,538 | (214,610,755 | ) | 652,370,783 | ||||||||||||||||||||||||||||||
| | | | | | | | | | | | | | | | | | | | | | | | | | | | | | | | | | | | | | | |
Ordinary loans | 52,263,935 | (44,963,272 | ) | 7,300,663 | 4,120,575 | (3,167,131 | ) | 953,444 | ||||||||||||||||||||||||||||||
| | | | | | | | | | | | | | | | | | | | | | | | | | | | | | | | | | | | | | | |
Doubtful loans | 53,187,855 | (21,101,885 | ) | 32,085,970 | 53,187,855 | (21,101,885 | ) | 32,085,970 | ||||||||||||||||||||||||||||||
| | | | | | | | | | | | | | | | | | | | | | | | | | | | | | | | | | | | | | | |
Claims probable in bankruptcy, | 809,673,108 | (190,341,739 | ) | 619,331,369 | 809,673,108 | (190,341,739 | ) | 619,331,369 | ||||||||||||||||||||||||||||||
| | | | | | | | | | | | | | | | | | | | | | | | | | | | | | | | | | | | | | | |
(Emigration projects in total) | 925,343,733 | (263,965,976 | ) | 661,377,757 | 867,733,411 | (215,034,109 | ) | 652,699,302 | ||||||||||||||||||||||||||||||
| | | | | | | | | | | | | | | | | | | | | | | | | | | | | | | | | | | | | | | |
| (Installments receivable on settlement projects) | ||||||||||||||||||||||||||||||||||||||
| | | | | | | | | | | | | | | | | | | | | | | | | | | | | | | | | | | | | | | |
| Short-term installments receivable on settlement projects | 54,838 | (8,391 | ) | 46,447 | 0 | 0 | 0 | |||||||||||||||||||||||||||||||
| | | | | | | | | | | | | | | | | | | | | | | | | | | | | | | | | | | | | | | |
Ordinary loans | 54,838 | (8,391 | ) | 46,447 | 0 | 0 | 0 | |||||||||||||||||||||||||||||||
| | | | | | | | | | | | | | | | | | | | | | | | | | | | | | | | | | | | | | | |
| Long-term installments receivable on settlement projects | 2,804,677 | (1,390,018 | ) | 1,414,659 | 2,641,747 | (1,273,535 | ) | 1,368,212 | ||||||||||||||||||||||||||||||
| | | | | | | | | | | | | | | | | | | | | | | | | | | | | | | | | | | | | | | |
Ordinary loans | 162,930 | (116,483 | ) | 46,447 | 0 | 0 | 0 | |||||||||||||||||||||||||||||||
| | | | | | | | | | | | | | | | | | | | | | | | | | | | | | | | | | | | | | | |
Doubtful loans | 0 | 0 | 0 | 0 | 0 | 0 | ||||||||||||||||||||||||||||||||
| | | | | | | | | | | | | | | | | | | | | | | | | | | | | | | | | | | | | | | |
Claims probable in bankruptcy, | 2,641,747 | (1,273,535 | ) | 1,368,212 | 2,641,747 | (1,273,535 | ) | 1,368,212 | ||||||||||||||||||||||||||||||
| | | | | | | | | | | | | | | | | | | | | | | | | | | | | | | | | | | | | | | |
| (Installments receivable on settlement projects in total) | 2,859,515 | (1,398,409 | ) | 1,461,106 | 2,641,747 | (1,273,535 | ) | 1,368,212 | ||||||||||||||||||||||||||||||
| | | | | | | | | | | | | | | | | | | | | | | | | | | | | | | | | | | | | | | |
| Total | 1,928,073,209 | (702,858,862 | ) | 1,225,214,347 | 1,000,533,298 | (222,575,220 | ) | 777,958,078 | ||||||||||||||||||||||||||||||
| | | | | | | | | | | | | | | | | | | | | | | | | | | | | | | | | | | | | | | |
- *
- Standard for appropriation of allowance for loan losses is described in No. 5 of Significant Accounting Policies.
F-79
(6) Details of asset retirement obligations
| (Unit: Yen) | |||||||||||||||||||||||||||||||||
| | | | | | | | | | | | | | | | | | | | | | | | | | | | | | | | | | |
| Classification | Balance at the beginning of the period | Increase during the period | Decrease during the period | Balance at the end of the period | Remarks | ||||||||||||||||||||||||||||
| | | | | | | | | | | | | | | | | | | | | | | | | | | | | | | | | | |
Obligations of restoration to original state based on a building lease agreement | 276,125,850 | 0 | 0 | 276,125,850 | Specified expenses in Accounting Standard for Incorporated Administrative Agency No. 91 | ||||||||||||||||||||||||||||
| | | | | | | | | | | | | | | | | | | | | | | | | | | | | | | | | | |
(7) Details of capital and capital surplus
| (Unit: Yen) | |||||||||||||||||||||||||||||||||
| | | | | | | | | | | | | | | | | | | | | | | | | | | | | | | | | | |
| Classification | Balance at the beginning of the period | Increase during the period | Decrease during the period | Balance at the end of the period | Remarks | ||||||||||||||||||||||||||||
| | | | | | | | | | | | | | | | | | | | | | | | | | | | | | | | | | |
| Capital | Government investment | 63,217,211,863 | 0 | 0 | 63,217,211,863 | ||||||||||||||||||||||||||||
| | | | | | | | | | | | | | | | | | | | | | | | | | | | | | | | | | |
| Total | 63,217,211,863 | 0 | 0 | 63,217,211,863 | |||||||||||||||||||||||||||||
| | | | | | | | | | | | | | | | | | | | | | | | | | | | | | | | | | |
| Capital surplus | |||||||||||||||||||||||||||||||||
| | | | | | | | | | | | | | | | | | | | | | | | | | | | | | | | | | |
| Facility expenses | 1,858,502,287 | 239,627,598 | 0 | 2,098,129,885 | Increase due to acquisition of non-current assets | ||||||||||||||||||||||||||||
| | | | | | | | | | | | | | | | | | | | | | | | | | | | | | | | | | |
| Operational grants | 165,777,111 | 38,728,361 | 12,800,995 | 191,704,477 | Increase/decrease due to long-term guarantee deposits | ||||||||||||||||||||||||||||
| | | | | | | | | | | | | | | | | | | | | | | | | | | | | | | | | | |
| Specified assets in Accounting Standard for Incorporated Administrative Agency No. 87 | (122,494,000 | ) | 0 | 0 | (122,494,000 | ) | |||||||||||||||||||||||||||
| | | | | | | | | | | | | | | | | | | | | | | | | | | | | | | | | | |
| Accumulated disposal and sale differential of non-current assets not included in expenses | (3,916,927,717 | ) | 2,052 | 444,998,045 | (4,361,923,710 | ) | Decrease due to sale or disposal of inherited assets | ||||||||||||||||||||||||||
| | | | | | | | | | | | | | | | | | | | | | | | | | | | | | | | | | |
| Lease contracts | (113,690,859 | ) | 0 | 0 | (113,690,859 | ) | |||||||||||||||||||||||||||
| | | | | | | | | | | | | | | | | | | | | | | | | | | | | | | | | | |
| Reserve fund carried over from the previous Mid-term Objective period | 5,560,950 | 3,186,440 | 0 | 8,747,390 | Increase due to acquisition of non-current assets | ||||||||||||||||||||||||||||
| | | | | | | | | | | | | | | | | | | | | | | | | | | | | | | | | | |
| Capital surplus | Specified expenses in Accounting Standard for Incorporated Administrative Agency No. 99 | 2,454,946,431 | 0 | 0 | 2,454,946,431 | ||||||||||||||||||||||||||||
| | | | | | | | | | | | | | | | | | | | | | | | | | | | | | | | | | |
| Total | 331,674,203 | 281,544,451 | 457,799,040 | 155,419,614 | |||||||||||||||||||||||||||||
| | | | | | | | | | | | | | | | | | | | | | | | | | | | | | | | | | |
| Accumulated depreciation not included in expenses | (16,778,074,305 | ) | (1,316,411,162 | ) | (368,519,385 | ) | (17,725,966,082 | ) | Increase due to depreciation of non-current assets | ||||||||||||||||||||||||
| | | | | | | | | | | | | | | | | | | | | | | | | | | | | | | | | | |
| Total | (16,778,074,305 | ) | (1,316,411,162 | ) | (368,519,385 | ) | (17,725,966,082 | ) | |||||||||||||||||||||||||
| | | | | | | | | | | | | | | | | | | | | | | | | | | | | | | | | | |
| Accumulated impairment loss not included in expenses | (289,381,446 | ) | 0 | 0 | (289,381,446 | ) | |||||||||||||||||||||||||||
| | | | | | | | | | | | | | | | | | | | | | | | | | | | | | | | | | |
| Total | (289,381,446 | ) | 0 | 0 | (289,381,446 | ) | |||||||||||||||||||||||||||
| | | | | | | | | | | | | | | | | | | | | | | | | | | | | | | | | | |
| Accumulated interest expenses not included in expenses | (7,189,037 | ) | 0 | 0 | (7,189,037 | ) | |||||||||||||||||||||||||||
| | | | | | | | | | | | | | | | | | | | | | | | | | | | | | | | | | |
| Total | (7,189,037 | ) | 0 | 0 | (7,189,037 | ) | |||||||||||||||||||||||||||
| | | | | | | | | | | | | | | | | | | | | | | | | | | | | | | | | | |
| Total balance | (16,742,970,585 | ) | (1,034,866,711 | ) | 89,279,655 | (17,867,116,951 | ) | ||||||||||||||||||||||||||
| | | | | | | | | | | | | | | | | | | | | | | | | | | | | | | | | | |
F-80
(8) Details of reserve fund and details of reversal of reserve fund for specific purpose
- 1.
- Details of reserve fund
(Unit: Yen) | ||||||||||||||||||||||||||||
| | | | | | | | | | | | | | | | | | | | | | | | | | | | | |
| Classification | Balance at the beginning of the period | Increase during the period | Decrease during the period | Balance at the end of the period | Remarks | ||||||||||||||||||||||
| | | | | | | | | | | | | | | | | | | | | | | | | | | | | |
| Reserve fund carried over from the previous Mid-term Objective period | 2,033,044,826 | 0 | 255,909,379 | 1,777,135,447 | |||||||||||||||||||||||
| | | | | | | | | | | | | | | | | | | | | | | | | | | | | |
| Reserve fund of Paragraph 1 Article 44 of the Act on General Rules | 1,681,756,203 | 1,436,297,748 | 0 | 3,118,053,951 | Increase from the profit appropriation for Business Year 2014 | ||||||||||||||||||||||
| | | | | | | | | | | | | | | | | | | | | | | | | | | | | |
| Total | 3,714,801,029 | 1,436,297,748 | 255,909,379 | 4,895,189,398 | |||||||||||||||||||||||
| | | | | | | | | | | | | | | | | | | | | | | | | | | | | |
- 2.
- Details of reversal of reserve fund for specific purpose
| (Unit: Yen) | ||||||||||||||||||||||
| | | | | | | | | | | | | | | | | | | | | | | |
| Classification | Amount | Remarks | ||||||||||||||||||||
| | | | | | | | | | | | | | | | | | | | | | | |
Reversal amount of reserve fund for specific purpose | Reserve fund carried over from previous Mid-term Objective period | 252,722,939 | Advance payments and prepaid expenses expensed for the current period | 252,722,939 | ||||||||||||||||||
| | | | | | | | | | | | | | | | | | | | | | | |
| Others | Reserve fund carried over from previous Mid-term Objective period | 3,186,440 | Purchase of assets | 3,186,440 | ||||||||||||||||||
| | | | | | | | | | | | | | | | | | | | | | | |
Total | 255,909,379 | |||||||||||||||||||||
| | | | | | | | | | | | | | | | | | | | | | | |
(9) Details of operational grant liabilities, transfer for the current period, etc.
- 1.
- Details of changes in operational grant liabilities
| (Unit: Yen) | |||||||||||||||||||||||||||||||||||||||
| | | | | | | | | | | | | | | | | | | | | | | | | | | | | | | | | | | | | | | | |
| Transfer for the current period | |||||||||||||||||||||||||||||||||||||||
| | | | | | | | | | | | | | | | | | | | | | | | | | | | | | | | | | | | | | | | |
| The year of grant | Balance at the beginning of the period | Operational grants for the current period | Revenues from operational grants | Contra- accounts for assets funded by operational grants | Capital surplus | Subtotal | Balance at the end of the period | ||||||||||||||||||||||||||||||||
| | | | | | | | | | | | | | | | | | | | | | | | | | | | | | | | | | | | | | | | |
| Business year 2012 | 2,153,786,178 | 0 | 1,237,762,018 | 0 | 0 | 1,237,762,018 | 916,024,160 | ||||||||||||||||||||||||||||||||
| | | | | | | | | | | | | | | | | | | | | | | | | | | | | | | | | | | | | | | | |
| Business year 2013 | 7,683,620,474 | 0 | 4,256,824,125 | 0 | 0 | 4,256,824,125 | 3,426,796,349 | ||||||||||||||||||||||||||||||||
| | | | | | | | | | | | | | | | | | | | | | | | | | | | | | | | | | | | | | | | |
| Business year 2014 | 36,403,575,650 | 0 | 25,032,925,391 | 23,342,951 | 741,719 | 25,057,010,061 | 11,346,565,589 | ||||||||||||||||||||||||||||||||
| | | | | | | | | | | | | | | | | | | | | | | | | | | | | | | | | | | | | | | | |
| Business year 2015 | 0 | 154,035,701,000 | 122,343,164,617 | 707,101,201 | 37,384,644 | 123,087,650,462 | 30,948,050,538 | ||||||||||||||||||||||||||||||||
| | | | | | | | | | | | | | | | | | | | | | | | | | | | | | | | | | | | | | | | |
| Total | 46,240,982,302 | 154,035,701,000 | 152,870,676,151 | 730,444,152 | 38,126,363 | 153,639,246,666 | 46,637,436,636 | ||||||||||||||||||||||||||||||||
| | | | | | | | | | | | | | | | | | | | | | | | | | | | | | | | | | | | | | | | |
F-81
- 2.
- Details of transfer of operational grant liabilities for the current period
- (1)
- Grant provided in business year 2012
(Unit: Yen) | |||||||||||||||||||||
| | | | | | | | | | | | | | | | | | | | | | |
Classification | Amount | Breakdown | |||||||||||||||||||
| | | | | | | | | | | | | | | | | | | | | | |
| Revenues from operational grants | 1,237,762,018 | (1) | Operation to which the revenue recognition method based on incurred expenses is applied: all operations financed by operational grants | |||||||||||||||||
| | | | | | | | | | | | | | | | | | | | | | |
| Transfer amount in accordance | Contra-accounts for assets funded by operational grants | 0 | (2) | Profit and loss in relation to the operation a) Amount of expenses recorded in the statement of income: ¥1,237,762,018 (Operating expenses: ¥1,237,762,018) | ||||||||||||||||
| | | | | | | | | | | | | | | | | | | | | | |
| Capital surplus | 0 | |||||||||||||||||||
| | | | | | | | | | | | | | | | | | | | | | |
| Total | 1,237,762,018 | |||||||||||||||||||
| | | | | | | | | | | | | | | | | | | | | | |
- (2)
- Grant provided in business year 2013
(Unit: Yen) | |||||||||||||||||||||
| | | | | | | | | | | | | | | | | | | | | | |
Classification | Amount | Breakdown | |||||||||||||||||||
| | | | | | | | | | | | | | | | | | | | | | |
| Revenues from operational grants | 4,256,824,125 | (1) | Operation to which the revenue recognition method based on incurred expenses is applied: all operations financed by operational grants | |||||||||||||||||
| | | | | | | | | | | | | | | | | | | | | | |
| Transfer amount in accordance | Contra-accounts for assets funded by operational grants | 0 | (2) | Profit and loss in relation to the operation a) Amount of expenses recorded in the statement of income: ¥4,256,824,125 (Operating expenses: ¥4,240,030,264, General administrative expenses: ¥16,793,861) | ||||||||||||||||
| | | | | | | | | | | | | | | | | | | | | | |
| Capital surplus | 0 | |||||||||||||||||||
| | | | | | | | | | | | | | | | | | | | | | |
| Total | 4,256,824,125 | |||||||||||||||||||
| | | | | | | | | | | | | | | | | | | | | | |
- (3)
- Grant provided in business year 2014
(Unit: Yen) | |||||||||||||||||||||
| | | | | | | | | | | | | | | | | | | | | | |
Classification | Amount | Breakdown | |||||||||||||||||||
| | | | | | | | | | | | | | | | | | | | | | |
| Revenues from operational grants | 25,032,925,391 | (1) | Operation to which the revenue recognition method based on incurred expenses is applied: all operations financed by operational grants | |||||||||||||||||
| | | | | | | | | | | | | | | | | | | | | | |
| Transfer amount in accordance | Contra-accounts for assets funded by operational grants | 23,342,951 | (2) | Profit and loss in relation to the operation a) Amount of expenses recorded in the statement of income: ¥25,032,925,391 (Operating expenses: ¥24,780,716,890, General administrative expenses: ¥252,208,501) b) Acquisition cost of non-current assets: ¥23,342,951 (Vehicles: ¥23,342,951) c) Long-term guarantee deposits: ¥741,719 | ||||||||||||||||
| | | | | | | | | | | | | | | | | | | | | | |
| Capital surplus | 741,719 | |||||||||||||||||||
| | | | | | | | | | | | | | | | | | | | | | |
| Total | 25,057,010,061 | |||||||||||||||||||
| | | | | | | | | | | | | | | | | | | | | | |
F-82
- (4)
- Grant provided in business year 2015
(Unit: Yen) | |||||||||||||||||||||
| | | | | | | | | | | | | | | | | | | | | | |
Classification | Amount | Breakdown | |||||||||||||||||||
| | | | | | | | | | | | | | | | | | | | | | |
| (1) | Operation to which the revenue recognition method based on incurred expenses is applied: all operations financed by operational grants | |||||||||||||||||||
| Revenues from operational grants | 122,343,164,617 | (2) | Profit and loss in relation to the operation a) Amount of expenses recorded in the statement of income: ¥215,733,923,694 (Operating expenses: ¥206,371,802,997, General administrative expenses: ¥9,362,120,697) b) Repayment amount for lease obligations: ¥149,399,986 | |||||||||||||||||
| | | | | | | | | | | | | | | | | | | | | | |
| c) Revenues recorded in relation to self-revenues: ¥3,816,522,320 | ||||||||||||||||||||
| (Revenues from contracted programs: ¥1,231,475,994, Revenues from interest on development projects: ¥15,958,529, Revenues from settlement projects: ¥174,057, | ||||||||||||||||||||
| Transfer amount in accordance with the revenue recognition method based on incurred expenses | Contra-accounts for assets funded by operational grants | 707,101,201 | Revenues from emigration projects: ¥3,552,080, Donation revenues: ¥11,744,374, Revenues from subsidy for facilities: ¥10,446,402, Interest income: ¥43,283,139, Miscellaneous income: ¥2,490,631,392, Gain on sales of non-current assets: ¥9,256,353) d) Acquisition cost of non-current assets: ¥707,101,201 Stored goods: ¥123,396,919, Buildings: ¥295,622,573, Structures: ¥42,009,685, Machinery and equipment: ¥6,091,559, Vehicles ¥98,749,679, Tools, furniture, and fixtures: ¥75,818,242, Construction in progress: ¥11,803,860 Software in progress: ¥47,656,245, Long-term guarantee deposits: ¥5,952,439) | |||||||||||||||||
| | | | | | | | | | | | | | | | | | | | | | |
| e) Amount recorded as long-term guarantee deposits: ¥37,384,644 | ||||||||||||||||||||
| Capital surplus | 37,384,644 | (3) | Estimation basis of transfer amount of operational grants Repayment amount of lease obligations (B) is added to the amount of expenses recorded in the statement of income (A), from which expenditure financed by resources other than operational grants (reserve fund carried over from the previous Mid-term Objective period and funds for grant aid) (C), expenditure to which self-revenues are allocated (D) and depreciation, etc., (E) are deducted. The calculation result is transferred to revenue. | |||||||||||||||||
| | | | | | | | | | | | | | | | | | | | | | |
| Total | 123,087,650,462 | (A) ¥215,733,923,694 + (B) ¥149,399,986–(C) ¥91,404,386,663–(D) ¥1,593,307,774–(E) ¥542,464,626 = ¥122,343,164,617 | ||||||||||||||||||
| | | | | | | | | | | | | | | | | | | | | | |
- 3.
- Details of the balance of operational grant liabilities
(Unit: Yen) | |||||||||||||||||||||
| | | | | | | | | | | | | | | | | | | | | | |
| The year of grant | Balance of operational grant liabilities | Reasons for the accrual of balance and revenue generation plan | ||||||||||||||||||
| | | | | | | | | | | | | | | | | | | | | | |
|
| Balance in relation to operations to which the revenue recognition method based on incurred expenses is applied | 916,024,160 | Reasons for the accrual of balance of operational grant liabilities are as follows: carryover to the next business year due to inevitable reasons, etc. The balance of operational grant liabilities carried forward to the next business year will be transferred to revenue in the next business year. | |||||||||||||||||
| | | | | | | | | | | | | | | | | | | | | | |
| Total | 916,024,160 | |||||||||||||||||||
| | | | | | | | | | | | | | | | | | | | | | |
|
| Balance in relation to operations to which the revenue recognition method based on incurred expenses is applied | 3,426,796,349 | Reasons for the accrual of balance of operational grant liabilities are as follows: carryover to the next business year due to inevitable reasons, etc., and posting as advance payments, etc. The balance of operational grant liabilities carried forward to the next business year will be transferred to revenue in the next business year. Out of the balance of operational grant liabilities, the balance of special operating expenses amounts to ¥219. | |||||||||||||||||
| | | | | | | | | | | | | | | | | | | | | | |
| Total | 3,426,796,349 | |||||||||||||||||||
| | | | | | | | | | | | | | | | | | | | | | |
|
| Balance in relation to operations to which the revenue recognition method based on incurred expenses is applied | 11,346,565,589 | Reasons for the accrual of balance of operational grant liabilities are as follows: carryover to the next business year due to inevitable reasons, etc., and posting as advance payments, prepaid expenses, etc. The balance of operational grant liabilities carried forward to the next business year will be transferred to revenue in the next business year. | |||||||||||||||||
| | | | | | | | | | | | | | | | | | | | | | |
| Total | 11,346,565,589 | |||||||||||||||||||
| | | | | | | | | | | | | | | | | | | | | | |
|
| Balance in relation to operations to which the revenue recognition method based on incurred expenses is applied | 30,948,050,538 | Reasons for the accrual of balance of operational grant liabilities are as follows: carryover to the next business year due to inevitable reasons, etc., and posting as advance payments, prepaid expenses, etc. The balance of operational grant liabilities carried forward to the next business year will be transferred to revenue in the next business year. | |||||||||||||||||
| | | | | | | | | | | | | | | | | | | | | | |
| Total | 30,948,050,538 | |||||||||||||||||||
| | | | | | | | | | | | | | | | | | | | | | |
F-83
(10) Details of facility expenses
| (Unit: Yen) | ||||||||||||||||||||||||||||
| | | | | | | | | | | | | | | | | | | | | | | | | | | | | |
| Breakdown of the accounting treatment mentioned on the left side | Remarks | |||||||||||||||||||||||||||
| | | | | | | | | | | | | | | | | | | | | | | | | | | | | |
| Classification | Amount granted in the current period | Construction in progress facility expenses | Capital surplus | Revenues from subsidy for facilities | ||||||||||||||||||||||||
| | | | | | | | | | | | | | | | | | | | | | | | | | | | | |
| Subsidy for facilities | 250,074,000 | 0 | 239,627,598 | 10,446,402 | ||||||||||||||||||||||||
| | | | | | | | | | | | | | | | | | | | | | | | | | | | | |
| Total | 250,074,000 | 0 | 239,627,598 | 10,446,402 | ||||||||||||||||||||||||
| | | | | | | | | | | | | | | | | | | | | | | | | | | | | |
(11) Details of remunerations and salaries of officers and employees
| (Unit: Thousands of yen, persons) | ||||||||||||||||||||||||
| | | | | | | | | | | | | | | | | | | | | | | | | |
| Remunerations or salaries | Retirement benefits | |||||||||||||||||||||||
| | | | | | | | | | | | | | | | | | | | | | | | | |
| Classification | Payment amount | Number of people | Payment amount | Number of people | ||||||||||||||||||||
| | | | | | | | | | | | | | | | | | | | | | | | | |
| Officers | 170,279 | 12 | 0 | 0 | ||||||||||||||||||||
| | | | | | | | | | | | | | | | | | | | | | | | | |
| Employees | 15,274,953 | 1,889 | 840,316 | 90 | ||||||||||||||||||||
| | | | | | | | | | | | | | | | | | | | | | | | | |
| Total | 15,445,232 | 1,901 | 840,316 | 90 | ||||||||||||||||||||
| | | | | | | | | | | | | | | | | | | | | | | | | |
| (Notes) | 1. | Standard of payment of remunerations and retirement benefits to officers | |||
Remunerations and retirement benefits to officers are paid based on "Rules on Remuneration for Officers" and "Rules on Retirement Benefits for Officers" in place for Incorporated Administrative Agency—Japan International Cooperation Agency. | |||||
2. | Standard of payment of salaries and retirement benefits to employees | ||||
Salaries and retirement benefits to employees are paid based on "Rules on Salaries for Employees" and "Rules on Retirement Benefits for Employees" in place for Incorporated Administrative Agency—Japan International Cooperation Agency. | |||||
3. | Number of people | ||||
As for the number of people to whom remunerations or salaries are paid, the average number of JICA officers and employees during the period is used. | |||||
4. | Others | ||||
There are no part-time officers or employees classified as external members. |
F-84
(12) Segment information to be disclosed
(Unit: Yen) | ||||||||||||||||||||||||||||||||||||||||||||||||||||||||||||||||
| | | | | | | | | | | | | | | | | | | | | | | | | | | | | | | | | | | | | | | | | | | | | | | | | | | | | | | | | | | | | | | | | |
| Classification | (1) Technical cooperation | (2) Grant aid | (3) Citizens' cooperation activities, etc. | (4) Emigration | (5) Disaster relief activities | (6) Personnel training and securing | (7) Research and study | (8) Contracted programs | (9) Other operations | Subtotal | (10) Corporate common expenses, etc. | Total | |||||||||||||||||||||||||||||||||||||||||||||||||||
| | | | | | | | | | | | | | | | | | | | | | | | | | | | | | | | | | | | | | | | | | | | | | | | | | | | | | | | | | | | | | | | | |
| I. Operating expenses, revenues, and profits and losses | |||||||||||||||||||||||||||||||||||||||||||||||||||||||||||||||
| | | | | | | | | | | | | | | | | | | | | | | | | | | | | | | | | | | | | | | | | | | | | | | | | | | | | | | | | | | | | | | | | |
| Operating expenses | 73,432,971,993 | 91,343,273,581 | 16,512,543,070 | 359,652,926 | 784,796,431 | 1,422,250,225 | 16,372,806,036 | 1,231,475,994 | 11,744,374 | 201,471,514,630 | 34,703,977,185 | 236,175,491,815 | |||||||||||||||||||||||||||||||||||||||||||||||||||
| | | | | | | | | | | | | | | | | | | | | | | | | | | | | | | | | | | | | | | | | | | | | | | | | | | | | | | | | | | | | | | | | |
| Outsourcing expenses | 37,394,152,818 | 176,695,188 | 4,342,150,268 | 123,477,480 | 230,620,046 | 0 | 12,618,840,604 | 1,162,106,715 | 9,808,196 | 56,057,851,315 | 0 | 56,057,851,315 | |||||||||||||||||||||||||||||||||||||||||||||||||||
| | | | | | | | | | | | | | | | | | | | | | | | | | | | | | | | | | | | | | | | | | | | | | | | | | | | | | | | | | | | | | | | | |
| Fees paid to experts | 9,822,770,420 | 0 | 7,384,532,148 | 0 | 44,488,851 | 1,372,188,108 | 1,218,502,213 | 0 | 0 | 19,842,481,740 | 10,000,346,830 | 29,842,828,570 | |||||||||||||||||||||||||||||||||||||||||||||||||||
| | | | | | | | | | | | | | | | | | | | | | | | | | | | | | | | | | | | | | | | | | | | | | | | | | | | | | | | | | | | | | | | | |
| Travelling and transportation expenses | 11,379,783,829 | 0 | 1,847,040,727 | 44,365,058 | 239,959,330 | 0 | 0 | 0 | 0 | 13,511,148,944 | 3,540,652,247 | 17,051,801,191 | |||||||||||||||||||||||||||||||||||||||||||||||||||
| | | | | | | | | | | | | | | | | | | | | | | | | | | | | | | | | | | | | | | | | | | | | | | | | | | | | | | | | | | | | | | | | |
| Personnel expenses | 0 | — | — | — | — | — | — | — | — | — | 13,563,147,781 | 13,563,147,781 | |||||||||||||||||||||||||||||||||||||||||||||||||||
| | | | | | | | | | | | | | | | | | | | | | | | | | | | | | | | | | | | | | | | | | | | | | | | | | | | | | | | | | | | | | | | | |
| Expenses for purchasing and sending equipment | 0 | 0 | 0 | 0 | 189,544,658 | 0 | 1,111,027,663 | 0 | 0 | 1,300,572,321 | 0 | 1,300,572,321 | |||||||||||||||||||||||||||||||||||||||||||||||||||
| | | | | | | | | | | | | | | | | | | | | | | | | | | | | | | | | | | | | | | | | | | | | | | | | | | | | | | | | | | | | | | | | |
| Insurance premiums | 0 | 0 | 0 | 0 | 0 | 0 | 0 | 0 | 0 | 0 | 0 | 0 | |||||||||||||||||||||||||||||||||||||||||||||||||||
| | | | | | | | | | | | | | | | | | | | | | | | | | | | | | | | | | | | | | | | | | | | | | | | | | | | | | | | | | | | | | | | | |
| Subsidies | 0 | 0 | 0 | 46,791,327 | 0 | 0 | 0 | 0 | 0 | 46,791,327 | 0 | 46,791,327 | |||||||||||||||||||||||||||||||||||||||||||||||||||
| | | | | | | | | | | | | | | | | | | | | | | | | | | | | | | | | | | | | | | | | | | | | | | | | | | | | | | | | | | | | | | | | |
| Fund provision | 0 | 91,151,663,724 | 0 | 0 | 0 | 0 | 0 | 0 | 0 | 91,151,663,724 | 0 | 91,151,663,724 | |||||||||||||||||||||||||||||||||||||||||||||||||||
| | | | | | | | | | | | | | | | | | | | | | | | | | | | | | | | | | | | | | | | | | | | | | | | | | | | | | | | | | | | | | | | | |
| Other expenses | 14,836,264,926 | 14,914,669 | 2,938,819,927 | 145,019,061 | 80,183,546 | 50,062,117 | 1,424,435,556 | 69,369,279 | 1,936,178 | 19,561,005,259 | 7,599,830,327 | 27,160,835,586 | |||||||||||||||||||||||||||||||||||||||||||||||||||
| | | | | | | | | | | | | | | | | | | | | | | | | | | | | | | | | | | | | | | | | | | | | | | | | | | | | | | | | | | | | | | | | |
| General administrative expenses | — | — | — | — | — | — | — | — | — | — | 9,631,123,059 | 9,631,123,059 | |||||||||||||||||||||||||||||||||||||||||||||||||||
| | | | | | | | | | | | | | | | | | | | | | | | | | | | | | | | | | | | | | | | | | | | | | | | | | | | | | | | | | | | | | | | | |
| Fees paid to experts | — | — | — | — | — | — | — | — | — | — | 1,133,051,151 | 1,133,051,151 | |||||||||||||||||||||||||||||||||||||||||||||||||||
| | | | | | | | | | | | | | | | | | | | | | | | | | | | | | | | | | | | | | | | | | | | | | | | | | | | | | | | | | | | | | | | | |
| Travelling and transportation expenses | — | — | — | — | — | — | — | — | — | — | 526,923,838 | 526,923,838 | |||||||||||||||||||||||||||||||||||||||||||||||||||
| | | | | | | | | | | | | | | | | | | | | | | | | | | | | | | | | | | | | | | | | | | | | | | | | | | | | | | | | | | | | | | | | |
| Personnel expenses | — | — | — | — | — | — | — | — | — | — | 2,722,400,949 | 2,722,400,949 | |||||||||||||||||||||||||||||||||||||||||||||||||||
| | | | | | | | | | | | | | | | | | | | | | | | | | | | | | | | | | | | | | | | | | | | | | | | | | | | | | | | | | | | | | | | | |
| Rents | — | — | — | — | — | — | — | — | — | — | 2,444,076,563 | 2,444,076,563 | |||||||||||||||||||||||||||||||||||||||||||||||||||
| | | | | | | | | | | | | | | | | | | | | | | | | | | | | | | | | | | | | | | | | | | | | | | | | | | | | | | | | | | | | | | | | |
| Other expenses | — | — | — | — | — | — | — | — | — | — | 2,804,670,558 | 2,804,670,558 | |||||||||||||||||||||||||||||||||||||||||||||||||||
| | | | | | | | | | | | | | | | | | | | | | | | | | | | | | | | | | | | | | | | | | | | | | | | | | | | | | | | | | | | | | | | | |
| Depreciation | — | — | — | — | — | — | — | — | — | — | 454,820,354 | 454,820,354 | |||||||||||||||||||||||||||||||||||||||||||||||||||
| | | | | | | | | | | | | | | | | | | | | | | | | | | | | | | | | | | | | | | | | | | | | | | | | | | | | | | | | | | | | | | | | |
| Loan losses | 0 | 0 | 0 | 0 | 0 | 0 | 0 | 0 | 32,185,656 | 32,185,656 | 0 | 32,185,656 | |||||||||||||||||||||||||||||||||||||||||||||||||||
| | | | | | | | | | | | | | | | | | | | | | | | | | | | | | | | | | | | | | | | | | | | | | | | | | | | | | | | | | | | | | | | | |
| Financial expenses | — | — | — | — | — | — | — | — | — | — | 324,482,111 | 324,482,111 | |||||||||||||||||||||||||||||||||||||||||||||||||||
| | | | | | | | | | | | | | | | | | | | | | | | | | | | | | | | | | | | | | | | | | | | | | | | | | | | | | | | | | | | | | | | | |
| Miscellaneous loss | 0 | 0 | 0 | 0 | 0 | 0 | 0 | 0 | 0 | 0 | 556,813 | 556,813 | |||||||||||||||||||||||||||||||||||||||||||||||||||
| | | | | | | | | | | | | | | | | | | | | | | | | | | | | | | | | | | | | | | | | | | | | | | | | | | | | | | | | | | | | | | | | |
| Total | 73,432,971,993 | 91,343,273,581 | 16,512,543,070 | 359,652,926 | 784,796,431 | 1,422,250,225 | 16,372,806,036 | 1,231,475,994 | 43,930,030 | 201,503,700,286 | 45,114,959,522 | 246,618,659,808 | |||||||||||||||||||||||||||||||||||||||||||||||||||
| | | | | | | | | | | | | | | | | | | | | | | | | | | | | | | | | | | | | | | | | | | | | | | | | | | | | | | | | | | | | | | | | |
| Operating revenues | |||||||||||||||||||||||||||||||||||||||||||||||||||||||||||||||
| | | | | | | | | | | | | | | | | | | | | | | | | | | | | | | | | | | | | | | | | | | | | | | | | | | | | | | | | | | | | | | | | |
| Revenues from operational grants | 72,880,208,870 | 191,609,857 | 16,501,156,543 | 359,652,926 | 712,956,985 | 1,412,152,751 | 16,372,806,036 | 0 | 0 | 108,430,543,968 | 44,440,132,183 | 152,870,676,151 | |||||||||||||||||||||||||||||||||||||||||||||||||||
| | | | | | | | | | | | | | | | | | | | | | | | | | | | | | | | | | | | | | | | | | | | | | | | | | | | | | | | | | | | | | | | | |
| Revenues from grant aid | 0 | 91,151,663,724 | 0 | 0 | 0 | 0 | 0 | 0 | 0 | 91,151,663,724 | 0 | 91,151,663,724 | |||||||||||||||||||||||||||||||||||||||||||||||||||
| | | | | | | | | | | | | | | | | | | | | | | | | | | | | | | | | | | | | | | | | | | | | | | | | | | | | | | | | | | | | | | | | |
| Revenues from contracted programs | 0 | 0 | 0 | 0 | 0 | 0 | 0 | 1,231,475,994 | 0 | 1,231,475,994 | 0 | 1,231,475,994 | |||||||||||||||||||||||||||||||||||||||||||||||||||
| | | | | | | | | | | | | | | | | | | | | | | | | | | | | | | | | | | | | | | | | | | | | | | | | | | | | | | | | | | | | | | | | |
| Revenues from interest on development projects | 0 | 0 | 3,348,408 | 0 | 0 | 0 | 0 | 0 | 0 | 3,348,408 | 12,610,121 | 15,958,529 | |||||||||||||||||||||||||||||||||||||||||||||||||||
| | | | | | | | | | | | | | | | | | | | | | | | | | | | | | | | | | | | | | | | | | | | | | | | | | | | | | | | | | | | | | | | | |
| Revenues from settlement projects | 0 | 0 | 0 | 0 | 0 | 0 | 0 | 0 | 0 | 0 | 174,057 | 174,057 | |||||||||||||||||||||||||||||||||||||||||||||||||||
| | | | | | | | | | | | | | | | | | | | | | | | | | | | | | | | | | | | | | | | | | | | | | | | | | | | | | | | | | | | | | | | | |
| Revenues from emigration projects | 0 | 0 | 0 | 0 | 0 | 0 | 0 | 0 | 0 | 0 | 3,552,080 | 3,552,080 | |||||||||||||||||||||||||||||||||||||||||||||||||||
| | | | | | | | | | | | | | | | | | | | | | | | | | | | | | | | | | | | | | | | | | | | | | | | | | | | | | | | | | | | | | | | | |
| Donation revenues | 0 | 0 | 0 | 0 | 0 | 0 | 0 | 0 | 11,744,374 | 11,744,374 | 0 | 11,744,374 | |||||||||||||||||||||||||||||||||||||||||||||||||||
| | | | | | | | | | | | | | | | | | | | | | | | | | | | | | | | | | | | | | | | | | | | | | | | | | | | | | | | | | | | | | | | | |
| Revenues from subsidy for facilities | — | — | — | — | — | — | — | — | — | — | 10,446,402 | 10,446,402 | |||||||||||||||||||||||||||||||||||||||||||||||||||
| | | | | | | | | | | | | | | | | | | | | | | | | | | | | | | | | | | | | | | | | | | | | | | | | | | | | | | | | | | | | | | | | |
| Reversal of allowance for loan losses | 0 | 0 | 0 | 0 | 0 | 0 | 0 | 0 | 61,604,856 | 61,604,856 | 0 | 61,604,856 | |||||||||||||||||||||||||||||||||||||||||||||||||||
| | | | | | | | | | | | | | | | | | | | | | | | | | | | | | | | | | | | | | | | | | | | | | | | | | | | | | | | | | | | | | | | | |
| Reversal of contra-accounts for assets funded by operational grants | 0 | 0 | 0 | 0 | 71,839,446 | 0 | 0 | 0 | 0 | 71,839,446 | 289,164,028 | 361,003,474 | |||||||||||||||||||||||||||||||||||||||||||||||||||
| | | | | | | | | | | | | | | | | | | | | | | | | | | | | | | | | | | | | | | | | | | | | | | | | | | | | | | | | | | | | | | | | |
| Financial revenues | — | — | — | — | — | — | — | — | — | — | 43,283,139 | 43,283,139 | |||||||||||||||||||||||||||||||||||||||||||||||||||
| | | | | | | | | | | | | | | | | | | | | | | | | | | | | | | | | | | | | | | | | | | | | | | | | | | | | | | | | | | | | | | | | |
| Miscellaneous income | 306,823,215 | 0 | 8,038,119 | 0 | 0 | 0 | 0 | 0 | 0 | 314,861,334 | 2,175,770,058 | 2,490,631,392 | |||||||||||||||||||||||||||||||||||||||||||||||||||
| | | | | | | | | | | | | | | | | | | | | | | | | | | | | | | | | | | | | | | | | | | | | | | | | | | | | | | | | | | | | | | | | |
| Total | 73,187,032,085 | 91,343,273,581 | 16,512,543,070 | 359,652,926 | 784,796,431 | 1,412,152,751 | 16,372,806,036 | 1,231,475,994 | 73,349,230 | 201,277,082,104 | 46,975,132,068 | 248,252,214,172 | |||||||||||||||||||||||||||||||||||||||||||||||||||
| | | | | | | | | | | | | | | | | | | | | | | | | | | | | | | | | | | | | | | | | | | | | | | | | | | | | | | | | | | | | | | | | |
| Operating income and loss | (245,939,908 | ) | 0 | 0 | 0 | 0 | (10,097,474 | ) | 0 | 0 | 29,419,200 | (226,618,182 | ) | 1,860,172,546 | 1,633,554,364 | ||||||||||||||||||||||||||||||||||||||||||||||||
| | | | | | | | | | | | | | | | | | | | | | | | | | | | | | | | | | | | | | | | | | | | | | | | | | | | | | | | | | | | | | | | | |
| II. Total assets | |||||||||||||||||||||||||||||||||||||||||||||||||||||||||||||||
| | | | | | | | | | | | | | | | | | | | | | | | | | | | | | | | | | | | | | | | | | | | | | | | | | | | | | | | | | | | | | | | | |
| Cash and deposits | 0 | 47,843,000,577 | 0 | 0 | 0 | 0 | 0 | 17,935,442 | 2,943,826,671 | 50,804,762,690 | 46,809,888,947 | 97,614,651,637 | |||||||||||||||||||||||||||||||||||||||||||||||||||
| | | | | | | | | | | | | | | | | | | | | | | | | | | | | | | | | | | | | | | | | | | | | | | | | | | | | | | | | | | | | | | | | |
| Securities | 0 | 84,000,000,000 | 0 | 0 | 0 | 0 | 0 | 0 | 0 | 84,000,000,000 | 0 | 84,000,000,000 | |||||||||||||||||||||||||||||||||||||||||||||||||||
| | | | | | | | | | | | | | | | | | | | | | | | | | | | | | | | | | | | | | | | | | | | | | | | | | | | | | | | | | | | | | | | | |
| Advance payments | 18,651,477,654 | 30,353,000 | 243,391,573 | 0 | 0 | 0 | 4,182,300,181 | 0 | 0 | 23,107,522,408 | 254,101,838 | 23,361,624,246 | |||||||||||||||||||||||||||||||||||||||||||||||||||
| | | | | | | | | | | | | | | | | | | | | | | | | | | | | | | | | | | | | | | | | | | | | | | | | | | | | | | | | | | | | | | | | |
| Buildings | — | — | — | — | — | — | — | — | — | — | 24,658,380,730 | 24,658,380,730 | |||||||||||||||||||||||||||||||||||||||||||||||||||
| | | | | | | | | | | | | | | | | | | | | | | | | | | | | | | | | | | | | | | | | | | | | | | | | | | | | | | | | | | | | | | | | |
| Land | — | — | — | — | — | — | — | — | — | — | 14,735,916,546 | 14,735,916,546 | |||||||||||||||||||||||||||||||||||||||||||||||||||
| | | | | | | | | | | | | | | | | | | | | | | | | | | | | | | | | | | | | | | | | | | | | | | | | | | | | | | | | | | | | | | | | |
| Other assets | 63,799,327 | 47,719 | 30,294,451 | 0 | 410,808,865 | 0 | 3,824,285 | 4,155,518 | 748,767,884 | 1,261,698,049 | 6,380,224,051 | 7,641,922,100 | |||||||||||||||||||||||||||||||||||||||||||||||||||
| | | | | | | | | | | | | | | | | | | | | | | | | | | | | | | | | | | | | | | | | | | | | | | | | | | | | | | | | | | | | | | | | |
| Total | 18,715,276,981 | 131,873,401,296 | 273,686,024 | 0 | 410,808,865 | 0 | 4,186,124,466 | 22,090,960 | 3,692,594,555 | 159,173,983,147 | 92,838,512,112 | 252,012,495,259 | |||||||||||||||||||||||||||||||||||||||||||||||||||
| | | | | | | | | | | | | | | | | | | | | | | | | | | | | | | | | | | | | | | | | | | | | | | | | | | | | | | | | | | | | | | | | |
- (Notes)
- 1. Segment classification and main descriptions
Operations are classified into eight segments in accordance with descriptions of the Mid-term Plan based on operations specified in Article 13 of the Act of the Incorporated Administrative Agency—Japan International Cooperation Agency.
Operations in relation to donations and operations in relation to management and collection of loans for development projects and other claims as well as operations prescribed in Article 13 are organized as other operations.
- 1)
- Operations in relation to technical cooperation
- 2)
- Operations in relation to grant aid
- 3)
- Operations in relation to citizens' cooperation activities, etc.
- 4)
- Operations in relation to emigration projects
F-85
- 5)
- Operations in relation to disaster relief activities
- 6)
- Operations in relation to personnel training and securing
- 7)
- Operations in relation to research and study
- 8)
- Operations in relation to contracted programs
- 2.
- Disclosure of operating expenses
- (1)
- Operating expenses in the statement of income are shown as operating expenses according to natural expense classification. Items that account for less than 5% of the total amount allocated to each segment are included in other expenses.
The relationship between operating expenses in this list and operating expenses in the statement of income is as follows:
- 1)
- Technical cooperation: amount of expenses for technical cooperation projects
- 2)
- Grant aid: amount of expenses for grant aid (operation support) and expenses for grant aid
- 3)
- Citizens' cooperation activities, etc.: amount of expenses for public participation-based cooperation
- 4)
- Emigration: amount of expenses for emigration projects
- 5)
- Disaster relief activities: amount of expenses for disaster relief activities
- 6)
- Personnel training and securing: amount of expenses for training and securing the personnel
- 7)
- Research and study: amount of expenses for assistance promotion * The amount includes expenses for surveys, such as cooperation preparation surveys
- 8)
- Contracted programs: amount of expenses for contracted programs
- 9)
- Other operations: amount of expenses for donation projects
- 10)
- Corporate common expenses, etc.: amounts of expenses related to operation, expenses for operation support, and facility expenses
- (2)
- Personnel expenses and rents, which accrue in relation to expenses related to operation and expenses for operation support that have been classified as corporate common expenses, etc., cannot be allocated to each segment due to the following reasons:
- 1)
- Personnel expenses: employees are in charge of several operations and their involvement in each operation is not uniform
- 2)
- Rents: a wide variety of buildings are included in target property and they are used for multiple operations
- 3.
- Disclosure of total assets
Assets are shown in account items of the balance sheet. Items that account for less than 5% of total assets are included in other assets.
- 4.
- Costs that are not reported as expenses in the statement of income and that should be disclosed are as follows, and they are classified as corporate common expenses, etc.
- (1)
- Accumulated depreciation not included in expenses amounts to ¥1,316,411,162.
- (2)
- Accumulated disposal and sale differential not included in expenses amounts to a loss of ¥76,476,608.
- (3)
- Estimated bonus payments not included in provision amounts to ¥90,095,805.
- (4)
- Estimated increase in retirement benefits not included in provision amounts to a loss of ¥12,604,721,620.
- 5.
- Partial operating expenses and general administrative expenses are financed by operational grants and reserve fund carried over from the previous Mid-term Objective period, which amount to ¥252,722,939, and the classifications and amounts are as follows:
- (1)
- Technical cooperation: ¥245,939,908; (10) Corporate common expenses, etc.: ¥6,783,031
- 6.
- Because operating expenses for (1) Technical cooperation and (3) Citizens' cooperation activities, etc., are financed by operational grants and revenues from operations, equivalent amounts are shown as miscellaneous income in operating revenues.
- 7.
- "—" is shown in the columns of amounts of items that have been organized only as corporate common expenses, etc., because they cannot be allocated to individual segments.
F-86
(13) Details of Grant-in-Aid for Scientific Research
| (Unit: Yen) | ||||||||||||||||
| | | | | | | | | | | | | | | | | |
| Classification | Amount granted in the current period | Number of the projects | Remarks | |||||||||||||
| | | | | | | | | | | | | | | | | |
| Grant-in-Aid for Challenging Exploratory Research A | (848,643) | |||||||||||||||
| 210,000 | 1 | |||||||||||||||
| | | | | | | | | | | | | | | | | |
| Grant-in-Aid for Challenging Exploratory Research B | (1,600,000) | Japan Society for the Promotion of Science | ||||||||||||||
| 480,000 | 1 | Grant-in-Aid for Scientific Research | ||||||||||||||
| | | | | | | | | | | | | | | | | |
| Grant-in-Aid for Challenging Exploratory Research C | (1,500,000) | |||||||||||||||
| 450,000 | 1 | |||||||||||||||
| | | | | | | | | | | | | | | | | |
| Total | (3,948,643) 1,140,000 | 3 | ||||||||||||||
| | | | | | | | | | | | | | | | | |
- (Note)
- Amount granted in the current period indicate the amount equivalent to indirect expenses. The amount equivalent to direct expenses are indicated in parentheses.
(14) Details of main assets and liabilities other than those mentioned above
- 1.
- Cash and deposits
| (Unit: Yen) | ||||||||||||
| | | | | | | | | | | | | |
| Classification | Amount | Remarks | ||||||||||
| | | | | | | | | | | | | |
| Cash | 3,004,247 | |||||||||||
Cash in foreign currency | 21,391,544 | |||||||||||
Deposit accounts | 88,636,853,236 | |||||||||||
Checking accounts | 3,034 | |||||||||||
Checking accounts in foreign currency | 2,953,399,576 | |||||||||||
Time deposits | 6,000,000,000 | |||||||||||
| | | | | | | | | | | | | |
| Total | 97,614,651,637 | |||||||||||
| | | | | | | | | | | | | |
- 2.
- Advance payments
| (Unit: Yen) | ||||||||||||||||
| | | | | | | | | | | | | | | | | |
| Classification | Amount | Counterparty | Remarks | |||||||||||||
| | | | | | | | | | | | | | | | | |
| Operating expenses | 23,361,151,649 | NIPPON KOEI CO., LTD.,etc | ||||||||||||||
General administrative expenses | 472,597 | Individual | ||||||||||||||
| | | | | | | | | | | | | | | | | |
| Total | 23,361,624,246 | |||||||||||||||
| | | | | | | | | | | | | | | | | |
F-87
- 3.
- Funds for grant aid
| (Unit: Yen) | ||||||||||||||||
| | | | | | | | | | | | | | | | | |
| Classification | Amount | Counterparty | Remarks | |||||||||||||
| | | | | | | | | | | | | | | | | |
| Funds for grant aid | 130,378,380,429 | Republic of the Union of Myanmar, etc. | ||||||||||||||
| | | | | | | | | | | | | | | | | |
| Total | 130,378,380,429 | |||||||||||||||
| | | | | | | | | | | | | | | | | |
- 4.
- Accounts payable
| (Unit: Yen) | ||||||||||||||||
| | | | | | | | | | | | | | | | | |
| Classification | Amount | Counterparty | Remarks | |||||||||||||
| | | | | | | | | | | | | | | | | |
| Operating expenses | 15,143,026,405 | NIPPON KOEI CO., LTD., etc. | ||||||||||||||
General administrative expenses | 1,280,235,945 | NTT Communications Co., Ltd., etc. | ||||||||||||||
Expenses for contracted programs | 195,201,349 | Yachiyo Engineering Co., Ltd., etc. | ||||||||||||||
Expenses for grant aid | 1,464,667,867 | Republic of the Union of Myanmar, etc. | ||||||||||||||
Expenses for donation projects | 64,775 | Sonorite Co., Ltd., etc. | ||||||||||||||
Others | 166,631,272 | Mutual Aid Association of JICA, etc. | ||||||||||||||
| | | | | | | | | | | | | | | | | |
| Total | 18,249,827,613 | |||||||||||||||
| | | | | | | | | | | | | | | | | |
F-88
(15) Details of affiliated companies and relevant public interest corporations
| | | | | | | | | | | | | | | | | |
| Corporation type and name | (Relevant public interest corporations, etc.) | (Relevant public interest corporations, etc.) | ||||||||||||||
| | | | | | | | | | | | | | | | | |
| Items | Japan Overseas Cooperative Association | The Association of Nikkei & Japanese Abroad | ||||||||||||||
| | | | | | | | | | | | | | | | | |
| Outline of operations | (1) International cooperative activities in developing countries and activities pertaining to the promotion, promulgation, and edification of international exchange and global understanding. (2) Assistance for postdisaster restoration and peace-building activities. (3) Activities pertaining to cooperation and collaboration with international and domestic support agencies, international cooperation associations, and other institutions. (4) Activities pertaining to support for the development of a multicultural symbiotic society and vitalization and internationalization of societies. (5) Activities to support integrated community building and human resource development involving various sectors for the purpose of regional revitalization in cooperation in local communities. (1) Planning, support on coordination and implementation of project for the purpose of integrated community building including various sectors such as education, welfare service and industrial promotion (2) Category II social welfare services prescribed in article 2 of the Social Welfare Act (a) Based on Child Welfare Act: — day care services for handicapped children — consultation services for handicapped children — after-school child sound upbringing services — regional base services of the child care support — nursery center management services (b) Based on act on Social Welfare for the Elderly — senior in-home care services — senior day-services (c) Based on act to comprehensively support daily and social lives of persons with disabilities — welfare services for persons with disabilities — consultation support services — services to support regional life — management of community activity support centers (3) Human resource development and training (6) Other activities necessary to achieve the objectives of the Association. | (1) Support and promulgation of economic, cultural, educational, and social activities in cooperation with overseas and domestic Japan-related organizations or by itself. (2) Cooperation pertaining to carrying out of international cooperative activities and international exchange activities. (3) Collaboration with municipalities and international exchange associations (4) Promulgation both at home and abroad of research outcomes and knowledge regarding activities pertaining international cooperation and international exchange endeavors (5) Provision of information and collaboration regarding migration and overseas expansion of businesses (6) Establishment and operation of centers for Japanese abroad (7) Consultations and intermediation for and regarding Japanese abroad (8) Publicity of and edification regarding situations in Japan (9) Organizing of the convention of Nikkei and Japanese abroad (10) Edification regarding investment from overseas, investment overseas, and businesses (11) Other activities necessary for the fulfillment of public good | ||||||||||||||
| | | | | | | | | | | | | | | | | |
| Name of officers | Number of officers: 27 President: YoshimasaTominaga | Number of officers: 16 President: Keiji Yamada | ||||||||||||||
| | | | | | | | | | | | | | | | | |
| Association chart on transactions between relevant public interest corporations and JICA | ||||||||||||||||
| | | | | | | | | | | | | | | | | |
| Assets | 1,288,962,154 yen | 212,369,769 yen | ||||||||||||||
| | | | | | | | | | | | | | | | | |
| Liabilities | 383,938,347 yen | 153,000,087 yen | ||||||||||||||
| | | | | | | | | | | | | | | | | |
| Balance of net assets at the beginning of the business year | 1,105,139,136 yen | 45,733,736 yen | ||||||||||||||
| | | | | | | | | | | | | | | | | |
| Changes in net assets for the current period | ||||||||||||||||
| | | | | | | | | | | | | | | | | |
Changes in general net assets | ||||||||||||||||
o Revenues | o Revenues | o Revenues | ||||||||||||||
—Subsidy received, etc. | —Subsidy received, etc. | 0 yen | —Subsidy received, etc. | 0 yen | ||||||||||||
—Other revenues | —Other revenues | 2,740,091,113 yen | —Other revenues | 431,222,056 yen | ||||||||||||
o Expenses | o Expenses | 2,943,312,453 yen | o Expenses | 417,586,110 yen | ||||||||||||
| | | | | | | | | | | | | | | | | |
Changes in specified net assets | ||||||||||||||||
o Revenues | o Revenues | o Revenues | ||||||||||||||
—Subsidy received, etc. | —Subsidy received, etc. | 0 yen | —Subsidy received, etc. | 0 yen | ||||||||||||
—Other revenues | —Other revenues | 3,106,011 yen | —Other revenues | 0 yen | ||||||||||||
o Expenses | o Expenses | 0 yen | o Expenses | 0 yen | ||||||||||||
| | | | | | | | | | | | | | | | | |
| Balance of net assets at the end of the business year | 905,023,807 yen | 59,369,682 yen | ||||||||||||||
| | | | | | | | | | | | | | | | | |
| Total revenues for the current period | — | 429,333,125 yen | ||||||||||||||
| | | | | | | | | | | | | | | | | |
| Total expenditures for the current period | — | 417,561,207 yen | ||||||||||||||
| | | | | | | | | | | | | | | | | |
| Amount of difference between revenues and expenditures for the current period | — | 11,771,918 yen | ||||||||||||||
| | | | | | | | | | | | | | | | | |
| Details of contributions and donations to basic funds of relevant public interest corporations, etc. Details of membership expenses and burden charges to be borne in order to be allocated to management expenses, operating expenses, etc. | N/A | N/A | ||||||||||||||
| | | | | | | | | | | | | | | | | |
| Details of receivables and payables to relevant public interest corporations | Accounts payable: ¥281,280,644, Accounts receivable: ¥126,546 | Accounts payable: ¥30,496,035 | ||||||||||||||
| | | | | | | | | | | | | | | | | |
| Details of debt guarantee | N/A | N/A | ||||||||||||||
| | | | | | | | | | | | | | | | | |
| Amounts and ratios in relation to operating revenues, order placement by JICA, etc. (amounts and ratios of competitive contracts, planning competitions and public selections, and noncompetitive negotiated contracts) | Total operating revenues: (Breakdown: JICA transactions, Competitive contract Planning competition and public selection Noncompetitive negotiated contracts | 2,284,284,621 yen 1,500,994,132 yen 65.7%) (1,015,829,909 yen 67.7%) (52,563,012 yen 3.5%) (10,800,000 yen 0.7%) | Total operating revenues: (Breakdown: JICA transactions, Competitive contract Planning competition and public selection Noncompetitive negotiated contracts | 418,234,835 yen 192,985,953 yen 46.1%) (102,859,793 yen 53.3%) (35,048,029 yen 18.2%) (52,028,965 yen 27.0%) | ||||||||||||
| | | | | | | | | | | | | | | | | |
(Note) Pursuant to "Concerning the revision of the accounting standards for public-interest corporations (agreement from the liaison council of relevant agencies guidance, supervision, etc., of public-interest corporations, etc., of October 14, 2004) ("Accounting Standards for Public-interest Corporations" hereinafter)," the entity is not legally required to create a statement of revenues and expenses; hence, such a statement is not prepared. | ||||||||||||||||
F-89
| | | | | | | | | | | | | | | | | |
| Corporation type and name | (Relevant public interest corporations, etc.) | (Relevant public interest corporations, etc.) | ||||||||||||||
| | | | | | | | | | | | | | | | | |
| Items | Kitakyushu International Techno-Cooperative Association | Japan International Medical Technology Foundation | ||||||||||||||
| | | | | | | | | | | | | | | | | |
| Outline of operations | (1) Development of necessary research studies and educational curriculums, creation and undertaking of training programs, dispatch of experts, and transfer of technologies overseas (2) Planning and undertaking of activities to promote international goodwill (3) Planning and undertaking of other activities for the purpose of fulfilling the aims of this association | (1) Training of experts from overseas in medical technology (2) Overseas dispatch of Japanese experts in medical technology and related areas (3) International cooperation with medical care-related organizations in Japan and overseas (4) Research and promotion of medical technologies in Japan and overseas (5) Disaster medical care (6) Other activities necessary to achieve the objective of the association | ||||||||||||||
| | | | | | | | | | | | | | | | | |
| Name of officers | Number of officers: 12 President: Hideki Furuno | Number of officers: 15 Representative Director: Shigeki Hayashi | ||||||||||||||
| | | | | | | | | | | | | | | | | |
| Association chart on transactions between relevant public interest corporations and JICA |  |  | ||||||||||||||
| | | | | | | | | | | | | | | | | |
| Assets | 627,230,047 yen | 356,238,902 yen | ||||||||||||||
| | | | | | | | | | | | | | | | | |
| Liabilities | 21,656,726 yen | 21,143,163 yen | ||||||||||||||
| | | | | | | | | | | | | | | | | |
| Balance of net assets at the beginning of the business year | 612,266,204 yen | 245,138,612 yen | ||||||||||||||
| | | | | | | | | | | | | | | | | |
| Changes in net assets for the current period | ||||||||||||||||
| | | | | | | | | | | | | | | | | |
Changes in general net assets | ||||||||||||||||
o Revenues | o Revenues | o Revenues | ||||||||||||||
—Subsidy received, etc. | —Subsidy received, etc. | 32,750,000 yen | —Subsidy received, etc. | 0 yen | ||||||||||||
—Other revenues | —Other revenues | 192,081,360 yen | —Other revenues | 149,715,891 yen | ||||||||||||
o Expenses | o Expenses | 375,524,243 yen | o Expenses | 58,633,996 yen | ||||||||||||
| | | | | | | | | | | | | | | | | |
Changes in specified net assets | ||||||||||||||||
o Revenues | o Revenues | o Revenues | ||||||||||||||
—Subsidy received, etc. | —Subsidy received, etc. | 0 yen | —Subsidy received, etc. | 0 yen | ||||||||||||
—Other revenues | —Other revenues | 144,000,000 yen | —Other revenues | 5,352,333 yen | ||||||||||||
o Expenses | o Expenses | 0 yen | o Expenses | 6,477,101 yen | ||||||||||||
| | | | | | | | | | | | | | | | | |
| Balance of net assets at the end of the business year | 605,573,321 yen | 335,095,739 yen | ||||||||||||||
| | | | | | | | | | | | | | | | | |
| Total revenues for the current period | 431,229,862 yen | — | ||||||||||||||
| | | | | | | | | | | | | | | | | |
| Total expenditures for the current period | 429,231,853 yen | — | ||||||||||||||
| | | | | | | | | | | | | | | | | |
| Amount of difference between revenues and expenditures for the current period | 1,998,009 yen | — | ||||||||||||||
| | | | | | | | | | | | | | | | | |
| Details of contributions and donations to basic funds of relevant public interest corporations, etc. Details of membership expenses and burden charges to be borne in order to be allocated to management expenses, operating expenses, etc. | N/A | N/A | ||||||||||||||
| | | | | | | | | | | | | | | | | |
| Details of receivables and payables to relevant public interest corporations | Accounts payable: ¥13,962,329 | N/A | ||||||||||||||
| | | | | | | | | | | | | | | | | |
| Details of debt guarantee | N/A | N/A | ||||||||||||||
| | | | | | | | | | | | | | | | | |
| Amounts and ratios in relation to operating revenues, order placement by JICA, etc. (amounts and ratios of competitive contracts, planning competitions and public selections, and noncompetitive negotiated contracts) | Total operating revenues: (Breakdown: JICA transactions, Competitive contract Planning competition and public selection Noncompetitive negotiated contracts | 186,985,837 yen 163,486,855 yen 87.4%) (0 yen 0.0%) 163,486,855 yen 100.0%) (0 yen 0.0%) | Total operating revenues: (Breakdown: JICA transactions, Competitive contract Planning competition and public selection Noncompetitive negotiated contracts | 2,775,120 yen 0 yen 0.0%) (0 yen 0.0%) (0 yen 0.0%) (0 yen 0.0%) | ||||||||||||
| | | | | | | | | | | | | | | | | |
(Note 1) The above amount pertains to the period from April 1, 2014, through March 31, 2015. | ||||||||||||||||
(Note 2) The entity is not legally required to create a statement of revenues and expenses pursuant to the "Accounting Standards for Public-interest Corporations"; hence, such a statement is not prepared. | ||||||||||||||||
F-90
| | | | | | | | | | | | | | | | | |
| Corporation type and name | (Relevant public interest corporations, etc.) | (Relevant public interest corporations, etc.) | ||||||||||||||
| | | | | | | | | | | | | | | | | |
| Items | The International Nursing Foundation of Japan | International Civil and Commercial Law Centre Foundation | ||||||||||||||
| | | | | | | | | | | | | | | | | |
| Outline of operations | (1) Organizing lectures and seminars (2) Providing scholarships to graduate students who engage in international nursing studies (3) Undertaking of technological cooperation for developing nations, etc. (4) Other activities necessary for the purpose of fulfilling the aims of this foundation | (1) Carrying out of training of personnel handling civil and commercial law chiefly in Asia and support (2) Invitation and dispatch, both from and to Japan, of researchers and experts on civil and commercial law and support (3) Organizing and support of lectures, study sessions, symposiums, seminars and other meetings for the purpose of research, study, training, and information exchange on civil and commercial law both in Japan and abroad (4) Gathering of information and material on civil and commercial law both in Japan abroad and conducting and support of such research and study (5) Publication of journals and other documents and distribution (6) Collaboration and cooperation with related institutes and organizations both in Japan and abroad (7) Other activities necessary to fulfill the aims | ||||||||||||||
| | | | | | | | | | | | | | | | | |
| Name of officers | Number of officers: 7 President: Kayoko Shimizu | Number of officers: 9 Representative director and chairman: Kenji Miyahara | ||||||||||||||
| | | | | | | | | | | | | | | | | |
| Association chart on transactions between relevant public interest corporations and JICA |  |  | ||||||||||||||
| | | | | | | | | | | | | | | | | |
| Assets | 99,319,758 yen | 87,628,904 yen | ||||||||||||||
| | | | | | | | | | | | | | | | | |
| Liabilities | 1,161,587 yen | 1,775,205 yen | ||||||||||||||
| | | | | | | | | | | | | | | | | |
| Balance of net assets at the beginning of the business year | 133,136,865 yen | 82,864,074 yen | ||||||||||||||
| | | | | | | | | | | | | | | | | |
| Changes in net assets for the current period | ||||||||||||||||
| | | | | | | | | | | | | | | | | |
Changes in general net assets | ||||||||||||||||
o Revenues | o Revenues | o Revenues | ||||||||||||||
—Subsidy received, etc. | —Subsidy received, etc. | 1,800,000 yen | —Subsidy received, etc. | 0 yen | ||||||||||||
—Other revenues | —Other revenues | 73,310,596 yen | —Other revenues | 95,489,609 yen | ||||||||||||
o Expenses | o Expenses | 81,431,056 yen | o Expenses | 94,999,984 yen | ||||||||||||
| | | | | | | | | | | | | | | | | |
Changes in specified net assets | ||||||||||||||||
o Revenues | o Revenues | o Revenues | ||||||||||||||
—Subsidy received, etc. | —Subsidy received, etc. | 0 yen | —Subsidy received, etc. | 0 yen | ||||||||||||
—Other revenues | —Other revenues | 0 yen | —Other revenues | 2,500,000 yen | ||||||||||||
o Expenses | o Expenses | 28,658,234 yen | o Expenses | 0 yen | ||||||||||||
| | | | | | | | | | | | | | | | | |
| Balance of net assets at the end of the business year | 98,158,171 yen | 85,853,699 yen | ||||||||||||||
| | | | | | | | | | | | | | | | | |
| Total revenues for the current period | — | — | ||||||||||||||
| | | | | | | | | | | | | | | | | |
| Total expenditures for the current period | — | — | ||||||||||||||
| | | | | | | | | | | | | | | | | |
| Amount of difference between revenues and expenditures for the current period | — | — | ||||||||||||||
| | | | | | | | | | | | | | | | | |
| Details of contributions and donations to basic funds of relevant public interest corporations, etc. Details of membership expenses and burden charges to be borne in order to be allocated to management expenses, operating expenses, etc. | N/A | N/A | ||||||||||||||
| | | | | | | | | | | | | | | | | |
| Details of receivables and payables to relevant public interest corporations | N/A | Accounts payable: ¥27,096,711 | ||||||||||||||
| | | | | | | | | | | | | | | | | |
| Details of debt guarantee | N/A | N/A | ||||||||||||||
| | | | | | | | | | | | | | | | | |
| Amounts and ratios in relation to operating revenues, order placement by JICA, etc. (amounts and ratios of competitive contracts, planning competitions and public selections, and noncompetitive negotiated contracts) | Total operating revenues: (Breakdown: JICA transactions, Competitive contract Planning competition and public selection Noncompetitive negotiated contracts | 34,725,133 yen 24,803,700 yen 71.4%) (0 yen 0.0 %) (24,803,700 yen 100.0%) (0 yen 0.0%) | Total operating revenues: (Breakdown: JICA transactions, Competitive contract Planning competition and public selection Noncompetitive negotiated contracts | 74,718,145 yen 74,718,145 yen 100.0%) (74,718,145 yen 100.0%) (0 yen 0.0%) (0 yen 0.0%) | ||||||||||||
| | | | | | | | | | | | | | | | | |
(Note) The entity is not legally required to create a statement of revenues and expenses pursuant to the "Accounting Standards for Public-interest Corporations"; hence, such a statement is not prepared. | (Note) The entity is not legally required to create a statement of revenues and expenses pursuant to the "Accounting Standards for Public-interest Corporations"; hence, such a statement is not prepared. | |||||||||||||||
F-91
| | | | | | | | | | | | | | | | | |
| Corporation type and name | (Relevant public interest corporations, etc.) | (Relevant public interest corporations, etc.) | ||||||||||||||
| | | | | | | | | | | | | | | | | |
| Items | Pacific Resource Exchange Center | i-i-network (Research and Action for Community Governance) | ||||||||||||||
| | | | | | | | | | | | | | | | | |
| Outline of operations | (1) Fostering human resources to contribute mainly to the growth of developing countries, etc. (2) Economic, cultural, and personal exchange activities mainly with developing countries, etc. (3) Cultivating human resources tasked with economic, cultural, and personal exchange activities mainly with developing countries. (4) Gathering information and research/study related to economic cooperation (5) Public awareness and publicity concerning the aforementioned activities (6) Other activities necessary for the achievement of objectives of this corporate body | (1) Activities to promote sharing of experiences regarding community-based development (2) Education and training, providing of information regarding international cooperation, and community-based development (3) Support for community-based development in Japan and around the world (4) Research, study, and publication activities regarding community-based development and international cooperation (5) Introducing products made by people engaged in community-based development in Japan and around the world (6) Other activities necessary to fulfill the aims of this organization | ||||||||||||||
| | | | | | | | | | | | | | | | | |
| Name of officers | Number of officers: 18 Chairman: Kiyoshi Otsubo | Number of officers: 7 Representative director: Makoto Nagahata | ||||||||||||||
| | | | | | | | | | | | | | | | | |
| Association chart on transactions between relevant public interest corporations and JICA |  |  | ||||||||||||||
| | | | | | | | | | | | | | | | | |
| Assets | 4,392,892,113 yen | 9,092,091 yen | ||||||||||||||
| | | | | | | | | | | | | | | | | |
| Liabilities | 51,383,463 yen | 6,821,083 yen | ||||||||||||||
| | | | | | | | | | | | | | | | | |
| Balance of net assets at the beginning of the business year | 4,110,395,206 yen | 4,758,193 yen | ||||||||||||||
| | | | | | | | | | | | | | | | | |
| Changes in net assets for the current period | ||||||||||||||||
| | | | | | | | | | | | | | | | | |
Changes in general net assets | ||||||||||||||||
o Revenues | o Revenues | o Revenues | ||||||||||||||
—Subsidy received, etc. | —Subsidy received, etc. | 0 yen | —Subsidy received, etc. | 20,380,717 yen | ||||||||||||
—Other revenues | —Other revenues | 375,593,297 yen | —Other revenues | 31,558,886 yen | ||||||||||||
o Expenses | o Expenses | 144,479,853 yen | o Expenses | 52,926,788 yen | ||||||||||||
| | | | | | | | | | | | | | | | | |
Changes in specified net assets | ||||||||||||||||
o Revenues | o Revenues | o Revenues | ||||||||||||||
—Subsidy received, etc. | —Subsidy received, etc. | 0 yen | —Subsidy received, etc. | 0 yen | ||||||||||||
—Other revenues | —Other revenues | 0 yen | —Other revenues | 0 yen | ||||||||||||
o Expenses | o Expenses | 0 yen | o Expenses | 1,500,000 yen | ||||||||||||
| | | | | | | | | | | | | | | | | |
| Balance of net assets at the end of the business year | 4,341,508,650 yen | 2,271,008 yen | ||||||||||||||
| | | | | | | | | | | | | | | | | |
| Total revenues for the current period | — | 51,939,603 yen | ||||||||||||||
| | | | | | | | | | | | | | | | | |
| Total expenditures for the current period | — | 54,426,788 yen | ||||||||||||||
| | | | | | | | | | | | | | | | | |
| Amount of difference between revenues and expenditures for the current period | — | (2,487,185 yen) | ||||||||||||||
| | | | | | | | | | | | | | | | | |
| Details of contributions and donations to basic funds of relevant public interest corporations, etc. Details of membership expenses and burden charges to be borne in order to be allocated to management expenses, operating expenses, etc. | N/A | N/A | ||||||||||||||
| | | | | | | | | | | | | | | | | |
| Details of receivables and payables to relevant public interest corporations | Accounts payable: ¥5,590,278, Accounts receivable: ¥3,461,231 | N/A | ||||||||||||||
| | | | | | | | | | | | | | | | | |
| Details of debt guarantee | N/A | N/A | ||||||||||||||
| | | | | | | | | | | | | | | | | |
| Amounts and ratios in relation to operating revenues, order placement by JICA, etc. (amounts and ratios of competitive contracts, planning competitions and public selections, and noncompetitive negotiated contracts) | Total operating revenues: (Breakdown: JICA transactions, Competitive contract Planning competition and public selection Noncompetitive negotiated contracts | 93,447,367 yen 66,328,403 yen 71.0%) (0 yen 0.0%) (66,328,403 yen 100.0%) (0 yen 0.0%) | Total operating revenues: (Breakdown: JICA transactions, Competitive contract Planning competition and public selection Noncompetitive negotiated contracts | 31,307,000 yen 29,706,301 yen 94.9%) (0 yen 0.0%) 29,706,301 yen 100%) (0 yen 0.0%) | ||||||||||||
| | | | | | | | | | | | | | | | | |
(Note 1) The above amount pertains to the period from April 1, 2014, through March 31, 2015 | (Note) The above amount pertains to the period from July 1, 2014, through June 30, 2015. | |||||||||||||||
|
| (Note 2) The entity is not legally required to create a statement of revenues and expenses pursuant to the "Accounting Standards for Public-interest Corporations"; hence, such a statement is not prepared. |
| |||||||||||||
F-92
| | | | | | | | | | | | | | | | | |
| Corporation type and name | (Relevant public interest corporations, etc.) | (Relevant public interest corporations, etc.) | ||||||||||||||
| | | | | | | | | | | | | | | | | |
| Items | Overseas Agricultural Development Association | Agricultural Development Consultants Association | ||||||||||||||
| | | | | | | | | | | | | | | | | |
| Outline of operations | (1) Proposal regarding effective undertaking of overseas agricultural development cooperation (2) Guidance and advice for overseas agricultural development cooperation by private-sector companies (3) Cooperation for activities by the government and private-sector companies regarding overseas agricultural development cooperation (4) Research and study regarding overseas agricultural development cooperation (5) Gathering and providing of information regarding overseas agricultural development cooperation (6) Carrying out of collaborative activities with community organizations regarding rural community promotion in Japan (7) Capacity building and securing of personnel who engage in rural community promotion in Japan (8) Establishment and operation of necessary facilities for aforementioned activities (9) Other activities necessary to fulfill the aims of this organization | (1) Technical research to create projects for overseas agricultural development (2) Research of information and gathering of material regarding overseas agricultural development (3) Guidance and advice for consulting firms and organizations (4) Organizing lectures and symposiums regarding overseas technical assistance (5) Support regarding activities for overseas agricultural development (6) Other activities necessary to fulfill the aims of this association | ||||||||||||||
| | | | | | | | | | | | | | | | | |
| Name of officers | Number of officers: 9 President: Hidekazu Toyohara | Number of officers: 8 Chairman: Shigeyasu Aoyama | ||||||||||||||
| | | | | | | | | | | | | | | | | |
| Association chart on transactions between relevant public interest corporations and JICA |  |  | ||||||||||||||
| | | | | | | | | | | | | | | | | |
| Assets | 17,365,613 yen | 106,093,969 yen | ||||||||||||||
| | | | | | | | | | | | | | | | | |
| Liabilities | 17,185,194 yen | 9,117,467 yen | ||||||||||||||
| | | | | | | | | | | | | | | | | |
| Balance of net assets at the beginning of the business year | 29,936 yen | 101,353,205 yen | ||||||||||||||
| | | | | | | | | | | | | | | | | |
| Changes in net assets for the current period | ||||||||||||||||
| | | | | | | | | | | | | | | | | |
Changes in general net assets | ||||||||||||||||
o Revenues | o Revenues | o Revenues | ||||||||||||||
—Subsidy received, etc. | —Subsidy received, etc. | 0 yen | —Subsidy received, etc. | 30,518,000 yen | ||||||||||||
—Other revenues | —Other revenues | 122,528,364 yen | —Other revenues | 41,791,233 yen | ||||||||||||
o Expenses | o Expenses | 122,374,881 yen | o Expenses | 76,685,936 yen | ||||||||||||
| | | | | | | | | | | | | | | | | |
Changes in specified net assets | ||||||||||||||||
o Revenues | o Revenues | o Revenues | ||||||||||||||
—Subsidy received, etc. | —Subsidy received, etc. | 0 yen | —Subsidy received, etc. | 0 yen | ||||||||||||
—Other revenues | —Other revenues | 0 yen | —Other revenues | 0 yen | ||||||||||||
o Expenses | o Expenses | 0 yen | o Expenses | 0 yen | ||||||||||||
| | | | | | | | | | | | | | | | | |
| Balance of net assets at the end of the business year | 180,419 yen | 96,976,502 yen | ||||||||||||||
| | | | | | | | | | | | | | | | | |
| Total revenues for the current period | — | — | ||||||||||||||
| | | | | | | | | | | | | | | | | |
| Total expenditures for the current period | — | — | ||||||||||||||
| | | | | | | | | | | | | | | | | |
| Amount of difference between revenues and expenditures for the current period | — | — | ||||||||||||||
| | | | | | | | | | | | | | | | | |
| Details of contributions and donations to basic funds of relevant public interest corporations, etc. Details of membership expenses and burden charges to be borne in order to be allocated to management expenses, operating expenses, etc. | N/A | N/A | ||||||||||||||
| | | | | | | | | | | | | | | | | |
| Details of receivables and payables to relevant public interest corporations | N/A | Accounts receivable: ¥233,854 | ||||||||||||||
| | | | | | | | | | | | | | | | | |
| Details of debt guarantee | N/A | N/A | ||||||||||||||
| | | | | | | | | | | | | | | | | |
| Amounts and ratios in relation to operating revenues, order placement by JICA, etc. (amounts and ratios of competitive contracts, planning competitions and public selections, and noncompetitive negotiated contracts) | Total operating revenues: (Breakdown: JICA transactions, Competitive contract Planning competition and public selection Noncompetitive negotiated contracts | 118,502,545 yen 107,060,738 yen 90.3%) (0 yen 0.0%) (105,220,726 yen 98.3%) (0 yen 0.0%) | Total operating revenues: (Breakdown: JICA transactions, Competitive contract Planning competition and public selection Noncompetitive negotiated contracts | 34,814,282 yen 34,814,282 yen 100.0%) (0 yen 0.0%) (34,814,282 yen 100.0%) (0 yen 0.0%) | ||||||||||||
| | | | | | | | | | | | | | | | | |
(Note) The entity is not legally required to create a statement of revenues and expenses pursuant to the "Accounting Standards for Public-interest Corporations"; hence, such a statement is not prepared. | (Note 1) The above amount pertains to the period from April 1, 2014, through March 31, 2015 (Note 2) The entity is not legally required to create a statement of revenues and expenses pursuant to the "Accounting Standards for Public-interest Corporations"; hence, such a statement is not prepared. | |||||||||||||||
F-93
| | | | | | | | | | | | | | | | | |
| Corporation type and name | (Relevant public interest corporations, etc.) | (Relevant public interest corporations, etc.) | ||||||||||||||
| | | | | | | | | | | | | | | | | |
| Items | Japan Overseas Forestry Consultants Association | Supporting Organization of J.O.C.V. | ||||||||||||||
| | | | | | | | | | | | | | | | | |
| Outline of operations | (1) Survey regarding overseas forest and forestry (2) Technical development regarding overseas forest and forestry (3) Afforestation in developing countries (4) Guidance and advice regarding overseas forest and forestry (5) Implementation of training regarding overseas forest and forestry (6) Gathering and provision of material and information on overseas forest and forestry (7) Other activities necessary to fulfill the purposes of the Association | (1) Activities for the diffusion of cooperation volunteers and their activities for awareness raising and for understanding promotion (2) Activities for promoting participation of young generation in cooperation volunteers (3) Activities for removing social impediment to participation to cooperation volunteers (4) Activities for providing moral support for volunteers after their return (5) Activities for supporting social reintegration and sustainable growth of cooperation (6) Other activities necessary to achieve the objectives of this corporation | ||||||||||||||
| | | | | | | | | | | | | | | | | |
| Name of officers | Number of officers: 11 President: Fusho Ozawa | Number of officers: 15 President: Fusao Adachi | ||||||||||||||
| | | | | | | | | | | | | | | | | |
| Association chart on transactions between relevant public interest corporations and JICA |  | |||||||||||||||
| | | | | | | | | | | | | | | | | |
| Assets | 267,458,352 yen | 60,663,849 yen | ||||||||||||||
| | | | | | | | | | | | | | | | | |
| Liabilities | 212,778,151 yen | 2,917,380 yen | ||||||||||||||
| | | | | | | | | | | | | | | | | |
| Balance of net assets at the beginning of the business year | 49,253,102 yen | 74,001,322 yen | ||||||||||||||
| | | | | | | | | | | | | | | | | |
| Changes in net assets for the current period | ||||||||||||||||
| | | | | | | | | | | | | | | | | |
Changes in general net assets | ||||||||||||||||
o Revenues | o Revenues | o Revenues | ||||||||||||||
—Subsidy received, etc. | —Subsidy received, etc. | 9,400,000 yen | —Subsidy received, etc. | 3,000,000 yen | ||||||||||||
—Other revenues | —Other revenues | 309,742,248 yen | —Other revenues | 118,260,604 yen | ||||||||||||
o Expenses | o Expenses | 313,715,149 yen | o Expenses | 137,515,457 yen | ||||||||||||
| | | | | | | | | | | | | | | | | |
Changes in specified net assets | ||||||||||||||||
o Revenues | o Revenues | o Revenues | ||||||||||||||
—Subsidy received, etc. | —Subsidy received, etc. | 0 yen | —Subsidy received, etc. | 0 yen | ||||||||||||
—Other revenues | —Other revenues | 0 yen | —Other revenues | 0 yen | ||||||||||||
o Expenses | o Expenses | 0 yen | o Expenses | 0 yen | ||||||||||||
| | | | | | | | | | | | | | | | | |
| Balance of net assets at the end of the business year | 54,680,201 yen | 57,746,469 yen | ||||||||||||||
| | | | | | | | | | | | | | | | | |
| Total revenues for the current period | 319,142,248 yen | — | ||||||||||||||
| | | | | | | | | | | | | | | | | |
| Total expenditures for the current period | 323,606,646 yen | — | ||||||||||||||
| | | | | | | | | | | | | | | | | |
| Amount of difference between revenues and expenditures for the current period | (4,464,398 yen) | — | ||||||||||||||
| | | | | | | | | | | | | | | | | |
| Details of contributions and donations to basic funds of relevant public interest corporations, etc. Details of membership expenses and burden charges to be borne in order to be allocated to management expenses, operating expenses, etc. | N/A | N/A | ||||||||||||||
| | | | | | | | | | | | | | | | | |
| Details of receivables and payables to relevant public interest corporations | N/A | Account payable ¥22,893,005 | ||||||||||||||
| | | | | | | | | | | | | | | | | |
| Details of debt guarantee | N/A | N/A | ||||||||||||||
| | | | | | | | | | | | | | | | | |
| Amounts and ratios in relation to operating revenues, order placement by JICA, etc. (amounts and ratios of competitive contracts, planning competitions and public selections, and noncompetitive negotiated contracts) | Total operating revenues: (Breakdown: JICA transactions, Competitive contract Planning competition and public selection Noncompetitive negotiated contracts | 275,827,750 yen 221,500,991 yen 80.3%) (0 yen 0.0%) (157,128,279 yen 70.9%) (64,372,712 yen 29.1%) | Total operating revenues: (Breakdown: JICA transactions, Competitive contract Planning competition and public selection Noncompetitive negotiated contracts | 97,194,107 yen 82,714,475 yen 85.1%) (80,306,929 yen 97.1%) (0 yen 0.0%) (0 yen 0.0%) | ||||||||||||
| | | | | | | | | | | | | | | | | |
(Note) The entity is not legally required to create a statement of revenues and expenses pursuant to the "Accounting Standards for Public-interest Corporations"; hence, such a statement is not prepared. | ||||||||||||||||
F-94
| | | | | | | | | | | | | | | | | |
| Corporation type and name | (Relevant public interest corporations, etc.) | (Relevant public interest corporations, etc.) | ||||||||||||||
| | | | | | | | | | | | | | | | | |
| Items | Overseas Vocational Training Association | Foundation for Advanced Studies on International Development | ||||||||||||||
| | | | | | | | | | | | | | | | | |
| Outline of operations | (1) Capacity building of necessary personnel for the planning and promotion of overseas vocational training (2) Undertaking of necessary international cooperation such as guidance and advice regarding establishment and operation of training institutions for the planning and promotion of overseas vocational training (3) Development and providing of necessary training material and methodology for the planning and promotion of overseas vocational training (4) Gathering and providing necessary information and material for the planning and promoting of overseas vocational training (5) Assisting the training for foreign trainees in Japan (6) Promotion of exchange between foreign trainees and Japanese local communities and families (7) Other activities necessary to fulfill the aims of this organization | (1) Cultivation of human resources for international development (2) Research and surveys for international development and assistance policy (3) Cooperation for advanced studies regarding international development (4) Technical cooperation projects overseas (5) Cooperation for private-sector business activities contributing to international development (6) Dissemination of information, edification, and publicity regarding international development (7) Activities in Japan drawing on insights from aforementioned activities (8) Other activities necessary to fulfill the aims of this foundation | ||||||||||||||
| | | | | | | | | | | | | | | | | |
| Name of officers | Number of officers: 8 President: Isao Aoki | Number of officers: 6 President: Tsuneo Sugishita | ||||||||||||||
| | | | | | | | | | | | | | | | | |
| Association chart on transactions between relevant public interest corporations and JICA |  |  | ||||||||||||||
| | | | | | | | | | | | | | | | | |
| Assets | 377,649,858 yen | 820,124,687 yen | ||||||||||||||
| | | | | | | | | | | | | | | | | |
| Liabilities | 123,425,144 yen | 102,237,188 yen | ||||||||||||||
| | | | | | | | | | | | | | | | | |
| Balance of net assets at the beginning of the business year | 324,721,066 yen | 744,853,414 yen | ||||||||||||||
| | | | | | | | | | | | | | | | | |
| Changes in net assets for the current period | ||||||||||||||||
| | | | | | | | | | | | | | | | | |
Changes in general net assets | ||||||||||||||||
o Revenues | o Revenues | o Revenues | ||||||||||||||
—Subsidy received, etc. | —Subsidy received, etc. | 0 yen | —Subsidy received, etc. | 1,000,000 yen | ||||||||||||
—Other revenues | —Other revenues | 100,798,641 yen | —Other revenues | 223,987,532 yen | ||||||||||||
o Expenses | o Expenses | 171,294,993 yen | o Expenses | 251,953,447 yen | ||||||||||||
| | | | | | | | | | | | | | | | | |
Changes in specified net assets | ||||||||||||||||
o Revenues | o Revenues | o Revenues | ||||||||||||||
—Subsidy received, etc. | —Subsidy received, etc. | 0 yen | —Subsidy received, etc. | 0 yen | ||||||||||||
—Other revenues | —Other revenues | 0 yen | —Other revenues | 0 yen | ||||||||||||
o Expenses | o Expenses | 0 yen | o Expenses | 0 yen | ||||||||||||
| | | | | | | | | | | | | | | | | |
| Balance of net assets at the end of the business year | 254,224,714 yen | 717,887,499 yen | ||||||||||||||
| | | | | | | | | | | | | | | | | |
| Total revenues for the current period | — | — | ||||||||||||||
| | | | | | | | | | | | | | | | | |
| Total expenditures for the current period | — | — | ||||||||||||||
| | | | | | | | | | | | | | | | | |
| Amount of difference between revenues and expenditures for the current period | — | — | ||||||||||||||
| | | | | | | | | | | | | | | | | |
| Details of contributions and donations to basic funds of relevant public interest corporations, etc. Details of membership expenses and burden charges to be borne in order to be allocated to management expenses, operating expenses, etc. | N/A | N/A | ||||||||||||||
| | | | | | | | | | | | | | | | | |
| Details of receivables and payables to relevant public interest corporations | N/A | Accounts payable: ¥53,300,512 | ||||||||||||||
| | | | | | | | | | | | | | | | | |
| Details of debt guarantee | N/A | N/A | ||||||||||||||
| | | | | | | | | | | | | | | | | |
| Amounts and ratios in relation to operating revenues, order placement by JICA, etc. (amounts and ratios of competitive contracts, planning competitions and public selections, and noncompetitive negotiated contracts) | Total operating revenues: (Breakdown: JICA transactions, Competitive contract Planning competition and public selection Noncompetitive negotiated contracts | 98,595,128 yen 27,073,145 yen 27.5%) (0 yen 0.0%) (23,171,858 yen 85.6%) (3,901,287 yen 14.4%) | Total operating revenues: (Breakdown: JICA transactions, Competitive contract Planning competition and public selection Noncompetitive negotiated contracts | 209,176,744 yen 158,223,861 yen 75.6%) (28,073,635 yen 17.7%) (125,428,557 yen 79.3%) (0 yen 0.0%) | ||||||||||||
| | | | | | | | | | | | | | | | | |
(Note 1) The above amount pertains to the period from April 1, 2014, through March 31, 2015 (Note 2) The entity is not legally required to create a statement of revenues and expenses pursuant to the "Accounting Standards for Public-interest Corporations"; hence, such a statement is not prepared. | (Note) The entity is not legally required to create a statement of revenues and expenses pursuant to the "Accounting Standards for Public-interest Corporations"; hence, such a statement is not prepared. | |||||||||||||||
F-95
| | | | | | | | | | | | | | | | | |
| Corporation type and name | (Relevant public interest corporations, etc.) | (Relevant public interest corporations, etc.) | ||||||||||||||
| | | | | | | | | | | | | | | | | |
| Items | The Overseas Coastal Area Development Institute of Japan | Kyoto Comparative Law Center | ||||||||||||||
| | | | | | | | | | | | | | | | | |
| Outline of operations | (1) Research and studies for projects 1. Research and studies on global coastal development and international logistics 2. Undertaking cooperative projects related to coastal development and logistics overseas (2) International cooperation support activities 1. Transfer of Japanese technology concerning coastal development and logistics 2. Gathering and analyzing information on global coastal development and international logistics (3) International exchange and publicity 1. Promotion of international relations with overseas researchers and experts on coastal development and logistics 2. Organizing of study sessions and lectures and publications on global coastal development and international logistics 3. Joint research on global coastal development and international logistics with domestic and overseas institutions (4) Other activities necessary for fulfilling the aims of this institution | (1) Interdisciplinary research among different fields of law, information science, and natural sciences (2) Collection and analysis of materials on both domestic and foreign law, systemization and provision of research outcomes (3) Studies of legal cultures and legal policies and policy recommendations based on research outcomes (4) Establishment of human network regarding (1)~(3) (5) Training for the promotion of national and economic development for developing countries (6) Publication, research promotion, conducting conference and seminar regarding (1)~(5) (7) Other activities needed to achieve the purpose of the organization according to (1)~(6) | ||||||||||||||
| | | | | | | | | | | | | | | | | |
| Name of officers | Number of officers: 9 Chairman: Koreshige Anami | Number of officers: 7 Director: Shinzaburo Nagata | ||||||||||||||
| | | | | | | | | | | | | | | | | |
| Association chart on transactions between relevant public interest corporations and JICA |  | |||||||||||||||
| | | | | | | | | | | | | | | | | |
| Assets | 1,444,460,275 yen | 66,096,517 yen | ||||||||||||||
| | | | | | | | | | | | | | | | | |
| Liabilities | 141,991,340 yen | 9,565,785 yen | ||||||||||||||
| | | | | | | | | | | | | | | | | |
| Balance of net assets at the beginning of the business year | 1,401,713,857 yen | 67,381,595 yen | ||||||||||||||
| | | | | | | | | | | | | | | | | |
| Changes in net assets for the current period | ||||||||||||||||
| | | | | | | | | | | | | | | | | |
Changes in general net assets | ||||||||||||||||
o Revenues | o Revenues | o Revenues | ||||||||||||||
—Subsidy received, etc. | —Subsidy received, etc. | 0 yen | —Subsidy received, etc. | 750,000 yen | ||||||||||||
—Other revenues | —Other revenues | 695,872,343 yen | —Other revenues | 61,737,740 yen | ||||||||||||
o Expenses | o Expenses | 795,117,265 yen | o Expenses | 73,338,603 yen | ||||||||||||
| | | | | | | | | | | | | | | | | |
Changes in specified net assets | ||||||||||||||||
o Revenues | o Revenues | o Revenues | ||||||||||||||
—Subsidy received, etc. | —Subsidy received, etc. | 0 yen | —Subsidy received, etc. | 0 yen | ||||||||||||
—Other revenues | —Other revenues | 0 yen | —Other revenues | 0 yen | ||||||||||||
o Expenses | o Expenses | 0 yen | o Expenses | 0 yen | ||||||||||||
| | | | | | | | | | | | | | | | | |
| Balance of net assets at the end of the business year | 1,302,468,935 yen | 56,530,732 yen | ||||||||||||||
| | | | | | | | | | | | | | | | | |
| Total revenues for the current period | — | 62,487,740 yen | ||||||||||||||
| | | | | | | | | | | | | | | | | |
| Total expenditures for the current period | — | 73,338,603 yen | ||||||||||||||
| | | | | | | | | | | | | | | | | |
| Amount of difference between revenues and expenditures for the current period | — | (10,850,863 yen) | ||||||||||||||
| | | | | | | | | | | | | | | | | |
| Details of contributions and donations to basic funds of relevant public interest corporations, etc. Details of membership expenses and burden charges to be borne in order to be allocated to management expenses, operating expenses, etc. | N/A | N/A | ||||||||||||||
| | | | | | | | | | | | | | | | | |
| Details of receivables and payables to relevant public interest corporations | Accounts payable: ¥38,309,560 | N/A | ||||||||||||||
| | | | | | | | | | | | | | | | | |
| Details of debt guarantee | N/A | N/A | ||||||||||||||
| | | | | | | | | | | | | | | | | |
| Amounts and ratios in relation to operating revenues, order placement by JICA, etc. (amounts and ratios of competitive contracts, planning competitions and public selections, and noncompetitive negotiated contracts) | Total operating revenues: (Breakdown: JICA transactions, Competitive contract Planning competition and public selection Noncompetitive negotiated contracts | 678,740,743 yen 276,593,008 yen 40.8%) (2,929,000 yen 1.1%) (273,664,008 yen 98.9%) (0 yen 0.0%) | Total operating revenues: (Breakdown: JICA transactions, Competitive contract Planning competition and public selection Noncompetitive negotiated contracts | 59,499,431 yen 28,077,084 yen 47.2%) (0 yen 0.0%) (27,919,271 yen 99.4%) (0 yen 0.0%) | ||||||||||||
| | | | | | | | | | | | | | | | | |
(Note 1) The above amount pertains to the period from April 1, 2014, through March 31, 2015 (Note 2) The entity is not legally required to create a statement of revenues and expenses pursuant to the "Accounting Standards for Public-interest Corporations"; hence, such a statement is not prepared. | ||||||||||||||||
F-96
| | | | | | | | | | | | | | | | | |
| Corporation type and name | (Relevant public interest corporations, etc.) | (Relevant public interest corporations, etc.) | ||||||||||||||
| | | | | | | | | | | | | | | | | |
| Items | HANDS (Health and Development Service) | SEEDS Asia | ||||||||||||||
| | | | | | | | | | | | | | | | | |
| Outline of operations | (1) Training of international health care cooperation experts and leaders in the area of population and health care (2) Establishment and undertaking of high-quality international health care cooperation and technical cooperation projects that match the needs of developing nations (3) Research and development of cooperation methods regarding comprehensive health care advancement in developing nations (4) Creation and providing of information and material regarding international health care cooperation (5) Advocacy to promote understanding of international health care cooperation (6) Activities regarding reduction of poverty and starvation, which are related to international health care cooperation, promulgation of elementary education, promotion of gender equality, and securing of environmental sustainability (7) Other activities necessary for fulfilling the aims of this organization | (1) Dispatch of the experts (2) Human resource development (3) Networking of the experts (4) Survey research (5) Collection of information and dissemination of knowledge regarding disaster management and environmental conservation (6) Other activities associated with the above activities | ||||||||||||||
| | | | | | | | | | | | | | | | | |
| Name of officers | Number of officers: 6 Representative director: Yasuhide Nakamura | Number of officers: 7 President: Rajib Shaw | ||||||||||||||
| | | | | | | | | | | | | | | | | |
| Association chart on transactions between relevant public interest corporations and JICA | ||||||||||||||||
| | | | | | | | | | | | | | | | | |
| Assets | 72,639,398 yen | 41,686,278 yen | ||||||||||||||
| | | | | | | | | | | | | | | | | |
| Liabilities | 87,149,283 yen | 40,896,328 yen | ||||||||||||||
| | | | | | | | | | | | | | | | | |
| Balance of net assets at the beginning of the business year | 12,428,551 yen | 2,226,212 yen | ||||||||||||||
| | | | | | | | | | | | | | | | | |
| Changes in net assets for the current period | ||||||||||||||||
| | | | | | | | | | | | | | | | | |
Changes in general net assets | ||||||||||||||||
o Revenues | o Revenues | o Revenues | ||||||||||||||
—Subsidy received, etc. | —Subsidy received, etc. | — | —Subsidy received, etc. | — | ||||||||||||
—Other revenues | —Other revenues | — | —Other revenues | — | ||||||||||||
o Expenses | o Expenses | — | o Expenses | — | ||||||||||||
| | | | | | | | | | | | | | | | | |
Changes in specified net assets | ||||||||||||||||
o Revenues | o Revenues | o Revenues | ||||||||||||||
—Subsidy received, etc. | —Subsidy received, etc. | — | —Subsidy received, etc. | — | ||||||||||||
—Other revenues | —Other revenues | — | —Other revenues | — | ||||||||||||
o Expenses | o Expenses | — | o Expenses | — | ||||||||||||
| | | | | | | | | | | | | | | | | |
| Balance of net assets at the end of the business year | (14,509,885 yen) | 789,950 yen | ||||||||||||||
| | | | | | | | | | | | | | | | | |
| Total revenues for the current period | 224,138,576 yen | 106,513,890 yen | ||||||||||||||
| | | | | | | | | | | | | | | | | |
| Total expenditures for the current period | 260,261,652 yen | 107,950,152 yen | ||||||||||||||
| | | | | | | | | | | | | | | | | |
| Amount of difference between revenues and expenditures for the current period | (36,123,076 yen) | (1,436,262 yen) | ||||||||||||||
| | | | | | | | | | | | | | | | | |
| Details of contributions and donations to basic funds of relevant public interest corporations, etc. Details of membership expenses and burden charges to be borne in order to be allocated to management expenses, operating expenses, etc. | N/A | N/A | ||||||||||||||
| | | | | | | | | | | | | | | | | |
| Details of receivables and payables to relevant public interest corporations | N/A | N/A | ||||||||||||||
| | | | | | | | | | | | | | | | | |
| Details of debt guarantee | N/A | N/A | ||||||||||||||
| | | | | | | | | | | | | | | | | |
| Amounts and ratios in relation to operating revenues, order placement by JICA, etc. (amounts and ratios of competitive contracts, planning competitions and public selections, and noncompetitive negotiated contracts) | Total operating revenues: (Breakdown: JICA transactions, Competitive contract Planning competition and public selection Noncompetitive negotiated contracts | 133,144,355 yen 121,566,048 yen 91.3%) (1,683,045 yen 1.4%) (119,883,003 yen 98.6%) (0 yen 0.0%) | Total operating revenues: (Breakdown: JICA transactions, Competitive contract Planning competition and public selection Noncompetitive negotiated contracts | 39,179,513 yen 36,373,825 yen 92.8%) (0 yen 0.0%) (36,373,825 yen 100.0%) (0 yen 0.0%) | ||||||||||||
| | | | | | | | | | | | | | | | | |
(Note 1) The above amount pertains to the period July 1, 2014, through June 30, 2015. (Note 2) Pursuant to the "Act amending part of the Act to Promote Specified Nonprofit Activities" (Act No. 70 of 2011) ("Act to Promote Specified Nonprofit Activities" hereinafter), the entity is not legally required to create a statement of changes in net assets; hence, such a statement is not prepared. | (Note) Pursuant to the Act to Promote Specified Nonprofit Activities, the entity is not legally required to create a statement of changes in net assets; hence, such a statement is not prepared. | |||||||||||||||
F-97
| | | | | | | | | | | | | | | | | |
| Corporation type and name | (Relevant public interest corporations, etc.) | (Relevant public interest corporations, etc.) | ||||||||||||||
| | | | | | | | | | | | | | | | | |
| Items | Okinawa Environment Club | Mura no Mirai | ||||||||||||||
| | | | | | | | | | | | | | | | | |
| Outline of operations | (1) Conservation of regional nature and environment (2) Promotion of environmental education (3) Community development making use of natural and environmental features (4) Necessary research and studies; gathering and providing of information (5) Publication of newsletters, etc. | (1) Activities regarding community development and support for community sustainability (2) Activities related to capacity building and receiving trainees (3) Activities related to research and studies (4) Activities related to promotion of international understanding and edification (5) Activities related to support of community promotion (6) Other activities necessary for fulfilling the aims of this organization | ||||||||||||||
| | | | | | | | | | | | | | | | | |
| Name of officers | Number of officers: 7 President: Kuniki Shimoji | Number of officers: 11 Representative director: Toyokazu Nakata | ||||||||||||||
| | | | | | | | | | | | | | | | | |
| Association chart on transactions between relevant public interest corporations and JICA | ||||||||||||||||
| | | | | | | | | | | | | | | | | |
| Assets | 31,312,560 yen | 16,096,997 yen | ||||||||||||||
| | | | | | | | | | | | | | | | | |
| Liabilities | 4,909,802 yen | 14,134,899 yen | ||||||||||||||
| | | | | | | | | | | | | | | | | |
| Balance of net assets at the beginning of the business year | 33,340,451 yen | 1,506,300 yen | ||||||||||||||
| | | | | | | | | | | | | | | | | |
| Changes in net assets for the current period | ||||||||||||||||
| | | | | | | | | | | | | | | | | |
Changes in general net assets | ||||||||||||||||
o Revenues | o Revenues | o Revenues | ||||||||||||||
—Subsidy received, etc. | —Subsidy received, etc. | — | —Subsidy received, etc. | — | ||||||||||||
—Other revenues | —Other revenues | — | —Other revenues | — | ||||||||||||
o Expenses | o Expenses | — | o Expenses | — | ||||||||||||
| | | | | | | | | | | | | | | | | |
Changes in specified net assets | ||||||||||||||||
o Revenues | o Revenues | o Revenues | ||||||||||||||
—Subsidy received, etc. | —Subsidy received, etc. | — | —Subsidy received, etc. | — | ||||||||||||
—Other revenues | —Other revenues | — | —Other revenues | — | ||||||||||||
o Expenses | o Expenses | — | o Expenses | — | ||||||||||||
| | | | | | | | | | | | | | | | | |
| Balance of net assets at the end of the business year | 26,402,758 yen | 1,962,098 yen | ||||||||||||||
| | | | | | | | | | | | | | | | | |
| Total revenues for the current period | 25,170,970 yen | 89,286,642 yen | ||||||||||||||
| | | | | | | | | | | | | | | | | |
| Total expenditures for the current period | 32,108,663 yen | 88,830,844 yen | ||||||||||||||
| | | | | | | | | | | | | | | | | |
| Amount of difference between revenues and expenditures for the current period | (6,937,693 yen) | 455,798 yen | ||||||||||||||
| | | | | | | | | | | | | | | | | |
| Details of contributions and donations to basic funds of relevant public interest corporations, etc. Details of membership expenses and burden charges to be borne in order to be allocated to management expenses, operating expenses, etc. | N/A | N/A | ||||||||||||||
| | | | | | | | | | | | | | | | | |
| Details of receivables and payables to relevant public interest corporations | N/A | Accounts receivable ¥9,400 | ||||||||||||||
| | | | | | | | | | | | | | | | | |
| Details of debt guarantee | Accounts receivable ¥196,498 | N/A | ||||||||||||||
| | | | | | | | | | | | | | | | | |
| Amounts and ratios in relation to operating revenues, order placement by JICA, etc. (amounts and ratios of competitive contracts, planning competitions and public selections, and noncompetitive negotiated contracts) | Total operating revenues: (Breakdown: JICA transactions, Competitive contract Planning competition and public selection Noncompetitive negotiated contracts | 23,750,145 yen 21,810,111 yen 91.8%) (0 yen 0.0%) (21,810,111 yen 100.0%) (0 yen 0.0%) | Total operating revenues: (Breakdown: JICA transactions, Competitive contract Planning competition and public selection Noncompetitive negotiated contracts | 61,968,557 yen 38,830,829 yen 62.7%) (0 yen 0.0%) (38,830,929 yen 100.0%) (0 yen 0.0%) | ||||||||||||
| | | | | | | | | | | | | | | | | |
(Note) Pursuant to the Act to Promote Specified Nonprofit Activities, the entity is not legally required to create a statement of changes in net assets; hence, such a statement is not prepared. | (Note) Pursuant to the Act to Promote Specified Nonprofit Activities, the entity is not legally required to create a statement of changes in net assets; hence, such a statement is not prepared. | |||||||||||||||
F-98
| | | | | | | | | | | | | | | | | |
| Corporation type and name | (Relevant public interest corporations, etc.) | (Relevant public interest corporations, etc.) | ||||||||||||||
| | | | | | | | | | | | | | | | | |
| Items | Lequio Wings | Non-profit Organization Kyushu International Cooperative Association, Japan | ||||||||||||||
| | | | | | | | | | | | | | | | | |
| Outline of operations | (1) International cooperation activities (2) International exchange activities (3) Activities regarding to capacity building (4) Activities regarding culture, sports, education, and academic exchange (5) Activities regarding promotion of communities in Okinawa (6) Support for the socially vulnerable and activities to promote peace (7) Other activities necessary for fulfilling the aims of this organization | (1) Activities to provide advice to overseas volunteer undertaking, such as government development assistance activities, support for research, studies and evaluation, and cooperation (2) Activities including international exchange by municipalities and various organizations, planning for international cooperation undertaking, and support and cooperation for research and studies (3) Organizing training and lectures, etc., to promote self-development of young people through international understanding and publicity (4) Activities to promote international cooperation through personnel exchange and cultural and technical assistance with regional communities of developing nations, etc. (5) Activities to help returnees of overseas cooperation volunteers find jobs, with a view to disseminating volunteer experiences throughout society (6) Activities for sales and providing information regarding goods and publications for promotion of the activities | ||||||||||||||
| | | | | | | | | | | | | | | | | |
| Name of officers | Number of officers: 7 Exective director: Chochu Awa | Number of officers: 16 President: Akinobu Yumiba | ||||||||||||||
| | | | | | | | | | | | | | | | | |
| Association chart on transactions between relevant public interest corporations and JICA |  | |||||||||||||||
| | | | | | | | | | | | | | | | | |
| Assets | 11,772,611 yen | 26,343,928 yen | ||||||||||||||
| | | | | | | | | | | | | | | | | |
| Liabilities | 11,140 yen | 3,385,436 yen | ||||||||||||||
| | | | | | | | | | | | | | | | | |
| Balance of net assets at the beginning of the business year | 8,527,579 yen | 27,740,075 yen | ||||||||||||||
| | | | | | | | | | | | | | | | | |
| Changes in net assets for the current period | ||||||||||||||||
| | | | | | | | | | | | | | | | | |
Changes in general net assets | ||||||||||||||||
o Revenues | o Revenues | o Revenues | ||||||||||||||
—Subsidy received, etc. | —Subsidy received, etc. | — | —Subsidy received, etc. | — | ||||||||||||
—Other revenues | —Other revenues | — | —Other revenues | — | ||||||||||||
o Expenses | o Expenses | — | o Expenses | — | ||||||||||||
| | | | | | | | | | | | | | | | | |
Changes in specified net assets | ||||||||||||||||
o Revenues | o Revenues | o Revenues | ||||||||||||||
—Subsidy received, etc. | —Subsidy received, etc. | — | —Subsidy received, etc. | — | ||||||||||||
—Other revenues | —Other revenues | — | —Other revenues | — | ||||||||||||
o Expenses | o Expenses | — | o Expenses | — | ||||||||||||
| | | | | | | | | | | | | | | | | |
| Balance of net assets at the end of the business year | 11,761,471 yen | 22,958,492 yen | ||||||||||||||
| | | | | | | | | | | | | | | | | |
| Total revenues for the current period | 30,679,836 yen | 44,892,190 yen | ||||||||||||||
| | | | | | | | | | | | | | | | | |
| Total expenditures for the current period | 27,445,944 yen | 49,673,773 yen | ||||||||||||||
| | | | | | | | | | | | | | | | | |
| Amount of difference between revenues and expenditures for the current period | 3,233,892 yen | (4,781,583 yen) | ||||||||||||||
| | | | | | | | | | | | | | | | | |
| Details of contributions and donations to basic funds of relevant public interest corporations, etc. Details of membership expenses and burden charges to be borne in order to be allocated to management expenses, operating expenses, etc. | N/A | N/A | ||||||||||||||
| | | | | | | | | | | | | | | | | |
| Details of receivables and payables to relevant public interest corporations | Accounts payable: ¥6,737,059 | Accounts payable: ¥4,527,630 | ||||||||||||||
| | | | | | | | | | | | | | | | | |
| Details of debt guarantee | N/A | N/A | ||||||||||||||
| | | | | | | | | | | | | | | | | |
| Amounts and ratios in relation to operating revenues, order placement by JICA, etc. (amounts and ratios of competitive contracts, planning competitions and public selections, and noncompetitive negotiated contracts) | Total operating revenues: (Breakdown: JICA transactions, Competitive contract Planning competition and public selection Noncompetitive negotiated contracts | 29,498,824 yen 29,498,824 yen 100.0%) (0 yen 0.0%) (29,498,824 yen 100.0%) (0 yen 0.0%) | Total operating revenues: (Breakdown: JICA transactions, Competitive contract Planning competition and public selection Noncompetitive negotiated contracts | 44,135,465 yen 34,041,656 yen 77.1%) (26,317,000 yen 77.3%) (7,436,806 yen 21.8%) (0 yen 0.0%) | ||||||||||||
| | | | | | | | | | | | | | | | | |
(Note) Pursuant to the Act to Promote Specified Nonprofit Activities, the entity is not legally required to create a statement of changes in net assets; hence, such a statement is not prepared. | (Note) Pursuant to the Act to Promote Specified Nonprofit Activities, the entity is not legally required to create a statement of changes in net assets, and it is difficult to identify the requested figure from the entity's financial statements; hence, the box is left blank. | |||||||||||||||
F-99
| | | | | | | | | | | | | | | | | |
| Corporation type and name | (Relevant public interest corporations, etc.) | (Relevant public interest corporations, etc.) | ||||||||||||||
| | | | | | | | | | | | | | | | �� | |
| Items | Japan NGO Center for International Cooperation | International Farmers Participation Technical Net-work | ||||||||||||||
| | | | | | | | | | | | | | | | | |
| Outline of operations | (1) Promote Partnership among NGOs (2) Strengthen Capacity and Social Responsibility of NGOs (3) Dissemination of knowledge and information regarding International cooperation and NGOs for international cooperation (4) Research and Advocacy (5) Promotion of education for realization of global citizenship society (6) Promotion of collaboration and interaction between United Nations institutions and domestic and international entities of central and local government and private sector (7) Other activities for the purpose of article 3 of Articles of incorporation | (1) Activities regarding international cooperation 1. As support for small-scale farmers, development of appropriate technologies regarding upland crop, rice cultivation, vegetable cultivation, improvement of agricultural instruments, and irrigation 2. Gathering and providing information on agricultural technology for small-scale farmers 3. Survey of situations of local agriculture, and research and development for appropriate technologies 4. Capacity building of local residents and technological support 5. Training in Japan as well as at operation site 6. Support through dispatching experts (2) Activities related to revitalization of economic activities 1. Cooperation for participatory rural development through appropriate agricultural technology 2. Cooperation for farmers to participate in local agricultural cooperatives, etc. 3. Cooperation for training of appropriate agricultural technology for local farmers (3) Activities related to promotion of learning 1. Development, research, and study of appropriate technology for local small-scale farmers 2. Exchange with Japanese farmers, students and experts engaging in international cooperation 3. Support and cooperation to universities and research institutions | ||||||||||||||
| | | | | | | | | | | | | | | | | |
| Name of officers | Number of officers: 22 President: Hiroshi Taniyama | Number of officers: 7 President: Nobutaka Ito | ||||||||||||||
| | | | | | | | | | | | | | | | | |
| Association chart on transactions between relevant public interest corporations and JICA |  |  | ||||||||||||||
| | | | | | | | | | | | | | | | | |
| Assets | 70,546,752 yen | 34,837,324 yen | ||||||||||||||
| | | | | | | | | | | | | | | | | |
| Liabilities | 36,200,212 yen | 19,494,570 yen | ||||||||||||||
| | | | | | | | | | | | | | | | | |
| Balance of net assets at the beginning of the business year | 41,167,849 yen | 26,978,801 yen | ||||||||||||||
| | | | | | | | | | | | | | | | | |
| Changes in net assets for the current period | ||||||||||||||||
| | | | | | | | | | | | | | | | | |
Changes in general net assets | ||||||||||||||||
o Revenues | o Revenues | o Revenues | ||||||||||||||
—Subsidy received, etc. | —Subsidy received, etc. | — | —Subsidy received, etc. | — | ||||||||||||
—Other revenues | —Other revenues | — | —Other revenues | — | ||||||||||||
o Expenses | o Expenses | — | o Expenses | — | ||||||||||||
| | | | | | | | | | | | | | | | | |
Changes in specified net assets | ||||||||||||||||
o Revenues | o Revenues | o Revenues | ||||||||||||||
—Subsidy received, etc. | —Subsidy received, etc. | — | —Subsidy received, etc. | — | ||||||||||||
—Other revenues | —Other revenues | — | —Other revenues | — | ||||||||||||
o Expenses | o Expenses | — | o Expenses | — | ||||||||||||
| | | | | | | | | | | | | | | | | |
| Balance of net assets at the end of the business year | 34,346,540 yen | 15,342,754 yen | ||||||||||||||
| | | | | | | | | | | | | | | | | |
| Total revenues for the current period | 146,543,596 yen | 69,755,826 yen | ||||||||||||||
| | | | | | | | | | | | | | | | | |
| Total expenditures for the current period | 153,364,905 yen | 81,391,873 yen | ||||||||||||||
| | | | | | | | | | | | | | | | | |
| Amount of difference between revenues and expenditures for the current period | (6,821,309 yen) | (11,636,047 yen) | ||||||||||||||
| | | | | | | | | | | | | | | | | |
| Details of contributions and donations to basic funds of relevant public interest corporations, etc. Details of membership expenses and burden charges to be borne in order to be allocated to management expenses, operating expenses, etc. | N/A | N/A | ||||||||||||||
| | | | | | | | | | | | | | | | | |
| Details of receivables and payables to relevant public interest corporations | Accounts payable: ¥13,164,577 | Accounts payable: ¥18,022,553, Accounts receivable: ¥267,524 | ||||||||||||||
| | | | | | | | | | | | | | | | | |
| Details of debt guarantee | N/A | N/A | ||||||||||||||
| | | | | | | | | | | | | | | | | |
| Amounts and ratios in relation to operating revenues, order placement by JICA, etc. (amounts and ratios of competitive contracts, planning competitions and public selections, and noncompetitive negotiated contracts) | Total operating revenues: (Breakdown: JICA transactions, Competitive contract Planning competition and public selection Noncompetitive negotiated contracts | 74,531,488 yen 24,610,362 yen 33.0%) (24,610,362 yen 100.0%) (0 yen 0.0%) (0 yen 0.0%) | Total operating revenues: (Breakdown: JICA transactions, Competitive contract Planning competition and public selection Noncompetitive negotiated contracts | 68,161,800 yen 67,392,609 yen 98.9%) (0 yen 0.0%) (67,392,609 yen 100.0%) (0 yen 0.0%) | ||||||||||||
| | | | | | | | | | | | | | | | | |
(Note) Pursuant to the Act to Promote Specified Nonprofit Activities, the entity is not legally required to create a statement of changes in net assets; hence, such a statement is not prepared. | (Note) Pursuant to the Act to Promote Specified Nonprofit Activities, the entity is not legally required to create a statement of changes in net assets; hence, such a statement is not prepared. | |||||||||||||||
F-100
To Mr. Shinichi Kitaoka, President
Japan International Cooperation Agency
We have audited the accompanying financial statements related to the finance and investment account of Japan International Cooperation Agency, which comprise the balance sheet as of March 31, 2016, and the statement of income, statement of cash flows and statement of administrative service operation cost for the year then ended, and a summary of significant accounting policies and other explanatory information, and the accompanying supplementary schedules (except for the information described based on the financial statements and business reports relating to the associated companies; the same shall apply hereinafter).
President's Responsibility for the Financial Statements
The president is responsible for the preparation and fair presentation of these financial statements in accordance with accounting principles for incorporated administrative agencies generally accepted in Japan, and for such internal control as the president determines is necessary to enable the preparation of financial statements that are free from material misstatement, whether due to fraud or error, or illegal acts.
Auditor's Responsibility
Our responsibility is to express an opinion on these financial statements based on our audit. We conducted our audit in accordance with auditing standards for incorporated administrative agencies generally accepted in Japan. Those standards require that we plan and perform the audit to obtain reasonable assurance about whether the financial statements are free from material misstatement. The audit was planned with adequate attention being paid to the possibility that any fraud or error, or illegal acts, of the president, other executive officers or staff members may result in material misstatement in the financial statements.
An audit involves performing procedures to obtain audit evidence about the amounts and disclosures in the financial statements. The procedures selected depend on the auditor's judgment, including the assessment of the risks of material misstatement of the financial statements, whether due to fraud or error, or illegal acts. In making those risk assessments, the auditor considers internal control relevant to the entity's preparation and fair presentation of the financial statements in order to design audit procedures that are appropriate in the circumstances, but not for the purpose of expressing an opinion on the effectiveness of the entity's internal control. An audit also includes evaluating the appropriateness of accounting policies used and the reasonableness of accounting estimates made by the president, as well as evaluating the overall presentation of the financial statements.
We believe that the audit evidence we have obtained is sufficient and appropriate to provide a basis for our audit opinion. The basis includes the fact that no such fraud or error, or illegal acts, of the president, other executive officers or staff members was found, to the extent that we conducted our audit. The audit we conducted is not intended to express an opinion on whether there was any fraud or error, or illegal acts, of the president, other executive officers or staff members, which would not result in material misstatement in the financial statements.
Opinion
In our opinion, the financial statements referred to above present fairly, in all material respects, the financial position of Japan International Cooperation Agency's finance and investment account as of March 31, 2016 and the results of its operations, cash flows and administrative service operation cost for the year then ended in accordance with accounting principles for incorporated administrative agencies generally accepted in Japan.
/s/ DELOITTE TOUCHE TOHMATSU LLC
June 22, 2016
F-101
Balance Sheet
(as of March 31, 2016)
Finance and Investment Account
| (Unit: Yen) |
Assets | |||||||||||||||||
I | Current assets | ||||||||||||||||
Cash and deposits | 87,531,224,966 | ||||||||||||||||
Loans | 11,502,090,784,898 | ||||||||||||||||
Allowance for loan losses | (153,208,197,398 | ) | 11,348,882,587,500 | ||||||||||||||
| | | | | | | | | | | | | | | | | | |
Advance payments | 9,753,544,819 | ||||||||||||||||
Prepaid expenses | 108,726,069 | ||||||||||||||||
Accrued income | |||||||||||||||||
Accrued interest on loans | 34,642,109,569 | ||||||||||||||||
Accrued commitment charges | 887,201,055 | ||||||||||||||||
Accrued interest | 88,076 | 35,529,398,700 | |||||||||||||||
| | | | | | | | | | | | | | | | | | |
Accounts receivable | 1,045,341,298 | ||||||||||||||||
Suspense payments | 4,463,250 | ||||||||||||||||
Advances paid | 614,633 | ||||||||||||||||
Short-term guarantee deposits | 43,182,000,000 | ||||||||||||||||
| | | | | | | | | | | | | | | | | | |
Total current assets | 11,526,037,901,235 | ||||||||||||||||
II | Non-current assets | ||||||||||||||||
| 1 | Tangible assets | ||||||||||||||||
Buildings | 3,244,509,548 | ||||||||||||||||
Accumulated depreciation | (899,795,733 | ) | |||||||||||||||
Accumulated impairment loss | (675,214,797 | ) | 1,669,499,018 | ||||||||||||||
| | | | | | | | | | | | | | | | | | |
Structures | 50,459,764 | ||||||||||||||||
Accumulated depreciation | (20,856,209 | ) | |||||||||||||||
Accumulated impairment loss | (11,670,468 | ) | 17,933,087 | ||||||||||||||
| | | | | | | | | | | | | | | | | | |
Machinery and equipment | 193,923,940 | ||||||||||||||||
Accumulated depreciation | (62,111,035 | ) | |||||||||||||||
Accumulated impairment loss | (102,287,680 | ) | 29,525,225 | ||||||||||||||
| | | | | | | | | | | | | | | | | | |
Vehicles | 341,704,167 | ||||||||||||||||
Accumulated depreciation | (217,899,918 | ) | 123,804,249 | ||||||||||||||
| | | | | | | | | | | | | | | | | | |
Tools, furniture, and fixtures | 352,585,435 | ||||||||||||||||
Accumulated depreciation | (208,164,963 | ) | 144,420,472 | ||||||||||||||
| | | | | | | | | | | | | | | | | | |
Land | 12,703,270,000 | ||||||||||||||||
Accumulated impairment loss | (6,091,196,973 | ) | 6,612,073,027 | ||||||||||||||
| | | | | | | | | | | | | | | | | | |
Construction in progress | 13,031,172 | ||||||||||||||||
| | | | | | | | | | | | | | | | | | |
Total tangible assets | 8,610,286,250 | ||||||||||||||||
| 2 | Intangible assets | ||||||||||||||||
Trademark right | 529,269 | ||||||||||||||||
Software | 42,658,030 | ||||||||||||||||
Software in progress | 192,453,675 | ||||||||||||||||
| | | | | | | | | | | | | | | | | | |
Total intangible assets | 235,640,974 | ||||||||||||||||
| 3 | Investments and other assets | ||||||||||||||||
Investment securities | 923,593,356 | ||||||||||||||||
Shares of affiliated companies | 41,753,390,955 | ||||||||||||||||
Claims probable in bankruptcy, claims probable in rehabilitation, and other | 63,845,414,239 | ||||||||||||||||
Allowance for loan losses | (63,845,414,239 | ) | 0 | ||||||||||||||
| | | | | | | | | | | | | | | | | | |
Long-term prepaid expenses | 18,333,132 | ||||||||||||||||
Long-term guarantee deposits | 726,528,994 | ||||||||||||||||
| | | | | | | | | | | | | | | | | | |
Total investments and other assets | 43,421,846,437 | ||||||||||||||||
| | | | | | | | | | | | | | | | | | |
Total non-current assets | 52,267,773,661 | ||||||||||||||||
| | | | | | | | | | | | | | | | | | |
Total assets | 11,578,305,674,896 | ||||||||||||||||
| | | | | | | | | | | | | | | | | | |
| | | | | | | | | | | | | | | | | | |
| | | | | | | | | | | | | | | | | | |
F-102
Balance Sheet (Continued)
(as of March 31, 2016)
| (Unit: Yen) |
Liabilities | |||||||||||||||||
I | Current liabilities | ||||||||||||||||
Current portion of borrowings from government fund for Fiscal Investment and Loan Program | 219,211,646,000 | ||||||||||||||||
Accounts payable | 6,024,351,871 | ||||||||||||||||
Accrued expenses | 6,793,821,158 | ||||||||||||||||
Derivatives | 43,259,483,859 | ||||||||||||||||
Lease obligations | 32,079,914 | ||||||||||||||||
Deposits received | 24,363,335 | ||||||||||||||||
Unearned revenue | 21,923,427 | ||||||||||||||||
Provision | |||||||||||||||||
Provision for bonuses | 259,858,791 | ||||||||||||||||
Provision for contingent losses | 15,766,237,754 | 16,026,096,545 | |||||||||||||||
| | | | | | | | | | | | | | | | | | |
Suspense receipt | 37,780,241 | ||||||||||||||||
| | | | | | | | | | | | | | | | | | |
Total current liabilities | 291,431,546,350 | ||||||||||||||||
II | Non-current liabilities | ||||||||||||||||
Bonds | 477,305,000,000 | ||||||||||||||||
Discounts on bonds payable | (169,202,563 | ) | |||||||||||||||
Borrowings from government fund for Fiscal Investment and Loan Program | 1,537,318,931,000 | ||||||||||||||||
Long-term lease obligations | 32,998,367 | ||||||||||||||||
Long-term deposits received | 1,161,485,000 | ||||||||||||||||
Provision for retirement benefits | 4,063,412,799 | ||||||||||||||||
Asset retirement obligations | 70,374,150 | ||||||||||||||||
| | | | | | | | | | | | | | | | | | |
Total non-current liabilities | 2,019,782,998,753 | ||||||||||||||||
| | | | | | | | | | | | | | | | | | |
Total liabilities | 2,311,214,545,103 | ||||||||||||||||
Net assets | |||||||||||||||||
I | Capital | ||||||||||||||||
Government investment | 7,862,157,840,510 | ||||||||||||||||
| | | | | | | | | | | | | | | | | | |
Total capital | 7,862,157,840,510 | ||||||||||||||||
II | Retained earnings | ||||||||||||||||
Reserve fund | 1,369,795,600,709 | ||||||||||||||||
Unappropriated income for the current business year | 102,762,464,386 | ||||||||||||||||
| | | | | | | | | | | | | | | | | | |
[Total income for the current business year] | [102,762,464,386] | ||||||||||||||||
Total retained earnings | 1,472,558,065,095 | ||||||||||||||||
III | Valuation and translation adjustments | ||||||||||||||||
Valuation difference on available-for-sale securities | (51,810,024 | ) | |||||||||||||||
Deferred gains or losses on hedges | (67,572,965,788 | ) | |||||||||||||||
| | | | | | | | | | | | | | | | | | |
Total valuation and translation adjustments | (67,624,775,812 | ) | |||||||||||||||
| | | | | | | | | | | | | | | | | | |
Total net assets | 9,267,091,129,793 | ||||||||||||||||
| | | | | | | | | | | | | | | | | | |
Total liabilities and net assets | 11,578,305,674,896 | ||||||||||||||||
| | | | | | | | | | | | | | | | | | |
| | | | | | | | | | | | | | | | | | |
| | | | | | | | | | | | | | | | | | |
F-103
Statement of Income
(April 1, 2015-March 31, 2016)
Finance and Investment Account
| (Unit: Yen) |
Ordinary expenses | ||||||||||
Expenses related to operations of cooperation through finance and investment | ||||||||||
Interest on bonds and notes | 5,750,649,584 | |||||||||
Interest on borrowings | 21,180,259,848 | |||||||||
Interest on interest rate swaps | 8,227,523,160 | |||||||||
Operations consignment expenses | 22,204,483,756 | |||||||||
Bond issuance cost | 329,293,249 | |||||||||
Personnel expenses | 3,624,946,268 | |||||||||
Provision for bonuses | 259,858,791 | |||||||||
Retirement benefit expenses | 133,207,468 | |||||||||
Operating and administrative expenses | 12,541,993,818 | |||||||||
Depreciation | 245,756,869 | |||||||||
Taxes | 81,334,300 | |||||||||
Loss on valuation of investment securities | 77,949,645 | |||||||||
Loss on valuation of shares of affiliated companies | 844,526,577 | |||||||||
Provision for allowance for loan losses | 10,797,999,542 | |||||||||
Provision for allowance for contingent losses | 4,089,303,465 | |||||||||
Other operating expenses | 13,141,443 | 90,402,227,783 | ||||||||
| | | | | | | | | | | |
Total ordinary expenses | 90,402,227,783 | |||||||||
Ordinary revenues | ||||||||||
Revenues from operations of cooperation through finance and investment | ||||||||||
Interest on loans | 161,474,437,954 | |||||||||
Interest on bonds | 9,099,453 | |||||||||
Dividends on investments | 24,369,414,558 | |||||||||
Commissions | 3,390,551,363 | |||||||||
Foreign exchange gains | 10,705,094 | |||||||||
Gain on valuation of shares of affiliated companies | 12,263,018 | 189,266,471,440 | ||||||||
| | | | | | | | | | | |
Financial revenues | ||||||||||
Interest income | 33,539,547 | 33,539,547 | ||||||||
| | | | | | | | | | | |
Miscellaneous income | 810,179,009 | |||||||||
Recoveries of written-off claims | 19,878,116 | |||||||||
| | | | | | | | | | | |
Total ordinary revenues | 190,130,068,112 | |||||||||
| | | | | | | | | | | |
Ordinary income | 99,727,840,329 | |||||||||
Extraordinary losses | ||||||||||
Loss on disposal of non-current assets | 3,368,052 | |||||||||
Loss on sales of non-current assets | 2,872,463 | 6,240,515 | ||||||||
| | | | | | | | | | | |
Extraordinary income | ||||||||||
Gain on sales of non-current assets | 8,428,366 | |||||||||
Gain on transfer of benefit obligation relating to employees' pension fund | 3,032,436,206 | 3,040,864,572 | ||||||||
| | | | | | | | | | | |
Net income | 102,762,464,386 | |||||||||
| | | | | | | | | | | |
Total income for the current business year | 102,762,464,386 | |||||||||
| | | | | | | | | | | |
| | | | | | | | | | | |
| | | | | | | | | | | |
F-104
Statement of Cash Flows
(April 1, 2015-March 31, 2016)
Finance and Investment Account
| (Unit: Yen) | |||||
I. | Cash flows from operating activities | |||||
Payments for loans | (964,720,165,305 | ) | ||||
Repayments of borrowings from the private sector | (166,300,000,000 | ) | ||||
Repayments of borrowings from government fund for Fiscal Investment and Loan Program | (244,354,953,000 | ) | ||||
Redemption of bonds | (10,000,000,00 | ) | ||||
Interest expenses paid | (47,717,619,104 | ) | ||||
Payments for personnel expenses | (4,224,090,139 | ) | ||||
Payments for other operations | (94,449,546,892 | ) | ||||
Proceeds from collection of loans | 696,468,637,693 | |||||
Proceeds from borrowings from the private sector | 166,300,000,000 | |||||
Proceeds from borrowings from government fund for Fiscal Investment and Loan Program | 297,300,000,000 | |||||
Proceeds from issuance of bonds | 59,670,706,751 | |||||
Proceeds from interest on loans | 157,425,496,231 | |||||
Proceeds from commissions | 3,154,307,597 | |||||
Proceeds from other operations | 40,112,146,712 | |||||
Subtotal | (111,335,079,456 | ) | ||||
Interest and dividend income received | 24,413,920,122 | |||||
| | | | | | | |
Net cash used in operating activities | (86,921,159,334 | ) | ||||
II. | Cash flows from investing activities | |||||
Payments for purchase of non-current assets | (339,762,722 | ) | ||||
Proceeds from sales of non-current assets | 22,413,012 | |||||
Payments for purchase of investment securities | (921,510,610 | ) | ||||
Proceeds from sales and collection of investment securities | 15,693,685 | |||||
Proceeds from sales and collection of shares of affiliated companies | 460,612,268 | |||||
Payments for purchase of negotiable deposits | (279,900,000,000 | ) | ||||
Proceeds from refund of negotiable deposits | 279,900,000,000 | |||||
| | | | | | | |
Net cash used in investing activities | (762,554,367 | ) | ||||
III. | Cash flows from financing activities | |||||
Repayments of lease obligations | (94,755,152 | ) | ||||
Receipt of government investment | 48,260,000,000 | |||||
| | | | | | | |
Net cash provided by financing activities | 48,165,244,848 | |||||
| | | | | | | |
IV. | Net increase in funds (decrease) | (39,518,468,853 | ) | |||
V. | Funds at the beginning of the business year | 127,049,693,819 | ||||
| | | | | | | |
VI. | Funds at the end of the business year | 87,531,224,966 | ||||
| | | | | | | |
| | | | | | | |
| | | | | | | |
F-105
Statement of Administrative Service Operation Cost
(April 1, 2015-March 31, 2016)
Finance and Investment Account
| (Unit: Yen) |
I. | Operating expenses | |||||||||||
(1) Expenses in the statement of income | ||||||||||||
Expenses related to operations of cooperation through finance and investment | 90,402,227,783 | |||||||||||
Loss on disposal of non-current assets | 3,368,052 | |||||||||||
Loss on sales of non-current assets | 2,872,463 | 90,408,468,298 | ||||||||||
| | | | | | | | | | | | | |
| ||||||||||||
Revenues from operations of cooperation through finance and investment | (189,266,471,440 | ) | ||||||||||
Financial revenues | (33,539,547 | ) | ||||||||||
Miscellaneous income | (810,179,009 | ) | ||||||||||
Recoveries of written-off claims | (19,878,116 | ) | ||||||||||
Gain on sales of non-current assets | (8,428,366 | ) | ||||||||||
Gain on transfer of benefit obligation relating to employees' pension fund | (3,032,436,206 | ) | (193,170,932,684 | ) | ||||||||
| | | | | | | | | | | | | |
Total operating expenses | (102,762,464,386 | ) | ||||||||||
II. | Estimated increase in retirement benefits not included in provision | 4,205,789 | ||||||||||
III. | Opportunity cost | |||||||||||
Opportunity cost of government investment | 0 | |||||||||||
| | | | | | | | | | | | | |
IV. | Administrative service operation cost | (102,758,258,597 | ) | |||||||||
| | | | | | | | | | | | | |
| | | | | | | | | | | | | |
| | | | | | | | | | | | | |
F-106
Basis of Presenting Financial Statements
The accompanying financial statements of JICA have been prepared in accordance with accounting principles for incorporated administrative agencies generally accepted in Japan, which are different in many respects as to application and disclosure requirements of accounting principles for business enterprises generally accepted in Japan.
Significant Accounting Policies
Finance and Investment Account
Effective for the year ended March 31, 2016, JICA adopted the "Accounting Standards for Incorporated Administrative Agencies" and "Notes to Accounting Standards for Incorporated Administrative Agencies" (February 16, 2000 (Revised January 27, 2015), and the "Q&A on Accounting Standards for Incorporated Administrative Agencies and Notes to Accounting Standards for Incorporated Administrative Agencies" (August 2000 (Finally revised February 2016)).
1. Depreciation method
- (1)
- Tangible assets (except for lease assets)
Straight-line method
The useful lives of major assets are as follows:
Buildings: | 2 - 50 years | |
Structures: | 2 - 46 years | |
Machinery and equipment: | 2 - 17 years | |
Vehicles: | 2 - 6 years | |
Tools, furniture, and fixtures: | 2 - 15 years |
- (2)
- Intangible assets (except for lease assets)
Straight-line method
Software used by JICA is depreciated over its useful life (5 years), which has been determined by JICA.
- (3)
- Lease assets
Lease assets are depreciated by the straight-line method over the lease term. Depreciation for lease assets is calculated with zero residual value being assigned to the asset.
2. Standard for appropriation of provision and estimation for bonuses
The provision for bonuses is calculated and provided for based on estimated amounts of future payments attributable to the services that have been rendered by officers and employees applicable to the current business year.
3. Standard for appropriation of provision and estimation for retirement benefits
The provision for retirement benefits is calculated and provided for based on estimated amounts of future payments attributable to the retirement of employees, and is accrued in line with the retirement benefit obligations and estimated plan assets applicable to the business year ended March 31, 2016. In calculating the retirement benefit obligations, the estimated amount of retirement benefit payments is
F-107
attributed to the period based on the straight-line basis. The profit and loss appropriation method for actuarial differences and past service costs are presented as follows:
Actuarial differences are recognized as a lump-sum gain or loss in the business year in which they occur.
Past service costs are recognized as a lump-sum gain or loss in the business year in which they occur.
The estimated increase in retirement benefits not included in provision in the statement of administrative service operation cost is reported as the current-year increase of provision for retirement benefits, calculated according to the Accounting Standard for Incorporated Administrative Agency No. 38.
4. Basis and standard for appropriation of allowance, etc.
- (1)
- Allowance for loan losses
The allowance for claims on debtors who are legally bankrupt ("Bankrupt borrowers") or substantially bankrupt ("Substantially bankrupt borrowers") is provided based on the outstanding balance of loan claims after the deductions of the amount expected to be collected through the disposal of collateral and execution of guarantees, or the same amount is written off directly. The allowance for claims on debtors who are not legally bankrupt, but are likely to become bankrupt ("Potentially bankrupt borrowers") is provided based on an overall assessment of the solvency of the debtors after the deductions of the amount expected to be collected through the disposal of collateral and the execution of guarantees, or the same amount is written off directly. There were no write-offs from the above-mentioned outstanding balance of loan claims for the business year 2015.
The allowance for claims on debtors other than Bankrupt borrowers, Substantially bankrupt borrowers, and Potentially bankrupt borrowers is provided primarily based on the default rate, which is calculated based on the actual defaults during a certain period in the past. The allowance for possible losses on specific overseas loans is provided based on the expected loss amount taking into consideration the political and economic situation of these countries.
All claims are assessed initially by the operational departments (including regional departments) based on internal rules for self-assessment of asset quality. Internal audit department, which is independent from the operational departments, reviews these self-assessments, and an allowance is provided based on the results of the assessments.
- (2)
- Provision for contingent losses
Provision for contingent losses is provided to prepare for the occurrence of contingent losses for a portion of the undisbursed balance of loan commitments, which JICA is absolutely obligated to extend. The amount of the provision is estimated based on the possibility of losses in the future.
5. Standard and method for the valuation of securities
- (1)
- Shares of affiliated companies
Shares of affiliated companies are stated at cost, determined using the moving-average method.
However, when the amount corresponding to the equity holding has fallen below the cost at acquisition, the amount corresponding to the equity holding is used.
- (2)
- Other investment securities (whose fair value is extremely difficult to determine)
Other investment securities are stated at cost, determined using the moving-average method.
F-108
Investments in limited partnerships and other similar partnerships, which are regarded as securities under Article 2, Clause 2 of the Japanese Financial Instruments and Exchange Law, are recognized at an amount equivalent to JICA's percentage share of the net assets of such partnerships, based upon the most recent financial statements available depending on the report date stipulated in the partnership agreement.
6. Standard and method for the valuation of derivative transactions
All derivative financial instruments are carried at fair value.
7. Method for amortization of discount on bonds payable
Discount on bonds payable is amortized over the duration of the bonds.
8. Translation standard for foreign currency-denominated assets and liabilities into yen
Foreign currency money claims and liabilities are translated into Japanese yen mainly at the spot exchange rate at the balance sheet date. Exchange differences are recognized as profit or loss.
9. Method for computing opportunity cost in the statement of administrative service operation cost
Interest rate used to compute opportunity cost concerning government investment:
0.000% with reference to the yield of 10-year fixed-rate Japanese government bonds at the end of March 2016.
10. Method of hedge accounting
- (1)
- Method of hedge accounting
Interest rate swaps are accounted for using the deferral hedge accounting method. As for interest rate and currency swaps, the interest rate part is accounted for using the accrual method and the currency part is accounted for by the assignment method.
- (2)
- Hedging instruments and hedged items
- [1]
- Hedging instruments...Interest rate swaps
- [2]
- Hedging instruments...Interest rate and currency swaps
Hedged items...Loans and bonds
Hedged items...Foreign currency bonds
- (3)
- Hedging policy
JICA engages in interest rate swaps or interest rate and currency swaps for the purpose of hedging interest rate or currency fluctuation risks.
- (4)
- Method of evaluation of hedge effectiveness
Hedges that offset market fluctuations of loans are assessed based on discrepancies with regard to maturity and notional principal and others between hedged loans and hedging instruments.
Hedges that offset market fluctuations of bonds are assessed by measuring and comparing the change in fair value of both hedging instruments and corresponding hedged items from the date of inception of the hedges to the assessment date. As for interest rate and currency swaps that satisfy the requirements of the accrual method and the assignment method, JICA is not required to periodically evaluate hedge effectiveness.
11. Accounting treatment for consumption taxes
Consumption taxes and local consumption taxes are included in transaction amounts.
F-109
Notes to the financial statements
Finance and Investment Account
(Balance Sheet)
- 1.
- Joint obligations
JICA is jointly liable for obligations arising from the following bonds issued by the former Japan Bank for International Cooperation which was succeeded by the Japan Bank for International Cooperation:
Fiscal Investment and Loan Program (FILP) Agency Bonds | 250,000,000,000 | Yen |
- 2.
- Undisbursed balance of loan commitments
Most of JICA's loans are long term. Ordinarily, when receiving a request for disbursement of a loan from a borrower, corresponding to the intended use of funds as stipulated by the loan agreement, and upon confirming the fulfillment of conditions prescribed under the loan agreement, JICA promises to loan a certain amount of funds within a certain range of the amount required by the borrower, with an outstanding balance within the limit of loan commitments. The undisbursed balance of loan commitments as of March 31, 2016 was ¥5,707,740,258,384.
(Statement of Income)
- 1.
- Gain (loss) on valuation of investment securities and gain (loss) on valuation of shares of affiliated companies
Gain (loss) on valuation of investment securities and gain (loss) on valuation of shares of affiliated companies include gain and loss resulting from valuations, sales and collections of these securities.
- 2.
- Recoveries of written-off claims
Recoveries of written-off claims include the amount recovered in excess of book value of the loans transferred to JICA on October 1, 2008, that are associated with the Overseas Economic Cooperation Account of the former Japan Bank for International Cooperation.
(Statement of Cash Flows)
The funds shown in the statement of cash flows are deposit accounts and checking accounts.
- 1.
- Breakdown of balance sheet items and ending balance of funds
| (as of March 31, 2016) | | |||
|---|---|---|---|---|
Cash and deposits | ¥87,531,224,966 | |||
| | | | | |
Ending balance of funds | ¥87,531,224,966 | |||
- 2.
- Description of significant non-cash transactions
Assets granted under finance lease
Tools, furniture, and fixtures | ¥ | 11,830,346 |
(Statement of Administrative Service Operation Cost)
Number of public officers temporarily transferred to JICA and accounted for as opportunity cost
F-110
Of the estimated increase in retirement benefits not included in the provision, ¥4,205,789 was recognized as the current-business-year increase of provision for retirement benefits for 29 public officers temporarily transferred to JICA according to JICA's internal rules.
(Financial instruments)
- 1.
- Status of financial instruments
- (1)
- Policy regarding financial instruments
- (2)
- Details of financial instruments and related risks
The Finance and Investment Account undertakes financial cooperation operations by providing debt and equity financing. In undertaking these operations, it raises funds by borrowing from the Japanese Government under the FILP, borrowing from financial institutions, issuing bonds, and receiving capital investment from the Japanese Government. From the perspective of asset-liability management (ALM), derivative transactions are conducted for mitigating the adverse impact caused by interest rate and foreign exchange fluctuations.
- (3)
- Risk management system for financial instruments
- [1]
- Credit risk management
The Finance and Investment Account has established and operates a system for credit management. This system encompasses credit appraisal, credit limit setting, credit information monitoring, internal rating, guarantee and collateral setting, problem loan management, etc., in accordance with integrated risk management rules and various credit risk-monitoring rules. This credit management is carried out by the respective departments responsible for each region in addition to the Credit Risk Analysis and Environmental Review Department and General Affairs Department. Additionally, the Risk Management Committee of the Finance and Investment Account and Board Meeting convene on a regular basis for the purpose of deliberating or reporting. Moreover, the Office of Audit monitors the status of credit management.
The credit risks of issuers of investment securities and shares of affiliated companies are monitored by the Private Sector Partnership and Finance Department, which regularly confirms their credit information, etc.
Counterparty risk in derivative transactions is monitored by regularly confirming the exposure and credit standing of counterparties and by securing collateral as necessary.
- [2]
- Market risk management
- (i)
- Interest rate risk management
Interest rates are determined in accordance with the methods prescribed by laws or statements of operational procedures. Interest rate swap transactions are conducted
The financial assets held in the Finance and Investment Account are loans mainly to developing regions, and are exposed to credit risk attributed to defaults by its borrowers and interest rate risk. Securities, investment securities, and shares of affiliated companies are held for policy-oriented purposes, and are exposed to credit risk of issuers, interest rate risk, and market price volatility risk.
Borrowings and bonds are exposed to liquidity risk as their payments or repayments cannot be duly serviced in such a situation where the account is unable to have access to markets for certain reasons. In addition to the above, foreign currency bonds are exposed to foreign exchange fluctuation risk.
F-111
- (ii)
- Foreign exchange risk management
Foreign currency bonds are exposed to foreign exchange fluctuation risk; as such, interest rate and currency swaps are employed to avert or reduce foreign exchange risk.
- (iii)
- Price volatility risk management
Stocks that are held for policy-oriented purposes are monitored for changes in value affected by the market environment or financial condition of the companies, exchange rates, and other factors.
This information is reported on a regular basis to the Risk Management Committee of the Finance and Investment Account and Board Meeting.
- [3]
- Liquidity risk management related to fund raising
The Finance and Investment Account prepares a funding plan and executes fund raising based on the government-affiliated agencies' budgets, as resolved by the National Diet.
- [4]
- Derivative transaction management
Pursuant to rules concerning swaps, derivative transactions are implemented and managed by separating the sections related to execution of transactions, assessment of hedge effectiveness, and logistics management based on a mechanism with an established internal system of checks and balances.
to hedge against the risk of interest rate fluctuations in light of their possible adverse impact.
- 2.
- Fair value of financial instruments
Balance sheet amount, fair value, and difference at the balance sheet date are as follows:
| (Unit: Yen) | ||||||||||||||||||
| | | | | | | | | | | | | | | | | | | |
| Balance sheet amount | Fair value | Difference | ||||||||||||||||
| | | | | | | | | | | | | | | | | | | |
| (1) | Loans | 11,502,090,784,898 | ||||||||||||||||
| | | | | | | | | | | | | | | | | | | |
| Allowance for loan losses | (153,208,197,398 | ) | ||||||||||||||||
| | | | | | | | | | | | | | | | | | | |
| 11,348,882,587,500 | 12,058,875,759,222 | 709,993,171,722 | ||||||||||||||||
| | | | | | | | | | | | | | | | | | | |
| (2) | Claims probable in bankruptcy, claims probable in rehabilitation, and other | 63,845,414,239 | ||||||||||||||||
| | | | | | | | | | | | | | | | | | | |
| Allowance for loan losses | (63,845,414,239 | ) | ||||||||||||||||
| | | | | | | | | | | | | | | | | | | |
| 0 | 0 | 0 | ||||||||||||||||
| | | | | | | | | | | | | | | | | | | |
| (3) | Borrowings from government fund for FILP (including borrowings due within one year) | (1,756,530,577,000 | ) | (1,866,440,558,883 | ) | (109,909,981,883 | ) | |||||||||||
| | | | | | | | | | | | | | | | | | | |
| (4) | Derivative transactions | (43,259,483,859 | ) | (43,259,483,859 | ) | 0 | ||||||||||||
| | | | | | | | | | | | | | | | | | | |
- *
- Liabilities are shown in parentheses ( ).
- (Note
- 1) Method for calculating fair values of financial instruments
- [1]
- Loans
Fair values of loans with floating interest rates are calculated at their book values, as policy interest rates (bank rates) are immediately reflected in their floating interest rates, and therefore, fair value approximates book value. On the other hand, fair values of loans with fixed interest rates are calculated by discounting the total amount of the principal and interest using a rate that combines a risk-free rate with the respective borrowers' credit risk.
- [2]
- Claims probable in bankruptcy, claims probable in rehabilitation, and other
Regarding claims probable in bankruptcy, claims probable in rehabilitation, and other, the estimated uncollectible
F-112
- [3]
- Borrowings from government fund for FILP (including borrowings due within one year)
Fair value of borrowings from government fund for FILP (including borrowings due within one year) is calculated by discounting the total amount of principal and interest using interest rates expected to be applied to new borrowings for the same total amount.
- [4]
- Derivative transactions
Derivative transactions are interest rate-related transactions (interest rate swaps), and fair values are based on discounted present values.
amount is calculated based on the expected recoverable amount through collateral and guarantees. Therefore, fair value approximates the balance sheet amount, less the current estimated uncollectible amount, and hence is calculated accordingly.
- (Note
- 2) The following are financial instruments whose fair values are deemed to be extremely difficult to determine. They are not included in the fair value information of financial instruments.
| (Unit: Yen) | ||||||||
| | | | | | | | | |
| Balance sheet amount | ||||||||
| | | | | | | | | |
| Investment securities*(1) | 923,593,356 | |||||||
| | | | | | | | | |
Shares of affiliated companies*(1) | 41,753,390,955 | |||||||
| | | | | | | | | |
Undisbursed balance of loan commitments*(2) | 0 | |||||||
| | | | | | | | | |
- *(1)
- These financial instruments have no market prices, and the calculation of their fair values is deemed to be impractical.
- *(2)
- The fair values of the undisbursed balances of loan commitments are deemed to be extremely difficult to determine. The main reason is the difficulty of reasonably estimating future extensions of loans, because of the extremely diverse range of implementation formats for projects in the developing countries where these loans are provided.
(Retirement benefits)
- 1.
- Overview of retirement benefit plans
To provide retirement benefits for employees, JICA has a defined benefit pension plan comprised of a defined benefit corporate pension plan and a lump-sum severance indemnity plan, and a defined contribution plan comprised of a defined contribution pension plan.
Effective March 1, 2014, JICA has been authorized by the Minister of Health, Labour and Welfare to be exempt from the obligations to pay future amounts in respect of the part of the welfare pension fund it manages for the government. Subsequently on April 1, 2015, JICA has been authorized to transfer to the government the past substitutional portion.
F-113
- 2.
- Defined benefit pension plan
- (1)
- The changes in the retirement benefit obligation are as follows:
| (Unit: Yen) | ||||
Retirement benefit obligation at the beginning of the fiscal year | 11,074,620,367 | |||
| | | | | |
Current service cost | 289,359,149 | |||
Interest cost | 89,647,646 | |||
Actuarial differences | (153,241,344 | ) | ||
Retirement benefit paid | (344,945,045 | ) | ||
Past service cost | 0 | |||
Contribution by the employee | 0 | |||
Decrease associated with the return of a substitutional portion of the Employees' Pension Fund | (3,032,436,206 | ) | ||
| | | | | |
Retirement benefit obligation at the end of the fiscal year | 7,923,004,567 | |||
| | | | | |
| | | | | |
| | | | | |
- (2)
- The changes in the plan assets are as follows:
| (Unit: Yen) | ||||
Plan assets at the beginning of the fiscal year | 3,743,728,949 | |||
| | | | | |
Expected return on plan assets | 0 | |||
Actuarial differences | 105,602,904 | |||
Contribution by the company | 119,127,422 | |||
Retirement benefit paid | (126,795,141 | ) | ||
Contribution by the employee | 17,927,634 | |||
| | | | | |
Plan assets at the end of the fiscal year | 3,859,591,768 | |||
| | | | | |
| | | | | |
| | | | | |
- (Note)
- Plan assets include ¥1,624,500,810 paid in advance to the National Treasury in relation to the return of the substitutional portion of the Employees' Pension Funds.
- (3)
- Reconciliation of the retirement benefit obligations and plan assets and provision for retirement benefits and prepaid pension expenses in the balance sheets
| (Unit: Yen) | ||||
Funded retirement benefit obligation | 4,396,285,857 | |||
Plan assets | (3,859,591,768 | ) | ||
| | | | | |
Unfunded benefit obligations of funded pension plan | 536,694,089 | |||
Unfunded benefit obligations of unfunded pension plan | 3,526,718,710 | |||
| | | | | |
Subtotal | 4,063,412,799 | |||
Unrecognized actuarial differences | 0 | |||
Unrecognized past service cost | 0 | |||
| | | | | |
Net amount of assets and liabilities in the balance sheets | 4,063,412,799 | |||
| | | | | |
| | | | | |
| | | | | |
Provision for retirement benefits | 4,063,412,799 | |||
Prepaid pension expenses | 0 | |||
| | | | | |
Net amount of assets and liabilities in the balance sheets | 4,063,412,799 | |||
| | | | | |
| | | | | |
| | | | | |
F-114
- (4)
- Profit or loss regarding retirement benefits
| (Unit: Yen) | ||||
Current service cost | 289,359,149 | |||
Interest cost | 89,647,646 | |||
Expected return on plans assets | 0 | |||
Realized actuarial differences | (258,844,248 | ) | ||
Amortization of past service cost | 0 | |||
Extraordinary additional retirement payments | 0 | |||
| | | | | |
Total | 120,162,547 | |||
| | | | | |
| | | | | |
| | | | | |
Profit or loss associated with the return of a substitutional portion of the Employees' Pension Fund (Note) | (3,032,436,206 | ) | ||
| | | | | |
- (Note)
- Recorded as a component of extraordinary income.
- (5)
- Major components of plan assets
Percentages of components to the total (excluding plan assets paid in advance) are as follows;
Bonds | 38 | % | ||
Stocks | 31 | % | ||
General account of life insurance company | 21 | % | ||
Others | 10 | % | ||
| | | | | |
Total | 100 | % | ||
| | | | | |
| | | | | |
| | | | | |
- (6)
- Method of determining the long-term expected rate of return on plan assets
- (7)
- Assumptions used
The long-term expected rate of return on plan assets is determined based on components of plan assets, its performance and market condition, etc.
Principal assumptions used in actuarial calculations at the end of the fiscal year
Discount rate | Defined benefit corporate pension plan | 0.23 | % | |||
Retirement benefits | 0.74 | % | ||||
Long-term expected rate of return on plan assets | 0.00 | % | ||||
- 3.
- Defined contribution plan
The amount of contribution required to be made to the defined contribution plan is ¥13,044,921.
(Lease transactions)
Future minimum lease payments related to operating lease transactions are as follows:
Future minimum lease payments due within one year of the balance sheet date | ¥ | 186,974 | ||
Future minimum lease payments corresponding to periods more than one year from the balance sheet date | ¥ | 744,377 |
(Asset retirement obligations)
JICA has a building lease agreement for its head office building, and has an obligation to restore the building to its original state at the termination of the lease period. Therefore, the asset retirement
F-115
obligations have been recorded. The estimate for the asset retirement obligations assumes a five-year lease period for the projected period of use and a discount rate of 0.529%.
The balance of the asset retirement obligations at the end of the current business year was ¥70,374,150.
(Profit and loss under the equity method)
JICA does not maintain any specific affiliated companies and, as such, does not prepare consolidated financial statements. However, profit and loss under the equity method related to affiliated companies are as follows:
Investment amount in affiliated companies | ¥ | 41,753,390,955 | ||
Investment amount when applying the equity method | ¥ | 50,160,905,916 | ||
Capital gain amount from investments when applying the equity method | ¥ | 18,016,408,651 |
(Significant Contractual Liabilities)
Not applicable.
(Significant subsequent events)
Appropriation of profit was approved as follows on May 31, 2016:
| (Unit: Yen) | |||||||||
| I. | Unappropriated income for the current business year | 102,762,464,386 | |||||||
| Total income for the current business year | 102,762,464,386 | ||||||||
II. | Profit appropriation amount | ||||||||
| Reserve fund | 102,762,464,386 | 102,762,464,386 | |||||||
F-116
The Accompanying Supplementary Schedules
Finance and Investment Account
(1) Details of acquisition and disposal of non-current assets, depreciation, and accumulated impairment loss
| (Unit: Yen) | |||||||||||||||||||||||||||||||||||||||||||||||||||||||||||||||
| | | | | | | | | | | | | | | | | | | | | | | | | | | | | | | | | | | | | | | | | | | | | | | | | | | | | | | | | | | | | | | | |
| Accumulated depreciation | Accumulated impairment loss | ||||||||||||||||||||||||||||||||||||||||||||||||||||||||||||||
| | | | | | | | | | | | | | | | | | | | | | | | | | | | | | | | | | | | | | | | | | | | | | | | | | | | | | | | | | | | | | | | |
| Type | Balance at the beginning of the period | Increase during the period | Decrease during the period | Balance at the end of the period | Depreciation during the period | Impairment loss during the period (recognized in the statement of income) | Impairment loss during the period (not recognized in the statement of income) | Net assets at the end of the period | Remarks | ||||||||||||||||||||||||||||||||||||||||||||||||||||||
| | | | | | | | | | | | | | | | | | | | | | | | | | | | | | | | | | | | | | | | | | | | | | | | | | | | | | | | | | | | | | | | |
| Buildings | 3,198,330,904 | 48,732,818 | 2,554,174 | 3,244,509,548 | 899,795,733 | 92,169,428 | 675,214,797 | 0 | 0 | 1,669,499,018 | |||||||||||||||||||||||||||||||||||||||||||||||||||||
| | | | | | | | | | | | | | | | | | | | | | | | | | | | | | | | | | | | | | | | | | | | | | | | | | | | | | | | | | | | | | | | |
| Structures | 50,459,764 | 0 | 0 | 50,459,764 | 20,856,209 | 1,936,128 | 11,670,468 | 0 | 0 | 17,933,087 | |||||||||||||||||||||||||||||||||||||||||||||||||||||
| | | | | | | | | | | | | | | | | | | | | | | | | | | | | | | | | | | | | | | | | | | | | | | | | | | | | | | | | | | | | | | | |
| Tangible assets (Depreciation included in expenses) | Machinery and equipment | 194,618,606 | 951,726 | 1,646,392 | 193,923,940 | 62,111,035 | 3,800,321 | 102,287,680 | 0 | 0 | 29,525,225 | ||||||||||||||||||||||||||||||||||||||||||||||||||||
| | | | | | | | | | | | | | | | | | | | | | | | | | | | | | | | | | | | | | | | | | | | | | | | | | | | | | | | | | | | | | | | |
| Vehicles | 350,083,187 | 35,216,023 | 43,595,043 | 341,704,167 | 217,899,918 | 32,825,776 | 0 | 0 | 0 | 123,804,249 | |||||||||||||||||||||||||||||||||||||||||||||||||||||
| | | | | | | | | | | | | | | | | | | | | | | | | | | | | | | | | | | | | | | | | | | | | | | | | | | | | | | | | | | | | | | | |
| Tools, furniture, and fixtures | 642,072,291 | 28,003,211 | 317,490,067 | 352,585,435 | 208,164,963 | 109,774,849 | 0 | 0 | 0 | 144,420,472 | |||||||||||||||||||||||||||||||||||||||||||||||||||||
| | | | | | | | | | | | | | | | | | | | | | | | | | | | | | | | | | | | | | | | | | | | | | | | | | | | | | | | | | | | | | | | |
| Total | 4,435,564,752 | 112,903,778 | 365,285,676 | 4,183,182,854 | 1,408,827,858 | 240,506,502 | 789,172,945 | 0 | 0 | 1,985,182,051 | |||||||||||||||||||||||||||||||||||||||||||||||||||||
| | | | | | | | | | | | | | | | | | | | | | | | | | | | | | | | | | | | | | | | | | | | | | | | | | | | | | | | | | | | | | | | |
| Tangible assets (Non-depreciable assets) | Land | 12,703,270,000 | 0 | 0 | 12,703,270,000 | 0 | 0 | 6,091,196,973 | 0 | 0 | 6,612,073,027 | ||||||||||||||||||||||||||||||||||||||||||||||||||||
| | | | | | | | | | | | | | | | | | | | | | | | | | | | | | | | | | | | | | | | | | | | | | | | | | | | | | | | | | | | | | | | |
| Construction in progress | 7,840,044 | 13,544,889 | 8,353,761 | 13,031,172 | 0 | 0 | 0 | 0 | 0 | 13,031,172 | |||||||||||||||||||||||||||||||||||||||||||||||||||||
| | | | | | | | | | | | | | | | | | | | | | | | | | | | | | | | | | | | | | | | | | | | | | | | | | | | | | | | | | | | | | | | |
| Total | 12,711,110,044 | 13,544,889 | 8,353,761 | 12,716,301,172 | 0 | 0 | 6,091,196,973 | 0 | 0 | 6,625,104,199 | |||||||||||||||||||||||||||||||||||||||||||||||||||||
| | | | | | | | | | | | | | | | | | | | | | | | | | | | | | | | | | | | | | | | | | | | | | | | | | | | | | | | | | | | | | | | |
| Buildings | 3,198,330,904 | 48,732,818 | 2,554,174 | 3,244,509,548 | 899,795,733 | 92,169,428 | 675,214,797 | 0 | 0 | 1,669,499,018 | |||||||||||||||||||||||||||||||||||||||||||||||||||||
| | | | | | | | | | | | | | | | | | | | | | | | | | | | | | | | | | | | | | | | | | | | | | | | | | | | | | | | | | | | | | | | |
| Structures | 50,459,764 | 0 | 0 | 50,459,764 | 20,856,209 | 1,936,128 | 11,670,468 | 0 | 0 | 17,933,087 | |||||||||||||||||||||||||||||||||||||||||||||||||||||
| | | | | | | | | | | | | | | | | | | | | | | | | | | | | | | | | | | | | | | | | | | | | | | | | | | | | | | | | | | | | | | | |
| Total tangible assets | Machinery and equipment | 194,618,606 | 951,726 | 1,646,392 | 193,923,940 | 62,111,035 | 3,800,321 | 102,287,680 | 0 | 0 | 29,525,225 | ||||||||||||||||||||||||||||||||||||||||||||||||||||
| | | | | | | | | | | | | | | | | | | | | | | | | | | | | | | | | | | | | | | | | | | | | | | | | | | | | | | | | | | | | | | | |
| Vehicles | 350,083,187 | 35,216,023 | 43,595,043 | 341,704,167 | 217,899,918 | 32,825,776 | 0 | 0 | 0 | 123,804,249 | |||||||||||||||||||||||||||||||||||||||||||||||||||||
| | | | | | | | | | | | | | | | | | | | | | | | | | | | | | | | | | | | | | | | | | | | | | | | | | | | | | | | | | | | | | | | |
| Tools, furniture, and fixtures | 642,072,291 | 28,003,211 | 317,490,067 | 352,585,435 | 208,164,963 | 109,774,849 | 0 | 0 | 0 | 144,420,472 | |||||||||||||||||||||||||||||||||||||||||||||||||||||
| | | | | | | | | | | | | | | | | | | | | | | | | | | | | | | | | | | | | | | | | | | | | | | | | | | | | | | | | | | | | | | | |
| Land | 12,703,270,000 | 0 | 0 | 12,703,270,000 | 0 | 0 | 6,091,196,973 | 0 | 0 | 6,612,073,027 | |||||||||||||||||||||||||||||||||||||||||||||||||||||
| | | | | | | | | | | | | | | | | | | | | | | | | | | | | | | | | | | | | | | | | | | | | | | | | | | | | | | | | | | | | | | | |
| Construction in progress | 7,840,044 | 13,544,889 | 8,353,761 | 13,031,172 | 0 | 0 | 0 | 0 | 0 | 13,031,172 | |||||||||||||||||||||||||||||||||||||||||||||||||||||
| | | | | | | | | | | | | | | | | | | | | | | | | | | | | | | | | | | | | | | | | | | | | | | | | | | | | | | | | | | | | | | | |
| Total | 17,146,674,796 | 126,448,667 | 373,639,437 | 16,899,484,026 | 1,408,827,858 | 240,506,502 | 6,880,369,918 | 0 | 0 | 8,610,286,250 | |||||||||||||||||||||||||||||||||||||||||||||||||||||
| | | | | | | | | | | | | | | | | | | | | | | | | | | | | | | | | | | | | | | | | | | | | | | | | | | | | | | | | | | | | | | | |
| Intangible assets (Depreciation included in expenses) | Trademark right | 731,316 | 0 | 0 | 731,316 | 202,047 | 76,364 | 0 | 0 | 0 | 529,269 | ||||||||||||||||||||||||||||||||||||||||||||||||||||
| | | | | | | | | | | | | | | | | | | | | | | | | | | | | | | | | | | | | | | | | | | | | | | | | | | | | | | | | | | | | | | | |
| Software | 0 | 47,832,033 | 0 | 47,832,033 | 5,174,003 | 5,174,003 | 0 | 0 | 0 | 42,658,030 | |||||||||||||||||||||||||||||||||||||||||||||||||||||
| | | | | | | | | | | | | | | | | | | | | | | | | | | | | | | | | | | | | | | | | | | | | | | | | | | | | | | | | | | | | | | | |
| Total | 731,316 | 47,832,033 | 0 | 48,563,349 | 5,376,050 | 5,250,367 | 0 | 0 | 0 | 43,187,299 | |||||||||||||||||||||||||||||||||||||||||||||||||||||
| | | | | | | | | | | | | | | | | | | | | | | | | | | | | | | | | | | | | | | | | | | | | | | | | | | | | | | | | | | | | | | | |
| Intangible assets (Non-depreciable assets) | Software in progress | 0 | 192,453,675 | 0 | 192,453,675 | 0 | 0 | 0 | 0 | 0 | 192,453,675 | ||||||||||||||||||||||||||||||||||||||||||||||||||||
| | | | | | | | | | | | | | | | | | | | | | | | | | | | | | | | | | | | | | | | | | | | | | | | | | | | | | | | | | | | | | | | |
| Total | 0 | 192,453,675 | 0 | 192,453,675 | 0 | 0 | 0 | 0 | 0 | 192,453,675 | |||||||||||||||||||||||||||||||||||||||||||||||||||||
| | | | | | | | | | | | | | | | | | | | | | | | | | | | | | | | | | | | | | | | | | | | | | | | | | | | | | | | | | | | | | | | |
| Trademark right | 731,316 | 0 | 0 | 731,316 | 202,047 | 76,364 | 0 | 0 | 0 | 529,269 | |||||||||||||||||||||||||||||||||||||||||||||||||||||
| | | | | | | | | | | | | | | | | | | | | | | | | | | | | | | | | | | | | | | | | | | | | | | | | | | | | | | | | | | | | | | | |
| Total intangible assets | Software | 0 | 47,832,033 | 0 | 47,832,033 | 5,174,003 | 5,174,003 | 0 | 0 | 0 | 42,658,030 | ||||||||||||||||||||||||||||||||||||||||||||||||||||
| | | | | | | | | | | | | | | | | | | | | | | | | | | | | | | | | | | | | | | | | | | | | | | | | | | | | | | | | | | | | | | | |
| Software in progress | 0 | 192,453,675 | 0 | 192,453,675 | 0 | 0 | 0 | 0 | 0 | 192,453,675 | |||||||||||||||||||||||||||||||||||||||||||||||||||||
| | | | | | | | | | | | | | | | | | | | | | | | | | | | | | | | | | | | | | | | | | | | | | | | | | | | | | | | | | | | | | | | |
| Total | 731,316 | 240,285,708 | 0 | 241,017,024 | 5,376,050 | 5,250,367 | 0 | 0 | 0 | 235,640,974 | |||||||||||||||||||||||||||||||||||||||||||||||||||||
| | | | | | | | | | | | | | | | | | | | | | | | | | | | | | | | | | | | | | | | | | | | | | | | | | | | | | | | | | | | | | | | |
| Investment securities | 139,850,556 | 948,845,991 | 165,103,191 | 923,593,356 | 0 | 0 | 0 | 0 | 0 | 923,593,356 | |||||||||||||||||||||||||||||||||||||||||||||||||||||
| | | | | | | | | | | | | | | | | | | | | | | | | | | | | | | | | | | | | | | | | | | | | | | | | | | | | | | | | | | | | | | | |
| Shares of affiliated companies | 43,046,266,782 | 0 | 1,292,875,827 | 41,753,390,955 | 0 | 0 | 0 | 0 | 0 | 41,753,390,955 | |||||||||||||||||||||||||||||||||||||||||||||||||||||
| | | | | | | | | | | | | | | | | | | | | | | | | | | | | | | | | | | | | | | | | | | | | | | | | | | | | | | | | | | | | | | | |
| Claims probable in bankruptcy, claims probable in rehabilitation, and other | 68,324,707,686 | 0 | 4,479,293,447 | 63,845,414,239 | 0 | 0 | 0 | 0 | 0 | 63,845,414,239 | |||||||||||||||||||||||||||||||||||||||||||||||||||||
| | | | | | | | | | | | | | | | | | | | | | | | | | | | | | | | | | | | | | | | | | | | | | | | | | | | | | | | | | | | | | | | |
| Investments and other assets | Allowance for loan losses (non-current) | (60,988,674,161 | ) | (2,856,740,078 | ) | 0 | (63,845,414,239 | ) | 0 | 0 | 0 | 0 | 0 | (63,845,414,239 | ) | ||||||||||||||||||||||||||||||||||||||||||||||||
| | | | | | | | | | | | | | | | | | | | | | | | | | | | | | | | | | | | | | | | | | | | | | | | | | | | | | | | | | | | | | | | |
| Long-term prepaid expenses | 28,634,369 | 5,456,254 | 15,757,491 | 18,333,132 | 0 | 0 | 0 | 0 | 0 | 18,333,132 | |||||||||||||||||||||||||||||||||||||||||||||||||||||
| | | | | | | | | | | | | | | | | | | | | | | | | | | | | | | | | | | | | | | | | | | | | | | | | | | | | | | | | | | | | | | | |
| Long-term guarantee deposits | 830,565,893 | 20,812,081 | 124,848,980 | 726,528,994 | 0 | 0 | 0 | 0 | 0 | 726,528,994 | |||||||||||||||||||||||||||||||||||||||||||||||||||||
| | | | | | | | | | | | | | | | | | | | | | | | | | | | | | | | | | | | | | | | | | | | | | | | | | | | | | | | | | | | | | | | |
| Total | 51,381,351,125 | (1,881,625,752 | ) | 6,077,878,936 | 43,421,846,437 | 0 | 0 | 0 | 0 | 0 | 43,421,846,437 | ||||||||||||||||||||||||||||||||||||||||||||||||||||
| | | | | | | | | | | | | | | | | | | | | | | | | | | | | | | | | | | | | | | | | | | | | | | | | | | | | | | | | | | | | | | | |
F-117
- (2)
- Details of securities
Securities recorded under investments and other assets
(Unit: Yen) | ||||||||||||||||||||||||||||||||||||||
| | | | | | | | | | | | | | | | | | | | | | | | | | | | | | | | | | | | | | | |
| Name | Acquisition cost | Value obtained by multiplying the net asset value by the percentage of shareholding | Balance sheet amount | Valuation difference recognized in the statement of income of the period | Remarks | ||||||||||||||||||||||||||||||||
| | | | | | | | | | | | | | | | | | | | | | | | | | | | | | | | | | | | | | | |
| Sumatra Pulp Corporation | 883,835,338 | (154,261,982 | ) | 1 | (804,114,098 | ) | |||||||||||||||||||||||||||||||
| | | | | | | | | | | | | | | | | | | | | | | | | | | | | | | | | | | | | | | |
| Japan Saudi Arabia Methanol Co., Inc. | 7,149,297,104 | 5,504,422,473 | 5,504,422,473 | 514,043 | |||||||||||||||||||||||||||||||||
| | | | | | | | | | | | | | | | | | | | | | | | | | | | | | | | | | | | | | | |
| Shares of affiliated companies | SPDC Ltd. | 7,269,880,619 | 14,615,960,836 | 7,269,880,619 | 0 | ||||||||||||||||||||||||||||||||
| | | | | | | | | | | | | | | | | | | | | | | | | | | | | | | | | | | | | | | |
| KAFCO Japan Investment Co., Ltd. | 2,436,204,983 | 2,503,698,876 | 2,436,204,983 | 0 | |||||||||||||||||||||||||||||||||
| | | | | | | | | | | | | | | | | | | | | | | | | | | | | | | | | | | | | | | |
| Nippon Amazon Aluminum Co., Ltd | 26,002,629,979 | 26,469,583,990 | 26,002,629,979 | 0 | |||||||||||||||||||||||||||||||||
| | | | | | | | | | | | | | | | | | | | | | | | | | | | | | | | | | | | | | | |
| The First MicroFinanceBank Ltd. | 218,880,000 | 301,380,110 | 218,880,000 | (40,926,522 | ) | ||||||||||||||||||||||||||||||||
| | | | | | | | | | | | | | | | | | | | | | | | | | | | | | | | | | | | | | | |
| Myanmar Japan Thilawa Development Ltd. | 321,372,900 | 639,967,413 | 321,372,900 | 0 | |||||||||||||||||||||||||||||||||
| | | | | | | | | | | | | | | | | | | | | | | | | | | | | | | | | | | | | | | |
| Total | 44,282,100,923 | 49,880,751,716 | 41,753,390,955 | (844,526,577 | ) | ||||||||||||||||||||||||||||||||
| | | | | | | | | | | | | | | | | | | | | | | | | | | | | | | | | | | | | | | |
| Type and name | Acquisition cost | Fair value | Balance sheet amount | Valuation difference recognized in the statement of income of the period | Valuation difference on other securities | Remarks | |||||||||||||||||||||||||||||||
| | | | | | | | | | | | | | | | | | | | | | | | | | | | | | | | | | | | | | | |
| Other securities | Prototype Carbon Fund | 1 | — | 1 | 0 | 0 | |||||||||||||||||||||||||||||||
| | | | | | | | | | | | | | | | | | | | | | | | | | | | | | | | | | | | | | | |
| MGM Sustainable Energy Fund L.P. | 236,233,010 | — | 151,458,803 | (77,949,645 | ) | (6,824,562 | ) | ||||||||||||||||||||||||||||||
| | | | | | | | | | | | | | | | | | | | | | | | | | | | | | | | | | | | | | | |
| Asia Climate Partner L.P. | 817,120,014 | — | 772,134,552 | 0 | (44,985,462 | ) | |||||||||||||||||||||||||||||||
| | | | | | | | | | | | | | | | | | | | | | | | | | | | | | | | | | | | | | | |
| Total | 1,053,353,025 | — | 923,593,356 | (77,949,645 | ) | (51,810,024 | ) | ||||||||||||||||||||||||||||||
| | | | | | | | | | | | | | | | | | | | | | | | | | | | | | | | | | | | | | | |
| Total balance sheet amount | 42,676,984,311 | (51,810,024 | ) | ||||||||||||||||||||||||||||||||||
| | | | | | | | | | | | | | | | | | | | | | | | | | | | | | | | | | | | | | | |
F-118
(3) Details of loans
| (Unit: Yen) | ||||||||||||||||||||||||||||||||||
| | | | | | | | | | | | | | | | | | | | | | | | | | | | | | | | | | | |
| Decrease during the period | ||||||||||||||||||||||||||||||||||
| | | | | | | | �� | | | | | | | | | | | | | | | | | | | | | | | | | | | |
| Classification | Balance at the beginning of the period | Increase during the period | Collection, etc. | Write-off | Balance at the end of the period | Remarks | ||||||||||||||||||||||||||||
| | | | | | | | | | | | | | | | | | | | | | | | | | | | | | | | | | | |
| Loans | 11,223,480,672,780 | 973,734,353,586 | 695,124,241,468 | 0 | 11,502,090,784,898 | |||||||||||||||||||||||||||||
| | | | | | | | | | | | | | | | | | | | | | | | | | | | | | | | | | | |
| Claims probable in bankruptcy, claims probable in rehabilitation, and other | 68,324,707,686 | 0 | 4,479,293,447 | 0 | 63,845,414,239 | |||||||||||||||||||||||||||||
| | | | | | | | | | | | | | | | | | | | | | | | | | | | | | | | | | | |
| Total | 11,291,805,380,466 | 973,734,353,586 | 699,603,534,915 | 0 | 11,565,936,199,137 | |||||||||||||||||||||||||||||
| | | | | | | | | | | | | | | | | | | | | | | | | | | | | | | | | | | |
- *
- Increase during the period and decrease during the period by collection in the current business year include reclassifications between "Loans" and "Claims probable in bankruptcy, claims probable in rehabilitation and other".
(4) Details of borrowings
| (Unit: Yen) | ||||||||||||||||||||||||||||||||||||||
| | | | | | | | | | | | | | | | | | | | | | | | | | | | | | | | | | | | | | | |
| Classification | Balance at the beginning of the period | Increase during the period | Decrease during the period | Balance at the end of the period | Average interest rate (%) | Maturity date | Remarks | |||||||||||||||||||||||||||||||
| | | | | | | | | | | | | | | | | | | | | | | | | | | | | | | | | | | | | | | |
| Borrowings from government fund for Fiscal Investment and Loan Program | 1,703,585,530,000 | 297,300,000,000 | 244,354,953,000 | 1,756,530,577,000 (219,211,646,000 | ) | 1.157 | June 2016- November 2040 | |||||||||||||||||||||||||||||||
| | | | | | | | | | | | | | | | | | | | | | | | | | | | | | | | | | | | | | | |
- *
- Figures in parentheses indicate the amount of borrowings repayable within one year.
F-119
(5) Details of bonds
(Unit: Yen) | ||||||||||||||||||||||||||||||||||||
| | | | | | | | | | | | | | | | | | | | | | | | | | | | | | | | | | | | | |
| Security name | Balance at the beginning of the period | Increase during the period | Decrease during the period | Balance at the end of the period | Coupon (%) | Maturity date | Remarks | ||||||||||||||||||||||||||||
| | | | | | | | | | | | | | | | | | | | | | | | | | | | | | | | | | | | | |
| FILP Agency Bonds | |||||||||||||||||||||||||||||||||||
| | | | | | | | | | | | | | | | | | | | | | | | | | | | | | | | | | | | | |
| FILP Agency Bonds (1st) | 0 | 30,000,000,000 (0 | ) | 2.470 | September 2028 | ||||||||||||||||||||||||||||||
| | | | | | | | | | | | | | | | | | | | | | | | | | | | | | | | | | | | | |
| FILP Agency Bonds (2nd) | 30,000,000,000 | 0 | 30,000,000,000 (0 | ) | 2.341 | June 2029 | |||||||||||||||||||||||||||||
| | | | | | | | | | | | | | | | | | | | | | | | | | | | | | | | | | | | | |
| FILP Agency Bonds (3rd) | 20,000,000,000 | 0 | 20,000,000,000 (0 | ) | 2.134 | December 2029 | |||||||||||||||||||||||||||||
| | | | | | | | | | | | | | | | | | | | | | | | | | | | | | | | | | | | | |
| FILP Agency Bonds (4th) | 0 | 20,000,000,000 (0 | ) | 2.079 | June 2030 | ||||||||||||||||||||||||||||||
| | | | | | | | | | | | | | | | | | | | | | | | | | | | | | | | | | | | | |
| FILP Agency Bonds (5th) | 0 | 20,000,000,000 (0 | ) | 1.918 | September 2030 | ||||||||||||||||||||||||||||||
| | | | | | | | | | | | | | | | | | | | | | | | | | | | | | | | | | | | | |
| FILP Agency Bonds (6th) | 0 | 20,000,000,000 (0 | ) | 2.098 | December 2030 | ||||||||||||||||||||||||||||||
| | | | | | | | | | | | | | | | | | | | | | | | | | | | | | | | | | | | | |
| FILP Agency Bonds (7th) | 0 | 20,000,000,000 (0 | ) | 1.991 | June 2031 | ||||||||||||||||||||||||||||||
| | | | | | | | | | | | | | | | | | | | | | | | | | | | | | | | | | | | | |
| FILP Agency Bonds (8th) | 0 | 15,000,000,000 (0 | ) | 1.554 | September 2026 | ||||||||||||||||||||||||||||||
| | | | | | | | | | | | | | | | | | | | | | | | | | | | | | | | | | | | | |
| FILP Agency Bonds (9th) | 0 | 5,000,000,000 (0 | ) | 2.129 | September 2041 | ||||||||||||||||||||||||||||||
| | | | | | | | | | | | | | | | | | | | | | | | | | | | | | | | | | | | | |
| FILP Agency Bonds (10th) | 0 (0 | ) | 0.380 | December 2015 | |||||||||||||||||||||||||||||||
| | | | | | | | | | | | | | | | | | | | | | | | | | | | | | | | | | | | | |
| FILP Agency Bonds (11th) | 0 | 10,000,000,000 (0 | ) | 1.140 | December 2021 | ||||||||||||||||||||||||||||||
| | | | | | | | | | | | | | | | | | | | | | | | | | | | | | | | | | | | | |
| FILP Agency Bonds (12th) | 0 | 10,000,000,000 (0 | ) | 0.901 | June 2022 | ||||||||||||||||||||||||||||||
| | | | | | | | | | | | | | | | | | | | | | | | | | | | | | | | | | | | | |
| FILP Agency Bonds (13th) | 0 | 10,000,000,000 (0 | ) | 1.752 | June 2032 | ||||||||||||||||||||||||||||||
| | | | | | | | | | | | | | | | | | | | | | | | | | | | | | | | | | | | | |
| FILP Agency Bonds (14th) | 0 | 10,000,000,000 (0 | ) | 0.825 | September 2022 | ||||||||||||||||||||||||||||||
| | | | | | | | | | | | | | | | | | | | | | | | | | | | | | | | | | | | | |
| FILP Agency Bonds (15th) | 0 | 10,000,000,000 (0 | ) | 1.724 | September 2032 | ||||||||||||||||||||||||||||||
| | | | | | | | | | | | | | | | | | | | | | | | | | | | | | | | | | | | | |
| FILP Agency Bonds (16th) | 0 | 10,000,000,000 (0 | ) | 0.300 | December 2018 | ||||||||||||||||||||||||||||||
| | | | | | | | | | | | | | | | | | | | | | | | | | | | | | | | | | | | | |
| FILP Agency Bonds (17th) | 0 | 10,000,000,000 (0 | ) | 0.720 | December 2022 | ||||||||||||||||||||||||||||||
| | | | | | | | | | | | | | | | | | | | | | | | | | | | | | | | | | | | | |
| FILP Agency Bonds (18th) | 0 | 10,000,000,000 (0 | ) | 0.868 | June 2023 | ||||||||||||||||||||||||||||||
| | | | | | | | | | | | | | | | | | | | | | | | | | | | | | | | | | | | | |
| FILP Agency Bonds (19th) | 0 | 10,000,000,000 (0 | ) | 1.725 | June 2033 | ||||||||||||||||||||||||||||||
| | | | | | | | | | | | | | | | | | | | | | | | | | | | | | | | | | | | | |
| FILP Agency Bonds (20th) | 0 | 10,000,000,000 (0 | ) | 0.787 | September 2023 | ||||||||||||||||||||||||||||||
| | | | | | | | | | | | | | | | | | | | | | | | | | | | | | | | | | | | | |
| FILP Agency Bonds (21st) | 0 | 10,000,000,000 (0 | ) | 1.734 | September 2033 | ||||||||||||||||||||||||||||||
| | | | | | | | | | | | | | | | | | | | | | | | | | | | | | | | | | | | | |
| FILP Agency Bonds (22nd) | 0 | 10,000,000,000 (0 | ) | 0.260 | December 2018 | ||||||||||||||||||||||||||||||
| | | | | | | | | | | | | | | | | | | | | | | | | | | | | | | | | | | | | |
| FILP Agency Bonds (23rd) | 0 | 10,000,000,000 (0 | ) | 0.684 | February 2024 | ||||||||||||||||||||||||||||||
| | | | | | | | | | | | | | | | | | | | | | | | | | | | | | | | | | | | | |
| FILP Agency Bonds (24th) | 0 | 10,000,000,000 (0 | ) | 0.655 | June 2024 | ||||||||||||||||||||||||||||||
| | | | | | | | | | | | | | | | | | | | | | | | | | | | | | | | | | | | | |
| FILP Agency Bonds (25th) | 0 | 10,000,000,000 (0 | ) | 1.520 | June 2034 | ||||||||||||||||||||||||||||||
| | | | | | | | | | | | | | | | | | | | | | | | | | | | | | | | | | | | | |
| FILP Agency Bonds (26th) | 0 | 10,000,000,000 (0 | ) | 0.588 | September 2024 | ||||||||||||||||||||||||||||||
| | | | | | | | | | | | | | | | | | | | | | | | | | | | | | | | | | | | | |
| FILP Agency Bonds (27th) | 0 | 10,000,000,000 (0 | ) | 1.451 | September 2034 | ||||||||||||||||||||||||||||||
| | | | | | | | | | | | | | | | | | | | | | | | | | | | | | | | | | | | | |
| FILP Agency Bonds (28th) | 0 | 10,000,000,000 (0 | ) | 0.150 | December 2019 | ||||||||||||||||||||||||||||||
| | | | | | | | | | | | | | | | | | | | | | | | | | | | | | | | | | | | | |
| FILP Agency Bonds (29th) | 0 | 10,000,000,000 (0 | ) | 0.583 | June 2025 | ||||||||||||||||||||||||||||||
| | | | | | | | | | | | | | | | | | | | | | | | | | | | | | | | | | | | | |
| FILP Agency Bonds (30th) | 0 | 10,000,000,000 (0 | ) | 1.299 | June 2035 | ||||||||||||||||||||||||||||||
| | | | | | | | | | | | | | | | | | | | | | | | | | | | | | | | | | | | | |
| FILP Agency Bonds (31th) | 0 | 10,000,000,000 (0 | ) | 0.530 | September 2025 | ||||||||||||||||||||||||||||||
| | | | | | | | | | | | | | | | | | | | | | | | | | | | | | | | | | | | | |
| FILP Agency Bonds (32th) | 0 | 10,000,000,000 (0 | ) | 1.212 | September 2035 | ||||||||||||||||||||||||||||||
| | | | | | | | | | | | | | | | | | | | | | | | | | | | | | | | | | | | | |
| FILP Agency Bonds (33th) | 0 | 10,000,000,000 (0 | ) | 1.130 | December 2035 | ||||||||||||||||||||||||||||||
| | | | | | | | | | | | | | | | | | | | | | | | | | | | | | | | | | | | | |
| FILP Agency Bonds (34th) | 0 | 10,000,000,000 (0 | ) | 0.245 | February 2026 | ||||||||||||||||||||||||||||||
| | | | | | | | | | | | | | | | | | | | | | | | | | | | | | | | | | | | | |
| Subtotal | 370,000,000,000 | 60,000,000,000 | 420,000,000,000 (0 | ) | |||||||||||||||||||||||||||||||
| | | | | | | | | | | | | | | | | | | | | | | | | | | | | | | | | | | | | |
F-120
(Unit: Yen) | ||||||||||||||||||||||||||||||||||||
| | | | | | | | | | | | | | | | | | | | | | | | | | | | | | | | | | | | | |
| Security name | Balance at the beginning of the period | Increase during the period | Decrease during the period | Balance at the end of the period | Coupon (%) | Maturity date | Remarks | ||||||||||||||||||||||||||||
| | | | | | | | | | | | | | | | | | | | | | | | | | | | | | | | | | | | | |
| Government-guaranteed bonds | |||||||||||||||||||||||||||||||||||
| | | | | | | | | | | | | | | | | | | | | | | | | | | | | | | | | | | | | |
| Japan International Cooperation Agency Government-guaranteed bonds (1st) | [$ | 500,000,000] | 0 | 57,305,000,000 [$500,000,000] (0 | ) | 1.875 | November 2019 | ||||||||||||||||||||||||||||
| | | | | | | | | | | | | | | | | | | | | | | | | | | | | | | | | | | | | |
| Subtotal | 0 | 57,305,000,000 (0 | ) | ||||||||||||||||||||||||||||||||
| | | | | | | | | | | | | | | | | | | | | | | | | | | | | | | | | | | | | |
| Total | 60,000,000,000 | 477,305,000,000 (0 | ) | ||||||||||||||||||||||||||||||||
| | | | | | | | | | | | | | | | | | | | | | | | | | | | | | | | | | | | | |
- *
- Figures in parentheses indicate the amount of bonds redeemable within one year. The amount in [ ] is denominated in a foreign currency
(6) Details of provisions
(Unit: Yen) | ||||||||||||||||||||||||||||||||||
| | | | | | | | | | | | | | | | | | | | | | | | | | | | | | | | | | | |
| Decrease during the period | |||||||||||||||||||||||||||||||||
| | | | | | | | | | | | | | | | | | | | | | | | | | | | | | | | | | | |
| Classification | Balance at the beginning of the period | Increase during the period | Use for purpose | Others | Balance at the end of the period | Remarks | |||||||||||||||||||||||||||
| | | | | | | | | | | | | | | | | | | | | | | | | | | | | | | | | | | |
| Provision for bonuses | 234,605,336 | 259,858,791 | 234,605,336 | 0 | 259,858,791 | ||||||||||||||||||||||||||||
| | | | | | | | | | | | | | | | | | | | | | | | | | | | | | | | | | | |
| Provision for contingent losses | 11,697,233,092 | 15,671,532,167 | 20,298,803 | 11,582,228,702 | 15,766,237,754 | ||||||||||||||||||||||||||||
| | | | | | | | | | | | | | | | | | | | | | | | | | | | | | | | | | | |
| Total | 11,931,838,428 | 15,931,390,958 | 254,904,139 | 11,582,228,702 | 16,026,096,545 | ||||||||||||||||||||||||||||
| | | | | | | | | | | | | | | | | | | | | | | | | | | | | | | | | | | |
- *
- Decrease during the period (others) for the provision for contingent losses indicates the amount of reversal of the provision after revaluation.
(7) Details of allowance for loan losses, etc.
| (Unit: Yen) | |||||||||||||||||||||||||||||||||||||||
| | | | | | | | | | | | | | | | | | | | | | | | | | | | | | | | | | | | | | | | |
| Balance of loans, etc. | Balance of allowance for loan losses | ||||||||||||||||||||||||||||||||||||||
| | | | | | | | | | | | | | | | | | | | | | | | | | | | | | | | | | | | | | | | |
| Classification | Balance at the beginning of the period | Increase or decrease during the period | Balance at the end of the period | Balance at the beginning of the period | Increase or decrease during the period | Balance at the end of the period | Remarks | ||||||||||||||||||||||||||||||||
| | | | | | | | | | | | | | | | | | | | | | | | | | | | | | | | | | | | | | | | |
| Loans | 11,223,480,672,780 | 278,610,112,118 | 11,502,090,784,898 | 145,266,937,934 | 7,941,259,464 | 153,208,197,398 | |||||||||||||||||||||||||||||||||
| | | | | | | | | | | | | | | | | | | | | | | | | | | | | | | | | | | | | | | | |
| Claims probable in bankruptcy, claims probable in rehabilitation, and other | 68,324,707,686 | (4,479,293,447 | ) | 63,845,414,239 | 60,988,674,161 | 2,856,740,078 | 63,845,414,239 | ||||||||||||||||||||||||||||||||
| | | | | | | | | | | | | | | | | | | | | | | | | | | | | | | | | | | | | | | | |
| Total | 11,291,805,380,466 | 274,130,818,671 | 11,565,936,199,137 | 206,255,612,095 | 10,797,999,542 | 217,053,611,637 | |||||||||||||||||||||||||||||||||
| | | | | | | | | | | | | | | | | | | | | | | | | | | | | | | | | | | | | | | | |
- *
- The standard for appropriation of allowance for loan losses is described in No. 4 of Significant Accounting Policies.
F-121
(8) Details of provision for retirement benefits
(Unit: Yen) | |||||||||||||||||||||||||||||||||
| | | | | | | | | | | | | | | | | | | | | | | | | | | | | | | | | | |
| Classification | Balance at the beginning of the period | Increase during the period | Decrease during the period | Balance at the end of the period | Remarks | |||||||||||||||||||||||||||
| | | | | | | | | | | | | | | | | | | | | | | | | | | | | | | | | | |
| Total retirement benefit obligations | 11,074,620,367 | 4,779,686,573 | 7,931,302,373 | 7,923,004,567 | ||||||||||||||||||||||||||||
| | | | | | | | | | | | | | | | | | | | | | | | | | | | | | | | | | |
| Retirement benefits | 3,495,624,861 | 249,243,753 | 218,149,904 | 3,526,718,710 | ||||||||||||||||||||||||||||
| | | | | | | | | | | | | | | | | | | | | | | | | | | | | | | | | | |
| Employees' Pension Fund | 7,578,995,506 | 7,361,822 | 7,586,357,328 | 0 | ||||||||||||||||||||||||||||
| | | | | | | | | | | | | | | | | | | | | | | | | | | | | | | | | | |
| Defined benefit corporate pension plan | 0 | 4,523,080,998 | 126,795,141 | 4,396,285,857 | ||||||||||||||||||||||||||||
| | | | | | | | | | | | | | | | | | | | | | | | | | | | | | | | | | |
| Unrecognized past service cost and unrecognized actuarial differences | 0 | (258,844,248 | ) | (258,844,248 | ) | 0 | ||||||||||||||||||||||||||
| | | | | | | | | | | | | | | | | | | | | | | | | | | | | | | | | | |
| Plan assets | 3,743,728,949 | 242,657,960 | 126,795,141 | 3,859,591,768 | ||||||||||||||||||||||||||||
| | | | | | | | | | | | | | | | | | | | | | | | | | | | | | | | | | |
| Provision for retirement benefits | 7,330,891,418 | 4,795,872,861 | 8,063,351,480 | 4,063,412,799 | ||||||||||||||||||||||||||||
| | | | | | | | | | | | | | | | | | | | | | | | | | | | | | | | | | |
- *
- JICA has been authorized by the Minister of Health, Labour and Welfare to transfer to the government the past substitutional portion in respect of the part of the welfare pension fund it manages for the government on April 1, 2015.
- *
- "Defined benefit corporate pension plan" and "Plan assets" include the amount corresponding to the refund (minimum actuarial liability) of a substitutional portion of Employees' Pension Fund.
(9) Details of asset retirement obligations
(Unit: Yen) | ||||||||||||||||||||||||||||
| | | | | | | | | | | | | | | | | | | | | | | | | | | | | |
| Classification | Balance at the beginning of the period | Increase during the period | Decrease during the period | Balance at the end of the period | Remarks | ||||||||||||||||||||||
| | | | | | | | | | | | | | | | | | | | | | | | | | | | | |
| Obligation of restoration to original state based on building lease agreement | 70,374,150 | 0 | 0 | 70,374,150 | Specified expenses in Accounting Standard for Incorporated Administrative Agency No. 91: None | ||||||||||||||||||||||
| | | | | | | | | | | | | | | | | | | | | | | | | | | | | |
F-122
(10) Details of liabilities for guarantee
(Unit: Yen) | |||||||||||||||||||||||||||||||||||||||||||||||||
| | | | | | | | | | | | | | | | | | | | | | | | | | | | | | | | | | | | | | | | | | | | | | | | | | |
| Balance at the beginning of the period | Increase during the period | Decrease during the period | Balance at the end of the period | |||||||||||||||||||||||||||||||||||||||||||||
| | | | | | | | | | | | | | | | | | | | | | | | | | | | | | | | | | | | | | | | | | | | | | | | | | |
| Classification | Number of bonds | Amount | Number of bonds | Amount | Number of bonds | Amount | Number of bonds | Amount | Remarks | |||||||||||||||||||||||||||||||||||||||
| | | | | | | | | | | | | | | | | | | | | | | | | | | | | | | | | | | | | | | | | | | | | | | | | | |
| FILP Agency Bonds (Public offering) | 10 | 350,000,000,000 | 0 | 0 | 2 | 100,000,000,000 | 8 | 250,000,000,000 | ||||||||||||||||||||||||||||||||||||||||
| | | | | | | | | | | | | | | | | | | | | | | | | | | | | | | | | | | | | | | | | | | | | | | | | | |
(Unit: U.S. Dollars) | |||||||||||||||||||||||||||||||||||||||||||||||||
| | | | | | | | | | | | | | | | | | | | | | | | | | | | | | | | | | | | | | | | | | | | | | | | | | |
| Balance at the beginning of the period | Increase during the period | Decrease during the period | Balance at the end of the period | |||||||||||||||||||||||||||||||||||||||||||||
| | | | | | | | | | | | | | | | | | | | | | | | | | | | | | | | | | | | | | | | | | | | | | | | | | |
| Classification | Number of bonds | Amount | Number of bonds | Amount | Number of bonds | Amount | Number of bonds | Amount | Remarks | |||||||||||||||||||||||||||||||||||||||
| | | | | | | | | | | | | | | | | | | | | | | | | | | | | | | | | | | | | | | | | | | | | | | | | | |
| Government-Guaranteed Foreign Bonds (Eurodollar bond [Public offering]) | 1 | 650,000,000 | 0 | 0 | 1 | 650,000,000 | 0 | 0 | ||||||||||||||||||||||||||||||||||||||||
| | | | | | | | | | | | | | | | | | | | | | | | | | | | | | | | | | | | | | | | | | | | | | | | | | |
- *
- JICA is jointly liable for obligations arising from the above bonds issued by the former Japan Bank for International Cooperation which was succeeded by the Japan Bank for International Cooperation.
(11) Details of capital and capital surplus
(Unit: Yen) | ||||||||||||||||||||||||||||||||
| | | | | | | | | | | | | | | | | | | | | | | | | | | | | | | | | |
| Classification | Balance at the beginning of the period | Increase during the period | Decrease during the period | Balance at the end of the period | Remarks | ||||||||||||||||||||||||||
| | | | | | | | | | | | | | | | | | | | | | | | | | | | | | | | | |
| Capital | Government investment | 7,813,897,840,510 | 48,260,000,000 | 0 | 7,862,157,840,510 | Increase in capital resulting from the receipt of government investment | |||||||||||||||||||||||||
| | | | | | | | | | | | | | | | | | | | | | | | | | | | | | | | | |
(12) Details of reserves
(Unit: Yen) | ||||||||||||||||||||||||||||
| | | | | | | | | | | | | | | | | | | | | | | | | | | | | |
| Classification | Balance at the beginning of the period | Increase during the period | Decrease during the period | Balance at the end of the period | Remarks | ||||||||||||||||||||||
| | | | | | | | | | | | | | | | | | | | | | | | | | | | | |
| Reserve fund stipulated in Paragraph 4 of Article 31 of the Act of the Incorporated Administrative Agency—Japan International Cooperation Agency | 1,255,357,507,833 | 114,438,092,876 | 0 | 1,369,795,600,709 | Increase resulting from the appropriation of profits for business year 2014 | ||||||||||||||||||||||
| | | | | | | | | | | | | | | | | | | | | | | | | | | | | |
F-123
(13) Details of remunerations and salaries of officers and employees
(Unit: Thousands of yen, persons) | ||||||||||||||||||||
| | | | | | | | | | | | | | | | | | | | | |
| Remunerations or salaries | Retirement benefits | ||||||||||||||||||
| | | | | | | | | | | | | | | | | | | | | |
| Classification | Payment amount | Number of people | Payment amount | Number of people | |||||||||||||||
| | | | | | | | | | | | | | | | | | | | | |
| Officers | 44,205 | 12 | 0 | 0 | |||||||||||||||
| | | | | | | | | | | | | | | | | | | | | |
| Employees | 3,965,446 | 1,889 | 218,150 | 90 | |||||||||||||||
| | | | | | | | | | | | | | | | | | | | | |
| Total | 4,009,652 | 1,901 | 218,150 | 90 | |||||||||||||||
| | | | | | | | | | | | | | | | | | | | | |
| (Notes) | 1. | Payment standard of remunerations and retirement benefits to officers | ||
Remunerations and retirement benefits to officers are paid based on "Rules on Remuneration for Officers" and "Rules on Retirement Benefits for Officers" in place for Incorporated Administrative Agency—Japan International Cooperation Agency. | ||||
2. | Payment standard of salaries and retirement benefits to employees | |||
Salaries and retirement benefits to employees are paid based on "Rules on Salaries for Employees" and "Rules on Retirement Benefits for Employees" in place for Incorporated Administrative Agency—Japan International Cooperation Agency. | ||||
3. | Number of people | |||
As for the number of people to whom remunerations or salaries are paid, the average number of JICA officers or employees during the period is used. | ||||
4. | Others | |||
There are no part-time officers or employees classified as external members. |
(14) Details of main assets, liabilities, and expenses, except those mentioned above
Operating and administrative expenses
(Unit: Yen) | |||||||||
| | | | | | | | | | |
| Classification | Amount | |||||||
| | | | | | | | | | |
| Operating expenses | 5,531,224,040 | |||||||
| Information system-related expenses | 1,511,919,960 | |||||||
| Rent expenses on real estate | 832,867,470 | |||||||
| Travelling and transportation expenses | 1,307,589,977 | |||||||
| Other expenses | 3,358,392,371 | |||||||
| | | | | | | | | | |
| Total | 12,541,993,818 | |||||||
| | | | | | | | | | |
F-124
(15) Details of affiliated companies
| | | | | | | | | | | | | | | |
| Corporation type and name | (Affiliated company) | (Affiliated company) | |||||||||||
| | | | | | | | | | | | | | | |
| Items | KAFCO Japan Investment Co., Ltd. | Karnaphuli Fertilizer Company Limited | |||||||||||
| | | | | | | | | | | | | | | |
| | | | | | | | | | | | | | | |
| Outline of operations | Production of urea and ammonia in Chittagong, Bangladesh | Production of urea and ammonia in Chittagong, Bangladesh | |||||||||||
| | | | | | | | | | | | | | | |
|
| Number of officers: 9 President and CEO: Tomomi Kawai | — | |||||||||||
| | | | | | | | | | | | | | | |
| Association chart on transactions between affiliated companies and JICA | | ||||||||||||
| | | | | | | | | | | | | | | |
| Assets | 6,291,904,913 yen | — | |||||||||||
| | | | | | | | | | | | | | | |
| Liabilities | 40,110,812 yen | — | |||||||||||
| | | | | | | | | | | | | | | |
| Capital | 5,023,900,000 yen | — | |||||||||||
| | | | | | | | | | | | | | | |
| Retained earnings | 1,227,894,101 yen | — | |||||||||||
| | | | | | | | | | | | | | | |
| Operating revenues | 2,100,219,815 yen | — | |||||||||||
| | | | | | | | | | | | | | | |
| Ordinary (loss) income | 2,103,984,831 yen | — | |||||||||||
| | | | | | | | | | | | | | | |
| Net (loss) income | 1,880,331,397 yen | — | |||||||||||
| | | | | | | | | | | | | | | |
| Unappropriated (loss) income for the current fiscal year | 1,036,985,901 yen | — | |||||||||||
| | | | | | | | | | | | | | | |
| Number of company shares owned by JICA, acquisition cost, balance sheet amount, etc. | • Number of company shares owned by JICA: 46,606 shares • Acquisition cost: ¥2,436,204,983 • Balance sheet amount: ¥2,436,204,983 (No changes from the end of the previous business year) • Legal basis: Item 2 (b), Paragraph 1, Article 13 of the Act of the Incorporated Administrative Agency—Japan International Cooperation Agency • Applicable provision of the act: To lend a person designated by the Minister for Foreign Affairs, such as an organization like a juridical person in Japan or the Development Areas, the funds required for the execution of their Development Projects or making capital contributions to such persons where there is a special necessity in order to effectuate Development Projects. • Purpose of investment: Capital contribution to the production of urea and ammonia by the company • Date of the initial investment: July 27, 1990 | • Number of company shares owned by JICA— • Acquisition cost:— • Balance sheet amount:— • Legal basis:— • Applicable provision of the act:— • Purpose of investment:— • Date of the initial investment:— | |||||||||||
| | | | | | | | | | | | | | | |
| Details of receivables and payables | N/A | — | |||||||||||
| | | | | | | | | | | | | | | |
| Details of debt guarantee | N/A | — | |||||||||||
| | | | | | | | | | | | | | | |
| Amounts and ratios in relation to gross sales, order placement by JICA, etc. (Amounts and ratios of competitive contracts, planning competitions and public selections, and non- competitive negotiated contracts) | N/A | — | |||||||||||
| | | | | | | | | | | | | | | |
F-125
| | | | | | | | | | | | | | | |
| Corporation type and name | (Affiliated company) | (Affiliated company) | ||||||||||||
| | | | | | | | | | | | | | | |
| Items | Nippon Amazon Aluminum Co., Ltd. | SPDC Ltd. | ||||||||||||
| | | | | | | | | | | | | | | |
| | | | | | | | | | | | | | | |
| Outline of operations | Production of alumina and smelting ammonium in the Amazon region | Production and sales of ethylene glycol and other petrochemical products in the Al Jubail Industrial Area | ||||||||||||
| | | | | | | | | | | | | | | |
| Name of officers | Number of officers: 15 President and CEO: Michitaka Nakatomi | Number of officers: 17 President and CEO: Hiroshi Kanamori | ||||||||||||
| | | | | | | | | | | | | | | |
| Association chart on transactions between affiliated companies and JICA | ||||||||||||||
| | | | | | | | | | | | | | | |
| Assets | 60,836,516,986 yen | 98,142,164,451 yen | ||||||||||||
| | | | | | | | | | | | | | | |
| Liabilities | 186,256,044 yen | 23,392,156,122 yen | ||||||||||||
| | | | | | | | | | | | | | | |
| Capital | 57,350,000,000 yen | 14,200,000,000 yen | ||||||||||||
| | | | | | | | | | | | | | | |
| Retained earnings | 3,300,260,942 yen | 60,550,008,329 yen | ||||||||||||
| | | | | | | | | | | | | | | |
| Operating revenues | 1,945,105,566 yen | 343,039,327 yen | ||||||||||||
| | | | | | | | | | | | | | | |
| Ordinary (loss) income | 1,961,867,835 yen | 20,238,926,173 yen | ||||||||||||
| | | | | | | | | | | | | | | |
| Net (loss) income | 1,962,807,310 yen | 18,017,735,224 yen | ||||||||||||
| | | | | | | | | | | | | | | |
| Unappropriated (loss) income for the current fiscal year | 2,048,883,942 yen | 35,450,008,329 yen | ||||||||||||
| | | | | | | | | | | | | | | |
| Number of company shares owned by JICA, acquisition cost, balance sheet amount, etc. | • Number of company shares owned by JICA: 51,520,000 shares • Acquisition cost: ¥26,002,629,979 • Balance sheet amount: ¥26,002,629,979 (No changes from the end of the previous business year) • Legal basis: Item 2 (b), Paragraph 1, Article 13 of the Act of the Incorporated Administrative Agency—Japan International Cooperation Agency • Applicable provision of the act: To lend a person designated by the Minister for Foreign Affairs, such as an organization like a juridical person in Japan or the Development Areas, the funds required for the execution of their Development Projects or making capital contributions to such persons where there is a special necessity in order to effectuate Development Projects. • Purpose of investment: Capital contribution to the smelting of alumina and aluminum • Date of the initial investment: August 29, 1978 | • Number of company shares owned by JICA: 2,107,500 shares • Acquisition cost: ¥7,269,880,619 • Balance sheet amount: ¥7,269,880,619 (No changes from the end of the previous business year) • Legal basis: Item 2 (b), Paragraph 1, Article 13 of the Act of the Incorporated Administrative Agency—Japan International Cooperation Agency • Applicable provision of the act: To lend a person designated by the Minister for Foreign Affairs, such as an organization like a juridical person in Japan or the Development Areas, the funds required for the execution of their Development Projects or making capital contributions to such persons where there is a special necessity in order to effectuate Development Projects. • Purpose of investment: Capital contribution to the manufacturing of ethylene glycol and other petrochemical products • Date of the initial investment: June 17, 1981 | ||||||||||||
| | | | | | | | | | | | | | | |
| Details of receivables and payables | N/A | N/A | ||||||||||||
| | | | | | | | | | | | | | | |
| Details of debt guarantee | N/A | N/A | ||||||||||||
| | | | | | | | | | | | | | | |
| Amounts and ratios in relation to gross sales, order placement by JICA, etc. (Amounts and ratios of competitive contracts, planning competitions and public selections, and non-competitive negotiated contracts) | N/A | N/A | ||||||||||||
| | | | | | | | | | | | | | | |
F-126
| | | | | | | | | | | | | | |
| Corporation type and name | (Affiliated company) | (Affiliated company) | ||||||||||
| | | | | | | | | | | ||||
| Items | Eastern Petrochemical Company | Sumatra Pulp Corporation | ||||||||||
| | | | | | | | | | | | | | |
| | | | | | | | | | | | | | |
| Outline of operations | Production and sales of ethylene glycol and other petrochemical products in the Al Jubail Industrial Area | Construction of a pulp mill to manufacture wood pulp from afforested acacia mangium, and production and sale of wood pulp in Muara Enim, South Sumatra | ||||||||||
| | | | | | | | | | | | | | |
| Name of officers | — | Number of officers: 7 President and CEO: Kazuo Hidaka Executive Vice President: Atsushi Sasaki (Chief Representative of JICA Indonesia Office) Auditor: Rentaro Tamaishi (former Senior Advisor of the Development Assistance Department I, former Japan Bank for International Cooperation) | ||||||||||
| | | | | | | | | | | | | | |
| Association chart on transactions between affiliated companies and JICA | | |||||||||||
| | | | | | | | | | | | | | |
| Assets | — | 288,770,355 yen | ||||||||||
| | | | | | | | | | | | | | |
| Liabilities | — | 649,989,765 yen | ||||||||||
| | | | | | | | | | | | | | |
| Capital | — | 13,350,850,000 yen | ||||||||||
| | | | | | | | | | | | | | |
| Retained earnings | — | (13,712,069,410 yen) | ||||||||||
| | | | | | | | | | | | | | |
| Operating revenues | — | (70,724,210 yen) | ||||||||||
| | | | | | | | | | | | | | |
| Ordinary (loss) income | — | (73,955,851 yen) | ||||||||||
| | | | | | | | | | | | | | |
| Net (loss) income | — | (2,179,424,589 yen) | ||||||||||
| | | | | | | | | | | | | | |
| Unappropriated (loss) income for the current fiscal year | — | (13,712,069,410 yen) | ||||||||||
| | | | | | | | | | | | | | |
| Number of company shares owned by JICA, acquisition cost, balance sheet amount, etc. | • Number of company shares owned by JICA— • Acquisition cost:— • Balance sheet amount:— • Legal basis:— • Applicable provision of the act:— • Purpose of investment:— • Date of the initial investment:— | • Number of company shares owned by JICA: 114,032 shares • Acquisition cost: ¥883,835,338 • Balance sheet amount: ¥1 (A decrease of ¥804,114,098 from the end of the previous business year) • Legal basis: Item 2 (b), Paragraph 1, Article 13 of the Act of the Incorporated Administrative Agency—Japan International Cooperation Agency • Applicable provision of the act: To lend a person designated by the Minister for Foreign Affairs, such as an organization like a juridical person in Japan or the Development Areas, the funds required for the execution of their Development Projects or making capital contributions to such persons where there is a special necessity in order to effectuate Development Projects. • Purpose of investment: Capital contribution to the pulp manufacturing business • Date of the initial investment: April 21, 1995 | ||||||||||
| | | | | | | | | | | | | | |
| Details of receivables and payables | — | N/A | ||||||||||
| | | | | | | | | | | | | | |
| Details of debt guarantee | — | N/A | ||||||||||
| | | | | | | | | | | | | | |
| Amounts and ratios in relation to gross sales, order placement by JICA, etc. (Amounts and ratios of competitive contracts, planning competitions and public selections, and non- competitive negotiated contracts) | — | N/A | ||||||||||
| | | | | | | | | | | | | | |
F-127
| | | | | | | | | | | | | | | |
| Corporation type and name | (Affiliated company) | (Affiliated company) | ||||||||||||
| | | | | | | | | | | | | | | |
| Items | Japan Saudi Arabia Methanol Co., Inc. | JSMC PANAMA S.A. | ||||||||||||
| | | | | | | | | | | | | | | |
| | | | | | | | | | | | | | | |
| Outline of operations | Production of methanol in the Al-Jubail Industrial Area | Transportation of methanol business | ||||||||||||
| | | | | | | | | | | | | | | |
| Name of officers | Number of officers: 12 Chairman: Akira Ishiwada Managing Director and General Manager of the General Affairs Department: Yutaka Ohashi (former General Manager of the Development Assistance Department IV, former Japan Bank for International Cooperation) Auditor: Shigeru Takeda (former Executive Director, former Japan Bank for International Cooperation) | — | ||||||||||||
| | | | | | | | | | | | | | | |
| Association chart on transactions between affiliated companies and JICA | | |||||||||||||
| | | | | | | | | | | | | | | |
| Assets | 55,606,048,117 yen | — | ||||||||||||
| | | | | | | | | | | | | | | |
| Liabilities | 4,669,648,205 yen | — | ||||||||||||
| | | | | | | | | | | | | | | |
| Capital | 2,310,000,000 yen | — | ||||||||||||
| | | | | | | | | | | | | | | |
| Retained earnings | 48,907,988,912 yen | — | ||||||||||||
| | | | | | | | | | | | | | | |
| Operating revenues | 34,997,184,369 yen | — | ||||||||||||
| | | | | | | | | | | | | | | |
| Ordinary (loss) income | 35,124,370,047 yen | — | ||||||||||||
| | | | | | | | | | | | | | | |
| Net (loss) income | 32,586,758,443 yen | — | ||||||||||||
| | | | | | | | | | | | | | | |
| Unappropriated (loss) income for the current fiscal year | 32,757,388,912 yen | — | ||||||||||||
| | | | | | | | | | | | | | | |
| Number of company shares owned by JICA, acquisition cost, balance sheet amount, etc. | • Number of company shares owned by JICA: 1,386,000 shares • Acquisition cost: ¥7,149,297,104 • Balance sheet amount: ¥5,504,422,473 (An increase of ¥514,043 from the end of the previous business year) • Legal basis: Item 2 (b), Paragraph 1, Article 13 of the Act of the Incorporated Administrative Agency—Japan International Cooperation Agency • Applicable provision of the act: To lend a person designated by the Minister for Foreign Affairs, such as an organization like a juridical person in Japan or the Development Areas, the funds required for the execution of their Development Projects or making capital contributions to such persons where there is a special necessity in order to effectuate Development Projects. • Purpose of investment: Capital contribution to the methanol manufacturing business • Date of the initial investment: December 17, 1979 | • Number of company shares owned by JICA— • Acquisition cost:— • Balance sheet amount:— • Legal basis:— • Applicable provision of the act:— • Purpose of investment:— • Date of the initial investment:— | ||||||||||||
| | | | | | | | | | | | | | | |
| Details of receivables and payables | N/A | — | ||||||||||||
| | | | | | | | | | | | | | | |
| Details of debt guarantee | N/A | — | ||||||||||||
| | | | | | | | | | | | | | | |
| Amounts and ratios in relation to gross sales, order placement by JICA, etc. (Amounts and ratios of competitive contracts, planning competitions and public selections, and non- competitive negotiated contracts) | N/A | — | ||||||||||||
| | | | | | | | | | | | | | | |
F-128
| | | | | | | | | | |
| Corporation type and name | (Affiliated company) | ||||||||
| | | | | | | | | | |
| Items | The First MicroFinanceBank Ltd. | ||||||||
| | | | | | | | | | |
| | | | | | | | | | |
| Outline of operations | Microfinance business | ||||||||
| | | | | | | | | | |
| Name of officers | Number of officers: 8 Chairman: Akbarali Pesnani Director: Hironobu Takahashi (Senior Advisor of the Private Sector Partnership and Finance Department, JICA) | ||||||||
| | | | | | | | | | |
| Association chart on transactions between affiliated companies and JICA | |||||||||
| | | | | | | | | | |
| Assets | 13,392,664,629 yen | ||||||||
| | | | | | | | | | |
| Liabilities | 11,695,516,876 yen | ||||||||
| | | | | | | | | | |
| Capital | 1,485,164,449 yen | ||||||||
| | | | | | | | | | |
| Retained earnings | 1,187,911 yen | ||||||||
| | | | | | | | | | |
| Operating revenues | 1,433,668,896 yen | ||||||||
| | | | | | | | | | |
| Ordinary (loss) income | 423,086,390 yen | ||||||||
| | | | | | | | | | |
| Net (loss) income | 342,543,614 yen | ||||||||
| | | | | | | | | | |
| Unappropriated (loss) income for the current fiscal year | 1,187,911 yen | ||||||||
| | | | | | | | | | |
| Number of company shares owned by JICA, acquisition cost, balance sheet amount, etc. | • Number of company shares owned by JICA: 24,000,000 shares • Acquisition cost: ¥218,880,000 • Balance sheet amount: ¥218,880,000 (An decrease of ¥40,926,522 from the end of the previous business year) • Legal basis: Item 2 (b), Paragraph 1, Article 13 of the Act of the Incorporated Administrative Agency—Japan International Cooperation Agency • Applicable provision of the act: To lend a person designated by the Minister for Foreign Affairs, such as an organization like a juridical person in Japan or the Development Areas, the funds required for the execution of their Development Projects or making capital contributions to such persons where there is a special necessity in order to effectuate Development Projects. • Purpose of investment: Capital contribution to microfinance business • Date of the initial investment: April 27, 2012 | ||||||||
| | | | | | | | | | |
| Details of receivables and payables | N/A | ||||||||
| | | | | | | | | | |
| Details of debt guarantee | N/A | ||||||||
| | | | | | | | | | |
| Amounts and ratios in relation to gross sales, order placement by JICA, etc. (Amounts and ratios of competitive contracts, planning competitions and public selections, and non- competitive negotiated contracts) | N/A | ||||||||
| | | | | | | | | | |
F-129