|
|
| Cautionary Statement Regarding Forward-Looking Statements |
| |
This presentation may contain forward-looking statements within the meaning of the federal securities laws. Forward-looking statements relate to expectations, beliefs, projections, future plans and strategies, anticipated events or trends and similar expressions concerning matters that are not historical facts. In some cases, you can identify forward-looking statements by the use of forward-looking terminology such as “may,” “will,” “should,” “expects,” “intends,” “plans,” “anticipates,” “believes,” “estimates,” “predicts,” or “potential” or the negative of these words and phrases or similar words or phrases which are predictions of or indicate future events or trends and which do not relate solely to historical matters. You can also identify forward-looking statements by discussions of strategy, plans or intentions.
Forward-looking statements involve known and unknown risks, uncertainties, assumptions and contingencies, many of which are beyond the Company’s control, and may cause the Company’s actual results to differ significantly from those expressed in any forward-looking statement.
Factors that might cause such a difference include, without limitation, our ability to achieve anticipated compensation and administrative cost savings pursuant to the Company’s corporate restructuring and reorganization plan, in the timeframe expected or at all, the Company’s ability to realize anticipated benefits from its strategic initiatives, including the acquisition of DBH, the potential sale of our industrial platform, the acquisition of a Latin American private equity platform, and the formation of certain other investment management platforms, including any impact of such initiatives on our company’s growth and earnings profile, the impact of changes to the Company’s management, employee and organizational structure, including the implementation and timing of CEO succession plans, the Company’s ability to complete a sale of its industrial portfolio, including the related management platform, on favorable terms, within the timeframe contemplated, or at all, the Company’s use of any proceeds received from a sale of its industrial portfolio if completed, whether the pending sale of NorthStar Realty Europe Corp. (“NRE”), including the anticipated termination of the Company’s management contract with NRE, will be completed within the timeframe and manner contemplated, or at all, Digital Colony’s ability to complete the pending acquisition of Zayo Group Holdings, Inc. on the terms contemplated or at all, Colony Capital’s liquidity, including its ability to complete sales of non-core investments, whether Colony Capital will be able to maintain its qualification as a real estate investment trust, or REIT, for U.S. federal income tax purposes, the timing of and ability to deploy available capital, the Company’s financial flexibility, including borrowing capacity under its revolving credit facility, Colony Capital's ability to grow its investment management business, the timing, pace of growth and performance of the Company's industrial platform, the performance of the Company's investment in Colony Credit Real Estate, Inc., Colony Capital’s ability to maintain or create future permanent capital vehicles under its management, the level of the Company’s commitments to its managed vehicles, the timing of and ability to complete additional repurchases of Colony Capital’s stock, Colony Capital’s ability to maintain inclusion and relative performance on the RMZ, Colony Capital’s leverage, including the ability to reduce debt and the timing and amount of borrowings under its credit facility, the ability of the Company to refinance certain mortgage debt on similar terms to those currently existing or at all, increased interest rates and operating costs, whether the Company will maintain or produce higher Core FFO per share (including or excluding gains and losses from sales of certain investments) in the coming quarters, or ever, the impact of any changes to the Company’s management agreements with NorthStar Healthcare Income, Inc. and other managed companies, adverse economic or real estate developments in Colony Capital’s markets, Colony Capital’s failure to successfully operate or lease acquired properties, decreased rental rates, increased vacancy rates or failure to renew or replace expiring leases, increased costs of capital expenditures, defaults on or non-renewal of leases by tenants, the impact of economic conditions on the borrowers of Colony Capital’s commercial real estate debt investments and the commercial mortgage loans underlying its commercial mortgage backed securities, adverse general and local economic conditions, an unfavorable capital market environment, decreased leasing activity or lease renewals, and other risks and uncertainties detailed in our filings with the U.S. Securities and Exchange Commission (“SEC”).
Statements regarding the following subjects, among others, may constitute forward-looking statements: the market, economic and environmental conditions in the Company’s real estate investment sectors; the Company’s business and investment strategy; the Company’s ability to dispose of its real estate investments; the performance of the real estate in which the Company owns an interest; market trends in the Company’s industry, interest rates, real estate values, the debt securities markets or the general economy; actions, initiatives and policies of the U.S. government and changes to U.S. government policies and the execution and impact of these actions, initiatives and policies; the state of the U.S. and global economy generally or in specific geographic regions; the Company’s ability to obtain and maintain financing arrangements, including securitizations; the amount and value of commercial mortgage loans requiring refinancing in future periods; the availability of attractive investment opportunities; the general volatility of the securities markets in which the Company participates; changes in the value of the Company’s assets; the impact of and changes in governmental regulations, tax law and rates, accounting guidance and similar matters; the Company’s ability to maintain its qualification as a real estate investment trust, or REIT, for U.S. federal income tax purposes; and the Company’s ability to maintain its exemption from registration as an investment company under the Investment Company Act of 1940, as amended.
All forward-looking statements reflect Colony Capital’s good faith beliefs, assumptions and expectations, but they are not guarantees of future performance. Additional information about these and other factors can be found in Colony Capital’s reports filed from time to time with the SEC. Colony Capital cautions investors not to unduly rely on any forward-looking statements. The forward-looking statements speak only as of the date of this presentation. Colony Capital is under no duty to update any of these forward-looking statements after the date of this presentation, nor to conform prior statements to actual results or revised expectations, and Colony Capital does not intend to do so.
This presentation may contain statistics and other data that has been obtained or compiled from information made available by third-party service providers. Colony Capital has not independently verified such statistics or data.
This presentation is for informational purposes only and does not constitute an offer to sell or a solicitation of an offer to buy any securities of Colony Capital. This information is not intended to be indicative of future results. Actual performance of Colony Capital may vary materially.
The appendices herein contain important information that is material to an understanding of this presentation and you should read this presentation only with and in context of the appendices.
|
| | |
Colony Capital | Supplemental Financial Report | | |
|
|
| Important Note Regarding Non-GAAP Financial Measures |
| |
This supplemental package includes certain “non-GAAP” supplemental measures that are not defined by generally accepted accounting principles, or GAAP, including; funds from operations, or FFO; core funds from operations, or Core FFO; net operating income (“NOI”); and pro rata financial information.
FFO: The Company calculates funds from operations (“FFO”) in accordance with standards established by the Board of Governors of the National Association of Real Estate Investment Trusts, which defines FFO as net income or loss calculated in accordance with GAAP, excluding (i) extraordinary items, as defined by GAAP; (ii) gains and losses from sales of depreciable real estate; (iii) impairment write-downs associated with depreciable real estate; (iv) gains and losses from a change in control in connection with interests in depreciable real estate or in-substance real estate, plus (v) real estate-related depreciation and amortization; and (vi) including similar adjustments for equity method investments. Included in FFO are gains and losses from sales of assets which are not depreciable real estate such as loans receivable, equity method investments, as well as equity and debt securities, as applicable.
Core FFO: The Company computes core funds from operations (“Core FFO”) by adjusting FFO for the following items, including the Company’s share of these items recognized by its unconsolidated partnerships and joint ventures: (i) gains and losses from sales of depreciable real estate within the Other Equity and Debt segment, net of depreciation, amortization and impairment previously adjusted for FFO; (ii) gains and losses from sales of businesses within the Investment Management segment and impairment write-downs associated with the Investment Management segment; (iii) equity-based compensation expense; (iv) effects of straight-line rent revenue and expense; (v) amortization of acquired above- and below-market lease values; (vi) amortization of deferred financing costs and debt premiums and discounts; (vii) unrealized fair value gains or losses on interest rate and foreign currency hedges, and foreign currency remeasurements; (viii) acquisition and merger related transaction costs; (ix) merger integration and restructuring costs; (x) amortization and impairment of finite-lived intangibles related to investment management contracts and customer relationships; (xi) gain on remeasurement of consolidated investment entities and the effect of amortization thereof; (xii) non-real estate depreciation and amortization; (xiii) change in fair value of contingent consideration; and (xiv) tax effect on certain of the foregoing adjustments. Beginning with the first quarter of 2018, the Company’s Core FFO from its interest in Colony Credit Real Estate (NYSE: CLNC) and NorthStar Realty Europe (NYSE: NRE) represented its percentage interest multiplied by CLNC’s Core Earnings and NRE’s Cash Available for Distribution (“CAD”), respectively. CLNC’s Core Earnings reflect adjustments to GAAP net income to exclude impairment of real estate and provision for loan losses. Such impairment and losses may ultimately be realized, in part or in full, upon a sale or monetization of the related asset or loan and such realized loss would be reflected in CLNC’s Core Earnings and, as a result, the Company’s Core FFO. Refer to CLNC’s and NRE's respective filings with the SEC for the definition and calculation of Core Earnings and CAD.
FFO and Core FFO should not be considered alternatives to GAAP net income as indications of operating performance, or to cash flows from operating activities as measures of liquidity, nor as indications of the availability of funds for our cash needs, including funds available to make distributions. FFO and Core FFO should not be used as supplements to or substitutes for cash flow from operating activities computed in accordance with GAAP. The Company’s calculations of FFO and Core FFO may differ from methodologies utilized by other REITs for similar performance measurements, and, accordingly, may not be comparable to those of other REITs.
The Company uses FFO and Core FFO as supplemental performance measures because, in excluding real estate depreciation and amortization and gains and losses from property dispositions, it provides a performance measure that captures trends in occupancy rates, rental rates, and operating costs. The Company also believes that, as widely recognized measures of the performance of REITs, FFO and Core FFO will be used by investors as a basis to compare its operating performance with that of other REITs. However, because FFO and Core FFO exclude depreciation and amortization and capture neither the changes in the value of the Company’s properties that resulted from use or market conditions nor the level of capital expenditures and leasing commissions necessary to maintain the operating performance of its properties, all of which have real economic effect and could materially impact the Company’s results from operations, the utility of FFO and Core FFO as measures of the Company’s performance is limited. FFO and Core FFO should be considered only as supplements to net income as a measure of the Company’s performance. Additionally, Core FFO excludes the impact of certain fair value fluctuations, which, if they were to be realized, could have a material impact on the Company’s operating performance. The Company also presents Core FFO excluding gains and losses from sales of certain investments as well as its share of similar adjustments for CLNC. The Company believes that such a measure is useful to investors as it excludes periodic gains and losses from sales of investments that are not representative of its ongoing operations.
|
| | |
Colony Capital | Supplemental Financial Report | | |
|
|
| Important Note Regarding Non-GAAP Financial Measures |
| |
NOI: NOI for our real estate segments represents total property and related income less property operating expenses, adjusted for the effects of (i) straight-line rental income adjustments; (ii) amortization of acquired above- and below-market lease adjustments to rental income; and (iii) other items such as adjustments for the Company’s share of NOI of unconsolidated ventures.
The Company believes that NOI is a useful measure of operating performance of its respective real estate portfolios as it is more closely linked to the direct results of operations at the property level. NOI also reflects actual rents received during the period after adjusting for the effects of straight-line rents and amortization of above- and below- market leases; therefore, a comparison of NOI across periods better reflects the trend in occupancy rates and rental rates of the Company’s properties.
NOI excludes historical cost depreciation and amortization, which are based on different useful life estimates depending on the age of the properties, as well as adjust for the effects of real estate impairment and gains or losses on sales of depreciated properties, which eliminate differences arising from investment and disposition decisions. This allows for comparability of operating performance of the Company’s properties period over period and also against the results of other equity REITs in the same sectors. Additionally, by excluding corporate level expenses or benefits such as interest expense, any gain or loss on early extinguishment of debt and income taxes, which are incurred by the parent entity and are not directly linked to the operating performance of the Company’s properties, NOI provides a measure of operating performance independent of the Company’s capital structure and indebtedness. However, the exclusion of these items as well as others, such as capital expenditures and leasing costs, which are necessary to maintain the operating performance of the Company’s properties, and transaction costs and administrative costs, may limit the usefulness of NOI. NOI may fail to capture significant trends in these components of U.S. GAAP net income (loss) which further limits its usefulness.
NOI should not be considered as an alternative to net income (loss), determined in accordance with U.S. GAAP, as an indicator of operating performance. In addition, the Company’s methodology for calculating NOI involves subjective judgment and discretion and may differ from the methodologies used by other comparable companies, including other REITs, when calculating the same or similar supplemental financial measures and may not be comparable with other companies.
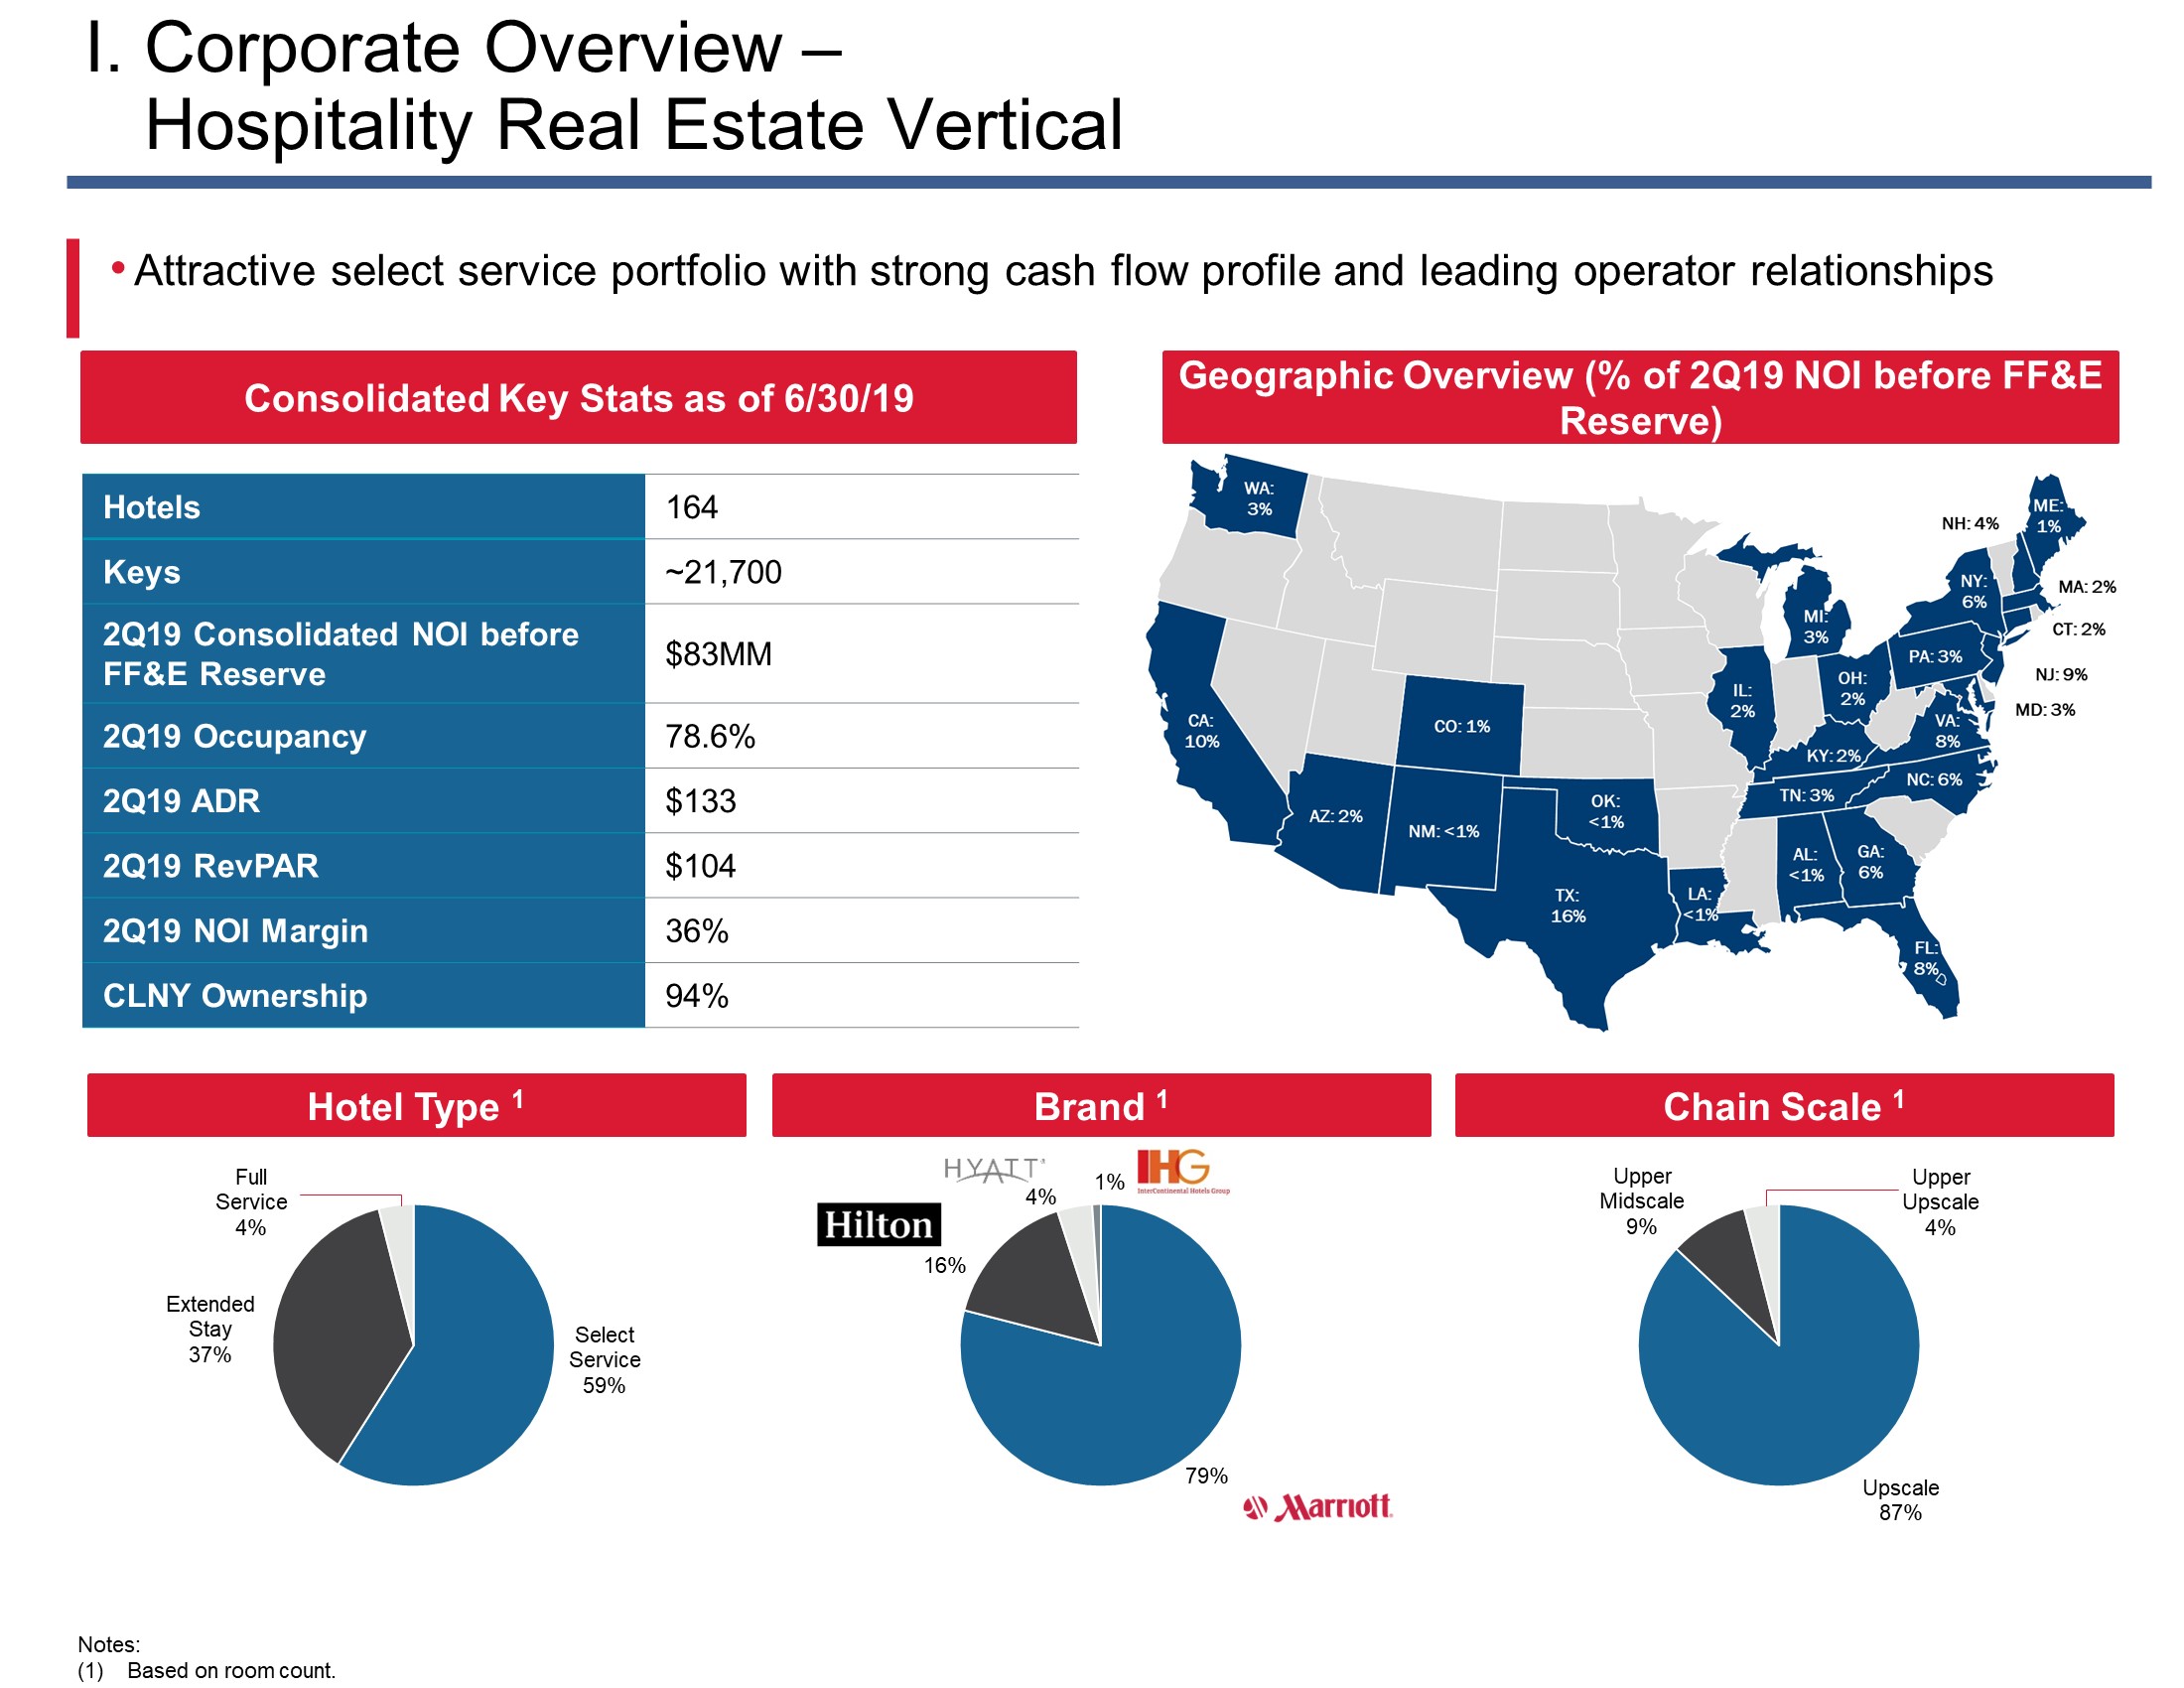
NOI before Reserve for Furniture, Fixtures and Equipment Expenditures (“NOI before FF&E Reserve”): For our hospitality real estate segment, NOI before FF&E Reserve represents NOI before the deduction of reserve contributions for the repair, replacement and refurbishment of furniture, fixtures, and equipment ("FF&E"), which are typically 4% to 5% of revenues, and required under certain debt agreements and/or franchise and brand-managed hotel agreements.
Pro-rata: The Company presents pro-rata financial information, which is not, and is not intended to be, a presentation in accordance with GAAP. The Company computes pro-rata financial information by applying its economic interest to each financial statement line item on an investment-by-investment basis. Similarly, noncontrolling interests’ share of assets, liabilities, profits and losses was computed by applying noncontrolling interests’ economic interest to each financial statement line item. The Company provides pro-rata financial information because it may assist investors and analysts in estimating the Company’s economic interest in its investments. However, pro-rata financial information as an analytical tool has limitations. Other equity REITs may not calculate their pro-rata information in the same methodology, and accordingly, the Company’s pro-rata information may not be comparable to such other REITs' pro-rata information. As such, the pro-rata financial information should not be considered in isolation or as a substitute for our financial statements as reported under GAAP, but may be used as a supplement to financial information as reported under GAAP.
Tenant/operator provided information: The information related to the Company’s tenants/operators that is provided in this presentation has been provided by, or derived from information provided by, such tenants/operators. The Company has not independently verified this information and has no reason to believe that such information is inaccurate in any material respect. The Company is providing this data for informational purposes only.
|
| | |
Colony Capital | Supplemental Financial Report | | |
|
|
Note Regarding CLNY Reportable Segments / Consolidated and OP Share of Consolidated Amounts
|
| |
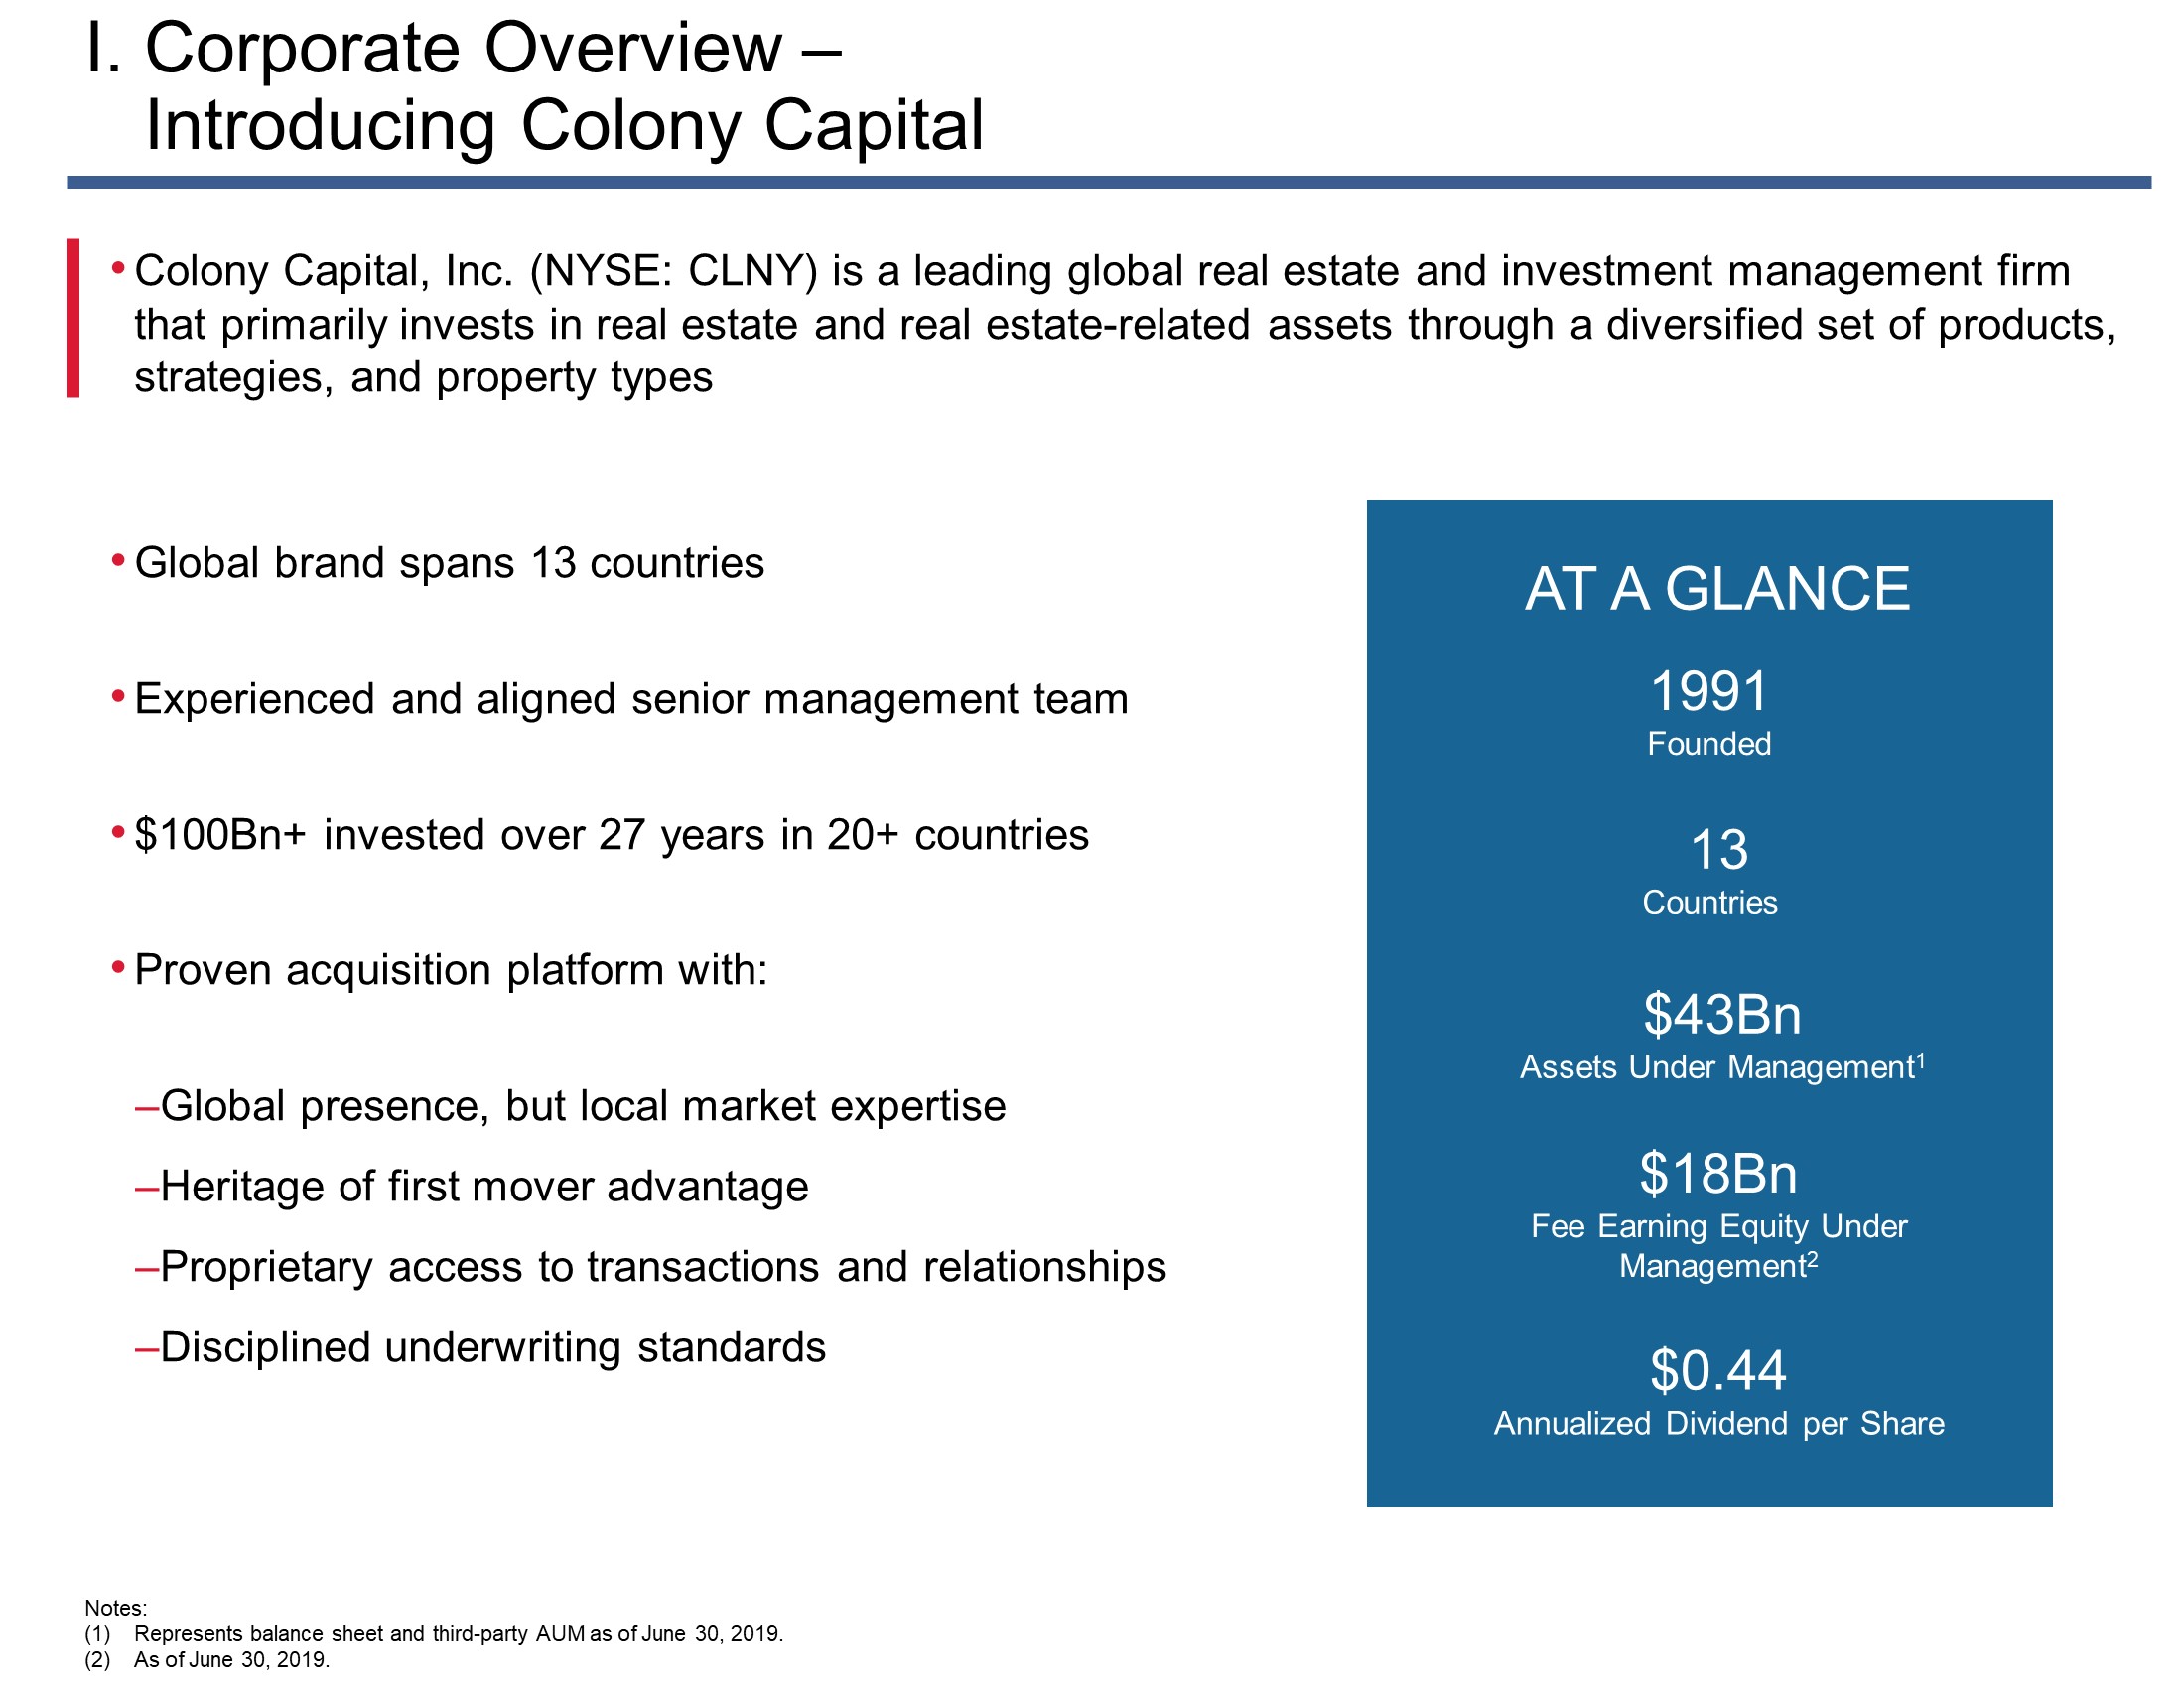
Colony Capital holds investment interests in six reportable segments: Healthcare Real Estate; Industrial Real Estate; Hospitality Real Estate; CLNC; Other Equity and Debt; and Investment Management.
Healthcare Real Estate
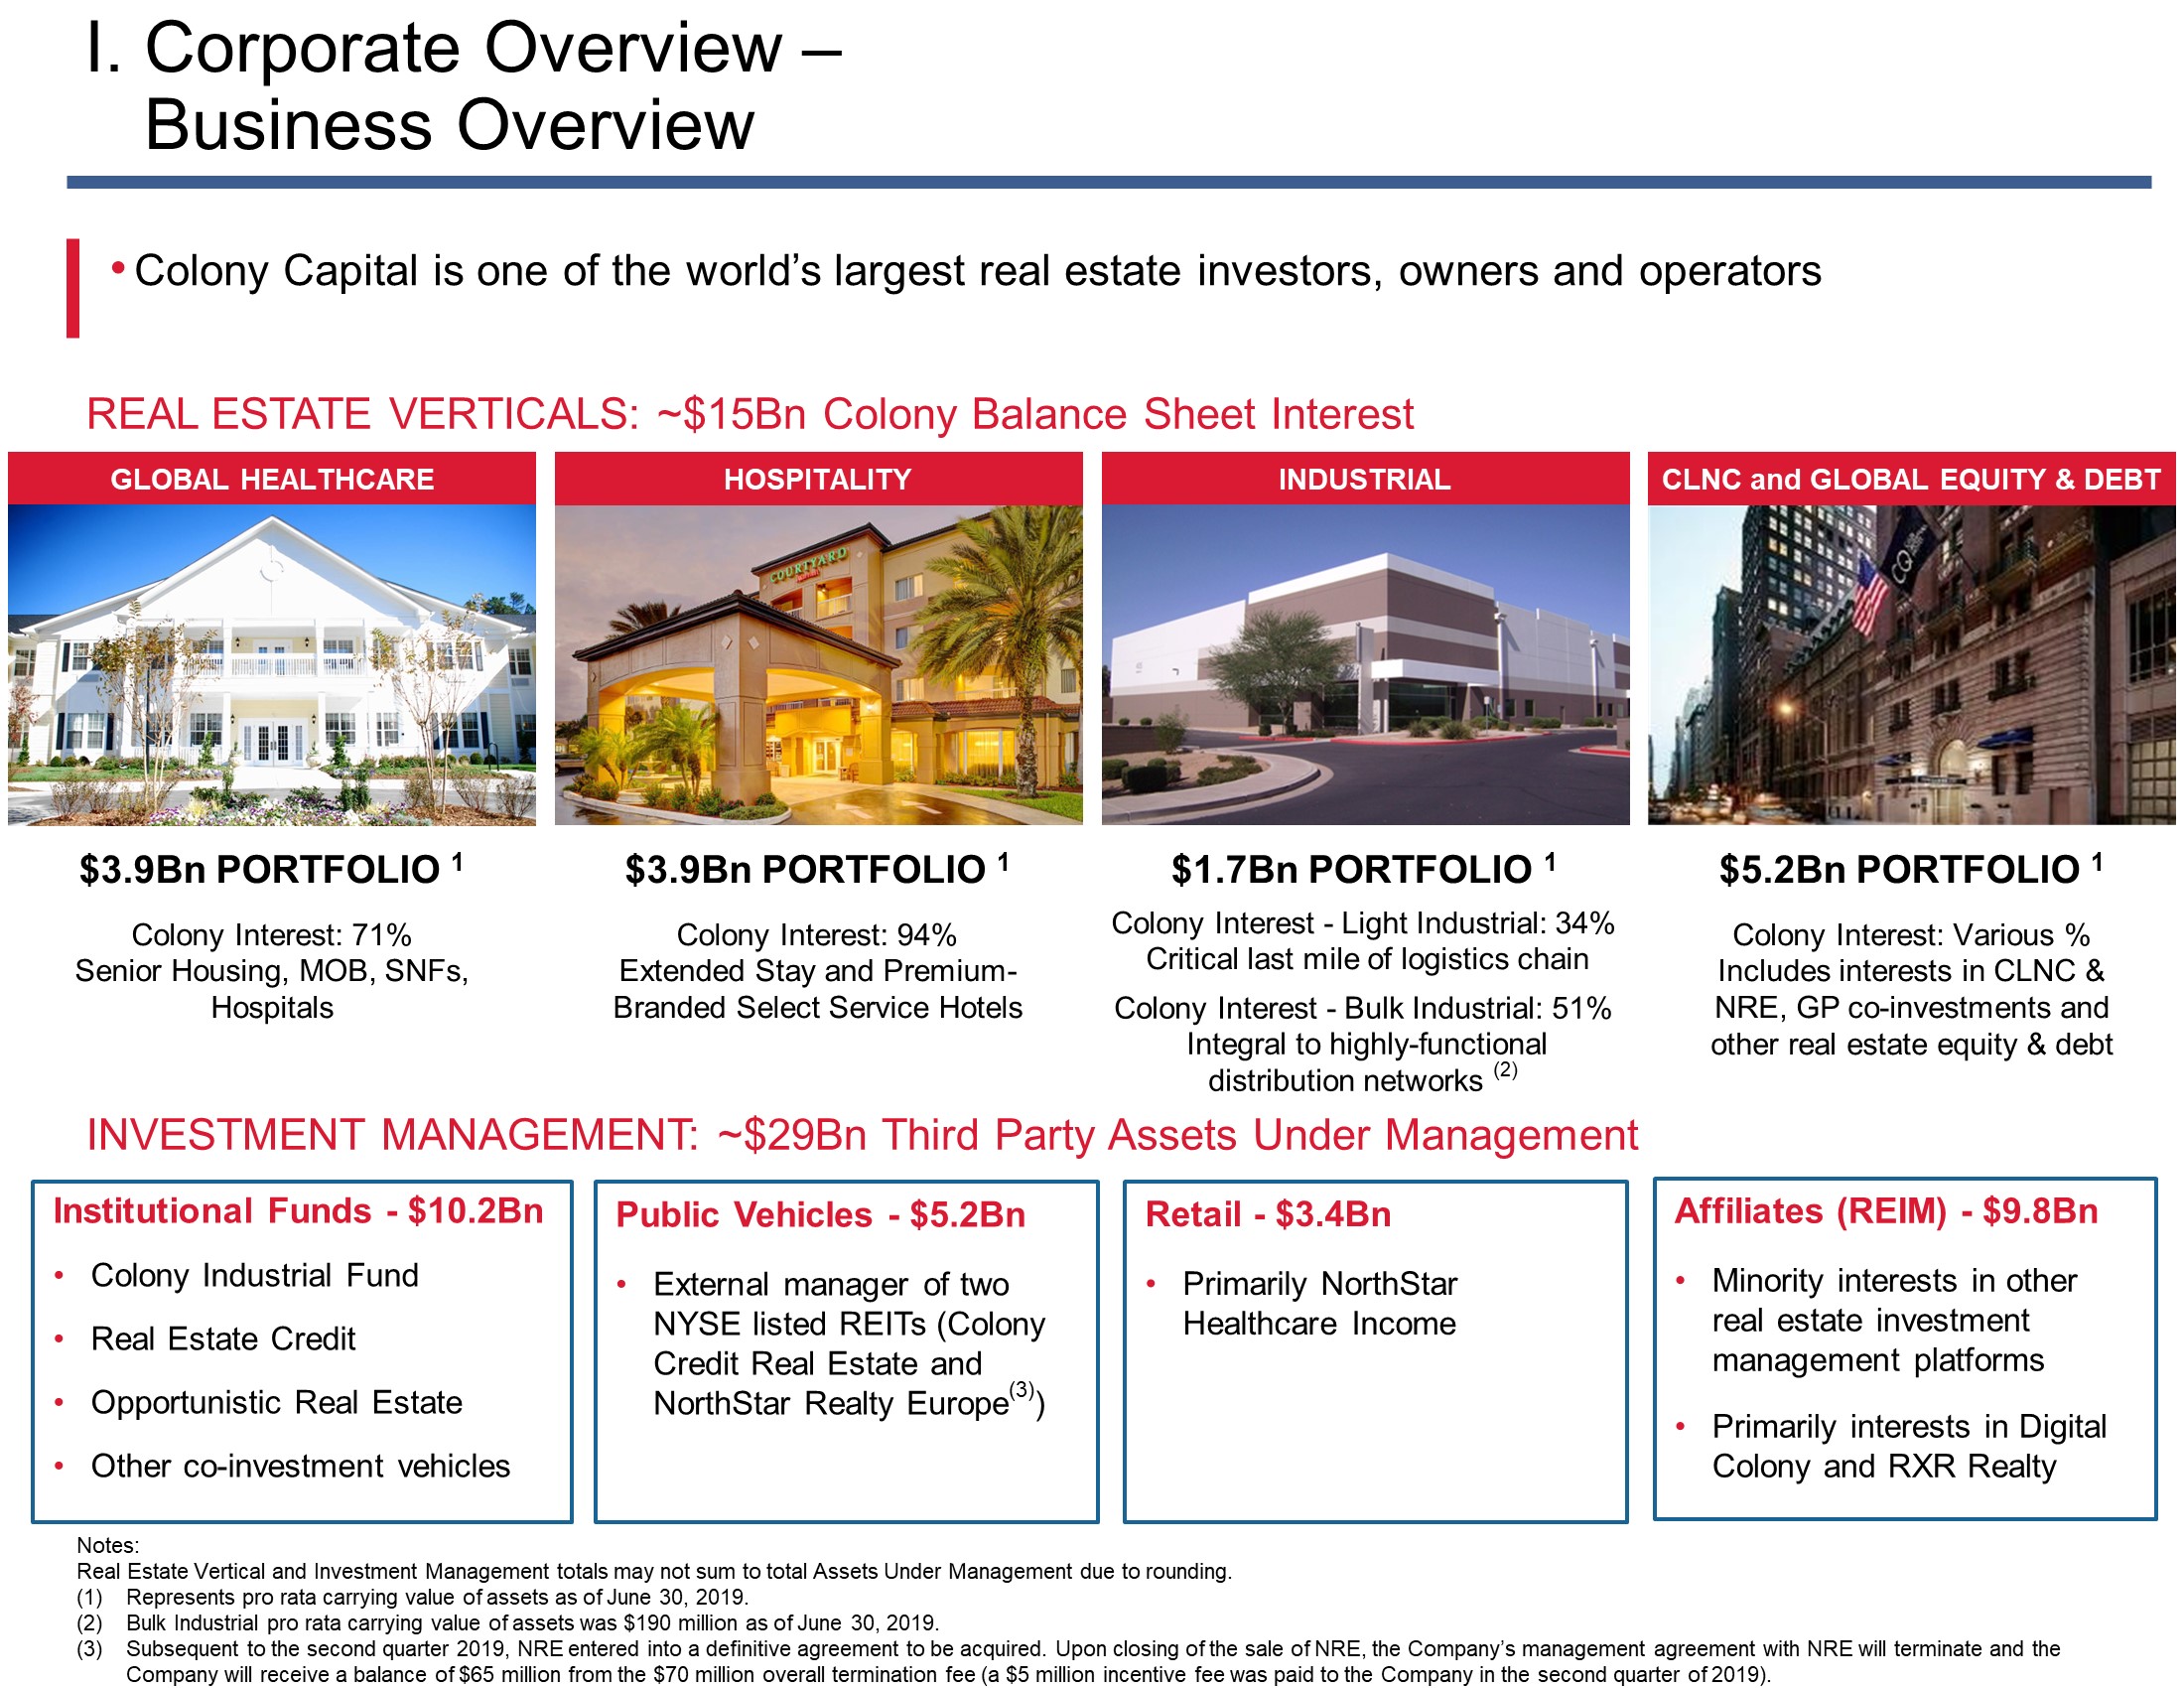
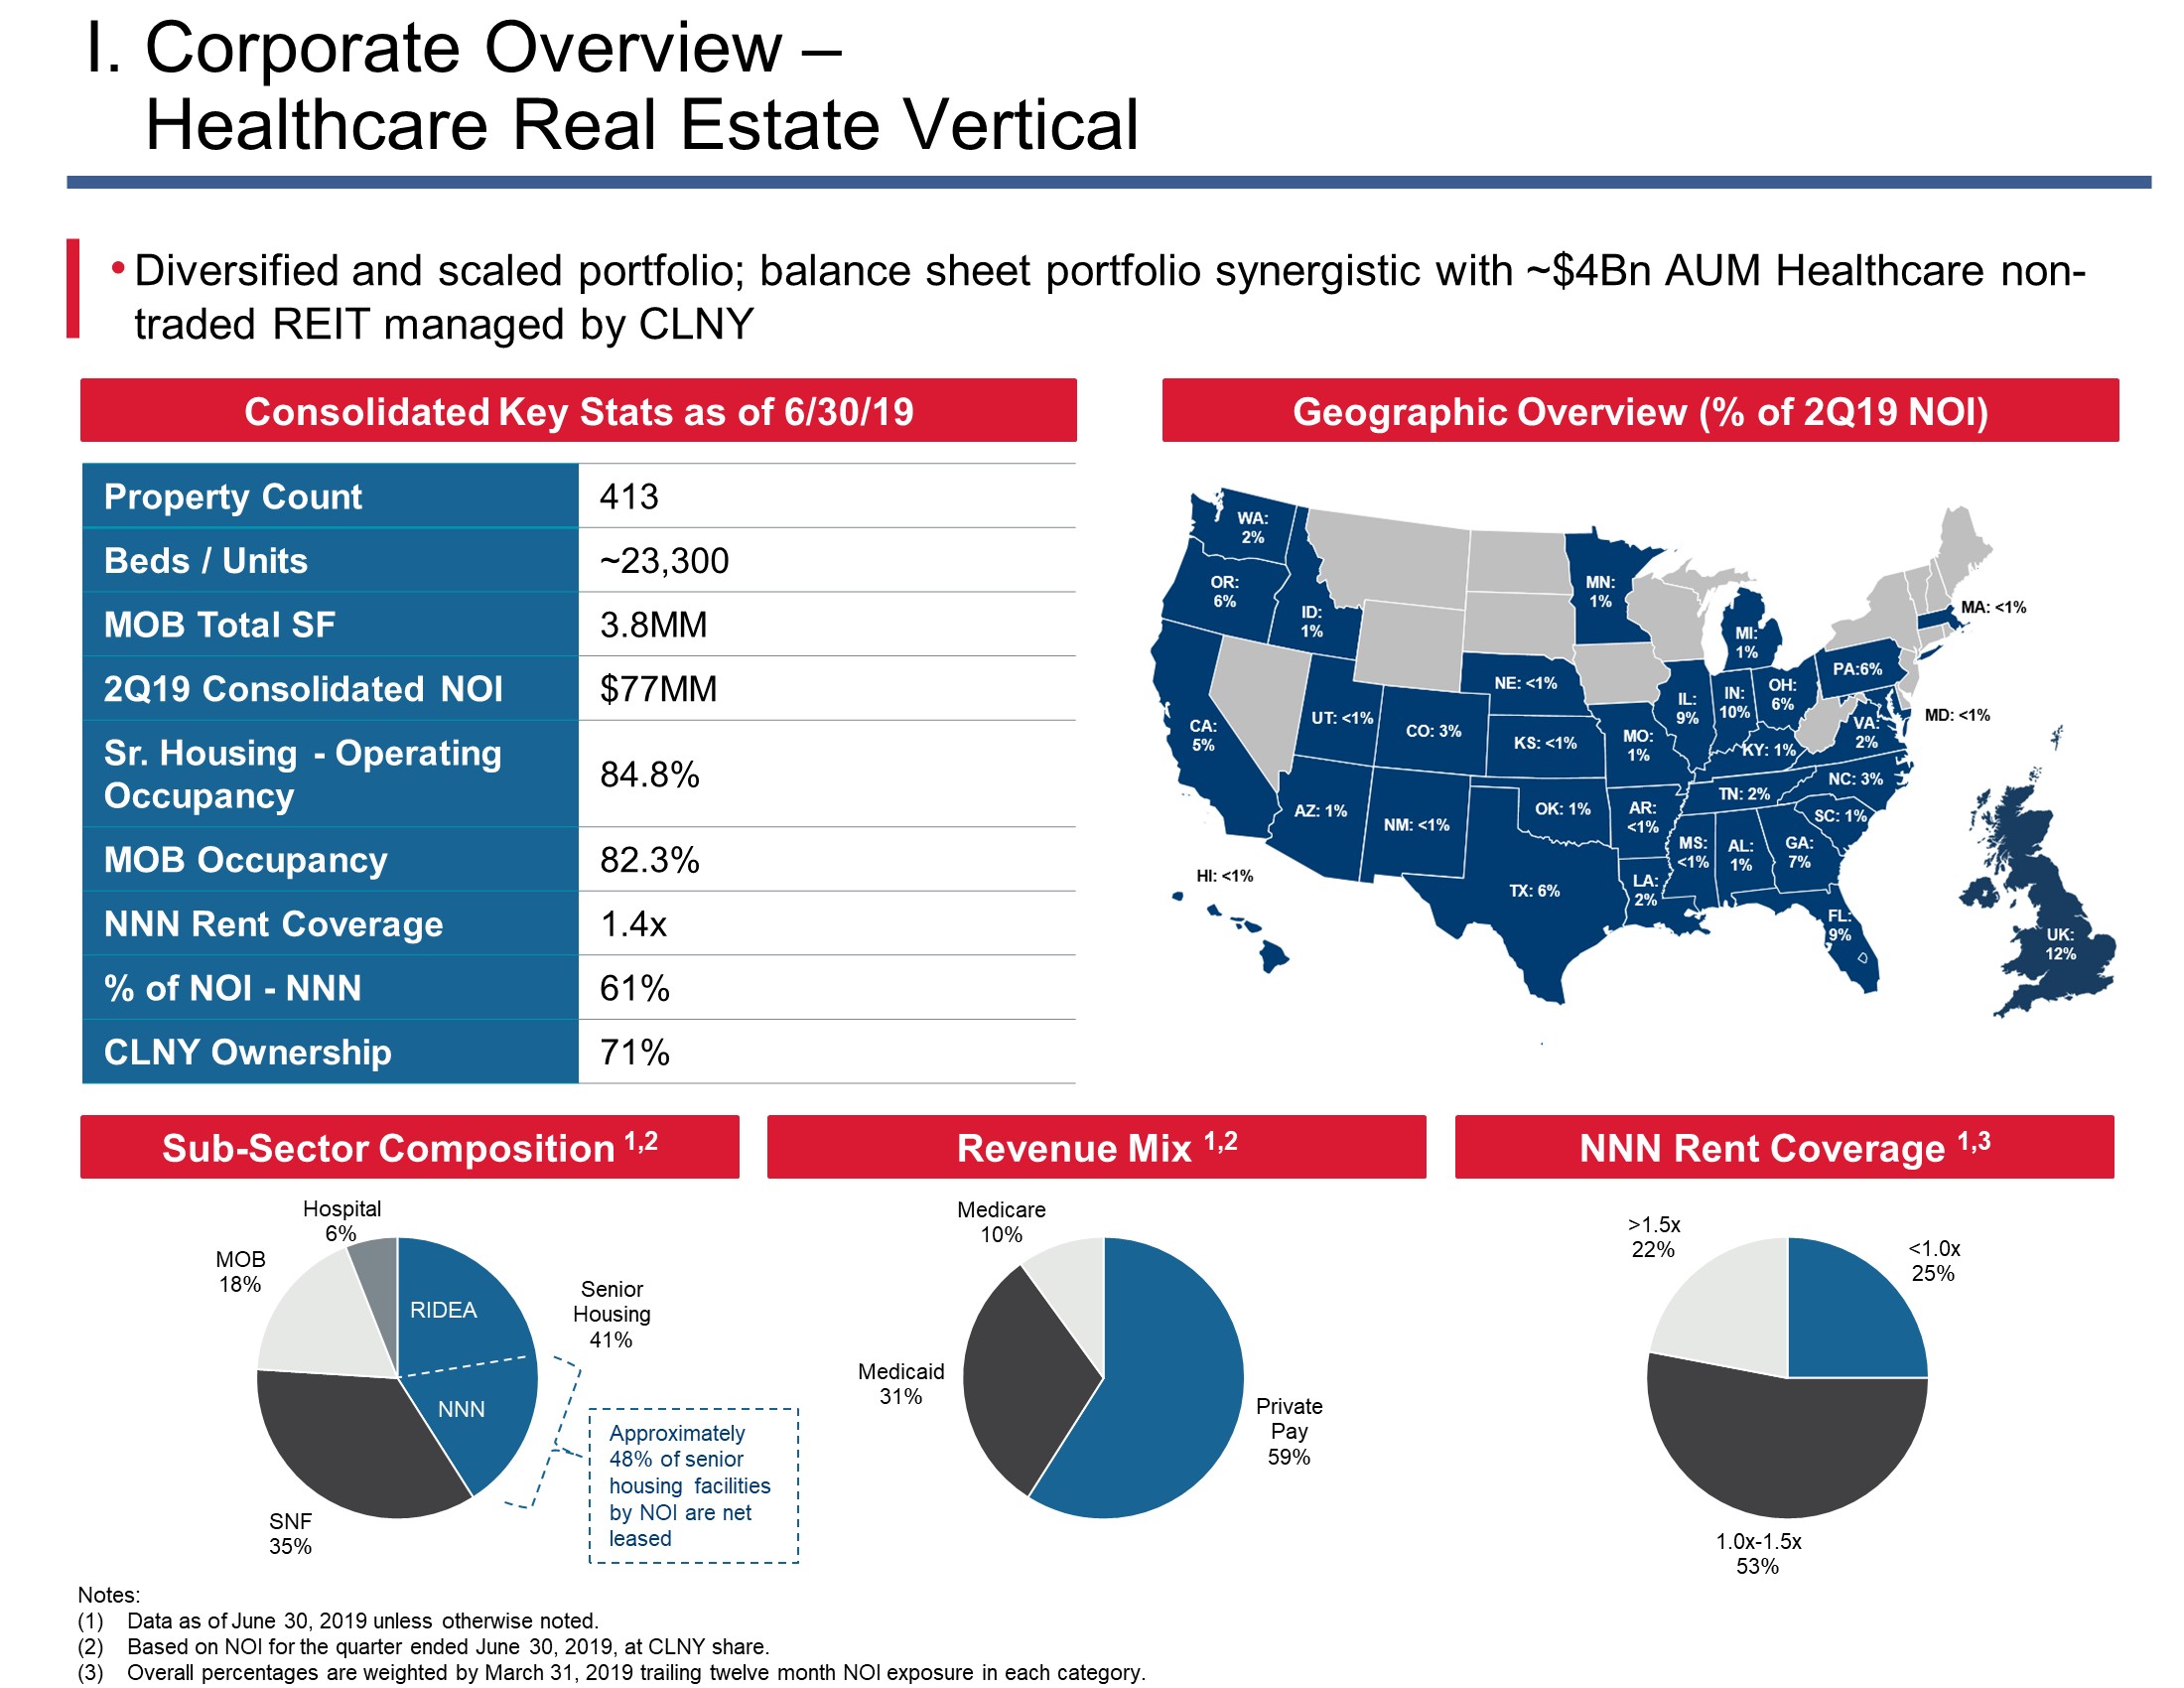
As of June 30, 2019, the consolidated healthcare portfolio consisted of 413 properties: 192 senior housing properties, 108 medical office properties, 99 skilled nursing facilities and 14 hospitals. The Company’s equity interest in the consolidated Healthcare Real Estate segment was approximately 71% as of June 30, 2019. The healthcare portfolio earns rental income from our senior housing, skilled nursing facilities and hospital assets that are under net leases to single tenants/operators and from medical office buildings which are both single tenant and multi-tenant. In addition, we also earn resident fee income from senior housing properties that are managed by operators under a REIT Investment Diversification and Empowerment Act of 2007 (“RIDEA”) structure.
Industrial Real Estate
As of June 30, 2019, the industrial segment met the criteria as held for sale and discontinued operations. Accordingly, for all prior periods presented, the related assets and liabilities were reclassified as assets and liabilities held for sale on the consolidated balance sheets and the related operating results were reclassified as income from discontinued operations on the consolidated statement of operations.
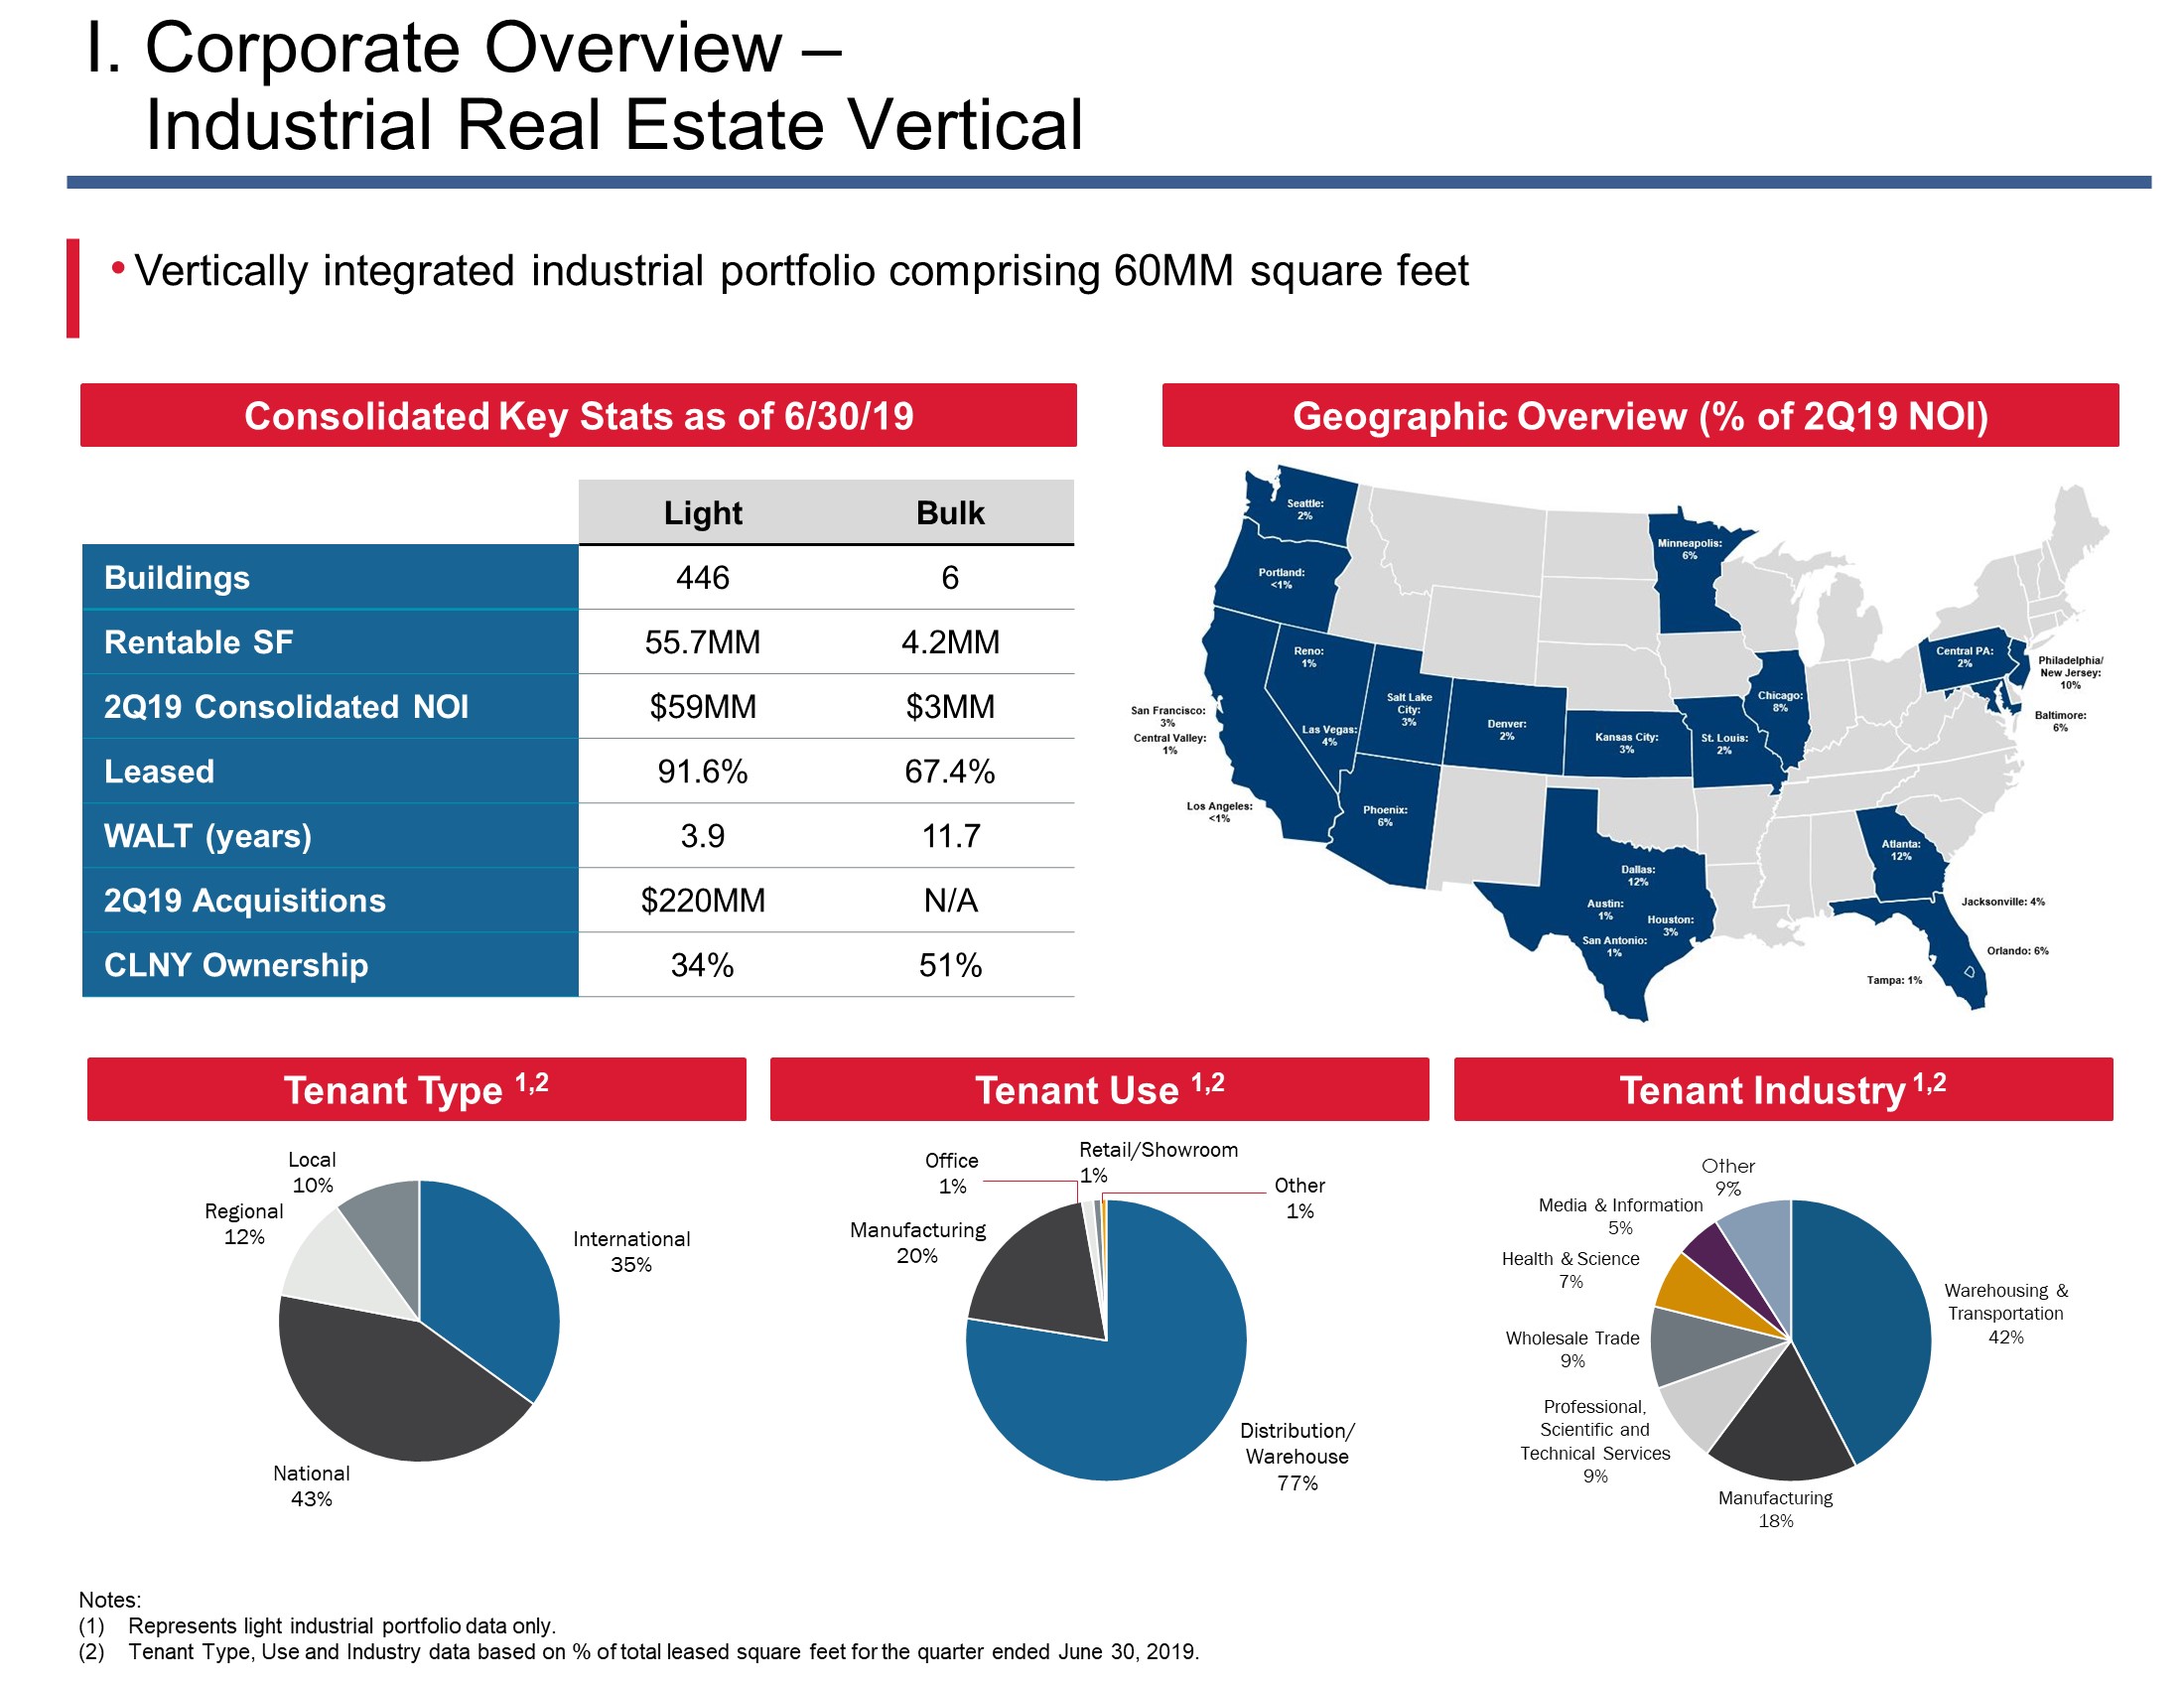
As of June 30, 2019, the consolidated light industrial portfolio consisted of 446 light industrial buildings totaling 55.7 million rentable square feet across 26 major U.S. markets and was 92% leased. The Company’s equity interest in the consolidated light industrial portfolio was approximately 34% as of June 30, 2019 and March 31, 2019. Total third-party capital commitments in the light industrial portfolio were approximately $1.7 billion compared to cumulative balance sheet contributions of $749 million as of June 30, 2019. The light industrial portfolio is composed of and primarily invests in light industrial properties in infill locations in major U.S. metropolitan markets generally targeting multi-tenanted warehouses less than 250,000 square feet.
As of June 30, 2019, the consolidated bulk industrial portfolio consisted of six bulk industrial buildings totaling 4.2 million rentable square feet across five major U.S. markets and was 67% leased. The Company's equity interest in the consolidated bulk industrial portfolio was approximately 51%, or $72 million, with the other 49% owned by third-party capital, which is managed by the Company's industrial operating platform.
Hospitality Real Estate
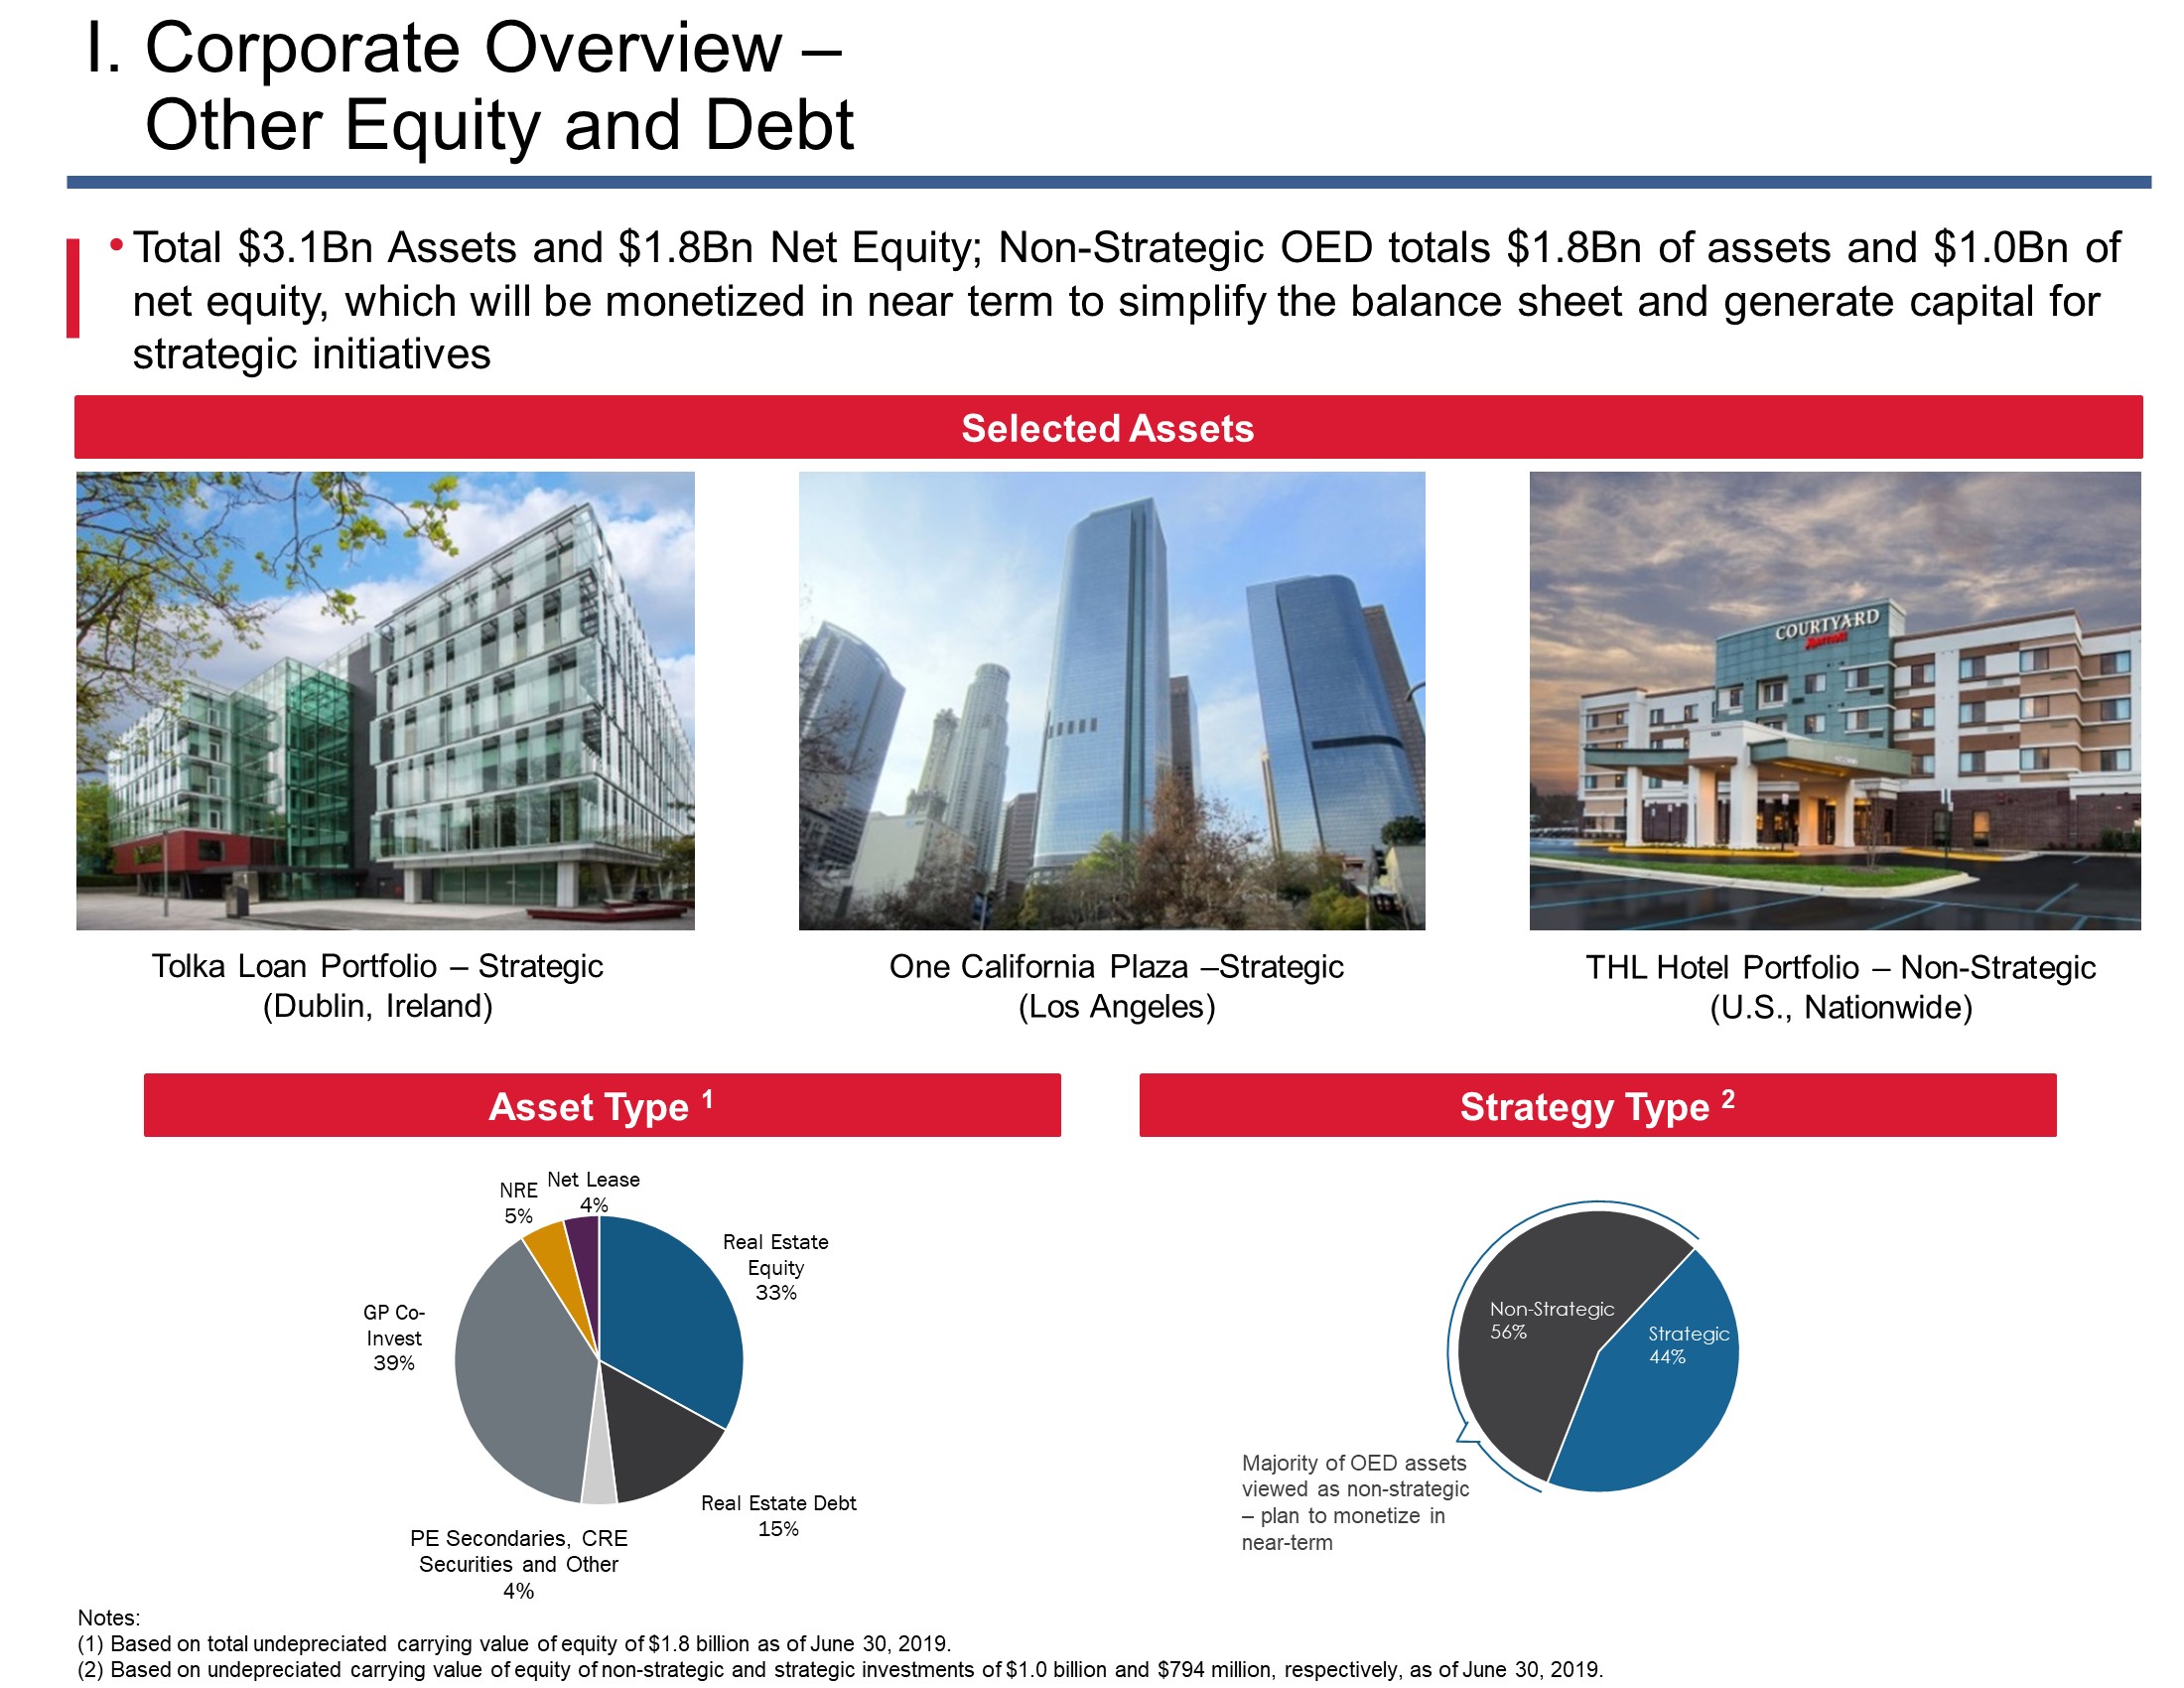
As of June 30, 2019, the consolidated hospitality portfolio consisted of 164 properties: 94 select service properties, 66 extended stay properties and 4 full service properties. The Company’s equity interest in the consolidated Hospitality Real Estate segment was approximately 94% as of June 30, 2019. The hospitality portfolio consists primarily of premium branded select service hotels and extended stay hotels located mostly in major metropolitan markets, of which a majority are affiliated with top hotel brands. The select service hospitality portfolio referred to as the THL Hotel Portfolio, which the Company acquired through consensual transfer during the third quarter 2017, is not included in the Hospitality Real Estate segment and is included in the Other Equity and Debt segment.
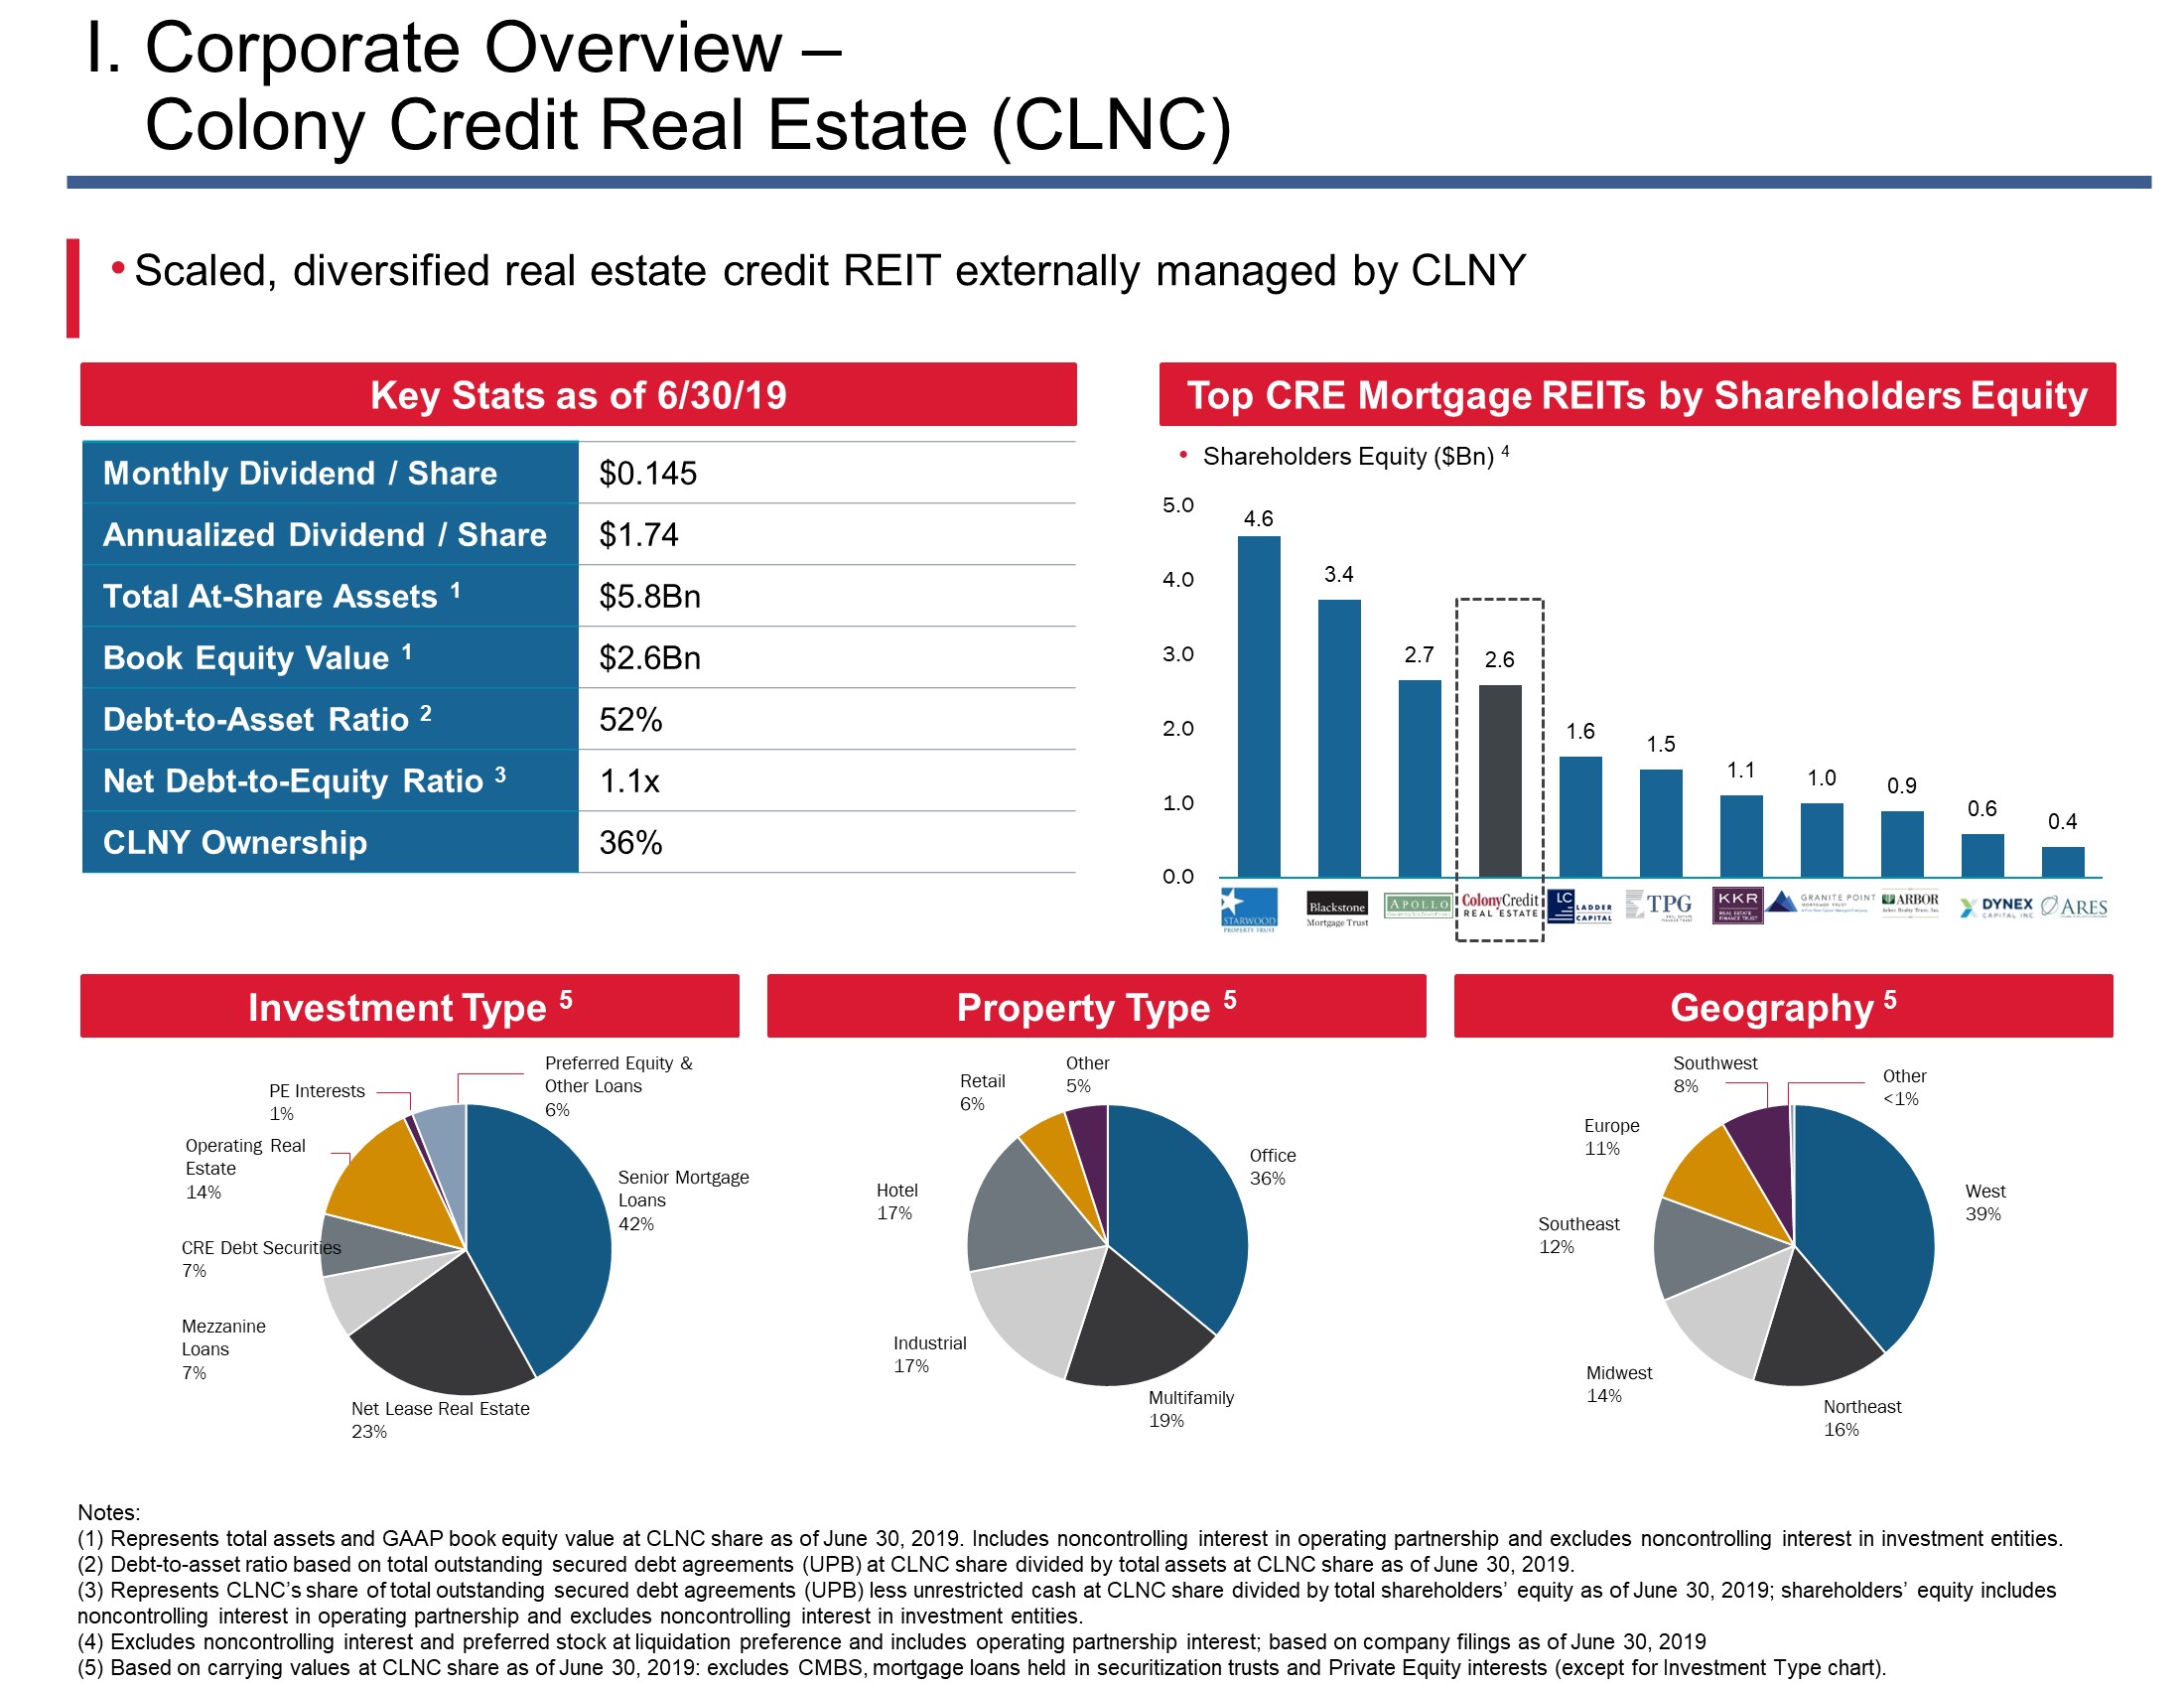
Colony Credit Real Estate, Inc. (“CLNC”)
Colony Credit Real Estate, Inc. is a commercial real estate credit REIT, externally managed by the Company, with $5.8 billion in assets and $2.6 billion in GAAP book equity value as of June 30, 2019. The Company owns 48.0 million shares and share equivalents, or 36%, of CLNC and earns an annual base management fee of 1.5% on stockholders’ equity (as defined in the CLNC management agreement) and an incentive fee of 20% of CLNC’s Core Earnings over a 7% hurdle rate.
Other Equity and Debt
The Company owns a diversified group of strategic and non-strategic real estate and real estate-related debt and equity investments. Strategic investments include our 11% interest in NorthStar Realty Europe Corp. (NYSE: NRE) and other investments for which the Company acts as a general partner and/or manager (“GP Co-Investments”) and receives various forms of investment management economics on the related third-party capital. Non-strategic investments are composed of those investments the Company does not intend to own for the long term including other real estate equity including the THL Hotel Portfolio and the Company’s interest in Albertsons; real estate debt; net leased assets; and multiple classes of commercial real estate (“CRE”) securities.
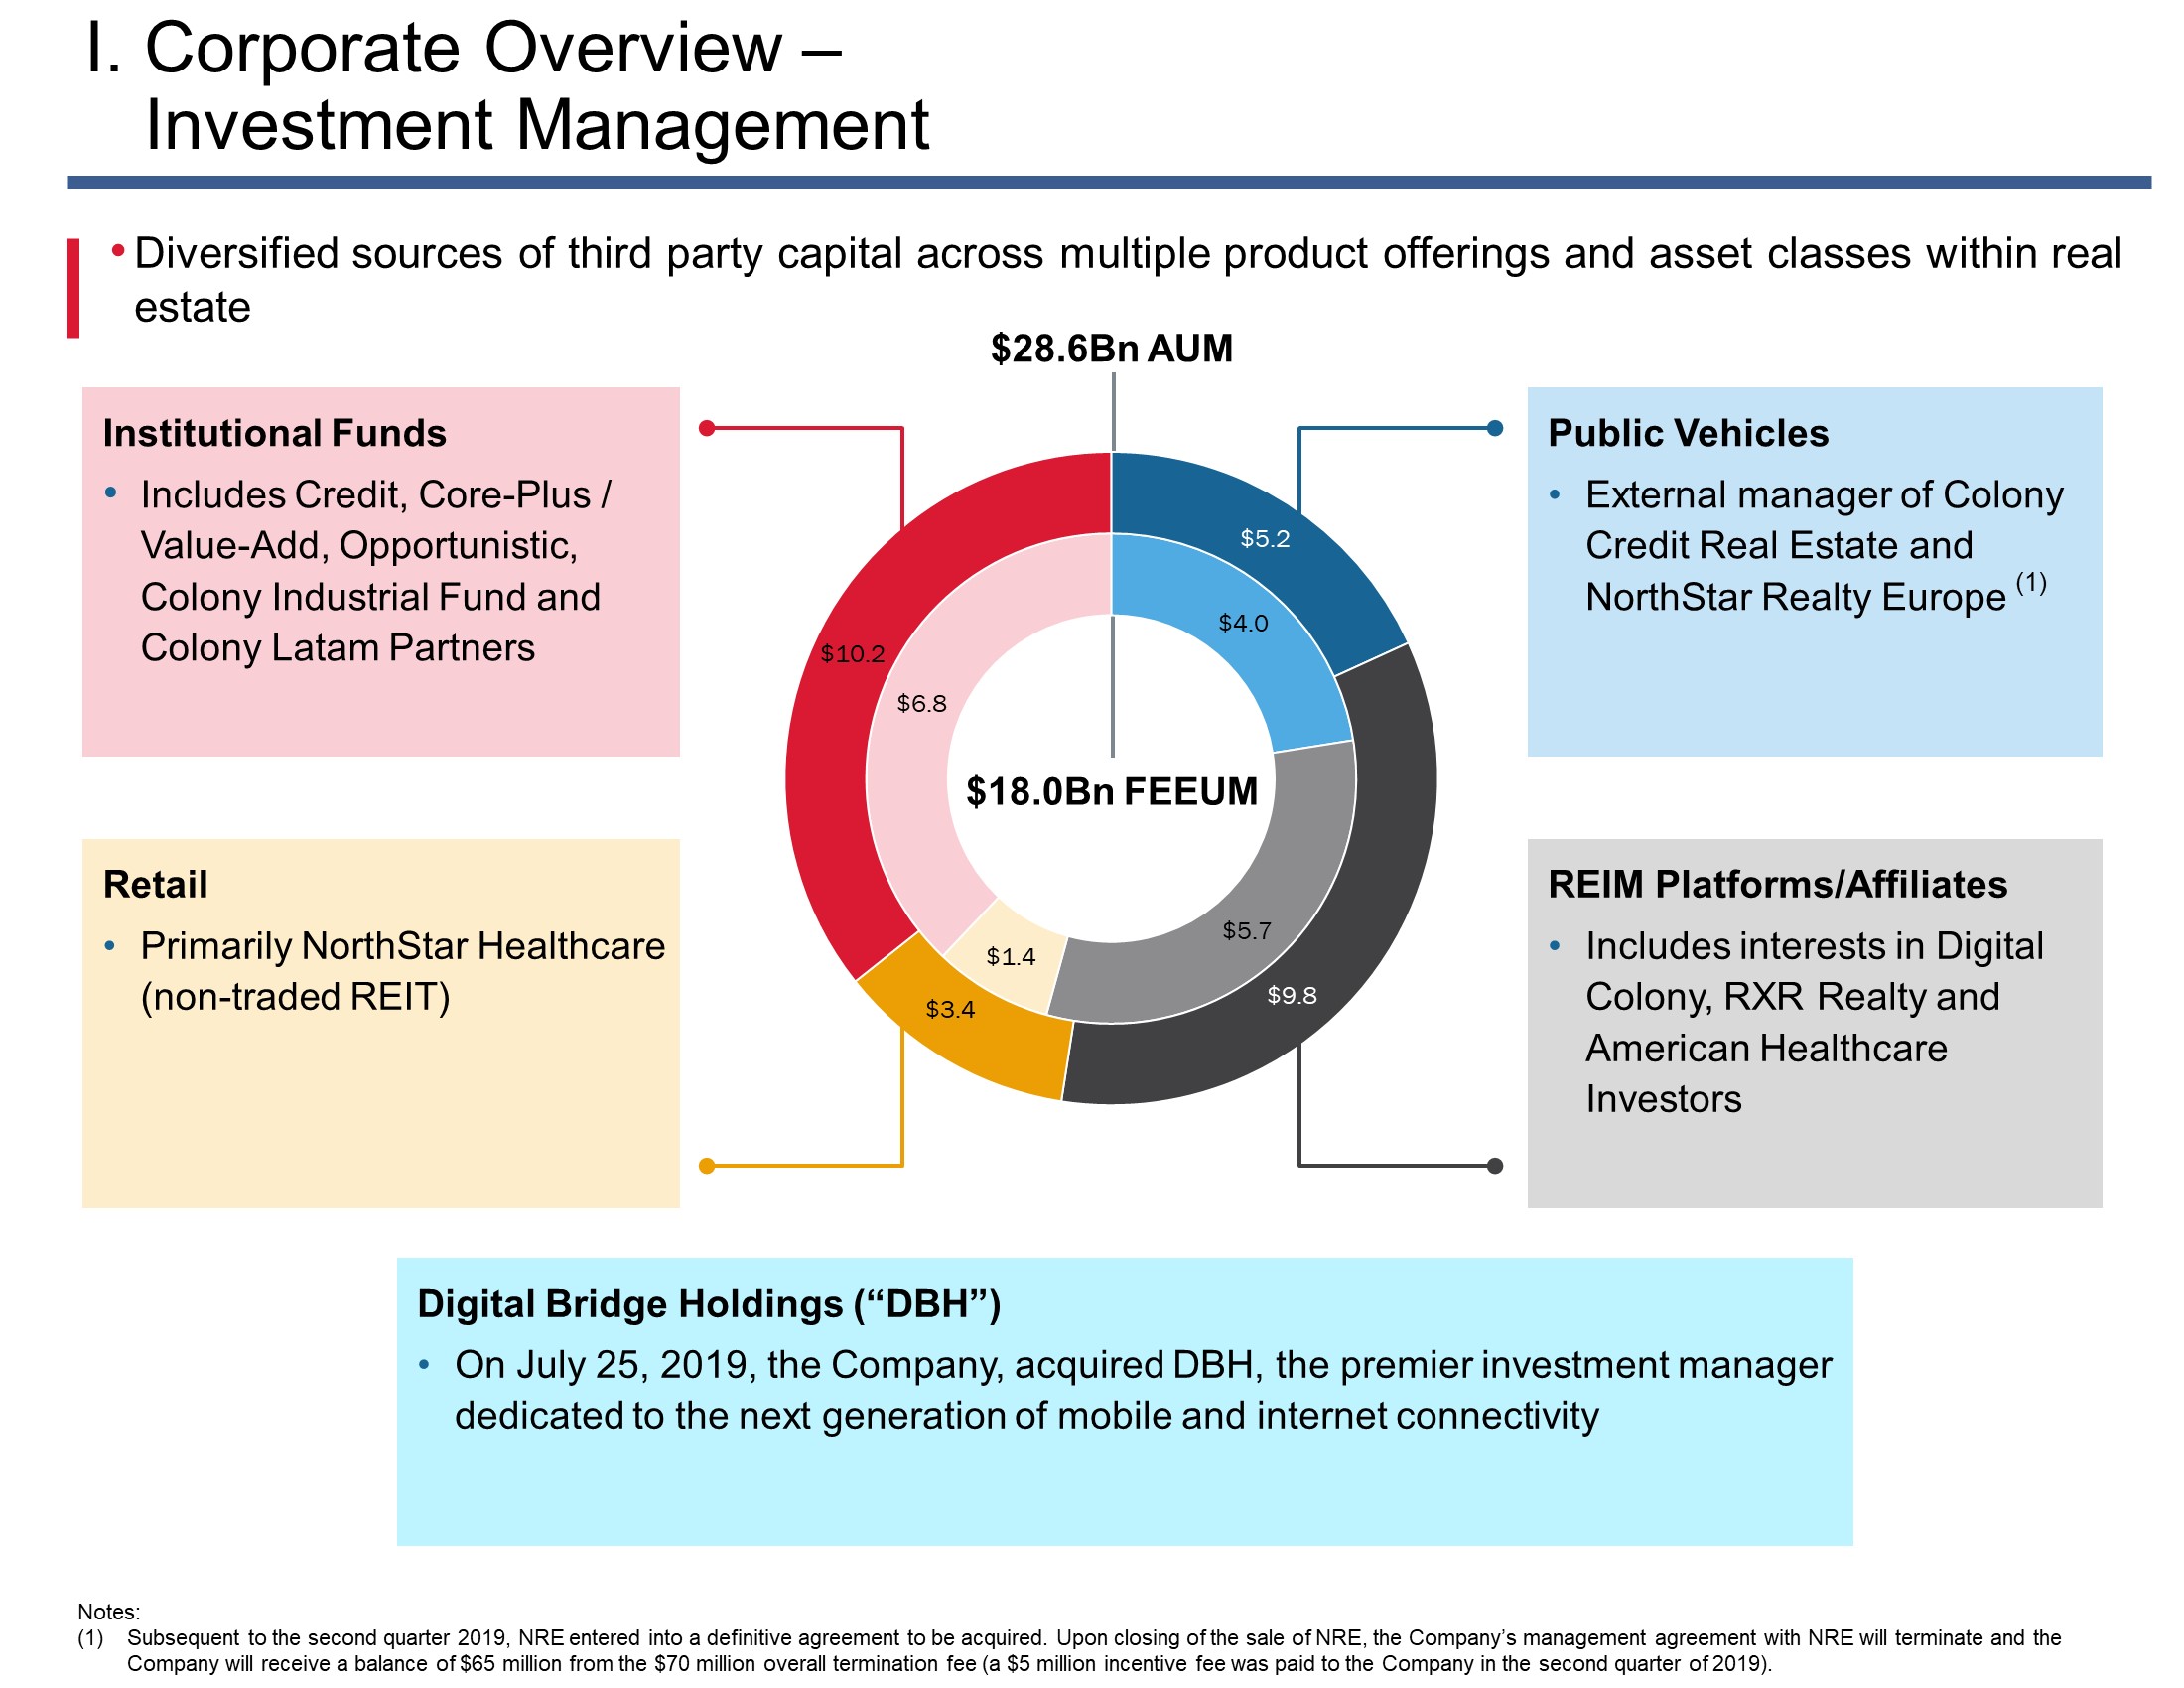
Investment Management
The Company’s Investment Management segment includes the business and operations of managing capital on behalf of third-party investors through closed and open-end private funds, traded and non-traded real estate investment trusts and registered investment companies.
Throughout this presentation, consolidated figures represent the interest of both the Company (and its subsidiary Colony Capital Operating Company or the “CLNY OP”) and noncontrolling interests. Figures labeled as CLNY OP share represent the Company’s pro-rata share.
|
| | |
Colony Capital | Supplemental Financial Report | | |
|
| | | |
| | | | Page |
| I. | | 6-15 |
| | | | |
| II. | Financial Overview | |
| | a. | | 16 |
| | b. | | 17-18 |
| III. | Financial Results | |
| | a. | | 19 |
| | b. | | 20 |
| | c. | | 21 |
| | d. | | 22 |
| | e. | | 23 |
| IV. | Capitalization | |
| | a. | | 24 |
| | b. | | 25 |
| | c. | | 26 |
| | d. | | 27 |
| | e. | | 28 |
| V. | Healthcare Real Estate | |
| | a. | | 29 |
| | b. | | 30-31 |
| VI. | Industrial Real Estate | |
| | a. | | 32 |
| | b. | | 33 |
| | | | |
|
| | | |
| | | | Page |
| VII. | Hospitality Real Estate | |
| | a. | | 34 |
| | b. | | 35 |
| VIII. | CLNC | |
| | a. | | 36 |
| IX. | | 37 |
| | a. | | 38 |
| | b. | | 39 |
| | c. | | 40-42 |
| | d. | | 43 |
| X. | Investment Management | |
| | a. | | 44 |
| | b. | | 45 |
| XI. | Appendices | |
| | a. | | 47-48 |
| | b. | | 49-50 |
| | c. | Industrial Real Estate - Held for Sale and Discontinued Operations | 51-52 |
| | | | |
| | | | |
| | | | |
| | | | |
| | | | |
| | | | |
|
| | | |
Colony Capital | Supplemental Financial Report | | 5
| |
|
| | | |
Colony Capital | Supplemental Financial Report | | 6
| |
|
| | | |
Colony Capital | Supplemental Financial Report | | 7
| |
|
| | | |
Colony Capital | Supplemental Financial Report | | 8
| |
|
| | | |
Colony Capital | Supplemental Financial Report | | 9
| |
|
| | | |
Colony Capital | Supplemental Financial Report | | 10
| |
|
| | | |
Colony Capital | Supplemental Financial Report | | 11
| |
|
| | | |
Colony Capital | Supplemental Financial Report | | 12
| |
|
| | | |
Colony Capital | Supplemental Financial Report | | 13
| |
|
| | | |
Colony Capital | Supplemental Financial Report | | 14
| |
|
| | | |
Colony Capital | Supplemental Financial Report | | 15
| |
|
|
| IIa. Financial Overview - Summary Metrics |
| |
|
| | | |
| ($ and shares in thousands, except per share data and as noted; as of or for the three months ended June 30, 2019, unless otherwise noted) (Unaudited) |
| Financial Data | |
| Net income (loss) attributable to common stockholders | $ | (468,890 | ) |
| Net income (loss) attributable to common stockholders per basic share | (0.98 | ) |
Core FFO(1) | 57,135 |
|
| Core FFO per basic share | 0.11 |
|
| Q3 2019 dividend per share | 0.11 |
|
| Annualized Q3 2019 dividend per share | 0.44 |
|
| | |
| Balance Sheet, Capitalization and Trading Statistics | |
| Total consolidated assets | $ | 22,658,538 |
|
| CLNY OP share of consolidated assets | 15,171,761 |
|
Total consolidated debt(2) | 10,958,484 |
|
CLNY OP share of consolidated debt(2) | 7,540,091 |
|
| Shares and OP units outstanding as of June 30, 2019 | 518,918 |
|
Shares and OP units outstanding as of August 6, 2019(3) | 540,350 |
|
| Share price as of August 6, 2019 | 5.41 |
|
| Market value of common equity & OP units as of August 6, 2019 | 2,923,294 |
|
| Liquidation preference of perpetual preferred equity | 1,436,605 |
|
| Insider ownership of shares and OP units as of August 6, 2019 | 9.4 | % |
| Total Assets Under Management ("AUM") | $ 43.3 billion |
|
| Fee Earning Equity Under Management ("FEEUM") | $ 18.0 billion |
|
Notes:
In evaluating the information presented throughout this presentation see the appendices to this presentation for definitions and reconciliations of non-GAAP financial measures to GAAP measures.
| |
| (1) | Second quarter 2019 Core FFO included net investment losses of $17.2 million. |
| |
| (2) | Represents principal balance and excludes debt issuance costs, discounts and premiums. |
| |
| (3) | Includes 21.5 million operating company units issued on July 25, 2019 for the acquisition of Digital Bridge Holdings. |
|
| | | |
Colony Capital | Supplemental Financial Report | | 16
| |
|
|
| IIb. Financial Overview - Summary of Segments |
| |
|
| | | | | | | |
| ($ in thousands; as of or for the three months ended June 30, 2019, unless otherwise noted) | Consolidated amount | | CLNY OP share of consolidated amount |
| Healthcare Real Estate | | | |
Q2 2019 net operating income(1)(2) | $ | 77,119 |
| | $ | 54,678 |
|
Annualized net operating income(3) | 304,756 |
| | 216,072 |
|
Investment-level non-recourse financing(4) | 3,022,747 |
| | 2,156,983 |
|
| | | | |
| Industrial Real Estate | | | |
Q2 2019 net operating income(2) | 62,239 |
| | 21,402 |
|
| Annualized net operating income | 248,956 |
| | 85,608 |
|
Investment-level non-recourse financing(4) | 2,022,391 |
| | 719,663 |
|
| | | | |
| Hospitality Real Estate | | | |
Q2 2019 NOI before FF&E Reserve(2) | 82,696 |
| | 77,982 |
|
TTM NOI before FF&E Reserve(5) | 283,585 |
| | 267,421 |
|
Investment-level non-recourse financing(4) | 2,659,562 |
| | 2,488,688 |
|
Notes:
| |
| (1) | NOI includes $0.9 million consolidated or $0.7 million CLNY OP share of interest earned related to $50 million consolidated or $35 million CLNY OP share carrying value of healthcare real estate development loans. This interest income is in the Interest Income line item on the Company’s Statement of Operations for the three months ended June 30, 2019. |
| |
| (2) | For a reconciliation of net income/(loss) attributable to common stockholders to NOI, please refer to the appendix to this presentation. |
| |
| (3) | Excludes $0.9 million of consolidated or $0.7 million CLNY OP share of one-time recovery of uncollectible rents received during the second quarter 2019. |
| |
| (4) | Represents unpaid principal balance. |
| |
| (5) | TTM = trailing twelve month. |
|
| | | |
Colony Capital | Supplemental Financial Report | | 17
| |
|
|
| IIb. Financial Overview - Summary of Segments (cont’d) |
| |
|
| | | | | | | | |
| ($ in thousands except as noted; as of or for the three months ended June 30, 2019, unless otherwise noted) | Consolidated amount | | CLNY OP share of consolidated amount | |
| CLNC | | | | |
| Net carrying value of 36% interest | $ | 743,015 |
| | $ | 743,015 |
| (1) |
Other Equity and Debt (2) | | | | |
| 1) Strategic Investments | | | | |
| a) GP co-investments - net carrying value | 1,879,642 |
| | 707,308 |
| |
| b) Net carrying value of 11% interest in NRE | 86,581 |
| | 86,581 |
| |
| 2) Net lease real estate equity | | | | |
| a) Q2 2019 net operating income | 695 |
| | 694 |
| |
b) Investment-level non-recourse financing(3) | 107,608 |
| | 106,983 |
| |
| 3) Other real estate equity | | | | |
a) Undepreciated carrying value of real estate assets(4) | 2,007,451 |
| | 1,031,488 |
| |
b) Investment-level non-recourse financing(3) | 1,341,950 |
| | 689,515 |
| |
| c) Carrying value - equity method investments (including Albertsons) | 333,128 |
| | 253,877 |
| |
| 4) Real estate debt | | | | |
a) Carrying value - consolidated(5) | 339,597 |
| | 239,120 |
| |
b) Investment-level non-recourse financing(3) | — |
| | — |
| |
| c) Carrying value - equity method investments | 18,253 |
| | 13,186 |
| |
d) Carrying value - real estate assets (REO within debt portfolio) and other(4) | 34,543 |
| | 21,261 |
| |
| 5) CRE securities and real estate PE fund investments | | | | |
| a) Carrying value | | | 67,940 |
| |
| Investment Management | | | | |
| Third-party AUM ($ in millions) | | | 28,569 |
| |
| FEEUM ($ in millions) | | | 17,960 |
| |
| Q2 2019 fee revenue and REIM platform equity method earnings | | | 40,204 |
| |
| Net Assets | | | | |
Cash and cash equivalents, restricted cash and other assets(6) | 1,298,021 |
| | 998,973 |
| |
Accrued and other liabilities and dividends payable(7) | 952,478 |
| | 832,904 |
| |
| Net assets | $ | 345,543 |
| | $ | 166,069 |
| |
Notes:
| |
| (1) | Includes a $228 million noncash write-down of the carrying value of the Company's 48 million shares of CLNC to a value based on CLNC’s closing stock price of $15.50 on June 28, 2019, the last trading day of the second quarter, required under generally accepted accounting principles as a result of the prolonged period of time in which the carrying value of the Company's CLNC shares has exceeded CLNC share trading prices. |
| |
| (2) | Includes assets classified as held for sale on the Company’s financial statements. |
| |
| (3) | Represents unpaid principal balance. |
| |
| (4) | Includes all components related to real estate assets, including tangible real estate and lease-related intangibles, and excludes accumulated depreciation. |
| |
| (5) | Excludes $50 million consolidated or $35 million CLNY OP share carrying value of healthcare real estate development loans. |
| |
| (6) | Other assets excludes $4 million consolidated and CLNY OP share of deferred financing costs and $54 million consolidated or $30 million CLNY OP share of restricted cash which is included in the undepreciated carrying value of the hotel portfolio in Other Real Estate Equity shown on page 41. |
| |
| (7) | Accrued and other liabilities exclude $40 million consolidated and CLNY OP share of deferred tax liabilities and other liabilities which are not due in cash and $112 million of derivative liability which is included in the debt of Other GP Co-investments shown on page 40. |
|
| | | |
Colony Capital | Supplemental Financial Report | | 18
| |
|
|
| IIIa. Financial Results - Consolidated Balance Sheet |
| |
|
| | | | |
| ($ in thousands, except per share data) (unaudited) | | As of June 30, 2019 |
| Assets | | |
| Cash and cash equivalents | | $ | 353,984 |
|
| Restricted cash | | 336,491 |
|
| Real estate, net | | 10,348,430 |
|
| Loans receivable, net | | 1,487,611 |
|
| Equity and debt investments | | 2,373,690 |
|
| Goodwill | | 1,514,561 |
|
| Deferred leasing costs and intangible assets, net | | 372,351 |
|
| Assets held for sale | | 5,205,340 |
|
| Other assets | | 621,673 |
|
| Due from affiliates | | 44,407 |
|
| Total assets | | $ | 22,658,538 |
|
| Liabilities | | |
| Debt, net | | $ | 8,739,667 |
|
| Accrued and other liabilities | | 1,020,709 |
|
| Intangible liabilities, net | | 100,730 |
|
| Liabilities related to assets held for sale | | 2,168,168 |
|
| Dividends and distributions payable | | 84,221 |
|
| Total liabilities | | 12,113,495 |
|
| Commitments and contingencies | | |
| Redeemable noncontrolling interests | | 7,945 |
|
| Equity | | |
| Stockholders’ equity: | | |
| Preferred stock, $0.01 par value per share; $1,436,605 liquidation preference; 250,000 shares authorized; 57,464 shares issued and outstanding | | 1,407,495 |
|
| Common stock, $0.01 par value per share | | |
| Class A, 949,000 shares authorized; 487,013 shares issued and outstanding | | 4,870 |
|
| Class B, 1,000 shares authorized; 734 shares issued and outstanding | | 7 |
|
| Additional paid-in capital | | 7,621,655 |
|
| Distributions in excess of earnings | | (2,699,276 | ) |
| Accumulated other comprehensive income | | 26,967 |
|
| Total stockholders’ equity | | 6,361,718 |
|
| Noncontrolling interests in investment entities | | 3,861,047 |
|
| Noncontrolling interests in Operating Company | | 314,333 |
|
| Total equity | | 10,537,098 |
|
| Total liabilities, redeemable noncontrolling interests and equity | | $ | 22,658,538 |
|
|
| | | |
Colony Capital | Supplemental Financial Report | | 19
| |
|
|
| IIIb. Financial Results - Noncontrolling Interests’ Share Balance Sheet |
| |
|
| | | | |
| ($ in thousands, except per share data) (unaudited) | | As of June 30, 2019 |
| Assets | | |
| Cash and cash equivalents | | $ | 123,623 |
|
| Restricted cash | | 105,530 |
|
| Real estate, net | | 2,608,800 |
|
| Loans receivable, net | | 695,595 |
|
| Equity and debt investments | | 510,135 |
|
| Deferred leasing costs and intangible assets, net | | 77,804 |
|
| Assets held for sale | | 3,270,934 |
|
| Other assets | | 94,356 |
|
| Total assets | | $ | 7,486,777 |
|
| Liabilities | | |
| Debt, net | | $ | 2,077,509 |
|
| Accrued and other liabilities | | 119,573 |
|
| Intangible liabilities, net | | 30,564 |
|
| Liabilities related to assets held for sale | | 1,390,139 |
|
| Total liabilities | | 3,617,785 |
|
| Commitments and contingencies | | |
| Redeemable noncontrolling interests | | 7,945 |
|
| Equity | | |
| Stockholders’ equity: | | |
| Preferred stock, $0.01 par value per share; $1,436,605 liquidation preference; 250,000 shares authorized; 57,464 shares issued and outstanding | | — |
|
| Common stock, $0.01 par value per share | | |
| Class A, 949,000 shares authorized; 487,013 shares issued and outstanding | | — |
|
| Class B, 1,000 shares authorized; 734 shares issued and outstanding | | — |
|
| Additional paid-in capital | | — |
|
| Distributions in excess of earnings | | — |
|
| Accumulated other comprehensive income | | — |
|
| Total stockholders’ equity | | — |
|
| Noncontrolling interests in investment entities | | 3,861,047 |
|
| Noncontrolling interests in Operating Company | | — |
|
| Total equity | | 3,861,047 |
|
| Total liabilities, redeemable noncontrolling interests and equity | | $ | 7,486,777 |
|
|
| | | |
Colony Capital | Supplemental Financial Report | | 20
| |
|
|
| IIIc. Financial Results - Consolidated Segment Operating Results |
| |
|
| | | | | | | | | | | | | | | | | | | | | | | | | | | | | | | | |
| | | Three Months Ended June 30, 2019 |
| ($ in thousands) (unaudited) | | Healthcare | | Industrial | | Hospitality | | CLNC | | Other Equity and Debt | | Investment Management | | Amounts not allocated to segments | | Total |
| Revenues | | | | | | | | | | | | | | | | |
| Property operating income | | $ | 144,863 |
| | $ | — |
| | $ | 227,016 |
| | $ | — |
| | $ | 116,909 |
| | $ | — |
| | $ | — |
| | $ | 488,788 |
|
| Interest income | | 946 |
| | — |
| | 1 |
| | — |
| | 32,983 |
| | 405 |
| | 720 |
| | 35,055 |
|
| Fee income | | — |
| | — |
| | — |
| | — |
| | — |
| | 35,433 |
| | — |
| | 35,433 |
|
| Other income | | 87 |
| | — |
| | 63 |
| | — |
| | 2,174 |
| | 7,964 |
| | 3,875 |
| | 14,163 |
|
| Total revenues | | 145,896 |
| | — |
| | 227,080 |
| | — |
| | 152,066 |
| | 43,802 |
| | 4,595 |
| | 573,439 |
|
| Expenses | | | | | | | | | | | | | | | | |
| Property operating expense | | 63,924 |
| | — |
| | 144,691 |
| | — |
| | 70,625 |
| | — |
| | — |
| | 279,240 |
|
| Interest expense | | 57,135 |
| | — |
| | 41,591 |
| | — |
| | 29,216 |
| | — |
| | 13,796 |
| | 141,738 |
|
| Investment and servicing expense | | 9,097 |
| | — |
| | 2,712 |
| | — |
| | 7,355 |
| | — |
| | 853 |
| | 20,017 |
|
| Transaction costs | | — |
| | — |
| | — |
| | — |
| | — |
| | 318 |
| | — |
| | 318 |
|
| Depreciation and amortization | | 40,778 |
| | — |
| | 37,008 |
| | — |
| | 23,166 |
| | 6,918 |
| | 1,512 |
| | 109,382 |
|
| Provision for loan loss | | — |
| | — |
| | — |
| | — |
| | 15,003 |
| | — |
| | — |
| | 15,003 |
|
| Impairment loss | | 51,324 |
| | — |
| | 420 |
| | — |
| | 32,302 |
| | — |
| | 649 |
| | 84,695 |
|
| Compensation expense | | | | | | | | | | | | | | | | |
| Cash and equity-based compensation | | 1,787 |
| | — |
| | 1,727 |
| | — |
| | 1,744 |
| | 17,332 |
| | 19,840 |
| | 42,430 |
|
| Carried interest and incentive compensation | | — |
| | — |
| | — |
| | — |
| | — |
| | 1,146 |
| | — |
| | 1,146 |
|
| Administrative expenses | | 514 |
| | — |
| | 456 |
| | — |
| | 1,952 |
| | 1,212 |
| | 16,012 |
| | 20,146 |
|
| Total expenses | | 224,559 |
| | — |
| | 228,605 |
| | — |
| | 181,363 |
| | 26,926 |
| | 52,662 |
| | 714,115 |
|
| Other income (loss) | | | | | | | | | | | | | | | | |
| Gain on sale of real estate assets | | — |
| | — |
| | 140 |
| | — |
| | 5,937 |
| | — |
| | — |
| | 6,077 |
|
| Other gain (loss), net | | (2,261 | ) | | — |
| | (114 | ) | | — |
| | (1,995 | ) | | 5 |
| | (85,141 | ) | | (89,506 | ) |
| Equity method earnings | | — |
| | — |
| | — |
| | (267,912 | ) | | 25,757 |
| | (17,133 | ) | | — |
| | (259,288 | ) |
| Equity method earnings—carried interest | | — |
| | — |
| | — |
| | — |
| | — |
| | 1,836 |
| | — |
| | 1,836 |
|
| Income (loss) before income taxes | | (80,924 | ) | | — |
| | (1,499 | ) | | (267,912 | ) | | 402 |
| | 1,584 |
| | (133,208 | ) | | (481,557 | ) |
| Income tax benefit (expense) | | (596 | ) | | — |
| | (2,006 | ) | | — |
| | (406 | ) | | 266 |
| | 157 |
| | (2,585 | ) |
| Income (loss) from continuing operations | | (81,520 | ) | | — |
| | (3,505 | ) | | (267,912 | ) | | (4 | ) | | 1,850 |
| | (133,051 | ) | | (484,142 | ) |
| Income (loss) from discontinued operations | | — |
| | (2,663 | ) | | — |
| | — |
| | — |
| | 2,159 |
| | — |
| | (504 | ) |
| Net income (loss) | | (81,520 | ) | | (2,663 | ) | | (3,505 | ) | | (267,912 | ) | | (4 | ) | | 4,009 |
| | (133,051 | ) | | (484,646 | ) |
| Net income (loss) attributable to noncontrolling interests: | | | | | | | | | | | | | | | | |
| Redeemable noncontrolling interests | | — |
| | — |
| | — |
| | — |
| | 509 |
| | — |
| | — |
| | 509 |
|
| Investment entities | | (19,181 | ) | | 673 |
| | 13 |
| | — |
| | 5,702 |
| | (621 | ) | | — |
| | (13,414 | ) |
| Operating Company | | (3,723 | ) | | (201 | ) | | (188 | ) | | (16,120 | ) | | (374 | ) | | 279 |
| | (9,662 | ) | | (29,989 | ) |
| Net income (loss) attributable to Colony Capital, Inc. | | (58,616 | ) | | (3,135 | ) | | (3,330 | ) | | (251,792 | ) | | (5,841 | ) | | 4,351 |
| | (123,389 | ) | | (441,752 | ) |
| Preferred stock dividends | | — |
| | — |
| | — |
| | — |
| | — |
| | — |
| | 27,138 |
| | 27,138 |
|
| Net income (loss) attributable to common stockholders | | $ | (58,616 | ) | | $ | (3,135 | ) | | $ | (3,330 | ) | | $ | (251,792 | ) | | $ | (5,841 | ) | | $ | 4,351 |
| | $ | (150,527 | ) | | $ | (468,890 | ) |
|
| | | |
Colony Capital | Supplemental Financial Report | | 21
| |
|
|
IIId. Financial Results - Noncontrolling Interests’ Share Segment Operating Results
|
| |
|
| | | | | | | | | | | | | | | | | | | | | | | | | | | | | | | | | |
| | | Three Months Ended June 30, 2019 |
| ($ in thousands) (unaudited) | | Healthcare | | Industrial | | Hospitality | | CLNC | | Other Equity and Debt | | Investment Management | | Amounts not allocated to segments | | Total |
| Revenues | | | | | | | — |
| | | | | | | | | |
| Property operating income | | $ | 40,987 |
| | $ | — |
| | $ | 14,035 |
| | $ | — |
| | $ | 58,392 |
| | $ | — |
| | $ | — |
| | $ | 113,414 |
|
| Interest income | | 287 |
| | — |
| | — |
| | — |
| | 19,318 |
| | — |
| | — |
| | 19,605 |
|
| Fee income | | — |
| | — |
| | — |
| | — |
| | — |
| | — |
| | — |
| | — |
|
| Other income | | 22 |
| | — |
| | 6 |
| | — |
| | 609 |
| | — |
| | — |
| | 637 |
|
| Total revenues | | 41,296 |
| | — |
| | 14,041 |
| | — |
| | 78,319 |
| | — |
| | — |
| | 133,656 |
|
| Expenses | | | | | | | | | | | | | | | | |
| Property operating expense | | 17,624 |
| | — |
| | 8,867 |
| | — |
| | 34,382 |
| | — |
| | — |
| | 60,873 |
|
| Interest expense | | 16,509 |
| | — |
| | 2,631 |
| | — |
| | 12,438 |
| | — |
| | — |
| | 31,578 |
|
| Investment and servicing expense | | 2,672 |
| | — |
| | 132 |
| | — |
| | 2,560 |
| | — |
| | — |
| | 5,364 |
|
| Transaction costs | | — |
| | — |
| | — |
| | — |
| | — |
| | — |
| | — |
| | — |
|
| Placement fees | | — |
| | — |
| | — |
| | — |
| | — |
| | — |
| | — |
| | — |
|
| Depreciation and amortization | | 11,762 |
| | — |
| | 2,357 |
| | — |
| | 12,415 |
| | — |
| | — |
| | 26,534 |
|
| Provision for loan loss | | — |
| | — |
| | — |
| | — |
| | 4,237 |
| | — |
| | — |
| | 4,237 |
|
| Impairment loss | | 14,456 |
| | — |
| | 1 |
| | — |
| | 22,739 |
| | — |
| | — |
| | 37,196 |
|
| Compensation expense | | | | | | | | | | | | | | | |
|
|
| Cash and equity-based compensation | | — |
| | — |
| | — |
| | — |
| | 124 |
| | — |
| | — |
| | 124 |
|
| Carried interest and incentive compensation | | — |
| | — |
| | — |
| | — |
| | — |
| | — |
| | — |
| | — |
|
| Administrative expenses | | 152 |
| | — |
| | 27 |
| | — |
| | 774 |
| | 5 |
| | — |
| | 958 |
|
| Total expenses | | 63,175 |
| | — |
| | 14,015 |
| | — |
| | 89,669 |
| | 5 |
| | — |
| | 166,864 |
|
| Other income (loss) | | | | | | | | | | | | | | | | |
| Gain on sale of real estate assets | | — |
| | — |
| | — |
| | — |
| | 3,772 |
| | — |
| | — |
| | 3,772 |
|
| Other gain (loss), net | | (686 | ) | | — |
| | (13 | ) | | — |
| | (370 | ) | | — |
| | — |
| | (1,069 | ) |
| Equity method earnings (losses) | | — |
| | — |
| | — |
| | — |
| | 14,171 |
| | (4 | ) | | | | 14,167 |
|
| Equity method earnings—carried interest | | — |
| | — |
| | — |
| | — |
| | — |
| | (270 | ) | | — |
| | (270 | ) |
| Income (loss) before income taxes | | (22,565 | ) | | — |
| | 13 |
| | — |
| | 6,223 |
| | (279 | ) | | — |
| | (16,608 | ) |
| Income tax benefit (expense) | | (104 | ) | | — |
| | — |
| | — |
| | (12 | ) | | — |
| | — |
| | (116 | ) |
| Net income (loss) | | (22,669 | ) | | — |
| | 13 |
| | — |
| | 6,211 |
| | (279 | ) | | — |
| | (16,724 | ) |
| Income (loss) from discontinued operations | | — |
| | 673 |
| | — |
| | — |
| | — |
| | — |
| | — |
| | 673 |
|
| Non-pro rata allocation of income (loss) to NCI | | 3,488 |
| | — |
| | — |
| | — |
| | — |
| | (342 | ) | | — |
| | 3,146 |
|
| Net income (loss) attributable to noncontrolling interests | | $ | (19,181 | ) | | $ | 673 |
| | $ | 13 |
| | $ | — |
| | $ | 6,211 |
| | $ | (621 | ) | | $ | — |
| | $ | (12,905 | ) |
|
| | | |
Colony Capital | Supplemental Financial Report | | 22
| |
|
| | | | | | | | | | | | | | | | | | | | | | | | | | | | | | | | | | | | | | | | |
| | | Three Months Ended June 30, 2019 |
| | | OP pro rata share by segment | | Amounts attributable to noncontrolling interests | | CLNY consolidated as reported |
| ($ in thousands) (Unaudited) | | Healthcare | | Industrial | | Hospitality | | CLNC | | Other Equity and Debt | | Investment Management | | Amounts not allocated to segments | | Total OP pro rata share | | |
| Net income (loss) attributable to common stockholders | | $ | (58,616 | ) | | $ | (3,135 | ) | | $ | (3,330 | ) | | $ | (251,792 | ) | | $ | (5,841 | ) | | $ | 4,351 |
| | $ | (150,527 | ) | | $ | (468,890 | ) | | $ | — |
| | $ | (468,890 | ) |
| Net income (loss) attributable to noncontrolling common interests in Operating Company | | (3,723 | ) | | (201 | ) | | (188 | ) | | (16,120 | ) | | (374 | ) | | 279 |
| | (9,662 | ) | | (29,989 | ) | | — |
| | (29,989 | ) |
| Net income (loss) attributable to common interests in Operating Company and common stockholders | | (62,339 | ) | | (3,336 | ) | | (3,518 | ) | | (267,912 | ) | | (6,215 | ) | | 4,630 |
| | (160,189 | ) | | (498,879 | ) | | — |
| | (498,879 | ) |
| Adjustments for FFO: | | | | | | | | | | | | | | | | | | | | |
| Real estate depreciation and amortization | | 29,732 |
| | 15,661 |
| | 34,651 |
| | 10,353 |
| | 11,702 |
| | 1,751 |
| | — |
| | 103,850 |
| | 55,646 |
| | 159,496 |
|
| Impairment of real estate | | 36,868 |
| | — |
| | 419 |
| | 3,555 |
| | 9,563 |
| | — |
| | — |
| | 50,405 |
| | 37,195 |
| | 87,600 |
|
| Gain from sales of real estate | | — |
| | (184 | ) | | (140 | ) | | — |
| | (2,628 | ) | | — |
| | — |
| | (2,952 | ) | | (4,136 | ) | | (7,088 | ) |
| Less: Adjustments attributable to noncontrolling interests in investment entities | | — |
| | — |
| | — |
| | — |
| | — |
| | — |
| | — |
| | — |
| | (88,705 | ) | | (88,705 | ) |
| FFO | | $ | 4,261 |
| | $ | 12,141 |
| | $ | 31,412 |
| | $ | (254,004 | ) | | $ | 12,422 |
| | $ | 6,381 |
| | $ | (160,189 | ) | | $ | (347,576 | ) | | $ | — |
| | $ | (347,576 | ) |
| Additional adjustments for Core FFO: | | | | | | | | | | | | | | | | | | | | |
(Gains) and losses from sales of depreciable real estate within the Other Equity and Debt segment, net of depreciation, amortization and impairment previously adjusted for FFO(1) | | — |
| | — |
| | — |
| | — |
| | 1,658 |
| | — |
| | — |
| | 1,658 |
| | 1,627 |
| | 3,285 |
|
| (Gains) and losses from sales of businesses within the Investment Management segment and impairment write-downs associated with the Investment Management segment | | — |
| | — |
| | — |
| | — |
| | — |
| | 19,878 |
| | — |
| | 19,878 |
| | — |
| | 19,878 |
|
CLNC Core Earnings & NRE Cash Available for Distribution adjustments(2) | | — |
| | — |
| | — |
| | 266,276 |
| | (482 | ) | | — |
| | — |
| | 265,794 |
| | — |
| | 265,794 |
|
| Equity-based compensation expense | | 498 |
| | 689 |
| | 498 |
| | 987 |
| | 627 |
| | 2,796 |
| | 3,290 |
| | 9,385 |
| | — |
| | 9,385 |
|
| Straight-line rent revenue and expense | | (1,814 | ) | | (1,103 | ) | | 279 |
| | — |
| | (1,361 | ) | | 189 |
| | (23 | ) | | (3,833 | ) | | (2,933 | ) | | (6,766 | ) |
| Amortization of acquired above- and below-market lease values | | (1,512 | ) | | (341 | ) | | 3 |
| | (303 | ) | | (51 | ) | | — |
| | — |
| | (2,204 | ) | | (1,254 | ) | | (3,458 | ) |
| Amortization of deferred financing costs and debt premiums and discounts | | 8,840 |
| | 465 |
| | 3,655 |
| | 77 |
| | 2,952 |
| | 88 |
| | 1,661 |
| | 17,738 |
| | 6,948 |
| | 24,686 |
|
| Unrealized fair value gains or losses on interest rate and foreign currency hedges, and foreign currency remeasurements | | 1,490 |
| | (3 | ) | | — |
| | — |
| | 179 |
| | (6 | ) | | 86,705 |
| | 88,365 |
| | 768 |
| | 89,133 |
|
| Acquisition and merger-related transaction costs | | — |
| | — |
| | — |
| | 174 |
| | 236 |
| | 873 |
| | — |
| | 1,283 |
| | — |
| | 1,283 |
|
Merger integration and restructuring costs(3) | | — |
| | — |
| | — |
| | — |
| | — |
| | — |
| | 361 |
| | 361 |
| | — |
| | 361 |
|
| Amortization and impairment of investment management intangibles | | — |
| | — |
| | — |
| | — |
| | — |
| | 6,911 |
| | — |
| | 6,911 |
| | — |
| | 6,911 |
|
| Non-real estate depreciation and amortization | | — |
| | 46 |
| | — |
| | — |
| | — |
| | 7 |
| | 1,512 |
| | 1,565 |
| | — |
| | 1,565 |
|
| Amortization of gain on remeasurement of consolidated investment entities | | — |
| | — |
| | — |
| | — |
| | 14 |
| | — |
| | — |
| | 14 |
| | 14 |
| | 28 |
|
| Deferred tax (benefit) expense, net | | — |
| | — |
| | — |
| | — |
| | — |
| | (2,119 | ) | | (85 | ) | | (2,204 | ) | | — |
| | (2,204 | ) |
| Less: Adjustments attributable to noncontrolling interests in investment entities | | — |
| | — |
| | — |
| | — |
| | — |
| | — |
| | — |
| | — |
| | (5,170 | ) | | (5,170 | ) |
| Core FFO | | $ | 11,763 |
| | $ | 11,894 |
| | $ | 35,847 |
| | $ | 13,207 |
| | $ | 16,194 |
| | $ | 34,998 |
| | $ | (66,768 | ) | | $ | 57,135 |
| | $ | — |
| | $ | 57,135 |
|
Notes:
| |
| (1) | Net of $3.1 million consolidated or $1.0 million CLNY OP share of depreciation, amortization and impairment charges previously adjusted to calculate FFO and Core Earnings. |
| |
| (2) | Represents adjustments to align the Company’s Core FFO with CLNC’s definition of Core Earnings and NRE’s definition of Cash Available for Distribution (“CAD”) to reflect the Company’s percentage interest in the respective company’s earnings. These adjustments include provisions for loan losses, realized gains and losses plus other differences that are included/excluded in CLNC’s core earnings and NRE’s CAD. |
| |
| (3) | Merger integration and restructuring costs represent costs and charges incurred during the integration of Colony, NSAM and NRF and from the corporate restructuring and reorganization plan. These integration and restructuring costs are not reflective of the Company’s core operating performance and the Company does not expect to incur these costs subsequent to the completion of the merger integration and restructuring and reorganization plan. The majority of these costs consist of severance, employee costs of those separated or scheduled for separation, system integration and lease terminations. |
|
| | | |
Colony Capital | Supplemental Financial Report | | 23
| |
|
|
| IVa. Capitalization - Overview |
| |
|
| | | | | | | | | | | |
| ($ in thousands; except per share data; as of June 30, 2019, unless otherwise noted) | | | Consolidated amount | | CLNY OP share of consolidated amount |
| | | | | | |
| Debt (UPB) | | | | | |
| $750,000 Revolving credit facility | | | $ | 85,000 |
| | $ | 85,000 |
|
| Convertible/exchangeable senior notes | | | 616,105 |
| | 616,105 |
|
| Corporate aircraft promissory note | | | 36,143 |
| | 36,143 |
|
| Trust Preferred Securities ("TruPS") | | | 280,117 |
| | 280,117 |
|
| Investment-level debt: | | | | | |
| Healthcare | | | 3,022,747 |
| | 2,156,983 |
|
| Industrial | | | 2,022,391 |
| | 719,663 |
|
| Hospitality | | | 2,659,562 |
| | 2,488,688 |
|
| Other Equity and Debt | | | 2,236,419 |
| | 1,157,392 |
|
| Total investment-level debt | | | 9,941,119 |
| | 6,522,726 |
|
| Total debt | | | $ | 10,958,484 |
| | $ | 7,540,091 |
|
| | | | | | |
| Perpetual preferred equity, redemption value | | | | | |
| Total perpetual preferred equity | | | | | $ | 1,436,605 |
|
| | | | | | |
| Common equity as of August 6, 2019 | Price per share | | Shares / Units | | |
| Class A and B common stock | $ | 5.41 |
| | 487,700 |
| | $ | 2,638,457 |
|
OP units(1) | 5.41 |
| | 52,650 |
| | 284,837 |
|
| Total market value of common equity | | | | | $ | 2,923,294 |
|
| | | | | | |
| Total market capitalization | | | | | $ | 11,899,990 |
|
Notes:
| |
| (1) | Includes 21.5 million operating company units issued on July 25, 2019 for the acquisition of Digital Bridge Holdings. |
|
| | | |
Colony Capital | Supplemental Financial Report | | 24
| |
|
|
| IVb. Capitalization - Investment-Level Debt Overview |
| |
|
| | | | | | | | | | | | | | | | |
| ($ in thousands; as of or for the three months ended June 30, 2019, unless otherwise noted) |
| Non-recourse investment-level debt overview |
| | | | | Consolidated | | CLNY OP share of consolidated amount |
| | | Fixed / Floating | | Unpaid principal balance | | Unpaid principal balance | | Wtd. avg. years remaining to maturity | | Wtd. avg. interest rate(1) |
| Healthcare | | Fixed | | $ | 405,980 |
| | $ | 285,038 |
| | 5.6 |
| | 4.5 | % |
| Healthcare | | Floating | | 2,616,767 |
| | 1,871,945 |
| | 4.2 |
| | 6.0 | % |
Light Industrial(2) | | Fixed | | 1,476,256 |
| | 495,403 |
| | 8.9 |
| | 3.8 | % |
Light Industrial(2) | | Floating | | 311,135 |
| | 104,410 |
| | 4.6 |
| | 3.8 | % |
| Bulk Industrial | | Floating | | 235,000 |
| | 119,850 |
| | 4.6 |
| | 4.4 | % |
| Hospitality | | Fixed | | 12,960 |
| | 12,636 |
| | 2.1 |
| | 13.0 | % |
| Hospitality | | Floating | | 2,646,602 |
| | 2,476,052 |
| | 3.5 |
| | 5.5 | % |
| Other Equity and Debt | | | | | | | | | | |
| Net lease real estate equity | | Fixed | | 107,608 |
| | 106,983 |
| | 3.5 |
| | 5.0 | % |
| Other real estate equity | | Fixed | | 58,310 |
| | 16,696 |
| | 3.7 |
| | 2.6 | % |
| Other real estate equity | | Floating | | 1,283,640 |
| | 672,819 |
| | 3.0 |
| | 4.9 | % |
| GP Co-investments | | Floating | | 785,744 |
| | 360,672 |
| | 2.6 |
| | 4.2 | % |
| GP Co-investments | | Fixed | | 1,117 |
| | 222 |
| | 4.1 |
| | 2.4 | % |
| Total investment-level debt | | | | $ | 9,941,119 |
| | $ | 6,522,726 |
| | 4.1 |
| | 5.3 | % |
| | | | | | | | | | | |
| Fixed / Floating Summary |
| Fixed | | | | $ | 2,062,231 |
| | $ | 916,978 |
| | | | |
| Floating | | | | 7,878,888 |
| | 5,605,748 |
| | | | |
| Total investment-level debt | | | | $ | 9,941,119 |
| | $ | 6,522,726 |
| | | | |
Notes:
| |
| (1) | Based on 1-month LIBOR of 2.40% and 3-month LIBOR of 2.32% for floating rate debt. |
| |
| (2) | $300 million consolidated or $101 million CLNY OP share of Light Industrial floating rate (LIBOR plus 135bps) term debt is categorized as fixed rate debt to reflect interest rate swaps resulting in an effective fixed rate of 3.50%. |
|
| | | |
Colony Capital | Supplemental Financial Report | | 25
| |
|
|
| IVc. Capitalization - Revolving Credit Facility Overview |
| |
|
| | | | |
| ($ in thousands, except as noted; as of June 30, 2019) | | |
| Revolving credit facility | | |
| Maximum principal amount | | $ | 750,000 |
|
| Amount outstanding | | 85,000 |
|
| Initial maturity | | January 11, 2021 |
|
| Fully-extended maturity | | January 10, 2022 |
|
| Interest rate | | LIBOR + 2.25% |
|
| | | |
| Financial covenants as defined in the Credit Agreement: | | Covenant level |
| Consolidated Tangible Net Worth | | Minimum $4,550 million |
Consolidated Fixed Charge Coverage Ratio(1) | | Minimum 1.30 to 1.00 |
Interest Coverage Ratio(2) | | Minimum 3.00 to 1.00 |
| Consolidated Leverage Ratio | | Maximum 0.65 to 1.00 |
| | | |
| Company status: As of June 30, 2019, CLNY is meeting all required covenant threshold levels |
Notes:
| |
| (1) | In the event the Fixed Charge Coverage Ratio is between 1.50 and 1.30 to 1.00, the borrowing base formula will be discounted by 10%. |
| |
| (2) | Interest Coverage Ratio represents the ratio of the sum of (1) earnings from borrowing base assets and (2) certain investment management earnings divided by the greater of (a) actual interest expense on the revolving credit facility and (b) the average balance of the facility multiplied by 7.0% for the applicable quarter. |
|
| | | |
Colony Capital | Supplemental Financial Report | | 26
| |
|
|
| IVd. Capitalization - Corporate Securities Overview |
| |
|
| | | | | | | | | | | | | | | | | | | | |
| ($ in thousands, except per share data; as of June 30, 2019, unless otherwise noted) |
| Convertible/exchangeable debt |
| Description | | Outstanding principal | | Final due date | �� | Interest rate | | Conversion price (per share of common stock) | | Conversion ratio | | Conversion shares | | Redemption date |
| 5.0% Convertible senior notes | | $ | 200,000 |
| | April 15, 2023 | | 5.00% fixed | | $ | 15.76 |
| | 63.4700 |
| | 12,694 |
| | On or after April 22, 2020(1) |
| 3.875% Convertible senior notes | | 402,500 |
| | January 15, 2021 | | 3.875% fixed | | 16.57 |
| | 60.3431 |
| | 24,288 |
| | On or after January 22, 2019(1) |
| 5.375% Exchangeable senior notes | | 13,605 |
| | June 15, 2033 | | 5.375% fixed | | 12.04 |
| | 83.0837 |
| | 1,130 |
| | On or after June 15, 2020(1) |
| Total convertible debt | | $ | 616,105 |
| | | | | | | | | | | | |
|
| | | | | | | | |
| TruPS | | | | | | |
| Description | | Outstanding principal | | Final due date | | Interest rate |
| Trust I | | $ | 41,240 |
| | March 30, 2035 | | 3M L + 3.25% |
| Trust II | | 25,780 |
| | June 30, 2035 | | 3M L + 3.25% |
| Trust III | | 41,238 |
| | January 30, 2036 | | 3M L + 2.83% |
| Trust IV | | 50,100 |
| | June 30, 2036 | | 3M L + 2.80% |
| Trust V | | 30,100 |
| | September 30, 2036 | | 3M L + 2.70% |
| Trust VI | | 25,100 |
| | December 30, 2036 | | 3M L + 2.90% |
| Trust VII | | 31,459 |
| | April 30, 2037 | | 3M L + 2.50% |
| Trust VIII | | 35,100 |
| | July 30, 2037 | | 3M L + 2.70% |
| Total TruPS | | $ | 280,117 |
| | | | |
|
| | | | | | | | | |
| Perpetual preferred stock | | | | | | |
| Description | | Liquidation preference | | Shares outstanding (In thousands) | | Callable period |
| Series B 8.25% cumulative redeemable perpetual preferred stock | | $ | 152,855 |
| | 6,114 |
| | Callable |
| Series E 8.75% cumulative redeemable perpetual preferred stock | | 250,000 |
| | 10,000 |
| | Callable |
| Series G 7.5% cumulative redeemable perpetual preferred stock | | 86,250 |
| | 3,450 |
| | Callable |
| Series H 7.125% cumulative redeemable perpetual preferred stock | | 287,500 |
| | 11,500 |
| | On or after April 13, 2020 |
| Series I 7.15% cumulative redeemable perpetual preferred stock | | 345,000 |
| | 13,800 |
| | On or after June 5, 2022 |
| Series J 7.125% cumulative redeemable perpetual preferred stock | | 315,000 |
| | 12,600 |
| | On or after September 22, 2022 |
| Total preferred stock | | $ | 1,436,605 |
| | 57,464 |
| | |
Notes:
| |
| (1) | Callable at principal amount only if CLNY common stock has traded at least 130% of the conversion price for 20 of 30 consecutive trading days. |
|
| | | |
Colony Capital | Supplemental Financial Report | | 27
| |
|
|
| IVe. Capitalization - Debt Maturity and Amortization Schedules |
| |
|
| | | | | | | | | | | | | | | | | | | | | | | | |
| ($ in thousands; as of June 30, 2019) | | Payments due by period(1) |
| Consolidated debt | Fixed / Floating | 2019 | | 2020 | | 2021 | | 2022 | | 2023 and after | | Total |
| $750,000 Revolving credit facility | Floating | $ | — |
| | $ | — |
| | $ | — |
| | $ | 85,000 |
| | $ | — |
| | $ | 85,000 |
|
| Convertible/exchangeable senior notes | Fixed | — |
| | — |
| | 402,500 |
| | — |
| | 213,605 |
| | 616,105 |
|
| Corporate aircraft promissory note | Fixed | 1,077 |
| | 2,243 |
| | 2,359 |
| | 2,480 |
| | 27,984 |
| | 36,143 |
|
| TruPS | Floating | — |
| | — |
| | — |
| | — |
| | 280,117 |
| | 280,117 |
|
| Investment-level debt: | | | | | | | | | | | | |
| Healthcare | Fixed | — |
| | 6,809 |
| | 8,083 |
| | 9,068 |
| | 382,020 |
| | 405,980 |
|
| Healthcare | Floating | 304,145 |
| | 97,502 |
| | 280,486 |
| | 4,212 |
| | 1,930,422 |
| | 2,616,767 |
|
Light Industrial(2) | Fixed | 424 |
| | 5,825 |
| | 2,690 |
| | 6,736 |
| | 1,460,581 |
| | 1,476,256 |
|
Light Industrial(2) | Floating | — |
| | — |
| | — |
| | — |
| | 311,135 |
| | 311,135 |
|
| Bulk Industrial | Floating | — |
| | — |
| | — |
| | — |
| | 235,000 |
| | 235,000 |
|
| Hospitality | Fixed | — |
| | — |
| | 12,960 |
| | — |
| | — |
| | 12,960 |
|
| Hospitality | Floating | — |
| | 132,250 |
| | 207,552 |
| | 1,630,000 |
| | 676,800 |
| | 2,646,602 |
|
| Other Equity and Debt | Fixed | 36,845 |
| | 13,616 |
| | 13,772 |
| | 19,838 |
| | 82,964 |
| | 167,035 |
|
| Other Equity and Debt | Floating | 100,725 |
| | 211,468 |
| | 265,520 |
| | 1,027,685 |
| | 463,986 |
| | 2,069,384 |
|
| Total consolidated debt | | $ | 443,216 |
| | $ | 469,713 |
| | $ | 1,195,922 |
| | $ | 2,785,019 |
| | $ | 6,064,614 |
| | $ | 10,958,484 |
|
| |
| Pro rata debt | Fixed / Floating | 2019 | | 2020 | | 2021 | | 2022 | | 2023 and after | | Total |
| $750,000 Revolving credit facility | Floating | $ | — |
| | $ | — |
| | $ | — |
| | $ | 85,000 |
| | $ | — |
| | $ | 85,000 |
|
| Convertible/exchangeable senior notes | Fixed | — |
| | — |
| | 402,500 |
| | — |
| | 213,605 |
| | 616,105 |
|
| Corporate aircraft promissory note | Fixed | 1,077 |
| | 2,243 |
| | 2,359 |
| | 2,480 |
| | 27,984 |
| | 36,143 |
|
| TruPS | Floating | — |
| | — |
| | — |
| | — |
| | 280,117 |
| | 280,117 |
|
| Investment-level debt: | | | | | | | | | | | | |
| Healthcare | Fixed | — |
| | 4,781 |
| | 5,675 |
| | 6,366 |
| | 268,216 |
| | 285,038 |
|
| Healthcare | Floating | 215,678 |
| | 74,095 |
| | 224,990 |
| | 2,948 |
| | 1,354,234 |
| | 1,871,945 |
|
Light Industrial(2) | Fixed | 142 |
| | 1,955 |
| | 903 |
| | 2,261 |
| | 490,142 |
| | 495,403 |
|
Light Industrial(2) | Floating | — |
| | — |
| | — |
| | — |
| | 104,410 |
| | 104,410 |
|
| Bulk Industrial | Floating | — |
| | — |
| | — |
| | — |
| | 119,850 |
| | 119,850 |
|
| Hospitality | Fixed | — |
| | — |
| | 12,636 |
| | — |
| | — |
| | 12,636 |
|
| Hospitality | Floating | — |
| | 132,250 |
| | 202,363 |
| | 1,464,639 |
| | 676,800 |
| | 2,476,052 |
|
| Other Equity and Debt | Fixed | 28,326 |
| | 4,944 |
| | 5,055 |
| | 6,815 |
| | 78,761 |
| | 123,901 |
|
| Other Equity and Debt | Floating | 65,959 |
| | 46,266 |
| | 239,190 |
| | 525,554 |
| | 156,522 |
| | 1,033,491 |
|
| Total pro rata debt | | $ | 311,182 |
| | $ | 266,534 |
| | $ | 1,095,671 |
| | $ | 2,096,063 |
| | $ | 3,770,641 |
| | $ | 7,540,091 |
|
Notes:
| |
| (1) | Based on initial maturity dates or extended maturity dates to the extent criteria are met and the extension option is at the borrower’s discretion. |
| |
| (2) | $300 million consolidated or $101 million CLNY OP share of Light Industrial floating rate (LIBOR plus 135bps) term debt is categorized as fixed rate debt to reflect interest rate swaps resulting in an effective fixed rate of 3.50%. |
|
| | | |
Colony Capital | Supplemental Financial Report | | 28
| |
|
|
| Va. Healthcare Real Estate - Summary Metrics and Operating Results |
| |
|
| | | | | | | | |
| ($ in thousands; as of or for the three months ended June 30, 2019, unless otherwise noted) | | Consolidated amount | | CLNY OP share of consolidated amount(1) |
| Net operating income | | |
| Net operating income: | | | | |
| Senior Housing - Operating | | $ | 16,468 |
| | $ | 11,676 |
|
| Medical Office Buildings | | 13,481 |
| | 9,558 |
|
| Triple-Net Lease: | | | | |
Senior Housing(2) | | 15,290 |
| | 10,841 |
|
Skilled Nursing Facilities(3) | | 26,895 |
| | 19,069 |
|
| Hospitals | | 4,985 |
| | 3,534 |
|
| Total net operating income | | $ | 77,119 |
| | $ | 54,678 |
|
|
| | | | | | | | | | | | | |
| Portfolio overview | | Total number of buildings | | Capacity | | % Occupied(4) | | TTM Lease Coverage(5) | | WA Remaining Lease Term |
| Senior Housing - Operating | | 108 |
| | 6,388 units | | 84.8 | % | | N/A | | N/A |
|
| Medical Office Buildings | | 108 |
| | 3.8 million sq. ft. | | 82.3 | % | | N/A | | 4.5 |
|
| Triple-Net Lease: | | | | | | | | | | |
| Senior Housing | | 84 |
| | 4,231 units | | 80.9 | % | | 1.3x | | 11.2 |
|
| Skilled Nursing Facilities | | 99 |
| | 11,829 beds | | 83.3 | % | | 1.2x | | 5.6 |
|
| Hospitals | | 14 |
| | 872 beds | | 63.4 | % | | 2.4x | | 9.7 |
|
| Total | | 413 |
| | | |
|
| | | |
|
|
|
| | | | | | | | | | | | | | | | | | | | | |
| Same store financial/operating results related to the segment | | | | | | |
| | | % Occupied(4) | | TTM Lease Coverage(5) | | NOI |
| | | Q2 2019 | | Q1 2019 | | 3/31/2019 | | 12/31/2018 | | Q2 2019 | | Q1 2019 | | % Change |
| Senior Housing - Operating | | 84.8 | % | | 86.7 | % | | N/A | | N/A | | $ | 16,480 |
| | $ | 17,335 |
| | (4.9 | )% |
| Medical Office Buildings | | 82.3 | % | | 82.4 | % | | N/A | | N/A | | 13,481 |
| | 12,424 |
| | 8.5 | % |
| Triple-Net Lease: | | | | | | | | | | | | | | |
| Senior Housing | | 80.9 | % | | 82.1 | % | | 1.3x | | 1.3x | | 15,290 |
| | 15,373 |
| | (0.5 | )% |
Skilled Nursing Facilities(3) | | 83.3 | % | | 82.4 | % | | 1.2x | | 1.2x | | 26,895 |
| | 25,750 |
| | 4.4 | % |
| Hospitals | | 63.4 | % | | 58.5 | % | | 2.4x | | 2.3x | | 4,985 |
| | 5,363 |
| | (7.0 | )% |
| Total | | | | | | | | | | $ | 77,131 |
| | $ | 76,245 |
| | 1.2 | % |
Notes:
| |
| (1) | CLNY OP Share represents Consolidated NOI multiplied by CLNY OP's interest of 71% as of June 30, 2019. |
| |
| (2) | NOI includes $0.9 million consolidated or $0.7 million CLNY OP share of interest earned related to $50 million consolidated or $35 million CLNY OP share carrying value of healthcare real estate development loans. This interest income is in the Interest Income line item on the Company’s Statement of Operations for the three months ended June 30, 2019. For a reconciliation of net income/(loss) attributable to common stockholders to NOI, please refer to the appendix to this presentation. |
(3) Second quarter 2019 NOI included $0.9 million of consolidated or $0.7 million CLNY OP share of one-time recovery of uncollectible rents in the skilled nursing facilities portfolio.
| |
| (4) | Occupancy % for Senior Housing - Operating represents average of the presented quarter, MOB’s is as of last day in the quarter and for Triple-Net Lease represents average of the prior quarter. Occupancy represents real estate property operator’s patient occupancy for all types except MOB. |
| |
| (5) | Represents the ratio of the tenant's/operator's EBITDAR to cash rent payable to the Company's Healthcare Real Estate segment on a trailing twelve month basis. Refer to Important Notes Regarding Non-GAAP Financial Measures and Definitions pages in this presentation for additional information regarding the use of tenant/operator EBITDAR. |
|
| | | |
Colony Capital | Supplemental Financial Report | | 29
| |
|
|
| Vb. Healthcare Real Estate - Portfolio Overview |
| |
|
| | | | | | | | | | | | | | | |
| (As of or for the three months ended June 30, 2019, unless otherwise noted) |
Triple-Net Lease Coverage(1) | | | | % of Triple-Net Lease TTM NOI as of March 31, 2019 | | |
| March 31, 2019 TTM Lease Coverage | | # of Leases | | Senior Housing | | Skilled Nursing Facilities & Hospitals | | % Triple-Net Lease NOI | | WA Remaining Lease Term |
| Less than 0.99x | | 7 |
| | 6 | % | | 19 | % | | 25 | % | | 5 yrs |
|
| 1.00x - 1.09x | | 1 |
| | — | % | | 10 | % | | 10 | % | | 8 yrs |
|
| 1.10x - 1.19x | | 1 |
| | 4 | % | | — | % | | 4 | % | | 9 yrs |
|
| 1.20x - 1.29x | | 1 |
| | — | % | | 11 | % | | 11 | % | | 9 yrs |
|
| 1.30x - 1.39x | | 3 |
| | 20 | % | | 8 | % | | 28 | % | | 11 yrs |
|
| 1.40x - 1.49x | | — |
| | — | % | | — | % | | — | % | | — |
|
| 1.50x and greater | | 4 |
| | 2 | % | | 20 | % | | 22 | % | | 4 yrs |
|
| Total / W.A. | | 17 |
| | 32 | % | | 68 | % | | 100 | % | | 8 yrs |
|
|
| | | | | | | | | |
Revenue Mix(2) | | March 31, 2019 TTM |
| | | Private Pay | | Medicare | | Medicaid |
| Senior Housing - Operating | | 86 | % | | 4 | % | | 10 | % |
| Medical Office Buildings | | 100 | % | | — | % | | — | % |
| Triple-Net Lease: | | | | | | |
| Senior Housing | | 63 | % | | — | % | | 37 | % |
| Skilled Nursing Facilities | | 27 | % | | 20 | % | | 53 | % |
| Hospitals | | 14 | % | | 42 | % | | 44 | % |
| W.A. | | 59 | % | | 10 | % | | 31 | % |
Notes:
| |
| (1) | Represents the ratio of the tenant's/operator's EBITDAR to cash rent payable to the Company's Healthcare Real Estate segment on a trailing twelve month basis. Refer to Important Notes Regarding Non-GAAP Financial Measures and Definitions pages in this presentation for additional information regarding the use of tenant/operator EBITDAR. Represents leases with EBITDAR coverage in each listed range. Excludes interest income associated with triple-net lease senior housing and hospital types. Caring Homes (U.K.) lease (EBITDAR) coverage includes additional collateral provided by the operator. |
| |
| (2) | Revenue mix represents percentage of revenues derived from private, Medicare and Medicaid payor sources. The payor source percentages for the hospital category excludes two operating partners, whom do not track or report payor source data and totals approximately one-third of NOI in the hospital category. Overall percentages are weighted by NOI exposure in each category. |
|
| | | |
Colony Capital | Supplemental Financial Report | | 30
| |
|
|
| Vb. Healthcare Real Estate - Portfolio Overview (cont’d) |
| |
|
| | | | | | | |
| ($ in thousands; as of or for the three months ended June 30, 2019, unless otherwise noted) |
| Top 10 Geographic Locations by NOI |
| | | Number of buildings | | NOI |
| United Kingdom | | 45 |
| | $ | 8,986 |
|
| Indiana | | 55 |
| | 7,309 |
|
| Illinois | | 35 |
| | 6,794 |
|
| Florida | | 27 |
| | 6,638 |
|
| Georgia | | 22 |
| | 5,309 |
|
| Pennsylvania | | 11 |
| | 4,920 |
|
| Texas | | 31 |
| | 4,585 |
|
| Oregon | | 31 |
| | 4,381 |
|
| Ohio | | 35 |
| | 4,285 |
|
| California | | 14 |
| | 3,869 |
|
| Total | | 306 |
| | $ | 57,076 |
|
|
| | | | | | | | | | | | | | | | |
| Top 10 Operators/Tenants by NOI |
| | | Property Type/Primary Segment | | Number of buildings | | NOI | | % Occupied | | TTM Lease Coverage | | WA Remaining Lease Term |
| Senior Lifestyle | | Sr. Housing / RIDEA | | 81 |
| | $ | 13,363 |
| | 87.0 | % | | N/A | | N/A |
Caring Homes (U.K.)(1) | | Sr. Housing / NNN | | 45 |
| | 9,932 |
| | 86.7 | % | | 1.4x | | 14 yrs |
Wellington Healthcare(2) | | SNF / NNN | | 11 |
| | 5,507 |
| | 90.0 | % | | 1.0x | | 8 yrs |
| Sentosa | | SNF / NNN | | 11 |
| | 4,920 |
| | 85.0 | % | | 1.2x | | 9 yrs |
| Millers | | SNF / NNN | | 28 |
| | 3,925 |
| | 71.0 | % | | 1.9x | | N/A |
| Frontier | | Sr. Housing / RIDEA / NNN | | 20 |
| | 3,439 |
| | 82.0 | % | | N/A | | N/A |
| Opis | | SNF / NNN | | 11 |
| | 2,880 |
| | 92.0 | % | | 1.4x | | 5 yrs |
| Grace | | SNF / NNN | | 9 |
| | 2,665 |
| | 81.0 | % | | 0.9x | | 2 yrs |
| Avanti Hospital Systems | | Hospital | | 5 |
| | 2,361 |
| | 57.0 | % | | 3.7x | | 8 yrs |
| Consulate | | SNF / NNN | | 10 |
| | 2,350 |
| | 89.0 | % | | 1.0x | | 9 yrs |
| Total | | | | 231 |
| | $ | 51,342 |
| | | | | | |
Notes:
| |
| (1) | Caring Homes (U.K.) lease (EBITDAR) coverage includes additional collateral provided by the operator. |
(2) Second quarter 2019 NOI included $0.9 million of consolidated or $0.7 million CLNY OP share of one-time recovery of uncollectible rents.
|
| | | |
Colony Capital | Supplemental Financial Report | | 31
| |
|
|
| VIa. Industrial Real Estate - Summary Metrics and Operating Results |
| |
|
| | | | | | | | |
| ($ in thousands; as of or for the three months ended June 30, 2019, unless otherwise noted) | | Consolidated amount(1) | | CLNY OP share of consolidated amount(1) |
| Net operating income | | |
| Light Industrial | | $ | 59,287 |
| | $ | 19,896 |
|
| Bulk Industrial | | 2,952 |
| | 1,506 |
|
| Total Industrial | | $ | 62,239 |
| | $ | 21,402 |
|
|
| | | | | | | | | |
| Portfolio overview | | Light | | Bulk | | Total |
| Total number of buildings | | 446 |
| | 6 |
| | 452 |
|
| Rentable square feet (thousands) | | 55,728 |
| | 4,183 |
| | 59,911 |
|
| % leased at end of period | | 91.6 | % | | 67.4 | % | |
|
|
| Average remaining lease term | | 3.9 |
| | 11.7 |
| |
|
|
|
| | | | | | | | | | | |
| Light industrial same store financial/operating results | | Q2 2019 | | Q1 2019 | | % Change |
| Same store number of buildings | | 312 |
| | 312 |
| | — |
|
| % leased at end of period | | 94.6 | % | | 95.1 | % | | (0.5 | )% |
| NOI | | $ | 42,315 |
| | $ | 41,919 |
| | 0.9 | % |
|
| | | | | | | | | | | | | | | |
| Recent acquisitions & dispositions | | Acquisition / Disposition date | | Number of buildings | | Rentable square feet (thousands) | | % leased | | Purchase price / Sales price |
| Q2 2019 acquisitions: | | | | | | | | | | |
| Orlando industrial property | | 5/8/2019 | | 1 |
| | 160 |
| | — | % | | $ | 15,500 |
|
| Atlanta industrial property | | 5/29/2019 | | 1 |
| | 120 |
| | 100.0 | % | | 12,275 |
|
| Northern New Jersey industrial portfolio | | 6/10/2019 | | 30 |
| | 1,350 |
| | 99.7 | % | | 177,500 |
|
| Land for development | | Various | | N/A |
| | N/A |
| | N/A |
| | 14,450 |
|
| Total / W.A. | | | | 32 |
| | 1,630 |
| | 89.9 | % | | $ | 219,725 |
|
| | | | | | | | | | | |
| Q2 2019 dispositions: | | | | | | | | | | |
| New Jersey industrial property | | 6/11/2019 | | 1 |
| | 76 |
| | N/A |
| | $ | 3,750 |
|
| Total / W.A. | | | | 1 |
| | 76 |
| | N/A |
| | $ | 3,750 |
|
Notes:
* As of June 30, 2019, the industrial segment met the criteria as held for sale and discontinued operations. Accordingly, for all prior periods presented, the related assets and liabilities were reclassified as assets and liabilities held for sale on the consolidated balance sheets and the related operating results were reclassified as income from discontinued operations on the consolidated statement of operations.
| |
| (1) | CLNY OP Share represents Consolidated NOI multiplied by CLNY OP's light industrial portfolio interest of 34% and bulk industrial portfolio interest of 51% as of June 30, 2019. For a reconciliation of net income/(loss) attributable to common stockholders to NOI, please refer to the appendix to this presentation. |
|
| | | |
Colony Capital | Supplemental Financial Report | | 32
| |
|
|
| VIb. Industrial Real Estate - Portfolio Overview |
| |
|
| | | | | | | | | | | | | |
| ($ in thousands; as of or for the three months ended June 30, 2019, unless otherwise noted) | | | | |
| Top 10 Geographic Locations by NOI - Light Industrial Portfolio | | Number of buildings | | Rentable square feet (thousands) | | NOI | | % leased at end of period |
| Atlanta | | 54 |
| | 6,979 |
| | $ | 7,289 |
| | 99.1 | % |
| Dallas | | 63 |
| | 6,982 |
| | 7,269 |
| | 95.6 | % |
| Chicago | | 37 |
| | 5,128 |
| | 4,830 |
| | 87.2 | % |
| Orlando | | 18 |
| | 3,011 |
| | 3,738 |
| | 94.7 | % |
| Minneapolis | | 18 |
| | 2,814 |
| | 3,594 |
| | 95.7 | % |
| Phoenix | | 27 |
| | 3,100 |
| | 3,346 |
| | 97.7 | % |
| Baltimore | | 23 |
| | 2,956 |
| | 3,345 |
| | 93.8 | % |
| Philadelphia | | 25 |
| | 3,159 |
| | 2,972 |
| | 88.7 | % |
| Northern New Jersey | | 41 |
| | 2,261 |
| | 2,666 |
| | 99.8 | % |
| Jacksonville | | 13 |
| | 2,305 |
| | 2,261 |
| | 87.1 | % |
| Total / W.A. | | 319 |
| | 38,695 |
| | $ | 41,310 |
| | 94.3 | % |
|
| | | | | | |
| Top 10 Tenant Base by Industry - Light Industrial Portfolio | | | | |
| Industry | | Total leased square feet (thousands) | | % of total |
| Warehousing & Transportation | | 21,659 |
| | 42.4 | % |
| Manufacturing | | 9,050 |
| | 17.8 | % |
| Professional, Scientific & Technical Services | | 4,786 |
| | 9.4 | % |
| Wholesale Trade | | 4,758 |
| | 9.3 | % |
| Health & Science | | 3,510 |
| | 6.9 | % |
| Media & Information | | 2,645 |
| | 5.2 | % |
| Construction & Contractors | | 2,146 |
| | 4.2 | % |
| Retail Trade | | 1,610 |
| | 3.2 | % |
| Entertainment & Recreation | | 723 |
| | 1.4 | % |
| Public Administration & Government | | 84 |
| | 0.2 | % |
| Total | | 50,971 |
| | 100.0 | % |
Notes:
* As of June 30, 2019, the industrial segment met the criteria as held for sale and discontinued operations. Accordingly, for all prior periods presented, the related assets and liabilities were reclassified as assets and liabilities held for sale on the consolidated balance sheets and the related operating results were reclassified as income from discontinued operations on the consolidated statement of operations.
|
| | | |
Colony Capital | Supplemental Financial Report | | 33
| |
|
|
| VIIa. Hospitality Real Estate - Summary Metrics and Operating Results |
| |
|
| | | | | | | | |
| ($ in thousands; as of or for the three months ended June 30, 2019, unless otherwise noted) | | | | CLNY OP share of consolidated amount(1) |
| NOI before FF&E Reserve | | Consolidated amount | |
| NOI before FF&E Reserve: | | | | |
| Select Service | | $ | 45,701 |
| | $ | 43,096 |
|
| Extended Stay | | 32,723 |
| | 30,858 |
|
| Full Service | | 4,272 |
| | 4,028 |
|
Total NOI before FF&E Reserve(2) | | $ | 82,696 |
| | $ | 77,982 |
|
|
| | | | | | | | | | | | | | | | | | | | | | | | |
| Portfolio overview by type | | | | | | | | | | | | | | |
| | | Number of hotels | | Number of rooms | | Avg. qtr. % occupancy | | Avg. daily rate (ADR) | | RevPAR | | Q2 2019 NOI before FF&E Reserve | | NOI before FF&E Reserve margin |
| Select service | | 94 |
| | 12,762 |
| | 76.0 | % | | $ | 128 |
| | $ | 98 |
| | $ | 45,701 |
| | 35.7 | % |
| Extended stay | | 66 |
| | 7,936 |
| | 83.0 | % | | 135 |
| | 112 |
| | 32,723 |
| | 39.3 | % |
| Full service | | 4 |
| | 966 |
| | 78.2 | % | | 168 |
| | 132 |
| | 4,272 |
| | 27.3 | % |
| Total / W.A. | | 164 |
| | 21,664 |
| | 78.6 | % | | $ | 133 |
| | $ | 104 |
| | $ | 82,696 |
| | 36.4 | % |
|
| | | | | | | | | | | | | | | | | | | | | | | | | | | | | | | | | |
| Same store financial/operating results related to the segment by brand | | | | | | | | | | |
| | | Avg. qtr. % occupancy | | Avg. daily rate (ADR) | | RevPAR | | NOI before FF&E Reserve |
| Brand | | Q2 2019 | | Q2 2018 | | Q2 2019 | | Q2 2018 | | Q2 2019 | | Q2 2018 | | Q2 2019 | | Q2 2018 | | % Change |
| Marriott | | 77.5 | % | | 78.5 | % | | $ | 132 |
| | $ | 131 |
| | $ | 102 |
| | $ | 103 |
| | $ | 63,530 |
| | $ | 65,725 |
| | (3.3 | )% |
| Hilton | | 82.1 | % | | 83.9 | % | | 135 |
| | 135 |
| | 110 |
| | 113 |
| | 14,237 |
| | 14,846 |
| | (4.1 | )% |
| Other | | 87.4 | % | | 86.3 | % | | 141 |
| | 138 |
| | 123 |
| | 119 |
| | 4,515 |
| | 4,349 |
| | 3.8 | % |
| Total / W.A. | | 78.7 | % | | 79.8 | % | | $ | 133 |
| | $ | 132 |
| | $ | 105 |
| | $ | 106 |
| | $ | 82,282 |
| | $ | 84,920 |
| | (3.1 | )% |
Notes:
| |
| (1) | CLNY OP Share represents Consolidated NOI before FF&E Reserve multiplied by CLNY OP's interest of 94% as of June 30, 2019. |
| |
| (2) | Q2 2019 FF&E reserve was $10.0 million consolidated or $9.4 million CLNY OP share. For a reconciliation of net income/(loss) attributable to common stockholders to NOI please refer to the appendix to this presentation. |
|
| | | |
Colony Capital | Supplemental Financial Report | | 34
| |
|
|
| VIIb. Hospitality Real Estate - Portfolio Overview |
| |
|
| | | | | | | | | | | | | | | | | | | |
| ($ in thousands; as of June 30, 2019, unless otherwise noted) |
| Top 10 Geographic Locations by NOI before FF&E Reserve | | Number of hotels | | Number of rooms | | Number of rooms-select service | | Number of rooms-extended stay | | Number of rooms-full service | | NOI before FF&E Reserve |
| California | | 18 |
| | 2,254 |
| | 1,243 |
| | 1,011 |
| | — |
| | $ | 12,679 |
|
| Texas | | 28 |
| | 3,230 |
| | 1,952 |
| | 1,278 |
| | — |
| | 8,669 |
|
| Florida | | 12 |
| | 2,065 |
| | 1,187 |
| | 291 |
| | 587 |
| | 8,110 |
|
| New Jersey | | 12 |
| | 1,884 |
| | 718 |
| | 942 |
| | 224 |
| | 6,022 |
|
| Virginia | | 10 |
| | 1,327 |
| | 1,064 |
| | 263 |
| | — |
| | 5,028 |
|
| North Carolina | | 7 |
| | 981 |
| | 831 |
| | 150 |
| | — |
| | 4,070 |
|
| New York | | 8 |
| | 1,010 |
| | 710 |
| | 300 |
| | — |
| | 4,053 |
|
| Washington | | 5 |
| | 664 |
| | 160 |
| | 504 |
| | — |
| | 3,848 |
|
| Maryland | | 7 |
| | 953 |
| | 666 |
| | 132 |
| | 155 |
| | 3,242 |
|
| Michigan | | 6 |
| | 809 |
| | 601 |
| | 208 |
| | — |
| | 2,952 |
|
| Total / W.A. | | 113 |
| | 15,177 |
| | 9,132 |
| | 5,079 |
| | 966 |
| | $ | 58,673 |
|
|
| | | |
Colony Capital | Supplemental Financial Report | | 35
| |
|
| | | | | | | | |
| ($ in thousands, except as noted and per share data; as of June 30, 2019, unless otherwise noted) | | Consolidated amount | | CLNY OP share of consolidated amount |
| Colony Credit Real Estate, Inc. (NYSE: CLNC) | | | | |
| CLNY OP interest in CLNC as of August 6, 2019 | | 36.4 | % | | 36.4 | % |
| CLNC shares beneficially owned by OP and common stockholders | | 48.0 million |
| | 48.0 million |
|
| CLNC share price as of August 6, 2019 | | $ | 15.65 |
| | $ | 15.65 |
|
| Total market value of CLNC shares | | $ | 750,214 |
| | $ | 750,214 |
|
| Net carrying value - CLNC | | $ | 743,015 |
| | $ | 743,015 |
|
| | | | | |
|
| | | |
Colony Capital | Supplemental Financial Report | | 36
| |
|
|
| IX. Other Equity and Debt Summary |
| |
|
| | | | | | | | | | | | | | | |
| ($ in thousands; as of June 30, 2019) | Consolidated amount | | CLNY OP share of consolidated amount |
| | Assets | | Equity | | Assets | | Equity |
Strategic(1) | | | | | | | |
| GP co-investments | $ | 2,755,573 |
| | $ | 1,879,642 |
| | $ | 1,175,934 |
| | $ | 707,308 |
|
| 11% interest in NRE | 86,581 |
| | 86,581 |
| | 86,581 |
| | 86,581 |
|
| Strategic Subtotal | 2,842,154 |
| | 1,966,223 |
| | 1,262,515 |
| | 793,889 |
|
| | | | | | | | |
Non-Strategic(1) | | | | | | | |
| Other real estate equity | 2,340,579 |
| | 998,627 |
| | 1,285,365 |
| | 595,850 |
|
| Net lease real estate equity | 185,055 |
| | 77,447 |
| | 184,034 |
| | 77,051 |
|
| Real estate debt | 392,393 |
| | 392,393 |
| | 273,567 |
| | 273,567 |
|
| CRE securities and real estate PE fund investments | 67,940 |
| | 67,940 |
| | 67,940 |
| | 67,940 |
|
| Non-Strategic Subtotal | 2,985,967 |
| | 1,536,407 |
| | 1,810,906 |
| | 1,014,408 |
|
| | | | | | | | |
| Other Equity and Debt Total | $ | 5,828,121 |
| | $ | 3,502,630 |
| | $ | 3,073,421 |
| | $ | 1,808,297 |
|
Notes:
| |
| (1) | For consolidated real estate equity assets, amounts include all components related to real estate assets, including tangible real estate and lease-related intangibles, and excludes accumulated depreciation, and for all other assets, amounts represent carrying value of investments. |
|
| | | |
Colony Capital | Supplemental Financial Report | | 37
| |
|
|
| IXa. Other Equity and Debt - Strategic Investments |
| |
|
| | | | | | | | |
| ($ in thousands, except as noted and per share data; as of June 30, 2019, unless otherwise noted) | | Consolidated amount | | CLNY OP share of consolidated amount |
| NorthStar Realty Europe Corp. (NYSE: NRE) | | | | |
| CLNY OP interest in NRE as of August 6, 2019 | | 11.1 | % | | 11.1 | % |
| NRE shares beneficially owned by OP and common stockholders | | 5.6 million |
| | 5.6 million |
|
| NRE share price as of August 6, 2019 | | $ | 17.07 |
| | $ | 17.07 |
|
| Total market value of NRE shares | | $ | 96,215 |
| | $ | 96,215 |
|
| Carrying value - NRE | | $ | 86,581 |
| | $ | 86,581 |
|
| | | | | |
| CLNY's GP Co-investments in CDCF IV Investments - CLNY's Most Recent Flagship Institutional Credit Fund | | | | |
Assets - carrying value(1) | | $ | 1,662,403 |
| | $ | 294,925 |
|
| Debt - UPB | | 508,606 |
| | 101,301 |
|
| Net carrying value | | $ | 1,153,797 |
| | $ | 193,624 |
|
| | | | | |
| NBV by Geography: | | | | |
| U.S. | | 32.9 | % | | 20.4 | % |
| Europe | | 67.1 | % | | 79.6 | % |
| Total | | 100.0 | % | | 100.0 | % |
| | | | | |
Other GP Co-investments (2) | | | | |
Assets - carrying value(3)(4) | | $ | 1,093,170 |
| | $ | 881,009 |
|
Debt - UPB(4) | | 367,325 |
| | 367,325 |
|
| Net carrying value | | $ | 725,845 |
| | $ | 513,684 |
|
Notes:
| |
| (1) | $724 million consolidated or $118 million CLNY OP share of assets are classified as Loans Receivable on the Company's balance sheet. |
| |
| (2) | Other GP co-investments represents: i) seed investments in certain registered investment companies sponsored by the Company, ii) investments in the general partnership of third party real estate operators primarily to seed investment commitments with their limited partners for which the Company will receive its share of earnings and incentive fees, or iii) general partnership capital in a fund or investment. |
| |
| (3) | $432 million consolidated or $397 million CLNY OP share of assets are classified as Loans Receivable on the Company's balance sheet. |
| |
| (4) | Debt includes $112 million of derivative liability with a corresponding derivative asset in Other GP Co-investments Assets above. |
|
| | | |
Colony Capital | Supplemental Financial Report | | 38
| |
|
|
IXb. Other Equity and Debt - Net Lease and Other Real Estate Equity |
| |
|
| | | | | | | | | | | | | | | | | | | | |
| ($ in thousands; as of June 30, 2019, unless otherwise noted) |
| Net Lease Real Estate Equity | | Number of buildings | | Rentable square feet (thousands) | | Consolidated amount | | CLNY OP share of consolidated amount | | % leased at end of period | | Weighted average remaining lease term |
| | | | | NOI(1) | | NOI(1) | | |
| U.S. office | | 3 |
| | 674 |
| | $ | 695 |
| | $ | 694 |
| | 85.7 | % | | 5.4 |
|
| Total / W.A. | | 3 |
| | 674 |
| | $ | 695 |
| | $ | 694 |
| | 85.7 | % | | 5.4 |
|
|
| | | | | | | | | | | | | | | | | | | | |
| Other Real Estate Equity | | Number of buildings | | Rentable square feet (thousands) | | Consolidated amount | | CLNY OP share of consolidated amount | | % leased at end of period | | Weighted average remaining lease term |
| | | | | Undepreciated carrying value | | Undepreciated carrying value | | |
| U.S.: | | | | | | | | | | | | |
| Office | | 9 |
| | 785 |
| | $ | 148,513 |
| | $ | 142,638 |
| | 63.3 | % | | 5.0 |
|
Hotel(2) | | 89 |
| | N/A |
| | 1,204,041 |
| | 663,684 |
| | 74.8 | % | | N/A |
|
| | | | | | | | | | | | | |
| Europe: | | | | | | | | | | | | |
| Office | | 15 |
| | 533 |
| | 74,541 |
| | 37,270 |
| | 77.3 | % | | 12.1 |
|
| Mixed / Retail | | 125 |
| | 3,576 |
| | 580,356 |
| | 187,896 |
| | 52.4 | % | | 4.5 |
|
| Total / W.A. | | 238 |
| | 4,894 |
| | $ | 2,007,451 |
| | $ | 1,031,488 |
| | 57.1 | % | | 5.4 |
|
| | | | | | | | | | | | | |
| Unconsolidated joint ventures (Other RE Equity) | | | | | | | | |
| Preferred equity: | | | | | | | | | | | | |
| Multifamily | | | | | | $ | 129,051 |
| | $ | 129,051 |
| | | | |
| | | | | | | | | | | | | |
| Equity & Other: | | | | | | | | | | | | |
| Albertsons | | | | | | 89,129 |
| | 44,565 |
| | | | |
| Residential Land | | | | | | 70,695 |
| | 36,008 |
| | | | |
| Other | | | | | | 28,742 |
| | 28,742 |
| | | | |
| Corporate CLO Equity | | | | | | 15,511 |
| | 15,511 |
| | | | |
| Total | |
|
| |
|
| | $ | 333,128 |
| | $ | 253,877 |
| | | | |
| | | | | | | | | | | | | |
Notes:
| |
| (1) | Second quarter 2019 net lease real estate equity NOI includes an aggregate $0.4 million deduction for prior year tenant expense reimbursement income and incremental rent concession for a new tenant taking partial space from an existing tenant. |
| |
| (2) | Includes $54 million consolidated or $30 million CLNY OP share of restricted cash. |
|
| | | |
Colony Capital | Supplemental Financial Report | | 39
| |
|
|
| IXc. Other Equity and Debt - Real Estate Debt |
| |
|
| | | | | | | | |
| ($ in thousands, except as noted; as of June 30, 2019, unless otherwise noted) | | | | |
Portfolio Overview(1) | | | | |
| | | Consolidated amount | | CLNY OP share of consolidated amount |
Non-PCI loans(2) | | | | |
| Carrying value - consolidated | | $ | 315,184 |
| | $ | 225,320 |
|
| Carrying value - equity method investments | | 17,234 |
| | 12,167 |
|
| | | | | . |
PCI loans(2) | | | | |
| Carrying value - consolidated | | 24,413 |
| | 13,800 |
|
| Carrying value - equity method investments | | 1,019 |
| | 1,019 |
|
| | | | | |
| Other | | | | |
| Carrying value - real estate assets (REO) | | 34,543 |
| | 21,261 |
|
| | | | | |
| Total Portfolio | | | | |
| Carrying value - consolidated | | 339,597 |
| | 239,120 |
|
| Carrying value - equity method investments | | 18,253 |
| | 13,186 |
|
| Carrying value - real estate assets (REO) | | 34,543 |
| | 21,261 |
|
| Non-recourse investment-level financing (UPB) | | — |
| | — |
|
Notes:
| |
| (1) | Excludes $50 million consolidated or $35 million CLNY OP share carrying value of healthcare real estate development loans. |
| |
| (2) | Strategic Non-PCI and PCI loans that are classified as Loans Receivable on the Company's balance sheet are categorized within GP co-investments in this supplemental financial presentation. |
|
| | | |
Colony Capital | Supplemental Financial Report | | 40
| |
|
|
| IXc. Other Equity and Debt - Real Estate Debt (cont’d) |
| |
|
| | | | | | | | | | | | | | |
| ($ in thousands; as of or for the three months ended June 30, 2019, unless otherwise noted) |
Non-strategic real estate debt by loan type(1) | | | | | | | | |
| | | Consolidated amount | | CLNY OP share of consolidated amount |
| | | Net carrying
amount | | Net carrying
amount | | Weighted average
yield | | Weighted average maturity in years |
Non-PCI loans(2) | | | | | | | | |
| Fixed rate | | | | | | | | |
| First mortgage loans | | $ | 33,988 |
| | $ | 16,994 |
| | — | % | | 0.9 |
|
| Second mortgage loans / B-notes | | 178,062 |
| | 99,832 |
| | 9.1 | % | | 1.8 |
|
| Mezzanine loans | | 61,758 |
| | 59,112 |
| | — | % | | 1.6 |
|
| Corporate | | 27,778 |
| | 27,778 |
| | 8.2 | % | | 7.5 |
|
| Total fixed rate non-PCI loans | | 301,586 |
| | 203,716 |
| | 5.6 | % | | 2.5 |
|
| | | | | | | | | |
| Variable rate | | | | | | | | |
| First mortgage loans | | 44,520 |
| | 44,520 |
| | 8.9 | % | | 1.5 |
|
| Total variable rate non-PCI loans | | 44,520 |
| | 44,520 |
| | 8.9 | % | | 1.5 |
|
| | | | | | | | | |
| Total non-PCI loans | | 346,106 |
| | 248,236 |
| | | | |
| Allowance for loan losses | | (30,922 | ) | | (22,916 | ) | | | | |
Total non-PCI loans, net of allowance for loan losses
| | 315,184 |
| | 225,320 |
| | | | |
| | | | | | | | | |
PCI loans(2) | | | | | | | | |
| First mortgage loans | | 39,723 |
| | 20,605 |
| | | | |
| Mezzanine loans | | 3,671 |
| | 3,671 |
| | | | |
| Total PCI loans | | 43,394 |
| | 24,276 |
| | | | |
| Allowance for loan losses | | (18,981 | ) | | (10,476 | ) | | | | |
| Total PCI loans, net of allowance for loan losses | | 24,413 |
| | 13,800 |
| | | | |
| | | | | | | | | |
| Total loans receivable, net of allowance for loan losses | | $ | 339,597 |
| | $ | 239,120 |
| | | | |
Notes:
| |
| (1) | Excludes $50 million consolidated or $35 million CLNY OP share carrying value of healthcare real estate development loans. |
| |
| (2) | Strategic Non-PCI and PCI loans that are classified as Loans Receivable on the Company's balance sheet are categorized within GP co-investments in this supplemental financial presentation. |
|
| | | |
Colony Capital | Supplemental Financial Report | | 41
| |
|
|
| IXc. Other Equity and Debt - Real Estate Debt (cont’d) |
| |
|
| | | | | | | | | | | | | | |
| ($ in thousands; as of or for the three months ended June 30, 2019, unless otherwise noted) | | | | | | |
Non-strategic real estate debt by collateral type(1) | | | | | | | | |
| | | Consolidated amount | | CLNY OP share of consolidated amount |
| | | Net carrying
amount | | Net carrying
amount | | Weighted average
yield | | Weighted average maturity in years |
Non-PCI Loans(2) | | | | | | | | |
| Retail | | $ | 117,979 |
| | $ | 112,829 |
| | 3.5 | % | | 1.4 |
|
| Office | | 140,296 |
| | 70,148 |
| | 13.0 | % | | 2.6 |
|
| Land | | 29,131 |
| | 14,565 |
| | — | % | | 0.9 |
|
| Corporate | | 27,778 |
| | 27,778 |
| | 8.2 | % | | 7.5 |
|
| Total non-PCI loans, net of allowance for loan losses | | 315,184 |
| | 225,320 |
| | 6.8 | % | | 2.5 |
|
| | | | | | | | | |
PCI Loans(2) | | | | | | | | |
| Retail | | 16,000 |
| | 8,237 |
| | | | |
| Office | | 4,731 |
| | 3,910 |
| | | | |
| Other | | 3,682 |
| | 1,653 |
| | | | |
| Total PCI loans, net of allowance for loan losses | | 24,413 |
| | 13,800 |
| | | | |
| | | | | | | | | |
| Total loans receivable, net of allowance for loan losses | | $ | 339,597 |
| | $ | 239,120 |
| | | | |
Notes:
| |
| (1) | Excludes $50 million consolidated or $35 million CLNY OP share carrying value of healthcare real estate development loans. |
| |
| (2) | Strategic Non-PCI and PCI loans that are classified as Loans Receivable on the Company's balance sheet are categorized within GP co-investments in this supplemental financial presentation. |
|
| | | |
Colony Capital | Supplemental Financial Report | | 42
| |
|
|
| IXd. Other Equity and Debt - CRE Securities and Real Estate PE Fund Interests |
| |
|
| | | | | |
| ($ in thousands; as of June 30, 2019) | | | |
| Portfolio Overview | | | Carrying Value |
| Deconsolidated CDO bonds | | | $ | 62,442 |
|
| Real estate PE fund interests | | | 5,498 |
|
| | | | |
| | | | |
| Core FFO | | | |
| Q2 2019 aggregate Core FFO | | | $ | 1,242 |
|
|
| | | |
Colony Capital | Supplemental Financial Report | | 43
| |
|
|
| Xa. Investment Management - Summary Metrics |
| |
|
| | | | |
| ($ in thousands, except as noted; as of June 30, 2019) | | Q2 2019 Fee Revenue - CLNY OP Share |
| Overview | |
Institutional funds(1) | | $ | 15,213 |
|
| Colony Credit Real Estate (NYSE:CLNC) | | 11,191 |
|
| NorthStar Realty Europe (NYSE:NRE) | | 3,847 |
|
| Retail companies | | 5,182 |
|
| Non-wholly owned REIM platforms (equity method earnings) | | 4,771 |
|
| Total reported fee revenue and REIM platform equity method earnings | | $ | 40,204 |
|
| Operating Results | | |
| Revenues | | |
| Total fee revenue and REIM earnings of investments in unconsolidated ventures | | $ | 40,204 |
|
| Interest Income and Other Income | | 8,369 |
|
| Expenses | | |
| Transaction costs | | 318 |
|
| Depreciation and amortization | | 6,918 |
|
| Compensation expense | | |
| Cash and equity-based compensation | | 17,332 |
|
| Carried interest and incentive compensation | | 1,146 |
|
| Administrative expenses | | 1,207 |
|
| Total expenses | | 26,921 |
|
| Other gain (loss), net | | 5 |
|
Equity method earnings(2) | | (21,900 | ) |
| Equity method earnings—carried interest | | 2,106 |
|
| Income tax benefit (expense) | | 266 |
|
| Income (loss) from discontinued operations | | 2,159 |
|
| Non-pro rata allocation of income (loss) to NCI | | 342 |
|
| Net income attributable to common interests in OP and common stockholders | | 4,630 |
|
| Real estate depreciation and amortization | | 1,751 |
|
| (Gains) and losses from sales of businesses and impairment write-downs associated with the Investment Management segment | | 19,878 |
|
| Equity-based compensation expense | | 2,796 |
|
| Straight-line rent revenue and expense | | 189 |
|
| Amortization of deferred financing costs and debt premiums and discounts | | 88 |
|
| Unrealized fair value gains or losses on interest rate and foreign currency hedges, and foreign currency remeasurements | | (6 | ) |
| Acquisition and merger-related transaction costs | | 873 |
|
| Amortization and impairment of investment management intangibles | | 6,911 |
|
| Non-real estate depreciation and amortization | | 7 |
|
| Deferred tax (benefit) expense, net | | (2,119 | ) |
| Core FFO | | $ | 34,998 |
|
Notes:
| |
| (1) | Includes $1 million of one-time advisory service fees. |
| |
| (2) | Includes a $20 million impairment as a result of a termination of future capital commitments to the Company's broker-dealer joint venture. |
|
| | | |
Colony Capital | Supplemental Financial Report | | 44
| |
|
|
| Xb. Investment Management – Assets Under Management |
| |
|
| | | | | | | | | | | | | | | |
| ($ in millions, except as noted; as of June 30, 2019, unless otherwise noted) | | | | |
| Segment | | Products (FEEUM) | | Description | | AUM CLNY OP Share | | FEEUM CLNY OP Share | | Fee Rate |
| | | | | | | | | | | |
| Institutional Funds | | • Credit ($2.5 billion) • Core plus / value-added ($0.1 billion) • Opportunistic ($0.5 billion) • Colony Industrial ($1.9 billion) • Colony Latam Partners ($0.5 billion) • Other co-investment vehicles ($1.3 billion) | | • 27 years of institutional investment management experience • Sponsorship of private equity funds and vehicles earning asset management fees and performance fees • More than 300 investor relationships • Colony Industrial Open-End Fund | | $ | 10,170 |
| | $ | 6,837 |
| | .8 | % |
| Public Companies | | • Colony Credit Real Estate, Inc. ($3.0 billion) • NorthStar Realty Europe Corp. ($1.0 billion) | | • CLNC: NYSE-listed credit focused REIT • NRE: NYSE-listed European equity REIT • Contracts with base management fees with potential for incentive fees | | 5,201 |
| | 4,045 |
| (1) | 1.5 | % |
| Retail Companies | | • NorthStar Healthcare ($1.3 billion)(2) • CC Real Estate Income Funds(3)(4) | | • Manage public non-traded vehicles earning asset management and performance fees | | 3,446 |
| | 1,365 |
| (2) | 1.5 | % |
| Non-Wholly Owned REIM Platforms | | • Digital Real Estate Infrastructure Co-sponsored Vehicle • RXR Realty • American Healthcare Investors • Hamburg Trust | | • CLNY recognizes at-share earnings from underlying non-wholly owned REIM platforms • 50% investment in Digital Colony, the Company's digital real estate infrastructure vehicle established in partnership with Digital Bridge with an aggregate $4 billion of committed capital • 27% investment in RXR Realty, a real estate owner, developer and investment management company with $20 billion of AUM • 43% investment in American Healthcare Investors, a healthcare investment management firm and sponsor of non-traded vehicles with $3 billion of AUM | | 9,752 |
| | 5,713 |
| | N/A |
|
| Total | | | | | | $ | 28,569 |
| | $ | 17,960 |
| |
|
Notes:
| |
| (1) | Subsequent to the second quarter 2019, NRE entered into a definitive agreement to be acquired. Upon closing of the sale of NRE, the Company’s management agreement with NRE will terminate and the Company will receive a balance of $65 million from the $70 million overall termination fee (a $5 million incentive fee was paid to the Company in the second quarter of 2019). |
| |
| (2) | FEEUM of NorthStar Healthcare Income represents its most recently published Net Asset Value. |
| |
| (3) | CC Real Estate Income Funds represents a master/feeder structure and pools investor capital raised through three feeder funds. |
| |
| (4) | In February 2019, the board of directors of CC Real Estate Income Fund approved a plan to dissolve, liquidate and terminate CCREIF and distribute the net proceeds of such liquidation to its shareholders. There is no assurances to the timing or completion of the liquidation. |
|
| | | |
Colony Capital | Supplemental Financial Report | | 45
| |
APPENDICES
|
| | | |
Colony Capital | Supplemental Financial Report | | 46
| |
|
|
| XIa. Appendices - Definitions |
| |
Assets Under Management (“AUM”)
Assets for which the Company and its affiliates provide investment management services, including assets for which the Company may or may not charge management fees and/or performance allocations. AUM is based on reported gross undepreciated carrying value of managed investments as reported by each underlying vehicle at June 30, 2019. AUM further includes a) uncalled capital commitments and b) includes the Company’s pro-rata share of each affiliate non wholly-owned real estate investment management platform’s assets as presented and calculated by the affiliate. Affiliates include the co-sponsored digital real estate infrastructure vehicle, RXR Realty LLC, American Healthcare Investors and Hamburg Trust. The Company's calculations of AUM may differ materially from the calculations of other asset managers, and as a result, this measure may not be comparable to similar measures presented by other asset managers.
CLNY Operating Partnership (“CLNY OP”)
The operating partnership through which the Company conducts all of its activities and holds substantially all of its assets and liabilities. CLNY OP share excludes noncontrolling interests in investment entities.
Fee-Earning Equity Under Management (“FEEUM”)
Equity for which the Company and its affiliates provides investment management services and derives management fees and/or performance allocations. FEEUM generally represents a) the basis used to derive fees, which may be based on invested equity, stockholders’ equity, or fair value pursuant to the terms of each underlying investment management agreement and b) the Company’s pro-rata share of fee bearing equity of each affiliate as presented and calculated by the affiliate. Affiliates include the co-sponsored digital real estate infrastructure vehicle, RXR Realty LLC, American Healthcare Investors and Hamburg Trust. The Company's calculations of FEEUM may differ materially from the calculations of other asset managers, and as a result, this measure may not be comparable to similar measures presented by other asset managers.
Healthcare same store portfolio: defined as properties in operation throughout the full periods presented under the comparison and included 413 properties in the comparisons. Properties acquired or disposed during these periods are excluded for the same store portfolio and same store results exclude certain non-recurring uncollectible rent.
Industrial same store portfolio: consisted of 312 buildings. The same store portfolio is defined once a year at the beginning of the current calendar year and includes buildings that were owned and stabilized throughout the entirety of both the current and prior calendar years. Properties acquired or disposed of after the same store portfolio is determined are excluded. Stabilized properties are defined as properties owned for more than one year or are greater than 90% leased. Same store NOI excludes lease termination fee revenue.
Hospitality same store portfolio: defined as hotels in operation throughout the full periods presented under the comparison and included 164 hotels.
NOI: Net Operating Income. NOI for the Company's real estate segments represents total property and related income less property operating expenses, adjusted for the effects of (i) straight-line rental income adjustments; (ii) amortization of acquired above- and below-market lease adjustments to rental income; and (iii) other items such as adjustments for the Company’s share of NOI of unconsolidated ventures.
NOI before FF&E Reserve: For our hospitality real estate segment, NOI before FF&E Reserve represents NOI before the deduction of reserve contributions for the repair, replacement and refurbishment of furniture, fixtures, and equipment ("FF&E"), which are typically 4% to 5% of revenues, and required under certain debt agreements and/or franchise and brand-managed hotel agreements.
|
| | | |
Colony Capital | Supplemental Financial Report | | 47
| |
|
|
| XIa. Appendices - Definitions |
| |
Earnings Before Interest, Tax, Depreciation, Amortization and Rent (“EBITDAR”)
Represents earnings before interest, taxes, depreciation, amortization and rent for facilities accruing to the tenant/operator of the property (not the Company) for the period presented. The Company uses EBITDAR in determining TTM Lease Coverage for triple-net lease properties in its Healthcare Real Estate segment. EBITDAR has limitations as an analytical tool. EBITDAR does not reflect historical cash expenditures or future cash requirements for facility capital expenditures or contractual commitments. In addition, EBITDAR does not represent a property's net income or cash flow from operations and should not be considered an alternative to those indicators. The Company utilizes EBITDAR as a supplemental measure of the ability of the Company's operators/tenants to generate sufficient liquidity to meet related obligations to the Company.
TTM Lease Coverage
Represents the ratio of EBITDAR to recognized cash rent for owned facilities on a trailing twelve month basis. TTM Lease Coverage is a supplemental measure of a tenant’s/operator’s ability to meet their cash rent obligations to the Company. However, its usefulness is limited by, among other things, the same factors that limit the usefulness of EBITDAR.
ADR: Average Daily Rate
RevPAR: Revenue per Available Room
UPB: Unpaid Principal Balance
PCI: Purchased Credit-Impaired
REIM: Real Estate Investment Management
|
| | | |
Colony Capital | Supplemental Financial Report | | 48
| |
|
|
| XIb. Appendices - Reconciliation of Net Income (Loss) to NOI |
| |
|
| | | | | | | | | | | | | | | | |
| ($ in thousands; for the three months ended June 30, 2019) | | | | | | | | |
| NOI Determined as Follows | | Healthcare | | Industrial | | Hospitality | | Other Equity and Debt—Net Lease Properties |
| Total revenues | | $ | 145,896 |
| | $ | 92,969 |
| | $ | 227,080 |
| | $ | 3,458 |
|
| Straight-line rent revenue and amortization of above- and below-market lease intangibles | | (4,817 | ) | | (4,067 | ) | | 316 |
| | (1,379 | ) |
| Interest income | | — |
| | (119 | ) | | (6 | ) | | — |
|
| Other income | | (36 | ) | | — |
| | (3 | ) | | — |
|
Property operating expenses(1) | | (63,924 | ) | | (25,669 | ) | | (144,691 | ) | | (1,384 | ) |
Compensation and administrative expense(1) | | — |
| | (875 | ) | | — |
| | — |
|
NOI(2) | | $ | 77,119 |
| | $ | 62,239 |
| | $ | 82,696 |
| | $ | 695 |
|
| | | | | | | | | |
| Reconciliation of Net Income (Loss) from Continuing Operations to NOI | |
| | | Healthcare | | Industrial | | Hospitality | | |
| Income (loss) | | $ | (81,520 | ) | | $ | (2,663 | ) | | $ | (3,505 | ) | | |
| Adjustments: | | | | | | | | |
| Straight-line rent revenue and amortization of above- and below-market lease intangibles | | (4,817 | ) | | (4,067 | ) | | 316 |
| | |
| Interest income | | — |
| | (119 | ) | | (6 | ) | | |
| Interest expense | | 57,135 |
| | 19,726 |
| | 41,591 |
| | |
| Transaction, investment and servicing costs | | 9,097 |
| | 8 |
| | 2,712 |
| | |
| Depreciation and amortization | | 40,778 |
| | 45,360 |
| | 37,008 |
| | |
| Impairment loss | | 51,324 |
| | — |
| | 420 |
| | |
| Compensation and administrative expense | | 2,301 |
| | 4,192 |
| | 2,183 |
| | |
| Gain on sale of real estate | | — |
| | (547 | ) | | (140 | ) | | |
| Other (gain) loss, net | | 2,261 |
| | 49 |
| | 114 |
| | |
| Other income | | (36 | ) | | — |
| | (3 | ) | | |
| Income tax (benefit) expense | | 596 |
| | 300 |
| | 2,006 |
| | |
NOI(2) | | $ | 77,119 |
| | $ | 62,239 |
| | $ | 82,696 |
| | |
Notes:
| |
| (1) | For healthcare and hospitality, property operating expenses includes property management fees paid to third parties. For industrial, there are direct costs of managing the portfolio which are included in compensation expense. |
| |
| (2) | For hospitality, NOI is before FF&E Reserve. |
|
| | | |
Colony Capital | Supplemental Financial Report | | 49
| |
|
|
| XIb. Appendices - Reconciliation of Net Income (Loss) to NOI (cont’d) |
| |
|
| | | | |
| ($ in thousands; for the three months ended June 30, 2019) | | |
| Reconciliation of Net Income from Continuing Operations of Other Equity and Debt Segment to NOI of Net Lease Real Estate Equity |
| | | Other Equity and Debt |
| Income from continuing operations | | $ | (4 | ) |
| Adjustments: | | |
| Property operating income of other real estate equity | | (113,452 | ) |
| Straight-line rent revenue and amortization of above- and below-market lease intangibles for net lease real estate equity | | (1,378 | ) |
| Interest income | | (32,983 | ) |
| Fee and other income | | (2,174 | ) |
| Property operating expense of other real estate equity | | 69,241 |
|
| Interest expense | | 29,216 |
|
| Transaction, investment and servicing costs | | 7,355 |
|
| Depreciation and amortization | | 23,166 |
|
| Provision for loan loss | | 15,003 |
|
| Impairment loss | | 32,302 |
|
| Compensation and administrative expense | | 3,696 |
|
| Gain on sale of real estate assets | | (5,937 | ) |
| Other loss, net | | 1,995 |
|
| Earnings of investments in unconsolidated ventures | | (25,757 | ) |
| Income tax expense | | 406 |
|
| NOI of net lease real estate equity | | $ | 695 |
|
|
| | | |
Colony Capital | Supplemental Financial Report | | 50
| |
|
|
| XIc. Appendices - Industrial Real Estate Segment Held For Sale |
| |
|
| | | | |
| ($ in thousands, except per share data) (unaudited) | | As of June 30, 2019 |
| Assets | | |
| Restricted cash | | 2,023 |
|
| Real estate, net | | 4,115,436 |
|
| Goodwill | | 20,000 |
|
| Deferred leasing costs and intangible assets, net | | 153,486 |
|
| Other assets | | 69,579 |
|
| Total assets | | $ | 4,360,524 |
|
| Liabilities | | |
| Debt, net | | $ | 2,004,201 |
|
| Accrued and other liabilities | | 90,462 |
|
| Intangible liabilities, net | | 14,012 |
|
| Total liabilities | | 2,108,675 |
|
|
| | | |
Colony Capital | Supplemental Financial Report | | 51
| |
|
|
| XIc. Appendices - Industrial Real Estate Segment Discontinued Operations |
| |
|
| | | | |
| ($ in thousands) (unaudited) | | Three Months Ended June 30, 2019 |
| Revenues | | |
| Property operating income | | $ | 91,741 |
|
| Interest income | | 119 |
|
| Other income | | 1,109 |
|
| Total revenues | | 92,969 |
|
| Expenses | | |
| Property operating expense | | 25,669 |
|
| Interest expense | | 19,726 |
|
| Investment and servicing expense | | 8 |
|
| Depreciation and amortization | | 45,360 |
|
| Compensation expense | | |
| Cash and equity-based compensation | | 3,680 |
|
| Administrative expenses | | 1,387 |
|
| Total expenses | | 95,830 |
|
| Other income (loss) | | |
| Gain on sale of real estate assets | | 547 |
|
| Other gain (loss), net | | (49 | ) |
| Income (loss) before income taxes | | (2,363 | ) |
| Income tax benefit (expense) | | (300 | ) |
| Income (loss) from continuing operations | | (2,663 | ) |
| Net income (loss) | | (2,663 | ) |
| Net income (loss) attributable to noncontrolling interests: | | |
| Investment entities | | 673 |
|
| Operating Company | | (201 | ) |
| Net income (loss) attributable to Colony Capital, Inc. | | (3,135 | ) |
| Net income (loss) attributable to common stockholders | | $ | (3,135 | ) |
|
| | | |
Colony Capital | Supplemental Financial Report | | 52
| |